Embed Size (px)
Citation preview
An 800-Year Record of AtmosphericAs, Mo, Sn, and Sb in Central Asiain High-Altitude Ice Cores from Mt.Qomolangma (Everest), HimalayasS U N G M I N H O N G , * , † K H A N G H Y U N L E E , † , ‡
S H U G U I H O U , § , | S O O N D O H U R , †
J I A W E N R E N , § L A U R I E J . B U R N , ⊥
K E V I N J . R . R O S M A N , # , ⊥
C A R L O B A R B A N T E , ∇ , O A N DC L A U D E F . B O U T R O N [ , ¶
Korea Polar Research Institute, Songdo Techno Park, 7-50,Songdo-dong, Yeonsu-gu, Incheon 406-840, Korea, Universityof Science & Technology, 113 Gwahangno, Yuseong-gu,Daejeon, Korea, State Key Laboratory of Cryospheric Science,Cold and Arid Regions Environmental and EngineeringResearch Institute, Chinese Academy of Science,Lanzhou 730000, China, School of Geographic andOceanographic Sciences, Nanjing University,Nanjing 210093, China, Department of Imaging and AppliedPhysics, Curtin University of Technology, GPO Box U1987,Perth, WA 6845, Australia, Department of EnvironmentalSciences, University of Venice, Ca’ Foscari, 30123 Venice, Italy,Centre for Studies on Environmental Chemistry andTechnology-CNR, University of Venice, Ca’ Foscari,30123 Venice, Italy, Laboratoire de Glaciologie et Geophysiquede l’Environnement, UMR CNRS 5183, B.P. 96, 38402, SaintMartin d’Heres Cedex, France, and Observatoire des Sciencesde l’Univers et Unite de Formation et de Recherche dePhysique, Universite Joseph Fourier de Grenoble (InstitutUniversitaire de France), B.P. 68, 38041 Grenoble, France
Received June 11, 2009. Revised manuscript receivedAugust 13, 2009. Accepted August 31, 2009.
As, Mo, Sn, and Sb have been determined by inductivelycoupled plasma sector field mass spectrometry (ICP-SFMS) in143 depth intervals of high-altitude ice cores from Mt.Everest, covering an 800-year time period from 1205 to 2002AD. The results clearly demonstrate the long-term historicalrecord of atmospheric transport and deposition of As, Mo, Sn,and Sb that has prevailed at high altitudes in the centralHimalayas. Natural contributions, mainly from mineral dust,have dominated the atmospheric cycles of As, Mo, Sn, and tosome extent Sb during the 700 years prior to the 20th century.Compared to those of the pre-1900 period, pronounced increases
of both concentrations and crustal enrichment factors areobserved since the 1970s, with the highest increase factor forSn and the lowest for As. Such increases are attributed toanthropogenicemissionsof theseelements, largely fromstationaryfossil fuel combustion and nonferrous metals production,particularly in India. Our central Himalayan ice core recordprovides an explicit recognition of rising atmospheric As, Mo,Sn, and Sb pollution in response to rapid economic growthin central Asia.
1. IntroductionThe extent and course of anthropogenic perturbation overtime are of great importance, because such informationprovides a useful barometer to assess the impact of changingemissions from various industrial processes on the naturalcycles of atmospheric trace elements. This is especially thecase for the atmospheric environment of the NorthernHemisphere where industrializations from ancient to moderntimes have been prominent (1). Previous investigations ofsnow and ice cores from Greenland (2-5), the Canadian Arctic(6-8), and the European Alps (9-12) extended our under-standing of past anthropogenic perturbations and theresponse of these regions to changing emissions from discreteindustrial activities in Eurasia and North America.
Despite the fact that Asia has become the single largestsource of anthropogenic trace elements emitted into theatmosphere as a result of rapid economic and industrialdevelopments (13), comparatively few snow and ice recordsare available to evaluate the historical impact of industri-alization on the atmospheric loading of trace elements inthe region over century to millennial time scales (14, 15). Itwas not until very recently that a longer time series, coveringthe past 350 years, was derived from Mt. Everest ice core(16), showing a gradual increase in concentrations andenrichment levels of Bi, U, and Cs since about the 1950s asa result of human activities.
Here we present the first comprehensive data set docu-menting the changing occurrence of atmospheric As, Mo,Sn, and Sb in high altitude Mt. Everest ice, dating to the last800 years. Such trace elements are of great interest becausethe anthropogenic emissions of these elements into theatmosphere are largely related to the use of fossil fuels andnonferrous metals, the consumption and production ratesof which have significantly increased in central Asia (13).
2. Materials and Methods2.1. Core Samples and Dating. In 2002, two firn/ice coresdrilled to bedrock (108.8 m [ER-a] and 95.8 m [ER-b] long,respectively) were recovered from the col of the East Rongbuk(ER) glacier located on the northern slope of Mt. Everest(28°03′ N, 86°96′ E, 6518 m asl). The drilling site is character-ized by a borehole temperature of -8.9 °C at the bottom anda high accumulation rate averaging 50 cm w.e.a-1 (17, 18).
The ER-a core was dated by combining several methods:counting annual layers from continuous records back to 1534AD, at a depth of 98 m, using seasonal variability in δD andsoluble ions; identification of major volcanic events usinghighly enriched Bi sourced to inputs from large volcaniceruptions; and use of a flow model below a depth of 98 mbecause of difficulties in counting annual layers due to layerthinning (17-19). Measurements of methane and the isotopiccomposition of atmospheric O2 (δ18Oatm) demonstrate thatthe ice close to the bedrock dates back to 1498-2055 yearsBP (20). Dating uncertainties are estimated to be ( 0 yearat 1963 based on the Agung volcanic eruption identified by
* Corresponding author phone: +82-32-2606008; fax: +82-32-2606109; e-mail: [email protected].
# This paper is dedicated to the memory of K. J. R. Rosman.† Korea Polar Research Institute.‡ University of Science & Technology.§ Chinese Academy of Science.| Nanjing University.⊥ Curtin University of Technology.∇ Department of Environmental Sciences, University of Venice.O Centre for Studies on Environmental Chemistry and Technology-
CNR, University of Venice.[ Laboratoire de Glaciologie et Geophysique de l’Environnement,
UMR CNRS 5183.¶ Universite Joseph Fourier de Grenoble (Institut Universitaire de
France).
Environ. Sci. Technol. 2009, 43, 8060–8065
8060 9 ENVIRONMENTAL SCIENCE & TECHNOLOGY / VOL. 43, NO. 21, 2009 10.1021/es901685u CCC: $40.75 2009 American Chemical SocietyPublished on Web 09/25/2009
a peak in the Bi concentration and ( 5 years at 1534 ADbased on the counting of preserved annual layers. Uncer-tainties then progressively increase with depth below 98 mas a result of layer thinning and the subsequent utilizationof a flow model (17-19).
All sections of the ER-b core are from the upper 25 m anddating of the ER-a core was applied directly to the ER-b core.Although this might result in some uncertainty in the datingresult of ER-b, we estimate this uncertainty to be within 1year or less.
2.2. Decontamination of the Core Sections. For thisstudy, 102 sections were selected from half cross sections ofER-a and ER-b ice cores and transported frozen to the KoreaPolar Research Institute (KOPRI). The depth of these sectionsranged from 1.4 to 105.7 m, corresponding to the years 2002AD and 1205 AD, respectively. Analyzed ER-b core sectionscovered the period from 1971 to 2002; sections of the ER-acore covered the pre-1970 period. The lengths of the coresections ranged between 20 and 65 cm; the time resolutionof ice samples also varied integrating one month to severalmonths in the upper ∼50 m (dated from the 1900s) andslightly less or more than 1 year below ∼50 m, depending onthe length of inner core analyzed.
Careful elimination of the significant contamination fromthe outside of the core sections was performed by mechani-cally chiseling successive layers of ice in progression fromthe outside toward the center of the section using ultracleanprocedures (21, 22). After the chiseling was completed, theinner core was either collected whole or, if longer than 20cm, was cut into several successive parts. Altogether, 143samples were analyzed and are presented in this study.
To ensure that the inner parts of the core sections werefree from outside contamination, changes in the measuredconcentrations of As, Mo, Sn, Sb, and Sc, as a function ofradius from the outside to the inside of the core, wereinvestigated for the selected core sections. Examples of suchconcentration profiles are shown in Supporting Information(SI) Figure 1. We observed well-established plateau values inthe central parts of the sections, indicating no transfer of theoutside contamination to the inner part of the core.
2.3. Analytical Procedures. All sample handling andanalytical operations were performed under a Class 10laminar airflow bench or booth in clean laboratories (Class1000) located at KOPRI (22). Concentrations of As, Mo, Sn,Sb, and Sc were measured separately in each concentric layerand inner core by inductively coupled plasma sector fieldmass spectrometry (ICP-SFMS) (Element2, Thermo FisherScientific, Bremen, Germany). The instrument was equippedwith an Apex high-sensitivity inlet system (Apex IR, ElementalScientific Incorporated, Omaha, NE), including an additionalmixing chamber and a microflow PFA nebulizer (100 µL/min), Pt sampler cone and Pt skimmer cone, and Pt O-ringfree injector. Instrumental parameters were optimized dailyto obtain high intensity and to minimize the oxide ratio. Allaliquots were acidified to 1% with Fisher “Optima” gradeultrapure HNO3.
Detection limits, defined as 3 times the standard deviationof the blank, are reported in SI Table 1. Quality of the datawas estimated by analyzing a certified riverine water referencematerial (SLRS-4, National Research Council Canada, Ottawa,Canada). Our data agree very well with the certified valuesfor the available elements (SI Table 1). For Sb and Sc, theother data to which our data can be compared, are alsopresented in SI Table 1.
3. Results and Discussion3.1. Character of the Data. Concentrations of As, Mo, Sn,Sb, and Sc measured in 143 depth intervals and summarystatistics are reported in SI Table 2. To our knowledge, theseelements have never been determined previously in Hima-
layan snow and ice for century-scale historical records. Asgiven in SI Table 2, there is a large variability in theconcentrations for each element, with the max/min ratiosranging from 32 for Sb to 111 for Sc. A pronounced variabilityin concentrations is linked to the short-term (inter-annualand intra-annual) variations. Such variations are well docu-mented in high altitude Himalayan snow and ice (16, 24),where higher concentrations of trace elements are observedduring winter-spring due to the strong influence of mineraldust from central Asia, and lower levels during the summermonsoon season in response to moisture originating fromthe Indian Ocean and increased regional precipitation, bothof which can dilute the concentration levels of trace elements.
3.2. Changes in Concentrations during the Past 800Years. Figure 1a shows that changes in concentrations of As,Mo, Sn, and Sb have been variable during the past 800 years.For the pre-1900 period, the largest variability is observedfor As; conversely, the Sn profile shows relatively constantconcentrations. In the 20th century, the profiles exhibit highlyelevated concentrations from the 1970s onward, especiallyfor Sn.
The change in magnitude and timing of increasing trendsin elemental concentrations in the 20th century can be seenin Table 1. The post-1900 specific time periods were chosenbecause highly elevated concentrations are observed duringthese time intervals. To facilitate comparisons among dif-ferent time periods, the pre-1900 period was chosen as areference because anthropogenic inputs are expected to bepotentially small (16). Additionally, since the short-termvariability in concentrations is more pronounced over therecent decades, due to the shorter time period that has beenintegrated by the ice (see above), individual data pointscorresponding to these periods have been averaged. Asindicated in Table 1, a slight increase in Mo concentrationsoccurs in the 1970s and the early 1990s. As and Sb show aslight increase for the periods 1900-1960s, 1980s, and thelate 1990s, but no significant increase factors are given forthe other time periods. Conversely, the most significantincrease factor of about 2 is shown for Sn, starting in theperiod 1900-1960s with a peak in the late 1990s.
3.3. Crustal Enrichment Factors before the 20th Cen-tury. We calculated the crustal enrichment factor (EF) toevaluate the degree to which the temporal changes inconcentrations of As, Mo, Sn, and Sb are linked to changingcrustal inputs. The EF is defined as the concentration ratioof a given element to that of a conservative crustal element,normalized to the same concentration ratio characteristicsof the upper continental crust. Using Sc, as a crustal referenceelement, for example, the calculation of EF for As is as follows:
The uncertainty in EF calculation is primarily attributedto the differences between elemental compositions of localsoil and reference crustal compositions. Very recently,chemical compositions in the bulk soil and the <20 µmfractions in soils of the Tibetan Plateau, one of the mostsignificant dust source regions in central Asia, were presented,showing that As is highly enriched especially in the <20 µmfractions, compared to the global average elemental ratiosin the upper continental crust (25). As a reference composi-tion, we thus used the median values of elemental composi-tions in the <20 µm fractions of the Tibetan Plateau soils,which can be easily transported over long ranges. Becauseno data were available for Sb, however, we adopted the Sb/Sc ratio in the upper crust commonly used in the literature(26).
Results shown in Figure 1b indicate that the pre-1900 EFsfor As, Mo, Sn, and Sb are more or less constant with a fewscattered values greater than twice the standard deviation.
EF(As) ) (As/Sc)ice/(As/Sc)crust
VOL. 43, NO. 21, 2009 / ENVIRONMENTAL SCIENCE & TECHNOLOGY 9 8061
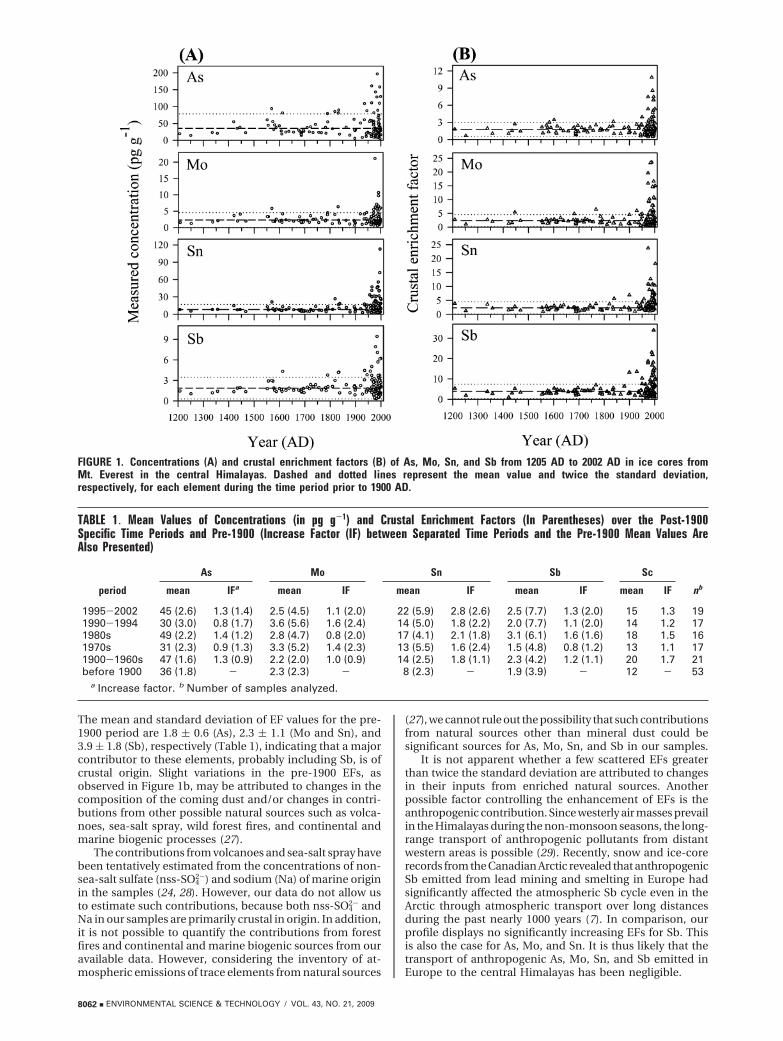
The mean and standard deviation of EF values for the pre-1900 period are 1.8 ( 0.6 (As), 2.3 ( 1.1 (Mo and Sn), and3.9 ( 1.8 (Sb), respectively (Table 1), indicating that a majorcontributor to these elements, probably including Sb, is ofcrustal origin. Slight variations in the pre-1900 EFs, asobserved in Figure 1b, may be attributed to changes in thecomposition of the coming dust and/or changes in contri-butions from other possible natural sources such as volca-noes, sea-salt spray, wild forest fires, and continental andmarine biogenic processes (27).
The contributions from volcanoes and sea-salt spray havebeen tentatively estimated from the concentrations of non-sea-salt sulfate (nss-SO4
2-) and sodium (Na) of marine originin the samples (24, 28). However, our data do not allow usto estimate such contributions, because both nss-SO4
2- andNa in our samples are primarily crustal in origin. In addition,it is not possible to quantify the contributions from forestfires and continental and marine biogenic sources from ouravailable data. However, considering the inventory of at-mospheric emissions of trace elements from natural sources
(27), we cannot rule out the possibility that such contributionsfrom natural sources other than mineral dust could besignificant sources for As, Mo, Sn, and Sb in our samples.
It is not apparent whether a few scattered EFs greaterthan twice the standard deviation are attributed to changesin their inputs from enriched natural sources. Anotherpossible factor controlling the enhancement of EFs is theanthropogenic contribution. Since westerly air masses prevailin the Himalayas during the non-monsoon seasons, the long-range transport of anthropogenic pollutants from distantwestern areas is possible (29). Recently, snow and ice-corerecords from the Canadian Arctic revealed that anthropogenicSb emitted from lead mining and smelting in Europe hadsignificantly affected the atmospheric Sb cycle even in theArctic through atmospheric transport over long distancesduring the past nearly 1000 years (7). In comparison, ourprofile displays no significantly increasing EFs for Sb. Thisis also the case for As, Mo, and Sn. It is thus likely that thetransport of anthropogenic As, Mo, Sn, and Sb emitted inEurope to the central Himalayas has been negligible.
FIGURE 1. Concentrations (A) and crustal enrichment factors (B) of As, Mo, Sn, and Sb from 1205 AD to 2002 AD in ice cores fromMt. Everest in the central Himalayas. Dashed and dotted lines represent the mean value and twice the standard deviation,respectively, for each element during the time period prior to 1900 AD.
TABLE 1. Mean Values of Concentrations (in pg g-1) and Crustal Enrichment Factors (In Parentheses) over the Post-1900Specific Time Periods and Pre-1900 (Increase Factor (IF) between Separated Time Periods and the Pre-1900 Mean Values AreAlso Presented)
As Mo Sn Sb Sc
period mean IFa mean IF mean IF mean IF mean IF nb
1995-2002 45 (2.6) 1.3 (1.4) 2.5 (4.5) 1.1 (2.0) 22 (5.9) 2.8 (2.6) 2.5 (7.7) 1.3 (2.0) 15 1.3 191990-1994 30 (3.0) 0.8 (1.7) 3.6 (5.6) 1.6 (2.4) 14 (5.0) 1.8 (2.2) 2.0 (7.7) 1.1 (2.0) 14 1.2 171980s 49 (2.2) 1.4 (1.2) 2.8 (4.7) 0.8 (2.0) 17 (4.1) 2.1 (1.8) 3.1 (6.1) 1.6 (1.6) 18 1.5 161970s 31 (2.3) 0.9 (1.3) 3.3 (5.2) 1.4 (2.3) 13 (5.5) 1.6 (2.4) 1.5 (4.8) 0.8 (1.2) 13 1.1 171900-1960s 47 (1.6) 1.3 (0.9) 2.2 (2.0) 1.0 (0.9) 14 (2.5) 1.8 (1.1) 2.3 (4.2) 1.2 (1.1) 20 1.7 21before 1900 36 (1.8) - 2.3 (2.3) - 8 (2.3) - 1.9 (3.9) - 12 - 53
a Increase factor. b Number of samples analyzed.
8062 9 ENVIRONMENTAL SCIENCE & TECHNOLOGY / VOL. 43, NO. 21, 2009
3.4. Anthropogenic Inputs of As, Mo, Sn, and Sb sincethe 1970s. In the 20th century, no systematic increases inEFs are apparent for the measured elements until the 1970s,except for a few data points, especially of Sb (Figure 1b).Rapidly increasing trends of individual data points are thenobserved for all elements from the 1970s onward. Table 1presents the mean factors of increase of EFs during specificpost-1900 time periods compared to those in the pre-1900period. Such factors are significant for Mo and Sn since the1970s, whereas the increase was twice the pre-1900 level forSb in the 1990s. Compared to the other elements, there wasa smaller increase for As since the 1970s.
Previous investigation of different trace elements in thesame ice core found that similar enhancements of EFs haveoccurred for Bi, U, and Cs in recent decades as a result ofanthropogenic emissions of these elements (16). On the basisof these data, it is therefore very likely that significantincreases of EFs for As, Mo, Sn, and Sb since the 1970s canbe attributed to anthropogenic input of these elements intothe high altitude central Himalayan atmosphere.
3.5. Sources of Anthropogenic As, Mo, Sn and Sb inCentral Himalayan Ice. The changing occurrence of atmo-spheric trace elements in the Himalayas is closely related toa strong variability in the air mass trajectories that impacton the region as a result of the southeast Asian monsooncycle (24). During the summer monsoon season, air massesmove from the south, whereas continental westerly windsprevail during the winter non-monsoon season. Such adistinct atmospheric circulation pattern results in a highinflux of mineral dust during the non-monsoon season dueto the large amounts of dust coming from central Asia (29).
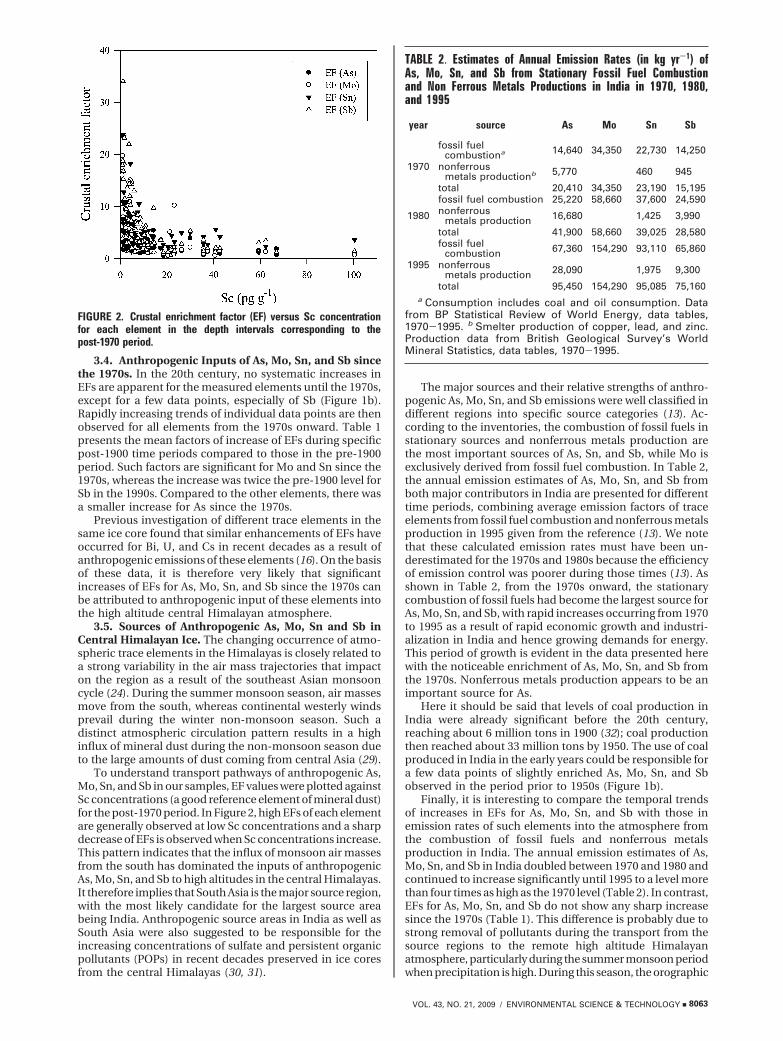
To understand transport pathways of anthropogenic As,Mo, Sn, and Sb in our samples, EF values were plotted againstSc concentrations (a good reference element of mineral dust)for the post-1970 period. In Figure 2, high EFs of each elementare generally observed at low Sc concentrations and a sharpdecrease of EFs is observed when Sc concentrations increase.This pattern indicates that the influx of monsoon air massesfrom the south has dominated the inputs of anthropogenicAs, Mo, Sn, and Sb to high altitudes in the central Himalayas.It therefore implies that South Asia is the major source region,with the most likely candidate for the largest source areabeing India. Anthropogenic source areas in India as well asSouth Asia were also suggested to be responsible for theincreasing concentrations of sulfate and persistent organicpollutants (POPs) in recent decades preserved in ice coresfrom the central Himalayas (30, 31).
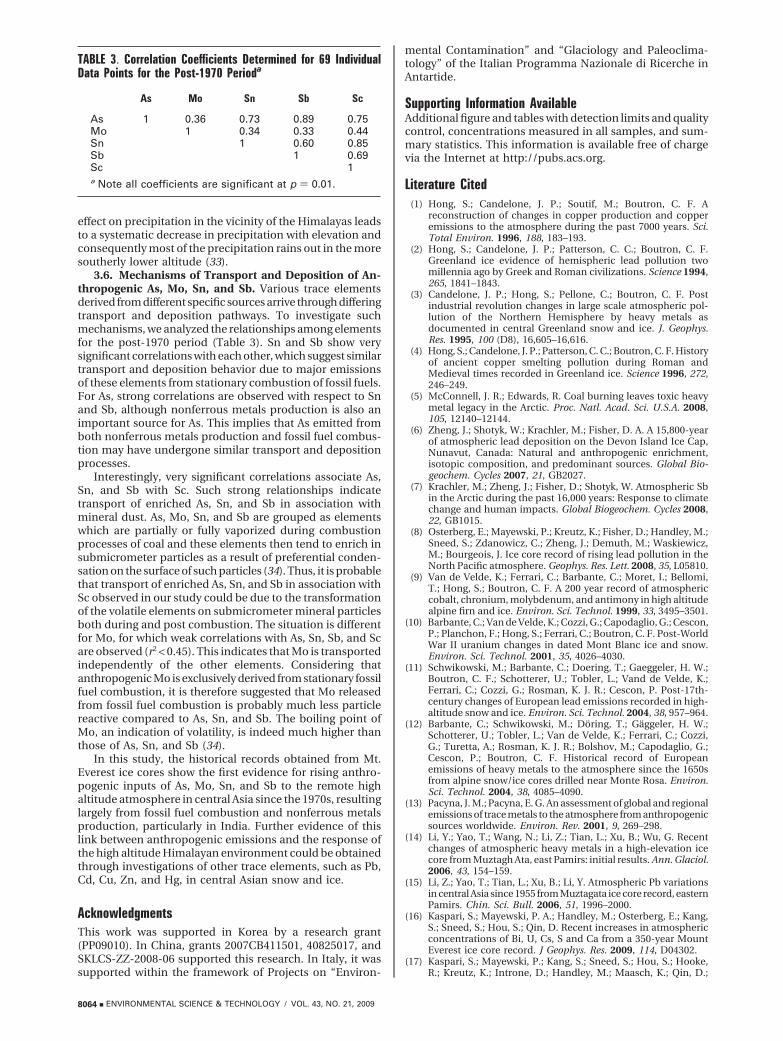
The major sources and their relative strengths of anthro-pogenic As, Mo, Sn, and Sb emissions were well classified indifferent regions into specific source categories (13). Ac-cording to the inventories, the combustion of fossil fuels instationary sources and nonferrous metals production arethe most important sources of As, Sn, and Sb, while Mo isexclusively derived from fossil fuel combustion. In Table 2,the annual emission estimates of As, Mo, Sn, and Sb fromboth major contributors in India are presented for differenttime periods, combining average emission factors of traceelements from fossil fuel combustion and nonferrous metalsproduction in 1995 given from the reference (13). We notethat these calculated emission rates must have been un-derestimated for the 1970s and 1980s because the efficiencyof emission control was poorer during those times (13). Asshown in Table 2, from the 1970s onward, the stationarycombustion of fossil fuels had become the largest source forAs, Mo, Sn, and Sb, with rapid increases occurring from 1970to 1995 as a result of rapid economic growth and industri-alization in India and hence growing demands for energy.This period of growth is evident in the data presented herewith the noticeable enrichment of As, Mo, Sn, and Sb fromthe 1970s. Nonferrous metals production appears to be animportant source for As.
Here it should be said that levels of coal production inIndia were already significant before the 20th century,reaching about 6 million tons in 1900 (32); coal productionthen reached about 33 million tons by 1950. The use of coalproduced in India in the early years could be responsible fora few data points of slightly enriched As, Mo, Sn, and Sbobserved in the period prior to 1950s (Figure 1b).
Finally, it is interesting to compare the temporal trendsof increases in EFs for As, Mo, Sn, and Sb with those inemission rates of such elements into the atmosphere fromthe combustion of fossil fuels and nonferrous metalsproduction in India. The annual emission estimates of As,Mo, Sn, and Sb in India doubled between 1970 and 1980 andcontinued to increase significantly until 1995 to a level morethan four times as high as the 1970 level (Table 2). In contrast,EFs for As, Mo, Sn, and Sb do not show any sharp increasesince the 1970s (Table 1). This difference is probably due tostrong removal of pollutants during the transport from thesource regions to the remote high altitude Himalayanatmosphere, particularly during the summer monsoon periodwhen precipitation is high. During this season, the orographic
FIGURE 2. Crustal enrichment factor (EF) versus Sc concentrationfor each element in the depth intervals corresponding to thepost-1970 period.
TABLE 2. Estimates of Annual Emission Rates (in kg yr-1) ofAs, Mo, Sn, and Sb from Stationary Fossil Fuel Combustionand Non Ferrous Metals Productions in India in 1970, 1980,and 1995
year source As Mo Sn Sb
1970
fossil fuelcombustiona 14,640 34,350 22,730 14,250
nonferrousmetals productionb 5,770 460 945
total 20,410 34,350 23,190 15,195
1980
fossil fuel combustion 25,220 58,660 37,600 24,590nonferrous
metals production 16,680 1,425 3,990
total 41,900 58,660 39,025 28,580
1995
fossil fuelcombustion 67,360 154,290 93,110 65,860
nonferrousmetals production 28,090 1,975 9,300
total 95,450 154,290 95,085 75,160a Consumption includes coal and oil consumption. Data
from BP Statistical Review of World Energy, data tables,1970-1995. b Smelter production of copper, lead, and zinc.Production data from British Geological Survey’s WorldMineral Statistics, data tables, 1970-1995.
VOL. 43, NO. 21, 2009 / ENVIRONMENTAL SCIENCE & TECHNOLOGY 9 8063
effect on precipitation in the vicinity of the Himalayas leadsto a systematic decrease in precipitation with elevation andconsequently most of the precipitation rains out in the moresoutherly lower altitude (33).
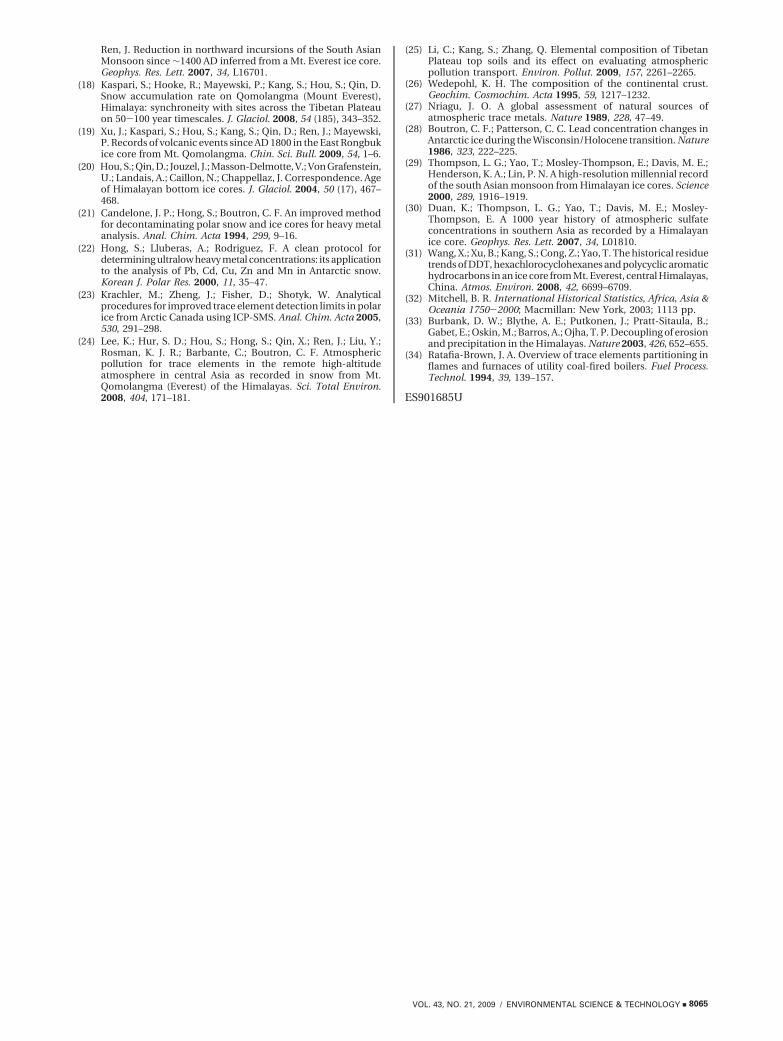
3.6. Mechanisms of Transport and Deposition of An-thropogenic As, Mo, Sn, and Sb. Various trace elementsderived from different specific sources arrive through differingtransport and deposition pathways. To investigate suchmechanisms, we analyzed the relationships among elementsfor the post-1970 period (Table 3). Sn and Sb show verysignificant correlations with each other, which suggest similartransport and deposition behavior due to major emissionsof these elements from stationary combustion of fossil fuels.For As, strong correlations are observed with respect to Snand Sb, although nonferrous metals production is also animportant source for As. This implies that As emitted fromboth nonferrous metals production and fossil fuel combus-tion may have undergone similar transport and depositionprocesses.
Interestingly, very significant correlations associate As,Sn, and Sb with Sc. Such strong relationships indicatetransport of enriched As, Sn, and Sb in association withmineral dust. As, Mo, Sn, and Sb are grouped as elementswhich are partially or fully vaporized during combustionprocesses of coal and these elements then tend to enrich insubmicrometer particles as a result of preferential conden-sation on the surface of such particles (34). Thus, it is probablethat transport of enriched As, Sn, and Sb in association withSc observed in our study could be due to the transformationof the volatile elements on submicrometer mineral particlesboth during and post combustion. The situation is differentfor Mo, for which weak correlations with As, Sn, Sb, and Scare observed (r2 < 0.45). This indicates that Mo is transportedindependently of the other elements. Considering thatanthropogenic Mo is exclusively derived from stationary fossilfuel combustion, it is therefore suggested that Mo releasedfrom fossil fuel combustion is probably much less particlereactive compared to As, Sn, and Sb. The boiling point ofMo, an indication of volatility, is indeed much higher thanthose of As, Sn, and Sb (34).
In this study, the historical records obtained from Mt.Everest ice cores show the first evidence for rising anthro-pogenic inputs of As, Mo, Sn, and Sb to the remote highaltitude atmosphere in central Asia since the 1970s, resultinglargely from fossil fuel combustion and nonferrous metalsproduction, particularly in India. Further evidence of thislink between anthropogenic emissions and the response ofthe high altitude Himalayan environment could be obtainedthrough investigations of other trace elements, such as Pb,Cd, Cu, Zn, and Hg, in central Asian snow and ice.
AcknowledgmentsThis work was supported in Korea by a research grant(PP09010). In China, grants 2007CB411501, 40825017, andSKLCS-ZZ-2008-06 supported this research. In Italy, it wassupported within the framework of Projects on “Environ-
mental Contamination” and “Glaciology and Paleoclima-tology” of the Italian Programma Nazionale di Ricerche inAntartide.
Supporting Information AvailableAdditional figure and tables with detection limits and qualitycontrol, concentrations measured in all samples, and sum-mary statistics. This information is available free of chargevia the Internet at http://pubs.acs.org.
Literature Cited(1) Hong, S.; Candelone, J. P.; Soutif, M.; Boutron, C. F. A
reconstruction of changes in copper production and copperemissions to the atmosphere during the past 7000 years. Sci.Total Environ. 1996, 188, 183–193.
(2) Hong, S.; Candelone, J. P.; Patterson, C. C.; Boutron, C. F.Greenland ice evidence of hemispheric lead pollution twomillennia ago by Greek and Roman civilizations. Science 1994,265, 1841–1843.
(3) Candelone, J. P.; Hong, S.; Pellone, C.; Boutron, C. F. Postindustrial revolution changes in large scale atmospheric pol-lution of the Northern Hemisphere by heavy metals asdocumented in central Greenland snow and ice. J. Geophys.Res. 1995, 100 (D8), 16,605–16,616.
(4) Hong, S.; Candelone, J. P.; Patterson, C. C.; Boutron, C. F. Historyof ancient copper smelting pollution during Roman andMedieval times recorded in Greenland ice. Science 1996, 272,246–249.
(5) McConnell, J. R.; Edwards, R. Coal burning leaves toxic heavymetal legacy in the Arctic. Proc. Natl. Acad. Sci. U.S.A. 2008,105, 12140–12144.
(6) Zheng, J.; Shotyk, W.; Krachler, M.; Fisher, D. A. A 15,800-yearof atmospheric lead deposition on the Devon Island Ice Cap,Nunavut, Canada: Natural and anthropogenic enrichment,isotopic composition, and predominant sources. Global Bio-geochem. Cycles 2007, 21, GB2027.
(7) Krachler, M.; Zheng, J.; Fisher, D.; Shotyk, W. Atmospheric Sbin the Arctic during the past 16,000 years: Response to climatechange and human impacts. Global Biogeochem. Cycles 2008,22, GB1015.
(8) Osterberg, E.; Mayewski, P.; Kreutz, K.; Fisher, D.; Handley, M.;Sneed, S.; Zdanowicz, C.; Zheng, J.; Demuth, M.; Waskiewicz,M.; Bourgeois, J. Ice core record of rising lead pollution in theNorth Pacific atmosphere. Geophys. Res. Lett. 2008, 35, L05810.
(9) Van de Velde, K.; Ferrari, C.; Barbante, C.; Moret, I.; Bellomi,T.; Hong, S.; Boutron, C. F. A 200 year record of atmosphericcobalt, chronium, molybdenum, and antimony in high altitudealpine firn and ice. Environ. Sci. Technol. 1999, 33, 3495–3501.
(10) Barbante, C.; Van de Velde, K.; Cozzi, G.; Capodaglio, G.; Cescon,P.; Planchon, F.; Hong, S.; Ferrari, C.; Boutron, C. F. Post-WorldWar II uranium changes in dated Mont Blanc ice and snow.Environ. Sci. Technol. 2001, 35, 4026–4030.
(11) Schwikowski, M.; Barbante, C.; Doering, T.; Gaeggeler, H. W.;Boutron, C. F.; Schotterer, U.; Tobler, L.; Vand de Velde, K.;Ferrari, C.; Cozzi, G.; Rosman, K. J. R.; Cescon, P. Post-17th-century changes of European lead emissions recorded in high-altitude snow and ice. Environ. Sci. Technol. 2004, 38, 957–964.
(12) Barbante, C.; Schwikowski, M.; Doring, T.; Gaggeler, H. W.;Schotterer, U.; Tobler, L.; Van de Velde, K.; Ferrari, C.; Cozzi,G.; Turetta, A.; Rosman, K. J. R.; Bolshov, M.; Capodaglio, G.;Cescon, P.; Boutron, C. F. Historical record of Europeanemissions of heavy metals to the atmosphere since the 1650sfrom alpine snow/ice cores drilled near Monte Rosa. Environ.Sci. Technol. 2004, 38, 4085–4090.
(13) Pacyna, J. M.; Pacyna, E. G. An assessment of global and regionalemissions of trace metals to the atmosphere from anthropogenicsources worldwide. Environ. Rev. 2001, 9, 269–298.
(14) Li, Y.; Yao, T.; Wang, N.; Li, Z.; Tian, L.; Xu, B.; Wu, G. Recentchanges of atmospheric heavy metals in a high-elevation icecore from Muztagh Ata, east Pamirs: initial results. Ann. Glaciol.2006, 43, 154–159.
(15) Li, Z.; Yao, T.; Tian, L.; Xu, B.; Li, Y. Atmospheric Pb variationsin central Asia since 1955 from Muztagata ice core record, easternPamirs. Chin. Sci. Bull. 2006, 51, 1996–2000.
(16) Kaspari, S.; Mayewski, P. A.; Handley, M.; Osterberg, E.; Kang,S.; Sneed, S.; Hou, S.; Qin, D. Recent increases in atmosphericconcentrations of Bi, U, Cs, S and Ca from a 350-year MountEverest ice core record. J Geophys. Res. 2009, 114, D04302.
(17) Kaspari, S.; Mayewski, P.; Kang, S.; Sneed, S.; Hou, S.; Hooke,R.; Kreutz, K.; Introne, D.; Handley, M.; Maasch, K.; Qin, D.;
TABLE 3. Correlation Coefficients Determined for 69 IndividualData Points for the Post-1970 Perioda
As Mo Sn Sb Sc
As 1 0.36 0.73 0.89 0.75Mo 1 0.34 0.33 0.44Sn 1 0.60 0.85Sb 1 0.69Sc 1a Note all coefficients are significant at p ) 0.01.
8064 9 ENVIRONMENTAL SCIENCE & TECHNOLOGY / VOL. 43, NO. 21, 2009
Ren, J. Reduction in northward incursions of the South AsianMonsoon since ∼1400 AD inferred from a Mt. Everest ice core.Geophys. Res. Lett. 2007, 34, L16701.
(18) Kaspari, S.; Hooke, R.; Mayewski, P.; Kang, S.; Hou, S.; Qin, D.Snow accumulation rate on Qomolangma (Mount Everest),Himalaya: synchroneity with sites across the Tibetan Plateauon 50-100 year timescales. J. Glaciol. 2008, 54 (185), 343–352.
(19) Xu, J.; Kaspari, S.; Hou, S.; Kang, S.; Qin, D.; Ren, J.; Mayewski,P. Records of volcanic events since AD 1800 in the East Rongbukice core from Mt. Qomolangma. Chin. Sci. Bull. 2009, 54, 1–6.
(20) Hou, S.; Qin, D.; Jouzel, J.; Masson-Delmotte, V.; Von Grafenstein,U.; Landais, A.; Caillon, N.; Chappellaz, J. Correspondence. Ageof Himalayan bottom ice cores. J. Glaciol. 2004, 50 (17), 467–468.
(21) Candelone, J. P.; Hong, S.; Boutron, C. F. An improved methodfor decontaminating polar snow and ice cores for heavy metalanalysis. Anal. Chim. Acta 1994, 299, 9–16.
(22) Hong, S.; Lluberas, A.; Rodriguez, F. A clean protocol fordetermining ultralow heavy metal concentrations: its applicationto the analysis of Pb, Cd, Cu, Zn and Mn in Antarctic snow.Korean J. Polar Res. 2000, 11, 35–47.
(23) Krachler, M.; Zheng, J.; Fisher, D.; Shotyk, W. Analyticalprocedures for improved trace element detection limits in polarice from Arctic Canada using ICP-SMS. Anal. Chim. Acta 2005,530, 291–298.
(24) Lee, K.; Hur, S. D.; Hou, S.; Hong, S.; Qin, X.; Ren, J.; Liu, Y.;Rosman, K. J. R.; Barbante, C.; Boutron, C. F. Atmosphericpollution for trace elements in the remote high-altitudeatmosphere in central Asia as recorded in snow from Mt.Qomolangma (Everest) of the Himalayas. Sci. Total Environ.2008, 404, 171–181.
(25) Li, C.; Kang, S.; Zhang, Q. Elemental composition of TibetanPlateau top soils and its effect on evaluating atmosphericpollution transport. Environ. Pollut. 2009, 157, 2261–2265.
(26) Wedepohl, K. H. The composition of the continental crust.Geochim. Cosmochim. Acta 1995, 59, 1217–1232.
(27) Nriagu, J. O. A global assessment of natural sources ofatmospheric trace metals. Nature 1989, 228, 47–49.
(28) Boutron, C. F.; Patterson, C. C. Lead concentration changes inAntarctic ice during the Wisconsin/Holocene transition. Nature1986, 323, 222–225.
(29) Thompson, L. G.; Yao, T.; Mosley-Thompson, E.; Davis, M. E.;Henderson, K. A.; Lin, P. N. A high-resolution millennial recordof the south Asian monsoon from Himalayan ice cores. Science2000, 289, 1916–1919.
(30) Duan, K.; Thompson, L. G.; Yao, T.; Davis, M. E.; Mosley-Thompson, E. A 1000 year history of atmospheric sulfateconcentrations in southern Asia as recorded by a Himalayanice core. Geophys. Res. Lett. 2007, 34, L01810.
(31) Wang, X.; Xu, B.; Kang, S.; Cong, Z.; Yao, T. The historical residuetrends of DDT, hexachlorocyclohexanes and polycyclic aromatichydrocarbons in an ice core from Mt. Everest, central Himalayas,China. Atmos. Environ. 2008, 42, 6699–6709.
(32) Mitchell, B. R. International Historical Statistics, Africa, Asia &Oceania 1750-2000; Macmillan: New York, 2003; 1113 pp.
(33) Burbank, D. W.; Blythe, A. E.; Putkonen, J.; Pratt-Sitaula, B.;Gabet, E.; Oskin, M.; Barros, A.; Ojha, T. P. Decoupling of erosionand precipitation in the Himalayas. Nature 2003, 426, 652–655.
(34) Ratafia-Brown, J. A. Overview of trace elements partitioning inflames and furnaces of utility coal-fired boilers. Fuel Process.Technol. 1994, 39, 139–157.
ES901685U
VOL. 43, NO. 21, 2009 / ENVIRONMENTAL SCIENCE & TECHNOLOGY 9 8065