Embed Size (px)
Citation preview
An agroclimatic potential
in southern Siberia in a changing climate
during the XXI century
Tchebakova Nadezda and Parfenova Elena
Institute of Forest, Siberian Branch, Russian Academy of Sciences
Lysanova Galina
Institute of Geography, Siberian Branch, Russian Academy of Sciences
and Soja Amber National Institute of Aerospace (NIA), NASA
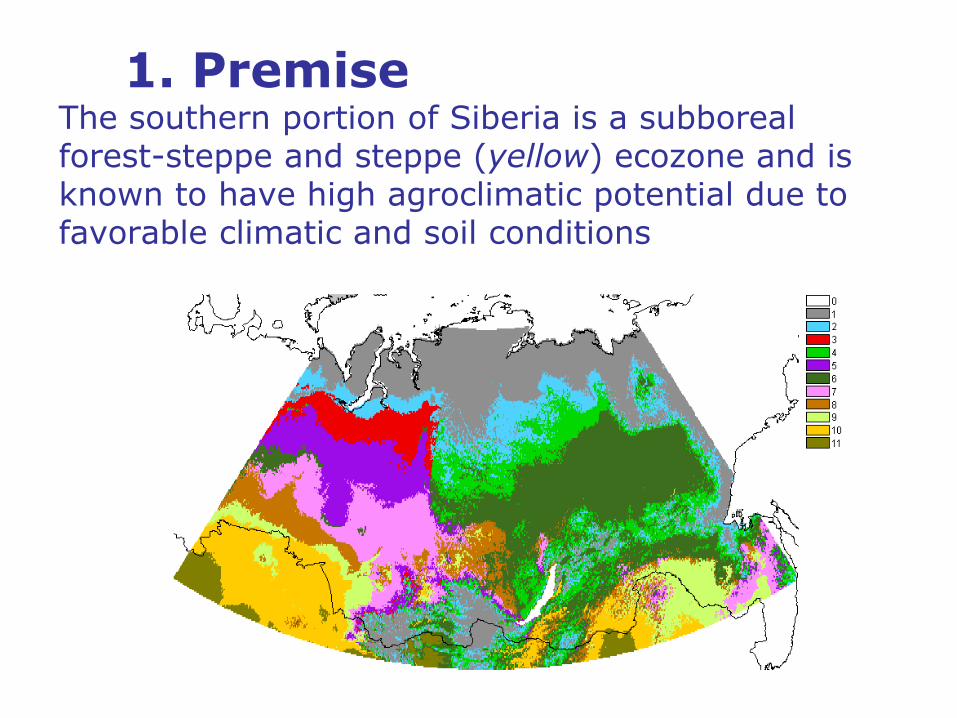
1. Premise The southern portion of Siberia is a subboreal forest-steppe and steppe (yellow) ecozone and is known to have high agroclimatic potential due to favorable climatic and soil conditions
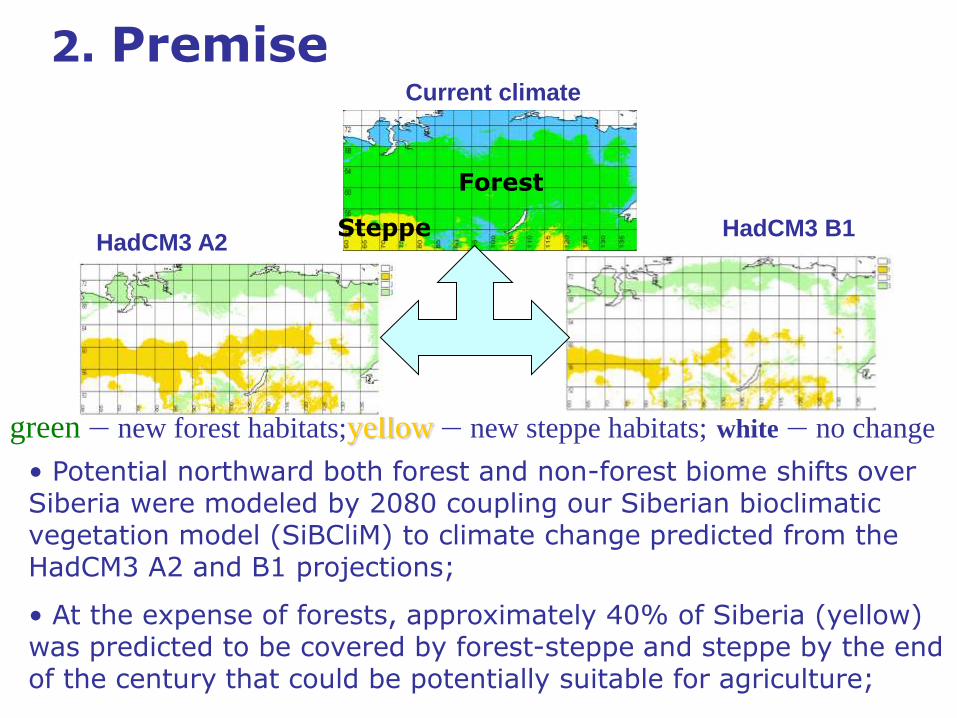
green – new forest habitats;yellow – new steppe habitats; white – no change
• Potential northward both forest and non-forest biome shifts over Siberia were modeled by 2080 coupling our Siberian bioclimatic vegetation model (SiBCliM) to climate change predicted from the HadCM3 A2 and B1 projections;
• At the expense of forests, approximately 40% of Siberia (yellow) was predicted to be covered by forest-steppe and steppe by the end of the century that could be potentially suitable for agriculture;
2. Premise
HadCM3 B1 HadCM3 A2
Steppe
Forest
Current climate
Our goals
• evaluate ongoing climate change in central Siberia from observed data: in the baseline period 1960-1990 and in 1990-2010;
• predict related hot spots of potential agriculture change in the contemporary climate 1990-2010 and in the future based on the Hadley 2020, 2050 and 2080 climate change projections;
• identify new agricultural regions based on a new agroclimatic potential that may evolve as climate changes.
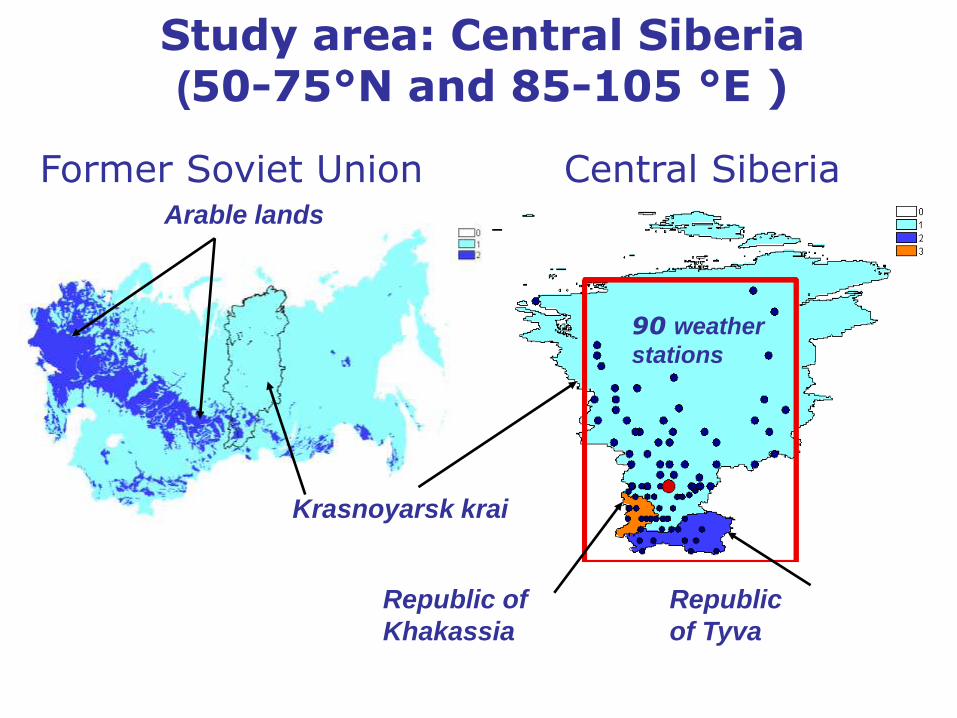
Study area: Central Siberia
(50-75°N and 85-105 °E )
Republic of
Khakassia
Former Soviet Union
Krasnoyarsk krai
Republic
of Tyva
Arable lands
Central Siberia
90 weather
stations
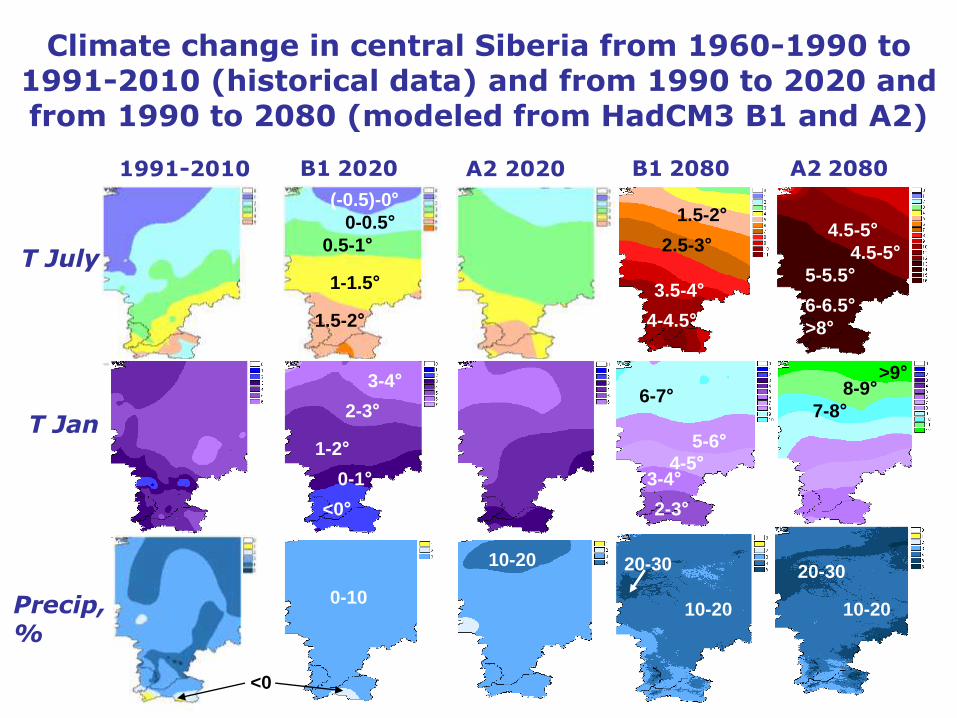
Climate change in central Siberia from 1960-1990 to 1991-2010 (historical data) and from 1990 to 2020 and from 1990 to 2080 (modeled from HadCM3 B1 and A2)
B1 2020 A2 2020 1991-2010
T July
T Jan
Precip, %
(-0.5)-0° 0-0.5°
0.5-1°
1-1.5°
1.5-2°
B1 2080 A2 2080
1.5-2°
2.5-3°
3.5-4°
4-4.5°
4.5-5°
5-5.5°
0-1°
6-6.5°
4.5-5°
>8°
5-6°
6-7° 3-4°
2-3°
1-2°
<0°
3-4° 4-5°
2-3°
7-8° 8-9°
>9°
<<0
0-10
10-20
10-20
20-30
10-20
20-30
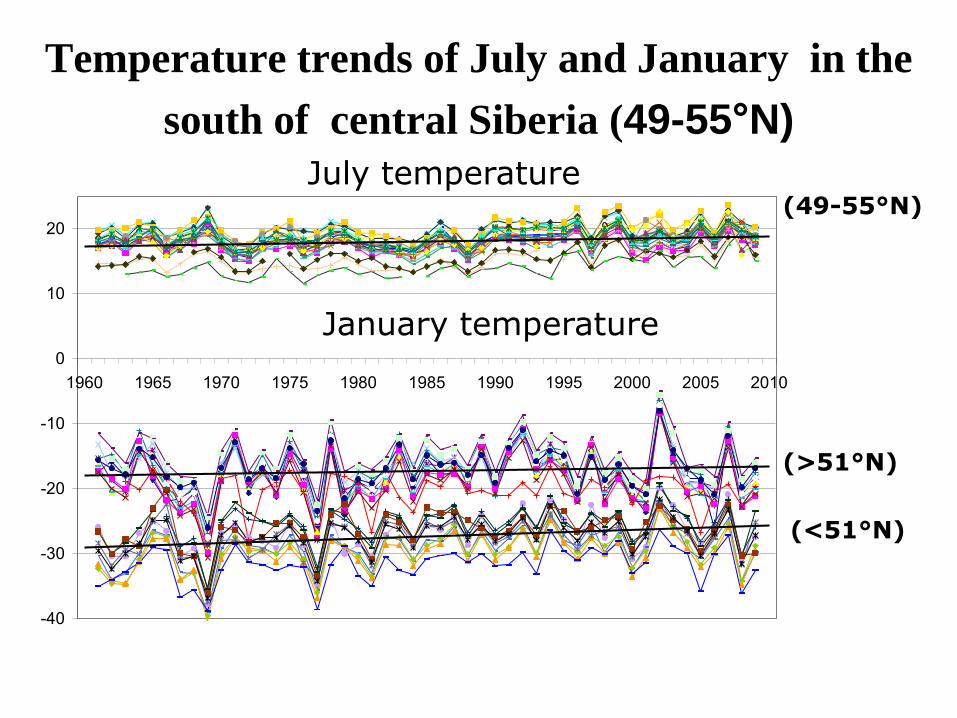
Temperature trends of July and January in the
south of central Siberia (49-55°N)
-40
-30
-20
-10
0
10
20
1960 1965 1970 1975 1980 1985 1990 1995 2000 2005 2010
July temperature
January temperature
(49-55°N)
(>51°N)
(<51°N)
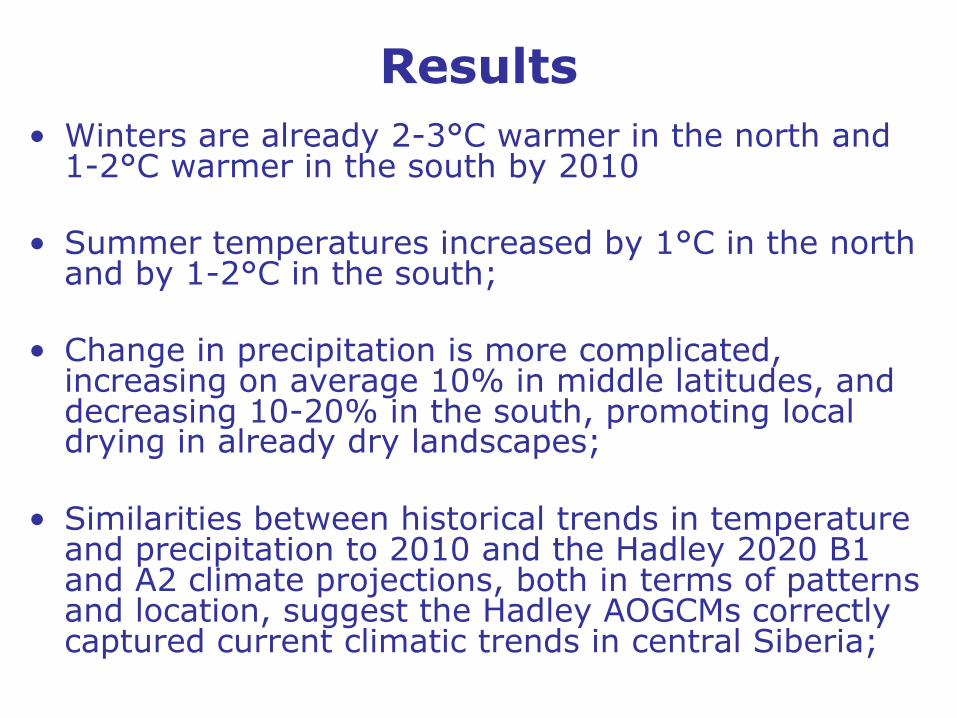
Results
• Winters are already 2-3°С warmer in the north and 1-2°С warmer in the south by 2010
• Summer temperatures increased by 1°С in the north and by 1-2°С in the south;
• Change in precipitation is more complicated, increasing on average 10% in middle latitudes, and decreasing 10-20% in the south, promoting local drying in already dry landscapes;
• Similarities between historical trends in temperature and precipitation to 2010 and the Hadley 2020 B1 and A2 climate projections, both in terms of patterns and location, suggest the Hadley AOGCMs correctly captured current climatic trends in central Siberia;
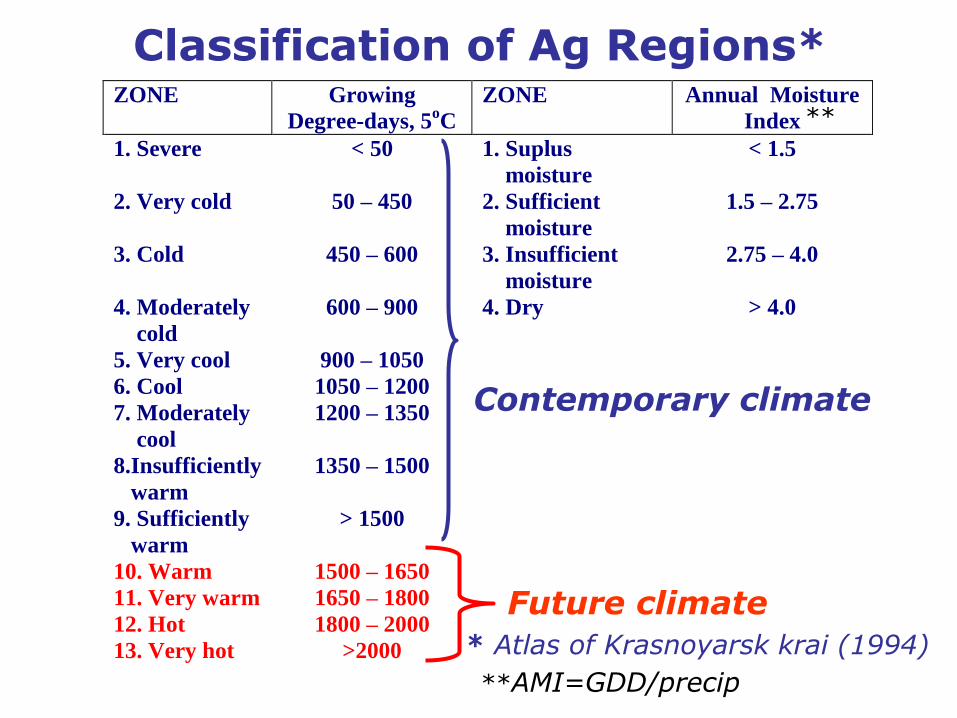
Classification of Ag Regions*
Contemporary climate
Future climate
ZONE Growing
Degree-days, 5oC
ZONE Annual Moisture
Index
1. Severe < 50 1. Suplus
moisture
< 1.5
2. Very cold 50 – 450 2. Sufficient
moisture
1.5 – 2.75
3. Cold 450 – 600 3. Insufficient
moisture
2.75 – 4.0
4. Moderately
cold
600 – 900 4. Dry > 4.0
5. Very cool 900 – 1050
6. Cool 1050 – 1200
7. Moderately
cool
1200 – 1350
8.Insufficiently
warm
1350 – 1500
9. Sufficiently
warm
> 1500
10. Warm 1500 – 1650
11. Very warm 1650 – 1800
12. Hot 1800 – 2000
13. Very hot >2000
* Atlas of Krasnoyarsk krai (1994)
**AMI=GDD/precip
**
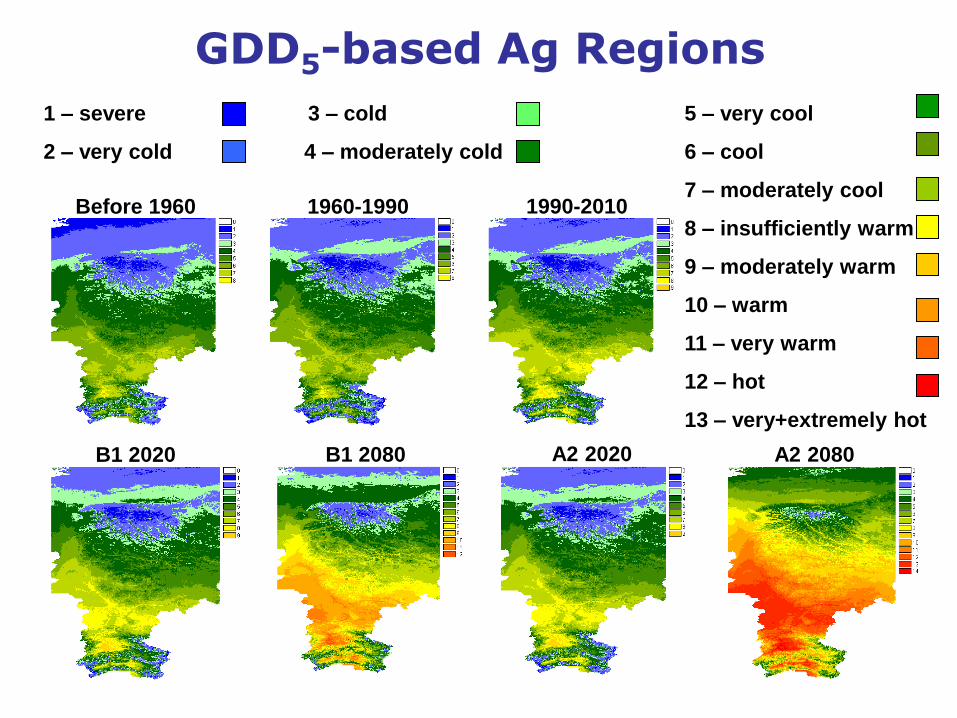
GDD5-based Ag Regions
B1 2020
Before 1960 1960-1990 1990-2010
B1 2080 A2 2020 A2 2080
5 – very cool
6 – cool
7 – moderately cool
8 – insufficiently warm
9 – moderately warm
10 – warm
11 – very warm
12 – hot
13 – very+extremely hot
1 – severe 3 – cold
2 – very cold 4 – moderately cold
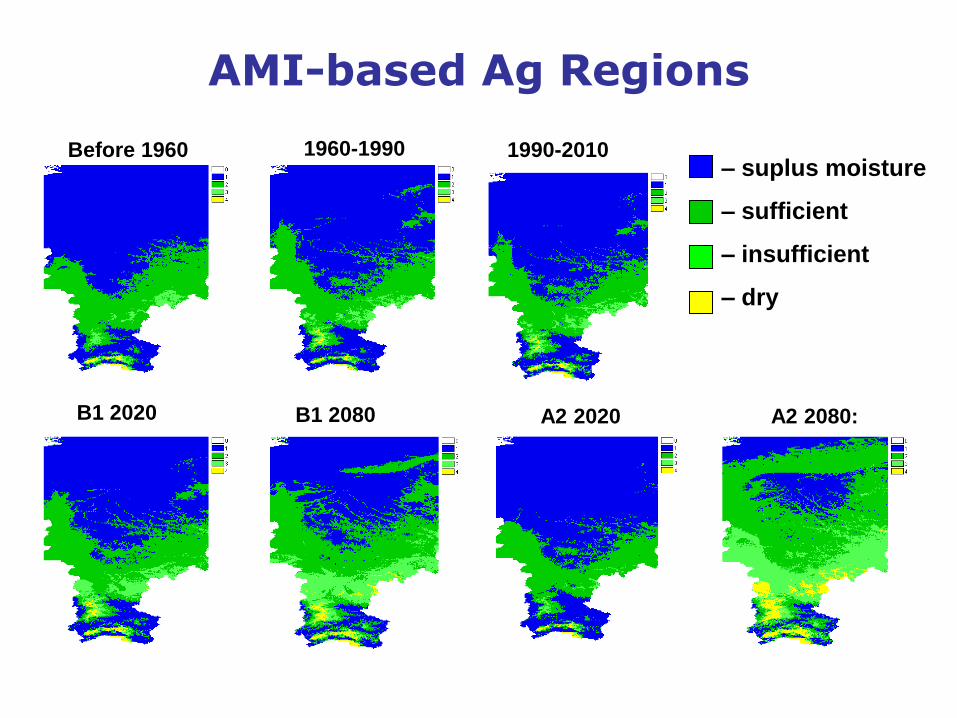
AMI-based Ag Regions
B1 2020
Before 1960 1960-1990 1990-2010
B1 2080 A2 2020
A2 2080:
– suplus moisture
– sufficient
– insufficient
– dry
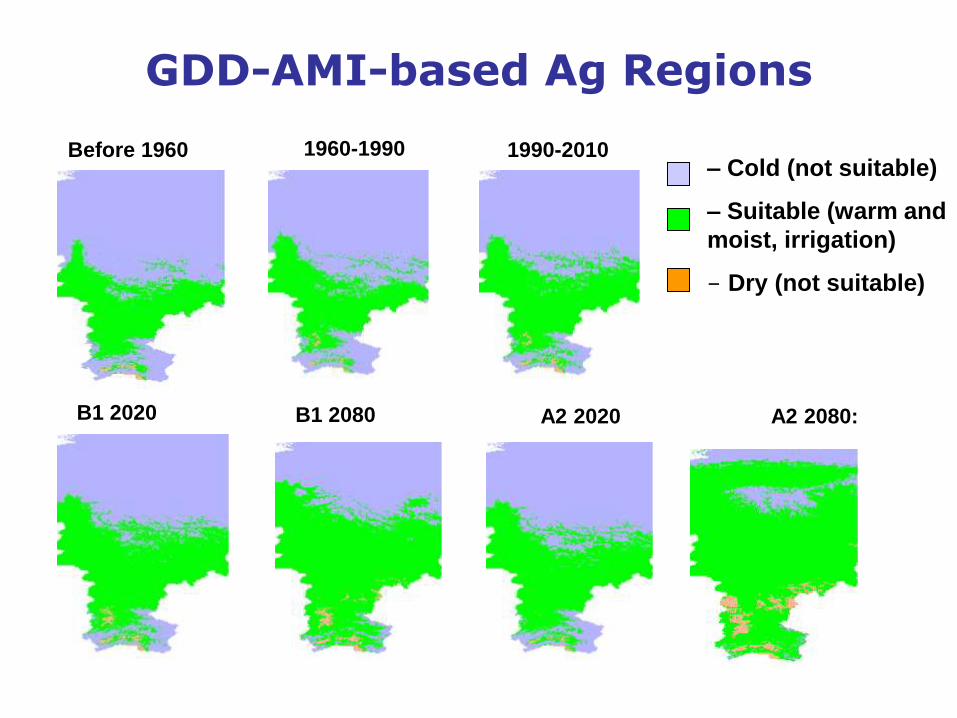
GDD-AMI-based Ag Regions
B1 2020
Before 1960 1960-1990 1990-2010
B1 2080 A2 2020
A2 2080:
– Cold (not suitable)
– Suitable (warm and
moist, irrigation)
– Dry (not suitable)
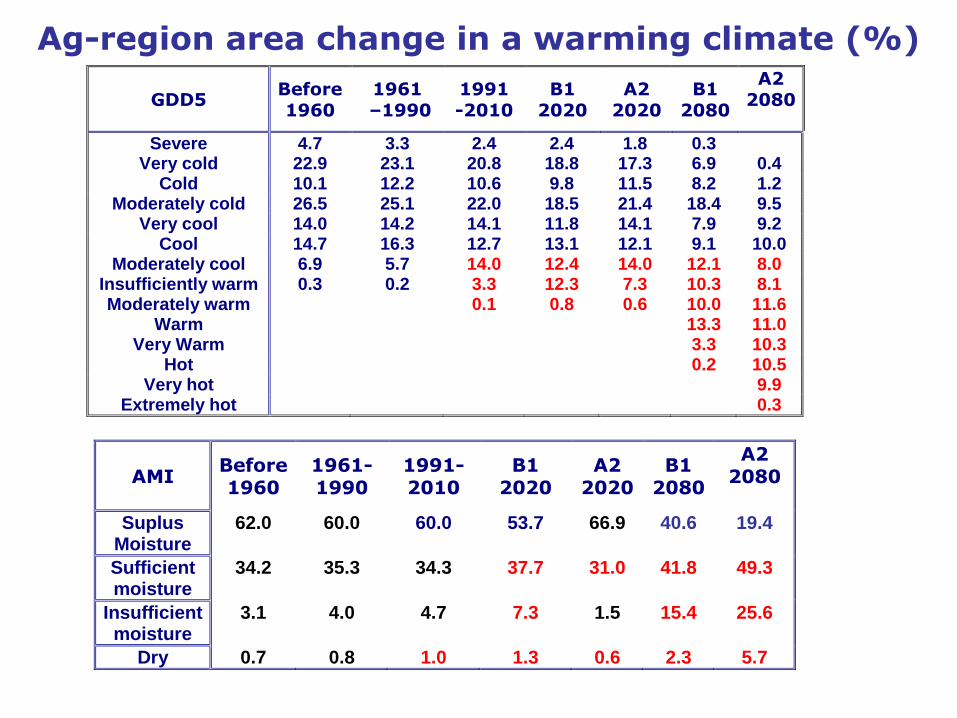
Ag-region area change in a warming climate (%)
AMI Before 1960
1961- 1990
1991- 2010
В1 2020
А2 2020
В1 2080
А2 2080
Suplus Moisture
62.0 60.0 60.0 53.7 66.9 40.6 19.4
Sufficient moisture
34.2 35.3 34.3 37.7 31.0 41.8 49.3
Insufficient moisture
3.1 4.0 4.7 7.3 1.5 15.4 25.6
Dry 0.7 0.8 1.0 1.3 0.6 2.3 5.7
GDD5 Before 1960
1961 –1990
1991 -2010
В1 2020
А2 2020
В1 2080
А2 2080
Severe 4.7 3.3 2.4 2.4 1.8 0.3 Very cold 22.9 23.1 20.8 18.8 17.3 6.9 0.4
Cold 10.1 12.2 10.6 9.8 11.5 8.2 1.2 Moderately cold 26.5 25.1 22.0 18.5 21.4 18.4 9.5
Very cool 14.0 14.2 14.1 11.8 14.1 7.9 9.2 Cool 14.7 16.3 12.7 13.1 12.1 9.1 10.0
Moderately cool 6.9 5.7 14.0 12.4 14.0 12.1 8.0 Insufficiently warm 0.3 0.2 3.3 12.3 7.3 10.3 8.1 Moderately warm 0.1 0.8 0.6 10.0 11.6
Warm 13.3 11.0 Very Warm 3.3 10.3
Hot 0.2 10.5 Very hot 9.9
Extremely hot 0.3
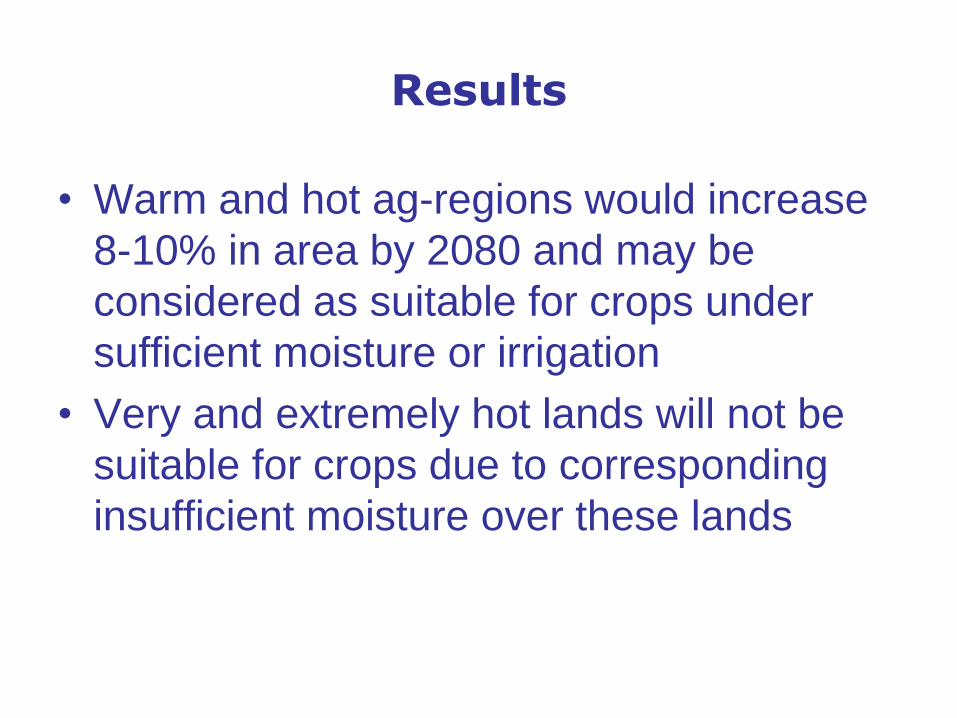
Results
• Warm and hot ag-regions would increase
8-10% in area by 2080 and may be
considered as suitable for crops under
sufficient moisture or irrigation
• Very and extremely hot lands will not be
suitable for crops due to corresponding
insufficient moisture over these lands
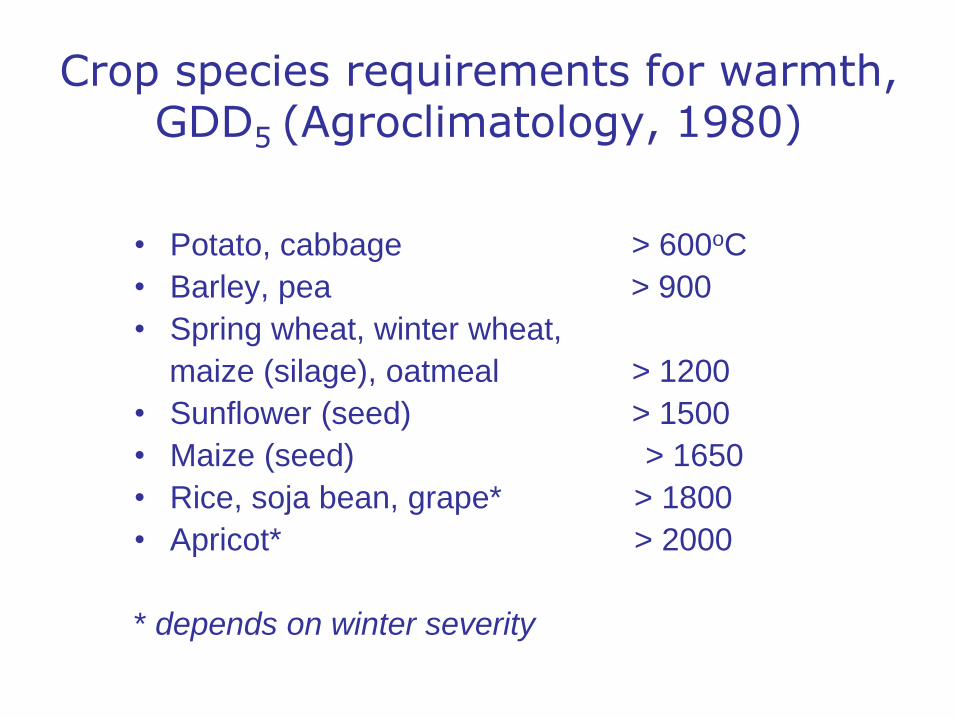
Crop species requirements for warmth, GDD5 (Agroclimatology, 1980)
• Potato, cabbage > 600oC
• Barley, pea > 900
• Spring wheat, winter wheat,
maize (silage), oatmeal > 1200
• Sunflower (seed) > 1500
• Maize (seed) > 1650
• Rice, soja bean, grape* > 1800
• Apricot* > 2000
* depends on winter severity
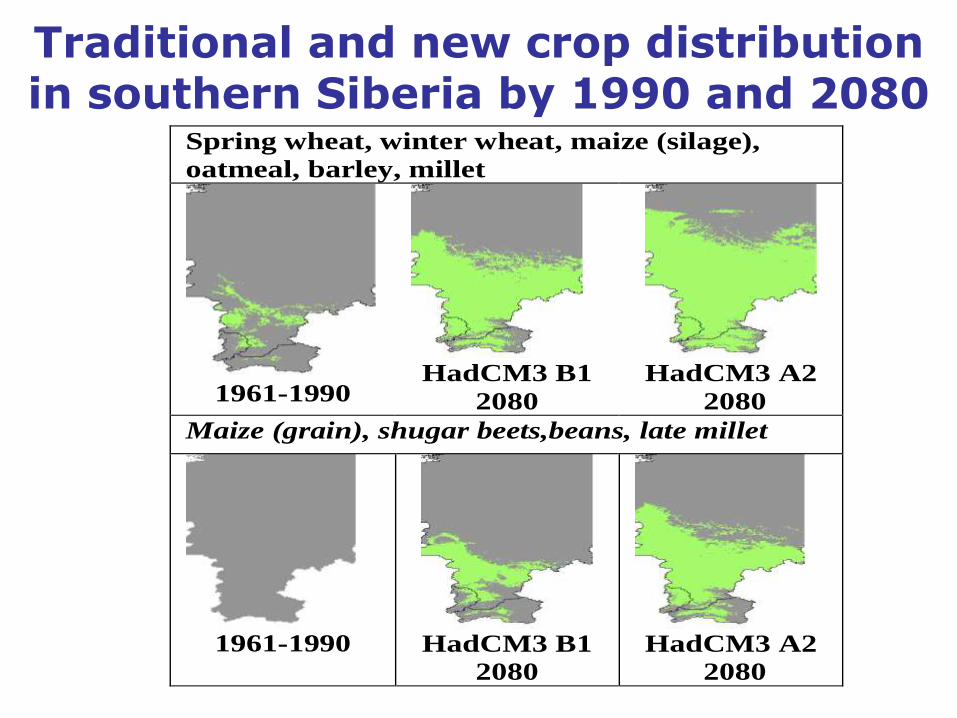
Traditional and new crop distribution in southern Siberia by 1990 and 2080
Spring wheat, winter wheat, maize (silage),
oatmeal, barley, millet
1961-1990
HadCM3 B1
2080
HadCM3 A2
2080
Maize (grain), shugar beets,beans, late millet
1961-1990
HadCM3 B1
2080
HadCM3 A2
2080
1
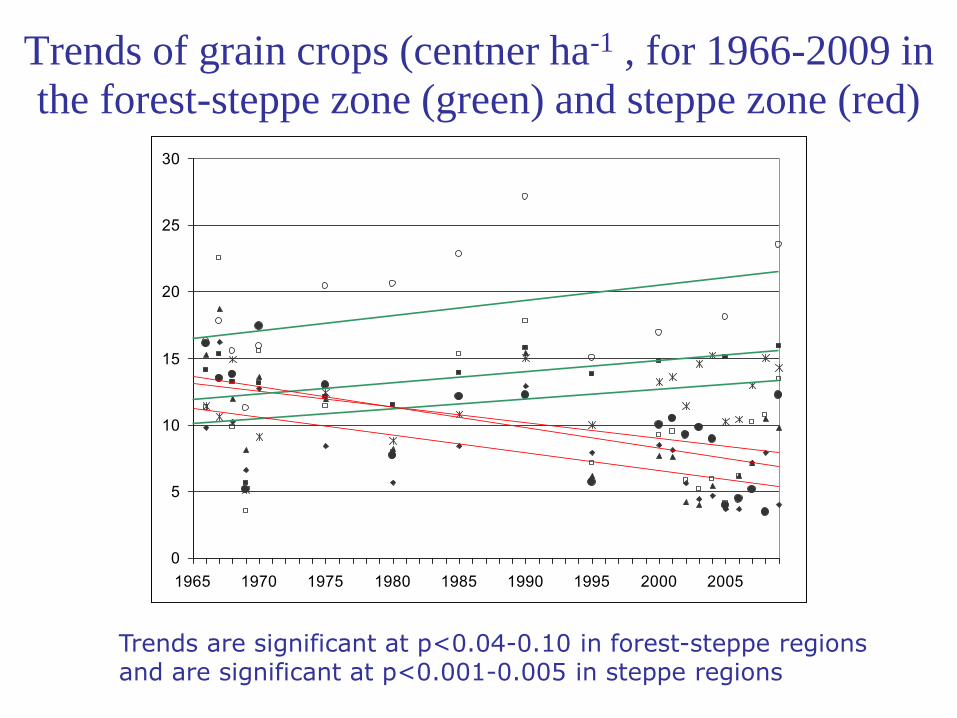
Trends of grain crops (centner ha-1 , for 1966-2009 in
the forest-steppe zone (green) and steppe zone (red)
0
5
10
15
20
25
30
1965 1970 1975 1980 1985 1990 1995 2000 2005
Trends are significant at p<0.04-0.10 in forest-steppe regions and are significant at p<0.001-0.005 in steppe regions
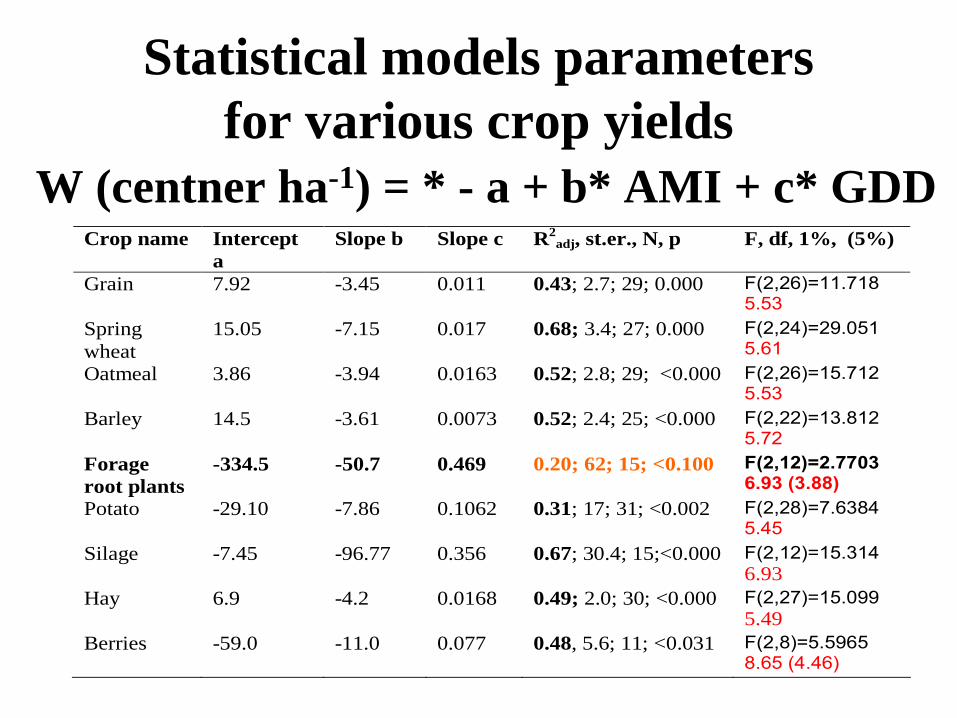
Statistical models parameters
for various crop yields
W (centner ha-1) = * - a + b* AMI + c* GDD Crop name Intercept
a
Slope b Slope c R2adj, st.er., N, p
F, df, 1%, (5%)
Grain 7.92
-3.45
0.011
0.43; 2.7; 29; 0.000
F(2,26)=11.718 5.53
Spring
wheat
15.05
-7.15
0.017
0.68; 3.4; 27; 0.000
F(2,24)=29.051 5.61
Oatmeal 3.86
-3.94
0.0163
0.52; 2.8; 29; <0.000
F(2,26)=15.712 5.53
Barley 14.5
-3.61
0.0073
0.52; 2.4; 25; <0.000
F(2,22)=13.812 5.72
Forage
root plants
-334.5
-50.7
0.469
0.20; 62; 15; <0.100
F(2,12)=2.7703 6.93 (3.88)
Potato -29.10
-7.86
0.1062
0.31; 17; 31; <0.002
F(2,28)=7.6384 5.45
Silage -7.45
-96.77
0.356
0.67; 30.4; 15;<0.000
F(2,12)=15.314
6.93
Hay
6.9
-4.2
0.0168
0.49; 2.0; 30; <0.000
F(2,27)=15.099
5.49
Berries -59.0
-11.0
0.077
0.48, 5.6; 11; <0.031
F(2,8)=5.5965 8.65 (4.46)
1
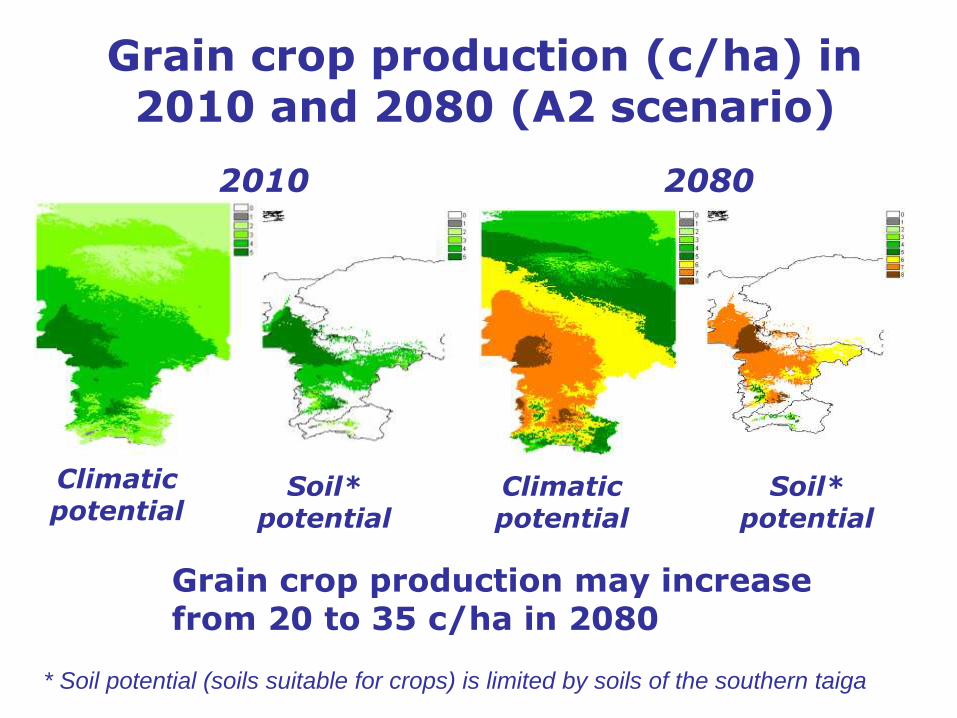
Grain crop production (c/ha) in 2010 and 2080 (A2 scenario)
Climatic potential
Soil* potential
Climatic potential
Soil* potential
2010 2080
* Soil potential (soils suitable for crops) is limited by soils of the southern taiga
Grain crop production may increase from 20 to 35 c/ha in 2080
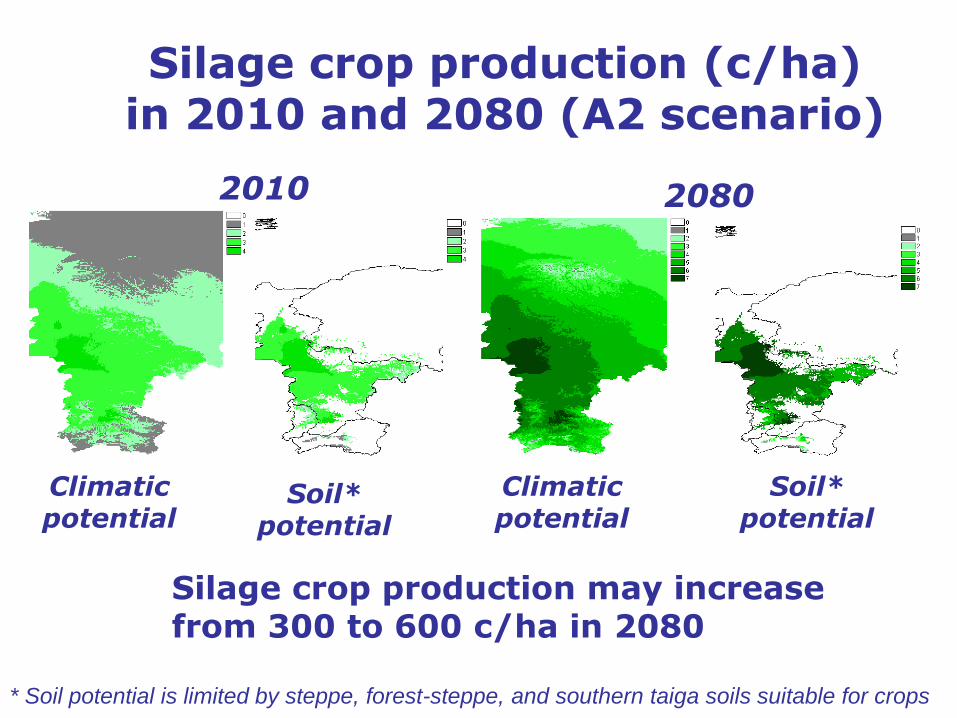
Silage crop production (c/ha) in 2010 and 2080 (A2 scenario)
Climatic potential
Soil* potential
Climatic potential
Soil* potential
2010 2080
* Soil potential is limited by steppe, forest-steppe, and southern taiga soils suitable for crops
Silage crop production may increase from 300 to 600 c/ha in 2080
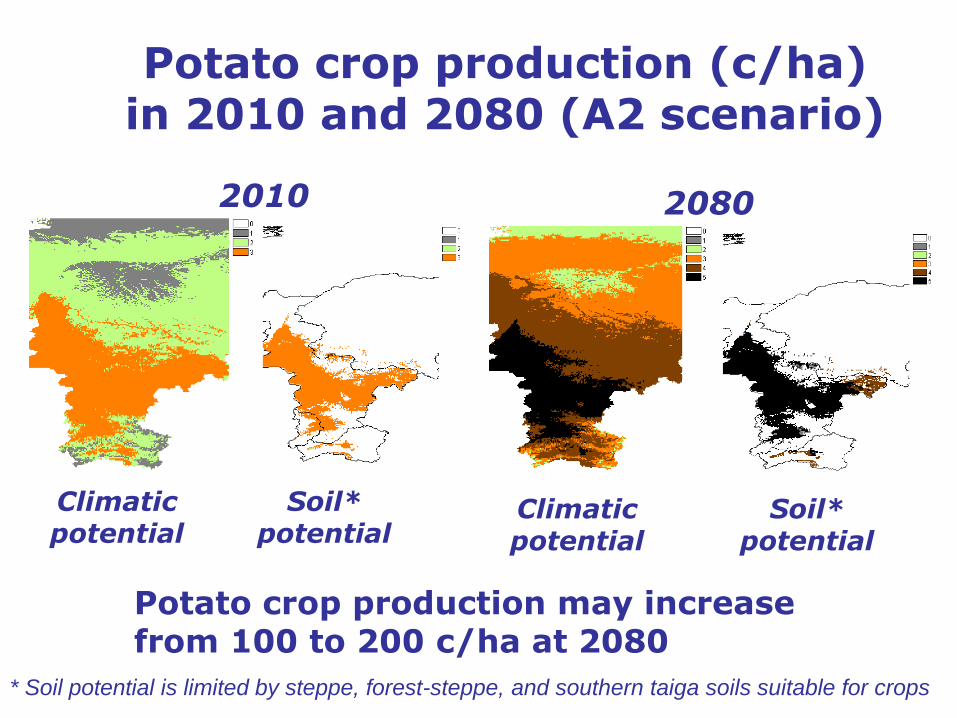
Potato crop production (c/ha) in 2010 and 2080 (A2 scenario)
Climatic potential
Soil* potential
Climatic potential
Soil* potential
2010 2080
* Soil potential is limited by steppe, forest-steppe, and southern taiga soils suitable for crops
Potato crop production may increase from 100 to 200 c/ha at 2080
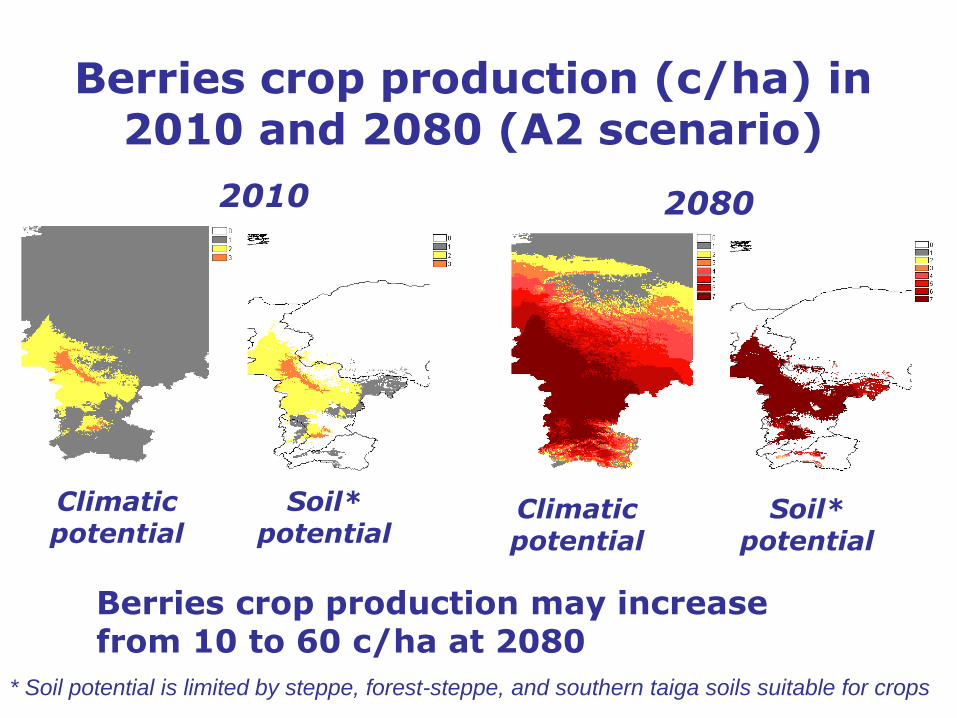
Berries crop production (c/ha) in 2010 and 2080 (A2 scenario)
Climatic potential
Soil* potential
Climatic potential
Soil* potential
2010 2080
* Soil potential is limited by steppe, forest-steppe, and southern taiga soils suitable for crops
Berries crop production may increase from 10 to 60 c/ha at 2080
Conclusions
• For half a century, from 1960 to 2010, summers have increasingly become 0.7-1.5°С warmer and winters have become 1-2°С warmer in the northern farming regions of the Munisinsk basin;
• Both summers and winters have become two times warmer 1.4-3.2°С and 2-4°С, correspondingly, in the southern farming regions in Tyva;
• The pattern of moisure change over the study area was complex with increased moisture in the forest-steppe zone and decreased moisture in the steppe zone;
• 50-85% of central Siberia is predicted to be climatically suitable for agriculture at the end of the century although potential croplands would be limited by the availability of suitable soils within the steppe, forest-steppe, subtaiga and southern taiga zones;
Conclusions
• Climatic factors control crop distribution and production in southern Siberia (R2 = 0.43-0.68);
• Crop production may increase by twofold as climate warms during the century;
• Traditional crops (grain, potato, maize for silage) could gradually shift as far as 500 km northwards (about 50-70 km per decade) and new crops (maize for grain, fruit trees) could be introduced in the far south depending on winter conditions and these would necessitate irrigation in the drier 2080 climate.
• Agriculture in central Siberia would likely benefit from climate warming
.
NM Tchebakova , EI Parfenova , GI Lysanova and AJ Soja
“Agro-climatic potential across central Siberia in an
altered twenty-first century”
Environmental Research Letters,6 (2011) 045207
Acknowledgements
• We would like to recognize the Northern Eurasian
Earth Science Partnership Initiative (NEESPI) and the
NASA Land Cover Land Use Change (LCLUC)
program.
• We are greatly appreciative of the current support for
this work, provided by the NASA Interdisciplenary
Science NNH09ZDA001N-IDS
and
• the Russian Foundation for Basic Research
10-05-00941