Embed Size (px)
Citation preview
19820September 1993
LATEN Dissemination Note # 5
An Analysis of Floodingin the ParaniYParaguayRiver Basin
September 1993
,a,g-X Z S~~~~~~~~~~~~~~~~~~~~~~~~~~~~~~~~. ..N . ...
Robert J. Anderson, Jr.Nelson da Franca Ribeiro dos SantosHenry F. Diaz
The World BankLatin America Technical Department tEnvironment Division
Pub
lic D
iscl
osur
e A
utho
rized
Pub
lic D
iscl
osur
e A
utho
rized
Pub
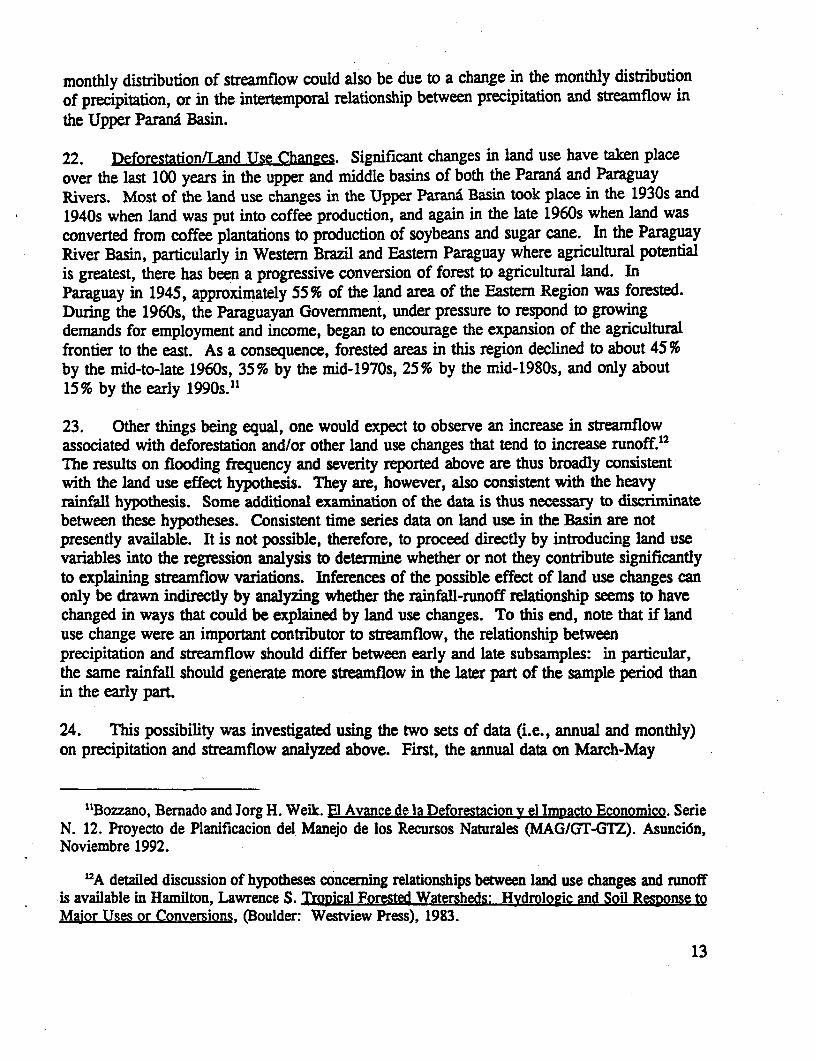
lic D
iscl
osur
e A
utho
rized
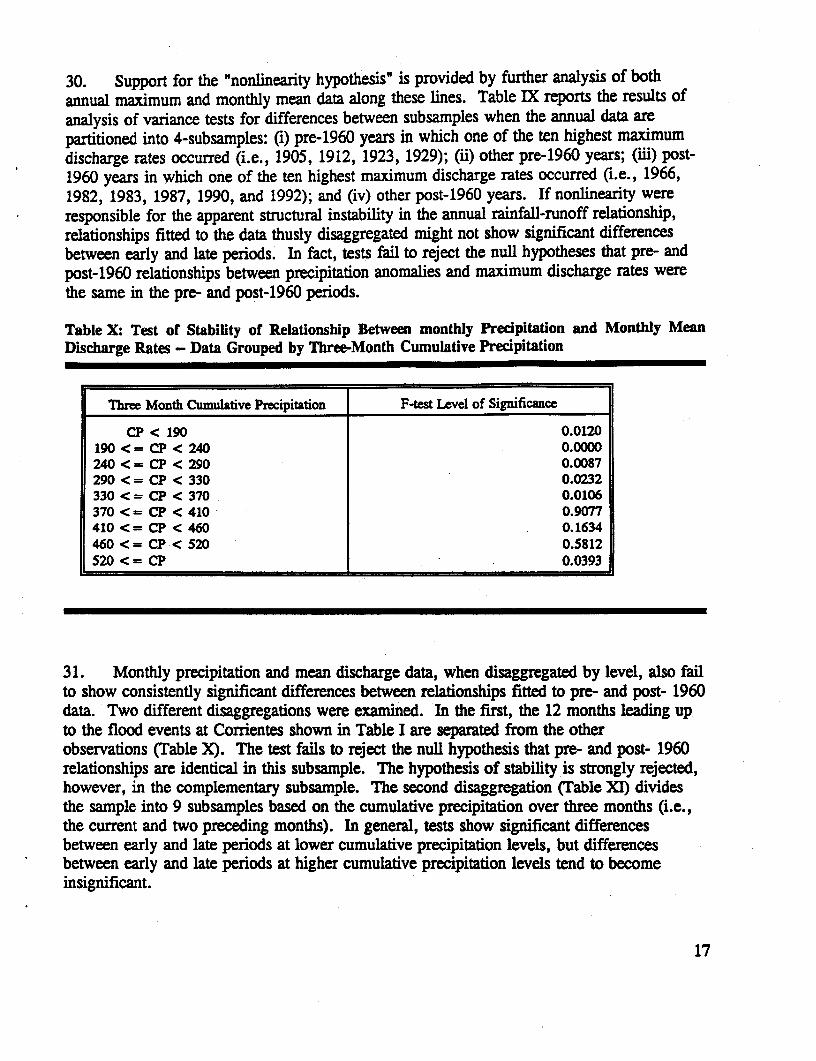
Pub
lic D
iscl
osur
e A
utho
rized
Pub
lic D
iscl
osur
e A
utho
rized
Pub
lic D
iscl
osur
e A
utho
rized
Pub
lic D
iscl
osur
e A
utho
rized
Pub
lic D
iscl
osur
e A
utho
rized

LATEN Dissemination Note # 5
An Analysis of Flooding in theParana'/Paraguay River Basin
September 1993
Robert J. Anderson, Jr.Nelson da Franca Ribeiro dos Santos
Henry F. Diaz
The World BankLatin America & the Caribbean Technical Department
Environment Division

FOREWORD
Late in 1991, unusually heavy rain began to fall in the catchmentareas of the Parana, Paraguay, and Uruguay Rivers. In 'normalH years, theaverage precipitation in this basin varies between 200 mm per year in thewestern part, the mountain range of the Andes, and 2,000 mm in thesoutheastern part, consisting of the Iguazu River basin. The rains are almostincessant during the year in the southern and southeastern parts of the basin.This rainfall distribution produces high river flows in the basin that begin inOctober/November and peak between February and June/July.
As in most flood years, torrential downpours in the Brazilian part ofthe Paran; River Basin between January and May 1992 produced massiveflows in the Parana River. In addition, heavy rains in the middle to lowerParaguay River basin during March and May led to peak flows in this riverthat were coincident with the peak flows of the Parana River. The Paranathus peaked in April/May 1992 at almost four times the yearly average. Theinitial data on the 1992 flood indicate that the peak flow was about 56000m3/s. This caused serious infrastructure damage and forced the evacuationof about 120,000 people from seven Argentine provinces - Buenos Aires,Chaco, Corrientes, Entre Rios, Formosa, Misiones, and Santa Fe. Althoughit is too early to attempt a precise estimate, indications are that the damagemay be on the same order of magnitude as that caused by the 1983 flood,which cost about US$ 1 billion to repair. Apart from the capital stockdamage, Argentina will also face substantial economic losses (e.g., lostproduction of grains, livestock, and cotton). Losses in Paraguay and Brazilwere also severe.
In September, 1992, the World Bank approved a loan to Argentina tocover a portion of the costs of repairing the damage due to this flood. TheBank also initiated the identification of a possible subsequent operation thatwould aim at improving Argentina's preparedness to deal with severeflooding. During the processing of the rehabilitation operation, the Bankbecame aware of satellite imagery evidence that heavy siltation appears to beoccurring along stretches of the Parani that are bordered by agriculture.This led the senior management of the LAC Region to question whetherdeforestation may be making the basin more prone to floods. Regionalsenior management asked the Region's Technical Department to examine thisissue.
Disentangling the impact of deforestation from other factors onflooding is a difficult undertaking under the best of circumstances. Thequantity and quality of historical data on land-use changes and otherinterventions affecting the hydrology of the basin and basic hydrologic dataare reasonably good by developing country standards. Records of ParanaRiver flows exist since 1901 and land-use data extend back perhaps 40 years.There are, however, serious gaps in meteorological information, and thehydrology of this large basin is extremely complex.
This paper, written by a team led by Robert J. Anderson, Jr.,formerly of LATEN, and comprised by Dr. Nelson da Franca Ribeiro dosSantos of the Organization of American States, and Dr. Henry F. Diaz of theNational Oceanic and Atmospheric Administration, draws upon these data toreach preliminary conclusions about the recent frequency and severity offlooding, and about the possible role that land use changes may be playing.During the preparation of the paper, Drs. Anderson, da Franca Ribeiro dosSantos, and Diaz benefitted from the comments of workshop in which severaldistinguished scientists and practitioners participated.'
While the data are far from perfect, the evidence examined indicatesthat flooding in the ParanAfParaguay basin has indeed been both morefrequent and more severe in recent years. Ten-year flood discharge rates arenow over 15% greater than they were in the early years of the 20th century.Mean discharge rates and extreme low discharge rates are higher too. Theanalysis also shows that changes in precipitation rates and patterns are by farthe most important explanatory factors in these observed changes instreamflow. Recent precipitation has been higher in the wet season, andlower in the dry season.
Reservoirs on the Upper Parand have also played a role, particularlyin increasing low flows. When these other factors are held constant, there isno systematic evidence that any other factor such as land use changes in theupper basin is playing a significant role in flooding.
These conclusions notwithstanding, the apparent lack of associationbetween flooding and land use changes is no reason to be complacent aboutthese changes. Data examined during the course of the research -particularly the satellite imagery suggestive of heavy sediment loads -suggest that land use changes in the upper basins may be exacting largeprivate and social costs in terms of lost productivity in agriculture andinfrastructure, and lost biodiversity.
Like other papers in this 'Dissemination Notesw series, the findings,interpretations, and conclusions expressed are entirely those of the author(s)and should not be attributed to the World Bank, members of its Board ofExecutive Directors, or the countries they represent.
Dennis J. MaharDivision Chief
Environment DivisionLatin American & the Caribbean
Technical Department
Workshop participants, in additon to the authors, included Dr. Kirk Rodgers (Orgaiionof American States), Professor Rafael Bras (Massahusetts Institute of Technology), Mr.Stephen Oliver (IBRD), Mr. Armando Araujo (IBRD), and Mr. Sri-Ram Aiyer (IBRD).
AN ANALYSIS OF FLOODING IN TIHEPARANA/PARAGUAY RIVER BASIN
Robert J. Anderson, Jr.Nelson da Franca Ribeiro dos Santos
Henry F. Diaz'
'The authors are respectively Principal Sector Economist, India Country Department, TheWorld Bank, Water Resources Senior Specialist, Department of Regional Development andEnvironment, and Climatologist, National Oceanic and Atmospheric Administration. Dr.Anderson led the team and was prinarily responsible for analysis and for preparation of themain body of the paper. Dr. da Franca Ribeiro dos Santos was primarily responsible for thepreparation of Annexes A and C. Dr. Diaz was primarily responsible for preparation ofAnnex B.
The views expressed in this paper are solely those of the authors and do not necessarilyreflect the views of organizations with which they are associated.

AN ANALYSIS OF FLOODING IN THEPARANAIPARAGUAY RIVER BASIN
Introduction
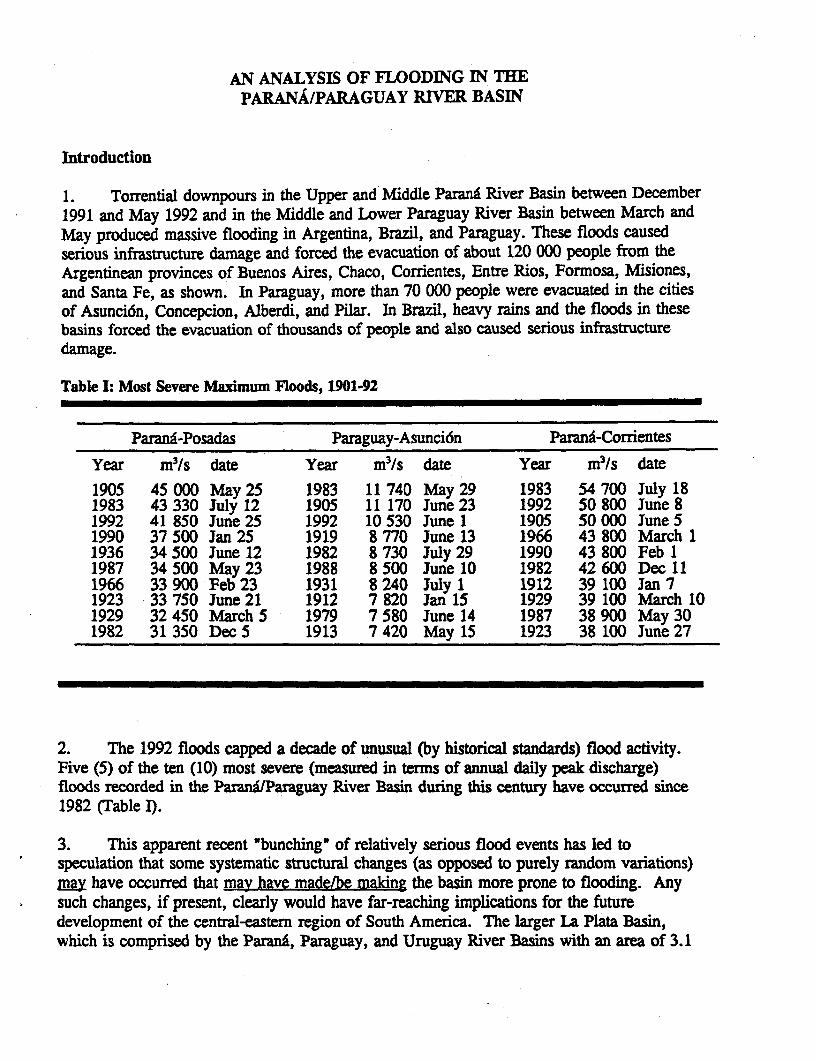
1. Torrential downpours in the Upper and Middle Parana River Basin between December1991 and May 1992 and in the Middle and Lower Paraguay River Basin between March andMay produced massive flooding in Argentina, Brazil, and Paraguay. These floods causedserious infrastructure damage and forced the evacuation of about 120 000 people from theArgentinean provinces of Buenos Aires, Chaco, Corrientes, Entre Rios, Formosa, Misiones,and Santa Fe, as shown. In Paraguay, more than 70 000 people were evacuated in the citiesof Asunci6n, Concepcion, Alberdi, and Pilar. In Brazi, heavy rains and the floods in thesebasins forced the evacuation of thousands of people and also caused serious infrastructuredamage.
Table I: Most Severe Maximum Floods, 1901-92
ParanA-Posadas Paraguay-Asunci6n Parang-Corrientes
Year m 3 /s date Year m3/s date Year m 3 /s date
1905 45 000 May 25 1983 11 740 May 29 1983 54 700 July 181983 43 330 July 12 1905 11 170 June 23 1992 50 800 June 81992 41 850 June 25 1992 10 530 June 1 1905 50 000 June 51990 37 500 Jan 25 1919 8 770 June 13 1966 43 800 March 11936 34 500 June 12 1982 8 730 July 29 1990 43 800 Feb 11987 34 500 May 23 1988 8 500 June 10 1982 42 600 Dec 111966 33 900 Feb 23 1931 8 240 July 1 1912 39 100 Jan 71923 33 750 June 21 1912 7 820 Jan 15 1929 39 100 March 101929 32 450 March 5 1979 7 580 June 14 1987 38 900 May 301982 31 350 Dec 5 1913 7 420 May 15 1923 38 100 June 27
2. The 1992 floods capped a decade of unusual (by historical standards) flood activity.Five (5) of the ten (10) most severe (measured in terms of annual daily peak discharge)floods recorded in the Parani/Paraguay River Basin during this century have occurred since1982 (Table I).
3. This apparent recent "bunching" of relatively serious flood events has led tospeculation that some systematic structural changes (as opposed to purely random variations)may have occurred that may have made/be maldng the basin more prone to flooding. Anysuch changes, if present, clearly would have far-reaching implications for the futuredevelopment of the central-eastern region of South America. The larger La Plata Basin,which is comprised by the Parand, Paraguay, and Uruguay River Basins with an area of 3.1
million km2 in Argentina, Bolivia, Brazil, Paraguay, and Uruguay constitutes the economicheart of this region. The ParanA/Paraguay River Basin encompasses 2.6 million km2 (84%of the total area of the La Plata Basin) in the four countries except Uruguay. It contains amultitude of natural resources: water, minerals, and arable soils. As a result, the area hasthe most developed agricultural and industrial zones of the continent; it holds some of themore important hydroelectric dams in Latin America (Itaipu and Yacyreta); it contains anextensive riverine and terrestrial transportation network; it generates around 80% of theGross Domestic Product of the countries and it is home to some 100 million people.'
4. Three major changes have occurred since the 1960s that potentially could affect thehydrometeorology of the region:
o Agricultural and industrial production in the basin has grown rapidly and thefrontier of agriculture and livestock production expanded. In Brazil, land inthe Upper Parana Basin has been converted from coffee plantations tosoybeans and sugar cane for alcohol fuel production. In the Paraguay Basin,deforestation and the expansion of the agricultural frontier to establishcropland and pasture, have been extensive in both the Brazilian andParaguayan portions of the basin. These land use changes may have increasedrunoff, streamflow, siltation and may be implicated in recent flood episodes.
O Hydroelectric development, mostly in the Upper Parara Basin, has expandedsignificantly. Some 20 hydroelectric power plants of more than 1000 MWincluding binational plants for Brazil-Paraguay and Argentina-Paraguay havebeen installed or are under construction. Overall potential in the basin is nowapproximately 42,000 MW and the total amount of water stored in thereservoirs is approximately 350,000 hm3, of which 120,000 hm3 are activestorage. Reservoir operation may have increased the flow of the Parana Riverat the confluence with the Paraguay at the time that the Paraguay River peaks.
o Wet season rainfall in the region of the Parana and Paraguay Basins has beenrelatively high since the early 1980s, raising the possibility that a change inclimate (as opposed to simple random variation in precipitation) may haveoccurred. It also begs the question whether any such change could be due tohuman influences on the environment (e.g., increased concentrations ofatmospheric 'greenhouse' gases, worldwide deforestation, stratospheric ozonedepletion, and increases in anthropogenic aerosol loading of the atmospherecould be contributing to these recent precipitation extremes).
'A basic description of the ParanL/Paraguay Basin is contained in Annex A.
2
5. This paper examines some of the evidence bearing on these developments and theirpossible effects on the hydrometeorology of the Basin. In particular, it considers twoquestions'
i Has flooding in the basin become more frequent and/or more severe?
ii Can observed variations in streamflow in the basin be explained by randomvariations in precipitation alone, or do other factors such as changes inclimate, land use, or operations of reservoirs also appear to have played arole?
Definitive answers to these questions are beyond the reach of the paper given the presentstate of the data. This limitation notwithstanding, however, the evidence is reasonably strongthat flooding was significantly (in a strict statistical sense) more frequent and more severe inrecent years, and that this was due primarily to unusually concentrated (in time and space)precipitation. There is no strong statistical evidence to indicate that any other factor played asignificant role in flooding. There is, however, some evidence that when precipitation is notextremely high, some change has taken place that causes streamflow to be greater thanotherwise would have been expected.
Has Flooding Become More Frequent or Severe?
6. The data presently available only permit a partial and preliminary analysis of thefrequency and severity of flooding in the Basin. This analysis is based on examination ofdischarge/stage extrema (i.e., maxima and minima) and mean discharges at a limited numberof stations
Annual Maximum Daily Discharges/Stages Since 1900
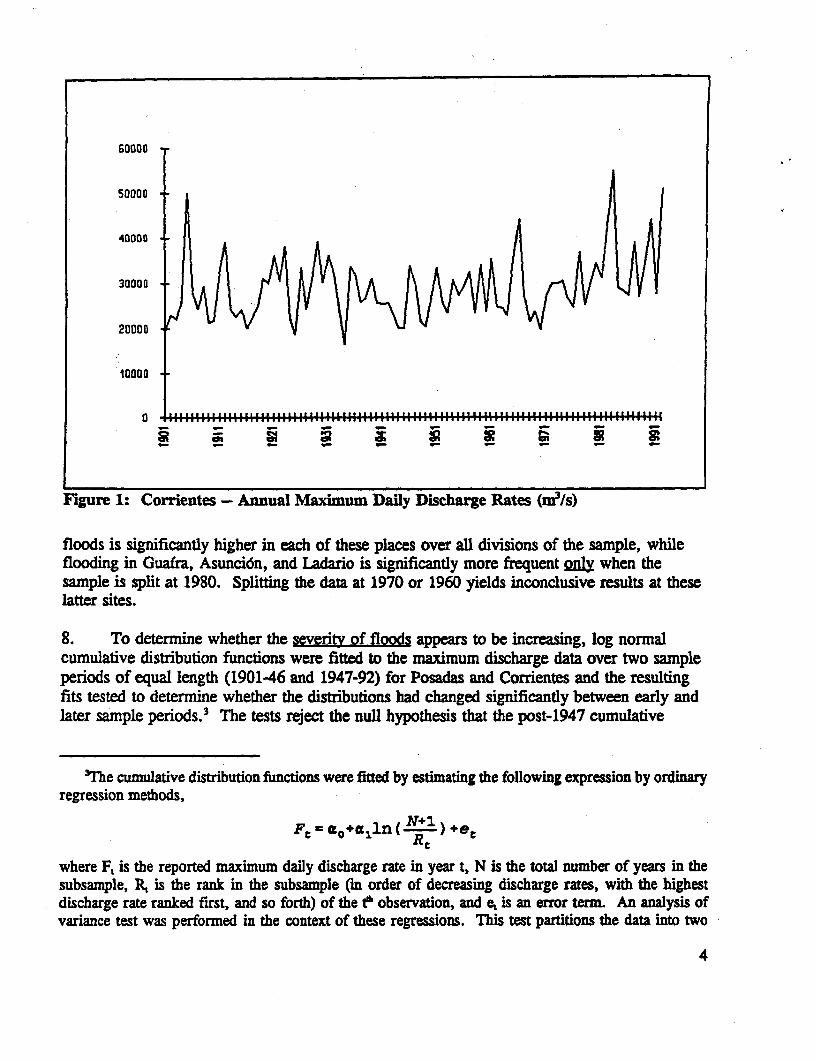
7. Data on annual maximum daily discharge rates/stages at Corrientes are shown inFigure 1.2 Other things being equal, if flooding were no more frequent in the latter yearsof the sample than in the early years, the proportion of the time that peak discharges exceeda given level would be about the same as in the earlier years of the sample. Visualinspection of the data shown in Figures 1 is not conclusive, but does suggest some bunchingof relatively high peak discharge rates toward the end of the sample period. A statisticalanalysis of the data in Annex C for Corrientes and other stations (based on binomialprobability distributions estimated from the data in these tables) rejects the hypothesis that thefrequency of extraordinary (i.e.. ten-year) floods was the same in the latter years of thesample (Table II). This conclusion is not sensitive to the point at which the sample is dividedin the cases of Corrientes, Posadas, and Porto Murtinho. The frequency of extraordinary
2Annual maximum daily discharge rates/stages at Corrientes, Posadas, Asuncidn, Porto Murtinho,Ladario, Guaira, and Jupia are reported in Annex C.
3
60000
50000 AII
40000
20000
t0000
0 i: :IiI,,ii:nt itt uuuu:i tt uu: uI 111111: Wtn
F"igure 1: Corrientes - Annual Maximum Daily Discharge Rates (m3Is)
floods is significantly higher in each of these places over all divisions of the sample, whileflooding in Guaira, Asunci6n, and Ladanio is significantly more frequent pi Ix when thesample is split at 1980. Splitting the data at 1970 or 1960 yields inconclusive results at theselatter sites.
8. To determine whether the seveity o loo~ds appears to be increasing, log normalcumulative distribution functions were fitted to the maximum discharge data over two sampleperiods of equal length (1901-46 and 1947-92) for Posadas and Corrientes and the resultingfits tested to determine whether the distributions had changed significantly between early andlater sample periods.3 The tests reject the null hypothesis that the post-1947 cumulative
3The cumulative distribution functions were fitted by estimating the following expression by ordinaryregression methods,
N+1
where F, is the reported maximum daily discharge rate in year t, N is the total number of years in thesubsample, R, is the rank in the subsample Cin order of decreasing discharge rates, with the highestdischarge rate ranked first, and so forth) of the te observation, and e, is an error term. An analysis ofvariance test was performed in the context of these regressions. This test partitions the data into two
4
Table II: Probability Analysis of Frequency of Extraordinary Floods
River Station Sample Split At
1980 1970 1960
Paraguay Asuncion 0.00972 0.07492 0.22555
Porto Murthinho 0.00001 0.00001 0.00177Ladario 0.02095 0.01069 0.25724
Parana Corrientes 0.00318 0.02346 0.00120Posadas 0.00021 0.01193 0.00133Guaira 0.16540 0.71984 0.37953
Table m: Estimated Flood Discharges (m31s) Corresponding to Alternative Return Periods (years)
StationlSample Significance Return Period (Years) l
Subperiod Level of Test 10 20 50 100
Posadas 0.09901901 -92 32700 36986 42653 469391901-46 32653 36968 42672 469871947-92 33653 38273 44382 49002
Corrientes 0.00001901-92 39204 44584 51696 570761901-46 37542 42659 49423 54540; 1947-92 41734 47694 55574 61535
distribution function is the same as the pre-1947 distribution function, although thesignificance level of the test at Posadas is only about 10% (Table Im). At both sites, higherflood peaks were associated with any given level of probability in the post-1947 period, orequivalently, the flood for any given return period was more severe.
9. While the samples of data analyzed as described above span relatively long timeperiods (i.e., 92 years in Corrientes and Posadas, and between 49 and 89 years at otherlocations), it should be kept in mind that a longer sample period might well lead to different
subperiods (in this case of equal length) and tests whether the estimated coefficients are, for statisticalpurposes, identical over the two subperiods.
5
conclusions. There exist references to extraordinary floods that occurred in Corrientes in1612 and 1748 (stage< 10.50 m), as well as in 1812, 1858, and 1878. Table IV reportsextraordinary floods in Corrientes prior to 1905 in comparison with the floods of 1983 and1992. It is not clear whether this is a complete record of extraordinary floods during the1800s. However, these three large floods during the 1800s underscore the point that, if thestatistical record could be extended back into the 1800s, the conclusions concerningfrequency and severity stated above might not stand.
Table IV: Extraordinary Floods in Corrientes Before Prior to 1905 Compared to the Floods of 1905and 1992
Year Stage lGM1 Dischargem m m3 /s
1812 9.53 50.93 58 0001983 9.02 50.42 54 700
1858 8.93 50.33 52 0001878 8.65 50.05 51 0001992 8.64 50.04 50 8001905 8.57 49.94 50 000
I-Gage-dacUm sbove swa level-InstitutoGcog~iSco MiIk, Aretn
Other Streamflow Characterisics
10. Two other streamflow characteristics, annual minimum daily discharge rates and meanmonthly discharge rates were examined to determine whether changes appear to haveoccurred in these parameters as well. Figure 2 suggests that annual minimum discharge rateshave tended to increase. Regression estimation fitting log normal cumulative probabilitydistributions to the annual minimum daily discharge rate data for Corrientes and Posadas andstatistical testing confirms that minimum daily flows were significantly higher at thesestations during the latter part of the sample period.4
'Data on annual minimum daily discharge rates/stages at Corrientes, Posadas, Guaira, Asunci6n,Porto Murtinho, and Ladario are reported in Annex C. Estimation and testing was carried out inaccordance with the procedure described in footnote 3 above.
6
258000-
20000
15000
10000
5000
Flgure 2: Annual Minimum Discharge Rates (m3Is) at Corrientes
20.1n a
190_ -9
4 ".0 1910-92,g
5.0
Jan Feb Mar Apr May Jun Jul Aug Gep Oct Nov Dec
Figure 3: Monthly Mean Discharge Rates (m3 /sec) at Corrientes
7
11. Figure 3 shows a distinct shift in the pattern of mean monthly flows in Corrientesover two subperiods (1901-67 and 1968-92).5 Visual inspection of the figure suggests thattwo changes have occurred. First, mean discharges seem generally to have increased. Meanannual discharge was between 15 and 20 percent higher during the second subperiod (1968-92) than in the earlier period. Second, there was a shift in the intra-annual pattern ofdischarges, with mean monthly flows becoming more uniform over the year due tosignificantly higher (in the second subperiod) mean flows in the months of May throughDecember. This latter shift in the distribution is what would be expected to occur as a resultof the operations of reservoirs in the Upper Basin.
12. In sum, the analyses described above suggest that the entire streamflow distributionwas shifted toward higher values in the later years of the sample period. Maximum annualdaily discharge rates, minimum annual daily discharge rates, and mean annual dailydischarge rates all were higher in the later years of the sample period. There is also someevidence of a change in the intra-annual distribution of streamflow.
What Accounts for Greater Flood Frequency and Severity?
13. The discharge data reviewed above thus are generally consistent with the hypothesisthat floods were both more frequent and more severe in the latter years of this century thanin the earlier years. It is of fundamental importance for the future development of the Basinto try to understand whether this is due to purely random variations in precipitation orwhether it represents a structural change in the hydrometeorology of the basin.
14. This is a complex undertaking. Runoff within a basin depends not only on theamount of rainfall but also upon its temporal distribution, vegetal cover, evapotranspiration,infiltration rates, soil moisture storage capacity, the amount of moisture in storage, surfacestorage, rate of groundwater outflow, losses due to deep percolation, and a host of otherfactors. Many of these parameters are interrelated. An extensive program of reservoirconstruction over the sample period on the Upper Parara introduces additional complications.For these reasons, the analysis presented here is indicative, but not conclusive.
Unusually Heavy Precipitation
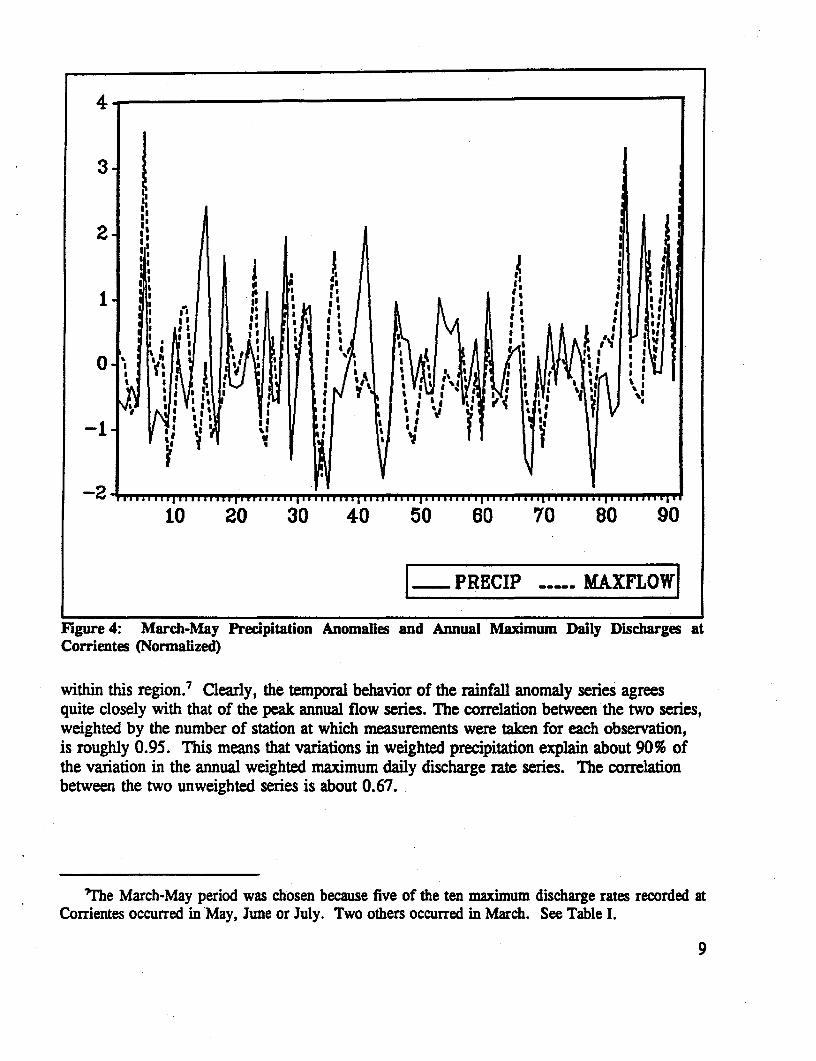
15. The most obvious possible explanation for recent heavy flooding is that it could havebeen"caused by too much rain falling in too short a period, or prolonged rain falling on landthat is already saturated with water."6 Figure 4 shows an annual time series of precipitationanomalies (i.e., deviations of precipitation from its mean value) over the region of theParanA/Paraguay Basins during a three-month period (March-May) derived from station data
'Data on mean monthly flows are presented in Annex A.
%Hamilton, Lawrence S. *The Recent Bangladesh Flood Disaster Was No Caused by DeforestationAlone." Environmental Conservation, 1988, pp 369-370.
8
4
ma
2-
iO 20 30 40 50 60 70 80 90
.~~~~~a
|_PRECIP .MAXFLOW|
Figure4: March-May Preupitation Anomalies and Annual Maximum Daily Dischages atCorrientes (Normnalized)
within this region.' Clearly, the temporal behavior of the rainfall anomaly sen'es agreesquite closely with that of the peak annual flow series. The correlation between the two series,weighted by the number of station at which measurements were taken for each observation,is roughly 0.95. This means that variations in weighted precipitation explain about 90% ofthe variation in the annual weighted maximum daiy discharge rate series. The correlation
between the two unweighted series is about 0.67.
Ilhe March-May period was chosen because five of the ten maximum discharge rates recorded atCorrientes occurred in May, June or July. Two others occurred in March. See Table I.
9
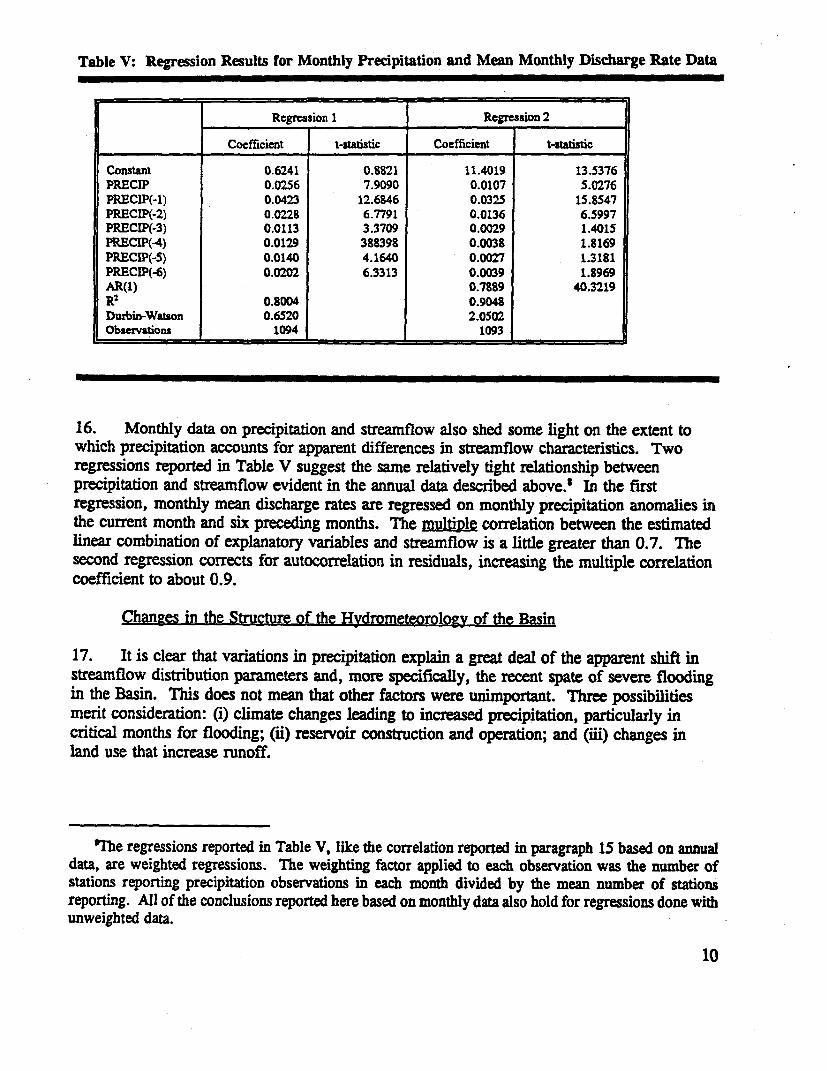
Table V: Regression Results for Monthly Precipitation and Mean Monthly Discharge Rate Data
Regression 1 Regression 2
Coefficient t-statistic Coefficient t-statistic
Constant 0.6241 0.8821 11.4019 13.5376PRECIP 0.0256 7.9090 0.0107 5.0276PRECIP(-1) 0.0423 12.6846 0.0325 15.8547PRECIP(-2) 0.0228 6.7791 0.0136 6.5997PRECIP(-3) 0.0113 3.3709 0.0029 1.4015PRECIP(4) 0.0129 388398 0.0038 1.8169PRECIP(-S) 0.0140 4.1640 0.0027 1.3181PRECIP(-6) 0.0202 6.3313 0.0039 1.8969AR(1) 0.7889 40.3219R2 0.8004 0.9048Dubin-Watson 0.6520 2.0502Observations 1094 1093
16. Monthly data on precipitation and streamflow also shed some light on the extent towhich precipitation accounts for apparent differences in streamflow characteristics. Tworegressions reported in Table V suggest the same relatively tight relationship betweenprecipitation and streamflow evident in the annual data described above.' In the firstregression, monthly mean discharge rates are regressed on monthly precipitation anomalies inthe current month and six preceding months. The multiple correlation between the estimatedlinear combination of explanatory variables and streamflow is a little greater than 0.7. Thesecond regression corrects for autocorrelation in residuals, increasing the multiple correlationcoefficient to about 0.9.
Changes in the Structure of the Hydrometeorology of the Basin
17. It is clear that variations in precipitation explain a great deal of the apparent shift instreamflow distribution parameters and, more specifically, the recent spate of severe floodingin the Basin. This does not mean that other factors were unimportant. Three possibilitiesmerit consideration: (i) climate changes leading to increased precipitation, particularly incntical months for flooding; (ii) reservoir construction and operation; and (iii) changes inland use that increase runoff.
'Tle regressions reported in Table V, like the correlation reported in paragraph 15 based on annualdata, are weighted regressions. The weighting factor applied to each observation was the number ofstations reporting precipitation observations in each month divided by the mean number of stationsreporting. All of the conclusions reported here based on monthly data also hold for regressions done withunweighted data.
10
440.00
40. 00
20.00l0.00
Jan Pab Mar APr way Jun Ju I Aug Sep OCt Nov Des
Figure 5: Mean Monthly Precipitation (mm)
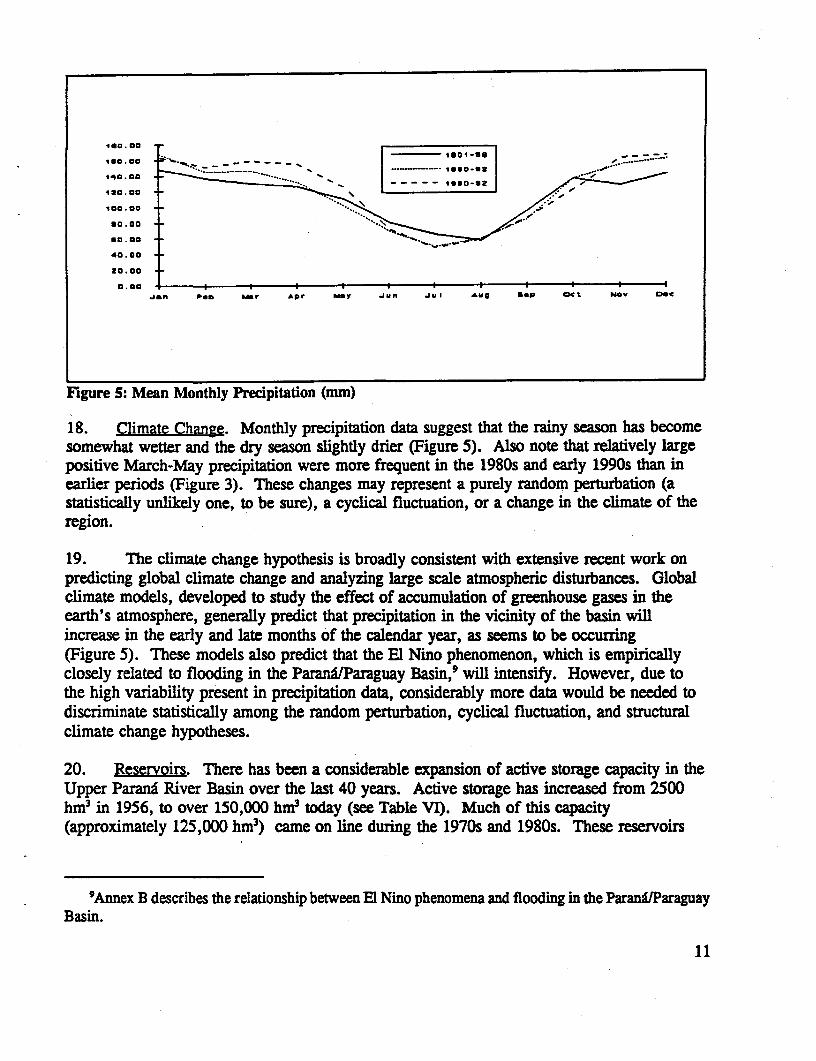
18. Climate Change. Monthly precipitation data suggest that the rainy season has becomesomewhat wetter and the dry season slightly drier (Figure 5). Also note that relatively largepositive March-May precipitation were more frequent in the 1980s and early 1990s than inearlier periods (Figure 3). These changes may represent a purely random perturbation (astatistically unlikely one, to be sure), a cyclical fluctuation, or a change in the climate of theregion.
19. The climate change hypothesis is broadly consistent with extensive recent work onpredicting global climate change and analyzing large scale atmospheric disturbances. Globalclimate models, developed to study the effect of accumulation of greenhouse gases in theearth's atmosphere, generally predict that precipitation in the vicinity of the basin willincrease in the early and late months of the calendar year, as seems to be occurring(Figure 5). These models also predict that the El Nino phenomenon, which is empiricallyclosely related to flooding in the ParanA/Paraguay Basin,' will intensify. However, due tothe high variability present in precipitation data, considerably more data would be needed todiscriminate statistically among the random perturbation, cyclical fluctuation, and structuralclimate change hypotheses.
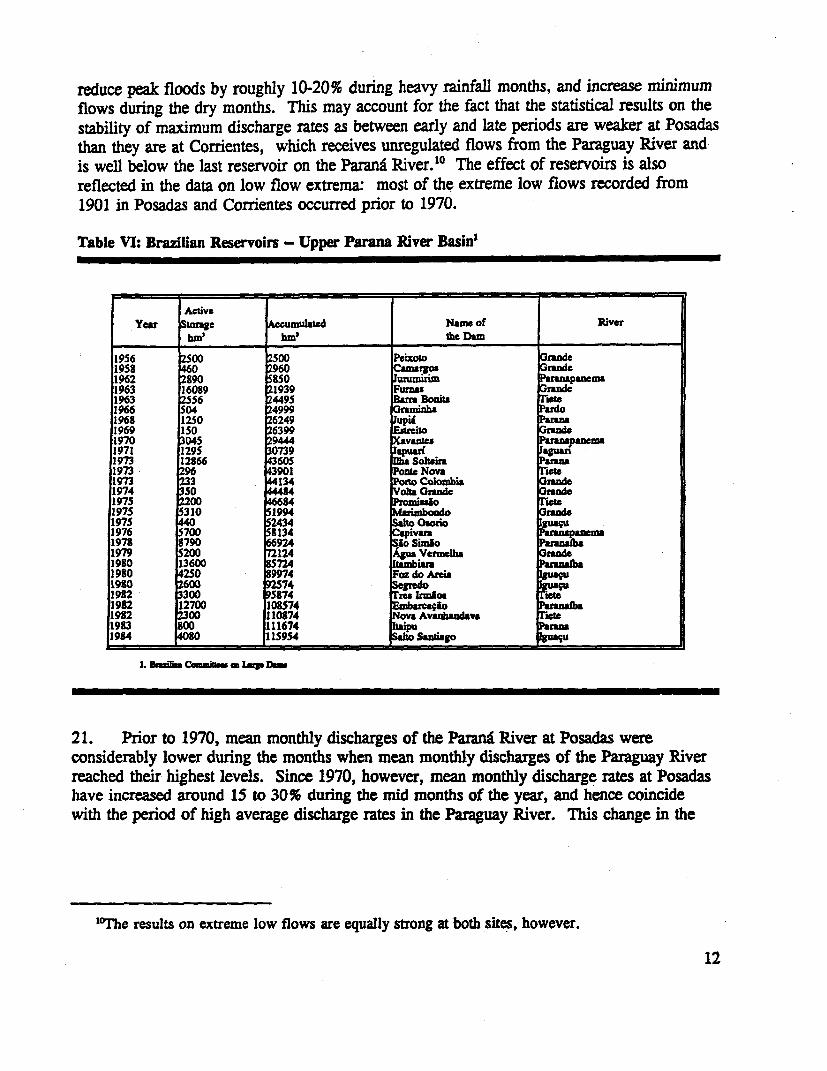
20. Reservoirs. There has been a considerable expansion of active storage capacity in theUpper Parana River Basin over the last 40 years. Active storage has increased from 2500hm3 in 1956, to over 150,000 hm3 today (see Table VI). Much of this capacity(approximately 125,000 hm3) came on line during the 1970s and 1980s. These reservoirs
'Annex B describes the relationship between El Nino phenomena and flooding in the ParanTlParaguayBasin.
11
reduce peak floods by roughly 10-20% during heavy rainfall months, and increase ninimumflows during the dry months. This may account for the fact that the statistical results on thestability of maximum discharge rates as between early and late periods are weaker at Posadasthan they are at Corrientes, which receives unregulated flows from the Paraguay River andis well below the last reservoir on the Parana River.10 The effect of reservoirs is alsoreflected in the data on low flow extrema: most of the extreme low flows recorded from1901 in Posadas and Corrientes occurred prior to 1970.
Table VI: Brazilian Reservoirs - Upper Parana River Basin'
ActiveYear Storge tmulated Name of River
hm' hm' the Dam
1956 2500 2500 Pizoto Grande1958 0 2960 C o Grand01962 2890 850 lurann PSapn1963 16089 1939 Furnas1963 2556 2449 Bar Bonita net.1966 04 24999 raninha1968 1250 249 upin1969 IS0 6399 Esiruito randc1970 045 9444 Xavates paner1971 1295 0739 'puar( g1973 12866 3605 SolIhrn1973 296 3901 Poate Nova iota1973 233 134 Pto Colombia rnd1974 50 Voha Grand1975 00 C84 PrDmiuJ o1975 310 S1994 ixndo1975 2434 ahoono u1976 700 1134 aprn1978 790 924 Sio Smbo1979 204 124 AguaVermIelba runde1980 13600 5724 InhiPrn1980 250 9974 Faz do Atia guaqu1980 600 741982 300 T874 ru Inrbc. ne1982 12700 108S74 E io1982 00 110874 Nova Avanhandava Mt.1983 800 1116741984 80 1S954 Santiago
1. DmimCauhw ag
21. Prior to 1970, mean monthly discharges of the Parana River at Posadas wereconsiderably lower during the months when mean monthly discharges of the Paraguay Riverreached their highest levels. Since 1970, however, mean monthly discharge rates at Posadashave increased around 15 to 30% during the mid months of the year, and hence coincidewith the period of high average discharge rates in the Paraguay River. This change in the
"MThe results on extreme low flows are equally strong at both sites, however.
12
monthly distribution of streamflow could also be due to a change in the monthly distributionof precipitation, or in the intertemporal relationship between precipitation and streamflow inthe Upper Parana Basin.
22. Deforestation/Land Use Changes. Significant changes in land use have taken placeover the last 100 years in the upper and middle basins of both the Parana and ParaguayRivers. Most of the land use changes in the Upper Paranr Basin took place in the 1930s and1940s when land was put into coffee production, and again in the late 1960s when land wasconverted from coffee plantations to production of soybeans and sugar cane. In the ParaguayRiver Basin, particularly in Western Brazil and Eastern Paraguay where agricultural potentialis greatest, there has been a progressive conversion of forest to agricultural land. InParaguay in 1945, approximately 55% of the land area of the Eastern Region was forested.During the 1960s, the Paraguayan Government, under pressure to respond to growingdemands for employment and income, began to encourage the expansion of the agriculturalfrontier to the east. As a consequence, forested areas in this region declined to about 45%by the mid-to-late 1960s, 35% by the mid-1970s, 25% by the mid-1980s, and only about15% by the early 1990s.1'
23. Other things being equal, one would expect to observe an increase in streamflowassociated with deforestation and/or other land use changes that tend to increase runoff.'2
The results on flooding frequency and severity reported above are thus broadly consistentwith the land use effect hypothesis. They are, however, also consistent with the heavyrainfall hypothesis. Some additional examination of the data is thus necessary to discriminatebetween these hypotheses. Consistent time series data on land use in the Basin are notpresently available. It is not possible, therefore, to proceed directly by introducing land usevariables into the regression analysis to determine whether or not they contribute significantlyto explaining streamflow variations. Inferences of the possible effect of land use changes canonly be drawn indirecty by analyzing whether the rainfall-runoff relationship seems to havechanged in ways that could be explained by land use changes. To this end, note that if landuse change were an important contributor to streamfiow, the relationship betweenprecipitation and streamflow should differ between early and late subsamples: in particular,the same rainfall should generate more streamflow in the later part of the sample period thanin the early part.
24. This possibility was investigated using the two sets of data (i.e., annual and monthly)on precipitation and streamflow analyzed above. First, the annual data on March-May
"Bozzano, Bernado and Jorg H. Weik. El Avance de la Deforestacion y el Impacto Economico. SerieN. 12. Proyecto de Planificacion del Manejo de los Recursos Naturales (MAG/GT-GTZ). Asunci6n,Noviembre 1992.
'A detailed discussion of hypotheses concerning relationships between land use changes and runoffis available in Hamilton, Lawrence S. Tropical Forested Watersheds: Hydrologic and Soil Response toMajor Uses or Conversions, (Boulder: Westview Press), 1983.
13
Table VII: Analysis of Variance Test for Stability in the Relationship Between PrecipitationAnomalies and Annual Maximum Daily Discharge Rates (F-test Significance Level)
Sample Period i
1901-92 1901-60 1961-92
Sample Break Point1930 0.78631940 0.3481 0.55171950 0.0986 0.82921960 0.03441965 0.01261970 0.03141975 0.0025 0.29961980 0.0003 0.17171985 0.8691
RegressionsCONSTANT 30581.507 27670.084 31295.372PRECIP 112.189 35.020 123.705R2 0.8538 0.6270 0.5668Durbin Watson 1.5397 1.9169 1.5566
precipitation anomalies and amual maximum discharge rates were split into early and latesubsamples and examined to see whether the relationship between precipitation anomalies andmaximum discharge discussed in paragraph 15 is stable C(able VIU). Three different sampleperiods (1901-92, 1901-60, and 1961-92) are considered. The first column of the tablereports results obtained analyzing the data from the full sample period. The numbersreported in the upper section of the table (i.e., the rows in the 'Break Point' section of thetable) are F-statistic probabilities associated with an analysis of variance test like thatdescribed in footnote 3. The numbers reported in the lower section of the table areregression summary statistics."3
25. The probabilities shown in Table VII are interpreted as follows. Consider the period1901-92. When the 1901-92 sample is divided into two subsamples - for example 1901-79
1 The results reported in Table VII are based on weighted regressions in which the number of stationsreporting precipitation observations is relative to the mean number of stations over the whole sampleperiod (i.e., 1901-92) is used as the weighting factor. This gives more weight to observations that arebased on more measurements of precipitation. An analysis (not reported in detail here) paralleling thatin Table VII was carried out using unweighted regressions. The results and conclusions of thisunreported analysis are exactly the same as those reported here.
14
and 1980-92 - the probability is only 0.0003 of getting an F-statistic as large as wasobtained in the analysis of variance test if the relationship between precipitation anomaliesand maximum discharges were in fact the same in both subsamples.
26. Three conclusions flow from the results (and, more importantly, the pattern of results)summarized in the table. First, the data strongly reject the hypothesis that the relationshipbetween March-May precipitation anomalies and maximum discharge rates was unchanging.For break points at 1960 or after, the test rejects the null hypothesis (i.e., no change) at the0.035 level of significance or better. Second, the change in the relationship appears to occursometime in the 1950s or 1960s. As can be seen in the column headed "1901-92", the nullhypothesis would be rejected only at much lower levels of significance (i.e., higherprobability values) if the sample were split at 1950 or 1940. This conclusion is confirmed bytwo additional cuts of the data. In the column of the table headed "1901-60", stability of theregression relationship within the 1901-60 subperiod is examined. As can be seen, the testfails to reject the null hypothesis at any reasonable level of significance (i.e., the highestlevel of significance obtained is 0.55). The same result is obtained for tests of splits withinthe subsample 1961-92 (i.e., the highest level of significance obtained is 0.17). Third, theregression coefficients behave qualitatively as they would be expected to if some change hadoccurred which increased the runoff produced by any given quantity of rainfall: thecoefficient of the precipitation variable (PRECIP) is much higher in the second subsample(1961-92) than it is in the first (1901-60), taldng a value of "123" versus "35".
27. The relationship between monthly precipitation and average stream flows exhibits thissame general pattern of -instability (Table VmI). The relationship is significantly differentin the latter part of the sample period. However, analysis of the post-1960 data indicatessignificant differences in the relationship within the post-1960 sample subperiod.
28. The statistical relationship between precipitation and streamfiow is widely held to behighly nonlinear and to depend crucially on the temporal pattern of precipitation as well as itsamount. At higher precipitation rates, other things being equal, streamflow should increasemore than in proportion since the other ways in which precipitation can be 'dissipated" (e.g.,infiltration, evapotranspiration, surface retention) have very definite maxima. The resultsreported in Tables VII and VIII could thus simply be a reflection of the fact that precipitationhas been far above "nonnal" throughout much of the 1980s and early 1990s. In the annualdata, the fact that the coefficient of the precipitation variable in the second subperiod is overthree times as large as it is in the first subperiod (i.e., 123 versus 35), which would be animplausibly large effect to attribute to structural changes in rainfall-runoff relationships,suggests that nonlinearity may be at work. In the monthly data, the instability of withinsubsample regression coefficient in the post-1960 period could also be associated withnonlinearity.
29. If nonlinearity were Ie explanation for apparent changes in the relationship betweenprecipitation and streamflow, we should expect to find significant differences betweenrelationships fitted to subsamples classified by precipitation ranges, and little if any
15
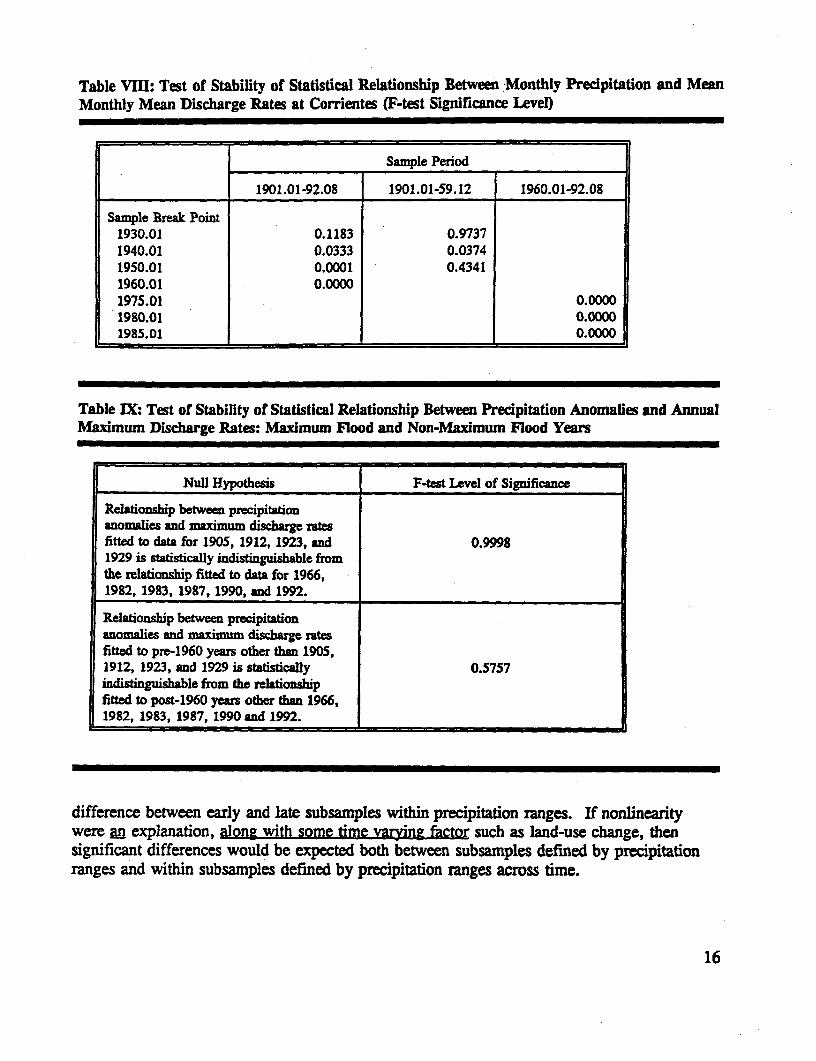
Table VIII: Test of Stability of Statistical Relationship Between Monthly Precipitation and MeanMonthly Mean Discharge Rates at Corrientes (F-test Significance Level)
Sample Period
1901.01-92.08 1901.01-59.12 1960.01-92.08
Sample Break Point1930.01 0.1183 0.97371940.01 0.0333 0.03741950.01 0.0001 0.43411960.01 0.00001975.01 0.00001980.01 0.00001985.01 0.0000
Table IX: Test of Stability of Statistical Relationship Between Precipitation Anomalies and AnnualMaximum Discharge Rates: Marimum Flood and Non-Maximum Flood Years
Nul Hypothesis F-test Level of Significance
Relationship between precipitationanomalies and maximum dischage ratesfitted to data for 1905, 1912, 1923, and 0.99981929 is statisticaUy indisinguihable fromthe elationship fitted to data for 1966,1982, 1983, 1987, 1990, and 1992.
Relationship between precipitationanomalies and maximum discharge ratesfitted to pre-1960 years other than 1905,1912, 1923, and 1929 is stadsticaly 0.5757indistinguishable from the relationshipfitted to post-1960 years other than 1966,1982, 1983, 1987, 1990 and 1992.
difference between early and late subsamples within precipitation ranges. If nonlinearitywere an explanation, along with some time varying factor such as land-use change, thensignificant differences would be expected both between subsamples defined by precipitationranges and within subsamples defined by precipitation ranges across time.
16
30. Support for the "nonlinearity hypothesis" is provided by further analysis of bothannual maximum and monthly mean data along these lines. Table IX reports the results ofanalysis of variance tests for differences between subsamples when the annual data arepartitioned into 4-subsamples: (i) pre-1960 years in which one of the ten highest maximumdischarge rates occurred (i.e., 1905, 1912, 1923, 1929); (ii) other pre-1960 years; (iii) post-1960 years in which one of the ten highest maximum discharge rates occurred (i.e., 1966,1982, 1983, 1987, 1990, and 1992); and (iv) other post-1960 years. If nonlinearity wereresponsible for the apparent structural instability in the annual rainfall-runoff relationship,relationships fitted to the data thusly disaggregated might not show significant differencesbetween early and late periods. In fact, tests fail to reject the null hypotheses that pre- andpost-1960 relationships between precipitation anomalies and maximum discharge rates werethe same in the pre- and post-1960 periods.
Table X: Test of Stability of Relationship Between monthly Precipitation and Monthly MeanDischarge Rates - Data Grouped by Three-Month Cumulative Precipitation
Throe Month Cumulative Precipitation F-test Level of Significance
CP < 190 0.0120190 <= CP < 240 0.0000240 <= CP < 290 0.0087290 <= CP < 330 0.0232330 <= CP < 370 0.0106370 <= CP < 410 0.9077410 <= CP <460 0.1634460 <= CP < 520 0.5812520 <= CP 0.0393
31. Monthly precipitation and mean discharge data, when disaggregated by level, also failto show consistently significant differences between relationships fitted to pre- and post- 1960data. Two different disaggregations were examined. In the first, the 12 months leading upto the flood events at Corrientes shown in Table I are separated from the otherobservations (Table X). The test fails to reject the null hypothesis that pre- and post- 1960relationships are identical in this subsample. The hypothesis of stability is strongly rejected,however, in the complementary subsample. The second disaggregation (Table XI) dividesthe sample into 9 subsamples based on the cumulative precipitation over three months (i.e.,the current and two preceding months). In general, tests show significant differencesbetween early and late periods at lower cumulative precipitation levels, but differencesbetween early and late periods at higher cumulative precipitation levels tend to becomeinsignificant.
17
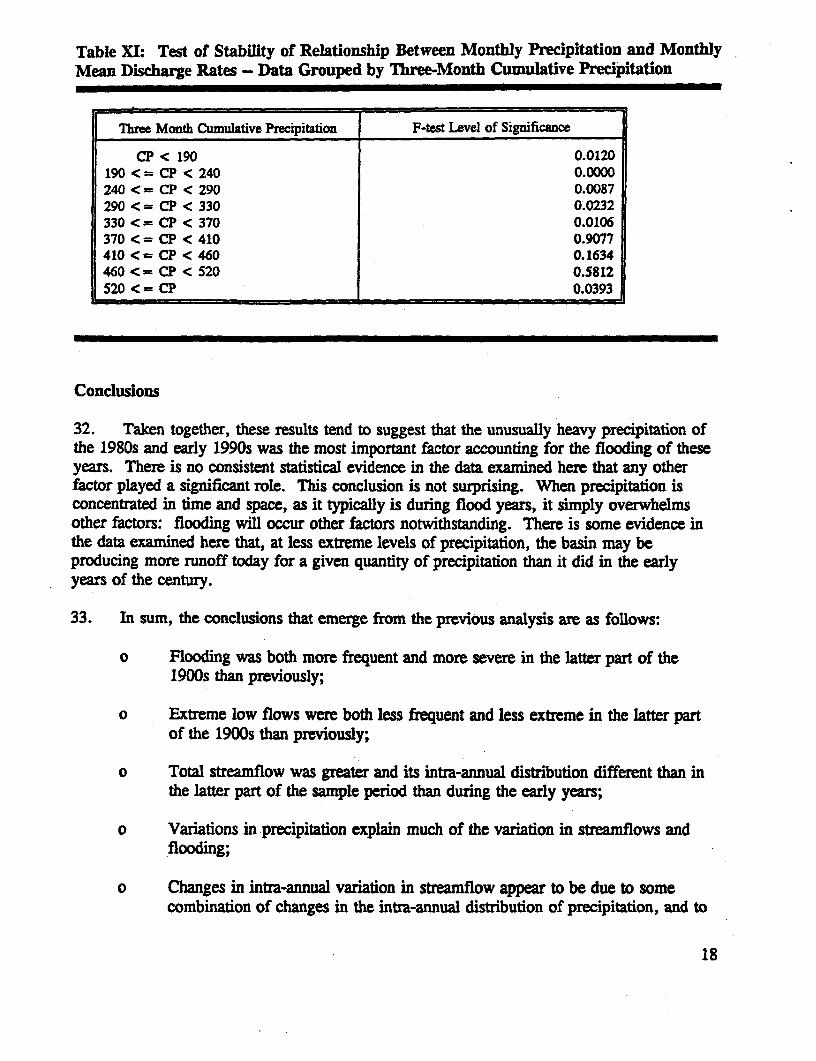
Table XI: Test of Stability of Relationship Between Monthly Precipitation and MonthlyMean Discharge Rates - Data Grouped by Three-Month Cumulative Precipitation
Three Month Cumulative Precipitation F-test Level of Significance
CP < 190 0.0120190 <= CP < 240 0.0000240 <= CP < 290 0.0087290 <= CP < 330 0.0232330 <= CP < 370 0.0106370 <= CP < 410 0.9077410 <= CP < 460 0.1634460 <= CP < 520 0.5812520 <= CP 0.0393
Conclusions
32. Taken together, these results tend to suggest that the unusually heavy precipitation ofthe 1980s and early 1990s was the most important factor accounting for the flooding of theseyears. There is no consistent statistical evidence in the data examined here that any otherfactor played a significant role. This conclusion is not surprising. When precipitation isconcentrated in time and space, as it typically is during flood years, it simply overwhelmsother factors: flooding will occur other factors notwithstanding. There is some evidence inthe data examined here that, at less extreme levels of precipitation, the basin may beproducing more runoff today for a given quantity of precipitation than it did in the earlyyears of the century.
33. In sum, the conclusions that emerge from the previous analysis are as follows:
o Flooding was both more frequent and more severe in the latter part of the1900s than previously;
o Extreme low flows were both less frequent and less extreme in the latter partof the 1900s than previously;
o Total streamflow was greater and its intra-annual distribution different than inthe latter part of the sample period than during the early years;
o Variations in precipitation explain much of the variation in streamflows andflooding;
0 Changes in intra-annual variation in streamflow appear to be due to somecombination of changes in the intra-annual distribution of precipitation, and to
18

the operation of reservoirs on the Parana which delay the propagation offloods; and
o There is no consistent evidence, statistical or otherwise, that changes inrainfall-runoff dynamics associated with land use changes have played animportant role in recent flooding in the Basin.
19

Annex A: Description of the Parana/Paraguay River Basin
1. This annex summarizes basic information and data on the Parana/Paraguay RiverBasin. Much of this information derives from international compacts established to managethe basin's resources.
Intergovernmental Cooperation on Hydrometeorology in the La Plata Basin
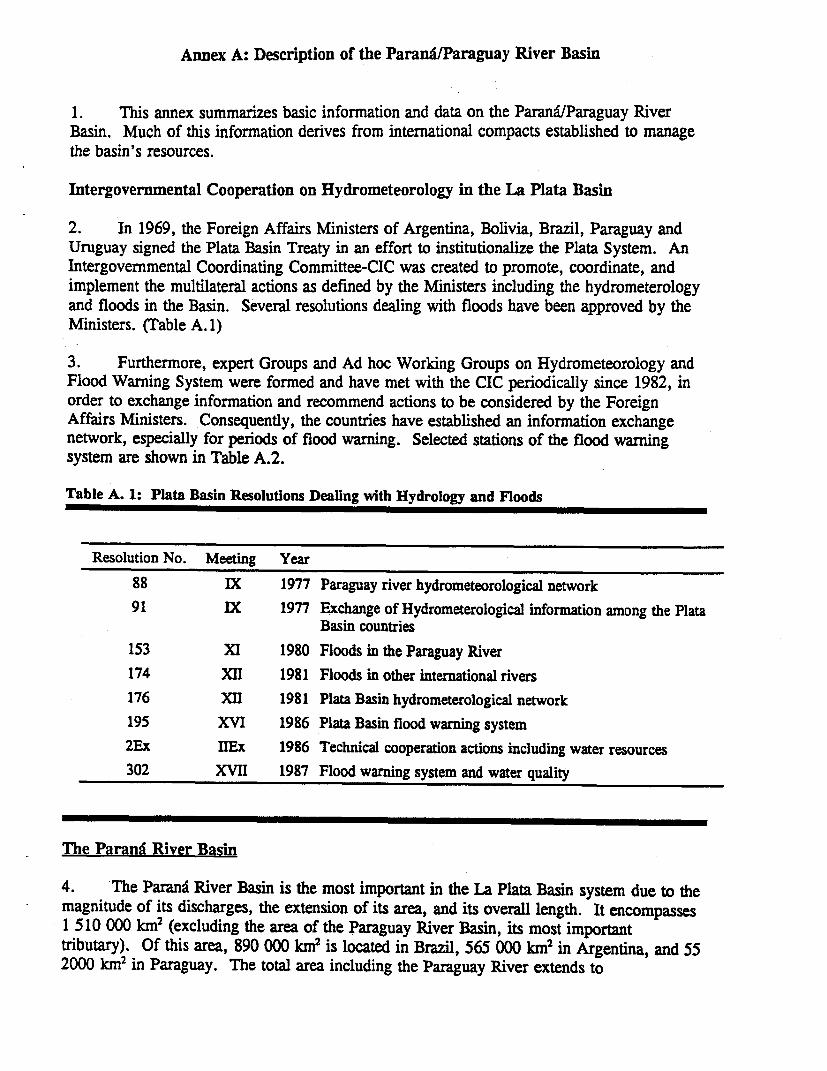
2. In 1969, the Foreign Affairs Ministers of Argentina, Bolivia, Brazil, Paraguay andUruguay signed the Plata Basin Treaty in an effort to institutionalize the Plata System. AnIntergovernmental Coordinating Committee-CIC was created to promote, coordinate, andimplement the multilateral actions as defined by the Ministers including the hydrometerologyand floods in the Basin. Several resolutions dealing with floods have been approved by theMinisters. (Table A. 1)
3. Furthermore, expert Groups and Ad hoc Working Groups on Hydrometeorology andFlood Warning System were formed and have met with the CIC periodically since 1982, inorder to exchange information and recommend actions to be considered by the ForeignAffairs Ministers. Consequently, the countries have established an information exchangenetwork, especially for periods of flood warning. Selected stations of the flood warningsystem are shown in Table A.2.
Table A. 1: Plata Basin Resolutions Dealing with Hydrology and Floods
Resolution No. Meeting Year
88 IX 1977 Paraguay river hydrometeorological network
91 IX 1977 Exchange of Hydrometerological information among the PlataBasin countries
153 XI 1980 Floods in the Paraguay River
174 XII 1981 Floods in other international rivers
176 XII 1981 Plata Basin hydrometerological network
195 XVI 1986 Plata Basin flood warning system
2Ex flEx 1986 Technical cooperation actions including water resources
302 XVII 1987 Flood warning system and water quality
The Paranf River Basin
4. The Parana River Basin is the most important in the La Plata Basin system due to themagnitude of its discharges, the extension of its area, and its overall length. It encompasses1 510 000 km2 (excluding the area of the Paraguay River Basin, its most importanttributary). Of this area, 890 000 km2 is located in Brazil, 565 000 km2 in Argentina, and 552000 km2 in Paraguay. The total area including the Paraguay River extends to
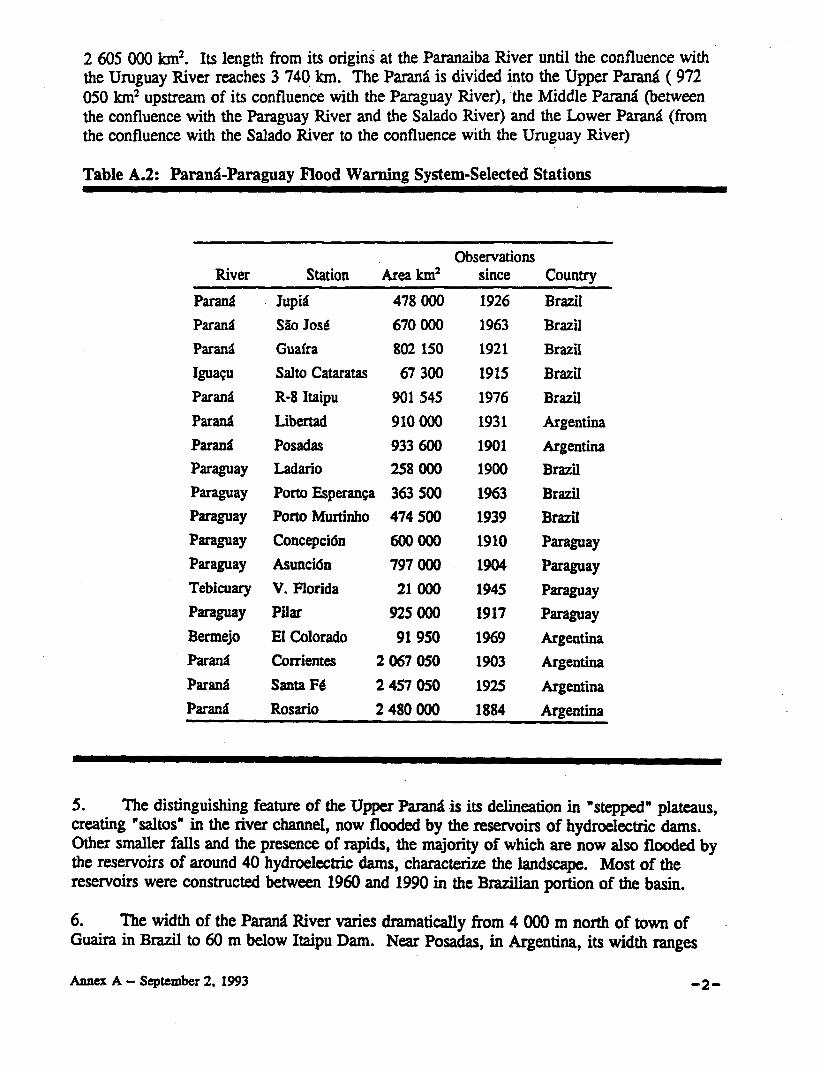
2 605 000 km2 . Its length from its origins at the Paranaiba River until the confluence withthe Uruguay River reaches 3 740 km. The ParanA is divided into the Upper Parana ( 972050 km2 upstream of its confluence with the Paraguay River), the Middle Parana (betweenthe confluence with the Paraguay River and the Salado River) and the Lower Parana (fromthe confluence with the Salado River to the confluence with the Uruguay River)
Table A.2: Parand-Paraguay Flood Warning System-Selected Stations
ObservationsRiver Station Area km2 since Country
Parana Jupia 478 000 1926 Brazil
Parana Sao Jos6 670 000 1963 Brazil
Parana Guafra 802 150 1921 Brazil
Iguagu Salto Cataratas 67 300 1915 Brazil
Parana R-8 Itaipu 901 545 1976 Brazil
Parana Libertad 910 000 1931 Argentina
Parana Posadas 933 600 1901 ArgentinaParaguay Ladario 258 000 1900 Brazil
Paraguay Porto Esperanga 363 500 1963 Brazil
Paraguay Porto Murtinho 474 500 1939 Brazil
Paraguay Concepcidn 600 000 1910 Paraguay
Paraguay Asunci6n 797 000 1904 ParaguayTebicuary V. Florida 21 000 1945 Paraguay
Paraguay Pilar 925 000 1917 Paraguay
Bermejo El Colorado 91 950 1969 Argentina
Parana Corrientes 2 067 050 1903 Argentina
Parand Santa Fe 2 457 050 1925 Argentina
ParanE Rosario 2 480 000 1884 Argentina
5. The distinguishing feature of the Upper Parana is its delineation in "stepped' plateaus,creating 'saltos" in the river channel, now flooded by the reservoirs of hydroelectric dams.Other smaller falls and the presence of rapids, the majority of which are now also flooded bythe reservoirs of around 40 hydroelectric dams, characterize the landscape. Most of thereservoirs were constructed between 1960 and 1990 in the Braziian portion of the basin.
6. The width of the Paran River vaies dramaticaly from 4 000 m north of town ofGuaira in Brazil to 60 m below Itaipu Dam. Near Posadas, in Argentina, its width ranges
Annex A - September 2, 1993 -2-
between 150 and 2 500 m. Downstream of Posadas, the river flows through a series ofislands, covering a 25 km-wide area. The river is 4 200 m wide at Corrientes, 2 600 m atBella Vista, and 2 300 m near Santa Fe. However, its flood plain gradually spreads out,especially over its right bank, which is lower than its left bank. The width of this flood plainvaries between 13 km near Corrientes to about 56 km near Rosario-Victoria. The delta ofthe river is 18 km wide at its beginning, growing to a width of about 60 km. Then throughits numerous branches, the Parana flows into the La Plata..
The Paraguay River Basin
7. The Paraguay River Basin encompasses 1 095 000 km2, of which nearly 365 000 km2
are in Brazil, 365 000 km2 in Paraguay, 182 500km2 in Argentina, and 182 500 km2 inBolivia. The origin of the Paraguay is found in Brazil, and the river, after flowing 2 800 km(Table A.3) reaches the Parana river, north of the Argentinean cities of Corrientes andResistencia. In its northeast portion (i.e., the Bafiados of Izozog in Bolivian territory), thebasin boundaries are not clearly defined.
8. Excluding the headwaters of the Pilcomayo and the Bermejo, which descend from theArgentine-Bolivian plateau in the Andes, and in the southern part of the left banks of theParaguay River, between the Apa River and its confluence with the Parana - which presentsa wavy relief with slopes of certain magnitudes- the rest of the river basin extends over animmense alluvial plain, very slight slope and extensive flood plains.
9. In the Upper Paraguay, the river banks are low and prone to floods, creating a zoneknown as the 'Pantanal' , a vast flood plain that covers close to 100 000 knm and that isperiodically covered by water. The terrain slope is very slight, as is the slope of the riverchannel. The river bed is sandy, very unstable, and the river meanders. There are somerocky stretches, but they do not affect the general character of the river.
10. In the area that extends from the Apa River to the confluence with the Tebicuary, theflood plain is restricted to a width that varies from 5 to 10 km, occupying mainly the rightbank. The mouth of the Paraguay river extends from this point until its confluence with theParanA (approximately 130 km). During floods, water rises over both banks in this region,occupying a strip of land 10 and 15 km wide. The major characteristics of the Paraguayriver in this section are the enormous amount of sediments carried from the Bermejo River,and the backwater phenomena produced by the waters from the Paranr at its confluence withthe Paraguay River.
Annex A - September 2, 1993 -3-
Table A.3: Limits and Slopes - Paraguay River'
Zones Limits Distances Median Slopes/Observations
Lower Confluence-Tebicuary River (260 km 130 km 5 cm/km. Suffers effectParaguay south of Asuncion) of the Parana when the
river is rising. TheBermejo River is at km87 and Pilar is at km 89.
Middle Tebicuary-Apa River (an 927, bordering 797 km 6 cm/km. Asunci6n is atParguay Brazil-Paraguay) km 390 and Concepcidn
at km 700.
Upper Apa River-headwaters (km 2 800) 1 873 km 3,1 cm/km. Includes theParaguay Pantanal. Porto Murtinho
is at kan 999, PortoEsperanca at km 1395,and Ladario is atkm 1 530.
1I-AS, 1992
Basic Basin Parameters
11. The concluding section of this annex (previous studies) contain a listing of datasources and of relevant previous studies of the hydrometeorology and floods of the ParanAand Paraguay river basins'. Many of these have been utilized in the preparation of thispaper. A wealth of information remains to be exploited, however.
12. The hydrometeorolgy of the Paranr-Paraguay River Basin is very complex. Severalsmall sub-basins have particular hydrological characteristics. Previous studies of the basinhave divided it into seven major sub-basins (EBY,1979):
'Data presented in Annex C on annual maximum and minimum daily floods and stages, mean monthlyflow and stages, and annual and monthly precipitation at selected stations were provided by the InstitutoNacional de Ciencia y Tecnica Hidricas (Argentina), Departamento Nacional de Aguas e Energia Eletrica(Brazil), and Direccion de Meteorologia e Hidrologia and Adminsitracion Nacional de Navegacion yPuertos (Paraguay).
Annex A - September 2, 1993 -4-
* Upper Paraguay River Upsream Porto Esperan- * Upper Parmnf River upstream Guafa(363 500 km) (802 150 kn2)
* Middle Paraguay River between P. Esperanza and * Upper Pamnr River between Guain andAsunci6n (433 500kmn) Confluence (169 900 km:
* Lower Paraguay River between Asunci6n andConfluence (29S 000 km)
* Middle Parani River between Confluence and Santa Fe/ Parani(390 000 kin)
* Lower Parani River downam Santa FeI Pararn(197 950 km2)
Precipitation
13. The runoff basins of the Parana and Paraguay Rivers are located in a region of heavyprecipitation that is prevalent almost throughout the year. Situated east of the Andes,between approximately 150 S and 30 0 S, the region is subject to rain-producing systems ofboth tropical and extratropical (frontal-type) origins. The annual mean rainfall in the Paranabasin varies from 1100 to 1600 mm, except in the upper basins of the Tiete, Paranapanemaand Iguacu with the annual mean reaching 2 200 mm. In the Paraguay Basin, it varies from400 to 1800 mm.
Mean Discharges
14. The Parana river system, shows a predominance of summer-fall discharges over thoseof winter-spring. The variability is more evident in the upper portion -due to the tropicalregime of rains- with high waters between December and April, pealing in February, and aperiod of low waters in the winter, with minimums in August and September. South ofGuaira, the tributaries of the Parant, like the Iguagu, exhibit a somewhat different seasonalpattern: lower waters in the summer, and high waters in the winter and spring due to thegreater persistence of rains during the entire year. After its confluence with the Paraguay,which also exhibits increased flows during the winter (June, July) due to the retardationeffect created by the Pantanal, the flows in the Parana exhibit less seasonal variability.Table A.4 summarizes the mean monthly and mean annual discharges for 1901-1992, 1901-1967 and 1968-1992.
15. An analysis of the origin of the Parani River flow is shown in Table A.5. Roughly78% of the mean annual flow originates in the Upper Parand. From Corrientes to theconfluence with the Uruguay River (around 540 000km2) the discharge of the Parani Riverincreases only 10%, less than 2 000 m3/s. Generally, the rainfall in the Upper Parana (i.e.,upstream of.Guaira) is the main source of the flows in the Middle and Lower Parana river,but in some years torrential rains between Guafra and the confluence with the Paraguay River(including the Iguacu River Basin) and between Asunci6n and Confluence are the main causeof the floods registered in Asunci6n, Posadas, Corrientes and downstream.
Amnex A - September 2, 1993 -5-
Table A.4: Mean Montly Discharge in Posadas and Corrientes-Parand River 1OOm3Is
Station Period I F M A M I Jl A S 0 N D AVG
Poudas 1901- 14.9 16.5 15.7 13.6 12.0 12.0 10.5 9.0 9.3 10.8 11.0 11.9 12.31992
Poaadas 1901- 14.5 16.3 16.1 13.6 11. 11.2 9.6 8.1 8.3 10.1 10.2 11.1 11.71967
Pouda 1968 16.1 16.8 14.7 13.7 13.5 13.9 12.9 11.4 12.0 12.9 13.1 14.1 13.81992
Corrients 1901- 17.6 20.3 20.3 18.6 16.7 17.0 15.1 11.6 12.2 13.8 14.2 15.0 16.11992
Corrientes 1901- 16.7 19.6 20.S 18.5 15.8 15.8 13.8 11.3 10.7 12.5 13.1 13.0 15.21967
Corentes 1968- 20.1 22.1 19.8 19.0 19.1 20.2 18.6 16.1 16.1 17.2 17.1 18.0 18.61992
16. An analysis of the ozigin of the Parand River flow is shown in Table A.5. Roughly78% of the mean annual flow originates in the Upper Parani. From Corrientes to theconfluence with the Uruguay River (around 540 000km2) the discharge of the Parand Riverincreases only 10%, less than 2 000 m3/s. Generally, the rainfall in the Upper Parari (i.e.,upstream of Guaira) is the main source of the flows in the Middle and Lower Parand river,but in some years torrential rains between Guafra and the confluence with the Paraguay River(including the Iguacu River Basin) and between Asunci6n and Confluence are the main causeof the floods registered in Asunci6n, Posadas, Corrientes and downstream.
17. The hydrological regime of the Upper Paraguay in Cuiaba is similar to the UpperParand, but the principal characteristic of the Paraguay River regime is the intra-annualvariation which occurs along its course. In the Upper Paraguay, before reaching the lowerand flood-prone area of the Pantanal, the maximum levels are reached in February and theminimums in August-September. However in Corumba, Ladario, and in the MiddleParaguay in Asunci6n and Concepci6n, the period of high flows is practically reversed, withthe maximum in June-July, and the minimum in December-January. This waterflow patternvariation is caused by the storage effect produced by the Pantanal, which creates a delay ofabout 3 months in the flood propagation, before arriving in Asuncion and at the confluencewith the Parana.
Annex A - September 2, 1993 -6-
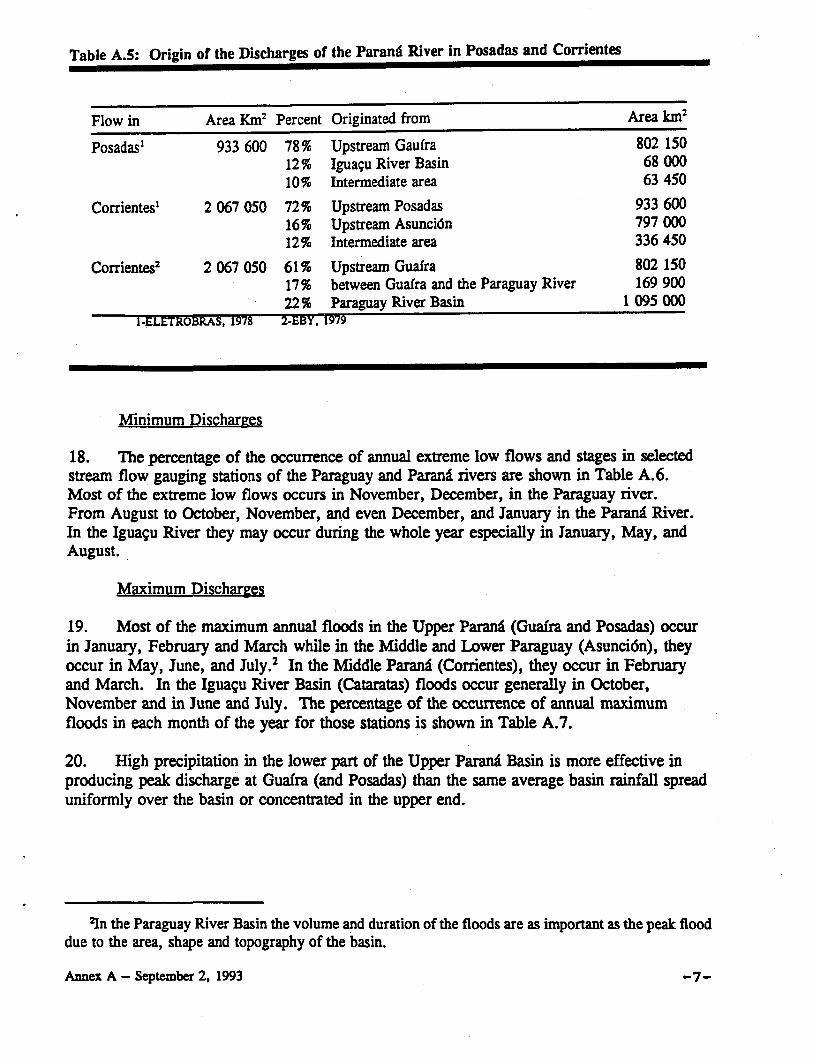
Table A.5: Origin of the Discharges of the Paranf River in Posadas and Corrientes
Flow in Area Km2 Percent Originated from Area km2
Posadas' 933 600 78% Upstream Gaufra 802 15012% Iguaqu River Basin 68 00010% Intermediate area 63 450
Corrientes' 2 067 050 72% Upstream Posadas 933 60016% Upstream Asunci6n 797 00012% Intermediate area 336 450
CorrienteS2 2 067 050 61 % Upstream Guafra 802 15017% between Guafra and the Paraguay River 169 90022% Paraguay River Basin 1 095 000
I-ELETROBRAS, 1978 2-EBY, 1979
Minimum Discharges
18. The percentage of the occurrence of annual extreme low flows and stages in selectedstream flow gauging stations of the Paraguay and Parana rivers are shown in Table A.6.Most of the extreme low flows occurs in November, December, in the Paraguay river.From August to October, November, and even December, and January in the Parana River.In the Iguacu River they may occur during the whole year especially in January, May, andAugust.
Maximum Discharges
19. Most of the maximum annual floods in the Upper Parana (Guafra and Posadas) occurin January, February and March while in the Middle and Lower Paraguay (Asunci6n), theyoccur in May, June, and July.2 In the Middle Parana (Corrientes), they occur in Februaryand March. In the Iguacu River Basin (Cataratas) floods occur generally in October,November and in June and July. The percentage of the occurrence of annual maximumfloods in each month of the year for those stations is shown in Table A.7.
20. High precipitation in the lower part of the Upper Parani Basin is more effective inproducing peak discharge at Guaira (and Posadas) than the same average basin rainfall spreaduniformly over the basin or concentrated in the upper end.
21n the Paraguay River Basin the volume and duration of the floods are as important as the peak flooddue to the area, shape and topography of the basin.
Annex A - September 2, 1993 -7-
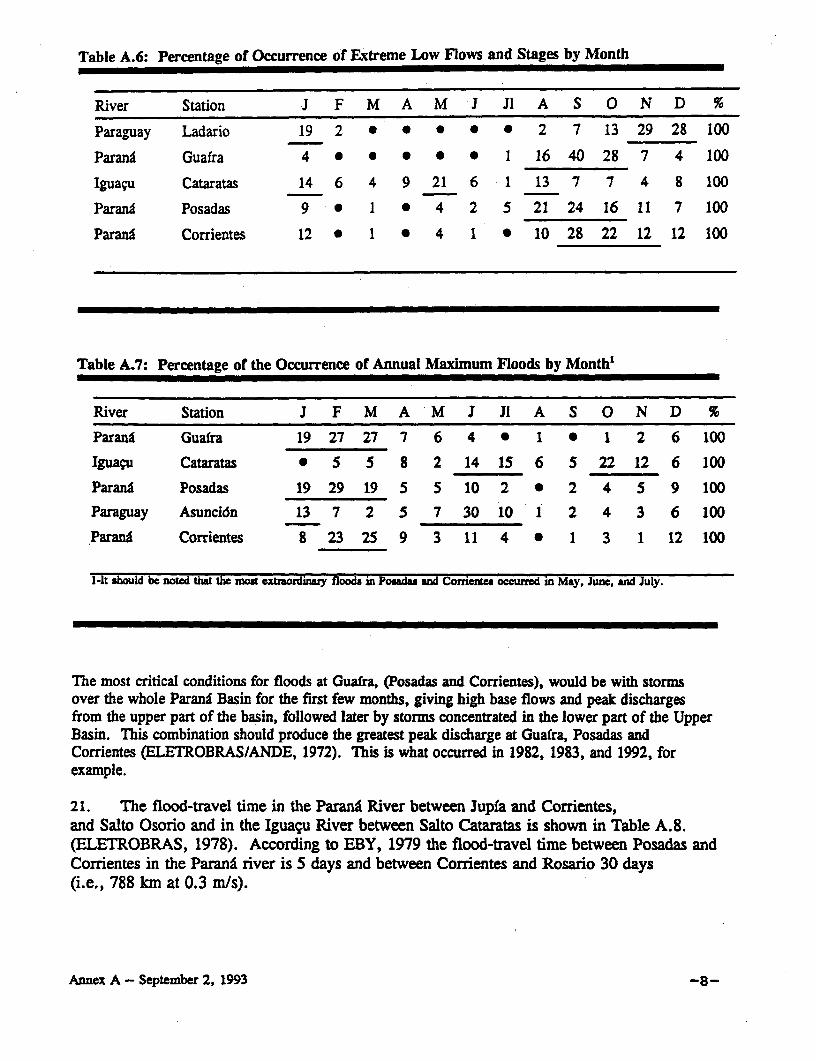
Table A.6: Percentage of Occurrence of Eitreme Low Flows and Stages by Month
River Station J F M A M J JI A S O N D %
Paraguay Ladario 19 2 * 0 0 * 0 2 7 13 29 28 100
ParanA Guafra 4 0 0 0 0 * 1 16 40 28 7 4 100
Iguagu Cataratas 14 6 4 9 21 6 1 13 7 7 4 8 100
Parana Posadas 9 * 1 0 4 2 5 21 24 16 11 7 100
Parana Corrientes 12 1 0 4 1 0 10 28 22 12 12 100
Table A.7: Percentage of the Occurrence of Annual Maximum Floods by Month'
River Station J F M A M J JI A S O N D %
Parang Guaira 19 2727 7 6 4 0 1 0 1 2 6 100
Iguagu Cataratas * 5 5 8 2 14 15 6 5 22 12 6 100
Parana Posadas 19 29 19 5 5 10 2 0 2 4 5 9 100
Paraguay Asunci6n 13 7 2 5 7 30 10 i 2 4 3 6 100
Parand Corrientes 8 23 25 9 3 11 4 0 1 3 1 12 100
i-It should be noted th the mots ezxtorimay floods in Poadas and Comfent occurrd in May, June, and July.
The most critical conditions for floods at Guafra, (Posadas and Corrientes), would be with stormsover the whole Parand Basin for the first few months, giving high base flows and peak dischargesfrom the upper part of the basin, followed later by storms concentrated in the lower part of the UpperBasin. This combination should produce the greatest peak discharge at Guafra, Posadas andCorrientes (ELETROBRAS/ANDE, 1972). This is what occurred in 1982, 1983, and 1992, forexample.
21. The flood-travel time in the ParanA River between Jupia and Corrientes,and Salto Osorio and in the Iguagu River between Salto Cataratas is shown in Table A.8.(ELETROBRAS, 1978). According to EBY, 1979 the flood-travel time between Posadas andCorrientes in the Parna river is 5 days and between Corrientes and Rosario 30 days(i.e., 788 km at 0.3 mls).
Annex A - September 2, 1993 -8-
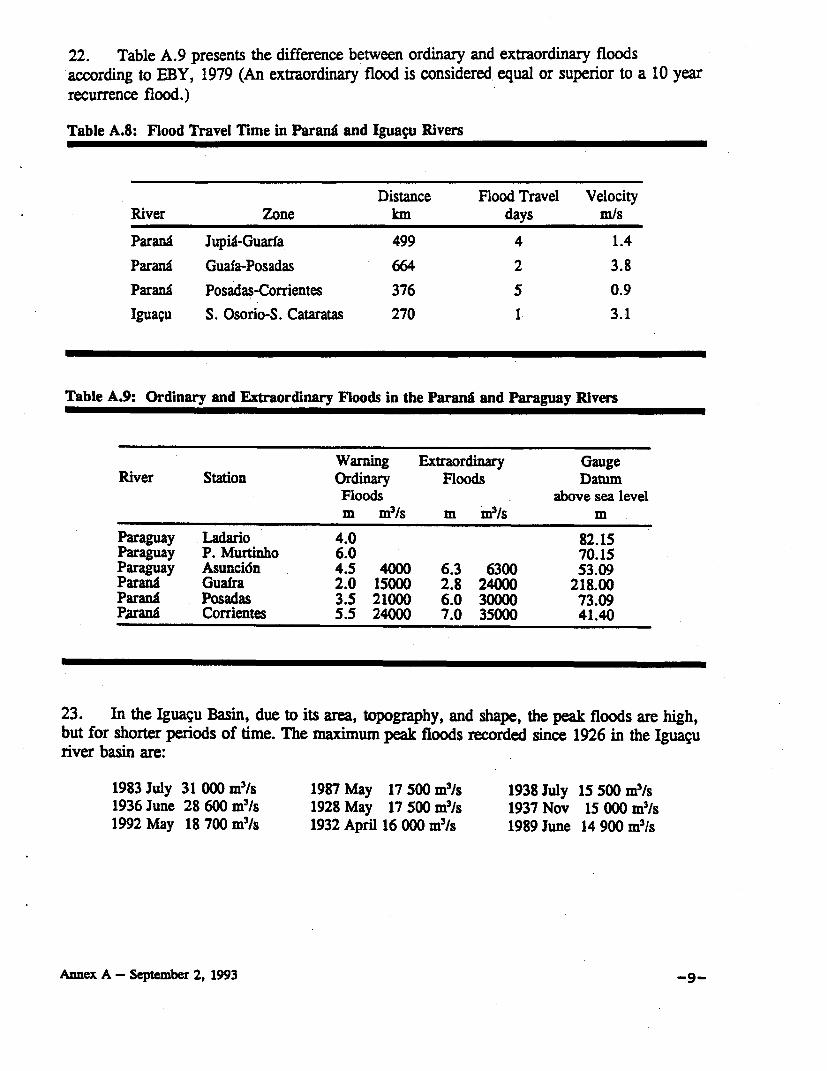
22. Table A.9 presents the difference between ordinary and extraordinary floodsaccording to EBY, 1979 (An extraordinary flood is considered equal or superior to a 10 yearrecurrence flood.)
Table A.8: Flood Travel rime in Parana and Iguagu Rivers
Distance Flood Travel VelocityRiver Zone km days m/s
Parana Jupia-Guarfa 499 4 1.4
Parana Guafa-Posadas 664 2 3.8
Parana Posadas-Corrientes 376 5 0.9
Iguagu S. Osorio-S. Cataratas 270 1 3.1
Table A.9: Ordinary and Extraordinary Floods in the Parana and Paraguay Rivers
Warning Extraordinary GaugeRiver Station Ordinary Floods Datum
Floods above sea levelm m3/s m m31s m
Paraguay Ladario 4.0 82.15Paraguay P. Murtinho 6.0 70.15Paraguay Asunci6n 4.5 4000 6.3 6300 53.09Parana Guafra 2.0 15000 2.8 24000 218.00Parana Posadas 3.5 21000 6.0 30000 73.09Parana Corrientes 5.5 24000 7.0 35000 41.40
23. In the Iguagu Basin, due to its area, topography, and shape, the peak floods are high,but for shorter periods of time. The maximum peak floods recorded since 1926 in the Iguacuriver basin are:
1983 July 31 000 m3/s 1987 May 17 500 m3/s 1938 July 15 500 m3/s1936 June 28 600 m31s 1928 May 17 500 m3/s 1937 Nov 15 000 m 3 /s1992 May 18 700 m3/s 1932 April 16 000 m'/s 1989 June 14 900 m3/s
Annex A - September 2, 1993 -9-
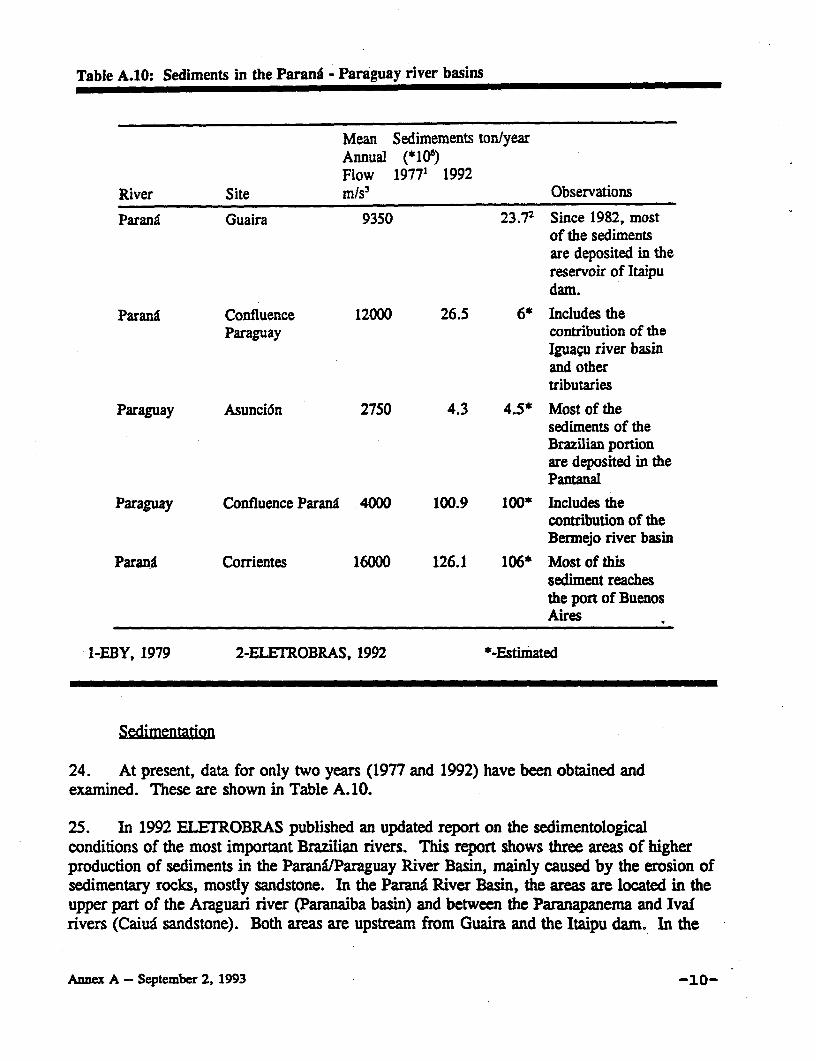
Table A.10: Sediments in the ParanA - Paraguay river basins
Mean Sedimements ton/yearAnnual (*106)Flow 1977' 1992
River Site W/s3 Observations
ParanA Guaira 9350 23.72 Since 1982, mostof the sedimentsare deposited in thereservoir of Itaipudam.
Parana Confluence 12000 26.5 6* Includes theParaguay contribution of the
Iguagu river basinand othertributaries
Paraguay Asunci6n 2750 4.3 4.5* Most of thesediments of theBrazilian portionare deposited in thePantanal
Paraguay Confluence Parang 4000 100.9 100* Includes thecontribution of theBermejo river basin
Parana Corrientes 16000 126.1 106* Most of thissediment reachesthe port of BuenosAires
I-EBY, 1979 2-ELETROBRAS, 1992 *-Estiriated
Sedimentation
24. At present, data for only two years (1977 and 1992) have been obtained andexamined. These are shown in Table A.10.
25. In 1992 ELETROBRAS published an updated report on the sedimentologicalconditions of the most important Brazilian rivers. This report shows three areas of higherproduction of sediments in the Paran6/Paraguay River Basin, mainly caused by the erosion ofsedimentary rocks, mostly sandstone. In the Parand River Basin, the areas are located in theupper part of the Araguari river (Paranaiba basin) and between the Paranapanema and Ivafrivers (Caiud sandstone). Both areas are upstream from Guaira and the Itaipu dam. In the
Annex A - September 2, 1993 -10-
Paraguay River Basin the area of high production of sediments is located in the upper part ofthe Pantanal.
26. As far as the Paraguay River Basin is concerned most of the sediments in theBrazilian portion are deposited in the Pantanal. The same occurs with the production ofsediments in the Parana River that remain deposited in the reservoirs of the hydroelectricdams.
27. The most important production of sediments in the Parana/Paraguay River Basinoccurs in the Bermejo River Basin (94 350 km2) that originates in the Andean slopes ofArgentina and Bolivia. Almost 100 000 000 tons of sediments are transported each year intothe Paraguay and Parani Rivers.
Previous Studies
The La Plata Basin
AISIKS, E.G. 1985. 'La Gran Crecida del Rfo Parana de 1983". Buenos Aires
CIC. 1982. 'Reuniones de las Contrapartes Tecnicas para el Programa de Alerta Hidrol6gicade laCuenca del Plata". Also the reports from 1984, 1989, and 1991 meetings held in Buenos Aires.
COIMBRA, R.M., OLIVEIRA, E., CUDO, K.J. 1992. "Monitoramento Quantitativo e Qualitativodas Aguas da Bacia do Prata' (Projetos Alerta Hidrologico e Qualidade das Aguas do CIC - Comit6Intergovernamental Coordenador da Bacia do Prata). Brasfia.
DIAZ, H.F. 1993. 'Temporal Patterns of Precipitation in the Parana and Paraguay River Basins andits Relationship to the El Ninlo Phenomenon". National Oceanic and Atmospheric Adminstration.Environmental Resaearch Laboratories. Boulder. Colorado.
DNAEE. 1987. 'Inventario das Estac6es Pluviom6tricas". Brasilia
DNAEE. 1987. 'Inventarios das Estacoes Fluviometricas". Brasilia
EBY. 1979. "Estudio de Crecidas Rfos Parana y Paraguay. Estudio realizado por MOTORCOLOMBUS Y Asociados para Entidad Binacional Yacireta. Buenos Aires-Asunci6n.
ELETROBRAS. 1992 'Diagn6stico das Condi06es Sedimentologicas dos Principais Rios Brasileiros".Instituto de Pesquisas Hidraulicas-IPH. Rio de Janeiro.
OEA. 1969. 'Cuenca del Plata. Estudio para su Planificaci6n y Desarrollo. Inventario de DatosHidrol6gicos y Climatol6gicos". Informe del estudio llevado a cabo por la Unidad de RecursosNaturales en 1967 y 1968. Washington, D.C.
OEA. 1971. 'Inventario y Analisis de la Informaci6n Basica sobre Recursos Naturales". Cuenca delRfo de la Plata. Estudio para su Planificacion y Desarrollo. Washington, D.C.
Annex A - September 2, 1993 -11-
OEA. 1969. " Indice Anotado de los Trabajos Aerofotograficos y de los Mapas Topograficos y deRecursos Naturales". Cuenca del Rio de la Plata. Estudio para su Planificaci6n y Desarrollo.Washington D.C.
OEA. 1985. 'Infraestructura y Potencial Energetico en la Cuenca del Plata'. Washington, D.C.
The Paraguay River Basin
ANNP. 'Anuarios Hidrograficos". Asunci6n
ARMADA NACIONAL. "Anuarios Hidrograficos'. Asuncidn
ARMADA NACIONAL. 1979. 'Estudio del Comportamiento del Rfo Paraguay y su Litoral DesdeConcepcidn Hasta Confluencia'. Asuncion.
CARVALHO, N. de O., AYRES R.M., ROCHA, J.P.G. 1992. 'Estudos Sedimentoldgicos da Baciado Sao Lourengo, MT'. ELETROBRAS/ Universidade Federal de Mato Grosso. Cuiaba.
CARVALHO, N. de O., MONTEIRO, A.E. 1991. 'Sistema de Alerta e Provisao de Cheias doPantanal'. ELETROBRAS/ Companhia de Pesquisas de Recursos Minerais. Rio de Janeiro.
DMH. 1992. 'Balance Hidrico Superficial de Paraguay". Asunci6n.
DNPVN. 1973. 'Estudo Hidrologico do Rio Paraguai. Perfodo 1966-1972 Relat6rios Parciais eRelat6rio Final'. Hidrologia Comercial Ltda. Rio de Janeiro
DNOS. 1974."Estudos Hidroldgicos da Bacia do Alto Paraguai%. 4 Volumes. Rio de Janeiro.
GIUSTI, E. V., LOPEZ M.A., 1984. 'On the Hydrology of the Paraguay River'. USGS. SelectedPapers in the Hydrologic Sciences. Reston.
HALCROW AND PARTNERS. 1973. 'Estudio de Navegabilidad del Rfo Paraguay al sur deAsuncicn'. Asunci6n.
JICA. 1985. 'Storm Drainage System. Improvement in Asuncion City'. Asunci6n.
LOPEZ, M.A. et alli. 1983. 'Hydrologic Hazards in Paraguay with Special Reference to the floodsof 1983.' USGS. Reston.
OEA. 1974. 'Alta Cuenca del Rio Bermejo. Argentina-Bolivia'. Estudio de los Recursos Hidricos.Washington, D.C.
OEA. 1977. "Cuenca Inferior del Rfo Bermejo. Argentina". Programaci6n para su Desarrollo.Washington, D.C.
OEA. 1975. ' Proyecto Aquidaban. Desarrollo de la Regi6n Nororiental del Paraguay". Washington,D.C.
Annex A - September 2, 1993 -12-
OEA. 1979. "Caracteristicas da Vegetacio da Bacia do Alto Paraguai" Informe preparado por elconsultor Jorge AdAmoli para o 'Estudo de Desenvolvimiento Integrado da Bacia do Alto Paraguai(EDIBAP)". Brasilfa.
OEA. 1992. "Proyecto de Reconstrucci6n y Desarrollo Integrado del Area Meterol6gica de Asunci6ny de los Entidades de Concepci6n, Alberdf, Pilar Afectadas por Inundaciones." Informe de las Misi6nPreliminar de la OEA/DDRMA. Washington.
PNUD. 1975. "Proyecto de Mejoramiento de la Navegaci6n del Rfo Paraguay". PAR/TS/006.Asunci6n.
PNUD. 1979. "Estudio de Inundaciones del Rfo Paraguay". Asunci6n.
PNUD. 1980. 'Modelos Estadlsticos para Previsi6n de Niveles del rfo Paraguay". PAR1801002.Asunci6n.
SUDECO. 1979. "Estudo de Desenvolvimento Integrado da Bacia do Alto Paraguai-EDIBAP".Convenio Governo Brasileiro PNUD-OEA Brasfia.
USCE. 1972. 'Application of the SSARR model to the Upper Paraguay River Basin". Portland,Oregon.
UNESCO/UNDP. 1973."Hydrological studies of the Upper Paraguay River Basin (Pantanal) (1966-1972) Technical Report". Bra. 66.521. Paris.
Parang River Basin
AyEE/DNCPyVN/CONCAP. 1973. "Estudio Hidrol6gico y Sedimentol6gico del rio Alto Parand."Buenos Aires.
AyEE. 1970. "Resumen de la Estadfstica Hidrol6gica Hasta 1967". Buenos Aires.
AyEE. 1960. "Estudio Hidrol6gico del Rio Alto Parana". Buenos Aires.
AHLQUIST, 0. 1906. "La Gran Creciente de 1905 del Rio Parana y sus Afluentes". Buenos Aires.
BERGER-BROKONSULT A.B. 1973. "Mejoramiento de la Navegaci6n del Rfo Parana. BuenosAires.
BRAZILIUNDP. 1966. "Power Study of South Central Brazil-Sao Paulo Group-HydrometerologyReport."Appendix No. 8. Canambra Engineering Consultants Limited. Montreal.
CARVALHO, N. de O., CATHARINO, M.G. 1992. 'Avaliacao do ssoreamento do Reservatorio daUHE Itaipu". ELETROBRAS, Diretoria de Planejamento e Engenharia. Rio de Janerio.
CARVALHO, N. de O., 1991. 'Producbo de Sedimentos da Area de Contribuisao ao Reservat6rio deItaipu". I Reuniao sobre Erosao e Sedimenta§bo, Curitiba.
Annex A - September 2, 1993 -13-
COMIP. 1977. 'Aprovechamiento del Rfo Paranl en el Tramo Limitrofe Comprendido Entre laDesembocadura del Rfo Iguazd y la Seccidn Encanaci6n- Posadas, con particular atenci6n a la zonade Corpus-Fase I" . Lahymer-Harza y Asociados. Buenos Aires.
CONCAP. 1970. 'Modelo Matematico de la Cuenca del Plata - Informe Preliminar de la Fase I -Factibilidad Tecnica de las Fases 2-3". Buenos Aires.
CONCAPlDNCPyVN/AyEE. 1973. 'Estudio Hidrol6gico y Sedimentol6gico del rio Alto ParanA".Buenos Aires.
COTTA, D. 1973. "Influencia Sobre el Rfo Parana del Material Sdlido Transportado por el RfoBermejo. Buenos Aires
DNCPyVN. 'Anuarios Hidrograficos". Ministerio de Economfa de la Replblica Argentina. BuenosAires.
EBY. 1973. "Estudio de Factibilidad Tecnica, Econ6mica y Financiera para el Desarrollo del RfoParand en el Area Yacyreta - Apipe". Consorcio Harza y Asociados. Asuncidn. Buenos Aires.
ELETROBRAS/ANDE. 1972. "Rio ParanA Study. Appendix A. Hydrology and Meterology",prepared by EECO- International Engineering Company of San Francisco, California and ELC-Electroconsult of Milan, Italy. Rio de Janeiro/Asunci6n.
ELETROBRAS. 1978. "Estudo da Genese das Vaz6es do Rio ParanA". 5 volumes realizados peloConsorcio Nacional de Engenheiros Consultores SA. Sao Paulo.
ELETROBRAS/GCOI. 1992. "AnAlise da Operacao de Controle de Cheias para as Bacias dos RiosParana e outros na Estagao Chuvosa 1991/1992". Subcomite de Estudos Energeticos. Rio de Janeiro.
ELETROBRAS/GCO1. 1992 'Analise da Operacao Hidraulica dos Aproveitamentos da Bacia do RioIguagu durante a Cheia Maio-Junho de 1992." Grupo de Trabalho de Hidrologfa Operativa. Rio deJaneiro.
EINSTEIN, H.A. 1972. -Report on the Sediment Problems Connected with the Apip6 Project on theParanA River. Buenos Aires.
FESQUET, H.B. 1975. 'Pron6stico de la Fecha de Culminaci6n de las crecientes del Rio Parana".Publicaci6n N°15, Serie Hidrometeorol6gica. Buenos Aires.
INCyTH. 1975. 'Cuenca Superior del Rfo Parana - Estudio de la Crecida Maxima Probable". BuenosAires.
OEA. 1973. *Noroeste do Estado do Parana-Brasil. Estudo para o Controle da Erosao". Washington,D.C.
PNUD. 1977. 'Proyecto Mejoramiento de la Navegacidn del Rio Parana, Mediciones de Transportede Sedimentos en el rfo Parana a altura de Corrientes", por J. Lelievre y E. Navntoft. Buenos Aires.
PNUDIINCYTH. 1974. "Estudio del Sistema Fluvial Parang-Santa Fe' SFIARGI66I521. BuenosAires.
Annex A - September 2, 1993 -14-
RAFFO, J.M. 1951. 'Pron6stico de las Crecientes del Rfo Parana, S.M.N., Publicaci6n N02. SerieHidrometeoroldgica. Buenos Aires.
STUCKRATH, T. 1969. 'Movement of Ondulation on the Bed of the Parang River". Buenos Aires.
VANONI, V. 1967. "Review of Sedimentation Problems of the Proposed Parana-Fe Tunnel". BuenosAires.
ACRONYMS
ANNP Administaci6n Nacional de Navegacidn y Puertos (Paraguay)
AyEE Agua y Energia Electrica (Argentina)
CFI Consejo Federal de Inversiones (Argentina)
CIC Comite Intergubernamental Coordinador de la Cuenca del Plata
COMIP Comision Mixta Argentina Parguaya del rfo Parang
CONCAP Comisi6n Nacional de la Cuenca del Plata (Argentina)
DEPVN Departamiento de Puertos y Vfas Nagigables (Aregentina)
DRDE Department of Regional Development and Environment
ELETOBRAS Centrais Eletricas Brasileiras SA
DMH Direcci6n de Meteorologfa e Hidrologfa (Paraguay)
DNAEE Departamento Nacional de Aguas e Energia Eletrica(Brazil)
DNCPyVN Departamento Nacional de Construcciones Portuarios y Vfas Navigables(Argentina)
DNPVN Departamento Nacional de Portos e Vias Navegaveis (Brazil)
DNOS Departamento Nacional de Obras de Saneamento (Brazil)
EBY Entidad Binacional YaciretA (Argentina/Paraguay)
EDIBAP Estudo para o Desenvolvimento Integrado da Bacia do Rio Paraguai (Brazil)
GCOI Grupo Coordenador para a Operagao Interligada (Brazil)
JICA Japan International Cooperation Agency
IECO/ELC Consultoras "Intemational Engineering* San Francisco / "Electroconsult" Milan
IGH Instituto Geogrlfico Militar (Argentina)
Annex A - September 2, 1993 -15-
INCyTH Instituto Nacional de Ciencia y Tdcnica Hfdricas (Argentina)
IPH Instituto de Pesquisas HidrAulicas (Brazil)
LAC Latin America and the Carribbean
MIT Massachusetts Institute of Technology
NOAA National Oceanic and Atmospheric Administration
OAS Organization of American States
SMN Servicio Meterol6gico Nacional (Argentina)
SUDECO Superintendencia do Desenvolvimento da Regiao Centro Oeste (Brazil)
SUCCE Subunidad Central de Coordinacidn para la Emergencia del Ministerio delInterior (Argentina)
UNDP United Nations Development Programme (PNUD in spanish)
UNESCO United Nations Educational, Scientific, and Cultural Organization
USAID United States Agency for International Development
USCE United States Corps of Engineers, North Pacific Division
USGS United States Geological Survey
Annex A - September 2, 1993 -16-
Annex B: Large Scale Atmospheric Disturbancesand Flooding in the Parana/Paraguay River Basin
1. Large-scale atmospheric disturbances and their temporal variability may play a role,via precipitation, in producing year-to-year changes in streamflow in the Parana\ParaguayBasin. In particular, a characteristic feature of the climate of the tropical Pacific Ocean is abiennial tendency in equatorial sea surface temperature (SSI) and associated atmosphericfields such as the surface winds, sea-level pressure, and rainfall. In general, conditionsalong the equatorial Pacific are such that warm surface waters and heavy rainfall arerestricted to its western areas (west of the International Dateline). During so-called El Nifioevents, warm equatorial Pacific waters are found much further east than usual, heavy rainfallshifts eastward, and between about December and March, can become excessive along thenormally dry coasts of southern Ecuador and Peru.
2. The shifts in rainfall pattems in the tropical Pacific perturb large scale atmosphericcirculation patterns all over the globe. Because the weather patterns associated with El Ninoevents can persist for about one year, the anomalous weather conditions that can beexperienced in those regions affected by the phenomenon can also be long-lasting.
3. In 1991-92, a moderate El Nifo event occurred in the Pacific. In the last decade, wehave experienced three moderate to very strong El Nifio events - in 1982-83, 1986-87 and in1991-92. The 1982-83 event is considered the strongest such event in this century. The typeof climatic anomalies experienced in any one part of the world depends on its geographiclocation, and it also tends to be seasonally dependent.
4. The pattern of anomalously high and low precipitation is quite characteristic of thetypical season response to El Nino events in this region (Kiladis and Diaz, 1989'; Diaz andKiladis, 19922). In particular, heavier than normal rainfall is experienced in theParana/Paraguary Basin and along the northern coast of Peru, and dryer than normal weatheris experienced in the Nordeste region of Brazil. Although this is the typical or characteristicresponse of the precipitation regime in South America, it does not necessarily occur in everyEl Nifio event to the same degree, whether in its spacial features or in its seasonaldistribution. Nevertheless, the frequency with which this typical response is observed, andthe fact that significant alterations of the normal climatological features in the affectedregions can occur, suggest that having knowledge of the expected climatic patterns when anEl Niino event is underway would be helpful in planning for the safety of life and property.
'Kiladis, G.N. and Diaz, H.F., 1989: Global climatic anomalies associated with the extremes of theSouthern Oscillation. Journal of Calimate, 2:1069-1090.
2Diaz, H.F. and Kiladis, G.N., 1992: Atmospheric teleconnections associated with the extreme phasesof the Southern Oscillation. In Diaz, H.F. and Markgraf, V. (eds.), El Mflo: Historical andPaleoclimatic Aspects of the Southern Oscilation, Cambridge University Press, Cambridge, pp. 7-28.
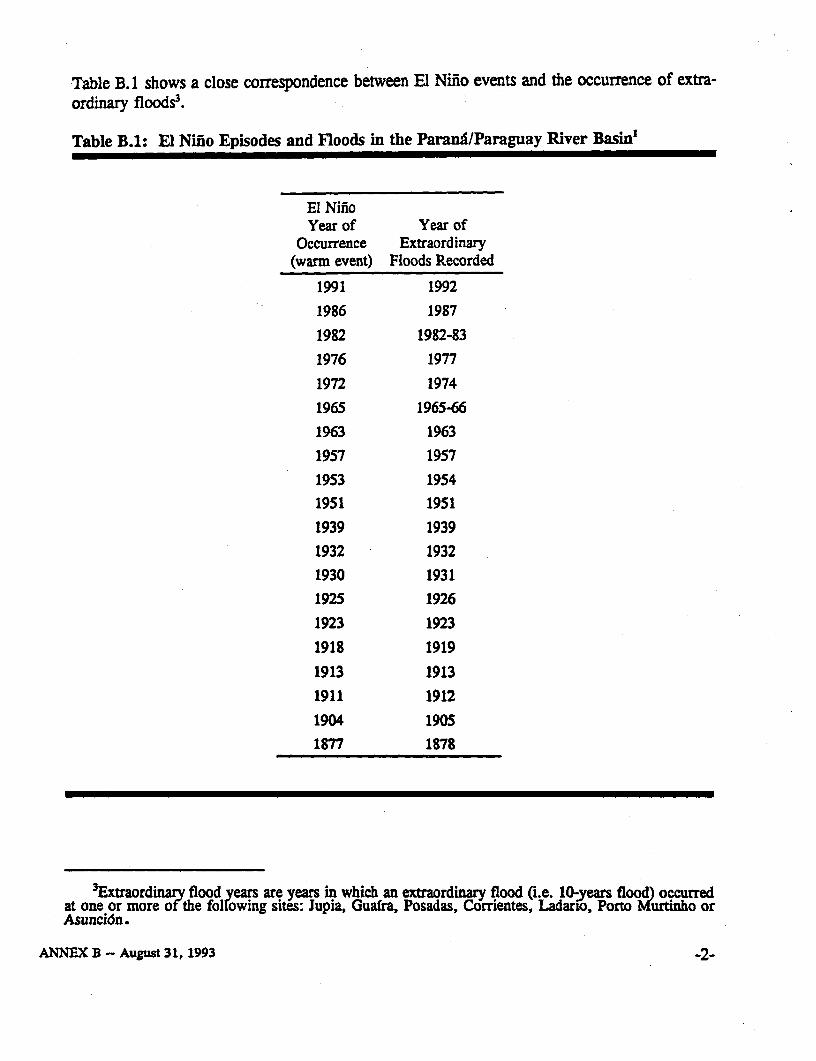
Table B. 1 shows a close correspondence between El Nino events and the occurrence of extra-ordinary floods'.
Table B.1: El Niiio Episodes and Floods in the ParanDIParaguay River Basin'
El NifnoYear of Year of
Occurrence Extraordinary(warm event) Floods Recorded
1991 19921986 1987
1982 1982-831976 1977
1972 1974
1965 1965-66
1963 19631957 1957
1953 19541951 19511939 1939
1932 1932
1930 1931
1925 1926
1923 1923
1918 1919
1913 19131911 1912
1904 19051877 1878
3Extraordinary flood years are years in which an extraordinary flood (i.e. 10-years flood) occurredat one or more of the folowing sites: Jupia, Guafra, Posadas, Corrientes, Ladario, Porto Murtinho orAsunci6n.
ANNEX B -AugUSt 31, 1993 -2-
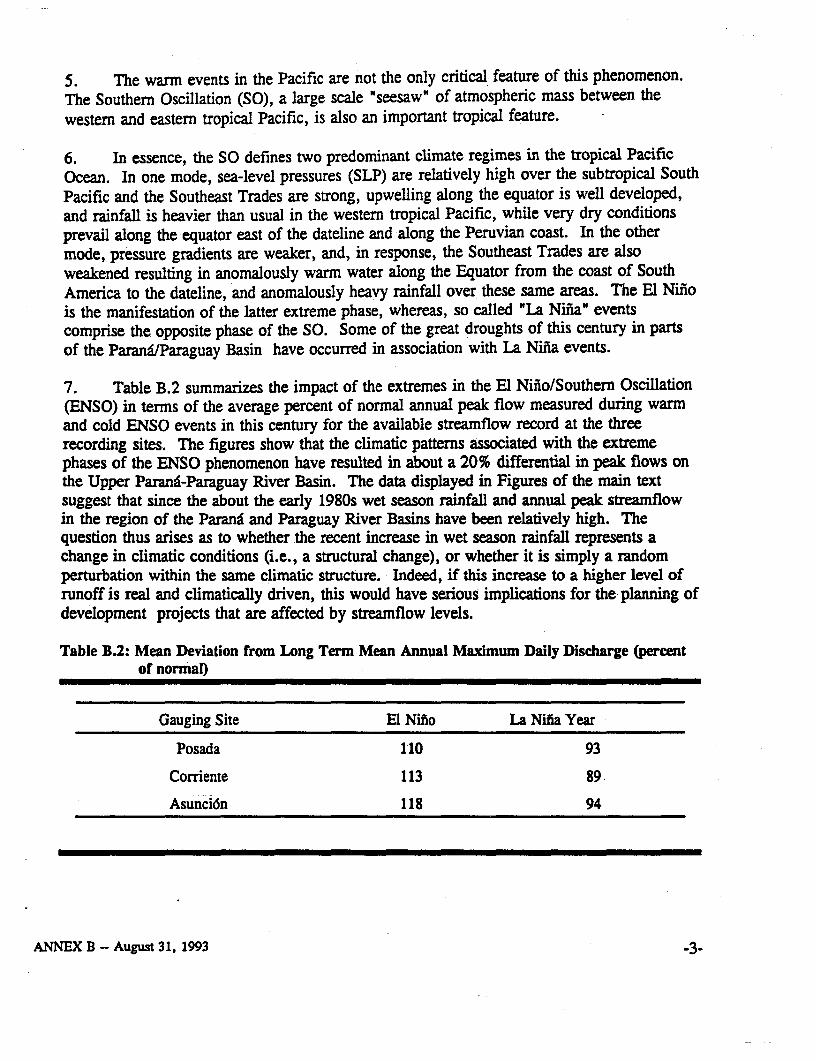
5. The warm events in the Pacific are not the only critical feature of this phenomenon.The Southern Oscillation (SO), a large scale "seesaw" of atmospheric mass between thewestern and eastern tropical Pacific, is also an important tropical feature.
6. In essence, the SO defines two predominant climate regimes in the tropical PacificOcean. In one mode, sea-level pressures (SLP) are relatively high over the subtropical SouthPacific and the Southeast Trades are strong, upwelling along the equator is well developed,and rainfall is heavier than usual in the western tropical Pacific, while very dry conditionsprevail along the equator east of the dateline and along the Peruvian coast. In the othermode, pressure gradients are weaker, and, in response, the Southeast Trades are alsoweakened resulting in anomalously warm water along the Equator from the coast of SouthAmerica to the dateline, and anomalously heavy rainfall over these same areas. The El Ninois the manifestation of the latter extreme phase, whereas, so called "La Nifia" eventscomprise the opposite phase of the SO. Some of the great droughts of this century in partsof the Parana/Paraguay Basin have occurred in association with La Nina events.
7. Table B.2 summarizes the impact of the extremes in the El Nihio/Southern Oscillation(ENSO) in terms of the average percent of normal annual peak flow measured during warmand cold ENSO events in this century for the available streamflow record at the threerecording sites. The figures show that the climatic patterns associated with the extremephases of the ENSO phenomenon have resulted in about a 20% differential in peak flows onthe Upper Parand-Paraguay River Basin. The data displayed in Figures of the main textsuggest that since the about the early 1980s wet season rainfall and annual peak streamflowin the region of the Parana and Paraguay River Basins have been relatively high. Thequestion thus arises as to whether the recent increase in wet season rainfall represents achange in climatic conditions (i.e., a structural change), or whether it is simply a randomperturbation within the same climatic structure. Indeed, if this increase to a higher level ofrunoff is real and climatically driven, this would have serious implications for the planning ofdevelopment projects that are affected by streamflow levels.
Table B.2: Mean Deviation from Long Term Mean Annual Maximum Daily Discharge (percentof normal)
Gauging Site El Nifno La Nifia Year
Posada 110 93
Corriente 113 89
Asuncion 118 94
ANNEX B-August 31, 1993 _3.

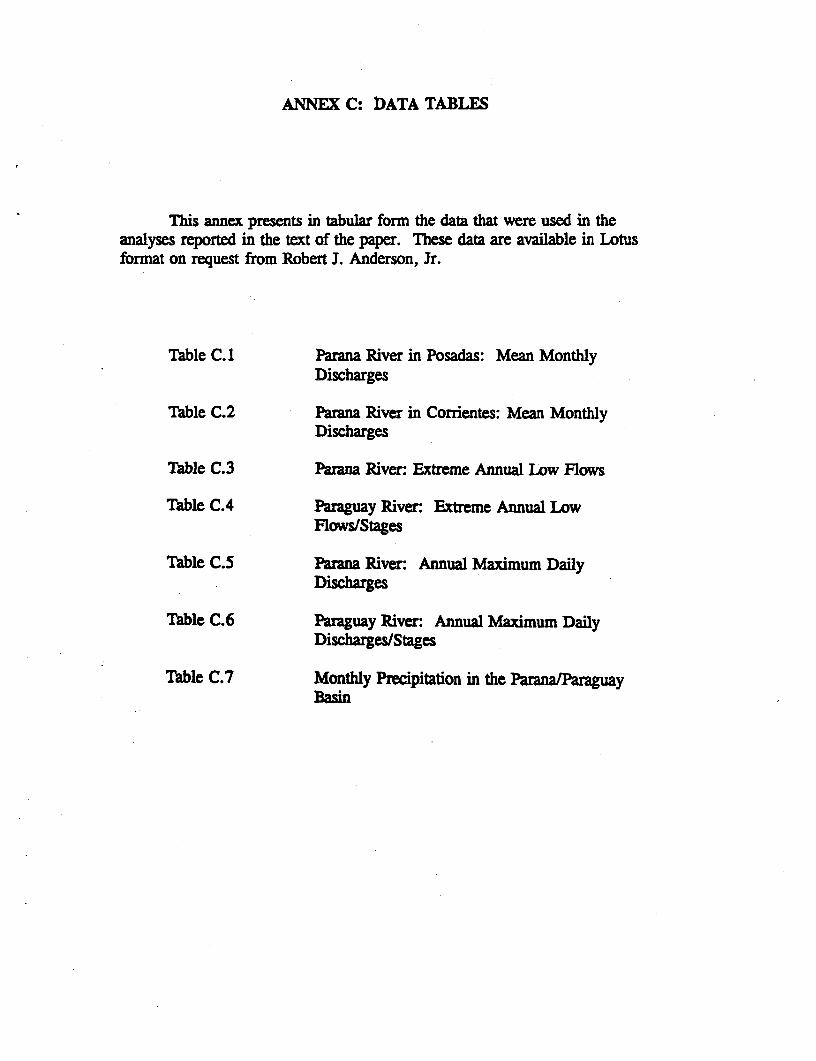
ANNEX C: DATA TABLES
This annex presents in tabular fonn the data that were used in theanalyses reported in the text of the paper. These data are available in Lotusformat on request from Robert J. Anderson, Jr.
Table C.1 Parana River in Posadas: Mean MonthlyDischarges
Table C.2 Parana River in Corrientes: Mean MonthlyDischarges
TAble C.3 Parana River: Extreme Annual Low Flows
Table C.4 Paraguay River: Extreme Annual LowFlows/Stages
Table C.5 Parana River: Annual Maximum DailyDischarges
Table C.6 Paraguay River: Annual Maximum DailyDischarges/Stages
Table C.7 Monthly Precipitation in the Parana/PaaguayBasin

I
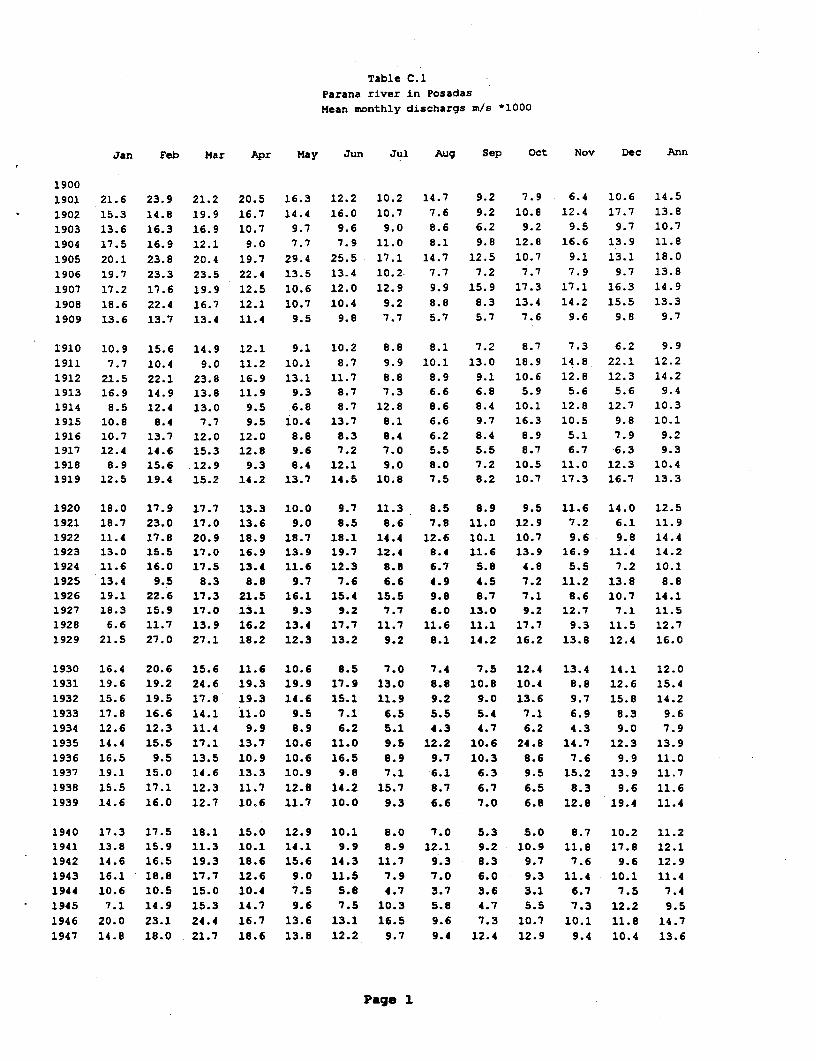
Table C.1
Parana river in Posadas
Mean monthly dischargs m/s *1000
Jan Feb Mar Apr May Jun Jul Aug Sep Oct Nov Dec Ann
19001901 21.6 23.9 21.2 20.5 16.3 12.2 10.2 14.7 9.2 7.9 6.4 10.6 14.5
1902 15.3 14.8 19.9 16.7 14.4 16.0 10.7 7.6 9.2 10.8 12.4 17.7 13.81903 13.6 16.3 16.9 10.7 9.7 9.6 9.0 8.6 6.2 9.2 9.5 9.7 10.7
1904 17.5 16.9 12.1 9.0 7.7 7.9 11.0 8.1 9.8 12.8 16.6 13.9 11.8
1905 20.1 23.8 20.4 19.7 29.4 25.5 17.1 14.7 12.5 10.7 9.1 13.1 18.0
1906 19.7 23.3 23.5 22.4 13.5 13.4 10.2. 7.7 7.2 7.7 7.9 9.7 13.8
1907 17.2 17.6 19.9 12.5 10.6 12.0 12.9 9.9 15.9 17.3 17.1 16.3 14.9
1908 18.6 22.4 16.7 12.1 10.7 10.4 9.2 8.8 8.3 13.4 14.2 15.5 13.3
1909 13.6 13.7 13.4 11.4 9.5 9.8 7.7 5.7 5.7 7.6 9.6 9.8 9.7
1910 10.9 15.6 14.9 12.1 9.1 10.2 8.8 8.1 7.2 8.7 7.3 6.2 9.9
1911 7.7 10.4 9.0 11.2 10.1 8.7 9.9 10.1 13.0 18.9 14.8 22.1 12.2
1912 21.5 22.1 23.8 16.9 13.1 11.7 8.8 8.9 9.1 10.6 12.8 12.3 14.21913 16.9 14.9 13.8 11.9 9.3 8.7 7.3 6.6 6.8 5.9 5.6 5.6 9.41914 8.5 12.4 13.0 9.5 6.8 8.7 12.8 8.6 8.4 10.1 12.8 12.7 10.31915 10.8 8.4 7.7 9.5 10.4 13.7 8.1 6.6 9.7 16.3 10.5 9.8 10.11916 10.7 13.7 12.0 12.0 8.8 8.3 8.4 6.2 8.4 8.9 5.1 7.9 9.21917 12.4 14.6 15.3 12.8 9.6 7.2 7.0 5.5 5.5 8.7 6.7 6.3 9.31918 8.9 15.6 12.9 9.3 8.4 12.1 9.0 8.0 7.2 10.5 11.0 12.3 10.41919 12.5 19.4 15.2 14.2 13.7 14.5 10.8 7.5 8.2 10.7 17.3 16.7 13.3
1920 18.0 17.9 17.7 13.3 10.0 9.7 11.3 8.5 8.9 9.5 11.6 14.0 12.5
1921 18.7 23.0 17.0 13.6 9.0 8.5 8.6 7.8 11.0 12.9 7.2 6.1 11.9
1922 11.4 17.8 20.9 18.9 18.7 18.1 14.4 12.6 10.1 10.7 9.6 9.8 14.4
1923 13.0 15.5 17.0 16.9 13.9 19.7 12.4 8.4 11.6 13.9 16.9 11.4 14.2
1924 11.6 16.0 17.5 13.4 11.6 12.3 8.8 6.7 5.8 4.8 5.5 7.2 10.1
1925 13.4 9.5 8.3 8.8 9.7 7.6 6.6 4.9 4.5 7.2 11.2 13.8 8.8
1926 19.1 22.6 17.3 21.5 16.1 15.4 15.5 9.8 8.7 7.1 8.6 10.7 14.1
1927 18.3 15.9 17.0 13.1 9.3 9.2 7.7 6.0 13.0 9.2 12.7 7.1 11.5
1928 6.6 11.7 13.9 16.2 13.4 17.7 11.7 11.6 11.1 17.7 9.3 11.5 12.71929 21.5 27.0 27.1 18.2 12.3 13.2 9.2 8.1 14.2 16.2 13.8 12.4 16.0
1930 16.4 20.6 15.6 11.6 10.6 8.5 7.0 7.4 7.5 12.4 13.4 14.1 12.0
1931 19.6 19.2 24.6 19.3 19.9 17.9 13.0 8.8 10.8 10.4 8.8 12.6 15.4
1932 15.6 19.5 17.8 19.3 14.6 15.1 11.9 9.2 9.0 13.6 9.7 15.8 14.2
1933 17.8 16.6 14.1 11.0 9.5 7.1 6.5 5.5 5.4 7.1 6.9 8.3 9.61934 12.6 12.3 11.4 9.9 8.9 6.2 5.1 4.3 4.7 6.2 4.3 9.0 7.9
1935 14.4 15.5 17.1 13.7 10.6 11.0 9.5 12.2 10.6 24.8 14.7 12.3 13.9
1936 16.5 9.5 13.5 10.9 10.6 16.5 8.9 9.7 10.3 8.6 7.6 9.9 11.0
1937 19.1 15.0 14.6 13.3 10.9 9.8 7.1 6.1 6.3 9.5 15.2 13.9 11.7
1938 15.5 17.1 12.3 11.7 12.8 14.2 15.7 8.7 6.7 6.5 8.3 9.6 11.6
1939 14.6 16.0 12.7 10.6 11.7 10.0 9.3 6.6 7.0 6.8 12.8 19.4 11.4
1940 17.3 17.5 18.1 15.0 12.9 10.1 8.0 7.0 5.3 5.0 8.7 10.2 11.2
1941 13.8 15.9 11.3 10.1 14.1 9.9 8.9 12.1 9.2 10.9 11.8 17.8 12.1
1942 14.6 16.5 19.3 18.6 15.6 14.3 11.7 9.3 8.3 9.7 7.6 9.6 12.9
1943 16.1 18.8 17.7 12.6 9.0 11.5 7.9 7.0 6.0 9.3 11.4 10.1 11.4
1944 10.6 10.5 15.0 10.4 7.5 5.8 4.7 3.7 3.6 3.1 6.7 7.5 7.4
1945 7.1 14.9 15.3 14.7 9.6 7.5 10.3 5.8 4.7 5.5 7.3 12.2 9.5
1946 20.0 23.1 24.4 16.7 13.6 13.1 16.5 9.6 7.3 10.7 10.1 11.8 14.7
1947 14.8 18.0 21.7 18.6 13.8 12.2 9.7 9.4 12.4 12.9 9.4 10.4 13.6
Page 1
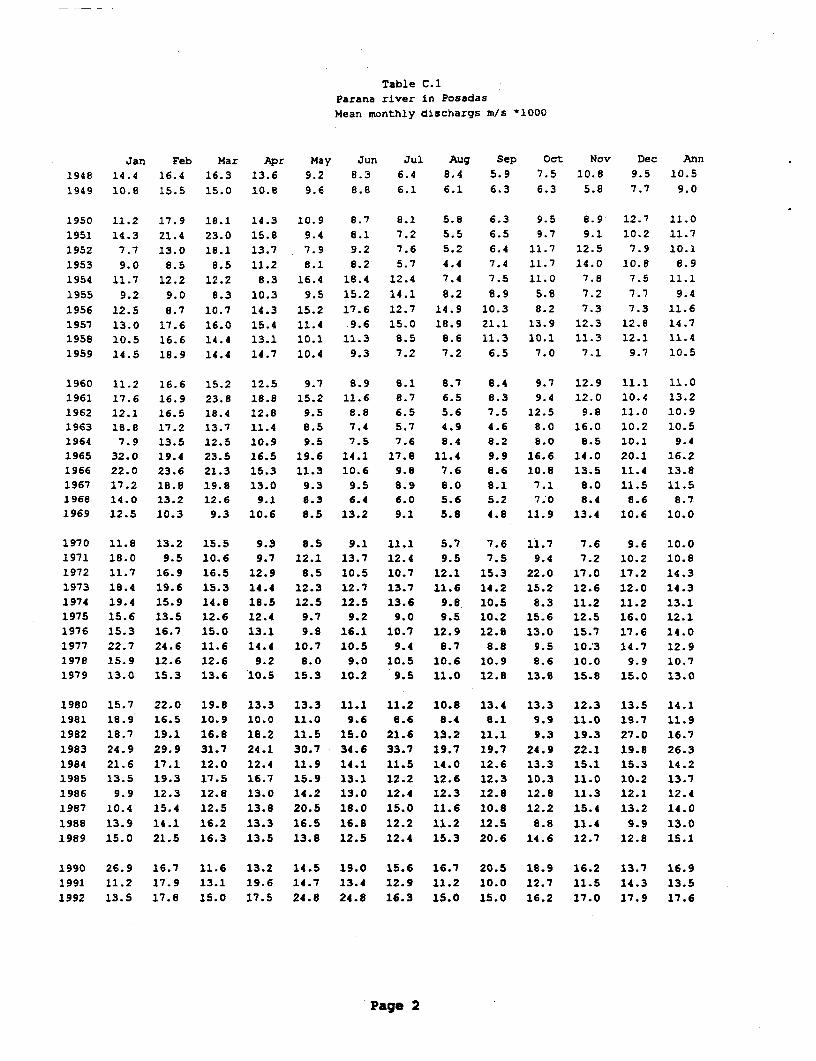
Table C.1
Parana river in Posadas
Mean monthly dischargs mI/s *1000
Jan Feb Mar Apr May Jun Jul Aug Sep Oct Nov Dec Ann1948 14.4 16.4 16.3 13.6 9.2 8.3 6.4 8.4 5.9 7.5 10.8 9.5 10.5
1949 10.8 15.5 15.0 10.8 9.6 8.8 6.1 6.1 6.3 6.3 5.8 7.7 9.0
1950 11.2 17.9 18.1 14.3 10.9 8.7 8.1 5.8 6.3 9.5 8.9 12.7 11.01951 14.3 21.4 23.0 15.8 9.4 8.1 7.2 5.5 6.5 9.7 9.1 10.2 11.71952 7.7 13.0 18.1 13.7 7.9 9.2 7.6 5.2 6.4 11.7 12.5 7.9 10.11953 9.0 8.5 8.5 11.2 8.1 8.2 5.7 4.4 7.4 11.7 14.0 10.8 8.91954 11.7 12.2 12.2 8.3 16.4 18.4 12.4 7.4 7.5 11.0 7.8 7.5 11.1
1955 9.2 9.0 8.3 10.3 9.5 15.2 14.1 8.2 8.9 5.8 7.2 7.7 9.4
1956 12.5 8.7 10.7 14.3 15.2 17.6 12.7 14.9 10.3 8.2 7.3 7.3 11.61957 13.0 17.6 16.0 15.4 11.4 9.6 15.0 18.9 21.1 13.9 12.3 12.8 14.71958 10.5 16.6 14.4 13.1 10.1 11.3 8.5 8.6 11.3 10.1 11.3 12.1 11.4
1959 14.5 18.9 14.4 14.7 10.4 9.3 7.2 7.2 6.5 7.0 7.1 9.7 10.5
1960 11.2 16.6 15.2 12.5 9.7 8.9 8.1 8.7 8.4 9.7 12.9 11.1 11.01961 17.6 16.9 23.8 18.8 15.2 11.6 8.7 6.5 8.3 9.4 12.0 10.4 13.21962 12.1 16.5 18.4 12.8 9.5 8.8 6.5 5.6 7.5 12.5 9.8 11.0 10.91963 18.8 17.2 13.7 11.4 8.5 7.4 5.7 4.9 4.6 8.0 16.0 10.2 10.51964 7.9 13.5 12.5 10.9 9.5 7.5 7.6 8.4 8.2 8.0 8.5 10.1 9.41965 32.0 19.4 23.5 16.5 19.6 14.1 17.8 11.4 9.9 16.6 14.0 20.1 16.21966 22.0 23.6 21.3 15.3 11.3 10.6 9.8 7.6 8.6 10.8 13.5 11.4 13.81967 17.2 18.8 19.8 13.0 9.3 9.5 8.9 8.0 8.1 7.1 8.0 11.5 11.51968 14.0 13.2 12.6 9.1 8.3 6.4 6.0 5.6 5.2 7.0 8.4 8.6 8.71969 12.5 10.3 9.3 10.6 8.5 13.2 9.1 5.8 4.8 11.9 13.4 10.6 10.0
1970 11.8 13.2 15.5 9.3 8.5 9.1 11.1 5.7 7.6 11.7 7.6 9.6 10.01971 18.0 9.5 10.6 9.7 12.1 13.7 12.4 9.5 7.5 9.4 7.2 10.2 10.81972 11.7 16.9 16.5 12.9 8.5 10.5 10.7 12.1 15.3 22.0 17.0 17.2 14.3
1973 18.4 19.6 15.3 14.4 12.3 12.7 13.7 11.6 14.2 15.2 12.6 12.0 14.3
1974 19.4 15.9 14.8 18.5 12.5 12.5 13.6 9.8 10.5 8.3 11.2 11.2 13.11975 15.6 13.5 12.6 12.4 9.7 9.2 9.0 9.5 10.2 15.6 12.5 16.0 12.11976 15.3 16.7 15.0 13.1 9.8 16.1 10.7 12.9 12.8 13.0 15.7 17.6 14.01977 22.7 24.6 11.6 14.4 10.7 10.5 9.4 8.7 8.8 9.5 10;3 14.7 12.91978 15.9 12.6 12.6 9.2 8.0 9.0 10.5 10.6 10.9 8.6 10.0 9.9 10.71979 13.0 15.3 13.6 10.5 15.3 10.2 9.5 11.0 12.8 13.9 15.8 15.0 13.0
1980 15.7 22.0 19.8 13.3 13.3 11.1 11.2 10.8 13.4 13.3 12.3 13.5 14.11981 18.9 16.5 10.9 10.0 11.0 9.6 0.6 8.4 8.. 9.9 11.0 19.7 11.9
1982 18.7 19.1 16.8 18.2 11.5 15.0 21.6 13.2 11.1 9.3 19.3 27.0 16.7
1983 24.9 29.9 31.7 24.1 30.7 34.6 33.7 19.7 19.7 24.9 22.1 19.8 26.3
1984 21.6 17.1 12.0 12.4 11.9 14.1 11.5 14.0 12.6 13.3 15.1 15.3 14.21985 13.5 19.3 17.5 16.7 15.9 13.1 12.2 12.6 12.3 10.3 11.0 10.2 13.7
1986 9.9 12.3 12.8 13.0 14.2 13.0 12.4 12.3 12.8 12.8 11.3 12.1 12.41987 10.4 15.4 12.5 13.8 20.5 18.0 15.0 11.6 10.8 12.2 15.4 13.2 14.0
1988 13.9 14.1 16.2 13.3 16.5 16.8 12.2 11.2 12.5 8.8 11.4 9.9 13.01989 15.0 21.5 16.3 13.5 13.8 12.5 12.4 15.3 20.6 14.6 12.7 12.8 15.1
1990 26.9 16.7 11.6 13.2 14.5 19.0 15.6 16.7 20.5 18.9 16.2 13.7 16.91991 11.2 17.9 13.1 19.6 14.7 13.4 12.9 11.2 10.0 12.7 11.S 14.3 13.51992 13.5 17.8 15.0 17.5 24.8 24.8 16.3 15.0 15.0 16.2 17.0 17.9 17.6
Page 2
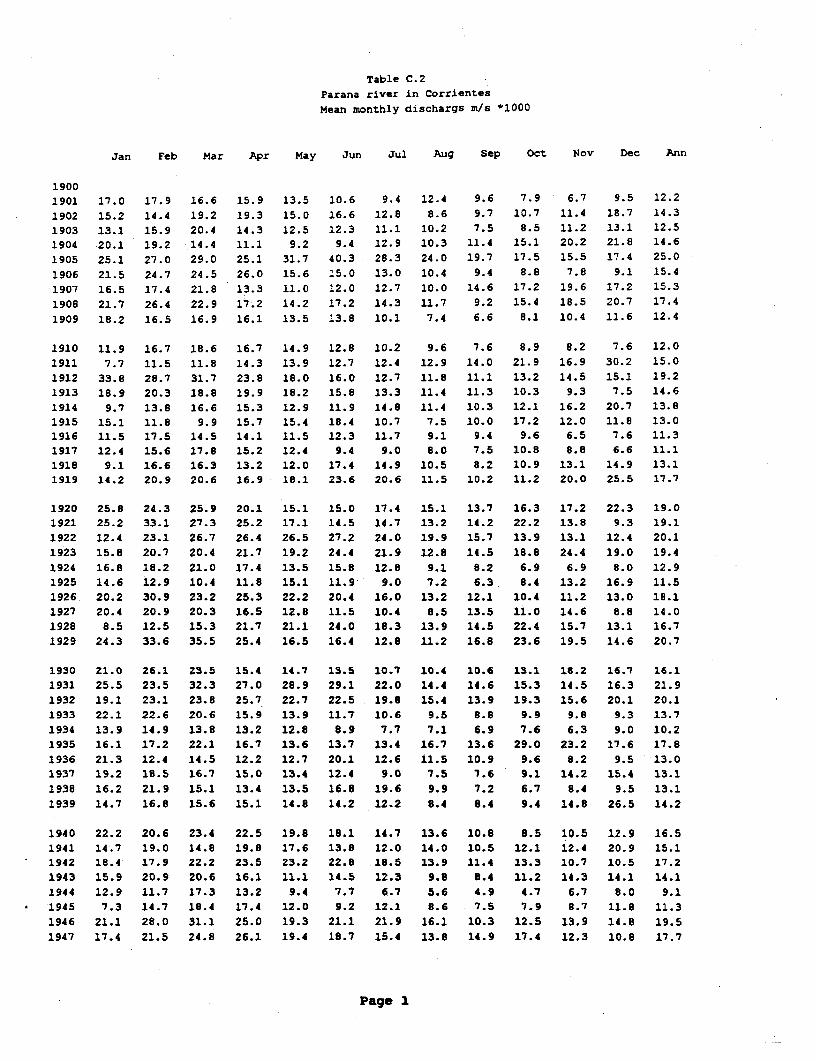
Table C.2
Parana river in Corrientes
Mean monthly dischargs m/a *1000
Jan Feb Mar Apr May Jun Jul Aug Sep Oct Nov Dec Ann
19001901 17.0 17.9 16.6 15.9 13.5 10.6 9.4 12.4 9.6 7.9 6.7 9.5 12.2
1902 15.2 14.4 19.2 19.3 15.0 16.6 12.8 8.6 9.7 10.7 11.4 18.7 14.3
1903 13.1 15.9 20.4 14.3 12.5 12.3 11.1 10.2 7.5 8.5 11.2 13.1 12.5
1904 20.1 19.2 14.4 11.1 9.2 9.4 12.9 10.3 11.4 15.1 20.2 21.8 14.6
1905 25.1 27.0 29.0 25.1 31.7 40.3 28.3 24.0 19.7 17.5 15.5 17.4 25.0
1906 21.5 24.7 24.5 26.0 15.6 15.0 13.0 10.4 9.4 8.8 7.8 9.1 15.4
1907 16.5 17.4 21.8 13.3 11.0 12.0 12.7 10.0 14.6 17.2 19.6 17.2 15.3
1908 21.7 26.4 22.9 17.2 14.2 17.2 14.3 11.7 9.2 15.4 18.5 20.7 17.4
1909 18.2 16.5 16.9 16.1 13.5 13.8 10.1 7.4 6.6 8.1 10.4 11.6 12.4
1910 11.9 16.7 18.6 16.7 14.9 12.8 10.2 9.6 7.6 8.9 8.2 7.6 12.0
1911 7.7 11.5 11.8 14.3 13.9 12.7 12.4 12.9 14.0 21.9 16.9 30.2 15.0
1912 33.8 28.7 31.7 23.8 18.0 16.0 12.7 11.8 11.1 13.2 14.5 15.1 19.2
1913 18.9 20.3 18.8 19.9 18.2 15.8 13.3 11.4 11.3 10.3 9.3 7.5 14.6
1914 9.7 13.8 16.6 15.3 12.9 11.9 14.8 11.4 10.3 12.1 16.2 20.7 13.8
1915 15.1 11.8 9.9 15.7 15.4 18.4 10.7 7.5 10.0 17.2 12.0 11.8 13.0
1916 11.5 17.5 14.5 14.1 11.5 12.3 11.7 9.1 9.4 9.6 6.5 7.6 11.31917 12.4 15.6 17.8 15.2 12.4 9.4 9.0 8.0 7.5 10.8 8.8 6.6 11.1
1918 9.1 16.6 16.3 13.2 12.0 17.4 14.9 10.5 8.2 10.9 13.1 14.9 13.1
1919 14.2 20.9 20.6 16.9 18.1 23.6 20.6 11.5 10.2 11.2 20.0 25.5 17.7
1920 25.8 24.3 25.9 20.1 15.1 15.0 17.4 15.1 13.7 16.3 17.2 22.3 19.0
1921 25.2 33.1 27.3 25.2 17.1 14.5 14.7 13.2 14.2 22.2 13.8 9.3 19.1
1922 12.4 23.1 26.7 26.4 26.5 27.2 24.0 19.9 15.7 13.9 13.1 12.4 20.1
1923 15.8 20.7 20.4 21.7 19.2 24.4 21.9 12.8 14.5 18.8 24.4 19.0 19.4
1924 16.8 18.2 21.0 17.4 13.5 15.8 12.8 9.1 8.2 6.9 6.9 8.0 12.9
1925 14.6 12.9 10.4 11.8 15.1 11.9 9.0 7.2 6.3 8.4 13.2 16.9 11.5
1926 20.2 30.9 23.2 25.3 22.2 20.4 16.0 13.2 12.1 10.4 11.2 13.0 18.1
1927 20.4 20.9 20.3 16.5 12.8 11.5 10.4 8.5 13.5 11.0 14.6 8.8 14.0
1928 8.5 12.5 15.3 21.7 21.1 24.0 18.3 13.9 14.5 22.4 15.7 13.1 16.7
1929 24.3 33.6 35.5 25.4 16.5 16.4 12.8 11.2 16.8 23.6 19.5 14.6 20.7
1930 21.0 26.1 23.5 15.4 14.7 13.5 10.7 10.4 10.6 13.1 18.2 16.7 16.1
1931 25.5 23.5 32.3 27.0 28.9 29.1 22.0 14.4 14.6 15.3 14.5 16.3 21.9
1932 19.1 23.1 23.8 25.7 22.7 22.5 19.8 15.4 13.9 19.3 15.6 20.1 20.1
1933 22.1 22.6 20.6 15.9 13.9 11.7 10.6 9.5 8.8 9.9 9.8 9.3 13.7
1934 13.9 14.9 13.8 13.2 12.8 8.9 7.7 7.1 6.9 7.6 6.3 9.0 10.2
1935 16.1 17.2 22.1 16.7 13.6 13.7 13.4 16.7 13.6 29.0 23.2 17.6 17.8
1936 21.3 12.4 14.5 12.2 12.7 20.1 12.6 11.5 10.9 9.6 8.2 9.5 13.0
1937 19.2 18.5 16.7 15.0 13.4 12.4 9.0 7.5 7.6 9.1 14.2 15.4 13.1
1938 16.2 21.9 15.1 13.4 13.5 16.8 19.6 9.9 7.2 6.7 8.4 9.5 13.1
1939 14.7 16.8 15.6 15.1 14.8 14.2 12.2 8.4 8.4 9.4 14.8 26.5 14.2
1940 22.2 20.6 23.4 22.5 19.8 18.1 14.7 13.6 10.8 8.5 10.5 12.9 16.5
1941 14.7 19.0 14.8 19.8 17.6 13.8 12.0 14.0 10.5 12.1 12.4 20.9 15.1
1942 18.4 17.9 22.2 23.5 23.2 22.8 18.5 13.9 11.4 13.3 10.7 10.5 17.2
1943 15.9 20.9 20.6 16.1 11.1 14.5 12.3 9.8 8.4 11.2 14.3 14.1 14.1
1944 12.9 11.7 17.3 13.2 9.4 7.7 6.7 5.6 4.9 4.7 6.7 8.0 9.1
1945 7.3 14.7 18.4 17.4 12.0 9.2 12.1 8.6 7.5 7.9 8.7 11.8 11.3
1946 21.1 28.0 31.1 25.0 19.3 21.1 21.9 16.1 10.3 12.5 13.9 14.8 19.5
1947 17.4 21.5 24.8 26.1 19.4 18.7 15.4 13.8 14.9 17.4 12.3 10.8 17.7
Page 1
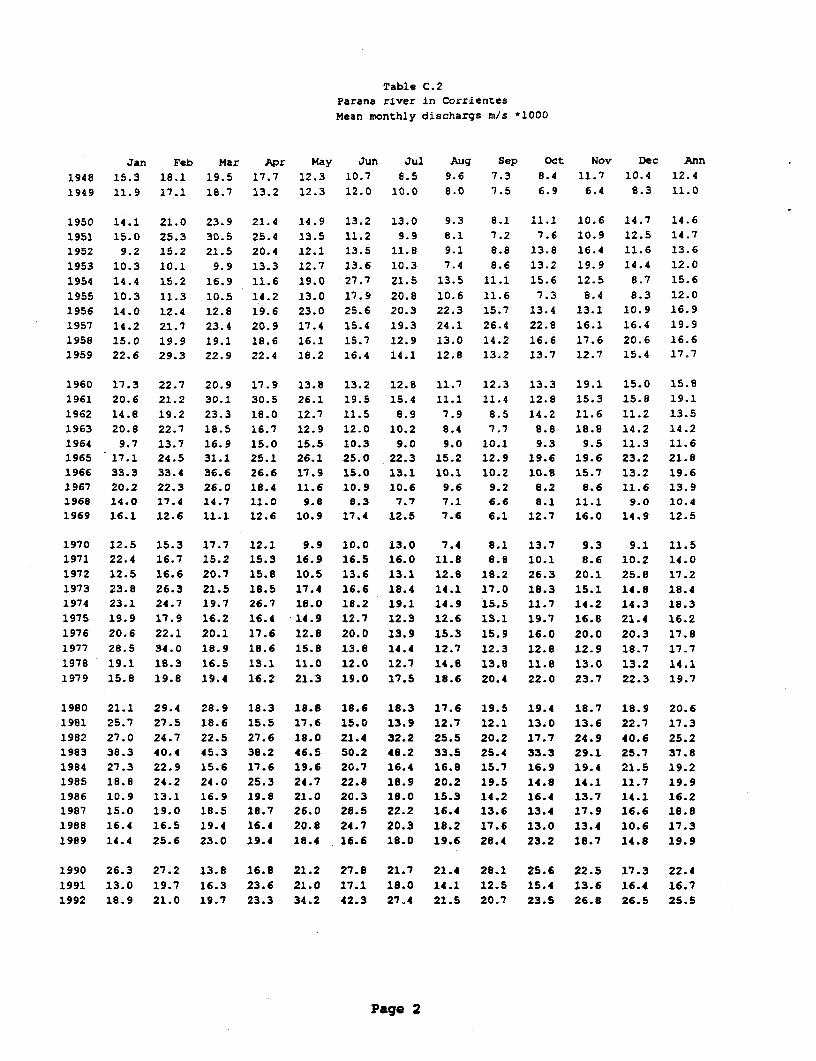
Table C.2
Parana river in Corrientes
Mean monthly dischargs m/s *1000
Jan Feb Mar Apr May Jun Jul Aug Sep Oct Nov Dec Ann
1948 15.3 18.1 19.5 17.7 12.3 10.7 8.5 9.6 7.3 8.4 11.7 10.4 12.4
1949 11.9 17.1 18.7 13.2 12.3 12.0 10.0 8.0 7.5 6.9 6.4 8.3 11.0
1950 14.1 21.0 23.9 21.4 14.9 13.2 13.0 9.3 8.1 11.1 10.6 14.7 14.61951 15.0 25.3 30.5 25.4 13.5 11.2 9.9 8.1 7.2 7.6 10.9 12.5 14.71952 9.2 15.2 21.5 20.4 12.1 13.5 11.8 9.1 8.8 13.8 16.4 11.6 13.6
1953 10.3 10.1 9.9 13.3 12.7 13.6 10.3 7.4 8.6 13.2 19.9 14.4 12.0
1954 14.4 15.2 16.9 11.6 19.0 27.7 21.5 13.5 11.1 15.6 12.5 8.7 15.6
1955 10.3 11.3 10.5 14.2 13.0 17.9 20.8 10.6 11.6 7.3 8.4 8.3 12.01956 14.0 12.4 12.8 19.6 23.0 25.6 20.3 22.3 15.7 13.4 13.1 10.9 16.91957 14.2 21.7 23.4 20.9 17.4 15.4 19.3 24.1 26.4 22.8 16.1 16.4 19.9
1958 15.0 19.9 19.1 18.6 16.1 15.7 12.9 13.0 14.2 16.6 17.6 20.6 16.6
1959 22.6 29.3 22.9 22.4 18.2 16.4 14.1 12.8 13.2 13.7 12.7 15.4 17.7
1960 17.3 22.7 20.9 17.9 13.8 13.2 12.8 11.7 12.3 13.3 19.1 15.0 15.81961 20.6 21.2 30.1 30.5 26.1 19.5 15.4 11.1 11.4 12.8 15.3 15.8 19.1
1962 14.8 19.2 23.3 18.0 12.7 11.5 8.9 7.9 8.5 14.2 11.6 11.2 13.5
1963 20.8 22.7 18.5 16.7 12.9 12.0 10.2 8.4 7.7 8.8 18.8 14.2 14.2
1964 9.7 13.7 16.9 15.0 15.5 10.3 9.0 9.0 10.1 9.3 9.5 11.3 11.61965 17.1 24.5 31.1 25.1 26.1 25.0 22.3 15.2 12.9 19.6 19.6 23.2 21.81966 33.3 33.4 36.6 26.6 17.9 15.0 13.1 10.1 10.2 10.8 15.7 13.2 19.61967 20.2 22.3 26.0 18.4 11.6 10.9 10.6 9.6 9.2 8.2 8.6 11.6 13.91968 14.0 17.4 14.7 11.0 9.8 8.3 7.7 7.1 6.6 8.1 11.1 9.0 10.41969 16.1 12.6 11.1 12.6 10.9 17.4 12.5 7.6 6.1 12.7 16.0 14.9 12.5
1970 12.5 15.3 17.7 12.1 9.9 10.0 13.0 7.4 8.1 13.7 9.3 9.1 11.5
1971 22.4 16.7 15.2 15.3 16.9 16.5 16.0 11.8 8.8 10.1 8.6 10.2 14.0
1972 12.5 16.6 20.7 15.8 10.5 13.6 13.1 12.9 18.2 26.3 20.1 25.8 17.2
1973 23.8 26.3 21.5 18.5 17.4 16.6 18.4 14.1 17.0 18.3 15.1 14.8 18.41974 23.1 24.7 19.7 26.7 18.0 18.2 19.1 14.9 15.5 11.7 14.2 14.3 18.3
1975 19.9 17.9 16.2 16.4 14.9 12.7 12.3 12.6 13.1 19.7 16.8 21.4 16.2
1976 20.6 22.1 20.1 17.6 12.8 20.0 13.9 15.3 15.9 16.0 20.0 20.3 17.8
1977 28.5 34.0 18.9 18.6 15.8 13.8 14.4 12.7 12.3 12.8 12.9 18.7 17.7
1978 19.1 18.3 16.5 13.1 11.0 12.0 12.7 14.8 13.8 11.8 13.0 13.2 14.1
1979 15.8 19.8 19.4 16.2 21.3 19.0 17.5 18.6 20.4 22.0 23.7 22.3 19.7
1980 21.1 29.4 28.9 18.3 18.8 18.6 18.3 17.6 19.5 19.4 18.7 18.9 20.6
1981 25.7 27.5 18.6 15.5 17.6 15.0 13.9 12.7 12.1 13.0 13.6 22.7 17.3
1982 27.0 24.7 22.5 27.6 18.0 21.4 32.2 25.5 20.2 17.7 24.9 40.6 25.21983 38.3 40.4 45.3 38.2 46.5 50.2 48.2 33.5 25.4 33.3 29.1 25.7 37.8
1984 27.3 22.9 15.6 17.6 19.6 20.7 16.4 16.8 15.7 16.9 19.4 21.5 19.2
1985 18.8 24.2 24.0 25.3 24.7 22.8 18.9 20.2 19.5 14.8 14.1 11.7 19.9
1986 10.9 13.1 16.9 19.8 21.0 20.3 18.0 15.3 14.2 16.4 13.7 14.1 16.21987 15.0 19.0 18.5 18.7 26.0 28.5 22.2 16.4 13.6 13.4 17.9 16.6 18.8
1988 16.4 16.5 19.4 16.4 20.8 24.7 20.3 18.2 17.6 13.0 13.4 10.6 17.3
1989 14.4 25.6 23.0 19.4 18.4 16.6 18.0 19.6 28.4 23.2 18.7 14.8 19.9
1990 26.3 27.2 13.8 16.8 21.2 27.8 21.7 21.4 28.1 25.6 22.5 17.3 22.4
1991 13.0 19.7 16.3 23.6 21.0 17.1 18.0 14.1 12.5 15.4 13.6 16.4 16.7
1992 18.9 21.0 19.7 23.3 34.2 42.3 27.4 21.5 20.7 23.5 26.8 26.6 25.5
Page 2
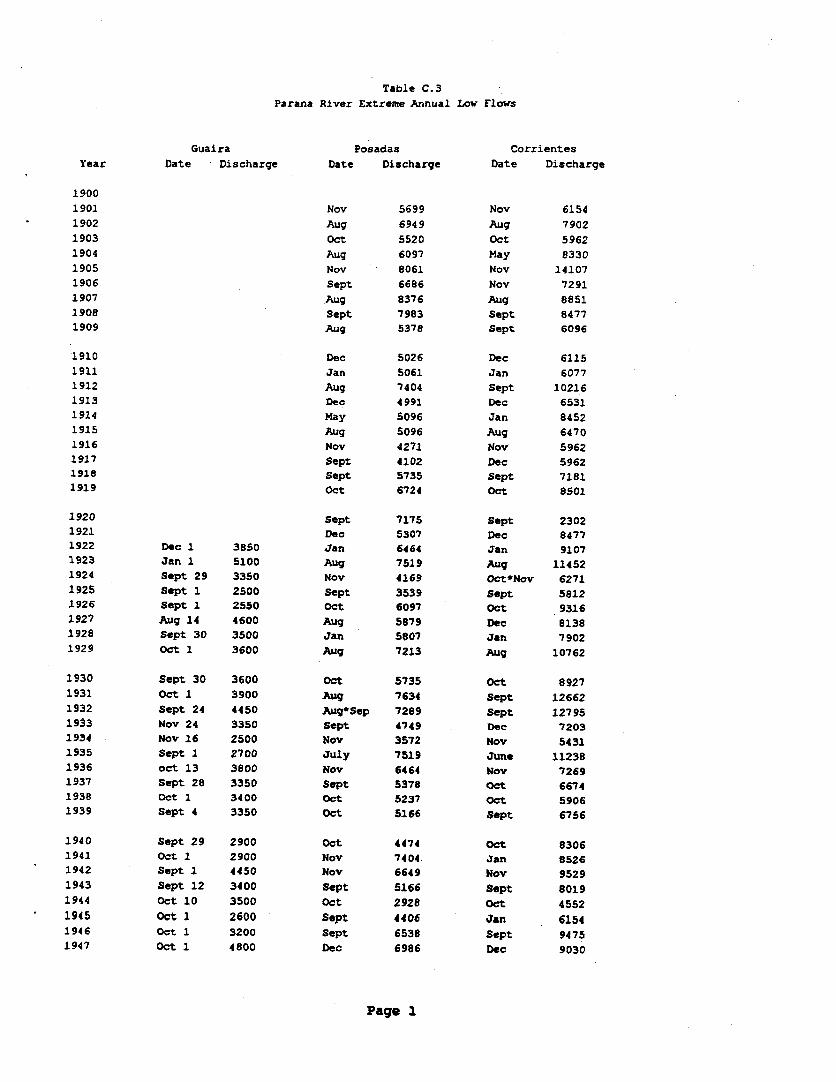
Table C.3Parana River Extreme Annual Low Flows
Guaira Posadas CorrientesYear Date Discharge Date Discharge Date Discharge
19001901 Nov 5699 Nov 61541902 Aug 6949 Aug 79021903 Oct 5520 Oct 59621904 Aug 6097 May 83301905
Nov 8061 Nov 141071906 Sept 6686 Nov 72911907 Aug 8376 Aug 88511908 Sept 7983 Sept 84771909 Aug 5378 Sept 6096
1910 Dec 5026 Dec 61151911 Jan 5061 Jan 60771912 Aug 7404 Sept 102161913 Dec 4991 Dec 65311914 May 5096 Jan 84521915 Aug 5096 Aug 64701916 Nov 4271 Nov 59621917 Sept 4102 Dec 59621918 Sept 5735 Sept 71811919 Oct 6724 Oct 8501
1920 Sept 7175 Sept 23021921 Dec 5307 Dec 84771922 Dec 1 3850 Jan 6464 Jan 91071923 Jan 1 5100 Aug 7519 Aug 114521924 Sept 29 3350 Nov 4169 Oct*NoV 62711925 Sept 1 2500 Sept 3539 Sept 58121926 Sept 1 2550 Oct 6097 Oct 93161927 Aug 14 4600 Aug 5879 Dec 81381928 Sept 30 3500 Jan 5807 Jan 79021929 Oct 1 3600 Aug 7213 Aug 10762
1930 Sept 30 3600 Oct 5735 Oct 89271931 Oct 1 3900 Aug 7634 Sept 126621932 Sept 24 4450 Aug*Sep 7299 Sept 127951933 Nov 24 3350 Sept 4749 Dec 72031934 Nov 16 2500 Nov 3572 Nov 54311935 Sept 1 2700 July 7519 June 112381936 oct 13 3800 Nov 6464 Nov 72691937 Sept 28 3350 Sept 5378 Oct 66741938 Oct 1 3400 Oct 5237 Oct 59061939 Sept 4 3350 Oct 5166 Sept 6756
1940 Sept 29 2900 Oct 4474 Oct 83061941 Oct 1 2900 Nov 7404. Jan 85261942 Sept 1 4450 Nov 6649 Nov 95291943 Sept 12 3400 Sept 5166 Sept 80191944 Oct 10 3500 Oct 2928 Oct 45521945 Oct 1 2600 Sept 4406 Jan 61541946 Oct 1 3200 Sept 6538 Sept 94751947 Oct 1 4800 Dec 6986 Dec 9030
Page 1
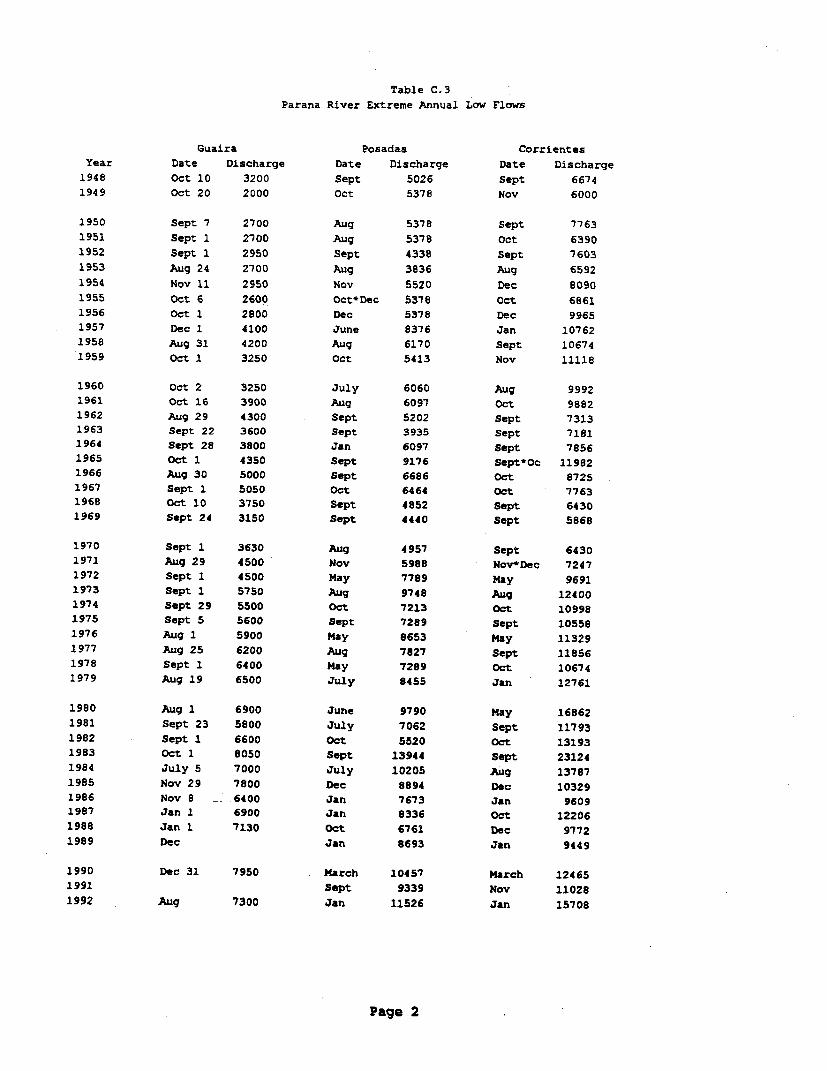
Table C.3
Parana River Extreme Annual Low Flows
Guaira Posadas Corrientes
Year Date Discharge Date Discharge Date Discharge
1948 Oct 10 3200 Sept 5026 Sept 6674
1949 Oct 20 2000 Oct 5378 Nov 6000
1950 Sept 7 2700 Aug 5378 Sept 7763
1951 Sept 1 2700 Aug 5378 Oct 6390
1952 Sept 1 2950 Sept 4338 Sept 7603
1953 Aug 24 2700 Aug 3836 Aug 6592
1954 Nov 11 2950 Nov 5520 Dec 8090
1955 Oct 6 2600 Oct*Dec 5378 Oct 68611956 Oct 1 2800 Dec 5378 Dec 9965
1957 Dec 1 4100 June 8376 Jan 10762
1958 Aug 31 4200 Aug 6170 Sept 10674
1959 Oct 1 3250 Oct 5413 Nov 11118
1960 Oct 2 3250 July 6060 Aug 9992
1961 Oct 16 3900 Aug 6097 Oct 9882
1962 Aug 29 4300 Sept 5202 Sept 73131963 Sept 22 3600 Sept 3935 Sept 7181
1964 Sept 28 3800 Jan 6097 Sept 7856
1965 Oct 1 4350 Sept 9176 Sept-Oc 119821966 Aug 30 5000 Sept 6686 Oct 87251967 Sept 1 5050 Oct 6464 Oct 77631968 Oct 10 3750 Sept 4852 Sept 64301969 Sept 24 3150 Sept 4440 Sept 5868
1970 Sept 1 3630 Aug 4957 Sept 6430
1971 Aug 29 4500 Nov 5988 Nov*Dec 7247
1972 Sept 1 4500 May 7789 May 96911973 Sept 1 5750 Aug 9748 Aug 12400
1974 Sept 29 5500 Oct 7213 Oct 10998
1975 Sept 5 5600 Sept 7289 Sept 10558
1976 Aug 1 5900 May 8653 May 11329
1977 Aug 25 6200 Aug 7827 Sept 11856
1978 Sept 1 6400 May 7289 Oct 10674
1979 Aug 19 6500 July 8455 Jan 12761
1980 Aug 1 6900 June 9790 May 16862
1981 Sept 23 5800 July 7062 Sept 11793
1982 Sept 1 6600 Oct 5520 Oct 131931983 Oct 1 8050 Sept 13944 Sept 23124
1984 July 5 7000 July 10205 Aug 13787
1985 Nov 29 7800 Dec 8894 Dec 10329
1986 Nov 8 - 6400 Jan 7673 Jan 96091987 Jan 1 6900 Jan 8336 Oct 12206
1988 Jan 1 7130 Oct 6761 Dec 97721989 Dec Jan 8693 Jan 9449
1990 Dec 31 7950 March 10457 March 124651991 Sept 9339 Nov 11028
1992 Aug 7300 Jan 11526 Jan 15708
Page 2
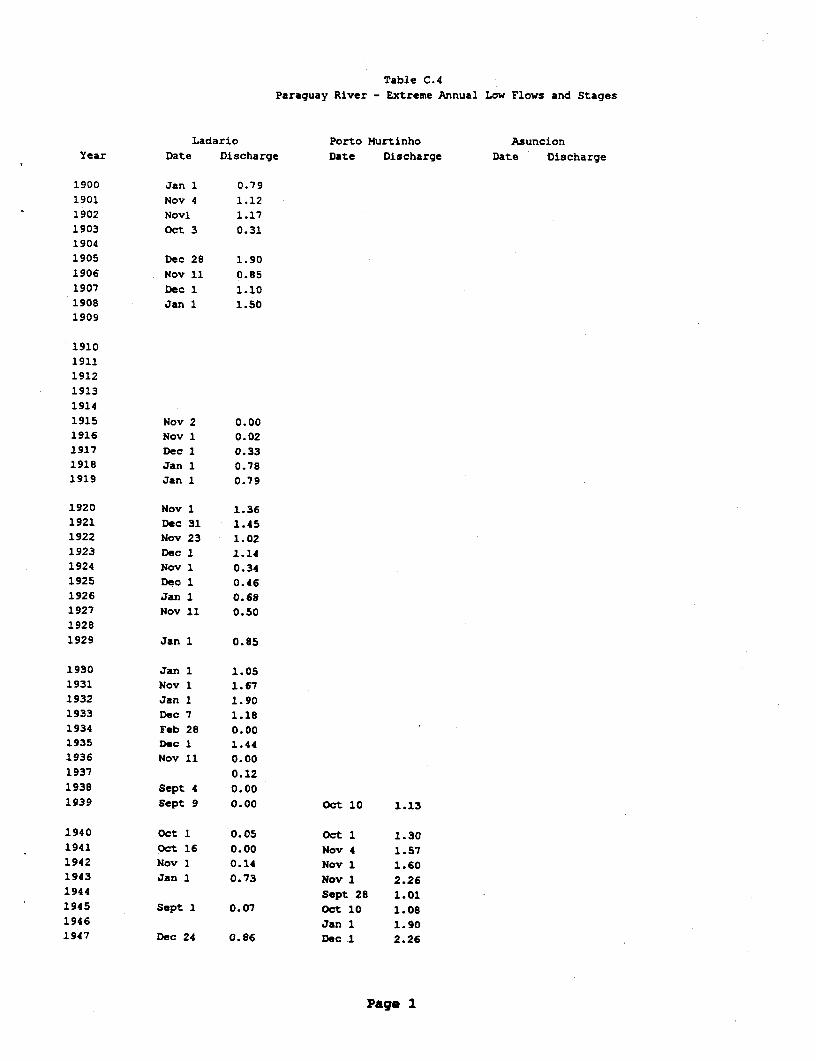
Table C.4
Paraguay River - Extreme Annual Low Flows and Stages
Ladario Porto Murtinho AsuncionYear Date Discharge Date Discharge Date Discharge
1900 Jan 1 0.791901 Nov 4 1.121902 Novl 1.171903 Oct 3 0.311904
1905 Dec 28 1.901906 Nov 11 0.851907 Dec 1 1.101908 Jan 1 1.501909
191019111912
1913
1914
1915 Nov 2 0.001916 Nov 1 0.021917 Dec 1 0.331918 Jan 1 0.781919 Jan 1 0.79
1920 Nov 1 1.361921 Dec 31 1.451922 Nov 23 1.021923 Dec 1 1.141924 Nov 1 0.341925 Dec 1 0.461926 Jan 1 0.681927 Nov 11 0.501928
1929 Jan 1 0.85
1930 Jan 1 1.051931 Nov 1 1.671932 Jan 1 1.901933 Dec 7 1.181934 Feb 28 0.001935 Dec 1 1.441936 Nov 11 0.001937 0.12
1938 Sept 4 0.001939 Sept 9 0.00 Oct 10 1.13
1940 Oct 1 0.05 Oct 1 1.301941 Oct 16 0.00 Nov 4 1.571942 Nov 1 0.14 Nov 1 1.601943 Jan 1 0.73 Nov 1 2.261944 Sept 28 1.011945 Sept 1 0.07 Oct 10 1.081946 Jan 1 1.901947 Dec 24 0.86 Dec 1 2.26
Page 1
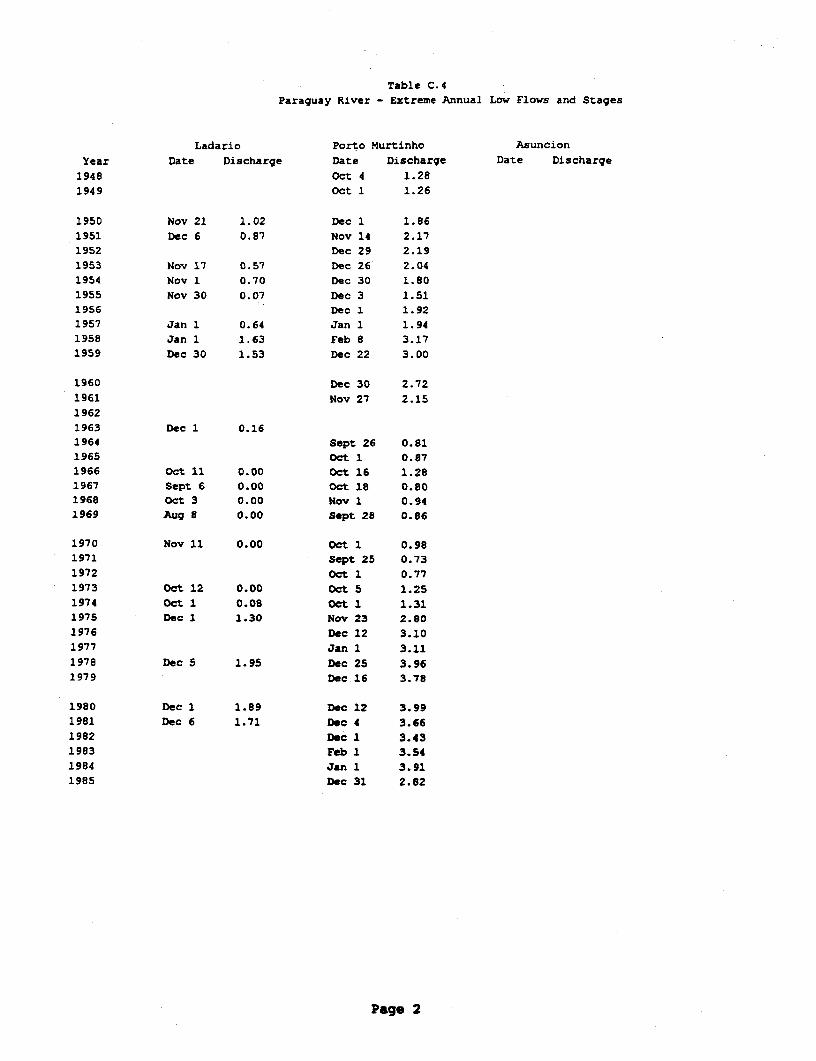
Table C.4
Paraguay River - Extreme Annual Low Flows and Stages
Ladario Porto Murtinho AsuncionYear Date Discharge Date Discharge Date Discharge
1948 Oct 4 1.281949 Oct 1 1.26
1950 Nov 21 1.02 Dec 1 1.86
1951 Dec 6 0.87 Nov 14 2.171952 Dec 29 2.19
1953 Nov 17 0.57 Dec 26 2.041954 Nov 1 0.70 Dec 30 1.80
1955 Nov 30 0.07 Dec 3 1.511956 Dec 1 1.921957 Jan 1 0.64 Jan 1 1.941958 Jan 1 1.63 Feb 8 3.171959 Dec 30 1.53 Dec 22 3.00
1960 Dec 30 2.721961 Nov 27 2.15
1962
1963 Dec 1 0.161964 Sept 26 0.811965 Oct 1 0.87
1966 Oct 11 0.00 Oct 16 1.281967 Sept 6 0.00 Oct 18 0.801968 Oct 3 0.00 Nov 1 0.941969 Aug 8 0.00 Sept 28 0.86
1970 Nov 11 0.00 Oct 1 0.981971 Sept 25 0.73
1972 Oct 1 0.77
1973 Oct 12 0.00 Oct 5 1.25
1974 Oct 1 0.08 Oct 1 1.311975 Dec 1 1.30 Nov 23 2.801976 Dec 12 3.10
1977 Jan 1 3.11
1978 Dec 5 1.95 Dec 25 3.961979 Dec 16 3.78
1980 Dec 1 1.89 Dec 12 3.991981 Dec 6 1.71 Dec 4 3.66
1982 Dec 1 3.431983 Feb 1 3.54
1984 Jan 1 3.911985 Dec 31 2.82
Page 2
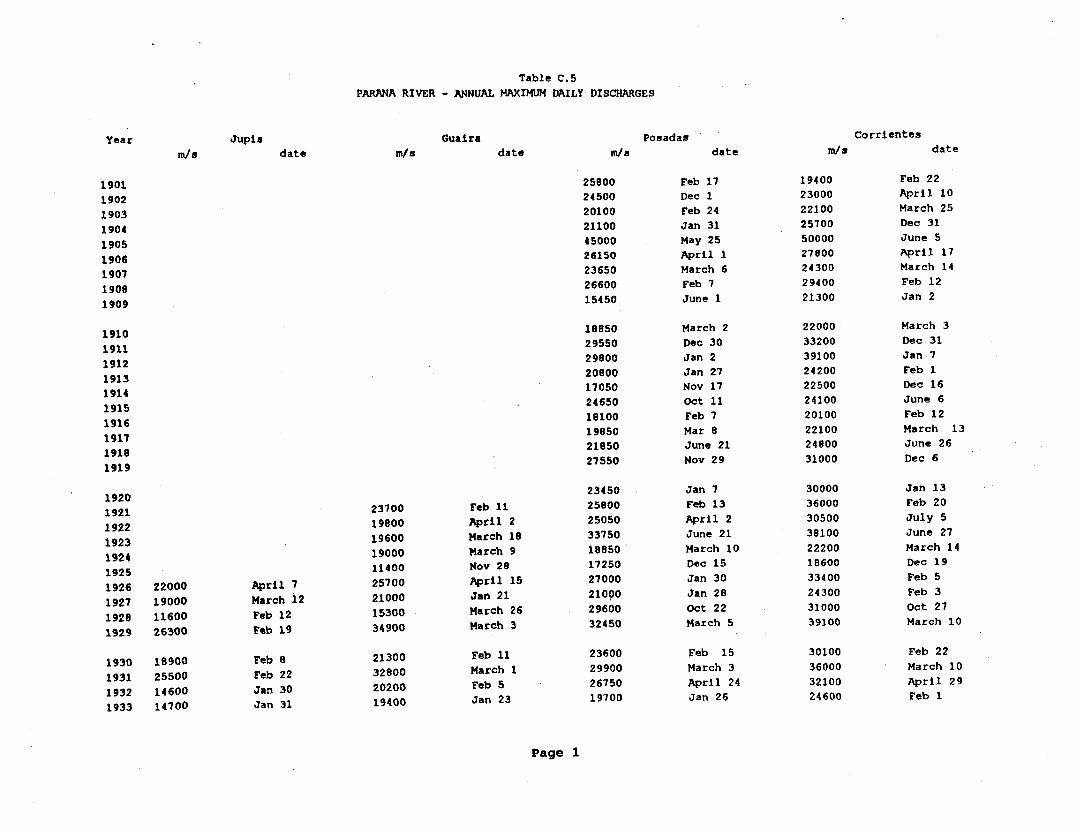
Table C.5PARANA RIVER - ANNUAL MAXIMUM DAILY DISCHARGES
Year Jupla Guaira Posadas Corrientesm/s date m/s date m/a date m/s date
1901 25800 Feb 17 19400 Feb 221902 24500 Dec 1 23000 April 101903 20100 Feb 24 22100 March 251904 21100 Jan 31 25700 Dec 311905 45000 May 25 50000 June 51906 26150 April 1 27800 April 171907 23650 March 6 24300 March 141908 26600 Feb 7 29400 Feb 121909 15450 June 1 21300 Jan 2
1910 18850 March 2 22000 March 31911 29550 Dec 30 33200 Dec 311912 29800 Jan 2 39100 Jan 71913 20800 Jan 27 24200 Feb 11914 17050 Nov 17 22500 Dec 161915 24650 Oct 11 24100 June 61916 18100 Feb 7 20100 Feb 121917 19850 Mar 8 22100 March 131919 21850 June 21 24800 June 261919 27550 Nov 29 31000 Dec 6
1920 23450 Jan 7 30000 Jan 131921 23700 Feb 11 25800 Feb 13 36000 Feb 201922 19800 April 2 25050 April 2 30500 July 51923 19600 March 18 33750 June 21 38100 June 271924 19000 March 9 18850 March 10 22200 March 141925 11400 Nov 28 17250 Dec 15 18600 Dec 191926 22000 April 7 25700 April 15 27000 Jan 30 33400 Feb 51927 19000 March 12 21000 Jan 21 21000 Jan 28 24300 Feb 31928 11600 Feb 12 15300 March 26 29600 Oct 22 31000 Oct 271929 26300 Feb 19 34900 March 3 32450 March 5 39100 March 10
1930 18900 Feb 8 21300 Feb 11 23600 Feb 15 30100 Feb 221931 25500 Feb 22 32800 March 1 29900 March 3 36000 March 101932 14600 Jan 30 20200 Feb 5 26750 April 24 32100 April 291933 14700 Jan 31 19400 Jan 23 19700 Jan 26 24600 Feb I
Page 1
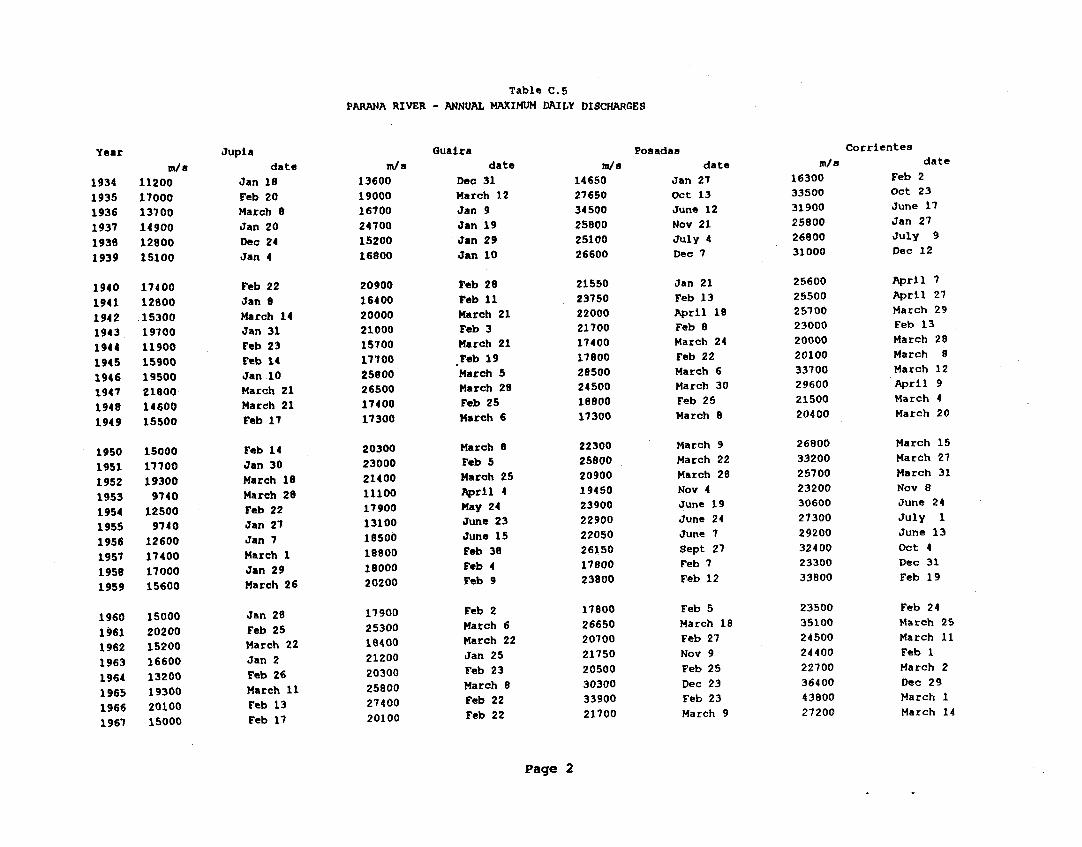
Table C.5PARANA RIVER - ANNUAL MAXIMUM DAILY DISCHARGES
Year Jupia Guaira
Posadas Corrientesm/a date m/a date e/ date r/s date
1934 11200 Jan 18 13600 Dec 31 14650 Jan 27 16300 Feb 21935 17000 Feb 20 19000 March 12 27650 Oct 13 33500 Oct 231936 13700 March 8 16700 Jan 9 34500 June 12 31900 June 171937 14900 Jan 20 24700 Jan 19 25800 Nov 21 25800 Jan 271938 12800 Dec 24 15200 Jan 29 25100 July 4 26800 July 91939 15100 Jan 4 16800 Jan 10 26600 Dec 7 31000 Dec 121940 17400 Feb 22 20900 Feb 28 21550 Jan 21 25600 April 71941 12800 Jan 8 16400 Feb 11 23750 Feb 13 25500 April 271942 15300 March 14 20000 March 21 22000 April 19 25700 March 291943 19700 Jan 31 21000 Feb 3 21700 Feb 8 23000 Feb 131944 11900 Feb 23 15700 March 21 17400 March 24 20000 March 281945 15900 Feb 14 17700 Feb 19 17800 Feb 22 20100 March 81946 19500 Jan 10 25900 March 5 28500 March 6 33700 March 121947 21800 March 21 26500 March 28 2i500 March 30 29600 April 91948 14600 March 21 17400 Feb 25 18800 Feb 25 21500 March 41949 15500 Feb 17 17300 March 6 17300 March 8 20400 March 201950 15000 Feb 14 20300 March 6 22300 March 9 26800 March 151951 17700 Jan 30 23000 Feb 5 25800 March 22 33200 March 271952 19300 March 18 21400 March 25 20900 March 28 25700 March 311953 9740 March 28 11100 Apr1l 4 19450 Nov 4 23200 Nov 81954 12500 Feb 22 17900 May 24 23900 June 19 30600 June 241955 9740 Jan 27 13100 June 23 22900 June 24 27300 July 11956 12600 Jan 7 1850o June 15 22050 June 7 29200 June 131957 17400 March 1 i18oo Feb 38 26150 Sept 27 32400 oct 41958 17000 Jan 29 18000 Feb 4 17800 Feb 7 23300 Dec 311959 15600 March 26 20200 Feb 9 23800 Feb 12 33800 Feb 191960 15000 Jan 28 17900 Feb 2 17800 Feb 5 23500 Feb 241961 20200 Feb 25 25300 March 6 26650 March 18 35100 March 251962 15200 March 22 18400 March 22 20700 Feb 27 24500 March 111963 16600 Jan 2 21200 Jan 25 21750 Nov 9 24400 Feb 11964 13200 Feb 26 20300 Feb 23 20500 Feb 25 22700 March 21965 19300 March 11 25800 March 8 30300 Dec 23 36400 Dec 291966 20100 Feb 13 27400 Feb 22 33900 Feb 23 43800 March l1967 15000 Feb 17 20100 Feb 22 21700 March 9 27200 March 14
Page 2
Table C.5
PARANA RIVER - ANNUAL MAXIMUM DAILY DISCHARGES
Year Jupia Guaira Posadas Corrientes
rn/a date m/s date m/s date m/s date
1968 11600 March 3 18300 Jan 23 18800 Jan 39 21300 Feb 3
1969 8680 Nov 19 13900 Nov 24 23100 Jan 1 23500 Jan 16
1970 14800 March 3 17100 March 7 17100 March 12 19600 March 19
1971 11500 Dec 12 16800 Jan 10 23450 Jan 3 27200 Jan 19
1972 12400 Dec 12 20000 Oct 17 24600 Oct 10 29800 Dec 11
1973 13400 April 6 22130 Jan 28 25050 Jan 31 29900 Feb 9
1974 18soo March 26 22880 April 2 23500 Jan 27 30400 Feb 2
1975 11000 Jan 9 16250 Jan 6 22850 Dec 11 26600 Dec 17
1976 14100 Dec 17 19770 Dec 31 21050 June 10 24400 June 17
1977 21270 Feb 6 28250 Feb'13 28000 Feb 15 36700 Feb 21
1978 l8830 Jan 1 19890 Jan 29 19700 Jan 31 25000 Feb 5
1979 15180 Jan 29 17400 Feb 27 25500 May 17 29800 May 23
1980 19000 Jan 31 26380 March 7 26850 March 8 34100 March 15
1981 13070 Dec 21 21250 Dec 29 25900 Dec 30 31000 Feb 5
1982 21220 March 27 27190 Dec 1 31350 Dec 5 42600 Dec 11
1983 28160 Feb 12 39850 June 15 43330 July 12 54700 July 18
1984 16080 Jan 7 19840 Aug 9 23100 Jan 6 28800 Jan 19
1985 16040 Feb 15 19550 Feb 18 21750 Feb 19 28300 Feb 23
1986 7920 April 3 15140 May 21 21000 May 22 27200 May 28
1987 7350 Jan 1 21310 May 23 34500 May 23 38900 May 30
1988 13970 March 10 17020 March 14 23450 May 27 26900 June 3
1989 12520 Feb 19 31250 Sept 16 35200 Sept 23
1990 16040 Jan 9 34180 Jan 19 37500 Jan 25 43800 Feb 1
1991 22380 Jan 13 21390 April 11 22800 April 14 27500 April 22
1992 16680 May 6 22520 May 9 41850 June 25 50800 June 8
Page 3

I
Table C.6
PARAGUAY RIVER - ANNUAL MAXIMUM DAILY STAGES AND DISCHARGES
Year Ladario Porto Murtinho Asuncion
m date m date m W/s date
1900 4.32 June 25
1901 4.39 June 10
1902 5.00 June 4
1903 2.71 May 16
1904 5.00 June 3 6.40 6320 Dec 11
1905 6.62 May 11 8.80 11170 June 23
1906 5.61 May 6 5.38 4980 Jan 1
1907 3.69 July 13 3.60 3320 Dec 31
1908 3.69 July 23 5.96 5730 March 21
1909 2.77 May 27 5.31 4900 Jan 1
1910 2.00 March 23 3.31 3110 March 19
1911 2.17 June 21 7.00 7280 Dec 31
1912 5.10 June 17 7.30 7820 Jan 15
1913 6.39 April 8 7.08 7420 May 15
1914 3.57 July 10 5.84 5540 Nov 30
1915 1.51 April 12 4.84 4400 June 9
1916 3.26 July 25 4.85 4410 Feb 20
1917 5.13 June 18 3.89 3550 Oct 16
1918 3.45 July 22 5.40 5010 June 18
1919 3.00 July 8 7.78 8770 June 13
1920 6.37 May .12 6.14 5950 Dec 6
1921 6.07 April 7 6.02 5780 July 18
1922 4.26 June 12 5.99 5740 Jul 30
1923 5.50 June 14 5.85 5560 Nov 19
1924 3.41 July 4 3.57 3300 Jan 1
1925 2.30 July 20 4.94 4500 May 13
1926 5.47 June 18 4.85 4410 May 28
1927 4.07 July 2 3.42 3190 May 5
1928 2.87 July 9 5.46 5080 June 17
1929 5.31 June 4 4.35 3940 Oct 16
1930 5.20 June 6 4.80 4360 Feb 17
1931 5.50 June 3 7.52 8240 July 1
1932 5.98 May 27 5.91 5630 July 4
1933 5.11 May 16 4.96 4520 Feb 1
Page 1
Table C.6PARAGUAY RIVER - ANNUAL MAXIMUM DAILY STAGES AND DIScHARGEs
Year Ladario Porto Murtinho
Asuncionm date m date m m/s date1934 3.99 July 1
2.87 2800 May 121935 5.74 June 11
5.03 4600 Aug 231936 2.25 June 12
5.04 4610 June 211937 2.43 July 12
3.52 3260 May 211938 1.60 June 9
3.26 3070 Feb 181939 2.01 June 16 3.16 June 6 4.60 4170 June 141940 5.03 June 12 6.49 May 25 6.36 6260 June 101941 1.96 May 28 3.94 April 1 4.50 4080 April 231942 5.25 June 28 6.06 Oct 5 5.06 4630 June 221943 5.03 June 23 5.46 Aug 12 5.07 4640 Nov 281944 2.05 June 13 3.98 May 25 3.11 2970 Jan 11945 5.24 June 19 5.64 Aug 24 3.02 2900 Sept 131946 4.15 July 15 5.79 July 21 6.50 6470 June 11947 4.57 July a 6.04 May 24 5.43 5040 June 31948 1.92 June 26 2.78 June 19 1.48 1910 May 31949 5.32 May 3 5.83 Auq 13 3.61 3330 July 11950 5.07 June 8 5.65 Aug 19 4.12 3740 April 221951 4.15 June 26 4.90 March 24 5.27 4860 June 61952 4.64 July 3 5.49 May 26 4.52 4100 June 111953 2.86 July 1 4.27 June 17 4.87 4430 June 61954 4.42 July 14 4.96 June 4 6.38 6290 June 181955 2.64 July a 3.66 July 12 3.01 2890 July 151956 4.30 August 3 6.16 Sept 21 6.45 6400 May 171957 4.19 July 22 5.60 Aug 10 5.45 5060 April 111958 5.01 June 25 6.20 Oct 1 6.02 5780 oct 231959 5.91 May 9 7.75 Aug 5 5.80 5500 Oct 171960 4.92 May 25 5.42 June 29 5.20 4780 Jan 11961 4.34 June 21 6.20 July 1 6.05 5820 May 201962 2.25 June 10
2.28 2420 May 281963 4.47 June 19
4.09 3710 June 271964 1.33 April 1 2.60 April 17 4.40 3980 May 21965 2.74 April 8 4.80 May 22 6.77 6900 June 11966 2.48 May 22 4.66 April 9 4.85 4410 Jan 261967 1.63 April 24 3.06 March 14 2.62 2640 April 1
Page 2
Table C.6PARAGUAY RIVER - ANNUAL MAXIMUM DAILY STAGES AND DISCHARGES
Year Ladario. Porto Murtinho Asuncionm date m date m m/e date
1969 2.05 June 6 4.36 Jan 30 2.34 2450 Feb 21969 1.80 May 31 3.82 May 9 4.50 4080 May 12
1970 2.13 June 16 2.96 July 11 1.60 19801971 1.11 May 4 2.77 May 11 6.35 6250 Jan 281972 1.97 May 25 3.18 May 12 3.96 3610 June 171973 2.09 June 19 4.86 Dec 31 3.33 3120 Jan 81974 5.46 June 5 6.87 Aug 15 4.98 4550 Feb 81975 4.33 June 16 4.98 Aug 13 4.20 3810 Dec 141976 4.95 June 22 5.59 May 29 3.65 3360 June 101977 5.52 April 20 6.97 July 29 4.74 4300 Jan 311979 5.36 May 2 6.41 July 20 3.75 3440 May 311979 6.25 April 1 9.15 June 6 7.17 7580 June 14
1980 6.14 April 18 8.54 July 1 6.53 6520 July 101981 5.46 May 19 6.64 July 16 4.40 3980 Jan 11982 6.52 April 21 9.71 June 29 7.76 8730 July 291983 5.36 May 10 9.08 May 29 9.01 11740 May 291994 5.07 June 1 5.95 July 20 5.55 5180 May 121985 9.20 June 7 6.95 7200 June 71986 4.69 4260 June 101997 5.90 5620 June 61988 7.65 8500 June 101989 6.42 6350 Sept 25
1990 5.75 5430 June 221991 5.49 6.64 June 31 4.73 4290 July 8
1992 5.38 7.90 8.55 10530 June 1
Page 3

I
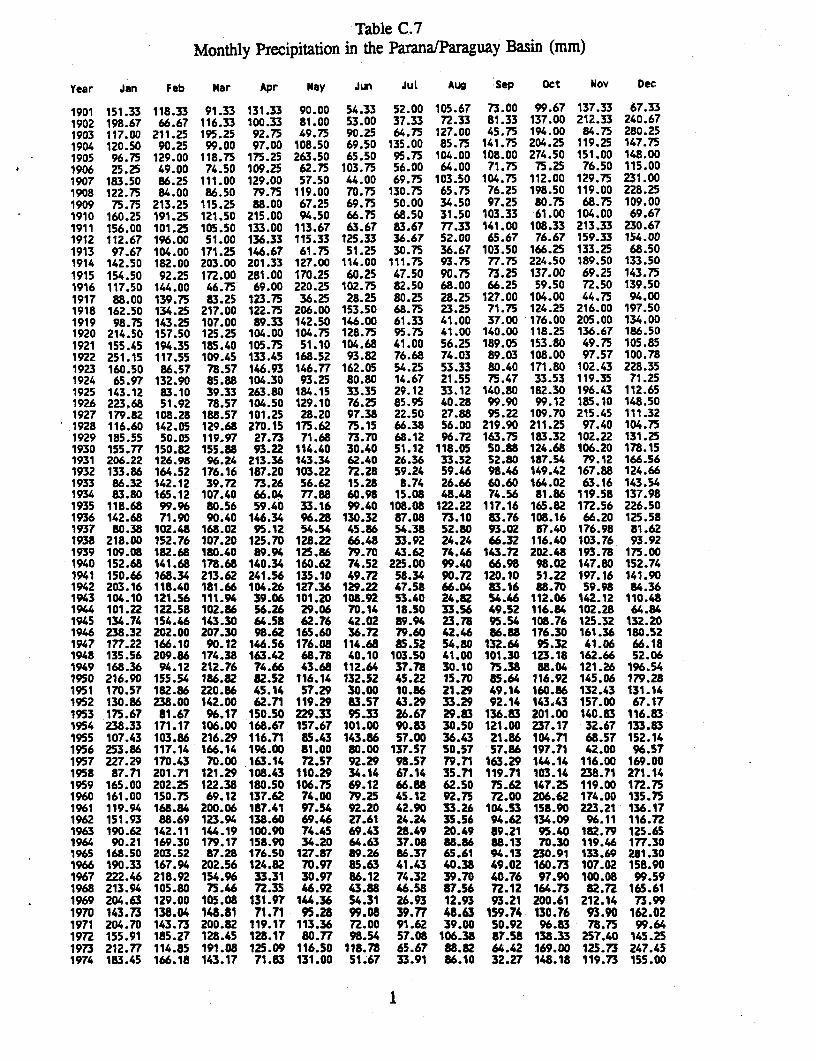
Table C.7Monthly Precipitation in the ParanafParaguay Basin (mm)
Year Jan Feb Mar Apr May Jun JuL Aug Sep Oct Nov Dec
1901 151.33 118.33 91.33 131.33 90.00 54.33 52.00 105.67 73.00 99.67 137.33 67.331902 198.67 66.67 116.33 100.33 81.00 53.00 37.33 72.33 81.33 137.00 212.33 240.671903 117.00 211.25 195.25 92.75 49.75 90.25 64.75 127.00 45.75 194.00 84.75 280.251904 120.50 90.25 99.00 97.00 108.50 69.50 135.00 85.75 141.75 204.25 119.25 147.751905 96.75 129.00 118.75 175.25 263.50 65.50 95.75 104.00 108.00 274.50 151.00 148.001906 25.25 49.00 74.50 109.25 62.75 103.75 56.00 64.00 71.75 75.25 76.50 115.001907 183.50 86.25 111.00 129.00 57.50 44.00 69.75 103.50 104.75 112.00 129.75 231.001908 122.75 84.00 86.50 79.75 119.00 70.75 130.75 65.75 76.25 198.50 119.00 228.251909 75.75 213.25 115.25 88.00 67.25 69.75 50.00 34.50 97.25 80.75 68.75 109.001910 160.25 191.25 121.50 215.00 94.50 66.75 68.50 31.50 103.33 61.00 104.00 69.671911 156.00 101.25 105.50 133.00 113.67 63.67 83.67 77.33 141.00 108.33 213.33 230.671912 112.67 196.00 51.00 136.33 115.33 125.33 36.67 52.00 65.67 76.67 159.33 154.001913 97.67 104.00 171.25 146.67 61.75 51.25 30.75 36.67 103.50 166.25 133.25 68.501914 142.50 182.00 203.00 201.33 127.00 114.00 111.75 93.75 77.75 224.50 189.50 133.501915 154.50 92.25 172.00 281.00 170.25 60.25 47.50 90.75 73.25 137.00 69.25 143.751916 117.50 144.00 46.75 69.00 220.25 102.75 82.50 68.00 66.25 59.50 72.50 139.501917 8.00 139.75 83.25 123.75 36.25 28.25 80.25 28.25 127.00 104.00 44.75 94.001918 162.50 134.25 217.00 122.75 206.00 153.50 68.75 23.25 71.75 124.25 216.00 197.501919 98.75 143.25 107.00 89.33 142.50 146.00 61.33 41.00 37.00 176.00 205.00 134.001920 214.50 157.50 125.25 104.00 104.75 128.75 95.75 41.00 140.00 118.25 136.67 186.501921 155.45 194.35 185.40 105.75 51.10 104.68 41.00 56.25 189.05 153.80 49.75 105.851922 251.15 117.55 109.45 133.45 168.52 93.82 76.68 74.03 89.03 108.00 97.57 100.781923 160.50 86.57 78.57 146.93 146.77 162.05 54.25 53.33 80.40 171.80 102.43 228.351924 65.97 132.90 85.88 104.30 93.25 80.80 14.67 21.55 75.47 33.53 119.35 71.251925 143.12 83.10 39.33 263.80 184.15 33.35 29.12 33.12 140.80 182.30 196.43 112.651926 223.68 51.92 78.57 104.50 129.10 76.25 85.95 40.28 99.90 99.12 185.10 148.501927 179.82 108.28 188.57 101.25 28.20 97.38 22.50 27.88 95.22 109.70 215.45 111.321928 116.60 142.05 129.68 270.15 175.62 75.15 66.38 56.00 219.90 211.25 97.40 104.751929 185.55 50.05 119.97 27.73 71.68 73.70 68.12 96.72 163.75 183.32 102.22 131.251930 155.77 150.82 155.88 93.22 114.40 30.40 51.12 118.05 50.88 124.68 106.20 178.151931 206.22 126.98 96.24 213.36 143.34 62.40 26.36 33.52 52.80 187.54 79.12 166.561932 133.86 164.52 176.16 187.20 103.22 72.28 59.24 59.46 98.46 149.42 167.88 124.661933 86.32 142.12 39.72 73.26 56.62 15.28 8.74 26.66 60.60 164.02 63.16 143.541934 83.80 165.12 107.40 66.04 77.88 60.98 15.08 48.48 74.56 81.86 119.58 137.981935 118.68 99.96 80.56 59.40 33.16 99.40 108.08 122.22 117.16 165.82 172.56 226.501936 142.68 71.90 90.40 146.34 96.28 130.32 87.08 73.10 83.76 108.16 66.20 125.581937 80.38 102.48 168.02 95.12 54.54 45.86 54.38 52.80 93.02 87.40 176.98 81.621938 218.00 152.76 107.20 125.70 128.22 66.48 33.92 24.24 66.32 116.40 103.76 93.921939 109.08 182.68 180.40 89.94 125.86 79.70 43.62 74.46 143.72 202.48 193.78 175.001940 152.68 141.68 178.68 140.34 160.62 74.52 225.00 99.40 66.98 98.02 147.80 152.741941 150.66 168.34 213.62 241.56 135.10 49.72 58.34 90.72 120.10 51.22 197.16 141.901942 203.16 118.40 181.66 104.26 127.36 129.22 47.58 66.04 83.16 88.70 59.98 84.361943 104.10 121.56 111.94 39.06 101.20 108.92 53.40 24.82 54.46 112.06 142.12 110.481944 101.22 122.58 102.86 56.26 29.06 70.14 18.50 33.56 49.52 116.84 102.28 64.841945 134.74 154.46 143.30 64.58 62.76 42.02 89.94 23.78 95.54 108.76 125.32 132.201946 238.32 202.00 207.30 98.62 165.60 36.72 79.60 42.46 86.88 176.30 161.36 180.521947 177.22 166.10 90.12 146.56 176.08 114.68 85.52 54.80 132.64 95.32 41.06 66.181948 135.56 209.86 174.38 163.42 68.78 40.10 103.50 41.00 101.30 123.18 162.66 52.061949 168.36 94.12 212.76 74.66 43.68 112.64 37.78 30.10 75.38 88.04 121.26 196.541950 216.90 155.54 186.82 82.52 116.14 132.52 45.22 15.70 85.64 116.92 145.06 179.281951 170.57 182.86 220.86 45.14 57.29 30.00 10.86 21.29 49.14 160.86 132.43 131.141952 130.86 238.00 142.00 62.71 119.29 83.57 43.29 33.29 92.14 143.43 157.00 67.171953 175.67 81.67 96.17 150.50 229.33 95.33 26.67 29.83 136.83 201.00 140.83 116.831954 238.33 171.17 106.00 168.67 157.67 101.00 90.83 30.50 121.00 237.17 32.67 133.831955 107.43 103.86 216.29 116.71 85.43 143.86 57.00 36.43 21.86 104.71 68.57 152.141956 253.86 117.14 166.14 196.Q0 81.00 80.00 137.57 50.57 57.86 197.71 42.00 96.571957 227.29 170.43 70.00 163.14 72.S7 92.29 98.57 79.71 163.29 144.14 116.00 169.001958 87.71 201.71 121.29 108.43 110.29 34.14 67.14 35.71 119.71 103.14 238.71 271.141959 165.00 202.25 122.38 180.50 106.75 69.12 66.88 62.50 75.62 147.25 119.00 172.751960 161.00 150.75 69.12 137.62 74.00 79.25 45.12 92.75 72.00 206.62 174.00 135.751961 119.94 168.84 200.06 187.41 97.54 92.20 42.90 33.26 104.53 158.90 223.21 136.171962 151.93 88.69 123.94 138.60 69.46 27.61 24.24 35.56 94.62 134.09 96.11 116.721963 190.62 142.11 144.19 100.90 74.45 69.43 28.49 20.49 89.21 95.40 182.79 125.651964 90.21 169.30 179.17 158.90 34.20 64.63 37.08 8.86 88.13 70.30 119.46 177.301965 168.50 203.S2 87.28 176.50 127.87 89.26 86.37 65.61 94.13 230.91 133.69 281.301966 190.33 167.94 202.56 124.82 70.97 85.63 41.43 40.38 49.02 160.73 107.02 158.901967 222.46 218.92 154.96 33.31 30.97 86.12 74.32 39.70 40.76 97.90 100.08 99.591968 213.94 105.80 75.46 72.35 46.92 43.U 46.58 87.56 72.12 164.73 82.72 165.611969 204.63 129.00 105.08 131.97 144.36 54.31 26.93 12.93 93.21 200.61 212.14 73.991970 143.73 138.04 148.81 71.71 95.28 99.08 39.77 48.63 159.74 130.76 93.90 162.021971 204.70 143.73 200.82 119.17 113.36 72.00 91.62 39.00 50.92 96.83 78.75 99.641972 155.91 185.27 128.45 128.17 80.77 98.54 57.08 106.38 87.58 138.33 257.40 145.251973 212.77 114.85 191.08 125.09 116.50 118.78 65.67 88.82 64.42 169.00 125.73 247.451974 183.45 166.18 143.17 71.83 131.00 51.67 33.91 86.10 32.27 148.18 119.73 155.Q0
1
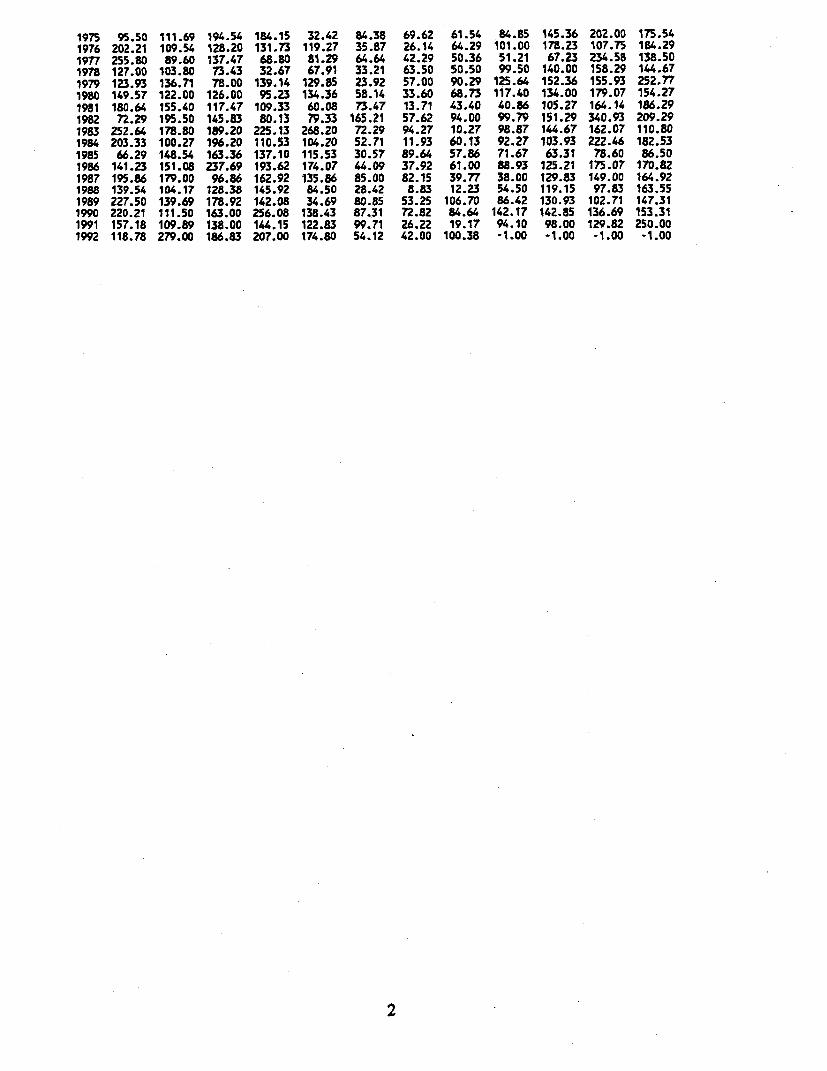
1975 95.50 111.69 194.54 184.15 32.42 84.38 69.62 61.54 84.85 145.36 202.00 175.541976 202.21 109.54 128.20 131.73 119.27 35.87 26.14 64.29 101.00 178.23 107.75 1K4.291977 255.80 89.60 137.47 68.80 81.29 64.64 42.29 50.36 51.21 67.23 234.58 138.501978 127.00 103.80 73.43 32.67 67.91 33.21 63.50 50.50 99.50 140.00 158.29 144.671979 123.93 136.71 78.00 139.14 129.85 23.92 57.00 90.29 125.64 152.36 155.93 252.771980 149.57 122.00 126.00 95.23 134.36 58.14 33.60 68.73 117.40 134.00 179.07 154.271981 180.64 155.40 117.47 109.33 60.08 73.47 13.71 43.40 40.86 105.27 164.14 186.291982 72.29 195.50 145.83 80.13 79.33 165.21 57.62 94.00 99.79 151.29 340.93 209.291983 252.64 178.80 189.20 225.13 268.20 72.29 94.27 10.27 98.87 144.67 162.07 110.801984 203.33 100.27 196.20 110.53 104.20 52.71 11.93 60.13 92.27 103.93 222.4 182.531985 66.29 148.54 163.36 137.10 115.53 30.57 89.64 57.86 71.67 63.31 78.60 86.501986 141.23 151.08 237.69 193.62 174.07 44.09 37.92 61.00 88.93 125.21 175.07 170.821987 195.86 179.00 96.86 162.92 135.86 85.00 82.15 39.77 38.00 129.83 149.00 164.921988 139.54 104.17 128.38 145.92 84.50 28.42 8.83 12.23 54.50 119.15 97.83 163.551989 227.50 139.69 178.92 142.08 34.69 80.85 53.25 106.70 86.42 130.93 102.71 147.311990 220.21 111.50 163.00 256.08 138.43 87.31 72.82 84.64 142.17 142.85 136.69 153.311991 157.18 109.89 138.00 144.15 122.83 99.71 26.22 19.17 94.10 98.00 129.82 250.001992 118.78 279.00 186.83 207.00 174.80 54.12 42.00 100.38 -1.00 -1.00 -1.00 -1.00
2