Embed Size (px)
Citation preview
Pertanika J. Soc. Sci. & Hum. 3(2): 113-1 18 (1995) ISS : 0 I28-7702© Universiti Pertanian Malaysia Press
An Analysis of Teaching Behaviours of Preschool StudentTeachers in a Laboratory School Setting
ZULKIFLI A. MANAFDepartment of Pedagogy and Educational Psychology
Faculty of EducationUniversiti Malaya
59100 Kuala Lumpur, Malaysia
Keywords: student teachers, teaching behaviours, laboratory school, observation
rating scales, factor analysis
ABSTRAK
Dalam kajian ini skala pemeringkatan terhadap sembilan dimensi tingkah laku mengajar 112 guru pelatihprasekolah yang telah dikenalpasti dalam kajian awal dianalisis semula dengan kaedah anaJisis faktortinjauan. Tingkah laku mengajar dicerap dan direkodkan dengan alat pengukuran 'Observer Rating Scales'.Satu pola tingkah laku dapat dikenalpasti. Empat pembolehubah terpendam didapati mendasari sembilandimensi tingkah laku mengajar yang dicerap. Pembolehubah-pembolehubah Ini adalah: (1) 'facilitating' (2)'interpersonal' (3) 'interactive' dan (4) 'flexible'. Pembolehubah terpendam atau faktor ini berkorelasisecara positif di antara satu dengan lain. Curu peJatih prasekolah dalam kajian ini didapati memperlihatkantingkah laku mengajar tersebut dalam situasi sekolah makmal. Saranan untuk kajian lanjutan untukmenentusahkan dapatan ini dengan menggunakan analisis faktor pengesahan dibentangkan. Maklumat darikajian ini diharap berguna sebagai panduan bagi pendidik guru dalam penyediaan guru pra-sekolah.
ABSTRACT
In this study, the rating of nine dimensions of teaching behaviours of 112 preschool student teachers froma previous study was analysed using exploratory factor analysis. The teaching behaviours were observed andrecorded using the observer rating scales. A pattern of behaviours was observed. Four latent variables werefound to underlie the nine teaching behaviours. These are: (1) facilitating (2) interpersonal (3) interactiveand (4) flexible. These latent variables are correlated with each other. Preschool student teachers in thestudy exhibited these teaching behaviours in their teaching performance in a laboratory school setting.Recommendations for future research to confirm the teaching behaviour model employing confirmatoryfactor analysis are presented. The findings of this study could hopefully serve as a useful guide for teachereducators in the preparation of preschool and early childhood teachers.
INTRODUCTION
Data from a previous study (Briggs andDickerscheid 1985) were re-analysed using thefactor analysis options on SAS. The data camefrom the ratings of teaching behaviours of 112preschool student teachers using the observerrating scales (ORS) , a 6-point rating scale with avalue of 1 as low and 6 as high (McDaniel et al.1974). This study was done concurrently in thelaboratory schools of two higher educationinstitutions in the Midwest USA. The observerrating scales have a "relatively high degree ofconstruct validity" and the inter-rater reliability
has been estimated to be .83 (Briggs andDickerscheid 1985: 59).
The student teachers were observed forapproximately 30 minutes. Their performancewas rated by trained observers in classroomsettings. All observations occurred during "freeplay" situations in which several classroomactivities were occurring simultaneously andchildren were moving freely from one activity toanother according to their interests.
The student teachers were rated on ninedimensions of teaching behaviours: warmth,enthusiasm, clarity, variety, individualization,
Zulkifli A. Manaf
feedback, cognitive demand, freedom, and ontask activity.
Definitions of the nine behaviour dimensions(Briggs and Dickerscheid 1985) are as follows:1. Warmth - the extent to which the teacher is
relaxed and comfortable; the degree towhich the teacher maintains positiveinterpersonal relationships with children.
2. Enthusiasm - the enthusiasm or interest levelexpressed by the teacher and children duringnursery school activities.
3. Clarity - the clarity of communication,instructions and expectations conveyed tothe children.
4. Variety - the extent to which the teacheruses a variety of materials and activities.
5. Individualization - the degree to which theteacher provides children with differentlevels of work suited to their particular needs,interests, and abilities, and the amount ofindividual assistance provided.
6. Feedback - the extent of communication tothe children of information about theadequacy, acceptability, completeness orcorrectness of his or her response.
7. Cognitive Demand - the level of intellectualactivity the teacher expects from thechildren.
8. Freedom - the degree to which the teacherprovides arrangements which facilitateindependence and individual freedom.
9. On-task Activity - the amount of child activitydirected toward the accomplishment ofinstructional objectives.The inter - relationship between the nine
teaching behaviours of the preschool teacherswas determined and the inference of thefindings was made to the population ofpreschool teachers from which the sample wasdrawn. As mentioned earlier, this study wasbased on secondary data: it was not intendedto relate the findings to the original article.Though factor analysis was used in the originalstudy, different statistical software was used.Furthermore, only two factors were extractedin the original study. The only material thatwas utilized from the Briggs and Dickerscheid(1985) study was the published correlationmatrix of the ratings on the nine teachingbehaviours of the preschool student teachers.The emphasis of this paper is not only theinterpretations of the data; equal importance isplaced on creating awareness among readers of
the importance of selecting an appropriatecomputer program and considering issues inmethodology when using factor analysis as astatistical technique.
METHOD
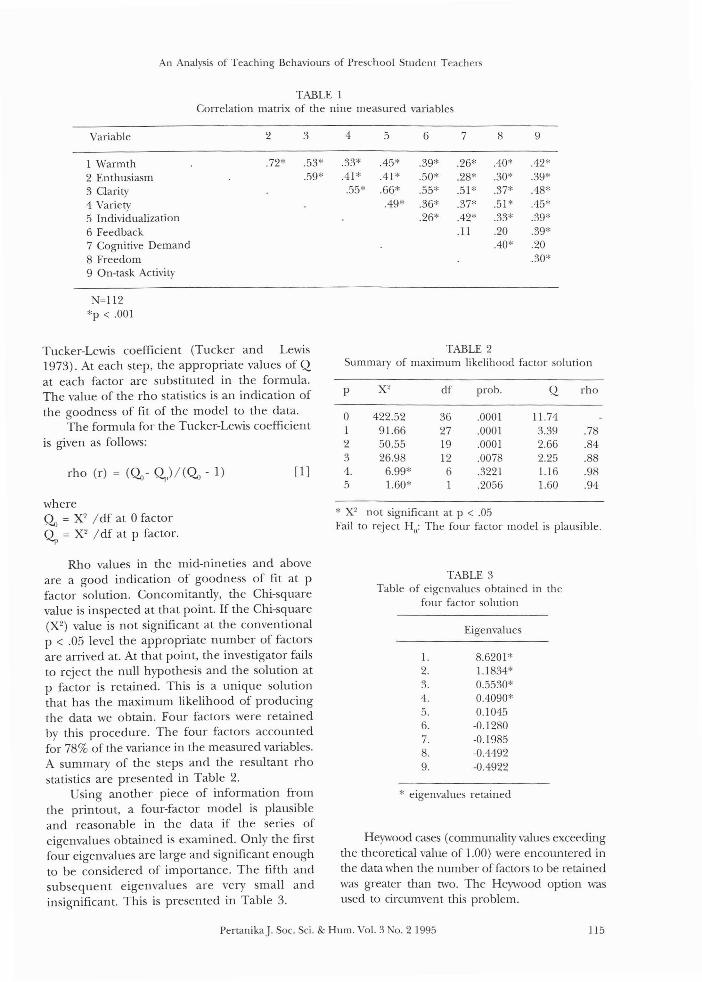
The exploratory factor analysis technique wasused to analyse the data as the investigator didnot have any prior theories on the relationshipbetween these teaching behaviours. The rawdata from the ratings of 112 student teachers onnine measured variables were first reduced to a9 x 9 correlation matrix. The upper triangularmatrix without the diagonal was used. Thecorrelation matrix showing the relationship ofthe measured variables is presented in Table 1.
Assuming that the common factor modelholds, a maximum likelihood method of factorextraction was performed on the data set, basedon the assumption that for m measured variables(MVs) there exists p latent variables (LVs) orfactors that account for the variation andcovariation in the measured variables. Anothercondition that needs to be satisfied is that p<m.
The Statistical Analysis System (SAS)program was used for the analysis due to itssuperior attributes in factor analysis proceduresand options (MacCallum 1983). The maximumlikelihood method of factor analysis was chosenbecause the investigator was not only providinga description of the relationship between thevariables but also recognizing that the data camefrom a population. Maximum likelihoodestimation provides information on whether thedata could have come from a population wherethe common factor model also holds. This wasdone through hypotheses testing at each step ofthe maximum likelihood factor extractionmethod.
Starting with zero factors, that is the variablesare not correlated in the population, the nullhypothesis is that there is zero common factoragainst an alternative hypothesis that there is atleast one common factor in the measuredvariables. At each step, the Q value at p factorhypothesized was calculated. The value of Q isobtained by dividing the Chi-square (X2) by therespective degree of freedom at p factor. TheChi-square (X2
) value at each step is significantand the null hypothesis is rejected at most stepsdue to the power of the test enhanced by thelarge sample size involved. This problem iscircumvented by using the rho statistics of the
114 PertanikaJ. Soc. Sci. & Hum. Vol. 3 No.2 1995
An Analysis of Teaching Behaviours of Preschool Student Teachers
TABLE 1Correlation matrix of the nine measured variables
2 3 4 5 6 7 8 9
.72* .53* .33* .45* .39* .26* .40* .42*.59* .41 * .41* .50* .28* .30* .39*
.55* .66* .55* .51* .37* .48*.49* .36* .37* .51* .45*
.26* .42* .33* .39*.11 .20 .39*
.40* .20.30*
1 Warmth2 En th usiasm3 Clarity4 Variety5 Individualization6 Feedback7 Cognitive Demand8 Freedom9 On-task Activity
Variable
N=1l2*p < .001
Tucker-Ley,,js coefficient (Tucker and Lewis1973). At each step, the appropriate values of Qat each factor are substituted in the formula.The value of the rho statistics is an indication ofthe goodness of fit of the model to the data.
The formula for the Tucker-LeMs coefficientis given as follows:
rho (I') = (~- ~)/(~ - 1)
where~ = X2 Idf at afactor~ = X2 I df at p factor.
[1]
TABLE 2Summary of maximum likelihood factor solution
p X2 df prob. Q rho
0 422.52 36 .0001 11.741 91.66 27 .0001 3.39 .782 50.55 19 .0001 2.66 .843 26.98 12 .0078 2.25 .884. 6.99* 6 .3221 1.16 .985 1.60* 1 .2056 1.60 .94
* X2 not significant at p < .05Fail to reject Ho: The four factor model is plausible.
Rho values in the mid-nineties and aboveare a good indication of goodness of fit at pfactor solution. Concomitantly, the Chi-squarevalue is inspected at that point. If the Chi-square(X2) value is not significant at the conventionalp < .05 level the appropriate number of factorsare arrived at. At that point, the investigator failsto reject the null hypothesis and the solution atp factor is retained. This is a unique solutionthat has the maximum likelihood of producingthe data we obtain. Four factors were retainedby this procedure. The four factors accountedfor 78% of the variance in the measured variables.A summary of the steps and the resultant rhostatistics are presented in Table 2.
Using another piece of information fromthe printout, a four-factor model is plausibleand reasonable in the data if the series ofeigenvalues obtained is examined. Only the firstfour eigenvalues are large and significant enoughto be considered of importance. The fifth andsubsequent eigenvalues are very small andinsignificant. This is presented in Table 3.
TABLE 3Table of eigenvalues obtained in the
four factor solution
Eigenvalues
1. 8.6201*2. 1.1834*3. 0.5530"4. 0.4090*5. 0.10456. -0.12807. -0.19858. -0.44929. -0.4922
* eigenvalues retained
Heywood cases (communality values exceedingthe theoretical value of 1.00) were encountered inthe data when the number of factors to be retainedwas greater than two. The Heywood option wasused to circumvent this problem.
PertanikaJ. Soc. Sci. & Hum. Vol. 3 No.2 1995 115
Zulkifli A. Manaf
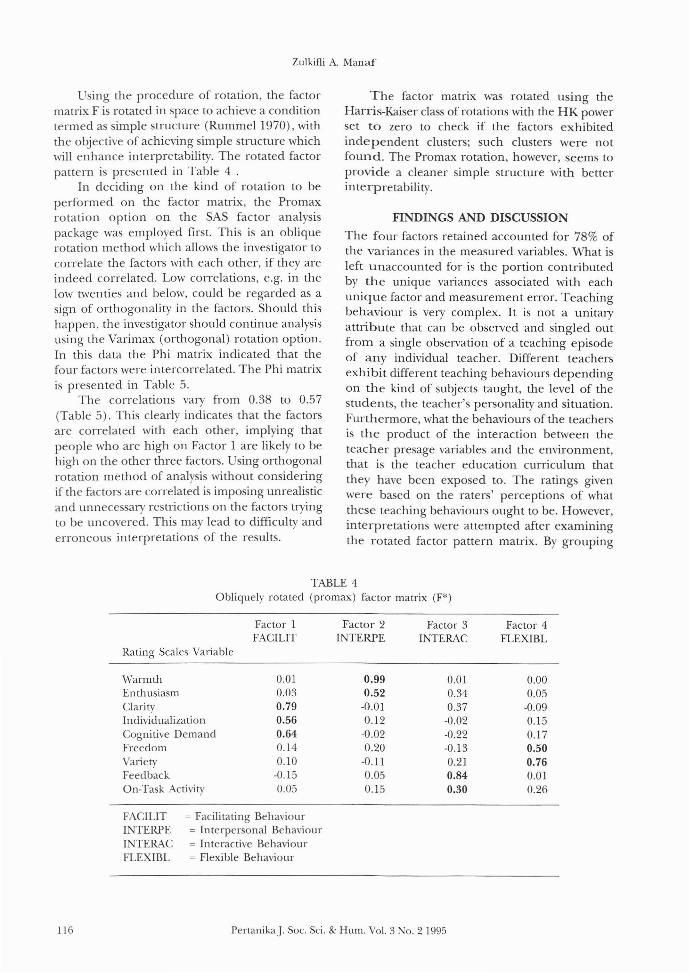
Using the procedure of rotation, the factormatrix F is rotated in space to achieve a conditiontermed as simple structure (Rummel 1970), withthe objective of achieving simple structure whichwill enhance interpretability. The rotated factorpattern is presented in Table 4 .
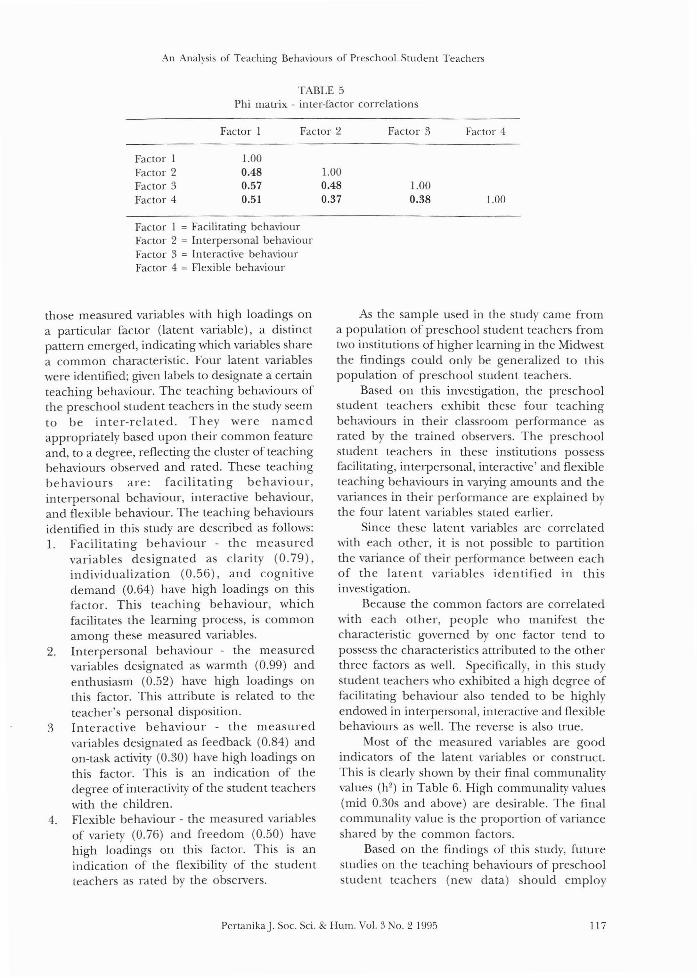
In deciding on the kind of rotation to beperformed on the factor matrix, the Promaxrotation option on the SAS factor analysispackage was employed first. This is an obliquerotation method which allows the investigator tocorrelate the factors with each other, if they areindeed correlated. Low correlations, e.g. in thelow twenties and below, could be regarded as asign of orthogonality in the factors. Should thishappen, the investigator should continue analysisusing the Varimax (orthogonal) rotation option.In this data the Phi matrix indicated that thefour factors were intercorrelated. The Phi matrixis presented in Table 5.
The correlations vary from 0.38 to 0.57(Table 5). This clearly indicates that the factorsare correlated with each other, implying thatpeople who are high on Factor 1 are likely to behigh on the other three factors. Using orthogonalrotation method of analysis without consideringif the factors are correlated is imposing unrealisticand unnecessary restrictions on the factors tryingto be uncovered. This may lead to difficulty anderroneous interpretations of the results.
The factor matrix was rotated using theHarris-Kaiser class of rotations with the HK powerset to zero to check if the factors exhibitedindependent clusters; such clusters were notfound. The Promax rotation, however, seems toprovide a cleaner simple structure with betterinterpretability.
FINDINGS AND DISCUSSION
The four factors retained accounted for 78% ofthe variances in the measured variables. What isleft unaccounted for is the portion contributedby the unique variances associated with eachunique factor and measurement error. Teachingbehaviour is very complex. It is not a unitaryattribute that can be observed and singled outfrom a single observation of a teaching episodeof any individual teacher. Different teachersexhibit different teaching behaviours dependingon the kind of subjects taught, the level of thestudents, the teacher's personality and situation.Furthermore, what the behaviours of the teachersis the product of the interaction between theteacher presage variables and the environment,that is the teacher education curriculum thatthey have been exposed to. The ratings givenwere based on the raters' perceptions of whatthese teaching behaviours ought to be. However,interpretations were attempted after examiningthe rotated factor pattern matrix. By grouping
116
TABLE 4Obliquely rotated (promax) factor matrix (F*)
Factor 1 Factor 2 Factor 3 Factor 4FACILIT INTERPE INTERAC FLEXIBL
Rating Scales Variable
Warmth 0.01 0.99 0.01 0.00Enthusiasm 0.03 0.52 0.34 0.05Clarity 0.79 -0.01 0.37 -0.09Individualization 0.56 0.12 -0.02 0.15Cognitive Demand 0.64 -0.02 -0.22 0.17Freedom 0.14 0.20 -0.13 0.50Variety 0.10 -0.11 0.21 0.76Feedback -0.15 0.05 0.84 0.01On-Task Activity 0.05 0.15 0.30 0.26
FACILIT = Facilitating BehaviourINTERPE = Interpersonal BehaviourINTERAC = Interactive BehaviourFLEXIBL = Flexible Behaviour
PertanikaJ. Soc. Sci. & Hum. Vol. 3 No.2 1995
An Analysis of Teaching Behaviours of Preschool. Student Teachers
TABLE 5Phi matrix - inter-factor correlations
Factor 1 Factor 2
Factor 1 1.00Factor 2 0.48 1.00Factor 3 0.57 0.48Factor 4 0.51 0.37
Factor 3
1.000.38
Factor 4
1.00
Factor 1 = Facilitating behaviourFactor 2 = Interpersonal behaviourFactor 3 = Interactive behaviourFactor 4 = Flexible behaviour
those measured variables with high loadings ona particular factor (latent variable), a distinctpattern emerged, indicating which variables sharea common characteristic. Four latent variableswere identified; given labels to designate a certainteaching behaviour. The teaching behaviours ofthe preschool student teachers in the study seemto be inter-related. They were namedappropriately based upon their common featureand, to a degree, reflecting the cluster of teachingbehaviours observed and rated. These teachingbehaviours are: facilitating behaviour,interpersonal behaviour, interactive behaviour,and flexible behaviour. The teaching behavioursidentified in this study are described as follows:1. Facilitating behaviour - the measured
variables designated as clarity (0.79),individualization (0.56), and cognitivedemand (0.64) have high loadings on thisfactor. This teaching behaviour, whichfacilitates the learning process, is commonamong these measured variables.
2. Interpersonal behaviour - the measuredvariables designated as warmth (0.99) andenthusiasm (0.52) have high loadings onthis factor. This attribute is related to theteacher's personal disposition.
3 Interactive behaviour - the measuredvariables designated as feedback (0.84) andon-task activity (0.30) have high loadings onthis factor. This is an indication of thedegree of interactivity of the student teacherswith the children.
4. Flexible behaviour - the measured variablesof variety (0.76) and freedom (0.50) havehigh loadings on this factor. This is anindication of the flexibility of the studentteachers as rated by the observers.
As the sample used in the study came froma population of preschool student teachers fromtwo institutions of higher learning in the Midwestthe findings could only be generalized to thispopulation of preschool student teachers.
Based on this investigation, the preschoolstudent teachers exhibit these four teachingbehaviours in their classroom performance asrated by the trained observers. The preschoolstudent teachers in these institutions possessfacilitating, interpersonal, interactive' and flexibleteaching behaviours in varying amounts and thevariances in their performance are explained bythe four latent variables stated earlier.
Since these latent variables are correlatedwith each other, it is not possible to partitionthe variance of their performance between eachof the latent variables identified in thisinvestigation.
Because the common factors are correlatedwith each other, people who manifest thecharacteristic governed by one factor tend topossess the characteristics attributed to the otherthree factors as well. Specifically, in this studystudent teachers who exhibited a high degree offacilitating behaviour also tended to be highlyendowed in interpersonal, interactive and flexiblebehaviours as well. The reverse is also true.
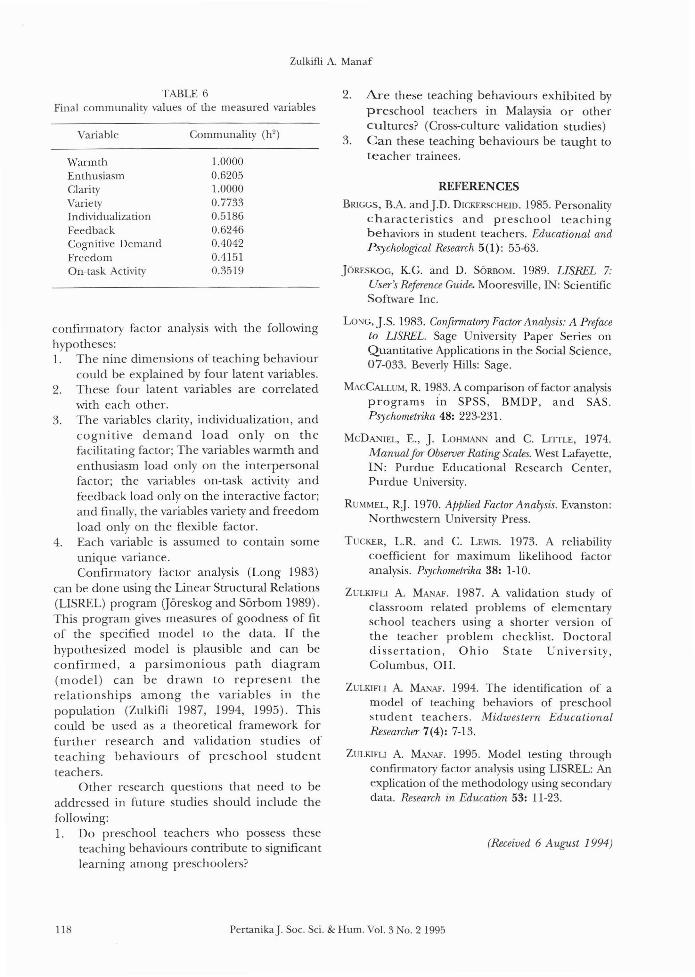
Most of the measured variables are goodindicators of the latent variables or construct.This is clearly shown by their final communalityvalues (h2
) in Table 6. High communality values(mid 0.30s and above) are desirable. The finalcommunality value is the proportion of varianceshared by the common factors.
Based on the findings of this study, futurestudies on the teaching behaviours of preschoolstudent teachers (new data) should employ
PertanikaJ. Soc. Sci. & Hum. Vol. 3 No.2 1995 117
Zulkifli A. Manaf
TABLE 6Final communality values of the measured variables
Variable
WarmthEnthusiasmClarityValietyIndividualizationFeedbackCognitive DemandFreedomOn-task Activity
Communality (h2)
1.00000.62051.00000.77330.51860.62460.40420.41510.3519
2. Are these teaching behaviours exhibited bypreschool teachers in Malaysia or othercultures? (Cross-culture validation studies)
3. Can these teaching behaviours be taught toteacher trainees.
REFERENCESBRIGGS, BA and J.D. DICKERSCHEID. 1985. Personality
characteristics and preschool teachingbehaviors in student teachers. Educational andPsychological Research 5(1): 55-63.
JORESKOG, K.G. and D. SORBOM. 1989. LISREL 7:User's Reference Guide. Mooresville, IN: ScientificSoftware Inc.
confirmatory factor analysis with the followinghypotheses:1. The nine dimensions of teaching behaviour
could be explained by four latent variables.2. These four latent variables are correlated
with each other.3. The variables clarity, individualization, and
cognitive demand load only on thefacilitating factor; The variables warmth andenthusiasm load only on the interpersonalfactor; the variables on-task activity andfeedback load only on the interactive factor;and finally, the variables variety and freedomload only on the flexible factor.
4. Each variable is assumed to contain someunique variance.Confirmatory factor analysis (Long 1983)
can be done using the Linear Structural Relations(LISREL) program (Joreskog and Sorbom 1989).This program gives measures of goodness of fitof the specified model to the data. If thehypothesized model is plausible and can beconfirmed, a parsimonious path diagram(model) can be drawn to represent therelationships among the variables in thepopulation (Zulkifli 1987, 1994, 1995). Thiscould be used as a theoretical framework forfurther research and validation studies ofteaching behaviours of preschool studentteachers.
Other research questions that need to beaddressed in future studies should include thefollowing:1. Do preschool teachers who possess these
teaching behaviours contribute to significantlearning among preschoolers?
LONG, l.S. 1983. Confirmatory Factor Analysis: A Prefaceto LISREL. Sage University Paper Series onQuantitative Applications in the Social Science,07-033. Beverly Hills: Sage.
MACCALLUM, R. 1983. A comparison of factor analysisprograms iOn SPSS, BMDP, and SAS.Psychometrika 48: 223-231.
McDANIEL, E., J. LOHMAN and C. LIlTLE, 1974.Manual for Observer Rating Scales. West Lafayette,IN: Purdue Educational Research Center,Purdue University.
RUMMEL, RJ. 1970. Applied Factor Analysis. Evanston:Northwestern University Press.
TUCKER, L.R. and C. LEWIS. 1973. A reliabilitycoefficient for maximum likelihood factoranalysis. Psychometrika 38: 1-10.
ZULlUFLI A. MANAF. 1987. A validation study ofclassroom related problems of elementaryschool teachers using a shorter version ofthe teacher problem checklist. Doctoraldissertation, Ohio State University,Columbus, OH.
ZULKIFLI A. MANAF. 1994. The identification of amodel of teaching behaviors of preschoolstuden t teachers. Midwestern EducationalResearcher 7(4): 7-13.
ZULKIFLI A. MANAF. 1995. Model testing throughconfirmatory factor analysis using LISREL: Anexplication of the methodology using secondarydata. Research in Education 53: 11-23.
(Received 6 August 1994)
118 PertanikaJ. Soc. Sci. & Hum. Vol. 3 0.21995