Embed Size (px)
Citation preview
Mihara Language Testing in Asia (2015) 5:12 DOI 10.1186/s40468-015-0021-5
RESEARCH Open Access
An analysis of the differences among L2listening comprehension test formats
Kei MiharaCorrespondence:[email protected] of Science and Engineering,Kinki University, Osaka, Japan
©LmC
Abstract
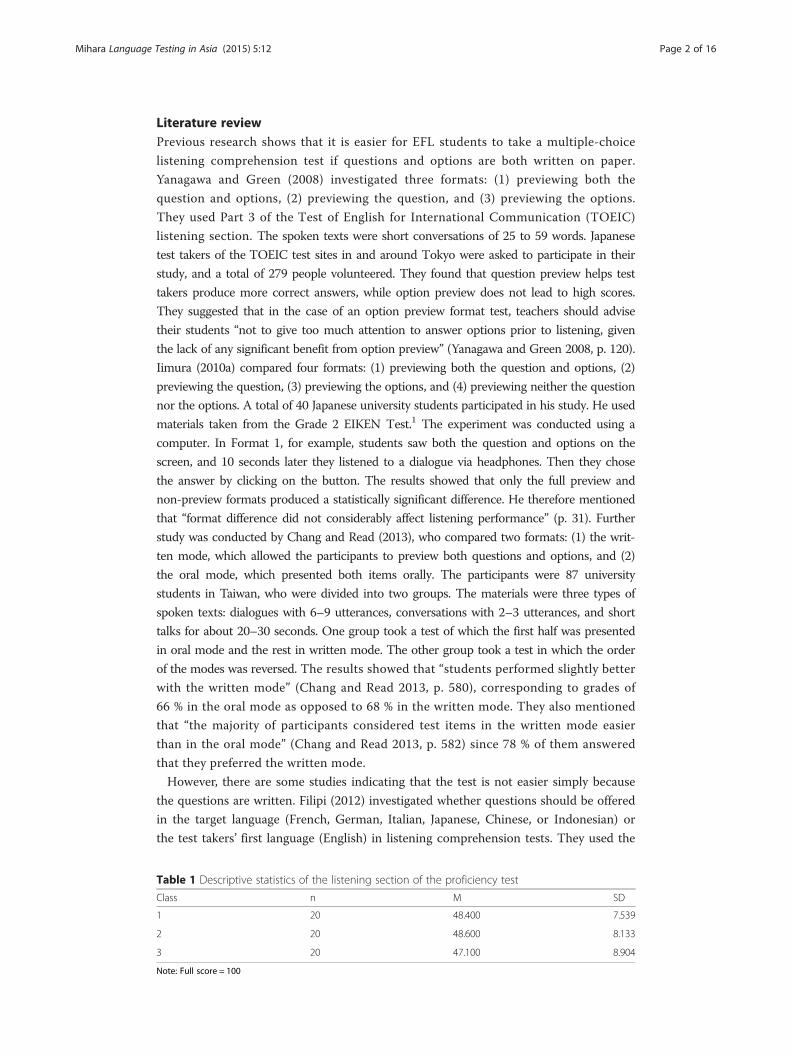
Background: The present study aims to investigate which variables affect English asa foreign language (EFL) students’ listening comprehension test performance. Itexamines two types of variables: (1) test formats and (2) test materials.
Methods: First, three types of test formats are investigated: (1) questions are not writtenbut given orally only once in English and in the students’ first language (L1) after they listento the spoken text and (2) questions are not written but given orally in English and in thestudents’ L1 before and after they listen to the spoken text. The third type is a controlgroup: Questions are written and also given orally in English after the students listen to thespoken text. The first type of test is similar to the Test of English as a Foreign LanguagePaper-Based Testing (TOEFL PBT) and the second type the General Tests of EnglishLanguage Proficiency (G-TELP). The third type, a control group, is the format of the Test ofEnglish for International Communication (TOEIC). Second, this study examines whether thereare any differences between dialogues and monologues in terms of students’ performance.
Results: The results show that test formats do not make a statistically significant differenceto students’ test performance.
Conclusions: Repeating questions after listening to the spoken text does not help themperform better, even if they listen to questions not only in English but also in their L1. Asfor differences in test materials, the results are not decisive. It is not possible todetermine whether there are any differences between dialogues and monologues.
Keywords: Listening; Test formats; Materials; Performance; L1 support
BackgroundThe present study investigates whether or not test takers’ performance is affected by
factors other than their English proficiency. The purpose of the present study is two-
fold. It first explores the possibilities of the differences in test formats affecting test re-
sults. It also tries to determine whether the differences in test materials have some
influence on students’ test performance.
Three test formats were investigated here. They were all multiple-choice formats, but
they differed in the mode of presentation of the questions, e.g., whether they had a chance
to listen to the questions once or twice. Previous studies have examined the effects of test
format on test takers’ performance; however, their results were mixed, indicating the need
for further research. As for the differences in test materials, less research has been con-
ducted so far. Thus, the present study examined whether there are any differences by com-
paring conversations between two people with short talks given by a single speaker.
2015 Mihara. Open Access This article is distributed under the terms of the Creative Commons Attribution 4.0 Internationalicense (http://creativecommons.org/licenses/by/4.0/), which permits unrestricted use, distribution, and reproduction in anyedium, provided you give appropriate credit to the original author(s) and the source, provide a link to the Creativeommons license, and indicate if changes were made.
Mihara Language Testing in Asia (2015) 5:12 Page 2 of 16
Literature reviewPrevious research shows that it is easier for EFL students to take a multiple-choice
listening comprehension test if questions and options are both written on paper.
Yanagawa and Green (2008) investigated three formats: (1) previewing both the
question and options, (2) previewing the question, and (3) previewing the options.
They used Part 3 of the Test of English for International Communication (TOEIC)
listening section. The spoken texts were short conversations of 25 to 59 words. Japanese
test takers of the TOEIC test sites in and around Tokyo were asked to participate in their
study, and a total of 279 people volunteered. They found that question preview helps test
takers produce more correct answers, while option preview does not lead to high scores.
They suggested that in the case of an option preview format test, teachers should advise
their students “not to give too much attention to answer options prior to listening, given
the lack of any significant benefit from option preview” (Yanagawa and Green 2008, p. 120).
Iimura (2010a) compared four formats: (1) previewing both the question and options, (2)
previewing the question, (3) previewing the options, and (4) previewing neither the question
nor the options. A total of 40 Japanese university students participated in his study. He used
materials taken from the Grade 2 EIKEN Test.1 The experiment was conducted using a
computer. In Format 1, for example, students saw both the question and options on the
screen, and 10 seconds later they listened to a dialogue via headphones. Then they chose
the answer by clicking on the button. The results showed that only the full preview and
non-preview formats produced a statistically significant difference. He therefore mentioned
that “format difference did not considerably affect listening performance” (p. 31). Further
study was conducted by Chang and Read (2013), who compared two formats: (1) the writ-
ten mode, which allowed the participants to preview both questions and options, and (2)
the oral mode, which presented both items orally. The participants were 87 university
students in Taiwan, who were divided into two groups. The materials were three types of
spoken texts: dialogues with 6–9 utterances, conversations with 2–3 utterances, and short
talks for about 20–30 seconds. One group took a test of which the first half was presented
in oral mode and the rest in written mode. The other group took a test in which the order
of the modes was reversed. The results showed that “students performed slightly better
with the written mode” (Chang and Read 2013, p. 580), corresponding to grades of
66 % in the oral mode as opposed to 68 % in the written mode. They also mentioned
that “the majority of participants considered test items in the written mode easier
than in the oral mode” (Chang and Read 2013, p. 582) since 78 % of them answered
that they preferred the written mode.
However, there are some studies indicating that the test is not easier simply because
the questions are written. Filipi (2012) investigated whether questions should be offered
in the target language (French, German, Italian, Japanese, Chinese, or Indonesian) or
the test takers’ first language (English) in listening comprehension tests. They used the
Table 1 Descriptive statistics of the listening section of the proficiency test
Class n M SD
1 20 48.400 7.539
2 20 48.600 8.133
3 20 47.100 8.904
Note: Full score = 100
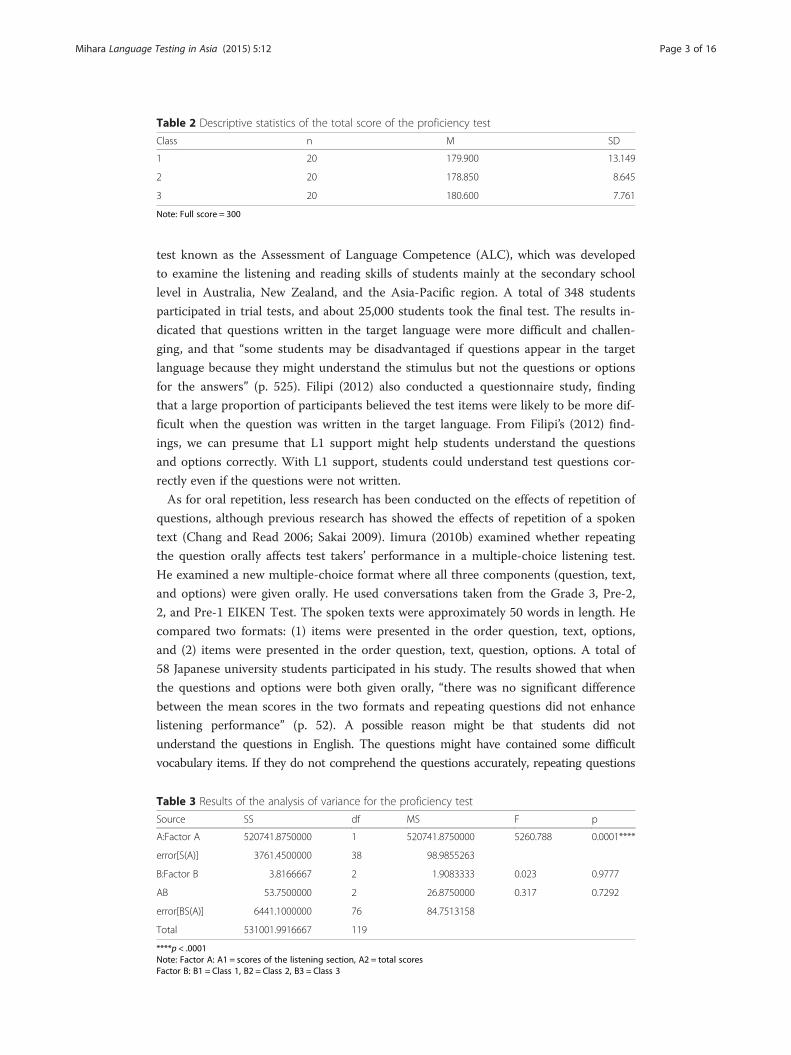
Table 2 Descriptive statistics of the total score of the proficiency test
Class n M SD
1 20 179.900 13.149
2 20 178.850 8.645
3 20 180.600 7.761
Note: Full score = 300
Mihara Language Testing in Asia (2015) 5:12 Page 3 of 16
test known as the Assessment of Language Competence (ALC), which was developed
to examine the listening and reading skills of students mainly at the secondary school
level in Australia, New Zealand, and the Asia-Pacific region. A total of 348 students
participated in trial tests, and about 25,000 students took the final test. The results in-
dicated that questions written in the target language were more difficult and challen-
ging, and that “some students may be disadvantaged if questions appear in the target
language because they might understand the stimulus but not the questions or options
for the answers” (p. 525). Filipi (2012) also conducted a questionnaire study, finding
that a large proportion of participants believed the test items were likely to be more dif-
ficult when the question was written in the target language. From Filipi’s (2012) find-
ings, we can presume that L1 support might help students understand the questions
and options correctly. With L1 support, students could understand test questions cor-
rectly even if the questions were not written.
As for oral repetition, less research has been conducted on the effects of repetition of
questions, although previous research has showed the effects of repetition of a spoken
text (Chang and Read 2006; Sakai 2009). Iimura (2010b) examined whether repeating
the question orally affects test takers’ performance in a multiple-choice listening test.
He examined a new multiple-choice format where all three components (question, text,
and options) were given orally. He used conversations taken from the Grade 3, Pre-2,
2, and Pre-1 EIKEN Test. The spoken texts were approximately 50 words in length. He
compared two formats: (1) items were presented in the order question, text, options,
and (2) items were presented in the order question, text, question, options. A total of
58 Japanese university students participated in his study. The results showed that when
the questions and options were both given orally, “there was no significant difference
between the mean scores in the two formats and repeating questions did not enhance
listening performance” (p. 52). A possible reason might be that students did not
understand the questions in English. The questions might have contained some difficult
vocabulary items. If they do not comprehend the questions accurately, repeating questions
Table 3 Results of the analysis of variance for the proficiency test
Source SS df MS F p
A:Factor A 520741.8750000 1 520741.8750000 5260.788 0.0001****
error[S(A)] 3761.4500000 38 98.9855263
B:Factor B 3.8166667 2 1.9083333 0.023 0.9777
AB 53.7500000 2 26.8750000 0.317 0.7292
error[BS(A)] 6441.1000000 76 84.7513158
Total 531001.9916667 119
****p < .0001Note: Factor A: A1 = scores of the listening section, A2 = total scoresFactor B: B1 = Class 1, B2 = Class 2, B3 = Class 3
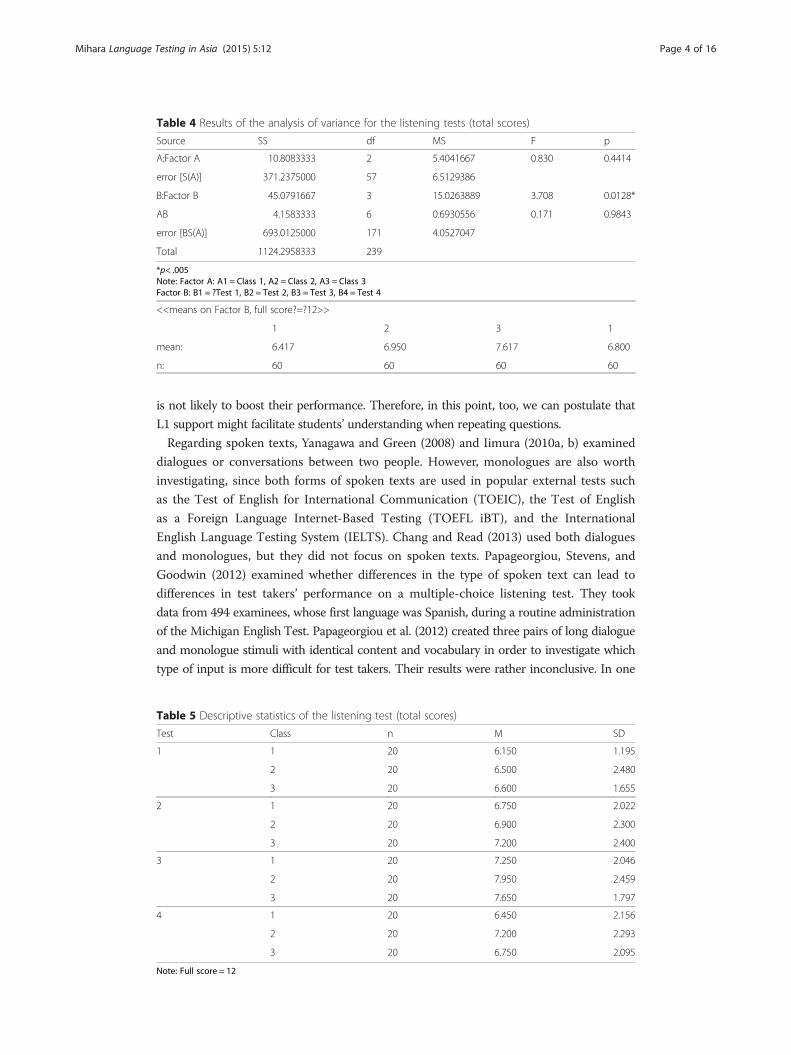
Table 4 Results of the analysis of variance for the listening tests (total scores)
Source SS df MS F p
A:Factor A 10.8083333 2 5.4041667 0.830 0.4414
error [S(A)] 371.2375000 57 6.5129386
B:Factor B 45.0791667 3 15.0263889 3.708 0.0128*
AB 4.1583333 6 0.6930556 0.171 0.9843
error [BS(A)] 693.0125000 171 4.0527047
Total 1124.2958333 239
*p< .005Note: Factor A: A1 = Class 1, A2 = Class 2, A3 = Class 3Factor B: B1 = ?Test 1, B2 = Test 2, B3 = Test 3, B4 = Test 4
<<means on Factor B, full score?=?12>>
1 2 3 1
mean: 6.417 6.950 7.617 6.800
n: 60 60 60 60
Mihara Language Testing in Asia (2015) 5:12 Page 4 of 16
is not likely to boost their performance. Therefore, in this point, too, we can postulate that
L1 support might facilitate students’ understanding when repeating questions.
Regarding spoken texts, Yanagawa and Green (2008) and Iimura (2010a, b) examined
dialogues or conversations between two people. However, monologues are also worth
investigating, since both forms of spoken texts are used in popular external tests such
as the Test of English for International Communication (TOEIC), the Test of English
as a Foreign Language Internet-Based Testing (TOEFL iBT), and the International
English Language Testing System (IELTS). Chang and Read (2013) used both dialogues
and monologues, but they did not focus on spoken texts. Papageorgiou, Stevens, and
Goodwin (2012) examined whether differences in the type of spoken text can lead to
differences in test takers’ performance on a multiple-choice listening test. They took
data from 494 examinees, whose first language was Spanish, during a routine administration
of the Michigan English Test. Papageorgiou et al. (2012) created three pairs of long dialogue
and monologue stimuli with identical content and vocabulary in order to investigate which
type of input is more difficult for test takers. Their results were rather inconclusive. In one
Table 5 Descriptive statistics of the listening test (total scores)
Test Class n M SD
1 1 20 6.150 1.195
2 20 6.500 2.480
3 20 6.600 1.655
2 1 20 6.750 2.022
2 20 6.900 2.300
3 20 7.200 2.400
3 1 20 7.250 2.046
2 20 7.950 2.459
3 20 7.650 1.797
4 1 20 6.450 2.156
2 20 7.200 2.293
3 20 6.750 2.095
Note: Full score = 12
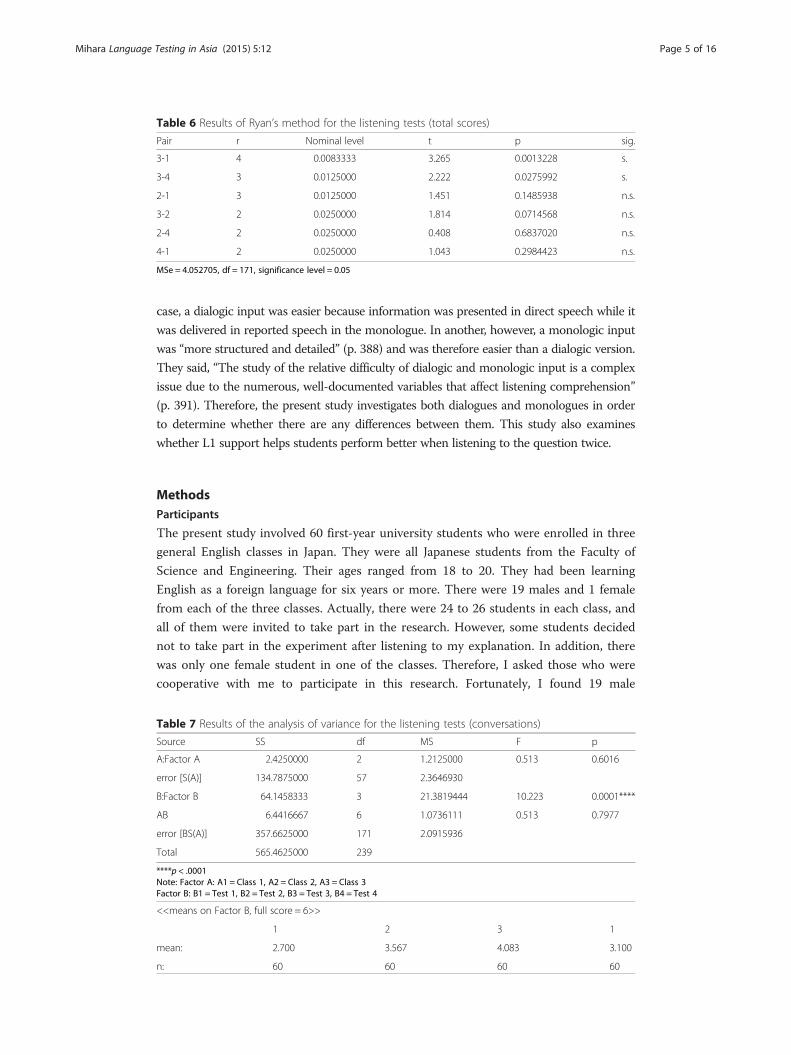
Table 6 Results of Ryan’s method for the listening tests (total scores)
Pair r Nominal level t p sig.
3-1 4 0.0083333 3.265 0.0013228 s.
3-4 3 0.0125000 2.222 0.0275992 s.
2-1 3 0.0125000 1.451 0.1485938 n.s.
3-2 2 0.0250000 1.814 0.0714568 n.s.
2-4 2 0.0250000 0.408 0.6837020 n.s.
4-1 2 0.0250000 1.043 0.2984423 n.s.
MSe = 4.052705, df = 171, significance level = 0.05
Mihara Language Testing in Asia (2015) 5:12 Page 5 of 16
case, a dialogic input was easier because information was presented in direct speech while it
was delivered in reported speech in the monologue. In another, however, a monologic input
was “more structured and detailed” (p. 388) and was therefore easier than a dialogic version.
They said, “The study of the relative difficulty of dialogic and monologic input is a complex
issue due to the numerous, well-documented variables that affect listening comprehension”
(p. 391). Therefore, the present study investigates both dialogues and monologues in order
to determine whether there are any differences between them. This study also examines
whether L1 support helps students perform better when listening to the question twice.
MethodsParticipants
The present study involved 60 first-year university students who were enrolled in three
general English classes in Japan. They were all Japanese students from the Faculty of
Science and Engineering. Their ages ranged from 18 to 20. They had been learning
English as a foreign language for six years or more. There were 19 males and 1 female
from each of the three classes. Actually, there were 24 to 26 students in each class, and
all of them were invited to take part in the research. However, some students decided
not to take part in the experiment after listening to my explanation. In addition, there
was only one female student in one of the classes. Therefore, I asked those who were
cooperative with me to participate in this research. Fortunately, I found 19 male
Table 7 Results of the analysis of variance for the listening tests (conversations)
Source SS df MS F p
A:Factor A 2.4250000 2 1.2125000 0.513 0.6016
error [S(A)] 134.7875000 57 2.3646930
B:Factor B 64.1458333 3 21.3819444 10.223 0.0001****
AB 6.4416667 6 1.0736111 0.513 0.7977
error [BS(A)] 357.6625000 171 2.0915936
Total 565.4625000 239
****p < .0001Note: Factor A: A1 = Class 1, A2 = Class 2, A3 = Class 3Factor B: B1 = Test 1, B2 = Test 2, B3 = Test 3, B4 = Test 4
<<means on Factor B, full score = 6>>
1 2 3 1
mean: 2.700 3.567 4.083 3.100
n: 60 60 60 60
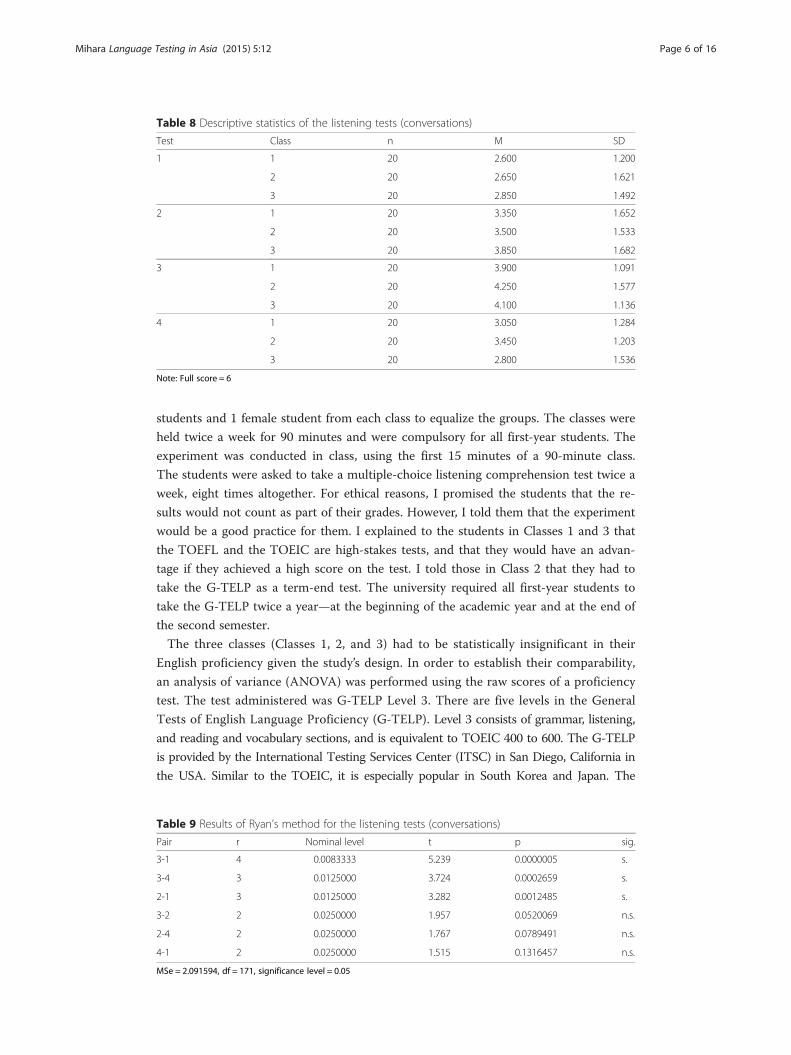
Table 8 Descriptive statistics of the listening tests (conversations)
Test Class n M SD
1 1 20 2.600 1.200
2 20 2.650 1.621
3 20 2.850 1.492
2 1 20 3.350 1.652
2 20 3.500 1.533
3 20 3.850 1.682
3 1 20 3.900 1.091
2 20 4.250 1.577
3 20 4.100 1.136
4 1 20 3.050 1.284
2 20 3.450 1.203
3 20 2.800 1.536
Note: Full score = 6
Mihara Language Testing in Asia (2015) 5:12 Page 6 of 16
students and 1 female student from each class to equalize the groups. The classes were
held twice a week for 90 minutes and were compulsory for all first-year students. The
experiment was conducted in class, using the first 15 minutes of a 90-minute class.
The students were asked to take a multiple-choice listening comprehension test twice a
week, eight times altogether. For ethical reasons, I promised the students that the re-
sults would not count as part of their grades. However, I told them that the experiment
would be a good practice for them. I explained to the students in Classes 1 and 3 that
the TOEFL and the TOEIC are high-stakes tests, and that they would have an advan-
tage if they achieved a high score on the test. I told those in Class 2 that they had to
take the G-TELP as a term-end test. The university required all first-year students to
take the G-TELP twice a year—at the beginning of the academic year and at the end of
the second semester.
The three classes (Classes 1, 2, and 3) had to be statistically insignificant in their
English proficiency given the study’s design. In order to establish their comparability,
an analysis of variance (ANOVA) was performed using the raw scores of a proficiency
test. The test administered was G-TELP Level 3. There are five levels in the General
Tests of English Language Proficiency (G-TELP). Level 3 consists of grammar, listening,
and reading and vocabulary sections, and is equivalent to TOEIC 400 to 600. The G-TELP
is provided by the International Testing Services Center (ITSC) in San Diego, California in
the USA. Similar to the TOEIC, it is especially popular in South Korea and Japan. The
Table 9 Results of Ryan’s method for the listening tests (conversations)
Pair r Nominal level t p sig.
3-1 4 0.0083333 5.239 0.0000005 s.
3-4 3 0.0125000 3.724 0.0002659 s.
2-1 3 0.0125000 3.282 0.0012485 s.
3-2 2 0.0250000 1.957 0.0520069 n.s.
2-4 2 0.0250000 1.767 0.0789491 n.s.
4-1 2 0.0250000 1.515 0.1316457 n.s.
MSe = 2.091594, df = 171, significance level = 0.05
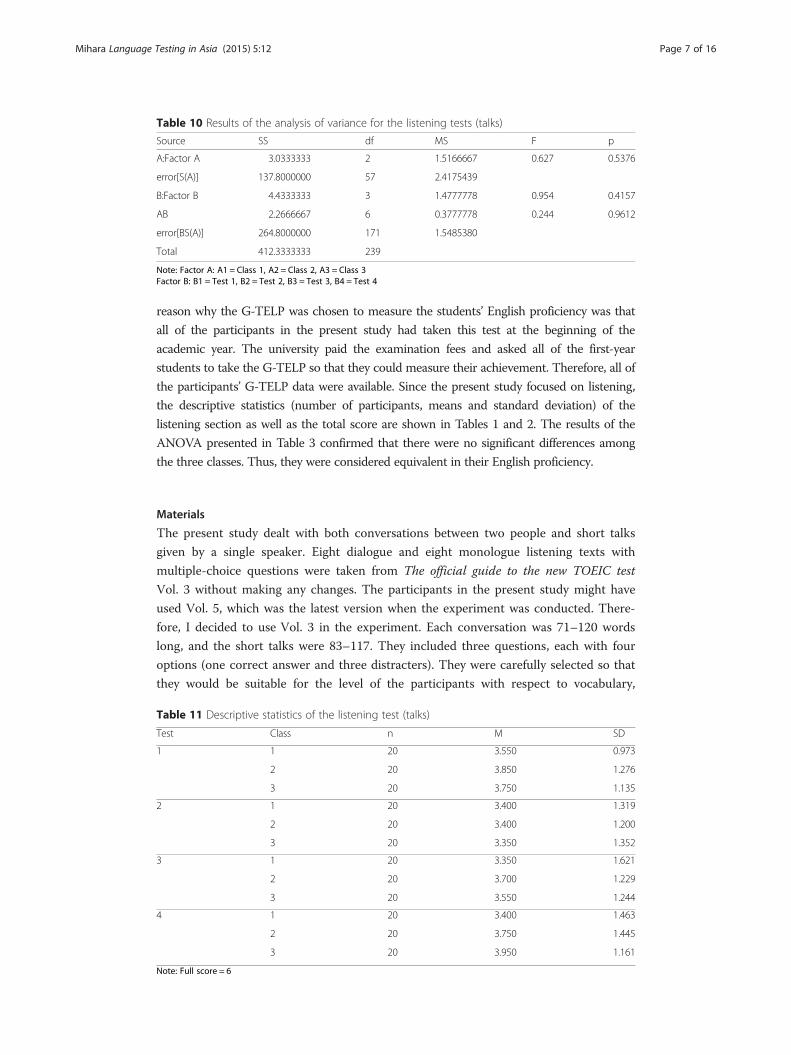
Table 10 Results of the analysis of variance for the listening tests (talks)
Source SS df MS F p
A:Factor A 3.0333333 2 1.5166667 0.627 0.5376
error[S(A)] 137.8000000 57 2.4175439
B:Factor B 4.4333333 3 1.4777778 0.954 0.4157
AB 2.2666667 6 0.3777778 0.244 0.9612
error[BS(A)] 264.8000000 171 1.5485380
Total 412.3333333 239
Note: Factor A: A1 = Class 1, A2 = Class 2, A3 = Class 3Factor B: B1 = Test 1, B2 = Test 2, B3 = Test 3, B4 = Test 4
Mihara Language Testing in Asia (2015) 5:12 Page 7 of 16
reason why the G-TELP was chosen to measure the students’ English proficiency was that
all of the participants in the present study had taken this test at the beginning of the
academic year. The university paid the examination fees and asked all of the first-year
students to take the G-TELP so that they could measure their achievement. Therefore, all of
the participants’ G-TELP data were available. Since the present study focused on listening,
the descriptive statistics (number of participants, means and standard deviation) of the
listening section as well as the total score are shown in Tables 1 and 2. The results of the
ANOVA presented in Table 3 confirmed that there were no significant differences among
the three classes. Thus, they were considered equivalent in their English proficiency.
Materials
The present study dealt with both conversations between two people and short talks
given by a single speaker. Eight dialogue and eight monologue listening texts with
multiple-choice questions were taken from The official guide to the new TOEIC test
Vol. 3 without making any changes. The participants in the present study might have
used Vol. 5, which was the latest version when the experiment was conducted. There-
fore, I decided to use Vol. 3 in the experiment. Each conversation was 71–120 words
long, and the short talks were 83–117. They included three questions, each with four
options (one correct answer and three distracters). They were carefully selected so that
they would be suitable for the level of the participants with respect to vocabulary,
Table 11 Descriptive statistics of the listening test (talks)
Test Class n M SD
1 1 20 3.550 0.973
2 20 3.850 1.276
3 20 3.750 1.135
2 1 20 3.400 1.319
2 20 3.400 1.200
3 20 3.350 1.352
3 1 20 3.350 1.621
2 20 3.700 1.229
3 20 3.550 1.244
4 1 20 3.400 1.463
2 20 3.750 1.445
3 20 3.950 1.161
Note: Full score = 6
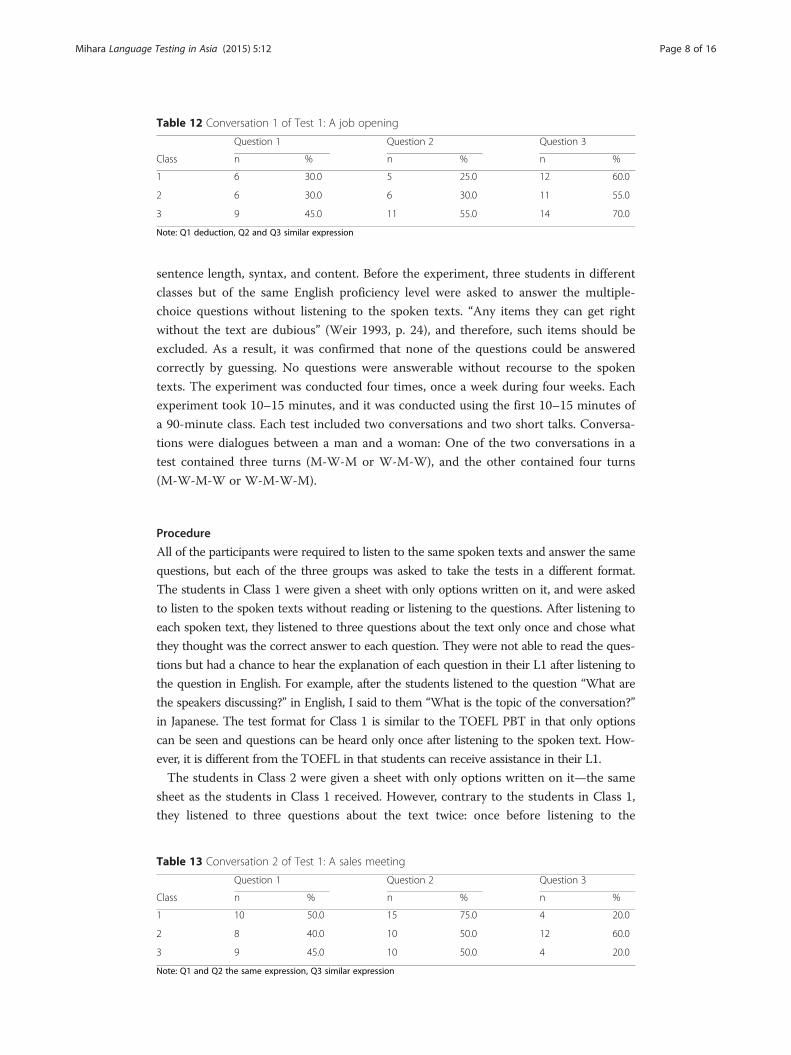
Table 12 Conversation 1 of Test 1: A job opening
Question 1 Question 2 Question 3
Class n % n % n %
1 6 30.0 5 25.0 12 60.0
2 6 30.0 6 30.0 11 55.0
3 9 45.0 11 55.0 14 70.0
Note: Q1 deduction, Q2 and Q3 similar expression
Mihara Language Testing in Asia (2015) 5:12 Page 8 of 16
sentence length, syntax, and content. Before the experiment, three students in different
classes but of the same English proficiency level were asked to answer the multiple-
choice questions without listening to the spoken texts. “Any items they can get right
without the text are dubious” (Weir 1993, p. 24), and therefore, such items should be
excluded. As a result, it was confirmed that none of the questions could be answered
correctly by guessing. No questions were answerable without recourse to the spoken
texts. The experiment was conducted four times, once a week during four weeks. Each
experiment took 10–15 minutes, and it was conducted using the first 10–15 minutes of
a 90-minute class. Each test included two conversations and two short talks. Conversa-
tions were dialogues between a man and a woman: One of the two conversations in a
test contained three turns (M-W-M or W-M-W), and the other contained four turns
(M-W-M-W or W-M-W-M).
Procedure
All of the participants were required to listen to the same spoken texts and answer the same
questions, but each of the three groups was asked to take the tests in a different format.
The students in Class 1 were given a sheet with only options written on it, and were asked
to listen to the spoken texts without reading or listening to the questions. After listening to
each spoken text, they listened to three questions about the text only once and chose what
they thought was the correct answer to each question. They were not able to read the ques-
tions but had a chance to hear the explanation of each question in their L1 after listening to
the question in English. For example, after the students listened to the question “What are
the speakers discussing?” in English, I said to them “What is the topic of the conversation?”
in Japanese. The test format for Class 1 is similar to the TOEFL PBT in that only options
can be seen and questions can be heard only once after listening to the spoken text. How-
ever, it is different from the TOEFL in that students can receive assistance in their L1.
The students in Class 2 were given a sheet with only options written on it—the same
sheet as the students in Class 1 received. However, contrary to the students in Class 1,
they listened to three questions about the text twice: once before listening to the
Table 13 Conversation 2 of Test 1: A sales meeting
Question 1 Question 2 Question 3
Class n % n % n %
1 10 50.0 15 75.0 4 20.0
2 8 40.0 10 50.0 12 60.0
3 9 45.0 10 50.0 4 20.0
Note: Q1 and Q2 the same expression, Q3 similar expression
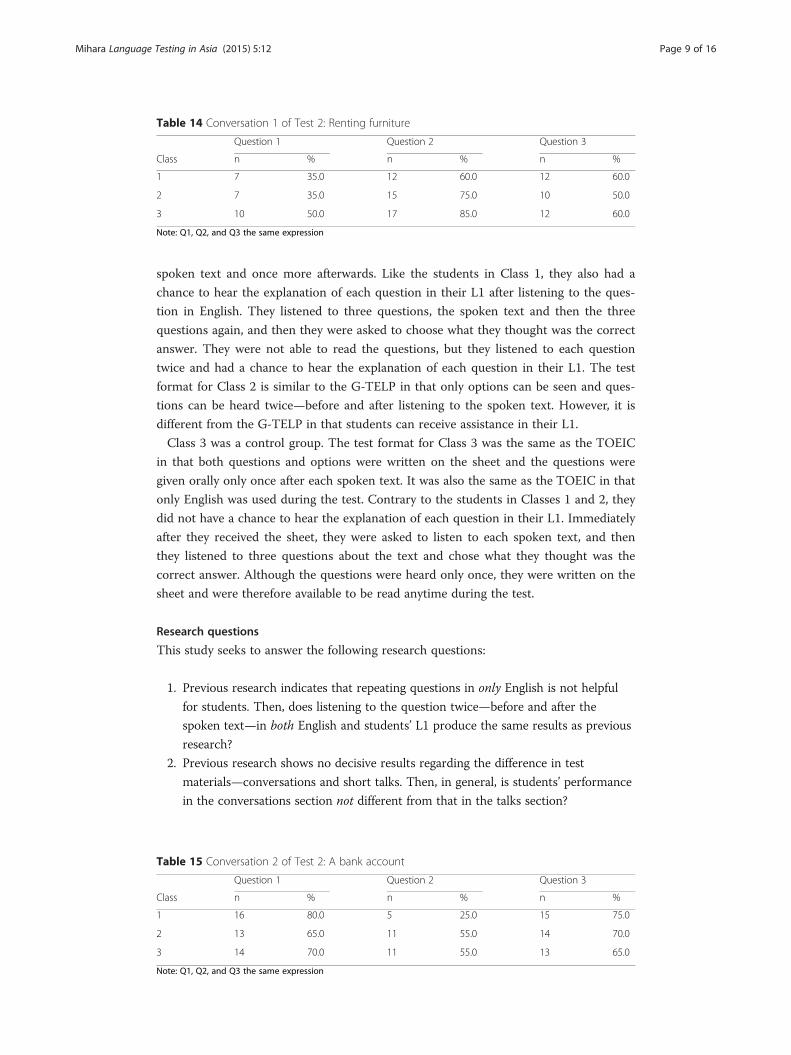
Table 14 Conversation 1 of Test 2: Renting furniture
Question 1 Question 2 Question 3
Class n % n % n %
1 7 35.0 12 60.0 12 60.0
2 7 35.0 15 75.0 10 50.0
3 10 50.0 17 85.0 12 60.0
Note: Q1, Q2, and Q3 the same expression
Mihara Language Testing in Asia (2015) 5:12 Page 9 of 16
spoken text and once more afterwards. Like the students in Class 1, they also had a
chance to hear the explanation of each question in their L1 after listening to the ques-
tion in English. They listened to three questions, the spoken text and then the three
questions again, and then they were asked to choose what they thought was the correct
answer. They were not able to read the questions, but they listened to each question
twice and had a chance to hear the explanation of each question in their L1. The test
format for Class 2 is similar to the G-TELP in that only options can be seen and ques-
tions can be heard twice—before and after listening to the spoken text. However, it is
different from the G-TELP in that students can receive assistance in their L1.
Class 3 was a control group. The test format for Class 3 was the same as the TOEIC
in that both questions and options were written on the sheet and the questions were
given orally only once after each spoken text. It was also the same as the TOEIC in that
only English was used during the test. Contrary to the students in Classes 1 and 2, they
did not have a chance to hear the explanation of each question in their L1. Immediately
after they received the sheet, they were asked to listen to each spoken text, and then
they listened to three questions about the text and chose what they thought was the
correct answer. Although the questions were heard only once, they were written on the
sheet and were therefore available to be read anytime during the test.
Research questions
This study seeks to answer the following research questions:
1. Previous research indicates that repeating questions in only English is not helpful
for students. Then, does listening to the question twice—before and after the
spoken text—in both English and students’ L1 produce the same results as previous
research?
2. Previous research shows no decisive results regarding the difference in test
materials—conversations and short talks. Then, in general, is students’ performance
in the conversations section not different from that in the talks section?
Table 15 Conversation 2 of Test 2: A bank account
Question 1 Question 2 Question 3
Class n % n % n %
1 16 80.0 5 25.0 15 75.0
2 13 65.0 11 55.0 14 70.0
3 14 70.0 11 55.0 13 65.0
Note: Q1, Q2, and Q3 the same expression
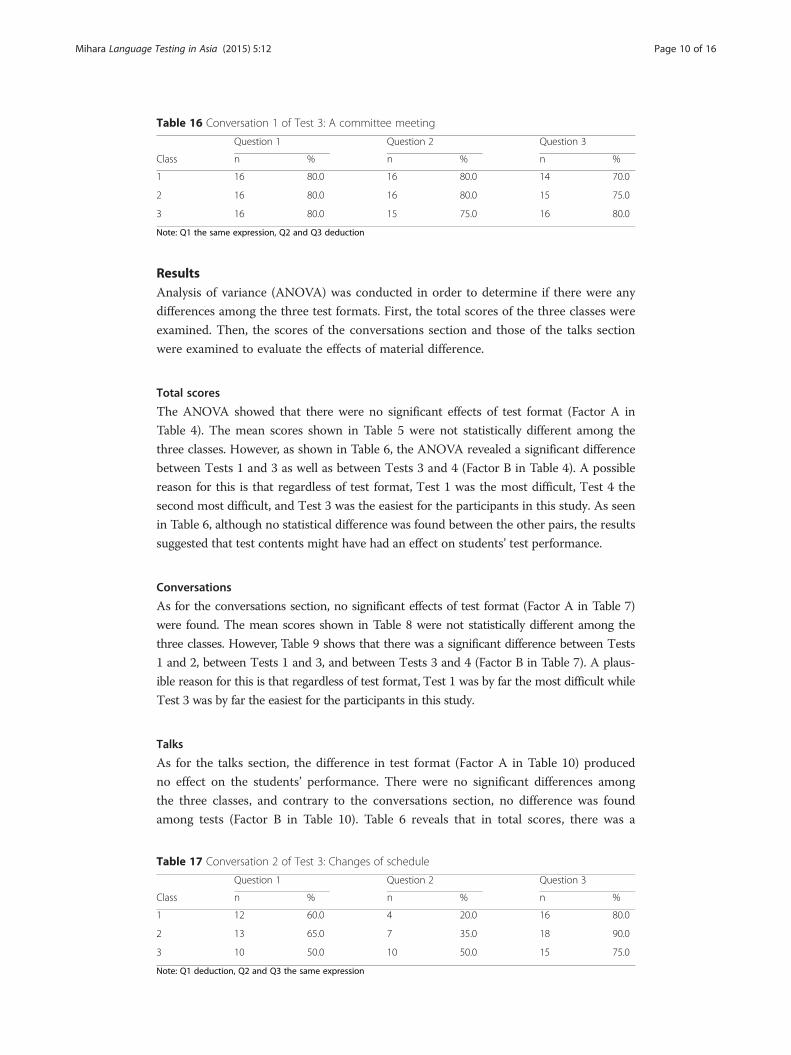
Table 16 Conversation 1 of Test 3: A committee meeting
Question 1 Question 2 Question 3
Class n % n % n %
1 16 80.0 16 80.0 14 70.0
2 16 80.0 16 80.0 15 75.0
3 16 80.0 15 75.0 16 80.0
Note: Q1 the same expression, Q2 and Q3 deduction
Mihara Language Testing in Asia (2015) 5:12 Page 10 of 16
ResultsAnalysis of variance (ANOVA) was conducted in order to determine if there were any
differences among the three test formats. First, the total scores of the three classes were
examined. Then, the scores of the conversations section and those of the talks section
were examined to evaluate the effects of material difference.
Total scores
The ANOVA showed that there were no significant effects of test format (Factor A in
Table 4). The mean scores shown in Table 5 were not statistically different among the
three classes. However, as shown in Table 6, the ANOVA revealed a significant difference
between Tests 1 and 3 as well as between Tests 3 and 4 (Factor B in Table 4). A possible
reason for this is that regardless of test format, Test 1 was the most difficult, Test 4 the
second most difficult, and Test 3 was the easiest for the participants in this study. As seen
in Table 6, although no statistical difference was found between the other pairs, the results
suggested that test contents might have had an effect on students’ test performance.
Conversations
As for the conversations section, no significant effects of test format (Factor A in Table 7)
were found. The mean scores shown in Table 8 were not statistically different among the
three classes. However, Table 9 shows that there was a significant difference between Tests
1 and 2, between Tests 1 and 3, and between Tests 3 and 4 (Factor B in Table 7). A plaus-
ible reason for this is that regardless of test format, Test 1 was by far the most difficult while
Test 3 was by far the easiest for the participants in this study.
Talks
As for the talks section, the difference in test format (Factor A in Table 10) produced
no effect on the students’ performance. There were no significant differences among
the three classes, and contrary to the conversations section, no difference was found
among tests (Factor B in Table 10). Table 6 reveals that in total scores, there was a
Table 17 Conversation 2 of Test 3: Changes of schedule
Question 1 Question 2 Question 3
Class n % n % n %
1 12 60.0 4 20.0 16 80.0
2 13 65.0 7 35.0 18 90.0
3 10 50.0 10 50.0 15 75.0
Note: Q1 deduction, Q2 and Q3 the same expression
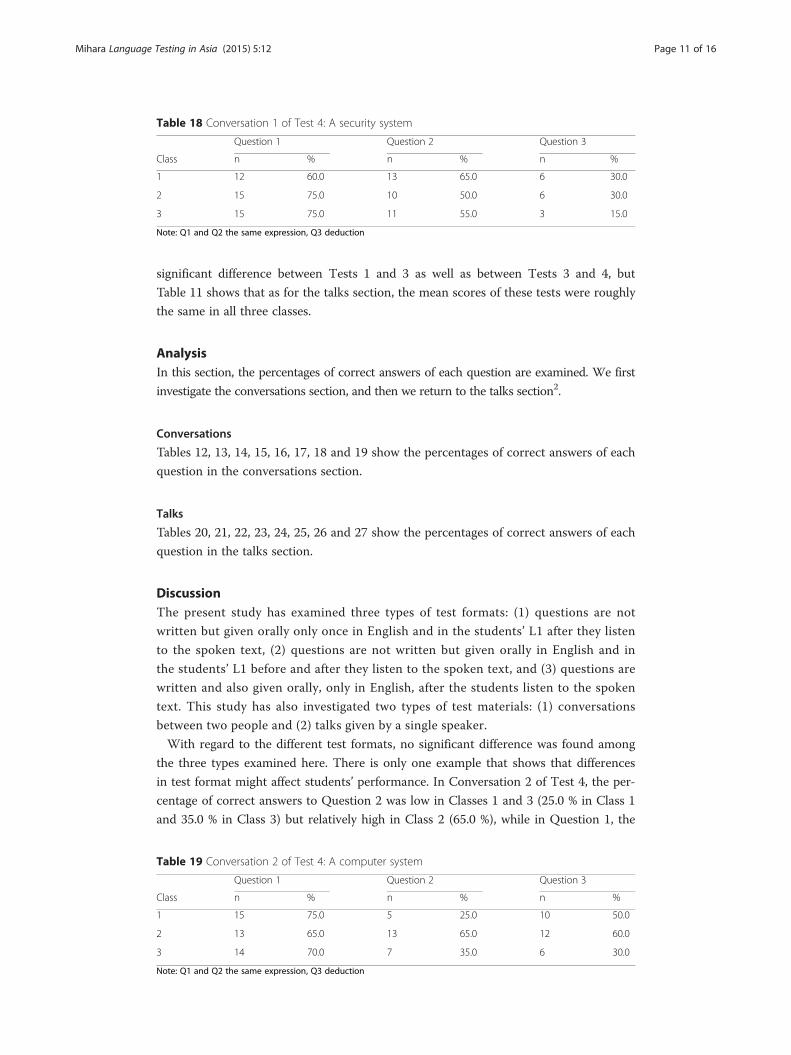
Table 18 Conversation 1 of Test 4: A security system
Question 1 Question 2 Question 3
Class n % n % n %
1 12 60.0 13 65.0 6 30.0
2 15 75.0 10 50.0 6 30.0
3 15 75.0 11 55.0 3 15.0
Note: Q1 and Q2 the same expression, Q3 deduction
Mihara Language Testing in Asia (2015) 5:12 Page 11 of 16
significant difference between Tests 1 and 3 as well as between Tests 3 and 4, but
Table 11 shows that as for the talks section, the mean scores of these tests were roughly
the same in all three classes.
AnalysisIn this section, the percentages of correct answers of each question are examined. We first
investigate the conversations section, and then we return to the talks section2.
Conversations
Tables 12, 13, 14, 15, 16, 17, 18 and 19 show the percentages of correct answers of each
question in the conversations section.
Talks
Tables 20, 21, 22, 23, 24, 25, 26 and 27 show the percentages of correct answers of each
question in the talks section.
DiscussionThe present study has examined three types of test formats: (1) questions are not
written but given orally only once in English and in the students’ L1 after they listen
to the spoken text, (2) questions are not written but given orally in English and in
the students’ L1 before and after they listen to the spoken text, and (3) questions are
written and also given orally, only in English, after the students listen to the spoken
text. This study has also investigated two types of test materials: (1) conversations
between two people and (2) talks given by a single speaker.
With regard to the different test formats, no significant difference was found among
the three types examined here. There is only one example that shows that differences
in test format might affect students’ performance. In Conversation 2 of Test 4, the per-
centage of correct answers to Question 2 was low in Classes 1 and 3 (25.0 % in Class 1
and 35.0 % in Class 3) but relatively high in Class 2 (65.0 %), while in Question 1, the
Table 19 Conversation 2 of Test 4: A computer system
Question 1 Question 2 Question 3
Class n % n % n %
1 15 75.0 5 25.0 10 50.0
2 13 65.0 13 65.0 12 60.0
3 14 70.0 7 35.0 6 30.0
Note: Q1 and Q2 the same expression, Q3 deduction
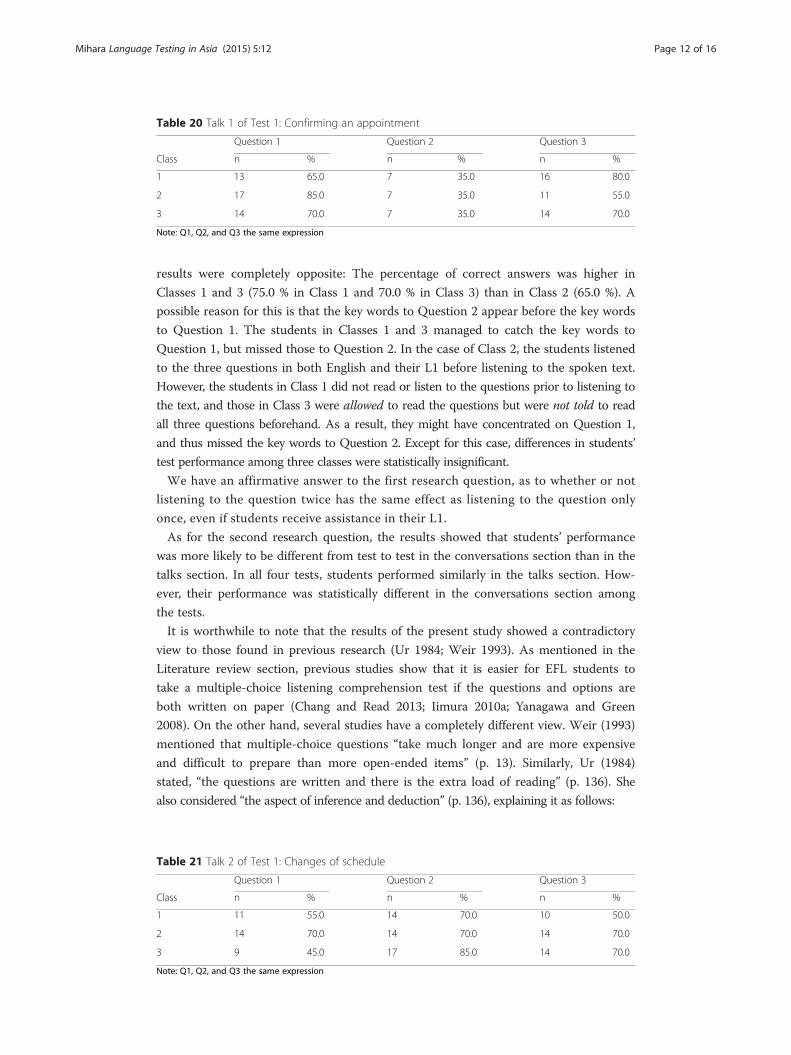
Table 20 Talk 1 of Test 1: Confirming an appointment
Question 1 Question 2 Question 3
Class n % n % n %
1 13 65.0 7 35.0 16 80.0
2 17 85.0 7 35.0 11 55.0
3 14 70.0 7 35.0 14 70.0
Note: Q1, Q2, and Q3 the same expression
Mihara Language Testing in Asia (2015) 5:12 Page 12 of 16
results were completely opposite: The percentage of correct answers was higher in
Classes 1 and 3 (75.0 % in Class 1 and 70.0 % in Class 3) than in Class 2 (65.0 %). A
possible reason for this is that the key words to Question 2 appear before the key words
to Question 1. The students in Classes 1 and 3 managed to catch the key words to
Question 1, but missed those to Question 2. In the case of Class 2, the students listened
to the three questions in both English and their L1 before listening to the spoken text.
However, the students in Class 1 did not read or listen to the questions prior to listening to
the text, and those in Class 3 were allowed to read the questions but were not told to read
all three questions beforehand. As a result, they might have concentrated on Question 1,
and thus missed the key words to Question 2. Except for this case, differences in students’
test performance among three classes were statistically insignificant.
We have an affirmative answer to the first research question, as to whether or not
listening to the question twice has the same effect as listening to the question only
once, even if students receive assistance in their L1.
As for the second research question, the results showed that students’ performance
was more likely to be different from test to test in the conversations section than in the
talks section. In all four tests, students performed similarly in the talks section. How-
ever, their performance was statistically different in the conversations section among
the tests.
It is worthwhile to note that the results of the present study showed a contradictory
view to those found in previous research (Ur 1984; Weir 1993). As mentioned in the
Literature review section, previous studies show that it is easier for EFL students to
take a multiple-choice listening comprehension test if the questions and options are
both written on paper (Chang and Read 2013; Iimura 2010a; Yanagawa and Green
2008). On the other hand, several studies have a completely different view. Weir (1993)
mentioned that multiple-choice questions “take much longer and are more expensive
and difficult to prepare than more open-ended items” (p. 13). Similarly, Ur (1984)
stated, “the questions are written and there is the extra load of reading” (p. 136). She
also considered “the aspect of inference and deduction” (p. 136), explaining it as follows:
Table 21 Talk 2 of Test 1: Changes of schedule
Question 1 Question 2 Question 3
Class n % n % n %
1 11 55.0 14 70.0 10 50.0
2 14 70.0 14 70.0 14 70.0
3 9 45.0 17 85.0 14 70.0
Note: Q1, Q2, and Q3 the same expression
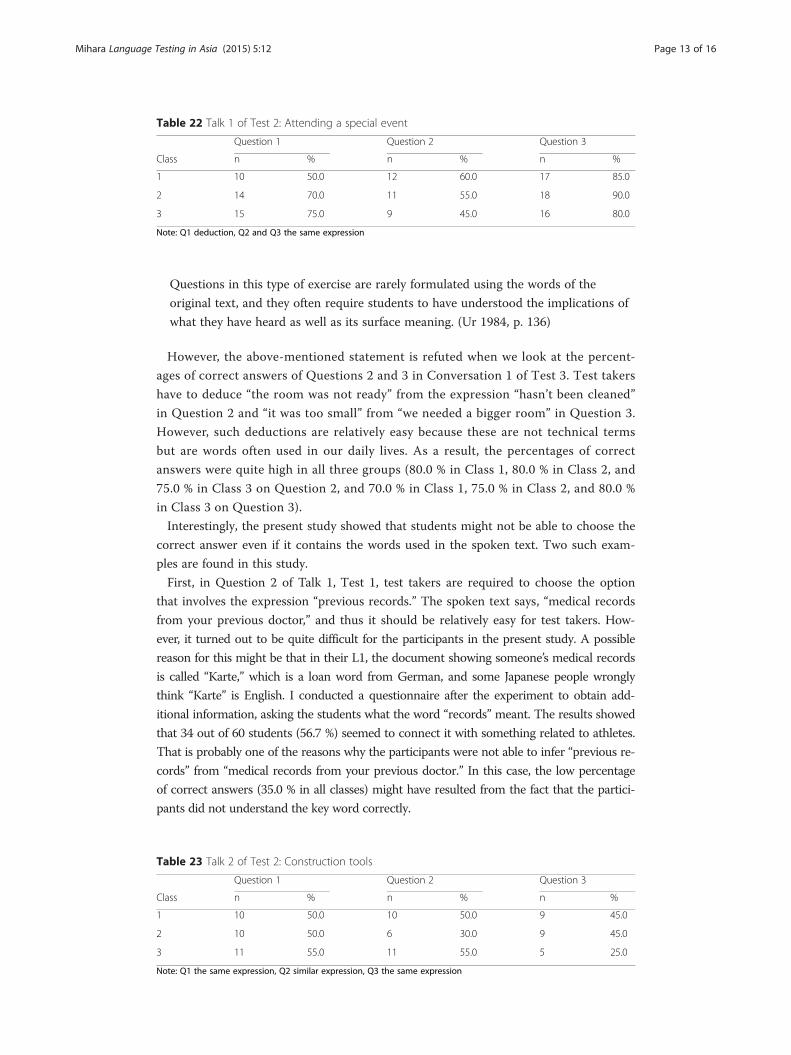
Table 22 Talk 1 of Test 2: Attending a special event
Question 1 Question 2 Question 3
Class n % n % n %
1 10 50.0 12 60.0 17 85.0
2 14 70.0 11 55.0 18 90.0
3 15 75.0 9 45.0 16 80.0
Note: Q1 deduction, Q2 and Q3 the same expression
Mihara Language Testing in Asia (2015) 5:12 Page 13 of 16
Questions in this type of exercise are rarely formulated using the words of the
original text, and they often require students to have understood the implications of
what they have heard as well as its surface meaning. (Ur 1984, p. 136)
However, the above-mentioned statement is refuted when we look at the percent-
ages of correct answers of Questions 2 and 3 in Conversation 1 of Test 3. Test takers
have to deduce “the room was not ready” from the expression “hasn’t been cleaned”
in Question 2 and “it was too small” from “we needed a bigger room” in Question 3.
However, such deductions are relatively easy because these are not technical terms
but are words often used in our daily lives. As a result, the percentages of correct
answers were quite high in all three groups (80.0 % in Class 1, 80.0 % in Class 2, and
75.0 % in Class 3 on Question 2, and 70.0 % in Class 1, 75.0 % in Class 2, and 80.0 %
in Class 3 on Question 3).
Interestingly, the present study showed that students might not be able to choose the
correct answer even if it contains the words used in the spoken text. Two such exam-
ples are found in this study.
First, in Question 2 of Talk 1, Test 1, test takers are required to choose the option
that involves the expression “previous records.” The spoken text says, “medical records
from your previous doctor,” and thus it should be relatively easy for test takers. How-
ever, it turned out to be quite difficult for the participants in the present study. A possible
reason for this might be that in their L1, the document showing someone’s medical records
is called “Karte,” which is a loan word from German, and some Japanese people wrongly
think “Karte” is English. I conducted a questionnaire after the experiment to obtain add-
itional information, asking the students what the word “records” meant. The results showed
that 34 out of 60 students (56.7 %) seemed to connect it with something related to athletes.
That is probably one of the reasons why the participants were not able to infer “previous re-
cords” from “medical records from your previous doctor.” In this case, the low percentage
of correct answers (35.0 % in all classes) might have resulted from the fact that the partici-
pants did not understand the key word correctly.
Table 23 Talk 2 of Test 2: Construction tools
Question 1 Question 2 Question 3
Class n % n % n %
1 10 50.0 10 50.0 9 45.0
2 10 50.0 6 30.0 9 45.0
3 11 55.0 11 55.0 5 25.0
Note: Q1 the same expression, Q2 similar expression, Q3 the same expression
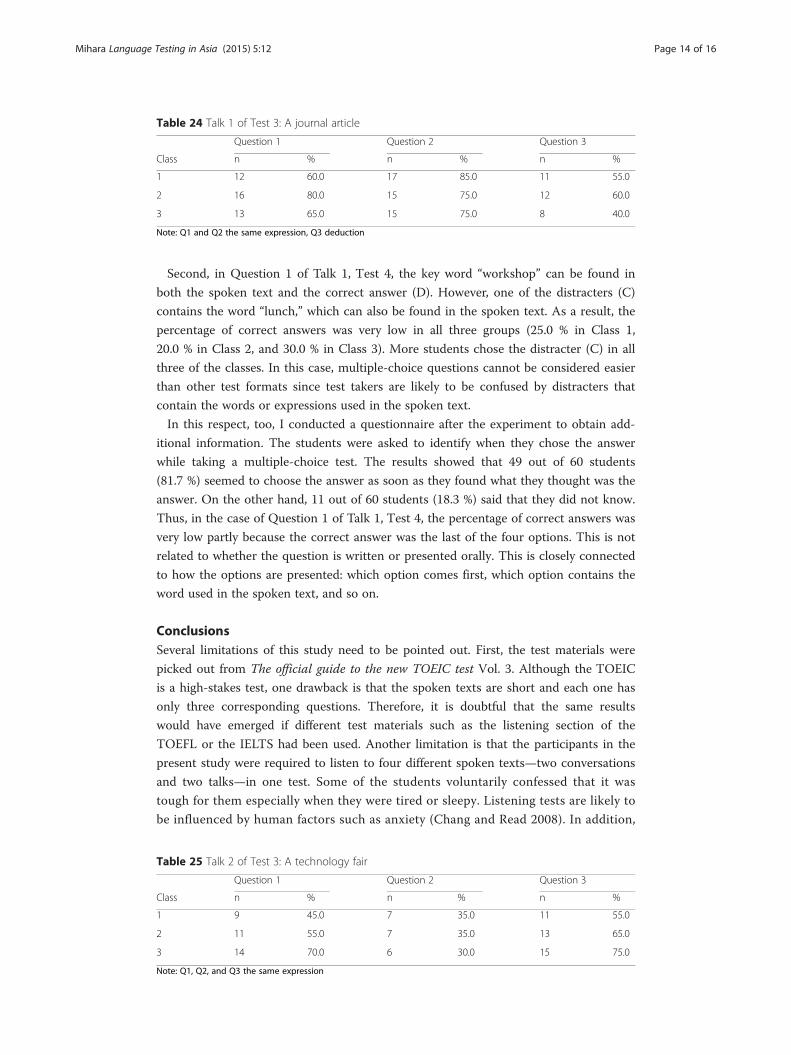
Table 24 Talk 1 of Test 3: A journal article
Question 1 Question 2 Question 3
Class n % n % n %
1 12 60.0 17 85.0 11 55.0
2 16 80.0 15 75.0 12 60.0
3 13 65.0 15 75.0 8 40.0
Note: Q1 and Q2 the same expression, Q3 deduction
Mihara Language Testing in Asia (2015) 5:12 Page 14 of 16
Second, in Question 1 of Talk 1, Test 4, the key word “workshop” can be found in
both the spoken text and the correct answer (D). However, one of the distracters (C)
contains the word “lunch,” which can also be found in the spoken text. As a result, the
percentage of correct answers was very low in all three groups (25.0 % in Class 1,
20.0 % in Class 2, and 30.0 % in Class 3). More students chose the distracter (C) in all
three of the classes. In this case, multiple-choice questions cannot be considered easier
than other test formats since test takers are likely to be confused by distracters that
contain the words or expressions used in the spoken text.
In this respect, too, I conducted a questionnaire after the experiment to obtain add-
itional information. The students were asked to identify when they chose the answer
while taking a multiple-choice test. The results showed that 49 out of 60 students
(81.7 %) seemed to choose the answer as soon as they found what they thought was the
answer. On the other hand, 11 out of 60 students (18.3 %) said that they did not know.
Thus, in the case of Question 1 of Talk 1, Test 4, the percentage of correct answers was
very low partly because the correct answer was the last of the four options. This is not
related to whether the question is written or presented orally. This is closely connected
to how the options are presented: which option comes first, which option contains the
word used in the spoken text, and so on.
ConclusionsSeveral limitations of this study need to be pointed out. First, the test materials were
picked out from The official guide to the new TOEIC test Vol. 3. Although the TOEIC
is a high-stakes test, one drawback is that the spoken texts are short and each one has
only three corresponding questions. Therefore, it is doubtful that the same results
would have emerged if different test materials such as the listening section of the
TOEFL or the IELTS had been used. Another limitation is that the participants in the
present study were required to listen to four different spoken texts—two conversations
and two talks—in one test. Some of the students voluntarily confessed that it was
tough for them especially when they were tired or sleepy. Listening tests are likely to
be influenced by human factors such as anxiety (Chang and Read 2008). In addition,
Table 25 Talk 2 of Test 3: A technology fair
Question 1 Question 2 Question 3
Class n % n % n %
1 9 45.0 7 35.0 11 55.0
2 11 55.0 7 35.0 13 65.0
3 14 70.0 6 30.0 15 75.0
Note: Q1, Q2, and Q3 the same expression
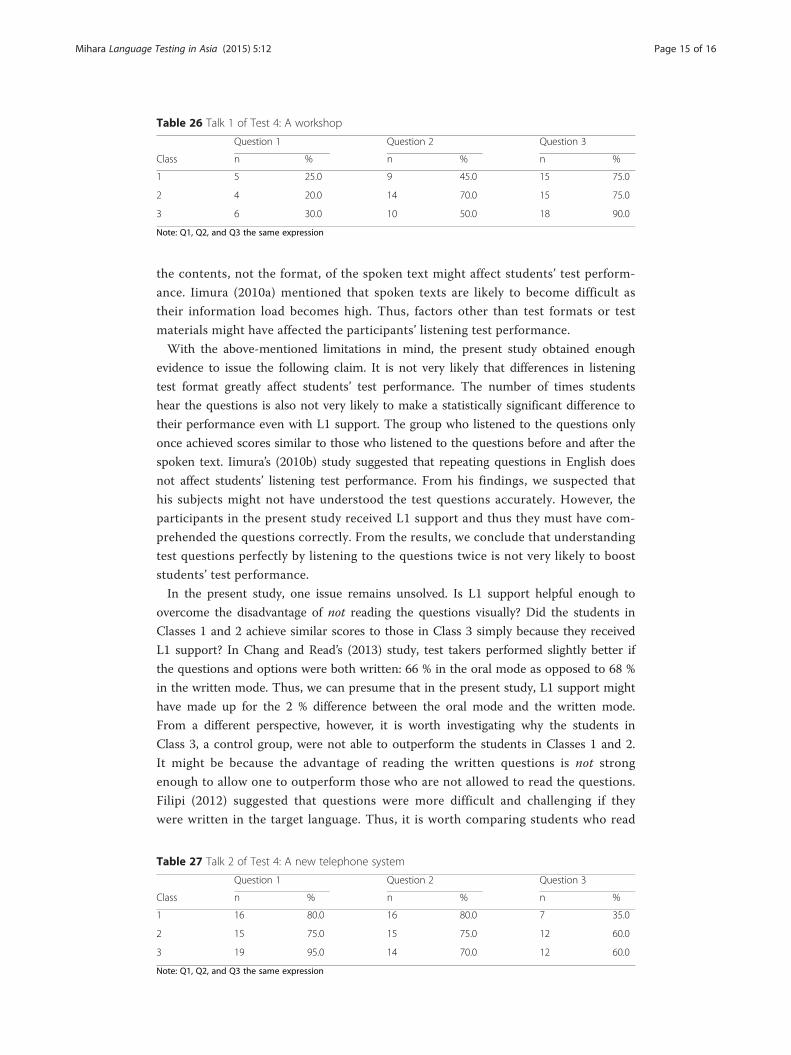
Table 26 Talk 1 of Test 4: A workshop
Question 1 Question 2 Question 3
Class n % n % n %
1 5 25.0 9 45.0 15 75.0
2 4 20.0 14 70.0 15 75.0
3 6 30.0 10 50.0 18 90.0
Note: Q1, Q2, and Q3 the same expression
Mihara Language Testing in Asia (2015) 5:12 Page 15 of 16
the contents, not the format, of the spoken text might affect students’ test perform-
ance. Iimura (2010a) mentioned that spoken texts are likely to become difficult as
their information load becomes high. Thus, factors other than test formats or test
materials might have affected the participants’ listening test performance.
With the above-mentioned limitations in mind, the present study obtained enough
evidence to issue the following claim. It is not very likely that differences in listening
test format greatly affect students’ test performance. The number of times students
hear the questions is also not very likely to make a statistically significant difference to
their performance even with L1 support. The group who listened to the questions only
once achieved scores similar to those who listened to the questions before and after the
spoken text. Iimura’s (2010b) study suggested that repeating questions in English does
not affect students’ listening test performance. From his findings, we suspected that
his subjects might not have understood the test questions accurately. However, the
participants in the present study received L1 support and thus they must have com-
prehended the questions correctly. From the results, we conclude that understanding
test questions perfectly by listening to the questions twice is not very likely to boost
students’ test performance.
In the present study, one issue remains unsolved. Is L1 support helpful enough to
overcome the disadvantage of not reading the questions visually? Did the students in
Classes 1 and 2 achieve similar scores to those in Class 3 simply because they received
L1 support? In Chang and Read’s (2013) study, test takers performed slightly better if
the questions and options were both written: 66 % in the oral mode as opposed to 68 %
in the written mode. Thus, we can presume that in the present study, L1 support might
have made up for the 2 % difference between the oral mode and the written mode.
From a different perspective, however, it is worth investigating why the students in
Class 3, a control group, were not able to outperform the students in Classes 1 and 2.
It might be because the advantage of reading the written questions is not strong
enough to allow one to outperform those who are not allowed to read the questions.
Filipi (2012) suggested that questions were more difficult and challenging if they
were written in the target language. Thus, it is worth comparing students who read
Table 27 Talk 2 of Test 4: A new telephone system
Question 1 Question 2 Question 3
Class n % n % n %
1 16 80.0 16 80.0 7 35.0
2 15 75.0 15 75.0 12 60.0
3 19 95.0 14 70.0 12 60.0
Note: Q1, Q2, and Q3 the same expression
Mihara Language Testing in Asia (2015) 5:12 Page 16 of 16
the questions only in English with students who receive L1 support in reading the
questions. Further research is needed in this respect.
Endnotes1The EIKEN Test, also called the STEP Test, is an English proficiency test conducted
by the EIKEN Foundation of Japan, which is a Japanese public-interest incorporated
foundation established in 1963. There are seven levels: Grade 1, Pre-1, 2, Pre-2, 3, 4,
and 5. The Grade 1 EIKEN Test is the most difficult while Grade 5 the easiest. The
Grade 2 EIKEN Test is suitable for high school graduates.2Each table is provided with the topic of each spoken text. The way to determine the
correct answer to each of the three questions is also written under each table. For ex-
ample, “Q1 the same expression” means that the correct answer to Question 1 involves
the same expression as that used in the spoken text. “Q2 similar expression” means that
the correct answer to Question 2 contains expressions similar to that used in the text.
In these cases, it is easier to find the key word. “Q1 deduction” means that test takers
have to deduce what the answer to Question 1 is from the spoken text. Therefore, this
type of question is the most difficult.
Competing interestsThe author declares that she has no competing interests.
Received: 14 May 2015 Accepted: 11 August 2015
References
Chang, AC-S, & Read, J. (2006). The effects of listening support on the listening performance of EFL learners. TESOLQuarterly, 40(2), 375–397.Chang, AC-S, & Read, J. (2008). Reducing listening test anxiety through various forms of listening support. TESL-EJ, 12(1),
1–25.Chang, AC-S, & Read, J. (2013). Investigating the effects of multiple-choice listening test items in the oral versus written
mode on L2 listeners’ performance and perceptions. System, 41(3), 575–586.Filipi, A. (2012). Do questions written in the target language make foreign language listening comprehension tests
more difficult? Language Testing, 29(4), 511–532.Iimura, H. (2010a). Factors affecting listening performance on multiple-choice tests: The effects of stem/option preview
and text characteristics. Language Education & Technology, 47, 17–36.Iimura, H. (2010b). The effects of repeating questions on auditory versions of multiple-choice listening tests: A
preliminary study. Japan Language Testing Association Journal [Nihon Gengo Tesuto Gakkai Kenkyu Kiyo], 13, 41–54.Papageorgiou, S, Stevens, R, & Goodwin, S. (2012). The relative difficulty of dialogic and monologic input in a
second-language listening comprehension test. Language Assessment Quarterly, 9(4), 375–397.Sakai, H. (2009). Effect of repetition of exposure and proficiency level in L2 listening tests. TESOL Quarterly, 43(2),
360–371.Ur, P. (1984). Teaching listening comprehension. Cambridge: Cambridge University Press.Weir, CJ. (1993). Understanding and developing language tests. New York: Prentice Hall.Yanagawa, K, & Green, A. (2008). To show or not to show: The effects of item stems and answer options on
performance on a multiple-choice listening comprehension test. System, 36(1), 107–122.
Submit your manuscript to a journal and benefi t from:
7 Convenient online submission
7 Rigorous peer review
7 Immediate publication on acceptance
7 Open access: articles freely available online
7 High visibility within the fi eld
7 Retaining the copyright to your article
Submit your next manuscript at 7 springeropen.com