Embed Size (px)
Citation preview
10.5731/pdajpst.2020.012047Access the most recent version at doi: 289-30175, 2021 PDA J Pharm Sci and Tech
Mark Jordi and Ted Heise Evaluation Threshold (AET)(Multidetector Approach) to Effectively Manage the AnalyticalOrthogonal Chromatographic and Detection Methods An Analytical Strategy Based on Multiple Complementary and
on January 26, 2022Downloaded from on January 26, 2022Downloaded from
COMMENTARY
An Analytical Strategy Based onMultiple Complementary andOrthogonal Chromatographic and Detection Methods(Multidetector Approach) to Effectively Manage the AnalyticalEvaluation Threshold (AET)
MARK JORDI1,* and TED HEISE2
1Jordi Labs, Mansfield, MA; and 2MED Institute Inc., West Lafayette, IN © PDA, Inc. 2021
ABSTRACT: To address patient safety, a drug product is chromatographically screened for organic leachables. Similarly, medi-
cal device and packaging system extracts are chromatographically screened for organic extractables as probable leachables. To
protect patient health, the screening methods must respond to all potentially unsafe substances. To be efficient, analytes deter-
mined to be below the toxicologically relevant threshold are removed from consideration before the subsequent analytical tasks
of identification and quantitation are performed. The analytical evaluation threshold (AET) was established for use as a toxico-
logically relevant threshold to differentiate between chromatographic peaks that are unlikely to be unsafe (and thus do not need
safety assessment) and those that are possibly unsafe (and thus require safety assessment). In practice, the instrumental
response associated with the AET is determined using surrogate standards. It is then assumed that the response strength for an
unknown extractable is equivalent to that for the surrogate standard at the AET concentration (i.e., relative response factor = 1).
It is an unfortunate reality that response factors vary for different compounds on nearly all detector systems. This complicates
the application of the AET and can result in a failure to include potentially toxicologically relevant compounds in the identifi-
cation phase of the analysis. To ensure protection, an uncertainty factor was built into the AET equation that adjusts the AET
downward to address response variation. Although this mechanism does increase the protectiveness of the AET, it assumes
that the available methodology and instrumentation is sufficiently sensitive to reach the new lowered AET value. However, in
some cases, the response variation is so great and the resulting uncertainty factor so large that the revised AET is below the
achievable sensitivity specifications of even state-of-the art, expertly operated instrumental technologies. The only option then
remaining is to concentrate the samples, which can result in adverse effects on analysis quality—counteracting the perceived
benefit of lowering the AET. This article demonstrates how an analytical strategy based on methods with multiple complemen-
tary and orthogonal detection techniques (a multidetector approach) mitigates the problem of response factor variation and thus
eliminates the need for large uncertainty factors and the resulting lower AET values. The primary concept is that all analytes
only need to be effectively detected by at least one of the combination of detectors applied, and it is this effective technique
(combination of all detectors and chromatographic methods utilized) that is used to perform the AET assessment.
KEYWORDS: Extractables, Leachables, Analytical evaluation threshold, AET, Uncertainty factor, Response factor var-
iation, Multidetector approach.
Introduction: The Analytical Evaluation Threshold
Leachables in drug products are foreign impurities
derived from the drug product’s packaging and manu-
facturing systems. These substances are transferred to a
patient as the patient is clinically treated with the drug
product. Leachables in medical devices are substances
present in the device that transfer from the device to
the patient during the device’s use with the patient
(1–3). In either circumstance, the effect of the leach-
ables on patient health and safety is of paramount
concern.
The purpose of an extractables/leachables study is to
establish either those extractables that could leach by
performing a controlled extraction study on the medi-
cal device or packaging and/or manufacturing system
* Corresponding Author: Jordi Labs, 200 Gilbert St,
Mansfield, MA 02048; Telephone: 508-966-1301;
E-mail: [email protected]
doi: 10.5731/pdajpst.2020.012047
Vol. 75, No. 3, May--June 2021 289
on January 26, 2022Downloaded from
or to establish those leachables that have leached
by performing a migration study. In either case, the
extract, the drug product (DP), or the contact medium
between a medical device and the patient is screened
for organic extractables or leachables using chromato-
graphic methods to discover, identify, and quantify
these substances.
An important consideration in screening for extractables
and leachables is “what limit of detection is required?”, or
alternatively “what is the concentration of an extractable
which is so low that likely the substance is safe regardless
of its identity?” Substances that are below this limit do not
need to be identified to establish that they are safe, thereby
reducing the analytical burden of identification. This is
highly significant, because in certain circumstances (such
as aggressive extraction of a chemically complex medical
device or container closure system [CCS]), the number of
peaks that need to be reported is large and the difficulty of
securing identities for all peaks is considerable. In such
circumstances, it may be challenging, if not impossible, to
produce credible identifications for all substances detected
at trace levels.
To this end, the concept of the analytical evaluation
threshold (AET) was developed by an Extractables and
Leachables Working Group of the Product Quality
Research Institute (PQRI) to facilitate the toxicological
risk assessment of extractables and leachables (4). This
concept was then further extended to medical devices
in a recent update to the ISO 10,993-18 standard as
shown in eq 1 (5):
AET ðlg=mLÞ ¼ DBT� A� 1Day
B� C� D� 1
UF(1)
In which DBT is a dose-based threshold such as the
threshold of toxicological concern, A is the number of
devices extracted, B is the extract volume, C is the
maximum number/mass of devices used per patient, D
is the dilution or concentration factor, and UF is an
uncertainty factor applied to account for response fac-
tor (RF) variation.
The AET establishes that level at and above which or-
ganic extractables or leachables must be reported for
toxicological risk assessment (6). In order for a reported
leachable to be toxicologically risk assessed, the analyt-
ical method must discover the leachable and provide in-
formation that leads to the leachable’s identity and
concentration in the drug product or extract. This makes
the AET a “protective” threshold, because the identifi-
cation and risk assessment of all compounds above the
AET is performed to protect patient health and safety.
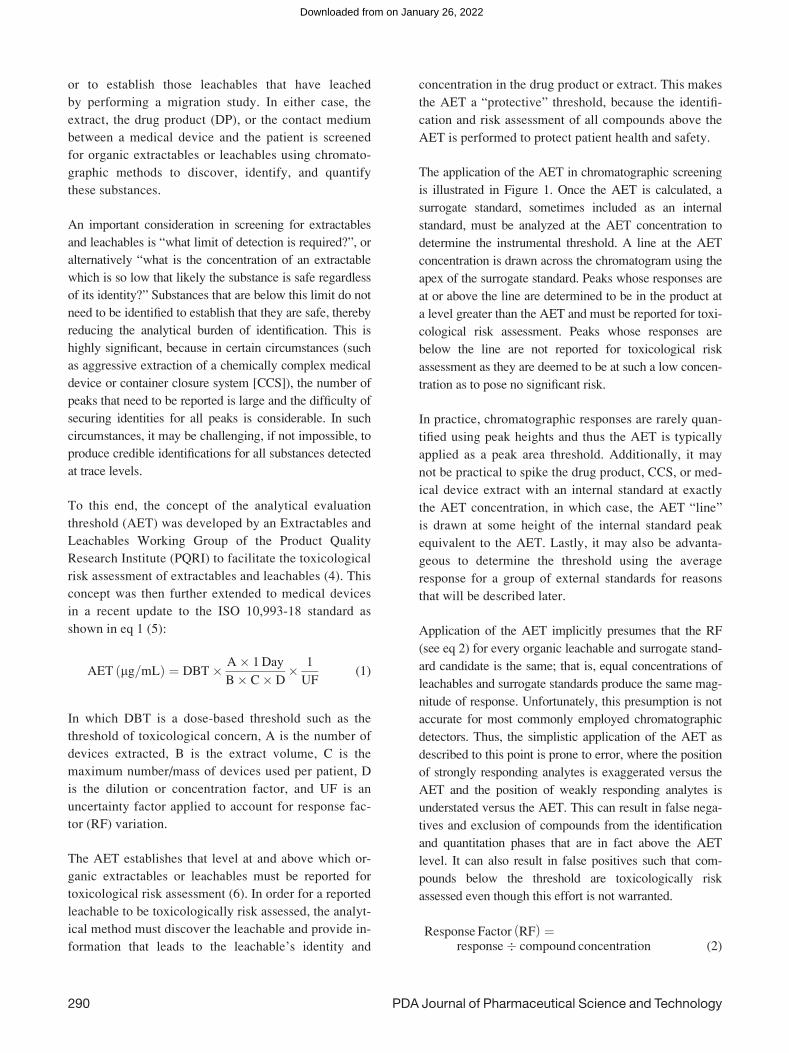
The application of the AET in chromatographic screening
is illustrated in Figure 1. Once the AET is calculated, a
surrogate standard, sometimes included as an internal
standard, must be analyzed at the AET concentration to
determine the instrumental threshold. A line at the AET
concentration is drawn across the chromatogram using the
apex of the surrogate standard. Peaks whose responses are
at or above the line are determined to be in the product at
a level greater than the AET and must be reported for toxi-
cological risk assessment. Peaks whose responses are
below the line are not reported for toxicological risk
assessment as they are deemed to be at such a low concen-
tration as to pose no significant risk.
In practice, chromatographic responses are rarely quan-
tified using peak heights and thus the AET is typically
applied as a peak area threshold. Additionally, it may
not be practical to spike the drug product, CCS, or med-
ical device extract with an internal standard at exactly
the AET concentration, in which case, the AET “line”
is drawn at some height of the internal standard peak
equivalent to the AET. Lastly, it may also be advanta-
geous to determine the threshold using the average
response for a group of external standards for reasons
that will be described later.
Application of the AET implicitly presumes that the RF
(see eq 2) for every organic leachable and surrogate stand-
ard candidate is the same; that is, equal concentrations of
leachables and surrogate standards produce the same mag-
nitude of response. Unfortunately, this presumption is not
accurate for most commonly employed chromatographic
detectors. Thus, the simplistic application of the AET as
described to this point is prone to error, where the position
of strongly responding analytes is exaggerated versus the
AET and the position of weakly responding analytes is
understated versus the AET. This can result in false nega-
tives and exclusion of compounds from the identification
and quantitation phases that are in fact above the AET
level. It can also result in false positives such that com-
pounds below the threshold are toxicologically risk
assessed even though this effort is not warranted.
Response Factor RFð Þ ¼response� compound concentration (2)
290 PDA Journal of Pharmaceutical Science and Technology
on January 26, 2022Downloaded from
If the root cause of the AET error is differing RFs
among analytes, then one way to address the error is to
adjust the AET downward to account for RF variation.
This is the purpose of the uncertainty factor (UF) in
eqs 1 and 3. The magnitude of the variation that must
be accounted for using the UF is dependent on the mag-
nitude of the RF variation between analytes and surro-
gate standards. Mathematically, such a correction to
the AET is shown in eq 3, which is a simplified version
of eq 1:
AETrevised ¼ AETinitial � UF (3)
The UF has previously been related to the RF distribu-
tion for all leachables and extractables analyzed by the
method using eq 4 (7, 8). Mathematically this is typi-
cally accomplished by calculating the relative standard
deviation (RSD) from an RF database created using the
specific analytical method applied and extractables
selected so as to be representative of the variety of the
compounds that are expected to be analyzed with the
method. By adjusting the AET downward via the UF,
analytes with RFs lower than that of the surrogate
standard now have responses that exceed the revised
AET and thus are properly reported for toxicological
risk assessment. An example of this can be seen in
Figure 1, where a UF of 3 was applied to adjust the
AET line downward to properly “capture” a previously
unreported compound.
UF ¼ 1= 1� RSDð Þ (4)
Although eqs 3 and 4 are mathematically uncompli-
cated, there are issues in establishing a useful and ac-
ceptable UF. Firstly, determination of the RSD of the
distribution for all leachables and extractables intended
Figure 1
Analytical evaluation threshold (AET): pictorial representation of the AET. An internal standard has been added to
the extract at a concentration equal to the AET. When the extract is analyzed, a line at the apex of the internal
standard peak is drawn horizontally across the chromatogram. Peaks whose responses are above the line must be
reported for toxicological risk assessment. Peaks whose responses are below the line need not be reported for toxico-
logical risk assessment, as they are deemed to have a negligible adverse effect on patient safety. Application of the
AET in this manner is based on the assumption that the internal standard and the analytes have the same response
factor. Assuming all three compounds are at an equal concentration (AET concentration), an “AET gap” is caused
by differing response factors. This gap is corrected by using an uncertainty factor that takes into account response
variation between analytes and internal standards. This has the effect of moving the AET line lower in the chromato-
gram and results in compound #1 being successfully “captured” by the AET assessment.
Vol. 75, No. 3, May--June 2021 291
on January 26, 2022Downloaded from
to be analyzed by the method presumes that the analyst
knows which extractables and leachables will need to
be identified. This presumption of the relevant potential
extractables and leachables is generally based on a
review of the chemistry of the materials of construction
and early screening results and can be termed focused
screening. Although some information is generally
available regarding the chemistry of expected extract-
ables and leachables when well characterized materials
of construction are being investigated, examples of
unexpected deleterious leachables have been reported,
highlighting the weaknesses inherent in a focused
screening approach. Examples such as the recall of
Tylenol because of 2,4,6-tribromoanisole from wood
pallets or the recall of breast implants because of
tainted industrial grade silicones with unexpected
impurities have shown that harmful leachables are not
always predictable based on the chemistry of the medi-
cal product under study (9, 18). For this reason, an
unbiased universal screening approach is preferred for
the safety assessment. This is not to deny the value in
using relevant chemical standards but rather to high-
light that the assumption that all relevant toxic impur-
ities are predictable has been shown historically to be
false. Another complication is limited availability of
analytical standards for all extractables and leach-
ables, preventing the determination of the RF values.
In the absence of a complete list of extractables and
without ready availability of reference standards, an
estimate of the RSD of the distribution will have to be
substituted for the true RSD. The accuracy of this esti-
mate then depends on the equivalence of the RSD for
the surrogate standards used in the focused screening
approach and that for the true distribution. This raises
questions as to how such an estimate should be con-
firmed to be representative, especially in the context
of a focused screening approach using a limited num-
ber of standards. In comparison, approaches intended
for universal screening can be continuously evaluated
as more extractables and leachables are analyzed with
the method providing an ever-improving estimate of
the true RSD of the method for the universe of
extractables.
Another significant problem is the large amount of RF
variation for some detection methods such as liquid
chromatography–mass spectrometry (LCMS), which
then results in high RSD values (8, 10, 11). Practically
speaking, as the RSD increases past 0.8 (a number that
is not unusual for LCMS RFs), the value of the UF rap-
idly increases. To a certain point, this escalation in the
UF is more a matter of practicality, as the revised AET
becomes smaller and more difficult to achieve as the
UF increases. However, at the point where the RSD
reaches and exceeds 1, the UF actually loses its physi-
cal significance as it produces an undefined result
(when the RSD= 1) and then becomes a negative num-
ber (as RSD becomes >1). In such cases, an AET can-
not be calculated using eq 1. Furthermore, if the
analytical method is not sufficiently sensitive to reach
the revised AET, then compounds that are potentially
unsafe will not be detected and the method is not pro-
tective of patient health and safety. It does the analyti-
cal chemist little good to have a revised AET that
cannot be achieved.
Mass spectrometry detectors are the “de facto work-
horse analytical instruments for extractables and leach-
ables (E&L) studies” (12). This is primarily a result of
their identification capabilities combined with their
generally high sensitivity and wide applicability. Alter-
native detectors (such as FID, UV, CAD, and so forth)
have typically not been emphasized in extractables and
leachables work, but examples of their use for drug im-
purity screening are not uncommon (13–16). One sig-
nificant advantage of using two detection methods is
that now there are two different analytical signals upon
which to judge whether the compound is above the
AET or not. Although either detector could be used for
this assessment, intuitively it is appropriate to base the
determination on the best method for the particular
analyte. Arguably, that best method is the one that has
the least amount of RF variation, as this would result in
the smallest UF and the least necessary adjustment of
the AET. If this concept makes sense for two detection
methods, its value is even greater when more detection
techniques are employed. In this case, one has informa-
tion from multiple different analytical signals upon
which to judge (1) whether the compound responsible
for the peaks in one or more of these combinations is
above the AET, (2) what the concentration of the com-
pound is, and (3) what the identity of the compound is.
The strengths of the multidetector approach are clear.
First and foremost, such an approach more comprehen-
sively covers the entire universe of potential extract-
ables and leachables, as an extractable that does not
respond to one detector is likely to respond to another
so long as their mechanisms of detection are indepen-
dent. Secondly, the approach produces a wealth of sup-
porting information that informs and enables accurate
quantitation and correct identification. The purpose of
292 PDA Journal of Pharmaceutical Science and Technology
on January 26, 2022Downloaded from
this publication is to describe a means for evaluation of
the AET using a multidetector approach and to demon-
strate how it can be used to mitigate the effects of RF
variation and thus reduce the need for large UF.
AET Evaluation Using Multiple Orthogonal and
Complementary Separation and Detection Methods
When considering the results obtained using a multide-
tector approach, the first decisions that must be made is
“which detector signal should be applied for AET
determination?” It is possible to get conflicting infor-
mation from the various detectors, especially if a re-
vised AET is applied and one or more of the methods
has high RF variation. Thus, possibly one (or more) de-
tector would indicate that a compound is “above the
AET” whereas other method combinations would say
“it is below the AET”, creating the dilemma of “which
one is right?” Three approaches could be applied to
this situation: (1) majority rules (and hope there is not
a tie), (2) the result from the best method for the ana-
lyte is taken (RF value closest to that for the internal
standard), or (3) if the peak is above the AET in one
detector, it is above the AET period. At this early stage
in the analysis, identification has not yet been per-
formed and hence there is limited information upon
which to gauge which detector system would be opti-
mum for an individual extractable or leachable. For
this reason, the third option (if a peak is above the AET
in one detector, it is above the AET) seems a necessary
approach until more information on the compound’s
identity is obtained.
To further illustrate how AET evaluation can be con-
ducted using a multidetector approach and how it can
prevent unreported compounds at the AET, consider
the following data from a recent publication by the
same primary author (10). In this work, a combination
of five different detectors were utilized as a part of two
chromatographic systems. The first system consisted of
a quadrupole time-of-flight liquid chromatography
mass spectrometer (QTOF-LCMS) coupled with a
charged aerosol detector (CAD) and an ultraviolet-visi-
ble detector (UV). This system is denoted as a QTOF-
LCMS-UV-CAD. The second system was a dual detec-
tion gas chromatography mass spectrometry (GCMS)
system using a Polyarc reactor system with flame ioni-
zation detection (FID) denoted as a GCMS-FID. The
combination of QTOF-LCMS-UV-CAD with GCMS-
FID provides five distinct mechanisms of detection
(ionizability for LCMS, light absorption for UV,
formation of charged particles for CAD, electron ioni-
zation for GCMS, and charged ions from combustion
for Polyarc FID). More correctly, the combination
includes six detection modes, as the LCMS provides
data when operated in either the positive or negative
ion mode. The AET was independently evaluated for
each detector signal by measuring the relative response
factor (RRF) value of each extractable on each detector
individually and comparing it with the average RRF
value for the distribution of extractables on each corre-
sponding detector as determined using a broadly
constituted database of extractables (10). A positive
response on any one or more of the six detectors (RRF
compound > RRF average/UF) resulted in inclusion
of that compound in the study. This method of evalua-
tion was based on using a surrogate standard with a
response corresponding to the average for all com-
pounds on that detector to establish the AET on each
detector, thus removing potential bias from standard
selection.
The goal of combining these detectors was to use the
synergies between the detection systems (optimum
detection approach for a given chemistry as guaged by
taking the highest signal observed among the detectors
applied for an unknown extractable or leachable) to
substantially reduce the probability that any com-
pounds are not reported when present at or above the
AET. It was essential that the detectors be selected
such that their mechanisms of detection were independ-
ent of one another and therefore poor response on any
one detector (such as LCMS) could be compensated for
using a detector with an enhanced response for that
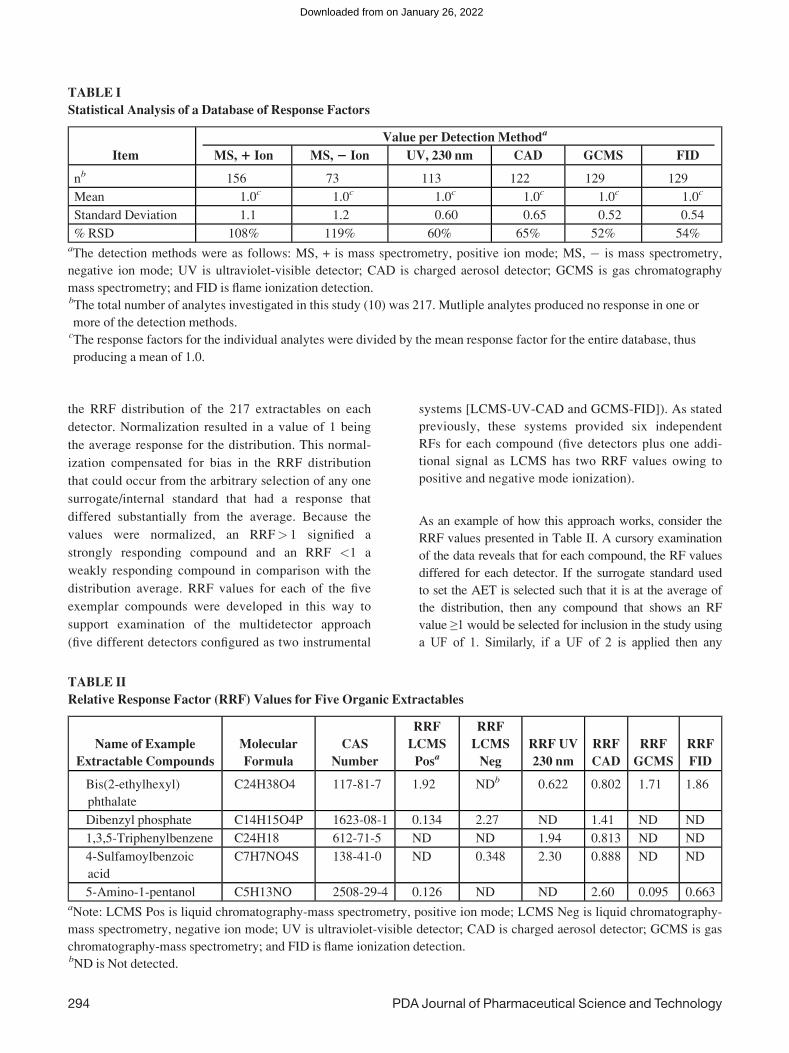
same compound (say UV or CAD). Pertinent statitical
analysis results for the RF distributions for the 217
extractables analyzed using this method are shown in
Table I.
Table II presents the RRF values for five example com-
pounds analyzed using the method. The RRF values
were obtained by dividing the slope of a calibration
curve (RF) for each compound by the slope of the cali-
bration curve for the surrogate/internal standard. If the
resulting RRF value was >1 then the compound would
be correctly detected during application of the AET
without the need for a UF value using that surrogate
standard. This was because an RRF> 1 indicated that
the response magnitude for that compound would be
greater than that for the surrogate standard at equal
concentrations. In Table II, the calculated RRF values
were then further normalized using the average RF for
Vol. 75, No. 3, May--June 2021 293
on January 26, 2022Downloaded from
the RRF distribution of the 217 extractables on each
detector. Normalization resulted in a value of 1 being
the average response for the distribution. This normal-
ization compensated for bias in the RRF distribution
that could occur from the arbitrary selection of any one
surrogate/internal standard that had a response that
differed substantially from the average. Because the
values were normalized, an RRF> 1 signified a
strongly responding compound and an RRF <1 a
weakly responding compound in comparison with the
distribution average. RRF values for each of the five
exemplar compounds were developed in this way to
support examination of the multidetector approach
(five different detectors configured as two instrumental
systems [LCMS-UV-CAD and GCMS-FID]). As stated
previously, these systems provided six independent
RFs for each compound (five detectors plus one addi-
tional signal as LCMS has two RRF values owing to
positive and negative mode ionization).
As an example of how this approach works, consider the
RRF values presented in Table II. A cursory examination
of the data reveals that for each compound, the RF values
differed for each detector. If the surrogate standard used
to set the AET is selected such that it is at the average of
the distribution, then any compound that shows an RF
value ≥1 would be selected for inclusion in the study usinga UF of 1. Similarly, if a UF of 2 is applied then any
TABLE I
Statistical Analysis of a Database of Response Factors
Item
Value per Detection Methoda
MS,+ Ion MS,− Ion UV, 230 nm CAD GCMS FID
nb 156 73 113 122 129 129
Mean 1.0c 1.0c 1.0c 1.0c 1.0c 1.0c
Standard Deviation 1.1 1.2 0.60 0.65 0.52 0.54
% RSD 108% 119% 60% 65% 52% 54%aThe detection methods were as follows: MS, + is mass spectrometry, positive ion mode; MS, � is mass spectrometry,
negative ion mode; UV is ultraviolet-visible detector; CAD is charged aerosol detector; GCMS is gas chromatography
mass spectrometry; and FID is flame ionization detection.bThe total number of analytes investigated in this study (10) was 217. Mutliple analytes produced no response in one or
more of the detection methods.cThe response factors for the individual analytes were divided by the mean response factor for the entire database, thus
producing a mean of 1.0.
TABLE II
Relative Response Factor (RRF) Values for Five Organic Extractables
Name of Example
Extractable Compounds
Molecular
Formula
CAS
Number
RRF
LCMS
Posa
RRF
LCMS
Neg
RRF UV
230 nm
RRF
CAD
RRF
GCMS
RRF
FID
Bis(2-ethylhexyl)
phthalate
C24H38O4 117-81-7 1.92 NDb 0.622 0.802 1.71 1.86
Dibenzyl phosphate C14H15O4P 1623-08-1 0.134 2.27 ND 1.41 ND ND
1,3,5-Triphenylbenzene C24H18 612-71-5 ND ND 1.94 0.813 ND ND
4-Sulfamoylbenzoic
acid
C7H7NO4S 138-41-0 ND 0.348 2.30 0.888 ND ND
5-Amino-1-pentanol C5H13NO 2508-29-4 0.126 ND ND 2.60 0.095 0.663aNote: LCMS Pos is liquid chromatography-mass spectrometry, positive ion mode; LCMS Neg is liquid chromatography-
mass spectrometry, negative ion mode; UV is ultraviolet-visible detector; CAD is charged aerosol detector; GCMS is gas
chromatography-mass spectrometry; and FID is flame ionization detection.bND is Not detected.
294 PDA Journal of Pharmaceutical Science and Technology
on January 26, 2022Downloaded from
compound with an RRF > 0.5 (1/UF=1/2 = 0.5) wouldbe selected for inclusioon. The first compound in the table,bis(2-ethylhexyl) phthalate showed a signal on five detec-tors (GCMS, FID, UV, CAD, and LCMS positive mode).The normalized RRF values were generally near 1 on alldetectors, indicating this compound would be easilyselected for inclusion when present above the AET usingany one of the detection methods with only a modest UFfactor (UF< 2). In comparison, the second compound,dibenzyl phosphate, showed a signal on only three of thefive detectors. In LCMS positive mode, the RRF valuewas only 0.134, indicating that a UF of 7.5 would berequired to include this compound in the study using onlythis detector. Fortunately, the RRF values in negativemode LCMS and in CAD were >1, indicating that no UFfactor would be required at all to include this compoundwhen present above the AET so long as these detectorswere applied. The third compound was 1,3,5-triphenylben-zene. This compound showed signal on only two detectors(UV and CAD). This means that no UF would be protec-tive for this compound using only GCMS and LCMS.However, using UV, this compound would be selected forinclusion when present above the AET even when no UFwas applied, as its RRF value on that detector was 1.94.
A consideration of the last two compounds (4-sulfa-
moylbenzoic acid and 5-amino-1-pentanol) shows how
the multidetector approach makes detection easier for
these acidic and basic compounds. Acids and bases are
classes of compounds that have often been noted to
have poor RFs and are therefore difficult to capture at
the AET in MS only methods. Notice how for 4-sulfa-
moylbenzoic acid, the UV and CAD both provided
stronger responses than the MS detectors for this other-
wise poorly responding compound. GCMS showed no
response for this compound because of its limited vola-
tility whereas LCMS showed a signal only in negative
mode with a weak RRF of 0.348. This compound
would require a UF of 3 for appropriate detection using
only GCMS and LCMS. In contrast, the UV RRF was
2.30, making this compound easily detectable with no
need for a UF. Lastly, the basic compound 5-amino-1-
pentanol showed very weak response by both LCMS
positive mode (0.126) and GCMS (0.095) and thus
would require a UF of 8 to be detected when above the
AET using only LCMS and GCMS. Fortunately, this
compound gave a strong response by CAD (RRF of
2.60) and a reasonable RRF in FID (0.663). This indi-
cates that no UF is required for inclusion of this com-
pound when CAD is applied and a UF of 2 would
assure inclusion using FID.
The previous examples made it clear that using a multi-
detector apporach allows reliable, positive detection
above the AET so long as each compound responds
strongly on at least one detector (with an RRF equal to
or greater than the RRF of the surrogate standard). It is
further noted in regards to the UF value that inclusion
of a compound in the study will occur whenever the
following criterion is met on at least one detector:
RRFcompound � RRFstandard=UF (5)
To more fully investigate the potential of the multide-
tector approach to prevent unreported compounds at
the AET, an examination of the data for the 217
extractables previously reported was performed (10).
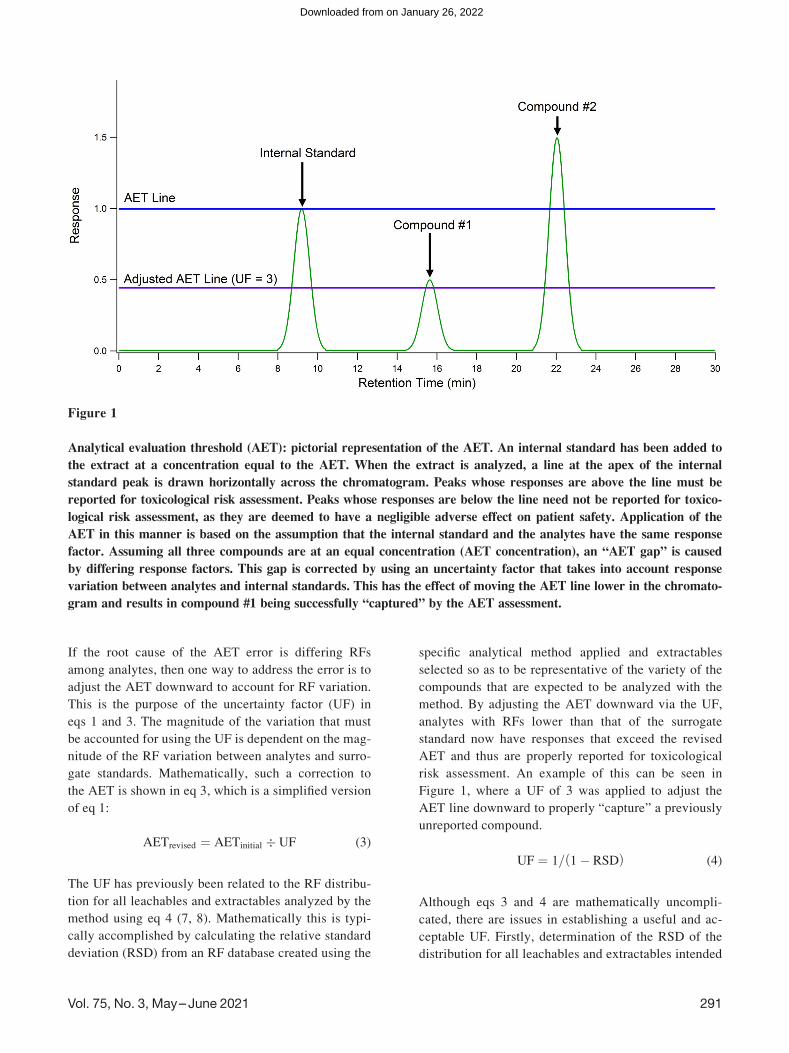
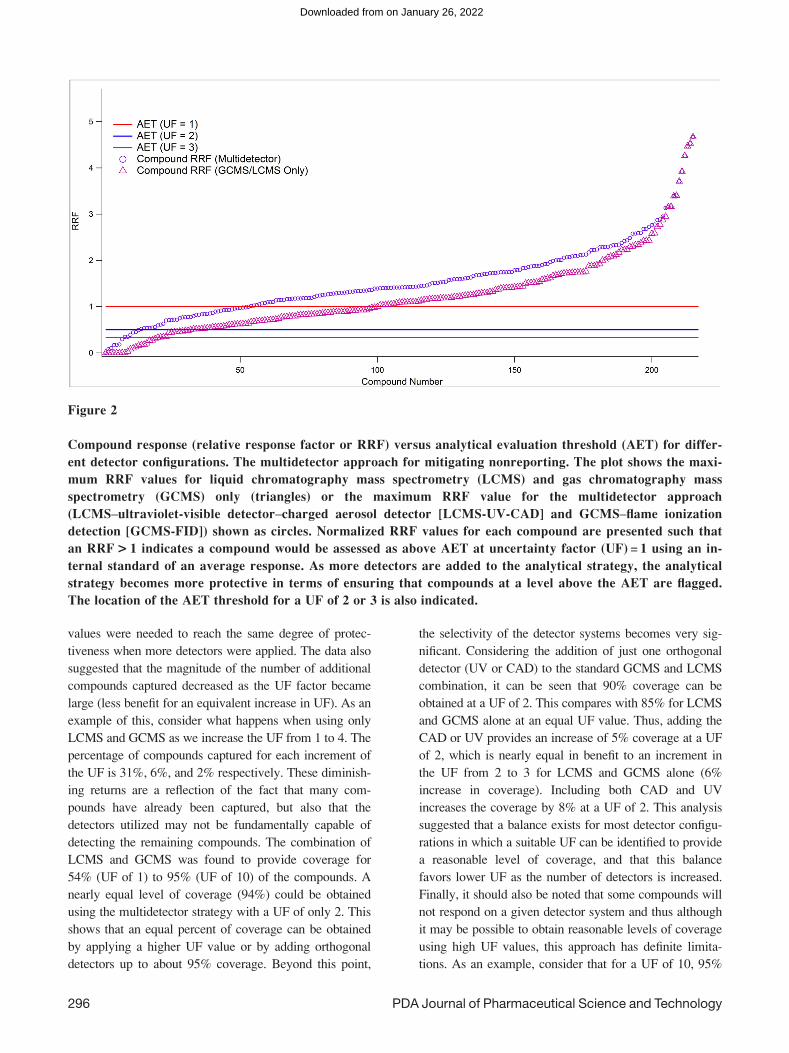
Figure 2 shows how many compounds were reported
as being above the AET level for the multidetector
approach as compared with using only LCMS and
GCMS for different UF values. In this plot, the circles
and triangles represent the maximum RRF value for an
individual compound using the strongest response from
among the combination of detectors utilized. The trian-
gles represent the highest RRF using only GCMS and
LCMS while the circles represent the highest RRF
from the combination of QTOF-LCMS-UV-CAD and
GCMS-FID. The analysis demonstrated that the multi-
detector approach using a UF of 2 resulted in positive
detection above the AET for 94% of the analytes. This
level of inclusivity was shown to be equivalent (within
1%) to using a UF of 10 when applying only LCMS
and GCMS (95% inclusion). This was a strong demon-
stration of the effectiveness of the multidetector
approach for mitigating the need for impractically large
values of UF resulting in revised AETs that potentially
exceed the sensitivity of even the most modern instru-
mentation. It accomplishes this with a reduced reliance
on sample concentration and work up, mitigating the
potential for compound loss, and is thus preferable. Fur-
thermore, it eliminates wasted effort in identifying,
quantifying, and risk assessing the excess number of
compounds that arise from needlessly low AETs.
Finally, as shown previously, some compounds pro-
vided no response on MS detectors (e.g., 1,3,5-triphe-
nylbenzene) and thus no UF was protective, whereas
the multidetector strategy provided alternative means to
overcome this limitation.
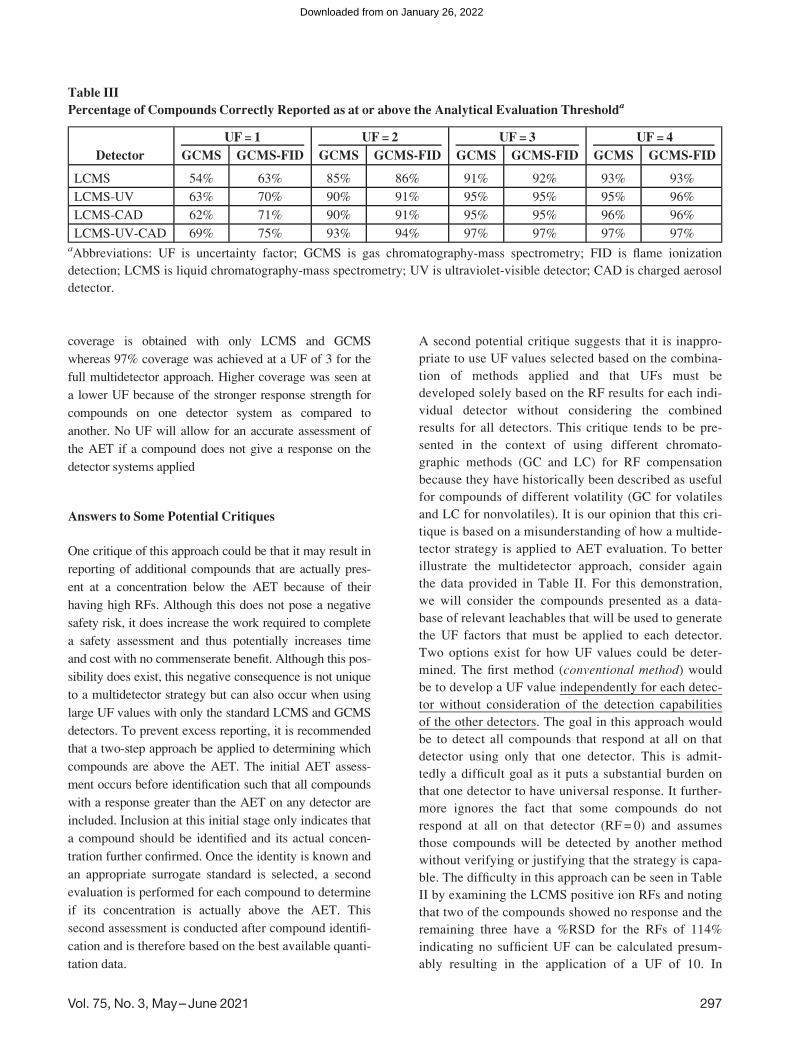
Table III compares the protectiveness of the multidetector
approach for different UF values ranging from 1 to 4 with
different detector combinations. The data indicated that a
UF factor was needed in all cases but that smaller UF
Vol. 75, No. 3, May--June 2021 295
on January 26, 2022Downloaded from
values were needed to reach the same degree of protec-
tiveness when more detectors were applied. The data also
suggested that the magnitude of the number of additional
compounds captured decreased as the UF factor became
large (less benefit for an equivalent increase in UF). As an
example of this, consider what happens when using only
LCMS and GCMS as we increase the UF from 1 to 4. The
percentage of compounds captured for each increment of
the UF is 31%, 6%, and 2% respectively. These diminish-
ing returns are a reflection of the fact that many com-
pounds have already been captured, but also that the
detectors utilized may not be fundamentally capable of
detecting the remaining compounds. The combination of
LCMS and GCMS was found to provide coverage for
54% (UF of 1) to 95% (UF of 10) of the compounds. A
nearly equal level of coverage (94%) could be obtained
using the multidetector strategy with a UF of only 2. This
shows that an equal percent of coverage can be obtained
by applying a higher UF value or by adding orthogonal
detectors up to about 95% coverage. Beyond this point,
the selectivity of the detector systems becomes very sig-
nificant. Considering the addition of just one orthogonal
detector (UV or CAD) to the standard GCMS and LCMS
combination, it can be seen that 90% coverage can be
obtained at a UF of 2. This compares with 85% for LCMS
and GCMS alone at an equal UF value. Thus, adding the
CAD or UV provides an increase of 5% coverage at a UF
of 2, which is nearly equal in benefit to an increment in
the UF from 2 to 3 for LCMS and GCMS alone (6%
increase in coverage). Including both CAD and UV
increases the coverage by 8% at a UF of 2. This analysis
suggested that a balance exists for most detector configu-
rations in which a suitable UF can be identified to provide
a reasonable level of coverage, and that this balance
favors lower UF as the number of detectors is increased.
Finally, it should also be noted that some compounds will
not respond on a given detector system and thus although
it may be possible to obtain reasonable levels of coverage
using high UF values, this approach has definite limita-
tions. As an example, consider that for a UF of 10, 95%
Figure 2
Compound response (relative response factor or RRF) versus analytical evaluation threshold (AET) for differ-
ent detector configurations. The multidetector approach for mitigating nonreporting. The plot shows the maxi-
mum RRF values for liquid chromatography mass spectrometry (LCMS) and gas chromatography mass
spectrometry (GCMS) only (triangles) or the maximum RRF value for the multidetector approach
(LCMS–ultraviolet-visible detector–charged aerosol detector [LCMS-UV-CAD] and GCMS–flame ionization
detection [GCMS-FID]) shown as circles. Normalized RRF values for each compound are presented such that
an RRF> 1 indicates a compound would be assessed as above AET at uncertainty factor (UF) = 1 using an in-
ternal standard of an average response. As more detectors are added to the analytical strategy, the analytical
strategy becomes more protective in terms of ensuring that compounds at a level above the AET are flagged.
The location of the AET threshold for a UF of 2 or 3 is also indicated.
296 PDA Journal of Pharmaceutical Science and Technology
on January 26, 2022Downloaded from
coverage is obtained with only LCMS and GCMS
whereas 97% coverage was achieved at a UF of 3 for the
full multidetector approach. Higher coverage was seen at
a lower UF because of the stronger response strength for
compounds on one detector system as compared to
another. No UF will allow for an accurate assessment of
the AET if a compound does not give a response on the
detector systems applied
Answers to Some Potential Critiques
One critique of this approach could be that it may result in
reporting of additional compounds that are actually pres-
ent at a concentration below the AET because of their
having high RFs. Although this does not pose a negative
safety risk, it does increase the work required to complete
a safety assessment and thus potentially increases time
and cost with no commenserate benefit. Although this pos-
sibility does exist, this negative consequence is not unique
to a multidetector strategy but can also occur when using
large UF values with only the standard LCMS and GCMS
detectors. To prevent excess reporting, it is recommended
that a two-step approach be applied to determining which
compounds are above the AET. The initial AET assess-
ment occurs before identification such that all compounds
with a response greater than the AET on any detector are
included. Inclusion at this initial stage only indicates that
a compound should be identified and its actual concen-
tration further confirmed. Once the identity is known and
an appropriate surrogate standard is selected, a second
evaluation is performed for each compound to determine
if its concentration is actually above the AET. This
second assessment is conducted after compound identifi-
cation and is therefore based on the best available quanti-
tation data.
A second potential critique suggests that it is inappro-
priate to use UF values selected based on the combina-
tion of methods applied and that UFs must be
developed solely based on the RF results for each indi-
vidual detector without considering the combined
results for all detectors. This critique tends to be pre-
sented in the context of using different chromato-
graphic methods (GC and LC) for RF compensation
because they have historically been described as useful
for compounds of different volatility (GC for volatiles
and LC for nonvolatiles). It is our opinion that this cri-
tique is based on a misunderstanding of how a multide-
tector strategy is applied to AET evaluation. To better
illustrate the multidetector approach, consider again
the data provided in Table II. For this demonstration,
we will consider the compounds presented as a data-
base of relevant leachables that will be used to generate
the UF factors that must be applied to each detector.
Two options exist for how UF values could be deter-
mined. The first method (conventional method) would
be to develop a UF value independently for each detec-
tor without consideration of the detection capabilities
of the other detectors. The goal in this approach would
be to detect all compounds that respond at all on that
detector using only that one detector. This is admit-
tedly a difficult goal as it puts a substantial burden on
that one detector to have universal response. It further-
more ignores the fact that some compounds do not
respond at all on that detector (RF = 0) and assumes
those compounds will be detected by another method
without verifying or justifying that the strategy is capa-
ble. The difficulty in this approach can be seen in Table
II by examining the LCMS positive ion RFs and noting
that two of the compounds showed no response and the
remaining three have a %RSD for the RFs of 114%
indicating no sufficient UF can be calculated presum-
ably resulting in the application of a UF of 10. In
Table III
Percentage of Compounds Correctly Reported as at or above the Analytical Evaluation Thresholda
Detector
UF= 1 UF= 2 UF= 3 UF= 4
GCMS GCMS-FID GCMS GCMS-FID GCMS GCMS-FID GCMS GCMS-FID
LCMS 54% 63% 85% 86% 91% 92% 93% 93%
LCMS-UV 63% 70% 90% 91% 95% 95% 95% 96%
LCMS-CAD 62% 71% 90% 91% 95% 95% 96% 96%
LCMS-UV-CAD 69% 75% 93% 94% 97% 97% 97% 97%aAbbreviations: UF is uncertainty factor; GCMS is gas chromatography-mass spectrometry; FID is flame ionization
detection; LCMS is liquid chromatography-mass spectrometry; UV is ultraviolet-visible detector; CAD is charged aerosol
detector.
Vol. 75, No. 3, May--June 2021 297
on January 26, 2022Downloaded from
LCMS negative mode, three compounds were not
detected and the remaining two compounds showed a
% RSD of 75% and a required UF of 4. Similarly, the
GCMS RF distribution showed a % RSD of 83% and
required a UF of 6.1 and failed to detect three com-
pounds. The combined strategy (LCMS positive and
negative mode and GCMS with UF of 10, 4, and 6.1)
failed to detect one compound (1,3,5-triphenylbenzene)
as it had no response on the applied detectors. The sec-
ond approach (multidetector approach) is based on
determining the UF value in consideration of all of the
detectors applied. This does not necessitate a consistent
UF for all detectors but it is generally preferable as it
minimize the need for sample concentration. The goal
is to determine the most optimum group of detectors
and methods that minimizes the required UF value
needed to obtain the desired percent of coverage. Said
another way, the goal is to demonstrate that a given
combination of detectors, methods, and UF when
applied in combination allow successful detection for
an agreed upon percentage of compounds. The effec-
tiveness of this approach can be seen in Table II by not-
ing that a UF of 1 is sufficient to detect all five
compounds so long as all detectors are considered (ev-
ery compound has an RRF> 1 on at least one detector).
The key assumption in the multidetector approach is
that when a new extractable is analyzed, the probability
of detection will be consistent with previous experi-
ence based on the analysis of a broadly constituted
database of extractables. The underlying assumption in
the multidetector approach can be justified based on
data from a broadly constituted database of extractables
and can be continuously improved as more extractables
are analyzed by the method. It can further be verified in
a particular analysis by analyzing standards of relevant
chemistry and demonstrating suitable detection. In com-
parison, the conventional approach assumes that all non-
responding compounds not measured on one detector
will be captured by the remaining detector without justi-
fication because these nonresponding compounds are
not included in the UF determination for an individual
detector and no reconciliation is typically performed to
confirm the overall coverage of the approach using a
broadly constituted database of extractables.
Practical Considerations When Applying a
Multidetector AET Approach
A few practical considerations are also worth noting
when applying the multidetector approach to the AET
determination. First, it is important to remember that in
all cases (using a multidetector or not) that appropriate
surrogate standard selection is essential. This presumes
a working knowledge of the method-specific RF distri-
butions for each detector, which requires the creation
of a RF database specific to each detector for a given
method. As stated previously, this database should be
broadly constituted (universal) so as to allow for detec-
tion of expected and unexpected extractables and
leachables as examples exist of toxic leachables that
would not have been predicted based on the materials
of construction. Further verification of the methods
appropriateness for the sample under study can be per-
formed using chemically relevant standards as judged
based on the materials of construction or early screen-
ing work as part of system suitability to confirm that
expected extractables are well covered by the specific
multidetector approach (combination of detectors,
methods, and UF values applied).
In the multidetector approach, an evaluation is per-
formed on each signal observed on any detector/chro-
matographic method and any compound that shows a
signal above the AET on at least one detector must be
included in the study. This by definition requires that
an AET be established on each detector so that an eval-
uation can be made. It is the combination of all of these
evaluations that must be sufficient to detect all relevant
extractables and leachables as no one method could
ever be expected to cover all compounds. The analysis
presented here assumed that the surrogate standard used
to set the AET had a response that was at the average of
the RF distribution for each detector. This avoids bias
caused by a strong or weak surrogate standard response.
If a particularly strongly responding surrogate standard
is selected, then this has the effect of increasing the
threshold value and decreases the conservatism of the
assessment. Similarly, if a poorly responding standard
is selected, this decreases the magnitude of the thresh-
old value making the study more conservative. In prac-
tice, it is difficult if not impossible to identify a single
standard that would be at the center of the response dis-
tribution for multiple detectors. The different detection
principles and classes of compounds to which they are
best suited generally necessitates that different stand-
ards be applied for different detectors. Even in the lim-
ited case of a single detector, it is difficult to identify a
standard that has a response that is at exactly the aver-
age of the RF distribution of even that one detector.
Two methods can be proposed to account for the result-
ing distribution bias. The first would be to use a surro-
gate standard appropriate to each detector that is at or
298 PDA Journal of Pharmaceutical Science and Technology
on January 26, 2022Downloaded from
below the middle of the distribution for that detector.
The extent to which the surrogate standard response is
below the average response would further increase the
conservatism of the study. If the response of the surro-
gate is higher than the average response, then a mathe-
matic adjustment could be applied to increase the
protectiveness of the threshold in proportion to the mag-
nitude of the bias introduced. This could be accom-
plished using the RRF value for the surrogate standard
and the average RRF for the distribution as determined
for each detector and could be expressed mathemati-
cally as shown in eq 5:
PeakArea Threashold� RRFAverage=RRFsurrogate standard
(6)
This may be preferred in cases for which a surrogate
standard was selected before determining the distribu-
tion characteristics as both of these mechanisms can
account for distribution bias. It is also noted that the
use of the average peak area for a series of surrogate
standards selected to be appropriate for each detector
system could be substituted for a single standard to
obtain a value for the threshold that approaches the av-
erage of the distribution on that detector. This approach
has the benefit of simultaneously demonstrating the
suitability of the method to detect compounds with a
range of RFs (strong and weakly responding com-
pounds) that can then serve as quantitation standards
following identification. A set of standards should
ideally be selected for each detector such that they
have an average RRF near the average of the distribu-
tion on that detector.
This then brings up one final important consideration,
which is that the sensitivity (limit of detection [LOD]
or limit of quantification [LOQ]) for the various detec-
tors must be sufficiently low to reach the AET. Detec-
tor sensitivity is not the same for all detectors. Thus,
the ability to effectively apply a full multidetector
approach is dependent upon the AET value required. If
the AET is so low that at least one of the detectors can-
not hit the required sensitivity, then the protectiveness
of the study will be reduced and the UF may need to be
increased to compensate. Fortunately, the magnitude of
the UF can generally remain low so long as at least one
orthogonal detector is applied in addition to GCMS
and LCMS. The authors would also note that there is
ongoing debate regarding the use of LOD or LOQ as
the appropriate measure of sensitivity when applied to
AET evaluation. The current ISO 10,993-18 guidance
states “if one purpose of the analytical testing is quanti-
fication, the AET should be higher than or equal to the
LOQ” (5). The AET was originally defined as “the
threshold at or above which a chemist should begin to
identify (emphasis added) a particular leachable and/or
extractable and report it for potential toxicological
assessment” (7). It is the authors’ opinion that although
it is always preferred to have improved signal to noise
in any evaluation (i.e., use LOQ), LOD is the appropri-
ate limit given that the AET is a reporting threshold
(compounds above this limit must be reported) and is a
starting place from which to begin identification. Hav-
ing a 3:1 signal/noise ratio (the common understanding
of LOD) is sufficient to determine if something is “de-
tectable as above the noise” hence it is a suitable metric
for determining if a signal is above the AET. Quantita-
tion is better reserved for a later stage in the analysis at
which more options exist for improving method sensi-
tivity, such as using targeted quantitation. This is an
analytical necessity in cases in which instrumental/
method LOQ is greater than the desired AET value and
for which options to increase method LOQ have been
exhausted. Using either LOD or LOQ does not funda-
mentally change the multidetector strategy so long as
each detector can reach the required sensitivity limit.
Finally, it is our opinion that the cost of increasing
method sensitivity through sample concentration (3.3�increase in concentration factor needed for LOQ vs.
LOD) and the resulting potential compound loss or
degradation likely outweighs the benefit obtained by
using LOQ at this early stage in the analysis.
Conclusion
The AET is an important tool for practical screening of
organic extractables and leachables as it minimizes the
amount of effort that must be expended identifying/
quantifying compounds for which there is a very low
risk of toxicologically adverse effects. As demon-
strated by previous product recalls, screening methods
for extractables and leachables should have broad
detection capabilities as it is not always possible to pre-
dict which toxicologically relevant leachables may be
present in a medical product. Successful application of
the traditional AET approach is dependent on analytical
responses being consistent, compound to compound, a
circumstance that is not realized using the common
detection methods applied for chromatographic screen-
ing for organic extractables and leachables. For poorly
responding analytes, the AET may lose its ability to
mitigate risk as the poorly responding analytes may
Vol. 75, No. 3, May--June 2021 299
on January 26, 2022Downloaded from
appear to be below the AET based on response but are
actually above the AET based on concentration.
To compensate for RF variation, the AET can be re-
vised via the use of a UF that is related to the magnitude
of the RF variation for the distribution of all extract-
ables and leachables analyzed using the method. How-
ever, AET adjustment becomes problematic for certain
individual analytical methods, such as LCMS, where
RF variation is large and the UF correction becomes
challenging, both mathematically and practically. These
problems are substantially reduced, however, using a
multidetector approach, an analytical approach that lev-
erages multiple chromatographic methods with multiple
complementary and orthogonal detection methods and a
UF value verified to provide sufficient coverage using a
broadly constituted database of extractables. The multi-
detector approach provides an alternative means to
reduce the effects of RF variation through the applica-
tion of a more optimum detector and thus reduce the
number of unreported compounds present in a sample at
or above the AET while also reducing the need for large
UF. By extension, this reduces the need for additional
sample preparation and concentration and with it the
risks of loss or degradation of extractables. Thus
although both methods (applying a larger UF and using
a multidetector appproach) would in theory provide an
equal degree of protection considering only response
variation, the multidetector approach has the advantage
of requiring less sample preparation and concentration
to reach the same extent of coverage and provides a
more protective result for cases in which sample prepa-
ration causes loss or degradation of extractables and
leachables.
Appropriate surrogate standard selection and correc-
tion for distribution bias remains an important consid-
eration no matter which strategy is applied. Standard
and UF selection are integrally related and standards
must be selected with a knowledge of the RF distribu-
tion for each detector. The use of chemically relevent
standards could be used as a part of system suitability
to validate the applied strategy for a particular device
chemistry.
Based on the concepts that (a) use of multiple detectors
makes it more likely that at least one detector will
effectively respond to every extractable or leachable
and (b) that the protectiveness of the AET is ensured
for each compound so long as it can be properly applied
on at least one detector (and not necessarily all
detection methods simultaneously), this manuscript has
established that a properly designed and appropriately
complementary and orthogonal multiple detection strat-
egy can ensure that the AET is protective without the
use of large and largely unmanageable UFs.
Conflict of Interest Declaration
The authors have no conflicts of interest to disclose;
however, Drs. Jordi and Heise note their affiliations
with contract research organizations (CROs) that pro-
vide extractables and leachables services to the pharma-
ceutical, food contact, and medical device industries.
References
1. Jenke, D. Identification, Analysis and Safety
Assessment of Leachables and Extractables. TrAC
Trends Anal. Chem. 2018, 101, 56–65.
2. U.S. Pharmacopeial Convention, General Chapter
<1663> Assessment of Extractables Associated
with Pharmaceutical Packaging/Delivery Systems.
In USP 40–NF 35, USP: Rockville, MD, 2017;
pp 2020–2035.
3. U.S. Pharmacopeial Convention, General Chapter
<1664> Assessment of Drug Product Leachables
Associated with Pharmaceutical Packaging/Deliv-
ery Systems. In USP 40–NF 35, USP: Rockville,
MD, 2017; pp 2035–2047.
4. PQRI Leachables and Extractables Working Group.
Safety Thresholds and Best Practices for Extractables and
Leachables in Orally Inhaled and Nasal Drug Products,
2006. PQRI Web site. http://pqri.org/wp-content/uploads/
2015/08/pdf/LE_Recommendations_to_FDA_09-29-06.
pdf (accessed June 16, 2019).
5. International Organization for Standardization, ISO
10993-18:2020 Biological Evaluation of Medical
Devices, Part 18: Chemical Characterization of
Medical Device Materials Within a Risk Manage-
ment Process, 2020. ISO Web site. https://www.iso.
org/standard/64750.html (accessed January 1, 2020).
6. Broschard, T. H.; Glowienke, S.; Bruen, U. S.;
Nagao, L. M.; Teasdale, A.; Stults, C. L. M.; Li,
K. L.; Iciek, L. A.; Erexson, G.; Martin, E. A.;
Ball, D. J. Assessing Safety of Extractables from
Materials and Leachables in Pharmaceuticals and
300 PDA Journal of Pharmaceutical Science and Technology
on January 26, 2022Downloaded from
Biologics—Current Challenges and Approaches.
Regul. Toxicol. Pharmacol. 2016, 81, 201–211.
7. Norwood, D. L.; Nagao, N. The Analytical Evalu-
ation Threshold (AET), 2005. PQRI Web site.
http://pqri.org/wp-content/uploads/2015/08/pdf/
PQRI_AET_Poster.pdf (accessed June 14, 2019).
8. Jordi, M. A.; Khera, S.; Roland, K.; Jiang, L.; Solo-
mon, P.; Nelson, J.; Lateef, S.; Woods, J.; Martin,
L.; Martin, S.; Aiello, F.; Chen, N. Qualitative
Assessment of Extractables from Single-Use Compo-
nents and the Impact of Reference Standard Selec-
tion. J. Pharm. Biomed. Anal. 2018, 150, 368–376.
9. McNeil Consumer Healthcare Recalls Wide Range
of Products. React. Wkly 2010, 1285 (3).
10. Jordi, M. A.; Rowland, K.; Liu, W.; Cao, X.; Zong,
J.; Ren, Y.; Liang, Z.; Zhou, X.; Louis, M.; Lerner,
K. Reducing Relative Response Factor Variation
Using a Multidetector System for Extractables and
Leachables (E&L) Analysis to Mitigate the Need
for Uncertainty Factors. J. Pharm. Biomed. Anal.
2020, 186 113334.
11. Blanz, J.; Williams, G.; Dayer, J.; Delemonte, T.;
Gertsch, W.; Ramstein, P.; Aichholz, R.; Trunzer,
M.; Pearson, D. Evaluation of Relative MS Response
Factors of Drug Metabolites for Semi-Quantitative
Assessment of Chemical Liabilities in Drug Discov-
ery. J. Mass Spectrom. 2017, 52 (4), 210–217.
12. Sica, V. P.; Krivos, K. L.; Kiehl, D. E.; Pulliam,
C. J.; Henry, I. D.; Baker, T. R. The Role of Mass
Spectrometry and Related Techniques in the Anal-
ysis of Extractable and Leachable Chemicals.
Mass Spectrom. Rev. 2020, 39 (1–2), 212–226.
13. Barbarin, N.; Henion, J. D.; Wu, Y. Comparison
between Liquid Chromatography–UV Detection
and Liquid Chromatography–Mass Spectrometry
for the Characterization of Impurities and/or
Degradants Present in Trimethoprim Tablets. J.
Chromatogr. A 2002, 970 (1–2), 141–154.
14. Baertschi, S. W. Analytical Methodologies for Discov-
ering and Profiling Degradation-Related Impurities.
TrAC Trends Anal. Chem. 2006, 25 (8), 758–767.
15. Wahl, O.; Holzgrabe, U. Impurity Profiling of
Ibandronate Sodium by HPLC–CAD. J. Pharm.
Biomed. Anal. 2015, 114, 254–264.
16. Hong, P.; Phoebe, A. D.; Jones, M. D. Study of
Relative Response Factors and Mass Balance
in Forced Degradation Studies with Liquid
Chromatography/Photo-Diode Array Detector/
Evaporative Light Scattering Detector/Mass
Spectrometry System. J. Chromatogr. A 2017,
1512, 61–70.
17. Jenke, D.; Odufu, A. Utilization of Internal Stand-
ard Response Factors to Estimate the Concentra-
tion of Organic Compounds Leached from
Pharmaceutical Packaging Systems and Applica-
tion of Such Estimated Concentrations to Safety
Assessment. J. Chromatogr. Sci. 2012, 50 (3),
206–212.
18. Love, B.; Flynn, D. France, UK Issue Clashing
Advice on Breast Implants, 2011. Reuters Web
site. https://www.reuters.com/article/us-breast-
implants/france-uk-issue-clashing-advice-on-breast-
implants-idUSTRE7BM14420111224 (accessed
February 25, 2016).
Vol. 75, No. 3, May--June 2021 301
on January 26, 2022Downloaded from
Authorized User or for the use by or distribution to other Authorized Users·Make a reasonable number of photocopies of a printed article for the individual use of an·Print individual articles from the PDA Journal for the individual use of an Authorized User ·Assemble and distribute links that point to the PDA Journal·Download a single article for the individual use of an Authorized User·Search and view the content of the PDA Journal permitted to do the following:Technology (the PDA Journal) is a PDA Member in good standing. Authorized Users are An Authorized User of the electronic PDA Journal of Pharmaceutical Science and
copyright information or notice contained in the PDA Journal·Delete or remove in any form or format, including on a printed article or photocopy, anytext or graphics·Make any edits or derivative works with respect to any portion of the PDA Journal including any·Alter, modify, repackage or adapt any portion of the PDA Journaldistribution of materials in any form, or any substantially similar commercial purpose·Use or copy the PDA Journal for document delivery, fee-for-service use, or bulk reproduction orJournal or its content·Sell, re-sell, rent, lease, license, sublicense, assign or otherwise transfer the use of the PDAof the PDA Journal ·Use robots or intelligent agents to access, search and/or systematically download any portion·Create a searchable archive of any portion of the PDA JournalJournal·Transmit electronically, via e-mail or any other file transfer protocols, any portion of the PDAor in any form of online publications·Post articles from the PDA Journal on Web sites, either available on the Internet or an Intranet,than an Authorized User· Display or otherwise make any information from the PDA Journal available to anyone otherPDA Journal·Except as mentioned above, allow anyone other than an Authorized User to use or access the Authorized Users are not permitted to do the following:
on January 26, 2022Downloaded from