Embed Size (px)
Citation preview
Running head: Approach comparing external and internal methods for analysing group dynamic 1
1
An approach to comparing external and internal methods for analysing group dynamic
Simon Bell and Stephen Morse
Maths, Computing and Technology Faculty, Open University, Milton Keynes UK
Centre for Environmental Strategy, University of Surrey, Guildford, UK
Author note:
Correspondence concerning this article should be addressed to Simon Bell, email:
Running head: Approach comparing external and internal methods for analysing group dynamic 2
2
Abstract
Beginning with the question, can a multi-methodology explore the nature of group work from
both the inside out (group participant self-analysis) and the outside in (facilitator observed
analysis), this paper presents the results of a statistical analysis comparing two different
approaches to assessing group function; SYMLOG (A SYstem for the Multiple Level
Observation of Groups) and BECM (Being, Engaging, Contextualising and Managing).
SYMLOG is a quantitative internal assessment of group function made by members of the
group, while BECM is qualitative external assessment made by an outsider observing the
groups. Together, it is argued, they provide a unique, triangulated assessment of the group
dynamic. By employing a ‘best subsets’ linear regression technique it was found that some of
the 26 characteristics of SYMLOG are related to BECM scoring (adjusted R2 = 0.82). The
paper discusses the reasons for this and the repercussions for such blending of approaches to
understanding group dynamic. The paper ends by discussing the relative advantages and
disadvantages of the two approaches and potential for further hybridising of them in blended
group dynamic approaches.
Keywords: Group function, Group dynamic, BECM, SYMLOG
Running head: Approach comparing external and internal methods for analysing group dynamic 3
3
Introduction
Developing means for assessing group dynamics as a way of appreciating team work is
not new, and the pages of this journal in particular and indeed others are replete with different
methods for accomplishing this in practice. Indeed the need for and means to achieve forms
of assessment of groups is well reported in the literature (Shadish 1984; Scudder et al. 1994;
Wheelan et al. 1998; Whiteoak et al. 2004), However, although group analysis is explored in
great detail, triangulation of analysis, involving participant self-analysis (we refer to this as
internal analysis) and observer (we use the term external analysis), is far less common and is
significantly under-explored in the literature. Similarly, the combination of quantitative and
qualitative analysis in forms of multi-methodology, although well documented in the
literature (e.g. see: Mingers and Brocklesby 1996; Mingers and Gill 1997; Zhu 1998; Munro
and Mingers 2000; Mingers and Rosenhead 2004) is far less evident as applied approaches in
group dynamics. One would expect, of course, a relationship between internal and external
assessments of the group dynamic, in the sense that what an external observer can see may
reflect what the group ‘feels’ about itself, but signals can also be misread. The balance
between all of this is little understood. Hence an ambition of the research explored in this
paper is to ascertain if diverse analytical methods (qualitative and quantitative) can be applied
from each end of the group work spectrum (group participant self-analysis and observer
analysis) so as to provide a unified frame of analysis. We argue that if this were to be
established then the door would be open to a range of benefits including cross-checking of
analysis results and formative questioning of some of the epistemological elements of group
analysis (e.g. why do groups do what they do and how do they learn?). We return to these
points at the end of the paper.
Running head: Approach comparing external and internal methods for analysing group dynamic 4
4
Method
Our research involves the use of two method, one largely quantitative in substance and the
other largely qualitative (although capable of quantitative representation).
The SYMLOG approach
On the quantitative, group self-analysis side, one contemporary example in daily use is the
SYMLOG (A SYstem for the Multiple Level Observation of Groups) methodology the theory
and practice of which has been set out in a various publications spanning more than 30 years
such as Nowack (1987), Hurley (1991), Hare et al. (2005) and Sjøvold (2007). SYMLOG has
a long research pedigree going back to 1979 when it was first introduced by Robert Bales and
colleagues (Bales et al. 1979) as a means of exploring the group dynamic. It has since the
1980s been applied in a wide range of contexts and examples including:
Sport (Park 1985)
Group conflict (Wall & Galanes 1986; Becker-Beck, 2001)
Dysfucntional teams (Keyton 1999)
Personality and group work (Lion & Gruenfield 1993)
Gender in groups (Schneider et al. 1989; Seibert & Gruenfield 1992)
Organisational communication (Keyton & Wall 1989)
Organisation development (Terjung, 1987)
Face-to-face versus computer-based communication (Becker-Beck et al., 2005)
Family relational behaviours (Kroger et al. 1987; Balck et al. 1991; Crespi 1993)
Political leadership (Ellis et al. 1996)
Heath care professionals working within a hospital (Gfroerer et al., 2007)
Primary health care (Cashman et al. 2004)
Running head: Approach comparing external and internal methods for analysing group dynamic 5
5
SYMLOG had its ‘heyday’ in the 1980s (37 articles published between 1985 and 1989) but
even from the 1990s to the present there have typically been 2 articles or more published each
year where the technique has been used to analyse group behaviour. Indeed the methodology
is still evolving, and Blumberg (2006) has produced a simplified version of the SYMLOG
questionnaire. It can therefore be said that SYMLOG is a comprehensive and powerful
approach to the study of group dynamic which has been applied in a wide variety of contexts
and has stood the test of time. The durability of SYMLOG means that there is much
experience in the collation, analysis and perhaps more critically – the interpretation – of
results. The SYMLOG Consulting Group website (www.SYMLOG.com) claims that:
“The SYMLOG research base contains over 1,000,000 profiles drawn from
applications in twelve languages, in sixty countries, on six continents.“
Linked to these results, there are useful interpretive devices such as SYMLOG ‘field
diagrams’ and ‘ideal’ group profiles that allow the categorisation of responses based upon
extensive experience.
However, in this depth and power rests some issues of ease of application given that the
quantitative assessments made by members of groups have to be processed. Linked to this are
further issues of intrusiveness into the work of groups and potentially creating reaction from
groups, some of which may be negative, when they are studied. While quantitative analysis
of the SYMLOG results can be achieved with software it does nonetheless make the analysis
somewhat cumbersome and limits the applicability of the approach in ‘real time’ i.e. as a
method that groups can apply (via a facilitator or in self-analysis) in order to assess their
Running head: Approach comparing external and internal methods for analysing group dynamic 6
6
functioning and provide guidance for improvement. The matter of intrusion and potentially
creating hostility in the group under analysis invokes more complicated potential issues.
The BECM method
There are more rapid approaches to assessing group dynamic than SYMLOG, although
often applied in a more external mode by facilitators who are not part of the groups. That is
certainly not to say, of course, that SYMLOG can only be employed as self-reflection; the
technique can be applied by people external to a group as a means of assessing the working
of the group. An example of a rapid assessment designed to be applied by external facilitators
is based on a method called the BECM matrix (B= Being, E= Engaging, C= Contextualising
and M= Managing). The BECM Matrix could be said to arise from a segment of the literature
which focuses on what Chambers (1992) referred to as ‘fairly quick and fairly clean’
qualitative methods. Many of these arose from social analysis in developing countries and
form part of the Rapid Rural Appraisal (RRA), Participatory Rural Appraisal (PRA) literature
(for a fairly catholic selection see: Cahill, C. 2007, Cecilia, C. et al, 2010; and the substantive
Chambers texts: Chambers, 1992, 1997 and 2002). BECM, building off the RRA/ PRA
approaches is a means of assessment which has also been adapted from a systemic approach
to teaching and assessment of the third level systems curriculum at the Open University to a
research tool for understanding group dynamics (Open University 1987; Open University
2000; Bell 2001; Zimmer 2001). In the late 1990s, academics at the Open University were
developing a new course for teaching systemic approaches to problem solving called
‘Managing Complexity: a systems approach’. The course required students to develop and
exhibit systemic traits and behaviours in their work. The course team at OU decided to apply
systems theory and practice in the assessment of the course. To do this the team adapted an
earlier matrix assessment method (derived from material dating back to the 1980s) which
Running head: Approach comparing external and internal methods for analysing group dynamic 7
7
allowed student work, as exhibited in their written material to be evaluated according to
systems criteria. This evaluation arose from a systems approach seeking to explore implicit
individual knowledge (also see: Kolb 1984; Muller et al. 2009) and in essence involved
academics scoring students written work in terms of pre-defined criteria. Because the
students were expected to express themselves in terms of rounded systemic concepts, the
framework for the 2000 OU course focused on highly generalised qualities: notions of how a
student is or his/ her being, how they engaged with the tasks suggested to them is assessment
material, how they contextualised what they already knew into what they were about to
attempt and how they managed their overall input. The BECM matrix had seven ‘levels’.
Level 1 behaviours demonstrated a highly systemic student profile, Level 7 highly un-
systemic with evidence of intolerance, closed mind, instrumentalism and even tyranny. If this
matrix approach is taken as originating in the 1980s (subject to considerable evolution), the
approach was deemed to be a highly successful way to assess student’s contribution and
development over the ten months of the systems course. Using this method thousands of
students were assessed between 1980 and 2011. The academics at the Open University have
applied the matrix in a number of different ways but in 2006, in a fairly radical departure
from the original intention, it was used as a means to assess the group behaviour of Local
Government Officials in the UK. This new use of BECM was carefully monitored as there
had been little opportunity prior to this exercise to explore group dynamics with it. The
results proved to be highly encouraging and were subsequently published. (see Bell, 2008). In
moving from a tutor assessment of a student’s performance to a facilitator’s ‘scoring’ of a
group’s behaviour required some adaptations to the method and this in turn meant that the
approach was extended in terms of its process if not its substantial underlying rationale and
theory of use (these are discussed more fully in Bell & Morse, 2011). The changes mainly
required that the assessment be made on explicitly observed behaviour, rather than the

Running head: Approach comparing external and internal methods for analysing group dynamic 8
8
previous student written presentation of behaviour. This change of use for BECM was
influenced by the adoption of psychodynamic observation techniques drawn from the
conference methodology applied by the Tavistock and Bayswater Institutes (one of the
authors worked with the Bayswater method for some time). Despite the successes of the new
BECM derivative as noted in the 2008 and 2011 papers, it should be noted that the
application of BECM comes with the usual issues of subjectivity and bias which all such
approaches are subject to (see Levin, 1997). However, to some extent face to face application
of method actually made the application of BECM more straightforward, easier to monitor
and much more open to corroboration (two facilitators can take independent BECM
observations and can compare and contrast their findings prior to making a definitive
overview. BECM as now expressed depended upon the group facilitator observing groups in
terms of a set of pre-defined criteria related to an assessment of the behaviour of the group in
the four areas: Being (the group’s level of internal cohesiveness); Engaging (the manner in
which the group undertakes tasks); Contextualising (the way in which a group applies its
knowledge and resources to new tasks) and Managing (how the group self-organises). These
four areas were also expressed in a BECM matrix by means of a fifth, over-arching set of
behaviours. Table 1 sets out the BECM criteria and the characteristics of each of the various
seven levels and qualities.
<Table 1 near here>
The BECM analysis was undertaken by both researchers and results compared, discussed and
a final quality agreed.
Procedure
Running head: Approach comparing external and internal methods for analysing group dynamic 9
9
While SYMLOG and BECM provide two quite different approaches to the assessment of
group dynamic, there are important issues of comparability and compatibility to consider.
When applied to the same groups they should provide results that are related to each other but
to what extent is this really the case and why would differences appear? After all one is
internal to the group while the other is external and it is not inconceivable that the outcomes
of the assessments will be entirely unrelated (i.e. self-assessment arising from a questionnaire
survey being at variance to external assessment from evidence of behaviour by a non-group
member). Can an external assessment, which by its nature is typically founded upon visual
clues, really pick up on dynamics that are internal to the group? These are important
questions which rest at the heart of attempts to assess the group dynamic but have rarely been
explored in the literature. This paper aims to set out some answers to the question within the
context of a European Union funded project involving 16 groups within 5 countries. The
dynamic of these groups was assessed by both SYMLOG and BECM and the paper sets out a
statistical comparison between the findings of the two methods and identifies points of
confluence and difference.
(a) The workshops
The results presented in this paper are based upon BECM and SYMLOG applied to a total
of 6 workshops that took place in 5 countries during 2009 – 2010 and facilitated by the
authors of the paper. A summary of the workshops and their composition is provided as Table
2. Each workshop took 2 days and groups typically comprised 5 individuals (range between 4
and 7). In the case of these workshops the topic was the influence of indicators in framing
and implementing sustainable development policy within the European Union. The results of
the workshops formed part of an EU Framework 7 funded research project. Participants were
for the most part experienced and knowledgeable in the policy influence of indicators within
Running head: Approach comparing external and internal methods for analysing group dynamic 10
10
the sectors in which they work. Each workshop was based on face-to-face interaction with
participants based in the same room and the authors acted as facilitators.
<Table 2 near here>
Three of the workshops had the theme of sustainable development, while one each had the
themes of transport, energy and agriculture. In total the workshops involved 16 groups across
the 5 countries:
Malta (Groups A and B)
Slovakia workshop 1 (groups C, D and E)
Slovakia workshop 2 (groups F, G and H)
Finland (groups I, J and K)
Denmark (groups L, M and N)
UK (groups O and P)
Participants were largely a mix of public sector staff (local, national government,
researchers, academics), non-governmental staff (mostly environmental NGOs) and students.
Relatively few participants were from the private sector.
The details of the structure of each workshop need not be given here but each comprised a
total of 5 distinct stages geared towards the analysis of a defined topic; in this case the
influence of indicators. Stages 1 and 2 took place on day1 for all groups, and for most of
them stage 3 also happened on day 1. Stages 4 and 5 typically happened during day 2. BECM
assessments were made for each of the stages, so each group in effect had a total of 5 BECM
assessments over the time of the workshop. SYMLOG assessments took place at the end of
Running head: Approach comparing external and internal methods for analysing group dynamic 11
11
each day of the workshop and respondents were asked to assess their group dynamic for that
day. Thus respondents were assessing the group as a whole, including their own involvement.
(b) BECM
BECM as originally designed provides a framework by which group function can be
assessed from the observer reviewing the group i.e. an analysis made by people external to
the group. The assessment of group members made by the researcher(s) in the current
research is based on noting evidence of the various behaviours of individuals within a group
and how they interact with others. It is important to note that the members of the groups were
not made aware that they were being assessed in terms of their dynamics; their only
understanding of being assessed was the presence of the facilitators in the room as they
worked. The researchers did not feel that this observation interfered excessively with their
dynamic. Of course all measurement imposes upon that which is measured, however, as the
premise of the workshop had nothing explicitly to do with group dynamic or interaction, the
assessment of the groups did not seem to impact heavily on their dynamic (this could be
assessed in terms of overt behaviour relating to individuals in the groups reacting to the
observation). All group observation was discreet and did not impinge on the group work.
Each group was assessed at all five stages of the workshop for its performance under the four
BECM columns, with a score of 7 broadly representing ‘poor group dynamics’ while a score
of ‘1’ represented ‘good group dynamic’. The matrix in Table 1 contains four columns
relating to observed behaviours in an individual or groups: Being, Engaging, Contextualising
and Managing. There are seven level of behaviour with level 7 being broadly seen as tyranny,
abuse and very poor practice and level 1 pertaining to highly self-reflective and systemic
practice. Thus an overall picture emerges, showing the tendency of group members and
identifying what practice is being experienced – practice being noted in terms of observation
Running head: Approach comparing external and internal methods for analysing group dynamic 12
12
of group dynamic (as noted earlier). However, it should be noted that despite the polarity
from 1 to 7 the BECM matrix is not intended to be judgemental in the sense of either lauding
or demonising the groups. The matrix is applied as shorthand for noting the general
awareness and behaviours of those engaged in each occasion. The matrix is deliberately not
intended to define the nature of any individual but rather is used as a reference for describing
the behaviours of the group as experienced by the researcher. It also needs reiterating that the
BECM analysis is based upon what behaviours the facilitators are able to observe in a series
of ‘snapshots’. Some aspects of the group interaction, such as discussion amongst
participants, were not accessible to the facilitators, especially as the language employed by
groups in many of the workshops was not English. Thus many of the signals in BECM are
related to body language and behaviour, and it is fair to say that BECM can only provide a
subjective picture (from the perspective of the external assessors) and partial of the entire
group experience.
A significant advantage of BECM is that, in the hands of a practiced observer, it is a
relatively quick and straightforward method of assessing groups. A disadvantage is that
visual keys can be interpreted in a variety of ways and it is possible to misinterpret the
signals, although a degree of experience and knowledge of group ‘signatures’ improves the
accuracy of the method. As a simple example, a group that may be standing and arguing
loudly can be interpreted as showing fracture, dominance and/or tyranny but that might not
be the case at all. They may indeed be strongly focussed, collaborative and highly engaged as
a group in what they are doing. These dangers of misinterpretation are magnified when the
discussions take place in a language which the facilitators cannot understand. Therefore there
is a need for the facilitator to observe keenly and to gain a view of not just the visual key but
also the more subtle clues which we label ‘group signature’. This process was aided in all
cases by the facilitators having access to skilled local observers who could translate group
Running head: Approach comparing external and internal methods for analysing group dynamic 13
13
conversation, at least in terms of the broad content rather than verbatim, and by the additional
assistance of all group presentations being given in English. The translators were conversant
with the overall research approach and were qualified to report accurately on specific
behaviours which would otherwise have been ambiguous.
The understanding of the group signatures is in practice internal to the researcher/
facilitator. Groups were not told of the BECM scoring system and what it was based upon,
and neither were they presented with any of the findings. At no point did the researchers
intervene to inform a group of their observations. This is an important point that will be
returned to later. Essentially, the groups are ‘watched’ and ‘lived with’ by the researcher who
is seeking to determine the signature of the group as it emerges over time. This involves the
researcher in ‘disappearing’ but being present. The intention is to allow the group to function
without being aware that their actions and words are being observed. The reason for this
approach is to provide the group with the necessary space to find itself and to hopefully allow
the group members to feel that they are working from their true centre and not in any way
performing to the room or to the facilitator.
Many of the workshops were not held entirely in English (although all groups used
English at times and in all cases in presentation during plenary) and the facilitator/ researcher
was not able to understand the conversation in full. To a large extent this issue was overcome
by means of local translation and the presentation of all group work in English. Furthermore,
all presentations were recorded and subsequently studied for detail. However, for a BECM
analysis this can cause problems. For example, to make an assessment of how well a group is
‘Contextualising’ its existing knowledge in the research situation is problematic in terms of
assessing the use the group makes of its internalised pre-understandings. Whereas, the groups
‘Being’ or, the tonality of how a group ‘is’, how it is ‘Engaging’ and how it ‘Manages’ its
work and the work of its members can be more readily observed in terms of evident
Running head: Approach comparing external and internal methods for analysing group dynamic 14
14
behaviour (body language and voice tone, etc.). As one means to mitigate against this
circumstance there were numerous reporting points (plenary) within each of the workshops
when the groups feedback in English. Also, the researchers are very experienced in the use of
BECM and could deduce from English reporting evidence of contextualised behaviour (e.g.
“We knew from our previous experience”, “one of our group had previously seen a similar…
“, “this was not new to us.. “ etc.). When reporting it was possible therefore to make an
assessment of how well the group had applied itself and its existing knowledge and
background of its members in ‘Contextualising’ its work in its own terms).
(c) SYMLOG
The SYMLOG methodology is outlined at www.SYMLOG.com and in the seminal work
of Bales et al. (1979). It is founded upon the completion of a questionnaire which comprises a
total of 26 questions by each member of the group. The questions are designed in such a way
as to draw out that individual’s view of the group function, and the questionnaire employed in
the workshops is shown as Table 3. Respondents were asked to tick the box that fits what
they perceived to be the prevalence of each of the characteristics in their group over each of
the two days of the workshop. Attempts have been made to simplify the SYMLOG
questionnaire (Blumberg 2006) but the original version of the form was the one employed
here.
<Table 3 near here>
Note that each of the questions in the questionnaire has a code (U, UF, UPF etc.) that relates
to coordinates within a SYMLOG field diagram. For the sake of brevity the details of the
coding and the rationale behind the questions and coordinates need not be given here and the
Running head: Approach comparing external and internal methods for analysing group dynamic 15
15
interested reader is referred to Bales et al. (1979) and more recently to that of Hare et al.
(2005) for an in-depth explanation. In basic terms:
Negative (N)/Positive (P) axis represents values in terms of ‘unfriendly’
(individualistic) behaviour versus ‘friendly’ (group-oriented) behaviour.
Forward (F)/Backward (B) axis represents values in terms of accepting or opposing
the task orientation of established authority.
Up (U)/Down (D) axis represents dominance versus submissiveness.
The questionnaire covers these 6 characteristics and various combinations of them. Thus
UF (“an assertive business-like manager”) is the vector between ‘up’ (dominant behaviour =
assertiveness) and ‘forward’ (accepting established authority = business like manager).
The process of completing the questionnaires was anonymous. For the individuals within a
group the answers to the 26 questions in the questionnaire were given scores as follows:
Rarely: 1
Sometimes: 2
Often: 3
The answers to the 26 SYMLOG questions were kept separate (from each other) so as to
allow a detailed comparison of responses with the BECM assessments (i.e. to allow
maximum resolution). Thus the answers were not grouped in terms of the N/P, F/B or U/D
axes, although this could be a facet for future work. It was assumed that some of the
SYMLOG characteristics were more likely to be associated with the BECM scores given that
Running head: Approach comparing external and internal methods for analysing group dynamic 16
16
the latter is based upon a visual observation of the groups by the facilitators, although no a
priori assumptions were made as to what these may be.
(d) Analysis
The prime focus of this paper is a comparison of BECM and SYMLOG rather than the
outcome of the workshops. The latter is referred to elsewhere (Bell and Morse 2010a, 2010b)
and will not be covered here. As suggested at the beginning of the paper, the results of
BECM might be expected to correlate with those of SYMLOG as one is an external and the
other an internal appraisal of the same thing (in this case a group function), even if they are
picking up on different clues. Of course BECM is the view of the facilitator and SYMLOG,
as applied here, is the self assessment of the participants and this is a key difference. It would
not be unreasonable to assume that some of the 26 SYMLOG questions (or characteristics)
are more likely to match up with the BECM observations than would others, and this need for
maximum ‘resolution’ is the main reason why the answers to the SYMLOG questions were
not grouped in terms of N/P, F/B or U/D axes. It is difficult to predict what these might be in
advance, and indeed that was a key objective of the analysis. Admittedly this does introduce
an element of exploration into the analysis, almost akin to a ‘Grounded Theory’ approach
where patterns are allowed to emerge from the data rather than begin with specific
expectations (Suddaby, 2006). Hence the key to comparing BECM with SYMLOG would be
an approach which allows for the 'best' subsets of the SYMLOG variables to be identified.
The ‘best subsets’ approach to regression analysis was adopted for comparing the results of
BECM and SYMLOG. This approach has the advantage of being straightforward to interpret
and allows the identification of a single best-fitting regression model that can be constructed
with a set of predictor variables. The process is an efficient way of identifying models that
Running head: Approach comparing external and internal methods for analysing group dynamic 17
17
contain as few predictors as possible, and in the context of this research it allows for the
identification of SYMLOG components (independent variables) that best correlate with the
BECM scores (dependent variables). ‘Best subset’ regression is related to ‘stepwise’
regression but there are also important differences. ‘Stepwise regression’ arrives at a single
model by automatically adding or removing individual predictors, one step at a time, based
upon their statistical significance. ‘Best subset’ regression compares all possible regression
models using a specified set of predictors, and displays the details of many models and their
summary statistics which the researcher can select from based upon a set of criteria they wish
to employ. In this case, one of the criteria adopted for section of the model was Mallows' Cp
statistic and adjusted R2
for each potential model, and in general the ‘best subset’ model is
assumed to be the one with the lowest Cp. A small Cp value indicates that the ‘best subset’
model is relatively precise (has small variance) in estimating the true regression coefficients.
Thus the ‘best subset’ approach does provide far more information to the researcher than does
‘stepwise regression’, and it is possible for the researcher to work with a series of models
based upon their knowledge of the variables being explored.
There are alternative approaches to ‘best subsets’ regression that could have been adopted
such as the use of Relative Weight Analysis (Johnson, 2000) across each of the 26 SYMLOG
variables, but there are problems with determining the statistical significance of the resulting
weights (i.e. how much more weight than zero or indeed other weights is significant). This is
a field undergoing active development (see for example the work reported in Tonidandel et
al, 2009), but more research is required. However, it has to be noted that the ‘best subset’
technique is not without criticism as they involve multiple runs of tests and thus can generate
‘false positives’. Also, much does indeed depend on the nature of the selection process
employed by the researcher as much information could be missed. Indeed it may not be the
Running head: Approach comparing external and internal methods for analysing group dynamic 18
18
case that a single model is necessarily the ‘best’. In this research the aim was to look for
relationships between BECM and SYMLOG, and thus for the sake of simplicity it was
decided to employ just the Cp and adjusted R2 to select the ‘best’ model and explore how that
related to BECM. It was deemed to be more important to explore whether the identified
elements of SYMLOG did have a logical fit, even if in part, with what BECM may have
picked up during the workshop. After all, one could make a reasonable a priori case that all of
the elements contained in the SYMLOG questionnaire should be identifiable to an external
observer, and many of the models generated via ‘best subsets’ may support just that, but can
this be seen with the ‘best’ model identified using Cp and adjusted R2 as selection criteria?
Of more secondary interest in the data is the difference in assessment of the groups via the
BECM and SYMLOG methodologies and how this varied across groups, days and countries.
Did the two approaches detect differences in the data? The analysis of the BECM and
SYMLOG data was primarily via a Kruskal Wallis (KW) non-parametric test (Kruskal and
Wallis, 1952) with separate codes for score component (4 elements of BECM and 26
components of SYMLOG), day of workshop (1 and 2), group (1 to 16) and country (1 to 5).
The KW test checks whether two or more independent samples come from identical
populations although not necessarily having a normal distribution, and is thus a
nonparametric alternative to a one-way ANOVA or t-test. The KW test is performed on ranks
of the original data rather than the data themselves. Hence the smallest value gets a rank of 1,
the next smallest gets a rank of 2 and so on for the entire dataset (procedures are in place to
accommodate tied ranks – usually by averaging). The test then compares the mean ranking of
the categories (not the medians of the raw data in the categories) and calculates a statistic
referred to as ‘H’. Also provided in the results presented here are the z-values (positive or
negative) which represent deviation for the mean rank of that category from the overall mean
Running head: Approach comparing external and internal methods for analysing group dynamic 19
19
rank for all observations. Negative values indicate that the mean rank for that category is
lower than the overall mean while positive z-values suggest the opposite.
Results
It is not necessary to present the detailed BECM and SYMLOG datasets. Instead the results
of the analyses of these data will be presented. Summaries of the BECM and SYMLOG
results are presented in Tables 4 and 5. Table 4 is the mean BECM score for each group and
for each day of the workshop. There are 32 values (16 group average scores X 2 days) in
Table 4, as one average BECM score was calculated for each group (16 in total) and for each
of the 2 days. Table 5 provides the mean SYMLOG scores for each group, 26 components of
the questionnaire and for the 2 days of the workshop (one questionnaire was issued at the end
of each day). There is a total of 16 (groups) X 26 (questions) X 2 (days) = 832 averages in
Table 5.
<Tables 4 and 5 near here>
Beginning with the main research question set out at the start of the paper, the results of a
best-subsets regression on the data in Tables 4 and 5 with BECM as the dependent variable
and the SYMLOG responses for each group as the independent variable are shown in Table
6. The dependent variable in the analysis is the BECM averages of Table 4 while the
independent variables are SYMLOG averages in Table 5. The best subsets method starts with
all those data and runs through various permutations until it arrives at a series of ‘best’ subset
models, each having an associated Mallows Cp statistic and adjusted R2. The ‘best subset’
model in Table 6 had an adjusted R2 of 0.82 (statistical significance of P < 0.001) and Cp
value of 4.7, and was selected for further exploration. The selected model does provide some

Running head: Approach comparing external and internal methods for analysing group dynamic 20
20
interesting insights into SYMLOG components that match with BECM-based observations.
Reducing the number of independent variables (SYMLOG components) in the model could
help increase the error df but explanatory power (adjusted R2) becomes less.
<Table 6 near here>
The ‘best subsets’ regression suggests that the BECM scores are indeed related to some of the
SYMLOG characteristics and it is instructive to note which ones. The shaded cells in Table 6
are those that have negative regression coefficients implying that these characteristics
become less prevalent with better group function as recorded via BECM (low BECM scores
equate to ‘better’ group function). The unshaded cells in Table 6 are those that have positive
regression coefficients and this implies that increased prevalence of those characteristics
equates to ‘worse’ group function. Do these implied trends match what would be expected
from self-assessment and observation?
Taking the negative coefficients first, these are for SYMLOG characteristics UPF, UB, F,
PB and DPF. External observation would certainly identify the presence of a purposeful and
democratic task leader and hence it is perhaps not surprising that a group’s assessment of this
being prevalent would also be picked up in BECM. Similarly the presence of laughter, good
spirits and atmosphere (UB, PB), an analytical, task-orientated and responsible group (F,
DPF) would also be expected to be readily observable and thus reflect well within BECM.
For the positive regression coefficients the picture is more mixed. Some of the coefficients
would indeed be expected to be more prevalent with observable ‘worse’ group function as
recorded via BECM. Examples here would be groups that show unfriendly and negative
behaviour (N) and those which have assertive managers which could easily be observed as
Running head: Approach comparing external and internal methods for analysing group dynamic 21
21
domineering (UF). Similarly it is not inconceivable that groups which see themselves as self-
punishing (DNF), emotional (B) and submissive (DF) would also be picked up by
experienced observers and given a poorer BECM score although the observable clues may be
quite subtle. This is admittedly an assumption based upon the authors’ many years of
experience in facilitating workshops, but it does seem reasonable all the same. Perhaps
surprisingly there are other characteristics included here that one would regard as being
associated with good group function, such as warmth (UPB), trust (DP) and being friendly
and equal (P). Why these three characteristics should be equated with poorer groups function
as assessed with BECM is not clear. Indeed when observing groups from outside there would
presumably be overlaps between characteristics such as UB and PB and UPB and P. These
are fine distinctions and it is odd that groups may see themselves as being fun to be part of
(PB) yet not warm (UPB) and friendly (P).
A further point worth noting is the absence of some of the SYMLOG characteristics from
the best subset model. For example, groups that perceive the presence of dominant
individuals that talk a lot (U) or domineering (UN) would be expected to be observable by
outsiders yet these don’t appear in the best subset. Similarly one would expect to readily
observe the presence of characteristics such as the presence of depressed or rejected
individuals (DN). It has to be noted, of course, that the ‘best subsets’ approach does generate
many models and in some of these the characteristics discussed above, as well as others, did
appear. Thus to some extent their omission may be a result of a focus on just one model,
albeit the one with the best adjusted R2 and Cp value. A further explanation experienced by
the authors is that individuals are less likely to acknowledge the presence of certain
characteristics in their group than others. During interviews after the workshops a number of
respondents did mention that they found some of the SYMLOG questions to be awkward and
uncomfortable. One respondent even used the term ‘aggressive’. After all, it should be noted

Running head: Approach comparing external and internal methods for analysing group dynamic 22
22
that respondents were being asked to report the characteristics of their group, and they had
been working together for some hours before reporting. BECM does not share that issue as it
is applied by people external to the group, but it has to be remembered that BECM could be
argued to be a less precise tool. This lack of precision derives from dependency on
observation. For example, dominance or domineering might be interpreted by someone
unfamiliar with using BECM to be similar to the presence of a purposeful and democratic
task leader (although this would not be consistent across the BECM criteria and should be
evident over a two day period). The members of a group will know the difference but outside
observers may not in the short term. Much the same confounding can be applied to other
SYMLOG characteristics. Indeed given this craft issue in BECM it is perhaps more
surprising that a best subset with an R2 as high as 82% was achievable at all with these data.
After all, while details of group membership have not been presented here it is easy to
imagine that a host of factors could also have influenced the SYMLOG assessments made by
group members, including group size, age and gender and of course un-calculable chance.
These could, of course, be accommodated in future research with groups and explored in
terms of their influence on SYMLOG responses. Indeed one possibility, nor pursued in the
research described here, would be to create groups having various balances of these
parameters but the number of groups required may well be large.
With regard to differences between groups, days etc. in terms of BECM and SYMLOG the
results of KW tests are presented as Tables 7 and 8. In this case the KW test was applied to a
total of 320 individual scores (80 each for the four components of BECM) across all the
groups. Thus Table 7 provides a series of comparisons of the BECM data; between the 4
components of BECM, the 5 stages of the workshops, the 16 groups and the 4 countries.
There are statistically significant differences between the components of BECM with groups
Running head: Approach comparing external and internal methods for analysing group dynamic 23
23
tending to do better (lower scores) in terms of ‘BEC’ rather than ‘M’ (Table 7a). Interestingly
over the stages of the workshop there is an improvement in BECM scores (they get lower;
Table 7b) as the workshops progress, suggesting that the group functioning does get better
with time. This is probably to be expected given that the longer the groups worked together
then the more comfortable they would have become. There are significant differences in
BECM between the 16 groups (Table 7c), and this in part reflects a significant difference
between the countries. The groups from Denmark had the best functioning (lowest score)
while the groups from Slovakia tended to do worst (Table 7d).
<Table 7 near here>
The results of a KW test applied to the SYMLOG scores are shown in Table 8. In this case
the dataset represents the responses by all respondents (not averaged within groups) over the
2 days. Hence there are 2152 responses for day 1 and 1812 for day 2 (some respondents
present during day 1 were not present in day 2). The comparisons are between the 26
SYMLOG variables, the 2 days of the workshop, the 16 groups and the 5 countries. As would
be expected the scores are significantly different across the 26 questions of the questionnaire
(Table 8a). By and large the SYMLOG scores are higher for the up-positive-forward (UPF)
components (P = 2.69; PF = 2.79; F = 2.62; UP = 2.58), and these are typically associated
with the ideal of ‘most effective teamwork’ (Ford and Kiran, 2008). This broad emphasis
upon the ‘UPF’ component from for these groups is similar to that found by other researchers
such as Leslie and van Velsor (1998) in their cross-national analysis of teamwork that
spanned a number of countries in the European Union. However, there are no significant
differences in SYMLOG scores between the two days of the workshop (Table 8b), and this
contradicts the BECM finding that groups performed ‘better’ in day 2 compared to day 1.
Running head: Approach comparing external and internal methods for analysing group dynamic 24
24
Hence SYMLOG suggests that individuals within the groups had much the same view of
their function on day 2 as they did on day 1, whereas the BECM results suggested that group
function improved over the course of the workshop. However, care has to be taken here as the
pattern of response across the 26 questions could be different over the 2 days. The SYMLOG
scores are significantly different between the groups (Table 8c) and indeed between the
countries (Table 8d), although care has to be taken with the interpretation of these findings as
all they suggest is that the answers to the questions are different between groups and
countries in an aggregate sense.
<Table 8 near here>
Discussion
BECM and SYMLOG are two different approaches to assessing group function and this
paper is the first attempt to make such as ‘internal’ versus ‘external’/ qualitative and
quantitative comparison in the form of a multi methodology. The analysis is, in essence,
exploratory as it was not known a priori what to expect. It also has to be noted that this is by
no means the first attempt to make comparisons between different ways of assessing group
function. For example, Balck et al. (1991) compared the FACES II (a self-report instrument
of the Family Circumplex Model) and SYMLOG methods. Schneider et al. (1989) compared
the outputs from SYMLOG with those of the BEM sex role inventory developed in 1971.
Isenberg and Ennis (1981) compared the results of an analysis based on SYMLOG with those
derived from a Multi-Dimensional Scaling (MDS) technique which derived dimensions based
on a perceived similarity of group members made by the members and not an external agent.
Perhaps unsurprisingly they found that results from SYMLOG and MDS had statistically
Running head: Approach comparing external and internal methods for analysing group dynamic 25
25
significant overlaps. But in some ways these are like-for-like comparisons in that FACES II,
BEM and MDS are ‘internal’ approaches; they are based on some form of self-assessment
made by the group members. They did not include an ‘outside in’ view of the group dynamic.
While BECM and SYMLOG are both designed to achieve meaningful assessment of
groups they differ in a number of important respects. Firstly BECM is an essentially
qualitative, observer assessment made by those who are not part of the group while
SYMLOG is designed to be an inside-out assessment made by the group members. As has
already been mentioned it is to be expected that these will differ, as outsiders will not
necessarily be privy to all the conversations and interactions that take place within groups and
will not have any inhibitions that may accompany a sense of ‘reporting on peers’. Thus
BECM inevitably has to be explicitly based on the appraisal of group function by picking up
on visual/tonal clues and what group members say during plenary sessions. In that sense
SYMLOG should, in theory, provide a more representative assessment of group function as
all those completing the form will have been immersed in the groups’ conversations although
the manner of their self-reporting is limited to their agendas and perceptional issues which
each member of the group inevitably brings with them into the group context. Thus while
SYMLOG may be more representational in the sense that all group members can take part in
the assessment, it is still prone to subjective vicissitudes (unavoidably), for example in terms
of the state of mind of the members of the group when the SYMLOG form is completed and
the interpretivistic leeway open to the researcher in the interpretation of variable responses. In
this sense, though to a lesser degree, it is open to the same subjectivity in assessment as
BECM.
Secondly, BECM, in keeping with its background in the PRA type of approaches, is a
relatively rapid and relatively easy procedure to implement. Many BECM assessments can be
made during stages of a workshop, and it is possible for a number of observers to make their
Running head: Approach comparing external and internal methods for analysing group dynamic 26
26
own assessment and compare notes thus triangulating their perceptions (as happened in these
workshops). There is no interference in group activity and neither is the assessor influenced
from a sense of ‘being’ in the group. However, BECM can only be applied by someone
familiar with the method and able to apply the observation criteria shown in Table 1, and of
course there is much potential for getting it wrong. By way of contrast SYMLOG involves
the completion of a questionnaire, and although this can take place relatively quickly it does
mean that the group has to break away from its activity. Inevitably this limits the number of
SYMLOG-based assessments that can be made of group function during a workshop as
participants would undoubtedly become frustrated if repeatedly asked to stop what they were
doing in order to complete a questionnaire.
In terms of similarities both BECM and SYMLOG as applied here were opaque to the
groups. The results were not given to them and thus were not allowed to interfere with the
group dynamic. SYMLOG questionnaires were completed individually and anonymously.
The results of BECM could have been given to the groups during the workshop almost in
‘real time’ but this may have changed behaviour or possibly resulted in debates over whether
what the facilitators observed was correct. Such near instantaneous feedback with SYMLOG
is more difficult given the need to enter the results into software for analysis, but is certainly
not impossible.
However, despite the major differences in approach it is interesting to note how a best subsets
regression can pick up relationships between some of the SYMLOG answers and BECM. The
fact that this is a partial picture is not surprising given the differences between the two
approaches, but it is nonetheless instructive to observe which aspects of SYMLOG do appear
to be most related to BECM even if this is based on just one of the models that ‘best subsets’
generates. As has been mentioned, the authors made no a priori assumptions as to what these
relationship may be but the outcomes of the analysis provide some logical as well as some
Running head: Approach comparing external and internal methods for analysing group dynamic 27
27
arguably ‘unexpected’ conclusions. The positive matching of characteristics such as the
presence of a purposeful and democratic task leader, laughter, good spirits and atmosphere as
well as an analytical, task-orientated and responsible group is logical. But there were others
such as warmth, trust and being friendly and equal that were negatively matched between
BECM and SYMLOG, and why that should be so is unclear. It is understandable that BECM
may not pick up the ‘warmth’ and ‘trust’ that may be within a group, but a negative
association would not be anticipated. Why may that be? As has already been mentioned, there
is the possibility that signals may be missed or even misread by an external assessor. There is
also the question as to the reproducibility of these findings to consider. In the example shown
here there were 14 statistically significant predictors in the model which had the lowest Cp
value and highest adjusted R2, but it has to be acknowledged that this is only based upon the
results of 16 workshops. It is possible that this best-subset model may not necessarily hold for
all workshops assessed via BECM and SYMLOG, and indeed even with these data the ‘best
subset’ approach generates a number of models some of which had only a slightly lower R2
and higher Cp. It would be instructive to repeat this process with a much larger set of
workshops to see whether the list of significant SYMLOG characteristics remains the same. It
is not difficult to rationalise as to why many of the SYMLOG characteristics may be picked
up by BECM, but how robust is that listing? Much more research is required in order to test
this. Indeed this linkage between SYMLOG and BECM does raise some interesting points for
discussion. If BECM does match at least some of the parts of the SYMLOG assessment then:
(a) What degree of skill is required for facilitators to implement BECM?
(b) If BECM is providing a quicker means by which the group dynamics can be assessed then
would there be advantages in providing the insights back to the groups?
Running head: Approach comparing external and internal methods for analysing group dynamic 28
28
Both of these are difficult questions to answer and this research can only begin the process.
The dangers within (a) are readily apparent and have been outlined earlier in the paper. In the
research described here there was an opportunity to triangulate with SYMLOG but a sole
reliance on BECM would create a strong dependency on the facilitators to “get it right”.
This point then feeds into (b). For example, a form of BECM rather than SYMLOG could be
used by group members for their own self assessment. It may also be possible to ask groups
to assess themselves in more open ways whereby all members discuss the BECM criteria and
arrive at a shared assessment. It would be much harder for a group to do this using SYMLOG
given the greater complexity involved in analysis of results. Whether this ‘open analysis’
would lead to positive or negative outcomes in terms of group dynamic is open to question.
There would undoubtedly be advantages for groups that are keen to improve their dynamic
but also disadvantages, and the impacts of the balance between these two may vary across
groups. If the BECM scores have been gauged incorrectly, then all of this could become
compounded. Secondly, the BECM criteria could be made more attuned to the SYMLOG
questions so that observers can perhaps differentiate between behaviours that may appear to
be the same but in practice quite different. The distinction between dominance of a group and
purposeful leadership has already been noted. Thus SYMLOG could help with a
differentiation of the BECM criteria. However, it should be noted that such hybridisation may
not necessarily be desirable as, after all, that would potentially negate triangulation. There is
indeed much more to learn.
Although further work is required to gain a more comprehensive understanding, the two
different perspectives on group dynamic are instructive for those facilitating workshops and
help provide a more complete picture of group function which can be used to better
understand the outputs arrived at by the group during the workshop. In effect BECM and
SYMLOG combine in a multi methodology to provide a triangulation on group dynamic –
Running head: Approach comparing external and internal methods for analysing group dynamic 29
29
quite different ways of assessing the same thing. They allow researchers to double check
from different perspective the results which would otherwise only emerge from one. This in
turn allows a deeper questioning of group output. New questions emerge such as:
If the SYMLOG and BECM concur on group dynamic in all phases of group work
does this indicate a high degree of confidence in analysis verity?
If consensus between methods indicates verity then can such analysis claim a degree
of conclusiveness which is not usually possible in group analysis?
If conclusiveness is evident how does this impact upon alternative forms of analysis?
Or,
If SYMLOG and BECM diverge in a significant manner, does this indicate a lack of
confidence in either approach and if so,
How could this be explained and
Does it allow us to fine tune our outside in or inside out forms of analysis?
Clearly such questioning provides an opportunity for some fundamental consideration of the
comparative value of group self-analysis as compared and contrasted to group observer
analysis.
Acknowledgements
The authors would also like to express their gratitude to all of their colleagues in POINT
but especially Louis Cassar and Liz Conrad (Malta), Zuzana Valkovcova and Daniela
Babicova (Slovakia), Jari Lyytimäki and Kautto Petrusand (Finland), Henrik Gudmundsson
(Denmark) and Markku Lehtonen (UK). Without their support the workshops would not have
been possible.
The research leading to these results has received funding from the European
Commission's Seventh Framework Programme (FP7/2007-2013) under the grant agreement
n° 217207 (POINT project, www.point.pb-works.com).
Running head: Approach comparing external and internal methods for analysing group dynamic 30
30
References
Balck, F., Jantschek, G. & Vonwietersheim, J. (1991). Diagnostics with families - a
comparison of FACES II and SYMLOG. Small Group Research, 22(1), 115-123
Bales, R., Cohen, S. & Williamson, A. (1979). SYMLOG: A system for the multiple level
observation of groups. New York, Free Press.
Becker-Beck, U. (2001). Methods for diagnosing interaction strategies: An application to
group interaction in conflict situations. Small Group Research, 32(3), 259 - 282.
Becker-Beck, U., Wintermantel, M. & Borg, A. (2005). Principles of regulating interaction
in teams practicing face-to-face communication versus teams practicing computer-mediated
communication. Small Group Research, 36(4), 499 - 536.
Bell, S. (2001). Special issue editorial: Systems thinking and practice at the UK Open
University. Systemic Practice and Action Research, 14(6), 661 - 668.
Bell, S. (2008). Systemic approaches to managing across the gap in the public sector: Results
of an action research programme. Systemic Practice and Action Research, 21(3), 227 - 240.
Bell, S. & Morse, S. (2010a). Rich Pictures: A means to explore the 'Sustainable Mind'?
Sustainable Development Wiley Online.
Bell, S. & Morse, S. (2010b). Triple Task Method: Systemic, reflective action research.
Systemic Practice and Action Research, 23(6), 443 – 452.
Bell, S. & Morse, S. (2011). Being, Engaging, Contextualising and Managing: BECM Matrix
– a means for non-specialists to assess group dynamics? Systems Research and Behavioural
Science Wiley Online.
Blumberg, H. H. (2006). A simplified version of the SYMLOG (R) trait rating form.
Psychological Reports, 99(1), 46 - 50.
Cahill, C. (2007). Participatory Data Analysis. Participatory Action Research Approaches and
Methods. S. Kindon, R. Pain and M. Kesby. London, Routledge.
Running head: Approach comparing external and internal methods for analysing group dynamic 31
31
Cashman, S., Reidy, P., Cody, K. & Lemay, C. (2004). Developing and measuring progress
toward collaborative, integrated, interdisciplinary health care teams. Journal of
Interprofessional Care, 18(2), 183-196
Cecilia, V.-S., N. F. David and A. K. Robert (2010). Participatory landscape planning and
sustainable community development: Methodological observations from a case study in rural
Mexico. 94: 63.
Chambers, R. (1992). Rural Appraisal: rapid, relaxed and participatory. Brighton, Institute of
Development Studies.
Chambers, R. (1997). Whose Reality Counts? Putting the first last. London, Intermediate
Technology Publications.
Chambers, R. (2002). Participatory Workshops: A sourcebook of 21 sets of ideas and
activities. London, Earthscan.
Crespi, T. D. (1993). SYMLOG - clinical-technology for therapist family-of-origin and
family system appraisal. Contemporary Family Therapy, 15(5), 369-380.
Ellis, S, Nadler, A. & Rabin, A. (1996). Political leaders in the SYMLOG space: Perceptions
of right and left wing leaders by right and left wing constituencies. Leadership Quarterly,
7(4), 507-526.
Ford, D.L. & Kiran, M.I. (2008). Perceived leader effectiveness across organizational roles:
Exploratory evidence from Central Eurasia. Eurasian Journal of Business and Economics,
1(2), 131-156.
Gfroerer, R., Bernard, U., Schaper, C., Bauer, M. & Schuepfer, G. K. (2007). Role
expectations of various professional groups in the operating theatre. Anaesthesist, 56(11),
1163-1169.
Running head: Approach comparing external and internal methods for analysing group dynamic 32
32
Hare, A.P., Sjøvold, E, Baker, H.G. & Powers J. (eds) (2005). Analysis of social interaction
systems. SYMLOG research and applications. University Press of America, Lanham
(Maryland).
Hurley, J. R. (1991). Self-Acceptance, Acceptance of Others, and SYMLOG: Equivalent
measures of the two central interpersonal dimensions? Journal of Clinical Psychology, 47(4),
576 - 582.
Isenberg, D.J. & Ennis, J.G. (1981). Perceiving group members: A comparison of derived and
imposed dimensions. Journal of Personality and Social Psychology, 41(2), 293-305
Johnson JW (2000). A heuristic method for estimating the relative weight of predictor
variables in multiple regression. Multivariate Behavioral Research 35(1), 1-19.
Keyton, J. (1999). Analyzing interaction patterns in dysfunctional teams. Small Group
Research, 30(4), 491 - 518.
Keyton, J. & Wall V.D.J. (1989). SYMLOG. Theory and method of measuring group and
organisational communication. Management Communication Quarterly, 2(4), 544 - 567.
Kolb, D. (1984). Experiential learning: experience as the source of learning and
development. London, Prentice-Hall.
Kroger, F., Drinkmann, A., Schneider, J.F. & Petzold, E (1987). Family diagnosis -
SYMLOG as an instrument for measuring family-interaction and perception structures
through internal and external rating. International Journal of Small Group Research, 3(2),
231-233
Kruskal, W.H. & Wallis, W.A. (1952). Use of ranks in one-criterion variance analysis.
Journal of the American Statistical Association, 47(260), 583-621.
Leslie, J. B. & van Velsor, E. (1998). A cross-national comparison of effective leadership and
teamwork: Toward a global workforce. Center for Creative Leadership, Greensboro North
Carolina.
Running head: Approach comparing external and internal methods for analysing group dynamic 33
33
Levin, M. (1997). The Quest for Quality in Participatory Inquiry. Forum 2: Action research
and Critical Systems Thinking, Hull, Centre for Systems Studies, University of Hull.
Lion, C.L. & Gruenfield, L.W. (1993). The behavior and personality of work group and basic
assumption group members. Small Group Research, 24(2), 236-257
Mingers, J. and J. Brocklesby (1996). "Mutlimethodology: towards a framework for critical
pluralism." Systemist 18(3): 101-131.
Mingers, J. and A. Gill, Eds. (1997). Multimethodology: The Theory and Practice of
Combining Managment Science Methodologies. Chichester, Wiley.
Mingers, J. and J. Rosenhead (2004). "Problem structuring methods in action." European
Journal of Operational Research 152(3): 530-554.
Munro, I. and J. Mingers (2000). The Use of Multimethodology in Practice - Results of a
survey of practitioners. Warwick, University of Warwick.
Muller, A., Herbig, B. & Petrovic, K. (2009). The Explication of Implicit Team Knowledge
and Its Supporting Effect on Team Processes and Technical Innovations: An Action
Regulation Perspective on Team Reflexivity. Small Group Research, 40(1), 28 - 51.
Nowack, W. (1987). SYMLOG as an instrument of internal and external perspective taking -
construct-validation and temporal change. International Journal of Small Group Research,
3(2), 180 - 197.
Open University (1987). T301 - Complexity Management and Change: a systems approach.
Open University Systems Group. Milton Keynes., The Open University Press.
Open University (2000). T306 Managing Complexity: a systems approach. Milton Keynes,
Open University.
Park, J. H. (1985). SYMLOG as a method of a team diagnosis of soccer teams. International
Journal of Sports Psychology, 16(4), 331 - 332.
Running head: Approach comparing external and internal methods for analysing group dynamic 34
34
Schneider, J. F., Schneiderduker, M & Becker-beck, U (1989). Sex-roles and social-behavior
- on the relation between the BEM sex-role inventory and the SYMLOG behavior rating-
scales. Journal of Social Psychology, 129(4), 471-479
Scudder, J., Herschel, R. & Crossland, M. (1994). Test of a model linking cognitive
motivation, assessment of alternatives, decision quality, and group process satisfaction. Small
Group Research, 25(1), 57 - 82.
Seibert, S. & Gruenfeld, L (1992). Masculinity, femininity, and behavior in groups. Small
Group Research, 23(1), 95-112
Shadish, W. (1984). Intimate Behavior and the Assessment of Benefits in Clinical Groups.
Small Group Research, 15(2), 204 - 221.
Sjovold, E. (2007). Systematizing Person-Group Relations (SPGR): A Field Theory of Social
Interaction. Small Group Research, 38(5), 615 - 635.
Suddaby R (2006). From the editors: What grounded theory is not. Academy of Management
Journal 49(4), 633–642.
Terjung B. (1987). SYMLOG organization-development in hospitals - a field-study.
International Journal of Small Group Research, 3(2), 244-244
Tonidandel, S, ;LeBreton, JM and Johnson JW (2009). Determining the statistical
significance of relative weights. Psychological Methods 14(4), 387-399
Wall, V. D. J. & Galanes, G.J. (1986). The SYMLOG Dimensions and Small Group Conflict.
Central States Speech Journal, 37(2), 61 - 78.
Wheelan, S., Buzaglo, G. & Tsumura, E. (1998). Developing Assessment Tools for Cross-
Cultural Group Research. Small Group Research, 29(3), 359 - 370.
Whiteoak, J., Chalip, L. & Hort, L. (2004). Assessing Group Efficacy: Comparing three
methods of assessment. Small Group Research, 35(2), 158 - 173.
Running head: Approach comparing external and internal methods for analysing group dynamic 35
35
Zhu, Z. (1998). "Conscious Mind, Forgetting Mind: Two approaches in Multimethodology."
Systemic Practice and Action Research 11(6): 669-690.
Zimmer, B. (2001). Practicing what we Preach in Teaching Systems Practice: The Action-
Learning Cycle. Systemic Practice and Action Research, 14(6), 697 - 714.

Running head: Approach comparing external and internal methods for analysing group dynamic 36
36
Table 1. BECM criteria for assessing group function.
Running head: Approach comparing external and internal methods for analysing group dynamic 37
37
Table 2. Composition of the workshop groups
Workshop topic
Location
Dates
Number of
participants (number
of groups)
Group
code
Type of participant
Sustainable
Development
Malta 3 – 5th
March 09 11 – 14 (2) A PCon, Gov, Gov, NGO, Ac, Gov, NGO
B PvS, Gov, Gov, Stu, Gov, LGov, Stu
Sustainable
Development
Slovakia 15 – 18th
March
09
15 - 23 (3) C Stu, Gov, Gov, Gov, Ac, LGov, LGov
D Gov, Stu, Res, NGO. NGO, LGov,
LGov, Ac
E NGO, Ac, Ac, Res, Stu, Pol, LGov,
LGov
Agriculture Slovakia 15th
and 16th
April 09
18 (3) F Res, Ac, Ac, Ac, Ac, LGov
G Res, NGO, Ac, Ac, Ac, Gov, NGO
H Res, Ac, Ac, Ac, Ac
Sustainable
Development
Finland 14th
and 15th
September 09
13 (3) I Gov, Gov, LGov, LGov, LGov
J LGov, LGov, LGov, PvS
K LGov, LGov, NGO, Ac, NGO
Transport Denmark 26th
and 27th
November 09
17 (3) L PvS, PvS, Res, Gov, Gov, PvS
M PvS, Res, LGov, Gov, NGO
N PvS, PCon, Gov, Res, Res, Gov
Energy UK 22nd
and 23rd
February 2010
14 (2) O Gov, Res, Res, Stu, Stu, Stu, Res, NGO
P Gov, LGov, Gov, NGO, Stu, Res
Running head: Approach comparing external and internal methods for analysing group dynamic 38
38
Participant codes
Code
PvS Private sector
PCon Private consultant
Gov Government employee (public sector) at the national level
Res Researcher
Ac Academic
LGov Local Government
NGO Non Governmental Organisation
Stu Student
Pol Politician
EC European Commission
Running head: Approach comparing external and internal methods for analysing group
dynamic 39
39
Table 3. SYMLOG self and group criteria.
Group members are asked to rate how often (rarely, sometimes, often) they show the
characteristics listed here for their group.
Question no.
Code
Characteristic Rar
ely
So
met
imes
Oft
en
1 U active, dominant, talks a lot
2 UP extroverted, outgoing, positive
3 UPF a purposeful democratic task leader
4 UF an assertive business-like manager
5 UNF authoritarian, controlling, disapproving
6 UN domineering, tough-minded, powerful
7 UNB provocative, egocentric, shows off
8 UB jokes around, expressive, dramatic
9 UPB entertaining, sociable, smiling, warm
10 P friendly, equalitarian
11 PF works cooperatively with others
12 F analytical, task-oriented, problem-solving
13 NF legalistic, has to be right
14 N unfriendly, negativistic
15 NB irritable, cynical, won't cooperate
16 B shows feelings and emotions
17 PB affectionate, likeable, fun to be with
18 DP looks up to others, appreciative, trustful
19 DPF gentle, willing to accept responsibility
20 DF obedient, works submissively
21 DNF self-punishing, works too hard
22 DN depressed, sad, resentful, rejecting
23 DNB alienated, quits, withdraws
24 DB afraid to try, doubts own ability
25 DPB quietly happy just to be with others
26 D passive, introverted, says little
Running head: Approach comparing external and internal methods for analysing group dynamic 40
40
Table 4. Mean BECM scores for each group and for each day of the workshop.
Mean BECM score
Groups Country Day 1 Day 2
A Malta
4.38 3.42
B 3.50 3.00
C
Slovakia
3.58 3.88
D 3.08 3.50
E 4.08 3.63
F 2.94 1.50
G 3.19 3.25
H 3.56 3.75
I
Finland
3.00 1.75
J 3.63 2.75
K 2.69 2.00
L
Denmark
2.31 1.75
M 2.63 2.00
N 2.69 2.50
O UK
4.00 2.50
P 3.06 3.25
Running head: Approach comparing external and internal methods for analysing group dynamic 41
41
Table 5. The mean Symlog scores for the 16 groups across the 26 questions and 2 days of each workshop.
(a) Day 1
Symlog characteristic (average score across group members) Group
U UP UPF UF UNF UN UNB UB UPB P PF F NF N NB B PB DP DPF DF DNF DN DNB DB DPB D
A 2.60 2.00 2.25 2.40 1.60 1.60 1.00 1.80 2.60 2.80 2.80 2.00 2.00 1.00 1.00 1.80 2.40 2.40 2.40 1.40 1.00 1.00 1.00 1.00 1.80 1.20
B 2.29 2.71 2.14 1.71 1.71 1.29 1.00 1.57 2.71 2.71 2.86 2.71 1.43 1.00 1.00 2.00 2.14 1.83 2.29 1.43 1.14 1.14 1.29 1.43 1.86 1.57
C 2.40 2.60 1.80 1.60 1.00 1.00 1.00 1.60 2.20 2.60 2.60 2.60 1.20 1.00 1.00 1.60 2.40 2.40 2.40 2.20 2.00 1.20 1.20 1.40 2.20 1.20
D 2.20 2.40 2.40 2.00 1.00 1.20 1.50 2.20 2.60 2.20 2.80 2.60 1.40 1.20 1.20 1.40 2.50 2.50 2.00 2.25 2.20 1.50 1.50 1.25 2.00 1.50
E 2.80 2.80 2.75 2.60 1.40 1.00 1.00 1.40 2.75 3.00 3.00 3.00 1.20 1.00 1.00 2.00 3.00 2.80 2.80 2.00 2.60 1.00 1.20 1.20 2.20 1.20
F 2.50 3.00 2.67 2.67 1.67 1.00 1.00 2.00 3.00 3.00 3.00 2.83 1.17 1.00 1.00 1.67 3.00 2.67 2.50 1.50 2.00 1.00 1.00 1.00 3.00 1.00
G 2.71 2.71 2.43 2.00 1.14 1.00 1.17 2.57 2.86 2.71 3.00 2.71 1.14 1.17 1.00 1.71 2.00 2.29 2.14 1.33 2.17 1.17 1.17 1.57 2.50 1.57
H 2.20 2.80 2.25 2.40 1.20 1.40 1.00 2.40 2.20 2.40 2.80 2.40 1.20 1.00 1.20 2.00 2.40 2.80 2.60 2.20 2.00 1.40 1.00 1.20 2.75 1.80
I 1.75 2.50 1.25 1.25 1.25 1.50 1.75 2.25 2.75 3.00 2.75 3.00 1.00 1.00 1.00 1.25 2.25 2.25 2.50 1.50 1.00 1.00 1.25 1.25 1.50 1.50
J 1.50 2.00 1.00 1.50 2.00 2.50 1.00 1.00 2.00 2.50 3.00 2.50 2.00 1.00 1.50 1.50 2.50 2.00 3.00 2.00 1.00 1.00 1.00 1.00 1.50 1.50
K 2.60 2.80 2.40 1.20 1.20 1.40 1.20 1.60 2.60 3.00 3.00 2.40 1.20 1.00 1.00 1.60 2.40 2.80 2.40 1.40 1.00 1.00 1.00 1.20 1.80 1.20
L 2.33 2.83 1.67 1.50 1.33 1.67 1.00 2.33 2.83 2.67 3.00 2.67 1.17 1.00 1.00 1.83 2.33 2.17 2.50 1.33 1.00 1.00 1.00 1.00 1.50 1.17
M 2.75 3.00 2.00 1.25 1.25 1.00 1.00 1.50 3.00 3.00 3.00 3.00 1.50 1.00 1.00 1.75 2.25 1.75 2.50 1.00 1.00 1.00 1.25 1.50 1.50 1.75
N 1.80 2.00 1.80 1.60 1.60 1.50 1.20 1.40 2.00 2.40 2.60 2.20 1.80 1.20 1.20 1.20 1.80 1.80 2.60 1.40 1.20 1.40 1.60 1.60 1.20 2.20
O 2.14 2.14 2.00 2.17 1.14 1.43 1.17 1.29 2.29 2.71 2.86 2.43 1.33 1.00 1.00 1.86 2.29 2.14 2.29 1.50 1.14 1.00 1.14 1.67 2.14 2.00
P 2.33 2.33 2.00 2.00 1.67 1.50 1.33 2.17 2.67 2.50 2.83 2.67 1.17 1.00 1.17 1.83 2.00 2.17 2.33 1.83 1.17 1.00 1.17 1.50 1.83 1.50
Running head: Approach comparing external and internal methods for analysing group dynamic 42
42
(b) Day 2
Symlog characteristic (average score across group members)
Group U UP UPF UF UNF UN UNB UB UPB P PF F NF N NB B PB DP DPF DF DNF DN DNB DB DPB D
A 2.50 2.33 2.17 2.00 1.83 1.50 1.33 2.00 2.33 2.50 2.50 1.83 1.50 1.00 1.17 1.83 2.33 1.83 2.33 1.83 1.33 1.00 1.33 1.17 2.00 1.17
B 1.60 2.60 2.40 2.00 1.60 1.40 1.00 1.20 2.60 2.80 3.00 2.80 1.80 1.00 1.00 1.60 2.40 2.20 2.40 1.80 1.00 1.00 1.80 1.60 2.20 2.00
C 2.25 2.25 1.75 1.25 1.25 1.50 1.50 1.50 2.50 2.50 2.00 2.50 1.00 1.25 1.75 1.25 2.00 1.75 2.00 1.75 1.25 1.25 1.75 1.50 2.00 2.00
D 2.50 2.75 2.75 2.75 1.50 1.25 1.00 1.75 2.50 2.75 2.50 2.75 1.50 1.00 1.00 1.50 2.75 2.50 2.50 2.25 3.00 1.00 1.50 1.50 2.50 1.25
E 3.00 3.00 3.00 3.00 1.50 1.00 1.00 2.00 2.50 3.00 3.00 3.00 1.50 1.00 1.00 2.50 3.00 3.00 2.50 2.00 3.00 1.00 1.00 1.00 2.50 1.00
F 2.50 3.00 3.00 2.50 1.50 1.00 1.00 1.50 3.00 3.00 3.00 3.00 1.00 1.00 1.00 2.00 3.00 2.00 2.50 1.50 2.00 1.00 1.00 1.00 2.50 2.00
G 2.86 2.71 2.71 2.43 1.57 1.43 1.14 2.29 2.57 2.71 2.71 2.43 1.14 1.00 1.00 1.57 2.14 2.43 2.17 1.43 2.00 1.14 1.29 1.14 2.29 1.14
H 2.40 3.00 2.60 2.00 1.20 1.20 1.20 2.40 2.40 2.60 2.60 2.60 1.60 1.00 1.20 1.60 2.00 2.40 2.00 2.40 2.20 1.40 1.40 1.40 2.40 1.40
I 2.00 3.00 2.40 1.00 1.00 1.40 1.40 2.40 2.80 3.00 2.80 2.20 1.20 1.20 1.00 1.60 2.40 2.20 2.40 1.20 1.00 1.00 1.60 1.40 1.60 1.60
J 2.50 2.75 2.00 1.75 1.25 1.50 1.25 1.50 2.50 2.50 2.75 2.75 1.50 1.00 1.00 1.75 2.50 2.50 2.75 1.75 1.00 1.00 1.25 1.25 1.75 1.75
K 2.25 2.25 1.75 1.25 1.00 1.50 1.50 1.25 1.75 2.50 2.50 2.50 1.50 1.00 1.00 1.50 2.00 1.75 2.25 1.25 1.00 1.50 1.50 1.75 2.25 2.00
L 2.00 2.40 1.40 1.60 1.20 1.60 1.00 2.20 2.40 2.60 3.00 2.80 1.20 1.00 1.00 1.40 2.40 1.60 2.40 1.20 1.00 1.00 1.20 1.20 1.20 1.20
M 3.00 3.00 1.75 1.50 1.25 1.75 1.00 2.00 2.75 2.50 3.00 3.00 1.50 1.00 1.00 1.75 2.50 2.00 2.00 1.50 1.00 1.00 1.50 1.50 1.50 1.50
N 1.50 2.50 1.75 1.50 1.00 1.25 1.25 1.75 2.50 2.75 3.00 3.00 1.50 1.00 1.00 1.50 1.75 1.75 3.00 2.00 1.00 1.00 1.25 1.00 1.75 1.75
O 2.40 2.80 2.80 1.60 1.20 1.20 1.00 1.40 2.60 3.00 2.80 3.00 1.25 1.00 1.00 1.80 2.40 2.60 2.40 1.25 1.40 1.00 1.25 1.40 2.40 1.80
P 2.00 1.75 1.75 2.00 1.25 1.25 1.25 1.75 2.00 2.25 2.25 2.75 1.25 1.50 1.00 2.00 2.00 1.50 2.25 1.75 1.00 1.00 1.25 1.50 1.75 1.25
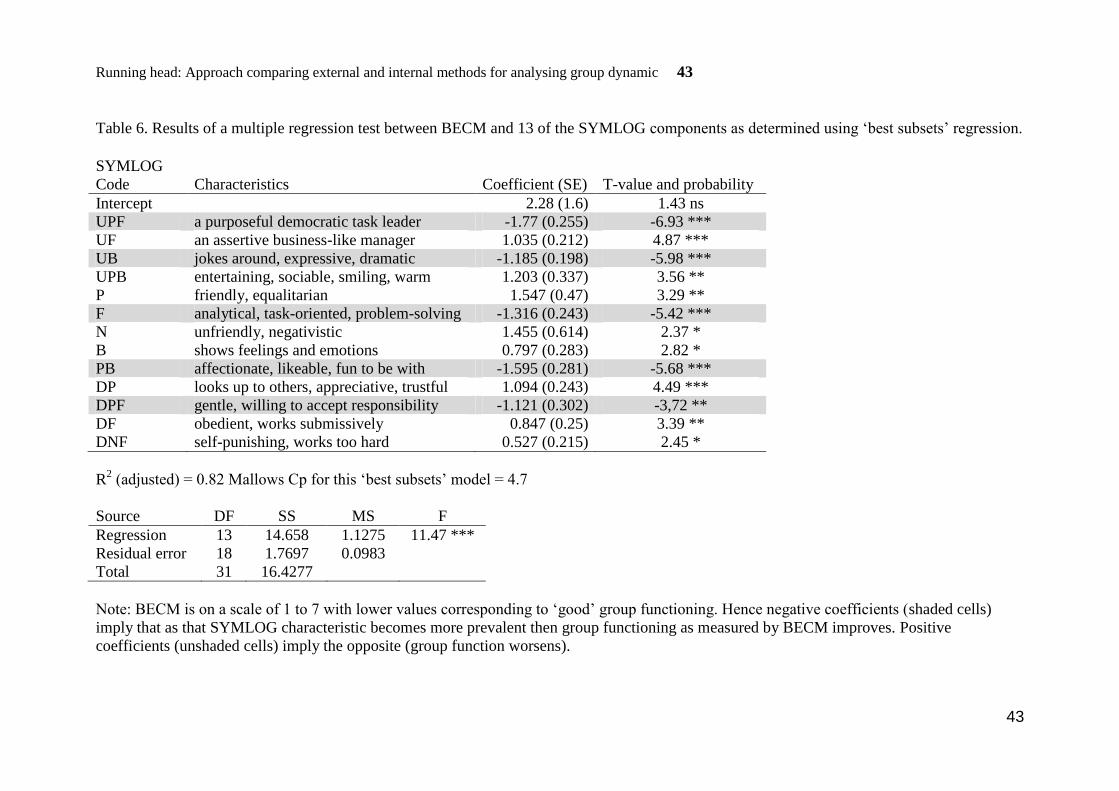
Running head: Approach comparing external and internal methods for analysing group dynamic 43
43
Table 6. Results of a multiple regression test between BECM and 13 of the SYMLOG components as determined using ‘best subsets’ regression.
SYMLOG
Code
Characteristics
Coefficient (SE)
T-value and probability
Intercept 2.28 (1.6) 1.43 ns
UPF a purposeful democratic task leader -1.77 (0.255) -6.93 ***
UF an assertive business-like manager 1.035 (0.212) 4.87 ***
UB jokes around, expressive, dramatic -1.185 (0.198) -5.98 ***
UPB entertaining, sociable, smiling, warm 1.203 (0.337) 3.56 **
P friendly, equalitarian 1.547 (0.47) 3.29 **
F analytical, task-oriented, problem-solving -1.316 (0.243) -5.42 ***
N unfriendly, negativistic 1.455 (0.614) 2.37 *
B shows feelings and emotions 0.797 (0.283) 2.82 *
PB affectionate, likeable, fun to be with -1.595 (0.281) -5.68 ***
DP looks up to others, appreciative, trustful 1.094 (0.243) 4.49 ***
DPF gentle, willing to accept responsibility -1.121 (0.302) -3,72 **
DF obedient, works submissively 0.847 (0.25) 3.39 **
DNF self-punishing, works too hard 0.527 (0.215) 2.45 *
R2 (adjusted) = 0.82 Mallows Cp for this ‘best subsets’ model = 4.7
Source DF SS MS F
Regression 13 14.658 1.1275 11.47 ***
Residual error 18 1.7697 0.0983
Total 31 16.4277
Note: BECM is on a scale of 1 to 7 with lower values corresponding to ‘good’ group functioning. Hence negative coefficients (shaded cells)
imply that as that SYMLOG characteristic becomes more prevalent then group functioning as measured by BECM improves. Positive
coefficients (unshaded cells) imply the opposite (group function worsens).
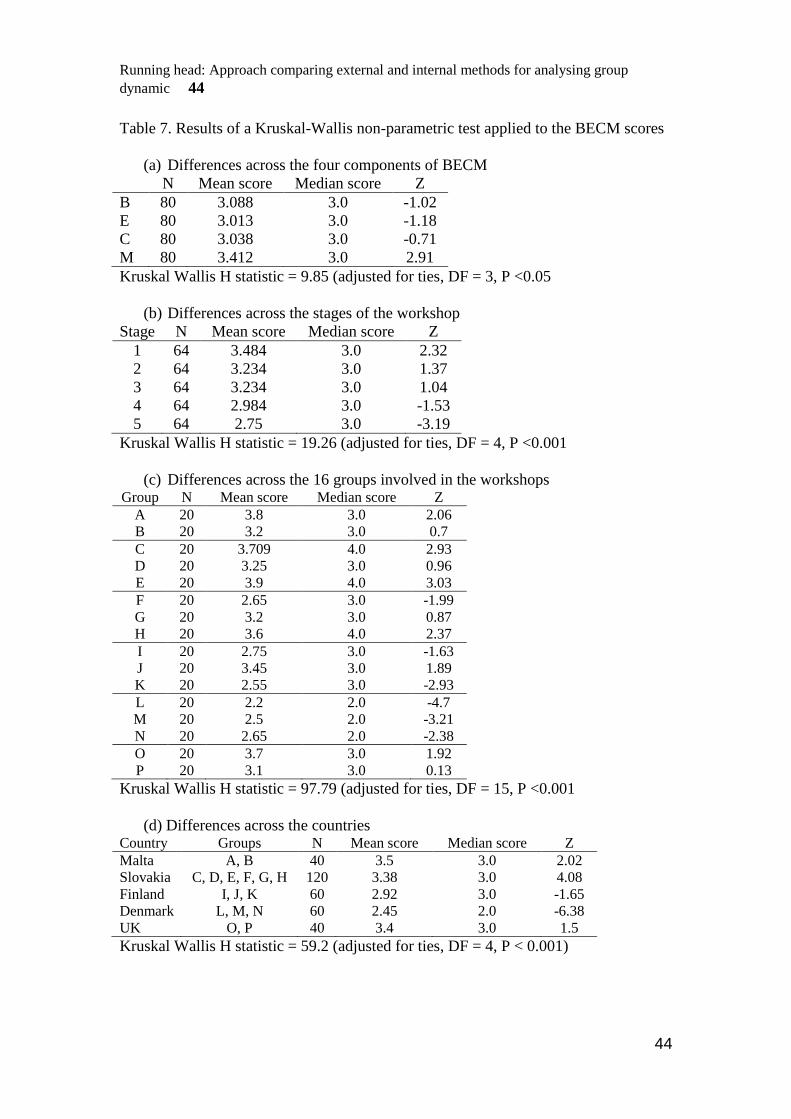
Running head: Approach comparing external and internal methods for analysing group
dynamic 44
44
Table 7. Results of a Kruskal-Wallis non-parametric test applied to the BECM scores
(a) Differences across the four components of BECM
N Mean score Median score Z
B 80 3.088 3.0 -1.02
E 80 3.013 3.0 -1.18
C 80 3.038 3.0 -0.71
M 80 3.412 3.0 2.91
Kruskal Wallis H statistic = 9.85 (adjusted for ties, DF = 3, P <0.05
(b) Differences across the stages of the workshop
Stage N Mean score Median score Z
1 64 3.484 3.0 2.32
2 64 3.234 3.0 1.37
3 64 3.234 3.0 1.04
4 64 2.984 3.0 -1.53
5 64 2.75 3.0 -3.19
Kruskal Wallis H statistic = 19.26 (adjusted for ties, DF = 4, P <0.001
(c) Differences across the 16 groups involved in the workshops Group N Mean score Median score Z
A 20 3.8 3.0 2.06
B 20 3.2 3.0 0.7
C 20 3.709 4.0 2.93
D 20 3.25 3.0 0.96
E 20 3.9 4.0 3.03
F 20 2.65 3.0 -1.99
G 20 3.2 3.0 0.87
H 20 3.6 4.0 2.37
I 20 2.75 3.0 -1.63
J 20 3.45 3.0 1.89
K 20 2.55 3.0 -2.93
L 20 2.2 2.0 -4.7
M 20 2.5 2.0 -3.21
N 20 2.65 2.0 -2.38
O 20 3.7 3.0 1.92
P 20 3.1 3.0 0.13
Kruskal Wallis H statistic = 97.79 (adjusted for ties, DF = 15, P <0.001
(d) Differences across the countries Country Groups N Mean score Median score Z
Malta A, B 40 3.5 3.0 2.02
Slovakia C, D, E, F, G, H 120 3.38 3.0 4.08
Finland I, J, K 60 2.92 3.0 -1.65
Denmark L, M, N 60 2.45 2.0 -6.38
UK O, P 40 3.4 3.0 1.5
Kruskal Wallis H statistic = 59.2 (adjusted for ties, DF = 4, P < 0.001)
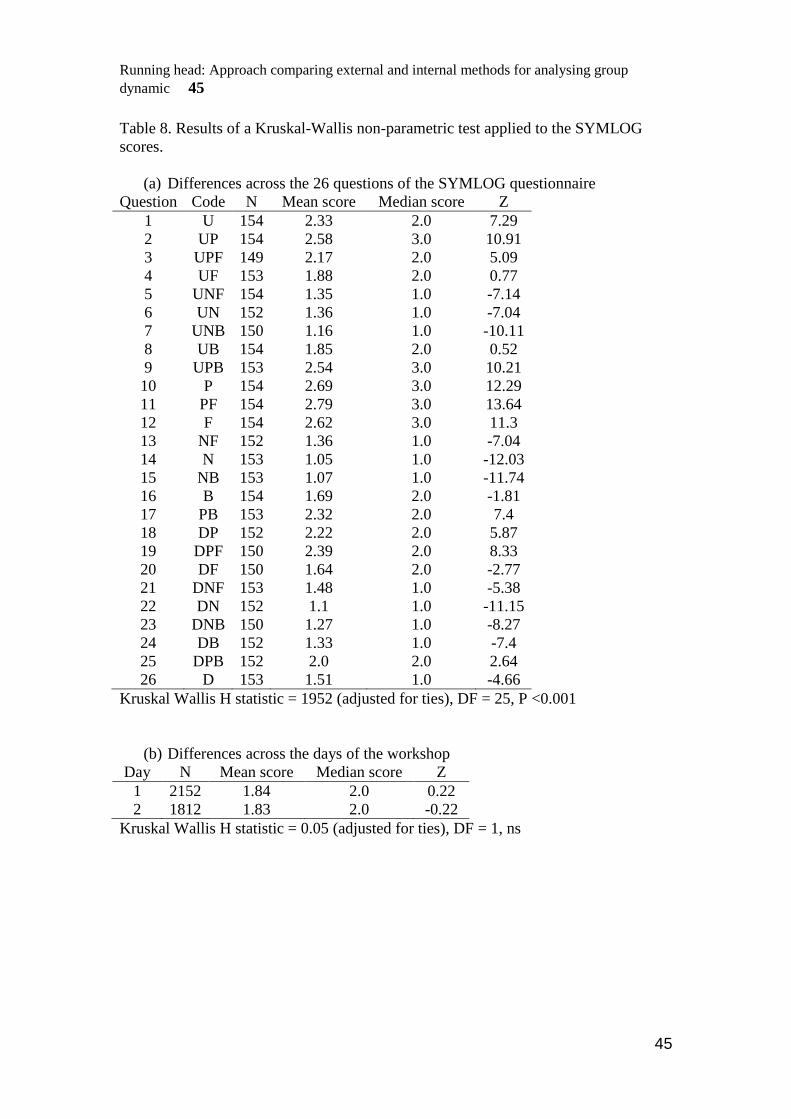
Running head: Approach comparing external and internal methods for analysing group
dynamic 45
45
Table 8. Results of a Kruskal-Wallis non-parametric test applied to the SYMLOG
scores.
(a) Differences across the 26 questions of the SYMLOG questionnaire
Question Code N Mean score Median score Z
1 U 154 2.33 2.0 7.29
2 UP 154 2.58 3.0 10.91
3 UPF 149 2.17 2.0 5.09
4 UF 153 1.88 2.0 0.77
5 UNF 154 1.35 1.0 -7.14
6 UN 152 1.36 1.0 -7.04
7 UNB 150 1.16 1.0 -10.11
8 UB 154 1.85 2.0 0.52
9 UPB 153 2.54 3.0 10.21
10 P 154 2.69 3.0 12.29
11 PF 154 2.79 3.0 13.64
12 F 154 2.62 3.0 11.3
13 NF 152 1.36 1.0 -7.04
14 N 153 1.05 1.0 -12.03
15 NB 153 1.07 1.0 -11.74
16 B 154 1.69 2.0 -1.81
17 PB 153 2.32 2.0 7.4
18 DP 152 2.22 2.0 5.87
19 DPF 150 2.39 2.0 8.33
20 DF 150 1.64 2.0 -2.77
21 DNF 153 1.48 1.0 -5.38
22 DN 152 1.1 1.0 -11.15
23 DNB 150 1.27 1.0 -8.27
24 DB 152 1.33 1.0 -7.4
25 DPB 152 2.0 2.0 2.64
26 D 153 1.51 1.0 -4.66
Kruskal Wallis H statistic = 1952 (adjusted for ties), DF = 25, P <0.001
(b) Differences across the days of the workshop
Day N Mean score Median score Z
1 2152 1.84 2.0 0.22
2 1812 1.83 2.0 -0.22
Kruskal Wallis H statistic = 0.05 (adjusted for ties), DF = 1, ns
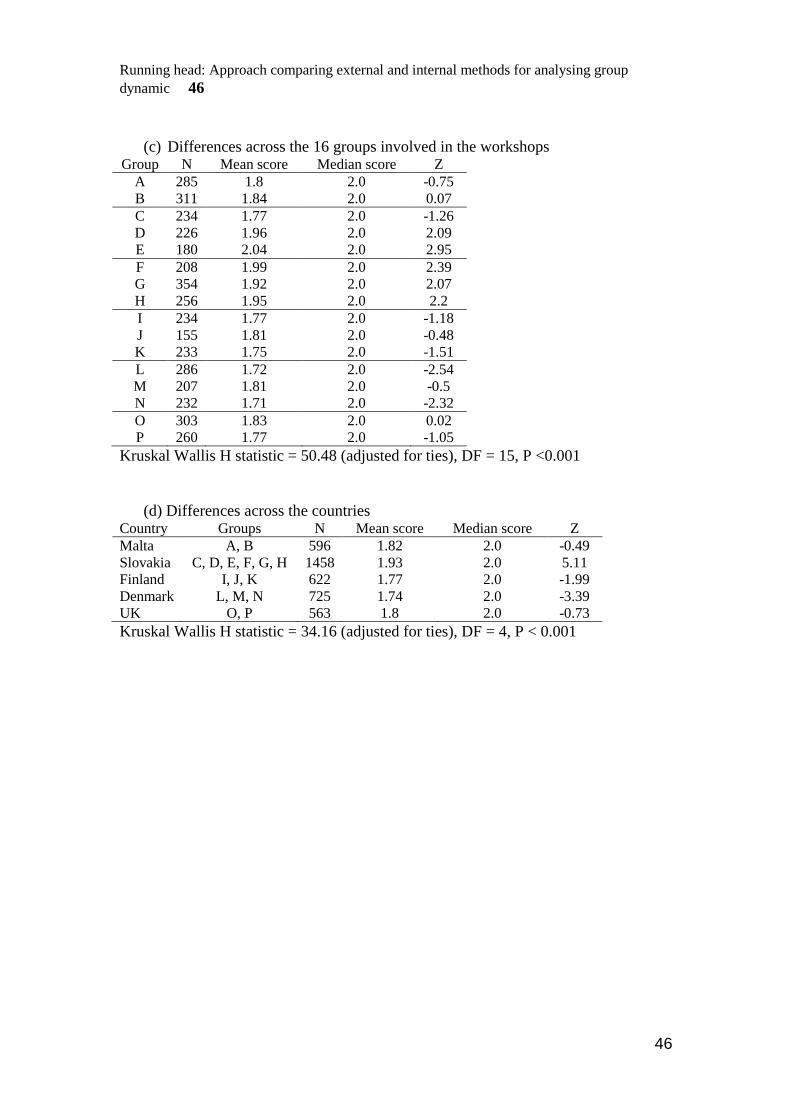
Running head: Approach comparing external and internal methods for analysing group
dynamic 46
46
(c) Differences across the 16 groups involved in the workshops Group N Mean score Median score Z
A 285 1.8 2.0 -0.75
B 311 1.84 2.0 0.07
C 234 1.77 2.0 -1.26
D 226 1.96 2.0 2.09
E 180 2.04 2.0 2.95
F 208 1.99 2.0 2.39
G 354 1.92 2.0 2.07
H 256 1.95 2.0 2.2
I 234 1.77 2.0 -1.18
J 155 1.81 2.0 -0.48
K 233 1.75 2.0 -1.51
L 286 1.72 2.0 -2.54
M 207 1.81 2.0 -0.5
N 232 1.71 2.0 -2.32
O 303 1.83 2.0 0.02
P 260 1.77 2.0 -1.05
Kruskal Wallis H statistic = 50.48 (adjusted for ties), DF = 15, P <0.001
(d) Differences across the countries Country Groups N Mean score Median score Z
Malta A, B 596 1.82 2.0 -0.49
Slovakia C, D, E, F, G, H 1458 1.93 2.0 5.11
Finland I, J, K 622 1.77 2.0 -1.99
Denmark L, M, N 725 1.74 2.0 -3.39
UK O, P 563 1.8 2.0 -0.73
Kruskal Wallis H statistic = 34.16 (adjusted for ties), DF = 4, P < 0.001