Embed Size (px)
Citation preview
This article was downloaded by: [McGill University Library]On: 26 August 2012, At: 02:23Publisher: RoutledgeInforma Ltd Registered in England and Wales Registered Number: 1072954Registered office: Mortimer House, 37-41 Mortimer Street, London W1T 3JH,UK
Journal of Quality Assurance inHospitality & TourismPublication details, including instructions forauthors and subscription information:http://www.tandfonline.com/loi/wqah20
An Empirical Applicationof Quantitative DerivedImportance-PerformanceAnalysis (QDIPA) for EmployeeSatisfactionDaniel J. Mount aa Pennsylvania State University, School of HRRM, 227Mateer Building, University Park, PA, 16802, USA
Version of record first published: 08 Sep 2008
To cite this article: Daniel J. Mount (2005): An Empirical Application of QuantitativeDerived Importance-Performance Analysis (QDIPA) for Employee Satisfaction, Journalof Quality Assurance in Hospitality & Tourism, 6:1-2, 65-76
To link to this article: http://dx.doi.org/10.1300/J162v06n01_05
PLEASE SCROLL DOWN FOR ARTICLE
Full terms and conditions of use: http://www.tandfonline.com/page/terms-and-conditions
This article may be used for research, teaching, and private study purposes.Any substantial or systematic reproduction, redistribution, reselling, loan,sub-licensing, systematic supply, or distribution in any form to anyone isexpressly forbidden.
The publisher does not give any warranty express or implied or make anyrepresentation that the contents will be complete or accurate or up todate. The accuracy of any instructions, formulae, and drug doses should be

independently verified with primary sources. The publisher shall not be liablefor any loss, actions, claims, proceedings, demand, or costs or damageswhatsoever or howsoever caused arising directly or indirectly in connectionwith or arising out of the use of this material.
Dow
nloa
ded
by [
McG
ill U
nive
rsity
Lib
rary
] at
02:
23 2
6 A
ugus
t 201
2
An Empirical Applicationof Quantitative Derived Importance-
Performance Analysis (QDIPA)for Employee Satisfaction
Daniel J. Mount
ABSTRACT. Importance-performance analysis (IPA) is a common an-alytical tool that has been used in a variety of applications. The methodhas been criticized for a number of reasons. Suggested alternative meth-ods utilize the concept of derived importance (Oliver, 1997; Mount,1997) and a quantitative interpretation of the traditionally visual results(Mount, 2000). This study illustrates how a method using both of thesuggested alternatives is utilized to analyze employee satisfaction issuesin a hotel. [Article copies available for a fee from The Haworth Document Deliv-ery Service: 1-800-HAWORTH. E-mail address: <[email protected]> Website: <http://www.HaworthPress.com> © 2005 by The Haworth Press,Inc. All rights reserved.]
KEYWORDS. Importance-performance analysis (IPA), derived impor-tance-performance analysis (DIPA), quantitative derived importance-performance analysis (QDIPA), employee satisfaction, lodging indus-try, performance assessment
The development of importance-performance analysis (IPA) beginswith Martilla and James (1977). Since their seminal piece, hundreds ofstudies have used or examined IPA. Almost all of the studies that use
Daniel J. Mount is Assistant Professor at The Pennsylvania State University, School ofHRRM, 227 Mateer Building, University Park, PA 16802 (E-mail: [email protected]).
Journal of Quality Assurance in Hospitality & Tourism, Vol. 6(1/2) 2005Available online at: http://www.haworthpress.com/web/JQAHT
© 2005 by The Haworth Press, Inc. All rights reserved.doi:10.1300/J162v06n01_05 65
Dow
nloa
ded
by [
McG
ill U
nive
rsity
Lib
rary
] at
02:
23 2
6 A
ugus
t 201
2
IPA utilize a visual matrix presentation. Action steps on the items ineach particular study are undertaken based on this visual analysis.
There have been two major issues discussed concerning the applica-tion of traditional IPA. The first issue is the use of self-stated importancein traditional IPA. The use of self-stated importance has been criticizedby various researchers as to its use in various research settings. Oliver(1997) makes his feelings clear when he refers to self-stated importanceas an, “ambiguous and unreliable concept” (p. 54). Both Oliver (1997)and Mount (1997) suggest using derived importance, either a regressionweight or correlation coefficient, to combine with performance in a “de-rived importance-performance analysis,” (Mount refers to the measure as“relative” importance).
The second issue is the placement of the gridlines to classify items.There are no statistical methods used by Martilla and James to support theclassification of items in their work. Classification, and subsequent plot-ting on a matrix, is based on subjective decisions on where to place thequadrant “crosshairs,” or “gridlines.” Acton steps, or marketing strategiessuggested by Martilla and James (1977), are formulated based on thequadrant placement of items; a placement dependent upon the subjectiveplacement of the gridlines. Oliver (1997) considers the guidelines as towhere to place these dichotomous splits “murky” (p. 36). Mount (2000)has proposed a quantitative methodology to mimic the importance-per-formance grid that removes the gridline placement issue.
This study will utilize an empirical approach to DIPA that includesthe quantitative method suggested by Mount (2000) to present a quanti-tative DIPA (QDIPA) of employee satisfaction data. The two cited is-sues (self-stated importance and subjective placement of gridlines)have been the topic of many studies. As such, the objective of this re-search is to present an empirical application that incorporates the latestdevelopments. This article will begin with a brief literature review ofIPA and approaches to resolving the key issues, continue with a presen-tation of empirical data using the proposed method, and close with adiscussion of the effectiveness of the method.
INTRODUCTION
Martilla and James (1977) presented an intentionally elemental ap-proach that examined issues relevant to marketing and other behaviorally-based disciplines. The technique, referred to as importance-performanceanalysis (IPA), provided an “easily-applied technique for measuring attri-
66 JOURNAL OF QUALITY ASSURANCE IN HOSPITALITY & TOURISM
Dow
nloa
ded
by [
McG
ill U
nive
rsity
Lib
rary
] at
02:
23 2
6 A
ugus
t 201
2
bute importance and performance” (p. 77). Martilla and James gatheredimportance and performance data on various attributes of an automobileservice department. They then plotted the points on a “performance grid.”Importance scores were plotted on the vertical axis and performance scoreswere plotted on the horizontal axis. They plotted gridlines at 3.0 (they useda four-point scale) on each axis leaving the performance grid with fourquadrants. The four quadrants are: concentrate here (high importance, lowperformance), keep up the good work (high importance, high performance),low priority (low importance, high performance), and possible overkill (lowimportance, high performance).
Martilla and James stated that the performance grid “facilitates man-agement interpretation of the data and increases the usefulness in makingstrategic marketing decisions” (p. 79). They felt that the grid provided auseful focus for developing strategies. In their application, strategieswere discussed that targeted the three attributes located in the “concen-trate here” quadrant.
The value of this introductory piece is clearly evident in the number ofstudies that have utilized IPA. IPA has been used in recreation (Kennedy,1986), tourism (Evans & Chon, 1989), health care (Hawes & Rao, 1985),and even education (Ortinau, Bush, Bush, & Twible, 1989). IPA has beenused to analyze the design function of an adult softball park (Bartlett &Einert, 1992), to evaluate technique in adult education (Alberty & Mihalik,1989), to identify strengths and weaknesses in staff/management rela-tions (Havitz, Twynam, & DeLorenzo, 1991), and to study motivation(Williams & Neal, 1993). The primary use of IPA seems to be as an as-sessment tool. IPA has been used in this manner by Duke and Persia(1996) in tourism, Dolinsky and Caputo (1991) in health care, Leong(1992) in competitive analysis, and Ennew, Reed, and Binks (1993) inbanking, among others. In hospitality, IPA has been used by to study res-taurant positioning (Keyt, 1993); customer satisfaction in foodservice(Almanza, Jaffe, & Lin, 1994; Seo & Shanklin, 2004); hotel customersatisfaction (Chu, 2002) and; slot player experience (Suh & Erdem,2004).
DISCUSSION
The major benefit of IPA is that it is an “easily-applied” technique.As such, IPA will always be useful for management application. Thisresearch will present modifications, as suggested in the literature, to tra-
Daniel J. Mount 67
Dow
nloa
ded
by [
McG
ill U
nive
rsity
Lib
rary
] at
02:
23 2
6 A
ugus
t 201
2
ditional IPA analysis that may enhance the capability of the traditionalapproach.
The first modification is based on the issue of importance as it is usedin traditional importance-performance analysis. The role of importancehas received a great deal of attention as it is considered in customer satis-faction or service quality models (Barsky, 1992; Carman, 1990; Cronin &Taylor, 1992; Oliver, 1997; Teas, 1993). Carman (1990) and Barsky(1992) both argue for the inclusion of importance weights in predictingcustomer satisfaction. Cronin and Taylor (1992), Oh and Parks (1998),and Oliver (1997) all conclude that importance weights do not contributeto explanation or prediction of satisfaction or quality. Oh and Parks(1998) add that attribute importance need not be measured if it is to beused only for weighting purposes, but add that their study does nothing todevalue previous work that focused on evaluating and comparing the im-portance of service attributes themselves. Oliver (1997) presents a strongstatement that, “(self-report importance measures) are an ambiguous andunreliable concept” (p. 54).
IPA can provide a different role for importance measurements. IPAis not only a predictive measure, but can be used as an assessment tech-nique. While importance may or may not be necessary in satisfaction orperformance prediction models, it is a factor when considering the alloca-tion of resources to improve operational issues (Carman, 1990). Cromptonand Love (1995) discuss the pragmatic perspective of including impor-tance considerations. They state that valuable insights may be lost to theorganization if only performance measures are used. There is the possi-bility of sub-optimal investment of resources in efforts to improve qual-ity. The authors capture the theoretical perspective of this study whenthey conclude their discussion by stating, “such investment of resourcesmay only be wise if those attributes are relatively important to visitors”(p. 22). Oliver (1997) does discuss the value of importance-performanceanalysis as an assessment tool. Oliver states that, given the problems withself-stated importance measures, an importance measure derived from aregression weight or correlation coefficient is the most appropriate im-portance measure to utilize in importance-performance analyses, creatinga derived importance-performance analysis. Chu’s (2002) work studiedboth approaches, using regression betas as the importance measure andsupported the notion that the “derived-importance approach is superior tothe stated-importance approach for its power of prediction and explana-tion” (p. 295).
The second modification is based on the placement of the grindlines inthe matrix presentation. Interpretation and subsequent action plans are
68 JOURNAL OF QUALITY ASSURANCE IN HOSPITALITY & TOURISM
Dow
nloa
ded
by [
McG
ill U
nive
rsity
Lib
rary
] at
02:
23 2
6 A
ugus
t 201
2
based on the placement of attributes in the quadrants determined by theplacement of the gridlines. The strict interpretation is that action planningaddresses those items that are in the “concentrate here” quadrant.
Many of the previously cited works suggest that policy, investment,or even a nation’s competitive strategy should be guided by the resultsobtained in the importance-performance classifications. The use of theanalysis in an absolute manner would suggest that decisions be based onthe quadrant in which an attribute is placed. No consideration is given tothe fact that an attribute may be very near a gridline that separates twovery different courses of action, i.e., “concentrate here” and “low prior-ity.” If an importance gridline is determined to be at 3.0 on a scale andthe importance of a particular attribute is at 2.99, then that attribute, bydefinition, will not be in the “concentrate here” classification, no matterhow poor the performance.
Martilla and James (1977) put their gridlines at the mid-point of theirfour-point scale and then adjusted the placement to the 3.0 level for bothimportance and performance scores. Had they left the gridlines at themid-point, 2.0, none of the items would have been placed in the “con-centrate here” quadrant. They argue that the placement of the gridlinesis, “a matter of judgment” (p. 79). They state that the value of the ap-proach lies in identifying relative, rather than absolute, levels of impor-tance and performance. Occasionally, as in their example, the absenceof low performance and importance scores, “may argue for moving theaxes over one position on the scale” (p. 79).
Others have debated the placement of the gridlines. Crompton andDuray (1985), in their study on four alternative approaches to IPA, usedthe mid-point of a five-point scale. Guadagnolo (1985), who stated,“Where the ‘crosshairs’ intersect will have significant impact on thefindings and subsequent responses” (p. 16-7), plotted his gridlines at thevalue of five on a seven-point scale based on the desires of the manage-ment team involved in his study. Ortinau, Bush, Bush and Twible(1989) used different points on each scale in their classification. Theyused the value of four on the importance score, and five on the perfor-mance score with the suggestion that one should, “keep in mind the rela-tive meaning of the grid’s quadrants” (p. 83).
There are then two points to consider when using a matrix presenta-tion. The first is the placement of the “murky” gridlines. The second is thestrict interpretation of points based on the quadrant placement. Mount(2000) developed a method with the objective of representing the matrixpresentation in quantitative terms. The method eliminates the matrix pre-sentation, thereby eliminating the gridline placement and interpretation
Daniel J. Mount 69
Dow
nloa
ded
by [
McG
ill U
nive
rsity
Lib
rary
] at
02:
23 2
6 A
ugus
t 201
2
concerns. To “mirror” the IPA matrix, there must be a combination of im-portance and performance scores. Mount combines the importance andperformance scores by obtaining the product of the importance correla-tion coefficient with a performance measure. The upper left quadrant inthe matrix presentation (concentrate here) is the quadrant of high impor-tance and low performance and is the focus of the analysis. As perfor-mance scores are usually measured on a positive scale, Mount uses thescale maximum less the actual performance score. If performance was ona seven-point scale, the calculation would be I * (7-P) where I is the corre-lation coefficient. The greatest product is obtained by an item that had ahigh importance score and/or a low performance score (7-P). Chu (2002)used a different approach to combining the measures, but did combine themeasures to produce a customer satisfaction index. This research will addthe quantitative component of the analysis and will compare the results ofperformance-only numbers, DIPA and quantitative derived importance-performance analysis (QDIPA).
METHOD
The research site was a full-service upscale hotel in a metropolitanarea. The hotel company completed the annual employee opinion surveyand forwarded the raw data to the research team. The survey had three de-mographic questions and thirty-two individual items. Four of the itemswere considered to be summary measures (I am satisfied in my job, I amproductive in my job, I would recommend as a good place to work, I amproud to work for this company), so twenty-eight items were kept in theanalysis. All individual items were on a seven-point Likert scale withseven representing “strongly agree” and one representing “strongly dis-agree.” The correlation coefficient of each item and the single item, “I amsatisfied in my job,” was used as the derived importance measure for eachitem. The hotel had 176 employees, 109 usable records were received.
RESULTS
Table 1 shows only the performance means of the ten lowest items onthe performance scale. If the analysis is at this level, the analysts typi-cally work from the “bottom up” in formulating responses and actionplans. Using this approach, the “top five” items (the lowest scoring fiveitems) for analysis would be: (1) I have the tools and equipment neededto do my job well (4.43); (2) All departments in this hotel cooperate and
70 JOURNAL OF QUALITY ASSURANCE IN HOSPITALITY & TOURISM
Dow
nloa
ded
by [
McG
ill U
nive
rsity
Lib
rary
] at
02:
23 2
6 A
ugus
t 201
2
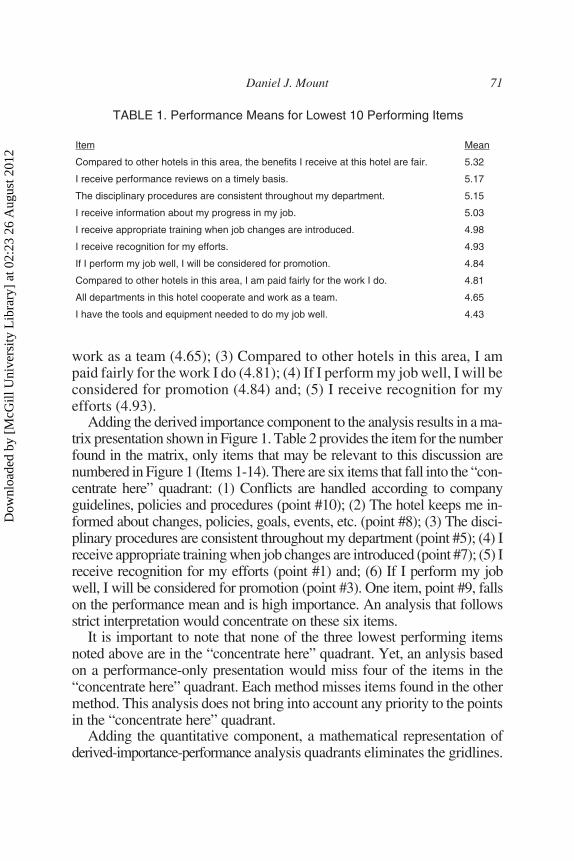
work as a team (4.65); (3) Compared to other hotels in this area, I ampaid fairly for the work I do (4.81); (4) If I perform my job well, I will beconsidered for promotion (4.84) and; (5) I receive recognition for myefforts (4.93).
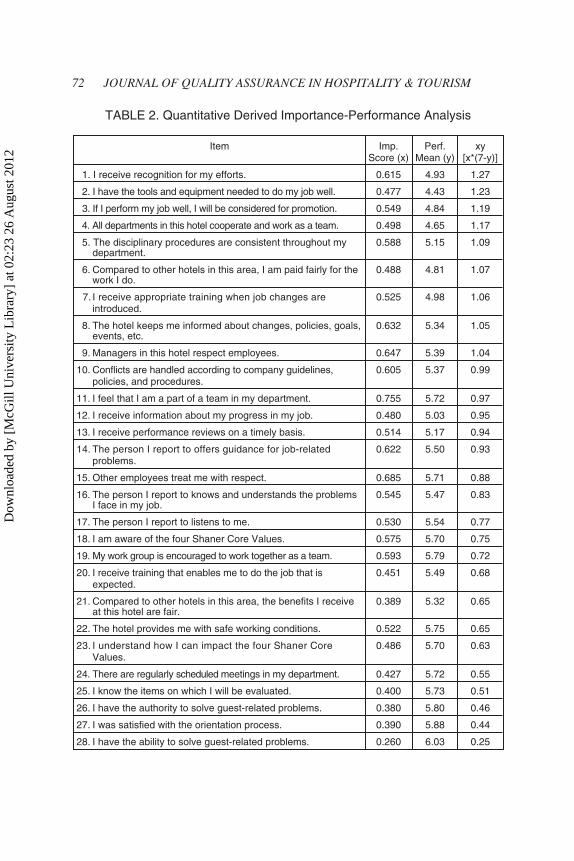
Adding the derived importance component to the analysis results in a ma-trix presentation shown in Figure 1. Table 2 provides the item for the numberfound in the matrix, only items that may be relevant to this discussion arenumbered in Figure 1 (Items 1-14). There are six items that fall into the “con-centrate here” quadrant: (1) Conflicts are handled according to companyguidelines, policies and procedures (point #10); (2) The hotel keeps me in-formed about changes, policies, goals, events, etc. (point #8); (3) The disci-plinary procedures are consistent throughout my department (point #5); (4) Ireceive appropriate training when job changes are introduced (point #7); (5) Ireceive recognition for my efforts (point #1) and; (6) If I perform my jobwell, I will be considered for promotion (point #3). One item, point #9, fallson the performance mean and is high importance. An analysis that followsstrict interpretation would concentrate on these six items.
It is important to note that none of the three lowest performing itemsnoted above are in the “concentrate here” quadrant. Yet, an anlysis basedon a performance-only presentation would miss four of the items in the“concentrate here” quadrant. Each method misses items found in the othermethod. This analysis does not bring into account any priority to the pointsin the “concentrate here” quadrant.
Adding the quantitative component, a mathematical representation ofderived-importance-performance analysis quadrants eliminates the gridlines.
Daniel J. Mount 71
TABLE 1. Performance Means for Lowest 10 Performing Items
Item Mean
Compared to other hotels in this area, the benefits I receive at this hotel are fair. 5.32
I receive performance reviews on a timely basis. 5.17
The disciplinary procedures are consistent throughout my department. 5.15
I receive information about my progress in my job. 5.03
I receive appropriate training when job changes are introduced. 4.98
I receive recognition for my efforts. 4.93
If I perform my job well, I will be considered for promotion. 4.84
Compared to other hotels in this area, I am paid fairly for the work I do. 4.81
All departments in this hotel cooperate and work as a team. 4.65
I have the tools and equipment needed to do my job well. 4.43
Dow
nloa
ded
by [
McG
ill U
nive
rsity
Lib
rary
] at
02:
23 2
6 A
ugus
t 201
2
72 JOURNAL OF QUALITY ASSURANCE IN HOSPITALITY & TOURISM
TABLE 2. Quantitative Derived Importance-Performance Analysis
Item Imp.Score (x)
Perf.Mean (y)
xy[x*(7-y)]
1. I receive recognition for my efforts. 0.615 4.93 1.27
2. I have the tools and equipment needed to do my job well. 0.477 4.43 1.23
3. If I perform my job well, I will be considered for promotion. 0.549 4.84 1.19
4. All departments in this hotel cooperate and work as a team. 0.498 4.65 1.17
5. The disciplinary procedures are consistent throughout mydepartment.
0.588 5.15 1.09
6. Compared to other hotels in this area, I am paid fairly for thework I do.
0.488 4.81 1.07
7. I receive appropriate training when job changes areintroduced.
0.525 4.98 1.06
8. The hotel keeps me informed about changes, policies, goals,events, etc.
0.632 5.34 1.05
9. Managers in this hotel respect employees. 0.647 5.39 1.04
10. Conflicts are handled according to company guidelines,policies, and procedures.
0.605 5.37 0.99
11. I feel that I am a part of a team in my department. 0.755 5.72 0.97
12. I receive information about my progress in my job. 0.480 5.03 0.95
13. I receive performance reviews on a timely basis. 0.514 5.17 0.94
14. The person I report to offers guidance for job-relatedproblems.
0.622 5.50 0.93
15. Other employees treat me with respect. 0.685 5.71 0.88
16. The person I report to knows and understands the problemsI face in my job.
0.545 5.47 0.83
17. The person I report to listens to me. 0.530 5.54 0.77
18. I am aware of the four Shaner Core Values. 0.575 5.70 0.75
19. My work group is encouraged to work together as a team. 0.593 5.79 0.72
20. I receive training that enables me to do the job that isexpected.
0.451 5.49 0.68
21. Compared to other hotels in this area, the benefits I receiveat this hotel are fair.
0.389 5.32 0.65
22. The hotel provides me with safe working conditions. 0.522 5.75 0.65
23. I understand how I can impact the four Shaner CoreValues.
0.486 5.70 0.63
24. There are regularly scheduled meetings in my department. 0.427 5.72 0.55
25. I know the items on which I will be evaluated. 0.400 5.73 0.51
26. I have the authority to solve guest-related problems. 0.380 5.80 0.46
27. I was satisfied with the orientation process. 0.390 5.88 0.44
28. I have the ability to solve guest-related problems. 0.260 6.03 0.25
Dow
nloa
ded
by [
McG
ill U
nive
rsity
Lib
rary
] at
02:
23 2
6 A
ugus
t 201
2
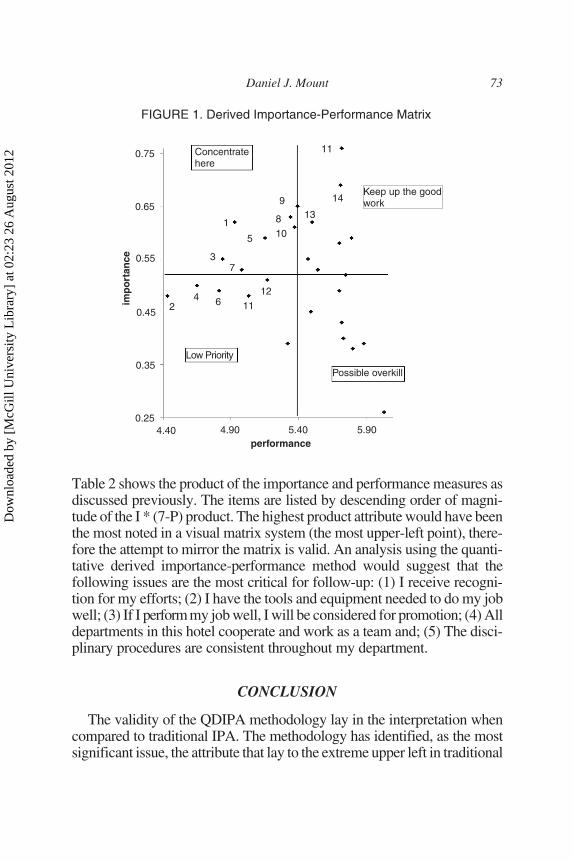
Table 2 shows the product of the importance and performance measures asdiscussed previously. The items are listed by descending order of magni-tude of the I * (7-P) product. The highest product attribute would have beenthe most noted in a visual matrix system (the most upper-left point), there-fore the attempt to mirror the matrix is valid. An analysis using the quanti-tative derived importance-performance method would suggest that thefollowing issues are the most critical for follow-up: (1) I receive recogni-tion for my efforts; (2) I have the tools and equipment needed to do my jobwell; (3) If I performmy job well, I will be considered for promotion; (4) Alldepartments in this hotel cooperate and work as a team and; (5) The disci-plinary procedures are consistent throughout my department.
CONCLUSION
The validity of the QDIPA methodology lay in the interpretation whencompared to traditional IPA. The methodology has identified, as the mostsignificant issue, the attribute that lay to the extreme upper left in traditional
Daniel J. Mount 73
0.75
0.65
0.55
0.45
0.35
0.25
Concentratehere
imp
ort
ance
Keep up the goodwork
Low Priority
Possible overkill
4.40 4.90 5.40 5.90performance
1
2
3
4
5
6
7
8
9
10
11
12
13
14
11
FIGURE 1. Derived Importance-Performance Matrix
Dow
nloa
ded
by [
McG
ill U
nive
rsity
Lib
rary
] at
02:
23 2
6 A
ugus
t 201
2
IPA. It has also identified other issues, which are, arguably, more of a con-cern than the other “concentrate here” issue in traditional IPA. The use ofthese quantitative methods for importance-performance analysis brings astatistical logic to what is traditionally a visual interpretation. The methodcan also bring some sense of order to points and issues which have hereto-fore been left to the subjective interpretation of the analyst.
The method can be used in any setting where importance and perfor-mance data is currently being collected. In hospitality the two settingsthat come to mind are in the collection of guest data and the collection ofemployee data. The use of the quantitative method presented here can as-sist in translating results into action. The identification of recognition asthe “most critical issue” would not have surfaced using performance-onlydata or traditional IPA. Using the QDIPA method, the hotel would ad-dress and focus on the recognition issue in follow-up action plans as wellas any other lower-rated QDIPA items.
A practical limitation of the quantitative method is its added level ofcomplexity. Proponents of traditional IPA suggest that the simplicity ofthe analysis is the attraction of the method. The quantitative methodpresented can be utilized in any spreadsheet format, but the real valuemay lie in developing software for survey analysis that incorporatesboth traditional IPA and the quantitative method.
Future research opportunities exist with this method. The use of cor-relation values for the importance measure in derived importance mayplace more emphasis on the importance score because there is a greatermathematical separation between the importance points due to non-nor-mal distributions on items. In this study, a few of the attributes exceededacceptable kurtosis and skewness statistics but in guest satisfaction datait would be anticipated that a greater of number of items would be iden-tified as having non-normal distribution. Methods that utilize standard-ized data techniques should be tested on non-normal distributions.
REFERENCES
Alberty, S., & Mihalik, B.J. (1989). Use of importance-performance analysis as anevaluative technique in adult education. Education Review, 13(1), 33-44.
Almanza, B.A.; Jaffe, W.; & Lin, L. (1994). Use of the service attribute matrix to mea-sure consumer satisfaction. Hospitality Research Journal, 17(2), 63-75.
Barsky, J.D., & Labagh, R. (1992) A strategy for customer satisfaction. The CornellHotel and Restaurant Quarterly, (October), 32-40.
74 JOURNAL OF QUALITY ASSURANCE IN HOSPITALITY & TOURISM
Dow
nloa
ded
by [
McG
ill U
nive
rsity
Lib
rary
] at
02:
23 2
6 A
ugus
t 201
2
Bartlett, P.A., & Einert, A.E. (1992). Analysis of the design function of an adult soft-ball complex in a new public recreation park. Journal of Parks and Recreation Ad-ministration, 10(1), 71-81.
Carman, J.M. (1990). Consumer perceptions of service quality: An assessment of theSERVQUAL dimensions. Journal of Retailing, 66(Spring), 33-51.
Chu, R. (2002). Stated importance versus derived importance customer satisfactionmeasurement. Journal of Services Marketing, 16(4), 285-301.
Crompton, J.L., & Duray, N.A. (1985). An investigation of the relative efficacy of fouralternative approaches to importance-performance analysis. Journal of the Acad-emy of Marketing Science, 13(4), 69-80.
Crompton, J.L. & Love, L.L. (1995). The predictive validity of alternative approachesto evaluation quality of a festival. Journal of Travel Research, 34(1), 11-24.
Cronin, J.J., & Taylor, S.A. (1992). Measuring service quality: A reexamination andextension. Journal of Marketing, 56(3), 55-58.
Dolinsky, A.L., & Caputo, R.K. (1991). Adding a competitive dimension to impor-tance-performance analysis: An application to traditional health care systems.Health Marketing Quarterly, 8(3/4), 61-79.
Duke, C.R., & Persia, M.A. (1996). Performance-importance analysis of escorted tourevaluations. Journal of Travel and Tourism Marketing, 5(3), 207-223.
Ennew, C.T.; Reed, G.V.; & Binks, M.R. (1993). Importance-performance analysisand the measurement of service quality. European Journal of Marketing, 27(2),59-70.
Evans, M.R., & Chon, K.S. (1989). Formulating and evaluating tourism policy usingimportance-performance analysis. Hospitality, Education and Research Journal,13(2), 203-213.
Guadagnolo, F.B. (1985). The importance-performance analysis: An evaluation andmarketing tool. Journal of Park and Recreation Administration, 3(1), 13-22.
Havitz, M.E.; Twynam, G.D.; & DeLorenzo, J.M. (1991). Importance-performanceanalysis as a staff evaluation tool. Journal of Park and Recreation Administration,9(1), 43-54.
Hawes, J.M., & Rao, C.P. (1985) Using importance-performance analysis to develophealth care marketing strategies. Journal of Health Care Marketing, 4(Fall), 19-25.
Kennedy, D.W. (1986). Importance-performance analysis in marketing and evaluatingtherapeutic recreation services. Therapeutic Recreation Journal, 20(3), 30-36.
Keyt, J.C. (1994). Importance-performance analysis: A case study in restaurant posi-tioning. International Journal of Retail & Distribution Management, 22(5), 35-40.
Leong, S.M. (1992). Assessing national competitive superiority: An importance-per-formance matrix approach. Marketing Intelligence & Planning, 10(1), 42-48.
Martilla, J.A., & James, J.C. (1977). Importance-performance analysis. Journal ofMarketing, 41 (January), 77-79.
Mount, D.J. (1997) Introducing relativity to traditional importance-performance anal-ysis. Journal of Hospitality & Tourism Research, 21(2), 111-121.
Mount, D.J. (2000). Determination of significant issues: Applying a quantitativemethod to importance-performance analysis. Journal of Quality Assurance in Hos-pitality & Tourism, 1(3), 49-63.
Daniel J. Mount 75
Dow
nloa
ded
by [
McG
ill U
nive
rsity
Lib
rary
] at
02:
23 2
6 A
ugus
t 201
2
Oh, H., & Parks, S.C. (1997). Customer satisfaction and service quality: A critical re-view of the literature and research implications for the hospitality industry. TheJournal of Hospitality and Tourism Research, 20(3), 35-64.
Oliver, R. (1997). Satisfaction: A behavioral perspective on the consumer. New York,NY: McGraw-Hill.
Ortinau, D.J.; Bush, A.J.; Bush, R.P.; & Twible, J.L. (1989). The Use of importance-per-formance analysis for improving the quality of marketing education: Interpreting fac-ulty-course evaluations. Journal of Marketing Education, 11(Summer), 78-86.
Seo, S. & Shanklin, C. (2004). Assessing importance and performance of food and ser-vice quality attributes of dining service in continuing care retirement community.2004 I-CHRIE Conference Proceedings (Philadelphia, PA), 295-300.
Suh, E. & Erdem, M. (2004). Gap analysis as a diagnostic tool for improving the slotplay experience. 2004 I-CHRIE Conference Proceedings (Philadelphia, PA),312-318.
Teas, R.K. (1993). Consumer expectations and the measurement of perceived servicequality. Journal of Professional Services Marketing, 8(2), 33-53.
Williams, A.E., & Neal, L.L. (1993). Motivational assessment in organizations: An ap-plication of importance-performance analysis. Journal of Parks and Recreation Ad-ministration, 11(2), 60-71.
SUBMITTED: 02/11/03REVISION SUBMITTED: 09/19/03
ACCEPTED: 12/10/03
76 JOURNAL OF QUALITY ASSURANCE IN HOSPITALITY & TOURISM
Dow
nloa
ded
by [
McG
ill U
nive
rsity
Lib
rary
] at
02:
23 2
6 A
ugus
t 201
2