Embed Size (px)
Citation preview
An Evaluation of Pennsylvania’sMain Street Programs

This research was sponsored by a grant from the Center for Rural Pennsylvania, a legislative agency of the Pennsylvania General Assembly.
The Center for Rural Pennsylvania is a bipartisan, bicameral legislative agency that serves as a resource for rural policy within the Pennsylvania General Assembly. It was created in 1987 under Act 16, the Rural Revital-ization Act, to promote and sustain the vitality of Pennsylvania’s rural and small communities.
Information contained in this report does not necessarily reflect the views of individual board members or the Center for Rural Pennsylvania. For more information, contact the Center for Rural Pennsylvania, 625 Forster St., Room 902, Harrisburg, PA 17120, telephone (717) 787-9555, email: [email protected], www.rural.palegislature.us.
An Evaluation of Pennsylvania’s Main Street Programs
By:Chad Kimmel, Ph.D. and Joel Schoening, Ph.D.
Shippensburg University of Pennsylvania
October 2011
Executive Summary
Table of Contents
The Main Street Program has had a role in community revitaliza-tion in Pennsylvania since 1980. As of 2010, there were 165 programs initiated in Pennsylvania. This research explored the viability and sustainability of Main Street Programs (MSPs) in Pennsylvania and developed policy considerations to support their continued viability and sustainability.
For the research, sustainable programs were defined as those that had stability in leadership, governance, finances and staffing.
The research, conducted in 2010, used existing data from the Penn-sylvania Downtown Center (PDC) and the U.S. Census, and new data from a mail questionnaire of Main Street managers and site visits to a selection of programs throughout the state.
According to the results, two variables emerged as significant predic-tors of MSP sustainability: the existence of a Business Improvement District (BID), and managers’ perceived effectiveness at using the Main Street Four-Point Approach.
The results also indicated that community buy-in is a strong indi-cator of a program’s sustainability/success as well as the length of service of the Main Street manager. The average manager turnover rate was 1.5 years. With most managers leaving programs after just 18 months, the research found that it becomes very difficult for programs to create momentum, establish legitimacy, and begin building the deep organizational roots and partnerships within their respective communi-ties that are needed to accomplish program goals. In terms of policy, the researchers suggest that consideration should be given to manager retention and increased training opportunities.
The researchers also recommend that the Pennsylvania Department of Community and Economic Development (DCED) take the lead in assessing and evaluating programs, and that the Pennsylvania Down-town Center (PDC) maintain its role in providing technical assistance, training and education to MSPs.
The researchers also recommend that the reporting structure for MSPs be changed from PDC to DCED. In doing so, greater oversight and accountability must be initiated if data gathered from MSPs is to have any real impact on measuring the effectiveness of state invest-ment.
Introduction ................................5Goals and Objectives .................7Methodology ..............................7Results ........................................9Conclusions ..............................15Policy Considerations ..............17References ................................19
An Evaluation of Pennsylvania’s Main Street Programs 5
Responding to the steep decline in the economic health of American downtowns in the 1970s, the National Trust for Historic Preservation developed the Main Street Project in 1977. For the first three years, the project focused on preserving downtown buildings that were facing demolition. The pilot project led to the creation of the Main Street Four-Point Approach, which focuses on organization, promotion, design, and economic restructuring. What evolved was a belief that to preserve historic buildings, the economic health of downtowns must first be stabilized and then improved. Between 1980 and 1983, Pennsylvania was among six states chosen to further develop this revitalization strategy.
Today there are more than 2,000 communities across the U.S. that share information and best practices re-garding the Main Street Program Four-Point Approach (Dono, 2009).
“The Main Street Approach,” according to commu-nity development expert Kent Robertson, “is arguably the most widely used and heralded method of down-town revitalization…in the United States” (2004: 56). Yet, how well has the Main Street Approach worked in such large and diverse states as Pennsylvania, with its 67 counties and 2,566 municipalities? Particularly, what roles have local Main Street Programs (MSPs) played and how successful have they been in creating sustainable downtown communities? And finally, what influence, if any, do community characteristics have in fostering more viable, sustainable MSPs?
Pennsylvania’s Main Street ProgramSince the MSP was introduced in Pennsylvania in
the early 1980s, it has played an active role in more than 140 communities. At the time of the research, the Department of Community and Economic Develop-ment (DCED), through its New Communities Program, appropriated funding for the Main Street Program (DCED, 2008). The Pennsylvania Downtown Center (PDC), a statewide nonprofit, contracts with DCED and provides communities with outreach, technical assis-tance and educational services. Within the Main Street organizational structure, PDC is considered a “coor-dinating program,” linking MSP communities and the state with the national program. Funding from DCED is available for administering an MSP, a Regional Main Street Coordination Program, or to undertake a specific activity that will impact and complement downtown revitalization efforts (DCED, 2008).
INTRODUCTION To receive DCED funding and the “Main Street” designation, however, communities must first submit a Central Business District Profile to both DCED and PDC that, among other things, addresses two important factors: the role that the community plays within the context of its region; and “…the presence of sustenta-tive assets within that community that make signifi-cant contributions to the regional economy” (DCED, 2008:1). In addition, the applicants must also speak to the level of endorsements they have, both financial and conceptual, private and public; the strength of their local committees and working groups, including, but certainly not limited to, the organizations that would administer the MSP; and overall public support of the project. This competitive process helps, as DCED puts it, those “asset-based projects” rise to the top, which “…focus[es] greater resources on those communities most likely to show the greatest return on the DCED investment of state funds” (2008:2). In the past, DCED made small grants available (approximately $25,000) to aid communities in the process of creating a successful profile and Main Street application. (Note: at the time of the research in 2010-2011, DCED was not accepting applications for Main Street status.)
Once given the Main Street designation, a program would ideally participate in five “rounds” of funding over the course of a three-year contract followed imme-diately by a two-year contract. Active programs could also apply for additional grants from DCED, such as the Anchor Building Grant. During the initial five rounds, programs would be eligible to receive a total of $200,000 in funding if they collected the required local matching funds according to the following schedule (DCED, 2008):
Round One - $50,000 in funding with $15,000 local match;Round Two - $45,000 in funding with $20,000 local match;Round Three - $40,000 in funding with $25,000 local match;Round Four - $35,000 in funding with $30,000 local match; and Round Five - $30,000 in funding with $35,000 local match.
To qualify for each successive round of funding, programs had to raise the necessary matching funds and complete an assessment for DCED that documented work accomplished, such as façade improvements, merchandising training sessions, streetscape improve-ments, and dollars invested in the Main Street area. Once a program completed the first five rounds, it could
6 The Center for Rural Pennsylvania
then apply for achiever status and up to four more years of funding through an additional contract(s). Many programs, however, did not fall neatly into the five-year cycle due to staff (manager) turnover or other organi-zational issues. In some cases, it took as many as seven years to complete the first five rounds of funding.
Generating the necessary matching funds is a peren-nial problem for MSPs. One method for generating a stable source of matching revenue is the creation of a Business Improvement District (BID). A BID is a voluntary local assessment created by the vote of busi-ness and property owners in a clearly defined area. The revenue that is generated may then be used to fund a variety of downtown investments, such as streetscape improvements, additional security or maintenance, sup-porting a business association, or marketing and adver-tising. Establishing a stable source of matching funds is a primary concern for Main Street Programs because the allocations from the state decrease over time, with the smallest amount of support in the last year of the cycle.
Research LiteratureDespite its rich history, the MSP is not well repre-
sented in the academic literature. Of the many publica-tions devoted to this approach, the vast majority are journalistic in nature, describing and photographing changes made to buildings and streetscapes (Lawnic-zak, 2005), journaling the challenges faced by com-munity volunteers to organize working committees and boards (Mowry, 2003), and compiling case studies of “success stories” and their achievements (Kelly, 1996; Dane, 1997). Moreover, there are practitioner’s guides and “how to” books that serve as toolkits for commu-nity revitalization, with chapters on funding, running a program, improving commercial dynamics, histori-cal preservation, heritage tourism and organizational structure (Dono, 2009). One of the only voices in the literature that relies on empirical, academic research on MSPs is Dr. Kent Robertson (1999, 2004). His research, though, has focused on teasing out the rela-tive effectiveness and use of each of the Main Street Program’s Four-Point Approach. He sheds little light on the long-term viability and sustainability of the programs or the characteristics that distinguish them. Furthermore, Robertson offers no direct evidence from Pennsylvania programs.
In Pennsylvania, as in other states following the Main Street Approach, there is no empirical research docu-menting the program’s history and overall impact on ru-ral or urban communities. Nor has research been done to document program sustainability. Some level of short
term “success” may be documented by snap-shots and journalistic accounts of streetscape improvements, new signage, freshly painted facades, planter-boxes, people participating in promotional events, or grants received. Measuring “sustainability,” however, requires a deeper and broader commitment to discovering the organiza-tional and financial structures that are the foundation of community revitalization.
For this study, the researchers looked for a defini-tion of sustainability that would capture the depth and breadth of the concept, while remaining method-ologically practical and fair to the mission of the Main Street Program. The researchers therefore relied on a definition of sustainability written by the Pennsylvania Downtown Center, which defines sustainable programs as those that: have stability in leadership, governance, finances and staffing; are flexible, innovative and entre-preneurial, and efficient at what they do; and frequently partner with other groups and public agencies, attract and retain volunteers, have credibility within their community, and are at the table and involved in other community-related initiatives (PDC, 2009).
In 1995, Kennedy Lawson Smith, former director of the National Trust for Historic Preservation’s Na-tional Main Street Center, concluded that “one of the most profound lessons we have learned in the Main Street Center’s first 15 years is that downtown revital-ization does not take place within the microcosm of the downtown; it takes place in the macrocosm of the community and region and in their community planning and economic development strategies” (p. 3). Simply put, communities today must have a larger perspective on downtown revitalization, particularly rural ones. For example, while the early success rates of commu-nities who started an MSP are quite good (82 percent made it through the first five years), of the 18 percent that failed, 90 percent failed for the following reasons (Smith, 1996:2): they did not grasp the interdisciplin-ary nature of the Main Street Approach, they wasted precious resources by duplicating activities/services because they lacked a “cooperatively developed revi-talization agenda,” and they focused too much on the commercial district and not enough on the interrelated economic, political and cultural factors.
“Downtown revitalization,” Smith wrote, “is about preserving a community, not just preserving a com-munity’s buildings” (1995:11). Moreover, communities must be careful not to “…upset the delicate balance of economic forces on Main Street” (1995:11). For example, Smith writes of a community in Florida that learned a hard lesson in its redevelopment project.
An Evaluation of Pennsylvania’s Main Street Programs 7
A group of investors bought up one-third of all the buildings and conducted a multi-million dollar renova-tion—the local government, too, chipped in funds for streetscape improvements. The renovations, however, increased the rents far above what the traditional, lo-cal business community could afford. Within a short amount of time, this part of the “community” dried up. Chain stores replaced familiar faces and standardiza-tion became the norm. It seems that any truly sustain-able revitalization project, one that aims to protect both the physical structure of the community (economic development) and the social fabric (community de-velopment), must work in tandem toward the goal of strengthening and preserving the local community. Downtowns ought to reflect as much of the people and cultures that built them as they do the unique stores and businesses that now inhabit them.
Clearly there is a need for a deeper understanding of the achievements made as well as the challenges that face MSPs in Pennsylvania.
This research was intended to fill these gaps in the knowledge and application of the Main Street Approach by paying special attention to the viability and sustain-ability of MSPs as they confront issues of regionalism, organization, and economic restructuring.
GOALS AND OBJECTIVESThe research goal was to evaluate Pennsylvania
MSPs to discover factors that most significantly contribute to, or hinder, MSP sustainability. To do so, the researchers: created statistical measures of MSP sustainability based on the PDC program definition of, “stability in leadership, governance, finances, and staff-ing” (PDC, 2009a); investigated the relationship be-tween the use of the Main Street Four-Point Approach and MSP sustainability; determined whether communi-ty characteristics influenced the sustainability of MSPs; and evaluated the influence of regional administrative and economic factors on MSP sustainability.
METHODOLOGYThe research, conducted in 2010, used a mixed-
methods approach to highlight factors that influence MSP sustainability, defined as stability in leadership, governance, finance, and staffing. The researchers used existing data from PDC to describe the basic charac-teristics (year started, address, program name) of every program in Pennsylvania since 1980. Additionally, the researchers used data from the 2000 Census to describe program community characteristics, such as median in-come, home values, and racial diversity. The research-
ers also collected new data through a mail question-naire and site visits.
The study focused on Pennsylvania MSPs, which are defined as all current and former MSPs in Pennsylva-nia. Programs were placed in one of five categories, based on the relationship between the program and the state, as follows:
• State Achievement Programs: Programs that are past their five-year cycle and have attained (or are in the process of applying for) their “achievement status.” This official status, which denotes commu-nities that have succeeded on all Four-Points of the Main Street Approach, opens up the opportunity for additional yearly funding.
• Ongoing Programs: Programs that continue to use the Main Street Four-Point Approach but are past their five-year cycle, or any of the funding rounds.
• Current Programs: Programs that are currently in their funding window, which could and often does extend beyond five years.
• Lapsed Programs: Programs that completed their funding cycle but have since disbanded (no active organization).
• Failed Programs: Communities that began a fund-ing cycle, but did not complete the program. In Pennsylvania’s history, only one program failed.
These categories are not intended to rank MSPs, nor are they a direct measure of MSP sustainability. Rather, these categories merely reflect the relationship between MSPs and their parent organizations of PDC and DCED, and serve to highlight the perceived stage of development of the MSP in the eyes of those parent organizations.
Though the above categories may be applied to all Main Street Programs in the state, there are two addi-tional distinctions. The majority of programs, labeled “traditional,” are independent programs in which a group of stakeholders in a municipality work col-lectively to earn the Main Street designation from the state. The other programs, labeled either “urban” or “re-gional,” are comprised of several discrete communities organized under one MSP. With urban programs, sev-eral discrete neighborhoods operate under one umbrella program.1 Regional programs primarily serve the state’s rural communities.2 In these programs, several discrete municipalities that share similar context and geography
1. There are seven urban programs in Philadelphia and 10 urban programs in Pittsburgh.2. Rural communities are defined as those municipalities with a popu-lation of less than 2,500 unless more than 50 percent of the popula-tion lives in an urbanized area. In this study, the researchers used 2000 Census data as the 2010 Census data were not yet available.
8 The Center for Rural Pennsylvania
are organized under one budget with one overarch-ing Main Street designation from the state. Regional programs oversee between four to eight communities and typically staff only one Main Street manager per regional program.
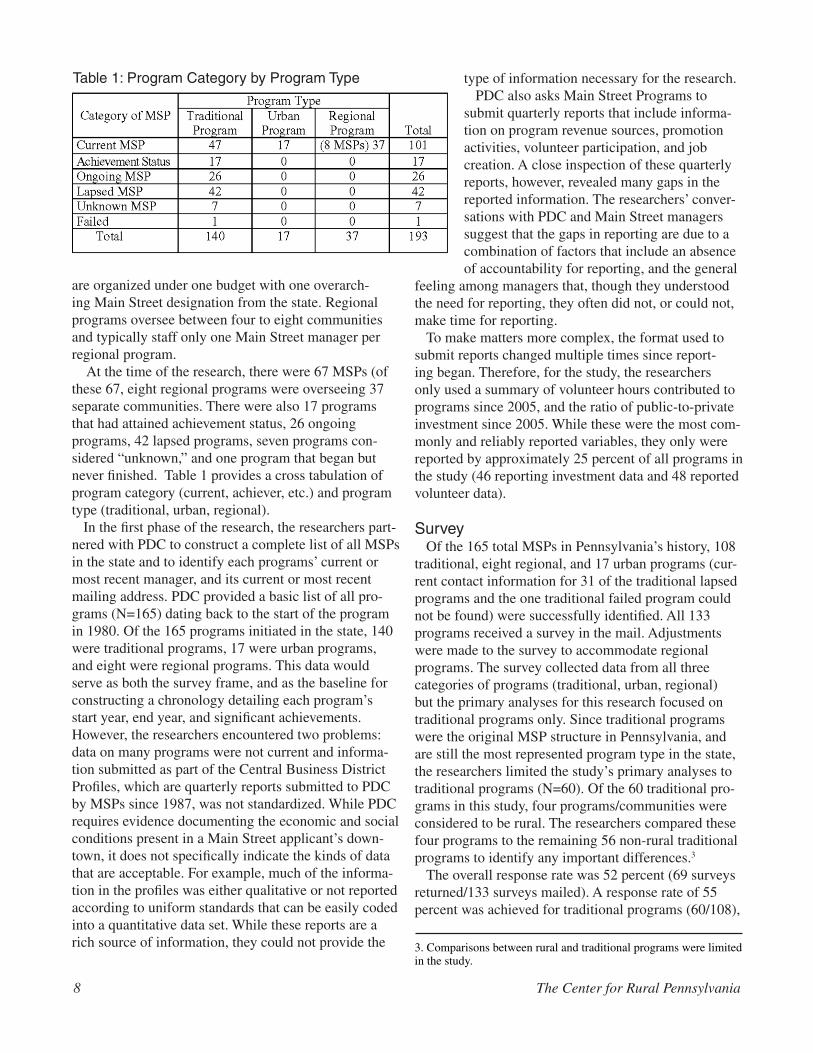
At the time of the research, there were 67 MSPs (of these 67, eight regional programs were overseeing 37 separate communities. There were also 17 programs that had attained achievement status, 26 ongoing programs, 42 lapsed programs, seven programs con-sidered “unknown,” and one program that began but never finished. Table 1 provides a cross tabulation of program category (current, achiever, etc.) and program type (traditional, urban, regional).
In the first phase of the research, the researchers part-nered with PDC to construct a complete list of all MSPs in the state and to identify each programs’ current or most recent manager, and its current or most recent mailing address. PDC provided a basic list of all pro-grams (N=165) dating back to the start of the program in 1980. Of the 165 programs initiated in the state, 140 were traditional programs, 17 were urban programs, and eight were regional programs. This data would serve as both the survey frame, and as the baseline for constructing a chronology detailing each program’s start year, end year, and significant achievements. However, the researchers encountered two problems: data on many programs were not current and informa-tion submitted as part of the Central Business District Profiles, which are quarterly reports submitted to PDC by MSPs since 1987, was not standardized. While PDC requires evidence documenting the economic and social conditions present in a Main Street applicant’s down-town, it does not specifically indicate the kinds of data that are acceptable. For example, much of the informa-tion in the profiles was either qualitative or not reported according to uniform standards that can be easily coded into a quantitative data set. While these reports are a rich source of information, they could not provide the
type of information necessary for the research. PDC also asks Main Street Programs to
submit quarterly reports that include informa-tion on program revenue sources, promotion activities, volunteer participation, and job creation. A close inspection of these quarterly reports, however, revealed many gaps in the reported information. The researchers’ conver-sations with PDC and Main Street managers suggest that the gaps in reporting are due to a combination of factors that include an absence of accountability for reporting, and the general
feeling among managers that, though they understood the need for reporting, they often did not, or could not, make time for reporting.
To make matters more complex, the format used to submit reports changed multiple times since report-ing began. Therefore, for the study, the researchers only used a summary of volunteer hours contributed to programs since 2005, and the ratio of public-to-private investment since 2005. While these were the most com-monly and reliably reported variables, they only were reported by approximately 25 percent of all programs in the study (46 reporting investment data and 48 reported volunteer data).
SurveyOf the 165 total MSPs in Pennsylvania’s history, 108
traditional, eight regional, and 17 urban programs (cur-rent contact information for 31 of the traditional lapsed programs and the one traditional failed program could not be found) were successfully identified. All 133 programs received a survey in the mail. Adjustments were made to the survey to accommodate regional programs. The survey collected data from all three categories of programs (traditional, urban, regional) but the primary analyses for this research focused on traditional programs only. Since traditional programs were the original MSP structure in Pennsylvania, and are still the most represented program type in the state, the researchers limited the study’s primary analyses to traditional programs (N=60). Of the 60 traditional pro-grams in this study, four programs/communities were considered to be rural. The researchers compared these four programs to the remaining 56 non-rural traditional programs to identify any important differences.3
The overall response rate was 52 percent (69 surveys returned/133 surveys mailed). A response rate of 55 percent was achieved for traditional programs (60/108),
3. Comparisons between rural and traditional programs were limited in the study.
Table 1: Program Category by Program Type
An Evaluation of Pennsylvania’s Main Street Programs 9
24 percent for urban programs (4/17) and 63 percent for regional programs (5/8).
The researchers used U.S. Census data to describe community characteristics, such as racial and ethnic make-up, age, education, household income, vacancy rates, owner occupancy rates, population, and property values. Data were collected for the U.S. postal code in which the Main Street Program office was located. Postal codes were chosen as the best approximation for the Main Street area.
The researchers compared the data with measures of MSP sustainability to investigate factors contributing to MSP sustainability that have less to do with internal aspects of the MSP, such as its organization or leader-ship, and more to do with the context in which the MSP operates, such as the relative prosperity of the com-munity. Though some programs operated prior to 2000 and others operated after 2000, the researchers chose to use 2000 Census data (2010 was not yet available). The 2000 data, though not representative of all communities at the time they were operating, allowed comparisons of communities at a particular point in time. Though the data cannot be used as a predictive variable for programs that operated prior to 2000, they do offer an additional level of description for each community.
The questionnaire included a mix of closed-ended, open-ended, and Likert scale questions intended to gather managers’ attitudes and knowledge as a result of their experience with the program. Questions on the survey were organized into three main categories: describing the MSP area, use of the Main Street Ap-proach, and general questions about sustainability and partnerships with local and regional public and private organizations.
This study set out to explore the relationships be-tween the dependent variable, program sustainability, and a host of independent variables that were indicators of community characteristics/assets (social, physical and economic), a community’s use of the Main Street Four-Point Approach, and leadership and organiza-tion within the community. Program sustainability was defined as “stability in leadership, governance, finances, and staffing” (PDC, 2009a). Toward this end, a single MSP sustainability variable was created by combining the indicators within the survey that were intended to measure leadership, governance, finances and staffing.
Site VisitsFrom the surveys, and the PDC database, the
researchers identified five communities to visit for
further research. These communities were chosen based on their relative score on a variety of indicators taken from the survey and from the Census data. The criteria the researchers used for selecting the sites included sus-tainability score, program category, number of months the manager was employed, the amount of state fund-ing received in 2009, multifunctional scores, potential challenges scores, building vacancy rates, geographic location, and population characteristics, such as per-cent of non-white population, average age, education, unemployment and average income. Based on these cri-teria, the researchers chose Gettysburg, Chambersburg, Phoenixville, Kennett Square, and Punxatawney. These programs were representative of the larger sample in that they have a variety of local assets and challenges, distinct geographies, and variation in their relationship with the state.
The researchers visited each program area and con-ducted interviews with someone knowledgeable about the program (in two cases it was the current manager, in two cases it was an individual who had recently left the manager position, and in one case it was a board member of a lapsed program and acting chamber of commerce director).
RESULTSThe researchers used the following four components
to measure program sustainability: Component Statistical MeasureLeadership: Manager MonthsGovernance: Effectiveness of Board of DirectorsFinances: Percentage of Budget from StateStaffing: Use of Volunteers
Stability in Leadership (Manager Months)Of the 60 traditional programs that responded to the
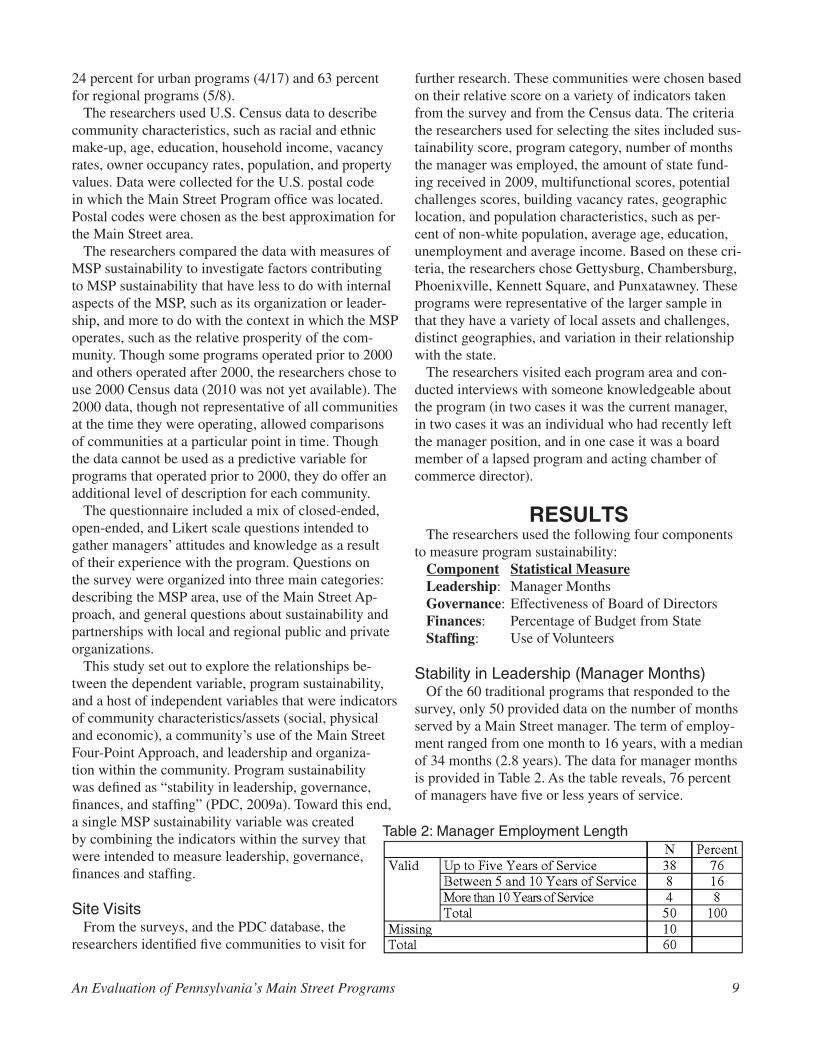
survey, only 50 provided data on the number of months served by a Main Street manager. The term of employ-ment ranged from one month to 16 years, with a median of 34 months (2.8 years). The data for manager months is provided in Table 2. As the table reveals, 76 percent of managers have five or less years of service.
Table 2: Manager Employment Length
10 The Center for Rural Pennsylvania
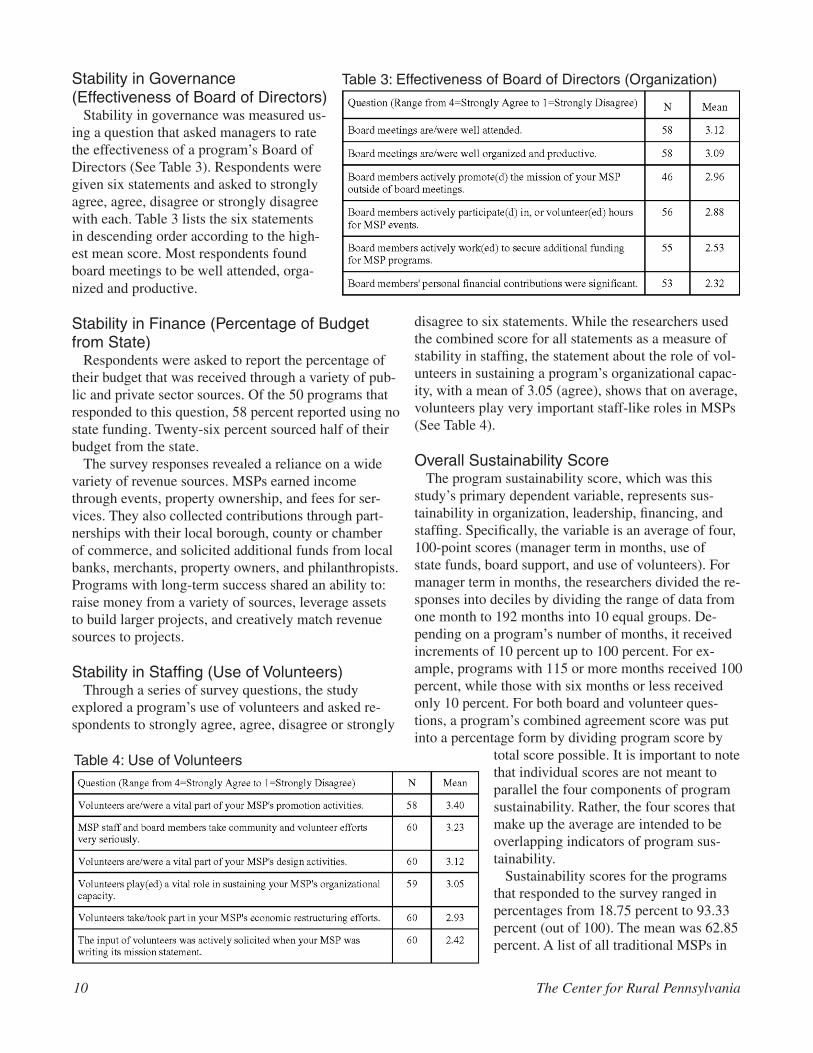
Stability in Governance (Effectiveness of Board of Directors)
Stability in governance was measured us-ing a question that asked managers to rate the effectiveness of a program’s Board of Directors (See Table 3). Respondents were given six statements and asked to strongly agree, agree, disagree or strongly disagree with each. Table 3 lists the six statements in descending order according to the high-est mean score. Most respondents found board meetings to be well attended, orga-nized and productive.
Stability in Finance (Percentage of Budget from State)
Respondents were asked to report the percentage of their budget that was received through a variety of pub-lic and private sector sources. Of the 50 programs that responded to this question, 58 percent reported using no state funding. Twenty-six percent sourced half of their budget from the state.
The survey responses revealed a reliance on a wide variety of revenue sources. MSPs earned income through events, property ownership, and fees for ser-vices. They also collected contributions through part-nerships with their local borough, county or chamber of commerce, and solicited additional funds from local banks, merchants, property owners, and philanthropists. Programs with long-term success shared an ability to: raise money from a variety of sources, leverage assets to build larger projects, and creatively match revenue sources to projects.
Stability in Staffing (Use of Volunteers)Through a series of survey questions, the study
explored a program’s use of volunteers and asked re-spondents to strongly agree, agree, disagree or strongly
disagree to six statements. While the researchers used the combined score for all statements as a measure of stability in staffing, the statement about the role of vol-unteers in sustaining a program’s organizational capac-ity, with a mean of 3.05 (agree), shows that on average, volunteers play very important staff-like roles in MSPs (See Table 4).
Overall Sustainability ScoreThe program sustainability score, which was this
study’s primary dependent variable, represents sus-tainability in organization, leadership, financing, and staffing. Specifically, the variable is an average of four, 100-point scores (manager term in months, use of state funds, board support, and use of volunteers). For manager term in months, the researchers divided the re-sponses into deciles by dividing the range of data from one month to 192 months into 10 equal groups. De-pending on a program’s number of months, it received increments of 10 percent up to 100 percent. For ex-ample, programs with 115 or more months received 100 percent, while those with six months or less received only 10 percent. For both board and volunteer ques-tions, a program’s combined agreement score was put into a percentage form by dividing program score by
total score possible. It is important to note that individual scores are not meant to parallel the four components of program sustainability. Rather, the four scores that make up the average are intended to be overlapping indicators of program sus-tainability.
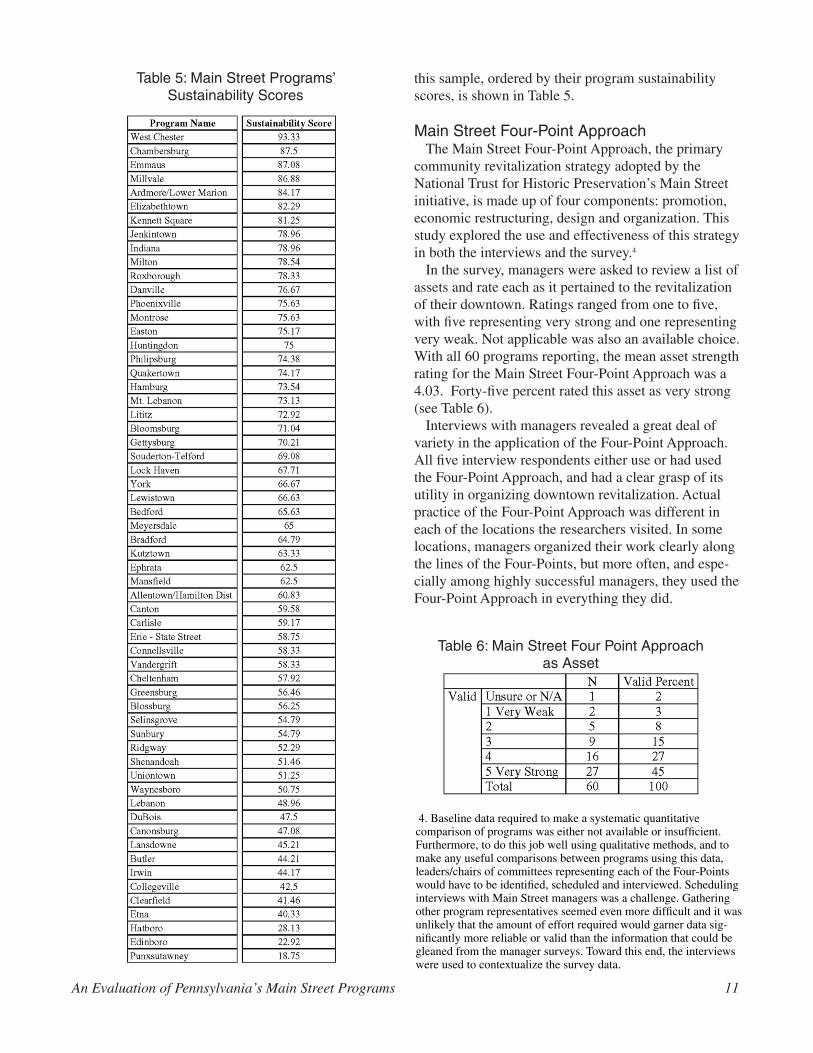
Sustainability scores for the programs that responded to the survey ranged in percentages from 18.75 percent to 93.33 percent (out of 100). The mean was 62.85 percent. A list of all traditional MSPs in
Table 3: Effectiveness of Board of Directors (Organization)
Table 4: Use of Volunteers
An Evaluation of Pennsylvania’s Main Street Programs 11
this sample, ordered by their program sustainability scores, is shown in Table 5.
Main Street Four-Point Approach The Main Street Four-Point Approach, the primary
community revitalization strategy adopted by the National Trust for Historic Preservation’s Main Street initiative, is made up of four components: promotion, economic restructuring, design and organization. This study explored the use and effectiveness of this strategy in both the interviews and the survey.4
In the survey, managers were asked to review a list of assets and rate each as it pertained to the revitalization of their downtown. Ratings ranged from one to five, with five representing very strong and one representing very weak. Not applicable was also an available choice. With all 60 programs reporting, the mean asset strength rating for the Main Street Four-Point Approach was a 4.03. Forty-five percent rated this asset as very strong (see Table 6).
Interviews with managers revealed a great deal of variety in the application of the Four-Point Approach. All five interview respondents either use or had used the Four-Point Approach, and had a clear grasp of its utility in organizing downtown revitalization. Actual practice of the Four-Point Approach was different in each of the locations the researchers visited. In some locations, managers organized their work clearly along the lines of the Four-Points, but more often, and espe-cially among highly successful managers, they used the Four-Point Approach in everything they did.
Table 5: Main Street Programs’Sustainability Scores
Table 6: Main Street Four Point Approach as Asset
4. Baseline data required to make a systematic quantitative comparison of programs was either not available or insufficient. Furthermore, to do this job well using qualitative methods, and to make any useful comparisons between programs using this data, leaders/chairs of committees representing each of the Four-Points would have to be identified, scheduled and interviewed. Scheduling interviews with Main Street managers was a challenge. Gathering other program representatives seemed even more difficult and it was unlikely that the amount of effort required would garner data sig-nificantly more reliable or valid than the information that could be gleaned from the manager surveys. Toward this end, the interviews were used to contextualize the survey data.
12 The Center for Rural Pennsylvania
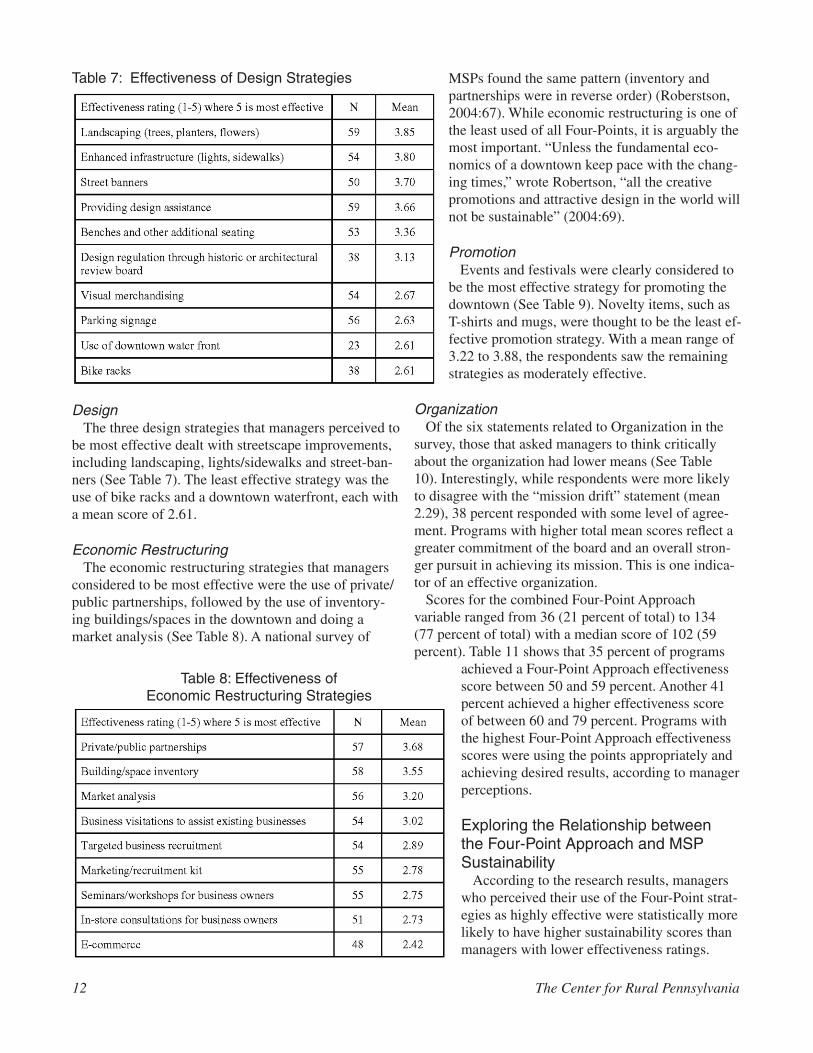
DesignThe three design strategies that managers perceived to
be most effective dealt with streetscape improvements, including landscaping, lights/sidewalks and street-ban-ners (See Table 7). The least effective strategy was the use of bike racks and a downtown waterfront, each with a mean score of 2.61.
Economic RestructuringThe economic restructuring strategies that managers
considered to be most effective were the use of private/public partnerships, followed by the use of inventory-ing buildings/spaces in the downtown and doing a market analysis (See Table 8). A national survey of
MSPs found the same pattern (inventory and partnerships were in reverse order) (Roberstson, 2004:67). While economic restructuring is one of the least used of all Four-Points, it is arguably the most important. “Unless the fundamental eco-nomics of a downtown keep pace with the chang-ing times,” wrote Robertson, “all the creative promotions and attractive design in the world will not be sustainable” (2004:69).
Promotion
Events and festivals were clearly considered to be the most effective strategy for promoting the downtown (See Table 9). Novelty items, such as T-shirts and mugs, were thought to be the least ef-fective promotion strategy. With a mean range of 3.22 to 3.88, the respondents saw the remaining strategies as moderately effective.
OrganizationOf the six statements related to Organization in the
survey, those that asked managers to think critically about the organization had lower means (See Table 10). Interestingly, while respondents were more likely to disagree with the “mission drift” statement (mean 2.29), 38 percent responded with some level of agree-ment. Programs with higher total mean scores reflect a greater commitment of the board and an overall stron-ger pursuit in achieving its mission. This is one indica-tor of an effective organization.
Scores for the combined Four-Point Approach variable ranged from 36 (21 percent of total) to 134 (77 percent of total) with a median score of 102 (59 percent). Table 11 shows that 35 percent of programs
achieved a Four-Point Approach effectiveness score between 50 and 59 percent. Another 41 percent achieved a higher effectiveness score of between 60 and 79 percent. Programs with the highest Four-Point Approach effectiveness scores were using the points appropriately and achieving desired results, according to manager perceptions.
Exploring the Relationship between the Four-Point Approach and MSP Sustainability
According to the research results, managers who perceived their use of the Four-Point strat-egies as highly effective were statistically more likely to have higher sustainability scores than managers with lower effectiveness ratings.
Table 8: Effectiveness ofEconomic Restructuring Strategies
Table 7: Effectiveness of Design Strategies

In terms of the separate components of the Four-Point Approach and MSP sustainability, the research found that the economic restructuring strategies were signifi-cantly related to MSP sustainability. These strategies included offering seminars/workshops for business owners, businesses using e-commerce, and the develop-
ment of a market analysis. Of all the economic re-structuring strategies, these three were statistically related to higher MSP sustainability scores.
Promotion was also significantly related to MSP sustainability. Likewise, the effective use of a website and branding campaigns, as separate promotion strategies, were considered successful strategies.
Lastly, while “design” itself was not signifi-cantly correlated with program sustainability, there were several separate design strategies that revealed some significant findings. The use of effective landscaping, enhancing infrastructure, such as streetlights and sidewalks, and using parking signage all significantly correlated with program sustainability. These correlations suggest that greater attention given to a more effective use of these particular Four-Point Approach strategies will likely result in greater program sustainability.
Overall, the Four-Point Approach, as a combined variable, is positively and significantly correlated with program sustainability. When the Four-Points were looked at individually though, only economic restructuring and promotion were positively and significantly correlated to program sustainability. However, there were a few separate design strate-gies that were positively and significantly corre-lated to program sustainability.
Exploring the Relationship between MSP Sustainability and Inter-Governmental and Regional Partnerships
In the survey, managers were asked to report if their programs partnered with other governmental
and non-governmental organizations. Respondents were also asked to rate the strength of those partnerships (five reflected the strongest partnership and one reflect-ed the weakest). Of the 48 managers who responded to the question of governmental partnerships, 35 percent partnered with bordering municipalities, towns or town-ships, 72 percent partnered with their county, 18 percent partnered with bordering counties and 25 percent did not partner at all. While the strength of such partnerships varied, it is clear that partnering with the program’s home county was especially important, as 62 percent perceived these partnerships as either strong or very strong.
Of the 56 managers who responded to the question on non-governmental partnerships, 98 percent partnered with one or more promotional organization, such as the chamber of commerce, 56 percent partnered with historic preservation organizations, 25 percent part-
An Evaluation of Pennsylvania’s Main Street Programs 13
Table 10: Effectiveness of Organization
Table 11: Effectiveness of Four-Point Approach, Total Percentages
Table 9: Effectiveness of Promotion Strategies
14 The Center for Rural Pennsylvania
nered with conservation/environmental organizations, 29 percent partnered with humanitarian/social service organizations, 83 percent partnered with banks, and 57 percent partnered with development groups. The survey did not ask about partnerships with tourism organizations specifically, but evidence from interviews suggests that programs were partnering with local tour-ism organizations and destinations. No program part-nered with either a union or a labor organization. The strengths of these partnerships varied, yet most were either strong or very strong. For example, of the promo-tion organization partnerships, 67 percent rated them as either strong or very strong, and 82 percent rated the bank partnerships as strong or very strong.
A combined non-governmental organization variable revealed the partnership activity levels among pro-grams. Thirty-four percent of programs partnered with three organizations, 28 percent partnered with four, and 12 percent partnered with five or six. The remaining 24 percent partnered with one or two.
The site visits and interviews revealed a number of re-gional partnerships and, more importantly, emphasized the significance of such partnerships. In the interviews conducted with representatives from highly successful programs, the interviewee always spoke highly of some kind of regional partner. These partnerships included regional chambers or economic development entities, nearby tourist attractions, regional industrial associa-tions or county governments.
When the researchers analyzed the responses related to partnering with governmental and non-governmental organizations, they found that two were significant: programs that partnered with historic preservation organizations and programs that had strong ratings for their county partnerships. Further, after correlating the combined non-governmental variable with pro-gram sustainability, they found evidence that the more non-governmental partnerships held by programs, the more likely they had greater program sustainability. Partnerships with governmental and non-governmental organizations outside of a program’s servicing area play important roles in sustaining program health.
Multiple Regression ModelFor the study, the researchers built a multiple regres-
sion model that included independent variables signifi-cantly related to MSP sustainability. According to the research, MSP sustainability scores were more likely to be high when/if:
• Programs had high Four-Point effectiveness scores;
• Programs had Business Improvement Districts (BIDs);• Programs were not challenged by negative public
perceptions of their downtowns; • Programs partnered with non-governmental historic
preservation organizations; • Programs considered their preservation and archi-
tectural heritage, their business owners, and the location of government offices in the downtown as strong assets; and
• Median rents were elevated.5
The researchers put the above independent variables into a multiple regression model with MSP sustainabil-ity. According to the model, the Four-Point Approach was one of two variables that retained its significance. The other was whether or not a program had a BID.
In other words, when taking into consideration the presence of other independent variables, both the Four-Point Approach and BID remained strong predictors of MSP sustainability. Effective use of the Four-Point Ap-proach and BIDs are indicators of MSP sustainability.
Exploring Differences between Rural and Non-Rural Programs Using the Main Street Approach
Five regional MSPs, representing 22 communities, were represented in this study. Of these, 14, or 64 percent, were rural. Of the 60 traditional programs that responded to this study, four, or 7 percent, were rural.
Compared to other traditional programs, the four rural traditional programs were statistically more likely to have fewer assets and weaker overall asset strength.6 Rural municipalities with smaller populations, and therefore a much smaller tax base, often lack a strong retail mix downtown, are less likely to have a college/university, and are a bit more remote in terms of trans-
5. Using Census data for the postal code of each program, there were only two variables that were significantly correlated to program sustainability: median rent (R=.298, p=.021) and median home value of owner occupied units (R=.280, p=.030). The final regression model addressed above included only median residential rents. A separate regression was run with median home value. This predictor did not perform any better than median rent, and when including both in the same regression model, the variance infla-tion factor for each was greater than two while all other variance inflation factors were less than two. As simple observation would suggest, there is high collinearity between median rent and median home values. At the bi-variate level, however, these correlations suggested downtowns/programs with higher residential rents and home values were statistically more likely to have higher program sustainability scores.6. Total Asset correlated with Yes Rural/No Rural produced an R= -.282, p=.029; Asset Strength correlation produced an R=-.247, p=.047.
portation routes. That these communities have fewer assets than other, more populated, economically active communities, then, follows a logical path.
When rural “regional” communities were compared with non-rural “regional” communities, the researchers found the differences to be a bit more pronounced and revealing. Rural regional communities were statistically more likely to have greater challenges to revitalizing their downtowns than their non-rural counterparts. When each of the challenges were analyzed separately, the research found that rural communities were more likely to be challenged by: large discounters/retailers outside of the Main Street area, absentee landlords that do not reside within their county, their distance from major population centers, the condition of their build-ings, and the lack of residents near the downtown.
Managers working in rural communities were statis-tically more likely to have more challenging working conditions than non-rural regional programs. When each of the challenges was analyzed separately, the researchers found that rural managers were more likely to be challenged by community/public expectations and the availability of quality physical resources, like of-fice space. Interestingly, these same rural communities were significantly less challenged by the availability of financial resources. Further, there was some evidence that a rural regional community’s organization may be stronger when it comes to identifying, crafting and embracing a program mission statement.
Lastly, regarding the use of the Main Street Four-Point Approach, rural regional communities, compared to their non-rural regional counterparts, found econom-ic restructuring strategies statistically less effective—no significant relationships existed between any of the other three Main Street approaches and whether or not a community was rural. Among the nine economic re-structuring strategies, rural communities found market analyses, marketing/recruitment kits (including targeted business recruitment), providing seminars/workshops or in-store consultations for business owners, and e-commerce to be least effective. Managers either found these strategies difficult to implement in their down-towns, given, for example, business owner reluctance/avoidance, or they lacked the education and experience needed to effectively make these strategies work.7
CONCLUSIONSIn this study, two variables emerged as significant
predictors of MSP sustainability: the existence of a BID, and managers’ perceived effectiveness of the Main Street Four-Point Approach. Of the 60 traditional pro-grams that participated in this study, only six had BIDs.
As of 2009, about 20 percent of all MSPs nationwide had BIDs.
Of all traditional programs in Pennsylvania’s Main Street history, only 8 percent had BIDs (11 out of 140). However, six out of the 19 urban programs (31.5 percent) had BIDs. Combining all types of programs in Pennsylvania (traditional, urban and regional), only 10 percent had BIDs (17 out of 168), which is half of the national figure. Essentially, BIDs provide programs with a long-term, stable funding source. When asked why their programs were successful, three managers pointed to their BIDs.
Often MSPs are the precursors to BIDs or other special assessment funding strategies implemented by downtowns or districts. Forty-three percent of managers responding to the BID question either had a BID, were in the process of developing one, or were early into the information gathering phase. Of the programs without BIDs, some managers wanted one but knew they had to strengthen the relationships between their downtown and residential areas to be successful. And still others stated that the downtown/business owners just were not ready for a BID, although some said they would keep trying. Other programs were still too new. Managers typically saw a BID as a goal for their community, but one for which significant groundwork was necessary. This speaks to both the need for BID education and the dampening effect of an often cautious, independent, tra-ditional, local business culture. In one community, for example, a BID organizing attempt failed because local merchants and property owners saw it as a tax, and felt they would have little control over the money. When the Main Street manager approached the merchants and property owners a few years later with the suggestion that they each pay a small amount into a pool that could be used to further market the downtown, the manager found more interest. Relying on the downtown business association instead of a new BID organization, the com-munity created an informal BID that now channels its
An Evaluation of Pennsylvania’s Main Street Programs 15
7. The analyses of rural and non-rural communities are not only limited by small sample size, but because of differences in budgets and manager responsibilities with regional programs, an MSP sustainability score could not be computed, which therefore prevented any kind of cross-comparison with traditional programs. By limiting the analyses to correlations alone, one cannot rule out the effects of other vari-ables in these established relationships. However, significant correlations can be strong indicators of the impact that some variables have on others. Given that a rural designation precedes MSP variables in time, that there were statistically significant correlations, and that these correlations make logical sense, the researchers have confidence that the relationships that are reported here have their roots in the true dif-ferences between rural and non-rural.
16 The Center for Rural Pennsylvania
money through the MSP. This informal BID collects more money than what was originally proposed in the formal BID years before.
For the 90 percent of programs that lack BIDs, financial security must be achieved in other ways. For managers of traditional programs, the availability of financial resources was by far the most challenging of all working conditions listed on the survey; its average rating was 4.28 out of five, where five represented the most challenging condition. While the survey did not explore the importance of planning specifically, manag-ers repeatedly emphasized the role of planning in the success of their programs.
The second most significant correlation with program sustainability was a program’s combined effectiveness using the Main Street Four-Point Approach. Accord-ing to the results, Main Street Programs have positive effects upon the communities in which they exist. Traditional programs in this study were asked to rate the strength of the Main Street Approach as an asset in their community. It received, on average, a 3.97 out of five, with five being the strongest asset. The results suggest that, as the perceived effectiveness of using the Four-Point Approach increases, so, too, does their MSP sustainability score. It must also be noted, however, that program sustainability/success does not stem from a standardized approach at using the Four-Points. On the contrary, programs adapt points to suit particular needs and blend them to meet daily challenges. The research-ers found that it is the capacity of the community, the skill sets of the manager, and the support of influential town leaders that determine what points are used, how often, and in what manner. For instance, one program focused on economic development/restructuring at the expense of other points. For others, volunteerism is a key factor in perceived success.
Further, the effect that community buy-in has on program sustainability/success cannot be underesti-mated. Unfortunately, the closest this study came to measuring this was in the public perception of the downtown, where the researchers found a significant, negative relationship, suggesting that a negative percep-tion of the downtown by the public impedes program sustainability. A program’s use of regional partnerships, particularly their county and non-governmental organi-zations, reflects, somewhat indirectly, a positive trend in community buy-in and program sustainability. Further, managers who rated community/public expectations
of their position as a significant challenge were signifi-cantly more likely to have higher program sustainability scores.8 In this sense, the researchers equated the high expectations of community to an engaged community, one that has its eye on the direction of the downtown, and one that is more likely to be involved in seeing that program goals and objectives are met.
The buy-in of the local community (government, chamber, etc.), particularly stakeholders with power and leverage, and perhaps most importantly, those who have social/political and financial interests in the downtown, is paramount to its success, especially for programs/downtowns that have not been socially, politically and economically blessed with perpetual good fortune. And to have these stakeholders represented on the board, in key positions, is crucial.
To what extent do community characteristics influ-ence the sustainability of MSPs? Overall, there was not as much of an impact on MSP sustainability by com-munity demographics as the researchers had originally thought. Only two Census variables, median residential rent and median home value of owner-occupied units, had a significant relationship with MSP sustainability. It is understood, then, that programs with higher MSP sustainability scores were more likely to have higher median rents and higher median home values. These increased values speak to the perceived quality of residential offerings within a program’s area. Develop-ing markets act as engines for economic growth and provide fertile ground for revitalization programs like Main Street.
Another variable important to the success of any pro-gram is the length of service of the Main Street man-ager. The median number of years for managers in the study was 2.8, which is slightly higher than the average manager turnover rate of 1.5 years.9 Length of service becomes important as one considers the learning curve that may take the entire first year. And with most man-agers leaving after six months of service, it becomes very difficult for programs to create momentum, es-tablish legitimacy, and to build the deep organizational roots and partnerships within their respective communi-ties that are needed to accomplish program goals.
The manager’s job is demanding. For a program to succeed, expectations need to be manageable and realistic for the community given the available human and financial resources. Managers must also be able to understand, negotiate, and navigate local politics. Being
8. Community/public expectations of managers as a significant challenge (R=.313, p=.015).9. Median years was chosen as months ranging from one to 192 months and a mean would be subject to extreme data points.
An Evaluation of Pennsylvania’s Main Street Programs 17
able to calculate a “return on investment” to sell the value of a program to local government or some other funding source was another important skill to master. It is no surprise, then, that managers do all of this and more by working between 50 and 70 hours a week.
In 2010, the average salary for the 43 Main Street managers attending the state-wide annual meeting was $44,769. Three-fifths of managers (61 percent) had administrative support for an average of 26 hours per week (PDC, 2010b:2). Of those managers responding to the survey, 25 percent received administrative sup-port from their municipalities, either at a reduced or no cost. Between 13 and 30 percent of them received of-fice and/or storage space, parking for staff, health care for staff, help with advertising/publicity, printing and fiduciary services. Managers, who generally receive support from either their municipality or local chamber of commerce, are in a better position to develop and sell the goals of their programs. External types of support help to provide stability in the daily workings of MSPs.
The research also exposed differences in rural and non-rural programs regarding Main Street manag-ers working conditions. For those regional programs responding to the survey, managers serving rural com-munities were more likely to be challenged by unreal-istic or excessive community/public expectations and the lack of physical support, such as office space.
POLICY CONSIDERATIONSWhile there are no easy fixes to the troubles that
plague programs that fail to thrive, the researchers sug-gest the following policy considerations to support the sustainability of MSPs.
In Pennsylvania, PDC fills the role of both educa-tor and police officer. This, the researchers believe, is counterproductive. PDC should not be responsible for both technical assistance and operational assessment. This research uncovered a distinct lack of reliability in reporting of MSP data and several possible explana-tions for the lack of reliability.
First, it seems that PDC is at least partially aware of this problem and has been actively searching for a better reporting method. A switch to an online report-ing system was one such change. Second, the research discovered no clear lines of accountability for most of the reporting methods. Though programs filed assess-ments to DCED to renew funding rounds, failure to file quarterly and annual reports to PDC seemed to occur with relative impunity. Finally, this research discovered a clear division of opinion among managers regarding
the effectiveness of PDC. Many managers made use of PDC training and found the PDC to be supportive. A vocal minority, however, viewed PDC as out of touch with the realities of program management and were suspicious of PDC mandates. This research provides no conclusive evidence as to whether these differences in manager opinion are representative of personality conflicts or structural issues in PDC policy. However, the researchers heard from a number of programs that either chose not to report or submitted false reports so that they would not be penalized by PDC.
The researchers recommend that DCED, or some other independent body, take the lead in assessing programs, and that PDC maintain its role of providing technical assistance, training and education to MSPs. The evidence suggests that the current model is inef-fective – more research needs to be conducted on the effectiveness of the educator/assessor role of PDC and its impact on data/reporting quality. There also needs to be greater accountability in reporting. Data from PDC were in poor order. Not only can the data’s reliability be called into question, but the sheer inconsistency in reporting makes any real effort of comparison difficult.Data from programs represent an important measure of the effectiveness of state investment; they should be trustworthy and complete. It is not clear yet whether the online reporting system will address these problems. Regardless, changes in oversight and accountability will strengthen the reporting process and increase data quality.
The researchers recommend that the reporting structure be changed from PDC to DCED. In doing so, greater oversight and accountability must be initiated if data gathered from MSPs are to have any real impact on measuring the effectiveness of state investment.
Another feature to address is manager retention. The fact that most managers last only about 18 months speaks less to flaws in character and more to inexperi-ence, lack of support, poor pay for hours worked and unrealistic expectations. Though the research did not investigate where managers went after leaving their po-sition with the MSP, some anecdotal evidence suggests that it is not uncommon for managers to move from one program to another. Even if there were a great deal of rotation among managers in the state, a high turnover rate is a threat to the sustainability of any organization, and may be one the most unsustainable features in the relatively short funding cycle of MSPs.
Evidence suggests that these conditions are exacer-bated in rural communities/programs throughout the
18 The Center for Rural Pennsylvania
state, as these programs are more likely to lack resident experts to assist managers.
The research indicated that many (not all) managers often come to their positions with little or no profes-sional experience in economic or community develop-ment.10 Perhaps not surprisingly then, an overwhelming majority of respondents (88 percent) agreed that their organization had taken advantage of the training op-portunities provided by PDC. Further, about 82 percent agreed that PDC offered training that was relevant to the needs of their programs. PDC training targets new manager orientation, organization, physical improve-ments (design), community marketing (promotion/image and identity), asset enhancement (economic restructuring/neighbors and economy), and more. How-ever, while managers may be well trained, there seems to be a disconnect between the types of training offered and the particular skill sets needed on the job. Most managers come to the job with little or no experience in downtown revitalization, and training in the Four-Point Approach does not provide the depth of experi-ence necessary to create the necessary expertise. This is especially true in the area of finance and economic development, which is perhaps the most important of the Four-Points for many rural MSPs.
To have managers stay in their positions longer, there should be a new approach to acclimating, training and supporting managers. Manager retention should be lengthened if state investments are to have any lasting, sustainable effect.
The researchers recommend that new managers be assigned a “manager mentor.” Mentors would be Main Street manager veterans with proven records of success. Mentors would take an active role in overseeing the de-velopment of a new program; help guide communities to set realistic goals and objectives; work closely with a new manager, attend meetings and trainings, and help them establish a sustainable organization/board; and as-sist in developing and carrying out an economic devel-opment plan/strategy. Mentors would be used intensive-ly for the first two years. After this period, the mentor would move on to a new community, but still maintain a schedule of weekly phone calls and a monthly visit to the first community. The use of mentors would help shorten the learning curve of new managers, leading to better manager retention. Mentors could concentrate on regions and would provide a direct link between
PDC and DCED. The researchers recommend that the manager mentor be employed/funded by DCED but be solely accountable to the mentored program. Main Street managers of the mentored program would submit quarterly evaluations of their mentor to DCED. PDC would oversee the mentoring program and provide coordination efforts between mentors and mentees; it would also help develop and facilitate the newly pro-posed economic development educational program in coordination with veteran managers/mentors (explained below).
According to the literature on MSPs, the most used of the Four-Point Approaches is promotion, followed by design. These approaches are most visible, quick and easier to assemble. Yet they are weak at targeting structural issues affecting downtowns. Unfortunately for downtowns across the state, practice has not kept up with the times.
The researchers recommend that while mentors will guide new managers along the path of economic de-velopment, significant training must be put in place to prepare all managers to be realtors, developers, fund-raisers and entrepreneurs. This becomes even more of an issue in rural communities that lack resident experts who could provide needed support and guidance – this statement is supported by the data. This training should extend beyond what is already offered in a two-day workshop on asset enhancement, part of the Com-munity Revitalization Academy – a required five-part intensive training series held throughout the year, every year. The economic development experiences of managers throughout the state should be culled into an intensive, year-long workshop series that showcases best practices and their successes in different types of communities given different community demographics. The researchers also recommend that this workshop series explore BIDs or other types of special assessment districts.
10. Unfortunately, the survey did not explore the background expe-riences of managers. These comments reflect evidence picked up through conversations with managers, both informal and formal.
An Evaluation of Pennsylvania’s Main Street Programs 19
ReferencesDane, S. 1997. Main Street Success Stories, Washington, D.C.: National Main Street Center. Dono, A. 2009. Revitalizing Main Street: A Practitioner’s Guide to Comprehensive Commercial District Revital-ization. Washington, D.C.: National Trust Main Street Center.
Kelly, S. 1996. “The Main Street Program in Mississippi.” Economic Development Review, 14 (2): 56-59.Lawniczak, J. 2005. “Inappropriate Building Materials on Main Street.” Main Street News (November, pp. 1-10).Mowry, M. 2003. “Reclaiming Main Street.” Business NH Magazine (March, pp. 16-22).Norusis, M. J. 2010. PASW Statistics Guide to Data Analysis. Prentice Hall, Upper Saddle River: NJ.Pennsylvania Department of Community and Economic Development, 2008. “New Communities: Program Guidelines.” Retrieved August 10, 2009 at http://www.newpa.com/find-and-apply-for-funding/funding-and-pro-gram-finder/funding-detail/index.aspx?progId=79.
Pennsylvania Downtown Center. 2009a. “Elm Street Program.” Retrieved August 10, 2009 at http://www.padown-town.org/programs/elmstreet/default.asp.
Pennsylvania Downtown Center. 2010b. “Managers’ Salary and Benefits Survey.” pp. 1-9.Pennsylvania Downtown Center. 2011c. “Community Revitalization 2010-2011 Academy.” New Manager Train-ing Manual.
Pennsylvania Downtown Center. 2011d. “Legislative Alert.” March 9, 2011, pp. 1-2.Robertson, K. 1999. “Can Small-City Downtowns Remain Viable?” Journal of the American Planning Associa-tion, Summer 65(3): 270-283.
Robertson, K. 2004. “The Main Street Approach to Downtown Development: An Examination of the Four-Point Program.” Journal of Architectural and Planning Research, Spring, 21(1): 55-72.
Smith, K. L. 1995. “Main Street at 15.” The Forum Journal, Spring, 9(3): 1-13.Smith, K. L. 1996. “How Main Street Programs Evolve and Change.” Main Street News (March, pp. 1-6).
The Center for Rural Pennsylvania625 Forster St., Room 902
Harrisburg, PA 17120Phone: (717) 787-9555
Fax: (717) 772-3587www.rural.palegislature.us
1P1011 – 400
The Center for Rural PennsylvaniaBoard of Directors
ChairmanSenator Gene Yaw
TreasurerSenator John Wozniak
SecretaryDr. Nancy Falvo
Clarion University
Dr. Livingston AlexanderUniversity of Pittsburgh
Dr. Theodore R. AlterPennsylvania State University
Stephen M. BrameGovernor’s Representative
Taylor A. Doebler, IIIGovernor’s Representative
Dr. Stephan J. GoetzNortheast Regional Center for Rural Development
Dr. Karen M. WhitneyClarion University