Embed Size (px)
Citation preview
An Experimental Evaluation of Specification Techniques for Improving Functional Testing
Kevin L. Mills National Institute of Standards and Technology, Gaithersburg, Maryland; and George Mason University, Fai@ii, Eginia
Numerous specification techniques have been pro-
posed to improve the development of computer soft-
ware. This article reports results from one experiment
to compare the effectiveness of functional testing given three different sets of software specifications. Three
groups of experienced programmers independently de-
veloped functional test cases for the same automated
cruise control software. One group worked sotely from
a natural language description, one was given a graphical real-time structured analysis (RTSA) specifi- cation to augment the natural language description, and a third was given, in addition to the English
language description and the RTSA specification, an
executable specification. Two measures of perfor-
mance were evaluated: the degree of statement cover-
age achieved by the test cases created by each group, and the amount of time taken to create the test cases.
No significant difference in performance was found among any of the groups for either of the measures.
Individual differences in performance among the sub-
jects were observed. Additional statistical tests were
used to evaluate the effect of other factors on these individual differences. Such differences appear to be
attributable to variations among the subjects in effort, ability, motivation, and understanding of the assign-
ment. These results suggest that software engineer-
ing researchers should investigate people-related
management issues that, perhaps, exert the most sig- nificant short-run influence on the performance of
software engineers.
Address correspondence to Kevin L. Mills, Chief; Systems and Network Architecture Diuision, National Institute of Standards and Technology, Building 225, Room B 217, Gaithersburg, MD 20899. E-mail: [email protected].
K. L. Mills attends George Mason University as a doctoral student while employed by the National Institute of Standards and Technology. The work described here was conducted during a doctoral seminar at Gcorgc Mason University.
1. INTRODUCTION
Numerous specification techniques have been pro- posed to improve the development of computer soft- ware (Bailin, 1989; Diller, 1990; Hare1 et al., 1987; Heninger, 1980; IS0 1987, 1989; Ward and Mellor, 19851986). Such techniques aim to remedy the shortcomings of natural language, that is, to increase precision and identify omissions and inconsistencies in specifications. Some specification techniques go further by providing an underlying semantic model that can be executed to explore the operational properties of a proposed software system (Hare1 et al., 1990; Lee and Sluzier, 1991; Zave and Schell, 1986). Occasionally, experiments have been con- ducted to evaluate the effectiveness of various speci- fication techniques at improving the design and im- plementation of software (Basili et al., 1986; Kelly and Murphy 1990); however, few experiments have been conducted to evaluate the effect of specifica- tion techniques on functional testing. As used in this article, functional (or black box) testing refers to testing a software system against a specification of the functions that the software is to perform, rather than testing against the code (white box testing) that implements those functions. Functional tests are written without the tester examining the code, while white box tests are written by the tester with full knowledge of the code. This article reports results from one experiment to compare the effectiveness of functional testing given three different sets of software specifications.
In the first case, an English-language description alone provides the information used to create func- tional test cases. In a second case, the English language description is augmented with a graphical specification notation known as real-time structured
J. SYSTEMS SOFTWARE 1996; 3283-95 0 1996 by Elsevier Science Inc. 655 Avenue of the Americas, New York, NY 10010
0164-1212/96/$1S.00 SSDI 0164-1212(95)00042-Y
84 J. SYSTEMS SOFTWARE 1996: 32:83-95
K. L. Mills
analysis (RTSA) (Ward and Mellor, 19851986). In the third case, the English language description and the RTSA specification are used, along with an executable specification. The experiment investi- gates whether these forms of specification affect the ability of experienced programmers to create func- tional tests for a given application. Two working hypotheses are adopted. First, the use of RTSA will improve the test couerage and decrease the time taken to create finctional tests over that which is achieved when only the English language description is avail- able. The introduction of a graphical notation, such as RTSA, should increase the precision of the speci- fication, allowing test developers to more readily identify the test cases needed to cover software written to meet the specification. In addition, obtain- ing a given coverage should take less time with the RTSA specification because those using only the natural language description would need to translate the natural language into a more precise model of the requirements in order to write effective test cases. No generally accepted measure exists for the effectiveness of functional testing. In this experi- ment, statement coverage is used to assess the ef- fectiveness of functional testing. Although statement coverage is a measure typically associated with white box testing, the software used in this experiment might allow statement coverage to provide a useful measure for the effectiveness of functional testing because most of the code composing the application software maps directly from the natural language description. Eleven of the eighteen modules in the software correspond directly to paragraphs in the natural language description. Four of the remaining seven modules provide control for sequencing appli- cation modules, while the final three modules encap- sulate data elements taken from the natural lan- guage description.
A second working hypothesis is that the use of an executable specification will improve the test coverage over that which is achieved with a natural language description and an RTSA specification. The marginal improvement gained with the executable specifica- tion is expected to stem from the capability to dy- namically model the problem, a capability that should reduce misunderstandings in some cases. In addi- tion, since the executable specification can interpret the functional test language, the intent of each test can be verified before using the test case against the actual application software. Use of an executable specification should increase the time taken to write tests over the time taken when only a natural lan- guage description and an RTSA specification are
available. This extra time will be used to dynamically evaluate the functional tests.
The remainder of the article describes an experi- ment intended to test these hypotheses. The experi- ment design is presented, followed by the details of conducting the experiment. Then, the results from the experiment are reported. Finally, conclusions are drawn. Due to space limitations, much of the sup- porting experimental material can only be outlined here. The complete set of materials, packaged as an experiment notebook, can be obtained from the author (Mills, 1993).
2. DESIGN
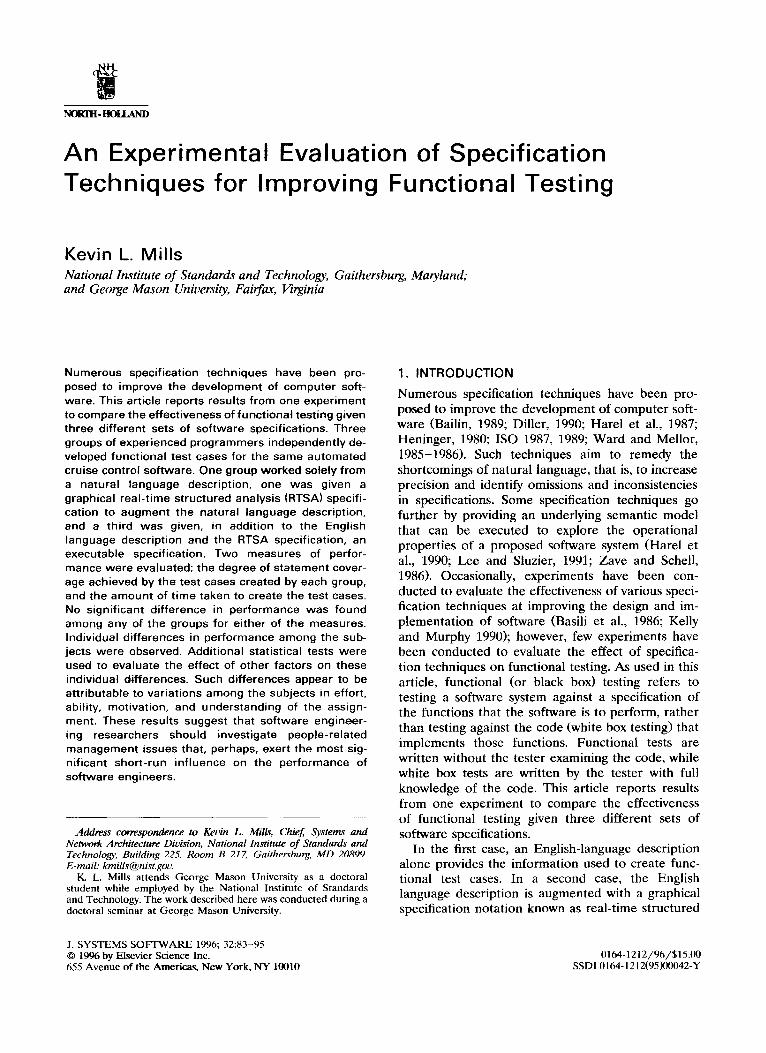
The overall design of the experiment required repli- cated development of functional tests by three groups of experienced, professional programmers. Figure 1 provides a pictorial overview of the general design. The subjects were drawn from a population of N 200 experienced programmers working within the Com- puter Systems Laboratory at the National Institute of Standards and Technology. In Figure 1, this popu- lation is represented as a grid, with the black boxes denoting a sample drawn from the population. I approached potential subjects with a memorandum (Mills, 1993) that explained the purpose of the ex- periment and solicited volunteers. The experiment called for three groups of at least five test writers. Each group was initially staffed with eight subjects in order to account for the possibility that some subjects might drop out of the experiment. Each subject was asked to respond to a questionnaire (Mills, 1993) requesting a name, an electronic mail address, the number of years of programming and functional testing experience, and the degree of familiarity with software requirements specifications, RTSA, and executable specifications. Subjects were assigned to groups on the basis of their answers to the questionnaire and on my assessment of their abilities. I had supervised or managed 19 of the 24 subjects and had worked with the remaining 5 as colleagues. These relationships occurred over the past 5 years. In these relationships, I had ample opportunities to gain an appreciation for the strengths and weaknesses of the subjects.
After comparable groups were formed, each group was assigned randomly to receive different sets of specifications for an automated cruise control sys- tem (ACCS). The ACCS application was excerpted from a real-time application suggested by Gomaa (1993). Gomaa’s application includes both cruise control and vehicle-monitoring functions. To reduce
Spec Techniques for Improving Testing J. SYSTEMS SOFTWARE 85 1996; 3283-95
/’ Acts “.L, I TEST SCRIPTS ! -Roab. ! a
0 ANSWERS TO ACCS
QUESTIONNAIRE j RTSA
[i ;
S~km ;
‘; ACCS
%%:;l; H ; : i
;
‘..,
PROGRAMMER ..,,,, . . . . . . . . ;:.I
PopuUnoN AT NIST -.- ._..___... __ ..* . . .
Figure 1. Overview of the Experimental Design.
the scope of the application but retain an interesting level of complexity, I selected the cruise control subsystem from Gomaa’s application and then used that subsystem as the application for the experi- ment.
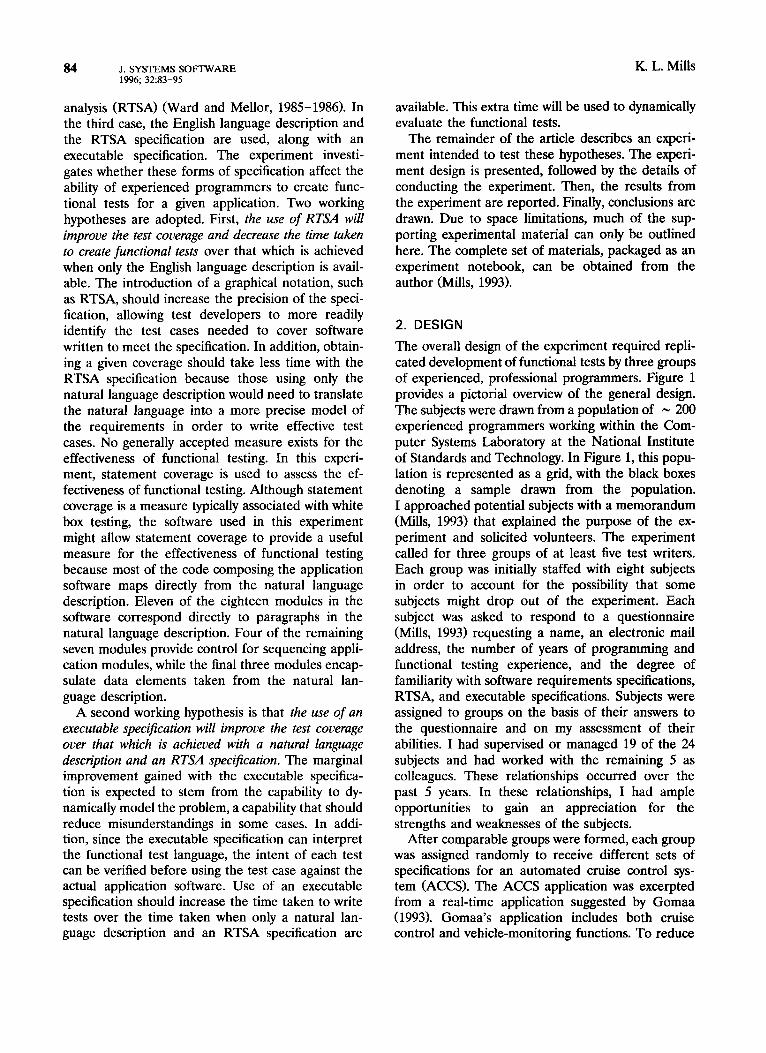
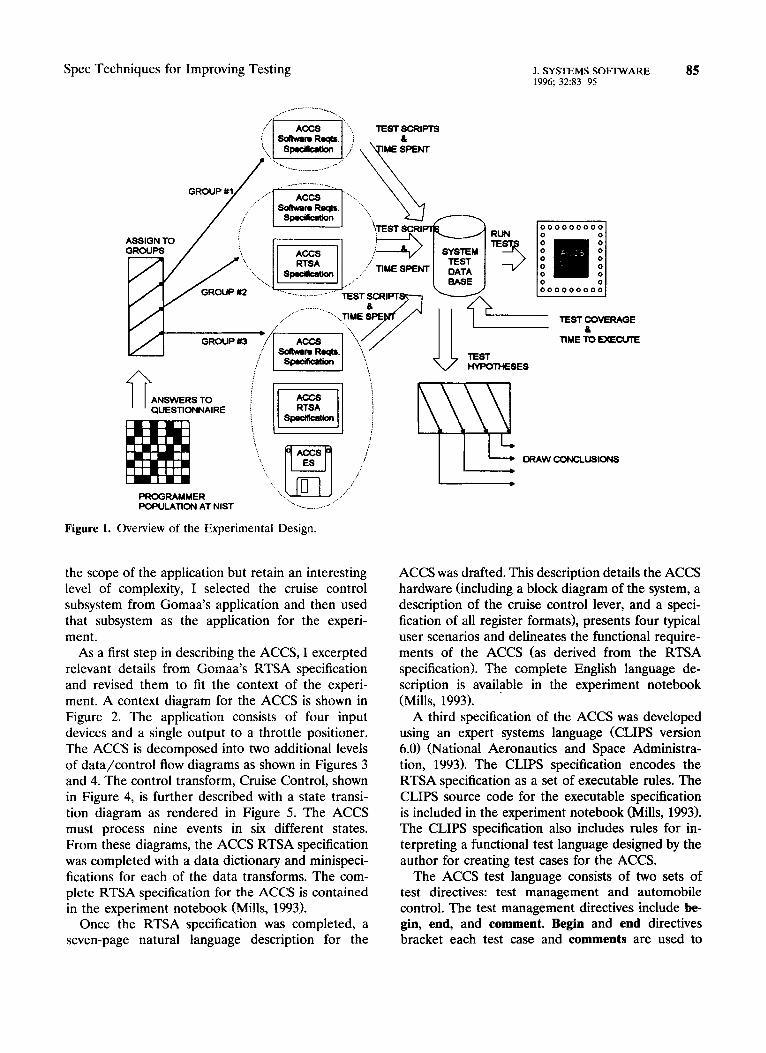
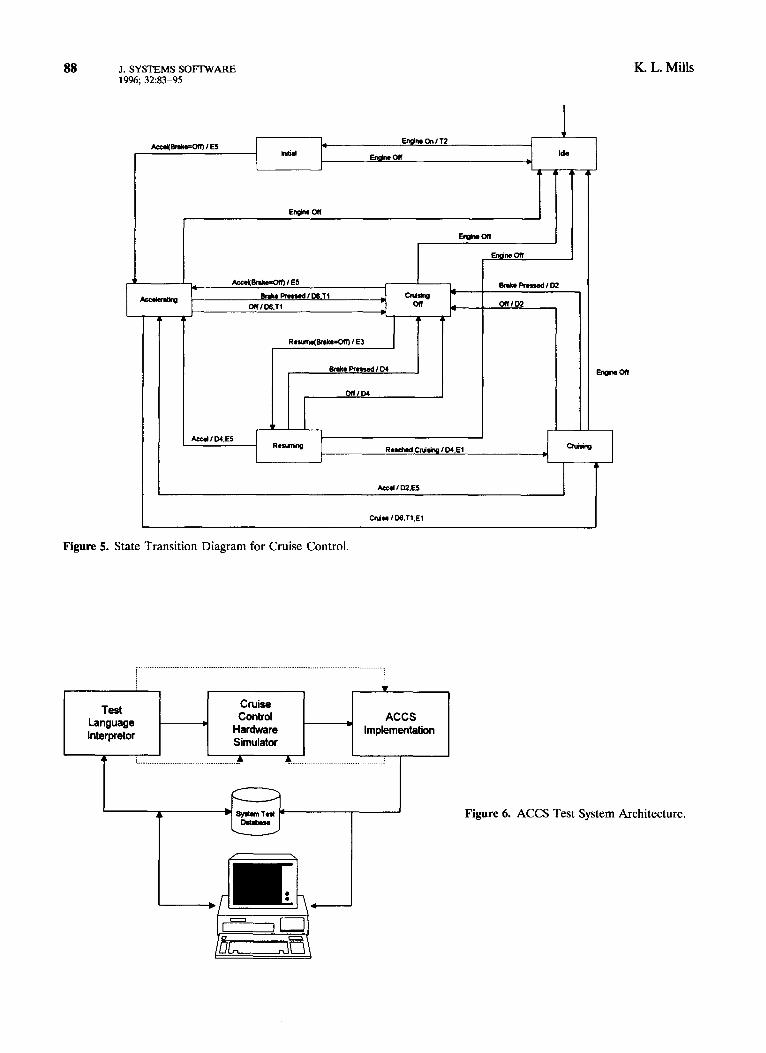
As a first step in describing the ACCS, I excerpted relevant details from Gomaa’s RTSA specification and revised them to fit the context of the experi- ment. A context diagram for the ACCS is shown in Figure 2. The application consists of four input devices and a single output to a throttle positioner. The ACCS is decomposed into two additional levels of data/control flow diagrams as shown in Figures 3 and 4. The control transform, Cruise Control, shown in Figure 4, is further described with a state transi- tion diagram as rendered in Figure 5. The ACCS must process nine events in six different states. From these diagrams, the ACCS RTSA specification was completed with a data dictionary and minispeci- fications for each of the data transforms. The com- plete RTSA specification for the ACCS is contained in the experiment notebook (Mills, 1993).
Once the RTSA specification was completed, a seven-page natural language description for the
TEST HYPOTHESES
w ORAW coNcLusloNs
I-
ACCS was drafted. This description details the ACCS hardware (including a block diagram of the system, a description of the cruise control lever, and a speci- fication of all register formats), presents four typical user scenarios and delineates the functional require- ments of the ACCS (as derived from the RTSA specification). The complete English language de- scription is available in the experiment notebook (Mills, 1993).
A third specification of the ACCS was developed using an expert systems language (CLIPS version 6.0) (National Aeronautics and Space Administra- tion, 1993). The CLIPS specification encodes the RTSA specification as a set of executable rules. The CLIPS source code for the executable specification is included in the experiment notebook (Mills, 1993). The CLIPS specification also includes rules for in- terpreting a functional test language designed by the author for creating test cases for the ACCS.
The ACCS test language consists of two sets of test directives: test management and automobile control. The test management directives include be- gin, end, and comment. Begin and end directives bracket each test case and comments are used to

86 J. SYSTEMS SOFTWARE 1996; 3283-95
Throttle Posilion
K. L. Mills
Figure 2. Automobile Cruise Control System Context Diagram.
Control Input
/
Cruise control Lever
explain the intent of a test. The automobile control directives include: speed, engine, brake, and lever. Speed is used to simulate changes in vehicle speed. Engine and brake are used to simulate actions taken by the driver to ignite and extinguish the engine or to depress and release the brake. Lever allows simu- lation of a driver adjusting the cruise control lever. Some automobile control directives enable a tester to indicate that a driver takes an action at a particu- lar vehicle speed. Specifically, the brake could be depressed, the cruise control lever could be set to the OFF position, or the cruise control lever could be released from the ACCEL position at specific vehicle speeds. As is explained below, the test lan- guage should also allow other directives to be trig- gered at specific speeds. A complete specification of the syntax and semantics of the test language [see the experiment notebook (Mills, 199311, was dis- tributed to each subject. Also distributed were four sample test scripts, one corresponding to each of the user scenarios given in the English language descrip- tion. The test language was used by the subjects to create functional test scripts for the ACCS.
I chose to conduct the experiment using working rather than laboratory conditions. This meant that the tasks were assigned, the subjects were given
I
duration deadlines, and the subjects were to track their own hours. The hours of effort recorded by the subjects themselves are potentially inaccurate; how- ever, closely monitoring the time spent by each subject would violate the intent to carry on the experiment under working conditions. Each subject was to return test scripts, along with an estimate of the amount of time spent reviewing the ACCS speci- fication, thinking, and writing test cases, via elec- tronic mail. Each set of test scripts was reviewed for correct syntax and then executed against an imple- mentation of the ACCS.
The ACCS implementation was written by the author in C and executed on a SUN SPARC 2. The implementation was augmented by a test language driver and a cruise control hardware simulator, as shown in Figure 6. Source code for all three compo- nents of the system is included in the experiment notebook (Mills, 1993). Tests can be executed inter- actively or from disk files, and test outputs can be written to a screen or to a log file. The solid lines in Figure 6 represent data exchange, and the dashed lines represent function calls. The Test Language Interpreter changes the state of the simulated hard- ware as directed by test cases and then calls the ACCS implementation. The ACCS implementation
Spec Techniques for Improving Testing J. SYSTEMS SOFTWARE 87 1996; 3283-95
Figure 3. First Level Decomposition of ACCS.
extracts the hardware state from the simulator and Together, these modules contain 116 basic blocks (a executes as necessary to respond to changes in hard- basic block is a sequence of code that, once entered, ware state. executes completely as a unit). The software design
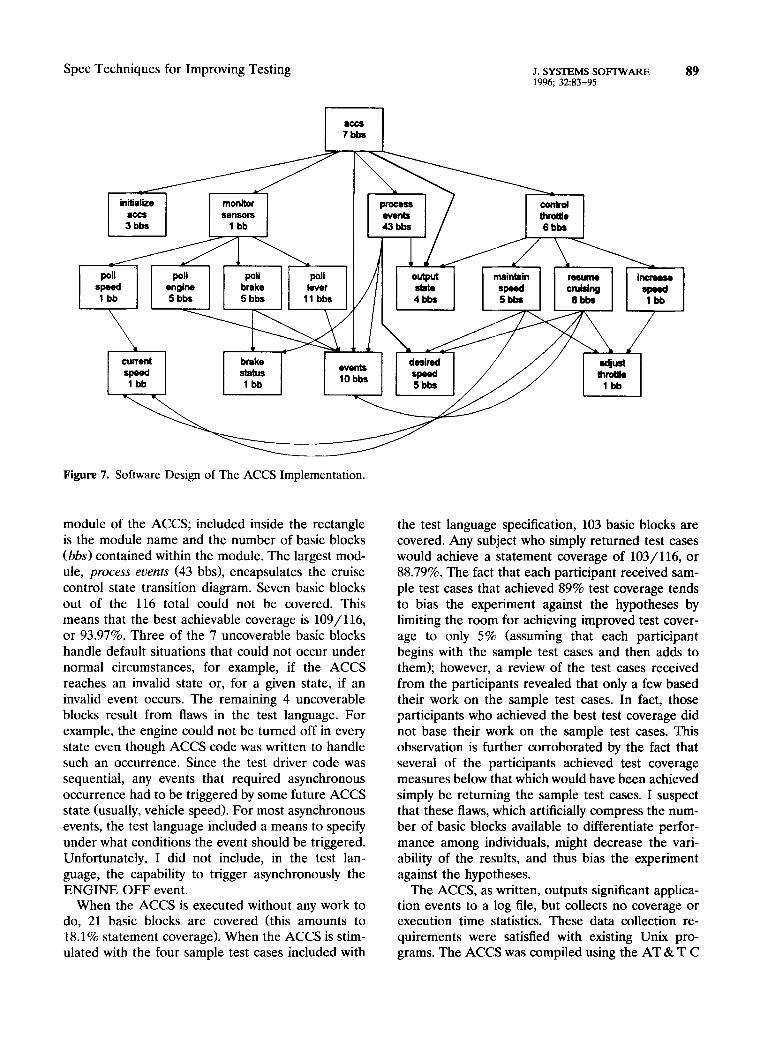
The ACCS implementation consists of 508 lines for the ACCS implementation is shown as a struc- (without comments) of code comprising 18 modules. ture chart in Figure 7. Each rectangle represents a
Decomposition Of Control Speed
Figure 4. Decomposition of Control Speed.
88 J. SYSTEMS SOFTWARE 1996; 3283-95
K. L. Mills
Aced I D2.E5 I
Cnisa/DG,Tl.El L
Figure 5. State Transition Diagram for Cruise Control.
.
Test Language Interpretor
Cruise Control + ACCS
Hardware ’ Implementation Simulator
t
j A A _ _ _. ~........ .._ ..______. i
I
Figure 6. ACCS Test System Architecture.
Spec Techniques for Improving Testing J. SYSTEMS SOFTWARE 89 1996: 3283-95
I 3bbs 1 I lbb 1
poll poll w-d engine 1 bb Sbbs
poll brake Sbbs
poll l0VQN
11 bbs
Figure 7. Software Design of The ACCS Implementation.
module of the ACCS; included inside the rectangle is the module name and the number of basic blocks (bbs) contained within the module. The largest mod- ule, process euenfs (43 bbs), encapsulates the cruise control state transition diagram. Seven basic blocks out of the 116 total could not be covered. This means that the best achievable coverage is 109/116, or 93.97%. Three of the 7 uncoverable basic blocks handle default situations that could not occur under normal circumstances, for example, if the ACCS reaches an invalid state or, for a given state, if an invalid event occurs. The remaining 4 uncoverable blocks result from flaws in the test language. For example, the engine could not be turned off in every state even though ACCS code was written to handle such an occurrence. Since the test driver code was sequential, any events that required asynchronous occurrence had to be triggered by some future ACCS state (usually, vehicle speed). For most asynchronous events, the test language included a means to specify under what conditions the event should be triggered. Unfortunately, I did not include, in the test lan- guage, the capability to trigger asynchronously the ENGINE OFF event.
When the ACCS is executed without any work to do, 21 basic blocks are covered (this amounts to 18.1% statement coverage). When the ACCS is stim- ulated with the four sample test cases included with
the test language specification, 103 basic blocks are covered. Any subject who simply returned test cases would achieve a statement coverage of 103/116, or 88.79%. The fact that each participant received sam- ple test cases that achieved 89% test coverage tends to bias the experiment against the hypotheses by limiting the room for achieving improved test cover- age to only 5% (assuming that each participant begins with the sample test cases and then adds to them); however, a review of the test cases received from the participants revealed that only a few based their work on the sample test cases. In fact, those participants who achieved the best test coverage did not base their work on the sample test cases. This observation is further corroborated by the fact that several of the participants achieved test coverage measures below that which would have been achieved simply be returning the sample test cases. I suspect that these flaws, which artificially compress the num- ber of basic blocks available to differentiate perfor- mance among individuals, might decrease the vari- ability of the results, and thus bias the experiment against the hypotheses.
The ACCS, as written, outputs significant applica- tion events to a log file, but collects no coverage or execution time statistics. These data collection re- quirements were satisfied with existing Unix pro- grams. The ACCS was compiled using the AT & T C
90 J. SYSTEMS SOFIWARE 1996; 3283-95
K. L. Mills
compiler -a option. This option generates an accs.d file where coverage data can be accumulated and inserts into the ACCS object code calls to coverage- counting routines. As the ACCS is executed, cover- age data is collected and then accumulated to the accs.d file at the close of each execution. A separate program, tcov, converts the accs.d file into an anno- tated source listing of the ACCS that includes cover- age statistics. To satisfy the requirement for execu- tion time recording, each test execution of the ACCS was run as a child of the Unix command time. The time command prints the amount of wall-clock and processor time used by its child.
3. CONDUCT OF THE EXPERIMENT
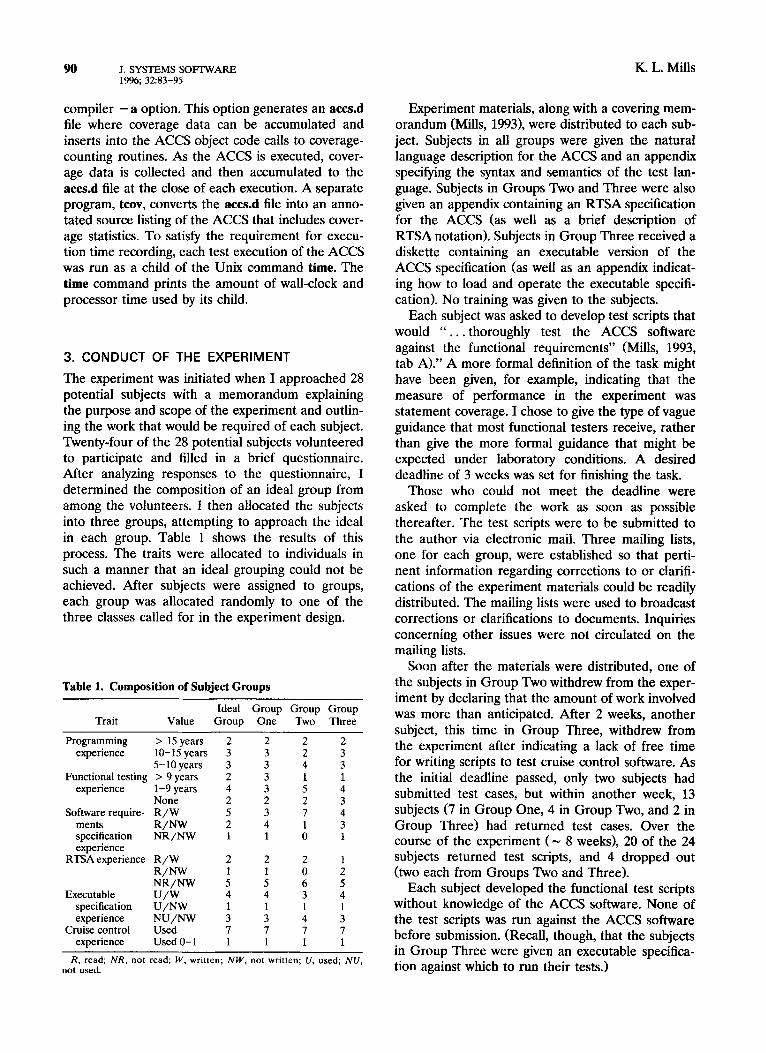
The experiment was initiated when I approached 28 potential subjects with a memorandum explaining the purpose and scope of the experiment and outlin- ing the work that would be required of each subject. Twenty-four of the 28 potential subjects volunteered to participate and filled in a brief questionnaire. After analyzing responses to the questionnaire, I determined the composition of an ideal group from among the volunteers. I then allocated the subjects into three groups, attempting to approach the ideal in each group. Table 1 shows the results of this process. The traits were allocated to individuals in such a manner that an ideal grouping could not be achieved. After subjects were assigned to groups, each group was allocated randomly to one of the three classes called for in the experiment design.
Table 1. Composition of Subject Groups
Ideal Group Group Group Trait Value Group One Two Three
Programming > 15years 2 2 2 2 experience lo-15 years 3 3 2 3
S-10 years 3 3 4 3 Functional testing > 9 years 2 3 1 1
experience l-9 years 4 3 5 4 None 2 2 2 3
Software require- R/W 5 3 I 4 ments R/NW 2 4 1 3 specification NR/NW 1 1 0 1 experience
RTSAexperience R/W 2 2 2 1 R/NW 1 1 0 2 NR/NW 5 5 6 5
Executable U/W 4 4 3 4 specification U/NW 1 1 1 1 experience NU/NW 3 3 4 3
Cruise control Used 7 7 7 7 experience Used O-l 1 1 1 1
R, read; NR, not read; W, written; NW, not written; U, used; NU, not used.
Experiment materials, along with a covering mem- orandum (Mills, 19931, were distributed to each sub- ject. Subjects in all groups were given the natural language description for the ACCS and an appendix specifying the syntax and semantics of the test lan- guage. Subjects in Groups Two and Three were also given an appendix containing an RTSA specification for the ACCS (as well as a brief description of RTSA notation). Subjects in Group Three received a diskette containing an executable version of the ACCS specification (as weH as an appendix indicat- ing how to load and operate the executable specifi- cation). No training was given to the subjects.
Each subject was asked to develop test scripts that would “.. . thoroughly test the ACCS software against the functional requirements” (Mills, 1993, tab A).” A more formal definition of the task might have been given, for example, indicating that the measure of performance in the experiment was statement coverage. I chose to give the type of vague guidance that most functional testers receive, rather than give the more formal guidance that might be expected under laboratory conditions. A desired deadline of 3 weeks was set for finishing the task.
Those who could not meet the deadline were asked to complete the work as soon as possible thereafter. The test scripts were to be submitted to the author via electronic mail. Three mailing lists, one for each group, were established so that perti- nent information regarding corrections to or clarifi- cations of the experiment materials could be readily distributed. The mailing lists were used to broadcast corrections or clarifications to documents. Inquiries concerning other issues were not circulated on the mailing lists.
Soon after the materials were distributed, one of the subjects in Group Two withdrew from the exper- iment by declaring that the amount of work involved was more than anticipated. After 2 weeks, another subject, this time in Group Three, withdrew from the experiment after indicating a lack of free time for writing scripts to test cruise control software. As the initial deadline passed, only two subjects had submitted test cases, but within another week, 13 subjects (7 in Group One, 4 in Group Two, and 2 in Group Three) had returned test cases. Over the course of the experiment (u 8 weeks), 20 of the 24 subjects returned test scripts, and 4 dropped out (two each from Groups Two and Three).
Each subject developed the functional test scripts without knowledge of the ACCS software. None of the test scripts was run against the ACCS software before submission. (Recall, though, that the subjects in Group Three were given an executable specifica- tion against which to run their tests.)
Spec Techniques for Improving Testing J. SYSTEMS SOFTWARE 91 1996; 32:83-95
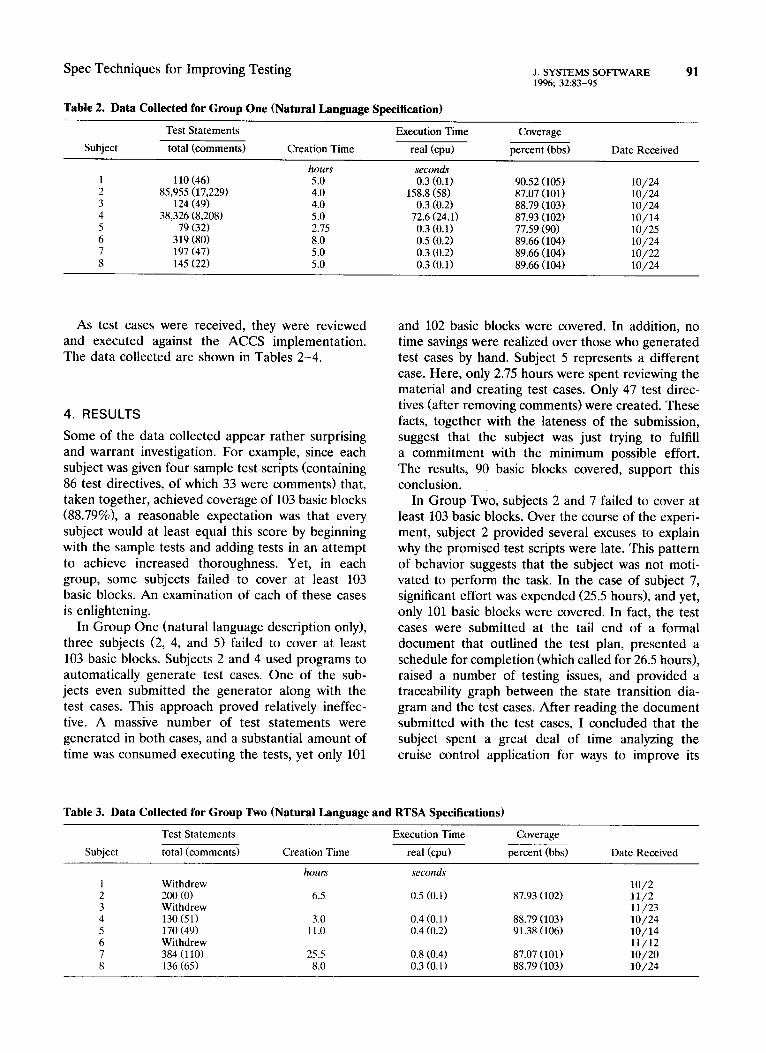
Table 2. Data Collected for Group One (Natural Language Specification)
Test Statements Execution Time Coverage
Subject total (comments) Creation Time real (cpu) percent (bbs) Date Received
hours seconds 110 (46) 5.0 0.3 (0.1) 90.52 (105)
85,955 (17,229) lo/24
4.0 158.8 (58) 87.07 (101) lo/24 124 (49) 4.0 0.3 (0.2) 88.79 (103) lo/24
38,326 (8,208) 5.0 72.6 (24.1) 87.93 (102) 79 (32)
10/14 2.15 0.3 (0.1) 77.59 (90)
(80) lo/25
319 8.0 0.5 (0.2) 89.66 (104) 197 (47)
lo/24 5.0 0.3 (0.2) 89.66 (104)
(22) 10/22
145 5.0 0.3 (0.1) 89.66 (104) IO/24
As test cases were received, they were reviewed and executed against the ACCS implementation. The data collected are shown in Tables 2-4.
4. RESULTS
Some of the data collected appear rather surprising and warrant investigation. For example, since each subject was given four sample test scripts (containing 86 test directives, of which 33 were comments) that, taken together, achieved coverage of 103 basic blocks (88.79%), a reasonable expectation was that every subject would at least equal this score by beginning with the sample tests and adding tests in an attempt to achieve increased thoroughness. Yet, in each group, some subjects failed to cover at least 103 basic blocks. An examination of each of these cases is enlightening.
In Group One (natural language description only), three subjects (2, 4, and 5) failed to cover at least 103 basic blocks. Subjects 2 and 4 used programs to automatically generate test cases. One of the sub- jects even submitted the generator along with the test cases. This approach proved relatively ineffec- tive. A massive number of test statements were generated in both cases, and a substantial amount of time was consumed executing the tests, yet only 101
and 102 basic blocks were covered. In addition, no time savings were realized over those who generated test cases by hand. Subject 5 represents a different case. Here, only 2.75 hours were spent reviewing the material and creating test cases. Only 47 test direc- tives (after removing comments) were created. These facts, together with the lateness of the submission, suggest that the subject was just trying to fulfill a commitment with the minimum possible effort. The results, 90 basic blocks covered, support this conclusion.
In Group Two, subjects 2 and 7 failed to cover at least 103 basic blocks. Over the course of the experi- ment, subject 2 provided several excuses to explain why the promised test scripts were late. This pattern of behavior suggests that the subject was not moti- vated to perform the task. In the case of subject 7, significant effort was expended (25.5 hours), and yet, only 101 basic blocks were covered. In fact, the test cases were submitted at the tail end of a formal document that outlined the test plan, presented a schedule for completion (which called for 26.5 hours), raised a number of testing issues, and provided a traceability graph between the state transition dia- gram and the test cases. After reading the document submitted with the test cases, I concluded that the subject spent a great deal of time analyzing the cruise control application for ways to improve its
Table 3. Data Collected for Group Two (Natural Language and RTSA Specifications)
Subject
Test Statements
total (comments) Creation Time
Execution Time Coverage
real kpu) percent (bbs) Date Received
Withdrew 200 (0) Withdrew 130 (51) 170 (49) Withdrew 384 (110) 136 (65)
hours seconds
6.5 0.5 (0.1)
3.0 0.4 (0.1) 11.0 0.4 (0.2)
25.5 0.8 (0.4) 8.0 0.3 (0.1)
10/2 87.93 (102) 11/2
11/23 88.79 (103) lo/24 91.38 (106) 10/14
11/12 87.07 (101) IO/20 88.79 (103) lo/24

92 J. SYSTEMS SOFTWARE K. L. Mills 1996; 3283-95
Table 4. Data Collected for Group Three (Natural Language, RTSA, and Executable Specifications)
Subject
Test Statements
total (comments) Creation Time
Execution Time Coverage
real (CPU) percent (bbs) Date Received
177 (91) Withdrew Withdrew 502 (192) 205 (74) 103 (28) 178 (59) 144 (48)
hours seconds 6.0 0.3 (0.1)
20.5 0.6 (0.2) 3.5 0.3 (0.1) 4.0 0.4 (0.1)
11.0 0.3 (0.1) 4.5 0.3 (0.0)
92.24 (107) 10/22 10/15 11/23
93.10 (108) lo/29 83.62 (97) 11/5 90.52 (105) 11/2 84.48 (98) lo/24 83.62 (97) lo/26
utility (clearly outside the scope of the assignment). Judging from the time spent, the document pro- duced, and the coverage achieved, this subject in- vested a great deal of effort in form at the cost of some substance.
In Group Three, subjects 5, 7, and 8 failed to cover even 100 basic blocks. After discussions with subject 5, I concluded that the subject had insuffi- cient time to dedicate to the task, but still wished to fulfill the commitment. This led the subject to de- vote a fixed amount of time to the task, rather than to aim for thoroughness. Further investigation into the case of subject 7 revealed that many of the test cases created were aimed at testing the test lan- guage interpreter, not the cruise control software. Apparently, subject 7 misunderstood the assignment. In the case of subject 8, many of the test cases probed around the boundary conditions of vehicle speed. It appears that this subject invested too much time at speed boundaries, sacrificing many cases in the state transition diagram.
Using the test scripts received, some commonly computed statistics were calculated for each group and are displayed in Table 5. Two statistics were used to search for significant differences in perfor- mance among the groups. A T statistic, computed for a nonparametric rank-sum test, @purr and Bonini, 1973, pp. 320-324) provided the primary
Table 5. Some Statistics Regarding The Groups
means to identify substantial variation among the groups. To verify these results, for each measure, a standard error test @purr and Bonini, 1973, pp. 268-273) was used on the difference between the means for each group. Table 6 displays the computed statistics.
Test coverage null hypothesis. No significant dif- ference in test coverage was achieved by any group. The statistical tests on the collected data support the null hypothesis. To identify a significant difference at the 95% confidence level in test coverage between groups One and Two, the T statistic must exceed 70 (74 at the 99% confidence level) or fall below 42 (38 at the 99% confidence level). The corresponding ranges for Groups One and Three are 76-44 (80-40 at the 99% confidence level), and for Groups Two and Three are 42-18 (44-16 at the 99% confidence level). The computed T statistics fall within the acceptable range. The T statistics are corroborated by the estimation of standard error in the difference between the mean test coverage of each group. To be significant, at the 95% confidence level, the stan- dard error values must exceed 1.96.
Test creation time null hypothesis. No significant difference in test creation time exists between any of the groups. The statistical tests on the collected data
Group
Coverage Creation Time Real Execution Time
Mean SD Mean SD Mean SD
1 2 3
bbs hours seconds 101.63 4.87 4.84 2.56 29.13* 58.16 103.00 1.87 10.80 8.71 0.48 0.19 102.00 5.22 8.25 6.59 0.37 0.12
*This high mean resulted from the two subjects who generated automatically a large number of test cases. These test cases took minutes of CPU time to execute. The time taken by most of the test cases was insignificant, so execution time is eliminated from further consideration.
SD, standard deviation; bbs, basic blocks.
Spec Techniques for Improving Testing
Table 6. Statistics to Test Hypotheses
Test Coverage Creation Time
T Statistic SE T Statistic SE
Group One vs. Group Two
Group One vs. Group Three
Group Two vs. Group Three
55.0 0.12 42.0 1.49
62.5 0.14 55.0 1.2
29.0 0.44 33.5 0.54
support the null hypothesis. To the degree that variability is seen in test creation times, the evidence suggests that subjects using the natural language description alone took less time to generate tests than did subjects in the other two groups.
4.1 Other Possible Explanations
Since both hypotheses were rejected by the experi- mental evidence, I considered other possible expla- nations. An earlier experiment by Curtis et al. (1989) found that, for three types of programming tasks (comprehension, modification, and debugging), a link existed between the number of programming lan- guages known by a subject and performance. To investigate whether programming language familiar- ity might explain the differences in individual perfor- mance among subjects in the current study, I queried those subjects who completed the experiment to determine how many programming languages each subject knew well enough to use to create working programs. This new information, along with some
J. SYSTEMS SOFTWARE 93 1996; 3283-95
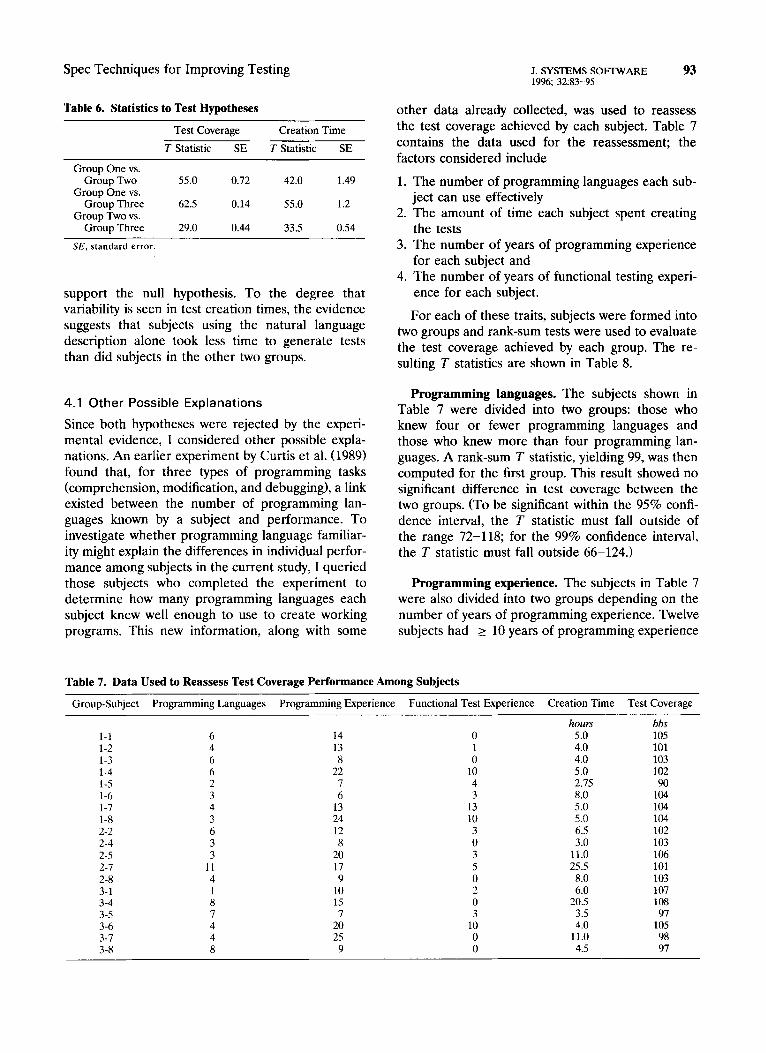
other data already collected, was used to reassess the test coverage achieved by each subject. Table 7 contains the data used for the reassessment; the factors considered include
1. The number of programming languages each sub- ject can use effectively
2. The amount of time each subject spent creating the tests
3. The number of years of programming experience for each subject and
4. The number of years of functional testing experi- ence for each subject.
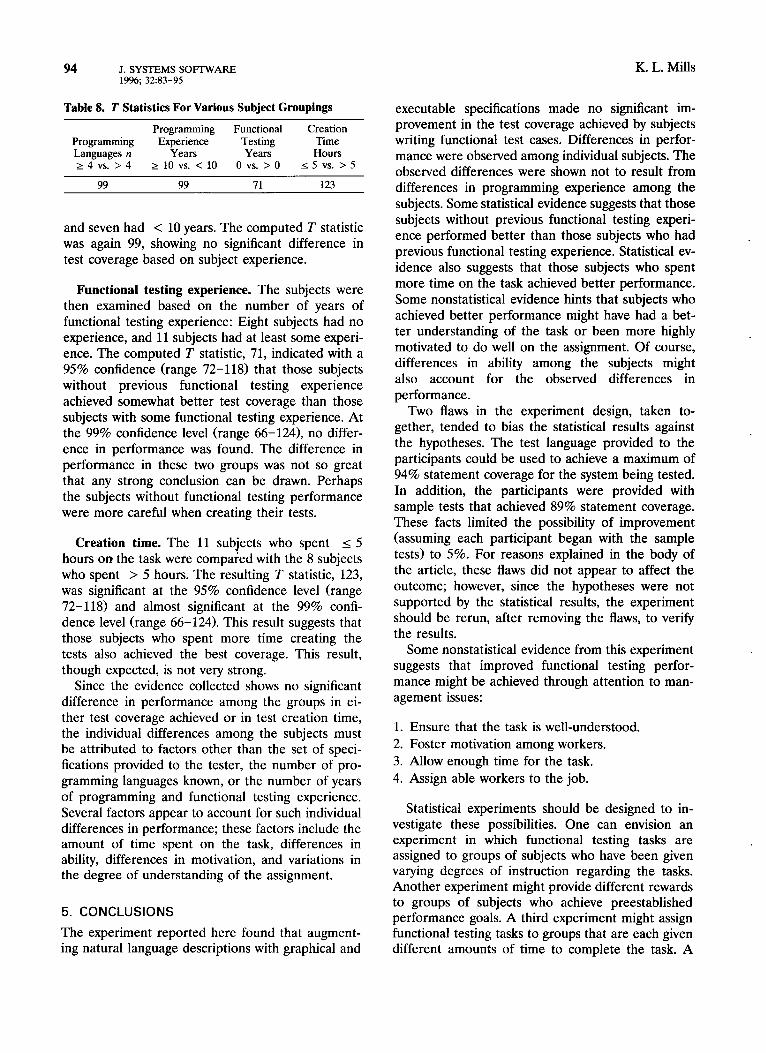
For each of these traits, subjects were formed into two groups and rank-sum tests were used to evaluate the test coverage achieved by each group. The re- sulting T statistics are shown in Table 8.
Programming languages. The subjects shown in Table 7 were divided into two groups: those who knew four or fewer programming languages and those who knew more than four programming lan- guages. A rank-sum T statistic, yielding 99, was then computed for the first group. This result showed no significant difference in test coverage between the two groups. (To be significant within the 95% confi- dence interval, the T statistic must fall outside of the range 72-118; for the 99% confidence interval, the T statistic must fall outside 66-124.)
Programming experience. The subjects in Table 7 were also divided into two groups depending on the number of years of programming experience. Twelve subjects had 2 10 years of programming experience
Table 7. Data Used to Reassess Test Coverage Performance Among Subjects
Group-Subject Programming Languages Programming Experience Functional Test Experience Creation Time Test Coverage
1-l 6 l-2 4 1-3 6 1-4 6 l-5 2 l-6 3 l-7 4 l-8 3 2-2 6 2-4 3 2-5 3 2-7 11 2-8 4 3-l 1 3-4 8 3-5 7 3-6 4 3-7 4 3-8 8
14 13 8
22 7 6
13 24 12 8
20 17 9
10 15 7
20 25 9
0 1 0
10 4 3
13 10 3 0 3 5 0 2 0 3
10 0 0
hours bbs
5.0 105
4.0 101 4.0 103 5.0 102 2.75 90 8.0 104 5.0 104 5.0 104 6.5 102 3.0 103
11.0 106 25.5 101
8.0 103 6.0 107
20.5 108 3.5 97 4.0 105
11.0 98 4.5 97
94 J. SYSTEMS SOFIWARE 1996; 3283-95
K. L. Mills
Table 8. T Statistics For Various Subject Groupings
Programming Functional Creation Programming Experience Testing Time Languages n Years Years Hours 2 4 vs. > 4 2 10 vs. < 10 0 vs. > 0 5 5 vs. > 5
99 99 71 123
and seven had < 10 years. The computed T statistic was again 99, showing no significant difference in test coverage based on subject experience.
Functional testing experience. The subjects were then examined based on the number of years of functional testing experience: Eight subjects had no experience, and 11 subjects had at least some experi- ence. The computed T statistic, 71, indicated with a 95% confidence (range 72-118) that those subjects without previous functional testing experience achieved somewhat better test coverage than those subjects with some functional testing experience. At the 99% confidence level (range 66-124), no differ- ence in performance was found. The difference in performance in these two groups was not so great that any strong conclusion can be drawn. Perhaps the subjects without functional testing performance were more careful when creating their tests.
Creation time. The 11 subjects who spent I 5 hours on the task were compared with the 8 subjects who spent > 5 hours. The resulting T statistic, 123, was significant at the 95% confidence level (range 72-118) and almost significant at the 99% confi- dence level (range 66-124). This result suggests that those subjects who spent more time creating the tests also achieved the best coverage. This result, though expected, is not very strong.
Since the evidence collected shows no significant difference in performance among the groups in ei- ther test coverage achieved or in test creation time, the individual differences among the subjects must be attributed to factors other than the set of speci- fications provided to the tester, the number of pro- gramming languages known, or the number of years of programming and functional testing experience. Several factors appear to account for such individual differences in performance; these factors include the amount of time spent on the task, differences in ability, differences in motivation, and variations in the degree of understanding of the assignment.
5. CONCLUSIONS
The experiment reported here found that augment- ing natural language descriptions with graphical and
executable specifications made no significant im- provement in the test coverage achieved by subjects writing functional test cases. Differences in perfor- mance were observed among individual subjects. The observed differences were shown not to result from differences in programming experience among the subjects. Some statistical evidence suggests that those subjects without previous functional testing experi- ence performed better than those subjects who had previous functional testing experience. Statistical ev- idence also suggests that those subjects who spent more time on the task achieved better performance. Some nonstatistical evidence hints that subjects who achieved better performance might have had a bet- ter understanding of the task or been more highly motivated to do well on the assignment. Of course, differences in ability among the subjects might also account for the observed differences in performance.
Two flaws in the experiment design, taken to- gether, tended to bias the statistical results against the hypotheses. The test language provided to the participants could be used to achieve a maximum of 94% statement coverage for the system being tested. In addition, the participants were provided with sample tests that achieved 89% statement coverage. These facts limited the possibility of improvement (assuming each participant began with the sample tests) to 5%. For reasons explained in the body of the article, these flaws did not appear to affect the outcome; however, since the hypotheses were not supported by the statistical results, the experiment should be rerun, after removing the flaws, to verify the results.
Some nonstatistical evidence from this experiment suggests that improved functional testing perfor- mance might be achieved through attention to man- agement issues:
1. Ensure that the task is well-understood. 2. Foster motivation among workers. 3. Allow enough time for the task. 4. Assign able workers to the job.
Statistical experiments should be designed to in- vestigate these possibilities. One can envision an experiment in which functional testing tasks are assigned to groups of subjects who have been given varying degrees of instruction regarding the tasks. Another experiment might provide different rewards to groups of subjects who achieve preestablished performance goals. A third experiment might assign functional testing tasks to groups that are each given different amounts of time to complete the task. A
Spec Techniques for Improving Testing J. SYSTEMS SOFTWARE 95 1996; 32:83-95
fourth experiment might prescreen subjects using some ability test, group the subjects by their perfor- mance on that test, and then assess the performance of the grouped subjects given the same functional testing task.
More philosophically, this experiment provides a reminder that software engineering is a business performed by people, for people. New tools and techniques can improve our ability to perform the work of software engineering, but variations in per- formance can still be expected because the tools and techniques are used by individuals who differ in ability, who vary in their understanding of the job, and who respond differently to the same situation. Software engineering researchers should not forget to investigate the people-related management issues that, perhaps, exert the most significant short- run influences on the performance of software engineers.
ACKNOWLEDGMENTS
I thank the 24 subjects from the Computer Systems Labora- tory of the National Institute of Standards and Technology for the time they spent on this experiment; most especially appreciated, of course, are those 20 who completed test scripts, In addition, I thank Dr. A. Jefferson Offutt for his insightful comments on early drafts of this article. I also benefited from the suggestions, criticisms, and encourage- ment of my fellow doctoral students.
REFERENCES
Bailin, S. C., An Object-Oriented Requirements Specifi- cation Method, Commun. ACM 32, 608-623 (1989).
Basili, V., Selby, R. W., and Hutchens, D. H., Experimen- tation in Software Engineering, IEEE Trans. Sofrware Eng. SE-12, 733-743 (1986).
Curtis, B., Sheppard, S. B., Kruesi-Bailey, E., Bailey, J., and Boehm-Davis, D. A., Experimental Evaluation of Software Documentation Formats, J. Sysr. Software 9, 167-207 (1989).
Diller, A., Z: An Introduction To Formal Methods, John Wiley & Sons, Chichester, U.K., 1990.
Gomaa, H., Software Design Methods for Concurrent and Real-Time Systems, Addison-Wesley, Reading, Mas- sachusetts, 1993.
Harel, D., Pnueli, A., Schmidt, J. P., and Sherman, R., On the Formal Semantics of State-Chatis, IEEE Press, 1987, pp. 54-64.
Harel, D., et al., STATEMATE: A Working Environment for the Development of Complex Reactive Systems, IEEE Trans. Software Eng. 16, 403-413 (1990).
Heninger, K. L., Specifying Software Requirements for Complex Systems: New Techniques and Their Applica- tion, IEEE Trans. Software Eng. SE-6, 2-13 (1980).
International Standards Organization, LOTOS: A Formal Description Technique Based on the Temporal Ordering of Observational Behavior, IS0 DIS 8807, International Standards Organization, 1987.
International Standards Organization, Estelle Tutorial, IS0 9074:1989/Amendment 1 Annex D, International Stan- dards Organization, 1989.
Kelly, J. P. J., and Murphy, S. C., Achieving Dependability Throughout the Development Process: A Distributed Software Experiment, IEEE Trans. Sof?ware Eng. 16, 153-165 (1990).
Lee, S., and Sluzier, S., An Executable Language For Modeling Simple Behavior, IEEE Trans. Software Eng. 17, 527-543 (1991).
Mills, K. L., Experiment Notebook For an Inft 821 Func- tional Testing Experiment Involving An Automated Cruise Control System, 1993, author’s personal manuscript, (un- published).
National Aeronautics and Space Administration, C Lan- guage Integrated Production System (CLIPS) Version 6.0 Reference Manual, Volume I: Basic Programming Guide, National Aeronautics and Space Administration, 1993.
Spurr, W. A., and Bonini, C. P., Statistical Analysis For Business Decisions, Richard D. Irwin, Homewood, Illi- nois, 1973.
Ward, P. T., and Mellor, S. J., Structured Development for Real-Time Systems, Yourdon Press, New York, 1985-1986.
Zave, P., and Schell, W., Salient Features of an Exe- cutable Specification Language and its Environment, IEEE Trans. Sofhvare Eng. SE-12, 312-325 (1986).