Embed Size (px)
Citation preview
Available online at www.sciencedirect.com
www.elsevier.com/locate/solener
ScienceDirect
Solar Energy 107 (2014) 461–474
An experimental investigation of an inclined passive wall solarchimney for natural ventilation
Rakesh Khanal ⇑, Chengwang Lei
School of Civil Engineering, The University of Sydney, Sydney, NSW 2006, Australia
Received 13 November 2013; received in revised form 7 March 2014; accepted 19 May 2014Available online 28 June 2014
Communicated by: Associate Editor S.A. Sherif
Abstract
Ongoing investigations into solar chimney development have resulted in constantly evolving new designs. In this study, experimentsare carried out with an inclined passive wall solar chimney (IPWSC) model with a uniform heat flux on the active (absorptive) wall. Theeffectiveness of this design has been examined for the heat flux range of 100 W/m2–500 W/m2 with a fixed base air gap width of 0.1 m andinclination angles of the passive wall in the range of 0–6 degrees. The experimental results show that the inclination angle of the passivewall has no significant effect on the temperature distribution across the air gap width and along the chimney height. On the other hand,the averaged air flow velocity across the air gap width is strongly affected by the inclination angle. The experimental results also showthat the IPWSC with 0.7 m absorber height and 0.1 m air gap width at an inclination angle of 6� and input heat flux of 500 W/m2 canproduce sufficient ventilation for a 27 m3 room based on ASHREA standards. Further, the present experimental results show that theIPWSC design can significantly improve the ventilation performance of a solar chimney in comparison to the conventional chimneydesign with vertical passive wall configuration. The experimental results are supported by flow visualization experiments and are consis-tent with scaling predictions.� 2014 Elsevier Ltd. All rights reserved.
Keywords: Natural ventilation; Solar chimney; Scale analysis; Flow visualization
1. Introduction
Natural ventilation in building has attracted a growingresearch interest, especially in the last two decades becauseof increasing environmental concern regarding greenhousegas emission and the need for an efficient and effectivepassive ventilation system as part of the green buildingarchitecture. In this regard, solar chimney offers a promis-ing solution. However, a recent review (Khanal and Lei,2011a) on the subject has revealed that solar chimney asa passive ventilation strategy has not been fully understood
http://dx.doi.org/10.1016/j.solener.2014.05.032
0038-092X/� 2014 Elsevier Ltd. All rights reserved.
⇑ Corresponding author. Tel.: +61 2 9351 5155; fax: +61 2 9351 3343.E-mail address: [email protected] (R. Khanal).
despite continuous research effort devoted to the topic overan extended period of time.
Bansal et al. (1993) established an idea of enhancedstack ventilation using solar chimney based on a steady-state mathematical model. A number of studies of thistopic are reported subsequently. Among these studies,Bouchair (1994) considered the idea of nocturnal ventila-tion using solar chimney for hot and arid climates in South-ern Algeria through experimental and analytical studies.Measurements of air temperature and velocity were carriedout for a full scale model under steady-state conditions.The emphasis was placed on the effect of the cavity width(air gap width) and the inlet aperture area on the mass flowrate. Reverse flow was observed for a 0.5 m wide cavity.
Nomenclature
A aspect ratioACH Air Change per Hour (h�1)Bo Boussinesq number (=RaPr)Dp penetration depth of the reverse flow (m)Gry local Grashof number ð¼ Ra
PrÞg gravitational acceleration (m/s2)Ha absorber height (m)k thermal conductivity (W/m K)_Mopt optimum mass flow rate
Nuy local Nusselt number ¼ q00Wy yDTk
� �Pr Prandtl number ð¼ t
aÞq00 input heat flux (W/m2)Ra global Rayleigh number ¼ gbq00H4
aamk
� �
Ray local Rayleigh number ¼ gbq00W y4
amk
� �
T local fluid temperature (K)Ta ambient air temperature (K)Tbs steady state temperature scale for the thermal
boundary layer (K)
TW wall temperature (K)V vertical component of the velocity (m/s)Vs steady state velocity scale of the thermal bound-
ary layer (m/s)Wg air gap width (m)x, y and z horizontal, vertical and spanwise coordinates
(m)
Greek symbols
a thermal diffusivity (m2/s)b coefficient of thermal expansion (1/K)DT temperature difference from the ambient tem-
perature (K)dT steady state thickness of the thermal boundary
layer (m)h inclination angle of the passive wall (�)t kinematic viscosity (m2/s)
462 R. Khanal, C. Lei / Solar Energy 107 (2014) 461–474
Chen et al. (2003) and more recently, Jing and Li (2012)also reported the occurrence of the reverse flow at thechimney exit. Both of these experiments were performedin an enclosed environment in which solar energy was sim-ulated using an electrical heating system.
The occurrence of the reverse flow was also confirmednumerically by several other researchers. Among theseinvestigations, Gan and Riffat (1998) reported the occur-rence of the reverse flow for a solar chimney with a 2.8 mhigh absorber wall under an asymmetrical heating condi-tion. They reported that, when the chimney width (i.e.the air gap width) was increased beyond 0.2 m, the air flowrate decreased, which was attributed to the effect of thereverse flow. Further, for a wide chimney of 0.5 m airgap width, the reverse flow was reported to penetratedownwards at the centre of the chimney. A similar observa-tion of the reverse flow was reported by Bouchair (1994)for a 0.5 m wide asymmetrically heated solar chimney.
In a separate investigation, Gan (2006) reported theoccurrence of the reverse flow for a 6 m tall chimney withan air gap width greater than 0.55 m under asymmetricalheating conditions. The existence of the reverse flow wasalso reported by Khanal and Lei (2011b) under an asym-metrical heating condition for a small size solar chimneywith an absorber height less than 1 m and for various airgap widths and inlet aperture heights.
All the above reported investigations were carried outfor asymmetrical heating conditions. For symmetrical heat-ing conditions, Zamora and Kaiser (2009) also reported theoccurrence of the reverse flow at the exit of the channel at aRayleigh number of 108 for an aspect ratio (the ratio of theair gap width to the absorber height) of 0.25 in their
numerical study. A considerable reduction of the mass flowrate was attributed to the effect of the reverse flow.
Despite that the reverse flow has frequently beenobserved and reported in both experimental and numericalstudies relevant to solar chimney ventilation, until recentlyno detailed investigation of the reverse flow phenomenonand its impact on the ventilation performance of solarchimney has been reported.
In a recent numerical investigation, Khanal and Lei(2012) attempted to quantify the reverse flow phenomenonand its impact on the ventilation performance of a solarchimney in terms of mass flow rate prediction. It wasreported that the reverse flow occurred as a result ofentrainment of air from downstream (chimney exit) intothe thermal boundary layer developing along the absorberwall of the solar chimney, the penetration depth of whichincreased monotonically with the Rayleigh number. Theoccurrence of the reverse flow is not desirable for ventila-tion applications. Therefore, in order to enhance the venti-lation performance of a solar chimney for high Rayleighnumber applications, a new solar chimney design, namelyan inclined passive wall solar chimney (IPWSC), was pro-posed by Khanal and Lei (2012). The effectiveness of thisdesign has been demonstrated numerically, which was sup-ported by scale analysis and confirmed qualitatively by asmoke flow visualization experiment.
After a further survey of the literature, it is revealed thatexcept for the qualitative experimental investigation men-tioned above, no detailed experimental investigation ofthe IPWSC has been reported in the public domain. Inaddition, most of the reported studies involved large solarchimneys. The study of small solar chimney for ventilation
R. Khanal, C. Lei / Solar Energy 107 (2014) 461–474 463
has received relatively less research attention despite itspotential for room ventilation (see for example Bansalet al., 2005; Mathur et al., 2006; Chantawong et al.,2006). These facts have motivated the present work.
In this work, experiments are carried out using anIPWSC model with a uniform heat flux on the verticalactive wall under steady state conditions. The temperatureand air flow rates for different Rayleigh numbers and incli-nation angles of the passive wall for a fixed base air gapwidth are measured and flow visualization experimentswith both smoke and shadowgraph techniques are carriedout. This is the first attempt to visualize the convective flowinside the solar chimney using the shadowgraph flow visu-alization technique.
2. Experimental setup and procedure
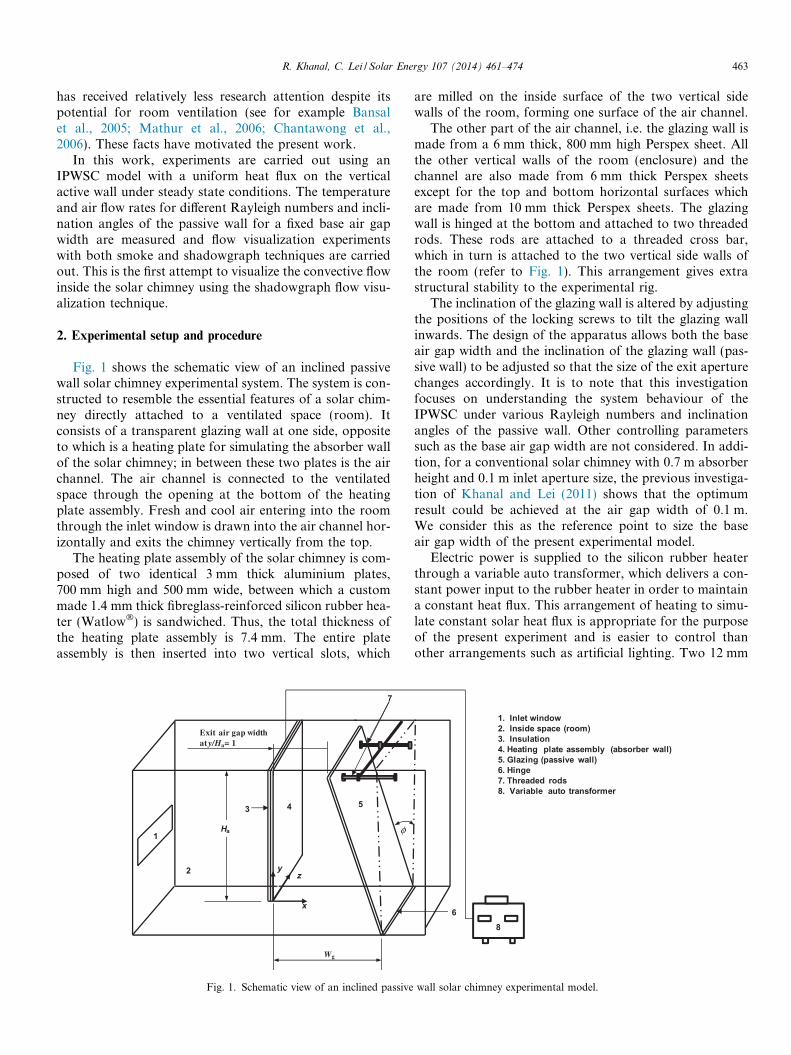
Fig. 1 shows the schematic view of an inclined passivewall solar chimney experimental system. The system is con-structed to resemble the essential features of a solar chim-ney directly attached to a ventilated space (room). Itconsists of a transparent glazing wall at one side, oppositeto which is a heating plate for simulating the absorber wallof the solar chimney; in between these two plates is the airchannel. The air channel is connected to the ventilatedspace through the opening at the bottom of the heatingplate assembly. Fresh and cool air entering into the roomthrough the inlet window is drawn into the air channel hor-izontally and exits the chimney vertically from the top.
The heating plate assembly of the solar chimney is com-posed of two identical 3 mm thick aluminium plates,700 mm high and 500 mm wide, between which a custommade 1.4 mm thick fibreglass-reinforced silicon rubber hea-ter (Watlow�) is sandwiched. Thus, the total thickness ofthe heating plate assembly is 7.4 mm. The entire plateassembly is then inserted into two vertical slots, which
5
1
3
2
7
4
Wg
x
zy
φHa
Exit air gap width at y/Ha= 1
Fig. 1. Schematic view of an inclined passive
are milled on the inside surface of the two vertical sidewalls of the room, forming one surface of the air channel.
The other part of the air channel, i.e. the glazing wall ismade from a 6 mm thick, 800 mm high Perspex sheet. Allthe other vertical walls of the room (enclosure) and thechannel are also made from 6 mm thick Perspex sheetsexcept for the top and bottom horizontal surfaces whichare made from 10 mm thick Perspex sheets. The glazingwall is hinged at the bottom and attached to two threadedrods. These rods are attached to a threaded cross bar,which in turn is attached to the two vertical side walls ofthe room (refer to Fig. 1). This arrangement gives extrastructural stability to the experimental rig.
The inclination of the glazing wall is altered by adjustingthe positions of the locking screws to tilt the glazing wallinwards. The design of the apparatus allows both the baseair gap width and the inclination of the glazing wall (pas-sive wall) to be adjusted so that the size of the exit aperturechanges accordingly. It is to note that this investigationfocuses on understanding the system behaviour of theIPWSC under various Rayleigh numbers and inclinationangles of the passive wall. Other controlling parameterssuch as the base air gap width are not considered. In addi-tion, for a conventional solar chimney with 0.7 m absorberheight and 0.1 m inlet aperture size, the previous investiga-tion of Khanal and Lei (2011) shows that the optimumresult could be achieved at the air gap width of 0.1 m.We consider this as the reference point to size the baseair gap width of the present experimental model.
Electric power is supplied to the silicon rubber heaterthrough a variable auto transformer, which delivers a con-stant power input to the rubber heater in order to maintaina constant heat flux. This arrangement of heating to simu-late constant solar heat flux is appropriate for the purposeof the present experiment and is easier to control thanother arrangements such as artificial lighting. Two 12 mm
1. Inlet window2. Inside space (room) 3. Insulation 4. Heating plate assembly (absorber wall) 5. Glazing (passive wall) 6. Hinge 7. Threaded rods8. Variable auto transformer
68
wall solar chimney experimental model.
464 R. Khanal, C. Lei / Solar Energy 107 (2014) 461–474
thick insulation boards of high density material of the samesize as the heating plate are fixed at the back side of theheating plate assembly as shown in Fig. 1 to reduce theheat loss to the room side. Insulation is also provided atthe bottom and the top of the heating plate assembly tofurther reduce the heat loss.
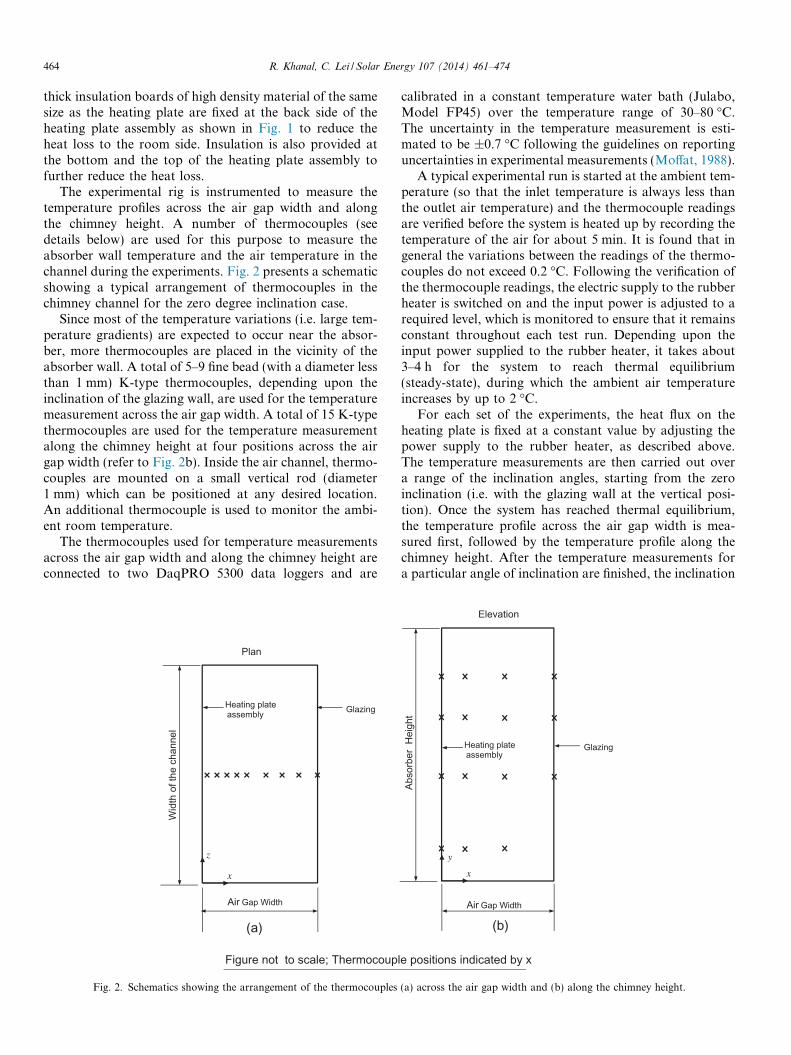
The experimental rig is instrumented to measure thetemperature profiles across the air gap width and alongthe chimney height. A number of thermocouples (seedetails below) are used for this purpose to measure theabsorber wall temperature and the air temperature in thechannel during the experiments. Fig. 2 presents a schematicshowing a typical arrangement of thermocouples in thechimney channel for the zero degree inclination case.
Since most of the temperature variations (i.e. large tem-perature gradients) are expected to occur near the absor-ber, more thermocouples are placed in the vicinity of theabsorber wall. A total of 5–9 fine bead (with a diameter lessthan 1 mm) K-type thermocouples, depending upon theinclination of the glazing wall, are used for the temperaturemeasurement across the air gap width. A total of 15 K-typethermocouples are used for the temperature measurementalong the chimney height at four positions across the airgap width (refer to Fig. 2b). Inside the air channel, thermo-couples are mounted on a small vertical rod (diameter1 mm) which can be positioned at any desired location.An additional thermocouple is used to monitor the ambi-ent room temperature.
The thermocouples used for temperature measurementsacross the air gap width and along the chimney height areconnected to two DaqPRO 5300 data loggers and are
Figure not to scale; Thermocoup
(a)
Air Gap Width
Wid
th o
f the
cha
nnel
Plan
GlazingHeating plateassembly
x
z
Fig. 2. Schematics showing the arrangement of the thermocouples
calibrated in a constant temperature water bath (Julabo,Model FP45) over the temperature range of 30–80 �C.The uncertainty in the temperature measurement is esti-mated to be ±0.7 �C following the guidelines on reportinguncertainties in experimental measurements (Moffat, 1988).
A typical experimental run is started at the ambient tem-perature (so that the inlet temperature is always less thanthe outlet air temperature) and the thermocouple readingsare verified before the system is heated up by recording thetemperature of the air for about 5 min. It is found that ingeneral the variations between the readings of the thermo-couples do not exceed 0.2 �C. Following the verification ofthe thermocouple readings, the electric supply to the rubberheater is switched on and the input power is adjusted to arequired level, which is monitored to ensure that it remainsconstant throughout each test run. Depending upon theinput power supplied to the rubber heater, it takes about3–4 h for the system to reach thermal equilibrium(steady-state), during which the ambient air temperatureincreases by up to 2 �C.
For each set of the experiments, the heat flux on theheating plate is fixed at a constant value by adjusting thepower supply to the rubber heater, as described above.The temperature measurements are then carried out overa range of the inclination angles, starting from the zeroinclination (i.e. with the glazing wall at the vertical posi-tion). Once the system has reached thermal equilibrium,the temperature profile across the air gap width is mea-sured first, followed by the temperature profile along thechimney height. After the temperature measurements fora particular angle of inclination are finished, the inclination
le positions indicated by x
Air Gap Width
Abso
rber
Hei
ght
(b)
Elevation
GlazingHeating plateassembly
x
y
(a) across the air gap width and (b) along the chimney height.
x/Wg
Inclination angle
(a)
x/Wg
Inclination angle
(b)
x/Wg
Inclination angle
(c)
(T-T
a)/(
TW
-Ta)
(T-T
a)/(
TW
-Ta)
(T-T
a)/(
TW
-Ta)
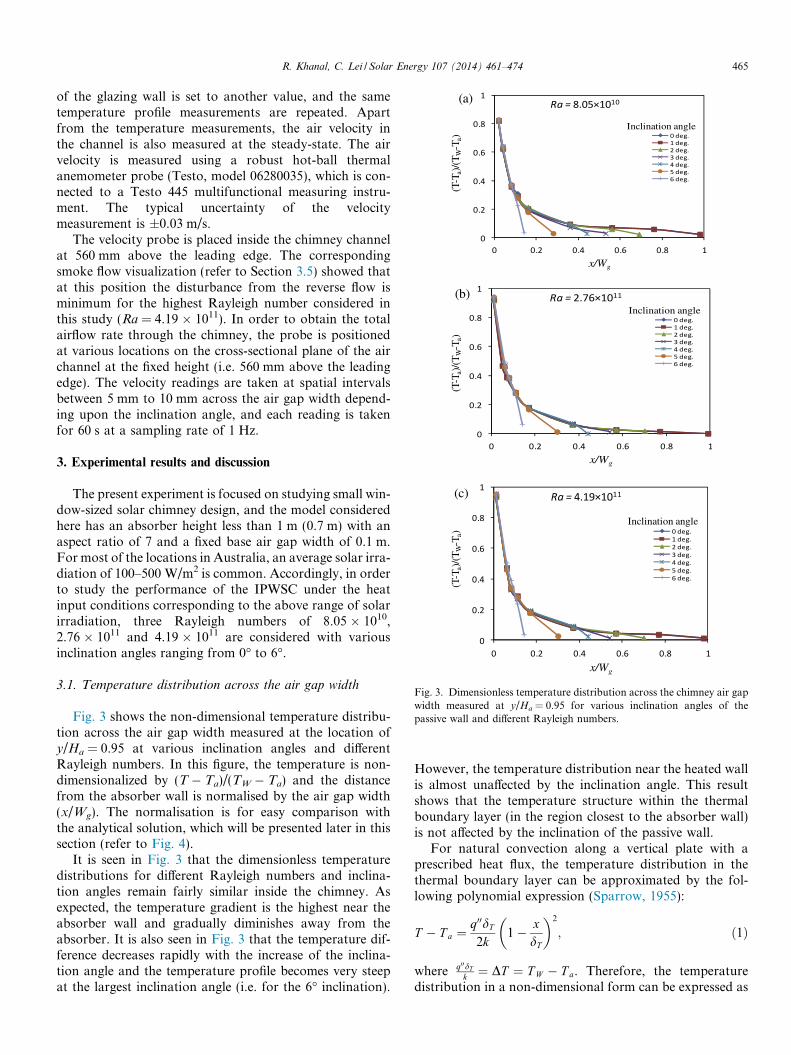
Fig. 3. Dimensionless temperature distribution across the chimney air gapwidth measured at y/Ha = 0.95 for various inclination angles of thepassive wall and different Rayleigh numbers.
R. Khanal, C. Lei / Solar Energy 107 (2014) 461–474 465
of the glazing wall is set to another value, and the sametemperature profile measurements are repeated. Apartfrom the temperature measurements, the air velocity inthe channel is also measured at the steady-state. The airvelocity is measured using a robust hot-ball thermalanemometer probe (Testo, model 06280035), which is con-nected to a Testo 445 multifunctional measuring instru-ment. The typical uncertainty of the velocitymeasurement is ±0.03 m/s.
The velocity probe is placed inside the chimney channelat 560 mm above the leading edge. The correspondingsmoke flow visualization (refer to Section 3.5) showed thatat this position the disturbance from the reverse flow isminimum for the highest Rayleigh number considered inthis study (Ra = 4.19 � 1011). In order to obtain the totalairflow rate through the chimney, the probe is positionedat various locations on the cross-sectional plane of the airchannel at the fixed height (i.e. 560 mm above the leadingedge). The velocity readings are taken at spatial intervalsbetween 5 mm to 10 mm across the air gap width depend-ing upon the inclination angle, and each reading is takenfor 60 s at a sampling rate of 1 Hz.
3. Experimental results and discussion
The present experiment is focused on studying small win-dow-sized solar chimney design, and the model consideredhere has an absorber height less than 1 m (0.7 m) with anaspect ratio of 7 and a fixed base air gap width of 0.1 m.For most of the locations in Australia, an average solar irra-diation of 100–500 W/m2 is common. Accordingly, in orderto study the performance of the IPWSC under the heatinput conditions corresponding to the above range of solarirradiation, three Rayleigh numbers of 8.05 � 1010,2.76 � 1011 and 4.19 � 1011 are considered with variousinclination angles ranging from 0� to 6�.
3.1. Temperature distribution across the air gap width
Fig. 3 shows the non-dimensional temperature distribu-tion across the air gap width measured at the location ofy/Ha = 0.95 at various inclination angles and differentRayleigh numbers. In this figure, the temperature is non-dimensionalized by (T � Ta)/(TW � Ta) and the distancefrom the absorber wall is normalised by the air gap width(x/Wg). The normalisation is for easy comparison withthe analytical solution, which will be presented later in thissection (refer to Fig. 4).
It is seen in Fig. 3 that the dimensionless temperaturedistributions for different Rayleigh numbers and inclina-tion angles remain fairly similar inside the chimney. Asexpected, the temperature gradient is the highest near theabsorber wall and gradually diminishes away from theabsorber. It is also seen in Fig. 3 that the temperature dif-ference decreases rapidly with the increase of the inclina-tion angle and the temperature profile becomes very steepat the largest inclination angle (i.e. for the 6� inclination).
However, the temperature distribution near the heated wallis almost unaffected by the inclination angle. This resultshows that the temperature structure within the thermalboundary layer (in the region closest to the absorber wall)is not affected by the inclination of the passive wall.
For natural convection along a vertical plate with aprescribed heat flux, the temperature distribution in thethermal boundary layer can be approximated by the fol-lowing polynomial expression (Sparrow, 1955):
T � T a ¼q00dT
2k1� x
dT
� �2
; ð1Þ
where q00dTk ¼ DT ¼ T W � T a. Therefore, the temperature
distribution in a non-dimensional form can be expressed as
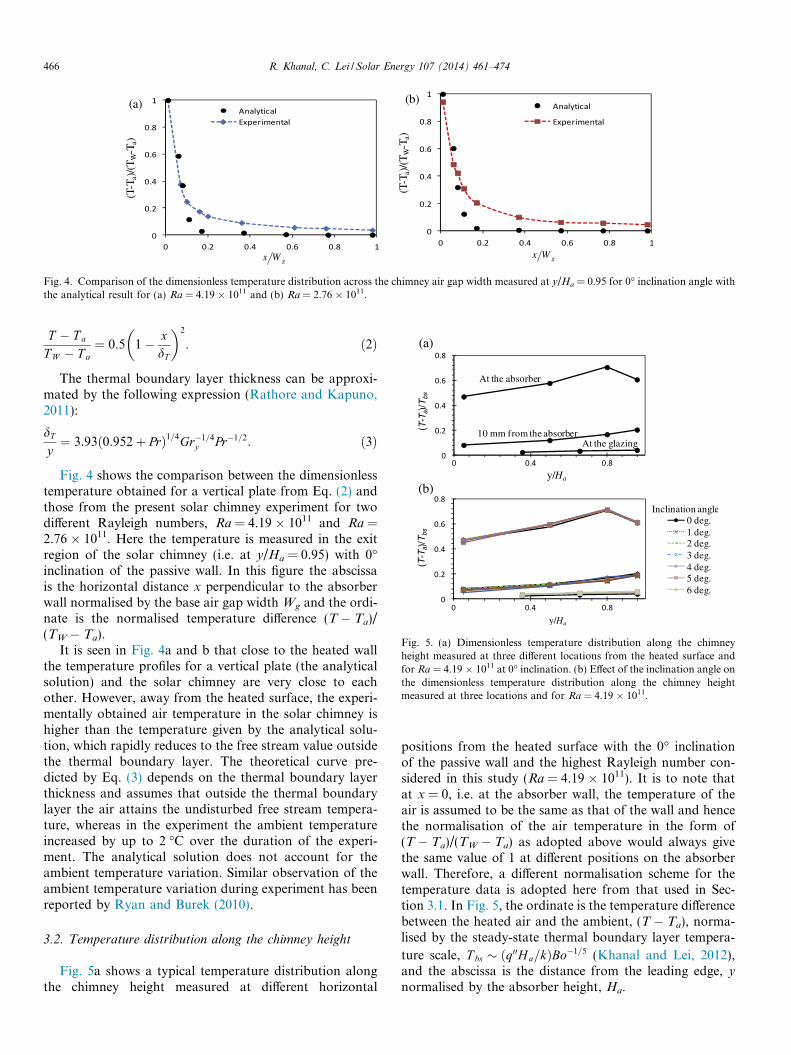
Fig. 4. Comparison of the dimensionless temperature distribution across the chimney air gap width measured at y/Ha = 0.95 for 0� inclination angle withthe analytical result for (a) Ra = 4.19 � 1011 and (b) Ra = 2.76 � 1011.
(a)
(b)
Fig. 5. (a) Dimensionless temperature distribution along the chimneyheight measured at three different locations from the heated surface andfor Ra = 4.19 � 1011 at 0� inclination. (b) Effect of the inclination angle onthe dimensionless temperature distribution along the chimney heightmeasured at three locations and for Ra = 4.19 � 1011.
466 R. Khanal, C. Lei / Solar Energy 107 (2014) 461–474
T � T a
T W � T a¼ 0:5 1� x
dT
� �2
: ð2Þ
The thermal boundary layer thickness can be approxi-mated by the following expression (Rathore and Kapuno,2011):
dT
y¼ 3:93ð0:952þ PrÞ1=4Gr�1=4
y Pr�1=2: ð3Þ
Fig. 4 shows the comparison between the dimensionlesstemperature obtained for a vertical plate from Eq. (2) andthose from the present solar chimney experiment for twodifferent Rayleigh numbers, Ra = 4.19 � 1011 and Ra =2.76 � 1011. Here the temperature is measured in the exitregion of the solar chimney (i.e. at y/Ha = 0.95) with 0�inclination of the passive wall. In this figure the abscissais the horizontal distance x perpendicular to the absorberwall normalised by the base air gap width Wg and the ordi-nate is the normalised temperature difference (T � Ta)/(TW � Ta).
It is seen in Fig. 4a and b that close to the heated wallthe temperature profiles for a vertical plate (the analyticalsolution) and the solar chimney are very close to eachother. However, away from the heated surface, the experi-mentally obtained air temperature in the solar chimney ishigher than the temperature given by the analytical solu-tion, which rapidly reduces to the free stream value outsidethe thermal boundary layer. The theoretical curve pre-dicted by Eq. (3) depends on the thermal boundary layerthickness and assumes that outside the thermal boundarylayer the air attains the undisturbed free stream tempera-ture, whereas in the experiment the ambient temperatureincreased by up to 2 �C over the duration of the experi-ment. The analytical solution does not account for theambient temperature variation. Similar observation of theambient temperature variation during experiment has beenreported by Ryan and Burek (2010).
3.2. Temperature distribution along the chimney height
Fig. 5a shows a typical temperature distribution alongthe chimney height measured at different horizontal
positions from the heated surface with the 0� inclinationof the passive wall and the highest Rayleigh number con-sidered in this study (Ra = 4.19 � 1011). It is to note thatat x = 0, i.e. at the absorber wall, the temperature of theair is assumed to be the same as that of the wall and hencethe normalisation of the air temperature in the form of(T � Ta)/(TW � Ta) as adopted above would always givethe same value of 1 at different positions on the absorberwall. Therefore, a different normalisation scheme for thetemperature data is adopted here from that used in Sec-tion 3.1. In Fig. 5, the ordinate is the temperature differencebetween the heated air and the ambient, (T � Ta), norma-lised by the steady-state thermal boundary layer tempera-
ture scale, T bs � ðq00Ha=kÞBo�1=5 (Khanal and Lei, 2012),and the abscissa is the distance from the leading edge, y
normalised by the absorber height, Ha.
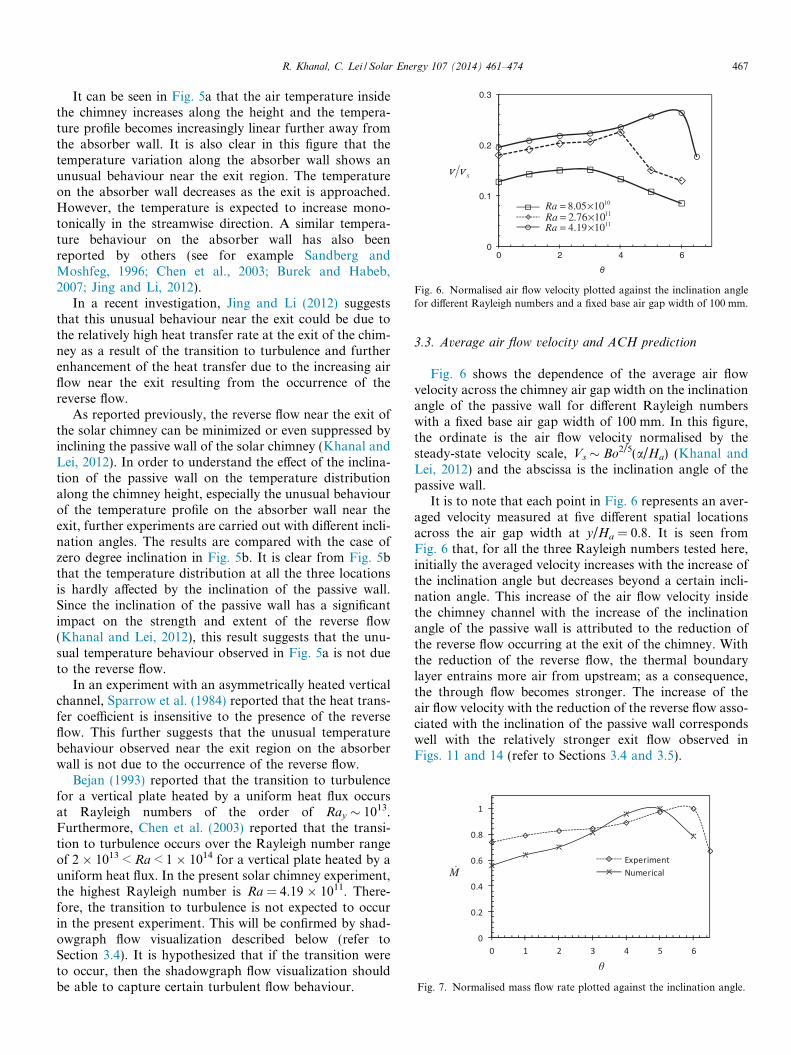
Fig. 6. Normalised air flow velocity plotted against the inclination anglefor different Rayleigh numbers and a fixed base air gap width of 100 mm.
Fig. 7. Normalised mass flow rate plotted against the inclination angle.
R. Khanal, C. Lei / Solar Energy 107 (2014) 461–474 467
It can be seen in Fig. 5a that the air temperature insidethe chimney increases along the height and the tempera-ture profile becomes increasingly linear further away fromthe absorber wall. It is also clear in this figure that thetemperature variation along the absorber wall shows anunusual behaviour near the exit region. The temperatureon the absorber wall decreases as the exit is approached.However, the temperature is expected to increase mono-tonically in the streamwise direction. A similar tempera-ture behaviour on the absorber wall has also beenreported by others (see for example Sandberg andMoshfeg, 1996; Chen et al., 2003; Burek and Habeb,2007; Jing and Li, 2012).
In a recent investigation, Jing and Li (2012) suggeststhat this unusual behaviour near the exit could be due tothe relatively high heat transfer rate at the exit of the chim-ney as a result of the transition to turbulence and furtherenhancement of the heat transfer due to the increasing airflow near the exit resulting from the occurrence of thereverse flow.
As reported previously, the reverse flow near the exit ofthe solar chimney can be minimized or even suppressed byinclining the passive wall of the solar chimney (Khanal andLei, 2012). In order to understand the effect of the inclina-tion of the passive wall on the temperature distributionalong the chimney height, especially the unusual behaviourof the temperature profile on the absorber wall near theexit, further experiments are carried out with different incli-nation angles. The results are compared with the case ofzero degree inclination in Fig. 5b. It is clear from Fig. 5bthat the temperature distribution at all the three locationsis hardly affected by the inclination of the passive wall.Since the inclination of the passive wall has a significantimpact on the strength and extent of the reverse flow(Khanal and Lei, 2012), this result suggests that the unu-sual temperature behaviour observed in Fig. 5a is not dueto the reverse flow.
In an experiment with an asymmetrically heated verticalchannel, Sparrow et al. (1984) reported that the heat trans-fer coefficient is insensitive to the presence of the reverseflow. This further suggests that the unusual temperaturebehaviour observed near the exit region on the absorberwall is not due to the occurrence of the reverse flow.
Bejan (1993) reported that the transition to turbulencefor a vertical plate heated by a uniform heat flux occursat Rayleigh numbers of the order of Ray � 1013.Furthermore, Chen et al. (2003) reported that the transi-tion to turbulence occurs over the Rayleigh number rangeof 2 � 1013 < Ra < 1 � 1014 for a vertical plate heated by auniform heat flux. In the present solar chimney experiment,the highest Rayleigh number is Ra = 4.19 � 1011. There-fore, the transition to turbulence is not expected to occurin the present experiment. This will be confirmed by shad-owgraph flow visualization described below (refer toSection 3.4). It is hypothesized that if the transition wereto occur, then the shadowgraph flow visualization shouldbe able to capture certain turbulent flow behaviour.
3.3. Average air flow velocity and ACH prediction
Fig. 6 shows the dependence of the average air flowvelocity across the chimney air gap width on the inclinationangle of the passive wall for different Rayleigh numberswith a fixed base air gap width of 100 mm. In this figure,the ordinate is the air flow velocity normalised by thesteady-state velocity scale, Vs � Bo2/5(a/Ha) (Khanal andLei, 2012) and the abscissa is the inclination angle of thepassive wall.
It is to note that each point in Fig. 6 represents an aver-aged velocity measured at five different spatial locationsacross the air gap width at y/Ha = 0.8. It is seen fromFig. 6 that, for all the three Rayleigh numbers tested here,initially the averaged velocity increases with the increase ofthe inclination angle but decreases beyond a certain incli-nation angle. This increase of the air flow velocity insidethe chimney channel with the increase of the inclinationangle of the passive wall is attributed to the reduction ofthe reverse flow occurring at the exit of the chimney. Withthe reduction of the reverse flow, the thermal boundarylayer entrains more air from upstream; as a consequence,the through flow becomes stronger. The increase of theair flow velocity with the reduction of the reverse flow asso-ciated with the inclination of the passive wall correspondswell with the relatively stronger exit flow observed inFigs. 11 and 14 (refer to Sections 3.4 and 3.5).
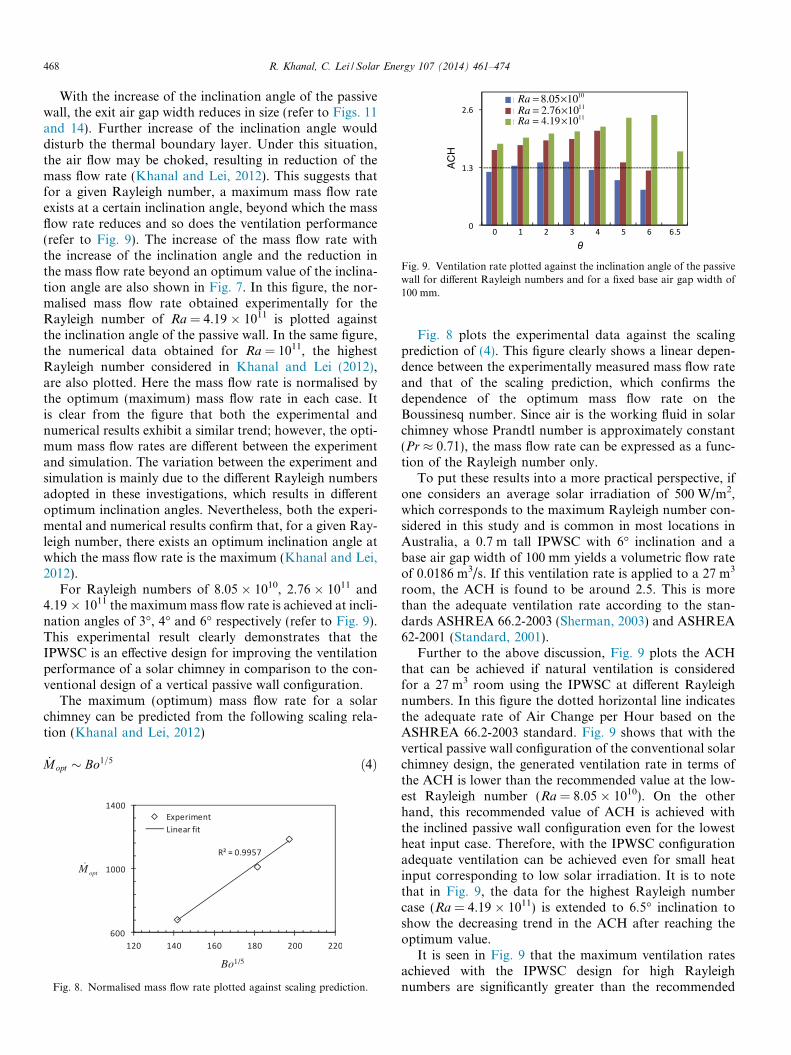
Fig. 9. Ventilation rate plotted against the inclination angle of the passivewall for different Rayleigh numbers and for a fixed base air gap width of100 mm.
468 R. Khanal, C. Lei / Solar Energy 107 (2014) 461–474
With the increase of the inclination angle of the passivewall, the exit air gap width reduces in size (refer to Figs. 11and 14). Further increase of the inclination angle woulddisturb the thermal boundary layer. Under this situation,the air flow may be choked, resulting in reduction of themass flow rate (Khanal and Lei, 2012). This suggests thatfor a given Rayleigh number, a maximum mass flow rateexists at a certain inclination angle, beyond which the massflow rate reduces and so does the ventilation performance(refer to Fig. 9). The increase of the mass flow rate withthe increase of the inclination angle and the reduction inthe mass flow rate beyond an optimum value of the inclina-tion angle are also shown in Fig. 7. In this figure, the nor-malised mass flow rate obtained experimentally for theRayleigh number of Ra = 4.19 � 1011 is plotted againstthe inclination angle of the passive wall. In the same figure,the numerical data obtained for Ra = 1011, the highestRayleigh number considered in Khanal and Lei (2012),are also plotted. Here the mass flow rate is normalised bythe optimum (maximum) mass flow rate in each case. Itis clear from the figure that both the experimental andnumerical results exhibit a similar trend; however, the opti-mum mass flow rates are different between the experimentand simulation. The variation between the experiment andsimulation is mainly due to the different Rayleigh numbersadopted in these investigations, which results in differentoptimum inclination angles. Nevertheless, both the experi-mental and numerical results confirm that, for a given Ray-leigh number, there exists an optimum inclination angle atwhich the mass flow rate is the maximum (Khanal and Lei,2012).
For Rayleigh numbers of 8.05 � 1010, 2.76 � 1011 and4.19 � 1011 the maximum mass flow rate is achieved at incli-nation angles of 3�, 4� and 6� respectively (refer to Fig. 9).This experimental result clearly demonstrates that theIPWSC is an effective design for improving the ventilationperformance of a solar chimney in comparison to the con-ventional design of a vertical passive wall configuration.
The maximum (optimum) mass flow rate for a solarchimney can be predicted from the following scaling rela-tion (Khanal and Lei, 2012)
_Mopt � Bo1=5 ð4Þ
Bo1/5
optM
Fig. 8. Normalised mass flow rate plotted against scaling prediction.
Fig. 8 plots the experimental data against the scalingprediction of (4). This figure clearly shows a linear depen-dence between the experimentally measured mass flow rateand that of the scaling prediction, which confirms thedependence of the optimum mass flow rate on theBoussinesq number. Since air is the working fluid in solarchimney whose Prandtl number is approximately constant(Pr � 0.71), the mass flow rate can be expressed as a func-tion of the Rayleigh number only.
To put these results into a more practical perspective, ifone considers an average solar irradiation of 500 W/m2,which corresponds to the maximum Rayleigh number con-sidered in this study and is common in most locations inAustralia, a 0.7 m tall IPWSC with 6� inclination and abase air gap width of 100 mm yields a volumetric flow rateof 0.0186 m3/s. If this ventilation rate is applied to a 27 m3
room, the ACH is found to be around 2.5. This is morethan the adequate ventilation rate according to the stan-dards ASHREA 66.2-2003 (Sherman, 2003) and ASHREA62-2001 (Standard, 2001).
Further to the above discussion, Fig. 9 plots the ACHthat can be achieved if natural ventilation is consideredfor a 27 m3 room using the IPWSC at different Rayleighnumbers. In this figure the dotted horizontal line indicatesthe adequate rate of Air Change per Hour based on theASHREA 66.2-2003 standard. Fig. 9 shows that with thevertical passive wall configuration of the conventional solarchimney design, the generated ventilation rate in terms ofthe ACH is lower than the recommended value at the low-est Rayleigh number (Ra = 8.05 � 1010). On the otherhand, this recommended value of ACH is achieved withthe inclined passive wall configuration even for the lowestheat input case. Therefore, with the IPWSC configurationadequate ventilation can be achieved even for small heatinput corresponding to low solar irradiation. It is to notethat in Fig. 9, the data for the highest Rayleigh numbercase (Ra = 4.19 � 1011) is extended to 6.5� inclination toshow the decreasing trend in the ACH after reaching theoptimum value.
It is seen in Fig. 9 that the maximum ventilation ratesachieved with the IPWSC design for high Rayleighnumbers are significantly greater than the recommended
R. Khanal, C. Lei / Solar Energy 107 (2014) 461–474 469
standard. For Ra = 8.05 � 1010, the maximum ventilationrate is achieved at 3� inclination and this value is still 9%higher than the recommended standard. Similarly the max-imum ventilation rate is achieved at 4� and 6� for Ra = 2.76� 1011 and Ra = 4.19 � 1011 and is 63% and 90% higherthan the recommended value respectively. This is asignificant improvement. Therefore, the IPWSC design isvery effective in enhancing natural ventilation for highRayleigh number (corresponding to high solar irradiation)applications.
3.4. Shadowgraph flow visualization
Visualization of natural convection flows using theshadowgraph technique with water as a working fluid hasbeen widely reported (see for example Schopf andPatterson, 1995; Schopf and Patterson, 1996; Lei andPatterson, 2002; Xu et al., 2006). However, the use of theshadowgraph technique for visualizing natural convectionflows in air is rarely reported, and to the best of theauthors’ knowledge, shadowgraph flow visualization ofnatural convection in solar chimney has not been reportedin the open literature. An attempt has been made in thisstudy to visualize the natural convection flow in a solarchimney using the shadowgraph technique under steady-state conditions in order to obtain further insight into theflow behaviour, and in particular, to confirm if the transi-tion to turbulence occurs inside the solar chimney.
The shadowgraph technique is based on the principle ofoptical refraction. The distribution of the light intensity inthe shadowgraph image represented the spatial tempera-ture field inside the fluid (for more detailed explanationrefer to Merzkirch, 1987; Lei and Patterson, 2002).
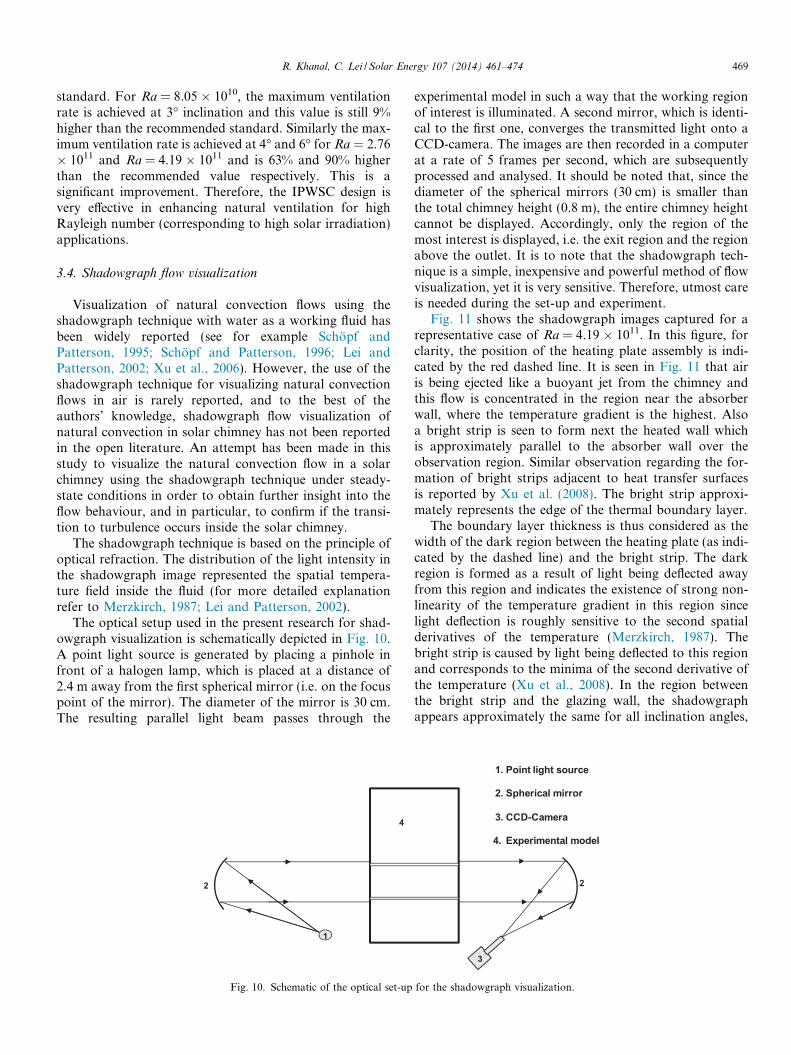
The optical setup used in the present research for shad-owgraph visualization is schematically depicted in Fig. 10.A point light source is generated by placing a pinhole infront of a halogen lamp, which is placed at a distance of2.4 m away from the first spherical mirror (i.e. on the focuspoint of the mirror). The diameter of the mirror is 30 cm.The resulting parallel light beam passes through the
1
2
4
4
Fig. 10. Schematic of the optical set-up
experimental model in such a way that the working regionof interest is illuminated. A second mirror, which is identi-cal to the first one, converges the transmitted light onto aCCD-camera. The images are then recorded in a computerat a rate of 5 frames per second, which are subsequentlyprocessed and analysed. It should be noted that, since thediameter of the spherical mirrors (30 cm) is smaller thanthe total chimney height (0.8 m), the entire chimney heightcannot be displayed. Accordingly, only the region of themost interest is displayed, i.e. the exit region and the regionabove the outlet. It is to note that the shadowgraph tech-nique is a simple, inexpensive and powerful method of flowvisualization, yet it is very sensitive. Therefore, utmost careis needed during the set-up and experiment.
Fig. 11 shows the shadowgraph images captured for arepresentative case of Ra = 4.19 � 1011. In this figure, forclarity, the position of the heating plate assembly is indi-cated by the red dashed line. It is seen in Fig. 11 that airis being ejected like a buoyant jet from the chimney andthis flow is concentrated in the region near the absorberwall, where the temperature gradient is the highest. Alsoa bright strip is seen to form next the heated wall whichis approximately parallel to the absorber wall over theobservation region. Similar observation regarding the for-mation of bright strips adjacent to heat transfer surfacesis reported by Xu et al. (2008). The bright strip approxi-mately represents the edge of the thermal boundary layer.
The boundary layer thickness is thus considered as thewidth of the dark region between the heating plate (as indi-cated by the dashed line) and the bright strip. The darkregion is formed as a result of light being deflected awayfrom this region and indicates the existence of strong non-linearity of the temperature gradient in this region sincelight deflection is roughly sensitive to the second spatialderivatives of the temperature (Merzkirch, 1987). Thebright strip is caused by light being deflected to this regionand corresponds to the minima of the second derivative ofthe temperature (Xu et al., 2008). In the region betweenthe bright strip and the glazing wall, the shadowgraphappears approximately the same for all inclination angles,
3
1. Point light source
2. Spherical mirror
3. CCD-Camera
4. Experimental model
2
for the shadowgraph visualization.
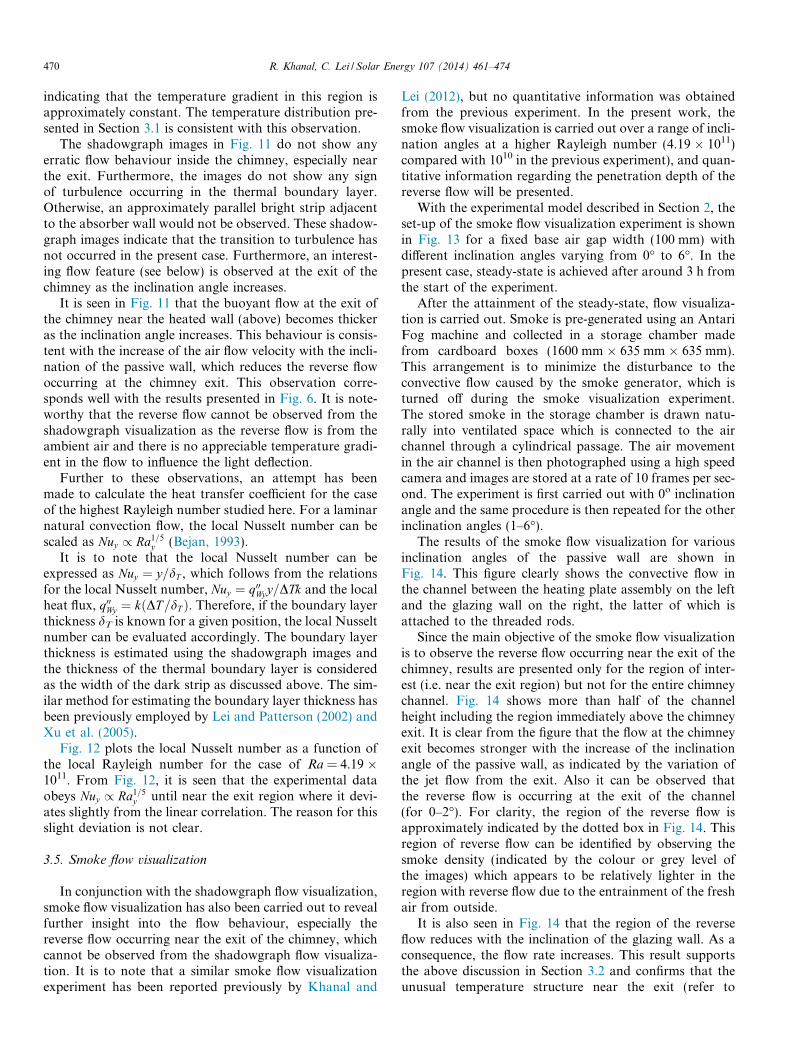
470 R. Khanal, C. Lei / Solar Energy 107 (2014) 461–474
indicating that the temperature gradient in this region isapproximately constant. The temperature distribution pre-sented in Section 3.1 is consistent with this observation.
The shadowgraph images in Fig. 11 do not show anyerratic flow behaviour inside the chimney, especially nearthe exit. Furthermore, the images do not show any signof turbulence occurring in the thermal boundary layer.Otherwise, an approximately parallel bright strip adjacentto the absorber wall would not be observed. These shadow-graph images indicate that the transition to turbulence hasnot occurred in the present case. Furthermore, an interest-ing flow feature (see below) is observed at the exit of thechimney as the inclination angle increases.
It is seen in Fig. 11 that the buoyant flow at the exit ofthe chimney near the heated wall (above) becomes thickeras the inclination angle increases. This behaviour is consis-tent with the increase of the air flow velocity with the incli-nation of the passive wall, which reduces the reverse flowoccurring at the chimney exit. This observation corre-sponds well with the results presented in Fig. 6. It is note-worthy that the reverse flow cannot be observed from theshadowgraph visualization as the reverse flow is from theambient air and there is no appreciable temperature gradi-ent in the flow to influence the light deflection.
Further to these observations, an attempt has beenmade to calculate the heat transfer coefficient for the caseof the highest Rayleigh number studied here. For a laminarnatural convection flow, the local Nusselt number can bescaled as Nuy / Ra1=5
y (Bejan, 1993).It is to note that the local Nusselt number can be
expressed as Nuy ¼ y=dT , which follows from the relationsfor the local Nusselt number, Nuy ¼ q00Wyy=DTk and the localheat flux, q00Wy ¼ kðDT =dT Þ. Therefore, if the boundary layerthickness dT is known for a given position, the local Nusseltnumber can be evaluated accordingly. The boundary layerthickness is estimated using the shadowgraph images andthe thickness of the thermal boundary layer is consideredas the width of the dark strip as discussed above. The sim-ilar method for estimating the boundary layer thickness hasbeen previously employed by Lei and Patterson (2002) andXu et al. (2005).
Fig. 12 plots the local Nusselt number as a function ofthe local Rayleigh number for the case of Ra = 4.19 �1011. From Fig. 12, it is seen that the experimental dataobeys Nuy / Ra1=5
y until near the exit region where it devi-ates slightly from the linear correlation. The reason for thisslight deviation is not clear.
3.5. Smoke flow visualization
In conjunction with the shadowgraph flow visualization,smoke flow visualization has also been carried out to revealfurther insight into the flow behaviour, especially thereverse flow occurring near the exit of the chimney, whichcannot be observed from the shadowgraph flow visualiza-tion. It is to note that a similar smoke flow visualizationexperiment has been reported previously by Khanal and
Lei (2012), but no quantitative information was obtainedfrom the previous experiment. In the present work, thesmoke flow visualization is carried out over a range of incli-nation angles at a higher Rayleigh number (4.19 � 1011)compared with 1010 in the previous experiment), and quan-titative information regarding the penetration depth of thereverse flow will be presented.
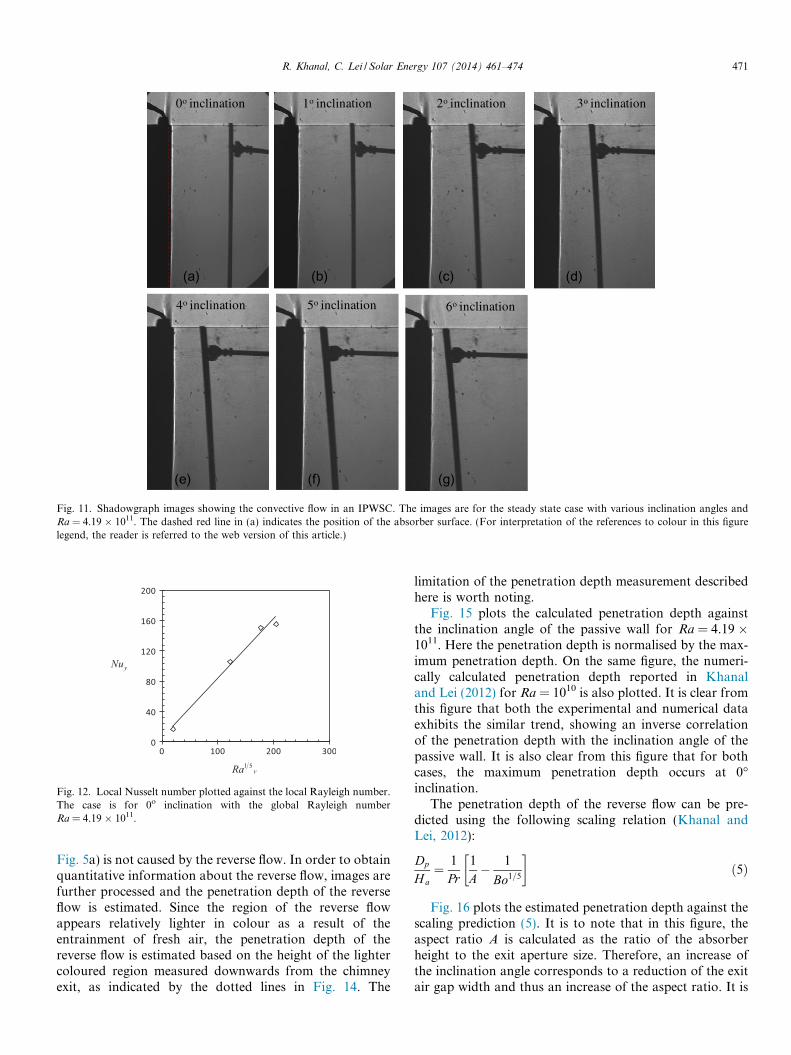
With the experimental model described in Section 2, theset-up of the smoke flow visualization experiment is shownin Fig. 13 for a fixed base air gap width (100 mm) withdifferent inclination angles varying from 0� to 6�. In thepresent case, steady-state is achieved after around 3 h fromthe start of the experiment.
After the attainment of the steady-state, flow visualiza-tion is carried out. Smoke is pre-generated using an AntariFog machine and collected in a storage chamber madefrom cardboard boxes (1600 mm � 635 mm � 635 mm).This arrangement is to minimize the disturbance to theconvective flow caused by the smoke generator, which isturned off during the smoke visualization experiment.The stored smoke in the storage chamber is drawn natu-rally into ventilated space which is connected to the airchannel through a cylindrical passage. The air movementin the air channel is then photographed using a high speedcamera and images are stored at a rate of 10 frames per sec-ond. The experiment is first carried out with 0o inclinationangle and the same procedure is then repeated for the otherinclination angles (1–6�).
The results of the smoke flow visualization for variousinclination angles of the passive wall are shown inFig. 14. This figure clearly shows the convective flow inthe channel between the heating plate assembly on the leftand the glazing wall on the right, the latter of which isattached to the threaded rods.
Since the main objective of the smoke flow visualizationis to observe the reverse flow occurring near the exit of thechimney, results are presented only for the region of inter-est (i.e. near the exit region) but not for the entire chimneychannel. Fig. 14 shows more than half of the channelheight including the region immediately above the chimneyexit. It is clear from the figure that the flow at the chimneyexit becomes stronger with the increase of the inclinationangle of the passive wall, as indicated by the variation ofthe jet flow from the exit. Also it can be observed thatthe reverse flow is occurring at the exit of the channel(for 0–2�). For clarity, the region of the reverse flow isapproximately indicated by the dotted box in Fig. 14. Thisregion of reverse flow can be identified by observing thesmoke density (indicated by the colour or grey level ofthe images) which appears to be relatively lighter in theregion with reverse flow due to the entrainment of the freshair from outside.
It is also seen in Fig. 14 that the region of the reverseflow reduces with the inclination of the glazing wall. As aconsequence, the flow rate increases. This result supportsthe above discussion in Section 3.2 and confirms that theunusual temperature structure near the exit (refer to
0o inclination 1o inclination 2o inclination 3o inclination
4o inclination 5o inclination 6o inclination
(d)(c)
(e) (g)(f)
(b)(a)
Fig. 11. Shadowgraph images showing the convective flow in an IPWSC. The images are for the steady state case with various inclination angles andRa = 4.19 � 1011. The dashed red line in (a) indicates the position of the absorber surface. (For interpretation of the references to colour in this figurelegend, the reader is referred to the web version of this article.)
Fig. 12. Local Nusselt number plotted against the local Rayleigh number.The case is for 0o inclination with the global Rayleigh numberRa = 4.19 � 1011.
R. Khanal, C. Lei / Solar Energy 107 (2014) 461–474 471
Fig. 5a) is not caused by the reverse flow. In order to obtainquantitative information about the reverse flow, images arefurther processed and the penetration depth of the reverseflow is estimated. Since the region of the reverse flowappears relatively lighter in colour as a result of theentrainment of fresh air, the penetration depth of thereverse flow is estimated based on the height of the lightercoloured region measured downwards from the chimneyexit, as indicated by the dotted lines in Fig. 14. The
limitation of the penetration depth measurement describedhere is worth noting.
Fig. 15 plots the calculated penetration depth againstthe inclination angle of the passive wall for Ra = 4.19 �1011. Here the penetration depth is normalised by the max-imum penetration depth. On the same figure, the numeri-cally calculated penetration depth reported in Khanaland Lei (2012) for Ra = 1010 is also plotted. It is clear fromthis figure that both the experimental and numerical dataexhibits the similar trend, showing an inverse correlationof the penetration depth with the inclination angle of thepassive wall. It is also clear from this figure that for bothcases, the maximum penetration depth occurs at 0�inclination.
The penetration depth of the reverse flow can be pre-dicted using the following scaling relation (Khanal andLei, 2012):
Dp
Ha¼ 1
Pr1
A� 1
Bo1=5
� �ð5Þ
Fig. 16 plots the estimated penetration depth against thescaling prediction (5). It is to note that in this figure, theaspect ratio A is calculated as the ratio of the absorberheight to the exit aperture size. Therefore, an increase ofthe inclination angle corresponds to a reduction of the exitair gap width and thus an increase of the aspect ratio. It is
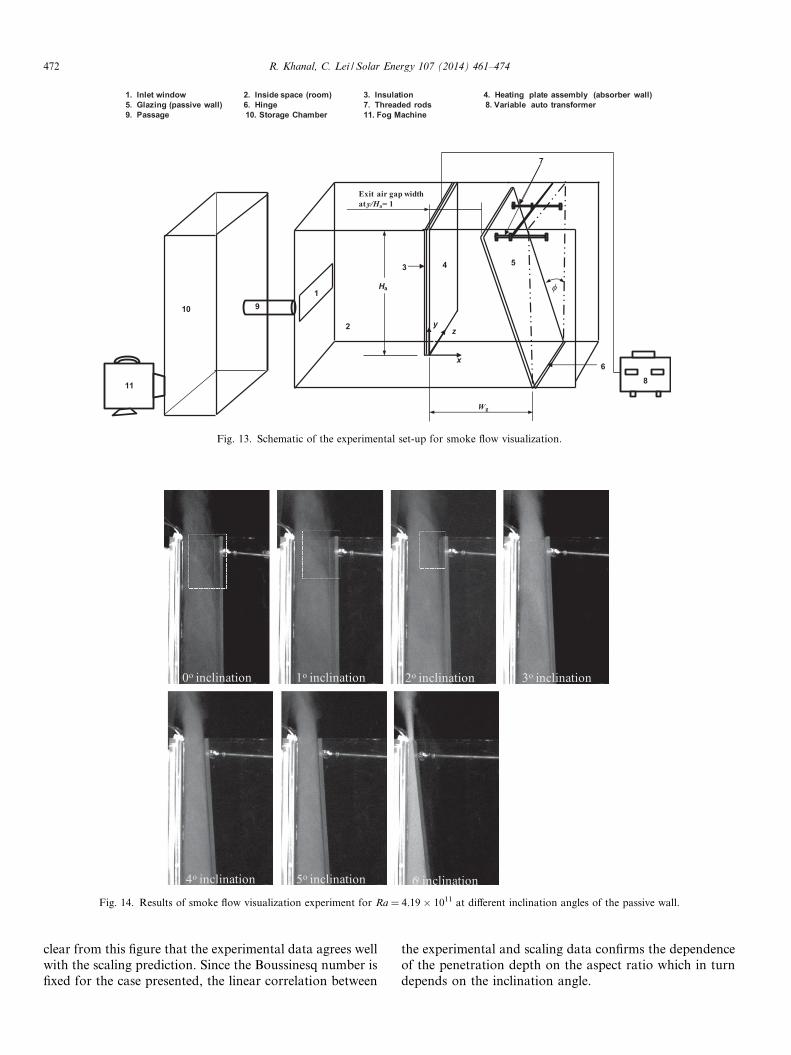
Fig. 13. Schematic of the experimental set-up for smoke flow visualization.
Fig. 14. Results of smoke flow visualization experiment for Ra = 4.19 � 1011 at different inclination angles of the passive wall.
472 R. Khanal, C. Lei / Solar Energy 107 (2014) 461–474
clear from this figure that the experimental data agrees wellwith the scaling prediction. Since the Boussinesq number isfixed for the case presented, the linear correlation between
the experimental and scaling data confirms the dependenceof the penetration depth on the aspect ratio which in turndepends on the inclination angle.
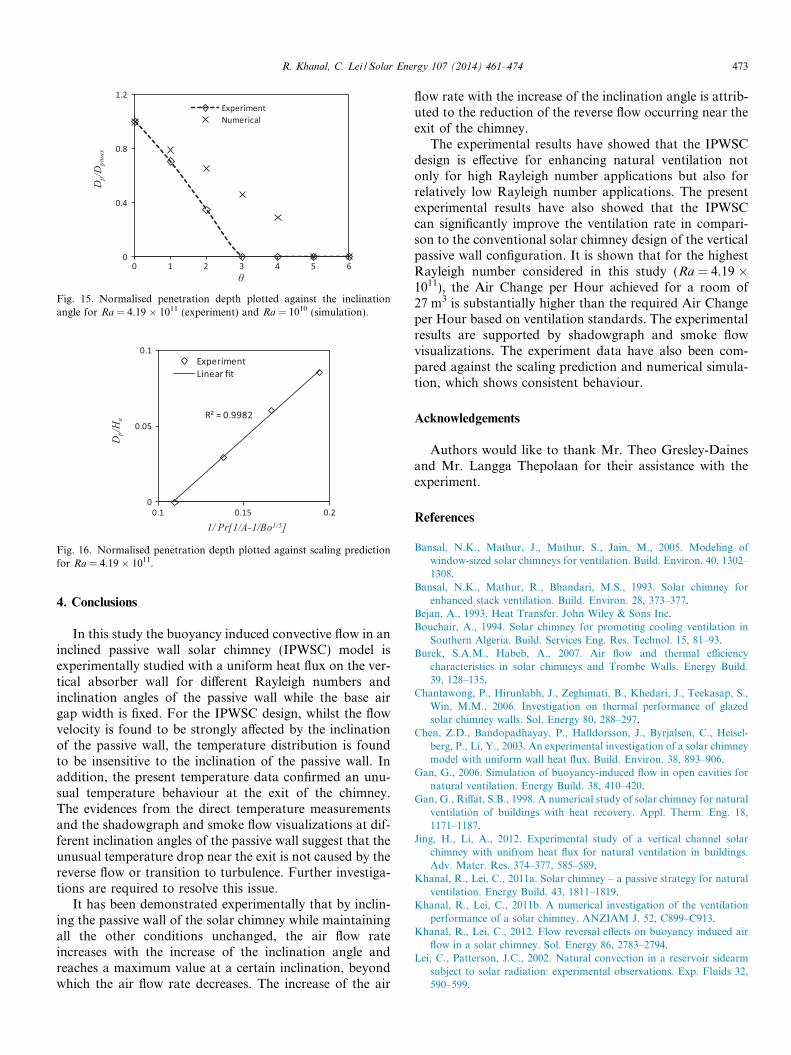
Fig. 15. Normalised penetration depth plotted against the inclinationangle for Ra = 4.19 � 1011 (experiment) and Ra = 1010 (simulation).
Fig. 16. Normalised penetration depth plotted against scaling predictionfor Ra = 4.19 � 1011.
R. Khanal, C. Lei / Solar Energy 107 (2014) 461–474 473
4. Conclusions
In this study the buoyancy induced convective flow in aninclined passive wall solar chimney (IPWSC) model isexperimentally studied with a uniform heat flux on the ver-tical absorber wall for different Rayleigh numbers andinclination angles of the passive wall while the base airgap width is fixed. For the IPWSC design, whilst the flowvelocity is found to be strongly affected by the inclinationof the passive wall, the temperature distribution is foundto be insensitive to the inclination of the passive wall. Inaddition, the present temperature data confirmed an unu-sual temperature behaviour at the exit of the chimney.The evidences from the direct temperature measurementsand the shadowgraph and smoke flow visualizations at dif-ferent inclination angles of the passive wall suggest that theunusual temperature drop near the exit is not caused by thereverse flow or transition to turbulence. Further investiga-tions are required to resolve this issue.
It has been demonstrated experimentally that by inclin-ing the passive wall of the solar chimney while maintainingall the other conditions unchanged, the air flow rateincreases with the increase of the inclination angle andreaches a maximum value at a certain inclination, beyondwhich the air flow rate decreases. The increase of the air
flow rate with the increase of the inclination angle is attrib-uted to the reduction of the reverse flow occurring near theexit of the chimney.
The experimental results have showed that the IPWSCdesign is effective for enhancing natural ventilation notonly for high Rayleigh number applications but also forrelatively low Rayleigh number applications. The presentexperimental results have also showed that the IPWSCcan significantly improve the ventilation rate in compari-son to the conventional solar chimney design of the verticalpassive wall configuration. It is shown that for the highestRayleigh number considered in this study (Ra = 4.19 �1011), the Air Change per Hour achieved for a room of27 m3 is substantially higher than the required Air Changeper Hour based on ventilation standards. The experimentalresults are supported by shadowgraph and smoke flowvisualizations. The experiment data have also been com-pared against the scaling prediction and numerical simula-tion, which shows consistent behaviour.
Acknowledgements
Authors would like to thank Mr. Theo Gresley-Dainesand Mr. Langga Thepolaan for their assistance with theexperiment.
References
Bansal, N.K., Mathur, J., Mathur, S., Jain, M., 2005. Modeling ofwindow-sized solar chimneys for ventilation. Build. Environ. 40, 1302–1308.
Bansal, N.K., Mathur, R., Bhandari, M.S., 1993. Solar chimney forenhanced stack ventilation. Build. Environ. 28, 373–377.
Bejan, A., 1993. Heat Transfer. John Wiley & Sons Inc.Bouchair, A., 1994. Solar chimney for promoting cooling ventilation in
Southern Algeria. Build. Services Eng. Res. Technol. 15, 81–93.Burek, S.A.M., Habeb, A., 2007. Air flow and thermal efficiency
characteristics in solar chimneys and Trombe Walls. Energy Build.39, 128–135.
Chantawong, P., Hirunlabh, J., Zeghimati, B., Khedari, J., Teekasap, S.,Win, M.M., 2006. Investigation on thermal performance of glazedsolar chimney walls. Sol. Energy 80, 288–297.
Chen, Z.D., Bandopadhayay, P., Halldorsson, J., Byrjalsen, C., Heisel-berg, P., Li, Y., 2003. An experimental investigation of a solar chimneymodel with uniform wall heat flux. Build. Environ. 38, 893–906.
Gan, G., 2006. Simulation of buoyancy-induced flow in open cavities fornatural ventilation. Energy Build. 38, 410–420.
Gan, G., Riffat, S.B., 1998. A numerical study of solar chimney for naturalventilation of buildings with heat recovery. Appl. Therm. Eng. 18,1171–1187.
Jing, H., Li, A., 2012. Experimental study of a vertical channel solarchimney with unifrom heat flux for natural ventilation in buildings.Adv. Mater. Res. 374–377, 585–589.
Khanal, R., Lei, C., 2011a. Solar chimney – a passive strategy for naturalventilation. Energy Build. 43, 1811–1819.
Khanal, R., Lei, C., 2011b. A numerical investigation of the ventilationperformance of a solar chimney. ANZIAM J. 52, C899–C913.
Khanal, R., Lei, C., 2012. Flow reversal effects on buoyancy induced airflow in a solar chimney. Sol. Energy 86, 2783–2794.
Lei, C., Patterson, J.C., 2002. Natural convection in a reservoir sidearmsubject to solar radiation: experimental observations. Exp. Fluids 32,590–599.

474 R. Khanal, C. Lei / Solar Energy 107 (2014) 461–474
Mathur, J., Bansal, N.K., Mathur, S., Jain, M., Anupama, 2006.Experimental investigations on solar chimney for room ventilation.Sol. Energy 80, 927–935.
Merzkirch, W., 1987. Flow Visualization. Academic Press Inc., Ltd.Moffat, R.J., 1988. Describing the uncertainties in experimental results.
Exp. Thermal Fluid Sci. 1, 3–17.Rathore, M.M., Kapuno, R.R., 2011. Engineering Heat Transfer. Jones &
Bartlett Learning LLC.Ryan, D., Burek, S.A.M., 2010. Experimental study of the influence of
collector height on the steady state performance of a passive solar airheater. Sol. Energy 84, 1676–1684.
Sandberg, M., Moshfeg, B., 1996. Investigation of fluid flow and heattransfer in a vertical channel heated from one side by PV elements,Part II – Experimental study. Renew. Energy 8, 254–258.
Schopf, W., Patterson, J., 1996. Visualization of natural convection in aside-heated cavity: transition to the final steady state. Int. J. Heat MassTransf. 39, 3497–3509.
Schopf, W., Patterson, J.C., 1995. Natural convection in a side-heatedcavity: visualization of the initial flow features. J. Fluid Mech. 295,357–380.
Sherman, M., 2003. ASHRAE’s first residential ventilation standard.LBNL Report Number.
Sparrow, E., 1955. In: Lewis Flight Propulsion Laboratory, C. (Ed.),Laminar Free Convection on a Vertical Plate With Prescribed NonUniform Wall Heat Flux or Prescribed Non Uniform Wall Temper-ature. National Advisory Committee for Aeronautics, Ohio.
Sparrow, E.M., Chrysler, G.M., Azevedo, L.F., 1984. Observed flowreversals and measured-predicted nusselt numbers for natural convectionin a one-sided heated vertical channel. J. Heat Transfer 106, 325–332.
Standard 62-2001, 2001. Ventilation for Acceptable Indoor Air Quality.American Society of Heating, Refrigerating, and Air-ConditioningEngineers, Atlanta, <www.ASHRAE.org>.
Xu, F., Patterson, J.C., Lei, C., 2005. Shadowgraph observations of thetransition of the thermal boundary layer in a side-heated cavity. Exp.Fluids 38, 770–779.
Xu, F., Patterson, J.C., Lei, C., 2006. Experimental observations of thethermal flow around a square obstruction on a vertical wall in adifferentially heated cavity. Exp. Fluids 40, 364–371.
Xu, F., Patterson, J.C., Lei, C., 2008. On the double-layer structure of theboundary layer adjacent to a sidewall of a differentially heated cavity.Int. J. Heat Mass Transf. 51, 3803–3815.
Zamora, B., Kaiser, A.S., 2009. Optimum wall-to-wall spacing in solarchimney shaped channels in natural convection by numerical investi-gation. Appl. Therm. Eng. 29, 762–769.