Embed Size (px)
Citation preview
i. n m i E
Shell Development Company, Emeryville, Cal i f .
Assoc. Mem. ASME
J. J. B A I L E Y Shell Development Company,
Houston, Texas
An Experimental Study of Drill-String Vibration
This paper describes equipment which has been developed for the measurement of axial force, torque, and axial and rotational motions at the top of a drill string. Meas-urements made in two wells with this equipment represent the first time these quantities have been recorded during drilling.
A large number of frequencies of vibration were found in the recordings. Some of these, particularly torsional readings, correlated with, predicted natural frequencies, but many did not. Several explanations have been proposed for these "extraneous" fre-quencies, but no completely satisfactory solution is available. In addition, some in-teresting interrelations between axial and torsional vibrations were observed.
ALL mechanical systems possessing mass and elas-ticity have a number of natural frequencies of free vibration. Associated with each of these frequencies is a natural mode (i.e., shape) of vibration. If a mechanical system, such as a drill string, is acted upon by fluctuating forces whose frequency is close to a natural frequency of the system, vibrations of very large amplitude may result. When the exciting frequency is equal to a natural frequency, the amplitude of vibration is limited only by damping (i.e., energy dissipation) in the system.1 If the damp-ing is insufficient, failure occurs. Many records of this type of failure can be found in the engineering literature (diesel-engine torsional vibrations, steam-turbine blade vibration, propeller-shaft longitudinal vibration, and so forth).
This type of failure is brought about by external application of forces to the system. Another broad class of vibration problems is self-excited vibration. Here, the exciting forces are produced by motion of the system itself. No external fluctuating forces are required to maintain such a vibration once it has started. This type of vibration has been found in aircraft wings, turbine blades, suspension bridges, electric transmission lines, and the like.
Since so many vibration problems are encountered in engineer-ing, it is rather surprising that they seem to have been of rela-tively little importance in drilling. The answer, in part, must be that the drill string, although possessing an infinite number of natural frequencies, is generally sufficiently highly damped by the surrounding fluid and by contact with the formation. Under cer-tain drilling conditions, however, very noticeable motion of the drill string is produced, and drill-string vibrations do seem to be a possible cause of drill-string failures. Certainly, this aspect of drilling mechanics appears to deserve investigation.
To obtain greater insight into the vibration behavior of drill strings, a series of tests was made on two operating drilling rigs. This paper describes the equipment developed for the tests, the test procedure, and the interpretation of the results. An ac-
1 Strictly speaking, the relationship of the exciting forces to the in-ertial forces corresponding to the natural modes must also be con-sidered .
Contributed by the Petroleum Division and presented at the Petroleum Mechanical Engineering Conference, Houston, Texas, S e p t e m b e r 2 0 - 2 3 , 1 9 5 9 , o f T H E A M E R I C A N S O C I E T Y OP M E C H A N I C A L E N G I N E E R S .
NOTE: Statements and opinions advanced in papers are to be understood as individual expressions of their authors and not those of the Society. Manuscript received at ASME Headquarters, July 1, 1959. Paper No. 59—Pet-16.
companying paper2 describes the analytical procedures which were developed for the prediction of natural frequencies.
Test Equipment In studying the behavior of a drill string in longitudinal vibra-
tion, for example, it is desirable to measure the longitudinal dis-placements at all points of the string as functions of time. If this is not possible, it is desirable to measure at least the displacement £ and the force at both ends of the drill string as functions of time. The derivative of the displacement £ with respect to the distance x along the string, b£/dx, is the longitudinal strain in the drill string and is hence proportional to the axial force. Instrumentation which enables the continuous recording of downhole-vibration data is not available. Since the object of the tests was the meas-urement of drill-string vibration and not the development of radically new equipment, vibration observations were confined to the top end of the drill string.
Torque, axial force, and rotational and axial displacements were measured as functions of time. Wire-resistance strain gages were used for torque and axial-load measurements, which were made below the rotary table. For displacement recording, the choice of a transducer was less clear cut. Either a velocity-sensi-t-ive pickup with an integrated output or an aecelerometer signal integrated twice will yield displacement. Direct-reading displace-ment pickups are not convenient because of their low natural fre-quency and large size. Generally speaking, an aecelerometer re-quires more elaborate instrumentation than does the self-generat-ing type of velocity pickup, particularly if displacement records are required. However, accelerometers have a flat response from zero frequency to very high frequencies, whereas velocity pickups drop oft' rapidly in output at low frequencies. In the present equipment, velocity pickups were selected for axial and rota-tional displacement measurements, principally because the pickups and their associated electronic equipment were available in the laboratory. The equipment was designed and constructed on a rush basis for testing certain wells. This led to a choice of units and design of equipment suited to availability and rapid construction rather than to strictly optimum performance.
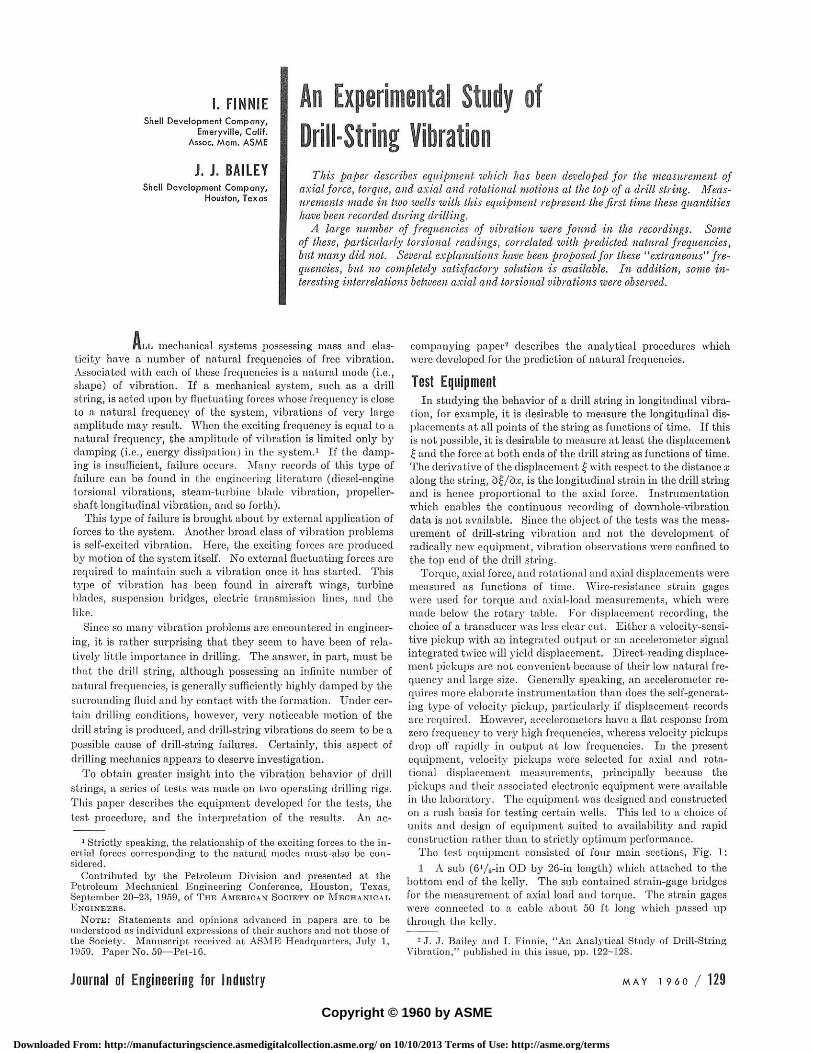
The test equipment consisted of four main sections, Fig. 1: 1 A sub (GVs-in OD by 26-in length) which attached to the
bottom end of the kelty. The sub contained strain-gage bridges for the measurement of axial load and torque. The strain gages were connected to a cable about 50 ft long which passed up through the kelly.
"J. J. Bailey and I. Finnie, "An Analytical Study of Drill-String Vibration," published in this issue, pp. 122-128.
Journal of Engineering for Industry MAY 1 9 6 0 / 129
Copyright © 1960 by ASME
Downloaded From: http://manufacturingscience.asmedigitalcollection.asme.org/ on 10/10/2013 Terms of Use: http://asme.org/terms
S W I V E L
T O P SUB
S L I P - R I N G A S S E M B L Y
R O T A R Y T A B L E
L O W E R S U B
D R I L L S T R I N G
Fig. 1 Schematic layout of test equipment
2 A sub (73/i-m OD by 3G-in length) which attached to the to]) end of the kclly. A pressure-tight gland at the bottom end of this sill) led out the cable from the bottom sub. A heavy flange was welded on the sub as a mounting for the slip-ring assembly and velocity pickups.
3 The slip-ring assembly, Fig. 2, which had an inner section that bolted to a flange on the top sub. There were leads to the inner section from the velocity pickups and from the strain-gage bridges on the bottom sub. The outer section of the slip-ring as-sembly remained stationary, and the inner section rotated. Electrical connections between the two sections were made by brushes which rubbed on the slip rings. A 50-ft cable led from a plug on the stationary part of the slip-ring assembly to the re-corders.
4 Conventional equipment which was used to record the strain-gage and velocity-pickup signals. The recorders were placed in the driller's doghouse.
In practice, this equipment performed very satisfactorily.
Test Procedure The procedure used was relatively simple. When the equip-
ment was designed, the sizes of the subs were chosen to match a spare kelly. This kelly was moved to the first test location and was placed on the pipewalk. The subs were then made hand-tight. to the kelly, and the gland in the top sub was sealed around the cable from the bottom sub. (The two subs and the kelly were intended to be handled as a single unit, but a downhole fire at the first test location destroyed the strain gages on the lower sub, which had to be removed and replaced by a spare lower sub.) Drilling continued while the subs and spare kelly were being as-sembled so that no rig time would be lost.
On the next trip out of the hole to change bits, the regular kelly was laid down and the kelly-subs combination was picked up. The subs were tightened on the kelly and the kelly was then held jn the kelly bushing while the slip-ring assembly was lowered by
hand over the top sub. After the slip-ring assembly was bolted to the top sub and the velocity pickups were attached, the whole unit was picked up and was placed in the rathole; thereafter, it was treated as a conventional kelly. Some rig time was lost dur-ing this phase of the operation, mainly because of the time re-quired to change the kelly. At the second test location, this procedure was simplified by attaching the slip-ring assembly be-fore the kelly was changed, see Fig. 2.
In subsequent drilling operations, the slip-ring housing was left free to rotate. Before data were recorded, the rig was stopped briefly, a cable was attached from the recorder to the slip rings, a rope was attached to prevent rotation of the slip-ring housing, and the bearings were lubricated.
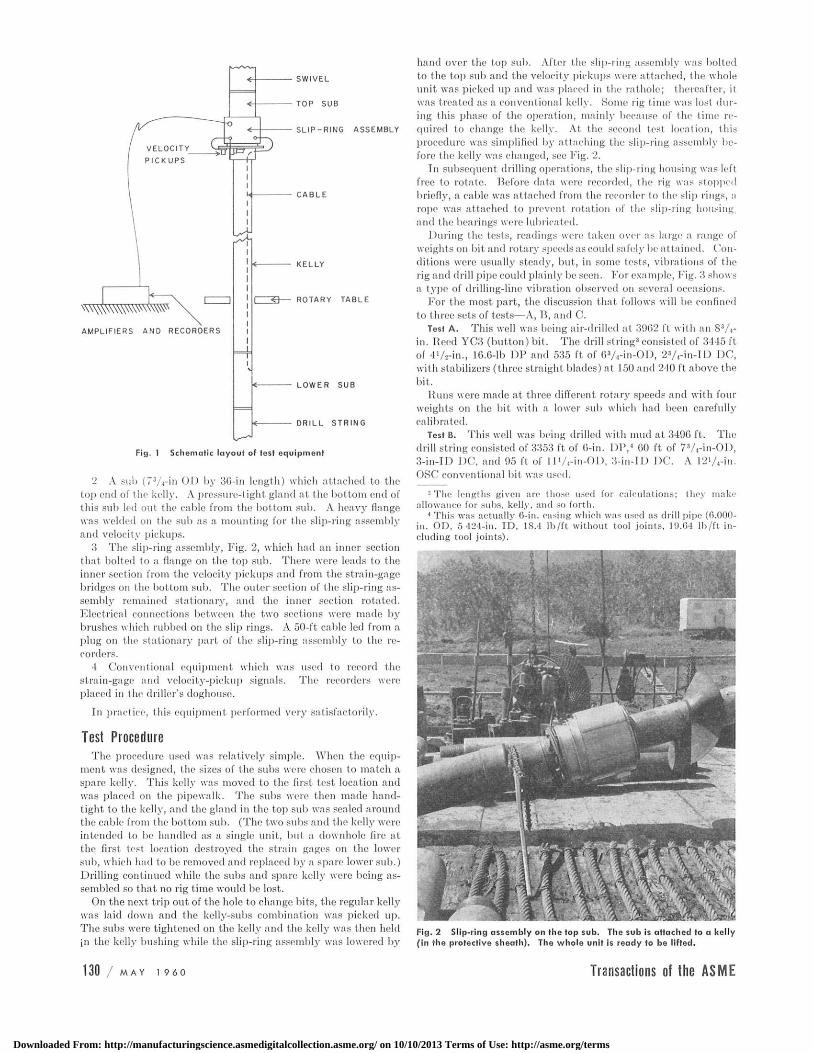
During the tests, readings were taken over as large a range of weights on bit and rotary speeds as could safely be attained. Con-ditions were usually stead}', but, in some tests, vibrations of the rig and drill pipe could plainly be seen. For example, Fig. 3 shows a type of drilling-line vibration observed on several occasions.
For the most part, the discussion that follows will be confined to three sets of tests—A, B, and C.
Test A. This well was being air-drilled at 3962 ft with an 83A-in. Reed YC3 (button) bit. The drill string3 consisted of 3445 ft of 4'/2-in., 16.6-lb DP and 535 ft of 63A-in-OD, 2'A-in-ID DC, with stabilizers (three straight blades) at 150 and 240 ft above the bit.
Runs were made at three different rotary speeds and with four weights on the bit with a lower sub which had been carefully calibrated.
Test B. This well was being drilled with mud at 3496 ft. The drill string consisted of 3353 ft of 6-in. DP,4 60 ft of 73A-in-OD, 3-in-ID DC, and 95 ft. of ll 'A-in-OD, 3-in-ID DC. A 12'A-in. OSC conventional bit. was used.
3 The lengths given are those used for calculations; they make allowance for subs, kelly, and so forth.
4 This was actually 6-in. casing which was used as drill pipe (6.000-in. O D , 5 424-in. I D , 18.4 l b / f t without tool joints, 19.64 l b / f t in-cluding tool joints) .
Fig. 2 Slip-ring assembly on the top sub. The sub is attached to a kel ly ( in the protective sheath). The who le unit is ready to be l i f ted.
130 / M A Y 1 9 6 0 T r a n s a c t i o n s of t h e AS iV IE
Downloaded From: http://manufacturingscience.asmedigitalcollection.asme.org/ on 10/10/2013 Terms of Use: http://asme.org/terms
Huns were made at four speeds and with four bit weights. The frequency of the rig power supply was very low during the tests (about 50 cps), and the data have been corrected for the resulting low chart speed of the recorder. An older version of the lower sub was used, because the other sub had been destroyed by a downhole fire at location A. The resistance of the strain gages on this sub to ground was not as high as would be desirable. In addition, one of the axial gages was damaged, and the remaining axial gages had to be rewired as a half-bridge. For this reason, the axial-load recordings made in runs B and C may include components due to bending. Although the results from this sub
may not be reliable for quantitative interpretation, they are probably qualitatively satisfactory.
Test C. These tests were run in the same well as those at loca-tion B. The string consisted of 3175 ft of 6-in-DP, 321 ft of 73A-in. DC, and 95 ft of l l ' / i -m. DC. The bit was a l2'/,-in. Se-curity conventional S4. This set of tests was the most complete; runs were made at seven rotary speeds and with six bit weights.
In addition to these three sets of tests, other runs were made. At well A, recordings were made as the rotary table was started and stopped and while the weight on bit was being changed. In test B, runs were made while the speed was changed (i.e., with continuously varying speed instead of with discrete values only).
Discussion of Results In vibrating mechanical systems, the frequencies that pre-
dominate are often the natural frequencies of the system. It is difficult to make quantitative strain-gage readings under field conditions. In the present tests, as a result of destruction of the first sub by fire, the later tests were run with a sub of questionable accuracy. However, although the amplitudes of the vibra-tions may bo subject to considerable distortion, the frequencies cannot be changed (though their relative prominence can be altered and extraneous frequencies may be introduced). There-fore the first step in considering the data was an analysis of the frequencies that occurred and a comparison of these with calcu-lated natural frequencies.
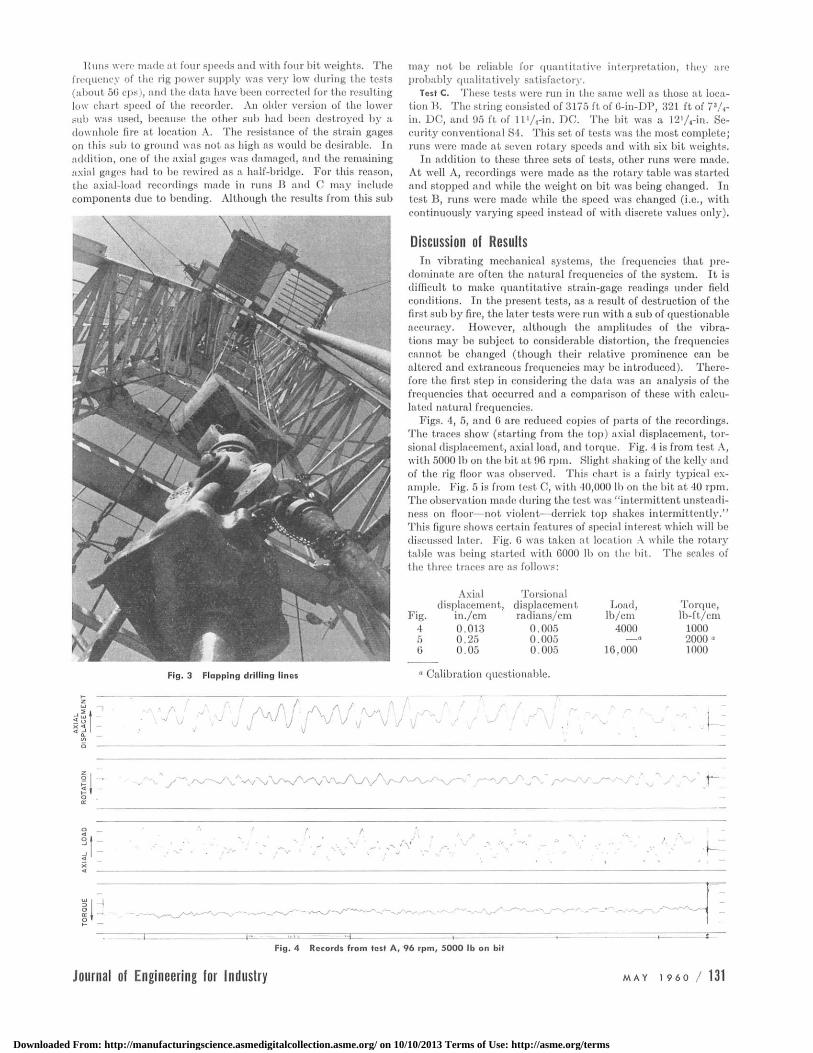
Figs. 4, 5, and G are reduced copies of parts of the recordings. The traces show (starting from the top) axial displacement, tor-sional displacement, axial load, and torque. Fig. 4 is from test A, with 5000 lb on the bit at 96 rpm. Slight shaking of the kelly and of the rig floor was observed. This chart is a fairly typical ex-ample. Fig. 5 is from test C, with 40,000 11) on the bit at 40 rpm. The observation made during the test was "intermittent unsteadi-ness on floor—not violent—derrick top shakes intermittently." This figure shows certain features of special interest which will be discussed later. Fig. 6 was taken at location A while the rotary table was being started with 6000 lb on the bit. The scales of the three traces are as follows:
Axial Torsional displacement, displacement Load, Torque,
Fig. in./cm radians/cm lb/cm lb-ft/cm 4 0.013 0.005 4000 1000 5 0.25 0.005 • — » 2000 ° 6 0.05 0.005 16,000 1000
Fig. 3 Flapping dr i l l ing lines a C a l i b r a t i o n q u e s t i o n a b l e .
7 V V w ' 7 A , / \ / " ' r t l i t : ^ v / v v / ^ v / v v ^ v r ^ • / A / y / v ,
I I- '«»- — — - — 1 > Fig. 4 Records f rom test A , 96 rpm, 5000 lb on bit
J o u r n a l of E n g i n e e r i n g fo r I n d u s t r y M A Y 1 9 6 0 / 131
Downloaded From: http://manufacturingscience.asmedigitalcollection.asme.org/ on 10/10/2013 Terms of Use: http://asme.org/terms
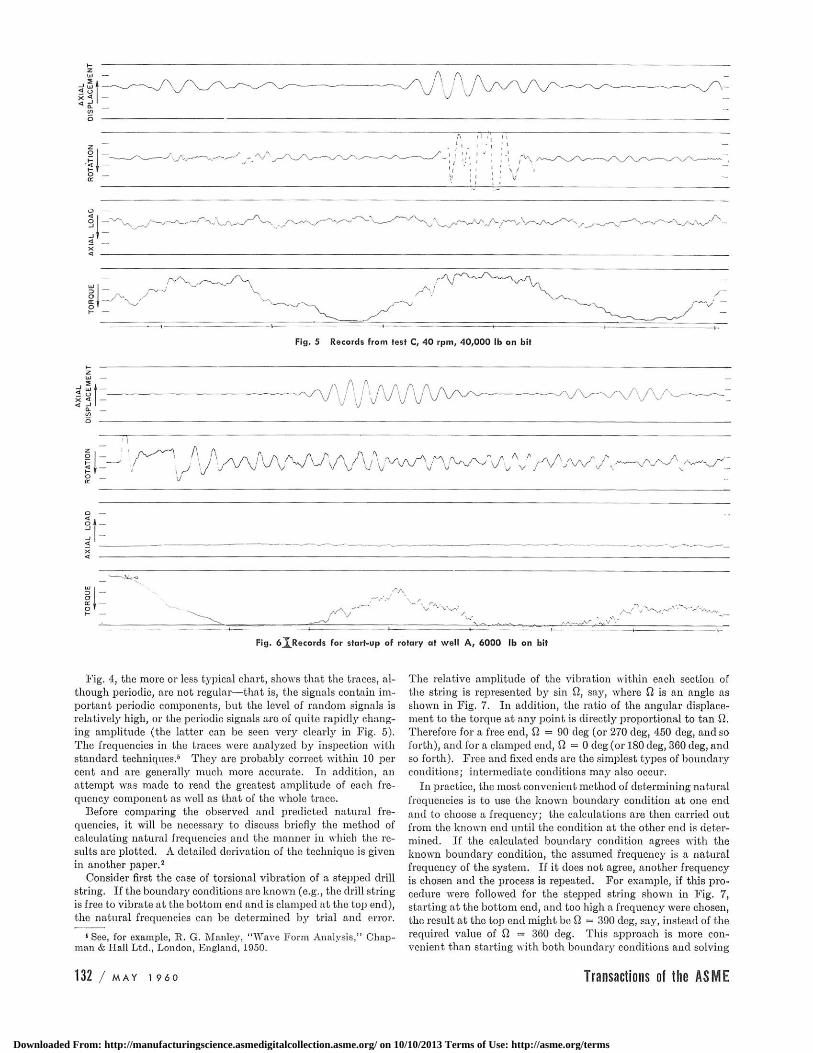
Fig. 6 Records for start-op of rotary at we l l A , 6000 lb on bit
Fig. 4, the more or less typical chart, shows that the traces, al-though periodic, are not regular—that is, the signals contain im-portant periodic components, but the level of random signals is relatively high, or the periodic signals are of quite rapidly chang-ing amplitude (the latter can be seen very clearly in Fig. 5). The frequencies in the traces were analyzed by inspection with standard techniques.6 They are probably correct within 10 per cent and are generally much more accurate. In addition, an attempt was made to read the greatest amplitude of each fre-quency component as well as that of the whole trace.
Before comparing the observed and predicted natural fre-quencies, it will be necessary to discuss briefly the method of calculating natural frequencies and the manner in which the re-sults are plotted. A detailed derivation of the technique is given in another paper.2
Consider first the case of torsional vibration of a stepped drill string. If the boundary conditions are known (e.g., the drill string is free to vibrate at the bottom end and is clamped at the top end), the natural frequencies can be determined by trial and error.
1 See, for example, R . G. Manley , " W a v e Form Analys is , " Chap -man & Hall Ltd. , London, England, 1950.
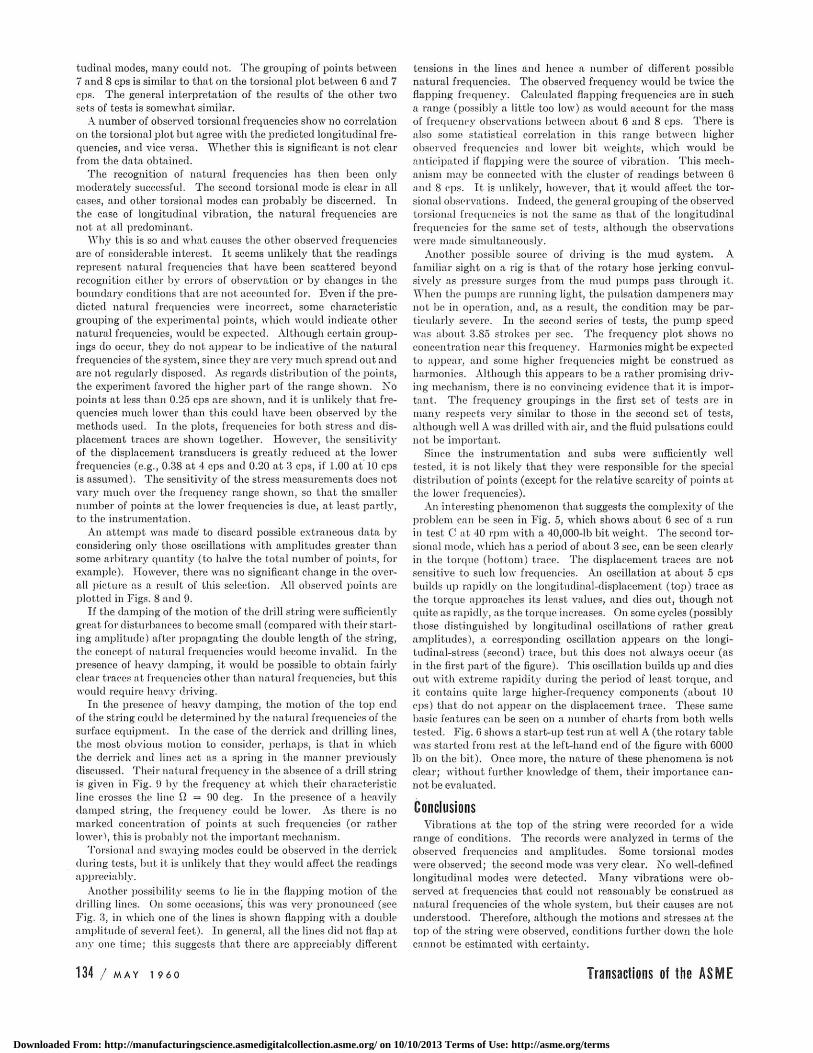
The relative amplitude of the vibration within each section of the string is represented by sin 0, say, where Q, is an angle as shown in Fig. 7. In addition, the ratio of the angular displace-ment to the torque at any point is directly proportional to tan fi. Therefore for a free end, fi = 90 deg (or 270 deg, 450 deg, and so forth), ancl for a clamped end, Q, = 0 deg (or 180 deg, 360 deg, and so forth). Free and fixed ends are the simplest types of boundary conditions; intermediate conditions may also occur.
In practice, the most convenient method of determining natural frequencies is to use the known boundary condition at one end and to choose a frequency; the calculations are then carried out from the known end until the condition at the other end is deter-mined. If the calculated boundary condition agrees with the known boundary condition, the assumed frequency is a natural frequency of the system. If it does not agree, another frequency is chosen and the process is repeated. For example, if this pro-cedure were followed for the stepped string shown in Fig. 7, starting at the bottom end, and too high a frequency were chosen, the result at the top end might be fl = 390 deg, say, instead of the required value of O = 360 cleg. This approach is more con-venient than starting with both boundary conditions and solving
132 / M A Y 1 9 6 0 Transactions of the ASiVIE
Downloaded From: http://manufacturingscience.asmedigitalcollection.asme.org/ on 10/10/2013 Terms of Use: http://asme.org/terms
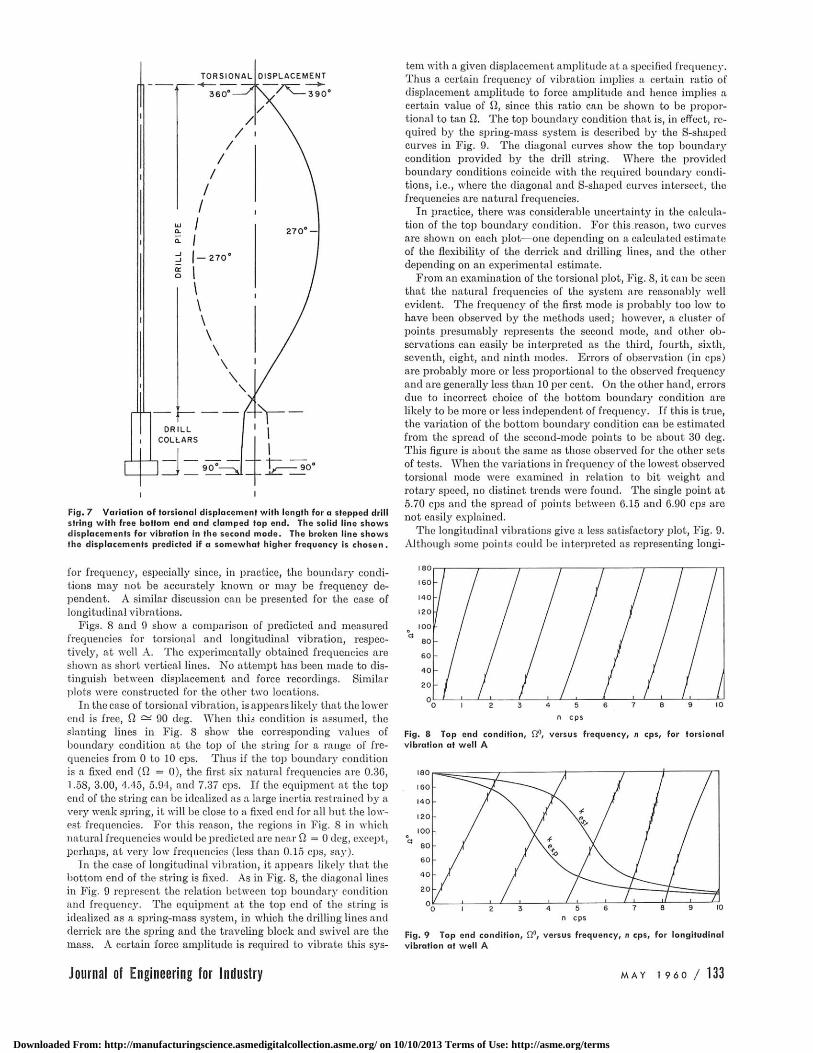
Fig. 7 Var ia t ion of tors ional d isplacement w i t h length for a stepped dr i l l s t r ing w i t h free bot tom end and c lamped top end. The sol id l ine shows d isp lacements for v ib ra t ion in the second mode . The broken l ine shows the d isp lacements predicted if a somewhat higher f requency is chosen .
tem with a given displacement amplitude at a specified frequency. Thus a certain frequency of vibration implies a certain ratio of displacement amplitude to force amplitude and hence implies a certain value of 0, since this ratio can be shown to be propor-tional to tan Q. The top boundary condition that is, in effect, re-quired by the spring-mass system is described by the S-shaped curves in Fig. 9. The diagonal curves show the top boundary condition provided by the drill string. Where the provided boundary conditions coincide with the required boundary condi-tions, i.e., where the diagonal and S-shaped curves intersect, the frequencies are natural frequencies.
In practice, there was considerable uncertainty in the calcula-tion of the top boundary condition. For this reason, two curves are shown on each plot—one depending on a calculated estimate of the flexibility of the derrick and drilling lines, and the other depending on an experimental estimate.
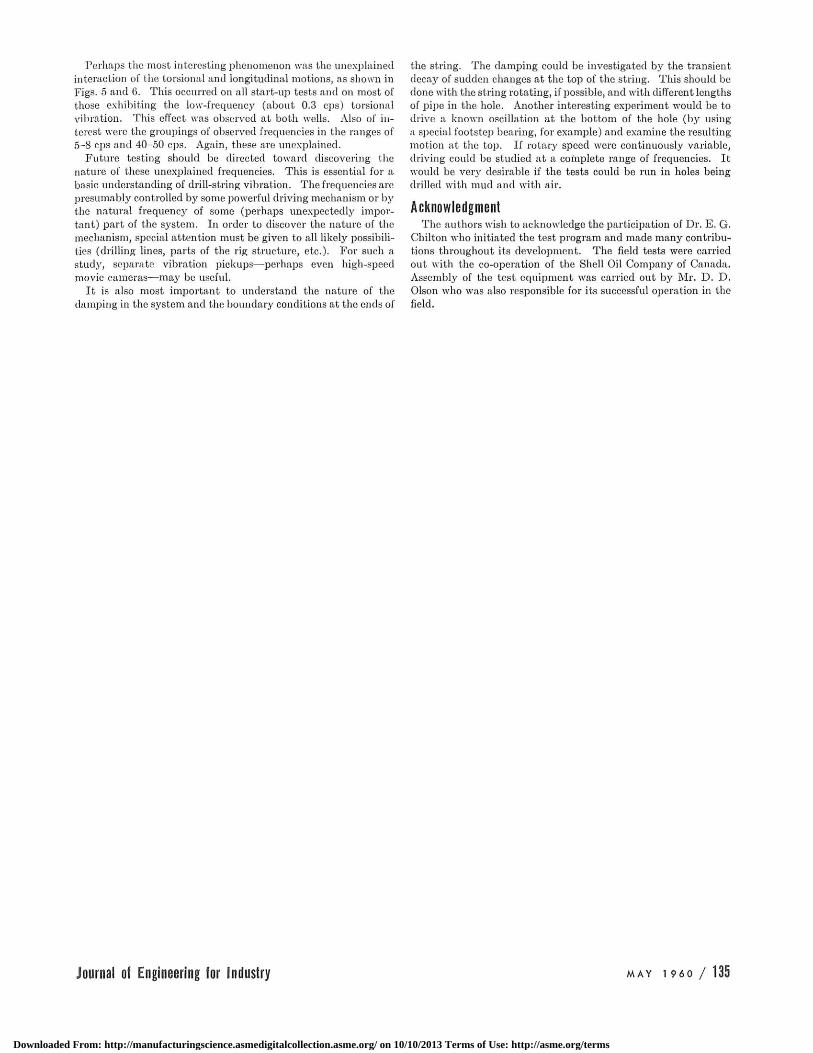
From an examination of the torsional plot, Fig. 8, it can be seen that the natural frequencies of the system are reasonably well evident. The frequency of the first mode is probably too low to have been observed by the methods used; however, a cluster of points presumably represents the second mode, and other ob-servations can easily be interpreted as the third, fourth, sixth, seventh, eight, and ninth modes. Errors of observation (in cps) are probably more or less proportional to the observed frequency and are general!}' less than 10 per cent. On the other hand, errors due to incorrect choice of the bottom boundary condition are likely to be more or less independent of frequency. If this is true, the variation of the bottom boundary condition can be estimated from the spread of the second-mode points to be about 30 deg. This figure is about the same as those observed for the other sets of tests. When the variations in frequency of the lowest observed torsional mode were examined in relation to bit weight and rotary speed, no distinct trends were found. The single point at 5.70 cps and the spread of points between 6.15 and 6.90 cps are not easily explained.
The longitudinal vibrations give a less satisfactory plot, Fig. 9. Although some points could be interpreted as representing longi-
for frequency, especially since, in practice, the boundary condi-tions may not be accurately known or may be frequency de-pendent. A similar discussion can be presented for the case of longitudinal vibrations.
Figs. 8 and 9 show a comparison of predicted and measured frequencies for torsional and longitudinal vibration, respec-tively, at well A. The experimentally obtained frequencies are shown as short, vertical lines. No attempt has been made to dis-tinguish between displacement and force recordings. Similar plots were constructed for the other two locations.
In the case of torsional vibration, is appears likely that the lower end is free, fl — 90 deg. When this condition is assumed, the slanting lines in Fig. 8 show the corresponding values of boundary condition at the to]) of the string for a range of fre-quencies from 0 to 10 cps. Thus if the top boundary condition is a fixed end ( 0 = 0), the first six natural frequencies are 0.36, 1.58, 3.00, 4.45, 5.94, and 7.37 cps. If the equipment at the top end of the string can lie idealized as a large inertia restrained by a very weak spring, it will be close to a fixed end for all but the low-est frequencies. For this reason, the regions in Fig. 8 in which natural frequencies would be predicted are near Q = 0 deg, except, perhaps, at very low frequencies (less than 0.15 cps, say).
In the case of longitudinal vibration, it appears likely that the bottom end of the string is fixed. As in Fig. 8, the diagonal lines in Fig. 9 represent the relation between top boundary condition and frequenc}'. The equipment at the top end of the string is idealized as a spring-mass system, in which the drilling lines and derrick are the spring and the traveling block and swivel are the mass. A certain force amplitude is required to vibrate this sys-
n c p s
Fig. 8 Top end condi t ion, versus f requency, n cps, for tors ional v ib ra t ion at we l l A
n cps
Fig. 9 Top end cond i t ion , versus f requency, n cps, for long i tud ina l v ib ra t ion at we l l A
J o u r n a l of E n g i n e e r i n g for I n d u s t r y M A Y 1 9 6 0 / 133
Downloaded From: http://manufacturingscience.asmedigitalcollection.asme.org/ on 10/10/2013 Terms of Use: http://asme.org/terms
tudinal modes, many could not. The grouping of points between 7 and 8 cps is similar to that on the torsional plot between 6 and 7 cps. The general interpretation of the results of the other two sets of tests is somewhat similar.
A number of observed torsional frequencies show no correlation on the torsional plot but agree with the predicted longitudinal fre-quencies, and vice versa. Whether this is significant is not clear from the data obtained.
The recognition of natural frequencies has then been only moderately successful. The second torsional mode is clear in all cases, and other torsional modes can probably be discerned. In the case of longitudinal vibration, the natural frequencies are not at all predominant.
Why this is so and what causes the other observed frequencies are of considerable interest. It seems unlikelj' that the readings represent natural frequencies that have been scattered bej'ond recognition either by errors of observation or by changes in the boundary conditions that are not accounted for. Even if the pre-dicted natural frequencies were incorrect, some characteristic grouping of the experimental points, which would indicate other natural frequencies, would be expected. Although certain group-ings do occur, they do not appear to be indicative of the natural frequencies of the system, since they are very much spread out and are not regularly disposed. As regards distribution of the points, the experiment favored the higher part of the range shown. No points at less than 0.25 cps are shown, and it is unlikely that fre-quencies much lower than this could have been observed by the methods used. In the plots, frequencies for both stress and dis-placement traces are shown together. However, the sensitivity of the displacement transducers is greatly reduced at the lower frequencies (e.g., 0.38 at 4 cps and 0.20 at 3 cps, if 1.00 at 10 cps is assumed). The sensitivity of the stress measurements does not vary much over the frequency range shown, so that, the smaller number of points at the lower frequencies is due, at. least partly, to the instrumentation.
An attempt was made to discard possible extraneous data by considering only those oscillations with amplitudes greater than some arbitrary quantity (to halve the total number of points, for example). However, there was no significant change in the over-all picture as a result of this selection. All observed points are plotted in Figs. 8 and 9.
If the damping of the motion of the drill string were sufficiently great for disturbances to become small (compared with their start-ing amplitude) after propagating the double length of the string, the concept of natural frequencies would become invalid. In the presence of heavy damping, it would be possible to obtain fairly clear traces at frequencies other than natural frequencies, but this would require heavy driving.
In the presence of heavy damping, the motion of the top end of the string could be determined by the natural frequencies of the surface equipment. In the case of the derrick and drilling lines, the most obvious motion to consider, perhaps, is that in which the derrick and lines act as a spring in the manner previously discussed. Their natural frequency in the absence of a drill string is given in Fig. 9 by the frequency at which their characteristic line crosses the line 0 = 90 deg. In the presence of a heavily damped string, the frequency could be lower. As there is no marked concentration of points at such frequencies (or rather lower \ this is probably not the important mechanism.
Torsional and swaying modes could be observed in the derrick din ing tests, but it is unlikely that they would affect the readings appreciably.
Another possibility seems to lie in the flapping motion of the drilling lines. On some occasions) this was very pronounced (see Fig. 3, in which one of the lines is shown flapping with a double amplitude of several feet). In general, all the lines did not flap at any one time; this suggests that there are appreciably different
tensions in the lines and hence a number of different possible natural frequencies. The observed frequency would be twice the flapping frequenc}'. Calculated flapping frequencies are in such a range (possibly a little too low) as would account for the mass of frequeue}' observations between about 6 and 8 cps. There is also some statistical correlation in this range between higher observed frequencies and lower bit weights, which would be anticipated if flapping were the source of vibration. This mech-anism may be connected with the cluster of readings between 6 and 8 cps. It is unlikely, however, that it would affect the tor-sional observations. Indeed, the general grouping of the observed torsional frequencies is not the same as that of the longitudinal frequencies for the same set of tests, although the observations were made simultaneously.
Another possible source of driving is the mud system. A familiar sight on a rig is that of the rotary hose jerking convul-sively as pressure surges from the mud pumps pass through it. When the pumps are running light, the pulsation dampeners may not be in operation, and, as a result, the condition may be par-ticularly severe. In the second series of tests, the pump speed was about 3.85 strokes per sec. The frequency plot shows no concentration near this frequency. Harmonics might be expected to appear, and some higher frequencies might be construed as harmonics. Although this appears to be a rather promising driv-ing mechanism, there is no convincing evidence that it is impor-tant. The frequency groupings in the first set of tests are in many respects very similar to those in the second set of tests, although well A was drilled with air, and the fluid pulsations could not be important.
Since the instrumentation and subs were sufficiently well tested, it is not likely that they were responsible for the special distribution of points (except for the relative scarcity of points at the lower frequencies).
An interesting phenomenon that suggests the complexity of the problem can be seen in Fig. 5, which shows about 6 sec of a run in test C at 40 rpm with a 40,000-lb bit weight. The second tor-sional mode, which has a period of about- 3 sec, can be seen clearly in the torque (bottom) trace. The displacement traces are not sensitive to such low frequencies. An oscillation at about 5 cps builds up rapidly on the longitudinal-displacement (top) trace as the torque approaches its least values, and dies out, though not quite as rapidly, as the torque increases. On some cycles (possibly those distinguished by longitudinal oscillations of rather great amplitudes), a corresponding oscillation appears on the longi-tudinal-stress (second) trace, but this does not always occur (as in the first part of the figure). This oscillation builds up and dies out with extreme rapidity during the period of least torque, and it contains quite large higher-frequency components (about 10 eps) that do not appear on the displacement trace. These same basic features can be seen on a number of charts from both wells tested. Fig. 0 shows a start-up test run at well A (the rotary table was started from rest at the left-hand end of the figure with 6000 lb on the bit). Once more, the nature of these phenomena is not clear; without further knowledge of them, their importance can-not be evaluated.
Conclusions Vibrations at the top of the string were recorded for a wide
range of conditions. The records were analyzed in terms of the observed frequencies and amplitudes. Some torsional modes were observed; the second mode was very clear. No well-defined longitudinal modes were detected. Many vibrations were ob-served at frequencies that could not reasonably be construed as natural frequencies of the whole system, but their causes are not understood. Therefore, although the motions and stresses at the top of the string were observed, conditions further down the hole cannot be estimated with certainty.
134 / M A Y 1 9 6 0 T r a n s a c t i o n s of t h e AS iV IE
Downloaded From: http://manufacturingscience.asmedigitalcollection.asme.org/ on 10/10/2013 Terms of Use: http://asme.org/terms
Perhaps the most interesting phenomenon was the unexplained interaction of the torsional and longitudinal motions, as shown in Figs. 5 and 6. This occurred on all start-up tests and on most of those exhibiting the low-frequency (about 0.3 cps) torsional vibration. This effect was observed at both wells. Also of in-terest were the groupings of observed frequencies in the ranges of 5-8 cps and 40-50 cps. Again, these are unexplained.
Future testing should be directed toward discovering the nature of these unexplained frequencies. This is essential for a basic understanding of drill-string vibration. The frequencies are presumably controlled by some powerful driving mechanism or by the natural frequency of some (perhaps unexpectedly impor-tant) part of the system. In order to discover the nature of the mechanism, special attention must be given to all likely possibili-ties (drilling lines, parts of the rig structure, etc.). For such a stud}', separate vibration pickups—perhaps even high-speed movie cameras—may be useful.
It is also most important to understand the nature of the damping in the system and the boundary conditions at the ends of
the string. The damping could be investigated by the transient decay of sudden changes at the top of the string. This should be done with the string rotating, if possible, and with different lengths of pipe in the hole. Another interesting experiment would be to drive a known oscillation at the bottom of the hole (by using a special footstep bearing, for example) and examine the resulting motion at the top. If rotary speed were continuously variable, driving could be studied at a complete range of frequencies. It would be very desirable if the tests could be run in holes being drilled with mud and with air.
Acknow ledgment The authors wish to acknowledge the participation of Dr. E. G.
Chilton who initiated the test program and made many contribu-tions throughout its development. The field tests were carried out with the co-operation of the Shell Oil Company of Canada. Assembly of the test equipment was carried out by Mr. D. D. Olson who was also responsible for its successful operation in the field.
J o u r n a l of E n g i n e e r i n g f o r I n d u s t r y M A Y 1 9 6 0 / 135
Downloaded From: http://manufacturingscience.asmedigitalcollection.asme.org/ on 10/10/2013 Terms of Use: http://asme.org/terms