Embed Size (px)
Citation preview
An Integrated Approach Involving Metabolomics
and Transcriptomics for a System-Wide
Understanding of the Interaction between Tomato
and Cladosporium fulvum
Desalegn Woldesenbet Etalo
Thesis committee
PromotorProf. Dr H.J. Bouwmeester Professor of Plant Physiology Wageningen University
Co-promotorsDr M.H.A.J. Joosten Associate professor, Laboratory of Phytopathology Wageningen University
Dr C.H. de VosSenior researcher, Plant Research International Wageningen University
Other membersProf. Dr G.C. Angenent, Plant Research International, Wageningen University Prof. Dr B.J.C. Cornelissen, University of Amsterdam Dr G. Smant, Wageningen UniversityDr R. Mumm, Plant Research International, Wageningen University
This research was conducted under the auspices of the Graduate School of Experimental Plant Science (EPS)
An Integrated Approach Involving Metabolomics
and Transcriptomics for a System-Wide
Understanding of the Interaction between Tomato
and Cladosporium fulvum
Desalegn Woldesenbet Etalo
Thesissubmitted in fulfilment of the requirement for the degree of doctor
at Wageningen Universityby the authority of the Rector Magnificus
Prof. Dr M.J. Kropff,in the presence of the
Thesis Committee appointed by the Academic Boardto be defended in public
on Thursday 20 March 2014at 11 a.m. in the Aula.
Desalegn Woldesenbet Etalo
An Integrated Approach Involving Metabolomics and Transcriptomics for a System-Wide Understanding of the Interaction between Tomato and Cladosporium fulvum, 272 pages.
PhD thesis Wageningen University, Wageningen, NL (2014)With references, with summary in English, Dutch and Amharic
ISBN 978-94-6173-821-9
Table of contents
Chapter 1General Introduction
7
Chapter 2System-Wide Hypersensitive Response-Associated Transcriptome and Metabolome Reprogramming in Tomato
21
Chapter 3Carbon Economy and the Maintenance of Energy Homeostasis during the Hypersensitive Response in Tomato
101
Chapter 4Genome-Wide Functional Analysis of Wrky Transcription Factors in Resistance of Tomato to Cladosporium fulvum
149
Chapter 5The Metabolic Arms Race Between Tomato and Cladosporium fulvum
183
Chapter 6General Discussion
233
Summary 253
Samenvatting 256
ማጠቃለያ (Amharic Summary) 260
Acknowledgements 262
Curriculum vitae 266
Publication list 267
Education statement 268

General Introduction
1Chapter
8
Chapter 1
The plant immune system The relationship between plants and fungi is often mutualistic, with only a small minority of fungal species breaking the fine balance of cooperation to become pathogens (Fraser, 2004; Holub, 2006). Modern agricultural practices based on monoculture cultivation of crop plants, which are often selected mainly for consumer-desired traits and not for disease resistance, is breaking the co-evolution cycle between plants and fungi and results in versatile pathogens (Dangl et al., 2013). These pathogens use highly adapted invasion strategies that have led to devastating epidemics. The Irish potato famine of the 1840s, caused by the oomycete Phytophthora infestans that causes late blight (Yoshida et al., 2013) and the current wheat stem, leaf and yellow stripe rust epidemics spreading from East Africa to the Indian subcontinent, caused by rust fungi Puccinia graminis and Puccinia striiformis (Singh et al., 2011), illustrate the recurring impact of plant diseases (Dangl et al., 2013).
Plant immunity is based on two interconnected layers that are surveyed by extracellular plasma membrane-localised receptors, being either receptor-like proteins (RLPs) or receptor-like kinases (RLKs), and intracellular receptors, referred to as nucleotide-binding-leucine-rich repeat (NB-LRR) proteins. These immune receptors play a critical role in perceiving non-self components and subsequent mounting of an adequate defence response to invading pathogens (Jones and Dangl, 2006). The first layer is in fact formed by so-called pattern recognition receptors (PRRs) that recognize highly conserved microbe-associated molecular patterns (MAMPs), such as fungal chitin and bacterial flagellin, and their perception leads to the induction of MAMP-triggered immunity (MTI). However, virulent microbes deliver specific effector proteins into the host cells that suppress MTI and cause effector-triggered susceptibility (ETS). Resistant plants in turn will use the second layer of surveillance that allows specific recognition of these effectors and halts pathogen ingress through the activation of effector-triggered immunity (ETI). Generally, MTI and ETI give rise to similar responses, although in most cases ETI is stronger, faster and more robust and often involves localized programmed cell death, referred to as the hypersensitive response (HR) (Tao et al., 2003; Chisholm et al., 2006; Jones and Dangl, 2006; Dodds and Rathjen, 2010; Thomma et al., 2011; Dangl et al., 2013). Successful pathogens will avoid ETI by deletion or mutation of the effector that is perceived by the host and will cause ETS by the action of yet another effector. This continuous battle between plants and pathogens that has been going on for many millennia has played a vital role in shaping the defensive and offensive machinery of plants and pathogens, respectively. This results in hosts and pathogens that show a continuous and rhythmic loss and gain of resistance and virulence, respectively.
General introduction
9
Chapter 1
The interaction between tomato and Cladosporium fulvum; a model for system-wide studies on plant-microbe interactions The Cladosporium fulvum-tomato pathosystem has been shown to be a versatile model system to study the evolutionary arms race between plants and pathogens (Rivas and Thomas, 2005; Stergiopoulos and de Wit, 2009). C. fulvum is a non-obligate biotrophic fungal pathogen that causes leaf mould disease on tomato and the interaction between plant and fungus can be divided into a compatible and an incompatible one, with tomato either being susceptible or resistant to C. fulvum, respectively. The interaction is primarily controlled in a gene-for-gene manner in which Cf resistance genes of tomato, encoding leucine-rich repeat- receptor-like proteins (LRR-RLPs), mediate recognition of avirulence factors (Avrs) of C. fulvum (Joosten and de Wit, 1999; Rivas and Thomas, 2005; Stergiopoulos and de Wit, 2009).
The compatible interaction between tomato and C. fulvum Different races of C. fulvum are defined according to their virulence spectrum on tomato lines harbouring specific Cf resistance genes, and are named according to the resistance genes that they can overcome. For example, C. fulvum race 5, which was used in most of our experiments, successfully colonizes tomato plants expressing either no Cf genes (Cf-0) or the Cf-5 resistance gene (Jones et al., 1994). Thus, race 5 has lost the Avr5 gene, thereby avoiding recognition by the Cf-5 protein. Similarly, C. fulvum race 4 lacks Avr4, thereby allowing successful colonization of Cf-4-expressing tomato, in addition to Cf-0 plants.
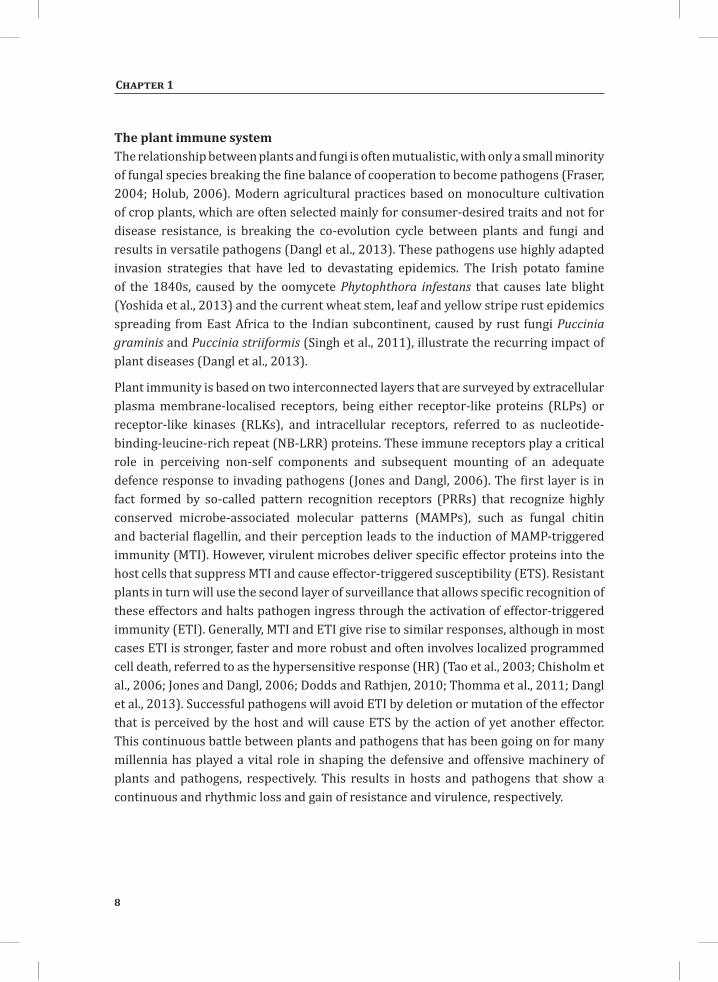
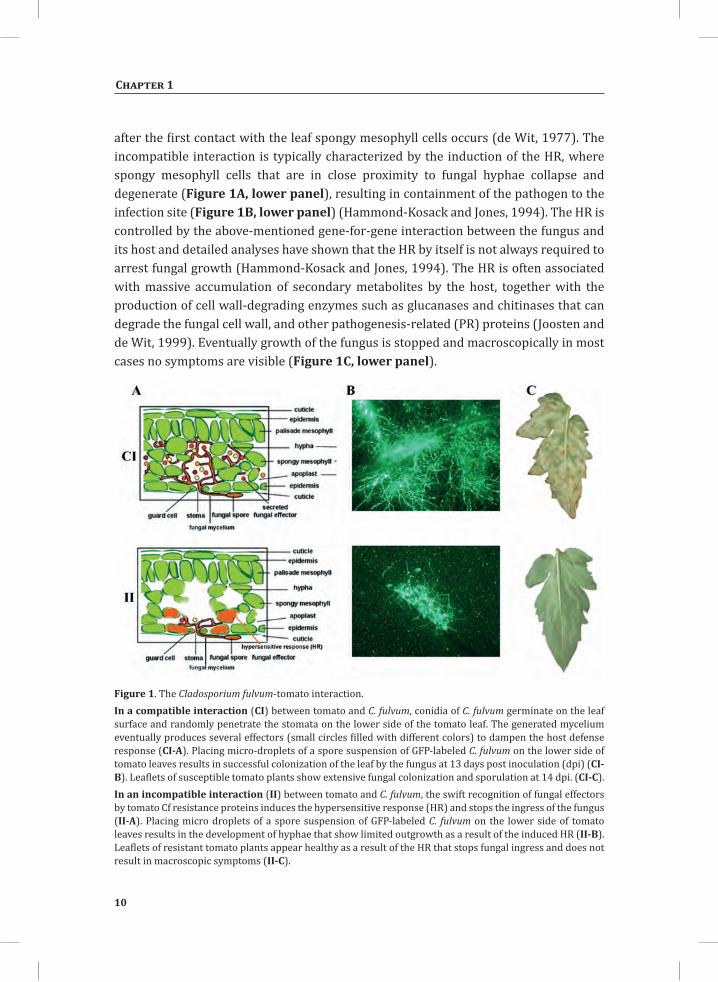
Under conditions of high relative humidity, conidia of C. fulvum germinate on the abaxial side of tomato leaves and generate runner hyphae that grow over the leaf surface and enter the leaf apoplast via the stomata. In a compatible interaction (CI), the fungal hyphae continue to grow between the cells in the spongy mesophyll, without forming haustoria (de Wit, 1977) (Figure 1A, upper panel), and produce various effectors with the aim to dampen the host immune response (Rooney et al., 2005; van den Burg et al., 2006; van Esse et al., 2008; de Jonge et al., 2010). Upon successful colonization (Figure 1B, upper panel), apoplastic sucrose is broken down to glucose and fructose by C. fulvum-encoded invertase and these monosaccharides are converted into mannitol by a fungal mannitol dehydrogenase (Joosten et al., 1990). Conidiophores, which originate from aerial hyphae in the sub-stomatal cavities, emerge through the stomata at approximately 10–12 days post inoculation (dpi) (de Wit, 1977)(Figure 1C, upper panel) and at later stages extensive degeneration of the leaf tissue takes place.
The incompatible interaction between tomato and C. fulvum In an incompatible interaction (II) between tomato and C. fulvum, the fungal hyphae are arrested in their development soon upon penetration of the sub-stomatal cavity,
10
Chapter 1
after the first contact with the leaf spongy mesophyll cells occurs (de Wit, 1977). The incompatible interaction is typically characterized by the induction of the HR, where spongy mesophyll cells that are in close proximity to fungal hyphae collapse and degenerate (Figure 1A, lower panel), resulting in containment of the pathogen to the infection site (Figure 1B, lower panel) (Hammond-Kosack and Jones, 1994). The HR is controlled by the above-mentioned gene-for-gene interaction between the fungus and its host and detailed analyses have shown that the HR by itself is not always required to arrest fungal growth (Hammond-Kosack and Jones, 1994). The HR is often associated with massive accumulation of secondary metabolites by the host, together with the production of cell wall-degrading enzymes such as glucanases and chitinases that can degrade the fungal cell wall, and other pathogenesis-related (PR) proteins (Joosten and de Wit, 1999). Eventually growth of the fungus is stopped and macroscopically in most cases no symptoms are visible (Figure 1C, lower panel).
Figure 1. The Cladosporium fulvum-tomato interaction. In a compatible interaction (CI) between tomato and C. fulvum, conidia of C. fulvum germinate on the leaf surface and randomly penetrate the stomata on the lower side of the tomato leaf. The generated mycelium eventually produces several effectors (small circles filled with different colors) to dampen the host defense response (CI-A). Placing micro-droplets of a spore suspension of GFP-labeled C. fulvum on the lower side of tomato leaves results in successful colonization of the leaf by the fungus at 13 days post inoculation (dpi) (CI-B). Leaflets of susceptible tomato plants show extensive fungal colonization and sporulation at 14 dpi. (CI-C).In an incompatible interaction (II) between tomato and C. fulvum, the swift recognition of fungal effectors by tomato Cf resistance proteins induces the hypersensitive response (HR) and stops the ingress of the fungus (II-A). Placing micro droplets of a spore suspension of GFP-labeled C. fulvum on the lower side of tomato leaves results in the development of hyphae that show limited outgrowth as a result of the induced HR (II-B). Leaflets of resistant tomato plants appear healthy as a result of the HR that stops fungal ingress and does not result in macroscopic symptoms (II-C).
General introduction
11
Chapter 1
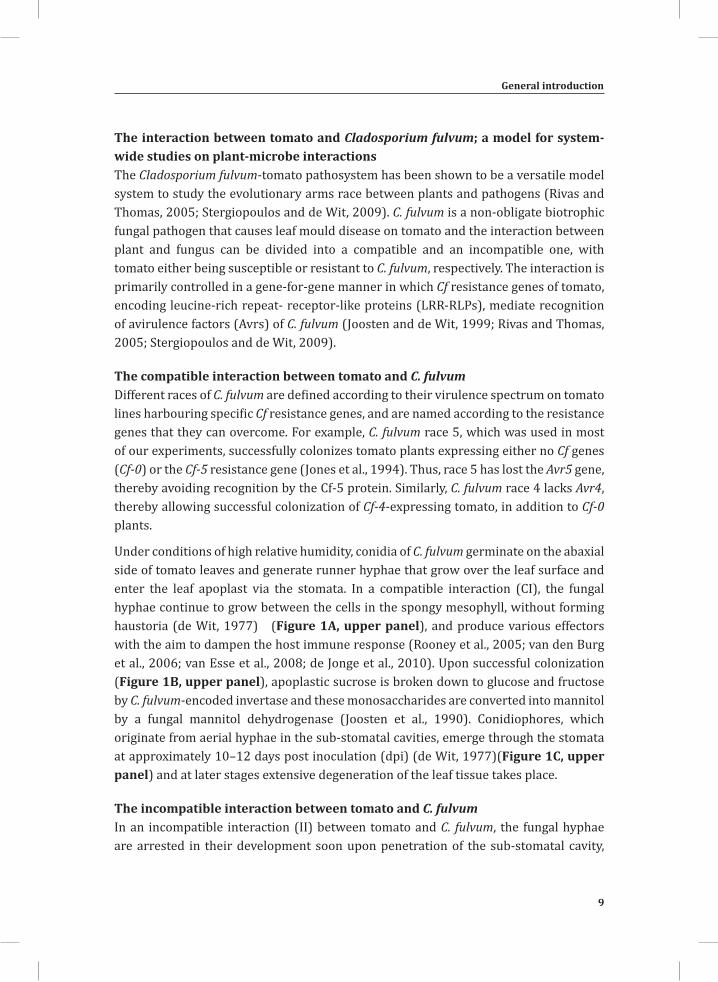
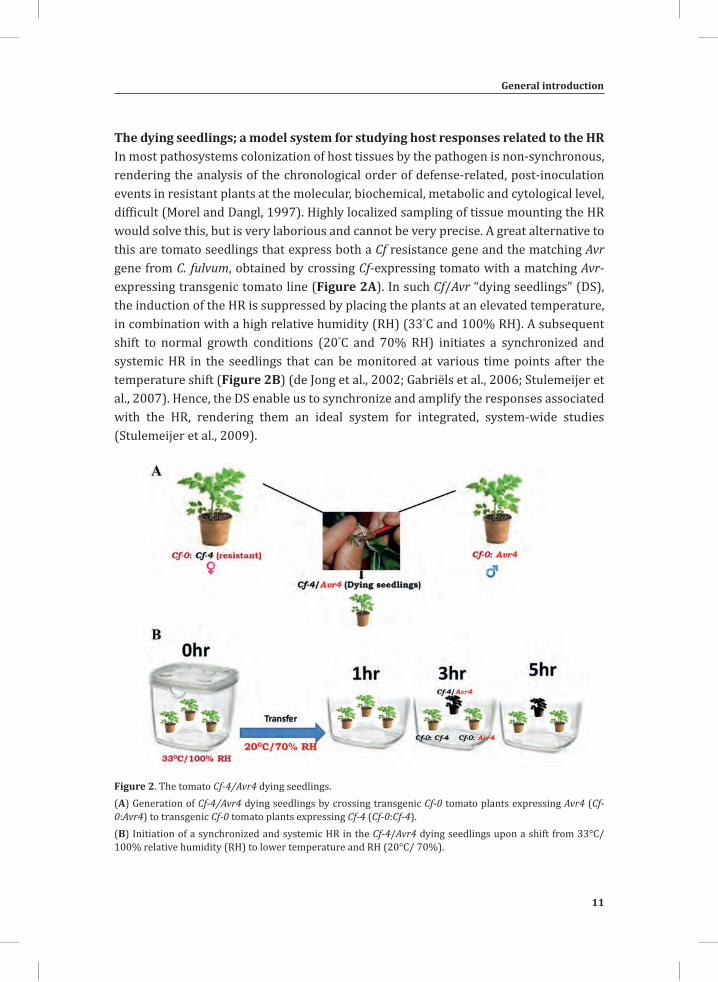
The dying seedlings; a model system for studying host responses related to the HR In most pathosystems colonization of host tissues by the pathogen is non-synchronous, rendering the analysis of the chronological order of defense-related, post-inoculation events in resistant plants at the molecular, biochemical, metabolic and cytological level, difficult (Morel and Dangl, 1997). Highly localized sampling of tissue mounting the HR would solve this, but is very laborious and cannot be very precise. A great alternative to this are tomato seedlings that express both a Cf resistance gene and the matching Avr gene from C. fulvum, obtained by crossing Cf-expressing tomato with a matching Avr-expressing transgenic tomato line (Figure 2A). In such Cf/Avr “dying seedlings” (DS), the induction of the HR is suppressed by placing the plants at an elevated temperature, in combination with a high relative humidity (RH) (33°C and 100% RH). A subsequent shift to normal growth conditions (20°C and 70% RH) initiates a synchronized and systemic HR in the seedlings that can be monitored at various time points after the temperature shift (Figure 2B) (de Jong et al., 2002; Gabriëls et al., 2006; Stulemeijer et al., 2007). Hence, the DS enable us to synchronize and amplify the responses associated with the HR, rendering them an ideal system for integrated, system-wide studies (Stulemeijer et al., 2009).
Figure 2. The tomato Cf-4/Avr4 dying seedlings.(A) Generation of Cf-4/Avr4 dying seedlings by crossing transgenic Cf-0 tomato plants expressing Avr4 (Cf-0:Avr4) to transgenic Cf-0 tomato plants expressing Cf-4 (Cf-0:Cf-4).(B) Initiation of a synchronized and systemic HR in the Cf-4/Avr4 dying seedlings upon a shift from 33°C/ 100% relative humidity (RH) to lower temperature and RH (20°C/ 70%).
12
Chapter 1
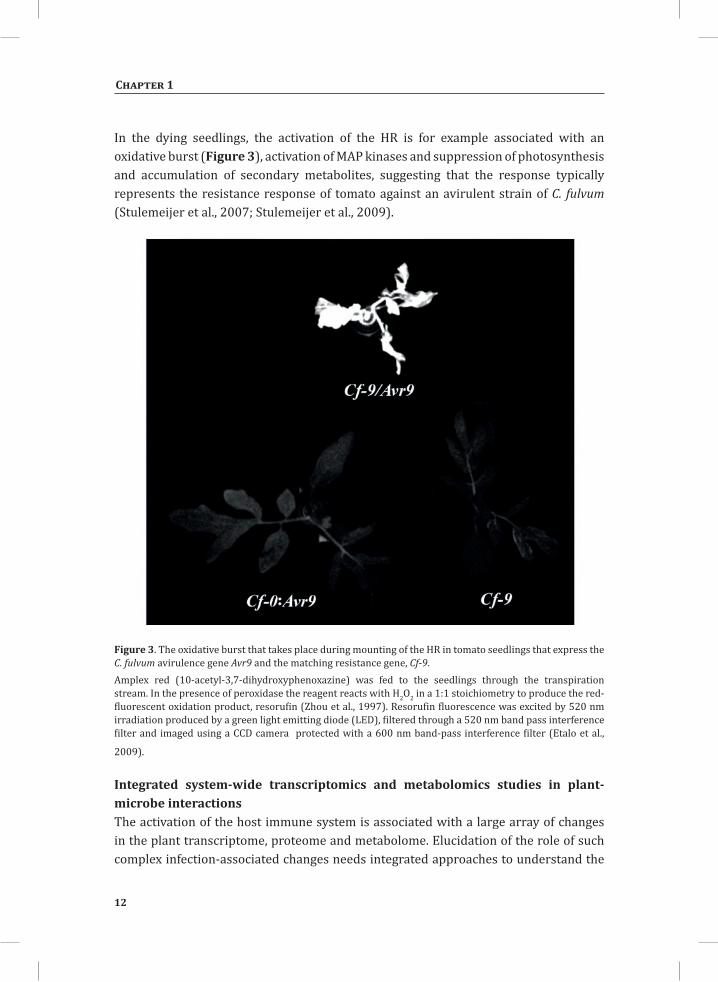
In the dying seedlings, the activation of the HR is for example associated with an oxidative burst (Figure 3), activation of MAP kinases and suppression of photosynthesis and accumulation of secondary metabolites, suggesting that the response typically represents the resistance response of tomato against an avirulent strain of C. fulvum (Stulemeijer et al., 2007; Stulemeijer et al., 2009).
Figure 3. The oxidative burst that takes place during mounting of the HR in tomato seedlings that express the C. fulvum avirulence gene Avr9 and the matching resistance gene, Cf-9.Amplex red (10-acetyl-3,7-dihydroxyphenoxazine) was fed to the seedlings through the transpiration stream. In the presence of peroxidase the reagent reacts with H2O2 in a 1:1 stoichiometry to produce the red-fluorescent oxidation product, resorufin (Zhou et al., 1997). Resorufin fluorescence was excited by 520 nm irradiation produced by a green light emitting diode (LED), filtered through a 520 nm band pass interference filter and imaged using a CCD camera protected with a 600 nm band-pass interference filter (Etalo et al.,
2009).
Integrated system-wide transcriptomics and metabolomics studies in plant-microbe interactionsThe activation of the host immune system is associated with a large array of changes in the plant transcriptome, proteome and metabolome. Elucidation of the role of such complex infection-associated changes needs integrated approaches to understand the
General introduction
13
Chapter 1
underlying mechanisms of plant resistance and strategies used by the pathogen resulting in host susceptibility. Integrated transcriptomics and metabolomics analysis forms a powerful tool to build the relationship between information elements of a system (genes and transcripts) and its functional elements (proteins and metabolites) in cells (Mercke et al., 2004; Li et al., 2010). Recently, the integration of these approaches has shown to be a viable approach in the study of systemic induced resistance in Arabidopsis plants in response to the non-pathogenic rhizobacterium Pseudomonas fluorescens SS101 (van de Mortel et al., 2012). Hence, in my PhD research, an integrated approach involving transcriptomics and metabolomics was used for a system-wide understanding of the interaction between tomato and C. fulvum.
Transcriptomics Transcriptomics, is a tool to analyze the pool of mRNA molecules present in a sample (Zhang et al., 2010). It has been more than a decade since the complete sequence of the human genome was published (Lander et al., 2001). Since then, the advent of next generation DNA sequencing technologies revolutionized genome sequencing and comparative genomics studies that focus on the DNA, which represents the static information for any given organism but does not show changes in response to short-term perturbations. Subtle and short-term changes can be monitored through transcriptomics technologies. Recently, RNA sequencing (RNA-Seq) has emerged as an alternative to classical microarrays for quantitative measurement of the dynamic expression of genes (Ye et al., 2001; James et al., 2002; Marioni et al., 2008). In my PhD study, I used both technologies to profile the dynamic changes in the tomato defense-transcriptome, allowing the identification of genes of which the expression changes during the activation of host defense responses.
MetabolomicsThe plant metabolome is a representation of the small molecules that are present in the various plant tissues and metabolomics is the high-throughput technology that provides a comprehensive and (semi-)quantitative overview of the metabolites present in an organism (Hall, 2006). Unlike the genome, the transcriptome and the proteome, capturing the metabolome from a complex system requires a number of different extraction, separation and analytical techniques. Moreover, in genomics and transcriptomics, the function and structure of unknown genes and transcripts can be predicted based on their sequence similarity with other known genes of the organism or from other species. The genome sequence of the model plant, Arabidopsis thaliana (The-Arabidopsis-Genome-Initiative, 2000) and the presence of mutants and T-DNA insertion lines, for example, have been vital for the identification and functional characterization of genes. This propels the prediction process for unknown genes in other species, which is further supported by new genome sequences, including the recently released tomato genome sequence (Sato et al., 2012). These methodologies, however, are not available for
14
Chapter 1
metabolomics and this hinders the identification of metabolites, rendering the biological interpretation of changes in the metabolome difficult.
In plant-microbe interaction studies, plant metabolomics should provide a substantial contribution to the understanding of the pathosystem, as infection of the plant often results in metabolic changes, which may be important for successful deterrence of the invading pathogen (Dixon, 2001; Allwood et al., 2006; Ward et al., 2010). In general, the plant metabolome can be divided into two, partly blurred categories, primary and secondary metabolites. Primary metabolites are required for growth, development, and reproduction of plants while secondary metabolites are defined as not having a direct role in these primary functions, but to contribute to the interaction of the organism with biotic and abiotic factors in its environment.
Secondary metabolites, which are sometimes also referred to as natural products, are highly diverse and the estimated number of these compounds in the Plant Kingdom exceeds 200,000 (Oldiges et al., 2007). These small molecules are known for a range of biological activities, including insect repellence, protection against excessive UV irradiation and antimicrobial activity (Hammerschmidt, 1999; Dixon, 2001). The latter are categorized as phytoanticipins (pre-formed infection inhibitors) and phytoalexins (induced antimicrobials). However, some compounds may be phytoalexins in one species and phytoanticipins in another (Dixon, 2001). Apart from aspects of plant defense itself, such as cell wall thickening (Huckelhoven, 2007) and production of antimicrobial chemicals (Wink, 1988; Osbourn, 1999; Kliebenstein et al., 2005), it is equally important to understand how microbes in turn manipulate host defense metabolism for their own benefit. Indeed, in response to the inherent resistance mechanisms present in plants, pathogenic bacteria and fungi in turn have developed strategies to breach the plant chemical defense line, for example by secreting phytoalexin-detoxifying enzymes (Ford et al., 1977; Roldan-Arjona et al., 1999; Kaup et al., 2005). Re-programming of both host and microbe metabolism is thus core to a biotrophic relationship and metabolomics approaches can play an important role in the exploration of these phenomena (Allwood et al., 2006; Abu-Nada et al., 2007; Allwood et al., 2008; Ward et al., 2010; Draper et al., 2011).
Integrated transcriptomics and metabolomicsIn some studies, the correlation between protein and mRNA abundance was shown to be non-significant (Gygi et al., 1999) or only very weak (Ideker et al., 2001; Greenbaum et al., 2002; Nie et al., 2008). Several factors have been suggested to determine the observed discrepancy, including the regulation of protein levels by post-translational modification, post-transcriptional regulation of protein synthesis, differences in the half-lives of mRNA and proteins, specific protein degradation, possible functional requirement for protein binding, and significant levels of experimental errors (Greenbaum et al., 2002; Beyer et al., 2004; Park et al., 2005). Hence, the combination of transcriptomics and metabolomics
General introduction
15
Chapter 1
will be a viable approach to monitor the relevant transcriptional changes that impact the metabolome, which in most cases reflect the cellular state of the system. Hence, in this thesis a combined transcriptomics and metabolomics approach was employed to gain a system-wide understanding of the molecular interaction between C. fulvum and tomato, with a primary focus on integration of the different biological levels. This integration of multilayer information should lay the foundation for a more robust statistical integration of the information that is already available to ultimately develop mathematical models to elucidate how cells function at the system level.
Objectives of the thesis
The objectives of this thesis are to gain insight in the system-wide changes occurring during the interaction between tomato and C. fulvum, using metabolomics and transcriptomics. The hypothesis is that the integration of multilayer information allows the identification of important regulators and regulatory mechanisms playing a role during the response of the host to the pathogen. Furthermore, such integrative approaches are anticipated to help unravelling the counter measures taken by pathogens to breach the host defense machinery.
To test these hypotheses, in Chapter 2 the transcriptional and metabolic changes associated with mounting of the hypersensitive response (HR) are studied, using micro-array analysis and metabolomics. For this the dying seedlings that mimic the localized resistance response of tomato plant against C. fulvum (Figure 2) are employed. Based on the information obtained from Chapter 2, in Chapter 3 the HR-associated transcriptional changes are further studied. In this case deep sequencing (RNA-seq) is performed, again during HR development in the Cf/Avr dying seedlings, but now also in resistant and susceptible tomato plants inoculated with C. fulvum. The chapter particularly focuses on processes involved in the regulation of energy homeostasis and carbon economy of the system. These two first experimental chapters contribute to the identification of a number of important regulators of the defense-transcriptome of tomato and using this information, in Chapter 4 a functional characterization of a number of tomato WRKY transcription factors is performed. This class of transcription factors consists of a group of key regulators, some of which are activating and some of which are suppressing the plant immune response. The results of several experiments support the involvement of the various WRKYs in the defence-associated metabolome reprogramming of tomato upon its colonisation by C. fulvum. In Chapter 5, to elucidate the major (bio)chemical changes associated with host resistance and the counter measures that are taken by the fungus, a comprehensive metabolic profiling of resistant and susceptible tomato plants inoculated with C. fulvum is performed. In addition, several C. fulvum enzymes that are involved in the detoxification of antimicrobial tomato metabolites are characterized. In Chapter 6, the work that is described in this thesis is discussed and placed in a broader perspective.
16
Chapter 1
References
Abu-Nada Y, Kushalappa AC, Marshall WD, Al-Mughrabi K, Murphy A (2007) Temporal dynamics of pathogenesis-related metabolites and their plausible pathways of induction in potato leaves following inoculation with Phytophthora infestans. Eur J Plant Pathol 118: 375-391
Allwood JW, Ellis DI, Goodacre R (2008) Metabolomic technologies and their application to the study of plants and plant–host interactions. Physiol. Plant 132: 117-135
Allwood JW, Ellis DI, Heald JK, Goodacre R, Mur LAJ (2006) Metabolomic approaches reveal that phosphatidic and phosphatidyl glycerol phospholipids are major discriminatory non-polar metabolites in responses by Brachypodium distachyon to challenge by Magnaporthe grisea. Plant J 46: 351-368
Beyer A, Hollunder J, Nasheuer HP, Wilhelm T (2004) Post-transcriptional expression regulation in the yeast Saccharomyces cerevisiae on a genomic scale. Mol Cell Proteomics 3: 1083-1092
Chisholm ST, Coaker G, Day B, Staskawicz BJ (2006) Host-microbe interactions: shaping the evolution of the plant immune response. Cell 124: 803-814
Dangl JL, Horvath DM, Staskawicz BJ (2013) Pivoting the plant immune system from dissection to deployment. Science 341: 746-751
de Jong CF, Takken FL, Cai X, de Wit PJGM, Joosten MHAJ (2002) Attenuation of Cf-mediated defense responses at elevated temperatures correlates with a decrease in elicitor-binding sites. Mol Plant-Microbe Interact 15: 1040-1049
de Jonge R, van Esse HP, Kombrink A, Shinya T, Desaki Y, Bours R, van der Krol S, Shibuya N, Joosten MHAJ, Thomma BPHJ (2010) Conserved fungal LysM effector Ecp6 prevents chitin-triggered immunity in plants. Science 329: 953-955
de Wit PJGM (1977) A light and scanning-electron microscopic study of infection of tomato plants by virulent and avirulent races of Cladosporium fulvum. Neth J Plant Path. 83: 109-122
Dixon RA (2001) Natural products and plant disease resistance. Nature 411: 843-847Dodds PN, Rathjen JP (2010) Plant immunity: towards an integrated view of plant-pathogen interactions.
Nat Rev Genet 11: 539-548Draper J, Rasmussen S, Zubair H (2011) Metabolite analysis and metabolomics in the study of biotrophic
interactions between plants and microbes. In Annual Plant Reviews Volume 43. Wiley-Blackwell, pp 25-59
Etalo DW, Harbinson J, van Meeteren U (2009) Could Wound-Induced Xylem Peroxide Contribute to the Postharvest Loss of Hydraulic Conductivity in Stems? Ix International Symposium on Postharvest Quality of Ornamental Plants 847: 287-293
Ford JE, McCance DJ, Drysdale RB (1977) The detoxification of α-tomatine by Fusarium oxysporum f. sp. lycopersici. Phytochemistry 16: 545-546
Fraser CM (2004) Insights into the evolution of phytopathogens. Trends Microbiol 12: 482-483Gabriëls SH, Takken FL, Vossen JH, de Jong CF, Liu Q, Turk SC, Wachowski LK, Peters J, Witsenboer HM,
de Wit PJGM, Joosten MHAJ (2006) cDNA-AFLP combined with functional analysis reveals novel genes involved in the hypersensitive response. Mol Plant-Microbe Interact 19: 567-576
Greenbaum D, Jansen R, Gerstein M (2002) Analysis of mRNA expression and protein abundance data: an approach for the comparison of the enrichment of features in the cellular population of proteins and transcripts. Bioinformatics 18: 585-596
Gygi SP, Rochon Y, Franza BR, Aebersold R (1999) Correlation between protein and mRNA abundance in yeast. Mol Cell Biol 19: 1720-1730
Hall RD (2006) Plant metabolomics: from holistic hope, to hype, to hot topic. New Phytologist 169: 453-468Hammerschmidt R (1999) Phytoalexins: What have we learned after 60 years? Annu Rev Phytopathol 37:
285-306Hammond-Kosack KE, Jones JDG (1994) Incomplete dominance of tomato Cf Genes for resistance to
Cladosporium fulvum. Mol Plant Microbe Interact 7: 58-70Holub EB (2006) Evolution of parasitic symbioses between plants and filamentous microorganisms. Curr
Opin Plant Biol 9: 397-405Huckelhoven R (2007) Cell wall-associated mechanisms of disease resistance and susceptibility. Annu Rev
Phytopathol 45: 101-127
General introduction
17
Chapter 1
Ideker T, Thorsson V, Ranish JA, Christmas R, Buhler J, Eng JK, Bumgarner R, Goodlett DR, Aebersold R, Hood L (2001) Integrated genomic and proteomic analyses of a systematically perturbed metabolic network. Science 292: 929-934
James TC, Campbell SG, Bond UM (2002) Comparative analysis of global gene expression in lager and laboratory yeast strains grown in Wort. P Ieee 90: 1887-1899
Jones DA, Thomas CM, Hammond-Kosack KE, Balintkurti PJ, Jones JDG (1994) Isolation of the tomato Cf-9 gene for resistance to Cladosporium fulvum by transposon tagging. Science 266: 789-793
Jones JDG, Dangl JL (2006) The plant immune system. Nature 444: 323-329Joosten MHAJ, de Wit PJGM (1999) The tomato-Cladosporium fulvum interaction. A versatile experimental
system to study plant-pathogen interactions. Annu Rev Phytopathol 37: 335-367Joosten MHAJ, Hendrickx LJM, de wit PJGM (1990) Carbohydrate-composition of apoplastic fluids isolated
from tomato leaves inoculated with virulent or avirulent races of Cladosporium fulvum (Syn Fulvia fulva). Neth J Plant Pathol 96: 103-112
Kaup O, Gräfen I, Zellermann E-M, Eichenlaub R, Gartemann K-H (2005) Identification of a tomatinase in the tomato-pathogenic actinomycete Clavibacter michiganensis subsp. michiganensis NCPPB382. Mol Plant Microbe Interact 18: 1090-1098
Kliebenstein DJ, Rowe HC, Denby KJ (2005) Secondary metabolites influence Arabidopsis/Botrytis interactions: variation in host production and pathogen sensitivity. Plant J 44: 25-36
Lander ES, Consortium IHGS, Linton LM, Birren B, Nusbaum C, Zody MC, Baldwin J, Devon K, Dewar K, Doyle M, FitzHugh W, Funke R, Gage D, Harris K, Heaford A, Howland J, Kann L, Lehoczky J, LeVine R, McEwan P, McKernan K, Meldrim J, Mesirov JP, Miranda C, Morris W, Naylor J, Raymond C, Rosetti M, Santos R, Sheridan A, Sougnez C, Stange-Thomann N, Stojanovic N, Subramanian A, Wyman D, Rogers J, Sulston J, Ainscough R, Beck S, Bentley D, Burton J, Clee C, Carter N, Coulson A, Deadman R, Deloukas P, Dunham A, Dunham I, Durbin R, French L, Grafham D, Gregory S, Hubbard T, Humphray S, Hunt A, Jones M, Lloyd C, McMurray A, Matthews L, Mercer S, Milne S, Mullikin JC, Mungall A, Plumb R, Ross M, Shownkeen R, Sims S, Waterston RH, Wilson RK, Hillier LW, McPherson JD, Marra MA, Mardis ER, Fulton LA, Chinwalla AT, Pepin KH, Gish WR, Chissoe SL, Wendl MC, Delehaunty KD, Miner TL, Delehaunty A, Kramer JB, Cook LL, Fulton RS, Johnson DL, Minx PJ, Clifton SW, Hawkins T, Branscomb E, Predki P, Richardson P, Wenning S, Slezak T, Doggett N, Cheng JF, Olsen A, Lucas S, Elkin C, Uberbacher E, Frazier M, Gibbs RA, Muzny DM, Scherer SE, Bouck JB, Sodergren EJ, Worley KC, Rives CM, Gorrell JH, Metzker ML, Naylor SL, Kucherlapati RS, Nelson DL, Weinstock GM, Sakaki Y, Fujiyama A, Hattori M, Yada T, Toyoda A, Itoh T, Kawagoe C, Watanabe H, Totoki Y, Taylor T, Weissenbach J, Heilig R, Saurin W, Artiguenave F, Brottier P, Bruls T, Pelletier E, Robert C, Wincker P, Rosenthal A, Platzer M, Nyakatura G, Taudien S, Rump A, Yang HM, Yu J, Wang J, Huang GY, Gu J, Hood L, Rowen L, Madan A, Qin SZ, Davis RW, Federspiel NA, Abola AP, Proctor MJ, Myers RM, Schmutz J, Dickson M, Grimwood J, Cox DR, Olson MV, Kaul R, Raymond C, Shimizu N, Kawasaki K, Minoshima S, Evans GA, Athanasiou M, Schultz R, Roe BA, Chen F, Pan HQ, Ramser J, Lehrach H, Reinhardt R, McCombie WR, de la Bastide M, Dedhia N, Blocker H, Hornischer K, Nordsiek G, Agarwala R, Aravind L, Bailey JA, Bateman A, Batzoglou S, Birney E, Bork P, Brown DG, Burge CB, Cerutti L, Chen HC, Church D, Clamp M, Copley RR, Doerks T, Eddy SR, Eichler EE, Furey TS, Galagan J, Gilbert JGR, Harmon C, Hayashizaki Y, Haussler D, Hermjakob H, Hokamp K, Jang WH, Johnson LS, Jones TA, Kasif S, Kaspryzk A, Kennedy S, Kent WJ, Kitts P, Koonin EV, Korf I, Kulp D, Lancet D, Lowe TM, McLysaght A, Mikkelsen T, Moran JV, Mulder N, Pollara VJ, Ponting CP, Schuler G, Schultz JR, Slater G, Smit AFA, Stupka E, Szustakowki J, Thierry-Mieg D, Thierry-Mieg J, Wagner L, Wallis J, Wheeler R, Williams A, Wolf YI, Wolfe KH, Yang SP, Yeh RF, Collins F, Guyer MS, Peterson J, Felsenfeld A, Wetterstrand KA, Patrinos A, Morgan MJ, Conso IHGS (2001) Initial sequencing and analysis of the human genome. Nature 409: 860-921
Li Y, Zhang Q, Zhang J, Wu L, Qi Y, Zhou JM (2010) Identification of microRNAs involved in pathogen-associated molecular pattern-triggered plant innate immunity. Plant Physiol 152: 2222-2231
Marioni JC, Mason CE, Mane SM, Stephens M, Gilad Y (2008) RNA-seq: an assessment of technical reproducibility and comparison with gene expression arrays. Genome Res 18: 1509-1517
Mercke P, Kappers IF, Verstappen FWA, Vorst O, Dicke M, Bouwmeester HJ (2004) Combined transcript and metabolite analysis reveals genes involved in spider mite induced volatile formation in cucumber plants. Plant Physiol 135: 2012-2024
18
Chapter 1
Morel JB, Dangl JL (1997) The hypersensitive response and the induction of cell death in plants. Cell Death Differ 4: 671-683
Nie L, Wu G, Zhang WW (2008) Statistical application and challenges in global gel-free proteomic analysis by mass spectrometry. Crit Rev Biotechnol 28: 297-307
Oldiges M, Lütz S, Pflug S, Schroer K, Stein N, Wiendahl C (2007) Metabolomics: current state and evolving methodologies and tools. 76: 495-511
Osbourn AE (1999) Antimicrobial phytoprotectants and fungal pathogens: a commentary. Fungal Genet Biol 26: 163-168
Park SJ, Lee SY, Cho J, Kim TY, Lee JW, Park JH, Han MJ (2005) Global physiological understanding and metabolic engineering of microorganisms based on omics studies. Appl Microbiol Biotechnol 68: 567-579
Rivas S, Thomas CM (2005) Molecular interactions between tomato and the leaf mold pathogen Cladosporium fulvum. Annu Rev Phytopathol 43: 395-436
Roldan-Arjona T, Perez-Espinosa A, Ruiz-Rubio M (1999) Tomatinase from Fusarium oxysporum f. sp lycopersici defines a new class of saponinases. Molecular Plant-Microbe Interactions 12: 852-861
Rooney HC, Van’t Klooster JW, van der Hoorn RA, Joosten MHAJ, Jones JD, de Wit PJGM (2005) Cladosporium Avr2 inhibits tomato Rcr3 protease required for Cf-2-dependent disease resistance. Science 308: 1783-1786
Sato S, Tabata S, Hirakawa H, Asamizu E, Shirasawa K, Isobe S, Kaneko T, Nakamura Y, Shibata D, Aoki K, Egholm M, Knight J, Bogden R, Li CB, Shuang Y, Xu X, Pan SK, Cheng SF, Liu X, Ren YY, Wang J, Albiero A, Dal Pero F, Todesco S, Van Eck J, Buels RM, Bombarely A, Gosselin JR, Huang MY, Leto JA, Menda N, Strickler S, Mao LY, Gao S, Tecle IY, York T, Zheng Y, Vrebalov JT, Lee J, Zhong SL, Mueller LA, Stiekema WJ, Ribeca P, Alioto T, Yang WC, Huang SW, Du YC, Zhang ZH, Gao JC, Guo YM, Wang XX, Li Y, He J, Li CY, Cheng ZK, Zuo JR, Ren JF, Zhao JH, Yan LH, Jiang HL, Wang B, Li HS, Li ZJ, Fu FY, Chen BT, Han B, Feng Q, Fan DL, Wang Y, Ling HQ, Xue YBA, Ware D, McCombie WR, Lippman ZB, Chia JM, Jiang K, Pasternak S, Gelley L, Kramer M, Anderson LK, Chang SB, Royer SM, Shearer LA, Stack SM, Rose JKC, Xu YM, Eannetta N, Matas AJ, McQuinn R, Tanksley SD, Camara F, Guigo R, Rombauts S, Fawcett J, Van de Peer Y, Zamir D, Liang CB, Spannagl M, Gundlach H, Bruggmann R, Mayer K, Jia ZQ, Zhang JH, Ye ZBA, Bishop GJ, Butcher S, Lopez-Cobollo R, Buchan D, Filippis I, Abbott J, Dixit R, Singh M, Singh A, Pal JK, Pandit A, Singh PK, Mahato AK, Dogra V, Gaikwad K, Sharma TR, Mohapatra T, Singh NK, Causse M, Rothan C, Schiex T, Noirot C, Bellec A, Klopp C, Delalande C, Berges H, Mariette J, Frasse P, Vautrin S, Zouine M, Latche A, Rousseau C, Regad F, Pech JC, Philippot M, Bouzayen M, Pericard P, Osorio S, del Carmen AF, Monforte A, Granell A, Fernandez-Munoz R, Conte M, Lichtenstein G, Carrari F, De Bellis G, Fuligni F, Peano C, Grandillo S, Termolino P, Pietrella M, Fantini E, Falcone G, Fiore A, Giuliano G, Lopez L, Facella P, Perrotta G, Daddiego L, Bryan G, Orozco M, Pastor X, Torrents D, van Schriek KNVMGM, Feron RMC, van Oeveren J, de Heer P, daPonte L, Jacobs-Oomen S, Cariaso M, Prins M, van Eijk MJT, Janssen A, van Haaren MJJ, Jo SH, Kim J, Kwon SY, Kim S, Koo DH, Lee S, Hur CG, Clouser C, Rico A, Hallab A, Gebhardt C, Klee K, Jocker A, Warfsmann J, Gobel U, Kawamura S, Yano K, Sherman JD, Fukuoka H, Negoro S, Bhutty S, Chowdhury P, Chattopadhyay D, Datema E, Smit S, Schijlen EWM, van de Belt J, van Haarst JC, Peters SA, van Staveren MJ, Henkens MHC, Mooyman PJW, Hesselink T, van Ham RCHJ, Jiang GY, Droege M, Choi D, Kang BC, Kim BD, Park M, Kim S, Yeom SI, Lee YH, Choi YD, Li GC, Gao JW, Liu YS, Huang SX, Fernandez-Pedrosa V, Collado C, Zuniga S, Wang GP, Cade R, Dietrich RA, Rogers J, Knapp S, Fei ZJ, White RA, Thannhauser TW, Giovannoni JJ, Botella MA, Gilbert L, Gonzalez R, Goicoechea JL, Yu Y, Kudrna D, Collura K, Wissotski M, Wing R, Schoof H, Meyers BC, Gurazada AB, Green PJ, Mathur S, Vyas S, Solanke AU, Kumar R, Gupta V, Sharma AK, Khurana P, Khurana JP, Tyagi AK, Dalmay T, Mohorianu I, Walts B, Chamala S, Barbazuk WB, Li JP, Guo H, Lee TH, Wang YP, Zhang D, Paterson AH, Wang XY, Tang HB, Barone A, Chiusano ML, Ercolano MR, D’Agostino N, Di Filippo M, Traini A, Sanseverino W, Frusciante L, Seymour GB, Elharam M, Fu Y, Hua A, Kenton S, Lewis J, Lin SP, Najar F, Lai HS, Qin BF, Qu CM, Shi RH, White D, White J, Xing YB, Yang KQ, Yi J, Yao ZY, Zhou LP, Roe BA, Vezzi A, D’Angelo M, Zimbello R, Schiavon R, Caniato E, Rigobello C, Campagna D, Vitulo N, Valle G, Nelson DR, De Paoli E, Szinay D, de Jong HH, Bai YL, Visser RGF, Lankhorst RMK, Beasley H, McLaren K, Nicholson C, Riddle C, Gianese G, Consortium TG (2012) The tomato genome sequence provides insights into fleshy fruit evolution. Nature 485: 635-641
General introduction
19
Chapter 1
Singh RP, Hodson DP, Huerta-Espino J, Jin Y, Bhavani S, Njau P, Herrera-Foessel S, Singh PK, Singh S, Govindan V (2011) The Emergence of Ug99 Races of the Stem Rust Fungus is a Threat to World Wheat Production. Annu Rev Phytopathol 49: 465-481
Stergiopoulos I, de Wit PJGM (2009) Fungal Effector Proteins. In Annual Review of Phytopathology, Vol 47, pp 233-263
Stulemeijer IJ, Joosten MHAJ, Jensen ON (2009) Quantitative phosphoproteomics of tomato mounting a hypersensitive response reveals a swift suppression of photosynthetic activity and a differential role for hsp90 isoforms. J Proteome Res 8: 1168-1182
Stulemeijer IJS, Stratmann JW, Joosten MHAJ (2007) Tomato mitogen-activated protein kinases LeMPK1, LeMPK2, and LeMPK3 are activated during the Cf-4/Avr4-induced hypersensitive response and have distinct phosphorylation specificities. Plant Physiol 144: 1481-1494
Tao Y, Xie ZY, Chen WQ, Glazebrook J, Chang HS, Han B, Zhu T, Zou GZ, Katagiri F (2003) Quantitative nature of Arabidopsis responses during compatible and incompatible interactions with the bacterial pathogen Pseudomonas syringae. Plant Cell 15: 317-330
The-Arabidopsis-Genome-Initiative (2000) Analysis of the genome sequence of the flowering plant Arabidopsis thaliana. Nature 408: 796-815
Thomma BPHJ, Nurnberger T, Joosten MHAJ (2011) Of PAMPs and effectors: the blurred PTI-ETI dichotomy. Plant Cell 23: 4-15
van de Mortel JE, de Vos RC, Dekkers E, Pineda A, Guillod L, Bouwmeester K, van Loon JJ, Dicke M, Raaijmakers JM (2012) Metabolic and transcriptomic changes induced in Arabidopsis by the rhizobacterium Pseudomonas fluorescens SS101. Plant Physiol 160: 2173-2188
van den Burg HA, Harrison SJ, Joosten MHAJ, Vervoort J, de Wit PJGM (2006) Cladosporium fulvum Avr4 protects fungal cell walls against hydrolysis by plant chitinases accumulating during infection. Mol. Plant-Microbe Interact 19: 1420-1430
van Esse HP, van’t Klooster JW, Bolton MD, Yadeta KA, van Baarlen P, Boeren S, Vervoort J, de Wit PJGM, Thomma BPHJ (2008) The Cladosporium fulvum virulence protein Avr2 inhibits host proteases required for basal defense. Plant Cell 20: 1948-1963
Ward JL, Forcat S, Beckmann M, Bennett M, Miller SJ, Baker JM, Hawkins ND, Vermeer CP, Lu C, Lin W, Truman WM, Beale MH, Draper J, Mansfield JW, Grant M (2010) The metabolic transition during disease following infection of Arabidopsis thaliana by Pseudomonas syringae pv. tomato. Plant J
Wink M (1988) Plant-breeding importance of plant secondary metabolites for protection against pathogens and herbivores. Theor Appl Genet 75: 225-233
Ye RW, Wang T, Bedzyk L, Croker KM (2001) Applications of DNA microarrays in microbial systems. J Microbiol Meth 47: 257-272
Yoshida K, Schuenemann VJ, Cano LM, Pais M, Mishra B, Sharma R, Lanz C, Martin FN, Kamoun S, Krause J, Thines M, Weigel D, Burbano HA, Baulcombe D (2013) The rise and fall of the Phytophthora infestans lineage that triggered the Irish potato famine. Elife 2
Zhang W, Li F, Nie L (2010) Integrating multiple ‘omics’ analysis for microbial biology: application and methodologies. Microbiology 156: 287-301
Zhou M, Diwu Z, Panchuk-Voloshina N, Haugland RP (1997) A stable nonfluorescent derivative of resorufin for the fluorometric determination of trace hydrogen peroxide: applications in detecting the activity of phagocyte NADPH oxidase and other oxidases. Anal Biochem 253:162–168


System-Wide Hypersensitive Response-Associated Transcriptome
and Metabolome Reprogramming in Tomato
Desalegn W. Etalo1,,4Ω, Iris J.E. Stulemeijer3,6, H. Peter van Esse3, Ric C.H. de Vos2,4,5, Harro J. Bouwmeester1,4* and Matthieu H.A.J. Joosten3,4,5 1Laboratory of Plant Physiology, Wageningen University, 6708 PB Wageningen, the Netherlands. 2 Plant Research International Bioscience, Wageningen University, 6708 PB Wageningen, the Netherlands.3Laboratory of Phytopathology, Wageningen University, 6708 PB Wageningen, the Netherlands 4 Centre for BioSystems Genomics, 6700 AB Wageningen, the Netherlands.5 Netherlands Metabolomics Centre, Einsteinweg 55, 2333 CC Leiden, the Netherlands.6 Present address: The Netherlands Cancer Institute, Plesmanlaan 121, 1066 CX Amsterdam, The Netherlands. ΩCurrent address: Plant Research International, Bioscience, Wageningen University, Wageningen, The Netherlands*Author for correspondence ([email protected]).
Published as Etalo et al., (2013) Plant Physiology 162: 1599-617.
2Chapter
22
Chapter 2
Abstract
The hypersensitive response (HR) is considered to be the hallmark of the resistance response of plants to pathogens. To study HR-associated transcriptome and metabolome reprogramming in tomato (Solanum lycopersicum), we used plants that express both a resistance gene to Cladosporium fulvum and the matching avirulence gene of this pathogen. In these plants indeed massive reprogramming occurred and we found that the HR and associated processes are highly energy-demanding. Ubiquitin-dependent protein degradation, hydrolysis of sugars, as well as lipid catabolism are used as alternative sources of amino acids, energy and carbon skeletons, respectively. We observed strong accumulation of secondary metabolites, such as hydroxycinnamic acid amides. Co-regulated expression of WRKY transcription factors and genes known to be involved in the HR, in addition to a strong enrichment of the W-box WRKY binding motif in the promoter sequences of the co-regulated genes, point to WRKYs as the most prominent orchestrators of the HR. Our study has revealed several novel HR-related genes and reverse genetics tools will allow to understand the role of each individual component in the HR.
HR-associated transcriptome and metabolome changes
23
Chapter 2
Introduction
Unlike animals, plants do not have a specialized adaptive immune system that recognizes and directly attacks and destroys infectious agents. Instead, plants are endowed with a broad range of sophisticated and efficient innate immunity mechanisms that enable them to recognize and restrain a plethora of pathogenic microbes in their natural habitat (Jones and Dangl, 2006). Plants carry so-called pattern recognition receptors (PRRs) that recognize conserved structural molecules of pathogens, referred to as pathogen-associated molecular patterns (PAMPs), leading to PAMP-triggered immunity (PTI). Invading pathogens, in their turn, secrete virulence proteins (so-called effectors) to suppress PTI, leading to effector-triggered susceptibility (ETS). As a response to this, plants have evolved resistance (R) proteins that recognize these effectors rendering them avirulence factors (Avrs), and subsequently mediate effector-triggered immunity (ETI). In fact, PTI and ETI function in a similar way and both types of immunity are based on the activation of immune receptors that trigger a level of defense that is sufficient to stop colonization by the pathogen (DeYoung and Innes, 2006; Jones and Dangl, 2006; Postel and Kemmerling, 2009; Dodds and Rathjen, 2010; Thomma et al., 2011). The innate immune response of plants often culminates in the hypersensitive response (HR). This particular response, which is considered to be one of the hallmarks of the immunity of plants to pathogens, involves programmed cell death (PCD) and occurs at the site of pathogen entry, resulting in efficient containment of the pathogen (Lam et al., 2001).
The interaction between tomato (Solanum lycopersicum) and the biotrophic extracellular fungus Cladosporium fulvum is a model pathosystem which is characterized as a typical gene-for-gene interaction, in which C. fulvum (Cf) resistance proteins of tomato mediate specific recognition of Avrs of the fungus (de Wit and Joosten, 1999; Rivas and Thomas, 2005; Thomma et al., 2005). In this interaction, the HR is one of the distinctive responses of resistant tomato plants to avirulent strains of the fungus. In most studied pathosystems, pathogen infection is non-synchronous, rendering the chronological ordering of defense-related post-infection events in resistant plants at the molecular, biochemical, metabolic and cytological level difficult (Morel and Dangl, 1997). To obtain insight into the global transcriptome and metabolome reprogramming that occurs in tomato when mounting the HR we studied tomato plants that express both a Cf resistance gene and the matching Avr gene from the fungus, obtained by crossing Cf-expressing tomato with an Avr-expressing tomato line. In such Cf/Avr “dying seedlings” (DS), the induction of the HR can be suppressed at an elevated temperature and high relative humidity (RH) (33°C and 100 % RH). A subsequent shift to normal growth conditions (20°C and 70 % RH) initiates a synchronized and systemic induction of the HR in the seedlings (de Jong et al., 2002; Gabriëls et al., 2006; Stulemeijer et al.,
24
Chapter 2
2007). In contrast, inoculation of Cf-expressing tomato plants with C. fulvum carrying the matching Avr gene results in an HR that is restricted to only a limited number of cells and which is by far not synchronized, which hampers research towards direct and small local effects. Hence, the DS enable us to synchronize and amplify the responses associated with the HR.
Here we performed transcriptome and metabolome profiling of DS expressing both Cf-4 and Avr4, as compared to the parental lines expressing either Cf-4 or Avr4, at various time points after the shift to the permissive condition of 20°C and 70 % RH. Unbiased transcriptome- and metabolome-wide approaches allow to investigate the behavior and relationships between different elements of a particular biological system (Schneider and Collmer, 2010). With the right tools, these approaches allow visualization of the underlying biological processes, leading to a better insight into the biology of the host cells while the plant is mounting defense to the invading pathogen (Bolton et al., 2008; van Baarlen et al., 2008; van Esse et al., 2008; van Esse et al., 2009; Hanssen et al., 2011). We used the Affymetrix® Tomato Genome Array to study changes in the global gene expression profiles in the DS as compared to their parental lines. In addition, we employed untargeted metabolomics, using GC-TOF and LC-PDA-QTOF mass spectrometry for profiling polar primary metabolites (PPM) and semi-polar secondary metabolites (SPSM) of the plant material, respectively. We analyzed and explored the datasets with various bioinformatics and statistics tools to identify major, system-wide transcriptome and metabolome reprogramming events associated with mounting of the HR. We found that the DS undergo a vast and coordinated reprogramming of their transcriptome within several hours after the shift to permissive conditions, on the one hand to induce the HR and on the other hand to control it. We revealed specific interrelationships of various metabolites associated with the HR and a critical role of energy homeostasis during mounting of the HR. Furthermore, we uncover major regulators and regulatory mechanisms of the HR in these tomato plants mounting a synchronous and systemic immune response.
Results
Hypersensitive Response-Associated Global Changes in Gene Expression in Tomato Seedlings The hierarchical cluster analysis (HCA) presented in Figure 1A provides an overview of the relative expression profiles of the genes that were interrogated by the Affymetrix® tomato microarrays in response to transferring the seedlings to environmental conditions permissive for HR. For each time point, the profiles of three independent biological replicates are shown. Before HR induction (t = 0 hr), the overall gene
HR-associated transcriptome and metabolome changes
25
Chapter 2
expression profile of the dying seedlings (DS) compared to a 1:1 mixture of their parental lines (PLS; see Materials and Methods) is very similar. At this stage, in both the DS and PLS the majority of the genes with relatively high expression appear to be associated with the initially relatively high temperature of 33°C, as their expression decreases within 1 hr after the shift to 20°C (Figure 1A, yellow-boxed gene cluster marked 0_U). This cluster represents a large number of genes, including some of the major marker genes for heat stress, such as genes encoding heat shock proteins (HSPs), heat stress-associated (HAS) proteins, heat shock protein-binding proteins, DNAJ heat shock proteins and universal stress proteins (USPs). Unlike the greater part of the genes in this cluster, which are further down-regulated at 3 and 5 hr, most of the HSPs show up-regulation at 5 hr after the temperature shift in the DS, when compared to the PLS (Supplemental Table S1).
Upon shifting the plants from 33°C to 20°C, within 1 hr moderate changes in gene expression were observed which for the greater part involve slight up-regulation of sets of genes in the DS compared to the PLS. This up-regulation becomes much more pronounced at 3 hr and 5 hr after the temperature shift (Figure 1A, yellow boxes marked 35_U1 and 35_U2). In contrast, gene set 35_D is down-regulated in the DS compared to the PLS. Figure 1B provides an overview of the numbers of genes that are either significantly up- or down-regulated in the DS compared to the PLS at t = 0 hr (33°C/100 % RH) and the different time points after the shift to 20°C/70 % RH, based on the averages between the three biological replicates for the individual time points. From the 10,219 genes represented on the tomato genome array, a total of 1,152 genes (11.3 %) shows differential regulation (a fold change (FC) > 2 and P-value < 0.05), at least under one of the conditions analyzed. Of these genes, 732 genes are up-regulated and 420 genes are down-regulated in the DS when compared to the PLS, representing about 7.2 % and 4.1 % of the total number of genes represented on the array, respectively (Figure 1B).
The rescue temperature of 33°C, in combination with 100 % RH, efficiently suppresses the expression of the majority of the defense-related genes (Figure 1A, yellow-boxed clusters 0_D1 and 0_D2) (Gabriëls et al., 2006; Stulemeijer et al., 2007). However, in the DS there are six genes that consistently show a higher expression compared to the PLS at all time points (Figure 1B, upper panel (0, 1, 3, 5)). These six genes encode a basic endo-chitinase, an acidic 26 kD endo-chitinase, a glycine-rich protein, a photo assimilate-responsive protein (PAR), a disease resistance-responsive family protein and aquaporin NIP1.1, which have all been reported to be involved in the response of plants to biotic stress (Margolles-Clark et al., 1996; Bienert et al., 2007; Hong et al., 2007; Gomes et al., 2009; Mangeon et al., 2010). This implicates that in the DS some level of defense is already induced before the temperature shift without the execution of the HR. One hour after the shift to 20°C, 81 genes show differential regulation in the DS
26
Chapter 2
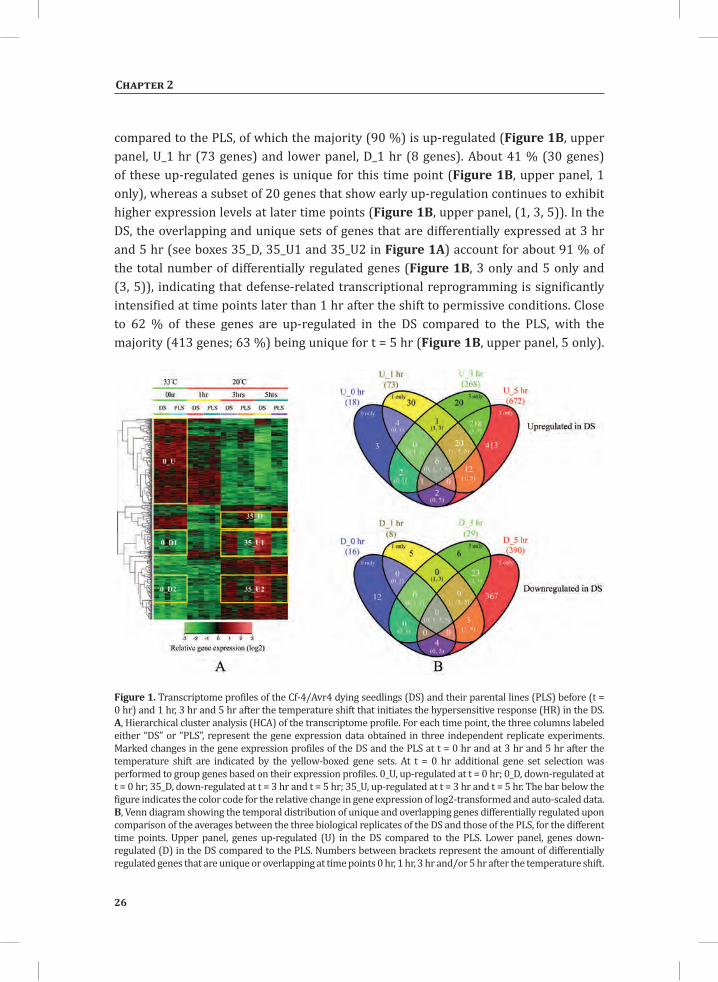
compared to the PLS, of which the majority (90 %) is up-regulated (Figure 1B, upper panel, U_1 hr (73 genes) and lower panel, D_1 hr (8 genes). About 41 % (30 genes) of these up-regulated genes is unique for this time point (Figure 1B, upper panel, 1 only), whereas a subset of 20 genes that show early up-regulation continues to exhibit higher expression levels at later time points (Figure 1B, upper panel, (1, 3, 5)). In the DS, the overlapping and unique sets of genes that are differentially expressed at 3 hr and 5 hr (see boxes 35_D, 35_U1 and 35_U2 in Figure 1A) account for about 91 % of the total number of differentially regulated genes (Figure 1B, 3 only and 5 only and (3, 5)), indicating that defense-related transcriptional reprogramming is significantly intensified at time points later than 1 hr after the shift to permissive conditions. Close to 62 % of these genes are up-regulated in the DS compared to the PLS, with the majority (413 genes; 63 %) being unique for t = 5 hr (Figure 1B, upper panel, 5 only).
Figure 1. Transcriptome profiles of the Cf-4/Avr4 dying seedlings (DS) and their parental lines (PLS) before (t = 0 hr) and 1 hr, 3 hr and 5 hr after the temperature shift that initiates the hypersensitive response (HR) in the DS. A, Hierarchical cluster analysis (HCA) of the transcriptome profile. For each time point, the three columns labeled either “DS” or “PLS”, represent the gene expression data obtained in three independent replicate experiments. Marked changes in the gene expression profiles of the DS and the PLS at t = 0 hr and at 3 hr and 5 hr after the temperature shift are indicated by the yellow-boxed gene sets. At t = 0 hr additional gene set selection was performed to group genes based on their expression profiles. 0_U, up-regulated at t = 0 hr; 0_D, down-regulated at t = 0 hr; 35_D, down-regulated at t = 3 hr and t = 5 hr; 35_U, up-regulated at t = 3 hr and t = 5 hr. The bar below the figure indicates the color code for the relative change in gene expression of log2-transformed and auto-scaled data. B, Venn diagram showing the temporal distribution of unique and overlapping genes differentially regulated upon comparison of the averages between the three biological replicates of the DS and those of the PLS, for the different time points. Upper panel, genes up-regulated (U) in the DS compared to the PLS. Lower panel, genes down-regulated (D) in the DS compared to the PLS. Numbers between brackets represent the amount of differentially regulated genes that are unique or overlapping at time points 0 hr, 1 hr, 3 hr and/or 5 hr after the temperature shift.
HR-associated transcriptome and metabolome changes
27
Chapter 2
In addition to a large set of up-regulated genes at t = 5 hr (U_5 hr; 672 genes), there is also a large number of down-regulated genes at this time point (397, from which 367 are even unique for t = 5 hr) (Figure 1B, lower panel, D_5 hr and 5 only, respectively).
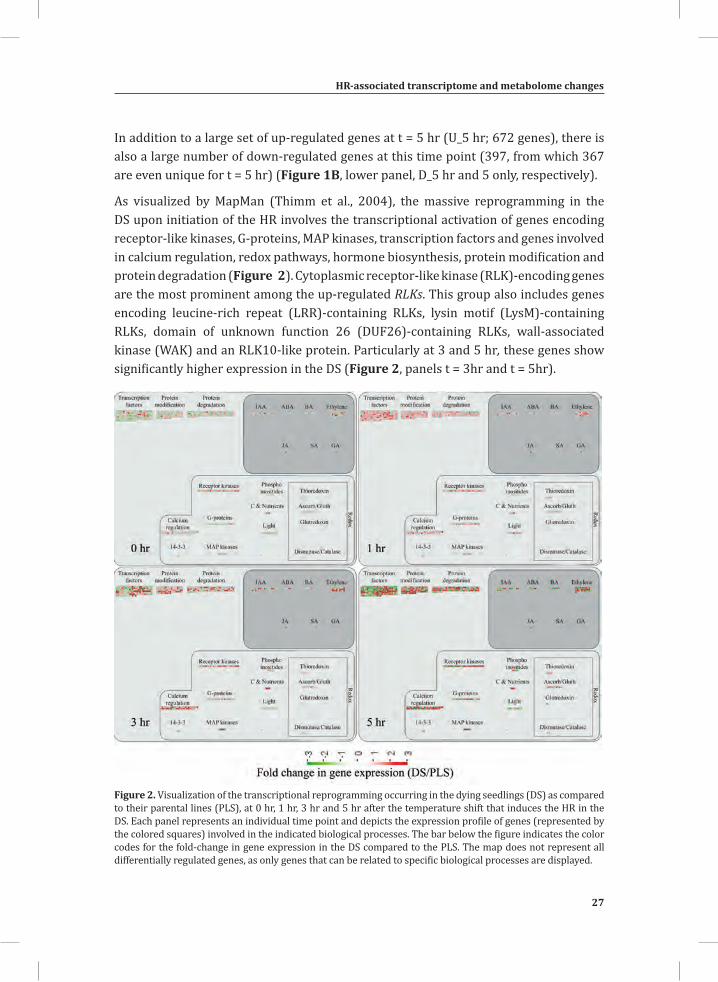
As visualized by MapMan (Thimm et al., 2004), the massive reprogramming in the DS upon initiation of the HR involves the transcriptional activation of genes encoding receptor-like kinases, G-proteins, MAP kinases, transcription factors and genes involved in calcium regulation, redox pathways, hormone biosynthesis, protein modification and protein degradation (Figure 2). Cytoplasmic receptor-like kinase (RLK)-encoding genes are the most prominent among the up-regulated RLKs. This group also includes genes encoding leucine-rich repeat (LRR)-containing RLKs, lysin motif (LysM)-containing RLKs, domain of unknown function 26 (DUF26)-containing RLKs, wall-associated kinase (WAK) and an RLK10-like protein. Particularly at 3 and 5 hr, these genes show significantly higher expression in the DS (Figure 2, panels t = 3hr and t = 5hr).
Figure 2. Visualization of the transcriptional reprogramming occurring in the dying seedlings (DS) as compared to their parental lines (PLS), at 0 hr, 1 hr, 3 hr and 5 hr after the temperature shift that induces the HR in the DS. Each panel represents an individual time point and depicts the expression profile of genes (represented by the colored squares) involved in the indicated biological processes. The bar below the figure indicates the color codes for the fold-change in gene expression in the DS compared to the PLS. The map does not represent all differentially regulated genes, as only genes that can be related to specific biological processes are displayed.
28
Chapter 2
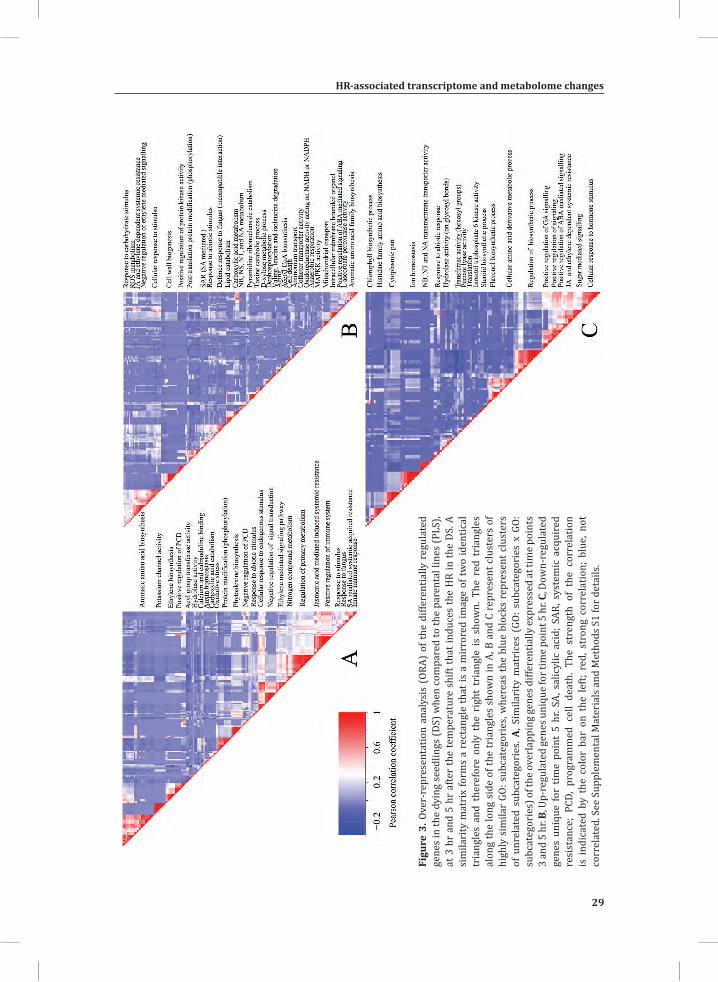
Over-Representation Analysis of Differentially Regulated Gene Sets Over-representation analysis (ORA) of genes within the up- and down-regulated categories (Figure 1B) allows making a temporal dissection of the different processes that occur upon mounting of the HR. ORA on gene sets that showed differential regulation at 3 hr and 5 hr after initiating the HR produced a vast list of significantly enriched or under-represented gene ontology (GO): subcategories. To visualize these lists of categories and to reduce the high level of redundancy, we built a similarity matrix using the (Gene x GO: subcategory) matrix, which is an output of GeneTrail software (Backes et al., 2007). In the (Gene x GO: subcategory) matrix, a differentially regulated gene gets a score of 1 when it belongs to a particular functional category, if not its score is 0. Subsequently, the resulting (0, 1) matrix was used to produce a set of manageable “GO: subcategory meta-clusters”, by comparing two GO: subcategories for the characteristic presence of a gene. In such an analysis, the high redundancy level of the GO: annotation is significantly reduced (see Supplemental Materials and Methods S1 for more details). In the panels that are shown, redundant GO: subcategories that have high correlation are indicated in red and fall along the diagonal axis of the similarity matrix (Figure 3).
ORA on the set of genes that show early transcriptional activation upon HR induction (Figure 1B, top panel, U_1 hr, 73 genes), revealed some significantly over-represented GO: subcategories, such as valine, leucine and isoleucine degradation, oxido-reductase activity, response to chemical stimulus, secondary metabolism and response to stimulus (Supplemental Table S2). At time points t = 3 hr and t = 5 hr, there is massive transcriptional reprogramming in the DS. ORA on the 218 overlapping up-regulated genes at these time points (Figure 1B, upper panel, (3, 5)) resulted in 226 significantly enriched GO: subcategories and a similarity matrix analysis on these subcategories produced 25 distinct meta-clusters (Figure 3A). Interestingly, functional categories associated with signal perception, signal transduction and activated defense responses are among these meta-clusters. Examples are sets of up-regulated genes associated with aromatic amino acid biosynthesis (phenylalanine and tyrosine), ethylene biosynthesis and signaling, calcium/calmodulin-dependent signaling, protein modification (phosphorylation), phytoalexin biosynthesis, and positive as well as negative regulation of programmed cell death (PCD) (Figure 3A).
HR-associated transcriptome and metabolome changes
29
Chapter 2
Figu
re 3
. Ove
r-re
pres
enta
tion
anal
ysis
(OR
A) o
f the
diff
eren
tially
reg
ulat
ed
gene
s in
the
dyin
g se
edlin
gs (D
S) w
hen
com
pare
d to
the
pare
ntal
line
s (P
LS),
at 3
hr
and
5 hr
afte
r th
e te
mpe
ratu
re s
hift
that
indu
ces
the
HR
in th
e DS
. A
sim
ilari
ty m
atri
x fo
rms
a re
ctan
gle
that
is a
mir
rore
d im
age
of tw
o id
entic
al
tria
ngle
s an
d th
eref
ore
only
the
rig
ht t
rian
gle
is s
how
n. T
he r
ed t
rian
gles
al
ong
the
long
sid
e of
the
tria
ngle
s sh
own
in A
, B a
nd C
rep
rese
nt c
lust
ers
of
high
ly s
imila
r GO
: sub
cate
gori
es, w
here
as th
e bl
ue b
lock
s re
pres
ent c
lust
ers
of u
nrel
ated
sub
cate
gori
es. A
, Sim
ilari
ty m
atri
ces
(GO:
sub
cate
gori
es x
GO:
su
bcat
egor
ies)
of t
he o
verl
appi
ng g
enes
diff
eren
tially
expr
esse
d at
tim
e po
ints
3
and
5 hr
. B, U
p-re
gula
ted
gene
s uni
que
for t
ime
poin
t 5 h
r. C,
Dow
n-re
gula
ted
gene
s un
ique
for
time
poin
t 5
hr. S
A, s
alic
ylic
aci
d; S
AR, s
yste
mic
acq
uire
d re
sist
ance
; PC
D, p
rogr
amm
ed c
ell
deat
h. T
he s
tren
gth
of t
he c
orre
latio
n is
ind
icat
ed b
y th
e co
lor
bar
on t
he l
eft;
red,
str
ong
corr
elat
ion;
blu
e, n
ot
corr
elat
ed. S
ee S
uppl
emen
tal M
ater
ials
and
Met
hods
S1
for d
etai
ls.
30
Chapter 2
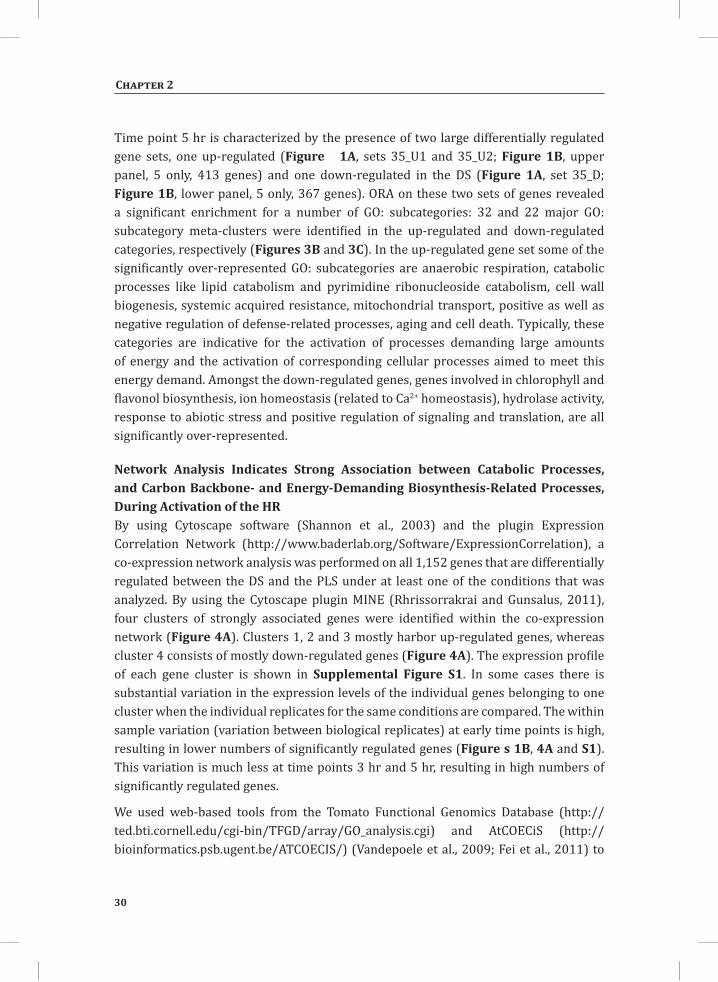
Time point 5 hr is characterized by the presence of two large differentially regulated gene sets, one up-regulated (Figure 1A, sets 35_U1 and 35_U2; Figure 1B, upper panel, 5 only, 413 genes) and one down-regulated in the DS (Figure 1A, set 35_D; Figure 1B, lower panel, 5 only, 367 genes). ORA on these two sets of genes revealed a significant enrichment for a number of GO: subcategories: 32 and 22 major GO: subcategory meta-clusters were identified in the up-regulated and down-regulated categories, respectively (Figures 3B and 3C). In the up-regulated gene set some of the significantly over-represented GO: subcategories are anaerobic respiration, catabolic processes like lipid catabolism and pyrimidine ribonucleoside catabolism, cell wall biogenesis, systemic acquired resistance, mitochondrial transport, positive as well as negative regulation of defense-related processes, aging and cell death. Typically, these categories are indicative for the activation of processes demanding large amounts of energy and the activation of corresponding cellular processes aimed to meet this energy demand. Amongst the down-regulated genes, genes involved in chlorophyll and flavonol biosynthesis, ion homeostasis (related to Ca2+ homeostasis), hydrolase activity, response to abiotic stress and positive regulation of signaling and translation, are all significantly over-represented.
Network Analysis Indicates Strong Association between Catabolic Processes, and Carbon Backbone- and Energy-Demanding Biosynthesis-Related Processes, During Activation of the HRBy using Cytoscape software (Shannon et al., 2003) and the plugin Expression Correlation Network (http://www.baderlab.org/Software/ExpressionCorrelation), a co-expression network analysis was performed on all 1,152 genes that are differentially regulated between the DS and the PLS under at least one of the conditions that was analyzed. By using the Cytoscape plugin MINE (Rhrissorrakrai and Gunsalus, 2011), four clusters of strongly associated genes were identified within the co-expression network (Figure 4A). Clusters 1, 2 and 3 mostly harbor up-regulated genes, whereas cluster 4 consists of mostly down-regulated genes (Figure 4A). The expression profile of each gene cluster is shown in Supplemental Figure S1. In some cases there is substantial variation in the expression levels of the individual genes belonging to one cluster when the individual replicates for the same conditions are compared. The within sample variation (variation between biological replicates) at early time points is high, resulting in lower numbers of significantly regulated genes (Figure s 1B, 4A and S1). This variation is much less at time points 3 hr and 5 hr, resulting in high numbers of significantly regulated genes.
We used web-based tools from the Tomato Functional Genomics Database (http://ted.bti.cornell.edu/cgi-bin/TFGD/array/GO_analysis.cgi) and AtCOECiS (http://bioinformatics.psb.ugent.be/ATCOECIS/) (Vandepoele et al., 2009; Fei et al., 2011) to
HR-associated transcriptome and metabolome changes
31
Chapter 2
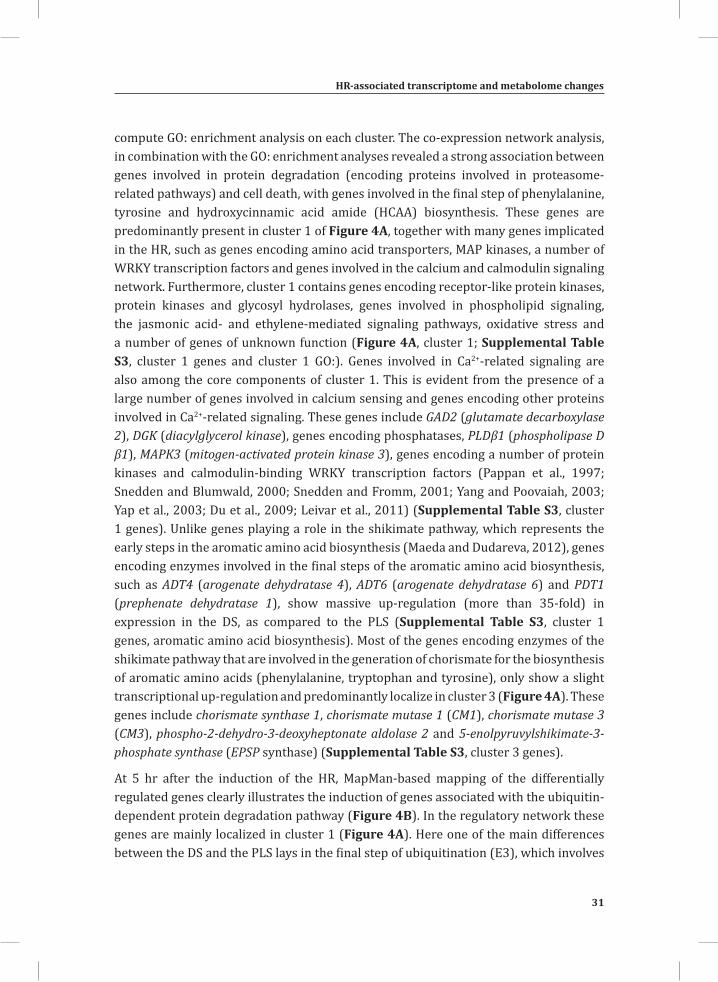
compute GO: enrichment analysis on each cluster. The co-expression network analysis, in combination with the GO: enrichment analyses revealed a strong association between genes involved in protein degradation (encoding proteins involved in proteasome-related pathways) and cell death, with genes involved in the final step of phenylalanine, tyrosine and hydroxycinnamic acid amide (HCAA) biosynthesis. These genes are predominantly present in cluster 1 of Figure 4A, together with many genes implicated in the HR, such as genes encoding amino acid transporters, MAP kinases, a number of WRKY transcription factors and genes involved in the calcium and calmodulin signaling network. Furthermore, cluster 1 contains genes encoding receptor-like protein kinases, protein kinases and glycosyl hydrolases, genes involved in phospholipid signaling, the jasmonic acid- and ethylene-mediated signaling pathways, oxidative stress and a number of genes of unknown function (Figure 4A, cluster 1; Supplemental Table S3, cluster 1 genes and cluster 1 GO:). Genes involved in Ca2+-related signaling are also among the core components of cluster 1. This is evident from the presence of a large number of genes involved in calcium sensing and genes encoding other proteins involved in Ca2+-related signaling. These genes include GAD2 (glutamate decarboxylase 2), DGK (diacylglycerol kinase), genes encoding phosphatases, PLDβ1 (phospholipase D β1), MAPK3 (mitogen-activated protein kinase 3), genes encoding a number of protein kinases and calmodulin-binding WRKY transcription factors (Pappan et al., 1997; Snedden and Blumwald, 2000; Snedden and Fromm, 2001; Yang and Poovaiah, 2003; Yap et al., 2003; Du et al., 2009; Leivar et al., 2011) (Supplemental Table S3, cluster 1 genes). Unlike genes playing a role in the shikimate pathway, which represents the early steps in the aromatic amino acid biosynthesis (Maeda and Dudareva, 2012), genes encoding enzymes involved in the final steps of the aromatic amino acid biosynthesis, such as ADT4 (arogenate dehydratase 4), ADT6 (arogenate dehydratase 6) and PDT1 (prephenate dehydratase 1), show massive up-regulation (more than 35-fold) in expression in the DS, as compared to the PLS (Supplemental Table S3, cluster 1 genes, aromatic amino acid biosynthesis). Most of the genes encoding enzymes of the shikimate pathway that are involved in the generation of chorismate for the biosynthesis of aromatic amino acids (phenylalanine, tryptophan and tyrosine), only show a slight transcriptional up-regulation and predominantly localize in cluster 3 (Figure 4A). These genes include chorismate synthase 1, chorismate mutase 1 (CM1), chorismate mutase 3 (CM3), phospho-2-dehydro-3-deoxyheptonate aldolase 2 and 5-enolpyruvylshikimate-3-phosphate synthase (EPSP synthase) (Supplemental Table S3, cluster 3 genes).
At 5 hr after the induction of the HR, MapMan-based mapping of the differentially regulated genes clearly illustrates the induction of genes associated with the ubiquitin-dependent protein degradation pathway (Figure 4B). In the regulatory network these genes are mainly localized in cluster 1 (Figure 4A). Here one of the main differences between the DS and the PLS lays in the final step of ubiquitination (E3), which involves
32
Chapter 2
the ligation of ubiquitin to proteins that are targeted for degradation, with considerably higher related gene expression in the DS (Figure 4B, RING and FBOX; Supplemental Table S3, cluster 1 genes). There are no clear differences between the DS and PLS concerning the expression of genes involved in processes like ubiquitin activation (E1), whereas at t = 5 hr in the DS there is a slight, but significant, down-regulation (about 2 fold) of the E2-related bin representing genes involved in ubiquitin-conjugation (Figure 4B).
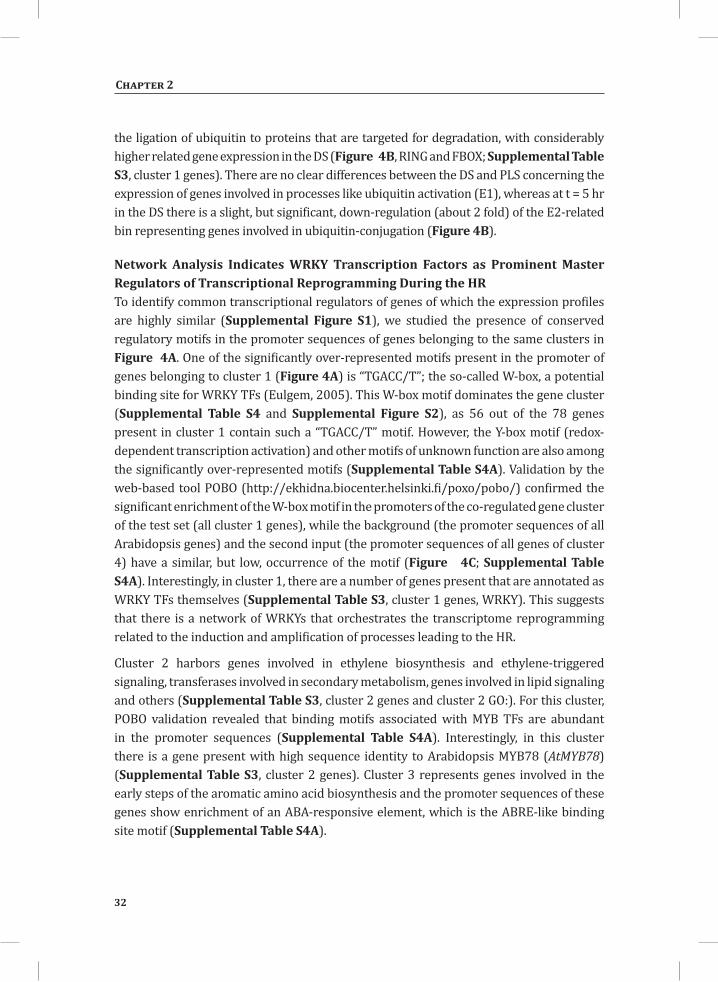
Network Analysis Indicates WRKY Transcription Factors as Prominent Master Regulators of Transcriptional Reprogramming During the HRTo identify common transcriptional regulators of genes of which the expression profiles are highly similar (Supplemental Figure S1), we studied the presence of conserved regulatory motifs in the promoter sequences of genes belonging to the same clusters in Figure 4A. One of the significantly over-represented motifs present in the promoter of genes belonging to cluster 1 (Figure 4A) is “TGACC/T”; the so-called W-box, a potential binding site for WRKY TFs (Eulgem, 2005). This W-box motif dominates the gene cluster (Supplemental Table S4 and Supplemental Figure S2), as 56 out of the 78 genes present in cluster 1 contain such a “TGACC/T” motif. However, the Y-box motif (redox-dependent transcription activation) and other motifs of unknown function are also among the significantly over-represented motifs (Supplemental Table S4A). Validation by the web-based tool POBO (http://ekhidna.biocenter.helsinki.fi/poxo/pobo/) confirmed the significant enrichment of the W-box motif in the promoters of the co-regulated gene cluster of the test set (all cluster 1 genes), while the background (the promoter sequences of all Arabidopsis genes) and the second input (the promoter sequences of all genes of cluster 4) have a similar, but low, occurrence of the motif (Figure 4C; Supplemental Table S4A). Interestingly, in cluster 1, there are a number of genes present that are annotated as WRKY TFs themselves (Supplemental Table S3, cluster 1 genes, WRKY). This suggests that there is a network of WRKYs that orchestrates the transcriptome reprogramming related to the induction and amplification of processes leading to the HR.
Cluster 2 harbors genes involved in ethylene biosynthesis and ethylene-triggered signaling, transferases involved in secondary metabolism, genes involved in lipid signaling and others (Supplemental Table S3, cluster 2 genes and cluster 2 GO:). For this cluster, POBO validation revealed that binding motifs associated with MYB TFs are abundant in the promoter sequences (Supplemental Table S4A). Interestingly, in this cluster there is a gene present with high sequence identity to Arabidopsis MYB78 (AtMYB78) (Supplemental Table S3, cluster 2 genes). Cluster 3 represents genes involved in the early steps of the aromatic amino acid biosynthesis and the promoter sequences of these genes show enrichment of an ABA-responsive element, which is the ABRE-like binding site motif (Supplemental Table S4A).
HR-associated transcriptome and metabolome changes
33
Chapter 2
Cluster 4 is characterized by the presence of genes that are involved in photosynthesis, the biosynthesis of flavonoids, ion homeostasis, circadian rhythm and others (Figure 3C; Supplemental Table S3, cluster 4 genes and cluster 4 GO:). One of the fascinating features of this cluster is that there are five genes present that encode unknown proteins and show an inversed expression pattern from the rest of the group. These genes might be involved in the coordinated repression of other genes within this cluster (Supplemental Figure S1; Supplemental Table S3, cluster 4 genes). Although the promoter sequences of the genes belonging to cluster 4 contain mostly unknown over-represented motifs, some of the identified motifs that were validated by POBO include AG (MADS) and SORLIP4 (phytochrome A-regulated gene expression) (Supplemental Table S4A).
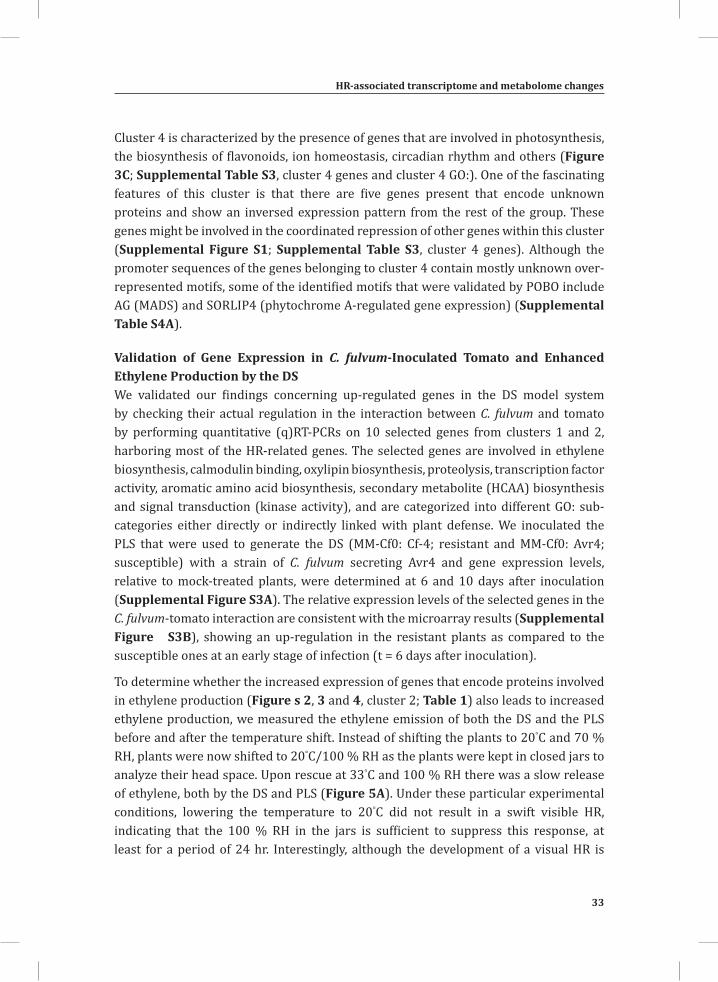
Validation of Gene Expression in C. fulvum-Inoculated Tomato and Enhanced Ethylene Production by the DSWe validated our findings concerning up-regulated genes in the DS model system by checking their actual regulation in the interaction between C. fulvum and tomato by performing quantitative (q)RT-PCRs on 10 selected genes from clusters 1 and 2, harboring most of the HR-related genes. The selected genes are involved in ethylene biosynthesis, calmodulin binding, oxylipin biosynthesis, proteolysis, transcription factor activity, aromatic amino acid biosynthesis, secondary metabolite (HCAA) biosynthesis and signal transduction (kinase activity), and are categorized into different GO: sub-categories either directly or indirectly linked with plant defense. We inoculated the PLS that were used to generate the DS (MM-Cf0: Cf-4; resistant and MM-Cf0: Avr4; susceptible) with a strain of C. fulvum secreting Avr4 and gene expression levels, relative to mock-treated plants, were determined at 6 and 10 days after inoculation (Supplemental Figure S3A). The relative expression levels of the selected genes in the C. fulvum-tomato interaction are consistent with the microarray results (Supplemental Figure S3B), showing an up-regulation in the resistant plants as compared to the susceptible ones at an early stage of infection (t = 6 days after inoculation).
To determine whether the increased expression of genes that encode proteins involved in ethylene production (Figure s 2, 3 and 4, cluster 2; Table 1) also leads to increased ethylene production, we measured the ethylene emission of both the DS and the PLS before and after the temperature shift. Instead of shifting the plants to 20°C and 70 % RH, plants were now shifted to 20°C/100 % RH as the plants were kept in closed jars to analyze their head space. Upon rescue at 33°C and 100 % RH there was a slow release of ethylene, both by the DS and PLS (Figure 5A). Under these particular experimental conditions, lowering the temperature to 20°C did not result in a swift visible HR, indicating that the 100 % RH in the jars is sufficient to suppress this response, at least for a period of 24 hr. Interestingly, although the development of a visual HR is
34
Chapter 2
suppressed, a marked increase in ethylene emission was observed at 4 hr after shifting the seedlings to 20°C/100 % RH, as the DS started to emit significantly higher amounts of ethylene than the PLS (Figure 5A). After 24 hr at 20°C/100 % RH, the DS had emitted about three times more ethylene than the PLS.
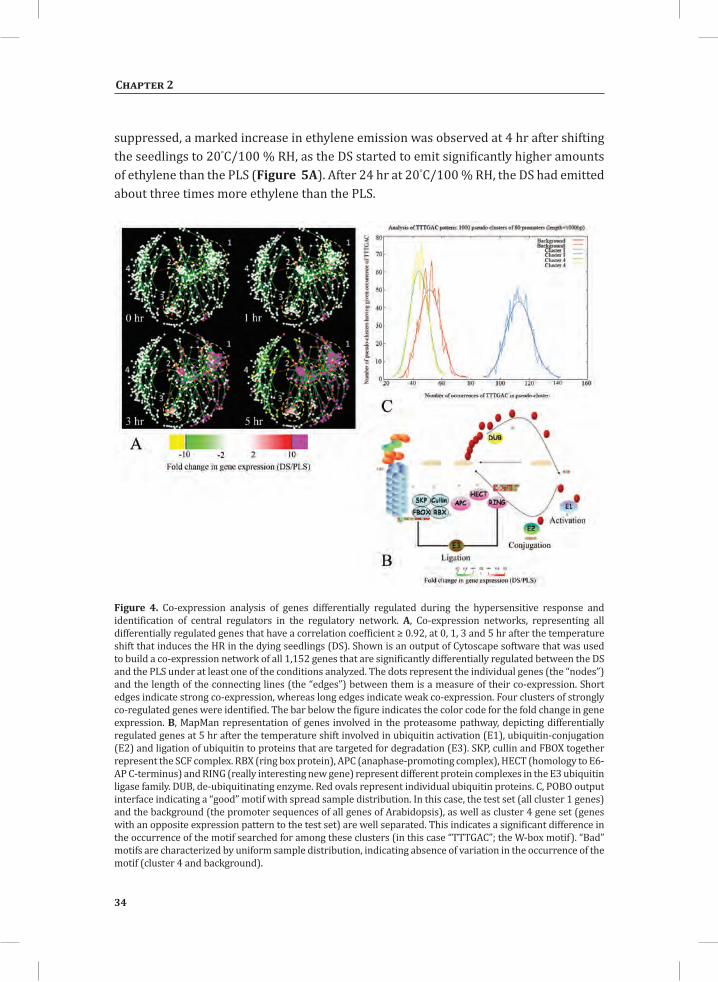
Figure 4. Co-expression analysis of genes differentially regulated during the hypersensitive response and identification of central regulators in the regulatory network. A, Co-expression networks, representing all differentially regulated genes that have a correlation coefficient ≥ 0.92, at 0, 1, 3 and 5 hr after the temperature shift that induces the HR in the dying seedlings (DS). Shown is an output of Cytoscape software that was used to build a co-expression network of all 1,152 genes that are significantly differentially regulated between the DS and the PLS under at least one of the conditions analyzed. The dots represent the individual genes (the “nodes”) and the length of the connecting lines (the “edges”) between them is a measure of their co-expression. Short edges indicate strong co-expression, whereas long edges indicate weak co-expression. Four clusters of strongly co-regulated genes were identified. The bar below the figure indicates the color code for the fold change in gene expression. B, MapMan representation of genes involved in the proteasome pathway, depicting differentially regulated genes at 5 hr after the temperature shift involved in ubiquitin activation (E1), ubiquitin-conjugation (E2) and ligation of ubiquitin to proteins that are targeted for degradation (E3). SKP, cullin and FBOX together represent the SCF complex. RBX (ring box protein), APC (anaphase-promoting complex), HECT (homology to E6-AP C-terminus) and RING (really interesting new gene) represent different protein complexes in the E3 ubiquitin ligase family. DUB, de-ubiquitinating enzyme. Red ovals represent individual ubiquitin proteins. C, POBO output interface indicating a “good” motif with spread sample distribution. In this case, the test set (all cluster 1 genes) and the background (the promoter sequences of all genes of Arabidopsis), as well as cluster 4 gene set (genes with an opposite expression pattern to the test set) are well separated. This indicates a significant difference in the occurrence of the motif searched for among these clusters (in this case “TTTGAC”; the W-box motif). “Bad” motifs are characterized by uniform sample distribution, indicating absence of variation in the occurrence of the motif (cluster 4 and background).
HR-associated transcriptome and metabolome changes
35
Chapter 2
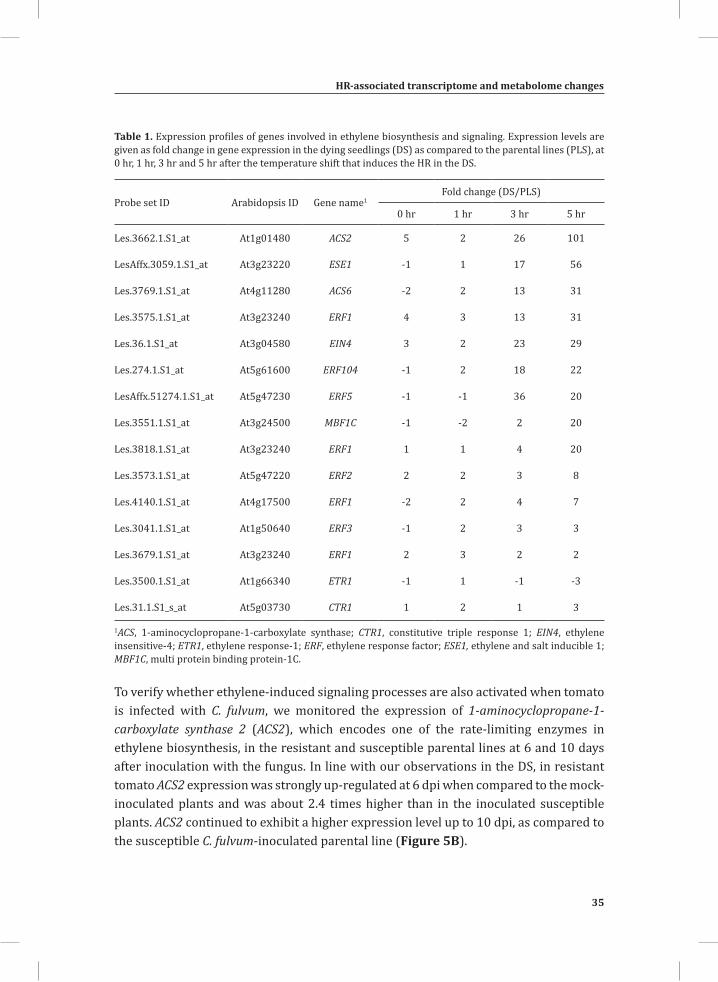
Table 1. Expression profiles of genes involved in ethylene biosynthesis and signaling. Expression levels are given as fold change in gene expression in the dying seedlings (DS) as compared to the parental lines (PLS), at 0 hr, 1 hr, 3 hr and 5 hr after the temperature shift that induces the HR in the DS.
Probe set ID Arabidopsis ID Gene name1Fold change (DS/PLS)
0 hr 1 hr 3 hr 5 hr
Les.3662.1.S1_at At1g01480 ACS2 5 2 26 101
LesAffx.3059.1.S1_at At3g23220 ESE1 -1 1 17 56
Les.3769.1.S1_at At4g11280 ACS6 -2 2 13 31
Les.3575.1.S1_at At3g23240 ERF1 4 3 13 31
Les.36.1.S1_at At3g04580 EIN4 3 2 23 29
Les.274.1.S1_at At5g61600 ERF104 -1 2 18 22
LesAffx.51274.1.S1_at At5g47230 ERF5 -1 -1 36 20
Les.3551.1.S1_at At3g24500 MBF1C -1 -2 2 20
Les.3818.1.S1_at At3g23240 ERF1 1 1 4 20
Les.3573.1.S1_at At5g47220 ERF2 2 2 3 8
Les.4140.1.S1_at At4g17500 ERF1 -2 2 4 7
Les.3041.1.S1_at At1g50640 ERF3 -1 2 3 3
Les.3679.1.S1_at At3g23240 ERF1 2 3 2 2
Les.3500.1.S1_at At1g66340 ETR1 -1 1 -1 -3
Les.31.1.S1_s_at At5g03730 CTR1 1 2 1 3
1ACS, 1-aminocyclopropane-1-carboxylate synthase; CTR1, constitutive triple response 1; EIN4, ethylene insensitive-4; ETR1, ethylene response-1; ERF, ethylene response factor; ESE1, ethylene and salt inducible 1; MBF1C, multi protein binding protein-1C.
To verify whether ethylene-induced signaling processes are also activated when tomato is infected with C. fulvum, we monitored the expression of 1-aminocyclopropane-1-carboxylate synthase 2 (ACS2), which encodes one of the rate-limiting enzymes in ethylene biosynthesis, in the resistant and susceptible parental lines at 6 and 10 days after inoculation with the fungus. In line with our observations in the DS, in resistant tomato ACS2 expression was strongly up-regulated at 6 dpi when compared to the mock-inoculated plants and was about 2.4 times higher than in the inoculated susceptible plants. ACS2 continued to exhibit a higher expression level up to 10 dpi, as compared to the susceptible C. fulvum-inoculated parental line (Figure 5B).
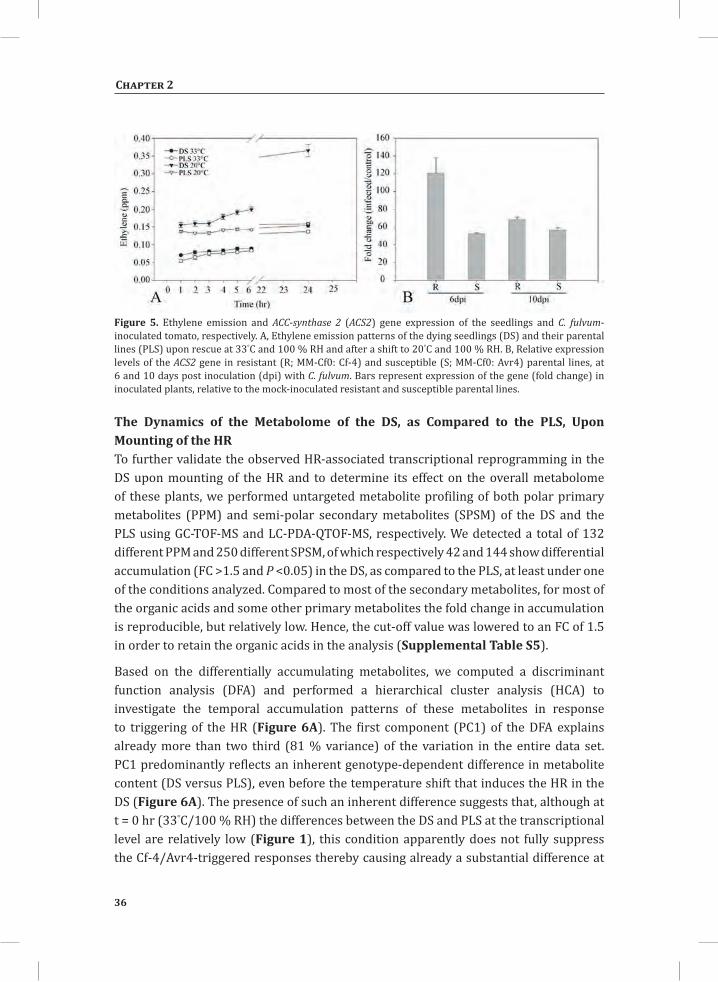
36
Chapter 2
Figure 5. Ethylene emission and ACC-synthase 2 (ACS2) gene expression of the seedlings and C. fulvum-inoculated tomato, respectively. A, Ethylene emission patterns of the dying seedlings (DS) and their parental lines (PLS) upon rescue at 33°C and 100 % RH and after a shift to 20°C and 100 % RH. B, Relative expression levels of the ACS2 gene in resistant (R; MM-Cf0: Cf-4) and susceptible (S; MM-Cf0: Avr4) parental lines, at 6 and 10 days post inoculation (dpi) with C. fulvum. Bars represent expression of the gene (fold change) in inoculated plants, relative to the mock-inoculated resistant and susceptible parental lines.
The Dynamics of the Metabolome of the DS, as Compared to the PLS, Upon Mounting of the HRTo further validate the observed HR-associated transcriptional reprogramming in the DS upon mounting of the HR and to determine its effect on the overall metabolome of these plants, we performed untargeted metabolite profiling of both polar primary metabolites (PPM) and semi-polar secondary metabolites (SPSM) of the DS and the PLS using GC-TOF-MS and LC-PDA-QTOF-MS, respectively. We detected a total of 132 different PPM and 250 different SPSM, of which respectively 42 and 144 show differential accumulation (FC >1.5 and P <0.05) in the DS, as compared to the PLS, at least under one of the conditions analyzed. Compared to most of the secondary metabolites, for most of the organic acids and some other primary metabolites the fold change in accumulation is reproducible, but relatively low. Hence, the cut-off value was lowered to an FC of 1.5 in order to retain the organic acids in the analysis (Supplemental Table S5).
Based on the differentially accumulating metabolites, we computed a discriminant function analysis (DFA) and performed a hierarchical cluster analysis (HCA) to investigate the temporal accumulation patterns of these metabolites in response to triggering of the HR (Figure 6A). The first component (PC1) of the DFA explains already more than two third (81 % variance) of the variation in the entire data set. PC1 predominantly reflects an inherent genotype-dependent difference in metabolite content (DS versus PLS), even before the temperature shift that induces the HR in the DS (Figure 6A). The presence of such an inherent difference suggests that, although at t = 0 hr (33°C/100 % RH) the differences between the DS and PLS at the transcriptional level are relatively low (Figure 1), this condition apparently does not fully suppress the Cf-4/Avr4-triggered responses thereby causing already a substantial difference at
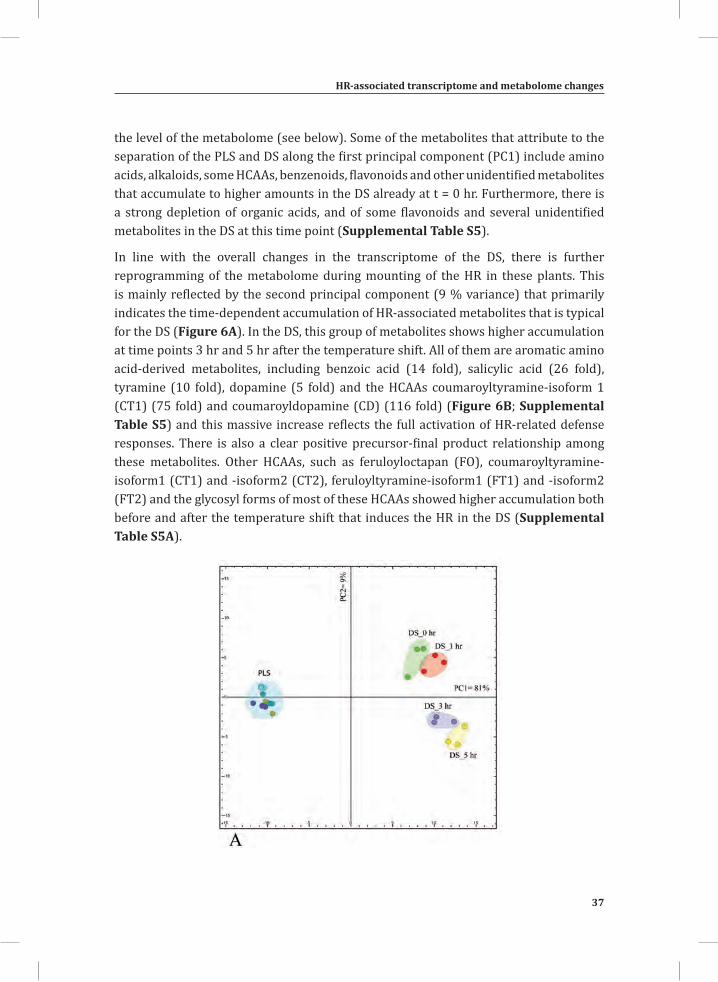
HR-associated transcriptome and metabolome changes
37
Chapter 2
the level of the metabolome (see below). Some of the metabolites that attribute to the separation of the PLS and DS along the first principal component (PC1) include amino acids, alkaloids, some HCAAs, benzenoids, flavonoids and other unidentified metabolites that accumulate to higher amounts in the DS already at t = 0 hr. Furthermore, there is a strong depletion of organic acids, and of some flavonoids and several unidentified metabolites in the DS at this time point (Supplemental Table S5).
In line with the overall changes in the transcriptome of the DS, there is further reprogramming of the metabolome during mounting of the HR in these plants. This is mainly reflected by the second principal component (9 % variance) that primarily indicates the time-dependent accumulation of HR-associated metabolites that is typical for the DS (Figure 6A). In the DS, this group of metabolites shows higher accumulation at time points 3 hr and 5 hr after the temperature shift. All of them are aromatic amino acid-derived metabolites, including benzoic acid (14 fold), salicylic acid (26 fold), tyramine (10 fold), dopamine (5 fold) and the HCAAs coumaroyltyramine-isoform 1 (CT1) (75 fold) and coumaroyldopamine (CD) (116 fold) (Figure 6B; Supplemental Table S5) and this massive increase reflects the full activation of HR-related defense responses. There is also a clear positive precursor-final product relationship among these metabolites. Other HCAAs, such as feruloyloctapan (FO), coumaroyltyramine-isoform1 (CT1) and -isoform2 (CT2), feruloyltyramine-isoform1 (FT1) and -isoform2 (FT2) and the glycosyl forms of most of these HCAAs showed higher accumulation both before and after the temperature shift that induces the HR in the DS (Supplemental Table S5A).
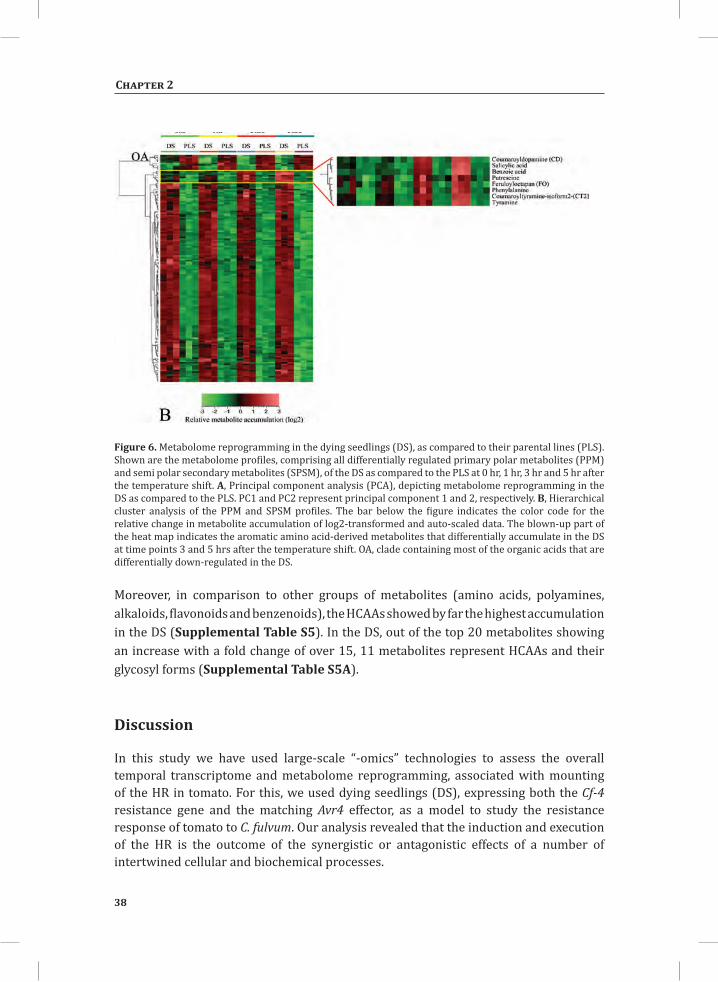
38
Chapter 2
Figure 6. Metabolome reprogramming in the dying seedlings (DS), as compared to their parental lines (PLS). Shown are the metabolome profiles, comprising all differentially regulated primary polar metabolites (PPM) and semi polar secondary metabolites (SPSM), of the DS as compared to the PLS at 0 hr, 1 hr, 3 hr and 5 hr after the temperature shift. A, Principal component analysis (PCA), depicting metabolome reprogramming in the DS as compared to the PLS. PC1 and PC2 represent principal component 1 and 2, respectively. B, Hierarchical cluster analysis of the PPM and SPSM profiles. The bar below the figure indicates the color code for the relative change in metabolite accumulation of log2-transformed and auto-scaled data. The blown-up part of the heat map indicates the aromatic amino acid-derived metabolites that differentially accumulate in the DS at time points 3 and 5 hrs after the temperature shift. OA, clade containing most of the organic acids that are differentially down-regulated in the DS.
Moreover, in comparison to other groups of metabolites (amino acids, polyamines, alkaloids, flavonoids and benzenoids), the HCAAs showed by far the highest accumulation in the DS (Supplemental Table S5). In the DS, out of the top 20 metabolites showing an increase with a fold change of over 15, 11 metabolites represent HCAAs and their glycosyl forms (Supplemental Table S5A).
Discussion
In this study we have used large-scale “-omics” technologies to assess the overall temporal transcriptome and metabolome reprogramming, associated with mounting of the HR in tomato. For this, we used dying seedlings (DS), expressing both the Cf-4 resistance gene and the matching Avr4 effector, as a model to study the resistance response of tomato to C. fulvum. Our analysis revealed that the induction and execution of the HR is the outcome of the synergistic or antagonistic effects of a number of intertwined cellular and biochemical processes.
HR-associated transcriptome and metabolome changes
39
Chapter 2
Major HR-Associated Signal Transduction and Metabolic PathwaysOur metabolome analysis, combined with the over-representation analysis on the differentially regulated genes, clearly shows the involvement of both ethylene and salicylic acid in intensifying the defense responses at later time points after initiating the HR by shifting the DS to permissive conditions (Figures 2, 3A and B, 5 and 6B; Table 1; Supplemental Table S5). The gene S-adenosyl-L-methionine carboxyl methyltransferase, which is involved in the conversion of SA to methyl salicylate was slightly upregulated at time points 0 and 1hr and showed dramatic reduction in expression (FC = 5) in the DS at later time points (3 hr and 5 hr). This might be a way to maintain high levels of SA during the HR (Figure 2, SA). Other genes such as MAPK4, NPR1, GRX480 and DOX1, which are involved in SA-mediated signaling, also showed upregulation. However, these genes could not be mapped in Figure 2. Ethylene plays an important role in the activation of different forms of programmed cell death (PCD), including the HR (Lund et al., 1998; Ciardi et al., 2000; Ciardi et al., 2001; van Loon et al., 2006; Mur et al., 2009). The well-controlled ethylene release by the DS over time only after HR initiation confirms the robustness of the “dying seedling” system and matches the observed increase in ethylene-related gene expression (Figure 2). Ethylene has been shown to be required for the induction of N-hydroxycinnamoyl-CoA: tyramine N-hydroxycinnamoyl transferase (THT) gene expression and the accumulation of HCAAs during defense of tomato against the bacterial pathogen Pseudomonas syringae (Zacares et al., 2007; Lopez-Gresa et al., 2011). In the latter studies, exogenous application of ethylene led to an increase in the expression of the THT genes in tomato, whereas application of the ethylene biosynthesis inhibitor AVG reduced the release of ethylene after P. syringae infection and consequently suppressed the expression of the THT genes. In potato, tomato and tobacco, THTs play a pivotal regulatory role in the biosynthesis of HCAAs by catalyzing the transfer of hydroxycinnamic acids from the respective CoA esters to tyramine, dopamine, octamine and various other amines (Guillet and De Luca, 2005; Kang et al., 2006).
The changes in the transcriptome and metabolome profiles of the DS revealed the activation of both primary and secondary metabolism during mounting of the HR (Figures 3 and 6). Aromatic amino acids (phenylalanine and tyrosine) and various aromatic secondary metabolites derived from these amino acids represent a large portion of the HR-associated metabolites (Figures 3A and B; Supplemental Table S5). Phenylalanine and tyrosine, in combination with various amines, are the primary precursors for the induced HCAA biosynthesis during defense of plants against pathogens and wounding (Facchini et al., 2002; von Roepenack-Lahaye et al., 2003; Walters, 2003; López-Gresa et al., 2011). At t = 3 hr and t = 5 hr, hydroxycinnamic acid-derived compounds, such as benzoic acid (14 fold increase), salicylic acid (26 fold increase) and many HCAAs (20 to 116 fold increase) showed massive accumulation in
40
Chapter 2
the DS (Figure 6B; Supplemental Tables S5). The increase in HCAA levels correlates with an up-regulation of the THT genes, as evidenced from the transcriptome of both the DS model and the C. fulvum-infected resistant tomato lines (Supplemental Figure S3, THT; Supplemental Table S7). In the DS, most of the induced HCAAs have tyramine and dopamine as a backbone. In line with this, tyramine (10 fold increase), dopamine (6 fold increase) and their precursor tyrosine (5 fold increase) were present at higher levels in the DS than in the PLS (Supplemental Table S5B). Extraction of HCAAs that are present in the form of higher complexes in the plant cell walls is less likely with the extraction technique that we used (see Materials and Methods). However, we detected various HCAAs in the leaf extracts of the DS. This might either indicate that there is a massive production of HCAAs, exceeding their rate of incorporation into the cell wall, or some of the HCAAs in their free form have additional functions, next to cell wall fortification. The increase in the amount of HCAAs is considered to be and indicator of the host plant mounting a barrier against the invading pathogen. Accumulation of HCAAs in the cell wall for example ensures a durable barrier against pathogens by reducing the cell wall digestibility by hydrolytic enzymes of the pathogen and/or by directly inhibiting further proliferation of the pathogen (Grandmaison et al., 1993; von Röpenack et al., 1998; Facchini et al., 1999). Moreover, the resulting fortified, and less permeable, cell wall ensures exclusion of the pathogen from accessing plant nutrients and water. In support of an additional function, HCAAs like coumaroyldopamine (CD) (116 fold) and coumaroyltyramine (CT) (75 fold) have been reported as novel induced HCAAs upon colonization of resistant tomato plants by P. syringae and were shown to have both antioxidant and antimicrobial activity (Zacares et al., 2007). In conclusion, both our transcriptional network and metabolome analysis indicate the HCAAs as a key class of metabolites associated with mounting of the HR in tomato.
The Energy Homeostasis and its Major Regulatory Mechanisms during the HR During rescue of the DS at 33˚C/100 % RH, only a small amount of genes (34) is differentially regulated in these plants, when compared to the PLS (Figures 1A and B, t = 0 hr). Still, there already is a marked difference in their metabolome when compared to the PLS, including metabolites associated with the HR (Figure 6; Supplemental Table S5). This is most likely explained by the activation of various defense-associated responses already at t = 0 hr (which is after two weeks of rescue), albeit to a low level and without the execution of the HR and without an increased production of ethylene (Figure 5A). This suggests that the activation of Cf-4-mediated responses is not completely blocked at elevated temperature and humidity, resulting in a gradual change in the overall metabolome of the DS during the two weeks of rescue before initiating the HR by the temperature and humidity shift. It should be noted that in an earlier experiment, using highly sensitive cDNA-AFLP analysis, it was found that at t = 0 hr already 70 % of all 442 Avr4-responsive tomato genes that were selected, were differentially expressed
HR-associated transcriptome and metabolome changes
41
Chapter 2
when compared to the PLS at that time point (Gabriëls et al., 2006). This observation supports our findings concerning the “leakiness” of the DS model. Indeed, in addition to the massively altered metabolome at t = 0 hr, the DS are smaller in size than the PLS (de Jong et al., 2002), which is in line with the theory that claims reduction in growth to be a consequence of carbon limitation caused by increased biosynthesis of defense-related metabolites. This results in a downward adjustment of growth to a level that can be supported by the new level of carbon availability (Smith and Stitt, 2007).
In an incompatible C. fulvum-tomato interaction, once fungal ingress has been resisted and defense responses have again been down-regulated, the plant restores its normal metabolism in order to bring the energy expenditure back to the original situation (Heil and Baldwin, 2002; Bolton, 2009). However, in the DS the introgression of the fungal Avr4 gene, in combination with the Cf-4 resistance gene, leads to a continuous systemic triggering of the defense machinery, resulting in an amplification of the responses that occur only locally in Cf-4 tomato challenged with C. fulvum expressing Avr4. The associated massive transcriptome and metabolome reprogramming that we observed in the DS costs energy and requires reducing power and carbon skeletons. Disruption of the ion homeostasis (Figure 3C, mainly at t = 5 hr) reflects the low energy status of the DS, as ATP is normally used to generate the proton motive force to regulate the transport of ions, such as Ca2+ across the plasma membrane, and ATP depletion is one of the main causes for the inability of a system to maintain its ion homeostasis (Chanson, 1993; Knickerbocker and Lutz, 2001; Arpagaus et al., 2002). Another marker reflecting ATP imbalance in the system is the up-regulation of adenylate kinase 1 (ADK1) in the DS (3 fold increase as compared to the PLS) at t = 5 hr. ADK1 plays a crucial role in maintaining the right equilibrium between ADP and ATP levels (Hardie et al., 2012).
To accommodate the massive metabolome reprogramming, the DS activate various alternative processes generating energy and carbon skeletons. These processes can be categorized into: (1) a switch to catabolism; (2) preferential diversion of precursors towards specific biochemical pathways and (3) increased anaerobic respiration. The first process involves an increased hydrolysis or oxidation of carbohydrates, proteins, nucleic acids and lipids. Increased hydrolysis of carbohydrates (specifically sucrose) into glucose is, for example, caused by transcriptional activation of the gene encoding cell wall invertase (CWI), which is more than 13 fold up-regulated at 5hr in the DS (Figure 7A). This ensures a continuous supply of glucose for the energy cycle, as well as for generating carbon skeletons required for the synthesis of primary metabolites, such as aromatic amino acids (Figure 7A). The importance of CWI in generating carbohydrates that are catabolized upon the activation of defense responses is shown by RNA interference (RNAi)-mediated knock-down of CWI in tobacco leaves. Lowered CWI expression resulted in compromised defense responses and a delay in the actual hypersensitive cell death (Essmann et al., 2008). Another form of alternative energy
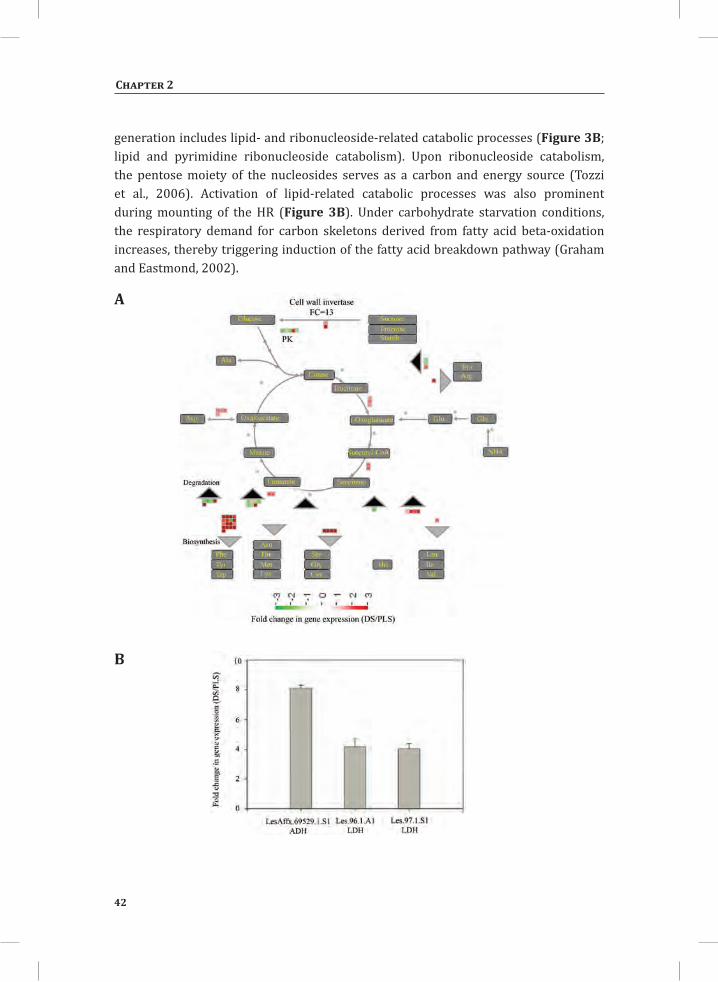
42
Chapter 2
generation includes lipid- and ribonucleoside-related catabolic processes (Figure 3B; lipid and pyrimidine ribonucleoside catabolism). Upon ribonucleoside catabolism, the pentose moiety of the nucleosides serves as a carbon and energy source (Tozzi et al., 2006). Activation of lipid-related catabolic processes was also prominent during mounting of the HR (Figure 3B). Under carbohydrate starvation conditions, the respiratory demand for carbon skeletons derived from fatty acid beta-oxidation increases, thereby triggering induction of the fatty acid breakdown pathway (Graham and Eastmond, 2002).
A
B
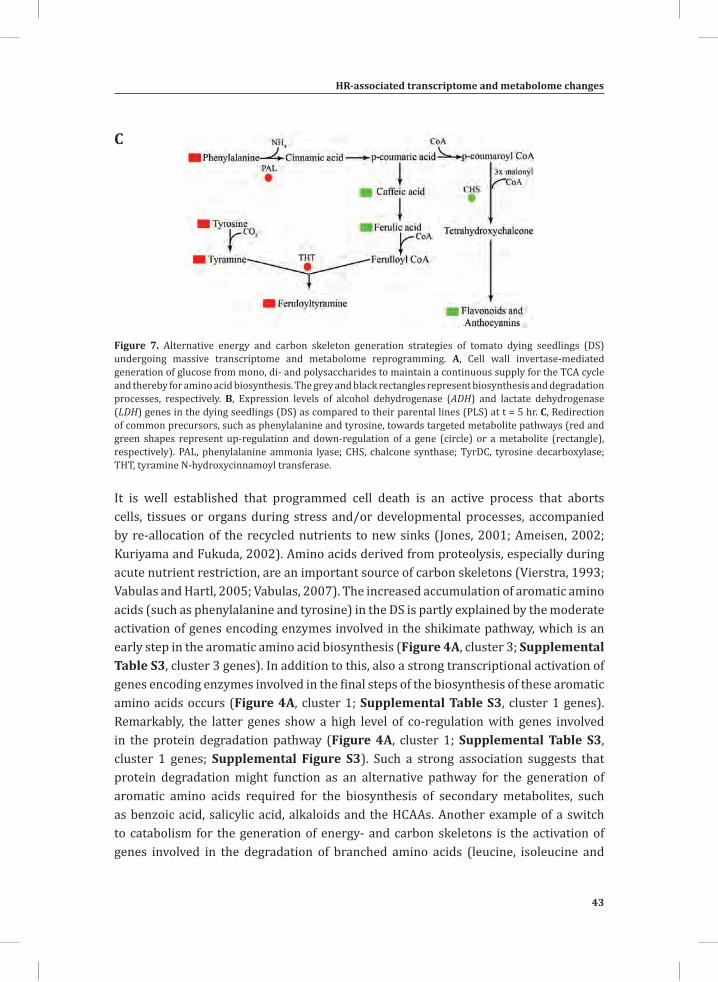
HR-associated transcriptome and metabolome changes
43
Chapter 2
C
Figure 7. Alternative energy and carbon skeleton generation strategies of tomato dying seedlings (DS) undergoing massive transcriptome and metabolome reprogramming. A, Cell wall invertase-mediated generation of glucose from mono, di- and polysaccharides to maintain a continuous supply for the TCA cycle and thereby for amino acid biosynthesis. The grey and black rectangles represent biosynthesis and degradation processes, respectively. B, Expression levels of alcohol dehydrogenase (ADH) and lactate dehydrogenase (LDH) genes in the dying seedlings (DS) as compared to their parental lines (PLS) at t = 5 hr. C, Redirection of common precursors, such as phenylalanine and tyrosine, towards targeted metabolite pathways (red and green shapes represent up-regulation and down-regulation of a gene (circle) or a metabolite (rectangle), respectively). PAL, phenylalanine ammonia lyase; CHS, chalcone synthase; TyrDC, tyrosine decarboxylase; THT, tyramine N-hydroxycinnamoyl transferase.
It is well established that programmed cell death is an active process that aborts cells, tissues or organs during stress and/or developmental processes, accompanied by re-allocation of the recycled nutrients to new sinks (Jones, 2001; Ameisen, 2002; Kuriyama and Fukuda, 2002). Amino acids derived from proteolysis, especially during acute nutrient restriction, are an important source of carbon skeletons (Vierstra, 1993; Vabulas and Hartl, 2005; Vabulas, 2007). The increased accumulation of aromatic amino acids (such as phenylalanine and tyrosine) in the DS is partly explained by the moderate activation of genes encoding enzymes involved in the shikimate pathway, which is an early step in the aromatic amino acid biosynthesis (Figure 4A, cluster 3; Supplemental Table S3, cluster 3 genes). In addition to this, also a strong transcriptional activation of genes encoding enzymes involved in the final steps of the biosynthesis of these aromatic amino acids occurs (Figure 4A, cluster 1; Supplemental Table S3, cluster 1 genes). Remarkably, the latter genes show a high level of co-regulation with genes involved in the protein degradation pathway (Figure 4A, cluster 1; Supplemental Table S3, cluster 1 genes; Supplemental Figure S3). Such a strong association suggests that protein degradation might function as an alternative pathway for the generation of aromatic amino acids required for the biosynthesis of secondary metabolites, such as benzoic acid, salicylic acid, alkaloids and the HCAAs. Another example of a switch to catabolism for the generation of energy- and carbon skeletons is the activation of genes involved in the degradation of branched amino acids (leucine, isoleucine and
44
Chapter 2
valine) (Figure 7A; Supplemental Table S2). The catabolism of leucine, isoleucine and valine generates acetyl-CoA which in the TCA cycle generates energy, a process widely observed during starvation and stress (Aubert et al., 1996; Fujiki et al., 2001; Taylor et al., 2004; Kochevenko et al., 2012). Our data suggest that the highly induced hydroxycinnamic acid (HCA)-derived secondary metabolite biosynthesis pathways are for the greater part responsible for the alterations in aromatic amino acids and carbon skeleton fluxes. Moreover, the depletion of organic acids (Figure 6B) in the DS suggests that these compounds are precursors for many of the primary (aromatic amino acids) and secondary metabolites. Hence, their depletion can be explained by the massive accumulation of the respective primary and secondary metabolites in the DS.
The second way by which the plant deals with the low carbon skeleton and energy supplies, is the preferential diversion of common precursors towards specific metabolic pathways. This is exemplified by suppression of the flavonoid biosynthesis pathway through down-regulation of chalcone synthase (CHS) gene expression, thereby increasing the availability of precursors like phenylalanine and tyrosine for the HCAA biosynthetic pathway (Figure 3C, flavonol biosynthesis; Figure 7C), accompanied by up-regulation of the THT genes (Supplemental Table S7). Similarly, preferential redirection of common flavonoid precursors towards the biosynthesis of HCCAs in onion epidermis upon infection by Botrytis cinerea was described (McLusky et al., 1999).
As a third way to obtain energy, the DS activate anaerobic energy production (fermentation) pathways which can be traced by transcriptional activation of L-lactate dehydrogenase (LDH) and alcohol dehydrogenase (ADH) genes (Stulemeijer et al., 2009) (Figure 7C) and the GABA shunt, evident from high expression of glutamate decarboxylase 2 (GAD2) and accumulation of GABA (Supplemental Table S3, cluster 1 genes; Supplemental Table S5B). In hypoxic conditions pyruvate is broken down by LDH to form lactate and NAD+, giving a boost in NAD+ for the glycolytic anaerobic energy generation (Bolton, 2009). Under particular, energy-demanding conditions, like the systemic activation of defense responses, pyruvate is produced in high amounts and pyruvate dehydrogenase (PDH) activity becomes a limiting step in converting pyruvate into acetyl CoA. Hence, the GABA shunt provides a means to utilize the excess of pyruvate for energy production (Bolton et al., 2008).
Major Regulators and Regulatory Mechanisms of the HROur data depict the HR as an active process, regulated at the transcriptional, post-transcriptional, translational and post-translational level, to maintain the cellular homeostasis of the system (Figures 2-4 and 7). The robustness of the system is maintained through tightly regulated activation and repression of defense signaling. For example, enhanced activation of 2C-type protein phosphatases that are associated with the regulation of MAPK4 and -6 and potassium channels (Lee et al., 2007; Schweighofer
HR-associated transcriptome and metabolome changes
45
Chapter 2
et al., 2007) can be mentioned as one of the major repression mechanisms of defense signaling during mounting of the HR (Figure 3B, de-phosphorylation; Supplemental Table S6). Another example is repression of the ethylene-induced signaling pathway through the transcriptional activation of repressors (RTE1, CTR1) (Huang et al., 2003; Dong et al., 2010) or lowered expression of signal receptors and transducers, such as EIN2 (Kieber et al., 1993) (Supplemental Table S6). Furthermore, repression of programmed cell death is enforced through down-regulation of positive regulators of cell death, such as LOL1 (LSD1-like 1) (Epple et al., 2003) and activation of the immune repressor RIN4 (Afzal et al., 2011) (Supplemental Table S6). Next to this, genes encoding glutathione S-transferases (class III, GST-TAU) that function as protectants against oxidative stress and as potent detoxifiers of toxins are transcriptionally activated (Figures 3A and B; Supplemental Table S6) (Marrs, 1996; Kilili et al., 2004). In addition to its role in protein turnover, ubiquitin-dependent protein degradation also regulates defense through targeted destruction of proteins involved in intensifying defense signaling (Santner and Estelle, 2009; Vierstra, 2009).
As in the DS massive and highly coordinated transcriptional changes are observed, it is anticipated that master regulators are involved. Some of the major transcription factors implicated in the regulation of the overall transcriptome and metabolome of the plant include WRKYs, AP2/ERFs, bZIPs and MYBs (Daniel et al., 1999; Singh et al., 2002; Eulgem and Somssich, 2007; Lippok et al., 2007; Oñate-Sánchez et al., 2007; Naoumkina et al., 2008; Rushton et al., 2010). Despite the presence of all these, and other, transcription factors in the different hubs of the network (Figures 4A and B; Supplemental Tables S3 and S4), WRKY transcription factors in particular seem to play a critical role in orchestrating the HR-related transcriptome changes of the DS. This observation is strengthened by the fact that a W-box motif, to which WRKY transcription factors bind, is present in the promoter sequence of 72 % of the genes that are implicated to have an essential role in the HR (Supplemental Table S4B) and that fall within the same cluster as these transcription factors themselves (Figure 4, cluster 1; Supplemental Table S3, cluster 1 genes). The presence of two genes encoding MAP kinases highly homologous to MAPK3 in the same cluster, supports the work that showed some WRKYs to be directly phosphorylated by MAPKs, thereby inducing phytoalexin biosynthesis (Mao et al., 2011). Our findings strengthen the role of WRKYs in plant defense and defense-related secondary metabolite reprogramming. Such a strong association of differentially regulated defense-related genes and the presence of a shared regulatory motif in their promoter region, takes the assumption of “guilt by association” one step further. Furthermore, this co-expression analysis should allow to predict the role of yet uncharacterized genes such as for example Les.113.1.S1_at, which shows 106 fold upregulation in the DS and locates to similar positions in the network as some of the well characterized gene groups (Supplemental Table S3, genes in each
46
Chapter 2
cluster listed as “no hit found”). Moreover, most of the genes that we found in our cluster analysis have not been characterized in tomato, although some of them are annotated based on the presence of functional domains and their sequence similarity with other plant genes. Hence, our analysis suggests that these novel genes are also involved in the HR. This approach shows that, based on a robust and synchronized inducible system, it is possible to extract valuable information from the complex biological events that take place during the response of resistant plants to pathogens.
Materials and Methods
Plant Material and Growth ConditionsDying seedlings (DS) were generated by crossing transgenic tomato Moneymaker (MM)-Cf0 expressing Avr4 (Cf0:Avr4), to MM-Cf0 tomato transgenic for the Hcr9-4D (Cf-4) resistance gene (Cf0:Cf-4) (de Jong et al., 2002; Gabriëls et al., 2006; Stulemeijer et al., 2007). Pre-treatment of the seeds before sowing was carried out as described by (Stulemeijer et al., 2007). Ten seeds were sown per pot of 7 x 7 x 8cm and these were kept in a transparent closed box for 7 days (till the cotyledons had emerged) at 25°C, under a 16 hr/8 hr light/dark regime in an incubator (Elbanton, Kerkdriel, The Netherlands). Plants were rescued at 33°C and 100 % RH for a period of two weeks, after which samples of the Cf-4/Avr4 DS and as control a 1:1 mixture of the Cf0:Cf-4 and Cf0:Avr4 parental lines (PLS) that were crossed to generate the Cf-4/Avr4 DS were collected at 0 hr, 1 hr, 3 hr and 5 hr after the initiation of the HR by a transfer of the plants to 20°C and 70 % RH. Samples consisted of cotyledons and just appearing primary leaves and were immediately frozen and ground to a fine powder in liquid nitrogen, and stored at -80°C until further use. Four pots, each containing 10 seedlings, were considered as an experimental unit and three independent biological replicates were generated for the DS and PLS at the individual time points.
To validate gene expression profiles observed in the DS and PLS, the Cf0:Avr4 (susceptible) and Cf0:Cf-4 (resistant) parental tomato lines were also inoculated with a race 5 of C. fulvum secreting Avr4 (de Wit, 1977). Four biological replicates were performed, also including mock-treated susceptible and resistant plants and leaflets were harvested at 6 days and 10 days after inoculation with the fungus.
Microarray Experiments Total RNA was extracted and purified from the collected tomato seedling material using the NucleoSpin RNA/protein kit (Machery-Nagel, GmbH and Co., Dueren, Germany). RNA labeling, hybridization of the microarrays (Affymetrix® Tomato Genome Arrays; GeneChip® Tomato Genome, Affymetrix, Santa Clara, CA, USA) and data extraction were
HR-associated transcriptome and metabolome changes
47
Chapter 2
performed by Service XS (Leiden, The Netherlands), according to standard protocols provided by the manufacturer. For this, the RNA concentration was determined with the Nanodrop (type ND-1000) and RNA quality was assessed with the RNA 6000 Nano Labchip kit (Agilent Technologies, Palo Alto, CA, USA). Biotin-labeled cRNA was synthesized from 2 µg of total RNA using Affymetrix one-cycle target labeling and control agents (Affymetrix, part nr. 900493). GeneChips were hybridized with 20 µg of fragmented biotin-labeled cRNA, followed by automated washing and staining and they were then scanned with an Affymetrix scanner, type G7. Affymetrix GCOS software was used to convert the raw data to CEL files and data analysis was performed by packages from the Bioconductor project (Gentleman et al., 2004), implemented in Genemath XT version 2.12 (Applied Maths, Inc. Austin, TX, USA). The raw array data (CEL files) were normalized using the GCRMA probe summarization algorithm, applying the empirical Bayes approach (Wu et al., 2004). For each time point, three independent biological replicates were performed.
RNA Isolation and qRT-PCR Gene Expression AnalysisRNA was isolated from 100 mg of tomato leaf tissue, using 1 ml of Trizol reagent (Invitrogen) according to the manufacturer’s instructions. The total RNA was treated with DNAse-I Amplification Grade (Invitrogen) and purified with an RNeasy Mini kit (Qiagen). RNA concentration and integrity was examined and 1µg of RNA was used for the reverse transcription reaction, using the iScript™ Select cDNA Synthesis Kit (Bio-Rad Laboratories), in a final volume of 20 µl. Quantitative RT-PCR was performed in triplicate reactions, with the same cDNA pool, in the presence of fluorescent dye (iQ SYBR GREEN super mix 2*), using an iCycler iQ instrument (Bio-Rad Laboratories) with specific primer pairs (Supplemental Table S8). The constitutively expressed actin gene from tomato (Solyc10g080500.1.1) was used as a reference and the expression levels of other genes were determined relative to this reference.
Extraction and Gas Chromatography Time-of-Flight Mass Spectrometry (GC-TOF-MS) Analysis of Polar Primary MetabolitesPolar primary metabolites were extracted following the procedure described by Lisec and co-workers (Lisec et al., 2006) with minor modifications. Briefly, 50 mg (fresh weight) of frozen leaf tissue was homogenized in an Eppendorf tube and extracted with 700 µl of methanol (100 %), pre-cooled at -20°C and spiked with ribitol (0.2 mg/ml) as an internal standard. The sample was then incubated for 10 min at 70°C and centrifuged at 21,000g for 10 min. The supernatant was transferred to a new Eppendorf tube and 375 µl of chloroform (pre-cooled at -20°C) and 750 µl of water (pre-cooled at 4°C) were added. The mixture was centrifuged at 21,000 g for 10 min and 200 µl of the supernatant was dried in a vacuum concentrator without heating. Online derivatization was performed with methoxyamination reagent (methoxyamine hydrochloride (20
48
Chapter 2
mg/ml pyridine)) and N-methyl-N-trimethylsilyltrifluoroacetamide (MSTFA) using a CTC CombiPal injection and pipetting robot.
A mixture (5 µl) containing a series of n-alkanes (C10-C34) was injected into each sample for the calculation of the retention index (RI). A 2 µl aliquot of each derivatized sample was injected with a gradient of 6°C/s from 70°C to 240°C, using an Optic3 injector (ATAS) in split ratio of 1:20, into an Agilent 6890N gas chromatograph (GC) equipped with a 40 m x 0.25 µm i.d. fused-silica capillary column with a chemically bonded 0.25 µm DB 5-MS stationary phase (J and W Scientific, Folsom, CA). The injector temperature was kept at 270°C, the septum purge flow rate was 20 ml/ min and the purge was turned on after 60 s. The gas flow rate through the column was 1 ml/min and the column temperature was held at 70°C for 2 min, then increased by 10°C/min to 310°C and held there for 5 min. The column effluent was introduced into the ion source of a Pegasus III time-of-flight mass spectrometer (TOF-MS; Leco Corp., St. Joseph, MI, USA). The transfer line and the ion source temperatures were 270°C and 200°C, respectively. Ions were generated by a 70 eV electron beam at an ionization current of 2.0 mA and compounds were detected at scanning range of 20 spectra/s and recorded in the mass range 50-600 m/z. The acceleration voltage was turned on after a solvent delay of 295 s. The detector voltage was 1400 V.
The resulting chromatograms were processed in an untargeted manner using the MetAlign software (Lommen, 2009) . Extraction and reconstitution of compound mass spectra were performed according to the method described before (Tikunov et al., 2012). The internal standard (ribitol) was used to normalize the reconstituted metabolites over the samples. Identification of metabolites was performed using NIST-MS Search and retention indices, using the Golm Metabolite database as a reference library (http://gmd.mpimp-golm.mpg.de/download/) and further confirmation was obtained through injection of authentic standards.
Extraction and Liquid Chromatography Quadrupole Time-of-Flight Mass Spectrometry (LC-QTOF-MS) Analysis of Semi-Polar Secondary MetabolitesExtraction and liquid chromatography quadrupole time-of-flight mass spectrometry (LC-QTOF-MS) analysis of semi-polar secondary metabolites were performed according to the protocols described by De Vos and co-workers (De Vos et al., 2007) with slight modifications. Briefly, 50 mg of ground frozen leaf tissue was extracted with 150 µl of a MeOH (99.875 %)-formic acid (0.125 %) mixture (v\v), and sonicated for 15 min. The mixture was centrifuged at 20,000g for 10 min and the supernatant was filtered using a 0.45 µm inorganic membrane filter (Anotop 10; Whatman), fitted onto a disposable syringe, and transferred into a 150 µl insert in a 1.8 ml glass vial.
HR-associated transcriptome and metabolome changes
49
Chapter 2
The LC-PDA-QTOF-MS platform consisted of a Waters Alliance 2795 HT HPLC system equipped with a Luna C18(2) pre-column (2.0 x 4 mm) and an analytical column (2.0 x 150 mm, pore size 100 Å and particle size 3 µm; Phenomenex), connected to an Ultima V4.00.00 QTOF mass spectrometer (Waters, MS Technologies). Degassed solutions of formic acid in ultrapure water (1:1,000, v/v; eluent A) and formic acid in acetonitrile (1:1,000, v/v; eluent B) were pumped into the HPLC system at 190 µl/min and the gradient was linearly increased from 5 % to 35 % eluent B over a 45 min period, followed by 15 min of washing and equilibration of the column. The column, sample and room temperatures were kept at 40°C, 20°C and 20°C, respectively. Ionization was performed using an electrospray ionization source, and masses were detected in negative mode. A collision energy of 10 eV was used for full-scan LC-MS in the range of m/z 100 to 1,500. For LC-MS/MS, collision energies of 35eV were applied. Leucine enkephaline, (M – H) = 554.2620, was used for online mass calibration (lock mass) using a separate spray inlet. The chromatograms were aligned using the MetAlign (accurate mass option) software package (Lommen, 2009). Extraction and reconstitution of compound mass spectra was performed according to the method described by Tikunov and co-workers (Tikunov et al., 2012).
The identification of the secondary metabolites was based on their detected accurate mass and their corresponding retention time recorded for tomato fruit, as present in the MOTO database (Iijima et al., 2008). We used different public databases (dictionary of natural products http://dnp.chemnetbase.com and KNApSAcK http://kanaya.aist-nara.ac.jp/KNApSAcK/) to putatively identify some of the metabolites that are not present in the MOTO database (Moco et al., 2006). For confirmation of the identity of these metabolites we performed MS3 fragmentation of the parent ion using a Thermo LC-LTQ-Obitrap FTMS system in high-mass resolution mode (van der Hooft et al., 2011). The identification levels were given according to the proposed minimum reporting standards for chemical analysis, Metabolomics Standards Initiative (MSI) (Sumner et al., 2007). The identity of the hydroxycinnamic acid amides (HCAAs) trans-feruloyltyramine (FT) and trans-coumaroyltyramine (CT) present in total extracts of the DS was confirmed by using synthetic trans-FT and trans-CT as standards. For this, trans-FT and trans-CT were synthesized according to López-Gresa et al. (2011) and chromatograms, UV absorption spectra and MS/MS spectra of the FT and CT standards and an extract of the DS obtained at t = 5 hr after the temperature shift were compared (Supplemental Figure S4).
Ethylene Measurements by Gas Chromatography Coupled to Flame Ionization Detection (GC-FID)Ethylene was measured using gas chromatography (GC) coupled to flame ionization detection (FID), on a focus GC (Thermo Scientific), equipped with a FID detector and a
50
Chapter 2
RT QPLOT (15m x 0.53mm ID) column (Restek), using helium as carrier gas. First, the seedlings were kept for 24 hr in 1000 ml air-tight glass jars at 33°C and 100 % RH and 2 ml samples were taken regularly from the headspace for analyses. Then the plants were transferred to 20°C /100 % RH and again regularly 2 ml air samples were collected over a period of 24 hrs. Samples were stored in air-tight syringes and were injected in the gas chromatograph using a 500 µl injection loop.
Statistical Analysis and Bioinformatics For both transcriptome and metabolome studies, three independent biological replicates were performed and analyzed. Differentially expressed genes were filtered based on the following criteria: fold change (FC) in expression > 2 and a P-value <0.05, based on two-tailed t-tests on the expression values of the DS and PLS at individual time points. The FC in gene expression was calculated by subtracting the expression value (log2) of the PLS (control) from the DS (treatment). The same procedure was employed to filter both polar primary metabolites and semi-polar secondary metabolites. Here we reduced the fold change cut-off value to 1.5, in order to include most of the tightly regulated primary metabolites in the analysis, and we corrected for the false discovery rate (FDR).
About 80 % to 90 % of the genes on the tomato Affymetrix® genome array are of unknown function. Therefore, to annotate them, the blast output of these genes from the Tomato Functional Genomics Database (http://ted.bti.cornell.edu/cgi-bin/TFGD/array/download_annotation.cgi) was used. In this output list, the potential Arabidopsis orthologues and their respective protein reference sequence IDs were included. Subsequently, this combined information was used to compute an over-representation analysis (ORA), aimed at identifying significantly enriched functional GO: (gene ontology) subcategories of genes that are differentially regulated during the HR. For this analysis, GeneTrail, a web-based tool that compares the frequency of differentially regulated genes belonging to a certain functional category in the test set, with that of a reference set (in this case all genes of Arabidopsis), was used. Separate computation of the ORA was done for the up- and down-regulated gene categories, using the sets of genes that have unique or overlapping expression patterns between the different time points. To reduce the amount of redundant functional categories describing the same biological process, a similarity matrix was built based on the output of GeneTrail using R software (Supplemental Materials and Methods S1). In addition to GeneTrail, we used other web-based tools like tomato functional genomics database (TFGD) GO: enrichment analysis (http://ted.bti.cornell.edu/cgi-bin/TFGD/array/GO_analysis.cgi) and AtCOECiS (http://bioinformatics.psb.ugent.be/ATCOECIS/) (Vandepoele et al., 2009; Fei et al., 2011) to compute GO: enrichment analysis of gene clusters that are selected from our co-expression network analysis.
HR-associated transcriptome and metabolome changes
51
Chapter 2
Genemaths XT software (Applied Maths, Inc. Austin, TX, USA) was used for discriminant function analysis (DFA) and hierarchical cluster analysis (HCA). For HCA, Pearson’s correlation coefficients were used to calculate the distance or similarity between two entries and the resulting clusters were summarized using a complete linkage algorithm. To compare the expression values, both for the transcriptome and the metabolome profile, the raw values of each sample were log-transformed and auto-scaled by the use of the average as an offset and the standard deviation as scale (raw value-average (offset)/SD (scale)).
To gain more insight into the interaction of differentially regulated genes at the systems level, a regulatory network was built using Cytoscape (version 2.6) (Shannon et al., 2003) and the expression correlation network plug-in (http://www.baderlab.org/Software/ExpressionCorrelation). Network construction was based on a weighed gene-gene network, in which an edge weight for two genes is given based on the similarity of their expression profiles. A similarity matrix was computed using Pearson’s correlation coefficients and was then converted into a sparse network by connecting each gene to its nearest neighbors with a strict similarity cut-off score of 0.92. This type of computation is based on selecting a gene and determining its nearest neighbors in the expression space within the defined distance cut-off value. The Cytoscape plug-in module identification in networks (MINE) was used to identify the major hubs where pathways converge. MINE performs a type of clustering that follows a guilt by association (GBA) approach (Rhrissorrakrai and Gunsalus, 2011).
We used Tair motif finder (http://www.arabidopsis.org/tools/bulk/motiffinder/index.jsp) to identify potential nucleotide patterns (hexamers) in the promoter regions (a 1 kb stretch upstream of the open reading frame) of the co-regulated genes. The web-based tool POBO (Kankainen and Holm, 2004) was used to validate the result from the Tair motif finder. MapMan (Thimm et al., 2004) was used to visualize the expression pattern of genes that fall into different functional groups.
52
Chapter 2
Acknowledgements
We are indebted to José María Bellés (Instituto de Biología Molecular y Celular de Plantas (IBMCP), Valencia, Spain) for providing hydroxycinnamic acid amide standards. We wish to thank Anna Undas and Francel Verstappen (Laboratory of Plant Physiology, Wageningen University), Bert Schipper (Plant Research International (PRI)), Arjen Peppel and Uulke van Meeteren (Horticultural Supply Chains Group, Wageningen University) for the technical help we received during primary and secondary metabolite analysis and with ethylene measurements. We are grateful for the technical advice we obtained from Chris Maliepaard on multivariate analysis of both the metabolome and transcriptome data. The excellent plant care by Bert Essenstam is highly appreciated. We are grateful for all technical and intellectual support we received from the Metabolomics groups of the Laboratory of Plant Physiology (Wageningen University) and of PRI.
References
Afzal AJ, da Cunha L, Mackey D (2011) Separable fragments and membrane tethering of Arabidopsis RIN4 regulate its suppression of PAMP-triggered immunity. Plant Cell 23: 3798-3811
Ameisen JC (2002) On the origin, evolution, and nature of programmed cell death: a timeline of four billion years. Cell Death Differ 9: 367-393
Arpagaus S, Rawyler A, Braendle R (2002) Occurrence and characteristics of the mitochondrial permeability transition in plants. J Biol Chem 277: 1780-1787
Aubert S, Alban C, Bligny R, Douce R (1996) Induction of β-methylcrotonyl-coenzyme A carboxylase in higher plant cells during carbohydrate starvation: evidence for a role of MCCase in leucine catabolism. FEBS Lett 383: 175-180
Backes C, Keller A, Kuentzer J, Kneissl B, Comtesse N, Elnakady YA, Muller R, Meese E, Lenhof HP (2007) GeneTrail--advanced gene set enrichment analysis. Nucleic Acids Res 35: 186-192
Bienert GP, Møller ALB, Kristiansen KA, Schulz A, Møller IM, Schjoerring JK, Jahn TP (2007) Specific aquaporins facilitate the diffusion of hydrogen peroxide across membranes. J Biol Chem 282: 1183-1192
Bolton MD (2009) Primary metabolism and plant defense—fuel for the fire. Mol Plant-Microbe Interact 22: 487-497
Bolton MD, Kolmer JA, Xu WW, Garvin DF (2008) Comparative transcript profiling of Lr1- and Lr34-mediated leaf rust resistance in wheat. Phytopathology 98: S24-S24
Bolton MD, Kolmer JA, Xu WW, Garvin DF (2008) Lr34-mediated leaf rust resistance in wheat: transcript profiling reveals a high energetic demand supported by transient recruitment of multiple metabolic pathways. Mol Plant-Microbe Interact 21: 1515-1527
Chanson A (1993) Active-transport of proton and calcium in higher-plant cells. . Plant Physiol and Bioch 31: 943-955
Ciardi JA, Tieman DM, Jones JB, Klee HJ (2001) Reduced expression of the tomato ethylene receptor gene LeETR4 enhances the hypersensitive response to Xanthomonas campestris pv. vesicatoria. Mol Plant-Microbe Interact 14: 487-495
Ciardi JA, Tieman DM, Lund ST, Jones JB, Stall RE, Klee HJ (2000) Response to Xanthomonas campestris pv.vesicatoria in tomato involves regulation of ethylene receptor gene expression. Plant Physiol 123: 81-92
Daniel X, Lacomme C, Morel J-B, Roby D (1999) A novel myb oncogene homologue in Arabidopsis thaliana related to hypersensitive cell death. Plant J 20: 57-66
HR-associated transcriptome and metabolome changes
53
Chapter 2
de Jong CF, Takken FL, Cai X, de Wit PJ, Joosten MH (2002) Attenuation of Cf-mediated defense responses at elevated temperatures correlates with a decrease in elicitor-binding sites. Mol Plant-Microbe Interact 15: 1040-1049
De Vos RCH, Moco S, Lommen A, Keurentjes JJB, Bino RJ, Hall RD (2007) Untargeted large-scale plant metabolomics using liquid chromatography coupled to mass spectrometry. Nat Protoc 2: 778-791
de Wit PJGM (1977) A light and scanning-electron microscopic study of infection of tomato plants by virulent and avirulent races of Cladosporium fulvum. Eur J Plant Pathol 83: 109-122
de Wit PJGM, Joosten MHAJ (1999) Avirulence and resistance genes in the Cladosporium fulvum-tomato interaction. Curr Opin Microbiol 2: 368-373
DeYoung BJ, Innes RW (2006) Plant NBS-LRR proteins in pathogen sensing and host defense. Nat Rev Immunol 7: 1243-1249
Dodds PN, Rathjen JP (2010) Plant immunity: towards an integrated view of plant–pathogen interactions. Nat Rev Genet 11: 539-548
Dong C-H, Jang M, Scharein B, Malach A, Rivarola M, Liesch J, Groth G, Hwang I, Chang C (2010) Molecular association of the Arabidopsis ETR1 ethylene receptor and a regulator of ethylene signaling, RTE1. J Biol Chem 285: 40706-40713
Du L, Ali GS, Simons KA, Hou J, Yang T, Reddy ASN, Poovaiah BW (2009) Ca2+/calmodulin regulates salicylic-acid-mediated plant immunity. Nature 457: 1154-1158
Epple P, Mack AA, Morris VR, Dangl JL (2003) Antagonistic control of oxidative stress-induced cell death in Arabidopsis by two related, plant-specific zinc finger proteins. Proc Natl Acad Sci U.S.A. 100: 6831-6836
Essmann J, Bones P, Weis E, Scharte J (2008) Leaf carbohydrate metabolism during defense: Intracellular sucrose-cleaving enzymes do not compensate repression of cell wall invertase. Plant Signal Behav 3: 885-887
Eulgem T (2005) Regulation of the Arabidopsis defense transcriptome. TRENDS in Plant Science 10: 71-78Eulgem T, Somssich IE (2007) Networks of WRKY transcription factors in defense signaling. Curr Opin Plant
Biol 10: 366-371Facchini PJ, Hagel J, Zulak KG (2002) Hydroxycinnamic acid amide metabolism: physiology and biochemistry.
Can J Bot 80: 577-589Facchini PJ, Yu M, Penzes-Yost C (1999) Decreased cell wall digestibility in canola transformed with chimeric
tyrosine decarboxylase genes from opium poppy. Plant Physiol 120: 653-664Fei Z, Joung J-G, Tang X, Zheng Y, Huang M, Lee JM, McQuinn R, Tieman DM, Alba R, Klee HJ, Giovannoni
JJ (2011) Tomato functional genomics database: a comprehensive resource and analysis package for tomato functional genomics. Nucleic Acids Res 39: 1156-1163
Fujiki Y, Ito M, Nishida I, Watanabe A (2001) Leucine and its keto acid enhance the coordinated expression of genes for branched-chain amino acid catabolism in Arabidopsis under sugar starvation. FEBS Lett 499: 161-165
Gabriëls SH, Takken FL, Vossen JH, de Jong CF, Liu Q, Turk SC, Wachowski LK, Peters J, Witsenboer HM, de Wit PJGM, Joosten MHAJ (2006) cDNA-AFLP combined with functional analysis reveals novel genes involved in the hypersensitive response. Mol Plant-Microbe Interact 19: 567-576
Gentleman R, Carey V, Bates D, Bolstad B, Dettling M, Dudoit S, Ellis B, Gautier L, Ge Y, Gentry J, Hornik K, Hothorn T, Huber W, Iacus S, Irizarry R, Leisch F, Li C, Maechler M, Rossini A, Sawitzki G, Smith C, Smyth G, Tierney L, Yang J, Zhang J (2004) Bioconductor: open software development for computational biology and bioinformatics. Genome Biol 5: R80-80.16
Gomes D, Agasse A, Thiebaud P, Delrot S, Geros H, Chaumont F (2009) Aquaporins are multifunctional water and solute transporters highly divergent in living organisms. Biochim Biophys Acta 1788: 1213-1228
Graham IA, Eastmond PJ (2002) Pathways of straight and branched chain fatty acid catabolism in higher plants. Prog Lipid Res 41: 156-181
Grandmaison J, Olah G.M, Van Calsteren MR, Furlan V (1993) Characterization and localization of plant phenolics likely involved in the pathogen resistance expressed by endomycorrhizal roots. Mycorrhiza 3: 155-164
Guillet G, De Luca V (2005) Wound-inducible biosynthesis of phytoalexin hydroxycinnamic acid amides of tyramine in tryptophan and tyrosine decarboxylase transgenic tobacco lines. Plant Physiol 137: 692-699
54
Chapter 2
Hanssen IM, van Esse HP, Ballester AR, Hogewoning SW, Parra NO, Paeleman A, Lievens B, Bovy AG, Thomma BP (2011) Differential tomato transcriptomic responses induced by pepino mosaic virus isolates with differential aggressiveness. Plant Physiol 156: 301-318
Hardie DG, Ross FA, Hawley SA (2012) AMPK: a nutrient and energy sensor that maintains energy homeostasis. Nat Rev Mol Cell Biol 13: 251-262
Heil M, Baldwin IT (2002) Fitness costs of induced resistance: emerging experimental support for a slippery concept. Trends Plant Sci 7: 61-67
Hong W, Xu YP, Zheng Z, Cao JS, Cai XZ (2007) Comparative transcript profiling by cDNA-AFLP reveals similar patterns of Avr4/Cf-4- and Avr9/Cf-9-dependent defence gene expression. Mol Plant Pathol 8: 515-527
Huang Y, Li H, Hutchison CE, Laskey J, Kieber JJ (2003) Biochemical and functional analysis of CTR1, a protein kinase that negatively regulates ethylene signaling in Arabidopsis. Plant J 33: 221-233
Iijima Y, Nakamura Y, Ogata Y, Tanaka Ki, Sakurai N, Suda K, Suzuki T, Suzuki H, Okazaki K, Kitayama M, Kanaya S, Aoki K, Shibata D (2008) Metabolite annotations based on the integration of mass spectral information. Plant J 54: 949-962
Jones AM (2001) Programmed cell death in development and defense. Plant Physiol 125: 94-97Jones JD, Dangl JL (2006) The plant immune system. Nature 444: 323-329Kang S, Kang K, Chung GC, Choi D, Ishihara A, Lee D-S, Back K (2006) Functional analysis of the amine
substrate specificity domain of pepper tyramine and serotonin N-hydroxycinnamoyltransferases. Plant Physiol 140: 704-715
Kankainen M, Holm L (2004) POBO, transcription factor binding site verification with bootstrapping. Nucleic Acids Res 32: 222-229
Kieber JJ, Rothenberg M, Roman G, Feldmann KA, Ecker JR (1993) CTR1, a negative regulator of the ethylene response pathway in Arabidopsis, encodes a member of the raf family of protein kinases. Cell 72: 427-441
Kilili KG, Atanassova N, Vardanyan A, Clatot N, Al-Sabarna K, Kanellopoulos PN, Makris AM, Kampranis SC (2004) Differential roles of tau class glutathione S-transferases in oxidative stress. J Biol Chem 279: 24540-24551
Knickerbocker DL, Lutz PL (2001) Slow ATP loss and the defense of ion homeostasis in the anoxic frog brain. J Exp Biol 204: 3547-3551
Kochevenko A, Araújo WL, Maloney GS, Tieman DM, Do PT, Taylor MG, Klee HJ, Fernie AR (2012) Catabolism of branched chain amino acids supports respiration but not volatile synthesis in tomato fruits. Molecular plant 5: 366-375
Kuriyama H, Fukuda H (2002) Developmental programmed cell death in plants. Curr Opin Plant Biol 5: 568-573
Lam E, Naohiro K, Lawton M (2001) Programmed cell death, mitochondria and the plant hypersensitive response. Nature 411: 848-853
Lee SC, Lan WZ, Kim BG, Li LG, Cheong YH, Pandey GK, Lu GH, Buchanan BB, Luan S (2007) A protein phosphorylation/dephosphorylation network regulates a plant potassium channel. Proc Natl Acad Sci U.S.A. 104: 15959-15964
Leivar P, Antolin-Llovera M, Ferrero S, Closa M, Arro M, Ferrer A, Boronat A, Campos N (2011) Multilevel control of Arabidopsis 3-hydroxy-3-methylglutaryl coenzyme A reductase by protein phosphatase 2A. Plant Cell 23: 1494-1511
Lippok B, Birkenbihl RP, Rivory G, Brümmer J, Schmelzer E, Logemann E, Somssich IE (2007) Expression of AtWRKY33 encoding a pathogen- or PAMP-responsive WRKY transcription factor is regulated by a composite DNA motif containing W box elements. Mol Plant-Microbe Interact 20: 420-429
Lisec J, Schauer N, Kopka J, Willmitzer L, Fernie AR (2006) Gas chromatography mass spectrometry-based metabolite profiling in plants. Nat Protoc 1: 387-396
Lommen A (2009) MetAlign: interface-driven, versatile metabolomics tool for hyphenated full-scan mass spectrometry data preprocessing. Anal Chem 81: 3079-3086
Lopez-Gresa MP, Torres C, Campos L, Lison P, Rodrigo I, Belles JM, Conejero V (2011) Identification of defence metabolites in tomato plants infected by the bacterial pathogen Pseudomonas syringae. Env Exp Bot 74: 216-228
López-Gresa MP, Torres C, Campos L, Lisón P, Rodrigo I, Bellés JM, Conejero V (2011) Identification of defence metabolites in tomato plants infected by the bacterial pathogen Pseudomonas syringae. Environ Exp Bot 74: 216-228
HR-associated transcriptome and metabolome changes
55
Chapter 2
Lund ST, Stall RE, Klee HJ (1998) Ethylene regulates the susceptible response to pathogen infection in tomato. Plant Cell 10: 371-382
Maeda H, Dudareva N (2012) The shikimate pathway and aromatic amino acid biosynthesis in plants. Annu Rev Plant Biol 63: 73-105
Mangeon A, Junqueira RM, Sachetto-Martins G (2010) Functional diversity of the plant glycine-rich proteins superfamily. Plant Signal Behav 5: 99-104
Mao G, Meng X, Liu Y, Zheng Z, Chen Z, Zhang S (2011) Phosphorylation of a WRKY transcription factor by two pathogen-responsive MAPKs drives phytoalexin biosynthesis in Arabidopsis. Plant Cell 23: 1639-1653
Margolles-Clark E, Harman GE, Penttila M (1996) Enhanced expression of endochitinase in Trichoderma harzianum with the cbh1 promoter of Trichoderma reesei. Appl Environ Microbiol 62: 2152-2155
Marrs KA (1996) The functions and regulation of glutathione S-transferases in plants. Annu Rev Plant Physiol Plant Mol Biol 47: 127-158
McLusky SR, Bennett MH, Beale MH, Lewis MJ, Gaskin P, Mansfield JW (1999) Cell wall alterations and localized accumulation of feruloyl-3′-methoxytyramine in onion epidermis at sites of attempted penetration by Botrytis allii are associated with actin polarisation, peroxidase activity and suppression of flavonoid biosynthesis. Plant J 17: 523-534
Moco S, Bino RJ, Vorst O, Verhoeven HA, de Groot J, van Beek TA, Vervoort J, de Vos CHR (2006) A Liquid Chromatography-Mass Spectrometry-Based Metabolome Database for Tomato. Plant Physiol 141: 1205-1218
Morel JB, Dangl JL (1997) The hypersensitive response and the induction of cell death in plants. Cell Death Differ 4: 671-683
Mur LA, Lloyd AJ, Cristescu SM, Harren FJ, Hall MA, Smith AR (2009) Biphasic ethylene production during the hypersensitive response in Arabidopsis: a window into defense priming mechanisms? Plant Signal Behav 4: 610-613
Naoumkina M, He X, Dixon R (2008) Elicitor-induced transcription factors for metabolic reprogramming of secondary metabolism in Medicago truncatula. BMC Plant Biol 8: 132
Oñate-Sánchez L, Anderson JP, Young J, Singh KB (2007) AtERF14, a member of the ERF family of transcription factors, plays a nonredundant role in plant defense. Plant Physiol 143: 400-409
Pappan K, Qin W, Dyer JH, Zheng L, Wang X (1997) Molecular cloning and functional analysis of polyphosphoinositide-dependent phospholipase D, PLDβ, from Arabidopsis. J Biol Chem 272: 7055-7061
Postel S, Kemmerling B (2009) Plant systems for recognition of pathogen-associated molecular patterns. Semine Cell Dev Biol 20: 1025-1031
Rhrissorrakrai K, Gunsalus K (2011) MINE: module identification in networks. BMC Bioinf 12: 192Rivas S, Thomas CM (2005) Molecular interactions between tomato and the leaf mold pathogen Cladosporium
fulvum. Annu Rev Phytopathol 43: 395-436Rushton PJ, Somssich IE, Ringler P, Shen QJ (2010) WRKY transcription factors. Trends Plant Sci 15: 247-
258Santner A, Estelle M (2009) Recent advances and emerging trends in plant hormone signalling. Nature 459:
1071-1078Schneider DJ, Collmer A (2010) Studying plant-pathogen interactions in the genomics era: beyond molecular
Koch’s postulates to systems biology. Ann Rev Phytopathol 48: 457-479Schweighofer A, Kazanaviciute V, Scheikl E, Teige M, Doczi R, Hirt H, Schwanninger M, Kant M,
Schuurink R, Mauch F, Buchala A, Cardinale F, Meskiene I (2007) The PP2C-type phosphatase AP2C1, which negatively regulates MPK4 and MPK6, modulates innate immunity, jasmonic acid, and ethylene levels in Arabidopsis. Plant Cell 19: 2213-2224
Shannon P, Markiel A, Ozier O, Baliga NS, Wang JT, Ramage D, Amin N, Schwikowski B, Ideker T (2003) Cytoscape: a software environment for integrated models of biomolecular interaction networks. Genome Res 13: 2498-2504
Singh KB, Foley RC, Oñate-Sánchez L (2002) Transcription factors in plant defense and stress responses. Curr Opin Plant Biol 5: 430-436
Smith AM, Stitt M (2007) Coordination of carbon supply and plant growth. Plant Cell Env 30: 1126-1149Snedden WA, Blumwald E (2000) Alternative splicing of a novel diacylglycerol kinase in tomato leads to a
calmodulin-binding isoform. Plant J 24: 317-326
56
Chapter 2
Snedden WA, Fromm H (2001) Calmodulin as a versatile calcium signal transducer in plants. New Phytol 151: 35-66
Stulemeijer IJS, Joosten MHAJ, Jensen ON (2009) Quantitative phosphoproteomics of tomato mounting a hypersensitive response reveals a swift suppression of photosynthetic activity and a differential role for hsp90 isoforms. J. Proteome Res 8: 1168-1182
Stulemeijer IJS, Stratmann JW, Joosten MHAJ (2007) Tomato mitogen-activated protein kinases LeMPK1, LeMPK2, and LeMPK3 are activated during the Cf-4/Avr4-induced hypersensitive response and have distinct phosphorylation specificities. Plant Physiol 144: 1481-1494
Sumner L, Amberg A, Barrett D, Beale M, Beger R, Daykin C, Fan TM, Fiehn O, Goodacre R, Griffin J, Hankemeier T, Hardy N, Harnly J, Higashi R, Kopka J, Lane A, Lindon J, Marriott P, Nicholls A, Reily M, Thaden J, Viant M (2007) Proposed minimum reporting standards for chemical analysis. Metabolomics 3: 211-221
Taylor NL, Heazlewood JL, Day DA, Millar AH (2004) Lipoic acid-dependent oxidative catabolism of α-Keto acids in mitochondria provides evidence for branched-chain amino acid catabolism in Arabidopsis. Plant Physiol 134: 838-848
Thimm O, Blasing O, Gibon Y, Nagel A, Meyer S, Kruger P, Selbig J, Muller LA, Rhee SY, Stitt M (2004) MAPMAN: a user-driven tool to display genomics data sets onto diagrams of metabolic pathways and other biological processes. Plant J 37: 914-939
Thomma BP, Nurnberger T, Joosten MH (2011) Of PAMPs and effectors: the blurred PTI-ETI dichotomy. Plant Cell 23: 4-15
Thomma BP, Van Esse HP, Crous PW, De Wit PJ (2005) Cladosporium fulvum (syn. Passalora fulva), a highly specialized plant pathogen as a model for functional studies on plant pathogenic Mycosphaerellaceae. Mol Plant Pathol 6: 379-393
Tikunov YM, Laptenok S, Hall RD, Bovy A, Vos RCH (2012) MSClust: a tool for unsupervised mass spectra extraction of chromatography-mass spectrometry ion-wise aligned data. Metabolomics 8: 714-718
Tozzi MG, Camici M, Mascia L, Sgarrella F, Ipata PL (2006) Pentose phosphates in nucleoside interconversion and catabolism. FEBS J 273: 1089-1101
Vabulas RM (2007) Proteasome function and protein biosynthesis. Curr Opin Clin Nutr Metab Care 10: 24-31Vabulas RM, Hartl FU (2005) Protein synthesis upon acute nutrient restriction relies on proteasome
function. Science 310: 1960-1963van Baarlen P, van Esse HP, Siezen RJ, Thomma BP (2008) Challenges in plant cellular pathway
reconstruction based on gene expression profiling. Trends Plant Sci 13: 44-50van der Hooft JJJ, Vervoort J, Bino RJ, Beekwilder J, de Vos RCH (2011) Polyphenol Identification Based
on Systematic and Robust High-Resolution Accurate Mass Spectrometry Fragmentation. Anal Chem 83: 409-416
van Esse HP, Fradin EF, de Groot PJ, de Wit PJ, Thomma BP (2009) Tomato transcriptional responses to a foliar and a vascular fungal pathogen are distinct. Mol Plant-Microbe Interact 22: 245-258
van Esse HP, Van’t Klooster JW, Bolton MD, Yadeta KA, van Baarlen P, Boeren S, Vervoort J, de Wit PJ, Thomma BP (2008) The Cladosporium fulvum virulence protein Avr2 inhibits host proteases required for basal defense. Plant Cell 20: 1948-1963
van Loon LC, Geraats BPJ, Linthorst HJM (2006) Ethylene as a modulator of disease resistance in plants. Trends Plant Sci 11: 184-191
Vandepoele K, Quimbaya M, Casneuf T, De Veylder L, Van de Peer Y (2009) Unraveling transcriptional control in Arabidopsis using cis-regulatory elements and coexpression networks. Plant Physiol 150: 535-546
Vierstra RD (1993) Protein-degradation in plants. Annu Rev Plant Physiol Plant Mol Biol 44: 385-410Vierstra RD (2009) The ubiquitin-26S proteasome system at the nexus of plant biology. Nat Rev Mol Cell Biol
10: 385-397von Roepenack-Lahaye E, Newman MA, Schornack S, Hammond-Kosack KE, Lahaye T, Jones JDG,
Daniels MJ, Dow JM (2003) P-coumaroylnoradrenaline, a novel plant metabolite implicated in tomato defense against pathogens. J Biol Chem 278: 43373-43383
von Röpenack E, Parr A, Schulze-Lefert P (1998) Structural analyses and dynamics of soluble and cell wall-bound phenolics in a broad spectrum resistance to the powdery mildew fungus in barley. J Biol Chem 273: 9013-9022
Walters DR (2003) Polyamines and plant disease. Phytochemistry 64: 97-107

HR-associated transcriptome and metabolome changes
57
Chapter 2
Wu Z, Irizarry RA, Gentleman R, Martinez-Murillo F, Spencer F (2004) A model-based background adjustment for oligonucleotide expression arrays. J Am Stat Assoc 99: 909-917
Yang T, Poovaiah BW (2003) Calcium/calmodulin-mediated signal network in plants. Trends Plant Sci 8: 505-512
Yap KL, Yuan T, Mal TK, Vogel HJ, Ikura M (2003) Structural basis for simultaneous binding of two carboxy-terminal peptides of plant glutamate decarboxylase to calmodulin. J Mol Biol 328: 193-204
Zacares L, Lopez-Gresa MP, Fayos J, Primo J, Belles JM, Conejero V (2007) Induction of p-coumaroyldopamine and feruloyldopamine, two novel metabolites, in tomato by the bacterial pathogen Pseudomonas syringae. Mol Plant-Microbe interact 20: 1439-1448
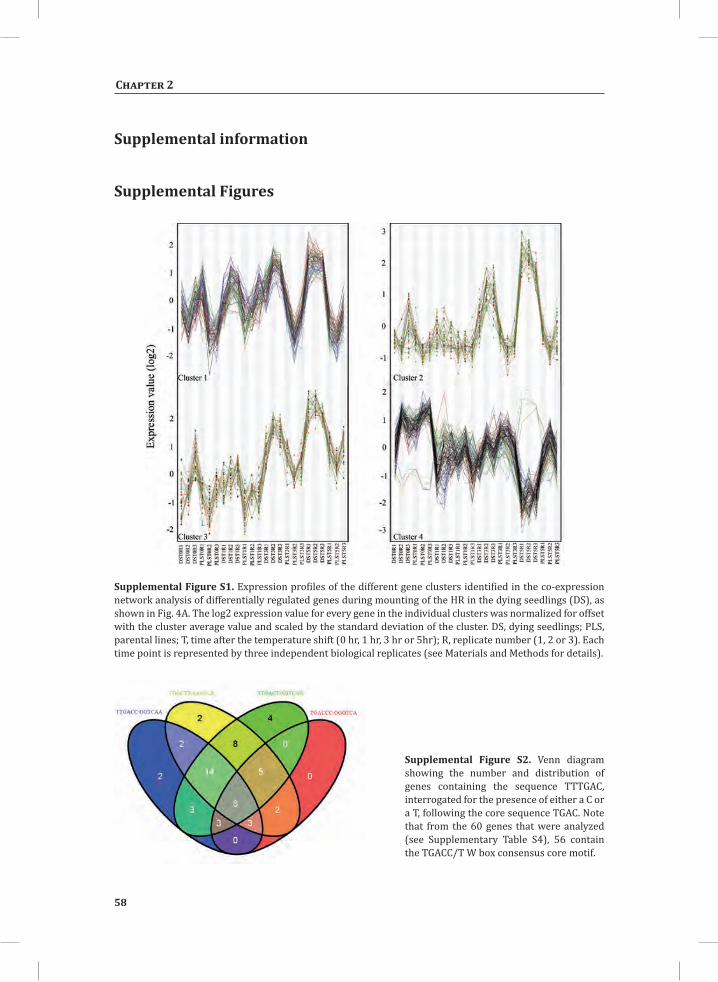
58
Chapter 2
Supplemental information
Supplemental Figures
Supplemental Figure S1. Expression profiles of the different gene clusters identified in the co-expression network analysis of differentially regulated genes during mounting of the HR in the dying seedlings (DS), as shown in Fig. 4A. The log2 expression value for every gene in the individual clusters was normalized for offset with the cluster average value and scaled by the standard deviation of the cluster. DS, dying seedlings; PLS, parental lines; T, time after the temperature shift (0 hr, 1 hr, 3 hr or 5hr); R, replicate number (1, 2 or 3). Each time point is represented by three independent biological replicates (see Materials and Methods for details).
Supplemental Figure S2. Venn diagram showing the number and distribution of genes containing the sequence TTTGAC, interrogated for the presence of either a C or a T, following the core sequence TGAC. Note that from the 60 genes that were analyzed (see Supplementary Table S4), 56 contain the TGACC/T W box consensus core motif.
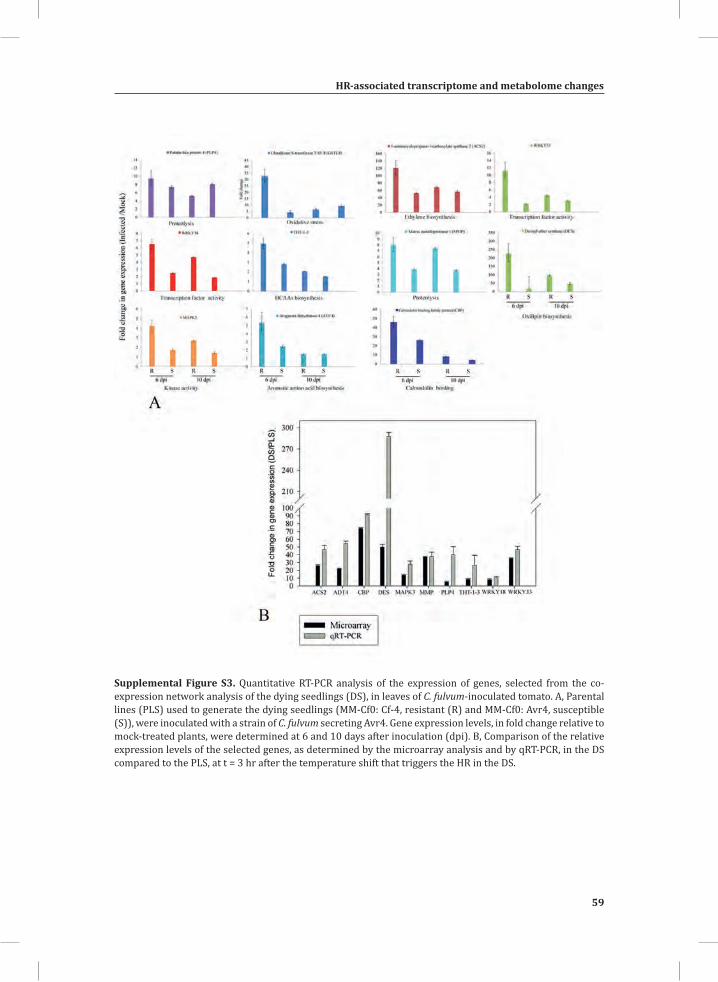
HR-associated transcriptome and metabolome changes
59
Chapter 2
Supplemental Figure S3. Quantitative RT-PCR analysis of the expression of genes, selected from the co-expression network analysis of the dying seedlings (DS), in leaves of C. fulvum-inoculated tomato. A, Parental lines (PLS) used to generate the dying seedlings (MM-Cf0: Cf-4, resistant (R) and MM-Cf0: Avr4, susceptible (S)), were inoculated with a strain of C. fulvum secreting Avr4. Gene expression levels, in fold change relative to mock-treated plants, were determined at 6 and 10 days after inoculation (dpi). B, Comparison of the relative expression levels of the selected genes, as determined by the microarray analysis and by qRT-PCR, in the DS compared to the PLS, at t = 3 hr after the temperature shift that triggers the HR in the DS.
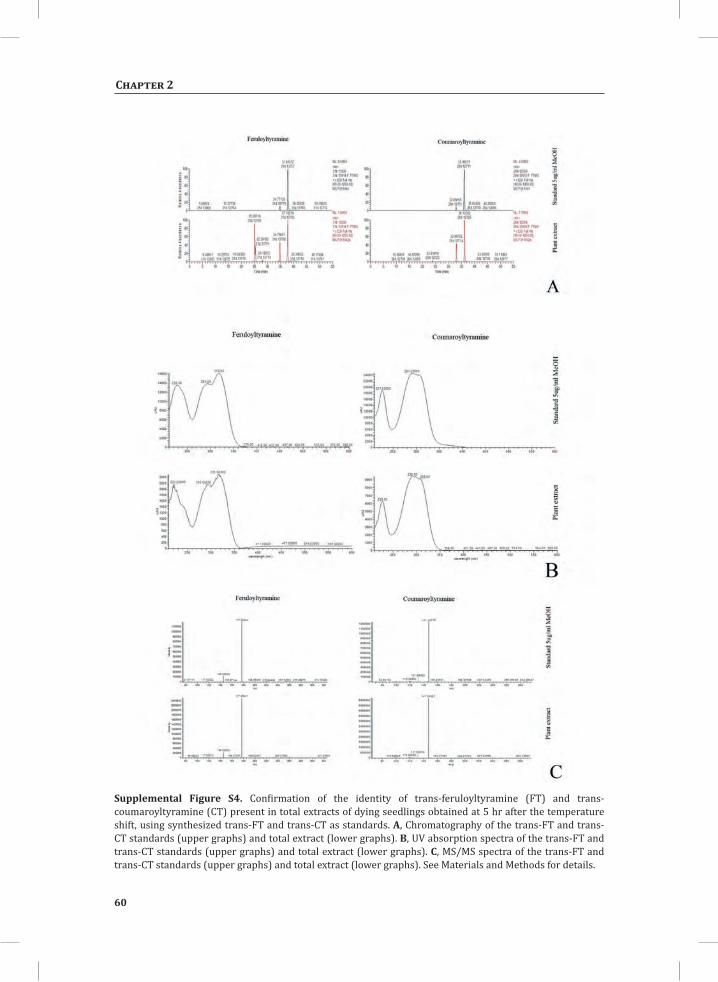
60
Chapter 2
Supplemental Figure S4. Confirmation of the identity of trans-feruloyltyramine (FT) and trans-coumaroyltyramine (CT) present in total extracts of dying seedlings obtained at 5 hr after the temperature shift, using synthesized trans-FT and trans-CT as standards. A, Chromatography of the trans-FT and trans-CT standards (upper graphs) and total extract (lower graphs). B, UV absorption spectra of the trans-FT and trans-CT standards (upper graphs) and total extract (lower graphs). C, MS/MS spectra of the trans-FT and trans-CT standards (upper graphs) and total extract (lower graphs). See Materials and Methods for details.
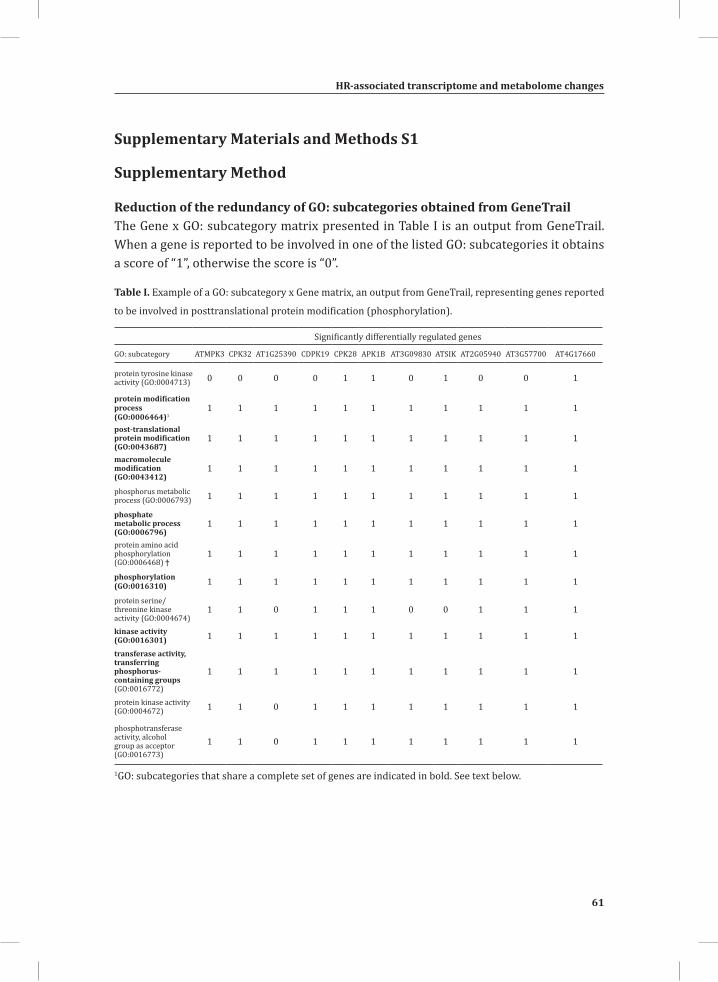
HR-associated transcriptome and metabolome changes
61
Chapter 2
Supplementary Materials and Methods S1
Supplementary Method
Reduction of the redundancy of GO: subcategories obtained from GeneTrailThe Gene x GO: subcategory matrix presented in Table I is an output from GeneTrail. When a gene is reported to be involved in one of the listed GO: subcategories it obtains a score of “1”, otherwise the score is “0”.
Table I. Example of a GO: subcategory x Gene matrix, an output from GeneTrail, representing genes reported
to be involved in posttranslational protein modification (phosphorylation).
Significantly differentially regulated genes
GO: subcategory ATMPK3 CPK32 AT1G25390 CDPK19 CPK28 APK1B AT3G09830 ATSIK AT2G05940 AT3G57700 AT4G17660
protein tyrosine kinase activity (GO:0004713) 0 0 0 0 1 1 0 1 0 0 1
protein modification process (GO:0006464)1
1 1 1 1 1 1 1 1 1 1 1
post-translational protein modification (GO:0043687)
1 1 1 1 1 1 1 1 1 1 1
macromolecule modification (GO:0043412)
1 1 1 1 1 1 1 1 1 1 1
phosphorus metabolic process (GO:0006793) 1 1 1 1 1 1 1 1 1 1 1
phosphate metabolic process (GO:0006796)
1 1 1 1 1 1 1 1 1 1 1
protein amino acid phosphorylation (GO:0006468) †
1 1 1 1 1 1 1 1 1 1 1
phosphorylation (GO:0016310) 1 1 1 1 1 1 1 1 1 1 1
protein serine/threonine kinase activity (GO:0004674)
1 1 0 1 1 1 0 0 1 1 1
kinase activity (GO:0016301) 1 1 1 1 1 1 1 1 1 1 1
transferase activity, transferring phosphorus-containing groups (GO:0016772)
1 1 1 1 1 1 1 1 1 1 1
protein kinase activity (GO:0004672) 1 1 0 1 1 1 1 1 1 1 1
phosphotransferase activity, alcohol group as acceptor (GO:0016773)
1 1 0 1 1 1 1 1 1 1 1
1GO: subcategories that share a complete set of genes are indicated in bold. See text below.
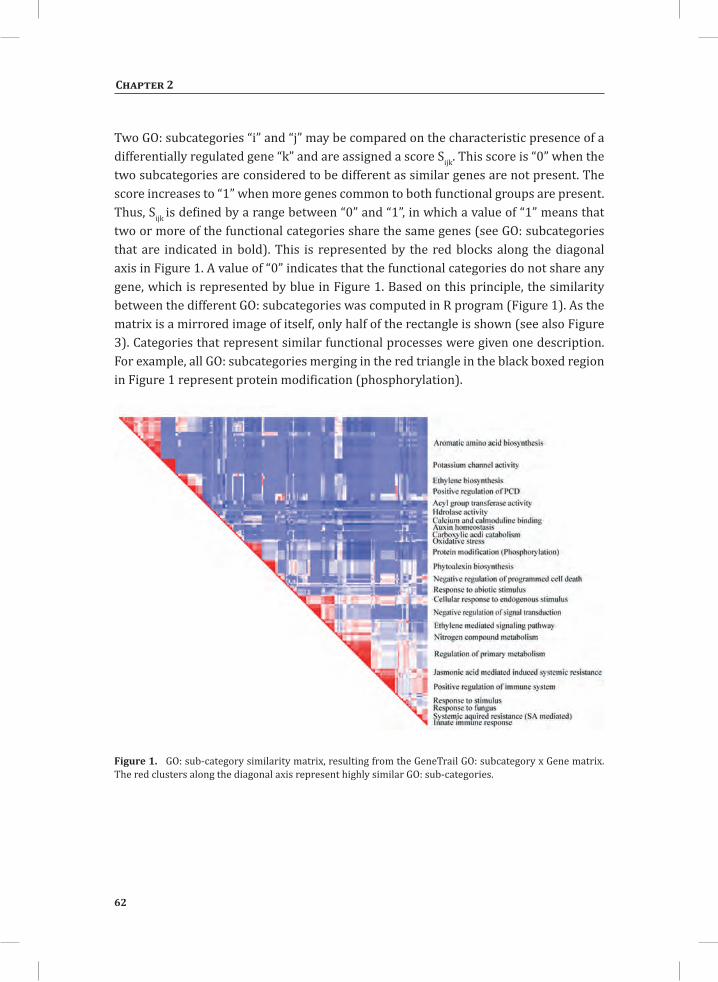
62
Chapter 2
Two GO: subcategories “i” and “j” may be compared on the characteristic presence of a differentially regulated gene “k” and are assigned a score Sijk. This score is “0” when the two subcategories are considered to be different as similar genes are not present. The score increases to “1” when more genes common to both functional groups are present. Thus, Sijk is defined by a range between “0” and “1”, in which a value of “1” means that two or more of the functional categories share the same genes (see GO: subcategories that are indicated in bold). This is represented by the red blocks along the diagonal axis in Figure 1. A value of “0” indicates that the functional categories do not share any gene, which is represented by blue in Figure 1. Based on this principle, the similarity between the different GO: subcategories was computed in R program (Figure 1). As the matrix is a mirrored image of itself, only half of the rectangle is shown (see also Figure 3). Categories that represent similar functional processes were given one description. For example, all GO: subcategories merging in the red triangle in the black boxed region in Figure 1 represent protein modification (phosphorylation).
Figure 1. GO: sub-category similarity matrix, resulting from the GeneTrail GO: subcategory x Gene matrix. The red clusters along the diagonal axis represent highly similar GO: sub-categories.
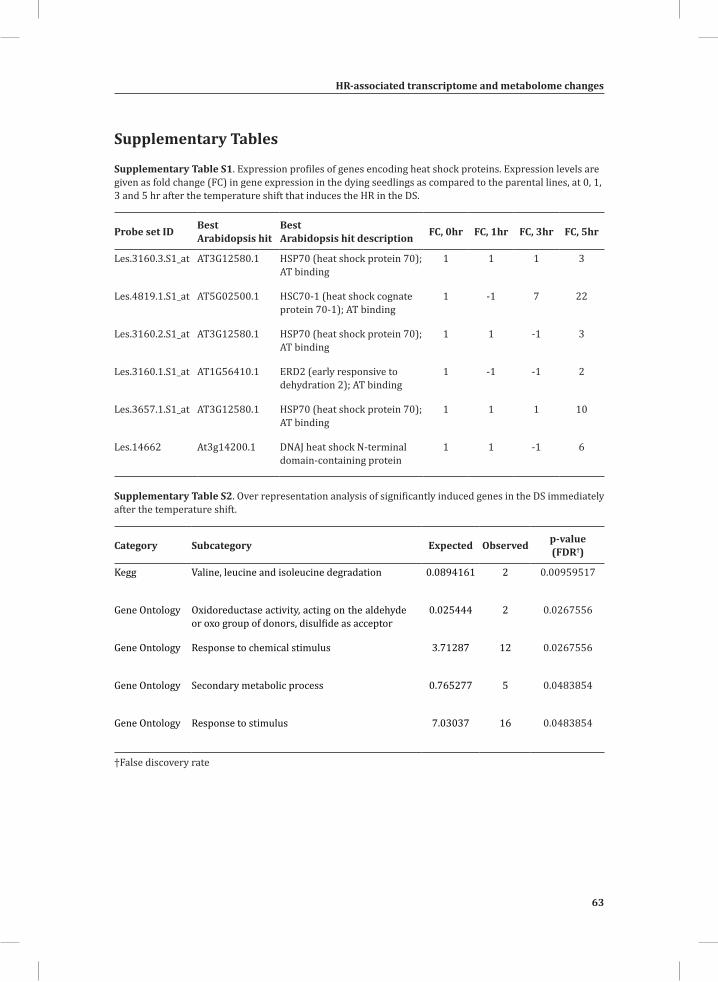
HR-associated transcriptome and metabolome changes
63
Chapter 2
Supplementary Tables
Supplementary Table S1. Expression profiles of genes encoding heat shock proteins. Expression levels are given as fold change (FC) in gene expression in the dying seedlings as compared to the parental lines, at 0, 1, 3 and 5 hr after the temperature shift that induces the HR in the DS.
Probe set ID Best Arabidopsis hit
Best Arabidopsis hit description FC, 0hr FC, 1hr FC, 3hr FC, 5hr
Les.3160.3.S1_at AT3G12580.1 HSP70 (heat shock protein 70); AT binding
1 1 1 3
Les.4819.1.S1_at AT5G02500.1 HSC70-1 (heat shock cognate protein 70-1); AT binding
1 -1 7 22
Les.3160.2.S1_at AT3G12580.1 HSP70 (heat shock protein 70); AT binding
1 1 -1 3
Les.3160.1.S1_at AT1G56410.1 ERD2 (early responsive to dehydration 2); AT binding
1 -1 -1 2
Les.3657.1.S1_at AT3G12580.1 HSP70 (heat shock protein 70); AT binding
1 1 1 10
Les.14662 At3g14200.1 DNAJ heat shock N-terminal domain-containing protein
1 1 -1 6
Supplementary Table S2. Over representation analysis of significantly induced genes in the DS immediately after the temperature shift.
Category Subcategory Expected Observed p-value (FDR†)
Kegg Valine, leucine and isoleucine degradation 0.0894161 2 0.00959517
Gene Ontology Oxidoreductase activity, acting on the aldehyde or oxo group of donors, disulfide as acceptor
0.025444 2 0.0267556
Gene Ontology Response to chemical stimulus 3.71287 12 0.0267556
Gene Ontology Secondary metabolic process 0.765277 5 0.0483854
Gene Ontology Response to stimulus 7.03037 16 0.0483854
†False discovery rate
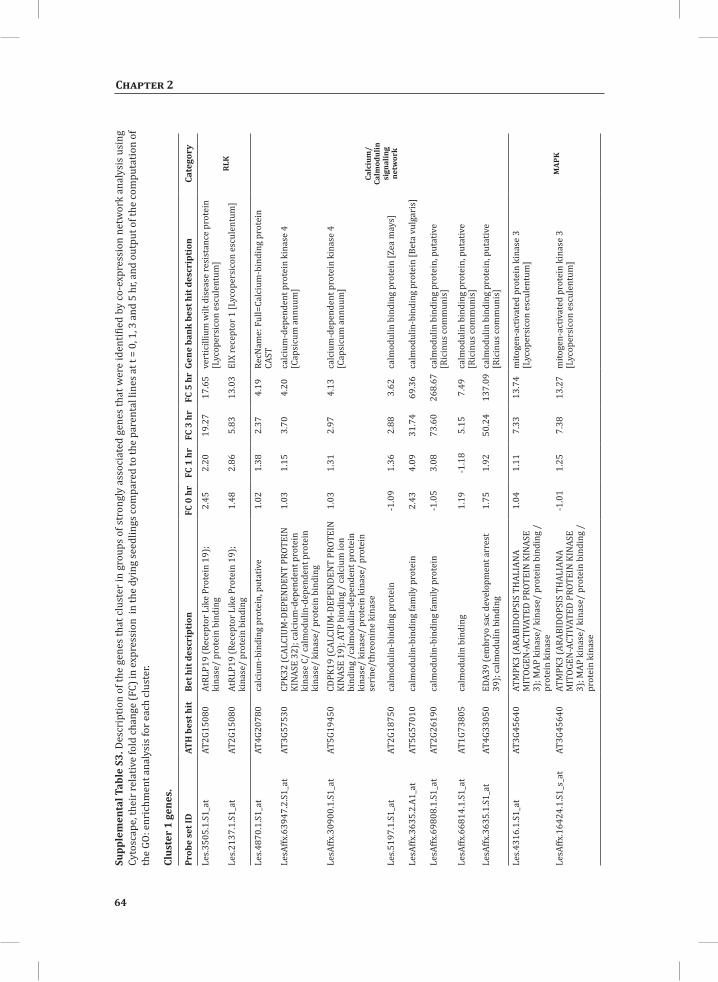
64
Chapter 2
Supp
lem
enta
l Tab
le S
3. D
escr
iptio
n of
the
gene
s th
at c
lust
er in
gro
ups
of s
tron
gly
asso
ciat
ed g
enes
that
wer
e id
entif
ied
by c
o-ex
pres
sion
net
wor
k an
alys
is u
sing
Cy
tosc
ape,
thei
r rel
ativ
e fo
ld ch
ange
(FC)
in e
xpre
ssio
n in
the
dyin
g se
edlin
gs co
mpa
red
to th
e pa
rent
al li
nes a
t t =
0, 1
, 3 a
nd 5
hr,
and
outp
ut o
f the
com
puta
tion
of
the
GO: e
nric
hmen
t ana
lysi
s for
eac
h cl
uste
r.
Clus
ter
1 ge
nes.
Prob
e se
t ID
ATH
bes
t hit
Bet h
it d
escr
ipti
on
FC 0
hr
FC 1
hr
FC 3
hr
FC 5
hr
Gene
ban
k be
st h
it d
escr
ipti
on
Cate
gory
Les.3
505.
1.S1
_at
AT2G
1508
0At
RLP1
9 (R
ecep
tor L
ike
Prot
ein
19);
kina
se/
prot
ein
bind
ing
2.45
2.20
19.2
717
.65
vert
icill
ium
wilt
dis
ease
resi
stan
ce p
rote
in
[Lyc
oper
sico
n es
cule
ntum
]RL
KLe
s.213
7.1.
S1_a
tAT
2G15
080
AtRL
P19
(Rec
epto
r Lik
e Pr
otei
n 19
); ki
nase
/ pr
otei
n bi
ndin
g1.
482.
865.
8313
.03
EIX
rece
ptor
1 [L
ycop
ersi
con
escu
lent
um]
Les.4
870.
1.S1
_at
AT4G
2078
0ca
lciu
m-b
indi
ng p
rote
in, p
utat
ive
1.02
1.38
2.37
4.19
RecN
ame:
Ful
l=Ca
lciu
m-b
indi
ng p
rote
in
CAST
Calc
ium
/Ca
lmod
ulin
si
gnal
ing
netw
ork
LesA
ffx.6
3947
.2.S
1_at
AT3G
5753
0CP
K32
(CAL
CIUM
-DEP
ENDE
NT
PROT
EIN
KI
NASE
32)
; cal
cium
-dep
ende
nt p
rote
in
kina
se C
/ ca
lmod
ulin
-dep
ende
nt p
rote
in
kina
se/
kina
se/
prot
ein
bind
ing
1.03
1.15
3.70
4.20
calc
ium
-dep
ende
nt p
rote
in k
inas
e 4
[Cap
sicu
m a
nnuu
m]
LesA
ffx.3
0900
.1.S
1_at
AT5G
1945
0CD
PK19
(CAL
CIUM
-DEP
ENDE
NT
PROT
EIN
KI
NASE
19)
; ATP
bin
ding
/ ca
lciu
m io
n bi
ndin
g /c
alm
odul
in-d
epen
dent
pro
tein
ki
nase
/ ki
nase
/ pr
otei
n ki
nase
/ pr
otei
n se
rine
/thr
eoni
ne k
inas
e
1.03
1.31
2.97
4.13
calc
ium
-dep
ende
nt p
rote
in k
inas
e 4
[Cap
sicu
m a
nnuu
m]
Les.5
197.
1.S1
_at
AT2G
1875
0ca
lmod
ulin
-bin
ding
pro
tein
-1.0
91.
362.
883.
62ca
lmod
ulin
bin
ding
pro
tein
[Zea
may
s]
LesA
ffx.3
635.
2.A1
_at
AT5G
5701
0ca
lmod
ulin
-bin
ding
fam
ily p
rote
in2.
434.
0931
.74
69.3
6ca
lmod
ulin
-bin
ding
pro
tein
[Bet
a vu
lgar
is]
LesA
ffx.6
9808
.1.S
1_at
AT2G
2619
0ca
lmod
ulin
-bin
ding
fam
ily p
rote
in-1
.05
3.08
73.6
026
8.67
calm
odul
in b
indi
ng p
rote
in, p
utat
ive
[Ric
inus
com
mun
is]
LesA
ffx.6
6814
.1.S
1_at
AT1G
7380
5ca
lmod
ulin
bin
ding
1.19
-1.1
85.
157.
49ca
lmod
ulin
bin
ding
pro
tein
, put
ativ
e [R
icin
us co
mm
unis
]Le
sAffx
.363
5.1.
S1_a
tAT
4G33
050
EDA3
9 (e
mbr
yo sa
c dev
elop
men
t arr
est
39);
calm
odul
in b
indi
ng1.
751.
9250
.24
137.
09ca
lmod
ulin
bin
ding
pro
tein
, put
ativ
e [R
icin
us co
mm
unis
]
Les.4
316.
1.S1
_at
AT3G
4564
0AT
MPK
3 (A
RABI
DOPS
IS T
HAL
IANA
M
ITOG
EN-A
CTIV
ATED
PRO
TEIN
KIN
ASE
3); M
AP k
inas
e/ k
inas
e/ p
rote
in b
indi
ng /
pr
otei
n ki
nase
1.04
1.11
7.33
13.7
4m
itoge
n-ac
tivat
ed p
rote
in k
inas
e 3
[Lyc
oper
sico
n es
cule
ntum
]
MAP
KLe
sAffx
.164
24.1
.S1_
s_at
AT3G
4564
0AT
MPK
3 (A
RABI
DOPS
IS T
HAL
IANA
M
ITOG
EN-A
CTIV
ATED
PRO
TEIN
KIN
ASE
3); M
AP k
inas
e/ k
inas
e/ p
rote
in b
indi
ng /
pr
otei
n ki
nase
-1.0
11.
257.
3813
.27
mito
gen-
activ
ated
pro
tein
kin
ase
3 [L
ycop
ersi
con
escu
lent
um]
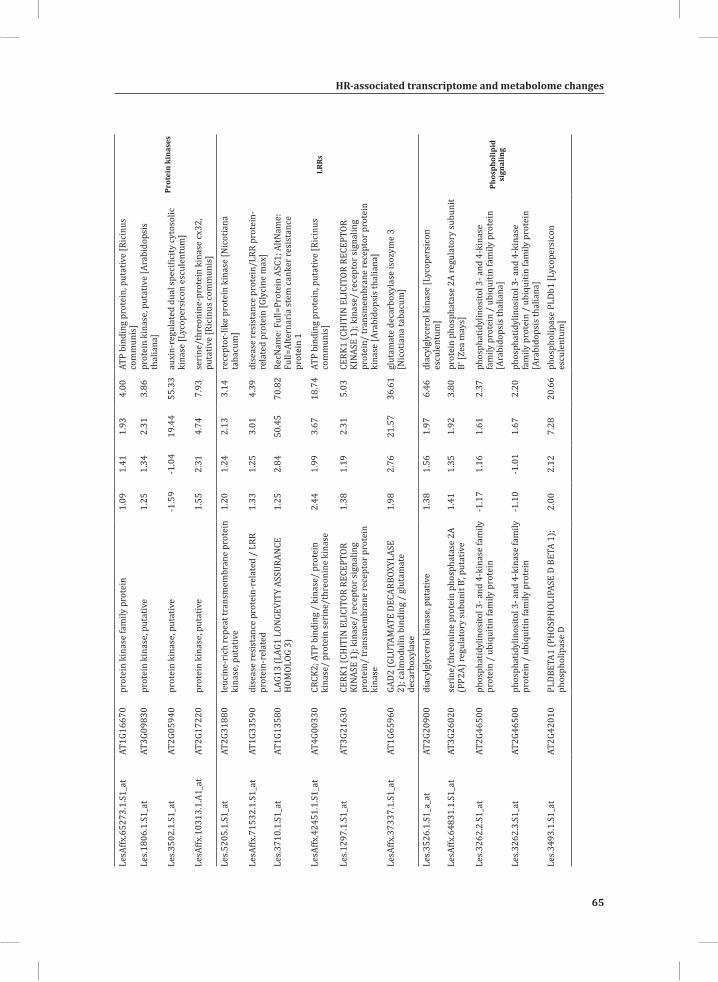
HR-associated transcriptome and metabolome changes
65
Chapter 2
LesA
ffx.6
5273
.1.S
1_at
AT1G
1667
0pr
otei
n ki
nase
fam
ily p
rote
in1.
091.
411.
934.
00AT
P bi
ndin
g pr
otei
n, p
utat
ive
[Ric
inus
co
mm
unis
]
Prot
ein
kina
ses
Les.1
806.
1.S1
_at
AT3G
0983
0pr
otei
n ki
nase
, put
ativ
e1.
251.
342.
313.
86pr
otei
n ki
nase
, put
ativ
e [A
rabi
dops
is
thal
iana
]
Les.3
502.
1.S1
_at
AT2G
0594
0pr
otei
n ki
nase
, put
ativ
e-1
.59
-1.0
419
.44
55.3
3au
xin-
regu
late
d du
al sp
ecifi
city
cyto
solic
ki
nase
[Lyc
oper
sico
n es
cule
ntum
]
LesA
ffx.1
0313
.1.A
1_at
AT2G
1722
0pr
otei
n ki
nase
, put
ativ
e1.
552.
314.
747.
93se
rine
/thr
eoni
ne-p
rote
in k
inas
e cx
32,
puta
tive
[Ric
inus
com
mun
is]
Les.5
205.
1.S1
_at
AT2G
3188
0le
ucin
e-ri
ch re
peat
tran
smem
bran
e pr
otei
n ki
nase
, put
ativ
e1.
201.
242.
133.
14re
cept
or-li
ke p
rote
in k
inas
e [N
icot
iana
ta
bacu
m]
LRRs
LesA
ffx.7
1532
.1.S
1_at
AT1G
3359
0di
seas
e re
sist
ance
pro
tein
-rel
ated
/ L
RR
prot
ein-
rela
ted
1.33
1.25
3.01
4.39
dise
ase
resi
stan
ce p
rote
in/L
RR p
rote
in-
rela
ted
prot
ein
[Gly
cine
max
]Le
s.371
0.1.
S1_a
tAT
1G13
580
LAG1
3 (L
AG1
LON
GEVI
TY A
SSUR
ANCE
H
OMOL
OG 3
)1.
252.
8450
.45
70.8
2Re
cNam
e: F
ull=
Prot
ein
ASC1
; AltN
ame:
Fu
ll=Al
tern
aria
stem
cank
er re
sist
ance
pr
otei
n 1
LesA
ffx.4
2451
.1.S
1_at
AT4G
0033
0CR
CK2;
ATP
bin
ding
/ k
inas
e/ p
rote
in
kina
se/
prot
ein
seri
ne/t
hreo
nine
kin
ase
2.44
1.99
3.67
18.7
4AT
P bi
ndin
g pr
otei
n, p
utat
ive
[Ric
inus
co
mm
unis
]
Les.1
297.
1.S1
_at
AT3G
2163
0CE
RK1
(CH
ITIN
ELI
CITO
R RE
CEPT
OR
KINA
SE 1
); ki
nase
/ re
cept
or si
gnal
ing
prot
ein/
tran
smem
bran
e re
cept
or p
rote
in
kina
se
1.38
1.19
2.31
5.03
CERK
1 (C
HIT
IN E
LICI
TOR
RECE
PTOR
KI
NASE
1);
kina
se/
rece
ptor
sign
alin
g pr
otei
n/ tr
ansm
embr
ane
rece
ptor
pro
tein
ki
nase
[Ara
bido
psis
thal
iana
]
LesA
ffx.3
7337
.1.S
1_at
AT1G
6596
0GA
D2 (G
LUTA
MAT
E DE
CARB
OXYL
ASE
2); c
alm
odul
in b
indi
ng /
glu
tam
ate
deca
rbox
ylas
e
1.98
2.76
21.5
736
.61
glut
amat
e de
carb
oxyl
ase
isoz
yme
3 [N
icot
iana
taba
cum
]
Les.3
526.
1.S1
_a_a
tAT
2G20
900
diac
ylgl
ycer
ol k
inas
e, p
utat
ive
1.38
1.56
1.97
6.46
diac
ylgl
ycer
ol k
inas
e [L
ycop
ersi
con
escu
lent
um]
Phos
phol
ipid
si
gnal
ing
LesA
ffx.6
4831
.1.S
1_at
AT3G
2602
0se
rine
/thr
eoni
ne p
rote
in p
hosp
hata
se 2
A (P
P2A)
regu
lato
ry su
buni
t B’, p
utat
ive
1.41
1.35
1.92
3.80
prot
ein
phos
phat
ase
2A re
gula
tory
subu
nit
B’ [Z
ea m
ays]
Les.3
262.
2.S1
_at
AT2G
4650
0ph
osph
atid
ylin
osito
l 3- a
nd 4
-kin
ase
fam
ily
prot
ein
/ ub
iqui
tin fa
mily
pro
tein
-1.1
71.
161.
612.
37ph
osph
atid
ylin
osito
l 3- a
nd 4
-kin
ase
fam
ily p
rote
in /
ubi
quiti
n fa
mily
pro
tein
[A
rabi
dops
is th
alia
na]
Les.3
262.
3.S1
_at
AT2G
4650
0ph
osph
atid
ylin
osito
l 3- a
nd 4
-kin
ase
fam
ily
prot
ein
/ ub
iqui
tin fa
mily
pro
tein
-1.1
0-1
.01
1.67
2.20
phos
phat
idyl
inos
itol 3
- and
4-k
inas
e fa
mily
pro
tein
/ u
biqu
itin
fam
ily p
rote
in
[Ara
bido
psis
thal
iana
]Le
s.349
3.1.
S1_a
tAT
2G42
010
PLDB
ETA1
(PH
OSPH
OLIP
ASE
D BE
TA 1
); ph
osph
olip
ase
D2.
002.
127.
2820
.66
phos
phol
ipas
e PL
Db1
[Lyc
oper
sico
n es
cule
ntum
]
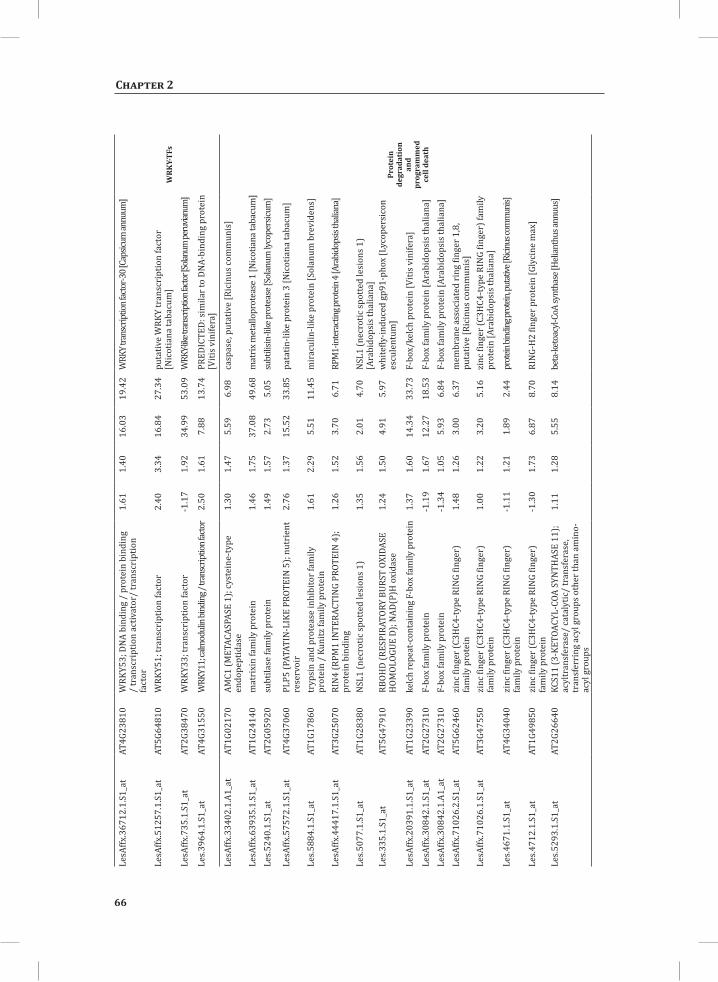
66
Chapter 2
LesA
ffx.3
6712
.1.S
1_at
AT4G
2381
0W
RKY5
3; D
NA b
indi
ng /
pro
tein
bin
ding
/
tran
scri
ptio
n ac
tivat
or/
tran
scri
ptio
n fa
ctor
1.61
1.40
16.0
319
.42
WRK
Y tra
nscr
iptio
n fac
tor-3
0 [Ca
psicu
m an
nuum
]
WRK
Y-TF
sLe
sAffx
.512
57.1
.S1_
atAT
5G64
810
WRK
Y51;
tran
scri
ptio
n fa
ctor
2.40
3.34
16.8
427
.34
puta
tive
WRK
Y tr
ansc
ript
ion
fact
or
[Nic
otia
na ta
bacu
m]
LesA
ffx.7
35.1
.S1_
atAT
2G38
470
WRK
Y33;
tran
scri
ptio
n fa
ctor
-1.1
71.
9234
.99
53.0
9W
RKY-l
ike tr
ansc
riptio
n fac
tor [
Solan
um pe
ruvia
num
]
Les.3
964.
1.S1
_at
AT4G
3155
0W
RKY1
1; ca
lmod
ulin
bind
ing /
tran
scrip
tion f
acto
r2.
501.
617.
8813
.74
PRED
ICTE
D: si
mila
r to
DNA-
bind
ing
prot
ein
[Viti
s vin
ifera
]
LesA
ffx.3
3402
.1.A
1_at
AT1G
0217
0AM
C1 (M
ETAC
ASPA
SE 1
); cy
stei
ne-t
ype
endo
pept
idas
e1.
301.
475.
596.
98ca
spas
e, p
utat
ive
[Ric
inus
com
mun
is]
Prot
ein
degr
adat
ion
and
prog
ram
med
ce
ll de
ath
LesA
ffx.6
3935
.1.S
1_at
AT1G
2414
0m
atri
xin
fam
ily p
rote
in1.
461.
7537
.08
49.6
8m
atrix
met
allo
prot
ease
1 [N
icot
iana
taba
cum
]Le
s.524
0.1.
S1_a
tAT
2G05
920
subt
ilase
fam
ily p
rote
in1.
491.
572.
735.
05su
btili
sin-li
ke p
rote
ase [
Sola
num
lyco
pers
icum
]
LesA
ffx.5
7572
.1.S
1_at
AT4G
3706
0PL
P5 (P
ATAT
IN-L
IKE
PROT
EIN
5);
nutr
ient
re
serv
oir
2.76
1.37
15.5
233
.85
pata
tin-li
ke p
rote
in 3
[Nic
otia
na ta
bacu
m]
Les.5
884.
1.S1
_at
AT1G
1786
0tr
ypsi
n an
d pr
otea
se in
hibi
tor f
amily
pr
otei
n /
Kuni
tz fa
mily
pro
tein
1.61
2.29
5.51
11.4
5m
irac
ulin
-like
pro
tein
[Sol
anum
bre
vide
ns]
LesA
ffx.4
4417
.1.S
1_at
AT3G
2507
0RI
N4
(RPM
1 IN
TERA
CTIN
G PR
OTEI
N 4
); pr
otei
n bi
ndin
g1.
261.
523.
706.
71RP
M1-
inte
racti
ng pr
otein
4 [A
rabi
dops
is th
alian
a]
Les.5
077.
1.S1
_at
AT1G
2838
0N
SL1
(nec
rotic
spot
ted
lesi
ons 1
)1.
351.
562.
014.
70N
SL1
(nec
rotic
spot
ted
lesi
ons 1
) [A
rabi
dops
is th
alia
na]
Les.3
35.1
.S1_
atAT
5G47
910
RBOH
D (R
ESPI
RATO
RY B
URST
OXI
DASE
H
OMOL
OGUE
D);
NAD(
P)H
oxi
dase
1.24
1.50
4.91
5.97
whi
tefly
-indu
ced
gp91
-pho
x [L
ycop
ersi
con
escu
lent
um]
LesA
ffx.2
0391
.1.S
1_at
AT1G
2339
0ke
lch
repe
at-c
onta
inin
g F-
box
fam
ily p
rote
in1.
371.
6014
.34
33.7
3F-
box/
kelc
h pr
otei
n [V
itis v
inife
ra]
LesA
ffx.3
0842
.1.S
1_at
AT2G
2731
0F-
box
fam
ily p
rote
in-1
.19
1.67
12.2
718
.53
F-bo
x fa
mily
pro
tein
[Ara
bido
psis
thal
iana
]Le
sAffx
.308
42.1
.A1_
atAT
2G27
310
F-bo
x fa
mily
pro
tein
-1.3
41.
055.
936.
84F-
box
fam
ily p
rote
in [A
rabi
dops
is th
alia
na]
LesA
ffx.7
1026
.2.S
1_at
AT5G
6246
0zi
nc fi
nger
(C3H
C4-t
ype
RIN
G fin
ger)
fa
mily
pro
tein
1.48
1.26
3.00
6.37
mem
bran
e as
soci
ated
ring
fing
er 1
,8,
puta
tive
[Ric
inus
com
mun
is]
LesA
ffx.7
1026
.1.S
1_at
AT3G
4755
0zi
nc fi
nger
(C3H
C4-t
ype
RIN
G fin
ger)
fa
mily
pro
tein
1.00
1.22
3.20
5.16
zinc
fing
er (C
3HC4
-typ
e RI
NG
finge
r) fa
mily
pr
otei
n [A
rabi
dops
is th
alia
na]
Les.4
671.
1.S1
_at
AT4G
3404
0zi
nc fi
nger
(C3H
C4-t
ype
RIN
G fin
ger)
fa
mily
pro
tein
-1.1
11.
211.
892.
44pr
otein
bind
ing p
rotei
n, pu
tative
[Rici
nus c
omm
unis]
Les.4
712.
1.S1
_at
AT1G
4985
0zi
nc fi
nger
(C3H
C4-t
ype
RIN
G fin
ger)
fa
mily
pro
tein
-1.3
01.
736.
878.
70RI
NG-
H2
finge
r pro
tein
[Gly
cine
max
]
Les.5
293.
1.S1
_at
AT2G
2664
0KC
S11
(3-K
ETOA
CYL-
COA
SYN
THAS
E 11
); ac
yltr
ansf
eras
e/ ca
taly
tic/
tran
sfer
ase,
tr
ansf
erri
ng a
cyl g
roup
s oth
er th
an a
min
o-ac
yl g
roup
s
1.11
1.28
5.55
8.14
beta
-ket
oacy
l-CoA
synt
hase
[Heli
anth
us an
nuus
]
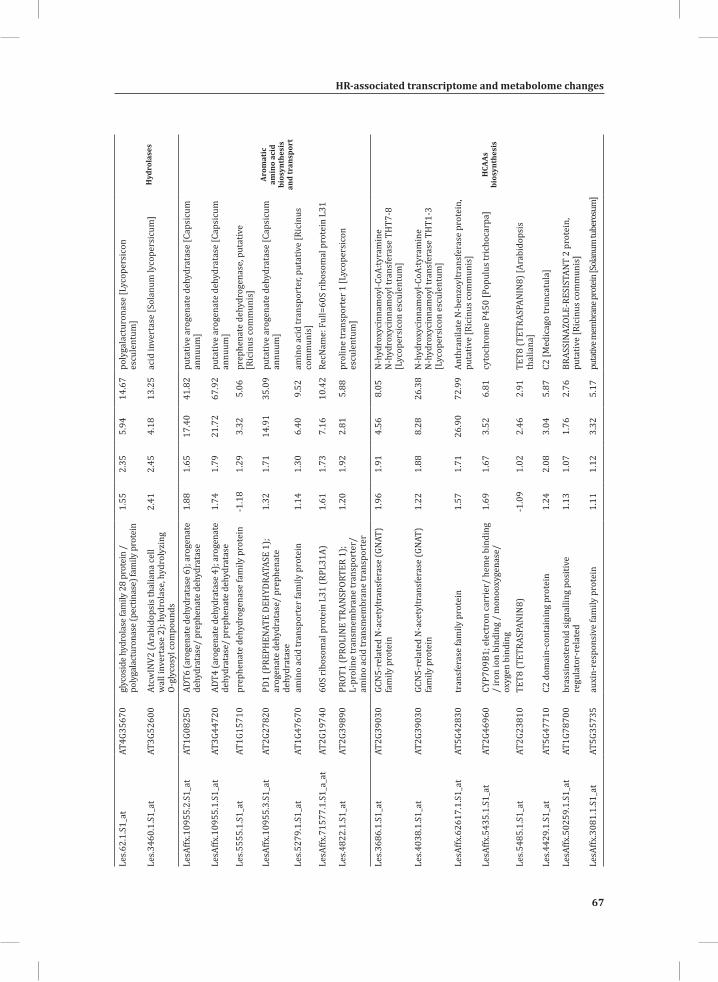
HR-associated transcriptome and metabolome changes
67
Chapter 2
Les.6
2.1.
S1_a
tAT
4G35
670
glyc
osid
e hy
drol
ase
fam
ily 2
8 pr
otei
n /
poly
gala
ctur
onas
e (p
ectin
ase)
fam
ily p
rote
in1.
552.
355.
9414
.67
poly
gala
ctur
onas
e [L
ycop
ersi
con
escu
lent
um]
Hyd
rola
ses
Les.3
460.
1.S1
_at
AT3G
5260
0At
cwIN
V2 (A
rabi
dops
is th
alia
na ce
ll w
all i
nver
tase
2);
hydr
olas
e, h
ydro
lyzi
ng
O-gl
ycos
yl co
mpo
unds
2.41
2.45
4.18
13.2
5ac
id in
vert
ase
[Sol
anum
lyco
pers
icum
]
LesA
ffx.1
0955
.2.S
1_at
AT1G
0825
0AD
T6 (a
roge
nate
deh
ydra
tase
6);
arog
enat
e de
hydr
atas
e/ p
reph
enat
e de
hydr
atas
e1.
881.
6517
.40
41.8
2pu
tativ
e ar
ogen
ate
dehy
drat
ase
[Cap
sicu
m
annu
um]
Arom
atic
am
ino
acid
bi
osyn
thes
is
and
tran
spor
t
LesA
ffx.1
0955
.1.S
1_at
AT3G
4472
0AD
T4 (a
roge
nate
deh
ydra
tase
4);
arog
enat
e de
hydr
atas
e/ p
reph
enat
e de
hydr
atas
e1.
741.
7921
.72
67.9
2pu
tativ
e ar
ogen
ate
dehy
drat
ase
[Cap
sicu
m
annu
um]
Les.5
555.
1.S1
_at
AT1G
1571
0pr
ephe
nate
deh
ydro
gena
se fa
mily
pro
tein
-1.1
81.
293.
325.
06pr
ephe
nate
deh
ydro
gena
se, p
utat
ive
[Ric
inus
com
mun
is]
LesA
ffx.1
0955
.3.S
1_at
AT2G
2782
0PD
1 (P
REPH
ENAT
E DE
HYD
RATA
SE 1
); ar
ogen
ate
dehy
drat
ase/
pre
phen
ate
dehy
drat
ase
1.32
1.71
14.9
135
.09
puta
tive
arog
enat
e de
hydr
atas
e [C
apsi
cum
an
nuum
]
Les.5
279.
1.S1
_at
AT1G
4767
0am
ino
acid
tran
spor
ter f
amily
pro
tein
1.14
1.30
6.40
9.52
amin
o ac
id tr
ansp
orte
r, pu
tativ
e [R
icin
us
com
mun
is]
LesA
ffx.7
1577
.1.S
1_a_
atAT
2G19
740
60S
ribo
som
al p
rote
in L
31 (R
PL31
A)1.
611.
737.
1610
.42
RecN
ame:
Ful
l=60
S ri
boso
mal
pro
tein
L31
Les.4
822.
1.S1
_at
AT2G
3989
0PR
OT1
(PRO
LIN
E TR
ANSP
ORTE
R 1)
; L-
prol
ine
tran
smem
bran
e tr
ansp
orte
r/
amin
o ac
id tr
ansm
embr
ane
tran
spor
ter
1.20
1.92
2.81
5.88
prol
ine
tran
spor
ter 1
[Lyc
oper
sico
n es
cule
ntum
]
Les.3
686.
1.S1
_at
AT2G
3903
0GC
N5-
rela
ted
N-a
cety
ltran
sfer
ase
(GNA
T)
fam
ily p
rote
in1.
961.
914.
568.
05N
-hyd
roxy
cinn
amoy
l-CoA
:tyra
min
e N
-hyd
roxy
cinn
amoy
l tra
nsfe
rase
TH
T7-8
[L
ycop
ersi
con
escu
lent
um]
HCA
As
bios
ynth
esis
Les.4
038.
1.S1
_at
AT2G
3903
0GC
N5-
rela
ted
N-a
cety
ltran
sfer
ase
(GNA
T)
fam
ily p
rote
in1.
221.
888.
2826
.38
N-h
ydro
xyci
nnam
oyl-C
oA:ty
ram
ine
N-h
ydro
xyci
nnam
oyl t
rans
fera
se T
HT1
-3
[Lyc
oper
sico
n es
cule
ntum
]
LesA
ffx.6
2617
.1.S
1_at
AT5G
4283
0tr
ansf
eras
e fa
mily
pro
tein
1.57
1.71
26.9
072
.99
Anth
rani
late
N-b
enzo
yltr
ansf
eras
e pr
otei
n,
puta
tive
[Ric
inus
com
mun
is]
LesA
ffx.5
435.
1.S1
_at
AT2G
4696
0CY
P709
B1; e
lect
ron
carr
ier/
hem
e bi
ndin
g /
iron
ion
bind
ing
/ m
onoo
xyge
nase
/ ox
ygen
bin
ding
1.69
1.67
3.52
6.81
cyto
chro
me
P450
[Pop
ulus
tric
hoca
rpa]
Les.5
485.
1.S1
_at
AT2G
2381
0TE
T8 (T
ETRA
SPAN
IN8)
-1.0
91.
022.
462.
91TE
T8 (T
ETRA
SPAN
IN8)
[Ara
bido
psis
th
alia
na]
Les.4
429.
1.S1
_at
AT5G
4771
0C2
dom
ain-
cont
aini
ng p
rote
in1.
242.
083.
045.
87C2
[Med
icag
o tr
unca
tula
]
LesA
ffx.5
0259
.1.S
1_at
AT1G
7870
0br
assi
nost
eroi
d si
gnal
ling
posi
tive
regu
lato
r-re
late
d1.
131.
071.
762.
76BR
ASSI
NAZO
LE-R
ESIS
TAN
T 2
prot
ein,
pu
tativ
e [R
icin
us co
mm
unis
]
LesA
ffx.3
081.
1.S1
_at
AT5G
3573
5au
xin-
resp
onsi
ve fa
mily
pro
tein
1.11
1.12
3.32
5.17
puta
tive m
embr
ane p
rote
in [S
olan
um tu
bero
sum
]
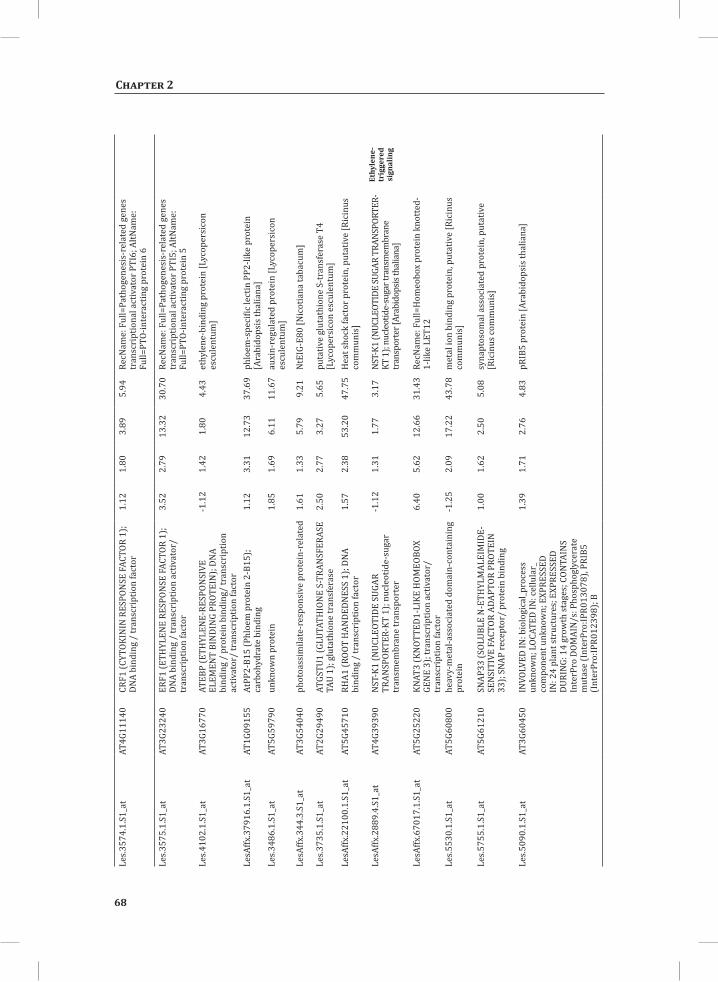
68
Chapter 2
Les.3
574.
1.S1
_at
AT4G
1114
0CR
F1 (C
YTOK
ININ
RES
PON
SE F
ACTO
R 1)
; DN
A bi
ndin
g /
tran
scri
ptio
n fa
ctor
1.12
1.80
3.89
5.94
RecN
ame:
Ful
l=Pa
thog
enes
is-r
elat
ed g
enes
tr
ansc
ript
iona
l act
ivat
or P
TI6;
AltN
ame:
Fu
ll=PT
O-in
tera
ctin
g pr
otei
n 6
Les.3
575.
1.S1
_at
AT3G
2324
0ER
F1 (E
THYL
ENE
RESP
ONSE
FAC
TOR
1);
DNA
bind
ing
/ tr
ansc
ript
ion
activ
ator
/ tr
ansc
ript
ion
fact
or
3.52
2.79
13.3
230
.70
RecN
ame:
Ful
l=Pa
thog
enes
is-r
elat
ed g
enes
tr
ansc
ript
iona
l act
ivat
or P
TI5;
AltN
ame:
Fu
ll=PT
O-in
tera
ctin
g pr
otei
n 5
Ethy
lene
-tr
igge
red
sign
alin
g
Les.4
102.
1.S1
_at
AT3G
1677
0AT
EBP
(ETH
YLEN
E-RE
SPON
SIVE
EL
EMEN
T BI
NDI
NG
PROT
EIN
); DN
A bi
ndin
g /
prot
ein
bind
ing/
tran
scri
ptio
n ac
tivat
or/
tran
scri
ptio
n fa
ctor
-1.1
21.
421.
804.
43et
hyle
ne-b
indi
ng p
rote
in [L
ycop
ersi
con
escu
lent
um]
LesA
ffx.3
7916
.1.S
1_at
AT1G
0915
5At
PP2-
B15
(Phl
oem
pro
tein
2-B
15);
carb
ohyd
rate
bin
ding
1.12
3.31
12.7
337
.69
phlo
em-s
peci
fic le
ctin
PP2
-like
pro
tein
[A
rabi
dops
is th
alia
na]
Les.3
486.
1.S1
_at
AT5G
5979
0un
know
n pr
otei
n1.
851.
696.
1111
.67
auxi
n-re
gula
ted
prot
ein
[Lyc
oper
sico
n es
cule
ntum
]
LesA
ffx.3
44.3
.S1_
atAT
3G54
040
phot
oass
imila
te-r
espo
nsiv
e pr
otei
n-re
late
d1.
611.
335.
799.
21N
tEIG
-E80
[Nic
otia
na ta
bacu
m]
Les.3
735.
1.S1
_at
AT2G
2949
0AT
GSTU
1 (G
LUTA
THIO
NE
S-TR
ANSF
ERAS
E TA
U 1)
; glu
tath
ione
tran
sfer
ase
2.50
2.77
3.27
5.65
puta
tive
glut
athi
one
S-tr
ansf
eras
e T4
[L
ycop
ersi
con
escu
lent
um]
LesA
ffx.2
2100
.1.S
1_at
AT5G
4571
0RH
A1 (R
OOT
HAN
DEDN
ESS
1); D
NA
bind
ing
/ tr
ansc
ript
ion
fact
or1.
572.
3853
.20
47.7
5H
eat s
hock
fact
or p
rote
in, p
utat
ive
[Ric
inus
co
mm
unis
]
LesA
ffx.2
889.
4.S1
_at
AT4G
3939
0N
ST-K
1 (N
UCLE
OTID
E SU
GAR
TRAN
SPOR
TER-
KT 1
); nu
cleo
tide-
suga
r tr
ansm
embr
ane
tran
spor
ter
-1.1
21.
311.
773.
17NS
T-K1
(NUC
LEOT
IDE
SUGA
R TR
ANSP
ORTE
R-KT
1);
nucle
otid
e-su
gar t
rans
mem
bran
e tr
ansp
orte
r [Ar
abid
opsis
thal
iana
]
LesA
ffx.6
7017
.1.S
1_at
AT5G
2522
0KN
AT3
(KN
OTTE
D1-L
IKE
HOM
EOBO
X GE
NE
3); t
rans
crip
tion
activ
ator
/ tr
ansc
ript
ion
fact
or
6.40
5.62
12.6
631
.43
RecN
ame:
Ful
l=H
omeo
box
prot
ein
knot
ted-
1-lik
e LE
T12
Les.5
530.
1.S1
_at
AT5G
6080
0he
avy-
met
al-a
ssoc
iate
d do
mai
n-co
ntai
ning
pr
otei
n-1
.25
2.09
17.2
243
.78
met
al io
n bi
ndin
g pr
otei
n, p
utat
ive
[Ric
inus
co
mm
unis
]
Les.5
755.
1.S1
_at
AT5G
6121
0SN
AP33
(SOL
UBLE
N-E
THYL
MAL
EIM
IDE-
SEN
SITI
VE F
ACTO
R AD
APTO
R PR
OTEI
N
33);
SNAP
rece
ptor
/ pr
otei
n bi
ndin
g
1.00
1.62
2.50
5.08
syna
ptos
omal
ass
ocia
ted
prot
ein,
put
ativ
e [R
icin
us co
mm
unis
]
Les.5
090.
1.S1
_at
AT3G
6045
0IN
VOLV
ED IN
: bio
logi
cal_p
roce
ss
unkn
own;
LOC
ATED
IN: c
ellu
lar_
com
pone
nt u
nkno
wn;
EXP
RESS
ED
IN: 2
4 pl
ant s
truc
ture
s; E
XPRE
SSED
DU
RIN
G: 1
4 gr
owth
stag
es; C
ONTA
INS
Inte
rPro
DOM
AIN
/s: P
hosp
hogl
ycer
ate
mut
ase
(Int
erPr
o:IP
R013
078)
, PRI
B5
(Int
erPr
o:IP
R012
398)
; B
1.39
1.71
2.76
4.83
pRIB
5 pr
otei
n [A
rabi
dops
is th
alia
na]
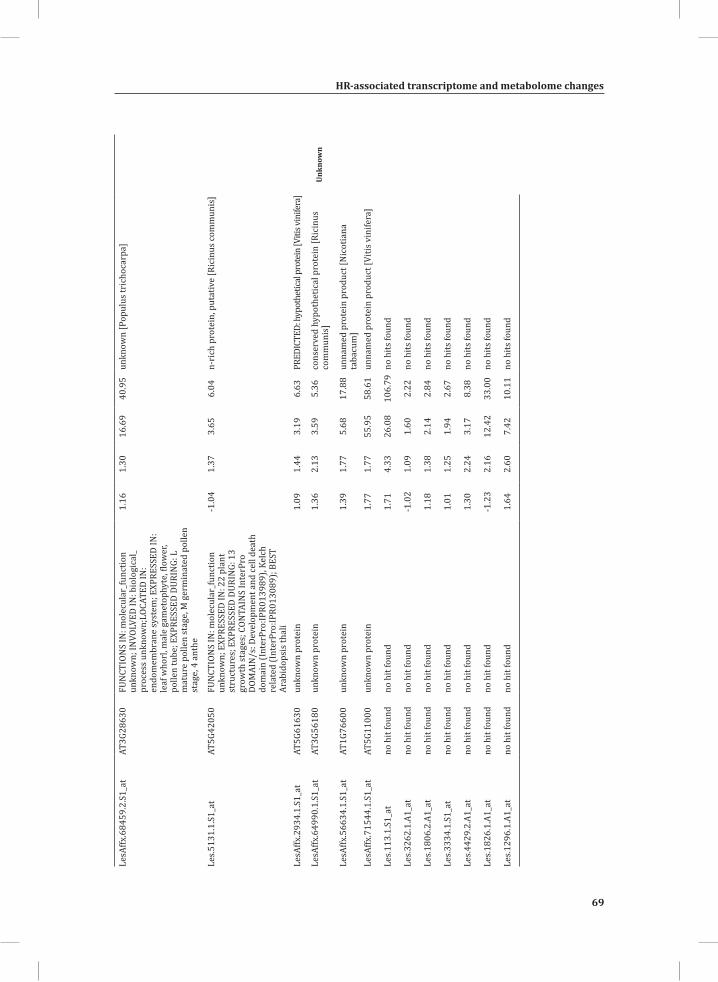
HR-associated transcriptome and metabolome changes
69
Chapter 2
LesA
ffx.6
8459
.2.S
1_at
AT3G
2863
0FU
NCT
ION
S IN
: mol
ecul
ar_f
unct
ion
unkn
own;
INVO
LVED
IN: b
iolo
gica
l_pr
oces
s unk
now
n;LO
CATE
D IN
: en
dom
embr
ane
syst
em; E
XPRE
SSED
IN:
leaf
who
rl, m
ale
gam
etop
hyte
, flo
wer
, po
llen
tube
; EXP
RESS
ED D
URIN
G: L
m
atur
e po
llen
stag
e, M
ger
min
ated
pol
len
stag
e, 4
ant
he
1.16
1.30
16.6
940
.95
unkn
own
[Pop
ulus
tric
hoca
rpa]
Unk
now
n
Les.5
131.
1.S1
_at
AT5G
4205
0FU
NCT
ION
S IN
: mol
ecul
ar_f
unct
ion
unkn
own;
EXP
RESS
ED IN
: 22
plan
t st
ruct
ures
; EXP
RESS
ED D
URIN
G: 1
3 gr
owth
stag
es; C
ONTA
INS
Inte
rPro
DO
MAI
N/s
: Dev
elop
men
t and
cell
deat
h do
mai
n (I
nter
Pro:
IPR0
1398
9), K
elch
re
late
d (I
nter
Pro:
IPR0
1308
9); B
EST
Arab
idop
sis t
hali
-1.0
41.
373.
656.
04n-
rich
pro
tein
, put
ativ
e [R
icin
us co
mm
unis
]
LesA
ffx.2
934.
1.S1
_at
AT5G
6163
0un
know
n pr
otei
n1.
091.
443.
196.
63PR
EDIC
TED:
hyp
othe
tical
pro
tein
[Viti
s vin
ifera
]
LesA
ffx.6
4990
.1.S
1_at
AT3G
5618
0un
know
n pr
otei
n1.
362.
133.
595.
36co
nser
ved
hypo
thet
ical
pro
tein
[Ric
inus
co
mm
unis
]
LesA
ffx.5
6634
.1.S
1_at
AT1G
7660
0un
know
n pr
otei
n1.
391.
775.
6817
.88
unna
med
pro
tein
pro
duct
[Nic
otia
na
taba
cum
]Le
sAffx
.715
44.1
.S1_
atAT
5G11
000
unkn
own
prot
ein
1.77
1.77
55.9
558
.61
unna
med
pro
tein
pro
duct
[Viti
s vin
ifera
]
Les.1
13.1
.S1_
atno
hit
foun
d no
hit
foun
d 1.
714.
3326
.08
106.
79no
hits
foun
d
Les.3
262.
1.A1
_at
no h
it fo
und
no h
it fo
und
-1.0
21.
091.
602.
22no
hits
foun
d
Les.1
806.
2.A1
_at
no h
it fo
und
no h
it fo
und
1.18
1.38
2.14
2.84
no h
its fo
und
Les.3
334.
1.S1
_at
no h
it fo
und
no h
it fo
und
1.01
1.25
1.94
2.67
no h
its fo
und
Les.4
429.
2.A1
_at
no h
it fo
und
no h
it fo
und
1.30
2.24
3.17
8.38
no h
its fo
und
Les.1
826.
1.A1
_at
no h
it fo
und
no h
it fo
und
-1.2
32.
1612
.42
33.0
0no
hits
foun
d
Les.1
296.
1.A1
_at
no h
it fo
und
no h
it fo
und
1.64
2.60
7.42
10.1
1no
hits
foun
d
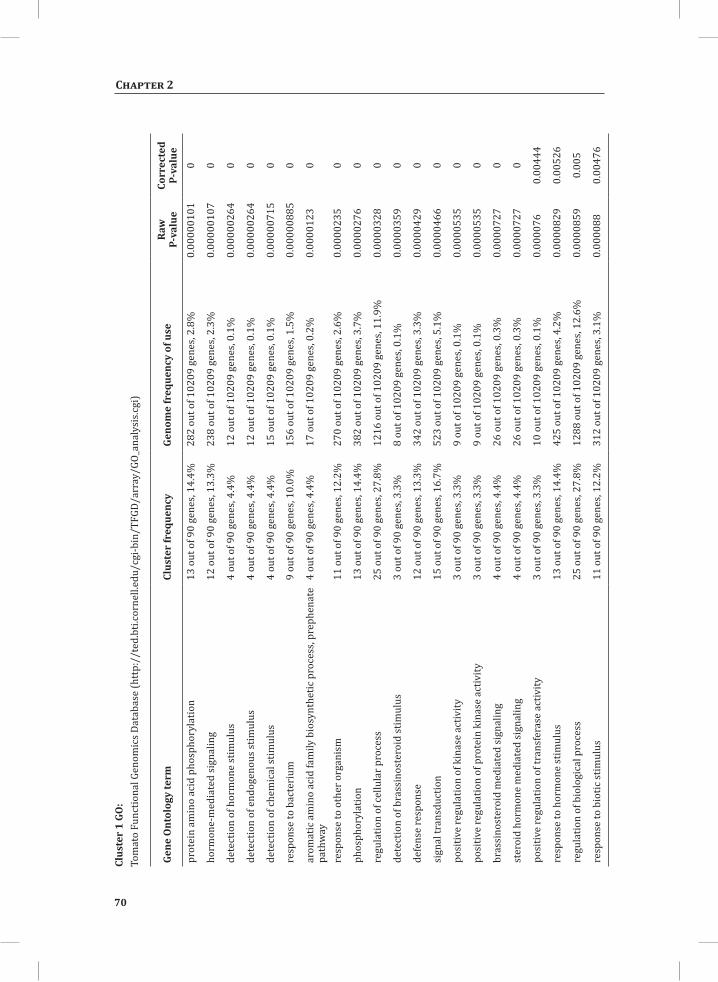
70
Chapter 2
Clus
ter
1 GO
:To
mat
o Fu
nctio
nal G
enom
ics D
atab
ase
(htt
p://
ted.
bti.c
orne
ll.ed
u/cg
i-bin
/TFG
D/ar
ray/
GO_a
naly
sis.c
gi)
Gene
Ont
olog
y te
rmCl
uste
r fr
eque
ncy
Geno
me
freq
uenc
y of
use
Raw
P-
valu
eCo
rrec
ted
P-va
lue
prot
ein
amin
o ac
id p
hosp
hory
latio
n13
out
of 9
0 ge
nes,
14.4
%28
2 ou
t of 1
0209
gen
es, 2
.8%
0.00
0001
010
horm
one-
med
iate
d si
gnal
ing
12 o
ut o
f 90
gene
s, 13
.3%
238
out o
f 102
09 g
enes
, 2.3
%0.
0000
0107
0
dete
ctio
n of
hor
mon
e st
imul
us4
out o
f 90
gene
s, 4.
4%12
out
of 1
0209
gen
es, 0
.1%
0.00
0002
640
dete
ctio
n of
end
ogen
ous s
timul
us4
out o
f 90
gene
s, 4.
4%12
out
of 1
0209
gen
es, 0
.1%
0.00
0002
640
dete
ctio
n of
chem
ical
stim
ulus
4 ou
t of 9
0 ge
nes,
4.4%
15 o
ut o
f 102
09 g
enes
, 0.1
%0.
0000
0715
0
resp
onse
to b
acte
rium
9 ou
t of 9
0 ge
nes,
10.0
%15
6 ou
t of 1
0209
gen
es, 1
.5%
0.00
0008
850
arom
atic
am
ino
acid
fam
ily b
iosy
nthe
tic p
roce
ss, p
reph
enat
e pa
thw
ay4
out o
f 90
gene
s, 4.
4%17
out
of 1
0209
gen
es, 0
.2%
0.00
0012
30
resp
onse
to o
ther
org
anis
m11
out
of 9
0 ge
nes,
12.2
%27
0 ou
t of 1
0209
gen
es, 2
.6%
0.00
0023
50
phos
phor
ylat
ion
13 o
ut o
f 90
gene
s, 14
.4%
382
out o
f 102
09 g
enes
, 3.7
%0.
0000
276
0
regu
latio
n of
cellu
lar p
roce
ss25
out
of 9
0 ge
nes,
27.8
%12
16 o
ut o
f 102
09 g
enes
, 11.
9%0.
0000
328
0
dete
ctio
n of
bra
ssin
oste
roid
stim
ulus
3 ou
t of 9
0 ge
nes,
3.3%
8 ou
t of 1
0209
gen
es, 0
.1%
0.00
0035
90
defe
nse
resp
onse
12 o
ut o
f 90
gene
s, 13
.3%
342
out o
f 102
09 g
enes
, 3.3
%0.
0000
429
0
sign
al tr
ansd
uctio
n15
out
of 9
0 ge
nes,
16.7
%52
3 ou
t of 1
0209
gen
es, 5
.1%
0.00
0046
60
posi
tive
regu
latio
n of
kin
ase
activ
ity3
out o
f 90
gene
s, 3.
3%9
out o
f 102
09 g
enes
, 0.1
%0.
0000
535
0
posi
tive
regu
latio
n of
pro
tein
kin
ase
activ
ity3
out o
f 90
gene
s, 3.
3%9
out o
f 102
09 g
enes
, 0.1
%0.
0000
535
0
bras
sino
ster
oid
med
iate
d si
gnal
ing
4 ou
t of 9
0 ge
nes,
4.4%
26 o
ut o
f 102
09 g
enes
, 0.3
%0.
0000
727
0
ster
oid
horm
one
med
iate
d si
gnal
ing
4 ou
t of 9
0 ge
nes,
4.4%
26 o
ut o
f 102
09 g
enes
, 0.3
%0.
0000
727
0
posi
tive
regu
latio
n of
tran
sfer
ase
activ
ity3
out o
f 90
gene
s, 3.
3%10
out
of 1
0209
gen
es, 0
.1%
0.00
0076
0.00
444
resp
onse
to h
orm
one
stim
ulus
13 o
ut o
f 90
gene
s, 14
.4%
425
out o
f 102
09 g
enes
, 4.2
%0.
0000
829
0.00
526
regu
latio
n of
bio
logi
cal p
roce
ss25
out
of 9
0 ge
nes,
27.8
%12
88 o
ut o
f 102
09 g
enes
, 12.
6%0.
0000
859
0.00
5
resp
onse
to b
iotic
stim
ulus
11 o
ut o
f 90
gene
s, 12
.2%
312
out o
f 102
09 g
enes
, 3.1
%0.
0000
880.
0047
6
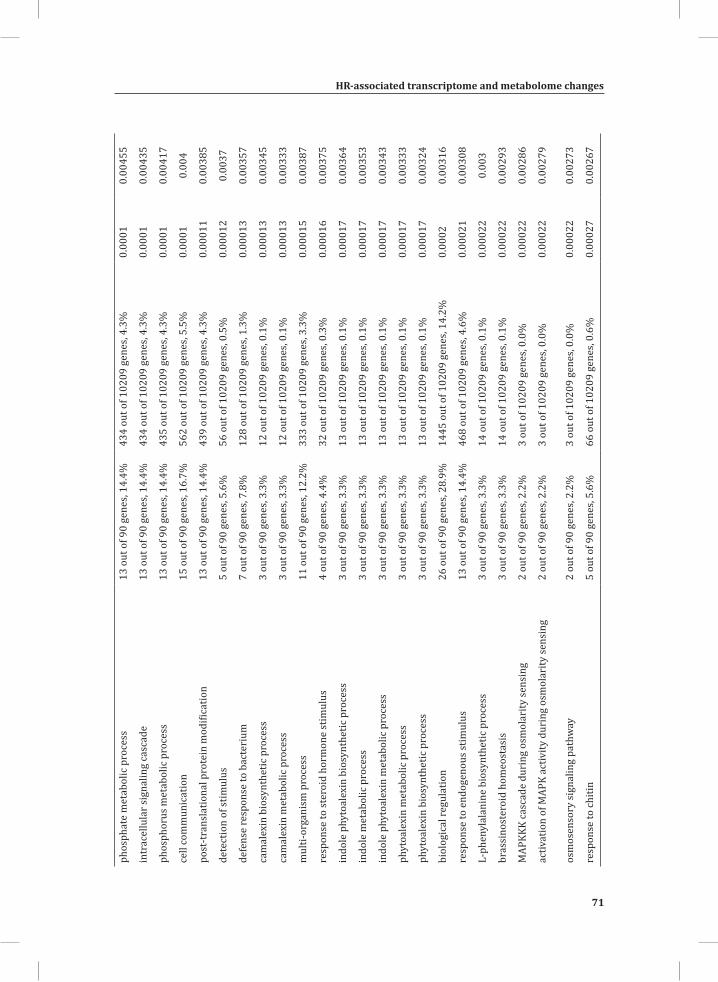
HR-associated transcriptome and metabolome changes
71
Chapter 2
phos
phat
e m
etab
olic
pro
cess
13 o
ut o
f 90
gene
s, 14
.4%
434
out o
f 102
09 g
enes
, 4.3
%0.
0001
0.00
455
intr
acel
lula
r sig
nalin
g ca
scad
e13
out
of 9
0 ge
nes,
14.4
%43
4 ou
t of 1
0209
gen
es, 4
.3%
0.00
010.
0043
5
phos
phor
us m
etab
olic
pro
cess
13 o
ut o
f 90
gene
s, 14
.4%
435
out o
f 102
09 g
enes
, 4.3
%0.
0001
0.00
417
cell
com
mun
icat
ion
15 o
ut o
f 90
gene
s, 16
.7%
562
out o
f 102
09 g
enes
, 5.5
%0.
0001
0.00
4
post
-tra
nsla
tiona
l pro
tein
mod
ifica
tion
13 o
ut o
f 90
gene
s, 14
.4%
439
out o
f 102
09 g
enes
, 4.3
%0.
0001
10.
0038
5
dete
ctio
n of
stim
ulus
5 ou
t of 9
0 ge
nes,
5.6%
56 o
ut o
f 102
09 g
enes
, 0.5
%0.
0001
20.
0037
defe
nse
resp
onse
to b
acte
rium
7 ou
t of 9
0 ge
nes,
7.8%
128
out o
f 102
09 g
enes
, 1.3
%0.
0001
30.
0035
7
cam
alex
in b
iosy
nthe
tic p
roce
ss3
out o
f 90
gene
s, 3.
3%12
out
of 1
0209
gen
es, 0
.1%
0.00
013
0.00
345
cam
alex
in m
etab
olic
pro
cess
3 ou
t of 9
0 ge
nes,
3.3%
12 o
ut o
f 102
09 g
enes
, 0.1
%0.
0001
30.
0033
3
mul
ti-or
gani
sm p
roce
ss11
out
of 9
0 ge
nes,
12.2
%33
3 ou
t of 1
0209
gen
es, 3
.3%
0.00
015
0.00
387
resp
onse
to st
eroi
d ho
rmon
e st
imul
us4
out o
f 90
gene
s, 4.
4%32
out
of 1
0209
gen
es, 0
.3%
0.00
016
0.00
375
indo
le p
hyto
alex
in b
iosy
nthe
tic p
roce
ss3
out o
f 90
gene
s, 3.
3%13
out
of 1
0209
gen
es, 0
.1%
0.00
017
0.00
364
indo
le m
etab
olic
pro
cess
3 ou
t of 9
0 ge
nes,
3.3%
13 o
ut o
f 102
09 g
enes
, 0.1
%0.
0001
70.
0035
3
indo
le p
hyto
alex
in m
etab
olic
pro
cess
3 ou
t of 9
0 ge
nes,
3.3%
13 o
ut o
f 102
09 g
enes
, 0.1
%0.
0001
70.
0034
3
phyt
oale
xin
met
abol
ic p
roce
ss3
out o
f 90
gene
s, 3.
3%13
out
of 1
0209
gen
es, 0
.1%
0.00
017
0.00
333
phyt
oale
xin
bios
ynth
etic
pro
cess
3 ou
t of 9
0 ge
nes,
3.3%
13 o
ut o
f 102
09 g
enes
, 0.1
%0.
0001
70.
0032
4
biol
ogic
al re
gula
tion
26 o
ut o
f 90
gene
s, 28
.9%
1445
out
of 1
0209
gen
es, 1
4.2%
0.00
020.
0031
6
resp
onse
to e
ndog
enou
s stim
ulus
13 o
ut o
f 90
gene
s, 14
.4%
468
out o
f 102
09 g
enes
, 4.6
%0.
0002
10.
0030
8
L-ph
enyl
alan
ine
bios
ynth
etic
pro
cess
3 ou
t of 9
0 ge
nes,
3.3%
14 o
ut o
f 102
09 g
enes
, 0.1
%0.
0002
20.
003
bras
sino
ster
oid
hom
eost
asis
3 ou
t of 9
0 ge
nes,
3.3%
14 o
ut o
f 102
09 g
enes
, 0.1
%0.
0002
20.
0029
3
MAP
KKK
casc
ade
duri
ng o
smol
arity
sens
ing
2 ou
t of 9
0 ge
nes,
2.2%
3 ou
t of 1
0209
gen
es, 0
.0%
0.00
022
0.00
286
activ
atio
n of
MAP
K ac
tivity
dur
ing
osm
olar
ity se
nsin
g2
out o
f 90
gene
s, 2.
2%3
out o
f 102
09 g
enes
, 0.0
%0.
0002
20.
0027
9
osm
osen
sory
sign
alin
g pa
thw
ay2
out o
f 90
gene
s, 2.
2%3
out o
f 102
09 g
enes
, 0.0
%0.
0002
20.
0027
3
resp
onse
to ch
itin
5 ou
t of 9
0 ge
nes,
5.6%
66 o
ut o
f 102
09 g
enes
, 0.6
%0.
0002
70.
0026
7
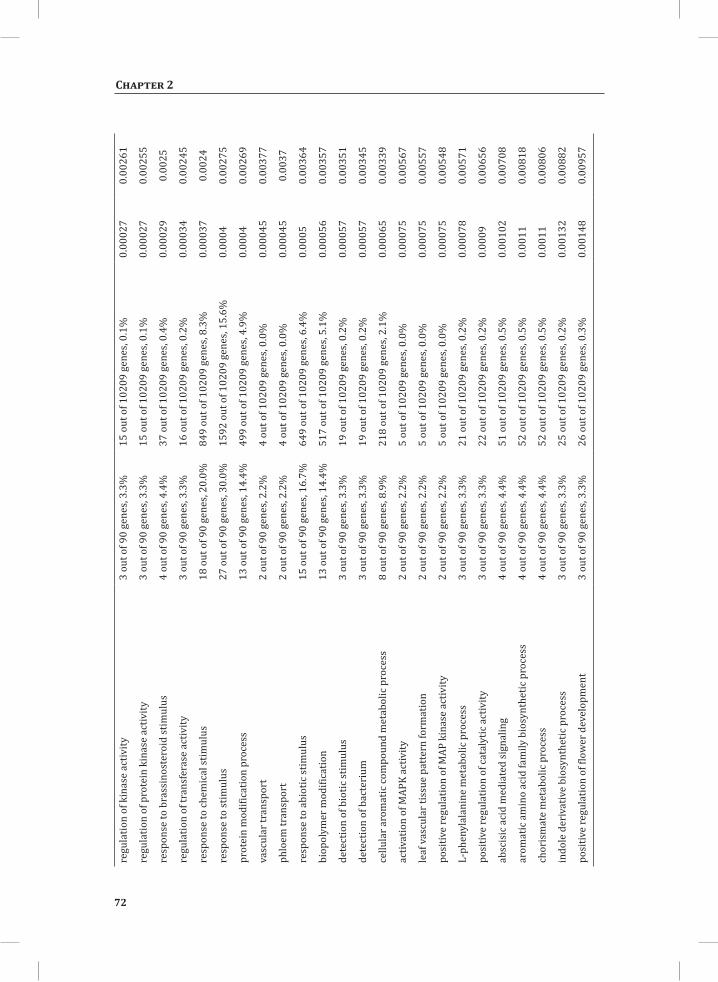
72
Chapter 2
regu
latio
n of
kin
ase
activ
ity3
out o
f 90
gene
s, 3.
3%15
out
of 1
0209
gen
es, 0
.1%
0.00
027
0.00
261
regu
latio
n of
pro
tein
kin
ase
activ
ity3
out o
f 90
gene
s, 3.
3%15
out
of 1
0209
gen
es, 0
.1%
0.00
027
0.00
255
resp
onse
to b
rass
inos
tero
id st
imul
us4
out o
f 90
gene
s, 4.
4%37
out
of 1
0209
gen
es, 0
.4%
0.00
029
0.00
25
regu
latio
n of
tran
sfer
ase
activ
ity3
out o
f 90
gene
s, 3.
3%16
out
of 1
0209
gen
es, 0
.2%
0.00
034
0.00
245
resp
onse
to ch
emic
al st
imul
us18
out
of 9
0 ge
nes,
20.0
%84
9 ou
t of 1
0209
gen
es, 8
.3%
0.00
037
0.00
24
resp
onse
to st
imul
us27
out
of 9
0 ge
nes,
30.0
%15
92 o
ut o
f 102
09 g
enes
, 15.
6%0.
0004
0.00
275
prot
ein
mod
ifica
tion
proc
ess
13 o
ut o
f 90
gene
s, 14
.4%
499
out o
f 102
09 g
enes
, 4.9
%0.
0004
0.00
269
vasc
ular
tran
spor
t2
out o
f 90
gene
s, 2.
2%4
out o
f 102
09 g
enes
, 0.0
%0.
0004
50.
0037
7
phlo
em tr
ansp
ort
2 ou
t of 9
0 ge
nes,
2.2%
4 ou
t of 1
0209
gen
es, 0
.0%
0.00
045
0.00
37
resp
onse
to a
biot
ic st
imul
us15
out
of 9
0 ge
nes,
16.7
%64
9 ou
t of 1
0209
gen
es, 6
.4%
0.00
050.
0036
4
biop
olym
er m
odifi
catio
n13
out
of 9
0 ge
nes,
14.4
%51
7 ou
t of 1
0209
gen
es, 5
.1%
0.00
056
0.00
357
dete
ctio
n of
bio
tic st
imul
us3
out o
f 90
gene
s, 3.
3%19
out
of 1
0209
gen
es, 0
.2%
0.00
057
0.00
351
dete
ctio
n of
bac
teri
um3
out o
f 90
gene
s, 3.
3%19
out
of 1
0209
gen
es, 0
.2%
0.00
057
0.00
345
cellu
lar a
rom
atic
com
poun
d m
etab
olic
pro
cess
8 ou
t of 9
0 ge
nes,
8.9%
218
out o
f 102
09 g
enes
, 2.1
%0.
0006
50.
0033
9
activ
atio
n of
MAP
K ac
tivity
2 ou
t of 9
0 ge
nes,
2.2%
5 ou
t of 1
0209
gen
es, 0
.0%
0.00
075
0.00
567
leaf
vas
cula
r tis
sue
patt
ern
form
atio
n2
out o
f 90
gene
s, 2.
2%5
out o
f 102
09 g
enes
, 0.0
%0.
0007
50.
0055
7
posi
tive
regu
latio
n of
MAP
kin
ase
activ
ity2
out o
f 90
gene
s, 2.
2%5
out o
f 102
09 g
enes
, 0.0
%0.
0007
50.
0054
8
L-ph
enyl
alan
ine
met
abol
ic p
roce
ss3
out o
f 90
gene
s, 3.
3%21
out
of 1
0209
gen
es, 0
.2%
0.00
078
0.00
571
posi
tive
regu
latio
n of
cata
lytic
act
ivity
3 ou
t of 9
0 ge
nes,
3.3%
22 o
ut o
f 102
09 g
enes
, 0.2
%0.
0009
0.00
656
absc
isic
aci
d m
edia
ted
sign
alin
g4
out o
f 90
gene
s, 4.
4%51
out
of 1
0209
gen
es, 0
.5%
0.00
102
0.00
708
arom
atic
am
ino
acid
fam
ily b
iosy
nthe
tic p
roce
ss4
out o
f 90
gene
s, 4.
4%52
out
of 1
0209
gen
es, 0
.5%
0.00
110.
0081
8
chor
ism
ate
met
abol
ic p
roce
ss4
out o
f 90
gene
s, 4.
4%52
out
of 1
0209
gen
es, 0
.5%
0.00
110.
0080
6
indo
le d
eriv
ativ
e bi
osyn
thet
ic p
roce
ss3
out o
f 90
gene
s, 3.
3%25
out
of 1
0209
gen
es, 0
.2%
0.00
132
0.00
882
posi
tive
regu
latio
n of
flow
er d
evel
opm
ent
3 ou
t of 9
0 ge
nes,
3.3%
26 o
ut o
f 102
09 g
enes
, 0.3
%0.
0014
80.
0095
7
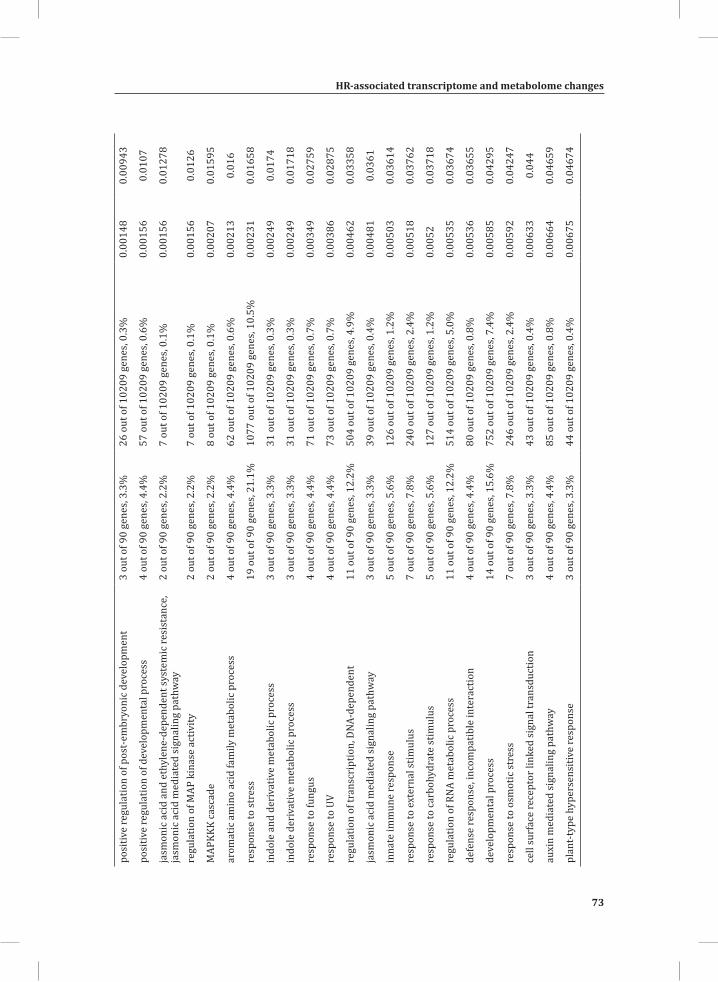
HR-associated transcriptome and metabolome changes
73
Chapter 2
posi
tive
regu
latio
n of
pos
t-em
bryo
nic d
evel
opm
ent
3 ou
t of 9
0 ge
nes,
3.3%
26 o
ut o
f 102
09 g
enes
, 0.3
%0.
0014
80.
0094
3
posi
tive
regu
latio
n of
dev
elop
men
tal p
roce
ss4
out o
f 90
gene
s, 4.
4%57
out
of 1
0209
gen
es, 0
.6%
0.00
156
0.01
07
jasm
onic
aci
d an
d et
hyle
ne-d
epen
dent
syst
emic
resi
stan
ce,
jasm
onic
aci
d m
edia
ted
sign
alin
g pa
thw
ay2
out o
f 90
gene
s, 2.
2%7
out o
f 102
09 g
enes
, 0.1
%0.
0015
60.
0127
8
regu
latio
n of
MAP
kin
ase
activ
ity2
out o
f 90
gene
s, 2.
2%7
out o
f 102
09 g
enes
, 0.1
%0.
0015
60.
0126
MAP
KKK
casc
ade
2 ou
t of 9
0 ge
nes,
2.2%
8 ou
t of 1
0209
gen
es, 0
.1%
0.00
207
0.01
595
arom
atic
am
ino
acid
fam
ily m
etab
olic
pro
cess
4 ou
t of 9
0 ge
nes,
4.4%
62 o
ut o
f 102
09 g
enes
, 0.6
%0.
0021
30.
016
resp
onse
to st
ress
19 o
ut o
f 90
gene
s, 21
.1%
1077
out
of 1
0209
gen
es, 1
0.5%
0.00
231
0.01
658
indo
le a
nd d
eriv
ativ
e m
etab
olic
pro
cess
3 ou
t of 9
0 ge
nes,
3.3%
31 o
ut o
f 102
09 g
enes
, 0.3
%0.
0024
90.
0174
indo
le d
eriv
ativ
e m
etab
olic
pro
cess
3 ou
t of 9
0 ge
nes,
3.3%
31 o
ut o
f 102
09 g
enes
, 0.3
%0.
0024
90.
0171
8
resp
onse
to fu
ngus
4 ou
t of 9
0 ge
nes,
4.4%
71 o
ut o
f 102
09 g
enes
, 0.7
%0.
0034
90.
0275
9
resp
onse
to U
V4
out o
f 90
gene
s, 4.
4%73
out
of 1
0209
gen
es, 0
.7%
0.00
386
0.02
875
regu
latio
n of
tran
scri
ptio
n, D
NA-d
epen
dent
11 o
ut o
f 90
gene
s, 12
.2%
504
out o
f 102
09 g
enes
, 4.9
%0.
0046
20.
0335
8
jasm
onic
aci
d m
edia
ted
sign
alin
g pa
thw
ay3
out o
f 90
gene
s, 3.
3%39
out
of 1
0209
gen
es, 0
.4%
0.00
481
0.03
61
inna
te im
mun
e re
spon
se5
out o
f 90
gene
s, 5.
6%12
6 ou
t of 1
0209
gen
es, 1
.2%
0.00
503
0.03
614
resp
onse
to e
xter
nal s
timul
us7
out o
f 90
gene
s, 7.
8%24
0 ou
t of 1
0209
gen
es, 2
.4%
0.00
518
0.03
762
resp
onse
to ca
rboh
ydra
te st
imul
us5
out o
f 90
gene
s, 5.
6%12
7 ou
t of 1
0209
gen
es, 1
.2%
0.00
520.
0371
8
regu
latio
n of
RNA
met
abol
ic p
roce
ss11
out
of 9
0 ge
nes,
12.2
%51
4 ou
t of 1
0209
gen
es, 5
.0%
0.00
535
0.03
674
defe
nse
resp
onse
, inc
ompa
tible
inte
ract
ion
4 ou
t of 9
0 ge
nes,
4.4%
80 o
ut o
f 102
09 g
enes
, 0.8
%0.
0053
60.
0365
5
deve
lopm
enta
l pro
cess
14 o
ut o
f 90
gene
s, 15
.6%
752
out o
f 102
09 g
enes
, 7.4
%0.
0058
50.
0429
5
resp
onse
to o
smot
ic st
ress
7 ou
t of 9
0 ge
nes,
7.8%
246
out o
f 102
09 g
enes
, 2.4
%0.
0059
20.
0424
7
cell
surf
ace
rece
ptor
link
ed si
gnal
tran
sduc
tion
3 ou
t of 9
0 ge
nes,
3.3%
43 o
ut o
f 102
09 g
enes
, 0.4
%0.
0063
30.
044
auxi
n m
edia
ted
sign
alin
g pa
thw
ay4
out o
f 90
gene
s, 4.
4%85
out
of 1
0209
gen
es, 0
.8%
0.00
664
0.04
659
plan
t-ty
pe h
yper
sens
itive
resp
onse
3 ou
t of 9
0 ge
nes,
3.3%
44 o
ut o
f 102
09 g
enes
, 0.4
%0.
0067
50.
0467
4
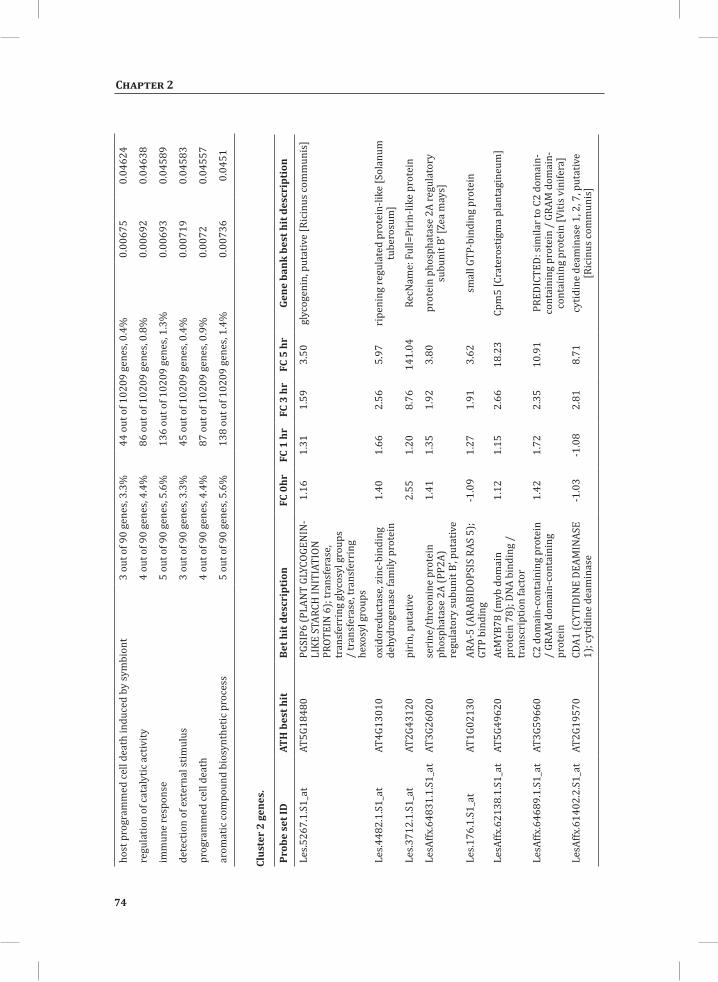
74
Chapter 2
Clus
ter
2 ge
nes.
host
pro
gram
med
cell
deat
h in
duce
d by
sym
bion
t3
out o
f 90
gene
s, 3.
3%44
out
of 1
0209
gen
es, 0
.4%
0.00
675
0.04
624
regu
latio
n of
cata
lytic
act
ivity
4 ou
t of 9
0 ge
nes,
4.4%
86 o
ut o
f 102
09 g
enes
, 0.8
%0.
0069
20.
0463
8
imm
une
resp
onse
5 ou
t of 9
0 ge
nes,
5.6%
136
out o
f 102
09 g
enes
, 1.3
%0.
0069
30.
0458
9
dete
ctio
n of
ext
erna
l stim
ulus
3 ou
t of 9
0 ge
nes,
3.3%
45 o
ut o
f 102
09 g
enes
, 0.4
%0.
0071
90.
0458
3
prog
ram
med
cell
deat
h4
out o
f 90
gene
s, 4.
4%87
out
of 1
0209
gen
es, 0
.9%
0.00
720.
0455
7
arom
atic
com
poun
d bi
osyn
thet
ic p
roce
ss5
out o
f 90
gene
s, 5.
6%13
8 ou
t of 1
0209
gen
es, 1
.4%
0.00
736
0.04
51
Prob
e se
t ID
ATH
bes
t hit
Bet h
it d
escr
ipti
on
FC 0
hrFC
1 h
rFC
3 h
rFC
5 h
rGe
ne b
ank
best
hit
des
crip
tion
Les.5
267.
1.S1
_at
AT5G
1848
0PG
SIP6
(PLA
NT
GLYC
OGEN
IN-
LIKE
STA
RCH
INIT
IATI
ON
PROT
EIN
6);
tran
sfer
ase,
tr
ansf
erri
ng g
lyco
syl g
roup
s /
tran
sfer
ase,
tran
sfer
ring
he
xosy
l gro
ups
1.16
1.31
1.59
3.50
glyc
ogen
in, p
utat
ive
[Ric
inus
com
mun
is]
Les.4
482.
1.S1
_at
AT4G
1301
0ox
idor
educ
tase
, zin
c-bi
ndin
g de
hydr
ogen
ase
fam
ily p
rote
in1.
401.
662.
565.
97ri
peni
ng re
gula
ted
prot
ein-
like
[Sol
anum
tu
bero
sum
]
Les.3
712.
1.S1
_at
AT2G
4312
0pi
rin,
put
ativ
e2.
551.
208.
7614
1.04
RecN
ame:
Ful
l=Pi
rin-
like
prot
ein
LesA
ffx.6
4831
.1.S
1_at
AT3G
2602
0se
rine
/thr
eoni
ne p
rote
in
phos
phat
ase
2A (P
P2A)
re
gula
tory
subu
nit B
’, put
ativ
e
1.41
1.35
1.92
3.80
prot
ein
phos
phat
ase
2A re
gula
tory
su
buni
t B’ [
Zea
may
s]
Les.1
76.1
.S1_
atAT
1G02
130
ARA-
5 (A
RABI
DOPS
IS R
AS 5
); GT
P bi
ndin
g-1
.09
1.27
1.91
3.62
smal
l GTP
-bin
ding
pro
tein
LesA
ffx.6
2138
.1.S
1_at
AT5G
4962
0At
MYB
78 (m
yb d
omai
n pr
otei
n 78
); DN
A bi
ndin
g /
tran
scri
ptio
n fa
ctor
1.12
1.15
2.66
18.2
3Cp
m5
[Cra
tero
stig
ma
plan
tagi
neum
]
LesA
ffx.6
4689
.1.S
1_at
AT3G
5966
0C2
dom
ain-
cont
aini
ng p
rote
in
/ GR
AM d
omai
n-co
ntai
ning
pr
otei
n
1.42
1.72
2.35
10.9
1PR
EDIC
TED:
sim
ilar t
o C2
dom
ain-
cont
aini
ng p
rote
in /
GRA
M d
omai
n-co
ntai
ning
pro
tein
[Viti
s vin
ifera
]Le
sAffx
.614
02.2
.S1_
atAT
2G19
570
CDA1
(CYT
IDIN
E DE
AMIN
ASE
1); c
ytid
ine
deam
inas
e-1
.03
-1.0
82.
818.
71cy
tidin
e de
amin
ase
1, 2
, 7, p
utat
ive
[Ric
inus
com
mun
is]
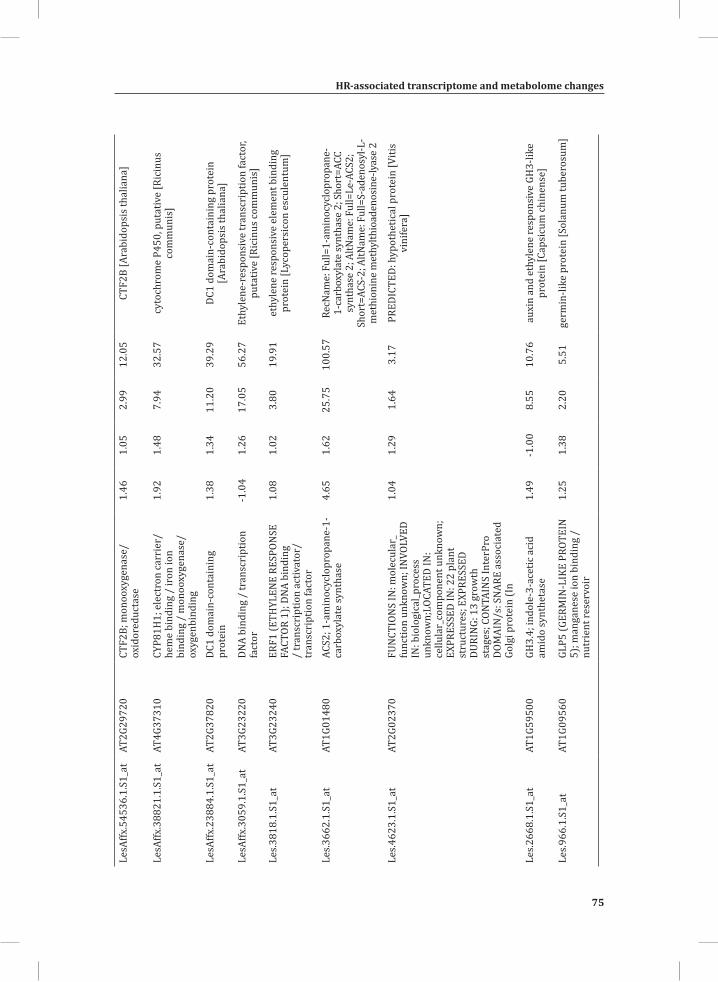
HR-associated transcriptome and metabolome changes
75
Chapter 2
LesA
ffx.5
4536
.1.S
1_at
AT2G
2972
0CT
F2B;
mon
ooxy
gena
se/
oxid
ored
ucta
se1.
461.
052.
9912
.05
CTF2
B [A
rabi
dops
is th
alia
na]
LesA
ffx.3
8821
.1.S
1_at
AT4G
3731
0CY
P81H
1; e
lect
ron
carr
ier/
he
me
bind
ing
/ ir
on io
n bi
ndin
g /
mon
ooxy
gena
se/
oxyg
enbi
ndin
g
1.92
1.48
7.94
32.5
7cy
toch
rom
e P4
50, p
utat
ive
[Ric
inus
co
mm
unis
]
LesA
ffx.2
3884
.1.S
1_at
AT2G
3782
0DC
1 do
mai
n-co
ntai
ning
pr
otei
n1.
381.
3411
.20
39.2
9DC
1 do
mai
n-co
ntai
ning
pro
tein
[A
rabi
dops
is th
alia
na]
LesA
ffx.3
059.
1.S1
_at
AT3G
2322
0DN
A bi
ndin
g /
tran
scri
ptio
n fa
ctor
-1.0
41.
2617
.05
56.2
7Et
hyle
ne-r
espo
nsiv
e tr
ansc
ript
ion
fact
or,
puta
tive
[Ric
inus
com
mun
is]
Les.3
818.
1.S1
_at
AT3G
2324
0ER
F1 (E
THYL
ENE
RESP
ONSE
FA
CTOR
1);
DNA
bind
ing
/ tr
ansc
ript
ion
activ
ator
/ tr
ansc
ript
ion
fact
or
1.08
1.02
3.80
19.9
1et
hyle
ne re
spon
sive
ele
men
t bin
ding
pr
otei
n [L
ycop
ersi
con
escu
lent
um]
Les.3
662.
1.S1
_at
AT1G
0148
0AC
S2; 1
-am
inoc
yclo
prop
ane-
1-ca
rbox
ylat
e sy
ntha
se4.
651.
6225
.75
100.
57Re
cNam
e: F
ull=
1-am
inoc
yclo
prop
ane-
1-ca
rbox
ylat
e sy
ntha
se 2
; Sho
rt=A
CC
synt
hase
2; A
ltNam
e: F
ull=
Le-A
CS2;
Sh
ort=
ACS-
2; A
ltNam
e: F
ull=
S-ad
enos
yl-L
-m
ethi
onin
e m
ethy
lthio
aden
osin
e-ly
ase
2
Les.4
623.
1.S1
_at
AT2G
0237
0FU
NCT
ION
S IN
: mol
ecul
ar_
func
tion
unkn
own;
INVO
LVED
IN
: bio
logi
cal_p
roce
ss
unkn
own;
LOCA
TED
IN:
cellu
lar_
com
pone
nt u
nkno
wn;
EX
PRES
SED
IN: 2
2 pl
ant
stru
ctur
es; E
XPRE
SSED
DU
RIN
G: 1
3 gr
owth
st
ages
; CON
TAIN
S In
terP
ro
DOM
AIN
/s: S
NARE
ass
ocia
ted
Golg
i pro
tein
(In
1.04
1.29
1.64
3.17
PRED
ICTE
D: h
ypot
hetic
al p
rote
in [V
itis
vini
fera
]
Les.2
668.
1.S1
_at
AT1G
5950
0GH
3.4;
indo
le-3
-ace
tic a
cid
amid
o sy
nthe
tase
1.49
-1.0
08.
5510
.76
auxi
n an
d et
hyle
ne re
spon
sive
GH
3-lik
e pr
otei
n [C
apsi
cum
chin
ense
]
Les.9
66.1
.S1_
atAT
1G09
560
GLP5
(GER
MIN
-LIK
E PR
OTEI
N
5); m
anga
nese
ion
bind
ing
/ nu
trie
nt re
serv
oir
1.25
1.38
2.20
5.51
germ
in-li
ke p
rote
in [S
olan
um tu
bero
sum
]
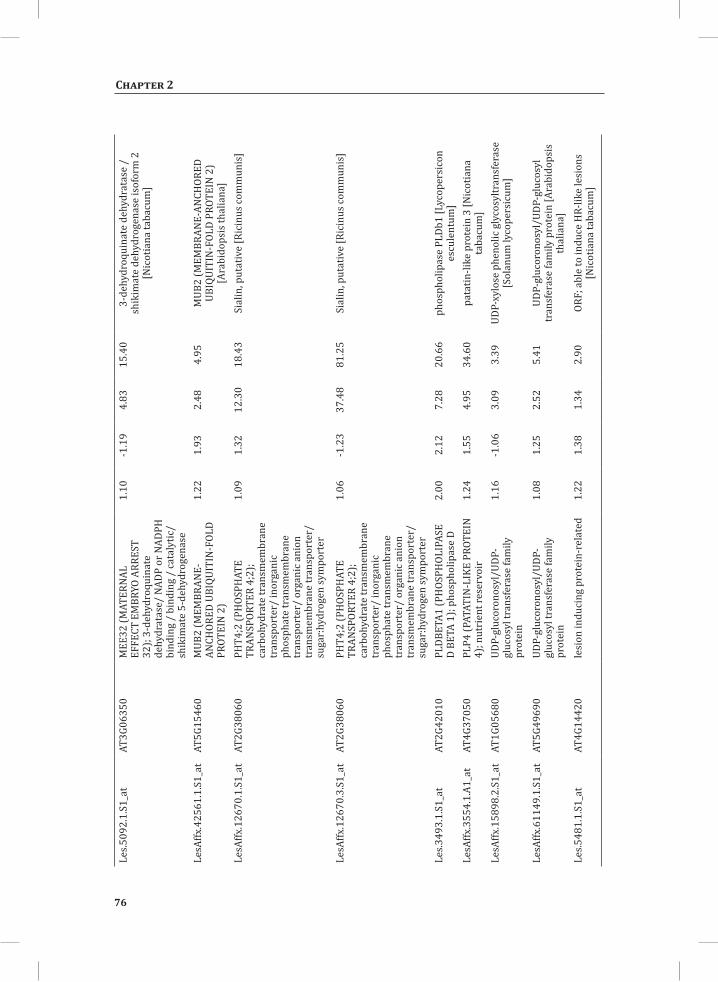
76
Chapter 2
Les.5
092.
1.S1
_at
AT3G
0635
0M
EE32
(MAT
ERNA
L EF
FECT
EM
BRYO
ARR
EST
32);
3-de
hydr
oqui
nate
de
hydr
atas
e/ N
ADP
or N
ADPH
bi
ndin
g /
bind
ing
/ ca
taly
tic/
shik
imat
e 5-
dehy
drog
enas
e
1.10
-1.1
94.
8315
.40
3-de
hydr
oqui
nate
deh
ydra
tase
/
shik
imat
e de
hydr
ogen
ase
isof
orm
2
[Nic
otia
na ta
bacu
m]
LesA
ffx.4
2561
.1.S
1_at
AT5G
1546
0M
UB2
(MEM
BRAN
E-AN
CHOR
ED U
BIQU
ITIN
-FOL
D PR
OTEI
N 2
)
1.22
1.93
2.48
4.95
MUB
2 (M
EMBR
ANE-
ANCH
ORED
UB
IQUI
TIN
-FOL
D PR
OTEI
N 2
) [A
rabi
dops
is th
alia
na]
LesA
ffx.1
2670
.1.S
1_at
AT2G
3806
0PH
T4;2
(PH
OSPH
ATE
TRAN
SPOR
TER
4;2)
; ca
rboh
ydra
te tr
ansm
embr
ane
tran
spor
ter/
inor
gani
c ph
osph
ate
tran
smem
bran
e tr
ansp
orte
r/ o
rgan
ic a
nion
tr
ansm
embr
ane
tran
spor
ter/
su
gar:
hydr
ogen
sym
port
er
1.09
1.32
12.3
018
.43
Sial
in, p
utat
ive
[Ric
inus
com
mun
is]
LesA
ffx.1
2670
.3.S
1_at
AT2G
3806
0PH
T4;2
(PH
OSPH
ATE
TRAN
SPOR
TER
4;2)
; ca
rboh
ydra
te tr
ansm
embr
ane
tran
spor
ter/
inor
gani
c ph
osph
ate
tran
smem
bran
e tr
ansp
orte
r/ o
rgan
ic a
nion
tr
ansm
embr
ane
tran
spor
ter/
su
gar:
hydr
ogen
sym
port
er
1.06
-1.2
337
.48
81.2
5Si
alin
, put
ativ
e [R
icin
us co
mm
unis
]
Les.3
493.
1.S1
_at
AT2G
4201
0PL
DBET
A1 (P
HOS
PHOL
IPAS
E D
BETA
1);
phos
phol
ipas
e D
2.00
2.12
7.28
20.6
6ph
osph
olip
ase
PLDb
1 [L
ycop
ersi
con
escu
lent
um]
LesA
ffx.3
554.
1.A1
_at
AT4G
3705
0PL
P4 (P
ATAT
IN-L
IKE
PROT
EIN
4)
; nut
rien
t res
ervo
ir1.
241.
554.
9534
.60
pata
tin-li
ke p
rote
in 3
[Nic
otia
na
taba
cum
]Le
sAffx
.158
98.2
.S1_
atAT
1G05
680
UDP-
gluc
oron
osyl
/UDP
-gl
ucos
yl tr
ansf
eras
e fa
mily
pr
otei
n
1.16
-1.0
63.
093.
39UD
P-xy
lose
phe
nolic
gly
cosy
ltran
sfer
ase
[Sol
anum
lyco
pers
icum
]
LesA
ffx.6
1149
.1.S
1_at
AT5G
4969
0UD
P-gl
ucor
onos
yl/U
DP-
gluc
osyl
tran
sfer
ase
fam
ily
prot
ein
1.08
1.25
2.52
5.41
UDP-
gluc
oron
osyl
/UDP
-glu
cosy
l tr
ansf
eras
e fa
mily
pro
tein
[Ara
bido
psis
th
alia
na]
Les.5
481.
1.S1
_at
AT4G
1442
0le
sion
indu
cing
pro
tein
-rel
ated
1.22
1.38
1.34
2.90
ORF;
abl
e to
indu
ce H
R-lik
e le
sion
s [N
icot
iana
taba
cum
]
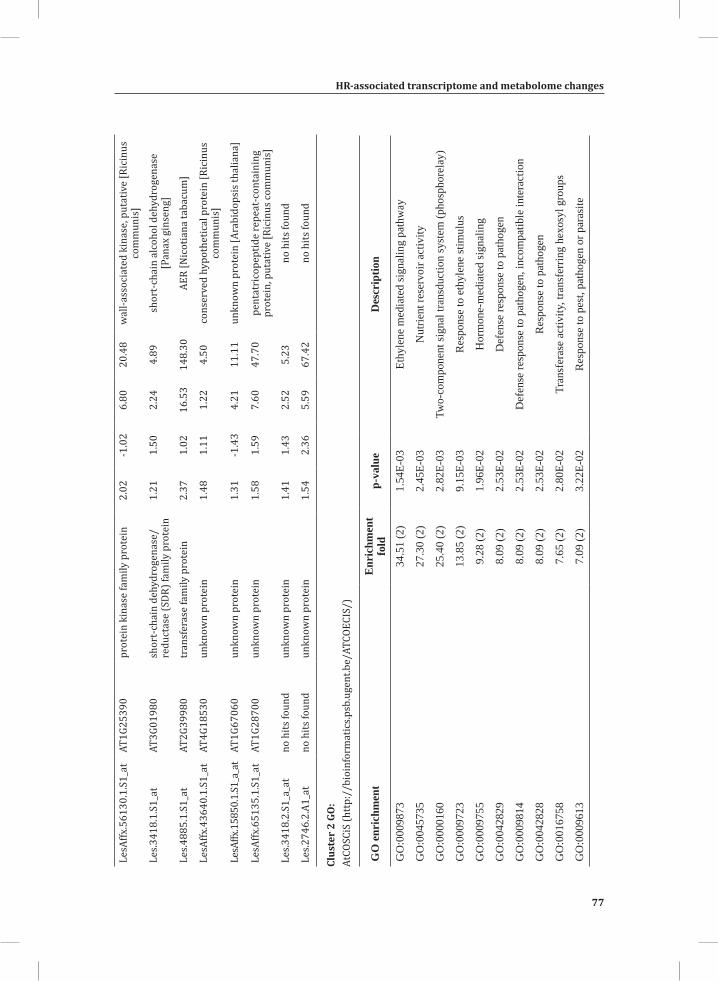
HR-associated transcriptome and metabolome changes
77
Chapter 2
Clus
ter
2 GO
:At
COSC
iS (h
ttp:
//bi
oinf
orm
atic
s.psb
.uge
nt.b
e/AT
COEC
IS/)
LesA
ffx.5
6130
.1.S
1_at
AT1G
2539
0pr
otei
n ki
nase
fam
ily p
rote
in2.
02-1
.02
6.80
20.4
8w
all-a
ssoc
iate
d ki
nase
, put
ativ
e [R
icin
us
com
mun
is]
Les.3
418.
1.S1
_at
AT3G
0198
0sh
ort-
chai
n de
hydr
ogen
ase/
redu
ctas
e (S
DR) f
amily
pro
tein
1.21
1.50
2.24
4.89
shor
t-ch
ain
alco
hol d
ehyd
roge
nase
[P
anax
gin
seng
]
Les.4
885.
1.S1
_at
AT2G
3998
0tr
ansf
eras
e fa
mily
pro
tein
2.37
1.02
16.5
314
8.30
AER
[Nic
otia
na ta
bacu
m]
LesA
ffx.4
3640
.1.S
1_at
AT4G
1853
0un
know
n pr
otei
n1.
481.
111.
224.
50co
nser
ved
hypo
thet
ical
pro
tein
[Ric
inus
co
mm
unis
]
LesA
ffx.1
5850
.1.S1
_a_a
tAT
1G67
060
unkn
own
prot
ein
1.31
-1.4
34.
2111
.11
unkn
own
prot
ein
[Ara
bido
psis
thal
iana
]
LesA
ffx.6
5135
.1.S
1_at
AT1G
2870
0un
know
n pr
otei
n1.
581.
597.
6047
.70
pent
atri
cope
ptid
e re
peat
-con
tain
ing
prot
ein,
put
ativ
e [R
icin
us co
mm
unis
]
Les.3
418.
2.S1
_a_a
tno
hits
foun
dun
know
n pr
otei
n1.
411.
432.
525.
23no
hits
foun
d
Les.2
746.
2.A1
_at
no h
its fo
und
unkn
own
prot
ein
1.54
2.36
5.59
67.4
2no
hits
foun
d
GO
enr
ichm
ent
Enr
ichm
ent
fold
p-va
lue
Des
crip
tion
GO
:000
9873
34.5
1 (2
)1.
54E-
03Et
hyle
ne m
edia
ted
sign
alin
g pa
thw
ay
GO
:004
5735
27.3
0 (2
)2.
45E-
03N
utrie
nt re
serv
oir a
ctiv
ity
GO
:000
0160
25.4
0 (2
)2.
82E-
03Tw
o-co
mpo
nent
sign
al tr
ansd
uctio
n sy
stem
(pho
spho
rela
y)
GO
:000
9723
13.8
5 (2
)9.
15E-
03R
espo
nse
to e
thyl
ene
stim
ulus
GO
:000
9755
9.28
(2)
1.96
E-02
Hor
mon
e-m
edia
ted
sign
alin
g
GO
:004
2829
8.09
(2)
2.53
E-02
Def
ense
resp
onse
to p
atho
gen
GO
:000
9814
8.09
(2)
2.53
E-02
Def
ense
resp
onse
to p
atho
gen,
inco
mpa
tible
inte
ract
ion
GO
:004
2828
8.09
(2)
2.53
E-02
Res
pons
e to
pat
hoge
n
GO
:001
6758
7.65
(2)
2.80
E-02
Tran
sfer
ase
activ
ity, t
rans
ferr
ing
hexo
syl g
roup
s
GO
:000
9613
7.09
(2)
3.22
E-02
Res
pons
e to
pes
t, pa
thog
en o
r par
asite
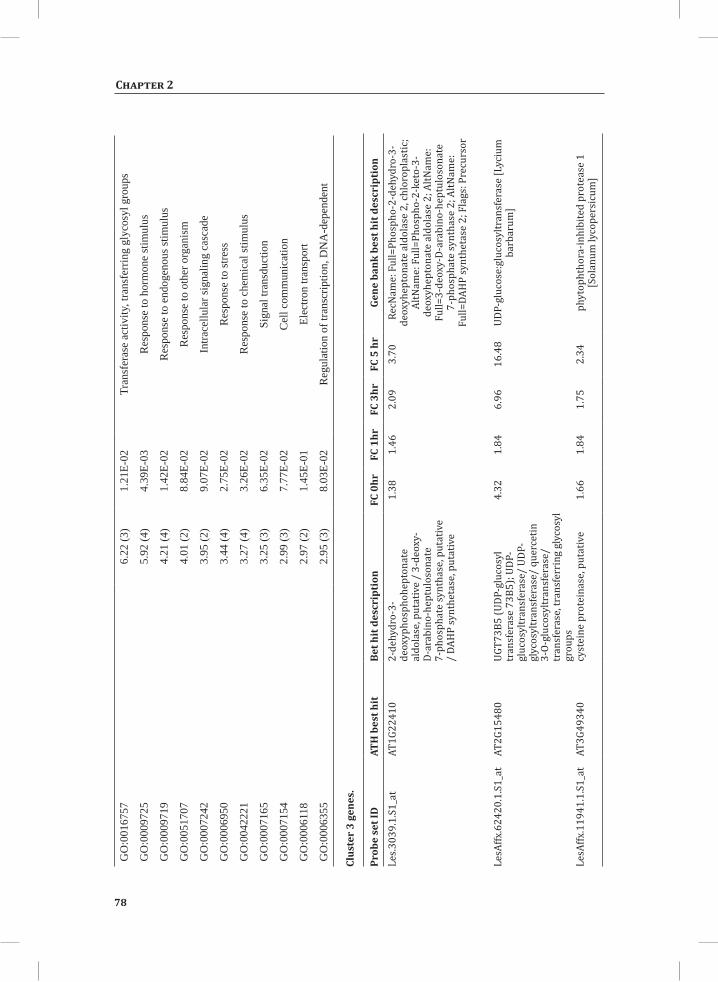
78
Chapter 2
GO
:001
6757
6.22
(3)
1.21
E-02
Tran
sfer
ase
activ
ity, t
rans
ferr
ing
glyc
osyl
gro
ups
GO
:000
9725
5.92
(4)
4.39
E-03
Res
pons
e to
hor
mon
e st
imul
us
GO
:000
9719
4.21
(4)
1.42
E-02
Res
pons
e to
end
ogen
ous s
timul
us
GO
:005
1707
4.01
(2)
8.84
E-02
Res
pons
e to
oth
er o
rgan
ism
GO
:000
7242
3.95
(2)
9.07
E-02
Intra
cellu
lar s
igna
ling
casc
ade
GO
:000
6950
3.44
(4)
2.75
E-02
Res
pons
e to
stre
ss
GO
:004
2221
3.27
(4)
3.26
E-02
Res
pons
e to
che
mic
al st
imul
us
GO
:000
7165
3.25
(3)
6.35
E-02
Sign
al tr
ansd
uctio
n
GO
:000
7154
2.99
(3)
7.77
E-02
Cel
l com
mun
icat
ion
GO
:000
6118
2.97
(2)
1.45
E-01
Elec
tron
trans
port
GO
:000
6355
2.95
(3)
8.03
E-02
Reg
ulat
ion
of tr
ansc
riptio
n, D
NA
-dep
ende
nt
Clus
ter
3 ge
nes.
Prob
e se
t ID
ATH
bes
t hit
Bet h
it d
escr
ipti
on
FC 0
hrFC
1hr
FC 3
hrFC
5 h
rGe
ne b
ank
best
hit
des
crip
tion
Les.3
039.
1.S1
_at
AT1G
2241
02-
dehy
dro-
3-de
oxyp
hosp
hohe
pton
ate
aldo
lase
, put
ativ
e /
3-de
oxy-
D-ar
abin
o-he
ptul
oson
ate
7-ph
osph
ate
synt
hase
, put
ativ
e /
DAH
P sy
nthe
tase
, put
ativ
e
1.38
1.46
2.09
3.70
RecN
ame:
Ful
l=Ph
osph
o-2-
dehy
dro-
3-de
oxyh
epto
nate
ald
olas
e 2,
chlo
ropl
astic
; Al
tNam
e: F
ull=
Phos
pho-
2-ke
to-3
-de
oxyh
epto
nate
ald
olas
e 2;
AltN
ame:
Fu
ll=3-
deox
y-D-
arab
ino-
hept
ulos
onat
e 7-
phos
phat
e sy
ntha
se 2
; AltN
ame:
Fu
ll=DA
HP
synt
heta
se 2
; Fla
gs: P
recu
rsor
LesA
ffx.6
2420
.1.S
1_at
AT2G
1548
0UG
T73B
5 (U
DP-g
luco
syl
tran
sfer
ase
73B5
); UD
P-gl
ucos
yltr
ansf
eras
e/ U
DP-
glyc
osyl
tran
sfer
ase/
que
rcet
in
3-O-
gluc
osyl
tran
sfer
ase/
tr
ansf
eras
e, tr
ansf
erri
ng g
lyco
syl
grou
ps
4.32
1.84
6.96
16.4
8UD
P-gl
ucos
e:gl
ucos
yltr
ansf
eras
e [L
yciu
m
barb
arum
]
LesA
ffx.1
1941
.1.S
1_at
AT3G
4934
0cy
stei
ne p
rote
inas
e, p
utat
ive
1.66
1.84
1.75
2.34
phyt
opht
hora
-inhi
bite
d pr
otea
se 1
[S
olan
um ly
cope
rsic
um]
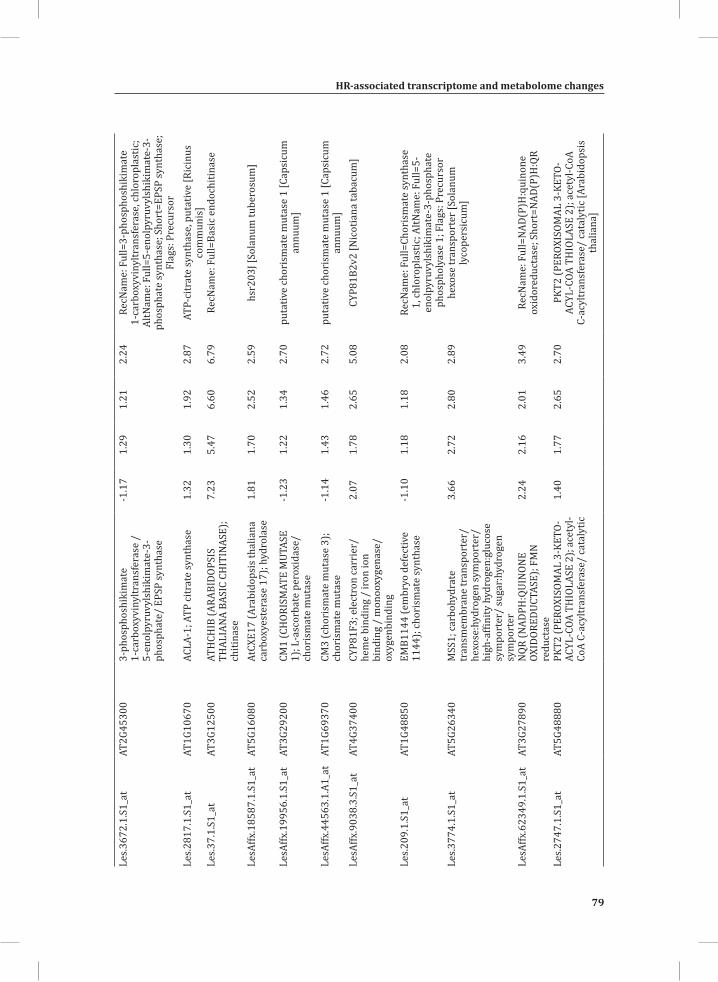
HR-associated transcriptome and metabolome changes
79
Chapter 2
Les.3
672.
1.S1
_at
AT2G
4530
03-
phos
phos
hiki
mat
e 1-
carb
oxyv
inyl
tran
sfer
ase
/ 5-
enol
pyru
vyls
hiki
mat
e-3-
phos
phat
e/ E
PSP
synt
hase
-1.1
71.
291.
212.
24Re
cNam
e: F
ull=
3-ph
osph
oshi
kim
ate
1-ca
rbox
yvin
yltr
ansf
eras
e, ch
loro
plas
tic;
AltN
ame:
Ful
l=5-
enol
pyru
vyls
hiki
mat
e-3-
phos
phat
e sy
ntha
se; S
hort
=EPS
P sy
ntha
se;
Flag
s: P
recu
rsor
Les.2
817.
1.S1
_at
AT1G
1067
0AC
LA-1
; ATP
citr
ate
synt
hase
1.32
1.30
1.92
2.87
ATP-
citr
ate
synt
hase
, put
ativ
e [R
icin
us
com
mun
is]
Les.3
7.1.
S1_a
tAT
3G12
500
ATH
CHIB
(ARA
BIDO
PSIS
TH
ALIA
NA B
ASIC
CH
ITIN
ASE)
; ch
itina
se
7.23
5.47
6.60
6.79
RecN
ame:
Ful
l=Ba
sic e
ndoc
hitin
ase
LesA
ffx.1
8587
.1.S
1_at
AT5G
1608
0At
CXE1
7 (A
rabi
dops
is th
alia
na
carb
oxye
ster
ase
17);
hydr
olas
e1.
811.
702.
522.
59hs
r203
J [So
lanu
m tu
bero
sum
]
LesA
ffx.1
9956
.1.S
1_at
AT3G
2920
0CM
1 (C
HOR
ISM
ATE
MUT
ASE
1); L
-asc
orba
te p
erox
idas
e/
chor
ism
ate
mut
ase
-1.2
31.
221.
342.
70pu
tativ
e ch
oris
mat
e m
utas
e 1
[Cap
sicu
m
annu
um]
LesA
ffx.4
4563
.1.A
1_at
AT1G
6937
0CM
3 (c
hori
smat
e m
utas
e 3)
; ch
oris
mat
e m
utas
e-1
.14
1.43
1.46
2.72
puta
tive
chor
ism
ate
mut
ase
1 [C
apsi
cum
an
nuum
]Le
sAffx
.903
8.3.
S1_a
tAT
4G37
400
CYP8
1F3;
ele
ctro
n ca
rrie
r/
hem
e bi
ndin
g /
iron
ion
bind
ing
/ m
onoo
xyge
nase
/ ox
ygen
bind
ing
2.07
1.78
2.65
5.08
CYP8
1B2v
2 [N
icot
iana
taba
cum
]
Les.2
09.1
.S1_
atAT
1G48
850
EMB1
144
(em
bryo
def
ectiv
e 11
44);
chor
ism
ate
synt
hase
-1.1
01.
181.
182.
08Re
cNam
e: F
ull=
Chor
ism
ate
synt
hase
1,
chlo
ropl
astic
; AltN
ame:
Ful
l=5-
enol
pyru
vyls
hiki
mat
e-3-
phos
phat
e ph
osph
olya
se 1
; Fla
gs: P
recu
rsor
Les.3
774.
1.S1
_at
AT5G
2634
0M
SS1;
carb
ohyd
rate
tr
ansm
embr
ane
tran
spor
ter/
he
xose
:hyd
roge
n sy
mpo
rter
/ hi
gh-a
ffini
ty h
ydro
gen:
gluc
ose
sym
port
er/
suga
r:hy
drog
en
sym
port
er
3.66
2.72
2.80
2.89
hexo
se tr
ansp
orte
r [So
lanu
m
lyco
pers
icum
]
LesA
ffx.6
2349
.1.S
1_at
AT3G
2789
0N
QR (N
ADPH
:QUI
NON
E OX
IDOR
EDUC
TASE
); FM
N
redu
ctas
e
2.24
2.16
2.01
3.49
RecN
ame:
Ful
l=NA
D(P)
H:q
uino
ne
oxid
ored
ucta
se; S
hort
=NAD
(P)H
:QR
Les.2
747.
1.S1
_at
AT5G
4888
0PK
T2 (P
EROX
ISOM
AL 3
-KET
O-AC
YL-C
OA T
HIO
LASE
2);
acet
yl-
CoA
C-ac
yltr
ansf
eras
e/ ca
taly
tic
1.40
1.77
2.65
2.70
PKT2
(PER
OXIS
OMAL
3-K
ETO-
ACYL
-COA
TH
IOLA
SE 2
); ac
etyl
-CoA
C-
acyl
tran
sfer
ase/
cata
lytic
[Ara
bido
psis
th
alia
na]
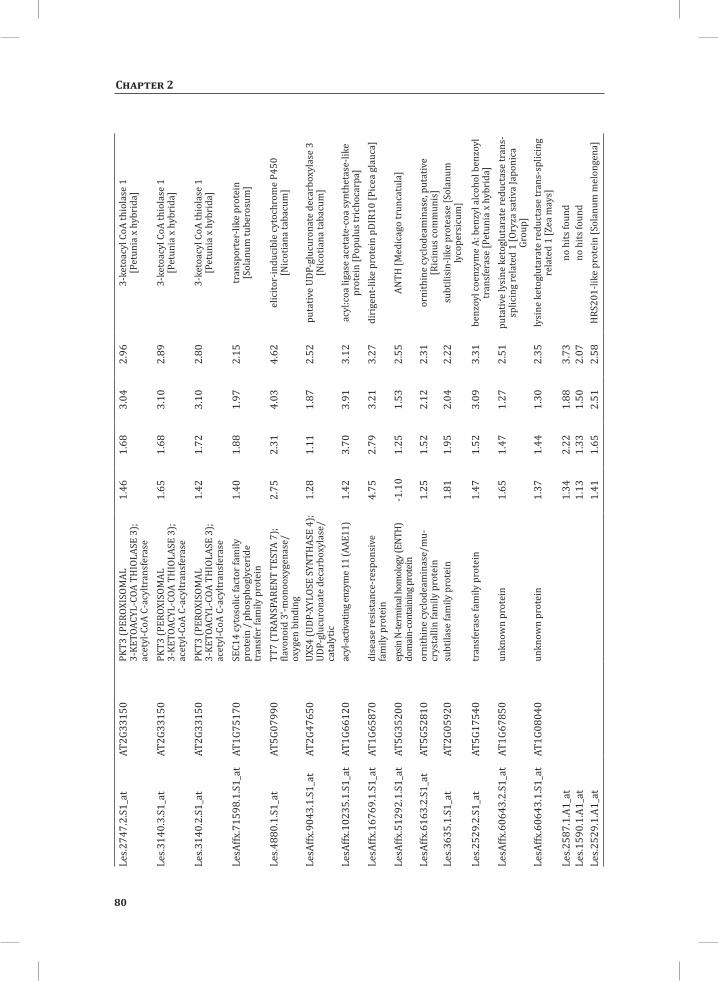
80
Chapter 2
Les.2
747.
2.S1
_at
AT2G
3315
0PK
T3 (P
EROX
ISOM
AL
3-KE
TOAC
YL-C
OA T
HIO
LASE
3);
acet
yl-C
oA C
-acy
ltran
sfer
ase
1.46
1.68
3.04
2.96
3-ke
toac
yl C
oA th
iola
se 1
[P
etun
ia x
hyb
rida
]
Les.3
140.
3.S1
_at
AT2G
3315
0PK
T3 (P
EROX
ISOM
AL
3-KE
TOAC
YL-C
OA T
HIO
LASE
3);
acet
yl-C
oA C
-acy
ltran
sfer
ase
1.65
1.68
3.10
2.89
3-ke
toac
yl C
oA th
iola
se 1
[P
etun
ia x
hyb
rida
]
Les.3
140.
2.S1
_at
AT2G
3315
0PK
T3 (P
EROX
ISOM
AL
3-KE
TOAC
YL-C
OA T
HIO
LASE
3);
acet
yl-C
oA C
-acy
ltran
sfer
ase
1.42
1.72
3.10
2.80
3-ke
toac
yl C
oA th
iola
se 1
[P
etun
ia x
hyb
rida
]
LesA
ffx.7
1598
.1.S
1_at
AT1G
7517
0SE
C14
cyto
solic
fact
or fa
mily
pr
otei
n /
phos
phog
lyce
ride
tr
ansf
er fa
mily
pro
tein
1.40
1.88
1.97
2.15
tran
spor
ter-
like
prot
ein
[Sol
anum
tube
rosu
m]
Les.4
880.
1.S1
_at
AT5G
0799
0TT
7 (T
RAN
SPAR
ENT
TEST
A 7)
; fla
vono
id 3
’-mon
ooxy
gena
se/
oxyg
en b
indi
ng
2.75
2.31
4.03
4.62
elic
itor-
indu
cibl
e cy
toch
rom
e P4
50[N
icot
iana
taba
cum
]
LesA
ffx.9
043.
1.S1
_at
AT2G
4765
0UX
S4 (U
DP-X
YLOS
E SY
NTH
ASE
4);
UDP-
gluc
uron
ate
deca
rbox
ylas
e/
cata
lytic
1.28
1.11
1.87
2.52
puta
tive
UDP-
gluc
uron
ate
deca
rbox
ylas
e 3
[Nic
otia
na ta
bacu
m]
LesA
ffx.1
0235
.1.S
1_at
AT1G
6612
0ac
yl-a
ctiv
atin
g enz
yme 1
1 (A
AE11
)1.
423.
703.
913.
12ac
yl:c
oa li
gase
ace
tate
-coa
synt
heta
se-li
ke
prot
ein
[Pop
ulus
tric
hoca
rpa]
LesA
ffx.1
6769
.1.S
1_at
AT1G
6587
0di
seas
e re
sist
ance
-res
pons
ive
fam
ily p
rote
in4.
752.
793.
213.
27di
rige
nt-li
ke p
rote
in p
DIR1
0 [P
icea
gla
uca]
LesA
ffx.5
1292
.1.S
1_at
AT5G
3520
0ep
sin N
-term
inal
hom
olog
y (EN
TH)
dom
ain-
cont
aini
ng p
rote
in-1
.10
1.25
1.53
2.55
ANTH
[Med
icag
o tr
unca
tula
]
LesA
ffx.6
163.
2.S1
_at
AT5G
5281
0or
nith
ine
cycl
odea
min
ase/
mu-
crys
talli
n fa
mily
pro
tein
1.25
1.52
2.12
2.31
orni
thin
e cy
clod
eam
inas
e, p
utat
ive
[Ric
inus
com
mun
is]
Les.3
635.
1.S1
_at
AT2G
0592
0su
btila
se fa
mily
pro
tein
1.81
1.95
2.04
2.22
subt
ilisi
n-lik
e pr
otea
se [S
olan
um
lyco
pers
icum
]
Les.2
529.
2.S1
_at
AT5G
1754
0tr
ansf
eras
e fa
mily
pro
tein
1.47
1.52
3.09
3.31
benz
oyl c
oenz
yme
A: b
enzy
l alc
ohol
ben
zoyl
tr
ansf
eras
e [P
etun
ia x
hyb
rida
]Le
sAffx
.606
43.2
.S1_
atAT
1G67
850
unkn
own
prot
ein
1.65
1.47
1.27
2.51
puta
tive
lysi
ne k
etog
luta
rate
redu
ctas
e tr
ans-
splic
ing
rela
ted
1 [O
ryza
sativ
a Ja
poni
ca
Grou
p]Le
sAffx
.606
43.1
.S1_
atAT
1G08
040
unkn
own
prot
ein
1.37
1.44
1.30
2.35
lysi
ne k
etog
luta
rate
redu
ctas
e tr
ans-
splic
ing
rela
ted
1 [Z
ea m
ays]
Les.2
587.
1.A1
_at
1.34
2.22
1.88
3.73
no h
its fo
und
Les.1
590.
1.A1
_at
1.13
1.33
1.50
2.07
no h
its fo
und
Les.2
529.
1.A1
_at
1.41
1.65
2.51
2.58
HRS
201-
like
prot
ein
[Sol
anum
mel
onge
na]
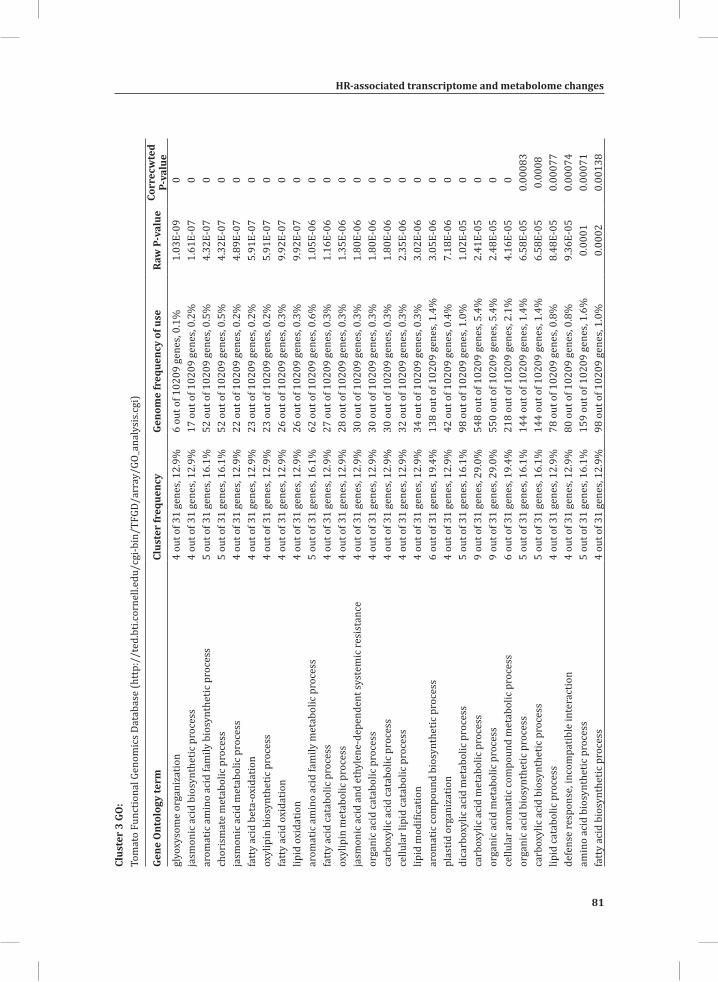
HR-associated transcriptome and metabolome changes
81
Chapter 2
Clus
ter
3 GO
:To
mat
o Fu
nctio
nal G
enom
ics D
atab
ase
(htt
p://
ted.
bti.c
orne
ll.ed
u/cg
i-bin
/TFG
D/ar
ray/
GO_a
naly
sis.c
gi)
Gene
Ont
olog
y te
rmCl
uste
r fr
eque
ncy
Geno
me
freq
uenc
y of
use
Raw
P-v
alue
Corr
ecw
ted
P-va
lue
glyo
xyso
me
orga
niza
tion
4 ou
t of 3
1 ge
nes,
12.9
%6
out o
f 102
09 g
enes
, 0.1
%1.
03E-
090
jasm
onic
aci
d bi
osyn
thet
ic p
roce
ss4
out o
f 31
gene
s, 12
.9%
17 o
ut o
f 102
09 g
enes
, 0.2
%1.
61E-
070
arom
atic
am
ino
acid
fam
ily b
iosy
nthe
tic p
roce
ss5
out o
f 31
gene
s, 16
.1%
52 o
ut o
f 102
09 g
enes
, 0.5
%4.
32E-
070
chor
ism
ate
met
abol
ic p
roce
ss5
out o
f 31
gene
s, 16
.1%
52 o
ut o
f 102
09 g
enes
, 0.5
%4.
32E-
070
jasm
onic
aci
d m
etab
olic
pro
cess
4 ou
t of 3
1 ge
nes,
12.9
%22
out
of 1
0209
gen
es, 0
.2%
4.89
E-07
0fa
tty
acid
bet
a-ox
idat
ion
4 ou
t of 3
1 ge
nes,
12.9
%23
out
of 1
0209
gen
es, 0
.2%
5.91
E-07
0ox
ylip
in b
iosy
nthe
tic p
roce
ss4
out o
f 31
gene
s, 12
.9%
23 o
ut o
f 102
09 g
enes
, 0.2
%5.
91E-
070
fatt
y ac
id o
xida
tion
4 ou
t of 3
1 ge
nes,
12.9
%26
out
of 1
0209
gen
es, 0
.3%
9.92
E-07
0lip
id o
xida
tion
4 ou
t of 3
1 ge
nes,
12.9
%26
out
of 1
0209
gen
es, 0
.3%
9.92
E-07
0ar
omat
ic a
min
o ac
id fa
mily
met
abol
ic p
roce
ss5
out o
f 31
gene
s, 16
.1%
62 o
ut o
f 102
09 g
enes
, 0.6
%1.
05E-
060
fatt
y ac
id ca
tabo
lic p
roce
ss4
out o
f 31
gene
s, 12
.9%
27 o
ut o
f 102
09 g
enes
, 0.3
%1.
16E-
060
oxyl
ipin
met
abol
ic p
roce
ss4
out o
f 31
gene
s, 12
.9%
28 o
ut o
f 102
09 g
enes
, 0.3
%1.
35E-
060
jasm
onic
aci
d an
d et
hyle
ne-d
epen
dent
syst
emic
resi
stan
ce4
out o
f 31
gene
s, 12
.9%
30 o
ut o
f 102
09 g
enes
, 0.3
%1.
80E-
060
orga
nic a
cid
cata
bolic
pro
cess
4 ou
t of 3
1 ge
nes,
12.9
%30
out
of 1
0209
gen
es, 0
.3%
1.80
E-06
0ca
rbox
ylic
aci
d ca
tabo
lic p
roce
ss4
out o
f 31
gene
s, 12
.9%
30 o
ut o
f 102
09 g
enes
, 0.3
%1.
80E-
060
cellu
lar l
ipid
cata
bolic
pro
cess
4 ou
t of 3
1 ge
nes,
12.9
%32
out
of 1
0209
gen
es, 0
.3%
2.35
E-06
0lip
id m
odifi
catio
n4
out o
f 31
gene
s, 12
.9%
34 o
ut o
f 102
09 g
enes
, 0.3
%3.
02E-
060
arom
atic
com
poun
d bi
osyn
thet
ic p
roce
ss6
out o
f 31
gene
s, 19
.4%
138
out o
f 102
09 g
enes
, 1.4
%3.
05E-
060
plas
tid o
rgan
izat
ion
4 ou
t of 3
1 ge
nes,
12.9
%42
out
of 1
0209
gen
es, 0
.4%
7.18
E-06
0di
carb
oxyl
ic a
cid
met
abol
ic p
roce
ss5
out o
f 31
gene
s, 16
.1%
98 o
ut o
f 102
09 g
enes
, 1.0
%1.
02E-
050
carb
oxyl
ic a
cid
met
abol
ic p
roce
ss9
out o
f 31
gene
s, 29
.0%
548
out o
f 102
09 g
enes
, 5.4
%2.
41E-
050
orga
nic a
cid
met
abol
ic p
roce
ss9
out o
f 31
gene
s, 29
.0%
550
out o
f 102
09 g
enes
, 5.4
%2.
48E-
050
cellu
lar a
rom
atic
com
poun
d m
etab
olic
pro
cess
6 ou
t of 3
1 ge
nes,
19.4
%21
8 ou
t of 1
0209
gen
es, 2
.1%
4.16
E-05
0or
gani
c aci
d bi
osyn
thet
ic p
roce
ss5
out o
f 31
gene
s, 16
.1%
144
out o
f 102
09 g
enes
, 1.4
%6.
58E-
050.
0008
3ca
rbox
ylic
aci
d bi
osyn
thet
ic p
roce
ss5
out o
f 31
gene
s, 16
.1%
144
out o
f 102
09 g
enes
, 1.4
%6.
58E-
050.
0008
lipid
cata
bolic
pro
cess
4 ou
t of 3
1 ge
nes,
12.9
%78
out
of 1
0209
gen
es, 0
.8%
8.48
E-05
0.00
077
defe
nse
resp
onse
, inc
ompa
tible
inte
ract
ion
4 ou
t of 3
1 ge
nes,
12.9
%80
out
of 1
0209
gen
es, 0
.8%
9.36
E-05
0.00
074
amin
o ac
id b
iosy
nthe
tic p
roce
ss5
out o
f 31
gene
s, 16
.1%
159
out o
f 102
09 g
enes
, 1.6
%0.
0001
0.00
071
fatt
y ac
id b
iosy
nthe
tic p
roce
ss4
out o
f 31
gene
s, 12
.9%
98 o
ut o
f 102
09 g
enes
, 1.0
%0.
0002
0.00
138
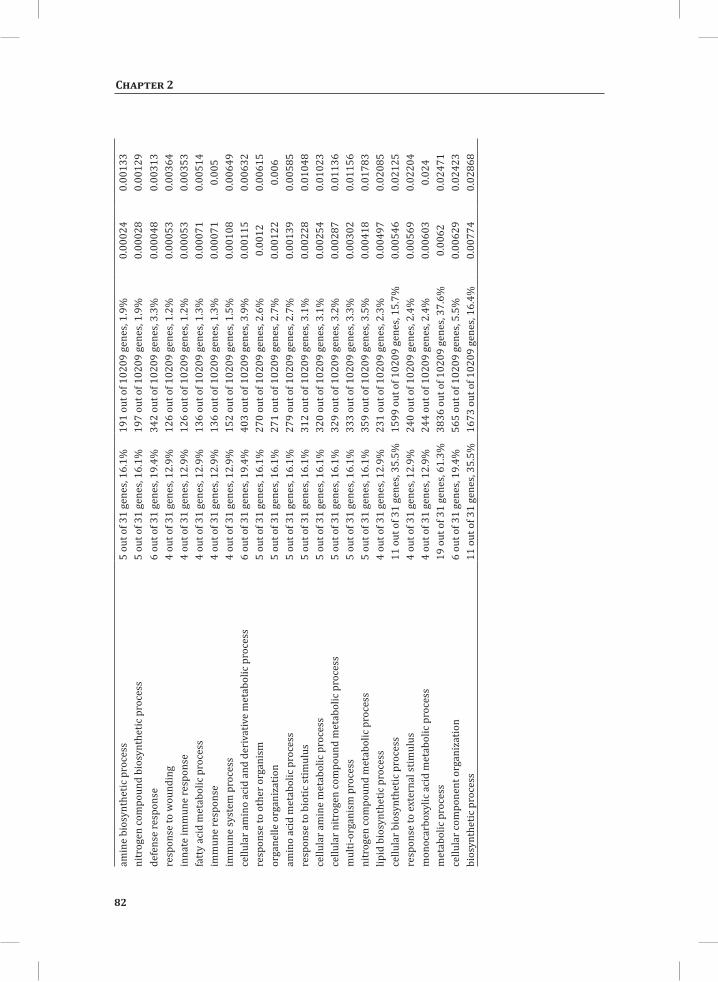
82
Chapter 2
amin
e bi
osyn
thet
ic p
roce
ss5
out o
f 31
gene
s, 16
.1%
191
out o
f 102
09 g
enes
, 1.9
%0.
0002
40.
0013
3ni
trog
en co
mpo
und
bios
ynth
etic
pro
cess
5 ou
t of 3
1 ge
nes,
16.1
%19
7 ou
t of 1
0209
gen
es, 1
.9%
0.00
028
0.00
129
defe
nse
resp
onse
6 ou
t of 3
1 ge
nes,
19.4
%34
2 ou
t of 1
0209
gen
es, 3
.3%
0.00
048
0.00
313
resp
onse
to w
ound
ing
4 ou
t of 3
1 ge
nes,
12.9
%12
6 ou
t of 1
0209
gen
es, 1
.2%
0.00
053
0.00
364
inna
te im
mun
e re
spon
se4
out o
f 31
gene
s, 12
.9%
126
out o
f 102
09 g
enes
, 1.2
%0.
0005
30.
0035
3fa
tty
acid
met
abol
ic p
roce
ss4
out o
f 31
gene
s, 12
.9%
136
out o
f 102
09 g
enes
, 1.3
%0.
0007
10.
0051
4im
mun
e re
spon
se4
out o
f 31
gene
s, 12
.9%
136
out o
f 102
09 g
enes
, 1.3
%0.
0007
10.
005
imm
une
syst
em p
roce
ss4
out o
f 31
gene
s, 12
.9%
152
out o
f 102
09 g
enes
, 1.5
%0.
0010
80.
0064
9ce
llula
r am
ino
acid
and
der
ivat
ive
met
abol
ic p
roce
ss6
out o
f 31
gene
s, 19
.4%
403
out o
f 102
09 g
enes
, 3.9
%0.
0011
50.
0063
2re
spon
se to
oth
er o
rgan
ism
5 ou
t of 3
1 ge
nes,
16.1
%27
0 ou
t of 1
0209
gen
es, 2
.6%
0.00
120.
0061
5or
gane
lle o
rgan
izat
ion
5 ou
t of 3
1 ge
nes,
16.1
%27
1 ou
t of 1
0209
gen
es, 2
.7%
0.00
122
0.00
6am
ino
acid
met
abol
ic p
roce
ss5
out o
f 31
gene
s, 16
.1%
279
out o
f 102
09 g
enes
, 2.7
%0.
0013
90.
0058
5re
spon
se to
bio
tic st
imul
us5
out o
f 31
gene
s, 16
.1%
312
out o
f 102
09 g
enes
, 3.1
%0.
0022
80.
0104
8ce
llula
r am
ine
met
abol
ic p
roce
ss5
out o
f 31
gene
s, 16
.1%
320
out o
f 102
09 g
enes
, 3.1
%0.
0025
40.
0102
3ce
llula
r nitr
ogen
com
poun
d m
etab
olic
pro
cess
5 ou
t of 3
1 ge
nes,
16.1
%32
9 ou
t of 1
0209
gen
es, 3
.2%
0.00
287
0.01
136
mul
ti-or
gani
sm p
roce
ss5
out o
f 31
gene
s, 16
.1%
333
out o
f 102
09 g
enes
, 3.3
%0.
0030
20.
0115
6ni
trog
en co
mpo
und
met
abol
ic p
roce
ss5
out o
f 31
gene
s, 16
.1%
359
out o
f 102
09 g
enes
, 3.5
%0.
0041
80.
0178
3lip
id b
iosy
nthe
tic p
roce
ss4
out o
f 31
gene
s, 12
.9%
231
out o
f 102
09 g
enes
, 2.3
%0.
0049
70.
0208
5ce
llula
r bio
synt
hetic
pro
cess
11 o
ut o
f 31
gene
s, 35
.5%
1599
out
of 1
0209
gen
es, 1
5.7%
0.00
546
0.02
125
resp
onse
to e
xter
nal s
timul
us4
out o
f 31
gene
s, 12
.9%
240
out o
f 102
09 g
enes
, 2.4
%0.
0056
90.
0220
4m
onoc
arbo
xylic
aci
d m
etab
olic
pro
cess
4 ou
t of 3
1 ge
nes,
12.9
%24
4 ou
t of 1
0209
gen
es, 2
.4%
0.00
603
0.02
4m
etab
olic
pro
cess
19 o
ut o
f 31
gene
s, 61
.3%
3836
out
of 1
0209
gen
es, 3
7.6%
0.00
620.
0247
1ce
llula
r com
pone
nt o
rgan
izat
ion
6 ou
t of 3
1 ge
nes,
19.4
%56
5 ou
t of 1
0209
gen
es, 5
.5%
0.00
629
0.02
423
bios
ynth
etic
pro
cess
11 o
ut o
f 31
gene
s, 35
.5%
1673
out
of 1
0209
gen
es, 1
6.4%
0.00
774
0.02
868
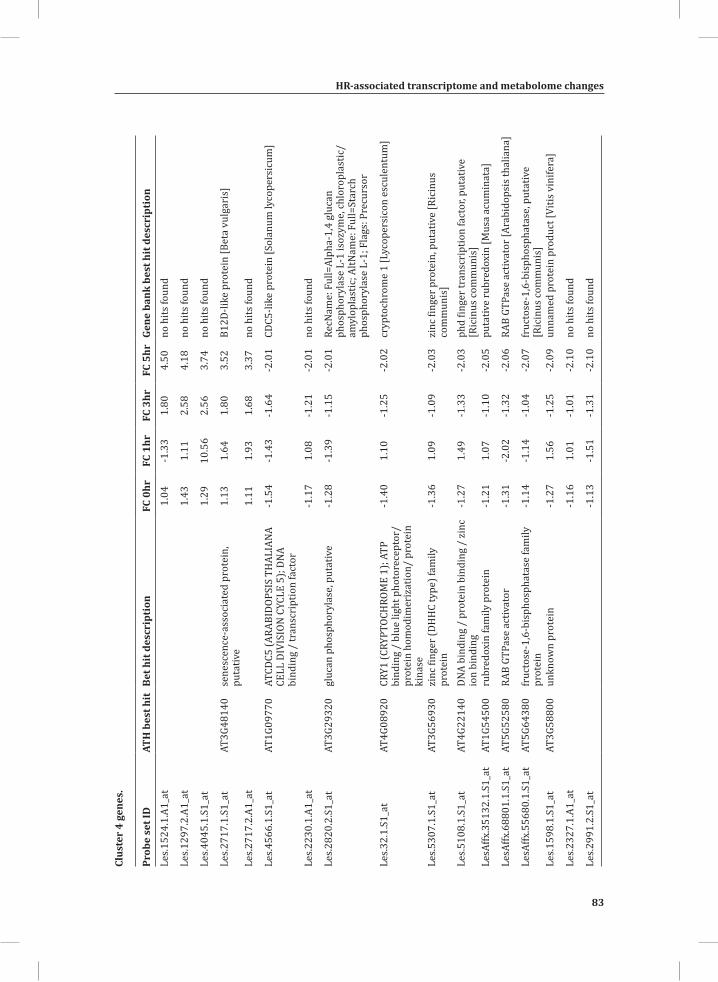
HR-associated transcriptome and metabolome changes
83
Chapter 2
Clus
ter
4 ge
nes.
Prob
e se
t ID
ATH
bes
t hit
Bet h
it d
escr
ipti
on
FC 0
hrFC
1hr
FC 3
hrFC
5hr
Gene
ban
k be
st h
it d
escr
ipti
on
Les.1
524.
1.A1
_at
1.04
-1.3
31.
804.
50no
hits
foun
d
Les.1
297.
2.A1
_at
1.43
1.11
2.58
4.18
no h
its fo
und
Les.4
045.
1.S1
_at
1.29
10.5
62.
563.
74no
hits
foun
d
Les.2
717.
1.S1
_at
AT3G
4814
0se
nesc
ence
-ass
ocia
ted
prot
ein,
pu
tativ
e1.
131.
641.
803.
52B1
2D-li
ke p
rote
in [B
eta
vulg
aris
]
Les.2
717.
2.A1
_at
1.11
1.93
1.68
3.37
no h
its fo
und
Les.4
566.
1.S1
_at
AT1G
0977
0AT
CDC5
(ARA
BIDO
PSIS
TH
ALIA
NA
CELL
DIV
ISIO
N C
YCLE
5);
DNA
bind
ing
/ tr
ansc
ript
ion
fact
or
-1.5
4-1
.43
-1.6
4-2
.01
CDC5
-like
pro
tein
[Sol
anum
lyco
pers
icum
]
Les.2
230.
1.A1
_at
-1.1
71.
08-1
.21
-2.0
1no
hits
foun
d
Les.2
820.
2.S1
_at
AT3G
2932
0gl
ucan
pho
spho
ryla
se, p
utat
ive
-1.2
8-1
.39
-1.1
5-2
.01
RecN
ame:
Ful
l=Al
pha-
1,4
gluc
an
phos
phor
ylas
e L-
1 is
ozym
e, ch
loro
plas
tic/
amyl
opla
stic
; AltN
ame:
Ful
l=St
arch
ph
osph
oryl
ase
L-1;
Fla
gs: P
recu
rsor
Les.3
2.1.
S1_a
tAT
4G08
920
CRY1
(CRY
PTOC
HRO
ME
1); A
TP
bind
ing
/ bl
ue li
ght p
hoto
rece
ptor
/ pr
otei
n ho
mod
imer
izat
ion/
pro
tein
ki
nase
-1.4
01.
10-1
.25
-2.0
2cr
ypto
chro
me
1 [L
ycop
ersi
con
escu
lent
um]
Les.5
307.
1.S1
_at
AT3G
5693
0zi
nc fi
nger
(DH
HC
type
) fam
ily
prot
ein
-1.3
61.
09-1
.09
-2.0
3zi
nc fi
nger
pro
tein
, put
ativ
e [R
icin
us
com
mun
is]
Les.5
108.
1.S1
_at
AT4G
2214
0DN
A bi
ndin
g /
prot
ein
bind
ing
/ zi
nc
ion
bind
ing
-1.2
71.
49-1
.33
-2.0
3ph
d fin
ger t
rans
crip
tion
fact
or, p
utat
ive
[Ric
inus
com
mun
is]
LesA
ffx.3
5132
.1.S
1_at
AT1G
5450
0ru
bred
oxin
fam
ily p
rote
in-1
.21
1.07
-1.1
0-2
.05
puta
tive
rubr
edox
in [M
usa
acum
inat
a]
LesA
ffx.6
8801
.1.S
1_at
AT5G
5258
0RA
B GT
Pase
act
ivat
or-1
.31
-2.0
2-1
.32
-2.0
6RA
B GT
Pase
act
ivat
or [A
rabi
dops
is th
alia
na]
LesA
ffx.5
5680
.1.S
1_at
AT5G
6438
0fr
ucto
se-1
,6-b
isph
osph
atas
e fa
mily
pr
otei
n-1
.14
-1.1
4-1
.04
-2.0
7fr
ucto
se-1
,6-b
isph
osph
atas
e, p
utat
ive
[Ric
inus
com
mun
is]
Les.1
598.
1.S1
_at
AT3G
5880
0un
know
n pr
otei
n-1
.27
1.56
-1.2
5-2
.09
unna
med
pro
tein
pro
duct
[Viti
s vin
ifera
]
Les.2
327.
1.A1
_at
-1.1
61.
01-1
.01
-2.1
0no
hits
foun
d
Les.2
991.
2.S1
_at
-1.1
3-1
.51
-1.3
1-2
.10
no h
its fo
und
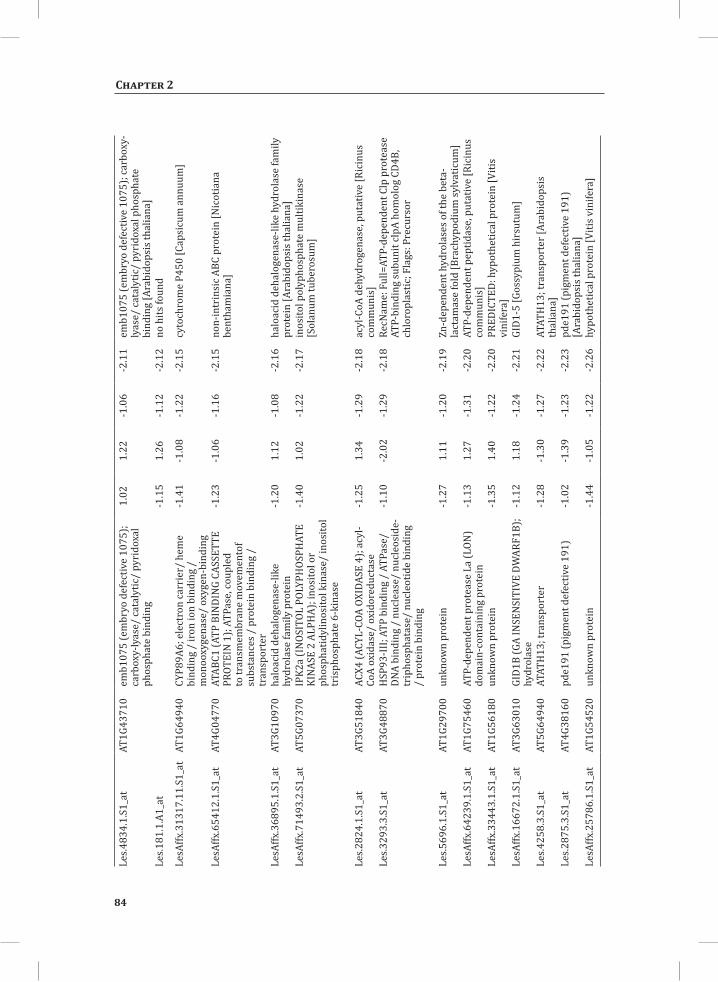
84
Chapter 2
Les.4
834.
1.S1
_at
AT1G
4371
0em
b107
5 (e
mbr
yo d
efec
tive
1075
); ca
rbox
y-ly
ase/
cata
lytic
/ py
rido
xal
phos
phat
e bi
ndin
g
1.02
1.22
-1.0
6-2
.11
emb1
075
(em
bryo
def
ectiv
e 10
75);
carb
oxy-
lyas
e/ ca
taly
tic/
pyri
doxa
l pho
spha
te
bind
ing
[Ara
bido
psis
thal
iana
]Le
s.181
.1.A
1_at
-1.1
51.
26-1
.12
-2.1
2no
hits
foun
d
LesA
ffx.3
1317
.11.
S1_a
tAT
1G64
940
CYP8
9A6;
ele
ctro
n ca
rrie
r/ h
eme
bind
ing
/ ir
on io
n bi
ndin
g /
mon
ooxy
gena
se/
oxyg
en-b
indi
ng
-1.4
1-1
.08
-1.2
2-2
.15
cyto
chro
me
P450
[Cap
sicu
m a
nnuu
m]
LesA
ffx.6
5412
.1.S
1_at
AT4G
0477
0AT
ABC1
(ATP
BIN
DIN
G CA
SSET
TE
PROT
EIN
1);
ATPa
se, c
oupl
ed
to tr
ansm
embr
ane
mov
emen
tof
subs
tanc
es /
pro
tein
bin
ding
/
tran
spor
ter
-1.2
3-1
.06
-1.1
6-2
.15
non-
intr
insi
c ABC
pro
tein
[Nic
otia
na
bent
ham
iana
]
LesA
ffx.3
6895
.1.S
1_at
AT3G
1097
0ha
loac
id d
ehal
ogen
ase-
like
hydr
olas
e fa
mily
pro
tein
-1.2
01.
12-1
.08
-2.1
6ha
loac
id d
ehal
ogen
ase-
like
hydr
olas
e fa
mily
pr
otei
n [A
rabi
dops
is th
alia
na]
LesA
ffx.7
1493
.2.S
1_at
AT5G
0737
0IP
K2a
(IN
OSIT
OL P
OLYP
HOS
PHAT
E KI
NASE
2 A
LPH
A); i
nosi
tol o
r ph
osph
atid
ylin
osito
l kin
ase/
inos
itol
tris
phos
phat
e 6-
kina
se
-1.4
01.
02-1
.22
-2.1
7in
osito
l pol
ypho
spha
te m
ultik
inas
e [S
olan
um tu
bero
sum
]
Les.2
824.
1.S1
_at
AT3G
5184
0AC
X4 (A
CYL-
COA
OXID
ASE
4); a
cyl-
CoA
oxid
ase/
oxi
dore
duct
ase
-1.2
51.
34-1
.29
-2.1
8ac
yl-C
oA d
ehyd
roge
nase
, put
ativ
e [R
icin
us
com
mun
is]
Les.3
293.
3.S1
_at
AT3G
4887
0H
SP93
-III;
ATP
bind
ing
/ AT
Pase
/ DN
A bi
ndin
g /
nucl
ease
/ nu
cleo
side
-tr
ipho
spha
tase
/ nu
cleo
tide
bind
ing
/ pr
otei
n bi
ndin
g
-1.1
0-2
.02
-1.2
9-2
.18
RecN
ame:
Ful
l=AT
P-de
pend
ent C
lp p
rote
ase
ATP-
bind
ing
subu
nit c
lpA
hom
olog
CD4
B,
chlo
ropl
astic
; Fla
gs: P
recu
rsor
Les.5
696.
1.S1
_at
AT1G
2970
0un
know
n pr
otei
n-1
.27
1.11
-1.2
0-2
.19
Zn-d
epen
dent
hyd
rola
ses o
f the
bet
a-la
ctam
ase
fold
[Bra
chyp
odiu
m sy
lvat
icum
]Le
sAffx
.642
39.1
.S1_
atAT
1G75
460
ATP-
depe
nden
t pro
teas
e La
(LON
) do
mai
n-co
ntai
ning
pro
tein
-1.1
31.
27-1
.31
-2.2
0AT
P-de
pend
ent p
eptid
ase,
put
ativ
e [R
icin
us
com
mun
is]
LesA
ffx.3
3443
.1.S
1_at
AT1G
5618
0un
know
n pr
otei
n-1
.35
1.40
-1.2
2-2
.20
PRED
ICTE
D: h
ypot
hetic
al p
rote
in [V
itis
vini
fera
]Le
sAffx
.166
72.1
.S1_
atAT
3G63
010
GID1
B (G
A IN
SEN
SITI
VE D
WAR
F1B)
; hy
drol
ase
-1.1
21.
18-1
.24
-2.2
1GI
D1-5
[Gos
sypi
um h
irsu
tum
]
Les.4
258.
3.S1
_at
AT5G
6494
0AT
ATH
13; t
rans
port
er-1
.28
-1.3
0-1
.27
-2.2
2AT
ATH
13; t
rans
port
er [A
rabi
dops
is
thal
iana
]Le
s.287
5.3.
S1_a
tAT
4G38
160
pde1
91 (p
igm
ent d
efec
tive
191)
-1.0
2-1
.39
-1.2
3-2
.23
pde1
91 (p
igm
ent d
efec
tive
191)
[A
rabi
dops
is th
alia
na]
LesA
ffx.2
5786
.1.S
1_at
AT1G
5452
0un
know
n pr
otei
n-1
.44
-1.0
5-1
.22
-2.2
6hy
poth
etic
al p
rote
in [V
itis v
inife
ra]
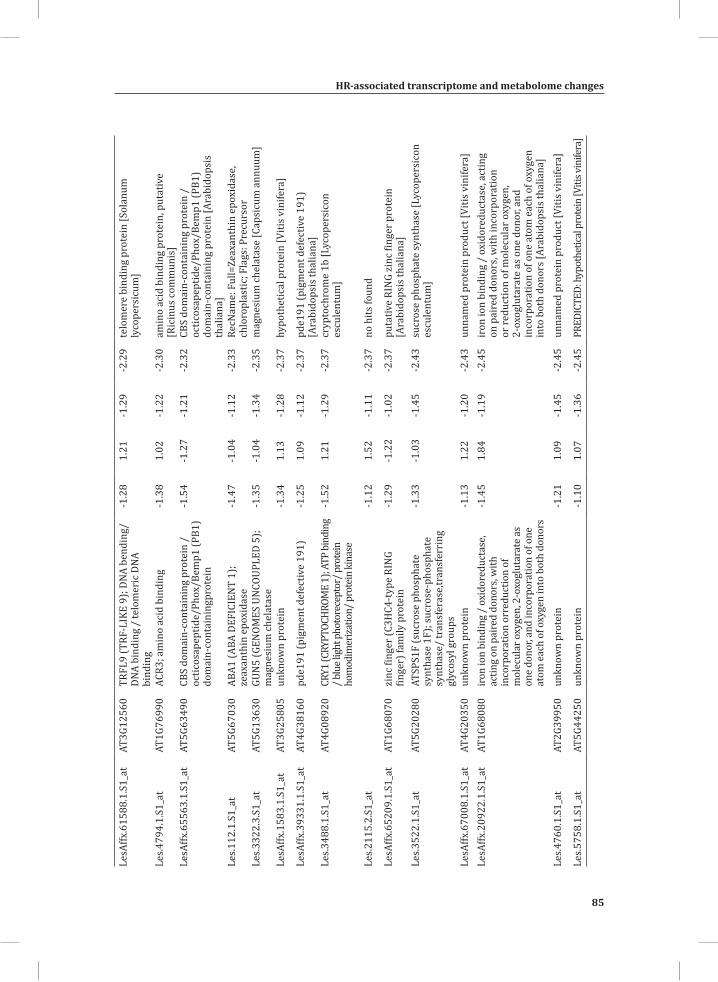
HR-associated transcriptome and metabolome changes
85
Chapter 2
LesA
ffx.6
1588
.1.S
1_at
AT3G
1256
0TR
FL9
(TRF
-LIK
E 9)
; DNA
ben
ding
/ DN
A bi
ndin
g /
telo
mer
ic D
NA
bind
ing
-1.2
81.
21-1
.29
-2.2
9te
lom
ere
bind
ing
prot
ein
[Sol
anum
ly
cope
rsic
um]
Les.4
794.
1.S1
_at
AT1G
7699
0AC
R3; a
min
o ac
id b
indi
ng-1
.38
1.02
-1.2
2-2
.30
amin
o ac
id b
indi
ng p
rote
in, p
utat
ive
[Ric
inus
com
mun
is]
LesA
ffx.6
5563
.1.S
1_at
AT5G
6349
0CB
S do
mai
n-co
ntai
ning
pro
tein
/
octic
osap
eptid
e/Ph
ox/B
emp1
(PB1
) do
mai
n-co
ntai
ning
prot
ein
-1.5
4-1
.27
-1.2
1-2
.32
CBS
dom
ain-
cont
aini
ng p
rote
in /
oc
ticos
apep
tide/
Phox
/Bem
p1 (P
B1)
dom
ain-
cont
aini
ng p
rote
in [A
rabi
dops
is
thal
iana
]Le
s.112
.1.S
1_at
AT5G
6703
0AB
A1 (A
BA D
EFIC
IEN
T 1)
; ze
axan
thin
epo
xida
se-1
.47
-1.0
4-1
.12
-2.3
3Re
cNam
e: F
ull=
Zeax
anth
in e
poxi
dase
, ch
loro
plas
tic; F
lags
: Pre
curs
orLe
s.332
2.3.
S1_a
tAT
5G13
630
GUN
5 (G
ENOM
ES U
NCO
UPLE
D 5)
; m
agne
sium
chel
atas
e-1
.35
-1.0
4-1
.34
-2.3
5m
agne
sium
chel
atas
e [C
apsi
cum
ann
uum
]
LesA
ffx.1
583.
1.S1
_at
AT3G
2580
5un
know
n pr
otei
n-1
.34
1.13
-1.2
8-2
.37
hypo
thet
ical
pro
tein
[Viti
s vin
ifera
]
LesA
ffx.3
9331
.1.S
1_at
AT4G
3816
0pd
e191
(pig
men
t def
ectiv
e 19
1)-1
.25
1.09
-1.1
2-2
.37
pde1
91 (p
igm
ent d
efec
tive
191)
[A
rabi
dops
is th
alia
na]
Les.3
488.
1.S1
_at
AT4G
0892
0CR
Y1 (C
RYPT
OCHR
OME
1); A
TP b
indi
ng
/ blu
e lig
ht p
hoto
rece
ptor
/ pro
tein
ho
mod
imer
izatio
n/ p
rote
in ki
nase
-1.5
21.
21-1
.29
-2.3
7cr
ypto
chro
me
1b [L
ycop
ersi
con
escu
lent
um]
Les.2
115.
2.S1
_at
-1.1
21.
52-1
.11
-2.3
7no
hits
foun
d
LesA
ffx.6
5209
.1.S
1_at
AT1G
6807
0zi
nc fi
nger
(C3H
C4-t
ype
RIN
G fin
ger)
fam
ily p
rote
in-1
.29
-1.2
2-1
.02
-2.3
7pu
tativ
e RI
NG
zinc
fing
er p
rote
in
[Ara
bido
psis
thal
iana
]Le
s.352
2.1.
S1_a
tAT
5G20
280
ATSP
S1F
(suc
rose
pho
spha
te
synt
hase
1F)
; suc
rose
-pho
spha
te
synt
hase
/ tr
ansf
eras
e,tr
ansf
erri
ng
glyc
osyl
gro
ups
-1.3
3-1
.03
-1.4
5-2
.43
sucr
ose
phos
phat
e sy
ntha
se [L
ycop
ersi
con
escu
lent
um]
LesA
ffx.6
7008
.1.S
1_at
AT4G
2035
0un
know
n pr
otei
n-1
.13
1.22
-1.2
0-2
.43
unna
med
pro
tein
pro
duct
[Viti
s vin
ifera
]Le
sAffx
.209
22.1
.S1_
atAT
1G68
080
iron
ion
bind
ing
/ ox
idor
educ
tase
, ac
ting
on p
aire
d do
nors
, with
in
corp
orat
ion
orre
duct
ion
of
mol
ecul
ar o
xyge
n, 2
-oxo
glut
arat
e as
on
e do
nor,
and
inco
rpor
atio
n of
one
at
om e
ach
of o
xyge
n in
to b
oth
dono
rs
-1.4
51.
84-1
.19
-2.4
5ir
on io
n bi
ndin
g /
oxid
ored
ucta
se, a
ctin
g on
pai
red
dono
rs, w
ith in
corp
orat
ion
or re
duct
ion
of m
olec
ular
oxy
gen,
2-
oxog
luta
rate
as o
ne d
onor
, and
in
corp
orat
ion
of o
ne a
tom
eac
h of
oxy
gen
into
bot
h do
nors
[Ara
bido
psis
thal
iana
]Le
s.476
0.1.
S1_a
tAT
2G39
950
unkn
own
prot
ein
-1.2
11.
09-1
.45
-2.4
5un
nam
ed p
rote
in p
rodu
ct [V
itis v
inife
ra]
Les.5
758.
1.S1
_at
AT5G
4425
0un
know
n pr
otei
n-1
.10
1.07
-1.3
6-2
.45
PRED
ICTE
D: h
ypot
hetic
al p
rote
in [V
itis v
inife
ra]
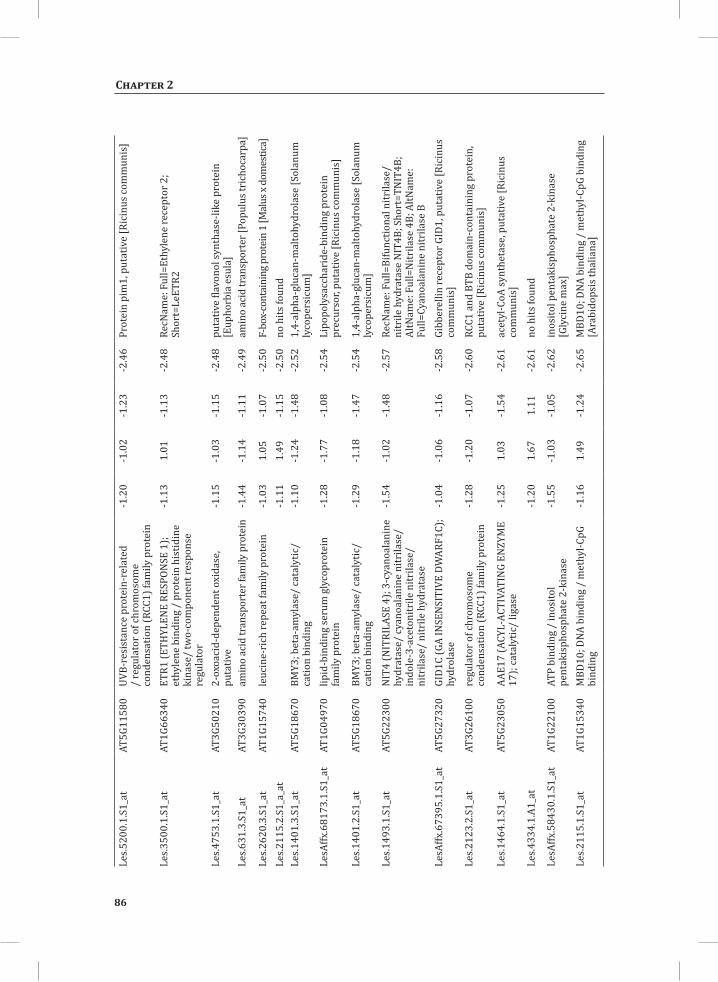
86
Chapter 2
Les.5
200.
1.S1
_at
AT5G
1158
0UV
B-re
sist
ance
pro
tein
-rel
ated
/
regu
lato
r of c
hrom
osom
e co
nden
satio
n (R
CC1)
fam
ily p
rote
in
-1.2
0-1
.02
-1.2
3-2
.46
Prot
ein
pim
1, p
utat
ive
[Ric
inus
com
mun
is]
Les.3
500.
1.S1
_at
AT1G
6634
0ET
R1 (E
THYL
ENE
RESP
ONSE
1);
ethy
lene
bin
ding
/ p
rote
in h
istid
ine
kina
se/
two-
com
pone
nt re
spon
se
regu
lato
r
-1.1
31.
01-1
.13
-2.4
8Re
cNam
e: F
ull=
Ethy
lene
rece
ptor
2;
Shor
t=Le
ETR2
Les.4
753.
1.S1
_at
AT3G
5021
02-
oxoa
cid-
depe
nden
t oxi
dase
, pu
tativ
e-1
.15
-1.0
3-1
.15
-2.4
8pu
tativ
e fla
vono
l syn
thas
e-lik
e pr
otei
n [E
upho
rbia
esu
la]
Les.6
31.3
.S1_
atAT
3G30
390
amin
o ac
id tr
ansp
orte
r fam
ily p
rote
in-1
.44
-1.1
4-1
.11
-2.4
9am
ino
acid
tran
spor
ter [
Popu
lus t
rich
ocar
pa]
Les.2
620.
3.S1
_at
AT1G
1574
0le
ucin
e-ri
ch re
peat
fam
ily p
rote
in-1
.03
1.05
-1.0
7-2
.50
F-bo
x-co
ntai
ning
pro
tein
1 [M
alus
x do
mes
tica]
Les.2
115.
2.S1
_a_a
t-1
.11
1.49
-1.1
5-2
.50
no h
its fo
und
Les.1
401.
3.S1
_at
AT5G
1867
0BM
Y3; b
eta-
amyl
ase/
cata
lytic
/ ca
tion
bind
ing
-1.1
0-1
.24
-1.4
8-2
.52
1,4-
alph
a-gl
ucan
-mal
tohy
drol
ase
[Sol
anum
ly
cope
rsic
um]
LesA
ffx.6
8173
.1.S
1_at
AT1G
0497
0lip
id-b
indi
ng se
rum
gly
copr
otei
n fa
mily
pro
tein
-1.2
8-1
.77
-1.0
8-2
.54
Lipo
poly
sacc
hari
de-b
indi
ng p
rote
in
prec
urso
r, pu
tativ
e [R
icin
us co
mm
unis
]
Les.1
401.
2.S1
_at
AT5G
1867
0BM
Y3; b
eta-
amyl
ase/
cata
lytic
/ ca
tion
bind
ing
-1.2
9-1
.18
-1.4
7-2
.54
1,4-
alph
a-gl
ucan
-mal
tohy
drol
ase
[Sol
anum
ly
cope
rsic
um]
Les.1
493.
1.S1
_at
AT5G
2230
0N
IT4
(NIT
RILA
SE 4
); 3-
cyan
oala
nine
hy
drat
ase/
cyan
oala
nine
nitr
ilase
/ in
dole
-3-a
ceto
nitr
ile n
itrila
se/
nitr
ilase
/ ni
trile
hyd
rata
se
-1.5
4-1
.02
-1.4
8-2
.57
RecN
ame:
Ful
l=Bi
func
tiona
l nitr
ilase
/ni
trile
hyd
rata
se N
IT4B
; Sho
rt=T
NIT
4B;
AltN
ame:
Ful
l=N
itrila
se 4
B; A
ltNam
e:
Full=
Cyan
oala
nine
nitr
ilase
BLe
sAffx
.673
95.1
.S1_
atAT
5G27
320
GID1
C (G
A IN
SEN
SITI
VE D
WAR
F1C)
; hy
drol
ase
-1.0
4-1
.06
-1.1
6-2
.58
Gibb
erel
lin re
cept
or G
ID1,
put
ativ
e [R
icin
us
com
mun
is]
Les.2
123.
2.S1
_at
AT3G
2610
0re
gula
tor o
f chr
omos
ome
cond
ensa
tion
(RCC
1) fa
mily
pro
tein
-1.2
8-1
.20
-1.0
7-2
.60
RCC1
and
BTB
dom
ain-
cont
aini
ng p
rote
in,
puta
tive
[Ric
inus
com
mun
is]
Les.1
464.
1.S1
_at
AT5G
2305
0AA
E17
(ACY
L-AC
TIVA
TIN
G EN
ZYM
E 17
); ca
taly
tic/
ligas
e-1
.25
1.03
-1.5
4-2
.61
acet
yl-C
oA sy
nthe
tase
, put
ativ
e [R
icin
us
com
mun
is]
Les.4
334.
1.A1
_at
-1.2
01.
671.
11-2
.61
no h
its fo
und
LesA
ffx.5
8430
.1.S
1_at
AT1G
2210
0AT
P bi
ndin
g /
inos
itol
pent
akis
phos
phat
e 2-
kina
se-1
.55
-1.0
3-1
.05
-2.6
2in
osito
l pen
taki
spho
spha
te 2
-kin
ase
[Gly
cine
max
]Le
s.211
5.1.
S1_a
tAT
1G15
340
MBD
10; D
NA b
indi
ng /
met
hyl-C
pG
bind
ing
-1.1
61.
49-1
.24
-2.6
5M
BD10
; DNA
bin
ding
/ m
ethy
l-CpG
bin
ding
[A
rabi
dops
is th
alia
na]
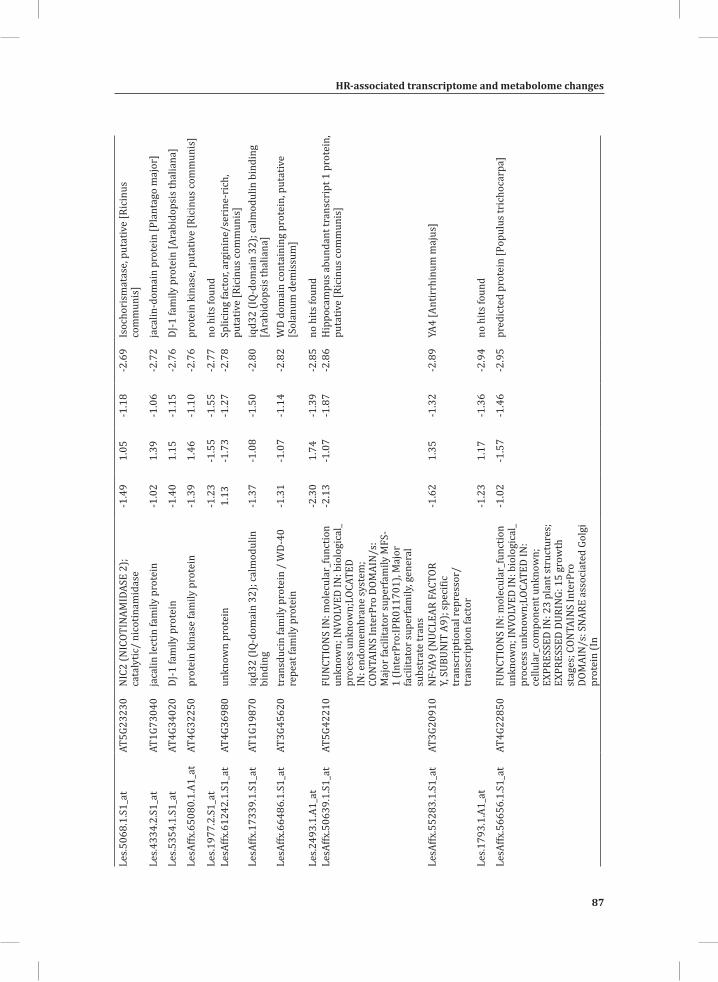
HR-associated transcriptome and metabolome changes
87
Chapter 2
Les.5
068.
1.S1
_at
AT5G
2323
0N
IC2
(NIC
OTIN
AMID
ASE
2);
cata
lytic
/ ni
cotin
amid
ase
-1.4
91.
05-1
.18
-2.6
9Is
ocho
rism
atas
e, p
utat
ive
[Ric
inus
co
mm
unis
]
Les.4
334.
2.S1
_at
AT1G
7304
0ja
calin
lect
in fa
mily
pro
tein
-1.0
21.
39-1
.06
-2.7
2ja
calin
-dom
ain
prot
ein
[Pla
ntag
o m
ajor
]
Les.5
354.
1.S1
_at
AT4G
3402
0DJ
-1 fa
mily
pro
tein
-1.4
01.
15-1
.15
-2.7
6DJ
-1 fa
mily
pro
tein
[Ara
bido
psis
thal
iana
]
LesA
ffx.6
5080
.1.A
1_at
AT4G
3225
0pr
otei
n ki
nase
fam
ily p
rote
in-1
.39
1.46
-1.1
0-2
.76
prot
ein
kina
se, p
utat
ive
[Ric
inus
com
mun
is]
Les.1
977.
2.S1
_at
-1.2
3-1
.55
-1.5
5-2
.77
no h
its fo
und
LesA
ffx.6
1242
.1.S
1_at
AT4G
3698
0un
know
n pr
otei
n1.
13-1
.73
-1.2
7-2
.78
Splic
ing
fact
or, a
rgin
ine/
seri
ne-r
ich,
pu
tativ
e [R
icin
us co
mm
unis
]Le
sAffx
.173
39.1
.S1_
atAT
1G19
870
iqd3
2 (I
Q-do
mai
n 32
); ca
lmod
ulin
bi
ndin
g-1
.37
-1.0
8-1
.50
-2.8
0iq
d32
(IQ-
dom
ain
32);
calm
odul
in b
indi
ng
[Ara
bido
psis
thal
iana
]Le
sAffx
.664
86.1
.S1_
atAT
3G45
620
tran
sduc
in fa
mily
pro
tein
/ W
D-40
re
peat
fam
ily p
rote
in-1
.31
-1.0
7-1
.14
-2.8
2W
D do
mai
n co
ntai
ning
pro
tein
, put
ativ
e [S
olan
um d
emis
sum
]
Les.2
493.
1.A1
_at
-2.3
01.
74-1
.39
-2.8
5no
hits
foun
dLe
sAffx
.506
39.1
.S1_
atAT
5G42
210
FUN
CTIO
NS
IN: m
olec
ular
_fun
ctio
n un
know
n; IN
VOLV
ED IN
: bio
logi
cal_
proc
ess u
nkno
wn;
LOCA
TED
IN: e
ndom
embr
ane
syst
em;
CON
TAIN
S In
terP
ro D
OMAI
N/s
: M
ajor
faci
litat
or su
perf
amily
MFS
-1
(Int
erPr
o:IP
R011
701)
, Maj
or
faci
litat
or su
perf
amily
, gen
eral
su
bstr
ate
tran
s
-2.1
3-1
.07
-1.8
7-2
.86
Hip
poca
mpu
s abu
ndan
t tra
nscr
ipt 1
pro
tein
, pu
tativ
e [R
icin
us co
mm
unis
]
LesA
ffx.5
5283
.1.S
1_at
AT3G
2091
0N
F-YA
9 (N
UCLE
AR F
ACTO
R Y,
SUB
UNIT
A9)
; spe
cific
tr
ansc
ript
iona
l rep
ress
or/
tran
scri
ptio
n fa
ctor
-1.6
21.
35-1
.32
-2.8
9YA
4 [A
ntir
rhin
um m
ajus
]
Les.1
793.
1.A1
_at
-1.2
31.
17-1
.36
-2.9
4no
hits
foun
d
LesA
ffx.5
6656
.1.S
1_at
AT4G
2285
0FU
NCT
ION
S IN
: mol
ecul
ar_f
unct
ion
unkn
own;
INVO
LVED
IN: b
iolo
gica
l_pr
oces
s unk
now
n;LO
CATE
D IN
: ce
llula
r_co
mpo
nent
unk
now
n;
EXPR
ESSE
D IN
: 23
plan
t str
uctu
res;
EX
PRES
SED
DURI
NG:
15
grow
th
stag
es; C
ONTA
INS
Inte
rPro
DO
MAI
N/s
: SNA
RE a
ssoc
iate
d Go
lgi
prot
ein
(In
-1.0
2-1
.57
-1.4
6-2
.95
pred
icte
d pr
otei
n [P
opul
us tr
icho
carp
a]
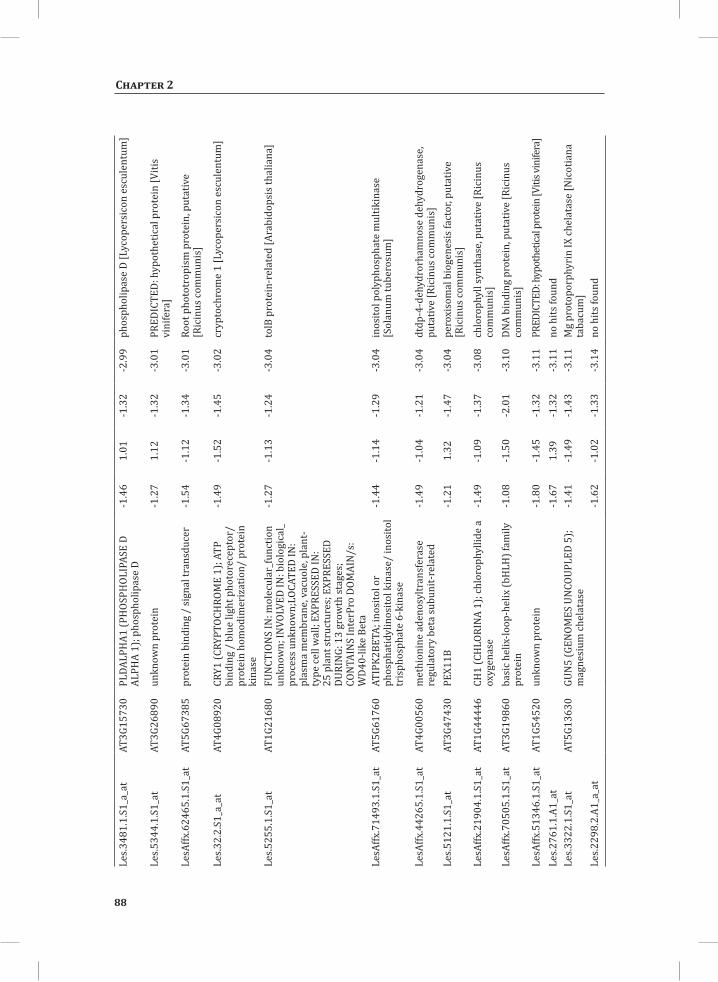
88
Chapter 2
Les.3
481.
1.S1
_a_a
tAT
3G15
730
PLDA
LPH
A1 (P
HOS
PHOL
IPAS
E D
ALPH
A 1)
; pho
spho
lipas
e D
-1.4
61.
01-1
.32
-2.9
9ph
osph
olip
ase
D [L
ycop
ersi
con
escu
lent
um]
Les.5
344.
1.S1
_at
AT3G
2689
0un
know
n pr
otei
n-1
.27
1.12
-1.3
2-3
.01
PRED
ICTE
D: h
ypot
hetic
al p
rote
in [V
itis
vini
fera
]
LesA
ffx.6
2465
.1.S
1_at
AT5G
6738
5pr
otei
n bi
ndin
g /
sign
al tr
ansd
ucer
-1.5
4-1
.12
-1.3
4-3
.01
Root
pho
totr
opis
m p
rote
in, p
utat
ive
[Ric
inus
com
mun
is]
Les.3
2.2.
S1_a
_at
AT4G
0892
0CR
Y1 (C
RYPT
OCH
ROM
E 1)
; ATP
bi
ndin
g /
blue
ligh
t pho
tore
cept
or/
prot
ein
hom
odim
eriz
atio
n/ p
rote
in
kina
se
-1.4
9-1
.52
-1.4
5-3
.02
cryp
toch
rom
e 1
[Lyc
oper
sico
n es
cule
ntum
]
Les.5
255.
1.S1
_at
AT1G
2168
0FU
NCT
ION
S IN
: mol
ecul
ar_f
unct
ion
unkn
own;
INVO
LVED
IN: b
iolo
gica
l_pr
oces
s unk
now
n;LO
CATE
D IN
: pl
asm
a m
embr
ane,
vac
uole
, pla
nt-
type
cell
wal
l; EX
PRES
SED
IN:
25 p
lant
stru
ctur
es; E
XPRE
SSED
DU
RIN
G: 1
3 gr
owth
stag
es;
CON
TAIN
S In
terP
ro D
OMAI
N/s
: W
D40-
like
Beta
-1.2
7-1
.13
-1.2
4-3
.04
tolB
pro
tein
-rel
ated
[Ara
bido
psis
thal
iana
]
LesA
ffx.7
1493
.1.S
1_at
AT5G
6176
0AT
IPK2
BETA
; ino
sito
l or
phos
phat
idyl
inos
itol k
inas
e/ in
osito
l tr
isph
osph
ate
6-ki
nase
-1.4
4-1
.14
-1.2
9-3
.04
inos
itol p
olyp
hosp
hate
mul
tikin
ase
[Sol
anum
tube
rosu
m]
LesA
ffx.4
4265
.1.S
1_at
AT4G
0056
0m
ethi
onin
e ad
enos
yltr
ansf
eras
e re
gula
tory
bet
a su
buni
t-re
late
d-1
.49
-1.0
4-1
.21
-3.0
4dt
dp-4
-deh
ydro
rham
nose
deh
ydro
gena
se,
puta
tive
[Ric
inus
com
mun
is]
Les.5
121.
1.S1
_at
AT3G
4743
0PE
X11B
-1.2
11.
32-1
.47
-3.0
4pe
roxi
som
al b
ioge
nesi
s fac
tor,
puta
tive
[Ric
inus
com
mun
is]
LesA
ffx.2
1904
.1.S
1_at
AT1G
4444
6CH
1 (C
HLO
RINA
1);
chlo
roph
yllid
e a
oxyg
enas
e-1
.49
-1.0
9-1
.37
-3.0
8ch
loro
phyl
l syn
thas
e, p
utat
ive
[Ric
inus
co
mm
unis
]Le
sAffx
.705
05.1
.S1_
atAT
3G19
860
basi
c hel
ix-lo
op-h
elix
(bH
LH) f
amily
pr
otei
n-1
.08
-1.5
0-2
.01
-3.1
0DN
A bi
ndin
g pr
otei
n, p
utat
ive
[Ric
inus
co
mm
unis
]
LesA
ffx.5
1346
.1.S
1_at
AT1G
5452
0un
know
n pr
otei
n-1
.80
-1.4
5-1
.32
-3.1
1PR
EDIC
TED:
hyp
othe
tical
pro
tein
[Viti
s vin
ifera
]Le
s.276
1.1.
A1_a
t-1
.67
1.39
-1.3
2-3
.11
no h
its fo
und
Les.3
322.
1.S1
_at
AT5G
1363
0GU
N5
(GEN
OMES
UN
COUP
LED
5);
mag
nesi
um ch
elat
ase
-1.4
1-1
.49
-1.4
3-3
.11
Mg
prot
opor
phyr
in IX
chel
atas
e [N
icot
iana
ta
bacu
m]
Les.2
298.
2.A1
_a_a
t-1
.62
-1.0
2-1
.33
-3.1
4no
hits
foun
d
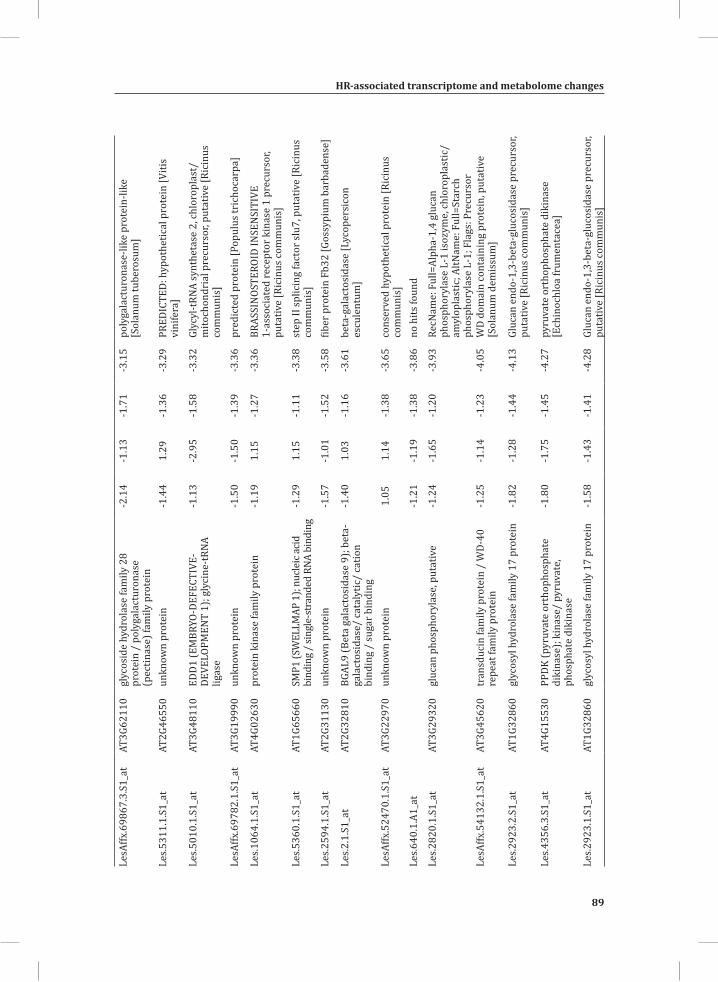
HR-associated transcriptome and metabolome changes
89
Chapter 2
LesA
ffx.6
9867
.3.S
1_at
AT3G
6211
0gl
ycos
ide
hydr
olas
e fa
mily
28
prot
ein
/ po
lyga
lact
uron
ase
(pec
tinas
e) fa
mily
pro
tein
-2.1
4-1
.13
-1.7
1-3
.15
poly
gala
ctur
onas
e-lik
e pr
otei
n-lik
e [S
olan
um tu
bero
sum
]
Les.5
311.
1.S1
_at
AT2G
4655
0un
know
n pr
otei
n-1
.44
1.29
-1.3
6-3
.29
PRED
ICTE
D: h
ypot
hetic
al p
rote
in [V
itis
vini
fera
]
Les.5
010.
1.S1
_at
AT3G
4811
0ED
D1 (E
MBR
YO-D
EFEC
TIVE
-DE
VELO
PMEN
T 1)
; gly
cine
-tRN
A lig
ase
-1.1
3-2
.95
-1.5
8-3
.32
Glyc
yl-t
RNA
synt
heta
se 2
, chl
orop
last
/m
itoch
ondr
ial p
recu
rsor
, put
ativ
e [R
icin
us
com
mun
is]
LesA
ffx.6
9782
.1.S
1_at
AT3G
1999
0un
know
n pr
otei
n-1
.50
-1.5
0-1
.39
-3.3
6pr
edic
ted
prot
ein
[Pop
ulus
tric
hoca
rpa]
Les.1
064.
1.S1
_at
AT4G
0263
0pr
otei
n ki
nase
fam
ily p
rote
in-1
.19
1.15
-1.2
7-3
.36
BRAS
SIN
OSTE
ROID
INSE
NSI
TIVE
1-
asso
ciat
ed re
cept
or k
inas
e 1
prec
urso
r, pu
tativ
e [R
icin
us co
mm
unis
]
Les.5
360.
1.S1
_at
AT1G
6566
0SM
P1 (S
WEL
LMAP
1);
nucl
eic a
cid
bind
ing
/ si
ngle
-str
ande
d RN
A bi
ndin
g-1
.29
1.15
-1.1
1-3
.38
step
II sp
licin
g fa
ctor
slu7
, put
ativ
e [R
icin
us
com
mun
is]
Les.2
594.
1.S1
_at
AT2G
3113
0un
know
n pr
otei
n-1
.57
-1.0
1-1
.52
-3.5
8fib
er p
rote
in F
b32
[Gos
sypi
um b
arba
dens
e]
Les.2
.1.S
1_at
AT2G
3281
0BG
AL9
(Bet
a ga
lact
osid
ase
9); b
eta-
gala
ctos
idas
e/ ca
taly
tic/
catio
n bi
ndin
g /
suga
r bin
ding
-1.4
01.
03-1
.16
-3.6
1be
ta-g
alac
tosi
dase
[Lyc
oper
sico
n es
cule
ntum
]
LesA
ffx.5
2470
.1.S
1_at
AT3G
2297
0un
know
n pr
otei
n1.
051.
14-1
.38
-3.6
5co
nser
ved
hypo
thet
ical
pro
tein
[Ric
inus
co
mm
unis
]Le
s.640
.1.A
1_at
-1.2
1-1
.19
-1.3
8-3
.86
no h
its fo
und
Les.2
820.
1.S1
_at
AT3G
2932
0gl
ucan
pho
spho
ryla
se, p
utat
ive
-1.2
4-1
.65
-1.2
0-3
.93
RecN
ame:
Ful
l=Al
pha-
1,4
gluc
an
phos
phor
ylas
e L-
1 is
ozym
e, ch
loro
plas
tic/
amyl
opla
stic
; AltN
ame:
Ful
l=St
arch
ph
osph
oryl
ase
L-1;
Fla
gs: P
recu
rsor
LesA
ffx.5
4132
.1.S
1_at
AT3G
4562
0tr
ansd
ucin
fam
ily p
rote
in /
WD-
40
repe
at fa
mily
pro
tein
-1.2
5-1
.14
-1.2
3-4
.05
WD
dom
ain
cont
aini
ng p
rote
in, p
utat
ive
[Sol
anum
dem
issu
m]
Les.2
923.
2.S1
_at
AT1G
3286
0gl
ycos
yl h
ydro
lase
fam
ily 1
7 pr
otei
n-1
.82
-1.2
8-1
.44
-4.1
3Gl
ucan
end
o-1,
3-be
ta-g
luco
sida
se p
recu
rsor
, pu
tativ
e [R
icin
us co
mm
unis
]
Les.4
356.
3.S1
_at
AT4G
1553
0PP
DK (p
yruv
ate
orth
opho
spha
te
diki
nase
); ki
nase
/ py
ruva
te,
phos
phat
e di
kina
se
-1.8
0-1
.75
-1.4
5-4
.27
pyru
vate
ort
hoph
osph
ate
diki
nase
[E
chin
ochl
oa fr
umen
tace
a]
Les.2
923.
1.S1
_at
AT1G
3286
0gl
ycos
yl h
ydro
lase
fam
ily 1
7 pr
otei
n-1
.58
-1.4
3-1
.41
-4.2
8Gl
ucan
end
o-1,
3-be
ta-g
luco
sida
se p
recu
rsor
, pu
tativ
e [R
icin
us co
mm
unis
]
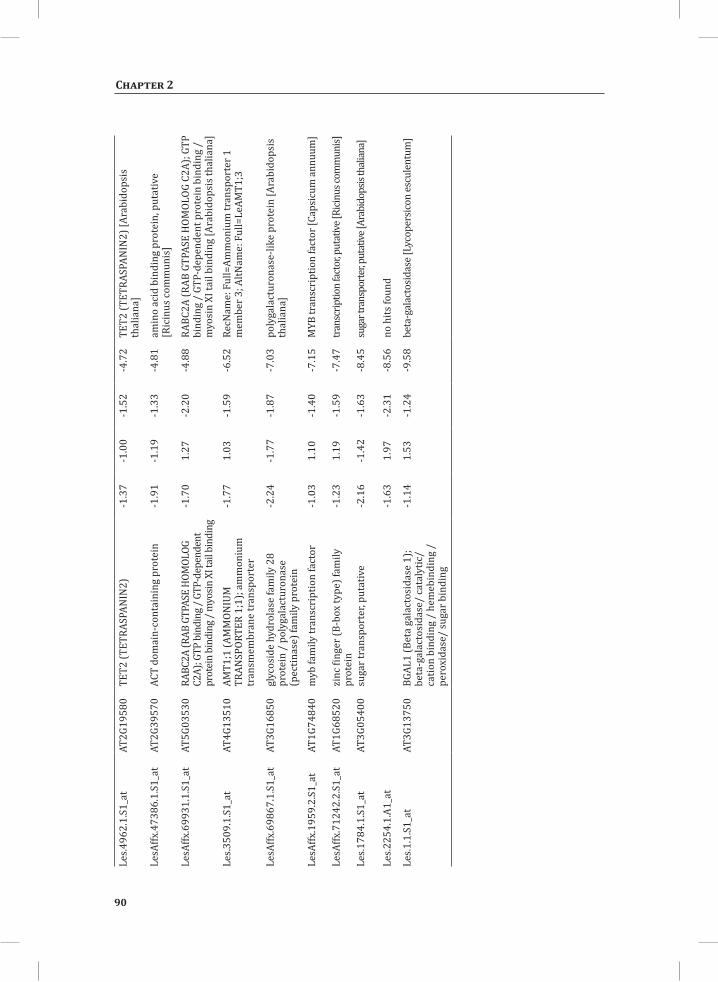
90
Chapter 2
Les.4
962.
1.S1
_at
AT2G
1958
0TE
T2 (T
ETRA
SPAN
IN2)
-1.3
7-1
.00
-1.5
2-4
.72
TET2
(TET
RASP
ANIN
2) [A
rabi
dops
is
thal
iana
]
LesA
ffx.4
7386
.1.S
1_at
AT2G
3957
0AC
T do
mai
n-co
ntai
ning
pro
tein
-1.9
1-1
.19
-1.3
3-4
.81
amin
o ac
id b
indi
ng p
rote
in, p
utat
ive
[Ric
inus
com
mun
is]
LesA
ffx.6
9931
.1.S
1_at
AT5G
0353
0RA
BC2A
(RAB
GTP
ASE
HOM
OLOG
C2
A); G
TP b
indi
ng /
GTP-
depe
nden
t pr
otei
n bi
ndin
g / m
yosin
XI t
ail b
indi
ng
-1.7
01.
27-2
.20
-4.8
8RA
BC2A
(RAB
GTP
ASE
HOM
OLOG
C2A
); GT
P bi
ndin
g /
GTP-
depe
nden
t pro
tein
bin
ding
/
myo
sin
XI ta
il bi
ndin
g [A
rabi
dops
is th
alia
na]
Les.3
509.
1.S1
_at
AT4G
1351
0AM
T1;1
(AM
MON
IUM
TR
ANSP
ORTE
R 1;
1); a
mm
oniu
m
tran
smem
bran
e tr
ansp
orte
r
-1.7
71.
03-1
.59
-6.5
2Re
cNam
e: F
ull=
Amm
oniu
m tr
ansp
orte
r 1
mem
ber 3
; AltN
ame:
Ful
l=Le
AMT1
;3
LesA
ffx.6
9867
.1.S
1_at
AT3G
1685
0gl
ycos
ide
hydr
olas
e fa
mily
28
prot
ein
/ po
lyga
lact
uron
ase
(pec
tinas
e) fa
mily
pro
tein
-2.2
4-1
.77
-1.8
7-7
.03
poly
gala
ctur
onas
e-lik
e pr
otei
n [A
rabi
dops
is
thal
iana
]
LesA
ffx.1
959.
2.S1
_at
AT1G
7484
0m
yb fa
mily
tran
scri
ptio
n fa
ctor
-1.0
31.
10-1
.40
-7.1
5M
YB tr
ansc
ript
ion
fact
or [C
apsi
cum
ann
uum
]
LesA
ffx.7
1242
.2.S
1_at
AT1G
6852
0zi
nc fi
nger
(B-b
ox ty
pe) f
amily
pr
otei
n-1
.23
1.19
-1.5
9-7
.47
trans
crip
tion
fact
or, p
utat
ive [R
icinu
s com
mun
is]
Les.1
784.
1.S1
_at
AT3G
0540
0su
gar t
rans
port
er, p
utat
ive
-2.1
6-1
.42
-1.6
3-8
.45
suga
r tra
nspo
rter, p
utat
ive [A
rabi
dops
is th
alian
a]
Les.2
254.
1.A1
_at
-1.6
31.
97-2
.31
-8.5
6no
hits
foun
d
Les.1
.1.S
1_at
AT3G
1375
0BG
AL1
(Bet
a ga
lact
osid
ase
1);
beta
-gal
acto
sida
se/
cata
lytic
/ ca
tion
bind
ing
/ he
meb
indi
ng /
pe
roxi
dase
/ su
gar b
indi
ng
-1.1
41.
53-1
.24
-9.5
8be
ta-g
alac
tosi
dase
[Lyc
oper
sico
n es
cule
ntum
]
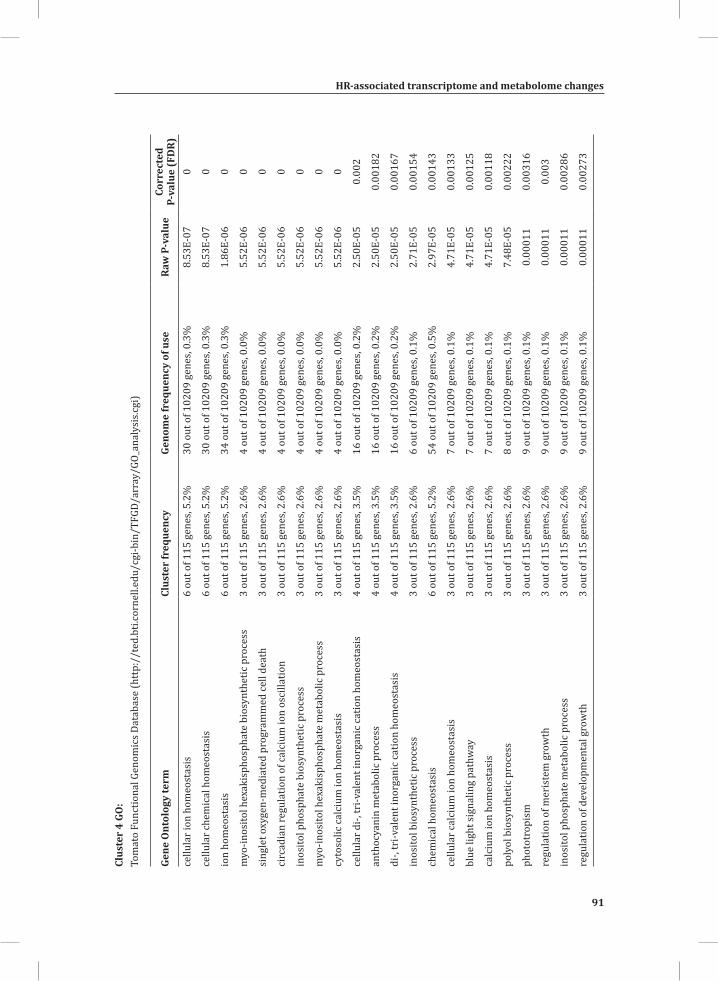
HR-associated transcriptome and metabolome changes
91
Chapter 2
Clus
ter
4 GO
:To
mat
o Fu
nctio
nal G
enom
ics D
atab
ase
(htt
p://
ted.
bti.c
orne
ll.ed
u/cg
i-bin
/TFG
D/ar
ray/
GO_a
naly
sis.c
gi)
Gene
Ont
olog
y te
rmCl
uste
r fr
eque
ncy
Geno
me
freq
uenc
y of
use
Raw
P-v
alue
Corr
ecte
d P-
valu
e (F
DR)
cellu
lar i
on h
omeo
stas
is6
out o
f 115
gen
es, 5
.2%
30 o
ut o
f 102
09 g
enes
, 0.3
%8.
53E-
070
cellu
lar c
hem
ical
hom
eost
asis
6 ou
t of 1
15 g
enes
, 5.2
%30
out
of 1
0209
gen
es, 0
.3%
8.53
E-07
0
ion
hom
eost
asis
6 ou
t of 1
15 g
enes
, 5.2
%34
out
of 1
0209
gen
es, 0
.3%
1.86
E-06
0
myo
-inos
itol h
exak
isph
osph
ate
bios
ynth
etic
pro
cess
3 ou
t of 1
15 g
enes
, 2.6
%4
out o
f 102
09 g
enes
, 0.0
%5.
52E-
060
sing
let o
xyge
n-m
edia
ted
prog
ram
med
cell
deat
h3
out o
f 115
gen
es, 2
.6%
4 ou
t of 1
0209
gen
es, 0
.0%
5.52
E-06
0
circ
adia
n re
gula
tion
of ca
lciu
m io
n os
cilla
tion
3 ou
t of 1
15 g
enes
, 2.6
%4
out o
f 102
09 g
enes
, 0.0
%5.
52E-
060
inos
itol p
hosp
hate
bio
synt
hetic
pro
cess
3 ou
t of 1
15 g
enes
, 2.6
%4
out o
f 102
09 g
enes
, 0.0
%5.
52E-
060
myo
-inos
itol h
exak
isph
osph
ate
met
abol
ic p
roce
ss3
out o
f 115
gen
es, 2
.6%
4 ou
t of 1
0209
gen
es, 0
.0%
5.52
E-06
0
cyto
solic
calc
ium
ion
hom
eost
asis
3 ou
t of 1
15 g
enes
, 2.6
%4
out o
f 102
09 g
enes
, 0.0
%5.
52E-
060
cellu
lar d
i-, tr
i-val
ent i
norg
anic
catio
n ho
meo
stas
is4
out o
f 115
gen
es, 3
.5%
16 o
ut o
f 102
09 g
enes
, 0.2
%2.
50E-
050.
002
anth
ocya
nin
met
abol
ic p
roce
ss4
out o
f 115
gen
es, 3
.5%
16 o
ut o
f 102
09 g
enes
, 0.2
%2.
50E-
050.
0018
2
di-,
tri-v
alen
t ino
rgan
ic ca
tion
hom
eost
asis
4 ou
t of 1
15 g
enes
, 3.5
%16
out
of 1
0209
gen
es, 0
.2%
2.50
E-05
0.00
167
inos
itol b
iosy
nthe
tic p
roce
ss3
out o
f 115
gen
es, 2
.6%
6 ou
t of 1
0209
gen
es, 0
.1%
2.71
E-05
0.00
154
chem
ical
hom
eost
asis
6 ou
t of 1
15 g
enes
, 5.2
%54
out
of 1
0209
gen
es, 0
.5%
2.97
E-05
0.00
143
cellu
lar c
alci
um io
n ho
meo
stas
is3
out o
f 115
gen
es, 2
.6%
7 ou
t of 1
0209
gen
es, 0
.1%
4.71
E-05
0.00
133
blue
ligh
t sig
nalin
g pa
thw
ay3
out o
f 115
gen
es, 2
.6%
7 ou
t of 1
0209
gen
es, 0
.1%
4.71
E-05
0.00
125
calc
ium
ion
hom
eost
asis
3 ou
t of 1
15 g
enes
, 2.6
%7
out o
f 102
09 g
enes
, 0.1
%4.
71E-
050.
0011
8
poly
ol b
iosy
nthe
tic p
roce
ss3
out o
f 115
gen
es, 2
.6%
8 ou
t of 1
0209
gen
es, 0
.1%
7.48
E-05
0.00
222
phot
otro
pism
3 ou
t of 1
15 g
enes
, 2.6
%9
out o
f 102
09 g
enes
, 0.1
%0.
0001
10.
0031
6
regu
latio
n of
mer
iste
m g
row
th3
out o
f 115
gen
es, 2
.6%
9 ou
t of 1
0209
gen
es, 0
.1%
0.00
011
0.00
3
inos
itol p
hosp
hate
met
abol
ic p
roce
ss3
out o
f 115
gen
es, 2
.6%
9 ou
t of 1
0209
gen
es, 0
.1%
0.00
011
0.00
286
regu
latio
n of
dev
elop
men
tal g
row
th3
out o
f 115
gen
es, 2
.6%
9 ou
t of 1
0209
gen
es, 0
.1%
0.00
011
0.00
273
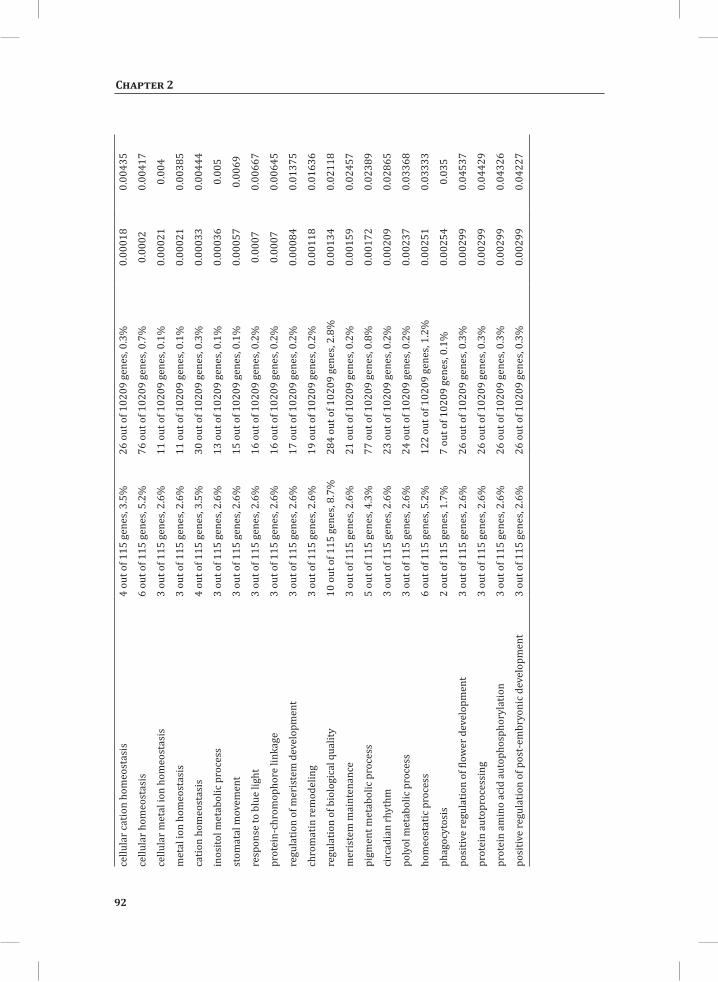
92
Chapter 2
cellu
lar c
atio
n ho
meo
stas
is4
out o
f 115
gen
es, 3
.5%
26 o
ut o
f 102
09 g
enes
, 0.3
%0.
0001
80.
0043
5
cellu
lar h
omeo
stas
is6
out o
f 115
gen
es, 5
.2%
76 o
ut o
f 102
09 g
enes
, 0.7
%0.
0002
0.00
417
cellu
lar m
etal
ion
hom
eost
asis
3 ou
t of 1
15 g
enes
, 2.6
%11
out
of 1
0209
gen
es, 0
.1%
0.00
021
0.00
4
met
al io
n ho
meo
stas
is3
out o
f 115
gen
es, 2
.6%
11 o
ut o
f 102
09 g
enes
, 0.1
%0.
0002
10.
0038
5
catio
n ho
meo
stas
is4
out o
f 115
gen
es, 3
.5%
30 o
ut o
f 102
09 g
enes
, 0.3
%0.
0003
30.
0044
4
inos
itol m
etab
olic
pro
cess
3 ou
t of 1
15 g
enes
, 2.6
%13
out
of 1
0209
gen
es, 0
.1%
0.00
036
0.00
5
stom
atal
mov
emen
t3
out o
f 115
gen
es, 2
.6%
15 o
ut o
f 102
09 g
enes
, 0.1
%0.
0005
70.
0069
resp
onse
to b
lue
light
3 ou
t of 1
15 g
enes
, 2.6
%16
out
of 1
0209
gen
es, 0
.2%
0.00
070.
0066
7
prot
ein-
chro
mop
hore
link
age
3 ou
t of 1
15 g
enes
, 2.6
%16
out
of 1
0209
gen
es, 0
.2%
0.00
070.
0064
5
regu
latio
n of
mer
iste
m d
evel
opm
ent
3 ou
t of 1
15 g
enes
, 2.6
%17
out
of 1
0209
gen
es, 0
.2%
0.00
084
0.01
375
chro
mat
in re
mod
elin
g3
out o
f 115
gen
es, 2
.6%
19 o
ut o
f 102
09 g
enes
, 0.2
%0.
0011
80.
0163
6
regu
latio
n of
bio
logi
cal q
ualit
y10
out
of 1
15 g
enes
, 8.7
%28
4 ou
t of 1
0209
gen
es, 2
.8%
0.00
134
0.02
118
mer
iste
m m
aint
enan
ce3
out o
f 115
gen
es, 2
.6%
21 o
ut o
f 102
09 g
enes
, 0.2
%0.
0015
90.
0245
7
pigm
ent m
etab
olic
pro
cess
5 ou
t of 1
15 g
enes
, 4.3
%77
out
of 1
0209
gen
es, 0
.8%
0.00
172
0.02
389
circ
adia
n rh
ythm
3 ou
t of 1
15 g
enes
, 2.6
%23
out
of 1
0209
gen
es, 0
.2%
0.00
209
0.02
865
poly
ol m
etab
olic
pro
cess
3 ou
t of 1
15 g
enes
, 2.6
%24
out
of 1
0209
gen
es, 0
.2%
0.00
237
0.03
368
hom
eost
atic
pro
cess
6 ou
t of 1
15 g
enes
, 5.2
%12
2 ou
t of 1
0209
gen
es, 1
.2%
0.00
251
0.03
333
phag
ocyt
osis
2 ou
t of 1
15 g
enes
, 1.7
%7
out o
f 102
09 g
enes
, 0.1
%0.
0025
40.
035
posi
tive
regu
latio
n of
flow
er d
evel
opm
ent
3 ou
t of 1
15 g
enes
, 2.6
%26
out
of 1
0209
gen
es, 0
.3%
0.00
299
0.04
537
prot
ein
auto
proc
essi
ng3
out o
f 115
gen
es, 2
.6%
26 o
ut o
f 102
09 g
enes
, 0.3
%0.
0029
90.
0442
9
prot
ein
amin
o ac
id a
utop
hosp
hory
latio
n3
out o
f 115
gen
es, 2
.6%
26 o
ut o
f 102
09 g
enes
, 0.3
%0.
0029
90.
0432
6
posi
tive
regu
latio
n of
pos
t-em
bryo
nic d
evel
opm
ent
3 ou
t of 1
15 g
enes
, 2.6
%26
out
of 1
0209
gen
es, 0
.3%
0.00
299
0.04
227
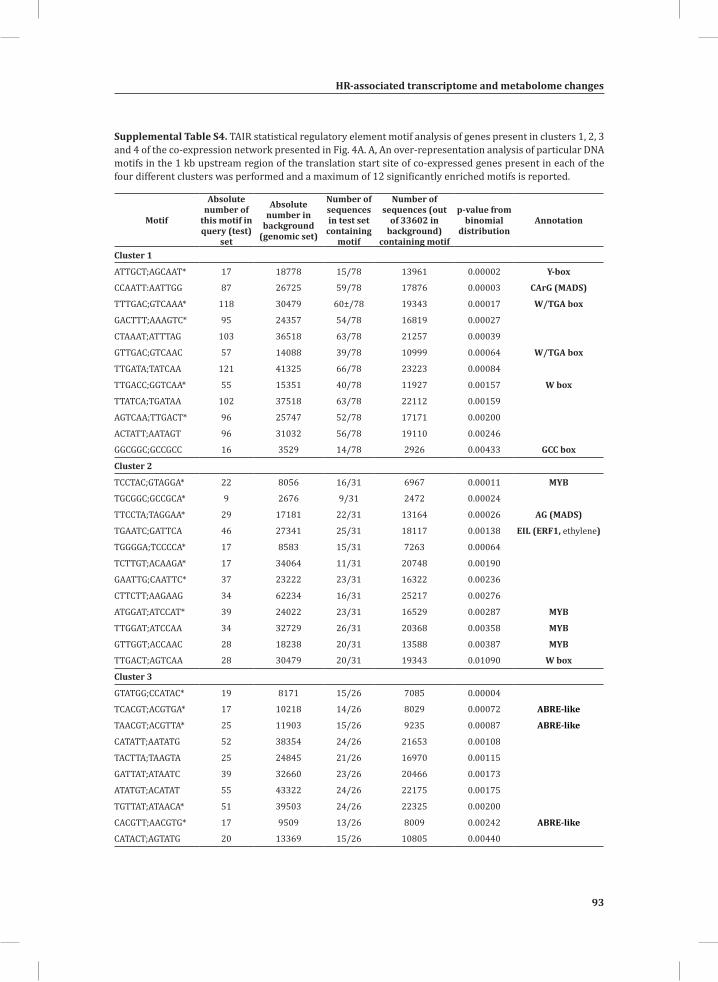
HR-associated transcriptome and metabolome changes
93
Chapter 2
Supplemental Table S4. TAIR statistical regulatory element motif analysis of genes present in clusters 1, 2, 3 and 4 of the co-expression network presented in Fig. 4A. A, An over-representation analysis of particular DNA motifs in the 1 kb upstream region of the translation start site of co-expressed genes present in each of the four different clusters was performed and a maximum of 12 significantly enriched motifs is reported.
Motif
Absolute number of
this motif in query (test)
set
Absolute number in
background (genomic set)
Number of sequences in test set
containing motif
Number of sequences (out
of 33602 in background)
containing motif
p-value from binomial
distributionAnnotation
Cluster 1
ATTGCT;AGCAAT* 17 18778 15/78 13961 0.00002 Y-box
CCAATT:AATTGG 87 26725 59/78 17876 0.00003 CArG (MADS)
TTTGAC;GTCAAA* 118 30479 60±/78 19343 0.00017 W/TGA box
GACTTT;AAAGTC* 95 24357 54/78 16819 0.00027
CTAAAT;ATTTAG 103 36518 63/78 21257 0.00039
GTTGAC;GTCAAC 57 14088 39/78 10999 0.00064 W/TGA box
TTGATA;TATCAA 121 41325 66/78 23223 0.00084
TTGACC;GGTCAA* 55 15351 40/78 11927 0.00157 W box
TTATCA;TGATAA 102 37518 63/78 22112 0.00159
AGTCAA;TTGACT* 96 25747 52/78 17171 0.00200
ACTATT;AATAGT 96 31032 56/78 19110 0.00246
GGCGGC;GCCGCC 16 3529 14/78 2926 0.00433 GCC box
Cluster 2
TCCTAC;GTAGGA* 22 8056 16/31 6967 0.00011 MYB
TGCGGC;GCCGCA* 9 2676 9/31 2472 0.00024
TTCCTA;TAGGAA* 29 17181 22/31 13164 0.00026 AG (MADS)
TGAATC;GATTCA 46 27341 25/31 18117 0.00138 EIL (ERF1, ethylene)
TGGGGA;TCCCCA* 17 8583 15/31 7263 0.00064
TCTTGT;ACAAGA* 17 34064 11/31 20748 0.00190
GAATTG;CAATTC* 37 23222 23/31 16322 0.00236
CTTCTT;AAGAAG 34 62234 16/31 25217 0.00276
ATGGAT;ATCCAT* 39 24022 23/31 16529 0.00287 MYB
TTGGAT;ATCCAA 34 32729 26/31 20368 0.00358 MYB
GTTGGT;ACCAAC 28 18238 20/31 13588 0.00387 MYB
TTGACT;AGTCAA 28 30479 20/31 19343 0.01090 W box
Cluster 3
GTATGG;CCATAC* 19 8171 15/26 7085 0.00004
TCACGT;ACGTGA* 17 10218 14/26 8029 0.00072 ABRE-like
TAACGT;ACGTTA* 25 11903 15/26 9235 0.00087 ABRE-like
CATATT;AATATG 52 38354 24/26 21653 0.00108
TACTTA;TAAGTA 25 24845 21/26 16970 0.00115
GATTAT;ATAATC 39 32660 23/26 20466 0.00173
ATATGT;ACATAT 55 43322 24/26 22175 0.00175
TGTTAT;ATAACA* 51 39503 24/26 22325 0.00200
CACGTT;AACGTG* 17 9509 13/26 8009 0.00242 ABRE-like
CATACT;AGTATG 20 13369 15/26 10805 0.00440
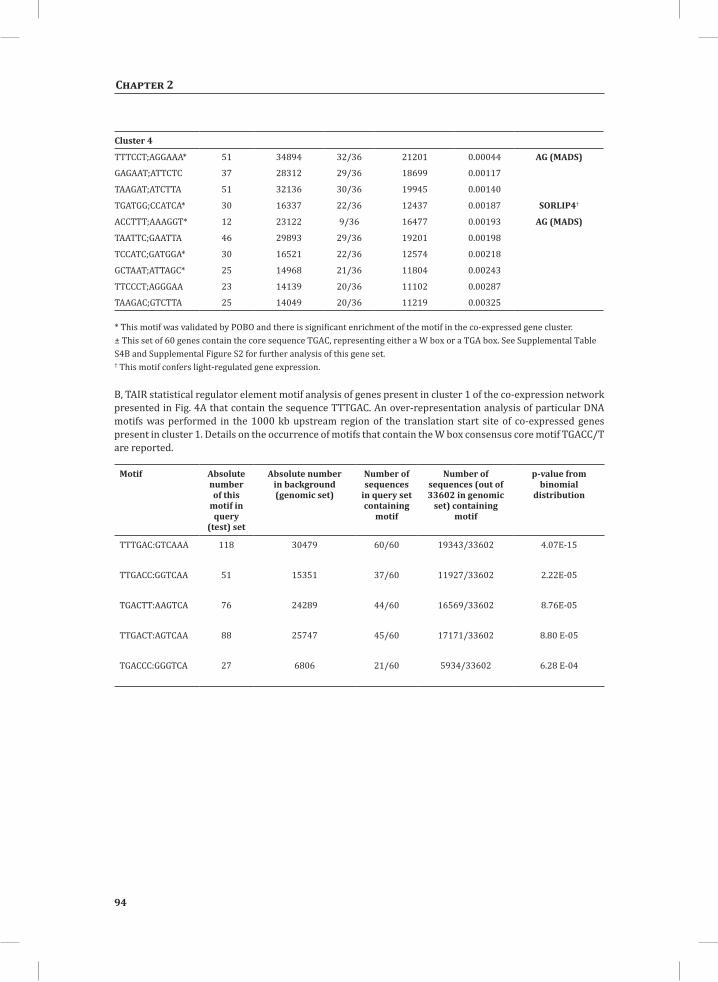
94
Chapter 2
Cluster 4
TTTCCT;AGGAAA* 51 34894 32/36 21201 0.00044 AG (MADS)
GAGAAT;ATTCTC 37 28312 29/36 18699 0.00117
TAAGAT;ATCTTA 51 32136 30/36 19945 0.00140
TGATGG;CCATCA* 30 16337 22/36 12437 0.00187 SORLIP4†
ACCTTT;AAAGGT* 12 23122 9/36 16477 0.00193 AG (MADS)
TAATTC;GAATTA 46 29893 29/36 19201 0.00198
TCCATC;GATGGA* 30 16521 22/36 12574 0.00218
GCTAAT;ATTAGC* 25 14968 21/36 11804 0.00243
TTCCCT;AGGGAA 23 14139 20/36 11102 0.00287
TAAGAC;GTCTTA 25 14049 20/36 11219 0.00325
* This motif was validated by POBO and there is significant enrichment of the motif in the co-expressed gene cluster.± This set of 60 genes contain the core sequence TGAC, representing either a W box or a TGA box. See Supplemental Table S4B and Supplemental Figure S2 for further analysis of this gene set.† This motif confers light-regulated gene expression.
B, TAIR statistical regulator element motif analysis of genes present in cluster 1 of the co-expression network presented in Fig. 4A that contain the sequence TTTGAC. An over-representation analysis of particular DNA motifs was performed in the 1000 kb upstream region of the translation start site of co-expressed genes present in cluster 1. Details on the occurrence of motifs that contain the W box consensus core motif TGACC/T are reported.
Motif Absolute number of this
motif in query
(test) set
Absolute number in background (genomic set)
Number of sequences
in query set containing
motif
Number of sequences (out of 33602 in genomic
set) containing motif
p-value from binomial
distribution
TTTGAC:GTCAAA 118 30479 60/60 19343/33602 4.07E-15
TTGACC:GGTCAA 51 15351 37/60 11927/33602 2.22E-05
TGACTT:AAGTCA 76 24289 44/60 16569/33602 8.76E-05
TTGACT:AGTCAA 88 25747 45/60 17171/33602 8.80 E-05
TGACCC:GGGTCA 27 6806 21/60 5934/33602 6.28 E-04
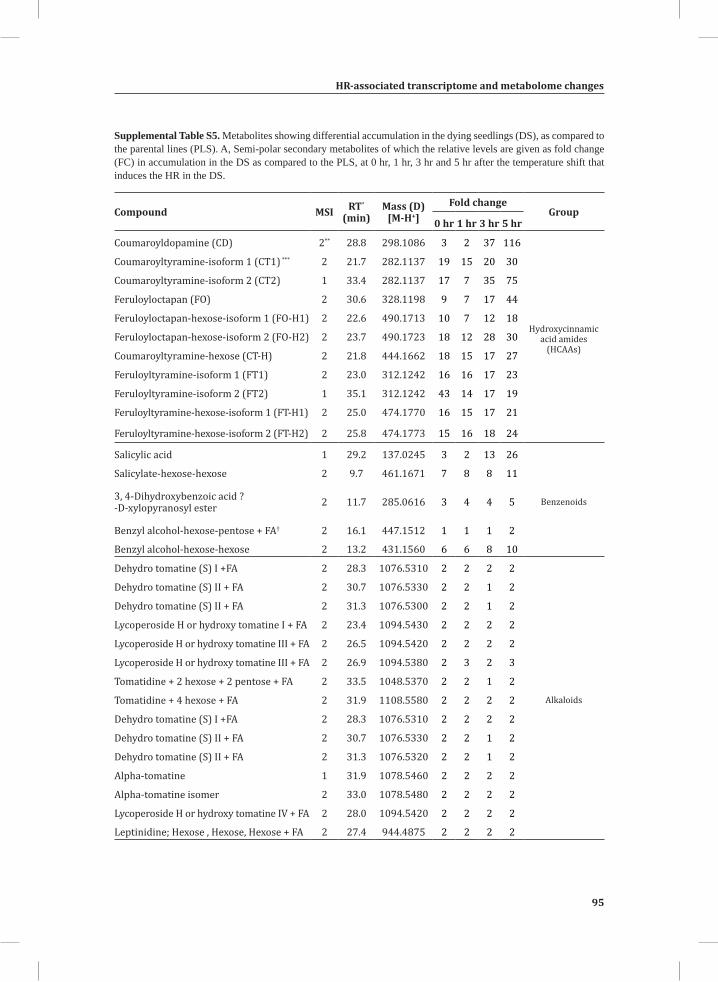
HR-associated transcriptome and metabolome changes
95
Chapter 2
Supplemental Table S5. Metabolites showing differential accumulation in the dying seedlings (DS), as compared to the parental lines (PLS). A, Semi-polar secondary metabolites of which the relative levels are given as fold change (FC) in accumulation in the DS as compared to the PLS, at 0 hr, 1 hr, 3 hr and 5 hr after the temperature shift that induces the HR in the DS.
Compound MSI RT*
(min)Mass (D)
[M-H+]Fold change
Group 0 hr 1 hr 3 hr 5 hr
Coumaroyldopamine (CD) 2** 28.8 298.1086 3 2 37 116
Hydroxycinnamic acid amides
(HCAAs)
Coumaroyltyramine-isoform 1 (CT1) *** 2 21.7 282.1137 19 15 20 30
Coumaroyltyramine-isoform 2 (CT2) 1 33.4 282.1137 17 7 35 75
Feruloyloctapan (FO) 2 30.6 328.1198 9 7 17 44
Feruloyloctapan-hexose-isoform 1 (FO-H1) 2 22.6 490.1713 10 7 12 18
Feruloyloctapan-hexose-isoform 2 (FO-H2) 2 23.7 490.1723 18 12 28 30
Coumaroyltyramine-hexose (CT-H) 2 21.8 444.1662 18 15 17 27
Feruloyltyramine-isoform 1 (FT1) 2 23.0 312.1242 16 16 17 23
Feruloyltyramine-isoform 2 (FT2) 1 35.1 312.1242 43 14 17 19
Feruloyltyramine-hexose-isoform 1 (FT-H1) 2 25.0 474.1770 16 15 17 21
Feruloyltyramine-hexose-isoform 2 (FT-H2) 2 25.8 474.1773 15 16 18 24
Salicylic acid 1 29.2 137.0245 3 2 13 26
Benzenoids
Salicylate-hexose-hexose 2 9.7 461.1671 7 8 8 11
3, 4-Dihydroxybenzoic acid ? -D-xylopyranosyl ester 2 11.7 285.0616 3 4 4 5
Benzyl alcohol-hexose-pentose + FA† 2 16.1 447.1512 1 1 1 2
Benzyl alcohol-hexose-hexose 2 13.2 431.1560 6 6 8 10
Dehydro tomatine (S) I +FA 2 28.3 1076.5310 2 2 2 2
Alkaloids
Dehydro tomatine (S) II + FA 2 30.7 1076.5330 2 2 1 2
Dehydro tomatine (S) II + FA 2 31.3 1076.5300 2 2 1 2
Lycoperoside H or hydroxy tomatine I + FA 2 23.4 1094.5430 2 2 2 2
Lycoperoside H or hydroxy tomatine III + FA 2 26.5 1094.5420 2 2 2 2
Lycoperoside H or hydroxy tomatine III + FA 2 26.9 1094.5380 2 3 2 3
Tomatidine + 2 hexose + 2 pentose + FA 2 33.5 1048.5370 2 2 1 2
Tomatidine + 4 hexose + FA 2 31.9 1108.5580 2 2 2 2
Dehydro tomatine (S) I +FA 2 28.3 1076.5310 2 2 2 2
Dehydro tomatine (S) II + FA 2 30.7 1076.5330 2 2 1 2
Dehydro tomatine (S) II + FA 2 31.3 1076.5320 2 2 1 2
Alpha-tomatine 1 31.9 1078.5460 2 2 2 2
Alpha-tomatine isomer 2 33.0 1078.5480 2 2 2 2
Lycoperoside H or hydroxy tomatine IV + FA 2 28.0 1094.5420 2 2 2 2
Leptinidine; Hexose , Hexose, Hexose + FA 2 27.4 944.4875 2 2 2 2
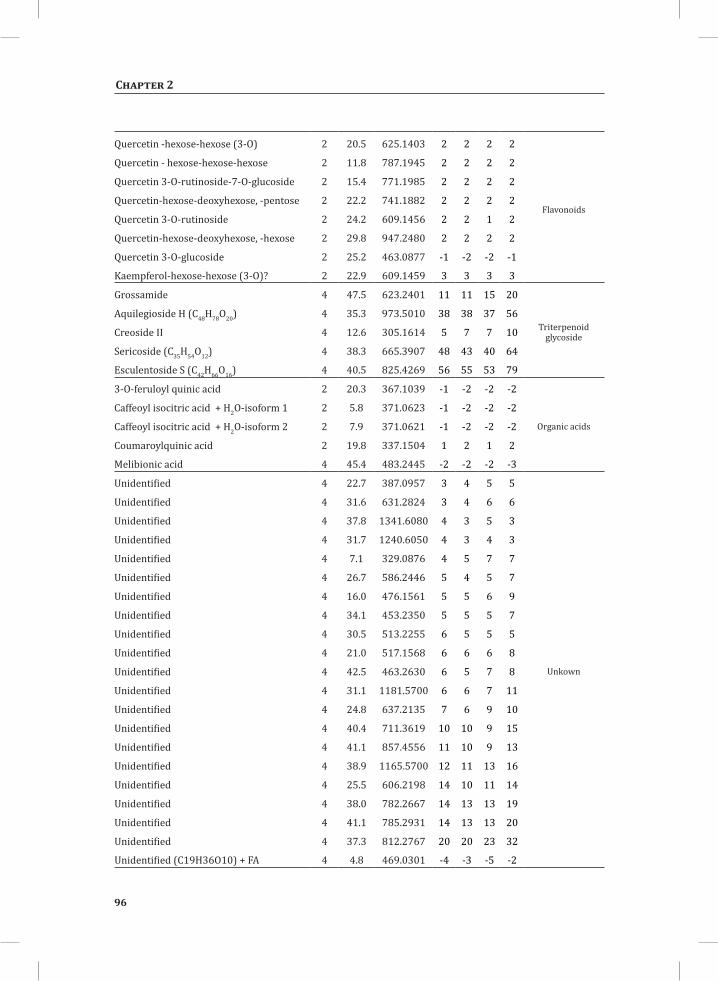
96
Chapter 2
Quercetin -hexose-hexose (3-O) 2 20.5 625.1403 2 2 2 2
Flavonoids
Quercetin - hexose-hexose-hexose 2 11.8 787.1945 2 2 2 2
Quercetin 3-O-rutinoside-7-O-glucoside 2 15.4 771.1985 2 2 2 2
Quercetin-hexose-deoxyhexose, -pentose 2 22.2 741.1882 2 2 2 2
Quercetin 3-O-rutinoside 2 24.2 609.1456 2 2 1 2
Quercetin-hexose-deoxyhexose, -hexose 2 29.8 947.2480 2 2 2 2
Quercetin 3-O-glucoside 2 25.2 463.0877 -1 -2 -2 -1
Kaempferol-hexose-hexose (3-O)? 2 22.9 609.1459 3 3 3 3
Grossamide 4 47.5 623.2401 11 11 15 20
Triterpenoid glycoside
Aquilegioside H (C48H78O20) 4 35.3 973.5010 38 38 37 56
Creoside II 4 12.6 305.1614 5 7 7 10
Sericoside (C35H54O12) 4 38.3 665.3907 48 43 40 64
Esculentoside S (C42H66O16) 4 40.5 825.4269 56 55 53 79
3-O-feruloyl quinic acid 2 20.3 367.1039 -1 -2 -2 -2
Organic acids
Caffeoyl isocitric acid + H2O-isoform 1 2 5.8 371.0623 -1 -2 -2 -2
Caffeoyl isocitric acid + H2O-isoform 2 2 7.9 371.0621 -1 -2 -2 -2
Coumaroylquinic acid 2 19.8 337.1504 1 2 1 2
Melibionic acid 4 45.4 483.2445 -2 -2 -2 -3
Unidentified 4 22.7 387.0957 3 4 5 5
Unkown
Unidentified 4 31.6 631.2824 3 4 6 6
Unidentified 4 37.8 1341.6080 4 3 5 3
Unidentified 4 31.7 1240.6050 4 3 4 3
Unidentified 4 7.1 329.0876 4 5 7 7
Unidentified 4 26.7 586.2446 5 4 5 7
Unidentified 4 16.0 476.1561 5 5 6 9
Unidentified 4 34.1 453.2350 5 5 5 7
Unidentified 4 30.5 513.2255 6 5 5 5
Unidentified 4 21.0 517.1568 6 6 6 8
Unidentified 4 42.5 463.2630 6 5 7 8
Unidentified 4 31.1 1181.5700 6 6 7 11
Unidentified 4 24.8 637.2135 7 6 9 10
Unidentified 4 40.4 711.3619 10 10 9 15
Unidentified 4 41.1 857.4556 11 10 9 13
Unidentified 4 38.9 1165.5700 12 11 13 16
Unidentified 4 25.5 606.2198 14 10 11 14
Unidentified 4 38.0 782.2667 14 13 13 19
Unidentified 4 41.1 785.2931 14 13 13 20
Unidentified 4 37.3 812.2767 20 20 23 32
Unidentified (C19H36O10) + FA 4 4.8 469.0301 -4 -3 -5 -2
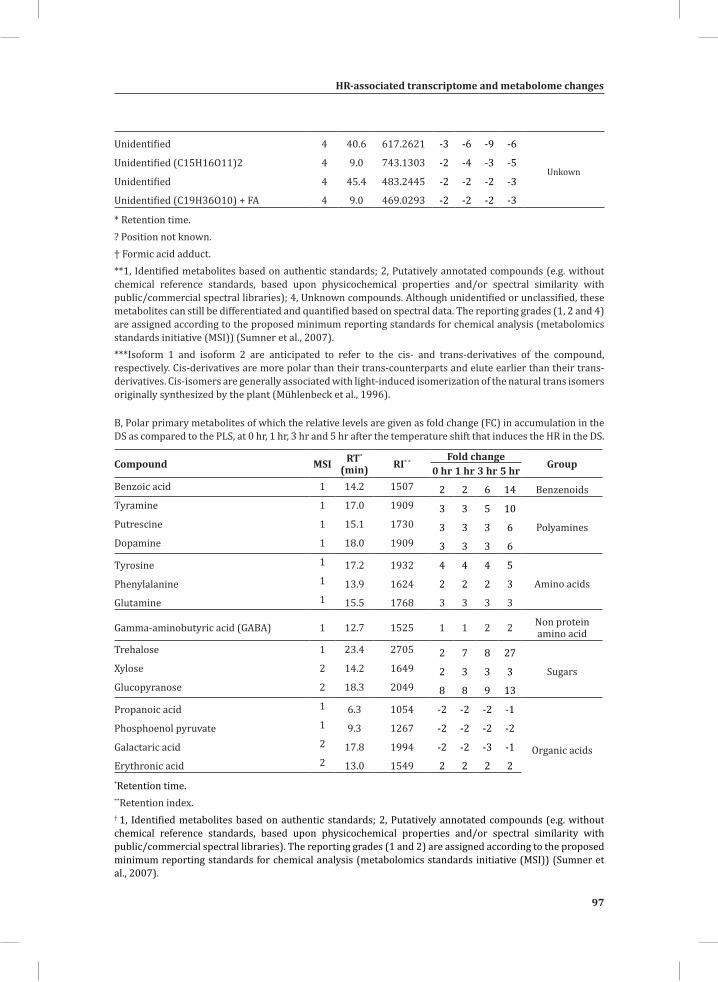
HR-associated transcriptome and metabolome changes
97
Chapter 2
Unidentified 4 40.6 617.2621 -3 -6 -9 -6
UnkownUnidentified (C15H16O11)2 4 9.0 743.1303 -2 -4 -3 -5
Unidentified 4 45.4 483.2445 -2 -2 -2 -3
Unidentified (C19H36O10) + FA 4 9.0 469.0293 -2 -2 -2 -3
* Retention time.? Position not known. † Formic acid adduct.**1, Identified metabolites based on authentic standards; 2, Putatively annotated compounds (e.g. without chemical reference standards, based upon physicochemical properties and/or spectral similarity with public/commercial spectral libraries); 4, Unknown compounds. Although unidentified or unclassified, these metabolites can still be differentiated and quantified based on spectral data. The reporting grades (1, 2 and 4) are assigned according to the proposed minimum reporting standards for chemical analysis (metabolomics standards initiative (MSI)) (Sumner et al., 2007).***Isoform 1 and isoform 2 are anticipated to refer to the cis- and trans-derivatives of the compound, respectively. Cis-derivatives are more polar than their trans-counterparts and elute earlier than their trans-derivatives. Cis-isomers are generally associated with light-induced isomerization of the natural trans isomers originally synthesized by the plant (Mühlenbeck et al., 1996).
B, Polar primary metabolites of which the relative levels are given as fold change (FC) in accumulation in the DS as compared to the PLS, at 0 hr, 1 hr, 3 hr and 5 hr after the temperature shift that induces the HR in the DS.
Compound MSI RT*
(min) RI* * Fold changeGroup 0 hr 1 hr 3 hr 5 hr
Benzoic acid 1 14.2 1507 2 2 6 14 BenzenoidsTyramine 1 17.0 1909 3 3 5 10
PolyaminesPutrescine 1 15.1 1730 3 3 3 6Dopamine 1 18.0 1909 3 3 3 6
Tyrosine 1 17.2 1932 4 4 4 5
Amino acidsPhenylalanine 1 13.9 1624 2 2 2 3
Glutamine 1 15.5 1768 3 3 3 3
Gamma-aminobutyric acid (GABA) 1 12.7 1525 1 1 2 2 Non protein amino acid
Trehalose 1 23.4 2705 2 7 8 27
SugarsXylose 2 14.2 1649 2 3 3 3Glucopyranose 2 18.3 2049 8 8 9 13
Propanoic acid 1 6.3 1054 -2 -2 -2 -1
Organic acids
Phosphoenol pyruvate 1 9.3 1267 -2 -2 -2 -2
Galactaric acid 2 17.8 1994 -2 -2 -3 -1
Erythronic acid 2 13.0 1549 2 2 2 2*Retention time.**Retention index.† 1, Identified metabolites based on authentic standards; 2, Putatively annotated compounds (e.g. without chemical reference standards, based upon physicochemical properties and/or spectral similarity with public/commercial spectral libraries). The reporting grades (1 and 2) are assigned according to the proposed minimum reporting standards for chemical analysis (metabolomics standards initiative (MSI)) (Sumner et al., 2007).
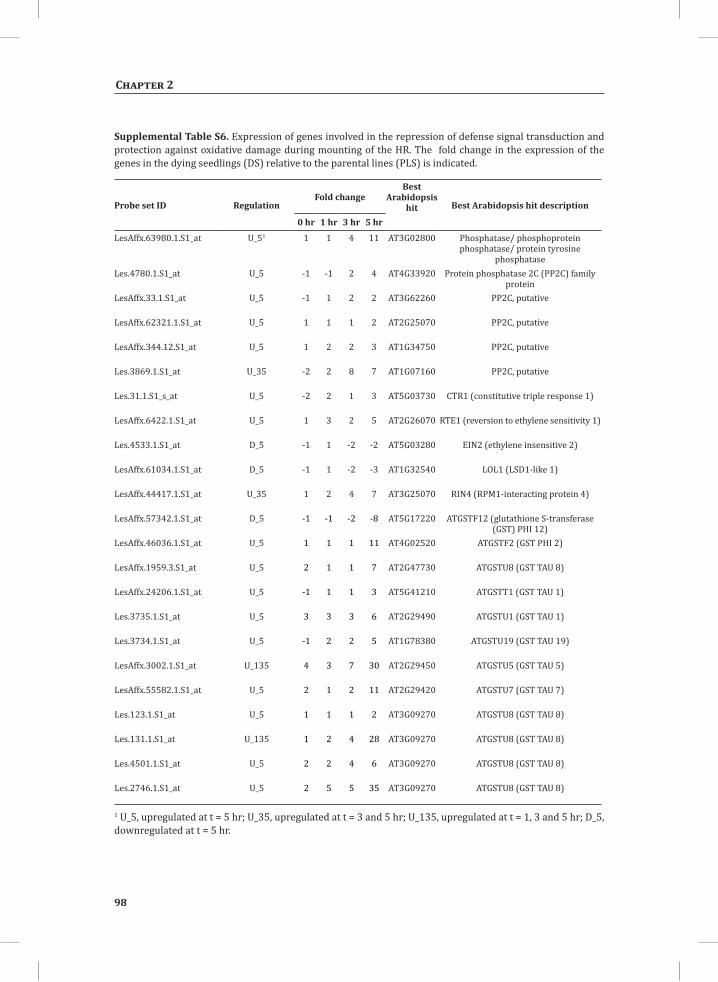
98
Chapter 2
Supplemental Table S6. Expression of genes involved in the repression of defense signal transduction and protection against oxidative damage during mounting of the HR. The fold change in the expression of the genes in the dying seedlings (DS) relative to the parental lines (PLS) is indicated.
Probe set ID RegulationFold change
Best Arabidopsis
hit Best Arabidopsis hit description
0 hr 1 hr 3 hr 5 hr
LesAffx.63980.1.S1_at U_51 1 1 4 11 AT3G02800 Phosphatase/ phosphoprotein phosphatase/ protein tyrosine
phosphataseLes.4780.1.S1_at U_5 -1 -1 2 4 AT4G33920 Protein phosphatase 2C (PP2C) family
proteinLesAffx.33.1.S1_at U_5 -1 1 2 2 AT3G62260 PP2C, putative
LesAffx.62321.1.S1_at U_5 1 1 1 2 AT2G25070 PP2C, putative
LesAffx.344.12.S1_at U_5 1 2 2 3 AT1G34750 PP2C, putative
Les.3869.1.S1_at U_35 -2 2 8 7 AT1G07160 PP2C, putative
Les.31.1.S1_s_at U_5 -2 2 1 3 AT5G03730 CTR1 (constitutive triple response 1)
LesAffx.6422.1.S1_at U_5 1 3 2 5 AT2G26070 RTE1 (reversion to ethylene sensitivity 1)
Les.4533.1.S1_at D_5 -1 1 -2 -2 AT5G03280 EIN2 (ethylene insensitive 2)
LesAffx.61034.1.S1_at D_5 -1 1 -2 -3 AT1G32540 LOL1 (LSD1-like 1)
LesAffx.44417.1.S1_at U_35 1 2 4 7 AT3G25070 RIN4 (RPM1-interacting protein 4)
LesAffx.57342.1.S1_at D_5 -1 -1 -2 -8 AT5G17220 ATGSTF12 (glutathione S-transferase (GST) PHI 12)
LesAffx.46036.1.S1_at U_5 1 1 1 11 AT4G02520 ATGSTF2 (GST PHI 2)
LesAffx.1959.3.S1_at U_5 2 1 1 7 AT2G47730 ATGSTU8 (GST TAU 8)
LesAffx.24206.1.S1_at U_5 -1 1 1 3 AT5G41210 ATGSTT1 (GST TAU 1)
Les.3735.1.S1_at U_5 3 3 3 6 AT2G29490 ATGSTU1 (GST TAU 1)
Les.3734.1.S1_at U_5 -1 2 2 5 AT1G78380 ATGSTU19 (GST TAU 19)
LesAffx.3002.1.S1_at U_135 4 3 7 30 AT2G29450 ATGSTU5 (GST TAU 5)
LesAffx.55582.1.S1_at U_5 2 1 2 11 AT2G29420 ATGSTU7 (GST TAU 7)
Les.123.1.S1_at U_5 1 1 1 2 AT3G09270 ATGSTU8 (GST TAU 8)
Les.131.1.S1_at U_135 1 2 4 28 AT3G09270 ATGSTU8 (GST TAU 8)
Les.4501.1.S1_at U_5 2 2 4 6 AT3G09270 ATGSTU8 (GST TAU 8)
Les.2746.1.S1_at U_5 2 5 5 35 AT3G09270 ATGSTU8 (GST TAU 8)
1 U_5, upregulated at t = 5 hr; U_35, upregulated at t = 3 and 5 hr; U_135, upregulated at t = 1, 3 and 5 hr; D_5, downregulated at t = 5 hr.
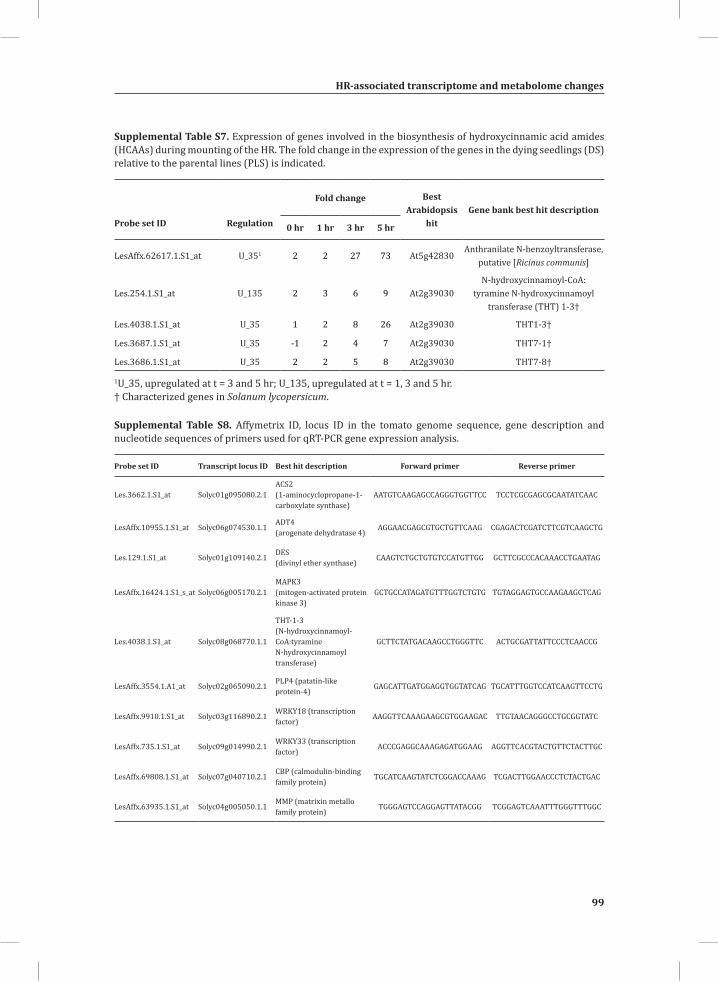
HR-associated transcriptome and metabolome changes
99
Chapter 2
Supplemental Table S7. Expression of genes involved in the biosynthesis of hydroxycinnamic acid amides (HCAAs) during mounting of the HR. The fold change in the expression of the genes in the dying seedlings (DS) relative to the parental lines (PLS) is indicated.
Probe set ID Regulation
Fold change Best Arabidopsis
hitGene bank best hit description
0 hr 1 hr 3 hr 5 hr
LesAffx.62617.1.S1_at U_351 2 2 27 73 At5g42830Anthranilate N-benzoyltransferase,
putative [Ricinus communis]
Les.254.1.S1_at U_135 2 3 6 9 At2g39030N-hydroxycinnamoyl-CoA:
tyramine N-hydroxycinnamoyl transferase (THT) 1-3†
Les.4038.1.S1_at U_35 1 2 8 26 At2g39030 THT1-3†
Les.3687.1.S1_at U_35 -1 2 4 7 At2g39030 THT7-1†
Les.3686.1.S1_at U_35 2 2 5 8 At2g39030 THT7-8†
1U_35, upregulated at t = 3 and 5 hr; U_135, upregulated at t = 1, 3 and 5 hr. † Characterized genes in Solanum lycopersicum.
Supplemental Table S8. Affymetrix ID, locus ID in the tomato genome sequence, gene description and nucleotide sequences of primers used for qRT-PCR gene expression analysis.
Probe set ID Transcript locus ID Best hit description Forward primer Reverse primer
Les.3662.1.S1_at Solyc01g095080.2.1ACS2 (1-aminocyclopropane-1-carboxylate synthase)
AATGTCAAGAGCCAGGGTGGTTCC TCCTCGCGAGCGCAATATCAAC
LesAffx.10955.1.S1_at Solyc06g074530.1.1 ADT4 (arogenate dehydratase 4) AGGAACGAGCGTGCTGTTCAAG CGAGACTCGATCTTCGTCAAGCTG
Les.129.1.S1_at Solyc01g109140.2.1 DES (divinyl ether synthase) CAAGTCTGCTGTGTCCATGTTGG GCTTCGCCCACAAACCTGAATAG
LesAffx.16424.1.S1_s_at Solyc06g005170.2.1MAPK3 (mitogen-activated protein kinase 3)
GCTGCCATAGATGTTTGGTCTGTG TGTAGGAGTGCCAAGAAGCTCAG
Les.4038.1.S1_at Solyc08g068770.1.1
THT-1-3 (N-hydroxycinnamoyl-CoA:tyramine N-hydroxycinnamoyl transferase)
GCTTCTATGACAAGCCTGGGTTC ACTGCGATTATTCCCTCAACCG
LesAffx.3554.1.A1_at Solyc02g065090.2.1 PLP4 (patatin-like protein-4) GAGCATTGATGGAGGTGGTATCAG TGCATTTGGTCCATCAAGTTCCTG
LesAffx.9910.1.S1_at Solyc03g116890.2.1 WRKY18 (transcription factor) AAGGTTCAAAGAAGCGTGGAAGAC TTGTAACAGGGCCTGCGGTATC
LesAffx.735.1.S1_at Solyc09g014990.2.1 WRKY33 (transcription factor) ACCCGAGGCAAAGAGATGGAAG AGGTTCACGTACTGTTCTACTTGC
LesAffx.69808.1.S1_at Solyc07g040710.2.1 CBP (calmodulin-binding family protein) TGCATCAAGTATCTCGGACCAAAG TCGACTTGGAACCCTCTACTGAC
LesAffx.63935.1.S1_at Solyc04g005050.1.1 MMP (matrixin metallo family protein) TGGGAGTCCAGGAGTTATACGG TCGGAGTCAAATTTGGGTTTGGC

Carbon Economy and the Maintenance of Energy Homeostasis during
the Hypersensitive Response in Tomato
Desalegn W. Etalo1,4Ω, Thierry L. Delatte1, Matthew J. Paul5, Ric C.H. De Vos2,4,6, Matthieu H.A.J. Joosten3,4 and Harro J. Bouwmeester1,4
1Laboratory of Plant Physiology, Wageningen University, Wageningen, The Netherlands.2Plant Research International Bioscience, Wageningen University, Wageningen, The Netherlands.3Laboratory of Phytopathology, Wageningen University, Wageningen, The Netherlands.4Centre for BioSystems Genomics, Wageningen, The Netherlands.5Center for Crop Genetic Improvement, Rothamsted Research, Harpenden, Hertfordshire,AL5 2JQ, United Kingdom. 6Netherlands Metabolomics Centre, Einsteinweg 55, 2333 CC Leiden, The Netherlands. ΩCurrent address: Plant Research International, Bioscience, Wageningen University, Wageningen, The Netherlands.
To be submitted
3Chapter
102
Chapter 3
Abstract
The hypersensitive response (HR) upon pathogen challenge of resistant plants is characterised by local cell death at the site of pathogen entry, resulting in efficient containment of the invading biotrophic pathogen. Cladosporium fulvum is a pathogen of tomato and when an avirulence factor of this fungus is expressed in a tomato line that carries the corresponding resistance gene, the plants will display a synchronized and amplified immune response, culminating in an HR (“dying seedlings”, DS). To monitor the HR-associated transcriptional response of these DS, we performed a deep RNA-seq analysis and compared the composition of the transcriptome with that of resistant and susceptible tomato plants inoculated with C. fulvum. The RNA-seq analysis revealed that plants that are mounting a resistance response to the fungus undergo massive transcriptional reprogramming that features a shift towards energy generation at the expense of growth. For example, a number of catabolic processes that generate acetyl-CoA, an important intermediate for the energy cycle and the biosynthesis of a wide range of defence-associated primary and secondary metabolites, were up-regulated. The induction of these catabolic processes coincides with a significant reduction in trehalose-6-phosphate, playing a central role in the maintenance of energy homeostasis during carbon starvation, and is accompanied by accumulation of trehalose. Genes regulating the circadian rhythm were down-regulated and this could potentially result in the suppression of genes involved in the biosynthesis and signalling of auxin as well as other hormones that are primarily produced through the isoprenoid pathways (brassinosteroids, cytokinins and gibberellins), resulting in suppression of growth. Our findings shed new light on the processes that are involved in the maintenance of carbon economy and energy homeostasis and that govern the trade-off between growth and the plant immune response.
Carbon economy and maintenance of energy homeostasis
103
Chapter 3
Introduction
Unlike animals, plants do not have an adaptive immune system, hence they solely rely on innate immunity to recognize and respond to invading pathogens. Innate immunity is generally divided into two blurred classes referred to as microbe-associated molecular pattern (MAMP)- triggered immunity (MTI) and effector-triggered immunity (ETI) (Dodds and Rathjen, 2010; Thomma et al., 2011). MTI is induced upon recognition of MAMPs, such as bacterial flagellin and fungal chitin, which are conserved and essential components of large classes of pathogens, by extracellular pattern recognition receptors (PRRs). In contrast, ETI is induced upon recognition of pathogen virulence molecules, referred to as effectors, and which are species-, race- or strain-specific, mostly by intracellular receptors (Chisholm et al., 2006; Jones and Dangl, 2006; Dodds and Rathjen, 2010; Thomma et al., 2011). Generally, MTI and ETI give rise to similar responses, although ETI in most cases is stronger, faster and more robust and often involves a form of localized cell death, called the hypersensitive response (HR) (Lam et al., 2001; Jones and Dangl, 2006; Dodds and Rathjen, 2010; Thomma et al., 2011).
The interaction between tomato and the biotrophic extracellular fungus Cladosporium fulvum is a model pathosystem and is characterized by a typical gene-for-gene interaction (de Wit and Joosten, 1999). In resistant tomato plants, recognition of an avirulence factor (Avr) by the matching Cf resistance gene product results in the HR (incompatible interaction). In contrast, in susceptible plants lacking the matching resistance gene the fungus can successfully colonize the leaf apoplastic space and cause disease (compatible interaction). The localized cell death is often associated with resistance response. A thorough investigation of the early molecular, biochemical and cellular changes at the infection site is obscured by the non-synchronous and highly localized response of just a few host cells during the initiation of the HR. However, transgenic tomato plants expressing an effector of C. fulvum that are crossed with a tomato line that contains the matching Cf resistance gene represent a versatile model system that perfectly mimics the highly localized response of resistant tomato plants to effectors of C. fulvum, but now in an amplified and synchronised way (Cai et al., 2001; de Jong et al., 2002; Stulemeijer et al., 2009; Etalo et al., 2013). The offspring of this cross will die soon after germination, due to the systemic HR that will occur as a result of the recognition of the expressed effector by the matching Cf protein. However, the HR is suppressed by incubating the plants at an elevated temperature and humidity. Indeed, when the offspring is placed at 33˚C and 100% relative humidity (RH) immediately after germination, the seedlings are rescued. Plants can then be grown for a few weeks under these conditions and subsequently, a systemic and highly synchronized HR is induced by placing the plants at permissive conditions (20˚C and 70% RH).
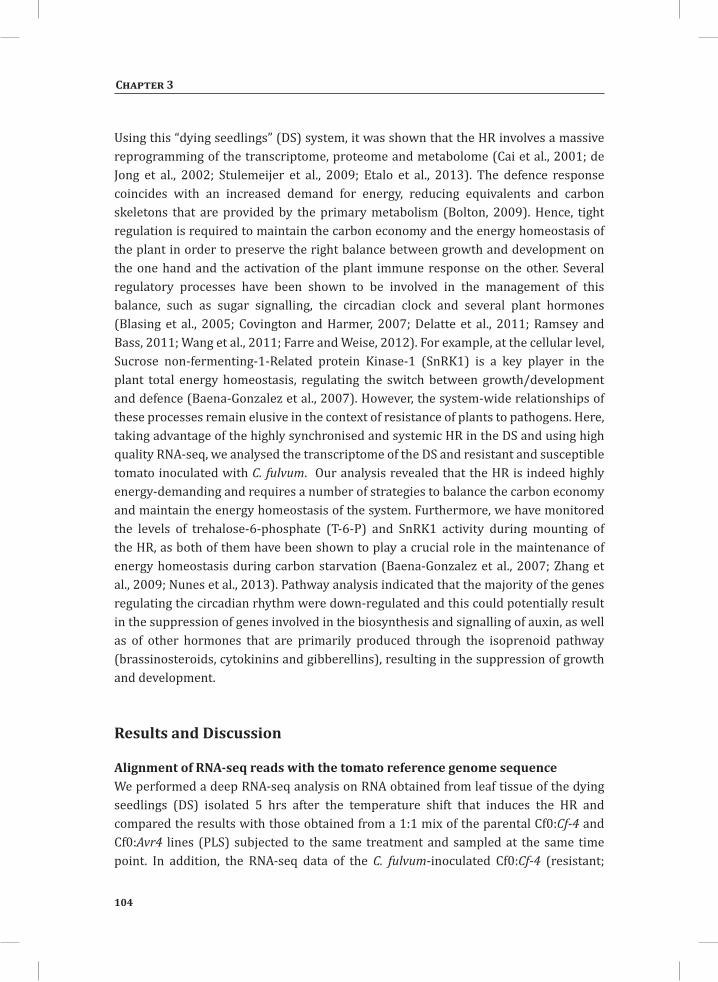
104
Chapter 3
Using this “dying seedlings” (DS) system, it was shown that the HR involves a massive reprogramming of the transcriptome, proteome and metabolome (Cai et al., 2001; de Jong et al., 2002; Stulemeijer et al., 2009; Etalo et al., 2013). The defence response coincides with an increased demand for energy, reducing equivalents and carbon skeletons that are provided by the primary metabolism (Bolton, 2009). Hence, tight regulation is required to maintain the carbon economy and the energy homeostasis of the plant in order to preserve the right balance between growth and development on the one hand and the activation of the plant immune response on the other. Several regulatory processes have been shown to be involved in the management of this balance, such as sugar signalling, the circadian clock and several plant hormones (Blasing et al., 2005; Covington and Harmer, 2007; Delatte et al., 2011; Ramsey and Bass, 2011; Wang et al., 2011; Farre and Weise, 2012). For example, at the cellular level, Sucrose non-fermenting-1-Related protein Kinase-1 (SnRK1) is a key player in the plant total energy homeostasis, regulating the switch between growth/development and defence (Baena-Gonzalez et al., 2007). However, the system-wide relationships of these processes remain elusive in the context of resistance of plants to pathogens. Here, taking advantage of the highly synchronised and systemic HR in the DS and using high quality RNA-seq, we analysed the transcriptome of the DS and resistant and susceptible tomato inoculated with C. fulvum. Our analysis revealed that the HR is indeed highly energy-demanding and requires a number of strategies to balance the carbon economy and maintain the energy homeostasis of the system. Furthermore, we have monitored the levels of trehalose-6-phosphate (T-6-P) and SnRK1 activity during mounting of the HR, as both of them have been shown to play a crucial role in the maintenance of energy homeostasis during carbon starvation (Baena-Gonzalez et al., 2007; Zhang et al., 2009; Nunes et al., 2013). Pathway analysis indicated that the majority of the genes regulating the circadian rhythm were down-regulated and this could potentially result in the suppression of genes involved in the biosynthesis and signalling of auxin, as well as of other hormones that are primarily produced through the isoprenoid pathway (brassinosteroids, cytokinins and gibberellins), resulting in the suppression of growth and development.
Results and Discussion
Alignment of RNA-seq reads with the tomato reference genome sequenceWe performed a deep RNA-seq analysis on RNA obtained from leaf tissue of the dying seedlings (DS) isolated 5 hrs after the temperature shift that induces the HR and compared the results with those obtained from a 1:1 mix of the parental Cf0:Cf-4 and Cf0:Avr4 lines (PLS) subjected to the same treatment and sampled at the same time point. In addition, the RNA-seq data of the C. fulvum-inoculated Cf0:Cf-4 (resistant;
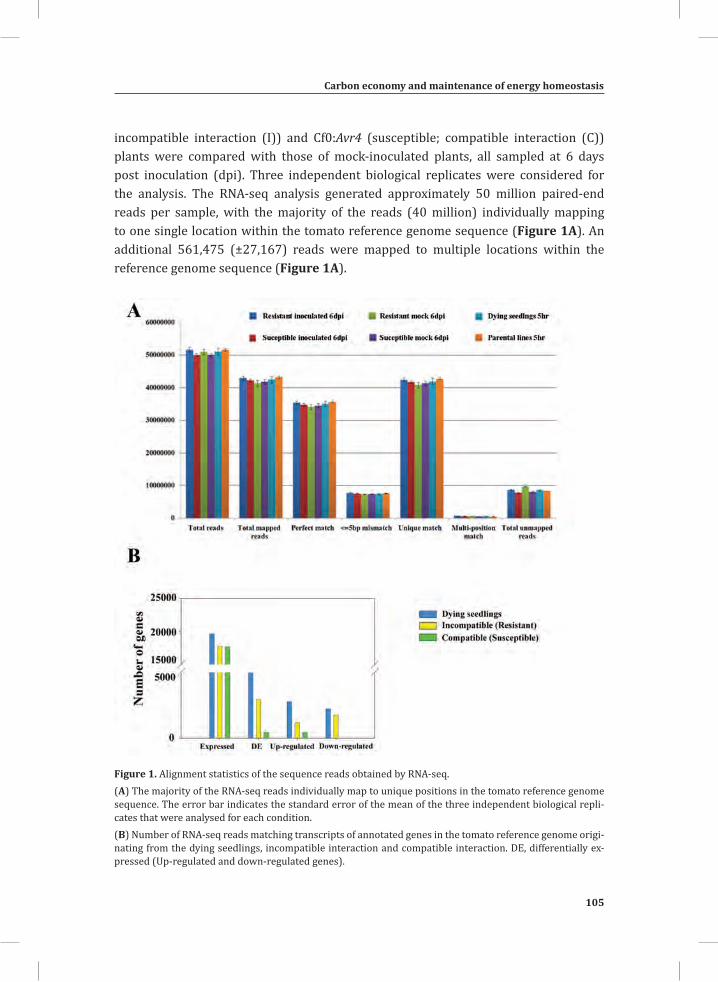
Carbon economy and maintenance of energy homeostasis
105
Chapter 3
incompatible interaction (I)) and Cf0:Avr4 (susceptible; compatible interaction (C)) plants were compared with those of mock-inoculated plants, all sampled at 6 days post inoculation (dpi). Three independent biological replicates were considered for the analysis. The RNA-seq analysis generated approximately 50 million paired-end reads per sample, with the majority of the reads (40 million) individually mapping to one single location within the tomato reference genome sequence (Figure 1A). An additional 561,475 (±27,167) reads were mapped to multiple locations within the reference genome sequence (Figure 1A).
Figure 1. Alignment statistics of the sequence reads obtained by RNA-seq.(A) The majority of the RNA-seq reads individually map to unique positions in the tomato reference genome sequence. The error bar indicates the standard error of the mean of the three independent biological repli-cates that were analysed for each condition.(B) Number of RNA-seq reads matching transcripts of annotated genes in the tomato reference genome origi-nating from the dying seedlings, incompatible interaction and compatible interaction. DE, differentially ex-pressed (Up-regulated and down-regulated genes).
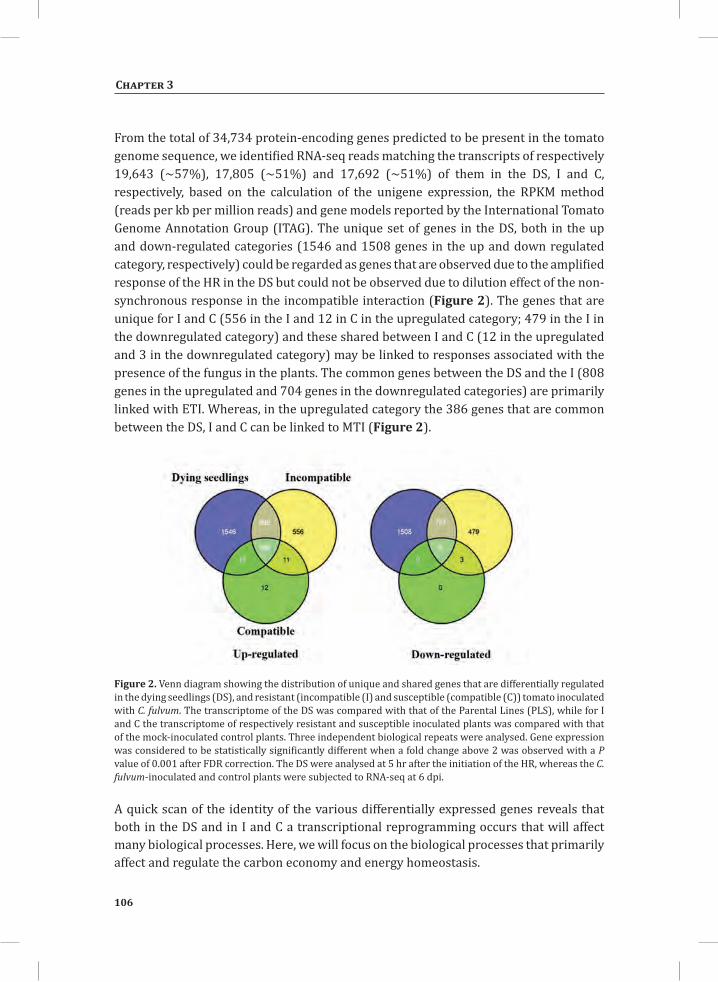
106
Chapter 3
From the total of 34,734 protein-encoding genes predicted to be present in the tomato genome sequence, we identified RNA-seq reads matching the transcripts of respectively 19,643 (~57%), 17,805 (~51%) and 17,692 (~51%) of them in the DS, I and C, respectively, based on the calculation of the unigene expression, the RPKM method (reads per kb per million reads) and gene models reported by the International Tomato Genome Annotation Group (ITAG). The unique set of genes in the DS, both in the up and down-regulated categories (1546 and 1508 genes in the up and down regulated category, respectively) could be regarded as genes that are observed due to the amplified response of the HR in the DS but could not be observed due to dilution effect of the non-synchronous response in the incompatible interaction (Figure 2). The genes that are unique for I and C (556 in the I and 12 in C in the upregulated category; 479 in the I in the downregulated category) and these shared between I and C (12 in the upregulated and 3 in the downregulated category) may be linked to responses associated with the presence of the fungus in the plants. The common genes between the DS and the I (808 genes in the upregulated and 704 genes in the downregulated categories) are primarily linked with ETI. Whereas, in the upregulated category the 386 genes that are common between the DS, I and C can be linked to MTI (Figure 2).
Figure 2. Venn diagram showing the distribution of unique and shared genes that are differentially regulated in the dying seedlings (DS), and resistant (incompatible (I) and susceptible (compatible (C)) tomato inoculated with C. fulvum. The transcriptome of the DS was compared with that of the Parental Lines (PLS), while for I and C the transcriptome of respectively resistant and susceptible inoculated plants was compared with that of the mock-inoculated control plants. Three independent biological repeats were analysed. Gene expression was considered to be statistically significantly different when a fold change above 2 was observed with a P value of 0.001 after FDR correction. The DS were analysed at 5 hr after the initiation of the HR, whereas the C. fulvum-inoculated and control plants were subjected to RNA-seq at 6 dpi.
A quick scan of the identity of the various differentially expressed genes reveals that both in the DS and in I and C a transcriptional reprogramming occurs that will affect many biological processes. Here, we will focus on the biological processes that primarily affect and regulate the carbon economy and energy homeostasis.
Carbon economy and maintenance of energy homeostasis
107
Chapter 3
Catabolic pathways converge to generate acetyl-CoA for energy and carbon skeleton generation during mounting of the HRIn comparison with the compatible interaction, the expression of genes involved in cellular energy metabolism was considerably up-regulated in the DS and resistant plants inoculated with C. fulvum (Figure 3A and 3B, respectively). This includes genes involved in the tricarboxylic acid (TCA) cycle, electron transport chain (ETC), oxidative pentose phosphate pathway and anaerobic (fermentative) energy generation (Figure 3, Supplementary Table S1). All these up-regulated genes belong to the 808 up-regulated genes that are shared between the DS and I (Figure 2, Up-regulated). In the TCA cycle, glucose is catabolised to produce energy in the form of ATP, and molecules that serve as precursors for anabolic reactions such as protein, lipid and carbohydrate biosynthesis. Hence the pathway serves as a link between catabolism and anabolism and which plays an essential role during mounting of the HR. The oxidative pentose phosphate pathway is a primary source of erythrose-4-phosphate (E-4-P), a precursor for aromatic amino acid biosynthesis. Indeed, we earlier observed that aromatic amino acids and secondary metabolites derived from this precursor showed accumulation in the DS (Etalo et al., 2013). Unlike as was observed in the resistant plants, in the susceptible inoculated plants the expression of genes involved in cellular energy metabolism is not significantly different from the control (Figure 3C).
Photosynthesis and aerobic oxidation of organic molecules such as fatty acids and sugars are the primary sources of ATP. However, in the DS and incompatible interaction, the HR is clearly associated with significant repression of photosynthesis, as 80 out of the 81 differentially expressed genes (DEGs) that are related to photosynthesis (98.8%) were down-regulated in the DS and 42 out of 46 DEGs related to photosynthesis (91.3%) were downregulated in the incompatible interaction (Figure 3D, for DS, Supplementary Table S2 and Supplementary Figure S1). In contrast, in the compatible interaction photosynthesis-related genes did not show significant differential regulation (results not shown). In agreement with our results, previous reports have shown the decrease in photosynthetic activity in the DS and in incompatible interactions between tobacco and Phytophthora nicotianae, barley and Blumeria graminis, and between Arabidopsis and Pseudomonas syringae (Scharte et al., 2005; Bonfig et al., 2006; Swarbrick et al., 2006; Stulemeijer et al., 2009). Chlorophyll fluorescence imaging of tobacco leaves on a macro- and microscopic scale, involved in an incompatible interaction with P. nicotianae, revealed that the decline in photosynthesis is a highly localized process which occurs in single mesophyll cells (Scharte et al., 2005).
Although there was a dramatic suppression of the expression of photosynthesis-related genes in the DS, the level of sucrose, which is the product of photosynthesis, was significantly higher in the DS as compared to the PLS at 1, 3 and 5 hrs after the temperature shift that induces the HR in the DS. The glucose and fructose levels were
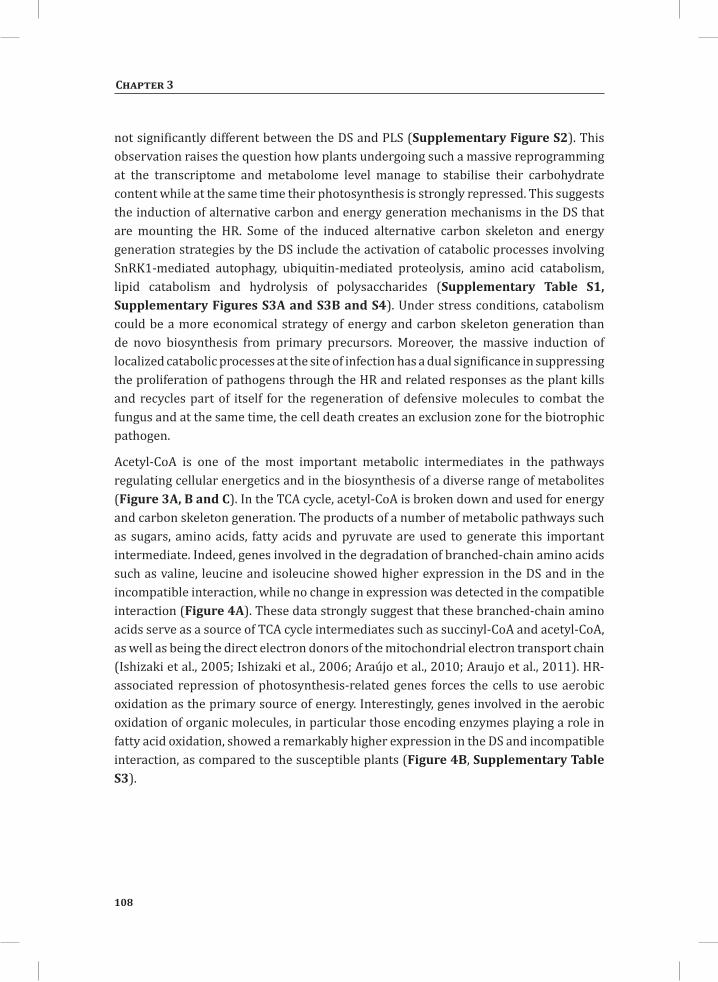
108
Chapter 3
not significantly different between the DS and PLS (Supplementary Figure S2). This observation raises the question how plants undergoing such a massive reprogramming at the transcriptome and metabolome level manage to stabilise their carbohydrate content while at the same time their photosynthesis is strongly repressed. This suggests the induction of alternative carbon and energy generation mechanisms in the DS that are mounting the HR. Some of the induced alternative carbon skeleton and energy generation strategies by the DS include the activation of catabolic processes involving SnRK1-mediated autophagy, ubiquitin-mediated proteolysis, amino acid catabolism, lipid catabolism and hydrolysis of polysaccharides (Supplementary Table S1, Supplementary Figures S3A and S3B and S4). Under stress conditions, catabolism could be a more economical strategy of energy and carbon skeleton generation than de novo biosynthesis from primary precursors. Moreover, the massive induction of localized catabolic processes at the site of infection has a dual significance in suppressing the proliferation of pathogens through the HR and related responses as the plant kills and recycles part of itself for the regeneration of defensive molecules to combat the fungus and at the same time, the cell death creates an exclusion zone for the biotrophic pathogen.
Acetyl-CoA is one of the most important metabolic intermediates in the pathways regulating cellular energetics and in the biosynthesis of a diverse range of metabolites (Figure 3A, B and C). In the TCA cycle, acetyl-CoA is broken down and used for energy and carbon skeleton generation. The products of a number of metabolic pathways such as sugars, amino acids, fatty acids and pyruvate are used to generate this important intermediate. Indeed, genes involved in the degradation of branched-chain amino acids such as valine, leucine and isoleucine showed higher expression in the DS and in the incompatible interaction, while no change in expression was detected in the compatible interaction (Figure 4A). These data strongly suggest that these branched-chain amino acids serve as a source of TCA cycle intermediates such as succinyl-CoA and acetyl-CoA, as well as being the direct electron donors of the mitochondrial electron transport chain (Ishizaki et al., 2005; Ishizaki et al., 2006; Araújo et al., 2010; Araujo et al., 2011). HR-associated repression of photosynthesis-related genes forces the cells to use aerobic oxidation as the primary source of energy. Interestingly, genes involved in the aerobic oxidation of organic molecules, in particular those encoding enzymes playing a role in fatty acid oxidation, showed a remarkably higher expression in the DS and incompatible interaction, as compared to the susceptible plants (Figure 4B, Supplementary Table S3).
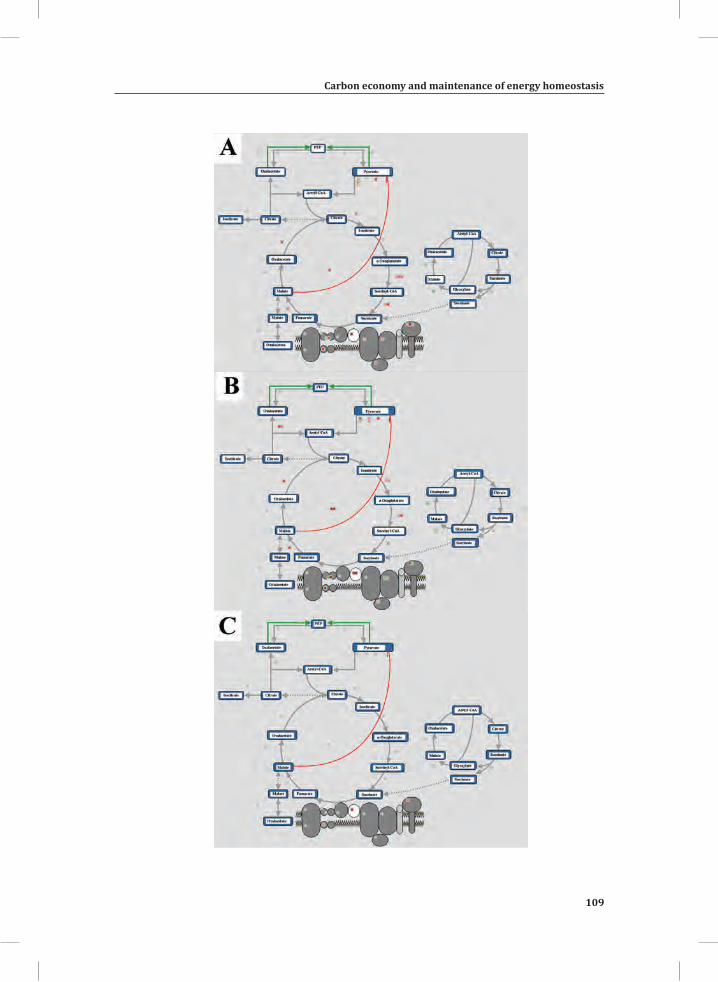
Carbon economy and maintenance of energy homeostasis
109
Chapter 3
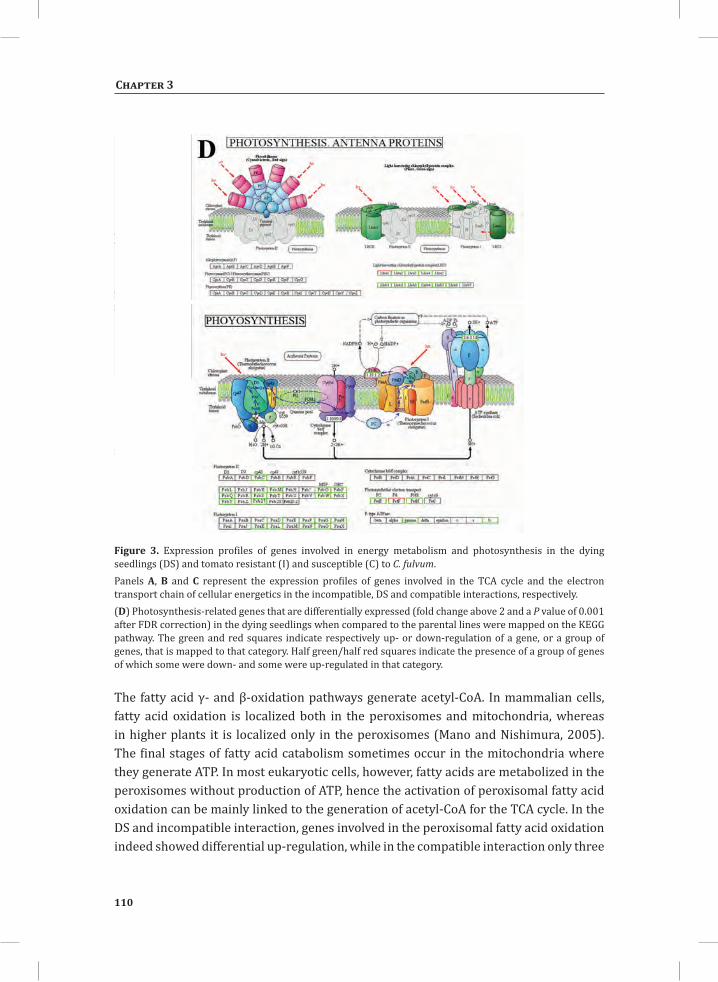
110
Chapter 3
Figure 3. Expression profiles of genes involved in energy metabolism and photosynthesis in the dying seedlings (DS) and tomato resistant (I) and susceptible (C) to C. fulvum. Panels A, B and C represent the expression profiles of genes involved in the TCA cycle and the electron transport chain of cellular energetics in the incompatible, DS and compatible interactions, respectively. (D) Photosynthesis-related genes that are differentially expressed (fold change above 2 and a P value of 0.001 after FDR correction) in the dying seedlings when compared to the parental lines were mapped on the KEGG pathway. The green and red squares indicate respectively up- or down-regulation of a gene, or a group of genes, that is mapped to that category. Half green/half red squares indicate the presence of a group of genes of which some were down- and some were up-regulated in that category.
The fatty acid γ- and β-oxidation pathways generate acetyl-CoA. In mammalian cells, fatty acid oxidation is localized both in the peroxisomes and mitochondria, whereas in higher plants it is localized only in the peroxisomes (Mano and Nishimura, 2005). The final stages of fatty acid catabolism sometimes occur in the mitochondria where they generate ATP. In most eukaryotic cells, however, fatty acids are metabolized in the peroxisomes without production of ATP, hence the activation of peroxisomal fatty acid oxidation can be mainly linked to the generation of acetyl-CoA for the TCA cycle. In the DS and incompatible interaction, genes involved in the peroxisomal fatty acid oxidation indeed showed differential up-regulation, while in the compatible interaction only three
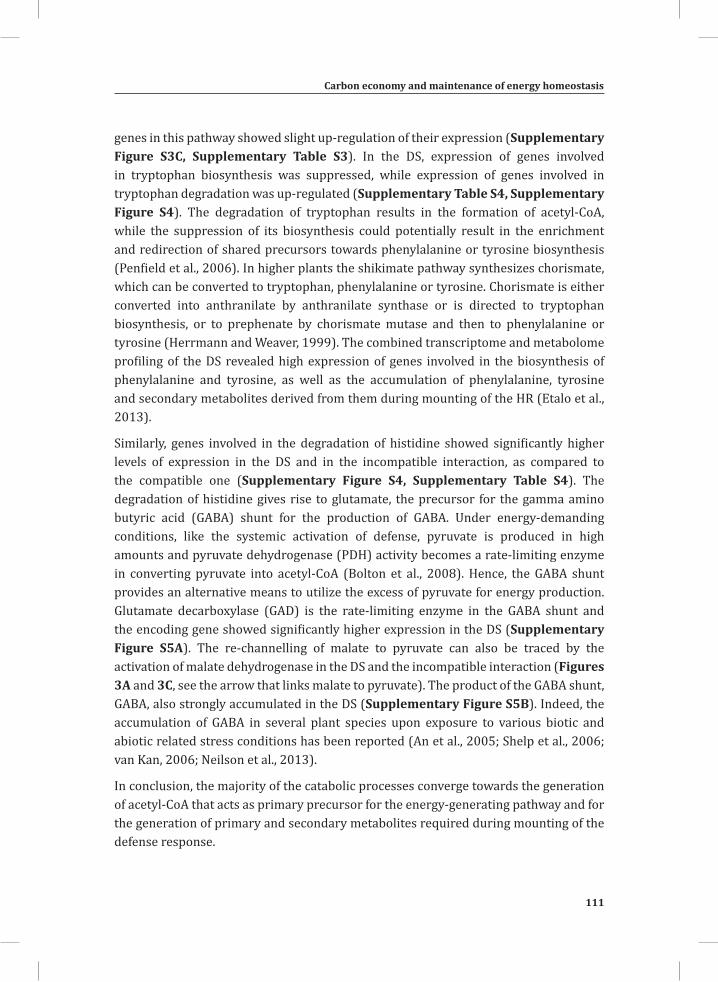
Carbon economy and maintenance of energy homeostasis
111
Chapter 3
genes in this pathway showed slight up-regulation of their expression (Supplementary Figure S3C, Supplementary Table S3). In the DS, expression of genes involved in tryptophan biosynthesis was suppressed, while expression of genes involved in tryptophan degradation was up-regulated (Supplementary Table S4, Supplementary Figure S4). The degradation of tryptophan results in the formation of acetyl-CoA, while the suppression of its biosynthesis could potentially result in the enrichment and redirection of shared precursors towards phenylalanine or tyrosine biosynthesis (Penfield et al., 2006). In higher plants the shikimate pathway synthesizes chorismate, which can be converted to tryptophan, phenylalanine or tyrosine. Chorismate is either converted into anthranilate by anthranilate synthase or is directed to tryptophan biosynthesis, or to prephenate by chorismate mutase and then to phenylalanine or tyrosine (Herrmann and Weaver, 1999). The combined transcriptome and metabolome profiling of the DS revealed high expression of genes involved in the biosynthesis of phenylalanine and tyrosine, as well as the accumulation of phenylalanine, tyrosine and secondary metabolites derived from them during mounting of the HR (Etalo et al., 2013).
Similarly, genes involved in the degradation of histidine showed significantly higher levels of expression in the DS and in the incompatible interaction, as compared to the compatible one (Supplementary Figure S4, Supplementary Table S4). The degradation of histidine gives rise to glutamate, the precursor for the gamma amino butyric acid (GABA) shunt for the production of GABA. Under energy-demanding conditions, like the systemic activation of defense, pyruvate is produced in high amounts and pyruvate dehydrogenase (PDH) activity becomes a rate-limiting enzyme in converting pyruvate into acetyl-CoA (Bolton et al., 2008). Hence, the GABA shunt provides an alternative means to utilize the excess of pyruvate for energy production. Glutamate decarboxylase (GAD) is the rate-limiting enzyme in the GABA shunt and the encoding gene showed significantly higher expression in the DS (Supplementary Figure S5A). The re-channelling of malate to pyruvate can also be traced by the activation of malate dehydrogenase in the DS and the incompatible interaction (Figures 3A and 3C, see the arrow that links malate to pyruvate). The product of the GABA shunt, GABA, also strongly accumulated in the DS (Supplementary Figure S5B). Indeed, the accumulation of GABA in several plant species upon exposure to various biotic and abiotic related stress conditions has been reported (An et al., 2005; Shelp et al., 2006; van Kan, 2006; Neilson et al., 2013).
In conclusion, the majority of the catabolic processes converge towards the generation of acetyl-CoA that acts as primary precursor for the energy-generating pathway and for the generation of primary and secondary metabolites required during mounting of the defense response.
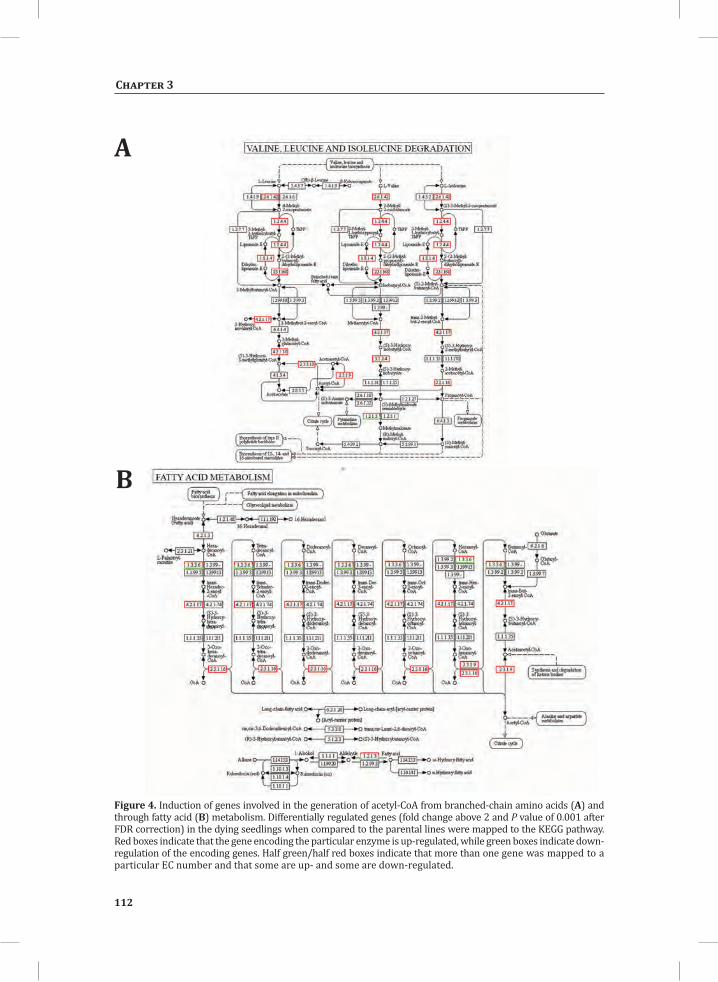
112
Chapter 3
A
B
Figure 4. Induction of genes involved in the generation of acetyl-CoA from branched-chain amino acids (A) and through fatty acid (B) metabolism. Differentially regulated genes (fold change above 2 and P value of 0.001 after FDR correction) in the dying seedlings when compared to the parental lines were mapped to the KEGG pathway. Red boxes indicate that the gene encoding the particular enzyme is up-regulated, while green boxes indicate down-regulation of the encoding genes. Half green/half red boxes indicate that more than one gene was mapped to a particular EC number and that some are up- and some are down-regulated.
Carbon economy and maintenance of energy homeostasis
113
Chapter 3
The HR is characterised by the suppression of energetically costly cellulose biosynthesis and cell wall modificationThe plant cell wall represents a first line of defence against pathogenic microorganisms. It is primarily composed of cellulose, hemicellulose and pectin. This carbon-rich polysaccharide complex represents a useful energy source for pathogen growth and proliferation (Cantu et al., 2008). Through co-evolution, many pathogens developed a strategy to penetrate the plant tissues and to catabolize this carbon source by secreting a mixture of cell wall-degrading enzymes, such as polygalacturonases, pectin methyl esterases, pectin/pectate lyases, xylanases, and endoglucanases (An et al., 2005; Bechtold et al., 2005; Chandra-Shekara et al., 2006; Shelp et al., 2006; van Kan, 2006). Plants use similar enzymes to modify the cell wall during cell wall expansion – occurring during growth - and in fruit ripening (Klessig et al., 2000; Nurnberger et al., 2004; Evrard et al., 2009). These plant cell wall-modifying and -degrading enzymes also represent a potential target for pathogenic microorganisms. In line with this, in the compatible interaction between tomato and C. fulvum, the majority of the genes involved in cell wall modification (11 out of the 13 (~85%) DEGs assigned to this biological process in MAPMAN), showed up-regulation, while in the DS and incompatible interaction respectively only 8 out of the 24 DEGs (~33%) and 3 out of the 17 (~18%) DEGs involved in cell wall modification showed up-regulation (Supplementary Table S5, bin 10.7).
Actually, in the DS and in the incompatible interaction many cell wall biosynthesis, modification and degradation pathway-related genes were suppressed (Supplementary Tables S1 and S5 and Figure 5). In the DS, MAPMAN analysis showed that there were 136 differentially regulated genes involved in cell wall metabolism of which 98 (72%) were down-regulated, while 37 (28%) were up-regulated (Figure 5, Supplementary Table S5). Among the down-regulated ones were genes encoding enzymes involved in cellulose biosynthesis, cell wall modification, cell wall precursor biosynthesis and cell wall degradation (cellulases and β-1,4-glucanases, mannan-xylose-arabinose-fucose, pectate lyases and polygalacturonases and pectin methyl esterases) and cell wall proteins (arabinogalactan proteins (AGPs) and LRRs). Among the up-regulated ones were genes involved in hemicellulose biosynthesis, cell wall modification, cell wall precursor biosynthesis, cell wall proteins (reversibly glycosylated polypeptide (RGP)) and cell wall degradation (cellulases and β-1,4-glucanases, pectate lyases and polygalacturonases and pectin methyl esterases) (Figure 5 and Supplementary Table S5).
Cellulose is primarily targeted by a cocktail of enzymes produced by pathogens for its degradation, whereas its biosynthesis by the plant is energetically costly. One of the astonishing features of the HR in resistant plants is the strong downregulation of the energetically costly cellulose biosynthesis (Figure 5A and B, bin 17, Supplementary Table S5, bin 10.2). Interestingly, genes involved in
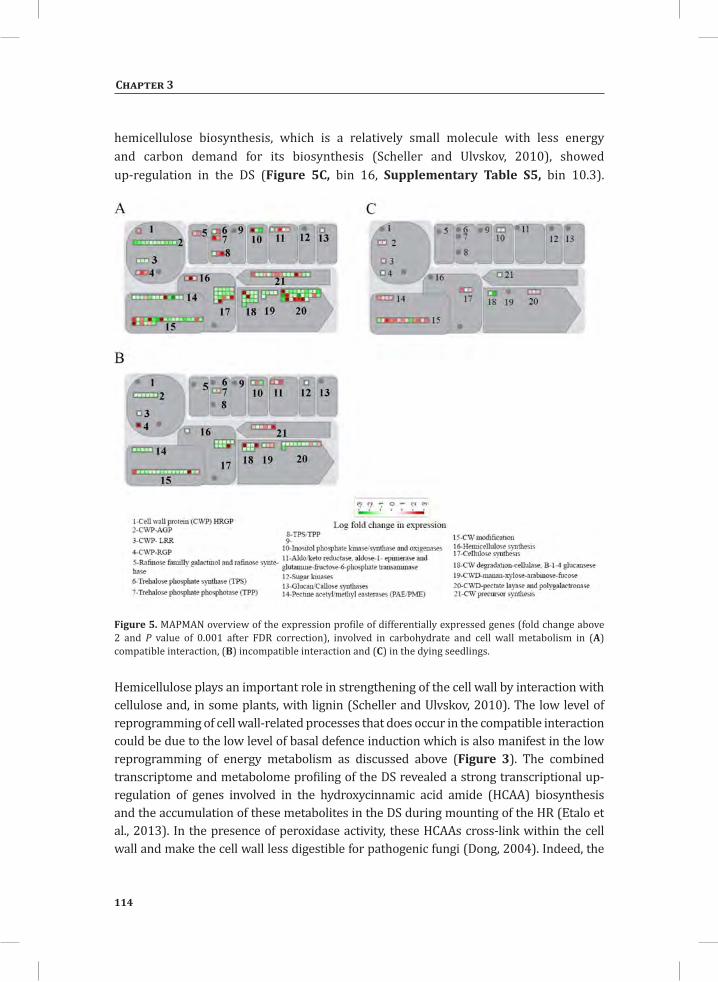
114
Chapter 3
hemicellulose biosynthesis, which is a relatively small molecule with less energy and carbon demand for its biosynthesis (Scheller and Ulvskov, 2010), showed up-regulation in the DS (Figure 5C, bin 16, Supplementary Table S5, bin 10.3).
Figure 5. MAPMAN overview of the expression profile of differentially expressed genes (fold change above 2 and P value of 0.001 after FDR correction), involved in carbohydrate and cell wall metabolism in (A) compatible interaction, (B) incompatible interaction and (C) in the dying seedlings.
Hemicellulose plays an important role in strengthening of the cell wall by interaction with cellulose and, in some plants, with lignin (Scheller and Ulvskov, 2010). The low level of reprogramming of cell wall-related processes that does occur in the compatible interaction could be due to the low level of basal defence induction which is also manifest in the low reprogramming of energy metabolism as discussed above (Figure 3). The combined transcriptome and metabolome profiling of the DS revealed a strong transcriptional up-regulation of genes involved in the hydroxycinnamic acid amide (HCAA) biosynthesis and the accumulation of these metabolites in the DS during mounting of the HR (Etalo et al., 2013). In the presence of peroxidase activity, these HCAAs cross-link within the cell wall and make the cell wall less digestible for pathogenic fungi (Dong, 2004). Indeed, the
Carbon economy and maintenance of energy homeostasis
115
Chapter 3
majority of the peroxidases (17 out of the 23 differentially regulated ones) showed up-regulation and 14 out of these 17 up-regulated genes showed a fold change in expression above 5 (Supplementary Table S6). This result, in combination with the observed down-regulation of cell wall biosynthesis-related genes, could be considered as a less energetically costly strategy of cell wall reinforcement.
The HR is characterised by activation of the mevalonate (MVA) pathway and suppression of the methylerythritol 4-phosphate/ deoxyxylulose 5-phosphate (MEP/DOXP) pathwayAll isoprenoids are derived from the common precursor isopentenyl diphosphate (IPP), which in plants is synthesized via the terpenoid backbone biosynthesis pathway (isoprenoid pathway). IPP synthesis involves two pathways, the mevalonate (MVA) pathway that is common to all eukaryotes and is localised in the cytosol, and the methylerythritol 4-phosphate/ deoxyxylulose 5-phosphate (MEP/DOXP) pathway, which is localized in the plastids (Logemann and Hahlbrock, 2002; Griebel and Zeier, 2008; Vranova et al., 2012) (Figure 6A). These pathways provide important precursors and intermediates for several biosynthetic pathways involved in almost all biological processes in plants, including the biosynthesis of carotenoids, chlorophylls, phylloquinone, plastoquinone, ubiquinone cytochrome a, steroids, the plant brassinosteroid hormones (BRs), abscisic acid (ABA), gibberellic acid (GA), cytokinins, strigolactones and terpenoids (mono-, sesqui-, di-, and tri-terpenoids) (Vranova et al., 2012). Most of the plant hormones produced through these pathways are involved in growth and development and the terpenoids are known to be amongst the major induced metabolites during the defence response of Solanaceous plants. Hence, the involvement of the pathway in both growth and defence makes it one of the potential pathways where the trade-off between growth and the immune response is determined.
Several hypotheses have been postulated to explain how plants can minimize the overall fitness costs of secondary metabolite biosynthesis (Neilson et al., 2013). One of them is the presence of shared biosynthetic enzymes and intermediates between pathways which is cost-effective and increases the plasticity. Farnesyl diphosphate (FPP) is synthesised through the terpenoid backbone biosynthesis pathway in the cytosol and serves as an intermediate for the biosynthesis of terpenoids, sterols and a number of plant hormones. The mono- and diterpenes and carotenoids are synthesized in the plastid through the MEP/DOXP pathway, whereas sesquiterpenoids and triterpenoids are formed in the cytosol through the MVA pathway. In the DS and incompatible interaction, the carotenoid, chlorophyll and steroid biosynthetic pathways were suppressed, which could favour the availability of precursors for tri- and sesquiterpenoid biosynthesis (Figures 6A, B and C). The carotenoids and chlorophylls are generated through the MEP pathway, whereas the steroids are primarily derived through the MVA pathways. Furthermore, within the terpenoid pathway, genes involved in the biosynthesis of monoterpenoids were also significantly down-regulated, while genes involved in the degradation of monoterpenes
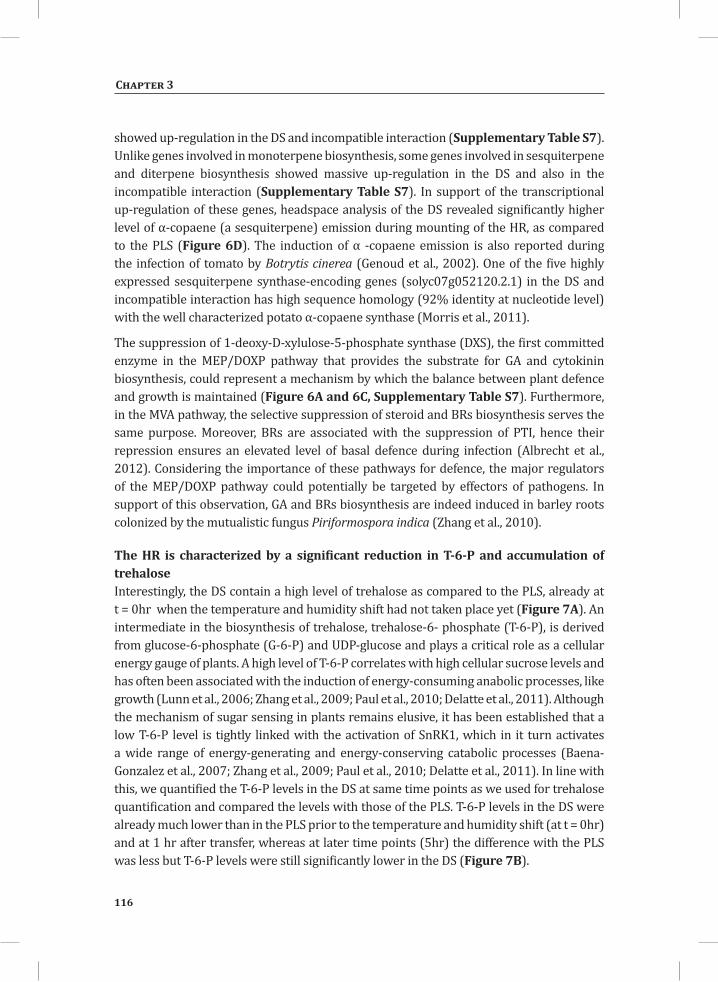
116
Chapter 3
showed up-regulation in the DS and incompatible interaction (Supplementary Table S7). Unlike genes involved in monoterpene biosynthesis, some genes involved in sesquiterpene and diterpene biosynthesis showed massive up-regulation in the DS and also in the incompatible interaction (Supplementary Table S7). In support of the transcriptional up-regulation of these genes, headspace analysis of the DS revealed significantly higher level of α-copaene (a sesquiterpene) emission during mounting of the HR, as compared to the PLS (Figure 6D). The induction of α -copaene emission is also reported during the infection of tomato by Botrytis cinerea (Genoud et al., 2002). One of the five highly expressed sesquiterpene synthase-encoding genes (solyc07g052120.2.1) in the DS and incompatible interaction has high sequence homology (92% identity at nucleotide level) with the well characterized potato α-copaene synthase (Morris et al., 2011).
The suppression of 1-deoxy-D-xylulose-5-phosphate synthase (DXS), the first committed enzyme in the MEP/DOXP pathway that provides the substrate for GA and cytokinin biosynthesis, could represent a mechanism by which the balance between plant defence and growth is maintained (Figure 6A and 6C, Supplementary Table S7). Furthermore, in the MVA pathway, the selective suppression of steroid and BRs biosynthesis serves the same purpose. Moreover, BRs are associated with the suppression of PTI, hence their repression ensures an elevated level of basal defence during infection (Albrecht et al., 2012). Considering the importance of these pathways for defence, the major regulators of the MEP/DOXP pathway could potentially be targeted by effectors of pathogens. In support of this observation, GA and BRs biosynthesis are indeed induced in barley roots colonized by the mutualistic fungus Piriformospora indica (Zhang et al., 2010).
The HR is characterized by a significant reduction in T-6-P and accumulation of trehalose Interestingly, the DS contain a high level of trehalose as compared to the PLS, already at t = 0hr when the temperature and humidity shift had not taken place yet (Figure 7A). An intermediate in the biosynthesis of trehalose, trehalose-6- phosphate (T-6-P), is derived from glucose-6-phosphate (G-6-P) and UDP-glucose and plays a critical role as a cellular energy gauge of plants. A high level of T-6-P correlates with high cellular sucrose levels and has often been associated with the induction of energy-consuming anabolic processes, like growth (Lunn et al., 2006; Zhang et al., 2009; Paul et al., 2010; Delatte et al., 2011). Although the mechanism of sugar sensing in plants remains elusive, it has been established that a low T-6-P level is tightly linked with the activation of SnRK1, which in it turn activates a wide range of energy-generating and energy-conserving catabolic processes (Baena-Gonzalez et al., 2007; Zhang et al., 2009; Paul et al., 2010; Delatte et al., 2011). In line with this, we quantified the T-6-P levels in the DS at same time points as we used for trehalose quantification and compared the levels with those of the PLS. T-6-P levels in the DS were already much lower than in the PLS prior to the temperature and humidity shift (at t = 0hr) and at 1 hr after transfer, whereas at later time points (5hr) the difference with the PLS was less but T-6-P levels were still significantly lower in the DS (Figure 7B).
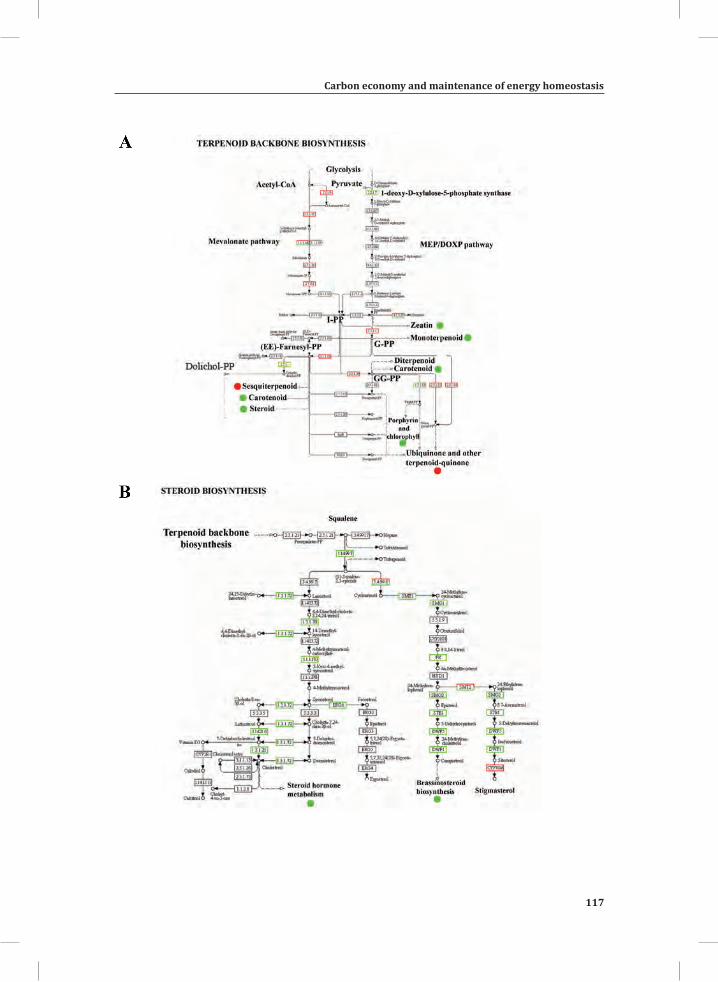
Carbon economy and maintenance of energy homeostasis
117
Chapter 3
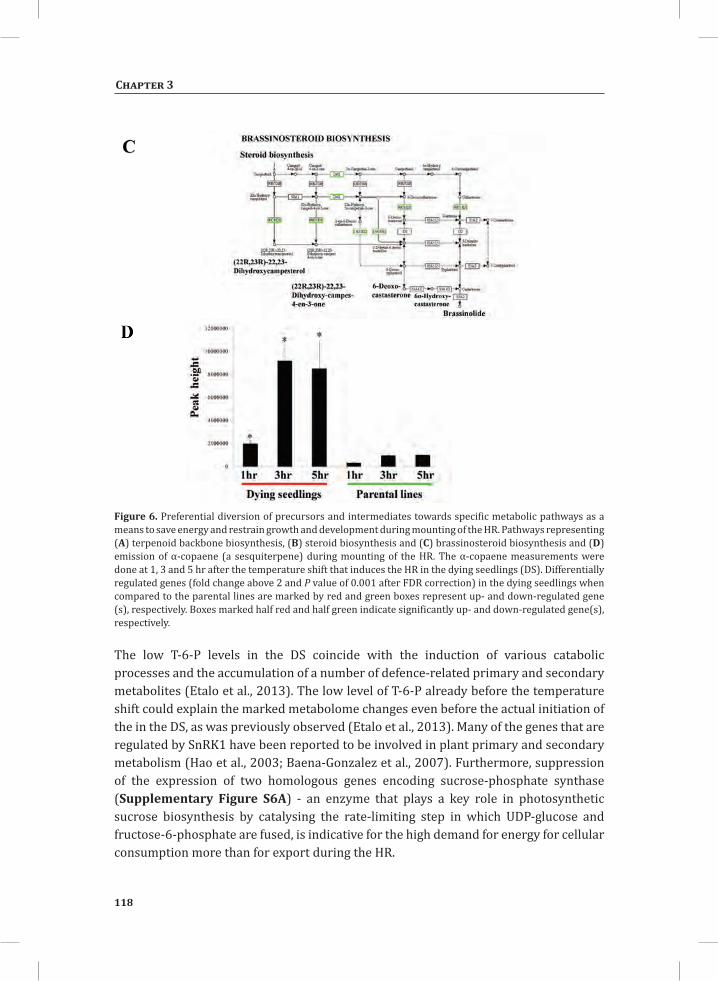
118
Chapter 3
Figure 6. Preferential diversion of precursors and intermediates towards specific metabolic pathways as a means to save energy and restrain growth and development during mounting of the HR. Pathways representing (A) terpenoid backbone biosynthesis, (B) steroid biosynthesis and (C) brassinosteroid biosynthesis and (D) emission of α-copaene (a sesquiterpene) during mounting of the HR. The α-copaene measurements were done at 1, 3 and 5 hr after the temperature shift that induces the HR in the dying seedlings (DS). Differentially regulated genes (fold change above 2 and P value of 0.001 after FDR correction) in the dying seedlings when compared to the parental lines are marked by red and green boxes represent up- and down-regulated gene (s), respectively. Boxes marked half red and half green indicate significantly up- and down-regulated gene(s), respectively.
The low T-6-P levels in the DS coincide with the induction of various catabolic processes and the accumulation of a number of defence-related primary and secondary metabolites (Etalo et al., 2013). The low level of T-6-P already before the temperature shift could explain the marked metabolome changes even before the actual initiation of the in the DS, as was previously observed (Etalo et al., 2013). Many of the genes that are regulated by SnRK1 have been reported to be involved in plant primary and secondary metabolism (Hao et al., 2003; Baena-Gonzalez et al., 2007). Furthermore, suppression of the expression of two homologous genes encoding sucrose-phosphate synthase (Supplementary Figure S6A) - an enzyme that plays a key role in photosynthetic sucrose biosynthesis by catalysing the rate-limiting step in which UDP-glucose and fructose-6-phosphate are fused, is indicative for the high demand for energy for cellular consumption more than for export during the HR.
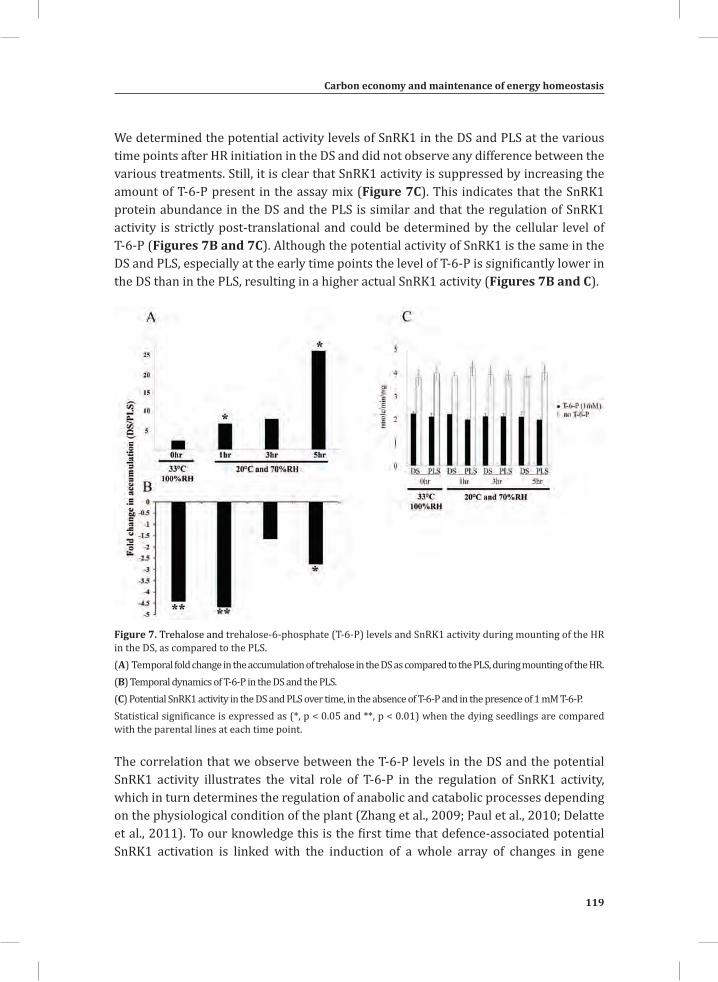
Carbon economy and maintenance of energy homeostasis
119
Chapter 3
We determined the potential activity levels of SnRK1 in the DS and PLS at the various time points after HR initiation in the DS and did not observe any difference between the various treatments. Still, it is clear that SnRK1 activity is suppressed by increasing the amount of T-6-P present in the assay mix (Figure 7C). This indicates that the SnRK1 protein abundance in the DS and the PLS is similar and that the regulation of SnRK1 activity is strictly post-translational and could be determined by the cellular level of T-6-P (Figures 7B and 7C). Although the potential activity of SnRK1 is the same in the DS and PLS, especially at the early time points the level of T-6-P is significantly lower in the DS than in the PLS, resulting in a higher actual SnRK1 activity (Figures 7B and C).
Figure 7. Trehalose and trehalose-6-phosphate (T-6-P) levels and SnRK1 activity during mounting of the HR in the DS, as compared to the PLS.(A) Temporal fold change in the accumulation of trehalose in the DS as compared to the PLS, during mounting of the HR.(B) Temporal dynamics of T-6-P in the DS and the PLS. (C) Potential SnRK1 activity in the DS and PLS over time, in the absence of T-6-P and in the presence of 1 mM T-6-P. Statistical significance is expressed as (*, p < 0.05 and **, p < 0.01) when the dying seedlings are compared with the parental lines at each time point.
The correlation that we observe between the T-6-P levels in the DS and the potential SnRK1 activity illustrates the vital role of T-6-P in the regulation of SnRK1 activity, which in turn determines the regulation of anabolic and catabolic processes depending on the physiological condition of the plant (Zhang et al., 2009; Paul et al., 2010; Delatte et al., 2011). To our knowledge this is the first time that defence-associated potential SnRK1 activation is linked with the induction of a whole array of changes in gene
120
Chapter 3
expression, resulting in energy conservation and energy production through catabolic processes and the inhibition of growth during mounting of the HR. At the time of the temperature shift that initiates the HR, the DS are smaller than the PLS (de Jong et al., 2002). This observation shows on the one hand that the DS system is slightly leaky and the activation of defence responses has already been triggered to some extent, as was also demonstrated by the altered metabolome of the DS even before the temperature shift (Etalo et al., 2013). On the other hand, this phenotype is in line with the theory that increased biosynthesis of defence-related metabolites should cause a reduction in growth because of carbon limitation, resulting in a downward adjustment of growth to a level that can be supported by the new level of carbon availability (Smith and Stitt, 2007). The SnRK1-mediated suppressive effect on growth, as a result of the activation of catabolism, could be one of the mechanisms by which plants maintain their energy and carbon homeostasis during the response of plants against pathogens. Moreover, the repression of energy-consuming anabolic processes such as steroid biosynthesis and fatty acid branching and the up-regulation of asparagine synthase and proline dehydrogenase, are additional indicators for increased activation of SnRK1 (Figure 7B, C and Supplementary Figures S6B, C and D) (Baena-Gonzalez et al., 2007; Hanson et al., 2008).
Two scenarios could explain the lower T-6-P levels that we observed to be present in the DS (Figure 7B). First, these low levels could be attributed to the high consumption of its precursor carbohydrates (G-6-P and UDP-glucose) to support the HR-associated transcriptome and metabolome reprogramming. However, the level of sucrose was even significantly higher in the DS at 1, 3 and 5 hrs after the temperature shift, while fructose and glucose levels were not significantly different between the DS and the PLS (Supplementary Figure S2). Maintenance of the relatively high steady-state levels of these mono- and disaccharides could be attributed to the activity of polysaccharide-hydrolysing enzymes in the DS. Indeed, a cell wall invertase (cwINV) was highly transcriptionally up-regulated in the DS and resistant plants inoculated with C. fulvum (Supplementary Table S8, Supplementary Figure S4). cwINV is found in the cell wall and catalyses the hydrolysis of sucrose into glucose and fructose for energy production and the generation of carbon skeletons for the biosynthesis of large molecules (Supplementary Figure S4). One of the cwINVs (solyc10g083290.1) that showed extremely high expression in the DS and incompatible interaction (a fold change of 26 and 18, respectively) was down-regulated by 2 fold in the compatible interaction (Supplementary Table S4), maybe indicating suppression by virulent C. fulvum. Hence, the active conversion of di- and polysaccharides into glucose and its continuous use in the defence-related biosynthesis pool might contribute to the maintenance of low, but stable levels of glucose that would otherwise cause a starvation response in the cell. The second scenario implies an active depletion of T-6-P, as a result of its conversion into
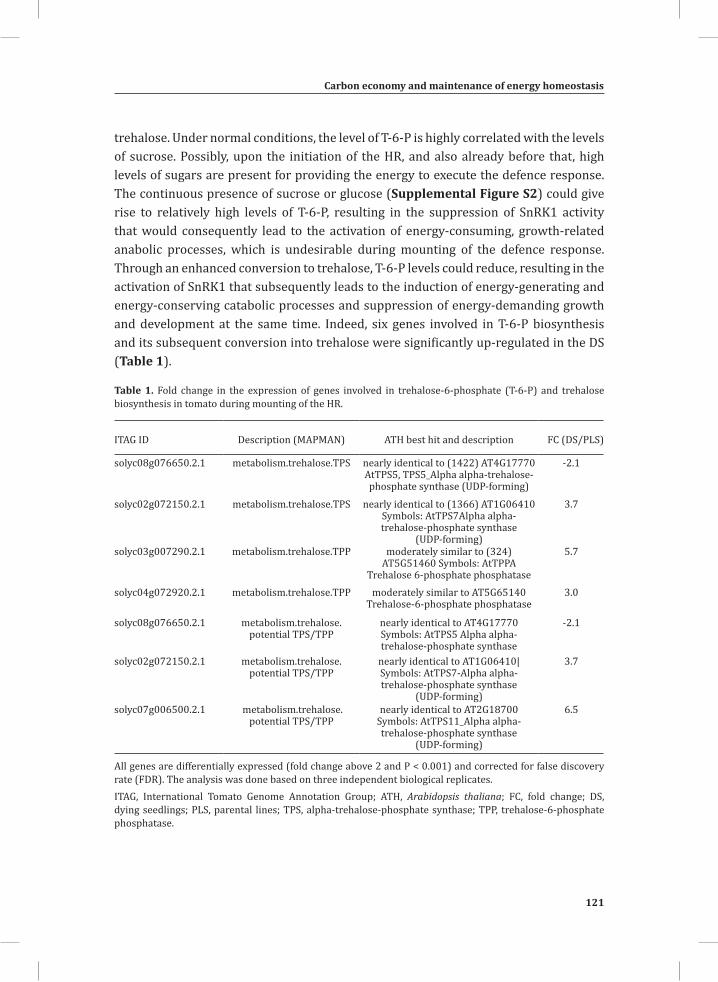
Carbon economy and maintenance of energy homeostasis
121
Chapter 3
trehalose. Under normal conditions, the level of T-6-P is highly correlated with the levels of sucrose. Possibly, upon the initiation of the HR, and also already before that, high levels of sugars are present for providing the energy to execute the defence response. The continuous presence of sucrose or glucose (Supplemental Figure S2) could give rise to relatively high levels of T-6-P, resulting in the suppression of SnRK1 activity that would consequently lead to the activation of energy-consuming, growth-related anabolic processes, which is undesirable during mounting of the defence response. Through an enhanced conversion to trehalose, T-6-P levels could reduce, resulting in the activation of SnRK1 that subsequently leads to the induction of energy-generating and energy-conserving catabolic processes and suppression of energy-demanding growth and development at the same time. Indeed, six genes involved in T-6-P biosynthesis and its subsequent conversion into trehalose were significantly up-regulated in the DS (Table 1).
Table 1. Fold change in the expression of genes involved in trehalose-6-phosphate (T-6-P) and trehalose biosynthesis in tomato during mounting of the HR.
ITAG ID Description (MAPMAN) ATH best hit and description FC (DS/PLS)
solyc08g076650.2.1 metabolism.trehalose.TPS nearly identical to (1422) AT4G17770 AtTPS5, TPS5_Alpha alpha-trehalose-phosphate synthase (UDP-forming)
-2.1
solyc02g072150.2.1 metabolism.trehalose.TPS nearly identical to (1366) AT1G06410 Symbols: AtTPS7Alpha alpha-trehalose-phosphate synthase
(UDP-forming)
3.7
solyc03g007290.2.1 metabolism.trehalose.TPP moderately similar to (324) AT5G51460 Symbols: AtTPPA
Trehalose 6-phosphate phosphatase
5.7
solyc04g072920.2.1 metabolism.trehalose.TPP moderately similar to AT5G65140 Trehalose-6-phosphate phosphatase
3.0
solyc08g076650.2.1 metabolism.trehalose.potential TPS/TPP
nearly identical to AT4G17770 Symbols: AtTPS5 Alpha alpha-trehalose-phosphate synthase
-2.1
solyc02g072150.2.1 metabolism.trehalose.potential TPS/TPP
nearly identical to AT1G06410| Symbols: AtTPS7-Alpha alpha-trehalose-phosphate synthase
(UDP-forming)
3.7
solyc07g006500.2.1 metabolism.trehalose.potential TPS/TPP
nearly identical to AT2G18700 Symbols: AtTPS11_Alpha alpha-trehalose-phosphate synthase
(UDP-forming)
6.5
All genes are differentially expressed (fold change above 2 and P < 0.001) and corrected for false discovery rate (FDR). The analysis was done based on three independent biological replicates.ITAG, International Tomato Genome Annotation Group; ATH, Arabidopsis thaliana; FC, fold change; DS, dying seedlings; PLS, parental lines; TPS, alpha-trehalose-phosphate synthase; TPP, trehalose-6-phosphate phosphatase.
122
Chapter 3
In conclusion, the high accumulation of trehalose appears to be the consequence of the active lowering of the T-6-P levels, which then results in SnRK1 activation and an increased expression of the genes regulated by SnRK1 kinase. The active depletion of T-6-P suggests a strong autophagic strategy used by the plant to maintain a high level of energy that can be used to mount the HR.
The circadian clock, hormone signalling and photosynthesis during the HRThe co-ordinated repression of auxin, BRs, cytokinins and GA biosynthesis- and signalling-related genes, in addition to genes involved in the circadian clock and in light harvesting and downstream photosynthetic processes, indicates the existence of an interaction between light, stress and hormone signalling pathways (Figures 6 and 8, Supplementary Figure S1 and Supplementary Table S1, bins 1, 17.2.2, 17.3, 17.6, 27.3.40 and 30.1) (Nemhauser et al., 2004; Bancos et al., 2006; Covington and Harmer, 2007; Alabadi and Blazquez, 2009; Arana et al., 2011). The circadian clock plays an important role in the interaction of plants with biotrophic pathogens as the life cycle of the pathogen is intimately linked with the host metabolism, which in turn is controlled by the cycle of day and night (Wang et al., 2011). Hence, the interaction of pathogens with their host may also be controlled by the circadian clock. This is especially likely as plants do not have specialized immune cells and their immune response has to be finely balanced with other cellular functions. Auxins, BRs, cytokinins, GA and strigolactones all have been implicated in the modulation of plant growth and development (Brian, 1959; Clouse and Sasse, 1998; Ferguson and Beveridge, 2009; Werner and Schmülling, 2009; Zhao, 2010). Restraining of growth-related processes is essential during the plant defence response to pathogens. The circadian clock has been found to regulate the expression of components involved in nearly every step in the auxin-signalling pathway, from its synthesis to the actual response to the hormone (Covington and Harmer, 2007). A time-dependent transcriptional co-expression analysis of the DS and the PLS also revealed the presence of a cluster of genes with significant SORLIP4 (phytochrome A-regulated gene expression) motif enrichment (Etalo et al., 2013). This cluster represents genes mostly associated with the circadian rhythm and light signalling.
All of the differentially regulated TCP transcription factors (8 genes in total) were down-regulated in the DS (Supplementary Table S9). TCP transcription factors are implicated in multiple aspects of developmental control and for example TCP4 mutants showed a growth-arrest phenotype (Palatnik et al., 2003). Accumulating evidence showed the involvement of the circadian clock in the regulation of the isoprenoid pathway (Rodriguez-Concepcion et al., 2004; Dudareva et al., 2005; Rodriguez-Villalon et al., 2009; Vranová et al., 2013). Furthermore, the MEP/DOXP pathway showed rhythmicity and was shown to be controlled by the circadian clock (Dudareva et al., 2005). The major plant growth regulators such as the BRs, GA, cytokinins, strigolactones, carotenoids and
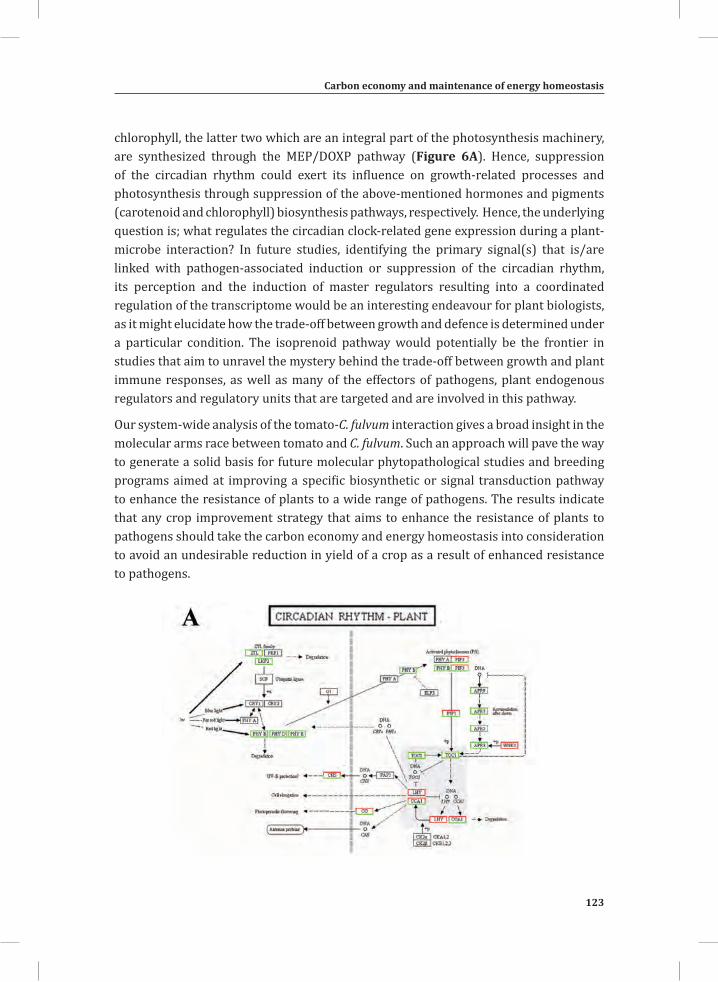
Carbon economy and maintenance of energy homeostasis
123
Chapter 3
chlorophyll, the latter two which are an integral part of the photosynthesis machinery, are synthesized through the MEP/DOXP pathway (Figure 6A). Hence, suppression of the circadian rhythm could exert its influence on growth-related processes and photosynthesis through suppression of the above-mentioned hormones and pigments (carotenoid and chlorophyll) biosynthesis pathways, respectively. Hence, the underlying question is; what regulates the circadian clock-related gene expression during a plant-microbe interaction? In future studies, identifying the primary signal(s) that is/are linked with pathogen-associated induction or suppression of the circadian rhythm, its perception and the induction of master regulators resulting into a coordinated regulation of the transcriptome would be an interesting endeavour for plant biologists, as it might elucidate how the trade-off between growth and defence is determined under a particular condition. The isoprenoid pathway would potentially be the frontier in studies that aim to unravel the mystery behind the trade-off between growth and plant immune responses, as well as many of the effectors of pathogens, plant endogenous regulators and regulatory units that are targeted and are involved in this pathway.
Our system-wide analysis of the tomato-C. fulvum interaction gives a broad insight in the molecular arms race between tomato and C. fulvum. Such an approach will pave the way to generate a solid basis for future molecular phytopathological studies and breeding programs aimed at improving a specific biosynthetic or signal transduction pathway to enhance the resistance of plants to a wide range of pathogens. The results indicate that any crop improvement strategy that aims to enhance the resistance of plants to pathogens should take the carbon economy and energy homeostasis into consideration to avoid an undesirable reduction in yield of a crop as a result of enhanced resistance to pathogens.
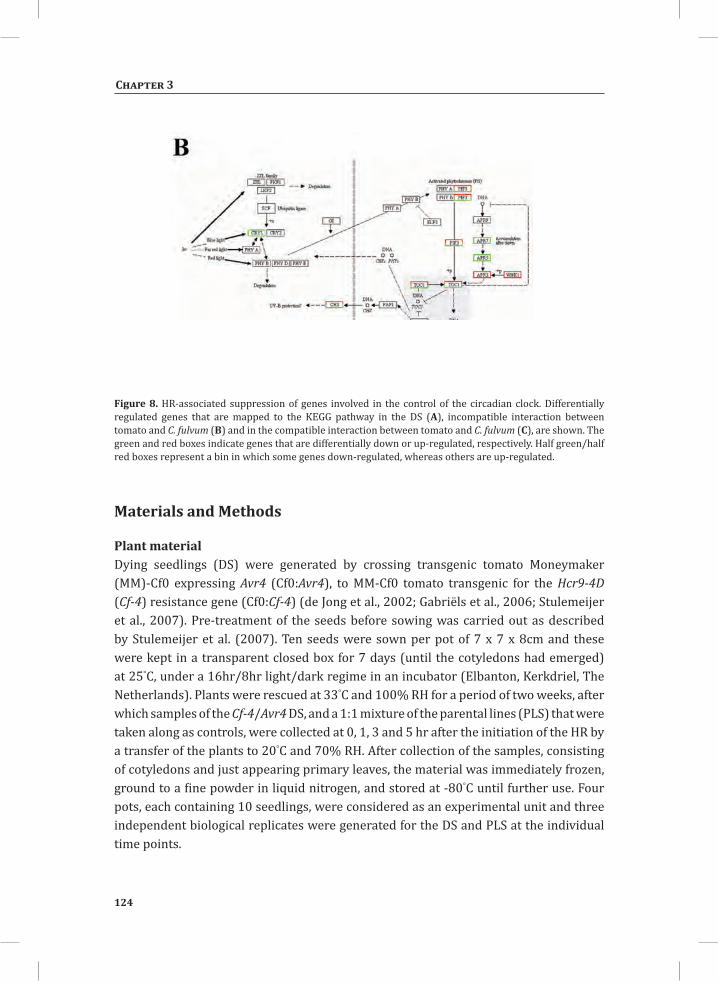
124
Chapter 3
Figure 8. HR-associated suppression of genes involved in the control of the circadian clock. Differentially regulated genes that are mapped to the KEGG pathway in the DS (A), incompatible interaction between tomato and C. fulvum (B) and in the compatible interaction between tomato and C. fulvum (C), are shown. The green and red boxes indicate genes that are differentially down or up-regulated, respectively. Half green/half red boxes represent a bin in which some genes down-regulated, whereas others are up-regulated.
Materials and Methods
Plant material Dying seedlings (DS) were generated by crossing transgenic tomato Moneymaker (MM)-Cf0 expressing Avr4 (Cf0:Avr4), to MM-Cf0 tomato transgenic for the Hcr9-4D (Cf-4) resistance gene (Cf0:Cf-4) (de Jong et al., 2002; Gabriëls et al., 2006; Stulemeijer et al., 2007). Pre-treatment of the seeds before sowing was carried out as described by Stulemeijer et al. (2007). Ten seeds were sown per pot of 7 x 7 x 8cm and these were kept in a transparent closed box for 7 days (until the cotyledons had emerged) at 25°C, under a 16hr/8hr light/dark regime in an incubator (Elbanton, Kerkdriel, The Netherlands). Plants were rescued at 33°C and 100% RH for a period of two weeks, after which samples of the Cf-4/Avr4 DS, and a 1:1 mixture of the parental lines (PLS) that were taken along as controls, were collected at 0, 1, 3 and 5 hr after the initiation of the HR by a transfer of the plants to 20°C and 70% RH. After collection of the samples, consisting of cotyledons and just appearing primary leaves, the material was immediately frozen, ground to a fine powder in liquid nitrogen, and stored at -80°C until further use. Four pots, each containing 10 seedlings, were considered as an experimental unit and three independent biological replicates were generated for the DS and PLS at the individual time points.
Carbon economy and maintenance of energy homeostasis
125
Chapter 3
To validate gene expression profiles observed in the DS and PLS, the Cf0:Avr4 (susceptible) and Cf0:Cf-4 (resistant) parental tomato lines were also inoculated with C. fulvum race 5, which produces (de Wit, 1977). Three independent biological replicates were used, each consisting of three plants. Mock-treated susceptible and resistant plants were used as controls. Leaves were harvested 6 days after inoculation with the fungus, immediately frozen, ground to a fine powder in liquid nitrogen, and stored at -80°C until further use.
RNA isolation and RNA-seq analysis The RNA-seq analysis was performed at the Beijing Genome Institute (BGI) (Beijing, China). For this, RNA was isolated from 100 mg of tomato leaf tissue, using 1 ml of Trizol reagent (Invitrogen) according to the manufacturer’s instructions. The total RNA was treated with DNAse-I Amplification Grade (Invitrogen) and purified with an RNeasy Mini kit (Qiagen). Beads with oligo(dT) were used to isolate poly(A) mRNA from the total RNA. Fragmentation buffer was added to section the mRNA into short fragments. Taking these short fragments as templates, random hexamer primers were used to synthesize the first-strand cDNA. The second-strand cDNA was synthesized using buffer, dNTPs, RNase H and DNA polymerase I. Short fragments were purified with the QiaQuick PCR extraction kit and resolved with EB buffer for end reparation and adding poly(A). After that, the short fragments were connected with sequencing adaptors. For amplification with PCR, suitable fragments were selected, as templates, with respect to the result of agarose gel electrophoresis. The library was sequenced using Illumina HiSeq™ 2000. Clean reads were mapped onto the tomato reference genome and gene sequences, using SOAP2 (Li et al., 2009). Mismatches of no more than 5 bases were allowed in the alignment. For the calculation of Unigene expression the RPKM method (Reads Per Kb per Million reads) was used (Mortazavi et al., 2008). When there was more than one transcript for a gene, the longest one was used to calculate its expression level and coverage. In our analysis, differentially expressed genes (DEGs) with a P value after false discovery rate (FDR) correction of ≤ 0.001 and a fold change (treatment/control) ratio larger than 2 were used for GO functional analysis and KEGG Pathway analysis. Hereto, all DEGs were first mapped to GO terms in the database (http://www.geneontology.org/), calculating gene numbers for every term. Then the ultra-geometric test was used to find significantly enriched GO terms in DEGs by comparing them to the genome background. Furthermore, pathway enrichment analysis was performed to identify significantly enriched metabolic pathways or signal transduction pathways in DEGs compared with the whole genome background.
Analysis of metabolites and determination of SnRK1 activityPolar primary metabolites were extracted following the procedure described by Lisec and co-workers (Lisec et al., 2006) with minor modifications, as described by Etalo et
126
Chapter 3
al. (2013). To analyse Volatile Organic Compounds (VOCs), one pot with 10 seedlings was placed in a 1 liter air-tight transparent glass jar and the headspace of the plants was collected using tenax adsorption that are mounted in the glass jar while the system was continuously flushed with fresh air (Tikunov et al., 2007). Headspace samples were analysed with a Thermo Trace gas chromatograph, connected to a Thermo Trace DSQ quadrupole mass spectrometer (Thermo Fisher Scientific, Waltham). Before thermo-desorption, cartridges were flushed with helium at 50 ml/min for 20 min to remove moisture and oxygen. After flushing, the collected volatiles were desorbed from the cartridges at 220°C (Ultra; Markes, Llantrisant) for 5 min with a helium flow of 30 ml/min with a split ratio of 1:1. The released compounds were focused on an electrically cooled sorbent trap (Unity; Markes, Llantrisant) at a temperature of 10°C. Volatiles were injected onto the analytical column (ZB-5MSi, 30 m x 0.25 mm ID, 1.0 μm – film thickness, Zebron, Phenomenex) with a split flow of 40 mL/min by ballistic heating of the cold trap to 250°C for 3 min. The temperature program started at 40°C (3 min hold) and rose with 10°C/min to 280°C (3 min hold). The column effluent was ionized by electron impact (EI) at 70 eV. Mass scanning was done from 45 to 450 m/z with a scan time of 6 scans/sec. The ion source temperature was set to 250°C and the transfer line was set to 275°C. The eluted compounds were identified using Xcalibur software (Thermo, Waltham) by comparing the mass spectra with those of authentic reference standards.
Samples for trehalose-6-phosphate (T-6-P) quantification where harvested, snap frozen in liquid nitrogen, and ground to a fine powder before extraction. T-6-P was analysed by the combination of liquid- and solid-phase extractions, followed by ion exchange chromatography-mass spectrometry according to Delatte et al. (2009). The method allowed baseline separation of phosphorylated-disaccharides such as: T-6-P, sucrose-6-phosphate, and the internal standard lactose-1-phosphate at the mass-to-charge ratio of T-6-P. Lactose-1-phosphate was used as an internal standard because it is not synthesized by plants. SnRK1 was assayed in the presence or absence of 1 mM T-6-P by determining phosphorylation of the AMARA peptide as described by Zhang et al. (2009).
Carbon economy and maintenance of energy homeostasis
127
Chapter 3
Acknowledgements
We wish to thank Bert Schipper (Plant Research International (PRI)), for technical assistance with primary and secondary metabolite analysis and Bert Essenstam for taking care of the plants. We thank all people in the Metabolomics groups of the Laboratory of Plant Physiology (Wageningen University) and of PRI for their kind support. This project was (co)financed by the Centre for BioSystems Genomics (CBSG; to DWE, RCHDV, MHAJJ and HJB) and The Netherlands Metabolomics Centre (to RCHDV) which are both part of the Netherlands Genomics Initiative / Netherlands Organisation for Scientific Research.
References
Alabadi D, Blazquez MA (2009) Molecular interactions between light and hormone signaling to control plant growth. Plant Mol Biol 69: 409-417
Albrecht C, Boutrot F, Segonzac C, Schwessinger B, Gimenez-Ibanez S, Chinchilla D, Rathjen JP, de Vries SC, Zipfel C (2012) Brassinosteroids inhibit pathogen-associated molecular pattern-triggered immune signaling independent of the receptor kinase BAK1. Proc Natl Acad Sci USA 109: 303-308
An HJ, Lurie S, Greve LC, Rosenquist D, Kirmiz C, Labavitch JM, Lebrilla CB (2005) Determination of pathogen-related enzyme action by mass spectrometry analysis of pectin breakdown products of plant cell walls. Anal Biochem 338: 71-82
Arana MV, Marín-de la Rosa N, Maloof JN, Blázquez MA, Alabadí D (2011) Circadian oscillation of gibberellin signaling in Arabidopsis. Proc Natl Acad Sci USA 108: 9292-9297
Araújo WL, Ishizaki K, Nunes-Nesi A, Larson TR, Tohge T, Krahnert I, Witt S, Obata T, Schauer N, Graham IA, Leaver CJ, Fernie AR (2010) Identification of the 2-hydroxyglutarate and isovaleryl-CoA dehydrogenases as alternative electron donors linking lysine catabolism to the electron transport chain of Arabidopsis mitochondria. Plant Cell 22: 1549-1563
Araujo WL, Tohge T, Ishizaki K, Leaver CJ, Fernie AR (2011) Protein degradation - an alternative respiratory substrate for stressed plants. Trends Plant Sci 16: 489-498
Baena-Gonzalez E, Rolland F, Thevelein JM, Sheen J (2007) A central integrator of transcription networks in plant stress and energy signalling. Nature 448: 938-942
Bancos S, Szatmári A-M, Castle J, Kozma-Bognár L, Shibata K, Yokota T, Bishop GJ, Nagy F, Szekeres M (2006) Diurnal regulation of the brassinosteroid-biosynthetic CPD gene in Arabidopsis. Plant Physiol 141: 299-309
Bechtold U, Karpinski S, Mullineaux PM (2005) The influence of the light environment and photosynthesis on oxidative signalling responses in plant-biotrophic pathogen interactions. Plant Cell Environ 28: 1046-1055
Blasing OE, Gibon Y, Gunther M, Hohne M, Morcuende R, Osuna D, Thimm O, Usadel B, Scheible WR, Stitt M (2005) Sugars and circadian regulation make major contributions to the global regulation of diurnal gene expression in Arabidopsis. Plant Cell 17: 3257-3281
Bolton MD (2009) Primary metabolism and plant defense--fuel for the fire. Mol Plant Microbe Interact 22: 487-497
Bolton MD, Kolmer JA, Xu WW, Garvin DF (2008) Comparative transcript profiling of Lr1- and Lr34-mediated leaf rust resistance in wheat. Phytopathology 98: S24-S24
Bonfig KB, Schreiber U, Gabler A, Roitsch T, Berger S (2006) Infection with virulent and avirulent P.syringae strains differentially affects photosynthesis and sink metabolism in Arabidopsis leaves. Planta 225: 1-12
Brian PW (1959) Effects of gibberellins on plant growth and development. Biol Rev 34: 37-77
128
Chapter 3
Cai X, Takken FLW, Joosten MHAJ, De Wit PJGM (2001) Specific recognition of AVR4 and AVR9 results in distinct patterns of hypersensitive cell death in tomato, but similar patterns of defence-related gene expression. Mol Plant Pathol 2: 77-86
Cantu D, Vicente AR, Labavitch JM, Bennett AB, Powell AL (2008) Strangers in the matrix: plant cell walls and pathogen susceptibility. Trends Plant Sci 13: 610-617
Chandra-Shekara AC, Gupte M, Navarre D, Raina S, Raina R, Klessig D, Kachroo P (2006) Light-dependent hypersensitive response and resistance signaling against Turnip Crinkle Virus in Arabidopsis. Plant J 45: 320-334
Chisholm ST, Coaker G, Day B, Staskawicz BJ (2006) Host-microbe interactions: shaping the evolution of the plant immune response. Cell 124: 803-814
Clouse SD, Sasse JM (1998) Brassinosteroids: Essential regulators of plant growth and development. Annu Rev Plant Physiol Plant Mol Biol 49: 427-451
Covington MF, Harmer SL (2007) The circadian clock regulates auxin signaling and responses in Arabidopsis. PLoS Biol 5: 1773-1784
de Jong CF, Takken FLW, Cai XH, de Wit PJGM, Joosten MHAJ (2002) Attenuation of Cf-mediated defense responses at elevated temperatures correlates with a decrease in elicitor-binding sites. Mol Plant-Microbe Interact 15: 1040-1049
de Wit PJGM (1977) A light and scanning-electron microscopic study of infection of tomato plants by virulent and avirulent races of Cladosporium fulvum. Neth J Plant Pathol. 83: 109-122
de Wit PJGM, Joosten MHAJ (1999) Avirulence and resistance genes in the Cladosporium fulvum-tomato interaction. Curr Opin Microbiol 2: 368-373
Delatte TL, Sedijani P, Kondou Y, Matsui M, de Jong GJ, Somsen GW, Wiese-Klinkenberg A, Primavesi LF, Paul MJ, Schluepmann H (2011) Growth arrest by trehalose-6-phosphate: an astonishing case of primary metabolite control over growth by way of the SnRK1 signaling pathway. Plant Physiol 157: 160-174
Dodds PN, Rathjen JP (2010) Plant immunity: towards an integrated view of plant-pathogen interactions. Nat Rev Genet 11: 539-548
Dong X (2004) NPR1, all things considered. Curr Opin Plant Biol 7: 547 - 552Dudareva N, Andersson S, Orlova I, Gatto N, Reichelt M, Rhodes D, Boland W, Gershenzon J (2005) The
nonmevalonate pathway supports both monoterpene and sesquiterpene formation in snapdragon flowers. Proc Natl Acad Sci USA 102: 933-938
Etalo DW, Stulemeijer IJE, Peter van Esse H, de Vos RCH, Bouwmeester HJ, Joosten MHAJ (2013) System-wide hypersensitive response-associated transcriptome and metabolome reprogramming in tomato. Plant Physiol 162: 1599-1617
Evrard A, Ndatimana T, Eulgem T (2009) FORCA, a promoter element that responds to crosstalk between defense and light signaling. BMC Plant Biol 9: 1-13
Farre EM, Weise SE (2012) The interactions between the circadian clock and primary metabolism. Curr Opin Plant Biol 15: 293-300
Ferguson BJ, Beveridge CA (2009) Roles for auxin, cytokinin, and strigolactone in regulating shoot branching. Plant Physiol 149: 1929-1944
Gabriëls SHEJ, Takken FLW, Vossen JH, de Jong CF, Liu Q, Turk SCHJ, Wachowski LK, Peters J, Witsenboer HMA, de Wit PJGM, Joosten MHAJ (2006) cDNA-AFLP combined with functional analysis reveals novel genes involved in the hypersensitive response. Mol Plant Microbe Interact 19: 567-576
Genoud T, Buchala A, Chua N, Metraux J (2002) Phytochrome signalling modulates the SA-perceptive pathway in Arabidopsis. Plant J 31: 87 - 95
Griebel T, Zeier J (2008) Light regulation and daytime dependency of inducible plant defenses in Arabidopsis: phytochrome signaling controls systemic acquired resistance rather than local defense. Plant Physiol 147: 790 - 801
Hanson J, Hanssen M, Wiese A, Hendriks MMWB, Smeekens S (2008) The sucrose regulated transcription factor bZIP11 affects amino acid metabolism by regulating the expression of ASPARAGINE SYNTHETASE1 and PROLINE DEHYDROGENASE2. Plant J 53: 935-949
Hao L, Wang H, Sunter G, Bisaro DM (2003) Geminivirus AL2 and L2 proteins interact with and inactivate SNF1 kinase. Plant Cell 15: 1034-1048
Herrmann KM, Weaver LM (1999) The Shikimate Pathway. Annu Rev Plant Physiol Plant Mol Biol 50: 473-503
Carbon economy and maintenance of energy homeostasis
129
Chapter 3
Ishizaki K, Larson TR, Schauer N, Fernie AR, Graham IA, Leaver CJ (2005) The critical role of Arabidopsis electron-transfer flavoprotein:ubiquinone oxidoreductase during dark-induced starvation. Plant Cell 17: 2587-2600
Ishizaki K, Schauer N, Larson TR, Graham IA, Fernie AR, Leaver CJ (2006) The mitochondrial electron transfer flavoprotein complex is essential for survival of Arabidopsis in extended darkness. Plant J 47: 751-760
Jones JD, Dangl JL (2006) The plant immune system. Nature 444: 323-329Klessig D, Durner J, Noad R, Navarre D, Wendehenne D, Kumar D, Zhou J, Shah J, Zhang S, Kachroo P,
Trifa Y, Pontier D, Lam E, Silva H (2000) Nitric oxide and salicylic acid signaling in plant defense. Proc Natl Acad Sci USA 97: 8849 - 8855
Lam E, Kato N, Lawton M (2001) Programmed cell death, mitochondria and the plant hypersensitive response. Nature 411: 848-853
Li R, Yu C, Li Y, Lam TW, Yiu SM, Kristiansen K, Wang J (2009) SOAP2: an improved ultrafast tool for short read alignment. Bioinformatics 25: 1966-1967
Lisec J, Schauer N, Kopka J, Willmitzer L, Fernie AR (2006) Gas chromatography mass spectrometry-based metabolite profiling in plants. Nat Protoc 1: 387-396
Logemann E, Hahlbrock K (2002) Crosstalk among stress responses in plants: pathogen defense overrides UV protection through an inversely regulated ACE/ACE type of light-responsive gene promoter unit. Proc Natl Acad Sci USA 99: 2428 - 2432
Lunn JE, Feil R, Hendriks JH, Gibon Y, Morcuende R, Osuna D, Scheible WR, Carillo P, Hajirezaei MR, Stitt M (2006) Sugar-induced increases in trehalose 6-phosphate are correlated with redox activation of ADPglucose pyrophosphorylase and higher rates of starch synthesis in Arabidopsis thaliana. Biochem J 397: 139-148
Mano S, Nishimura M (2005) Plant peroxisomes. Vitam Horm 72: 111-154Morris WL, Ducreux LJM, Shepherd T, Lewinsohn E, Davidovich-Rikanati R, Sitrit Y, Taylor MA (2011)
Utilisation of the MVA pathway to produce elevated levels of the sesquiterpene α-copaene in potato tubers. Phytochemistry 72: 2288-2293
Mortazavi A, Williams BA, McCue K, Schaeffer L, Wold B (2008) Mapping and quantifying mammalian transcriptomes by RNA-Seq. Nat Methods 5: 621-628
Neilson EH, Goodger JQD, Woodrow IE, Møller BL (2013) Plant chemical defense: at what cost? Trends Plant Sci 18: 250-258
Nemhauser JL, Mockler TC, Chory J (2004) Interdependency of brassinosteroid and auxin signaling in Arabidopsis. PLoS Biol 2: 1260-1271
Nunes C, O’Hara LE, Primavesi LF, Delatte TL, Schluepmann H, Somsen GW, Silva AB, Fevereiro PS, Wingler A, Paul MJ (2013) The trehalose 6-phosphate/SnRK1 signaling pathway primes growth recovery following relief of sink limitation. Plant Physiol 162: 1720-1732
Nurnberger T, Brunner F, Kemmerling B, Piater L (2004) Innate immunity in plants and animals: striking similarities and obvious differences. Immunol Rev 198: 249 - 266
Palatnik JF, Allen E, Wu X, Schommer C, Schwab R, Carrington JC, Weigel D (2003) Control of leaf morphogenesis by microRNAs. 425: 257-263
Paul MJ, Jhurreea D, Zhang Y, Primavesi LF, Delatte T, Schluepmann H, Wingler A (2010) Upregulation of biosynthetic processes associated with growth by trehalose 6-phosphate. Plant Signal Behav 5: 386-392
Penfield S, Pinfield-Wells HM, Graham IA (2006) Storage reserve mobilisation and seedling establishment in Arabidopsis. Arabidopsis Book 4: 1-17
Ramsey KM, Bass J (2011) Circadian clocks in fuel harvesting and energy homeostasis. Cold Spring Harb Symp Quant Biol 76: 63-72
Rodriguez-Concepcion M, Fores O, Martinez-Garcia JF, Gonzalez V, Phillips MA, Ferrer A, Boronat A (2004) Distinct light-mediated pathways regulate the biosynthesis and exchange of isoprenoid precursors during Arabidopsis seedling development. Plant Cell 16: 144-156
Rodriguez-Villalon A, Gas E, Rodriguez-Concepcion M (2009) Phytoene synthase activity controls the biosynthesis of carotenoids and the supply of their metabolic precursors in dark-grown Arabidopsis seedlings. Plant J 60: 424-435
Scharte J, Schon H, Weis E (2005) Photosynthesis and carbohydrate metabolism in tobacco leaves during an incompatible interaction with Phytophthora nicotianae. Plant Cell Environ 28: 1421-1435
130
Chapter 3
Scheller HV, Ulvskov P (2010) Hemicelluloses. Annu Rev Plant Biol 61: 263-289Shelp BJ, Bown AW, Faure D (2006) Extracellular gamma-aminobutyrate mediates communication between
plants and other organisms. Plant Physiol 142: 1350-1352Smith AM, Stitt M (2007) Coordination of carbon supply and plant growth. Plant Cell Environ 30: 1126-1149Stulemeijer IJ, Joosten MHAJ, Jensen ON (2009) Quantitative phosphoproteomics of tomato mounting a
hypersensitive response reveals a swift suppression of photosynthetic activity and a differential role for hsp90 isoforms. J Proteome Res 8: 1168-1182
Stulemeijer IJE, Stratmann JW, Joosten MHAJ (2007) Tomato mitogen-activated protein kinases LeMPK1, LeMPK2, and LeMPK3 are activated during the cf-4/Avr4-induced hypersensitive response and have distinct phosphorylation specificities. Plant Physiol 144: 1481-1494
Swarbrick PJ, Schulze-Lefert P, Scholes JD (2006) Metabolic consequences of susceptibility and resistance (race-specific and broad-spectrum) in barley leaves challenged with powdery mildew. Plant Cell Environ 29: 1061-1076
Thimm O, Blasing O, Gibon Y, Nagel A, Meyer S, Kruger P, Selbig J, Muller LA, Rhee SY, Stitt M (2004) MAPMAN: a user-driven tool to display genomics data sets onto diagrams of metabolic pathways and other biological processes. Plant J 37: 914-939
Thomma BP, Nurnberger T, Joosten MHAJ (2011) Of PAMPs and effectors: the blurred PTI-ETI dichotomy. Plant Cell 23: 4-15
Tikunov YM, Verstappen FW, Hall RD (2007) Metabolomic profiling of natural volatiles: headspace trapping: GC-MS. Methods Mol Biol 358: 39-53
van Kan JAL (2006) Licensed to kill: the lifestyle of a necrotrophic plant pathogen. Trends Plant Sci 11: 247-253
Vranova E, Coman D, Gruissem W (2012) Structure and dynamics of the isoprenoid pathway network. Mol Plant 5: 318-333
Vranová E, Coman D, Gruissem W (2013) Network analysis of the MVA and MEP pathways for isoprenoid synthesis. Annu Rev Plant Biol 64: 665-700
Wang W, Barnaby JY, Tada Y, Li H, Tor M, Caldelari D, Lee DU, Fu XD, Dong X (2011) Timing of plant immune responses by a central circadian regulator. Nature 470: 110-114
Werner T, Schmülling T (2009) Cytokinin action in plant development. Curr Opin Plant Biol 12: 527-538Zhang AP, Liu CF, Sun RC (2010) Fractional isolation and characterization of lignin and hemicelluloses from
triploid of Populus tomentosa Carr. Ind Crop Prod 31: 357-362Zhang Y, Primavesi LF, Jhurreea D, Andralojc PJ, Mitchell RAC, Powers SJ, Schluepmann H, Delatte T,
Wingler A, Paul MJ (2009) Inhibition of SNF1-related protein kinase1 activity and regulation of metabolic pathways by trehalose-6-phosphate. Plant Physiol 149: 1860-1871
Zhao Y (2010) Auxin biosynthesis and its role in plant development. Annu Rev Plant Biol 61: 49-64
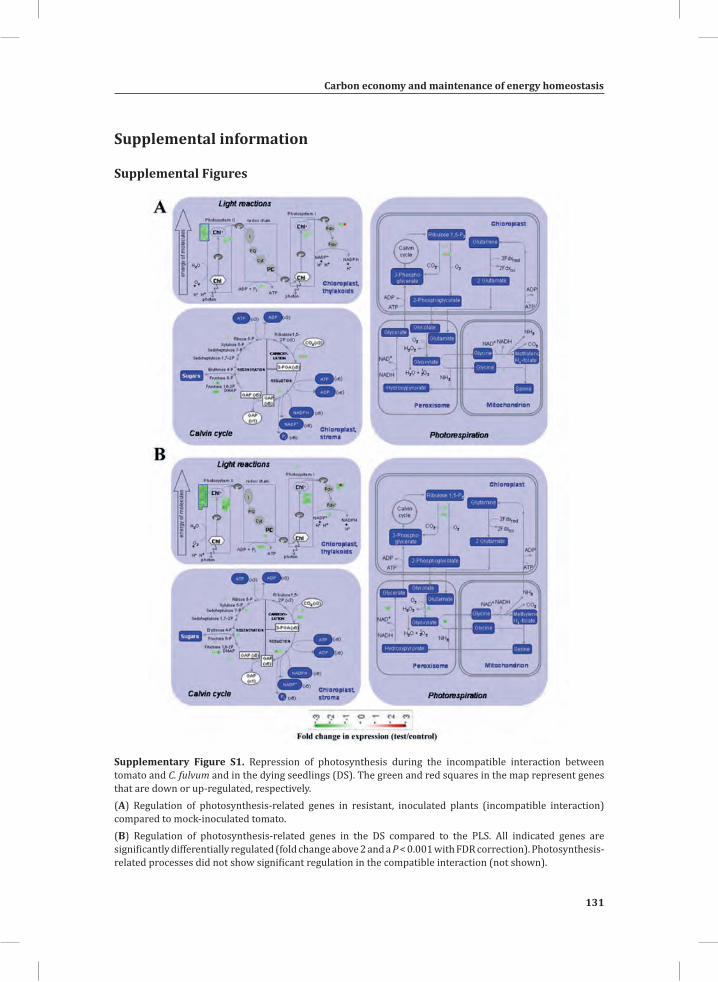
Carbon economy and maintenance of energy homeostasis
131
Chapter 3
Supplemental information
Supplemental Figures
Supplementary Figure S1. Repression of photosynthesis during the incompatible interaction between tomato and C. fulvum and in the dying seedlings (DS). The green and red squares in the map represent genes that are down or up-regulated, respectively. (A) Regulation of photosynthesis-related genes in resistant, inoculated plants (incompatible interaction) compared to mock-inoculated tomato. (B) Regulation of photosynthesis-related genes in the DS compared to the PLS. All indicated genes are significantly differentially regulated (fold change above 2 and a P < 0.001 with FDR correction). Photosynthesis-related processes did not show significant regulation in the compatible interaction (not shown).
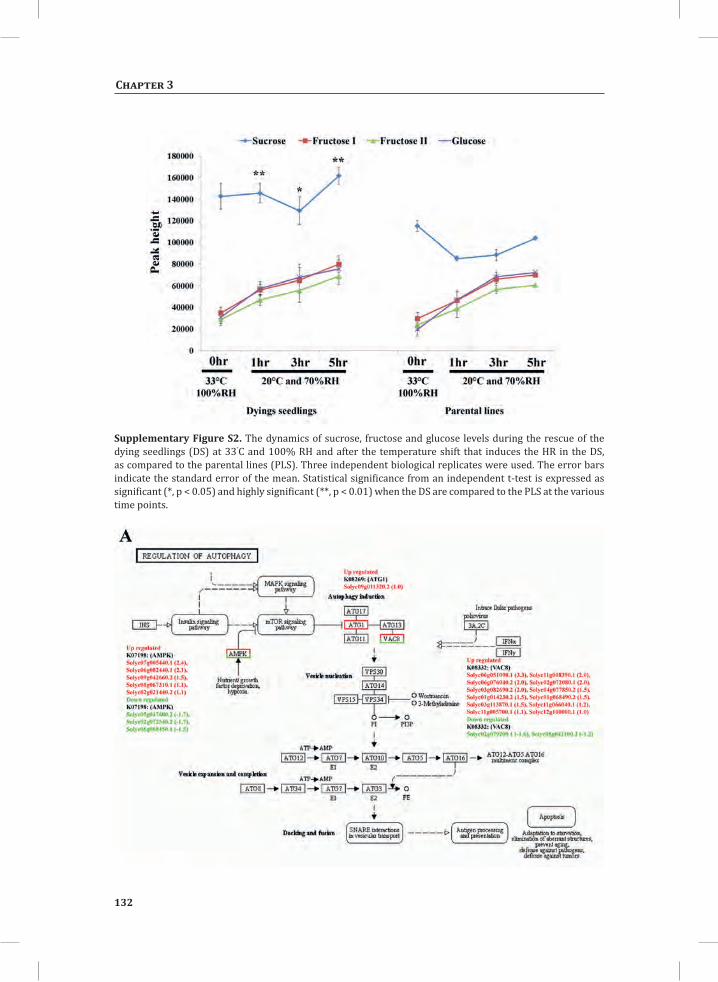
132
Chapter 3
Supplementary Figure S2. The dynamics of sucrose, fructose and glucose levels during the rescue of the dying seedlings (DS) at 33˚C and 100% RH and after the temperature shift that induces the HR in the DS, as compared to the parental lines (PLS). Three independent biological replicates were used. The error bars indicate the standard error of the mean. Statistical significance from an independent t-test is expressed as significant (*, p < 0.05) and highly significant (**, p < 0.01) when the DS are compared to the PLS at the various time points.
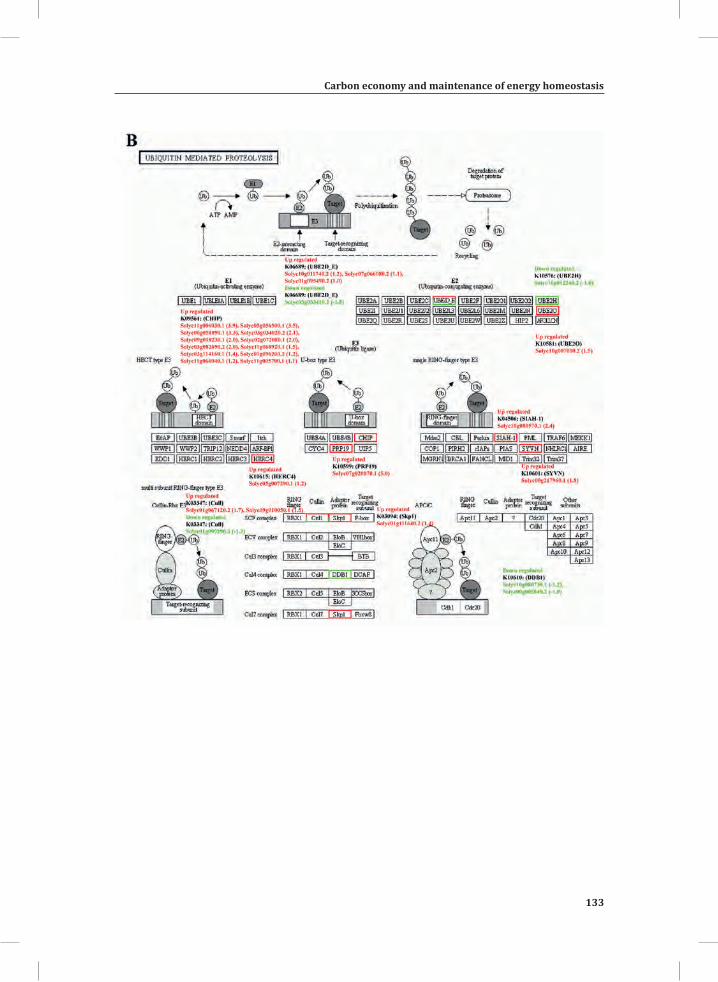
Carbon economy and maintenance of energy homeostasis
133
Chapter 3
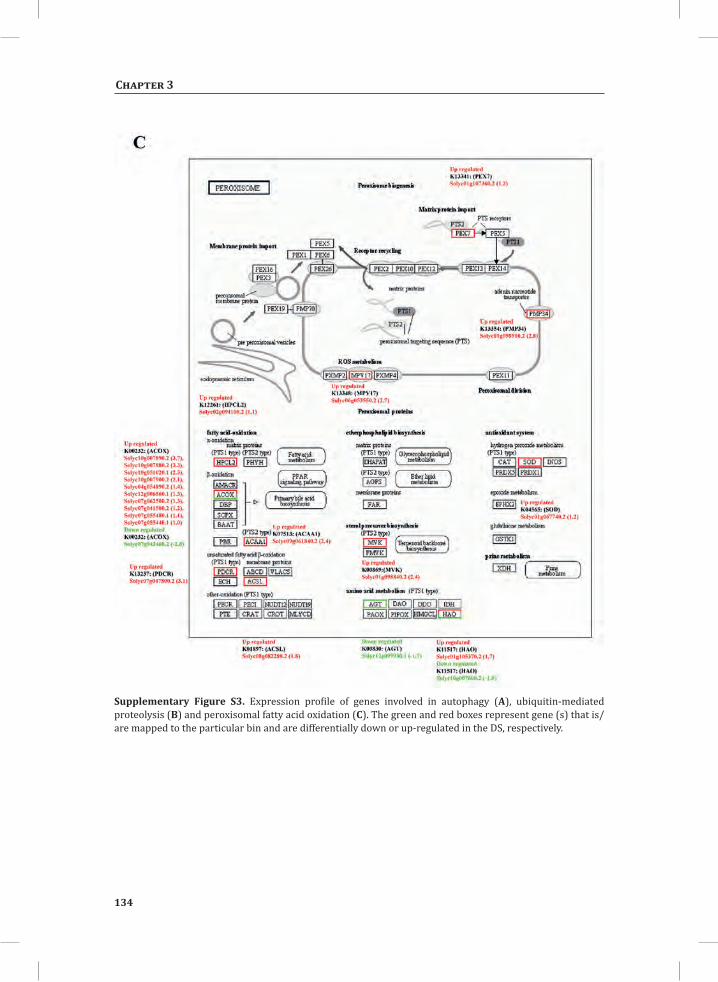
134
Chapter 3
Supplementary Figure S3. Expression profile of genes involved in autophagy (A), ubiquitin-mediated proteolysis (B) and peroxisomal fatty acid oxidation (C). The green and red boxes represent gene (s) that is/are mapped to the particular bin and are differentially down or up-regulated in the DS, respectively.
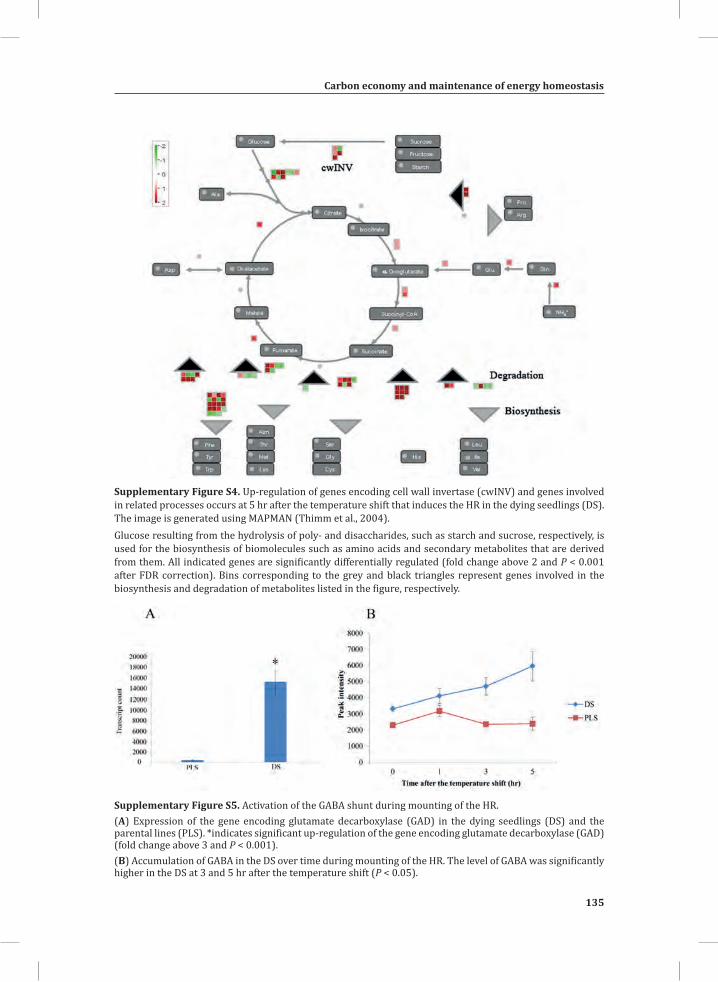
Carbon economy and maintenance of energy homeostasis
135
Chapter 3
Supplementary Figure S4. Up-regulation of genes encoding cell wall invertase (cwINV) and genes involved in related processes occurs at 5 hr after the temperature shift that induces the HR in the dying seedlings (DS). The image is generated using MAPMAN (Thimm et al., 2004).Glucose resulting from the hydrolysis of poly- and disaccharides, such as starch and sucrose, respectively, is used for the biosynthesis of biomolecules such as amino acids and secondary metabolites that are derived from them. All indicated genes are significantly differentially regulated (fold change above 2 and P < 0.001 after FDR correction). Bins corresponding to the grey and black triangles represent genes involved in the biosynthesis and degradation of metabolites listed in the figure, respectively.
Supplementary Figure S5. Activation of the GABA shunt during mounting of the HR. (A) Expression of the gene encoding glutamate decarboxylase (GAD) in the dying seedlings (DS) and the parental lines (PLS). *indicates significant up-regulation of the gene encoding glutamate decarboxylase (GAD) (fold change above 3 and P < 0.001).(B) Accumulation of GABA in the DS over time during mounting of the HR. The level of GABA was significantly higher in the DS at 3 and 5 hr after the temperature shift (P < 0.05).
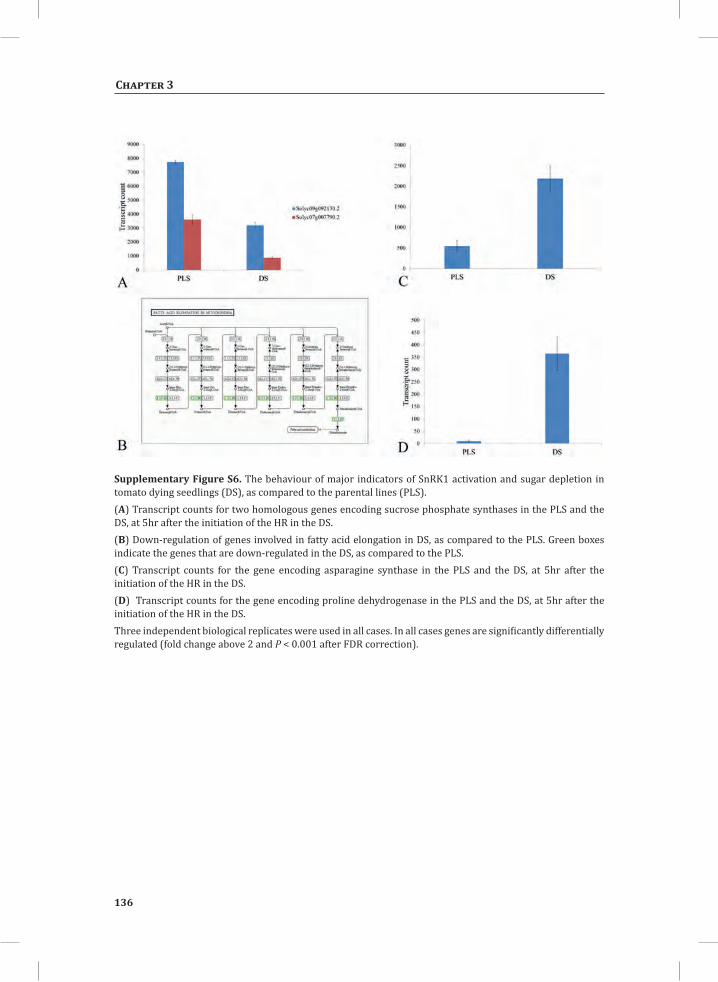
136
Chapter 3
Supplementary Figure S6. The behaviour of major indicators of SnRK1 activation and sugar depletion in tomato dying seedlings (DS), as compared to the parental lines (PLS). (A) Transcript counts for two homologous genes encoding sucrose phosphate synthases in the PLS and the DS, at 5hr after the initiation of the HR in the DS.(B) Down-regulation of genes involved in fatty acid elongation in DS, as compared to the PLS. Green boxes indicate the genes that are down-regulated in the DS, as compared to the PLS.(C) Transcript counts for the gene encoding asparagine synthase in the PLS and the DS, at 5hr after the initiation of the HR in the DS.(D) Transcript counts for the gene encoding proline dehydrogenase in the PLS and the DS, at 5hr after the initiation of the HR in the DS. Three independent biological replicates were used in all cases. In all cases genes are significantly differentially regulated (fold change above 2 and P < 0.001 after FDR correction).
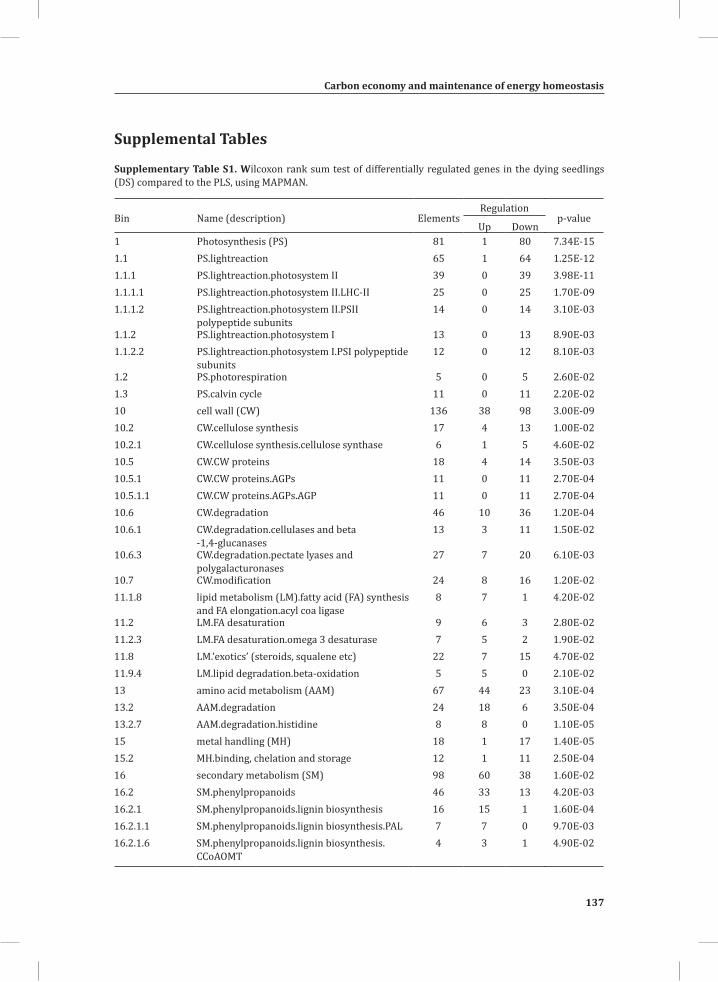
Carbon economy and maintenance of energy homeostasis
137
Chapter 3
Supplemental Tables
Supplementary Table S1. Wilcoxon rank sum test of differentially regulated genes in the dying seedlings (DS) compared to the PLS, using MAPMAN.
Bin Name (description) ElementsRegulation
p-valueUp Down
1 Photosynthesis (PS) 81 1 80 7.34E-151.1 PS.lightreaction 65 1 64 1.25E-121.1.1 PS.lightreaction.photosystem II 39 0 39 3.98E-111.1.1.1 PS.lightreaction.photosystem II.LHC-II 25 0 25 1.70E-091.1.1.2 PS.lightreaction.photosystem II.PSII
polypeptide subunits14 0 14 3.10E-03
1.1.2 PS.lightreaction.photosystem I 13 0 13 8.90E-031.1.2.2 PS.lightreaction.photosystem I.PSI polypeptide
subunits12 0 12 8.10E-03
1.2 PS.photorespiration 5 0 5 2.60E-021.3 PS.calvin cycle 11 0 11 2.20E-0210 cell wall (CW) 136 38 98 3.00E-0910.2 CW.cellulose synthesis 17 4 13 1.00E-0210.2.1 CW.cellulose synthesis.cellulose synthase 6 1 5 4.60E-0210.5 CW.CW proteins 18 4 14 3.50E-0310.5.1 CW.CW proteins.AGPs 11 0 11 2.70E-0410.5.1.1 CW.CW proteins.AGPs.AGP 11 0 11 2.70E-0410.6 CW.degradation 46 10 36 1.20E-0410.6.1 CW.degradation.cellulases and beta
-1,4-glucanases13 3 11 1.50E-02
10.6.3 CW.degradation.pectate lyases and polygalacturonases
27 7 20 6.10E-03
10.7 CW.modification 24 8 16 1.20E-0211.1.8 lipid metabolism (LM).fatty acid (FA) synthesis
and FA elongation.acyl coa ligase8 7 1 4.20E-02
11.2 LM.FA desaturation 9 6 3 2.80E-0211.2.3 LM.FA desaturation.omega 3 desaturase 7 5 2 1.90E-0211.8 LM.’exotics’ (steroids, squalene etc) 22 7 15 4.70E-0211.9.4 LM.lipid degradation.beta-oxidation 5 5 0 2.10E-0213 amino acid metabolism (AAM) 67 44 23 3.10E-0413.2 AAM.degradation 24 18 6 3.50E-0413.2.7 AAM.degradation.histidine 8 8 0 1.10E-0515 metal handling (MH) 18 1 17 1.40E-0515.2 MH.binding, chelation and storage 12 1 11 2.50E-0416 secondary metabolism (SM) 98 60 38 1.60E-0216.2 SM.phenylpropanoids 46 33 13 4.20E-0316.2.1 SM.phenylpropanoids.lignin biosynthesis 16 15 1 1.60E-0416.2.1.1 SM.phenylpropanoids.lignin biosynthesis.PAL 7 7 0 9.70E-0316.2.1.6 SM.phenylpropanoids.lignin biosynthesis.
CCoAOMT4 3 1 4.90E-02
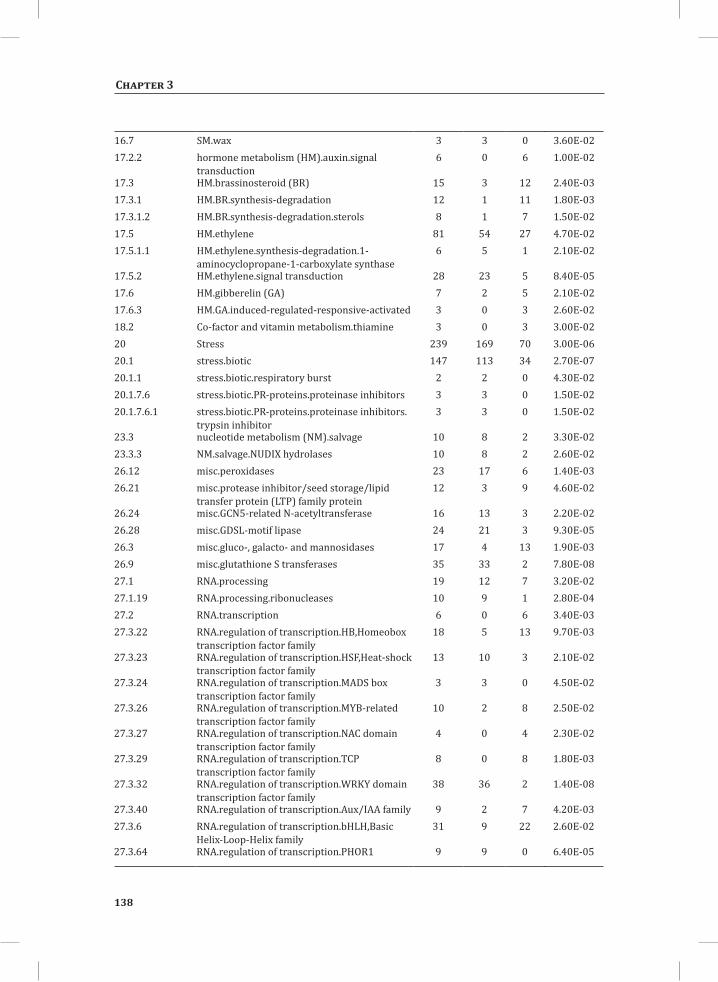
138
Chapter 3
16.7 SM.wax 3 3 0 3.60E-0217.2.2 hormone metabolism (HM).auxin.signal
transduction6 0 6 1.00E-02
17.3 HM.brassinosteroid (BR) 15 3 12 2.40E-0317.3.1 HM.BR.synthesis-degradation 12 1 11 1.80E-0317.3.1.2 HM.BR.synthesis-degradation.sterols 8 1 7 1.50E-0217.5 HM.ethylene 81 54 27 4.70E-0217.5.1.1 HM.ethylene.synthesis-degradation.1-
aminocyclopropane-1-carboxylate synthase6 5 1 2.10E-02
17.5.2 HM.ethylene.signal transduction 28 23 5 8.40E-0517.6 HM.gibberelin (GA) 7 2 5 2.10E-0217.6.3 HM.GA.induced-regulated-responsive-activated 3 0 3 2.60E-0218.2 Co-factor and vitamin metabolism.thiamine 3 0 3 3.00E-0220 Stress 239 169 70 3.00E-0620.1 stress.biotic 147 113 34 2.70E-0720.1.1 stress.biotic.respiratory burst 2 2 0 4.30E-0220.1.7.6 stress.biotic.PR-proteins.proteinase inhibitors 3 3 0 1.50E-0220.1.7.6.1 stress.biotic.PR-proteins.proteinase inhibitors.
trypsin inhibitor3 3 0 1.50E-02
23.3 nucleotide metabolism (NM).salvage 10 8 2 3.30E-0223.3.3 NM.salvage.NUDIX hydrolases 10 8 2 2.60E-0226.12 misc.peroxidases 23 17 6 1.40E-0326.21 misc.protease inhibitor/seed storage/lipid
transfer protein (LTP) family protein12 3 9 4.60E-02
26.24 misc.GCN5-related N-acetyltransferase 16 13 3 2.20E-0226.28 misc.GDSL-motif lipase 24 21 3 9.30E-0526.3 misc.gluco-, galacto- and mannosidases 17 4 13 1.90E-0326.9 misc.glutathione S transferases 35 33 2 7.80E-0827.1 RNA.processing 19 12 7 3.20E-0227.1.19 RNA.processing.ribonucleases 10 9 1 2.80E-0427.2 RNA.transcription 6 0 6 3.40E-0327.3.22 RNA.regulation of transcription.HB,Homeobox
transcription factor family18 5 13 9.70E-03
27.3.23 RNA.regulation of transcription.HSF,Heat-shock transcription factor family
13 10 3 2.10E-02
27.3.24 RNA.regulation of transcription.MADS box transcription factor family
3 3 0 4.50E-02
27.3.26 RNA.regulation of transcription.MYB-related transcription factor family
10 2 8 2.50E-02
27.3.27 RNA.regulation of transcription.NAC domain transcription factor family
4 0 4 2.30E-02
27.3.29 RNA.regulation of transcription.TCP transcription factor family
8 0 8 1.80E-03
27.3.32 RNA.regulation of transcription.WRKY domain transcription factor family
38 36 2 1.40E-08
27.3.40 RNA.regulation of transcription.Aux/IAA family 9 2 7 4.20E-0327.3.6 RNA.regulation of transcription.bHLH,Basic
Helix-Loop-Helix family31 9 22 2.60E-02
27.3.64 RNA.regulation of transcription.PHOR1 9 9 0 6.40E-05
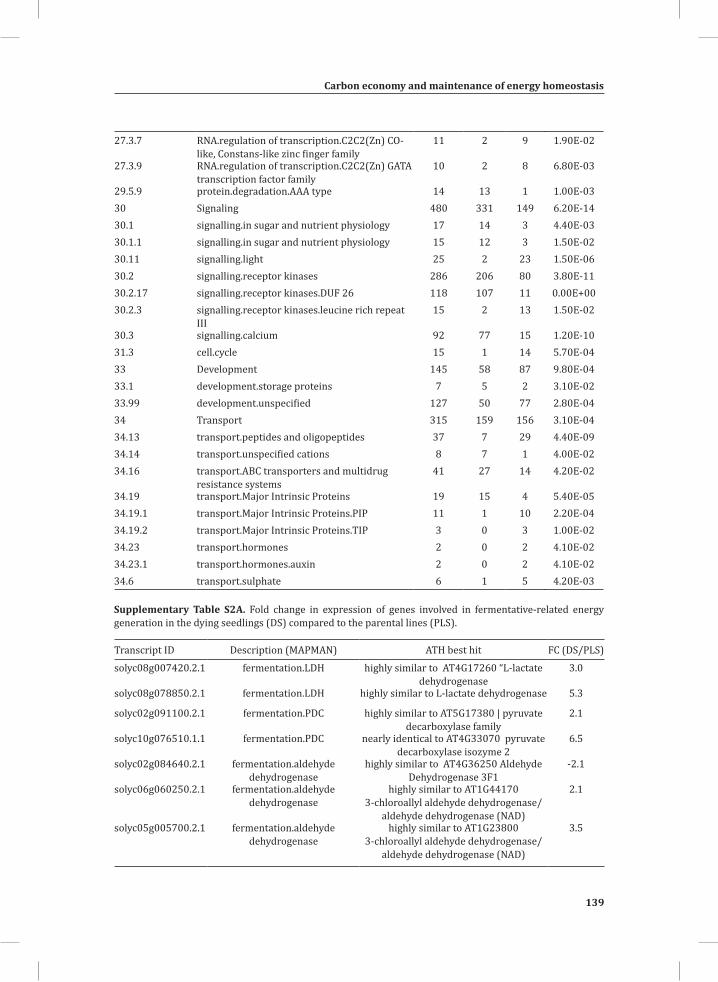
Carbon economy and maintenance of energy homeostasis
139
Chapter 3
27.3.7 RNA.regulation of transcription.C2C2(Zn) CO-like, Constans-like zinc finger family
11 2 9 1.90E-02
27.3.9 RNA.regulation of transcription.C2C2(Zn) GATA transcription factor family
10 2 8 6.80E-03
29.5.9 protein.degradation.AAA type 14 13 1 1.00E-0330 Signaling 480 331 149 6.20E-1430.1 signalling.in sugar and nutrient physiology 17 14 3 4.40E-0330.1.1 signalling.in sugar and nutrient physiology 15 12 3 1.50E-0230.11 signalling.light 25 2 23 1.50E-0630.2 signalling.receptor kinases 286 206 80 3.80E-1130.2.17 signalling.receptor kinases.DUF 26 118 107 11 0.00E+0030.2.3 signalling.receptor kinases.leucine rich repeat
III15 2 13 1.50E-02
30.3 signalling.calcium 92 77 15 1.20E-1031.3 cell.cycle 15 1 14 5.70E-0433 Development 145 58 87 9.80E-0433.1 development.storage proteins 7 5 2 3.10E-0233.99 development.unspecified 127 50 77 2.80E-0434 Transport 315 159 156 3.10E-0434.13 transport.peptides and oligopeptides 37 7 29 4.40E-0934.14 transport.unspecified cations 8 7 1 4.00E-0234.16 transport.ABC transporters and multidrug
resistance systems41 27 14 4.20E-02
34.19 transport.Major Intrinsic Proteins 19 15 4 5.40E-0534.19.1 transport.Major Intrinsic Proteins.PIP 11 1 10 2.20E-0434.19.2 transport.Major Intrinsic Proteins.TIP 3 0 3 1.00E-0234.23 transport.hormones 2 0 2 4.10E-0234.23.1 transport.hormones.auxin 2 0 2 4.10E-0234.6 transport.sulphate 6 1 5 4.20E-03
Supplementary Table S2A. Fold change in expression of genes involved in fermentative-related energy generation in the dying seedlings (DS) compared to the parental lines (PLS).
Transcript ID Description (MAPMAN) ATH best hit FC (DS/PLS)
solyc08g007420.2.1 fermentation.LDH highly similar to AT4G17260 “L-lactate dehydrogenase
3.0
solyc08g078850.2.1 fermentation.LDH highly similar to L-lactate dehydrogenase 5.3
solyc02g091100.2.1 fermentation.PDC highly similar to AT5G17380 | pyruvate decarboxylase family
2.1
solyc10g076510.1.1 fermentation.PDC nearly identical to AT4G33070 pyruvate decarboxylase isozyme 2
6.5
solyc02g084640.2.1 fermentation.aldehyde dehydrogenase
highly similar to AT4G36250 Aldehyde Dehydrogenase 3F1
-2.1
solyc06g060250.2.1 fermentation.aldehyde dehydrogenase
highly similar to AT1G44170 3-chloroallyl aldehyde dehydrogenase/
aldehyde dehydrogenase (NAD)
2.1
solyc05g005700.2.1 fermentation.aldehyde dehydrogenase
highly similar to AT1G23800 3-chloroallyl aldehyde dehydrogenase/
aldehyde dehydrogenase (NAD)
3.5
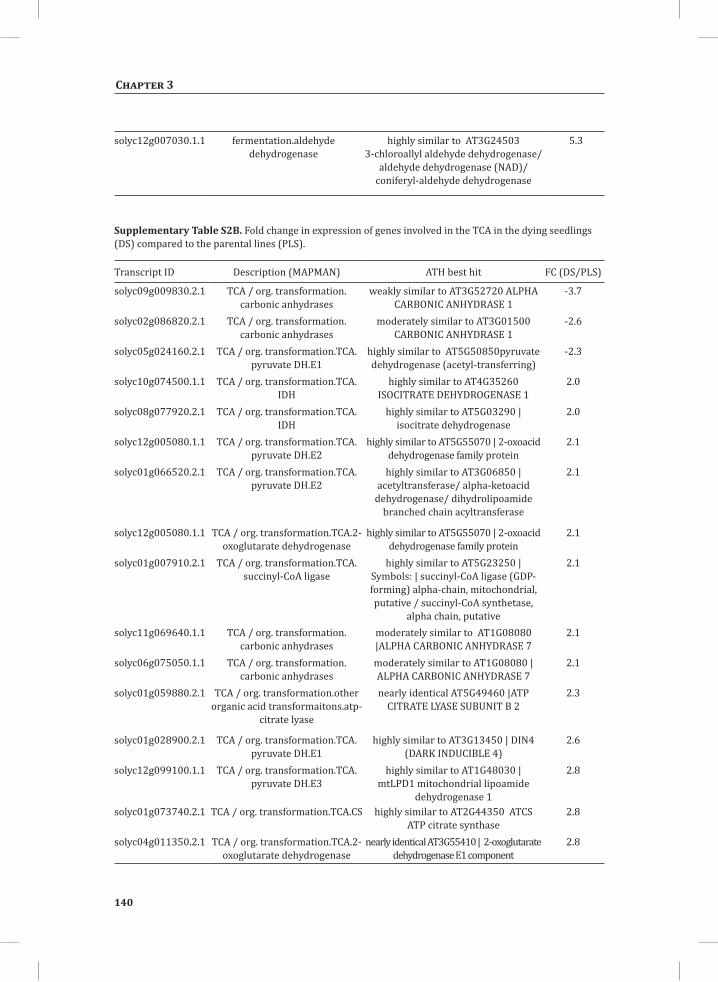
140
Chapter 3
solyc12g007030.1.1 fermentation.aldehyde dehydrogenase
highly similar to AT3G24503 3-chloroallyl aldehyde dehydrogenase/
aldehyde dehydrogenase (NAD)/ coniferyl-aldehyde dehydrogenase
5.3
Supplementary Table S2B. Fold change in expression of genes involved in the TCA in the dying seedlings (DS) compared to the parental lines (PLS).
Transcript ID Description (MAPMAN) ATH best hit FC (DS/PLS)
solyc09g009830.2.1 TCA / org. transformation.carbonic anhydrases
weakly similar to AT3G52720 ALPHA CARBONIC ANHYDRASE 1
-3.7
solyc02g086820.2.1 TCA / org. transformation.carbonic anhydrases
moderately similar to AT3G01500 CARBONIC ANHYDRASE 1
-2.6
solyc05g024160.2.1 TCA / org. transformation.TCA.pyruvate DH.E1
highly similar to AT5G50850pyruvate dehydrogenase (acetyl-transferring)
-2.3
solyc10g074500.1.1 TCA / org. transformation.TCA.IDH
highly similar to AT4G35260 ISOCITRATE DEHYDROGENASE 1
2.0
solyc08g077920.2.1 TCA / org. transformation.TCA.IDH
highly similar to AT5G03290 | isocitrate dehydrogenase
2.0
solyc12g005080.1.1 TCA / org. transformation.TCA.pyruvate DH.E2
highly similar to AT5G55070 | 2-oxoacid dehydrogenase family protein
2.1
solyc01g066520.2.1 TCA / org. transformation.TCA.pyruvate DH.E2
highly similar to AT3G06850 | acetyltransferase/ alpha-ketoacid
dehydrogenase/ dihydrolipoamide branched chain acyltransferase
2.1
solyc12g005080.1.1 TCA / org. transformation.TCA.2-oxoglutarate dehydrogenase
highly similar to AT5G55070 | 2-oxoacid dehydrogenase family protein
2.1
solyc01g007910.2.1 TCA / org. transformation.TCA.succinyl-CoA ligase
highly similar to AT5G23250 | Symbols: | succinyl-CoA ligase (GDP-forming) alpha-chain, mitochondrial, putative / succinyl-CoA synthetase,
alpha chain, putative
2.1
solyc11g069640.1.1 TCA / org. transformation.carbonic anhydrases
moderately similar to AT1G08080 |ALPHA CARBONIC ANHYDRASE 7
2.1
solyc06g075050.1.1 TCA / org. transformation.carbonic anhydrases
moderately similar to AT1G08080 | ALPHA CARBONIC ANHYDRASE 7
2.1
solyc01g059880.2.1 TCA / org. transformation.other organic acid transformaitons.atp-
citrate lyase
nearly identical AT5G49460 |ATP CITRATE LYASE SUBUNIT B 2
2.3
solyc01g028900.2.1 TCA / org. transformation.TCA.pyruvate DH.E1
highly similar to AT3G13450 | DIN4 (DARK INDUCIBLE 4)
2.6
solyc12g099100.1.1 TCA / org. transformation.TCA.pyruvate DH.E3
highly similar to AT1G48030 | mtLPD1 mitochondrial lipoamide
dehydrogenase 1
2.8
solyc01g073740.2.1 TCA / org. transformation.TCA.CS highly similar to AT2G44350 ATCS ATP citrate synthase
2.8
solyc04g011350.2.1 TCA / org. transformation.TCA.2-oxoglutarate dehydrogenase
nearly identical AT3G55410 | 2-oxoglutarate dehydrogenase E1 component
2.8
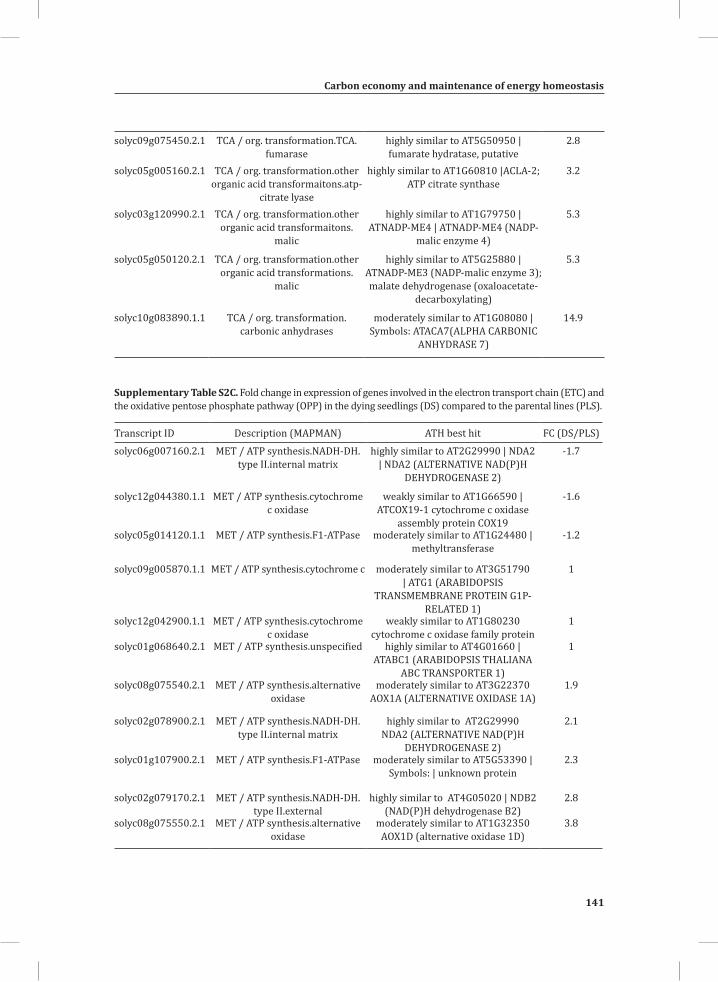
Carbon economy and maintenance of energy homeostasis
141
Chapter 3
solyc09g075450.2.1 TCA / org. transformation.TCA.fumarase
highly similar to AT5G50950 | fumarate hydratase, putative
2.8
solyc05g005160.2.1 TCA / org. transformation.other organic acid transformaitons.atp-
citrate lyase
highly similar to AT1G60810 |ACLA-2; ATP citrate synthase
3.2
solyc03g120990.2.1 TCA / org. transformation.other organic acid transformaitons.
malic
highly similar to AT1G79750 | ATNADP-ME4 | ATNADP-ME4 (NADP-
malic enzyme 4)
5.3
solyc05g050120.2.1 TCA / org. transformation.other organic acid transformations.
malic
highly similar to AT5G25880 | ATNADP-ME3 (NADP-malic enzyme 3); malate dehydrogenase (oxaloacetate-
decarboxylating)
5.3
solyc10g083890.1.1 TCA / org. transformation.carbonic anhydrases
moderately similar to AT1G08080 | Symbols: ATACA7(ALPHA CARBONIC
ANHYDRASE 7)
14.9
Supplementary Table S2C. Fold change in expression of genes involved in the electron transport chain (ETC) and the oxidative pentose phosphate pathway (OPP) in the dying seedlings (DS) compared to the parental lines (PLS).
Transcript ID Description (MAPMAN) ATH best hit FC (DS/PLS)
solyc06g007160.2.1 MET / ATP synthesis.NADH-DH.type II.internal matrix
highly similar to AT2G29990 | NDA2 | NDA2 (ALTERNATIVE NAD(P)H
DEHYDROGENASE 2)
-1.7
solyc12g044380.1.1 MET / ATP synthesis.cytochrome c oxidase
weakly similar to AT1G66590 | ATCOX19-1 cytochrome c oxidase
assembly protein COX19
-1.6
solyc05g014120.1.1 MET / ATP synthesis.F1-ATPase moderately similar to AT1G24480 | methyltransferase
-1.2
solyc09g005870.1.1 MET / ATP synthesis.cytochrome c moderately similar to AT3G51790 | ATG1 (ARABIDOPSIS
TRANSMEMBRANE PROTEIN G1P-RELATED 1)
1
solyc12g042900.1.1 MET / ATP synthesis.cytochrome c oxidase
weakly similar to AT1G80230 cytochrome c oxidase family protein
1
solyc01g068640.2.1 MET / ATP synthesis.unspecified highly similar to AT4G01660 | ATABC1 (ARABIDOPSIS THALIANA
ABC TRANSPORTER 1)
1
solyc08g075540.2.1 MET / ATP synthesis.alternative oxidase
moderately similar to AT3G22370 AOX1A (ALTERNATIVE OXIDASE 1A)
1.9
solyc02g078900.2.1 MET / ATP synthesis.NADH-DH.type II.internal matrix
highly similar to AT2G29990 NDA2 (ALTERNATIVE NAD(P)H
DEHYDROGENASE 2)
2.1
solyc01g107900.2.1 MET / ATP synthesis.F1-ATPase moderately similar to AT5G53390 | Symbols: | unknown protein
2.3
solyc02g079170.2.1 MET / ATP synthesis.NADH-DH.type II.external
highly similar to AT4G05020 | NDB2 (NAD(P)H dehydrogenase B2)
2.8
solyc08g075550.2.1 MET / ATP synthesis.alternative oxidase
moderately similar to AT1G32350 AOX1D (alternative oxidase 1D)
3.8
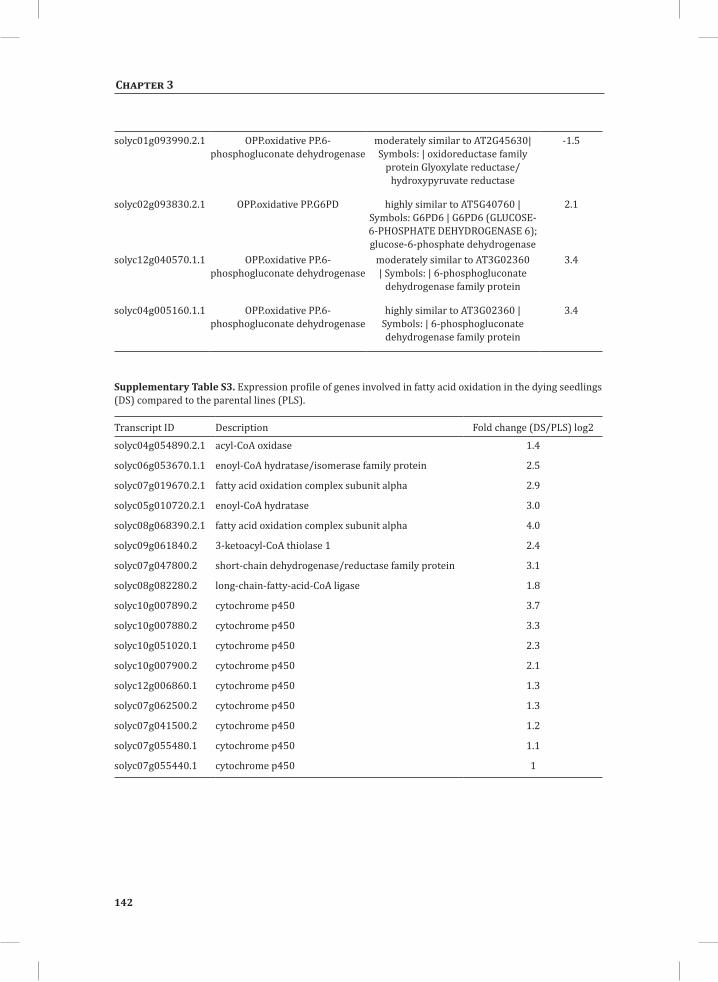
142
Chapter 3
solyc01g093990.2.1 OPP.oxidative PP.6-phosphogluconate dehydrogenase
moderately similar to AT2G45630|Symbols: | oxidoreductase family
protein Glyoxylate reductase/hydroxypyruvate reductase
-1.5
solyc02g093830.2.1 OPP.oxidative PP.G6PD highly similar to AT5G40760 | Symbols: G6PD6 | G6PD6 (GLUCOSE-6-PHOSPHATE DEHYDROGENASE 6); glucose-6-phosphate dehydrogenase
2.1
solyc12g040570.1.1 OPP.oxidative PP.6-phosphogluconate dehydrogenase
moderately similar to AT3G02360 | Symbols: | 6-phosphogluconate
dehydrogenase family protein
3.4
solyc04g005160.1.1 OPP.oxidative PP.6-phosphogluconate dehydrogenase
highly similar to AT3G02360 | Symbols: | 6-phosphogluconate dehydrogenase family protein
3.4
Supplementary Table S3. Expression profile of genes involved in fatty acid oxidation in the dying seedlings (DS) compared to the parental lines (PLS).
Transcript ID Description Fold change (DS/PLS) log2
solyc04g054890.2.1 acyl-CoA oxidase 1.4
solyc06g053670.1.1 enoyl-CoA hydratase/isomerase family protein 2.5
solyc07g019670.2.1 fatty acid oxidation complex subunit alpha 2.9
solyc05g010720.2.1 enoyl-CoA hydratase 3.0
solyc08g068390.2.1 fatty acid oxidation complex subunit alpha 4.0
solyc09g061840.2 3-ketoacyl-CoA thiolase 1 2.4
solyc07g047800.2 short-chain dehydrogenase/reductase family protein 3.1
solyc08g082280.2 long-chain-fatty-acid-CoA ligase 1.8
solyc10g007890.2 cytochrome p450 3.7
solyc10g007880.2 cytochrome p450 3.3
solyc10g051020.1 cytochrome p450 2.3
solyc10g007900.2 cytochrome p450 2.1
solyc12g006860.1 cytochrome p450 1.3
solyc07g062500.2 cytochrome p450 1.3
solyc07g041500.2 cytochrome p450 1.2
solyc07g055480.1 cytochrome p450 1.1
solyc07g055440.1 cytochrome p450 1
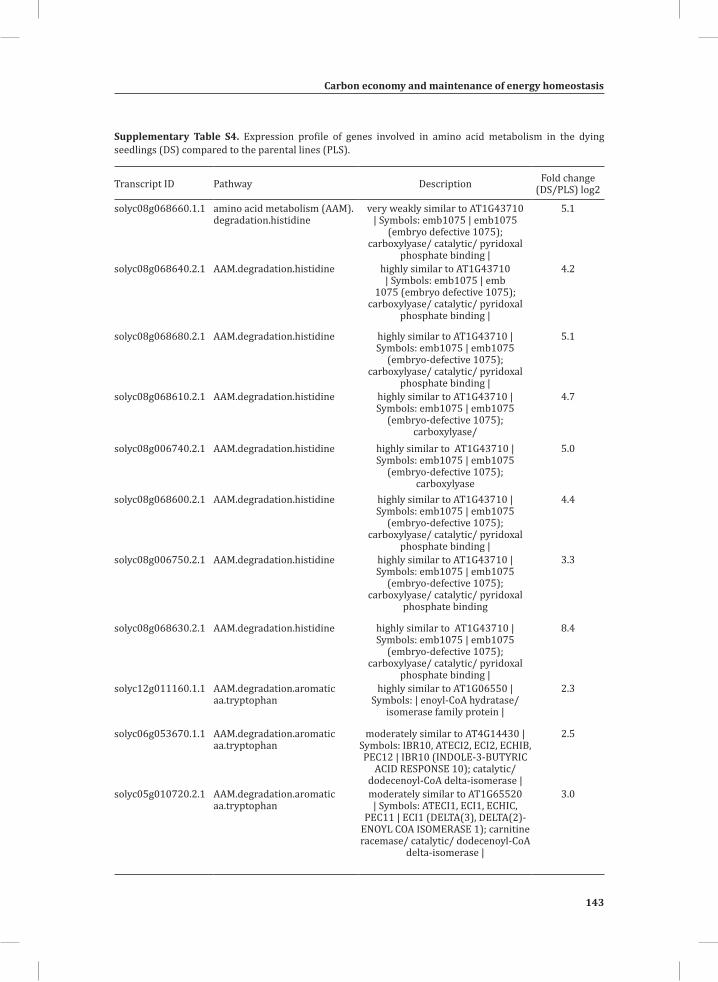
Carbon economy and maintenance of energy homeostasis
143
Chapter 3
Supplementary Table S4. Expression profile of genes involved in amino acid metabolism in the dying seedlings (DS) compared to the parental lines (PLS).
Transcript ID Pathway Description Fold change (DS/PLS) log2
solyc08g068660.1.1 amino acid metabolism (AAM).degradation.histidine
very weakly similar to AT1G43710 | Symbols: emb1075 | emb1075
(embryo defective 1075); carboxylyase/ catalytic/ pyridoxal
phosphate binding |
5.1
solyc08g068640.2.1 AAM.degradation.histidine highly similar to AT1G43710 | Symbols: emb1075 | emb
1075 (embryo defective 1075); carboxylyase/ catalytic/ pyridoxal
phosphate binding |
4.2
solyc08g068680.2.1 AAM.degradation.histidine highly similar to AT1G43710 | Symbols: emb1075 | emb1075
(embryo-defective 1075); carboxylyase/ catalytic/ pyridoxal
phosphate binding |
5.1
solyc08g068610.2.1 AAM.degradation.histidine highly similar to AT1G43710 | Symbols: emb1075 | emb1075
(embryo-defective 1075); carboxylyase/
4.7
solyc08g006740.2.1 AAM.degradation.histidine highly similar to AT1G43710 | Symbols: emb1075 | emb1075
(embryo-defective 1075); carboxylyase
5.0
solyc08g068600.2.1 AAM.degradation.histidine highly similar to AT1G43710 | Symbols: emb1075 | emb1075
(embryo-defective 1075); carboxylyase/ catalytic/ pyridoxal
phosphate binding |
4.4
solyc08g006750.2.1 AAM.degradation.histidine highly similar to AT1G43710 | Symbols: emb1075 | emb1075
(embryo-defective 1075); carboxylyase/ catalytic/ pyridoxal
phosphate binding
3.3
solyc08g068630.2.1 AAM.degradation.histidine highly similar to AT1G43710 | Symbols: emb1075 | emb1075
(embryo-defective 1075); carboxylyase/ catalytic/ pyridoxal
phosphate binding |
8.4
solyc12g011160.1.1 AAM.degradation.aromatic aa.tryptophan
highly similar to AT1G06550 | Symbols: | enoyl-CoA hydratase/
isomerase family protein |
2.3
solyc06g053670.1.1 AAM.degradation.aromatic aa.tryptophan
moderately similar to AT4G14430 | Symbols: IBR10, ATECI2, ECI2, ECHIB, PEC12 | IBR10 (INDOLE-3-BUTYRIC
ACID RESPONSE 10); catalytic/ dodecenoyl-CoA delta-isomerase |
2.5
solyc05g010720.2.1 AAM.degradation.aromatic aa.tryptophan
moderately similar to AT1G65520 | Symbols: ATECI1, ECI1, ECHIC,
PEC11 | ECI1 (DELTA(3), DELTA(2)-ENOYL COA ISOMERASE 1); carnitine racemase/ catalytic/ dodecenoyl-CoA
delta-isomerase |
3.0
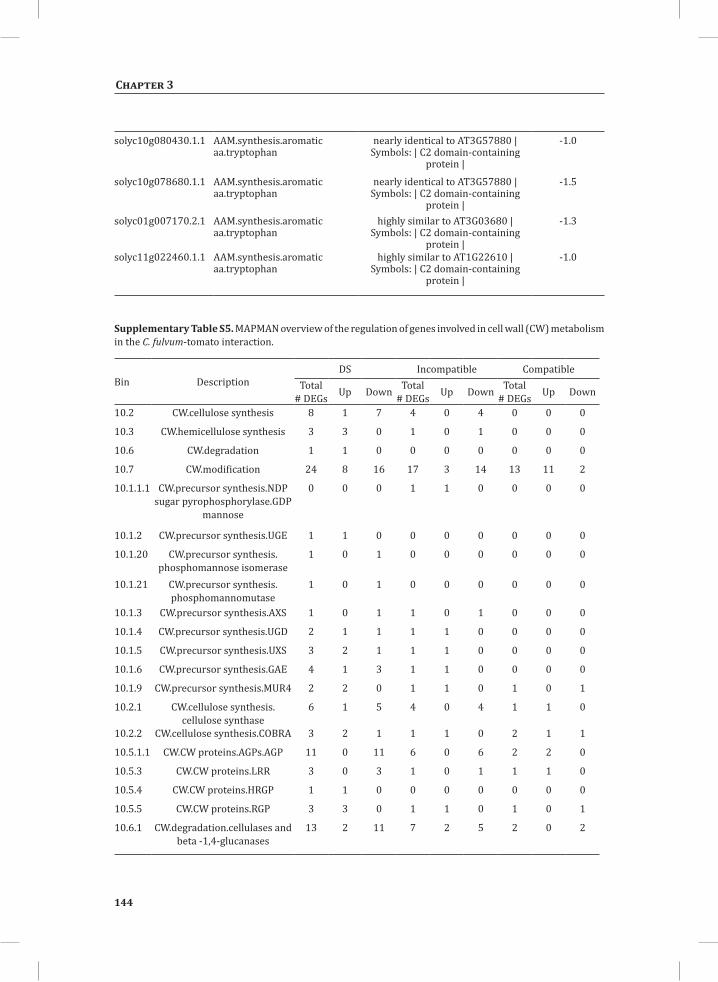
144
Chapter 3
solyc10g080430.1.1 AAM.synthesis.aromatic aa.tryptophan
nearly identical to AT3G57880 | Symbols: | C2 domain-containing
protein |
-1.0
solyc10g078680.1.1 AAM.synthesis.aromatic aa.tryptophan
nearly identical to AT3G57880 | Symbols: | C2 domain-containing
protein |
-1.5
solyc01g007170.2.1 AAM.synthesis.aromatic aa.tryptophan
highly similar to AT3G03680 | Symbols: | C2 domain-containing
protein |
-1.3
solyc11g022460.1.1 AAM.synthesis.aromatic aa.tryptophan
highly similar to AT1G22610 | Symbols: | C2 domain-containing
protein |
-1.0
Supplementary Table S5. MAPMAN overview of the regulation of genes involved in cell wall (CW) metabolism in the C. fulvum-tomato interaction.
Bin DescriptionDS Incompatible Compatible
Total # DEGs Up Down Total
# DEGs Up Down Total # DEGs Up Down
10.2 CW.cellulose synthesis 8 1 7 4 0 4 0 0 0
10.3 CW.hemicellulose synthesis 3 3 0 1 0 1 0 0 0
10.6 CW.degradation 1 1 0 0 0 0 0 0 0
10.7 CW.modification 24 8 16 17 3 14 13 11 2
10.1.1.1 CW.precursor synthesis.NDP sugar pyrophosphorylase.GDP
mannose
0 0 0 1 1 0 0 0 0
10.1.2 CW.precursor synthesis.UGE 1 1 0 0 0 0 0 0 0
10.1.20 CW.precursor synthesis.phosphomannose isomerase
1 0 1 0 0 0 0 0 0
10.1.21 CW.precursor synthesis.phosphomannomutase
1 0 1 0 0 0 0 0 0
10.1.3 CW.precursor synthesis.AXS 1 0 1 1 0 1 0 0 0
10.1.4 CW.precursor synthesis.UGD 2 1 1 1 1 0 0 0 0
10.1.5 CW.precursor synthesis.UXS 3 2 1 1 1 0 0 0 0
10.1.6 CW.precursor synthesis.GAE 4 1 3 1 1 0 0 0 0
10.1.9 CW.precursor synthesis.MUR4 2 2 0 1 1 0 1 0 1
10.2.1 CW.cellulose synthesis.cellulose synthase
6 1 5 4 0 4 1 1 0
10.2.2 CW.cellulose synthesis.COBRA 3 2 1 1 1 0 2 1 1
10.5.1.1 CW.CW proteins.AGPs.AGP 11 0 11 6 0 6 2 2 0
10.5.3 CW.CW proteins.LRR 3 0 3 1 0 1 1 1 0
10.5.4 CW.CW proteins.HRGP 1 1 0 0 0 0 0 0 0
10.5.5 CW.CW proteins.RGP 3 3 0 1 1 0 1 0 1
10.6.1 CW.degradation.cellulases and beta -1,4-glucanases
13 2 11 7 2 5 2 0 2
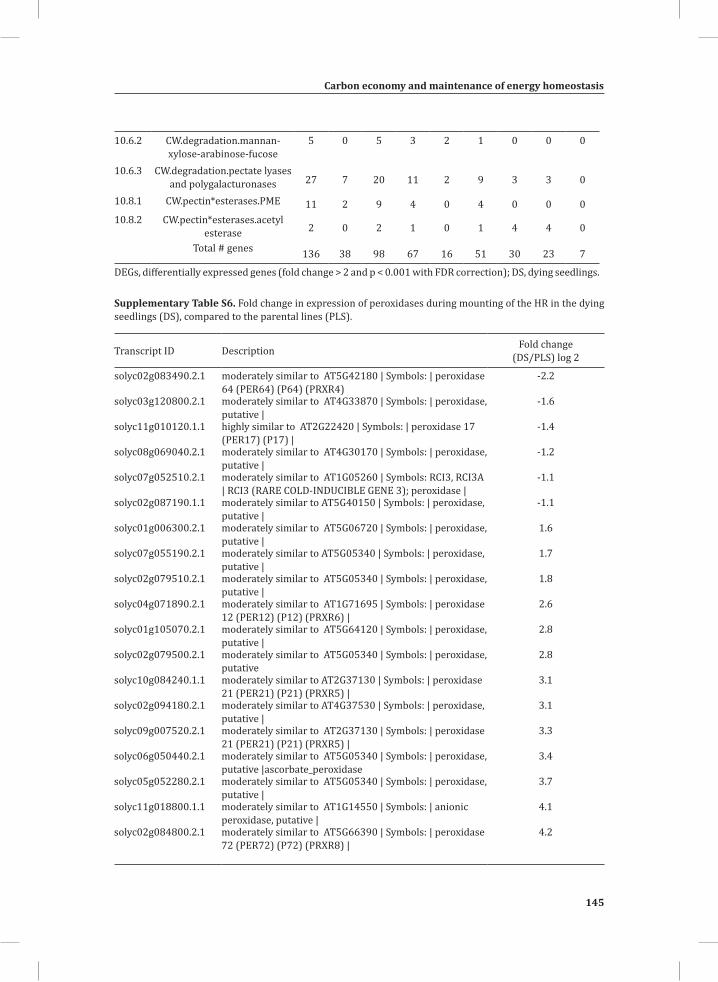
Carbon economy and maintenance of energy homeostasis
145
Chapter 3
10.6.2 CW.degradation.mannan-xylose-arabinose-fucose
5 0 5 3 2 1 0 0 0
10.6.3 CW.degradation.pectate lyases and polygalacturonases 27 7 20 11 2 9 3 3 0
10.8.1 CW.pectin*esterases.PME 11 2 9 4 0 4 0 0 010.8.2 CW.pectin*esterases.acetyl
esterase 2 0 2 1 0 1 4 4 0
Total # genes 136 38 98 67 16 51 30 23 7
DEGs, differentially expressed genes (fold change > 2 and p < 0.001 with FDR correction); DS, dying seedlings.
Supplementary Table S6. Fold change in expression of peroxidases during mounting of the HR in the dying seedlings (DS), compared to the parental lines (PLS).
Transcript ID Description Fold change (DS/PLS) log 2
solyc02g083490.2.1 moderately similar to AT5G42180 | Symbols: | peroxidase 64 (PER64) (P64) (PRXR4)
-2.2
solyc03g120800.2.1 moderately similar to AT4G33870 | Symbols: | peroxidase, putative |
-1.6
solyc11g010120.1.1 highly similar to AT2G22420 | Symbols: | peroxidase 17 (PER17) (P17) |
-1.4
solyc08g069040.2.1 moderately similar to AT4G30170 | Symbols: | peroxidase, putative |
-1.2
solyc07g052510.2.1 moderately similar to AT1G05260 | Symbols: RCI3, RCI3A | RCI3 (RARE COLD-INDUCIBLE GENE 3); peroxidase |
-1.1
solyc02g087190.1.1 moderately similar to AT5G40150 | Symbols: | peroxidase, putative |
-1.1
solyc01g006300.2.1 moderately similar to AT5G06720 | Symbols: | peroxidase, putative |
1.6
solyc07g055190.2.1 moderately similar to AT5G05340 | Symbols: | peroxidase, putative |
1.7
solyc02g079510.2.1 moderately similar to AT5G05340 | Symbols: | peroxidase, putative |
1.8
solyc04g071890.2.1 moderately similar to AT1G71695 | Symbols: | peroxidase 12 (PER12) (P12) (PRXR6) |
2.6
solyc01g105070.2.1 moderately similar to AT5G64120 | Symbols: | peroxidase, putative |
2.8
solyc02g079500.2.1 moderately similar to AT5G05340 | Symbols: | peroxidase, putative
2.8
solyc10g084240.1.1 moderately similar to AT2G37130 | Symbols: | peroxidase 21 (PER21) (P21) (PRXR5) |
3.1
solyc02g094180.2.1 moderately similar to AT4G37530 | Symbols: | peroxidase, putative |
3.1
solyc09g007520.2.1 moderately similar to AT2G37130 | Symbols: | peroxidase 21 (PER21) (P21) (PRXR5) |
3.3
solyc06g050440.2.1 moderately similar to AT5G05340 | Symbols: | peroxidase, putative |ascorbate_peroxidase
3.4
solyc05g052280.2.1 moderately similar to AT5G05340 | Symbols: | peroxidase, putative |
3.7
solyc11g018800.1.1 moderately similar to AT1G14550 | Symbols: | anionic peroxidase, putative |
4.1
solyc02g084800.2.1 moderately similar to AT5G66390 | Symbols: | peroxidase 72 (PER72) (P72) (PRXR8) |
4.2
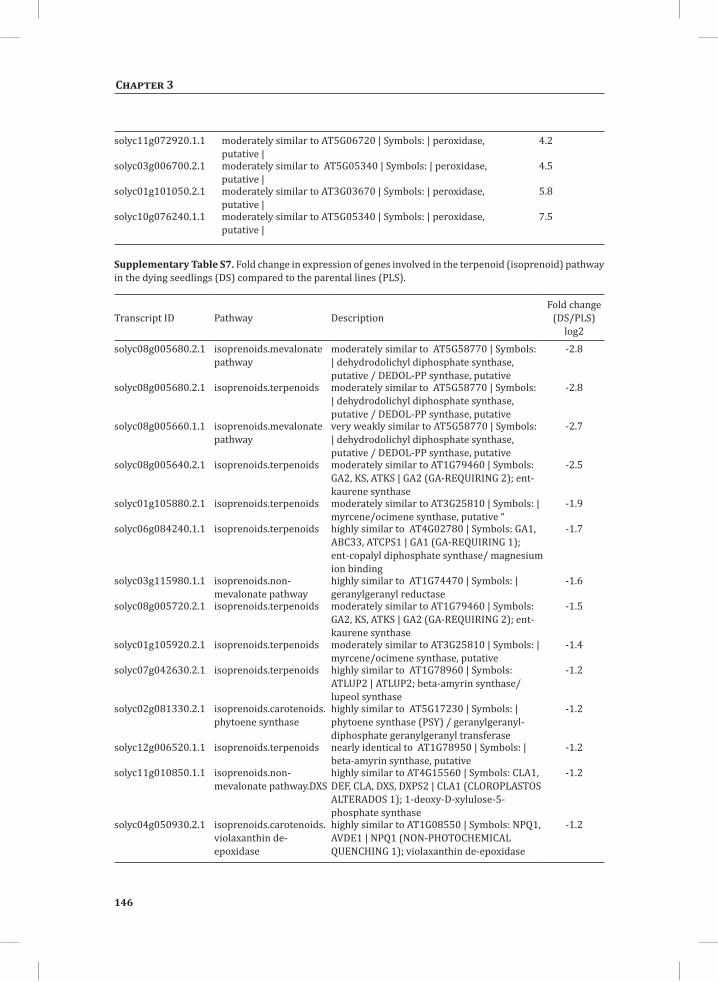
146
Chapter 3
solyc11g072920.1.1 moderately similar to AT5G06720 | Symbols: | peroxidase, putative |
4.2
solyc03g006700.2.1 moderately similar to AT5G05340 | Symbols: | peroxidase, putative |
4.5
solyc01g101050.2.1 moderately similar to AT3G03670 | Symbols: | peroxidase, putative |
5.8
solyc10g076240.1.1 moderately similar to AT5G05340 | Symbols: | peroxidase, putative |
7.5
Supplementary Table S7. Fold change in expression of genes involved in the terpenoid (isoprenoid) pathway in the dying seedlings (DS) compared to the parental lines (PLS).
Transcript ID Pathway Description Fold change
(DS/PLS) log2
solyc08g005680.2.1 isoprenoids.mevalonate pathway
moderately similar to AT5G58770 | Symbols: | dehydrodolichyl diphosphate synthase, putative / DEDOL-PP synthase, putative
-2.8
solyc08g005680.2.1 isoprenoids.terpenoids moderately similar to AT5G58770 | Symbols: | dehydrodolichyl diphosphate synthase, putative / DEDOL-PP synthase, putative
-2.8
solyc08g005660.1.1 isoprenoids.mevalonate pathway
very weakly similar to AT5G58770 | Symbols: | dehydrodolichyl diphosphate synthase, putative / DEDOL-PP synthase, putative
-2.7
solyc08g005640.2.1 isoprenoids.terpenoids moderately similar to AT1G79460 | Symbols: GA2, KS, ATKS | GA2 (GA-REQUIRING 2); ent-kaurene synthase
-2.5
solyc01g105880.2.1 isoprenoids.terpenoids moderately similar to AT3G25810 | Symbols: | myrcene/ocimene synthase, putative “
-1.9
solyc06g084240.1.1 isoprenoids.terpenoids highly similar to AT4G02780 | Symbols: GA1, ABC33, ATCPS1 | GA1 (GA-REQUIRING 1); ent-copalyl diphosphate synthase/ magnesium ion binding
-1.7
solyc03g115980.1.1 isoprenoids.non-mevalonate pathway
highly similar to AT1G74470 | Symbols: | geranylgeranyl reductase
-1.6
solyc08g005720.2.1 isoprenoids.terpenoids moderately similar to AT1G79460 | Symbols: GA2, KS, ATKS | GA2 (GA-REQUIRING 2); ent-kaurene synthase
-1.5
solyc01g105920.2.1 isoprenoids.terpenoids moderately similar to AT3G25810 | Symbols: | myrcene/ocimene synthase, putative
-1.4
solyc07g042630.2.1 isoprenoids.terpenoids highly similar to AT1G78960 | Symbols: ATLUP2 | ATLUP2; beta-amyrin synthase/ lupeol synthase
-1.2
solyc02g081330.2.1 isoprenoids.carotenoids.phytoene synthase
highly similar to AT5G17230 | Symbols: | phytoene synthase (PSY) / geranylgeranyl-diphosphate geranylgeranyl transferase
-1.2
solyc12g006520.1.1 isoprenoids.terpenoids nearly identical to AT1G78950 | Symbols: | beta-amyrin synthase, putative
-1.2
solyc11g010850.1.1 isoprenoids.non-mevalonate pathway.DXS
highly similar to AT4G15560 | Symbols: CLA1, DEF, CLA, DXS, DXPS2 | CLA1 (CLOROPLASTOS ALTERADOS 1); 1-deoxy-D-xylulose-5-phosphate synthase
-1.2
solyc04g050930.2.1 isoprenoids.carotenoids.violaxanthin de-epoxidase
highly similar to AT1G08550 | Symbols: NPQ1, AVDE1 | NPQ1 (NON-PHOTOCHEMICAL QUENCHING 1); violaxanthin de-epoxidase
-1.2
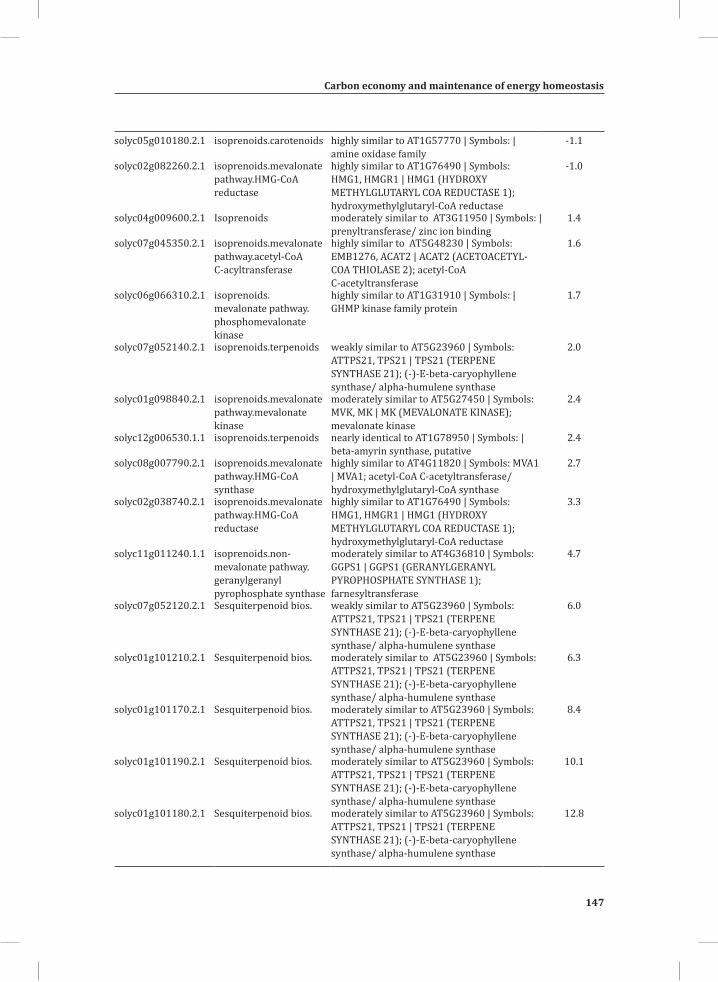
Carbon economy and maintenance of energy homeostasis
147
Chapter 3
solyc05g010180.2.1 isoprenoids.carotenoids highly similar to AT1G57770 | Symbols: | amine oxidase family
-1.1
solyc02g082260.2.1 isoprenoids.mevalonate pathway.HMG-CoA reductase
highly similar to AT1G76490 | Symbols: HMG1, HMGR1 | HMG1 (HYDROXY METHYLGLUTARYL COA REDUCTASE 1); hydroxymethylglutaryl-CoA reductase
-1.0
solyc04g009600.2.1 Isoprenoids moderately similar to AT3G11950 | Symbols: | prenyltransferase/ zinc ion binding
1.4
solyc07g045350.2.1 isoprenoids.mevalonate pathway.acetyl-CoA C-acyltransferase
highly similar to AT5G48230 | Symbols: EMB1276, ACAT2 | ACAT2 (ACETOACETYL-COA THIOLASE 2); acetyl-CoA C-acetyltransferase
1.6
solyc06g066310.2.1 isoprenoids.mevalonate pathway.phosphomevalonate kinase
highly similar to AT1G31910 | Symbols: | GHMP kinase family protein
1.7
solyc07g052140.2.1 isoprenoids.terpenoids weakly similar to AT5G23960 | Symbols: ATTPS21, TPS21 | TPS21 (TERPENE SYNTHASE 21); (-)-E-beta-caryophyllene synthase/ alpha-humulene synthase
2.0
solyc01g098840.2.1 isoprenoids.mevalonate pathway.mevalonate kinase
moderately similar to AT5G27450 | Symbols: MVK, MK | MK (MEVALONATE KINASE); mevalonate kinase
2.4
solyc12g006530.1.1 isoprenoids.terpenoids nearly identical to AT1G78950 | Symbols: | beta-amyrin synthase, putative
2.4
solyc08g007790.2.1 isoprenoids.mevalonate pathway.HMG-CoA synthase
highly similar to AT4G11820 | Symbols: MVA1 | MVA1; acetyl-CoA C-acetyltransferase/ hydroxymethylglutaryl-CoA synthase
2.7
solyc02g038740.2.1 isoprenoids.mevalonate pathway.HMG-CoA reductase
highly similar to AT1G76490 | Symbols: HMG1, HMGR1 | HMG1 (HYDROXY METHYLGLUTARYL COA REDUCTASE 1); hydroxymethylglutaryl-CoA reductase
3.3
solyc11g011240.1.1 isoprenoids.non-mevalonate pathway.geranylgeranyl pyrophosphate synthase
moderately similar to AT4G36810 | Symbols: GGPS1 | GGPS1 (GERANYLGERANYL PYROPHOSPHATE SYNTHASE 1); farnesyltransferase
4.7
solyc07g052120.2.1 Sesquiterpenoid bios. weakly similar to AT5G23960 | Symbols: ATTPS21, TPS21 | TPS21 (TERPENE SYNTHASE 21); (-)-E-beta-caryophyllene synthase/ alpha-humulene synthase
6.0
solyc01g101210.2.1 Sesquiterpenoid bios. moderately similar to AT5G23960 | Symbols: ATTPS21, TPS21 | TPS21 (TERPENE SYNTHASE 21); (-)-E-beta-caryophyllene synthase/ alpha-humulene synthase
6.3
solyc01g101170.2.1 Sesquiterpenoid bios. moderately similar to AT5G23960 | Symbols: ATTPS21, TPS21 | TPS21 (TERPENE SYNTHASE 21); (-)-E-beta-caryophyllene synthase/ alpha-humulene synthase
8.4
solyc01g101190.2.1 Sesquiterpenoid bios. moderately similar to AT5G23960 | Symbols: ATTPS21, TPS21 | TPS21 (TERPENE SYNTHASE 21); (-)-E-beta-caryophyllene synthase/ alpha-humulene synthase
10.1
solyc01g101180.2.1 Sesquiterpenoid bios. moderately similar to AT5G23960 | Symbols: ATTPS21, TPS21 | TPS21 (TERPENE SYNTHASE 21); (-)-E-beta-caryophyllene synthase/ alpha-humulene synthase
12.8
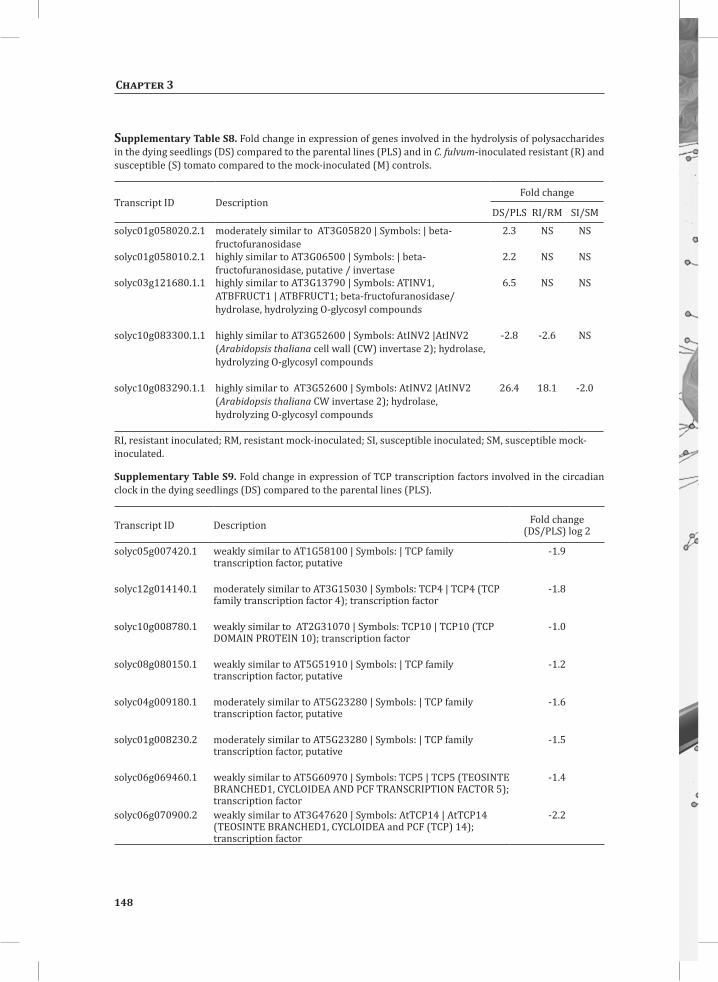
148
Chapter 3
Supplementary Table S8. Fold change in expression of genes involved in the hydrolysis of polysaccharides in the dying seedlings (DS) compared to the parental lines (PLS) and in C. fulvum-inoculated resistant (R) and susceptible (S) tomato compared to the mock-inoculated (M) controls.
Transcript ID Description Fold change
DS/PLS RI/RM SI/SM
solyc01g058020.2.1 moderately similar to AT3G05820 | Symbols: | beta-fructofuranosidase
2.3 NS NS
solyc01g058010.2.1 highly similar to AT3G06500 | Symbols: | beta-fructofuranosidase, putative / invertase
2.2 NS NS
solyc03g121680.1.1 highly similar to AT3G13790 | Symbols: ATINV1, ATBFRUCT1 | ATBFRUCT1; beta-fructofuranosidase/ hydrolase, hydrolyzing O-glycosyl compounds
6.5 NS NS
solyc10g083300.1.1 highly similar to AT3G52600 | Symbols: AtINV2 |AtINV2 (Arabidopsis thaliana cell wall (CW) invertase 2); hydrolase, hydrolyzing O-glycosyl compounds
-2.8 -2.6 NS
solyc10g083290.1.1 highly similar to AT3G52600 | Symbols: AtINV2 |AtINV2 (Arabidopsis thaliana CW invertase 2); hydrolase, hydrolyzing O-glycosyl compounds
26.4 18.1 -2.0
RI, resistant inoculated; RM, resistant mock-inoculated; SI, susceptible inoculated; SM, susceptible mock-inoculated.
Supplementary Table S9. Fold change in expression of TCP transcription factors involved in the circadian clock in the dying seedlings (DS) compared to the parental lines (PLS).
Transcript ID Description Fold change (DS/PLS) log 2
solyc05g007420.1 weakly similar to AT1G58100 | Symbols: | TCP family transcription factor, putative
-1.9
solyc12g014140.1 moderately similar to AT3G15030 | Symbols: TCP4 | TCP4 (TCP family transcription factor 4); transcription factor
-1.8
solyc10g008780.1 weakly similar to AT2G31070 | Symbols: TCP10 | TCP10 (TCP DOMAIN PROTEIN 10); transcription factor
-1.0
solyc08g080150.1 weakly similar to AT5G51910 | Symbols: | TCP family transcription factor, putative
-1.2
solyc04g009180.1 moderately similar to AT5G23280 | Symbols: | TCP family transcription factor, putative
-1.6
solyc01g008230.2 moderately similar to AT5G23280 | Symbols: | TCP family transcription factor, putative
-1.5
solyc06g069460.1 weakly similar to AT5G60970 | Symbols: TCP5 | TCP5 (TEOSINTE BRANCHED1, CYCLOIDEA AND PCF TRANSCRIPTION FACTOR 5); transcription factor
-1.4
solyc06g070900.2 weakly similar to AT3G47620 | Symbols: AtTCP14 | AtTCP14 (TEOSINTE BRANCHED1, CYCLOIDEA and PCF (TCP) 14); transcription factor
-2.2
Chapter 3
Genome-Wide Functional Analysis of WRKY Transcription Factors in Resistance of
Tomato to Cladosporium fulvum
Desalegn W. Etalo1, 3 Ω, Wladimir I.L.Tameling5†, Ric C.H. De Vos2,3,4, Harro J. Bouwmeester1,3* and Matthieu H.A.J. Joosten3,5
1 Laboratory of Plant Physiology, Wageningen University, Wageningen, the Netherlands.2 Plant Research International, Bioscience, Wageningen University, Wageningen, The Netherlands.3 Centre for BioSystems Genomics, Wageningen, The Netherlands.4 Netherlands Metabolomics Centre, Einsteinweg 55, 2333 CC Leiden, the Netherlands.5 Laboratory of Phytopathology, Wageningen University, Wageningen, the Netherlands.*Corresponding author.Laboratory of Plant Physiology, Wageningen University, Droevendaalsesteeg 1, 6708 PB Wageningen, The Netherlands.Tel.: +31 (0)317-489859.Fax: +31 (0)317-418094.E-mail: [email protected] † Current address: KEYGENE N.V., 6700 AE Wageningen, The Netherlands Ω Current address: Plant Research International, Bioscience, Wageningen University, Wageningen, The Netherlands.
To be submitted
4Chapter
150
Chapter 4
Abstract
The absence of specialized immune cells forces plants to tightly control the immune response. As entire plant organs could potentially mount an immune response (and consequently die), this response has to be strictly regulated. Furthermore, this control is required to balance the allocation of resources, of which the efficiency determines the fitness of plants in their natural habitat. Hence, any response to a perturbation of plant homeostasis should be accompanied by a fast switch between alternative gene transcription programs to ensure an efficient response with the least impact on growth. Transcription factor (TF)-mediated transcriptional regulation shapes the defence transcriptome of resistant plants upon mounting their response to invading pathogens. We study this response in tomato (Solanum lycopersicum, Sl) carrying Cf resistance genes to the pathogenic fungus Cladosporium fulvum. Although many different classes of TFs showed differential regulation, genes encoding WRKY TFs (SlWRKYs) showed the most pronounced changes at the transcriptional level upon activation of the defence response in tomato resistant to C. fulvum. Out of a total of 59 expressed SlWRKYs, 36 were transcriptionally up-regulated, whereas the transcription of only two of them was suppressed. Virus-induced gene silencing (VIGS) of selected differentially regulated, and possibly functionally redundant, SlWRKYs showed that this class of TFs consists of a group of key regulators, some of which are activating and some of which are suppressing the plant immune response. Untargeted metabolomics showed that inhibition of the expression of SlWRKY31/33 and SlWRKY80 (an ortholog of AtWRKY70) by VIGS, resulted in an increase in susceptibility, which is comparable with the increased susceptibility when the resistance gene Cf-4 itself is knocked-down. Targeting of defence repressors (SlWRKY39/40/45/46) boosted the basal defence in susceptible plants, thereby resulting in a drastic reduction in C. fulvum proliferation. Targeting of the genes encoding these transcription factors and other combinations of SlWRKYs resulted in the alteration of the apoplat metabolome towards susceptibility, supporting their involvement in the defence-associated metabolome reprogramming of tomato upon its colonisation by C. fulvum.
Genome-wide WRKY functional analysis
151
Chapter 4
Introduction
Plants are continuously exposed to a myriad of microbes but only few manage to cause disease. Two interconnected layers of plant immunity surveyed by extracellular plasma membrane-localised receptors and intracellular receptors, referred to as nucleotide-binding-leucine-rich repeat (NB-LRR) proteins, play a critical role in perceiving non-self components and mounting an adequate defence response (Jones and Dangl, 2006). Extracellular pattern recognition receptors (PRRs) recognize highly conserved microbe-associated molecular patterns (MAMPs), such as fungal chitin and bacterial flagellin, and their perception leads to the induction of MAMP-triggered immunity (MTI). However, virulent microbes deliver specific effector proteins into the host cell that suppress the MTI and promote effector-triggered susceptibility (ETS). Resistant plants in turn will use the second layer of surveillance that allows specific recognition of pathogen effectors and halts pathogen ingress through the activation of effector-triggered immunity (ETI). Generally, MTI and ETI give rise to similar responses, although in most cases ETI is stronger, faster and more robust and often involves localized programmed cell death, referred to as the hypersensitive response (HR) (Tao et al., 2003; Chisholm et al., 2006; Jones and Dangl, 2006; Dodds and Rathjen, 2010; Thomma et al., 2011; Dangl et al., 2013).
The absence of specialized immune cells imposes the need for a tight control of the immune response of plants, as otherwise complete tissues could mount this response and undergo an HR. Furthermore, the allocation of resources has to be balanced between various biological processes and an efficient use of energy determines the overall fitness and survival of plants (Kliebenstein and Rowe, 2008; Denance et al., 2013; Neilson et al., 2013). Hence, any response to a perturbation of plant homeostasis should be accompanied by a fast switch to the appropriate gene transcription programme and suppression of other programmes to ensure an economic and efficient reaction. Therefore, factors that are involved in the regulation of this response are essential for plant survival and are subject of studies that use systems biology approaches (Eulgem et al., 1999; Li et al., 2004; Moore et al., 2011; Etalo et al., 2013; Shoji et al., 2013). Key components allowing fast transcriptional reprogramming are transcription factors (TFs). Binding of transcription factors to the appropriate promoter regions in the DNA enables the recruitment of RNA polymerase II to induce gene transcription. Some well-known transcription factors involved in plant defense transcriptome reprogramming include AP2/ERF, bZIP, MYC, MYB and WRKY TFs (Rushton and Somssich, 1998; Pozo et al., 2008; Rushton et al., 2010; Alves et al., 2013; Chang et al., 2013; Meng et al., 2013).
Recently, a system-wide analysis indicated a prominent role of WRKY TFs in orchestrating the HR-associated transcriptome and metabolome reprogramming in tomato (Solanum lycopersicum, Sl) (Etalo et al., 2013). The WRKY family is among the ten largest families
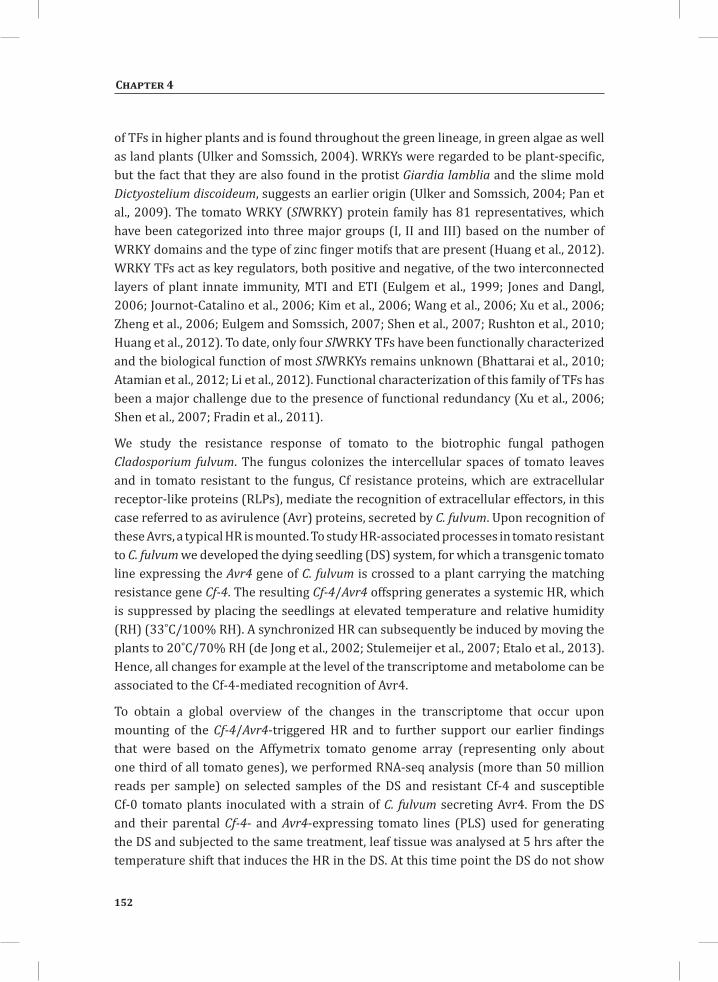
152
Chapter 4
of TFs in higher plants and is found throughout the green lineage, in green algae as well as land plants (Ulker and Somssich, 2004). WRKYs were regarded to be plant-specific, but the fact that they are also found in the protist Giardia lamblia and the slime mold Dictyostelium discoideum, suggests an earlier origin (Ulker and Somssich, 2004; Pan et al., 2009). The tomato WRKY (SlWRKY) protein family has 81 representatives, which have been categorized into three major groups (I, II and III) based on the number of WRKY domains and the type of zinc finger motifs that are present (Huang et al., 2012). WRKY TFs act as key regulators, both positive and negative, of the two interconnected layers of plant innate immunity, MTI and ETI (Eulgem et al., 1999; Jones and Dangl, 2006; Journot-Catalino et al., 2006; Kim et al., 2006; Wang et al., 2006; Xu et al., 2006; Zheng et al., 2006; Eulgem and Somssich, 2007; Shen et al., 2007; Rushton et al., 2010; Huang et al., 2012). To date, only four SlWRKY TFs have been functionally characterized and the biological function of most SlWRKYs remains unknown (Bhattarai et al., 2010; Atamian et al., 2012; Li et al., 2012). Functional characterization of this family of TFs has been a major challenge due to the presence of functional redundancy (Xu et al., 2006; Shen et al., 2007; Fradin et al., 2011).
We study the resistance response of tomato to the biotrophic fungal pathogen Cladosporium fulvum. The fungus colonizes the intercellular spaces of tomato leaves and in tomato resistant to the fungus, Cf resistance proteins, which are extracellular receptor-like proteins (RLPs), mediate the recognition of extracellular effectors, in this case referred to as avirulence (Avr) proteins, secreted by C. fulvum. Upon recognition of these Avrs, a typical HR is mounted. To study HR-associated processes in tomato resistant to C. fulvum we developed the dying seedling (DS) system, for which a transgenic tomato line expressing the Avr4 gene of C. fulvum is crossed to a plant carrying the matching resistance gene Cf-4. The resulting Cf-4/Avr4 offspring generates a systemic HR, which is suppressed by placing the seedlings at elevated temperature and relative humidity (RH) (33˚C/100% RH). A synchronized HR can subsequently be induced by moving the plants to 20˚C/70% RH (de Jong et al., 2002; Stulemeijer et al., 2007; Etalo et al., 2013). Hence, all changes for example at the level of the transcriptome and metabolome can be associated to the Cf-4-mediated recognition of Avr4.
To obtain a global overview of the changes in the transcriptome that occur upon mounting of the Cf-4/Avr4-triggered HR and to further support our earlier findings that were based on the Affymetrix tomato genome array (representing only about one third of all tomato genes), we performed RNA-seq analysis (more than 50 million reads per sample) on selected samples of the DS and resistant Cf-4 and susceptible Cf-0 tomato plants inoculated with a strain of C. fulvum secreting Avr4. From the DS and their parental Cf-4- and Avr4-expressing tomato lines (PLS) used for generating the DS and subjected to the same treatment, leaf tissue was analysed at 5 hrs after the temperature shift that induces the HR in the DS. At this time point the DS do not show
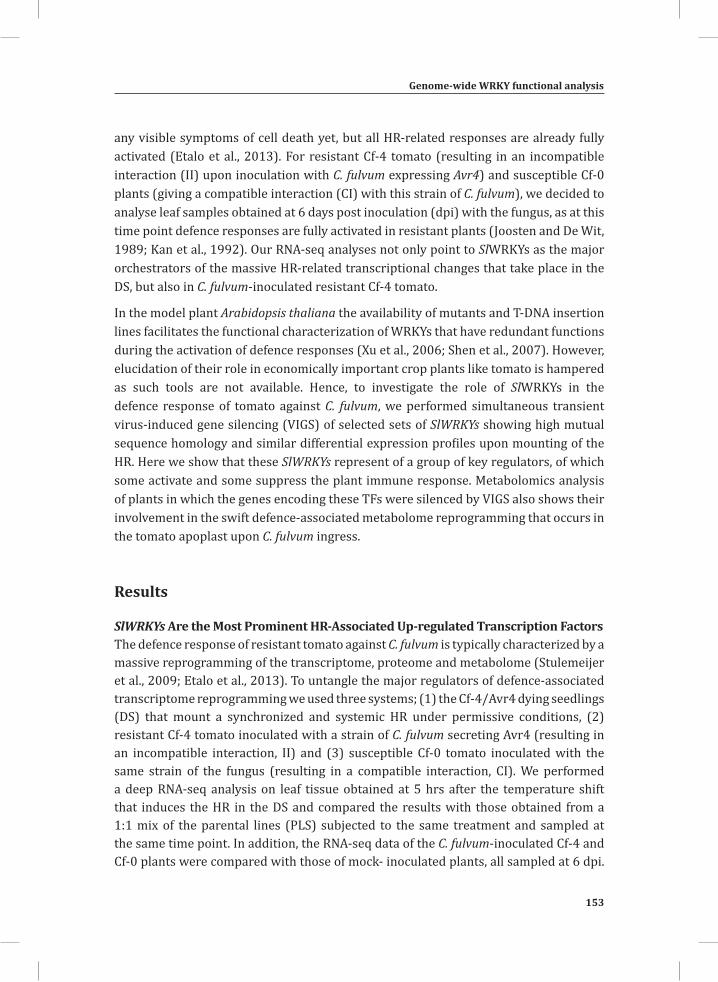
Genome-wide WRKY functional analysis
153
Chapter 4
any visible symptoms of cell death yet, but all HR-related responses are already fully activated (Etalo et al., 2013). For resistant Cf-4 tomato (resulting in an incompatible interaction (II) upon inoculation with C. fulvum expressing Avr4) and susceptible Cf-0 plants (giving a compatible interaction (CI) with this strain of C. fulvum), we decided to analyse leaf samples obtained at 6 days post inoculation (dpi) with the fungus, as at this time point defence responses are fully activated in resistant plants (Joosten and De Wit, 1989; Kan et al., 1992). Our RNA-seq analyses not only point to SlWRKYs as the major orchestrators of the massive HR-related transcriptional changes that take place in the DS, but also in C. fulvum-inoculated resistant Cf-4 tomato.
In the model plant Arabidopsis thaliana the availability of mutants and T-DNA insertion lines facilitates the functional characterization of WRKYs that have redundant functions during the activation of defence responses (Xu et al., 2006; Shen et al., 2007). However, elucidation of their role in economically important crop plants like tomato is hampered as such tools are not available. Hence, to investigate the role of SlWRKYs in the defence response of tomato against C. fulvum, we performed simultaneous transient virus-induced gene silencing (VIGS) of selected sets of SlWRKYs showing high mutual sequence homology and similar differential expression profiles upon mounting of the HR. Here we show that these SlWRKYs represent of a group of key regulators, of which some activate and some suppress the plant immune response. Metabolomics analysis of plants in which the genes encoding these TFs were silenced by VIGS also shows their involvement in the swift defence-associated metabolome reprogramming that occurs in the tomato apoplast upon C. fulvum ingress.
Results
SlWRKYs Are the Most Prominent HR-Associated Up-regulated Transcription FactorsThe defence response of resistant tomato against C. fulvum is typically characterized by a massive reprogramming of the transcriptome, proteome and metabolome (Stulemeijer et al., 2009; Etalo et al., 2013). To untangle the major regulators of defence-associated transcriptome reprogramming we used three systems; (1) the Cf-4/Avr4 dying seedlings (DS) that mount a synchronized and systemic HR under permissive conditions, (2) resistant Cf-4 tomato inoculated with a strain of C. fulvum secreting Avr4 (resulting in an incompatible interaction, II) and (3) susceptible Cf-0 tomato inoculated with the same strain of the fungus (resulting in a compatible interaction, CI). We performed a deep RNA-seq analysis on leaf tissue obtained at 5 hrs after the temperature shift that induces the HR in the DS and compared the results with those obtained from a 1:1 mix of the parental lines (PLS) subjected to the same treatment and sampled at the same time point. In addition, the RNA-seq data of the C. fulvum-inoculated Cf-4 and Cf-0 plants were compared with those of mock- inoculated plants, all sampled at 6 dpi.
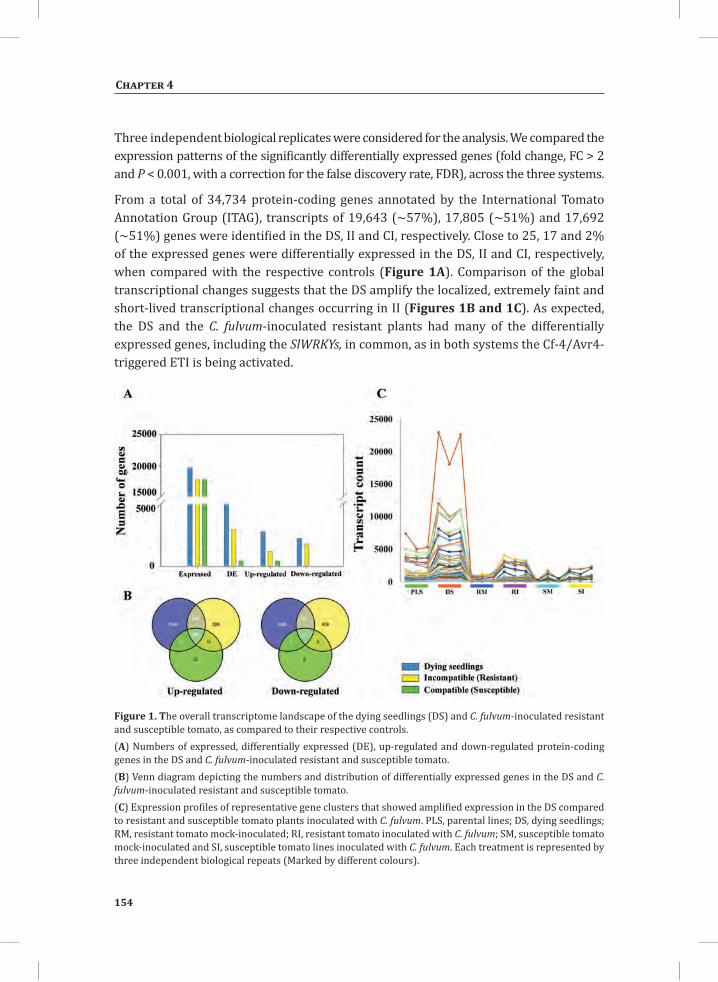
154
Chapter 4
Three independent biological replicates were considered for the analysis. We compared the expression patterns of the significantly differentially expressed genes (fold change, FC > 2 and P < 0.001, with a correction for the false discovery rate, FDR), across the three systems.
From a total of 34,734 protein-coding genes annotated by the International Tomato Annotation Group (ITAG), transcripts of 19,643 (~57%), 17,805 (~51%) and 17,692 (~51%) genes were identified in the DS, II and CI, respectively. Close to 25, 17 and 2% of the expressed genes were differentially expressed in the DS, II and CI, respectively, when compared with the respective controls (Figure 1A). Comparison of the global transcriptional changes suggests that the DS amplify the localized, extremely faint and short-lived transcriptional changes occurring in II (Figures 1B and 1C). As expected, the DS and the C. fulvum-inoculated resistant plants had many of the differentially expressed genes, including the SlWRKYs, in common, as in both systems the Cf-4/Avr4-triggered ETI is being activated.
Figure 1. The overall transcriptome landscape of the dying seedlings (DS) and C. fulvum-inoculated resistant and susceptible tomato, as compared to their respective controls.(A) Numbers of expressed, differentially expressed (DE), up-regulated and down-regulated protein-coding genes in the DS and C. fulvum-inoculated resistant and susceptible tomato. (B) Venn diagram depicting the numbers and distribution of differentially expressed genes in the DS and C. fulvum-inoculated resistant and susceptible tomato. (C) Expression profiles of representative gene clusters that showed amplified expression in the DS compared to resistant and susceptible tomato plants inoculated with C. fulvum. PLS, parental lines; DS, dying seedlings; RM, resistant tomato mock-inoculated; RI, resistant tomato inoculated with C. fulvum; SM, susceptible tomato mock-inoculated and SI, susceptible tomato lines inoculated with C. fulvum. Each treatment is represented by three independent biological repeats (Marked by different colours).
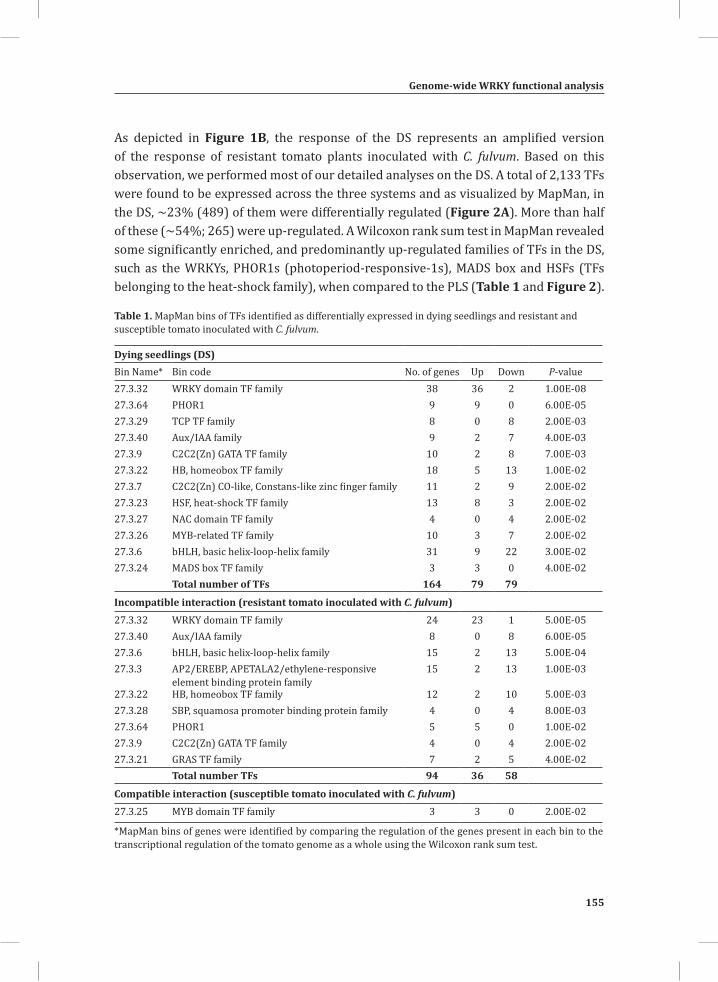
Genome-wide WRKY functional analysis
155
Chapter 4
As depicted in Figure 1B, the response of the DS represents an amplified version of the response of resistant tomato plants inoculated with C. fulvum. Based on this observation, we performed most of our detailed analyses on the DS. A total of 2,133 TFs were found to be expressed across the three systems and as visualized by MapMan, in the DS, ~23% (489) of them were differentially regulated (Figure 2A). More than half of these (~54%; 265) were up-regulated. A Wilcoxon rank sum test in MapMan revealed some significantly enriched, and predominantly up-regulated families of TFs in the DS, such as the WRKYs, PHOR1s (photoperiod-responsive-1s), MADS box and HSFs (TFs belonging to the heat-shock family), when compared to the PLS (Table 1 and Figure 2).
Table 1. MapMan bins of TFs identified as differentially expressed in dying seedlings and resistant and susceptible tomato inoculated with C. fulvum.
Dying seedlings (DS)Bin Name* Bin code No. of genes Up Down P-value27.3.32 WRKY domain TF family 38 36 2 1.00E-0827.3.64 PHOR1 9 9 0 6.00E-0527.3.29 TCP TF family 8 0 8 2.00E-0327.3.40 Aux/IAA family 9 2 7 4.00E-0327.3.9 C2C2(Zn) GATA TF family 10 2 8 7.00E-0327.3.22 HB, homeobox TF family 18 5 13 1.00E-0227.3.7 C2C2(Zn) CO-like, Constans-like zinc finger family 11 2 9 2.00E-0227.3.23 HSF, heat-shock TF family 13 8 3 2.00E-0227.3.27 NAC domain TF family 4 0 4 2.00E-0227.3.26 MYB-related TF family 10 3 7 2.00E-0227.3.6 bHLH, basic helix-loop-helix family 31 9 22 3.00E-0227.3.24 MADS box TF family 3 3 0 4.00E-02
Total number of TFs 164 79 79
Incompatible interaction (resistant tomato inoculated with C. fulvum)27.3.32 WRKY domain TF family 24 23 1 5.00E-0527.3.40 Aux/IAA family 8 0 8 6.00E-0527.3.6 bHLH, basic helix-loop-helix family 15 2 13 5.00E-0427.3.3 AP2/EREBP, APETALA2/ethylene-responsive
element binding protein family15 2 13 1.00E-03
27.3.22 HB, homeobox TF family 12 2 10 5.00E-0327.3.28 SBP, squamosa promoter binding protein family 4 0 4 8.00E-0327.3.64 PHOR1 5 5 0 1.00E-0227.3.9 C2C2(Zn) GATA TF family 4 0 4 2.00E-0227.3.21 GRAS TF family 7 2 5 4.00E-02
Total number TFs 94 36 58
Compatible interaction (susceptible tomato inoculated with C. fulvum)27.3.25 MYB domain TF family 3 3 0 2.00E-02
*MapMan bins of genes were identified by comparing the regulation of the genes present in each bin to the transcriptional regulation of the tomato genome as a whole using the Wilcoxon rank sum test.
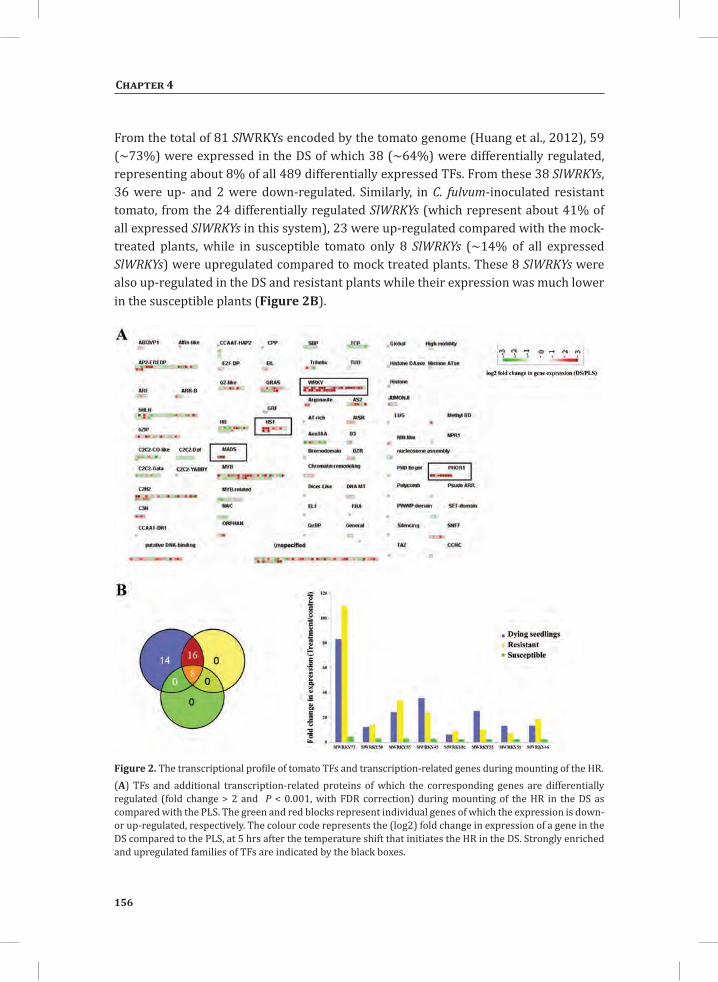
156
Chapter 4
From the total of 81 SlWRKYs encoded by the tomato genome (Huang et al., 2012), 59 (~73%) were expressed in the DS of which 38 (~64%) were differentially regulated, representing about 8% of all 489 differentially expressed TFs. From these 38 SlWRKYs, 36 were up- and 2 were down-regulated. Similarly, in C. fulvum-inoculated resistant tomato, from the 24 differentially regulated SlWRKYs (which represent about 41% of all expressed SlWRKYs in this system), 23 were up-regulated compared with the mock-treated plants, while in susceptible tomato only 8 SlWRKYs (~14% of all expressed SlWRKYs) were upregulated compared to mock treated plants. These 8 SlWRKYs were also up-regulated in the DS and resistant plants while their expression was much lower in the susceptible plants (Figure 2B).
Figure 2. The transcriptional profile of tomato TFs and transcription-related genes during mounting of the HR.(A) TFs and additional transcription-related proteins of which the corresponding genes are differentially regulated (fold change > 2 and P < 0.001, with FDR correction) during mounting of the HR in the DS as compared with the PLS. The green and red blocks represent individual genes of which the expression is down- or up-regulated, respectively. The colour code represents the (log2) fold change in expression of a gene in the DS compared to the PLS, at 5 hrs after the temperature shift that initiates the HR in the DS. Strongly enriched and upregulated families of TFs are indicated by the black boxes.
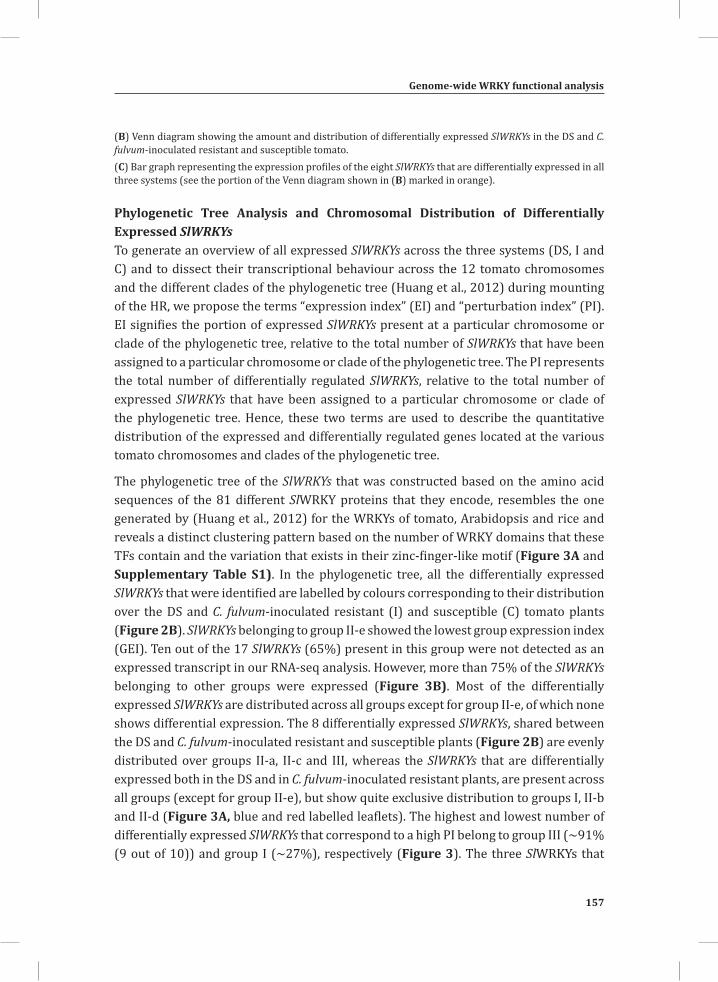
Genome-wide WRKY functional analysis
157
Chapter 4
(B) Venn diagram showing the amount and distribution of differentially expressed SlWRKYs in the DS and C. fulvum-inoculated resistant and susceptible tomato. (C) Bar graph representing the expression profiles of the eight SlWRKYs that are differentially expressed in all three systems (see the portion of the Venn diagram shown in (B) marked in orange).
Phylogenetic Tree Analysis and Chromosomal Distribution of Differentially Expressed SlWRKYs To generate an overview of all expressed SlWRKYs across the three systems (DS, I and C) and to dissect their transcriptional behaviour across the 12 tomato chromosomes and the different clades of the phylogenetic tree (Huang et al., 2012) during mounting of the HR, we propose the terms “expression index” (EI) and “perturbation index” (PI). EI signifies the portion of expressed SlWRKYs present at a particular chromosome or clade of the phylogenetic tree, relative to the total number of SlWRKYs that have been assigned to a particular chromosome or clade of the phylogenetic tree. The PI represents the total number of differentially regulated SlWRKYs, relative to the total number of expressed SlWRKYs that have been assigned to a particular chromosome or clade of the phylogenetic tree. Hence, these two terms are used to describe the quantitative distribution of the expressed and differentially regulated genes located at the various tomato chromosomes and clades of the phylogenetic tree.
The phylogenetic tree of the SlWRKYs that was constructed based on the amino acid sequences of the 81 different SlWRKY proteins that they encode, resembles the one generated by (Huang et al., 2012) for the WRKYs of tomato, Arabidopsis and rice and reveals a distinct clustering pattern based on the number of WRKY domains that these TFs contain and the variation that exists in their zinc-finger-like motif (Figure 3A and Supplementary Table S1). In the phylogenetic tree, all the differentially expressed SlWRKYs that were identified are labelled by colours corresponding to their distribution over the DS and C. fulvum-inoculated resistant (I) and susceptible (C) tomato plants (Figure 2B). SlWRKYs belonging to group II-e showed the lowest group expression index (GEI). Ten out of the 17 SlWRKYs (65%) present in this group were not detected as an expressed transcript in our RNA-seq analysis. However, more than 75% of the SlWRKYs belonging to other groups were expressed (Figure 3B). Most of the differentially expressed SlWRKYs are distributed across all groups except for group II-e, of which none shows differential expression. The 8 differentially expressed SlWRKYs, shared between the DS and C. fulvum-inoculated resistant and susceptible plants (Figure 2B) are evenly distributed over groups II-a, II-c and III, whereas the SlWRKYs that are differentially expressed both in the DS and in C. fulvum-inoculated resistant plants, are present across all groups (except for group II-e), but show quite exclusive distribution to groups I, II-b and II-d (Figure 3A, blue and red labelled leaflets). The highest and lowest number of differentially expressed SlWRKYs that correspond to a high PI belong to group III (~91% (9 out of 10)) and group I (~27%), respectively (Figure 3). The three SlWRKYs that
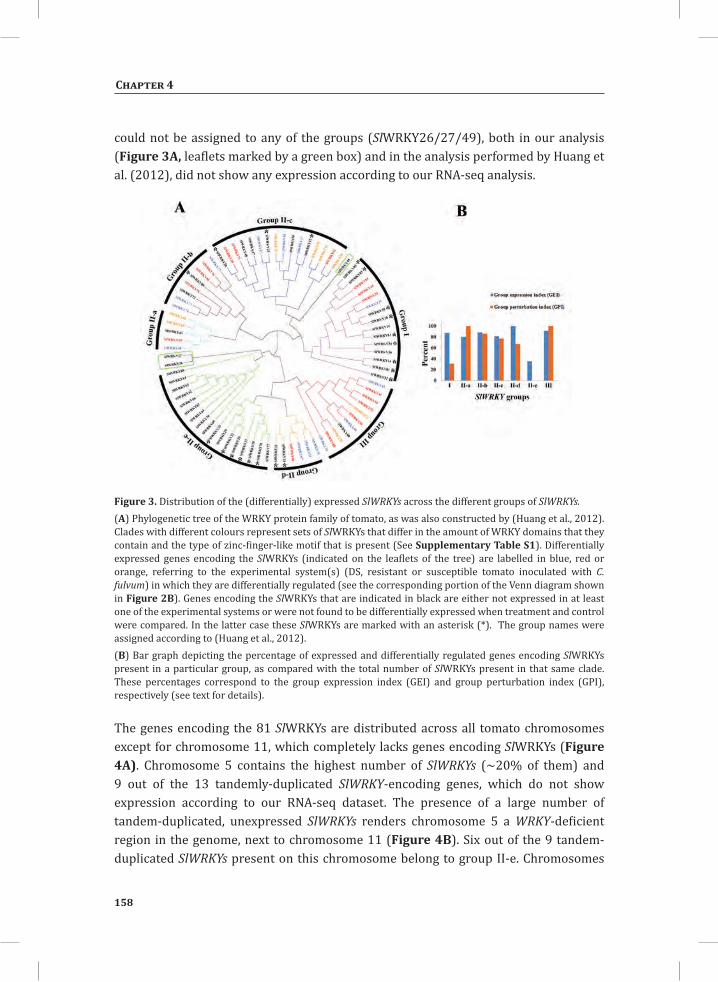
158
Chapter 4
could not be assigned to any of the groups (SlWRKY26/27/49), both in our analysis (Figure 3A, leaflets marked by a green box) and in the analysis performed by Huang et al. (2012), did not show any expression according to our RNA-seq analysis.
Figure 3. Distribution of the (differentially) expressed SlWRKYs across the different groups of SlWRKYs.(A) Phylogenetic tree of the WRKY protein family of tomato, as was also constructed by (Huang et al., 2012). Clades with different colours represent sets of SlWRKYs that differ in the amount of WRKY domains that they contain and the type of zinc-finger-like motif that is present (See Supplementary Table S1). Differentially expressed genes encoding the SlWRKYs (indicated on the leaflets of the tree) are labelled in blue, red or orange, referring to the experimental system(s) (DS, resistant or susceptible tomato inoculated with C. fulvum) in which they are differentially regulated (see the corresponding portion of the Venn diagram shown in Figure 2B). Genes encoding the SlWRKYs that are indicated in black are either not expressed in at least one of the experimental systems or were not found to be differentially expressed when treatment and control were compared. In the latter case these SlWRKYs are marked with an asterisk (*). The group names were assigned according to (Huang et al., 2012). (B) Bar graph depicting the percentage of expressed and differentially regulated genes encoding SlWRKYs present in a particular group, as compared with the total number of SlWRKYs present in that same clade. These percentages correspond to the group expression index (GEI) and group perturbation index (GPI), respectively (see text for details).
The genes encoding the 81 SlWRKYs are distributed across all tomato chromosomes except for chromosome 11, which completely lacks genes encoding SlWRKYs (Figure 4A). Chromosome 5 contains the highest number of SlWRKYs (~20% of them) and 9 out of the 13 tandemly-duplicated SlWRKY-encoding genes, which do not show expression according to our RNA-seq dataset. The presence of a large number of tandem-duplicated, unexpressed SlWRKYs renders chromosome 5 a WRKY-deficient region in the genome, next to chromosome 11 (Figure 4B). Six out of the 9 tandem-duplicated SlWRKYs present on this chromosome belong to group II-e. Chromosomes
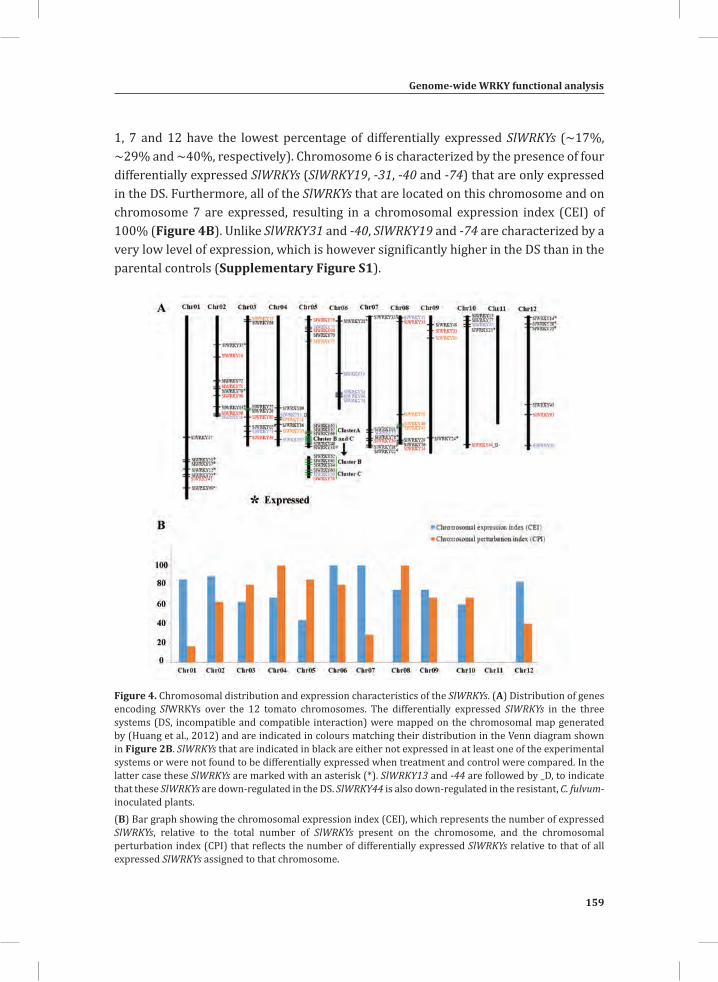
Genome-wide WRKY functional analysis
159
Chapter 4
1, 7 and 12 have the lowest percentage of differentially expressed SlWRKYs (~17%, ~29% and ~40%, respectively). Chromosome 6 is characterized by the presence of four differentially expressed SlWRKYs (SlWRKY19, -31, -40 and -74) that are only expressed in the DS. Furthermore, all of the SlWRKYs that are located on this chromosome and on chromosome 7 are expressed, resulting in a chromosomal expression index (CEI) of 100% (Figure 4B). Unlike SlWRKY31 and -40, SlWRKY19 and -74 are characterized by a very low level of expression, which is however significantly higher in the DS than in the parental controls (Supplementary Figure S1).
Figure 4. Chromosomal distribution and expression characteristics of the SlWRKYs. (A) Distribution of genes encoding SlWRKYs over the 12 tomato chromosomes. The differentially expressed SlWRKYs in the three systems (DS, incompatible and compatible interaction) were mapped on the chromosomal map generated by (Huang et al., 2012) and are indicated in colours matching their distribution in the Venn diagram shown in Figure 2B. SlWRKYs that are indicated in black are either not expressed in at least one of the experimental systems or were not found to be differentially expressed when treatment and control were compared. In the latter case these SlWRKYs are marked with an asterisk (*). SlWRKY13 and -44 are followed by _D, to indicate that these SlWRKYs are down-regulated in the DS. SlWRKY44 is also down-regulated in the resistant, C. fulvum-inoculated plants. (B) Bar graph showing the chromosomal expression index (CEI), which represents the number of expressed SlWRKYs, relative to the total number of SlWRKYs present on the chromosome, and the chromosomal perturbation index (CPI) that reflects the number of differentially expressed SlWRKYs relative to that of all expressed SlWRKYs assigned to that chromosome.
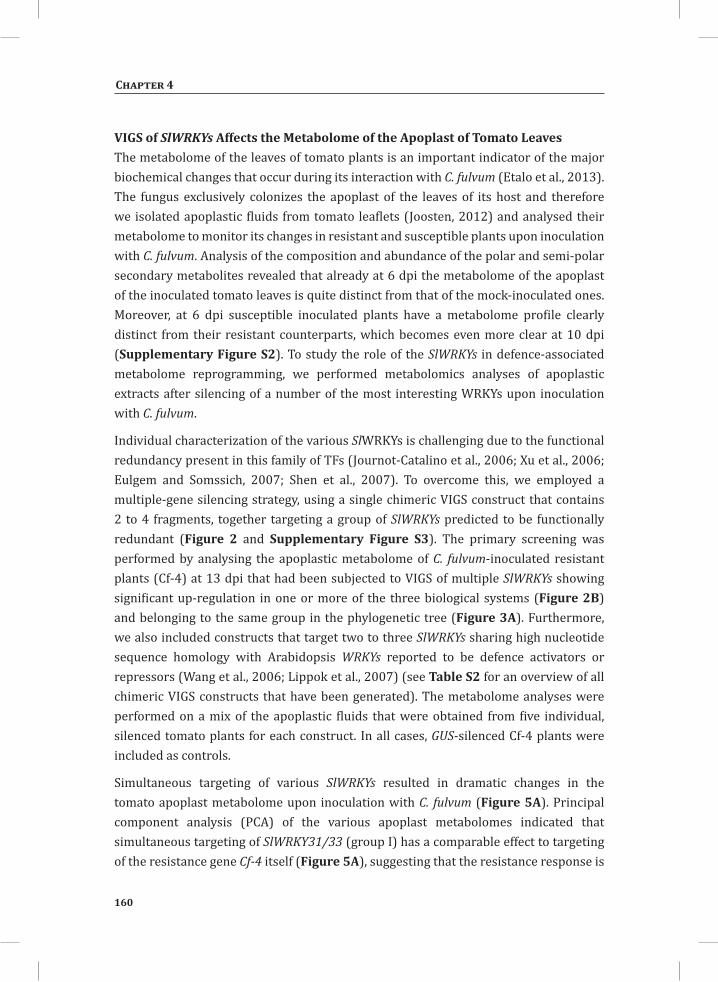
160
Chapter 4
VIGS of SlWRKYs Affects the Metabolome of the Apoplast of Tomato Leaves The metabolome of the leaves of tomato plants is an important indicator of the major biochemical changes that occur during its interaction with C. fulvum (Etalo et al., 2013). The fungus exclusively colonizes the apoplast of the leaves of its host and therefore we isolated apoplastic fluids from tomato leaflets (Joosten, 2012) and analysed their metabolome to monitor its changes in resistant and susceptible plants upon inoculation with C. fulvum. Analysis of the composition and abundance of the polar and semi-polar secondary metabolites revealed that already at 6 dpi the metabolome of the apoplast of the inoculated tomato leaves is quite distinct from that of the mock-inoculated ones. Moreover, at 6 dpi susceptible inoculated plants have a metabolome profile clearly distinct from their resistant counterparts, which becomes even more clear at 10 dpi (Supplementary Figure S2). To study the role of the SlWRKYs in defence-associated metabolome reprogramming, we performed metabolomics analyses of apoplastic extracts after silencing of a number of the most interesting WRKYs upon inoculation with C. fulvum.
Individual characterization of the various SlWRKYs is challenging due to the functional redundancy present in this family of TFs (Journot-Catalino et al., 2006; Xu et al., 2006; Eulgem and Somssich, 2007; Shen et al., 2007). To overcome this, we employed a multiple-gene silencing strategy, using a single chimeric VIGS construct that contains 2 to 4 fragments, together targeting a group of SlWRKYs predicted to be functionally redundant (Figure 2 and Supplementary Figure S3). The primary screening was performed by analysing the apoplastic metabolome of C. fulvum-inoculated resistant plants (Cf-4) at 13 dpi that had been subjected to VIGS of multiple SlWRKYs showing significant up-regulation in one or more of the three biological systems (Figure 2B) and belonging to the same group in the phylogenetic tree (Figure 3A). Furthermore, we also included constructs that target two to three SlWRKYs sharing high nucleotide sequence homology with Arabidopsis WRKYs reported to be defence activators or repressors (Wang et al., 2006; Lippok et al., 2007) (see Table S2 for an overview of all chimeric VIGS constructs that have been generated). The metabolome analyses were performed on a mix of the apoplastic fluids that were obtained from five individual, silenced tomato plants for each construct. In all cases, GUS-silenced Cf-4 plants were included as controls.
Simultaneous targeting of various SlWRKYs resulted in dramatic changes in the tomato apoplast metabolome upon inoculation with C. fulvum (Figure 5A). Principal component analysis (PCA) of the various apoplast metabolomes indicated that simultaneous targeting of SlWRKY31/33 (group I) has a comparable effect to targeting of the resistance gene Cf-4 itself (Figure 5A), suggesting that the resistance response is
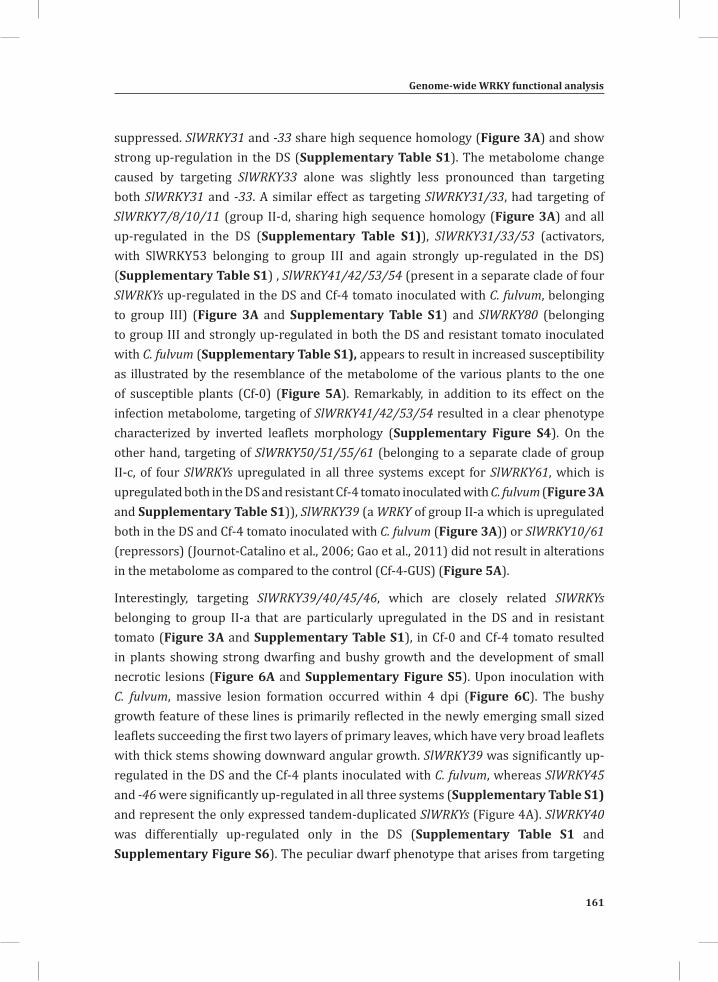
Genome-wide WRKY functional analysis
161
Chapter 4
suppressed. SlWRKY31 and -33 share high sequence homology (Figure 3A) and show strong up-regulation in the DS (Supplementary Table S1). The metabolome change caused by targeting SlWRKY33 alone was slightly less pronounced than targeting both SlWRKY31 and -33. A similar effect as targeting SlWRKY31/33, had targeting of SlWRKY7/8/10/11 (group II-d, sharing high sequence homology (Figure 3A) and all up-regulated in the DS (Supplementary Table S1)), SlWRKY31/33/53 (activators, with SlWRKY53 belonging to group III and again strongly up-regulated in the DS) (Supplementary Table S1) , SlWRKY41/42/53/54 (present in a separate clade of four SlWRKYs up-regulated in the DS and Cf-4 tomato inoculated with C. fulvum, belonging to group III) (Figure 3A and Supplementary Table S1) and SlWRKY80 (belonging to group III and strongly up-regulated in both the DS and resistant tomato inoculated with C. fulvum (Supplementary Table S1), appears to result in increased susceptibility as illustrated by the resemblance of the metabolome of the various plants to the one of susceptible plants (Cf-0) (Figure 5A). Remarkably, in addition to its effect on the infection metabolome, targeting of SlWRKY41/42/53/54 resulted in a clear phenotype characterized by inverted leaflets morphology (Supplementary Figure S4). On the other hand, targeting of SlWRKY50/51/55/61 (belonging to a separate clade of group II-c, of four SlWRKYs upregulated in all three systems except for SlWRKY61, which is upregulated both in the DS and resistant Cf-4 tomato inoculated with C. fulvum (Figure 3A and Supplementary Table S1)), SlWRKY39 (a WRKY of group II-a which is upregulated both in the DS and Cf-4 tomato inoculated with C. fulvum (Figure 3A)) or SlWRKY10/61 (repressors) (Journot-Catalino et al., 2006; Gao et al., 2011) did not result in alterations in the metabolome as compared to the control (Cf-4-GUS) (Figure 5A).
Interestingly, targeting SlWRKY39/40/45/46, which are closely related SlWRKYs belonging to group II-a that are particularly upregulated in the DS and in resistant tomato (Figure 3A and Supplementary Table S1), in Cf-0 and Cf-4 tomato resulted in plants showing strong dwarfing and bushy growth and the development of small necrotic lesions (Figure 6A and Supplementary Figure S5). Upon inoculation with C. fulvum, massive lesion formation occurred within 4 dpi (Figure 6C). The bushy growth feature of these lines is primarily reflected in the newly emerging small sized leaflets succeeding the first two layers of primary leaves, which have very broad leaflets with thick stems showing downward angular growth. SlWRKY39 was significantly up-regulated in the DS and the Cf-4 plants inoculated with C. fulvum, whereas SlWRKY45 and -46 were significantly up-regulated in all three systems (Supplementary Table S1) and represent the only expressed tandem-duplicated SlWRKYs (Figure 4A). SlWRKY40 was differentially up-regulated only in the DS (Supplementary Table S1 and Supplementary Figure S6). The peculiar dwarf phenotype that arises from targeting
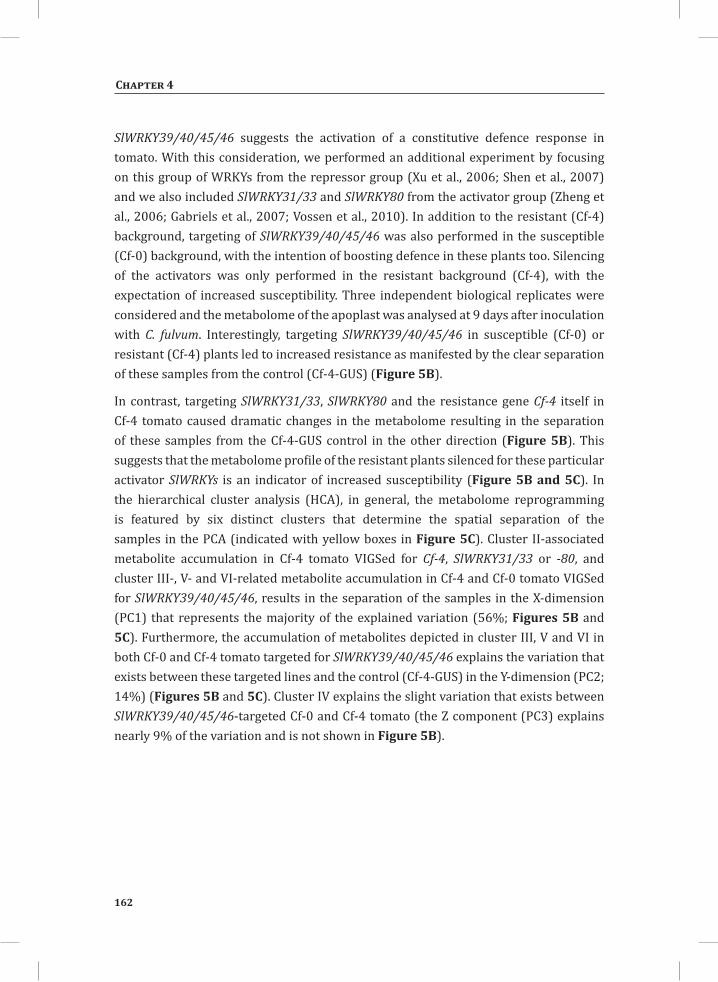
162
Chapter 4
SlWRKY39/40/45/46 suggests the activation of a constitutive defence response in tomato. With this consideration, we performed an additional experiment by focusing on this group of WRKYs from the repressor group (Xu et al., 2006; Shen et al., 2007) and we also included SlWRKY31/33 and SlWRKY80 from the activator group (Zheng et al., 2006; Gabriels et al., 2007; Vossen et al., 2010). In addition to the resistant (Cf-4) background, targeting of SlWRKY39/40/45/46 was also performed in the susceptible (Cf-0) background, with the intention of boosting defence in these plants too. Silencing of the activators was only performed in the resistant background (Cf-4), with the expectation of increased susceptibility. Three independent biological replicates were considered and the metabolome of the apoplast was analysed at 9 days after inoculation with C. fulvum. Interestingly, targeting SlWRKY39/40/45/46 in susceptible (Cf-0) or resistant (Cf-4) plants led to increased resistance as manifested by the clear separation of these samples from the control (Cf-4-GUS) (Figure 5B).
In contrast, targeting SlWRKY31/33, SlWRKY80 and the resistance gene Cf-4 itself in Cf-4 tomato caused dramatic changes in the metabolome resulting in the separation of these samples from the Cf-4-GUS control in the other direction (Figure 5B). This suggests that the metabolome profile of the resistant plants silenced for these particular activator SlWRKYs is an indicator of increased susceptibility (Figure 5B and 5C). In the hierarchical cluster analysis (HCA), in general, the metabolome reprogramming is featured by six distinct clusters that determine the spatial separation of the samples in the PCA (indicated with yellow boxes in Figure 5C). Cluster II-associated metabolite accumulation in Cf-4 tomato VIGSed for Cf-4, SlWRKY31/33 or -80, and cluster III-, V- and VI-related metabolite accumulation in Cf-4 and Cf-0 tomato VIGSed for SlWRKY39/40/45/46, results in the separation of the samples in the X-dimension (PC1) that represents the majority of the explained variation (56%; Figures 5B and 5C). Furthermore, the accumulation of metabolites depicted in cluster III, V and VI in both Cf-0 and Cf-4 tomato targeted for SlWRKY39/40/45/46 explains the variation that exists between these targeted lines and the control (Cf-4-GUS) in the Y-dimension (PC2; 14%) (Figures 5B and 5C). Cluster IV explains the slight variation that exists between SlWRKY39/40/45/46-targeted Cf-0 and Cf-4 tomato (the Z component (PC3) explains nearly 9% of the variation and is not shown in Figure 5B).
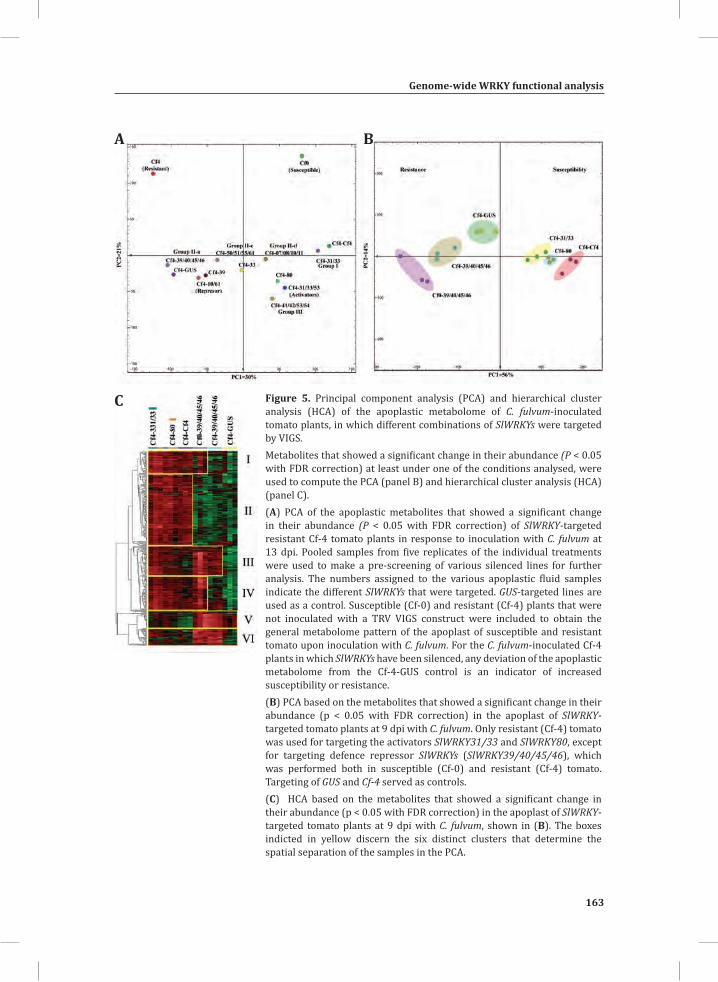
Genome-wide WRKY functional analysis
163
Chapter 4
Figure 5. Principal component analysis (PCA) and hierarchical cluster analysis (HCA) of the apoplastic metabolome of C. fulvum-inoculated tomato plants, in which different combinations of SlWRKYs were targeted by VIGS. Metabolites that showed a significant change in their abundance (P < 0.05 with FDR correction) at least under one of the conditions analysed, were used to compute the PCA (panel B) and hierarchical cluster analysis (HCA) (panel C). (A) PCA of the apoplastic metabolites that showed a significant change in their abundance (P < 0.05 with FDR correction) of SlWRKY-targeted resistant Cf-4 tomato plants in response to inoculation with C. fulvum at 13 dpi. Pooled samples from five replicates of the individual treatments were used to make a pre-screening of various silenced lines for further analysis. The numbers assigned to the various apoplastic fluid samples indicate the different SlWRKYs that were targeted. GUS-targeted lines are used as a control. Susceptible (Cf-0) and resistant (Cf-4) plants that were not inoculated with a TRV VIGS construct were included to obtain the general metabolome pattern of the apoplast of susceptible and resistant tomato upon inoculation with C. fulvum. For the C. fulvum-inoculated Cf-4 plants in which SlWRKYs have been silenced, any deviation of the apoplastic metabolome from the Cf-4-GUS control is an indicator of increased susceptibility or resistance. (B) PCA based on the metabolites that showed a significant change in their abundance (p < 0.05 with FDR correction) in the apoplast of SlWRKY-targeted tomato plants at 9 dpi with C. fulvum. Only resistant (Cf-4) tomato was used for targeting the activators SlWRKY31/33 and SlWRKY80, except for targeting defence repressor SlWRKYs (SlWRKY39/40/45/46), which was performed both in susceptible (Cf-0) and resistant (Cf-4) tomato. Targeting of GUS and Cf-4 served as controls.(C) HCA based on the metabolites that showed a significant change in their abundance (p < 0.05 with FDR correction) in the apoplast of SlWRKY-targeted tomato plants at 9 dpi with C. fulvum, shown in (B). The boxes indicted in yellow discern the six distinct clusters that determine the spatial separation of the samples in the PCA.
A B
C
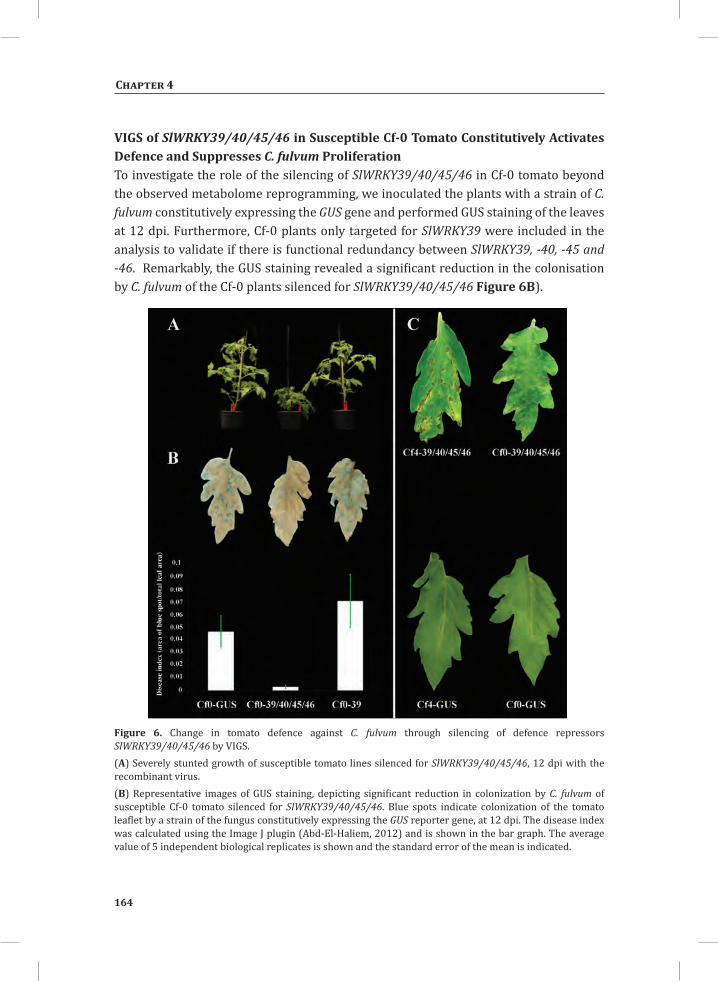
164
Chapter 4
VIGS of SlWRKY39/40/45/46 in Susceptible Cf-0 Tomato Constitutively Activates Defence and Suppresses C. fulvum Proliferation To investigate the role of the silencing of SlWRKY39/40/45/46 in Cf-0 tomato beyond the observed metabolome reprogramming, we inoculated the plants with a strain of C. fulvum constitutively expressing the GUS gene and performed GUS staining of the leaves at 12 dpi. Furthermore, Cf-0 plants only targeted for SlWRKY39 were included in the analysis to validate if there is functional redundancy between SlWRKY39, -40, -45 and -46. Remarkably, the GUS staining revealed a significant reduction in the colonisation by C. fulvum of the Cf-0 plants silenced for SlWRKY39/40/45/46 Figure 6B).
Figure 6. Change in tomato defence against C. fulvum through silencing of defence repressors SlWRKY39/40/45/46 by VIGS.(A) Severely stunted growth of susceptible tomato lines silenced for SlWRKY39/40/45/46, 12 dpi with the recombinant virus. (B) Representative images of GUS staining, depicting significant reduction in colonization by C. fulvum of susceptible Cf-0 tomato silenced for SlWRKY39/40/45/46. Blue spots indicate colonization of the tomato leaflet by a strain of the fungus constitutively expressing the GUS reporter gene, at 12 dpi. The disease index was calculated using the Image J plugin (Abd-El-Haliem, 2012) and is shown in the bar graph. The average value of 5 independent biological replicates is shown and the standard error of the mean is indicated.
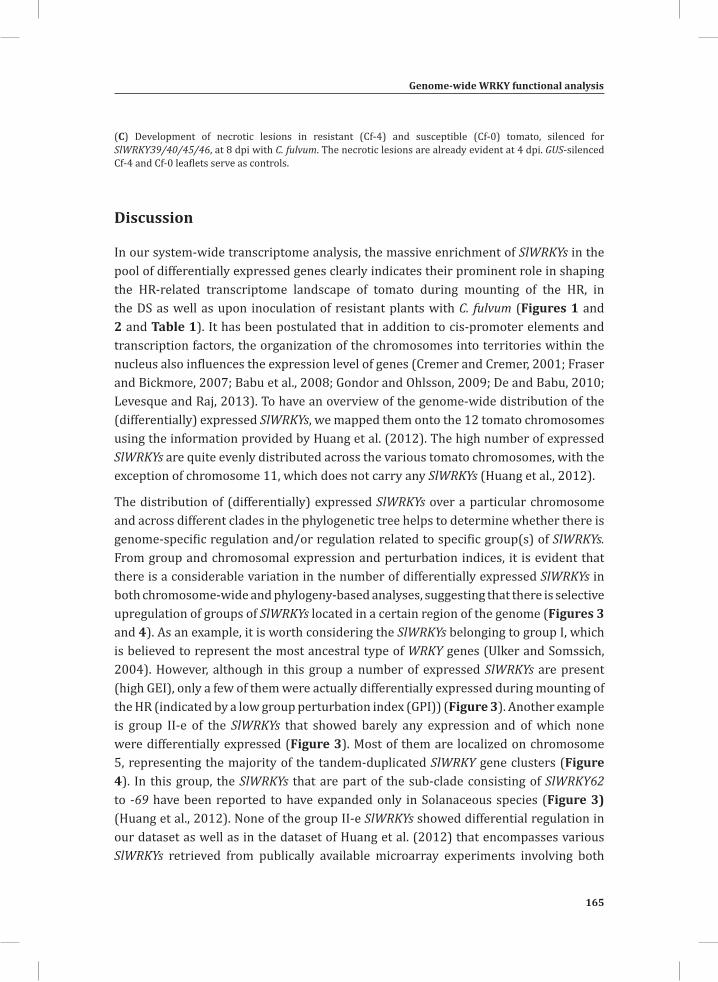
Genome-wide WRKY functional analysis
165
Chapter 4
(C) Development of necrotic lesions in resistant (Cf-4) and susceptible (Cf-0) tomato, silenced for SlWRKY39/40/45/46, at 8 dpi with C. fulvum. The necrotic lesions are already evident at 4 dpi. GUS-silenced Cf-4 and Cf-0 leaflets serve as controls.
Discussion
In our system-wide transcriptome analysis, the massive enrichment of SlWRKYs in the pool of differentially expressed genes clearly indicates their prominent role in shaping the HR-related transcriptome landscape of tomato during mounting of the HR, in the DS as well as upon inoculation of resistant plants with C. fulvum (Figures 1 and 2 and Table 1). It has been postulated that in addition to cis-promoter elements and transcription factors, the organization of the chromosomes into territories within the nucleus also influences the expression level of genes (Cremer and Cremer, 2001; Fraser and Bickmore, 2007; Babu et al., 2008; Gondor and Ohlsson, 2009; De and Babu, 2010; Levesque and Raj, 2013). To have an overview of the genome-wide distribution of the (differentially) expressed SlWRKYs, we mapped them onto the 12 tomato chromosomes using the information provided by Huang et al. (2012). The high number of expressed SlWRKYs are quite evenly distributed across the various tomato chromosomes, with the exception of chromosome 11, which does not carry any SlWRKYs (Huang et al., 2012).
The distribution of (differentially) expressed SlWRKYs over a particular chromosome and across different clades in the phylogenetic tree helps to determine whether there is genome-specific regulation and/or regulation related to specific group(s) of SlWRKYs. From group and chromosomal expression and perturbation indices, it is evident that there is a considerable variation in the number of differentially expressed SlWRKYs in both chromosome-wide and phylogeny-based analyses, suggesting that there is selective upregulation of groups of SlWRKYs located in a certain region of the genome (Figures 3 and 4). As an example, it is worth considering the SlWRKYs belonging to group I, which is believed to represent the most ancestral type of WRKY genes (Ulker and Somssich, 2004). However, although in this group a number of expressed SlWRKYs are present (high GEI), only a few of them were actually differentially expressed during mounting of the HR (indicated by a low group perturbation index (GPI)) (Figure 3). Another example is group II-e of the SlWRKYs that showed barely any expression and of which none were differentially expressed (Figure 3). Most of them are localized on chromosome 5, representing the majority of the tandem-duplicated SlWRKY gene clusters (Figure 4). In this group, the SlWRKYs that are part of the sub-clade consisting of SlWRKY62 to -69 have been reported to have expanded only in Solanaceous species (Figure 3) (Huang et al., 2012). None of the group II-e SlWRKYs showed differential regulation in our dataset as well as in the dataset of Huang et al. (2012) that encompasses various SlWRKYs retrieved from publically available microarray experiments involving both
166
Chapter 4
biotic (tomato spotted wilt virus (TSWV), Clavibacter michiganensis, fungal ethylene-inducing xylanase (EIX), and inoculation with the fungal necrotrophic pathogen Botrytis cinerea) as well as abiotic (salt and drought) stresses suggesting that they are likely to be non-functional WRKYs (Supplementary Figure S8, provides information on unique and overlapping upregulated genes between the DS and TSWV, EIX and Botrytis cinerea-challenged tomato). SlWRKYs belonging to groups I, II-b and II-d specifically showed differential expression in the DS and resistant tomato inoculated with C. fulvum. As these experimental systems predominantly represent ETI, this suggests that there could be a specific network of genes that induces the expression of this specific group of SlWRKYs upon triggering of ETI.
The timing of the transcriptional reprogramming in response to perturbation of plant homeostasis is critical. However, elucidation of the underlying mechanisms that regulate the switch to an alternative gene transcription programme remains a major challenge. A fast and coordinated transcriptional switch contributes to the fitness of plants by enabling them to maintain the right carbon economy and energy homeostasis. The SlWRKY transcriptional network, in combination with other differentially regulated TFs (Figure 2A), provides the proper balance to respond quickly and to efficiently activate defence thereby deterring pathogens, but at the same time represses defence responses as their uncontrolled activation will have detrimental consequences on plant fitness. The upregulation of defence repressor genes such as the group II-a SlWRKY39/40/45/46 (Xu et al., 2006; Shen et al., 2007), together with genes actively required to boost the immune system, creates a fine balance regulating the transcriptional reprogramming associated with mounting of the HR (Supplementary Figure S6). In agreement with this, the orthologs of these group II-a SlWRKYs in Arabidopsis (AtWRKY18/40/60) are also upregulated upon inoculation with an avirulent strain of the bacterial pathogen Pseudomonas syringae and upon treatment of the plants with salicylic acid (Dong et al., 2003; Huang et al., 2012). Hence, the observed constitutive defence activation in susceptible tomato upon targeting of SlWRKY39/40/45/46 by VIGS (Figure 6B) strongly supports our argument that an upregulation of defence activators and defence repressors in parallel is essential to boost the immune system but at the same time control it.
The regulatory importance of this group of defence repressors is manifested by the strong dwarf phenotype of the SlWRKY39/40/45/46-targeted lines (Figure 6A). Our result is consistent with previous studies showing that Arabidopsis double or triple mutants of wrky18/40 or wrky18/40/60 exhibit enhanced resistance to the virulent hemi-biotrophic P. syringae and powdery mildew Golovinomyces orontii (Xu et al., 2006; Shen et al., 2007). In Arabidopsis this group of WRKYs has been reported to have both physical and functional interaction. The functional interaction is more complex, having additive, cooperative and antagonistic effects (Wang et al., 2006; Xu et al., 2006; Shen
Genome-wide WRKY functional analysis
167
Chapter 4
et al., 2007; Chen et al., 2010). The leucine zipper motif present at their N-terminus has been shown to be important for homo- and hetero-dimerization of these WRKYs (Xu et al., 2006). Moreover, AtWRKY18/40/60 also interact with group II-b, II-d and III AtWRKYs, signifying their central regulatory role in the WRKY network (Xie et al., 2006; Arabidopsis Interactome Mapping, 2011; Chi et al., 2013). Targeting of SlWRKY39 only, which is highly similar to AtWRKY18, did not result in constitutive defence activation, indicating that this particular SlWRKY has a redundant function (Figure 6). Similarly, from the group of activators, the impact of targeting only SlWRKY33 on the tomato apoplast metabolome was low as compared to targeting of both SlWRKY31 and -33, that both belong to group I (Figure 3 and 5A). The impact at the level of the metabolome of targeting SlWRKY31/33 by VIGS is comparable to that of targeting the resistance gene Cf-4 itself, suggesting that these two group I SlWRKYs act as defence activators. In line with this, in Arabidopsis AtWRKY33, which has a high sequence similarity with SlWRKY31/33, has also been suggested to be a positive regulator of defence as it stimulates camalexin biosynthesis during colonization by Botrytis cinerea (Mao et al., 2011). The same report showed that AtWRKY33 is a substrate of the MAP kinases MPK3 and MPK6 and mutation of the MPK3/MPK6-targeted phosphorylation sites in AtWRKY33 compromised its ability to complement the lack of induction of camalexin production in a wrky33 mutant. Furthermore, the impact of targeting SlWRKY80 alone is also as significant as targeting of the resistance gene Cf-4 itself (Figure 5A). SlWRKY80 has significant amino acid sequence similarity to AtWRKY70, which has been shown to regulate the balance between salicylic acid- and jasmonic acid- mediated signalling cross talk that plays an important role in defence against biotrophic pathogens and insects (Li et al., 2004).
Comparative analysis of the differentially upregulated SlWRKYs in our data set (DS) and datasets produced by Huang et al. (2012) that encompas B. cinerea-, TSWV- and EIX-challenged tomato plants, indicates that both SlWRKY31 and -33 were commonly upregulated in all systems indicating that this set of SlWRKYs plays a significant role in defence against a broad range of microbes. Similarly, except for B. cinerea-inoculated tomato, SlWRKY80 showed differential upregulation in all the above-mentioned datasets (Supplementary Figure 8). This information and the observed increased susceptibility upon targeting of both SlWRKY31/33 and SlWRKY80 in our VIGS experiments signifies the crucial role of this group of SlWRKYs in the defence of tomato against a variety of micro-organisms.
Specific clusters of metabolites positioned in different clades of the hierarchical cluster analysis (HCA) could be used as an indicator of compromised/induced immune responses due to targeting of a group of redundant SlWRKYs (Figure 5C). The metabolite patterns in the SlWRKY- and Cf-4-targeted plants also could show the link between Cf-4-dependent signalling pathways within the SlWRKY network. For example, compared
168
Chapter 4
with the Cf-4 plants targeted for GUS (Cf-4-GUS), metabolites belonging to cluster II showed higher accumulation when either the gene encoding the upstream receptor Cf-4 itself or the genes encoding the downstream defence regulators SlWRKY31/33 or SlWRKY80 were targeted, suggesting that the SlWRKY31/33- and SlWRKY80-regulated networks are closely linked with Cf-4-mediated defence signalling (Figure 5C ). However, upon silencing of SlWRKYs39/40/45/46 in Cf-0, metabolites in cluster II showed the same profile as in Cf-4-GUS or Cf-4-39/40/45/46, suggesting that the response is not solely Cf-4-dependent and also is most likely related to a constitutively induced basal defence response. This observation further strengthens the intricate and inseparable nature of the two blurred layers of the plant immune system (Thomma et al., 2011). In the PCA, this cluster II of metabolites contributes to the separation of the treatments in the X dimension (PC1) that represents Cf-0/Cf-4-39/40/45/46 and Cf-4-GUS on the left and Cf-4-31/33, -80 and -Cf4 on the panel that correspond to either increased resistance or susceptibility, respectively (Figure 5B). One possible explanation for the accumulation of this cluster of metabolites in the lines showing compromised defence activation (Cf-4-Cf-4, Cf-4-31/33 and Cf-4-80), is that in resistant Cf-4 plants or in susceptible Cf-0 plants with constitutively induced basal defence (Cf-0-39/40/45/46), these metabolites could be redirected towards the synthesis of defence-related secondary metabolites during the activation of basal defence. Hence, the seemingly high accumulation of these metabolites in Cf-4-Cf-4, Cf-4-31/33 and Cf-4-80 could be linked to compromised defence activation, associated with targeting of the SlWRKYs or Cf-4. This is also supported by our previous findings, where in the DS some of the organic acids that act as building blocks for most amino acids and secondary metabolites derived from these amino acids showed an inverse accumulation pattern with that of most of defence related primary and secondary metabolites (Etalo et al., 2013).
Interestingly, metabolite clusters I and IV showed accumulation when Cf-4 or the downstream defence activators SlWRKY31/33 or SlWRKY80 were silenced (Figure 5C). Unlike the metabolites in cluster II, metabolites in these two clusters also showed accumulation in Cf-0-39/40/45/46, but not in Cf-4-39/40/45/46, indicating that these metabolites are an indicator of increased susceptibility when Cf-4 or Cf-4-WRKY31/33 and WRKY80 circuits is disrupted. Clusters V and VI explain the separation of both Cf-0-39/40/45/46 and Cf-4-39/40/45/46 lines from the Cf-4-GUS and Cf-4 plants in which other groups of SlWRKYs have been targeted, in the PCA plots (Figure 5A and 5B). This can be linked to increased resistance due to targeting of the defence repressors SlWRKY39/40/45/46. Hence, our work for the first time shows the impact of WRKY TFs on defence-associated global metabolome reprogramming and also underlines the potential of metabolomics to deliver markers that can be used to dissect the different layers of the plant immune system.
Genome-wide WRKY functional analysis
169
Chapter 4
Based on our genome-wide analysis, which is supported by deep RNA-seq, untargeted metabolomics and VIGS, the key regulatory function of SlWRKYs, both positive and negative, for plant innate immune system is undisputable. The fact that group I, II-b, II-d SlWRKY TFs are exclusively expressed in the DS and resistant inoculated tomato suggests that these group of SlWRKY TFs are a key regulator of the ETI (Figure 3). Group I, II-b, II-d SlWRKY TFs are reported to be a substrate for the MAPKs and also to be influenced by CaM and Ca2+ fluxes (Menke et al., 2005; Park et al., 2005; Qiu et al., 2008; Popescu et al., 2009; Ishihama et al., 2011; Mao et al., 2011).
The robustness of the DS system helps to amplify small, short lived and non-synchronous plant immune-associated responses to a higher level. The combined use of such a reliable biological system with RNA-seq analysis significantly enhances the amount of biologically relevant information that can be retrieved. This can for example be concluded from the number of differentially expressed SlWRKYs identified in the DS, in comparison with the C. fulvum-inoculated plants (Figures 3 and 4 and Table 1). In a previous study, using the Affymetrix tomato genome array representing only one third of all tomato genes, we only detected 12 differentially expressed SlWRKYs, representing 20% of all expressed SlWRKYs (Etalo et al., 2013). In our current analysis more than 64% (38 out of 59) of the expressed SlWRKYs showed to be differentially expressed. Our previous and current study establish a solid foundation for demonstrating how systems biology approaches combining a robust biological system with ~omics technologies provides reliable information on how the plant immune system is regulated. Furthermore, VIGS targeting multiple genes at the same time will substantially contribute to functional characterization of redundant gene families in a crop plant like tomato. Hence, future studies focussing on the 38 differentially expressed SlWRKYs will surely provide a significant contribution to our quest to understand the role of the WRKY TF network in the immune response of plants to detrimental pathogens.
Materials and Methods
RNA Isolation and RNA-seq Analysis RNA was isolated from 100 mg of tomato leaf tissue, using 1 ml of Trizol reagent (Invitrogen) according to the manufacturer’s instructions. RNA-seq was performed at the Beijing Genome Institute (BGI, Beijing, China), according to the following protocol. Total RNA was treated with DNAse-I Amplification Grade (Invitrogen) and purified with an RNeasy Mini kit (Qiagen). Oligo (dT) beads were used to isolate poly (A) mRNA from the total RNA and fragmentation buffer was added to fragment the mRNA into short fragments. Taking these short fragments as templates, random hexamer primers were used to synthesize the first-strand cDNA. Second-strand cDNA was synthesized using buffer, dNTPs, RNase H and DNA polymerase I, respectively. The cDNA fragments were
170
Chapter 4
purified using a QiaQuick PCR extraction kit and resolved with EB buffer for end repair and adding poly (A). After that, sequencing adaptors were added to the short fragments and for amplification by PCR suitable fragments were selected as templates with respect to the result of agarose gel electrophoresis. Lastly, the library was sequenced using Illumina HiSeq™ 2000 technology. Clean reads were mapped to the tomato reference genome and gene sequences respectively using SOAP2 (Li et al., 2009). Mismatches of no more than 5 bases were allowed in the alignments. For the calculation of the Unigene expression, the RPKM method (reads per kb per million reads) was used (Mortazavi et al., 2008). When there is more than one transcript for a certain gene, the longest one is used to calculate its expression level and coverage. In our analysis, differentially expressed genes (DEGs) with a P-value (after false discovery rate (FDR) correction) ≤ 0.001 and a fold-change (treatment/control) ratio higher than 2 were used for further studies.
Virus Induced Gene Silencing (VIGS) of Multiple Genes
Generation of VIGS Constructs The fragments for VIGS of SlWRKYs with plausible redundant function (based on sequence similarity, the presence of orthologues in other species with confirmed redundancy and expression patterns), were generated by PCR-mediated specific fragment amplification of the individual SlWRKYs to be targeted. For this, cDNA obtained from tomato dying seedlings was employed as a template, using FWD and REV primers that introduce specific restriction enzyme sites (Supplementary Table S2). Fragments were checked by sequencing and subjecting them to BLAST searches against the tomato coding sequences present in the recently released tomato genome. All fragments were cloned into pCR4-TOPO (Invitrogen) and chimeric silencing fragments containing the desired specific combination of multiple gene fragments were produced by ligating the individual fragments overnight at 16°C using T4 ligase. Ligation products containing the desired combination of the genes to be targeted were PCR-amplified using the FWD and REV primers from the first and the last gene, respectively (Supplementary Figure S3). The chimeric fragment was then cloned into pCR4-TOPO (Invitrogen) and sequenced. Correct fragments were excised from pCR4-TOPO by using restriction enzymes specific for each construct and cloned into pTRV2: RNA2 (pYL156) that was linearized with the same enzymes, to generate the VIGS constructs indicated in Supplementary Table S2.
VIGS in Tomato and C. fulvum Disease Assays Tomato was subjected to VIGS as described before (Liebrand et al., 2012). For C. fulvum disease assays, tomato plants transformed with the Hcr9-4D (Cf-4) gene (Thomas et al., 1997), fully resistant to a race 5 strain of C. fulvum (secreting Avr4), were subjected to agroinoculation with various recombinant TRV:VIGS constructs containing a chimeric
Genome-wide WRKY functional analysis
171
Chapter 4
fragment to target multiple SlWRKYs. Non-agroinoculated MM-Cf-0 and Cf-4 plants served as fully susceptible and resistant controls, respectively. GUS-silenced Cf-4 plants (Cf-4-GUS) were used as a negative control. Five plants were used per treatment in each experiment. C. fulvum inoculations were performed as described (Liebrand et al., 2012) and C. fulvum race 5-pGPD:GUS, constitutively expressing the GUS reporter gene, was used for inoculation (Stulemeijer et al., 2007). Infected leaf samples from the contrasting treatments were destained with ethanol and the extent of the fungal proliferation was quantified by using an image J plugin that compares the blue-stained area to the total leaf area (Abd-El-Haliem, 2012).
Analysis of the Composition and Abundance of Semi-Polar and Polar Secondary Metabolites Present in Apoplastic Fluid Obtained From Tomato LeavesApoplastic fluid was isolated from tomato leaves as described by Joosten (2012) and 2 ml aliquots were freeze-dried and extracted with 300 µl of 75% methanol (MeOH) in water, containing 0.1% formic acid. Samples were briefly vortexed, sonicated for 30 min and centrifuged at 21,000g. Supernatants were filtered through a 0.2 µm inorganic membrane filter and transferred to HPLC vials. An LTQ-Orbitrap hybrid mass spectrometer (Thermo Fisher Scientific) was used for the analyses of semi-polar and polar secondary metabolites, with Xcalibur software to control the instrument, and for data acquisition and analysis (van der Hooft et al., 2011). The mass chromatograms that were generated by the LTQ-Orbitrap were processed (peak picking and baseline correction) using the MetAlign software package (Lommen, 2009). Extraction and reconstitution of compound mass spectra were performed according to the method described by Tikunov et al. (2012) and Genemath XT was used for principal component analysis (PCA) as described by Etalo et al. (2013).
Construction of a Phylogenetic Tree of the SlWRKYs and Mapping of the Differentially Expressed Genes on the Tomato Chromosomes For the phylogenetic tree construction, the 81 amino acid sequences that were identified as WRKY transcription factors by Huang et al. (2012) were extracted from the tomato genome(ftp://ftp.sgn.cornell.edu/genomes/Solanum_lycopersIcum/annotatIon/ITAG2.3_release/). The phylogenetic tree was produced in CLCbio main workbench 6 after aligning the sequences using the default settings, followed by phylogenetic tree construction using the UPGMA algorithm with 1,000 bootstrap. The output of the analysis was saved in NETWIK format and further modification of the tree was performed in FigTree (http://Itol.embl.de/Itol.cgI). The differentially expressed SlWRKYs in the three systems (DS, incompatible (I) and compatible (C) interaction) were mapped on the chromosomal map generated by Huang et al. (2012) and indicated in colours that reflect their distribution over these three systems. The Venn diagrams shown in Figures 1 and 2 have been generated in Venny (http://bioinfogp.cnb.csic.es/tools/venny/).
172
Chapter 4
Acknowledgements
We acknowledge Bert Schipper for help with the analysis of the apoplast metabolome and all metabolomics group members of Plant Research International (PRI) and the Laboratory of Plant Physiology (Wageningen University) for their technical and intellectual contribution. We acknowledge Bert Essenstam for excellent plant care. This project was (co)financed by the Centre for BioSystems Genomics (CBSG) and The Netherlands Metabolomics Centre (specifically DWE and RCHDV), which are both part of the Netherlands Genomics Initiative/Netherlands Organisation for Scientific Research.
References
Abd-El-Haliem A (2012) An unbiased method for the quantitation of disease phenotypes using a custom-built macro plugin for the program ImageJ. Methods Mol Biol 835: 635-644
Alves MS, Dadalto SP, Goncalves AB, De Souza GB, Barros VA, Fietto LG (2013) Plant bZIP transcription factors responsive to pathogens: A review. Int J Mol Sci 14: 7815-7828
Arabidopsis Interactome Mapping C (2011) Evidence for network evolution in an Arabidopsis interactome map. Science 333: 601-607
Atamian H, Eulgem T, Kaloshian I (2012) SlWRKY70 is required for Mi-1-mediated resistance to aphids and nematodes in tomato. Planta 235: 299-309
Babu MM, Janga SC, de Santiago I, Pombo A (2008) Eukaryotic gene regulation in three dimensions and its impact on genome evolution. Curr Opin Genet Dev 18: 571-582
Bhattarai KK, Atamian HS, Kaloshian I, Eulgem T (2010) WRKY72-type transcription factors contribute to basal immunity in tomato and Arabidopsis as well as gene-for-gene resistance mediated by the tomato R gene Mi-1. Plant J 63: 229-240
Chang C, Yu D, Jiao J, Jing S, Schulze-Lefert P, Shen QH (2013) Barley MLA immune receptors directly interfere with antagonistically acting transcription factors to initiate disease resistance signaling. Plant Cell 25: 1158-1173
Chen H, Lai ZB, Shi JW, Xiao Y, Chen ZX, Xu XP (2010) Roles of arabidopsis WRKY18, WRKY40 and WRKY60 transcription factors in plant responses to abscisic acid and abiotic stress. Bmc Plant Biol 10
Chi Y, Yang Y, Zhou Y, Zhou J, Fan B, Yu JQ, Chen Z (2013) Protein-protein interactions in the regulation of WRKY transcription factors. Mol Plant 6: 287-300
Chisholm ST, Coaker G, Day B, Staskawicz BJ (2006) Host-microbe interactions: shaping the evolution of the plant immune response. Cell 124: 803-814
Cremer T, Cremer C (2001) Chromosome territories, nuclear architecture and gene regulation in mammalian cells. Nat Rev Genet 2: 292-301
Dangl JL, Horvath DM, Staskawicz BJ (2013) Pivoting the plant immune system from dissection to deployment. Science 341: 746-751
de Jong CF, Takken FLW, Cai XH, de Wit PJGM, Joosten MHAJ (2002) Attenuation of Cf-mediated defense responses at elevated temperatures correlates with a decrease in elicitor-binding sites. Mol Plant Microbe Interact 15: 1040-1049
De S, Babu MM (2010) Genomic neighbourhood and the regulation of gene expression. Curr Opin Cell Biol 22: 326-333
Denance N, Sanchez-Vallet A, Goffner D, Molina A (2013) Disease resistance or growth: the role of plant hormones in balancing immune responses and fitness costs. Front Plant Sci 4: 155
Dodds PN, Rathjen JP (2010) Plant immunity: towards an integrated view of plant-pathogen interactions. Nat Rev Genet 11: 539-548
Dong JX, Chen CH, Chen ZX (2003) Expression profiles of the Arabidopsis WRKY gene superfamily during plant defense response. Plant Mol Biol 51: 21-37
Genome-wide WRKY functional analysis
173
Chapter 4
Etalo DW, Stulemeijer IJ, van Esse HP, de Vos RC, Bouwmeester HJ, Joosten MHAJ (2013) System-wide hypersensitive response-associated transcriptome and metabolome reprogramming in tomato. Plant Physiol 162: 1599-1617
Eulgem T, Rushton PJ, Schmelzer E, Hahlbrock K, Somssich IE (1999) Early nuclear events in plant defence signalling: rapid gene activation by WRKY transcription factors. EMBO J. 18: 4689-4699
Eulgem T, Somssich IE (2007) Networks of WRKY transcription factors in defense signaling. Curr Opin Plant Biol 10: 366-371
Fradin EF, Abd-El-Haliem A, Masini L, van den Berg GC, Joosten MH, Thomma BP (2011) Interfamily transfer of tomato Ve1 mediates Verticillium resistance in Arabidopsis. Plant Physiol 156: 2255-2265
Fraser P, Bickmore W (2007) Nuclear organization of the genome and the potential for gene regulation. Nature 447: 413-417
Gabriels SH, Vossen JH, Ekengren SK, van Ooijen G, Abd-El-Haliem AM, van den Berg GC, Rainey DY, Martin GB, Takken FL, de Wit PJGM, Joosten MHAJ (2007) An NB-LRR protein required for HR signalling mediated by both extra- and intracellular resistance proteins. Plant J 50: 14-28
Gao QM, Venugopal S, Navarre D, Kachroo A (2011) Low oleic acid-derived repression of jasmonic acid-inducible defense responses requires the WRKY50 and WRKY51 proteins. Plant Physiol 155: 464-476
Gondor A, Ohlsson R (2009) Chromosome crosstalk in three dimensions. Nature 461: 212-217Huang S, Gao Y, Liu J, Peng X, Niu X, Fei Z, Cao S, Liu Y (2012) Genome-wide analysis of WRKY transcription
factors in Solanum lycopersicum. Mol Genet Genomics 287: 495-513Ishihama N, Yamada R, Yoshioka M, Katou S, Yoshioka H (2011) Phosphorylation of the Nicotiana
benthamiana WRKY8 transcription factor by MAPK functions in the defense response. Plant Cell 23: 1153-1170
Jones JDG, Dangl JL (2006) The plant immune system. Nature 444: 323-329Joosten MHAJ (2012) Isolation of apoplastic fluid from leaf tissue by the vacuum infiltration-centrifugation
technique. Methods Mol Biol. 835: 603-610Joosten MHAJ, De Wit PJGM (1989) Identification of several pathogenesis-related proteins in tomato leaves
inoculated with Cladosporium fulvum (syn. Fulvia fulva) as 1,3-β-glucanases and chitinases. Plant Physiol 89: 945-951
Journot-Catalino N, Somssich IE, Roby D, Kroj T (2006) The transcription factors WRKY11 and WRKY17 act as negative regulators of basal resistance in Arabidopsis thaliana. Plant Cell 18: 3289-3302
Kan JL, Joosten MHAJ, Wagemakers CM, Berg-Velthuis GM, Wit PJGM (1992) Differential accumulation of mRNAs encoding extracellular and intracellular PR proteins in tomato induced by virulent and avirulent races of Cladosporium fulvum. Plant Mol. Biol. 20: 513-527
Kim K-C, Fan B, Chen Z (2006) Pathogen-induced Arabidopsis WRKY7 is a transcriptional repressor and enhances plant susceptibility to Pseudomonas syringae. Plant Physiol 142: 1180-1192
Kliebenstein DJ, Rowe HC (2008) Ecological costs of biotrophic versus necrotrophic pathogen resistance, the hypersensitive response and signal transduction. Plant Sci 174: 551-556
Levesque MJ, Raj A (2013) Single-chromosome transcriptional profiling reveals chromosomal gene expression regulation. Nat Methods 10: 246-248
Li J-b, Luan Y-s, Jin H (2012) The tomato SlWRKY gene plays an important role in the regulation of defense responses in tobacco. Biochem Biophys Res Commun 427: 671-676
Li J, Brader G, Palva ET (2004) The WRKY70 transcription factor: a node of convergence for jasmonate-mediated and salicylate-mediated signals in plant defense. Plant Cell 16: 319-331
Li R, Yu C, Li Y, Lam TW, Yiu SM, Kristiansen K, Wang J (2009) SOAP2: an improved ultrafast tool for short read alignment. Bioinformatics 25: 1966-1967
Liebrand TW, Smit P, Abd-El-Haliem A, de Jonge R, Cordewener JH, America AH, Sklenar J, Jones AM, Robatzek S, Thomma BP, Tameling WI, Joosten MH (2012) Endoplasmic reticulum-quality control chaperones facilitate the biogenesis of Cf receptor-like proteins involved in pathogen resistance of tomato. Plant Physiol. 159: 1819-1833
Lippok B, Birkenbihl RP, Rivory G, Brummer J, Schmelzer E, Logemann E, Somissich IE (2007) Expression of AtWRKY33 encoding a pathogen- or PAMP-responsive WRKY transcription factor is regulated by a composite DNA motif containing W box elements. Mol Plant Microbe Interact 20: 420-429
Lommen A (2009) MetAlign: Interface-driven, versatile metabolomics tool for hyphenated full-scan mass spectrometry data preprocessing. Anal Chem. 81: 3079-3086
174
Chapter 4
Mao G, Meng X, Liu Y, Zheng Z, Chen Z, Zhang S (2011) Phosphorylation of a WRKY transcription factor by two pathogen-responsive MAPKs drives phytoalexin biosynthesis in Arabidopsis. Plant Cell 23: 1639-1653
Meng X, Xu J, He Y, Yang KY, Mordorski B, Liu Y, Zhang S (2013) Phosphorylation of an ERF transcription factor by Arabidopsis MPK3/MPK6 regulates plant defense gene induction and fungal resistance. Plant Cell 25: 1126-1142
Menke FL, Kang HG, Chen Z, Park JM, Kumar D, Klessig DF (2005) Tobacco transcription factor WRKY1 is phosphorylated by the MAP kinase SIPK and mediates HR-like cell death in tobacco. Mol Plant Microbe Interact 18: 1027-1034
Moore JW, Loake GJ, Spoel SH (2011) Transcription dynamics in plant immunity. Plant Cell 23: 2809-2820Mortazavi A, Williams BA, McCue K, Schaeffer L, Wold B (2008) Mapping and quantifying mammalian
transcriptomes by RNA-Seq. Nat. Methods 5: 621-628Neilson EH, Goodger JQD, Woodrow IE, Moller BL (2013) Plant chemical defense: at what cost? Trends
Plant Sci 18: 250-258Pan YJ, Cho CC, Kao YY, Sun CH (2009) A novel WRKY-like protein involved in transcriptional activation of
cyst wall protein genes in Giardia lamblia. J Biol Chem 284: 17975-17988Park CY, Lee JH, Yoo JH, Moon BC, Choi MS, Kang YH, Lee SM, Kim HS, Kang KY, Chung WS, Lim CO, Cho
MJ (2005) WRKY group IId transcription factors interact with calmodulin. FEBS Lett 579: 1545-1550Popescu SC, Popescu GV, Bachan S, Zhang Z, Gerstein M, Snyder M, Dinesh-Kumar SP (2009) MAPK target
networks in Arabidopsis thaliana revealed using functional protein microarrays. Genes Dev 23: 80-92Pozo MJ, Van Der Ent S, Van Loon LC, Pieterse CMJ (2008) Transcription factor MYC2 is involved in priming
for enhanced defense during rhizobacteria-induced systemic resistance in Arabidopsis thaliana. New Phytol 180: 511-523
Qiu JL, Fiil BK, Petersen K, Nielsen HB, Botanga CJ, Thorgrimsen S, Palma K, Suarez-Rodriguez MC, Sandbech-Clausen S, Lichota J, Brodersen P, Grasser KD, Mattsson O, Glazebrook J, Mundy J, Petersen M (2008) Arabidopsis MAP kinase 4 regulates gene expression through transcription factor release in the nucleus. EMBO J 27: 2214-2221
Rushton PJ, Somssich IE (1998) Transcriptional control of plant genes responsive to pathogens. Curr Opin Plant Biol 1: 311-315
Rushton PJ, Somssich IE, Ringler P, Shen QJ (2010) WRKY transcription factors. Trends Plant Sci 15: 247-258
Shen QH, Saijo Y, Mauch S, Biskup C, Bieri S, Keller B, Seki H, Ulker B, Somssich IE, Schulze-Lefert P (2007) Nuclear activity of MLA immune receptors links isolate-specific and basal disease-resistance responses. Science 315: 1098-1103
Shoji T, Mishima M, Hashimoto T (2013) Divergent DNA-binding specificities of a group of ethylene response factor transcription factors involved in plant defense. Plant Physiol 162: 977-990
Stulemeijer IJ, Joosten MHAJ, Jensen ON (2009) Quantitative phosphoproteomics of tomato mounting a hypersensitive response reveals a swift suppression of photosynthetic activity and a differential role for hsp90 isoforms. J Proteome Res 8: 1168-1182
Stulemeijer IJ, Stratmann JW, Joosten MH (2007) Tomato mitogen-activated protein kinases LeMPK1, LeMPK2, and LeMPK3 are activated during the Cf-4/Avr4-induced hypersensitive response and have distinct phosphorylation specificities. Plant Physiol. 144: 1481-1494
Tao Y, Xie ZY, Chen WQ, Glazebrook J, Chang HS, Han B, Zhu T, Zou GZ, Katagiri F (2003) Quantitative nature of Arabidopsis responses during compatible and incompatible interactions with the bacterial pathogen Pseudomonas syringae. Plant Cell 15: 317-330
Thomas CM, Jones DA, Parniske M, Harrison K, Balint-Kurti PJ, Hatzixanthis K, Jones JD (1997) Characterization of the tomato Cf-4 gene for resistance to Cladosporium fulvum identifies sequences that determine recognitional specificity in Cf-4 and Cf-9. Plant Cell 9: 2209-2224
Thomma BPHJ, Nurnberger T, Joosten MHAJ (2011) Of PAMPs and effectors: the blurred PTI-ETI dichotomy. Plant Cell 23: 4-15
Tikunov YM, Laptenok S, Hall RD, Bovy A, de Vos RCH (2012) MSClust: a tool for unsupervised mass spectra extraction of chromatography-mass spectrometry ion-wise aligned data. Metabolomics. 8: 714-718
Ulker B, Somssich IE (2004) WRKY transcription factors: from DNA binding towards biological function. Curr Opin Plant Biol 7: 491-498
Genome-wide WRKY functional analysis
175
Chapter 4
van der Hooft JJ, Vervoort J, Bino RJ, Beekwilder J, de Vos RC (2011) Polyphenol identification based on systematic and robust high-resolution accurate mass spectrometry fragmentation. Anal Chem. 83: 409-416
Vossen JH, Abd-El-Haliem A, Fradin EF, van den Berg GC, Ekengren SK, Meijer HJ, Seifi A, Bai Y, ten Have A, Munnik T, Thomma BP, Joosten MHAJ (2010) Identification of tomato phosphatidylinositol-specific phospholipase-C (PI-PLC) family members and the role of PLC4 and PLC6 in HR and disease resistance. Plant J 62: 224-239
Wang D, Amornsiripanitch N, Dong XN (2006) A genomic approach to identify regulatory nodes in the transcriptional network of systemic acquired resistance in plants. PLoS Pathog 2: 1042-1050
Xie Z, Zhang ZL, Zou X, Yang G, Komatsu S, Shen QJ (2006) Interactions of two abscisic-acid induced WRKY genes in repressing gibberellin signaling in aleurone cells. Plant J 46: 231-242
Xu X, Chen C, Fan B, Chen Z (2006) Physical and functional interactions between pathogen-induced Arabidopsis WRKY18, WRKY40, and WRKY60 transcription factors. Plant Cell 18: 1310-1326
Zheng ZY, Abu Qamar S, Chen ZX, Mengiste T (2006) Arabidopsis WRKY33 transcription factor is required for resistance to necrotrophic fungal pathogens. Plant J 48: 592-605
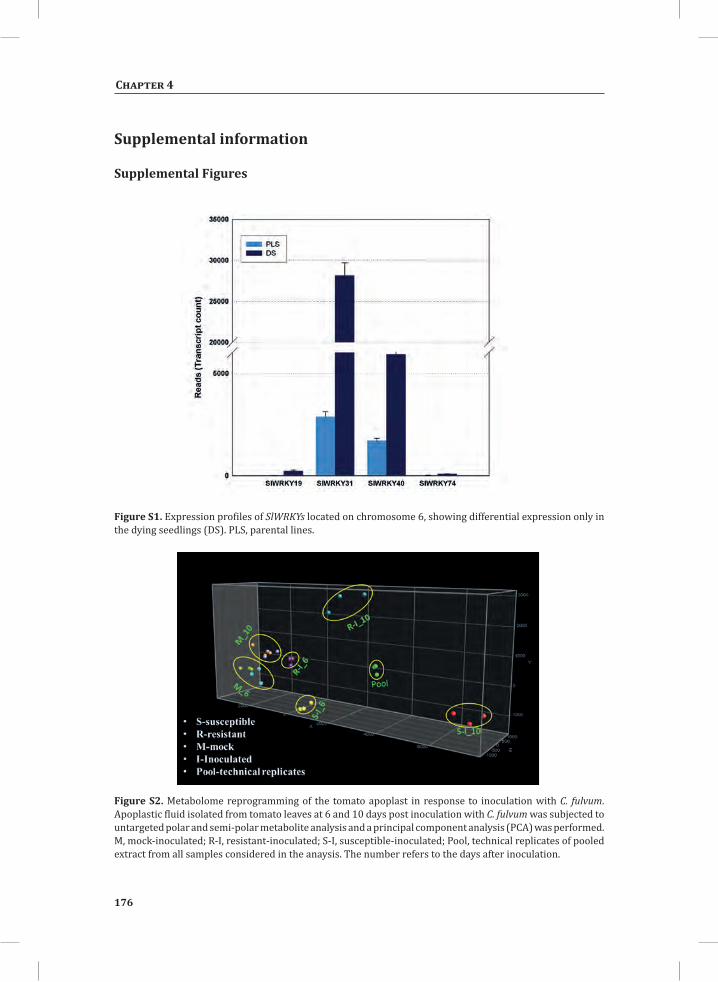
176
Chapter 4
Supplemental information
Supplemental Figures
Figure S1. Expression profiles of SlWRKYs located on chromosome 6, showing differential expression only in the dying seedlings (DS). PLS, parental lines.
Figure S2. Metabolome reprogramming of the tomato apoplast in response to inoculation with C. fulvum. Apoplastic fluid isolated from tomato leaves at 6 and 10 days post inoculation with C. fulvum was subjected to untargeted polar and semi-polar metabolite analysis and a principal component analysis (PCA) was performed. M, mock-inoculated; R-I, resistant-inoculated; S-I, susceptible-inoculated; Pool, technical replicates of pooled extract from all samples considered in the anaysis. The number refers to the days after inoculation.
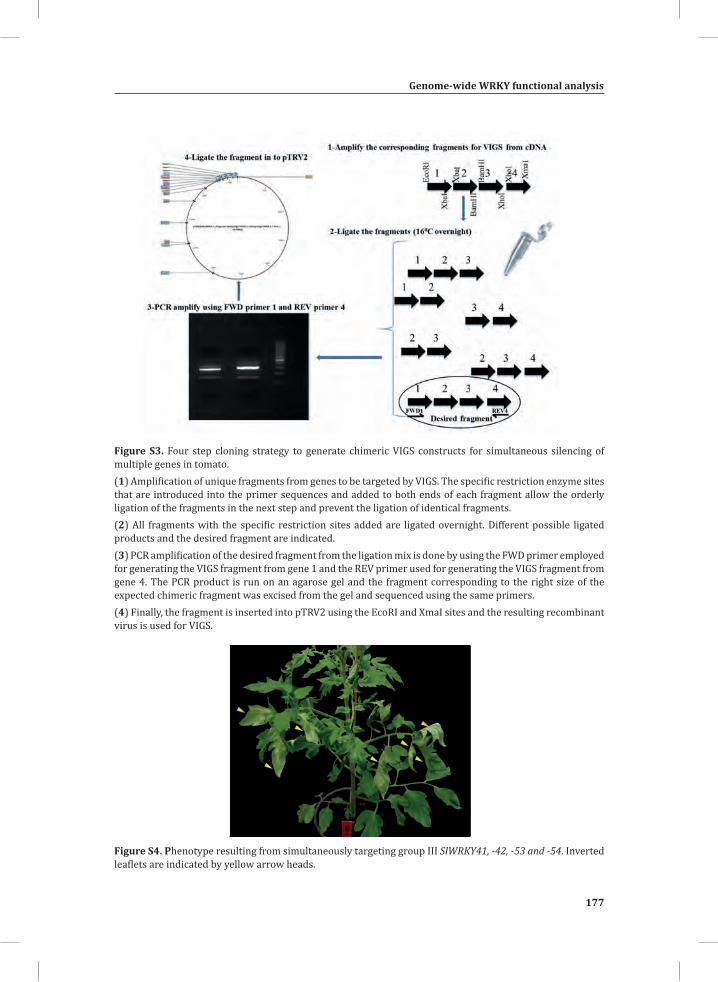
Genome-wide WRKY functional analysis
177
Chapter 4
Figure S3. Four step cloning strategy to generate chimeric VIGS constructs for simultaneous silencing of multiple genes in tomato. (1) Amplification of unique fragments from genes to be targeted by VIGS. The specific restriction enzyme sites that are introduced into the primer sequences and added to both ends of each fragment allow the orderly ligation of the fragments in the next step and prevent the ligation of identical fragments.(2) All fragments with the specific restriction sites added are ligated overnight. Different possible ligated products and the desired fragment are indicated.(3) PCR amplification of the desired fragment from the ligation mix is done by using the FWD primer employed for generating the VIGS fragment from gene 1 and the REV primer used for generating the VIGS fragment from gene 4. The PCR product is run on an agarose gel and the fragment corresponding to the right size of the expected chimeric fragment was excised from the gel and sequenced using the same primers. (4) Finally, the fragment is inserted into pTRV2 using the EcoRI and XmaI sites and the resulting recombinant virus is used for VIGS.
Figure S4. Phenotype resulting from simultaneously targeting group III SlWRKY41, -42, -53 and -54. Inverted leaflets are indicated by yellow arrow heads.
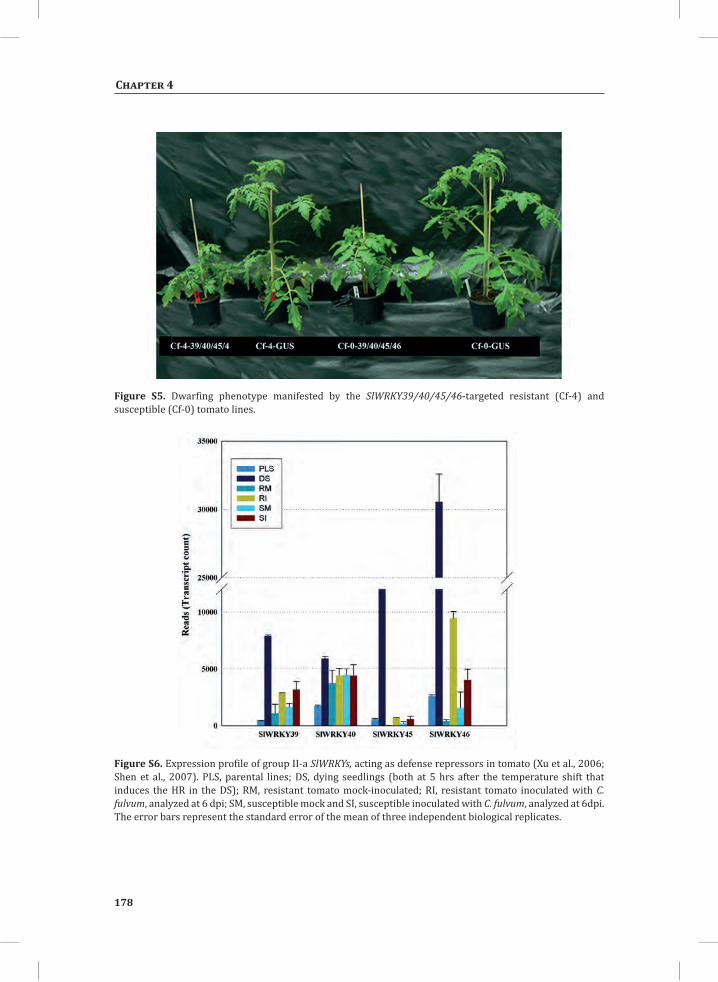
178
Chapter 4
Figure S5. Dwarfing phenotype manifested by the SlWRKY39/40/45/46-targeted resistant (Cf-4) and susceptible (Cf-0) tomato lines.
Figure S6. Expression profile of group II-a SlWRKYs, acting as defense repressors in tomato (Xu et al., 2006; Shen et al., 2007). PLS, parental lines; DS, dying seedlings (both at 5 hrs after the temperature shift that induces the HR in the DS); RM, resistant tomato mock-inoculated; RI, resistant tomato inoculated with C. fulvum, analyzed at 6 dpi; SM, susceptible mock and SI, susceptible inoculated with C. fulvum, analyzed at 6dpi. The error bars represent the standard error of the mean of three independent biological replicates.
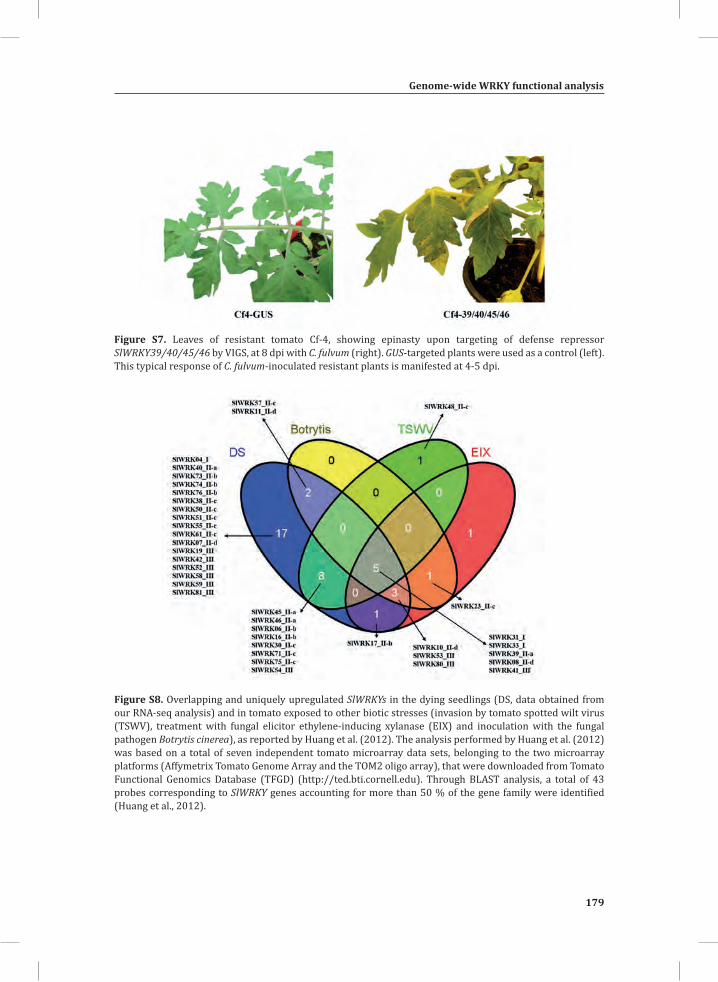
Genome-wide WRKY functional analysis
179
Chapter 4
Figure S7. Leaves of resistant tomato Cf-4, showing epinasty upon targeting of defense repressor SlWRKY39/40/45/46 by VIGS, at 8 dpi with C. fulvum (right). GUS-targeted plants were used as a control (left). This typical response of C. fulvum-inoculated resistant plants is manifested at 4-5 dpi.
Figure S8. Overlapping and uniquely upregulated SlWRKYs in the dying seedlings (DS, data obtained from our RNA-seq analysis) and in tomato exposed to other biotic stresses (invasion by tomato spotted wilt virus (TSWV), treatment with fungal elicitor ethylene-inducing xylanase (EIX) and inoculation with the fungal pathogen Botrytis cinerea), as reported by Huang et al. (2012). The analysis performed by Huang et al. (2012) was based on a total of seven independent tomato microarray data sets, belonging to the two microarray platforms (Affymetrix Tomato Genome Array and the TOM2 oligo array), that were downloaded from Tomato Functional Genomics Database (TFGD) (http://ted.bti.cornell.edu). Through BLAST analysis, a total of 43 probes corresponding to SlWRKY genes accounting for more than 50 % of the gene family were identified (Huang et al., 2012).
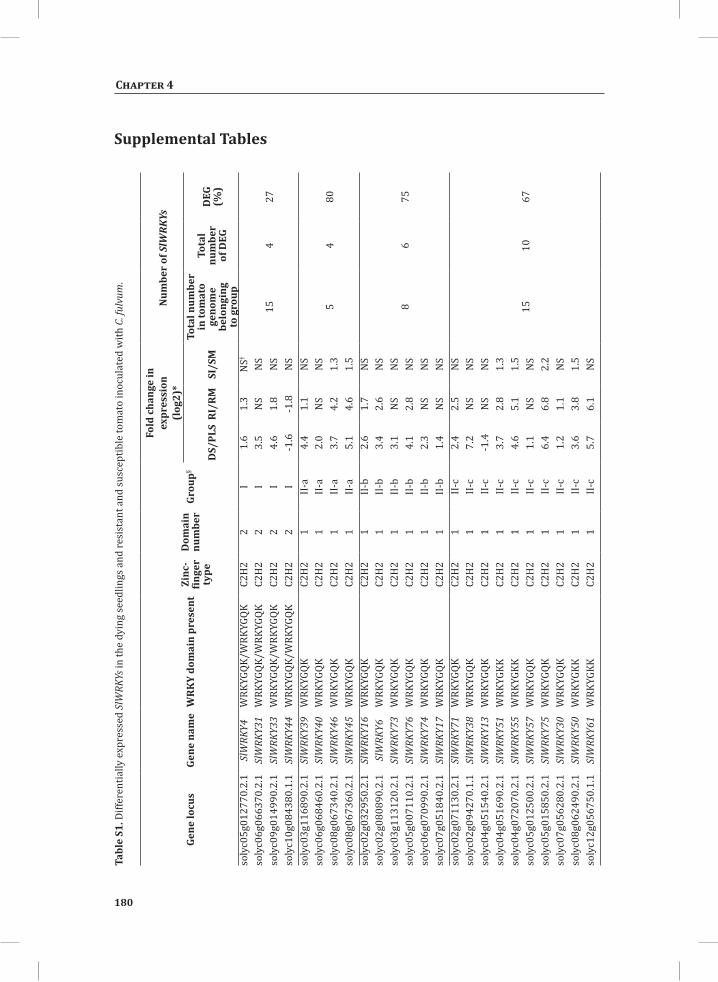
180
Chapter 4
Supplemental Tables
Gene
locu
s Ge
ne n
ame
WRK
Y do
mai
n pr
esen
tZi
nc-
finge
r ty
pe
Dom
ain
num
ber
Grou
p§
Fold
cha
nge
in
expr
essi
on(l
og2)
*N
umbe
r of
SlW
RKYs
DS/
PLS
RI/R
MSI
/SM
Tota
l num
ber
in to
mat
o ge
nom
e be
long
ing
to g
roup
Tota
l nu
mbe
r of
DEG
DEG
(%
)
soly
c05g
0127
70.2
.1Sl
WRK
Y4W
RKYG
QK/W
RKYG
QKC2
H2
2I
1.6
1.3
NS†
154
27so
lyc0
6g06
6370
.2.1
SlW
RKY3
1W
RKYG
QK/W
RKYG
QKC2
H2
2I
3.5
NS
NS
soly
c09g
0149
90.2
.1Sl
WRK
Y33
WRK
YGQK
/WRK
YGQK
C2H
22
I4.
61.
8N
Sso
lyc1
0g08
4380
.1.1
SlW
RKY4
4W
RKYG
QK/W
RKYG
QKC2
H2
2I
-1.6
-1.8
NS
soly
c03g
1168
90.2
.1Sl
WRK
Y39
WRK
YGQK
C2H
21
II-a
4.4
1.1
NS
54
80so
lyc0
6g06
8460
.2.1
SlW
RKY4
0W
RKYG
QKC2
H2
1II-
a2.
0N
SN
Sso
lyc0
8g06
7340
.2.1
SlW
RKY4
6W
RKYG
QKC2
H2
1II-
a3.
74.
21.
3so
lyc0
8g06
7360
.2.1
SlW
RKY4
5W
RKYG
QKC2
H2
1II-
a5.
14.
61.
5so
lyc0
2g03
2950
.2.1
SlW
RKY1
6W
RKYG
QKC2
H2
1II-
b2.
61.
7N
S
86
75
soly
c02g
0808
90.2
.1Sl
WRK
Y6W
RKYG
QKC2
H2
1II-
b3.
42.
6N
Sso
lyc0
3g11
3120
.2.1
SlW
RKY7
3W
RKYG
QKC2
H2
1II-
b3.
1N
SN
Sso
lyc0
5g00
7110
.2.1
SlW
RKY7
6W
RKYG
QKC2
H2
1II-
b4.
12.
8N
Sso
lyc0
6g07
0990
.2.1
SlW
RKY7
4W
RKYG
QKC2
H2
1II-
b2.
3N
SN
Sso
lyc0
7g05
1840
.2.1
SlW
RKY1
7W
RKYG
QKC2
H2
1II-
b1.
4N
SN
Sso
lyc0
2g07
1130
.2.1
SlW
RKY7
1W
RKYG
QKC2
H2
1II-
c2.
42.
5N
S
1510
67
soly
c02g
0942
70.1
.1Sl
WRK
Y38
WRK
YGQK
C2H
21
II-c
7.2
NS
NS
soly
c04g
0515
40.2
.1Sl
WRK
Y13
WRK
YGQK
C2H
21
II-c
-1.4
NS
NS
soly
c04g
0516
90.2
.1Sl
WRK
Y51
WRK
YGKK
C2H
21
II-c
3.7
2.8
1.3
soly
c04g
0720
70.2
.1Sl
WRK
Y55
WRK
YGKK
C2H
21
II-c
4.6
5.1
1.5
soly
c05g
0125
00.2
.1Sl
WRK
Y57
WRK
YGQK
C2H
21
II-c
1.1
NS
NS
soly
c05g
0158
50.2
.1Sl
WRK
Y75
WRK
YGQK
C2H
21
II-c
6.4
6.8
2.2
soly
c07g
0562
80.2
.1Sl
WRK
Y30
WRK
YGQK
C2H
21
II-c
1.2
1.1
NS
soly
c08g
0624
90.2
.1Sl
WRK
Y50
WRK
YGKK
C2H
21
II-c
3.6
3.8
1.5
soly
c12g
0567
50.1
.1Sl
WRK
Y61
WRK
YGKK
C2H
21
II-c
5.7
6.1
NS
Tabl
e S1
. Diff
eren
tially
exp
ress
ed S
lWRK
Ys in
the
dyin
g se
edlin
gs a
nd re
sist
ant a
nd su
scep
tible
tom
ato
inoc
ulat
ed w
ith C
. ful
vum
.
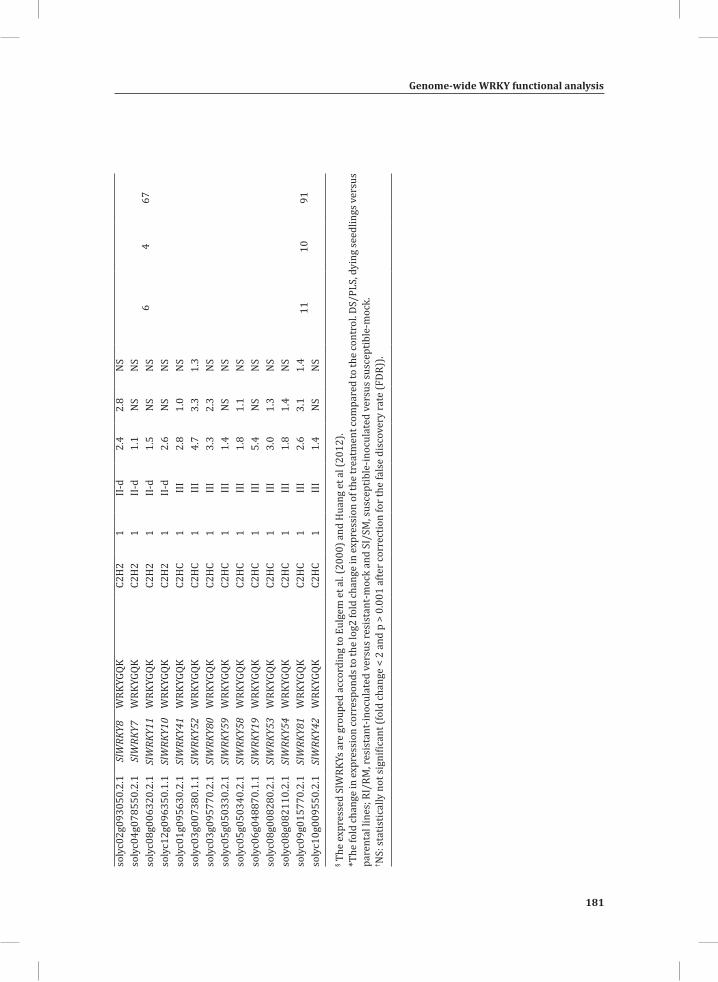
Genome-wide WRKY functional analysis
181
Chapter 4
soly
c02g
0930
50.2
.1Sl
WRK
Y8W
RKYG
QKC2
H2
1II-
d2.
42.
8N
S
64
67so
lyc0
4g07
8550
.2.1
SlW
RKY7
WRK
YGQK
C2H
21
II-d
1.1
NS
NS
soly
c08g
0063
20.2
.1Sl
WRK
Y11
WRK
YGQK
C2H
21
II-d
1.5
NS
NS
soly
c12g
0963
50.1
.1Sl
WRK
Y10
WRK
YGQK
C2H
21
II-d
2.6
NS
NS
soly
c01g
0956
30.2
.1Sl
WRK
Y41
WRK
YGQK
C2H
C1
III2.
81.
0N
S
1110
91
soly
c03g
0073
80.1
.1Sl
WRK
Y52
WRK
YGQK
C2H
C1
III4.
73.
31.
3so
lyc0
3g09
5770
.2.1
SlW
RKY8
0W
RKYG
QKC2
HC
1III
3.3
2.3
NS
soly
c05g
0503
30.2
.1Sl
WRK
Y59
WRK
YGQK
C2H
C1
III1.
4N
SN
Sso
lyc0
5g05
0340
.2.1
SlW
RKY5
8W
RKYG
QKC2
HC
1III
1.8
1.1
NS
soly
c06g
0488
70.1
.1Sl
WRK
Y19
WRK
YGQK
C2H
C1
III5.
4N
SN
Sso
lyc0
8g00
8280
.2.1
SlW
RKY5
3W
RKYG
QKC2
HC
1III
3.0
1.3
NS
soly
c08g
0821
10.2
.1Sl
WRK
Y54
WRK
YGQK
C2H
C1
III1.
81.
4N
Sso
lyc0
9g01
5770
.2.1
SlW
RKY8
1W
RKYG
QKC2
HC
1III
2.6
3.1
1.4
soly
c10g
0095
50.2
.1Sl
WRK
Y42
WRK
YGQK
C2H
C1
III1.
4N
SN
S
§ The
exp
ress
ed S
lWRK
Ys a
re g
roup
ed a
ccor
ding
to E
ulge
m e
t al.
(200
0) a
nd H
uang
et a
l (20
12).
*The
fold
chan
ge in
exp
ress
ion
corr
espo
nds t
o th
e lo
g2 fo
ld ch
ange
in e
xpre
ssio
n of
the
trea
tmen
t com
pare
d to
the
cont
rol.
DS/P
LS, d
ying
seed
lings
ver
sus
pare
ntal
line
s; R
I/RM
, res
ista
nt-in
ocul
ated
ver
sus r
esis
tant
-moc
k an
d SI
/SM
, sus
cept
ible
-inoc
ulat
ed v
ersu
s sus
cept
ible
-moc
k.
† NS:
stat
istic
ally
not
sign
ifica
nt (f
old
chan
ge <
2 a
nd p
> 0
.001
afte
r cor
rect
ion
for t
he fa
lse
disc
over
y ra
te (F
DR))
.
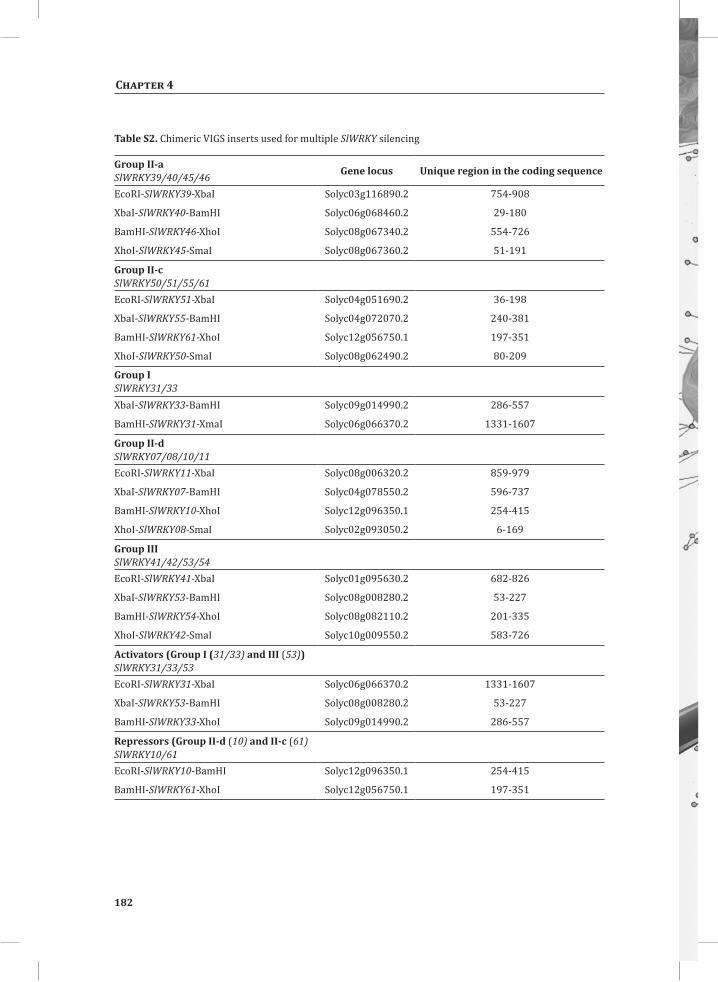
182
Chapter 4
Table S2. Chimeric VIGS inserts used for multiple SlWRKY silencing
Group II-aSlWRKY39/40/45/46 Gene locus Unique region in the coding sequence
EcoRI-SlWRKY39-XbaI Solyc03g116890.2 754-908
XbaI-SlWRKY40-BamHI Solyc06g068460.2 29-180
BamHI-SlWRKY46-XhoI Solyc08g067340.2 554-726
XhoI-SlWRKY45-SmaI Solyc08g067360.2 51-191
Group II-cSlWRKY50/51/55/61EcoRI-SlWRKY51-XbaI Solyc04g051690.2 36-198
XbaI-SlWRKY55-BamHI Solyc04g072070.2 240-381
BamHI-SlWRKY61-XhoI Solyc12g056750.1 197-351
XhoI-SlWRKY50-SmaI Solyc08g062490.2 80-209
Group ISlWRKY31/33XbaI-SlWRKY33-BamHI Solyc09g014990.2 286-557
BamHI-SlWRKY31-XmaI Solyc06g066370.2 1331-1607
Group II-dSlWRKY07/08/10/11EcoRI-SlWRKY11-XbaI Solyc08g006320.2 859-979
XbaI-SlWRKY07-BamHI Solyc04g078550.2 596-737
BamHI-SlWRKY10-XhoI Solyc12g096350.1 254-415
XhoI-SlWRKY08-SmaI Solyc02g093050.2 6-169
Group IIISlWRKY41/42/53/54EcoRI-SlWRKY41-XbaI Solyc01g095630.2 682-826
XbaI-SlWRKY53-BamHI Solyc08g008280.2 53-227
BamHI-SlWRKY54-XhoI Solyc08g082110.2 201-335
XhoI-SlWRKY42-SmaI Solyc10g009550.2 583-726
Activators (Group I (31/33) and III (53))SlWRKY31/33/53EcoRI-SlWRKY31-XbaI Solyc06g066370.2 1331-1607
XbaI-SlWRKY53-BamHI Solyc08g008280.2 53-227
BamHI-SlWRKY33-XhoI Solyc09g014990.2 286-557
Repressors (Group II-d (10) and II-c (61)SlWRKY10/61 EcoRI-SlWRKY10-BamHI Solyc12g096350.1 254-415
BamHI-SlWRKY61-XhoI Solyc12g056750.1 197-351
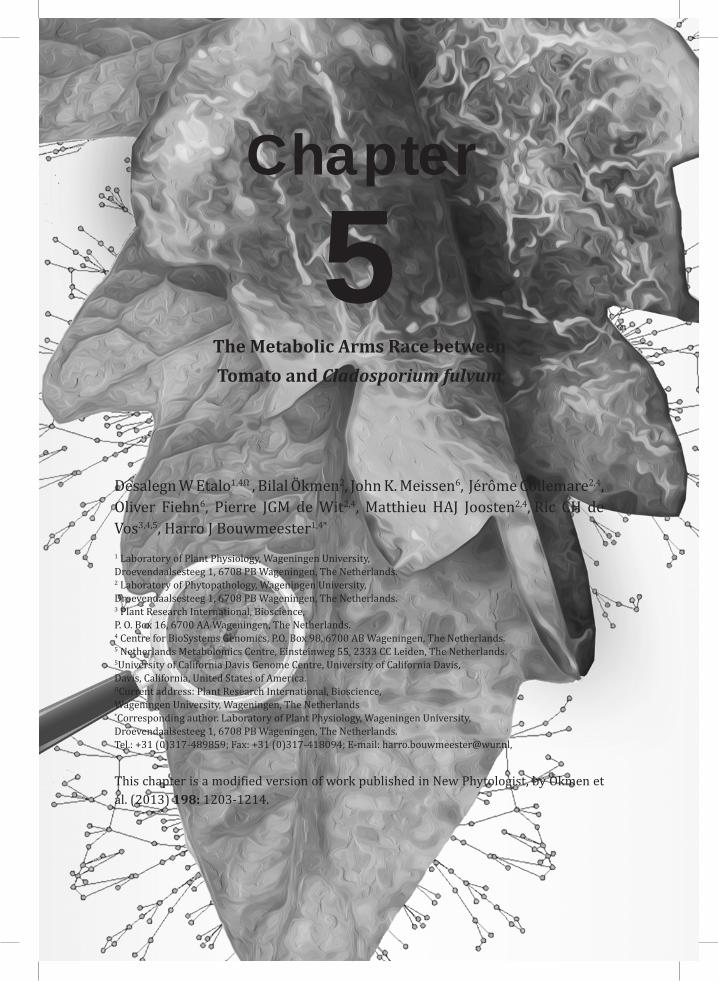
Chapter 4
The Metabolic Arms Race between Tomato and Cladosporium fulvum
Desalegn W Etalo1,4Ω , Bilal Ökmen2, John K. Meissen6, Jérôme Collemare2,4, Oliver Fiehn6, Pierre JGM de Wit2,4, Matthieu HAJ Joosten2,4, Ric CH de Vos3,4,5, Harro J Bouwmeester1,4*
1 Laboratory of Plant Physiology, Wageningen University, Droevendaalsesteeg 1, 6708 PB Wageningen, The Netherlands.2 Laboratory of Phytopathology, Wageningen University, Droevendaalsesteeg 1, 6708 PB Wageningen, The Netherlands.3 Plant Research International, Bioscience, P. O. Box 16, 6700 AA Wageningen, The Netherlands.4 Centre for BioSystems Genomics, P.O. Box 98, 6700 AB Wageningen, The Netherlands.5 Netherlands Metabolomics Centre, Einsteinweg 55, 2333 CC Leiden, The Netherlands.5University of California Davis Genome Centre, University of California Davis, Davis, California, United States of America.ΩCurrent address: Plant Research International, Bioscience, Wageningen University, Wageningen, The Netherlands*Corresponding author. Laboratory of Plant Physiology, Wageningen University, Droevendaalsesteeg 1, 6708 PB Wageningen, The Netherlands. Tel.: +31 (0)317-489859; Fax: +31 (0)317-418094; E-mail: [email protected],
This chapter is a modified version of work published in New Phytologist, by Ökmen et al. (2013) 198: 1203-1214.
5Chapter
184
Chapter 5
Abstract
The outcome of Cladosporium fulvum infection of tomato is determined by the ability of the fungal pathogen to successfully colonize the apoplastic space of tomato leaves. Here, the fungus deploys effectors that suppress the plant immune response, while the plant tries to contain the fungus possibly also using defensive metabolites. To obtain a global view of the major alterations that occur in the metabolome upon successful and unsuccessful infection, we used comprehensive untargeted metabolic profiling of leaf as well as leaf apoplast extracts from resistant (incompatible interaction) and susceptible (compatible interaction) tomato plants challenged with C. fulvum. In whole leaf extracts substantial changes were detectable in a large variety of metabolites, including polar, semi-polar and apolar compounds, while in the apoplast extract only the more polar and semi-polar compounds changed. In the incompatible interaction, an early (4-6 days post inoculation (dpi)) increase in the accumulation of a number of phospholipids and secondary metabolites occurred. However, in the compatible interaction the major change was the degradation of a number of fungitoxic glycoalkaloids into their less toxic derivatives and the accumulation of sugar alcohols, in both the whole leaf and apoplast extract. Although α-tomatine, the most abundant tomato glycoalkaloid, is thought to be localized in the vacuole, for the first time we show that it is also present in the apoplast, and we show that it is hydrolyzed by C. fulvum tomatinase-1 (CfTom1) upon colonization of the leaf apoplast. CfTom1 belongs to the glycosyl hydrolase (GH)-10 family and encodes a functional tomatinase, which degrades α-tomatine into its non-toxic aglycone, tomatidine, both in vitro and during colonization of tomato leaves. Functional analysis of ∆cftom1 knock-out mutants of C. fulvum showed that degradation of α-tomatine is required for full virulence of the fungus on tomato, which is likely due to increased sensitivity of these mutants to α-tomatine, rather than to the presumed suppression of basal defense responses by its breakdown products.
The metabolic arms race
185
Chapter 5
Introduction
The relationship between plants and fungi is often mutually beneficial, with only a small minority of fungal species breaking the fine balance of cooperation to become plant pathogens (Fraser, 2004; Holub, 2006). The genetic background of resistance or susceptibility of plants to pathogens has been an area of intense investigation already for a long time and the studies have provided valuable information on the organization of the plant immune system. However, the intimate cellular, molecular and metabolic interactions occurring at the host-microbe interface as a biotrophic relationship between plant and pathogen is established, remains to be investigated (Perfect and Green, 2001; O’Connell and Panstruga, 2006). Recent advances in molecular plant pathology based on exploiting model pathosystems have significantly increased our understanding of the molecular arms race between plants and pathogens, particularly occurring at the levels of signal perception and signal transduction (Hématy et al., 2009; de Jonge et al., 2010; Caillaud et al., 2012; Howden and Huitema, 2012; Hann et al., 2013; Liebrand et al., 2013). Furthermore, the coupling of these studies with recently developed system biology tools such as genomics, transcriptomics, proteomics and metabolomics, has provided an overview of the great complexity of the ongoing plant-microbe warfare (Stulemeijer et al., 2009; Ward et al., 2010; de Wit et al., 2012; Etalo et al., 2013). This continuous battle for co-existence between plants and pathogens that has been taking place already for millennia plays a vital role in shaping the defense machinery of both plants and pathogens, resulting in versatile organisms that show non-stop, rhythmic loss and gain of resistance and gain and loss of virulence, respectively. In the previous chapters, the defense machineries involved in signal perception and transduction have been discussed. In this chapter, the focus will be on the defense response of the plant that involves the deployment of its phytochemical arsenal and the counter measures that are taken by the fungus.
Chemical plant defense involves the deployment of constitutive chemical barriers (phytoanticipins) and inducible antimicrobials (phytoalexins). In addition to their antimicrobial properties, some of the induced metabolites, for example the hydroxycinnamic acid amides are involved in the reinforcement of the plant cell wall, which is the first line of defense against microbes (Zacares et al., 2007; Etalo et al., 2013). Another interesting group of small molecules are membrane-associated lipids, such as the phospholipids. Beyond their role as a component of the membrane, phospholipids can be co-factors for membrane-associated enzymes, signal precursors, or signaling molecules themselves (de Jong et al., 2004; Park et al., 2004; Vossen et al., 2010). Furthermore, specific phospholipids generated in certain membrane domains can serve as a docking site for cytosolic proteins (Laxalt and Munnik, 2002; van Meer et al., 2008).
186
Chapter 5
A well-known class of preformed antimicrobial compounds present in plants comprises the saponins, which are glycosylated steroids or steroidal alkaloids representing a constitutive chemical barrier against a wide range of fungal and bacterial pathogens (Osbourn, 1996). Saponins cause the loss of membrane integrity in target organisms by forming complexes with sterols, resulting in pore formation and cell lysis (Bowyer et al., 1995; Keukens et al., 1995; Osbourn, 1996). Sensitivity to saponins is correlated with the type of sterols present in the membranes of potential pathogens. Fungal membranes that contain sterols with free 3-β-hydroxy groups are sensitive to saponins, while plant cell membranes are insensitive to these compounds due to the presence of sterol glycosides (Steel and Drysdale, 1988). Similarly, oomycetes are insensitive to saponins because their membranes lack 3-β-hydroxy sterols (Steel and Drysdale, 1988).
Apart from the major aspects of plant defense, such as cell wall thickening (Huckelhoven, 2007) and production of antimicrobial chemicals (Wink, 1988; Osbourn, 1999; Kliebenstein et al., 2005), it is equally important to understand how microbes succeed to manipulate the host defensive metabolism to their benefit. Re-programming of both host and microbe metabolism is thus core to a biotrophic relationship and metabolomics approaches can play an important role in the exploration of these phenomena (Allwood et al., 2006; Abu-Nada et al., 2007; Allwood et al., 2008; Ward et al., 2010; Draper et al., 2011; Etalo et al., 2013). In response to these inherent resistance mechanisms present in plants, pathogenic bacteria and fungi in turn have developed various strategies to breach the plant chemical defense line, for example by secreting detoxifying enzymes (Ford et al., 1977; Roldan-Arjona et al., 1999).
Saponin detoxification by pathogens has mainly been studied for avenacin and α-tomatine, which are present in oat and tomato, respectively. During infection of oat roots, the fungus Gaeumannomyces graminis var. avenae secretes the avenacinase enzyme that detoxifies avenacin, a triterpenoid saponin. Mutants for the avenacinase are no longer able to infect oat, while they are still virulent on wheat, a host that does not produce saponins (Bowyer et al., 1995; Kaup et al., 2005). In tomato (Solanum lycopersicum L.), the major saponin is α-tomatine, a steroidal glycoalkaloid that is present in roots, leaves and green fruits in concentrations as high as 1 mM (Roddick, 1977; Osbourn, 1996). α-Tomatine consists of the aglycone tomatidine and the tetrasaccharide lycotetraose. Toxicity of α-tomatine depends on the presence of a lycotetraose moiety, because removal of one or all four sugar residues renders α-tomatine less toxic (Osbourn, 1996). During tomato infection, bacterial and fungal pathogens secrete various types of tomatinase enzymes that can detoxify α-tomatine by removing one or more sugar residues from the compound (Martin-Hernandez et al., 2000; Kaup et al., 2005; Pareja-Jaime et al., 2008). Tomatinase enzymes secreted by Septoria lycopersici, Botrytis cinerea, and Verticillium albo-atrum belong to the glycosyl hydrolase family 3 (GH3) of carbohydrate-degrading enzymes (CAZY) (Martin-
The metabolic arms race
187
Chapter 5
Hernandez et al., 2000). They remove the terminal β-1,2-D-glucose or β-1,3-D-xylose residues from α-tomatine (Osbourn et al., 1995; Quidde et al., 1998). Other tomato pathogens, such as the fungus Fusarium oxysporum f. sp. lycopersici and the bacterium Clavibacter michiganensis subsp. michiganensis, secrete a tomatinase that belongs to the glycosyl hydrolase family 10 (GH10) (Roldan-Arjona et al., 1999; Kaup et al., 2005). GH10 tomatinases remove the complete lycotetraose sugar from α-tomatine to form the aglycone tomatidine (Roldan-Arjona et al., 1999; Pareja-Jaime et al., 2008). Although several knock-out studies have been performed to assess the role of tomatinases in the virulence of bacterial and fungal tomato pathogens (Martin-Hernandez et al., 2000; Kaup et al., 2005), only the GH10 tomatinase FoTom1 from F. oxysporum f. sp. lycopersici was shown to play a role in virulence of this vascular pathogen (Pareja-Jaime et al., 2008). It has also been suggested that products resulting from tomatinase activity play an indirect role in virulence of tomato pathogens by suppressing the defence responses of the plant. For example, breakdown products of α-tomatine (β-tomatine, tomatidine and lycotetraose) were reported to suppress various defense responses, including the oxidative burst and the hypersensitive response (Bouarab et al., 2002; Ito et al., 2007).
The non-obligate biotrophic fungus Cladosporium fulvum is a well-studied tomato pathogen that causes leaf mold. C. fulvum enters tomato leaves through stomata and colonizes the apoplastic space surrounding mesophyll cells (Stergiopoulos and de Wit, 2009). Although pathogenic on tomato, it was previously reported that C. fulvum is not able to detoxify α-tomatine, possibly because of the vacuolar location of α-tomatine which does not harm the fungus and allows it to infect tomato (Melton et al., 1998). However, heterologous expression of the GH3 tomatinase from Septoria lycopersici in C. fulvum resulted in transformants showing increased sporulation during colonization of tomato leaves, as compared with the wild-type fungus (Melton et al., 1998). These results suggest that C. fulvum might be exposed to α-tomatine during colonization of the apoplastic space of tomato, and that it does not produce functional tomatinase enzymes itself. However, recent sequencing of the C. fulvum genome revealed the presence of 19 genes encoding GH3 and two genes encoding GH10 enzymes .
To obtain a global view of the major changes in the infection metabolome, both in whole leaves and in the apoplast, where C. fulvum actually resides, we performed large scale metabolic profiling of samples obtained from resistant and susceptible plants that were challenged with C. fulvum and compared their metabolome with the respective controls. We used both HILIC-QTOF MS (HILIC-MS) and C18 reversed-phase LC-Orbitrap FTMS (C18-MS) metabolomics platforms, in order to profile both polar, semi-polar and apolar compounds. Our analysis shows that upon infection substantial changes occur in the metabolome of the leaf, while the major change in the apoplast consists of a significantly altered polar and semipolar metabolome. In line with the transcriptome analysis that we performed in chapter four, resistant plants showed an early (6 days post inoculation
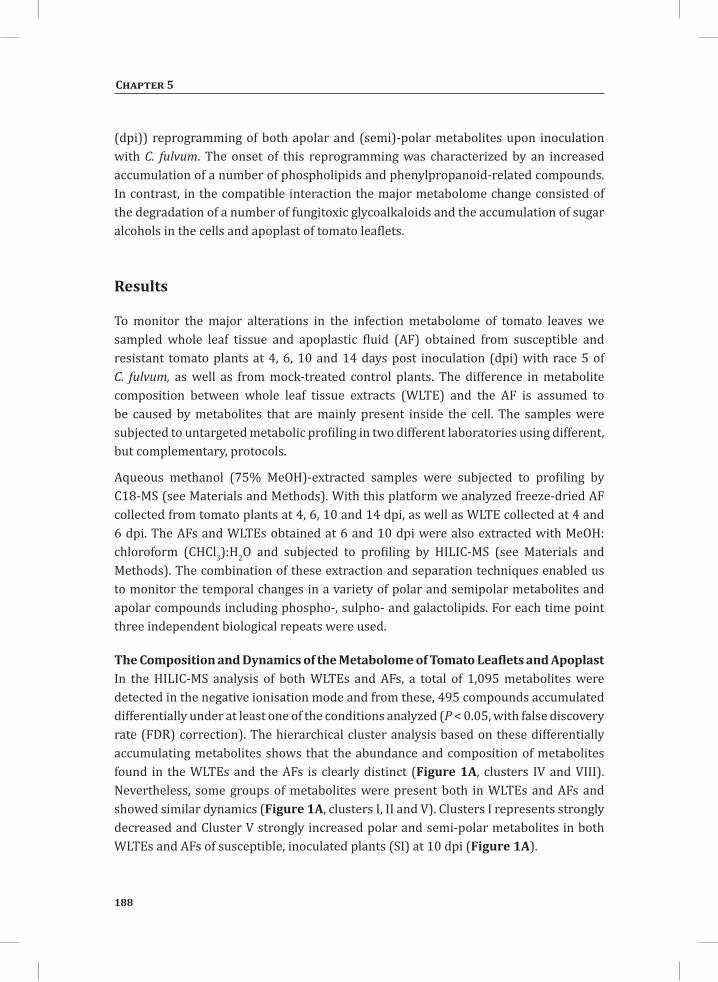
188
Chapter 5
(dpi)) reprogramming of both apolar and (semi)-polar metabolites upon inoculation with C. fulvum. The onset of this reprogramming was characterized by an increased accumulation of a number of phospholipids and phenylpropanoid-related compounds. In contrast, in the compatible interaction the major metabolome change consisted of the degradation of a number of fungitoxic glycoalkaloids and the accumulation of sugar alcohols in the cells and apoplast of tomato leaflets.
Results
To monitor the major alterations in the infection metabolome of tomato leaves we sampled whole leaf tissue and apoplastic fluid (AF) obtained from susceptible and resistant tomato plants at 4, 6, 10 and 14 days post inoculation (dpi) with race 5 of C. fulvum, as well as from mock-treated control plants. The difference in metabolite composition between whole leaf tissue extracts (WLTE) and the AF is assumed to be caused by metabolites that are mainly present inside the cell. The samples were subjected to untargeted metabolic profiling in two different laboratories using different, but complementary, protocols.
Aqueous methanol (75% MeOH)-extracted samples were subjected to profiling by C18-MS (see Materials and Methods). With this platform we analyzed freeze-dried AF collected from tomato plants at 4, 6, 10 and 14 dpi, as well as WLTE collected at 4 and 6 dpi. The AFs and WLTEs obtained at 6 and 10 dpi were also extracted with MeOH: chloroform (CHCl3):H2O and subjected to profiling by HILIC-MS (see Materials and Methods). The combination of these extraction and separation techniques enabled us to monitor the temporal changes in a variety of polar and semipolar metabolites and apolar compounds including phospho-, sulpho- and galactolipids. For each time point three independent biological repeats were used.
The Composition and Dynamics of the Metabolome of Tomato Leaflets and Apoplast In the HILIC-MS analysis of both WLTEs and AFs, a total of 1,095 metabolites were detected in the negative ionisation mode and from these, 495 compounds accumulated differentially under at least one of the conditions analyzed (P < 0.05, with false discovery rate (FDR) correction). The hierarchical cluster analysis based on these differentially accumulating metabolites shows that the abundance and composition of metabolites found in the WLTEs and the AFs is clearly distinct (Figure 1A, clusters IV and VIII). Nevertheless, some groups of metabolites were present both in WLTEs and AFs and showed similar dynamics (Figure 1A, clusters I, II and V). Clusters I represents strongly decreased and Cluster V strongly increased polar and semi-polar metabolites in both WLTEs and AFs of susceptible, inoculated plants (SI) at 10 dpi (Figure 1A).
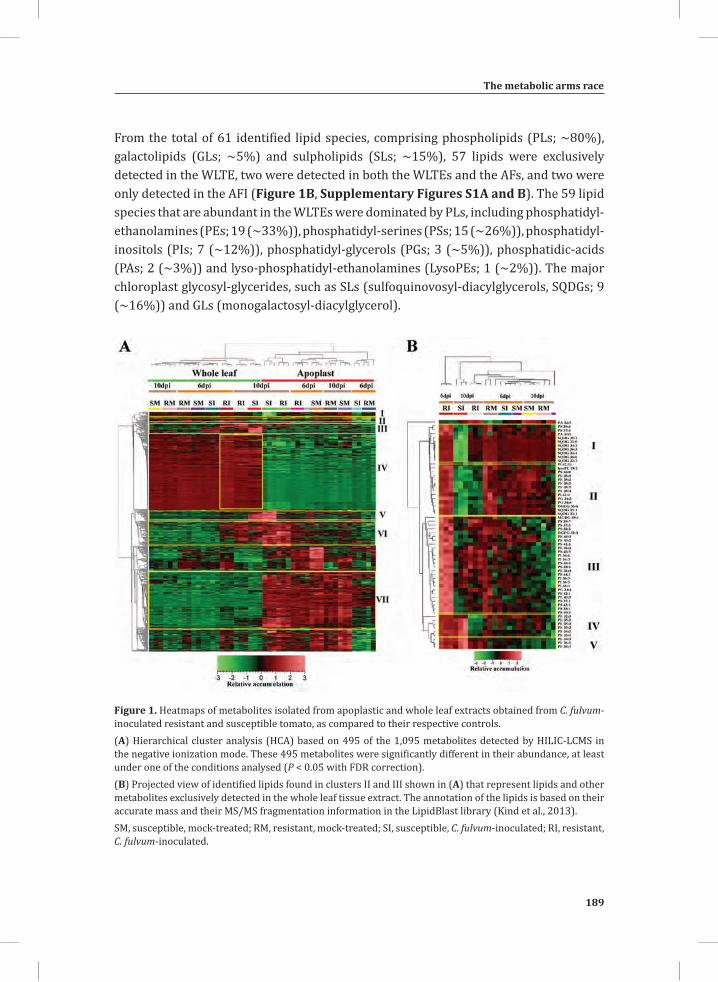
The metabolic arms race
189
Chapter 5
From the total of 61 identified lipid species, comprising phospholipids (PLs; ~80%), galactolipids (GLs; ~5%) and sulpholipids (SLs; ~15%), 57 lipids were exclusively detected in the WLTE, two were detected in both the WLTEs and the AFs, and two were only detected in the AFI (Figure 1B, Supplementary Figures S1A and B). The 59 lipid species that are abundant in the WLTEs were dominated by PLs, including phosphatidyl-ethanolamines (PEs; 19 (~33%)), phosphatidyl-serines (PSs; 15 (~26%)), phosphatidyl-inositols (PIs; 7 (~12%)), phosphatidyl-glycerols (PGs; 3 (~5%)), phosphatidic-acids (PAs; 2 (~3%)) and lyso-phosphatidyl-ethanolamines (LysoPEs; 1 (~2%)). The major chloroplast glycosyl-glycerides, such as SLs (sulfoquinovosyl-diacylglycerols, SQDGs; 9 (~16%)) and GLs (monogalactosyl-diacylglycerol).
Figure 1. Heatmaps of metabolites isolated from apoplastic and whole leaf extracts obtained from C. fulvum-inoculated resistant and susceptible tomato, as compared to their respective controls. (A) Hierarchical cluster analysis (HCA) based on 495 of the 1,095 metabolites detected by HILIC-LCMS in the negative ionization mode. These 495 metabolites were significantly different in their abundance, at least under one of the conditions analysed (P < 0.05 with FDR correction).(B) Projected view of identified lipids found in clusters II and III shown in (A) that represent lipids and other metabolites exclusively detected in the whole leaf tissue extract. The annotation of the lipids is based on their accurate mass and their MS/MS fragmentation information in the LipidBlast library (Kind et al., 2013). SM, susceptible, mock-treated; RM, resistant, mock-treated; SI, susceptible, C. fulvum-inoculated; RI, resistant, C. fulvum-inoculated.
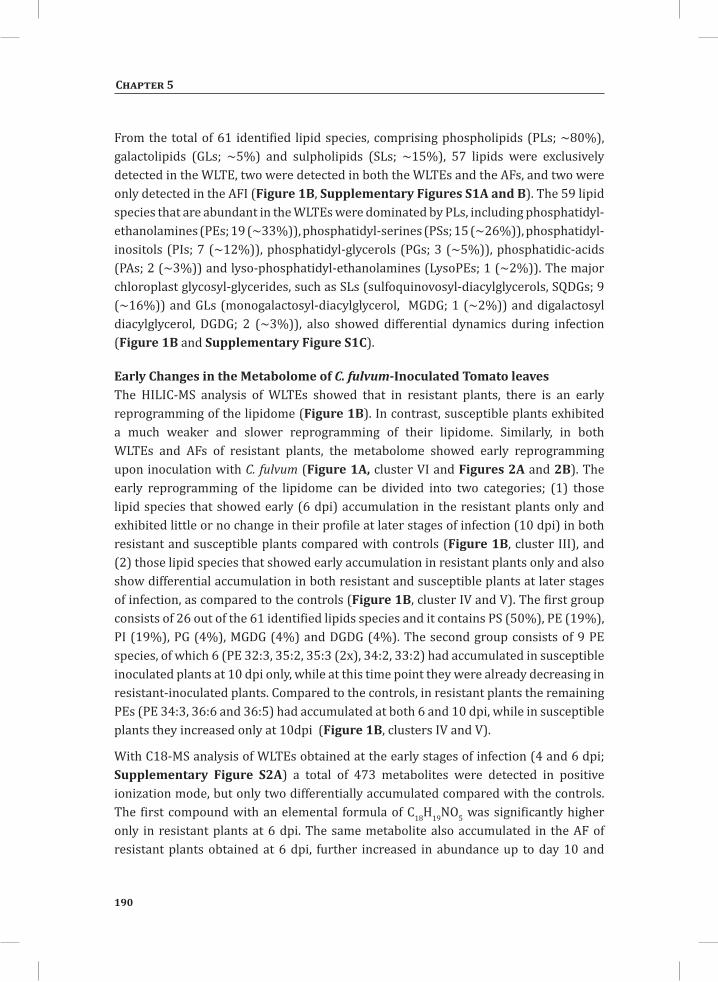
190
Chapter 5
From the total of 61 identified lipid species, comprising phospholipids (PLs; ~80%), galactolipids (GLs; ~5%) and sulpholipids (SLs; ~15%), 57 lipids were exclusively detected in the WLTE, two were detected in both the WLTEs and the AFs, and two were only detected in the AFI (Figure 1B, Supplementary Figures S1A and B). The 59 lipid species that are abundant in the WLTEs were dominated by PLs, including phosphatidyl-ethanolamines (PEs; 19 (~33%)), phosphatidyl-serines (PSs; 15 (~26%)), phosphatidyl-inositols (PIs; 7 (~12%)), phosphatidyl-glycerols (PGs; 3 (~5%)), phosphatidic-acids (PAs; 2 (~3%)) and lyso-phosphatidyl-ethanolamines (LysoPEs; 1 (~2%)). The major chloroplast glycosyl-glycerides, such as SLs (sulfoquinovosyl-diacylglycerols, SQDGs; 9 (~16%)) and GLs (monogalactosyl-diacylglycerol, MGDG; 1 (~2%)) and digalactosyl diacylglycerol, DGDG; 2 (~3%)), also showed differential dynamics during infection (Figure 1B and Supplementary Figure S1C).
Early Changes in the Metabolome of C. fulvum-Inoculated Tomato leavesThe HILIC-MS analysis of WLTEs showed that in resistant plants, there is an early reprogramming of the lipidome (Figure 1B). In contrast, susceptible plants exhibited a much weaker and slower reprogramming of their lipidome. Similarly, in both WLTEs and AFs of resistant plants, the metabolome showed early reprogramming upon inoculation with C. fulvum (Figure 1A, cluster VI and Figures 2A and 2B). The early reprogramming of the lipidome can be divided into two categories; (1) those lipid species that showed early (6 dpi) accumulation in the resistant plants only and exhibited little or no change in their profile at later stages of infection (10 dpi) in both resistant and susceptible plants compared with controls (Figure 1B, cluster III), and (2) those lipid species that showed early accumulation in resistant plants only and also show differential accumulation in both resistant and susceptible plants at later stages of infection, as compared to the controls (Figure 1B, cluster IV and V). The first group consists of 26 out of the 61 identified lipids species and it contains PS (50%), PE (19%), PI (19%), PG (4%), MGDG (4%) and DGDG (4%). The second group consists of 9 PE species, of which 6 (PE 32:3, 35:2, 35:3 (2x), 34:2, 33:2) had accumulated in susceptible inoculated plants at 10 dpi only, while at this time point they were already decreasing in resistant-inoculated plants. Compared to the controls, in resistant plants the remaining PEs (PE 34:3, 36:6 and 36:5) had accumulated at both 6 and 10 dpi, while in susceptible plants they increased only at 10dpi (Figure 1B, clusters IV and V).
With C18-MS analysis of WLTEs obtained at the early stages of infection (4 and 6 dpi; Supplementary Figure S2A) a total of 473 metabolites were detected in positive ionization mode, but only two differentially accumulated compared with the controls. The first compound with an elemental formula of C18H19NO5 was significantly higher only in resistant plants at 6 dpi. The same metabolite also accumulated in the AF of resistant plants obtained at 6 dpi, further increased in abundance up to day 10 and
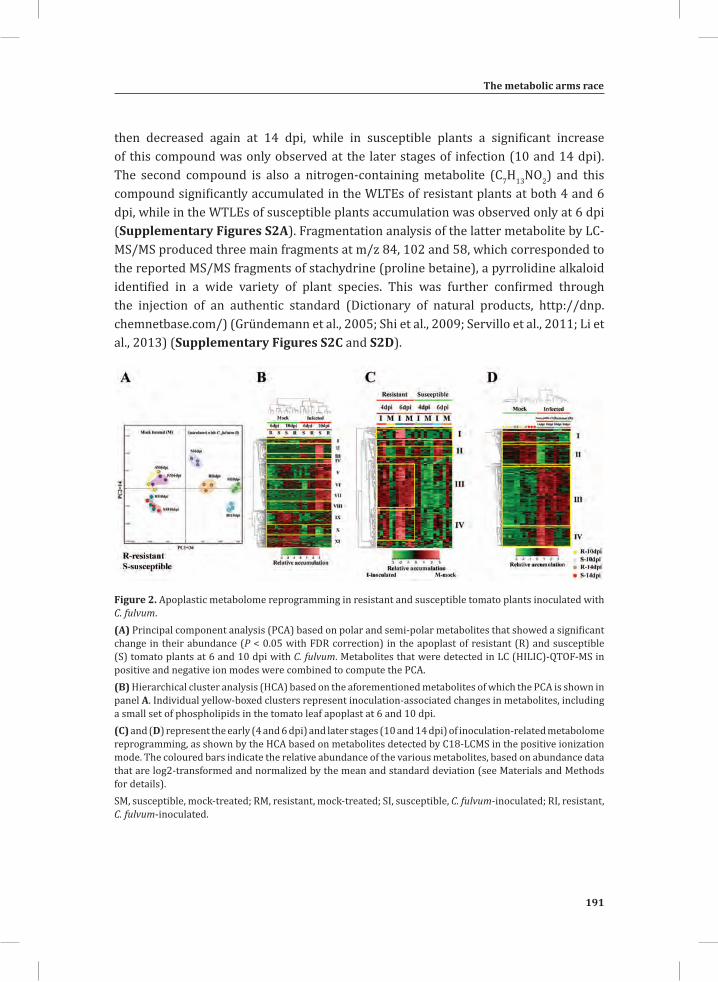
The metabolic arms race
191
Chapter 5
then decreased again at 14 dpi, while in susceptible plants a significant increase of this compound was only observed at the later stages of infection (10 and 14 dpi). The second compound is also a nitrogen-containing metabolite (C7H13NO2) and this compound significantly accumulated in the WLTEs of resistant plants at both 4 and 6 dpi, while in the WTLEs of susceptible plants accumulation was observed only at 6 dpi (Supplementary Figures S2A). Fragmentation analysis of the latter metabolite by LC-MS/MS produced three main fragments at m/z 84, 102 and 58, which corresponded to the reported MS/MS fragments of stachydrine (proline betaine), a pyrrolidine alkaloid identified in a wide variety of plant species. This was further confirmed through the injection of an authentic standard (Dictionary of natural products, http://dnp.chemnetbase.com/) (Gründemann et al., 2005; Shi et al., 2009; Servillo et al., 2011; Li et al., 2013) (Supplementary Figures S2C and S2D).
Figure 2. Apoplastic metabolome reprogramming in resistant and susceptible tomato plants inoculated with C. fulvum. (A) Principal component analysis (PCA) based on polar and semi-polar metabolites that showed a significant change in their abundance (P < 0.05 with FDR correction) in the apoplast of resistant (R) and susceptible (S) tomato plants at 6 and 10 dpi with C. fulvum. Metabolites that were detected in LC (HILIC)-QTOF-MS in positive and negative ion modes were combined to compute the PCA.(B) Hierarchical cluster analysis (HCA) based on the aforementioned metabolites of which the PCA is shown in panel A. Individual yellow-boxed clusters represent inoculation-associated changes in metabolites, including a small set of phospholipids in the tomato leaf apoplast at 6 and 10 dpi.(C) and (D) represent the early (4 and 6 dpi) and later stages (10 and 14 dpi) of inoculation-related metabolome reprogramming, as shown by the HCA based on metabolites detected by C18-LCMS in the positive ionization mode. The coloured bars indicate the relative abundance of the various metabolites, based on abundance data that are log2-transformed and normalized by the mean and standard deviation (see Materials and Methods for details).SM, susceptible, mock-treated; RM, resistant, mock-treated; SI, susceptible, C. fulvum-inoculated; RI, resistant, C. fulvum-inoculated.
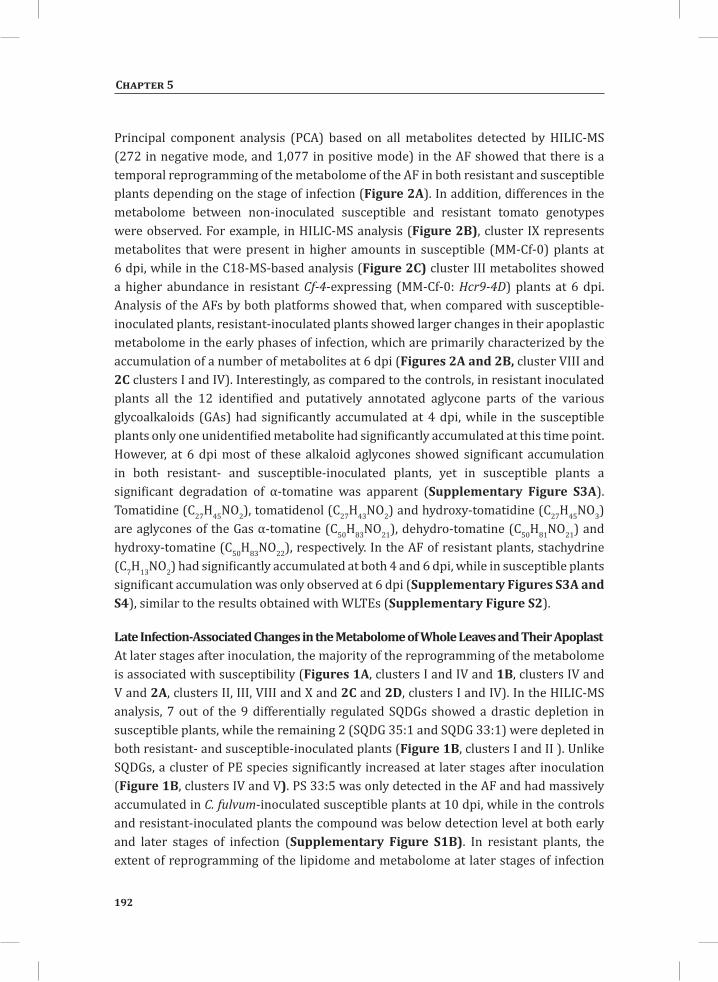
192
Chapter 5
Principal component analysis (PCA) based on all metabolites detected by HILIC-MS (272 in negative mode, and 1,077 in positive mode) in the AF showed that there is a temporal reprogramming of the metabolome of the AF in both resistant and susceptible plants depending on the stage of infection (Figure 2A). In addition, differences in the metabolome between non-inoculated susceptible and resistant tomato genotypes were observed. For example, in HILIC-MS analysis (Figure 2B), cluster IX represents metabolites that were present in higher amounts in susceptible (MM-Cf-0) plants at 6 dpi, while in the C18-MS-based analysis (Figure 2C) cluster III metabolites showed a higher abundance in resistant Cf-4-expressing (MM-Cf-0: Hcr9-4D) plants at 6 dpi. Analysis of the AFs by both platforms showed that, when compared with susceptible-inoculated plants, resistant-inoculated plants showed larger changes in their apoplastic metabolome in the early phases of infection, which are primarily characterized by the accumulation of a number of metabolites at 6 dpi (Figures 2A and 2B, cluster VIII and 2C clusters I and IV). Interestingly, as compared to the controls, in resistant inoculated plants all the 12 identified and putatively annotated aglycone parts of the various glycoalkaloids (GAs) had significantly accumulated at 4 dpi, while in the susceptible plants only one unidentified metabolite had significantly accumulated at this time point. However, at 6 dpi most of these alkaloid aglycones showed significant accumulation in both resistant- and susceptible-inoculated plants, yet in susceptible plants a significant degradation of α-tomatine was apparent (Supplementary Figure S3A). Tomatidine (C27H45NO2), tomatidenol (C27H43NO2) and hydroxy-tomatidine (C27H45NO3) are aglycones of the Gas α-tomatine (C50H83NO21), dehydro-tomatine (C50H81NO21) and hydroxy-tomatine (C50H83NO22), respectively. In the AF of resistant plants, stachydrine (C7H13NO2) had significantly accumulated at both 4 and 6 dpi, while in susceptible plants significant accumulation was only observed at 6 dpi (Supplementary Figures S3A and S4), similar to the results obtained with WLTEs (Supplementary Figure S2).
Late Infection-Associated Changes in the Metabolome of Whole Leaves and Their ApoplastAt later stages after inoculation, the majority of the reprogramming of the metabolome is associated with susceptibility (Figures 1A, clusters I and IV and 1B, clusters IV and V and 2A, clusters II, III, VIII and X and 2C and 2D, clusters I and IV). In the HILIC-MS analysis, 7 out of the 9 differentially regulated SQDGs showed a drastic depletion in susceptible plants, while the remaining 2 (SQDG 35:1 and SQDG 33:1) were depleted in both resistant- and susceptible-inoculated plants (Figure 1B, clusters I and II ). Unlike SQDGs, a cluster of PE species significantly increased at later stages after inoculation (Figure 1B, clusters IV and V). PS 33:5 was only detected in the AF and had massively accumulated in C. fulvum-inoculated susceptible plants at 10 dpi, while in the controls and resistant-inoculated plants the compound was below detection level at both early and later stages of infection (Supplementary Figure S1B). In resistant plants, the extent of reprogramming of the lipidome and metabolome at later stages of infection
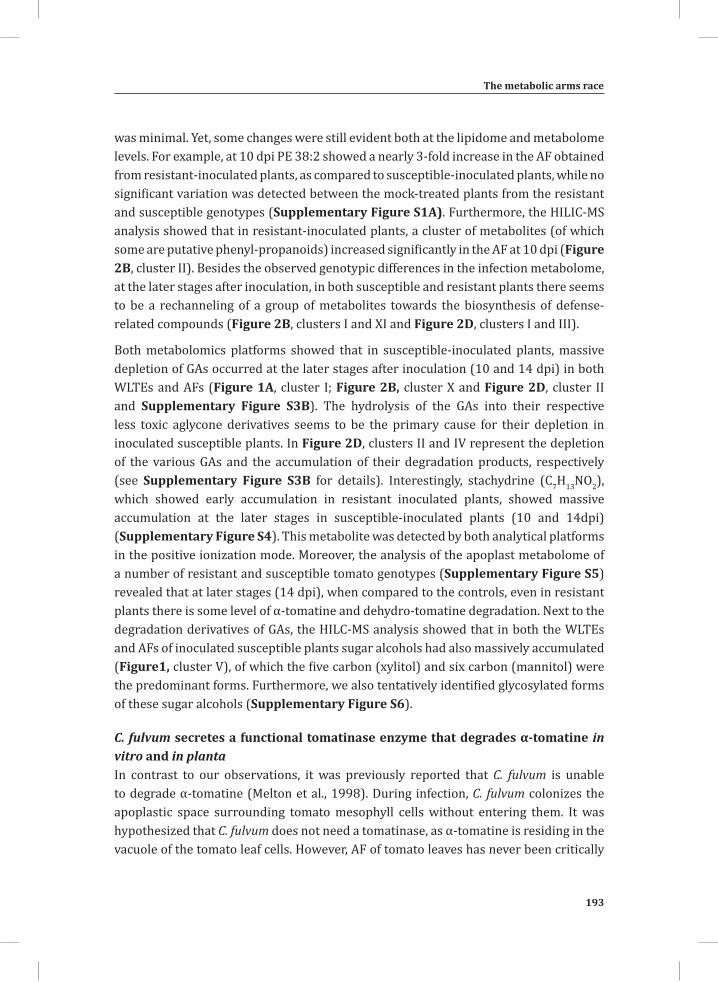
The metabolic arms race
193
Chapter 5
was minimal. Yet, some changes were still evident both at the lipidome and metabolome levels. For example, at 10 dpi PE 38:2 showed a nearly 3-fold increase in the AF obtained from resistant-inoculated plants, as compared to susceptible-inoculated plants, while no significant variation was detected between the mock-treated plants from the resistant and susceptible genotypes (Supplementary Figure S1A). Furthermore, the HILIC-MS analysis showed that in resistant-inoculated plants, a cluster of metabolites (of which some are putative phenyl-propanoids) increased significantly in the AF at 10 dpi (Figure 2B, cluster II). Besides the observed genotypic differences in the infection metabolome, at the later stages after inoculation, in both susceptible and resistant plants there seems to be a rechanneling of a group of metabolites towards the biosynthesis of defense-related compounds (Figure 2B, clusters I and XI and Figure 2D, clusters I and III).
Both metabolomics platforms showed that in susceptible-inoculated plants, massive depletion of GAs occurred at the later stages after inoculation (10 and 14 dpi) in both WLTEs and AFs (Figure 1A, cluster I; Figure 2B, cluster X and Figure 2D, cluster II and Supplementary Figure S3B). The hydrolysis of the GAs into their respective less toxic aglycone derivatives seems to be the primary cause for their depletion in inoculated susceptible plants. In Figure 2D, clusters II and IV represent the depletion of the various GAs and the accumulation of their degradation products, respectively (see Supplementary Figure S3B for details). Interestingly, stachydrine (C7H13NO2), which showed early accumulation in resistant inoculated plants, showed massive accumulation at the later stages in susceptible-inoculated plants (10 and 14dpi) (Supplementary Figure S4). This metabolite was detected by both analytical platforms in the positive ionization mode. Moreover, the analysis of the apoplast metabolome of a number of resistant and susceptible tomato genotypes (Supplementary Figure S5) revealed that at later stages (14 dpi), when compared to the controls, even in resistant plants there is some level of α-tomatine and dehydro-tomatine degradation. Next to the degradation derivatives of GAs, the HILC-MS analysis showed that in both the WLTEs and AFs of inoculated susceptible plants sugar alcohols had also massively accumulated (Figure1, cluster V), of which the five carbon (xylitol) and six carbon (mannitol) were the predominant forms. Furthermore, we also tentatively identified glycosylated forms of these sugar alcohols (Supplementary Figure S6).
C. fulvum secretes a functional tomatinase enzyme that degrades α-tomatine in vitro and in plantaIn contrast to our observations, it was previously reported that C. fulvum is unable to degrade α-tomatine (Melton et al., 1998). During infection, C. fulvum colonizes the apoplastic space surrounding tomato mesophyll cells without entering them. It was hypothesized that C. fulvum does not need a tomatinase, as α-tomatine is residing in the vacuole of the tomato leaf cells. However, AF of tomato leaves has never been critically
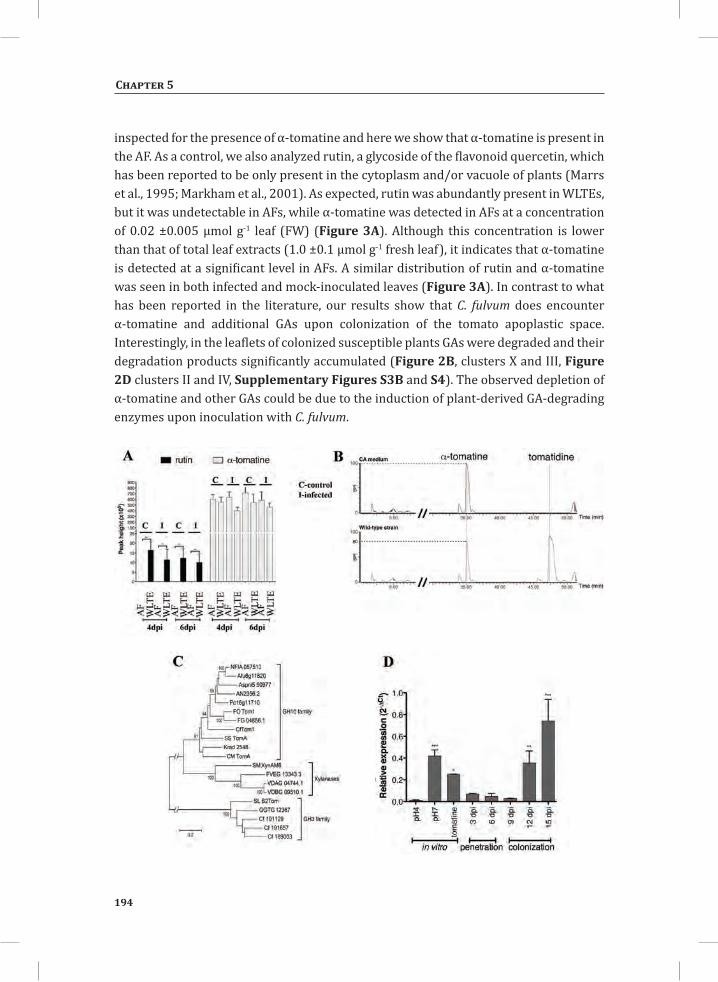
194
Chapter 5
inspected for the presence of α-tomatine and here we show that α-tomatine is present in the AF. As a control, we also analyzed rutin, a glycoside of the flavonoid quercetin, which has been reported to be only present in the cytoplasm and/or vacuole of plants (Marrs et al., 1995; Markham et al., 2001). As expected, rutin was abundantly present in WLTEs, but it was undetectable in AFs, while α-tomatine was detected in AFs at a concentration of 0.02 ±0.005 μmol g-1 leaf (FW) (Figure 3A). Although this concentration is lower than that of total leaf extracts (1.0 ±0.1 μmol g-1 fresh leaf), it indicates that α-tomatine is detected at a significant level in AFs. A similar distribution of rutin and α-tomatine was seen in both infected and mock-inoculated leaves (Figure 3A). In contrast to what has been reported in the literature, our results show that C. fulvum does encounter α-tomatine and additional GAs upon colonization of the tomato apoplastic space. Interestingly, in the leaflets of colonized susceptible plants GAs were degraded and their degradation products significantly accumulated (Figure 2B, clusters X and III, Figure 2D clusters II and IV, Supplementary Figures S3B and S4). The observed depletion of α-tomatine and other GAs could be due to the induction of plant-derived GA-degrading enzymes upon inoculation with C. fulvum.
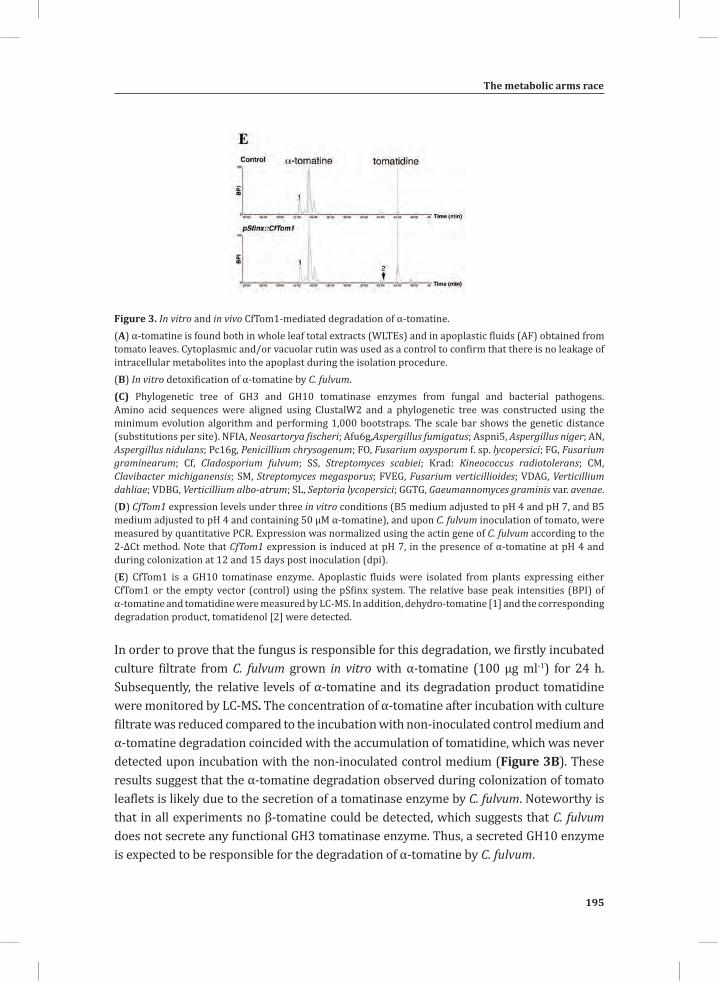
The metabolic arms race
195
Chapter 5
Figure 3. In vitro and in vivo CfTom1-mediated degradation of α-tomatine. (A) α-tomatine is found both in whole leaf total extracts (WLTEs) and in apoplastic fluids (AF) obtained from tomato leaves. Cytoplasmic and/or vacuolar rutin was used as a control to confirm that there is no leakage of intracellular metabolites into the apoplast during the isolation procedure. (B) In vitro detoxification of α-tomatine by C. fulvum. (C) Phylogenetic tree of GH3 and GH10 tomatinase enzymes from fungal and bacterial pathogens. Amino acid sequences were aligned using ClustalW2 and a phylogenetic tree was constructed using the minimum evolution algorithm and performing 1,000 bootstraps. The scale bar shows the genetic distance (substitutions per site). NFIA, Neosartorya fischeri; Afu6g,Aspergillus fumigatus; Aspni5, Aspergillus niger; AN, Aspergillus nidulans; Pc16g, Penicillium chrysogenum; FO, Fusarium oxysporum f. sp. lycopersici; FG, Fusarium graminearum; Cf, Cladosporium fulvum; SS, Streptomyces scabiei; Krad: Kineococcus radiotolerans; CM, Clavibacter michiganensis; SM, Streptomyces megasporus; FVEG, Fusarium verticillioides; VDAG, Verticillium dahliae; VDBG, Verticillium albo-atrum; SL, Septoria lycopersici; GGTG, Gaeumannomyces graminis var. avenae.(D) CfTom1 expression levels under three in vitro conditions (B5 medium adjusted to pH 4 and pH 7, and B5 medium adjusted to pH 4 and containing 50 µM α-tomatine), and upon C. fulvum inoculation of tomato, were measured by quantitative PCR. Expression was normalized using the actin gene of C. fulvum according to the 2-∆Ct method. Note that CfTom1 expression is induced at pH 7, in the presence of α-tomatine at pH 4 and during colonization at 12 and 15 days post inoculation (dpi).(E) CfTom1 is a GH10 tomatinase enzyme. Apoplastic fluids were isolated from plants expressing either CfTom1 or the empty vector (control) using the pSfinx system. The relative base peak intensities (BPI) of α-tomatine and tomatidine were measured by LC-MS. In addition, dehydro-tomatine [1] and the corresponding degradation product, tomatidenol [2] were detected.
In order to prove that the fungus is responsible for this degradation, we firstly incubated culture filtrate from C. fulvum grown in vitro with α-tomatine (100 µg ml-1) for 24 h. Subsequently, the relative levels of α-tomatine and its degradation product tomatidine were monitored by LC-MS. The concentration of α-tomatine after incubation with culture filtrate was reduced compared to the incubation with non-inoculated control medium and α-tomatine degradation coincided with the accumulation of tomatidine, which was never detected upon incubation with the non-inoculated control medium (Figure 3B). These results suggest that the α-tomatine degradation observed during colonization of tomato leaflets is likely due to the secretion of a tomatinase enzyme by C. fulvum. Noteworthy is that in all experiments no β-tomatine could be detected, which suggests that C. fulvum does not secrete any functional GH3 tomatinase enzyme. Thus, a secreted GH10 enzyme is expected to be responsible for the degradation of α-tomatine by C. fulvum.
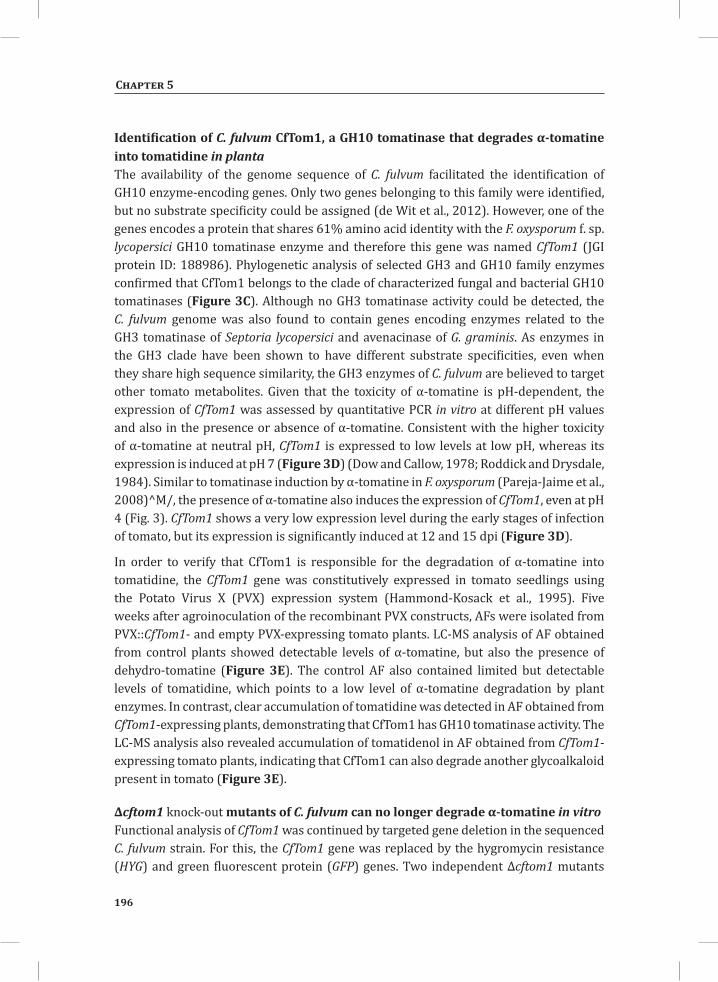
196
Chapter 5
Identification of C. fulvum CfTom1, a GH10 tomatinase that degrades α-tomatine into tomatidine in plantaThe availability of the genome sequence of C. fulvum facilitated the identification of GH10 enzyme-encoding genes. Only two genes belonging to this family were identified, but no substrate specificity could be assigned (de Wit et al., 2012). However, one of the genes encodes a protein that shares 61% amino acid identity with the F. oxysporum f. sp. lycopersici GH10 tomatinase enzyme and therefore this gene was named CfTom1 (JGI protein ID: 188986). Phylogenetic analysis of selected GH3 and GH10 family enzymes confirmed that CfTom1 belongs to the clade of characterized fungal and bacterial GH10 tomatinases (Figure 3C). Although no GH3 tomatinase activity could be detected, the C. fulvum genome was also found to contain genes encoding enzymes related to the GH3 tomatinase of Septoria lycopersici and avenacinase of G. graminis. As enzymes in the GH3 clade have been shown to have different substrate specificities, even when they share high sequence similarity, the GH3 enzymes of C. fulvum are believed to target other tomato metabolites. Given that the toxicity of α-tomatine is pH-dependent, the expression of CfTom1 was assessed by quantitative PCR in vitro at different pH values and also in the presence or absence of α-tomatine. Consistent with the higher toxicity of α-tomatine at neutral pH, CfTom1 is expressed to low levels at low pH, whereas its expression is induced at pH 7 (Figure 3D) (Dow and Callow, 1978; Roddick and Drysdale, 1984). Similar to tomatinase induction by α-tomatine in F. oxysporum (Pareja-Jaime et al., 2008)^M/, the presence of α-tomatine also induces the expression of CfTom1, even at pH 4 (Fig. 3). CfTom1 shows a very low expression level during the early stages of infection of tomato, but its expression is significantly induced at 12 and 15 dpi (Figure 3D).
In order to verify that CfTom1 is responsible for the degradation of α-tomatine into tomatidine, the CfTom1 gene was constitutively expressed in tomato seedlings using the Potato Virus X (PVX) expression system (Hammond-Kosack et al., 1995). Five weeks after agroinoculation of the recombinant PVX constructs, AFs were isolated from PVX::CfTom1- and empty PVX-expressing tomato plants. LC-MS analysis of AF obtained from control plants showed detectable levels of α-tomatine, but also the presence of dehydro-tomatine (Figure 3E). The control AF also contained limited but detectable levels of tomatidine, which points to a low level of α-tomatine degradation by plant enzymes. In contrast, clear accumulation of tomatidine was detected in AF obtained from CfTom1-expressing plants, demonstrating that CfTom1 has GH10 tomatinase activity. The LC-MS analysis also revealed accumulation of tomatidenol in AF obtained from CfTom1-expressing tomato plants, indicating that CfTom1 can also degrade another glycoalkaloid present in tomato (Figure 3E).
∆cftom1 knock-out mutants of C. fulvum can no longer degrade α-tomatine in vitroFunctional analysis of CfTom1 was continued by targeted gene deletion in the sequenced C. fulvum strain. For this, the CfTom1 gene was replaced by the hygromycin resistance (HYG) and green fluorescent protein (GFP) genes. Two independent ∆cftom1 mutants
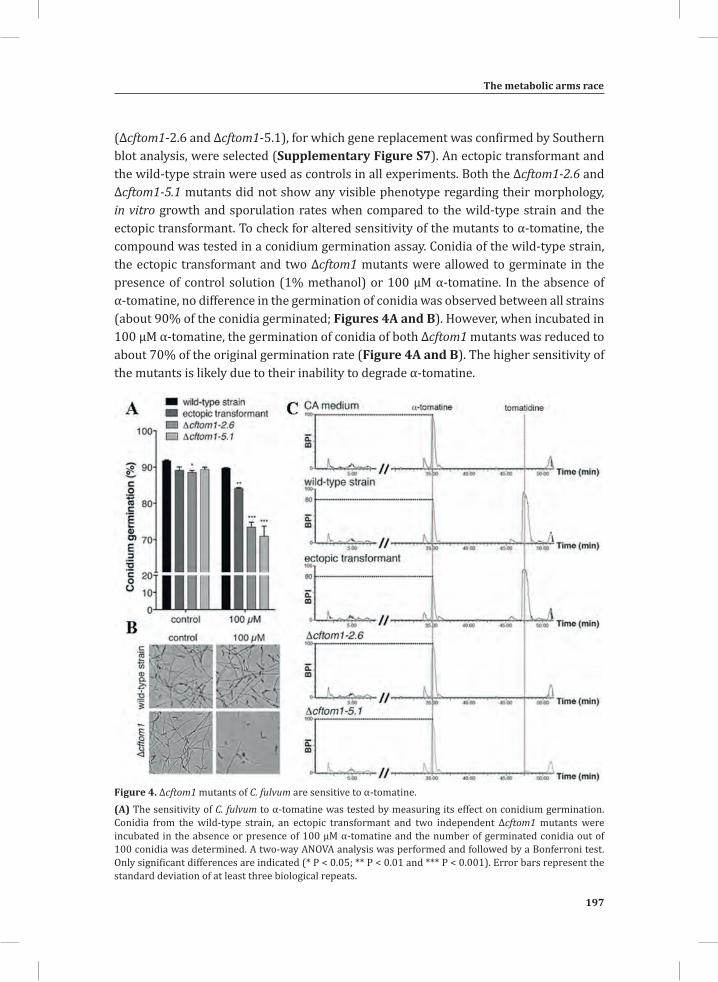
The metabolic arms race
197
Chapter 5
(∆cftom1-2.6 and ∆cftom1-5.1), for which gene replacement was confirmed by Southern blot analysis, were selected (Supplementary Figure S7). An ectopic transformant and the wild-type strain were used as controls in all experiments. Both the ∆cftom1-2.6 and ∆cftom1-5.1 mutants did not show any visible phenotype regarding their morphology, in vitro growth and sporulation rates when compared to the wild-type strain and the ectopic transformant. To check for altered sensitivity of the mutants to α-tomatine, the compound was tested in a conidium germination assay. Conidia of the wild-type strain, the ectopic transformant and two ∆cftom1 mutants were allowed to germinate in the presence of control solution (1% methanol) or 100 µM α-tomatine. In the absence of α-tomatine, no difference in the germination of conidia was observed between all strains (about 90% of the conidia germinated; Figures 4A and B). However, when incubated in 100 µM α-tomatine, the germination of conidia of both ∆cftom1 mutants was reduced to about 70% of the original germination rate (Figure 4A and B). The higher sensitivity of the mutants is likely due to their inability to degrade α-tomatine.
Figure 4. ∆cftom1 mutants of C. fulvum are sensitive to α-tomatine.(A) The sensitivity of C. fulvum to α-tomatine was tested by measuring its effect on conidium germination. Conidia from the wild-type strain, an ectopic transformant and two independent ∆cftom1 mutants were incubated in the absence or presence of 100 µM α-tomatine and the number of germinated conidia out of 100 conidia was determined. A two-way ANOVA analysis was performed and followed by a Bonferroni test. Only significant differences are indicated (* P < 0.05; ** P < 0.01 and *** P < 0.001). Error bars represent the standard deviation of at least three biological repeats.
198
Chapter 5
(B) Representative pictures of the conidium germination assay to assess the sensitivity of the wild-type strain and a ∆cftom1 mutant of C. fulvum to α-tomatine.(C) Sterile CA medium (control) and culture filtrates from the same C. fulvum strains as shown in (A) were supplemented with 100 µg ml-1 α-tomatine. After 24 h of incubation, the relative base peak intensities (BPIs) of α-tomatine and tomatidine were measured by LC-MS.
To verify this hypothesis, culture filtrates of the deletion mutants were incubated with α-tomatine (100 µg ml-1), along with culture filtrates of the wild-type strain and ectopic transformant as positive controls, and non-inoculated culture medium as a negative control. After 24 h of incubation, both α-tomatine depletion and tomatidine accumulation were observed for the wild-type strain and the ectopic transformant (Figure 4C). In contrast, culture filtrates from both ∆cftom1 knock-out mutants were not able to degrade α-tomatine and no tomatidine accumulation was detected. These results show that the higher sensitivity of the ∆cftom1 mutants to α-tomatine is due to their inability to degrade the compound in vitro.
In planta degradation of α-tomatine is required for full virulence of C. fulvum on tomatoThe ability to degrade α-tomatine appears to be important for successful infection of tomato by fungal pathogens (Pareja-Jaime et al., 2008). The role of CfTom1 in C. fulvum virulence was analyzed by inoculating susceptible tomato plants with the wild-type strain, the ectopic transformant and two ∆cftom1 mutants. The virulence of the various strains was subsequently determined by quantifying the fungal biomass by quantitative PCRs. No significant difference in fungal biomass was observed for the wild-type, the ectopic transformant and two Δcftom1 mutants during the early stages of infection (until 8 dpi) (Figure 5A). However, from 10 dpi onwards, the biomass of the two ∆cftom1 mutants was reduced by approximately 63% when compared to the wild-type strain and the ectopic transformant (Figure 5A). The reduction in fungal biomass is correlated with a delay in disease progression at 10 dpi, indicating that CfTom1 is required for full virulence of C. fulvum on tomato.
Depletion of α-tomatine and the accumulation of its degradation product tomatidine were measured at 10 dpi of the wild-type, the ectopic transformant and two Δcftom1 mutants on susceptible tomato plants. Similar to the in vitro results, no tomatidine could be detected in AFs obtained from plants inoculated with the ∆cftom1 mutants, whereas this compound clearly accumulated in the AFs of plants inoculated with the wild-type and the ectopic transformant (Figure 5B). Therefore, the reduction in fungal biomass production by the deletion mutants could be explained by their inability to degrade α-tomatine.
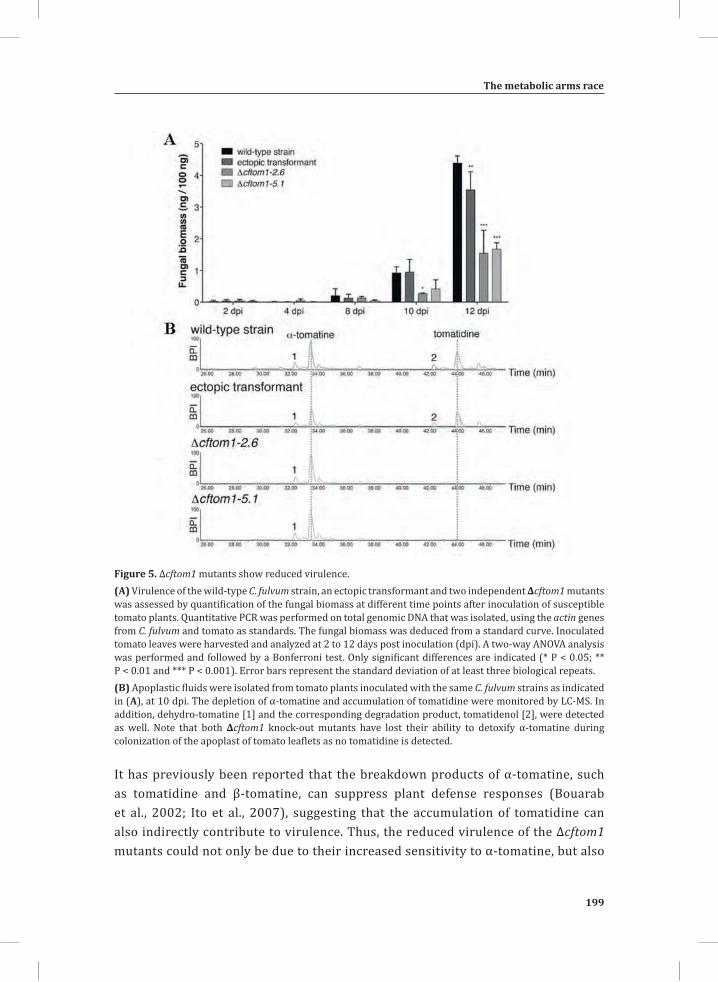
The metabolic arms race
199
Chapter 5
Figure 5. ∆cftom1 mutants show reduced virulence.(A) Virulence of the wild-type C. fulvum strain, an ectopic transformant and two independent ∆cftom1 mutants was assessed by quantification of the fungal biomass at different time points after inoculation of susceptible tomato plants. Quantitative PCR was performed on total genomic DNA that was isolated, using the actin genes from C. fulvum and tomato as standards. The fungal biomass was deduced from a standard curve. Inoculated tomato leaves were harvested and analyzed at 2 to 12 days post inoculation (dpi). A two-way ANOVA analysis was performed and followed by a Bonferroni test. Only significant differences are indicated (* P < 0.05; ** P < 0.01 and *** P < 0.001). Error bars represent the standard deviation of at least three biological repeats.(B) Apoplastic fluids were isolated from tomato plants inoculated with the same C. fulvum strains as indicated in (A), at 10 dpi. The depletion of α-tomatine and accumulation of tomatidine were monitored by LC-MS. In addition, dehydro-tomatine [1] and the corresponding degradation product, tomatidenol [2], were detected as well. Note that both ∆cftom1 knock-out mutants have lost their ability to detoxify α-tomatine during colonization of the apoplast of tomato leaflets as no tomatidine is detected.
It has previously been reported that the breakdown products of α-tomatine, such as tomatidine and β-tomatine, can suppress plant defense responses (Bouarab et al., 2002; Ito et al., 2007), suggesting that the accumulation of tomatidine can also indirectly contribute to virulence. Thus, the reduced virulence of the ∆cftom1 mutants could not only be due to their increased sensitivity to α-tomatine, but also
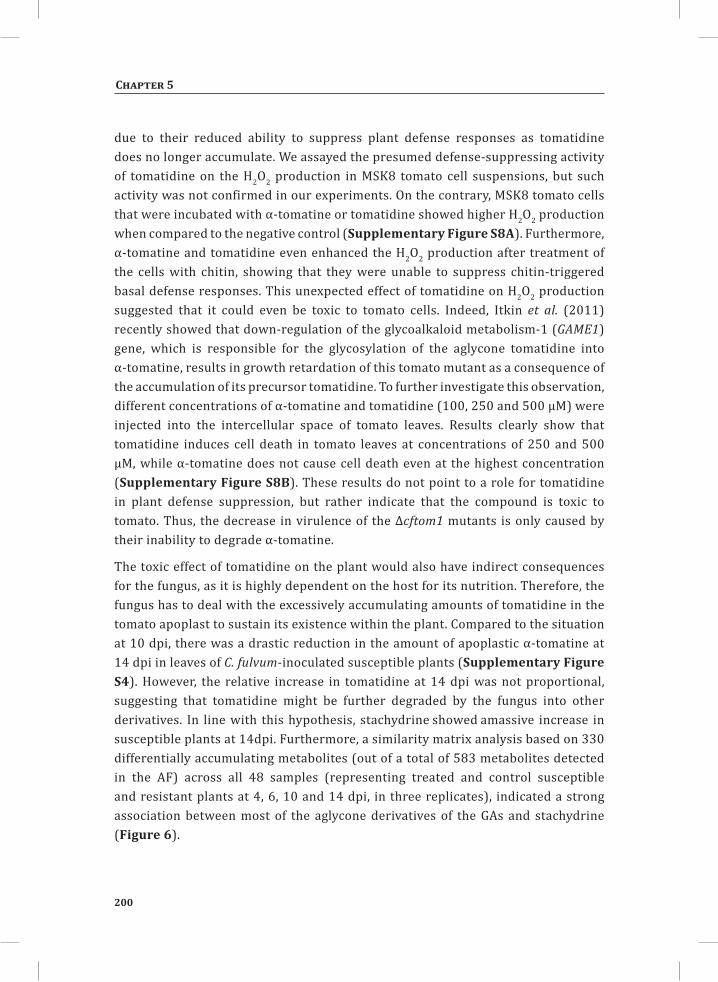
200
Chapter 5
due to their reduced ability to suppress plant defense responses as tomatidine does no longer accumulate. We assayed the presumed defense-suppressing activity of tomatidine on the H2O2 production in MSK8 tomato cell suspensions, but such activity was not confirmed in our experiments. On the contrary, MSK8 tomato cells that were incubated with α-tomatine or tomatidine showed higher H2O2 production when compared to the negative control (Supplementary Figure S8A). Furthermore, α-tomatine and tomatidine even enhanced the H2O2 production after treatment of the cells with chitin, showing that they were unable to suppress chitin-triggered basal defense responses. This unexpected effect of tomatidine on H2O2 production suggested that it could even be toxic to tomato cells. Indeed, Itkin et al. (2011) recently showed that down-regulation of the glycoalkaloid metabolism-1 (GAME1) gene, which is responsible for the glycosylation of the aglycone tomatidine into α-tomatine, results in growth retardation of this tomato mutant as a consequence of the accumulation of its precursor tomatidine. To further investigate this observation, different concentrations of α-tomatine and tomatidine (100, 250 and 500 µM) were injected into the intercellular space of tomato leaves. Results clearly show that tomatidine induces cell death in tomato leaves at concentrations of 250 and 500 µM, while α-tomatine does not cause cell death even at the highest concentration (Supplementary Figure S8B). These results do not point to a role for tomatidine in plant defense suppression, but rather indicate that the compound is toxic to tomato. Thus, the decrease in virulence of the ∆cftom1 mutants is only caused by their inability to degrade α-tomatine.
The toxic effect of tomatidine on the plant would also have indirect consequences for the fungus, as it is highly dependent on the host for its nutrition. Therefore, the fungus has to deal with the excessively accumulating amounts of tomatidine in the tomato apoplast to sustain its existence within the plant. Compared to the situation at 10 dpi, there was a drastic reduction in the amount of apoplastic α-tomatine at 14 dpi in leaves of C. fulvum-inoculated susceptible plants (Supplementary Figure S4). However, the relative increase in tomatidine at 14 dpi was not proportional, suggesting that tomatidine might be further degraded by the fungus into other derivatives. In line with this hypothesis, stachydrine showed amassive increase in susceptible plants at 14dpi. Furthermore, a similarity matrix analysis based on 330 differentially accumulating metabolites (out of a total of 583 metabolites detected in the AF) across all 48 samples (representing treated and control susceptible and resistant plants at 4, 6, 10 and 14 dpi, in three replicates), indicated a strong association between most of the aglycone derivatives of the GAs and stachydrine (Figure 6).
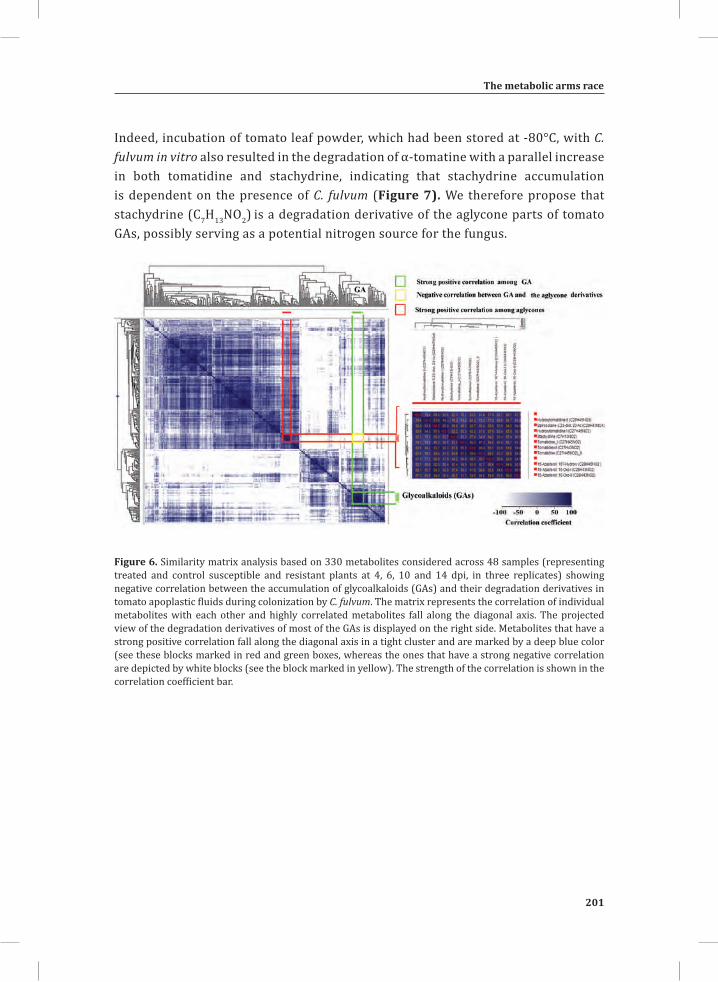
The metabolic arms race
201
Chapter 5
Indeed, incubation of tomato leaf powder, which had been stored at -80°C, with C. fulvum in vitro also resulted in the degradation of α-tomatine with a parallel increase in both tomatidine and stachydrine, indicating that stachydrine accumulation is dependent on the presence of C. fulvum (Figure 7). We therefore propose that stachydrine (C7H13NO2) is a degradation derivative of the aglycone parts of tomato GAs, possibly serving as a potential nitrogen source for the fungus.
Figure 6. Similarity matrix analysis based on 330 metabolites considered across 48 samples (representing treated and control susceptible and resistant plants at 4, 6, 10 and 14 dpi, in three replicates) showing negative correlation between the accumulation of glycoalkaloids (GAs) and their degradation derivatives in tomato apoplastic fluids during colonization by C. fulvum. The matrix represents the correlation of individual metabolites with each other and highly correlated metabolites fall along the diagonal axis. The projected view of the degradation derivatives of most of the GAs is displayed on the right side. Metabolites that have a strong positive correlation fall along the diagonal axis in a tight cluster and are marked by a deep blue color (see these blocks marked in red and green boxes, whereas the ones that have a strong negative correlation are depicted by white blocks (see the block marked in yellow). The strength of the correlation is shown in the correlation coefficient bar.
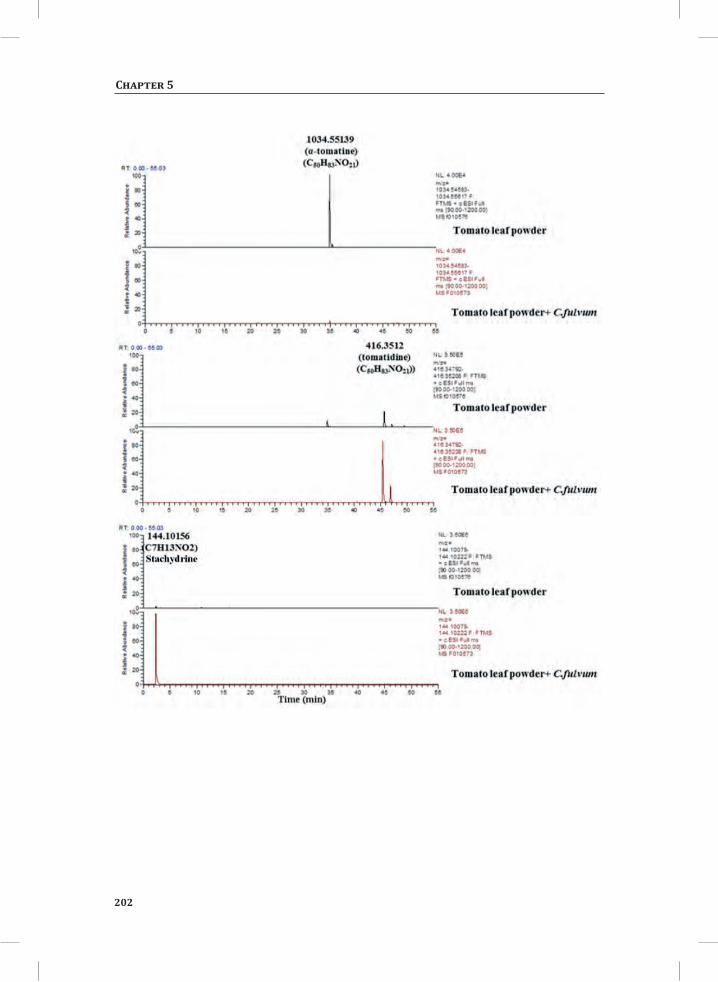
202
Chapter 5
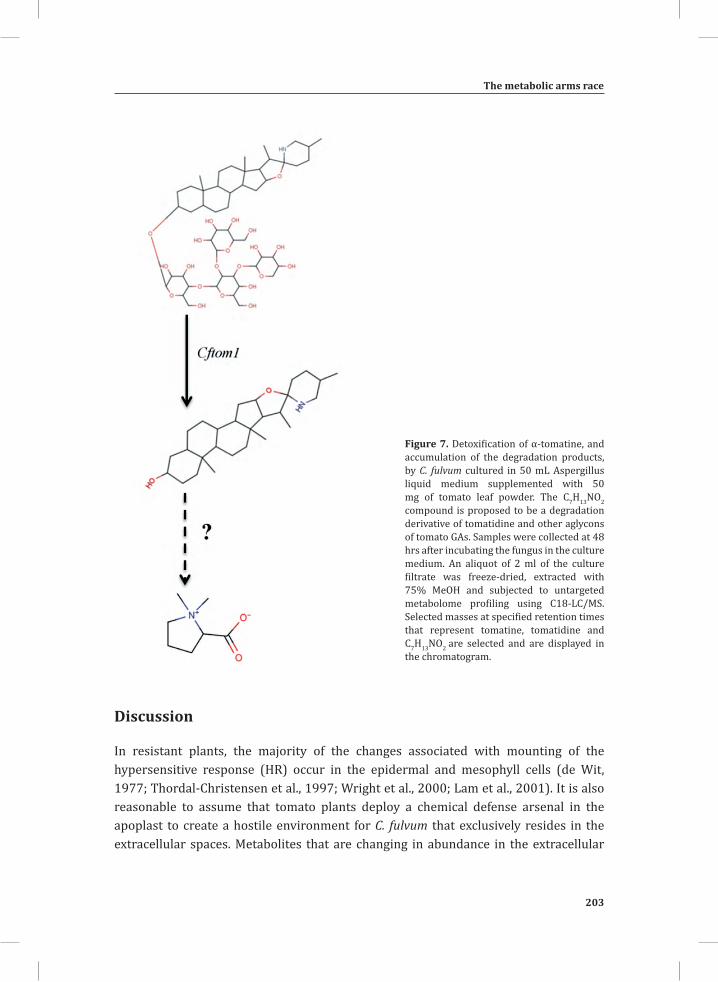
The metabolic arms race
203
Chapter 5
Figure 7. Detoxification of α-tomatine, and accumulation of the degradation products, by C. fulvum cultured in 50 mL Aspergillus liquid medium supplemented with 50 mg of tomato leaf powder. The C7H13NO2 compound is proposed to be a degradation derivative of tomatidine and other aglycons of tomato GAs. Samples were collected at 48 hrs after incubating the fungus in the culture medium. An aliquot of 2 ml of the culture filtrate was freeze-dried, extracted with 75% MeOH and subjected to untargeted metabolome profiling using C18-LC/MS. Selected masses at specified retention times that represent tomatine, tomatidine and C7H13NO2 are selected and are displayed in the chromatogram.
Discussion
In resistant plants, the majority of the changes associated with mounting of the hypersensitive response (HR) occur in the epidermal and mesophyll cells (de Wit, 1977; Thordal-Christensen et al., 1997; Wright et al., 2000; Lam et al., 2001). It is also reasonable to assume that tomato plants deploy a chemical defense arsenal in the apoplast to create a hostile environment for C. fulvum that exclusively resides in the extracellular spaces. Metabolites that are changing in abundance in the extracellular
204
Chapter 5
(apoplastic) space hallmark the molecular warfare that takes place between tomato and C. fulvum. To monitor the metabolic alterations taking place in the apoplast and in the mesophyll cells, both as a part of the plant defense response and/or as a consequence of the manipulation of the host metabolism by the fungus, apoplastic fluids (AFs) and whole leaf tissue extracts (WLTEs) obtained from resistant and susceptible tomato plants inoculated with C. fulvum and their respective mock-inoculated controls, were subjected to untargeted metabolome profiling by two partly overlapping and partly complementary analytical platforms, C18 (reversed-phase) LCMS and HILIC-LCMS. The distinct features of the metabolome of the AFs and WLTEs upon inoculation with C. fulvum, reveals the power of local sampling in the study of plant-microbe interactions to elucidate the major alterations that take place locally (Figure 1). Furthermore, coupling of local sampling with analytical techniques that employ different extraction and separation procedures is a viable approach to monitor the alteration of different classes of metabolites during the interaction between tomato and C. fulvum. For example, phospholipids were predominantly found in WLTEs when obtained using MeOH: CHCl3: H2O. On the other hand, sugar alcohols are abundantly found in both WLTEs and AFs and due to their highly polar nature they are better separated by the HILIC column than the RP-C18 column that we used. PS 33:5, which is specific to AF obtained from leaves of C. fulvum-inoculated susceptible tomato, could be used as a susceptibility biomarker, particularly in relation to the presence of the fungus. Such lipids could also play a role as a signaling molecule and further studies are needed to confirm whether they are produced by the plant or by the fungus during the interaction. The depletion of SQDGs is another indicator for the progression of the disease (Figure 1B, cluster I). SQDGs are most abundant in the thylakoids, the membranous cellular structures that bear the photosynthetic pigments in plants (Welti et al., 2003; Shimojima, 2011). In green algae, SQDGs have been shown to be utilized as a major internal sulfur source for protein synthesis in the early phase of sulfur starvation and are suggested to function as sulfur storage lipids in these cells (Sugimoto et al., 2007; Sugimoto et al., 2010). Likewise, the tomato SQDGs may possibly be targeted by the C. fulvum enzymes as a source of sulfur. Further, investigation is needed to identify the fungal enzyme (s) that are involved in these processes and such information may provide more insight in the fungal nutrient acquisition strategies.
In WLTEs obtained from resistant-inoculated plants, the early reprogramming of the infection lipidome, which is characterized by the accumulation of a number of membrane phospholipid species (PEs, PSs, PIs and PGs) that have both a structural and a signaling role as a secondary messengers (Meijer and Munnik, 2003), hallmarks the activation of the host defense response against C. fulvum (Figure 1B and Supplementary Figure S1C). Although phosphatidyl-serines (PSs) represent only a minor phospholipid constituent of the leaves of many plant species (Vance and Steenbergen, 2005), in the
The metabolic arms race
205
Chapter 5
incompatible interaction they represent 50% of the early induced lipid species found in cluster III of Figure 1B. In animals, PSs are reported to have a crucial role in the regulation of programmed cell death in response to particular calcium-dependent stimuli, primarily related to their externalization from the inner membrane lipids, giving an “eat me” signal by the dying cells to phagocytes (OBrien et al., 1997; Bell, 2007; Ravichandran, 2010; Segawa et al., 2012). PSs have also been shown to be essential cofactors that bind to and activate a large number of proteins, especially those with signaling activity (Vance and Steenbergen, 2005). Furthermore, a rise in PS levels was reported while the level of other PLs decreased in senescing carrot leaves upon dark treatment, suggesting that the rise in PSs is one of the biochemical events occurring during membrane degradation caused by either starvation or senescence (Manoharan et al., 2000).
In the incompatible interaction and the “Dying Seedlings (DS)” of tomato, a model that represents the amplified localized response of resistant tomato plants to C. fulvum (Etalo et al., 2013), the early transcriptional activation of genes involved in lipid metabolism and signaling supports the role of lipids and lipid-derived compounds in the early resistance response of tomato against C. fulvum (Table 1). Particularly, genes involved in fatty acid desaturation showed higher expression levels in the incompatible interaction and the DS when compared to the compatible interaction. The fatty acid desaturases (FADs) play an important role in the introduction of double bonds into the fatty acid chain. They greatly influence the biosynthesis of membrane phospholipids and have been shown to play an important role in the plant defense response (Kachroo et al., 2001; Kachroo et al., 2003; Walley et al., 2013). Elucidation of the role of these FADs in the reprogramming of the early infection lipidome and its subsequent impact on the tomato defense against C. fulvum is an interesting future line of research.
In the incompatible interaction, in addition to the changes in the lipidome dynamics of the WLTEs, our comprehensive time-course studies clearly indicated that at the early phase of infection (4-6 dpi) a number of polar and semi-polar secondary metabolites accumulate in the apoplast (Figures 1A, 1B, 2A, 2B and 2C). In agreement with this, in chapter 3 of this thesis, our comparative transcriptional profiling clearly indicated that the incompatible interaction features a fast and massive reprogramming of the host transcriptome at 6 dpi. This indicates that the early transcriptional rewiring is an important factor for the observed reprogramming of the metabolome, suggesting that multiple integrated -omics approaches as applied here, will enable a comprehensive dissection of all metabolic changes occurring during the interaction between tomato and C. fulvum.
At the later stages of infection, major changes in the metabolome occur in the compatible interaction, suggesting that the manipulation of the host metabolism by the fungus is
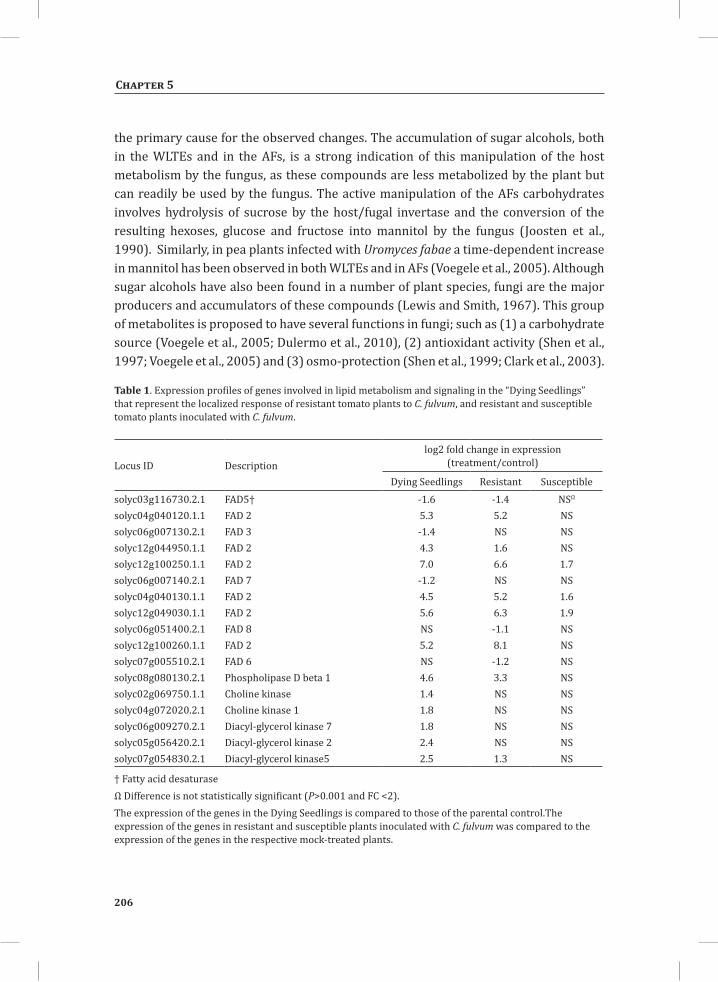
206
Chapter 5
the primary cause for the observed changes. The accumulation of sugar alcohols, both in the WLTEs and in the AFs, is a strong indication of this manipulation of the host metabolism by the fungus, as these compounds are less metabolized by the plant but can readily be used by the fungus. The active manipulation of the AFs carbohydrates involves hydrolysis of sucrose by the host/fugal invertase and the conversion of the resulting hexoses, glucose and fructose into mannitol by the fungus (Joosten et al., 1990). Similarly, in pea plants infected with Uromyces fabae a time-dependent increase in mannitol has been observed in both WLTEs and in AFs (Voegele et al., 2005). Although sugar alcohols have also been found in a number of plant species, fungi are the major producers and accumulators of these compounds (Lewis and Smith, 1967). This group of metabolites is proposed to have several functions in fungi; such as (1) a carbohydrate source (Voegele et al., 2005; Dulermo et al., 2010), (2) antioxidant activity (Shen et al., 1997; Voegele et al., 2005) and (3) osmo-protection (Shen et al., 1999; Clark et al., 2003).
Table 1. Expression profiles of genes involved in lipid metabolism and signaling in the “Dying Seedlings” that represent the localized response of resistant tomato plants to C. fulvum, and resistant and susceptible tomato plants inoculated with C. fulvum.
Locus ID Description log2 fold change in expression
(treatment/control)
Dying Seedlings Resistant Susceptible solyc03g116730.2.1 FAD5† -1.6 -1.4 NSΩ
solyc04g040120.1.1 FAD 2 5.3 5.2 NSsolyc06g007130.2.1 FAD 3 -1.4 NS NSsolyc12g044950.1.1 FAD 2 4.3 1.6 NSsolyc12g100250.1.1 FAD 2 7.0 6.6 1.7solyc06g007140.2.1 FAD 7 -1.2 NS NSsolyc04g040130.1.1 FAD 2 4.5 5.2 1.6solyc12g049030.1.1 FAD 2 5.6 6.3 1.9solyc06g051400.2.1 FAD 8 NS -1.1 NSsolyc12g100260.1.1 FAD 2 5.2 8.1 NSsolyc07g005510.2.1 FAD 6 NS -1.2 NSsolyc08g080130.2.1 Phospholipase D beta 1 4.6 3.3 NSsolyc02g069750.1.1 Choline kinase 1.4 NS NSsolyc04g072020.2.1 Choline kinase 1 1.8 NS NSsolyc06g009270.2.1 Diacyl-glycerol kinase 7 1.8 NS NSsolyc05g056420.2.1 Diacyl-glycerol kinase 2 2.4 NS NSsolyc07g054830.2.1 Diacyl-glycerol kinase5 2.5 1.3 NS
† Fatty acid desaturase Ω Difference is not statistically significant (P>0.001 and FC <2).The expression of the genes in the Dying Seedlings is compared to those of the parental control.The expression of the genes in resistant and susceptible plants inoculated with C. fulvum was compared to the expression of the genes in the respective mock-treated plants.
The metabolic arms race
207
Chapter 5
At later stages of infection, the degradation of GAs is another indicator of the progression of the disease in susceptible plants. GAs are antimicrobial compounds present in plants that provide constitutive protection against a broad range of pathogens (Osbourn, 1996). In tomato, the major GA that has been characterized is α-tomatine, a compound that disrupts fungal membranes. Tomato pathogens, however, can overcome this chemical barrier by production of tomatinases that detoxify α-tomatine into β-tomatine (by GH3 enzymes) or into tomatidine and lycotetraose (by GH10 enzymes) (Roldan-Arjona et al., 1999; Martin-Hernandez et al., 2000).
The concentration of α-tomatine in tomato leaves can reach levels as high as 1 mM, assuming a uniform distribution in all cells (Arneson and Durbin, 1967). In previous reports it was assumed that α-tomatine is localized in the vacuoles (Roddick, 1977). For this reason, and the fact that C. fulvum grows in the intercellular space in a biotrophic way (Stergiopoulos and de Wit, 2009), it was expected that this fungus would not need to detoxify α-tomatine during its colonization of tomato leaflets. However, the assumed vacuolar localization is questionable, as the original conclusion of Roddick (1977) was mainly based on the fact that α-tomatine was present in the supernatant after sequential centrifugation, including ultracentrifugation, without taking into account the possibility of possible localization in the apoplast. Our analysis shows for the first time the concentration of α-tomatine in AFs to be 0.02 ±0.005 μmol g-1 fresh leaf. This quantification seems to be reliable because the concentration of α-tomatine in WLTEs (1.0 ±0.1 μmol g-1 fresh leaf) is comparable to what has been reported by others (Melton et al., 1998). The higher concentration in WLTEs suggests that α-tomatine is indeed more abundant inside the plant cells, but still it also significantly accumulates in the apoplast. Assuming that α-tomatine is not randomly distributed in the apoplast, it is likely that the actual concentration of α-tomatine that C. fulvum encounters around the mesophyll cells inside tomato leaves is higher than in the AF extract.
Monitoring α-tomatine degradation and tomatidine accumulation during tomato colonization by C. fulvum revealed that the fungus is able to detoxify this GA. This result contrasts with previous reports, which could possibly be explained by a lower sensitivity of the analytical methods used by others. In their analysis, Melton et al., (1998) performed thin-layer chromatography (TLC), which is much less sensitive than LC-MS, to detect breakdown products of α-tomatine after incubation with proteinaceous extracts isolated from cultures filtrates of C. fulvum (Melton et al., 1998). More importantly, the culture filtrates they used in their assay originate from C. fulvum grown on B5 medium, of which the pH is approximately 4.5. Our expression data showed that CfTom1 is barely expressed in the same medium at pH 4 (Figure 3D), suggesting that the absence of tomatinase activity in this earlier study is due to a limited expression of CfTom1.
Analysis of the C. fulvum genes encoding CAZymes revealed two GH10 and 19 GH3 genes
208
Chapter 5
in its genome(de Wit et al., 2012) . A phylogenetic analysis showed that only one of the GH10 enzymes belongs to the GH10 tomatinase clade (CfTom1), while three GH3 enzymes belong to the GH3 tomatinase/avenacinase clade. Our results showed that C. fulvum degrades α-tomatine into tomatidine, both in vitro and during colonization of tomato leaflets, suggesting that CfTom1 is responsible for the observed activity. A specific search for the presence of β-tomatine in the extracts, based on its accurate mass in the LCMS chromatograms, was unsuccessful, suggesting that the enzymes encoded by the three putative GH3 genes cannot degrade α-tomatine to β-tomatine. Alternatively, CfTom1 could also degrade β-tomatine into tomatidine. However, this is unlikely because the presence of β-tomatine was neither observed in vitro nor in planta when α-tomatine degradation was determined for the ∆cftom1 mutants. These results indicate that CfTom1 is probably the only enzyme responsible for degradation of α-tomatine by C. fulvum and the three putative GH3 tomatinases cannot complement ∆cftom1 mutants for α-tomatine degradation. The predicted protein sequences suggest that the GH3 enzymes are functional, but they might be involved in the degradation of other (secondary metabolite) compounds present in tomato. Indeed, although the homology between the GH3 enzymes is high, they could have different substrate specificities. For example, the amino acid identity between Septoria lycopersici GH3 tomatinase and G. graminis var. avenae GH3 avenacinase is only 53% (Osbourn et al., 1995)/. In addition, recent RNA-seq analysis performed on C. fulvum-inoculated leaves of susceptible tomato plants revealed that the three GH3 genes are poorly expressed, both in vitro and in planta (unpublished results, P.J.G.M. de Wit).
Our results showed a clear correlation between α-tomatine depletion (Figure 2D, cluster II and Supplementary Figures S3 and S4), CfTom1 gene expression (Figure 3D) and C. fulvum growth (Figure 5A). Therefore, we assume that the depletion of α-tomatine is related to the fungal biomass and the expression level of CfTom1. The ability of tomato pathogens to specifically degrade α-tomatine suggests that tomatinase enzymes play an important role in the infection process. Several tomatinases have been characterized from bacterial and fungal tomato pathogens (Martin-Hernandez et al., 2000; Sandrock and Vanetten, 2001; Kaup et al., 2005; Seipke and Loria, 2008). However, neither GH3 tomatinase knock-out mutants in Septoria lycopersici (Martin-Hernandez et al., 2000) nor GH10 tomatinase knock-out mutants in C. michiganensis subsp. michiganensis showed a significant decrease in virulence as compared to wild-type strains (Kaup et al., 2005). These results could be due to only subtle effects on virulence that were difficult to detect, or due to the presence of additional tomatinase-encoding genes in the genomes of these pathogens (Sandrock and Vanetten, 2001; Pareja-Jaime et al., 2008); this study).
So far, the only strong evidence for the involvement of a tomatinase enzyme in fungal pathogenicity was found for the GH10 tom1 gene of F. oxysporum f. sp. lycopersici,
The metabolic arms race
209
Chapter 5
although the genome of this fungus also contains putative GH3 tomatinase genes (Pareja-Jaime et al., 2008). Our study shows that the GH10 CfTom1 gene of C. fulvum is involved in virulence. Colonization of tomato leaves by ∆cftom1 mutants was reduced as shown by the significant reduction in fungal biomass from 10 dpi onwards (Figure 5A). No significant difference in biomass was observed between the mutants, wild-type strain and ectopic transformant at the early stages of infection (2-8 dpi), at which time points the CfTom1 gene was also only weakly expressed. CfTom1 gene expression is induced after 9 dpi, which explains the difference in growth between the mutants and controls at later stages of infection. Accordingly, degradation of α-tomatine to tomatidine during infection was found to occur from 10 dpi onwards. This study confirms the previous finding that heterologous expression of the Septoria lycopersici GH3 tomatinase gene in C. fulvum causes increased sporulation in susceptible tomato plants and supports a role for α-tomatine degradation in C. fulvum virulence (Melton et al., 1998).
Since it was reported that breakdown products of α-tomatine, such as β-tomatine and tomatidine, suppress plant defense responses (Bouarab et al., 2002; Ito et al., 2007), the absence of this indirect activity may also contribute to the reduction in virulence of the ∆cftom1 mutants, in addition to the increased sensitivity of the mutant fungus to α-tomatine. However, suppression of plant defense responses by tomatidine could not be confirmed in our experiments. On the contrary, we found that tomatidine was toxic to tomato cells and caused cell death when infiltrated into tomato leaves. A similar effect was also found by Itkin and co-workers in mutant tomato plants accumulating tomatidine (Itkin et al., 2011). These results suggest that the reduction in virulence of the ∆cftom1 mutants is only due to an increased sensitivity to α-tomatine.
The fate of the tomatidine produced by the fungus in the tomato apoplast still needs to be elucidated, as it seems to be suicidal for the biotrophic fungus to accumulate phytotoxic degradation products. The hierarchial cluster analysis showed a strong association between stachydrine and the aglycon forms of the various GAs. Here we postulate that stachydrine is a degradation product of tomatidine and other aglycons of GAs. The strong association was evident at both the early and late stages after inoculation. In the incompatible interaction this metabolite had significantly accumulated in both WLTEs and AF at 4dpi. At this stage of infection, it is less likely for stachydrine to be a degradation product of GA, as the CfTom1 gene, necessary for producing tomatidine, was only weakly expressed. Hence, we assume that elicitation of tomato plants could contribute to de novo biosynthesis of stachydrine. Further work, which utilizes 14C- and 15N-labeled α-tomatine, may help to elucidate the fate of both the lycotetraose and the aglycon part of α-tomatine. The lycotetraose and the aglycone parts of GA could be potential carbon and nitrogen sources for the fungus. Like mannitol, stachdydrine is reported to be osmo-protective suggesting that enrichment of osmo-protectant is a common strategy adopted by fungi to overcome harsh conditions associated with plant
210
Chapter 5
defense (McNeil et al., 1999; Shen et al., 1999; Clark et al., 2003).
Altogether, our results clearly show that an early reprogramming of the metabolome of both the mesophyll cells and the apoplast play a crucial role in the resistance response of tomato against C. fulvum. At the later stages of infection, the majority of the alterations are the result of the manipulation of the host metabolism by the fungus to breach the defense line and get access to the carbon reserves of the host. The intercellular tomato pathogen C. fulvum encounters α-tomatine and other GAs during colonization of the apoplast of tomato leaves and CfTom1 is the major, and possibly only, α-tomatine-detoxifying enzyme that contributes to full virulence of this fungus on tomato. This activity certainly contributed to the adaptation of C. fulvum to tomato after divergence from its close relative Dothistroma septosporum that is pathogenic on pine and lacks a homologue of the CfTom1 gene(de Wit et al., 2012) . The present work shows how powerful the combined use of metabolomics and genome mining is to elucidate the major metabolic alterations occurring at the interface of the host and microbe when the biotrophic relationship is established.
Materials and Methods
Plant Materials and C. fulvum Disease Assays Susceptible Money Maker (MM)-Cf-0 and resistant (Cf-0: Hcr9-4D (Cf-4)) tomato lines were grown in the greenhouse at 70% relative humidity, at 23-25°C during daytime and at 19-21°C at night, with a light/dark regime of 16/8 h and 100Watt m-2 supplemental light when light intensity was less than 150 Watt m-2. Plants were inoculated with race 5 of C. fulvum secreting Avr4(de Wit, 1977). From C. fulvum-inoculated susceptible and resistant plants, leaflets were harvested at 4, 6, 10 and 14 days post inoculation (dpi) with the fungus and at the same time points leaflets were harvested from the non-inoculated (mock-treated) plants. Three biological replicates were performed, while each biological replicate was represented by four plants. Furthermore, we monitored the dynamics of the apoplastic glycoalkaloids upon inoculation of an additional six resistant and seven susceptible tomato genotypes with C. fulvum (Supplementary Figure S4).
Large Scale Untargeted Metabolomics Profiling during Tomato Infection
Metabolite extraction and their analysis by LC (RP-C18)-PDA-LTQ-Orbitrap-FTMS (C18-LCMS) Sample preparation Apoplastic fluid was isolated from tomato leaves as described by Joosten (2012) and 2 ml aliquots were freeze-dried (2 ml of AF is obtained from 4 g (fresh weight (FW))
The metabolic arms race
211
Chapter 5
of leaves) and extracted with 300 µl of 75% methanol (MeOH) in water containing 0.1% formic acid (FA). For the analysis of the whole leaf tissue metabolome, 0.1g FW of frozen leaf powder was used and extracted with 300 µl of 99.9% MeOH containing 0.1% FA. Samples were briefly mixed, sonicated for 30 min and centrifuged at 21,000g. Supernatants were filtered through a 0.2 µm inorganic membrane filter and transferred to HPLC vials.
Metabolite analysis using C18-LCMSThe LC-PDA-LTQ-Orbitrap-FTMS instrument consisted of an Accela HPLC system (Accela photodiode array (PDA) and auto-sampler), interfaced to an LTQ/Orbitrap hybrid mass spectrometer (Thermo Fisher Scientific) that was equipped with an ESI source (van der Hooft et al., 2011). A Luna RP-C18 (2) analytical column (Phenomenex, USA) was used for chromatographic separation. The mobile phase consisted of a binary eluent solvent system of degassed ultra-pure water (solvent A) and acetonitrile (solvent B), both containing 0.1% v/v FA. The sample injection volume was 5µl, while keeping the flow rate of the eluents at 0.19 ml/min and keeping the column temperature at 40 °C. The HPLC gradient started at 5% B and linearly increased to 35% B in 45 min. The column was re-equilibrated for 15 min following the separation of each sample (van der Hooft et al., 2011). The mass chromatograms that were generated by the Orbitrap-FTMS were processed (peak picking and baseline correction) using the MetAlign software package (Lommen, 2009). Extraction and reconstitution of compound mass spectra were performed according to the method described by Tikunov et al. (2012). From the processed data, information on the relative peak height of the representative masses [M+H]+ for α-tomatine, dehydro-tomatine and their degradation products, tomatidine and tomatidenol, was extracted at their recorded retention time for tomato fruit (Supporting Information, Table S2), according to the MOTO database (Moco et al., 2006) and the Komics database (http://webs2.kazusa.or.jp/komics/) (Iijima et al., 2008). Quantification of α-tomatine was done using a standard curve of commercial α-tomatine (Sigma Aldrich). Genemath XT was used to compute the principal component analysis (PCA), hierarchical cluster analysis (HCA) and similarity matrix analysis as described by (Etalo et al., 2013).
Extraction of and analysis of metabolites by LC (HILIC)-QTOF-MS (HILIC-LCMS) Sample preparation For the measurements of both apoplastic fluids and whole leaf tissue extracts, freeze-dried samples of 2 mg were used. The extraction solvent was prepared by mixing methanol/chloroform/water at a ratio of 5:2:2 (v/v/v) and degassing this mixture by directing a gentle stream of nitrogen through the solvent for 5 min. One ml of precooled solvent (-20oC) was added, the mixture was vortexed for 20 sec and shaken at 4 °C for 6 min to extract the metabolites and simultaneously precipitate the proteins.
212
Chapter 5
After centrifugation at 14,000g for 2 min, the supernatant was transferred into a new Eppendorf tube, dried in a vacuum concentrator and kept at -20oC until further use.
Metabolite analysis using HILIC-LCMS The instrumentation consisted of an Agilent 1200 LC stack (binary pump SL, degasser, auto-sampler, thermostat and column oven) interfaced to an Agilent 6530 accurate-mass quadrupole time-of-flight (Q-TOF) with a JetStream ESI source. The HPLC system was equipped with a Waters Acquity BEH HILIC column (2.1×150 mm, 1.7 µm particle size, Waters Corporation, Milford, MA) at 40 °C. The mobile phase consisted of (A) water with 5mM ammonium acetate and 0.2% acetic acid, and (B) 9:1 acetonitrile/water with 5mM ammonium acetate and 0.2% acetic acid. The gradient method was: 0 to 4 min: 100% B, 4 to 12 min: linear gradient to 45% B and 12 to 20 min: 45% B. The column was re-equilibrated for 20 min following the separation of each sample and the flow-rate was 0.25 ml/min. MS and MS/MS data were collected with a scan rate of 0.25 sec in both profile and centroid modes, and mass calibration was maintained by constant infusion of reference ions at m/z 121.0509 and 922.0098. MS/MS data were generated utilizing data-dependent MS/MS triggering with dynamic exclusion. Precursor ions, with a minimum 1 k signal intensity were isolated with a 4 m/z isolation width (medium setting), and a variable collision energy was applied based on precursor ion m/z (10 eV + 0.03 eV × ion m/z). Ions were excluded from data-dependent MS/MS analysis for 30 sec following acquisition of two spectra. Data were exported into the open exchange format mzXML. Samples were measured in both negative and positive mode. Additionally, blank runs were acquired to determine background contaminations. The mass chromatograms that were generated by the QTOF-MS were processed using the MZmine software package (Pluskal et al., 2010). For identification of lipid species, the accurate mass and MS/MS information in the LipidBlast library was used (Kind et al., 2013).
Functional characterization of CfTom1 in vitro and in vivo
Fungal materialsCladosporium fulvum race 0WU (CBS131901)(de Wit et al., 2012) was grown on half-strength potato dextrose agar (19.5 g l-1 PDA and 15 g l-1 technical agar, Oxoid) at 20 °C for 2-3 weeks for conidia production and DNA isolation. Stocks of conidia were maintained in 25% glycerol at -80°C. For tomatinase activity assays, the fungus was grown in liquid CA medium (10 g l-1 casamino acids, 10 mM ammonium sulfate and 0.5 g l-1 yeast nitrogen base, pH 6.5). To induce the expression of the CfTom1 gene, C. fulvum was pre-incubated in Gamborg B5 medium supplemented with 20 g l-1 sucrose at 22°C and incubated in an orbital shaker at 200 rpm for 6 days. Mycelium was then transferred to several B5 induction media at pH 4, pH 7, in the absence or presence of 50 µM α-tomatine, and cultured for 24 h.
The metabolic arms race
213
Chapter 5
DNA extraction, quantitative PCRs and Southern blottingDNA was isolated from freeze-dried mycelia of C. fulvum strains, which were scraped from PDA plates, or from ground C. fulvum-inoculated tomato leaves frozen in liquid nitrogen, using the DNeasy plant mini kit (Qiagen Benelux bv, Venlo, The Netherlands), according to the manufacturer’s instructions. Total RNA was isolated from ground mycelia or C. fulvum-inoculated tomato leaves using the hybrid method as described by van Esse et al. (2008).
cDNA was synthesized from 5 µg of total RNA using the SuperScript II reverse transcriptase kit (Invitrogen) as previously described (Bolton et al., 2008). Quantitative PCR was performed with the 7300 System (Applied Biosystems, Foster City, U.S.A.). Each reaction was performed in 25 µl, containing 12.5 µl Sensimix (Biolab), 1 µl of 10 µM dNTPs, 1 µl of each forward and reverse oligonucleotide (5 µM), 100 ng of template cDNA and 9.5 µl ddH2O. The thermal profile included an initial 95°C denaturation step for 10 min, followed by denaturation for 15 s at 95°C and annealing/extension for 45 s at 60°C for 40 cycles. qCfActin_F and qCfActin_R, and qCfTom1_F and qCfTom1_R oligonucleotide pairs were designed with Primer3 Plus (Supporting Information, Table S1) (Untergasser et al., 2007). The efficiency and specificity of the oligonucleotide pairs were determined with a dilution series of genomic DNA prior to use. The C. fulvum actin gene was used as a reference gene for normalization and results were analyzed using the 2-∆Ct method (Livak and Schmittgen, 2001). Results are the average of three biological repeats.
All PCRs were performed in 25 μl using Pfu or GoTaq DNA polymerase (Promega) following the manufacturer’s recommendations, and using 100 ng of genomic DNA as template. The PCR program was initiated by a denaturation step at 94°C for 5 min, followed by 32 cycles of denaturation at 94°C for 1 min, annealing at 55°C for 45 s, and extension at 72°C for 1 min, with a final extension step at 72°C for 7 min.
Southern blotting was performed with digoxigenin-labeled probes using a DIG DNA Labeling and Detection Kit (Roche, Basel, Switzerland) according to the manufacturer’s instructions. The probe was generated using the pCfTom1_US_F and pCfTom1_US_R primer pair (Supporting Information, Table S1).
Identification and cloning of the CfTom1 gene and its expression by the Potato Virus X expression system in tomatoAmino acid sequences of GH3 and GH10 tomatinases were aligned with ClustalW2 (Larkin et al., 2007) and edited in GeneDoc software (Nicholas et al., 1997). A consensus phylogenetic tree was constructed using the minimum-evolution algorithm with default parameters and 1000 bootstrap replications in the MEGA5 software (Tamura et al., 2011).
214
Chapter 5
The GH10 tomatinase gene (CfTom1; jgiID 188986) from C. fulvum was amplified by PCR using the following oligonucleotide set; the CfTom1_F oligonucleotide excludes the native signal peptide sequence of the tomatinase gene and includes a 15-nucleotide overhang sequence corresponding to the PR1A signal peptide sequence; the CfTom1_R oligonucleotide contains the NotI restriction site (Supporting Information, Table S1). A second PCR was performed to amplify the PR1A signal peptide sequence by using the PR1A_F oligonucleotide containing a ClaI restriction site and PR1A_R oligonucleotide. Overlapping PCR was performed to fuse the PR1A signal peptide sequence to the CfTom1 coding sequence using the PR1A_F and CfTom1_R oligonucleotides (Supporting Information, Table S1). The amplified PR1A-CfTom1 fragment was purified from the agarose gel using the IllustraTM GFXTM PCR DNA and Gel Band Purification Kit (GE Healthcare). The purified PR1A-CfTom1 fragment was cloned into the pGEM-T Easy vector (Promega) according to the manufacturer’s instructions. The recombinant pGEM-T vector was introduced into chemically-competent Escherichia coli cells (DH5α) by the standard heat shock transformation protocol. The plasmid was retrieved from a positive clone using the Miniprep plasmid isolation kit (Qiagen) and the insert was sequenced by Macrogen Inc. The correct PR1A-CfTom1 insert was isolated using ClaI and NotI restriction enzymes (Promega) and was ligated (Promega) into the binary Potato Virus X (PVX)-based vector pSfinx (Hammond-Kosack et al., 1995; Takken and Lu, 2001) that was digested with the same restriction enzymes. The product of the ligation reaction was introduced into E. coli and the obtained pSfinx::PR1A-CfTom1 plasmid was finally introduced into Agrobacterium tumefaciens (GV3101) by electroporation. A positive A. tumefaciens clone containing the pSfinx::PR1A-CfTom1 construct was cultured on plates containing modified LB medium (10 g l-1 bacto-peptone; 5 g l-1 yeast extract; 5 g l-1 NaCl) supplemented with 100 µg ml-1 kanamycin and 25 µg ml-1 rifampicin for 48 h at 28°C. Heterologous expression of pSfinx::PR1A-CfTom1 in tomato seedlings was performed as described previously (Stergiopoulos et al., 2010).
Construction of the cftom1 targeted deletion plasmidThe gene replacement vector pR4R3∆cftom1 was constructed using the MultiSite Gateway® Three-Fragment Vector Construction Kit (InvitrogenTM) according to the manufacturer’s instructions. The upstream (US, 1.8kb) and downstream (DS, 1.55kb) flanking regions of CfTom1 were amplified using oligonucleotides with overhang sequences homologous to the AttB4, AttB1r, AttB2r or AttB3 recombination sites (Supporting Information, Table S1). Purified US and DS fragments were cloned into pDONR™ P4-P1R and pDONR™ P2R-P3, respectively, using 1 µl of BP clonaseTM II enzyme mix (InvitrogenTM), 70 ng of insert DNA and 70 ng of pDNORTM in a 5 µl reaction volume, and introduced into E. coli. The p221_GFP_HYG pENTRY vector was kindly provided by Rafael Arango Isaza (Plant Research International, Wageningen). To construct the final replacement vector, an LR reaction was performed with 50 ng of pDONR™ P4-P1R_cftom1US, 50 ng of pDONR™ P2R-P_cftom1DS, 50 ng of p221_GFP_HYG and 70 ng of
The metabolic arms race
215
Chapter 5
pDESTTMR4-R3 destination vector in the presence of 1 µl of LR clonaseTM II enzyme mix (Invitrogen) in a 5 µl total volume. The product of the LR reaction was introduced into E. coli to obtain the final pR4R3∆cftom1 plasmid. Insertion of all fragments was confirmed by PCR using insert-specific primers (Supporting Information, Table S1).
Agrobacterium tumefaciens-mediated fungal transformation and mutant screening The pR4R3∆cftom1 construct was transformed into Agrobacterium tumefaciens AGL1 by electroporation. A. tumefaciens-mediated transformation of C. fulvum was performed as described previously (Zwiers and De Waard, 2001) with the following modifications. A. tumefaciens AGL1 cells containing the pR4R3∆cftom1 construct were grown in minimal medium (MM) (10 mM K2HPO4, 10 mM KH2PO4, 2.5 mM NaCl, 2 mM MgSO4, 0.7 mM CaCl2, 9 µM FeSO4, 4 mM NH4SO4, and 10 mM glucose; adjusted to pH 5.5) supplemented with 100 µg ml-1 spectinomycin and 10 µg ml-1 rifampicin for 2-3 days at 28°C. A. tumefaciens AGL1 cells were collected by centrifugation at 3363×g for 8 min and resuspended in induction medium (IM) [MM; 40 mM 2-(N-morpholino) ethanesulfonic acid, pH 5.3; 0.5% glycerol (w/v); 200 µM acetosyringone] supplemented with appropriate antibiotics to the final OD600 of 0.15. Prior to co-cultivation, the A. tumefaciens AGL1 culture was incubated at 28°C for 4-6 h to an OD600 of 0.25. C. fulvum conidia were collected from half-strength PDA plates with sterile water and passed through two layers of miracloth to remove mycelium. The A. tumefaciens AGL1 culture (200 µl; OD600 0.25) was co-cultivated with 200 µl conidia suspension (1×10⁷ conidia ml-1). The co-cultivation mixture was plated on H Bond-nitrocellulose membrane that was previously placed on IM plates and incubated for 2 days at 20°C. After 2 days co-incubation, membranes were transferred to MM plates supplemented with 100 µg ml-1 hygromycin and 200 µM cefotaxime. Transformed fungal colonies (2-3-week-old) were transferred onto PDA plates supplemented with 100 µg ml-1 hygromycin and 200 µM cefotaxime, and incubated at 20°C for 2-3 weeks. Fungal transformants were sub-cultured twice on selective PDA plates and once on non-selective PDA plates. Subsequently, transformants were tested on PDA plates containing 100 µg ml-1 hygromycin.
α-Tomatine sensitivity assayConidia from wild-type C. fulvum, one ectopic transformant and two independent ∆cftom1 mutants were collected and diluted to a final concentration of 2×10⁴ conidia ml-1. Agar plugs were prepared on sterile microscope slides by addition of 250 µl CA medium (CA medium supplemented with 1% technical agar). Conidia (20 µl) were mixed with 10 mM α-tomatine (in methanol) (Sigma Aldrich) to obtain a final concentration of 100 µM, and incubated on the CA agar plugs at 20°C for 2 days. As a negative control, conidia were incubated in methanol (1% v/v) but without α-tomatine. For each sample, the germination of 100 conidia was analyzed. The results are the average of two biological repeats.
216
Chapter 5
Tomatinase activity monitoring by LC-MSFor in vitro α-tomatine degradation, 1×10⁶ conidia of C. fulvum wild-type strain, ectopic transformant and ∆cftom1 mutants were cultured in 30 ml liquid CA medium at 22°C with shaking at 200 rpm for 5-6 days, using three biological replicates. The fungal cultures were filtered to remove mycelia and the supernatants were used to determine tomatinase activity. Culture filtrate (4 ml) of each strain was incubated with 100 µg ml-1 α-tomatine (Sigma Aldrich) for 24 h with shaking at 28°C. After 24 h incubation, samples were prepared for Liquid Chromatography-Quadrupole Time of Flight-Mass Spectrometry (LC-QTOF-MS) analysis to determine α-tomatine, and its degradation products tomatidine and β-tomatine following the method described by (De Vos et al., 2007). This experiment was performed with three biological replicates.
A. tumefaciens strains containing the pSfinx::CfTom1 and the original pSfinx (empty virus) vectors were inoculated on 10-day-old MM-Cf-0 tomato seedlings for transient heterologous CfTom1 gene expression. This experiment was performed in three biological replicates. After 5 weeks, pSfinx::CfTom1 or pSfinx::Empty construct-transformed tomato leaves were collected for AF isolation. AF isolation was performed by vacuum infiltration according to the method described by de Wit and Spikman (1982). 15 ml of AF for each sample was freeze-dried and re-suspended in 6 ml methanol containing 0.1% FA. Prior to LC-MS analysis, 1 ml of each sample was filtered through 0.45 µm pore size filters and samples were analyzed by LC-MS in positive ionization mode to determine depletion of α-tomatine and accumulation of tomatidine. This experiment was also performed for wild-type, ectopic and ∆cftom1 mutants-inoculated tomato plants. Here, AF was isolated from inoculated tomato plants at 10 dpi with the different strains (this experiment was performed with two biological replicates).
C. fulvum virulence assaysWild-type C. fulvum (race 0WU; CBS131901), one ectopic and two independent ∆cftom1 mutants (∆cftom1-2.6 and ∆cftom1-5.1) were grown on half-strength PDA plates for 2-3 weeks at 20°C. Conidia were collected from the plates with water and subsequently passed through one layers of miracloth to remove fungal mycelium. The suspension of conidia was diluted to a final concentration of 5×10⁵ conidia ml-1. Five-week-old MM-Cf-0 tomato plants were inoculated with conidia from the wild-type, the ectopic mutant and the two ∆cftom1 mutants via spray-inoculation on the abaxial side of the tomato leaves. C. fulvum-inoculated tomato plants were kept in plastic-covered cages for two days to ensure 100% relative humidity for conidial germination. After two days, plastic covers were removed and disease development of the wild-type, ectopic transformant and ∆cftom1 mutants were assayed every two days. Inoculated leaves were collected at different days after inoculation (2, 4, 8, 10 and 12 dpi) (the experiment was performed with three biological replicates). Fungal biomass quantification was performed using quantitative PCR analysis as described previously but using genomic DNA. Genomic
The metabolic arms race
217
Chapter 5
DNAs were isolated from wild-type, ectopic transformant and ∆cftom1 mutants infected leaves and were diluted to final concentration of 100 ng µl-1. A standard curve was constructed by using serial dilutions of C. fulvum genomic DNA (10 ng µl-1; 1 ng µl-1; 0.1 ng µl-1; 0.01 ng µl-1; 0.001 ng µl-1) and using actin as a reference gene. Logarithms (base 10) of DNA concentrations were plotted against crossing point of Ct values.
The effect of tomatidine on H2O2 accumulationCell suspensions of MSK8 tomato (Lycopersicon esculentum Mill.) were grown in Murashige and Skoog plant salt base (4.3 g l-1) liquid medium supplemented with B5 vitamins (myo-inositol (100 g l-1), nicotinic acid (1 g l-1), pyridoxine.HCl (1 g l-1) and thiamine.HCl (10 g l-1), sucrose (3%) and kinetin (0.1 mg ml-1). The MSK8 cells were continuously rotated at 125 rpm in the dark at 25°C. Five-day-old MSK8 cell suspensions were used for the H2O2 accumulation assay. 2 ml of MSK8 cell suspensions were transferred to 12 well-plates and stabilized for two hours in a rotary shaker before further use. These cells were co-incubated either with α-tomatine (final concentration of 40 µM) or tomatidine (final concentration of 40 µM) in the presence of the histochemical stain DAB (100 µg ml-1) and with or without 1 µM chitin-hexamer. The MSK8 cell suspensions treated with same dilution range of methanol (0.8% v/v) were used as a control. Pictures were taken at 15 h post co-incubation. A reddish-brown precipitate indicates the accumulation of H2O2.
Assessing phytotoxic effects of α-tomatine and tomatidine towards tomato100, 250 and 500 µM of α-tomatine and tomatidine (diluted from a 5 mM stock of α-tomatine and tomatidine in methanol) (Sigma Aldrich) were infiltrated into 5- or 6-week-old tomato leaves. The same dilution range of methanol (10%, 5% and 2% v/v) was used as a negative control. Pictures were taken at 3 days after treatment with α-tomatine or tomatidine. The experiment was performed with three biological replicates.
In vitro degradation of α-tomatine in tomato leaf powder by C. fulvumFor in vitro α-tomatine degradation, conidia of C. fulvum race 5 were cultured in 50 ml of liquid Aspergillus medium at 22°C with shaking at 200 rpm for 5-6 days, using three biological replicates. The expanded mycelium was filtered in sterile cheese close and transferred to the same liquid medium, containing 50 mg of ground frozen tomato leaf powder and incubated for 48 h, while shaking at 22°C. After 48 h of incubation, the culture filtrated was collected and 2 mL aliquots of freeze-dried samples were extracted with 75% MeOH (containing 0.1% FA) and subjected to LC-LTQ-Orbitrap-FTMS analysis to determine the levels of α-tomatine, and its degradation products tomatidine and C7H13NO2, following the method used by van der Hooft et al. (2011). This experiment was performed using three biological replicates.
218
Chapter 5
Acknowledgements
We thank Bert Schipper for his help with the C18-LCMS analysis of the apoplast metabolome. We extend our gratitude to all metabolomics group members of Plant Research International (PRI) and the Laboratory of Plant Physiology (Wageningen University) for their invaluable technical and intellectual contributions. We acknowledge Bert Essenstam for excellent plant care. This project was (co)financed by the Centre for BioSystems Genomics (CBSG) and The Netherlands Metabolomics Centre (specifically DWE and RCHDV), who are both part of the Netherlands Genomics Initiative/Netherlands Organisation for Scientific Research.
References
Abu-Nada Y, Kushalappa AC, Marshall WD, Al-Mughrabi K, Murphy A (2007) Temporal dynamics of pathogenesis-related metabolites and their plausible pathways of induction in potato leaves following inoculation with Phytophthora infestans. Eur J Plant Pathol 118: 375-391
Allwood JW, Ellis DI, Goodacre R (2008) Metabolomic technologies and their application to the study of plants and plant–host interactions. Physiol Plant 132: 117-135
Allwood JW, Ellis DI, Heald JK, Goodacre R, Mur LAJ (2006) Metabolomic approaches reveal that phosphatidic and phosphatidyl glycerol phospholipids are major discriminatory non-polar metabolites in responses by Brachypodium distachyon to challenge by Magnaporthe grisea. Plant J 46: 351-368
Arneson PA, Durbin RD (1967) Hydrolysis of tomatine by Septoria lycopersici - a detoxification mechanism. Phytopathology 57: 1358-1360
Bell E (2007) Apoptosis: Recognizing ‘eat-me’ signals. Nat Rev Immunol 7: 917-917Bolton MD, van Esse HP, Vossen JH, de Jonge R, Stergiopoulos I, Stulemeijer IJ, van den Berg GC, Borras-
Hidalgo O, Dekker HL, de Koster CG, de Wit PJGM, Joosten MHAJ, Thomma BP (2008) The novel Cladosporium fulvum lysin motif effector Ecp6 is a virulence factor with orthologues in other fungal species. Mol Microbiol 69: 119-136
Bouarab K, Melton R, Peart J, Baulcombe D, Osbourn A (2002) A saponin-detoxifying enzyme mediates suppression of plant defences. Nature 418: 889-892
Bowyer P, Clarke BR, Lunness P, Daniels MJ, Osbourn AE (1995) Host-range of a plant-pathogenic fungus determined by a saponin detoxifying enzyme. Science 267: 371-374
Caillaud MC, Wirthmueller L, Fabro G, Piquerez SJ, Asai S, Ishaque N, Jones JD (2012) Mechanisms of nuclear suppression of host immunity by effectors from the Arabidopsis downy mildew pathogen Hyaloperonospora arabidopsidis (Hpa). Cold Spring Harb Symp Quant Biol 77: 285-293
Clark AJ, Blissett KJ, Oliver RP (2003) Investigating the role of polyols in Cladosporium fulvum during growth under hyper-osmotic stress and in planta. Planta 216: 614-619
de Jong CF, Laxalt AM, Bargmann BOR, de Wit PJGM, Joosten MHAJ, Munnik T (2004) Phosphatidic acid accumulation is an early response in the Cf-4/Avr4 interaction. Plant J 39: 1-12
de Jonge R, van Esse HP, Kombrink A, Shinya T, Desaki Y, Bours R, van der Krol S, Shibuya N, Joosten MHAJ, Thomma BP (2010) Conserved fungal LysM effector Ecp6 prevents chitin-triggered immunity in plants. Science 329: 953-955
de Wit PJGM (1977) A light and scanning-electron microscopic study of infection of tomato plants by virulent and avirulent races of Cladosporium fulvum. Neth J Plant Path 83: 109-122
de Wit PJGM, Spikman G (1982) Evidence for the occurrence of race and cultivar-specific elicitors of necrosis in intercellular fluids of compatible interactions of Cladosporium fulvum and tomato. Physiol Plant Pathol 21: 1-11
The metabolic arms race
219
Chapter 5
de Wit PJGM, van der Burgt A, Ökmen B, Stergiopoulos I, Abd-Elsalam K, Aerts AL, Bahkali AHA, Beenen H, Chettri P, Cox MP, Datema E, de Vries RP, Dhillon B, Ganley AR, Griffiths S, Guo Y, Hamelin RC, Henrissat B, Kabir MS, Jashni MK, Kema G, Klaubauf S, Lapidus A, Levasseur A, Lindquist E, Mehrabi R, Ohm RA, Owen TJ, Salamov A, Schwelm A, Schijlen E, Sun H, van den Burg HA, van Ham RCHJ, Zhang S, Goodwin SB, Grigoriev IV, Collemare J, Bradshaw RE (2012) The genomes of the fungal plant pathogens Cladosporium fulvum and Dothistroma septosporum reveal adaptation to different hosts and lifestyles but also signatures of common ancestry. PLOS Genet 8: 1-22
Dow JM, Callow JA (1978) A possible role for α-tomatine in the varietal-specific resistance of tomato to Cladosporium fulvum. Phytopath. Z. 92: 211-216
Draper J, Rasmussen S, Zubair H (2011) Metabolite analysis and metabolomics in the study of biotrophic interactions between plants and microbes. In Annual Plant Reviews Volume 43. Wiley-Blackwell, pp 25-59
Dulermo T, Rascle C, Billon-Grand G, Gout E, Bligny R, Cotton P (2010) Novel insights into mannitol metabolism in the fungal plant pathogen Botrytis cinerea. Biochem J 427: 323-332
Etalo DW, Stulemeijer IJE, van Esse HP, de Vos RCH, Bouwmeester HJ, Joosten MHAJ (2013) System-wide hypersensitive response-associated transcriptome and metabolome reprogramming in tomato. Plant Physiol 162: 1599-1617
Ford JE, McCance DJ, Drysdale RB (1977) The detoxification of α-tomatine by Fusarium oxysporum f. sp. lycopersici. Phytochemistry 16: 545-546
Fraser CM (2004) Insights into the evolution of phytopathogens. Trends Microbiol 12: 482-483Gründemann D, Harlfinger S, Golz S, Geerts A, Lazar A, Berkels R, Jung N, Rubbert A, Schömig E (2005)
Discovery of the ergothioneine transporter. Proc Nat Acad Sci USA 102: 5256-5261Hammond-Kosack KE, Staskawicz BJ, Jones JDG, Baulcombe DC (1995) Functional expression of a fungal
avirulence gene from a modified potato-virus-x genome. Mol Plant-Microbe Interact 8: 181-185Hann DR, Dominguez-Ferreras A, Motyka V, Dobrev PI, Schornack S, Jehle A, Felix G, Chinchilla D,
Rathjen JP, Boller T (2013) The Pseudomonas type III effector HopQ1 activates cytokinin signaling and interferes with plant innate immunity. New Phytol 201: 585-598
Hématy K, Cherk C, Somerville S (2009) Host–pathogen warfare at the plant cell wall. Curr Opin Plant Biol 12: 406-413
Holub EB (2006) Evolution of parasitic symbioses between plants and filamentous microorganisms. Curr Opin Plant Biol 9: 397-405
Howden AJM, Huitema E (2012) Effector-triggered post-translational modifications and their role in suppression of plant immunity. Front Plant Sci 3: 1-6
Huckelhoven R (2007) Cell wall-associated mechanisms of disease resistance and susceptibility. Annu Rev Phytopathol 45: 101-127
Iijima Y, Nakamura Y, Ogata Y, Tanaka Ki, Sakurai N, Suda K, Suzuki T, Suzuki H, Okazaki K, Kitayama M, Kanaya S, Aoki K, Shibata D (2008) Metabolite annotations based on the integration of mass spectral information. Plant J 54: 949-962
Itkin M, Rogachev I, Alkan N, Rosenberg T, Malitsky S, Masini L, Meir S, Iijima Y, Aoki K, de Vos R, Prusky D, Burdman S, Beekwilder J, Aharoni A (2011) Glycoalkaloid metabolism1 is required for steroidal alkaloid glycosylation and prevention of phytotoxicity in tomato. Plant Cell 23: 4507-4525
Ito S-I, Ihara T, Tamura H, Tanaka S, Ikeda T, Kajihara H, Dissanayake C, Abdel-Motaal FF, El-Sayed MA (2007) α-Tomatine, the major saponin in tomato, induces programmed cell death mediated by reactive oxygen species in the fungal pathogen Fusarium oxysporum. FEBS Letters 581: 3217-3222
Joosten MHAJ (2012) Isolation of apoplastic fluid from leaf tissue by the vacuum infiltration-centrifugation technique. Methods Mol Biol 835: 603-610
Joosten MHAJ, Hendrickx LM, Wit PJGM (1990) Carbohydrate composition of apoplastic fluids isolated from tomato leaves inoculated with virulent or avirulent races of Cladosporium fulvum (syn. Fulvia fulva). Neth J Plant Pathol. 96: 103-112
Kachroo A, Lapchyk L, Fukushige H, Hildebrand D, Klessig D, Kachroo P (2003) Plastidial fatty acid signaling modulates salicylic acid– and jasmonic acid–mediated defense pathways in the arabidopsis ssi2 mutant. Plant Cell 15: 2952-2965
Kachroo P, Shanklin J, Shah J, Whittle EJ, Klessig DF (2001) A fatty acid desaturase modulates the activation of defense signaling pathways in plants. Proc Natl Acad Sci U S A 98: 9448-9453
220
Chapter 5
Kaup O, Grafen I, Zellermann EM, Eichenlaub R, Gartemann KH (2005) Identification of a tomatinase in the tomato-pathogenic actinomycete Clavibacter michiganensis subsp michiganensis NCPPB382. Mol Plant-Microbe Interact 18: 1090-1098
Keukens EAJ, de Vrije T, van den Boom C, de Waard P, Plasman HH, Thiel F, Chupin V, Jongen WMF, de Kruijff B (1995) Molecular basis of glycoalkaloid induced membrane disruption. BBA- Biomembranes 1240: 216-228
Kind T, Liu KH, Lee do Y, DeFelice B, Meissen JK, Fiehn O (2013) LipidBlast in silico tandem mass spectrometry database for lipid identification. Nat Methods 10: 755-758
Kliebenstein DJ, Rowe HC, Denby KJ (2005) Secondary metabolites influence Arabidopsis/Botrytis interactions: variation in host production and pathogen sensitivity. Plant J 44: 25-36
Lam E, Kato N, Lawton M (2001) Programmed cell death, mitochondria and the plant hypersensitive response. Nature 411: 848-853
Larkin MA, Blackshields G, Brown NP, Chenna R, McGettigan PA, McWilliam H, Valentin F, Wallace IM, Wilm A, Lopez R, Thompson JD, Gibson TJ, Higgins DG (2007) Clustal W and clustal X version 2.0. Bioinformatics 23: 2947-2948
Laxalt AM, Munnik T (2002) Phospholipid signalling in plant defence. Curr Opin Plant Biol 5: 332-338Lewis DH, Smith DC (1967) Sugar alcohols (polyols) in fungi and green plants . Distribution physiology and
metabolism. New Phytol 66: 143-&Li B, Wu J, Li X (2013) Simultaneous determination and pharmacokinetic study of stachydrine and leonurine
in rat plasma after oral administration of Herba Leonuri extract by LC–MS/MS. J Pharm Biomed Anal 76: 192-199
Liebrand TWH, van den Berg GCM, Zhang Z, Smit P, Cordewener JHG, America AHP, Sklenar J, Jones AME, Tameling WIL, Robatzek S, Thomma BPHJ, Joosten MHAJ (2013) Receptor-like kinase SOBIR1/EVR interacts with receptor-like proteins in plant immunity against fungal infection Proc Natl Acad Sci U S A 110: 13228-13228
Livak KJ, Schmittgen TD (2001) Analysis of relative gene expression data using real-time quantitative PCR and the 2(T)(-Delta Delta C) method. Methods 25: 402-408
Lommen A (2009) MetAlign: Interface-driven, versatile metabolomics tool for hyphenated full-scan mass spectrometry data preprocessing. Anal Chem 81: 3079-3086
Manoharan K, Chae HS, Myoung J, Cho SH, Shin SH, Cho BH, Lee WS (2000) Synthesis of phosphatidylserine in carrot cells cultured under carbon-source starvation. Plant Cell Physiol 41: 1143-1148
Markham KR, Gould KS, Ryan KG (2001) Cytoplasmic accumulation of flavonoids in flower petals and its relevance to yellow flower colouration. Phytochemistry 58: 403-413
Marrs KA, Alfenito MR, Lloyd AM, Walbot V (1995) A glutathione-S-transferase involved in vacuolar transfer encoded by the maize gene Bronze-2. Nature 375: 397-400
Martin-Hernandez AM, Dufresne M, Hugouvieux V, Melton R, Osbourn A (2000) Effects of targeted replacement of the tomatinase gene on the interaction of Septoria lycopersici with tomato plants. Mol Plant-Microbe Interact 13: 1301-1311
McNeil SD, Nuccio ML, Hanson AD (1999) Betaines and related osmoprotectants. Targets for metabolic engineering of stress resistance. Plant Physiol 120: 945-950
Meijer HJG, Munnik T (2003) Phospholipid-based signaling in plants Annu Rev Plant Biol 54: 265-306Melton RE, Flegg LM, Brown JKM, Oliver RP, Daniels MJ, Osbourn AE (1998) Heterologous expression
of Septoria lycopersici tomatinase in Cladosporium fulvum: Effects on compatible and incompatible interactions with tomato seedlings. Mol Plant-Microbe Interact 11: 228-236
Moco S, Bino RJ, Vorst O, Verhoeven HA, de Groot J, van Beek TA, Vervoort J, de Vos CHR (2006) A liquid chromatography-mass spectrometry-based metabolome database for tomato. Plant Physiol 141: 1205-1218
Nicholas KB, Nicholas HB, Deerfield DW (1997) GeneDoc: Analysis and visualization of genetic variation. EMBNEW NEWS 4: 14
O’Connell RJ, Panstruga R (2006) Tete a tete inside a plant cell: establishing compatibility between plants and biotrophic fungi and oomycetes. New Phytol 171: 699-718
OBrien IEW, Reutelingsperger CPM, Holdaway KM (1997) Annexin-V and TUNEL use in monitoring the progression of apoptosis in plants. Cytometry 29: 28-33
Osbourn A (1996) Saponins and plant defence - A soap story. Trends Plant Sci 1: 4-9
The metabolic arms race
221
Chapter 5
Osbourn A, Bowyer P, Lunness P, Clarke B, Daniels M (1995) Fungal pathogens of oat roots and tomato leaves employ closely related enzymes to detoxify different host plant saponins. Mol Plant-Microbe Interact 8: 971-978
Osbourn AE (1999) Antimicrobial phytoprotectants and fungal pathogens: a commentary. Fungal Genet Biol 26: 163-168
Pareja-Jaime Y, Roncero MIG, Ruiz-Roldan MC (2008) Tomatinase from Fusarium oxysporum f. sp lycopersici is required for full virulence on tomato plants. Mol Plant-Microbe Interact 21: 728-736
Park J, Gu Y, Lee Y, Yang Z, Lee Y (2004) Phosphatidic acid induces leaf cell death in Arabidopsis by activating the Rho-related small G protein GTPase-mediated pathway of reactive oxygen species generation. Plant Physiol 134: 129-136
Perfect SE, Green JR (2001) Infection structures of biotrophic and hemibiotrophic fungal plant pathogens. Mol Plant Pathol 2: 101-108
Pluskal T, Castillo S, Villar-Briones A, Oresic M (2010) MZmine 2: Modular framework for processing, visualizing, and analyzing mass spectrometry-based molecular profile data. Bmc Bioinformatics 11
Quidde T, Osbourn AE, Tudzynski P (1998) Detoxification of α-tomatine by Botrytis cinerea. Physiol Mol Plant Pathol 52: 151-165
Ravichandran KS (2010) Find-me and eat-me signals in apoptotic cell clearance: progress and conundrums. J Exp Med 207: 1807-1817
Roddick JG (1977) Subcellular localization of steroidal glycoalkaloids in vegetative organs of Lycopersicon esculentum and Solanum tuberosum. Phytochemistry 16: 805-807
Roddick JG, Drysdale RB (1984) Destabilization of liposome membranes by the steroidal glycoalkaloid alpha-tomatine. Phytochemistry 23: 543-547
Roldan-Arjona T, Perez-Espinosa A, Ruiz-Rubio M (1999) Tomatinase from Fusarium oxysporum f. sp lycopersici defines a new class of saponinases. Mol Plant-Microbe Interact 12: 852-861
Sandrock RW, Vanetten HD (2001) The relevance of tomatinase activity in pathogens of tomato: disruption of the beta(2)-tomatinase gene in Colletotrichum coccodes and Septoria lycopersici and heterologous expression of the Septoria lycopersici beta(2)-tomatinase in Nectria haematococca, a pathogen of tomato fruit. Physiol Mol Plant Pathology 58: 159-171
Segawa K, Suzuki J, Nagata S (2012) Constitutive exposure of phosphatidylserine on viable cells P Natl Acad Sci USA 109: 995-995
Seipke RF, Loria R (2008) Streptomyces scabies 87-22 possesses a functional tomatinase. J Bacteriol 190: 7684-7692
Servillo L, Giovane A, Balestrieri ML, Ferrari G, Cautela D, Castaldo D (2011) Occurrence of pipecolic acid and pipecolic acid betaine (Homostachydrine) in citrus genus plants. J Agric Food Chem 60: 315-321
Shen B, Hohmann S, Jensen RG, Bohnert a H (1999) Roles of sugar alcohols in osmotic stress adaptation. Replacement of glycerol by mannitol and sorbitol in yeast. Plant Physiol 121: 45-52
Shen B, Jensen RG, Bohnert HJ (1997) Increased resistance to oxidative stress in transgenic plants by targeting mannitol biosynthesis to chloroplasts. Plant Physiol 113: 1177-1183
Shi Q, Liu Z, Yang Y, Geng P, Zhu Y-y, Zhang Q, Bai F, Bai G (2009) Identification of anti-asthmatic compounds in Pericarpium citri reticulatae and evaluation of their synergistic effects. Acta Pharmacol Sin. 30: 567-575
Shimojima M (2011) Biosynthesis and functions of the plant sulfolipid. Prog Lipid Res 50: 234-239Steel CC, Drysdale RB (1988) Electrolyte leakage from plant and fungal tissues and disruption of liposome
membranes by α-tomatine. Phytochemistry 27: 1025-1030Stergiopoulos I, de Wit PJGM (2009) Fungal effector proteins. In Annu Rev Phytopathol, Vol 47, pp 233-263Stergiopoulos I, van den Burg HA, Ökmen B, Beenen HG, van Liere S, Kema GHJ, de Wit PJGM (2010)
Tomato Cf resistance proteins mediate recognition of cognate homologous effectors from fungi pathogenic on dicots and monocots. Proc Natl Acad Sci U S A 107: 7610-7615
Stulemeijer IJ, Joosten MHAJ, Jensen ON (2009) Quantitative phosphoproteomics of tomato mounting a hypersensitive response reveals a swift suppression of photosynthetic activity and a differential role for hsp90 isoforms. J Proteome Res 8: 1168-1182
Sugimoto K, Sato N, Tsuzuki M (2007) Utilization of a chloroplast membrane sulfolipid as a major internal sulfur source for protein synthesis in the early phase of sulfur starvation in Chlamydomonas reinhardtii. FEBS Letters 581: 4519-4522
222
Chapter 5
Sugimoto K, Tsuzuki M, Sato N (2010) Regulation of synthesis and degradation of a sulfolipid under sulfur-starved conditions and its physiological significance in Chlamydomonas reinhardtii. New Phytol 185: 676-686
Takken FLW, Lu R (2001) A functional cloning strategy, based on a binary PVX-expression vector, to isolate HR-inducing cDNAs of plant pathogens Plant J 26: 363-363
Tamura K, Peterson D, Peterson N, Stecher G, Nei M, Kumar S (2011) MEGA5: Molecular evolutionary genetics analysis using maximum likelihood, evolutionary distance, and maximum parsimony methods. Mol Biol Evol 28: 2731-2739
Thordal-Christensen H, Zhang Z, Wei Y, Collinge DB (1997) Subcellular localization of H2O2 in plants. H2O2 accumulation in papillae and hypersensitive response during the barley—powdery mildew interaction. Plant J 11: 1187-1194
Tikunov YM, Laptenok S, Hall RD, Bovy A, de Vos RCH (2012) MSClust: a tool for unsupervised mass spectra extraction of chromatography-mass spectrometry ion-wise aligned data. Metabolomics 8: 714-718
Untergasser A, Nijveen H, Rao X, Bisseling T, Geurts R, Leunissen JAM (2007) Primer3Plus, an enhanced web interface to Primer3. Nucleic Acids Res 35: W71-W74
van der Hooft JJ, Vervoort J, Bino RJ, Beekwilder J, de Vos RC (2011) Polyphenol identification based on systematic and robust high-resolution accurate mass spectrometry fragmentation. Anal Chem 83: 409-416
van Meer G, Voelker DR, Feigenson GW (2008) Membrane lipids: where they are and how they behave. Nat Rev Mol Cell Bio 9: 112-124
Vance JE, Steenbergen R (2005) Metabolism and functions of phosphatidylserine. Prog Lipid Res 44: 207-234
Voegele RT, Hahn M, Lohaus G, Link T, Heiser I, Mendgen K (2005) Possible roles for mannitol and mannitol dehydrogenase in the biotrophic plant pathogen Uromyces fabae. Plant Physiol 137: 190-198
Vossen JH, Abd-El-Haliem A, Fradin EF, Van Den Berg GCM, Ekengren SK, Meijer HJG, Seifi A, Bai Y, Ten Have A, Munnik T, Thomma BPHJ, Joosten MHAJ (2010) Identification of tomato phosphatidylinositol-specific phospholipase-C (PI-PLC) family members and the role of PLC4 and PLC6 in HR and disease resistance. Plant J 62: 224-239
Walley JW, Kliebenstein DJ, Bostock RM, Dehesh K (2013) Fatty acids and early detection of pathogens. Curr Opin Plant Biol 16: 520-526
Ward JL, Forcat S, Beckmann M, Bennett M, Miller SJ, Baker JM, Hawkins ND, Vermeer CP, Lu C, Lin W, Truman WM, Beale MH, Draper J, Mansfield JW, Grant M (2010) The metabolic transition during disease following infection of Arabidopsis thaliana by Pseudomonas syringae pv. tomato. Plant J 63: 443-457
Welti R, Wang X, Williams TD (2003) Electrospray ionization tandem mass spectrometry scan modes for plant chloroplast lipids. Anal. Biochem 314: 149-152
Wink M (1988) Plant-breeding - importance of plant secondary metabolites for protection against pathogens and herbivores. Theor Appl Genet 75: 225-233
Wright KM, Duncan GH, Pradel KS, Carr F, Wood S, Oparka KJ, Cruz SS (2000) Analysis of the N gene hypersensitive response induced by a fluorescently tagged tobacco mosaic virus. Plant Physiol 123: 1375-1386
Zacares L, Lopez-Gresa MP, Fayos J, Primo J, Belles JM, Conejero V (2007) Induction of p-coumaroyldopamine and feruloyldopamine, two novel metabolites, in tomato by the bacterial pathogen Pseudomonas syringae. Mol Plant Microbe Interact 20: 1439-1448
Zwiers LH, De Waard MA (2001) Efficient Agrobacterium tumefaciens-mediated gene disruption in the phytopathogen Mycosphaerella graminicola. Current Genetics 39: 388-393
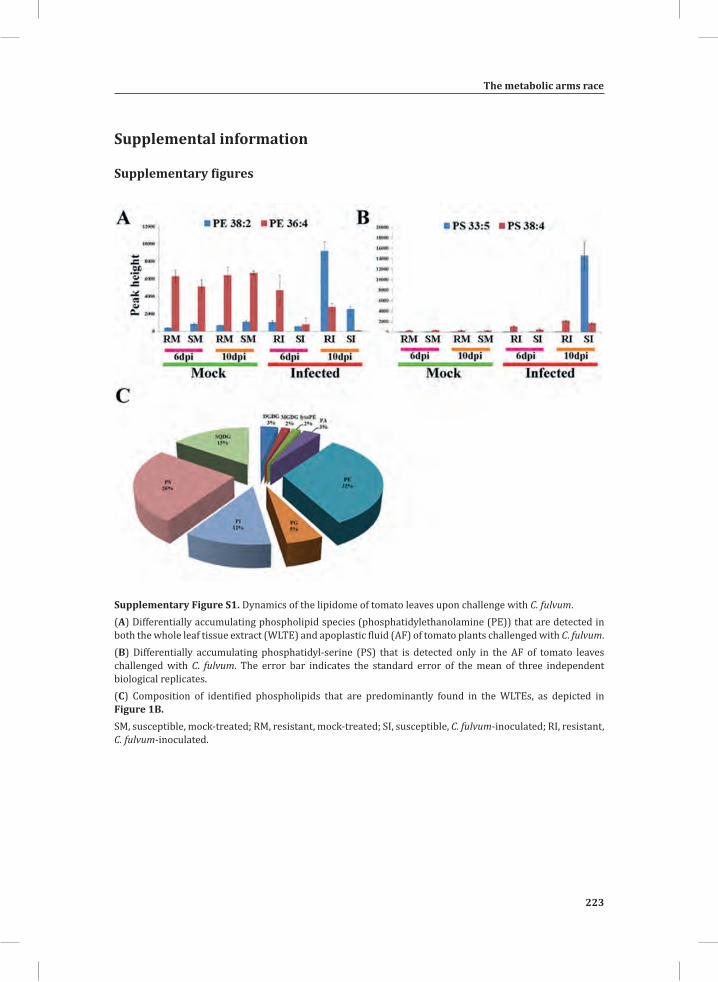
The metabolic arms race
223
Chapter 5
Supplemental information
Supplementary figures
Supplementary Figure S1. Dynamics of the lipidome of tomato leaves upon challenge with C. fulvum. (A) Differentially accumulating phospholipid species (phosphatidylethanolamine (PE)) that are detected in both the whole leaf tissue extract (WLTE) and apoplastic fluid (AF) of tomato plants challenged with C. fulvum.(B) Differentially accumulating phosphatidyl-serine (PS) that is detected only in the AF of tomato leaves challenged with C. fulvum. The error bar indicates the standard error of the mean of three independent biological replicates.(C) Composition of identified phospholipids that are predominantly found in the WLTEs, as depicted in Figure 1B. SM, susceptible, mock-treated; RM, resistant, mock-treated; SI, susceptible, C. fulvum-inoculated; RI, resistant, C. fulvum-inoculated.

224
Chapter 5
A
B
C
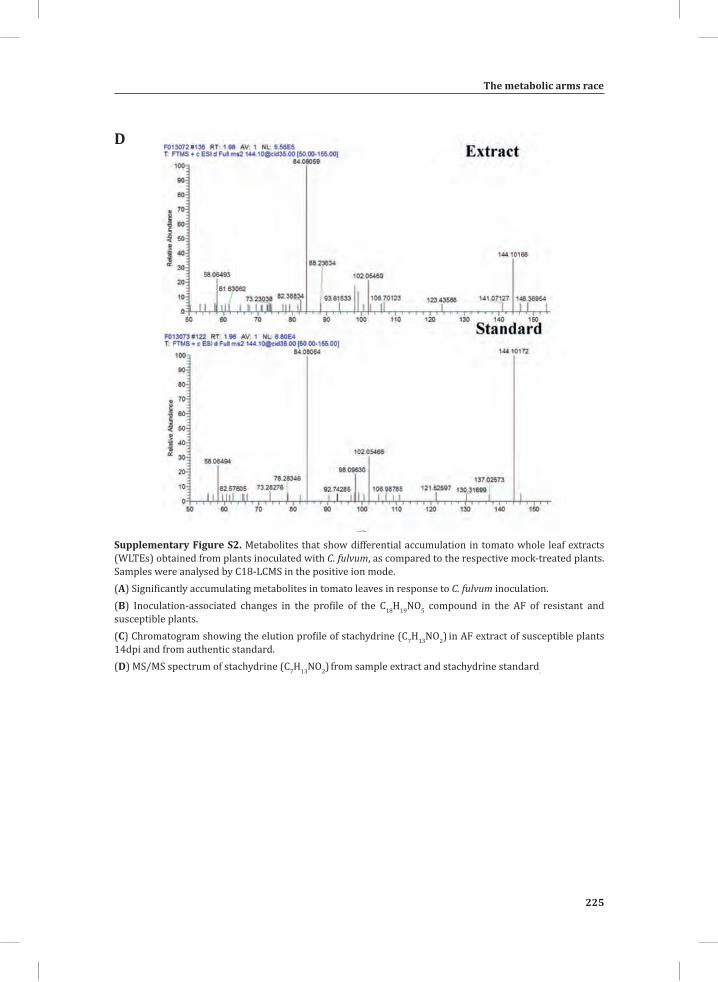
The metabolic arms race
225
Chapter 5
D
Supplementary Figure S2. Metabolites that show differential accumulation in tomato whole leaf extracts (WLTEs) obtained from plants inoculated with C. fulvum, as compared to the respective mock-treated plants. Samples were analysed by C18-LCMS in the positive ion mode.(A) Significantly accumulating metabolites in tomato leaves in response to C. fulvum inoculation.(B) Inoculation-associated changes in the profile of the C18H19NO5 compound in the AF of resistant and susceptible plants.(C) Chromatogram showing the elution profile of stachydrine (C7H13NO2) in AF extract of susceptible plants 14dpi and from authentic standard.(D) MS/MS spectrum of stachydrine (C7H13NO2) from sample extract and stachydrine standard.
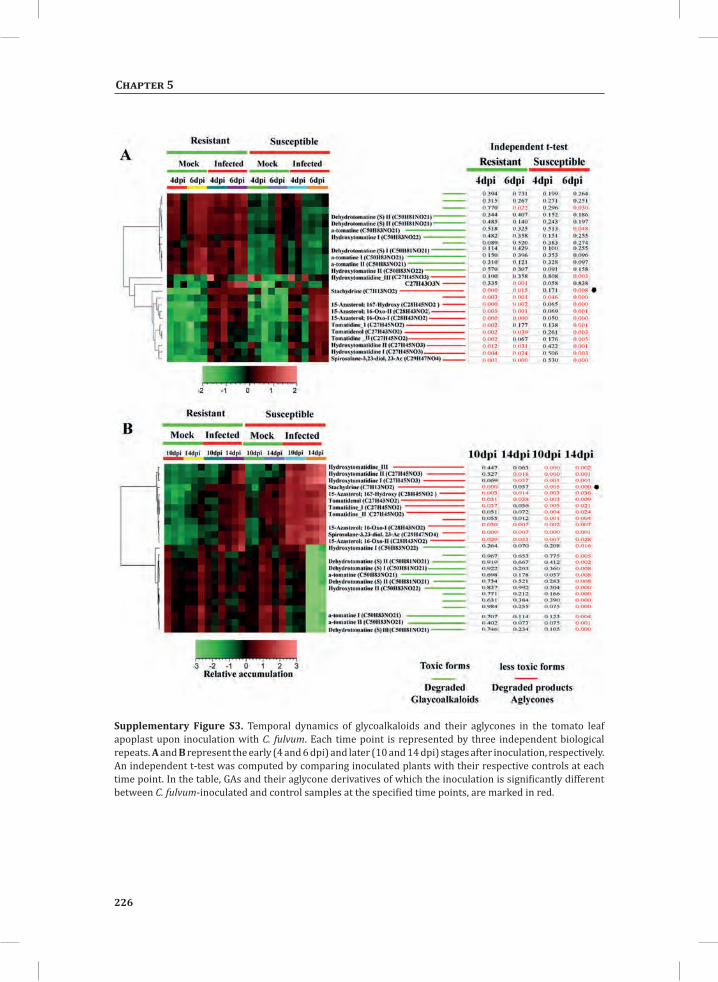
226
Chapter 5
Supplementary Figure S3. Temporal dynamics of glycoalkaloids and their aglycones in the tomato leaf apoplast upon inoculation with C. fulvum. Each time point is represented by three independent biological repeats. A and B represent the early (4 and 6 dpi) and later (10 and 14 dpi) stages after inoculation, respectively. An independent t-test was computed by comparing inoculated plants with their respective controls at each time point. In the table, GAs and their aglycone derivatives of which the inoculation is significantly different between C. fulvum-inoculated and control samples at the specified time points, are marked in red.
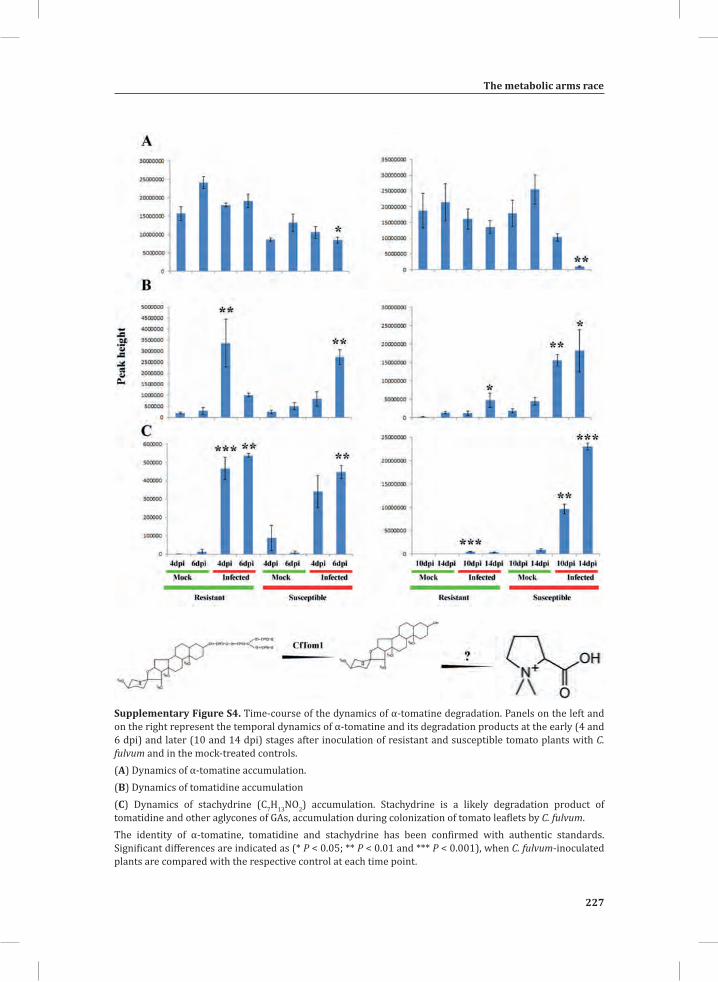
The metabolic arms race
227
Chapter 5
Supplementary Figure S4. Time-course of the dynamics of α-tomatine degradation. Panels on the left and on the right represent the temporal dynamics of α-tomatine and its degradation products at the early (4 and 6 dpi) and later (10 and 14 dpi) stages after inoculation of resistant and susceptible tomato plants with C. fulvum and in the mock-treated controls.(A) Dynamics of α-tomatine accumulation.(B) Dynamics of tomatidine accumulation(C) Dynamics of stachydrine (C7H13NO2) accumulation. Stachydrine is a likely degradation product of tomatidine and other aglycones of GAs, accumulation during colonization of tomato leaflets by C. fulvum.The identity of α-tomatine, tomatidine and stachydrine has been confirmed with authentic standards. Significant differences are indicated as (* P < 0.05; ** P < 0.01 and *** P < 0.001), when C. fulvum-inoculated plants are compared with the respective control at each time point.
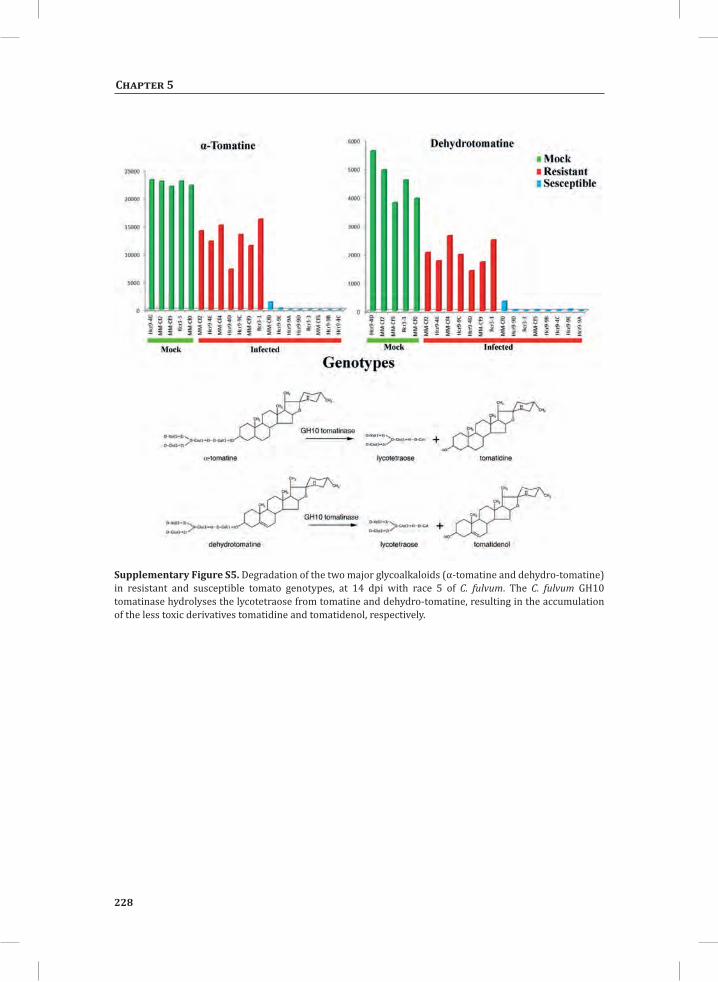
228
Chapter 5
Supplementary Figure S5. Degradation of the two major glycoalkaloids (α-tomatine and dehydro-tomatine) in resistant and susceptible tomato genotypes, at 14 dpi with race 5 of C. fulvum. The C. fulvum GH10 tomatinase hydrolyses the lycotetraose from tomatine and dehydro-tomatine, resulting in the accumulation of the less toxic derivatives tomatidine and tomatidenol, respectively.
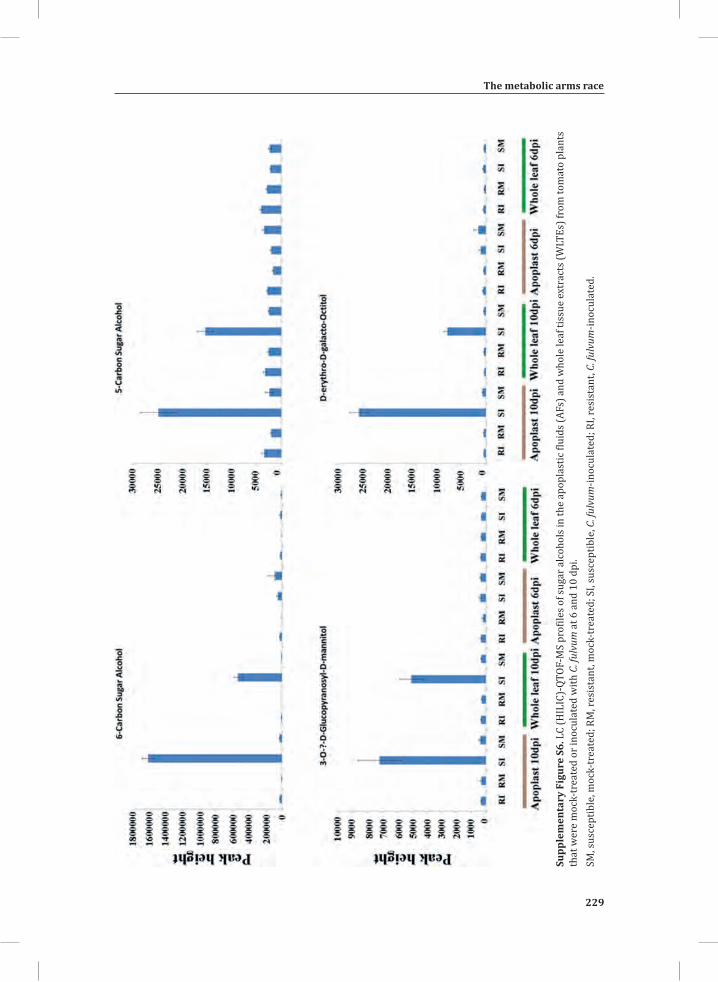
The metabolic arms race
229
Chapter 5
Supp
lem
enta
ry F
igur
e S6
. LC
(HIL
IC)-
QTOF
-MS
prof
iles o
f sug
ar a
lcoh
ols i
n th
e ap
opla
stic
flui
ds (A
Fs) a
nd w
hole
leaf
tiss
ue e
xtra
cts (
WLT
Es) f
rom
tom
ato
plan
ts
that
wer
e m
ock-
trea
ted
or in
ocul
ated
with
C. f
ulvu
m a
t 6 a
nd 1
0 dp
i. SM
, sus
cept
ible
, moc
k-tr
eate
d; R
M, r
esis
tant
, moc
k-tr
eate
d; S
I, su
scep
tible
, C. f
ulvu
m-in
ocul
ated
; RI,
resi
stan
t, C.
fulv
um-in
ocul
ated
.
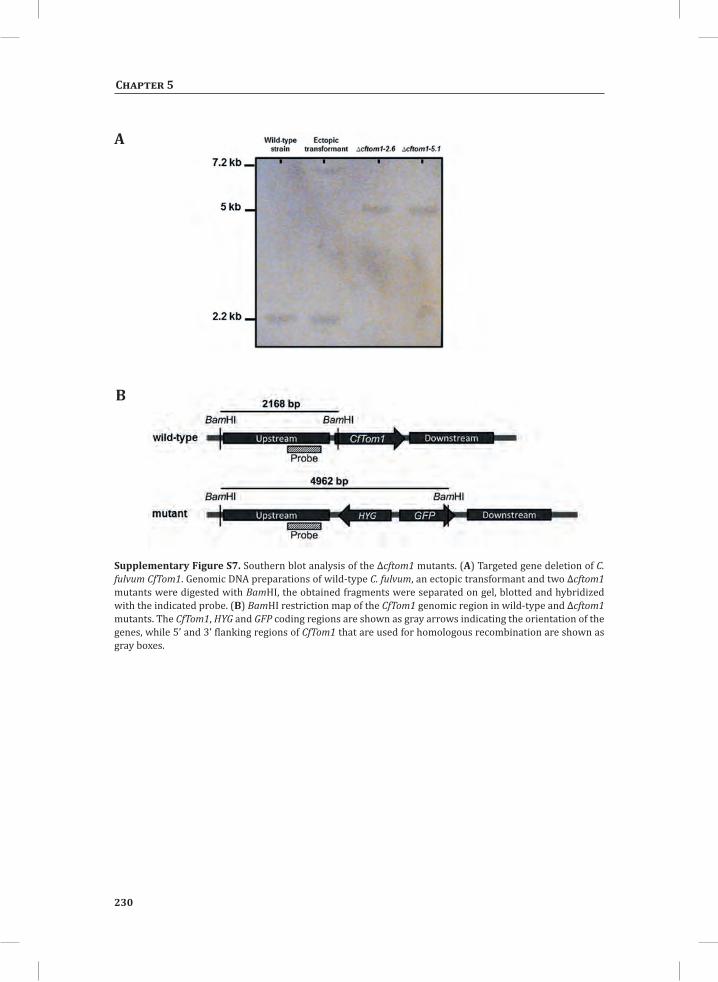
230
Chapter 5
A
B
Supplementary Figure S7. Southern blot analysis of the ∆cftom1 mutants. (A) Targeted gene deletion of C. fulvum CfTom1. Genomic DNA preparations of wild-type C. fulvum, an ectopic transformant and two ∆cftom1 mutants were digested with BamHI, the obtained fragments were separated on gel, blotted and hybridized with the indicated probe. (B) BamHI restriction map of the CfTom1 genomic region in wild-type and ∆cftom1 mutants. The CfTom1, HYG and GFP coding regions are shown as gray arrows indicating the orientation of the genes, while 5’ and 3’ flanking regions of CfTom1 that are used for homologous recombination are shown as gray boxes.
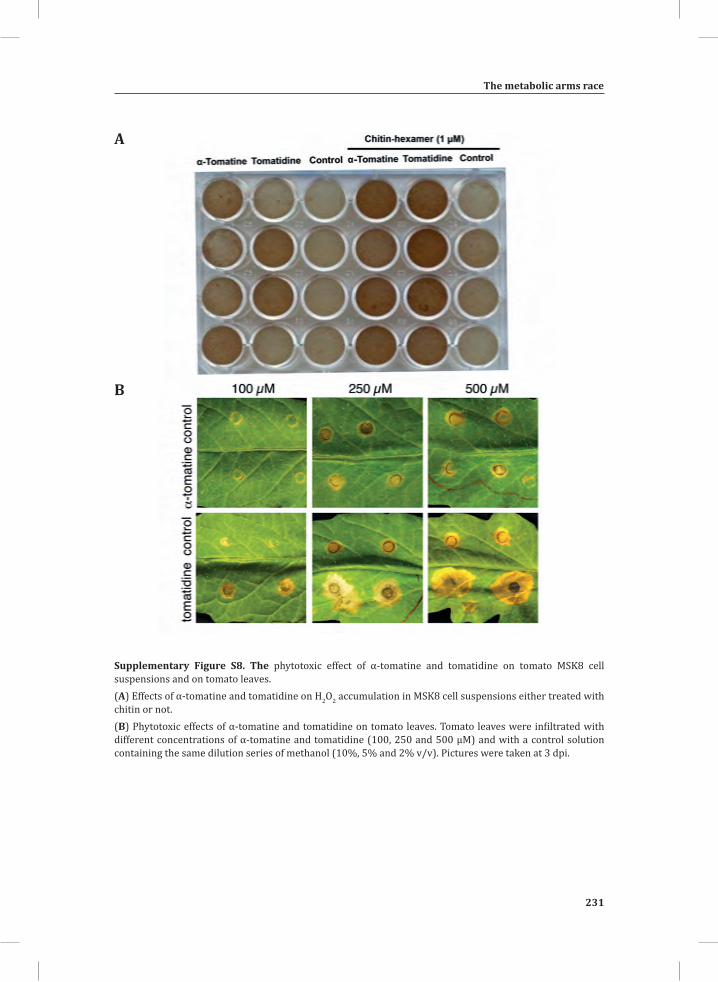
The metabolic arms race
231
Chapter 5
Supplementary Figure S8. The phytotoxic effect of α-tomatine and tomatidine on tomato MSK8 cell suspensions and on tomato leaves.(A) Effects of α-tomatine and tomatidine on H2O2 accumulation in MSK8 cell suspensions either treated with chitin or not.(B) Phytotoxic effects of α-tomatine and tomatidine on tomato leaves. Tomato leaves were infiltrated with different concentrations of α-tomatine and tomatidine (100, 250 and 500 µM) and with a control solution containing the same dilution series of methanol (10%, 5% and 2% v/v). Pictures were taken at 3 dpi.
A
B

General DiscussionThe Cladosporium fulvum - tomato interaction, a model for biological integration of
multilayer information: a systems biology perspective
6Chapter
234
Chapter 6
Technology meets biology in the systems-wide analysis of plant-microbe interactions
Systems biology and systems-wide studies in plant-microbe interactions Although defining and labelling things is not what I like, it is tradition in science to give a definition to the subjects that we are dealing with. Hence, I searched the web for the definition of “systems biology”. Numerous definitions appeared and in some cases, for example, digging for its definition in a commentary of renowned systems biologist Marc W. Kirschner, entitled the “meaning of systems biology” (Kirschner, 2005)/, one can easily lose patience as it took him two pages to finally state that the explicit definition of systems biology should not come from him, but we should await the words of the first great modern systems biologist. Here, it is not my intention to take the reader to the end of this discussion to provide a brief definition of systems biology. Most of the definitions that have been proposed share a common view and I would like to mention the definition given by Athel Cornish-Bowden, who shared the same points of view with two other highly esteemed scientists, Hans Westerhoff and Denis Noble. He stated, and I quote: “Systems biology or systems thinking is beyond collecting of a huge amount of data, more than just moving from a focus on the elements of a system towards a focus on the interactions between them; it means seeking a vision of the system as a whole: not just its components, not just the connections between them, but a vision of how the whole system works” (Cornish-Bowden, 2011).
The other major hurdle of defining systems biology is that of the question: What is a system itself? Is it a cell, an organ, an organism, a species, a species and its functioning by itself and in combination with other species and/or its interaction with its environment? We could keep going on and on, with no sight of the horizon. However, the statement given about what a system is, by Francois Jacob is impressive and is worth mentioning, as he put forward: “Every object that biology studies is a system of systems” (Jacob, 1974).
As other emerging scientific fields, the infant research area of systems biology also faced fierce resistance from the scientific community. One of the most out-spoken critics of systems biology is the renowned scientist and Nobel laureate Sydney Brenner. In an interview in Nature Molecular Cell Biology, he described ~omics-assisted systems biology studies as “low-input, high-throughput, no-output biology” (Friedberg, 2008). According to Brenner, the claims of systems biology cannot be met, and a weaker version is just a new name for physiology. I personally do not want to put myself in the camp of Cornish-Bowden or Sydney Brenner. However, the humble statements given by Cornish-Bowden are remarkable and deserve to be appreciated by the scientific community (Cornish-Bowden, 2011). With great respect and appreciation for Sydney Brenner, both as a person and as a fellow scientist, with all due respect I do not agree with his point of view on systems biology.
General discussion
235
Chapter 6
Systems biology in fact is not more than a tool that has tremendous potential to contribute to our quest towards the understanding of life and existence, and the scientific community should realize that none of the specific scientific fields will bring the silver bullet to solve the challenges that our planet is facing. It is only the integration of systems and components of biology with physical, social and material sciences that could help us broaden our understanding of the mystery and complexity behind life and existence. The question therefore is not: Does systems or integrative biology work, or not? Rather, the question should be: How can we make it work? What are the most important technological and biological considerations? Here, I will propose some changes that to my opinion are required to make systems biology successful. This starts with a number of prerequisites before data are being generated, and an integration procedure is followed to ultimately obtain the general picture of the functioning of a system at the cellular level. To mention some: a robust biological system, a solid method to synchronically perturb the system, precise and temporal sampling and reliable sampling techniques, support by high-throughput technologies and most of all, the availability of integrative data mining bioinformatics-based methods. I will also put some emphasis on spatial sampling to show its potential contribution to systems biology studies, in the concluding remarks of the discussion.
The Cladosporium fulvum-tomato pathosystem: a versatile model for plant-microbe interaction studies The Cladosporium fulvum-tomato interaction is a well-studied and versatile pathosystem that has significantly contributed to the expansion of our understanding of the molecular basis of plant-microbe interactions (de Wit, 1977; Joosten et al., 1997; van Esse et al., 2008; de Jonge et al., 2010; de Jonge et al., 2012; Sato et al., 2012; Etalo et al., 2013; Liebrand et al., 2013). The interaction can be divided into a compatible and an incompatible interaction between the pathogenic fungus and tomato, which is referring to the interaction of either susceptible or resistant tomato plants with C. fulvum, respectively (Joosten and de Wit, 1999; de Wit et al., 2009).
Any biological, within or among species, interaction involves alterations in the transcriptome, proteome and eventually the metabolome of the organisms that are involved. These terms are referring to the presence and abundance of (1) RNA transcripts, (2) proteins encoded by the genome and (3) small molecules in a system, respectively. Interestingly, however, it is not always straightforward to identify the cause of these alterations when the interaction involves more than one organism. This is mainly because various proteins and metabolites that originate from the interacting organisms will influence the rate of alteration of the global transcriptome, proteome and metabolome of the system, which in most cases includes both organisms during sampling. This problem is solved in the “dying seedlings” system used in my thesis,
236
Chapter 6
in which defence-associated responses are induced in the absence of the fungus, by only introducing the avirulence factor (Avr) from the fungus into a resistant plant that expresses the matching Cf resistance gene. Under permissive conditions these seedlings undergo a synchronized and systemic defence response that leads to the induction of the hypersensitive response (HR) (Cai et al., 2001; de Jong et al., 2002; Stulemeijer et al., 2007; Etalo et al., 2013).
In chapters 3 and 4 of this thesis we showed that at the transcriptome level, the dying seedlings reliably mimic the (local) response of resistant tomato plants to inoculation by C. fulvum. Hence, any changes in the transcriptome, proteome and metabolome can be directly linked to the activation of the defence response of the host plant upon recognition of the fungal avirulence factor (Stulemeijer et al., 2009; Etalo et al., 2013). In chapter 2 of this thesis, a temporal study of such a synchronized and systemic response revealed the dynamic changes in a multitude of biological processes that are linked to signal perception and transduction, and the resulting defence response that is ultimately manifested by the massive reprogramming of the host metabolome (Etalo et al., 2013). For a comprehensive understanding of the molecular and metabolic alterations that occur during the interaction, we combined this highly robust “dying seedlings” system with state-of-the-art transcriptomics and metabolomics technologies.
The availability of these powerful technologies, together with the recent release of the full genome sequence of tomato (Sato et al., 2012) and C. fulvum (de Wit et al., 2012), renders the C. fulvum-tomato pathosystem an ideal model for systems biology studies. For example, Avr5 (C. fulvum avirulence factor 5) has successfully been identified by comparing two RNA-seq data sets, both obtained from a compatible interaction between tomato and C. fulvum (Mesarich et al., unpublished data). One of the datasets was obtained by RNA-seq analysis of Cf-0 tomato plants colonised by a race 5 of C. fulvum, which secretes all avirulence factors, except Avr5 (we used this RNA-seq dataset in chapters 3 and 4). The other dataset was obtained by RNA-seq analysis of Cf-0 plants that were colonised by a race 0 of C. fulvum, secreting all avirulence factors. A comparative analysis of all genes expressed by C. fulvum, eventually resulted in the identification of a specific transcript that was abundant in the RNA-seq dataset obtained from the race 0-inoculated Cf-0 tomato plants, whereas this transcript was not present in the transcriptome of the Cf-0 tomato plants that had been inoculated with race 5 of C. fulvum. Eventually, it was proven that this transcript indeed codes for the avirulence factor Avr5 of C. fulvum (Mesarich et al., unpublished data). The success of this approach shows that parallel integration of RNA-seq data obtained from two highly complex biological systems that theoretically only differ in one gene, by using state-of-the-art bioinformatics, can sieve-out information from such complex datasets, a task comparable with finding a needle in a haystack.
General discussion
237
Chapter 6
Choice of ~omics technologies ~Omics technologies allow the exact and simultaneous quantitative monitoring of the abundance of thousands of genes, proteins and metabolites in a high-throughput way. It should be noted that no single ~omics analysis can fully unravel the complexity of the fundamental changes that occur during the progress of a plant-microbe interaction. Hence, the integration of multiple layers of information is not an alternative but rather an obligatory procedure if one wants to explore the interconnected real-time changes that take place when a system is perturbed. Hence, in this thesis we followed an integrated approach involving metabolomics and transcriptomics for a system-wide understanding of the interaction between tomato and C. fulvum.
Genome-wide transcriptome profiling technologies used in this study At the start of the project, microarrays were the traditional and most widely used transcriptome profiling tools for systems-wide analysis of plant-microbe interactions (Maleck et al., 2000; Thilmony et al., 2006). In chapter 2 of this thesis, we used data generated using the Affymetrix tomato genome array (a microarray that only contains about one third of all tomato genes), to elucidate the major HR-associated transcriptional alterations occurring in the dying seedlings. Recent advances in Next Generation Sequencing technologies and bioinformatics tools revolutionized the use of RNA-seq analysis in systems biology studies and we used this exciting technology to perform whole transcriptome profiling of the tomato-C. fulvum pathosystem (both the dying seedlings, as well as the compatible and incompatible interaction between tomato and the fungus). When the two technologies are compared, as expected the number of differentially regulated transcripts identified in the RNA-seq analysis was nearly five times higher than in the Affymetrix tomato genome array analysis (Chapters 2 and 3). This figure would have been much higher if we had not used highly stringent filtering criteria on the RNA-seq dataset. Nevertheless, this technology has provided a huge amount of information that was used in almost all chapters of this thesis to obtain insight into the complex and versatile regulatory mechanisms that are underlying the maintenance of the homeostasis of the system.
Metabolic profiling technologies used in this study The output from the cellular integration of the transcriptome and proteome is the metabolome, which consists of chemically diverse small molecules and represents a functional readout of the cellular state (Joyce and Palsson, 2006). Bacteria, representing the simplest form of life, still produce at least 600 different metabolites, whereas for plants this is estimated to be more than 200,000 (Oldiges et al., 2007). Unlike the genome, the transcriptome and the proteome, capturing a representative part of the metabolome of a complex system requires a series of extraction, separation and detection techniques. We have used several metabolomics platforms that enabled us to monitor the dynamics of metabolites with a wide range of chemical and physical properties.
238
Chapter 6
These metabolites include volatile organic compounds (VOCs) (identified by TD-GC-MS, chapter 3), semipolar metabolites (for which we employed C18-LC-MS and HILIC-LC-MS chapters 2, 4 and 5), polar and apolar metabolites (identified by GC-TOF-MS and HILIC-LC-MS, chapters 2 and 5). Here I want to mention some biologically important metabolic processes occurring in the tomato-C. fulvum interaction that were revealed by the use of these platforms. In chapter 3 measurement of the VOCs showed the massive emission of α-copaene, a sesquiterpene, by the dying seedlings during mounting of the HR. Similarly, in chapter 2 our discovery of the accumulation of aromatic amino acids (identified by GC-TOF-MS) and secondary metabolites that are derived from them (shown by LC-MS), was an important milestone in establishing a biological connection between datasets that had been obtained from various measurements. Furthermore, extraction of non-volatile compounds combined with HILIC-MS analysis showed important changes in the lipidome. The results from these complementary integrated platforms clearly showed how complex the defence metabolome is in tomato.
The Hypersensitive Response: a Cause or a Consequence of Host Defence? A systems perspectiveIt has been nearly a century since Elvin C Stakman’s observation on black stem rust (Puccinia graminis) resulted in the establishment of the concept of the hypersensitive response (HR) of a resistant host plant to infection (Stakman, 1915). This response, which is considered to be one of the hallmarks of the immunity of plants to pathogens, involves a type of programmed cell death (PCD) and occurs at the site of pathogen entry, resulting in efficient containment of the pathogen (Lam et al., 2001). Since the formulation of the concept of the HR, the following question remained unanswered. Is the HR causal to disease resistance or is it a consequence of the defence response?
In chapters 2, 3 and 4, the multilayer information obtained by transcriptome and metabolome analysis suggested that the HR represents the final stage invoked by tomato plants to resist C. fulvum infection. In chapter 2, the observed metabolome reprogramming in the dying seedlings prior to the temperature shift that induces the HR, strongly suggests that the system is slightly leaky and that there is already an induction of the defence response, without the execution of the HR. Projection of the HR from the observed response in the dying seedlings suggests that the HR is most likely the consequence of the escalated signalling response at the site of infection. This escalated signalling results in massive reprogramming of the transcriptome and the metabolome, a highly carbon- and energy-demanding process (Chapters 2 and 3). In both chapters, the role of energy homeostasis during the HR was discussed. In conclusion, although the HR is often associated with induced defence, in line with a number of other reports, our results suggest that the HR is not causal for disease resistance (Kiraly et al., 1972; Lehnackers and Knogge, 1990; Goulden and Baulcombe, 1993; Jakobek and Lindgren,
General discussion
239
Chapter 6
1993; Hammond-Kosack and Jones, 1996; Schiffer et al., 1997; Bendahmane et al., 1999; Bulgarelli et al., 2010; Etalo et al., 2013).
In chapter 2, the combined metabolome and transcriptome analysis suggests that the HR potentially contributes to fuel the defence response by acting as a bio-recycler. In the dying seedlings, the massive up-regulation of genes involved in the final step of aromatic amino acid biosynthesis (Chapter 2), the accumulation of phenylalanine and tyrosine (Chapter 2), the accumulation of secondary metabolites that are derived from these aromatic amino acids and the activation of genes that are involved in their biosynthesis (Chapter 2) are examples of the profound changes that occur during mounting of the HR. On the other hand, the activation of a number of catabolic pathways that converge to produce acetyl-CoA (Chapters 2 and 3) and the massive up-regulation of genes involved in the cellular energetics (Chapter 3), are indicators of the role of the HR as a bio-recycler for the generation of energy and carbon skeletons to sustain the activation of the defence response.
Finally, my suggestion about the HR is that it should not be treated as a process having only one origin following predefined routes and playing a predefined role. The HR is simply the ultimate manifestation of various developmental- and stress-related responses. For example, in plants programmed cell death (PCD) plays a vital role in the differentiation of vascular bundles (Fukuda, 2000) and in the hypersensitivity response of plants to pathogens and cell death is induced even by PAMPs (Naito et al., 2008) and low temperature (Wolter et al., 1993). Hence, the attempts to put the HR in a box need rethinking by the scientific community. Refocussing from the final manifestation, which in this case is the HR, to the differences and similarities between the associated pathways in fact leading to the HR, will provide an important contribution to understanding the significance of the HR in a particular situation. Such comparative analysis contributes to the identification of the point where various stress signalling pathways converge to enforce the HR. Most importantly, in experiments that focus on the identification of genes important for plant defence, utilization of the HR as marker for induced defence responses has its limitations, as the activation of defence may not always end up with the HR. Altogether, our integrated analysis suggests that the HR is a highly controlled biological demolition process that takes place in parallel with biosynthetic processes, thus reaffirming that the HR does not only involve cellular degradation but requires active transcription to take place (He et al., 1994). In relation to this, regulatory mechanisms that underlie the plant defence response in general and the HR in particular will be discussed below.
240
Chapter 6
Regulation of the defense transcriptome
Uncontrolled defense costs lifeThe absence of specialized immune cells imposes a tight control of the immune response of plants, as complete tissues are able to mount this response and can potentially undergo an HR. Furthermore, the allocation of energy and other resources has to be balanced between various biological processes, such as development and defence, and an efficient use of energy eventually determines the overall fitness and chances of survival of plants (Kliebenstein and Rowe, 2008; Denance et al., 2013; Neilson et al., 2013). Hence, any response to a perturbation of plant homeostasis should be accompanied by a fast switch to the appropriate gene transcription programme and suppression of other programmes to ensure an economic and efficient reaction. In chapter 2 of this thesis we have shown the parallel transcriptional activation of genes associated with defence response activation and genes involved in its suppression, suggesting that a parallel and tight regulation is essential to keep the fine balance between plant defence and other biological processes, such as growth and development. Furthermore, in chapter 4, simultaneous virus-induced gene silencing (VIGS) of genes encoding defence repressor WRKY transcription factors (SlWRKY-39/40/45/46), resulted in constitutive defence activation at the expense of plant growth. All together, these results indicate that defence is costly and if uncontrolled, it could even cost life. Therefore, factors that are involved in the regulation of this response are essential for plant survival and are subject of study in systems biology (Moore et al., 2011; Etalo et al., 2013). Transcription factors, like the WRKYs, play an important role in the regulation of the defence transcriptome (Rushton and Somssich, 1998; Pozo et al., 2008; Rushton et al., 2010; Berr et al., 2012; Chang et al., 2013; Meng et al., 2013). Chapter 4 of this thesis is exclusively dedicated to the functional characterization of these defence-related TFs.
The role of WRKY transcription factors in regulating the defence transcriptome and beyond
Guilt by Association (GBA); from a social perspective to systems biology “Birds of a feather flock together” is a saying often used to express: “tell me your friends and I will tell you who you are”. Similarly, most of the data analyses involving ~omics-based datasets highly depend on the assumption that genes, proteins and metabolites that have similar expression or accumulation patterns across many samples, are regulated in the same way. This analogy is not accepted by most reductionists and it is also one of the seemingly weak points of systems biology that are mentioned by its fierce critic Sydney Brenner. In principle, it is obvious that correlation does not necessarily indicate a causal relationship. The confounding of direct and indirect associations is also
General discussion
241
Chapter 6
another setback for correlation-based inferences (Opgen-Rhein and Strimmer, 2007). Hence, any inference that is made based on correlation needs to be substantiated by additional analysis, including the targeting of the implicated components for example through the use of reverse genetics tools.
In chapter 2, the co-expression network analysis indicated a prominent role of WRKY transcription factors in the orchestration of the HR in tomato. Over-representation analysis of the promoter regions of clusters of genes that were all massively upregulated during mounting of the HR, indicated that there was a significantly high incidence of the W-box motif, which is a WRKY-binding domain, at 1kb upstream of the promoter region of these genes. Furthermore, in chapter 3, our RNA-seq analysis revealed that in the dying seedlings and in an incompatible interaction between tomato and C. fulvum, a large number of genes encoding WRKY transcription factors (TFs) showed up-regulation. Furthermore, a Wilcoxon rank sum test indicated that, as compared to other TFs, WRKYs are the most over-represented amongst the regulated genes, suggesting that WRKYs are the key regulators of the defence transcriptome in tomato plants. Based on results from our co-expression analyses, we targeted a number of genes encoding WRKY transcription factors using VIGS. We used a strategy of simultaneous gene silencing through the use of chimeric constructs aimed at targeting multiple genes encoding WRKY TFs that have functional redundancy (Chapter 4). This is a useful strategy for use in (crop) plant species, like tomato, for which there is no or less availability of mutants and T-DNA insertion lines. The VIGS analysis of several WRKY TFs confirmed their prominent role as both defence activators and repressors (Chapter 4). The constitutive defence activation, in combination with a dramatic reduction in growth of tomato plants targeted for SlWRKY-39/40/45/46, suggests that these TFs also play an important role in the regulation of the trade-off between defence and growth. Further system-based studies aimed at unravelling the exact targets of these transcription factors should further unravel the tomato WRKY defence network. In conclusion, based on the analysis of the dying seedlings and an incompatible and compatible interaction, WRKY TFs appear to act as key regulators of the defence response in tomato. These TFs have both positive and negative roles in the regulation of the two interconnected layers of plant innate immunity, which are PAMP-triggered immunity (PTI) and effector-triggered immunity (ETI), and have also been shown to strongly influence the defence metabolome of the host (Chapters 2, 3 and 4).
Envisioning the defence versus growth trade off, following a ‘hypothetico-deductive’ processThe traditional hypothesis generation is referred to as the ‘hypothetico-deductive’ process. First, it involves scientific expertise and imagination to formulate possible hypotheses and then the deductive consequences of these hypothesises are tested by
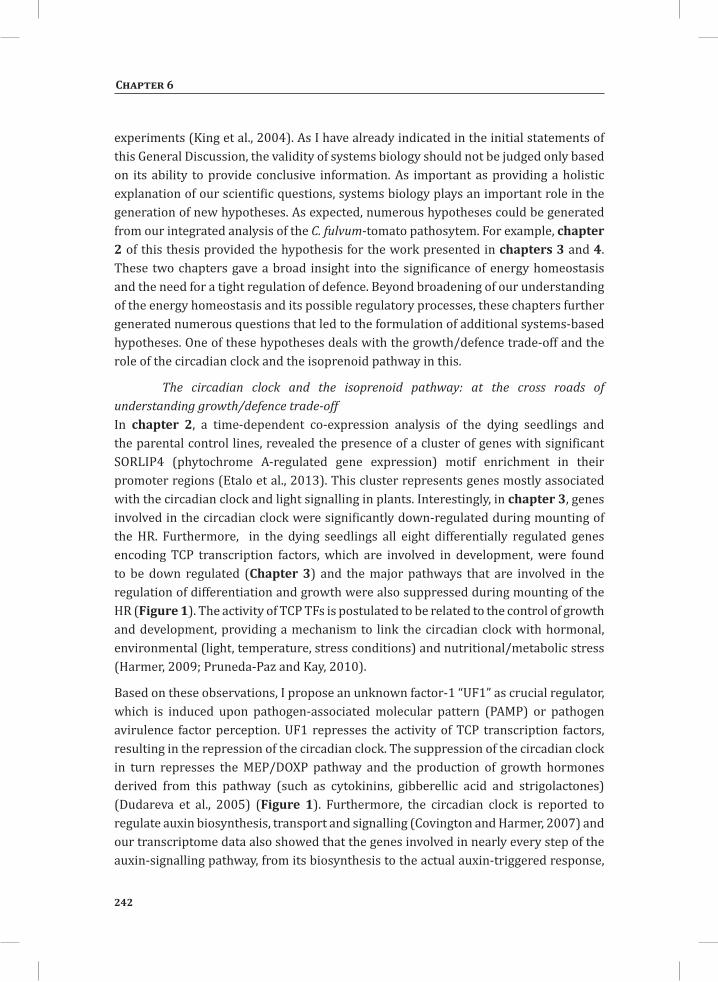
242
Chapter 6
experiments (King et al., 2004). As I have already indicated in the initial statements of this General Discussion, the validity of systems biology should not be judged only based on its ability to provide conclusive information. As important as providing a holistic explanation of our scientific questions, systems biology plays an important role in the generation of new hypotheses. As expected, numerous hypotheses could be generated from our integrated analysis of the C. fulvum-tomato pathosytem. For example, chapter 2 of this thesis provided the hypothesis for the work presented in chapters 3 and 4. These two chapters gave a broad insight into the significance of energy homeostasis and the need for a tight regulation of defence. Beyond broadening of our understanding of the energy homeostasis and its possible regulatory processes, these chapters further generated numerous questions that led to the formulation of additional systems-based hypotheses. One of these hypotheses deals with the growth/defence trade-off and the role of the circadian clock and the isoprenoid pathway in this.
The circadian clock and the isoprenoid pathway: at the cross roads of understanding growth/defence trade-offIn chapter 2, a time-dependent co-expression analysis of the dying seedlings and the parental control lines, revealed the presence of a cluster of genes with significant SORLIP4 (phytochrome A-regulated gene expression) motif enrichment in their promoter regions (Etalo et al., 2013). This cluster represents genes mostly associated with the circadian clock and light signalling in plants. Interestingly, in chapter 3, genes involved in the circadian clock were significantly down-regulated during mounting of the HR. Furthermore, in the dying seedlings all eight differentially regulated genes encoding TCP transcription factors, which are involved in development, were found to be down regulated (Chapter 3) and the major pathways that are involved in the regulation of differentiation and growth were also suppressed during mounting of the HR (Figure 1). The activity of TCP TFs is postulated to be related to the control of growth and development, providing a mechanism to link the circadian clock with hormonal, environmental (light, temperature, stress conditions) and nutritional/metabolic stress (Harmer, 2009; Pruneda-Paz and Kay, 2010).
Based on these observations, I propose an unknown factor-1 “UF1” as crucial regulator, which is induced upon pathogen-associated molecular pattern (PAMP) or pathogen avirulence factor perception. UF1 represses the activity of TCP transcription factors, resulting in the repression of the circadian clock. The suppression of the circadian clock in turn represses the MEP/DOXP pathway and the production of growth hormones derived from this pathway (such as cytokinins, gibberellic acid and strigolactones) (Dudareva et al., 2005) (Figure 1). Furthermore, the circadian clock is reported to regulate auxin biosynthesis, transport and signalling (Covington and Harmer, 2007) and our transcriptome data also showed that the genes involved in nearly every step of the auxin-signalling pathway, from its biosynthesis to the actual auxin-triggered response,
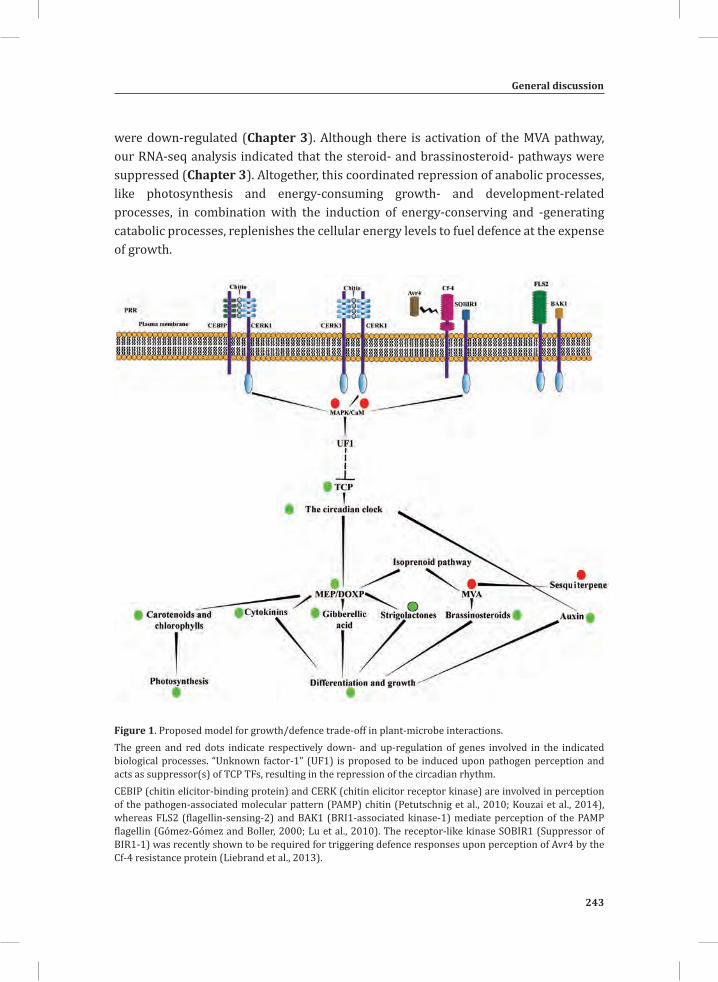
General discussion
243
Chapter 6
were down-regulated (Chapter 3). Although there is activation of the MVA pathway, our RNA-seq analysis indicated that the steroid- and brassinosteroid- pathways were suppressed (Chapter 3). Altogether, this coordinated repression of anabolic processes, like photosynthesis and energy-consuming growth- and development-related processes, in combination with the induction of energy-conserving and -generating catabolic processes, replenishes the cellular energy levels to fuel defence at the expense of growth.
Figure 1. Proposed model for growth/defence trade-off in plant-microbe interactions.The green and red dots indicate respectively down- and up-regulation of genes involved in the indicated biological processes. “Unknown factor-1” (UF1) is proposed to be induced upon pathogen perception and acts as suppressor(s) of TCP TFs, resulting in the repression of the circadian rhythm. CEBIP (chitin elicitor-binding protein) and CERK (chitin elicitor receptor kinase) are involved in perception of the pathogen-associated molecular pattern (PAMP) chitin (Petutschnig et al., 2010; Kouzai et al., 2014), whereas FLS2 (flagellin-sensing-2) and BAK1 (BRI1-associated kinase-1) mediate perception of the PAMP flagellin (Gómez-Gómez and Boller, 2000; Lu et al., 2010). The receptor-like kinase SOBIR1 (Suppressor of BIR1-1) was recently shown to be required for triggering defence responses upon perception of Avr4 by the Cf-4 resistance protein (Liebrand et al., 2013).
244
Chapter 6
Pirinformospora indica is a mutualistic fungus that colonizes a broad range of mono- and dicotyledonous plants. Recently, using systems biology approaches, the deployment of an “inverse” strategy by the fungus to manipulate barley innate immunity during colonization of the roots has been shown (Schafer et al., 2009). In this study, a stage-specific upregulation of genes involved in the metabolism of phytohormones, mainly encompassing gibberellin, brassinosteroids, auxin and abscisic acid is shown, whereas interestingly, salicylic acid (SA)-associated gene expression was suppressed. Further genetic studies showed a reduced fungal colonization of mutants that are impaired in gibberellin synthesis as well as in its perception (Schafer et al., 2009). Overall, these results show that the isoprenoid pathway forms the backbone of the plant defence signalling pathway and therefore is a potential target for fungi with mutualistic association with the plant. Hence, the circadian clock and isoprenoid pathway should be the focus of studies that aim to unravel the mystery behind the trade-off between growth and plant immune responses. Furthermore, it will be interesting to determine which effectors of pathogens are targeting these pathways. Metabolomics: the revival of the interest in the role of small molecules in plant-microbe interactions
Metabolomics as a tool for the discovery of novel biomarkers for resistance and susceptibility of plants to pathogens Chapter 5 of this thesis demonstrates the power of metabolomics for the elucidation of the (bio) chemical changes that are taking place upon successful colonization of the host by a pathogen on the one hand and successful activation of the plant defense response on the other. The degradation of a number of antimicrobial glycoalkaloids (α-tomatine, dehydrotomatine and hydroxytomatine), sulpholipids (sulfoquinovosyl diacylglycerols; SQDGs), in combination with the accumulation of the sugar alcohols mannitol and xylitol and the phosphatidylserine (PS) 38:3, can be considered as indicators of susceptibility. On the other hand, the early accumulation of specific phospholipids (PSs, PEs and PIs) (Chapter 5) and the production of hydroxycinnamic acid amides (Chapter 2) are indicators of induced defense responses. In my study, the metabolomics work has revealed novel metabolites associated with susceptibility. One of these is the partially characterized fatty acid, amino acid-conjugated compound (FAC), hydroxyphenylglycinoyl alkyl glycine, of which the predicted structure, obtained by MS/MS analysis, is shown in Figure 2A. This compound is only detected in the leaf apoplast originating from compatible interactions at the later stages of colonization (10-14 days post inoculation), while analysis of the dying seedlings showed that the compound is not part of the plant-induced defense response. In the same way, the analysis of in vitro grown mycelium of C. fulvum showed that the metabolite is not constitutively present in the fungus. Hence, we can conclude that the compound is produced by C. fulvum, but only upon successful colonization of the leaves of tomato (Figure 2B).
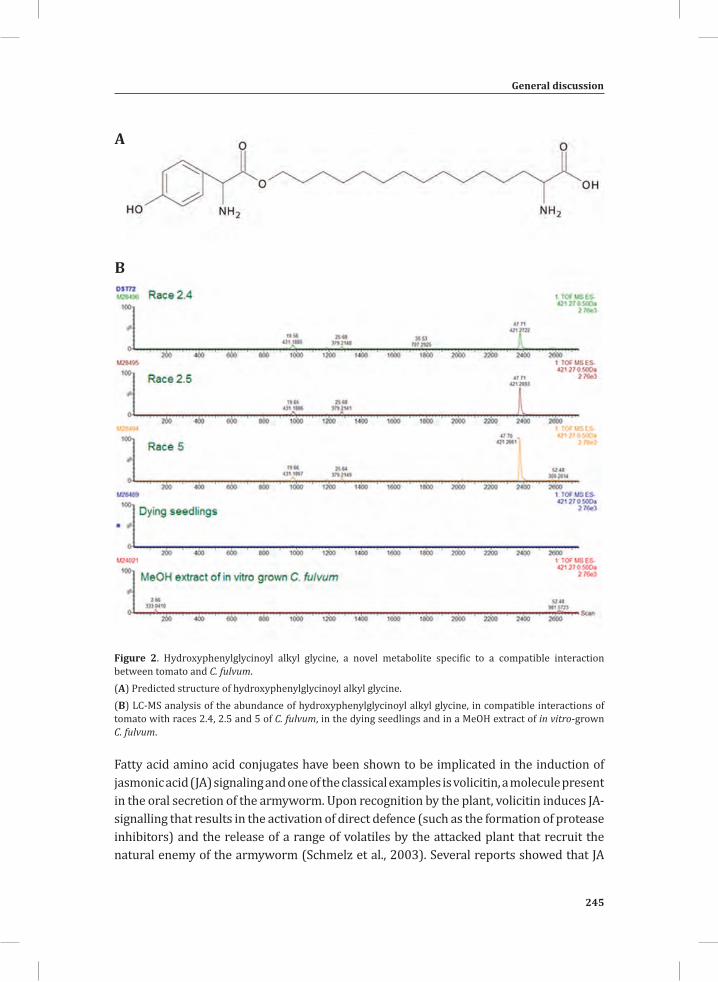
General discussion
245
Chapter 6
A
B
Figure 2. Hydroxyphenylglycinoyl alkyl glycine, a novel metabolite specific to a compatible interaction between tomato and C. fulvum.(A) Predicted structure of hydroxyphenylglycinoyl alkyl glycine.(B) LC-MS analysis of the abundance of hydroxyphenylglycinoyl alkyl glycine, in compatible interactions of tomato with races 2.4, 2.5 and 5 of C. fulvum, in the dying seedlings and in a MeOH extract of in vitro-grown C. fulvum.
Fatty acid amino acid conjugates have been shown to be implicated in the induction of jasmonic acid (JA) signaling and one of the classical examples is volicitin, a molecule present in the oral secretion of the armyworm. Upon recognition by the plant, volicitin induces JA-signalling that results in the activation of direct defence (such as the formation of protease inhibitors) and the release of a range of volatiles by the attacked plant that recruit the natural enemy of the armyworm (Schmelz et al., 2003). Several reports showed that JA
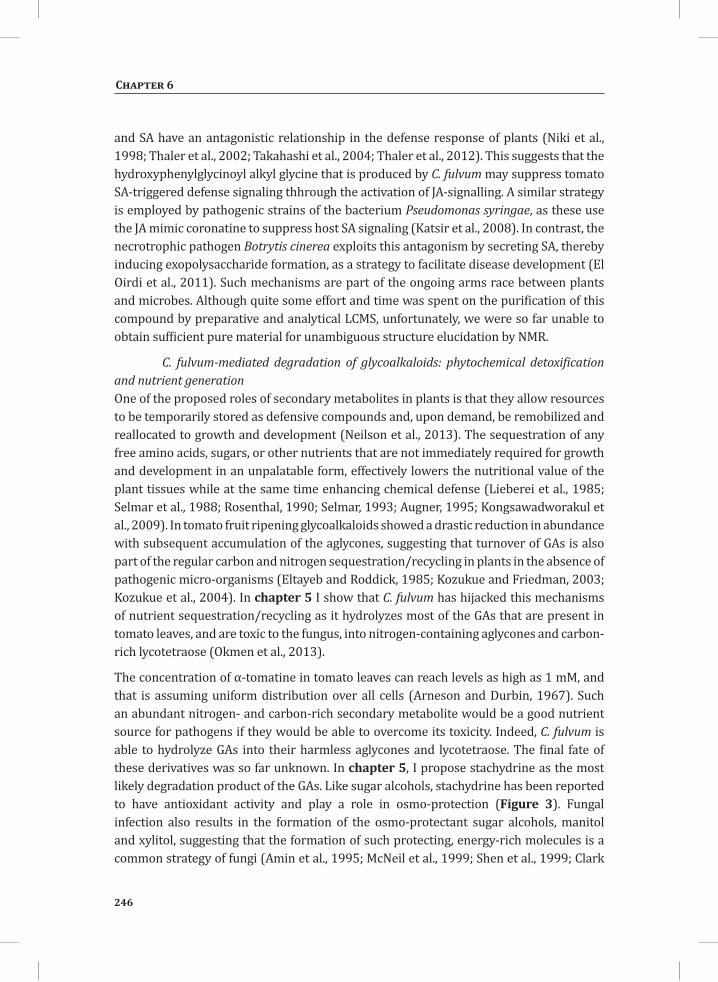
246
Chapter 6
and SA have an antagonistic relationship in the defense response of plants (Niki et al., 1998; Thaler et al., 2002; Takahashi et al., 2004; Thaler et al., 2012). This suggests that the hydroxyphenylglycinoyl alkyl glycine that is produced by C. fulvum may suppress tomato SA-triggered defense signaling thhrough the activation of JA-signalling. A similar strategy is employed by pathogenic strains of the bacterium Pseudomonas syringae, as these use the JA mimic coronatine to suppress host SA signaling (Katsir et al., 2008). In contrast, the necrotrophic pathogen Botrytis cinerea exploits this antagonism by secreting SA, thereby inducing exopolysaccharide formation, as a strategy to facilitate disease development (El Oirdi et al., 2011). Such mechanisms are part of the ongoing arms race between plants and microbes. Although quite some effort and time was spent on the purification of this compound by preparative and analytical LCMS, unfortunately, we were so far unable to obtain sufficient pure material for unambiguous structure elucidation by NMR.
C. fulvum-mediated degradation of glycoalkaloids: phytochemical detoxification and nutrient generation One of the proposed roles of secondary metabolites in plants is that they allow resources to be temporarily stored as defensive compounds and, upon demand, be remobilized and reallocated to growth and development (Neilson et al., 2013). The sequestration of any free amino acids, sugars, or other nutrients that are not immediately required for growth and development in an unpalatable form, effectively lowers the nutritional value of the plant tissues while at the same time enhancing chemical defense (Lieberei et al., 1985; Selmar et al., 1988; Rosenthal, 1990; Selmar, 1993; Augner, 1995; Kongsawadworakul et al., 2009). In tomato fruit ripening glycoalkaloids showed a drastic reduction in abundance with subsequent accumulation of the aglycones, suggesting that turnover of GAs is also part of the regular carbon and nitrogen sequestration/recycling in plants in the absence of pathogenic micro-organisms (Eltayeb and Roddick, 1985; Kozukue and Friedman, 2003; Kozukue et al., 2004). In chapter 5 I show that C. fulvum has hijacked this mechanisms of nutrient sequestration/recycling as it hydrolyzes most of the GAs that are present in tomato leaves, and are toxic to the fungus, into nitrogen-containing aglycones and carbon-rich lycotetraose (Okmen et al., 2013).
The concentration of α-tomatine in tomato leaves can reach levels as high as 1 mM, and that is assuming uniform distribution over all cells (Arneson and Durbin, 1967). Such an abundant nitrogen- and carbon-rich secondary metabolite would be a good nutrient source for pathogens if they would be able to overcome its toxicity. Indeed, C. fulvum is able to hydrolyze GAs into their harmless aglycones and lycotetraose. The final fate of these derivatives was so far unknown. In chapter 5, I propose stachydrine as the most likely degradation product of the GAs. Like sugar alcohols, stachydrine has been reported to have antioxidant activity and play a role in osmo-protection (Figure 3). Fungal infection also results in the formation of the osmo-protectant sugar alcohols, manitol and xylitol, suggesting that the formation of such protecting, energy-rich molecules is a common strategy of fungi (Amin et al., 1995; McNeil et al., 1999; Shen et al., 1999; Clark
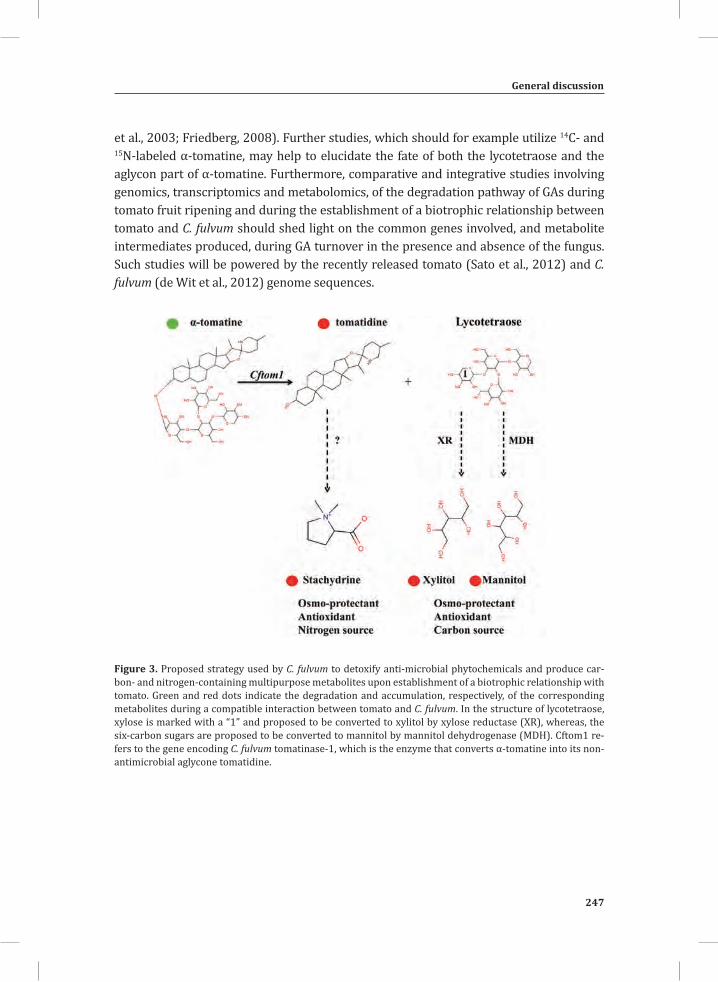
General discussion
247
Chapter 6
et al., 2003; Friedberg, 2008). Further studies, which should for example utilize 14C- and 15N-labeled α-tomatine, may help to elucidate the fate of both the lycotetraose and the aglycon part of α-tomatine. Furthermore, comparative and integrative studies involving genomics, transcriptomics and metabolomics, of the degradation pathway of GAs during tomato fruit ripening and during the establishment of a biotrophic relationship between tomato and C. fulvum should shed light on the common genes involved, and metabolite intermediates produced, during GA turnover in the presence and absence of the fungus. Such studies will be powered by the recently released tomato (Sato et al., 2012) and C. fulvum (de Wit et al., 2012) genome sequences.
Figure 3. Proposed strategy used by C. fulvum to detoxify anti-microbial phytochemicals and produce car-bon- and nitrogen-containing multipurpose metabolites upon establishment of a biotrophic relationship with tomato. Green and red dots indicate the degradation and accumulation, respectively, of the corresponding metabolites during a compatible interaction between tomato and C. fulvum. In the structure of lycotetraose, xylose is marked with a “1” and proposed to be converted to xylitol by xylose reductase (XR), whereas, the six-carbon sugars are proposed to be converted to mannitol by mannitol dehydrogenase (MDH). Cftom1 re-fers to the gene encoding C. fulvum tomatinase-1, which is the enzyme that converts α-tomatine into its non-antimicrobial aglycone tomatidine.
248
Chapter 6
Concluding remarks
This thesis reflects the power of integrative systems biology for the elucidation of the molecular mechanisms underpinning host resistance and the subsequent countermeasures taken by the pathogen during the establishment of a biotrophic relationship. The availability of transcriptome and metabolome data on a range of samples enabled us to identify many important components of the host defense response. The remarkable correlations between primary and secondary metabolites, lipids and plant hormones (SA and ethylene) on the one hand, and the regulation of genes involved in the biosynthesis and signaling of these small molecules, on the other, suggests that the different technological platforms can now take us to the point of biological integration. Further advances can be made through statistical integration of the multilayer information, for example through combined gene expression-metabolic networks, which could help with gene function prediction and metabolite identification. It should be noted, though, that for such an approach large numbers of samples of different plant-fungal genotype combinations sampled over time are needed, in order to obtain sufficient statistical power in the correlation analysis. Furthermore, the success of statistical and biological integration is vital for developing mathematical models to describe the system dynamics. Such models will give leads for “fluxomics” studies (Winter and Kromer, 2013) and will create a bridge between systems and synthetic biology.
To obtain a high level of integration between the various systems, local sampling and sampling technologies will play an increasingly important role. The results obtained using the dying seedlings and the apoplastic metabolome reflect the power of local sampling. Further utilization of laser micro-dissection technologies for the highly localized sampling of tissues for transcriptome and metabolome analysis, will make a paramount contribution to the generation of high quality data for integration. Another important area is to obtain knowledge on the exact cellular localization of metabolites at the infection sites. For that, in situ MS technologies with high spatial resolution, such as Laser Ablation Electro Spray Ionization (LAESI), will provide the metabolome read out of a tissue at around 200µm (10-15 plant cells) resolution (Nemes et al., 2010; Rubakhin et al., 2010). These technological advances will allows us to capture the biological changes at the tissue and cellular level. The next challenge will be to understand a living system at the level of cellular compartmentalization of biological processes, a daunting challenge for systems biology for the coming decades. However, looking back to the technological advances that we made during the past 5 decades, I would say that although it is not easy, it will not be impossible to ultimately capture the real sense of cellular networking.
General discussion
249
Chapter 6
References
Amin U, Lash T, Wilkinson B (1995) Proline betaine is a highly effective osmoprotectant for Staphylococcus aureus. Arch Microbiol. 163: 138-142
Arneson PA, Durbin RD (1967) Hydrolysis of tomatine by Septoria lycopersici - a detoxification mechanism. Phytopathology 57: 1358-1360
Augner M (1995) Low nutritive quality as a plant defence: Effects of herbivore-mediated interactions. Evol Ecol. 9: 605-616
Bendahmane A, Kanyuka K, Baulcombe DC (1999) The Rx gene from potato controls separate virus resistance and cell death responses. Plant Cell 11: 781-791
Berr A, Menard R, Heitz T, Shen WH (2012) Chromatin modification and remodelling: a regulatory landscape for the control of Arabidopsis defence responses upon pathogen attack. Cell Microbiol 14: 829-839
Bulgarelli D, Biselli C, Collins NC, Consonni G, Stanca AM, Schulze-Lefert P, Vale G (2010) The CC-NB-LRR-type Rdg2a resistance gene confers immunity to the seed-borne barley leaf stripe pathogen in the absence of hypersensitive cell death. PLoS One 5
Cai XZ, Takken FLW, Joosten MHAJ, De Wit PJGM (2001) Specific recognition of AVR4 and AVR9 results in distinct patterns of hypersensitive cell death in tomato, but similar patterns of defence-related gene expression. Mol Plant Pathol 2: 77-86
Chang C, Yu D, Jiao J, Jing S, Schulze-Lefert P, Shen QH (2013) Barley MLA immune receptors directly interfere with antagonistically acting transcription factors to initiate disease resistance signaling. Plant Cell 25: 1158-1173
Clark AJ, Blissett KJ, Oliver RP (2003) Investigating the role of polyols in Cladosporium fulvum during growth under hyper-osmotic stress and in planta. Planta 216: 614-619
Cornish-Bowden A (2011) Systems biology. How far has it come. Biochemist 33: 16-18Covington MF, Harmer SL (2007) The circadian clock regulates auxin signaling and responses in Arabidopsis.
PLoS Biol 5: e222de Jong CF, Takken FLW, Cai XH, de Wit PJGM, Joosten MHAJ (2002) Attenuation of Cf-mediated defense
responses at elevated temperatures correlates with a decrease in elicitor-binding sites. Mol Plant Microbe Interact 15: 1040-1049
de Jonge R, van Esse HP, Kombrink A, Shinya T, Desaki Y, Bours R, van der Krol S, Shibuya N, Joosten MH, Thomma BP (2010) Conserved fungal LysM effector Ecp6 prevents chitin-triggered immunity in plants. Science 329: 953-955
de Jonge R, van Esse HP, Maruthachalam K, Bolton MD, Santhanam P, Saber MK, Zhang Z, Usami T, Lievens B, Subbarao KV, Thomma BPHJ (2012) Tomato immune receptor Ve1 recognizes effector of multiple fungal pathogens uncovered by genome and RNA sequencing. P Natl Acad Sci USA 109: 5110-5115
de Wit PGM (1977) A light and scanning-electron microscopic study of infection of tomato plants by virulent and avirulent races of Cladosporium fulvum. 83: 109-122
de Wit PJGM, van der Burgt A, Okmen B, Stergiopoulos I, Abd-Elsalam KA, Aerts AL, Bahkali AH, Beenen HG, Chettri P, Cox MP, Datema E, de Vries RP, Dhillon B, Ganley AR, Griffiths SA, Guo YA, Hamelin RC, Henrissat B, Kabir MS, Jashni MK, Kema G, Klaubauf S, Lapidus A, Levasseur A, Lindquist E, Mehrabi R, Ohm RA, Owen TJ, Salamov A, Schwelm A, Schijlen E, Sun H, van den Burg HA, van Ham RCHJ, Zhang SG, Goodwin SB, Grigoriev IV, Collemare J, Bradshaw RE (2012) The genomes of the fungal plant pathogens Cladosporium fulvum and Dothistroma septosporum reveal adaptation to different hosts and lifestyles but also signatures of common ancestry. Plos Genet 8: 1-22
de Wit PJGMd, Joosten MHAJ, Thomma BPHJ, Stergiopoulos I (2009) Gene for gene models and beyond: the Cladosporium fulvum-tomato pathosystem. In Plant Relationships. Springer, Berlin Heidelberg, pp 135-156
Denance N, Sanchez-Vallet A, Goffner D, Molina A (2013) Disease resistance or growth: the role of plant hormones in balancing immune responses and fitness costs. Front Plant Sci 4: 155
Dudareva N, Andersson S, Orlova I, Gatto N, Reichelt M, Rhodes D, Boland W, Gershenzon J (2005) The nonmevalonate pathway supports both monoterpene and sesquiterpene formation in snapdragon flowers. Proc Natl Acad Sci USA 102: 933-938
El Oirdi M, El Rahman TA, Rigano L, El Hadrami A, Rodriguez MC, Daayf F, Vojnov A, Bouarab K (2011) Botrytis cinerea manipulates the antagonistic effects between immune pathways to promote disease development in tomato. Plant cell 23: 2405-2421
Eltayeb EA, Roddick JG (1985) Biosynthesis and degradation of alpha-tomatine in developing tomato fruits. Phytochemistry 24: 253-257
250
Chapter 6
Etalo DW, Stulemeijer IJ, van Esse HP, de Vos RC, Bouwmeester HJ, Joosten MHAJ (2013) System-wide hypersensitive response-associated transcriptome and metabolome reprogramming in tomato. Plant Physiol 162: 1599-1617
Friedberg EC (2008) Sydney Brenner. Nat Rev Mol Cell Biol. 9: 8-9Fukuda H (2000) Programmed cell death of tracheary elements as a paradigm in plants. Plant Mol Biol 44:
245-253Gómez-Gómez L, Boller T (2000) FLS2: An LRR Receptor–like Kinase Involved in the Perception of the
Bacterial Elicitor Flagellin in Arabidopsis. Mol Cell 5: 1003-1011Goulden MG, Baulcombe DC (1993) Functionally homologous host components recognize potato virus X in
Gomphrena globosa and potato. Plant Cell 5: 921-930Hammond-Kosack KE, Jones JD (1996) Resistance gene-dependent plant defense responses. Plant Cell 8:
1773-1791Harmer SL (2009) The circadian system in higher plants. Annu Rev Plant Biol 60: 357-377He SY, Bauer DW, Collmer A, Beer SV (1994) Hypersensitive response elicited by Erwinia amylovora harpin
requires active-plant metabolism. Mol Plant Microbe Interact 7: 289-292Jacob F (1974) The logic of living systems. London: Allen Lane Jakobek JL, Lindgren PB (1993) Generalized induction of defense responses in bean is not correlated with the
induction of the hypersensitive reaction. Plant Cell 5: 49-56Joosten MAHJ, de Wit PJGM (1999) The tomato-Cladosporium fulvum interaction : A versatile experimental
system to study plant-pathogen interactions. Annu Rev Phytopathol 37: 335-367Joosten MHAJ, Vogelsang R, Cozijnsen TJ, Verberne MC, DeWit PJGM (1997) The biotrophic fungus
Cladosporium fulvum circumvents Cf-4-mediated resistance by producing unstable AVR4 elicitors. Plant Cell 9: 367-379
Joyce AR, Palsson BO (2006) The model organism as a system: integrating ‘omics’ data sets. Nat Rev Mol Cell Bio 7: 198-210
Katsir L, Schilmiller AL, Staswick PE, He SY, Howe GA (2008) COI1 is a critical component of a receptor for jasmonate and the bacterial virulence factor coronatine. P Natl Acad Sci USA 105: 7100-7105
King RD, Whelan KE, Jones FM, Reiser PGK, Bryant CH, Muggleton SH, Kell DB, Oliver SG (2004) Functional genomic hypothesis generation and experimentation by a robot scientist. Nature 427: 247-252
Kiraly Z, Barna B, Ersek T (1972) Hypersensitivity as a consequence, not cause, of plant resistance to infection. Nature 239: 456-&
Kirschner MW (2005) The meaning of systems biology. Cell 121: 503-504Kliebenstein DJ, Rowe HC (2008) Ecological costs of biotrophic versus necrotrophic pathogen resistance, the
hypersensitive response and signal transduction. Plant Sci 174: 551-556Kongsawadworakul P, Viboonjun U, Romruensukharom P, Chantuma P, Ruderman S, Chrestin H (2009)
The leaf, inner bark and latex cyanide potential of Hevea brasiliensis: Evidence for involvement of cyanogenic glucosides in rubber yield. Phytochemistry 70: 730-739
Kouzai Y, Nakajima K, Hayafune M, Ozawa K, Kaku H, Shibuya N, Minami E, Nishizawa Y (2014) CEBiP is the major chitin oligomer-binding protein in rice and plays a main role in the perception of chitin oligomers. Plant Mol Biol. 84: 519-528
Kozukue N, Friedman M (2003) Tomatine, chlorophyll, β-carotene and lycopene content in tomatoes during growth and maturation. J Sci Food Agric 83: 195-200
Kozukue N, Han JS, Lee KR, Friedman M (2004) Dehydrotomatine and alpha-tomatine content in tomato fruits and vegetative plant tissues. J Agr Food Chem 52: 2079-2083
Lehnackers H, Knogge W (1990) Cytological studies on the infection of barley cultivars with known resistance genotypes by Rhynchosporium-Secalis. Can J Bot 68: 1953-1961
Lieberei R, Selmar D, Biehl B (1985) Metabolization of Cyanogenic Glucosides in Hevea-Brasiliensis. Plant Syst Evol 150: 49-63
Liebrand TWH, van den Berg GCM, Zhang Z, Smit P, Cordewener JHG, America AHP, Sklenar J, Jones AME, Tameling WIL, Robatzek S, Thomma BPHJ, Joosten MHAJ (2013) Receptor-like kinase SOBIR1/EVR interacts with receptor-like proteins in plant immunity against fungal infection. P Natl Acad Sci USA 110: 13228-13228
Lu D, Wu S, Gao X, Zhang Y, Shan L, He P (2010) A receptor-like cytoplasmic kinase, BIK1, associates with a flagellin receptor complex to initiate plant innate immunity. Proc Natl Acad Sci U S A 107: 496-501
Maleck K, Levine A, Eulgem T, Morgan A, Schmid J, Lawton KA, Dangl JL, Dietrich RA (2000) The transcriptome of Arabidopsis thaliana during systemic acquired resistance. Nat Genet 26: 403-410
McNeil SD, Nuccio ML, Hanson AD (1999) Betaines and related osmoprotectants. Targets for metabolic engineering of stress resistance. Plant Physiol 120: 945-950
General discussion
251
Chapter 6
Meng X, Xu J, He Y, Yang KY, Mordorski B, Liu Y, Zhang S (2013) Phosphorylation of an ERF transcription factor by Arabidopsis MPK3/MPK6 regulates plant defense gene induction and fungal resistance. Plant Cell 25: 1126-1142
Moore JW, Loake GJ, Spoel SH (2011) Transcription dynamics in plant immunity. Plant Cell 23: 2809-2820Naito K, Taguchi F, Suzuki T, Inagaki Y, Toyoda K, Shiraishi T, Ichinose Y (2008) Amino acid sequence
of bacterial microbe-associated molecular pattern flg22 is required for virulence. Mol Plant Microbe Interact 21: 1165-1174
Neilson EH, Goodger JQD, Woodrow IE, Moller BL (2013) Plant chemical defense: at what cost? Trends Plant Sci 18: 250-258
Nemes P, Woods AS, Vertes A (2010) Simultaneous imaging of small metabolites and lipids in rat brain tissues at atmospheric pressure by laser ablation electrospray ionization mass spectrometry. Anal Chem 82: 982-988
Niki T, Mitsuhara I, Seo S, Ohtsubo N, Ohashi Y (1998) Antagonistic effect of salicylic acid and jasmonic acid on the expression of pathogenesis-related (PR) protein genes in wounded mature tobacco leaves. Plant Cell Physiol 39: 500-507
Okmen B, Etalo DW, Joosten MHAJ, Bouwmeester HJ, de Vos RCH, Collemare J, de Wit PJGM (2013) Detoxification of -tomatine by Cladosporium fulvum is required for full virulence on tomato. New Phytol 198: 1203-1214
Oldiges M, Lütz S, Pflug S, Schroer K, Stein N, Wiendahl C (2007) Metabolomics: current state and evolving methodologies and tools. Appl Microbiol Biotechnol. 76: 495-511
Opgen-Rhein R, Strimmer K (2007) From correlation to causation networks: a simple approximate learning algorithm and its application to high-dimensional plant gene expression data. Bmc Syst Biol 1: 1-10
Petutschnig EK, Jones AME, Serazetdinova L, Lipka U, Lipka V (2010) The Lysin Motif Receptor-like Kinase (LysM-RLK) CERK1 Is a Major Chitin-binding Protein in Arabidopsis thaliana and Subject to Chitin-induced Phosphorylation. J Biol Chem 285: 28902-28911
Pozo MJ, Van Der Ent S, Van Loon LC, Pieterse CMJ (2008) Transcription factor MYC2 is involved in priming for enhanced defense during rhizobacteria-induced systemic resistance in Arabidopsis thaliana. New Phytol 180: 511-523
Pruneda-Paz JL, Kay SA (2010) An expanding universe of circadian networks in higher plants. Trends Plant Sci 15: 259-265
Rosenthal GA (1990) Metabolism of L-canavanine and L-canaline in leguminous plants. Plant Physiol 94: 1-3Rubakhin SS, Sweedler JV, Nemes P, Vertes A (2010) Laser ablation electrospray ionization for atmospheric
pressure molecular imaging mass spectrometry. In Mass Spectrometry Imaging, Vol 656. Humana Press, pp 159-171
Rushton PJ, Somssich IE (1998) Transcriptional control of plant genes responsive to pathogens. Curr Opin Plant Biol 1: 311-315
Rushton PJ, Somssich IE, Ringler P, Shen QJ (2010) WRKY transcription factors. Trends Plant Sci 15: 247-258Sato S, Tabata S, Hirakawa H, Asamizu E, Shirasawa K, Isobe S, Kaneko T, Nakamura Y, Shibata D, Aoki
K, Egholm M, Knight J, Bogden R, Li CB, Shuang Y, Xu X, Pan SK, Cheng SF, Liu X, Ren YY, Wang J, Albiero A, Dal Pero F, Todesco S, Van Eck J, Buels RM, Bombarely A, Gosselin JR, Huang MY, Leto JA, Menda N, Strickler S, Mao LY, Gao S, Tecle IY, York T, Zheng Y, Vrebalov JT, Lee J, Zhong SL, Mueller LA, Stiekema WJ, Ribeca P, Alioto T, Yang WC, Huang SW, Du YC, Zhang ZH, Gao JC, Guo YM, Wang XX, Li Y, He J, Li CY, Cheng ZK, Zuo JR, Ren JF, Zhao JH, Yan LH, Jiang HL, Wang B, Li HS, Li ZJ, Fu FY, Chen BT, Han B, Feng Q, Fan DL, Wang Y, Ling HQ, Xue YBA, Ware D, McCombie WR, Lippman ZB, Chia JM, Jiang K, Pasternak S, Gelley L, Kramer M, Anderson LK, Chang SB, Royer SM, Shearer LA, Stack SM, Rose JKC, Xu YM, Eannetta N, Matas AJ, McQuinn R, Tanksley SD, Camara F, Guigo R, Rombauts S, Fawcett J, Van de Peer Y, Zamir D, Liang CB, Spannagl M, Gundlach H, Bruggmann R, Mayer K, Jia ZQ, Zhang JH, Ye ZBA, Bishop GJ, Butcher S, Lopez-Cobollo R, Buchan D, Filippis I, Abbott J, Dixit R, Singh M, Singh A, Pal JK, Pandit A, Singh PK, Mahato AK, Dogra V, Gaikwad K, Sharma TR, Mohapatra T, Singh NK, Causse M, Rothan C, Schiex T, Noirot C, Bellec A, Klopp C, Delalande C, Berges H, Mariette J, Frasse P, Vautrin S, Zouine M, Latche A, Rousseau C, Regad F, Pech JC, Philippot M, Bouzayen M, Pericard P, Osorio S, del Carmen AF, Monforte A, Granell A, Fernandez-Munoz R, Conte M, Lichtenstein G, Carrari F, De Bellis G, Fuligni F, Peano C, Grandillo S, Termolino P, Pietrella M, Fantini E, Falcone G, Fiore A, Giuliano G, Lopez L, Facella P, Perrotta G, Daddiego L, Bryan G, Orozco M, Pastor X, Torrents D, van Schriek KNVMGM, Feron RMC, van Oeveren J, de Heer P, daPonte L, Jacobs-Oomen S, Cariaso M, Prins M, van Eijk MJT, Janssen A, van Haaren MJJ, Jo SH, Kim J, Kwon SY, Kim S, Koo DH, Lee S, Hur CG, Clouser C, Rico A, Hallab A, Gebhardt C, Klee K, Jocker A, Warfsmann J, Gobel U, Kawamura S, Yano K, Sherman JD,
Summary
252
Chapter 6
Fukuoka H, Negoro S, Bhutty S, Chowdhury P, Chattopadhyay D, Datema E, Smit S, Schijlen EWM, van de Belt J, van Haarst JC, Peters SA, van Staveren MJ, Henkens MHC, Mooyman PJW, Hesselink T, van Ham RCHJ, Jiang GY, Droege M, Choi D, Kang BC, Kim BD, Park M, Kim S, Yeom SI, Lee YH, Choi YD, Li GC, Gao JW, Liu YS, Huang SX, Fernandez-Pedrosa V, Collado C, Zuniga S, Wang GP, Cade R, Dietrich RA, Rogers J, Knapp S, Fei ZJ, White RA, Thannhauser TW, Giovannoni JJ, Botella MA, Gilbert L, Gonzalez R, Goicoechea JL, Yu Y, Kudrna D, Collura K, Wissotski M, Wing R, Schoof H, Meyers BC, Gurazada AB, Green PJ, Mathur S, Vyas S, Solanke AU, Kumar R, Gupta V, Sharma AK, Khurana P, Khurana JP, Tyagi AK, Dalmay T, Mohorianu I, Walts B, Chamala S, Barbazuk WB, Li JP, Guo H, Lee TH, Wang YP, Zhang D, Paterson AH, Wang XY, Tang HB, Barone A, Chiusano ML, Ercolano MR, D’Agostino N, Di Filippo M, Traini A, Sanseverino W, Frusciante L, Seymour GB, Elharam M, Fu Y, Hua A, Kenton S, Lewis J, Lin SP, Najar F, Lai HS, Qin BF, Qu CM, Shi RH, White D, White J, Xing YB, Yang KQ, Yi J, Yao ZY, Zhou LP, Roe BA, Vezzi A, D’Angelo M, Zimbello R, Schiavon R, Caniato E, Rigobello C, Campagna D, Vitulo N, Valle G, Nelson DR, De Paoli E, Szinay D, de Jong HH, Bai YL, Visser RGF, Lankhorst RMK, Beasley H, McLaren K, Nicholson C, Riddle C, Gianese G, Consortium TG (2012) The tomato genome sequence provides insights into fleshy fruit evolution. Nature 485: 635-641
Schafer P, Pfiffi S, Voll LM, Zajic D, Chandler PM, Waller F, Scholz U, Pons-Kuhnemann J, Sonnewald S, Sonnewald U, Kogel KH (2009) Manipulation of plant innate immunity and gibberellin as factor of compatibility in the mutualistic association of barley roots with Piriformospora indica. Plant J 59: 461-474
Schiffer R, Gorg R, Jarosch B, Beckhove U, Bahrenberg G, Kogel KH, Schulze-Lefert P (1997) Tissue dependence and differential cordycepin sensitivity of race-specific resistance responses in the barley powdery mildew interaction. Mol Plant Microbe Interact 10: 830-839
Schmelz EA, Alborn HT, Tumlinson JH (2003) Synergistic interactions between volicitin, jasmonic acid and ethylene mediate insect-induced volatile emission in Zea mays. Physiol Plant 117: 403-412
Selmar D (1993) Transport of cyanogenic glucosides - linustatin Uptake by hevea cotyledons. Planta 191: 191-199
Selmar D, Lieberei R, Biehl B (1988) Mobilization and utilization of cyanogenic glycosides - the linustatin pathway. Plant Physiol 86: 711-716
Shen B, Hohmann S, Jensen RG, Bohnert a H (1999) Roles of sugar alcohols in osmotic stress adaptation. Replacement of glycerol by mannitol and sorbitol in yeast. Plant Physiol 121: 45-52
Stakman EC (1915) Relation between Puccinia graminis and plants highly resistant to its attack. J Agric Res 4: 193–200
Stulemeijer IJ, Joosten MH, Jensen ON (2009) Quantitative phosphoproteomics of tomato mounting a hypersensitive response reveals a swift suppression of photosynthetic activity and a differential role for hsp90 isoforms. J Proteome Res 8: 1168-1182
Stulemeijer IJE, Stratmann JW, Joosten MHAJ (2007) Tomato mitogen-activated protein kinases LeMPK1, LeMPK2, and LeMPK3 are activated during the cf-4/Avr4-induced hypersensitive response and have distinct phosphorylation specificities. Plant Physiol 144: 1481-1494
Takahashi H, Kanayama Y, Zheng MS, Kusano T, Hase S, Ikegami M, Shah J (2004) Antagonistic interactions between the SA and JA signaling pathways in Arabidopsis modulate expression of defense genes and gene-for-gene resistance to cucumber mosaic virus. Plant Cell Physiol 45: 803-809
Thaler J, Fidantsef A, Bostock R (2002) Antagonism between jasmonate- and salicylate-mediated induced plant resistance: Effects of concentration and timing of elicitation on defense-related proteins, herbivore, and pathogen performance in tomato. J Chem Ecol. 28: 1131-1159
Thaler JS, Humphrey PT, Whiteman NK (2012) Evolution of jasmonate and salicylate signal crosstalk. Trends Plant Sci 17: 260-270
Thilmony R, Underwood W, He SY (2006) Genome-wide transcriptional analysis of the Arabidopsis thaliana interaction with the plant pathogen Pseudomonas syringae pv. tomato DC3000 and the human pathogen Escherichia coli O157:H7. Plant J 46: 34-53
van Esse HP, van’t Klooster JW, Bolton MD, Yadeta KA, van Baarlen P, Boeren S, Vervoort J, de Wit PJGM, Thomma BPHJ (2008) The Cladosporium fulvum virulence protein Avr2 inhibits host proteases required for basal defense. Plant Cell 20: 1948-1963
Winter G, Kromer JO (2013) Fluxomics - connecting ‘omics analysis and phenotypes. Environ Microbiol 15: 1901-1916
Wolter M, Hollricher K, Salamini F, Schulze-Lefert P (1993) The mlo resistance alleles to powdery mildew infection in barley trigger a developmentally controlled defence mimic phenotype. Mol Gen Genet 239: 122-128
253
SummaryChapter 6
Summary
Reductionist approaches have been dominating studies on plant defense against invading pathogens and have resulted in a profound insight into the complexity of the molecular warfare between plants and pathogens. To further deal with this complexity, the joining of forces between component biology and systems biology has proven to be a viable strategy. Although the field of systems biology is rapidly evolving, the use of this discipline as a tool to integrate high-throughput ~omics technologies to study plant-microbe interactions, is just beginning to be explored. In the work described in this thesis, an integrated approach involving transcriptomics and metabolomics was used to explore the mechanisms underpinning tomato resistance to the leaf mold fungus Cladosporium fulvum and the counter measures taken by the fungus, leading to host susceptibility.
Chapter 1 provides a brief overview of the various systems biology approaches in studies aimed at deciphering plant-microbe interactions. The chapter also introduces the tomato-C. fulvum pathosystem and describes the different layers of the plant immune system, with special emphasis on chemical defense.
Chapter 2 describes the analysis of the transcriptional and metabolic changes associated with mounting of the hypersensitive response (HR), which is a form of programmed cell death that occurs at the site of pathogen entry in resistant plants. For this study, tomato plants that express both a Cf gene for resistance to C. fulvum and the matching avirulence (Avr) gene of this pathogen, are used. In these so-called dying seedlings, a massive reprogramming of both the transcriptome (microarray-based) and the metabolome occurred upon mounting of the Cf/Avr-induced HR. The multilayer information that was obtained showed that the aromatic amino acid (AAA) biosynthesis pathway and AAA-derived phenylpropanoid accumulation were highly induced in these Cf/Avr plants. In addition to the induction of the biosynthesis of primary and secondary metabolites, there was a massive induction of energy-generating and energy-conserving catabolic processes. Co-expression analysis pointed to WRKY transcription factors as the most prominent orchestrators of the HR.
Chapter 3 provides a systems view on the regulatory mechanisms involved in the growth/defence trade-off. Using RNA-seq analysis, the global change in the transcriptome of the dying seedlings, also employed in chapter 2, was compared to that of resistant and susceptible tomato plants inoculated with C. fulvum. This analysis revealed that plants that are mounting a resistance response to the fungus undergo massive transcriptional reprogramming resulting in a shift towards energy generation at the expense of growth. For example, a number of catabolic processes that generate acetyl-CoA, an important intermediate for the energy cycle and the biosynthesis of a wide
254
Summary Summary
range of defence-associated primary and secondary metabolites, were up-regulated. The induction of these catabolic processes coincides with a significant reduction in the levels of trehalose-6-phosphate, which plays a central role in the maintenance of energy homeostasis during carbon starvation, and is accompanied by the accumulation of trehalose.
Chapter 4 deals with the functional characterization of tomato WRKY transcription factors (SlWRKYs) in the regulation of the defense transcriptome and metabolome. Both in the microarray-based (chapter 2) and in the RNA-seq-based (chapter 3) transcriptional profiling studies, genes encoding tomato WRKYs (SlWRKYs) showed the most pronounced changes upon activation of the defence response of tomato resistant to C. fulvum. In the RNA-seq analysis 36, out of a total of 59 expressed SlWRKYs, were transcriptionally up-regulated, whereas the transcription of only two of them was suppressed. Virus-induced gene silencing (VIGS) of selected differentially regulated, and possibly functionally redundant, SlWRKYs showed that this class of transcription factors consists of a group of key regulators, some of which are activating and some of which are suppressing the plant immune response. Untargeted metabolomics showed that suppression of the expression of SlWRKY31/33 and SlWRKY80 (an ortholog of AtWRKY70) by VIGS in resistant Cf-4-expressing tomato plants resulted in an increase in plant susceptibility, which is similar to the increased susceptibility that is observed when the expression of the resistance gene Cf-4 itself is knocked-down. Targeting of the expression of defence repressors (SlWRKY39/40/45/46) boosted basal defence in susceptible plants, resulting in a drastic reduction of C. fulvum proliferation. Compared to the control (GUS-silenced) plants, targeting of (combinations of) the genes encoding these SlWRKYs in resistant plants, followed by inoculation with C. fulvum, resulted in significant changes in the apoplast metabolome. This supports their involvement in the defence-associated metabolome reprogramming of tomato upon its colonisation by C. fulvum.
Chapter 5 provides a detailed analysis of the major alterations that occur in the metabolome of tomato leaves upon successful and unsuccessful colonization by C. fulvum. For this, we performed a comprehensive untargeted metabolic profiling of whole leaf, as well as of leaf apoplastic extracts of resistant (incompatible interaction) and susceptible (compatible interaction) tomato plants challenged with C. fulvum. In whole leaf extracts, substantial changes were detectable for a large variety of metabolites, including polar, semi-polar and apolar compounds, while in the apoplast only the more polar and semi-polar compounds changed in abundance. In the incompatible interaction, an early (4-6 days post inoculation) increase in the accumulation of a number of phospholipids and secondary metabolites was apparent. Interestingly, in the compatible interaction the major change that was observed was the conversion of a number of antimicrobial glycoalkaloids into their less toxic derivatives and the accumulation of several sugar
255
Summary Summary
alcohols in both the whole leaf and the apoplast. Although α-tomatine, the most abundant tomato glycoalkaloid, was thought to be localized in the vacuole, for the first time we show that this compound is also present in the apoplast. Furthermore, we show that α-tomatine is hydrolyzed by C. fulvum tomatinase-1 (CfTom1), upon colonization of the leaf apoplast by the fungus. CfTom1 belongs to the glycosyl hydrolase (GH)-10 gene family and encodes a tomatinase, for which we showed that it can degrade α-tomatine into its non-toxic aglycone, tomatidine, in vitro as well as in planta during successful colonization of tomato leaves. Functional analysis of ∆cftom1 knock-out mutants of C. fulvum showed that degradation of α-tomatine is required for full virulence of the fungus on tomato. We observed that this must be due to the higher level of the toxic α-tomatine, rather than to the presumed suppression of basal defense by α-tomatine breakdown products. Finally, based on experimental evidence, we propose stachydrine, a pyrrolidine alkaloid reported to be present in several plant species, to be a possible degradation product of α-tomatine.
Chapter 6 provides a systems biology perspective on the biological integration of multilayer information obtained from ~omics data. Based on the integration of all this information, inferences are made about the possible role of the HR in the resistance response of tomato. Furthermore, this chapter provides insight into the possible key regulatory components that govern the growth/defense trade-off. The potential of metabolomics studies in the discovery of pathogen effectors and biomarkers associated with susceptibility and resistance is discussed. Chapter 6 also provides insight into the possible implications of the comprehensive metabolic changes that occur during the interaction of C. fulvum with tomato, with an emphasis on the strategies that enable C. fulvum to establish a successful biotrophic relationship with its host. The importance of biological integration and the need for statistical integration and mathematical modeling of a system are discussed and they are suggested to form a bridge between systems and synthetic biology. Finally, the contribution of spatial sampling technologies to complement a meaningful integration of multilayer information is discussed.
256
Samenvatting Samenvatting
Samenvatting
Wetenschappelijke studies gericht op de afweer van planten tegen binnendringende ziekteverwekkers zijn tot nu toe voornamelijk uitgevoerd vanuit een reductionistische benadering. Deze studies hebben geleid tot een gedetailleerd inzicht in de complexiteit van de strijd tussen planten en ziekteverwekkers op moleculair niveau. Een combinatie van deze reductionistische benadering met een meer moderne systeem-biologische benadering, gebaseerd op “high-throughput” “-omics” technologieën zou moeten helpen deze complexiteit beter te begrijpen. Echter, het gebruik van een dergelijke geïntegreerde benadering bij onderzoek aan de interactie tussen planten en micro-organismen is nog maar net begonnen. In het onderzoek beschreven in dit proefschrift is gebruik gemaakt van een combinatie van transcriptomics (genexpressie analyse) en metabolomics (metaboliet analyse) om meer inzicht te krijgen in de mechanismen die ten grondslag liggen aan de resistentie van tomaat tegen het bladpathogeen Cladosporium fulvum en de strategie van de schimmel om die afweer af te slaan en de plant te infecteren.
Hoofdstuk 1 geeft een kort overzicht van de verschillende, op systeembiologie gebaseerde studies gericht op het ontcijferen van de interacties tussen planten en hun microbiële ziekteverwekkers. Het hoofdstuk introduceert ook het tomaat - C. fulvum pathosysteem en beschrijft de diverse lagen van het immuunsysteem van de plant, met speciale nadruk op de chemische afweer van planten tegen de binnendringende schimmel.
Hoofdstuk 2 beschrijft de analyse van de transcriptionele en metabolische veranderingen die geassocieerd zijn met het activeren van de zogenaamde overgevoeligheidsreactie (“hypersensitieve response”). Dit is een vorm van geprogrammeerde celdood die specifiek in resistente planten plaatsvindt op de plaats waar de ziekteverwekker het plantenweefsel binnen probeert te dringen en verdere kolonisatie door de schimmel effectief tegengaat. Voor deze studie werden tomatenplanten gebruikt die zowel een gen voor resistentie tegen C. fulvum als het bijbehorende avirulentie (Avr) gen van de ziekteverwekker tot expressie brengen. In deze zogenaamde ‘doodgaande zaailingen’ vindt de geïnduceerde celdood (als gevolg van het activeren van de Cf/Avr-interactie) plaats in de gehele plant zonder dat inoculatie met de schimmel nodig is. Met deze transgene planten kunnen de processen bestudeerd worden die normaal in resistente planten bij schimmelinfectie slechts zeer lokaal plaatsvinden en daardoor moeilijk te onderzoeken zijn. Het bleek dat er tijdens deze Cf/Avr-geïnduceerde celdood een massale herprogrammering plaatsvindt op zowel transcriptioneel niveau (gebaseerd op microarrays) als metabolisch niveau (gebaseerd op massaspectrometrie). Met name de aromatische aminozuur biosynthese en de hiervan afgeleide phenyl-propanoïden biosynthese werden sterk geïnduceerd in deze Cf/Avr planten. Naast de inductie van de
257
Samenvatting Samenvatting
biosynthese van deze primaire en secundaire metabolieten was er een sterke activering van energie producerende en energie besparende katabolische processen. Co-expressie analyse liet zien dat zogenaamde “WRKY” transcriptiefactoren belangrijke regulatoren zijn bij deze overgevoeligheidsreactie.
Hoofdstuk 3 geeft een overzicht van de mechanismen die betrokken zijn bij het negatieve effect van het activeren van de resistentiereactie op de groei van de plant. Met behulp van transcriptoom sequentieanalyse (RNA-seq) werden de veranderingen in het transcriptoom van de ‘doodgaande zaailingen’ vergeleken met die van resistente (incompatibele interactie) en vatbare (compatibele interactie) tomatenplanten die waren geïnoculeerd met C. fulvum. Dit onderzoek liet zien dat ook resistente planten door hun lokale overgevoeligheidsreactie een zeer sterke transcriptionele herprogrammering ondergaan. De veranderingen in het transcriptoom wezen op een verschuiving naar het opwekken van energie ten koste van de groei. Een aantal katabolische processen die acetyl-CoA genereren - dat een belangrijk tussenproduct is in de energiecyclus en in de biosynthese van een breed scala aan afweer-gerelateerde primaire en secundaire metabolieten - waren sterk geactiveerd. De inductie van deze katabolische processen viel samen met een duidelijke vermindering van de hoeveelheid trehalose-6-fosfaat, dat een centrale rol speelt in het behoud van de energie homeostase gedurende een koolstoftekort, en een accumulatie van trehalose.
Hoofdstuk 4 behandelt de functionele karakterisering van tomaat WRKY transcriptiefactoren die een belangrijke rol lijken te spelen bij de regulatie van het transcriptoom en metaboloom tijdens de resistentiereactie. Uit de Hoofdstukken 2 en 3 bleek dat genen die coderen voor tomaat WRKYs (SlWRKYs) de meest uitgesproken veranderingen op transcriptioneel niveau vertonen tijdens de activering van de afweerreactie van tomatenplanten tegen C. fulvum. Uit de RNA-seq analyse bleek dat 36 van de 59 SlWRKYs transcriptioneel waren geactiveerd, terwijl de transcriptie van slechts twee van hen was onderdrukt. Virus-geïnduceerde gen “silencing” (VIGS) in tomaat van geselecteerde differentieel gereguleerde, en eventueel functioneel redundante, SlWRKYs toonde aan dat deze familie van transcriptiefactoren bestaat uit een groep van centrale regulatoren, waarvan sommige de afweerreactie van de plant activeren en anderen deze juist onderdrukken. De onderdrukking van de expressie van SlWRKY31/33 en SlWRKY80 (een ortholoog van AtWRKY70) met behulp van VIGS in tomaat met het Cf-4 resistentiegen, resulteerde in een verhoogde gevoeligheid voor C. fulvum en een metabolietprofiel dat vergelijkbaar was met dat van planten waarvan de expressie van het resistentiegen Cf-4 zelf wordt onderdrukt. Anderzijds resulteerde de verlaging van de expressie van afweer-onderdrukkende WRKYs (SlWRKY39/40/45/46) in een metabolietprofiel dat wijst op een stimulatie van de basale afweerreactie van vatbare planten. Deze planten vertoonden inderdaad een sterk verminderde vatbaarheid voor C. fulvum. Vergeleken met controleplanten waarin VIGS van GUS plaatsvond, leidde VIGS
258
Samenvatting Samenvatting
van (combinaties van) de genen die coderen voor deze SlWRKYs in resistente planten, gevolgd door inoculatie met C. fulvum, tot sterke veranderingen in het metaboloom van de apoplast, wat de ruimte tussen de cellen is waarin de schimmel groeit. Deze resultaten ondersteunen de betrokkenheid van de diverse SlWRKYs bij de afweer-gerelateerde herprogrammering van het metaboloom van tomaat tijdens de kolonisatie van het bladweefsel door C. fulvum.
Hoofdstuk 5 geeft een gedetailleerde analyse van de belangrijkste veranderingen die optreden in het metaboloom van tomatenbladeren na succesvolle en niet-succesvolle kolonisatie door C. fulvum. Hiervoor is een uitgebreide metaboliet analyse toegepast op gehele bladeren, evenals op de apoplast van resistente en vatbare tomatenplanten, die waren geïnoculeerd met C. fulvum. In het totale bladextract waren sterke wijzigingen meetbaar in de hoeveelheden van een grote verscheidenheid aan metabolieten, waaronder polaire, semi-polaire en apolaire verbindingen, terwijl in de apoplast alleen de meer polaire en semi-polaire verbindingen sterk in hoeveelheid veranderden. In de incompatibele interactie was er al vroeg (binnen 4 tot 6 dagen na inoculatie) een sterke accumulatie van een aantal fosfolipiden en secundaire metabolieten waar te nemen. Interessant is dat in de compatibele interactie omzettingen plaatsvonden van antimicrobiële glyco-alkaloïden in hun minder toxische derivaten en dat accumulatie optrad van verschillende suiker-alcoholen in zowel het hele blad als in de apoplast. Er werd tot nu toe aangenomen dat α-tomatine, het meest voorkomende tomaat glyco-alkaloïd, enkel aanwezig is in de vacuole van de plantencel. In dit onderzoek kon echter voor het eerst worden aangetoond dat deze verbinding (ook) in de apoplast aanwezig is en C. fulvum hiermee dus direct in contact kan komen. Daarnaast werd aangetoond dat bij de kolonisatie het α-tomatine dat aanwezig in de apoplast wordt gehydrolyseerd door C. fulvum met behulp van het enzym tomatinase-1 (CfTom1). CfTom1 behoort tot de glycosyl hydrolase (GH) -10 gen familie en codeert voor een tomatinase, waarvoor nu is aangetoond dat het α-tomatine kan afbreken tot het voor de schimmel minder of niet-toxische aglycon, tomatidine. Dit gebeurt zowel in vitro, als ook in planta bij een succesvolle kolonisatie van de plant. Verder bleek uit een functionele analyse van Δcftom1 “knock-out” mutanten van C. fulvum dat voor een volledige virulentie van de schimmel op tomaat de afbraak van het voor de schimmel giftige α-tomatine vereist is. Gebaseerd hierop, wordt verondersteld dat de eerder gepostuleerde onderdrukking van de basale plantafweer door afbraakproducten van α-tomatine, onjuist is. Daarnaast lijkt stachydrine, een pyrrolidine-alkaloïd dat in verschillende plantensoorten aanwezig is, in tomaat een schimmel-geïnduceerd afbraakproduct van α-tomatine te zijn.
Hoofdstuk 6 schetst een systeem-biologisch perspectief op de integratie van informatie van “omics” data verkregen op meerdere niveaus. Gebaseerd op de integratie van alle informatie beschreven in de voorafgaande hoofdstukken zijn conclusies getrokken over de mogelijke rol van de overgevoeligheidsreactie in de resistentie van tomaat
259
Samenvatting Samenvatting
tegen C. fulvum. Bovendien geeft dit hoofdstuk inzicht in de belangrijkste componenten die de balans tussen groei en afweer kunnen reguleren. De potentie van metaboliet analyses voor het karakteriseren van effectoren van ziekteverwekkers en het opsporen van bio-merkers die geassocieerd zijn met gevoeligheid en resistentie, wordt hier ook besproken. Tevens geeft dit hoofdstuk inzicht in de mogelijke gevolgen van de sterke veranderingen die optreden in het metaboloom tijdens de interactie van C. fulvum met tomaat, met een nadruk op de strategieën die het C. fulvum mogelijk maken om een succesvolle biotrofe relatie (compatibele interactie) met zijn gastheer te verkrijgen. Verder wordt ingegaan op het belang van een goede integratie van statistische analyses en mathematische modellering van het systeem, omdat deze een brug zouden kunnen vormen tussen systeembiologie en synthetische biologie. Tenslotte wordt de bijdrage van de manier van bemonstering aan een zinvolle integratie van de informatie die verkregen is op de diverse niveaus, besproken.
260
ማጠቃለያ (Amharic Summary) ማጠቃለያ (Amharic Summary)
ማጠቃለያ
ተክሎች ከበሽታ አምጪ ህዋሳት ጋር የሚያደርጉት እልህ ኣስጨራሽ ግብ ግብ ለረጅም ጊዜ ሲጠና የነበረው እያንዳንዱን የተክል ባህሪ ወሳኝ የሆኑትን ህብለ ዘሮች አንድ በአንድ ነጣጥሎ በማጥናት ነበር። ዪሄ የሳይንስ ዘዴ ለግንዛቤኣችን ከፍተኛ አስተዋዕፆ እያደረገ ቢገኝም በተክሎች እና በበሽታ አምጪ ህዋሳት መካከል የሚካሄደውን የተወሳሰበ ትግል በበለጠ ለማብራራት ተጨማሪ የሳይንስ ዘዴ ኣስፈላጊ ነው። ይህ ግንዛቤ ሁሉን አቀፍ የስነ ሕይወት የሳይንስ ዘርፍ አንዲወለድ መንገዱን ከፍቷል። ይህ ሁሉን አቀፍ የስነ ሕይወት የሳይንስ ዘርፍ እያንዳንዱ ህብለ ዘሮች እንዴት እርስ በርሳቸው እንደተያያዙና በተክሉ የጤና መከላከያ ዘዴ ላይ ተፅዕኖ እንደሚያረጉ ያጠናል። ከህብለ ዘሮች በተጨማሪም በጥናቴ ተክሎች በሚያመርቷቸው ኬሚካሎች እንዴት በሽታ ኣምጪ ህዋሳትን እንደሚከላከሉ እና በተጨማሪም እንዴት በሽታ ኣምጪ ህዋሳት ከነዚህ መርዛማ የተክል ኬሚካሎች ራሳቸውን እንደሚከላከሉ ኣሳይቻለሁ።
ምዕራፍ ፩ ይህ ምዕራፍ ስለ ተክሎች የጤና መከላከያ ዘዴ አደረጃጀት በሰፊው ያብራራል። ለበሽታ በቀላሉ ተጋላጭ በሆኑ ፣ በሽታውን መቋቋም በሚችሉ የቲማቲም ተክሎች እና በበሽታ አምጪ ተህዋሲው ክላዶስፖሪም መካከል ያለውን ግብ ግብ ያብራራል። በተጨማሪም ስለ አጠቃላይ የተክል የኬሚካል ይዘት ስለሚያጠናው አዲሱ የሳይንስ ዘርፍ ሜታቦሎሚክስ እና ስለ አጠቃላይ ተገላጭ ህብለ ዘሮች የሚያጠናውን የሳይንስ ዘርፍ ትራንስክሪፕቶሚክስ በሰፊው ያብራራል።
ምዕራፍ ፪ ይህ ምዕራፍ በሽታ ተቛቛሚ ተክሎች በሽታው በተከሰተበት ኣካባቢ የሚገኙ የተወሰኑ የራሳቸውን ሴሎች በመግደል እንዴት በሽታው ወደሌላው ጤነኛ ክፍል እንዳይስፋፋ እንደሚያደርጉ ያብራራል። ከዚህ ሂደት ጋር የተያያዙ የአጠቃላይ የህብለ ዘር መገለጽ ለውጦችንና የተክሉ አጠቃላይ ኬሚካላዊ ለውጦችን በሰፊው ይዳስሳል። ውርኪ የተባሉ የህብለ ዘር መገለጽ አቀነባባሪዎች በለውጡ ላይ ከፍተኛ ሚና አንደሚጫወቱ ጥናቱ በቂ መረጃ ይሰጣል። ከዚህም በተረፈ በሽታን መከላከል ተክሉን ከፍተኛ ጉልበት አንደሚጠይቀው ጥናቱ ያመለክታል። ተክሉ የራሱን የተወሰነ ክፍል በመግደል በሽታው ወደጤነኛ ክፍል እንዳይስፋፋ ከማረጉም በተጨማሪ የሞተውን አካሉን የኬሚካል ይዘቱን መልሶ ጸረ ተህዋሲያን ኬሚካሎች ለመስሪያ ሊጠቀምበት እንደሚችል ጥናቱ ያመለክታል።
ምዕራፍ ፫ ይህ ምዕራፍ ተክሎች በሽታን በሚከላከሉበት ወቅት ያላቸውን የሃይል ምጣኔ ሃብት ኣጠቃቀምን ሂደት ይዳስሳል። በዋንኛነት ተክሎች በሽታን በሚከላከሉበት ወቅት እንዴት ከእድገት ጋር የተያያዙ ሂደቶችን በማስቆም ተክሉ ያለውን ውሱን ሃይል ለበሽታ መከላከል እንደሚያውሉት ያብራራል።
ምዕራፍ ፬ ይህ ምዕራፍ ቀደም ብሎ በምዕራፍ ፪ ላይ አንደተገለጸው ውርኪ የተባሉ የህብለ ዘር መገለጽ አቀነባባሪዎች በተክሉ የበሽታ መከላከያ አወቃቀር ላያ ያላቸውን ሚና ያጠናል። ሚናቸውን ለማወቅም ቫይረስ በመጠቀም የተወሰኑትን ተክሉ በሽታ በሚከላከልበት ወቅት እንዳይገለጹ በማድረግ ሚናቸውን ለማወቅ ተችሏል። የተወሰኑት የተክሉ የበሽታ መከላከያ አቅም እንዲነቃቃ ሲያደርጉ የተቀሩት ደግሞ የተክሉ የበሽታ መከላከያ አቅም ከመጠን በላይ እንዳይነቃቃ ይቆጣጠሩታል። በተጨማሪም የተክሉ አጠቃላይ የኬሚካል ይዘት ላይ ተጽኖ እንደሚያሳድሩም ጥናቱ ያመለክታል።
ምዕራፍ ፭ ይህ ምዕራፍ በተክሎችና በበሽታ አምጪ ተህዋሲያን መካከል የሚደረገውን የኬሚካል የጦር መሳሪያ እሽቅድድም በሰፊው ያብራራል። የቲማቲም ተክል በሽታ ኣምጪ የሆኑ ባክቴሪያ እና ፈንገሶችን ቶማቲን የተባለ ኬሚካል በመጠቀም ይከላከላል። ይህ ቶማቲን የተባለው ኬሚካል
261
ማጠቃለያ (Amharic Summary) ማጠቃለያ (Amharic Summary)
የፈንገሱን ህዋስ ሽፋን በመበጣጠስ ይገለዋል። በአንጻሩ ፈንገሱ ደግሞ ይህንን አደገኛ ኬሚካል ኢንዛይሞቹን በመጠቀም መርዛማ ወዳልሆኑ የኬሚካል አይነቶች ይለውጣቸዋል። ቶማቲዲን እና ስታቺድሪን የተባሉት ኬሚካሎች ለበሽታው ተጋላጭ በሆኑ የቲማቲም ዝርያዎች ላይ ከፍተኛ ክምጭት አሳይተዋል። ባጠቃላይ ተክሎች ራሳቸውን ከበሽታ አምጪ ተህዋሲያን ለመከላከል አያሌ ኬሚካሎችን ሲጠቀሙ ጠላት ተህዋሲያን ደግሞ የተለያዩ ኢንዛይሞቻቸውን በመጠቅም እነዚህን አደገኛ ኬሚካሎች ያወድማሉ።
ምዕራፍ ፮ ይህ ምዕራፍ ቀደም ብለው የተጠቀሱት ምዕራፎች ያላቸውን ተያያዥነት ጠቅለል አድርጎ ያብራራል። ማብራሪያው የተደረጉት ጥናቶች ከሁሉን አቀፍ የስነ ህይወት ሳይንስ አንጻር እንዴት ይታያሉ ሚለውን ይዳስሳል። በተጨማሪም ከተለያዩ ቴክኖሎጂዎች የመጡ መረጃዎች አንዴት ሊዋቀሩና የተክሉን መሰረታዊ የበሽታ መከላከያ ዘዴ በበለጠ ሊያብራሩ አንደሚችሉ ሃሳቦችን ይሰጣል። በስተመጨረሻም የሁሉን አቀፍ የስነ ህይወት ሳይንስ እንዴት ከተለያዩ ቴክኖሎጂዎች የመጡ መረጃዎችን አዋቅሮ ወደ ስነ ህይወታዊ ሂሳባዊ ማሳያዎች(ሞዴል)መለወጥ የሚቻልበትን መንገድ ይገልጻል። ብሎም እንዴት የሁሉን አቀፍ የስነ ህይወት ሳይንስ እና ስነ ህይወታዊ ሂሳባዊ ማሳያዎች ሲጣመሩ አዲሰ ለተወለደው የሳይንስ ዘርፍ ሰው ሰራሽ (ሲንተቲክ) የስነ ህይወት የጥናት ዘርፍ አስተዋጾ እንደሚያደርጉ ያብራራል።

262
Acknowledgements Acknowledgements
Acknowledgements
A number of people have helped and taught me immensely throughout my personal and educational life and I am very grateful for all of them. For convenience, only a handful of them are mentioned below in the acknowledgement and those who are not listed will always be in my heart and remembered. This thesis is the result of many years of experiences that I have accumulated at Wageningen University and it is attributed to all remarkable individuals who invested on me, believed in me, and gave me the opportunity to explore all possibilities and the combination of these factors remarkably contributed to the successful completion of this project.
First of all, special acknowledgement goes to Harro; my promoter, mentor, friend, and above all a wonderful human being. I witnessed your ability to give guidance without compromising my freedom which was crucial in finding my way without getting lost into the wildness. Especially in the last stage of writing, you showed your organizational skills and it was the moment that I clearly understood why you destined to be a professor. I am also thankful for the opportunity you gave me to spend some time with you in University of California, Davis during your sabbatical. In just one month, I managed to learn and do a number of metabolomics analysis and its success was strongly attributed to your personal and financial commitment. Beyond science, our stay at Davis also gave me the opportunity to get to know you well as a person. I am sure you will remember how impressed I was when we visited Yosemite National Park. It was such an awesome experience and most of all while camping, the delicious breakfast that you made with your rudimentary cooking utensils was delicious and it is unforgettable experience. Here I would like to confess to the world that the Professor also knows how to survive in the jungle. I am very grateful for having the opportunity to work with you and continue our collaboration in the future. Thank you Harro!
It was during my MSc thesis that I got to know Matthieu (Matt), my co-promoter. He has been my inspiration and tutor who introduced me to the word of phytopathology and molecular sciences. Matt, who would care about me like you do? Who would believe in me and my ability to makes things happen like you do? Who would potentially give me such an opportunity to grow myself in the field of science like you do? And of course who would serve me such a nice BBQ with the most prestigious wines like you do? I shall extend my deepest and heartfelt appreciation to this wonderful soul! I am blessed to have your presence in my life and you are not only a scientist but also a good man with a good heart and that makes working with you very enjoyable experience. Without you, I would find it difficult to imagine for things to happen in a way they happen in this project. Thanks Matt! You are all-in-one!
263
Acknowledgements Acknowledgements
Ric, my co-promoter is the busiest person around and yet he manages to allot time to everyone who needs his help while maintaining his smile and cheerful conversation. In that sense, I would say he is an evergreen person! He baptized me and let the spirit of metabolomics to get into my veins and he continues to give me the inspiration that helped me to dive deep into the world of small molecules. Especially at the final writing stage of my thesis, I have realized that for my project the combination of Harro, Matthieu, and Ric brought a peculiar flavor to the project and for sure that made us a dream team.
Thanks to Robert Hall, currently I am working on mass spectrometer imaging (LAESI) using a state-of-the-art technology. What I can say is that it is fascinating technology and it is a privilege to be chosen to handle this project. Robert, you believe in me and supported me in many ways. The dinner we had at your place was prestigious and I, Fe and Carlos were really impressed with your kindness and care at the dinner table. Our trip to the flower bulb fields was also memorable and I am grateful for having the opportunity to work with you.
During my PhD, I collaborated with a number of individuals in WUR and outside of WUR. I would like to thank Wladimir Tameling for continuous support I got from him when I was performing VIGS experiment on WRKY transcription factors. Your ability to explain things in very understandable manner makes life easier and it shows how deeply you understand the subject matter. Thank you Wlad for everything! Similarly, the help I got from Thierry Delatte in the analysis of trehalose -6-phosphate was remarkable. My good friend Bilal, his promoter and supervisors; Pierre and Jérôme are great people to work with. I am very grateful for all the experience we shared during the course of this work.
Anna Undas was the first person who taught me the practical aspect of Gas Chromatography Mass Spectrometry (GCMS). That also gave a good foundation for our friendship. Anna, the dinner and the discussion we had at your place were magnificent and most of all I am very much entertained by the way your cute rabbit cleans its face. Thanks Anna! You are a true friend and I treasure our friendship. At the beginning of my PhD, Francel was my other mentor in the lab and had it not been for him, it would probably took me significantly more time to get used to the situation in the lab. Furthermore, his cheerful face and positive outlook were like a morning coffee that helped me to have a fresh start of the day. Francel you give color to these who are around you! Without Bert I would probably find it difficult to analyze my samples in LCMS and you taught me a lot about the practical aspect of LCMS. Your patience, smiley face, and friendly character make working with you a pleasant experience. Bert, thank you for the unreserved support and friendship you showed me during the course of my PhD.
My friendship with Mahdere and Abiy dates back to a decade and started when we were studying at Jimma University, Ethiopia. Fortunately, we got the opportunity to move to Wageningen to continue our study. This further strengthened our friendship and has
264
Acknowledgements Acknowledgements
enriched us with memorable moments. This year they have their first daughter Edna; the little angel and the most adorable being. She even makes our bond stronger. Although staying abroad for many years is a bit challenging, the close relation I have with you makes me feel at home. Your family has a special place in my heart. Furthermore, the Friday evening small party with Mahi, Abelo, Rutta will always be remember and I am glad that we have a story to tell and to remember.
Often describing what Natalia means to me is challenging. The problem is that words are limited and shallow and they often describe what mind can see or conditioned to see. My connection with Natalia transcends all the barriers and what I see is the expansion of myself in her and the expansion of herself in me. This glorify our oneness and that realization ridicule the fact that time and space exist and her presence in my life can be felt at any moment of time. Nati, thank you for being you and I am fortunate to have you and your friendship in my life!
Jules and Catja, what a wonderful office mates! Sitting with you was refreshing and a lot of fun. The Friday afternoon soft drink session was one of the best moments of our friendship. The way our team popularize Rakia is threatening Coca-Cola and other soft drink producers. Our expertise expands from molecular biology and metabolomics to the Rakiomics. The post cards from Vicky, our beloved friend in France gave our office a grace. Vicky’s move on the dance floor is one of a kind and will drive anyone crazy. Vicky you’ve got the move! My friends, one who gets the opportunity to sit with you in that office finds the key to happiness! As it has been said; “one who brings happiness to others will find it”.
I would like to thank Rina, she is an outstanding secretary, and she dealt with all my administrative-related issues promptly and make sure that things are done accordingly and on time. Rina, you are the best and thank you for your help and kindness.
All shengo (ሸንጎ) members and friends in Wageningen; Dugshu, Arabu, Gecho, Mahdi, Byo, Mahi, Tuta, Sinte, Eske, Dele, Abelo, Asfshe, Tade, Mule, Wess, Dani, Ashu bret, Gicho, Fredi and Jembe; Saturday evening will always be remembered. All the philosophical, political, social, economic......issues that were discussed and all the laughter that we shared were refreshing and will remain to be a memorable moment of our life. Our Saturday night gathering gave relief to mind and made us ready for the upcoming productive working days. My friends back in Ethiopia; Ben, Siraw, Ngsti, Dave, Brooke melese, Heluye, Fanni, Ade, Habtsh; your continuous support from a distance was important to keep my spirit high. Thank you so much for your friendship. Habtshe, Selamina and Brooke you are true friends!
My friends in wageningen; Anna (green), Viviane, Manickam, Neli, Lemeng, Aldana, Julio, Wei song, Jimmy, Rik Padraic, Charles, Daniela, Ralph, Thomas, Chunxu and all others

265
Acknowledgements Acknowledgements
that are not listed here made my stay in Wageningen enjoyable. All the ideas, beer, fun and laughter we shared made my stay in Wageningen a pleasurable experience. The wolf screaming on our way back from the international club (the way Julio and wei were screaming and laughing), the train party we had on our way back from Rotterdam (the pole dancer and the meditator) and the movember cave-manship are some of the memorable moments we had together. Thank you guys, you gave color to my life!
Kangmo Lee, my best friend, our stay in Wageningen was full of adventure. Our friendship created a bridge that helped me to explore Korea, its magnificent culture and most of all the delicious foods. Kimchi, the fried rice, the korean BBQ, tattorita, Bibimpap....are all delicious and as I write, I am salivating. Your foods have great influence on my cooking and the fusion Ethio-Korean foods brought the fourth dimension to the taste. Many thanks to my longtime friends Jhamna, Luis, Alina, Loes and Yodit. You guys are awesome.
Working with all members of plant physiology, phytopathology, and plant research international PRI (bioscience) was one of the most interesting experiences I had in Wageningen. I couldn’t imagine a place where there is such deep rooted scientific collaboration between groups while maintaining a very good interpersonal relationship. I am proud to be associated with Wageningen University. Wageningen gave me all the challenges and opportunities that I need for the evolution of my consciousness and that profoundly affect me both as a person and a scientist.
Last but not the least, I would like to thank my family; mama, papa, Atse, Tade, Jhon, Azi and my nephew DD (Robel); your love is like a food to my soul! Most of all I am very grateful for my brother Tade who invested too much on me. I am very happy that you will be traveling all ways long to attend on my defense ceremony. Tade, I would like to say from the bottom of my heart, it is all because of you!
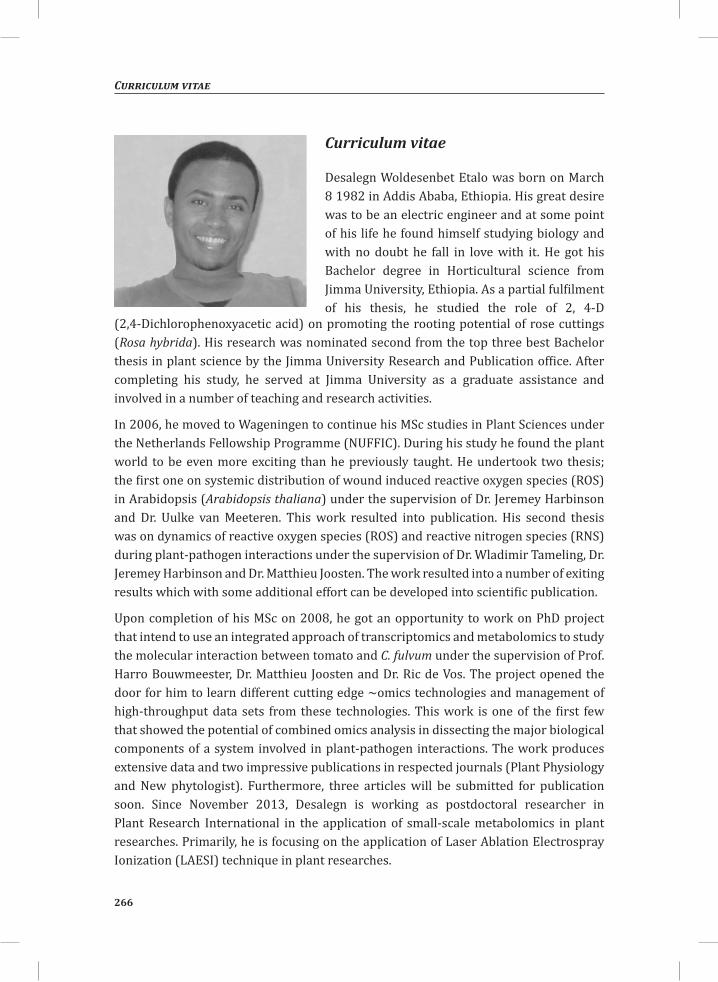
Publication list
266
Curriculum vitae
(2,4-Dichlorophenoxyacetic acid) on promoting the rooting potential of rose cuttings (Rosa hybrida). His research was nominated second from the top three best Bachelor thesis in plant science by the Jimma University Research and Publication office. After completing his study, he served at Jimma University as a graduate assistance and involved in a number of teaching and research activities.
In 2006, he moved to Wageningen to continue his MSc studies in Plant Sciences under the Netherlands Fellowship Programme (NUFFIC). During his study he found the plant world to be even more exciting than he previously taught. He undertook two thesis; the first one on systemic distribution of wound induced reactive oxygen species (ROS) in Arabidopsis (Arabidopsis thaliana) under the supervision of Dr. Jeremey Harbinson and Dr. Uulke van Meeteren. This work resulted into publication. His second thesis was on dynamics of reactive oxygen species (ROS) and reactive nitrogen species (RNS) during plant-pathogen interactions under the supervision of Dr. Wladimir Tameling, Dr. Jeremey Harbinson and Dr. Matthieu Joosten. The work resulted into a number of exiting results which with some additional effort can be developed into scientific publication.
Upon completion of his MSc on 2008, he got an opportunity to work on PhD project that intend to use an integrated approach of transcriptomics and metabolomics to study the molecular interaction between tomato and C. fulvum under the supervision of Prof. Harro Bouwmeester, Dr. Matthieu Joosten and Dr. Ric de Vos. The project opened the door for him to learn different cutting edge ~omics technologies and management of high-throughput data sets from these technologies. This work is one of the first few that showed the potential of combined omics analysis in dissecting the major biological components of a system involved in plant-pathogen interactions. The work produces extensive data and two impressive publications in respected journals (Plant Physiology and New phytologist). Furthermore, three articles will be submitted for publication soon. Since November 2013, Desalegn is working as postdoctoral researcher in Plant Research International in the application of small-scale metabolomics in plant researches. Primarily, he is focusing on the application of Laser Ablation Electrospray Ionization (LAESI) technique in plant researches.
Curriculum vitae
Desalegn Woldesenbet Etalo was born on March 8 1982 in Addis Ababa, Ethiopia. His great desire was to be an electric engineer and at some point of his life he found himself studying biology and with no doubt he fall in love with it. He got his Bachelor degree in Horticultural science from Jimma University, Ethiopia. As a partial fulfilment of his thesis, he studied the role of 2, 4-D
267
Publication listCurriculum vitae
Publications
Etalo DW, Stulemeijer IJE, Peter van Esse H, de Vos RCH, Bouwmeester HJ, Joosten MHAJ (2013) System-wide hypersensitive response-associated transcriptome and metabolome reprogramming in tomato. Plant Physiol. 162: 1599-1617
Ökmen B., Etalo D.W, Joosten M. H.A.J., Bouwmeester H. J., De Vos R. C.H, Collemare J. and de Wit P.J.G.M (2013). Detoxification of tomatine by Cladosporium fulvum is required for full virulence on tomato. New Phytol 198: 1203-1214
Etalo, D.W., Harbinson, J. and van Meeteren, U. (2009). Could wound-induced xylem peroxide Contribute to the Hydraulic Conductivity in Stems? Acta Hort 847:287-294.
268
Education statement Education statement
Education Statement of the Graduate SchoolExperimental Plant Sciences
Issued to: Desalegn EtaloDate: 20 March 2014Group: Plant Physiology, Wageningen University & Research Centre
1) Start-up phase date
First presentation of your project
Metabolomics X Transcriptomics in tomato caldosporium interaction for gene discovery Mar 30, 2009
Writing or rewriting a project proposal
Combined Metabolomic and Transcriptional Profiling of the Molecular Interaction between the Plant Host Tomato (Lycopersicum esculentum L.) and the Pathogen Tomato Leaf Mold Disease (Cladosporium fulvum) as a Tool to Clone Secondary Metabolite Pathway Genes
Jan 28, 2009
Writing a review or book chapter
MSc courses
Genomics (ABG-30306) 2009
Laboratory use of isotopes
Subtotal Start-up Phase 13.5 credits*
2) Scientific Exposure date
EPS PhD student days
European Retreat of PhD students in Plant Sciences, Cologne (Germany) Apr 15-17, 2010
EPS PhD student day, Utrecht University Jun 01, 2010
EPS PhD student day, Wageningen UR May 20, 2011
EPS theme symposia
EPS theme 2 symposium 'Iinteractions between Plants and Biotic Agents', Utrecht University Jan 22, 2009
EPS theme 3 symposium 'Metabolism and Adaptation', University of Amsterdam Feb 18, 2009
EPS theme 3 symposium 'Metabolism and Adaptation', Leiden University Feb 19, 2010
EPS theme 2 symposium 'Iinteractions between Plants and Biotic Agents, University of Amsterdam Feb 03, 2011
EPS theme 3 symposium 'Metabolism and Adaptation', Wageningen UR Feb 10, 2011
EPS theme 2 symposium 'Iinteractions between Plants and Biotic Agents, Wageningen UR Feb 10, 2012
269
Education statement Education statement
EPS theme 3 symposium 'Metabolism and Adaptation' Utrecht University Apr 26, 2012
NWO Lunteren days and other National Platforms
ALW meeting 'Experimental Plant Sciences', Lunteren Apr 06-07, 2009
ALW meeting 'Experimental Plant Sciences', Lunteren Apr 19-20, 2010
ALW meeting 'Experimental Plant Sciences', Lunteren Apr 02-05, 2011
ALW meeting 'Experimental Plant Sciences', Lunteren Apr 02-03, 2012
Seminars (series), workshops and symposia
CBSG_summit 2009 Mar 16-17 2009
CBSG_summit 2010 Mar 15-16 2010
CBSG_summit 2011 Jan 31-Feb 01, 2011
Seminar plus
International symposia and congresses
Metabolomics conference 2010 Amsterdam Jun 27-Jul 01, 2010
Metabolomics conference 2013 Glasgow Jul 01-04, 2013
Presentations
Omics assisted gene hunting in cladosporiumx tomato pathosysntem- cologne_Germany (Oral) Apr 15-17, 2010
Combined metabolomic and transcriptomics profiling of the tomatoxcladosporium pathosysntem: a tool to clone seconday metabolite genes: Amsterdam metabolomics conference 2010 (Poster)
Jun 27-Jul 01, 2010
System wide analysis of the defense response of resistant (Cf-4) tomato lines during recongnition of the avirulence (Avr4) factor of cladosporium fulvum using high-thoughput omics technology _Annual EPS Theme Meeting 3 Symposium (Oral)
Feb 19, 2010
Systems Biology of Plant-Pathogen Interactions: temporal dissection of the hypersensitive response in tomato dying seedlings (Cf-4/Avr4) using cutting-edge ~omics technologies-Annual EPS Theme 3 Symposium (Oral)
Feb 10, 2011
The Arms race between tomato and C. fulvum at metabolome level, Metabolomics conference, Glasgow Jul 02, 2013
IAB interview Feb 17, 2011
Excursions
CBSG matchmaking event (excursion to Rijk Zwaan and Monsanto)
Subtotal Scientific Exposure 16.5 credits*
3) In-Depth Studies date
EPS courses or other PhD courses
Summerschool on Environmental Signaling Aug 24-26, 2009
Comparative label-free LC-MS for Quantitative Proteomics Apr 21-23 2010
Systems Biology; Statistical analysis of ~omics data' Dec 13-17, 2010
270
Education statement
Bioinformatics-A User's Approach Aug 29-Sep 2 2011
CBSG Bioinformatics 'Plant genome mining' Oct 2011
EPS Autumn School 'Host-Microbe Interactomics' Nov 01-03, 2011
Journal club
member of literature discussion group at Plant Physiology 2009-2012
Individual research training
Traning in Metabolomics and metabolomics data analylsis, University of California Davis, Oliver Fiehn Lab July14-Aug 14, 2011
Subtotal In-Depth Studies 12.0 credits*
4) Personal development date
Skill training courses
Scientific Writing, WGS course Jun 2011
Intellectual property rights in a breeding contexts, CBSG workshop Apr 2012
Organisation of PhD students day, course or conference
Membership of Board, Committee or PhD council
Subtotal Personal Development 2.1 credits*
TOTAL NUMBER OF CREDIT POINTS* 44.1
Herewith the Graduate School declares that the PhD candidate has complied with the educational requirements set by the Educational Committee of EPS which comprises of a minimum total of 30 ECTS credits
* A credit represents a normative study load of 28 hours of study.

Education statement
The research described in this thesis was carried out at the Laboratories of Plant Physiology, Phytopathology and Plant Research International at Wageningen University, Wageningen, The Netherlands, and it was financially supported by the Centre for BioSystems Genomics (CBSG 2012), an initiative under the auspices of the Netherlands Genomics Initiative (NGI).
Financial support from Wageningen University for printing this thesis is gratefully acknowledged.
Cover and layout design: Agilecolor Design Studio/Atelier || www.agilecolor.com
Printed by: Proefschriftmaken.nl || Uitgeverij BOXPress