Embed Size (px)
Citation preview
Microchemical Journal 114 (2014) 80–88
Contents lists available at ScienceDirect
Microchemical Journal
j ourna l homepage: www.e lsev ie r .com/ locate /mic roc
An integrated multi-analytical approach to the study of the dome wallpaintings by Correggio in Parma cathedral
Danilo Bersani a, Michela Berzioli b, Simone Caglio c, Antonella Casoli b,⁎, Pier Paolo Lottici a, Laura Medeghini d,Gianluca Poldi e, Paolo Zannini f
a Dipartimento di Fisica e Scienze della Terra, Università degli Studi, Parco Area delle Scienze, 7/a, 43124 Parma, Italyb Dipartimento di Chimica, Università degli Studi, Parco Area delle Scienze 17/a, 43124 Parma, Italyc Ricerca Scientifica, via Matteotti 28, 20048 Carate Brianza (MI), Italyd Dipartimento di Scienze della Terra, Università la Sapienza, P.le Aldo Moro 5, 00185 Rome, Italye Centro di Arti Visive (CAV), Università degli Studi di Bergamo, Via Pignolo 123, 24121 Bergamo, Italyf Dipartimento di Scienze Chimiche e Geologiche, Università di Modena e Reggio Emilia, Via Campi 183, 41125 Modena, Italy
⁎ Corresponding author.E-mail address: [email protected] (A. Casoli).
0026-265X/$ – see front matter © 2013 Elsevier B.V. All rhttp://dx.doi.org/10.1016/j.microc.2013.11.014
a b s t r a c t
a r t i c l e i n f oArticle history:Received 31 October 2013Received in revised form 25 November 2013Accepted 25 November 2013Available online 8 December 2013
Keywords:Wall paintingsNon-invasive analysesMicroanalysesPigmentsOrganic bindersRestoration materialsCorreggio
The restoration of one of the most famous masterpieces of the Renaissance, the wall paintings regarding the As-sumption of the VirginMary painted inside the dome of the Cathedral of Parma by Antonio Allegri called Correggio(1489–1534) between 1526 and 1530, allowed an in-depth chemical-physical study of materials. Non-invasiveinfrared imaging and spectroscopic techniques (reflectance spectrometry in the visible range and in-situ X-rayfluorescence) and micro-invasive analytical techniques (optical microscopy, scanning electron microscopywith energy dispersive X-ray microanalysis, powder X-ray diffraction, micro-FTIR spectroscopy, micro-Ramanspectroscopy, and gas chromatography coupled with mass spectrometry) were chosen in order to provide thehigher set of significant data, limiting as much as possible sampling. The joined use of different techniquesallowed to deeply explore Correggio's palette, on the use of a fresco and/or a secco technique, to study aswell deg-radation products and the diffused and old restorationmaterials like consolidants. The study allowed the charac-terization of a wide range of pigments, the identification of the binding media, mainly egg and animal glue, therestoration materials (acrylic resins, paraffin waxes, various pigments) and the degradation products (calciumsulfate dihydrate and calcium oxalate).
© 2013 Elsevier B.V. All rights reserved.
1. Introduction
From a chemical point of view, an integrated analytical approachbased on the use of non-invasive and micro-invasive techniques isdemanded to define painting materials and technique, the state of con-servation and causes of degradation of the wall paintings [1,2]. A largeset of analytical techniques, performed on the field and in laboratory,is not frequently provided, and generally only non-invasive or samplingmethods are chosen. In particular, when large surfaces have to be exam-ined, as for mural paintings, non-invasive tools must be reduced to por-table ones and a specific protocol dealing with the most effectivemethods and timeline should be set in order to optimize the work toget better results.
A good protocol should normally follow this sequence, starting withnon-invasive tests and then concluding with sampling [3,4]:
1. imaging analyses;2. non-invasive spectroscopic analyses;
ights reserved.
3. micro-sampling, useful for different kind of non-destructive or de-structive exams.
About this last point, depending on the goal of the research, samplescan be studied as they are or mounting cross-sections for microscopicand spectroscopic analyses, or destroyed to carry out chromatographicanalyses.
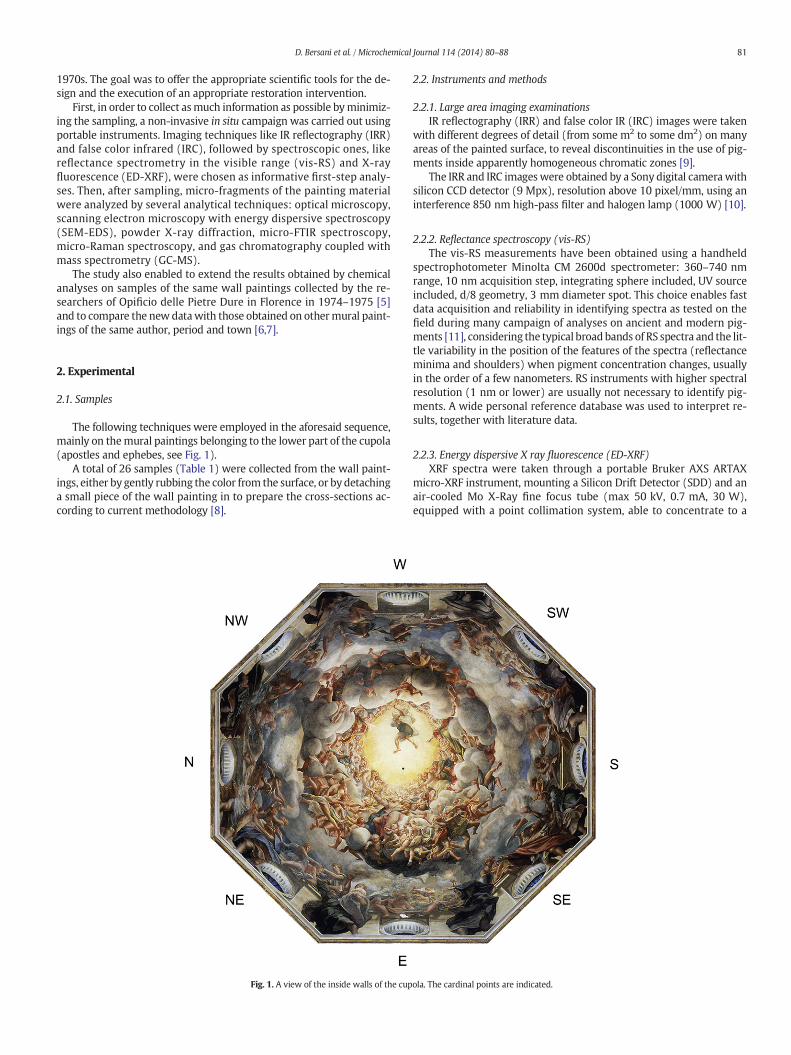
The restoration of one of the most famous masterpieces ofthe Renaissance, the wall paintings regarding the Assumption ofthe Virgin Mary (Fig. 1) painted inside the dome of the Cathedralof Parma by Antonio Allegri called Correggio (1489–1534) between1526 and 1530, allowed an in-depth chemical–physical study ofmaterials.
In this case the above mentioned protocol was used, with the aimto obtain a characterization of the organic and inorganic compo-nents employed, including the stratigraphic sequence of thepigments and the organic binders. The objective was to elucidatethe painting technique, the state of preservation, the possibledecay processes and the possible additions made during previousrestorations.
The scientific analyses were performed during the last recent cam-paign of restoration, following the previous one that took place in
81D. Bersani et al. / Microchemical Journal 114 (2014) 80–88
1970s. The goal was to offer the appropriate scientific tools for the de-sign and the execution of an appropriate restoration intervention.
First, in order to collect asmuch information as possible byminimiz-ing the sampling, a non-invasive in situ campaign was carried out usingportable instruments. Imaging techniques like IR reflectography (IRR)and false color infrared (IRC), followed by spectroscopic ones, likereflectance spectrometry in the visible range (vis-RS) and X-rayfluorescence (ED-XRF), were chosen as informative first-step analy-ses. Then, after sampling, micro-fragments of the painting materialwere analyzed by several analytical techniques: optical microscopy,scanning electron microscopy with energy dispersive spectroscopy(SEM-EDS), powder X-ray diffraction, micro-FTIR spectroscopy,micro-Raman spectroscopy, and gas chromatography coupled withmass spectrometry (GC-MS).
The study also enabled to extend the results obtained by chemicalanalyses on samples of the same wall paintings collected by the re-searchers of Opificio delle Pietre Dure in Florence in 1974–1975 [5]and to compare the newdatawith those obtained on othermural paint-ings of the same author, period and town [6,7].
2. Experimental
2.1. Samples
The following techniques were employed in the aforesaid sequence,mainly on themural paintings belonging to the lower part of the cupola(apostles and ephebes, see Fig. 1).
A total of 26 samples (Table 1) were collected from the wall paint-ings, either by gently rubbing the color from the surface, or by detachinga small piece of the wall painting in to prepare the cross-sections ac-cording to current methodology [8].
Fig. 1. A view of the inside walls of the cup
2.2. Instruments and methods
2.2.1. Large area imaging examinationsIR reflectography (IRR) and false color IR (IRC) images were taken
with different degrees of detail (from some m2 to some dm2) on manyareas of the painted surface, to reveal discontinuities in the use of pig-ments inside apparently homogeneous chromatic zones [9].
The IRR and IRC images were obtained by a Sony digital camerawithsilicon CCD detector (9 Mpx), resolution above 10 pixel/mm, using aninterference 850 nm high-pass filter and halogen lamp (1000 W) [10].
2.2.2. Reflectance spectroscopy (vis-RS)The vis-RS measurements have been obtained using a handheld
spectrophotometer Minolta CM 2600d spectrometer: 360–740 nmrange, 10 nm acquisition step, integrating sphere included, UV sourceincluded, d/8 geometry, 3 mm diameter spot. This choice enables fastdata acquisition and reliability in identifying spectra as tested on thefield during many campaign of analyses on ancient and modern pig-ments [11], considering the typical broad bands of RS spectra and the lit-tle variability in the position of the features of the spectra (reflectanceminima and shoulders) when pigment concentration changes, usuallyin the order of a few nanometers. RS instruments with higher spectralresolution (1 nm or lower) are usually not necessary to identify pig-ments. A wide personal reference database was used to interpret re-sults, together with literature data.
2.2.3. Energy dispersive X ray fluorescence (ED-XRF)XRF spectra were taken through a portable Bruker AXS ARTAX
micro-XRF instrument, mounting a Silicon Drift Detector (SDD) and anair-cooled Mo X-Ray fine focus tube (max 50 kV, 0.7 mA, 30 W),equipped with a point collimation system, able to concentrate to a
ola. The cardinal points are indicated.
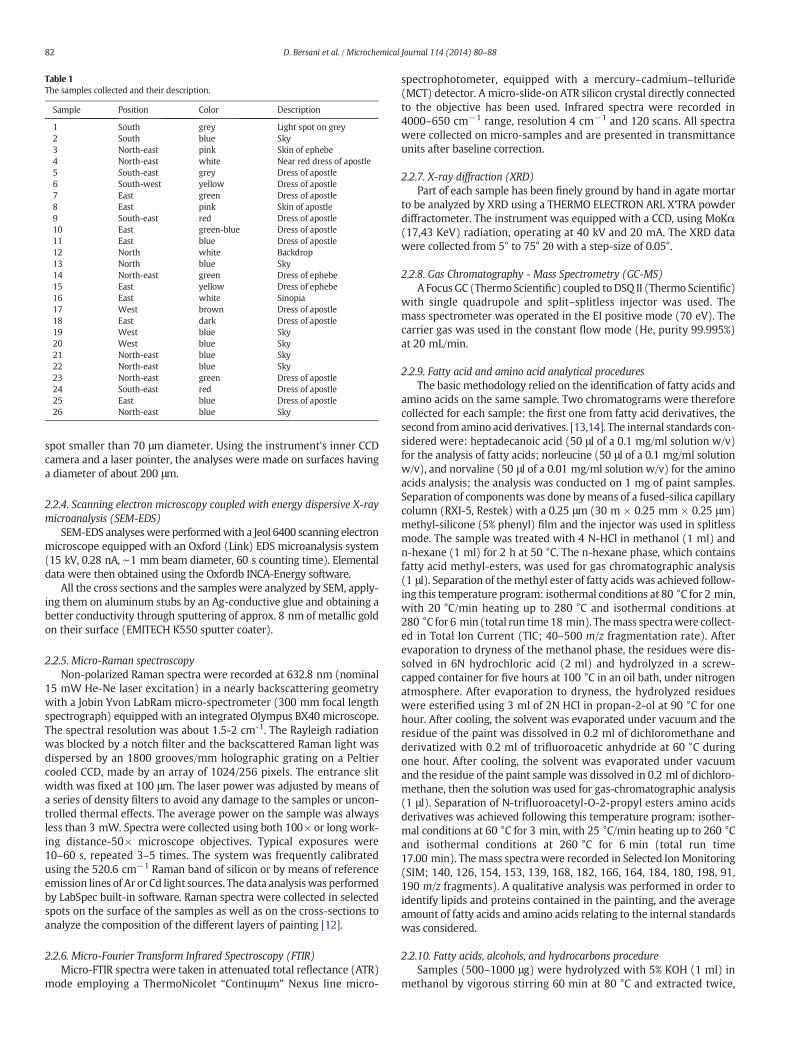
Table 1The samples collected and their description.
Sample Position Color Description
1 South grey Light spot on grey2 South blue Sky3 North-east pink Skin of ephebe4 North-east white Near red dress of apostle5 South-east grey Dress of apostle6 South-west yellow Dress of apostle7 East green Dress of apostle8 East pink Skin of apostle9 South-east red Dress of apostle10 East green-blue Dress of apostle11 East blue Dress of apostle12 North white Backdrop13 North blue Sky14 North-east green Dress of ephebe15 East yellow Dress of ephebe16 East white Sinopia17 West brown Dress of apostle18 East dark Dress of apostle19 West blue Sky20 West blue Sky21 North-east blue Sky22 North-east blue Sky23 North-east green Dress of apostle24 South-east red Dress of apostle25 East blue Dress of apostle26 North-east blue Sky
82 D. Bersani et al. / Microchemical Journal 114 (2014) 80–88
spot smaller than 70 μm diameter. Using the instrument's inner CCDcamera and a laser pointer, the analyses were made on surfaces havinga diameter of about 200 μm.
2.2.4. Scanning electron microscopy coupled with energy dispersive X-raymicroanalysis (SEM-EDS)
SEM-EDS analyseswere performedwith a Jeol 6400 scanning electronmicroscope equipped with an Oxford (Link) EDS microanalysis system(15 kV, 0.28 nA, ∼1 mm beam diameter, 60 s counting time). Elementaldata were then obtained using the Oxfordb INCA-Energy software.
All the cross sections and the samples were analyzed by SEM, apply-ing them on aluminum stubs by an Ag-conductive glue and obtaining abetter conductivity through sputtering of approx. 8 nm of metallic goldon their surface (EMITECH K550 sputter coater).
2.2.5. Micro-Raman spectroscopyNon-polarized Raman spectra were recorded at 632.8 nm (nominal
15 mW He-Ne laser excitation) in a nearly backscattering geometrywith a Jobin Yvon LabRam micro-spectrometer (300 mm focal lengthspectrograph) equipped with an integrated Olympus BX40 microscope.The spectral resolution was about 1.5-2 cm-1. The Rayleigh radiationwas blocked by a notch filter and the backscattered Raman light wasdispersed by an 1800 grooves/mm holographic grating on a Peltiercooled CCD, made by an array of 1024/256 pixels. The entrance slitwidth was fixed at 100 μm. The laser power was adjusted by means ofa series of density filters to avoid any damage to the samples or uncon-trolled thermal effects. The average power on the sample was alwaysless than 3 mW. Spectra were collected using both 100× or long work-ing distance-50× microscope objectives. Typical exposures were10–60 s, repeated 3–5 times. The system was frequently calibratedusing the 520.6 cm−1 Raman band of silicon or by means of referenceemission lines of Ar or Cd light sources. The data analysiswas performedby LabSpec built-in software. Raman spectra were collected in selectedspots on the surface of the samples as well as on the cross-sections toanalyze the composition of the different layers of painting [12].
2.2.6. Micro-Fourier Transform Infrared Spectroscopy (FTIR)Micro-FTIR spectra were taken in attenuated total reflectance (ATR)
mode employing a ThermoNicolet “Continuμm” Nexus line micro-
spectrophotometer, equipped with a mercury–cadmium–telluride(MCT) detector. A micro-slide-on ATR silicon crystal directly connectedto the objective has been used. Infrared spectra were recorded in4000–650 cm−1 range, resolution 4 cm−1 and 120 scans. All spectrawere collected on micro-samples and are presented in transmittanceunits after baseline correction.
2.2.7. X-ray diffraction (XRD)Part of each sample has been finely ground by hand in agate mortar
to be analyzed by XRD using a THERMO ELECTRON ARL X'TRA powderdiffractometer. The instrument was equipped with a CCD, using MoKα(17,43 KeV) radiation, operating at 40 kV and 20 mA. The XRD datawere collected from 5° to 75° 2θ with a step-size of 0.05°.
2.2.8. Gas Chromatography - Mass Spectrometry (GC-MS)A Focus GC (ThermoScientific) coupled toDSQ II (Thermo Scientific)
with single quadrupole and split–splitless injector was used. Themass spectrometer was operated in the EI positive mode (70 eV). Thecarrier gas was used in the constant flow mode (He, purity 99.995%)at 20 mL/min.
2.2.9. Fatty acid and amino acid analytical proceduresThe basic methodology relied on the identification of fatty acids and
amino acids on the same sample. Two chromatograms were thereforecollected for each sample: the first one from fatty acid derivatives, thesecond fromamino acid derivatives. [13,14]. The internal standards con-sidered were: heptadecanoic acid (50 μl of a 0.1 mg/ml solution w/v)for the analysis of fatty acids; norleucine (50 μl of a 0.1 mg/ml solutionw/v), and norvaline (50 μl of a 0.01 mg/ml solution w/v) for the aminoacids analysis; the analysis was conducted on 1 mg of paint samples.Separation of components was done bymeans of a fused-silica capillarycolumn (RXI-5, Restek) with a 0.25 μm (30 m × 0.25 mm × 0.25 μm)methyl-silicone (5% phenyl) film and the injector was used in splitlessmode. The sample was treated with 4 N-HCl in methanol (1 ml) andn-hexane (1 ml) for 2 h at 50 °C. The n-hexane phase, which containsfatty acid methyl-esters, was used for gas chromatographic analysis(1 μl). Separation of themethyl ester of fatty acids was achieved follow-ing this temperature program: isothermal conditions at 80 °C for 2 min,with 20 °C/min heating up to 280 °C and isothermal conditions at280 °C for 6 min (total run time 18 min). Themass spectrawere collect-ed in Total Ion Current (TIC; 40–500 m/z fragmentation rate). Afterevaporation to dryness of the methanol phase, the residues were dis-solved in 6N hydrochloric acid (2 ml) and hydrolyzed in a screw-capped container for five hours at 100 °C in an oil bath, under nitrogenatmosphere. After evaporation to dryness, the hydrolyzed residueswere esterified using 3 ml of 2N HCl in propan-2-ol at 90 °C for onehour. After cooling, the solvent was evaporated under vacuum and theresidue of the paint was dissolved in 0.2 ml of dichloromethane andderivatized with 0.2 ml of trifluoroacetic anhydride at 60 °C duringone hour. After cooling, the solvent was evaporated under vacuumand the residue of the paint sample was dissolved in 0.2 ml of dichloro-methane, then the solution was used for gas-chromatographic analysis(1 μl). Separation of N-trifluoroacetyl-O-2-propyl esters amino acidsderivatives was achieved following this temperature program: isother-mal conditions at 60 °C for 3 min, with 25 °C/min heating up to 260 °Cand isothermal conditions at 260 °C for 6 min (total run time17.00 min). Themass spectra were recorded in Selected IonMonitoring(SIM; 140, 126, 154, 153, 139, 168, 182, 166, 164, 184, 180, 198, 91,190 m/z fragments). A qualitative analysis was performed in order toidentify lipids and proteins contained in the painting, and the averageamount of fatty acids and amino acids relating to the internal standardswas considered.
2.2.10. Fatty acids, alcohols, and hydrocarbons procedureSamples (500–1000 μg) were hydrolyzed with 5% KOH (1 ml) in
methanol by vigorous stirring 60 min at 80 °C and extracted twice,

83D. Bersani et al. / Microchemical Journal 114 (2014) 80–88
after cooling at room temperature, with hexane (2 ml). The hexane ex-tract (neutral fraction), transferred in a closed conic vials, was admixedwith 1 ml standard solution of N-eicosane (internal standard, 500 ppmin hexane). Then, the mixture was acidified with 1 ml hydrocloridricacid (6N) and extracted twicewith 1 ml of diethyl ether (acid fraction).The extracts were put either in a screw cap test tube, dried under a gen-tle flow of nitrogen and submitted to trimethylsilylation with 100 μl N,O-bis(trimethylsilyl)trifluoroacetamide (BSTFA). The reaction wasperformed at 60 °C for 30 min. A 1 μl volume of the derivatized solu-tions was analyzed. Mass spectra were acquired in the scan range40–500 m/z. The MS transfer line temperature was 280 °C; the MS ionsource temperature was kept at 230 °C. The gas chromatographic sepa-rationwas done in aDB5 fused-silica capillary column, 5% diphenyl–95%dimethylpolysiloxane, 30 m × 0.25 mm id, 0.25 μm, film thickness,(J&W Scientific, Agilent Technologies, Palo Alto, CA). The PTV injectorwas used in split mode at 280 °C. The chromatographic oven was pro-grammed as follows: 80 °C, isothermal for 2 min, 10 °C/min up to200 °C, 200 °C, isothermal for 5 min, 20 °C/min up to 280 °C, 280 °C,isothermal for 20 min.
3. Results and discussion
Energy dispersive X-ray fluorescence (ED-XRF) and visible Reflec-tance Spectroscopy (vis-RS), carried out on about 100 measurementpoints, were performed after the execution of IRR and IRC exams, andfollowed by sampling. Samples were chosen among areas suspected topresent chromatic alterations (fading, darkening, etc.) or structural al-terations (cracking, detachment, etc.).
3.1. Pigments
3.1.1. Blue pigmentsMany points investigated by non-destructive techniques were cho-
sen in the areas representing the sky and the dresses of apostles andephebes.
A smalt blue pigment was identified by vis-RS through the typicalabsorption bands at about 530, 600 and 630–640 nm (Fig. 2) [15].This occurred mainly in the areas depicting the sky. Smalt blue is an
Fig. 2. Vis-RS spectra of blue areas characterized by smalt blue (solid lines) or by azurite(dotted lines). The spectrum of pale blue or grey-blue of some areas of the sky (curve18) has lost its typical maximum in the blue region (440–500 nm).
artificial potassium-glass where the blue color is due to the presenceof cobalt [16]: it is used as a pigment since at least XIV century, andsince XVI century in mural paintings [17].
XRF analysis confirmed this identification owing to the presence ofCo (Kα at 6.93 keV, Kβ at 7.65 keV), As (Kα at 10.53 keV, Kβ at11.73 keV) and Bi (Lα at 10.76 keV, Lβ at 13.00 keV, Lγ at 15.25 keV).As and Bi are common impurities in cobalt minerals, used to color theglass.
In the case of smalt-blue themicro-Raman spectroscopy cannot givea contribution because of strong fluorescence signal of cobalt ions in theglass and the absence of characteristic vibrational features to beassigned to cobalt oxides.
Only in some areas of the sky, where the XRF spectrum gives Cucharacteristic lines, the micro-Raman spectra gave evidence of azurite[Cu3(CO3)2(OH)2] through the typical features at 245, 277, 396, 761,830, 930, 1093 cm−1 (Fig. 4). This copper carbonate pigment usuallyused a secco, with organic binders of different nature (see next para-graph). XRD results on sample 11, collected in the south wall, also indi-cate azurite, togetherwith thewhite calcium carbonate (CaCO3),mainlybelonging to the plaster, and gypsum (CaSO4 ⋅ 2H2O). The latter couldbe found in the plaster, but often is due by sulphatation process, asdiscussed in the following. The XRD spectra show a strong backgroundnoise probably due to blue smalt pigment that, as glass, gives broad dif-fraction pattern. Moreover, in the areas of the sky, lazurite mineral [(Na,Ca)8((SO4,S,Cl)2|(AlSiO4)6], the main component of ultramarine blue(lapis lazuli), has been identified. Raman analysis carried out on cross-sections shows that ultramarine blue is located only on the surface(Fig. 3).
Vis-RS analysis did not identify this pigment, usually well detectableby its strong large absorbance around 600 nmdue to its scarce presencein comparison to smalt. The expensive lapis lazuli was perhaps usedonly in thin layer (glazing) to achieve a better uniformity in the surfacecolor, and its use a secco was most likely subjected to a larger damageduring past cleanings.
Blue areas of the fresco depicting clothes are characterized by wide-spread use of azurite.
Through the IRC images (Fig. 4) it easily evidenced the distributionof this pigment on the surface by the dark blue-violet coloration,while red-pink areas refer to smalt blue (predominant, in this case) orto ultramarine blue [4].
The presence of azurite was confirmed by vis-RS, showing the typi-cal absorption band at about 640 nm. Micro-Raman spectroscopyfurther confirmed the presence of azurite in dresses, mixed with ultra-marine blue in the surface layers.
Raman spectra gave also evidence of hematite (Fe2O3), showingmain peaks at 224, 290, 299 and 408 cm−1 [18], in the blue areas
Fig. 3. Representative Raman spectra collected in blue areas showing the presence of lapislazuli and azurite.
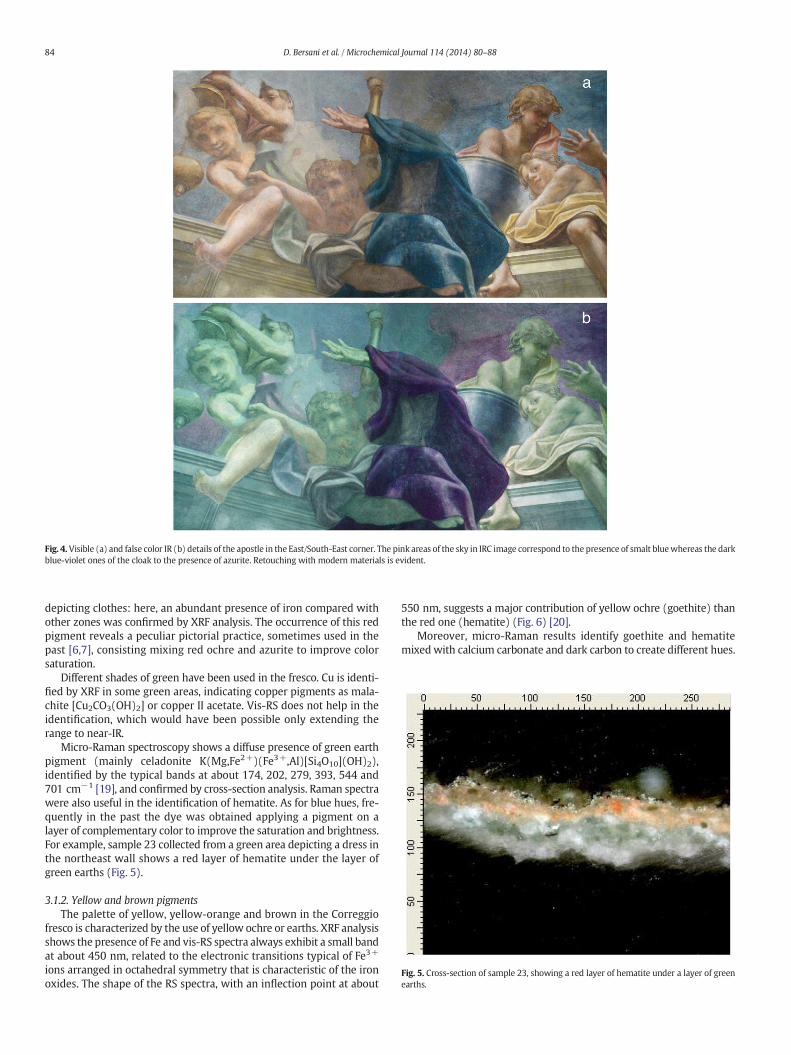
Fig. 4.Visible (a) and false color IR (b) details of the apostle in the East/South-East corner. The pink areas of the sky in IRC image correspond to the presence of smalt bluewhereas the darkblue-violet ones of the cloak to the presence of azurite. Retouching with modern materials is evident.
Fig. 5. Cross-section of sample 23, showing a red layer of hematite under a layer of greenearths.
84 D. Bersani et al. / Microchemical Journal 114 (2014) 80–88
depicting clothes: here, an abundant presence of iron compared withother zones was confirmed by XRF analysis. The occurrence of this redpigment reveals a peculiar pictorial practice, sometimes used in thepast [6,7], consisting mixing red ochre and azurite to improve colorsaturation.
Different shades of green have been used in the fresco. Cu is identi-fied by XRF in some green areas, indicating copper pigments as mala-chite [Cu2CO3(OH)2] or copper II acetate. Vis-RS does not help in theidentification, which would have been possible only extending therange to near-IR.
Micro-Raman spectroscopy shows a diffuse presence of green earthpigment (mainly celadonite K(Mg,Fe2+)(Fe3+,Al)[Si4O10](OH)2),identified by the typical bands at about 174, 202, 279, 393, 544 and701 cm−1 [19], and confirmed by cross-section analysis. Raman spectrawere also useful in the identification of hematite. As for blue hues, fre-quently in the past the dye was obtained applying a pigment on alayer of complementary color to improve the saturation and brightness.For example, sample 23 collected from a green area depicting a dress inthe northeast wall shows a red layer of hematite under the layer ofgreen earths (Fig. 5).
3.1.2. Yellow and brown pigmentsThe palette of yellow, yellow-orange and brown in the Correggio
fresco is characterized by the use of yellow ochre or earths. XRF analysisshows the presence of Fe and vis-RS spectra always exhibit a small bandat about 450 nm, related to the electronic transitions typical of Fe3+
ions arranged in octahedral symmetry that is characteristic of the ironoxides. The shape of the RS spectra, with an inflection point at about
550 nm, suggests a major contribution of yellow ochre (goethite) thanthe red one (hematite) (Fig. 6) [20].
Moreover, micro-Raman results identify goethite and hematitemixedwith calcium carbonate and dark carbon to create different hues.
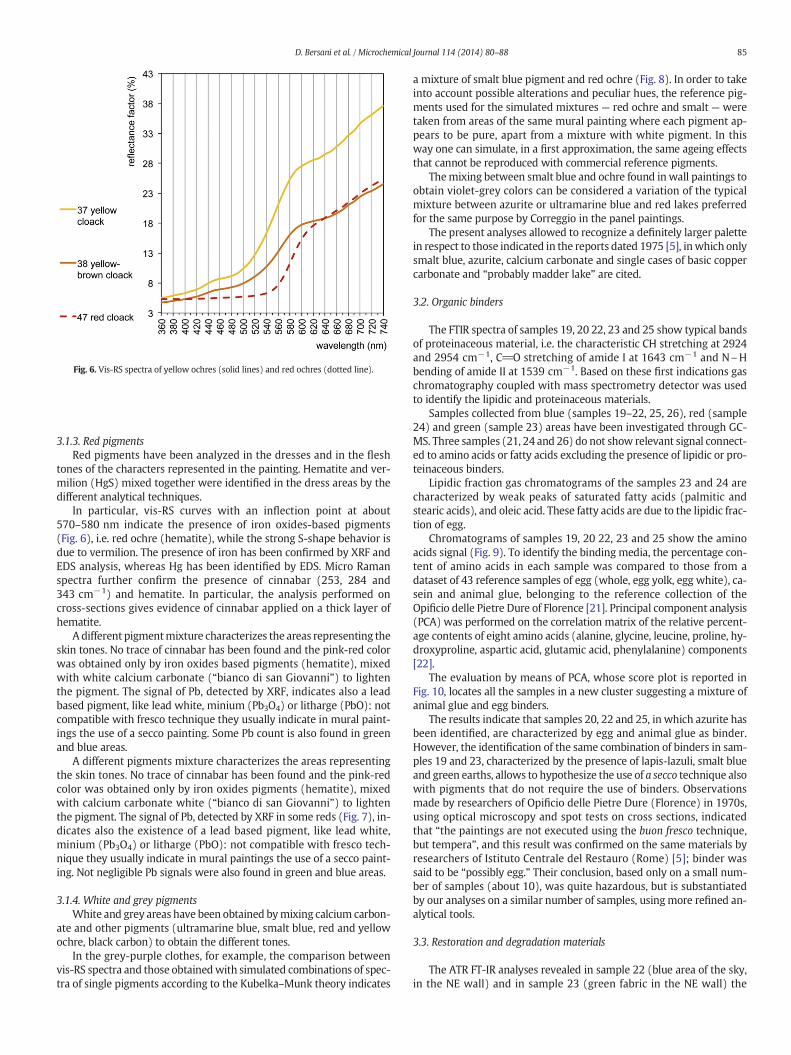
Fig. 6. Vis-RS spectra of yellow ochres (solid lines) and red ochres (dotted line).
85D. Bersani et al. / Microchemical Journal 114 (2014) 80–88
3.1.3. Red pigmentsRed pigments have been analyzed in the dresses and in the flesh
tones of the characters represented in the painting. Hematite and ver-milion (HgS) mixed together were identified in the dress areas by thedifferent analytical techniques.
In particular, vis-RS curves with an inflection point at about570–580 nm indicate the presence of iron oxides-based pigments(Fig. 6), i.e. red ochre (hematite), while the strong S-shape behavior isdue to vermilion. The presence of iron has been confirmed by XRF andEDS analysis, whereas Hg has been identified by EDS. Micro Ramanspectra further confirm the presence of cinnabar (253, 284 and343 cm−1) and hematite. In particular, the analysis performed oncross-sections gives evidence of cinnabar applied on a thick layer ofhematite.
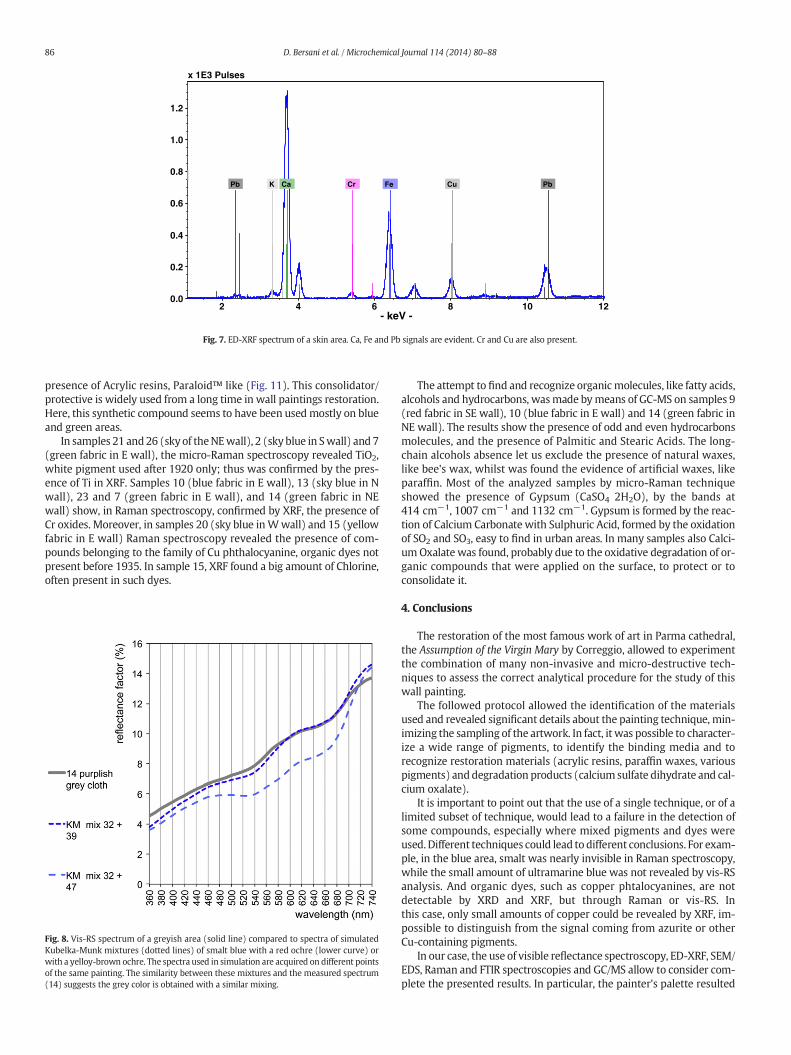
A different pigmentmixture characterizes the areas representing theskin tones. No trace of cinnabar has been found and the pink-red colorwas obtained only by iron oxides based pigments (hematite), mixedwith white calcium carbonate (“bianco di san Giovanni”) to lightenthe pigment. The signal of Pb, detected by XRF, indicates also a leadbased pigment, like lead white, minium (Pb3O4) or litharge (PbO): notcompatible with fresco technique they usually indicate in mural paint-ings the use of a secco painting. Some Pb count is also found in greenand blue areas.
A different pigments mixture characterizes the areas representingthe skin tones. No trace of cinnabar has been found and the pink-redcolor was obtained only by iron oxides pigments (hematite), mixedwith calcium carbonate white (“bianco di san Giovanni”) to lightenthe pigment. The signal of Pb, detected by XRF in some reds (Fig. 7), in-dicates also the existence of a lead based pigment, like lead white,minium (Pb3O4) or litharge (PbO): not compatible with fresco tech-nique they usually indicate in mural paintings the use of a secco paint-ing. Not negligible Pb signals were also found in green and blue areas.
3.1.4. White and grey pigmentsWhite and grey areas have been obtained bymixing calcium carbon-
ate and other pigments (ultramarine blue, smalt blue, red and yellowochre, black carbon) to obtain the different tones.
In the grey-purple clothes, for example, the comparison betweenvis-RS spectra and those obtainedwith simulated combinations of spec-tra of single pigments according to the Kubelka–Munk theory indicates
a mixture of smalt blue pigment and red ochre (Fig. 8). In order to takeinto account possible alterations and peculiar hues, the reference pig-ments used for the simulated mixtures — red ochre and smalt — weretaken from areas of the same mural painting where each pigment ap-pears to be pure, apart from a mixture with white pigment. In thisway one can simulate, in a first approximation, the same ageing effectsthat cannot be reproduced with commercial reference pigments.
Themixing between smalt blue and ochre found in wall paintings toobtain violet-grey colors can be considered a variation of the typicalmixture between azurite or ultramarine blue and red lakes preferredfor the same purpose by Correggio in the panel paintings.
The present analyses allowed to recognize a definitely larger palettein respect to those indicated in the reports dated 1975 [5], inwhich onlysmalt blue, azurite, calcium carbonate and single cases of basic coppercarbonate and “probably madder lake” are cited.
3.2. Organic binders
The FTIR spectra of samples 19, 20 22, 23 and 25 show typical bandsof proteinaceous material, i.e. the characteristic CH stretching at 2924and 2954 cm−1, C_O stretching of amide I at 1643 cm−1 and N\Hbending of amide II at 1539 cm−1. Based on these first indications gaschromatography coupled with mass spectrometry detector was usedto identify the lipidic and proteinaceous materials.
Samples collected from blue (samples 19–22, 25, 26), red (sample24) and green (sample 23) areas have been investigated through GC-MS. Three samples (21, 24 and 26) do not show relevant signal connect-ed to amino acids or fatty acids excluding the presence of lipidic or pro-teinaceous binders.
Lipidic fraction gas chromatograms of the samples 23 and 24 arecharacterized by weak peaks of saturated fatty acids (palmitic andstearic acids), and oleic acid. These fatty acids are due to the lipidic frac-tion of egg.
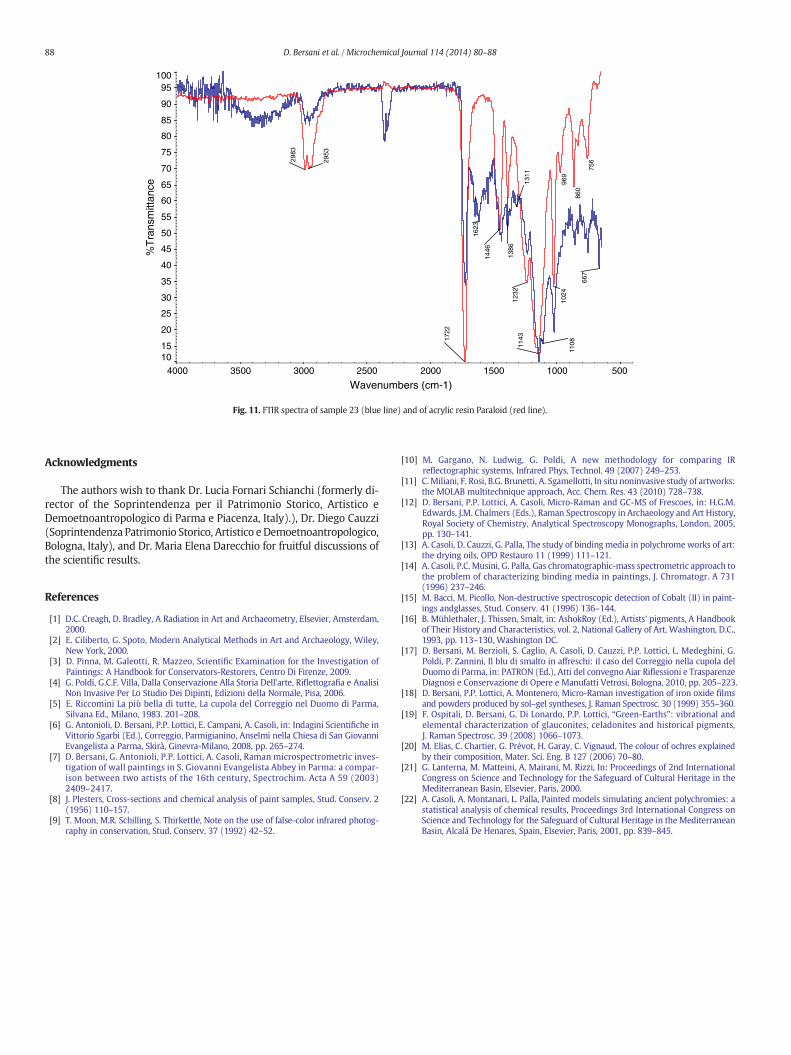
Chromatograms of samples 19, 20 22, 23 and 25 show the aminoacids signal (Fig. 9). To identify the binding media, the percentage con-tent of amino acids in each sample was compared to those from adataset of 43 reference samples of egg (whole, egg yolk, egg white), ca-sein and animal glue, belonging to the reference collection of theOpificio delle Pietre Dure of Florence [21]. Principal component analysis(PCA) was performed on the correlation matrix of the relative percent-age contents of eight amino acids (alanine, glycine, leucine, proline, hy-droxyproline, aspartic acid, glutamic acid, phenylalanine) components[22].
The evaluation by means of PCA, whose score plot is reported inFig. 10, locates all the samples in a new cluster suggesting a mixture ofanimal glue and egg binders.
The results indicate that samples 20, 22 and 25, in which azurite hasbeen identified, are characterized by egg and animal glue as binder.However, the identification of the same combination of binders in sam-ples 19 and 23, characterized by the presence of lapis-lazuli, smalt blueand green earths, allows to hypothesize the use of a secco technique alsowith pigments that do not require the use of binders. Observationsmade by researchers of Opificio delle Pietre Dure (Florence) in 1970s,using optical microscopy and spot tests on cross sections, indicatedthat “the paintings are not executed using the buon fresco technique,but tempera”, and this result was confirmed on the same materials byresearchers of Istituto Centrale del Restauro (Rome) [5]; binder wassaid to be “possibly egg.” Their conclusion, based only on a small num-ber of samples (about 10), was quite hazardous, but is substantiatedby our analyses on a similar number of samples, usingmore refined an-alytical tools.
3.3. Restoration and degradation materials
The ATR FT-IR analyses revealed in sample 22 (blue area of the sky,in the NE wall) and in sample 23 (green fabric in the NE wall) the
2 4 6 8 10 12- keV -
0.0
0.2
0.4
0.6
0.8
1.0
1.2
x 1E3 Pulses
Ca Fe Pb Pb Cr Cu K
Fig. 7. ED-XRF spectrum of a skin area. Ca, Fe and Pb signals are evident. Cr and Cu are also present.
86 D. Bersani et al. / Microchemical Journal 114 (2014) 80–88
presence of Acrylic resins, Paraloid™ like (Fig. 11). This consolidator/protective is widely used from a long time in wall paintings restoration.Here, this synthetic compound seems to have been usedmostly on blueand green areas.
In samples 21 and26 (sky of theNEwall), 2 (sky blue in Swall) and 7(green fabric in E wall), the micro-Raman spectroscopy revealed TiO2,white pigment used after 1920 only; thus was confirmed by the pres-ence of Ti in XRF. Samples 10 (blue fabric in E wall), 13 (sky blue in Nwall), 23 and 7 (green fabric in E wall), and 14 (green fabric in NEwall) show, in Raman spectroscopy, confirmed by XRF, the presence ofCr oxides. Moreover, in samples 20 (sky blue inWwall) and 15 (yellowfabric in E wall) Raman spectroscopy revealed the presence of com-pounds belonging to the family of Cu phthalocyanine, organic dyes notpresent before 1935. In sample 15, XRF found a big amount of Chlorine,often present in such dyes.
Fig. 8. Vis-RS spectrum of a greyish area (solid line) compared to spectra of simulatedKubelka-Munk mixtures (dotted lines) of smalt blue with a red ochre (lower curve) orwith a yelloy-brown ochre. The spectra used in simulation are acquired on different pointsof the same painting. The similarity between these mixtures and the measured spectrum(14) suggests the grey color is obtained with a similar mixing.
The attempt to find and recognize organicmolecules, like fatty acids,alcohols and hydrocarbons, wasmade bymeans of GC-MS on samples 9(red fabric in SE wall), 10 (blue fabric in E wall) and 14 (green fabric inNE wall). The results show the presence of odd and even hydrocarbonsmolecules, and the presence of Palmitic and Stearic Acids. The long-chain alcohols absence let us exclude the presence of natural waxes,like bee's wax, whilst was found the evidence of artificial waxes, likeparaffin. Most of the analyzed samples by micro-Raman techniqueshowed the presence of Gypsum (CaSO4 2H2O), by the bands at414 cm−1, 1007 cm−1 and 1132 cm−1. Gypsum is formed by the reac-tion of Calcium Carbonate with Sulphuric Acid, formed by the oxidationof SO2 and SO3, easy to find in urban areas. In many samples also Calci-um Oxalate was found, probably due to the oxidative degradation of or-ganic compounds that were applied on the surface, to protect or toconsolidate it.
4. Conclusions
The restoration of the most famous work of art in Parma cathedral,the Assumption of the Virgin Mary by Correggio, allowed to experimentthe combination of many non-invasive and micro-destructive tech-niques to assess the correct analytical procedure for the study of thiswall painting.
The followed protocol allowed the identification of the materialsused and revealed significant details about the painting technique, min-imizing the sampling of the artwork. In fact, it was possible to character-ize a wide range of pigments, to identify the binding media and torecognize restoration materials (acrylic resins, paraffin waxes, variouspigments) anddegradation products (calcium sulfate dihydrate and cal-cium oxalate).
It is important to point out that the use of a single technique, or of alimited subset of technique, would lead to a failure in the detection ofsome compounds, especially where mixed pigments and dyes wereused. Different techniques could lead to different conclusions. For exam-ple, in the blue area, smalt was nearly invisible in Raman spectroscopy,while the small amount of ultramarine blue was not revealed by vis-RSanalysis. And organic dyes, such as copper phtalocyanines, are notdetectable by XRD and XRF, but through Raman or vis-RS. Inthis case, only small amounts of copper could be revealed by XRF, im-possible to distinguish from the signal coming from azurite or otherCu-containing pigments.
In our case, the use of visible reflectance spectroscopy, ED-XRF, SEM/EDS, Raman and FTIR spectroscopies and GC/MS allow to consider com-plete the presented results. In particular, the painter's palette resulted
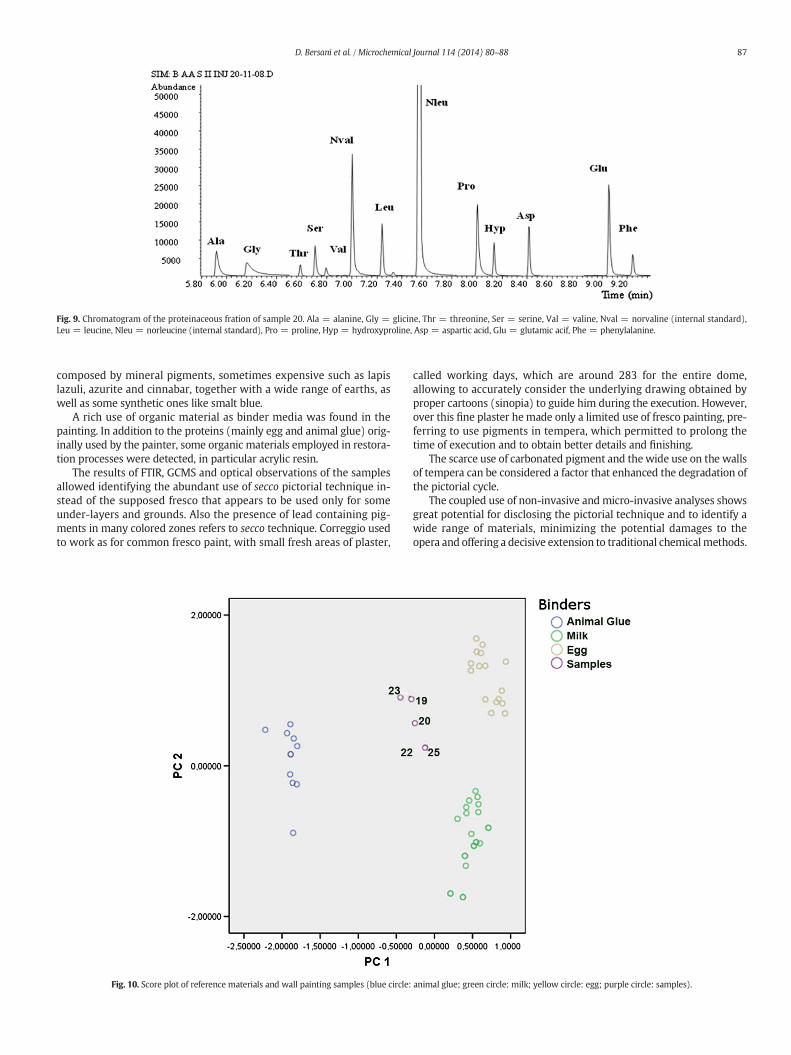
Fig. 9. Chromatogram of the proteinaceous fration of sample 20. Ala = alanine, Gly = glicine, Thr = threonine, Ser = serine, Val = valine, Nval = norvaline (internal standard),Leu = leucine, Nleu = norleucine (internal standard), Pro = proline, Hyp = hydroxyproline, Asp = aspartic acid, Glu = glutamic acif, Phe = phenylalanine.
87D. Bersani et al. / Microchemical Journal 114 (2014) 80–88
composed by mineral pigments, sometimes expensive such as lapislazuli, azurite and cinnabar, together with a wide range of earths, aswell as some synthetic ones like smalt blue.
A rich use of organic material as binder media was found in thepainting. In addition to the proteins (mainly egg and animal glue) orig-inally used by the painter, some organic materials employed in restora-tion processes were detected, in particular acrylic resin.
The results of FTIR, GCMS and optical observations of the samplesallowed identifying the abundant use of secco pictorial technique in-stead of the supposed fresco that appears to be used only for someunder-layers and grounds. Also the presence of lead containing pig-ments in many colored zones refers to secco technique. Correggio usedto work as for common fresco paint, with small fresh areas of plaster,
Fig. 10. Score plot of reference materials and wall painting samples (blue circle:
called working days, which are around 283 for the entire dome,allowing to accurately consider the underlying drawing obtained byproper cartoons (sinopia) to guide him during the execution. However,over this fine plaster hemade only a limited use of fresco painting, pre-ferring to use pigments in tempera, which permitted to prolong thetime of execution and to obtain better details and finishing.
The scarce use of carbonated pigment and thewide use on the wallsof tempera can be considered a factor that enhanced the degradation ofthe pictorial cycle.
The coupled use of non-invasive and micro-invasive analyses showsgreat potential for disclosing the pictorial technique and to identify awide range of materials, minimizing the potential damages to theopera and offering a decisive extension to traditional chemicalmethods.
animal glue; green circle: milk; yellow circle: egg; purple circle: samples).
667
1108
1311
1623
756
860
969
1024
1143
1232
1386
1446
1722
2953
2983
10 15
20
25
30
35
40
45
50
55
60
65
70
75
80
85
90
95 100
%T
rans
mitt
ance
500 1000 1500 2000 2500 3000 3500 4000
Wavenumbers (cm-1)
Fig. 11. FTIR spectra of sample 23 (blue line) and of acrylic resin Paraloid (red line).
88 D. Bersani et al. / Microchemical Journal 114 (2014) 80–88
Acknowledgments
The authors wish to thank Dr. Lucia Fornari Schianchi (formerly di-rector of the Soprintendenza per il Patrimonio Storico, Artistico eDemoetnoantropologico di Parma e Piacenza, Italy).), Dr. Diego Cauzzi(Soprintendenza Patrimonio Storico, Artistico e Demoetnoantropologico,Bologna, Italy), and Dr. Maria Elena Darecchio for fruitful discussions ofthe scientific results.
References
[1] D.C. Creagh, D. Bradley, A Radiation in Art and Archaeometry, Elsevier, Amsterdam,2000.
[2] E. Ciliberto, G. Spoto, Modern Analytical Methods in Art and Archaeology, Wiley,New York, 2000.
[3] D. Pinna, M. Galeotti, R. Mazzeo, Scientific Examination for the Investigation ofPaintings: A Handbook for Conservators-Restorers, Centro Di Firenze, 2009.
[4] G. Poldi, G.C.F. Villa, Dalla Conservazione Alla Storia Dell'arte, Riflettografia e AnalisiNon Invasive Per Lo Studio Dei Dipinti, Edizioni della Normale, Pisa, 2006.
[5] E. Riccomini La più bella di tutte, La cupola del Correggio nel Duomo di Parma,Silvana Ed., Milano, 1983. 201–208.
[6] G. Antonioli, D. Bersani, P.P. Lottici, E. Campani, A. Casoli, in: Indagini Scientifiche inVittorio Sgarbi (Ed.), Correggio, Parmigianino, Anselmi nella Chiesa di San GiovanniEvangelista a Parma, Skirà, Ginevra-Milano, 2008, pp. 265–274.
[7] D. Bersani, G. Antonioli, P.P. Lottici, A. Casoli, Raman microspectrometric inves-tigation of wall paintings in S. Giovanni Evangelista Abbey in Parma: a compar-ison between two artists of the 16th century, Spectrochim. Acta A 59 (2003)2409–2417.
[8] J. Plesters, Cross-sections and chemical analysis of paint samples, Stud. Conserv. 2(1956) 110–157.
[9] T. Moon, M.R. Schilling, S. Thirkettle, Note on the use of false-color infrared photog-raphy in conservation, Stud. Conserv. 37 (1992) 42–52.
[10] M. Gargano, N. Ludwig, G. Poldi, A new methodology for comparing IRreflectographic systems, Infrared Phys. Technol. 49 (2007) 249–253.
[11] C. Miliani, F. Rosi, B.G. Brunetti, A. Sgamellotti, In situ noninvasive study of artworks:the MOLAB multitechnique approach, Acc. Chem. Res. 43 (2010) 728–738.
[12] D. Bersani, P.P. Lottici, A. Casoli, Micro-Raman and GC-MS of Frescoes, in: H.G.M.Edwards, J.M. Chalmers (Eds.), Raman Spectroscopy in Archaeology and Art History,Royal Society of Chemistry, Analytical Spectroscopy Monographs, London, 2005,pp. 130–141.
[13] A. Casoli, D. Cauzzi, G. Palla, The study of binding media in polychromeworks of art:the drying oils, OPD Restauro 11 (1999) 111–121.
[14] A. Casoli, P.C. Musini, G. Palla, Gas chromatographic-mass spectrometric approach tothe problem of characterizing binding media in paintings, J. Chromatogr. A 731(1996) 237–246.
[15] M. Bacci, M. Picollo, Non-destructive spectroscopic detection of Cobalt (II) in paint-ings andglasses, Stud. Conserv. 41 (1996) 136–144.
[16] B. Mühlethaler, J. Thissen, Smalt, in: AshokRoy (Ed.), Artists' pigments, A Handbookof Their History and Characteristics, vol. 2, National Gallery of Art, Washington, D.C.,1993, pp. 113–130, Washington DC.
[17] D. Bersani, M. Berzioli, S. Caglio, A. Casoli, D. Cauzzi, P.P. Lottici, L. Medeghini, G.Poldi, P. Zannini, Il blu di smalto in affreschi: il caso del Correggio nella cupola delDuomo di Parma, in: PATRON (Ed.), Atti del convegno Aiar Riflessioni e TrasparenzeDiagnosi e Conservazione di Opere e Manufatti Vetrosi, Bologna, 2010, pp. 205–223.
[18] D. Bersani, P.P. Lottici, A. Montenero, Micro-Raman investigation of iron oxide filmsand powders produced by sol–gel syntheses, J. Raman Spectrosc. 30 (1999) 355–360.
[19] F. Ospitali, D. Bersani, G. Di Lonardo, P.P. Lottici, “Green-Earths”: vibrational andelemental characterization of glauconites, celadonites and historical pigments,J. Raman Spectrosc. 39 (2008) 1066–1073.
[20] M. Elias, C. Chartier, G. Prévot, H. Garay, C. Vignaud, The colour of ochres explainedby their composition, Mater. Sci. Eng. B 127 (2006) 70–80.
[21] G. Lanterna, M. Matteini, A. Mairani, M. Rizzi, In: Proceedings of 2nd InternationalCongress on Science and Technology for the Safeguard of Cultural Heritage in theMediterranean Basin, Elsevier, Paris, 2000.
[22] A. Casoli, A. Montanari, L. Palla, Painted models simulating ancient polychromies: astatistical analysis of chemical results, Proceedings 3rd International Congress onScience and Technology for the Safeguard of Cultural Heritage in the MediterraneanBasin, Alcalá De Henares, Spain, Elsevier, Paris, 2001, pp. 839–845.