Embed Size (px)
Citation preview
Analysis of overtone flexural modes operation in quartz-enhanced photoacoustic spectroscopy
Frank K. Tittel,1 Angelo Sampaolo,1,2 Pietro Patimisco,1,2 Lei Dong,3 Antonina Geras,4 Tomasz Starecki,4 and Vincenzo Spagnolo2,*
1Department of Electrical and Computer Engineering, Rice University, 6100 Main Street, Houston, TX 77005, USA 2Dipartimento Interateneo di Fisica, Università e Politecnico di Bari, CNR-IFN BARI, Via Amendola 173, Bari, Italy
3State Key Laboratory of Quantum Optics and Quantum Optics Devices, Institute of Laser Spectroscopy, Shanxi University, Taiyuan 030006, China
4Institute of Electronic Systems, Warsaw University of Technology, Nowowiejska 15/19, 00-665 Warsaw, Poland *[email protected]
Abstract: A detailed investigation of a set of custom quartz tuning forks (QTFs), operating in the fundamental and first overtone flexural modes is reported. Support losses are the dominant energy dissipation processes when the QTFs vibrate at the first overtone mode. These losses can be decreased by increasing the ratio between the prong length and its thickness. The QTFs were implemented in a quartz enhanced photoacoustic spectroscopy (QEPAS) based sensor operating in the near-IR spectral range and water vapor was selected as the gas target. QTF flexural modes having the highest quality factor exhibit the largest QEPAS signal, demonstrating that, by optimizing the QTF prongs sizes, overtone modes can provide a higher QEPAS sensor performance with respect to using the fundamental mode.
©2016 Optical Society of America
OCIS codes: (280.3420) Laser sensors; (110.5125) Photoacoustics; (120.7280) Vibration analysis.
References and links
1. J. Hodgkinson and R.P. Tatam, “Optical gas sensing: a review,” Meas. Sci. Technol. 24, 012004 (2013). 2. L. Dong, Y. Yu, C. Li, S. So, and F. K. Tittel, “Ppb-level formaldehyde detection using a CW room-temperature
interband cascade laser and a miniature dense pattern multipass gas cell,” Opt. Express 23(15), 19821–19830 (2015).
3. G. Gagliardi and H. P. Loock, Cavity-Enhanced Spectroscopy and Sensing (Springer, 2014). 4. I. Galli, S. Bartalini, S. Borri, P. Cancio, D. Mazzotti, P. De Natale, and G. Giusfredi, “Molecular gas sensing
below parts per trillion: radiocarbon-dioxide optical detection,” Phys. Rev. Lett. 107(27), 270802 (2011). 5. A. Elia, P. M. Lugarà, C. Di Franco, and V. Spagnolo, “Photoacoustic techniques for trace gas sensing based on
semiconductor laser sources,” Sensors (Basel) 9(12), 9616–9628 (2009). 6. P. Patimisco, G. Scamarcio, F. K. Tittel, and V. Spagnolo, “Quartz-enhanced photoacoustic spectroscopy: a
review,” Sensors (Basel) 14(4), 6165–6206 (2014). 7. A. A. Kosterev, F. K. Tittel, D. Serebryakov, A. L. Malinovsky, and I. Morozov, “Applications of Quartz Tuning
Forks in Spectroscopic Gas Sensing,” Rev. Sci. Instrum. 76(4), 043105 (2005). 8. V. Spagnolo, P. Patimisco, S. Borri, G. Scamarcio, B. E. Bernacki, and J. Kriesel, “Part-per-trillion level SF6
detection using a quartz enhanced photoacoustic spectroscopy-based sensor with single-mode fiber-coupled quantum cascade laser excitation,” Opt. Lett. 37(21), 4461–4463 (2012).
9. V. Spagnolo, P. Patimisco, S. Borri, G. Scamarcio, B. E. Bernacki, and J. Kriesel, “Mid-infrared fiber-coupled QCL-QEPAS sensor,” Appl. Phys. B 112(1), 25–33 (2013).
10. S. Borri, P. Patimisco, I. Galli, D. Mazzotti, G. Giusfredi, N. Akikusa, M. Yamanishi, G. Scamarcio, P. De Natale, and V. Spagnolo, “Intracavity quartz-enhanced photoacoustic sensor,” Appl. Phys. Lett. 104(9), 091114 (2014).
11. P. Patimisco, S. Borri, I. Galli, D. Mazzotti, G. Giusfredi, N. Akikusa, M. Yamanishi, G. Scamarcio, P. De Natale, and V. Spagnolo, “High finesse optical cavity coupled with a quartz-enhanced photoacoustic spectroscopic sensor,” Analyst 140(3), 736–743 (2015).
12. A. Sampaolo, P. Patimisco, L. Dong, A. Geras, G. Scamarcio, T. Starecki, F. K. Tittel, and V. Spagnolo, “Quartz-Enhanced Photoacoustic Spectroscopy exploiting tuning fork overtone modes,” Appl. Phys. Lett. 107(23), 231102 (2015).
13. W. H. Flygare, “Molecular relaxation,” Acc. Chem. Res. 1(4), 121–127 (1968).
#257598 Received 15 Jan 2016; revised 23 Feb 2016; accepted 23 Feb 2016; published 17 Mar 2016 © 2016 OSA 21 Mar 2016 | Vol. 24, No. 6 | DOI:10.1364/OE.24.00A682 | OPTICS EXPRESS A682
14. P. Patimisco, S. Borri, A. Sampaolo, H. E. Beere, D. A. Ritchie, M. S. Vitiello, G. Scamarcio, and V. Spagnolo, “A quartz enhanced photo-acoustic gas sensor based on a custom tuning fork and a terahertz quantum cascade laser,” Analyst (Lond.) 139(9), 2079–2087 (2014).
15. Z. Hao, A. Erbil, and F. Ayazi, ““An analytical model for support loss in micromachined beam resonators with in-plane flexural vibrations,” Sensor. Actuat,” Sensor. Actuat. A-Phys. 109, 156–164 (2003).
16. R. R. Archer, N. H. Cook, S. H. Crandall, N. C. Dahl, F. A. McClintock, E. Rabinowicz, and G. S. Reichenbach, “An Introduction to the Mechanics of Solids,” (McGraw-Hill, 1959).
17. H. Hosaka, K. Itao, and S. Kuroda, ““Damping characteristics of beam-shaped micro-oscillatiors,” Sensor. Actuat. A-Phys. 49, 87–95 (1995).
18. Y. Ma, G. Yu, J. Zhang, X. Yu, R. Sun, and F. K. Tittel, “Quartz enhanced photoacoustic spectroscopy based trace gas sensors using different quartz tuning forks,” Sensors (Basel) 15(4), 7596–7604 (2015).
19. P. Patimisco, A. Sampaolo, L. Dong, M. Giglio, G. Scamarcio, F. K. Tittel, and V. Spagnolo, ““Analysis of the electro-elastic properties of custom quartz tuning forks for optoacoustic gas sensing,” Sensor. Actuat,” Biol. Chem. 227, 539–546 (2016).
20. D. I. Bradley, M. J. Fear, S. N. Fisher, A. M. Guénault, R. P. Haley, C. R. Lawson, G. R. Pickett, R. Schanen, V. Tsepelin, and L. A. Wheatland, “Stability of flow and the transition to turbulence around a quartz tuning fork in superfluid 4He at very low temperatures,” Phys. Rev. B 89(21), 214503 (2014).
21. L. S. Rothman, I. E. Gordon, Y. Babikov, A. Barbe, D. Chris Benner, P. F. Bernath, M. Birk, L. Bizzocchi, V. Boudon, L. R. Brown, A. Campargue, K. Chance, E. A. Cohen, L. H. Coudert, V. M. Devi, B. J. Drouin, A. Fayt, J.-M. Flaud, R. R. Gamache, J. J. Harrison, J.-M. Hartmann, C. Hill, J. T. Hodges, D. Jacquemart, A. Jolly, J. Lamouroux, R. J. Le Roy, G. Li, D. A. Long, O. M. Lyulin, C. J. Mackie, S. T. Massie, S. Mikhailenko, H. S. P. Muller, O. V. Naumenko, A. V. Nikitin, J. Orphal, V. Perevalov, A. Perrin, E. R. Polovtseva, C. Richard, M. A. H. Smith, E. Starikova, K. Sung, S. Tashkun, J. Tennyson, G. C. Toon, V. G. Tyuterev, and G. Wagner, “The HITRAN2012 molecular spectroscopic database,” J. Quant. Spectrosc. Radiat. Transf. 130, 4–50 (2013).
22. A. A. Kosterev, Y. A. Bakhirkin, F. K. Tittel, S. McWhorter, and B. Ashcraft, “QEPAS methane sensor performance for humidified gases,” Appl. Phys. B 92(1), 103–109 (2008).
1. Introduction
Laser-based spectroscopic sensors for trace gas detection have made significant progress in recent years as a result of major developments in optical sources and detector performance and these sensors now offer high sensitivity and selectivity, large dynamic range in concentration as well as non-invasive and in situ operation [1]. Detection schemes such as multi-pass absorption spectroscopy (MPS) [2], cavity-enhanced absorption spectroscopy (CEAS) [3] and cavity ring-down spectroscopy (CRDS) [4] are well-established optical techniques. These optical techniques make use of coherent sources coupled to an optical cavity and take advantage of power build-up (CEAS and CRDS) or long optical pathlengths (MPS) occurring inside the cavity, resulting in increased detection sensitivities with respect to the standard direct-absorption spectroscopic approach. The detection of the optical signal is accomplished by using low-noise, fast optical detectors. Photoacoustic spectroscopy (PAS), on the other hand, is a sensitive gas-detection technique that does not require the use of optical detectors [5]. In PAS, the energy is accumulated by the target gas via absorption of modulated optical radiation and is converted into local heating by collisional processes, thereby creating pressure waves. This acoustic signal is then detected either by a microphone (conventional PAS) or by means of piezoelectric quartz tuning fork (QTF), both acting as acousto-electric transducers. This now well-established variant of PAS is known as quartz-enhanced photoacoustic spectroscopy (QEPAS) [6,7]. QEPAS operation requires proper focalization of the excitation laser beam between the prongs of the QTF and modulation of the excitation source at a frequency matching one of the resonant frequencies of the QTF. Usually, readily commercially available QTFs with a resonance frequency at 32.78 kHz and a related quality factor of ~10000 in air are employed. QEPAS combined with a mid-infrared quantum cascade laser (QCL) source has demonstrated record sensitivities of < 50 part-per-trillion (ppt) concentration levels [8,9]. A combination of QEPAS and CEAS (i.e. intracavity-QEPAS) together with a low-power QCL source was also recently reported for CO2 detection, resulting in detection sensitivities in the ppt concentration range [10,11]. Furthermore, the feasibility to employ custom-made QTFs to significantly improve the sensitivity of QEPAS acoustic detection modules was reported [12].
#257598 Received 15 Jan 2016; revised 23 Feb 2016; accepted 23 Feb 2016; published 17 Mar 2016 © 2016 OSA 21 Mar 2016 | Vol. 24, No. 6 | DOI:10.1364/OE.24.00A682 | OPTICS EXPRESS A683
With respect to the standard 32 kHz QTF, the resonance frequency of the fundamental mode was reduced to a few kHz, in order to approach the typical energy relaxation time of targeted gases [13], while maintaining a high resonator quality factor. Both conditions can be simultaneously satisfied by an appropriate design of the QTF prong sizes. However, lowering the fundamental resonance frequency reduces also the overtone frequencies, leading to their investigation and use in QEPAS sensor systems. This is not feasible with a 32 kHz QTF, since its first overtone mode occurs at frequencies higher than 190 kHz, which is impractical for QEPAS based gas detection. In previous work [12], we reported the first demonstration of a QEPAS sensor employing a custom-made QTF and operating in both the fundamental and the first overtone vibrational mode resonances. In this work, we compared the photoacoustic performance of three custom-made QTFs, with prong sizes designed to provide fundamental resonance frequencies of a few kHz and the first overtone mode of ≤ 50 kHz. To evaluate the custom-made QTFs acousto-electric transduction efficiency, we implemented the QTFs in a QEPAS sensor system operating in the near-IR spectral range and selected water vapor as the target gas. We compared the QEPAS signals obtained using both the fundamental and the first overtone QTFs flexural modes and in Section 2 present a detailed analysis of the dependence of the QTFs first overtone mode quality factor on the prongs’ geometry.
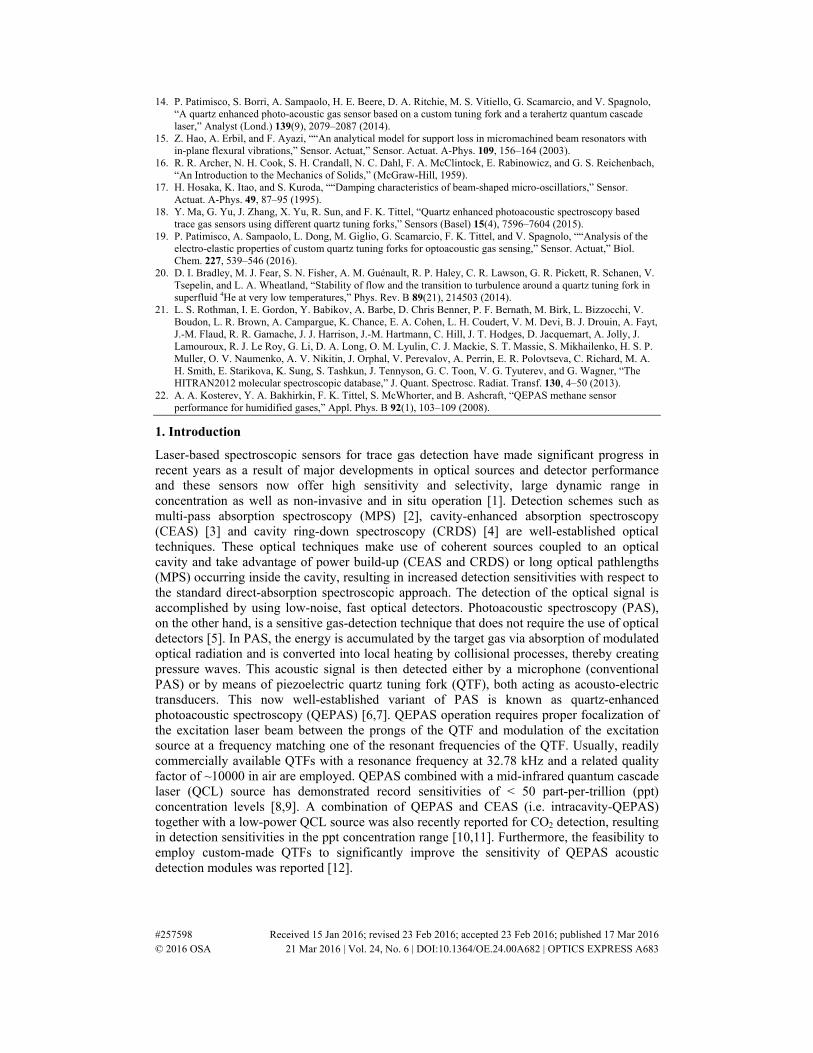
2. Theory of the vibrating prongs of a tuning fork
For a QTF vibrating in its in-plane flexural modes, the prong dynamics in a direction perpendicular to the prong at the rest position can be described by the Bernoulli-Euler equation [14]:
02
2
4
4
=∂∂Σ+
∂∂
t
y
EIx
y ρ
(1)
where E = 0.72·1011 N/m2 and ρ = 2650 Kg/m3 denote Young’s modulus and density of the quartz, respectively, x is the direction identified by the prong at the rest position, y is the direction orthogonal to x in the QTF plane (see Fig. 1), I (Kg·m2) and Σ (m2) are the moment of inertia and cross-section area of the prong, respectively. Imposing clamped-free boundary conditions, the above equation can be solved in order to determine both the resonance frequency and the prong vibration profiles, related to the specific time-harmonic excitation. The analytic solution for the flexural vibration resonance frequencies is specified by [14]:
2
2128nn
E
L
Tf ν
ρπ=
(2)
and the displacement along the y-axis as function of the distance from the prong base x is given by [15]:
( ) ( ) ( ) ( )( ) ( ) ( ) ( )[ ]
−
+−+−= xkxk
LkLk
LkLkxkxkAxy nn
nn
nnnn sinsinh
coshcos
sinhsincoscosh)( (3)
where A is the vibration amplitude and the subscript n denotes different resonance mode numbers (n = 1 is the fundamental mode, n = 2 the first overtone mode, n = 3 the second overtone mode, etc.), L and T are the prong length and thickness, respectively. kn⋅L are constant values related to the resonance frequencies for the vibrating prong by the equation: kn
4 = 4π2fn2ρΣ/EI. For the fundamental mode, υ1 = 1.194 and k1L = 1.875, while for the first
overtone mode, υ2 = 2.988 and k2L = 4.694 [14].
#257598 Received 15 Jan 2016; revised 23 Feb 2016; accepted 23 Feb 2016; published 17 Mar 2016 © 2016 OSA 21 Mar 2016 | Vol. 24, No. 6 | DOI:10.1364/OE.24.00A682 | OPTICS EXPRESS A684
The most relevant parameter for a resonator is its quality factor Q, which is inversely proportional to the total losses. The total losses can be evaluated by considering the sum of the different factors causing energy dissipation and hence the overall quality factor for a QTF operating in air can be expressed as:
+=
airQQKQ
1111
sup0
(4)
where 1/Qsup denotes the contribution due to losses at the junction, between the QTF prong’s base and its support, as well as 1/Qair, which represents the extrinsic losses contribution due air damping. The factor K0 takes into account the fraction of the collected piezoelectric charge with respect to the total generated charge, due to the partial coverage of the QTF surface by electric contacts. Support losses are due to dissipation of the prong vibrational energy through its support. Since the dimensions of the support are assumed to be much larger than those of the prong, flexural vibrations can be treated using the single cantilever beam theory. A formulation of the support losses in a QTF prong, Qsup in terms of its geometrical parameters and vibration mode is given by [15]:
3
2sup
1
∝
T
L
kQ
n
(5)
assuming that the crystal width w of the QTF is much smaller than the wavelength of the elastic wave propagating along the x-axis. Qsup is mainly influenced by the ratio between the prong length and its thickness, and decreases for higher order modes. This can be explained by modeling the flexural mode vibrational profile of a resonating prong considering point forces applied on each antinode point [16]. Thus, for the fundamental flexural mode one can assume that there is only one point force, applied on the top of the prong. The higher the L/T ratio, the lower will be the mechanical stress onto the QTF support. Conversely, the overtone modes show a distribution of more point forces along the prong, implying a higher stress on the prong base.
A resonating prong in a surrounding medium can be physically treated as a solid body immersed in an airflow with a small Reynolds number (i.e., in case of laminar flow). The damping dynamics are derived from the Navier-Stokes equation and the continuity equation for incompressible fluids. When the prongs are oscillating at the n-th natural flexural frequency, the quality factor associated with the air damping Qair can be assumed proportional to the inverse of the damping ratio βn [17]:
na
n
nair
fww
fTwQ
μπρππμ
πρβ 4
43
3
41
2
2
+=∝
(6)
where ρa is the air density, μ is the air viscosity. Qair increases with the resonance frequency, since the air damping effect decreases with the increasing overtone mode order n. The Qair factor is almost independent of the crystal width w, if 3/4πw2√(4πρaμfn) >> 3πμw, which implies that fn >> 4μ/(πρaw
2). In our case, at an air pressure of 75 Torr and temperature of 25°C, μ = 1.81·10−5 kg·m/s and ρa = 0.119 kg/m3, which means that the above condition requires that fn >> 3 kHz. In our experiments, this approximation is only valid for the QTFs
#257598 Received 15 Jan 2016; revised 23 Feb 2016; accepted 23 Feb 2016; published 17 Mar 2016 © 2016 OSA 21 Mar 2016 | Vol. 24, No. 6 | DOI:10.1364/OE.24.00A682 | OPTICS EXPRESS A685
overtone modes, and hence leading to the following dependence for the Qair, overtone in terms of its geometrical parameters:
L
TfTQ
a
novertoneair
2/3
, 3
8 ∝∝μπρ
ρ
(7)
Therefore, to reduce the support losses of the overtone modes, the factor (L/T)3 should be increased (see Eq. (5)), but without making the prongs too thin, since this may lead to a substantial increase of the air damping loss factor.
3. Custom-made tuning forks and their characterization
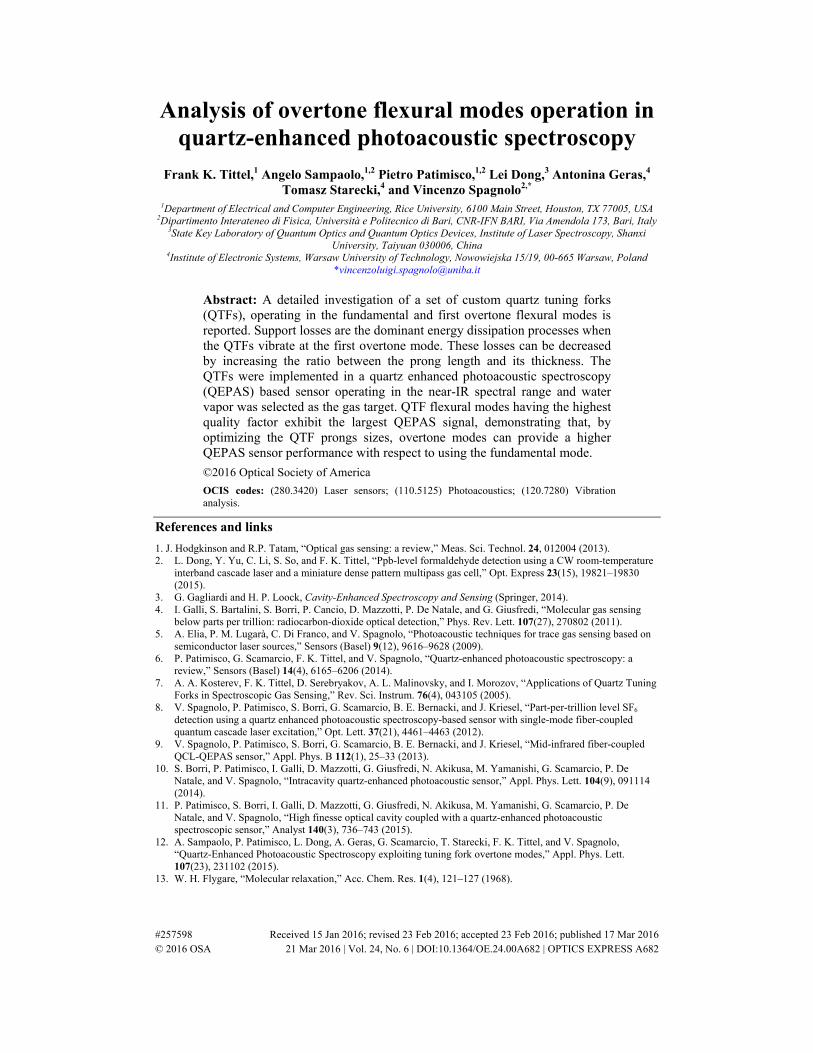
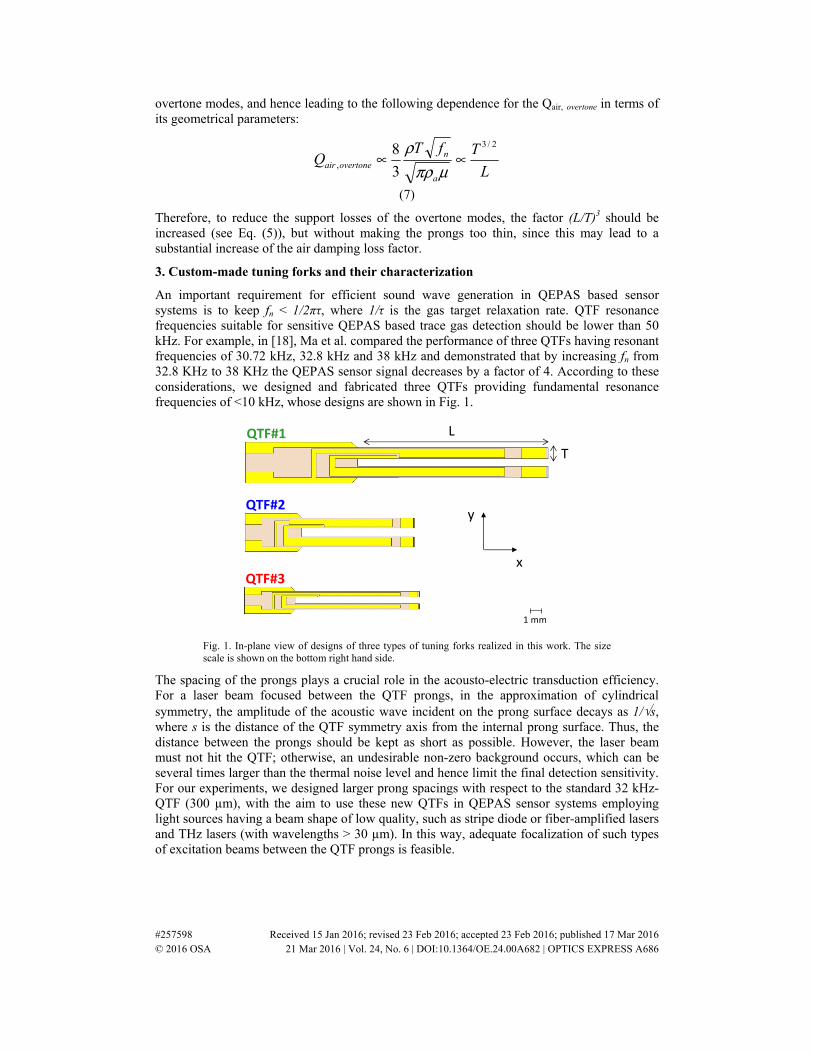
An important requirement for efficient sound wave generation in QEPAS based sensor systems is to keep fn < 1/2πτ, where 1/τ is the gas target relaxation rate. QTF resonance frequencies suitable for sensitive QEPAS based trace gas detection should be lower than 50 kHz. For example, in [18], Ma et al. compared the performance of three QTFs having resonant frequencies of 30.72 kHz, 32.8 kHz and 38 kHz and demonstrated that by increasing fn from 32.8 KHz to 38 KHz the QEPAS sensor signal decreases by a factor of 4. According to these considerations, we designed and fabricated three QTFs providing fundamental resonance frequencies of <10 kHz, whose designs are shown in Fig. 1.
QTF#1
QTF#2
QTF#3
LT
1 mm
x
y
Fig. 1. In-plane view of designs of three types of tuning forks realized in this work. The size scale is shown on the bottom right hand side.
The spacing of the prongs plays a crucial role in the acousto-electric transduction efficiency. For a laser beam focused between the QTF prongs, in the approximation of cylindrical symmetry, the amplitude of the acoustic wave incident on the prong surface decays as 1/√s, where s is the distance of the QTF symmetry axis from the internal prong surface. Thus, the distance between the prongs should be kept as short as possible. However, the laser beam must not hit the QTF; otherwise, an undesirable non-zero background occurs, which can be several times larger than the thermal noise level and hence limit the final detection sensitivity. For our experiments, we designed larger prong spacings with respect to the standard 32 kHz-QTF (300 µm), with the aim to use these new QTFs in QEPAS sensor systems employing light sources having a beam shape of low quality, such as stripe diode or fiber-amplified lasers and THz lasers (with wavelengths > 30 µm). In this way, adequate focalization of such types of excitation beams between the QTF prongs is feasible.
#257598 Received 15 Jan 2016; revised 23 Feb 2016; accepted 23 Feb 2016; published 17 Mar 2016 © 2016 OSA 21 Mar 2016 | Vol. 24, No. 6 | DOI:10.1364/OE.24.00A682 | OPTICS EXPRESS A686
In Table 1 are reported the calculated resonance frequencies for both the fundamental and the first overtone mode by using Eq. (1), and the correlated node and antinode positions (using Eq. (3)), together with the respective QTFs prong sizes.
Table 1. Prong sizes, resonance frequencies, node and antinode points measured starting from the top of the prong, for the three investigated QTFs. Also reported are two
geometrical factors Tw/L and L3/T3, and the ratio between the gold contacts area, as well as the total surface of the prongs.
QTF#1 QTF#2 QTF#3
L (mm) 17 10 11 T (mm) 1 0.9 0.5 w (mm) 0.25 0.25 0.25 Prongs spacing (mm)
0.7 0.8 0.6
Tw/L (mm) 0.0147 0.0225 0.0114 L3/T3 4913.0 1371.0 10648.0 Ratio
between the prongs gold
contacts area and the total surface
0.90 0.95 0.75
n = 1 n = 2 n = 1 n = 2 n = 1 n = 2
fn (Hz) 2,913.42 18,245.49 7,577.81 47,456.54 3,479.25 21,789.04 node points
(mm) 17 3.7
17 10 2.2
10 11 2.4
11
antinode points (mm)
0 0 9
0 0 5.3
0 0 5.8
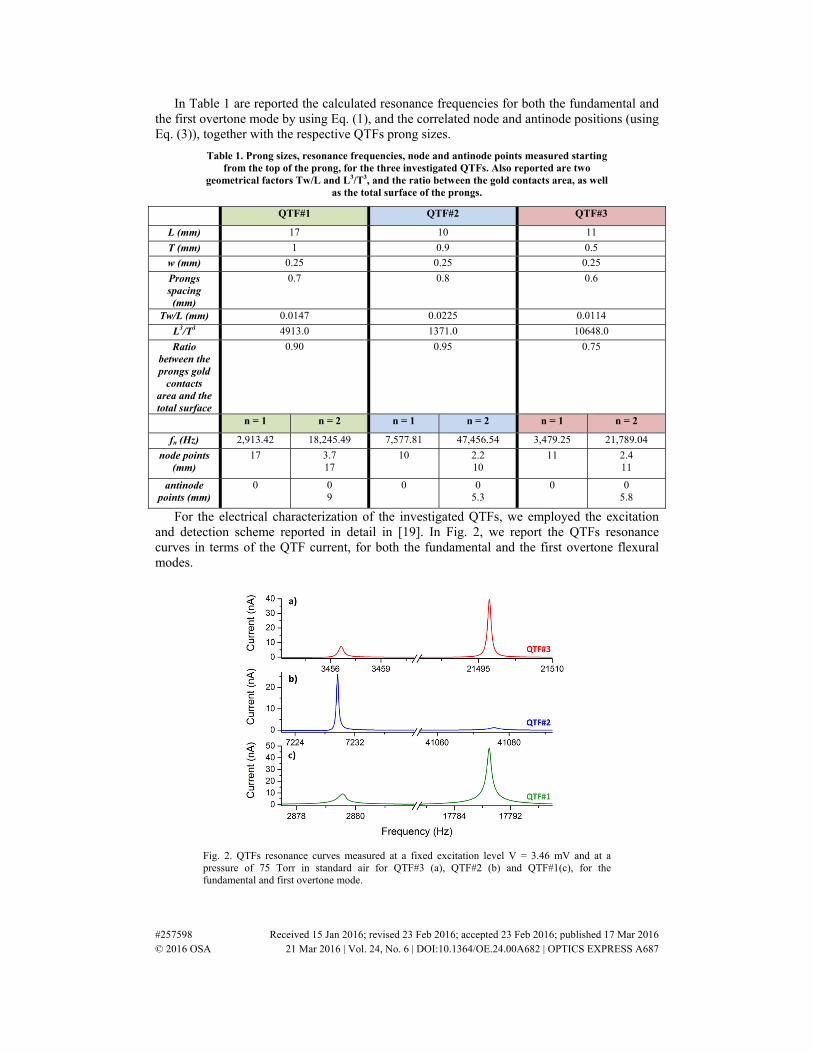
For the electrical characterization of the investigated QTFs, we employed the excitation and detection scheme reported in detail in [19]. In Fig. 2, we report the QTFs resonance curves in terms of the QTF current, for both the fundamental and the first overtone flexural modes.
Fig. 2. QTFs resonance curves measured at a fixed excitation level V = 3.46 mV and at a pressure of 75 Torr in standard air for QTF#3 (a), QTF#2 (b) and QTF#1(c), for the fundamental and first overtone mode.
#257598 Received 15 Jan 2016; revised 23 Feb 2016; accepted 23 Feb 2016; published 17 Mar 2016 © 2016 OSA 21 Mar 2016 | Vol. 24, No. 6 | DOI:10.1364/OE.24.00A682 | OPTICS EXPRESS A687
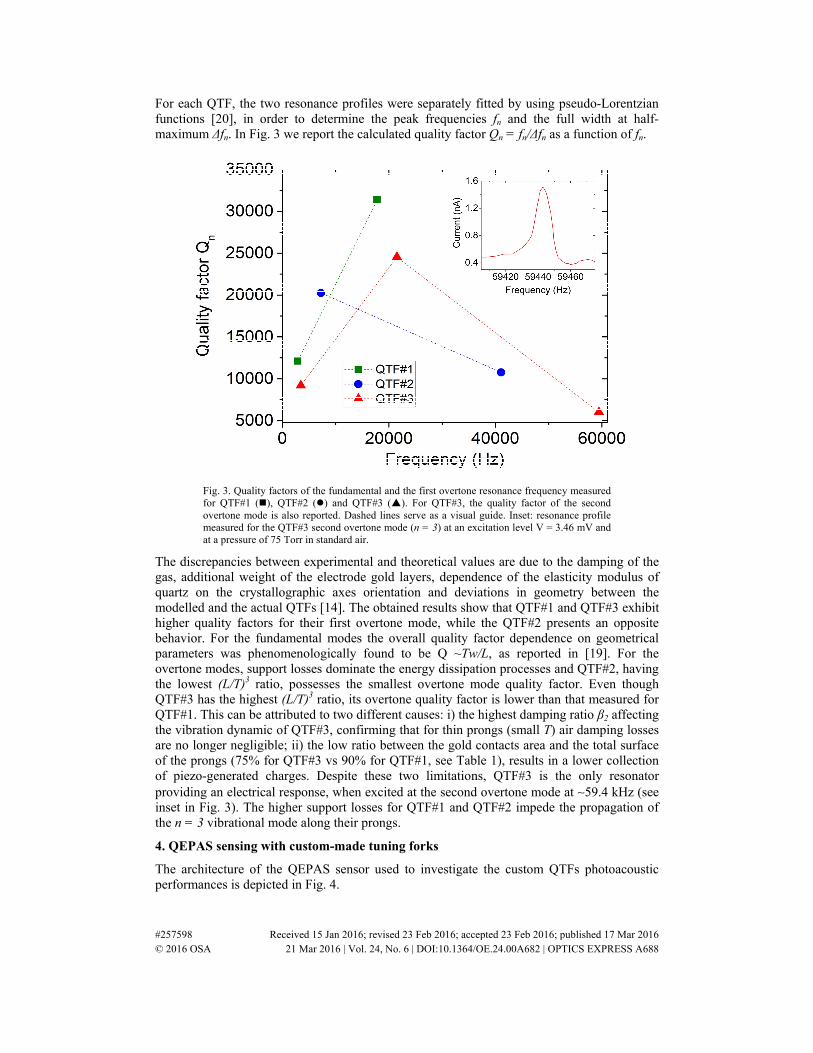
For each QTF, the two resonance profiles were separately fitted by using pseudo-Lorentzian functions [20], in order to determine the peak frequencies fn and the full width at half-maximum Δfn. In Fig. 3 we report the calculated quality factor Qn = fn/Δfn as a function of fn.
Fig. 3. Quality factors of the fundamental and the first overtone resonance frequency measured for QTF#1 (), QTF#2 () and QTF#3 (). For QTF#3, the quality factor of the second overtone mode is also reported. Dashed lines serve as a visual guide. Inset: resonance profile measured for the QTF#3 second overtone mode (n = 3) at an excitation level V = 3.46 mV and at a pressure of 75 Torr in standard air.
The discrepancies between experimental and theoretical values are due to the damping of the gas, additional weight of the electrode gold layers, dependence of the elasticity modulus of quartz on the crystallographic axes orientation and deviations in geometry between the modelled and the actual QTFs [14]. The obtained results show that QTF#1 and QTF#3 exhibit higher quality factors for their first overtone mode, while the QTF#2 presents an opposite behavior. For the fundamental modes the overall quality factor dependence on geometrical parameters was phenomenologically found to be Q ~Tw/L, as reported in [19]. For the overtone modes, support losses dominate the energy dissipation processes and QTF#2, having the lowest (L/T)3 ratio, possesses the smallest overtone mode quality factor. Even though QTF#3 has the highest (L/T)3 ratio, its overtone quality factor is lower than that measured for QTF#1. This can be attributed to two different causes: i) the highest damping ratio β2 affecting the vibration dynamic of QTF#3, confirming that for thin prongs (small T) air damping losses are no longer negligible; ii) the low ratio between the gold contacts area and the total surface of the prongs (75% for QTF#3 vs 90% for QTF#1, see Table 1), results in a lower collection of piezo-generated charges. Despite these two limitations, QTF#3 is the only resonator providing an electrical response, when excited at the second overtone mode at ∼59.4 kHz (see inset in Fig. 3). The higher support losses for QTF#1 and QTF#2 impede the propagation of the n = 3 vibrational mode along their prongs.
4. QEPAS sensing with custom-made tuning forks
The architecture of the QEPAS sensor used to investigate the custom QTFs photoacoustic performances is depicted in Fig. 4.
#257598 Received 15 Jan 2016; revised 23 Feb 2016; accepted 23 Feb 2016; published 17 Mar 2016 © 2016 OSA 21 Mar 2016 | Vol. 24, No. 6 | DOI:10.1364/OE.24.00A682 | OPTICS EXPRESS A688
CurrentDriver
Lock-inAmplifier
QTF
DiodeLaser
HousingLens
Transimpedance AmplifierΣ
ramp
sine
Detector
Lens
PC
NafionHumidifier
air Pressure Controller
Vacuum Pump
Valve Valve
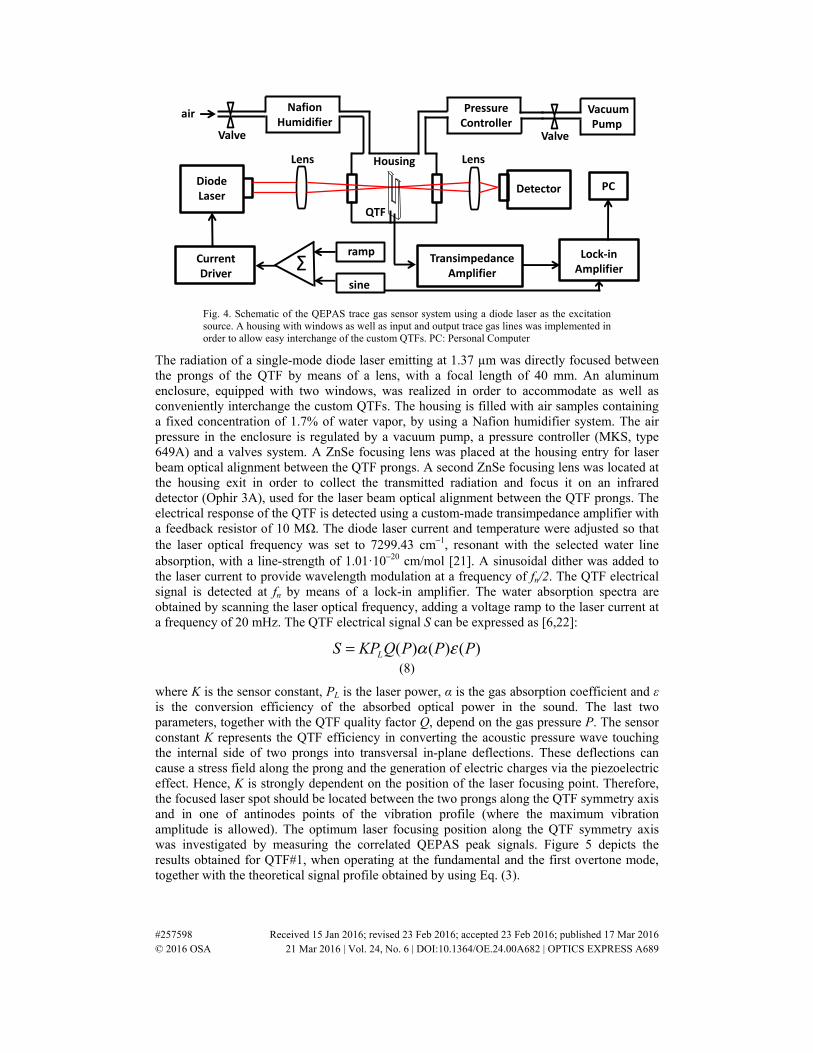
Fig. 4. Schematic of the QEPAS trace gas sensor system using a diode laser as the excitation source. A housing with windows as well as input and output trace gas lines was implemented in order to allow easy interchange of the custom QTFs. PC: Personal Computer
The radiation of a single-mode diode laser emitting at 1.37 µm was directly focused between the prongs of the QTF by means of a lens, with a focal length of 40 mm. An aluminum enclosure, equipped with two windows, was realized in order to accommodate as well as conveniently interchange the custom QTFs. The housing is filled with air samples containing a fixed concentration of 1.7% of water vapor, by using a Nafion humidifier system. The air pressure in the enclosure is regulated by a vacuum pump, a pressure controller (MKS, type 649A) and a valves system. A ZnSe focusing lens was placed at the housing entry for laser beam optical alignment between the QTF prongs. A second ZnSe focusing lens was located at the housing exit in order to collect the transmitted radiation and focus it on an infrared detector (Ophir 3A), used for the laser beam optical alignment between the QTF prongs. The electrical response of the QTF is detected using a custom-made transimpedance amplifier with a feedback resistor of 10 MΩ. The diode laser current and temperature were adjusted so that the laser optical frequency was set to 7299.43 cm−1, resonant with the selected water line absorption, with a line-strength of 1.01·10−20 cm/mol [21]. A sinusoidal dither was added to the laser current to provide wavelength modulation at a frequency of fn/2. The QTF electrical signal is detected at fn by means of a lock-in amplifier. The water absorption spectra are obtained by scanning the laser optical frequency, adding a voltage ramp to the laser current at a frequency of 20 mHz. The QTF electrical signal S can be expressed as [6,22]:
)()()( PPPQKPS L εα=
(8)
where K is the sensor constant, PL is the laser power, α is the gas absorption coefficient and ε is the conversion efficiency of the absorbed optical power in the sound. The last two parameters, together with the QTF quality factor Q, depend on the gas pressure P. The sensor constant K represents the QTF efficiency in converting the acoustic pressure wave touching the internal side of two prongs into transversal in-plane deflections. These deflections can cause a stress field along the prong and the generation of electric charges via the piezoelectric effect. Hence, K is strongly dependent on the position of the laser focusing point. Therefore, the focused laser spot should be located between the two prongs along the QTF symmetry axis and in one of antinodes points of the vibration profile (where the maximum vibration amplitude is allowed). The optimum laser focusing position along the QTF symmetry axis was investigated by measuring the correlated QEPAS peak signals. Figure 5 depicts the results obtained for QTF#1, when operating at the fundamental and the first overtone mode, together with the theoretical signal profile obtained by using Eq. (3).
#257598 Received 15 Jan 2016; revised 23 Feb 2016; accepted 23 Feb 2016; published 17 Mar 2016 © 2016 OSA 21 Mar 2016 | Vol. 24, No. 6 | DOI:10.1364/OE.24.00A682 | OPTICS EXPRESS A689
Overtone modeFundamental modea)
b)
c)
d)
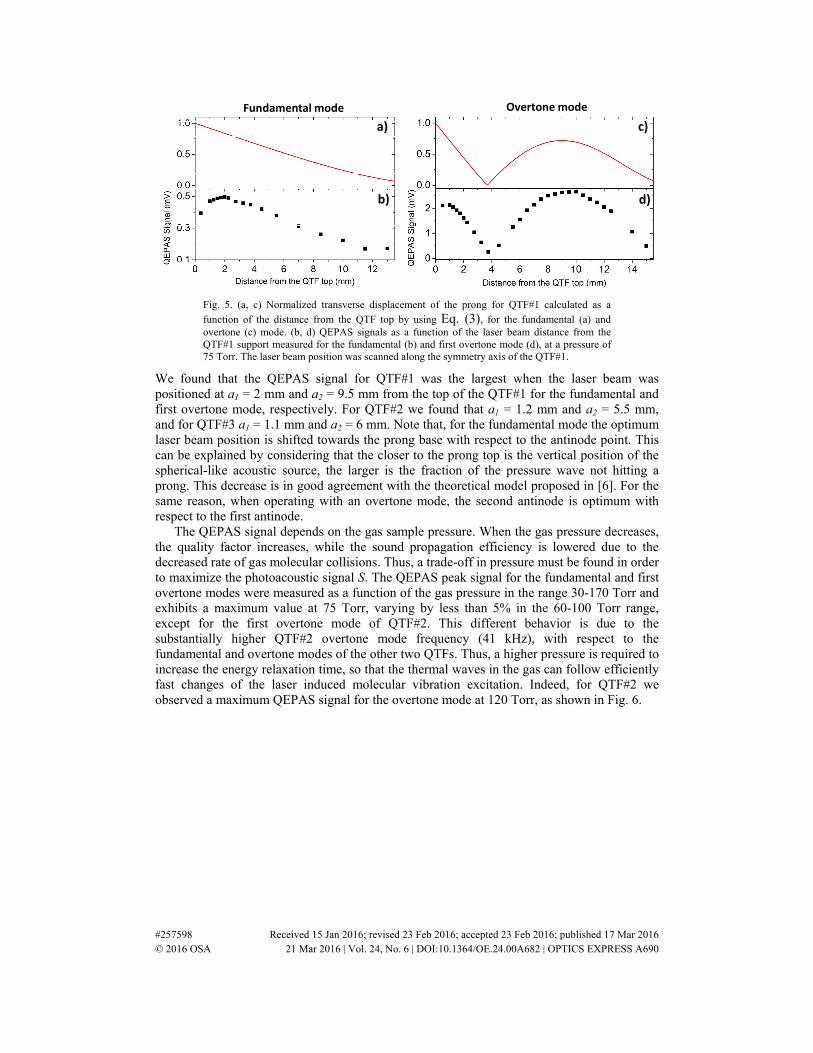
Fig. 5. (a, c) Normalized transverse displacement of the prong for QTF#1 calculated as a
function of the distance from the QTF top by using Eq. (3), for the fundamental (a) and overtone (c) mode. (b, d) QEPAS signals as a function of the laser beam distance from the QTF#1 support measured for the fundamental (b) and first overtone mode (d), at a pressure of 75 Torr. The laser beam position was scanned along the symmetry axis of the QTF#1.
We found that the QEPAS signal for QTF#1 was the largest when the laser beam was positioned at a1 = 2 mm and a2 = 9.5 mm from the top of the QTF#1 for the fundamental and first overtone mode, respectively. For QTF#2 we found that a1 = 1.2 mm and a2 = 5.5 mm, and for QTF#3 a1 = 1.1 mm and a2 = 6 mm. Note that, for the fundamental mode the optimum laser beam position is shifted towards the prong base with respect to the antinode point. This can be explained by considering that the closer to the prong top is the vertical position of the spherical-like acoustic source, the larger is the fraction of the pressure wave not hitting a prong. This decrease is in good agreement with the theoretical model proposed in [6]. For the same reason, when operating with an overtone mode, the second antinode is optimum with respect to the first antinode.
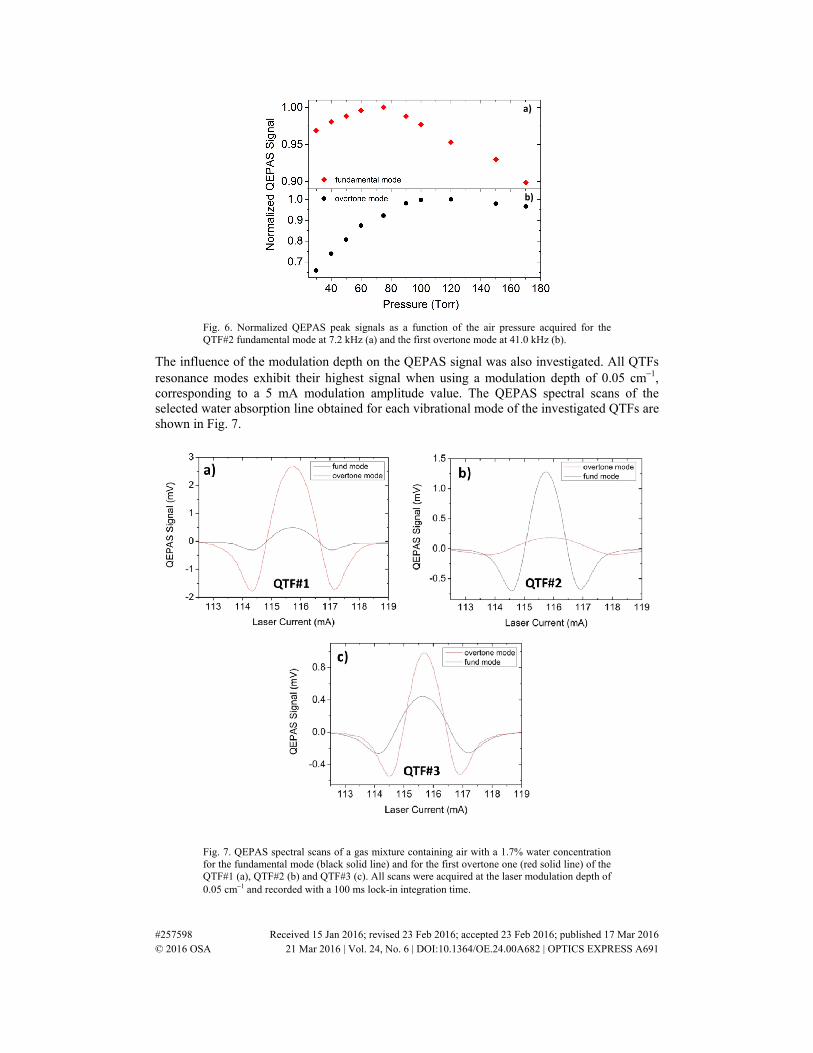
The QEPAS signal depends on the gas sample pressure. When the gas pressure decreases, the quality factor increases, while the sound propagation efficiency is lowered due to the decreased rate of gas molecular collisions. Thus, a trade-off in pressure must be found in order to maximize the photoacoustic signal S. The QEPAS peak signal for the fundamental and first overtone modes were measured as a function of the gas pressure in the range 30-170 Torr and exhibits a maximum value at 75 Torr, varying by less than 5% in the 60-100 Torr range, except for the first overtone mode of QTF#2. This different behavior is due to the substantially higher QTF#2 overtone mode frequency (41 kHz), with respect to the fundamental and overtone modes of the other two QTFs. Thus, a higher pressure is required to increase the energy relaxation time, so that the thermal waves in the gas can follow efficiently fast changes of the laser induced molecular vibration excitation. Indeed, for QTF#2 we observed a maximum QEPAS signal for the overtone mode at 120 Torr, as shown in Fig. 6.
#257598 Received 15 Jan 2016; revised 23 Feb 2016; accepted 23 Feb 2016; published 17 Mar 2016 © 2016 OSA 21 Mar 2016 | Vol. 24, No. 6 | DOI:10.1364/OE.24.00A682 | OPTICS EXPRESS A690
a)
b)
Fig. 6. Normalized QEPAS peak signals as a function of the air pressure acquired for the QTF#2 fundamental mode at 7.2 kHz (a) and the first overtone mode at 41.0 kHz (b).
The influence of the modulation depth on the QEPAS signal was also investigated. All QTFs resonance modes exhibit their highest signal when using a modulation depth of 0.05 cm−1, corresponding to a 5 mA modulation amplitude value. The QEPAS spectral scans of the selected water absorption line obtained for each vibrational mode of the investigated QTFs are shown in Fig. 7.
Fig. 7. QEPAS spectral scans of a gas mixture containing air with a 1.7% water concentration for the fundamental mode (black solid line) and for the first overtone one (red solid line) of the QTF#1 (a), QTF#2 (b) and QTF#3 (c). All scans were acquired at the laser modulation depth of 0.05 cm−1 and recorded with a 100 ms lock-in integration time.
#257598 Received 15 Jan 2016; revised 23 Feb 2016; accepted 23 Feb 2016; published 17 Mar 2016 © 2016 OSA 21 Mar 2016 | Vol. 24, No. 6 | DOI:10.1364/OE.24.00A682 | OPTICS EXPRESS A691
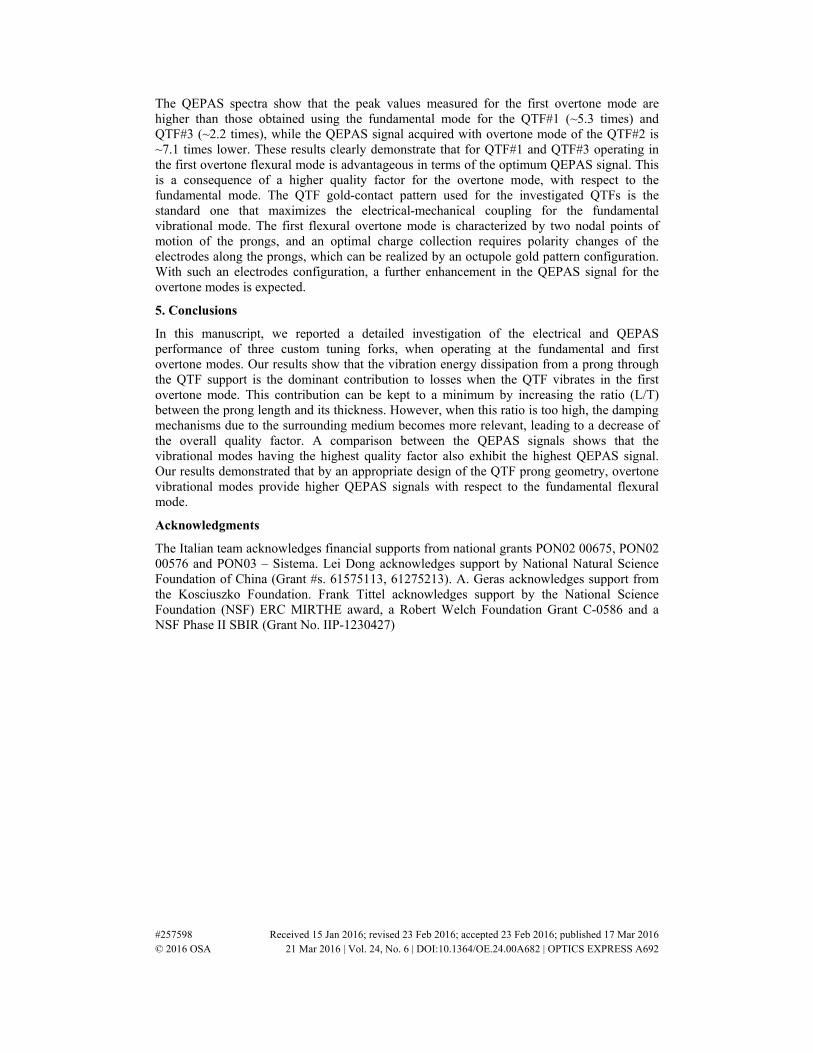
The QEPAS spectra show that the peak values measured for the first overtone mode are higher than those obtained using the fundamental mode for the QTF#1 (~5.3 times) and QTF#3 (~2.2 times), while the QEPAS signal acquired with overtone mode of the QTF#2 is ~7.1 times lower. These results clearly demonstrate that for QTF#1 and QTF#3 operating in the first overtone flexural mode is advantageous in terms of the optimum QEPAS signal. This is a consequence of a higher quality factor for the overtone mode, with respect to the fundamental mode. The QTF gold-contact pattern used for the investigated QTFs is the standard one that maximizes the electrical-mechanical coupling for the fundamental vibrational mode. The first flexural overtone mode is characterized by two nodal points of motion of the prongs, and an optimal charge collection requires polarity changes of the electrodes along the prongs, which can be realized by an octupole gold pattern configuration. With such an electrodes configuration, a further enhancement in the QEPAS signal for the overtone modes is expected.
5. Conclusions
In this manuscript, we reported a detailed investigation of the electrical and QEPAS performance of three custom tuning forks, when operating at the fundamental and first overtone modes. Our results show that the vibration energy dissipation from a prong through the QTF support is the dominant contribution to losses when the QTF vibrates in the first overtone mode. This contribution can be kept to a minimum by increasing the ratio (L/T) between the prong length and its thickness. However, when this ratio is too high, the damping mechanisms due to the surrounding medium becomes more relevant, leading to a decrease of the overall quality factor. A comparison between the QEPAS signals shows that the vibrational modes having the highest quality factor also exhibit the highest QEPAS signal. Our results demonstrated that by an appropriate design of the QTF prong geometry, overtone vibrational modes provide higher QEPAS signals with respect to the fundamental flexural mode.
Acknowledgments
The Italian team acknowledges financial supports from national grants PON02 00675, PON02 00576 and PON03 – Sistema. Lei Dong acknowledges support by National Natural Science Foundation of China (Grant #s. 61575113, 61275213). A. Geras acknowledges support from the Kosciuszko Foundation. Frank Tittel acknowledges support by the National Science Foundation (NSF) ERC MIRTHE award, a Robert Welch Foundation Grant C-0586 and a NSF Phase II SBIR (Grant No. IIP-1230427)
#257598 Received 15 Jan 2016; revised 23 Feb 2016; accepted 23 Feb 2016; published 17 Mar 2016 © 2016 OSA 21 Mar 2016 | Vol. 24, No. 6 | DOI:10.1364/OE.24.00A682 | OPTICS EXPRESS A692