Embed Size (px)
Citation preview
Analysis of Proposer & Reviewer Workloads
Michael H. New Planetary Science Division Science Mission Directorate
NASA HQ
What are the issues?
• It’s claimed that the Planetary Science community is over-burdened by writing too many proposals
• It’s also claimed that the same community is over-burdened with reviewing proposals.
GOAL: Address these questions through analysis of NSPIRES data, not anecdotes.
PROPOSER WORKLOAD
ROSES-2009 Proposal Database
• Contains records of 1,375 proposals submitted to PSD program elements of ROSES-2009. – 17 solicitations
• 6 Core, 4 DAPs, 1 PSP, 5 Targeted, 1 Tech Dev – 917 unique PIs
• Hand-curated from collected selection spreadsheets. – Thanks to Dr. Susan Keddie for collecting the
spreadsheets.
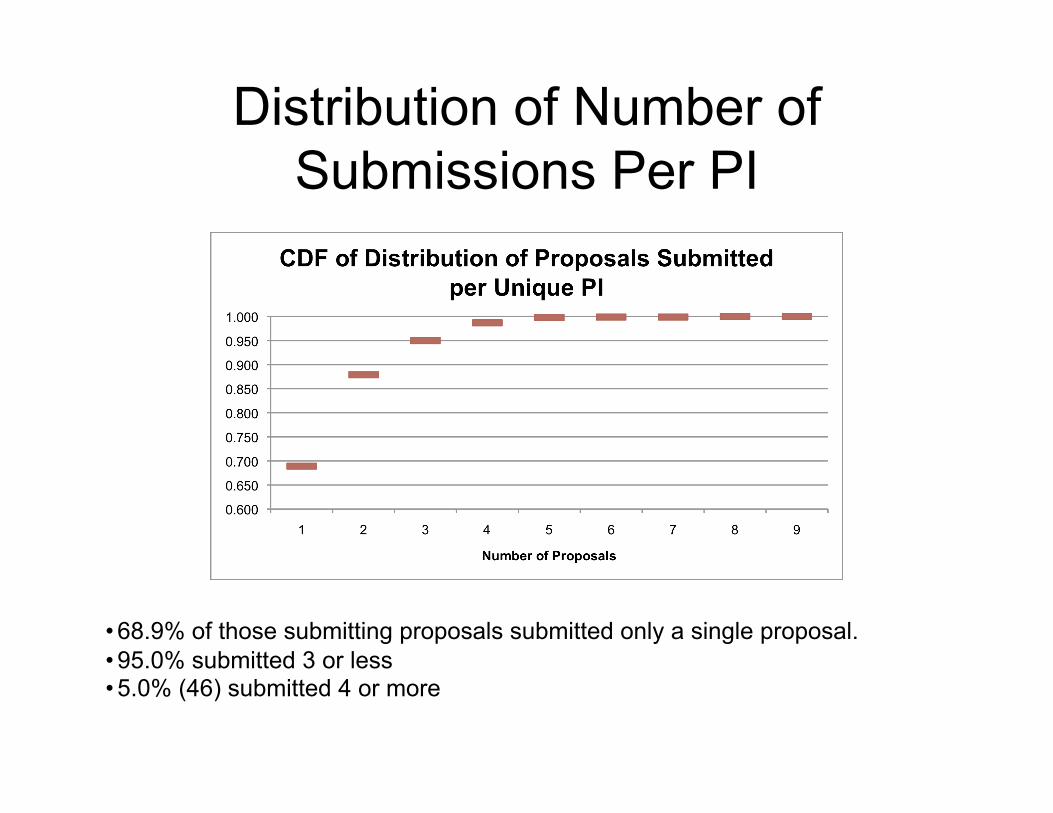
Distribution of Number of Submissions Per PI
• 68.9% of those submitting proposals submitted only a single proposal. • 95.0% submitted 3 or less • 5.0% (46) submitted 4 or more
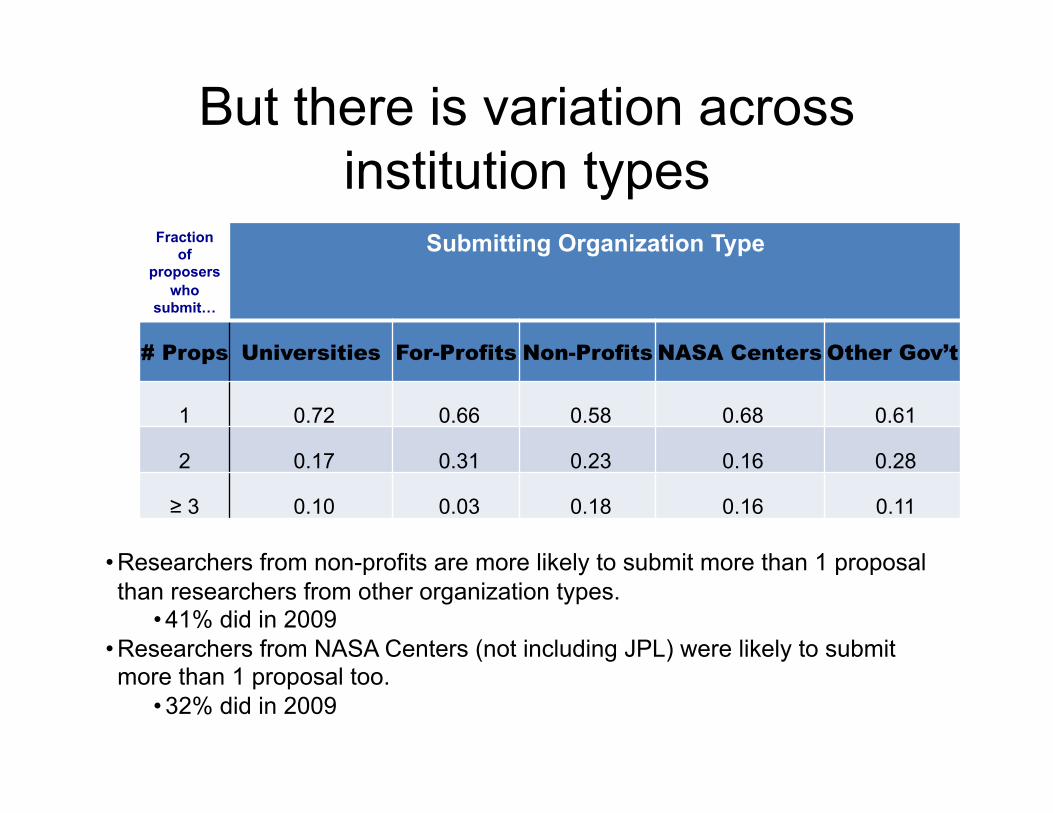
But there is variation across institution types
Fraction of
proposers who
submit…
Submitting Organization Type
# Props Universities For-Profits Non-Profits NASA Centers Other Gov’t
1 0.72 0.66 0.58 0.68 0.61
2 0.17 0.31 0.23 0.16 0.28
≥ 3 0.10 0.03 0.18 0.16 0.11
• Researchers from non-profits are more likely to submit more than 1 proposal than researchers from other organization types.
• 41% did in 2009 • Researchers from NASA Centers (not including JPL) were likely to submit more than 1 proposal too.
• 32% did in 2009
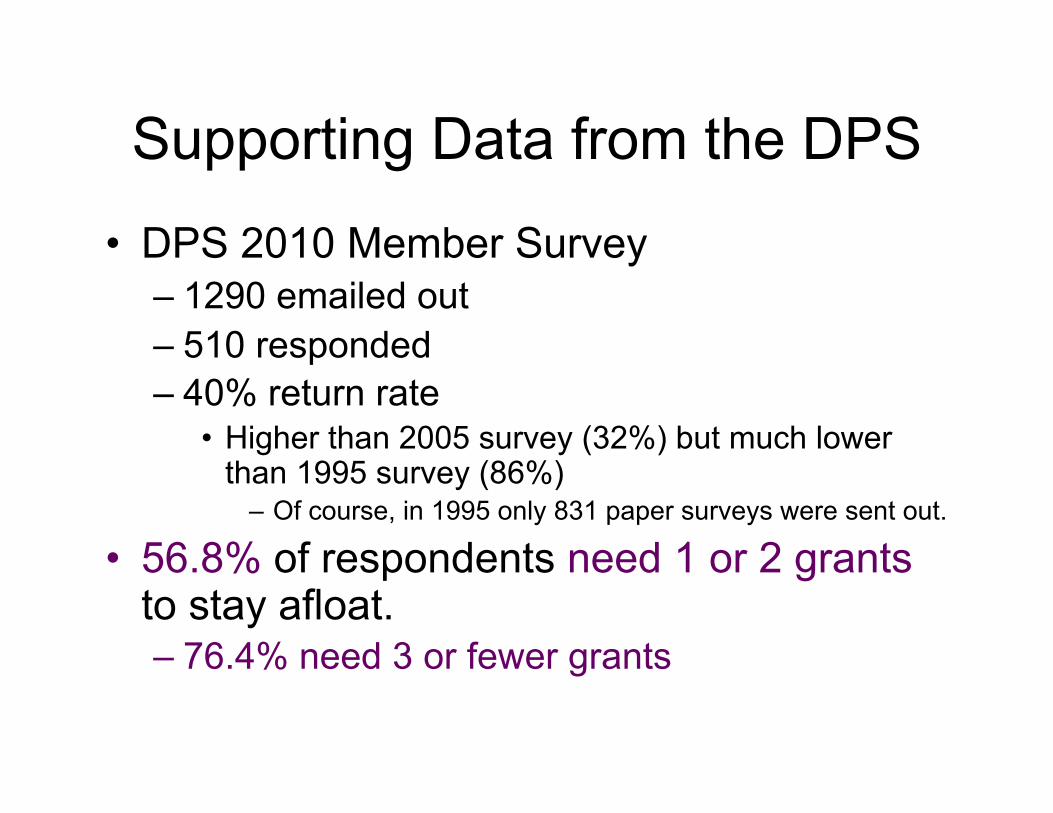
Supporting Data from the DPS
• DPS 2010 Member Survey – 1290 emailed out – 510 responded – 40% return rate
• Higher than 2005 survey (32%) but much lower than 1995 survey (86%)
– Of course, in 1995 only 831 paper surveys were sent out.
• 56.8% of respondents need 1 or 2 grants to stay afloat. – 76.4% need 3 or fewer grants

REVIEWER WORKLOAD
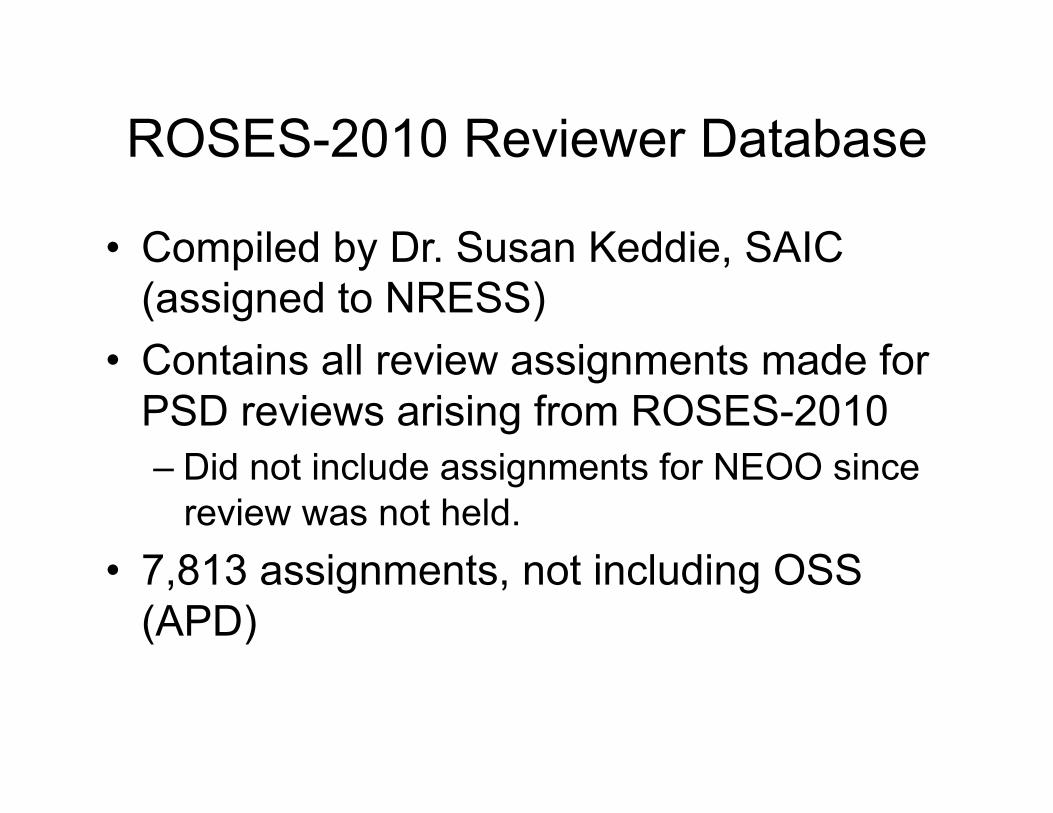
ROSES-2010 Reviewer Database
• Compiled by Dr. Susan Keddie, SAIC (assigned to NRESS)
• Contains all review assignments made for PSD reviews arising from ROSES-2010 – Did not include assignments for NEOO since
review was not held. • 7,813 assignments, not including OSS
(APD)
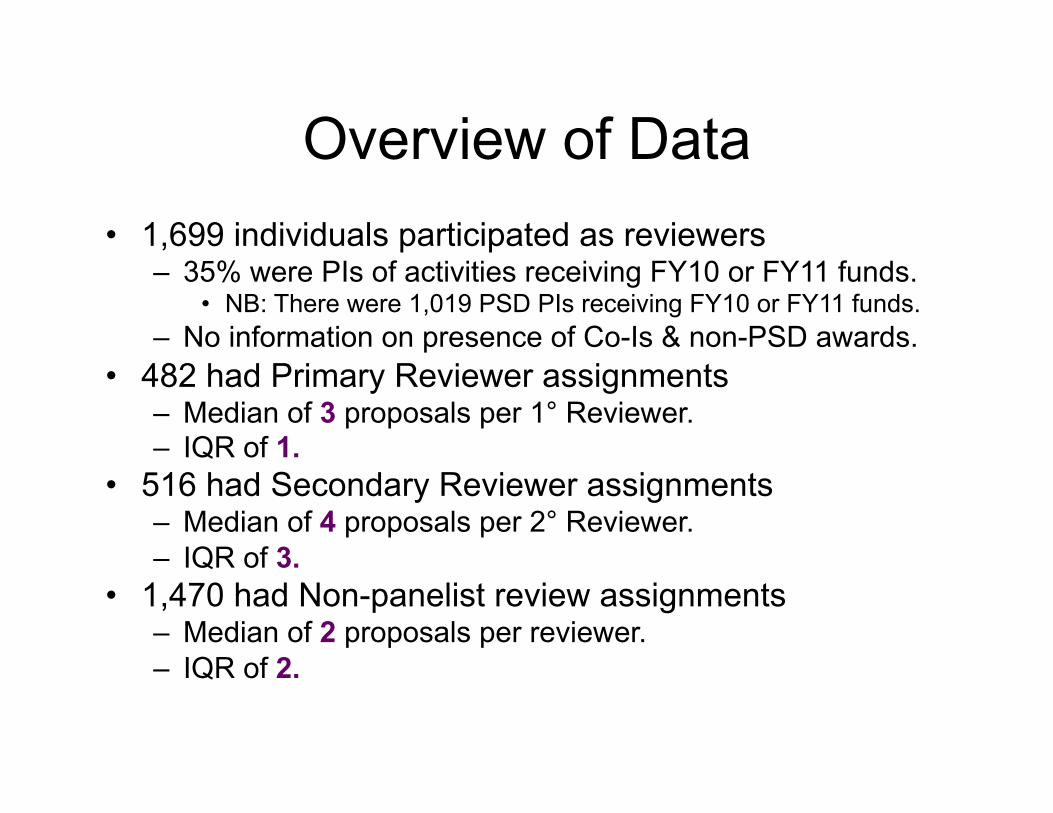
Overview of Data • 1,699 individuals participated as reviewers
– 35% were PIs of activities receiving FY10 or FY11 funds. • NB: There were 1,019 PSD PIs receiving FY10 or FY11 funds.
– No information on presence of Co-Is & non-PSD awards. • 482 had Primary Reviewer assignments
– Median of 3 proposals per 1° Reviewer. – IQR of 1.
• 516 had Secondary Reviewer assignments – Median of 4 proposals per 2° Reviewer. – IQR of 3.
• 1,470 had Non-panelist review assignments – Median of 2 proposals per reviewer. – IQR of 2.
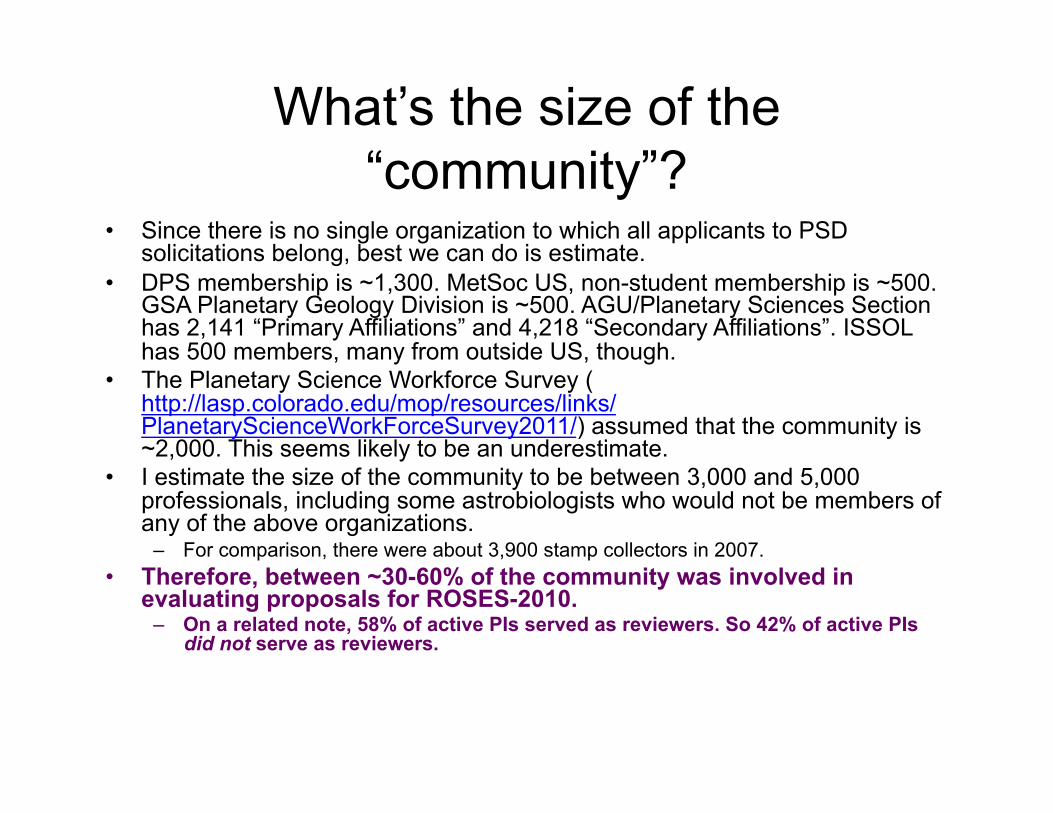
What’s the size of the “community”?
• Since there is no single organization to which all applicants to PSD solicitations belong, best we can do is estimate.
• DPS membership is ~1,300. MetSoc US, non-student membership is ~500. GSA Planetary Geology Division is ~500. AGU/Planetary Sciences Section has 2,141 “Primary Affiliations” and 4,218 “Secondary Affiliations”. ISSOL has 500 members, many from outside US, though.
• The Planetary Science Workforce Survey (http://lasp.colorado.edu/mop/resources/links/PlanetaryScienceWorkForceSurvey2011/) assumed that the community is ~2,000. This seems likely to be an underestimate.
• I estimate the size of the community to be between 3,000 and 5,000 professionals, including some astrobiologists who would not be members of any of the above organizations.
– For comparison, there were about 3,900 stamp collectors in 2007. • Therefore, between ~30-60% of the community was involved in
evaluating proposals for ROSES-2010. – On a related note, 58% of active PIs served as reviewers. So 42% of active PIs
did not serve as reviewers.
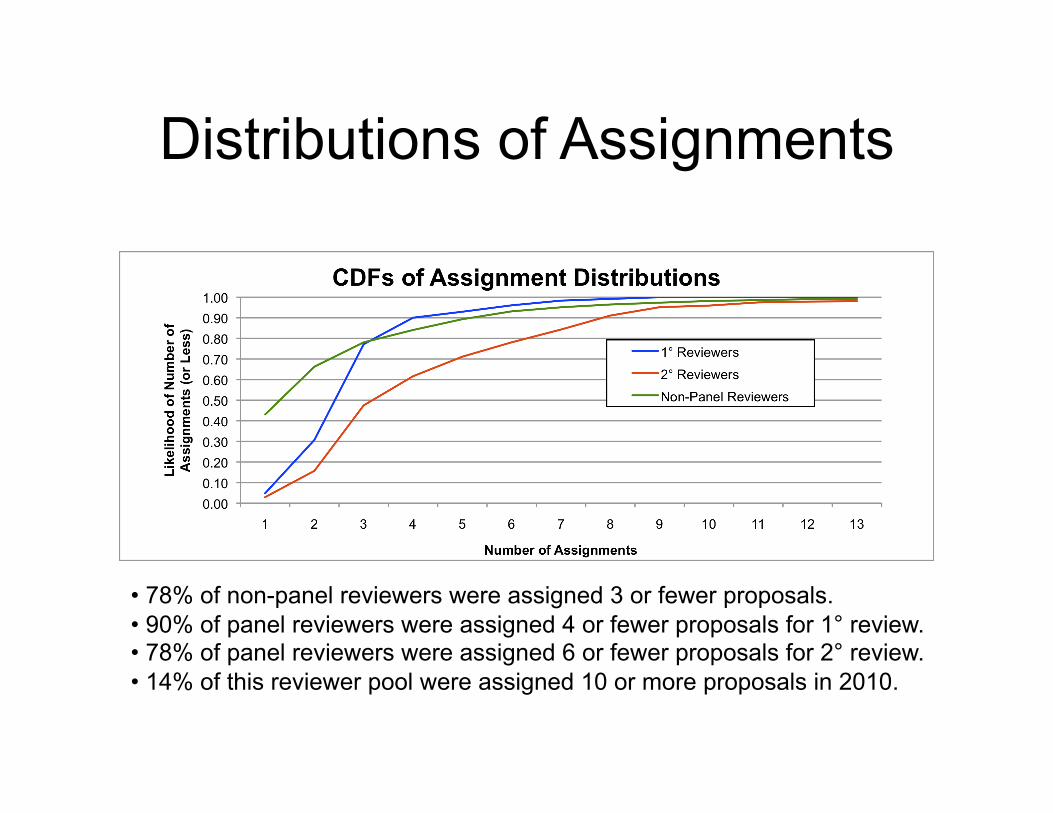
Distributions of Assignments
• 78% of non-panel reviewers were assigned 3 or fewer proposals. • 90% of panel reviewers were assigned 4 or fewer proposals for 1° review. • 78% of panel reviewers were assigned 6 or fewer proposals for 2° review. • 14% of this reviewer pool were assigned 10 or more proposals in 2010.
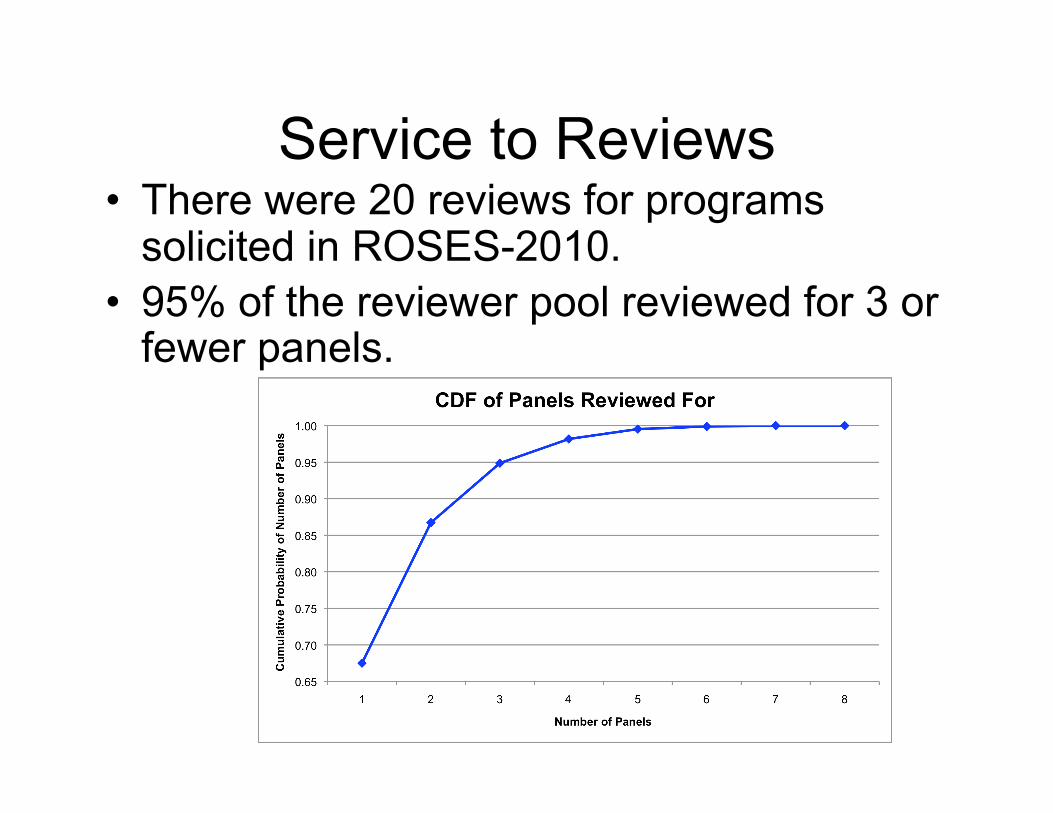
Service to Reviews • There were 20 reviews for programs
solicited in ROSES-2010. • 95% of the reviewer pool reviewed for 3 or
fewer panels.
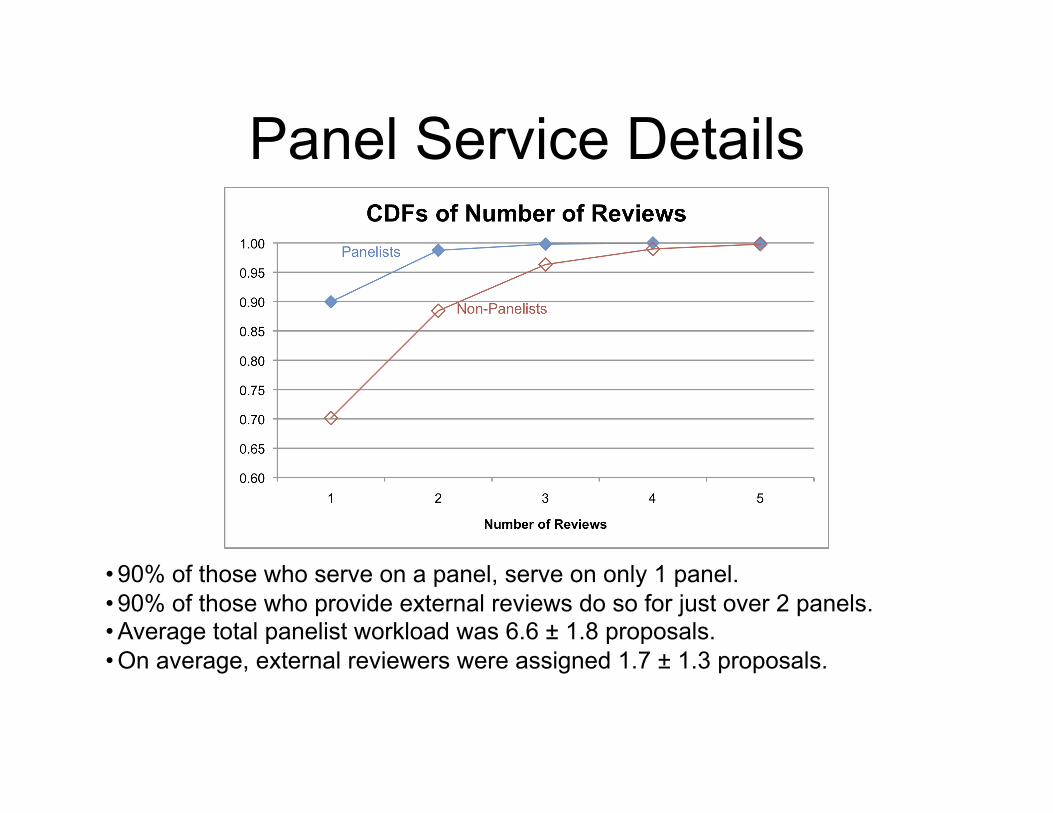
Panel Service Details
• 90% of those who serve on a panel, serve on only 1 panel. • 90% of those who provide external reviews do so for just over 2 panels. • Average total panelist workload was 6.6 ± 1.8 proposals. • On average, external reviewers were assigned 1.7 ± 1.3 proposals.
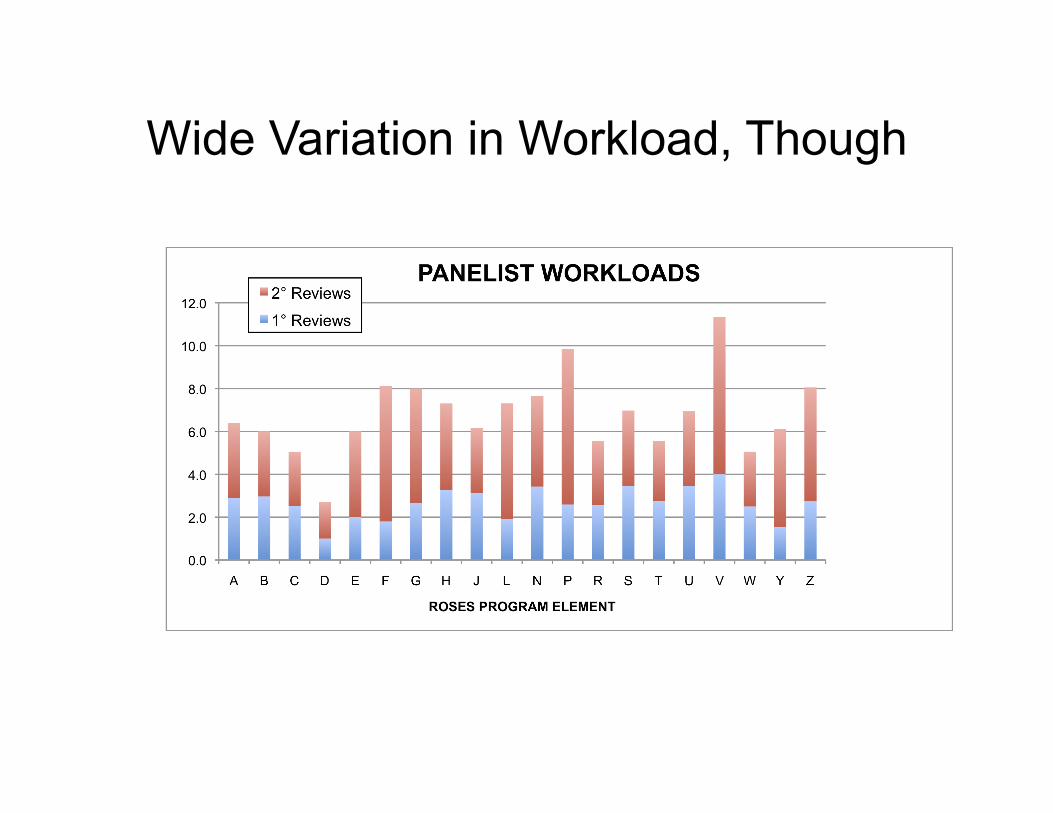
Wide Variation in Workload, Though
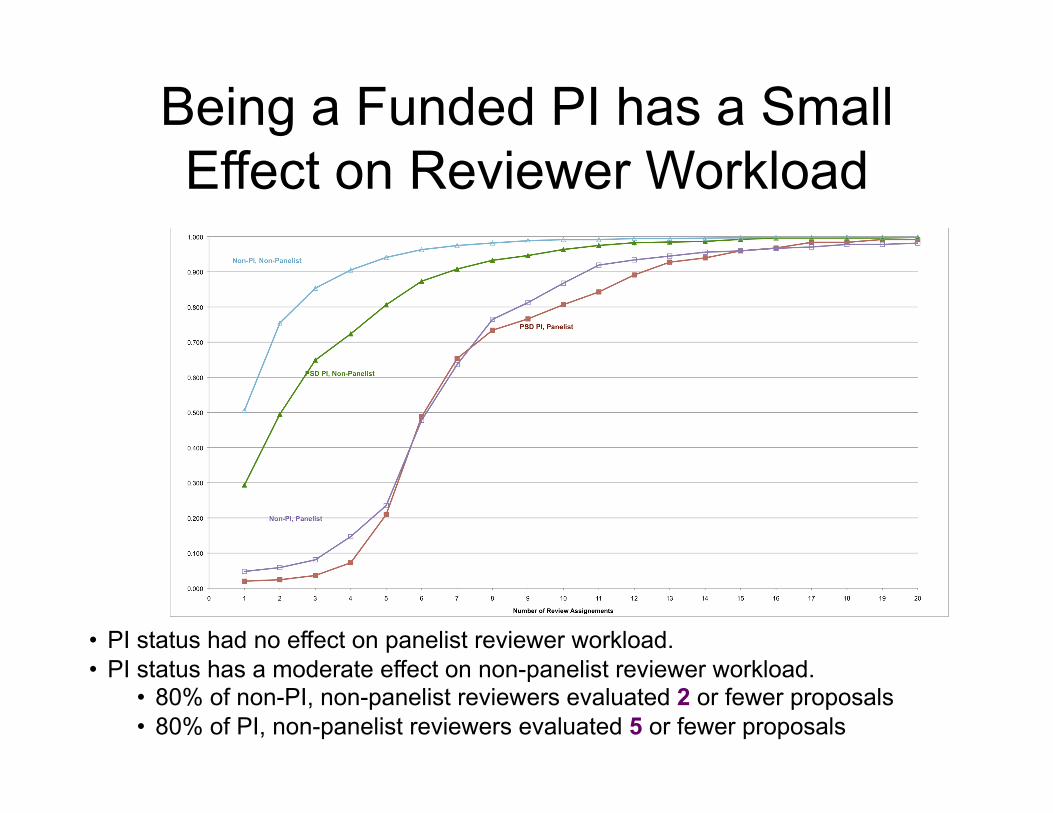
Being a Funded PI has a Small Effect on Reviewer Workload
• PI status had no effect on panelist reviewer workload. • PI status has a moderate effect on non-panelist reviewer workload.
• 80% of non-PI, non-panelist reviewers evaluated 2 or fewer proposals • 80% of PI, non-panelist reviewers evaluated 5 or fewer proposals
Conclusions • On average, the community is not submitting multiple proposals to
NASA – Some sub-groups and individuals are.
• On average, community members serve on only 1 review panel per year and provide a small number of non-panelist reviews to 2 other panels. – A large fraction of the community is involved in reviewing each year.
• This large fraction may be the source of the sentiment that the community is over-burdened by review assignments.
– A small fraction of the community agrees to perform many reviews • Possibly too many (>10)
• Funded PIs are assigned more non-panelist reviews than those not currently funded by PSD.
• Approximately 58% of funded PIs served as reviewers. 35% of the analyzed reviewer pool were PSD PIs. – So 42% of funded PIs didn’t serve as reviewers.