Embed Size (px)
Citation preview
STRICTLY PRIVATE & CONFIDENTIAL
ANALYST BRIEFING SEPT 2011ANALYST BRIEFING SEPT 2011
Page 2
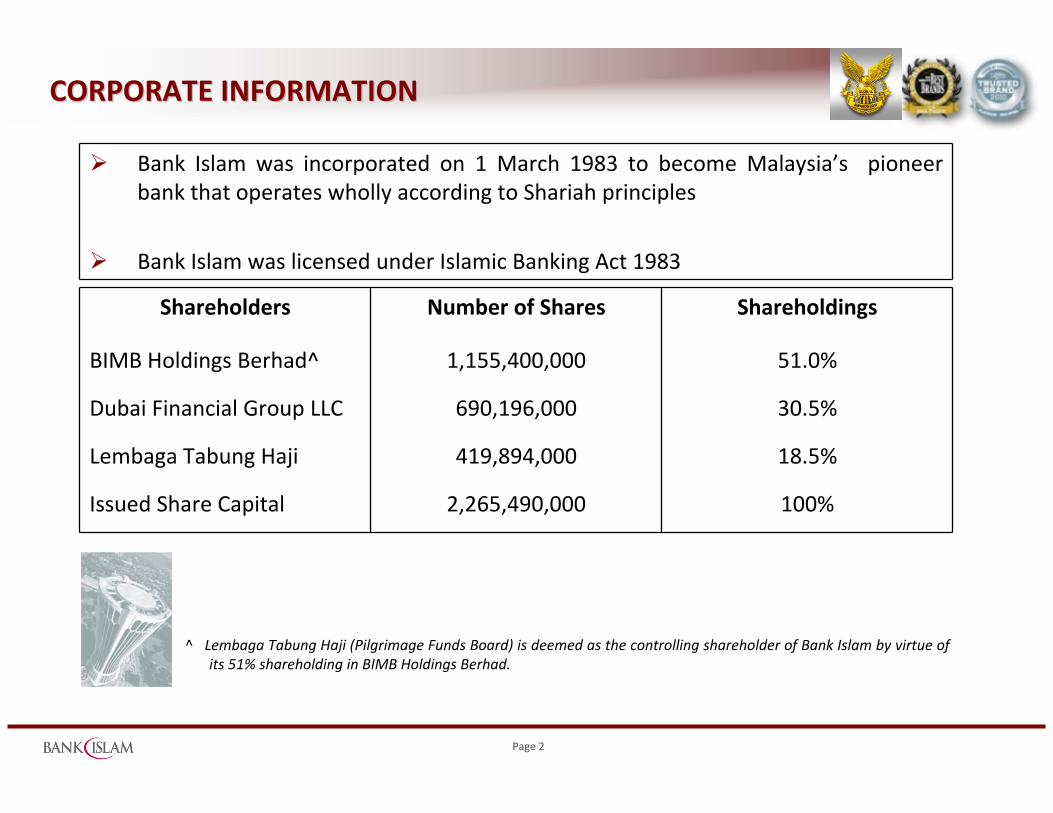
CORPORATE INFORMATIONCORPORATE INFORMATION
Shareholders Number of Shares Shareholdings
BIMB Holdings Berhad^ 1,155,400,000 51.0%
Dubai Financial Group LLC 690,196,000 30.5%
Lembaga Tabung Haji 419,894,000 18.5%
Issued Share Capital 2,265,490,000 100%
Bank Islam was incorporated on 1 March 1983 to become Malaysia’s pioneer bank that operates wholly according to Shariah principles
Bank Islam was licensed under Islamic Banking Act 1983
^ Lembaga Tabung Haji (Pilgrimage Funds Board) is deemed as the controlling shareholder of Bank Islam by virtue of its 51% shareholding in BIMB Holdings Berhad.
Page 3
OUR SHAREHOLDERSOUR SHAREHOLDERS
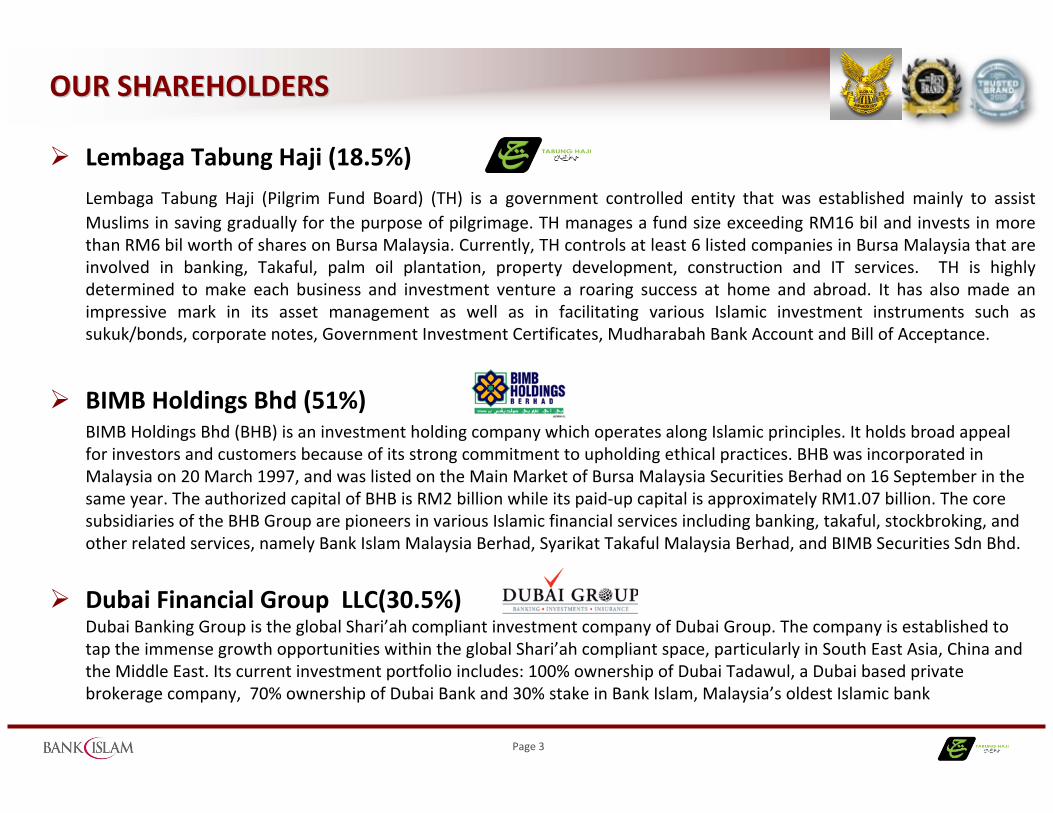
Lembaga Tabung Haji (18.5%)
Lembaga Tabung Haji (Pilgrim Fund Board) (TH) is a government controlled entity that was established mainly to assist Muslims in saving gradually for the purpose of pilgrimage. TH manages a fund size exceeding RM16 bil and invests in more than RM6 bil worth of shares on Bursa Malaysia. Currently, TH controls at least 6 listed companies in Bursa Malaysia that are involved in banking, Takaful, palm oil plantation, property development, construction and IT services. TH is highly determined to make each business and investment venture a roaring success at home and abroad. It has also made an impressive mark in its asset management as well as in facilitating various Islamic investment instruments such as sukuk/bonds, corporate notes, Government Investment Certificates, Mudharabah Bank Account and Bill of Acceptance.
BIMB Holdings Bhd (51%)BIMB Holdings Bhd (BHB) is an investment holding company which operates along Islamic principles. It holds broad appeal for investors and customers because of its strong commitment to upholding ethical practices. BHB was incorporated in Malaysia on 20 March 1997, and was listed on the Main Market of Bursa Malaysia Securities Berhad on 16 September in the same year. The authorized capital of BHB is RM2 billion while its paid‐up capital is approximately RM1.07 billion. The core subsidiaries of the BHB Group are pioneers in various Islamic financial services including banking, takaful, stockbroking, and other related services, namely Bank Islam Malaysia Berhad, Syarikat Takaful Malaysia Berhad, and BIMB Securities Sdn Bhd.
Dubai Financial Group LLC(30.5%)Dubai Banking Group is the global Shari’ah compliant investment company of Dubai Group. The company is established to tap the immense growth opportunities within the global Shari’ah compliant space, particularly in South East Asia, China and the Middle East. Its current investment portfolio includes: 100% ownership of Dubai Tadawul, a Dubai based private brokerage company, 70% ownership of Dubai Bank and 30% stake in Bank Islam, Malaysia’s oldest Islamic bank
Page 4
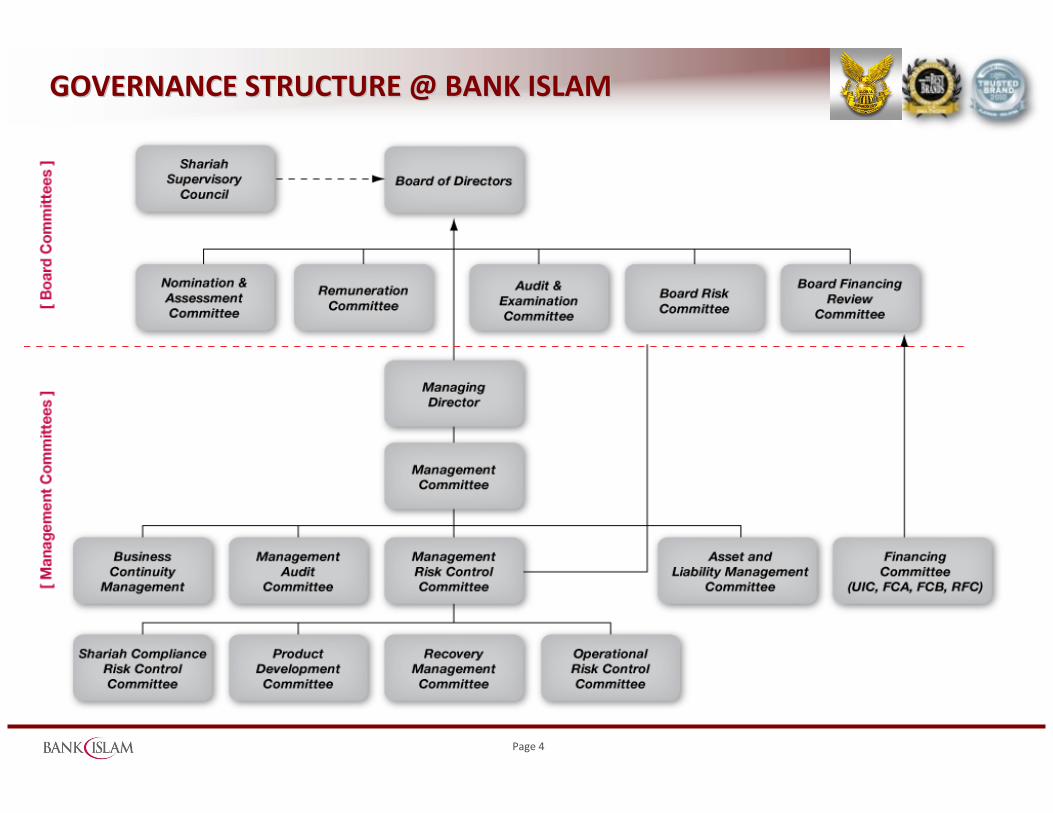
GOVERNANCE STRUCTURE @ BANK ISLAMGOVERNANCE STRUCTURE @ BANK ISLAM

Page 5
BOARD OF DIRECTORSBOARD OF DIRECTORS
Zaiton Mohd HassanChairman, Board Risk Committee
Mohamed Ridza bin Mohamed AbdullaIndependent Director
Zahari @ Mohd Zin IdrisChairman, Audit & Examination CommitteeChairman, Board Financing Review Committee
…INDEPENDENT DIRECTOR
Dato’ Zamani Abdul GhaniChairman

Page 6
BOARD OF DIRECTORSBOARD OF DIRECTORS……contcont
Dato’ Sri Zukri SamatManaging Director
Bank Islam Malaysia Bhd
Datuk Ismee IsmailGroup Managing DirectorLembaga Tabung Haji
Johan AbdullahGroup Managing Director
BIMB Holdings Bhd
… NON INDEPENDENT DIRECTOR
Abdullah AbdulRahman Abdullah Sharafi Board Member
Mohammed Abdul Ghafar HussainBoard Member
Page 7
MANAGEMENT TEAMMANAGEMENT TEAM
Page 8
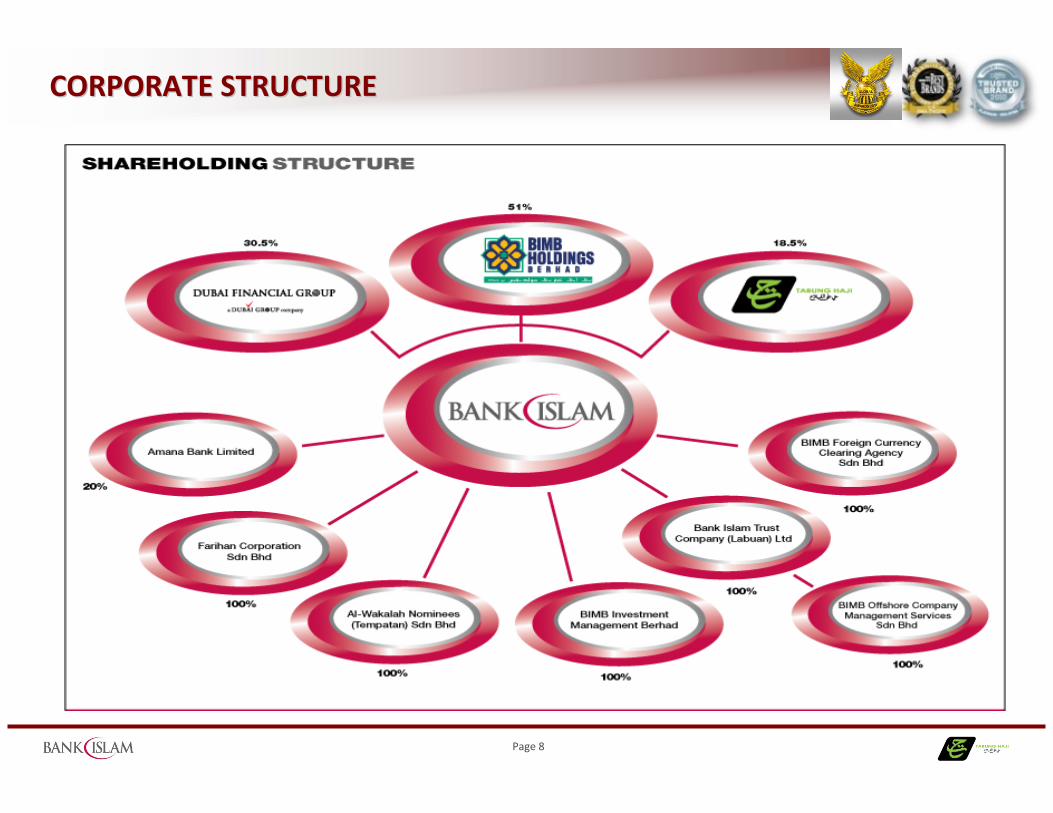
CORPORATE STRUCTURECORPORATE STRUCTURE
Page 9
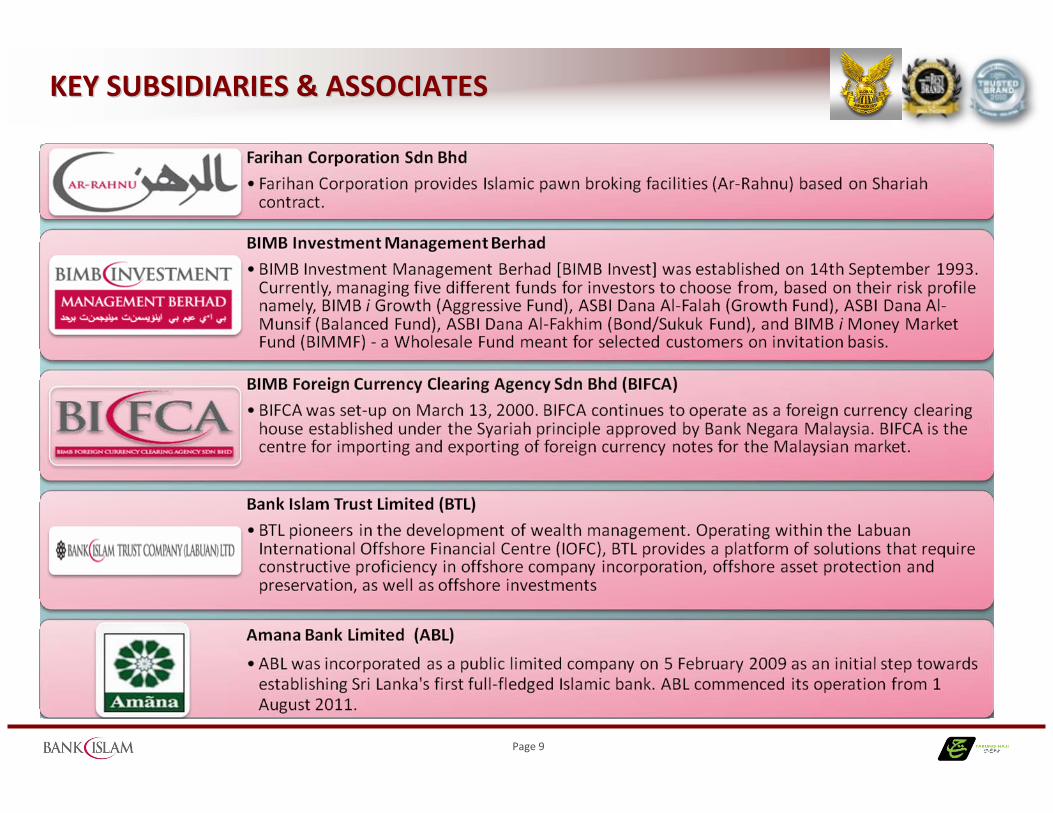
KEY SUBSIDIARIES & ASSOCIATESKEY SUBSIDIARIES & ASSOCIATES
Page 10
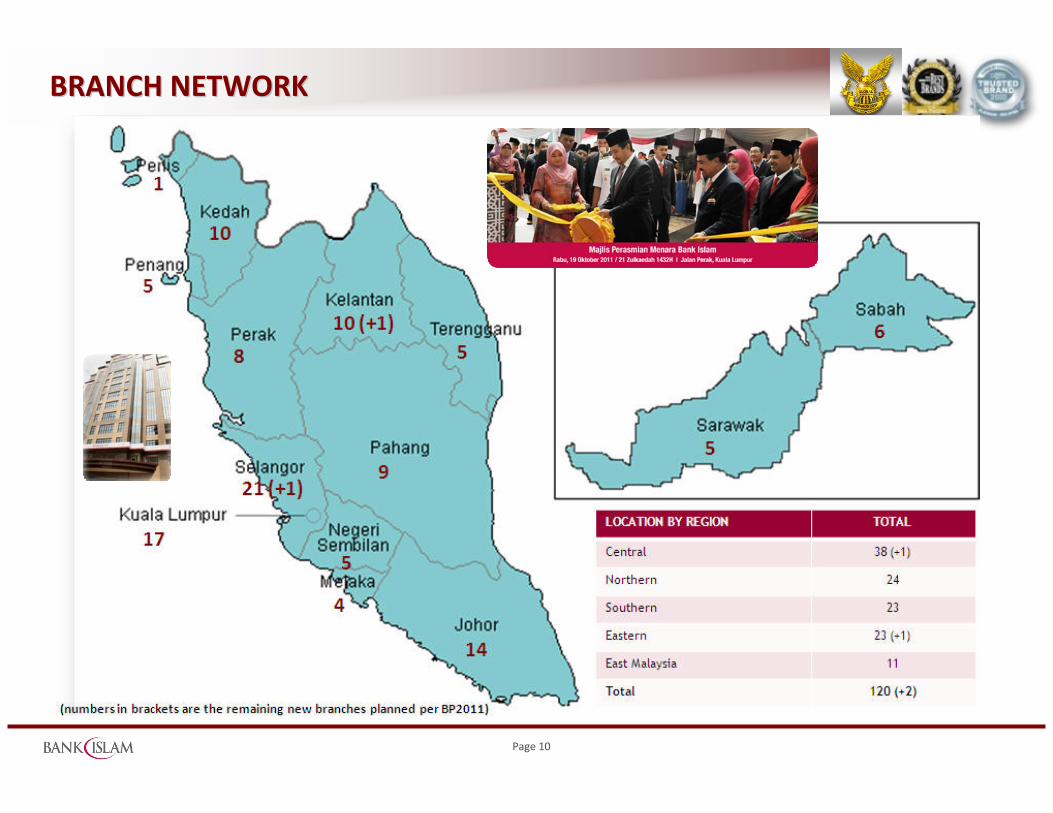
BRANCH NETWORKBRANCH NETWORK
Page 11
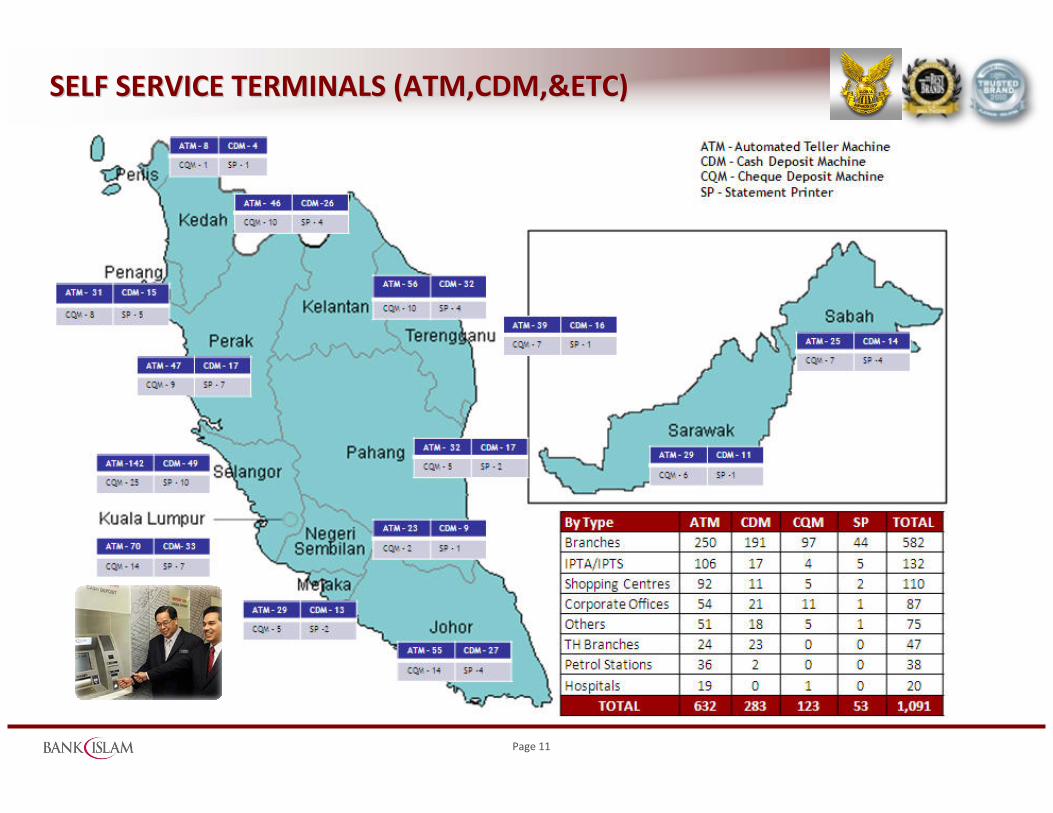
SELF SERVICE TERMINALS (ATM,CDM,&ETC)SELF SERVICE TERMINALS (ATM,CDM,&ETC)
Page 12
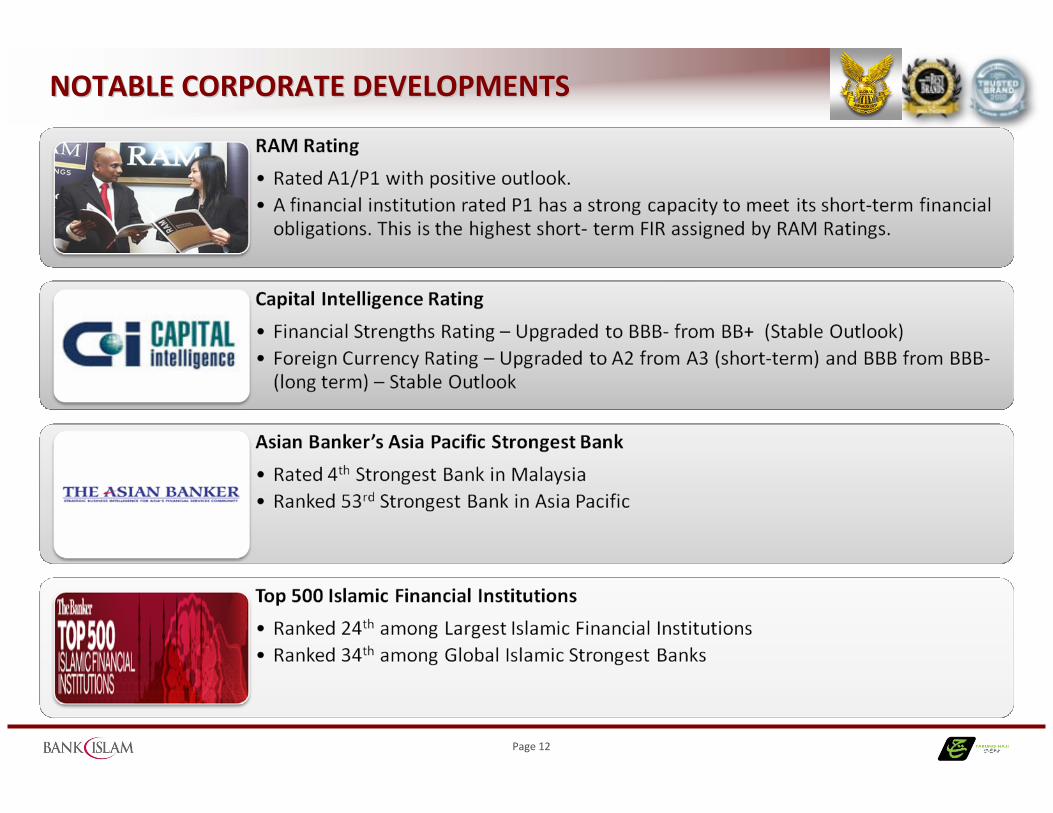
NOTABLE CORPORATE DEVELOPMENTSNOTABLE CORPORATE DEVELOPMENTS

Page 13
WINNING NOTABLE AWARDSWINNING NOTABLE AWARDS

Page 14
WINNING NOTABLE AWARDSWINNING NOTABLE AWARDS
Page 15
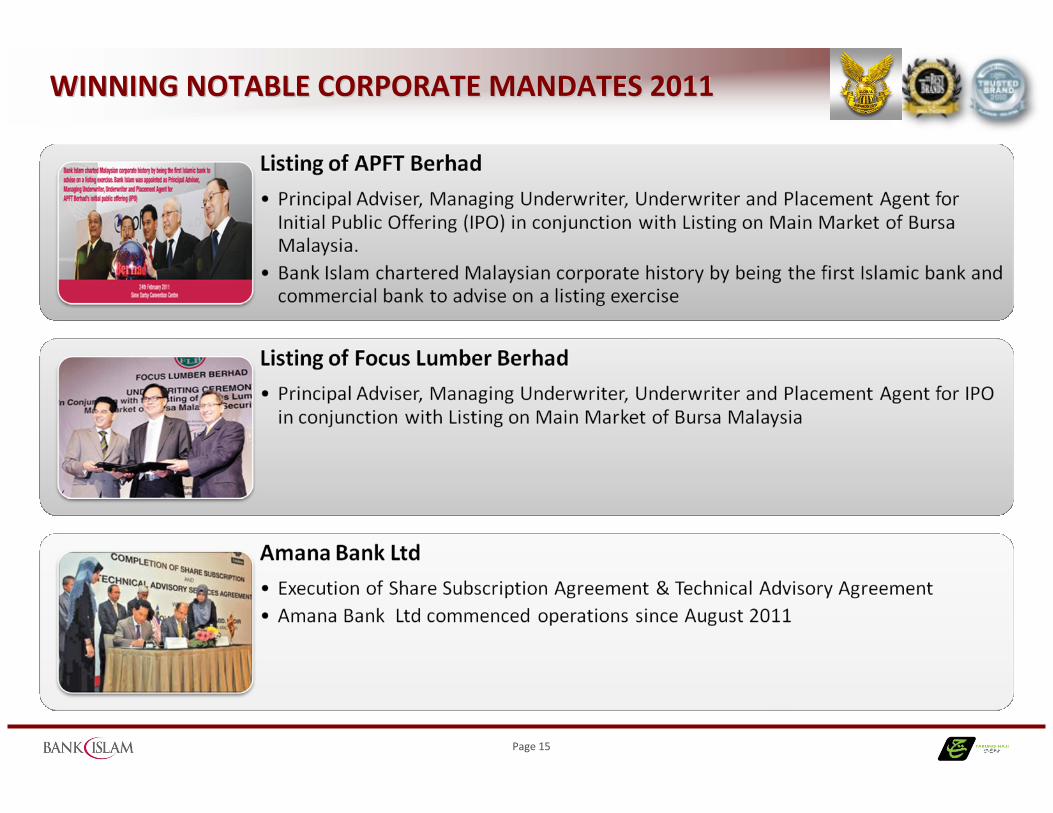
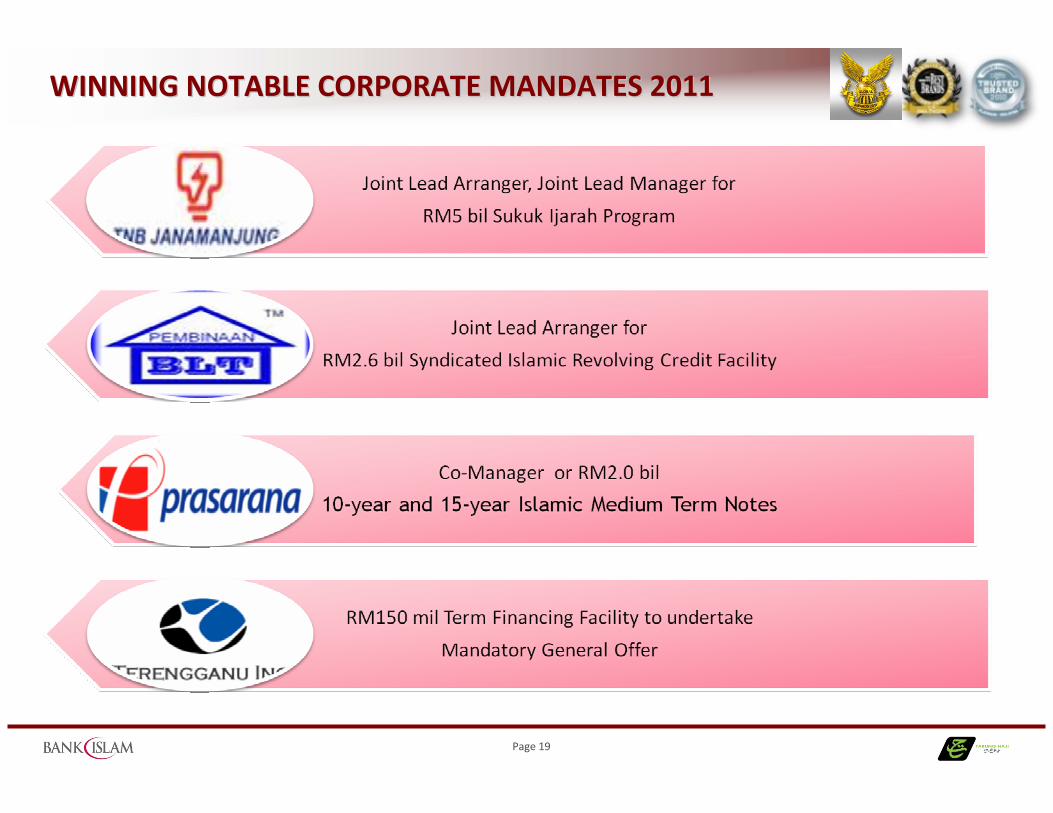
WINNING NOTABLE CORPORATE MANDATES 2011WINNING NOTABLE CORPORATE MANDATES 2011
Page 16
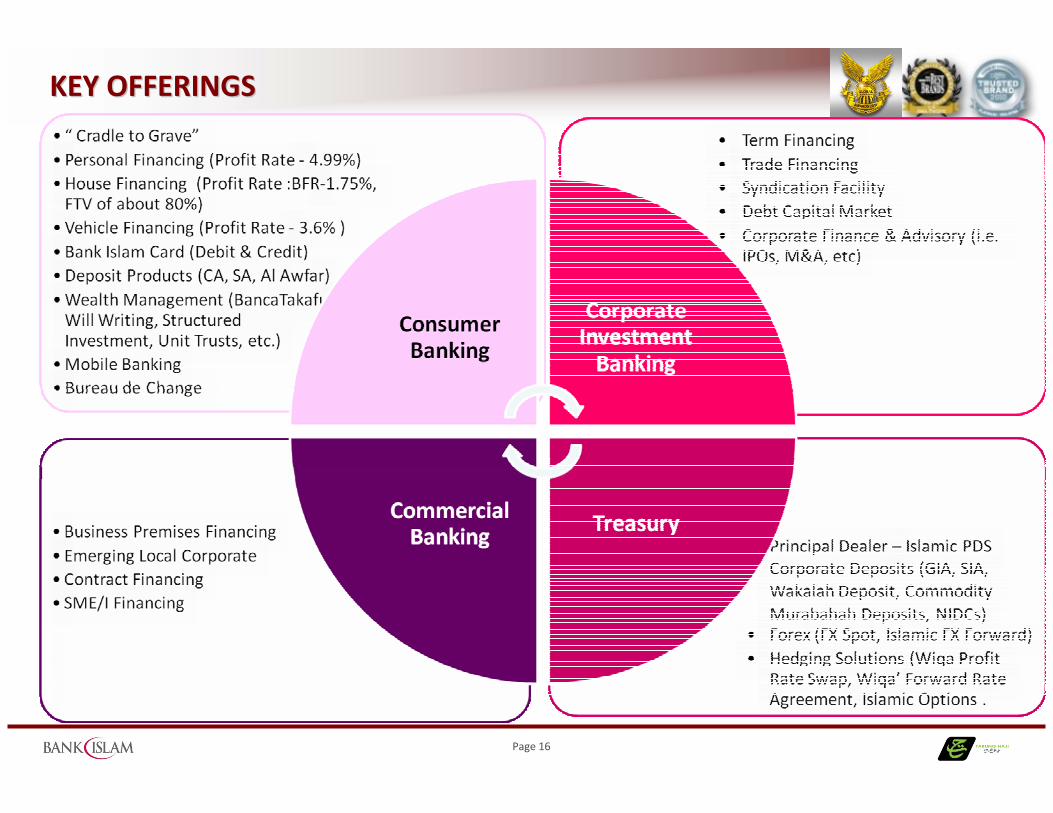
KEY OFFERINGSKEY OFFERINGS
Page 17
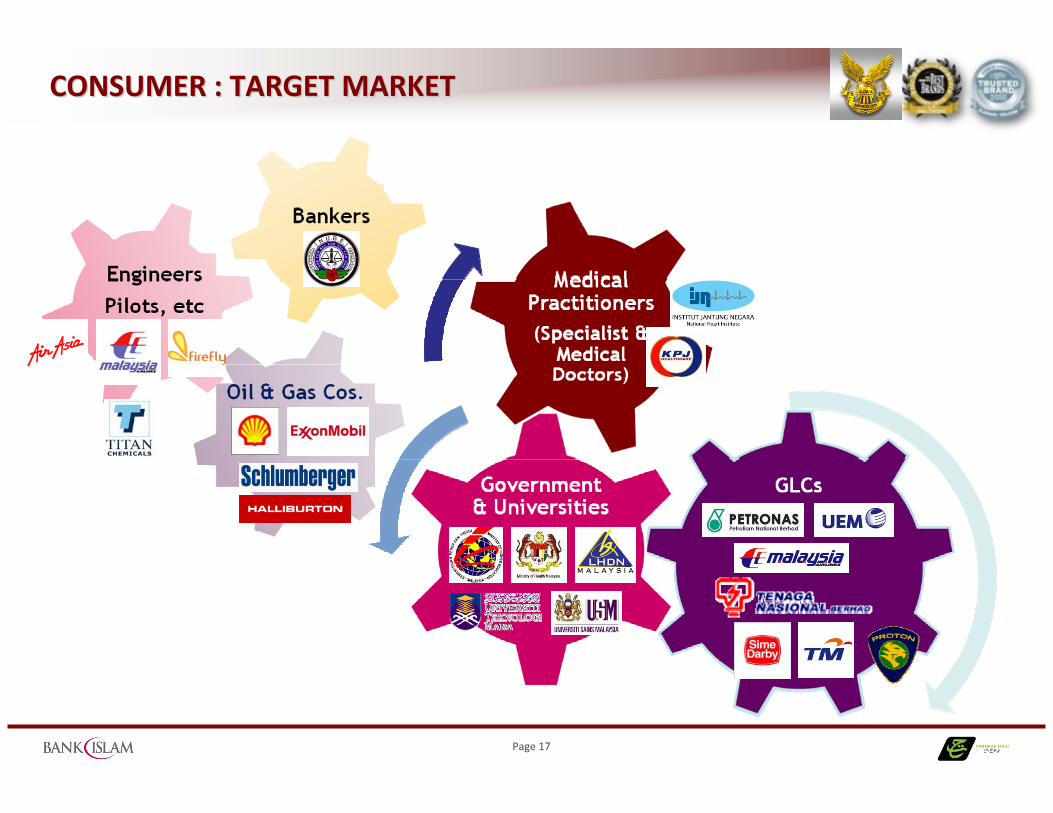
CONSUMER : TARGET MARKETCONSUMER : TARGET MARKET
Page 18
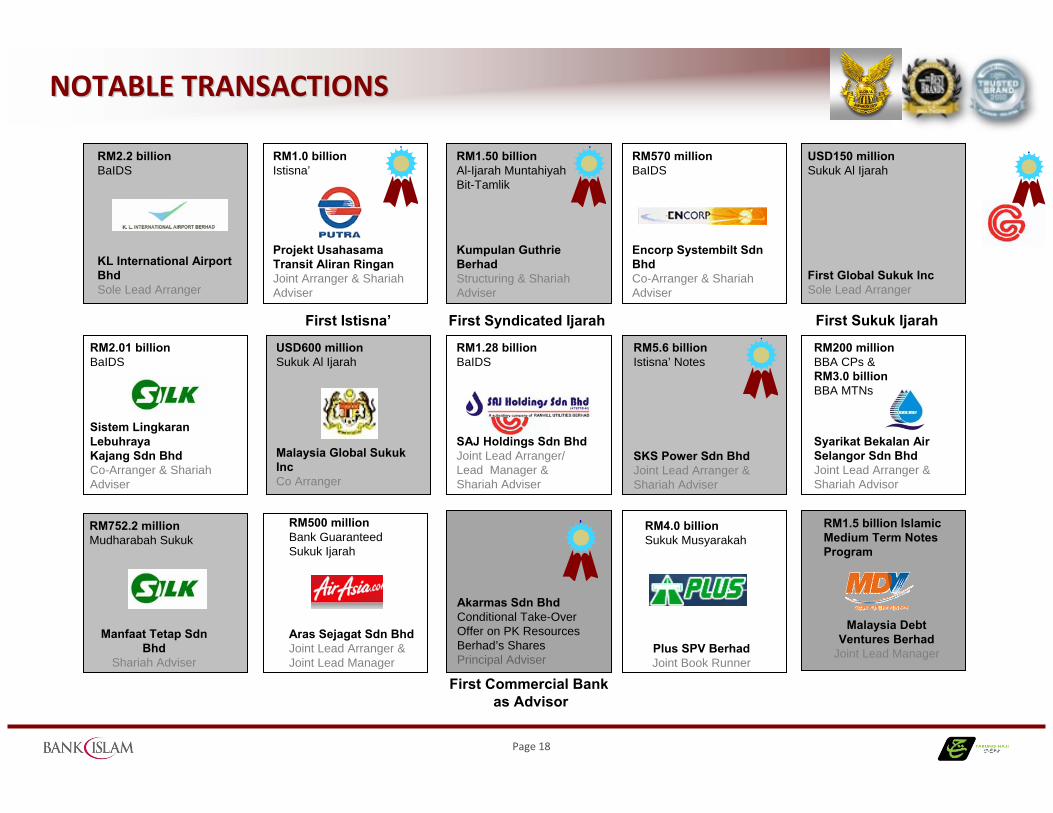
RM2.2 billionBaIDS
KL International Airport BhdSole Lead Arranger
RM1.0 billionIstisna’
Projekt Usahasama Transit Aliran RinganJoint Arranger & Shariah Adviser
First Istisna’ First Syndicated Ijarah
RM1.50 billionAl-Ijarah Muntahiyah Bit-Tamlik
Kumpulan Guthrie BerhadStructuring & Shariah Adviser
NOTABLE TRANSACTIONSNOTABLE TRANSACTIONS
RM570 millionBaIDS
Encorp Systembilt Sdn BhdCo-Arranger & Shariah Adviser
First Sukuk Ijarah
USD150 millionSukuk Al Ijarah
First Global Sukuk IncSole Lead Arranger
RM2.01 billionBaIDS
Sistem Lingkaran Lebuhraya Kajang Sdn BhdCo-Arranger & Shariah Adviser
USD600 millionSukuk Al Ijarah
Malaysia Global Sukuk IncCo Arranger
RM1.28 billionBaIDS
SAJ Holdings Sdn BhdJoint Lead Arranger/ Lead Manager & Shariah Adviser
RM5.6 billionIstisna’ Notes
SKS Power Sdn BhdJoint Lead Arranger & Shariah Adviser
RM200 millionBBA CPs &RM3.0 billion BBA MTNs
Syarikat Bekalan Air Selangor Sdn BhdJoint Lead Arranger &Shariah Advisor
RM500 millionBank Guaranteed Sukuk Ijarah
Aras Sejagat Sdn BhdJoint Lead Arranger &Joint Lead Manager
Akarmas Sdn BhdConditional Take-Over Offer on PK ResourcesBerhad’s SharesPrincipal Adviser
RM752.2 millionMudharabah Sukuk
Manfaat Tetap Sdn Bhd
Shariah Adviser
RM4.0 billionSukuk Musyarakah
Plus SPV BerhadJoint Book Runner
First Commercial Bank as Advisor
RM1.5 billion Islamic Medium Term Notes Program
Malaysia Debt Ventures Berhad
Joint Lead Manager
Page 19
WINNING NOTABLE CORPORATE MANDATES 2011WINNING NOTABLE CORPORATE MANDATES 2011
Page 20
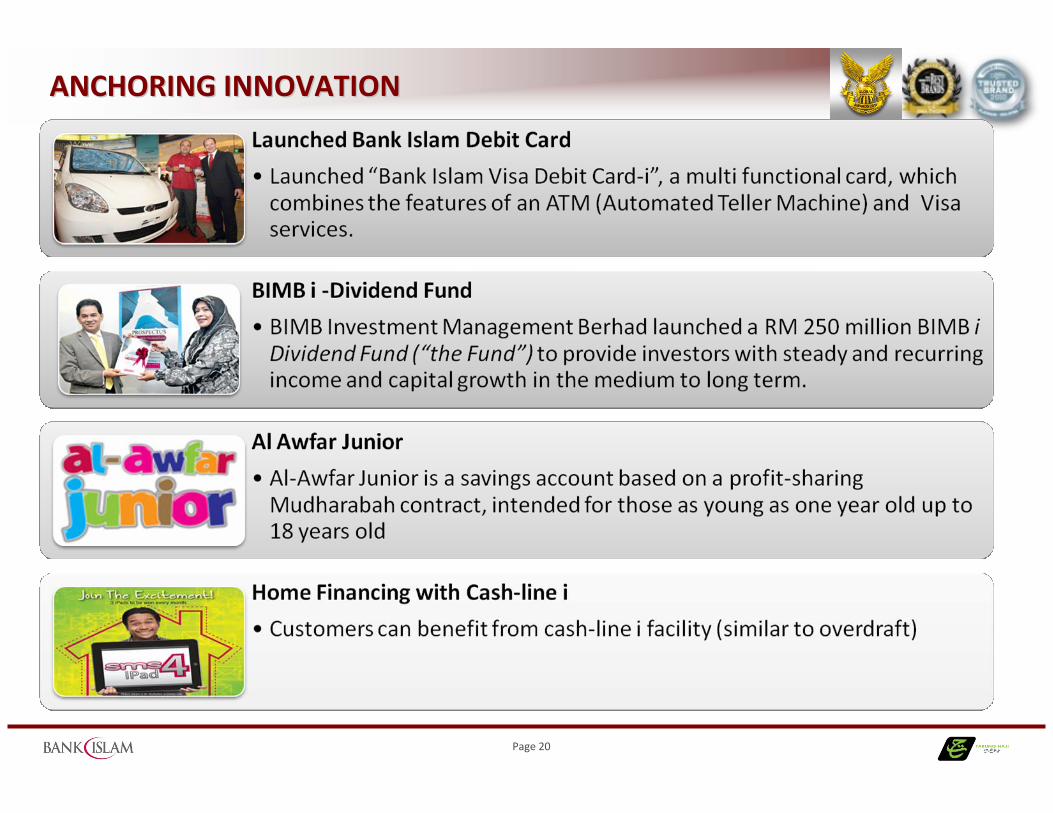
ANCHORING INNOVATIONANCHORING INNOVATION
Page 21
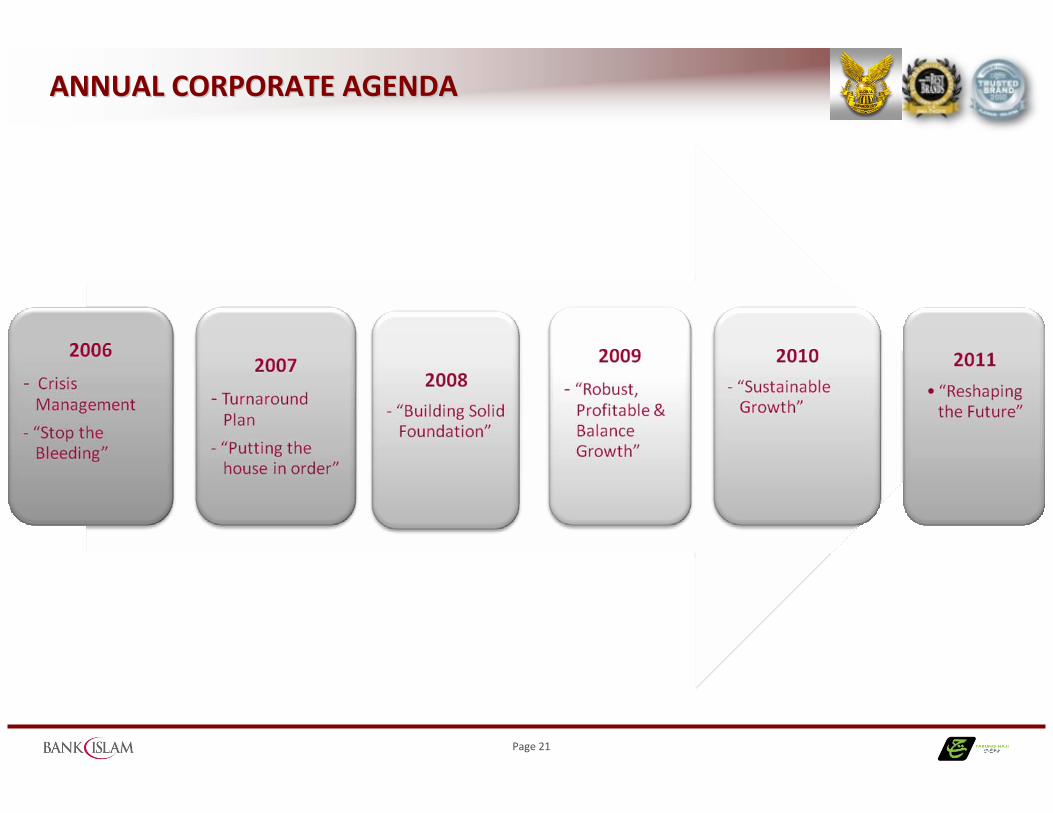
ANNUAL CORPORATE AGENDAANNUAL CORPORATE AGENDA
Page 22
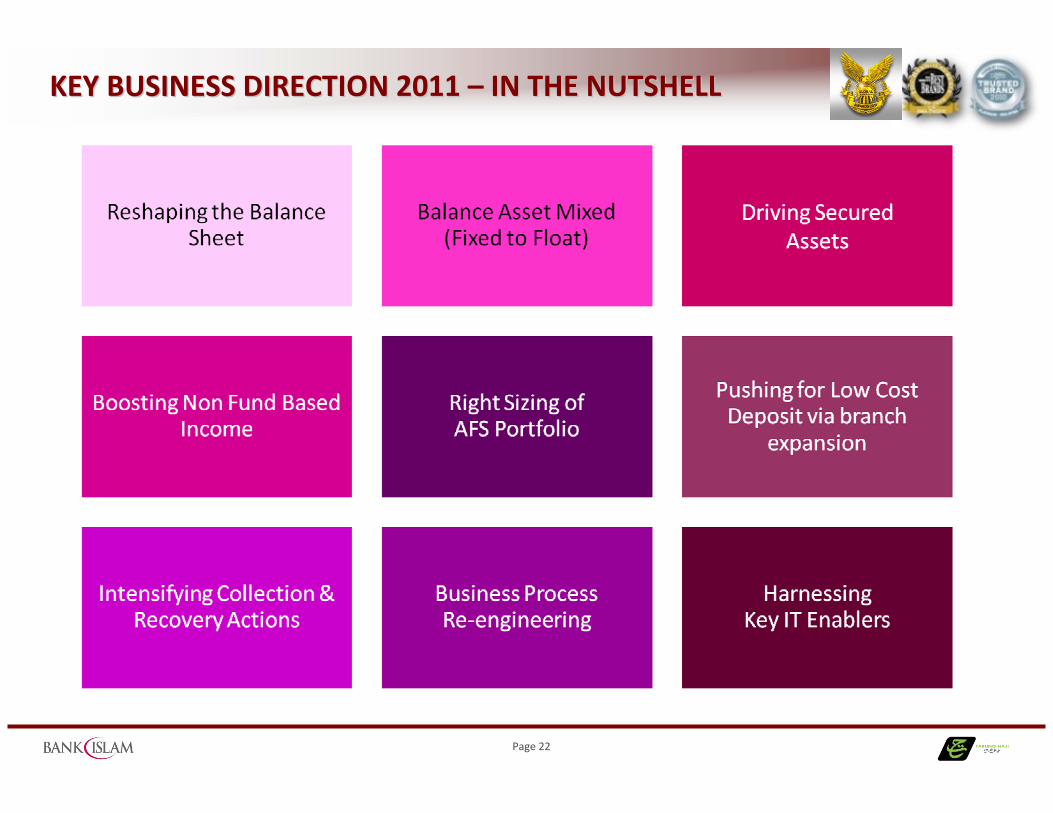
KEY BUSINESS DIRECTION 2011 KEY BUSINESS DIRECTION 2011 –– IN THE NUTSHELLIN THE NUTSHELL
Page 23
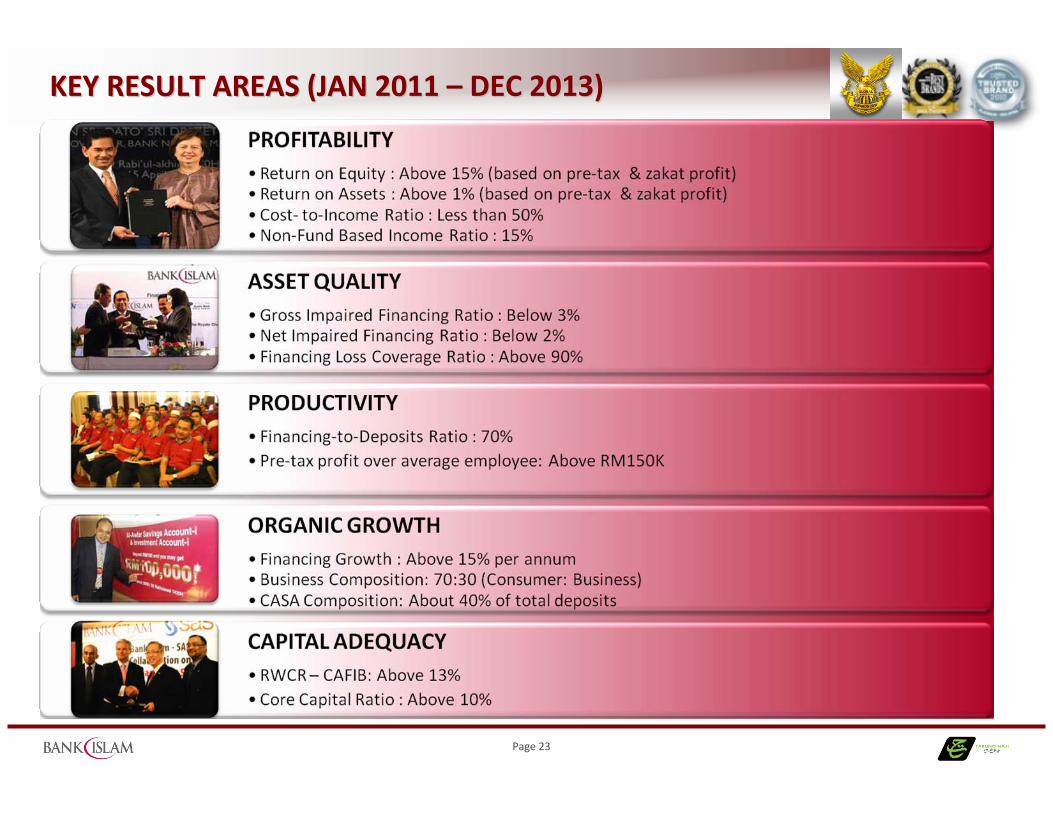
KEY RESULT AREAS (JAN 2011 KEY RESULT AREAS (JAN 2011 –– DEC 2013)DEC 2013)
Page 24
FINANCIAL HIGHLIGHTSFINANCIAL HIGHLIGHTS
Page 25
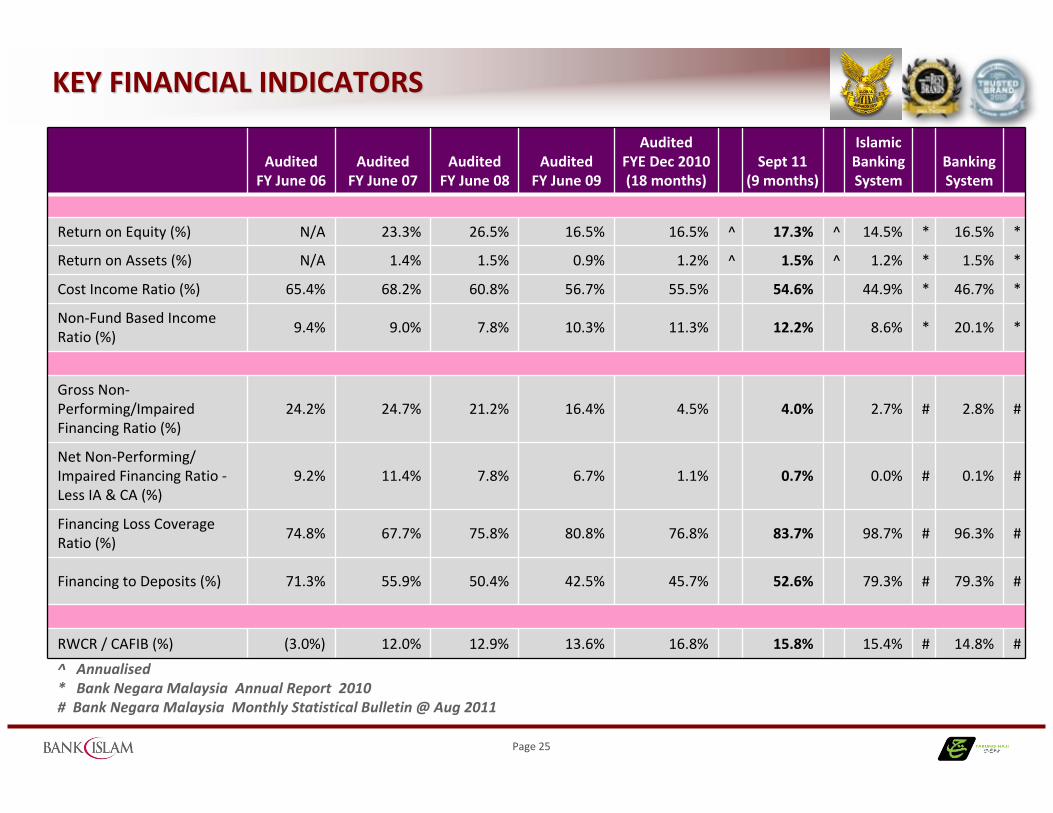
KEY FINANCIAL INDICATORSKEY FINANCIAL INDICATORS
^ Annualised* Bank Negara Malaysia Annual Report 2010 # Bank Negara Malaysia Monthly Statistical Bulletin @ Aug 2011
Audited FY June 06
AuditedFY June 07
AuditedFY June 08
Audited FY June 09
AuditedFYE Dec 2010(18 months)
Sept 11(9 months)
IslamicBanking System
Banking System
Return on Equity (%) N/A 23.3% 26.5% 16.5% 16.5% ^ 17.3% ^ 14.5% * 16.5% *
Return on Assets (%) N/A 1.4% 1.5% 0.9% 1.2% ^ 1.5% ^ 1.2% * 1.5% *
Cost Income Ratio (%) 65.4% 68.2% 60.8% 56.7% 55.5% 54.6% 44.9% * 46.7% *
Non‐Fund Based Income Ratio (%)
9.4% 9.0% 7.8% 10.3% 11.3% 12.2% 8.6% * 20.1% *
Gross Non‐Performing/Impaired Financing Ratio (%)
24.2% 24.7% 21.2% 16.4% 4.5% 4.0% 2.7% # 2.8% #
Net Non‐Performing/ Impaired Financing Ratio ‐Less IA & CA (%)
9.2% 11.4% 7.8% 6.7% 1.1% 0.7% 0.0% # 0.1% #
Financing Loss Coverage Ratio (%)
74.8% 67.7% 75.8% 80.8% 76.8% 83.7% 98.7% # 96.3% #
Financing to Deposits (%) 71.3% 55.9% 50.4% 42.5% 45.7% 52.6% 79.3% # 79.3% #
RWCR / CAFIB (%) (3.0%) 12.0% 12.9% 13.6% 16.8% 15.8% 15.4% # 14.8% #
Page 26
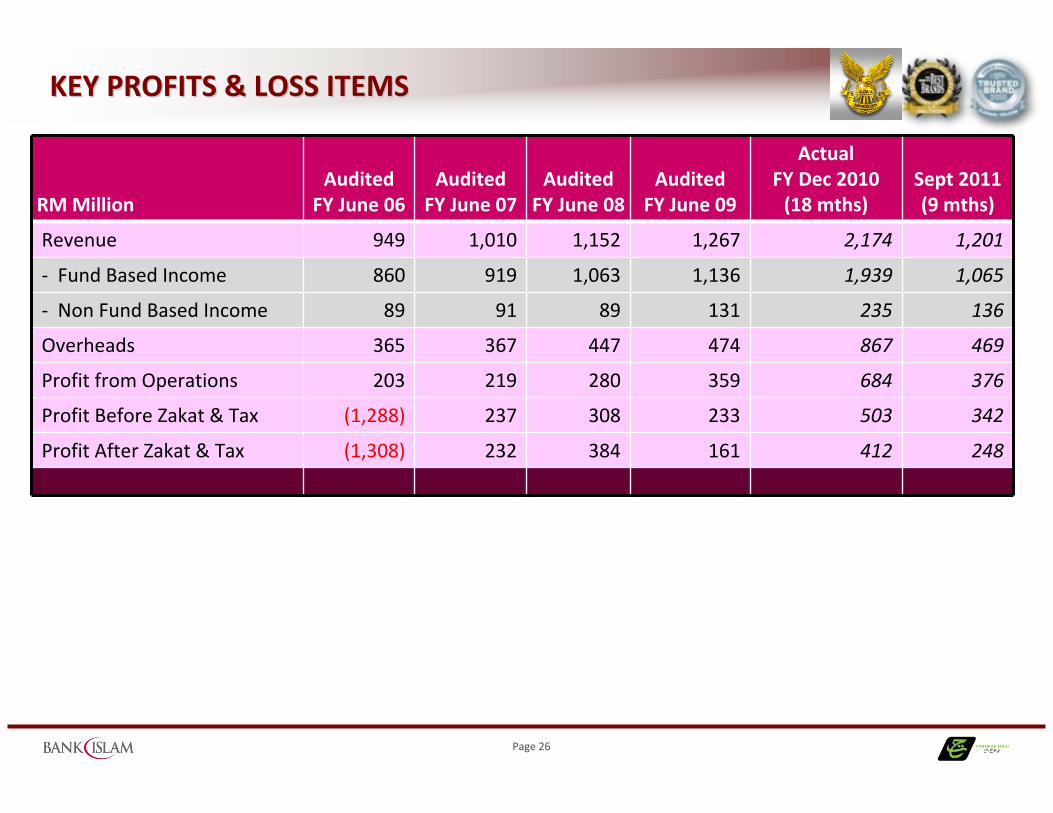
KEY PROFITS & LOSS ITEMS KEY PROFITS & LOSS ITEMS
RM MillionAudited
FY June 06Audited
FY June 07Audited
FY June 08Audited
FY June 09
Actual FY Dec 2010 (18 mths)
Sept 2011(9 mths)
Revenue 949 1,010 1,152 1,267 2,174 1,201
‐ Fund Based Income 860 919 1,063 1,136 1,939 1,065
‐ Non Fund Based Income 89 91 89 131 235 136
Overheads 365 367 447 474 867 469
Profit from Operations 203 219 280 359 684 376
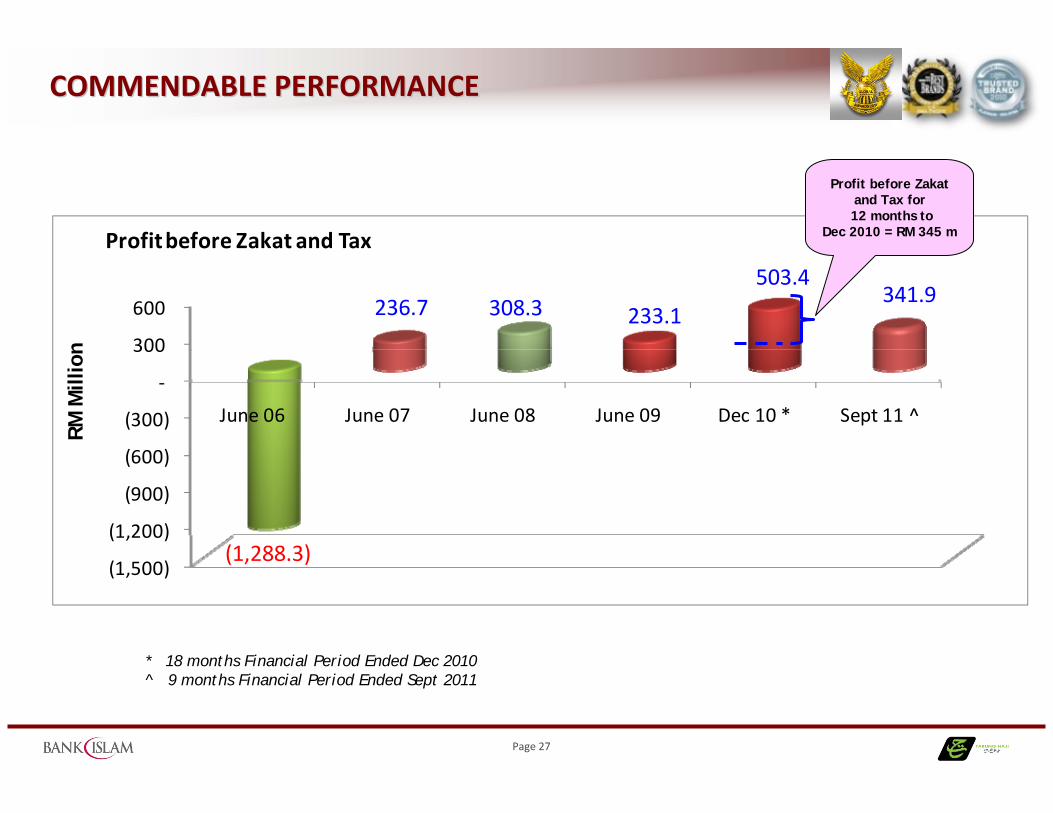
Profit Before Zakat & Tax (1,288) 237 308 233 503 342
Profit After Zakat & Tax (1,308) 232 384 161 412 248
Page 27
(1,500)
(1,200)
(900)
(600)
(300)
‐
300
600
June 06 June 07 June 08 June 09 Dec 10 * Sept 11 ^
(1,288.3)
236.7 308.3 233.1
503.4341.9
RM M
illio
n
Profit before Zakat and Tax
COMMENDABLE PERFORMANCECOMMENDABLE PERFORMANCE
* 18 months Financial Period Ended Dec 2010 ^ 9 months Financial Period Ended Sept 2011
Profit before Zakat and Tax for12 months to
Dec 2010 = RM 345 m
Page 28
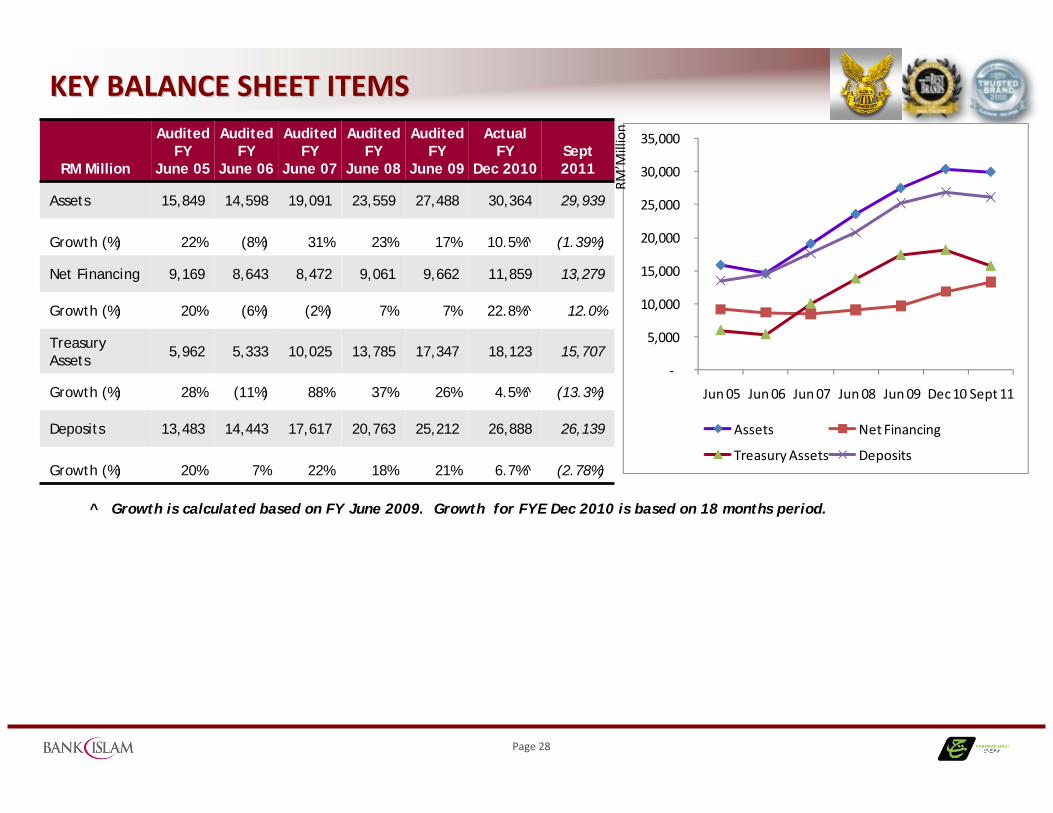
KEY BALANCE SHEET ITEMSKEY BALANCE SHEET ITEMS
RM Million
AuditedFY
June 05
AuditedFY
June 06
AuditedFY
June 07
AuditedFY
June 08
Audited FY
June 09
Actual FY
Dec 2010 Sept 2011
Assets 15,849 14,598 19,091 23,559 27,488 30,364 29,939
Growth (%) 22% (8%) 31% 23% 17% 10.5%^ (1.39%)
Net Financing 9,169 8,643 8,472 9,061 9,662 11,859 13,279
Growth (%) 20% (6%) (2%) 7% 7% 22.8%^ 12.0%
Treasury Assets
5,962 5,333 10,025 13,785 17,347 18,123 15,707
Growth (%) 28% (11%) 88% 37% 26% 4.5%^ (13.3%)
Deposits 13,483 14,443 17,617 20,763 25,212 26,888 26,139
Growth (%) 20% 7% 22% 18% 21% 6.7%^ (2.78%)
^ Growth is calculated based on FY June 2009. Growth for FYE Dec 2010 is based on 18 months period.
‐
5,000
10,000
15,000
20,000
25,000
30,000
35,000
Jun 05 Jun 06 Jun 07 Jun 08 Jun 09 Dec 10 Sept 11
Assets Net Financing
Treasury Assets Deposits
RM’M
illion
Page 29
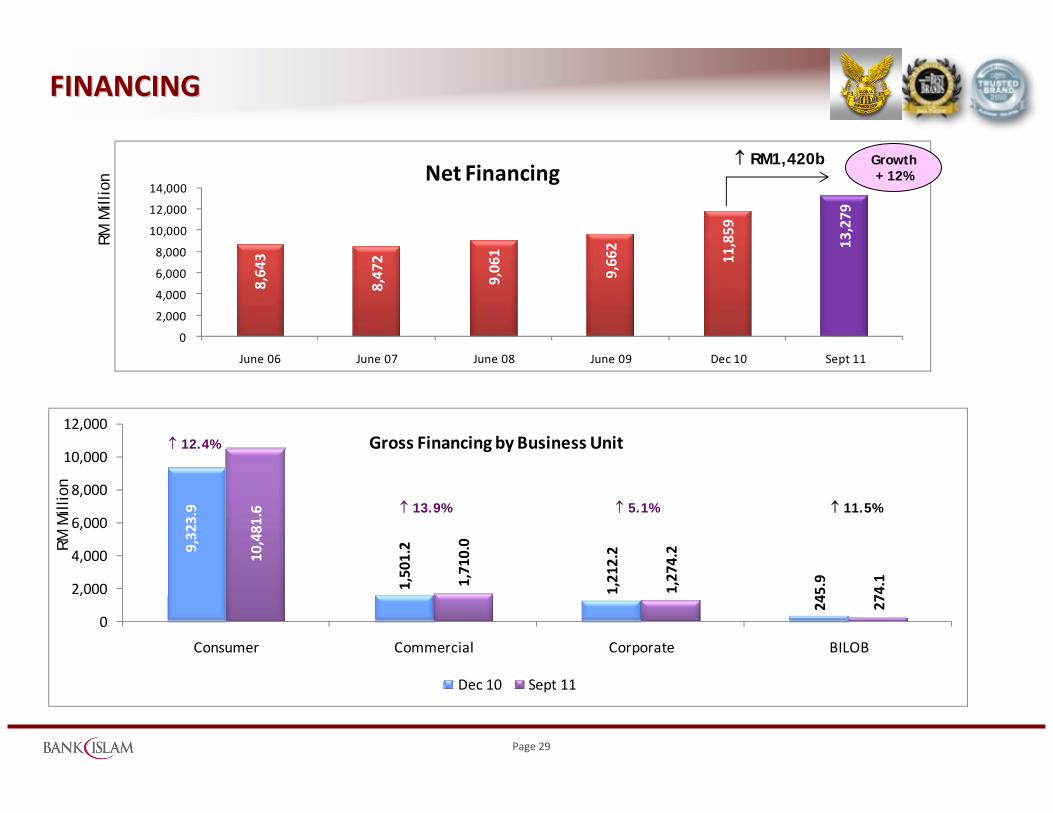
FINANCINGFINANCING
9,323.9
1,501.2
1,212.2
245.9
10,481.6
1,710.0
1,274.2
274.1
0
2,000
4,000
6,000
8,000
10,000
12,000
Consumer Commercial Corporate BILOB
Gross Financing by Business Unit
Dec 10 Sept 11
↑ 12.4%
↑ 13.9% ↑ 5.1% ↑ 11.5%
RM M
illio
n
RM M
illio
n
8,643
8,472
9,061
9,662
11,859
13,279
0
2,000
4,000
6,000
8,000
10,000
12,000
14,000
June 06 June 07 June 08 June 09 Dec 10 Sept 11
Net Financing↑ RM1,420b Growth
+ 12%
Page 30
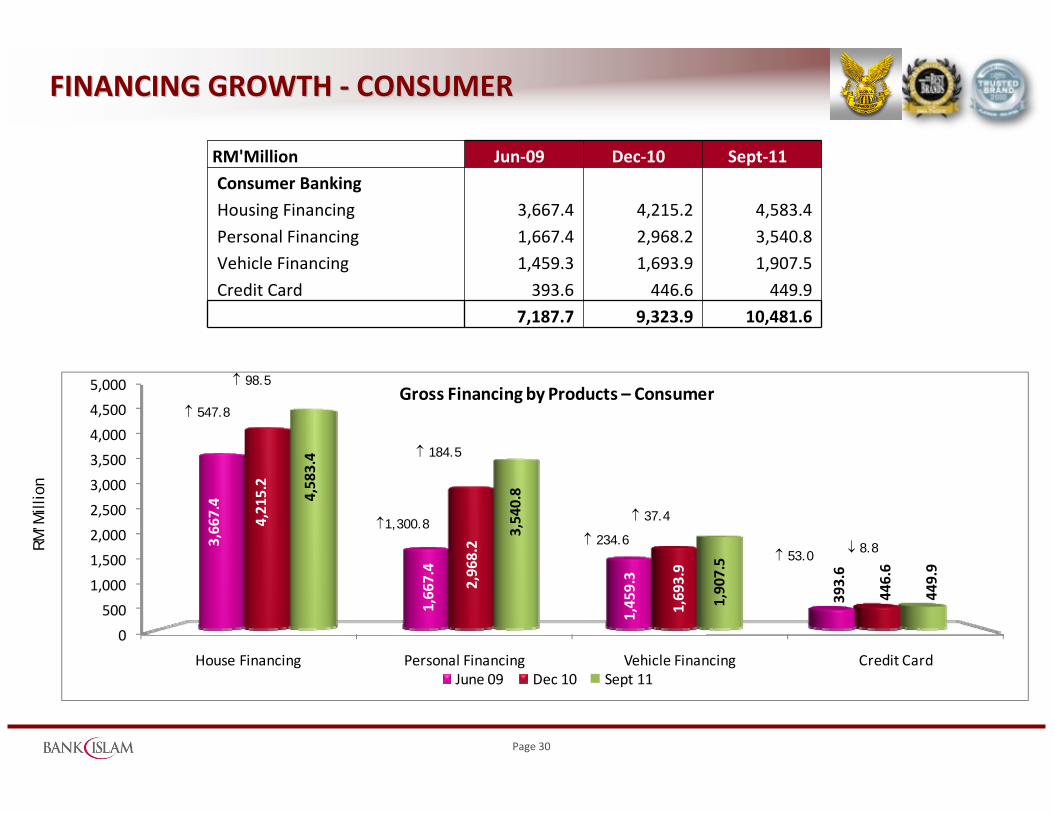
FINANCING GROWTH FINANCING GROWTH ‐‐ CONSUMERCONSUMER
0
500
1,000
1,500
2,000
2,500
3,000
3,500
4,000
4,500
5,000
House Financing Personal Financing Vehicle Financing Credit Card
3,667.4
1,667.4
1,459.3
393.6
4,215.2
2,968.2
1,693.9
446.6
4,583.4
3,540.8
1,907.5
449.9
Gross Financing by Products – Consumer
June 09 Dec 10 Sept 11
↑ 547.8
↑1,300.8↑ 234.6
↑ 53.0
RM’M
illio
n
RM'Million Jun‐09 Dec‐10 Sept‐11
Consumer Banking
Housing Financing 3,667.4 4,215.2 4,583.4
Personal Financing 1,667.4 2,968.2 3,540.8Vehicle Financing 1,459.3 1,693.9 1,907.5
Credit Card 393.6 446.6 449.97,187.7 9,323.9 10,481.6
↑ 98.5
↑ 37.4
↑ 184.5
↓ 8.8
Page 31
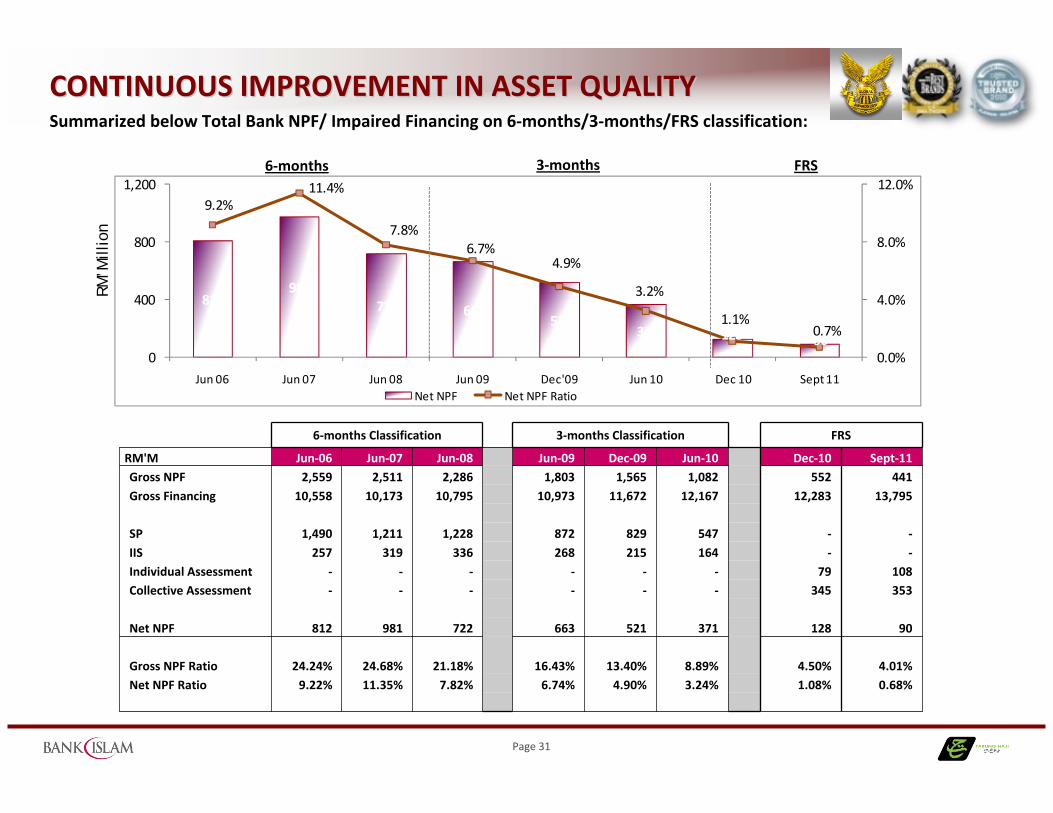
CONTINUOUS IMPROVEMENT IN ASSET QUALITYCONTINUOUS IMPROVEMENT IN ASSET QUALITYSummarized below Total Bank NPF/ Impaired Financing on 6‐months/3‐months/FRS classification:
6‐months Classification 3‐months Classification FRS
RM'M Jun‐06 Jun‐07 Jun‐08 Jun‐09 Dec‐09 Jun‐10 Dec‐10 Sept‐11Gross NPF 2,559 2,511 2,286 1,803 1,565 1,082 552 441Gross Financing 10,558 10,173 10,795 10,973 11,672 12,167 12,283 13,795
SP 1,490 1,211 1,228 872 829 547 ‐ ‐IIS 257 319 336 268 215 164 ‐ ‐Individual Assessment ‐ ‐ ‐ ‐ ‐ ‐ 79 108Collective Assessment ‐ ‐ ‐ ‐ ‐ ‐ 345 353
Net NPF 812 981 722 663 521 371 128 90
Gross NPF Ratio 24.24% 24.68% 21.18% 16.43% 13.40% 8.89% 4.50% 4.01%Net NPF Ratio 9.22% 11.35% 7.82% 6.74% 4.90% 3.24% 1.08% 0.68%
812981
722 663 521
371 128 90
9.2%11.4%
7.8%6.7%
4.9%
3.2%
1.1%0.7%
0.0%
4.0%
8.0%
12.0%
0
400
800
1,200
Jun 06 Jun 07 Jun 08 Jun 09 Dec'09 Jun 10 Dec 10 Sept 11Net NPF Net NPF Ratio
RM’M
illio
n
6‐months 3‐months FRS
Page 32
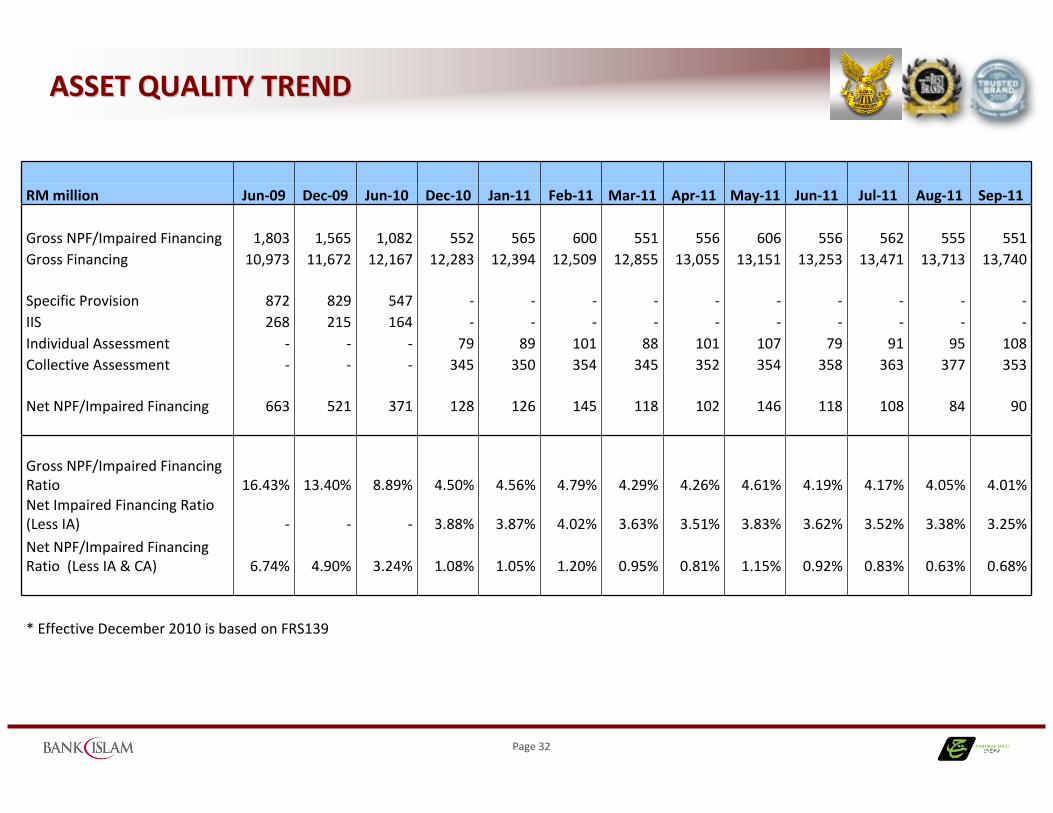
ASSET QUALITY TRENDASSET QUALITY TREND
RM million Jun‐09 Dec‐09 Jun‐10 Dec‐10 Jan‐11 Feb‐11 Mar‐11 Apr‐11 May‐11 Jun‐11 Jul‐11 Aug‐11 Sep‐11
Gross NPF/Impaired Financing 1,803 1,565 1,082 552 565 600 551 556 606 556 562 555 551Gross Financing 10,973 11,672 12,167 12,283 12,394 12,509 12,855 13,055 13,151 13,253 13,471 13,713 13,740
Specific Provision 872 829 547 ‐ ‐ ‐ ‐ ‐ ‐ ‐ ‐ ‐ ‐IIS 268 215 164 ‐ ‐ ‐ ‐ ‐ ‐ ‐ ‐ ‐ ‐Individual Assessment ‐ ‐ ‐ 79 89 101 88 101 107 79 91 95 108Collective Assessment ‐ ‐ ‐ 345 350 354 345 352 354 358 363 377 353
Net NPF/Impaired Financing 663 521 371 128 126 145 118 102 146 118 108 84 90
Gross NPF/Impaired Financing Ratio 16.43% 13.40% 8.89% 4.50% 4.56% 4.79% 4.29% 4.26% 4.61% 4.19% 4.17% 4.05% 4.01%Net Impaired Financing Ratio (Less IA) ‐ ‐ ‐ 3.88% 3.87% 4.02% 3.63% 3.51% 3.83% 3.62% 3.52% 3.38% 3.25%
Net NPF/Impaired Financing Ratio (Less IA & CA) 6.74% 4.90% 3.24% 1.08% 1.05% 1.20% 0.95% 0.81% 1.15% 0.92% 0.83% 0.63% 0.68%
* Effective December 2010 is based on FRS139
Page 33
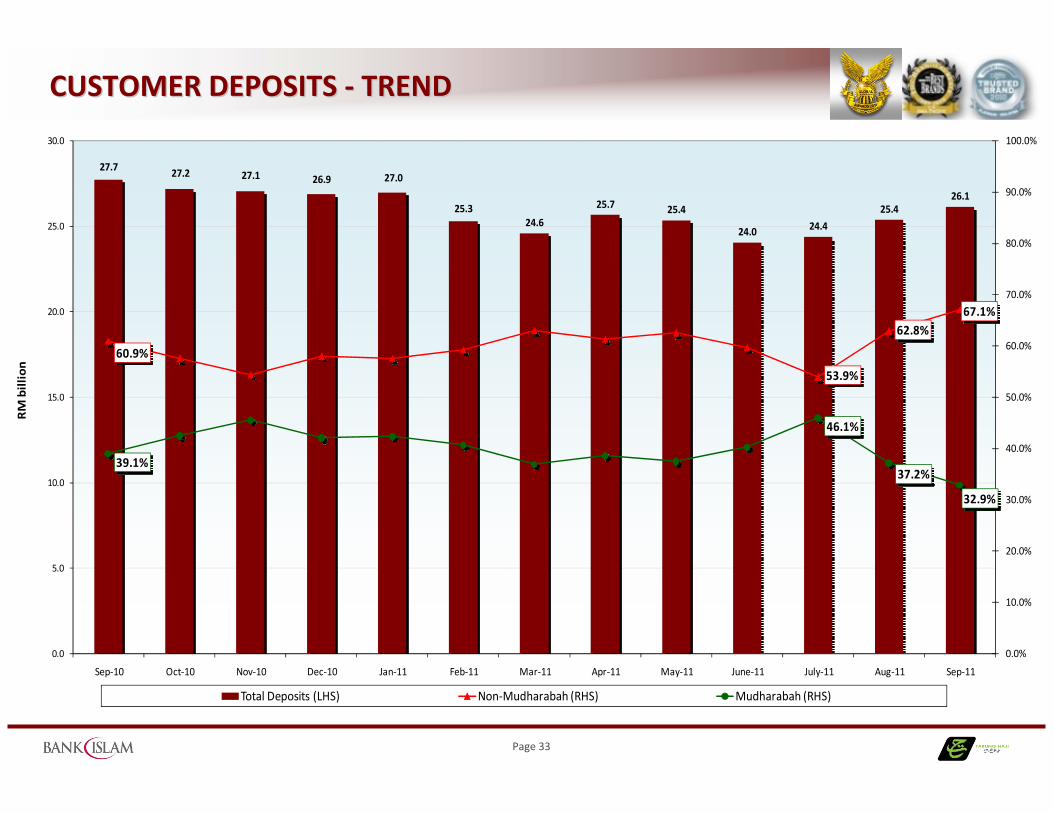
CUSTOMER DEPOSITS CUSTOMER DEPOSITS ‐‐ TRENDTREND
27.7 27.2 27.1 26.9 27.0
25.324.6
25.7 25.4
24.0 24.4
25.426.1
60.9%
53.9%
62.8%67.1%
39.1%
46.1%
37.2%
32.9%
0.0%
10.0%
20.0%
30.0%
40.0%
50.0%
60.0%
70.0%
80.0%
90.0%
100.0%
0.0
5.0
10.0
15.0
20.0
25.0
30.0
Sep‐10 Oct‐10 Nov‐10 Dec‐10 Jan‐11 Feb‐11 Mar‐11 Apr‐11 May‐11 June‐11 July‐11 Aug‐11 Sep‐11
RM billion
Total Deposits (LHS) Non‐Mudharabah (RHS) Mudharabah (RHS)
Page 34
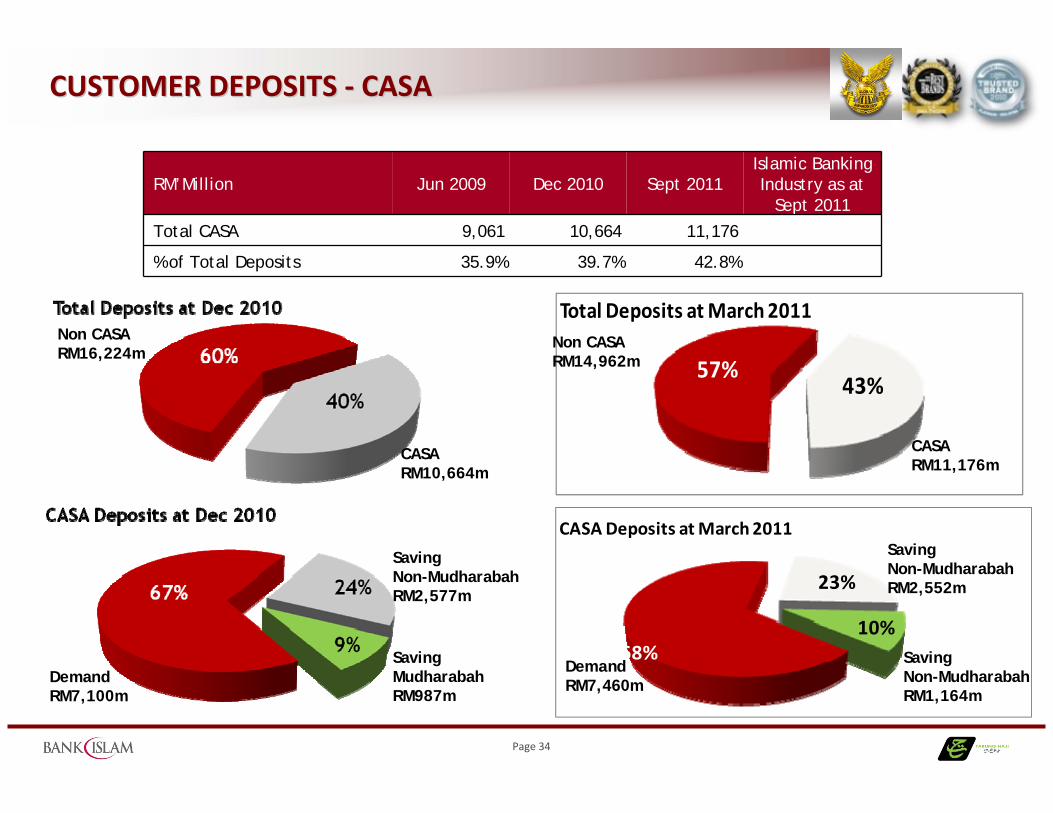
CUSTOMER DEPOSITS CUSTOMER DEPOSITS ‐‐ CASACASA
RM’Million Jun 2009 Dec 2010 Sept 2011Islamic Banking Industry as at
Sept 2011
Total CASA 9,061 10,664 11,176
% of Total Deposits 35.9% 39.7% 42.8%
CASA RM10,664m
Non CASA RM16,224m
Demand RM7,100m
Saving Mudharabah RM987m
Saving Non-Mudharabah RM2,577m
57%43%
Total Deposits at March 2011
68%
23%
10%
CASA Deposits at March 2011
Demand RM7,460m
Non CASA RM14,962m
CASA RM11,176m
Saving Non-Mudharabah RM2,552m
Saving Non-Mudharabah RM1,164m
Page 35
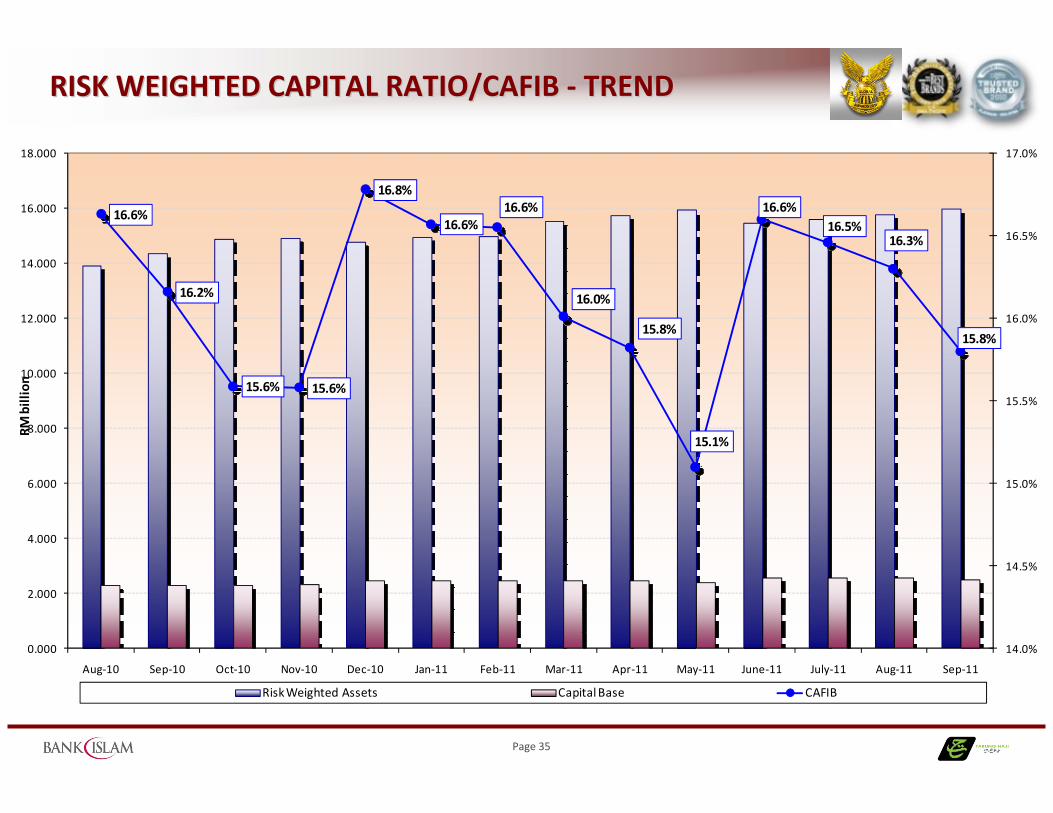
RISK WEIGHTED CAPITAL RATIO/CAFIB RISK WEIGHTED CAPITAL RATIO/CAFIB ‐‐ TRENDTREND
16.6%
16.2%
15.6% 15.6%
16.8%
16.6%16.6%
16.0%
15.8%
15.1%
16.6%16.5%
16.3%
15.8%
14.0%
14.5%
15.0%
15.5%
16.0%
16.5%
17.0%
0.000
2.000
4.000
6.000
8.000
10.000
12.000
14.000
16.000
18.000
Aug‐10 Sep‐10 Oct‐10 Nov‐10 Dec‐10 Jan‐11 Feb‐11 Mar‐11 Apr‐11 May‐11 June‐11 July‐11 Aug‐11 Sep‐11
RM billion
Risk Weighted Assets Capital Base CAFIB
Page 36
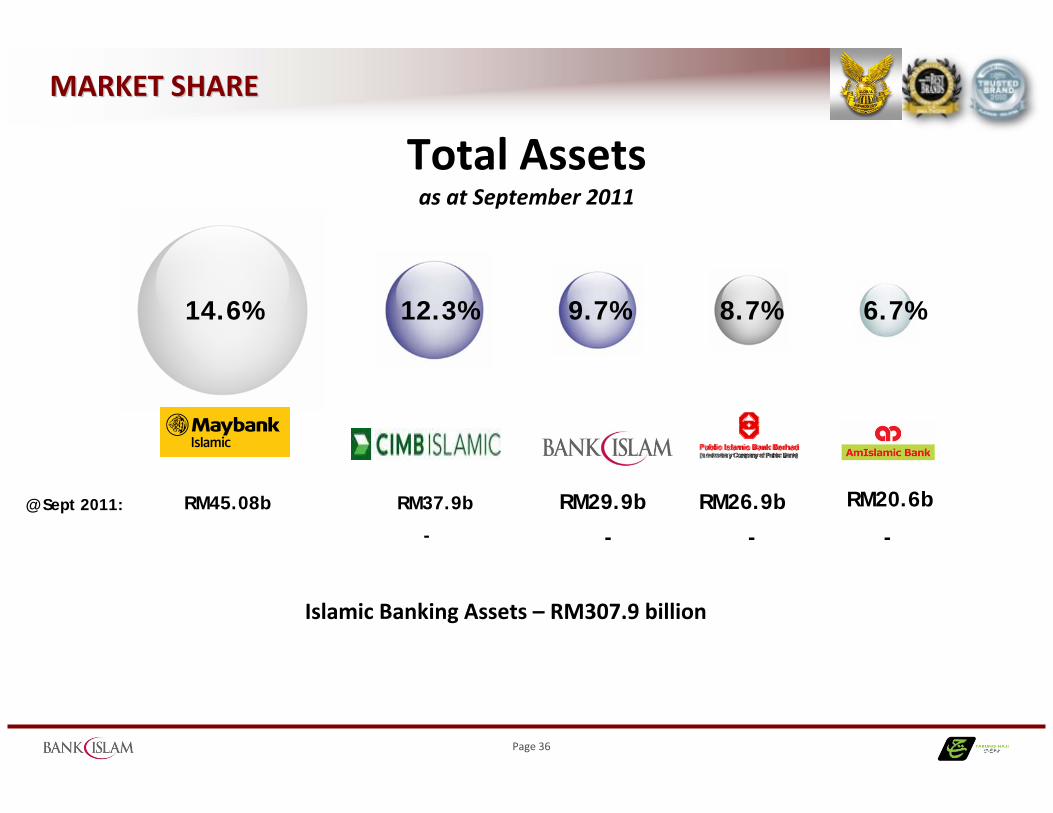
MARKET SHAREMARKET SHARE
14.6% 12.3% 9.7% 8.7% 6.7%
RM45.08b RM29.9bRM37.9b RM26.9b
Islamic Banking Assets – RM307.9 billion
@ Sept 2011:
-- -
RM20.6b
-
Total Assetsas at September 2011
Page 37
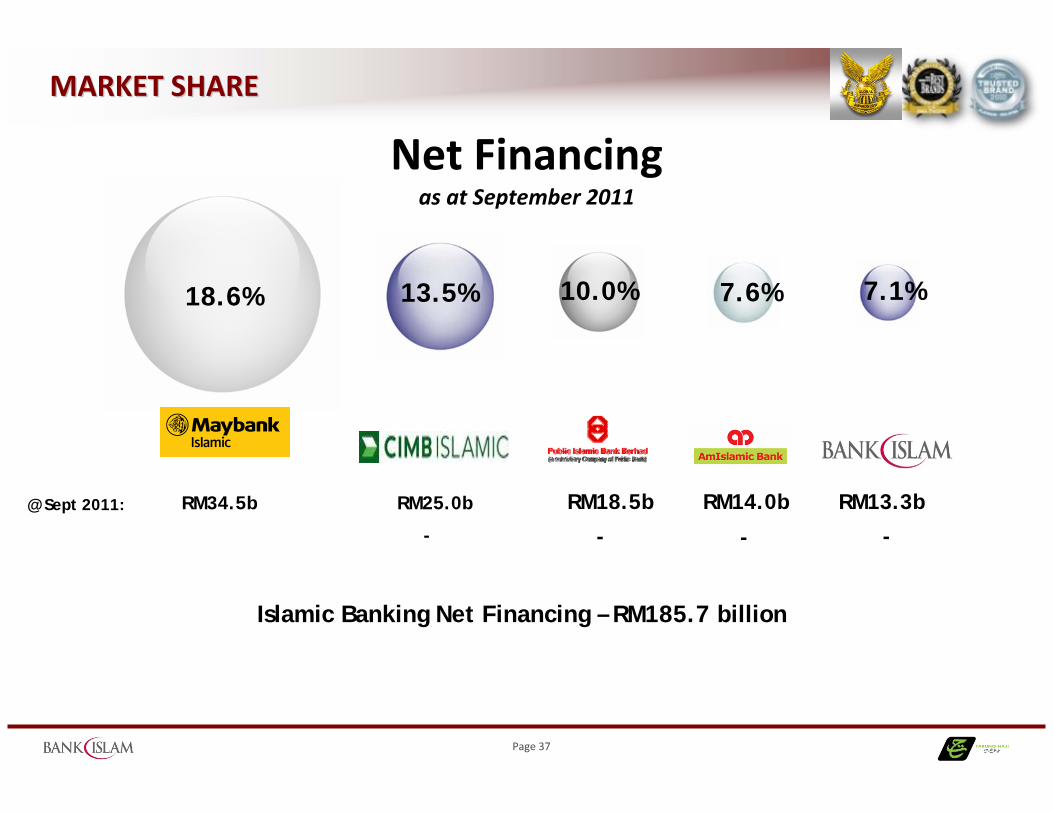
MARKET SHAREMARKET SHARE
18.6% 13.5% 10.0% 7.6% 7.1%
RM34.5b RM18.5bRM25.0b RM14.0b
Islamic Banking Net Financing – RM185.7 billion
@ Sept 2011:
-- -
RM13.3b
-
Net Financingas at September 2011
Page 38
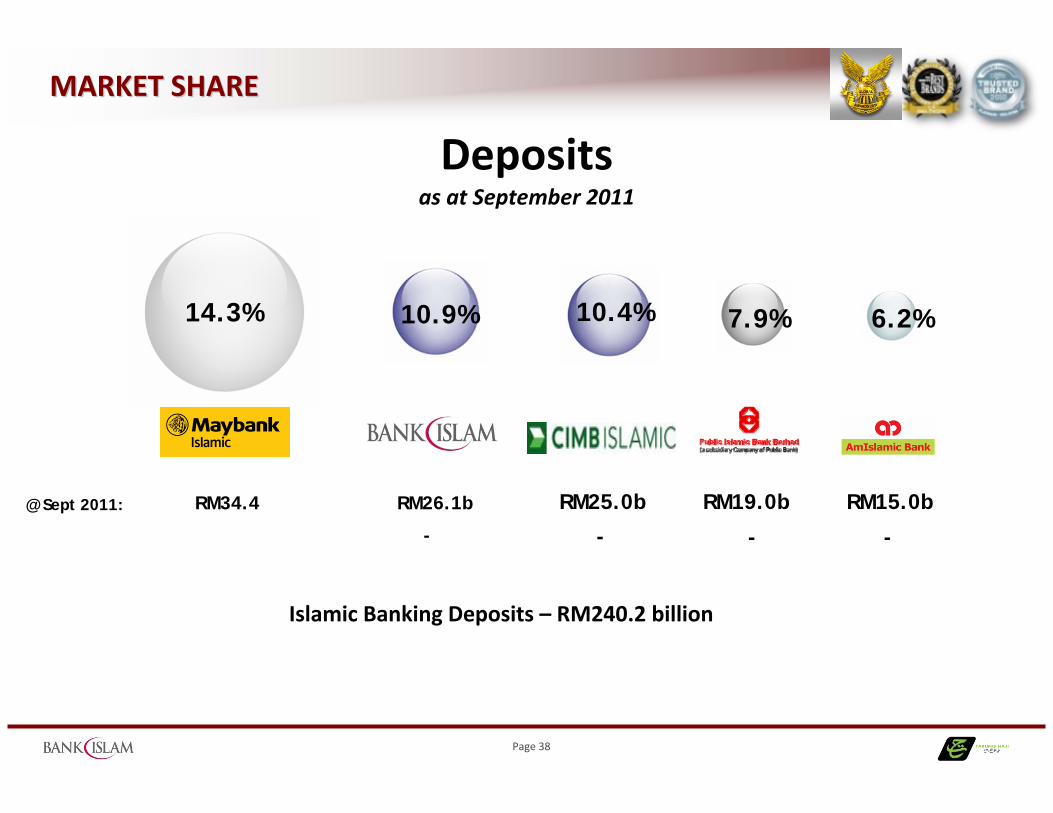
MARKET SHAREMARKET SHARE
14.3% 10.9% 10.4% 7.9% 6.2%
RM34.4 RM25.0bRM26.1b RM19.0b
Islamic Banking Deposits – RM240.2 billion
@ Sept 2011:
-- -
RM15.0b
-
Depositsas at September 2011
Page 39
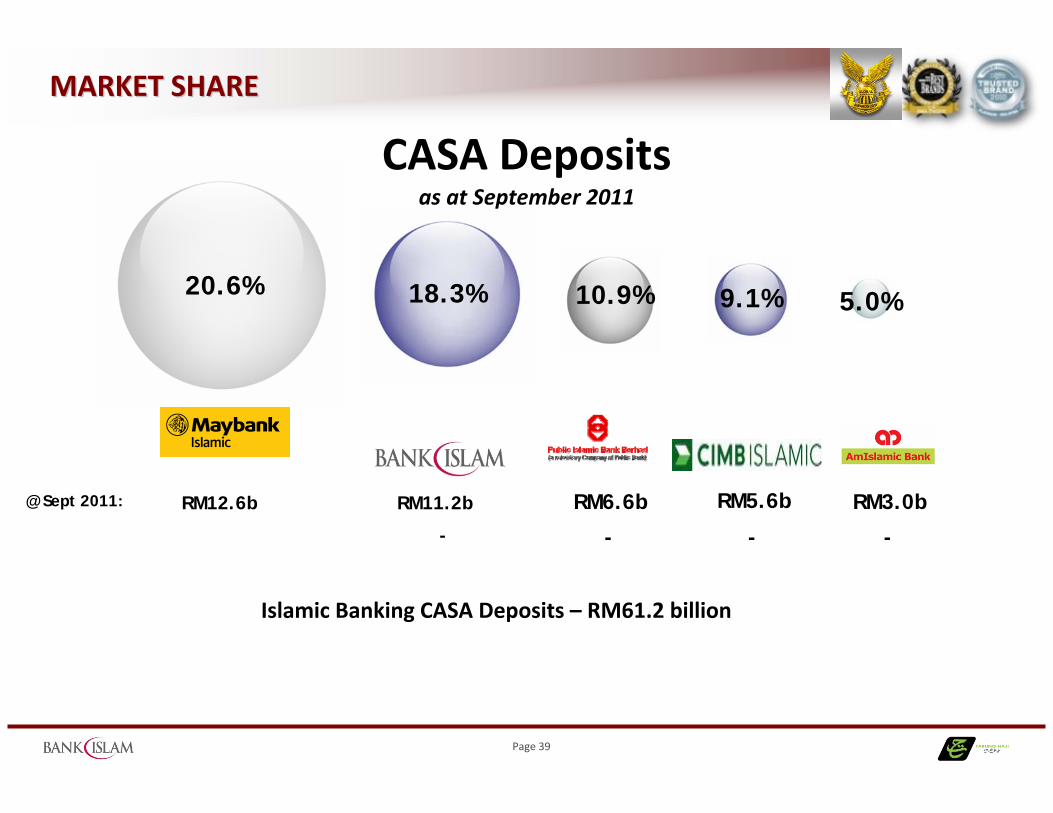
MARKET SHAREMARKET SHARE
20.6% 18.3% 10.9% 9.1% 5.0%
RM12.6b RM6.6bRM11.2b RM5.6b
Islamic Banking CASA Deposits – RM61.2 billion
@ Sept 2011:
-- -
RM3.0b
-
CASA Depositsas at September 2011
Page 40
IMPAIRED FINANCING RATIOS IMPAIRED FINANCING RATIOS ‐‐ COMPARISON AGAINST COMPARISON AGAINST MAJOR COMPETITORS MAJOR COMPETITORS
RM’Million
Bank Islam Major Competitors
ActualSep 11
Public BankSep 11
CIMBSep 11
MaybankSep 11
AmBankSep 11
Banking System
Gross Impaired Financing 551.1 1,586.9 363.9 846.1 820.3
Gross Impaired Financing Ratio (%) 4.01 0.92 3.89 3.25 3.13
Net Impaired Financing Ratio (less IA & CA) (%) 0.68 ‐0.73 0.83 0.60 0.40
Islamic Banking System
Gross Impaired Financing 551.1 177.1 389.3 928.5 229.8
Gross Impaired Financing Ratio 4.01 0.94 1.53 1.99 1.43
Net Impaired Financing Ratio (less IA & CA) 0.68 ‐0.58 ‐0.53 0.00 ‐1.59
Page 41
شكراشكراوالسالوالسالجزيالجزيال
ممDisclaimer: This presentation material has been prepared by Bank Islam Malaysia Berhad (the Bank”) for information purposes only and does not purport to contain all the information that may be required to evaluate the Bank or its financial position. No representation or warranty, express r implied, is given by or on behalf of the Bank as to the accuracy of the information or opinions contained in this presentation. The presentation does not constitute or form part of an offer, solicitation or invitation of any offer, to buy or subscribe for any securities , nor should it or any part of it form the basis of, or be relied in any connection with, any contract, investment decision or commitment whatsoever. The Bank does not accept any liability whatsoever for any loss howsoever arising from any use of this presentation or their contents or otherwise arising in connection therewith.
BANK ISLAM MALAYSIA BERHAD11th Floor, Wisma Bank IslamJalan Dungun, Bukit Damansara50490 Kuala LumpurTel: 603 2088 8222
www.bankislam.com.my
Malkit Singh MaanChief Financial OfficerContact: 602 2088 8118Email: [email protected]
Hizamuddin JamalluddinAGM, Strategic PlanningContact: 602 2088 8077Email: [email protected]