Embed Size (px)
Citation preview
Analytical Reports ‐ using Query Studio
Query Studio allows you to create your own custom reports using ROSS data that is current to the time you run the report. The features in Query Studio allow you to modify the look of your report by creating a Crosstab report or chart, filter for and/or manipulate report values, and perform calculations on quantitative report values. Topics include:
• Before you begin
• Getting started
• Creating, running, and saving a report in Query Studio
• Manipulating report values
• Changing the look and feel of your Query Studio report
• Working with Crosstab reports and charts.
Before you begin
Access to Query Studio is limited to the following NAP Account holders:
• Intelligence Officers at a GACC
• ROSS users who run ad‐hoc reports for a GACC or teams at least once‐a week during incidents
• Those who have completed the Query Studio Report training provided by your GACC.
To obtain access to Query Studio
1 Request and obtain an active, NAP User Account.
See, “Requesting a NAP User Account.”
See, “Getting Started with NAP.”
2 Request and obtain access to Query Studio.
See, Query Studio Access Request Form.
To log on to Query Studio
1 Start your Internet browser.
2 In the Address bar, type http://rossreports‐pr.nwcg.gov/cognos/cgi‐bin/cognos.cgi and then press [ENTER].
3 On the Log on page, perform the following and then click OK
‐ Under User ID, type your NAP User Account Name
‐ User Password, type your NAP Password.
February 9, 2016 version 2.16.4 1
ROSS User Guide Analytical Reports ‐ using Query Studio
4 On the Cognos Connection home page, on the Public Folders tab, click the ROSS link.
5 On the Cognos Connection home page on the Public Folders tab, perform the following
‐ click the Launch drop‐down arrow
‐ click Query Studio.
6 On the Select a package (Navigate) page, under Recently used packages, click the ROSS‐AR link.
The following graphic shows the Log on page.
The following graphic shows the Public Folders tab on the IBM Cognos Connection home page. The arrow points to the ROSS link.
2 version 2.16.4 February 9, 2016
Analytical Reports ‐ using Query Studio ROSS User Guide
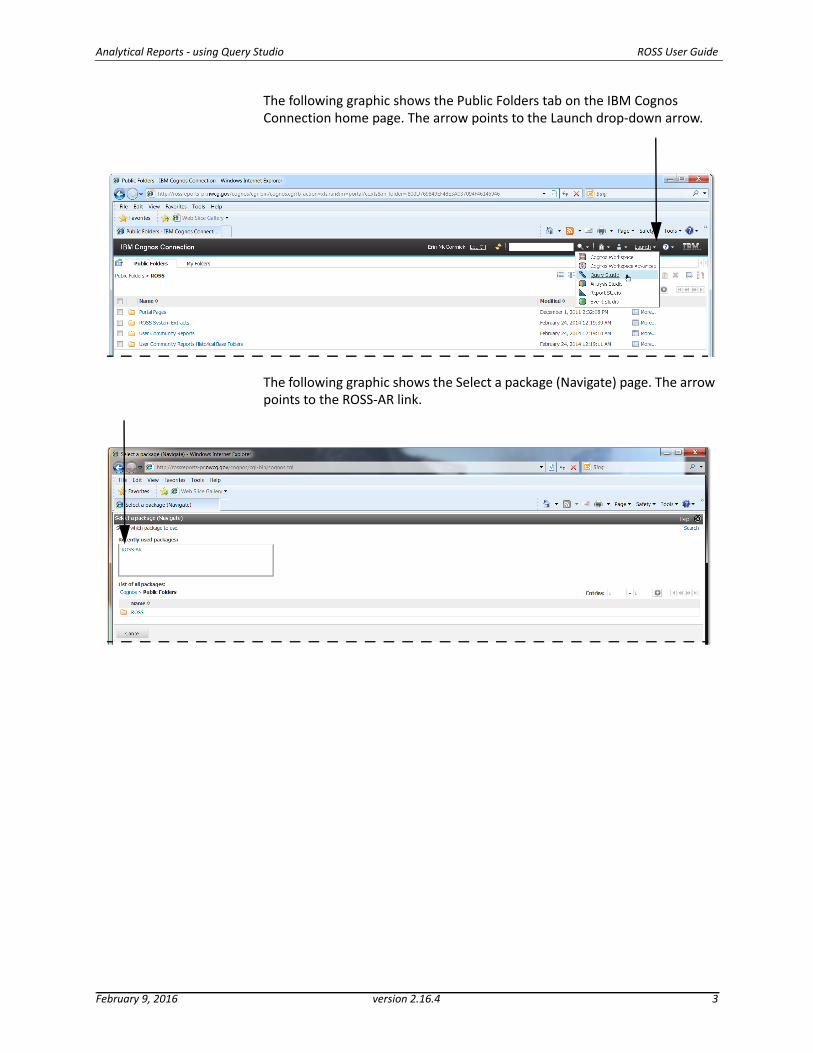
The following graphic shows the Public Folders tab on the IBM Cognos Connection home page. The arrow points to the Launch drop‐down arrow.
The following graphic shows the Select a package (Navigate) page. The arrow points to the ROSS‐AR link.
February 9, 2016 version 2.16.4 3
ROSS User Guide Analytical Reports ‐ using Query Studio
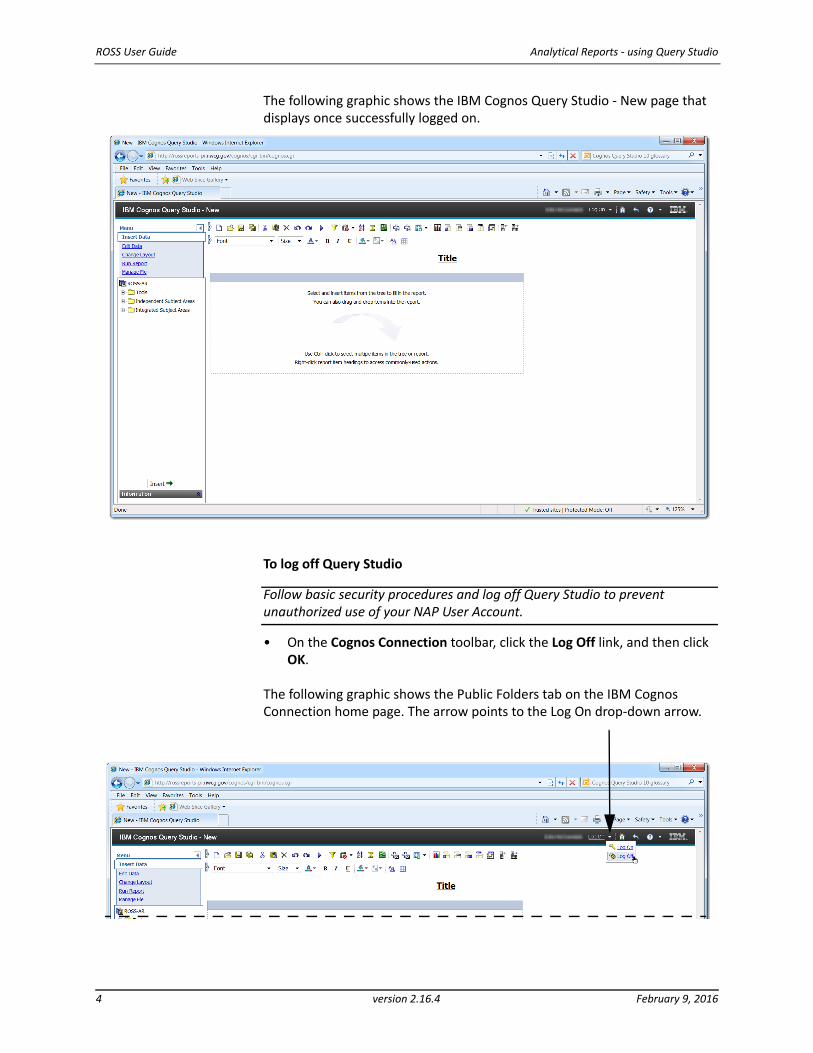
The following graphic shows the IBM Cognos Query Studio ‐ New page that displays once successfully logged on.
To log off Query Studio
Follow basic security procedures and log off Query Studio to prevent unauthorized use of your NAP User Account.
• On the Cognos Connection toolbar, click the Log Off link, and then click OK.
The following graphic shows the Public Folders tab on the IBM Cognos Connection home page. The arrow points to the Log On drop‐down arrow.
4 version 2.16.4 February 9, 2016
Analytical Reports ‐ using Query Studio ROSS User Guide
Getting started
This section explains the terminology and functionality in Query Studio. This section also outlines the toolbars, menu, and submenus you will use while creating, running, and saving your reports. Topics include:
• Understanding Query Studio terminology and functionality
• Understanding Query Studio toolbars
• Understanding the Query Studio Menu and submenus.
Understanding Query Studio terminology
Some of the basic terminology when creating reports in Query Studio includes:
• Analytical Reporting System Data Dictionary. The Analytical Reporting System Data Dictionary contains the definitions of the data elements used in Cognos. Located on the ROSS web site under “DDS/Analytical Rpts,” it allows you to obtain information on how Subject Areas can relate to each other.
See, “Analytical Report System Data Dictionary.”
See, “Historical Analytical Reporting System Data Dictionary.”
• Cascading Filter. A cascading filter is a pre‐defined filter that filters for multiple Report Items. The filters are listed in sequence, where the first Report Item is the first filter performed, and the last Report Item is the last filter performed. Selections made at each level of the filter also filters the selections available at lower levels of the filter. Cascading filters are listed under the corresponding Subject Area on the Insert menu.
For example, if you select a filter for the Overhead catalog, only categories appropriate to the Overhead catalog display as selections for the next level of filter.
See, “To add a cascading filter to your report.”
• Target Area. The Target Area is where you place selected Query Items when building your report. You can move Query Items into the Target Area by performing one of the following
‐ double‐click the Query Items in the order you want to view them in your report
‐ drag and drop Query Items in the order you want to view them in your report
‐ press and hold CTRL, click the Query Item(s) in the order you want to view them in your report, and then click the Insert button.
See, “Changing the look and feel of your report.”
February 9, 2016 version 2.16.4 5
ROSS User Guide Analytical Reports ‐ using Query Studio
• Independent Subject Areas. This folder contains Subject Areas that were built to “stand alone.” Their Query Items may not be combined with Query Items from other Subject Areas.
• Integrated Subject Areas. This folder contains Incidents, Request, and Resources Query Subjects. These Subject Areas are classified as “integrated” because relationships exist between the underlying data structures in these Subject Areas. This allows you to select and combine Query Items from different Subject Areas into a single report.
• Query Item. A Query Item is an individual field in the Query Subject (source). It is the lowest level of information. Once you add a Query Item to the Target Area it becomes a “Report Item.”
For example, you can create a report using Query Items from the Incident Subject Area and the Incident Query Subject, and Query Items from the Request Subject Area and Request Query Subject.
• Report Item. A Report Item is a Query Item you added to your report by adding it to the Target Area. In a List Report, Report Items are listed in columns, with the Report Item names listed as the column headings. By default, when adding a Report Item to your report, the Report Item is added as the next column.
• Report Value. A report value is the information returned from the database to an individual cell in a column or row.
Understanding Query Studio toolbars
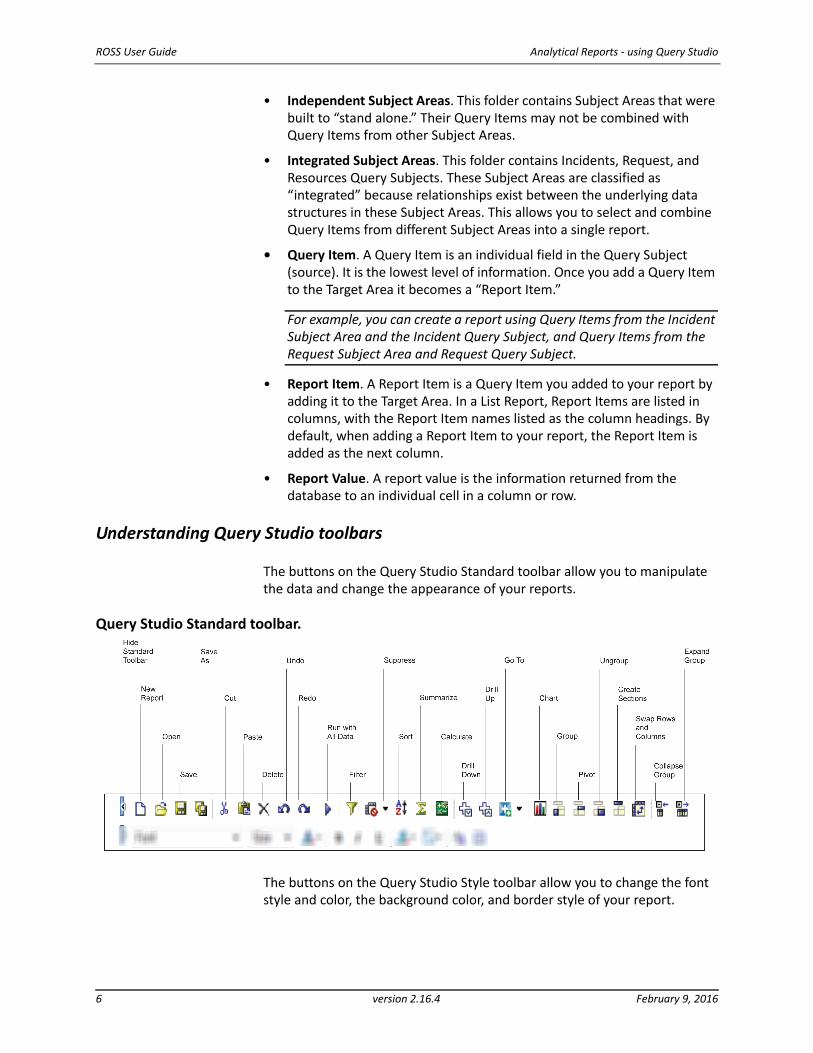
The buttons on the Query Studio Standard toolbar allow you to manipulate the data and change the appearance of your reports.
Query Studio Standard toolbar.
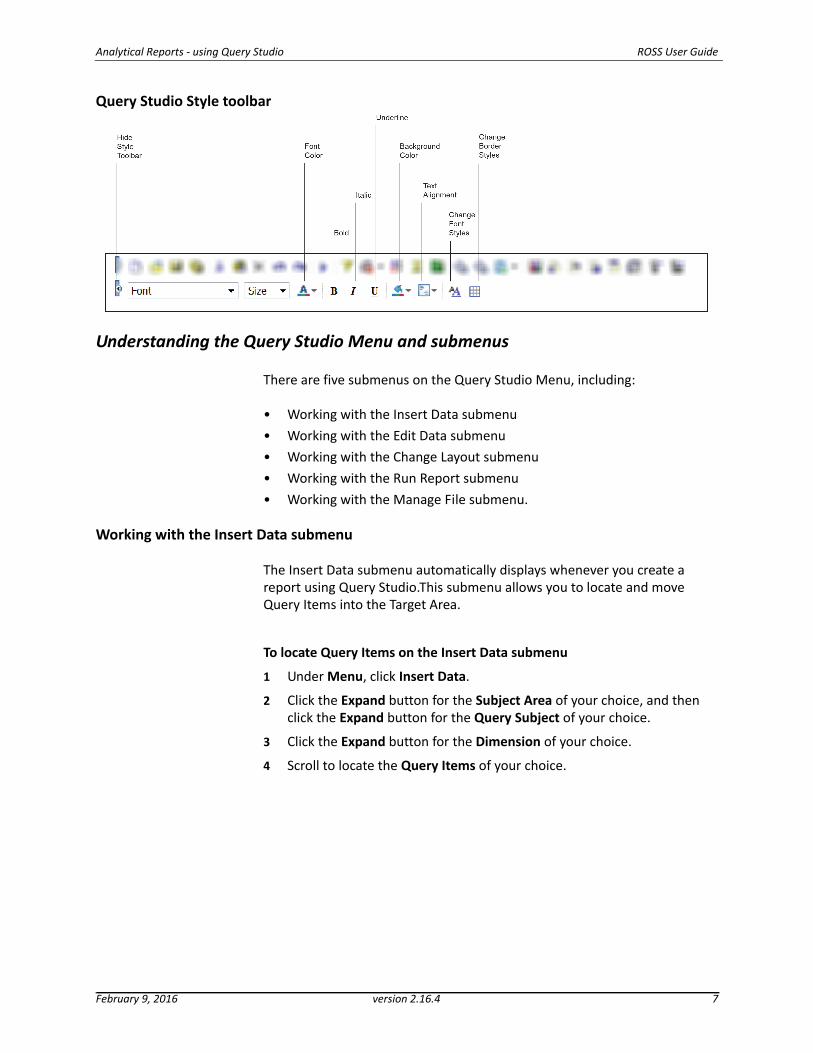
The buttons on the Query Studio Style toolbar allow you to change the font style and color, the background color, and border style of your report.
6 version 2.16.4 February 9, 2016
Analytical Reports ‐ using Query Studio ROSS User Guide
Query Studio Style toolbar
Understanding the Query Studio Menu and submenus
There are five submenus on the Query Studio Menu, including:
• Working with the Insert Data submenu
• Working with the Edit Data submenu
• Working with the Change Layout submenu
• Working with the Run Report submenu
• Working with the Manage File submenu.
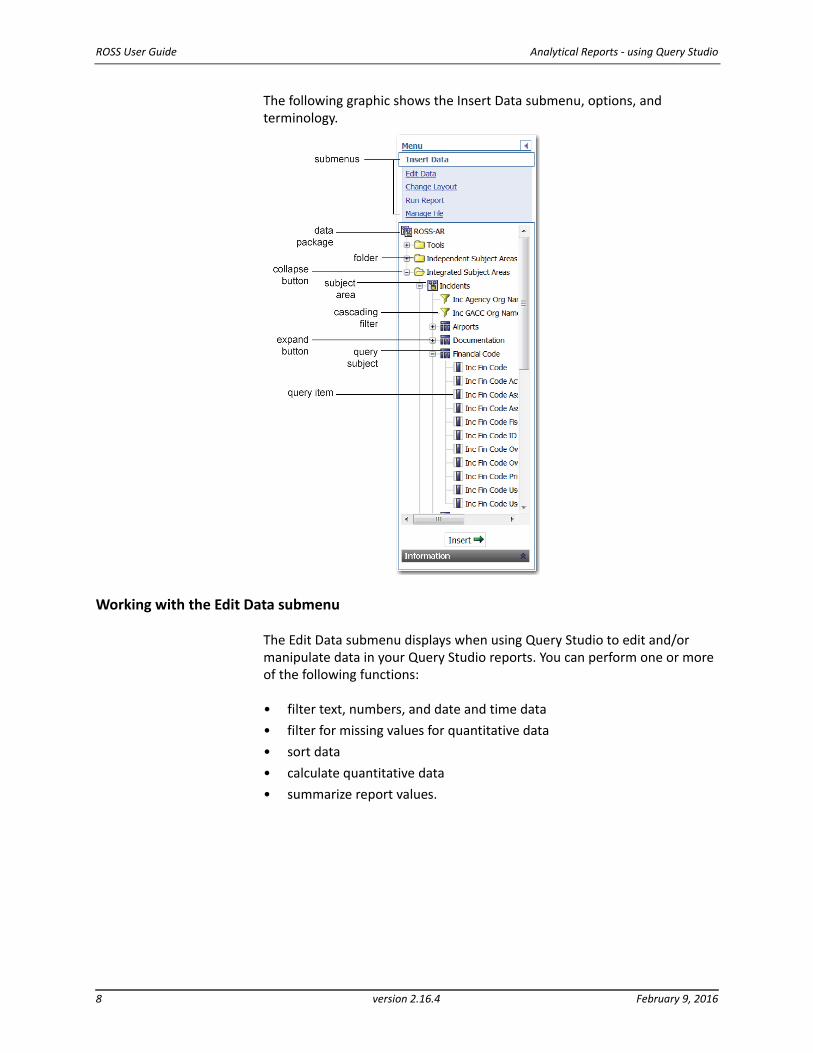
Working with the Insert Data submenu
The Insert Data submenu automatically displays whenever you create a report using Query Studio.This submenu allows you to locate and move Query Items into the Target Area.
To locate Query Items on the Insert Data submenu
1 Under Menu, click Insert Data.
2 Click the Expand button for the Subject Area of your choice, and then click the Expand button for the Query Subject of your choice.
3 Click the Expand button for the Dimension of your choice.
4 Scroll to locate the Query Items of your choice.
February 9, 2016 version 2.16.4 7
ROSS User Guide Analytical Reports ‐ using Query Studio
The following graphic shows the Insert Data submenu, options, and terminology.
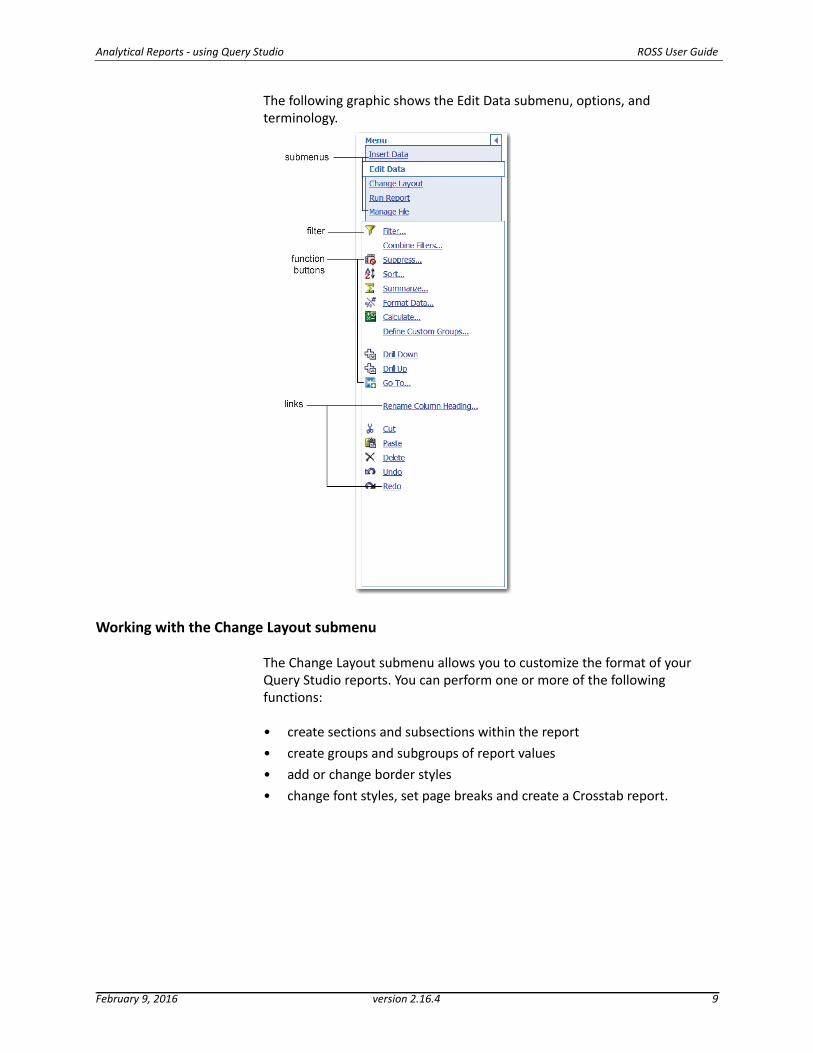
Working with the Edit Data submenu
The Edit Data submenu displays when using Query Studio to edit and/or manipulate data in your Query Studio reports. You can perform one or more of the following functions:
• filter text, numbers, and date and time data
• filter for missing values for quantitative data
• sort data
• calculate quantitative data
• summarize report values.
8 version 2.16.4 February 9, 2016
Analytical Reports ‐ using Query Studio ROSS User Guide
The following graphic shows the Edit Data submenu, options, and terminology.
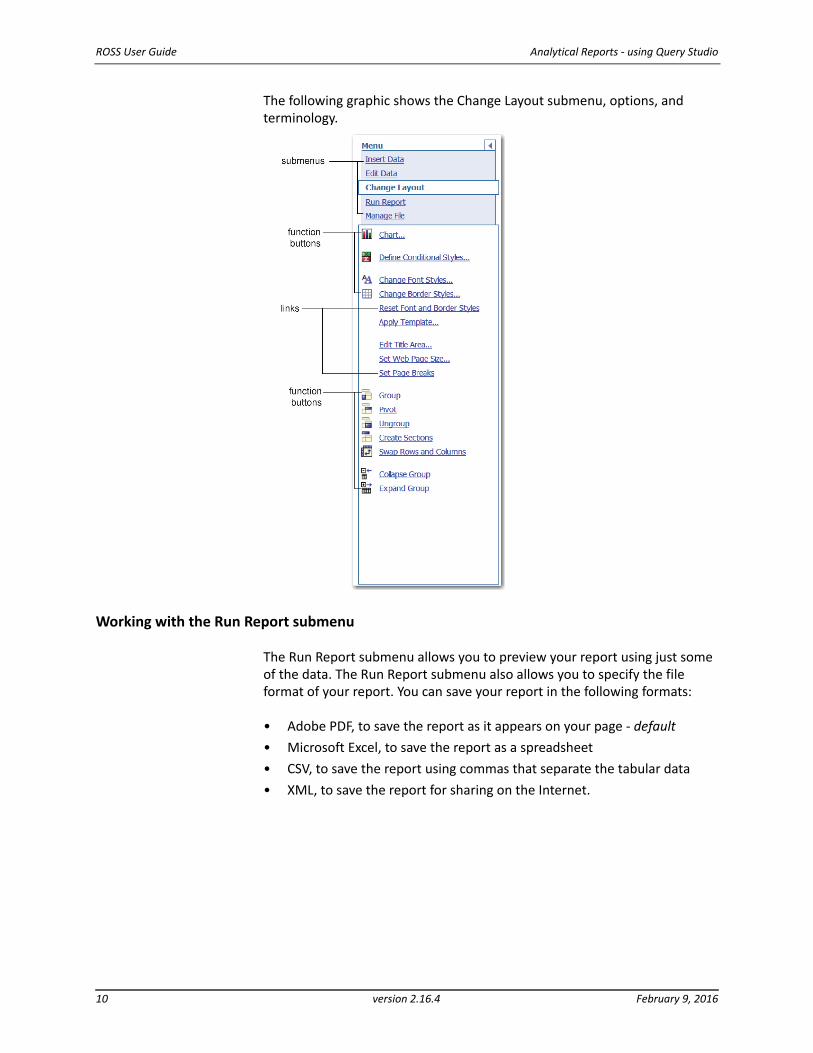
Working with the Change Layout submenu
The Change Layout submenu allows you to customize the format of your Query Studio reports. You can perform one or more of the following functions:
• create sections and subsections within the report
• create groups and subgroups of report values
• add or change border styles
• change font styles, set page breaks and create a Crosstab report.
February 9, 2016 version 2.16.4 9
ROSS User Guide Analytical Reports ‐ using Query Studio
The following graphic shows the Change Layout submenu, options, and terminology.
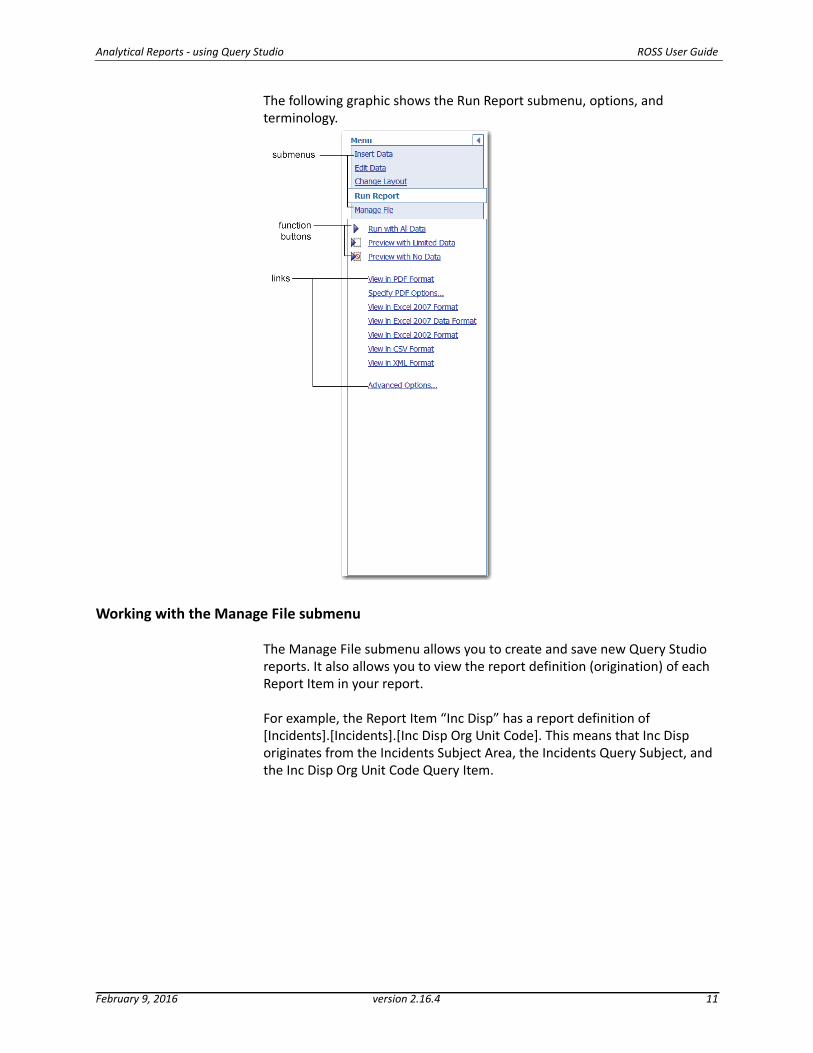
Working with the Run Report submenu
The Run Report submenu allows you to preview your report using just some of the data. The Run Report submenu also allows you to specify the file format of your report. You can save your report in the following formats:
• Adobe PDF, to save the report as it appears on your page ‐ default
• Microsoft Excel, to save the report as a spreadsheet
• CSV, to save the report using commas that separate the tabular data
• XML, to save the report for sharing on the Internet.
10 version 2.16.4 February 9, 2016
Analytical Reports ‐ using Query Studio ROSS User Guide
The following graphic shows the Run Report submenu, options, and terminology.
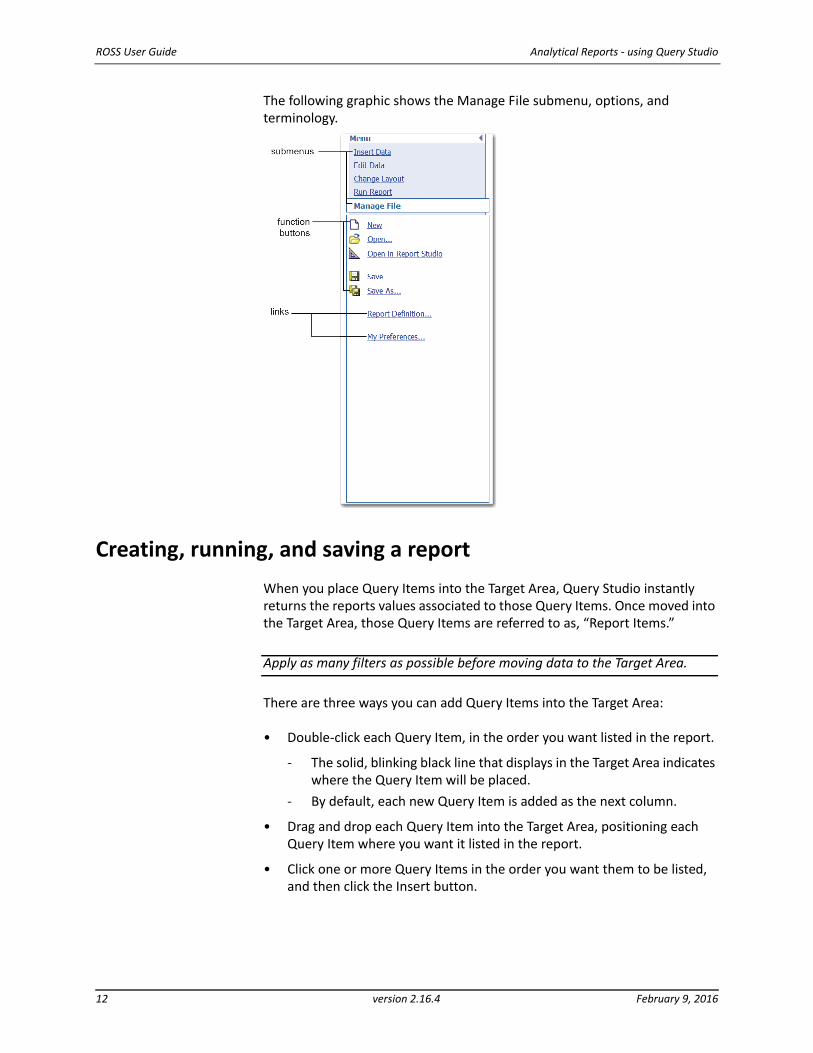
Working with the Manage File submenu
The Manage File submenu allows you to create and save new Query Studio reports. It also allows you to view the report definition (origination) of each Report Item in your report.
For example, the Report Item “Inc Disp” has a report definition of [Incidents].[Incidents].[Inc Disp Org Unit Code]. This means that Inc Disp originates from the Incidents Subject Area, the Incidents Query Subject, and the Inc Disp Org Unit Code Query Item.
February 9, 2016 version 2.16.4 11
ROSS User Guide Analytical Reports ‐ using Query Studio
The following graphic shows the Manage File submenu, options, and terminology.
Creating, running, and saving a report
When you place Query Items into the Target Area, Query Studio instantly returns the reports values associated to those Query Items. Once moved into the Target Area, those Query Items are referred to as, “Report Items.”
Apply as many filters as possible before moving data to the Target Area.
There are three ways you can add Query Items into the Target Area:
• Double‐click each Query Item, in the order you want listed in the report.
‐ The solid, blinking black line that displays in the Target Area indicates where the Query Item will be placed.
‐ By default, each new Query Item is added as the next column.
• Drag and drop each Query Item into the Target Area, positioning each Query Item where you want it listed in the report.
• Click one or more Query Items in the order you want them to be listed, and then click the Insert button.
12 version 2.16.4 February 9, 2016
Analytical Reports ‐ using Query Studio ROSS User Guide
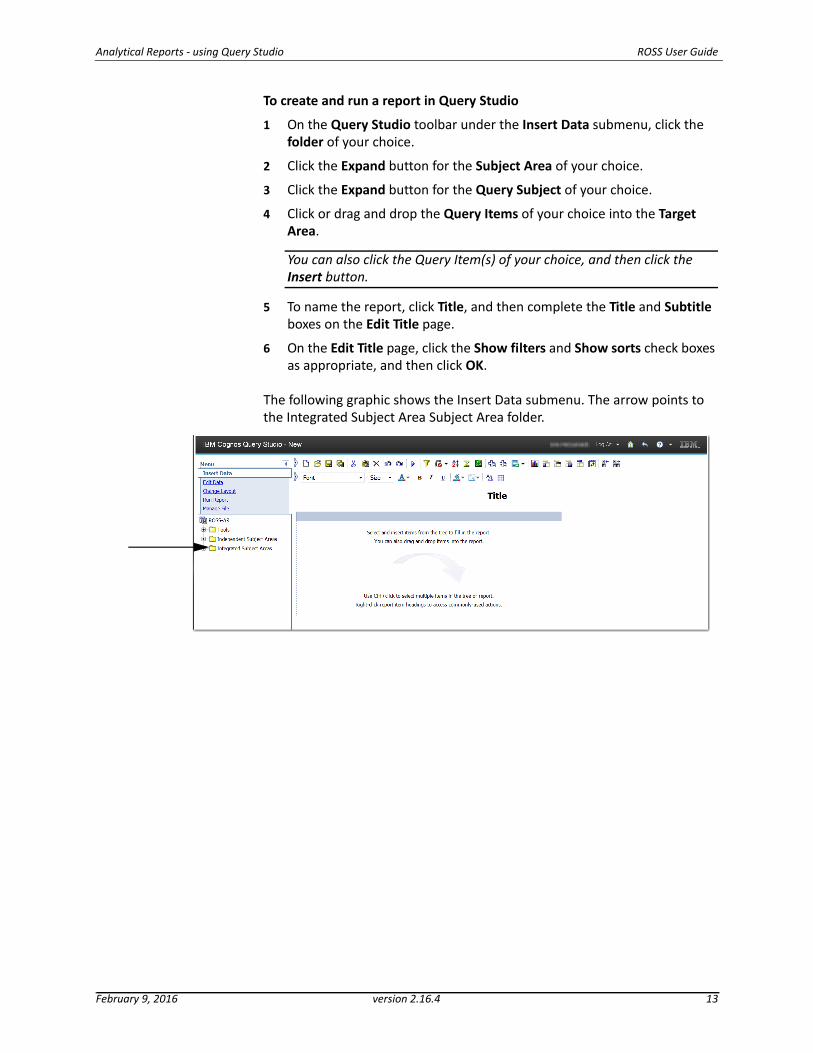
To create and run a report in Query Studio
1 On the Query Studio toolbar under the Insert Data submenu, click the folder of your choice.
2 Click the Expand button for the Subject Area of your choice.
3 Click the Expand button for the Query Subject of your choice.
4 Click or drag and drop the Query Items of your choice into the Target Area.
You can also click the Query Item(s) of your choice, and then click the Insert button.
5 To name the report, click Title, and then complete the Title and Subtitle boxes on the Edit Title page.
6 On the Edit Title page, click the Show filters and Show sorts check boxes as appropriate, and then click OK.
The following graphic shows the Insert Data submenu. The arrow points to the Integrated Subject Area Subject Area folder.
February 9, 2016 version 2.16.4 13
ROSS User Guide Analytical Reports ‐ using Query Studio
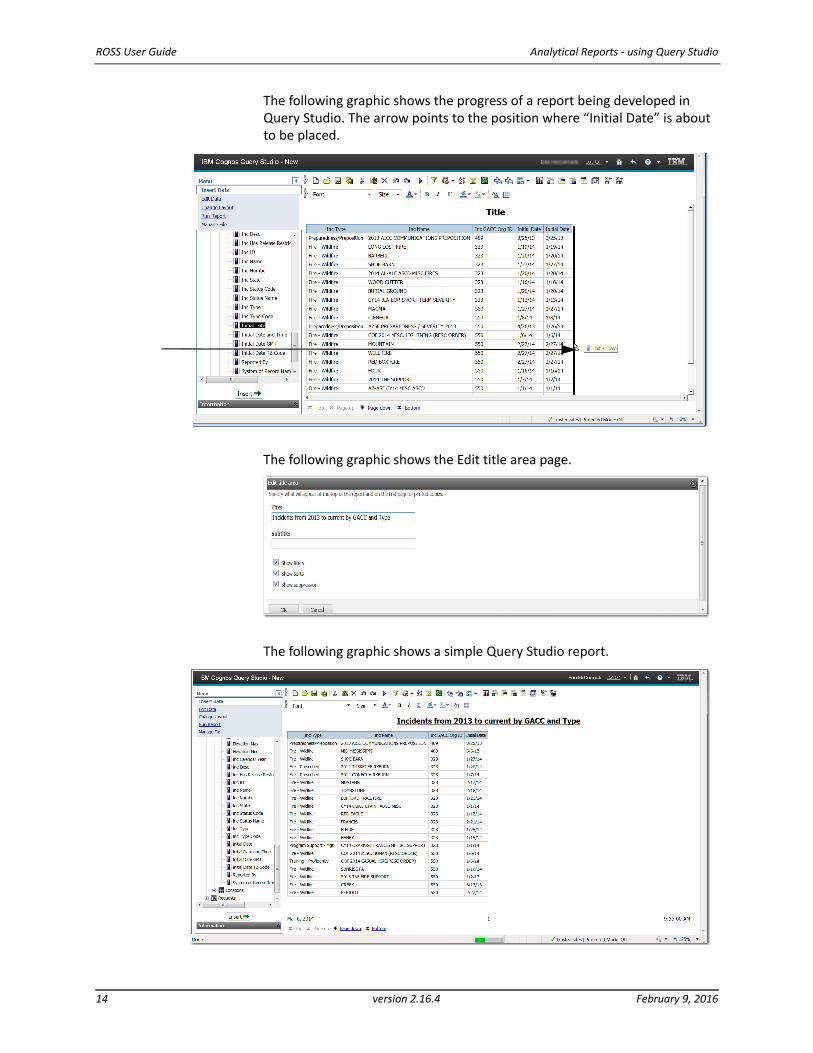
The following graphic shows the progress of a report being developed in Query Studio. The arrow points to the position where “Initial Date” is about to be placed.
The following graphic shows the Edit title area page.
The following graphic shows a simple Query Studio report.
14 version 2.16.4 February 9, 2016
Analytical Reports ‐ using Query Studio ROSS User Guide
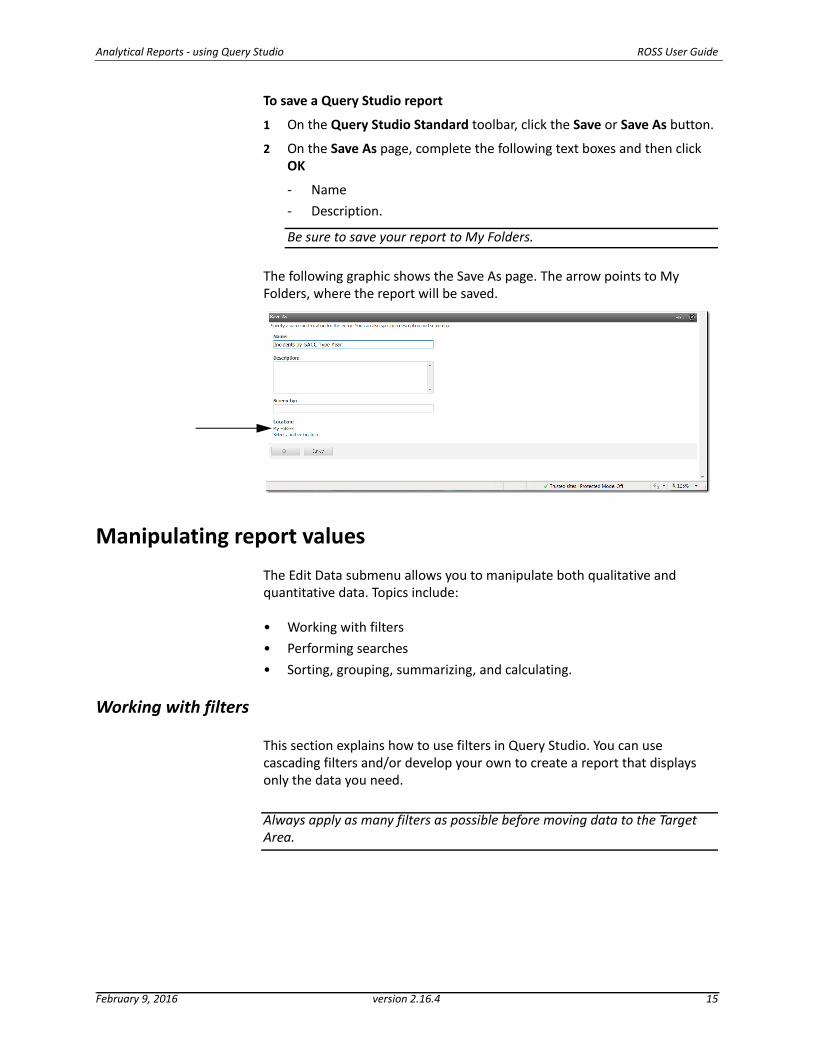
To save a Query Studio report
1 On the Query Studio Standard toolbar, click the Save or Save As button.
2 On the Save As page, complete the following text boxes and then click OK
‐ Name
‐ Description.
Be sure to save your report to My Folders.
The following graphic shows the Save As page. The arrow points to My Folders, where the report will be saved.
Manipulating report values
The Edit Data submenu allows you to manipulate both qualitative and quantitative data. Topics include:
• Working with filters
• Performing searches
• Sorting, grouping, summarizing, and calculating.
Working with filters
This section explains how to use filters in Query Studio. You can use cascading filters and/or develop your own to create a report that displays only the data you need.
Always apply as many filters as possible before moving data to the Target Area.
February 9, 2016 version 2.16.4 15
ROSS User Guide Analytical Reports ‐ using Query Studio
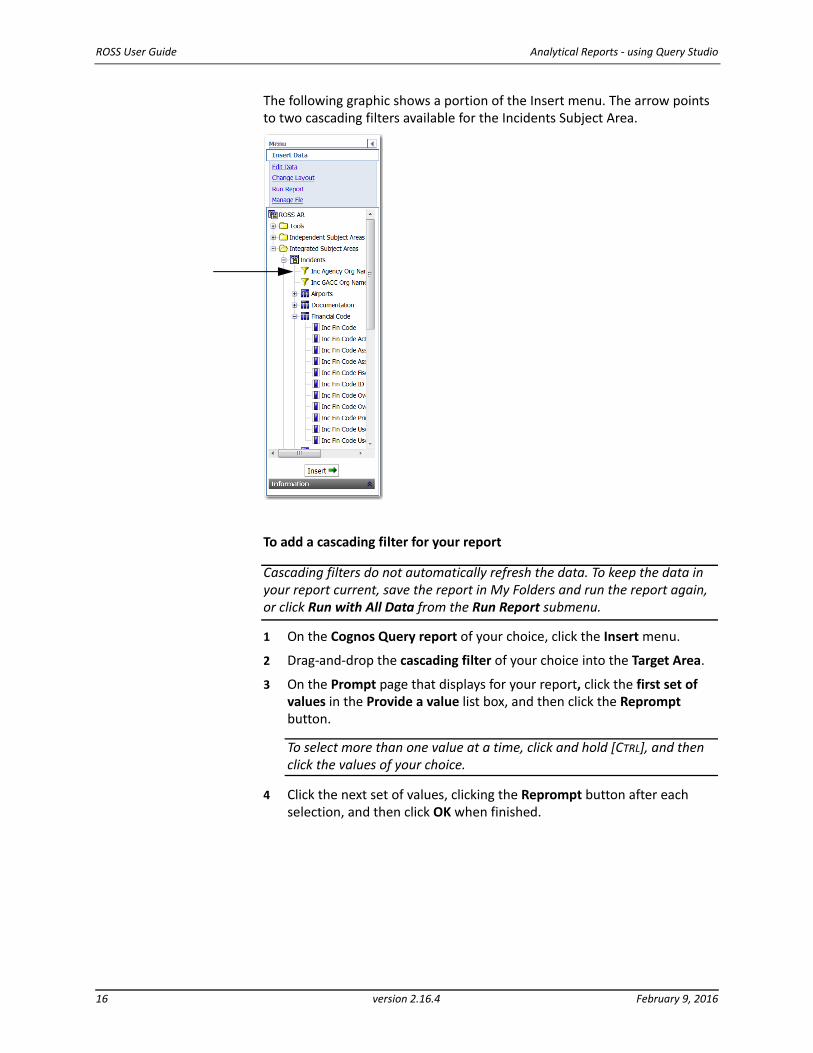
The following graphic shows a portion of the Insert menu. The arrow points to two cascading filters available for the Incidents Subject Area.
To add a cascading filter for your report
Cascading filters do not automatically refresh the data. To keep the data in your report current, save the report in My Folders and run the report again, or click Run with All Data from the Run Report submenu.
1 On the Cognos Query report of your choice, click the Insert menu.
2 Drag‐and‐drop the cascading filter of your choice into the Target Area.
3 On the Prompt page that displays for your report, click the first set of values in the Provide a value list box, and then click the Reprompt button.
To select more than one value at a time, click and hold [CTRL], and then click the values of your choice.
4 Click the next set of values, clicking the Reprompt button after each selection, and then click OK when finished.
16 version 2.16.4 February 9, 2016
Analytical Reports ‐ using Query Studio ROSS User Guide
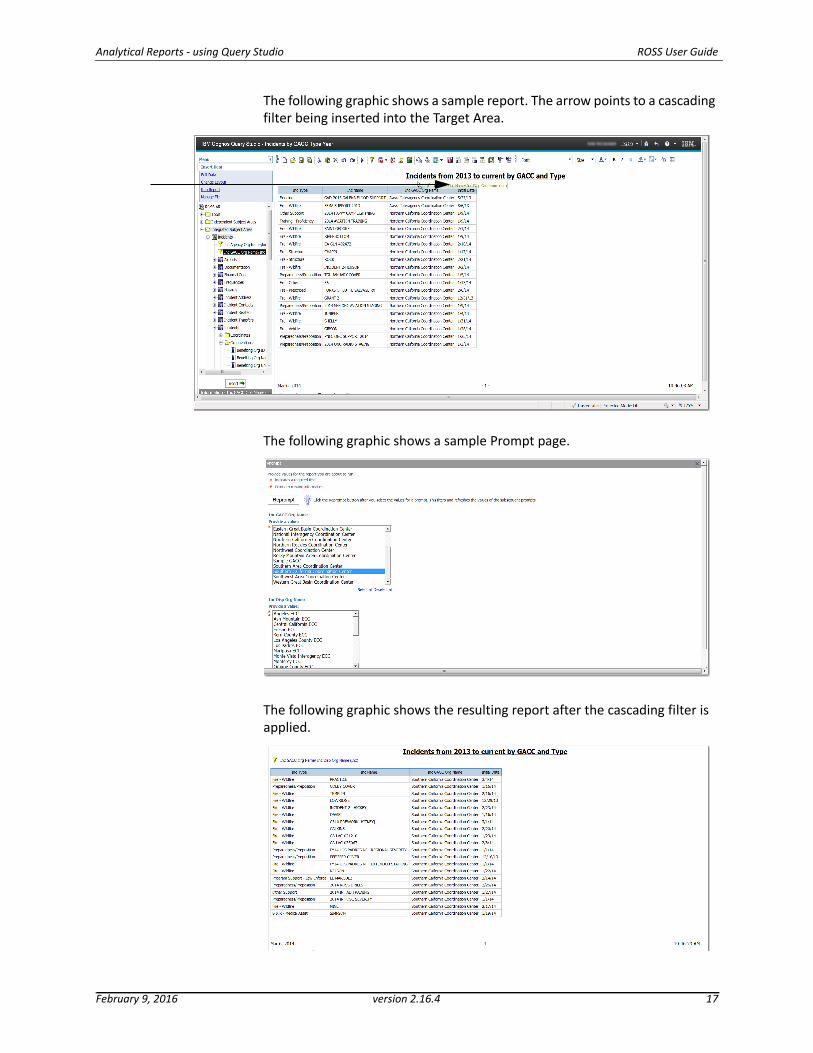
The following graphic shows a sample report. The arrow points to a cascading filter being inserted into the Target Area.
The following graphic shows a sample Prompt page.
The following graphic shows the resulting report after the cascading filter is applied.
February 9, 2016 version 2.16.4 17
ROSS User Guide Analytical Reports ‐ using Query Studio
To display filter subtitles
1 On the Query Studio report of your choice, click the Title of the report.
2 On the Edit title area page, click the Show filters check box.
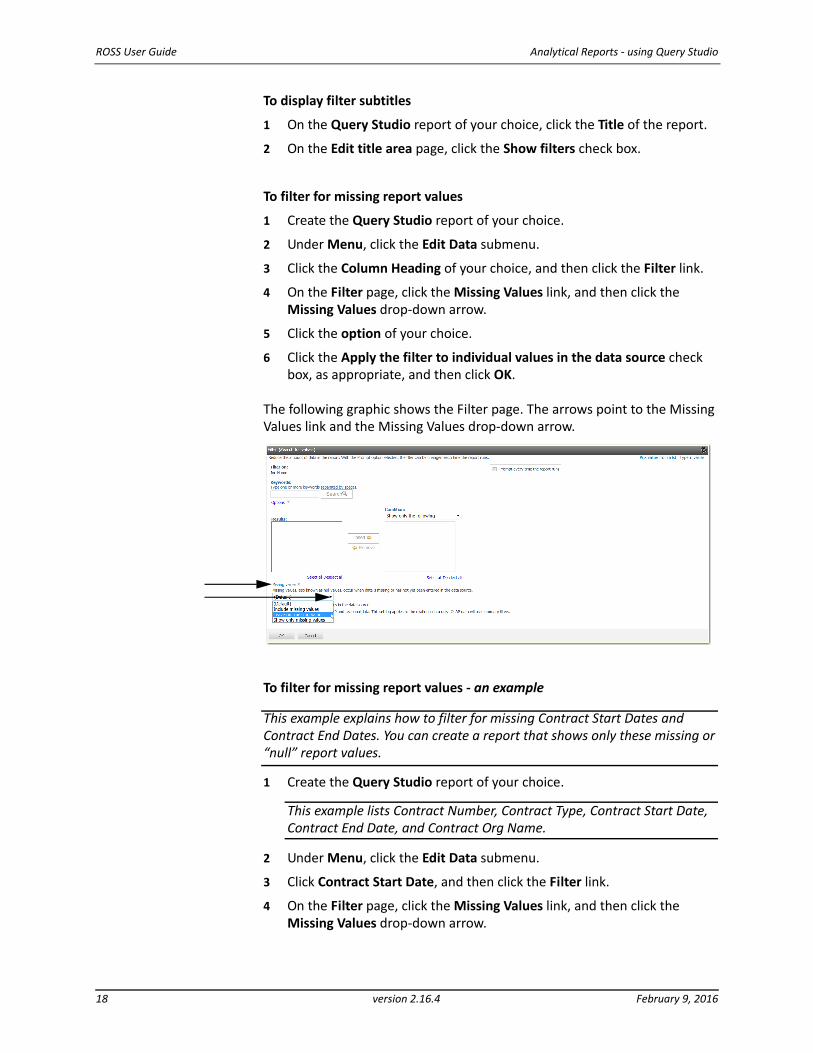
To filter for missing report values
1 Create the Query Studio report of your choice.
2 Under Menu, click the Edit Data submenu.
3 Click the Column Heading of your choice, and then click the Filter link.
4 On the Filter page, click the Missing Values link, and then click the Missing Values drop‐down arrow.
5 Click the option of your choice.
6 Click the Apply the filter to individual values in the data source check box, as appropriate, and then click OK.
The following graphic shows the Filter page. The arrows point to the Missing Values link and the Missing Values drop‐down arrow.
To filter for missing report values ‐ an example
This example explains how to filter for missing Contract Start Dates and Contract End Dates. You can create a report that shows only these missing or “null” report values.
1 Create the Query Studio report of your choice.
This example lists Contract Number, Contract Type, Contract Start Date, Contract End Date, and Contract Org Name.
2 Under Menu, click the Edit Data submenu.
3 Click Contract Start Date, and then click the Filter link.
4 On the Filter page, click the Missing Values link, and then click the Missing Values drop‐down arrow.
18 version 2.16.4 February 9, 2016
Analytical Reports ‐ using Query Studio ROSS User Guide
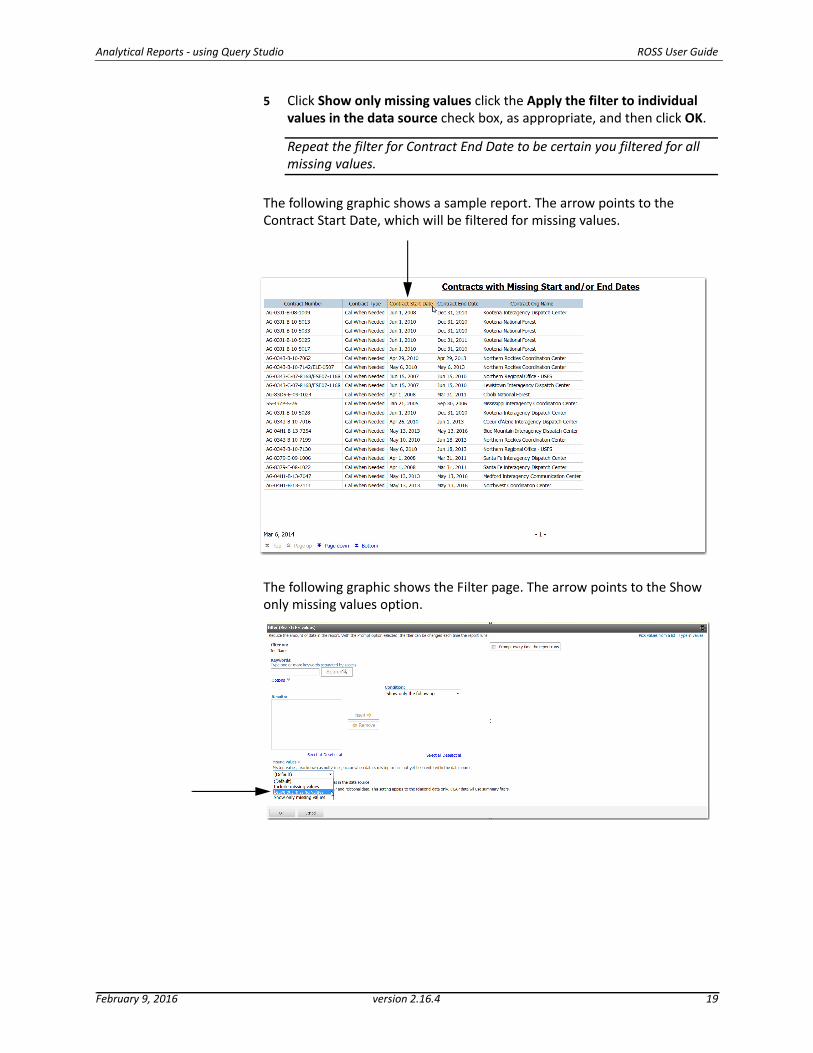
5 Click Show only missing values click the Apply the filter to individual values in the data source check box, as appropriate, and then click OK.
Repeat the filter for Contract End Date to be certain you filtered for all missing values.
The following graphic shows a sample report. The arrow points to the Contract Start Date, which will be filtered for missing values.
The following graphic shows the Filter page. The arrow points to the Show only missing values option.
February 9, 2016 version 2.16.4 19
ROSS User Guide Analytical Reports ‐ using Query Studio
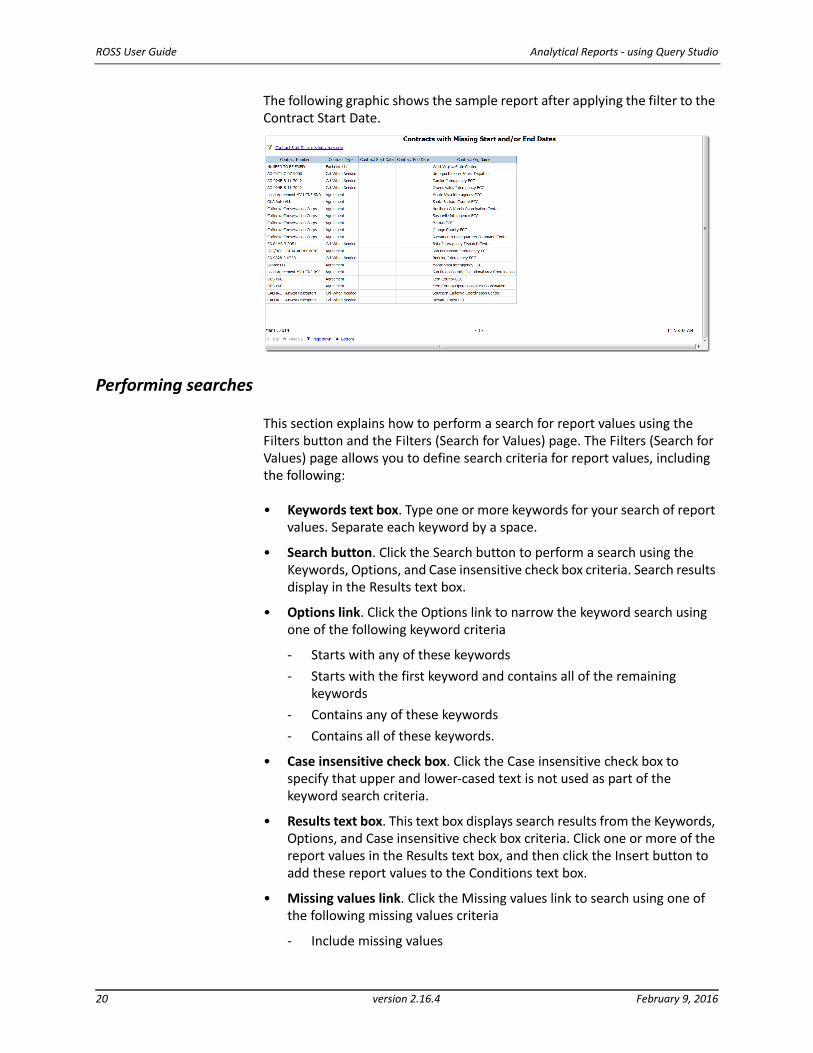
The following graphic shows the sample report after applying the filter to the Contract Start Date.
Performing searches
This section explains how to perform a search for report values using the Filters button and the Filters (Search for Values) page. The Filters (Search for Values) page allows you to define search criteria for report values, including the following:
• Keywords text box. Type one or more keywords for your search of report values. Separate each keyword by a space.
• Search button. Click the Search button to perform a search using the Keywords, Options, and Case insensitive check box criteria. Search results display in the Results text box.
• Options link. Click the Options link to narrow the keyword search using one of the following keyword criteria
‐ Starts with any of these keywords
‐ Starts with the first keyword and contains all of the remaining keywords
‐ Contains any of these keywords
‐ Contains all of these keywords.
• Case insensitive check box. Click the Case insensitive check box to specify that upper and lower‐cased text is not used as part of the keyword search criteria.
• Results text box. This text box displays search results from the Keywords, Options, and Case insensitive check box criteria. Click one or more of the report values in the Results text box, and then click the Insert button to add these report values to the Conditions text box.
• Missing values link. Click the Missing values link to search using one of the following missing values criteria
‐ Include missing values
20 version 2.16.4 February 9, 2016
Analytical Reports ‐ using Query Studio ROSS User Guide
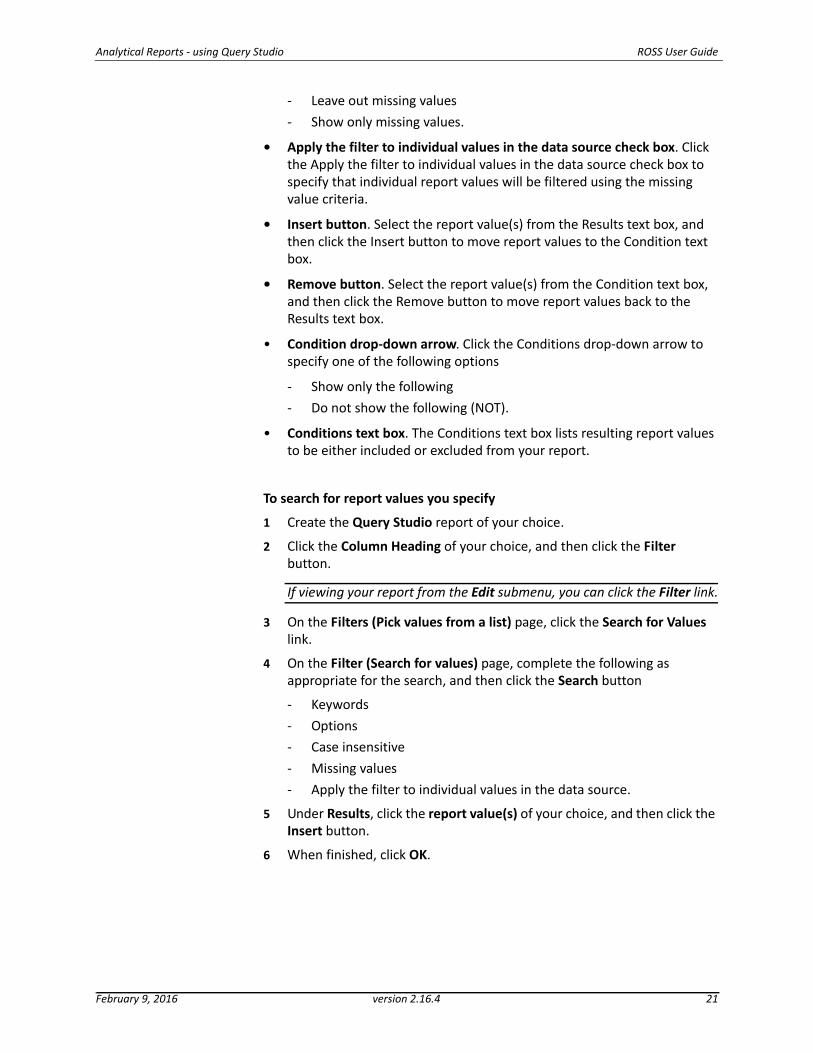
‐ Leave out missing values
‐ Show only missing values.
• Apply the filter to individual values in the data source check box. Click the Apply the filter to individual values in the data source check box to specify that individual report values will be filtered using the missing value criteria.
• Insert button. Select the report value(s) from the Results text box, and then click the Insert button to move report values to the Condition text box.
• Remove button. Select the report value(s) from the Condition text box, and then click the Remove button to move report values back to the Results text box.
• Condition drop‐down arrow. Click the Conditions drop‐down arrow to specify one of the following options
‐ Show only the following
‐ Do not show the following (NOT).
• Conditions text box. The Conditions text box lists resulting report values to be either included or excluded from your report.
To search for report values you specify
1 Create the Query Studio report of your choice.
2 Click the Column Heading of your choice, and then click the Filter button.
If viewing your report from the Edit submenu, you can click the Filter link.
3 On the Filters (Pick values from a list) page, click the Search for Values link.
4 On the Filter (Search for values) page, complete the following as appropriate for the search, and then click the Search button
‐ Keywords
‐ Options
‐ Case insensitive
‐ Missing values
‐ Apply the filter to individual values in the data source.
5 Under Results, click the report value(s) of your choice, and then click the Insert button.
6 When finished, click OK.
February 9, 2016 version 2.16.4 21
ROSS User Guide Analytical Reports ‐ using Query Studio
The following graphic shows a sample Filter (Pick values from a list) page. The arrow points to the Search for values link.
The following graphic shows a sample Filter (Search for values) page.
To filter report values by picking from a list
1 Create the Query Studio report of your choice.
2 Under Menu, click the Edit Data submenu.
3 Click the Column Heading of your choice, and then click the Filter link.
4 On the Filter (Search for values) page, click the Pick values from a list link.
5 On the Filter (Pick values from a list) page, click the Condition drop‐down arrow, and then click the Condition of your choice.
6 Click the Report Values of your choice, and then click OK.
22 version 2.16.4 February 9, 2016
Analytical Reports ‐ using Query Studio ROSS User Guide
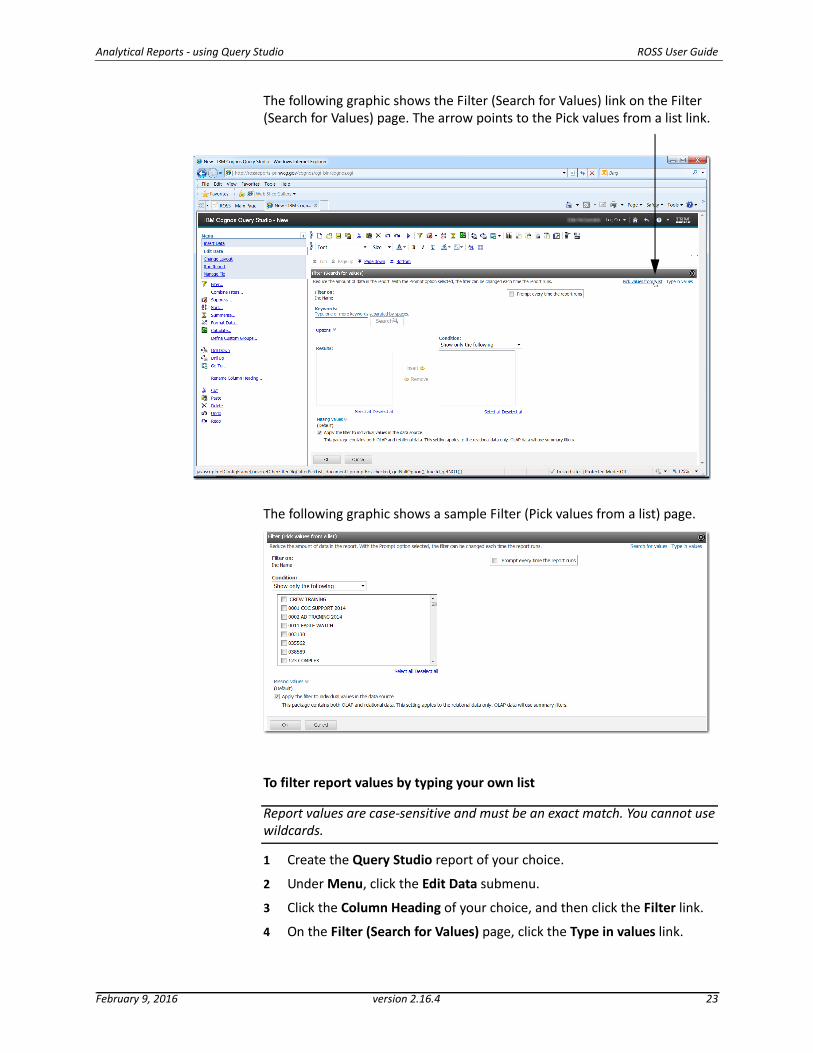
The following graphic shows the Filter (Search for Values) link on the Filter (Search for Values) page. The arrow points to the Pick values from a list link.
The following graphic shows a sample Filter (Pick values from a list) page.
To filter report values by typing your own list
Report values are case‐sensitive and must be an exact match. You cannot use wildcards.
1 Create the Query Studio report of your choice.
2 Under Menu, click the Edit Data submenu.
3 Click the Column Heading of your choice, and then click the Filter link.
4 On the Filter (Search for Values) page, click the Type in values link.
February 9, 2016 version 2.16.4 23
ROSS User Guide Analytical Reports ‐ using Query Studio
5 Click the Condition drop‐down arrow, and then click one of the following conditions
‐ Show only the following
‐ Do not show the following (NOT).
6 On the Filter (Type in values) page under New value, type the report value of your choice to match the condition, and then click the Insert button.
7 Click the Report Values of your choice, and then click OK.
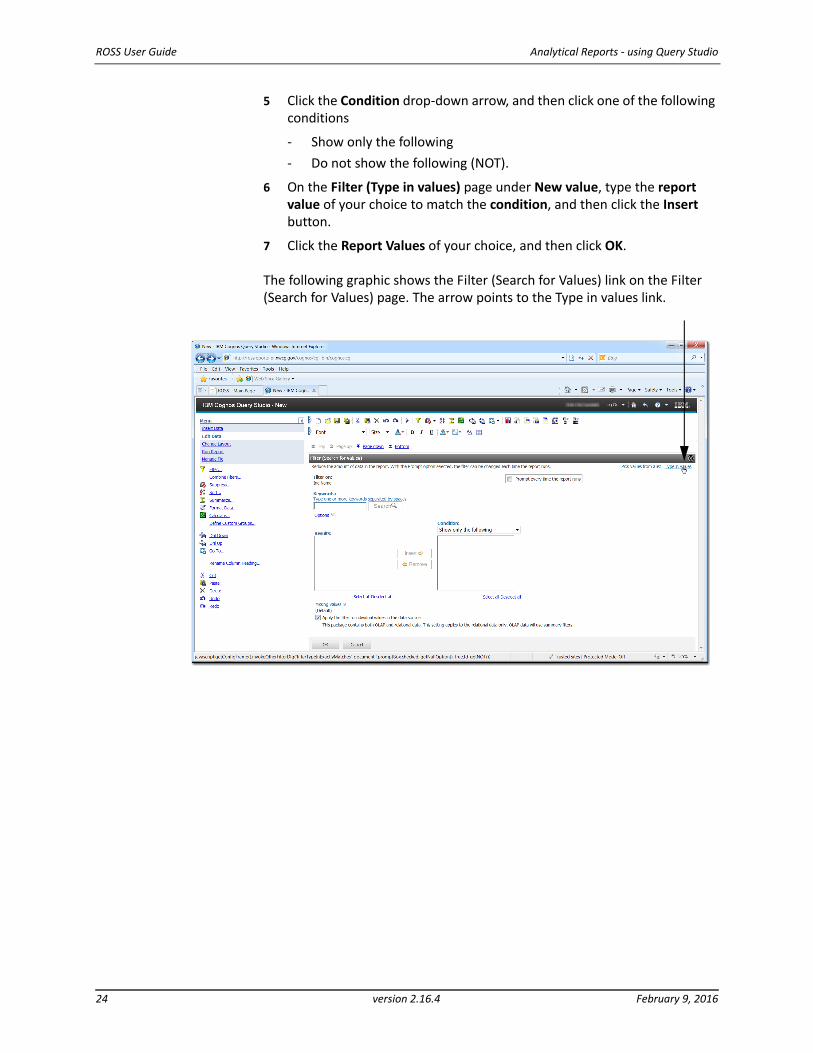
The following graphic shows the Filter (Search for Values) link on the Filter (Search for Values) page. The arrow points to the Type in values link.
24 version 2.16.4 February 9, 2016
Analytical Reports ‐ using Query Studio ROSS User Guide
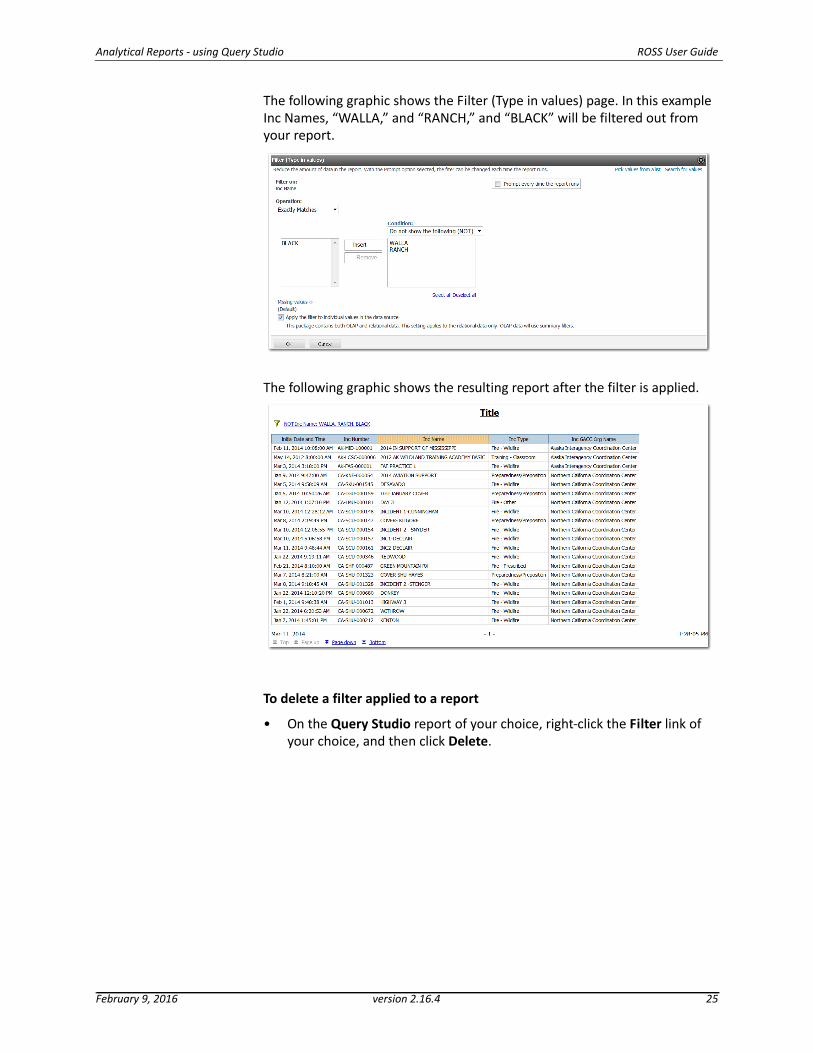
The following graphic shows the Filter (Type in values) page. In this example Inc Names, “WALLA,” and “RANCH,” and “BLACK” will be filtered out from your report.
The following graphic shows the resulting report after the filter is applied.
To delete a filter applied to a report
• On the Query Studio report of your choice, right‐click the Filter link of your choice, and then click Delete.
February 9, 2016 version 2.16.4 25
ROSS User Guide Analytical Reports ‐ using Query Studio
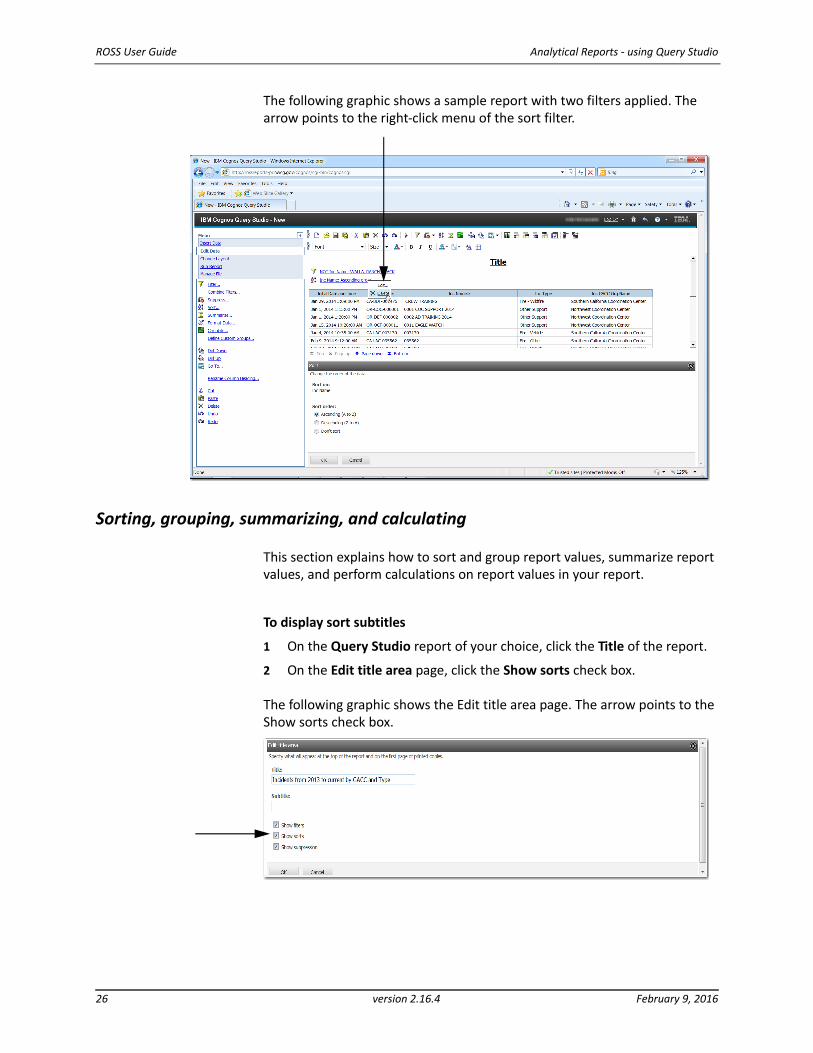
The following graphic shows a sample report with two filters applied. The arrow points to the right‐click menu of the sort filter.
Sorting, grouping, summarizing, and calculating
This section explains how to sort and group report values, summarize report values, and perform calculations on report values in your report.
To display sort subtitles
1 On the Query Studio report of your choice, click the Title of the report.
2 On the Edit title area page, click the Show sorts check box.
The following graphic shows the Edit title area page. The arrow points to the Show sorts check box.
26 version 2.16.4 February 9, 2016
Analytical Reports ‐ using Query Studio ROSS User Guide
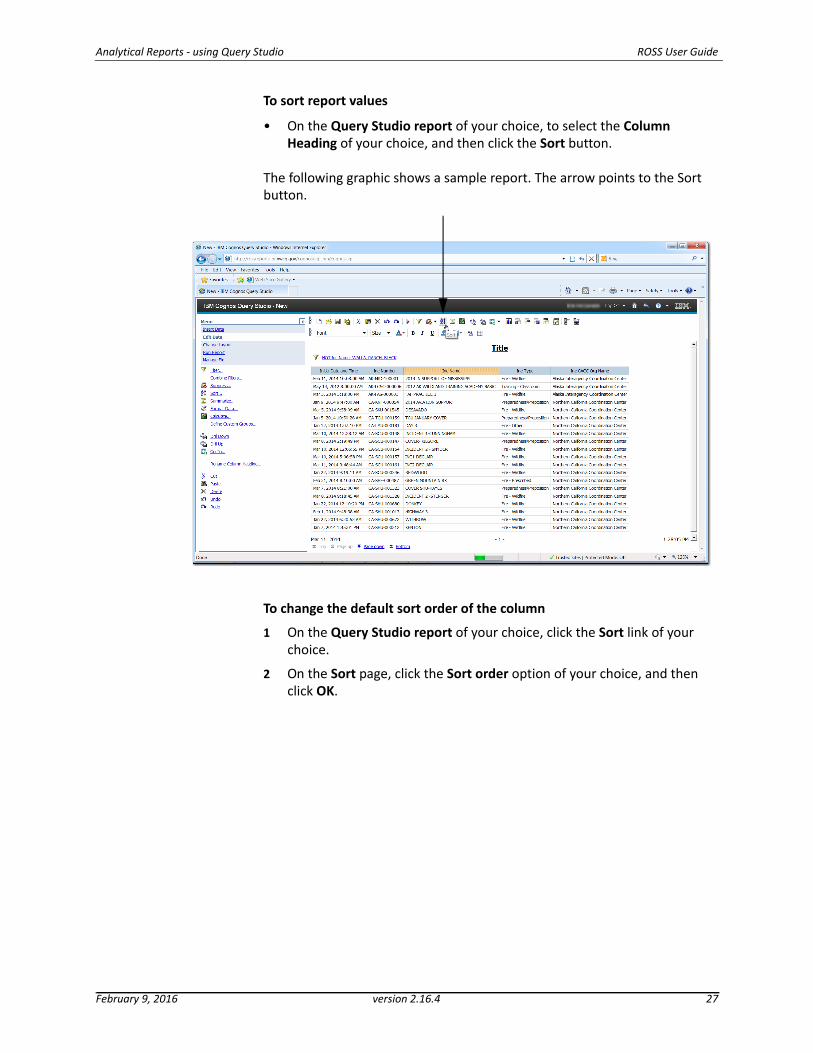
To sort report values
• On the Query Studio report of your choice, to select the Column Heading of your choice, and then click the Sort button.
The following graphic shows a sample report. The arrow points to the Sort button.
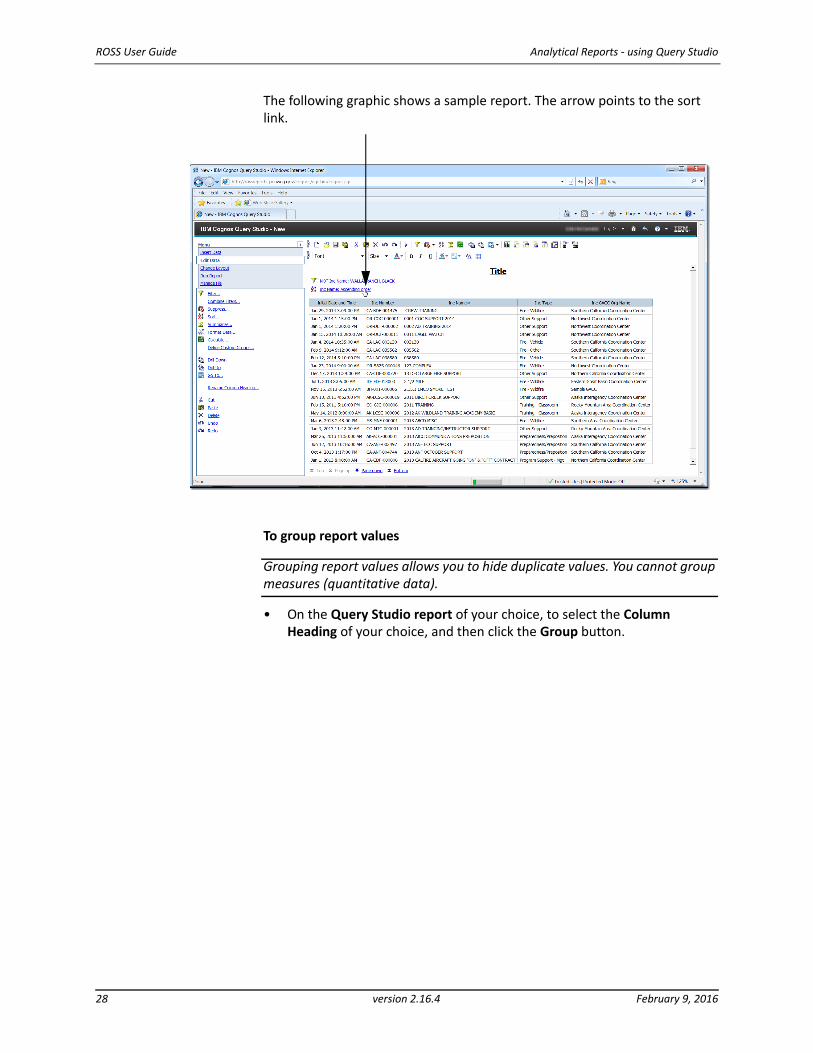
To change the default sort order of the column
1 On the Query Studio report of your choice, click the Sort link of your choice.
2 On the Sort page, click the Sort order option of your choice, and then click OK.
February 9, 2016 version 2.16.4 27
ROSS User Guide Analytical Reports ‐ using Query Studio
The following graphic shows a sample report. The arrow points to the sort link.
To group report values
Grouping report values allows you to hide duplicate values. You cannot group measures (quantitative data).
• On the Query Studio report of your choice, to select the Column Heading of your choice, and then click the Group button.
28 version 2.16.4 February 9, 2016
Analytical Reports ‐ using Query Studio ROSS User Guide
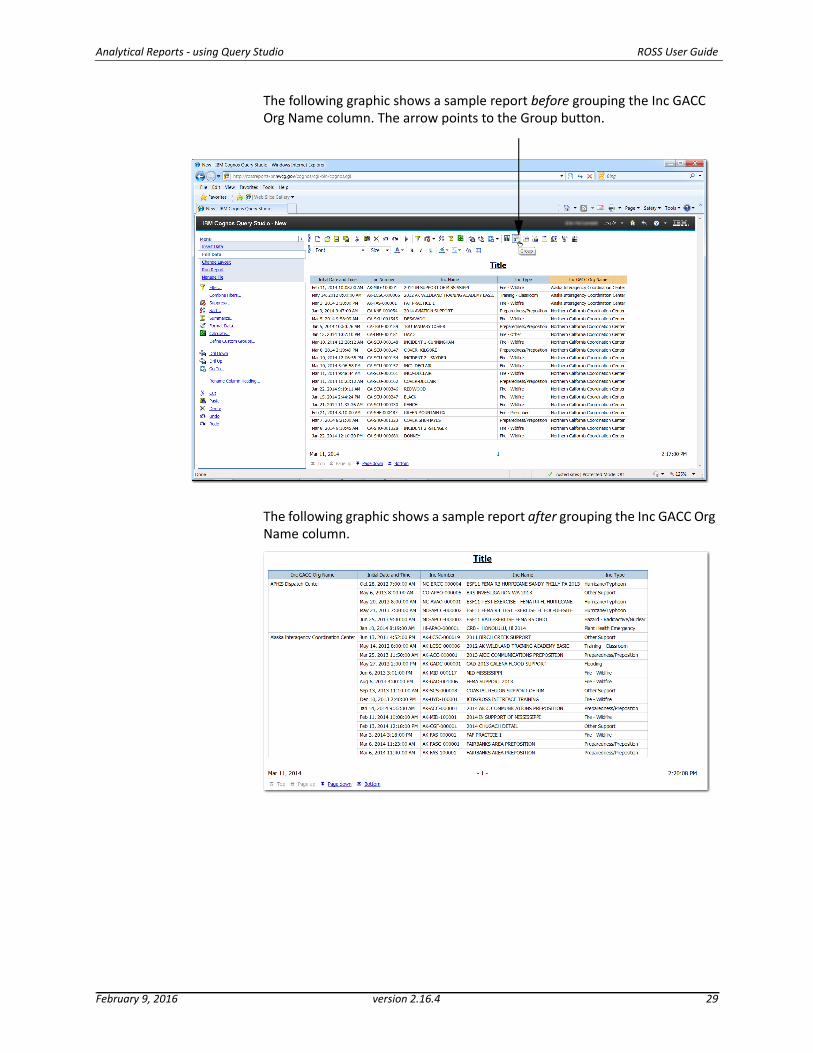
The following graphic shows a sample report before grouping the Inc GACC Org Name column. The arrow points to the Group button.
The following graphic shows a sample report after grouping the Inc GACC Org Name column.
February 9, 2016 version 2.16.4 29
ROSS User Guide Analytical Reports ‐ using Query Studio
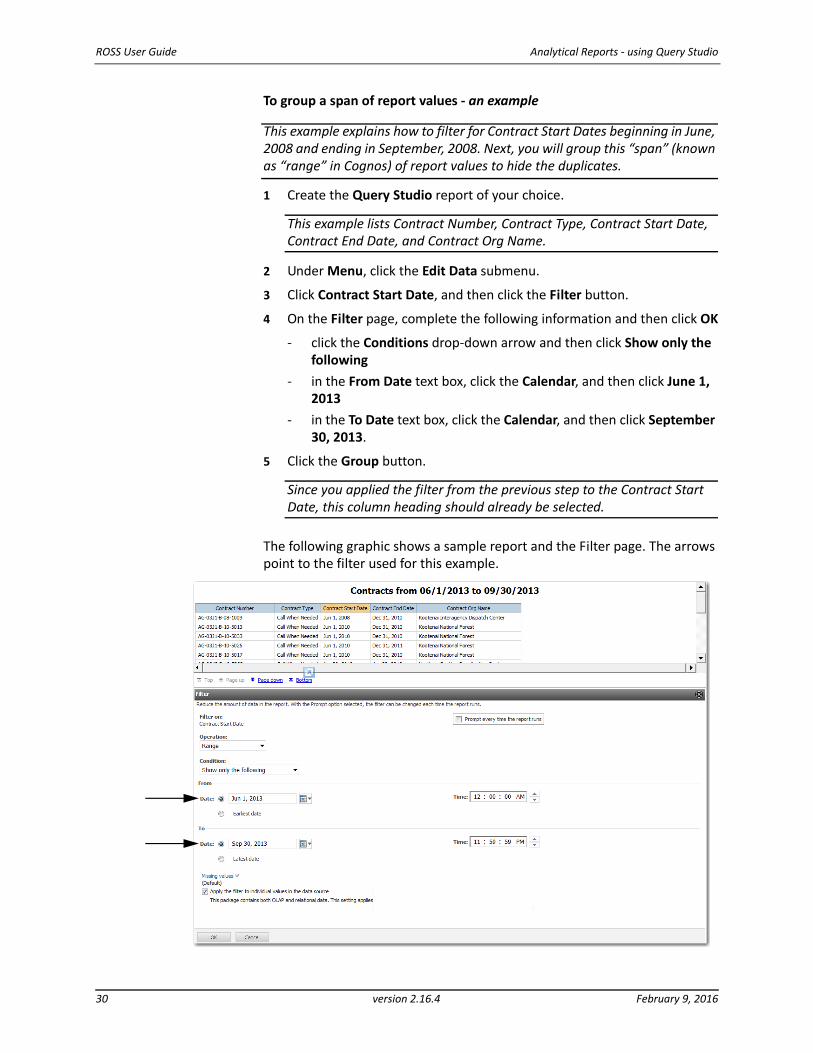
To group a span of report values ‐ an example
This example explains how to filter for Contract Start Dates beginning in June, 2008 and ending in September, 2008. Next, you will group this “span” (known as “range” in Cognos) of report values to hide the duplicates.
1 Create the Query Studio report of your choice.
This example lists Contract Number, Contract Type, Contract Start Date, Contract End Date, and Contract Org Name.
2 Under Menu, click the Edit Data submenu.
3 Click Contract Start Date, and then click the Filter button.
4 On the Filter page, complete the following information and then click OK
‐ click the Conditions drop‐down arrow and then click Show only the following
‐ in the From Date text box, click the Calendar, and then click June 1, 2013
‐ in the To Date text box, click the Calendar, and then click September 30, 2013.
5 Click the Group button.
Since you applied the filter from the previous step to the Contract Start Date, this column heading should already be selected.
The following graphic shows a sample report and the Filter page. The arrows point to the filter used for this example.
30 version 2.16.4 February 9, 2016
Analytical Reports ‐ using Query Studio ROSS User Guide
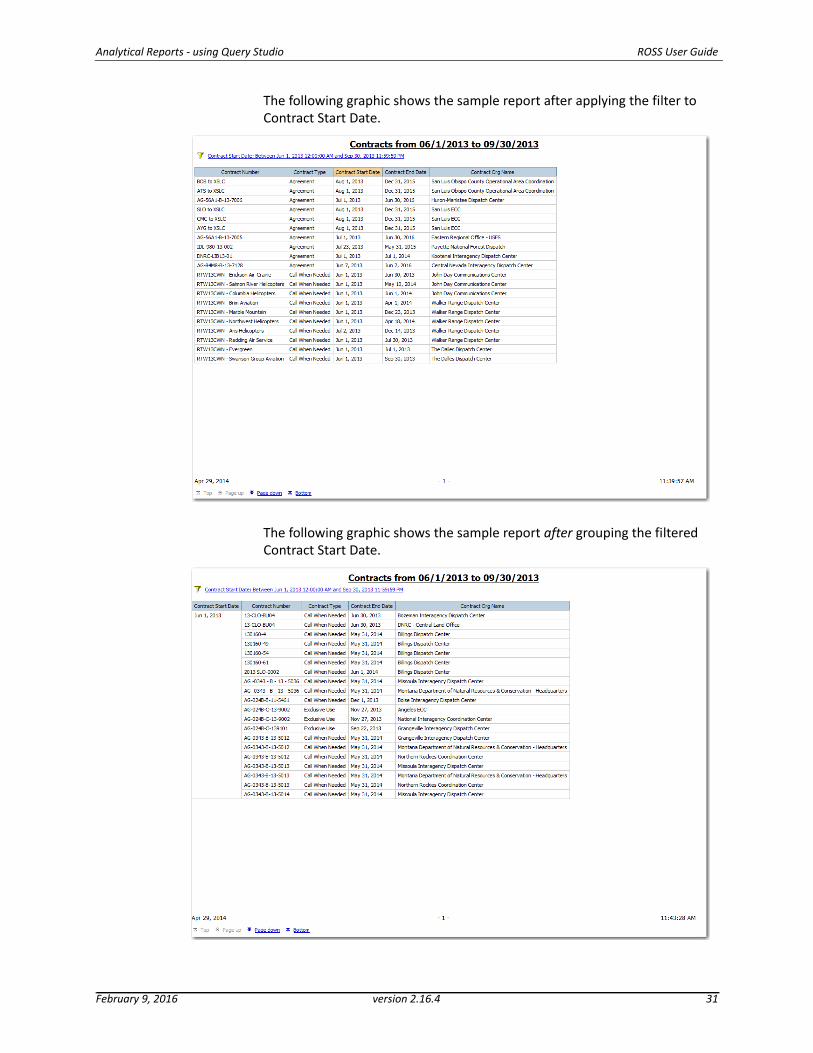
The following graphic shows the sample report after applying the filter to Contract Start Date.
The following graphic shows the sample report after grouping the filtered Contract Start Date.
February 9, 2016 version 2.16.4 31
ROSS User Guide Analytical Reports ‐ using Query Studio
To calculate quantitative report values
The results of the calculation creates a new column in your report. Cognos performs a re‐calculation each time the report is run.
1 On the Query Studio report of your choice, to select the Column Heading of your choice, and then click the Calculate button.
You may select multiple Report Items for your calculation, such as First Name and Last Name.
2 On the Calculate page, click the Operation drop‐down arrow, and then click the Operation of your choice.
3 Based on the column heading you selected, complete the Calculate page as appropriate.
The operations available depend on the type of data (alphanumeric, numeric, date) in the column heading(s) you select.
4 In the New item name box, type the Name of the New Column Heading, as appropriate, and then click the Insert button.
You can, if desired, delete the Report Item used for the calculation as it is no longer needed.
To concatenate multiple report values ‐ an example
The sample pages in this task shows how to create a new column that lists Roster GACC Org Name, Roster Disp Org Name.
1 On the Query Studio report of your choice, click the Column Headings of your choice, and then click the Calculate button.
2 On the Calculate page, click the Operation drop‐down arrow, and then click Concatenation.
3 Under New item name, type the name of the New Column Heading.
4 Under Separator between Report Items, click the Separator of your choice, or type the Separator of your choice in the text box.
In this example, a comma followed by a space is used to separate Roster GACC Org Name from Roster Disp Org Name.
5 Complete the following text boxes as appropriate, and then click the Insert button.
‐ Preceding text
‐ Following text.
6 To delete the source report values used in the concatenation, click the Column Headings of your choice, and then click the Delete button.
32 version 2.16.4 February 9, 2016
Analytical Reports ‐ using Query Studio ROSS User Guide
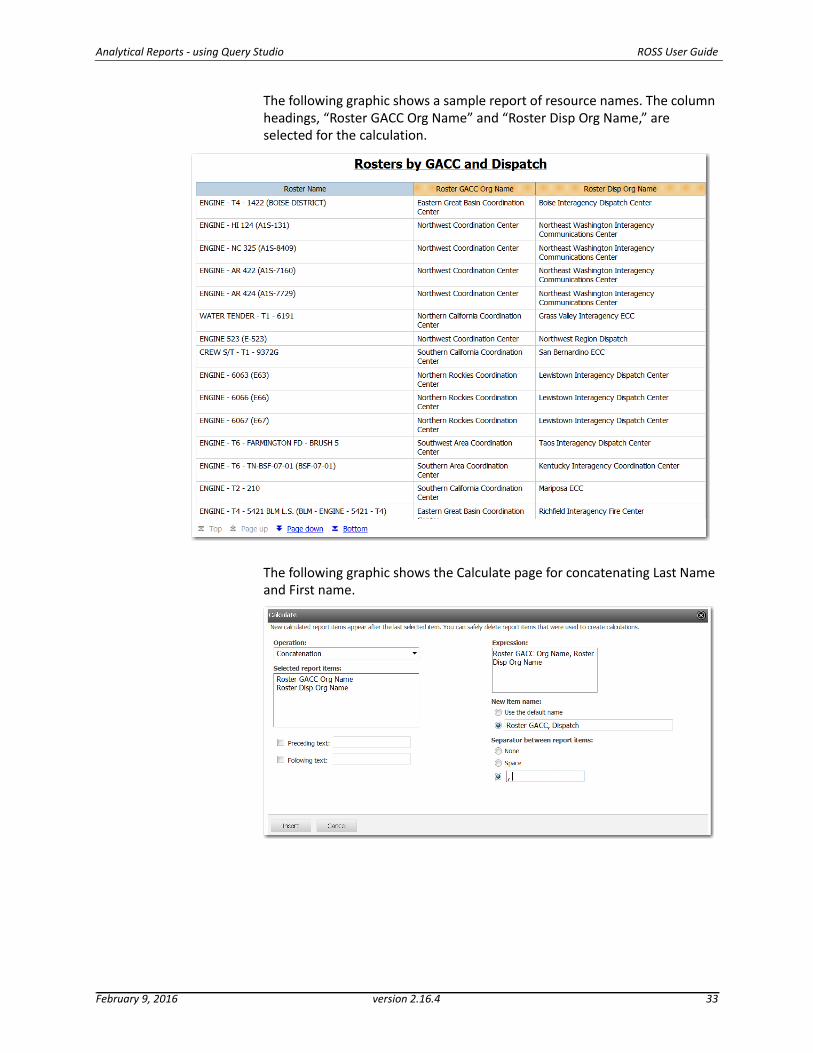
The following graphic shows a sample report of resource names. The column headings, “Roster GACC Org Name” and “Roster Disp Org Name,” are selected for the calculation.
The following graphic shows the Calculate page for concatenating Last Name and First name.
February 9, 2016 version 2.16.4 33
ROSS User Guide Analytical Reports ‐ using Query Studio
To summarize report values without footers
The type of summary you can perform depends on the type of data you select. It is a form of calculation that condenses (summarizes) your data. In this example, the Inc Name column is summarized to display counts instead of individual incident names.
1 On the Query Studio report of your choice, click the Edit Data submenu.
2 Click the Column Heading of your choice, and then click the Summarize link.
3 On the Summarize page, click the Advanced link.
4 On the Summarize (advanced) page, click the Summary for cells drop‐down arrow, and then click one of the following
‐ Count Distinct
‐ Count
‐ None.
For this example, click Count.
5 Click the Summary for footers drop‐down arrow, click one of the following, and then click OK
‐ Total
‐ Average
‐ Maximum
‐ Minimum
‐ Median
‐ Standard Deviation
‐ Variance
‐ Count Distinct
‐ Count
‐ Calculated
‐ Automatic
‐ None.
For this example, click None.
6 Rename the Title and Column Heading as appropriate.
34 version 2.16.4 February 9, 2016
Analytical Reports ‐ using Query Studio ROSS User Guide
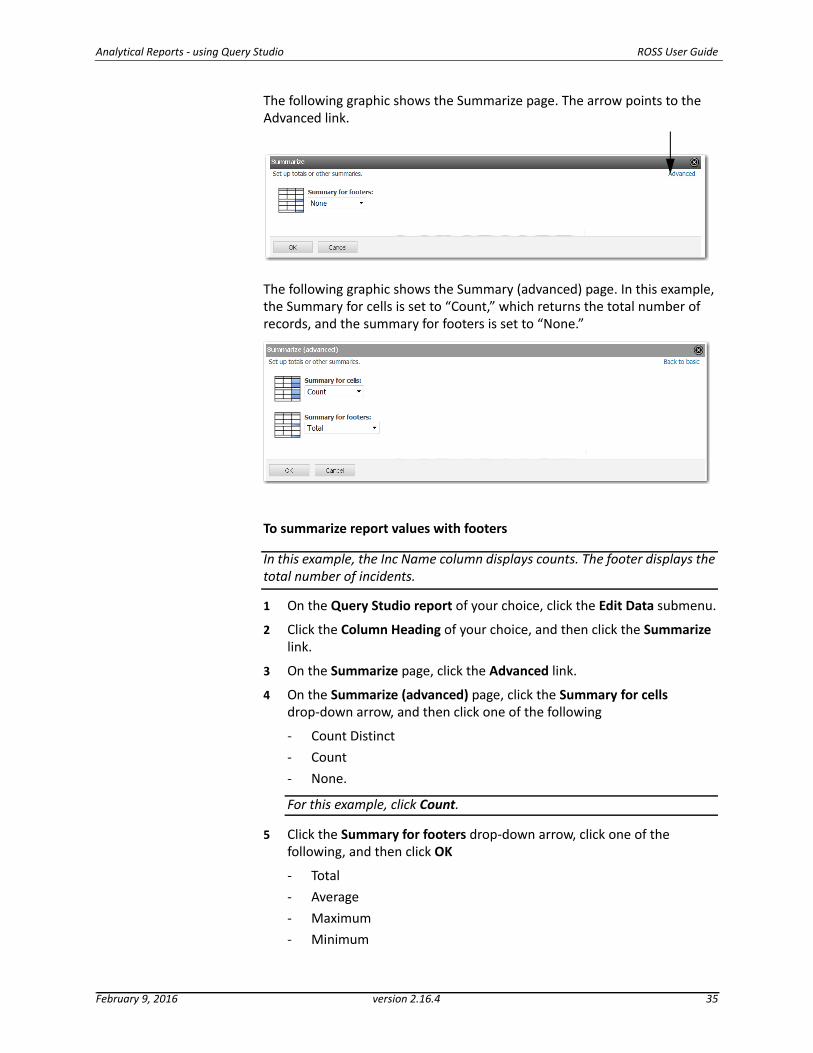
The following graphic shows the Summarize page. The arrow points to the Advanced link.
The following graphic shows the Summary (advanced) page. In this example, the Summary for cells is set to “Count,” which returns the total number of records, and the summary for footers is set to “None.”
To summarize report values with footers
In this example, the Inc Name column displays counts. The footer displays the total number of incidents.
1 On the Query Studio report of your choice, click the Edit Data submenu.
2 Click the Column Heading of your choice, and then click the Summarize link.
3 On the Summarize page, click the Advanced link.
4 On the Summarize (advanced) page, click the Summary for cells drop‐down arrow, and then click one of the following
‐ Count Distinct
‐ Count
‐ None.
For this example, click Count.
5 Click the Summary for footers drop‐down arrow, click one of the following, and then click OK
‐ Total
‐ Average
‐ Maximum
‐ Minimum
February 9, 2016 version 2.16.4 35
ROSS User Guide Analytical Reports ‐ using Query Studio
‐ Median
‐ Standard Deviation
‐ Variance
‐ Count Distinct
‐ Count
‐ Calculated
‐ Automatic
‐ None.
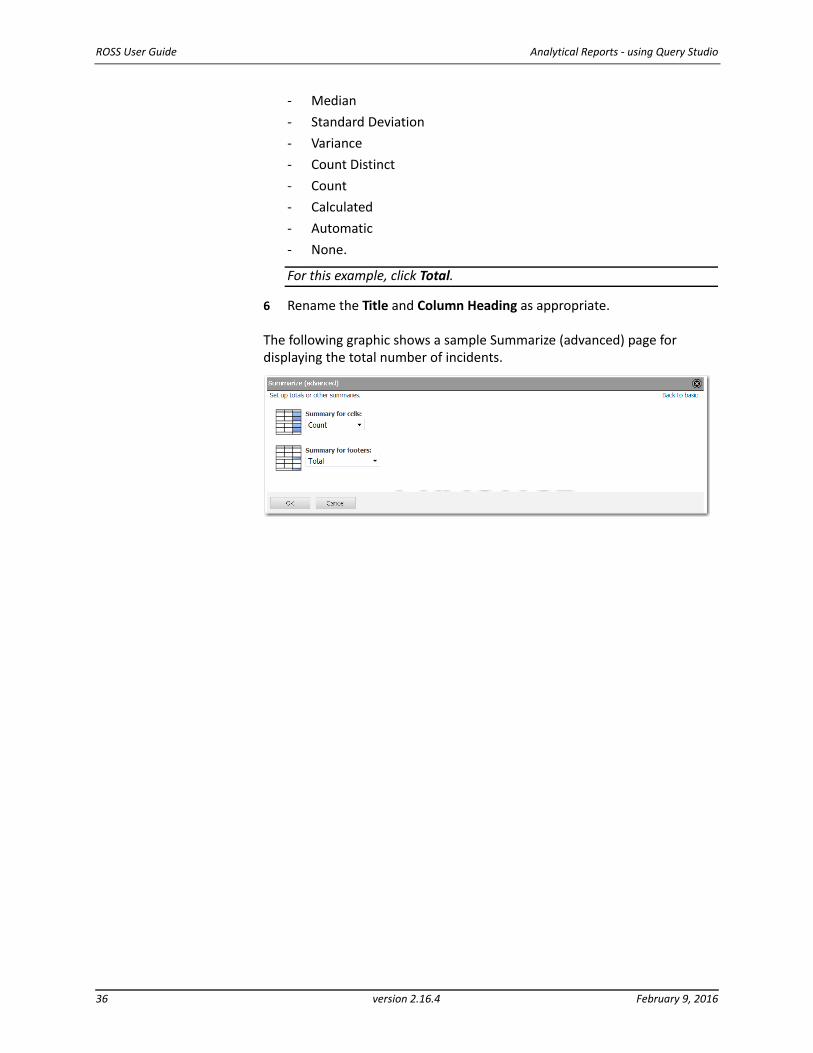
For this example, click Total.
6 Rename the Title and Column Heading as appropriate.
The following graphic shows a sample Summarize (advanced) page for displaying the total number of incidents.
36 version 2.16.4 February 9, 2016
Analytical Reports ‐ using Query Studio ROSS User Guide
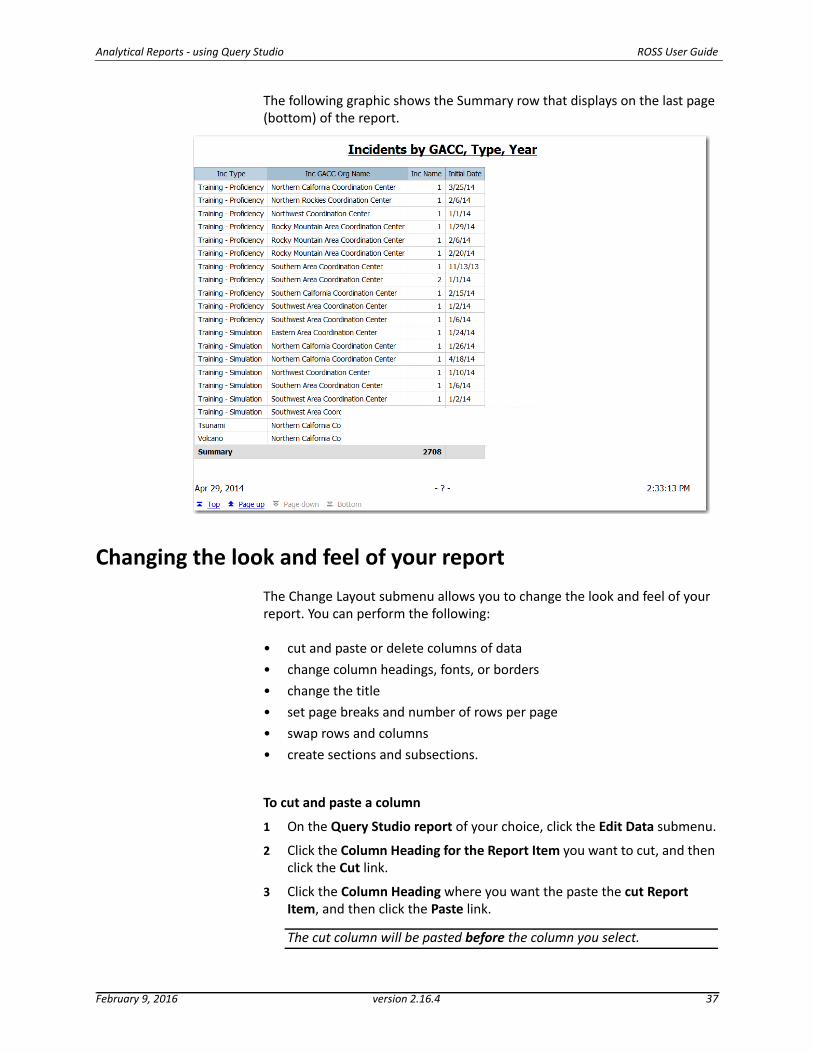
The following graphic shows the Summary row that displays on the last page (bottom) of the report.
Changing the look and feel of your report
The Change Layout submenu allows you to change the look and feel of your report. You can perform the following:
• cut and paste or delete columns of data
• change column headings, fonts, or borders
• change the title
• set page breaks and number of rows per page
• swap rows and columns
• create sections and subsections.
To cut and paste a column
1 On the Query Studio report of your choice, click the Edit Data submenu.
2 Click the Column Heading for the Report Item you want to cut, and then click the Cut link.
3 Click the Column Heading where you want the paste the cut Report Item, and then click the Paste link.
The cut column will be pasted before the column you select.
February 9, 2016 version 2.16.4 37
ROSS User Guide Analytical Reports ‐ using Query Studio
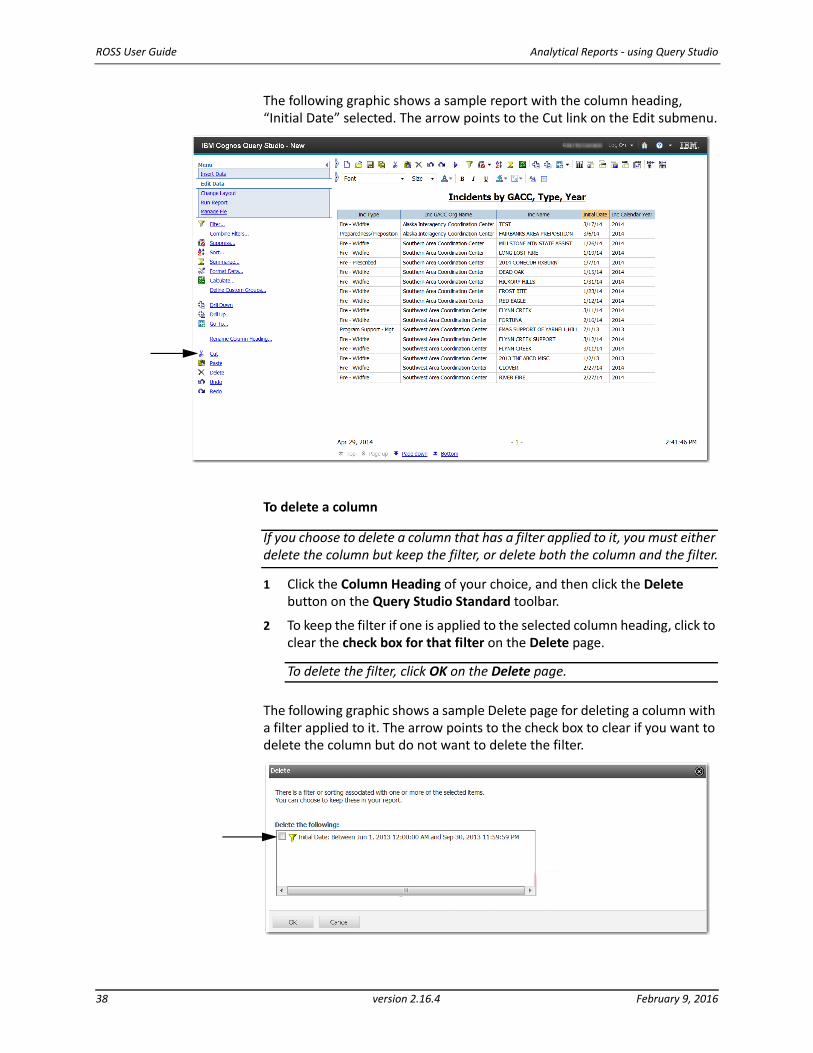
The following graphic shows a sample report with the column heading, “Initial Date” selected. The arrow points to the Cut link on the Edit submenu.
To delete a column
If you choose to delete a column that has a filter applied to it, you must either delete the column but keep the filter, or delete both the column and the filter.
1 Click the Column Heading of your choice, and then click the Delete button on the Query Studio Standard toolbar.
2 To keep the filter if one is applied to the selected column heading, click to clear the check box for that filter on the Delete page.
To delete the filter, click OK on the Delete page.
The following graphic shows a sample Delete page for deleting a column with a filter applied to it. The arrow points to the check box to clear if you want to delete the column but do not want to delete the filter.
38 version 2.16.4 February 9, 2016
Analytical Reports ‐ using Query Studio ROSS User Guide
To change a Report Item heading
1 On the Query Studio report of your choice, double‐click the Column Heading of your choice.
2 On the Rename page, type the new name of the Column Heading in the Name box, and then click OK.
To change the report text font, size, and formatting
1 On the Query Studio report of your choice, click the Column Heading, Title, or other heading of your choice.
2 To change the font, click the Font drop‐ down arrow on the Query Studio Standard toolbar, and then click the font of your choice.
3 To change the size of the font, click the Size drop‐down arrow on the Query Studio Standard toolbar, and then click the font of your choice.
4 To change the formatting, click the Bold, Italic, and/or Underline buttons on the Query Studio Standard toolbar.
To change the report title
• On the Query Studio report of your choice, click the Report Title, and then complete the Title box as appropriate.
To add or change borders in your report
1 On the Query Studio report of your choice, click the Change Layout submenu.
2 On the Change Layout submenu, click the Change Border Styles link.
3 On the Change border styles page under Table borders, click one of the following borders
‐ All borders
‐ Headings
‐ Headings and Summaries
‐ No borders.
4 Under Color, click the drop‐down arrow, and then click the border color of your choice.
5 Click the Width drop‐down arrow, and then click the border width of your choice.
6 When finished, click OK.
February 9, 2016 version 2.16.4 39
ROSS User Guide Analytical Reports ‐ using Query Studio
The following graphic shows a sample Change border styles page.
To set page breaks in your report
To set page breaks in a list report, you must select one grouped or sectioned Report Item.
1 On the Query Studio report of your choice, click the Change Layout submenu.
2 On the Change Layout submenu, click the Set Page Breaks link.
To set the number of rows per page
1 On the Query Studio report of your choice, click the Change Layout submenu.
2 On the Change Layout submenu, click the Set Web Page Size link.
3 On the Set web page size page, click the Number of rows drop‐down arrow, and then click the number of your choice.
To show row numbers in your report
1 On the Query Studio report of your choice, click the Change Layout submenu.
2 On the Change Layout submenu, click the Set Web Page Size link.
3 On the Set web page size page, click the Show row numbers check box, and then click OK.
To create a section
The report value you select becomes the heading of a section.
1 On the Query Studio report of your choice, click the Change Layout submenu.
2 Click the First Cell in the column of your choice, and then click the Create Sections link.
You may also click the Create Sections button on the Query Studio Standard toolbar.
40 version 2.16.4 February 9, 2016
Analytical Reports ‐ using Query Studio ROSS User Guide
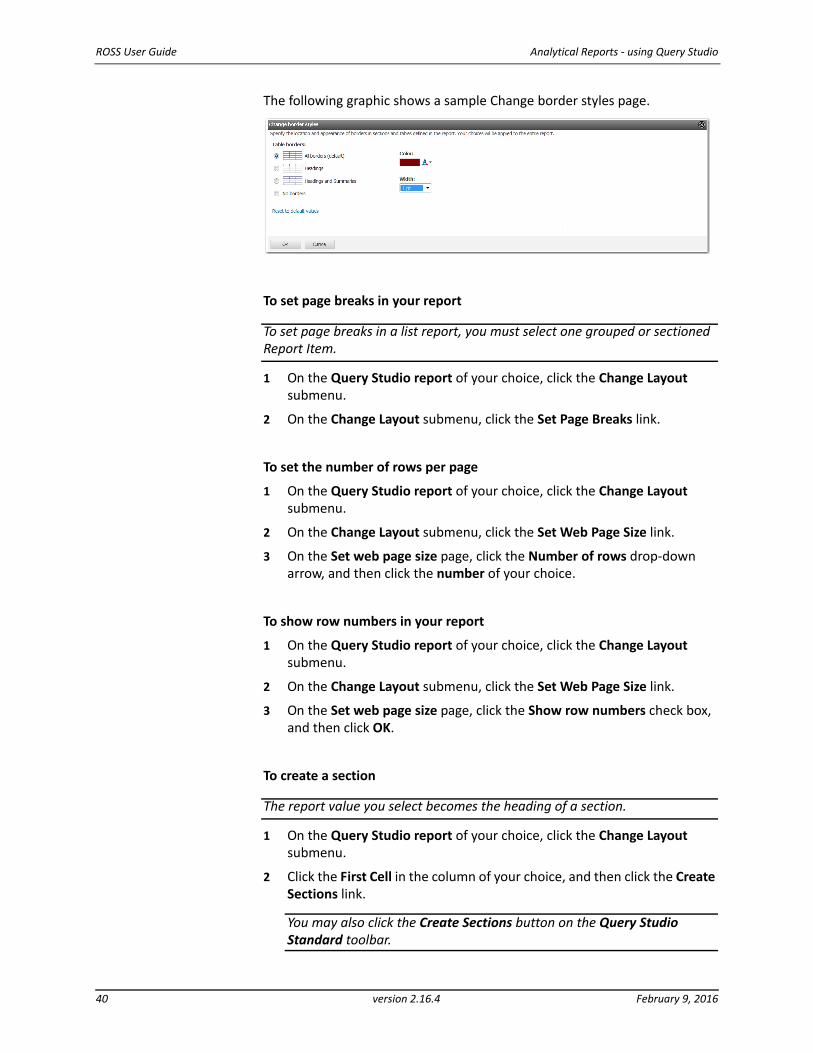
The following graphic shows a sample list report. The arrow points to Inc Type, which will be used to create a section.
The following graphic shows the sample list report after creating a section for Inc Type.
February 9, 2016 version 2.16.4 41
ROSS User Guide Analytical Reports ‐ using Query Studio
Working with Crosstab reports and charts
The Change Layout menu allows you to create a Crosstab report and/or a chart from the most summarized data of your report. Topics include:
• Creating a Crosstab report
• Creating a chart.
Creating a Crosstab report
Create a Crosstab report when your report displays the same rows for multiple Report Items and you want to:
• swing the common rows up to become columns
• show measures at the intersection of each row and column.
To create a Crosstab report of summarized values
1 Create and save the Query Studio report of your choice.
2 Summarize the Report Cell(s) of your choice.
3 Click the Column Heading to use as the common row, and then click the Pivot button on the Query Studio Standard toolbar.
4 Rename the report as appropriate, and then click OK.
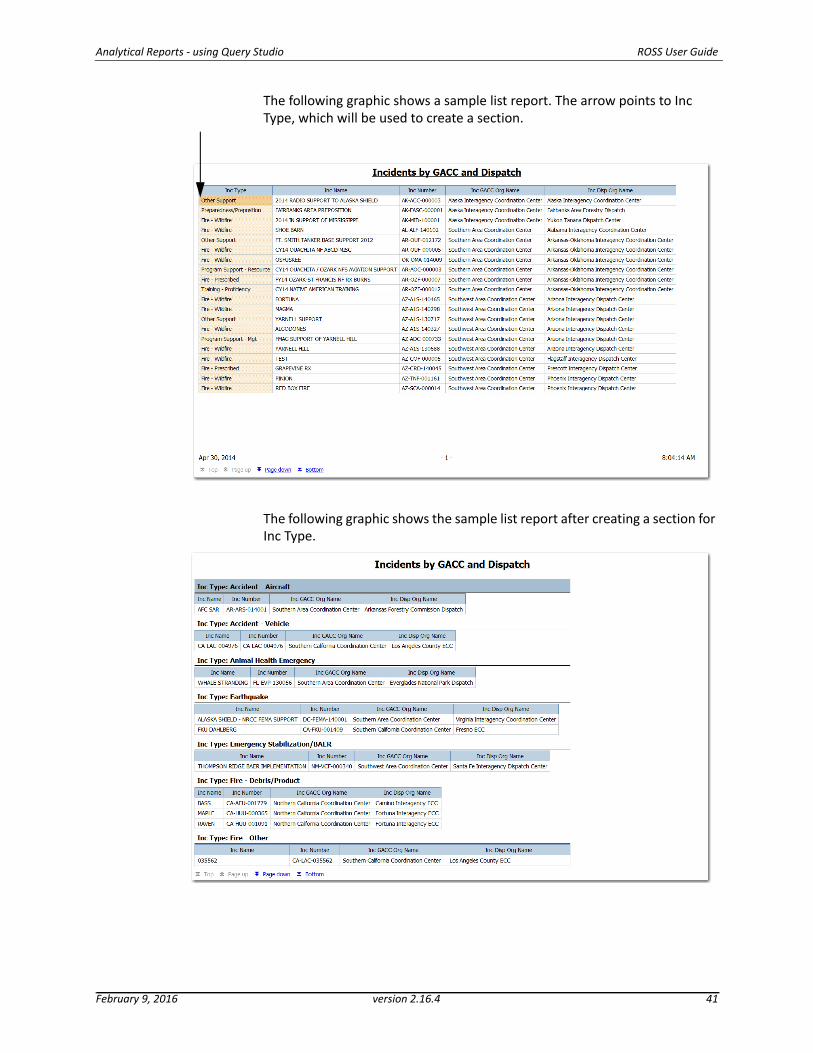
The following graphic shows a sample report before pressing the Pivot button. Inc Type has been summarized and Year is selected as the common row.
42 version 2.16.4 February 9, 2016
Analytical Reports ‐ using Query Studio ROSS User Guide
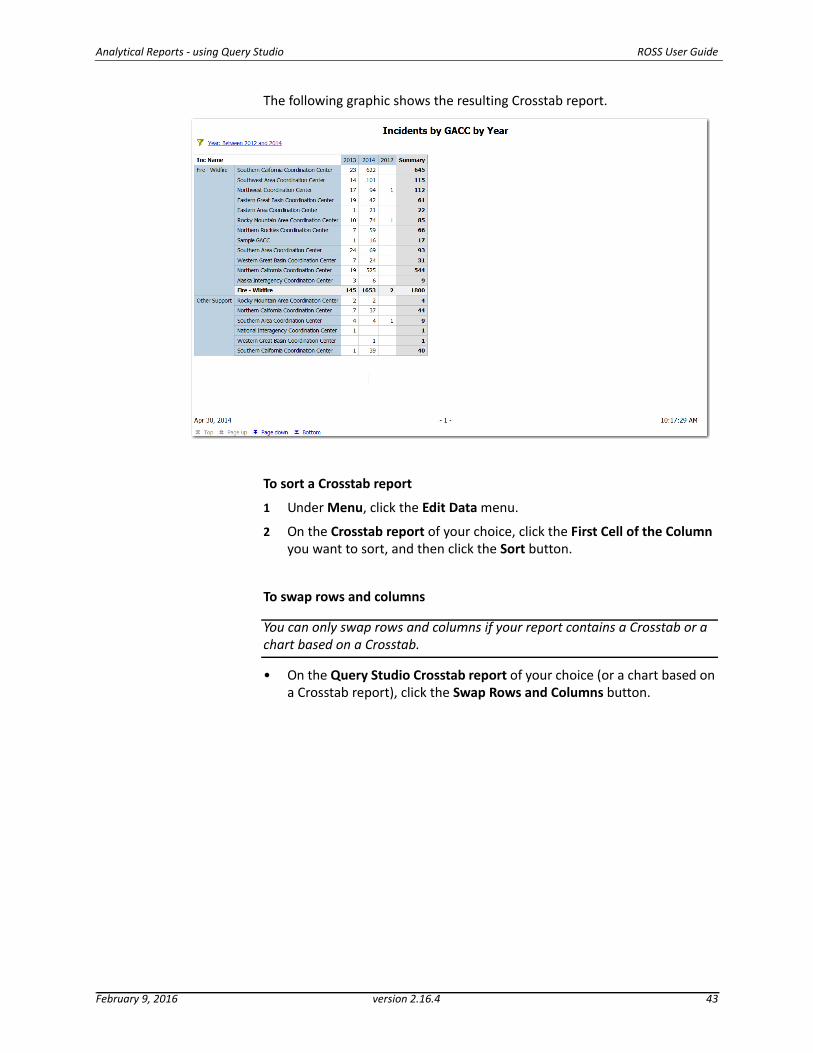
The following graphic shows the resulting Crosstab report.
To sort a Crosstab report
1 Under Menu, click the Edit Data menu.
2 On the Crosstab report of your choice, click the First Cell of the Column you want to sort, and then click the Sort button.
To swap rows and columns
You can only swap rows and columns if your report contains a Crosstab or a chart based on a Crosstab.
• On the Query Studio Crosstab report of your choice (or a chart based on a Crosstab report), click the Swap Rows and Columns button.
February 9, 2016 version 2.16.4 43
ROSS User Guide Analytical Reports ‐ using Query Studio
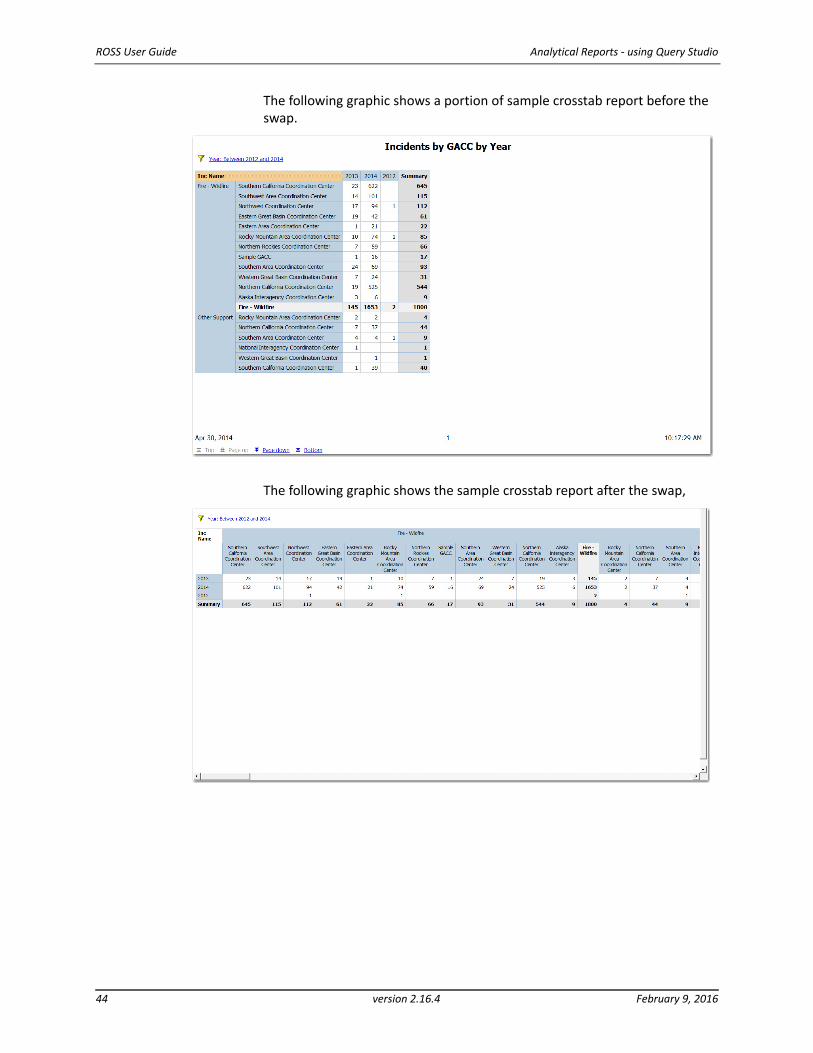
The following graphic shows a portion of sample crosstab report before the swap.
The following graphic shows the sample crosstab report after the swap,
44 version 2.16.4 February 9, 2016
Analytical Reports ‐ using Query Studio ROSS User Guide
Creating a chart
The Change Layout menu allows you to create a chart from the most summarized data of your report. The report must have at least one measure (quantitative data) and one non‐measure (qualitative data), but must have no more than two non‐measures. The report may have unlimited measures. When creating a report to generate a chart, remember these key points:
• You must have at least one measure (quantitative data) and one non‐measure (qualitative data) to create a chart.
• You can graph an unlimited number of measures, but a maximum of two non‐measures.
• Remove measures not meaningful to the chart.
• Reorder non‐measurement columns as needed.
• Collapse any groups.
To create a chart from your Query Studio report
1 Create the Query Studio report of your choice, and then click the Edit Data submenu.
2 Perform the appropriate calculations and/or summarizations, and then remove non‐meaningful measures and non‐measures from the report.
3 On the Query Studio Standard toolbar, click the Chart button.
4 On the Chart page, click the Chart type drop‐down arrow, click one of the following chart options
‐ Column
‐ Column ‐ Line
‐ Bar
‐ Area
‐ Pie
‐ Line
‐ Radar.
5 Click the Show the values on the chart check box, as appropriate.
6 Under Show the following on the report, click one of the following, and then click OK
‐ Chart and table
‐ Chart only.
February 9, 2016 version 2.16.4 45
ROSS User Guide Analytical Reports ‐ using Query Studio
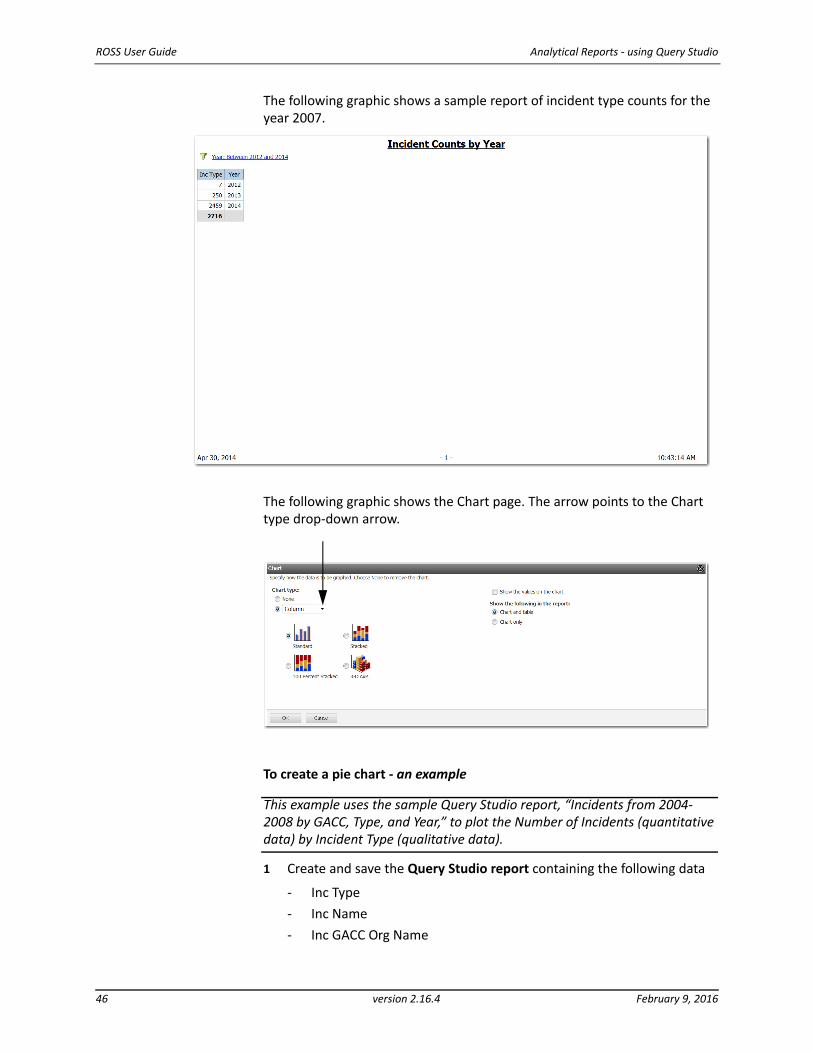
The following graphic shows a sample report of incident type counts for the year 2007.
The following graphic shows the Chart page. The arrow points to the Chart type drop‐down arrow.
To create a pie chart ‐ an example
This example uses the sample Query Studio report, “Incidents from 2004‐2008 by GACC, Type, and Year,” to plot the Number of Incidents (quantitative data) by Incident Type (qualitative data).
1 Create and save the Query Studio report containing the following data
‐ Inc Type
‐ Inc Name
‐ Inc GACC Org Name
46 version 2.16.4 February 9, 2016
Analytical Reports ‐ using Query Studio ROSS User Guide
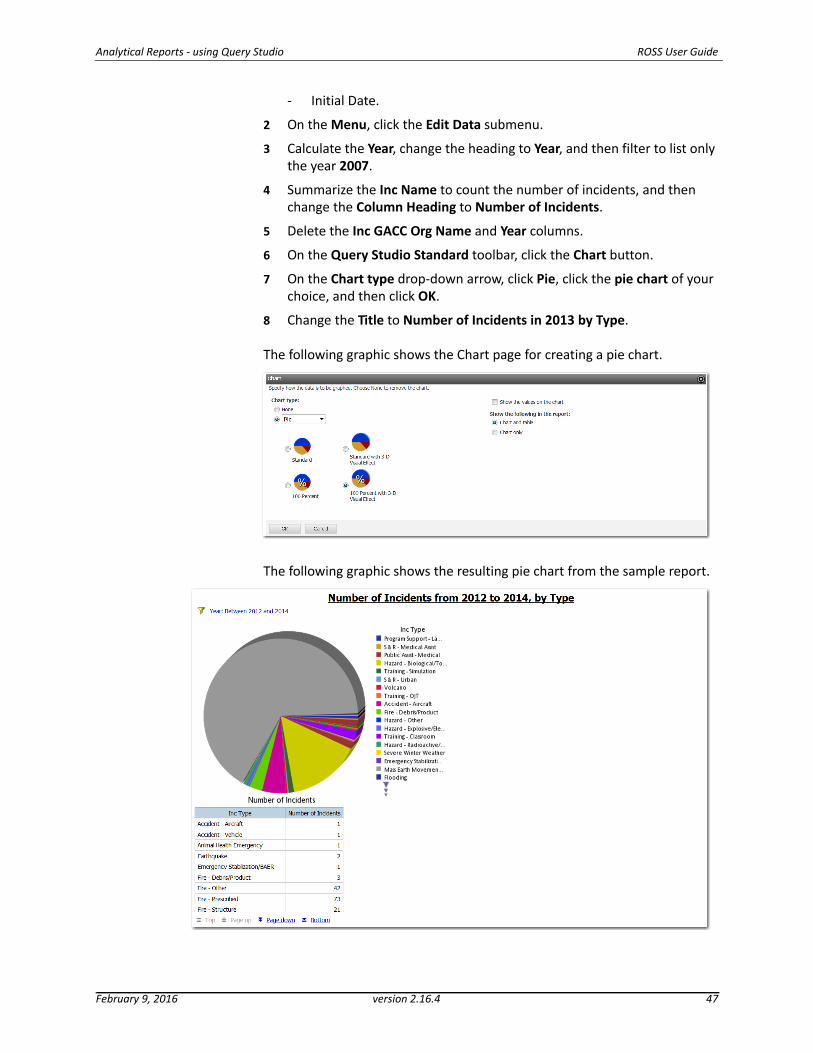
‐ Initial Date.
2 On the Menu, click the Edit Data submenu.
3 Calculate the Year, change the heading to Year, and then filter to list only the year 2007.
4 Summarize the Inc Name to count the number of incidents, and then change the Column Heading to Number of Incidents.
5 Delete the Inc GACC Org Name and Year columns.
6 On the Query Studio Standard toolbar, click the Chart button.
7 On the Chart type drop‐down arrow, click Pie, click the pie chart of your choice, and then click OK.
8 Change the Title to Number of Incidents in 2013 by Type.
The following graphic shows the Chart page for creating a pie chart.
The following graphic shows the resulting pie chart from the sample report.
February 9, 2016 version 2.16.4 47
![Multi-query Optimization for On-Line Analytical Processing · The so-called On-Line Analytical Processing (OLAP) [2] queries typically involve large amounts of data and their processing](https://img.pdfslide.net/doc/110x75/5e9a47b5200e0c59752caa25/multi-query-optimization-for-on-line-analytical-processing-the-so-called-on-line.jpg)