Embed Size (px)
Citation preview
Oracle® Hospitality Reporting andAnalyticsUser Guide
Release 9.0E72023-04March 2018
Oracle Hospitality Reporting and Analytics User Guide, Release 9.0
E72023-04
Copyright © 2000, 2018, Oracle and/or its affiliates. All rights reserved.
This software and related documentation are provided under a license agreement containing restrictions onuse and disclosure and are protected by intellectual property laws. Except as expressly permitted in yourlicense agreement or allowed by law, you may not use, copy, reproduce, translate, broadcast, modify,license, transmit, distribute, exhibit, perform, publish, or display any part, in any form, or by any means.Reverse engineering, disassembly, or decompilation of this software, unless required by law forinteroperability, is prohibited.
The information contained herein is subject to change without notice and is not warranted to be error-free. Ifyou find any errors, please report them to us in writing.
If this is software or related documentation that is delivered to the U.S. Government or anyone licensing it onbehalf of the U.S. Government, then the following notice is applicable:
U.S. GOVERNMENT END USERS: Oracle programs, including any operating system, integrated software,any programs installed on the hardware, and/or documentation, delivered to U.S. Government end users are"commercial computer software" pursuant to the applicable Federal Acquisition Regulation and agency-specific supplemental regulations. As such, use, duplication, disclosure, modification, and adaptation of theprograms, including any operating system, integrated software, any programs installed on the hardware,and/or documentation, shall be subject to license terms and license restrictions applicable to the programs.No other rights are granted to the U.S. Government.
This software or hardware is developed for general use in a variety of information management applications.It is not developed or intended for use in any inherently dangerous applications, including applications thatmay create a risk of personal injury. If you use this software or hardware in dangerous applications, then youshall be responsible to take all appropriate fail-safe, backup, redundancy, and other measures to ensure itssafe use. Oracle Corporation and its affiliates disclaim any liability for any damages caused by use of thissoftware or hardware in dangerous applications.
Oracle and Java are registered trademarks of Oracle and/or its affiliates. Other names may be trademarks oftheir respective owners.
Intel and Intel Xeon are trademarks or registered trademarks of Intel Corporation. All SPARC trademarks areused under license and are trademarks or registered trademarks of SPARC International, Inc. AMD, Opteron,the AMD logo, and the AMD Opteron logo are trademarks or registered trademarks of Advanced MicroDevices. UNIX is a registered trademark of The Open Group.
This software or hardware and documentation may provide access to or information about content, products,and services from third parties. Oracle Corporation and its affiliates are not responsible for and expresslydisclaim all warranties of any kind with respect to third-party content, products, and services unless otherwiseset forth in an applicable agreement between you and Oracle. Oracle Corporation and its affiliates will not beresponsible for any loss, costs, or damages incurred due to your access to or use of third-party content,products, or services, except as set forth in an applicable agreement between you and Oracle.
Contents
Preface
1 Using Reporting and Analytics
Using Reporting and Analytics 1-1
Choosing a Report Type 1-1
Choosing a Dashboard 1-2
Configuration Guidelines 1-4
Maintaining Organizations 1-4
Maintaining Users and Roles 1-5
Maintaining Point-of-Sale Data 1-5
Re-Aggregating Data 1-6
2 Analysis Reports
Analysis Report Examples 2-3
Report Walkthrough: Revenue and Cost Comparisons 2-6
Running, Printing, and Exporting Analysis Reports 2-9
Creating Analysis Reports 2-10
Managing Analysis Reports 2-11
Analysis Report Permissions 2-12
File Permissions and Publishing 2-12
Configuring Analysis Report Permissions 2-13
Publishing an Analysis Report 2-13
Analysis Report Date Session Variables 2-14
3 Core Reports
Running Reports 3-1
Modifying Reports 3-1
Exporting Reports 3-3
iii
4 Custom Reports in Microsoft Excel
Installing iQuery 4-1
Building a Custom Report in Microsoft Excel 4-1
5 Scheduled Reports
Scheduling Reports for Email Distribution 5-1
6 Guest Check Information
Retrieving Information with Check Query 6-1
Retrieving Transaction Information with Audit & Analysis 6-2
Exporting Audit & Analysis Queries 6-3
7 Manager Communication
Configuring Manager Log Entry Categories 7-1
Working with the Manager Log 7-1
Searching the Manager Log 7-2
Adding an Entry to the Manager Log 7-2
Updating and Closing an Entry 7-2
Adding a Note to the Manager Log 7-3
8 User Settings
myPage 8-1
Configuring myPage Content 8-1
Configuring User Preferences 8-2
9 Organizational Hierarchies
Revenue Centers 9-2
Adding Levels 9-2
Adding Locations 9-2
Establishing Relationships Between Levels and Locations 9-3
10
Users and Roles
Creating Roles 10-1
Adding Users 10-2
iv
11
End User Access to Content
Creating Portlets 11-1
Assigning Portlets to Roles 11-2
Assigning Side Menus to Roles 11-2
Assigning Reports to Roles 11-2
Outage Alerts 11-3
Setting Outage Alert Recipients 11-3
Installing Remote Transfer Agent (RTA) at a Location 11-3
12
Financial Calendars and Day Parts
Financial Calendars 12-1
Accounting Cycles 12-3
Last Week of the Financial Year 12-5
Creating a Financial Calendar 12-5
Creating a Financial Year with the Automated Wizard 12-6
Creating a Financial Year Manually 12-6
Creating Day Parts 12-7
Overriding Day Parts 12-7
13
Currency and Exchange Rate
Enabling Currency Configuration and Setting the Common Currency 13-1
Adding a Currency Type 13-1
Adding and Updating Exchange Rates 13-2
14
Reason Codes
Creating Reason Codes 14-1
15
Reporting Hierarchies
Creating Reporting Hierarchies 15-1
16
Item Alignment
Master Groups and Master Stores 16-1
Alignment Rules 16-2
Configuring a Master Group 16-3
Assigning a Location as a Master Store 16-3
Assigning Locations to the Master Group 16-4
v
Creating Alignment Rules 16-4
Manually Aligning Items 16-5
17
Category Groups
Creating Category Groups 17-1
Creating Category Group Hierarchies 17-1
18
Cost Tiers
Creating Cost Tiers 18-1
Assigning Menu Items to Cost Tiers 18-1
19
Legacy Reports
Converting Interactive Reports to Analysis Reports 19-1
Converting Ad Hoc Reports to Analysis Reports 19-2
20
Standard Export
vi
Preface
Oracle Hospitality Reporting and Analytics is a web-based application that centralizespoint-of-sale (POS) data to provide operational and analytical insights into businessoperations, and to improve efficiency by delivering information to all roles within anorganization.
Purpose
This document is intended for customers subscribed to Oracle Hospitality Reportingand Analytics Advanced Cloud Services. Customers using Standard Cloud Servicesand On-Premise deployments may not have access to all features described in thedocumentation. Your organization type can affect visibility and access to featureswithin Reporting and Analytics.
The navigation instructions throughout the documentation may not accurately depictthe menu layout for your Oracle Hospitality Enterprise Back Office deploymentbecause administrators can customize the name and organization of the groups andlinks in the sidebar menu. Use the navigation instructions provided as a guideline forlocating the links in your deployment, or contact an administrator for assistance.
Audience
Oracle Hospitality Enterprise Back Office documentation applies to the following users:
• Users who perform day-to-day operations with Enterprise Back Office and whotypically do not have permissions to configure applications.
• Administrators who configure and maintain Enterprise Back Office. Administratorscan also have permissions to configure applications.
• System Administrators or Super Administrators who maintain Enterprise BackOffice servers and configuration files, implement initial application settings andconfigurations, and maintain back-end processes such as automated jobs anddata interfaces with third-party applications.
Customer Support
To contact Oracle Customer Support, access My Oracle Support at the following URL:
https://support.oracle.com
When contacting Customer Support, please provide the following:
• Product version and program/module name
• Functional and technical description of the problem (include business impact)
• Detailed step-by-step instructions to re-create
• Exact error message received
• Screen shots of each step you take
vii
Documentation
Oracle Hospitality product documentation is available on the Oracle Help Center at http://docs.oracle.com/en/industries/hospitality/.
Revision History
Table 1 Revision History
Date Description of Change
March 2017 Initial Publication
April 2017 Removed extraneous topics related to legacyreports.
September 2017 Corrected missing text in the Analysis Reportstopic.
March 2018 Removed the Standard Export chapter andreplaced with reference to the Standard ExportUser Guide that can be found in the EnterpriseBack Office 9.0 library.
Preface
viii
1Using Reporting and Analytics
Oracle Hospitality Reporting and Analytics is a web-based application that centralizespoint-of-sale (POS) data to provide operational and analytical insights into businessoperations, and to improve efficiency by delivering information to all roles within anorganization.
• Using Reporting and Analytics
• Choosing a Report Type
• Choosing a Dashboard
• Configuration Guidelines
• Maintaining Organizations
• Maintaining Users and Roles
• Maintaining Point-of-Sale Data
• Re-Aggregating Data
Using Reporting and AnalyticsUsers can perform the following non-administrative tasks to retrieve data or topersonalize Reporting and Analytics:
Table 1-1 Using Reporting and Analytics
I Want To Go To
Build or run reports that consolidate and applybusiness analytics to Point-of-Sale data.
Choosing a Report Type
View dashboards containing pre-constructedreports and data visualizations.
Choosing a Dashboard
Search for details for specific guest checks. Guest Check Information
Read and post comments and status updatesbetween managers.
Manager Communication
View and configure a personal dashboardcontaining reports, visualizations, and widgets.
myPage
Configure regional settings and personalizefilter and login defaults.
User Settings
Choosing a Report TypePoint-of-Sale (POS) applications post data to the Enterprise Back Office database,and Reporting and Analytics applies business intelligence and analytics to the data toproduce visualizations and reports for analysis and interpretation.
1-1
The reports generated by Reporting and Analytics include child reports, or drill-downreports, which inherit scope and properties from the parent report to display moreextensive and detailed information about the user selection. For example, if you arelooking at a sales report that includes a breakdown of sales by menu item, you canselect a menu item to view a drill-down report containing sales, tax, and servicecharge details specific to the selected menu item.
Reporting and Analytics allows you to leverage the following types of reports:
Table 1-2 Report Types
I Want To Go To
Reports that can be customized based onspecific sets of data from operations subjectareas and with applied business intelligence.
Analysis Reports
Pre-defined reports that show informationtargeting specific business operations.
Core Reports
Reports that can be customized with selectedsubjects and columns using a Microsoft Excelplug-in.
Custom Reports in Microsoft Excel
Related Topics
• Using Reporting and Analytics
Choosing a DashboardReporting and Analytics dashboards provide a collection of data and visualizationsdesigned to give you an overview of information on one screen and to allow you to drilldown for more detailed information. Some dashboards show different informationdepending on whether your location or organization is set to Table ServiceRestaurants (TSR) or Quick Service Restaurants (QSR).
You can add and view the following dashboards:
Chapter 1Choosing a Dashboard
1-2
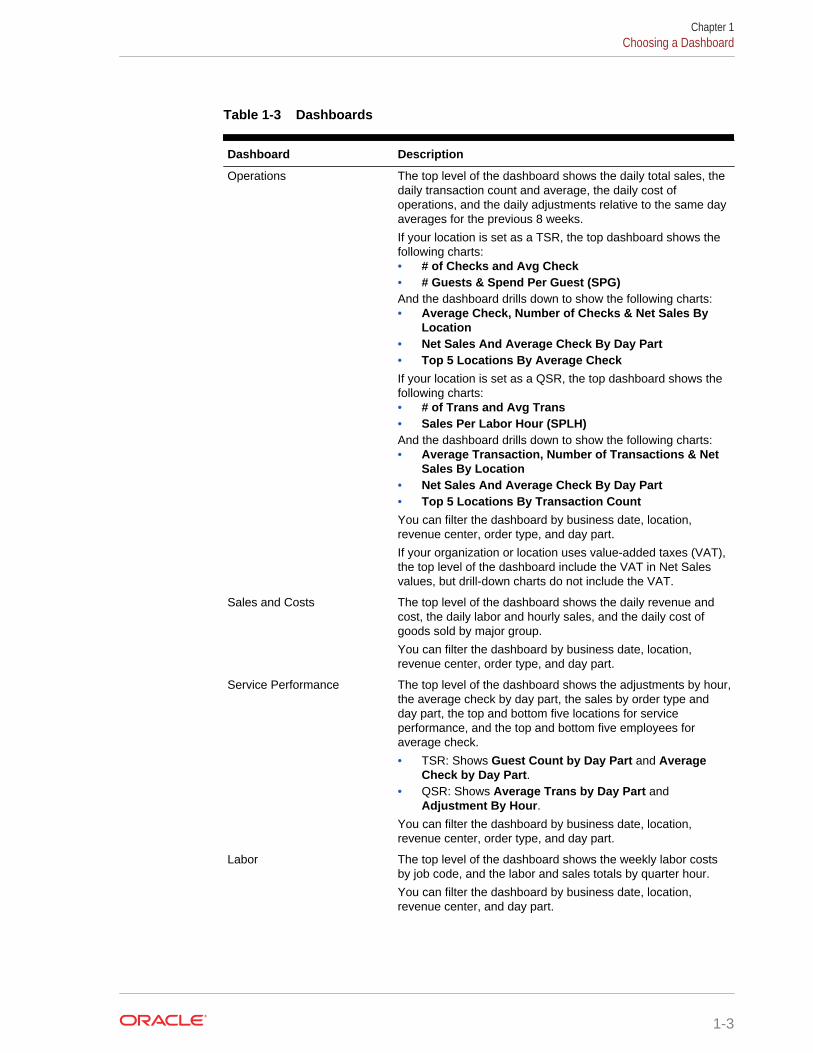
Table 1-3 Dashboards
Dashboard Description
Operations The top level of the dashboard shows the daily total sales, thedaily transaction count and average, the daily cost ofoperations, and the daily adjustments relative to the same dayaverages for the previous 8 weeks.
If your location is set as a TSR, the top dashboard shows thefollowing charts:• # of Checks and Avg Check• # Guests & Spend Per Guest (SPG)And the dashboard drills down to show the following charts:• Average Check, Number of Checks & Net Sales By
Location• Net Sales And Average Check By Day Part• Top 5 Locations By Average CheckIf your location is set as a QSR, the top dashboard shows thefollowing charts:• # of Trans and Avg Trans• Sales Per Labor Hour (SPLH)And the dashboard drills down to show the following charts:• Average Transaction, Number of Transactions & Net
Sales By Location• Net Sales And Average Check By Day Part• Top 5 Locations By Transaction CountYou can filter the dashboard by business date, location,revenue center, order type, and day part.
If your organization or location uses value-added taxes (VAT),the top level of the dashboard include the VAT in Net Salesvalues, but drill-down charts do not include the VAT.
Sales and Costs The top level of the dashboard shows the daily revenue andcost, the daily labor and hourly sales, and the daily cost ofgoods sold by major group.
You can filter the dashboard by business date, location,revenue center, order type, and day part.
Service Performance The top level of the dashboard shows the adjustments by hour,the average check by day part, the sales by order type andday part, the top and bottom five locations for serviceperformance, and the top and bottom five employees foraverage check.
• TSR: Shows Guest Count by Day Part and AverageCheck by Day Part.
• QSR: Shows Average Trans by Day Part andAdjustment By Hour.
You can filter the dashboard by business date, location,revenue center, order type, and day part.
Labor The top level of the dashboard shows the weekly labor costsby job code, and the labor and sales totals by quarter hour.
You can filter the dashboard by business date, location,revenue center, and day part.
Chapter 1Choosing a Dashboard
1-3
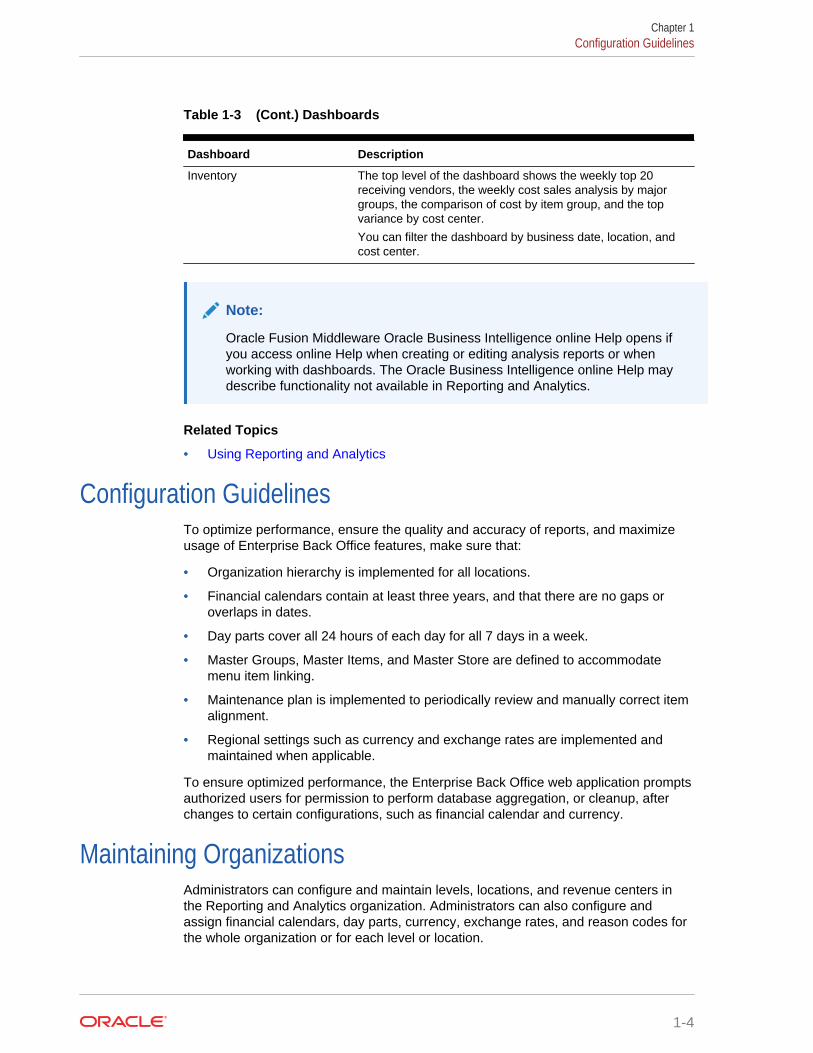
Table 1-3 (Cont.) Dashboards
Dashboard Description
Inventory The top level of the dashboard shows the weekly top 20receiving vendors, the weekly cost sales analysis by majorgroups, the comparison of cost by item group, and the topvariance by cost center.
You can filter the dashboard by business date, location, andcost center.
Note:
Oracle Fusion Middleware Oracle Business Intelligence online Help opens ifyou access online Help when creating or editing analysis reports or whenworking with dashboards. The Oracle Business Intelligence online Help maydescribe functionality not available in Reporting and Analytics.
Related Topics
• Using Reporting and Analytics
Configuration GuidelinesTo optimize performance, ensure the quality and accuracy of reports, and maximizeusage of Enterprise Back Office features, make sure that:
• Organization hierarchy is implemented for all locations.
• Financial calendars contain at least three years, and that there are no gaps oroverlaps in dates.
• Day parts cover all 24 hours of each day for all 7 days in a week.
• Master Groups, Master Items, and Master Store are defined to accommodatemenu item linking.
• Maintenance plan is implemented to periodically review and manually correct itemalignment.
• Regional settings such as currency and exchange rates are implemented andmaintained when applicable.
To ensure optimized performance, the Enterprise Back Office web application promptsauthorized users for permission to perform database aggregation, or cleanup, afterchanges to certain configurations, such as financial calendar and currency.
Maintaining OrganizationsAdministrators can configure and maintain levels, locations, and revenue centers inthe Reporting and Analytics organization. Administrators can also configure andassign financial calendars, day parts, currency, exchange rates, and reason codes forthe whole organization or for each level or location.
Chapter 1Configuration Guidelines
1-4
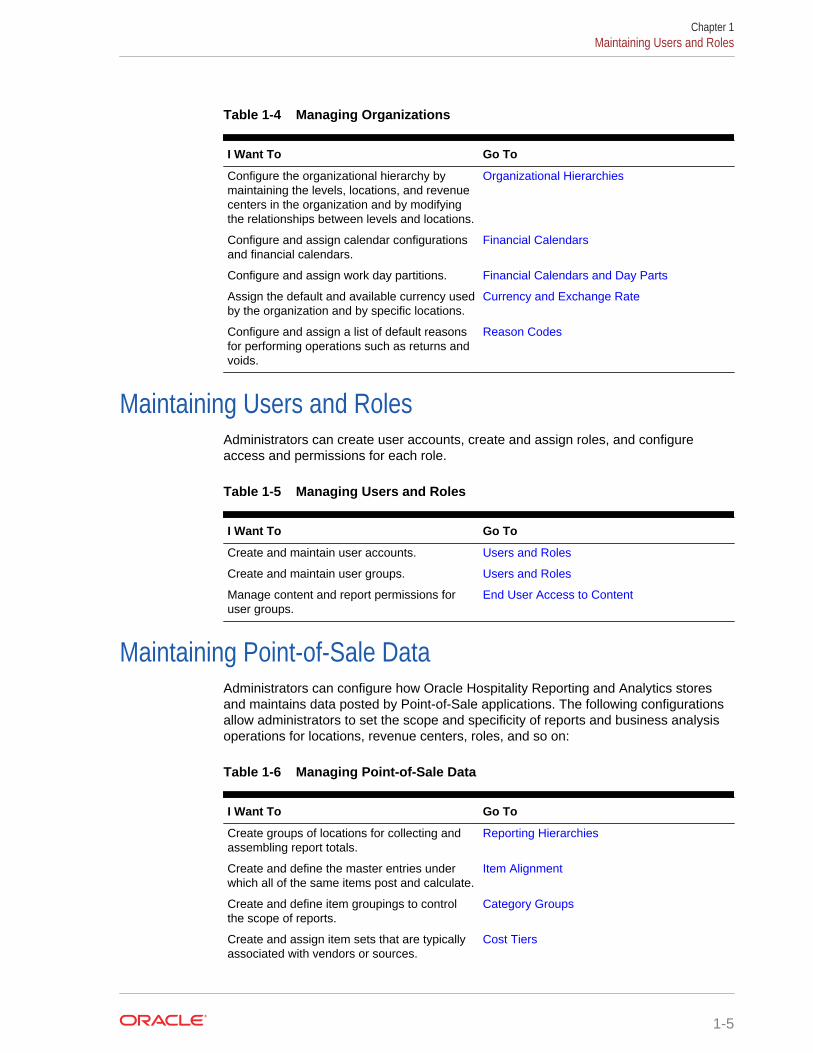
Table 1-4 Managing Organizations
I Want To Go To
Configure the organizational hierarchy bymaintaining the levels, locations, and revenuecenters in the organization and by modifyingthe relationships between levels and locations.
Organizational Hierarchies
Configure and assign calendar configurationsand financial calendars.
Financial Calendars
Configure and assign work day partitions. Financial Calendars and Day Parts
Assign the default and available currency usedby the organization and by specific locations.
Currency and Exchange Rate
Configure and assign a list of default reasonsfor performing operations such as returns andvoids.
Reason Codes
Maintaining Users and RolesAdministrators can create user accounts, create and assign roles, and configureaccess and permissions for each role.
Table 1-5 Managing Users and Roles
I Want To Go To
Create and maintain user accounts. Users and Roles
Create and maintain user groups. Users and Roles
Manage content and report permissions foruser groups.
End User Access to Content
Maintaining Point-of-Sale DataAdministrators can configure how Oracle Hospitality Reporting and Analytics storesand maintains data posted by Point-of-Sale applications. The following configurationsallow administrators to set the scope and specificity of reports and business analysisoperations for locations, revenue centers, roles, and so on:
Table 1-6 Managing Point-of-Sale Data
I Want To Go To
Create groups of locations for collecting andassembling report totals.
Reporting Hierarchies
Create and define the master entries underwhich all of the same items post and calculate.
Item Alignment
Create and define item groupings to controlthe scope of reports.
Category Groups
Create and assign item sets that are typicallyassociated with vendors or sources.
Cost Tiers
Chapter 1Maintaining Users and Roles
1-5
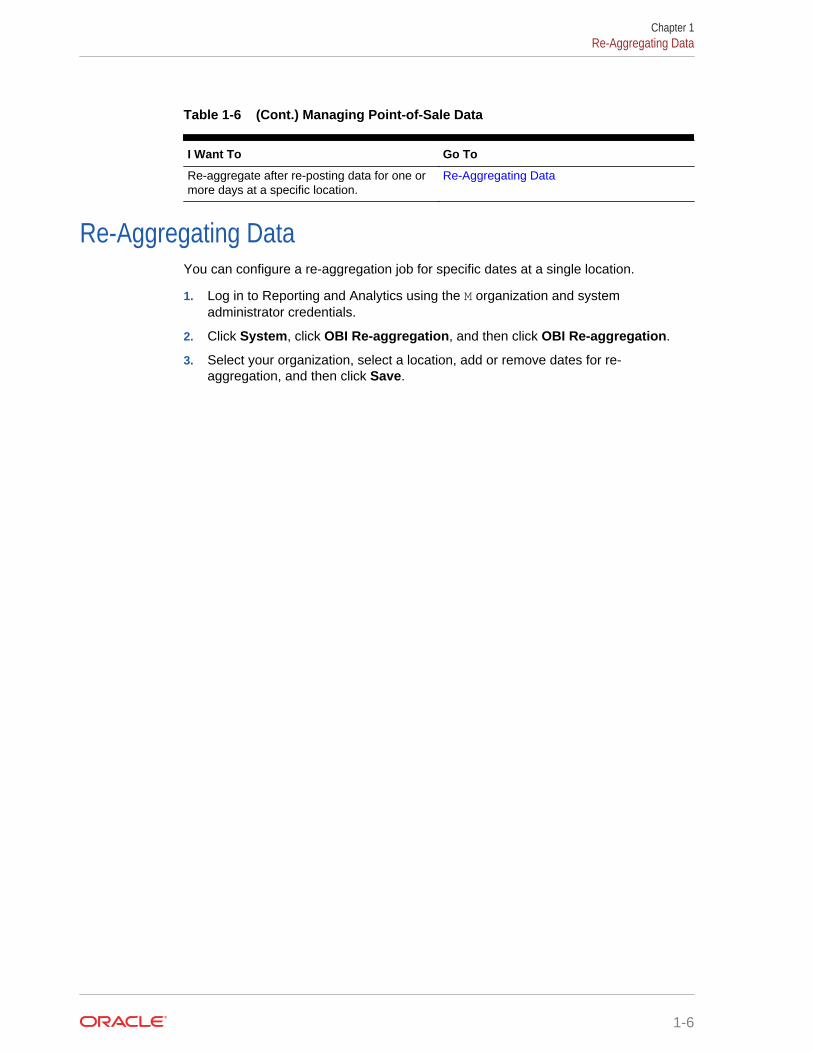
Table 1-6 (Cont.) Managing Point-of-Sale Data
I Want To Go To
Re-aggregate after re-posting data for one ormore days at a specific location.
Re-Aggregating Data
Re-Aggregating DataYou can configure a re-aggregation job for specific dates at a single location.
1. Log in to Reporting and Analytics using the M organization and systemadministrator credentials.
2. Click System, click OBI Re-aggregation, and then click OBI Re-aggregation.
3. Select your organization, select a location, add or remove dates for re-aggregation, and then click Save.
Chapter 1Re-Aggregating Data
1-6
2Analysis Reports
Analysis Reports allow you to design and maintain reports and visualizations of dataposted to Enterprise Back Office. Analysis reports are comprised of:
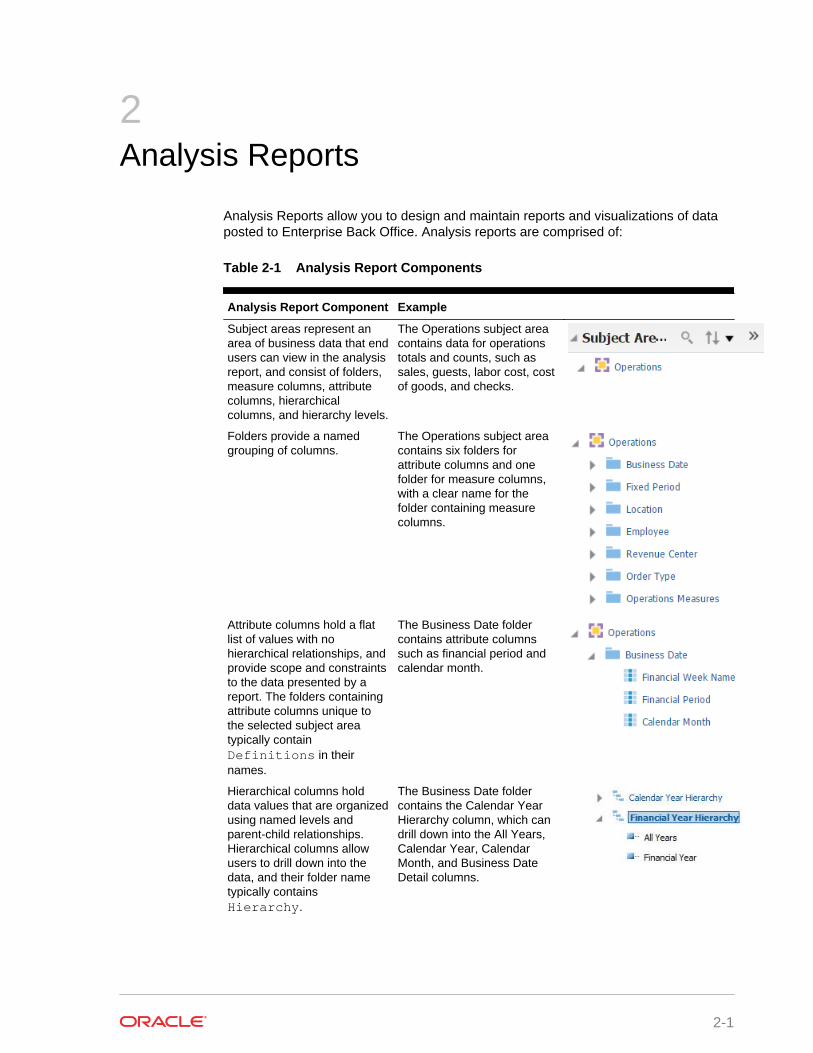
Table 2-1 Analysis Report Components
Analysis Report Component Example
Subject areas represent anarea of business data that endusers can view in the analysisreport, and consist of folders,measure columns, attributecolumns, hierarchicalcolumns, and hierarchy levels.
The Operations subject areacontains data for operationstotals and counts, such assales, guests, labor cost, costof goods, and checks.
Folders provide a namedgrouping of columns.
The Operations subject areacontains six folders forattribute columns and onefolder for measure columns,with a clear name for thefolder containing measurecolumns.
Attribute columns hold a flatlist of values with nohierarchical relationships, andprovide scope and constraintsto the data presented by areport. The folders containingattribute columns unique tothe selected subject areatypically containDefinitions in theirnames.
The Business Date foldercontains attribute columnssuch as financial period andcalendar month.
Hierarchical columns holddata values that are organizedusing named levels andparent-child relationships.Hierarchical columns allowusers to drill down into thedata, and their folder nametypically containsHierarchy.
The Business Date foldercontains the Calendar YearHierarchy column, which candrill down into the All Years,Calendar Year, CalendarMonth, and Business DateDetail columns.
2-1
Table 2-1 (Cont.) Analysis Report Components
Analysis Report Component Example
Measure columns hold a list ofdata values that typicallyreside in the BusinessIntelligence repository as afact table, which can changeor be added or aggregated.The folders containingmeasure columns typicallycontain Measures in theirnames.
The Operations subject areacontains the OperationsMeasures folder, whichcontains measure columnssuch as Net Sales, SalesCount, and Number ofChecks.
You can select the operational subject area, or business model, that applies to thereport or visualization you want to view or create, and then you can apply businessanalytics by:
• Selecting specific data sets to use in the report, and then applying filters to eachdata set.
• Selecting and configuring the resulting appearance of data, such as by rearrangingcolumns and rows in the table, inserting visualizations and charts, and changingcolumn labels.
• Adding and configuring user prompts to allow users viewing the report to configuredata filters as needed. For example, you can add a date selection prompt to allowusers to set the range of dates for which they need the report.
Oracle Fusion Middleware Oracle Business Intelligence online Help opens if youaccess online Help when creating or editing analysis reports or when working withdashboards. The Oracle Business Intelligence online Help may describe functionalitynot available in Reporting and Analytics.
• Analysis Report Examples
• Report Walkthrough: Revenue and Cost Comparisons
• Running, Printing, and Exporting Analysis Reports
• Creating Analysis Reports
• Managing Analysis Reports
• Analysis Report Permissions
• File Permissions and Publishing
• Configuring Analysis Report Permissions
• Publishing an Analysis Report
• Analysis Report Date Session Variables
Related Topics
• Choosing a Report Type
Related Topics
• File Permissions and Publishing
Chapter 2
2-2
Related Topics
• Scheduled Reports
Analysis Report ExamplesThe following analysis reports provide examples of how you can leverage andimplement analysis reports to solve business information needs.
Chief Operating Officer
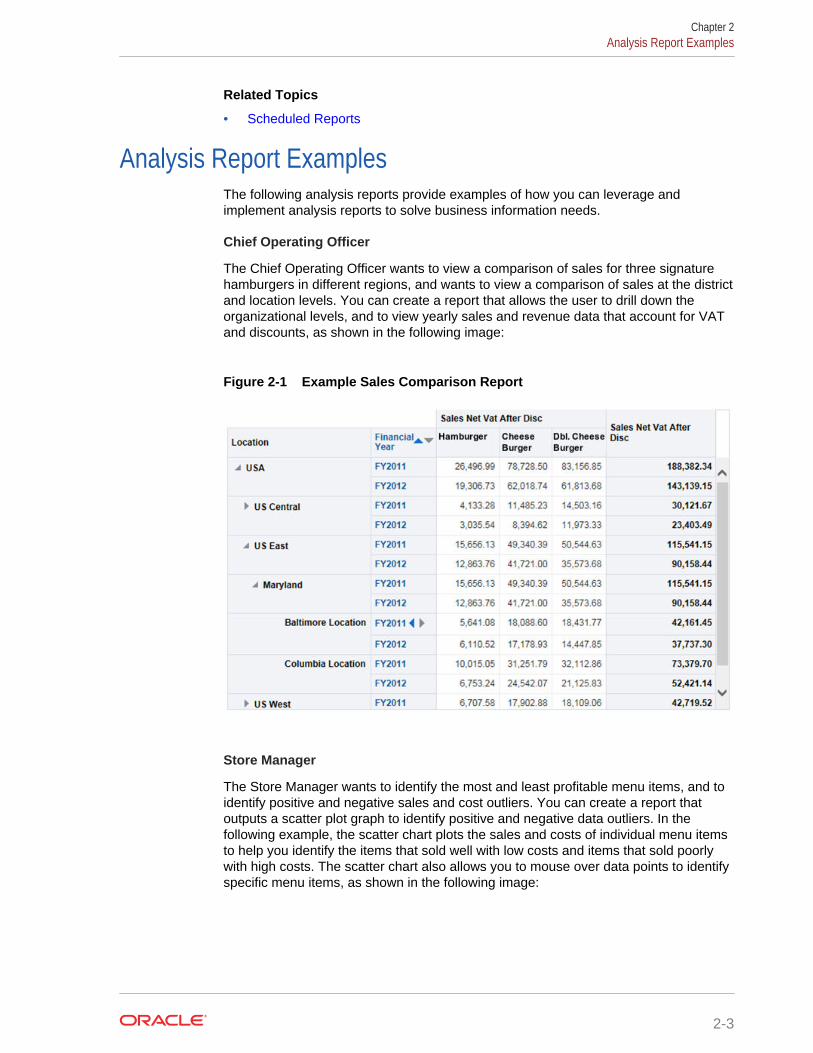
The Chief Operating Officer wants to view a comparison of sales for three signaturehamburgers in different regions, and wants to view a comparison of sales at the districtand location levels. You can create a report that allows the user to drill down theorganizational levels, and to view yearly sales and revenue data that account for VATand discounts, as shown in the following image:
Figure 2-1 Example Sales Comparison Report
Store Manager
The Store Manager wants to identify the most and least profitable menu items, and toidentify positive and negative sales and cost outliers. You can create a report thatoutputs a scatter plot graph to identify positive and negative data outliers. In thefollowing example, the scatter chart plots the sales and costs of individual menu itemsto help you identify the items that sold well with low costs and items that sold poorlywith high costs. The scatter chart also allows you to mouse over data points to identifyspecific menu items, as shown in the following image:
Chapter 2Analysis Report Examples
2-3
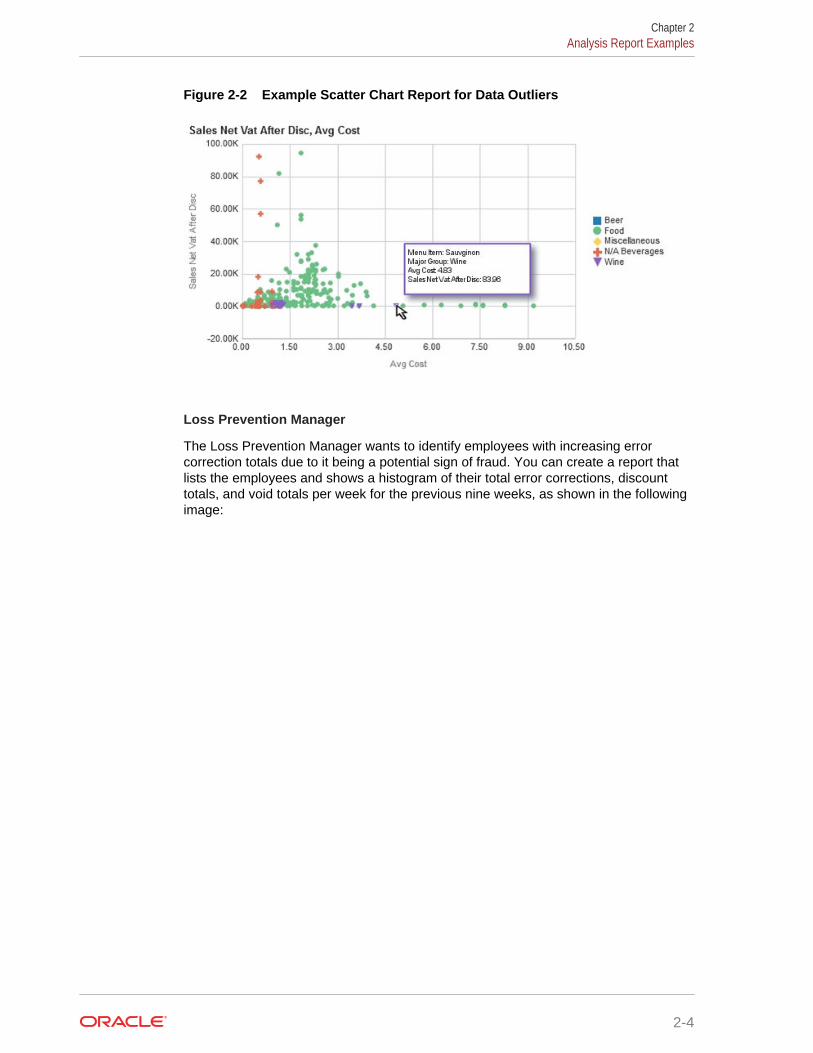
Figure 2-2 Example Scatter Chart Report for Data Outliers
Loss Prevention Manager
The Loss Prevention Manager wants to identify employees with increasing errorcorrection totals due to it being a potential sign of fraud. You can create a report thatlists the employees and shows a histogram of their total error corrections, discounttotals, and void totals per week for the previous nine weeks, as shown in the followingimage:
Chapter 2Analysis Report Examples
2-4
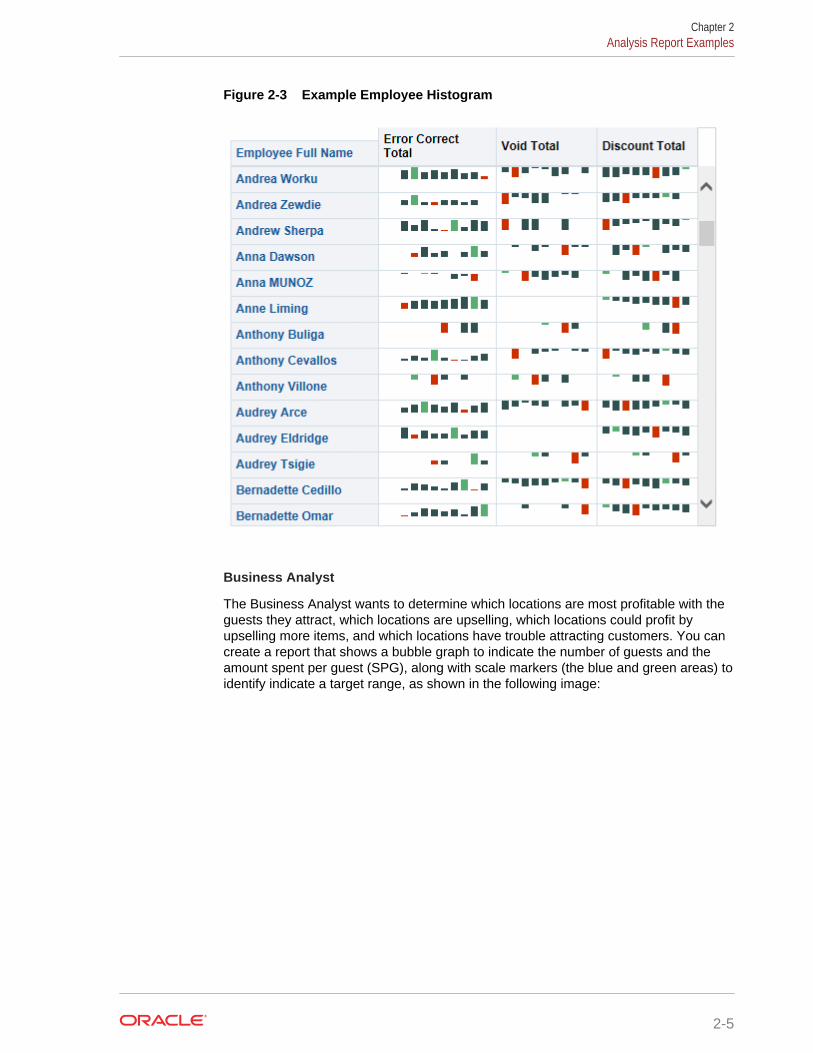
Figure 2-3 Example Employee Histogram
Business Analyst
The Business Analyst wants to determine which locations are most profitable with theguests they attract, which locations are upselling, which locations could profit byupselling more items, and which locations have trouble attracting customers. You cancreate a report that shows a bubble graph to indicate the number of guests and theamount spent per guest (SPG), along with scale markers (the blue and green areas) toidentify indicate a target range, as shown in the following image:
Chapter 2Analysis Report Examples
2-5
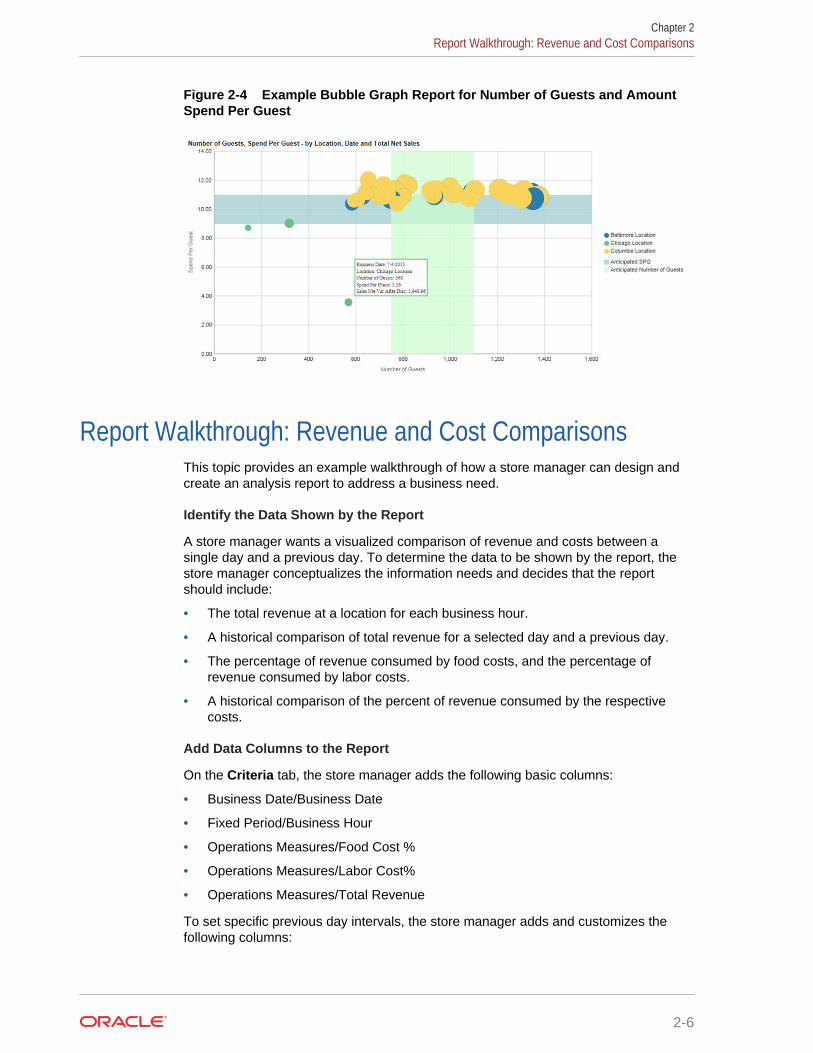
Figure 2-4 Example Bubble Graph Report for Number of Guests and AmountSpend Per Guest
Report Walkthrough: Revenue and Cost ComparisonsThis topic provides an example walkthrough of how a store manager can design andcreate an analysis report to address a business need.
Identify the Data Shown by the Report
A store manager wants a visualized comparison of revenue and costs between asingle day and a previous day. To determine the data to be shown by the report, thestore manager conceptualizes the information needs and decides that the reportshould include:
• The total revenue at a location for each business hour.
• A historical comparison of total revenue for a selected day and a previous day.
• The percentage of revenue consumed by food costs, and the percentage ofrevenue consumed by labor costs.
• A historical comparison of the percent of revenue consumed by the respectivecosts.
Add Data Columns to the Report
On the Criteria tab, the store manager adds the following basic columns:
• Business Date/Business Date
• Fixed Period/Business Hour
• Operations Measures/Food Cost %
• Operations Measures/Labor Cost%
• Operations Measures/Total Revenue
To set specific previous day intervals, the store manager adds and customizes thefollowing columns:
Chapter 2Report Walkthrough: Revenue and Cost Comparisons
2-6
• Operations Measures/Food Cost % (Last Financial Week): AGO("OperationsMeasures"."Food Cost %", "Business Date"."Financial YearHierarchy"."Financial Week",1)
• Operations Measures/Food Cost % (Last Financial Quarter): AGO("OperationsMeasures"."Food Cost %", "Business Date"."Financial YearHierarchy"."Financial Quarter",1)
• Operations Measures/Labor Cost % (Last Financial Week): AGO("OperationsMeasures"."Labor Cost %", "Business Date"."Financial YearHierarchy"."Financial Week",1)
• Operations Measures/Labor Cost % (Last Financial Quarter): AGO("OperationsMeasures"."Labor Cost %", "Business Date"."Financial YearHierarchy"."Financial Quarter",1)
• Operations Measures/Total Revenue(Last Financial Week): AGO("OperationsMeasures"."Total Revenue", "Business Date"."Financial YearHierarchy"."Financial Week",1)
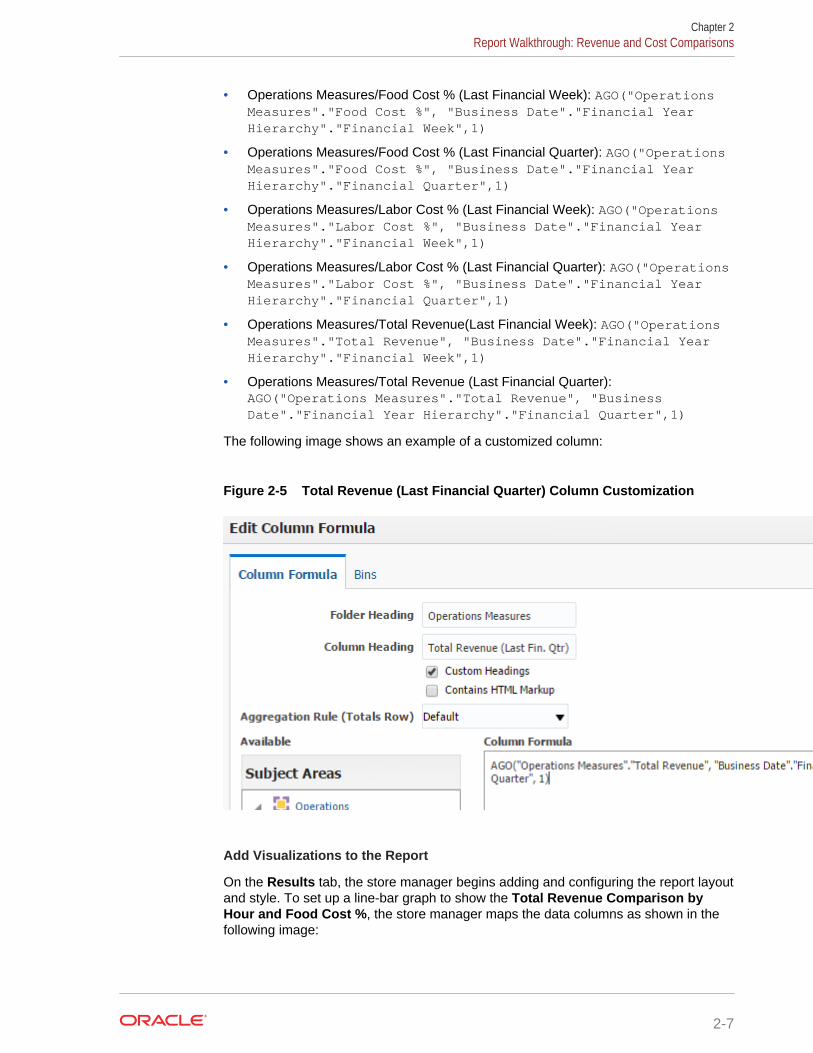
• Operations Measures/Total Revenue (Last Financial Quarter):AGO("Operations Measures"."Total Revenue", "BusinessDate"."Financial Year Hierarchy"."Financial Quarter",1)
The following image shows an example of a customized column:
Figure 2-5 Total Revenue (Last Financial Quarter) Column Customization
Add Visualizations to the Report
On the Results tab, the store manager begins adding and configuring the report layoutand style. To set up a line-bar graph to show the Total Revenue Comparison byHour and Food Cost %, the store manager maps the data columns as shown in thefollowing image:
Chapter 2Report Walkthrough: Revenue and Cost Comparisons
2-7
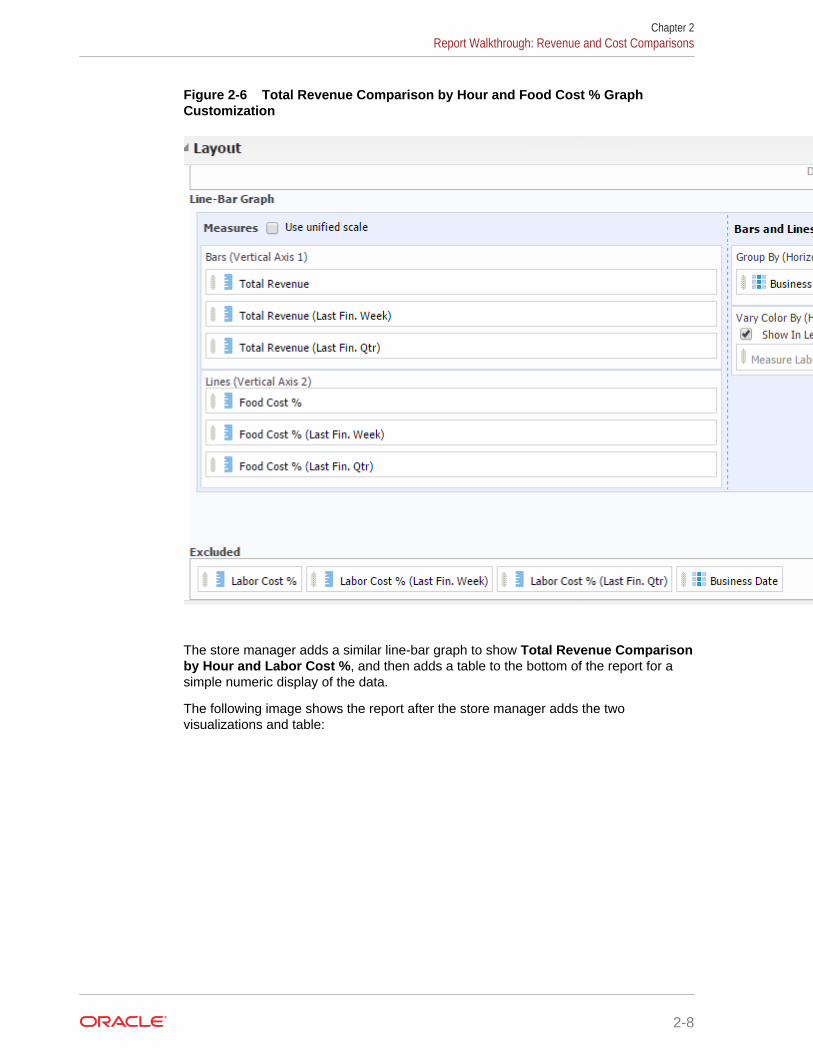
Figure 2-6 Total Revenue Comparison by Hour and Food Cost % GraphCustomization
The store manager adds a similar line-bar graph to show Total Revenue Comparisonby Hour and Labor Cost %, and then adds a table to the bottom of the report for asimple numeric display of the data.
The following image shows the report after the store manager adds the twovisualizations and table:
Chapter 2Report Walkthrough: Revenue and Cost Comparisons
2-8
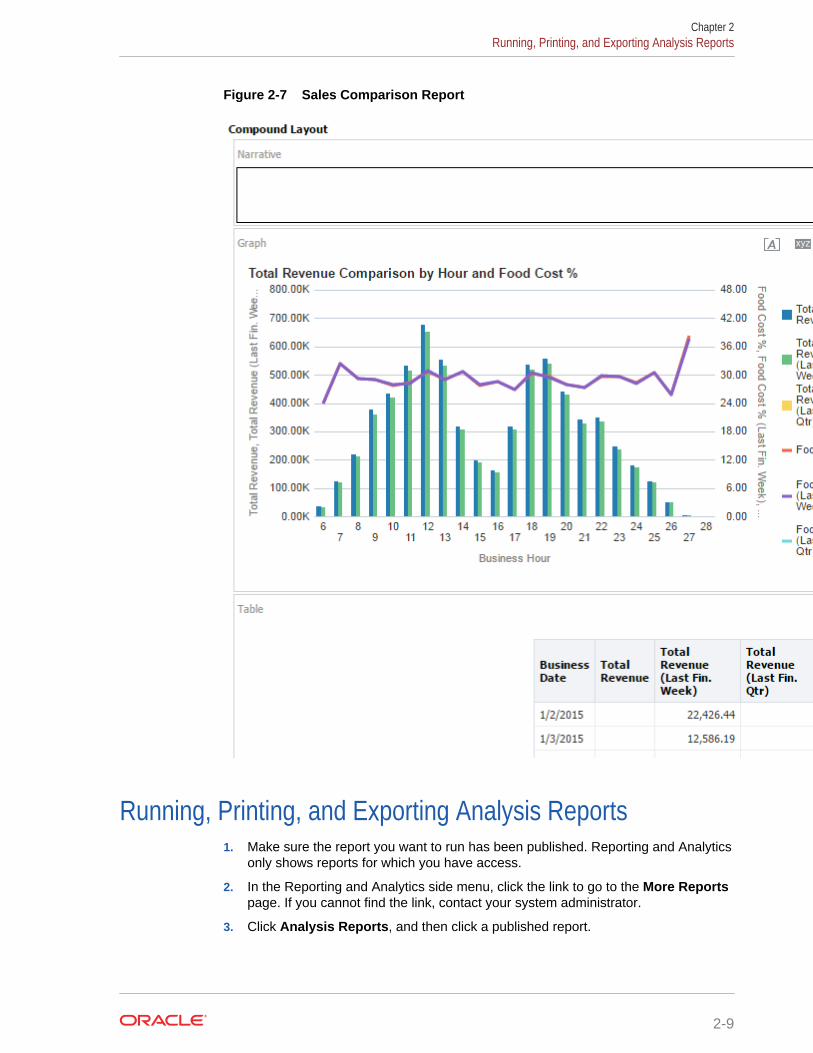
Figure 2-7 Sales Comparison Report
Running, Printing, and Exporting Analysis Reports1. Make sure the report you want to run has been published. Reporting and Analytics
only shows reports for which you have access.
2. In the Reporting and Analytics side menu, click the link to go to the More Reportspage. If you cannot find the link, contact your system administrator.
3. Click Analysis Reports, and then click a published report.
Chapter 2Running, Printing, and Exporting Analysis Reports
2-9
4. To run and view the analysis report, select or enter the report parameters, andthen click OK.
5. To clear the report parameters, click Reset.
6. To print the analysis report, click Print, and then select a printable format.
7. To export the analysis report, click Export, and then select a file or data format.
8. To add the analysis report to a collection of reports and dashboards, click Add toBriefing Book. You can download the briefing book as a PDF or HTML.
Creating Analysis ReportsThe Oracle Fusion Middleware User's Guide for Oracle Business IntelligenceEnterprise Edition contains information and instructions for using the analysis editor,but also contains information for features and functionality not included in theReporting and Analytics implementation.
1. In the Reporting and Analytics side menu, click the link to go to the AnalysisReports page. If you cannot find the link, contact your system administrator.
2. Click Create Analysis, and then click the subject area for which you want tocreate the report.
3. Configure the report:
a. On the Criteria tab, drag and drop columns from the Subject Area pane tothe Selected Columns pane to add columns to the report and to configuredefault sorting and filters.
b. On the Criteria tab, add, edit, and remove filters in the Filters pane. You mustkeep the Business Date and Location filters to allow the report to publish andto allow ReportMail to work with the report.
c. On the Results tab, preview the appearance and output of the report, and editthe layout of the report. You can customize the appearance of the report,change column labels, and apply aggregation rules for direct databaserequests.
d. On the Results tab, you can configure rules for data selection in the SelectionSteps pane to refine the data on which the report works.
e. On the Prompts tab, you can add and configure user input prompts in thePrompts pane to create a form in which users specify their report parameters.
f. On the Prompts tab, you can configure the title, text, and appearance of theprompts form in the Display pane.
4. To add subject areas to the report:
a. On the Criteria tab, click Show More Buttons in the Subject Area pane.
b. Click Add / Remove Subject Areas, select the subject areas, and then clickOK
5. To add and configure columns for the report:
a. On the Criteria tab, find the columns you want to add to the report in theSubject Area pane.
If you added another subject area to the report, measure columns do notreturn values if the attribute and hierarchy columns in the report do not applyto all subject areas.
Chapter 2Creating Analysis Reports
2-10
b. Drag and drop the columns to the Selected Columns pane.
c. To configure the sorting order for a column, click the configure icon, selectSort, and then select the sorting method.
d. To change the aggregation rule for a column, click the configure icon, selectEdit Formula, and then select the Aggregation Rule from the drop-down list.
e. To configure filters for a column, click the configure icon, select Filter, andthen configure the filter for the column.
6. To add a filter for a subject area element that is not a column in the report:
a. On the Criteria tab, click the Create a filter for the current Subject Areabutton in the Filters pane.
b. Navigate to the subject area element by which you want to filter, and then clickOK.
c. Configure the filter settings, and then click OK.
7. To add and configure prompts for user input when running the report:
a. On the Prompts tab, click the New button.
b. Select the type of prompt you want to add.
c. Configure the prompt, and then click OK.
8. To configure the prompt form:
a. On the Prompts tab, click the Edit button in the Display pane.
b. Configure the form, such as by setting the title and information text to showwith the user input prompts, and then click OK.
9. Click Save As to save the report in your My Folder. You can now publish thereport.
Related Topics
• Publishing an Analysis Report
Related Topics
• Converting Ad Hoc Reports to Analysis Reports
• Converting Interactive Reports to Analysis Reports
Related Topics
• Analysis Report Date Session Variables
Managing Analysis ReportsIf you have access to the Oracle Business Intelligence (OBI) portlet, you can accessthe analysis reports that you created and saved to your personal folder.
1. In the Reporting and Analytics side menu, click the link to go to the AnalysisReports page. If you cannot find the link, contact your system administrator.
2. Click Modify/Delete Analysis.
3. In My Folders, navigate to the analysis report.
4. To edit the analysis report, click Edit. Changes to the report only affect your localinstance and do not affect the published instance of the report. If you want to applychanges to a published report, you must unpublish and then republish the report.
Chapter 2Managing Analysis Reports
2-11
5. To print the analysis report, right-click the report, click Print, and then select aprintable format.
6. To export the analysis report, right-click the report, click Export, and then select afile or data format.
7. To add the analysis report to a collection of reports and dashboards, right-click thereport, and then click Add to Briefing Book. You can download the briefing bookas a PDF or HTML
8. To delete the analysis report, right-click the report, and then click Delete. Thisdoes not affect the published instance of a report.
9. To make a copy of the analysis report, right-click the report, and then click Copy.
10. To change the filename of the analysis report, right-click the report, and then clickRename. This does not affect the published instance of a report.
Related Topics
• Publishing an Analysis Report
Analysis Report PermissionsAnalysis Reports implement the following user permissions:
• All users with access to OBIEE Analysis can create, preview, modify, and publishtheir own reports through the portlet.
Users with the Publish/Un-Publish Analysis permission can publish reportscreated by other users.
• All users, regardless of access to OBIEE Analysis, can run published reports, andcan then export, print, add to a briefing book, and copy the analysis XML for thereport output.
Related Topics
• File Permissions and Publishing
• Configuring Analysis Report Permissions
• Publishing an Analysis Report
File Permissions and PublishingAnalysis Reports enforce file permissions by restricting access to the My Folder foreach user account and to the Shared Folder for each organization:
• Only the specific user can view and access the contents of their My Folder.
• All users can view the content of the Shared Folder but cannot enact changes.
When you create an analysis report, the system creates and saves the report in yourMy Folder. This prevents all other users from being able to run and performmodifications on your report.
When you publish the report, the system creates a copy of your saved report in theShared Folder, and allows users without access to the OBIEE Analysis portlet torun the report.
Chapter 2Analysis Report Permissions
2-12
Related Topics
• Analysis Reports
Related Topics
• Analysis Report Permissions
• Configuring Analysis Report Permissions
• Publishing an Analysis Report
Configuring Analysis Report Permissions1. In the Reporting and Analytics side menu, click the link to go to the Role Portlets
Administrator For page. If you cannot find the link, contact your systemadministrator.
2. Select the user role for which you want to configure analysis reports publishingpermissions, and then click Configure.
3. Add the OBIEE Analysis portlet, or select OBIEE Analysis and then click Edit.
4. Select or unselect Publish/Un-Publish Analysis, and then click Save.
Related Topics
• File Permissions and Publishing
• Analysis Report Permissions
• Publishing an Analysis Report
Publishing an Analysis Report1. In the Reporting and Analytics side menu, click the link to go to the Analysis
Reports page. If you cannot find the link, contact your system administrator.
2. Click Publish Analysis.
3. Use the filters to find and select the report for which you want to configurepermissions, and then click Publish.
4. Select whether to configure permissions for the report at the Roles level or at theindividual Users level.
You cannot configure a report to have both role-level and user-level permissions.For example, if you configure role-based permissions for a report, and thenconfigure user-based permissions, the user-based permissions overwrite the role-based permissions.
5. Use the lists and arrows to add or remove permissions, and then click Save.
Related Topics
• Creating Analysis Reports
Related Topics
• Managing Analysis Reports
Related Topics
• File Permissions and Publishing
Chapter 2Configuring Analysis Report Permissions
2-13
• Analysis Report Permissions
• Configuring Analysis Report Permissions
Analysis Report Date Session VariablesYou can use the Oracle Business Intelligence function or session variables installed byReporting and Analytics as described in the following tables when configuring formulasand columns for dates in Analysis Reports.
All examples assume that:
• The Point-of-Sale application at the store runs End-of-Day (EOD) operations everyday, even when the store remains closed.
• The starting day of the week for the 4-4-4 financial year is Thursday.
Today and Yesterday
The Today and Yesterday variables do not work based off of the current calendardate, as described in the following table:
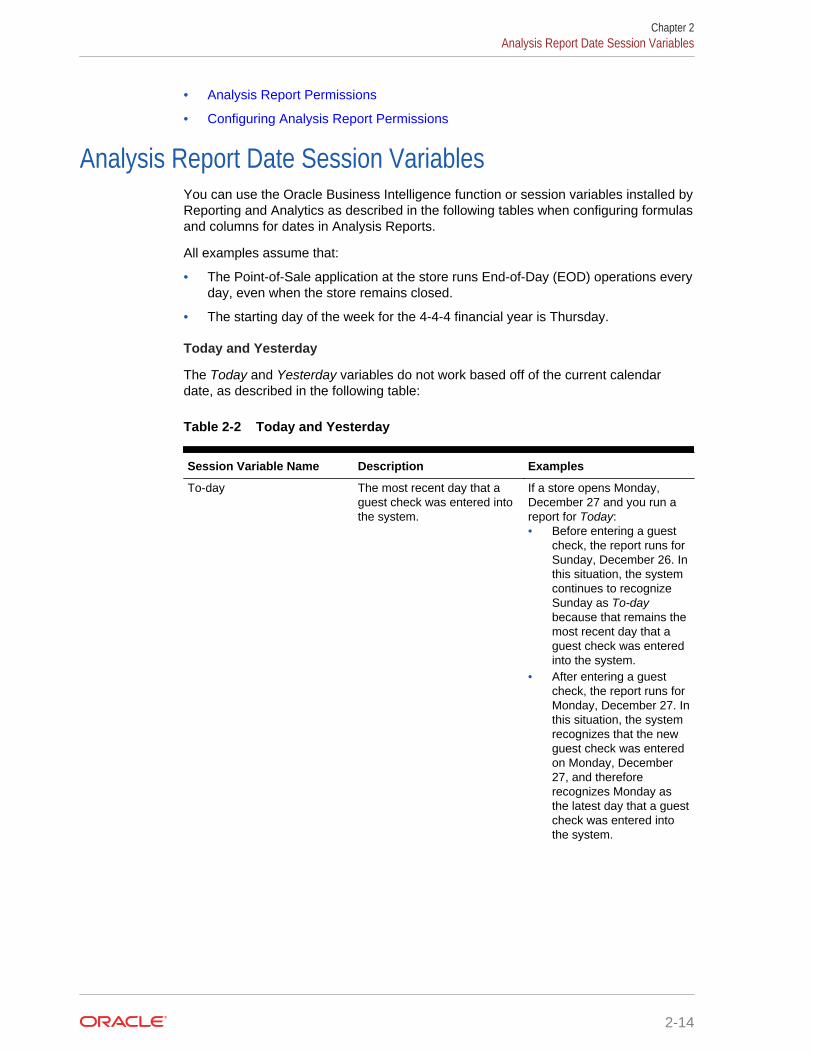
Table 2-2 Today and Yesterday
Session Variable Name Description Examples
To-day The most recent day that aguest check was entered intothe system.
If a store opens Monday,December 27 and you run areport for Today:• Before entering a guest
check, the report runs forSunday, December 26. Inthis situation, the systemcontinues to recognizeSunday as To-daybecause that remains themost recent day that aguest check was enteredinto the system.
• After entering a guestcheck, the report runs forMonday, December 27. Inthis situation, the systemrecognizes that the newguest check was enteredon Monday, December27, and thereforerecognizes Monday asthe latest day that a guestcheck was entered intothe system.
Chapter 2Analysis Report Date Session Variables
2-14
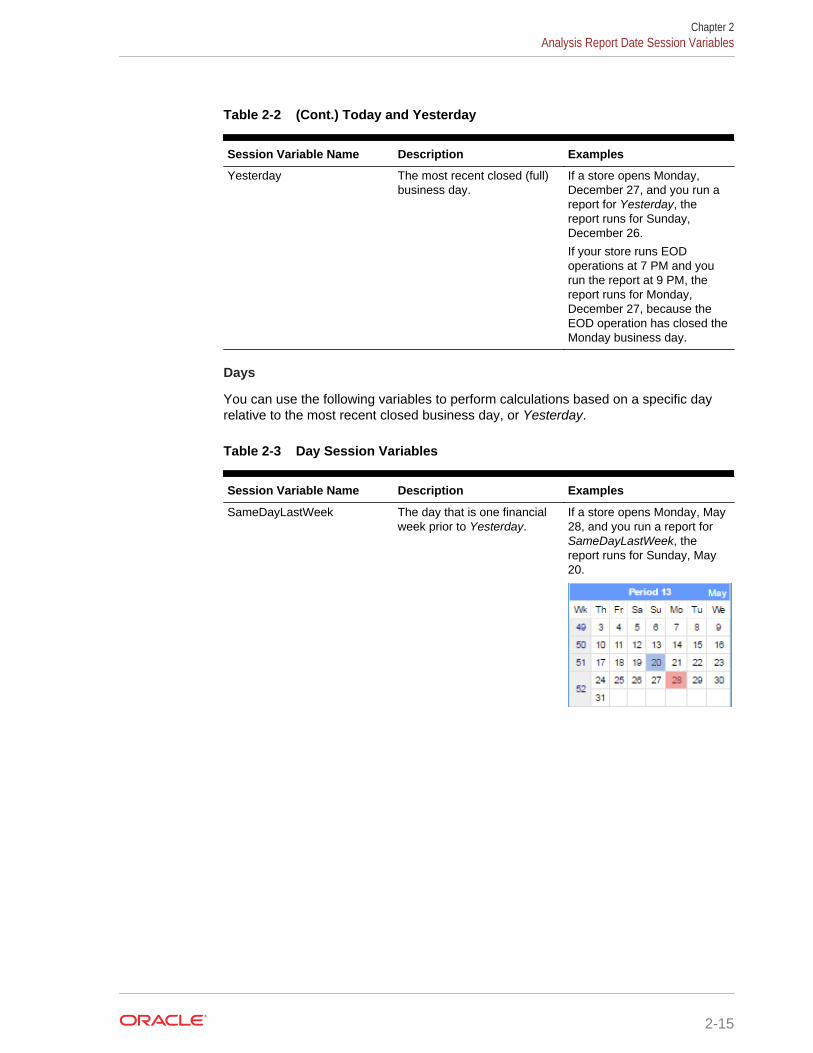
Table 2-2 (Cont.) Today and Yesterday
Session Variable Name Description Examples
Yesterday The most recent closed (full)business day.
If a store opens Monday,December 27, and you run areport for Yesterday, thereport runs for Sunday,December 26.
If your store runs EODoperations at 7 PM and yourun the report at 9 PM, thereport runs for Monday,December 27, because theEOD operation has closed theMonday business day.
Days
You can use the following variables to perform calculations based on a specific dayrelative to the most recent closed business day, or Yesterday.
Table 2-3 Day Session Variables
Session Variable Name Description Examples
SameDayLastWeek The day that is one financialweek prior to Yesterday.
If a store opens Monday, May28, and you run a report forSameDayLastWeek, thereport runs for Sunday, May20.
Chapter 2Analysis Report Date Session Variables
2-15
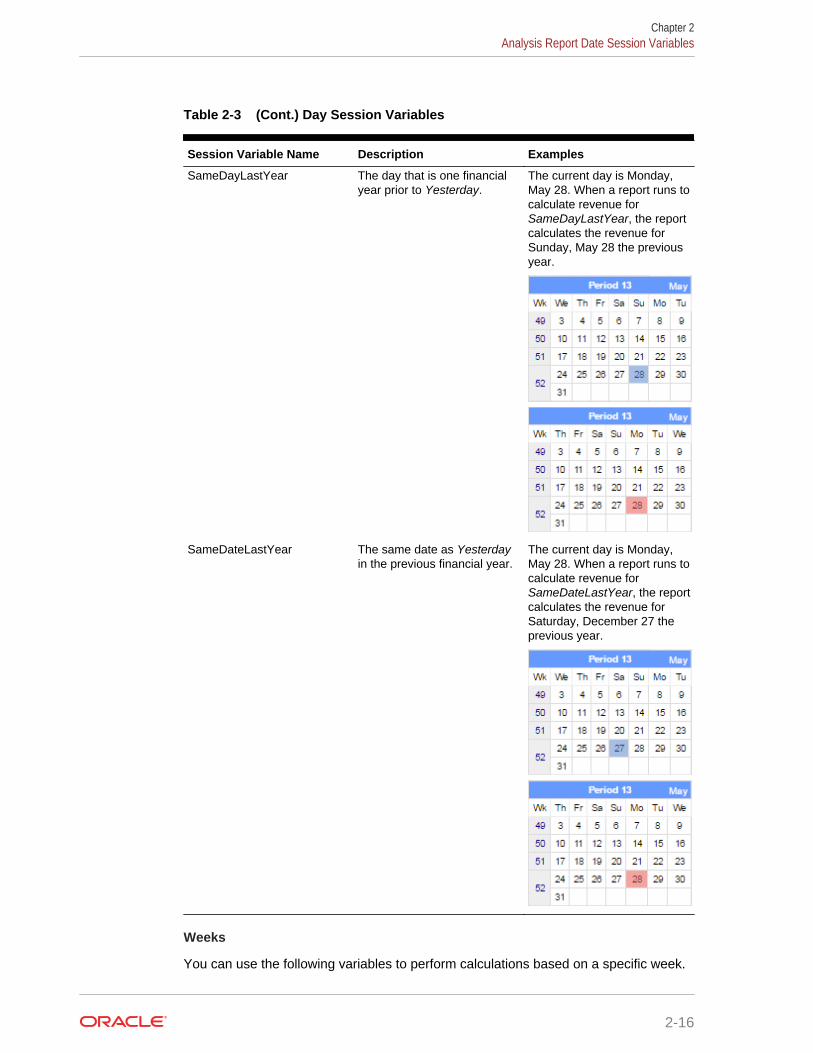
Table 2-3 (Cont.) Day Session Variables
Session Variable Name Description Examples
SameDayLastYear The day that is one financialyear prior to Yesterday.
The current day is Monday,May 28. When a report runs tocalculate revenue forSameDayLastYear, the reportcalculates the revenue forSunday, May 28 the previousyear.
SameDateLastYear The same date as Yesterdayin the previous financial year.
The current day is Monday,May 28. When a report runs tocalculate revenue forSameDateLastYear, the reportcalculates the revenue forSaturday, December 27 theprevious year.
Weeks
You can use the following variables to perform calculations based on a specific week.
Chapter 2Analysis Report Date Session Variables
2-16
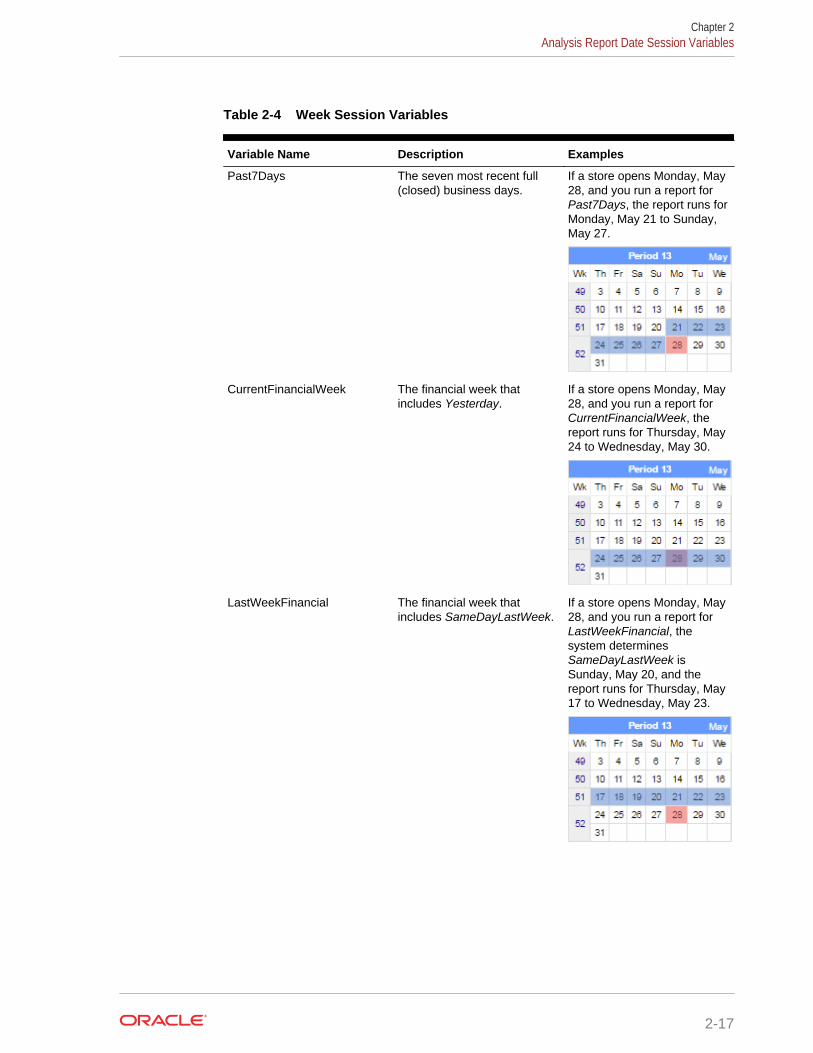
Table 2-4 Week Session Variables
Variable Name Description Examples
Past7Days The seven most recent full(closed) business days.
If a store opens Monday, May28, and you run a report forPast7Days, the report runs forMonday, May 21 to Sunday,May 27.
CurrentFinancialWeek The financial week thatincludes Yesterday.
If a store opens Monday, May28, and you run a report forCurrentFinancialWeek, thereport runs for Thursday, May24 to Wednesday, May 30.
LastWeekFinancial The financial week thatincludes SameDayLastWeek.
If a store opens Monday, May28, and you run a report forLastWeekFinancial, thesystem determinesSameDayLastWeek isSunday, May 20, and thereport runs for Thursday, May17 to Wednesday, May 23.
Chapter 2Analysis Report Date Session Variables
2-17
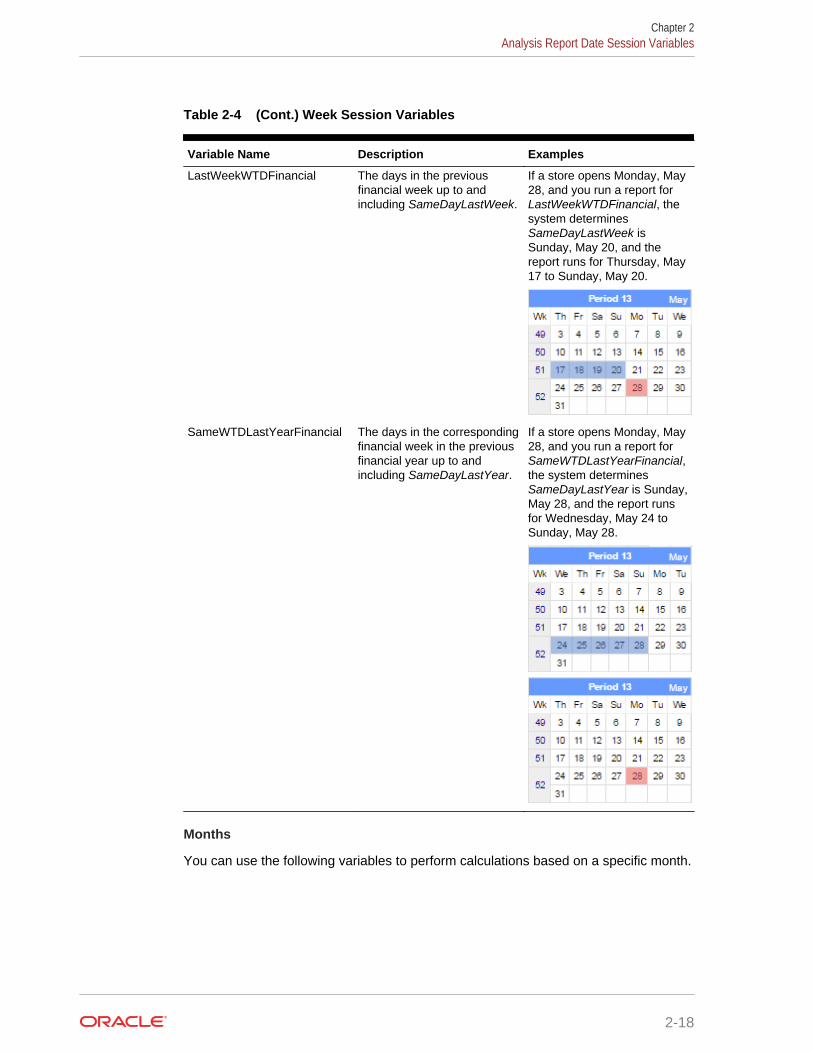
Table 2-4 (Cont.) Week Session Variables
Variable Name Description Examples
LastWeekWTDFinancial The days in the previousfinancial week up to andincluding SameDayLastWeek.
If a store opens Monday, May28, and you run a report forLastWeekWTDFinancial, thesystem determinesSameDayLastWeek isSunday, May 20, and thereport runs for Thursday, May17 to Sunday, May 20.
SameWTDLastYearFinancial The days in the correspondingfinancial week in the previousfinancial year up to andincluding SameDayLastYear.
If a store opens Monday, May28, and you run a report forSameWTDLastYearFinancial,the system determinesSameDayLastYear is Sunday,May 28, and the report runsfor Wednesday, May 24 toSunday, May 28.
Months
You can use the following variables to perform calculations based on a specific month.
Chapter 2Analysis Report Date Session Variables
2-18
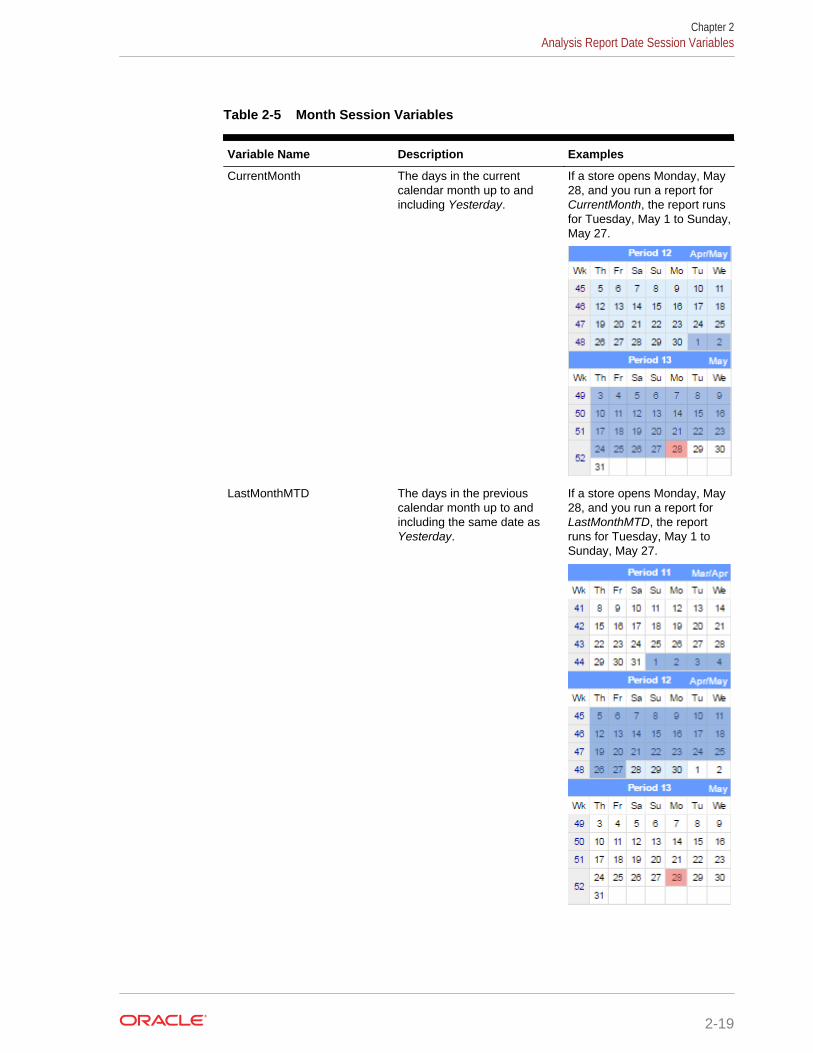
Table 2-5 Month Session Variables
Variable Name Description Examples
CurrentMonth The days in the currentcalendar month up to andincluding Yesterday.
If a store opens Monday, May28, and you run a report forCurrentMonth, the report runsfor Tuesday, May 1 to Sunday,May 27.
LastMonthMTD The days in the previouscalendar month up to andincluding the same date asYesterday.
If a store opens Monday, May28, and you run a report forLastMonthMTD, the reportruns for Tuesday, May 1 toSunday, May 27.
Chapter 2Analysis Report Date Session Variables
2-19
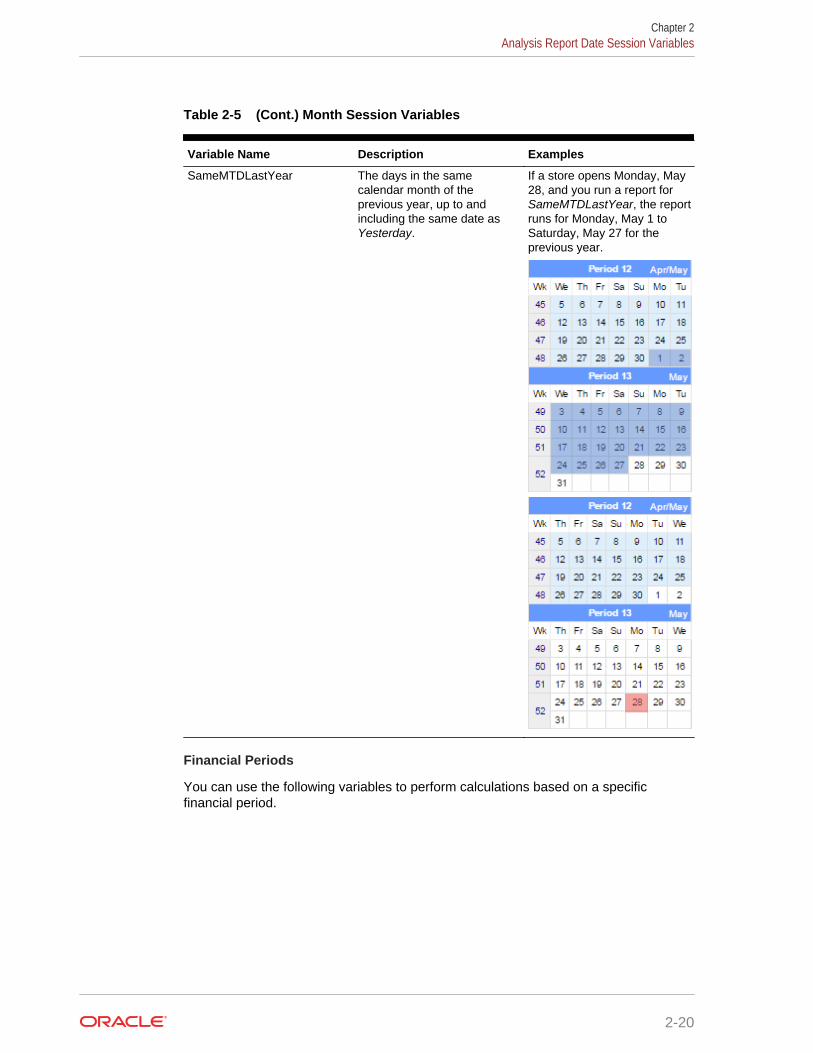
Table 2-5 (Cont.) Month Session Variables
Variable Name Description Examples
SameMTDLastYear The days in the samecalendar month of theprevious year, up to andincluding the same date asYesterday.
If a store opens Monday, May28, and you run a report forSameMTDLastYear, the reportruns for Monday, May 1 toSaturday, May 27 for theprevious year.
Financial Periods
You can use the following variables to perform calculations based on a specificfinancial period.
Chapter 2Analysis Report Date Session Variables
2-20
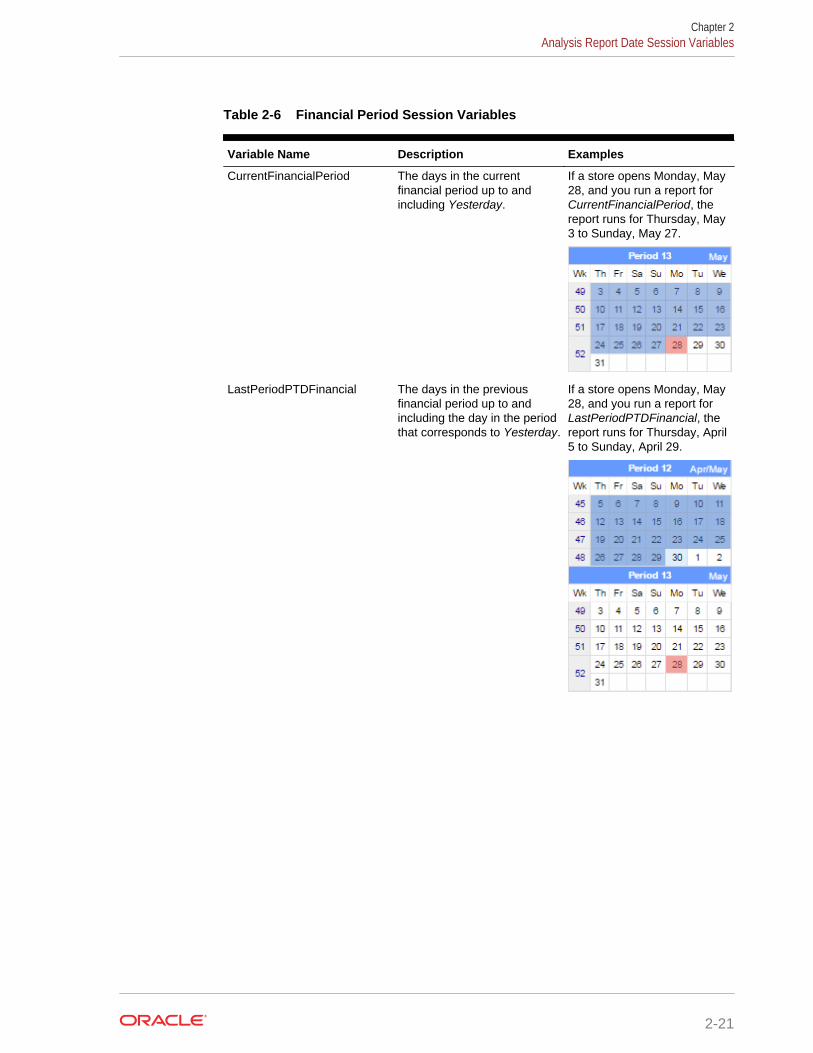
Table 2-6 Financial Period Session Variables
Variable Name Description Examples
CurrentFinancialPeriod The days in the currentfinancial period up to andincluding Yesterday.
If a store opens Monday, May28, and you run a report forCurrentFinancialPeriod, thereport runs for Thursday, May3 to Sunday, May 27.
LastPeriodPTDFinancial The days in the previousfinancial period up to andincluding the day in the periodthat corresponds to Yesterday.
If a store opens Monday, May28, and you run a report forLastPeriodPTDFinancial, thereport runs for Thursday, April5 to Sunday, April 29.
Chapter 2Analysis Report Date Session Variables
2-21
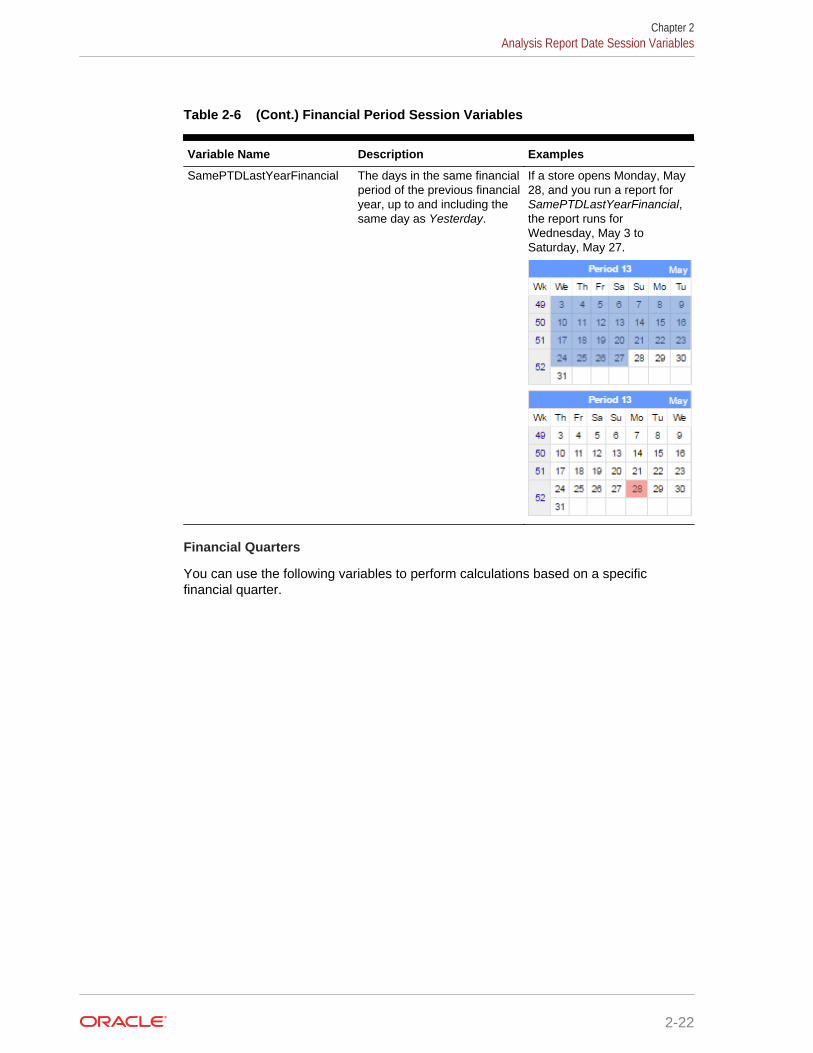
Table 2-6 (Cont.) Financial Period Session Variables
Variable Name Description Examples
SamePTDLastYearFinancial The days in the same financialperiod of the previous financialyear, up to and including thesame day as Yesterday.
If a store opens Monday, May28, and you run a report forSamePTDLastYearFinancial,the report runs forWednesday, May 3 toSaturday, May 27.
Financial Quarters
You can use the following variables to perform calculations based on a specificfinancial quarter.
Chapter 2Analysis Report Date Session Variables
2-22
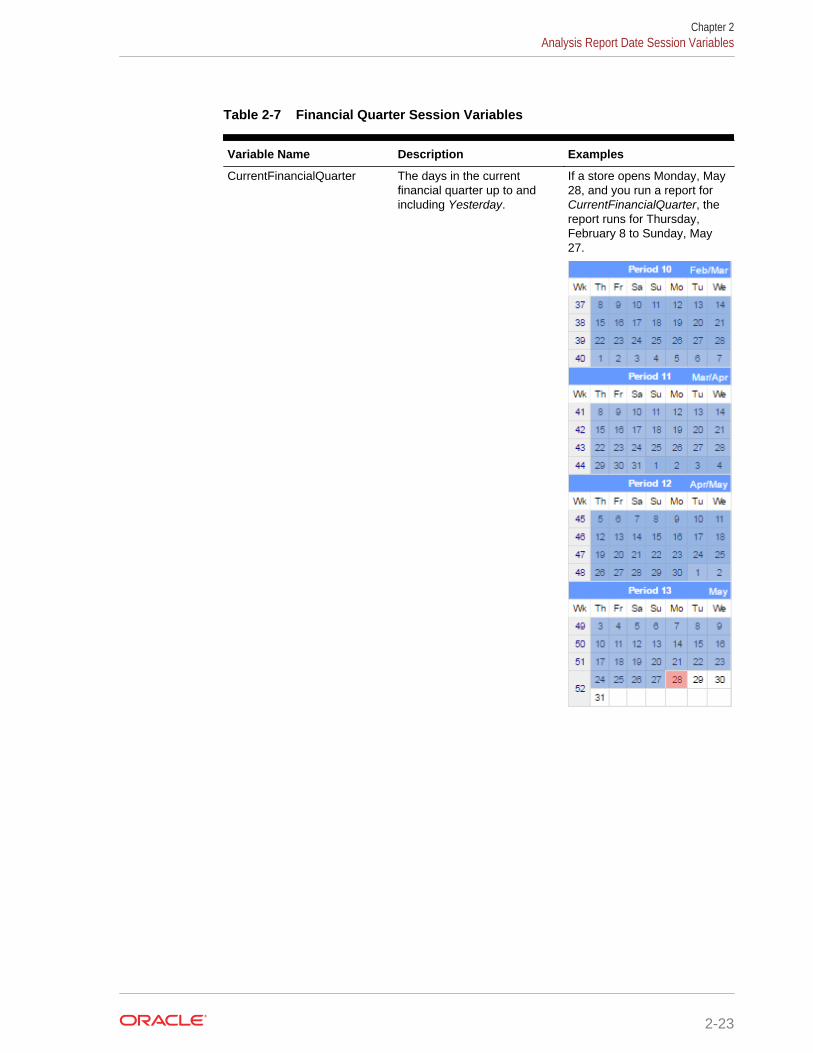
Table 2-7 Financial Quarter Session Variables
Variable Name Description Examples
CurrentFinancialQuarter The days in the currentfinancial quarter up to andincluding Yesterday.
If a store opens Monday, May28, and you run a report forCurrentFinancialQuarter, thereport runs for Thursday,February 8 to Sunday, May27.
Chapter 2Analysis Report Date Session Variables
2-23
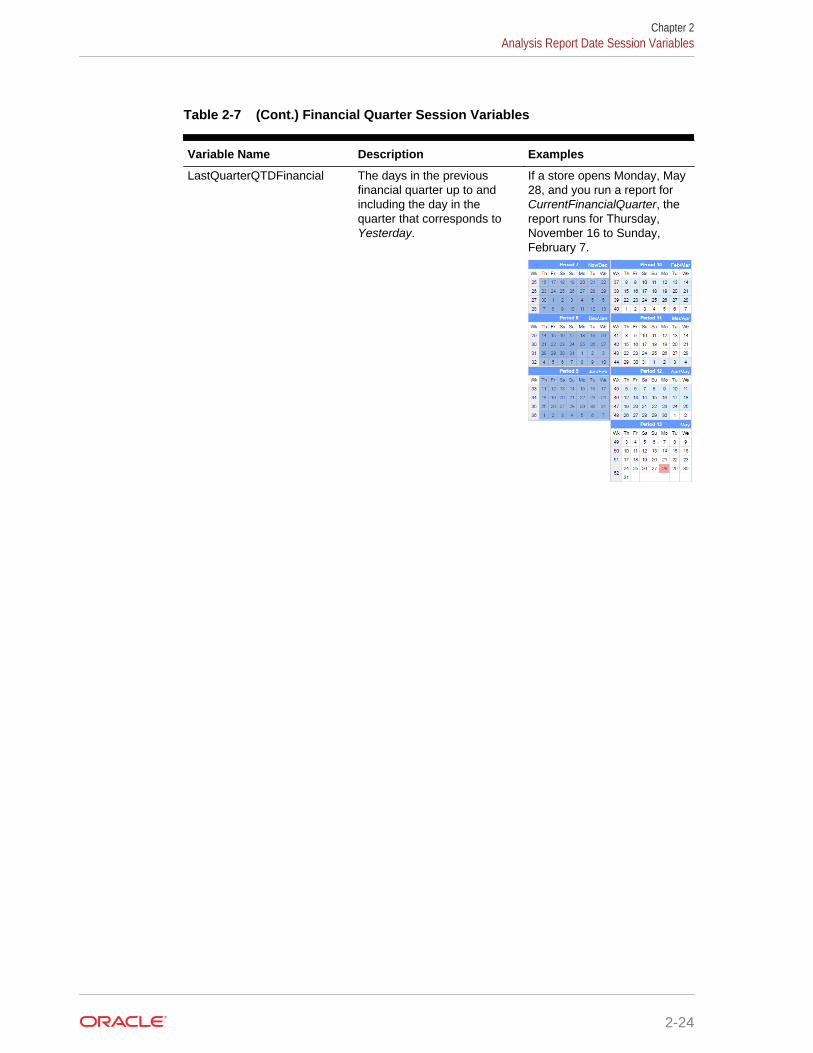
Table 2-7 (Cont.) Financial Quarter Session Variables
Variable Name Description Examples
LastQuarterQTDFinancial The days in the previousfinancial quarter up to andincluding the day in thequarter that corresponds toYesterday.
If a store opens Monday, May28, and you run a report forCurrentFinancialQuarter, thereport runs for Thursday,November 16 to Sunday,February 7.
Chapter 2Analysis Report Date Session Variables
2-24
Table 2-7 (Cont.) Financial Quarter Session Variables
Variable Name Description Examples
SameQTDLastYearFinancial The days in the same financialquarter of the previousfinancial year, up to andincluding the same day asYesterday.
If a store opens Monday, May28, and you run a report forSameQTDLastYearFinancial,the report runs for Thursday,February 8 to Saturday, May27.
Chapter 2Analysis Report Date Session Variables
2-25
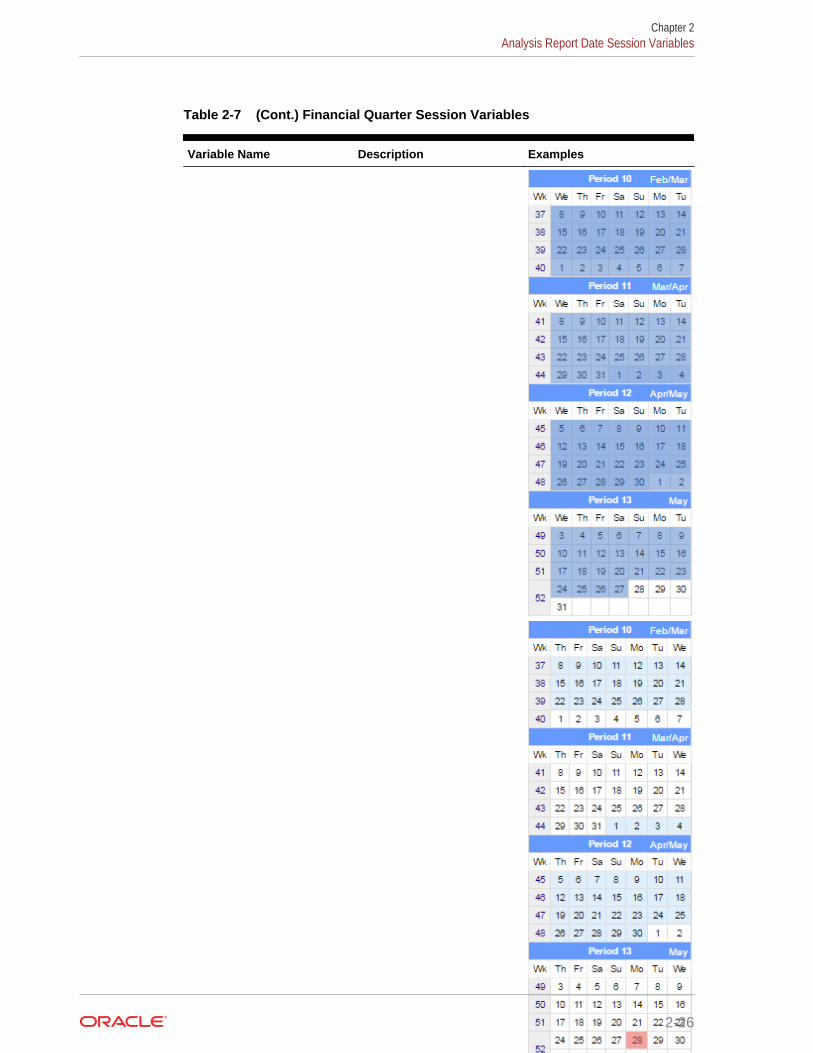
Table 2-7 (Cont.) Financial Quarter Session Variables
Variable Name Description Examples
Chapter 2Analysis Report Date Session Variables
2-26
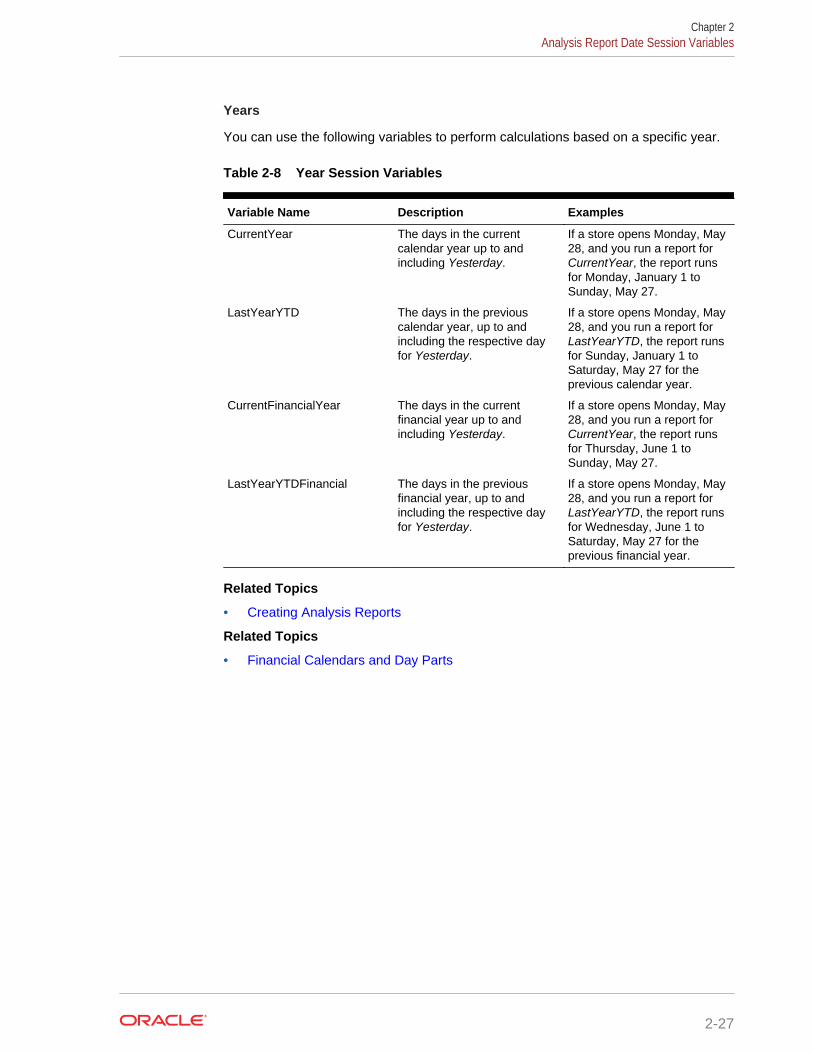
Years
You can use the following variables to perform calculations based on a specific year.
Table 2-8 Year Session Variables
Variable Name Description Examples
CurrentYear The days in the currentcalendar year up to andincluding Yesterday.
If a store opens Monday, May28, and you run a report forCurrentYear, the report runsfor Monday, January 1 toSunday, May 27.
LastYearYTD The days in the previouscalendar year, up to andincluding the respective dayfor Yesterday.
If a store opens Monday, May28, and you run a report forLastYearYTD, the report runsfor Sunday, January 1 toSaturday, May 27 for theprevious calendar year.
CurrentFinancialYear The days in the currentfinancial year up to andincluding Yesterday.
If a store opens Monday, May28, and you run a report forCurrentYear, the report runsfor Thursday, June 1 toSunday, May 27.
LastYearYTDFinancial The days in the previousfinancial year, up to andincluding the respective dayfor Yesterday.
If a store opens Monday, May28, and you run a report forLastYearYTD, the report runsfor Wednesday, June 1 toSaturday, May 27 for theprevious financial year.
Related Topics
• Creating Analysis Reports
Related Topics
• Financial Calendars and Day Parts
Chapter 2Analysis Report Date Session Variables
2-27
3Core Reports
Reporting and Analytics installs core reports, which are pre-defined reports that showinformation targeting specific business operations. The core reports do not includecore reports from other regions such as EMEA, customized reports, and reportsinstalled by other Enterprise Back Office products. You can configure the core reportsto handle information from within a certain date range or from data that applies to acertain organizational level, such as a revenue center or a location.
For example, you can use the Daily Operations Summary report as part of your start-of-day process to review high-level operations data for the previous business day at aspecific store. You can then run the report for all locations and compare the store tothe whole enterprise.
• Running Reports
• Modifying Reports
• Exporting Reports
Related Topics
• Choosing a Report Type
Related Topics
• Scheduled Reports
Running Reports1. In the Reporting and Analytics side menu, click the link to go to the More Reports
page. If you cannot find the link, contact your system administrator.
2. In the Reports list, click the report name, and then click the specific report.
3. Click Run Report.
Modifying Reports1. In the Reporting and Analytics side menu, click the link to go to the More Reports
page. If you cannot find the link, contact your system administrator.
2. In the Reports list, click the report name, and then click the specific report.
3. On the Modify Report tab, modify the report as described in the following table:
3-1
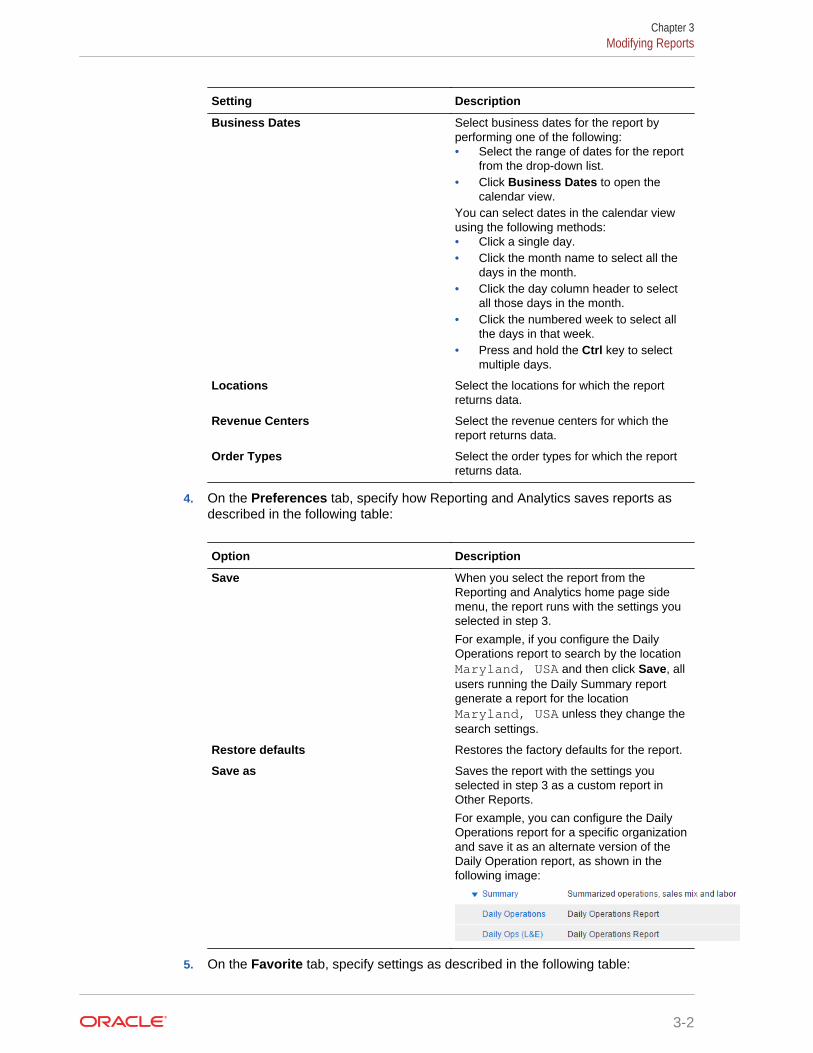
Setting Description
Business Dates Select business dates for the report byperforming one of the following:• Select the range of dates for the report
from the drop-down list.• Click Business Dates to open the
calendar view.You can select dates in the calendar viewusing the following methods:• Click a single day.• Click the month name to select all the
days in the month.• Click the day column header to select
all those days in the month.• Click the numbered week to select all
the days in that week.• Press and hold the Ctrl key to select
multiple days.
Locations Select the locations for which the reportreturns data.
Revenue Centers Select the revenue centers for which thereport returns data.
Order Types Select the order types for which the reportreturns data.
4. On the Preferences tab, specify how Reporting and Analytics saves reports asdescribed in the following table:
Option Description
Save When you select the report from theReporting and Analytics home page sidemenu, the report runs with the settings youselected in step 3.
For example, if you configure the DailyOperations report to search by the locationMaryland, USA and then click Save, allusers running the Daily Summary reportgenerate a report for the locationMaryland, USA unless they change thesearch settings.
Restore defaults Restores the factory defaults for the report.
Save as Saves the report with the settings youselected in step 3 as a custom report inOther Reports.
For example, you can configure the DailyOperations report for a specific organizationand save it as an alternate version of theDaily Operation report, as shown in thefollowing image:
5. On the Favorite tab, specify settings as described in the following table:
Chapter 3Modifying Reports
3-2
Setting Description
Set as Favorite Makes the report easier to access.Reporting and Analytics adds a star next tothe report name and adds it to the Reportssection of the home page side menu.
Set as Home Report You can configure your personal settings toopen the report when you log in to Reportingand Analytics.
Configuring User Preferences providesmore information.
Enable Auto Run Controls if the report runs after you click thereport. If you turn off this setting, you haveto click Run Report every time you want torun the report.
6. Click Run Report.
Exporting ReportsYou can export reports as file formats configured by administrators, such as PDF,Microsoft Excel, and comma-separated values.
1. Run a report or modify and then run a report.
2. Click the export format icon next to the Favorites tab.
3. Save the exported file.
Chapter 3Exporting Reports
3-3
4Custom Reports in Microsoft Excel
iQuery is a Microsoft Excel plug-in that enables you to create reports using selectedsubjects and columns.
For example, if you want a start-of-day report that replaces the Operating Metricssection of the Daily Operations Summary report with information about the three best-selling items for that day and some labor performance and efficiency analysis, you cancreate a report with the fields you want to see. You can then save the custom reportinto Reporting and Analytics so you can launch the report from the sidebar.
• Installing iQuery
• Building a Custom Report in Microsoft Excel
Related Topics
• Choosing a Report Type
Related Topics
• Scheduled Reports
Installing iQuery1. Close Microsoft Excel if it is open.
2. In the Reporting and Analytics side menu, click the link to go to the iQueryDownload page. If you cannot find the link, contact your system administrator.
3. Click Install MICROS iQuery - Office 2007+ and then save iQuerySetup.exeto a temporary location on your computer.
4. Double-click the iQuerySetup.exe file and then follow the prompts to install thesoftware.
5. Validate the installation:
a. Open Microsoft Excel.
b. Locate the iQuery plug-in, and then open iQuery.
The location varies depending on the version of Microsoft Excel. For example,in Microsoft Excel 2013, access iQuery from the ADD-INS ribbon.
c. Log in to iQuery.
Building a Custom Report in Microsoft Excel1. Select a query subject.
2. Select the column data that appears in the spreadsheet when you run the query.
Use the up and down arrows to adjust the order of the columns in thespreadsheet. For example, if you move a column to the top of the list, that columnis the first column in the spreadsheet.
4-1
3. To apply a mathematical operation to column data, select it from the Operationdrop-down list.
4. Specify filters to refine query results:
a. Select a business date or date range.
b. Select locations.
c. Select revenue centers for the locations.
d. Select other filters.
5. Define the order in which iQuery sorts the data.
6. Click Preview to verify that the query returns the correct results.
If the preview does not return results or returns too many rows, change querysettings and the preview the query again.
7. Click Run to show the results in Microsoft Excel.
8. Save the query.
To save the query on your computer so you can run it at a later time fromMicrosoft Excel, click Query. iQuery does not save the business date because youchange the date each time you run the query.
To save the query as a report, click Report. Users assigned to the role foraccessing custom reports can run the report from Reporting and Analytics.
Chapter 4Building a Custom Report in Microsoft Excel
4-2
5Scheduled Reports
You can use Report Mail to schedule reports to run at a specified date and time, andto distribute the report by email to a user or role.
For example, you can configure Report Mail to generate and send an inventory reportevery morning so that you can check on re-stocks or pre-prepared food.
• Scheduling Reports for Email Distribution
Related Topics
• Choosing a Report Type
Related Topics
• Analysis Reports
• Core Reports
• Custom Reports in Microsoft Excel
Scheduling Reports for Email Distribution1. In the Reporting and Analytics side menu, click the link to go to the Report Mail
Administration Menu page. If you cannot find the link, contact your systemadministrator.
2. Click Report Mail, and then click Add.
3. On the Content tab, specify email content as described in the following table:
Setting Description
Type Select the report type.
Report Selection Select the report. For long lists of reports,specify search criteria to locate the report.
Preferences Specify delivery preferences. The report youselect determines the preferences thatappear.
If you select multiple locations, Reportingand Analytics sends one report for eachlocation.
If you select Consolidated, Reporting andAnalytics sends aggregate report data for alllocations in one email.
Reporting and Analytics sends each reportin a separate email. If you select Zipmultiple files, Reporting and Analyticssends one mail with a ZIP file containing thereport files.
4. On the Name tab, specify email settings as described in the following table:
5-1
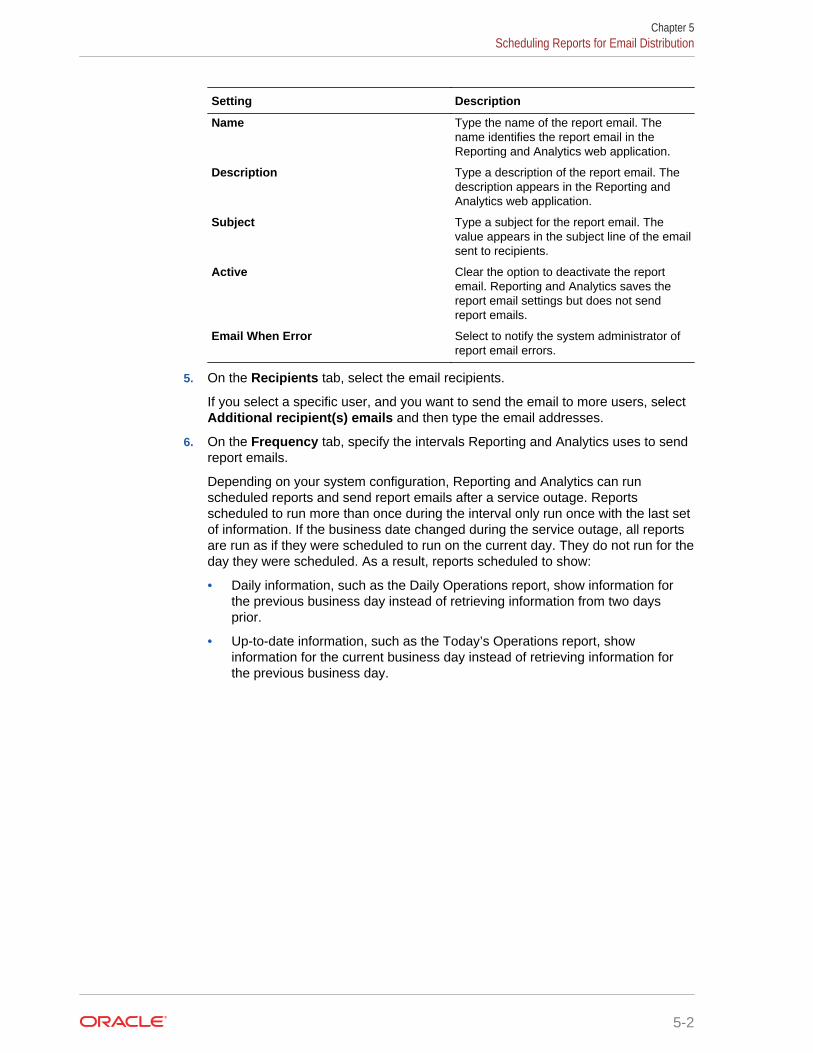
Setting Description
Name Type the name of the report email. Thename identifies the report email in theReporting and Analytics web application.
Description Type a description of the report email. Thedescription appears in the Reporting andAnalytics web application.
Subject Type a subject for the report email. Thevalue appears in the subject line of the emailsent to recipients.
Active Clear the option to deactivate the reportemail. Reporting and Analytics saves thereport email settings but does not sendreport emails.
Email When Error Select to notify the system administrator ofreport email errors.
5. On the Recipients tab, select the email recipients.
If you select a specific user, and you want to send the email to more users, selectAdditional recipient(s) emails and then type the email addresses.
6. On the Frequency tab, specify the intervals Reporting and Analytics uses to sendreport emails.
Depending on your system configuration, Reporting and Analytics can runscheduled reports and send report emails after a service outage. Reportsscheduled to run more than once during the interval only run once with the last setof information. If the business date changed during the service outage, all reportsare run as if they were scheduled to run on the current day. They do not run for theday they were scheduled. As a result, reports scheduled to show:
• Daily information, such as the Daily Operations report, show information forthe previous business day instead of retrieving information from two daysprior.
• Up-to-date information, such as the Today’s Operations report, showinformation for the current business day instead of retrieving information forthe previous business day.
Chapter 5Scheduling Reports for Email Distribution
5-2
6Guest Check Information
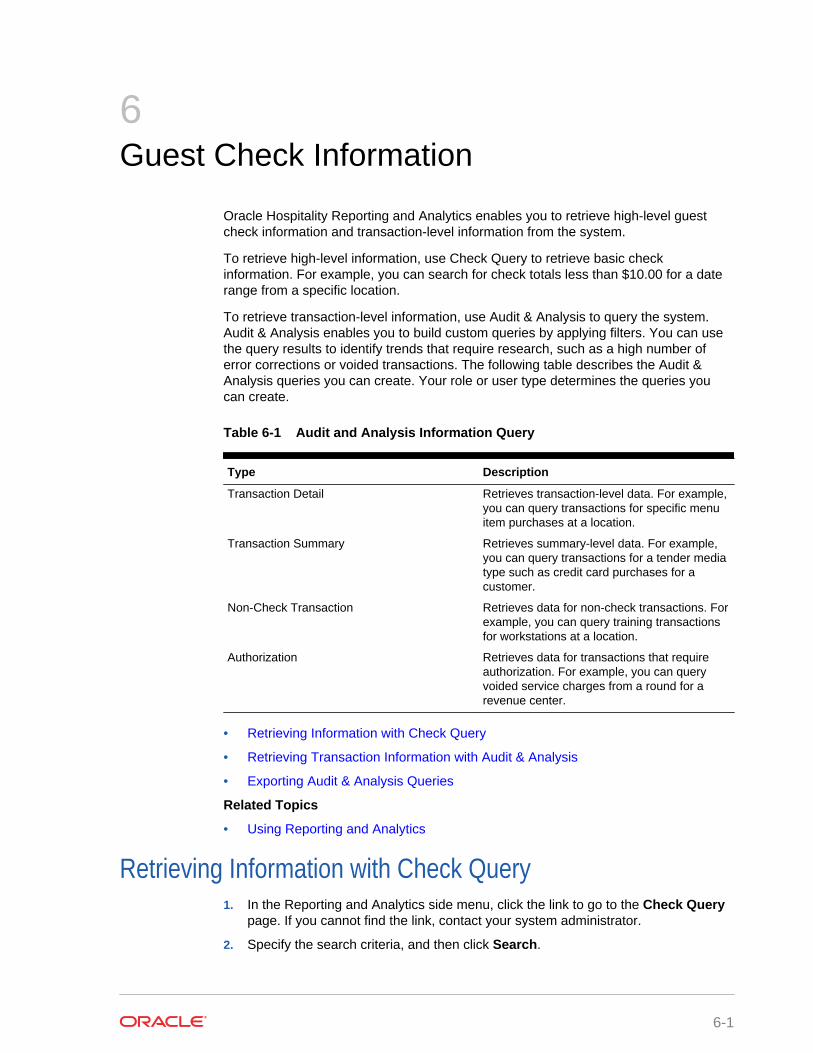
Oracle Hospitality Reporting and Analytics enables you to retrieve high-level guestcheck information and transaction-level information from the system.
To retrieve high-level information, use Check Query to retrieve basic checkinformation. For example, you can search for check totals less than $10.00 for a daterange from a specific location.
To retrieve transaction-level information, use Audit & Analysis to query the system.Audit & Analysis enables you to build custom queries by applying filters. You can usethe query results to identify trends that require research, such as a high number oferror corrections or voided transactions. The following table describes the Audit &Analysis queries you can create. Your role or user type determines the queries youcan create.
Table 6-1 Audit and Analysis Information Query
Type Description
Transaction Detail Retrieves transaction-level data. For example,you can query transactions for specific menuitem purchases at a location.
Transaction Summary Retrieves summary-level data. For example,you can query transactions for a tender mediatype such as credit card purchases for acustomer.
Non-Check Transaction Retrieves data for non-check transactions. Forexample, you can query training transactionsfor workstations at a location.
Authorization Retrieves data for transactions that requireauthorization. For example, you can queryvoided service charges from a round for arevenue center.
• Retrieving Information with Check Query
• Retrieving Transaction Information with Audit & Analysis
• Exporting Audit & Analysis Queries
Related Topics
• Using Reporting and Analytics
Retrieving Information with Check Query1. In the Reporting and Analytics side menu, click the link to go to the Check Query
page. If you cannot find the link, contact your system administrator.
2. Specify the search criteria, and then click Search.
6-1
• Retrieving Transaction Information with Audit & Analysis
• Exporting Audit & Analysis Queries
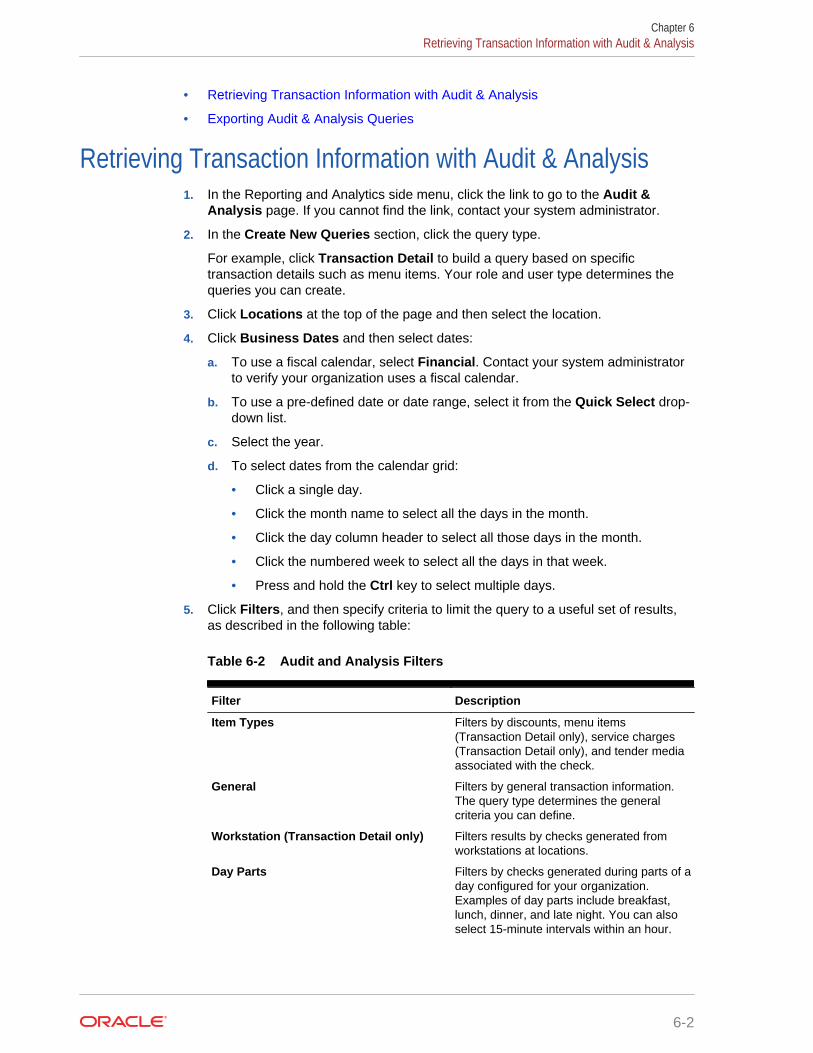
Retrieving Transaction Information with Audit & Analysis1. In the Reporting and Analytics side menu, click the link to go to the Audit &
Analysis page. If you cannot find the link, contact your system administrator.
2. In the Create New Queries section, click the query type.
For example, click Transaction Detail to build a query based on specifictransaction details such as menu items. Your role and user type determines thequeries you can create.
3. Click Locations at the top of the page and then select the location.
4. Click Business Dates and then select dates:
a. To use a fiscal calendar, select Financial. Contact your system administratorto verify your organization uses a fiscal calendar.
b. To use a pre-defined date or date range, select it from the Quick Select drop-down list.
c. Select the year.
d. To select dates from the calendar grid:
• Click a single day.
• Click the month name to select all the days in the month.
• Click the day column header to select all those days in the month.
• Click the numbered week to select all the days in that week.
• Press and hold the Ctrl key to select multiple days.
5. Click Filters, and then specify criteria to limit the query to a useful set of results,as described in the following table:
Table 6-2 Audit and Analysis Filters
Filter Description
Item Types Filters by discounts, menu items(Transaction Detail only), service charges(Transaction Detail only), and tender mediaassociated with the check.
General Filters by general transaction information.The query type determines the generalcriteria you can define.
Workstation (Transaction Detail only) Filters results by checks generated fromworkstations at locations.
Day Parts Filters by checks generated during parts of aday configured for your organization.Examples of day parts include breakfast,lunch, dinner, and late night. You can alsoselect 15-minute intervals within an hour.
Chapter 6Retrieving Transaction Information with Audit & Analysis
6-2
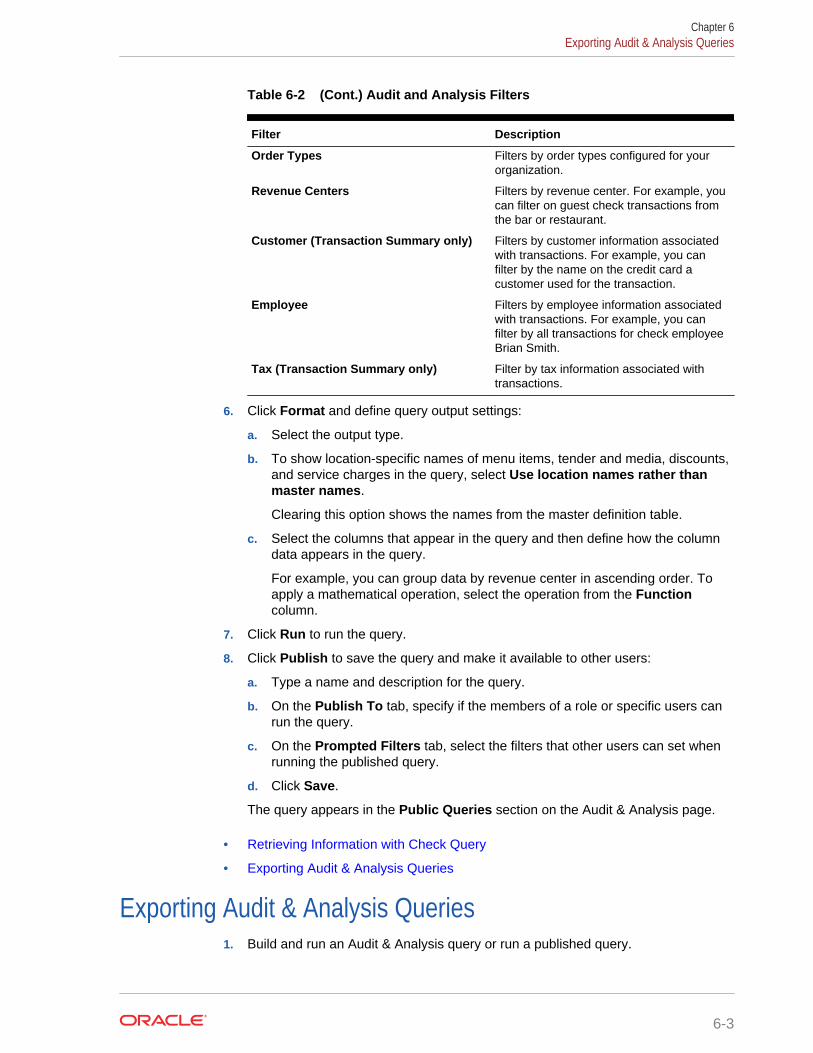
Table 6-2 (Cont.) Audit and Analysis Filters
Filter Description
Order Types Filters by order types configured for yourorganization.
Revenue Centers Filters by revenue center. For example, youcan filter on guest check transactions fromthe bar or restaurant.
Customer (Transaction Summary only) Filters by customer information associatedwith transactions. For example, you canfilter by the name on the credit card acustomer used for the transaction.
Employee Filters by employee information associatedwith transactions. For example, you canfilter by all transactions for check employeeBrian Smith.
Tax (Transaction Summary only) Filter by tax information associated withtransactions.
6. Click Format and define query output settings:
a. Select the output type.
b. To show location-specific names of menu items, tender and media, discounts,and service charges in the query, select Use location names rather thanmaster names.
Clearing this option shows the names from the master definition table.
c. Select the columns that appear in the query and then define how the columndata appears in the query.
For example, you can group data by revenue center in ascending order. Toapply a mathematical operation, select the operation from the Functioncolumn.
7. Click Run to run the query.
8. Click Publish to save the query and make it available to other users:
a. Type a name and description for the query.
b. On the Publish To tab, specify if the members of a role or specific users canrun the query.
c. On the Prompted Filters tab, select the filters that other users can set whenrunning the published query.
d. Click Save.
The query appears in the Public Queries section on the Audit & Analysis page.
• Retrieving Information with Check Query
• Exporting Audit & Analysis Queries
Exporting Audit & Analysis Queries1. Build and run an Audit & Analysis query or run a published query.
Chapter 6Exporting Audit & Analysis Queries
6-3
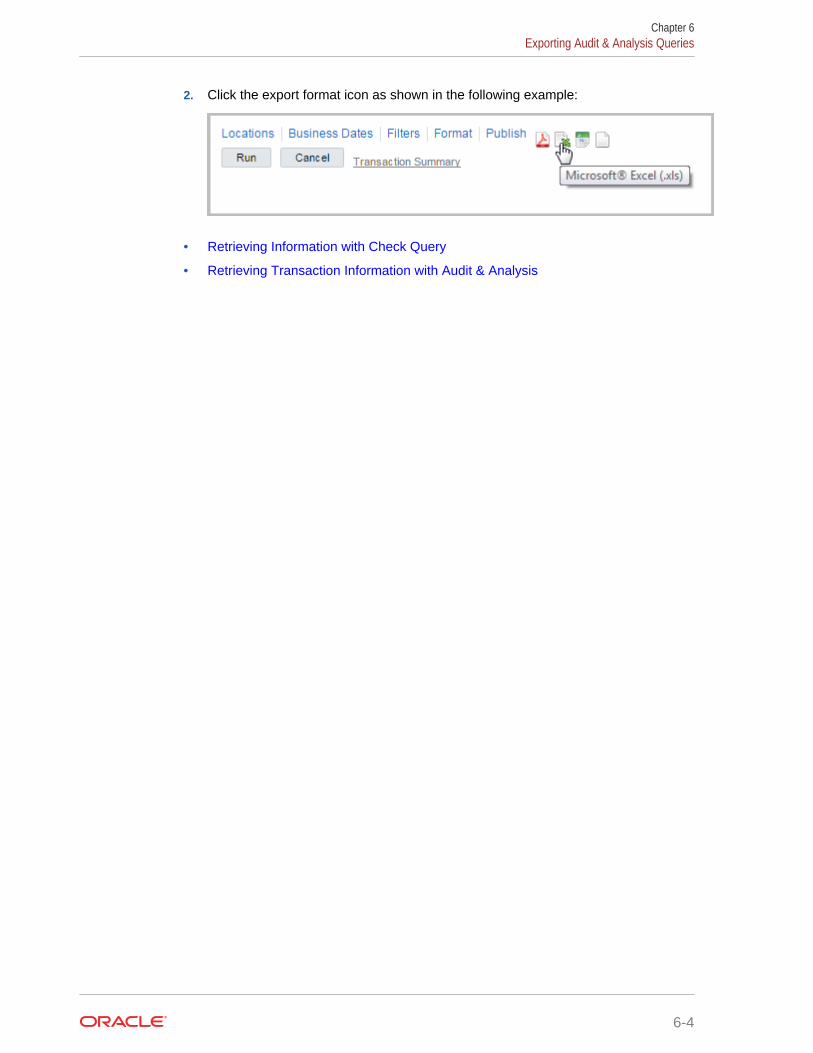
2. Click the export format icon as shown in the following example:
• Retrieving Information with Check Query
• Retrieving Transaction Information with Audit & Analysis
Chapter 6Exporting Audit & Analysis Queries
6-4
7Manager Communication
The Reporting and Analytics Manager Log is a location-based communication tool formanagers. Use the log to add entries and notes for other managers at the location. Forexample, you are a morning manager at your restaurant and you notice you are low oneggs. Add a to-do log entry for the evening manager to order more eggs. After theevening manager orders the eggs, the evening manager can mark the to-do entry ascomplete. You can also use the Manager Log to add notes on daily operations.
• Configuring Manager Log Entry Categories
• Working with the Manager Log
• Searching the Manager Log
• Adding an Entry to the Manager Log
• Updating and Closing an Entry
• Adding a Note to the Manager Log
Related Topics
• Using Reporting and Analytics
Configuring Manager Log Entry CategoriesAdd Manager Log categories so managers can use them to organize log entries at alocation.
1. In Reporting and Analytics, click Admin, click Warehouse, click Miscellaneous,and click Manager Log Config.
2. Configure the name, column label, and description for each category, and clickSave.
Working with the Manager Log1. In the Reporting and Analytics side menu, click the link to go to the Manager Log
page. If you cannot find the link, contact your system administrator.
2. Select the location, and then click View.
3. To add an entry:
a. Click Add Entry.
Your administrator adds the categories you can select when completing theform.
b. Complete the form, and then click Add.
4. To update an entry:
a. Select the entry from the list, and then click Update Entry.
b. Update the form, and then click Update.
7-1
5. To mark an entry as complete:
a. Select the entry from the list, and then click Update Entry.
b. Click Mark Completed.
Reporting and Analytics removes the entry from the list of active entries.
6. To add a note:
a. Click Add Note.
b. Complete the form, and then click Save.
7. To update a note:
a. Select the note from the list, and then click Update Note.
b. Update the form, and then click Save.
8. To view the log history:
a. Click View History.
b. Select the date range and log details.
c. To define filters for searching log entries, specify the search criteria, and thenclick Add.
d. Click View.
Searching the Manager Log1. In the Reporting and Analytics side menu, click the link to go to the Manager Log
page. If you cannot find the link, contact your system administrator.
2. Click View History, configure the search filters, and then click View.
The Manager Log search does not include notes in the search results.
3. On the results page, click Select Again to perform another search.
Adding an Entry to the Manager Log1. In the Reporting and Analytics side menu, click the link to go to the Manager Log
page. If you cannot find the link, contact your system administrator.
2. Click Add Entry, fill out the form, and click Add.
Administrators can configure the list of Categories.
Updating and Closing an Entry1. In the Reporting and Analytics side menu, click the link to go to the Manager Log
page. If you cannot find the link, contact your system administrator.
2. Click the entry you want to update, click Update Entry, and then make changes tothe form.
3. Click Update to finalize the changes to the entry, or click Mark Completed tochange the status of the entry to Complete.
Chapter 7Searching the Manager Log
7-2
Adding a Note to the Manager Log1. In the Reporting and Analytics side menu, click the link to go to the Manager Log
page. If you cannot find the link, contact your system administrator.
2. Click Add Note, fill out the form, and then click Save.
Chapter 7Adding a Note to the Manager Log
7-3
8User Settings
You can configure the content and layout of myPage and change personal applicationsettings.
• myPage
• Configuring myPage Content
• Configuring User Preferences
Related Topics
• Using Reporting and Analytics
myPageThe myPage screen appears after you log in to Reporting and Analytics. You canperform the following configurations:
• Add or remove charts or reports to run upon login.
• Change the color scheme.
• Resize windows on the screen.
You can configure up to three myPage screens. Reporting and Analytics shows yourfirst myPage screen after you log in.
Related Topics
• Using Reporting and Analytics
Related Topics
• Configuring myPage Content
• Configuring User Preferences
Configuring myPage Content1. To add or remove content:
a. From the myPage menu, click Content.
b. Select or deselect the information you want show on myPage. The systemadministrator manages the content available in this list.
2. To move or resize content:
a. From the myPage menu, click Layout and then click OK.
b. Drag the center of the content to move it.
c. Drag the corner of the content to change its size.
8-1
Related Topics
• myPage
Configuring User Preferences1. On the myPage you want to configure, click Preferences.
2. Select your Language and Time Zone regional settings.
3. Select your Reporting and Analytics color scheme From the Style drop-down list.
4. Select Remember Report Selections if you want to save your filter selections foreach report.
5. For the First login of the day and Subsequent logins, you can configurewhether to:
a. Show the content configured for your myPage.
b. Show the report currently set as the Home Report. You cannot change theHome Report from the user preferences menu.
c. Show the dashboard set as the Home Dashboard.
6. Select the dashboard you want to set as the Home Dashboard.
7. Click Save.
Related Topics
• myPage
Chapter 8Configuring User Preferences
8-2
9Organizational Hierarchies
An organizational hierarchy provides the structure to an enterprise and its restaurants.The enterprise has only one organizational hierarchy. The hierarchy ensures totalsfrom all locations are available for reports and controls how charts show information inReporting and Analytics.
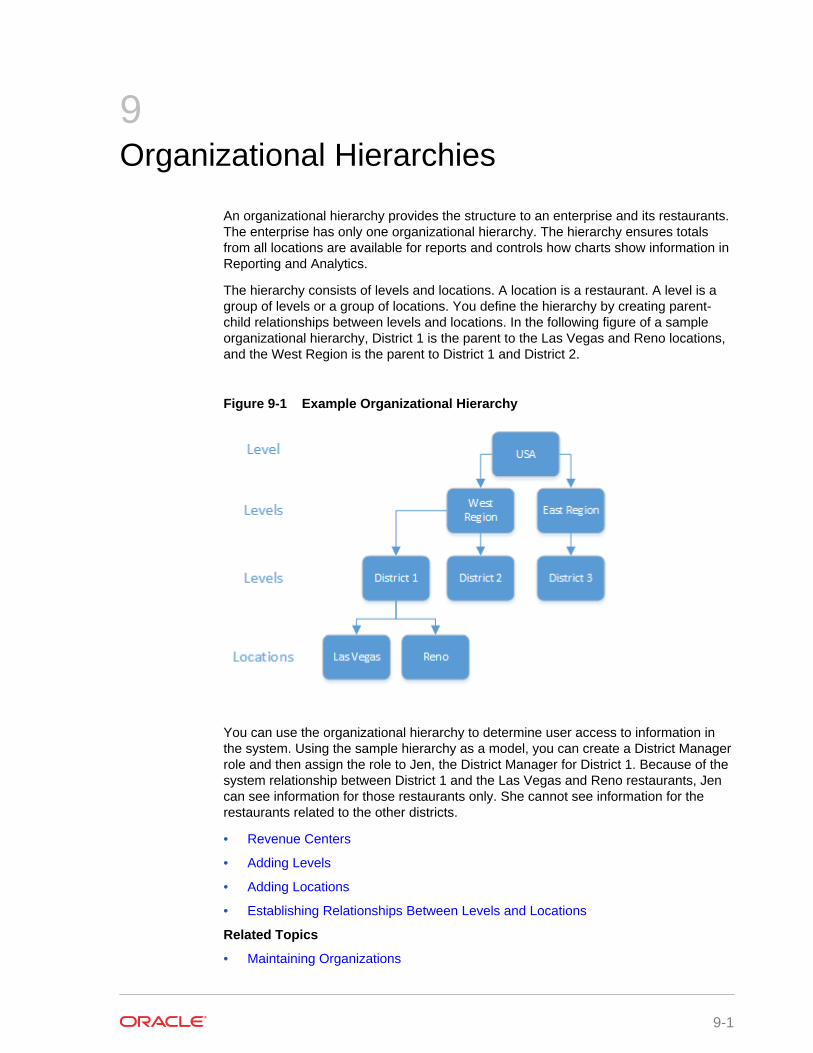
The hierarchy consists of levels and locations. A location is a restaurant. A level is agroup of levels or a group of locations. You define the hierarchy by creating parent-child relationships between levels and locations. In the following figure of a sampleorganizational hierarchy, District 1 is the parent to the Las Vegas and Reno locations,and the West Region is the parent to District 1 and District 2.
Figure 9-1 Example Organizational Hierarchy
You can use the organizational hierarchy to determine user access to information inthe system. Using the sample hierarchy as a model, you can create a District Managerrole and then assign the role to Jen, the District Manager for District 1. Because of thesystem relationship between District 1 and the Las Vegas and Reno restaurants, Jencan see information for those restaurants only. She cannot see information for therestaurants related to the other districts.
• Revenue Centers
• Adding Levels
• Adding Locations
• Establishing Relationships Between Levels and Locations
Related Topics
• Maintaining Organizations
9-1
Revenue CentersRevenue centers enable organizations to categorize revenue data by functions withina location. At a fast food restaurant, each register and the drive-thru are examples ofcost centers. At a table service restaurant, the bar and dining area are examples ofcost centers. If your organization is configured for revenue centers, Reporting andAnalytics enables you to filter by revenue center when you modify and run standardreports. You can also filter by revenue center when you use iQuery to work withreporting data in Microsoft Excel.
Related Topics
• Adding Levels
• Adding Locations
• Establishing Relationships Between Levels and Locations
Adding Levels1. In Reporting and Analytics, click Portal, click Organizational Structure, and then
click Levels.
2. Click Add.
3. Type a level name.
For example, type District 1 for a district level or type East to for a regionlevel.
4. Type a level reference to indicate the level position within the organizationalhierarchy.
Use a value of 0 if the level is the highest corporate level in the organization. Usetext or numbers when adding lower levels to the organization. For example, youcan use 10 for one district and 20 for another district.
5. Select the financial calendar for the level.
For example, if the organization uses a financial calendar based on a fiscal year,select the corresponding calendar.
6. Specify values for basic level settings on the form, such as address and postalcode, and then click Save.
Related Topics
• Revenue Centers
Adding Locations1. In Reporting and Analytics, click Admin, click Portal, click Organizational
Structure, and then click Locations.
2. Click Add.
3. In the Name field, type a unique name for the location.
For example, type Columbia for a restaurant location in Columbia, Maryland.
Chapter 9Revenue Centers
9-2
4. In the Location Reference field, type a value to indicate the location positionwithin the organizational hierarchy.
You can use a number to indicate the position. For example, if the location is thefourth location in a district level, you can use a value of 4. You can also use text toindicate the position. For example, you can use East for a location on the Easternside of a district level.
5. If the location uses a financial calendar different than the parent level or theorganization, select it from the Financial Calendar drop-down list.
6. Specify values for the remaining settings on the form and then click Save.
Related Topics
• Revenue Centers
Establishing Relationships Between Levels and Locations1. In Reporting and Analytics, click Admin, click Portal, click Organizational
Structure, and then click Relationships.
2. Select the highest level in the organization, and then click Edit.
3. Select No Parent from the Parent Name drop-down list.
Select No Parent if there is only one level in the organization.
4. Click Save.
5. Select a location and then click Edit.
6. Select the parent level for the location and then click Save.
7. Repeat steps 5 and 6 to establish relationships for the remaining locations.
Related Topics
• Revenue Centers
Chapter 9Establishing Relationships Between Levels and Locations
9-3
10Users and Roles
You create user accounts to enable users to access information in Reporting andAnalytics. When you add a user to the system, you assign the user to an organizationlevel and a role. The role determines the level of access to information in the system.The following table describes the default roles in Reporting and Analytics:
Role Description
System Administrator Superuser account with access to every areaof the enterprise. System administrators canperform any action and make any change inthe system.
Enterprise Manager Manager account with access to view dataacross the enterprise. Users assigned to thisrole cannot make changes in the system.
Store Manager Manager account with access to restaurant-level reports and functions.
Business requirements determine if you create roles to support your organizationalhierarchy. For example, your organizational hierarchy has a district level with threedistricts. Each district has three restaurants. You can create a District Manager role.When you add a District Manager as a user to the system, you assign the user to thedistrict organization level and to the new District Manager role. Because of the district-restaurant relationship settings in Reporting and Analytics, District Managers can viewinformation for only the restaurants in their districts.
• Creating Roles
• Adding Users
Related Topics
• Maintaining Users and Roles
Creating Roles1. In Reporting and Analytics, click Admin, click Portal, click Roles, and then click
Roles.
2. Click Add.
3. Type a unique name to identify the role in the system.
4. Optionally configure role privileges as described in the following table:
Field Description
Enterprise User Role members can view data. Rolemembers cannot change data.
Personalization Role members can customize their myPagepages.
10-1
Field Description
Password Change Role members can change their passwords.
Guest Role members have guest-level systemaccess and cannot make changes.
Active Indicates the role is active. You cannotdelete roles from the system. If you nolonger need a role, clear the Active checkbox to deactivate the role.
Market Segment Select TSR if the role applies to tableservice restaurants.
Select QSR if the role applies to quickservice restaurants.
Select HTL if the role applies to leisure andentertainment.
Sys Admin Assigns system administrator rights to rolemembers.
Role Access Select the role access.
Power Role Role members can configure a report toshow more than 5,000 rows of data.
Enabled my2ndPage Provides role members with a secondmyPage.
Enabled my3rdPage Provides role members with a third myPage.
Info Distribution Administrator Enables report mail for role members. Rolemembers can schedule reports for emaildistribution.
Change Info Distribution Preferences Role members can change report mailcreated by other users.
Can Be Assigned in HR Form Members of the role can be used in HRforms.
Restrict Access to inMotion Role members do not have permission tolog in to the InMotion Mobile application.
Can Administer API Users Role members have system rights toadminister API user accounts. API useraccounts enable you to integrate withReporting and Analytics through APIs.
Revenue Center Type Select the revenue center to whichmembers of this role have access.
5. Click Save.
Adding Users1. In Reporting and Analytics, click Admin, click Portal, click Users, and then click
Users.
2. Click Add and then specify basic user information on the form, such as the logonname and password.
3. Select the user role from the Role drop-down list.
The user inherits the system privileges associated with the role.
4. Select the organization level from the Org Level drop-down list.
Chapter 10Adding Users
10-2
The level you select determines the level of access to information in the system.For example, if you are adding a District Manager, the District Manager canaccess information for all the locations related to the level. If you are adding astore manager and you want to restrict access to a specific store, select the storefrom the drop-down list.
5. To use the account to integrate with Reporting and Analytics through APIs, selectAPI User, and then click Save.
Chapter 10Adding Users
10-3
11End User Access to Content
Reporting and Analytics uses portlets to control user access to functionality andinformation in the system. End users access portlets from side menus on theReporting and Analytics home page. A report is an example of a portlet. After youcreate the report portlet, you assign it to a role so users who belong to the role canaccess the report from the side menu.
• Creating Portlets
• Assigning Portlets to Roles
• Assigning Side Menus to Roles
• Assigning Reports to Roles
• Outage Alerts
• Setting Outage Alert Recipients
• Installing Remote Transfer Agent (RTA) at a Location
Related Topics
• Maintaining Users and Roles
Creating Portlets1. In Reporting and Analytics, click Admin, click Portal, click Portlets, and then click
Portlets.
2. Click Add.
3. Configure the portlet as described in the following table:
Field Description
Name Type a unique name for the portlet. Forexample, when creating a report portlet,type the report name that appears in theReporting and Analytics side menu.
Type Select the portlet type. For example, selectReport to create a report portlet.
URL Type or select the portlet URL.
The portlet type you select determines thevalues that appear in the URL drop-downlist. For example, if you select Report fromthe Type drop-down list, system reportsappear in the URL drop-down list.
Description Type a description of the portlet.
myPage Title Type the title for the portlet that appears onthe user myPage.
Effective Dates Select a start date for the portlet.
11-1
Field Description
to Select an end date for the portlet. Theportlet expires on the date you select.
Assigning Portlets to Roles1. In Reporting and Analytics, click Admin, click Portal, click Roles, and then click
Portlets.
2. Select the role, and then click Configure.
3. Click Add.
4. Configure settings as described in the following table:
Field Description
Portlet Select the portlet.
Side Menu Title Select the side menu in which the portletappears on the Reporting and Analyticshome page.
Sort Order Specify the order in which the portletappears in the side menu. For example, ifyou type 1, the portlet is the first portletlisted in the side menu.
Hide Hides the portlet in the side menu.
Enable myPage Enables users to add the portlet when theycustomize their myPage.
5. Click Save.
Assigning Side Menus to Roles1. In Reporting and Analytics, click Admin, click Portal, click Roles, and then click
Side Menus.
2. Select the role, and then click Configure.
3. Click Add.
4. Type a side menu title.
5. Type a side menu number.
The number determines the order in which the menu appears in the Reporting andAnalytics navigation pane. For example, if you type 1, the menu is the first menulisted in the navigation pane on the Reporting and Analytics home page.
6. Click Save.
Assigning Reports to Roles1. In Reporting and Analytics, click Admin, click Warehouse, click Reports, and
then click Report Roles.
2. Select the role, and then click Select.
Chapter 11Assigning Portlets to Roles
11-2
3. Click Add.
4. Select the report, and then click Save.
Outage AlertsSystem administrators can configure Reporting and Analytics to send an email whencommunication with the hosting center fails. If there is no communication outage,Reporting and Analytics sends an email every two hours with the status All OK.
Related Topics
• Setting Outage Alert Recipients
Setting Outage Alert Recipients1. In Reporting and Analytics, click Admin, click Portal, click Alerts, and then click
Outage Alerts.
2. Enter up to four recipient email addresses and then click Save.
Related Topics
• Outage Alerts
Installing Remote Transfer Agent (RTA) at a Location1. Make sure you know the your location ID and download password:
a. In Reporting and Analytics, click Reports, click More Reports, click AdminReports, and then click Download Report.
b. Make a note of the Restaurant ID for your location.
c. Navigate to .Connect Admin or RTA Admin depending on your systemconfigurations, select your location, and select Display Password.
If .Connect Admin or RTA Admin do not populate a list of locations, you donot have the Can View Download passwords portlet permission enabled foryour role.
d. Make a note of the Download Password.
2. Download and install the Remote Transfer Agent (RTA) for your location:
a. In Reporting and Analytics, click Admin, and then click Store Download.
b. Enter the Restaurant ID and the Download Password, and then click Next.
If the installation fails, Reporting and Analytics shows the error log in a texteditor.
Chapter 11Outage Alerts
11-3
12Financial Calendars and Day Parts
Reporting and Analytics manages the following methods for grouping time intervals forreporting and calculating data:
• Calendar: You can perform calculations based on standard calendar intervals,such as years, months, and weeks.
• Financial Calendar: You can configure financial calendars and financial years toperform configurations on fiscal intervals, such as fiscal years and fiscal quarters.
• Day Parts: You can divide workdays into day parts to perform calculations ondifferent time intervals, such as breakfast periods, lunch periods, and dinnerperiods.
• Financial Calendars
• Accounting Cycles
• Last Week of the Financial Year
• Creating a Financial Calendar
• Creating a Financial Year with the Automated Wizard
• Creating a Financial Year Manually
• Creating Day Parts
• Overriding Day Parts
Related Topics
• Maintaining Organizations
Related Topics
• Analysis Report Date Session Variables
Financial CalendarsThe sales information received by Reporting and Analytics from the Point-of-Sale(POS) application is processed by each business day, as configured by the POS End-of-Day (or End-of-Night) operations. For example, if a store is configured to performEnd-of-Day operations every night even when the store is closed on weekends, thePOS creates Saturday and Sunday as business days with no sales values, resulting ina seven-day week. If a store is configured to perform End-of-Day operations everyweek day, the POS only creates Monday to Friday, and the empty sales values fromSaturday and Sunday are rolled into Monday, resulting in a five-day week.
The Reporting and Analytics financial calendar organizes the business dates within thefollowing defined fiscal year components:
• The start and end of the fiscal year. Financial calendars also define how to handlethe surplus day(s) at the end of the year.
• The starting day of each week.
12-1
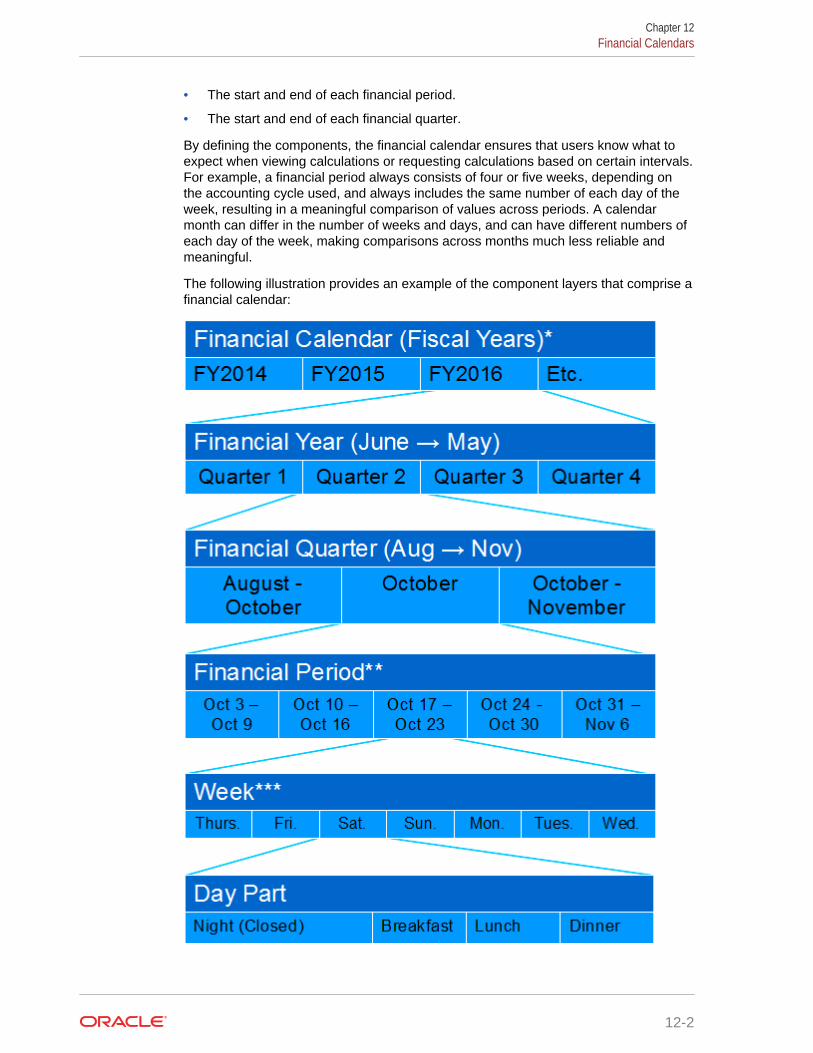
• The start and end of each financial period.
• The start and end of each financial quarter.
By defining the components, the financial calendar ensures that users know what toexpect when viewing calculations or requesting calculations based on certain intervals.For example, a financial period always consists of four or five weeks, depending onthe accounting cycle used, and always includes the same number of each day of theweek, resulting in a meaningful comparison of values across periods. A calendarmonth can differ in the number of weeks and days, and can have different numbers ofeach day of the week, making comparisons across months much less reliable andmeaningful.
The following illustration provides an example of the component layers that comprise afinancial calendar:
Chapter 12Financial Calendars
12-2
* The financial calendar can be assigned to an organization level and location, with thelocation settings overriding the level settings. When using Analysis Reports, you mustconfigure the system-generated Default Calendar.
** The length of a financial period depends on the accounting cycle selected for thefinancial year. Financial periods are defined by the number of weeks since the start ofthe financial quarter, and do not correlate to any one specific calendar month. In thisexample, all three financial periods in the financial quarter include at least one day inOctober.
*** Each financial week begins with the day of the week of the first business day of thefinancial year. For example, if a financial year begins Thursday, June 1, every financialweek begins on Thursday and ends on the following Wednesday.
Related Topics
• Accounting Cycles
• Last Week of the Financial Year
Related Topics
• Creating a Financial Calendar
• Creating a Financial Year with the Automated Wizard
• Creating a Financial Year Manually
Accounting CyclesAccounting cycles define the number of weeks in each financial period in eachfinancial quarter. For example, the 4-4-5 accounting cycle means that in each quarter,the first financial period consists of the first four weeks, the second period consists ofthe next four weeks, and the third period consists if the next five weeks. This quarterthen accounts for 13 weeks, and the four quarters account for 52 weeks, or the fullcalendar year.
You can configure a financial year to adhere to one of the following accounting cycles:
Chapter 12Accounting Cycles
12-3
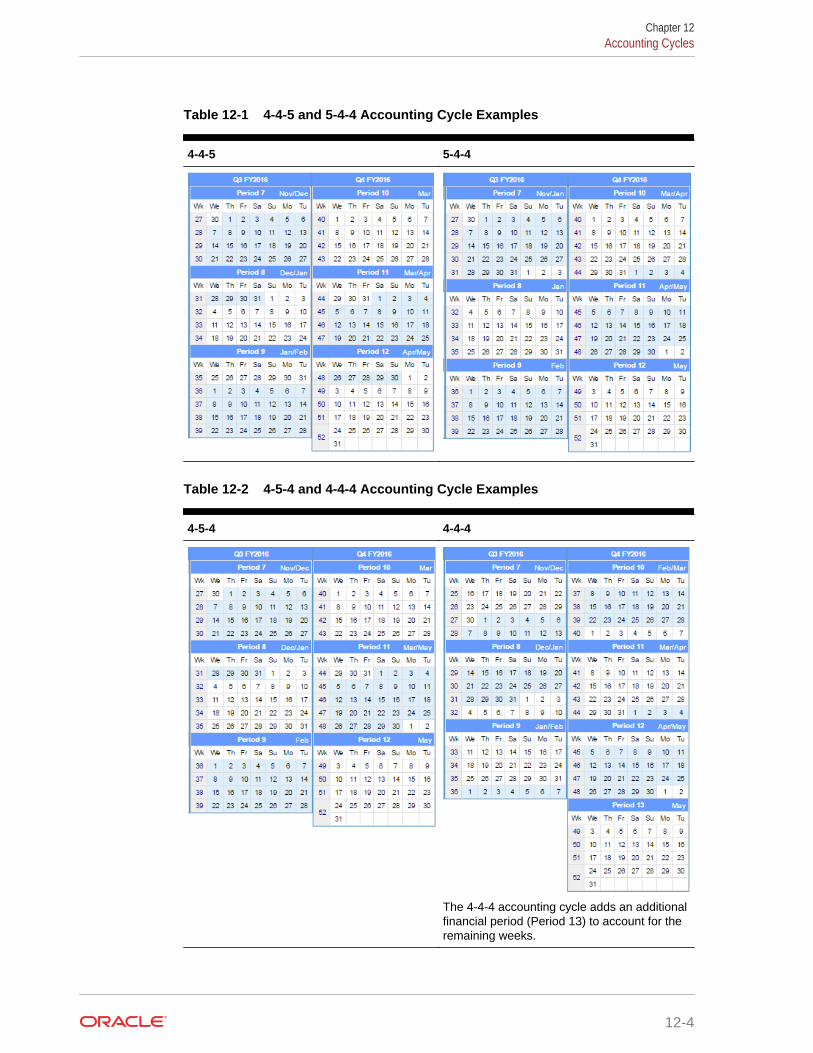
Table 12-1 4-4-5 and 5-4-4 Accounting Cycle Examples
4-4-5 5-4-4
Table 12-2 4-5-4 and 4-4-4 Accounting Cycle Examples
4-5-4 4-4-4
The 4-4-4 accounting cycle adds an additionalfinancial period (Period 13) to account for theremaining weeks.
Chapter 12Accounting Cycles
12-4
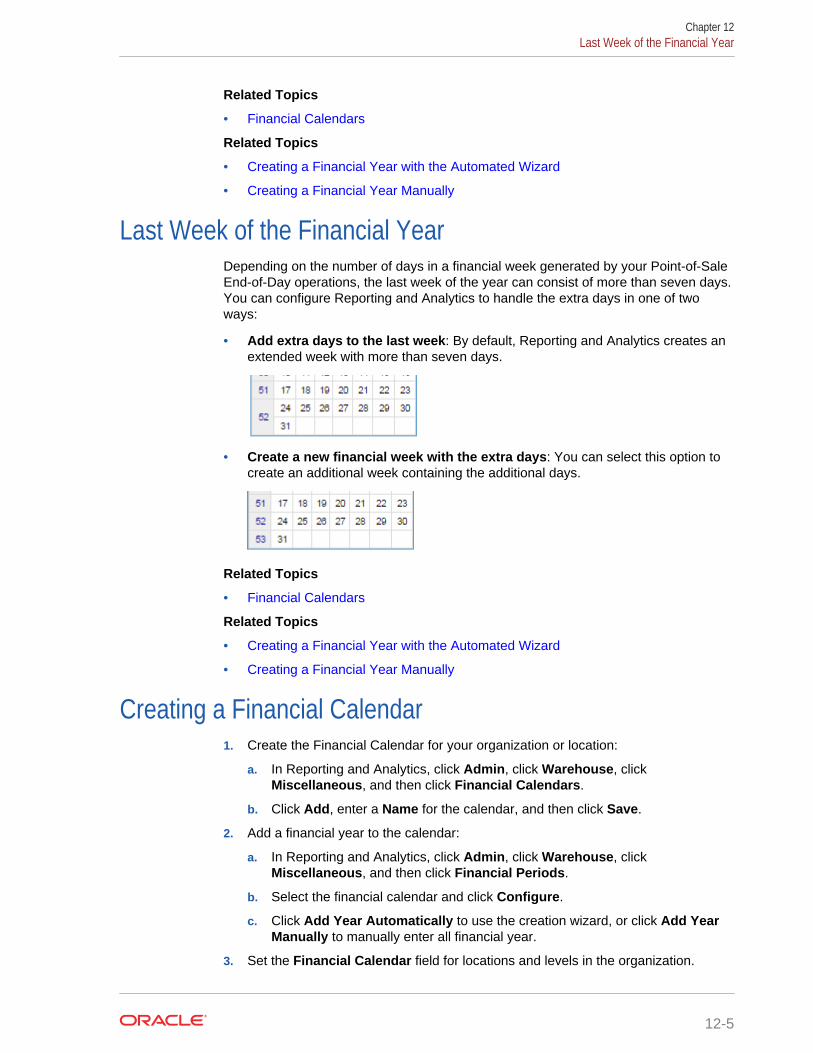
Related Topics
• Financial Calendars
Related Topics
• Creating a Financial Year with the Automated Wizard
• Creating a Financial Year Manually
Last Week of the Financial YearDepending on the number of days in a financial week generated by your Point-of-SaleEnd-of-Day operations, the last week of the year can consist of more than seven days.You can configure Reporting and Analytics to handle the extra days in one of twoways:
• Add extra days to the last week: By default, Reporting and Analytics creates anextended week with more than seven days.
• Create a new financial week with the extra days: You can select this option tocreate an additional week containing the additional days.
Related Topics
• Financial Calendars
Related Topics
• Creating a Financial Year with the Automated Wizard
• Creating a Financial Year Manually
Creating a Financial Calendar1. Create the Financial Calendar for your organization or location:
a. In Reporting and Analytics, click Admin, click Warehouse, clickMiscellaneous, and then click Financial Calendars.
b. Click Add, enter a Name for the calendar, and then click Save.
2. Add a financial year to the calendar:
a. In Reporting and Analytics, click Admin, click Warehouse, clickMiscellaneous, and then click Financial Periods.
b. Select the financial calendar and click Configure.
c. Click Add Year Automatically to use the creation wizard, or click Add YearManually to manually enter all financial year.
3. Set the Financial Calendar field for locations and levels in the organization.
Chapter 12Last Week of the Financial Year
12-5
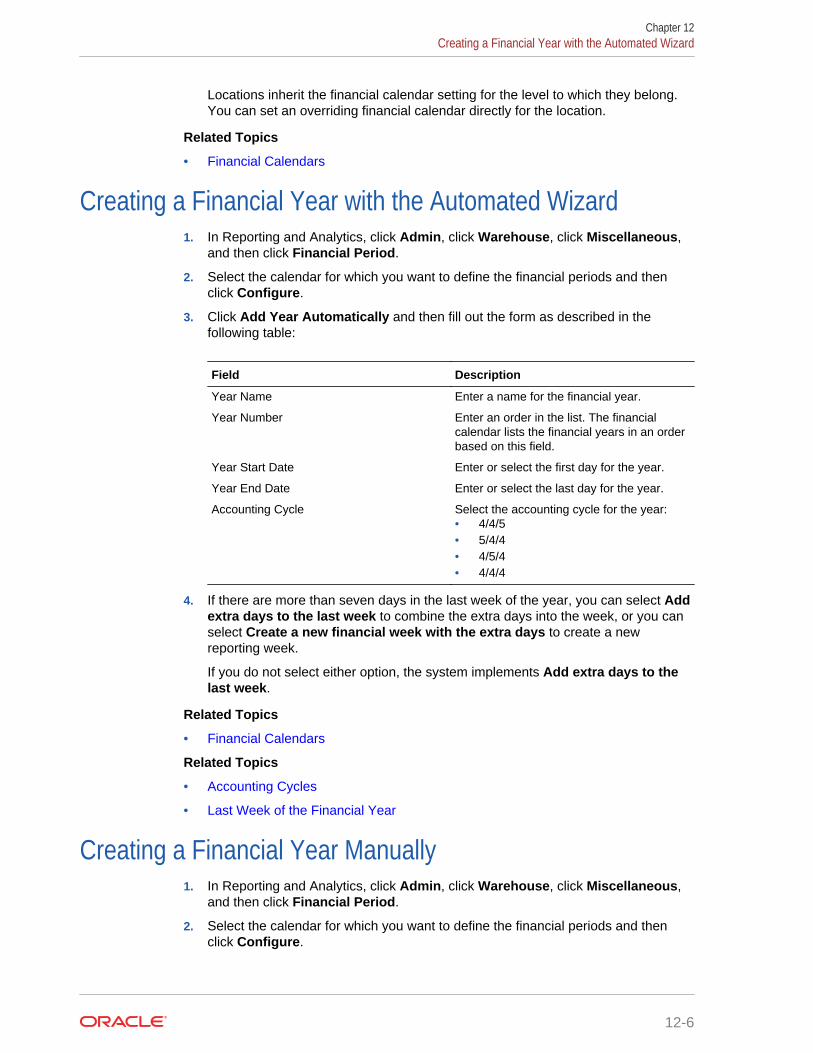
Locations inherit the financial calendar setting for the level to which they belong.You can set an overriding financial calendar directly for the location.
Related Topics
• Financial Calendars
Creating a Financial Year with the Automated Wizard1. In Reporting and Analytics, click Admin, click Warehouse, click Miscellaneous,
and then click Financial Period.
2. Select the calendar for which you want to define the financial periods and thenclick Configure.
3. Click Add Year Automatically and then fill out the form as described in thefollowing table:
Field Description
Year Name Enter a name for the financial year.
Year Number Enter an order in the list. The financialcalendar lists the financial years in an orderbased on this field.
Year Start Date Enter or select the first day for the year.
Year End Date Enter or select the last day for the year.
Accounting Cycle Select the accounting cycle for the year:• 4/4/5• 5/4/4• 4/5/4• 4/4/4
4. If there are more than seven days in the last week of the year, you can select Addextra days to the last week to combine the extra days into the week, or you canselect Create a new financial week with the extra days to create a newreporting week.
If you do not select either option, the system implements Add extra days to thelast week.
Related Topics
• Financial Calendars
Related Topics
• Accounting Cycles
• Last Week of the Financial Year
Creating a Financial Year Manually1. In Reporting and Analytics, click Admin, click Warehouse, click Miscellaneous,
and then click Financial Period.
2. Select the calendar for which you want to define the financial periods and thenclick Configure.
Chapter 12Creating a Financial Year with the Automated Wizard
12-6
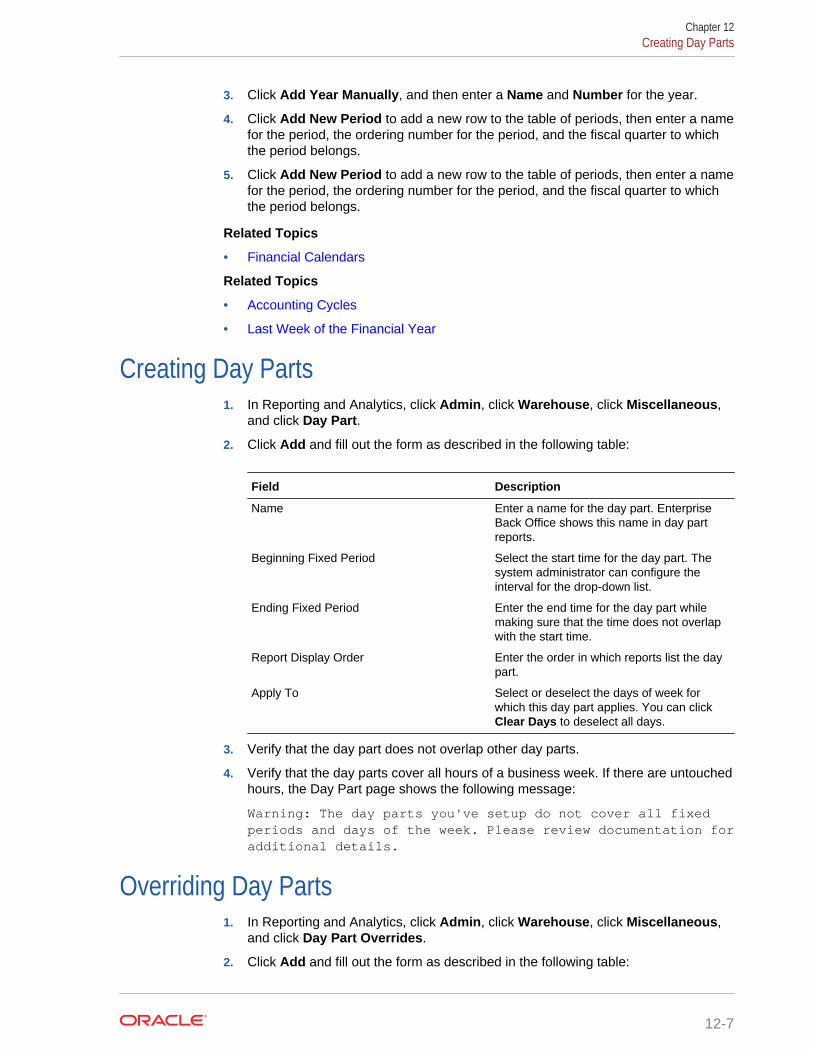
3. Click Add Year Manually, and then enter a Name and Number for the year.
4. Click Add New Period to add a new row to the table of periods, then enter a namefor the period, the ordering number for the period, and the fiscal quarter to whichthe period belongs.
5. Click Add New Period to add a new row to the table of periods, then enter a namefor the period, the ordering number for the period, and the fiscal quarter to whichthe period belongs.
Related Topics
• Financial Calendars
Related Topics
• Accounting Cycles
• Last Week of the Financial Year
Creating Day Parts1. In Reporting and Analytics, click Admin, click Warehouse, click Miscellaneous,
and click Day Part.
2. Click Add and fill out the form as described in the following table:
Field Description
Name Enter a name for the day part. EnterpriseBack Office shows this name in day partreports.
Beginning Fixed Period Select the start time for the day part. Thesystem administrator can configure theinterval for the drop-down list.
Ending Fixed Period Enter the end time for the day part whilemaking sure that the time does not overlapwith the start time.
Report Display Order Enter the order in which reports list the daypart.
Apply To Select or deselect the days of week forwhich this day part applies. You can clickClear Days to deselect all days.
3. Verify that the day part does not overlap other day parts.
4. Verify that the day parts cover all hours of a business week. If there are untouchedhours, the Day Part page shows the following message:
Warning: The day parts you've setup do not cover all fixedperiods and days of the week. Please review documentation foradditional details.
Overriding Day Parts1. In Reporting and Analytics, click Admin, click Warehouse, click Miscellaneous,
and click Day Part Overrides.
2. Click Add and fill out the form as described in the following table:
Chapter 12Creating Day Parts
12-7
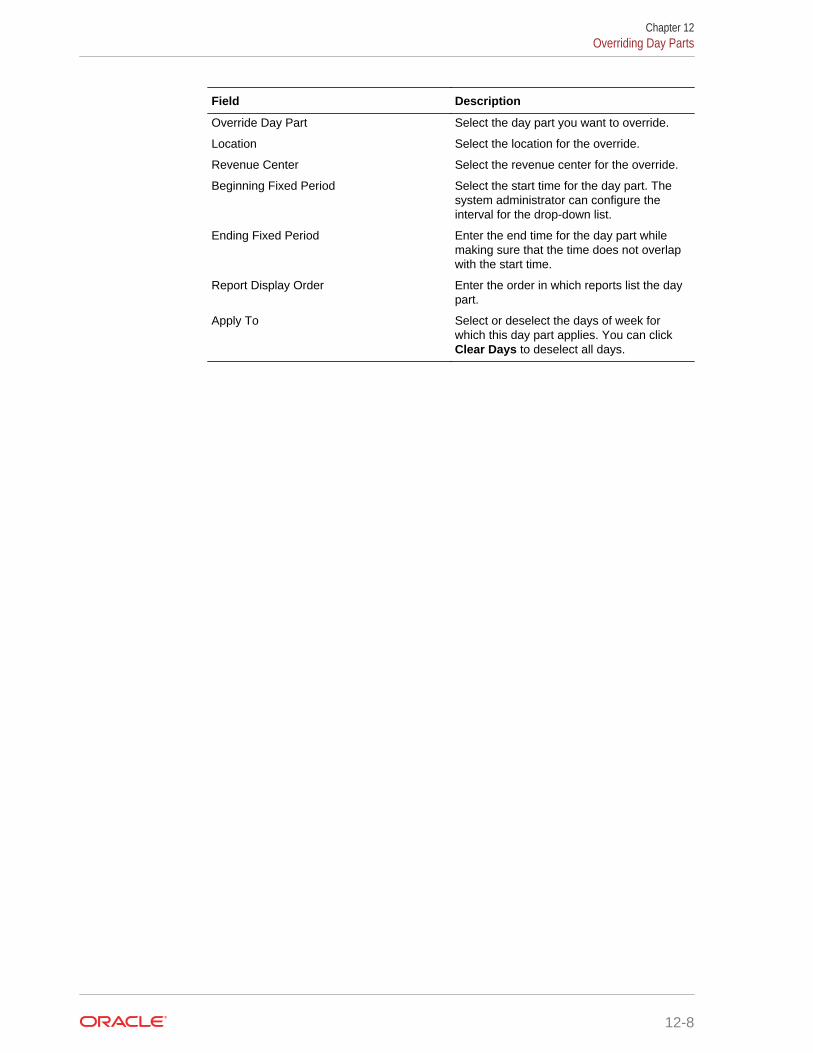
Field Description
Override Day Part Select the day part you want to override.
Location Select the location for the override.
Revenue Center Select the revenue center for the override.
Beginning Fixed Period Select the start time for the day part. Thesystem administrator can configure theinterval for the drop-down list.
Ending Fixed Period Enter the end time for the day part whilemaking sure that the time does not overlapwith the start time.
Report Display Order Enter the order in which reports list the daypart.
Apply To Select or deselect the days of week forwhich this day part applies. You can clickClear Days to deselect all days.
Chapter 12Overriding Day Parts
12-8
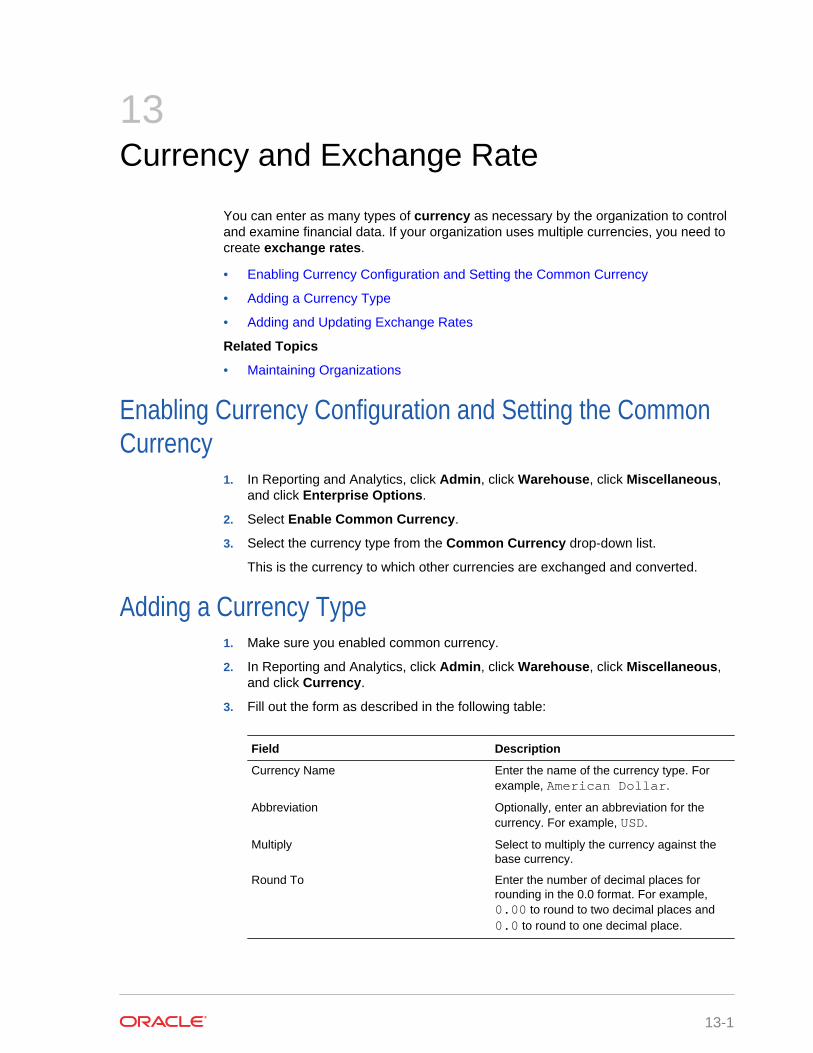
13Currency and Exchange Rate
You can enter as many types of currency as necessary by the organization to controland examine financial data. If your organization uses multiple currencies, you need tocreate exchange rates.
• Enabling Currency Configuration and Setting the Common Currency
• Adding a Currency Type
• Adding and Updating Exchange Rates
Related Topics
• Maintaining Organizations
Enabling Currency Configuration and Setting the CommonCurrency
1. In Reporting and Analytics, click Admin, click Warehouse, click Miscellaneous,and click Enterprise Options.
2. Select Enable Common Currency.
3. Select the currency type from the Common Currency drop-down list.
This is the currency to which other currencies are exchanged and converted.
Adding a Currency Type1. Make sure you enabled common currency.
2. In Reporting and Analytics, click Admin, click Warehouse, click Miscellaneous,and click Currency.
3. Fill out the form as described in the following table:
Field Description
Currency Name Enter the name of the currency type. Forexample, American Dollar.
Abbreviation Optionally, enter an abbreviation for thecurrency. For example, USD.
Multiply Select to multiply the currency against thebase currency.
Round To Enter the number of decimal places forrounding in the 0.0 format. For example,0.00 to round to two decimal places and0.0 to round to one decimal place.
13-1
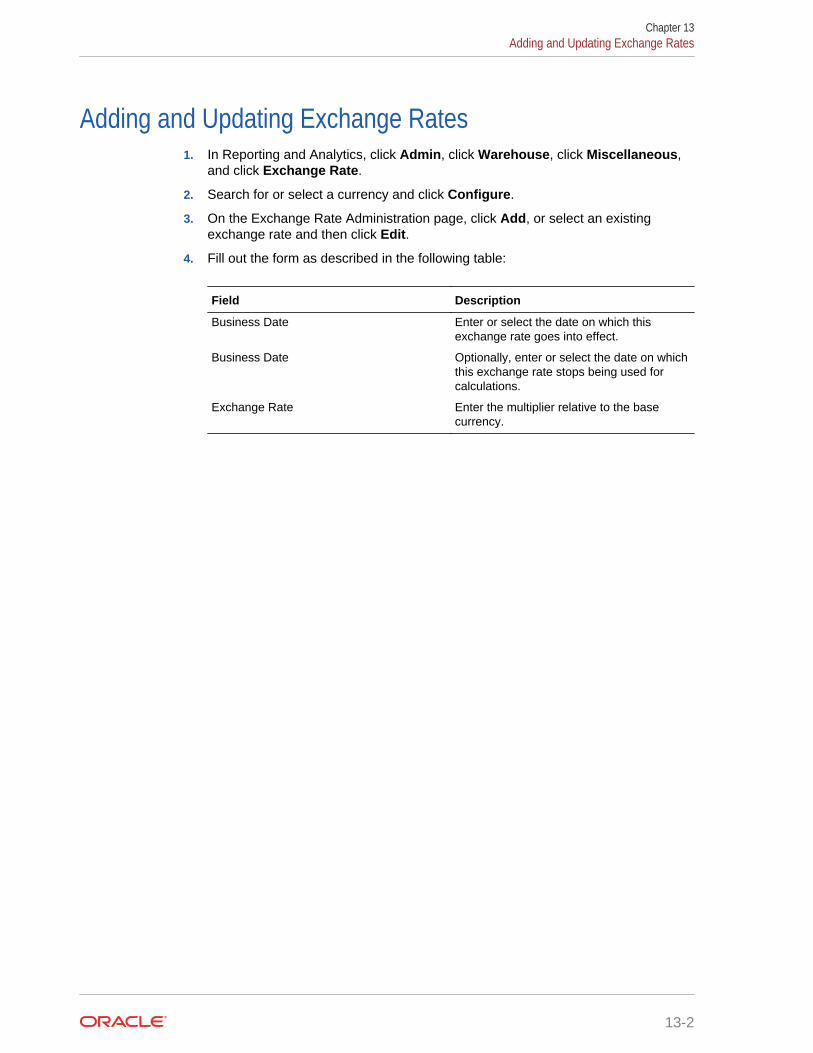
Adding and Updating Exchange Rates1. In Reporting and Analytics, click Admin, click Warehouse, click Miscellaneous,
and click Exchange Rate.
2. Search for or select a currency and click Configure.
3. On the Exchange Rate Administration page, click Add, or select an existingexchange rate and then click Edit.
4. Fill out the form as described in the following table:
Field Description
Business Date Enter or select the date on which thisexchange rate goes into effect.
Business Date Optionally, enter or select the date on whichthis exchange rate stops being used forcalculations.
Exchange Rate Enter the multiplier relative to the basecurrency.
Chapter 13Adding and Updating Exchange Rates
13-2
14Reason Codes
Point-of-Sale operations such as voids, returns, time card adjustments, pay ratechanges, and leaves of absence typically require the manager or employee to enter areason. You can use Enterprise Reason Codes to define and configure types ofreasons and to define the available predefined reasons that managers and employeescan select.
• Creating Reason Codes
Related Topics
• Maintaining Organizations
Creating Reason Codes1. In Reporting and Analytics, click Admin, click Warehouse, click Miscellaneous,
and click Enterprise Reason Codes.
2. Select the action and then click Select. For example, you can select Time CardAdjustments to configure the list of reasons available to managers when theyjustify changes to a time card.
3. Click Add, or select an existing reason and click Edit to open the reasonconfiguration form.
4. Enter the reason in the Reason Code field.
5. To set the code as the default for the action, select Default and then click Save.
14-1
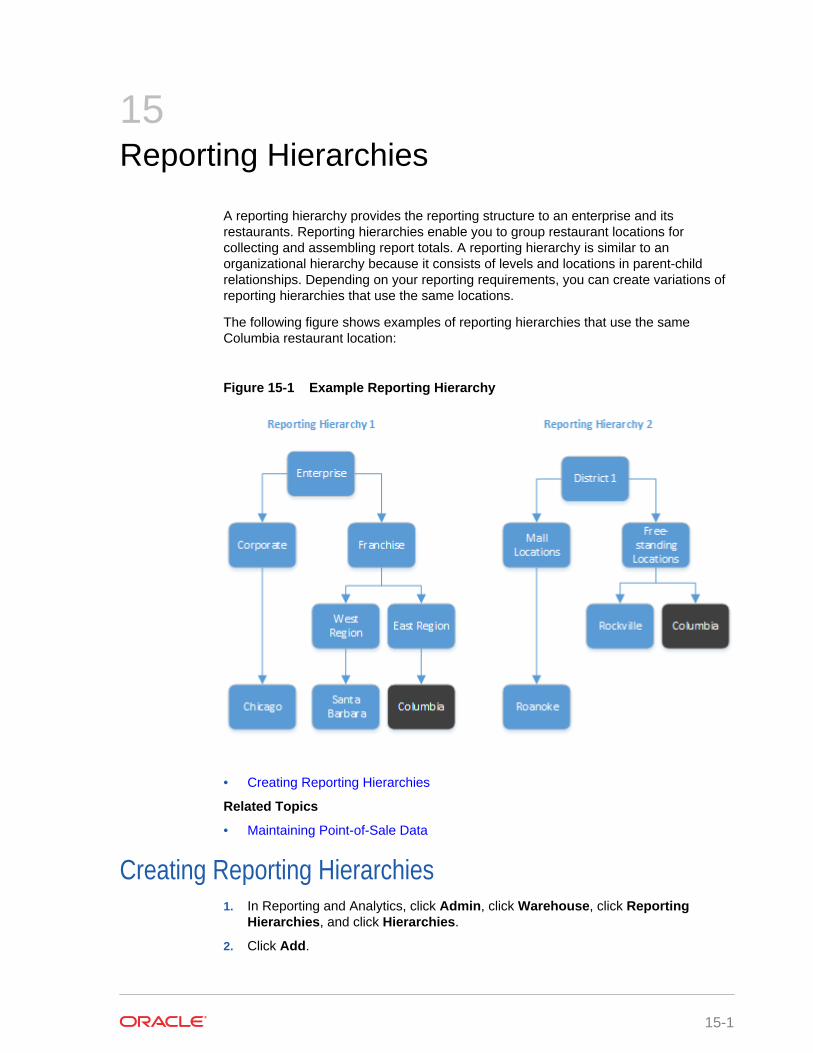
15Reporting Hierarchies
A reporting hierarchy provides the reporting structure to an enterprise and itsrestaurants. Reporting hierarchies enable you to group restaurant locations forcollecting and assembling report totals. A reporting hierarchy is similar to anorganizational hierarchy because it consists of levels and locations in parent-childrelationships. Depending on your reporting requirements, you can create variations ofreporting hierarchies that use the same locations.
The following figure shows examples of reporting hierarchies that use the sameColumbia restaurant location:
Figure 15-1 Example Reporting Hierarchy
• Creating Reporting Hierarchies
Related Topics
• Maintaining Point-of-Sale Data
Creating Reporting Hierarchies1. In Reporting and Analytics, click Admin, click Warehouse, click Reporting
Hierarchies, and click Hierarchies.
2. Click Add.
15-1
3. Type a hierarchy name (for example, District 1).
4. Add levels to the hierarchy:
a. Click Admin, click Warehouse, click Reporting Hierarchies, and clickLevels.
b. Click Add.
c. Type a reporting level name (for example, Free-standing).
d. Click Save.
e. Repeat these substeps to add more levels.
5. Establish relationships between levels:
a. Click Admin, click Warehouse, click Reporting Hierarchies, and clickRelationships.
b. Select the reporting hierarchy name and then click Select.
c. Click Assign Level.
d. Select the level (for example, Free-standing).
e. Select the parent level. If the level you are assigning is the first level, select NoParent from the Parent Level Name drop-down list.
f. Click Assign Level.
g. Repeat these substeps to assign more levels.
6. Establish relationships between levels and locations:
a. Click Assign Location.
b. Select the location (for example, Columbia).
c. Select the parent level for the location (for example, Free-standing).
d. Click Assign Location.
e. Repeat these substeps to establish remaining level-location relationships.
Chapter 15Creating Reporting Hierarchies
15-2
16Item Alignment
When your organization does not use an enterprise management module to controldata entry, different locations can enter the same item with slight variances. Itemalignment allows you to define the master entry under which all of the same item postsand calculates.
Item Alignment consists of the following components:
• Master Groups: Store groupings for which you can specify master items andassign locations. Each Master Group must have one Master Store.
• Master Stores: Assigned locations that define the default master items to whichother locations in the same Master Group align.
• Master Items: The parent item instance under which items post.
• Alias Items: The alias name for aligned items to consolidate under in reports.
• Master Groups and Master Stores
• Alignment Rules
• Configuring a Master Group
• Assigning a Location as a Master Store
• Assigning Locations to the Master Group
• Creating Alignment Rules
• Manually Aligning Items
Related Topics
• Maintaining Point-of-Sale Data
Master Groups and Master StoresYou can configure Master Groups to create groups of stores with separate itemalignment rules, and assign a Master Store to each group. The following figureprovides an example of an organization that defines two master groups to separateitem alignment between fast food restaurants and seated diner restaurants.
16-1
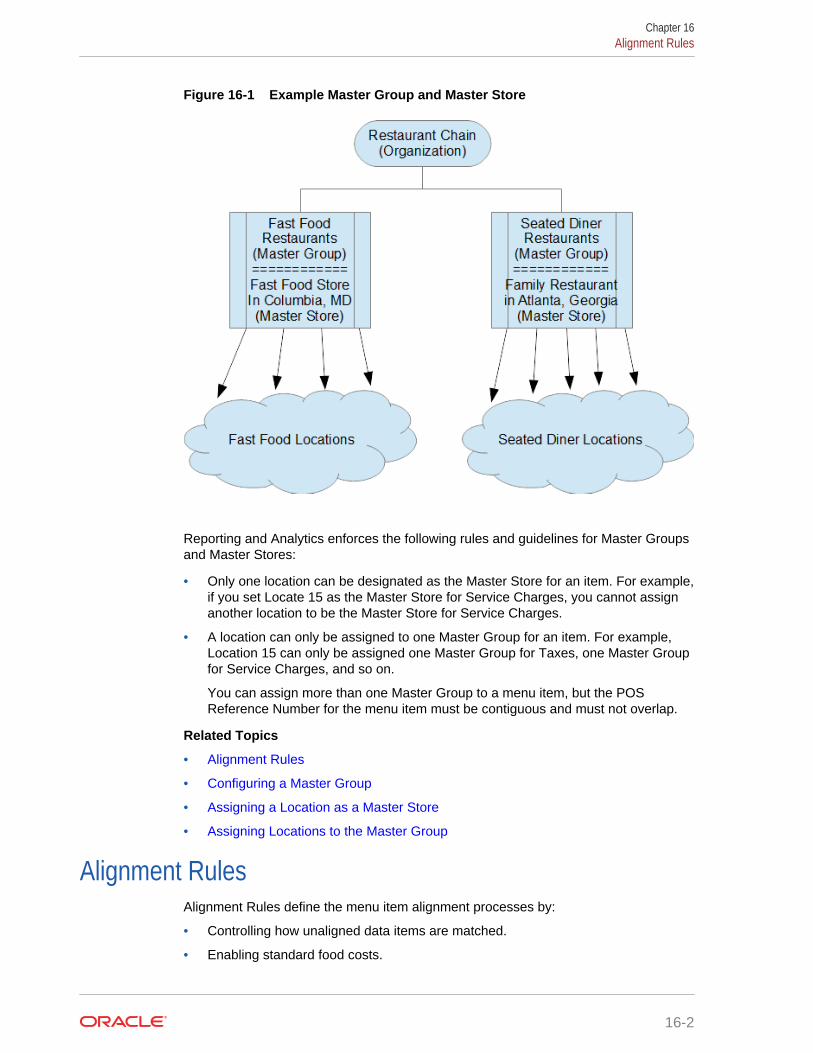
Figure 16-1 Example Master Group and Master Store
Reporting and Analytics enforces the following rules and guidelines for Master Groupsand Master Stores:
• Only one location can be designated as the Master Store for an item. For example,if you set Locate 15 as the Master Store for Service Charges, you cannot assignanother location to be the Master Store for Service Charges.
• A location can only be assigned to one Master Group for an item. For example,Location 15 can only be assigned one Master Group for Taxes, one Master Groupfor Service Charges, and so on.
You can assign more than one Master Group to a menu item, but the POSReference Number for the menu item must be contiguous and must not overlap.
Related Topics
• Alignment Rules
• Configuring a Master Group
• Assigning a Location as a Master Store
• Assigning Locations to the Master Group
Alignment RulesAlignment Rules define the menu item alignment processes by:
• Controlling how unaligned data items are matched.
• Enabling standard food costs.
Chapter 16Alignment Rules
16-2
• Enabling menu item aliasing.
• Setting the start and end times for charts.
• Defining the default methods for identifying new menu items.
• Defining how new menu items are matched to existing values.
Alignment rules do not guarantee that all new menu items are aligned to existing menuitems. You can use the rules to increase the likelihood of successfully automatedmatches. Administrators should continue to perform routine checks of unaligned itemsand review menu item alignment to ensure accuracy.
Related Topics
• Master Groups and Master Stores
• Configuring a Master Group
• Assigning a Location as a Master Store
• Assigning Locations to the Master Group
Related Topics
• Creating Alignment Rules
Configuring a Master Group1. In Reporting and Analytics, click Admin, click Warehouse, click Miscellaneous,
and then click Master Groups.
2. Click Add, or select a Master Group and then click Edit.
3. Enter a name, suffix, and comment for the Master Group, and then click Save.
Reporting and Analytics appends the suffix to items aligned with the Master Store.This allows you to immediately identify the alignment status of items whenperforming manual alignment. For example, if you configure the Front ofHouse Master Group with the FOH suffix, and then set a Master Item forCOCKTAIL, Reporting and Analytics appends the suffix and shows the item asCOCKTAIL FOH.
Related Topics
• Master Groups and Master Stores
• Alignment Rules
Assigning a Location as a Master Store1. In Reporting and Analytics, click Admin, click Warehouse, click Miscellaneous,
and then click Master Groups.
2. Select a Master Group, and then click Assign Store Master.
3. Click Add, and then select a Location from the drop-down list.
4. Select the item types or groups to designate the Master Items. You cannotdesignate an item type or group as a Master Item if it has been set for anotherMaster Store in the same Master Group.
Chapter 16Configuring a Master Group
16-3
5. You can select Assign as location if you deactivate the location as a MasterStore.
6. Click Save.
Related Topics
• Master Groups and Master Stores
• Alignment Rules
Assigning Locations to the Master Group1. In Reporting and Analytics, click Admin, click Warehouse, click Miscellaneous,
and then click Master Groups.
2. Select a Master Group, and then click Assign Location.
3. Click Add, and then select a Location from the drop-down list.
4. Select the item types or groups to align to the Master Items in this Master Group.
5. Click Save.
Related Topics
• Master Groups and Master Stores
• Alignment Rules
Creating Alignment Rules1. In Reporting and Analytics, click Admin, click Warehouse, click Miscellaneous,
and click Alignment Rules.
2. Select one of the following alignment methods from the Method Item AlignmentBased On drop-down list:
• POS Number
• Name 1
• Name 2
• Name 1 and POS Number
3. Select one of the following general alignment methods from the GeneralAlignment Type drop-down list:
• POS Item Number Only
• POS Name Only
• POS Item Number and Name
4. Select one of the following back-of-house alignment methods from the BOH AlignType drop-down list:
• POS Item Number Only
• POS Name Only
• POS Item Number and Name
5. Enter the start and end time for all charts in the portal using the 24-hour format.
Chapter 16Assigning Locations to the Master Group
16-4
6. Enter the default food cost percentage for when a percentage is not included in theMaster table or the data posted from the POS.
7. Select how the system handles new menu items from the Menu Item NameChange drop-down list:
• Replace an Old Name
• Create a New Menu Item
8. Enter the Number of Attempts to be made to align each menu item.
9. Select Enable Menu Item Aliasing to allow one menu item to link to multiplepossible names.
10. Select Enable Other Table Aliasing to allow unaligned menu items to alias withitems found in other database tables.
Related Topics
• Alignment Rules
Manually Aligning Items1. In Reporting and Analytics, click Admin, click Warehouse, click Alignment, and
click the type of database item.
If the organization is configured to match family group or major group, you mustperform alignment in the order of Family Group, Major Group, and then MenuItems.
2. Select the Master Group and the Location, and then click Submit.
In the alignment window, you can:
• Hold the Shift key to select multiple items.
• Click Options and filter the list of master items.
• Click Options and configure the columns shown in the Unaligned Items andAligned Items tabs.
• Click Run Alignment to run the alignment process immediately.
3. To align an item:
a. Click the master item from the Master Items list.
b. Click the unaligned item from the Unaligned Items tab, and then click Align.
4. To change item alignment:
a. Click the master item from the Master Items list.
b. Click the item from the Aligned Items tab, and then click Transfer.
c. In the Select destination master item window, click the destination masteritem, and then click OK.
5. To unalign an item:
a. Click the master item from the Master Items list.
b. Click the item from the Aligned Items tab, and then click Unalign.
6. To merge master items:
a. Click the master items from the Master Items list, and then click Merge.
Chapter 16Manually Aligning Items
16-5
b. In the Select master item dialog box, click the master item you want to keep,and then click OK.
7. To designate an unaligned item as a new master item:
a. Click an item from the Unaligned Items tab and then click Create Master.
b. Fill out the Create Master form, and then click OK.
8. To configure alignment rules:
a. Click Modify Rules.
b. Fill out the form, and then click Create.
You can enter the characters to remove or ignore during the alignmentprocess, such as slashes and apostrophes.
Chapter 16Manually Aligning Items
16-6
17Category Groups
Category Groups organize database items to control the scope of reports. Forexample, Reporting and Analytics considers the Major menu item groups and Familymenu item groups used in many Point-of-Sale applications as category groups andallows users to run reports against one or both groups. Reporting and Analytics doesnot limit the number of category groups that you can use and allows you to organizethe category groups in Category Group Hierarchies so you can run reports againstmultiple category groups.
For example, one location combines beer, wine, and liquor into the Alcohol group.Another location has a combined group named Beverages but also organizes eachbeverage by type, so they have a Beer group consisting of domestic, import, anddraft. You can use category groups to create a unified set of groups and hierarchies toconsolidate information from different systems and produce accurate reports.
• Creating Category Groups
• Creating Category Group Hierarchies
Related Topics
• Maintaining Point-of-Sale Data
Creating Category Groups1. In Reporting and Analytics, click Admin, click Warehouse, click Category
Groups, and click Category Groups.
2. Enter a name for the category group and then click Save.
Creating Category Group Hierarchies1. To create a category group hierarchy:
a. In Reporting and Analytics, click Admin, click Warehouse, click CategoryGroups, and click Hierarchies.
b. Click Add and then enter a name for the hierarchy.
c. Select the category type from the drop-down list and then click Save.
2. To add category groups to the hierarchy and to configure parent-childrelationships:
a. In Reporting and Analytics, click Admin, click Warehouse, click CategoryGroups, and click Relationships.
b. Select the hierarchy and then click Select.
c. To add a category group to the hierarchy, click Assign Group, select thegroup and the parent, and click Save.
d. To change the parent-child relationship of a group, select the child group, clickEdit, change the parent group, and click Save.
17-1
18Cost Tiers
A cost tier is a saved set of menu items typically associated with a vendor or source.For example, you can create a cost tier for four different produce suppliers and thenassign the menu item Lettuce to each cost tier.
• Creating Cost Tiers
• Assigning Menu Items to Cost Tiers
Related Topics
• Maintaining Point-of-Sale Data
Creating Cost Tiers1. In Reporting and Analytics, click Admin, click Warehouse, click Miscellaneous,
and click Cost Tier.
2. Click Add, fill out the form, and click Save.
3. You can enter an external database reference link for custom development.
Assigning Menu Items to Cost Tiers1. In Reporting and Analytics, click Admin, click Warehouse, click Miscellaneous,
and click Menu Item Cost Tier.
2. Select the Point-of-Sale Major Group, Family Group, or an applicable Reportingand Analytics Category Group.
3. Select the group or category from the drop-down list.
4. Select the menu item and then click Select.
5. Click Add, select the Cost Tier from the drop-down list, fill out the form, and clickSave.
18-1
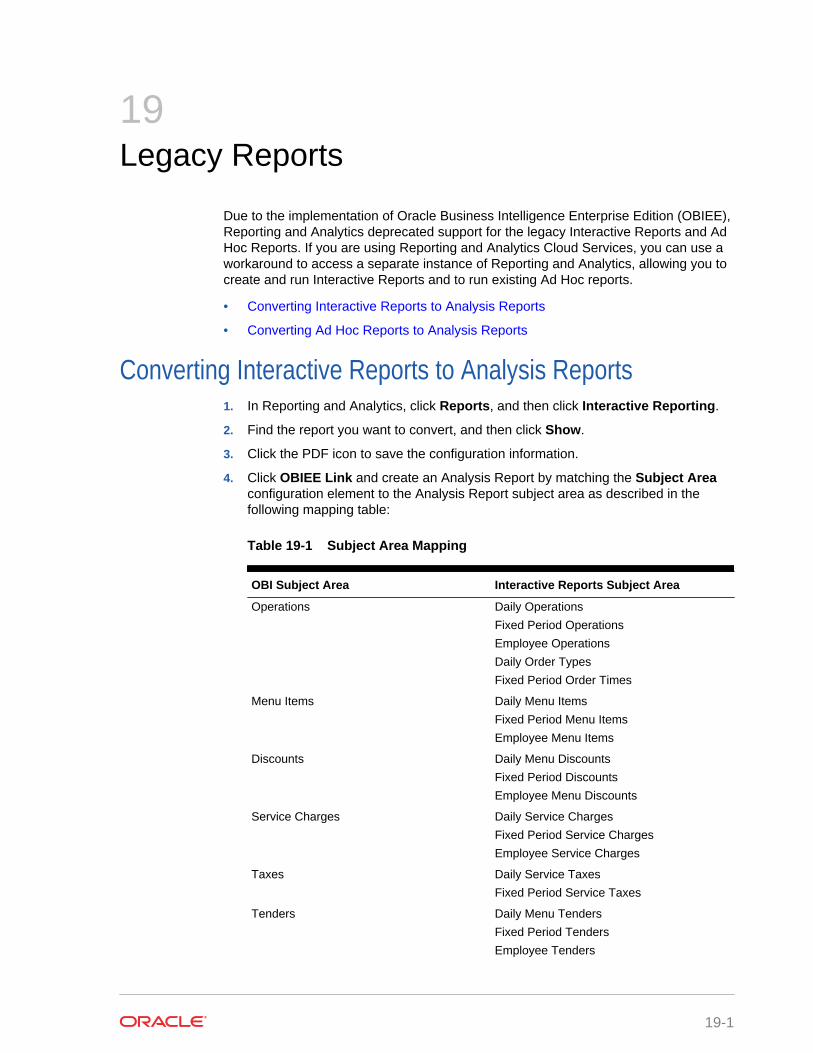
19Legacy Reports
Due to the implementation of Oracle Business Intelligence Enterprise Edition (OBIEE),Reporting and Analytics deprecated support for the legacy Interactive Reports and AdHoc Reports. If you are using Reporting and Analytics Cloud Services, you can use aworkaround to access a separate instance of Reporting and Analytics, allowing you tocreate and run Interactive Reports and to run existing Ad Hoc reports.
• Converting Interactive Reports to Analysis Reports
• Converting Ad Hoc Reports to Analysis Reports
Converting Interactive Reports to Analysis Reports1. In Reporting and Analytics, click Reports, and then click Interactive Reporting.
2. Find the report you want to convert, and then click Show.
3. Click the PDF icon to save the configuration information.
4. Click OBIEE Link and create an Analysis Report by matching the Subject Areaconfiguration element to the Analysis Report subject area as described in thefollowing mapping table:
Table 19-1 Subject Area Mapping
OBI Subject Area Interactive Reports Subject Area
Operations Daily Operations
Fixed Period Operations
Employee Operations
Daily Order Types
Fixed Period Order Times
Menu Items Daily Menu Items
Fixed Period Menu Items
Employee Menu Items
Discounts Daily Menu Discounts
Fixed Period Discounts
Employee Menu Discounts
Service Charges Daily Service Charges
Fixed Period Service Charges
Employee Service Charges
Taxes Daily Service Taxes
Fixed Period Service Taxes
Tenders Daily Menu Tenders
Fixed Period Tenders
Employee Tenders
19-1
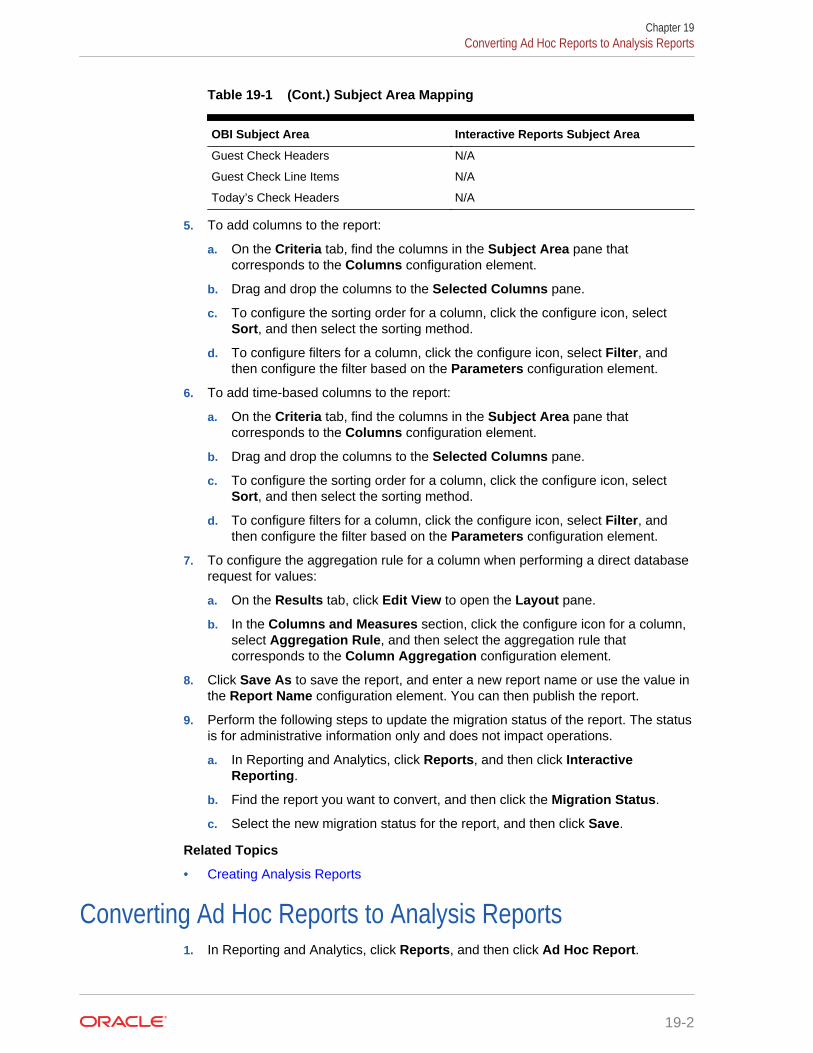
Table 19-1 (Cont.) Subject Area Mapping
OBI Subject Area Interactive Reports Subject Area
Guest Check Headers N/A
Guest Check Line Items N/A
Today’s Check Headers N/A
5. To add columns to the report:
a. On the Criteria tab, find the columns in the Subject Area pane thatcorresponds to the Columns configuration element.
b. Drag and drop the columns to the Selected Columns pane.
c. To configure the sorting order for a column, click the configure icon, selectSort, and then select the sorting method.
d. To configure filters for a column, click the configure icon, select Filter, andthen configure the filter based on the Parameters configuration element.
6. To add time-based columns to the report:
a. On the Criteria tab, find the columns in the Subject Area pane thatcorresponds to the Columns configuration element.
b. Drag and drop the columns to the Selected Columns pane.
c. To configure the sorting order for a column, click the configure icon, selectSort, and then select the sorting method.
d. To configure filters for a column, click the configure icon, select Filter, andthen configure the filter based on the Parameters configuration element.
7. To configure the aggregation rule for a column when performing a direct databaserequest for values:
a. On the Results tab, click Edit View to open the Layout pane.
b. In the Columns and Measures section, click the configure icon for a column,select Aggregation Rule, and then select the aggregation rule thatcorresponds to the Column Aggregation configuration element.
8. Click Save As to save the report, and enter a new report name or use the value inthe Report Name configuration element. You can then publish the report.
9. Perform the following steps to update the migration status of the report. The statusis for administrative information only and does not impact operations.
a. In Reporting and Analytics, click Reports, and then click InteractiveReporting.
b. Find the report you want to convert, and then click the Migration Status.
c. Select the new migration status for the report, and then click Save.
Related Topics
• Creating Analysis Reports
Converting Ad Hoc Reports to Analysis Reports1. In Reporting and Analytics, click Reports, and then click Ad Hoc Report.
Chapter 19Converting Ad Hoc Reports to Analysis Reports
19-2
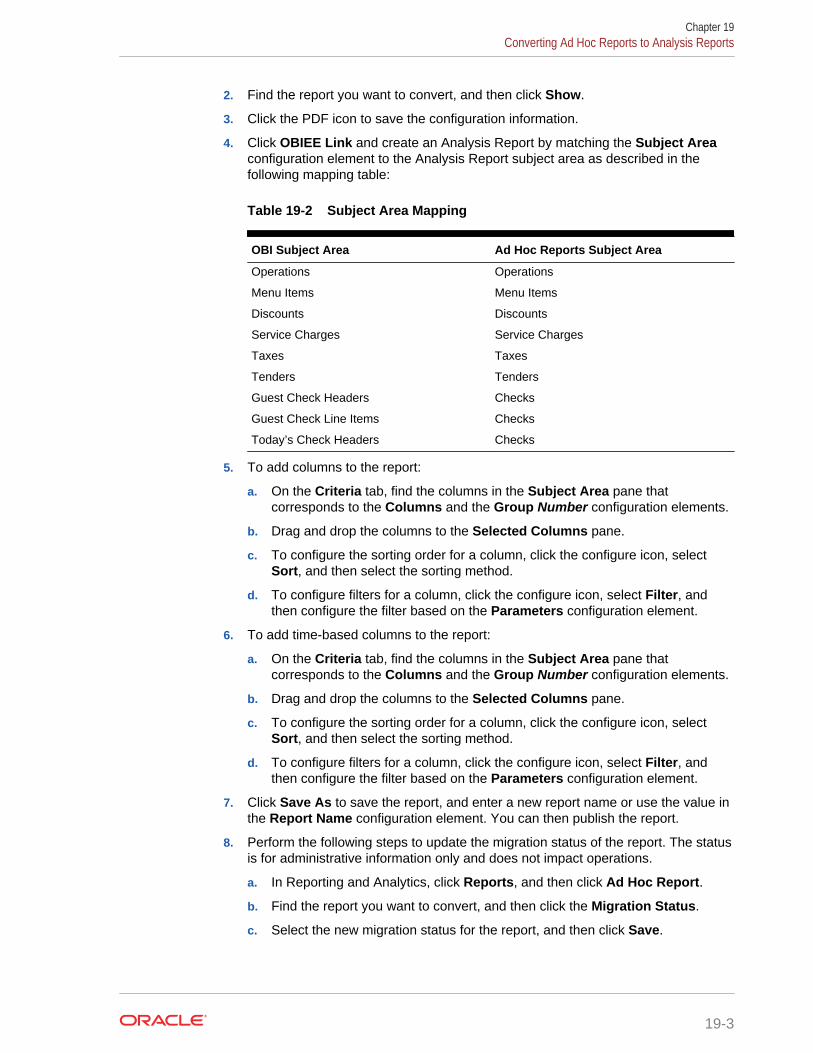
2. Find the report you want to convert, and then click Show.
3. Click the PDF icon to save the configuration information.
4. Click OBIEE Link and create an Analysis Report by matching the Subject Areaconfiguration element to the Analysis Report subject area as described in thefollowing mapping table:
Table 19-2 Subject Area Mapping
OBI Subject Area Ad Hoc Reports Subject Area
Operations Operations
Menu Items Menu Items
Discounts Discounts
Service Charges Service Charges
Taxes Taxes
Tenders Tenders
Guest Check Headers Checks
Guest Check Line Items Checks
Today’s Check Headers Checks
5. To add columns to the report:
a. On the Criteria tab, find the columns in the Subject Area pane thatcorresponds to the Columns and the Group Number configuration elements.
b. Drag and drop the columns to the Selected Columns pane.
c. To configure the sorting order for a column, click the configure icon, selectSort, and then select the sorting method.
d. To configure filters for a column, click the configure icon, select Filter, andthen configure the filter based on the Parameters configuration element.
6. To add time-based columns to the report:
a. On the Criteria tab, find the columns in the Subject Area pane thatcorresponds to the Columns and the Group Number configuration elements.
b. Drag and drop the columns to the Selected Columns pane.
c. To configure the sorting order for a column, click the configure icon, selectSort, and then select the sorting method.
d. To configure filters for a column, click the configure icon, select Filter, andthen configure the filter based on the Parameters configuration element.
7. Click Save As to save the report, and enter a new report name or use the value inthe Report Name configuration element. You can then publish the report.
8. Perform the following steps to update the migration status of the report. The statusis for administrative information only and does not impact operations.
a. In Reporting and Analytics, click Reports, and then click Ad Hoc Report.
b. Find the report you want to convert, and then click the Migration Status.
c. Select the new migration status for the report, and then click Save.
Chapter 19Converting Ad Hoc Reports to Analysis Reports
19-3
Related Topics
• Creating Analysis Reports
Chapter 19Converting Ad Hoc Reports to Analysis Reports
19-4
20Standard Export
Standard Export supports end-of-day (EOD) and end-of-week (EOW) exports from allPoint-of-Sale (POS) applications that can interface with Oracle Hospitality EnterpriseBack Office.
The Enterprise Information Portal (EIP) collects information from the Point-of-Sale.When used with Oracle Hospitality RES 3700, the EIP collects transactionalinformation every 15 minutes and daily information such as time and labor activityevery night after end-of-day. When using with Oracle Hospitality Simphony, the EIPcollects transactional information in realtime. The EIP then loads the information intoan Oracle Data Warehouse to be made available for reporting and exporting.
The Admin Schedule creates an export file based on system administrator or, in somecases, customer configurations.
For detailed information about standard export, refer to the Oracle HospitalityReporting and Analytics Standard Export User Guide.
20-1


![Facebook Certification - Reporting & analytics [curriculum]](https://img.pdfslide.net/doc/110x75/55c2a1a3bb61eb9b358b47a4/facebook-certification-reporting-analytics-curriculum.jpg)