1
ANCHOR BANCORP WISCONSIN, INC Exchange NMS Symbol ABCW Price $7.68 (8/29/2008) 52Wk Range 28.99-5.86 Yield 5.21 P/E 6.05 *7 Year Price Score 65.82 *12 Month Price Score 44.57 *NYSE Composite Index=100 Interim Earnings (Per Share) Qtr. Jun Sep Dec Mar 2005-06 0.52 0.48 0.50 0.53 2006-07 0.49 0.44 0.48 0.38 2007-08 0.46 0.44 0.30 0.27 2008-09 0.26 ... ... ... Interim Dividends (Per Share) Amt Decl Ex Rec Pay 0.18Q 10/19/2007 10/30/2007 11/01/2007 11/15/2007 0.18Q 01/22/2008 01/29/2008 01/31/2008 02/15/2008 0.18Q 04/21/2008 04/28/2008 04/30/2008 05/15/2008 0.10Q 07/22/2008 07/30/2008 08/01/2008 08/15/2008 Indicated Div: $0.40 Valuation Analysis Forecast EPS $0.60 (09/06/2008) Market Cap $165.0 Million Book Value 343.6 Million Price/Book 0.48 Price/Sales 0.48 Dividend Achiever Status 10 Year Growth Rate 16.95% Total Years of Dividend Growth 14 TRADING VOLUME (thousand shares) 5 7.5 10 12.5 15 17.5 20 22.5 25 27.5 30 32.5 35 1999 2000 2001 2002 2003 2004 2005 2006 2007 2008 0 25 50 75 Business Summary: Other Depository Banking (MIC: SIC: 6036 NAIC: 522120) Anchor BanCorp Wisconsin is a savings and loan holding company. Through its subsidiary, AnchorBank, fsb, Co. is engaged in the provision of checking, savings, money market accounts, mortgages, home equity and other consumer loans, student loans, credit cards, annuities and related consumer financial services as well as banking services to businesses, including checking accounts, lines of credit, secured loans and commercial real estate loans. Also, Co. invests in real estate partnerships through its non-banking subsidiary, Investment Directions, Inc. As of Mar 31 2008, Co. had total assets of $5.15 billion and total deposits of $3.54 billion. Recent Developments: For the quarter ended June 30 2008, net income decreased 44.2% to US$5.5 million from US$9.9 million in the year-earlier quarter. Net interest income increased 7.8% to US$33.4 million from US$31.0 million in the year-earlier quarter. Provision for loan losses was US$9.4 million versus US$2.3 million in the prior-year quarter, an increase of 313.9%. Non-interest income fell 19.3% to US$11.8 million from US$14.6 million, while non-interest expense declined 0.4% to US$26.8 million. Prospects: Co.'s recent earnings are being negatively affected by an increase in provision for loan losses and a decrease in non-interest income, partially offset by acceleration in net interest income and lower non-interest expense. Specifically, Co. attributes the decline in non-interest income primarily to the decrease in real estate partnership revenue as a result of no sales, as well as lower loan servicing income. In addition, Co.'s net interest margin continues to be hampered by a decline in yield on interest-earning assets. Nevertheless, Co.'s net interest income is being driven by stringent management of deposit rates that reduced its cost of funds and improved its interest rate spread. Financial Data Address: 25 West Main Street, Madison, WI 53703 Telephone: 608-252-8700 Web Site: www.anchorbank.com Officers: Douglas J. Timmerman - Chairman, President, Chief Executive Officer J. Anthony Cattelino - Executive Vice President, Recording Secretary Transfer Agents: American Stock Transfer Company, New York, NY Investor Contact: 608-252-1810 No of Institutions: 115 Shares: 12,393,970 % Held: 55.64 (US$ in Thousands) 3 Mos 03/31/2008 03/31/2007 03/31/2006 03/31/2005 03/31/2004 03/31/2003 03/31/2002 Earnings Per Share 1.27 1.48 1.80 2.03 2.10 2.02 2.02 1.55 Cash Flow Per Share 0.02 0.80 1.94 2.13 2.86 3.84 2.41 (1.43) Tang Book Value Per Share 12.63 12.78 14.62 13.78 13.03 12.27 11.40 11.12 Dividends Per Share 0.720 0.710 0.670 0.615 0.485 0.430 0.362 0.323 Dividend Payout % 56.69 47.97 37.22 30.30 23.10 21.29 17.95 20.81 Income Statement Interest Income 70,508 296,675 280,692 238,550 199,979 190,262 209,605 225,701 Interest Expense 37,087 167,670 152,646 105,846 79,276 79,907 92,856 128,454 Net Interest Income 33,421 129,005 128,046 132,704 120,703 110,355 116,749 97,247 Provision for Losses 9,400 22,551 11,255 3,900 1,579 1,950 1,800 2,485 Non-Interest Income 11,809 51,587 53,999 66,976 134,864 82,076 32,753 21,615 Non-Interest Expense 26,791 107,661 107,473 118,447 162,575 113,641 68,004 59,531 Income Before Taxes 9,078 50,782 63,558 75,610 77,867 76,840 79,698 56,846 Income Taxes 3,566 19,650 24,586 30,927 29,532 29,471 30,135 20,479 Net Income 5,512 31,132 38,972 44,683 48,335 47,369 49,563 36,367 Average Shares 20,928 21,095 21,688 22,026 23,011 23,399 24,592 23,462 Balance Sheet Net Loans & Leases 4,135,694 4,212,502 3,878,523 3,619,774 3,418,969 3,081,390 2,814,042 2,673,768 Total Assets 4,949,335 5,149,557 4,539,685 4,275,140 4,050,456 3,810,386 3,538,621 3,507,076 Total Deposits 3,406,975 3,539,994 3,248,246 3,040,217 2,873,533 2,602,954 2,574,188 2,553,987 Total Liabilities 4,605,736 4,804,441 4,202,819 3,954,115 3,739,778 3,508,838 3,245,617 3,229,564 Stockholders' Equity 343,599 345,116 336,866 321,025 310,678 301,548 293,004 277,512 Shares Outstanding 21,480 21,348 21,669 21,854 22,319 22,954 23,942 24,950 Statistical Record Return on Assets % 0.56 0.64 0.88 1.07 1.23 1.29 1.41 1.10 Return on Equity % 7.93 9.10 11.85 14.15 15.79 15.89 17.37 14.63 Net Interest Margin % 47.40 43.48 45.62 55.63 60.36 58.00 55.70 43.09 Efficiency Ratio % 32.55 30.91 32.11 38.77 48.55 41.73 28.06 24.07 Loans to Deposits 1.21 1.19 1.19 1.19 1.19 1.18 1.09 1.05 Price Range 28.99-7.01 28.99-17.06 30.60-26.91 32.78-26.32 29.61-24.00 27.10-21.95 24.25-17.99 21.64-13.13 P/E Ratio 22.83-5.52 19.59-11.53 17.00-14.95 16.15-12.97 14.10-11.43 13.42-10.87 12.00-8.91 13.96-8.47 Average Yield % 3.38 2.86 2.31 2.05 1.82 1.74 1.69 1.94 13

Anchor Bancorp Wisconsin, Inc

  • View
    212

  • Download
    0

Embed Size (px)

Citation preview

ANCHOR BANCORP WISCONSIN, INCExchange

NMSSymbolABCW

Price$7.68 (8/29/2008)

52Wk Range28.99-5.86

Yield5.21

P/E6.05

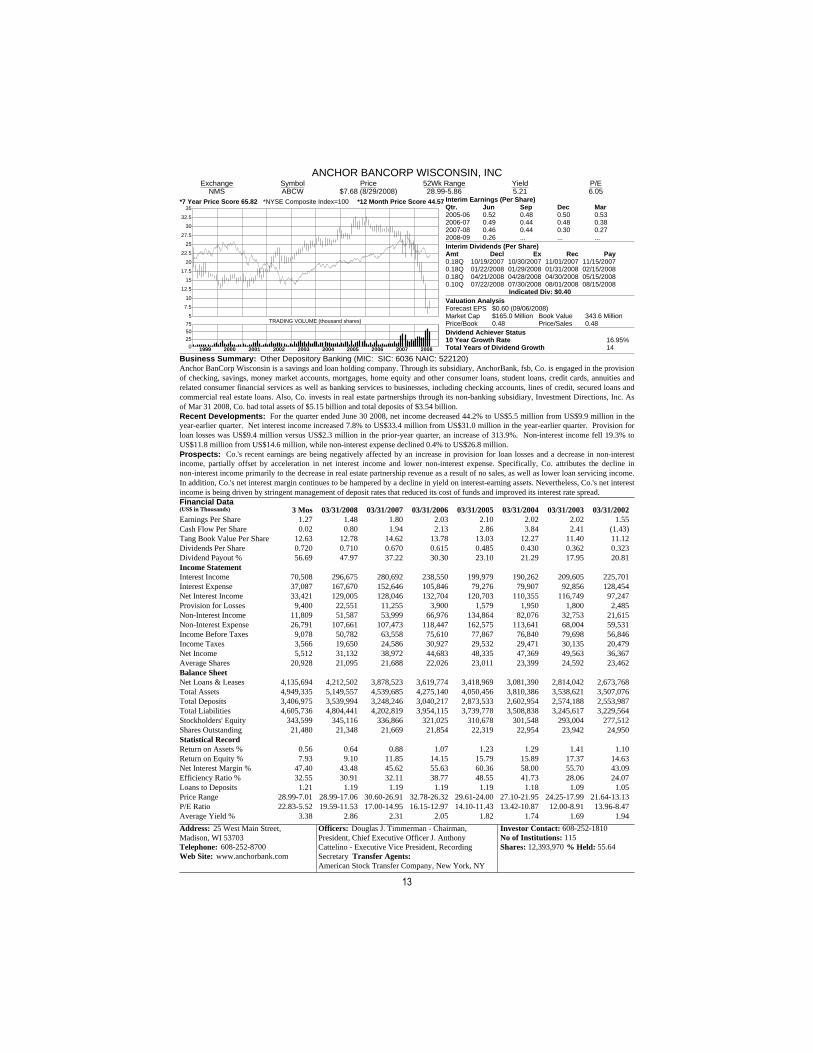
*7 Year Price Score 65.82 *12 Month Price Score 44.57*NYSE Composite Index=100 Interim Earnings (Per Share)Qtr. Jun Sep Dec Mar2005-06 0.52 0.48 0.50 0.532006-07 0.49 0.44 0.48 0.382007-08 0.46 0.44 0.30 0.272008-09 0.26 ... ... ...Interim Dividends (Per Share)Amt Decl Ex Rec Pay0.18Q 10/19/2007 10/30/2007 11/01/2007 11/15/20070.18Q 01/22/2008 01/29/2008 01/31/2008 02/15/20080.18Q 04/21/2008 04/28/2008 04/30/2008 05/15/20080.10Q 07/22/2008 07/30/2008 08/01/2008 08/15/2008

Indicated Div: $0.40Valuation AnalysisForecast EPS $0.60 (09/06/2008)Market Cap $165.0 Million Book Value 343.6 MillionPrice/Book 0.48 Price/Sales 0.48Dividend Achiever Status10 Year Growth Rate 16.95%Total Years of Dividend Growth 14

TRADING VOLUME (thousand shares)5

7.5

10

12.5

15

17.5

20

22.5

25

27.5

30

32.5

35

1999 2000 2001 2002 2003 2004 2005 2006 2007 20080255075

Business Summary: Other Depository Banking (MIC: SIC: 6036 NAIC: 522120)Anchor BanCorp Wisconsin is a savings and loan holding company. Through its subsidiary, AnchorBank, fsb, Co. is engaged in the provisionof checking, savings, money market accounts, mortgages, home equity and other consumer loans, student loans, credit cards, annuities andrelated consumer financial services as well as banking services to businesses, including checking accounts, lines of credit, secured loans andcommercial real estate loans. Also, Co. invests in real estate partnerships through its non-banking subsidiary, Investment Directions, Inc. Asof Mar 31 2008, Co. had total assets of $5.15 billion and total deposits of $3.54 billion.Recent Developments: For the quarter ended June 30 2008, net income decreased 44.2% to US$5.5 million from US$9.9 million in theyear-earlier quarter. Net interest income increased 7.8% to US$33.4 million from US$31.0 million in the year-earlier quarter. Provision forloan losses was US$9.4 million versus US$2.3 million in the prior-year quarter, an increase of 313.9%. Non-interest income fell 19.3% toUS$11.8 million from US$14.6 million, while non-interest expense declined 0.4% to US$26.8 million. Prospects: Co.'s recent earnings are being negatively affected by an increase in provision for loan losses and a decrease in non-interestincome, partially offset by acceleration in net interest income and lower non-interest expense. Specifically, Co. attributes the decline innon-interest income primarily to the decrease in real estate partnership revenue as a result of no sales, as well as lower loan servicing income.In addition, Co.'s net interest margin continues to be hampered by a decline in yield on interest-earning assets. Nevertheless, Co.'s net interestincome is being driven by stringent management of deposit rates that reduced its cost of funds and improved its interest rate spread.Financial Data

Address: 25 West Main Street,Madison, WI 53703 Telephone: 608-252-8700Web Site: www.anchorbank.com

Officers: Douglas J. Timmerman - Chairman,President, Chief Executive Officer J. AnthonyCattelino - Executive Vice President, RecordingSecretary Transfer Agents: American Stock Transfer Company, New York, NY

Investor Contact: 608-252-1810No of Institutions: 115Shares: 12,393,970 % Held: 55.64

(US$ in Thousands) 3 Mos 03/31/2008 03/31/2007 03/31/2006 03/31/2005 03/31/2004 03/31/2003 03/31/2002Earnings Per Share 1.27 1.48 1.80 2.03 2.10 2.02 2.02 1.55Cash Flow Per Share 0.02 0.80 1.94 2.13 2.86 3.84 2.41 (1.43)Tang Book Value Per Share 12.63 12.78 14.62 13.78 13.03 12.27 11.40 11.12Dividends Per Share 0.720 0.710 0.670 0.615 0.485 0.430 0.362 0.323Dividend Payout % 56.69 47.97 37.22 30.30 23.10 21.29 17.95 20.81Income StatementInterest Income 70,508 296,675 280,692 238,550 199,979 190,262 209,605 225,701Interest Expense 37,087 167,670 152,646 105,846 79,276 79,907 92,856 128,454Net Interest Income 33,421 129,005 128,046 132,704 120,703 110,355 116,749 97,247Provision for Losses 9,400 22,551 11,255 3,900 1,579 1,950 1,800 2,485Non-Interest Income 11,809 51,587 53,999 66,976 134,864 82,076 32,753 21,615Non-Interest Expense 26,791 107,661 107,473 118,447 162,575 113,641 68,004 59,531Income Before Taxes 9,078 50,782 63,558 75,610 77,867 76,840 79,698 56,846Income Taxes 3,566 19,650 24,586 30,927 29,532 29,471 30,135 20,479Net Income 5,512 31,132 38,972 44,683 48,335 47,369 49,563 36,367Average Shares 20,928 21,095 21,688 22,026 23,011 23,399 24,592 23,462Balance SheetNet Loans & Leases 4,135,694 4,212,502 3,878,523 3,619,774 3,418,969 3,081,390 2,814,042 2,673,768Total Assets 4,949,335 5,149,557 4,539,685 4,275,140 4,050,456 3,810,386 3,538,621 3,507,076Total Deposits 3,406,975 3,539,994 3,248,246 3,040,217 2,873,533 2,602,954 2,574,188 2,553,987Total Liabilities 4,605,736 4,804,441 4,202,819 3,954,115 3,739,778 3,508,838 3,245,617 3,229,564Stockholders' Equity 343,599 345,116 336,866 321,025 310,678 301,548 293,004 277,512Shares Outstanding 21,480 21,348 21,669 21,854 22,319 22,954 23,942 24,950Statistical RecordReturn on Assets % 0.56 0.64 0.88 1.07 1.23 1.29 1.41 1.10Return on Equity % 7.93 9.10 11.85 14.15 15.79 15.89 17.37 14.63Net Interest Margin % 47.40 43.48 45.62 55.63 60.36 58.00 55.70 43.09Efficiency Ratio % 32.55 30.91 32.11 38.77 48.55 41.73 28.06 24.07Loans to Deposits 1.21 1.19 1.19 1.19 1.19 1.18 1.09 1.05Price Range 28.99-7.01 28.99-17.06 30.60-26.91 32.78-26.32 29.61-24.00 27.10-21.95 24.25-17.99 21.64-13.13P/E Ratio 22.83-5.52 19.59-11.53 17.00-14.95 16.15-12.97 14.10-11.43 13.42-10.87 12.00-8.91 13.96-8.47Average Yield % 3.38 2.86 2.31 2.05 1.82 1.74 1.69 1.94

13