Embed Size (px)
Citation preview
Umeå University 2002-12-17 Dept. for Applied Physics and Electronics and Molecular Biology Supervisor: Dr. E. Börje Lindström Teknisk biologi, Projektkurs 7p
Bioleaching with Sulfolobus metallicus in Different Sodium Chloride Concentrations
Andersson M., Björkdahl C., Dahlman L., Edlund M., Gradin A.M., Hyötylä L.,
Ollikainen M., Westman M.
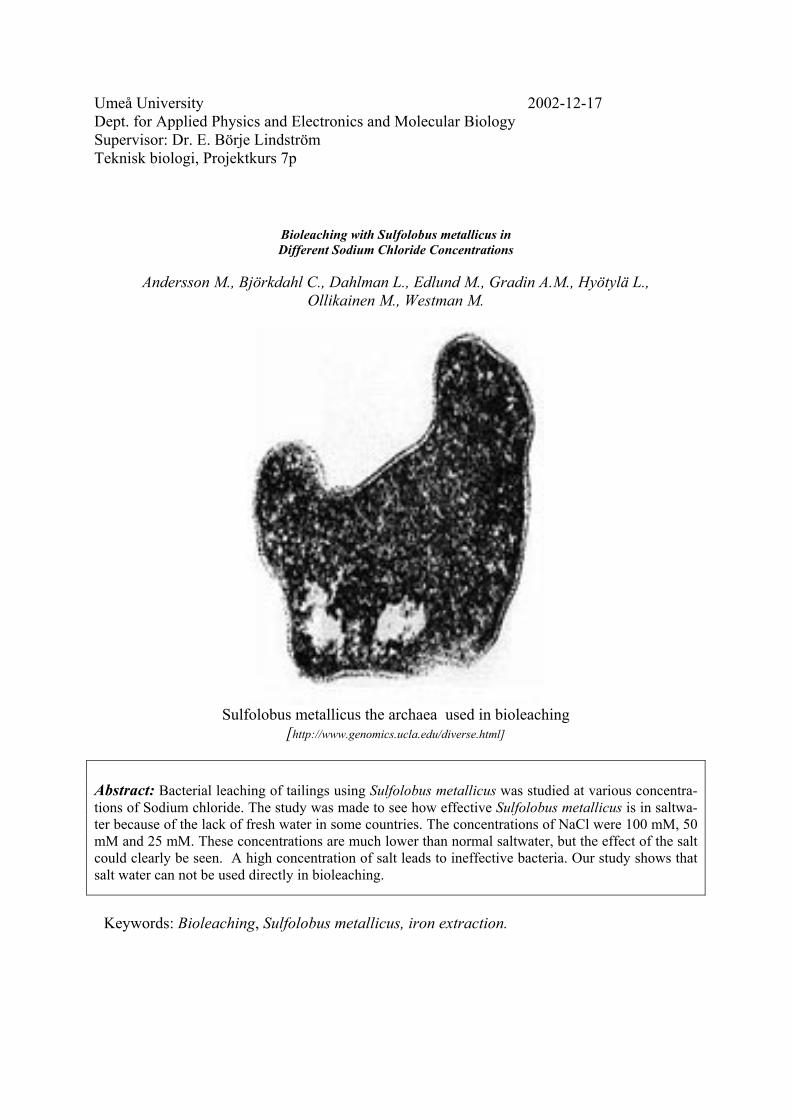
Sulfolobus metallicus the archaea used in bioleaching
[http://www.genomics.ucla.edu/diverse.html] Abstract: Bacterial leaching of tailings using Sulfolobus metallicus was studied at various concentra-tions of Sodium chloride. The study was made to see how effective Sulfolobus metallicus is in saltwa-ter because of the lack of fresh water in some countries. The concentrations of NaCl were 100 mM, 50 mM and 25 mM. These concentrations are much lower than normal saltwater, but the effect of the salt could clearly be seen. A high concentration of salt leads to ineffective bacteria. Our study shows that salt water can not be used directly in bioleaching.
Keywords: Bioleaching, Sulfolobus metallicus, iron extraction.

INDEX INTRODUCTION...................................................................................................................... 3
Figure 1. Energy gain in iron oxidizing microorganisms................................................... 3 Figure 2. A bilayer, B monolayer....................................................................................... 4 Figure 3. A Bilayer forming lipids in bacteria ................................................................... 4 B Monolayer forming lipids in archaea............................................................... 4
MATERIALS AND METHODS ............................................................................................... 4 Organism and medium ........................................................................................................... 4 Mineral Samples..................................................................................................................... 4
Figure 4. Equipment ........................................................................................................... 5 Reactor and stirring ................................................................................................................ 5 Ventilation, pH- & temperature- adjustment, cooling............................................................ 5 Sampling................................................................................................................................. 5 Sample Analysis..................................................................................................................... 5
RESULTS................................................................................................................................... 5 Figure 5. pH-value for samples A, B, C and D .................................................................. 5 Figure 6. Redox for samples A, B, C and D....................................................................... 6 Figure 7. Fe2+ concentration for samples A, B, C and D.................................................... 6 Figure 8 . Total concentration of iron for samples A, B, C and D .................................... 6 Figure 9. Concentration of iron for the supernatant in the samples A, B, C and D. .......... 6
DISCUSSION ............................................................................................................................ 7 CONCLUSIONS........................................................................................................................ 8 REFERENCES........................................................................................................................... 8 APPENDIX 1: Determination of iron content in tailings. APPENDIX 2: Atomic absorption-spectrophotometer. APPENDIX 3: Tables with data over taken samples. APPENDIX 4: Calculations for the concentration of NaCl in seawater. APPENDIX 5: Excursion to Boliden.

Bioleaching with Sulfolobus metallicus using Umeå University different sodium-chloride concentrations Dept. for Applied Physics and Electronics
and Dept. for Molecular Biology INTRODUCTION The conventional method to extract minerals from sulphide ores is after grinding and en-richment by flotation to heat the concentrates. SO2- is a wasteproduct in the process. In order to use this technique the mineral concentration has to bee quite high and the ore composition can’t be to complex. One way to overcome these problems is to use another type of extrac-tion called bioleaching. Bioleaching can also be used to extract more metals from the tail-ings, then conventional leaching. The process involves the use of microorganisms that can oxidize iron ions and sulfur ions and reduce oxygen. In this process the organisms receive their energy from Fe2+ that oxidizes to Fe3+ and the oxidation of S2- to SO4
2- by energy rich compounds linked together in the respiratory chain. This energy generating process is lo-cated in the cytoplasmic membrane of the or-ganism. Figure 1 is a simplified way of de-scribing the process.
Figure 1. Energy gain in the cytoplasmic membrane
of iron oxidizing microorganisms.1 The reaction preformed by the organisms can be described in chemical terms.2 Fe 2+ +¼ O2 + H+ ⇒ Fe 3+ + ½ H2O (1) In equilibrium solid sulfur can be formed. The surface of the tailings can then be covered by sulfur, but because of the Sulfolobus ability to oxidize sulfur, this is not a problem in bioleaching. The following reaction will oc-cur.3 2 S0 + 3 O2 + 2 H2O ⇒ 2 H2SO4 (2)
1 Verbal information from Dr E Börje Lindström 2 Gleisner M. & Herbert Jr R.B. (2002) 3 Lindström E.B. & Sandström Å. (1998)
When Fe3+ are produced a second reaction will occur with no interference of the organisms. The sulfur rich mineral will react with the ions and water and produce more Fe2+ sulfate ions and hydrogen ions.4 FeS2 + 14 Fe 3+ + 8 H2O ⇒ 15 Fe 2+ + 2 SO4
2- + 16 H+ (3) This reaction produces hydrogen ions that leads to more acidic conditions for the organ-isms. The use of microorganisms has several advan-tages. Bioleaching is a rather simple method and therefore cheaper to operate and maintain than traditional methods. The technique makes less damage to the landscape since the bacteria grow naturally and the surrounding area can be left relatively untouched. Bioleaching has also a great advantage when the concentrations in the ores are low. The bacteria are only inter-ested in “their” mineral and ignore the sur-rounding elements. Compared to conventional mining this gives a really high yield, but it demands more time. Some disadvantages with this technique are that the method is slow and since Sulfuric acid is produced, it may leak into the ground turning the surroundings acidic.5 The microorganism used in this experiment was the thermophile archaea bacteria Sul-folobus metallicus strain BC. It has a growth maximum at a temperature between 65 to 70 °C and pH optima at 2. Sulfolobus metallicus has the ability to oxidize: iron, copper and sulfur ions. It was first found in a hot spring in Iceland but have later also been spotted in coal supplies in England. It will probably be found were ever its conditions of life are fulfilled.6
4 Gleisner M. & Herbert Jr R.B. (2002) 5 http://www.wikipedia.org/wiki/bioleaching 6 www.ne.se
3
Bioleaching with Sulfolobus metallicus using Umeå University different sodium-chloride concentrations Dept. for Applied Physics and Electronics
and Dept. for Molecular Biology
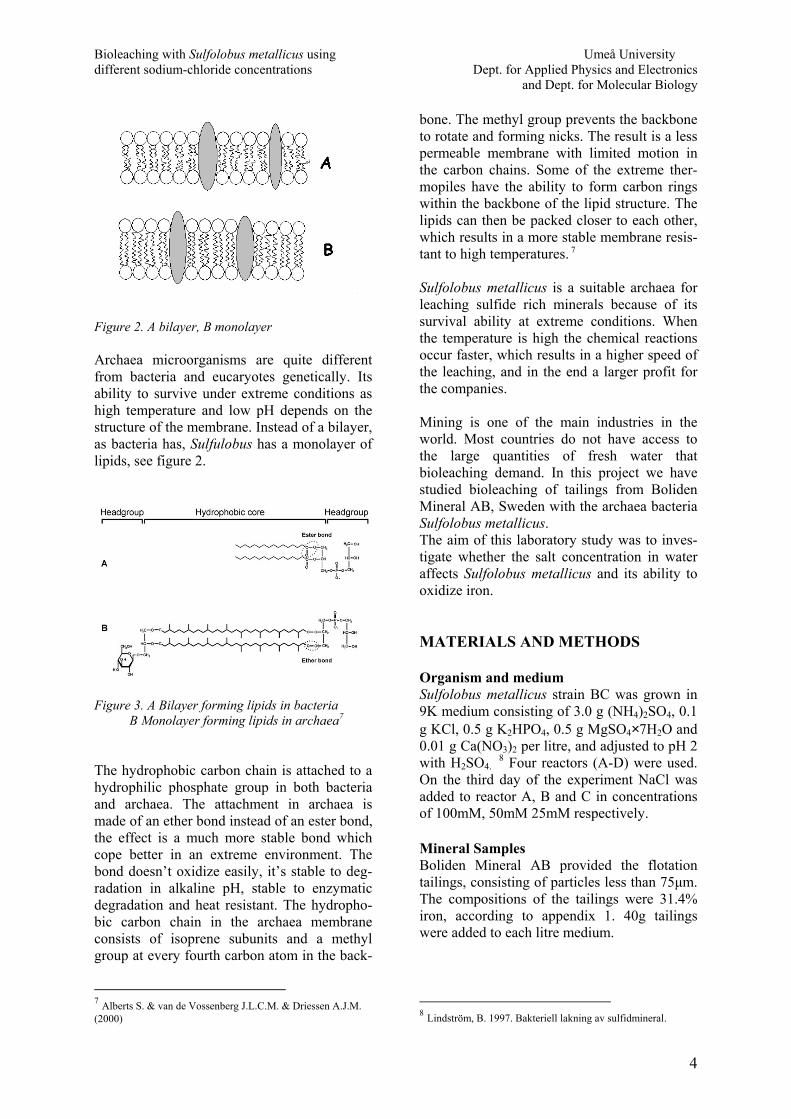
Figure 2. A bilayer, B monolayer Archaea microorganisms are quite different from bacteria and eucaryotes genetically. Its ability to survive under extreme conditions as high temperature and low pH depends on the structure of the membrane. Instead of a bilayer, as bacteria has, Sulfulobus has a monolayer of lipids, see figure 2.
Figure 3. A Bilayer forming lipids in bacteria
B Monolayer forming lipids in archaea7 The hydrophobic carbon chain is attached to a hydrophilic phosphate group in both bacteria and archaea. The attachment in archaea is made of an ether bond instead of an ester bond, the effect is a much more stable bond which cope better in an extreme environment. The bond doesn’t oxidize easily, it’s stable to deg-radation in alkaline pH, stable to enzymatic degradation and heat resistant. The hydropho-bic carbon chain in the archaea membrane consists of isoprene subunits and a methyl group at every fourth carbon atom in the back-
bone. The methyl group prevents the backbone to rotate and forming nicks. The result is a less permeable membrane with limited motion in the carbon chains. Some of the extreme ther-mopiles have the ability to form carbon rings within the backbone of the lipid structure. The lipids can then be packed closer to each other, which results in a more stable membrane resis-tant to high temperatures. 7
7 Alberts S. & van de Vossenberg J.L.C.M. & Driessen A.J.M.
(2000)
Sulfolobus metallicus is a suitable archaea for leaching sulfide rich minerals because of its survival ability at extreme conditions. When the temperature is high the chemical reactions occur faster, which results in a higher speed of the leaching, and in the end a larger profit for the companies. Mining is one of the main industries in the world. Most countries do not have access to the large quantities of fresh water that bioleaching demand. In this project we have studied bioleaching of tailings from Boliden Mineral AB, Sweden with the archaea bacteria Sulfolobus metallicus. The aim of this laboratory study was to inves-tigate whether the salt concentration in water affects Sulfolobus metallicus and its ability to oxidize iron. MATERIALS AND METHODS Organism and medium Sulfolobus metallicus strain BC was grown in 9K medium consisting of 3.0 g (NH4)2SO4, 0.1 g KCl, 0.5 g K2HPO4, 0.5 g MgSO4×7H2O and 0.01 g Ca(NO3)2 per litre, and adjusted to pH 2 with H2SO4.
8 Four reactors (A-D) were used. On the third day of the experiment NaCl was added to reactor A, B and C in concentrations of 100mM, 50mM 25mM respectively. Mineral Samples Boliden Mineral AB provided the flotation tailings, consisting of particles less than 75µm. The compositions of the tailings were 31.4% iron, according to appendix 1. 40g tailings were added to each litre medium.
8 Lindström, B. 1997. Bakteriell lakning av sulfidmineral.
4
Bioleaching with Sulfolobus metallicus using Umeå University different sodium-chloride concentrations Dept. for Applied Physics and Electronics
and Dept. for Molecular Biology
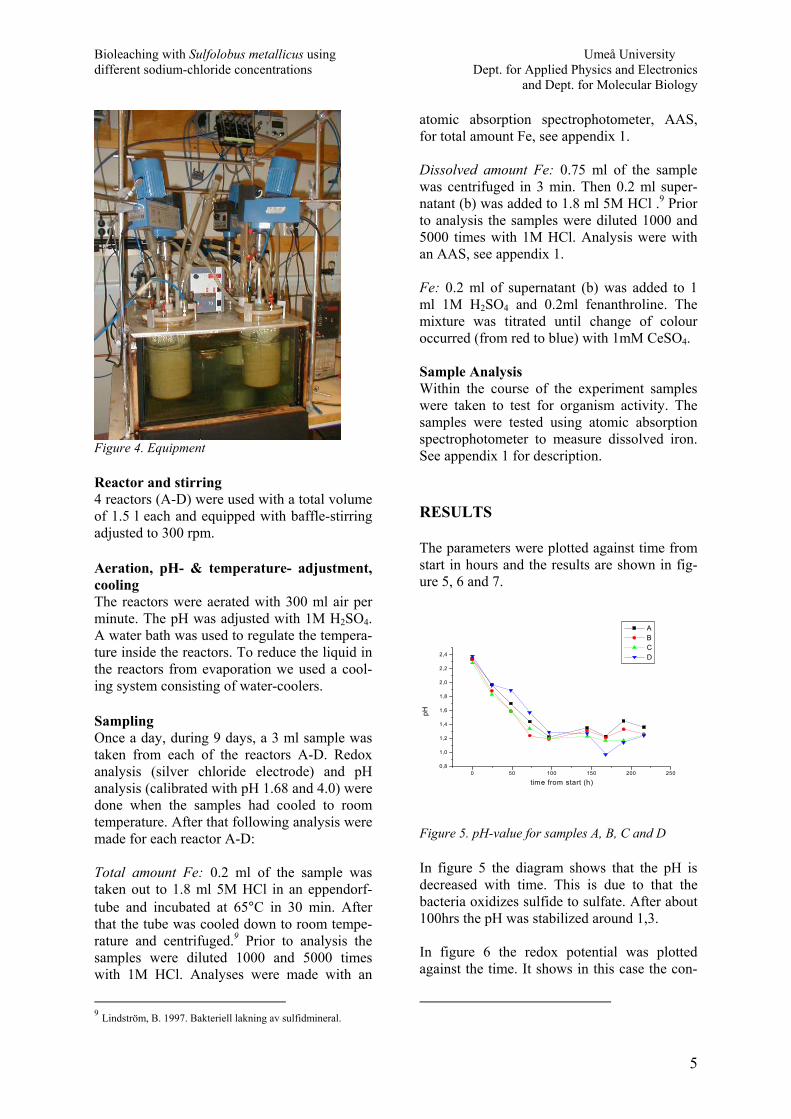
Figure 4. Equipment Reactor and stirring 4 reactors (A-D) were used with a total volume of 1.5 l each and equipped with baffle-stirring adjusted to 300 rpm. Aeration, pH- & temperature- adjustment, cooling The reactors were aerated with 300 ml air per minute. The pH was adjusted with 1M H2SO4. A water bath was used to regulate the tempera-ture inside the reactors. To reduce the liquid in the reactors from evaporation we used a cool-ing system consisting of water-coolers. Sampling Once a day, during 9 days, a 3 ml sample was taken from each of the reactors A-D. Redox analysis (silver chloride electrode) and pH analysis (calibrated with pH 1.68 and 4.0) were done when the samples had cooled to room temperature. After that following analysis were made for each reactor A-D: Total amount Fe: 0.2 ml of the sample was taken out to 1.8 ml 5M HCl in an eppendorf-tube and incubated at 65°C in 30 min. After that the tube was cooled down to room tempe-rature and centrifuged.9 Prior to analysis the samples were diluted 1000 and 5000 times with 1M HCl. Analyses were made with an
atomic absorption spectrophotometer, AAS, for total amount Fe, see appendix 1.
igure 5. pH-value for samples A, B, C and D
figure 5 the diagram shows that the pH is
figure 6 the redox potential was plotted against the time. It shows in this case the con-
9 Lindström, B. 1997. Bakteriell lakning av sulfidmineral.
Dissolved amount Fe: 0.75 ml of the sample was centrifuged in 3 min. Then 0.2 ml super-natant (b) was added to 1.8 ml 5M HCl .9 Prior to analysis the samples were diluted 1000 and 5000 times with 1M HCl. Analysis were with an AAS, see appendix 1. Fe: 0.2 ml of supernatant (b) was added to 1 ml 1M H2SO4 and 0.2ml fenanthroline. The mixture was titrated until change of colour occurred (from red to blue) with 1mM CeSO4. Sample Analysis Within the course of the experiment samples were taken to test for organism activity. The samples were tested using atomic absorption spectrophotometer to measure dissolved iron. See appendix 1 for description. RESULTS The parameters were plotted against time from start in hours and the results are shown in fig-ure 5, 6 and 7.
0 50 100 150 200 2500,8
1,0
1,2
1,4
1,6
1,8
2,0
2,2
2,4
A B C D
pH
time from start (h)
F Indecreased with time. This is due to that the bacteria oxidizes sulfide to sulfate. After about 100hrs the pH was stabilized around 1,3. In
5
Bioleaching with Sulfolobus metallicus using Umeå University different sodium-chloride concentrations Dept. for Applied Physics and Electronics
and Dept. for Molecular Biology
6
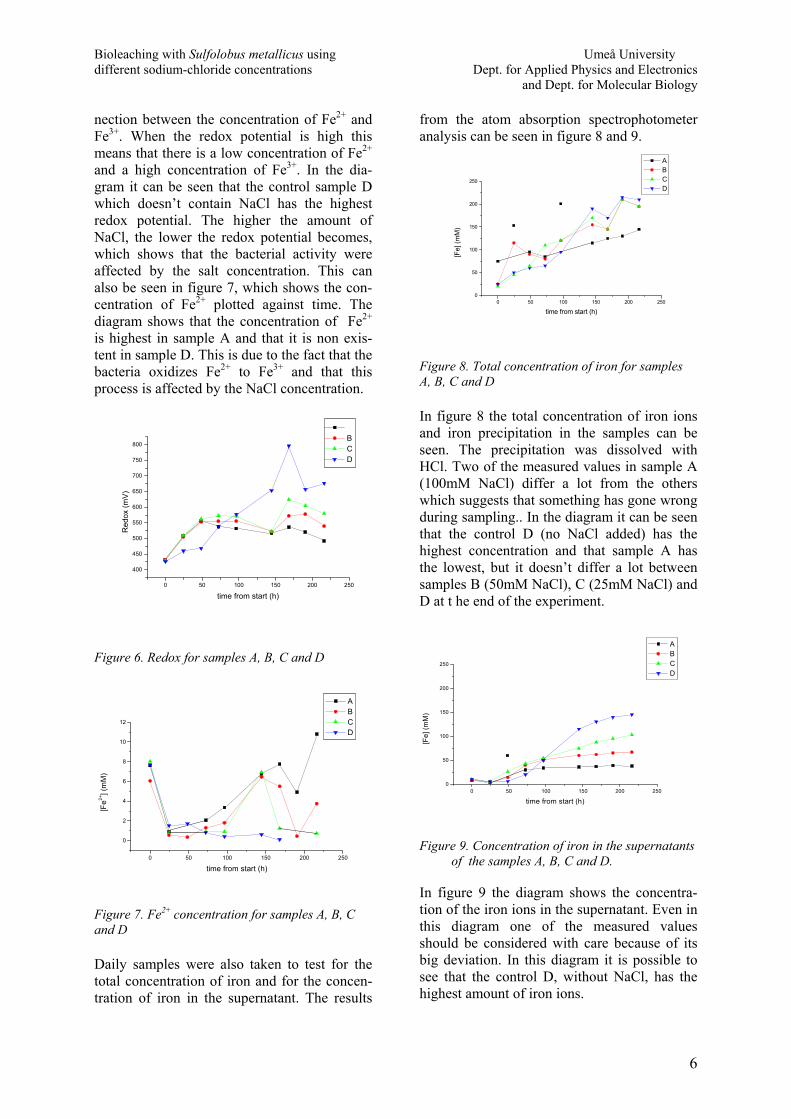
nection between the concentration of Fe2+ and Fe3+. When the redox potential is high this means that there is a low concentration of Fe2+ and a high concentration of Fe3+. In the dia-gram it can be seen that the control sample D which doesn’t contain NaCl has the highest redox potential. The higher the amount of NaCl, the lower the redox potential becomes, which shows that the bacterial activity were affected by the salt concentration. This can also be seen in figure 7, which shows the con-centration of Fe2+ plotted against time. The diagram shows that the concentration of Fe2+ is highest in sample A and that it is non exis-tent in sample D. This is due to the fact that the bacteria oxidizes Fe2+ to Fe3+ and that this process is affected by the NaCl concentration.
A
0 50 100 150 200 2500
50
100
150
200
250
A B C D
[Fe]
(mM
)
time from start (h)
Fi
nd D
ples were also taken to test for the tal concentration of iron and for the concen-
gure 6. Redox for samples A, B, C and D
0 50 100 150 200 250
400
450
500
550
600
650
700
750 D
Red
ox (m
V)
time from start (h)
Figure 7. Fe2+ concentration for samples A, B, C
0 50 100 150 200 250
0
2
4
6
8
10
12
B C D
[Fe2+
] (m
M)
time from start (h)
a Daily samtotration of iron in the supernatant. The results
from the atom absorption spectrophotometer analysis can be seen in figure 8 and 9.
igure 8. Total concentration of iron for samples
figure 8 the total concentration of iron ions
igure 9. Concentration of iron in the supernatants
n figure 9 the diagram shows the concentra-
FA, B, C and D Inand iron precipitation in the samples can be seen. The precipitation was dissolved with HCl. Two of the measured values in sample A (100mM NaCl) differ a lot from the others which suggests that something has gone wrong during sampling.. In the diagram it can be seen that the control D (no NaCl added) has the highest concentration and that sample A has the lowest, but it doesn’t differ a lot between samples B (50mM NaCl), C (25mM NaCl) and D at t he end of the experiment.
0 50 100 150 200 2500
50
100
150
200
250
A B C D
[Fe]
(mM
)
time from start (h)
Fof the samples A, B, C and D.
Ition of the iron ions in the supernatant. Even in this diagram one of the measured values should be considered with care because of its big deviation. In this diagram it is possible to see that the control D, without NaCl, has the highest amount of iron ions.
A
800 B C
Bioleaching with Sulfolobus metallicus using Umeå University different sodium-chloride concentrations Dept. for Applied Physics and Electronics
and Dept. for Molecular Biology
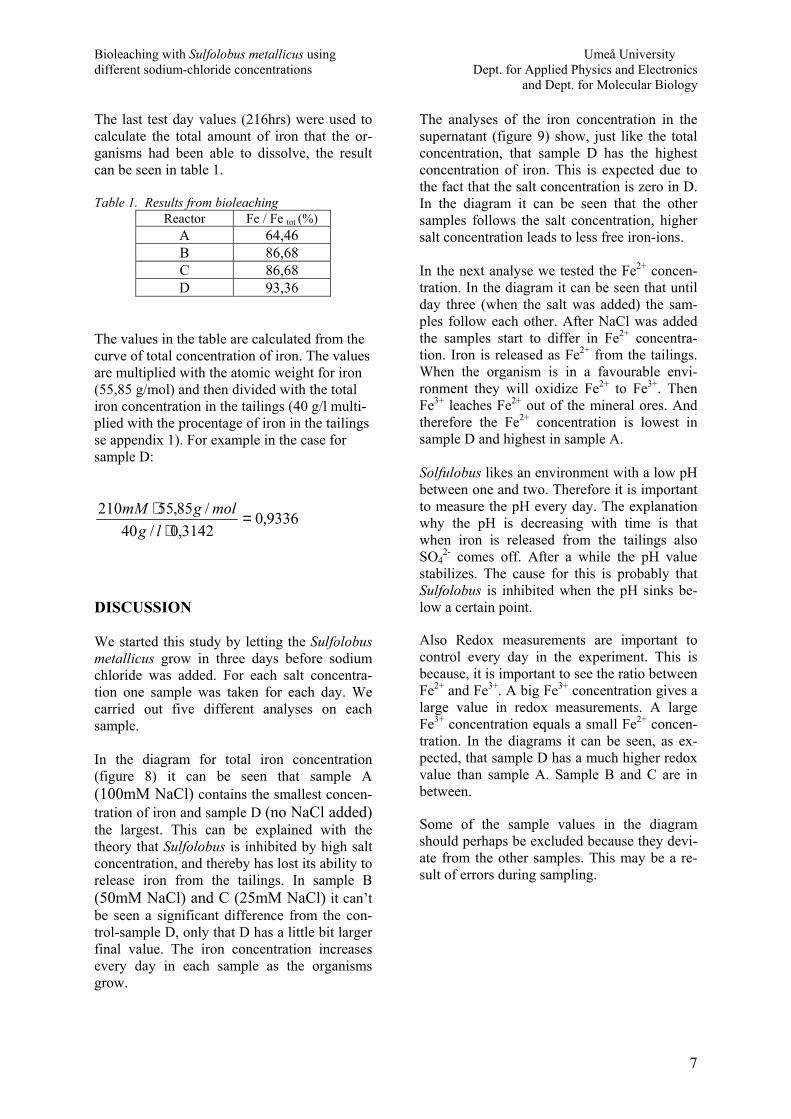
he last test day values (216hrs) were used to
able 1. Results from bioleaching tot (%)
Tcalculate the total amount of iron that the or-ganisms had been able to dissolve, the result can be seen in table 1. T
Reactor Fe / Fe A 64,46 B 86,68 C 86,68 D 93,36
he values in the table are calculated from the
Tcurve of total concentration of iron. The valuesare multiplied with the atomic weight for iron (55,85 g/mol) and then divided with the total iron concentration in the tailings (40 g/l multi-plied with the procentage of iron in the tailingsse appendix 1). For example in the case for sample D:
9336,03142,0/40
/85,55 =⋅
⋅lg
molgmM
ISCUSSION
e started this study by letting the Sulfolobus
the diagram for total iron concentration
210
D Wmetallicus grow in three days before sodium chloride was added. For each salt concentra-tion one sample was taken for each day. We carried out five different analyses on each sample. In (figure 8) it can be seen that sample A (100mM NaCl) contains the smallest concen-tration of iron and sample D (no NaCl added) the largest. This can be explained with the theory that Sulfolobus is inhibited by high salt concentration, and thereby has lost its ability to release iron from the tailings. In sample B (50mM NaCl) and C (25mM NaCl) it can’t be seen a significant difference from the con-trol-sample D, only that D has a little bit larger final value. The iron concentration increases every day in each sample as the organisms grow.
The analyses of the iron concentration in the supernatant (figure 9) show, just like the total concentration, that sample D has the highest concentration of iron. This is expected due to the fact that the salt concentration is zero in D. In the diagram it can be seen that the other samples follows the salt concentration, higher salt concentration leads to less free iron-ions. In the next analyse we tested the Fe2+ concen-tration. In the diagram it can be seen that until day three (when the salt was added) the sam-ples follow each other. After NaCl was added the samples start to differ in Fe2+ concentra-tion. Iron is released as Fe2+ from the tailings. When the organism is in a favourable envi-ronment they will oxidize Fe2+ to Fe3+. Then Fe3+ leaches Fe2+ out of the mineral ores. And therefore the Fe2+ concentration is lowest in sample D and highest in sample A. Solfulobus likes an environment with a low pH between one and two. Therefore it is important to measure the pH every day. The explanation why the pH is decreasing with time is that when iron is released from the tailings also SO4
2- comes off. After a while the pH value stabilizes. The cause for this is probably that Sulfolobus is inhibited when the pH sinks be-low a certain point.
Also Redox measurements are important to control every day in the experiment. This is because, it is important to see the ratio between Fe2+ and Fe3+. A big Fe3+ concentration gives a large value in redox measurements. A large Fe3+ concentration equals a small Fe2+ concen-tration. In the diagrams it can be seen, as ex-pected, that sample D has a much higher redox value than sample A. Sample B and C are in between.
Some of the sample values in the diagram should perhaps be excluded because they devi-ate from the other samples. This may be a re-sult of errors during sampling.
7
Bioleaching with Sulfolobus metallicus using Umeå University different sodium-chloride concentrations Dept. for Applied Physics and Electronics
and Dept. for Molecular Biology The sources of errors are probably the follow-ing:
• Differences in the work with the pi-pette when taking samples.
• Difficulties in the measurements of the colour in Fe2+ tests.
• When taking sample for total iron con-centration it is difficult to receive a homogenuous solution.
• Trouble with the air supply. The pipes got blocked and cleaning was neces-sary every day. The reactors contain-ing a higher amount of NaCl seemed to have more trouble with the aeration.
• When we did the dilution for the analyses of iron concentration we might have diluted twice or not at all in some cases.
• Instrumental errors such as the pH-meter that was out of order and had to be repaired.
• Sometime between the seventh and eighth sampling the temperature sank due to excessive water evaporation. This can be seen in figure 7. The fol-lowing day the Fe2+ concentration in-creased again.
CONCLUSIONS
To summarise the results of this project we can say that sodium chloride inhibit the activity of Solfulobus in bioleaching. However, the proc-ess is hardly effected at a lower level of the salt, such as 0-50mM. But higher concentra-tions will affect the leaching process in a nega-tive sense. The salt concentration in the ocean is about 600 mM (see appendix 4), that means that salty water from the ocean is no good to use.
In future projects it would be a good idea to improve the air supply system, so that it will not affect the results.
REFERENCES
Alberts S. & van de Vossenberg J.L.C.M. & Driessen A.J.M. (2000): Adaptions of the Archaeal Cell Membrane to Heat Stress. Frontiers in Bioscience 5, d796-803, September 2000
Gleisner M. & Herbert Jr R.B. (2002): Sul-fide Mineral Oxidation in Freshly Proc-essed Tailings. Journal of Geochemical Exploration 76(2002) s139-153
Harahuc, L. Lizama, Hector M. Suzuki, I. (2000). Effect of anions on selective solubilization of zinc and copper in bac-terial leaching of sulfide ores. Biotech-nology and bioengineering. 69:196-203
Lindström, B. (1997). Bakteriell lakning av sulfidmineral. Institutionenför mikrobio-logi.
Lindström E.B. & Sandström Å. (1998): Bio-technical Recovery of Metals from Sulphicic Minerals, Luleå Universitet, Umeå Universitet
Lindström, E Börje personal communica-tions
http://www.wikipedia.org/wiki/bioleaching
http://www.ne.se
8
Bioleaching with Sulfolobus metallicus using Umeå University different sodium-chloride concentrations Dept. for Applied Physics and Electronics
and Dept. for Molecular Biology APPENDIX 1 Determination of iron content in tailings Should be made in triplets 1. Weight 200 mg of tailings and put in a glass cylinder and add 10 ml of HNO3 and 10 ml of HCl both concentrated. 2. Boil not covered sample for 5 min and then cover with a lid and boil until it is dry in fume cupboard. 3. If the sediment is not dissolved after the procedure add 5 ml of each acid more and boil again until the sample is dry. 4. Dissolve the sample in 50 ml HCl 1M and mark it stock solution. 5. Prepare: 10;100 and 500 times dilusions of the sample. 6. Perform atomic absorbance spectroscopy (AAS) assay with these dilusions. The result of AAS measurements is given in mM. 7. Calculate the results in mg/l concentration of a stock solution considering the delusion. 8. Calculate the amount of iron in 200 mg of sample from stock solution concentration. 9. Calculate the amount of iron in 1 mg of tailings. Iron content of Boliden tailings. AAS measurements showed that concentration of iron in 500 mg times dilusion (see point 5 above) is 45 mM what makes 1256.6 mg/l in stock solution 45 × 500 × 55.85 = 1256.6 [mg/L] Where 45 is a result from AAS; 500 is a dilusion; 55.85 is atomic mass of iron; Then the amount of iron in 200 mg of sample was found as follows: 1256.6 / 20 = 62.83 [mg] The of iron percentage in the tailings is: 62.83 × 100 / 200 = 31.415 %
9
Bioleaching with Sulfolobus metallicus using Umeå University different sodium-chloride concentrations Dept. for Applied Physics and Electronics
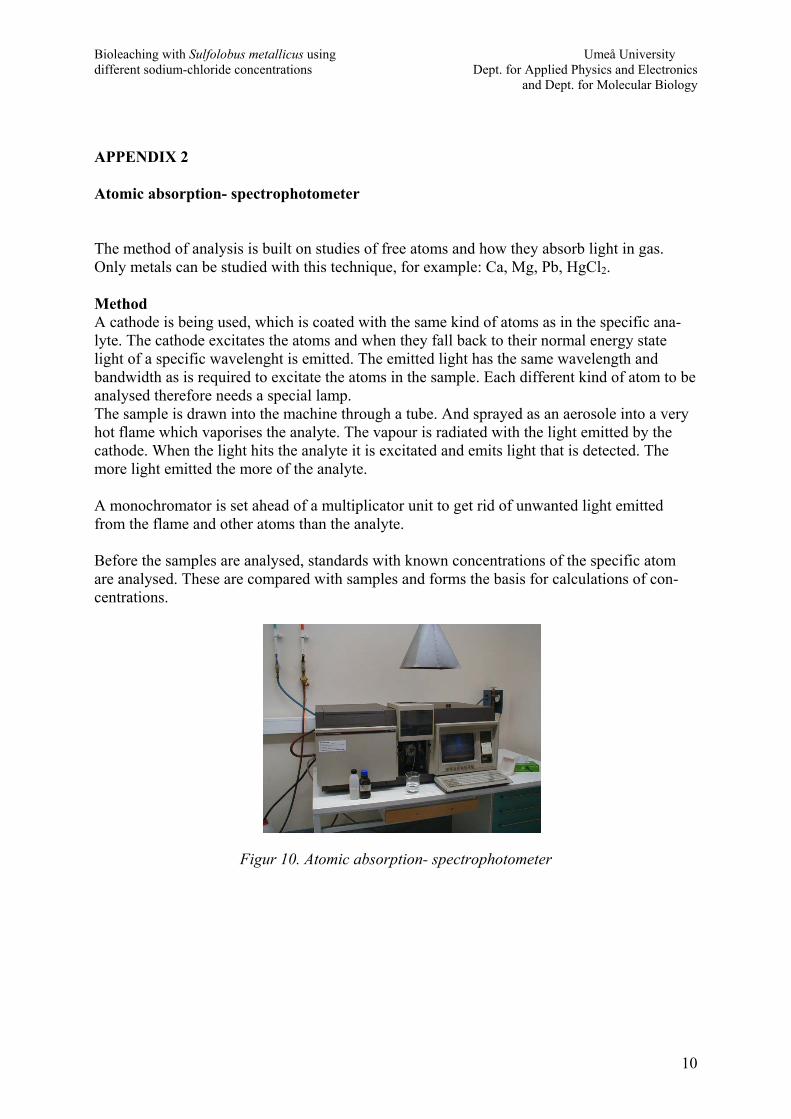
and Dept. for Molecular Biology APPENDIX 2 Atomic absorption- spectrophotometer The method of analysis is built on studies of free atoms and how they absorb light in gas. Only metals can be studied with this technique, for example: Ca, Mg, Pb, HgCl2. Method A cathode is being used, which is coated with the same kind of atoms as in the specific ana-lyte. The cathode excitates the atoms and when they fall back to their normal energy state light of a specific wavelenght is emitted. The emitted light has the same wavelength and bandwidth as is required to excitate the atoms in the sample. Each different kind of atom to be analysed therefore needs a special lamp. The sample is drawn into the machine through a tube. And sprayed as an aerosole into a very hot flame which vaporises the analyte. The vapour is radiated with the light emitted by the cathode. When the light hits the analyte it is excitated and emits light that is detected. The more light emitted the more of the analyte. A monochromator is set ahead of a multiplicator unit to get rid of unwanted light emitted from the flame and other atoms than the analyte. Before the samples are analysed, standards with known concentrations of the specific atom are analysed. These are compared with samples and forms the basis for calculations of con-centrations.
Figur 10. Atomic absorption- spectrophotometer
10
Bioleaching with Sulfolobus metallicus using Umeå University different sodium-chloride concentrations Dept. for Applied Physics and Electronics
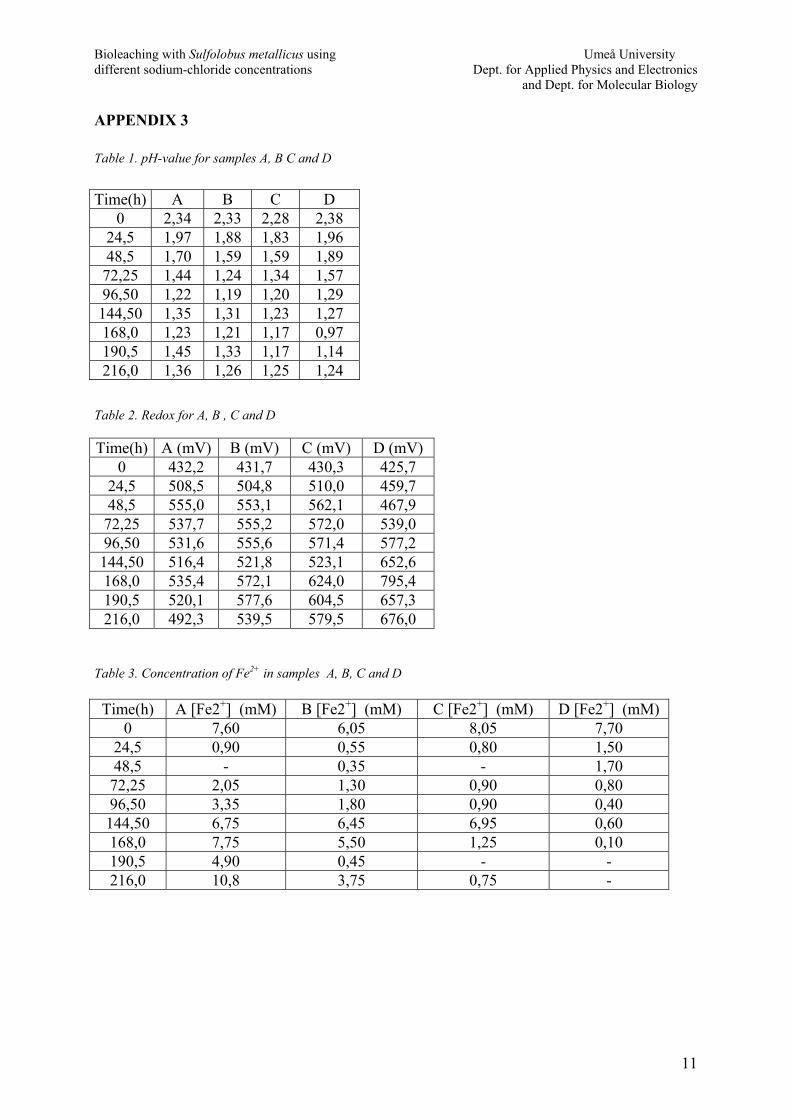
and Dept. for Molecular Biology APPENDIX 3 Table 1. pH-value for samples A, B C and D
Time(h) A B C D 0 2,34 2,33 2,28 2,38
24,5 1,97 1,88 1,83 1,96 48,5 1,70 1,59 1,59 1,89 72,25 1,44 1,24 1,34 1,57 96,50 1,22 1,19 1,20 1,29 144,50 1,35 1,31 1,23 1,27 168,0 1,23 1,21 1,17 0,97 190,5 1,45 1,33 1,17 1,14 216,0 1,36 1,26 1,25 1,24
Table 2. Redox for A, B , C and D Time(h) A (mV) B (mV) C (mV) D (mV)
0 432,2 431,7 430,3 425,7 24,5 508,5 504,8 510,0 459,7 48,5 555,0 553,1 562,1 467,9 72,25 537,7 555,2 572,0 539,0 96,50 531,6 555,6 571,4 577,2 144,50 516,4 521,8 523,1 652,6 168,0 535,4 572,1 624,0 795,4 190,5 520,1 577,6 604,5 657,3 216,0 492,3 539,5 579,5 676,0
Table 3. Concentration of Fe2+ in samples A, B, C and D Time(h) A [Fe2+] (mM) B [Fe2+] (mM) C [Fe2+] (mM) D [Fe2+] (mM)
0 7,60 6,05 8,05 7,70 24,5 0,90 0,55 0,80 1,50 48,5 - 0,35 - 1,70 72,25 2,05 1,30 0,90 0,80 96,50 3,35 1,80 0,90 0,40 144,50 6,75 6,45 6,95 0,60 168,0 7,75 5,50 1,25 0,10 190,5 4,90 0,45 - - 216,0 10,8 3,75 0,75 -
11
Bioleaching with Sulfolobus metallicus using Umeå University different sodium-chloride concentrations Dept. for Applied Physics and Electronics
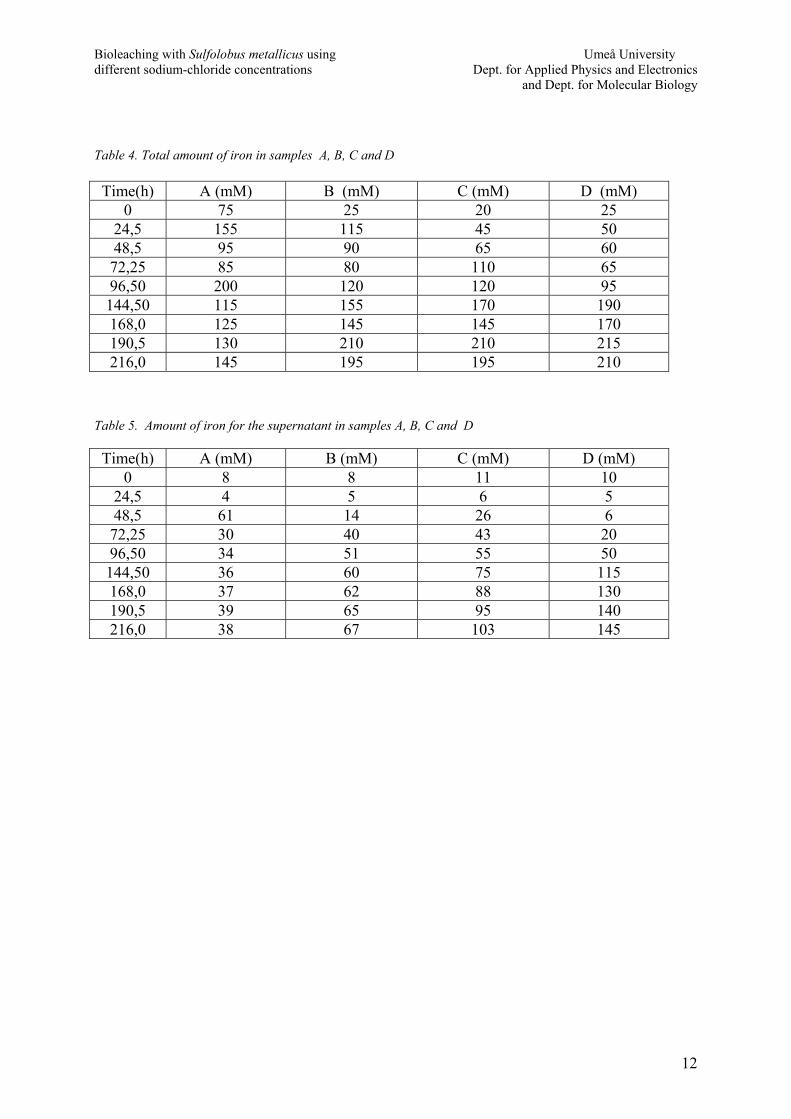
and Dept. for Molecular Biology Table 4. Total amount of iron in samples A, B, C and D Time(h) A (mM) B (mM) C (mM) D (mM)
0 75 25 20 25 24,5 155 115 45 50 48,5 95 90 65 60 72,25 85 80 110 65 96,50 200 120 120 95 144,50 115 155 170 190 168,0 125 145 145 170 190,5 130 210 210 215 216,0 145 195 195 210
Table 5. Amount of iron for the supernatant in samples A, B, C and D Time(h) A (mM) B (mM) C (mM) D (mM)
0 8 8 11 10 24,5 4 5 6 5 48,5 61 14 26 6 72,25 30 40 43 20 96,50 34 51 55 50 144,50 36 60 75 115 168,0 37 62 88 130 190,5 39 65 95 140 216,0 38 67 103 145
12

Bioleaching with Sulfolobus metallicus using Umeå University different sodium-chloride concentrations Dept. for Applied Physics and Electronics
and Dept. for Molecular Biology
APPENDIX 4 Calculations for the concentration of NaCl in seawater. 35 g NaCl per litre H2O.10 MNaCl= 58,443 g/mol n= m/M = 35 / 58,443 = 0,5989 mol ⇒ 600 mM
10 www.ne.se
13
Bioleaching with Sulfolobus metallicus using Umeå University different sodium-chloride concentrations Dept. for Applied Physics and Electronics
and Dept. for Molecular Biology
und-amheter
an-
APPENDIX 5 Studieresa till Boliden
Efter en härlig resa i vinterland nådde vi till Boliden. Vi blev välkomnade av Jan-Eric Skvist och Jens Söderlund som inledde med att presentera Boliden och dess olika verksvärlden över. Vi fick bland annat veta att Boliden varje år bryter 1.8 Mton malm. Av detta utvinns 9600 ton koppar, 3200 ton bly, 49600 ton zink, 65000 kg silver och 2600 kg guld. Efter den allmänna delen av informationen fick vi en mer detaljerad genomgång av cyanidlakningsprocessen av guld. Den nya investeringen var en god affär för Boliden. Utbytet av guld har ökat till 90%, då endast gravemetri (vaskpanneteknik) användes var utbytet 55%. I processen finns 8 st tkar på 850m3. I den första och i den andra tanken tillsätts cyanid. Luft tillsätts i samtliga tan-kar. Detta ger en reaktion enligt nedan:
−−− ++→+++ OHOHCNAuOHOCNAu s 2)(2242 22222)( −−− ++→++ OHOHCNAuOHCNAu s 2)(2242 22222)(
Elsners ekvation: −−− +→+++ OHCNAuOOHCNAu s 4)(2284 222)(
Cyaniden importeras som NaCN från Tyskland. Pulpen självrinner från tank till tank. Största delen av guldet löser sig i tank 1 och 2. I tank 3 och de tankar som följer finns aktivt kol som tillverkats av kokosnöt skal från Sri Lanka. Samtidigt som resterande lakbart guld löser sig fastnar (adsorberas) AuCN komplexet på det aktiva kolet som Mg-Ca-AuCN-komplex. För att förhindra att kolet följer pulpen nedström finns siktar installerade i tankar. För att kunna ladda kolet med höga halter av guld flyttas det motström pulpen genom pumpning. I tank 3 finns den högsta guldhalten på kolet och därifrån pumpas cirka 4 ton kol med 4-12 kilo Au via en sikt till kolonn för eluering. I ett första steg används där HCl för att tvätta bort kalkbelägg-ningar (Ca, Mg och ev pulp), detta sker vid en rumstemperatur. En ”pre-soak” lösning (3% NaCN och lut (NaOH)- lösning) tillsätts sedan, samtidigt som temperaturen höjs till 110°-115° C, för att Au ska släppa från kolet genom att Na ersätter Ca och Mg plats i det adsorbe-rade guldkomplexet. Detta leder till ett mer lättlösligt komplex. Efter ”pre-soak” sker elue-ring- desorptionsprocessen med rent vatten vid 115-120 oC enligt:
[ ] −+−+ +→ 222 )()()( CNnAuMaktivtkolCNAuM nn Det guldhaltiga eluatet från elueringsprocess samlas upp i en elektrolyttank. Nästa steg i processen är elektrovinning, vilket innebär att man utvinner guldet från eluatet genom elektrolys. Detta sker genom att man rundpumpar lösningen via elektrolysceller (anod- rosfritt stålgaller, katod- lindad stålull, 700 amp, 3.5V). Lut tilsätts för att få rätt led-ningsförmåga. Processtiden för detta är ca 30h sedan kommer största delen av guldinnehållet att finnas på stålullen. Katoden lyfts upp, dräneras på elektrolyt och körs sedan in i en ugn vid 700°C. Kalcineringen (=rostning, kalcinat=rostad katod) gör så att oädla metaller oxideras och kan avskiljas genom att bilda en slagg. Efter detta produceras en doretacka, en legering av
14
Bioleaching with Sulfolobus metallicus using Umeå University different sodium-chloride concentrations Dept. for Applied Physics and Electronics
and Dept. for Molecular Biology
utskrub-
35% silver och 59% guld. Kolet reaktiveras och förs tillbaka till laktankarna för att användas igen. Detta görs via en cylinderugn som roterar, ökning av temperaturen (-750°C) sker stegvis för att olika typer av organiska föreningar ska destillera av. Ugnens atmosfär består främst av vattenånga som deltar i den reaktion som gör att kolet reaktiveras. Boliden hade vissa uppstartsproblem med att utgående gas från regenereringsugnen innehåller svavelföreningar (som tex H2S). För att förhindra att dessa släpps ut i luften har en lber installerats för rening av processgas. I början av cyanidprocessen finns omkring 200mg fri CN och i slutet 100mg per liter lösning. Innan pulpen leds ut till sandmagasinet destrueras den i en anläggning där cyaniden omvand-las till cyanatjoner, vilka anses vara 10 000 ggr mindre giftig än cyanidjoner. I sandmagasinet faller cyanaten i sin tur sönder till CO2 och NH4
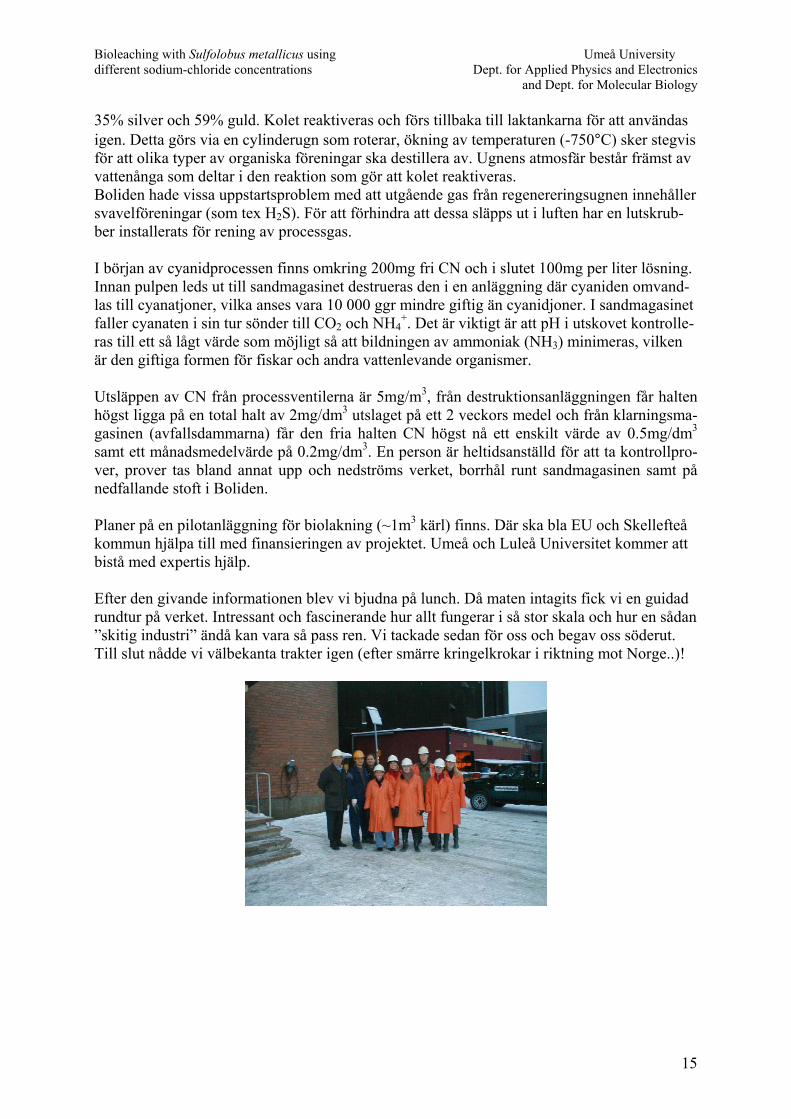
+. Det är viktigt är att pH i utskovet kontrolle-ras till ett så lågt värde som möjligt så att bildningen av ammoniak (NH3) minimeras, vilken är den giftiga formen för fiskar och andra vattenlevande organismer. Utsläppen av CN från processventilerna är 5mg/m3, från destruktionsanläggningen får halten högst ligga på en total halt av 2mg/dm3 utslaget på ett 2 veckors medel och från klarningsma-gasinen (avfallsdammarna) får den fria halten CN högst nå ett enskilt värde av 0.5mg/dm3 samt ett månadsmedelvärde på 0.2mg/dm3. En person är heltidsanställd för att ta kontrollpro-ver, prover tas bland annat upp och nedströms verket, borrhål runt sandmagasinen samt på nedfallande stoft i Boliden. Planer på en pilotanläggning för biolakning (~1m3 kärl) finns. Där ska bla EU och Skellefteå kommun hjälpa till med finansieringen av projektet. Umeå och Luleå Universitet kommer att bistå med expertis hjälp. Efter den givande informationen blev vi bjudna på lunch. Då maten intagits fick vi en guidad rundtur på verket. Intressant och fascinerande hur allt fungerar i så stor skala och hur en sådan ”skitig industri” ändå kan vara så pass ren. Vi tackade sedan för oss och begav oss söderut. Till slut nådde vi välbekanta trakter igen (efter smärre kringelkrokar i riktning mot Norge..)!
15


![Biology Direct BioMed Central - link.springer.com · 17], anaerobic bacteria including other Planctomycetes have been reported with the ability of synthesising lipids containing multiple](https://img.pdfslide.net/doc/110x75/5eddb9c1ad6a402d6668e617/biology-direct-biomed-central-link-17-anaerobic-bacteria-including-other-planctomycetes.jpg)