Embed Size (px)
Citation preview
1
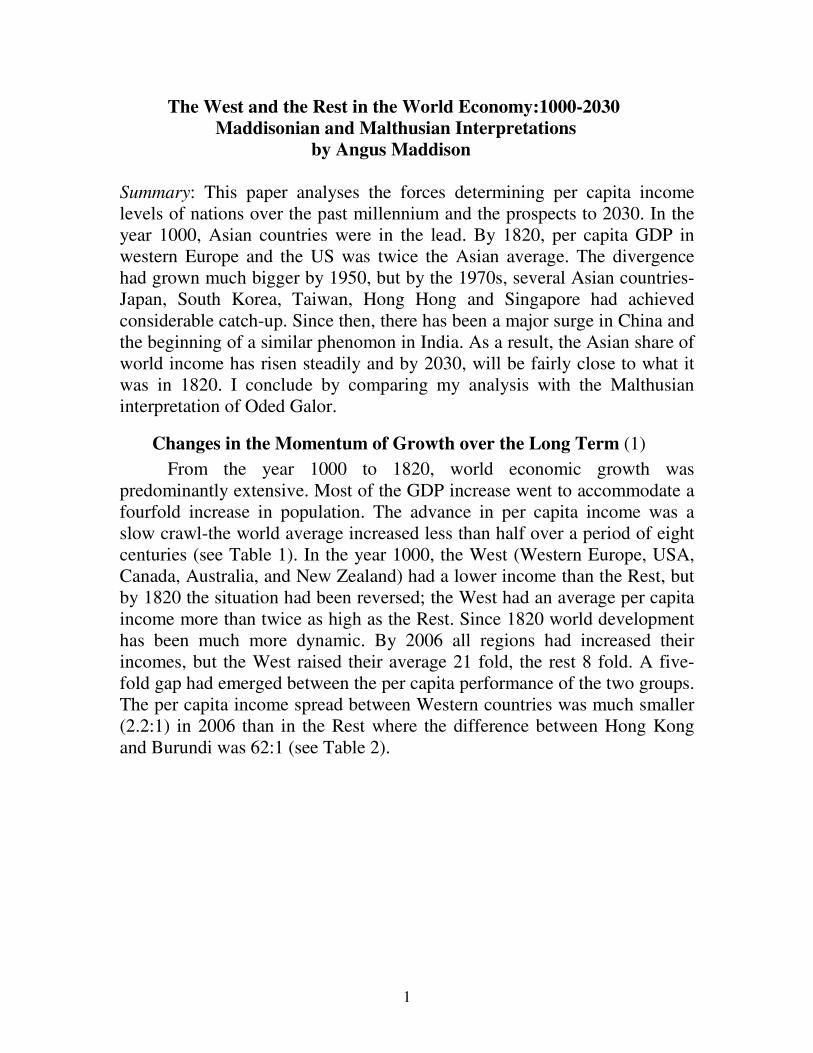
The West and the Rest in the World Economy:1000-2030 Maddisonian and Malthusian Interpretations
by Angus Maddison Summary: This paper analyses the forces determining per capita income levels of nations over the past millennium and the prospects to 2030. In the year 1000, Asian countries were in the lead. By 1820, per capita GDP in western Europe and the US was twice the Asian average. The divergence had grown much bigger by 1950, but by the 1970s, several Asian countries-Japan, South Korea, Taiwan, Hong Hong and Singapore had achieved considerable catch-up. Since then, there has been a major surge in China and the beginning of a similar phenomon in India. As a result, the Asian share of world income has risen steadily and by 2030, will be fairly close to what it was in 1820. I conclude by comparing my analysis with the Malthusian interpretation of Oded Galor.
Changes in the Momentum of Growth over the Long Term (1)
From the year 1000 to 1820, world economic growth was predominantly extensive. Most of the GDP increase went to accommodate a fourfold increase in population. The advance in per capita income was a slow crawl-the world average increased less than half over a period of eight centuries (see Table 1). In the year 1000, the West (Western Europe, USA, Canada, Australia, and New Zealand) had a lower income than the Rest, but by 1820 the situation had been reversed; the West had an average per capita income more than twice as high as the Rest. Since 1820 world development has been much more dynamic. By 2006 all regions had increased their incomes, but the West raised their average 21 fold, the rest 8 fold. A five-fold gap had emerged between the per capita performance of the two groups. The per capita income spread between Western countries was much smaller (2.2:1) in 2006 than in the Rest where the difference between Hong Kong and Burundi was 62:1 (see Table 2).
2
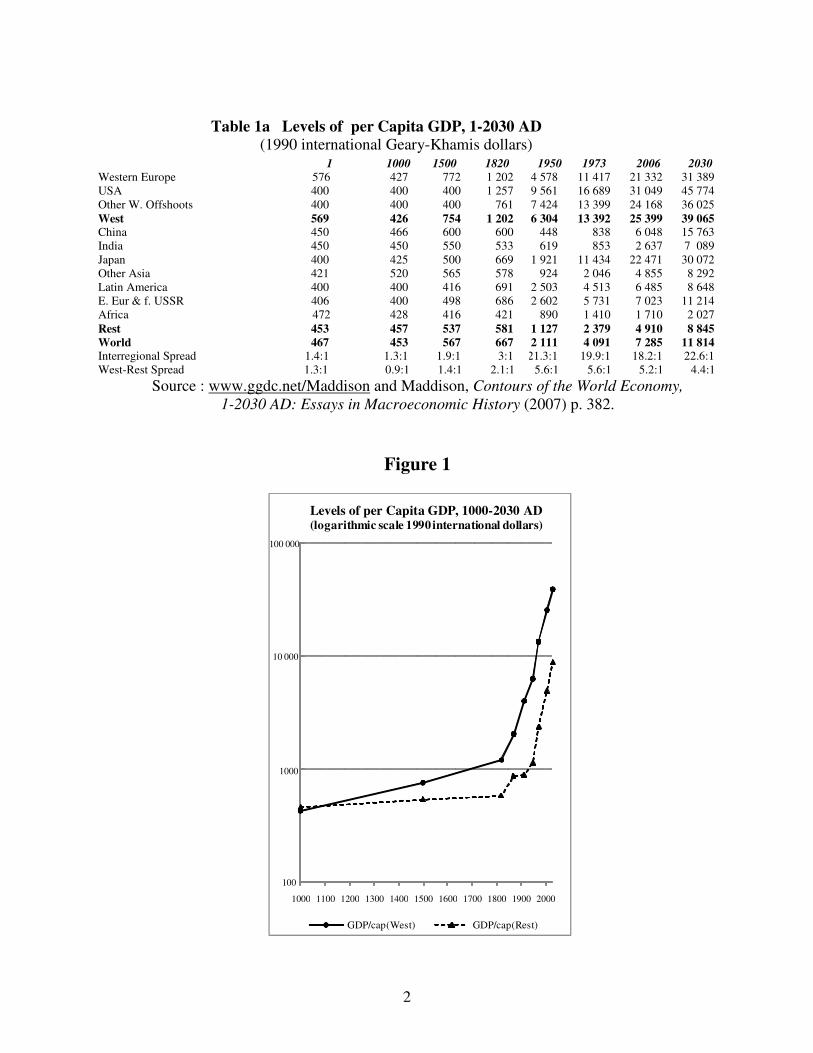
Table 1a Levels of per Capita GDP, 1-2030 AD
(1990 international Geary-Khamis dollars) 1 1000 1500 1820 1950 1973 2006 2030
Western Europe 57 576 427 772 1 202 4 578 11 417 21 332 31 389 USA 400 400 400 1 257 9 561 16 689 31 049 45 774 Other W. Offshoots 400 400 400 761 7 424 13 399 24 168 36 025 West 569 426 754 1 202 6 304 13 392 25 399 39 065 China 450 466 600 600 448 838 6 048 15 763 India 450 450 550 533 619 853 2 637 7 089 Japan 400 425 500 669 1 921 11 434 22 471 30 072 Other Asia 421 520 565 578 924 2 046 4 855 8 292 Latin America 400 400 416 691 2 503 4 513 6 485 8 648 E. Eur & f. USSR 406 400 498 686 2 602 5 731 7 023 11 214 Africa 472 428 416 421 890 1 410 1 710 2 027
Rest 453 457 537 581 1 127 2 379 4 910 8 845 World 467 453 567 667 2 111 4 091 7 285 11 814 Interregional Spread 1.4:1 1.3:1 1.9:1 3:1 21.3:1 19.9:1 18.2:1 22.6:1 West-Rest Spread 1.3:1 0.9:1 1.4:1 2.1:1 5.6:1 1 5.6:1 5.2:1 4.4:1
Source : www.ggdc.net/Maddison and Maddison, Contours of the World Economy,
1-2030 AD: Essays in Macroeconomic History (2007) p. 382.
Figure 1
1000 1100 1200 1300 1400 1500 1600 1700 1800 1900 2000
Levels of per Capita GDP, 1000-2030 AD(logarithmic scale 1990 international dollars)
GDP/cap(West) GDP/cap(Rest)
1000
10 000
100
100 000
3
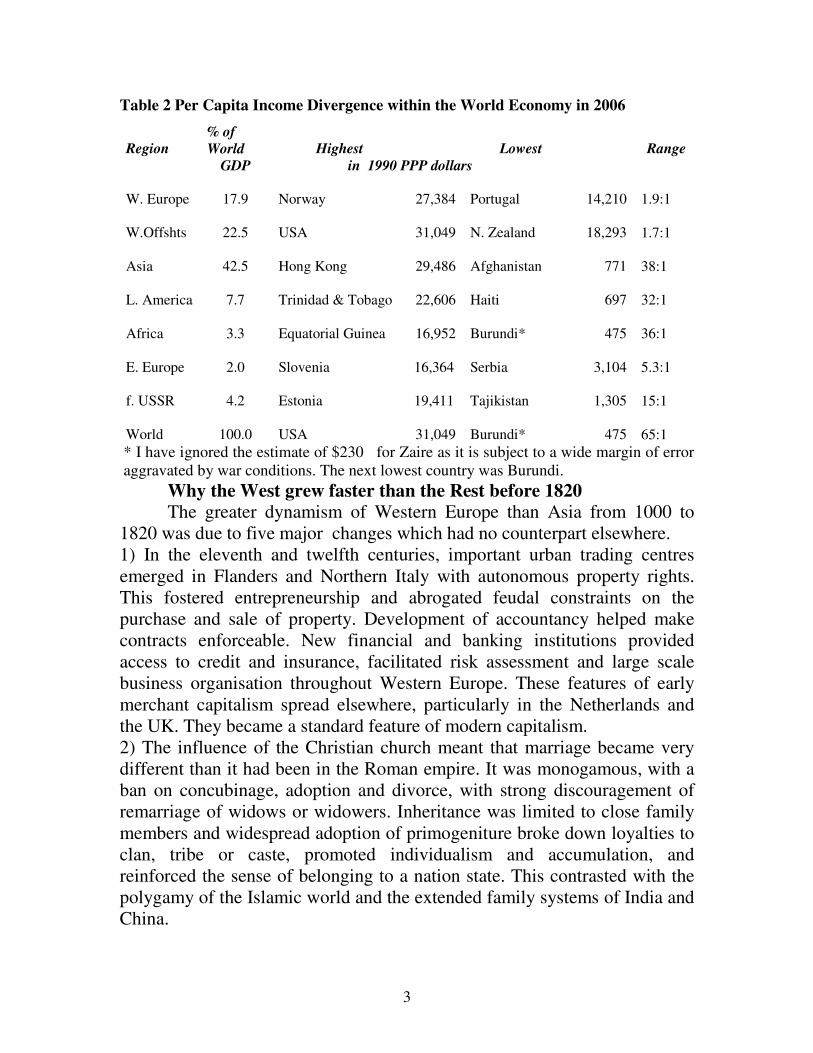
Table 2 Per Capita Income Divergence within the World Economy in 2006
Region
% of
World Highest Lowest Range
GDP in 1990 PPP dollars
W. Europe 17.9 Norway 27,384 Portugal 14,210 1.9:1
W.Offshts 22.5 USA 31,049 N. Zealand 18,293 1.7:1
Asia 42.5 Hong Kong 29,486 Afghanistan 771 38:1
L. America 7.7 Trinidad & Tobago 22,606 Haiti 697 32:1
Africa 3.3 Equatorial Guinea 16,952 Burundi* 475 36:1
E. Europe 2.0 Slovenia 16,364 Serbia 3,104 5.3:1
f. USSR 4.2 Estonia 19,411 Tajikistan 1,305 15:1
World 100.0 USA 31,049 Burundi* 475 65:1
* I have ignored the estimate of $230 for Zaire as it is subject to a wide margin of error aggravated by war conditions. The next lowest country was Burundi.
Why the West grew faster than the Rest before 1820 The greater dynamism of Western Europe than Asia from 1000 to
1820 was due to five major changes which had no counterpart elsewhere. 1) In the eleventh and twelfth centuries, important urban trading centres emerged in Flanders and Northern Italy with autonomous property rights. This fostered entrepreneurship and abrogated feudal constraints on the purchase and sale of property. Development of accountancy helped make contracts enforceable. New financial and banking institutions provided access to credit and insurance, facilitated risk assessment and large scale business organisation throughout Western Europe. These features of early merchant capitalism spread elsewhere, particularly in the Netherlands and the UK. They became a standard feature of modern capitalism. 2) The influence of the Christian church meant that marriage became very different than it had been in the Roman empire. It was monogamous, with a ban on concubinage, adoption and divorce, with strong discouragement of remarriage of widows or widowers. Inheritance was limited to close family members and widespread adoption of primogeniture broke down loyalties to clan, tribe or caste, promoted individualism and accumulation, and reinforced the sense of belonging to a nation state. This contrasted with the polygamy of the Islamic world and the extended family systems of India and China.
4
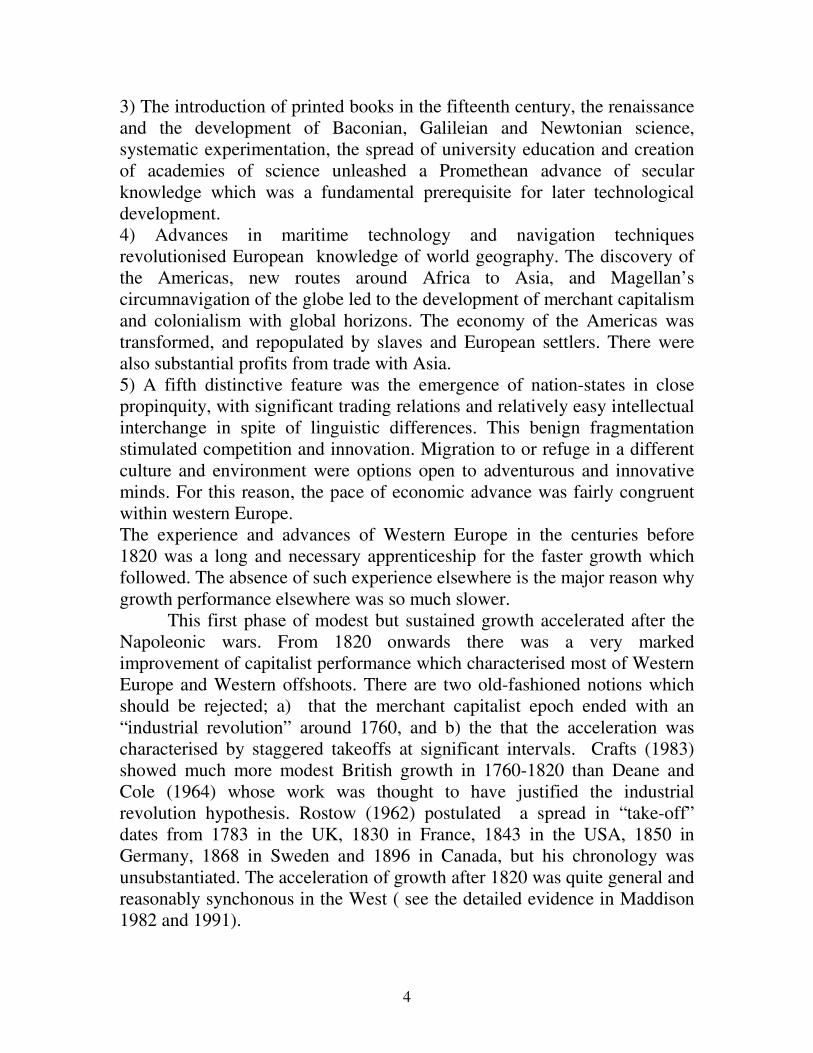
3) The introduction of printed books in the fifteenth century, the renaissance and the development of Baconian, Galileian and Newtonian science, systematic experimentation, the spread of university education and creation of academies of science unleashed a Promethean advance of secular knowledge which was a fundamental prerequisite for later technological development. 4) Advances in maritime technology and navigation techniques revolutionised European knowledge of world geography. The discovery of the Americas, new routes around Africa to Asia, and Magellan’s circumnavigation of the globe led to the development of merchant capitalism and colonialism with global horizons. The economy of the Americas was transformed, and repopulated by slaves and European settlers. There were also substantial profits from trade with Asia. 5) A fifth distinctive feature was the emergence of nation-states in close propinquity, with significant trading relations and relatively easy intellectual interchange in spite of linguistic differences. This benign fragmentation stimulated competition and innovation. Migration to or refuge in a different culture and environment were options open to adventurous and innovative minds. For this reason, the pace of economic advance was fairly congruent within western Europe. The experience and advances of Western Europe in the centuries before 1820 was a long and necessary apprenticeship for the faster growth which followed. The absence of such experience elsewhere is the major reason why growth performance elsewhere was so much slower.
This first phase of modest but sustained growth accelerated after the Napoleonic wars. From 1820 onwards there was a very marked improvement of capitalist performance which characterised most of Western Europe and Western offshoots. There are two old-fashioned notions which should be rejected; a) that the merchant capitalist epoch ended with an “industrial revolution” around 1760, and b) the that the acceleration was characterised by staggered takeoffs at significant intervals. Crafts (1983) showed much more modest British growth in 1760-1820 than Deane and Cole (1964) whose work was thought to have justified the industrial revolution hypothesis. Rostow (1962) postulated a spread in “take-off” dates from 1783 in the UK, 1830 in France, 1843 in the USA, 1850 in Germany, 1868 in Sweden and 1896 in Canada, but his chronology was unsubstantiated. The acceleration of growth after 1820 was quite general and reasonably synchonous in the West ( see the detailed evidence in Maddison 1982 and 1991).
5
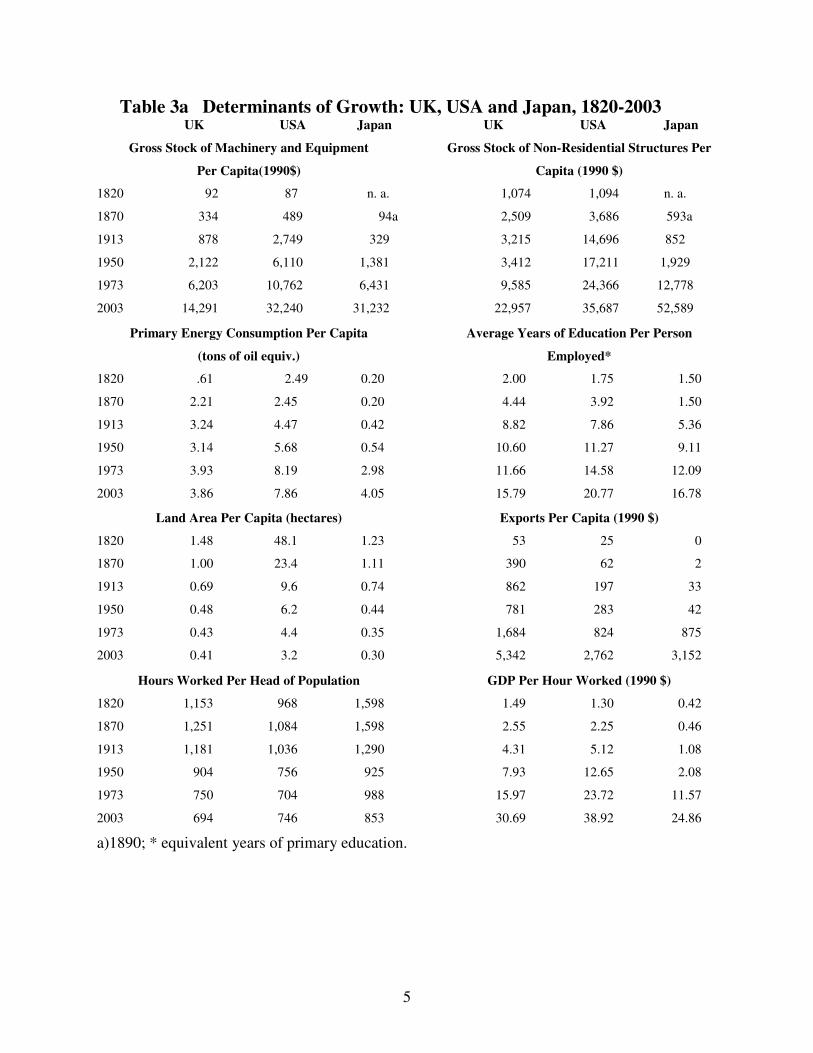
Table 3a Determinants of Growth: UK, USA and Japan, 1820-2003 UK USA Japan UK USA Japan
Gross Stock of Machinery and Equipment
Per Capita(1990$)
Gross Stock of Non-Residential Structures Per
Capita (1990 $)
1820 92 87 n. a. 1,074 1,094 n. a.
1870 334 489 94a 2,509 3,686 593a
1913 878 2,749 329 3,215 14,696 852
1950 2,122 6,110 1,381 3,412 17,211 1,929
1973 6,203 10,762 6,431 9,585 24,366 12,778
2003 14,291 32,240 31,232 22,957 35,687 52,589
Primary Energy Consumption Per Capita
(tons of oil equiv.)
Average Years of Education Per Person
Employed*
1820 .61 2.49 0.20 2.00 1.75 1.50
1870 2.21 2.45 0.20 4.44 3.92 1.50
1913 3.24 4.47 0.42 8.82 7.86 5.36
1950 3.14 5.68 0.54 10.60 11.27 9.11
1973 3.93 8.19 2.98 11.66 14.58 12.09
2003 3.86 7.86 4.05 15.79 20.77 16.78
Land Area Per Capita (hectares) Exports Per Capita (1990 $)
1820 1.48 48.1 1.23 53 25 0
1870 1.00 23.4 1.11 390 62 2
1913 0.69 9.6 0.74 862 197 33
1950 0.48 6.2 0.44 781 283 42
1973 0.43 4.4 0.35 1,684 824 875
2003 0.41 3.2 0.30 5,342 2,762 3,152
Hours Worked Per Head of Population GDP Per Hour Worked (1990 $)
1820 1,153 968 1,598 1.49 1.30 0.42
1870 1,251 1,084 1,598 2.55 2.25 0.46
1913 1,181 1,036 1,290 4.31 5.12 1.08
1950 904 756 925 7.93 12.65 2.08
1973 750 704 988 15.97 23.72 11.57
2003 694 746 853 30.69 38.92 24.86
a)1890; * equivalent years of primary education.
6
Why the divergence between the West and Rest continued in the capitalist era from 1820 to 1950 After 1820, economic growth accelerated in western Europe for three reasons; leading countries had acquired most of the institutional and intellectual attributes of a modern capitalist state, ceased to follow beggar-your neighbour policies, and there was a faster pace of technical change.
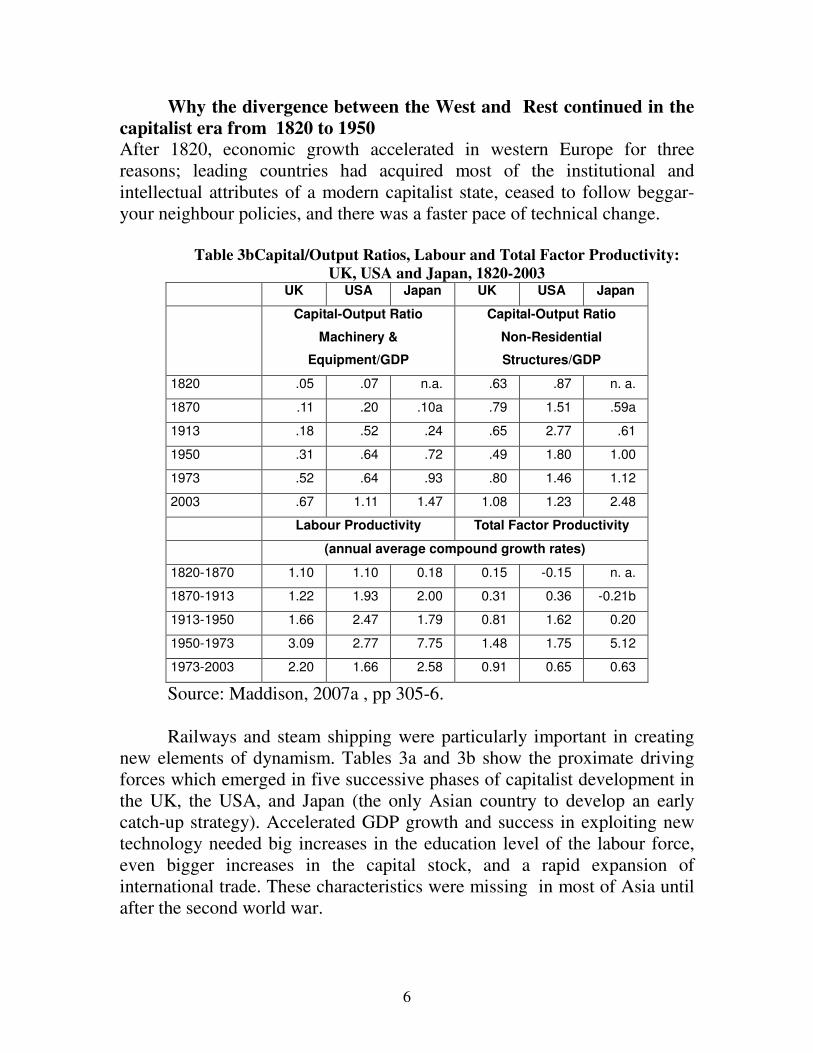
Table 3bCapital/Output Ratios, Labour and Total Factor Productivity: UK, USA and Japan, 1820-2003
UK USA Japan UK USA Japan
Capital-Output Ratio
Machinery &
Equipment/GDP
Capital-Output Ratio
Non-Residential
Structures/GDP
1820 .05 .07 n.a. .63 .87 n. a.
1870 .11 .20 .10a .79 1.51 .59a
1913 .18 .52 .24 .65 2.77 .61
1950 .31 .64 .72 .49 1.80 1.00
1973 .52 .64 .93 .80 1.46 1.12
2003 .67 1.11 1.47 1.08 1.23 2.48
Labour Productivity Total Factor Productivity
(annual average compound growth rates)
1820-1870 1.10 1.10 0.18 0.15 -0.15 n. a.
1870-1913 1.22 1.93 2.00 0.31 0.36 -0.21b
1913-1950 1.66 2.47 1.79 0.81 1.62 0.20
1950-1973 3.09 2.77 7.75 1.48 1.75 5.12
1973-2003 2.20 1.66 2.58 0.91 0.65 0.63
Source: Maddison, 2007a , pp 305-6. Railways and steam shipping were particularly important in creating
new elements of dynamism. Tables 3a and 3b show the proximate driving forces which emerged in five successive phases of capitalist development in the UK, the USA, and Japan (the only Asian country to develop an early catch-up strategy). Accelerated GDP growth and success in exploiting new technology needed big increases in the education level of the labour force, even bigger increases in the capital stock, and a rapid expansion of international trade. These characteristics were missing in most of Asia until after the second world war.
7
West European countries had lost most of their American colonies by 1820, but augmented their imperialist ambitions in Asia and subsequently in Africa. Merchant capitalist policies had generally been beggar-your neighbour, but imperialism became much more collusive in the nineteenth century, (especially so in China). Generally, the imperialist powers avoided conflict with each other. From 1820 to until the outbreak of the second world war, western powers regarded colonialism as a significant contribution to their prosperity, but nationalist politicians in the colonised countries, notably in China, India and Indonesia, rightly considered colonial policy a major barrier to their economic performance.
Western Europe’s Postwar Golden Age From 1950 to 1973, west European per capita GDP grew 4 per cent a year, three times as fast as in any earlier phase of development. There was a potential for catch-up due to prewar stagnation and wartime destruction. The east-west split reinforced harmony of interests between the capitalist economies. The policy conflicts of interwar years did not recur. The US played a generous and effective role from 1948, providing a substantial flow of Marshall aid, fostering liberal trading policies, creating a functioning international order with explicit and rational codes of behaviour, and institutions for cooperation. West European governments gave much greater emphasis to economic growth objectives than ever in the past, and were meticulous in measuring performance. They promoted high levels of demand and employment and openness to international trade. The productivity gaps within the western world were significantly reduced. After 1973, average per capita growth in Western Europe was similar to that in the US, the catch-up phase had ended in most of countries, but the slowdown was warranted as they were operating much closer to the frontier of technology. The success of growth policies reduced the appeal of imperialism. Prewar policies of colonial tutelege were abandoned and emphasis switched to stimulating development by providing financial aid. Can one characterise modern Western growth as industrialisation? There is a tendancy to equate Western economic growth as a process of industrialisation. This is an error as shown in Table 4a, on the structure of employment. The share of industrial employment rose fairly steadily in Western countries from 1700 to the end of the 1960s and has declined significantly since then. At no time has industrial employment been more than half of total employment. The fastest rise has been in the service sector, and the biggest

8
decline has been in agriculture. There is little difference now in the shares of industrial employment and value added, which means there is not a wide variation in inter-secor productivity. The situation is very different in China where the share of employment in industry is not too different from the situation in the West. However, The share of Chinese industry in value added is hugely different from that in the West. In 2003 it was 57 per cent of GDP, far higher than ever in Western experience. The higher relative level of industrial productivity is due to official policy in prioritising industrial development in many ways.
Table 4a Structure of Employment 1700-2006 Percent of total agriculture industry services Netherlands 40 33 27
1700 UK 56 22 22 USA n.a. n.a. n.a. Netherlands 42 28 30
1820 UK 37 33 30 USA 70 15 15 Netherlands 14 40 46
1950 UK 5 47 48 USA 13 33 54 Netherlands 7 38 55
1970 UK 3 44 53 USA 4 31 65 Netherlands 3 21 76
2006 UK 1 22 77 USA 3 21 76 China 2002 52 20 28
Sources: Maddison (2007a, p.76 updated. Agriculture includes forestry and fishing; industry includes mining, manufacturing, electricity, gas, water and construction; services is a residual including all other activity, private and governmental (including military). Chinese estimates are from Maddison and Wu (2008), pp. 33 and 37-38
Table 4b Structure of Value Added
Netherlands 2 24 74 2006 UK 1 23 76
USA 1 23 76 China 2003 16 57 27
9
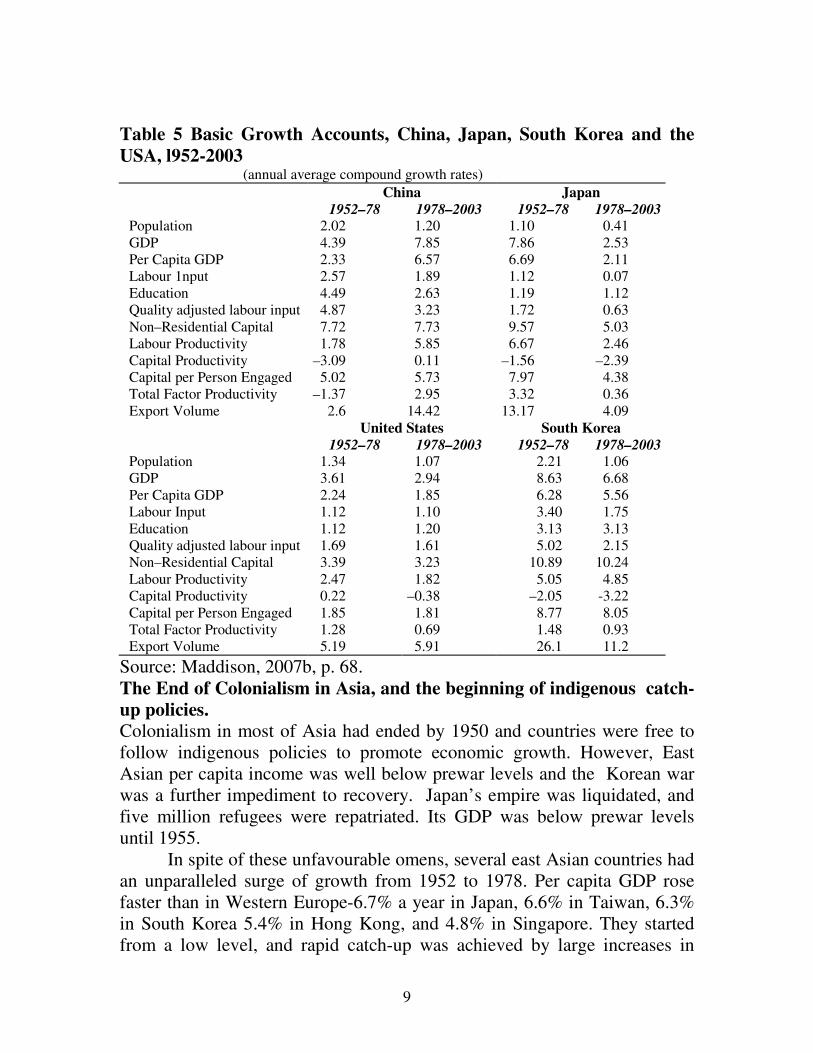
Table 5 Basic Growth Accounts, China, Japan, South Korea and the USA, l952-2003
(annual average compound growth rates)
China Japan 1952–78 1978–2003 1952–78 1978–2003 Population 2.02 1.20 1.10 0.41 GDP 4.39 7.85 7.86 2.53 Per Capita GDP 2.33 6.57 6.69 2.11 Labour 1nput 2.57 1.89 1.12 0.07 Education 4.49 2.63 1.19 1.12 Quality adjusted labour input 4.87 3.23 1.72 0.63 Non–Residential Capital 7.72 7.73 9.57 5.03 Labour Productivity 1.78 5.85 6.67 2.46 Capital Productivity –3.09 0.11 –1.56 –2.39 Capital per Person Engaged 5.02 5.73 7.97 4.38 Total Factor Productivity –1.37 2.95 3.32 0.36 Export Volume 2.6 14.42 13.17 4.09 United States South Korea 1952–78 1978–2003 1952–78 1978–2003 Population 1.34 1.07 2.21 1.06 GDP 3.61 2.94 8.63 6.68 Per Capita GDP 2.24 1.85 6.28 5.56 Labour Input 1.12 1.10 3.40 1.75 Education 1.12 1.20 3.13 3.13 Quality adjusted labour input 1.69 1.61 5.02 2.15 Non–Residential Capital 3.39 3.23 10.89 10.24 Labour Productivity 2.47 1.82 5.05 4.85 Capital Productivity 0.22 –0.38 –2.05 -3.22 Capital per Person Engaged 1.85 1.81 8.77 8.05 Total Factor Productivity 1.28 0.69 1.48 0.93 Export Volume 5.19 5.91 26.1 11.2
Source: Maddison, 2007b, p. 68. The End of Colonialism in Asia, and the beginning of indigenous catch- up policies. Colonialism in most of Asia had ended by 1950 and countries were free to follow indigenous policies to promote economic growth. However, East Asian per capita income was well below prewar levels and the Korean war was a further impediment to recovery. Japan’s empire was liquidated, and five million refugees were repatriated. Its GDP was below prewar levels until 1955.
In spite of these unfavourable omens, several east Asian countries had an unparalleled surge of growth from 1952 to 1978. Per capita GDP rose faster than in Western Europe-6.7% a year in Japan, 6.6% in Taiwan, 6.3% in South Korea 5.4% in Hong Kong, and 4.8% in Singapore. They started from a low level, and rapid catch-up was achieved by large increases in

10
capital stock, improvements in educational level, and rapid growth in exports (see the comparative growth accounts for China, Japan, the USA and South Korea in Table 5).
Japan was the most successful because it could switch all of its already highly educated labour force to peacetime pursuits and its international interaction benefitted from its early emergence as an ally of the United States. South Korea and Taiwan also benefitted in their reconstruction and rapid development from being US allies and recipients of US aid. Growth slowed a little after 1978 in most of these countries, but in Japan there was a particularly sharp deceleration. Japan operated nearer to the technological frontier, and government policy had pushed investment to a point of diminishing returns (see the Japanese capital output ratios in Table 3 b and Figure 2 which compares British and Japanese growth experience).
Figure 2 Confrontation of British and Japanese Growth Experience
Comparative Levels of GDP per Capita, 1500-2030
(1990 international dollars)
100
1000
10000
100000
1500
1550
1600
1650
1700
1750
1800
1850
1900
1950
2000
United Kingdom
11
The Asian surge spreads to China and India In 1952-78, per capita GDP growth in China and India was well below the Asian average. In both cases, domestic policies bore some of the responsibility.
In China, the establishment of the people’s republic brought a sharp change in the political elite and mode of governance (bigger than the Meiji shakeup in nineteenth century Japan). The degree of central control was much greater than under the Ch’ing dynasty or the KMT. Landlords, national and foreign capitalist interests were eliminated by expropriation of private property and there were mininal links to the world economy. The political changes had substantial costs. China’s version of communism involved risky experimentation on a grand scale. Self–inflicted wounds brought the economic and political system close to collapse during the Great Leap Forward (1958–60), and again in the Cultural Revolution (1966–76) when education and the political system were deeply shaken. Allocation of resources was extremely inefficient. From 1952 to 1973 the United States applied a comprehensive embargo on trade, travel and financial transactions, and from 1960 onwards the USSR did the same. China grew more slowly than other communist economies and somewhat less than the world average. Nevertheless, economic performance was a great improvement over the past. GDP trebled, per capita real product rose by more than 80 per cent. After 1978, Chinese economic performance surged at a similar pace to that attained earlier in Japan, and this surge is likely to last much longer, as China operates much further from the technical frontier.
In India, from 1952 to 1978, per capita GDP grew by 1.7 per cent a year, faster than in colonial times, but below potential, because Nehruvian policies involved high levels of public investment in heavy industry and detailed controls on the private sector. The Gandhian heritage placed great emphasis on self sufficiency. These policies were modified somewhat and per capita growth rose to 2.6 per cent a year in 1978-90. Policy became substantially more liberal when Manmohan Singh became minister of finance in 1991-96. Since 2004 he has been prime minister and given a further booost to expansionist policies. He greatly reduced the degree to which economic activity was constrained by official permits and encouraged the inflow of foreign investment. As a result, per capita GDP rose by an average of 3.9 per cent a year from 1990 to 2003 and accelerated to 6.5 per cent in 2003-2006, coming close to the growth performance of China.
12
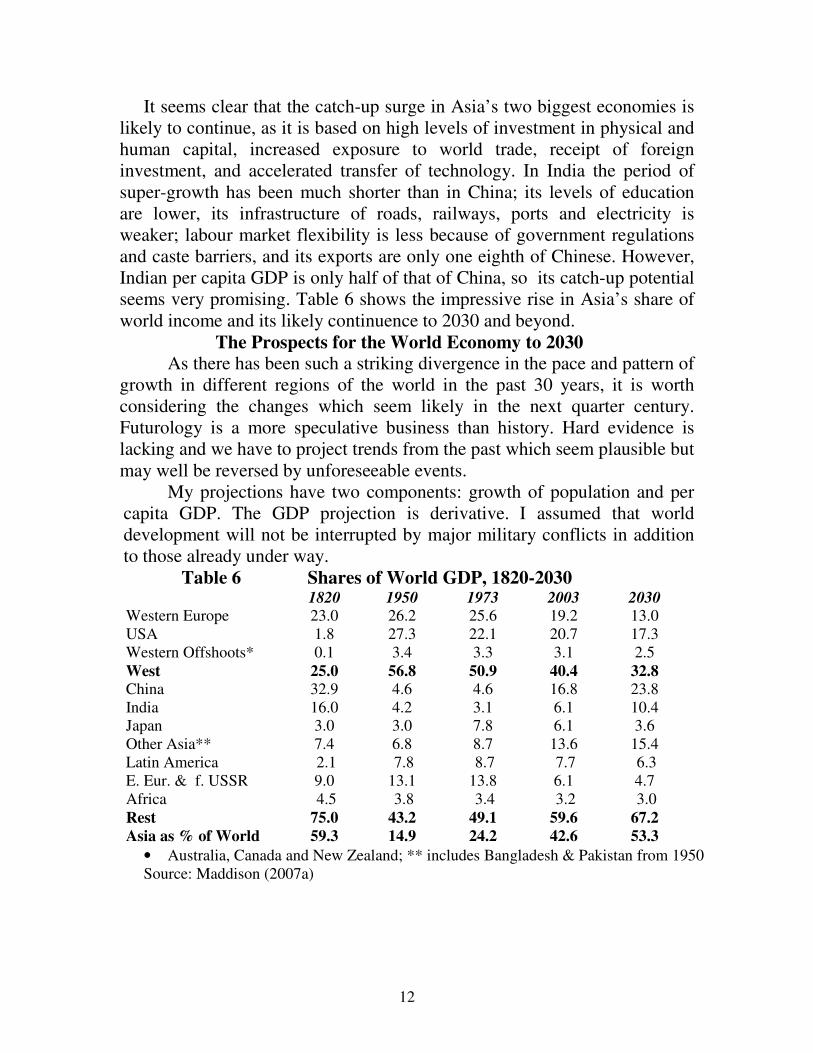
It seems clear that the catch-up surge in Asia’s two biggest economies is likely to continue, as it is based on high levels of investment in physical and human capital, increased exposure to world trade, receipt of foreign investment, and accelerated transfer of technology. In India the period of super-growth has been much shorter than in China; its levels of education are lower, its infrastructure of roads, railways, ports and electricity is weaker; labour market flexibility is less because of government regulations and caste barriers, and its exports are only one eighth of Chinese. However, Indian per capita GDP is only half of that of China, so its catch-up potential seems very promising. Table 6 shows the impressive rise in Asia’s share of world income and its likely continuence to 2030 and beyond. The Prospects for the World Economy to 2030 As there has been such a striking divergence in the pace and pattern of growth in different regions of the world in the past 30 years, it is worth considering the changes which seem likely in the next quarter century. Futurology is a more speculative business than history. Hard evidence is lacking and we have to project trends from the past which seem plausible but may well be reversed by unforeseeable events. My projections have two components: growth of population and per capita GDP. The GDP projection is derivative. I assumed that world development will not be interrupted by major military conflicts in addition to those already under way.
Table 6 Shares of World GDP, 1820-2030 1820 1950 1973 2003 2030 Western Europe 23.0 26.2 25.6 19.2 13.0 USA 1.8 27.3 22.1 20.7 17.3 Western Offshoots* 0.1 3.4 3.3 3.1 2.5 West 25.0 56.8 50.9 40.4 32.8 China 32.9 4.6 4.6 16.8 23.8 India 16.0 4.2 3.1 6.1 10.4 Japan 3.0 3.0 7.8 6.1 3.6 Other Asia** 7.4 6.8 8.7 13.6 15.4 Latin America 2.1 7.8 8.7 7.7 6.3 E. Eur. & f. USSR 9.0 13.1 13.8 6.1 4.7 Africa 4.5 3.8 3.4 3.2 3.0 Rest 75.0 43.2 49.1 59.6 67.2 Asia as % of World 59.3 14.9 24.2 42.6 53.3
• Australia, Canada and New Zealand; ** includes Bangladesh & Pakistan from 1950 Source: Maddison (2007a)
13
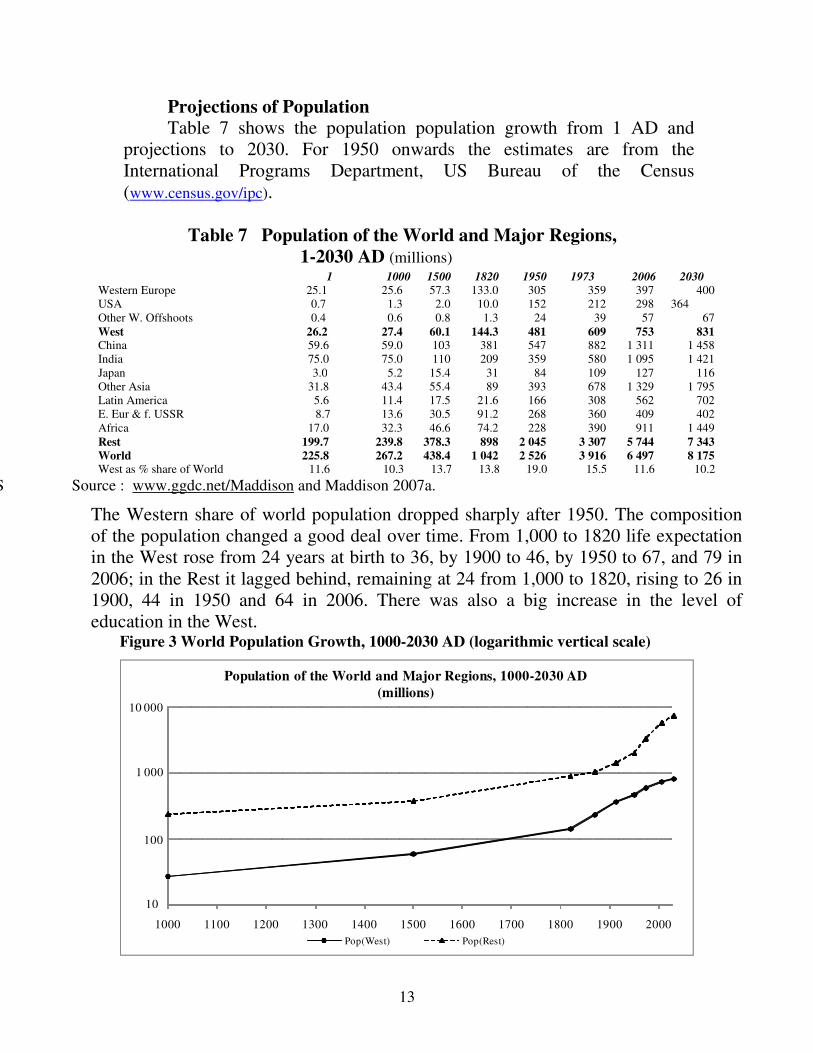
Projections of Population Table 7 shows the population population growth from 1 AD and projections to 2030. For 1950 onwards the estimates are from the International Programs Department, US Bureau of the Census (www.census.gov/ipc).
Table 7 Population of the World and Major Regions, 1-2030 AD (millions)
1 1000 1500 1820 1950 1973 2006 2030
Western Europe 25.1 25.1 25.6 57.3 133.0 305 359 397 400 USA 0.7 1.3 2.0 10.0 152 212 298 364 Other W. Offshoots 0.4 0.6 0.8 1.3 24 39 57 67 West 26.2 27.4 60.1 144.3 481 609 753 831 China 59.6 59.0 103 381 547 882 1 311 1 458 India 75.0 75.0 110 209 359 580 1 095 1 421 Japan 3.0 5.2 15.4 31 84 109 127 116 Other Asia 31.8 43.4 55.4 89 393 678 1 329 1 795 Latin America 5.6 11.4 17.5 21.6 166 308 562 702 E. Eur & f. USSR 8.7 13.6 30.5 91.2 268 360 409 402 Africa 17.0 32.3 46.6 74.2 228 390 911 1 449 Rest 199.7 239.8 378.3 898 2 045 3 307 5 744 7 343 World 225.8 267.2 438.4 1 042 2 526 3 916 6 497 8 175 West as % share of World 111 1.6 11.6 10.3 13.7 13.8 19.0 15.5 11.6 10.2
S Source : www.ggdc.net/Maddison and Maddison 2007a.
The Western share of world population dropped sharply after 1950. The composition of the population changed a good deal over time. From 1,000 to 1820 life expectation in the West rose from 24 years at birth to 36, by 1900 to 46, by 1950 to 67, and 79 in 2006; in the Rest it lagged behind, remaining at 24 from 1,000 to 1820, rising to 26 in 1900, 44 in 1950 and 64 in 2006. There was also a big increase in the level of education in the West.
Figure 3 World Population Growth, 1000-2030 AD (logarithmic vertical scale)
1000 1100 1200 1300 1400 1500 1600 1700 1800 1900 2000
Population of the World and Major Regions, 1000-2030 AD
(millions)
Pop(West) Pop(Rest)
100
1 000
10 000
10
14
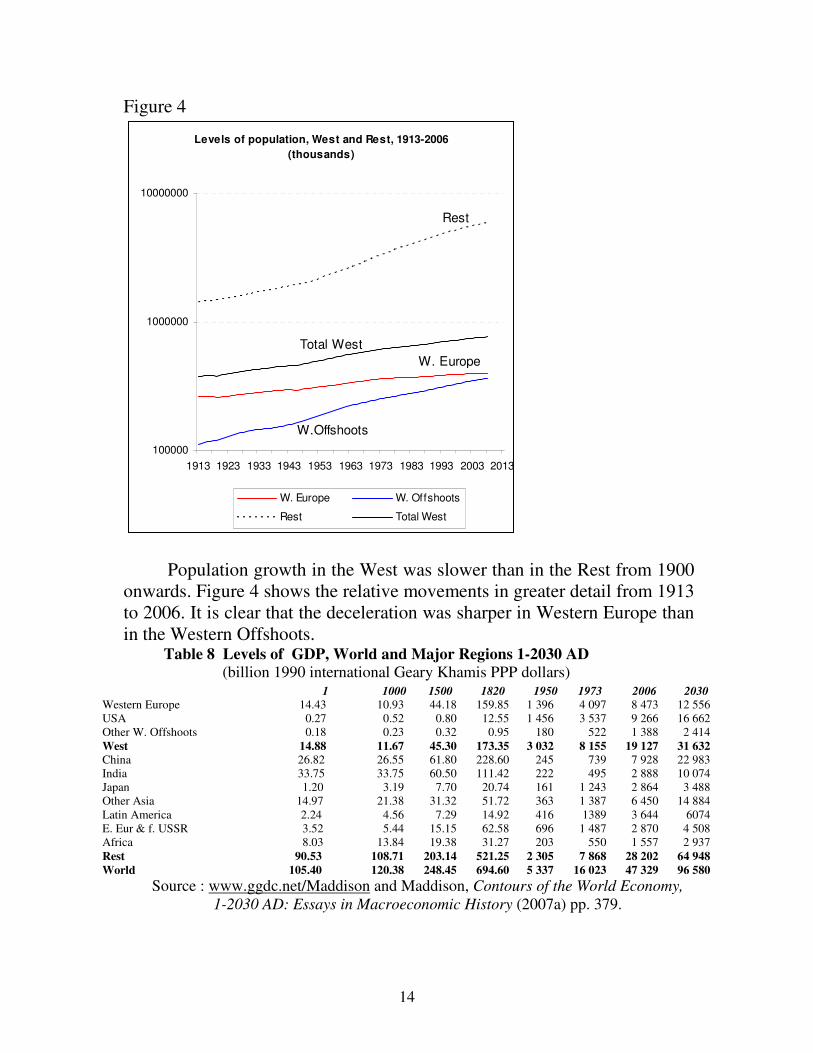
Figure 4
Levels of population, West and Rest, 1913-2006
(thousands)
W. Europe
W.Offshoots
Rest
Total West
100000
1000000
10000000
1913 1923 1933 1943 1953 1963 1973 1983 1993 2003 2013
W. Europe W. Offshoots
Rest Total West
Population growth in the West was slower than in the Rest from 1900 onwards. Figure 4 shows the relative movements in greater detail from 1913 to 2006. It is clear that the deceleration was sharper in Western Europe than in the Western Offshoots.
Table 8 Levels of GDP, World and Major Regions 1-2030 AD (billion 1990 international Geary Khamis PPP dollars)
1 1000 1500 1820 1950 1973 2006 2030
Western Europe 14.43 10.93 44.18 159.85 1 396 4 097 8 473 12 556 USA 0.27 0.52 0.80 12.55 1 456 3 537 9 266 16 662 Other W. Offshoots 0.18 0.23 0.32 0.95 180 522 1 388 2 414 West 14.88 11.67 45.30 173.35 3 032 8 155 19 127 31 632 China 26.82 26.55 61.80 228.60 245 739 7 928 22 983 India 33.75 33.75 60.50 111.42 222 495 2 888 10 074 Japan 1.20 3.19 7.70 20.74 161 1 243 2 864 3 488 Other Asia 14.97 21.38 31.32 51.72 363 1 387 6 450 14 884 Latin America 2.24 4.56 7.29 14.92 416 1389 3 644 6074 E. Eur & f. USSR 3.52 5.44 15.15 62.58 696 1 487 2 870 4 508 Africa 8.03 13.84 19.38 31.27 203 550 1 557 2 937 Rest 90.53 108.71 203.14 521.25 2 305 7 868 28 202 64 948 World 105.40 120.38 248.45 694.60 5 337 16 023 47 329 96 580
Source : www.ggdc.net/Maddison and Maddison, Contours of the World Economy,
1-2030 AD: Essays in Macroeconomic History (2007a) pp. 379.

15
Figure 5 Levels of World GDP, 1000-2030 (logarithmic vertical scale)
1000 1100 1200 1300 1400 1500 1600 1700 1800 1900 2000
Levels of GDP, World and Major Regions 1000-2030 AD
(billion 1990 international dollars)
GDP(West) GDP(Rest)
10
1000
10 000
100 000
100
0
Assumptions Underlying the Projections to 2030 For population the US Bureau of the Census made individual projections for 224 countries, see www.ggdc.net/Maddison. My projections of per capita GDP are much more aggregative. They cover major regions, and the five of the countries with the biggest shares of world GDP. They are not the result of an econometric exercise, but are based on an analysis of changes in the momentum of growth in different parts of the world economy, and my asessment of the likelihood of their continuation or change. They were conceived as likely continuation or deviation from the momentum of growth in 1990-2003. Table 9a Comparative GDP Performance of China, Russia, Japan, India and the USA, 1990-2030 (GDP levels in billion 1990 PPP dollars) (China as per cent of)
Russia Japan China USA India Russia Japan USA India
1990 1,151 2,321 2,124 5,803 1,098 185 92 37 199 1991 1,093 2,399 2,264 5,792 1,112 207 94 39 204 1992 935 2,422 2,484 5,985 1,169 266 103 42 212 1993 854 2,428 2,724 6,146 1,238 319 112 44 220 1994 745 2,455 2,997 6,396 1,328 402 122 47 226 1995 715 2,504 3,450 6,558 1,426 483 138 53 242 1996 689 2,590 3,521 6,804 1,537 511 136 52 229 1997 699 2,636 3,707 7,110 1,611 530 141 52 230 2006 1,113 2,864 7,928 9,266 2,888 712 277 86 275 2015 1,300 3,116 12,271 11,467 4,665 944 394 107 263 2030 2,017 3,488 22,983 16,662 10,074 1,139 659 138 228

16
Source: 1990-2006 from www.ggdc.net/Maddison; 2015 and 2030 projections derived from Maddison (2007b). Table 9 b Comparative Per Capita GDP Performance of China, Russia, Japan, India and the USA, 1990-2030
(Per capita GDP levels in 1990 PPP dollars) (China as per cent of)
Russia Japan China USA India Russia Japan USA India
1990 7,779 18,789 1,871 23,201 1,309 24 10 8 143 1991 7,373 19,355 1,967 22,849 1,299 27 10 9 151 1992 6,300 19,482 2,132 23,298 1,341 34 11 9 159 1993 5,752 19,478 2,312 23,616 1,390 40 12 10 166 1994 5,020 19,637 2,515 24,279 1,463 50 13 10 172 1995 4,813 19,979 2,863 24,603 1,538 59 14 12 186 1996 4,645 20,616 2,892 25,230 1,630 62 14 11 177 1997 4,717 20,929 3,013 26,052 1,680 64 14 12 179 2006 7,786 22,471 6,048 31,049 2,637 78 27 19 229 2015 9,554 24,775 8,807 35,547 3,663 88 36 25 240 2030 16,007 30,072 15,763 45,774 7,089 98 52 34 222
Source: 1990-2006 from www.ggdc.net/Maddison; 2015 and 2030 projections derived from Maddison (2007b).
The West For the advanced capitalist group, i.e. western Europe, the USA, the other western offshoots and Japan, their aggregate per capita GDP is assumed to advance at the same pace as in 1990-2003. This does not mean that all component countries will have the same growth rate. The rapid and widespread catch-up on US per capita income levels in the golden age (1950-73) had ended for most countries by the 1990s. France, Germany, Italy and Japan advanced more slowly than the USA in 1990-2003, but Ireland made a remarkable bound forward, while Australia, Spain and the UK had a respectable degree of catch-up. Labour input per head of population is generally lower in western Europe than in the USA, so the gap in performance is smaller in terms of productivity than in per capita GDP. This is due in part to shorter working hours and longer holidays, but in France, Germany and Italy unemployment rates were much higher than in the USA and UK from 1990 to 2006. This contrasts with the situation in the golden age, when European unemployment rates were much lower than in the USA. With more flexible labour market policies there would be some scope for better European performance (see van Ark, 2006 and Gordon, 2006). Asia
In the past three decades, the biggest change in the structure of the world economy was the increased share of Asia, which is likely to continue. China has been the most dynamic of the Asian economies, but growth will probably
17
decelerate for several reasons. In the reform period, the emphasis on population control and changes in age structure made it possible to raise the activity rate to a degree that cannot be repeated. Because of the low starting point, the average educational level of the labour force was multiplied by a factor of six from 1952 to 2003. China has suffered environmental deterioration in its push for rapid growth. In future it will have to devote greater resources to mitigate this damage. Income growth has lagged in rural areas and there has been a neglect of rural educational and health facilities. Bigger resources will be needed to compensate for this. Some slowdown can also be expected as Chinese wages rise and the average technological level gets closer to the frontier in the advanced countries. I assumed that per capita income will grow at an average rate of 4.5 per cent a year between 2003 and 2030, but that the rate of advance will taper off. Specifically, I assume a rate of 5.6 per cent a year to 2010, 4.6 percent between 2010 and 2020, and a little more than 3.6 per cent a year from 2020 to 2030. By then, it will have reached the same per capita level as western Europe in 1990. As it approaches this level, technical advance will be more costly as imitation is replaced by innovation. Even on my rather conservative assumptions, China would again become the world’s biggest economy by 2015, the USA would be number two and India number three. The average per capita income level in China would still be a good deal lower than in the USA, western Europe and Japan, but it would be well above the world average.
The Malthusian Interpretation of World Development In a recent issue of World Economics, Brian Snowdon (2008) reviewed
Oded Galor’s “unified” theory of economic growth (see Galor, 2005). I was surprised that Galor had drawn extensively on my database to illustrate an interpretation of world economic history so different from mine.
Galor assumes that within in the past 10,000 years, there was no growth in per capita income in the first 9,750 years. A “Malthusian regime dominated” “all of human history until we come to the Industial Revolution”. “The Malthusian regime describes a world in low-level equilibrium in terms of income per capita. Technological progress took place, but very slowly. The growth of total output was matched by population growth so that per capita income fluctuated around a low stable level, with no significant progress in average living standards.”
This was followed by a “post-Malthusian” regime, when technical progress accelerated and there was the beginning of growth in per capita income. This was followed by a demographic transition which engendered a “modern regime” where growth is faster and sustained. In this regime, parents invest in human capital,
18
substituting quality for quantity of their offspring. Thus the Malthusian constraint eventually “generates the necessary evolutionary pressure for the ultimate take-off”.
Galor’s main interest is in his theory, which is both Malthusian amd Darwinian. In his “single dynamical system” “steady-state equilibria are altered qualitatively in the process of development due to latent state variables that evolve behind the scene” and allow the economy to escape from the Malthusian equilibrium and “gravitate towards a sustained growth regime”. As an example of a masked behind-the-scene processes he refers to population growth and “evolution of the distribution of genetic characteristics” which are causal elements in his schema.
Galor is an econometrician,whose theory is not derived from his own detailed measurement of change. His evidence is illustrative. In Galor (2005) it consists of 42 Figures and 13 pages of algebra. He presents no tables. 21 of his graphs are attributed to Maddison, but in all except two cases, these graphs are not mine, but are derived from tables in Maddison (2001). The trouble with these 19 graphs is that they have an arithmetic vertical scale, and are misleading when presenting rates of change over 2000 years. I use a vertical logarithmic scale to illustrate proportionate change in per capita income. My graph (left of Figure 6) shows a significant but slow rise in western per capita income between 1000 and 1820 AD. His graph (right hand of Figure 6) is shaped like a half-opened jacknife with a sharp and sudden jump from flat to sharply vertical.
As I explained at the beginning of this paper, I consider the achievement of the West between 1000 and 1820 to be a long and significant apprenticeship to modern economic growth, and am very sceptical of sudden takeoff theories. This is not my only disagreement with Galor’s ingenious theory, which attributes too much importance to popuation change and Darwinian changes in human intelligence.
There are other economists, Bradford DeLong (2000) and Gregory Clark (2007) who would agree with Galor’s jacknife interpretation of history, but lack Galor’s subtlety.

19
Figure 6 Confrontation of Maddison and Galor Style of Interpretating Per Capita
Growth, 1000-2030 AD
1000 1100 1200 1300 1400 1500 1600 1700 1800 1900 2000
Levels of per Capita GDP, 1000-2030 AD(logarithmic scale 1990 international dollars)
GDP/cap(West) GDP/cap(Rest)
1000
10 000
100
100 000
0
4000
8000
12000
16000
20000
24000
28000
32000
36000
40000
1000 1100 1200 1300 1400 1500 1600 1700 1800 1900 2000
Levels of per Capita GDP, 1000-2030 AD(arithmetic scale 1990 international dollars)
GDP/cap(West) GDP/cap(Rest)
Bibliography Bardhan, P. (2006), “Awakening Giants, Feet of Clay, A comparative Assessment of the Rise of China and India”, Journal of South Asian Development, No.1,1. Clark, G. (2007), A Farewell to Alms, Princeton University Press. Crafts, N. F. R. (1983), “British Economic Growh, 1700-1831: A Review of the Evidence”, Economic History Review, vol. 36, no 2, May. Deane, P. and A. Cole, (1964), British Economic Growth: 1688-1959, Cambridge Univesity Press. DeLong. B. (2000), “Cornucopia: Increasing Wealth in the Twentieth Century” www.j-bradford-delong.net Galor, O. (2005), “From Stagnation to Growth: Unified Growth Theory”, in Aghion, P. and S. N. Durlauf, Handbook of Economic Growth, Elsevier, Amsterdam. Galor, O. and O. Moav (2001), “Evolution and Growth”, European Economic Review, No. 45, pp. 718-729. Galor, O. and O. Moav (2002), “Natural Selection and the Origin of Economic Growth”, Quarterly Journal of Economics, November.
20
Galor, O. and O. Moav (2004), “From Physical to Human Capital Accumulation: Inequality and the Process of Development”, Review of Economic Studies, No.71, pp 1001-1026. Galor, O. and D. N. Weil (2000), “ Population, Technology, and Growth: from Malthusian Stagnation to the Demographic Transition and Beyond”, American Economic
Review, September. Garnaut, R. (2006), “Driving Forces in Chinese Growth since 1978 and the Outlook to 2030”, paper presented to Seminar on World Economic Performance; Past, Present and Future, Queensland University, Brisbane, December 5-6th. Gordon, R. J. (2006), “Future US Productivity Growth: Looking Ahead by Looking Back”, ”, paper presented to workshop on World Economic Performance; Past, Prent and Future’ University of Groningen, October 27. Lal, D. (2008), “An Indian Economic Miracle?”, Cato Journal, vol. 28, No.1. Lin, J. Y. (2006), “Needham Puzzle, Weber Question and China’s Miracle: Long term Performance since the Sung Dynasty”, paper presented to Seminar on World Economic Performance; Past, Present and Future, Queensland University, Brisbane, December 5-6.. Maddison, A. (1982), Phases of Capitalist Development, Oxford University Press. Maddison, A. (1991), Dynamic Forces in Capitalist Development, Oxford University Press. Maddison, A. (1995), Monitoring the World Economy, 1820-1992, OECD, Paris. Maddison, A. (2001), The World Economy: A Millennial Perspective, OECD, Paris. Maddison, A. (2005), “Measuring and Interpreting World Economic Performance, 1500-2001” Review of Income and Wealth, March, pp.1-36. Maddison, A. (2007a ), Contours of the World Economy, 1-2030 AD: Essays in. Macroeconomic History, Oxford University Press. Maddison, A. (2007b), Chinese Economic Performance in the Long Run, 960-2030 AD, OECD, Paris. Maddison, A.(2008), “Shares of the Rich and the Rest in the World Economy: Income D ivergence between Nations, 1820-2030”, Asian Economic Policy Review, Vol.3, No. 1, June. Maddison, A. and H. X. Wu (2008), “Measuring China’s Economic Performance”, World Economics, vol. 9, No.2, April-June. Menshikov, S. M. (2006), “Analysis of Russian Performance since 1990 and Future Outlook”, paper presented to workshop on World Economic Performance; Past, Prent and Future, University of Groningen, October 27. Menshikov, S. M. (2007), The Anatomy of Russian Capitalism, EIR News Service, Washington DC. Perkins, D. H. and T. C. Rawski (2008), “Forecasting China’s Economic Growth to 2025”chapter 20 in Brandt, L.and Y. G. Rawski, (eds.), China’s Great Economic
Transformation, Cambridge University Press. Rostow, W. W. (1962), The Stages of Economic Growth, Cambridge University Press. Snowdon, B. and O. Galor (2008), “Towards a Unified Theory of Economic Growth”, World Economics, vol.9, No. 2. van Ark, B. (2006), “Europe’s Productivity Gap: Catching Up or Getting Stuck”, paper presented to workshop on World Economic Performance; Past, Present and Future’ University of Groningen, October 27.
21
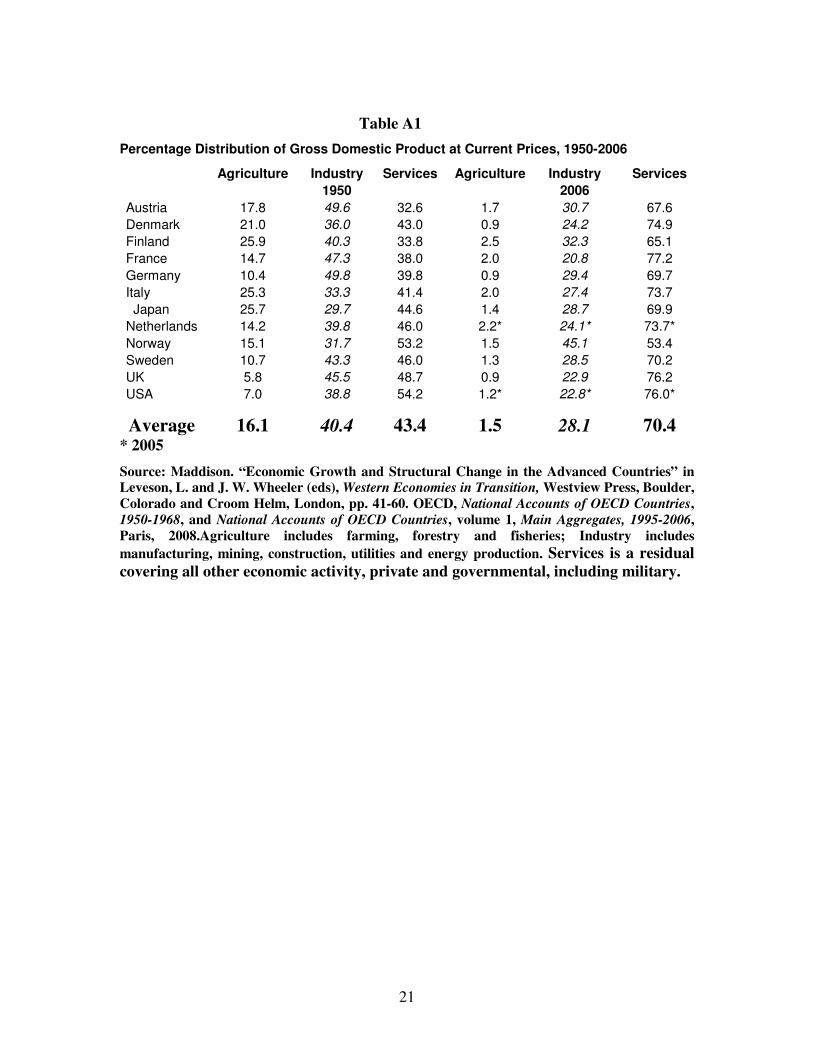
Table A1
Percentage Distribution of Gross Domestic Product at Current Prices, 1950-2006
Agriculture Industry Services Agriculture Industry Services
1950 2006
Austria 17.8 49.6 32.6 1.7 30.7 67.6
Denmark 21.0 36.0 43.0 0.9 24.2 74.9
Finland 25.9 40.3 33.8 2.5 32.3 65.1
France 14.7 47.3 38.0 2.0 20.8 77.2
Germany 10.4 49.8 39.8 0.9 29.4 69.7
Italy 25.3 33.3 41.4 2.0 27.4 73.7
Japan 25.7 29.7 44.6 1.4 28.7 69.9
Netherlands 14.2 39.8 46.0 2.2* 24.1* 73.7*
Norway 15.1 31.7 53.2 1.5 45.1 53.4
Sweden 10.7 43.3 46.0 1.3 28.5 70.2
UK 5.8 45.5 48.7 0.9 22.9 76.2
USA 7.0 38.8 54.2 1.2* 22.8* 76.0*
Average 16.1 40.4 43.4 1.5 28.1 70.4 * 2005
Source: Maddison. “Economic Growth and Structural Change in the Advanced Countries” in Leveson, L. and J. W. Wheeler (eds), Western Economies in Transition, Westview Press, Boulder, Colorado and Croom Helm, London, pp. 41-60. OECD, National Accounts of OECD Countries, 1950-1968, and National Accounts of OECD Countries, volume 1, Main Aggregates, 1995-2006, Paris, 2008.Agriculture includes farming, forestry and fisheries; Industry includes
manufacturing, mining, construction, utilities and energy production. Services is a residual covering all other economic activity, private and governmental, including military.
22
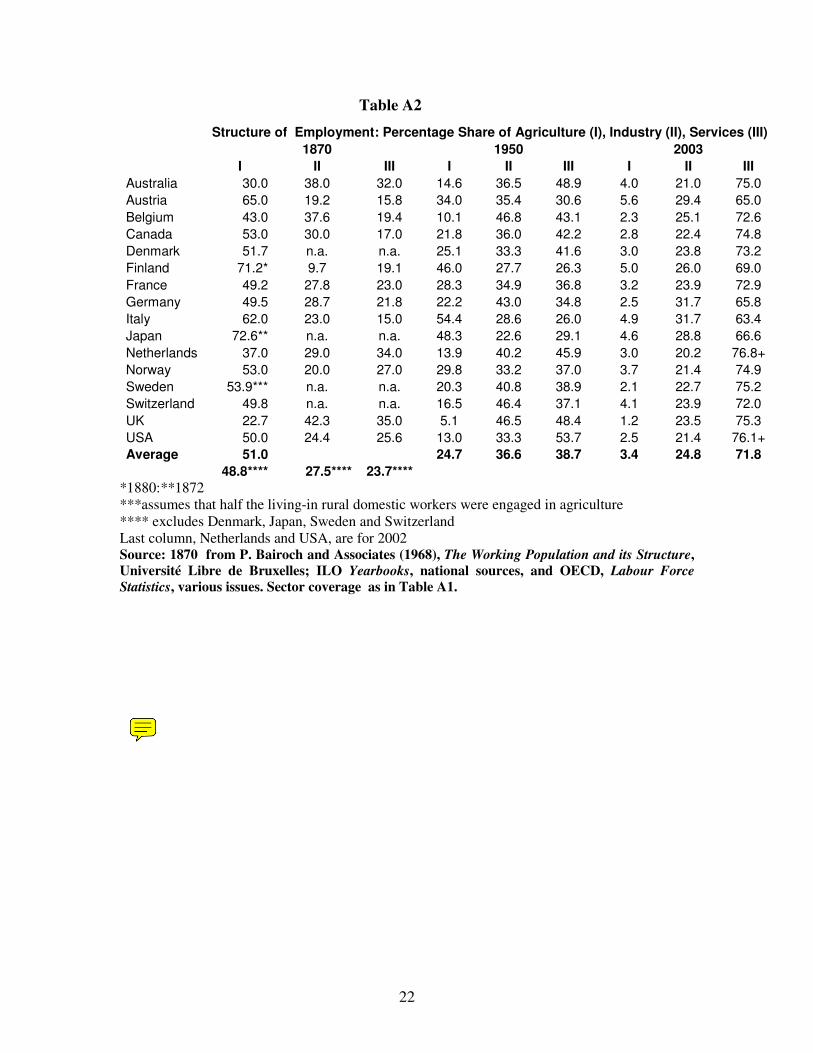
Table A2
Structure of Employment: Percentage Share of Agriculture (I), Industry (II), Services (III)
1870 1950 2003
I II III I II III I II III
Australia 30.0 38.0 32.0 14.6 36.5 48.9 4.0 21.0 75.0
Austria 65.0 19.2 15.8 34.0 35.4 30.6 5.6 29.4 65.0
Belgium 43.0 37.6 19.4 10.1 46.8 43.1 2.3 25.1 72.6
Canada 53.0 30.0 17.0 21.8 36.0 42.2 2.8 22.4 74.8
Denmark 51.7 n.a. n.a. 25.1 33.3 41.6 3.0 23.8 73.2
Finland 71.2* 9.7 19.1 46.0 27.7 26.3 5.0 26.0 69.0
France 49.2 27.8 23.0 28.3 34.9 36.8 3.2 23.9 72.9
Germany 49.5 28.7 21.8 22.2 43.0 34.8 2.5 31.7 65.8
Italy 62.0 23.0 15.0 54.4 28.6 26.0 4.9 31.7 63.4
Japan 72.6** n.a. n.a. 48.3 22.6 29.1 4.6 28.8 66.6
Netherlands 37.0 29.0 34.0 13.9 40.2 45.9 3.0 20.2 76.8+
Norway 53.0 20.0 27.0 29.8 33.2 37.0 3.7 21.4 74.9
Sweden 53.9*** n.a. n.a. 20.3 40.8 38.9 2.1 22.7 75.2
Switzerland 49.8 n.a. n.a. 16.5 46.4 37.1 4.1 23.9 72.0
UK 22.7 42.3 35.0 5.1 46.5 48.4 1.2 23.5 75.3
USA 50.0 24.4 25.6 13.0 33.3 53.7 2.5 21.4 76.1+
Average 51.0 24.7 36.6 38.7 3.4 24.8 71.8
48.8**** 27.5**** 23.7****
*1880:**1872 ***assumes that half the living-in rural domestic workers were engaged in agriculture **** excludes Denmark, Japan, Sweden and Switzerland Last column, Netherlands and USA, are for 2002 Source: 1870 from P. Bairoch and Associates (1968), The Working Population and its Structure, Université Libre de Bruxelles; ILO Yearbooks, national sources, and OECD, Labour Force
Statistics, various issues. Sector coverage as in Table A1.