Embed Size (px)
Citation preview
GOVERNMENT OF SAINT LUCIA
ANNUAL AGRICULTURAL
STATISTICAL DIGEST 2005
MINISTRY OF AGRICULTURE, FORESTRY AND FISHERIES
AAD. Vol. Number 23
FOREWORD Foreword The Agricultural Statistical Digest, a publication of the Statistics Unit of the Ministry of Agriculture, Forestry and Fisheries, is designed to provide information on the agriculture and fishing sectors in St. Lucia. This edition presents data specifically for the period January to December 2005, and it also includes data for the historical period from 2001 – 2004. The Statistics Unit would like to take this opportunity to thank all those who so willingly supplied the data within the Digest. We would also like to extend our gratitude to those who assisted by providing suggestions or criticisms regarding the improvement of this digest and/or future publications. This Ministry would also like to inform readers that the Agricultural Statistical Digest is posted on the Ministry of Agriculture, Forestry and Fisheries’ website at http://www.slumaffe.org .
ii
CONTENTS Contents FOREWORD TABLES I – 1 Gross Domestic Product at Factor Cost 1 Constant Prices, 2001 – 2005 I – 2 Total Domestic and Agricultural Exports, 2001 – 2005 3 II – 1 Banana Exports by Quantity and Value for the Windward 4 Islands, 2001 – 2005 II – 2 Banana Exports by Banana Companies, 2001 - 2005 5 II – 3 Price Range of Banana Inputs, 2005 6 II – 4 Fertilizer Imports by Type, Quantity and Value, 2001 – 2005 7 III – 1 Purchases and Exports of Cocoa Beans, 2001 – 2005 8 IV – 1 Copra Purchases, 2001 – 2005 9 IV – 2 Exports of Copra Products by Quantity and Value, 2001 – 2005 10 V – 1 Quantity of Selected Agricultural Produce Purchased by 11 Selected Marketing Outlets, 2005 V – 2 Quantity of Selected Agricultural Produce Purchased by 13 Selected Marketing Outlets, 2001 – 2005 V – 3 Prices of Selected Agricultural Produce Purchased by 15
Selected Marketing Outlets - 2005 V – 4 Quantity of Selected Agricultural Produce Purchased by 19 Selected Hotels, 2005 V – 5 Quantity of Selected Agricultural Produce Purchased by 21 Selected Hotels, 2001 – 2005 V – 6 Prices of Selected Agricultural Produce Purchased by 23
Selected Hotels – 2005 VI – 1 Estimated Quantity of Fish Landed at Landing Sites, 2001 – 2005 27
iii
CONTENTS Contents TABLES VI – 2 Fish Landings by Species and Quantity, 2001 – 2005 27 VI – 3 Fish Imports by Type, Quantity and Cost, 2001 – 2005 28 VII – 1 Milk Production, 2001 – 2005 30 VII – 2 Estimated Livestock Slaughtered, 2001 – 2005 31 VII – 3 Table Egg Production and Imports, 2001 – 2005 32 VII – 4 Poultry Imports by Species, Quantity and Value, 2001 – 2005 34 VII – 5 Local Poultry (Chicken) Production, 2001 – 2005 35 VII – 6 Meat Imports by Type, Quantity and Cost, 2001 – 2005 36 VII – 7 Local Pork Production, 2001 – 2005 37 VII – 8 Imports of Selected Livestock Products, 2001 – 2005 38 VII – 9 Imports of Feed by Type, Quantity and Cost, 2001 – 2005 38 VIII – 1 Number, Value and Percentage of Agricultural and Fishing Loans Type of Credit Scheme 39 VIII – 2 Loans Approved for Agricultural and Fishing Activities, 40 IX – 1 Trade Balance on Food, 2001 – 2005 42 IX – 2 Composition of Food Imports, 2001 – 2005 43 IX – 3 Exports of Selected Agricultural Produce, 2005 44 IX – 4 Exports of Selected Agricultural Produce, 2001 – 2005 45 IX – 5 Imports of Selected Agricultural Produce, 2005 46
IX – 6 Imports of Selected Agricultural Produce, 2001 – 2005 47 IX – 7 Regional Exports of Food Products by Destination, 2005 49 IX – 8 Regional Imports of Food Products by Country, 2005 50
iv
CONTENTS Contents FIGURES I – 1 Three Major Sectors’ Contribution to GDP, 2001 – 2005 2 I – 2 Domestic, Agricultural and Banana Exports, 2001 – 2005 3 II – 1 Banana Exports and Price Structure, 2001 – 2005 4 III – 1 Cocoa Bean Exports, 2001 – 2005 8 IV – 1 Copra Purchases (by principal purchaser), 2001 – 2005 9 V – 1 Purchases of Fresh Agricultural Commodities by Leading Marketing 17
Outlets V – 2 Purchases of Selected Vegetables by Leading Marketing Outlets 17 V – 3 Purchases of Selected Food Crops by Leading Marketing Outlets 18 V – 4 Purchases of Fresh Agricultural Commodities by Selected Hotels 25 V – 5 Purchases of Selected Vegetables by Selected Hotels 25 V – 6 Purchases of Selected Food Crops by Selected Hotels 26 VI - 1 Fish Landings and Imports, 2001 – 2005 29 VII – 1 Milk Production, 2001 – 2005 31 VII – 2 Table Egg Production, 2001 - 2005 33 VII – 3 Meat Imports, 2001 - 2005 36 VII – 4 Local Pork Production, 2001 - 2005 37 VIII – 1 Number of Agricultural Loans Disbursed by Type of Activity, 41 2001 – 2005 VIII – 2 Value of Agricultural Loans Disbursed by Type of Activity, 41 2001 – 2005 IX – 1 Food Exports and Imports, 2001 – 2005 42 IX – 2 Imports of Selected Vegetables, 2001 - 2005 48
v
CONTENTS Contents APPENDICES: A. Agricultural Gross Domestic Product by Economic Activity, 2001 – 2005 52 B1. Fishing Vessel Registration, 2005 53 B2. Fisher Registration by District, 2005 54 B3. Fisher Registration, 2001 – 2005 55 C1. Rainfall Data (mm) from Observation Stations, 2005 56 C2. Rainfall Data (mm) from Observation Stations, 2001 – 2005 57 C3. Average Monthly Minimum and Maximum Temperatures, 2001 – 2005 58 C4. Temperature, Relative Humidity, Wind and Evaporation, 2001 – 2005 59 C5. Annual Temperature Range, 2001 – 2005 60
vi
EXPLANATORY NOTES Explanatory Notes The Agricultural Statistical Unit advises its readers to refer to the following notes before reviewing the tables. The notes are intended to offer clarity to the data as well as to acquaint readers with its sources. THE BANANA INDUSTRY The figures published for banana production represent the total quantity of bananas purchased by the St. Lucia Banana Corporation (SLBC) from banana producers. However, since the privatization of the banana industry, the data is now being sourced from the Windward Island Banana Development Exporting Company Ltd. (WIBDECO). The quantities of bananas purchased account for an estimated 90-95% of the island’s total production, and are exclusively for exports mainly to the United Kingdom. Variations between the purchase and export figures are due to rejected fruit. THE COCOA INDUSTRY Data on cocoa beans are collected from the sole exporter of the crop – the St. Lucia Agriculturists’ Association (SLAA). The SLAA also supplies cocoa beans to local private individuals for domestic and commercial purposes from time to time. Purchases of cocoa beans by SLAA represent an estimated 90% of the island’s cocoa bean production. Cocoa bean exports are mainly to Europe—particularly to the United Kingdom—and the United States of America. THE COCONUT INDUSTRY Copra is produced from an estimated 85% of the island’s total production of coconut and is purchased in bulk solely by the St. Lucia Coconut Growers Association (SLCGA). The SLCGA purchased the assets of the Copra Manufacturers Limited (CML). The SLCGA normally purchases all of the island’s copra production for domestic use, and therefore, copra is not exported. However, coconuts are exported in the green (water nuts) and dried forms. The early 1990’s have witnessed an increasing demand for water nuts. THE NON-TRADITIONAL CROP SECTOR Presently, data concerning the quantities and prices of domestic agricultural produce are obtained from St. Lucia Marketing Board (SLMB) and leading supermarkets on a regular basis. The produce price is the price the farmer/producer is paid for his or her crop at the various market outlets.
vii
EXPLANATORY NOTES Explanatory Notes THE FISHING INDUSTRY These figures represent the estimated total amount of fish landed at the various fishing districts/landing sites. Fish landings are monitored daily at the various fishing districts by the Department of Fisheries of the Ministry of Agriculture Forestry and Fisheries. The fishing season extends from January to June, and there are approximately seven hundred (700) registered fishing vessels on the island . An ongoing programme has been established for boat registration with the Fisheries Co-operatives. This is done on a voluntary basis by fishermen as is a prerequisite for receiving duty-free concessions such as rebate on fuel. THE LIVESTOCK SECTOR Table egg production data is sourced from an estimated 100 poultry farms island wide and are monitored on a monthly basis by the Livestock Division of the Ministry of Agriculture, Forestry and Fisheries. The table egg production data do es not include figures for backyard production or subsistence farming. AGRICULTURAL FINANCING These figures are obtained from the Bank of St. Lucia (BOSL), formerly the National Commercial Bank of Saint Lucia. They relate to the number of loan applications that the BOSL has approved during each respective year, and the funding of these loans is facilitated by the Caribbean Development Bank (CDB). It should be noted that not all the funds were disbursed by the BOSL in the same year that the loans were approved. THE TRADE BALANCE ON FOOD The data in this section illustrates agricultural trade in non-traditional crops as well as fresh produce. Also presented in this section is the trade balance on food.
viii
EXPLANATORY NOTES Explanatory Notes NOTES 1. Symbols used in this digest:
… - Nil or Negligible n.a./(-) - Not available R - Revised
P - Provisional 2. The figures in most tables are rounded off to the nearest final digit. The sum of those
rounded off figures may not always agree exactly with the rounded off totals shown in the tables.
3. All monetary values are in Eastern Caribbean dollars (EC$)
US $1.00 is equivalent to EC$2.71 4. All trade data (i.e. imports and exports) for 2005 are provisional.
1
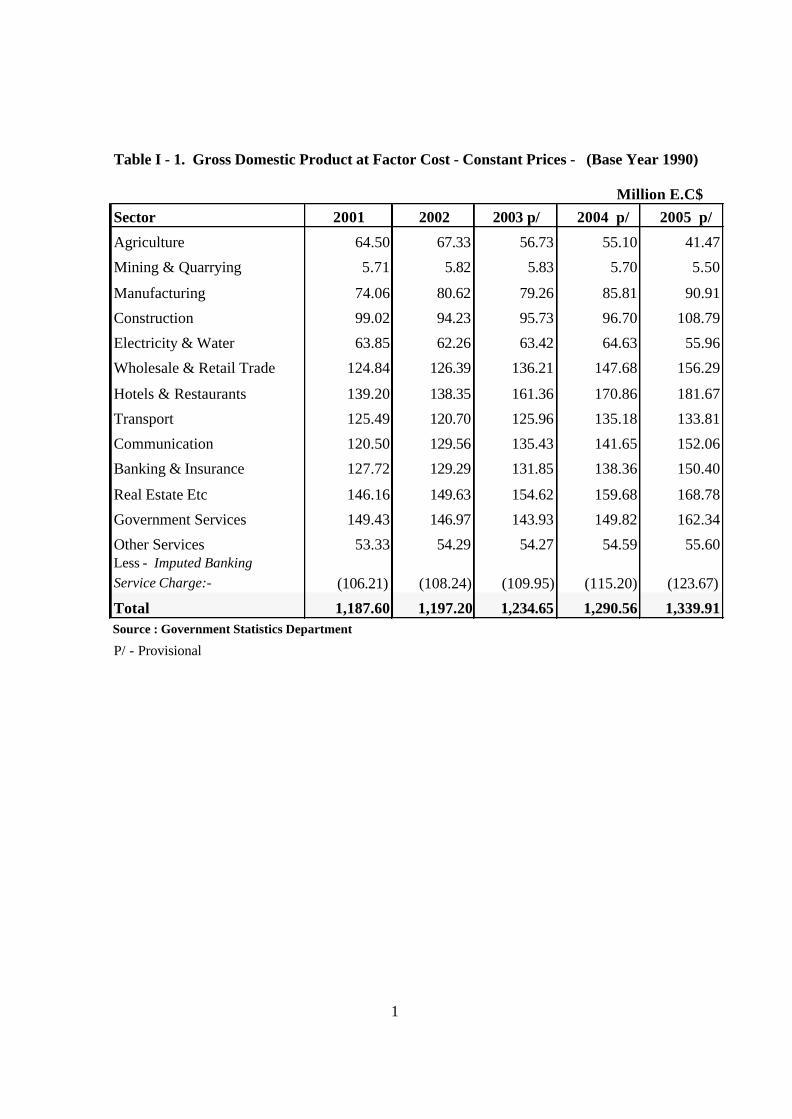
Million E.C$Sector 2001 2002 2003 p/ 2004 p/ 2005 p/
Agriculture 64.50 67.33 56.73 55.10 41.47
Mining & Quarrying 5.71 5.82 5.83 5.70 5.50
Manufacturing 74.06 80.62 79.26 85.81 90.91
Construction 99.02 94.23 95.73 96.70 108.79
Electricity & Water 63.85 62.26 63.42 64.63 55.96
Wholesale & Retail Trade 124.84 126.39 136.21 147.68 156.29
Hotels & Restaurants 139.20 138.35 161.36 170.86 181.67
Transport 125.49 120.70 125.96 135.18 133.81
Communication 120.50 129.56 135.43 141.65 152.06
Banking & Insurance 127.72 129.29 131.85 138.36 150.40
Real Estate Etc 146.16 149.63 154.62 159.68 168.78
Government Services 149.43 146.97 143.93 149.82 162.34
Other Services 53.33 54.29 54.27 54.59 55.60Less - Imputed BankingService Charge:- (106.21) (108.24) (109.95) (115.20) (123.67)
Total 1,187.60 1,197.20 1,234.65 1,290.56 1,339.91Source : Government Statistics Department
P/ - Provisional
Table I - 1. Gross Domestic Product at Factor Cost - Constant Prices - (Base Year 1990)
2
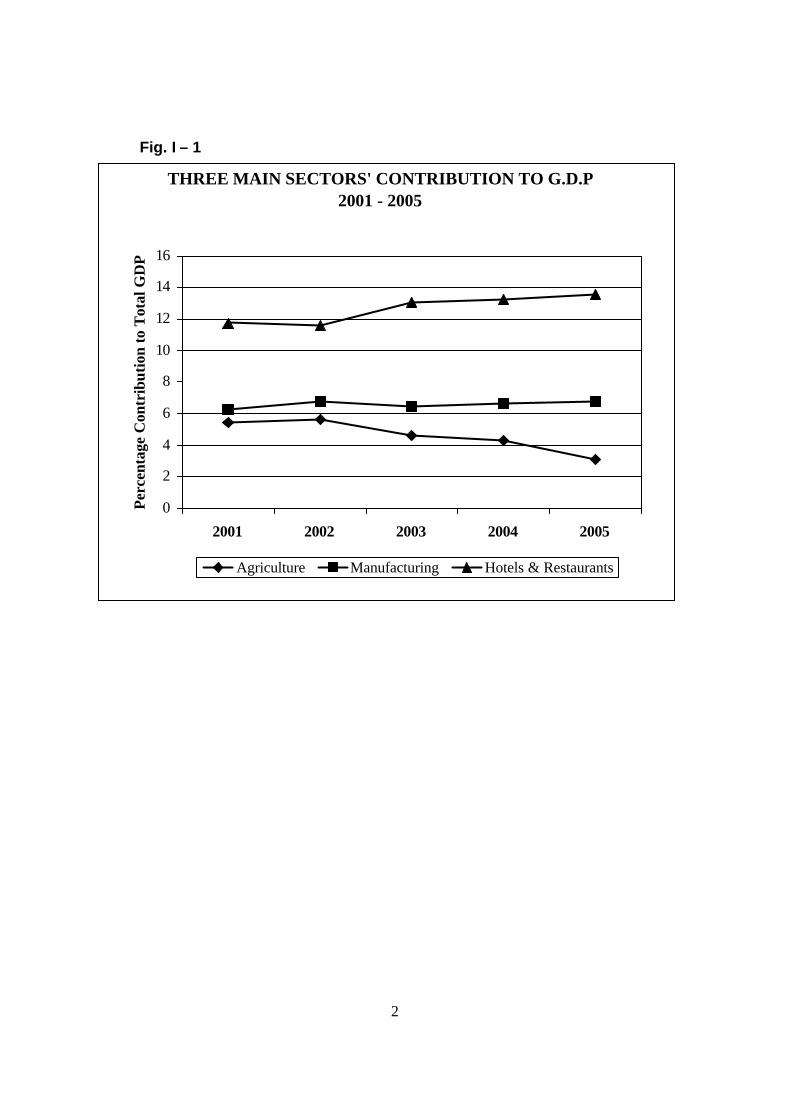
Fig. I – 1
THREE MAIN SECTORS' CONTRIBUTION TO G.D.P 2001 - 2005
0
2
4
6
8
10
12
14
16
2001 2002 2003 2004 2005
Per
cent
age
Con
trib
utio
n to
Tot
al G
DP
Agriculture Manufacturing Hotels & Restaurants
3
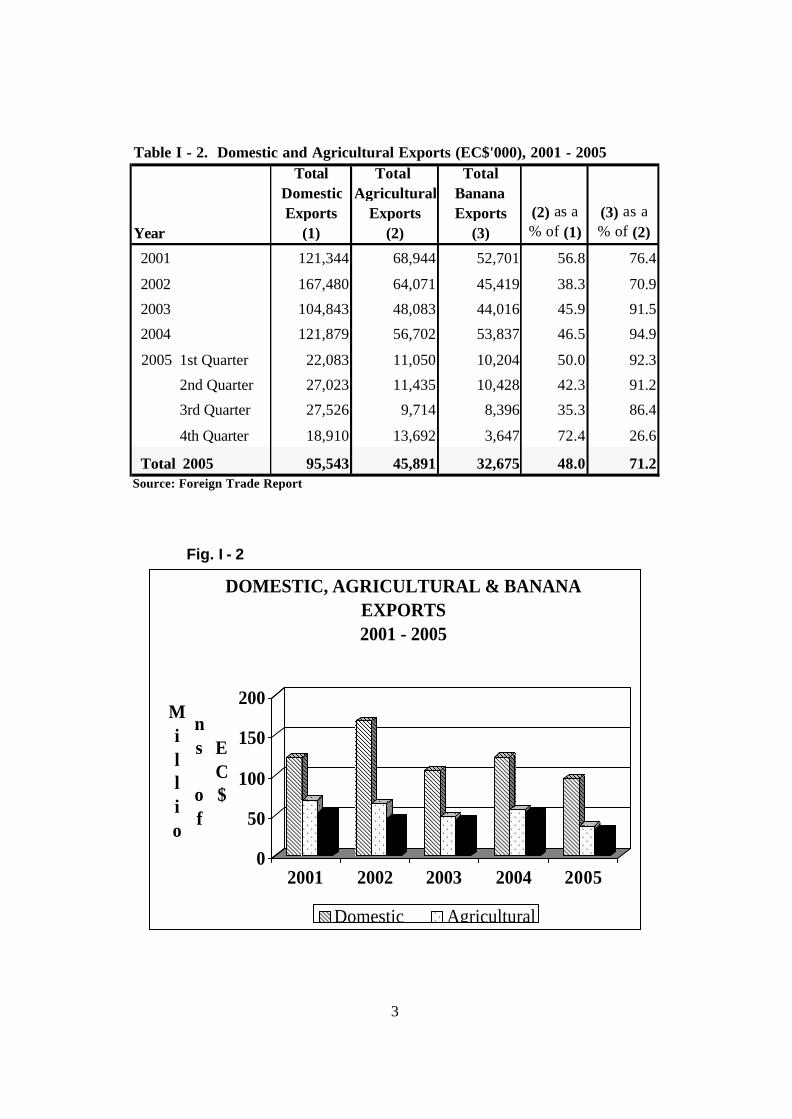
Total Total TotalDomestic Agricultural BananaExports Exports Exports (2) as a (3) as a
Year (1) (2) (3) % of (1) % of (2)
2001 121,344 68,944 52,701 56.8 76.4
2002 167,480 64,071 45,419 38.3 70.9
2003 104,843 48,083 44,016 45.9 91.5
2004 121,879 56,702 53,837 46.5 94.9
2005 1st Quarter 22,083 11,050 10,204 50.0 92.3
2nd Quarter 27,023 11,435 10,428 42.3 91.2
3rd Quarter 27,526 9,714 8,396 35.3 86.4
4th Quarter 18,910 13,692 3,647 72.4 26.6
Total 2005 95,543 45,891 32,675 48.0 71.2Source: Foreign Trade Report
Table I - 2. Domestic and Agricultural Exports (EC$'000), 2001 - 2005
Fig. I - 2
0
50
100
150
200Millio
ns of
EC$
2001 2002 2003 2004 2005
DOMESTIC, AGRICULTURAL & BANANA EXPORTS2001 - 2005
Domestic AgriculturalBanana
4
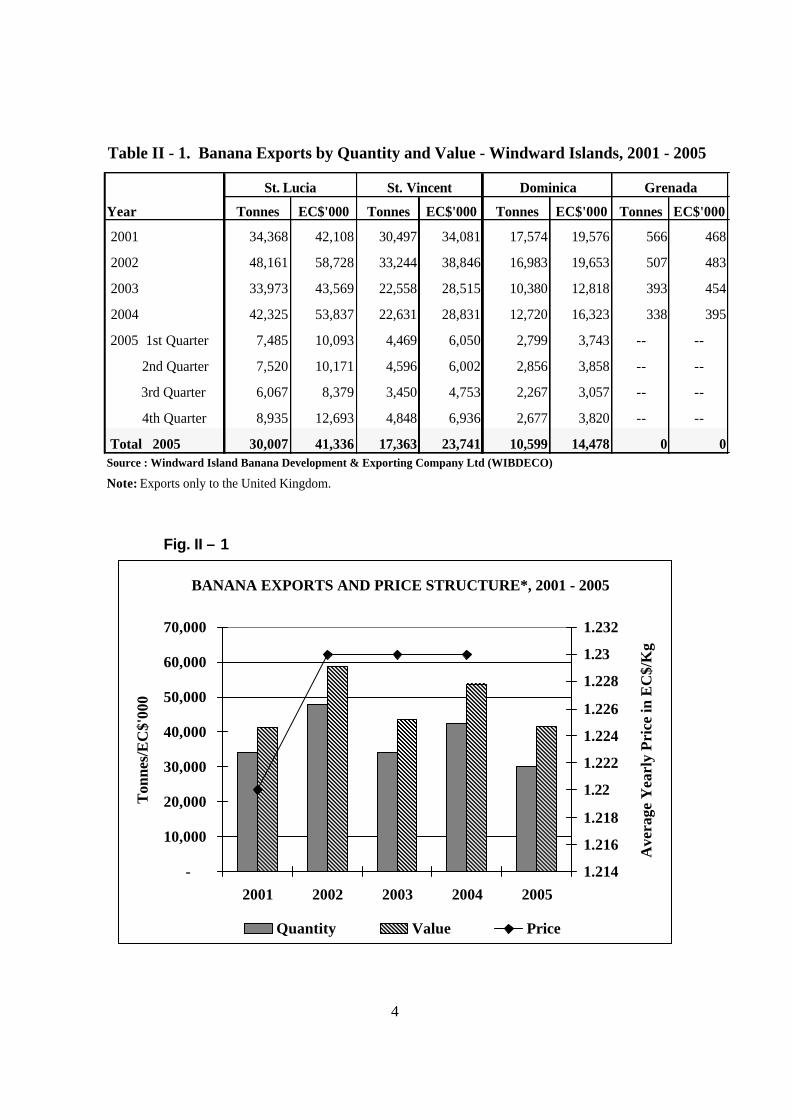
St. Lucia St. Vincent Dominica Grenada
Year Tonnes EC$'000 Tonnes EC$'000 Tonnes EC$'000 Tonnes EC$'000
2001 34,368 42,108 30,497 34,081 17,574 19,576 566 468
2002 48,161 58,728 33,244 38,846 16,983 19,653 507 483
2003 33,973 43,569 22,558 28,515 10,380 12,818 393 454
2004 42,325 53,837 22,631 28,831 12,720 16,323 338 395
2005 1st Quarter 7,485 10,093 4,469 6,050 2,799 3,743 -- --
2nd Quarter 7,520 10,171 4,596 6,002 2,856 3,858 -- --
3rd Quarter 6,067 8,379 3,450 4,753 2,267 3,057 -- --
4th Quarter 8,935 12,693 4,848 6,936 2,677 3,820 -- --
Total 2005 30,007 41,336 17,363 23,741 10,599 14,478 0 0Source : Windward Island Banana Development & Exporting Company Ltd (WIBDECO)
Note: Exports only to the United Kingdom.
Table II - 1. Banana Exports by Quantity and Value - Windward Islands, 2001 - 2005
Fig. II – 1
BANANA EXPORTS AND PRICE STRUCTURE*, 2001 - 2005
-
10,000
20,000
30,000
40,000
50,000
60,000
70,000
2001 2002 2003 2004 2005
Ton
nes/
EC
$'00
0
1.214
1.216
1.218
1.22
1.222
1.224
1.226
1.228
1.23
1.232A
vera
ge Y
earl
y P
rice
in E
C$/
Kg
Quantity Value Price
5
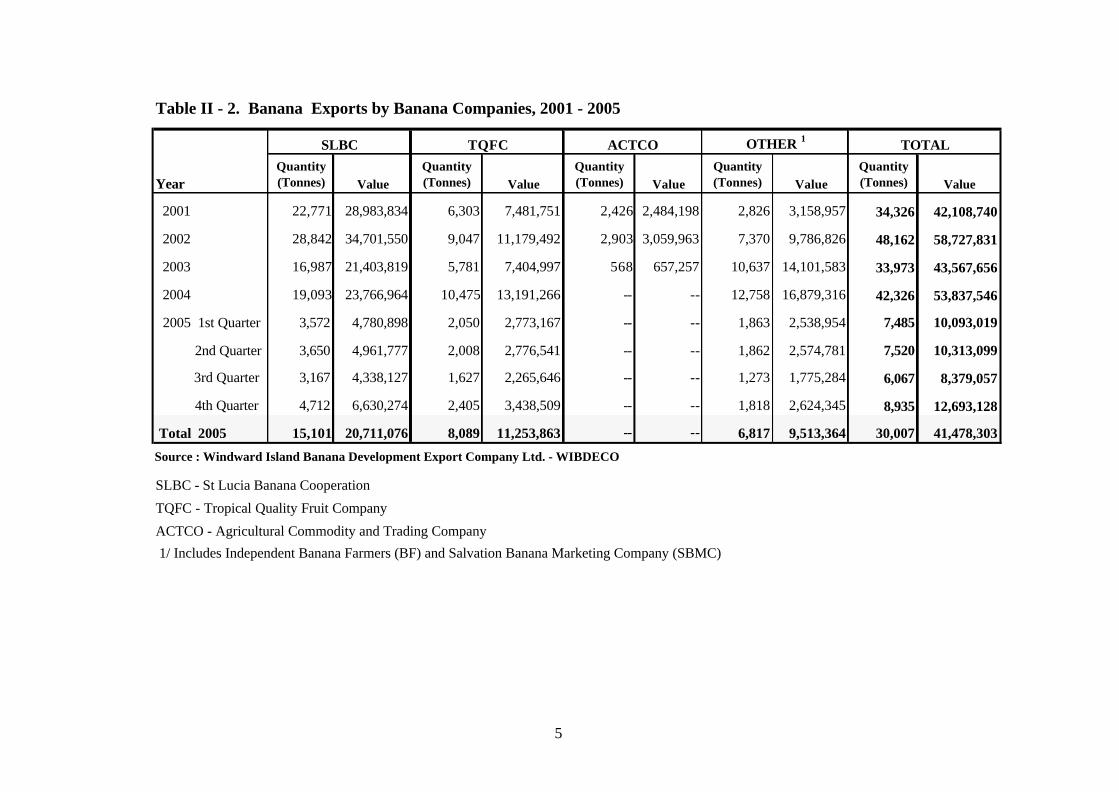
SLBC TQFC ACTCO OTHER 1 TOTAL
YearQuantity (Tonnes) Value
Quantity (Tonnes) Value
Quantity (Tonnes) Value
Quantity (Tonnes) Value
Quantity (Tonnes) Value
2001 22,771 28,983,834 6,303 7,481,751 2,426 2,484,198 2,826 3,158,957 34,326 42,108,740
2002 28,842 34,701,550 9,047 11,179,492 2,903 3,059,963 7,370 9,786,826 48,162 58,727,831
2003 16,987 21,403,819 5,781 7,404,997 568 657,257 10,637 14,101,583 33,973 43,567,656
2004 19,093 23,766,964 10,475 13,191,266 -- -- 12,758 16,879,316 42,326 53,837,546
2005 1st Quarter 3,572 4,780,898 2,050 2,773,167 -- -- 1,863 2,538,954 7,485 10,093,019
2nd Quarter 3,650 4,961,777 2,008 2,776,541 -- -- 1,862 2,574,781 7,520 10,313,099
3rd Quarter 3,167 4,338,127 1,627 2,265,646 -- -- 1,273 1,775,284 6,067 8,379,057
4th Quarter 4,712 6,630,274 2,405 3,438,509 -- -- 1,818 2,624,345 8,935 12,693,128
Total 2005 15,101 20,711,076 8,089 11,253,863 -- -- 6,817 9,513,364 30,007 41,478,303
SLBC - St Lucia Banana Cooperation
TQFC - Tropical Quality Fruit Company
ACTCO - Agricultural Commodity and Trading Company
1/ Includes Independent Banana Farmers (BF) and Salvation Banana Marketing Company (SBMC)
Table II - 2. Banana Exports by Banana Companies, 2001 - 2005
Source : Windward Island Banana Development Export Company Ltd. - WIBDECO
6
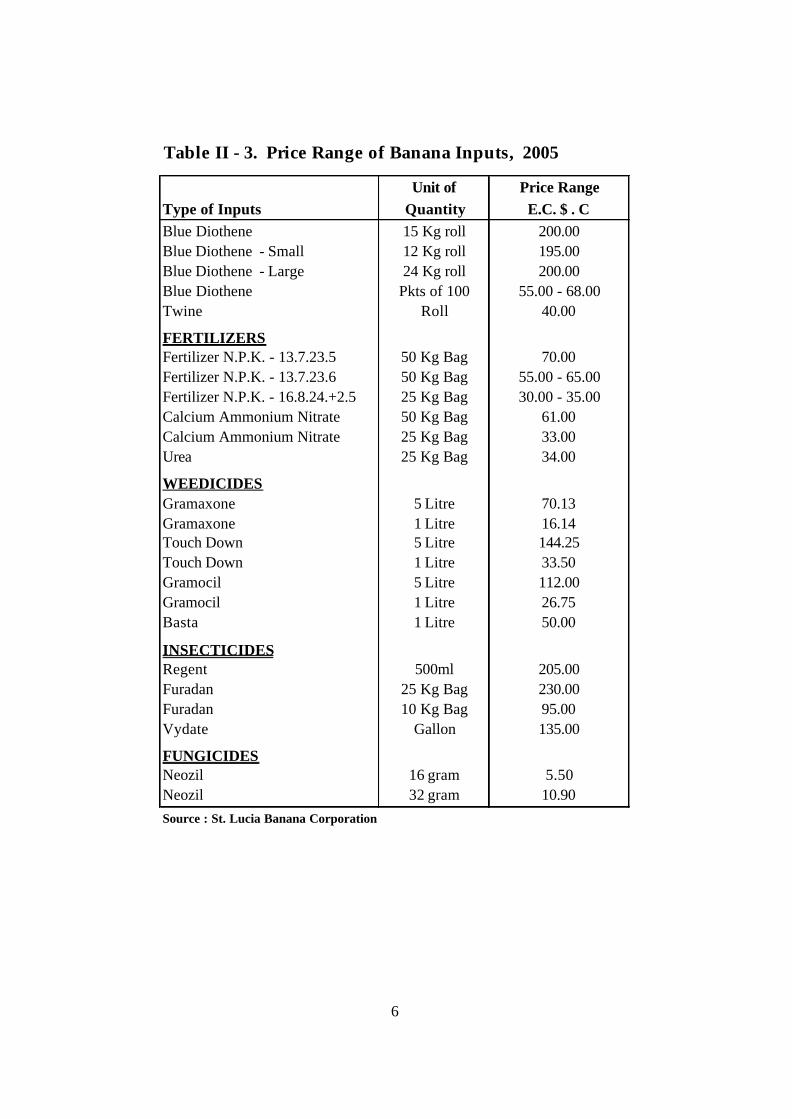
Unit of Price RangeType of Inputs Quantity E.C. $ . CBlue Diothene 15 Kg roll 200.00Blue Diothene - Small 12 Kg roll 195.00Blue Diothene - Large 24 Kg roll 200.00Blue Diothene Pkts of 100 55.00 - 68.00Twine Roll 40.00
FERTILIZERSFertilizer N.P.K. - 13.7.23.5 50 Kg Bag 70.00Fertilizer N.P.K. - 13.7.23.6 50 Kg Bag 55.00 - 65.00Fertilizer N.P.K. - 16.8.24.+2.5 25 Kg Bag 30.00 - 35.00Calcium Ammonium Nitrate 50 Kg Bag 61.00Calcium Ammonium Nitrate 25 Kg Bag 33.00Urea 25 Kg Bag 34.00
WEEDICIDESGramaxone 5 Litre 70.13Gramaxone 1 Litre 16.14Touch Down 5 Litre 144.25Touch Down 1 Litre 33.50Gramocil 5 Litre 112.00Gramocil 1 Litre 26.75Basta 1 Litre 50.00
INSECTICIDESRegent 500ml 205.00Furadan 25 Kg Bag 230.00Furadan 10 Kg Bag 95.00Vydate Gallon 135.00
FUNGICIDESNeozil 16 gram 5.50Neozil 32 gram 10.90Source : St. Lucia Banana Corporation
Table II - 3. Price Range of Banana Inputs, 2005
7
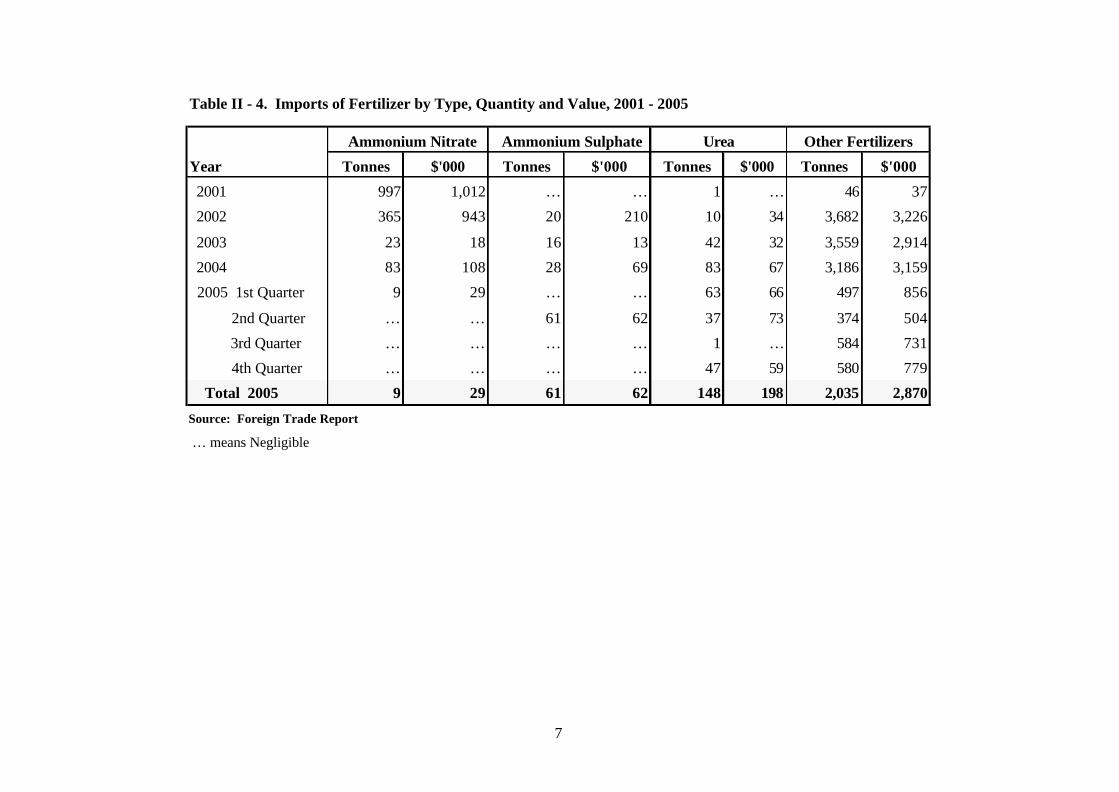
Year Tonnes $'000 Tonnes $'000 Tonnes $'000 Tonnes $'000
2001 997 1,012 … … 1 … 46 37
2002 365 943 20 210 10 34 3,682 3,226
2003 23 18 16 13 42 32 3,559 2,914
2004 83 108 28 69 83 67 3,186 3,159
2005 1st Quarter 9 29 … … 63 66 497 856
2nd Quarter … … 61 62 37 73 374 504
3rd Quarter … … … … 1 … 584 731
4th Quarter … … … … 47 59 580 779
Total 2005 9 29 61 62 148 198 2,035 2,870
Source: Foreign Trade Report
… means Negligible
Table II - 4. Imports of Fertilizer by Type, Quantity and Value, 2001 - 2005
Ammonium Sulphate Urea Other Fertilizers Ammonium Nitrate
8
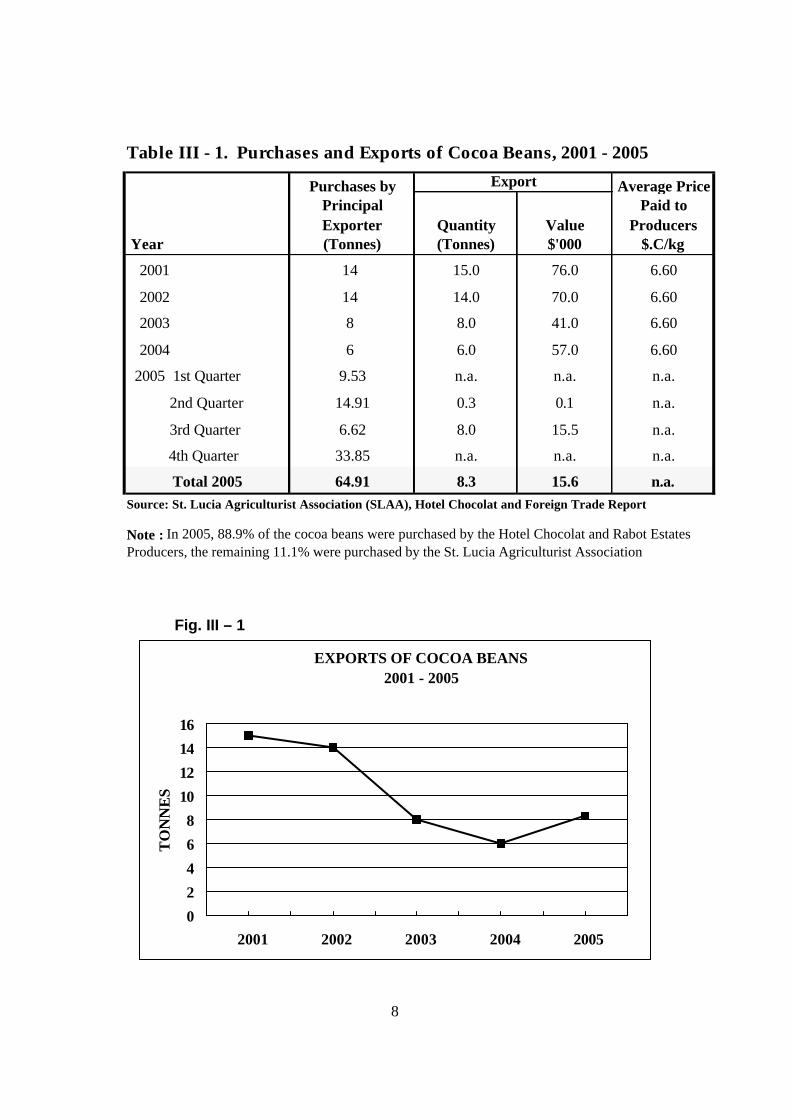
Year
2001 14 15.0 76.0 6.60
2002 14 14.0 70.0 6.60
2003 8 8.0 41.0 6.60
2004 6 6.0 57.0 6.60
2005 1st Quarter 9.53 n.a. n.a. n.a.
2nd Quarter 14.91 0.3 0.1 n.a.
3rd Quarter 6.62 8.0 15.5 n.a.
4th Quarter 33.85 n.a. n.a. n.a.
Total 2005 64.91 8.3 15.6 n.a.Source: St. Lucia Agriculturist Association (SLAA), Hotel Chocolat and Foreign Trade Report
Table III - 1. Purchases and Exports of Cocoa Beans, 2001 - 2005
Note : In 2005, 88.9% of the cocoa beans were purchased by the Hotel Chocolat and Rabot Estates Producers, the remaining 11.1% were purchased by the St. Lucia Agriculturist Association
Purchases by Principal Exporter (Tonnes)
Export Average Price Paid to
Producers $.C/kg
Quantity (Tonnes)
Value $'000
Fig. III – 1
EXPORTS OF COCOA BEANS2001 - 2005
0
2
4
6
8
10
12
14
16
2001 2002 2003 2004 2005
TO
NN
ES
9
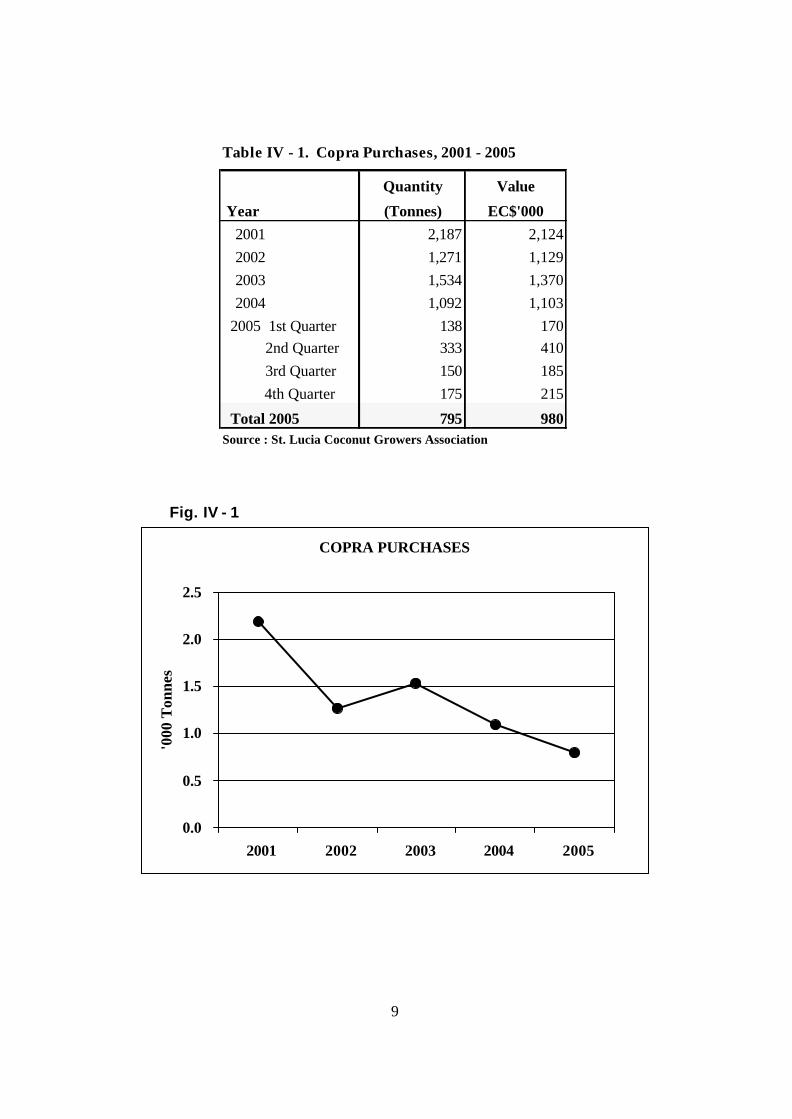
Table IV - 1. Copra Purchases, 2001 - 2005
Quantity Value
Year (Tonnes) EC$'0002001 2,187 2,1242002 1,271 1,1292003 1,534 1,370
2004 1,092 1,103 2005 1st Quarter 138 170 2nd Quarter 333 410 3rd Quarter 150 185 4th Quarter 175 215
Total 2005 795 980Source : St. Lucia Coconut Growers Association
Fig. IV - 1
COPRA PURCHASES
0.0
0.5
1.0
1.5
2.0
2.5
2001 2002 2003 2004 2005
'000
Ton
nes
10
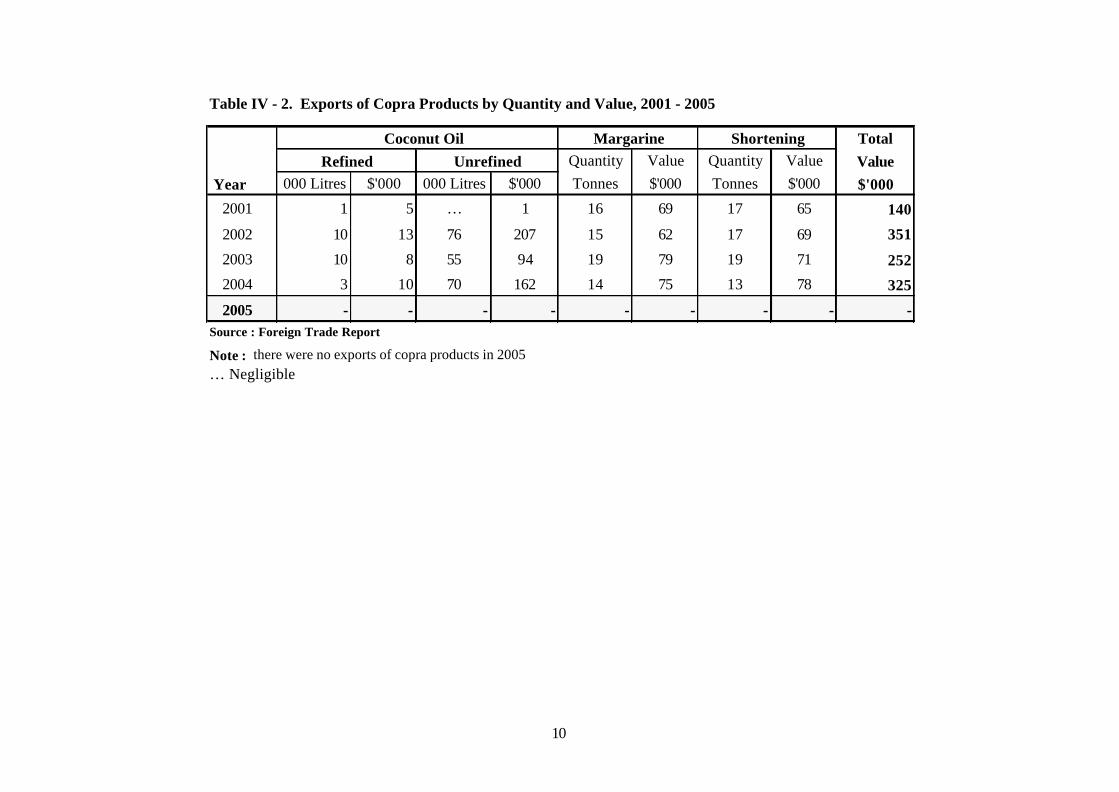
TotalQuantity Value Quantity Value Value
Year 000 Litres $'000 000 Litres $'000 Tonnes $'000 Tonnes $'000 $'000
2001 1 5 … 1 16 69 17 65 140
2002 10 13 76 207 15 62 17 69 351
2003 10 8 55 94 19 79 19 71 252
2004 3 10 70 162 14 75 13 78 325
2005 - - - - - - - - -Source : Foreign Trade Report
Note : there were no exports of copra products in 2005… Negligible
Table IV - 2. Exports of Copra Products by Quantity and Value, 2001 - 2005
ShorteningRefined Unrefined
Coconut Oil Margarine
11
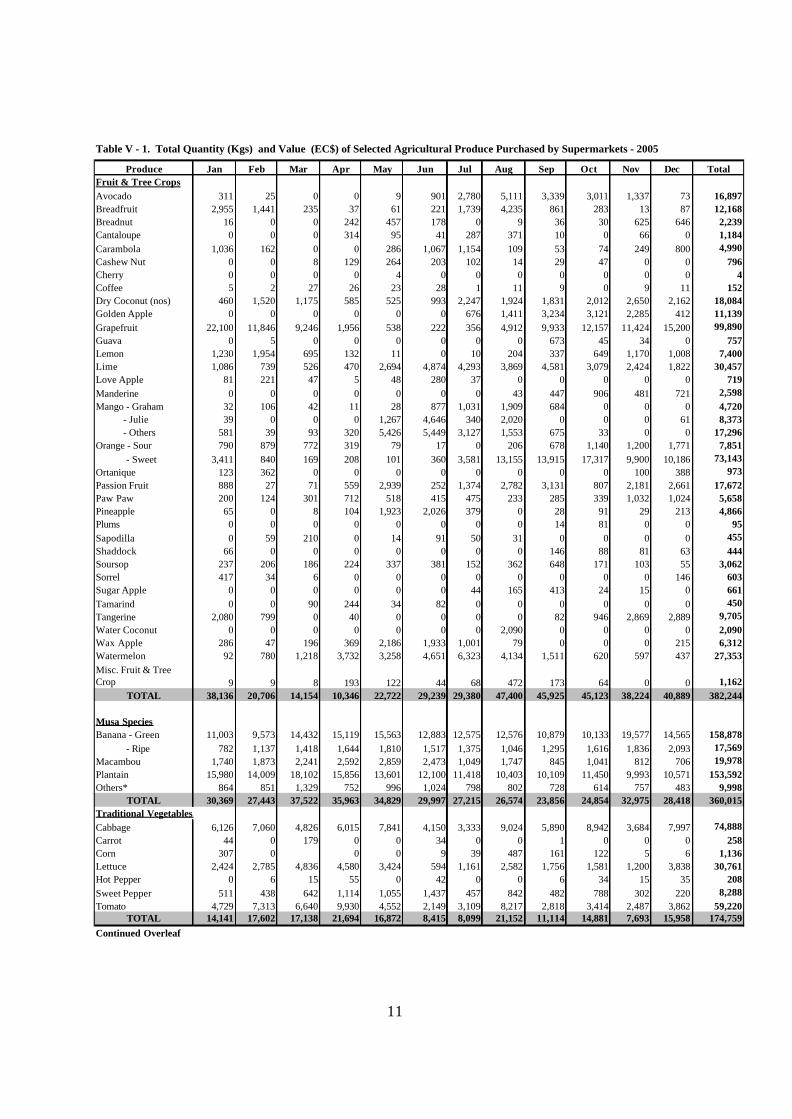
Produce Jan Feb Mar Apr May Jun Jul Aug Sep Oct Nov Dec TotalFruit & Tree Crops Avocado 311 25 0 0 9 901 2,780 5,111 3,339 3,011 1,337 73 16,897Breadfruit 2,955 1,441 235 37 61 221 1,739 4,235 861 283 13 87 12,168Breadnut 16 0 0 242 457 178 0 9 36 30 625 646 2,239Cantaloupe 0 0 0 314 95 41 287 371 10 0 66 0 1,184Carambola 1,036 162 0 0 286 1,067 1,154 109 53 74 249 800 4,990Cashew Nut 0 0 8 129 264 203 102 14 29 47 0 0 796Cherry 0 0 0 0 4 0 0 0 0 0 0 0 4Coffee 5 2 27 26 23 28 1 11 9 0 9 11 152Dry Coconut (nos) 460 1,520 1,175 585 525 993 2,247 1,924 1,831 2,012 2,650 2,162 18,084Golden Apple 0 0 0 0 0 0 676 1,411 3,234 3,121 2,285 412 11,139Grapefruit 22,100 11,846 9,246 1,956 538 222 356 4,912 9,933 12,157 11,424 15,200 99,890Guava 0 5 0 0 0 0 0 0 673 45 34 0 757Lemon 1,230 1,954 695 132 11 0 10 204 337 649 1,170 1,008 7,400Lime 1,086 739 526 470 2,694 4,874 4,293 3,869 4,581 3,079 2,424 1,822 30,457Love Apple 81 221 47 5 48 280 37 0 0 0 0 0 719Manderine 0 0 0 0 0 0 0 43 447 906 481 721 2,598Mango - Graham 32 106 42 11 28 877 1,031 1,909 684 0 0 0 4,720 - Julie 39 0 0 0 1,267 4,646 340 2,020 0 0 0 61 8,373 - Others 581 39 93 320 5,426 5,449 3,127 1,553 675 33 0 0 17,296Orange - Sour 790 879 772 319 79 17 0 206 678 1,140 1,200 1,771 7,851 - Sweet 3,411 840 169 208 101 360 3,581 13,155 13,915 17,317 9,900 10,186 73,143Ortanique 123 362 0 0 0 0 0 0 0 0 100 388 973Passion Fruit 888 27 71 559 2,939 252 1,374 2,782 3,131 807 2,181 2,661 17,672Paw Paw 200 124 301 712 518 415 475 233 285 339 1,032 1,024 5,658Pineapple 65 0 8 104 1,923 2,026 379 0 28 91 29 213 4,866Plums 0 0 0 0 0 0 0 0 14 81 0 0 95Sapodilla 0 59 210 0 14 91 50 31 0 0 0 0 455Shaddock 66 0 0 0 0 0 0 0 146 88 81 63 444Soursop 237 206 186 224 337 381 152 362 648 171 103 55 3,062Sorrel 417 34 6 0 0 0 0 0 0 0 0 146 603Sugar Apple 0 0 0 0 0 0 44 165 413 24 15 0 661Tamarind 0 0 90 244 34 82 0 0 0 0 0 0 450Tangerine 2,080 799 0 40 0 0 0 0 82 946 2,869 2,889 9,705Water Coconut 0 0 0 0 0 0 0 2,090 0 0 0 0 2,090Wax Apple 286 47 196 369 2,186 1,933 1,001 79 0 0 0 215 6,312Watermelon 92 780 1,218 3,732 3,258 4,651 6,323 4,134 1,511 620 597 437 27,353Misc. Fruit & Tree Crop 9 9 8 193 122 44 68 472 173 64 0 0 1,162
TOTAL 38,136 20,706 14,154 10,346 22,722 29,239 29,380 47,400 45,925 45,123 38,224 40,889 382,244
Musa SpeciesBanana - Green 11,003 9,573 14,432 15,119 15,563 12,883 12,575 12,576 10,879 10,133 19,577 14,565 158,878 - Ripe 782 1,137 1,418 1,644 1,810 1,517 1,375 1,046 1,295 1,616 1,836 2,093 17,569Macambou 1,740 1,873 2,241 2,592 2,859 2,473 1,049 1,747 845 1,041 812 706 19,978Plantain 15,980 14,009 18,102 15,856 13,601 12,100 11,418 10,403 10,109 11,450 9,993 10,571 153,592Others* 864 851 1,329 752 996 1,024 798 802 728 614 757 483 9,998
TOTAL 30,369 27,443 37,522 35,963 34,829 29,997 27,215 26,574 23,856 24,854 32,975 28,418 360,015Traditional VegetablesCabbage 6,126 7,060 4,826 6,015 7,841 4,150 3,333 9,024 5,890 8,942 3,684 7,997 74,888Carrot 44 0 179 0 0 34 0 0 1 0 0 0 258Corn 307 0 0 0 9 39 487 161 122 5 6 1,136Lettuce 2,424 2,785 4,836 4,580 3,424 594 1,161 2,582 1,756 1,581 1,200 3,838 30,761Hot Pepper 0 6 15 55 0 42 0 0 6 34 15 35 208Sweet Pepper 511 438 642 1,114 1,055 1,437 457 842 482 788 302 220 8,288Tomato 4,729 7,313 6,640 9,930 4,552 2,149 3,109 8,217 2,818 3,414 2,487 3,862 59,220
TOTAL 14,141 17,602 17,138 21,694 16,872 8,415 8,099 21,152 11,114 14,881 7,693 15,958 174,759Continued Overleaf
Table V - 1. Total Quantity (Kgs) and Value (EC$) of Selected Agricultural Produce Purchased by Supermarkets - 2005
12
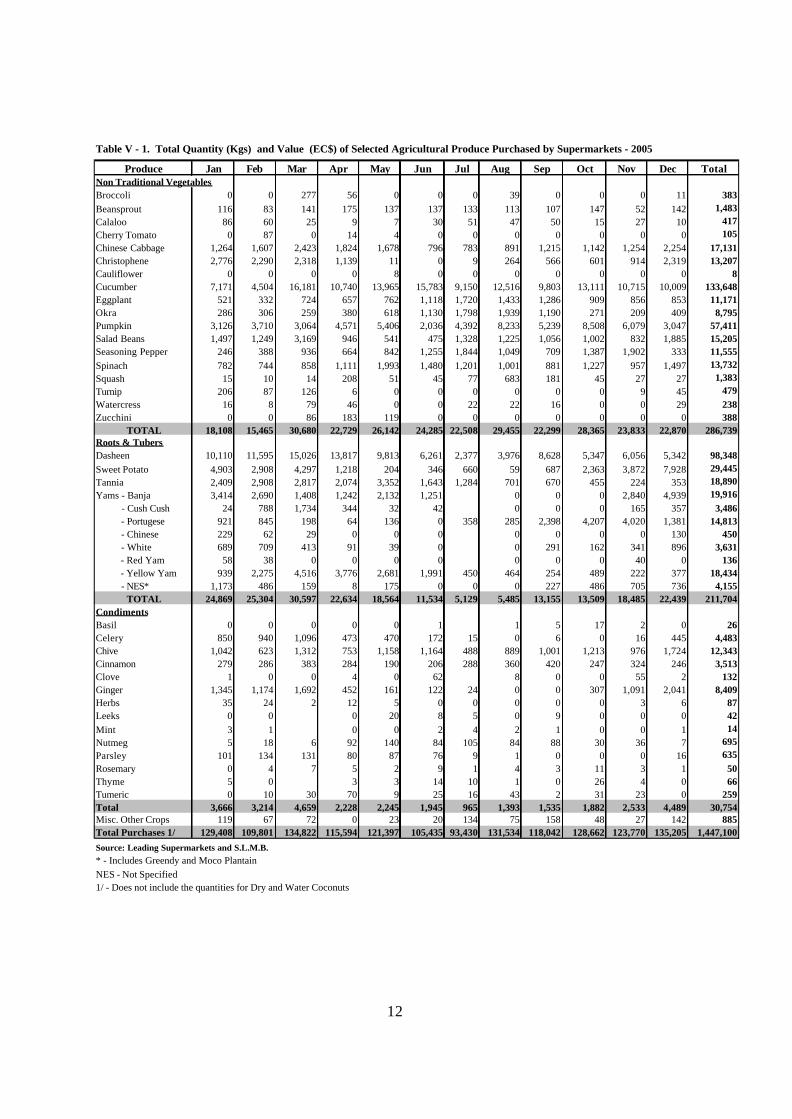
Produce Jan Feb Mar Apr May Jun Jul Aug Sep Oct Nov Dec TotalNon Traditional VegetablesBroccoli 0 0 277 56 0 0 0 39 0 0 0 11 383Beansprout 116 83 141 175 137 137 133 113 107 147 52 142 1,483Calaloo 86 60 25 9 7 30 51 47 50 15 27 10 417Cherry Tomato 0 87 0 14 4 0 0 0 0 0 0 0 105Chinese Cabbage 1,264 1,607 2,423 1,824 1,678 796 783 891 1,215 1,142 1,254 2,254 17,131Christophene 2,776 2,290 2,318 1,139 11 0 9 264 566 601 914 2,319 13,207Cauliflower 0 0 0 0 8 0 0 0 0 0 0 0 8Cucumber 7,171 4,504 16,181 10,740 13,965 15,783 9,150 12,516 9,803 13,111 10,715 10,009 133,648Eggplant 521 332 724 657 762 1,118 1,720 1,433 1,286 909 856 853 11,171Okra 286 306 259 380 618 1,130 1,798 1,939 1,190 271 209 409 8,795Pumpkin 3,126 3,710 3,064 4,571 5,406 2,036 4,392 8,233 5,239 8,508 6,079 3,047 57,411Salad Beans 1,497 1,249 3,169 946 541 475 1,328 1,225 1,056 1,002 832 1,885 15,205Seasoning Pepper 246 388 936 664 842 1,255 1,844 1,049 709 1,387 1,902 333 11,555Spinach 782 744 858 1,111 1,993 1,480 1,201 1,001 881 1,227 957 1,497 13,732Squash 15 10 14 208 51 45 77 683 181 45 27 27 1,383Turnip 206 87 126 6 0 0 0 0 0 0 9 45 479Watercress 16 8 79 46 0 0 22 22 16 0 0 29 238Zucchini 0 0 86 183 119 0 0 0 0 0 0 0 388
TOTAL 18,108 15,465 30,680 22,729 26,142 24,285 22,508 29,455 22,299 28,365 23,833 22,870 286,739Roots & TubersDasheen 10,110 11,595 15,026 13,817 9,813 6,261 2,377 3,976 8,628 5,347 6,056 5,342 98,348Sweet Potato 4,903 2,908 4,297 1,218 204 346 660 59 687 2,363 3,872 7,928 29,445Tannia 2,409 2,908 2,817 2,074 3,352 1,643 1,284 701 670 455 224 353 18,890Yams - Banja 3,414 2,690 1,408 1,242 2,132 1,251 0 0 0 2,840 4,939 19,916 - Cush Cush 24 788 1,734 344 32 42 0 0 0 165 357 3,486 - Portugese 921 845 198 64 136 0 358 285 2,398 4,207 4,020 1,381 14,813 - Chinese 229 62 29 0 0 0 0 0 0 0 130 450 - White 689 709 413 91 39 0 0 291 162 341 896 3,631 - Red Yam 58 38 0 0 0 0 0 0 0 40 0 136 - Yellow Yam 939 2,275 4,516 3,776 2,681 1,991 450 464 254 489 222 377 18,434 - NES* 1,173 486 159 8 175 0 0 0 227 486 705 736 4,155
TOTAL 24,869 25,304 30,597 22,634 18,564 11,534 5,129 5,485 13,155 13,509 18,485 22,439 211,704CondimentsBasil 0 0 0 0 0 1 1 5 17 2 0 26Celery 850 940 1,096 473 470 172 15 0 6 0 16 445 4,483Chive 1,042 623 1,312 753 1,158 1,164 488 889 1,001 1,213 976 1,724 12,343Cinnamon 279 286 383 284 190 206 288 360 420 247 324 246 3,513Clove 1 0 0 4 0 62 8 0 0 55 2 132Ginger 1,345 1,174 1,692 452 161 122 24 0 0 307 1,091 2,041 8,409Herbs 35 24 2 12 5 0 0 0 0 0 3 6 87Leeks 0 0 0 20 8 5 0 9 0 0 0 42Mint 3 1 0 0 2 4 2 1 0 0 1 14Nutmeg 5 18 6 92 140 84 105 84 88 30 36 7 695Parsley 101 134 131 80 87 76 9 1 0 0 0 16 635Rosemary 0 4 7 5 2 9 1 4 3 11 3 1 50Thyme 5 0 3 3 14 10 1 0 26 4 0 66Tumeric 0 10 30 70 9 25 16 43 2 31 23 0 259Total 3,666 3,214 4,659 2,228 2,245 1,945 965 1,393 1,535 1,882 2,533 4,489 30,754Misc. Other Crops 119 67 72 0 23 20 134 75 158 48 27 142 885Total Purchases 1/ 129,408 109,801 134,822 115,594 121,397 105,435 93,430 131,534 118,042 128,662 123,770 135,205 1,447,100Source: Leading Supermarkets and S.L.M.B.* - Includes Greendy and Moco Plantain NES - Not Specified1/ - Does not include the quantities for Dry and Water Coconuts
Table V - 1. Total Quantity (Kgs) and Value (EC$) of Selected Agricultural Produce Purchased by Supermarkets - 2005
13
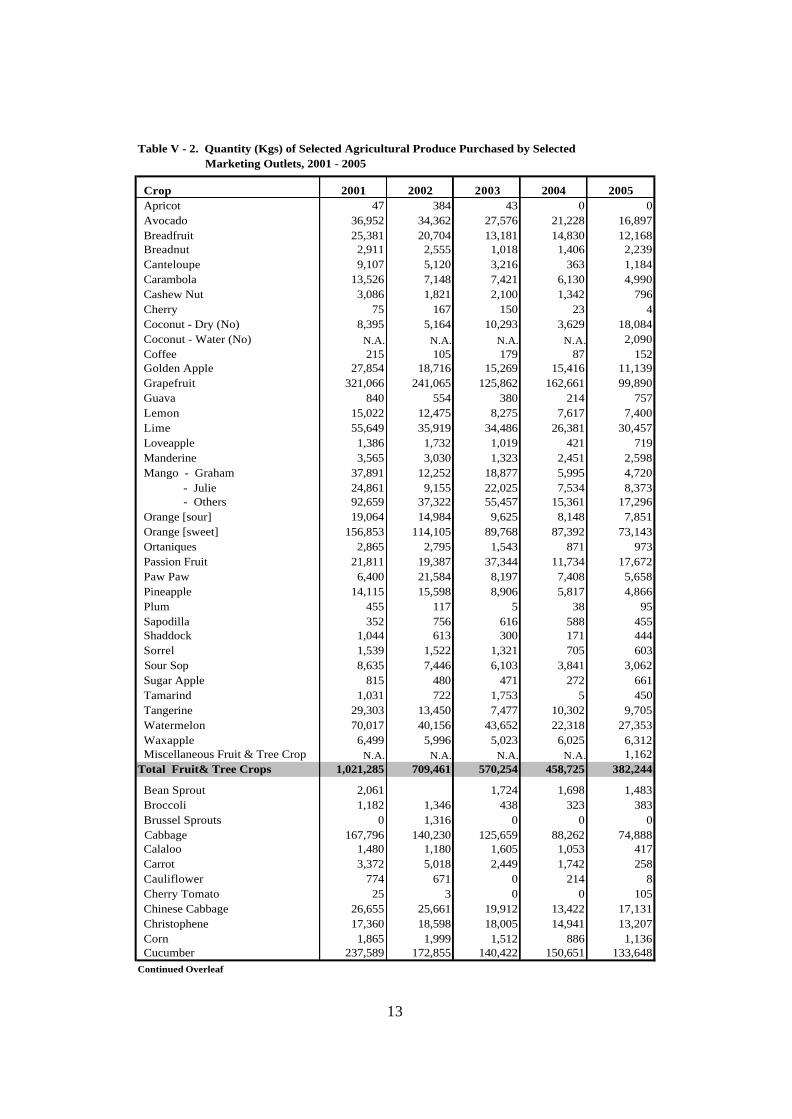
Crop 2001 2002 2003 2004 2005 Apricot 47 384 43 0 0 Avocado 36,952 34,362 27,576 21,228 16,897 Breadfruit 25,381 20,704 13,181 14,830 12,168 Breadnut 2,911 2,555 1,018 1,406 2,239 Canteloupe 9,107 5,120 3,216 363 1,184 Carambola 13,526 7,148 7,421 6,130 4,990 Cashew Nut 3,086 1,821 2,100 1,342 796 Cherry 75 167 150 23 4 Coconut - Dry (No) 8,395 5,164 10,293 3,629 18,084 Coconut - Water (No) N.A. N.A. N.A. N.A. 2,090 Coffee 215 105 179 87 152 Golden Apple 27,854 18,716 15,269 15,416 11,139 Grapefruit 321,066 241,065 125,862 162,661 99,890 Guava 840 554 380 214 757 Lemon 15,022 12,475 8,275 7,617 7,400 Lime 55,649 35,919 34,486 26,381 30,457 Loveapple 1,386 1,732 1,019 421 719 Manderine 3,565 3,030 1,323 2,451 2,598 Mango - Graham 37,891 12,252 18,877 5,995 4,720 - Julie 24,861 9,155 22,025 7,534 8,373 - Others 92,659 37,322 55,457 15,361 17,296 Orange [sour] 19,064 14,984 9,625 8,148 7,851 Orange [sweet] 156,853 114,105 89,768 87,392 73,143 Ortaniques 2,865 2,795 1,543 871 973 Passion Fruit 21,811 19,387 37,344 11,734 17,672 Paw Paw 6,400 21,584 8,197 7,408 5,658 Pineapple 14,115 15,598 8,906 5,817 4,866 Plum 455 117 5 38 95 Sapodilla 352 756 616 588 455 Shaddock 1,044 613 300 171 444 Sorrel 1,539 1,522 1,321 705 603 Sour Sop 8,635 7,446 6,103 3,841 3,062 Sugar Apple 815 480 471 272 661 Tamarind 1,031 722 1,753 5 450 Tangerine 29,303 13,450 7,477 10,302 9,705 Watermelon 70,017 40,156 43,652 22,318 27,353 Waxapple 6,499 5,996 5,023 6,025 6,312 Miscellaneous Fruit & Tree Crop N.A. N.A. N.A. N.A. 1,162Total Fruit& Tree Crops 1,021,285 709,461 570,254 458,725 382,244
Bean Sprout 2,061 1,724 1,698 1,483 Broccoli 1,182 1,346 438 323 383 Brussel Sprouts 0 1,316 0 0 0 Cabbage 167,796 140,230 125,659 88,262 74,888 Calaloo 1,480 1,180 1,605 1,053 417 Carrot 3,372 5,018 2,449 1,742 258 Cauliflower 774 671 0 214 8 Cherry Tomato 25 3 0 0 105 Chinese Cabbage 26,655 25,661 19,912 13,422 17,131 Christophene 17,360 18,598 18,005 14,941 13,207 Corn 1,865 1,999 1,512 886 1,136 Cucumber 237,589 172,855 140,422 150,651 133,648Continued Overleaf
Table V - 2. Quantity (Kgs) of Selected Agricultural Produce Purchased by Selected Marketing Outlets, 2001 - 2005
14
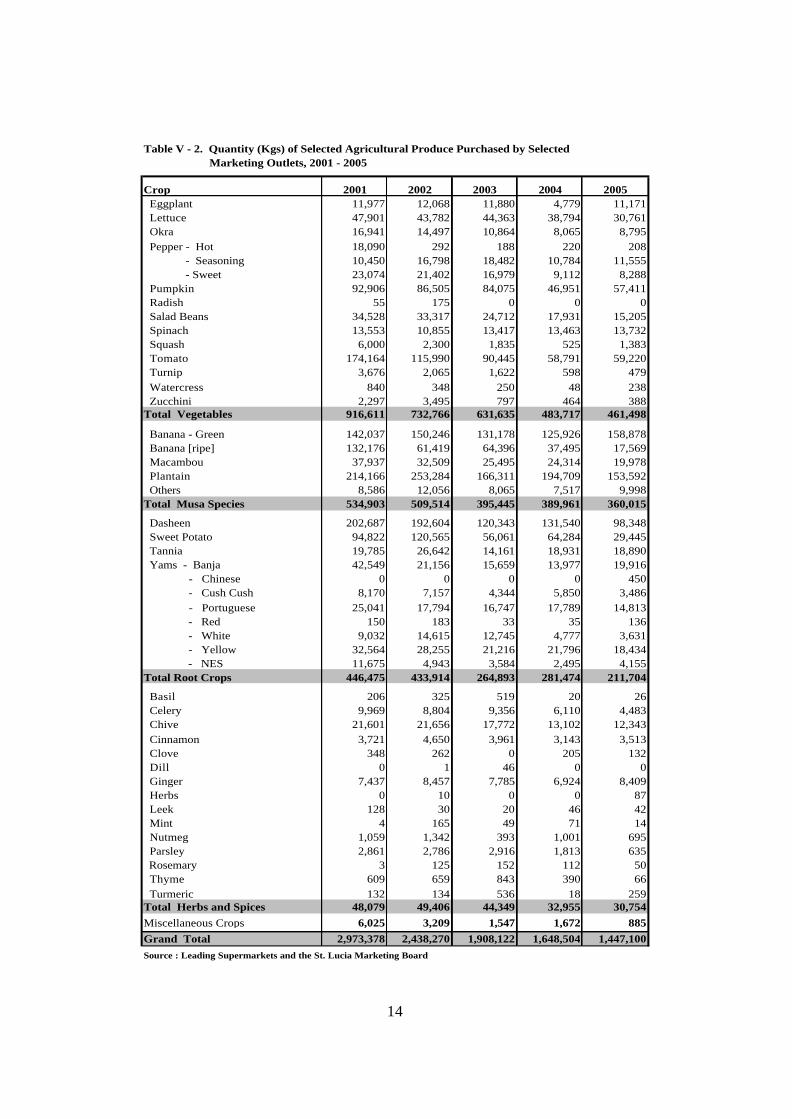
Crop 2001 2002 2003 2004 2005 Eggplant 11,977 12,068 11,880 4,779 11,171 Lettuce 47,901 43,782 44,363 38,794 30,761 Okra 16,941 14,497 10,864 8,065 8,795 Pepper - Hot 18,090 292 188 220 208 - Seasoning 10,450 16,798 18,482 10,784 11,555 - Sweet 23,074 21,402 16,979 9,112 8,288 Pumpkin 92,906 86,505 84,075 46,951 57,411 Radish 55 175 0 0 0 Salad Beans 34,528 33,317 24,712 17,931 15,205 Spinach 13,553 10,855 13,417 13,463 13,732 Squash 6,000 2,300 1,835 525 1,383 Tomato 174,164 115,990 90,445 58,791 59,220 Turnip 3,676 2,065 1,622 598 479 Watercress 840 348 250 48 238 Zucchini 2,297 3,495 797 464 388Total Vegetables 916,611 732,766 631,635 483,717 461,498
Banana - Green 142,037 150,246 131,178 125,926 158,878 Banana [ripe] 132,176 61,419 64,396 37,495 17,569 Macambou 37,937 32,509 25,495 24,314 19,978 Plantain 214,166 253,284 166,311 194,709 153,592 Others 8,586 12,056 8,065 7,517 9,998Total Musa Species 534,903 509,514 395,445 389,961 360,015
Dasheen 202,687 192,604 120,343 131,540 98,348 Sweet Potato 94,822 120,565 56,061 64,284 29,445 Tannia 19,785 26,642 14,161 18,931 18,890 Yams - Banja 42,549 21,156 15,659 13,977 19,916 - Chinese 0 0 0 0 450 - Cush Cush 8,170 7,157 4,344 5,850 3,486 - Portuguese 25,041 17,794 16,747 17,789 14,813 - Red 150 183 33 35 136 - White 9,032 14,615 12,745 4,777 3,631 - Yellow 32,564 28,255 21,216 21,796 18,434 - NES 11,675 4,943 3,584 2,495 4,155Total Root Crops 446,475 433,914 264,893 281,474 211,704
Basil 206 325 519 20 26 Celery 9,969 8,804 9,356 6,110 4,483 Chive 21,601 21,656 17,772 13,102 12,343 Cinnamon 3,721 4,650 3,961 3,143 3,513 Clove 348 262 0 205 132 Dill 0 1 46 0 0 Ginger 7,437 8,457 7,785 6,924 8,409 Herbs 0 10 0 0 87 Leek 128 30 20 46 42 Mint 4 165 49 71 14 Nutmeg 1,059 1,342 393 1,001 695 Parsley 2,861 2,786 2,916 1,813 635 Rosemary 3 125 152 112 50 Thyme 609 659 843 390 66 Turmeric 132 134 536 18 259Total Herbs and Spices 48,079 49,406 44,349 32,955 30,754Miscellaneous Crops 6,025 3,209 1,547 1,672 885Grand Total 2,973,378 2,438,270 1,908,122 1,648,504 1,447,100Source : Leading Supermarkets and the St. Lucia Marketing Board
Marketing Outlets, 2001 - 2005Table V - 2. Quantity (Kgs) of Selected Agricultural Produce Purchased by Selected
15
Produce Jan Feb Mar Apr May Jun Jul Aug Sept Oct Nov Dec
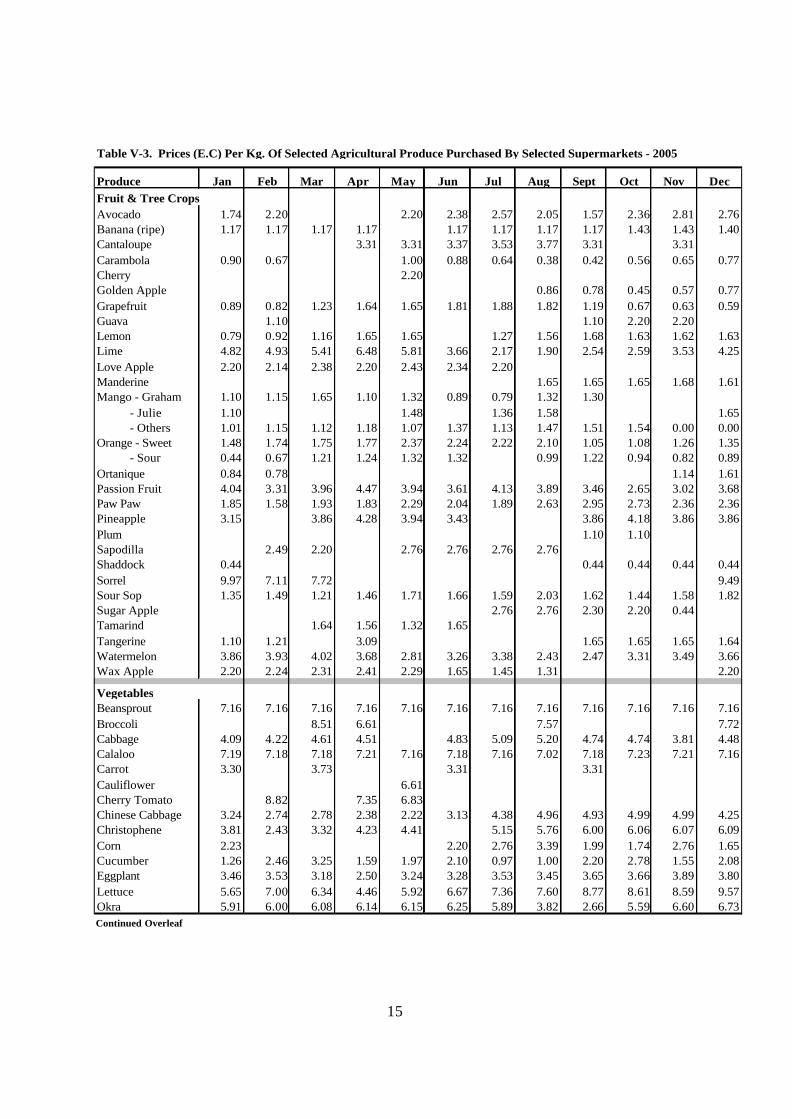
Avocado 1.74 2.20 2.20 2.38 2.57 2.05 1.57 2.36 2.81 2.76Banana (ripe) 1.17 1.17 1.17 1.17 1.17 1.17 1.17 1.17 1.43 1.43 1.40Cantaloupe 3.31 3.31 3.37 3.53 3.77 3.31 3.31Carambola 0.90 0.67 1.00 0.88 0.64 0.38 0.42 0.56 0.65 0.77Cherry 2.20Golden Apple 0.86 0.78 0.45 0.57 0.77Grapefruit 0.89 0.82 1.23 1.64 1.65 1.81 1.88 1.82 1.19 0.67 0.63 0.59Guava 1.10 1.10 2.20 2.20Lemon 0.79 0.92 1.16 1.65 1.65 1.27 1.56 1.68 1.63 1.62 1.63Lime 4.82 4.93 5.41 6.48 5.81 3.66 2.17 1.90 2.54 2.59 3.53 4.25Love Apple 2.20 2.14 2.38 2.20 2.43 2.34 2.20Manderine 1.65 1.65 1.65 1.68 1.61Mango - Graham 1.10 1.15 1.65 1.10 1.32 0.89 0.79 1.32 1.30 - Julie 1.10 1.48 1.36 1.58 1.65 - Others 1.01 1.15 1.12 1.18 1.07 1.37 1.13 1.47 1.51 1.54 0.00 0.00Orange - Sweet 1.48 1.74 1.75 1.77 2.37 2.24 2.22 2.10 1.05 1.08 1.26 1.35 - Sour 0.44 0.67 1.21 1.24 1.32 1.32 0.99 1.22 0.94 0.82 0.89Ortanique 0.84 0.78 1.14 1.61Passion Fruit 4.04 3.31 3.96 4.47 3.94 3.61 4.13 3.89 3.46 2.65 3.02 3.68Paw Paw 1.85 1.58 1.93 1.83 2.29 2.04 1.89 2.63 2.95 2.73 2.36 2.36Pineapple 3.15 3.86 4.28 3.94 3.43 3.86 4.18 3.86 3.86Plum 1.10 1.10Sapodilla 2.49 2.20 2.76 2.76 2.76 2.76Shaddock 0.44 0.44 0.44 0.44 0.44Sorrel 9.97 7.11 7.72 9.49Sour Sop 1.35 1.49 1.21 1.46 1.71 1.66 1.59 2.03 1.62 1.44 1.58 1.82Sugar Apple 2.76 2.76 2.30 2.20 0.44Tamarind 1.64 1.56 1.32 1.65Tangerine 1.10 1.21 3.09 1.65 1.65 1.65 1.64Watermelon 3.86 3.93 4.02 3.68 2.81 3.26 3.38 2.43 2.47 3.31 3.49 3.66Wax Apple 2.20 2.24 2.31 2.41 2.29 1.65 1.45 1.31 2.20
Beansprout 7.16 7.16 7.16 7.16 7.16 7.16 7.16 7.16 7.16 7.16 7.16 7.16Broccoli 8.51 6.61 7.57 7.72Cabbage 4.09 4.22 4.61 4.51 4.83 5.09 5.20 4.74 4.74 3.81 4.48Calaloo 7.19 7.18 7.18 7.21 7.16 7.18 7.16 7.02 7.18 7.23 7.21 7.16Carrot 3.30 3.73 3.31 3.31Cauliflower 6.61Cherry Tomato 8.82 7.35 6.83Chinese Cabbage 3.24 2.74 2.78 2.38 2.22 3.13 4.38 4.96 4.93 4.99 4.99 4.25Christophene 3.81 2.43 3.32 4.23 4.41 5.15 5.76 6.00 6.06 6.07 6.09Corn 2.23 2.20 2.76 3.39 1.99 1.74 2.76 1.65Cucumber 1.26 2.46 3.25 1.59 1.97 2.10 0.97 1.00 2.20 2.78 1.55 2.08Eggplant 3.46 3.53 3.18 2.50 3.24 3.28 3.53 3.45 3.65 3.66 3.89 3.80Lettuce 5.65 7.00 6.34 4.46 5.92 6.67 7.36 7.60 8.77 8.61 8.59 9.57Okra 5.91 6.00 6.08 6.14 6.15 6.25 5.89 3.82 2.66 5.59 6.60 6.73Continued Overleaf
Table V-3. Prices (E.C) Per Kg. Of Selected Agricultural Produce Purchased By Selected Supermarkets - 2005
Fruit & Tree Crops
Vegetables
16
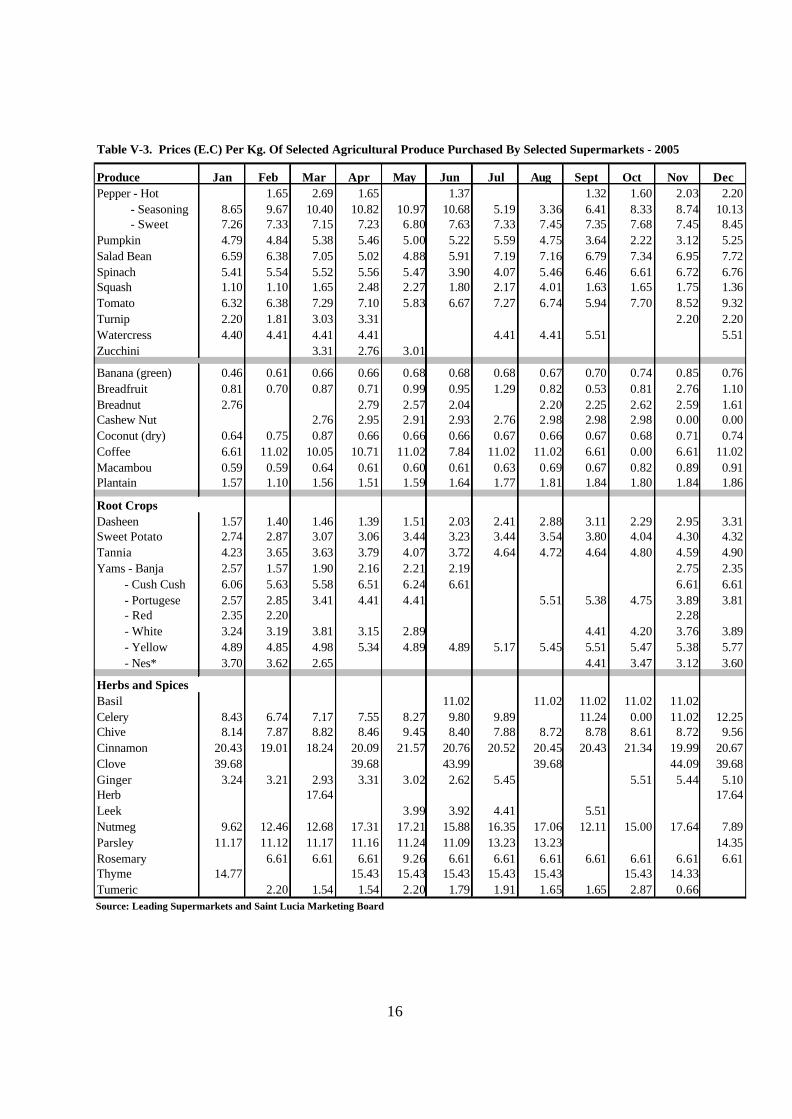
Produce Jan Feb Mar Apr May Jun Jul Aug Sept Oct Nov DecPepper - Hot 1.65 2.69 1.65 1.37 1.32 1.60 2.03 2.20 - Seasoning 8.65 9.67 10.40 10.82 10.97 10.68 5.19 3.36 6.41 8.33 8.74 10.13 - Sweet 7.26 7.33 7.15 7.23 6.80 7.63 7.33 7.45 7.35 7.68 7.45 8.45Pumpkin 4.79 4.84 5.38 5.46 5.00 5.22 5.59 4.75 3.64 2.22 3.12 5.25Salad Bean 6.59 6.38 7.05 5.02 4.88 5.91 7.19 7.16 6.79 7.34 6.95 7.72Spinach 5.41 5.54 5.52 5.56 5.47 3.90 4.07 5.46 6.46 6.61 6.72 6.76Squash 1.10 1.10 1.65 2.48 2.27 1.80 2.17 4.01 1.63 1.65 1.75 1.36Tomato 6.32 6.38 7.29 7.10 5.83 6.67 7.27 6.74 5.94 7.70 8.52 9.32Turnip 2.20 1.81 3.03 3.31 2.20 2.20Watercress 4.40 4.41 4.41 4.41 4.41 4.41 5.51 5.51Zucchini 3.31 2.76 3.01
Banana (green) 0.46 0.61 0.66 0.66 0.68 0.68 0.68 0.67 0.70 0.74 0.85 0.76Breadfruit 0.81 0.70 0.87 0.71 0.99 0.95 1.29 0.82 0.53 0.81 2.76 1.10Breadnut 2.76 2.79 2.57 2.04 2.20 2.25 2.62 2.59 1.61Cashew Nut 2.76 2.95 2.91 2.93 2.76 2.98 2.98 2.98 0.00 0.00Coconut (dry) 0.64 0.75 0.87 0.66 0.66 0.66 0.67 0.66 0.67 0.68 0.71 0.74Coffee 6.61 11.02 10.05 10.71 11.02 7.84 11.02 11.02 6.61 0.00 6.61 11.02Macambou 0.59 0.59 0.64 0.61 0.60 0.61 0.63 0.69 0.67 0.82 0.89 0.91Plantain 1.57 1.10 1.56 1.51 1.59 1.64 1.77 1.81 1.84 1.80 1.84 1.86
Dasheen 1.57 1.40 1.46 1.39 1.51 2.03 2.41 2.88 3.11 2.29 2.95 3.31Sweet Potato 2.74 2.87 3.07 3.06 3.44 3.23 3.44 3.54 3.80 4.04 4.30 4.32Tannia 4.23 3.65 3.63 3.79 4.07 3.72 4.64 4.72 4.64 4.80 4.59 4.90Yams - Banja 2.57 1.57 1.90 2.16 2.21 2.19 2.75 2.35 - Cush Cush 6.06 5.63 5.58 6.51 6.24 6.61 6.61 6.61 - Portugese 2.57 2.85 3.41 4.41 4.41 5.51 5.38 4.75 3.89 3.81 - Red 2.35 2.20 2.28 - White 3.24 3.19 3.81 3.15 2.89 4.41 4.20 3.76 3.89 - Yellow 4.89 4.85 4.98 5.34 4.89 4.89 5.17 5.45 5.51 5.47 5.38 5.77 - Nes* 3.70 3.62 2.65 4.41 3.47 3.12 3.60
Basil 11.02 11.02 11.02 11.02 11.02Celery 8.43 6.74 7.17 7.55 8.27 9.80 9.89 11.24 0.00 11.02 12.25Chive 8.14 7.87 8.82 8.46 9.45 8.40 7.88 8.72 8.78 8.61 8.72 9.56Cinnamon 20.43 19.01 18.24 20.09 21.57 20.76 20.52 20.45 20.43 21.34 19.99 20.67Clove 39.68 39.68 43.99 39.68 44.09 39.68Ginger 3.24 3.21 2.93 3.31 3.02 2.62 5.45 5.51 5.44 5.10Herb 17.64 17.64Leek 3.99 3.92 4.41 5.51Nutmeg 9.62 12.46 12.68 17.31 17.21 15.88 16.35 17.06 12.11 15.00 17.64 7.89Parsley 11.17 11.12 11.17 11.16 11.24 11.09 13.23 13.23 14.35Rosemary 6.61 6.61 6.61 9.26 6.61 6.61 6.61 6.61 6.61 6.61 6.61Thyme 14.77 15.43 15.43 15.43 15.43 15.43 15.43 14.33Tumeric 2.20 1.54 1.54 2.20 1.79 1.91 1.65 1.65 2.87 0.66
Root Crops
Herbs and Spices
Source: Leading Supermarkets and Saint Lucia Marketing Board
Table V-3. Prices (E.C) Per Kg. Of Selected Agricultural Produce Purchased By Selected Supermarkets - 2005
17
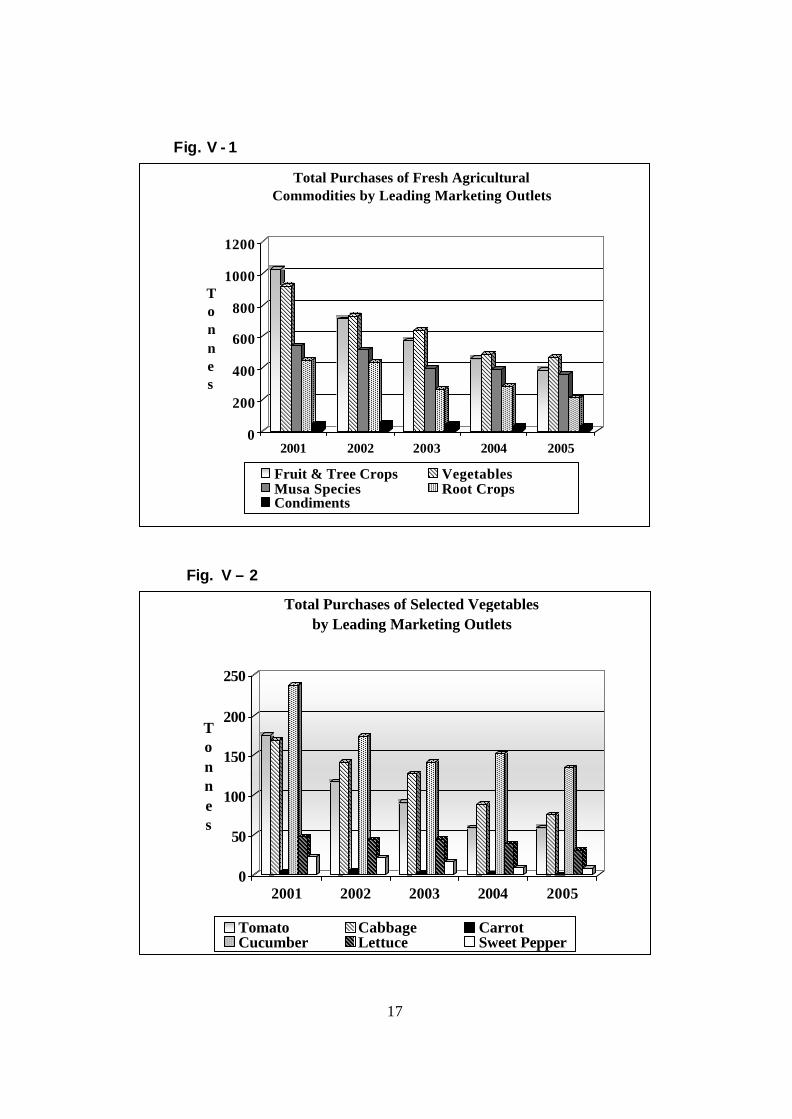
Fig. V - 1
0
200
400
600
800
1000
1200
Tonnes
2001 2002 2003 2004 2005
Total Purchases of Fresh Agricultural Commodities by Leading Marketing Outlets
Fruit & Tree Crops VegetablesMusa Species Root CropsCondiments
Fig. V – 2
0
50
100
150
200
250
Tonnes
2001 2002 2003 2004 2005
Total Purchases of Selected Vegetables by Leading Marketing Outlets
Tomato Cabbage CarrotCucumber Lettuce Sweet Pepper
18
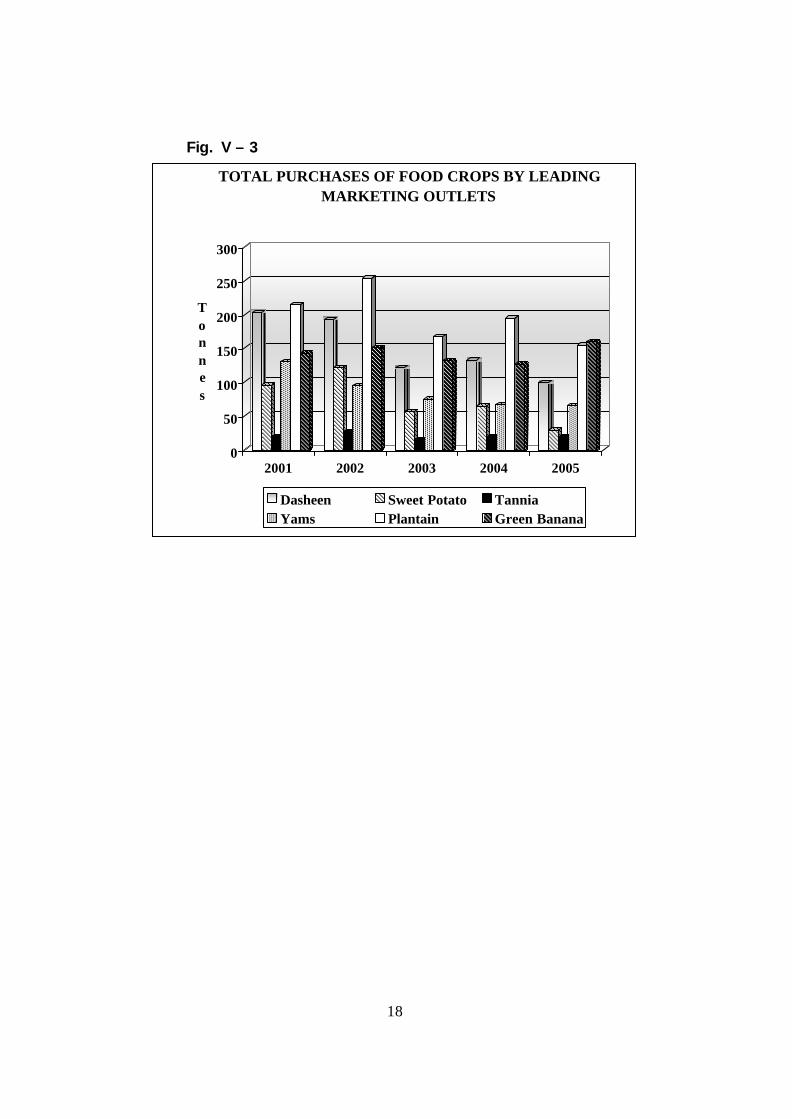
Fig. V – 3
0
50
100
150
200
250
300
Tonnes
2001 2002 2003 2004 2005
TOTAL PURCHASES OF FOOD CROPS BY LEADING MARKETING OUTLETS
Dasheen Sweet Potato TanniaYams Plantain Green Banana
19
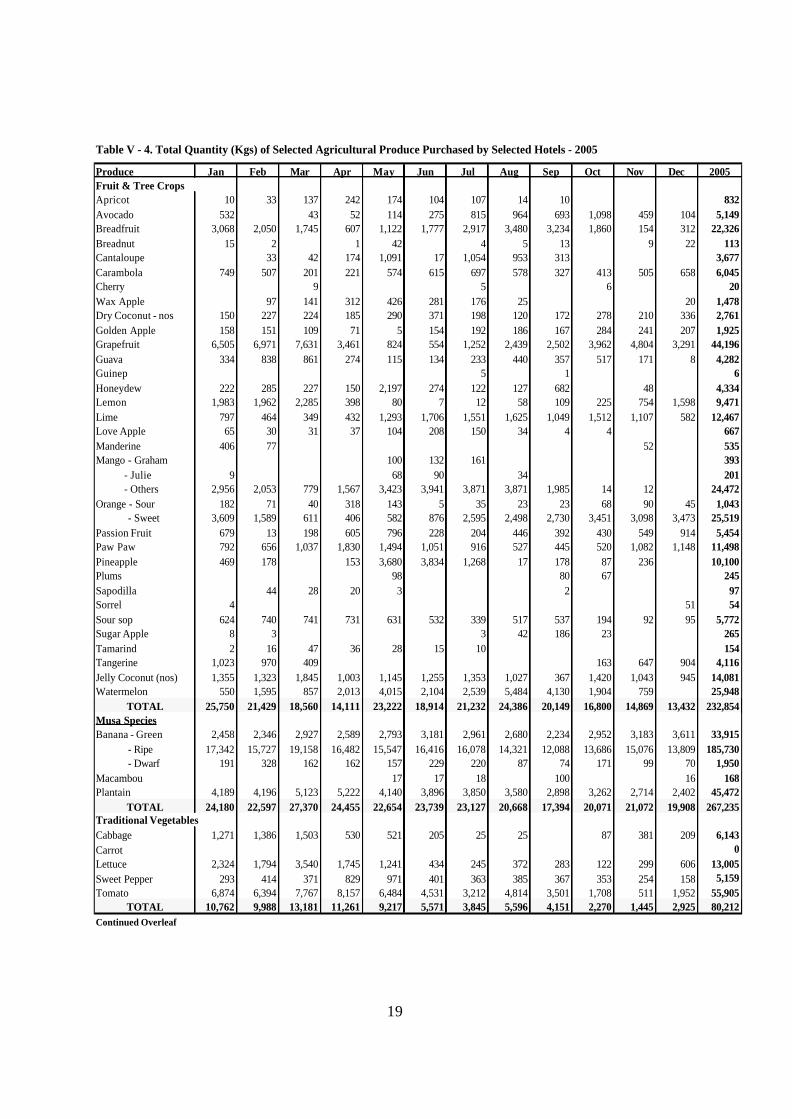
Produce Jan Feb Mar Apr May Jun Jul Aug Sep Oct Nov Dec 2005
Apricot 10 33 137 242 174 104 107 14 10 832Avocado 532 43 52 114 275 815 964 693 1,098 459 104 5,149Breadfruit 3,068 2,050 1,745 607 1,122 1,777 2,917 3,480 3,234 1,860 154 312 22,326Breadnut 15 2 1 42 4 5 13 9 22 113Cantaloupe 33 42 174 1,091 17 1,054 953 313 3,677Carambola 749 507 201 221 574 615 697 578 327 413 505 658 6,045Cherry 9 5 6 20Wax Apple 97 141 312 426 281 176 25 20 1,478Dry Coconut - nos 150 227 224 185 290 371 198 120 172 278 210 336 2,761Golden Apple 158 151 109 71 5 154 192 186 167 284 241 207 1,925Grapefruit 6,505 6,971 7,631 3,461 824 554 1,252 2,439 2,502 3,962 4,804 3,291 44,196Guava 334 838 861 274 115 134 233 440 357 517 171 8 4,282Guinep 5 1 6Honeydew 222 285 227 150 2,197 274 122 127 682 48 4,334Lemon 1,983 1,962 2,285 398 80 7 12 58 109 225 754 1,598 9,471Lime 797 464 349 432 1,293 1,706 1,551 1,625 1,049 1,512 1,107 582 12,467Love Apple 65 30 31 37 104 208 150 34 4 4 667Manderine 406 77 52 535Mango - Graham 100 132 161 393 - Julie 9 68 90 34 201 - Others 2,956 2,053 779 1,567 3,423 3,941 3,871 3,871 1,985 14 12 24,472Orange - Sour 182 71 40 318 143 5 35 23 23 68 90 45 1,043 - Sweet 3,609 1,589 611 406 582 876 2,595 2,498 2,730 3,451 3,098 3,473 25,519Passion Fruit 679 13 198 605 796 228 204 446 392 430 549 914 5,454Paw Paw 792 656 1,037 1,830 1,494 1,051 916 527 445 520 1,082 1,148 11,498Pineapple 469 178 153 3,680 3,834 1,268 17 178 87 236 10,100Plums 98 80 67 245Sapodilla 44 28 20 3 2 97Sorrel 4 51 54Sour sop 624 740 741 731 631 532 339 517 537 194 92 95 5,772Sugar Apple 8 3 3 42 186 23 265Tamarind 2 16 47 36 28 15 10 154Tangerine 1,023 970 409 163 647 904 4,116Jelly Coconut (nos) 1,355 1,323 1,845 1,003 1,145 1,255 1,353 1,027 367 1,420 1,043 945 14,081Watermelon 550 1,595 857 2,013 4,015 2,104 2,539 5,484 4,130 1,904 759 25,948
TOTAL 25,750 21,429 18,560 14,111 23,222 18,914 21,232 24,386 20,149 16,800 14,869 13,432 232,854Musa SpeciesBanana - Green 2,458 2,346 2,927 2,589 2,793 3,181 2,961 2,680 2,234 2,952 3,183 3,611 33,915 - Ripe 17,342 15,727 19,158 16,482 15,547 16,416 16,078 14,321 12,088 13,686 15,076 13,809 185,730 - Dwarf 191 328 162 162 157 229 220 87 74 171 99 70 1,950Macambou 17 17 18 100 16 168Plantain 4,189 4,196 5,123 5,222 4,140 3,896 3,850 3,580 2,898 3,262 2,714 2,402 45,472
TOTAL 24,180 22,597 27,370 24,455 22,654 23,739 23,127 20,668 17,394 20,071 21,072 19,908 267,235
Cabbage 1,271 1,386 1,503 530 521 205 25 25 87 381 209 6,143Carrot 0Lettuce 2,324 1,794 3,540 1,745 1,241 434 245 372 283 122 299 606 13,005Sweet Pepper 293 414 371 829 971 401 363 385 367 353 254 158 5,159Tomato 6,874 6,394 7,767 8,157 6,484 4,531 3,212 4,814 3,501 1,708 511 1,952 55,905
TOTAL 10,762 9,988 13,181 11,261 9,217 5,571 3,845 5,596 4,151 2,270 1,445 2,925 80,212Continued Overleaf
Fruit & Tree Crops
Table V - 4. Total Quantity (Kgs) of Selected Agricultural Produce Purchased by Selected Hotels - 2005
Traditional Vegetables
20
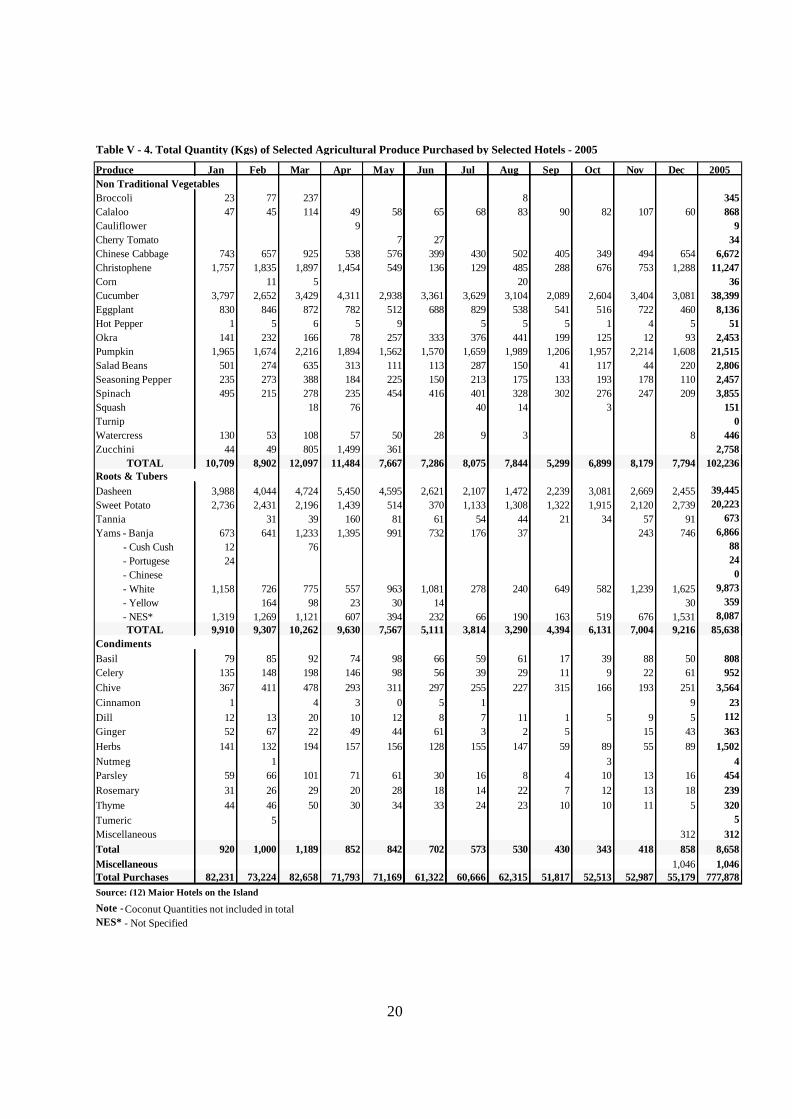
Produce Jan Feb Mar Apr May Jun Jul Aug Sep Oct Nov Dec 2005
Broccoli 23 77 237 8 345Calaloo 47 45 114 49 58 65 68 83 90 82 107 60 868Cauliflower 9 9Cherry Tomato 7 27 34Chinese Cabbage 743 657 925 538 576 399 430 502 405 349 494 654 6,672Christophene 1,757 1,835 1,897 1,454 549 136 129 485 288 676 753 1,288 11,247Corn 11 5 20 36Cucumber 3,797 2,652 3,429 4,311 2,938 3,361 3,629 3,104 2,089 2,604 3,404 3,081 38,399Eggplant 830 846 872 782 512 688 829 538 541 516 722 460 8,136Hot Pepper 1 5 6 5 9 5 5 5 1 4 5 51Okra 141 232 166 78 257 333 376 441 199 125 12 93 2,453Pumpkin 1,965 1,674 2,216 1,894 1,562 1,570 1,659 1,989 1,206 1,957 2,214 1,608 21,515Salad Beans 501 274 635 313 111 113 287 150 41 117 44 220 2,806Seasoning Pepper 235 273 388 184 225 150 213 175 133 193 178 110 2,457Spinach 495 215 278 235 454 416 401 328 302 276 247 209 3,855Squash 18 76 40 14 3 151Turnip 0Watercress 130 53 108 57 50 28 9 3 8 446Zucchini 44 49 805 1,499 361 2,758
TOTAL 10,709 8,902 12,097 11,484 7,667 7,286 8,075 7,844 5,299 6,899 8,179 7,794 102,236
Dasheen 3,988 4,044 4,724 5,450 4,595 2,621 2,107 1,472 2,239 3,081 2,669 2,455 39,445Sweet Potato 2,736 2,431 2,196 1,439 514 370 1,133 1,308 1,322 1,915 2,120 2,739 20,223Tannia 31 39 160 81 61 54 44 21 34 57 91 673Yams - Banja 673 641 1,233 1,395 991 732 176 37 243 746 6,866 - Cush Cush 12 76 88 - Portugese 24 24 - Chinese 0 - White 1,158 726 775 557 963 1,081 278 240 649 582 1,239 1,625 9,873 - Yellow 164 98 23 30 14 30 359 - NES* 1,319 1,269 1,121 607 394 232 66 190 163 519 676 1,531 8,087
TOTAL 9,910 9,307 10,262 9,630 7,567 5,111 3,814 3,290 4,394 6,131 7,004 9,216 85,638
Basil 79 85 92 74 98 66 59 61 17 39 88 50 808Celery 135 148 198 146 98 56 39 29 11 9 22 61 952Chive 367 411 478 293 311 297 255 227 315 166 193 251 3,564Cinnamon 1 4 3 0 5 1 9 23Dill 12 13 20 10 12 8 7 11 1 5 9 5 112Ginger 52 67 22 49 44 61 3 2 5 15 43 363Herbs 141 132 194 157 156 128 155 147 59 89 55 89 1,502Nutmeg 1 3 4Parsley 59 66 101 71 61 30 16 8 4 10 13 16 454Rosemary 31 26 29 20 28 18 14 22 7 12 13 18 239Thyme 44 46 50 30 34 33 24 23 10 10 11 5 320Tumeric 5 5Miscellaneous 312 312Total 920 1,000 1,189 852 842 702 573 530 430 343 418 858 8,658Miscellaneous 1,046 1,046Total Purchases 82,231 73,224 82,658 71,793 71,169 61,322 60,666 62,315 51,817 52,513 52,987 55,179 777,878
Table V - 4. Total Quantity (Kgs) of Selected Agricultural Produce Purchased by Selected Hotels - 2005
NES* - Not SpecifiedNote - Coconut Quantities not included in total
Source: (12) Major Hotels on the Island
Non Traditional Vegetables
Roots & Tubers
Condiments
21
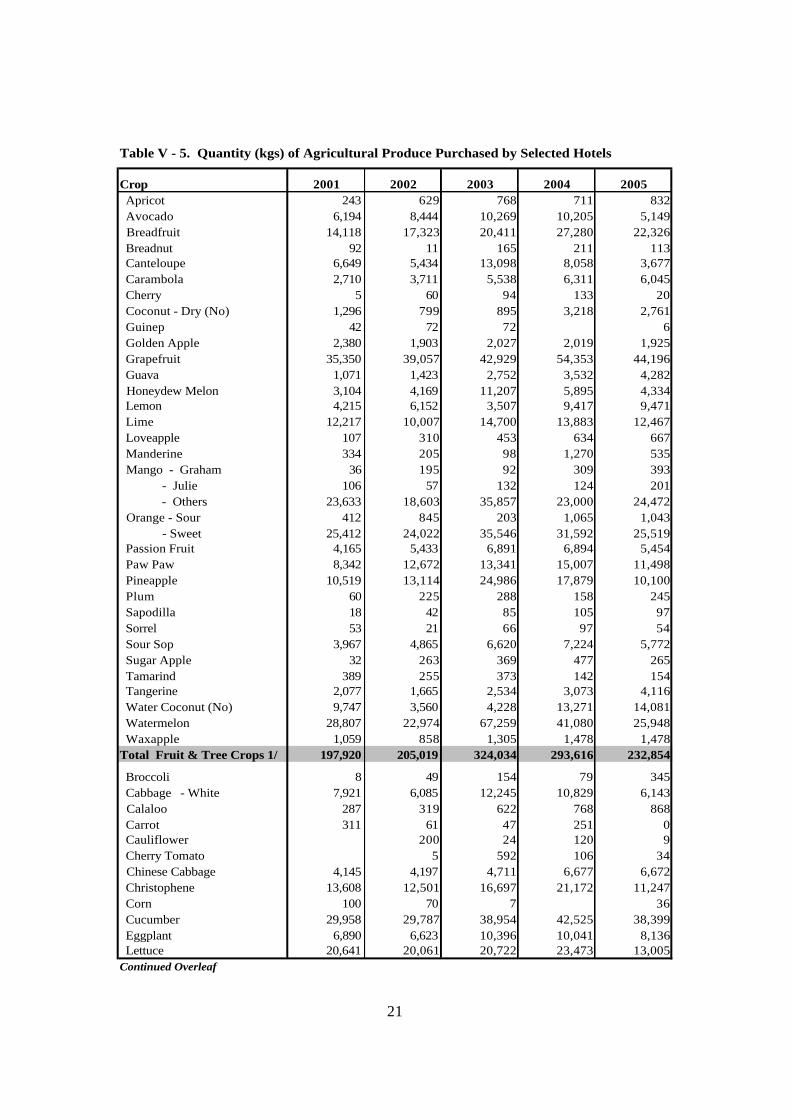
Crop 2001 2002 2003 2004 2005 Apricot 243 629 768 711 832 Avocado 6,194 8,444 10,269 10,205 5,149 Breadfruit 14,118 17,323 20,411 27,280 22,326 Breadnut 92 11 165 211 113 Canteloupe 6,649 5,434 13,098 8,058 3,677 Carambola 2,710 3,711 5,538 6,311 6,045 Cherry 5 60 94 133 20 Coconut - Dry (No) 1,296 799 895 3,218 2,761 Guinep 42 72 72 6 Golden Apple 2,380 1,903 2,027 2,019 1,925 Grapefruit 35,350 39,057 42,929 54,353 44,196 Guava 1,071 1,423 2,752 3,532 4,282 Honeydew Melon 3,104 4,169 11,207 5,895 4,334 Lemon 4,215 6,152 3,507 9,417 9,471 Lime 12,217 10,007 14,700 13,883 12,467 Loveapple 107 310 453 634 667 Manderine 334 205 98 1,270 535 Mango - Graham 36 195 92 309 393 - Julie 106 57 132 124 201 - Others 23,633 18,603 35,857 23,000 24,472 Orange - Sour 412 845 203 1,065 1,043 - Sweet 25,412 24,022 35,546 31,592 25,519 Passion Fruit 4,165 5,433 6,891 6,894 5,454 Paw Paw 8,342 12,672 13,341 15,007 11,498 Pineapple 10,519 13,114 24,986 17,879 10,100 Plum 60 225 288 158 245 Sapodilla 18 42 85 105 97 Sorrel 53 21 66 97 54 Sour Sop 3,967 4,865 6,620 7,224 5,772 Sugar Apple 32 263 369 477 265 Tamarind 389 255 373 142 154 Tangerine 2,077 1,665 2,534 3,073 4,116 Water Coconut (No) 9,747 3,560 4,228 13,271 14,081 Watermelon 28,807 22,974 67,259 41,080 25,948 Waxapple 1,059 858 1,305 1,478 1,478Total Fruit & Tree Crops 1/ 197,920 205,019 324,034 293,616 232,854
Broccoli 8 49 154 79 345 Cabbage - White 7,921 6,085 12,245 10,829 6,143 Calaloo 287 319 622 768 868 Carrot 311 61 47 251 0 Cauliflower 200 24 120 9 Cherry Tomato 5 592 106 34 Chinese Cabbage 4,145 4,197 4,711 6,677 6,672 Christophene 13,608 12,501 16,697 21,172 11,247 Corn 100 70 7 36 Cucumber 29,958 29,787 38,954 42,525 38,399 Eggplant 6,890 6,623 10,396 10,041 8,136 Lettuce 20,641 20,061 20,722 23,473 13,005Continued Overleaf
Table V - 5. Quantity (kgs) of Agricultural Produce Purchased by Selected Hotels
22
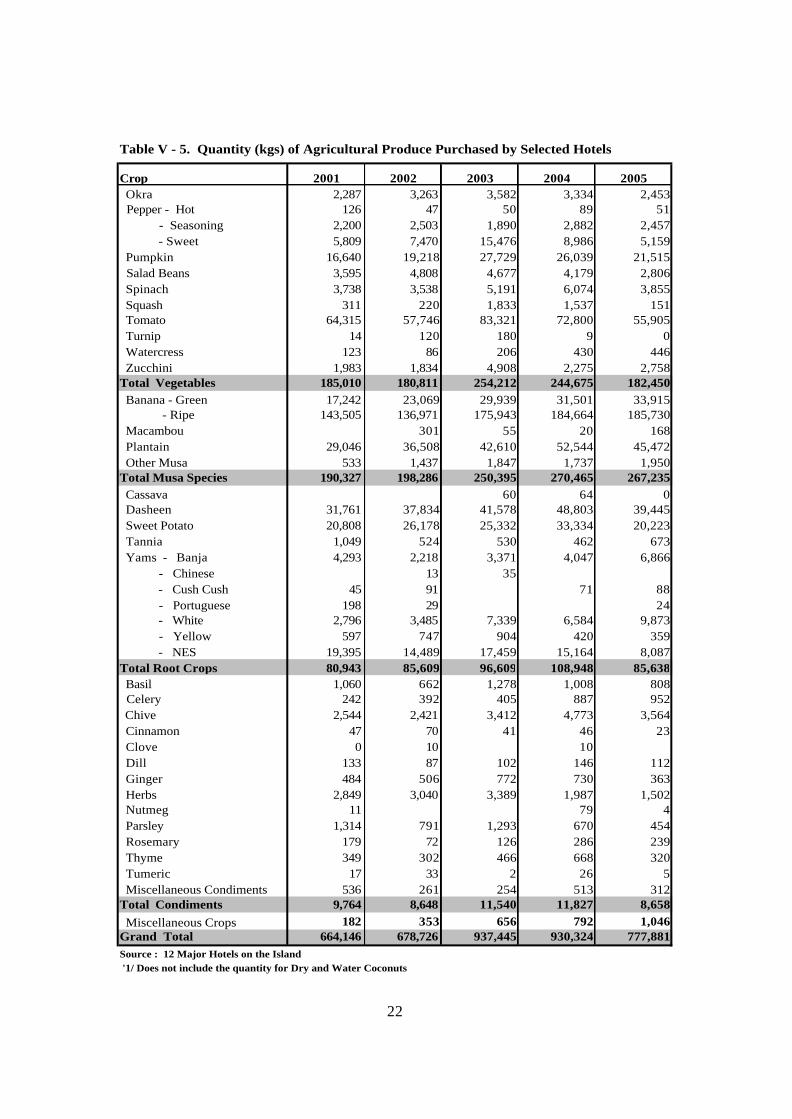
Crop 2001 2002 2003 2004 2005 Okra 2,287 3,263 3,582 3,334 2,453 Pepper - Hot 126 47 50 89 51 - Seasoning 2,200 2,503 1,890 2,882 2,457 - Sweet 5,809 7,470 15,476 8,986 5,159 Pumpkin 16,640 19,218 27,729 26,039 21,515 Salad Beans 3,595 4,808 4,677 4,179 2,806 Spinach 3,738 3,538 5,191 6,074 3,855 Squash 311 220 1,833 1,537 151 Tomato 64,315 57,746 83,321 72,800 55,905 Turnip 14 120 180 9 0 Watercress 123 86 206 430 446 Zucchini 1,983 1,834 4,908 2,275 2,758Total Vegetables 185,010 180,811 254,212 244,675 182,450 Banana - Green 17,242 23,069 29,939 31,501 33,915 - Ripe 143,505 136,971 175,943 184,664 185,730 Macambou 301 55 20 168 Plantain 29,046 36,508 42,610 52,544 45,472 Other Musa 533 1,437 1,847 1,737 1,950Total Musa Species 190,327 198,286 250,395 270,465 267,235 Cassava 60 64 0 Dasheen 31,761 37,834 41,578 48,803 39,445 Sweet Potato 20,808 26,178 25,332 33,334 20,223 Tannia 1,049 524 530 462 673 Yams - Banja 4,293 2,218 3,371 4,047 6,866 - Chinese 13 35 - Cush Cush 45 91 71 88 - Portuguese 198 29 24 - White 2,796 3,485 7,339 6,584 9,873 - Yellow 597 747 904 420 359 - NES 19,395 14,489 17,459 15,164 8,087Total Root Crops 80,943 85,609 96,609 108,948 85,638 Basil 1,060 662 1,278 1,008 808 Celery 242 392 405 887 952 Chive 2,544 2,421 3,412 4,773 3,564 Cinnamon 47 70 41 46 23 Clove 0 10 10 Dill 133 87 102 146 112 Ginger 484 506 772 730 363 Herbs 2,849 3,040 3,389 1,987 1,502 Nutmeg 11 79 4 Parsley 1,314 791 1,293 670 454 Rosemary 179 72 126 286 239 Thyme 349 302 466 668 320 Tumeric 17 33 2 26 5 Miscellaneous Condiments 536 261 254 513 312Total Condiments 9,764 8,648 11,540 11,827 8,658 Miscellaneous Crops 182 353 656 792 1,046Grand Total 664,146 678,726 937,445 930,324 777,881Source : 12 Major Hotels on the Island '1/ Does not include the quantity for Dry and Water Coconuts
Table V - 5. Quantity (kgs) of Agricultural Produce Purchased by Selected Hotels
23
Produce Jan Feb Mar Apr May Jun Jul Aug Sep Oct Nov Dec
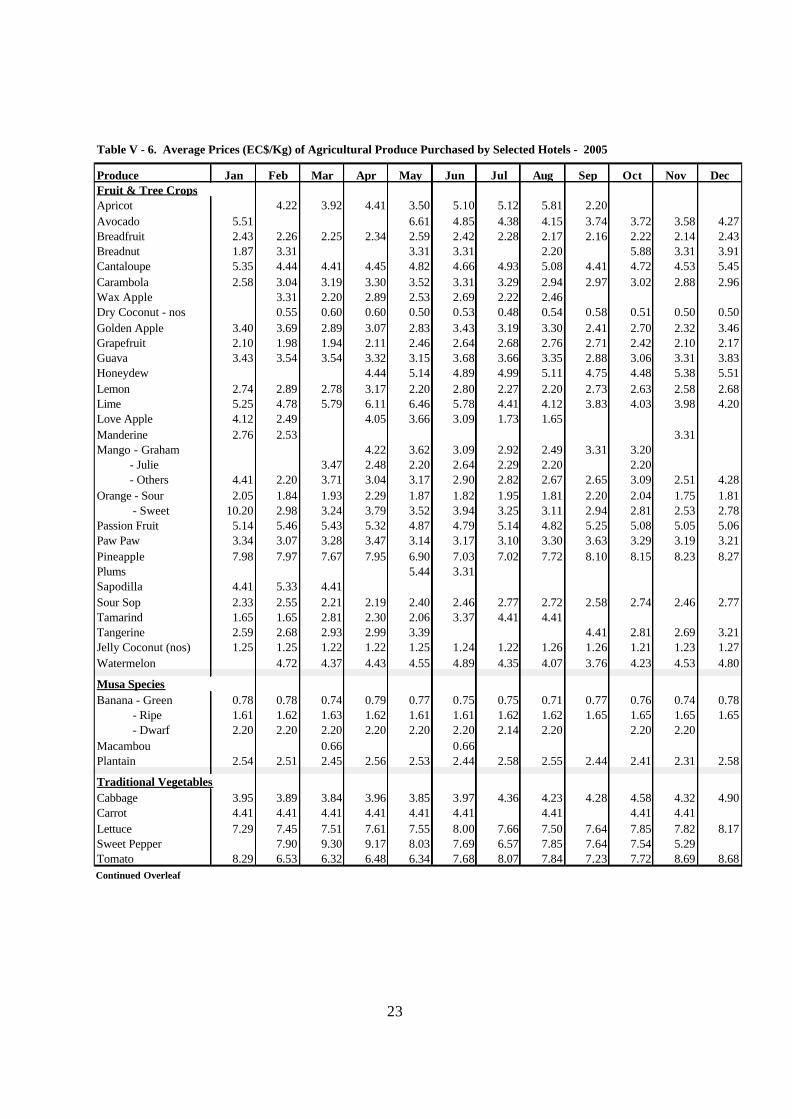
Apricot 4.22 3.92 4.41 3.50 5.10 5.12 5.81 2.20Avocado 5.51 6.61 4.85 4.38 4.15 3.74 3.72 3.58 4.27Breadfruit 2.43 2.26 2.25 2.34 2.59 2.42 2.28 2.17 2.16 2.22 2.14 2.43Breadnut 1.87 3.31 3.31 3.31 2.20 5.88 3.31 3.91Cantaloupe 5.35 4.44 4.41 4.45 4.82 4.66 4.93 5.08 4.41 4.72 4.53 5.45Carambola 2.58 3.04 3.19 3.30 3.52 3.31 3.29 2.94 2.97 3.02 2.88 2.96Wax Apple 3.31 2.20 2.89 2.53 2.69 2.22 2.46Dry Coconut - nos 0.55 0.60 0.60 0.50 0.53 0.48 0.54 0.58 0.51 0.50 0.50Golden Apple 3.40 3.69 2.89 3.07 2.83 3.43 3.19 3.30 2.41 2.70 2.32 3.46Grapefruit 2.10 1.98 1.94 2.11 2.46 2.64 2.68 2.76 2.71 2.42 2.10 2.17Guava 3.43 3.54 3.54 3.32 3.15 3.68 3.66 3.35 2.88 3.06 3.31 3.83Honeydew 4.44 5.14 4.89 4.99 5.11 4.75 4.48 5.38 5.51Lemon 2.74 2.89 2.78 3.17 2.20 2.80 2.27 2.20 2.73 2.63 2.58 2.68Lime 5.25 4.78 5.79 6.11 6.46 5.78 4.41 4.12 3.83 4.03 3.98 4.20Love Apple 4.12 2.49 4.05 3.66 3.09 1.73 1.65Manderine 2.76 2.53 3.31Mango - Graham 4.22 3.62 3.09 2.92 2.49 3.31 3.20 - Julie 3.47 2.48 2.20 2.64 2.29 2.20 2.20 - Others 4.41 2.20 3.71 3.04 3.17 2.90 2.82 2.67 2.65 3.09 2.51 4.28Orange - Sour 2.05 1.84 1.93 2.29 1.87 1.82 1.95 1.81 2.20 2.04 1.75 1.81 - Sweet 10.20 2.98 3.24 3.79 3.52 3.94 3.25 3.11 2.94 2.81 2.53 2.78Passion Fruit 5.14 5.46 5.43 5.32 4.87 4.79 5.14 4.82 5.25 5.08 5.05 5.06Paw Paw 3.34 3.07 3.28 3.47 3.14 3.17 3.10 3.30 3.63 3.29 3.19 3.21Pineapple 7.98 7.97 7.67 7.95 6.90 7.03 7.02 7.72 8.10 8.15 8.23 8.27Plums 5.44 3.31Sapodilla 4.41 5.33 4.41Sour Sop 2.33 2.55 2.21 2.19 2.40 2.46 2.77 2.72 2.58 2.74 2.46 2.77Tamarind 1.65 1.65 2.81 2.30 2.06 3.37 4.41 4.41Tangerine 2.59 2.68 2.93 2.99 3.39 4.41 2.81 2.69 3.21Jelly Coconut (nos) 1.25 1.25 1.22 1.22 1.25 1.24 1.22 1.26 1.26 1.21 1.23 1.27Watermelon 4.72 4.37 4.43 4.55 4.89 4.35 4.07 3.76 4.23 4.53 4.80
Banana - Green 0.78 0.78 0.74 0.79 0.77 0.75 0.75 0.71 0.77 0.76 0.74 0.78 - Ripe 1.61 1.62 1.63 1.62 1.61 1.61 1.62 1.62 1.65 1.65 1.65 1.65 - Dwarf 2.20 2.20 2.20 2.20 2.20 2.20 2.14 2.20 2.20 2.20Macambou 0.66 0.66Plantain 2.54 2.51 2.45 2.56 2.53 2.44 2.58 2.55 2.44 2.41 2.31 2.58
Cabbage 3.95 3.89 3.84 3.96 3.85 3.97 4.36 4.23 4.28 4.58 4.32 4.90Carrot 4.41 4.41 4.41 4.41 4.41 4.41 4.41 4.41 4.41Lettuce 7.29 7.45 7.51 7.61 7.55 8.00 7.66 7.50 7.64 7.85 7.82 8.17Sweet Pepper 7.90 9.30 9.17 8.03 7.69 6.57 7.85 7.64 7.54 5.29Tomato 8.29 6.53 6.32 6.48 6.34 7.68 8.07 7.84 7.23 7.72 8.69 8.68Continued Overleaf
Table V - 6. Average Prices (EC$/Kg) of Agricultural Produce Purchased by Selected Hotels - 2005
Fruit & Tree Crops
Musa Species
Traditional Vegetables
24
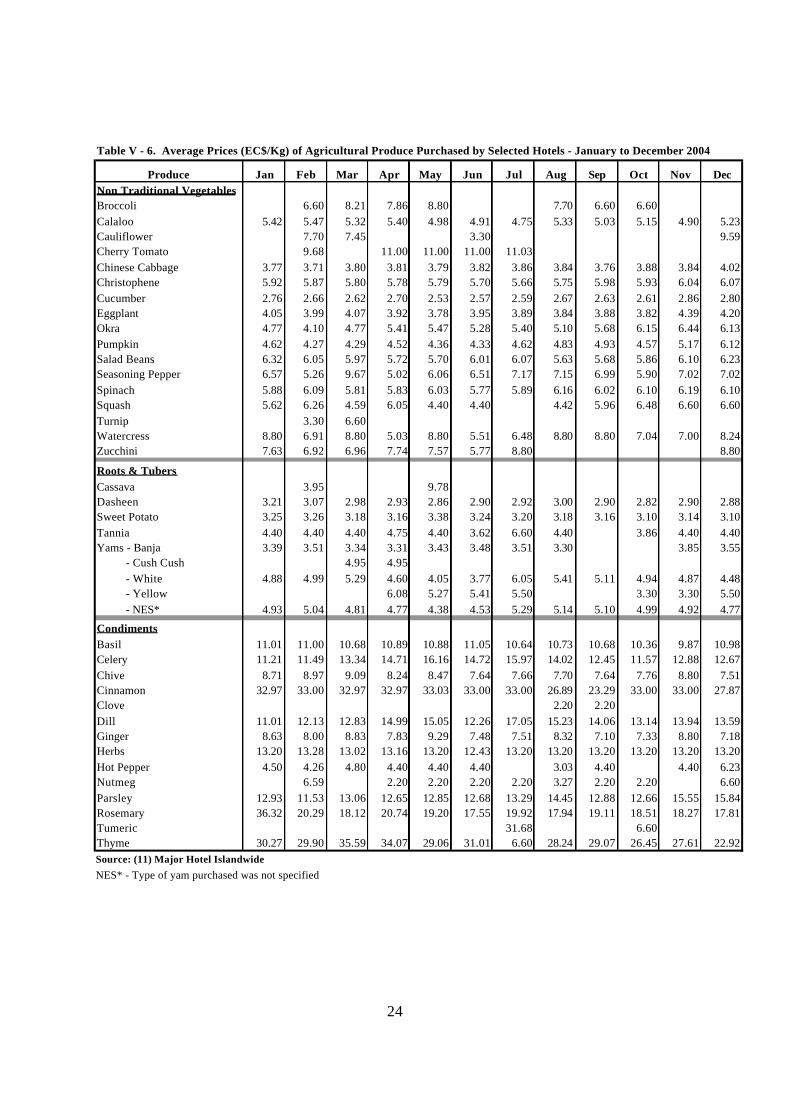
Produce Jan Feb Mar Apr May Jun Jul Aug Sep Oct Nov DecNon Traditional VegetablesBroccoli 6.60 8.21 7.86 8.80 7.70 6.60 6.60Calaloo 5.42 5.47 5.32 5.40 4.98 4.91 4.75 5.33 5.03 5.15 4.90 5.23Cauliflower 7.70 7.45 3.30 9.59Cherry Tomato 9.68 11.00 11.00 11.00 11.03Chinese Cabbage 3.77 3.71 3.80 3.81 3.79 3.82 3.86 3.84 3.76 3.88 3.84 4.02Christophene 5.92 5.87 5.80 5.78 5.79 5.70 5.66 5.75 5.98 5.93 6.04 6.07Cucumber 2.76 2.66 2.62 2.70 2.53 2.57 2.59 2.67 2.63 2.61 2.86 2.80Eggplant 4.05 3.99 4.07 3.92 3.78 3.95 3.89 3.84 3.88 3.82 4.39 4.20Okra 4.77 4.10 4.77 5.41 5.47 5.28 5.40 5.10 5.68 6.15 6.44 6.13Pumpkin 4.62 4.27 4.29 4.52 4.36 4.33 4.62 4.83 4.93 4.57 5.17 6.12Salad Beans 6.32 6.05 5.97 5.72 5.70 6.01 6.07 5.63 5.68 5.86 6.10 6.23Seasoning Pepper 6.57 5.26 9.67 5.02 6.06 6.51 7.17 7.15 6.99 5.90 7.02 7.02Spinach 5.88 6.09 5.81 5.83 6.03 5.77 5.89 6.16 6.02 6.10 6.19 6.10Squash 5.62 6.26 4.59 6.05 4.40 4.40 4.42 5.96 6.48 6.60 6.60Turnip 3.30 6.60Watercress 8.80 6.91 8.80 5.03 8.80 5.51 6.48 8.80 8.80 7.04 7.00 8.24Zucchini 7.63 6.92 6.96 7.74 7.57 5.77 8.80 8.80
Roots & TubersCassava 3.95 9.78Dasheen 3.21 3.07 2.98 2.93 2.86 2.90 2.92 3.00 2.90 2.82 2.90 2.88Sweet Potato 3.25 3.26 3.18 3.16 3.38 3.24 3.20 3.18 3.16 3.10 3.14 3.10Tannia 4.40 4.40 4.40 4.75 4.40 3.62 6.60 4.40 3.86 4.40 4.40Yams - Banja 3.39 3.51 3.34 3.31 3.43 3.48 3.51 3.30 3.85 3.55 - Cush Cush 4.95 4.95 - White 4.88 4.99 5.29 4.60 4.05 3.77 6.05 5.41 5.11 4.94 4.87 4.48 - Yellow 6.08 5.27 5.41 5.50 3.30 3.30 5.50 - NES* 4.93 5.04 4.81 4.77 4.38 4.53 5.29 5.14 5.10 4.99 4.92 4.77
CondimentsBasil 11.01 11.00 10.68 10.89 10.88 11.05 10.64 10.73 10.68 10.36 9.87 10.98Celery 11.21 11.49 13.34 14.71 16.16 14.72 15.97 14.02 12.45 11.57 12.88 12.67Chive 8.71 8.97 9.09 8.24 8.47 7.64 7.66 7.70 7.64 7.76 8.80 7.51Cinnamon 32.97 33.00 32.97 32.97 33.03 33.00 33.00 26.89 23.29 33.00 33.00 27.87Clove 2.20 2.20Dill 11.01 12.13 12.83 14.99 15.05 12.26 17.05 15.23 14.06 13.14 13.94 13.59Ginger 8.63 8.00 8.83 7.83 9.29 7.48 7.51 8.32 7.10 7.33 8.80 7.18Herbs 13.20 13.28 13.02 13.16 13.20 12.43 13.20 13.20 13.20 13.20 13.20 13.20Hot Pepper 4.50 4.26 4.80 4.40 4.40 4.40 3.03 4.40 4.40 6.23Nutmeg 6.59 2.20 2.20 2.20 2.20 3.27 2.20 2.20 6.60Parsley 12.93 11.53 13.06 12.65 12.85 12.68 13.29 14.45 12.88 12.66 15.55 15.84Rosemary 36.32 20.29 18.12 20.74 19.20 17.55 19.92 17.94 19.11 18.51 18.27 17.81Tumeric 31.68 6.60Thyme 30.27 29.90 35.59 34.07 29.06 31.01 6.60 28.24 29.07 26.45 27.61 22.92Source: (11) Major Hotel Islandwide
NES* - Type of yam purchased was not specified
Table V - 6. Average Prices (EC$/Kg) of Agricultural Produce Purchased by Selected Hotels - January to December 2004
25
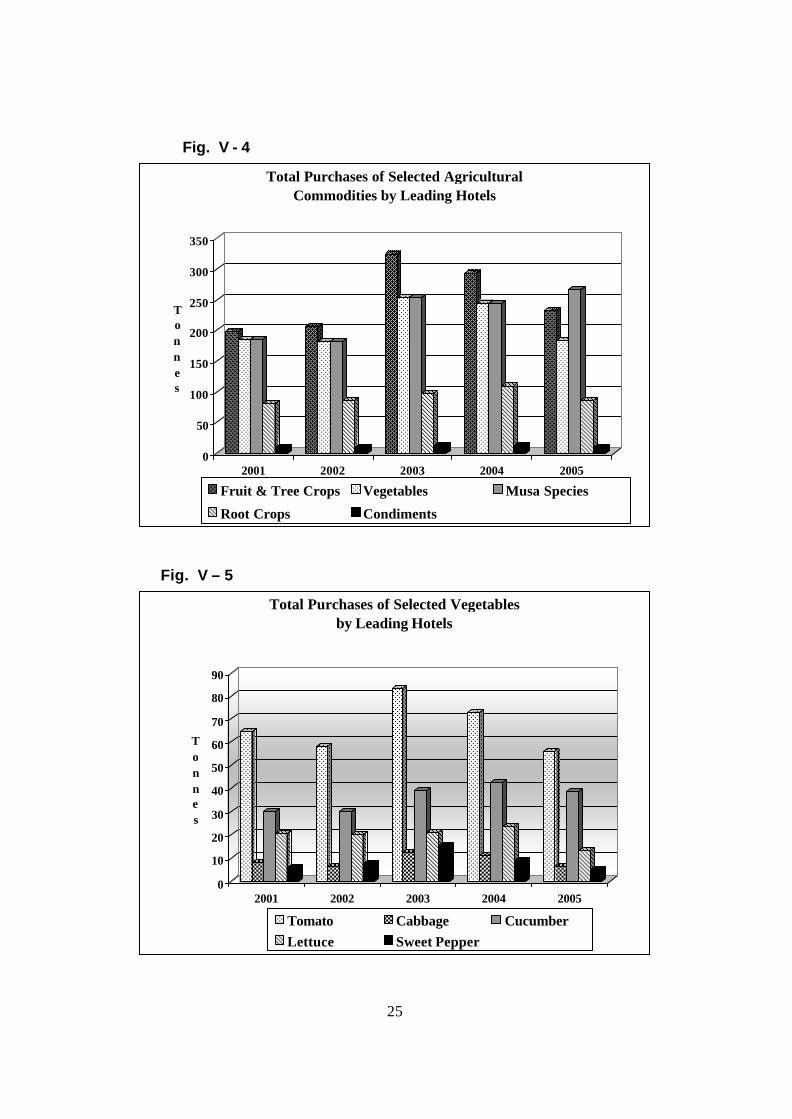
Fig. V - 4
0
50
100
150
200
250
300
350
Tonnes
2001 2002 2003 2004 2005
Total Purchases of Selected Agricultural Commodities by Leading Hotels
Fruit & Tree Crops Vegetables Musa Species
Root Crops Condiments
Fig. V – 5
0
10
20
30
40
50
60
70
80
90
Tonnes
2001 2002 2003 2004 2005
Total Purchases of Selected Vegetables by Leading Hotels
Tomato Cabbage CucumberLettuce Sweet Pepper
26
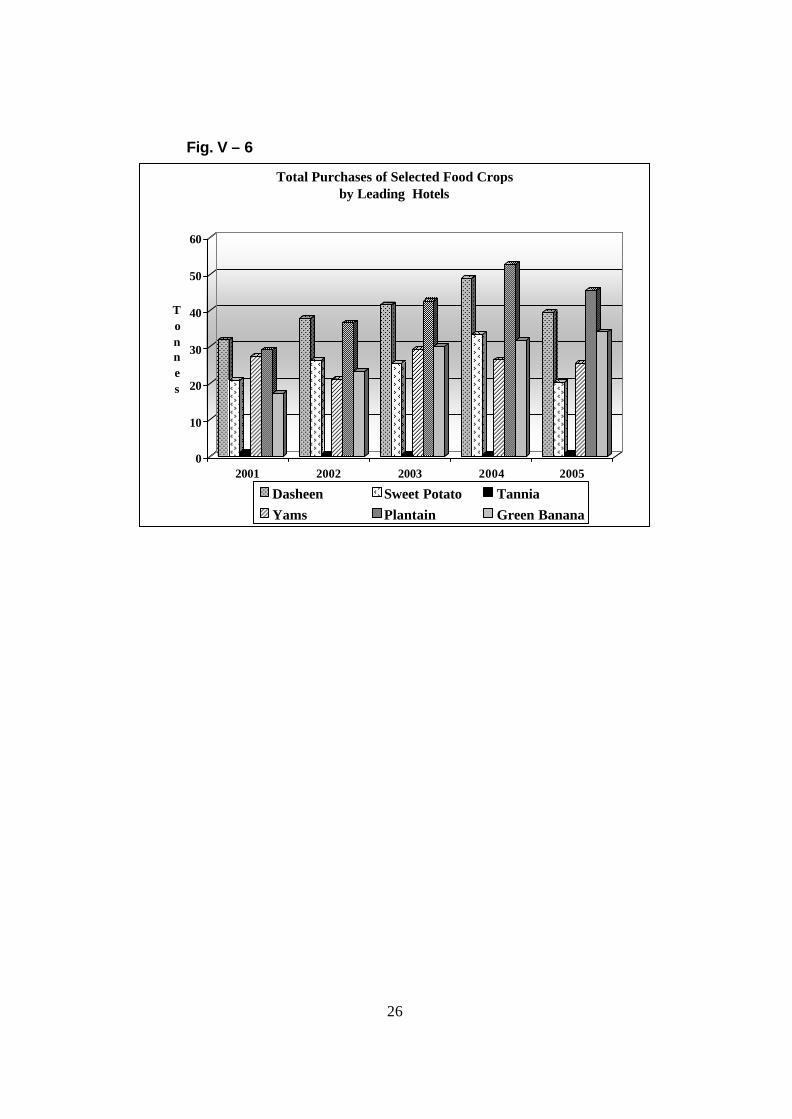
Fig. V – 6
0
10
20
30
40
50
60
Tonnes
2001 2002 2003 2004 2005
Total Purchases of Selected Food Crops by Leading Hotels
Dasheen Sweet Potato TanniaYams Plantain Green Banana
27
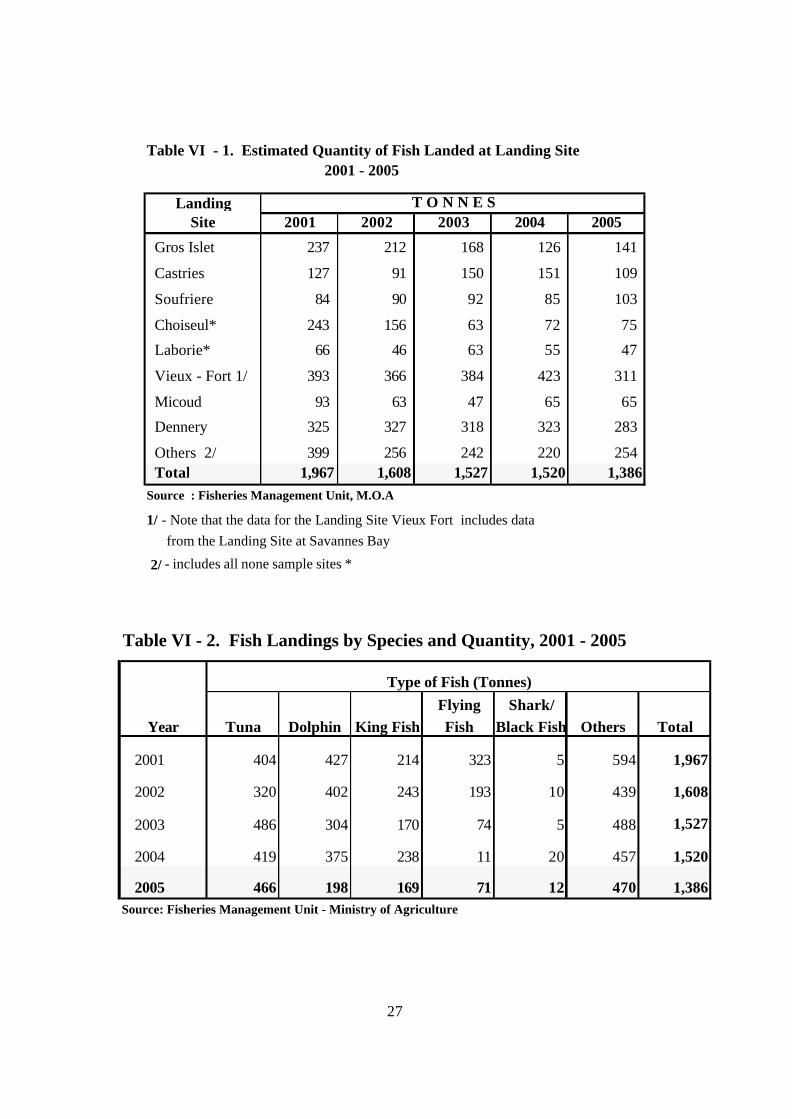
2001 2002 2003 2004 2005
Gros Islet 237 212 168 126 141
Castries 127 91 150 151 109
Soufriere 84 90 92 85 103
Choiseul* 243 156 63 72 75
Laborie* 66 46 63 55 47
Vieux - Fort 1/ 393 366 384 423 311
Micoud 93 63 47 65 65
Dennery 325 327 318 323 283
Others 2/ 399 256 242 220 254 Total 1,967 1,608 1,527 1,520 1,386Source : Fisheries Management Unit, M.O.A
1/ - Note that the data for the Landing Site Vieux Fort includes data from the Landing Site at Savannes Bay
2/ - includes all none sample sites *
Table VI - 1. Estimated Quantity of Fish Landed at Landing Site 2001 - 2005
Landing Site
T O N N E S
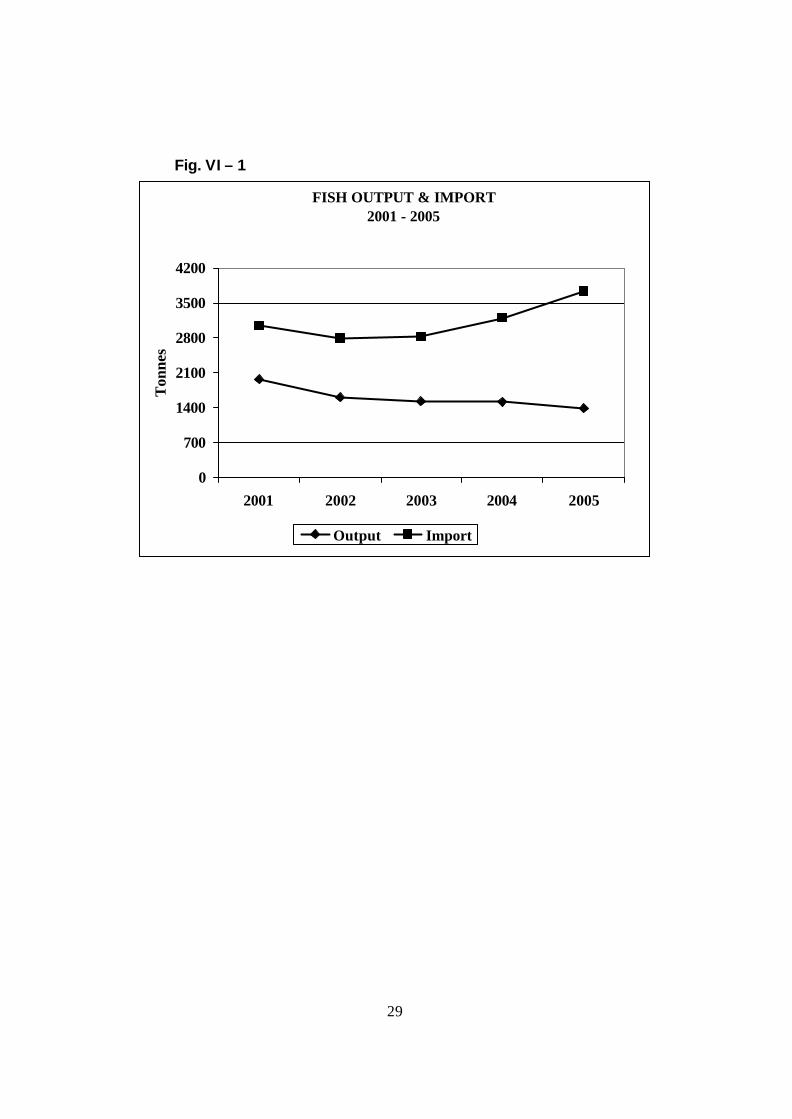
Flying Shark/Year Tuna Dolphin King Fish Fish Black Fish Others Total
2001 404 427 214 323 5 594 1,967
2002 320 402 243 193 10 439 1,608
2003 486 304 170 74 5 488 1,527
2004 419 375 238 11 20 457 1,520
2005 466 198 169 71 12 470 1,386Source: Fisheries Management Unit - Ministry of Agriculture
Type of Fish (Tonnes)
Table VI - 2. Fish Landings by Species and Quantity, 2001 - 2005
28
Total Fresh & Chilled Canned Other
Year Tonnes $'000 Tonnes $'000 Tonnes $'000 Tonnes $'000
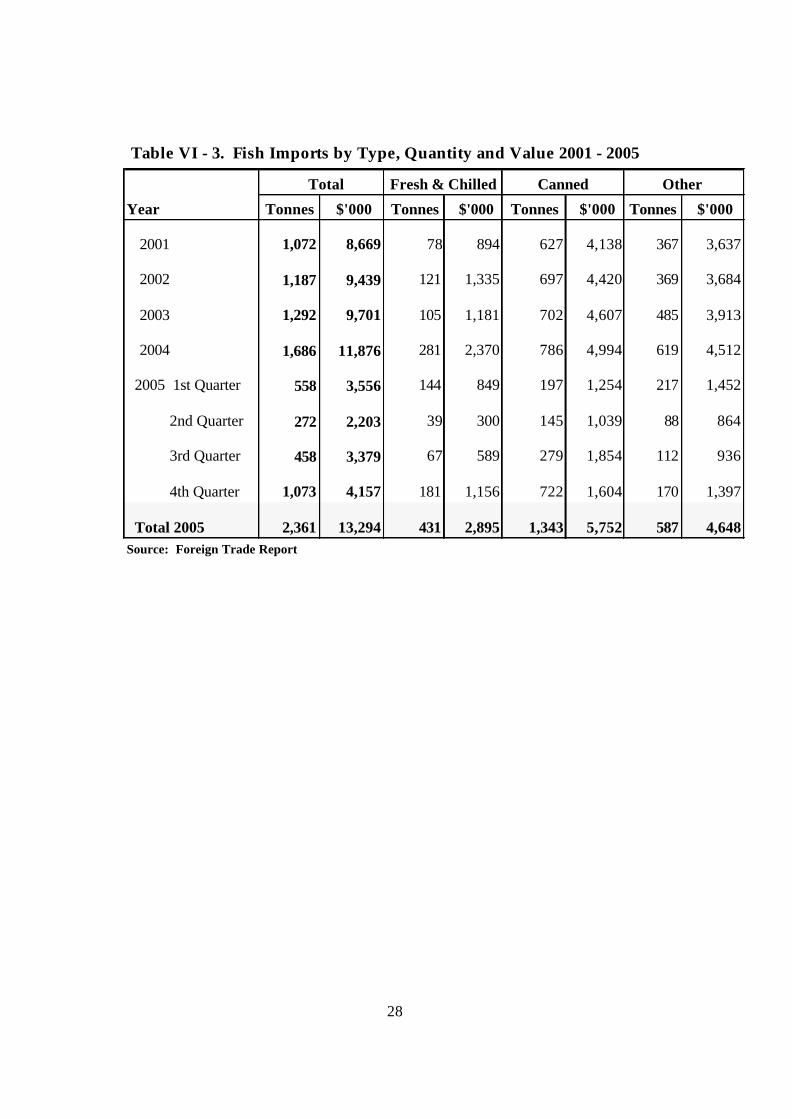
2001 1,072 8,669 78 894 627 4,138 367 3,637
2002 1,187 9,439 121 1,335 697 4,420 369 3,684
2003 1,292 9,701 105 1,181 702 4,607 485 3,913
2004 1,686 11,876 281 2,370 786 4,994 619 4,512
2005 1st Quarter 558 3,556 144 849 197 1,254 217 1,452
2nd Quarter 272 2,203 39 300 145 1,039 88 864
3rd Quarter 458 3,379 67 589 279 1,854 112 936
4th Quarter 1,073 4,157 181 1,156 722 1,604 170 1,397
Total 2005 2,361 13,294 431 2,895 1,343 5,752 587 4,648Source: Foreign Trade Report
Table VI - 3. Fish Imports by Type, Quantity and Value 2001 - 2005
29
Fig. VI – 1
FISH OUTPUT & IMPORT2001 - 2005
0
700
1400
2100
2800
3500
4200
2001 2002 2003 2004 2005
Ton
nes
Output Import
30
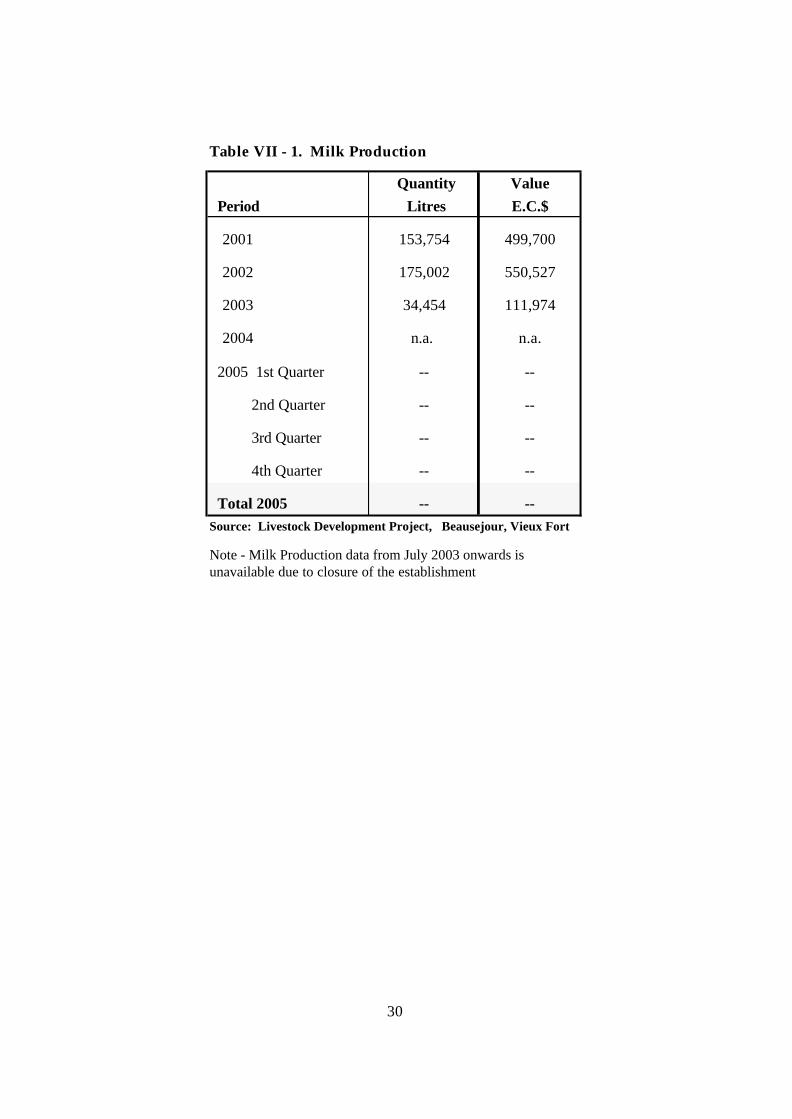
Table VII - 1. Milk Production
Quantity Value Period Litres E.C.$
2001 153,754 499,700
2002 175,002 550,527
2003 34,454 111,974
2004 n.a. n.a.
2005 1st Quarter -- --
2nd Quarter -- --
3rd Quarter -- --
4th Quarter -- --
Total 2005 -- --Source: Livestock Development Project, Beausejour, Vieux Fort
Note - Milk Production data from July 2003 onwards is unavailable due to closure of the establishment
31
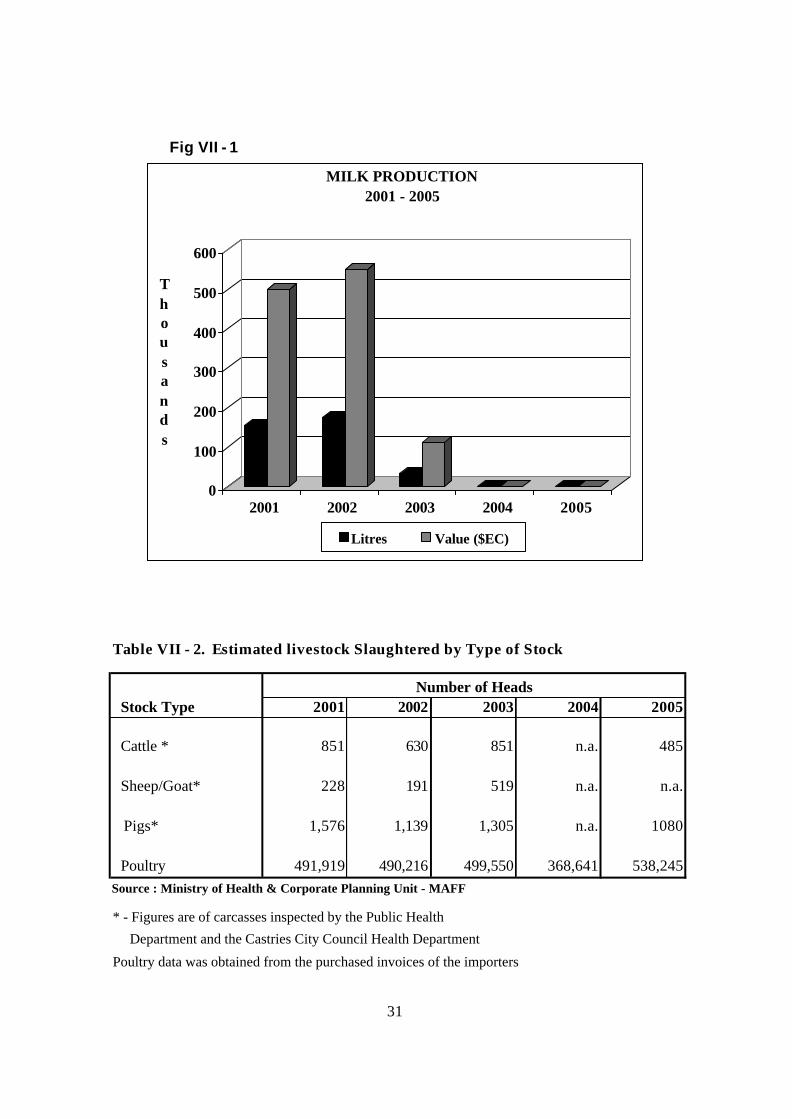
Fig VII - 1
0
100
200
300
400
500
600
Thousands
2001 2002 2003 2004 2005
MILK PRODUCTION2001 - 2005
Litres Value ($EC)
Stock Type 2001 2002 2003 2004 2005
Cattle * 851 630 851 n.a. 485
Sheep/Goat* 228 191 519 n.a. n.a.
Pigs* 1,576 1,139 1,305 n.a. 1080
Poultry 491,919 490,216 499,550 368,641 538,245Source : Ministry of Health & Corporate Planning Unit - MAFF * - Figures are of carcasses inspected by the Public Health
Department and the Castries City Council Health Department
Poultry data was obtained from the purchased invoices of the importers
Table VII - 2. Estimated livestock Slaughtered by Type of Stock
Number of Heads
32
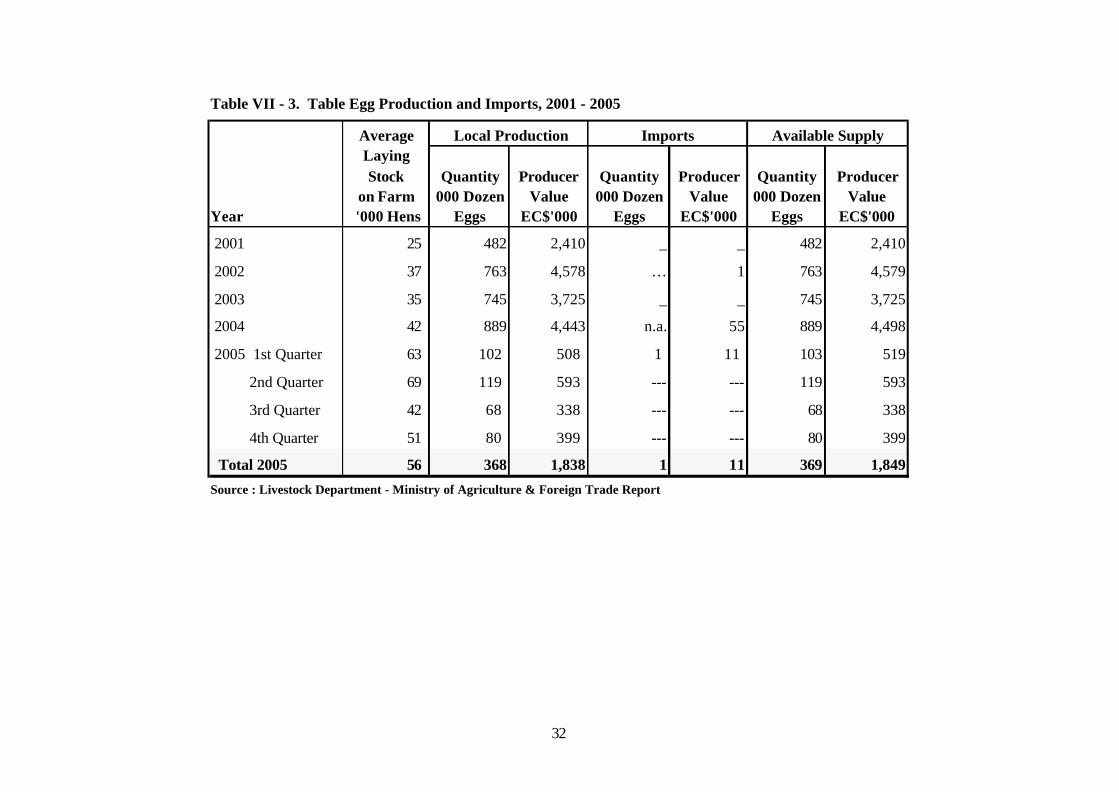
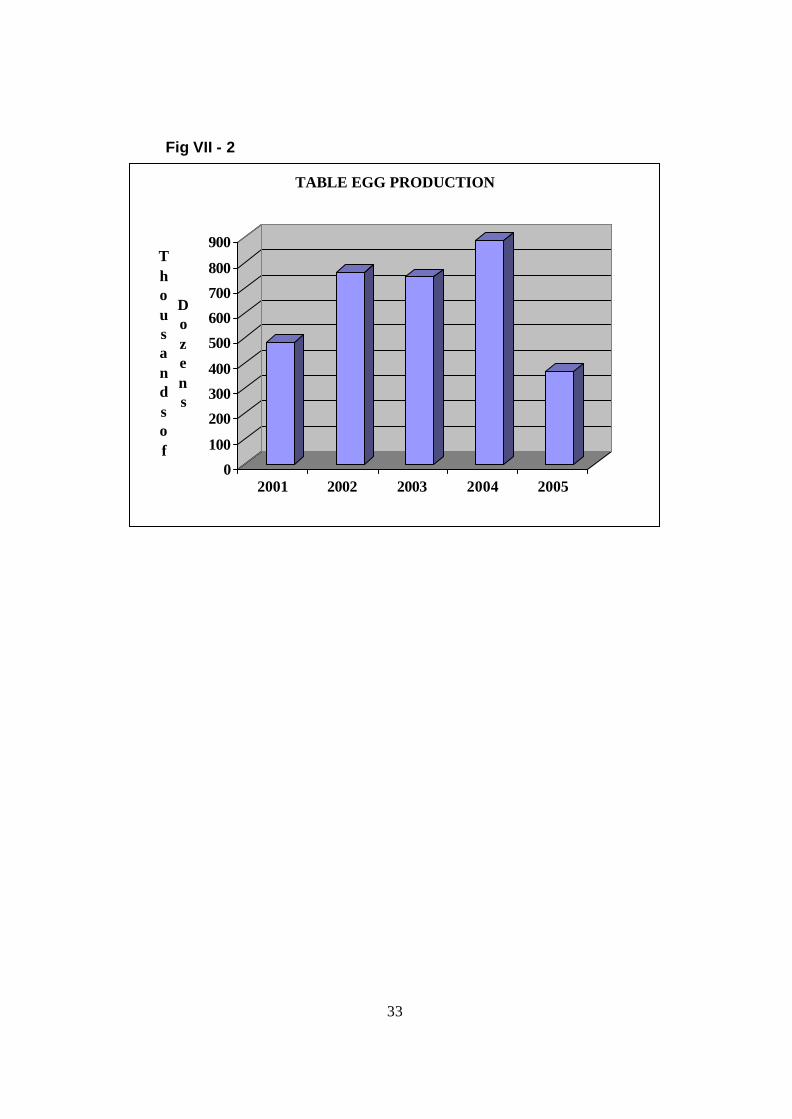
AverageLayingStock Quantity Producer Quantity Producer Quantity Producer
on Farm 000 Dozen Value 000 Dozen Value 000 Dozen ValueYear '000 Hens Eggs EC$'000 Eggs EC$'000 Eggs EC$'000
2001 25 482 2,410 _ _ 482 2,410
2002 37 763 4,578 … 1 763 4,579
2003 35 745 3,725 _ _ 745 3,725
2004 42 889 4,443 n.a. 55 889 4,498
2005 1st Quarter 63 102 508 1 11 103 519
2nd Quarter 69 119 593 --- --- 119 593
3rd Quarter 42 68 338 --- --- 68 338
4th Quarter 51 80 399 --- --- 80 399
Total 2005 56 368 1,838 1 11 369 1,849
Table VII - 3. Table Egg Production and Imports, 2001 - 2005
Available Supply
Source : Livestock Department - Ministry of Agriculture & Foreign Trade Report
Local Production Imports
33
Fig VII - 2
0
100
200
300
400
500
600
700
800
900Thousandsof
Dozens
2001 2002 2003 2004 2005
TABLE EGG PRODUCTION
34
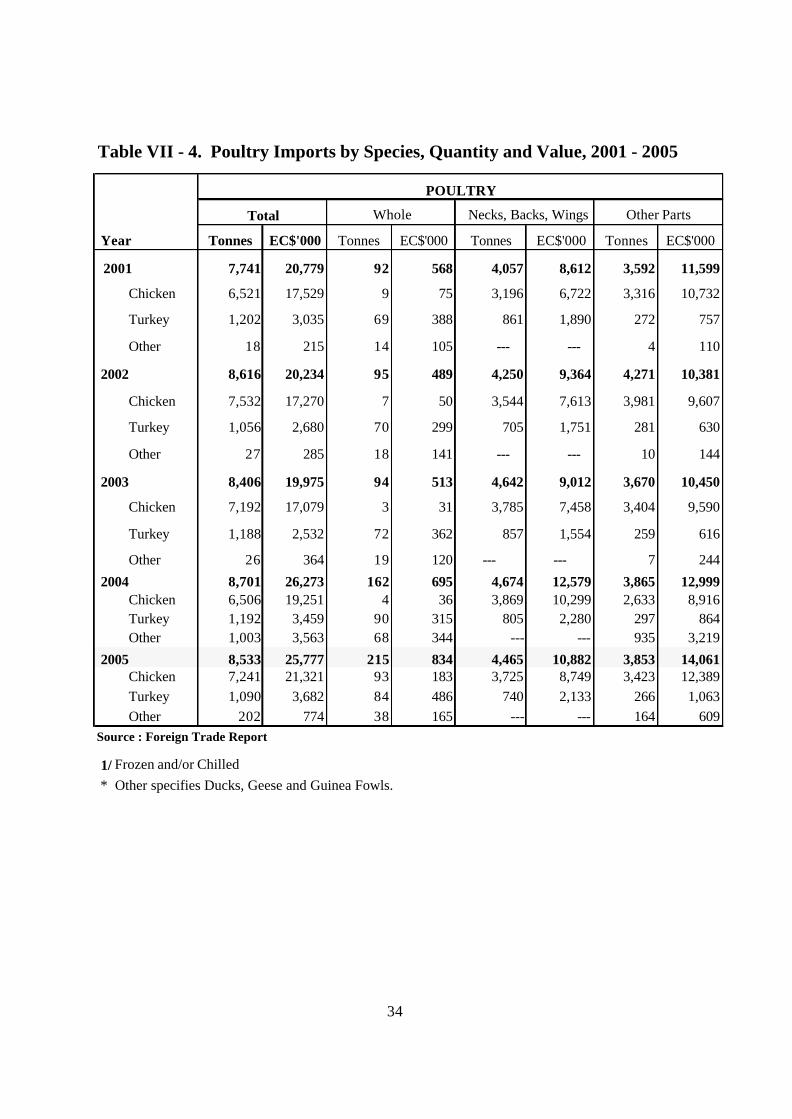
Year Tonnes EC$'000 Tonnes EC$'000 Tonnes EC$'000 Tonnes EC$'000
2001 7,741 20,779 92 568 4,057 8,612 3,592 11,599
Chicken 6,521 17,529 9 75 3,196 6,722 3,316 10,732
Turkey 1,202 3,035 69 388 861 1,890 272 757
Other 18 215 14 105 --- --- 4 110
2002 8,616 20,234 95 489 4,250 9,364 4,271 10,381
Chicken 7,532 17,270 7 50 3,544 7,613 3,981 9,607
Turkey 1,056 2,680 70 299 705 1,751 281 630
Other 27 285 18 141 --- --- 10 144
2003 8,406 19,975 94 513 4,642 9,012 3,670 10,450
Chicken 7,192 17,079 3 31 3,785 7,458 3,404 9,590
Turkey 1,188 2,532 72 362 857 1,554 259 616
Other 26 364 19 120 --- --- 7 244
2004 8,701 26,273 162 695 4,674 12,579 3,865 12,999 Chicken 6,506 19,251 4 36 3,869 10,299 2,633 8,916 Turkey 1,192 3,459 90 315 805 2,280 297 864 Other 1,003 3,563 68 344 --- --- 935 3,219
2005 8,533 25,777 215 834 4,465 10,882 3,853 14,061 Chicken 7,241 21,321 93 183 3,725 8,749 3,423 12,389 Turkey 1,090 3,682 84 486 740 2,133 266 1,063 Other 202 774 38 165 --- --- 164 609Source : Foreign Trade Report
1/ Frozen and/or Chilled * Other specifies Ducks, Geese and Guinea Fowls.
POULTRY
Table VII - 4. Poultry Imports by Species, Quantity and Value, 2001 - 2005
Whole Other Parts Necks, Backs, WingsTotal
35
Dressed Weight
(Tonnes)Value
EC$'000
Dressed Weight
(Tonnes)Value
EC$'000
Dressed Weight
(Tonnes)Value
EC$'000
Dressed Weight
(Tonnes)Value
EC$'000
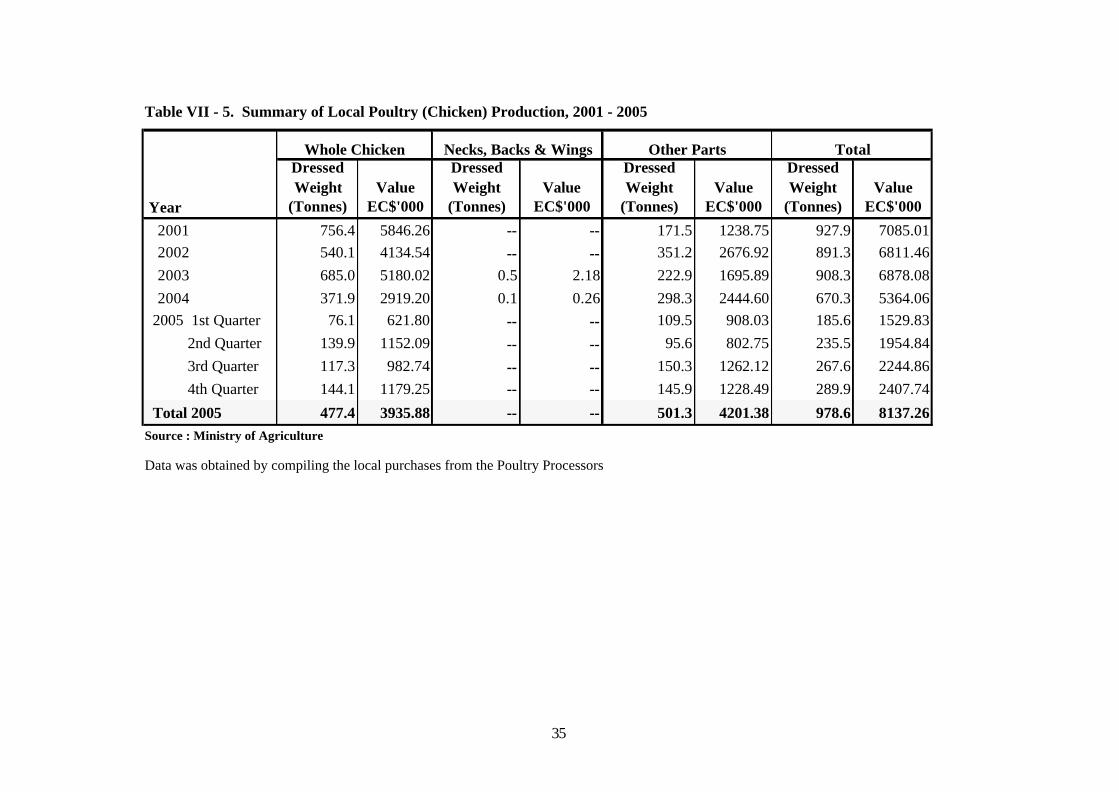
2001 756.4 5846.26 -- -- 171.5 1238.75 927.9 7085.012002 540.1 4134.54 -- -- 351.2 2676.92 891.3 6811.462003 685.0 5180.02 0.5 2.18 222.9 1695.89 908.3 6878.082004 371.9 2919.20 0.1 0.26 298.3 2444.60 670.3 5364.06
2005 1st Quarter 76.1 621.80 -- -- 109.5 908.03 185.6 1529.83 2nd Quarter 139.9 1152.09 -- -- 95.6 802.75 235.5 1954.84 3rd Quarter 117.3 982.74 -- -- 150.3 1262.12 267.6 2244.86 4th Quarter 144.1 1179.25 -- -- 145.9 1228.49 289.9 2407.74
Total 2005 477.4 3935.88 -- -- 501.3 4201.38 978.6 8137.26Source : Ministry of Agriculture
Data was obtained by compiling the local purchases from the Poultry Processors
Table VII - 5. Summary of Local Poultry (Chicken) Production, 2001 - 2005
Whole Chicken Necks, Backs & Wings Other Parts Total
Year
36
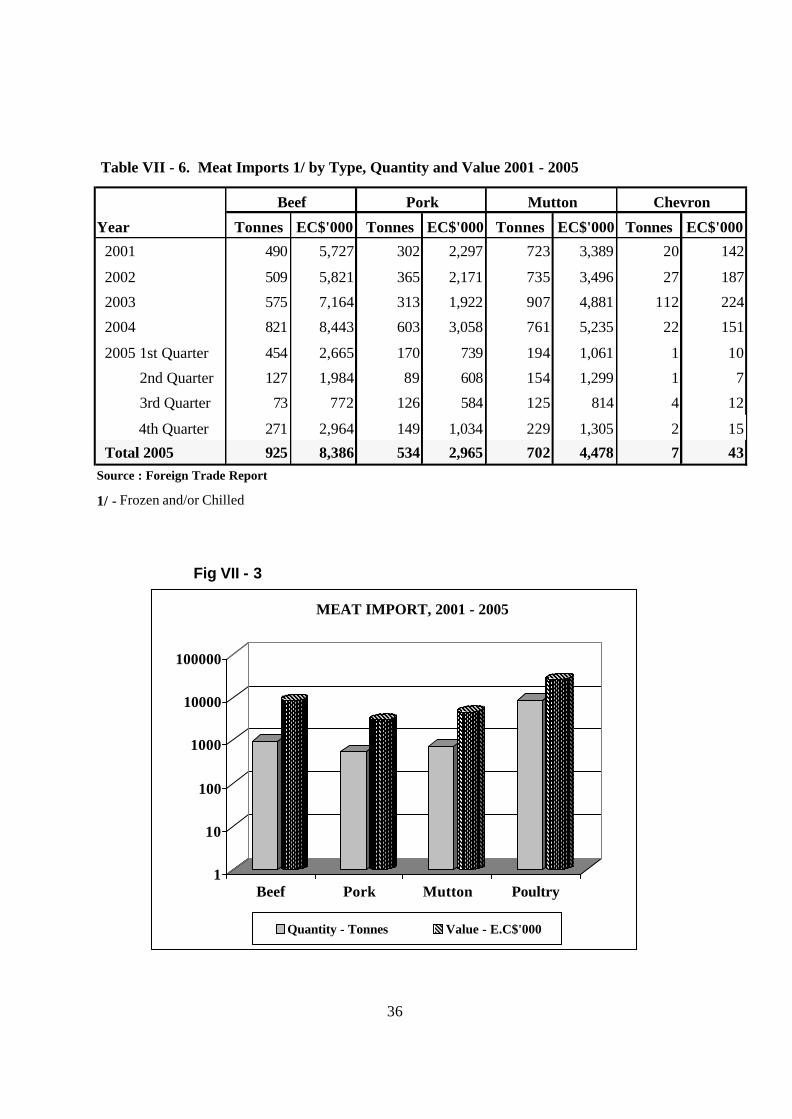
Year Tonnes EC$'000 Tonnes EC$'000 Tonnes EC$'000 Tonnes EC$'000
2001 490 5,727 302 2,297 723 3,389 20 142
2002 509 5,821 365 2,171 735 3,496 27 187
2003 575 7,164 313 1,922 907 4,881 112 224
2004 821 8,443 603 3,058 761 5,235 22 151
2005 1st Quarter 454 2,665 170 739 194 1,061 1 10
2nd Quarter 127 1,984 89 608 154 1,299 1 7
3rd Quarter 73 772 126 584 125 814 4 12
4th Quarter 271 2,964 149 1,034 229 1,305 2 15
Total 2005 925 8,386 534 2,965 702 4,478 7 43Source : Foreign Trade Report
1/ - Frozen and/or Chilled
Table VII - 6. Meat Imports 1/ by Type, Quantity and Value 2001 - 2005
ChevronBeef Pork Mutton
Fig VII - 3
1
10
100
1000
10000
100000
Beef Pork Mutton Poultry
MEAT IMPORT, 2001 - 2005
Quantity - Tonnes Value - E.C$'000
37
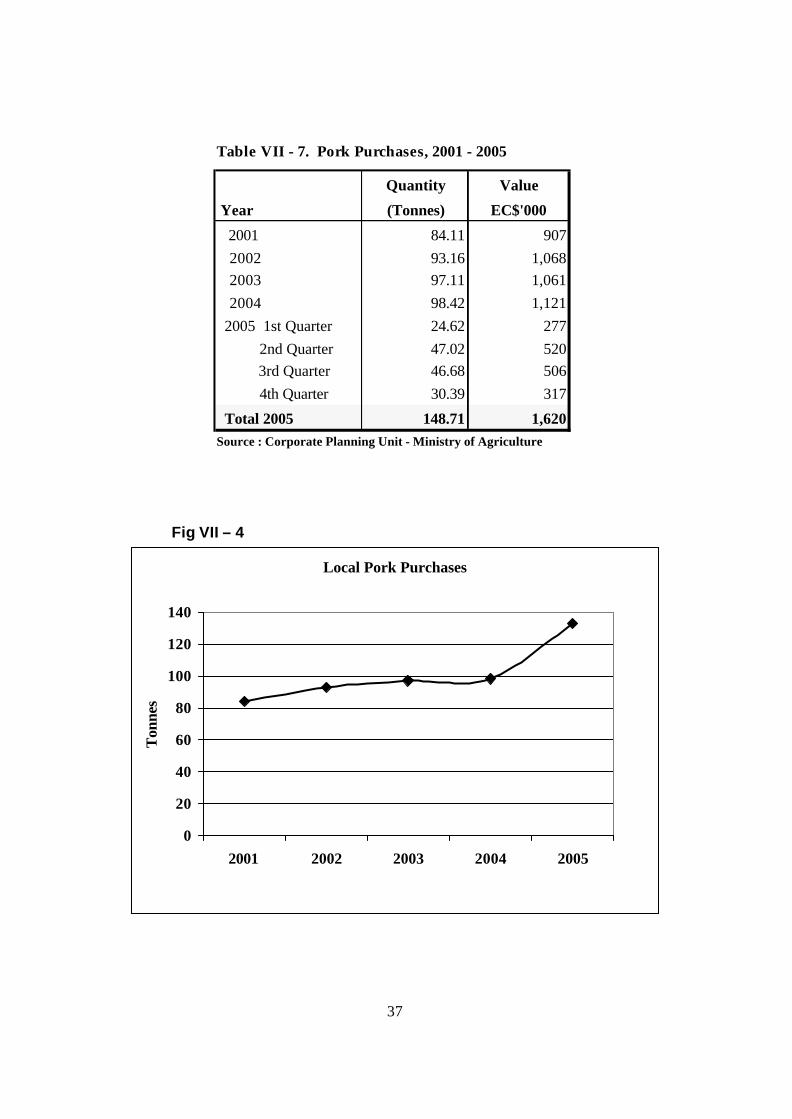
Quantity Value
Year (Tonnes) EC$'000
2001 84.11 9072002 93.16 1,0682003 97.11 1,0612004 98.42 1,121
2005 1st Quarter 24.62 277 2nd Quarter 47.02 520 3rd Quarter 46.68 506 4th Quarter 30.39 317
Total 2005 148.71 1,620Source : Corporate Planning Unit - Ministry of Agriculture
Table VII - 7. Pork Purchases, 2001 - 2005
Fig VII – 4
Local Pork Purchases
0
20
40
60
80
100
120
140
2001 2002 2003 2004 2005
Ton
nes
38
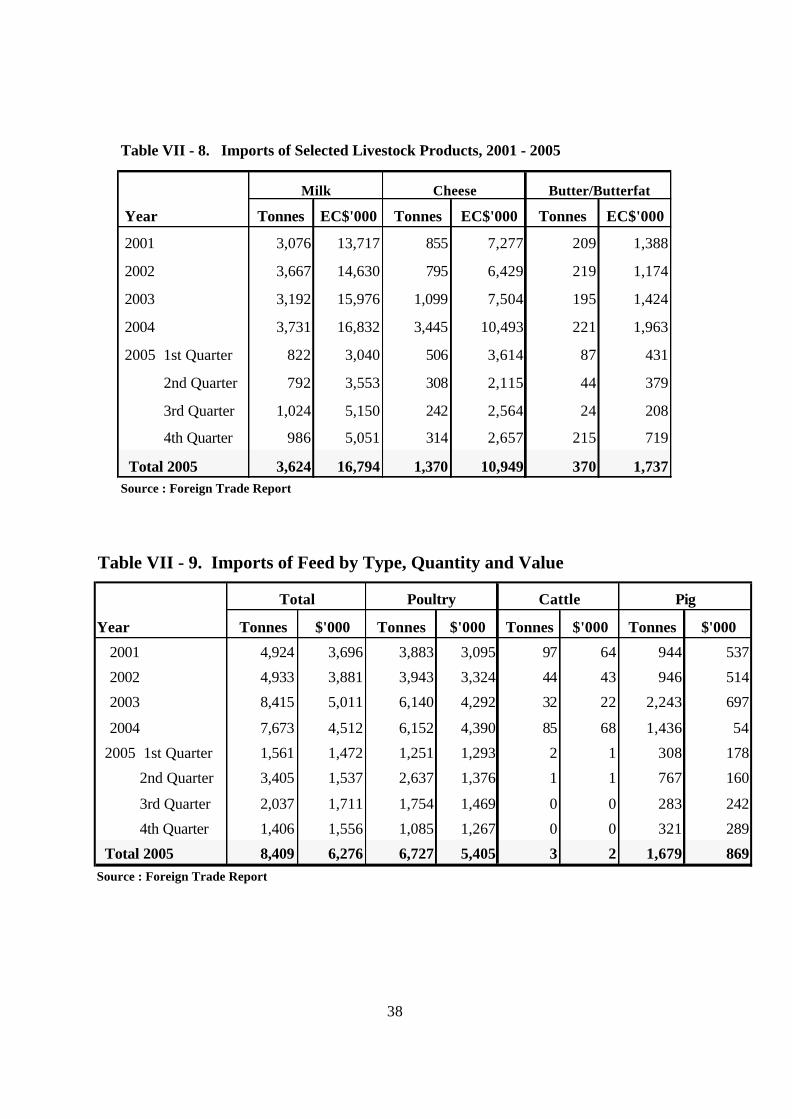
Milk Cheese Butter/Butterfat
Year Tonnes EC$'000 Tonnes EC$'000 Tonnes EC$'000
2001 3,076 13,717 855 7,277 209 1,388
2002 3,667 14,630 795 6,429 219 1,174
2003 3,192 15,976 1,099 7,504 195 1,424
2004 3,731 16,832 3,445 10,493 221 1,963
2005 1st Quarter 822 3,040 506 3,614 87 431
2nd Quarter 792 3,553 308 2,115 44 379
3rd Quarter 1,024 5,150 242 2,564 24 208
4th Quarter 986 5,051 314 2,657 215 719
Total 2005 3,624 16,794 1,370 10,949 370 1,737Source : Foreign Trade Report
Table VII - 8. Imports of Selected Livestock Products, 2001 - 2005
Total Poultry Cattle Pig
Year Tonnes $'000 Tonnes $'000 Tonnes $'000 Tonnes $'000
2001 4,924 3,696 3,883 3,095 97 64 944 537
2002 4,933 3,881 3,943 3,324 44 43 946 514
2003 8,415 5,011 6,140 4,292 32 22 2,243 697
2004 7,673 4,512 6,152 4,390 85 68 1,436 54
2005 1st Quarter 1,561 1,472 1,251 1,293 2 1 308 178
2nd Quarter 3,405 1,537 2,637 1,376 1 1 767 160
3rd Quarter 2,037 1,711 1,754 1,469 0 0 283 242
4th Quarter 1,406 1,556 1,085 1,267 0 0 321 289
Total 2005 8,409 6,276 6,727 5,405 3 2 1,679 869Source : Foreign Trade Report
Table VII - 9. Imports of Feed by Type, Quantity and Value
39
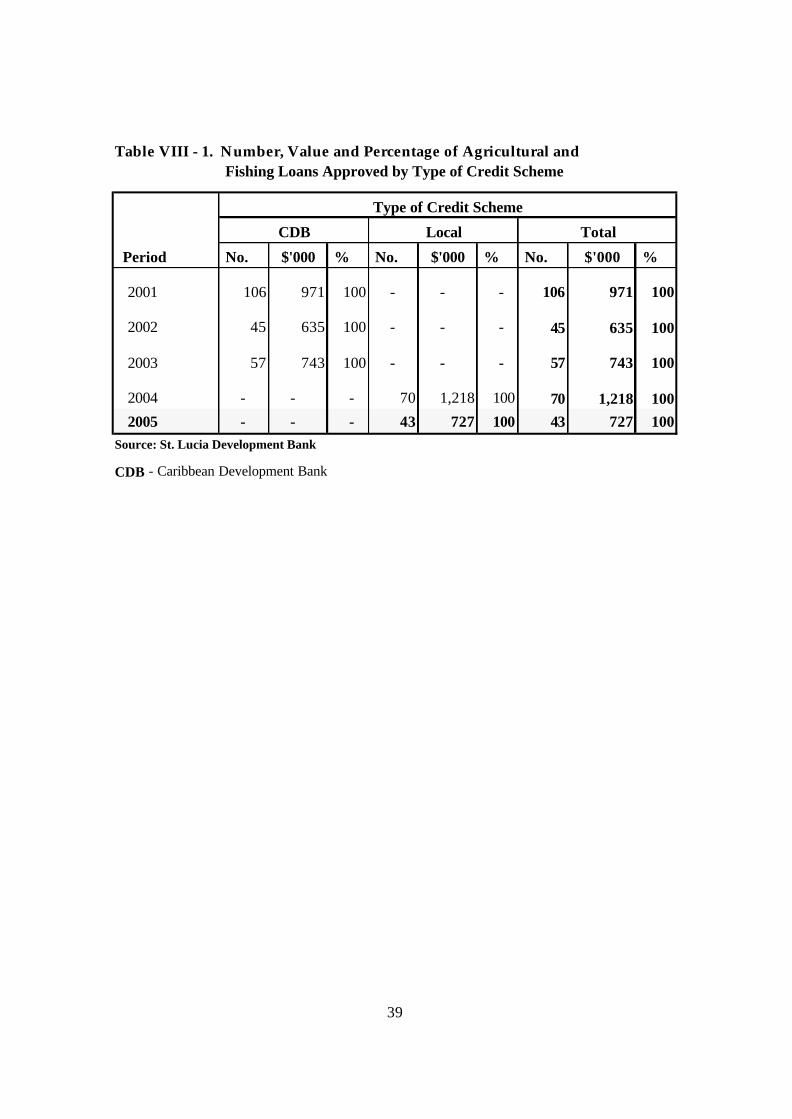
Table VIII - 1. Number, Value and Percentage of Agricultural and Fishing Loans Approved by Type of Credit Scheme
Type of Credit Scheme
Period No. $'000 % No. $'000 % No. $'000 %
2001 106 971 100 - - - 106 971 100
2002 45 635 100 - - - 45 635 100
2003 57 743 100 - - - 57 743 100
2004 - - - 70 1,218 100 70 1,218 1002005 - - - 43 727 100 43 727 100
Source: St. Lucia Development Bank
CDB - Caribbean Development Bank
Local TotalCDB
Fishing Loans Approved by Type of Credit Scheme
40
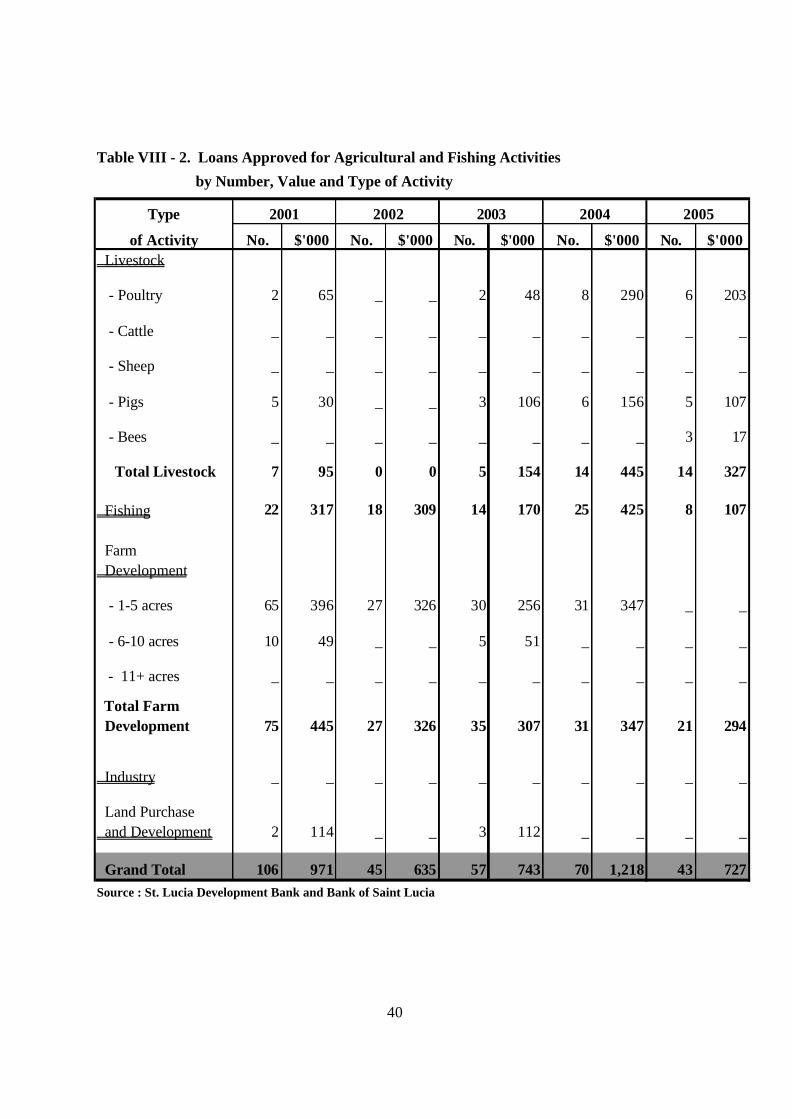
Type
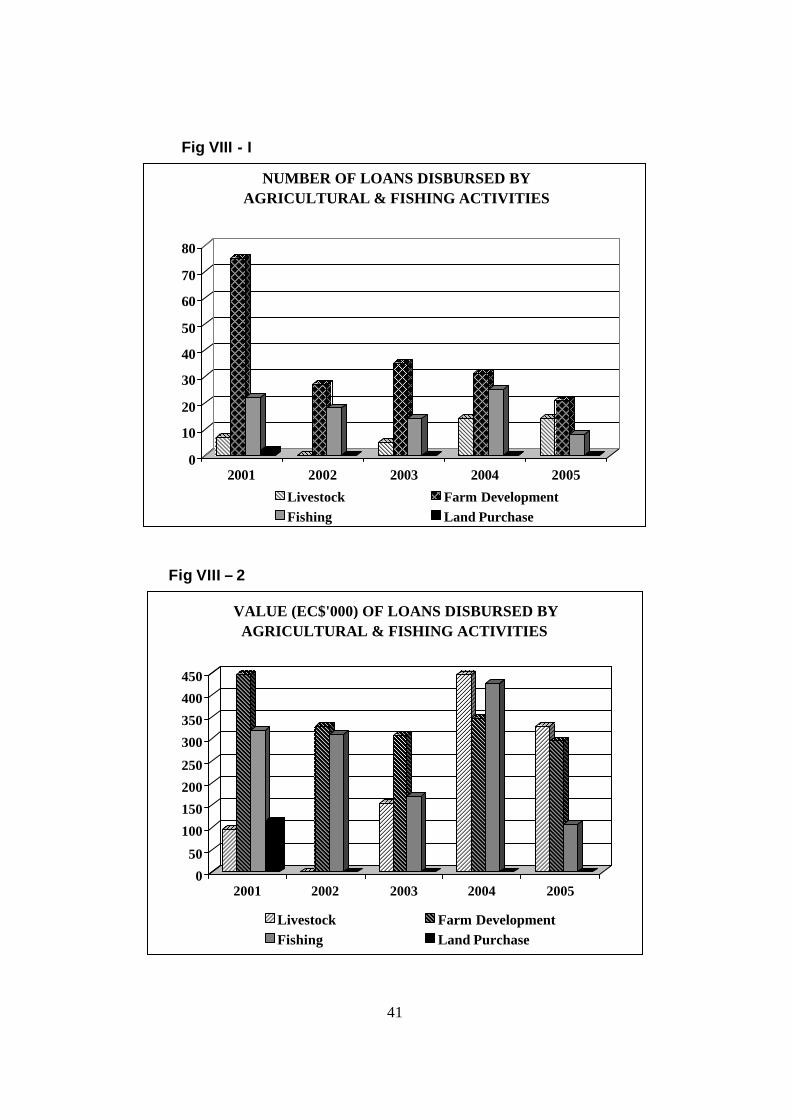
of Activity No. $'000 No. $'000 No. $'000 No. $'000 No. $'000 Livestock
- Poultry 2 65 _ _ 2 48 8 290 6 203
- Cattle _ _ _ _ _ _ _ _ _ _
- Sheep _ _ _ _ _ _ _ _ _ _
- Pigs 5 30 _ _ 3 106 6 156 5 107
- Bees _ _ _ _ _ _ _ _ 3 17
Total Livestock 7 95 0 0 5 154 14 445 14 327
Fishing 22 317 18 309 14 170 25 425 8 107
Farm Development
- 1-5 acres 65 396 27 326 30 256 31 347 _ _
- 6-10 acres 10 49 _ _ 5 51 _ _ _ _
- 11+ acres _ _ _ _ _ _ _ _ _ _
Total Farm Development 75 445 27 326 35 307 31 347 21 294
Industry _ _ _ _ _ _ _ _ _ _
Land Purchase and Development 2 114 _ _ 3 112 _ _ _ _
Grand Total 106 971 45 635 57 743 70 1,218 43 727Source : St. Lucia Development Bank and Bank of Saint Lucia
Table VIII - 2. Loans Approved for Agricultural and Fishing Activities
by Number, Value and Type of Activity
2001 2002 2003 2004 2005
41
Fig VIII - I
0
10
20
30
40
50
60
70
80
2001 2002 2003 2004 2005
NUMBER OF LOANS DISBURSED BY AGRICULTURAL & FISHING ACTIVITIES
Livestock Farm DevelopmentFishing Land Purchase
Fig VIII – 2
0
50
100
150
200
250
300
350
400
450
2001 2002 2003 2004 2005
VALUE (EC$'000) OF LOANS DISBURSED BY AGRICULTURAL & FISHING ACTIVITIES
Livestock Farm DevelopmentFishing Land Purchase
42
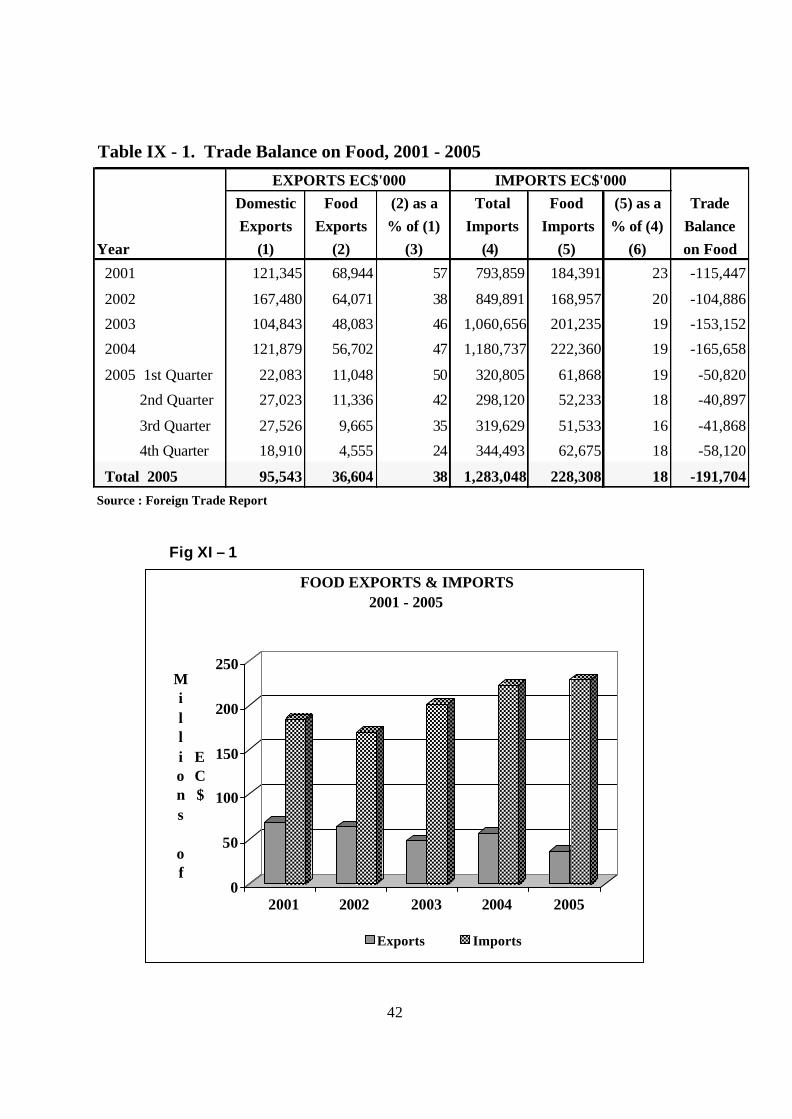
EXPORTS EC$'000 IMPORTS EC$'000Domestic Food (2) as a Total Food (5) as a TradeExports Exports % of (1) Imports Imports % of (4) Balance
Year (1) (2) (3) (4) (5) (6) on Food
2001 121,345 68,944 57 793,859 184,391 23 -115,447
2002 167,480 64,071 38 849,891 168,957 20 -104,886
2003 104,843 48,083 46 1,060,656 201,235 19 -153,152
2004 121,879 56,702 47 1,180,737 222,360 19 -165,658
2005 1st Quarter 22,083 11,048 50 320,805 61,868 19 -50,820
2nd Quarter 27,023 11,336 42 298,120 52,233 18 -40,897
3rd Quarter 27,526 9,665 35 319,629 51,533 16 -41,868
4th Quarter 18,910 4,555 24 344,493 62,675 18 -58,120
Total 2005 95,543 36,604 38 1,283,048 228,308 18 -191,704Source : Foreign Trade Report
Table IX - 1. Trade Balance on Food, 2001 - 2005
Fig XI – 1
0
50
100
150
200
250Millions of
EC$
2001 2002 2003 2004 2005
FOOD EXPORTS & IMPORTS 2001 - 2005
Exports Imports
43
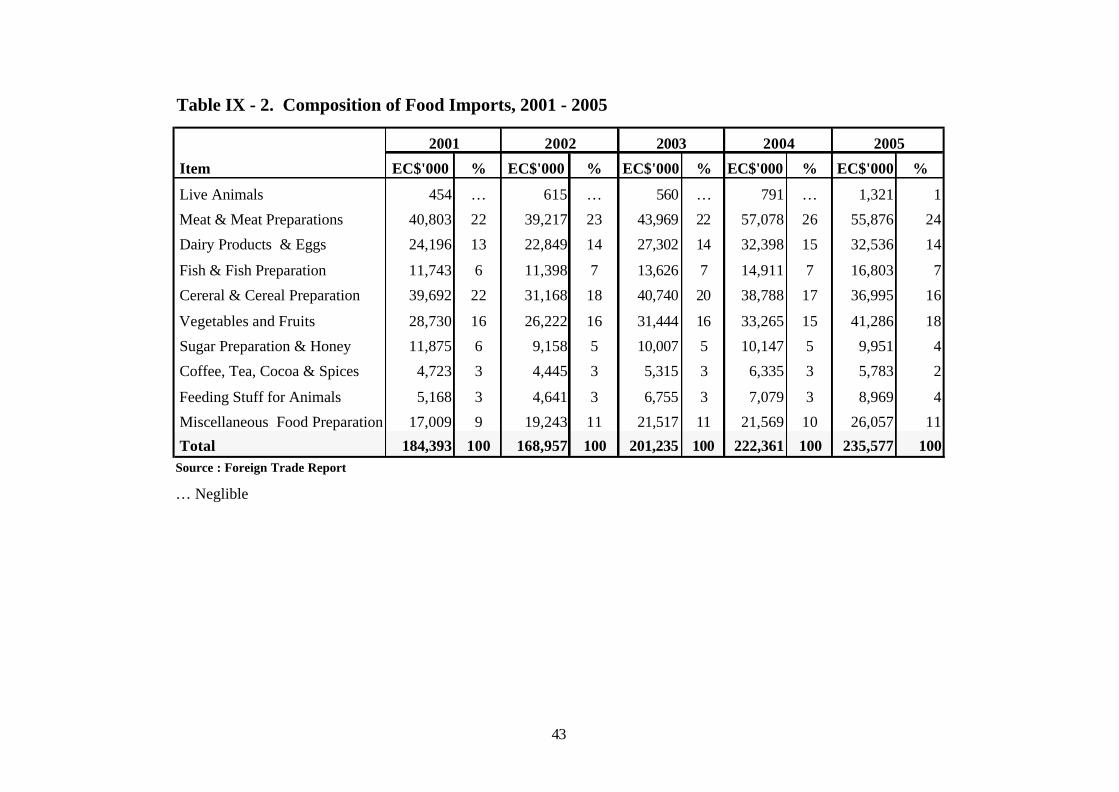
2001 2002 2003 2004 2005
Item EC$'000 % EC$'000 % EC$'000 % EC$'000 % EC$'000 %
Live Animals 454 … 615 … 560 … 791 … 1,321 1
Meat & Meat Preparations 40,803 22 39,217 23 43,969 22 57,078 26 55,876 24
Dairy Products & Eggs 24,196 13 22,849 14 27,302 14 32,398 15 32,536 14
Fish & Fish Preparation 11,743 6 11,398 7 13,626 7 14,911 7 16,803 7
Cereral & Cereal Preparation 39,692 22 31,168 18 40,740 20 38,788 17 36,995 16
Vegetables and Fruits 28,730 16 26,222 16 31,444 16 33,265 15 41,286 18
Sugar Preparation & Honey 11,875 6 9,158 5 10,007 5 10,147 5 9,951 4
Coffee, Tea, Cocoa & Spices 4,723 3 4,445 3 5,315 3 6,335 3 5,783 2
Feeding Stuff for Animals 5,168 3 4,641 3 6,755 3 7,079 3 8,969 4
Miscellaneous Food Preparation 17,009 9 19,243 11 21,517 11 21,569 10 26,057 11
Total 184,393 100 168,957 100 201,235 100 222,361 100 235,577 100Source : Foreign Trade Report
… Neglible
Table IX - 2. Composition of Food Imports, 2001 - 2005
44
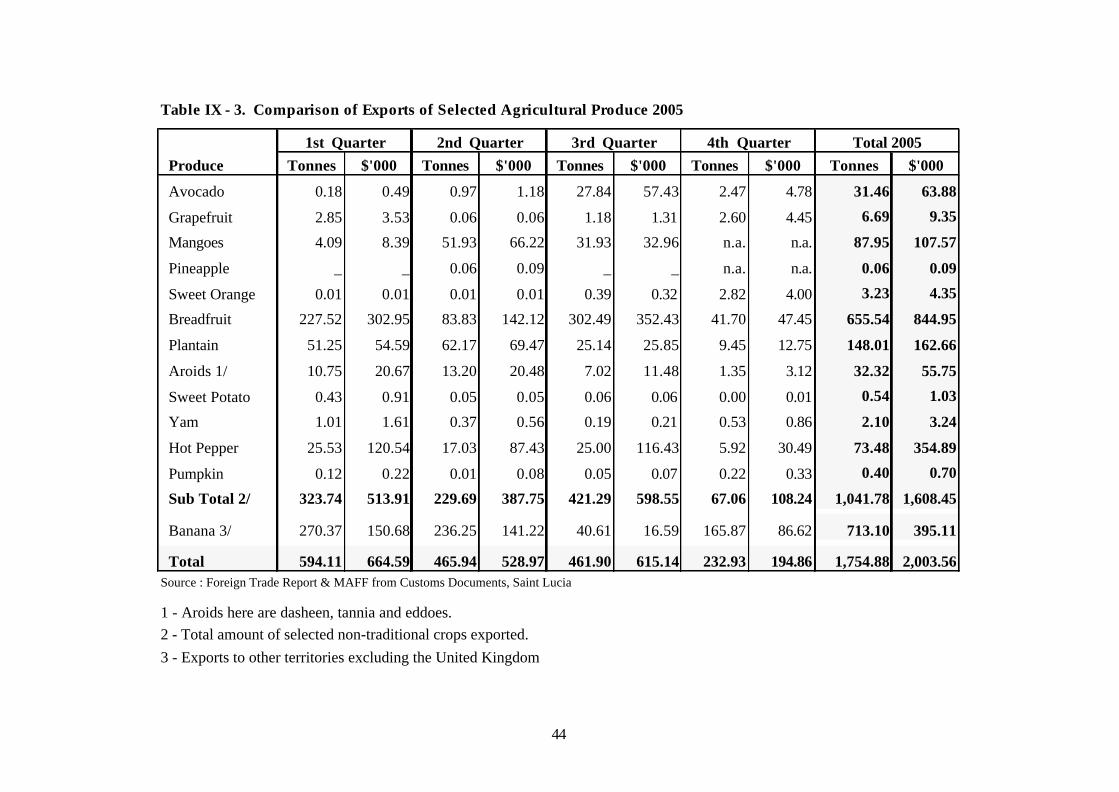
1st Quarter 2nd Quarter 3rd Quarter 4th Quarter Total 2005 Produce Tonnes $'000 Tonnes $'000 Tonnes $'000 Tonnes $'000 Tonnes $'000
Avocado 0.18 0.49 0.97 1.18 27.84 57.43 2.47 4.78 31.46 63.88
Grapefruit 2.85 3.53 0.06 0.06 1.18 1.31 2.60 4.45 6.69 9.35
Mangoes 4.09 8.39 51.93 66.22 31.93 32.96 n.a. n.a. 87.95 107.57
Pineapple _ _ 0.06 0.09 _ _ n.a. n.a. 0.06 0.09
Sweet Orange 0.01 0.01 0.01 0.01 0.39 0.32 2.82 4.00 3.23 4.35
Breadfruit 227.52 302.95 83.83 142.12 302.49 352.43 41.70 47.45 655.54 844.95
Plantain 51.25 54.59 62.17 69.47 25.14 25.85 9.45 12.75 148.01 162.66
Aroids 1/ 10.75 20.67 13.20 20.48 7.02 11.48 1.35 3.12 32.32 55.75
Sweet Potato 0.43 0.91 0.05 0.05 0.06 0.06 0.00 0.01 0.54 1.03
Yam 1.01 1.61 0.37 0.56 0.19 0.21 0.53 0.86 2.10 3.24
Hot Pepper 25.53 120.54 17.03 87.43 25.00 116.43 5.92 30.49 73.48 354.89
Pumpkin 0.12 0.22 0.01 0.08 0.05 0.07 0.22 0.33 0.40 0.70
Sub Total 2/ 323.74 513.91 229.69 387.75 421.29 598.55 67.06 108.24 1,041.78 1,608.45
Banana 3/ 270.37 150.68 236.25 141.22 40.61 16.59 165.87 86.62 713.10 395.11
Total 594.11 664.59 465.94 528.97 461.90 615.14 232.93 194.86 1,754.88 2,003.56Source : Foreign Trade Report & MAFF from Customs Documents, Saint Lucia
1 - Aroids here are dasheen, tannia and eddoes.2 - Total amount of selected non-traditional crops exported.3 - Exports to other territories excluding the United Kingdom
Table IX - 3. Comparison of Exports of Selected Agricultural Produce 2005
45
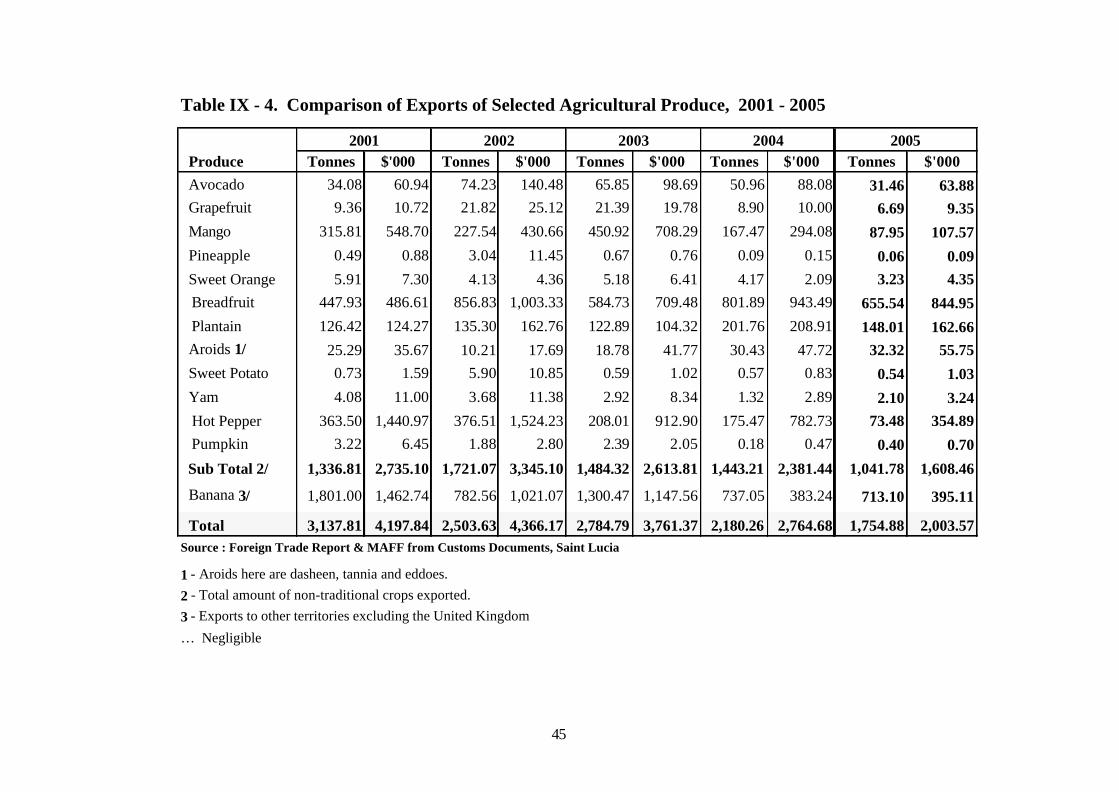
2001 2002 2003 2004 2005 Produce Tonnes $'000 Tonnes $'000 Tonnes $'000 Tonnes $'000 Tonnes $'000 Avocado 34.08 60.94 74.23 140.48 65.85 98.69 50.96 88.08 31.46 63.88 Grapefruit 9.36 10.72 21.82 25.12 21.39 19.78 8.90 10.00 6.69 9.35 Mango 315.81 548.70 227.54 430.66 450.92 708.29 167.47 294.08 87.95 107.57 Pineapple 0.49 0.88 3.04 11.45 0.67 0.76 0.09 0.15 0.06 0.09 Sweet Orange 5.91 7.30 4.13 4.36 5.18 6.41 4.17 2.09 3.23 4.35 Breadfruit 447.93 486.61 856.83 1,003.33 584.73 709.48 801.89 943.49 655.54 844.95 Plantain 126.42 124.27 135.30 162.76 122.89 104.32 201.76 208.91 148.01 162.66 Aroids 1/ 25.29 35.67 10.21 17.69 18.78 41.77 30.43 47.72 32.32 55.75 Sweet Potato 0.73 1.59 5.90 10.85 0.59 1.02 0.57 0.83 0.54 1.03 Yam 4.08 11.00 3.68 11.38 2.92 8.34 1.32 2.89 2.10 3.24 Hot Pepper 363.50 1,440.97 376.51 1,524.23 208.01 912.90 175.47 782.73 73.48 354.89 Pumpkin 3.22 6.45 1.88 2.80 2.39 2.05 0.18 0.47 0.40 0.70
Sub Total 2/ 1,336.81 2,735.10 1,721.07 3,345.10 1,484.32 2,613.81 1,443.21 2,381.44 1,041.78 1,608.46
Banana 3/ 1,801.00 1,462.74 782.56 1,021.07 1,300.47 1,147.56 737.05 383.24 713.10 395.11
Total 3,137.81 4,197.84 2,503.63 4,366.17 2,784.79 3,761.37 2,180.26 2,764.68 1,754.88 2,003.57Source : Foreign Trade Report & MAFF from Customs Documents, Saint Lucia
1 - Aroids here are dasheen, tannia and eddoes.
2 - Total amount of non-traditional crops exported.
3 - Exports to other territories excluding the United Kingdom
… Negligible
Table IX - 4. Comparison of Exports of Selected Agricultural Produce, 2001 - 2005
46
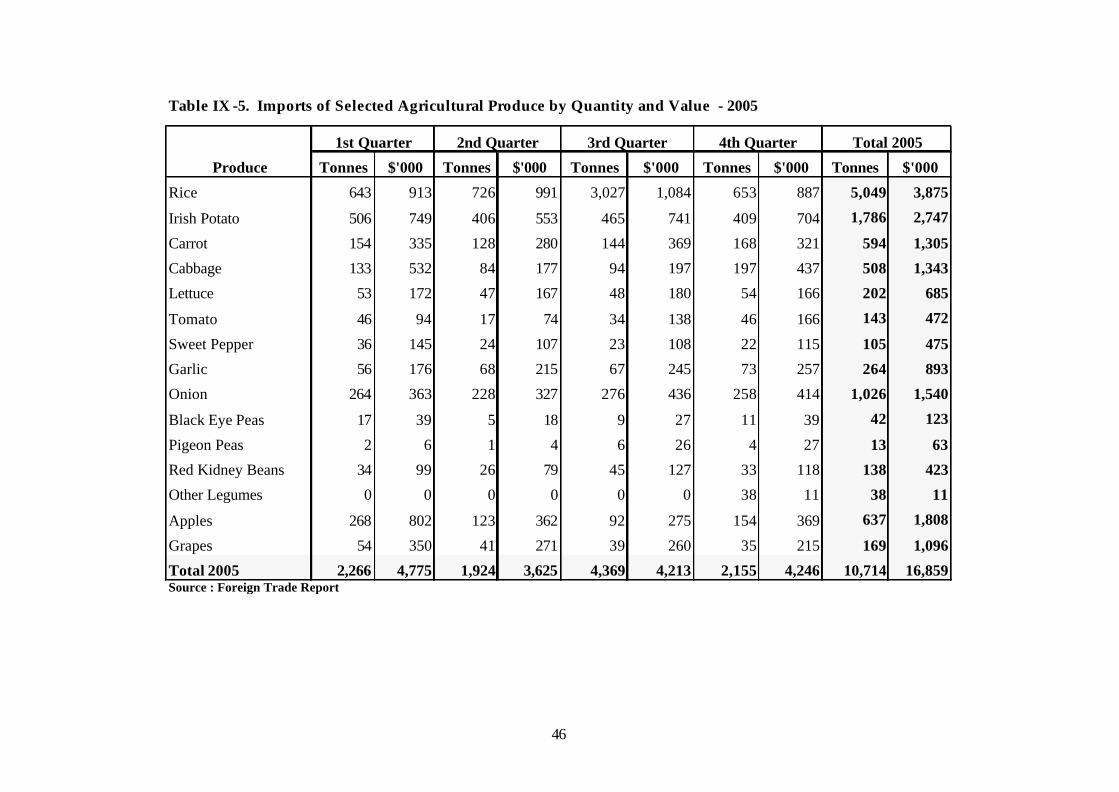
1st Quarter 2nd Quarter 3rd Quarter 4th Quarter Total 2005
Produce Tonnes $'000 Tonnes $'000 Tonnes $'000 Tonnes $'000 Tonnes $'000
Rice 643 913 726 991 3,027 1,084 653 887 5,049 3,875
Irish Potato 506 749 406 553 465 741 409 704 1,786 2,747
Carrot 154 335 128 280 144 369 168 321 594 1,305
Cabbage 133 532 84 177 94 197 197 437 508 1,343
Lettuce 53 172 47 167 48 180 54 166 202 685
Tomato 46 94 17 74 34 138 46 166 143 472
Sweet Pepper 36 145 24 107 23 108 22 115 105 475
Garlic 56 176 68 215 67 245 73 257 264 893
Onion 264 363 228 327 276 436 258 414 1,026 1,540
Black Eye Peas 17 39 5 18 9 27 11 39 42 123
Pigeon Peas 2 6 1 4 6 26 4 27 13 63
Red Kidney Beans 34 99 26 79 45 127 33 118 138 423
Other Legumes 0 0 0 0 0 0 38 11 38 11
Apples 268 802 123 362 92 275 154 369 637 1,808
Grapes 54 350 41 271 39 260 35 215 169 1,096
Total 2005 2,266 4,775 1,924 3,625 4,369 4,213 2,155 4,246 10,714 16,859Source : Foreign Trade Report
Table IX -5. Imports of Selected Agricultural Produce by Quantity and Value - 2005
47
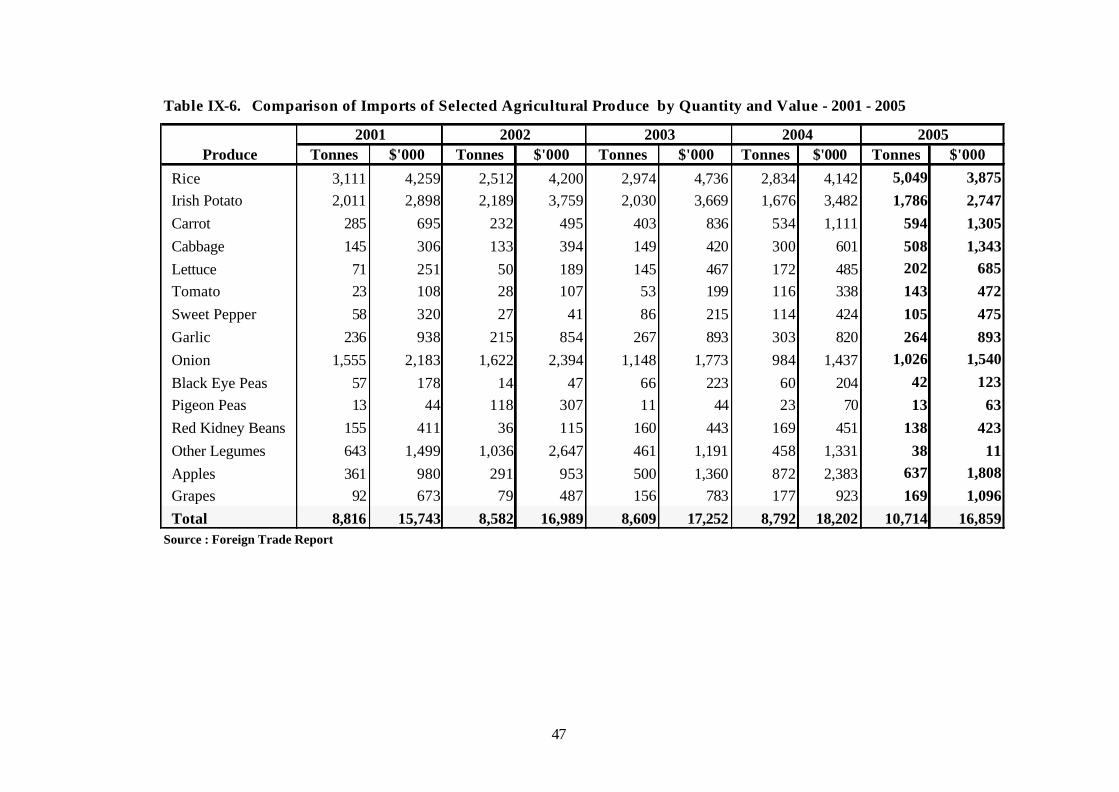
2001 2002 2003Produce Tonnes $'000 Tonnes $'000 Tonnes $'000 Tonnes $'000 Tonnes $'000
Rice 3,111 4,259 2,512 4,200 2,974 4,736 2,834 4,142 5,049 3,875 Irish Potato 2,011 2,898 2,189 3,759 2,030 3,669 1,676 3,482 1,786 2,747 Carrot 285 695 232 495 403 836 534 1,111 594 1,305 Cabbage 145 306 133 394 149 420 300 601 508 1,343 Lettuce 71 251 50 189 145 467 172 485 202 685 Tomato 23 108 28 107 53 199 116 338 143 472 Sweet Pepper 58 320 27 41 86 215 114 424 105 475 Garlic 236 938 215 854 267 893 303 820 264 893 Onion 1,555 2,183 1,622 2,394 1,148 1,773 984 1,437 1,026 1,540
Black Eye Peas 57 178 14 47 66 223 60 204 42 123 Pigeon Peas 13 44 118 307 11 44 23 70 13 63 Red Kidney Beans 155 411 36 115 160 443 169 451 138 423 Other Legumes 643 1,499 1,036 2,647 461 1,191 458 1,331 38 11 Apples 361 980 291 953 500 1,360 872 2,383 637 1,808 Grapes 92 673 79 487 156 783 177 923 169 1,096 Total 8,816 15,743 8,582 16,989 8,609 17,252 8,792 18,202 10,714 16,859Source : Foreign Trade Report
Table IX-6. Comparison of Imports of Selected Agricultural Produce by Quantity and Value - 2001 - 2005
2004 2005
48
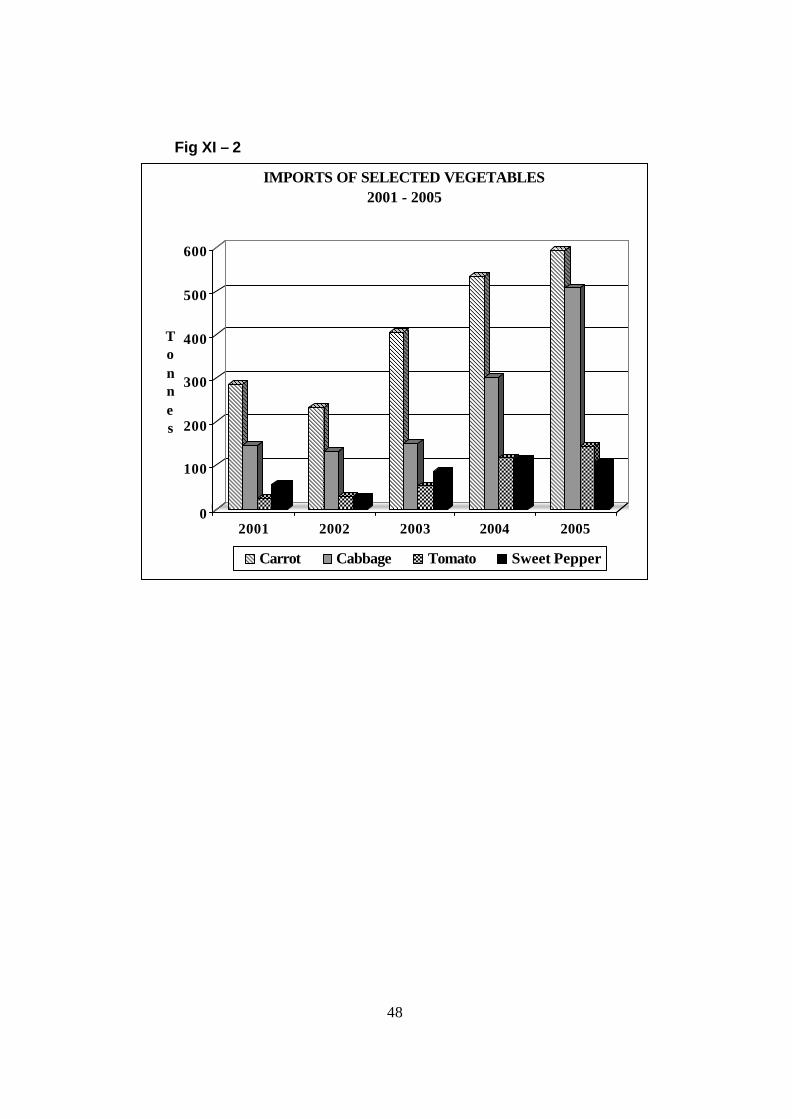
Fig XI – 2
0
100
200
300
400
500
600
Tonnes
2001 2002 2003 2004 2005
IMPORTS OF SELECTED VEGETABLES2001 - 2005
Carrot Cabbage Tomato Sweet Pepper
49
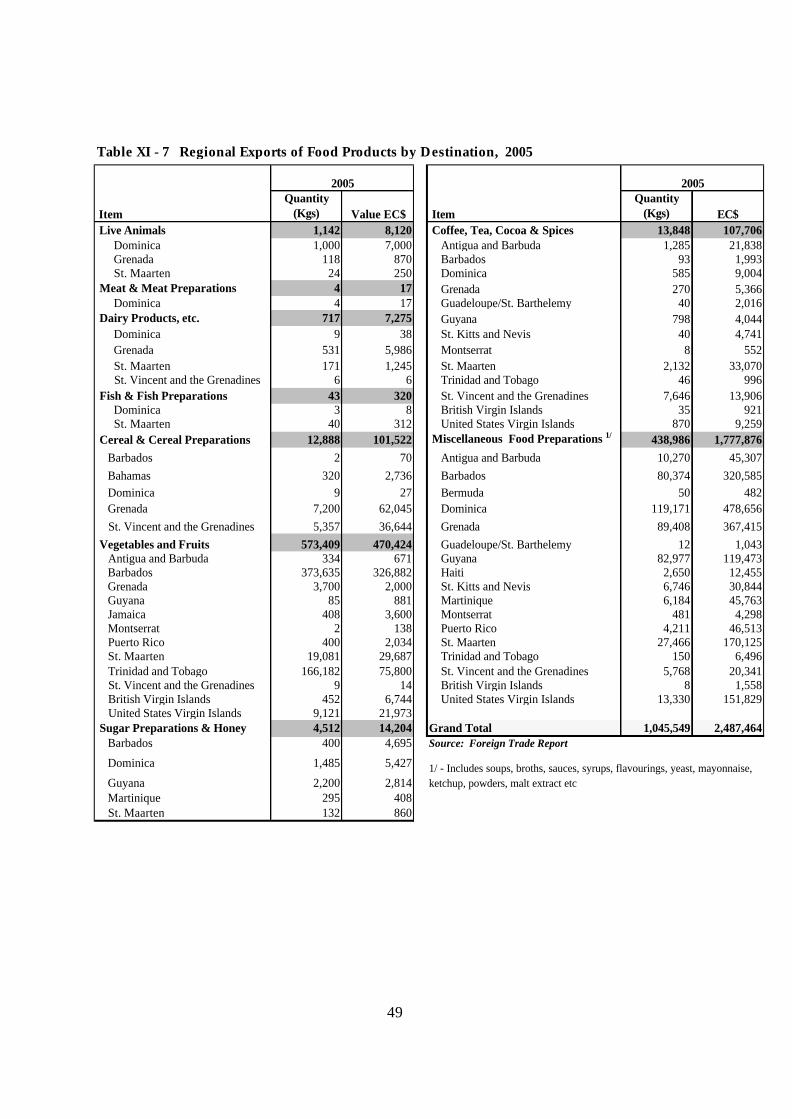
ItemQuantity
(Kgs) Value EC$ ItemQuantity
(Kgs) EC$ Live Animals 1,142 8,120 Coffee, Tea, Cocoa & Spices 13,848 107,706 Dominica 1,000 7,000 Antigua and Barbuda 1,285 21,838 Grenada 118 870 Barbados 93 1,993 St. Maarten 24 250 Dominica 585 9,004 Meat & Meat Preparations 4 17 Grenada 270 5,366 Dominica 4 17 Guadeloupe/St. Barthelemy 40 2,016 Dairy Products, etc. 717 7,275 Guyana 798 4,044 Dominica 9 38 St. Kitts and Nevis 40 4,741 Grenada 531 5,986 Montserrat 8 552 St. Maarten 171 1,245 St. Maarten 2,132 33,070 St. Vincent and the Grenadines 6 6 Trinidad and Tobago 46 996 Fish & Fish Preparations 43 320 St. Vincent and the Grenadines 7,646 13,906 Dominica 3 8 British Virgin Islands 35 921 St. Maarten 40 312 United States Virgin Islands 870 9,259 Cereal & Cereal Preparations 12,888 101,522 Miscellaneous Food Preparations 1/ 438,986 1,777,876 Barbados 2 70 Antigua and Barbuda 10,270 45,307 Bahamas 320 2,736 Barbados 80,374 320,585 Dominica 9 27 Bermuda 50 482 Grenada 7,200 62,045 Dominica 119,171 478,656 St. Vincent and the Grenadines 5,357 36,644 Grenada 89,408 367,415 Vegetables and Fruits 573,409 470,424 Guadeloupe/St. Barthelemy 12 1,043 Antigua and Barbuda 334 671 Guyana 82,977 119,473 Barbados 373,635 326,882 Haiti 2,650 12,455 Grenada 3,700 2,000 St. Kitts and Nevis 6,746 30,844 Guyana 85 881 Martinique 6,184 45,763 Jamaica 408 3,600 Montserrat 481 4,298 Montserrat 2 138 Puerto Rico 4,211 46,513 Puerto Rico 400 2,034 St. Maarten 27,466 170,125 St. Maarten 19,081 29,687 Trinidad and Tobago 150 6,496 Trinidad and Tobago 166,182 75,800 St. Vincent and the Grenadines 5,768 20,341 St. Vincent and the Grenadines 9 14 British Virgin Islands 8 1,558 British Virgin Islands 452 6,744 United States Virgin Islands 13,330 151,829 United States Virgin Islands 9,121 21,973 Sugar Preparations & Honey 4,512 14,204 Grand Total 1,045,549 2,487,464 Barbados 400 4,695 Source: Foreign Trade Report
Dominica 1,485 5,427
Guyana 2,200 2,814 Martinique 295 408 St. Maarten 132 860
Table XI - 7 Regional Exports of Food Products by Destination, 2005
2005 2005
1/ - Includes soups, broths, sauces, syrups, flavourings, yeast, mayonnaise, ketchup, powders, malt extract etc
50
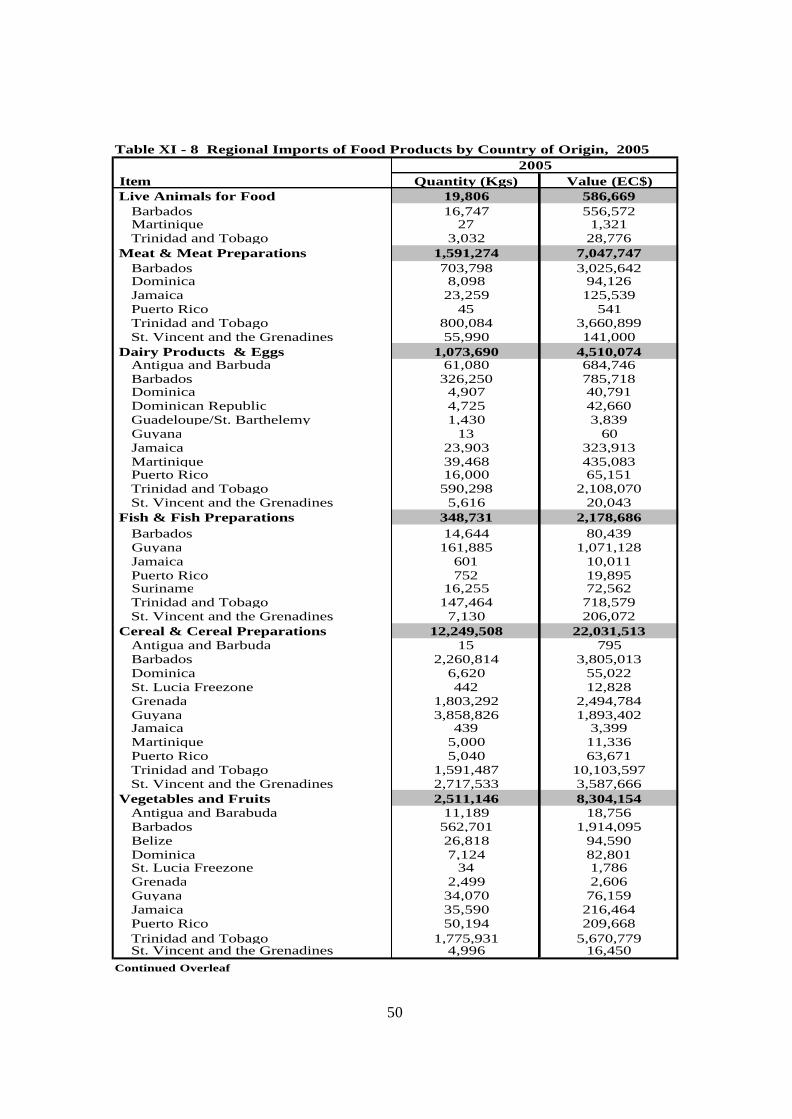
Item Quantity (Kgs) Value (EC$) Live Animals for Food 19,806 586,669 Barbados 16,747 556,572 Martinique 27 1,321 Trinidad and Tobago 3,032 28,776 Meat & Meat Preparations 1,591,274 7,047,747 Barbados 703,798 3,025,642 Dominica 8,098 94,126 Jamaica 23,259 125,539 Puerto Rico 45 541 Trinidad and Tobago 800,084 3,660,899 St. Vincent and the Grenadines 55,990 141,000 Dairy Products & Eggs 1,073,690 4,510,074 Antigua and Barbuda 61,080 684,746 Barbados 326,250 785,718 Dominica 4,907 40,791 Dominican Republic 4,725 42,660 Guadeloupe/St. Barthelemy 1,430 3,839 Guyana 13 60 Jamaica 23,903 323,913 Martinique 39,468 435,083 Puerto Rico 16,000 65,151 Trinidad and Tobago 590,298 2,108,070 St. Vincent and the Grenadines 5,616 20,043 Fish & Fish Preparations 348,731 2,178,686 Barbados 14,644 80,439 Guyana 161,885 1,071,128 Jamaica 601 10,011 Puerto Rico 752 19,895 Suriname 16,255 72,562 Trinidad and Tobago 147,464 718,579 St. Vincent and the Grenadines 7,130 206,072 Cereal & Cereal Preparations 12,249,508 22,031,513 Antigua and Barbuda 15 795 Barbados 2,260,814 3,805,013 Dominica 6,620 55,022 St. Lucia Freezone 442 12,828 Grenada 1,803,292 2,494,784 Guyana 3,858,826 1,893,402 Jamaica 439 3,399 Martinique 5,000 11,336 Puerto Rico 5,040 63,671 Trinidad and Tobago 1,591,487 10,103,597 St. Vincent and the Grenadines 2,717,533 3,587,666 Vegetables and Fruits 2,511,146 8,304,154 Antigua and Barabuda 11,189 18,756 Barbados 562,701 1,914,095 Belize 26,818 94,590 Dominica 7,124 82,801 St. Lucia Freezone 34 1,786 Grenada 2,499 2,606 Guyana 34,070 76,159 Jamaica 35,590 216,464 Puerto Rico 50,194 209,668 Trinidad and Tobago 1,775,931 5,670,779 St. Vincent and the Grenadines 4,996 16,450Continued Overleaf
Table XI - 8 Regional Imports of Food Products by Country of Origin, 20052005
51
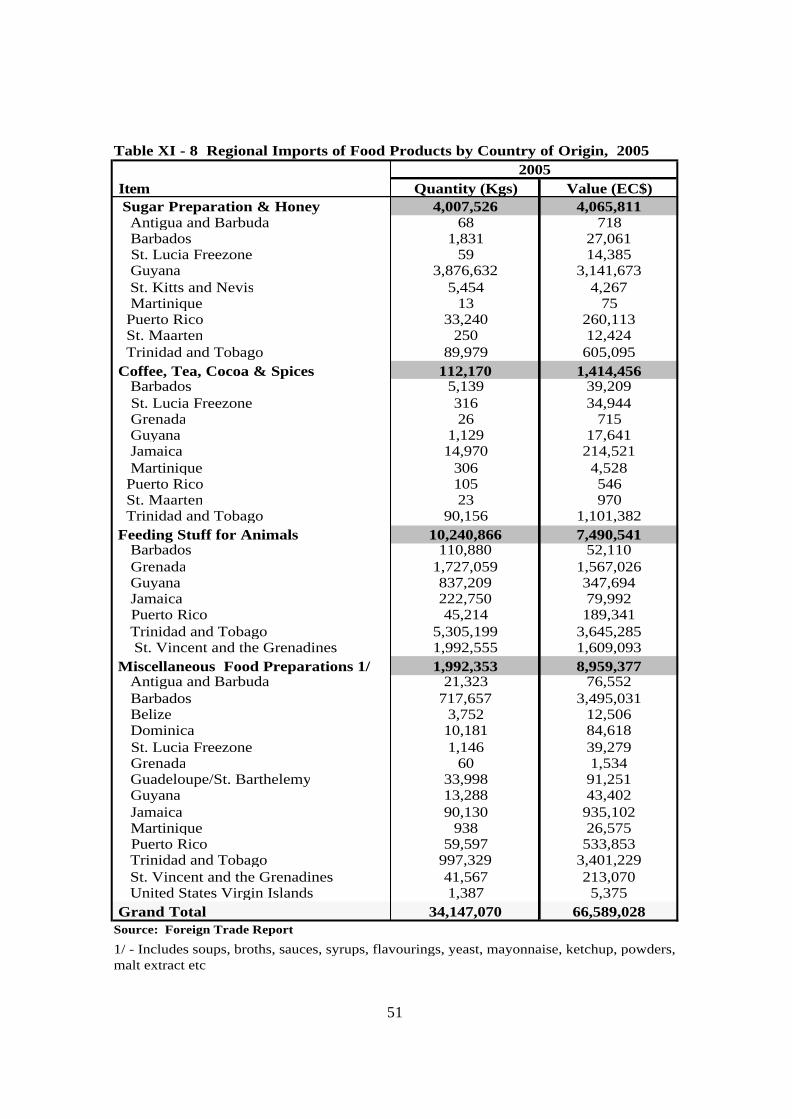
Item Quantity (Kgs) Value (EC$) Sugar Preparation & Honey 4,007,526 4,065,811 Antigua and Barbuda 68 718 Barbados 1,831 27,061 St. Lucia Freezone 59 14,385 Guyana 3,876,632 3,141,673 St. Kitts and Nevis 5,454 4,267 Martinique 13 75 Puerto Rico 33,240 260,113 St. Maarten 250 12,424 Trinidad and Tobago 89,979 605,095 Coffee, Tea, Cocoa & Spices 112,170 1,414,456 Barbados 5,139 39,209 St. Lucia Freezone 316 34,944 Grenada 26 715 Guyana 1,129 17,641 Jamaica 14,970 214,521 Martinique 306 4,528 Puerto Rico 105 546 St. Maarten 23 970 Trinidad and Tobago 90,156 1,101,382 Feeding Stuff for Animals 10,240,866 7,490,541 Barbados 110,880 52,110 Grenada 1,727,059 1,567,026 Guyana 837,209 347,694 Jamaica 222,750 79,992 Puerto Rico 45,214 189,341 Trinidad and Tobago 5,305,199 3,645,285 St. Vincent and the Grenadines 1,992,555 1,609,093 Miscellaneous Food Preparations 1/ 1,992,353 8,959,377 Antigua and Barbuda 21,323 76,552 Barbados 717,657 3,495,031 Belize 3,752 12,506 Dominica 10,181 84,618 St. Lucia Freezone 1,146 39,279 Grenada 60 1,534 Guadeloupe/St. Barthelemy 33,998 91,251 Guyana 13,288 43,402 Jamaica 90,130 935,102 Martinique 938 26,575 Puerto Rico 59,597 533,853 Trinidad and Tobago 997,329 3,401,229 St. Vincent and the Grenadines 41,567 213,070 United States Virgin Islands 1,387 5,375 Grand Total 34,147,070 66,589,028Source: Foreign Trade Report
2005Table XI - 8 Regional Imports of Food Products by Country of Origin, 2005
1/ - Includes soups, broths, sauces, syrups, flavourings, yeast, mayonnaise, ketchup, powders, malt extract etc
52
Appendix A
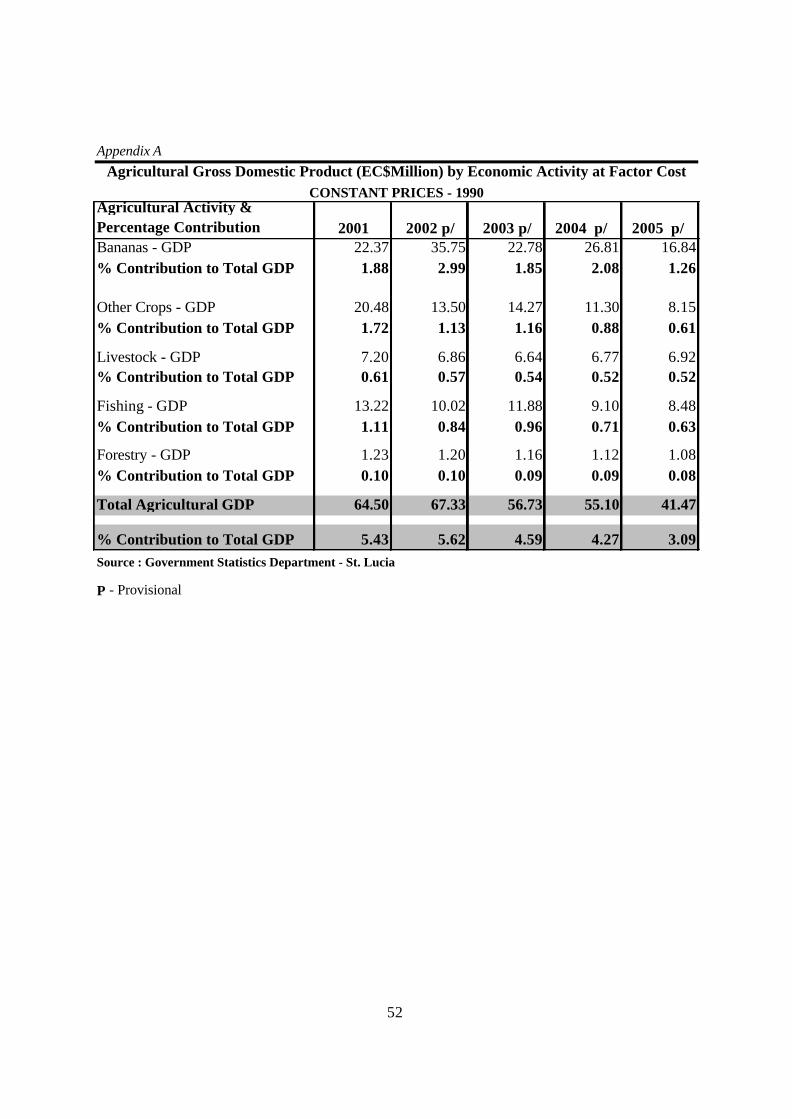
Agricultural Activity & Percentage Contribution 2001 2002 p/ 2003 p/ 2004 p/ 2005 p/Bananas - GDP 22.37 35.75 22.78 26.81 16.84% Contribution to Total GDP 1.88 2.99 1.85 2.08 1.26
Other Crops - GDP 20.48 13.50 14.27 11.30 8.15% Contribution to Total GDP 1.72 1.13 1.16 0.88 0.61
Livestock - GDP 7.20 6.86 6.64 6.77 6.92% Contribution to Total GDP 0.61 0.57 0.54 0.52 0.52
Fishing - GDP 13.22 10.02 11.88 9.10 8.48% Contribution to Total GDP 1.11 0.84 0.96 0.71 0.63
Forestry - GDP 1.23 1.20 1.16 1.12 1.08% Contribution to Total GDP 0.10 0.10 0.09 0.09 0.08
Total Agricultural GDP 64.50 67.33 56.73 55.10 41.47
% Contribution to Total GDP 5.43 5.62 4.59 4.27 3.09Source : Government Statistics Department - St. Lucia
P - Provisional
Agricultural Gross Domestic Product (EC$Million) by Economic Activity at Factor CostCONSTANT PRICES - 1990
53
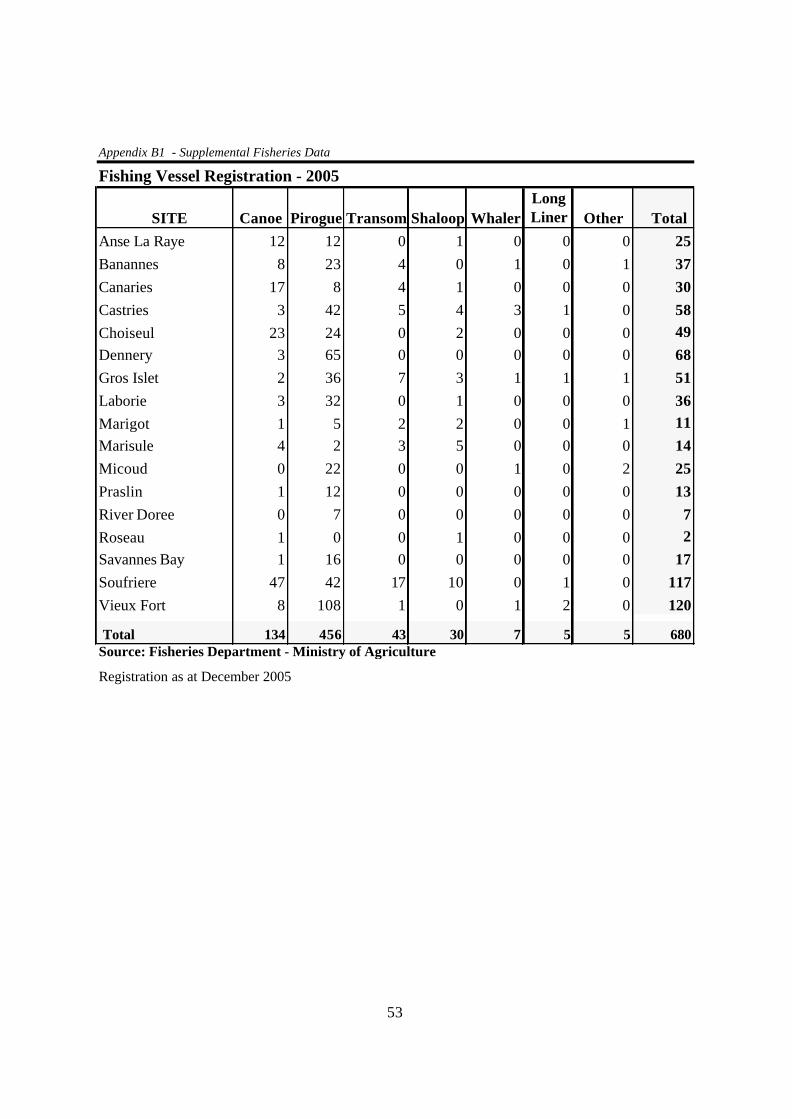
SITE Canoe Pirogue Transom Shaloop WhalerLong Liner Other Total
Anse La Raye 12 12 0 1 0 0 0 25Banannes 8 23 4 0 1 0 1 37Canaries 17 8 4 1 0 0 0 30Castries 3 42 5 4 3 1 0 58Choiseul 23 24 0 2 0 0 0 49Dennery 3 65 0 0 0 0 0 68Gros Islet 2 36 7 3 1 1 1 51Laborie 3 32 0 1 0 0 0 36Marigot 1 5 2 2 0 0 1 11Marisule 4 2 3 5 0 0 0 14Micoud 0 22 0 0 1 0 2 25Praslin 1 12 0 0 0 0 0 13River Doree 0 7 0 0 0 0 0 7Roseau 1 0 0 1 0 0 0 2Savannes Bay 1 16 0 0 0 0 0 17Soufriere 47 42 17 10 0 1 0 117Vieux Fort 8 108 1 0 1 2 0 120
Total 134 456 43 30 7 5 5 680Source: Fisheries Department - Ministry of Agriculture
Registration as at December 2005
Appendix B1 - Supplemental Fisheries Data
Fishing Vessel Registration - 2005
54
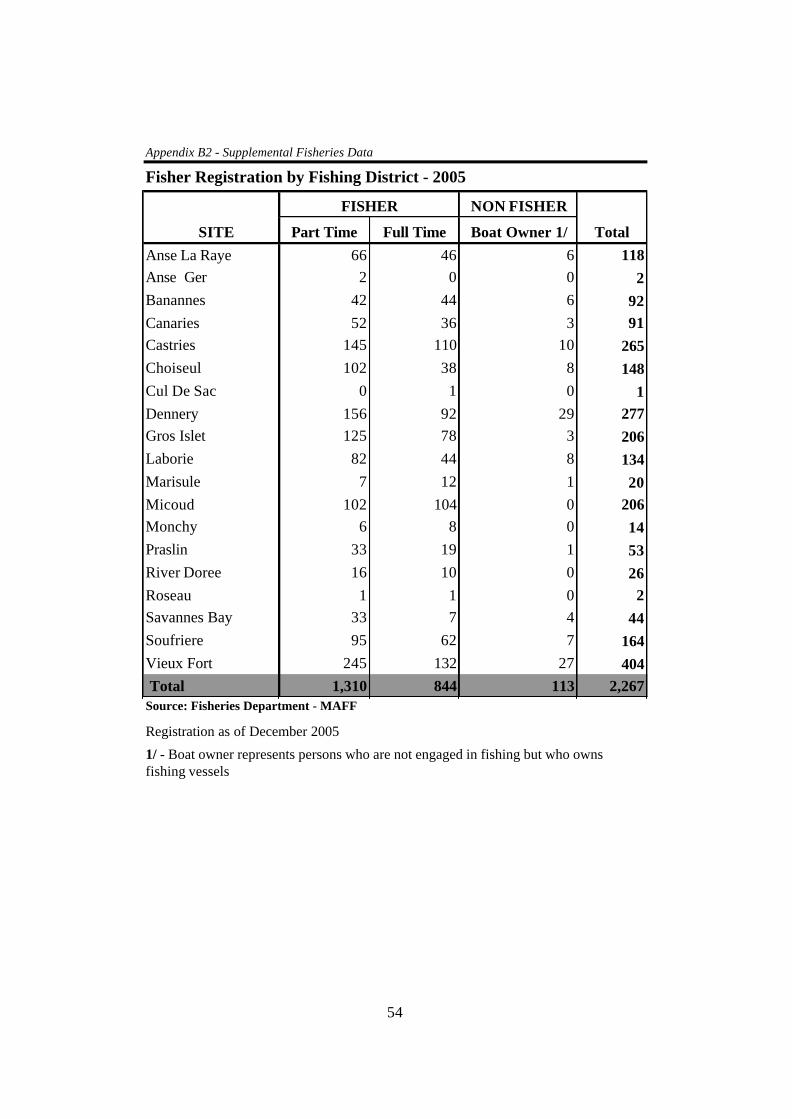
NON FISHER
SITE Part Time Full Time Boat Owner 1/Anse La Raye 66 46 6 118Anse Ger 2 0 0 2Banannes 42 44 6 92Canaries 52 36 3 91Castries 145 110 10 265Choiseul 102 38 8 148Cul De Sac 0 1 0 1Dennery 156 92 29 277Gros Islet 125 78 3 206Laborie 82 44 8 134Marisule 7 12 1 20Micoud 102 104 0 206Monchy 6 8 0 14Praslin 33 19 1 53River Doree 16 10 0 26Roseau 1 1 0 2Savannes Bay 33 7 4 44Soufriere 95 62 7 164Vieux Fort 245 132 27 404 Total 1,310 844 113 2,267
Registration as of December 2005
1/ - Boat owner represents persons who are not engaged in fishing but who owns fishing vessels
FISHER
Fisher Registration by Fishing District - 2005
Total
Appendix B2 - Supplemental Fisheries Data
Source: Fisheries Department - MAFF
55
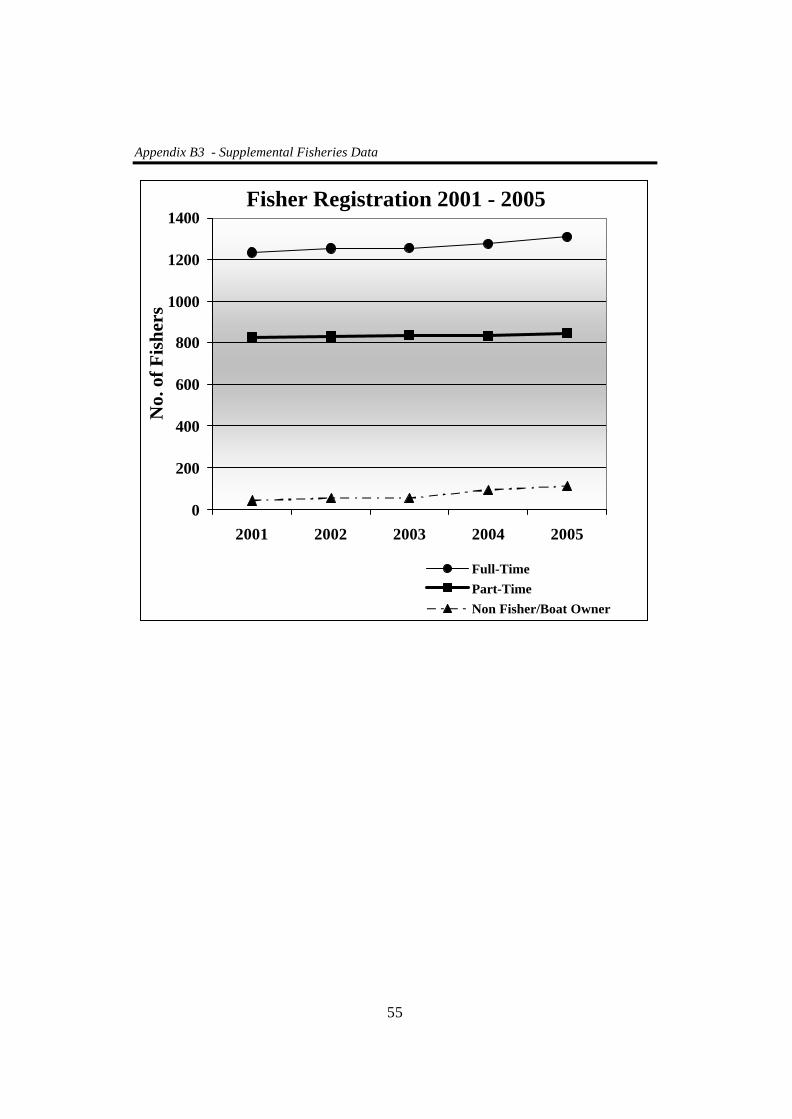
Appendix B3 - Supplemental Fisheries Data
Fisher Registration 2001 - 2005
0
200
400
600
800
1000
1200
1400
2001 2002 2003 2004 2005
No.
of F
ishe
rs
Full-TimePart-TimeNon Fisher/Boat Owner
56
Total Station Jan Feb Mar Apr May Jun Jul Aug Sept Oct Nov Dec 2005 Marquis Babonneau 269.6 196.2 31.4 19.0 298.4 328.8 n a 117.0 103.6 367.8 403.0 108.2 2243.0 Trouya 171.2 151.8 33.8 16.0 257.1 226.1 269.1 170.2 94.6 233.7 344.2 92.5 2060.3 Union 346.1 147.2 30.8 31.8 313.6 276.4 343.9 209.4 150.1 285.5 500.9 116.2 2751.9 Souci 321.4 112.3 60.6 16.2 204.6 369.0 290.3 142.9 69.0 289.5 388.4 113.9 2378.1 George V Park 220.2 76.4 28.3 27.6 285.1 344.2 279.1 156.3 122.7 312.2 382.1 94.0 2328.2 Government House 253.8 77.2 31.7 9.3 304.3 324.8 273.1 122.7 84.6 288.5 312.7 90.6 2173.3 Roseau, Winban 320.5 73.4 43.6 13.8 282.8 371.6 202.4 186.6 74.6 352.4 357.6 125.8 2405.1 Barre D'Isle 377.0 157.8 50.6 61.4 287.2 374.4 204.4 189.0 95.0 334.4 303.6 154.0 2588.8 CARDI 325.8 184.0 60.0 28.9 166.0 429.5 264.2 164.5 118.7 334.8 378.6 102.9 2557.9 Canaries 180.6 114.4 22.8 60.4 271.0 267.0 268.2 159.9 53.3 317.5 322.5 102.0 2139.6 Mamiku 350.0 118.4 39.6 28.4 165.0 298.2 284.8 215.4 137.2 335.2 303.9 106.5 2382.6 Errard Estate 443.0 146.0 70.5 56.4 228.1 397.0 378.7 291.5 193.2 373.1 421.9 114.7 3114.1 Mahaut 286.0 135.8 69.0 62.0 246.0 344.6 328.0 216.0 110.0 486.0 477.1 133.0 2893.5 Patience 213.0 121.4 30.0 10.4 180.6 323.2 230.7 236.6 154.8 353.7 341.4 118.0 2313.8 Barthe Nursery 244.4 60.4 42.6 46.6 296.4 425.8 287.0 182.5 85.8 432.8 393.6 139.5 2637.4 Delcer 108.2 26.4 16.2 9.1 165.6 363.6 210.4 100.8 53.0 272.0 256.0 104.4 1685.7 Union Vale 131.6 68.2 28.4 15.3 207.2 388.8 234.6 114.8 61.2 257.4 289.4 74.2 1871.1 Soufriere 192.2 52.6 20.2 36.8 n a n a n a n a n a n a n a n a 301.8 Edmond Forest 489.0 127.6 56.2 82.8 332.8 503.6 378.4 223.0 132.0 634.8 613.0 308.0 3881.2 Troumassee 185.6 75.8 17.2 14.2 134.6 348.2 239.8 134.0 54.2 330.8 296.8 67.4 1898.6 Hewannora Airport 181.8 55.1 21.0 23.6 105.0 364.3 205.3 154.1 51.7 429.7 208.9 92.1 1892.6 Cap Estate 120.6 118.2 34.4 7.8 145.4 276.0 252.6 141.2 105.8 229.2 328.0 54.8 1814.0 Desraches 563.0 86.8 25.0 135.0 376.4 441.6 393.8 216.6 166.0 558.0 521.8 286.0 3770.0 Anse La Raye 272.0 75.0 23.2 39.6 248.8 213.0 242.8 176.8 76.2 318.0 320.8 94.8 2101.0 George Charles Airport 269.4 101.0 28.8 15.9 272.8 268.0 275.7 141.5 103.6 305.8 368.5 92.1 2243.1Source : Water Resource Management Unit - Ministry of Agriculture
Appendix C1- Climatic DataRainfall Data (mm) from Observation Stations - 2005
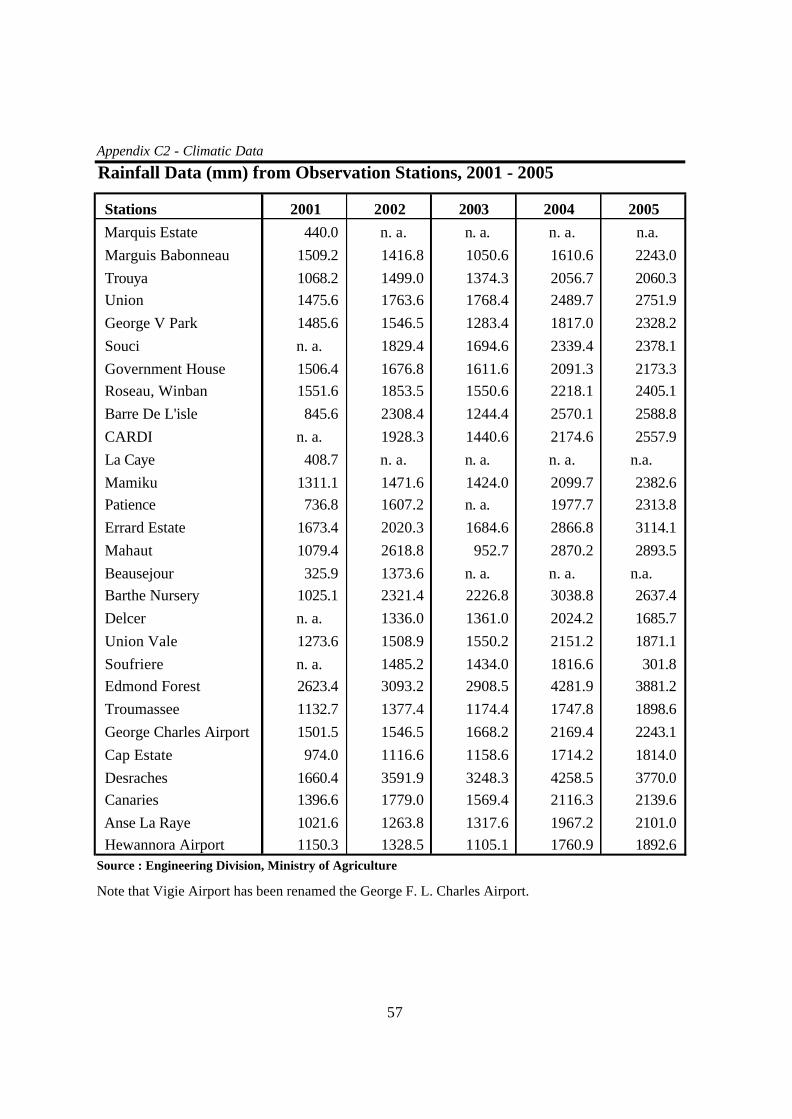
57
Rainfall Data (mm) from Observation Stations, 2001 - 2005
Stations 2001 2002 2003 2004 2005 Marquis Estate 440.0 n. a. n. a. n. a. n.a. Marguis Babonneau 1509.2 1416.8 1050.6 1610.6 2243.0 Trouya 1068.2 1499.0 1374.3 2056.7 2060.3 Union 1475.6 1763.6 1768.4 2489.7 2751.9 George V Park 1485.6 1546.5 1283.4 1817.0 2328.2 Souci n. a. 1829.4 1694.6 2339.4 2378.1 Government House 1506.4 1676.8 1611.6 2091.3 2173.3 Roseau, Winban 1551.6 1853.5 1550.6 2218.1 2405.1 Barre De L'isle 845.6 2308.4 1244.4 2570.1 2588.8 CARDI n. a. 1928.3 1440.6 2174.6 2557.9 La Caye 408.7 n. a. n. a. n. a. n.a. Mamiku 1311.1 1471.6 1424.0 2099.7 2382.6 Patience 736.8 1607.2 n. a. 1977.7 2313.8 Errard Estate 1673.4 2020.3 1684.6 2866.8 3114.1 Mahaut 1079.4 2618.8 952.7 2870.2 2893.5 Beausejour 325.9 1373.6 n. a. n. a. n.a. Barthe Nursery 1025.1 2321.4 2226.8 3038.8 2637.4 Delcer n. a. 1336.0 1361.0 2024.2 1685.7 Union Vale 1273.6 1508.9 1550.2 2151.2 1871.1 Soufriere n. a. 1485.2 1434.0 1816.6 301.8 Edmond Forest 2623.4 3093.2 2908.5 4281.9 3881.2 Troumassee 1132.7 1377.4 1174.4 1747.8 1898.6 George Charles Airport 1501.5 1546.5 1668.2 2169.4 2243.1 Cap Estate 974.0 1116.6 1158.6 1714.2 1814.0 Desraches 1660.4 3591.9 3248.3 4258.5 3770.0 Canaries 1396.6 1779.0 1569.4 2116.3 2139.6 Anse La Raye 1021.6 1263.8 1317.6 1967.2 2101.0 Hewannora Airport 1150.3 1328.5 1105.1 1760.9 1892.6Source : Engineering Division, Ministry of Agriculture
Note that Vigie Airport has been renamed the George F. L. Charles Airport.
Appendix C2 - Climatic Data
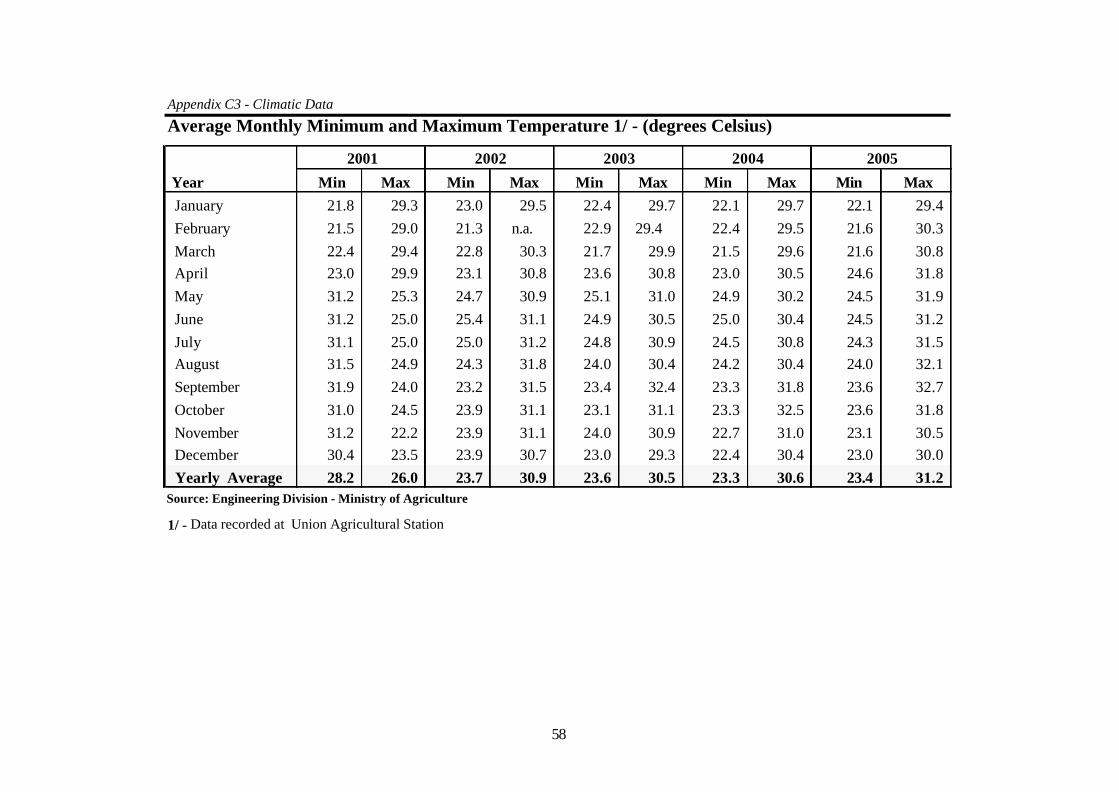
58
2001 2002 2003 2004
Year Min Max Min Max Min Max Min Max Min Max January 21.8 29.3 23.0 29.5 22.4 29.7 22.1 29.7 22.1 29.4 February 21.5 29.0 21.3 n.a. 22.9 29.4 22.4 29.5 21.6 30.3 March 22.4 29.4 22.8 30.3 21.7 29.9 21.5 29.6 21.6 30.8 April 23.0 29.9 23.1 30.8 23.6 30.8 23.0 30.5 24.6 31.8 May 31.2 25.3 24.7 30.9 25.1 31.0 24.9 30.2 24.5 31.9 June 31.2 25.0 25.4 31.1 24.9 30.5 25.0 30.4 24.5 31.2 July 31.1 25.0 25.0 31.2 24.8 30.9 24.5 30.8 24.3 31.5 August 31.5 24.9 24.3 31.8 24.0 30.4 24.2 30.4 24.0 32.1 September 31.9 24.0 23.2 31.5 23.4 32.4 23.3 31.8 23.6 32.7 October 31.0 24.5 23.9 31.1 23.1 31.1 23.3 32.5 23.6 31.8 November 31.2 22.2 23.9 31.1 24.0 30.9 22.7 31.0 23.1 30.5 December 30.4 23.5 23.9 30.7 23.0 29.3 22.4 30.4 23.0 30.0 Yearly Average 28.2 26.0 23.7 30.9 23.6 30.5 23.3 30.6 23.4 31.2Source: Engineering Division - Ministry of Agriculture
1/ - Data recorded at Union Agricultural Station
Average Monthly Minimum and Maximum Temperature 1/ - (degrees Celsius)Appendix C3 - Climatic Data
2005
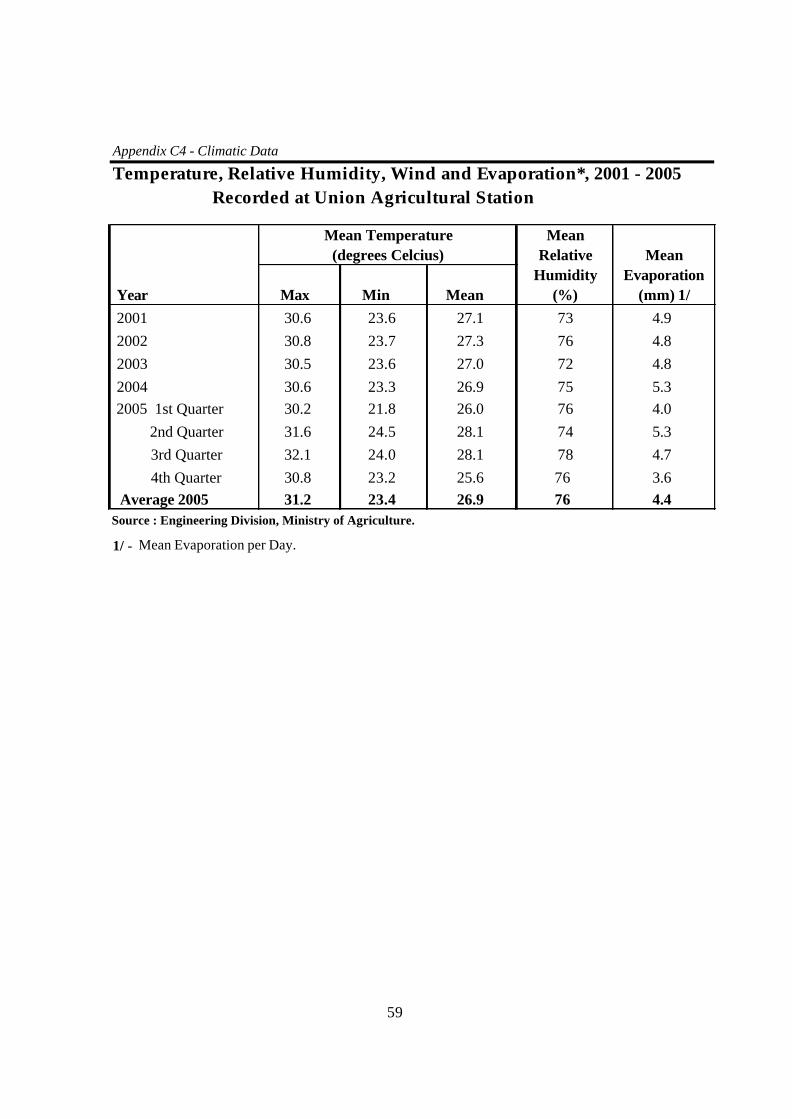
59
Mean Temperature Mean(degrees Celcius) Relative Mean
Humidity Evaporation Year Max Min Mean (%) (mm) 1/ 2001 30.6 23.6 27.1 73 4.9 2002 30.8 23.7 27.3 76 4.8 2003 30.5 23.6 27.0 72 4.8 2004 30.6 23.3 26.9 75 5.3 2005 1st Quarter 30.2 21.8 26.0 76 4.0 2nd Quarter 31.6 24.5 28.1 74 5.3 3rd Quarter 32.1 24.0 28.1 78 4.7 4th Quarter 30.8 23.2 25.6 76 3.6 Average 2005 31.2 23.4 26.9 76 4.4Source : Engineering Division, Ministry of Agriculture.
1/ - Mean Evaporation per Day.
Temperature, Relative Humidity, Wind and Evaporation*, 2001 - 2005 Recorded at Union Agricultural Station
Appendix C4 - Climatic Data
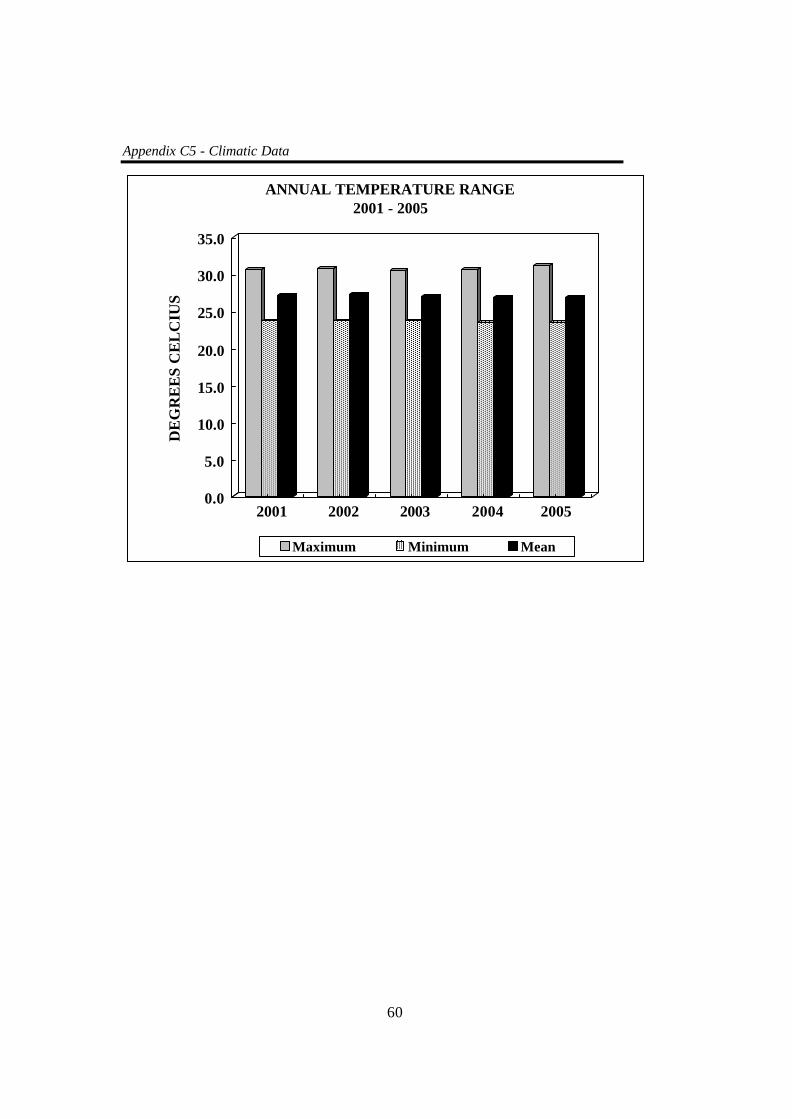
60
Appendix C5 - Climatic Data
0.0
5.0
10.0
15.0
20.0
25.0
30.0
35.0
DE
GR
EE
S C
EL
CIU
S
2001 2002 2003 2004 2005
ANNUAL TEMPERATURE RANGE2001 - 2005
Maximum Minimum Mean