Embed Size (px)
Citation preview
Annual Bulletin ofAgricultural StatisticsIssued in December 2010
Annu
al B
ulle
tin o
f Agr
icul
tura
l Sta
tistic
s 20
09

Annual Bulletin ofAgricultural StatisticsIssued in December 2010

Foreword
Abu Dhabi Statistics Centre is pleased to provide decision and policy makers, businessmen, researchers, and all those concerned with agricultural statistics and indicators with the second issue of the Centre’s Agricultural Bulletin, which sheds light on the indicators of the comprehensive agricultural development in Abu Dhabi during 2009, under the wise leadership of H.H. Sheikh Khalifa Bin Zayed Al Nahyan, President of the UAE and Ruler of Abu Dhabi, and the unlimited support of H.H. General Sheikh Mohammed Bin Zayed Al Nahyan – Crown Prince of Abu Dhabi and Deputy Supreme Commander of the Armed Forces, and Chairman of the Executive Council of Abu Dhabi.
The report tackles in detail all aspects of the agricultural sector, and presents a large array of analytical statistics and indicators that assist in pursuing the objectives of this sector through in-depth study and analysis of its data to produce future forecasts and develop integrated policies and strategies that are conducive to the sustainable development of the agricultural, in line with Abu Dhabi Economic Vision 2030.
The report presents detailed charts and tables depicting a wide range of agricultural indicators on all aspects of the sector, including plants, livestock and fisheries statistics, along with a summary of important for the agricultural season under review.
Statistics Centre - Abu Dhabi wishes to extend its thanks and appreciation to all those who contributed to the compilation of this bulletin, particularly our strategic partners; all of whom believe in the importance of team work, and are keen to achieve sublimate of the one homeland, the home of all.
We hope that this bulletin will help to meet the development needs of the agricultural sector in the Emirate of Abu Dhabi.
Butti Ahmed Mohammed Bin Butti Al Qubaisi Director General

Contents
Summary of Agricultural Indicators 6Introduction 7
I Plant Production Statistics 81.1 General Overview of Agricultural Land Use 121.2 Development of Plant Production Activities 151.3 Greenhouse Farming 161.4 Vegetables 181.5 Fruit Trees 201.6 Field Crops 221.7 Wells 241.8 Agricultural Loans 251.9 Agricultural Pesticides 261.10 Forests 271.11 Public Parks 291.12 Date Palms 321.13 Foreign Trade of Agricultural Commodities 331.14 Agricultural Producer Price Indices 371.15 Agricultural Machinery 381.16 Agricultural Centres 39
II Livestock Statistics 402.1 Structural Change in the Size of Livestock 432.2 Livestock Health Statistics 462.3 Poultry 502.4 Livestock Production 51
III Fisheries Statistics 52
IV Annex 604.1. Definitions and Classifications 62
of6
Summary of Agricultural Indicators
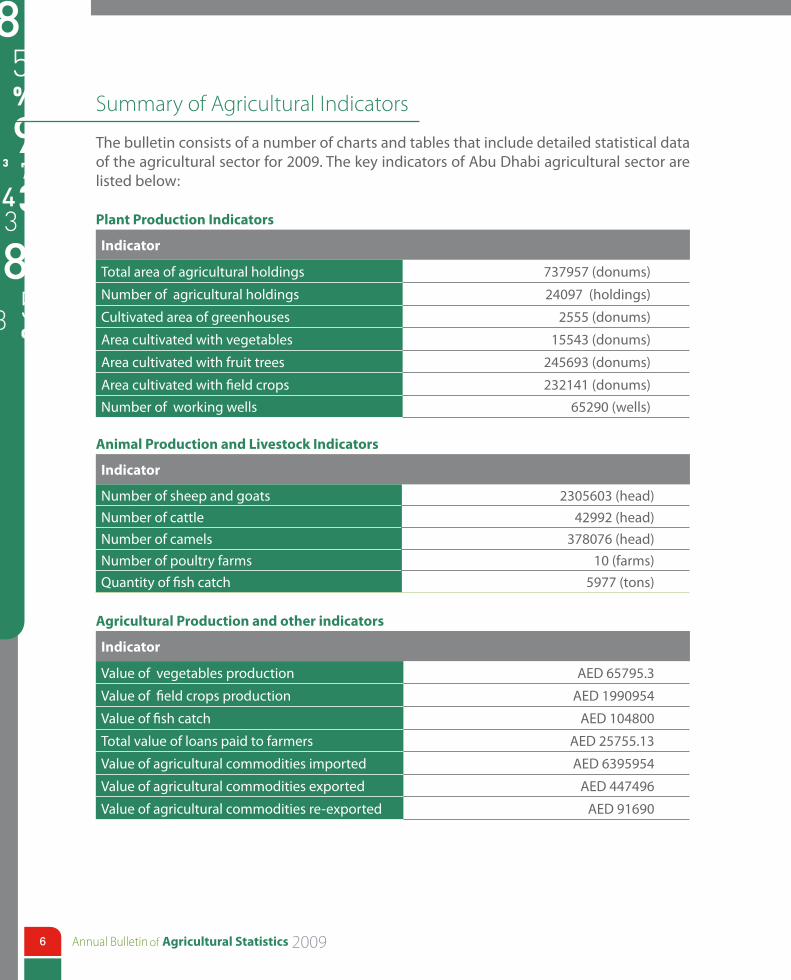
The bulletin consists of a number of charts and tables that include detailed statistical data of the agricultural sector for 2009. The key indicators of Abu Dhabi agricultural sector are listed below:
Plant Production Indicators
Indicator
Total area of agricultural holdings 737957 (donums)
Number of agricultural holdings 24097 (holdings)
Cultivated area of greenhouses 2555 (donums)
Area cultivated with vegetables 15543 (donums)
Area cultivated with fruit trees 245693 (donums)
Area cultivated with field crops 232141 (donums)
Number of working wells 65290 (wells)
Animal Production and Livestock Indicators
Indicator
Number of sheep and goats 2305603 (head)Number of cattle 42992 (head)Number of camels 378076 (head)Number of poultry farms 10 (farms)Quantity of fish catch 5977 (tons)
Agricultural Production and other indicators
Indicator
Value of vegetables production AED 65795.3
Value of field crops production AED 1990954
Value of fish catch AED 104800
Total value of loans paid to farmers AED 25755.13
Value of agricultural commodities imported AED 6395954
Value of agricultural commodities exported AED 447496
Value of agricultural commodities re-exported AED 91690
7
Introduction
Agriculture is one of the key productive sectors of the economy. It employs large numbers of agricultural holders and their families, in addition to being the main source of food products an supplie of primary materials to several manufacturing industries that raise the contribution of this sector to the GDP.
Therefore statistical data and information represent the basis on which plans and projects for development of the agricultural sector are built, necessitating the provision of accurate and reliable statistics in order for decisions makers to reach sound decisions in the areas of production, marketing, consumption, etc. The field of agricultural statistics and the modern methods of collection and analysis of agricultural data are becoming increasingly important, especially in recent years, in light of the challenges confronting this sector, such as the scarcity of water and the high prices of agricultural inputs. Plant production statistics present data on the numbers of farms, agricultural land, crop area and the quantity and value of agricultural production. Livestock statistics provide details about the sheep, goats, cattle, camels and poultry. Fisheries statistics present data on the quantity and value of fish catch in 2009.
The methodology followed uses descriptive analysis of agricultural indicators. The bulletin draws mainly on agricultural data provided by various government entities that are concerned with the agricultural sector, most importantly the Abu Dhabi Food Control Authority.
Agricultural statistics are an important sources of statistical figures on the agricultural sector in the Emirate of Abu Dhabi, aand are therefore instrumental in supporting agricultural scientific research and guiding policy-makers in the developent of future agricultural plans.
I Plant Production Statistics
of10
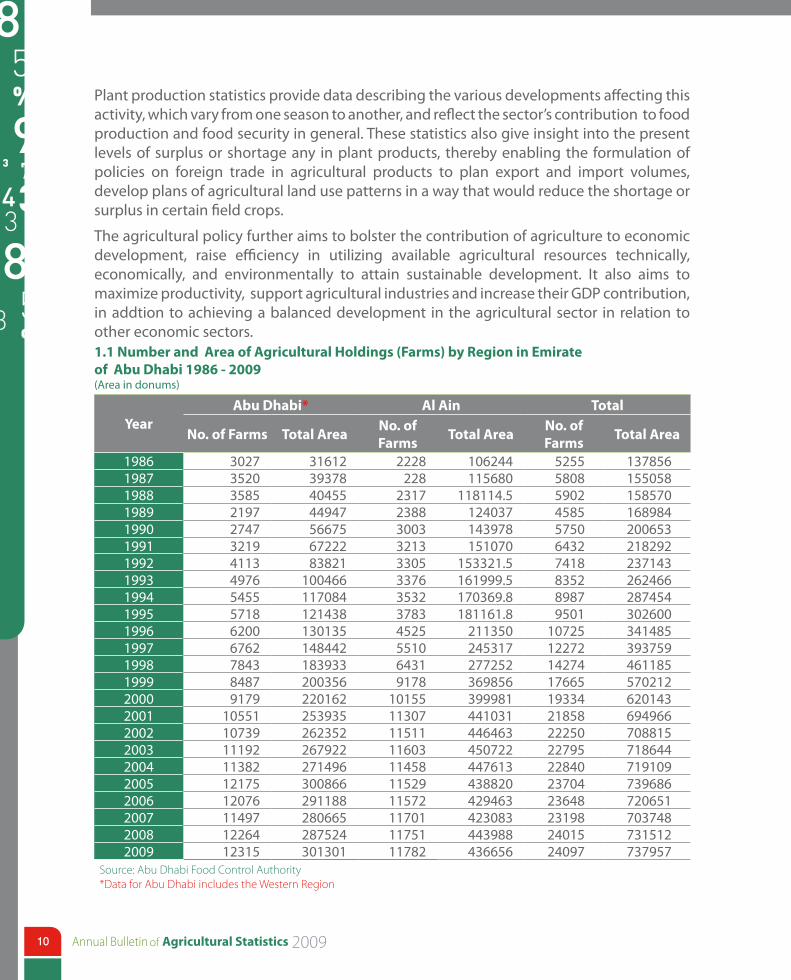
Plant production statistics provide data describing the various developments affecting this activity, which vary from one season to another, and reflect the sector’s contribution to food production and food security in general. These statistics also give insight into the present levels of surplus or shortage any in plant products, thereby enabling the formulation of policies on foreign trade in agricultural products to plan export and import volumes, develop plans of agricultural land use patterns in a way that would reduce the shortage or surplus in certain field crops.
The agricultural policy further aims to bolster the contribution of agriculture to economic development, raise efficiency in utilizing available agricultural resources technically, economically, and environmentally to attain sustainable development. It also aims to maximize productivity, support agricultural industries and increase their GDP contribution, in addtion to achieving a balanced development in the agricultural sector in relation to other economic sectors.1.1 Number and Area of Agricultural Holdings (Farms) by Region in Emirate of Abu Dhabi 1986 - 2009 (Area in donums)
TotalAl AinAbu Dhabi*Year
Total AreaNo. of Farms
Total AreaNo. of Farms
Total AreaNo. of Farms
137856525510624422283161230271986155058580811568022839378352019871585705902118114.5231740455358519881689844585124037238844947219719892006535750143978300356675274719902182926432151070321367222321919912371437418153321.5330583821411319922624668352161999.53376100466497619932874548987170369.83532117084545519943026009501181161.837831214385718199534148510725211350452513013562001996393759122722453175510148442676219974611851427427725264311839337843199857021217665369856917820035684871999620143193343999811015522016291792000694966218584410311130725393510551200170881522250446463115112623521073920027186442279545072211603267922111922003719109228404476131145827149611382200473968623704438820115293008661217520057206512364842946311572291188120762006703748231984230831170128066511497200773151224015443988117512875241226420087379572409743665611782301301123152009
Source: Abu Dhabi Food Control Authority*Data for Abu Dhabi includes the Western Region
11
1986
1987
1988
1989
1990
1991
1992
1993
1994
1995
1996
1997
1998
1999
2000
2001
2002
2003
2004
2005
2006
2007
2008
2009
1600000
1400000
1200000
1000000
800000
600000
400000
200000
0
Abu Dhabi Al Ain Total
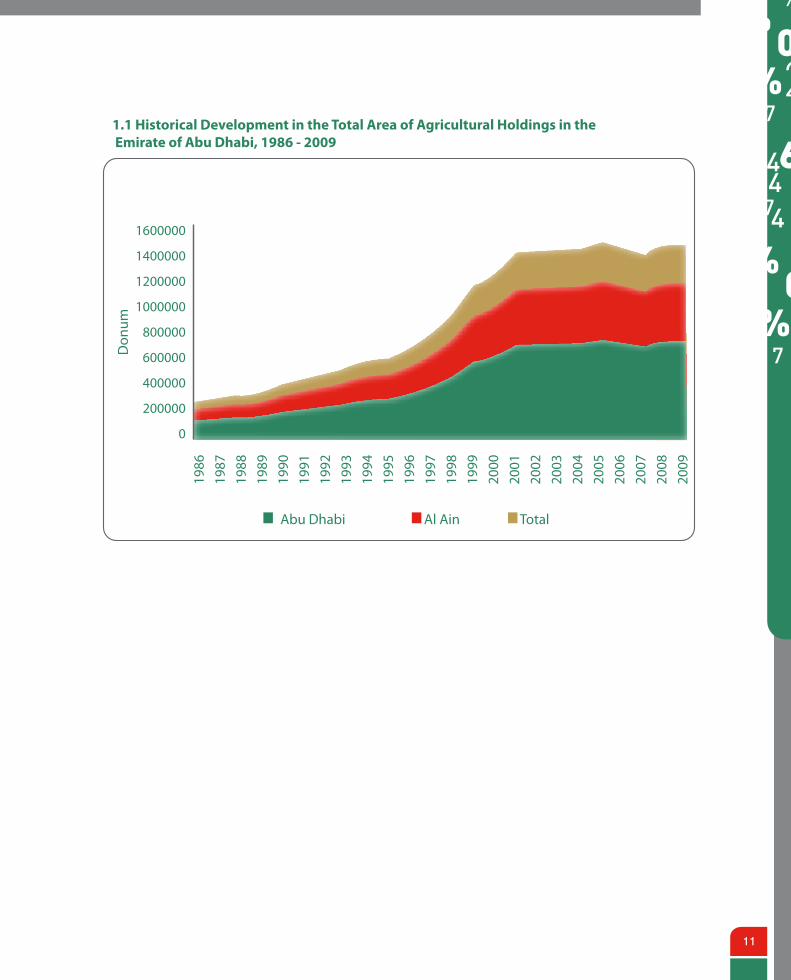
1.1 Historical Development in the Total Area of Agricultural Holdings in the Emirate of Abu Dhabi, 1986 - 2009
Don
um
of12
1.1 A General Overview of Agricultural Land Use
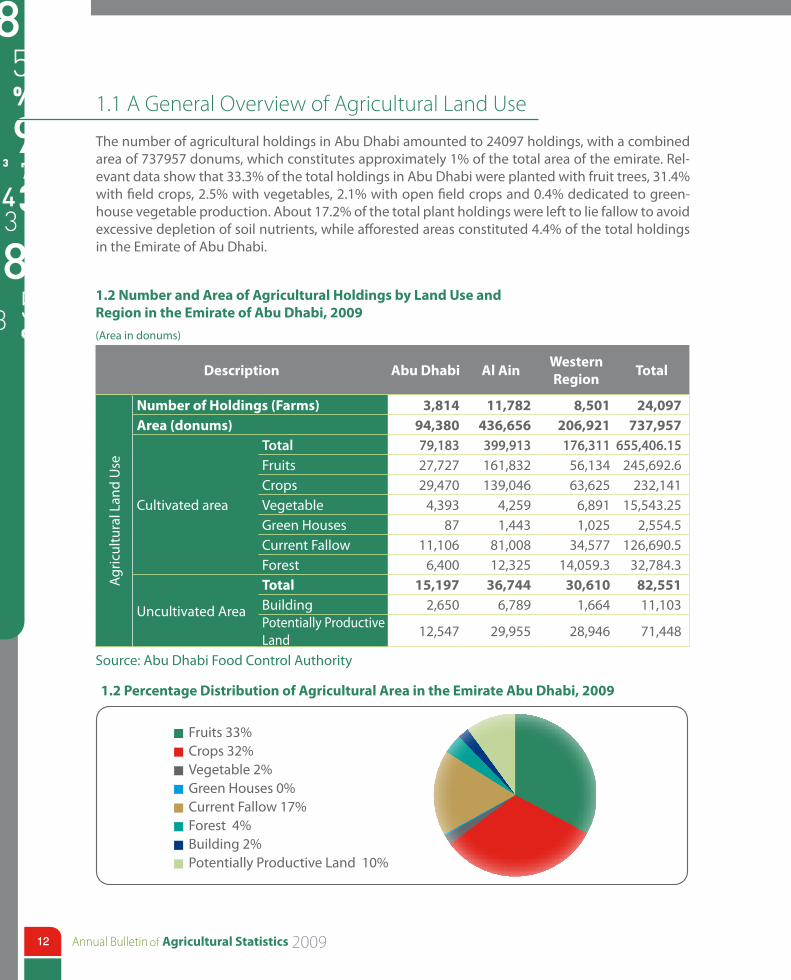
The number of agricultural holdings in Abu Dhabi amounted to 24097 holdings, with a combined area of 737957 donums, which constitutes approximately 1% of the total area of the emirate. Rel-evant data show that 33.3% of the total holdings in Abu Dhabi were planted with fruit trees, 31.4% with field crops, 2.5% with vegetables, 2.1% with open field crops and 0.4% dedicated to green-house vegetable production. About 17.2% of the total plant holdings were left to lie fallow to avoid excessive depletion of soil nutrients, while afforested areas constituted 4.4% of the total holdings in the Emirate of Abu Dhabi.
1.2 Number and Area of Agricultural Holdings by Land Use and Region in the Emirate of Abu Dhabi, 2009
(Area in donums)
TotalWestern Region
Al AinAbu DhabiDescription
24,0978,50111,7823,814Number of Holdings (Farms)
Agric
ultu
ral L
and
Use
737,957206,921436,65694,380Area (donums)655,406.15176,311399,91379,183Total
Cultivated area
245,692.656,134161,83227,727Fruits232,14163,625139,04629,470Crops
15,543.256,8914,2594,393Vegetable2,554.51,0251,44387Green Houses
126,690.534,57781,00811,106Current Fallow32,784.314,059.312,3256,400Forest
82,55130,61036,74415,197Total
Uncultivated Area 11,1031,6646,7892,650Building
71,44828,94629,95512,547Potentially Productive Land
Source: Abu Dhabi Food Control Authority
Fruits 33%Crops 32%Vegetable 2%Green Houses 0%Current Fallow 17%Forest 4%Building 2%Potentially Productive Land 10%
1.2 Percentage Distribution of Agricultural Area in the Emirate Abu Dhabi, 2009
13
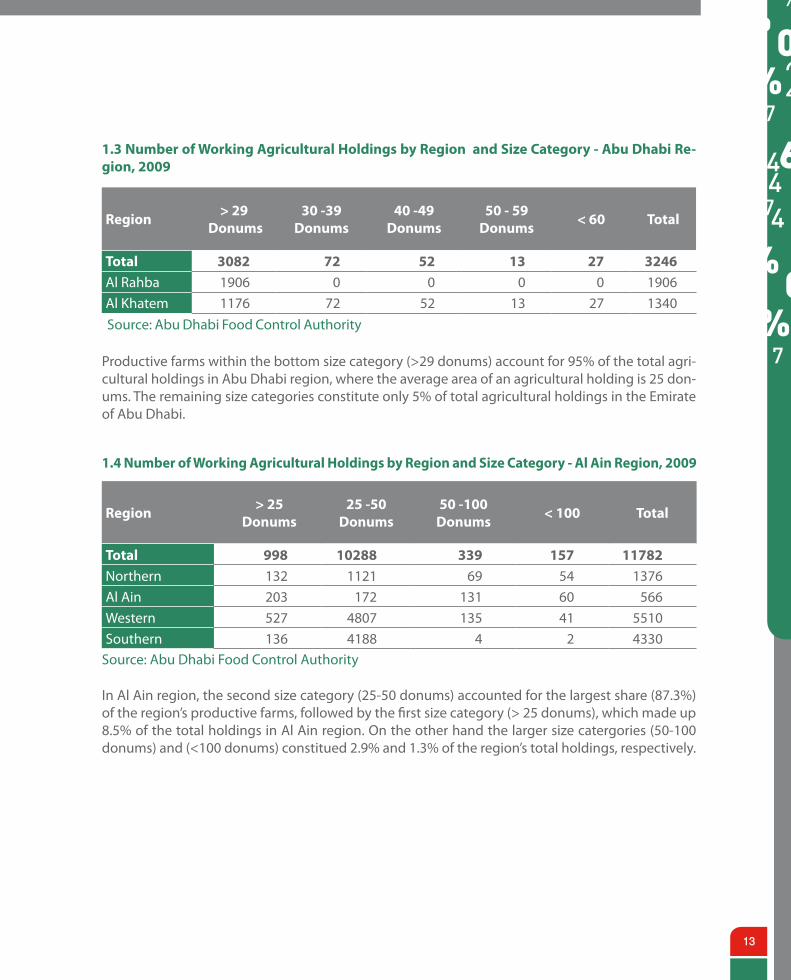
1.3 Number of Working Agricultural Holdings by Region and Size Category - Abu Dhabi Re-gion, 2009
Region> 29
Donums30 -39
Donums 40 -49
Donums50 - 59
Donums< 60 Total
Total 3082 72 52 13 27 3246 Al Rahba 1906 0 0 0 0 1906Al Khatem 1176 72 52 13 27 1340Source: Abu Dhabi Food Control Authority
Productive farms within the bottom size category (>29 donums) account for 95% of the total agri-cultural holdings in Abu Dhabi region, where the average area of an agricultural holding is 25 don-ums. The remaining size categories constitute only 5% of total agricultural holdings in the Emirate of Abu Dhabi.
1.4 Number of Working Agricultural Holdings by Region and Size Category - Al Ain Region, 2009
Region > 25
Donums25 -50
Donums 50 -100
Donums< 100 Total
Total 998 10288 339 157 11782Northern 132 1121 69 54 1376Al Ain 203 172 131 60 566Western 527 4807 135 41 5510Southern 136 4188 4 2 4330
Source: Abu Dhabi Food Control Authority
In Al Ain region, the second size category (25-50 donums) accounted for the largest share (87.3%) of the region’s productive farms, followed by the first size category (> 25 donums), which made up 8.5% of the total holdings in Al Ain region. On the other hand the larger size catergories (50-100 donums) and (<100 donums) constitued 2.9% and 1.3% of the region’s total holdings, respectively.
of14
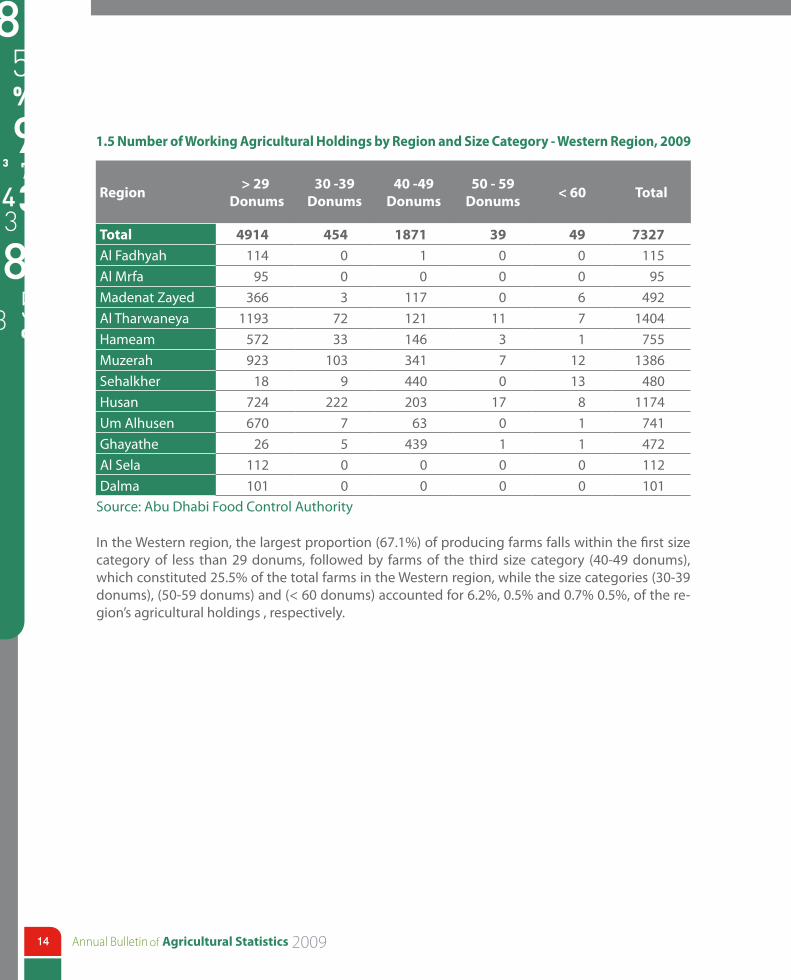
1.5 Number of Working Agricultural Holdings by Region and Size Category - Western Region, 2009
Region> 29
Donums30 -39
Donums40 -49
Donums50 - 59
Donums< 60 Total
Total 4914 454 1871 39 49 7327Al Fadhyah 114 0 1 0 0 115Al Mrfa 95 0 0 0 0 95Madenat Zayed 366 3 117 0 6 492Al Tharwaneya 1193 72 121 11 7 1404Hameam 572 33 146 3 1 755Muzerah 923 103 341 7 12 1386Sehalkher 18 9 440 0 13 480Husan 724 222 203 17 8 1174Um Alhusen 670 7 63 0 1 741Ghayathe 26 5 439 1 1 472Al Sela 112 0 0 0 0 112Dalma 101 0 0 0 0 101
Source: Abu Dhabi Food Control Authority
In the Western region, the largest proportion (67.1%) of producing farms falls within the first size category of less than 29 donums, followed by farms of the third size category (40-49 donums), which constituted 25.5% of the total farms in the Western region, while the size categories (30-39 donums), (50-59 donums) and (< 60 donums) accounted for 6.2%, 0.5% and 0.7% 0.5%, of the re-gion’s agricultural holdings , respectively.
15
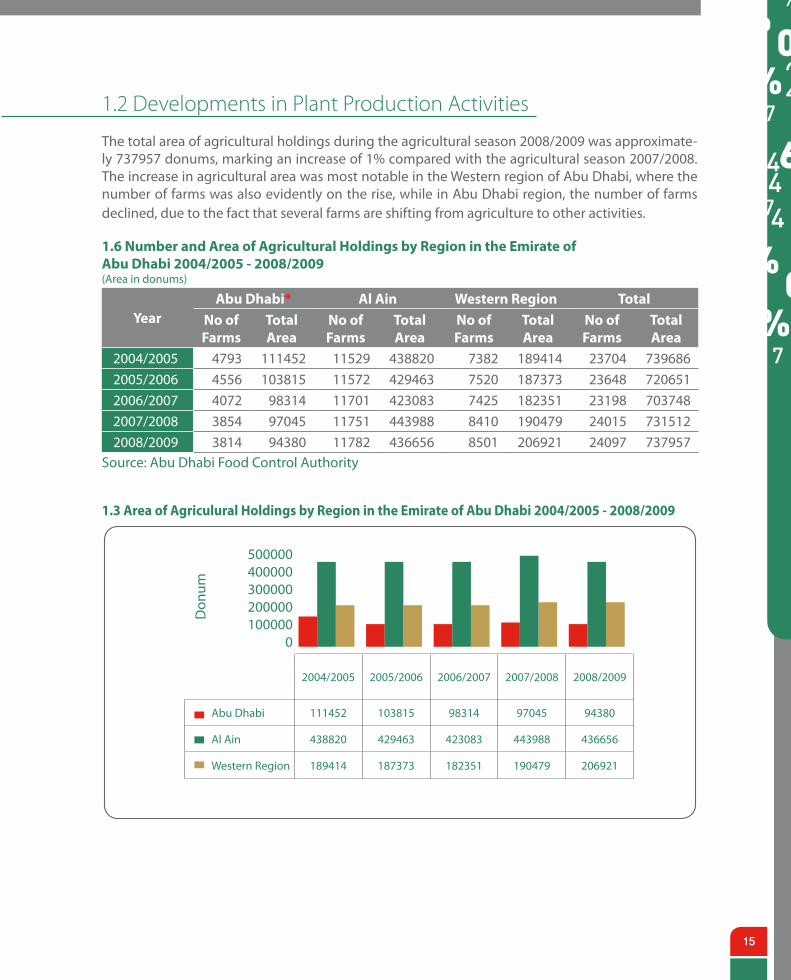
1.6 Number and Area of Agricultural Holdings by Region in the Emirate of Abu Dhabi 2004/2005 - 2008/2009(Area in donums)
YearAbu Dhabi* Al Ain Western Region Total
No of Farms
Total Area
No of Farms
Total Area
No of Farms
Total Area
No of Farms
Total Area
2004/2005 4793 111452 11529 438820 7382 189414 23704 7396862005/2006 4556 103815 11572 429463 7520 187373 23648 7206512006/2007 4072 98314 11701 423083 7425 182351 23198 7037482007/2008 3854 97045 11751 443988 8410 190479 24015 7315122008/2009 3814 94380 11782 436656 8501 206921 24097 737957
Source: Abu Dhabi Food Control Authority
1.2 Developments in Plant Production Activities
The total area of agricultural holdings during the agricultural season 2008/2009 was approximate-ly 737957 donums, marking an increase of 1% compared with the agricultural season 2007/2008. The increase in agricultural area was most notable in the Western region of Abu Dhabi, where the number of farms was also evidently on the rise, while in Abu Dhabi region, the number of farms declined, due to the fact that several farms are shifting from agriculture to other activities.
500000400000300000200000100000
0
2004/2005 2005/2006 2006/2007 2007/2008 2008/2009
Abu Dhabi 111452 103815 98314 97045 94380
Al Ain 438820 429463 423083 443988 436656
Western Region 189414 187373 182351 190479 206921
1.3 Area of Agriculural Holdings by Region in the Emirate of Abu Dhabi 2004/2005 - 2008/2009
Don
um
of16
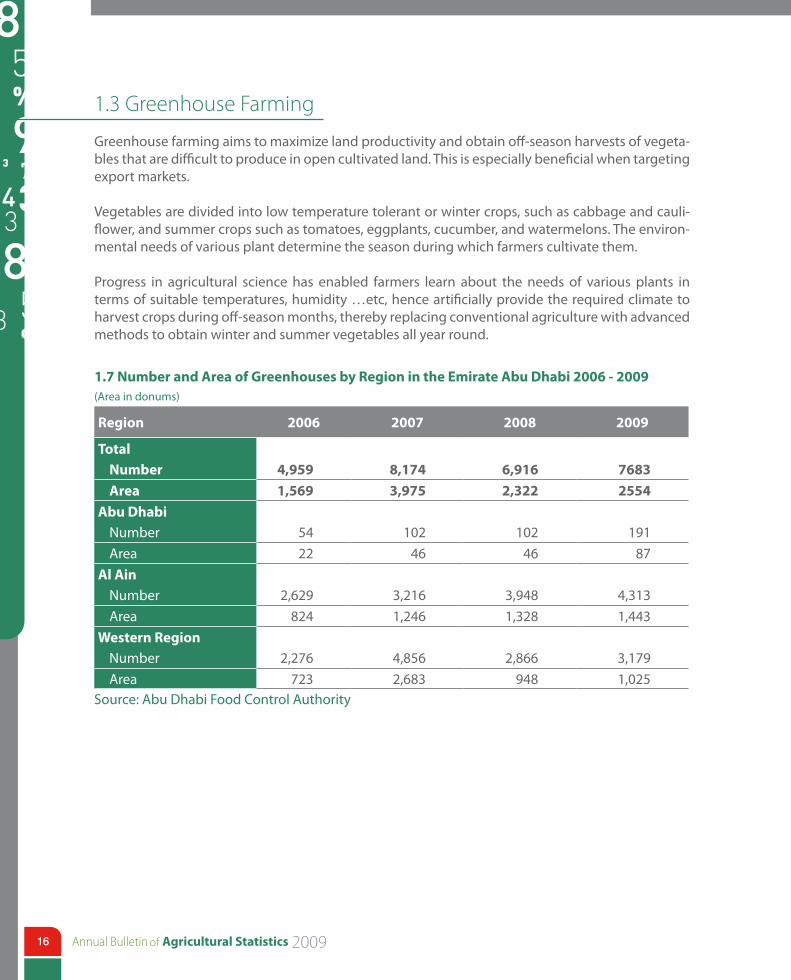
1.7 Number and Area of Greenhouses by Region in the Emirate Abu Dhabi 2006 - 2009(Area in donums) Region 2006 2007 2008 2009
TotalNumber 4,959 8,174 6,916 7683
Area 1,569 3,975 2,322 2554
Abu DhabiNumber 54 102 102 191Area 22 46 46 87
Al AinNumber 2,629 3,216 3,948 4,313Area 824 1,246 1,328 1,443
Western RegionNumber 2,276 4,856 2,866 3,179Area 723 2,683 948 1,025
Source: Abu Dhabi Food Control Authority
1.3 Greenhouse Farming
Greenhouse farming aims to maximize land productivity and obtain off-season harvests of vegeta-bles that are difficult to produce in open cultivated land. This is especially beneficial when targeting export markets.
Vegetables are divided into low temperature tolerant or winter crops, such as cabbage and cauli-flower, and summer crops such as tomatoes, eggplants, cucumber, and watermelons. The environ-mental needs of various plant determine the season during which farmers cultivate them.
Progress in agricultural science has enabled farmers learn about the needs of various plants in terms of suitable temperatures, humidity …etc, hence artificially provide the required climate to harvest crops during off-season months, thereby replacing conventional agriculture with advanced methods to obtain winter and summer vegetables all year round.
17
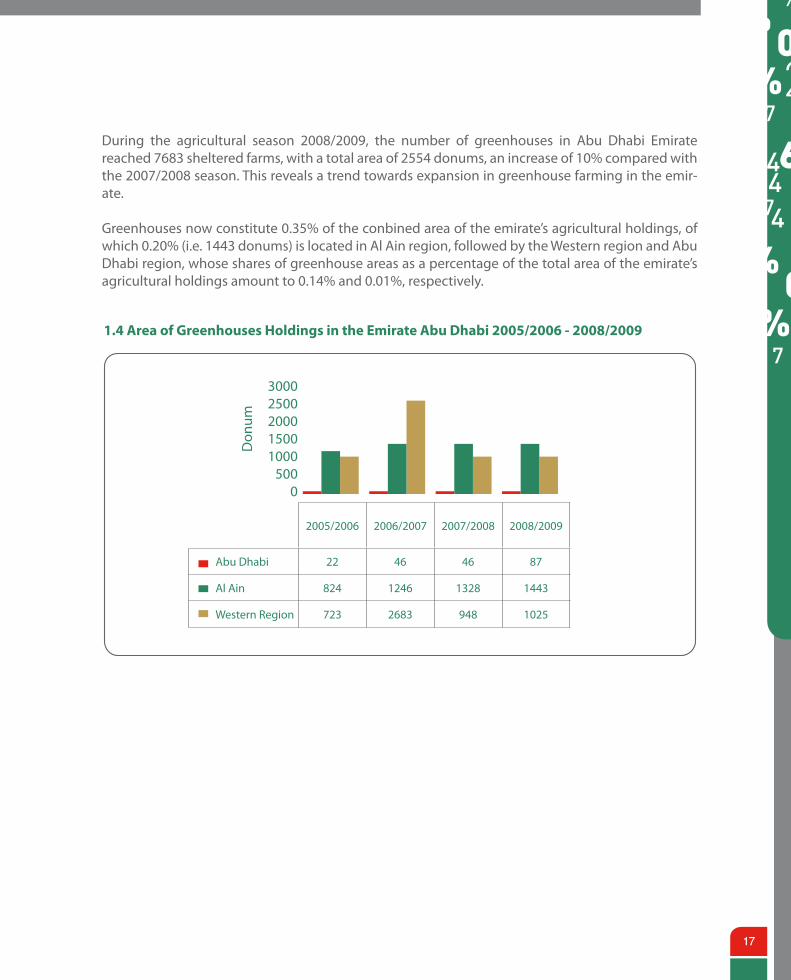
During the agricultural season 2008/2009, the number of greenhouses in Abu Dhabi Emirate reached 7683 sheltered farms, with a total area of 2554 donums, an increase of 10% compared with the 2007/2008 season. This reveals a trend towards expansion in greenhouse farming in the emir-ate.
Greenhouses now constitute 0.35% of the conbined area of the emirate’s agricultural holdings, of which 0.20% (i.e. 1443 donums) is located in Al Ain region, followed by the Western region and Abu Dhabi region, whose shares of greenhouse areas as a percentage of the total area of the emirate’s agricultural holdings amount to 0.14% and 0.01%, respectively.
1.4 Area of Greenhouses Holdings in the Emirate Abu Dhabi 2005/2006 - 2008/2009
30002500200015001000
5000
2005/2006 2006/2007 2007/2008 2008/2009
Abu Dhabi 22 46 46 87
Al Ain 824 1246 1328 1443
Western Region 723 2683 948 1025
Don
um
of18
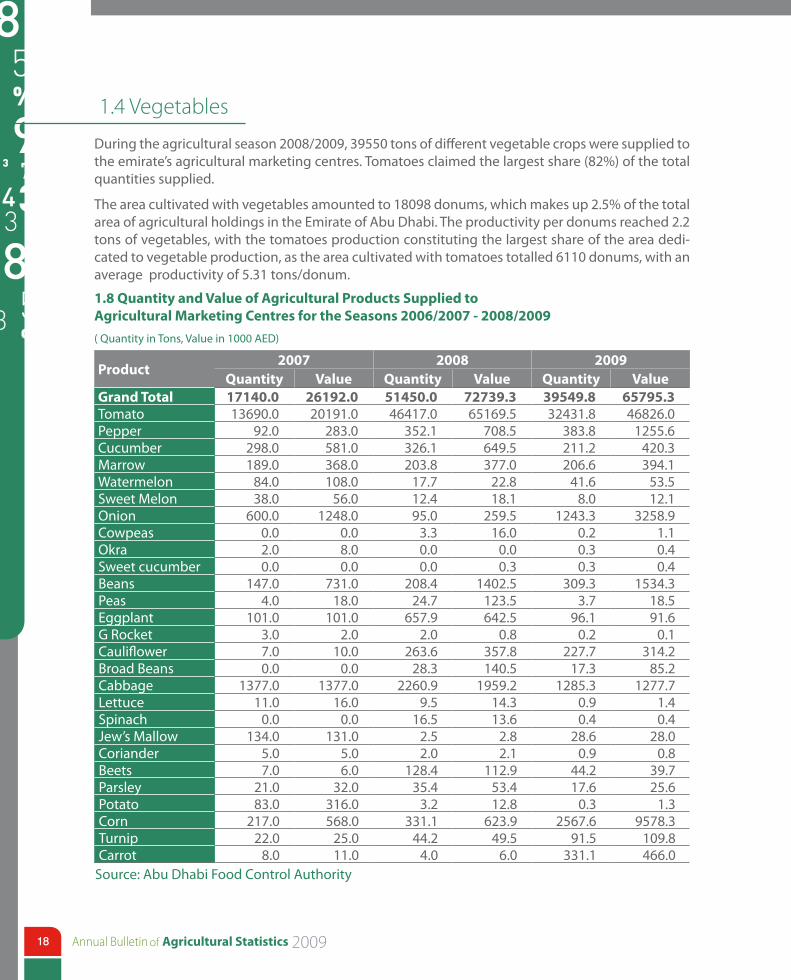
1.4 Vegetables
During the agricultural season 2008/2009, 39550 tons of different vegetable crops were supplied to the emirate’s agricultural marketing centres. Tomatoes claimed the largest share (82%) of the total quantities supplied.
The area cultivated with vegetables amounted to 18098 donums, which makes up 2.5% of the total area of agricultural holdings in the Emirate of Abu Dhabi. The productivity per donums reached 2.2 tons of vegetables, with the tomatoes production constituting the largest share of the area dedi-cated to vegetable production, as the area cultivated with tomatoes totalled 6110 donums, with an average productivity of 5.31 tons/donum.
1.8 Quantity and Value of Agricultural Products Supplied to Agricultural Marketing Centres for the Seasons 2006/2007 - 2008/2009
( Quantity in Tons, Value in 1000 AED)
Product2007 2008 2009
Quantity Value Quantity Value Quantity ValueGrand Total 17140.0 26192.0 51450.0 72739.3 39549.8 65795.3Tomato 13690.0 20191.0 46417.0 65169.5 32431.8 46826.0Pepper 92.0 283.0 352.1 708.5 383.8 1255.6Cucumber 298.0 581.0 326.1 649.5 211.2 420.3Marrow 189.0 368.0 203.8 377.0 206.6 394.1Watermelon 84.0 108.0 17.7 22.8 41.6 53.5Sweet Melon 38.0 56.0 12.4 18.1 8.0 12.1Onion 600.0 1248.0 95.0 259.5 1243.3 3258.9Cowpeas 0.0 0.0 3.3 16.0 0.2 1.1Okra 2.0 8.0 0.0 0.0 0.3 0.4Sweet cucumber 0.0 0.0 0.0 0.3 0.3 0.4Beans 147.0 731.0 208.4 1402.5 309.3 1534.3Peas 4.0 18.0 24.7 123.5 3.7 18.5Eggplant 101.0 101.0 657.9 642.5 96.1 91.6G Rocket 3.0 2.0 2.0 0.8 0.2 0.1Cauliflower 7.0 10.0 263.6 357.8 227.7 314.2Broad Beans 0.0 0.0 28.3 140.5 17.3 85.2Cabbage 1377.0 1377.0 2260.9 1959.2 1285.3 1277.7Lettuce 11.0 16.0 9.5 14.3 0.9 1.4Spinach 0.0 0.0 16.5 13.6 0.4 0.4Jew’s Mallow 134.0 131.0 2.5 2.8 28.6 28.0Coriander 5.0 5.0 2.0 2.1 0.9 0.8Beets 7.0 6.0 128.4 112.9 44.2 39.7Parsley 21.0 32.0 35.4 53.4 17.6 25.6Potato 83.0 316.0 3.2 12.8 0.3 1.3Corn 217.0 568.0 331.1 623.9 2567.6 9578.3Turnip 22.0 25.0 44.2 49.5 91.5 109.8Carrot 8.0 11.0 4.0 6.0 331.1 466.0
Source: Abu Dhabi Food Control Authority
19
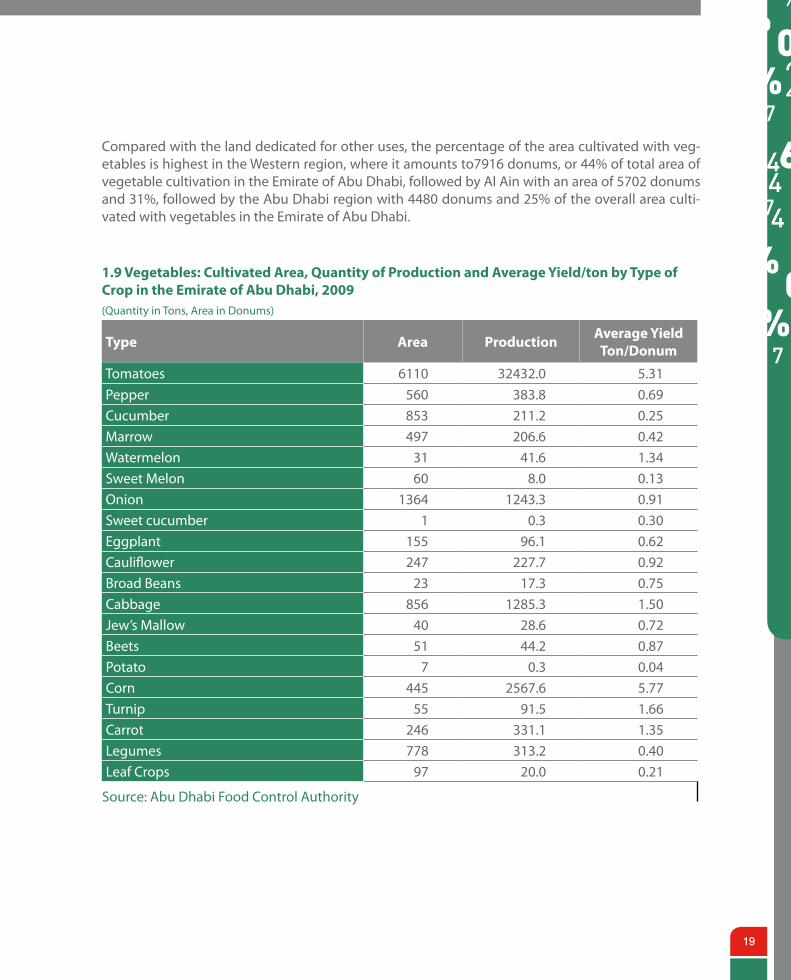
Compared with the land dedicated for other uses, the percentage of the area cultivated with veg-etables is highest in the Western region, where it amounts to7916 donums, or 44% of total area of vegetable cultivation in the Emirate of Abu Dhabi, followed by Al Ain with an area of 5702 donums and 31%, followed by the Abu Dhabi region with 4480 donums and 25% of the overall area culti-vated with vegetables in the Emirate of Abu Dhabi.
1.9 Vegetables: Cultivated Area, Quantity of Production and Average Yield/ton by Type of Crop in the Emirate of Abu Dhabi, 2009(Quantity in Tons, Area in Donums)
Type Area ProductionAverage Yield
Ton/Donum
Tomatoes 6110 32432.0 5.31Pepper 560 383.8 0.69Cucumber 853 211.2 0.25Marrow 497 206.6 0.42Watermelon 31 41.6 1.34Sweet Melon 60 8.0 0.13Onion 1364 1243.3 0.91Sweet cucumber 1 0.3 0.30Eggplant 155 96.1 0.62Cauliflower 247 227.7 0.92Broad Beans 23 17.3 0.75Cabbage 856 1285.3 1.50Jew’s Mallow 40 28.6 0.72Beets 51 44.2 0.87Potato 7 0.3 0.04Corn 445 2567.6 5.77Turnip 55 91.5 1.66Carrot 246 331.1 1.35Legumes 778 313.2 0.40Leaf Crops 97 20.0 0.21
Source: Abu Dhabi Food Control Authority
of20
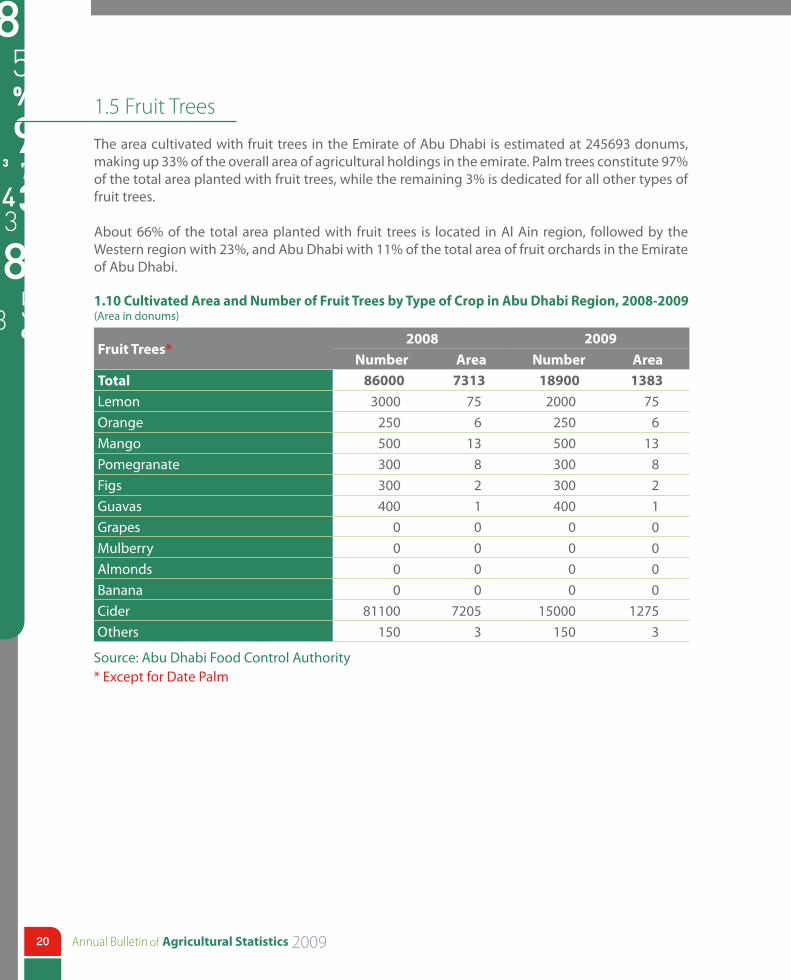
1.5 Fruit Trees
The area cultivated with fruit trees in the Emirate of Abu Dhabi is estimated at 245693 donums, making up 33% of the overall area of agricultural holdings in the emirate. Palm trees constitute 97% of the total area planted with fruit trees, while the remaining 3% is dedicated for all other types of fruit trees.
About 66% of the total area planted with fruit trees is located in Al Ain region, followed by the Western region with 23%, and Abu Dhabi with 11% of the total area of fruit orchards in the Emirate of Abu Dhabi.
1.10 Cultivated Area and Number of Fruit Trees by Type of Crop in Abu Dhabi Region, 2008-2009(Area in donums)
Fruit Trees*2008 2009
Number Area Number AreaTotal 86000 7313 18900 1383
Lemon 3000 75 2000 75Orange 250 6 250 6Mango 500 13 500 13Pomegranate 300 8 300 8Figs 300 2 300 2Guavas 400 1 400 1Grapes 0 0 0 0Mulberry 0 0 0 0Almonds 0 0 0 0Banana 0 0 0 0Cider 81100 7205 15000 1275Others 150 3 150 3
Source: Abu Dhabi Food Control Authority* Except for Date Palm
21
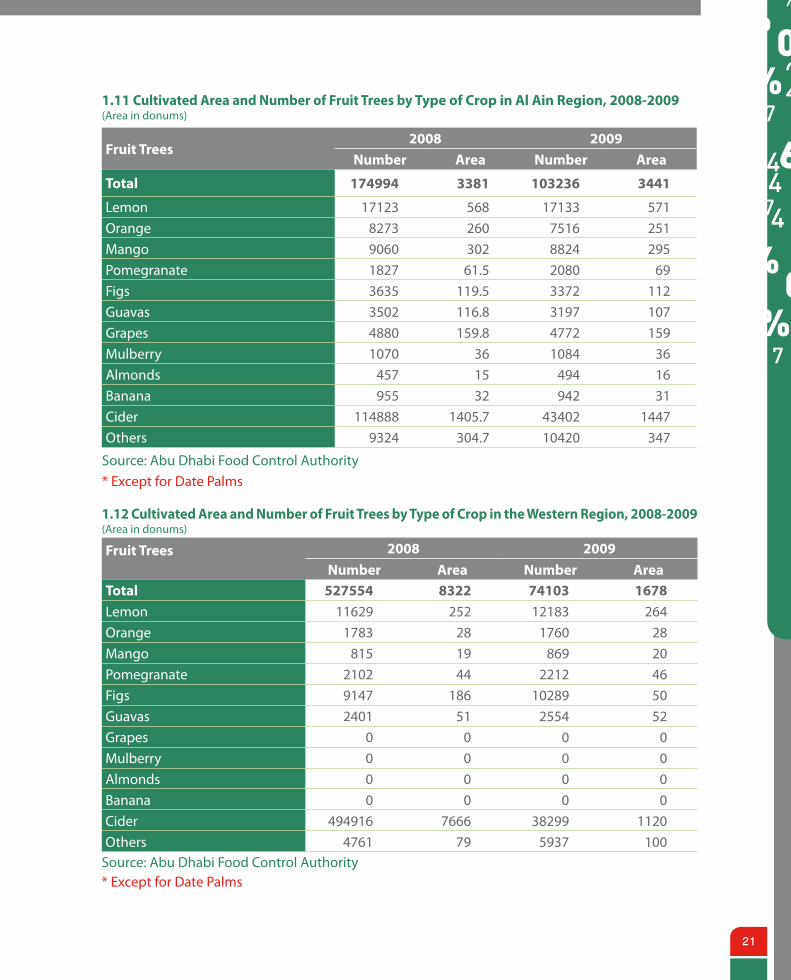
1.11 Cultivated Area and Number of Fruit Trees by Type of Crop in Al Ain Region, 2008-2009(Area in donums)
Fruit Trees2008 2009
Number Area Number Area
Total 174994 3381 103236 3441
Lemon 17123 568 17133 571Orange 8273 260 7516 251Mango 9060 302 8824 295Pomegranate 1827 61.5 2080 69Figs 3635 119.5 3372 112Guavas 3502 116.8 3197 107Grapes 4880 159.8 4772 159Mulberry 1070 36 1084 36Almonds 457 15 494 16Banana 955 32 942 31Cider 114888 1405.7 43402 1447Others 9324 304.7 10420 347
Source: Abu Dhabi Food Control Authority* Except for Date Palms
1.12 Cultivated Area and Number of Fruit Trees by Type of Crop in the Western Region, 2008-2009(Area in donums)
Fruit Trees 2008 2009
Number Area Number AreaTotal 527554 8322 74103 1678
Lemon 11629 252 12183 264Orange 1783 28 1760 28Mango 815 19 869 20Pomegranate 2102 44 2212 46Figs 9147 186 10289 50Guavas 2401 51 2554 52Grapes 0 0 0 0Mulberry 0 0 0 0Almonds 0 0 0 0Banana 0 0 0 0Cider 494916 7666 38299 1120Others 4761 79 5937 100
Source: Abu Dhabi Food Control Authority* Except for Date Palms
of22
1.6 Field Crops
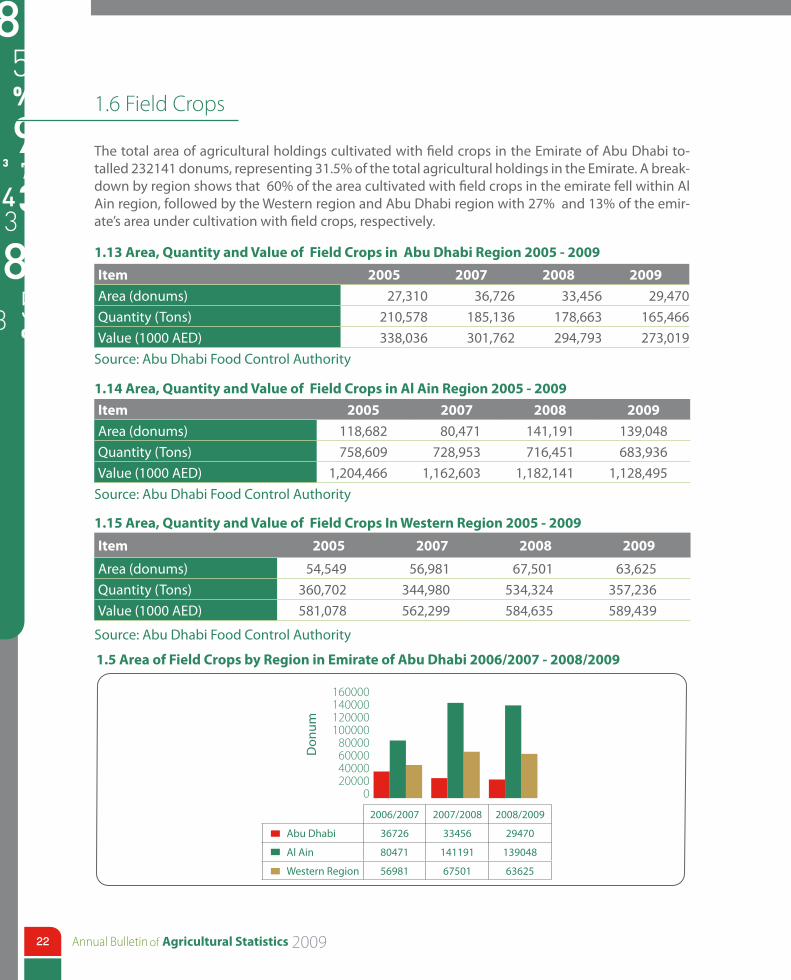
The total area of agricultural holdings cultivated with field crops in the Emirate of Abu Dhabi to-talled 232141 donums, representing 31.5% of the total agricultural holdings in the Emirate. A break-down by region shows that 60% of the area cultivated with field crops in the emirate fell within Al Ain region, followed by the Western region and Abu Dhabi region with 27% and 13% of the emir-ate’s area under cultivation with field crops, respectively.
1.13 Area, Quantity and Value of Field Crops in Abu Dhabi Region 2005 - 2009
Item 2005 2007 2008 2009
Area (donums) 27,310 36,726 33,456 29,470Quantity (Tons) 210,578 185,136 178,663 165,466Value (1000 AED) 338,036 301,762 294,793 273,019
Source: Abu Dhabi Food Control Authority
1.14 Area, Quantity and Value of Field Crops in Al Ain Region 2005 - 2009
Item 2005 2007 2008 2009
Area (donums) 118,682 80,471 141,191 139,048Quantity (Tons) 758,609 728,953 716,451 683,936Value (1000 AED) 1,204,466 1,162,603 1,182,141 1,128,495
Source: Abu Dhabi Food Control Authority
1.15 Area, Quantity and Value of Field Crops In Western Region 2005 - 2009
Item 2005 2007 2008 2009
Area (donums) 54,549 56,981 67,501 63,625Quantity (Tons) 360,702 344,980 534,324 357,236Value (1000 AED) 581,078 562,299 584,635 589,439
Source: Abu Dhabi Food Control Authority
1.5 Area of Field Crops by Region in Emirate of Abu Dhabi 2006/2007 - 2008/2009
2006/2007 2007/2008 2008/2009
Abu Dhabi 36726 33456 29470
Al Ain 80471 141191 139048
Western Region 56981 67501 63625
Don
um
160000140000120000100000
80000600004000020000
0
23
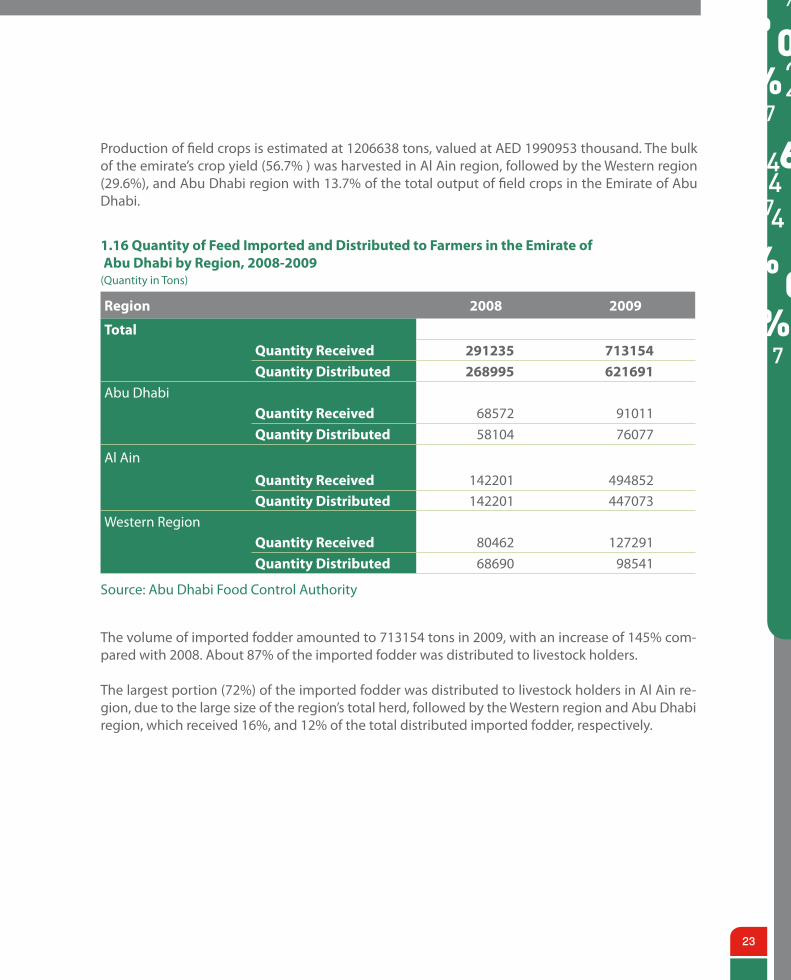
1.16 Quantity of Feed Imported and Distributed to Farmers in the Emirate of Abu Dhabi by Region, 2008-2009(Quantity in Tons)
Region 2008 2009
TotalQuantity َََReceived 291235 713154Quantity َََDistributed 268995 621691
Abu DhabiQuantity َََReceived 68572 91011Quantity َََDistributed 58104 76077
Al Ain
Quantity َََReceived 142201 494852Quantity َََDistributed 142201 447073
Western RegionQuantity َََReceived 80462 127291
Quantity َََDistributed 68690 98541
Source: Abu Dhabi Food Control Authority
The volume of imported fodder amounted to 713154 tons in 2009, with an increase of 145% com-pared with 2008. About 87% of the imported fodder was distributed to livestock holders.
The largest portion (72%) of the imported fodder was distributed to livestock holders in Al Ain re-gion, due to the large size of the region’s total herd, followed by the Western region and Abu Dhabi region, which received 16%, and 12% of the total distributed imported fodder, respectively.
Production of field crops is estimated at 1206638 tons, valued at AED 1990953 thousand. The bulk of the emirate’s crop yield (56.7% ) was harvested in Al Ain region, followed by the Western region (29.6%), and Abu Dhabi region with 13.7% of the total output of field crops in the Emirate of Abu Dhabi.
of24
1.7 Wells
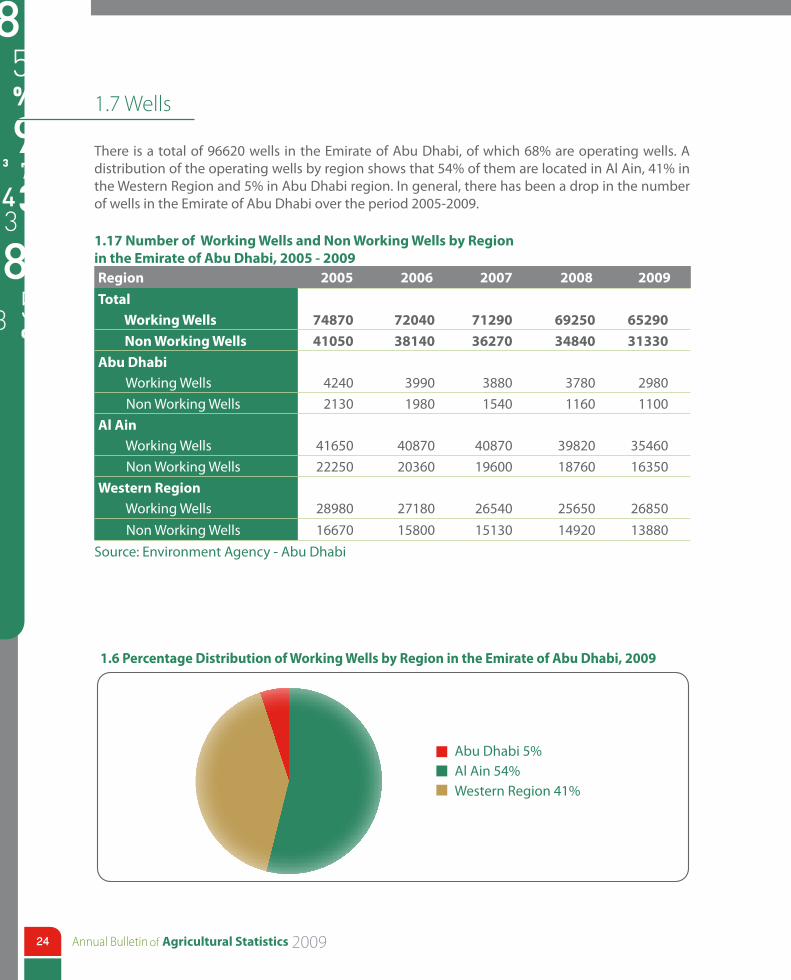
There is a total of 96620 wells in the Emirate of Abu Dhabi, of which 68% are operating wells. A distribution of the operating wells by region shows that 54% of them are located in Al Ain, 41% in the Western Region and 5% in Abu Dhabi region. In general, there has been a drop in the number of wells in the Emirate of Abu Dhabi over the period 2005-2009.
1.17 Number of Working Wells and Non Working Wells by Regionin the Emirate of Abu Dhabi, 2005 - 2009 Region 2005 2006 2007 2008 2009
Total Working Wells 74870 72040 71290 69250 65290
Non Working Wells 41050 38140 36270 34840 31330
Abu Dhabi Working Wells 4240 3990 3880 3780 2980 Non Working Wells 2130 1980 1540 1160 1100Al Ain Working Wells 41650 40870 40870 39820 35460 Non Working Wells 22250 20360 19600 18760 16350Western Region Working Wells 28980 27180 26540 25650 26850 Non Working Wells 16670 15800 15130 14920 13880
Source: Environment Agency - Abu Dhabi
1.6 Percentage Distribution of Working Wells by Region in the Emirate of Abu Dhabi, 2009
Abu Dhabi 5%Al Ain 54%Western Region 41%
25
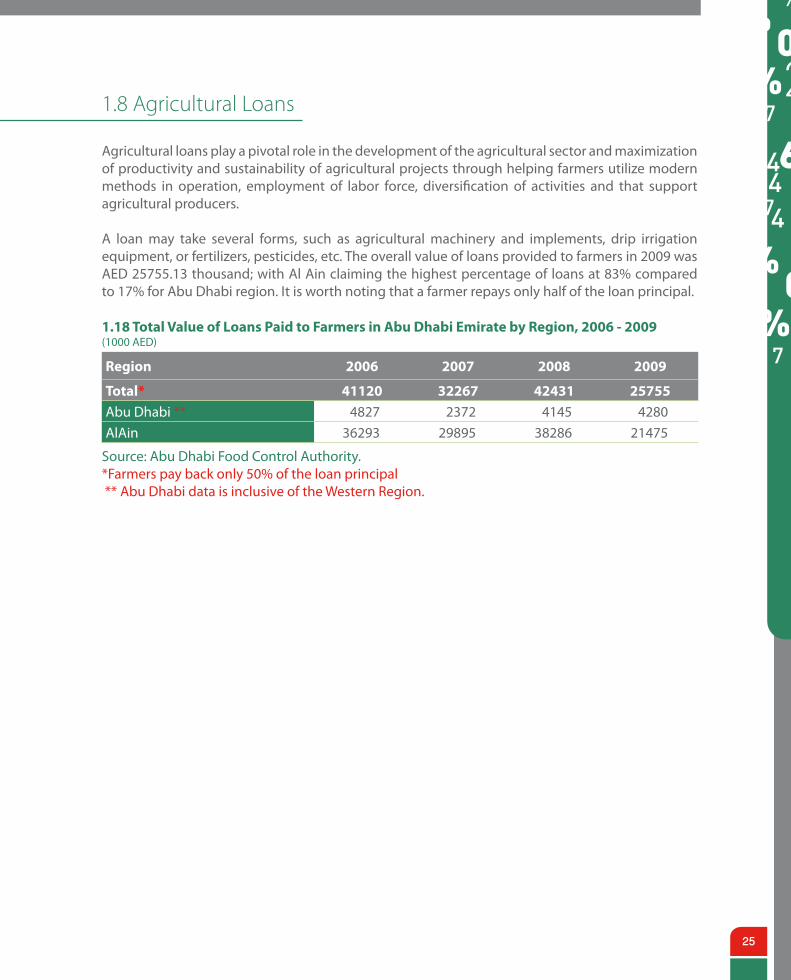
1.8 Agricultural Loans
Agricultural loans play a pivotal role in the development of the agricultural sector and maximization of productivity and sustainability of agricultural projects through helping farmers utilize modern methods in operation, employment of labor force, diversification of activities and that support agricultural producers.
A loan may take several forms, such as agricultural machinery and implements, drip irrigation equipment, or fertilizers, pesticides, etc. The overall value of loans provided to farmers in 2009 was AED 25755.13 thousand; with Al Ain claiming the highest percentage of loans at 83% compared to 17% for Abu Dhabi region. It is worth noting that a farmer repays only half of the loan principal.
1.18 Total Value of Loans Paid to Farmers in Abu Dhabi Emirate by Region, 2006 - 2009(1000 AED)
Region 2006 2007 2008 2009
Total* 41120 32267 42431 25755Abu Dhabi ** 4827 2372 4145 4280AlAin 36293 29895 38286 21475
Source: Abu Dhabi Food Control Authority.*Farmers pay back only 50% of the loan principal ** Abu Dhabi data is inclusive of the Western Region.
of26
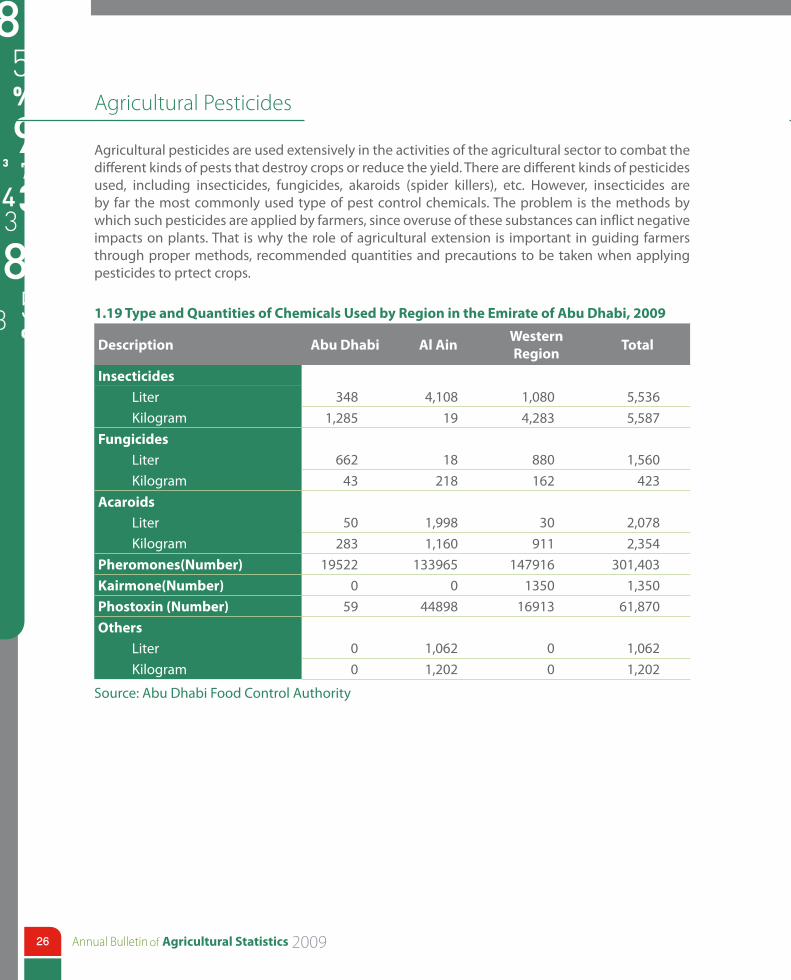
Agricultural Pesticides
Agricultural pesticides are used extensively in the activities of the agricultural sector to combat the different kinds of pests that destroy crops or reduce the yield. There are different kinds of pesticides used, including insecticides, fungicides, akaroids (spider killers), etc. However, insecticides are by far the most commonly used type of pest control chemicals. The problem is the methods by which such pesticides are applied by farmers, since overuse of these substances can inflict negative impacts on plants. That is why the role of agricultural extension is important in guiding farmers through proper methods, recommended quantities and precautions to be taken when applying pesticides to prtect crops.
1.19 Type and Quantities of Chemicals Used by Region in the Emirate of Abu Dhabi, 2009
Description Abu Dhabi Al AinWestern Region
Total
Insecticides Liter 348 4,108 1,080 5,536Kilogram 1,285 19 4,283 5,587
FungicidesLiter 662 18 880 1,560Kilogram 43 218 162 423
AcaroidsLiter 50 1,998 30 2,078Kilogram 283 1,160 911 2,354
Pheromones(Number) 19522 133965 147916 301,403Kairmone(Number) 0 0 1350 1,350Phostoxin (Number) 59 44898 16913 61,870Others
Liter 0 1,062 0 1,062Kilogram 0 1,202 0 1,202
Source: Abu Dhabi Food Control Authority
27
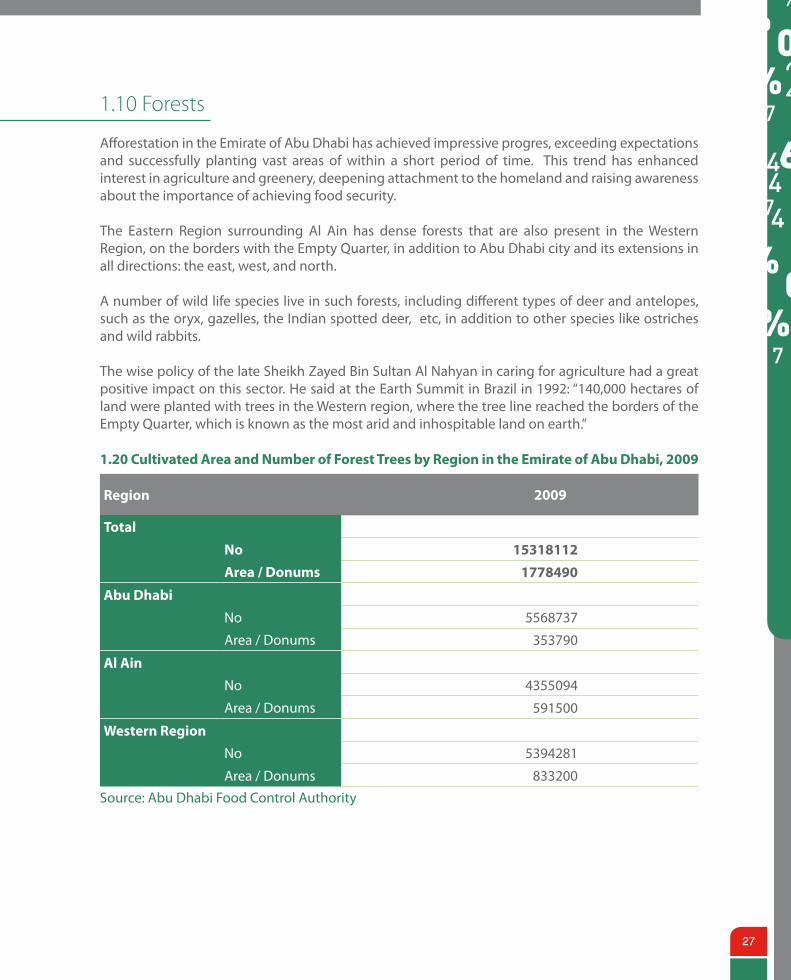
1.10 Forests
Afforestation in the Emirate of Abu Dhabi has achieved impressive progres, exceeding expectations and successfully planting vast areas of within a short period of time. This trend has enhanced interest in agriculture and greenery, deepening attachment to the homeland and raising awareness about the importance of achieving food security.
The Eastern Region surrounding Al Ain has dense forests that are also present in the Western Region, on the borders with the Empty Quarter, in addition to Abu Dhabi city and its extensions in all directions: the east, west, and north.
A number of wild life species live in such forests, including different types of deer and antelopes, such as the oryx, gazelles, the Indian spotted deer, etc, in addition to other species like ostriches and wild rabbits.
The wise policy of the late Sheikh Zayed Bin Sultan Al Nahyan in caring for agriculture had a great positive impact on this sector. He said at the Earth Summit in Brazil in 1992: “140,000 hectares of land were planted with trees in the Western region, where the tree line reached the borders of the Empty Quarter, which is known as the most arid and inhospitable land on earth.”
1.20 Cultivated Area and Number of Forest Trees by Region in the Emirate of Abu Dhabi, 2009
Region 2009
Total
No 15318112
Area / Donums 1778490
Abu Dhabi
No 5568737
Area / Donums 353790
Al Ain
No 4355094
Area / Donums 591500
Western Region
No 5394281
Area / Donums 833200Source: Abu Dhabi Food Control Authority
of28
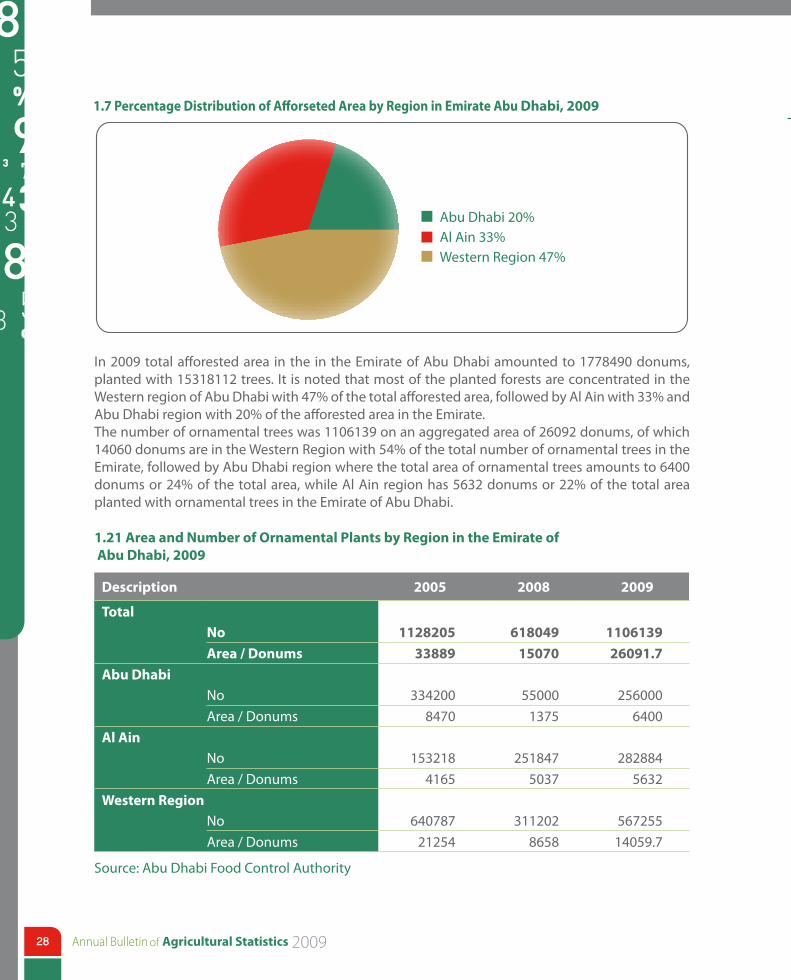
In 2009 total afforested area in the in the Emirate of Abu Dhabi amounted to 1778490 donums, planted with 15318112 trees. It is noted that most of the planted forests are concentrated in the Western region of Abu Dhabi with 47% of the total afforested area, followed by Al Ain with 33% and Abu Dhabi region with 20% of the afforested area in the Emirate. The number of ornamental trees was 1106139 on an aggregated area of 26092 donums, of which 14060 donums are in the Western Region with 54% of the total number of ornamental trees in the Emirate, followed by Abu Dhabi region where the total area of ornamental trees amounts to 6400 donums or 24% of the total area, while Al Ain region has 5632 donums or 22% of the total area planted with ornamental trees in the Emirate of Abu Dhabi.
1.21 Area and Number of Ornamental Plants by Region in the Emirate of Abu Dhabi, 2009
Description 2005 2008 2009
TotalNo 1128205 618049 1106139
Area / Donums 33889 15070 26091.7
Abu DhabiNo 334200 55000 256000Area / Donums 8470 1375 6400
Al AinNo 153218 251847 282884Area / Donums 4165 5037 5632
Western RegionNo 640787 311202 567255
Area / Donums 21254 8658 14059.7
Source: Abu Dhabi Food Control Authority
1.7 Percentage Distribution of Afforseted Area by Region in Emirate Abu Dhabi, 2009
Abu Dhabi 20%Al Ain 33%Western Region 47%
29
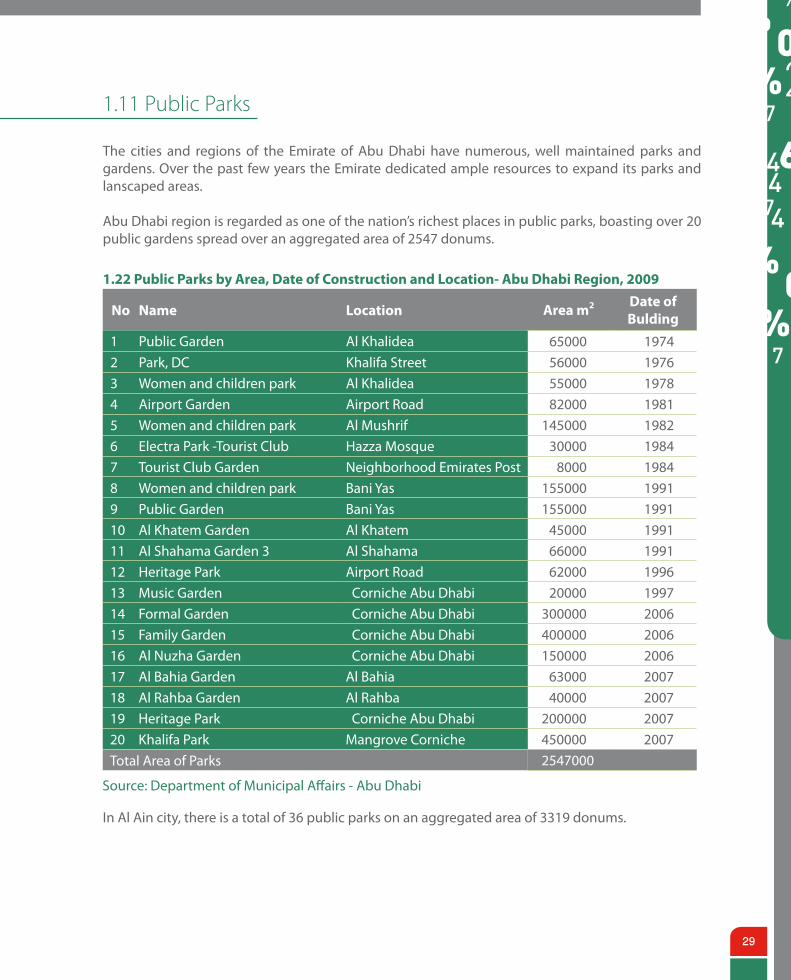
1.11 Public Parks
The cities and regions of the Emirate of Abu Dhabi have numerous, well maintained parks and gardens. Over the past few years the Emirate dedicated ample resources to expand its parks and lanscaped areas.
Abu Dhabi region is regarded as one of the nation’s richest places in public parks, boasting over 20 public gardens spread over an aggregated area of 2547 donums.
1.22 Public Parks by Area, Date of Construction and Location- Abu Dhabi Region, 2009
No Name Location Area m2 Date of Bulding
1 Public Garden Al Khalidea 65000 19742 Park, DC Khalifa Street 56000 19763 Women and children park Al Khalidea 55000 19784 Airport Garden Airport Road 82000 19815 Women and children park Al Mushrif 145000 19826 Electra Park -Tourist Club Hazza Mosque 30000 19847 Tourist Club Garden Neighborhood Emirates Post 8000 19848 Women and children park Bani Yas 155000 19919 Public Garden Bani Yas 155000 199110 Al Khatem Garden Al Khatem 45000 199111 Al Shahama Garden 3 Al Shahama 66000 199112 Heritage Park Airport Road 62000 199613 Music Garden Corniche Abu Dhabi 20000 199714 Formal Garden Corniche Abu Dhabi 300000 200615 Family Garden Corniche Abu Dhabi 400000 200616 Al Nuzha Garden Corniche Abu Dhabi 150000 200617 Al Bahia Garden Al Bahia 63000 200718 Al Rahba Garden Al Rahba 40000 200719 Heritage Park Corniche Abu Dhabi 200000 200720 Khalifa Park Mangrove Corniche 450000 2007Total Area of Parks 2547000
Source: Department of Municipal Affairs - Abu Dhabi
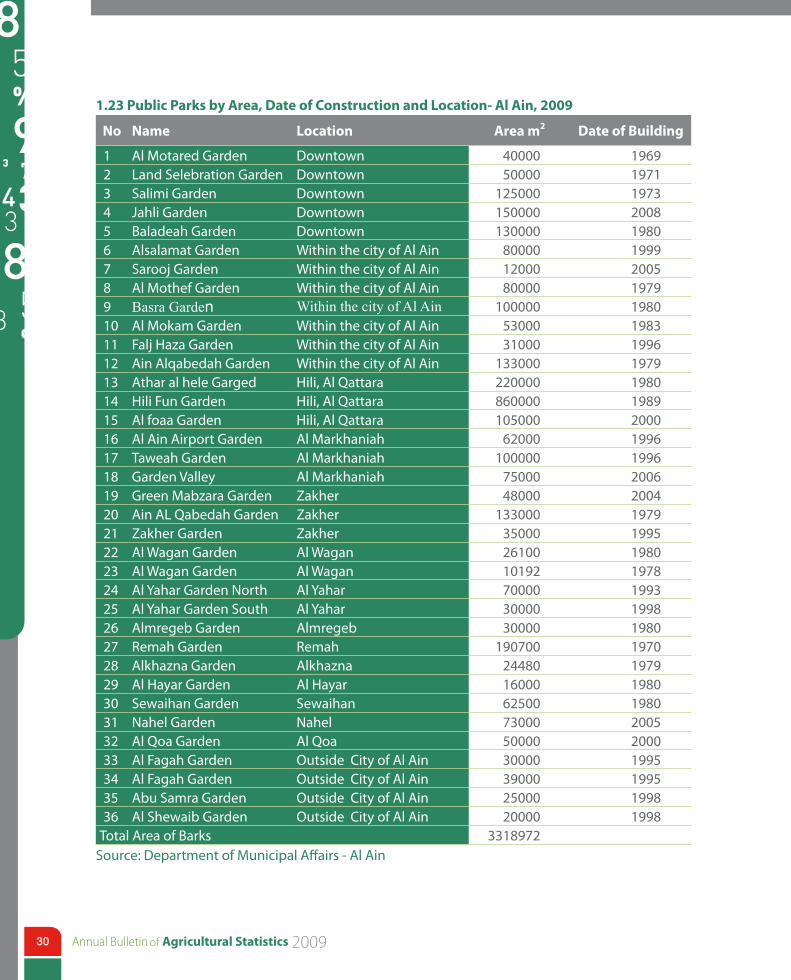
In Al Ain city, there is a total of 36 public parks on an aggregated area of 3319 donums.
of30
1.23 Public Parks by Area, Date of Construction and Location- Al Ain, 2009
No Name Location Area m2 Date of Building
1 Al Motared Garden Downtown 40000 19692 Land Selebration Garden Downtown 50000 19713 Salimi Garden Downtown 125000 19734 Jahli Garden Downtown 150000 20085 Baladeah Garden Downtown 130000 19806 Alsalamat Garden Within the city of Al Ain 80000 19997 Sarooj Garden Within the city of Al Ain 12000 20058 Al Mothef Garden Within the city of Al Ain 80000 19799 Basra Garden Within the city of Al Ain 100000 198010 Al Mokam Garden Within the city of Al Ain 53000 198311 Falj Haza Garden Within the city of Al Ain 31000 199612 Ain Alqabedah Garden Within the city of Al Ain 133000 197913 Athar al hele Garged Hili, Al Qattara 220000 198014 Hili Fun Garden Hili, Al Qattara 860000 198915 Al foaa Garden Hili, Al Qattara 105000 200016 Al Ain Airport Garden Al Markhaniah 62000 199617 Taweah Garden Al Markhaniah 100000 199618 Garden Valley Al Markhaniah 75000 200619 Green Mabzara Garden Zakher 48000 200420 Ain AL Qabedah Garden Zakher 133000 197921 Zakher Garden Zakher 35000 199522 Al Wagan Garden Al Wagan 26100 198023 Al Wagan Garden Al Wagan 10192 197824 Al Yahar Garden North Al Yahar 70000 199325 Al Yahar Garden South Al Yahar 30000 199826 Almregeb Garden Almregeb 30000 198027 Remah Garden Remah 190700 197028 Alkhazna Garden Alkhazna 24480 197929 Al Hayar Garden Al Hayar 16000 198030 Sewaihan Garden Sewaihan 62500 198031 Nahel Garden Nahel 73000 200532 Al Qoa Garden Al Qoa 50000 200033 Al Fagah Garden Outside City of Al Ain 30000 199534 Al Fagah Garden Outside City of Al Ain 39000 199535 Abu Samra Garden Outside City of Al Ain 25000 199836 Al Shewaib Garden Outside City of Al Ain 20000 1998
Total Area of Barks 3318972 Source: Department of Municipal Affairs - Al Ain
31
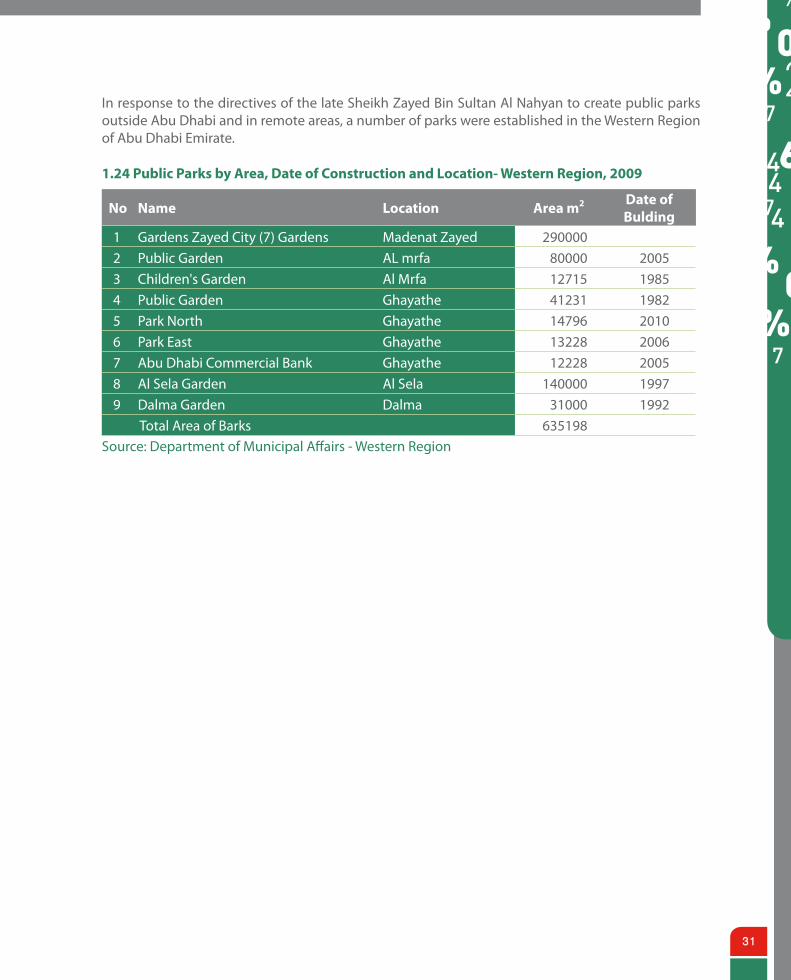
In response to the directives of the late Sheikh Zayed Bin Sultan Al Nahyan to create public parks outside Abu Dhabi and in remote areas, a number of parks were established in the Western Region of Abu Dhabi Emirate.
1.24 Public Parks by Area, Date of Construction and Location- Western Region, 2009
No Name Location Area m2 Date of Bulding
1 Gardens Zayed City (7) Gardens Madenat Zayed 290000 2 Public Garden AL mrfa 80000 20053 Children's Garden Al Mrfa 12715 19854 Public Garden Ghayathe 41231 19825 Park North Ghayathe 14796 20106 Park East Ghayathe 13228 20067 Abu Dhabi Commercial Bank Ghayathe 12228 20058 Al Sela Garden Al Sela 140000 19979 Dalma Garden Dalma 31000 1992
Total Area of Barks 635198 Source: Department of Municipal Affairs - Western Region
of32
1.12 Date Palm Trees
The government accords great importance to agriculture in general, and the growing of date palms in particular, in terms of the efforts made and the resources mobilized to develop the cultivation of palm trees, by increasing the number of trees planted and the areas cultivated with date palms on the one hand, and through improving the quality of produce on the other, by means of optimized investment of natural resources and encouraging investment in this subsector.
The dates processing industry is also emerging as one of the new food industries, whereas the Emir-ate’s production of dates a few decades ago was not at a commercial level or exportable quantities. However, the emirate achieved great progress in cultivating palm trees and producing dates as vast areas of land were planted with date palm saplings that are adapted to the prevailing natural conditions. This efforts have placed the emirate among the world’s leading producers of dates and their derivatives.
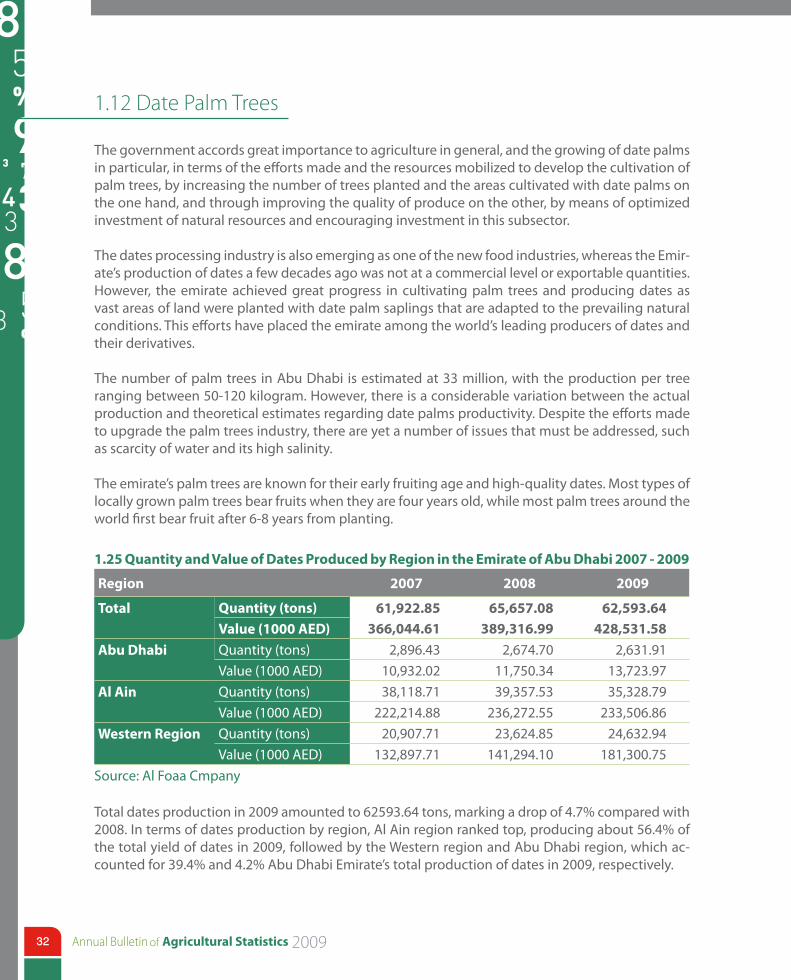
The number of palm trees in Abu Dhabi is estimated at 33 million, with the production per tree ranging between 50-120 kilogram. However, there is a considerable variation between the actual production and theoretical estimates regarding date palms productivity. Despite the efforts made to upgrade the palm trees industry, there are yet a number of issues that must be addressed, such as scarcity of water and its high salinity.
The emirate’s palm trees are known for their early fruiting age and high-quality dates. Most types of locally grown palm trees bear fruits when they are four years old, while most palm trees around the world first bear fruit after 6-8 years from planting.
1.25 Quantity and Value of Dates Produced by Region in the Emirate of Abu Dhabi 2007 - 2009
Region 2007 2008 2009
Total Quantity (tons) 61,922.85 65,657.08 62,593.64 Value (1000 AED) 366,044.61 389,316.99 428,531.58
Abu Dhabi Quantity (tons) 2,896.43 2,674.70 2,631.91 Value (1000 AED) 10,932.02 11,750.34 13,723.97Al Ain Quantity (tons) 38,118.71 39,357.53 35,328.79 Value (1000 AED) 222,214.88 236,272.55 233,506.86Western Region Quantity (tons) 20,907.71 23,624.85 24,632.94 Value (1000 AED) 132,897.71 141,294.10 181,300.75
Source: Al Foaa Cmpany
Total dates production in 2009 amounted to 62593.64 tons, marking a drop of 4.7% compared with 2008. In terms of dates production by region, Al Ain region ranked top, producing about 56.4% of the total yield of dates in 2009, followed by the Western region and Abu Dhabi region, which ac-counted for 39.4% and 4.2% Abu Dhabi Emirate’s total production of dates in 2009, respectively.
33
1.13 Foreign Trade in Agricultural Commodities
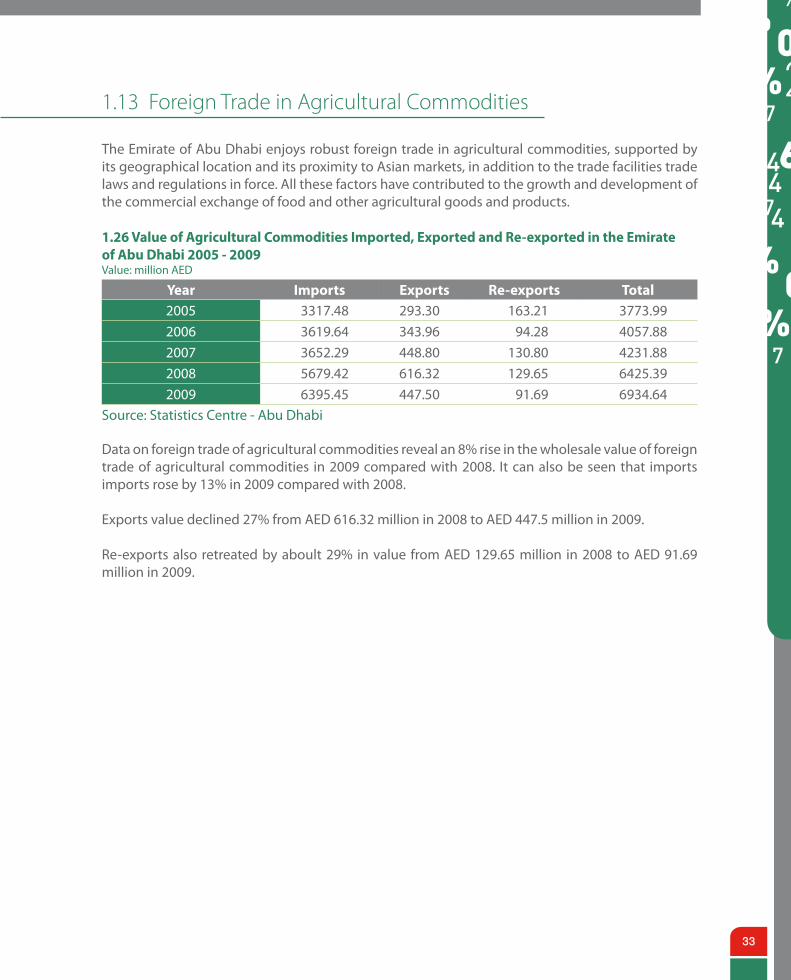
The Emirate of Abu Dhabi enjoys robust foreign trade in agricultural commodities, supported by its geographical location and its proximity to Asian markets, in addition to the trade facilities trade laws and regulations in force. All these factors have contributed to the growth and development of the commercial exchange of food and other agricultural goods and products.
1.26 Value of Agricultural Commodities Imported, Exported and Re-exported in the Emirateof Abu Dhabi 2005 - 2009Value: million AED
Year Imports Exports Re-exports Total2005 3317.48 293.30 163.21 3773.992006 3619.64 343.96 94.28 4057.882007 3652.29 448.80 130.80 4231.882008 5679.42 616.32 129.65 6425.392009 6395.45 447.50 91.69 6934.64
Source: Statistics Centre - Abu Dhabi
Data on foreign trade of agricultural commodities reveal an 8% rise in the wholesale value of foreign trade of agricultural commodities in 2009 compared with 2008. It can also be seen that imports imports rose by 13% in 2009 compared with 2008.
Exports value declined 27% from AED 616.32 million in 2008 to AED 447.5 million in 2009.
Re-exports also retreated by aboult 29% in value from AED 129.65 million in 2008 to AED 91.69 million in 2009.
of34
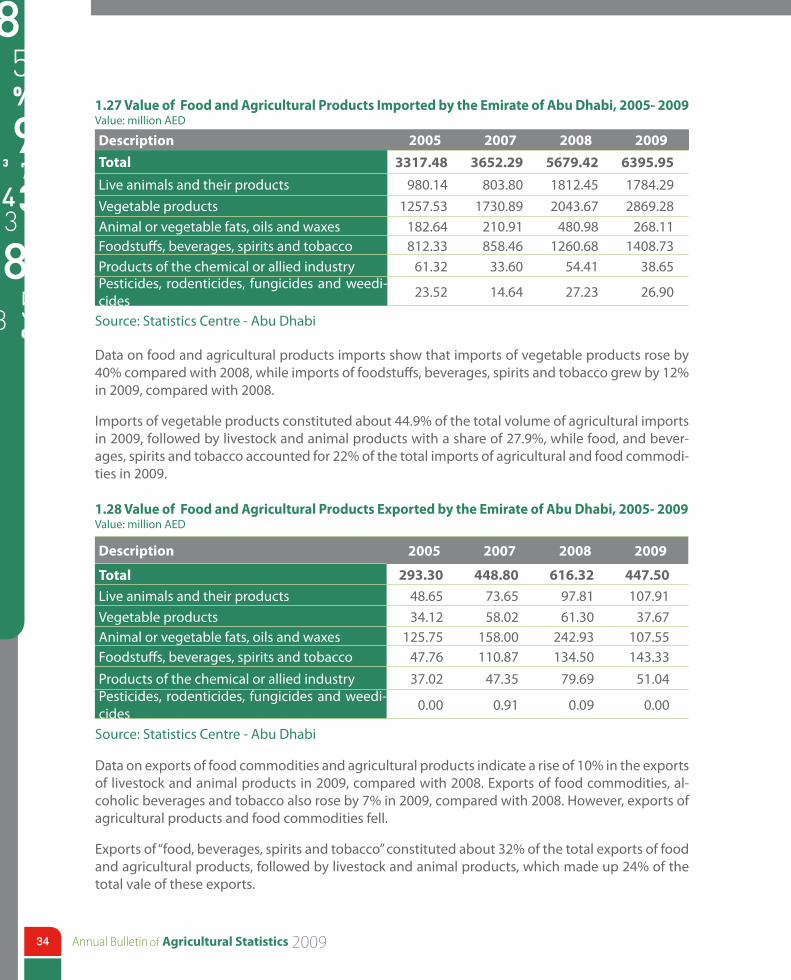
1.27 Value of Food and Agricultural Products Imported by the Emirate of Abu Dhabi, 2005- 2009Value: million AED
Description 2005 2007 2008 2009
Total 3317.48 3652.29 5679.42 6395.95
Live animals and their products 980.14 803.80 1812.45 1784.29Vegetable products 1257.53 1730.89 2043.67 2869.28Animal or vegetable fats, oils and waxes 182.64 210.91 480.98 268.11Foodstuffs, beverages, spirits and tobacco 812.33 858.46 1260.68 1408.73Products of the chemical or allied industry 61.32 33.60 54.41 38.65Pesticides, rodenticides, fungicides and weedi-cides
23.52 14.64 27.23 26.90
Source: Statistics Centre - Abu Dhabi
Data on food and agricultural products imports show that imports of vegetable products rose by 40% compared with 2008, while imports of foodstuffs, beverages, spirits and tobacco grew by 12% in 2009, compared with 2008.
Imports of vegetable products constituted about 44.9% of the total volume of agricultural imports in 2009, followed by livestock and animal products with a share of 27.9%, while food, and bever-ages, spirits and tobacco accounted for 22% of the total imports of agricultural and food commodi-ties in 2009.
1.28 Value of Food and Agricultural Products Exported by the Emirate of Abu Dhabi, 2005- 2009Value: million AED
Description 2005 2007 2008 2009
Total 293.30 448.80 616.32 447.50
Live animals and their products 48.65 73.65 97.81 107.91Vegetable products 34.12 58.02 61.30 37.67Animal or vegetable fats, oils and waxes 125.75 158.00 242.93 107.55Foodstuffs, beverages, spirits and tobacco 47.76 110.87 134.50 143.33Products of the chemical or allied industry 37.02 47.35 79.69 51.04Pesticides, rodenticides, fungicides and weedi-cides 0.00 0.91 0.09 0.00
Source: Statistics Centre - Abu Dhabi
Data on exports of food commodities and agricultural products indicate a rise of 10% in the exports of livestock and animal products in 2009, compared with 2008. Exports of food commodities, al-coholic beverages and tobacco also rose by 7% in 2009, compared with 2008. However, exports of agricultural products and food commodities fell.
Exports of “food, beverages, spirits and tobacco” constituted about 32% of the total exports of food and agricultural products, followed by livestock and animal products, which made up 24% of the total vale of these exports.
35
1.29 Value of Food and Agricultural Products Re-exported by the Emirate of Abu Dhabi, 2005- 2009Value: million AED
Description 2005 2007 2008 2009Total 163.21 130.80 129.65 91.69Live animals and their products 37.68 47.13 40.86 32.85Vegetable products 45.01 55.90 55.24 18.97Animal or vegetable fats, oils and waxes 27.77 4.29 3.52 9.66Foodstuffs, beverages, spirits and tobacco 50.86 22.71 29.66 29.00Products of the chemical or allied industry 0.68 0.47 0.20 0.26Pesticides, rodenticides, fungicides and weedi-cides 1.21 0.29 0.17 0.95
Source: Statistics Centre - Abu Dhabi
Data pertaining to the re-export of agricultural goods reveal an increase of 174% in the re-exports of “animal or vegetable fats, oils and waxes” in 2009 compared with 2008, followed by pest control products. However, there was a marked drop in the re-exports of other agricultural goods.
Re-exports of livestock and animal products constituted about 36% of the overall volume of re-exported food and agricultural goods; followed by “foodstuffs, beverages, spirits and tobacco” with a contribution of 32%, and vegetable products, which accounted for 21% of re-exported food and agricultural products by value.
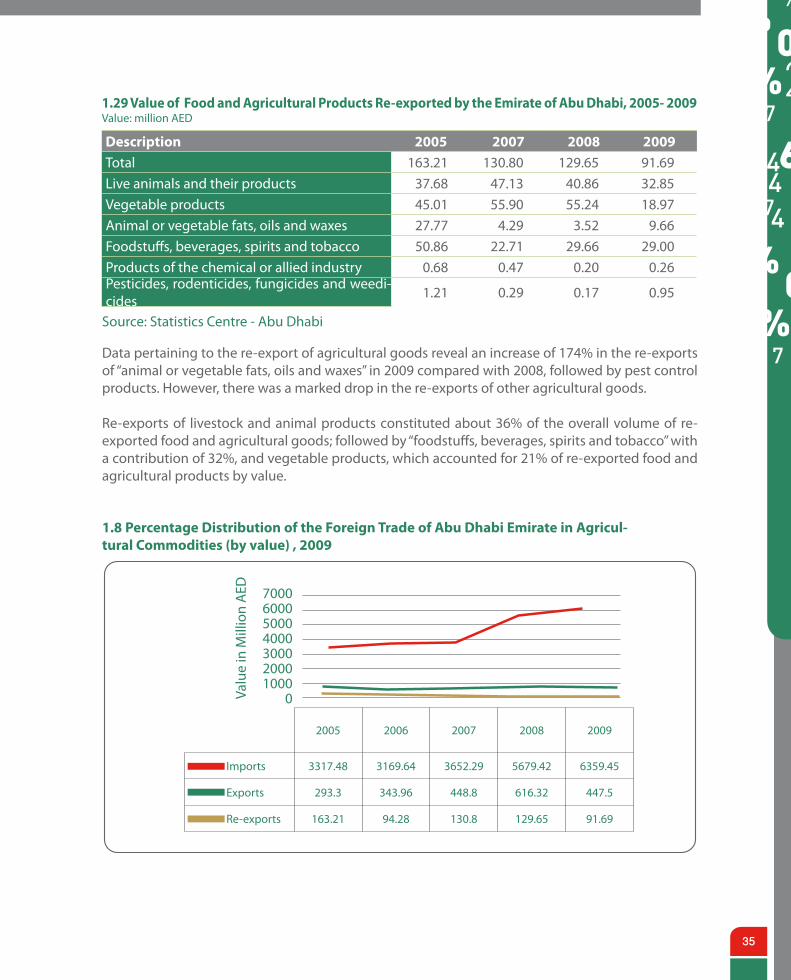
1.8 Percentage Distribution of the Foreign Trade of Abu Dhabi Emirate in Agricul-tural Commodities (by value) , 2009
7000600050004000300020001000
0
2005 2006 2007 2008 2009
Imports 3317.48 3169.64 3652.29 5679.42 6359.45
Exports 293.3 343.96 448.8 616.32 447.5
Re-exports 163.21 94.28 130.8 129.65 91.69
Valu
e in
Mill
ion
AED
of36
The volume of foreign trade in agricultural commodities the Emirate of Abu Dhabi grew over the period 2005-2009 at an average rate of 18% per annum, which is largely due to the rise in the vol-ume of exports on the one hand, and the rise in the volume of imports on the other.
The contribution of the foreign trade of agricultural commodities imports to the Emirate of Abu Dhabi constitutes up to 92%, while the contribution of the aggregated volume of foreign trade of agricultural commodities amounted to 6%, while the re-exported volume of food and agricultural products contribution amounted to 2% of the overall foreign trade of agricultural commodities in the Emirate of Abu Dhabi in 2009.
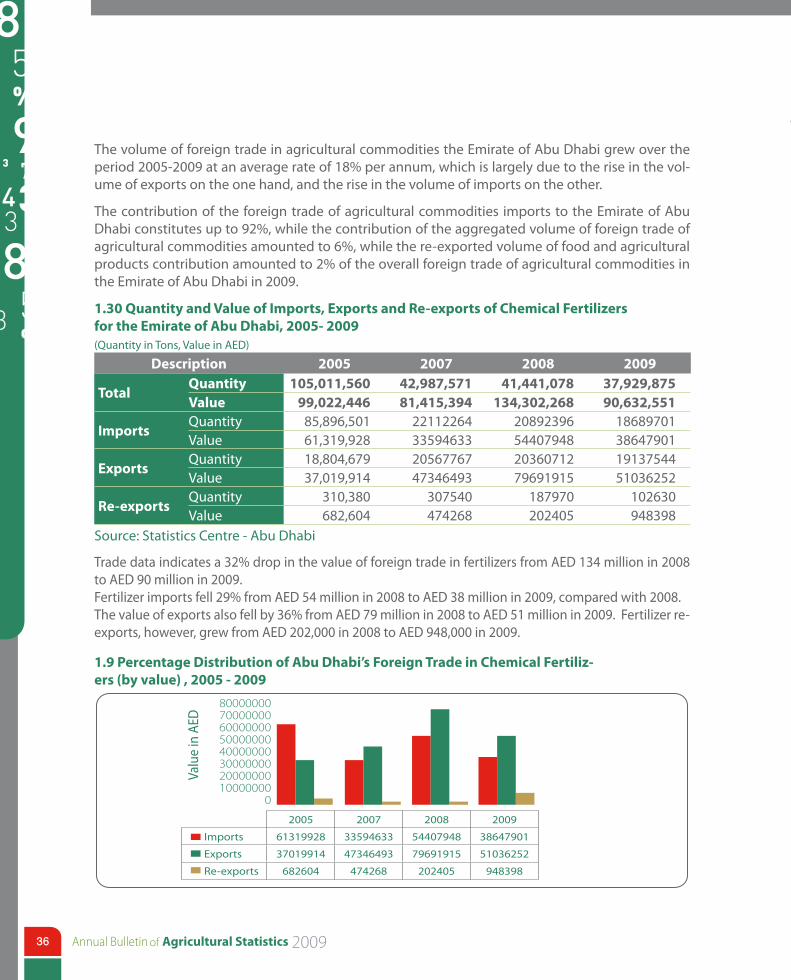
1.30 Quantity and Value of Imports, Exports and Re-exports of Chemical Fertilizers for the Emirate of Abu Dhabi, 2005- 2009(Quantity in Tons, Value in AED)
Description 2005 2007 2008 2009
TotalQuantity 105,011,560 42,987,571 41,441,078 37,929,875Value 99,022,446 81,415,394 134,302,268 90,632,551
ImportsQuantity 85,896,501 22112264 20892396 18689701Value 61,319,928 33594633 54407948 38647901
ExportsQuantity 18,804,679 20567767 20360712 19137544Value 37,019,914 47346493 79691915 51036252
Re-exportsQuantity 310,380 307540 187970 102630Value 682,604 474268 202405 948398
Source: Statistics Centre - Abu Dhabi
Trade data indicates a 32% drop in the value of foreign trade in fertilizers from AED 134 million in 2008 to AED 90 million in 2009.Fertilizer imports fell 29% from AED 54 million in 2008 to AED 38 million in 2009, compared with 2008. The value of exports also fell by 36% from AED 79 million in 2008 to AED 51 million in 2009. Fertilizer re-exports, however, grew from AED 202,000 in 2008 to AED 948,000 in 2009.
2005 2007 2008 2009
Imports 61319928 33594633 54407948 38647901
Exports 37019914 47346493 79691915 51036252
Re-exports 682604 474268 202405 948398
Valu
e in
AED
1.9 Percentage Distribution of Abu Dhabi’s Foreign Trade in Chemical Fertiliz-ers (by value) , 2005 - 2009
8000000070000000600000005000000040000000300000002000000010000000
0
37
1.14 Agricultural Producer Price Indices
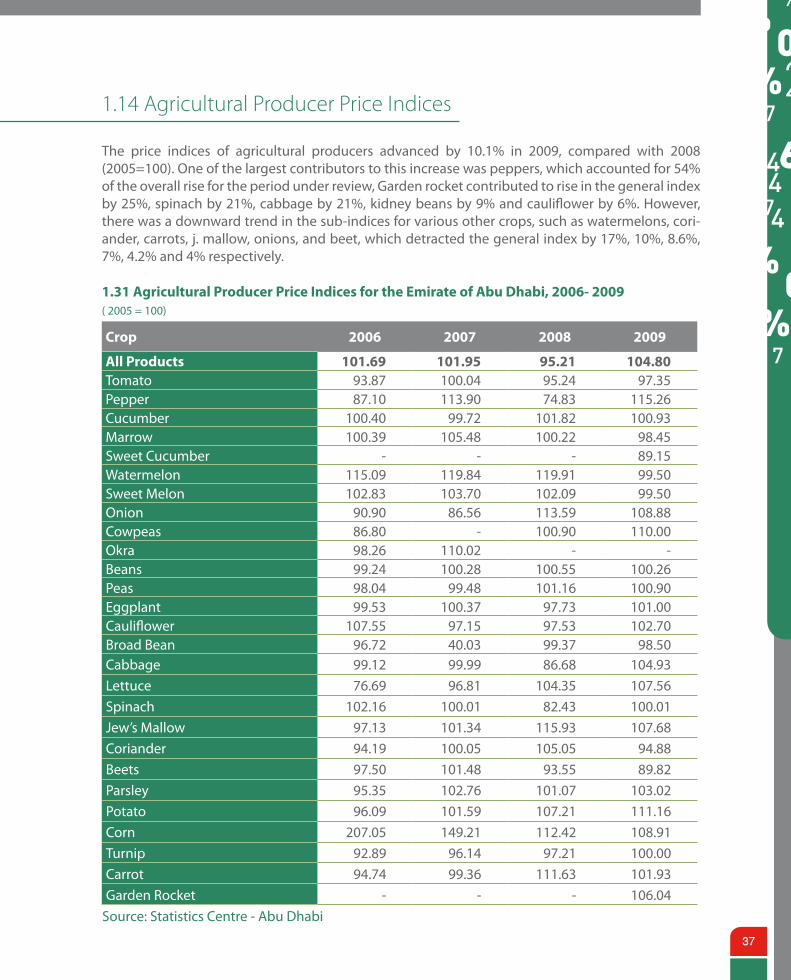
The price indices of agricultural producers advanced by 10.1% in 2009, compared with 2008 (2005=100). One of the largest contributors to this increase was peppers, which accounted for 54% of the overall rise for the period under review, Garden rocket contributed to rise in the general index by 25%, spinach by 21%, cabbage by 21%, kidney beans by 9% and cauliflower by 6%. However, there was a downward trend in the sub-indices for various other crops, such as watermelons, cori-ander, carrots, j. mallow, onions, and beet, which detracted the general index by 17%, 10%, 8.6%, 7%, 4.2% and 4% respectively.
1.31 Agricultural Producer Price Indices for the Emirate of Abu Dhabi, 2006- 2009( 2005 = 100)
Crop 2006 2007 2008 2009
All Products 101.69 101.95 95.21 104.80Tomato 93.87 100.04 95.24 97.35Pepper 87.10 113.90 74.83 115.26Cucumber 100.40 99.72 101.82 100.93Marrow 100.39 105.48 100.22 98.45Sweet Cucumber - - - 89.15Watermelon 115.09 119.84 119.91 99.50Sweet Melon 102.83 103.70 102.09 99.50Onion 90.90 86.56 113.59 108.88Cowpeas 86.80 - 100.90 110.00Okra 98.26 110.02 - -Beans 99.24 100.28 100.55 100.26Peas 98.04 99.48 101.16 100.90Eggplant 99.53 100.37 97.73 101.00Cauliflower 107.55 97.15 97.53 102.70Broad Bean 96.72 40.03 99.37 98.50Cabbage 99.12 99.99 86.68 104.93Lettuce 76.69 96.81 104.35 107.56Spinach 102.16 100.01 82.43 100.01Jew’s Mallow 97.13 101.34 115.93 107.68Coriander 94.19 100.05 105.05 94.88Beets 97.50 101.48 93.55 89.82Parsley 95.35 102.76 101.07 103.02Potato 96.09 101.59 107.21 111.16Corn 207.05 149.21 112.42 108.91Turnip 92.89 96.14 97.21 100.00Carrot 94.74 99.36 111.63 101.93Garden Rocket - - - 106.04
Source: Statistics Centre - Abu Dhabi
of38
1.15 Agricultural Machinery
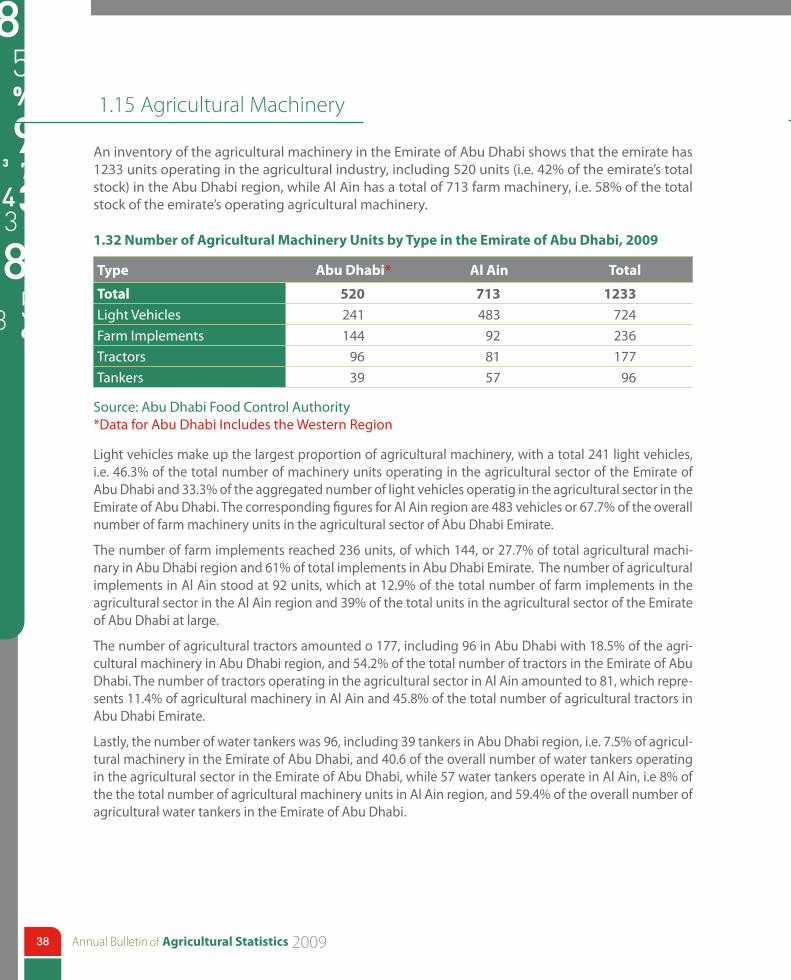
An inventory of the agricultural machinery in the Emirate of Abu Dhabi shows that the emirate has 1233 units operating in the agricultural industry, including 520 units (i.e. 42% of the emirate’s total stock) in the Abu Dhabi region, while Al Ain has a total of 713 farm machinery, i.e. 58% of the total stock of the emirate’s operating agricultural machinery.
1.32 Number of Agricultural Machinery Units by Type in the Emirate of Abu Dhabi, 2009
Type Abu Dhabi* Al Ain Total
Total 520 713 1233Light Vehicles 241 483 724Farm Implements 144 92 236Tractors 96 81 177Tankers 39 57 96
Source: Abu Dhabi Food Control Authority *Data for Abu Dhabi Includes the Western Region
Light vehicles make up the largest proportion of agricultural machinery, with a total 241 light vehicles, i.e. 46.3% of the total number of machinery units operating in the agricultural sector of the Emirate of Abu Dhabi and 33.3% of the aggregated number of light vehicles operatig in the agricultural sector in the Emirate of Abu Dhabi. The corresponding figures for Al Ain region are 483 vehicles or 67.7% of the overall number of farm machinery units in the agricultural sector of Abu Dhabi Emirate.
The number of farm implements reached 236 units, of which 144, or 27.7% of total agricultural machi-nary in Abu Dhabi region and 61% of total implements in Abu Dhabi Emirate. The number of agricultural implements in Al Ain stood at 92 units, which at 12.9% of the total number of farm implements in the agricultural sector in the Al Ain region and 39% of the total units in the agricultural sector of the Emirate of Abu Dhabi at large.
The number of agricultural tractors amounted o 177, including 96 in Abu Dhabi with 18.5% of the agri-cultural machinery in Abu Dhabi region, and 54.2% of the total number of tractors in the Emirate of Abu Dhabi. The number of tractors operating in the agricultural sector in Al Ain amounted to 81, which repre-sents 11.4% of agricultural machinery in Al Ain and 45.8% of the total number of agricultural tractors in Abu Dhabi Emirate.
Lastly, the number of water tankers was 96, including 39 tankers in Abu Dhabi region, i.e. 7.5% of agricul-tural machinery in the Emirate of Abu Dhabi, and 40.6 of the overall number of water tankers operating in the agricultural sector in the Emirate of Abu Dhabi, while 57 water tankers operate in Al Ain, i.e 8% of the the total number of agricultural machinery units in Al Ain region, and 59.4% of the overall number of agricultural water tankers in the Emirate of Abu Dhabi.
39
1.16 Agricultural Centres
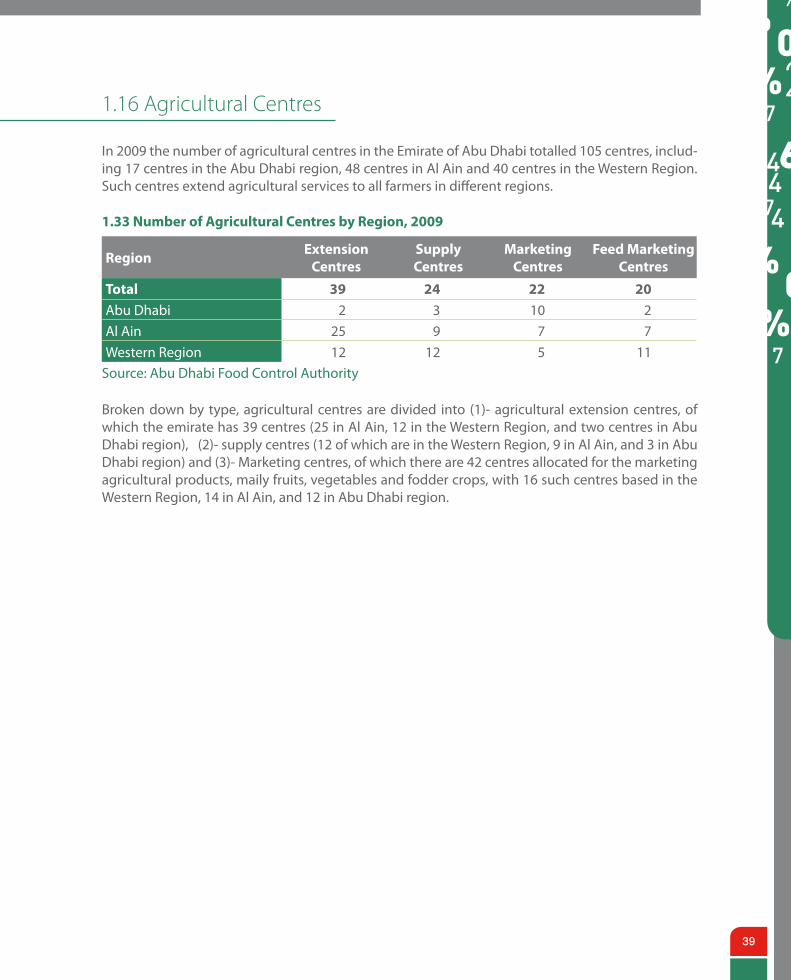
In 2009 the number of agricultural centres in the Emirate of Abu Dhabi totalled 105 centres, includ-ing 17 centres in the Abu Dhabi region, 48 centres in Al Ain and 40 centres in the Western Region. Such centres extend agricultural services to all farmers in different regions.
1.33 Number of Agricultural Centres by Region, 2009
RegionExtension
CentresSupply Centres
Marketing Centres
Feed Marketing Centres
Total 39 24 22 20
Abu Dhabi 2 3 10 2Al Ain 25 9 7 7Western Region 12 12 5 11
Source: Abu Dhabi Food Control Authority
Broken down by type, agricultural centres are divided into (1)- agricultural extension centres, of which the emirate has 39 centres (25 in Al Ain, 12 in the Western Region, and two centres in Abu Dhabi region), (2)- supply centres (12 of which are in the Western Region, 9 in Al Ain, and 3 in Abu Dhabi region) and (3)- Marketing centres, of which there are 42 centres allocated for the marketing agricultural products, maily fruits, vegetables and fodder crops, with 16 such centres based in the Western Region, 14 in Al Ain, and 12 in Abu Dhabi region.
II Livestock Statistics
of42
In the course of their historical development, humans societies had adopted livestock raising prior to farming activities as source of livelihood. And even though agriculture came to attract greater interest as man realized the need to increase the area and productivity of cultivated land, herding remained closely associated with farming to supply the socity’s requirements of animal products and foods. As a result of this demand, large segments of society adopted herding, breeding and improving of livestock as their major econmic activity.
Arab societies were no exception to this course of development, livestock raising being a traditional component of Arab culture and way of living in most rural areas, especially in desert regions, which are still the breeding grounds of goats, sheep and camels. As the process of social and economic development continued, however, agricultural production was transformed from conventional to an activity a commercial focus. Due to all this, in addition to other factors breeding livestock in rural areas retreated, bringing about a shift from production to consumer of animal products.
The livestock sector is regarded as one of the pillars of development. It is therefore necessary to identify the basic inputs and infrastructures required by this sector to to assist in drafting and sys-tematically implementing development plans that fulfills the aspirations of the local population in terms of growth and stability. Moreover, the availability of information pertaining to livestock enables the rise of a socio-economic structure that gives individuals an equal opportunity to con-tribute to the development of their communities.
Recognizing the importance of agriculture in food security, the government pays particular atten-tion the development of this sector, which is essential to economic development of rural areas and the improvement of the living standard of their populations.
The harsh weather conditions and the marked drop in annual in rainfall, coupled with the increas-ing scarcity of surface and underground water, rising soil salinity and reduction in the cultivation of strategic crops makes it imperative to place greater emphasis on the livestock breeding activities of the agricultural sector, in order ensure greater contribution by this sector to the agricultural do-mestic product, replace the loss in the plant sector, provide sufficient supplies of animal production and achieve a surplus for export to benefit of the county and its people.
43
2.1 Structural Change in the Size Livestock Populations
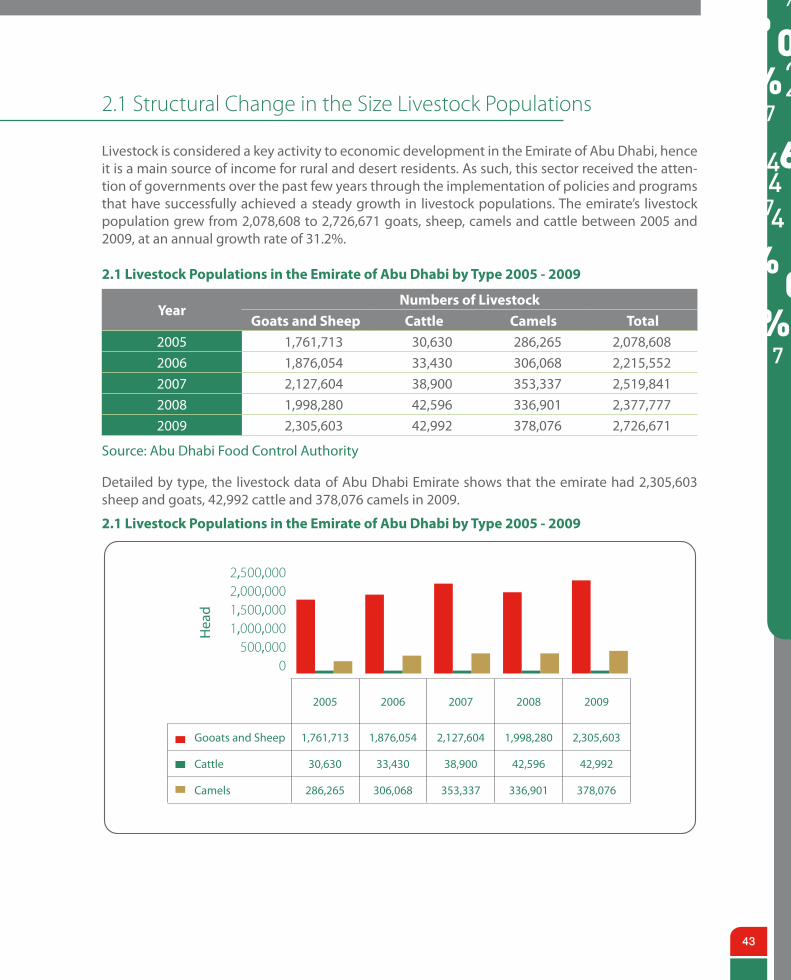
Livestock is considered a key activity to economic development in the Emirate of Abu Dhabi, hence it is a main source of income for rural and desert residents. As such, this sector received the atten-tion of governments over the past few years through the implementation of policies and programs that have successfully achieved a steady growth in livestock populations. The emirate’s livestock population grew from 2,078,608 to 2,726,671 goats, sheep, camels and cattle between 2005 and 2009, at an annual growth rate of 31.2%.
2.1 Livestock Populations in the Emirate of Abu Dhabi by Type 2005 - 2009
YearNumbers of Livestock
Goats and Sheep Cattle Camels Total2005 1,761,713 30,630 286,265 2,078,6082006 1,876,054 33,430 306,068 2,215,5522007 2,127,604 38,900 353,337 2,519,8412008 1,998,280 42,596 336,901 2,377,7772009 2,305,603 42,992 378,076 2,726,671
Source: Abu Dhabi Food Control Authority
Detailed by type, the livestock data of Abu Dhabi Emirate shows that the emirate had 2,305,603 sheep and goats, 42,992 cattle and 378,076 camels in 2009.
2005 2006 2007 2008 2009
Gooats and Sheep 1,761,713 1,876,054 2,127,604 1,998,280 2,305,603
Cattle 30,630 33,430 38,900 42,596 42,992
Camels 286,265 306,068 353,337 336,901 378,076
2.1 Livestock Populations in the Emirate of Abu Dhabi by Type 2005 - 2009
Hea
d
2,500,0002,000,0001,500,0001,000,000
500,0000
of44
Foreign trade figures indicate that national exports of livestock in 2009 amounted to AED 107.91 million, compared with AED 97.81 million in 2008.
The Emirate of Abu Dhabi livestock imports in 2009 amounted to AED 1784.29 million compared with AED 1812.45 million in 2008.
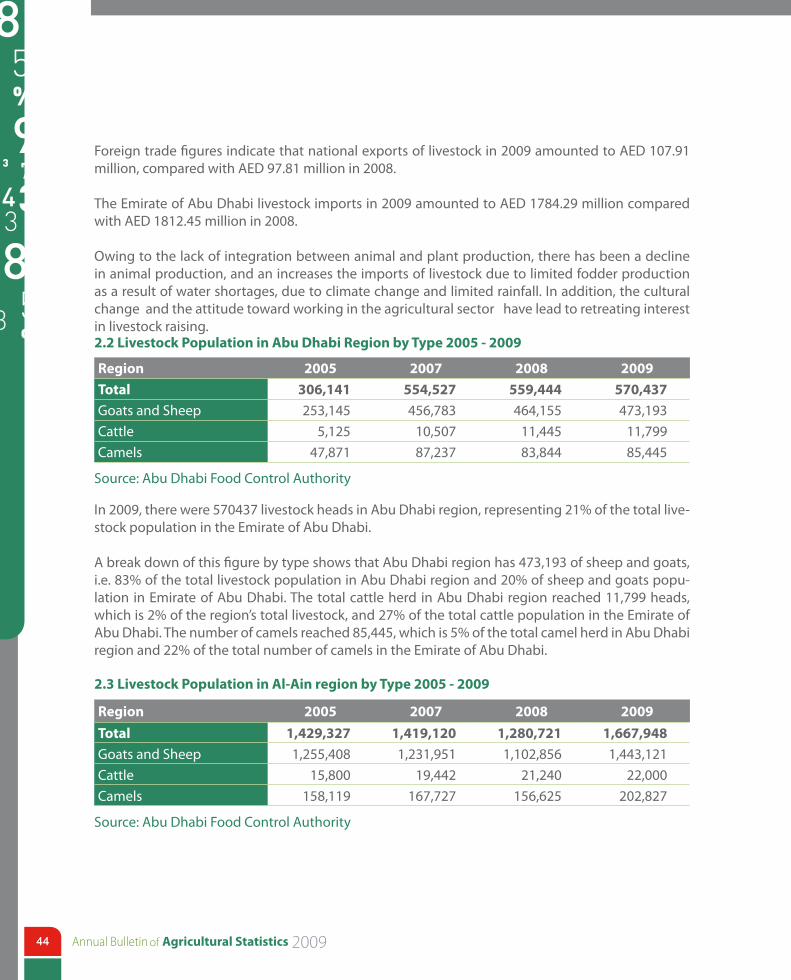
Owing to the lack of integration between animal and plant production, there has been a decline in animal production, and an increases the imports of livestock due to limited fodder production as a result of water shortages, due to climate change and limited rainfall. In addition, the cultural change and the attitude toward working in the agricultural sector have lead to retreating interest in livestock raising.2.2 Livestock Population in Abu Dhabi Region by Type 2005 - 2009
Region 2005 2007 2008 2009
Total 306,141 554,527 559,444 570,437Goats and Sheep 253,145 456,783 464,155 473,193Cattle 5,125 10,507 11,445 11,799Camels 47,871 87,237 83,844 85,445
Source: Abu Dhabi Food Control Authority
In 2009, there were 570437 livestock heads in Abu Dhabi region, representing 21% of the total live-stock population in the Emirate of Abu Dhabi.
A break down of this figure by type shows that Abu Dhabi region has 473,193 of sheep and goats, i.e. 83% of the total livestock population in Abu Dhabi region and 20% of sheep and goats popu-lation in Emirate of Abu Dhabi. The total cattle herd in Abu Dhabi region reached 11,799 heads, which is 2% of the region’s total livestock, and 27% of the total cattle population in the Emirate of Abu Dhabi. The number of camels reached 85,445, which is 5% of the total camel herd in Abu Dhabi region and 22% of the total number of camels in the Emirate of Abu Dhabi.
2.3 Livestock Population in Al-Ain region by Type 2005 - 2009
Region 2005 2007 2008 2009
Total 1,429,327 1,419,120 1,280,721 1,667,948Goats and Sheep 1,255,408 1,231,951 1,102,856 1,443,121Cattle 15,800 19,442 21,240 22,000Camels 158,119 167,727 156,625 202,827
Source: Abu Dhabi Food Control Authority
45
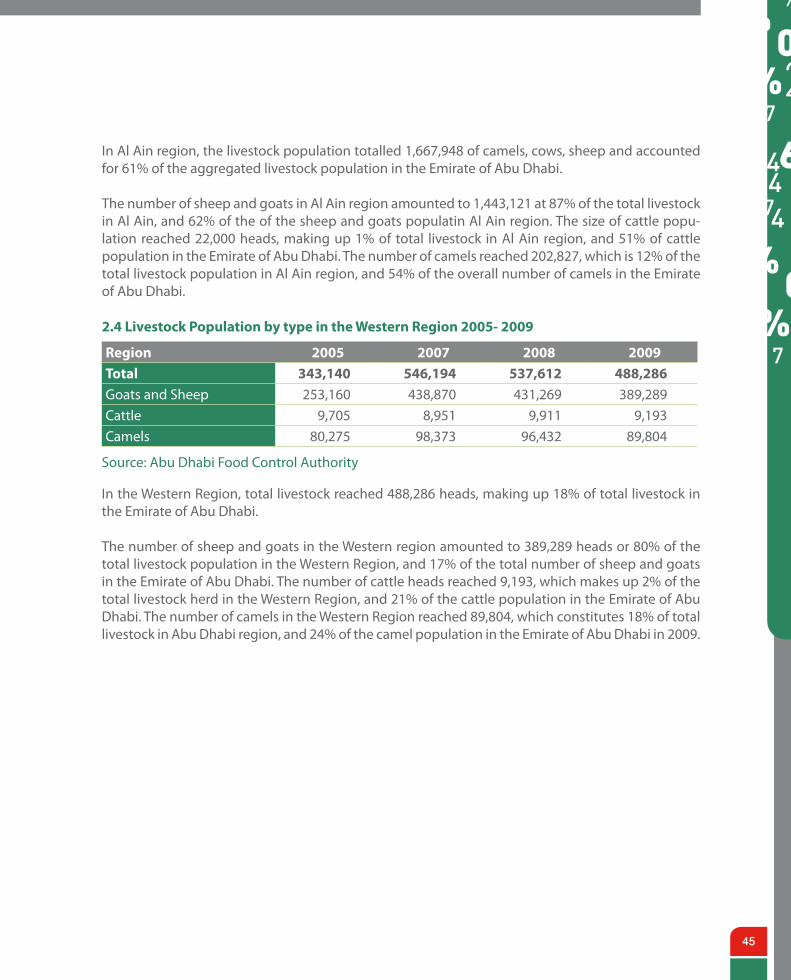
In Al Ain region, the livestock population totalled 1,667,948 of camels, cows, sheep and accounted for 61% of the aggregated livestock population in the Emirate of Abu Dhabi.
The number of sheep and goats in Al Ain region amounted to 1,443,121 at 87% of the total livestock in Al Ain, and 62% of the of the sheep and goats populatin Al Ain region. The size of cattle popu-lation reached 22,000 heads, making up 1% of total livestock in Al Ain region, and 51% of cattle population in the Emirate of Abu Dhabi. The number of camels reached 202,827, which is 12% of the total livestock population in Al Ain region, and 54% of the overall number of camels in the Emirate of Abu Dhabi.
2.4 Livestock Population by type in the Western Region 2005- 2009
Region 2005 2007 2008 2009Total 343,140 546,194 537,612 488,286Goats and Sheep 253,160 438,870 431,269 389,289Cattle 9,705 8,951 9,911 9,193Camels 80,275 98,373 96,432 89,804
Source: Abu Dhabi Food Control Authority
In the Western Region, total livestock reached 488,286 heads, making up 18% of total livestock in the Emirate of Abu Dhabi.
The number of sheep and goats in the Western region amounted to 389,289 heads or 80% of the total livestock population in the Western Region, and 17% of the total number of sheep and goats in the Emirate of Abu Dhabi. The number of cattle heads reached 9,193, which makes up 2% of the total livestock herd in the Western Region, and 21% of the cattle population in the Emirate of Abu Dhabi. The number of camels in the Western Region reached 89,804, which constitutes 18% of total livestock in Abu Dhabi region, and 24% of the camel population in the Emirate of Abu Dhabi in 2009.
of46
2.2 Livestock Health Statistics
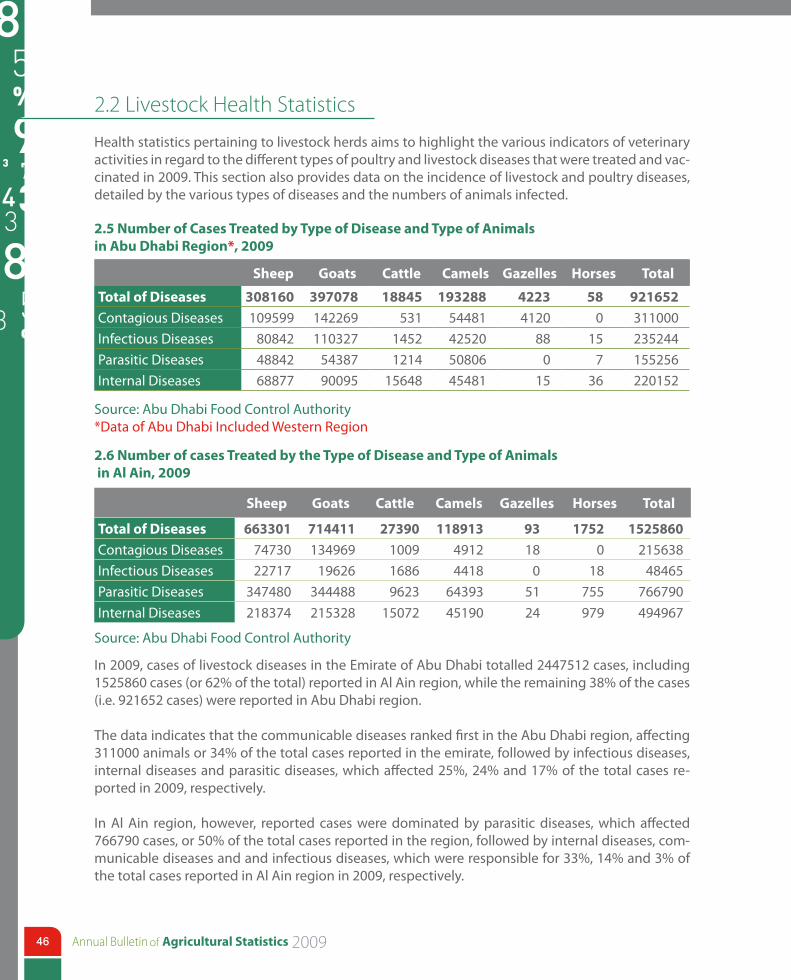
Health statistics pertaining to livestock herds aims to highlight the various indicators of veterinary activities in regard to the different types of poultry and livestock diseases that were treated and vac-cinated in 2009. This section also provides data on the incidence of livestock and poultry diseases, detailed by the various types of diseases and the numbers of animals infected.
2.5 Number of Cases Treated by Type of Disease and Type of Animals in Abu Dhabi Region*, 2009
Sheep Goats Cattle Camels Gazelles Horses Total
Total of Diseases 308160 397078 18845 193288 4223 58 921652Contagious Diseases 109599 142269 531 54481 4120 0 311000Infectious Diseases 80842 110327 1452 42520 88 15 235244Parasitic Diseases 48842 54387 1214 50806 0 7 155256Internal Diseases 68877 90095 15648 45481 15 36 220152
Source: Abu Dhabi Food Control Authority*Data of Abu Dhabi Included Western Region
2.6 Number of cases Treated by the Type of Disease and Type of Animals in Al Ain, 2009
Sheep Goats Cattle Camels Gazelles Horses Total
Total of Diseases 663301 714411 27390 118913 93 1752 1525860Contagious Diseases 74730 134969 1009 4912 18 0 215638Infectious Diseases 22717 19626 1686 4418 0 18 48465Parasitic Diseases 347480 344488 9623 64393 51 755 766790Internal Diseases 218374 215328 15072 45190 24 979 494967
Source: Abu Dhabi Food Control Authority
In 2009, cases of livestock diseases in the Emirate of Abu Dhabi totalled 2447512 cases, including 1525860 cases (or 62% of the total) reported in Al Ain region, while the remaining 38% of the cases (i.e. 921652 cases) were reported in Abu Dhabi region.
The data indicates that the communicable diseases ranked first in the Abu Dhabi region, affecting 311000 animals or 34% of the total cases reported in the emirate, followed by infectious diseases, internal diseases and parasitic diseases, which affected 25%, 24% and 17% of the total cases re-ported in 2009, respectively.
In Al Ain region, however, reported cases were dominated by parasitic diseases, which affected 766790 cases, or 50% of the total cases reported in the region, followed by internal diseases, com-municable diseases and and infectious diseases, which were responsible for 33%, 14% and 3% of the total cases reported in Al Ain region in 2009, respectively.
47
700000600000500000400000300000200000100000
0
A close look at the cases of animal diseases in the Emirate of Abu Dhabi level, we find that parasitic diseases was ranked first as its number reached 922046 cases at 38%, followed by internal diseases, which number reached 715119 cases at 29%, followed by communicable diseases which number reached 526638 cases at 21%, and finally infectious diseases, which number reached 283709 cases at 12% of the aggregated number of infected cases in the Emirate of Abu Dhabi in 2009.
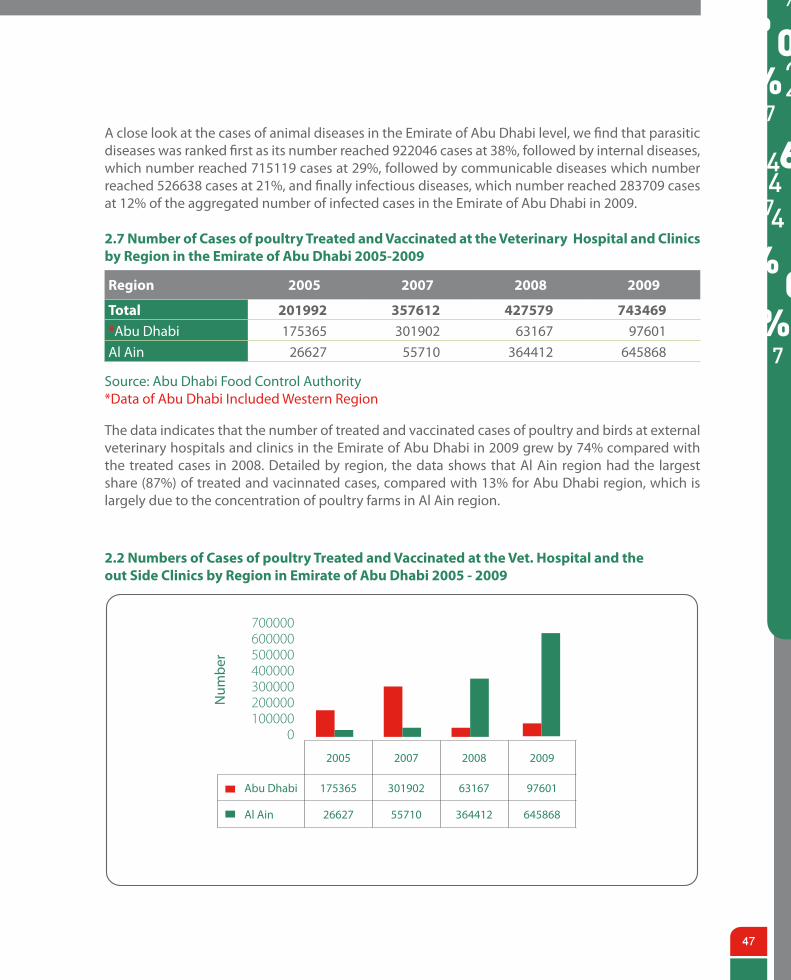
2.7 Number of Cases of poultry Treated and Vaccinated at the Veterinary Hospital and Clinics by Region in the Emirate of Abu Dhabi 2005-2009
Region 2005 2007 2008 2009
Total 201992 357612 427579 743469*Abu Dhabi 175365 301902 63167 97601Al Ain 26627 55710 364412 645868
Source: Abu Dhabi Food Control Authority *Data of Abu Dhabi Included Western Region
The data indicates that the number of treated and vaccinated cases of poultry and birds at external veterinary hospitals and clinics in the Emirate of Abu Dhabi in 2009 grew by 74% compared with the treated cases in 2008. Detailed by region, the data shows that Al Ain region had the largest share (87%) of treated and vacinnated cases, compared with 13% for Abu Dhabi region, which is largely due to the concentration of poultry farms in Al Ain region.
2.2 Numbers of Cases of poultry Treated and Vaccinated at the Vet. Hospital and the out Side Clinics by Region in Emirate of Abu Dhabi 2005 - 2009
2005 2007 2008 2009
Abu Dhabi 175365 301902 63167 97601
Al Ain 26627 55710 364412 645868
Num
ber
of48
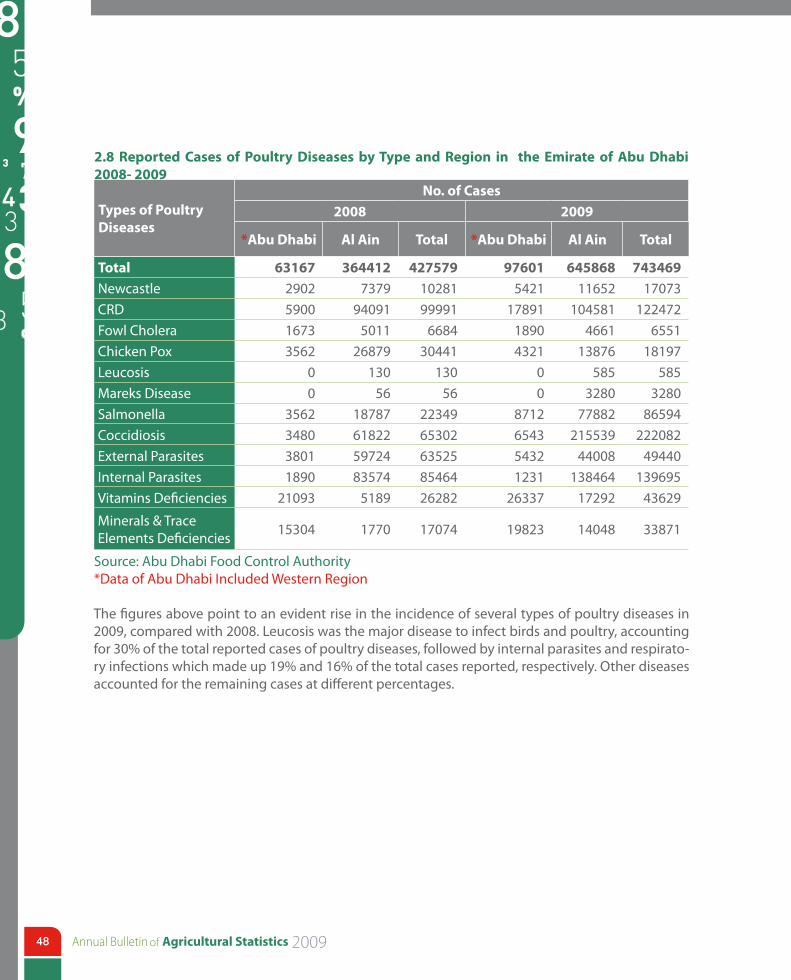
2.8 Reported Cases of Poultry Diseases by Type and Region in the Emirate of Abu Dhabi 2008- 2009
Types of Poultry Diseases
No. of Cases2008 2009
*Abu Dhabi Al Ain Total *Abu Dhabi Al Ain Total
Total 63167 364412 427579 97601 645868 743469Newcastle 2902 7379 10281 5421 11652 17073CRD 5900 94091 99991 17891 104581 122472Fowl Cholera 1673 5011 6684 1890 4661 6551Chicken Pox 3562 26879 30441 4321 13876 18197Leucosis 0 130 130 0 585 585Mareks Disease 0 56 56 0 3280 3280Salmonella 3562 18787 22349 8712 77882 86594Coccidiosis 3480 61822 65302 6543 215539 222082External Parasites 3801 59724 63525 5432 44008 49440Internal Parasites 1890 83574 85464 1231 138464 139695Vitamins Deficiencies 21093 5189 26282 26337 17292 43629
Minerals & Trace Elements Deficiencies 15304 1770 17074 19823 14048 33871
Source: Abu Dhabi Food Control Authority *Data of Abu Dhabi Included Western Region
The figures above point to an evident rise in the incidence of several types of poultry diseases in 2009, compared with 2008. Leucosis was the major disease to infect birds and poultry, accounting for 30% of the total reported cases of poultry diseases, followed by internal parasites and respirato-ry infections which made up 19% and 16% of the total cases reported, respectively. Other diseases accounted for the remaining cases at different percentages.
49
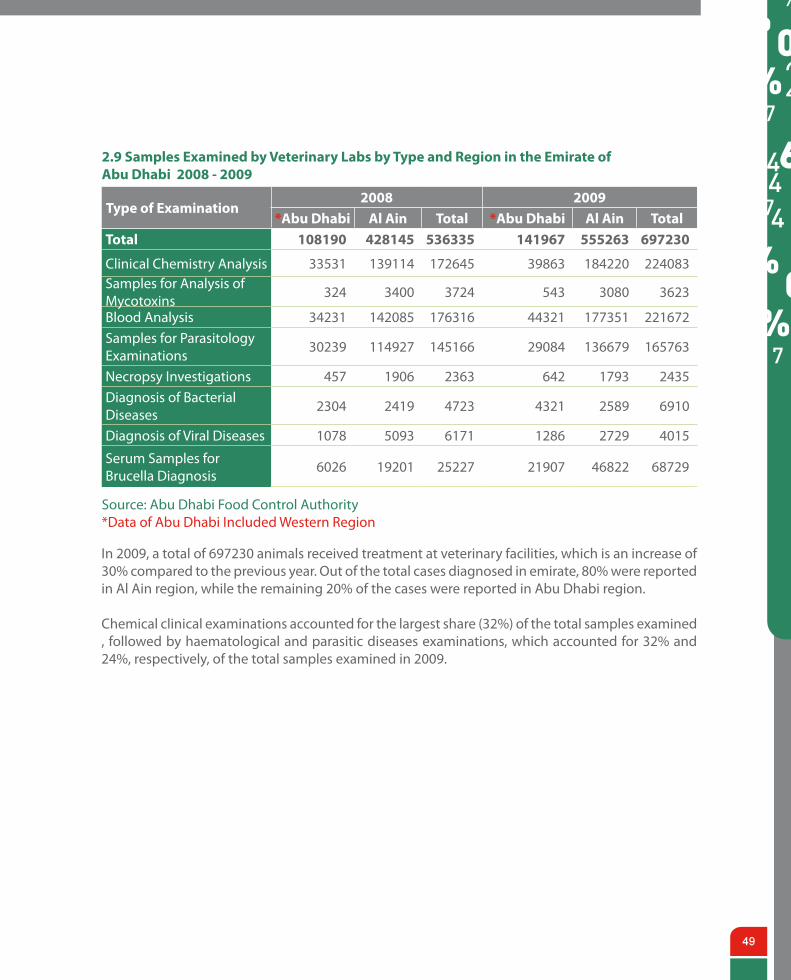
2.9 Samples Examined by Veterinary Labs by Type and Region in the Emirate ofAbu Dhabi 2008 - 2009
Type of Examination2008 2009
*Abu Dhabi Al Ain Total *Abu Dhabi Al Ain TotalTotal 108190 428145 536335 141967 555263 697230
Clinical Chemistry Analysis 33531 139114 172645 39863 184220 224083Samples for Analysis of Mycotoxins 324 3400 3724 543 3080 3623
Blood Analysis 34231 142085 176316 44321 177351 221672Samples for Parasitology Examinations 30239 114927 145166 29084 136679 165763
Necropsy Investigations 457 1906 2363 642 1793 2435Diagnosis of Bacterial Diseases 2304 2419 4723 4321 2589 6910
Diagnosis of Viral Diseases 1078 5093 6171 1286 2729 4015
Serum Samples for Brucella Diagnosis
6026 19201 25227 21907 46822 68729
Source: Abu Dhabi Food Control Authority *Data of Abu Dhabi Included Western Region
In 2009, a total of 697230 animals received treatment at veterinary facilities, which is an increase of 30% compared to the previous year. Out of the total cases diagnosed in emirate, 80% were reported in Al Ain region, while the remaining 20% of the cases were reported in Abu Dhabi region.
Chemical clinical examinations accounted for the largest share (32%) of the total samples examined , followed by haematological and parasitic diseases examinations, which accounted for 32% and 24%, respectively, of the total samples examined in 2009.
of50
2.3 Poultry
The poultry industry faces numerous challenges, particularly in light of the price rise of some basic inputs, mainly fodder prices. Despite the fact that such problems are global they have had a direct impact on the local poultry industry directly, necessitating intervention by the government to pro-mote this industry.
Each kilogram of poultry requires up to 2 kilograms of fodder, but in light of rising fodder prices, in addition to the cost of labour, power and equipment, a kilogram of poultry meat costs between AED 12.5-13. If each kilogram is sold at AED 16, the profitability margin will range between AED 13-16. After deducting the retail profit margin from this price, the remainder represents the profit of the breeder. All of the aforementioned contributes to reduced profitability for breeders, leaving locally produced poultry unable to compete with imported items. In addition, the local poultry industry suffers from high mortality rates, especially during summer months, due to high tempera-tures. Nevertheless prices remain fixed, despite the low and eroding profitability.
2.10 Number and Production of Poultry Farms in the Emirate of Abu Dhabi 2008 - 2009
2008 2009
Broiler poultry farmsNo. 9 7Tons 12000 13228
Layer poultry farmsNo. 4 31000 Egg 130120.8 155648
Source: Abu Dhabi Food Control Authority
In 2009, there were 10 poultry farms in the Emirate of Abu Dhabi, seven of which are for the produc-tion of poultry meat (broiler farms), and three farms for the production of table eggs (layer farms). The quantity of locally produced poultry meat amounted to 13,000 tons, an increase of 10.2% com-pared with 2008.
The number of eggs produced locally in 2009 was 155648 thousand eggs, marking an increase of 19.6% compared with 2008.
51
2.4 Livestock Production
Animal production constitutes a basic element of agricultural production. whereas the livestock consumes the natural agricultural resources to produce animal protein, which is regarded as an indirect production of agricultural land. Animal production constitutes 27% of the aggregated agriculture production, which is an important element to achieve food security, especially in terms of animal protein. Livestock products are part of many agricultural activities that depend on them as raw materials for production. Therefore, the development in animal production contributes in providing the expansion requirements of many industries that depend on such materials for its activities.
Livestock is also an essential component in the provision of food, whereas nutritionists estimated the individual daily requirement of protein to 70 grams per day, and that 66% of such requirements must be derived from animals, such as meat, eggs, and yoghurt. One study shows that the minimum individual requirement of animal protein is subject to variation in estimates, whereby a UN expert estimated it at 23 grams, while other experts estimated it at an average of 24 grams per person.
Sheep and goats are ranked first in terms of providing red meat in the Emirate, followed by camels and cows. Sheep and goats are regarded as a major source for red meat, and may contribute largely in resolving the shortage in animal protein, which is envisaged as one of the key food security concerns in general.
2.11 Number of Animals Slaughtered and Quantities of Meat Produced by Region in the Emirate of Abu Dhabi 2009Quantity in ton
Animal Type*Abu Dhabi Al Ain Total
Number Quantity Number Quantity Number QuantityTotal 517089 6452.84 271887 5988.20 788976 12441.04Sheep & Goats 510352 5205.09 253457 2661.30 763809 7866.39Cattle 1993 298.95 7182 1077.30 9175 1376.25Camels 4744 948.8 11248 2249.60 15992 3198.40
Source: Abu Dhabi Food Control Authority *Data of Abu Dhabi Included Western Region
The volume of locally produced meat amounted to 12441 tons in 2009, including 6453 tons in Abu Dhabi region at 52%, and 5988 tons in Al Ain region with 48% of the overall volume of red meat produced in the Emirate of Abu Dhabi.
Upon comparing the volume of red meat, by type, we find that sheep and goat meat are ranked first in terms of the produced volume with 63%, followed by camel meat with 26%, and lastly cows meat with 11% of the aggregated volume of produced red meat in the Emirate of Abu Dhabi in 2009.
The produced quantity of cow milk in the Emirate of Abu Dhabi amounted to 75807 tons in 2009, constituting an increase by 7% compared with 2008 where the produced quantity amounted to 70566 tons of cow milk.
III Fish Production Statistics
of54
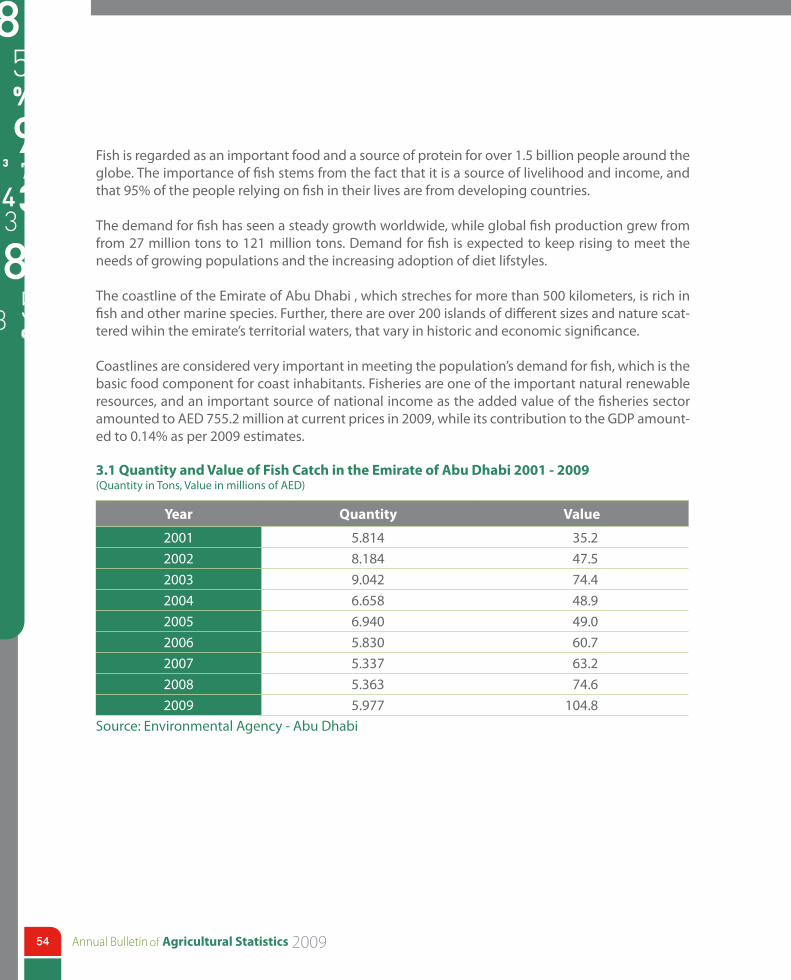
Fish is regarded as an important food and a source of protein for over 1.5 billion people around the globe. The importance of fish stems from the fact that it is a source of livelihood and income, and that 95% of the people relying on fish in their lives are from developing countries.
The demand for fish has seen a steady growth worldwide, while global fish production grew from from 27 million tons to 121 million tons. Demand for fish is expected to keep rising to meet the needs of growing populations and the increasing adoption of diet lifstyles.
The coastline of the Emirate of Abu Dhabi , which streches for more than 500 kilometers, is rich in fish and other marine species. Further, there are over 200 islands of different sizes and nature scat-tered wihin the emirate’s territorial waters, that vary in historic and economic significance.
Coastlines are considered very important in meeting the population’s demand for fish, which is the basic food component for coast inhabitants. Fisheries are one of the important natural renewable resources, and an important source of national income as the added value of the fisheries sector amounted to AED 755.2 million at current prices in 2009, while its contribution to the GDP amount-ed to 0.14% as per 2009 estimates.
3.1 Quantity and Value of Fish Catch in the Emirate of Abu Dhabi 2001 - 2009(Quantity in Tons, Value in millions of AED)
Year Quantity Value
2001 5.814 35.22002 8.184 47.52003 9.042 74.42004 6.658 48.92005 6.940 49.02006 5.830 60.72007 5.337 63.22008 5.363 74.62009 5.977 104.8
Source: Environmental Agency - Abu Dhabi
55
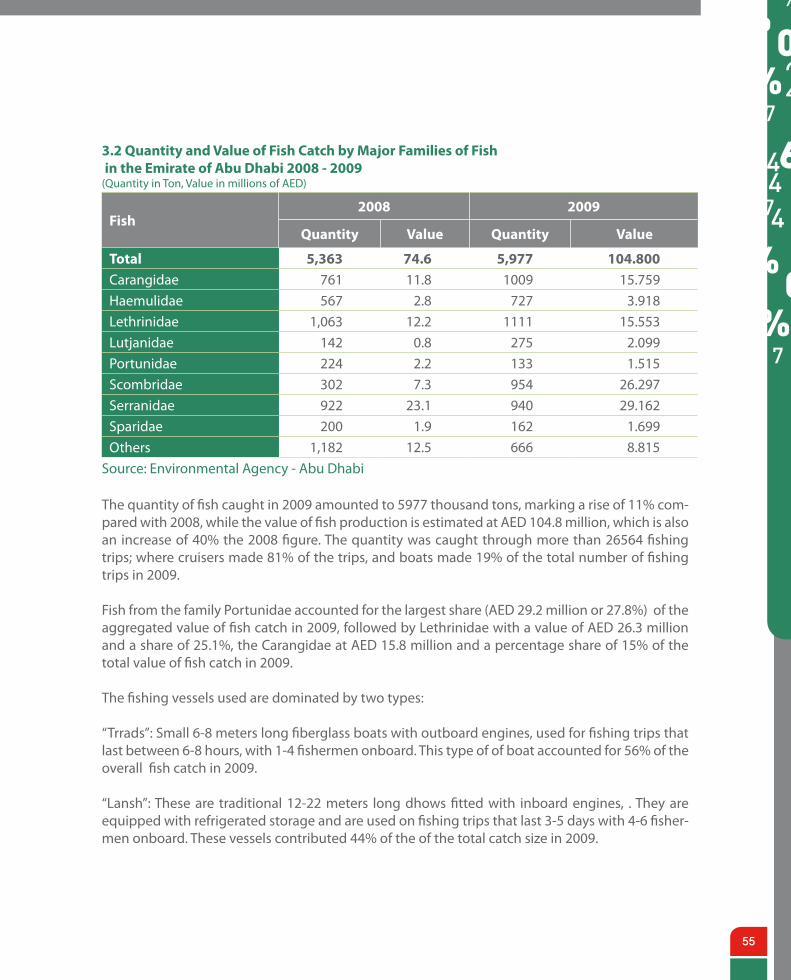
3.2 Quantity and Value of Fish Catch by Major Families of Fish in the Emirate of Abu Dhabi 2008 - 2009(Quantity in Ton, Value in millions of AED)
Fish2008 2009
Quantity Value Quantity Value
Total 5,363 74.6 5,977 104.800Carangidae 761 11.8 1009 15.759Haemulidae 567 2.8 727 3.918Lethrinidae 1,063 12.2 1111 15.553Lutjanidae 142 0.8 275 2.099Portunidae 224 2.2 133 1.515Scombridae 302 7.3 954 26.297Serranidae 922 23.1 940 29.162Sparidae 200 1.9 162 1.699Others 1,182 12.5 666 8.815
Source: Environmental Agency - Abu Dhabi
The quantity of fish caught in 2009 amounted to 5977 thousand tons, marking a rise of 11% com-pared with 2008, while the value of fish production is estimated at AED 104.8 million, which is also an increase of 40% the 2008 figure. The quantity was caught through more than 26564 fishing trips; where cruisers made 81% of the trips, and boats made 19% of the total number of fishing trips in 2009.
Fish from the family Portunidae accounted for the largest share (AED 29.2 million or 27.8%) of the aggregated value of fish catch in 2009, followed by Lethrinidae with a value of AED 26.3 million and a share of 25.1%, the Carangidae at AED 15.8 million and a percentage share of 15% of the total value of fish catch in 2009.
The fishing vessels used are dominated by two types:
“Trrads”: Small 6-8 meters long fiberglass boats with outboard engines, used for fishing trips that last between 6-8 hours, with 1-4 fishermen onboard. This type of of boat accounted for 56% of the overall fish catch in 2009.
“Lansh”: These are traditional 12-22 meters long dhows fitted with inboard engines, . They are equipped with refrigerated storage and are used on fishing trips that last 3-5 days with 4-6 fisher-men onboard. These vessels contributed 44% of the of the total catch size in 2009.
of56
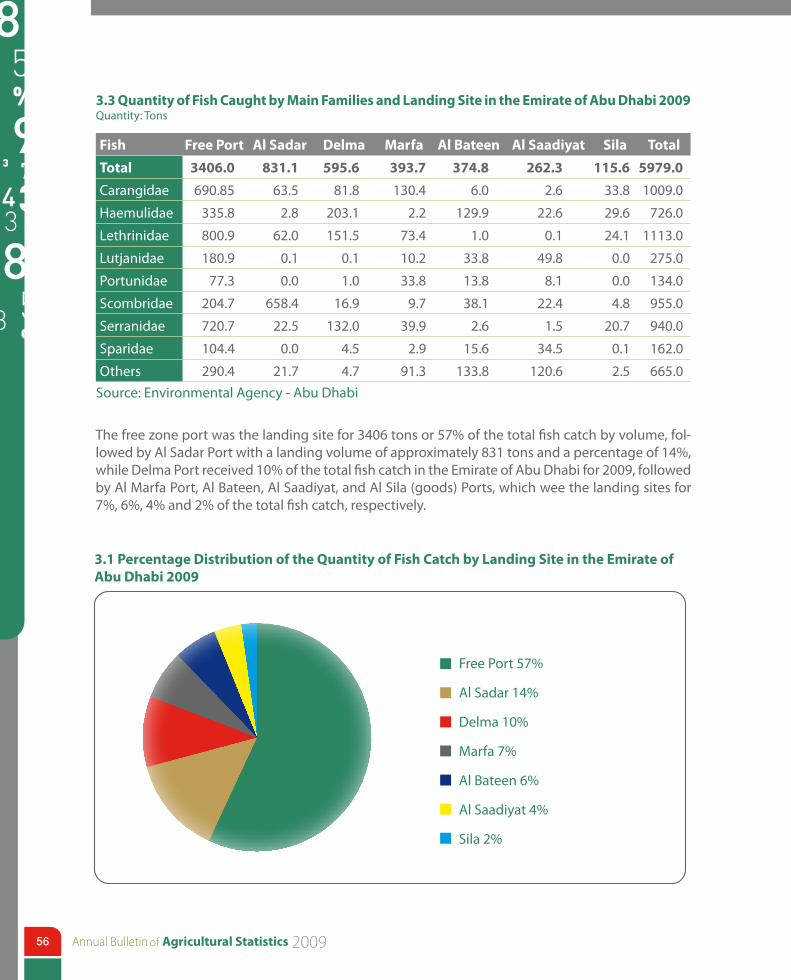
3.3 Quantity of Fish Caught by Main Families and Landing Site in the Emirate of Abu Dhabi 2009Quantity: Tons
Fish Free Port Al Sadar Delma Marfa Al Bateen Al Saadiyat Sila Total
Total 3406.0 831.1 595.6 393.7 374.8 262.3 115.6 5979.0
Carangidae 690.85 63.5 81.8 130.4 6.0 2.6 33.8 1009.0
Haemulidae 335.8 2.8 203.1 2.2 129.9 22.6 29.6 726.0
Lethrinidae 800.9 62.0 151.5 73.4 1.0 0.1 24.1 1113.0
Lutjanidae 180.9 0.1 0.1 10.2 33.8 49.8 0.0 275.0
Portunidae 77.3 0.0 1.0 33.8 13.8 8.1 0.0 134.0
Scombridae 204.7 658.4 16.9 9.7 38.1 22.4 4.8 955.0
Serranidae 720.7 22.5 132.0 39.9 2.6 1.5 20.7 940.0
Sparidae 104.4 0.0 4.5 2.9 15.6 34.5 0.1 162.0
Others 290.4 21.7 4.7 91.3 133.8 120.6 2.5 665.0Source: Environmental Agency - Abu Dhabi
The free zone port was the landing site for 3406 tons or 57% of the total fish catch by volume, fol-lowed by Al Sadar Port with a landing volume of approximately 831 tons and a percentage of 14%, while Delma Port received 10% of the total fish catch in the Emirate of Abu Dhabi for 2009, followed by Al Marfa Port, Al Bateen, Al Saadiyat, and Al Sila (goods) Ports, which wee the landing sites for 7%, 6%, 4% and 2% of the total fish catch, respectively.
3.1 Percentage Distribution of the Quantity of Fish Catch by Landing Site in the Emirate of Abu Dhabi 2009
Free Port 57%
Al Sadar 14%
Delma 10%
Marfa 7%
Al Bateen 6%
Al Saadiyat 4%
Sila 2%
57
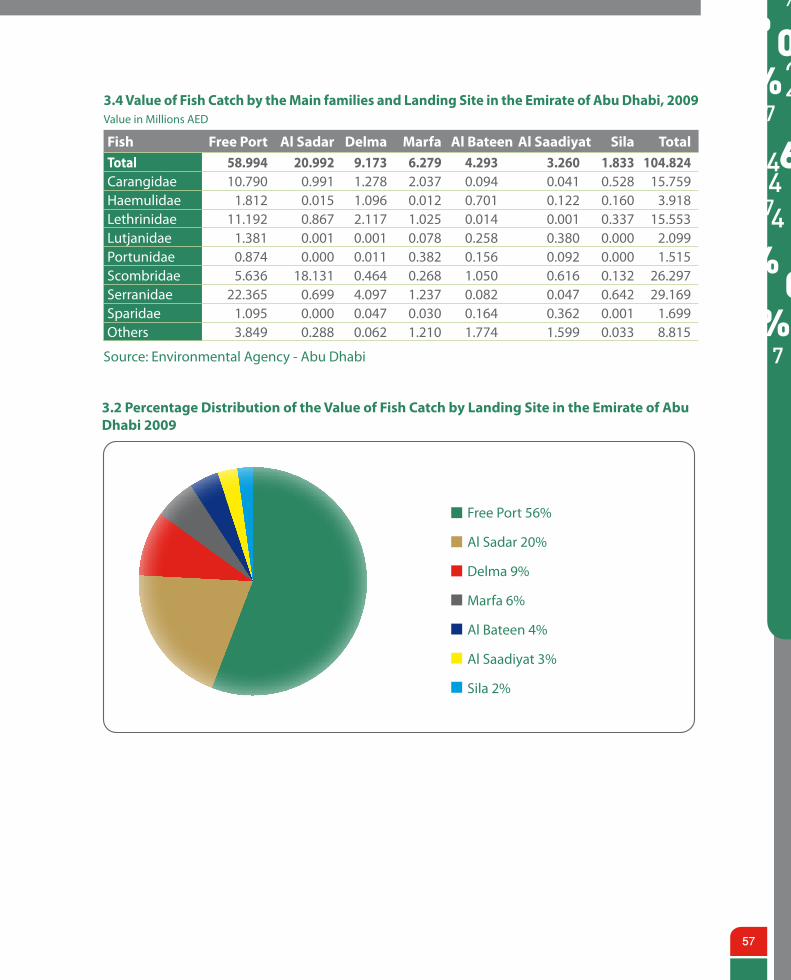
3.2 Percentage Distribution of the Value of Fish Catch by Landing Site in the Emirate of Abu Dhabi 2009
Free Port 56%
Al Sadar 20%
Delma 9%
Marfa 6%
Al Bateen 4%
Al Saadiyat 3%
Sila 2%
3.4 Value of Fish Catch by the Main families and Landing Site in the Emirate of Abu Dhabi, 2009 Value in Millions AED
Fish Free Port Al Sadar Delma Marfa Al Bateen Al Saadiyat Sila TotalTotal 58.994 20.992 9.173 6.279 4.293 3.260 1.833 104.824Carangidae 10.790 0.991 1.278 2.037 0.094 0.041 0.528 15.759Haemulidae 1.812 0.015 1.096 0.012 0.701 0.122 0.160 3.918Lethrinidae 11.192 0.867 2.117 1.025 0.014 0.001 0.337 15.553Lutjanidae 1.381 0.001 0.001 0.078 0.258 0.380 0.000 2.099Portunidae 0.874 0.000 0.011 0.382 0.156 0.092 0.000 1.515Scombridae 5.636 18.131 0.464 0.268 1.050 0.616 0.132 26.297Serranidae 22.365 0.699 4.097 1.237 0.082 0.047 0.642 29.169Sparidae 1.095 0.000 0.047 0.030 0.164 0.362 0.001 1.699Others 3.849 0.288 0.062 1.210 1.774 1.599 0.033 8.815
Source: Environmental Agency - Abu Dhabi
of58
The free port ranked first amongst other ports in terms of landing value, where it contributed with 56% of the total sale value, followed by Al Sadar port with 20%. Delma island followed in third place with a contribution percentage of 9% of the total caught fish in 2009, followed by Al Marfa, Al Bateen, Al Saadiyat, and lastly Al Sila (goods) with percentages of 6%, 4%, 3%, and 2% respectively.
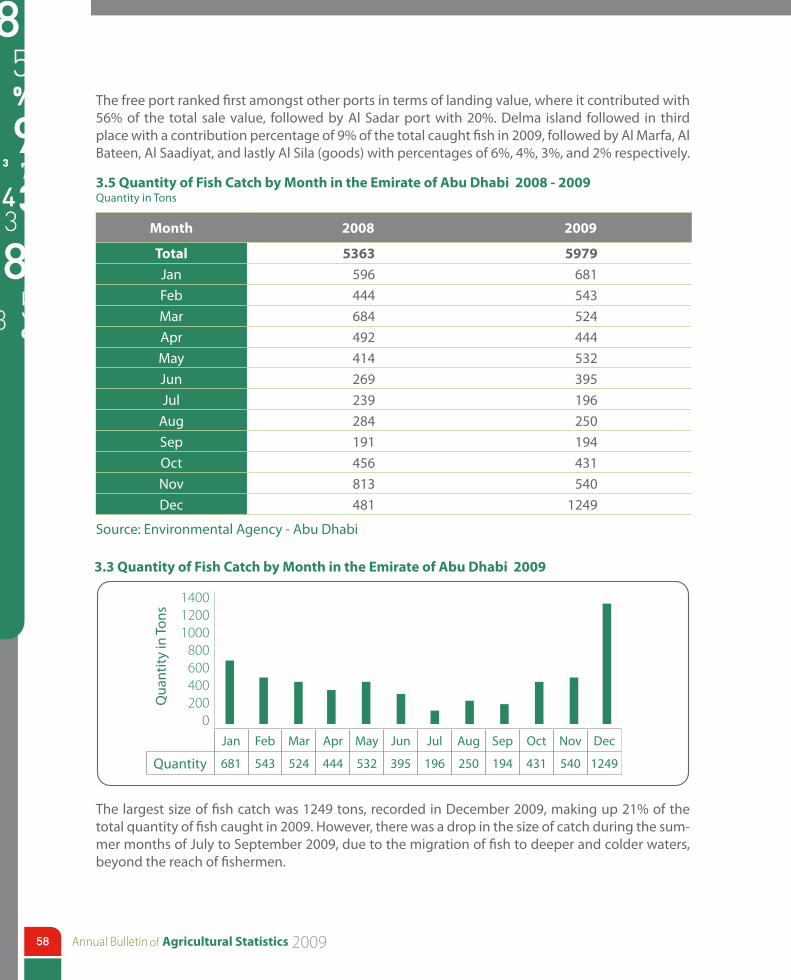
3.5 Quantity of Fish Catch by Month in the Emirate of Abu Dhabi 2008 - 2009Quantity in Tons
Month 2008 2009
Total 5363 5979Jan 596 681Feb 444 543Mar 684 524Apr 492 444May 414 532Jun 269 395Jul 239 196
Aug 284 250Sep 191 194Oct 456 431Nov 813 540Dec 481 1249
Source: Environmental Agency - Abu Dhabi
The largest size of fish catch was 1249 tons, recorded in December 2009, making up 21% of the total quantity of fish caught in 2009. However, there was a drop in the size of catch during the sum-mer months of July to September 2009, due to the migration of fish to deeper and colder waters, beyond the reach of fishermen.
Jan Feb Mar Apr May Jun Jul Aug Sep Oct Nov Dec
Quantity 681 543 524 444 532 395 196 250 194 431 540 1249
Qua
ntity
in To
ns
3.3 Quantity of Fish Catch by Month in the Emirate of Abu Dhabi 2009
140012001000
800600400200
0
59
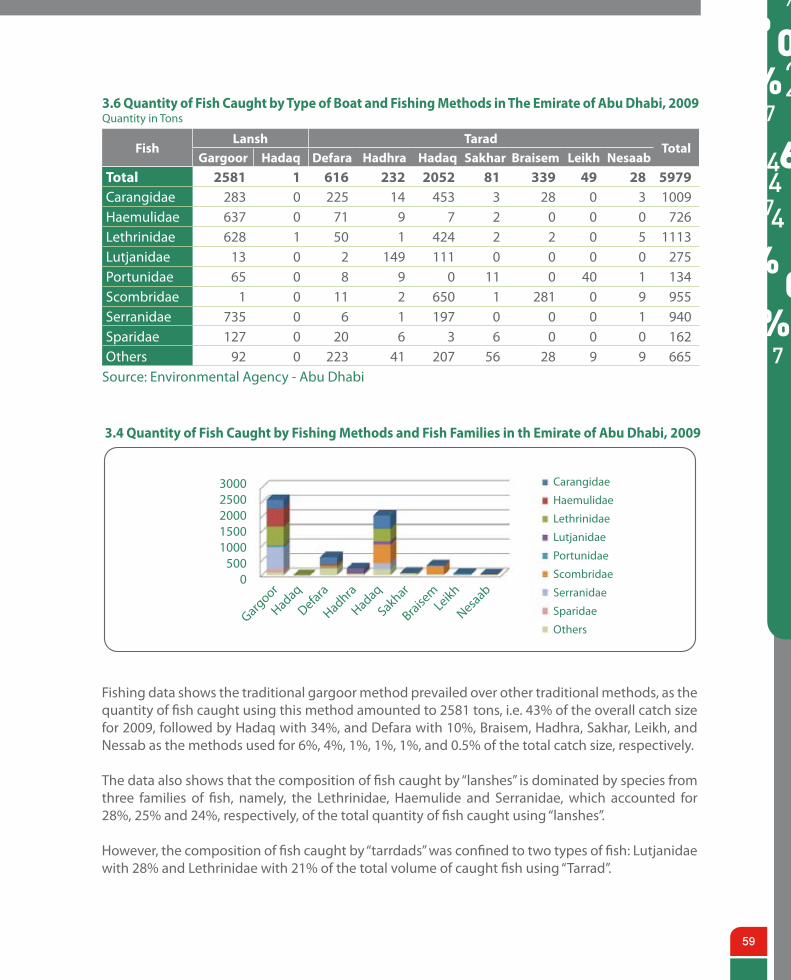
3.6 Quantity of Fish Caught by Type of Boat and Fishing Methods in The Emirate of Abu Dhabi, 2009Quantity in Tons
FishLansh Tarad
TotalGargoor Hadaq Defara Hadhra Hadaq Sakhar Braisem Leikh Nesaab
Total 2581 1 616 232 2052 81 339 49 28 5979Carangidae 283 0 225 14 453 3 28 0 3 1009Haemulidae 637 0 71 9 7 2 0 0 0 726Lethrinidae 628 1 50 1 424 2 2 0 5 1113Lutjanidae 13 0 2 149 111 0 0 0 0 275Portunidae 65 0 8 9 0 11 0 40 1 134Scombridae 1 0 11 2 650 1 281 0 9 955Serranidae 735 0 6 1 197 0 0 0 1 940Sparidae 127 0 20 6 3 6 0 0 0 162Others 92 0 223 41 207 56 28 9 9 665
Source: Environmental Agency - Abu Dhabi
Fishing data shows the traditional gargoor method prevailed over other traditional methods, as the quantity of fish caught using this method amounted to 2581 tons, i.e. 43% of the overall catch size for 2009, followed by Hadaq with 34%, and Defara with 10%, Braisem, Hadhra, Sakhar, Leikh, and Nessab as the methods used for 6%, 4%, 1%, 1%, 1%, and 0.5% of the total catch size, respectively.
The data also shows that the composition of fish caught by “lanshes” is dominated by species from three families of fish, namely, the Lethrinidae, Haemulide and Serranidae, which accounted for 28%, 25% and 24%, respectively, of the total quantity of fish caught using “lanshes”.
However, the composition of fish caught by “tarrdads” was confined to two types of fish: Lutjanidae with 28% and Lethrinidae with 21% of the total volume of caught fish using “Tarrad”.
Gargoor
Hadaq
Defara
Hadhra
Hadaq
Sakhar
Braisem
Leikh
Nesaab
30002500200015001000
5000
3.4 Quantity of Fish Caught by Fishing Methods and Fish Families in th Emirate of Abu Dhabi, 2009
Carangidae
Haemulidae
Lethrinidae
Lutjanidae
Portunidae
Scombridae
Serranidae
Sparidae
Others

IV Annex

of62
4.1 Definitions and Classifications
Agricultural Holding: An economic unit for agricultural production that is subject to a single administrative unit, and consists of all or part of the lands utilized for the purposes of agricultural production, regardless of ownership, legal form or area. The single unit may be under the control of an individual or a family, or may be shared by two persons or two families or more. It also may be under the control of a clan or a tribe, or may be subject to the control of a legal person such as a company or a cooperative society, or govern-mental agency. A holding may consist of one piece (partial holding) or more that is located in one or more of the separated areas of a regional or administrative jurisdiction, provided that all holdings share the same production methods utilized by the holding such as laborers, buildings, machines, or draft animals. Sharing the same production methods must be evident to an extent that justifies considering all land pieces an integral part of one economic unit. The economic units whose activities are confined to the hereunder economic activities may not be regarded as agricultural holdings; as such economic activities are located outside the agricultural framework:1. Hunting, and breeding game. 2. Exploiting forests or wood cutting. 3. Fishing.4. Agricultural services.
Part of Holding:Refers piece of land that is separated from other holding lands, whether it be land not under the control of the holding owner, or separated by a railroad, or a public road, or by forests, or anything similar.
Aggregated Holding Area: The overall area of all pieces of land comprising an agricultural holding. Any land that is owned by the holding owner or leased to others should not be accounted for in calculating the holding area. The ag-gregated holding area consists of the farmyard, and the area upon which a farm buildings are erected. Further, the dwelling of the holding owner is also calculated within the holding area, unless it is erected outside the holding parameters (i.e. in a residential area of a village or a close city), and not for residen-tial purposes. The aggregated holding area should include the area cultivated with crops during the ref-erence period, and the farmed area which is not cultivated yet. Deserted land should not be taken into account during the reference period. Holding owners should not also take into account their estimated share of land used as pastures. The aggregated holding area should be equal to the total land area used for different purposes.
Agricultural Land: A term that coves lands used for a wide range of activities, including, temporary farming land, land for permanent crops, permanent grazing land, fallow land, and other lands not specified elsewhere.
Land Not Suitable for Agriculture: Any part of the aggregated area of a holding that is not suitable for any farming due to a permanent or temporary obstacle, such as salinity, rocky terrain, and extreme slopes.
63
Livestock Owner: it is the person who has administrative authority on the operation of a livestock holding. It also refers to the person who takes the key decisions pertinent to the use of available resources, and is responsible for all technical and economic liabilities related to the holding. He may assume all responsibilities or share part of such responsibilities with others. Any person in possession of ten or more sheep or goats, or both; or owns one or more cows; or three or more camels; or five or more bee hives; or 30 or more hens; or a poultry farm; or a hatching facility may be considered a livestock owner.
Aggregated Animal Production: The value of goods and services produced during a set period of time as a result of undertaking a pro-ductive activity, whether primary or secondary, consisting of produced goods and services for personal use.
Agricultural Prices: Defined as the exchange value of agricultural products that is expressed in the value of money (dirham/Kg). The used agricultural prices are the prices of agricultural products at central markets or the gate prices at farms.
Index: indices are defined as a tool to measure relative variation in the value of phenomena from time to time, or from one place to another. An index is a relative figure that is attainable through a variable percent-age, or apparent value, or quantity during a period of time to the same variable or apparent value or quantity during another period of time. The reference period is known as the base period, and the sec-ond is called the comparison period.
Agricultural Pesticides: any substance or mixture of substances that is used for the prevention, control, or eradication of pests that include transmitters of human or animal diseases, in addition to the undesired species of animals and plants. Pesticides may cause damages during production, or upon preparation, storage, transport, or marketing of food commodities or agricultural goods. Pesticides may be used in spraying agricultural animals to combat pests, spiders, and other types of pests that live on or in their bodies.
Animal Communicable Diseases: include the plague of ruminants, foot and mouth, bovine viral diarrhea, blood poisoning, Pleuropneu-monia, smallpox, dermatitis.
Infectious Animal Diseases: Include menstruation diseases, jnflammation of lymph nodes, Jones disease (equal to TB), favus and fungal skin diseases, and mastitis.
Parasitic Animal Diseases: Include internal parasites and myiasis atef, external parasites, skin myiasis, tick paralysis, blood para-sites, scabies, and Kuryat disease.
Internal Animal Diseases: Include stomatitis, emphysema, indigestion, colic, inflammatory bowls, food diarrhea, bowel obstruc-tion, inflammation of the larynx and trachea, bronchitis, Pneumonia, cystitis, ear inflammation, urine retention, conjunctiva and cornea inflammation, dehydration, dropsy, muscle inflammation, arthritis, skin sensitivity, skin inflammation, and anemia diseases.

Note:
Annual Bulletin ofAgricultural StatisticsIssued in December 2010
Annu
al B
ulle
tin o
f Agr
icul
tura
l Sta
tistic
s 20
09