Embed Size (px)
Citation preview
United States
Department of
Agriculture
National
Agricultural
Statistics
Service
Research and
Development Division
Washington DC 20250
RDD Research Report
Number RDD-11-02
November 2011
Annual Land Utilization
Survey (ALUS): Design
and Methodology
Hailin Sang
Pam Arroway
Kenneth K. Lopiano
Denise A. Abreu
Andrea C. Lamas
Linda J. Young
This report was prepared for limited distribution to the research community outside the United
States Department of Agriculture. The views expressed herein are not necessarily those of the
National Agricultural Statistics Service or of the United States Department of Agriculture.
2
EXECUTIVE SUMMARY
The National Agricultural Statistics Service (NASS) obtains annual estimates of farm numbers
from its annual June Area Survey (JAS). Every five years, the annual numbers of farms
estimates are compared to the one obtained from the quinquennial census of agriculture
(conducted during years ending in 2 and 7). The JAS annual numbers have been declining
steadily between censuses, especially between the 2002 and 2007 Censuses. Furthermore, in
2002 and 2007, the JAS farm numbers indications1 were considerably lower than farm numbers
from the census and, in 2007, the difference could not be attributed to sampling error alone.
Additionally, results from a 2007 qualitative study revealed that agricultural operations were
being incorrectly classified as non-agricultural during the screening procedures of the JAS.
In an attempt to get a better understanding of the misclassification leading to this undercount in
the JAS number of farms indications, a post-JAS intensive screening called the Farm Numbers
Research Project (FNRP) was undertaken in the fall of 2009 (Abreu, McCarthy and Colburn,
2010). The design of the JAS includes rotating in new segments each year, while rotating out the
oldest segments. Segments stay in the JAS sample for five years. Each year’s sample is
comprised of segments from each of five rotations. Thus, the 2009 JAS contained segments that
were rotated into the sample in 2009, 2008, 2007, 2006 and 2005. The sampling design of the
FNRP targeted the 20-percent of JAS segments that were newly rotated in 2009. It targeted three
types of tracts in these segments: 1) non-agricultural tracts; 2) agricultural tracts that refused to
participate in the JAS and were estimated; and 3) agricultural tracts that were inaccessible in
June and were estimated. The FNRP results suggest misclassification may be reduced through
improvements in the screening questionnaire and by enhanced enumerator training guidelines.
To fully address this concern, NASS and the National Institute of Statistical Sciences (NISS)
formed a research team to review methodology associated with the design of the JAS and to
suggest improvements. This team was one of the three academic-government teams of the two-
year collaborative research program between NASS and NISS called Cross-Sector Research in
Residence Program. This research report documents the design and methodology of the Annual
Land Utilization Survey (ALUS), which is a follow-on survey to the JAS. ALUS builds upon
the experience gained in the FNRP. From a methodological perspective, the two primary
differences between the ALUS and the FNRP are the following: (1) All estimated and non-
agricultural JAS tracts have a probability for inclusion in ALUS, but only the 20-percent newly
rotated in estimated and non-agricultural JAS tracts were included in the FNRP; and (2) All of
the FNRP-eligible tracts were included in the FNRP sample, but only a sample of the ALUS-
eligible tracts will be included in the ALUS. Because a sample of all estimated and non-
agricultural JAS tracts will be collected, ALUS represents the second phase of a two-phase
sample with the first phase being the traditional JAS.
As in the JAS, ALUS will be a stratified sample of segments, using JAS strata and sampling
across rotations. Segments that are eligible for inclusion in ALUS must have at least one tract
that was pre-screened as non-agricultural (regardless of potential) or that was estimated in the
JAS (as either farm or non-farm). The sample allocation of ALUS segments to each state-stratum
1 Indications refer to point estimates derived from the survey results and could differ from official published
estimates.
3
combination considers two factors: the proportion of the ALUS population in the stratum and the
proportion of the FNRP adjustment from non-agricultural tracts in the stratum. For a selected
segment, all tracts satisfying one of these criteria will be re-evaluated using a modified combined
JAS-FNRP questionnaire. In the 2009 and 2010 JAS, over 90-percent of all segments would
have been considered eligible for ALUS. The collection of eligible segments in a particular year
will be called the ALUS population. The 2010 ALUS-eligible population is used to demonstrate
the sampling design.
As stated earlier, the combination of JAS and ALUS can be considered as a two-phase sample-
JAS being the first phase and ALUS the second. The two-phase JAS-ALUS stratified design,
can be applied to any estimate produced by the JAS. Given that each phase makes use of a
probability sampling design with known inclusion probabilities, standard results can be used to
construct a design-based estimator (Sarndal and Swensson, 1987). However, non-response is also
expected to occur in ALUS. In this report, methodology for a three-phase sampling design is
developed by extending the methodology of Sarndal and Swensson (1987). A general sampling
design is assumed in each phase. The estimator and its estimated variance are unbiased. Here we
use this methodology for the two-phase JAS-ALUS, with the third phase being non-response.
This methodology can be applied not only to estimates of the number of farms but to all
variables collected in the ALUS. Thus, although the primary impetus for this work is to improve
the estimates for the number of farms, it can also be used to improve estimates of other important
variables.
4
RECOMMENDATIONS
1) A follow-on survey to the JAS, called ALUS, should be conducted so that the farm number
indications (as well as any included commodities) from the JAS can be adjusted for
misclassification.
2) The ALUS questionnaire should be a modified version of the JAS-FNRP questionnaire.
While essentially a shortened version of the JAS questionnaire, the FNRP questionnaire was also
designed to target misclassification of farms and capture data on the type of farms that were
believed to have been misclassified via multiple modes of data collection (face-to-face, phone, or
mail). Additional JAS variables added to this questionnaire would allow the ability to adjust
these variables as well.
3) The methodology for a two-phase study with nonresponse (considered as a third phase), as
developed in this report, should be used for the analysis of the JAS-ALUS.
Note: The recommendations above were discussed at the January 2011 Senior Executive Team
meeting where the decision was made to not conduct the ALUS in 2011 due to budget
constraints.
5
Annual Land Utilization Survey (ALUS): Design and Methodology Hailin Sang
2, Pam Arroway
3, Kenneth K. Lopiano
4,
Denise A. Abreu5, Andrea C. Lamas
5, Linda J. Young
4
Abstract
Each year, the National Agricultural Statistics Service (NASS) publishes an estimate of the
number of farms in the United States based on the June Area Survey (JAS). Independent studies
showed that the JAS number of farm indications have significant undercount due to
misclassification. To adjust for this undercount, a follow-on survey to the JAS called the Annual
Land Utilization Survey (ALUS) has been proposed. ALUS is designed and developed based on
the Farm Numbers Research Project (FNRP). NASS conducted the FNRP in the fall of 2009
(Abreu, McCarthy and Colburn, 2010). ALUS samples from all JAS segments containing any
estimated or non-agricultural JAS tracts. For a selected segment, all estimated and non-
agricultural JAS tracts will be re-evaluated. The collection of eligible segments in a particular
year will be called the ALUS population. The sample allocation of ALUS segments to each state-
stratum combination considers two factors: the proportion of the ALUS population in the stratum
and the proportion of the FNRP adjustment from non-agricultural tracts in the stratum. ALUS
can be treated as a second phase to the JAS. The two-phase stratified design, JAS-ALUS, can be
applied to any estimate produced by the JAS. However, ALUS has non-response. In this paper,
methodology for a three-phase sampling design is developed by extending the two-phase
sampling design methodology proposed by Sarndal and Swensson (1987). A general sampling
design is allowed in each phase; that is, the inclusion probabilities in each phase are arbitrary.
The estimator is unbiased, and an unbiased estimator for the variance is provided. Here, this
method is applied to the two-phase JAS-ALUS with the third phase being response/non-
response.
KEYWORDS: three-phase sampling design estimation, unbiased estimator, variance
estimation, non-response
2 National Institute of Statistical Sciences, 19 T.W. Alexander Drive, Research Triangle Park, NC 27709
3 Department of Statistics, North Carolina State University, Raleigh, NC 27695
4 Department of Statistics, University of Florida, Gainesville, FL 32611
5 National Agricultural Statistics Service, USDA, 3251 Old Lee Hwy, Fairfax VA 22030
6
1. INTRODUCTION
The National Agricultural Statistics Service (NASS) uses its annual June Area Survey (JAS) as
the vehicle to generate annual estimates of the number of farms. Every five years, the annual
numbers of farms estimates are compared to the one obtained from the quinquennial census of
agriculture (conducted during years ending in 2 and 7). The annual numbers have been declining
steadily between censuses, especially between the 2002 and 2007 Censuses. Furthermore, in
2002 and 2007, the JAS farm numbers indications were considerably lower than farm numbers
from the census and, in 2007, the difference could not be attributed to sampling error alone.
Additionally, results from a 2007 qualitative study revealed that agricultural operations were
being incorrectly classified as non-agricultural during the screening procedures of the JAS.
In an attempt to get a better understanding of the misclassification leading to this undercount in
the JAS number of farms indication, the NISS/NASS farm numbers research team6 proposes a
yearly follow-on survey to the JAS called the Annual Land Utilization Survey (ALUS). The
purpose of ALUS is to provide information about misclassification of farms and non-farms,
focusing on tracts that are a) determined to be non-agricultural in June or b) are estimated in
June. ALUS results could be used to directly augment the JAS indications of farm numbers. In
addition, data collection will include several other variables, allowing indications of other
commodities to be adjusted using ALUS.
ALUS is modeled on the 2009 Farm Numbers Research Project (FNRP). FNRP was a one-time
follow-on survey to the JAS segments (Abreu, McCarthy and Colburn, 2010). The design of the
JAS includes rotating in new segments each year. Segments stay in the JAS sample for five
years. Each year’s sample is comprised of segments from each of five rotations. Thus, the 2009
JAS contained segments that were rotated into the sample in 2009, 2008, 2007, 2006 and 2005.
The sampling design of the FNRP targeted the 20-percent of JAS segments that were newly
rotated in for 2009 (“2009 segments”). All tracts in 2009 segments that were non-agricultural or
estimated in JAS were selected for FNRP.
Current NASS procedures define a tract as a unique land operating arrangement. However, for
densely populated tracts, it is possible that multiple operations (places of interest) may be
present. For a selected tract, all places of interest are considered subtracts. Subtracts are
subsampled if there are 8 or more per tract. The FNRP sample consisted of 10,204 tracts, which
resulted in a total of 17,191 subtracts.
The FNRP recommended changes to the screening procedures to improve the quality of
information obtained in the JAS, based on analysis of the misclassification of tracts as
farms/non-farms. The results of those recommendations may first be seen in the 2010 JAS, but
misclassification will certainly persist. An annual follow-up like ALUS will allow researchers to
6 NASS had a two year collaborative research program with the National Institute of Statistical Sciences (NISS)
called the Cross-Sector Research in Residence Program. This program was composed of three academic-
government teams focusing on important NASS research issues. One of the teams was entrusted to work on
potential improvements to the methodology and design of the June Area Survey.
7
monitor misclassification rates for farms/non-farms, as well as measurement error for additional
variables.
There are two primary differences between the ALUS and the FNRP: (1) FNRP only included
the 20-percent newly rotated in estimated and non-agricultural JAS tracts while ALUS will have
a positive probability of inclusion of all estimated and non-agricultural JAS tracts and (2) all
FNRP-eligible tracts were included in the FNRP sample, but only a sample of the ALUS-eligible
tracts will be included in the ALUS. Therefore, ALUS represents the second phase of a two-
phase sample with the first phase being the traditional JAS.
Although non-response was not allowed in FNRP, the second-phase ALUS sample will have
non-response. A design-based approach to estimation is to use methodology for a three-phase
sampling design, with the third phase addressing the non-response in the second phase. The
three-phase design-based estimator developed here is general in the sense that the inclusion
probabilities in each phase are arbitrary. The estimator is shown to be unbiased. The variance of
the estimator is derived and an unbiased estimator of it is developed. At the end, this
methodology is applied to JAS-ALUS, with the third phase design addressing non-response in
ALUS. We also provide an estimator and its variance estimation in the JAS terminologies. This
methodology can be applied not only to estimates of the number of farms but to all variables
collected in the ALUS.
2. THE DESIGN OF ALUS
2.1 Major Findings From FNRP
An analysis of the impact of JAS screening procedures used in FNRP was completed by Abreu,
McCarthy and Colburn (2010). A major finding of this work is that, assuming misclassification
rates are the same for all rotations, the JAS indication of number of farms would increase by
approximately 580,000 farms using FNRP data. We will refer to this as the “FNRP adjustment”
to the JAS indication (see Table 1). The bulk of these farms were “found” in tracts that had been
identified as non-agricultural with no potential in the JAS. On the order of 45-percent of tracts
are pre-screened into this category in a typical JAS. In FNRP, 6-percent of the sampled subtracts
selected from this category were determined to be farms, resulting in 500,000 of the FNRP
adjustment. Another 75,000 of the FNRP adjustment came from tracts pre-screened as non-
agricultural with either potential for agriculture or unknown potential. The remaining FNRP
adjustment came from tracts that had to be estimated in JAS. Although most tracts (92-percent)
that had been estimated as farms in JAS were confirmed as such in FNRP, approximately 30-
percent of those that had been estimated as non-farms were identified as farms in FNRP. The net
FNRP adjustment from estimated tracts was about 5,000 farms.
8
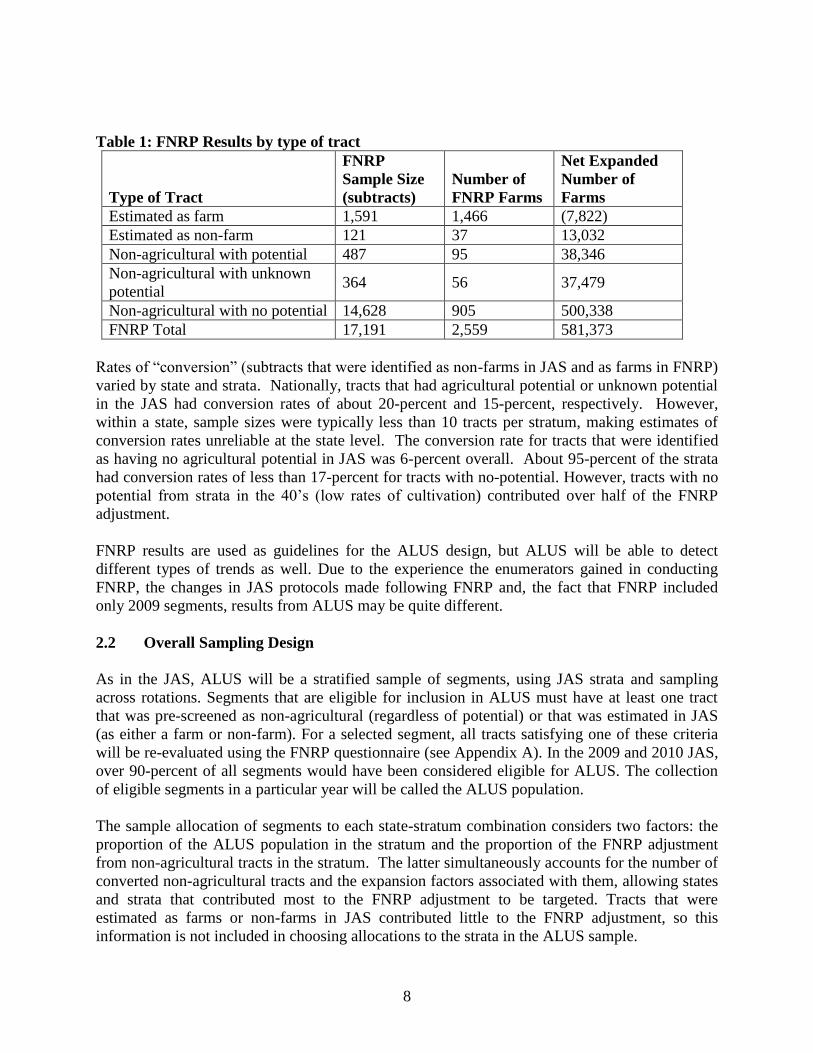
Table 1: FNRP Results by type of tract
Type of Tract
FNRP
Sample Size
(subtracts)
Number of
FNRP Farms
Net Expanded
Number of
Farms
Estimated as farm 1,591 1,466 (7,822)
Estimated as non-farm 121 37 13,032
Non-agricultural with potential 487 95 38,346
Non-agricultural with unknown
potential 364 56 37,479
Non-agricultural with no potential 14,628 905 500,338
FNRP Total 17,191 2,559 581,373
Rates of “conversion” (subtracts that were identified as non-farms in JAS and as farms in FNRP)
varied by state and strata. Nationally, tracts that had agricultural potential or unknown potential
in the JAS had conversion rates of about 20-percent and 15-percent, respectively. However,
within a state, sample sizes were typically less than 10 tracts per stratum, making estimates of
conversion rates unreliable at the state level. The conversion rate for tracts that were identified
as having no agricultural potential in JAS was 6-percent overall. About 95-percent of the strata
had conversion rates of less than 17-percent for tracts with no-potential. However, tracts with no
potential from strata in the 40’s (low rates of cultivation) contributed over half of the FNRP
adjustment.
FNRP results are used as guidelines for the ALUS design, but ALUS will be able to detect
different types of trends as well. Due to the experience the enumerators gained in conducting
FNRP, the changes in JAS protocols made following FNRP and, the fact that FNRP included
only 2009 segments, results from ALUS may be quite different.
2.2 Overall Sampling Design
As in the JAS, ALUS will be a stratified sample of segments, using JAS strata and sampling
across rotations. Segments that are eligible for inclusion in ALUS must have at least one tract
that was pre-screened as non-agricultural (regardless of potential) or that was estimated in JAS
(as either a farm or non-farm). For a selected segment, all tracts satisfying one of these criteria
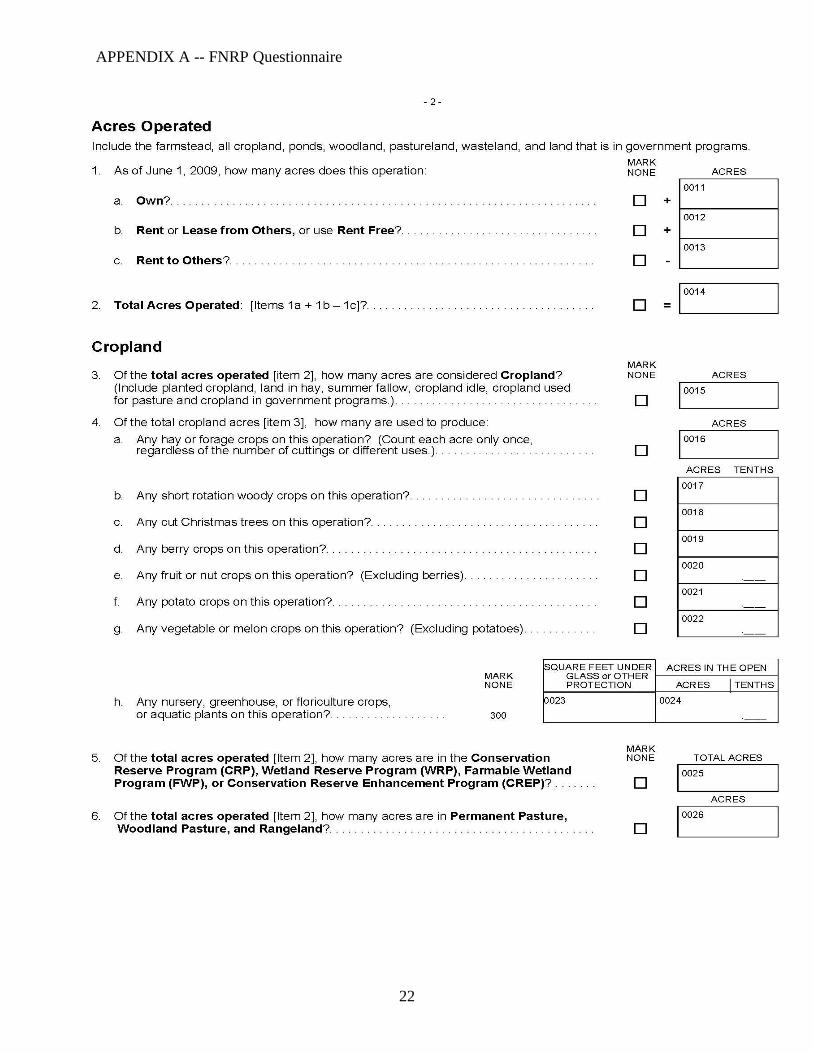
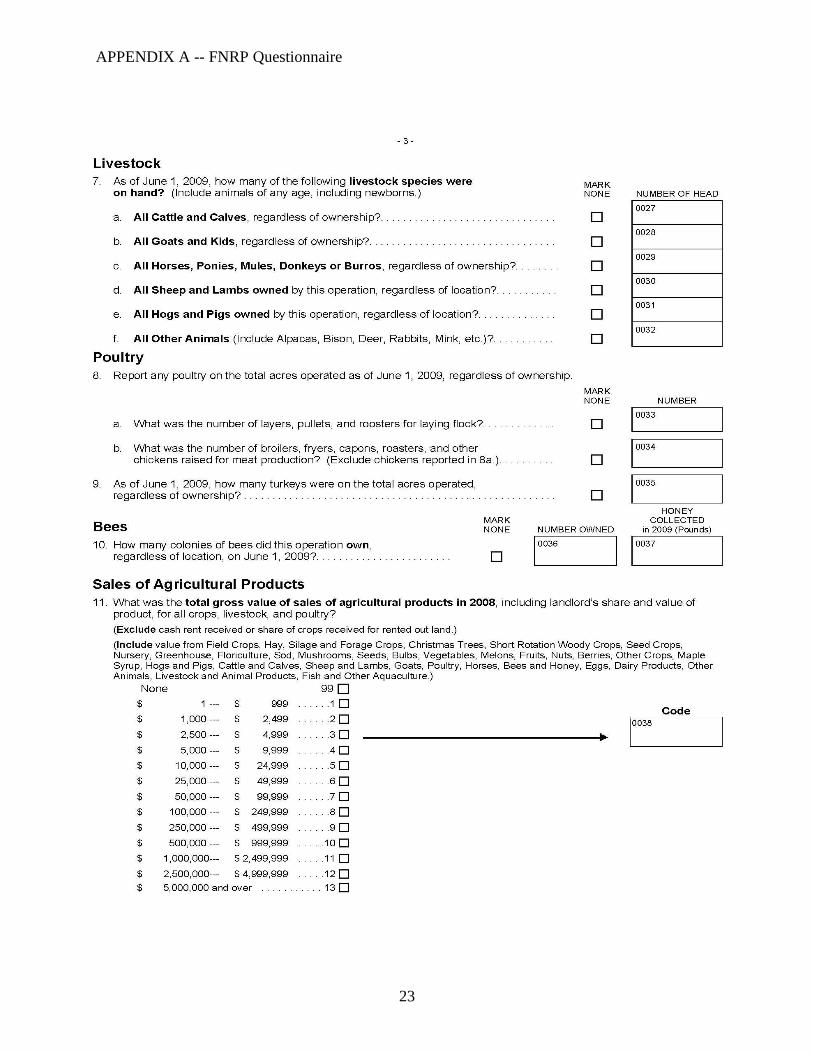
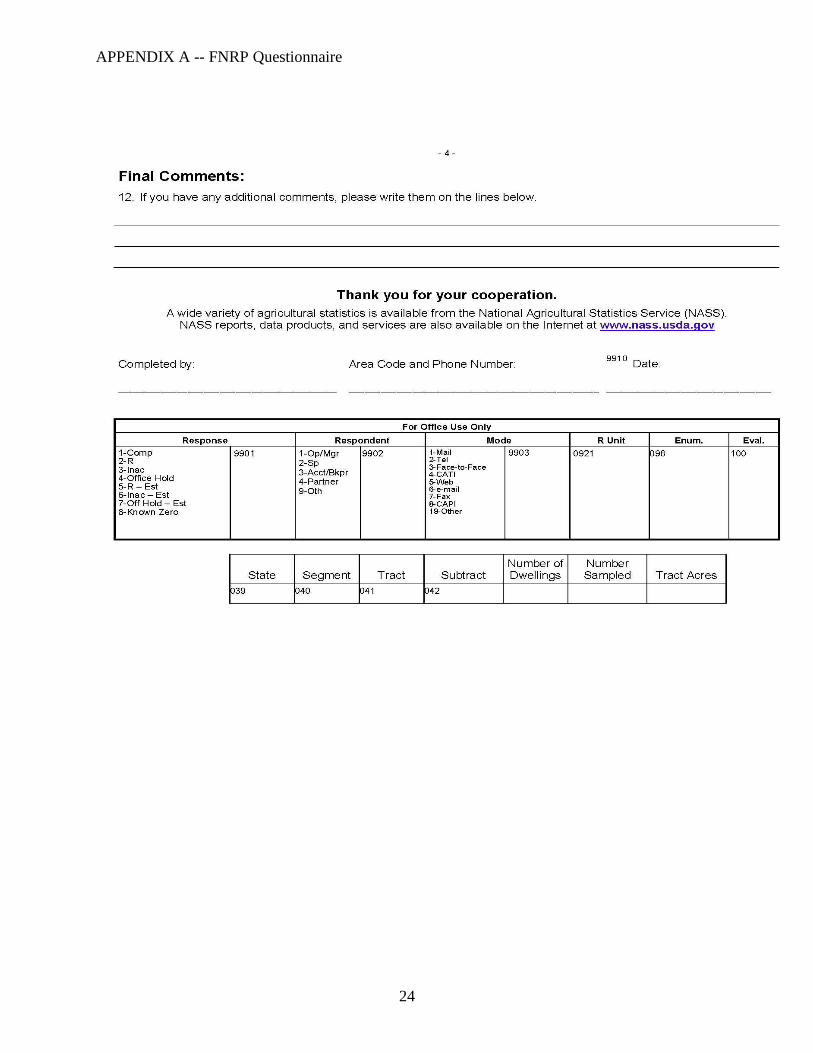
will be re-evaluated using the FNRP questionnaire (see Appendix A). In the 2009 and 2010 JAS,
over 90-percent of all segments would have been considered eligible for ALUS. The collection
of eligible segments in a particular year will be called the ALUS population.
The sample allocation of segments to each state-stratum combination considers two factors: the
proportion of the ALUS population in the stratum and the proportion of the FNRP adjustment
from non-agricultural tracts in the stratum. The latter simultaneously accounts for the number of
converted non-agricultural tracts and the expansion factors associated with them, allowing states
and strata that contributed most to the FNRP adjustment to be targeted. Tracts that were
estimated as farms or non-farms in JAS contributed little to the FNRP adjustment, so this
information is not included in choosing allocations to the strata in the ALUS sample.
9
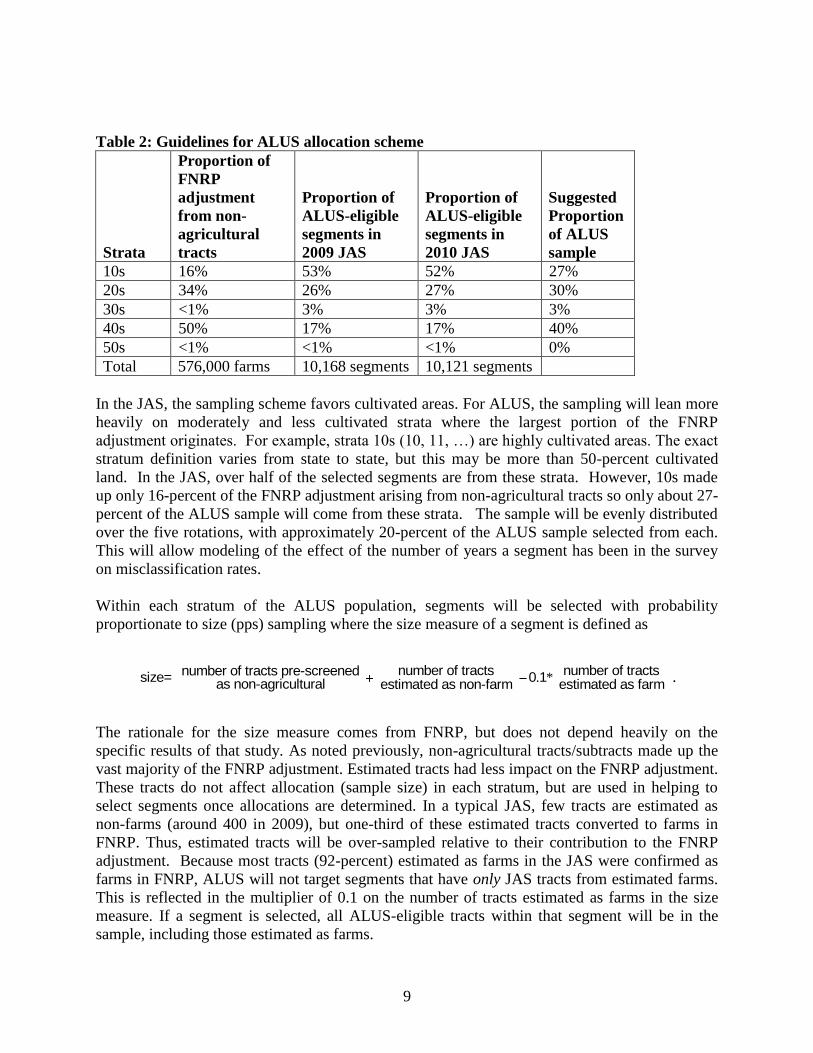
Table 2: Guidelines for ALUS allocation scheme
Strata
Proportion of
FNRP
adjustment
from non-
agricultural
tracts
Proportion of
ALUS-eligible
segments in
2009 JAS
Proportion of
ALUS-eligible
segments in
2010 JAS
Suggested
Proportion
of ALUS
sample
10s 16% 53% 52% 27%
20s 34% 26% 27% 30%
30s <1% 3% 3% 3%
40s 50% 17% 17% 40%
50s <1% <1% <1% 0%
Total 576,000 farms 10,168 segments 10,121 segments
In the JAS, the sampling scheme favors cultivated areas. For ALUS, the sampling will lean more
heavily on moderately and less cultivated strata where the largest portion of the FNRP
adjustment originates. For example, strata 10s (10, 11, …) are highly cultivated areas. The exact
stratum definition varies from state to state, but this may be more than 50-percent cultivated
land. In the JAS, over half of the selected segments are from these strata. However, 10s made
up only 16-percent of the FNRP adjustment arising from non-agricultural tracts so only about 27-
percent of the ALUS sample will come from these strata. The sample will be evenly distributed
over the five rotations, with approximately 20-percent of the ALUS sample selected from each.
This will allow modeling of the effect of the number of years a segment has been in the survey
on misclassification rates.
Within each stratum of the ALUS population, segments will be selected with probability
proportionate to size (pps) sampling where the size measure of a segment is defined as
. *number of tracts number of tractsnumber of tracts pre-screenedsize= 0 1
as non-agricultural estimated as non-farm estimated as farm.
The rationale for the size measure comes from FNRP, but does not depend heavily on the
specific results of that study. As noted previously, non-agricultural tracts/subtracts made up the
vast majority of the FNRP adjustment. Estimated tracts had less impact on the FNRP adjustment.
These tracts do not affect allocation (sample size) in each stratum, but are used in helping to
select segments once allocations are determined. In a typical JAS, few tracts are estimated as
non-farms (around 400 in 2009), but one-third of these estimated tracts converted to farms in
FNRP. Thus, estimated tracts will be over-sampled relative to their contribution to the FNRP
adjustment. Because most tracts (92-percent) estimated as farms in the JAS were confirmed as
farms in FNRP, ALUS will not target segments that have only JAS tracts from estimated farms.
This is reflected in the multiplier of 0.1 on the number of tracts estimated as farms in the size
measure. If a segment is selected, all ALUS-eligible tracts within that segment will be in the
sample, including those estimated as farms.
10
Within selected tracts, sampling rates of subtracts will be the same as FNRP. That is, if the tract
contains 7 dwellings or less, then all are sampled. If the tract contains 8-20 dwellings, half are
sampled. If there are more than 20 dwellings, one-sixth are sampled.
2.3 Example Allocations
Both the standard error and the cost of the proposed ALUS were investigated using FNRP data.
This required development of specific example allocations for each state and stratum. In practice,
ALUS allocations will need to be determined each year after the JAS data are collected because a
segment’s weight for the probability proportionate to size (pps) sampling will depend on its JAS
classification.
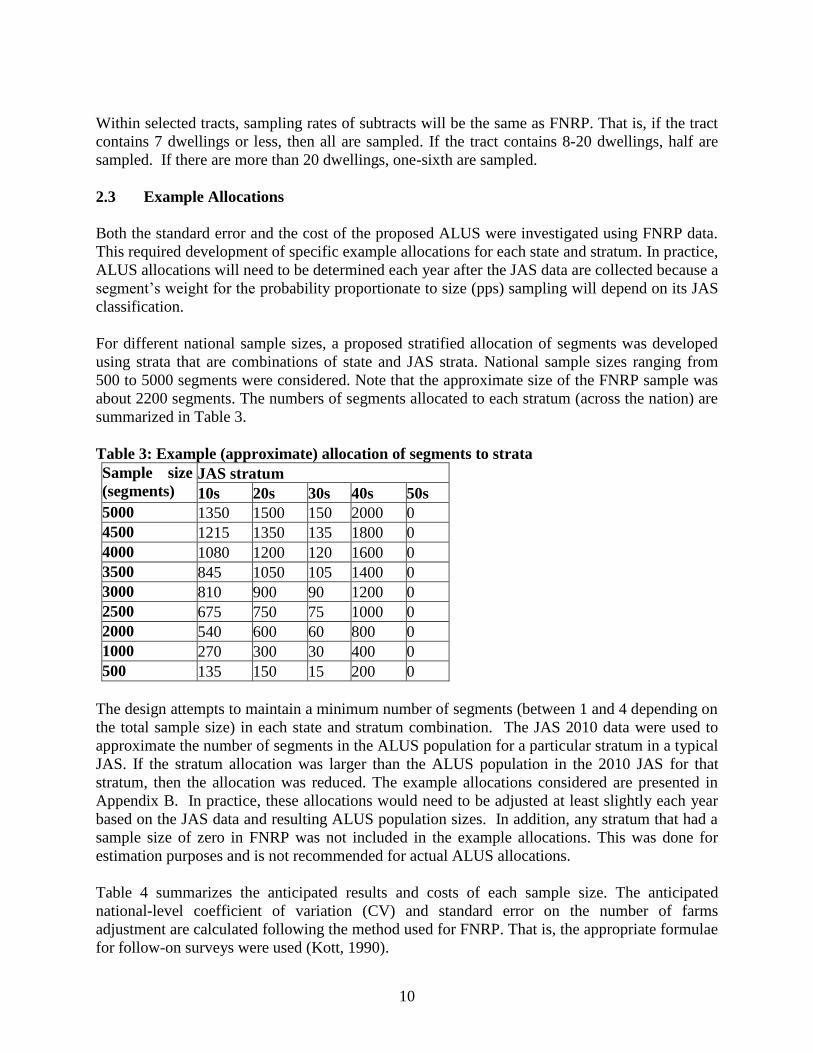
For different national sample sizes, a proposed stratified allocation of segments was developed
using strata that are combinations of state and JAS strata. National sample sizes ranging from
500 to 5000 segments were considered. Note that the approximate size of the FNRP sample was
about 2200 segments. The numbers of segments allocated to each stratum (across the nation) are
summarized in Table 3.
Table 3: Example (approximate) allocation of segments to strata
Sample size
(segments) JAS stratum
10s 20s 30s 40s 50s
5000 1350 1500 150 2000 0
4500 1215 1350 135 1800 0
4000 1080 1200 120 1600 0
3500 845 1050 105 1400 0
3000 810 900 90 1200 0
2500 675 750 75 1000 0
2000 540 600 60 800 0
1000 270 300 30 400 0
500 135 150 15 200 0
The design attempts to maintain a minimum number of segments (between 1 and 4 depending on
the total sample size) in each state and stratum combination. The JAS 2010 data were used to
approximate the number of segments in the ALUS population for a particular stratum in a typical
JAS. If the stratum allocation was larger than the ALUS population in the 2010 JAS for that
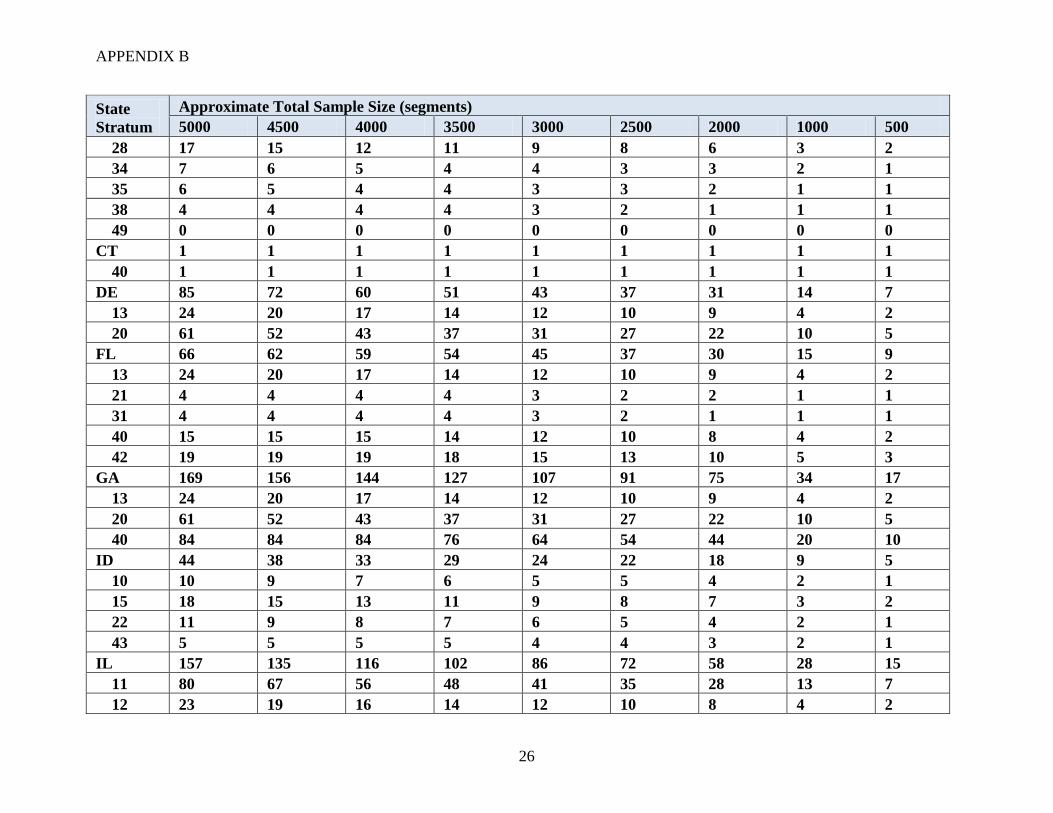
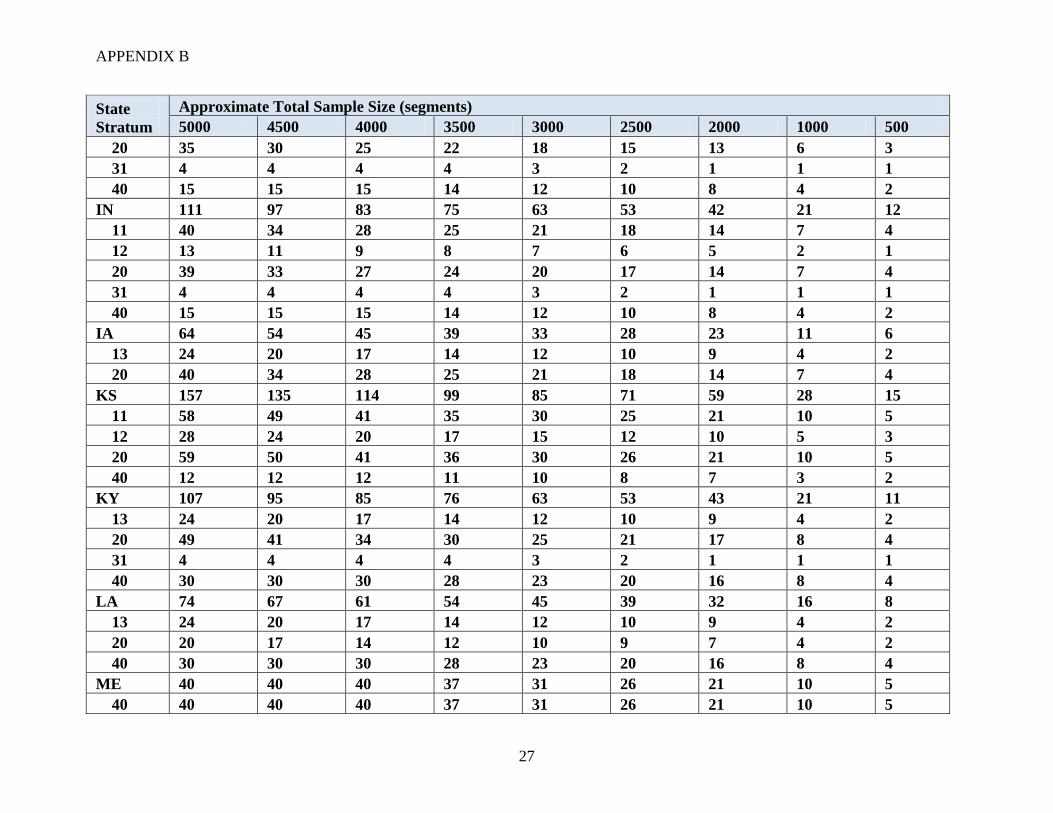
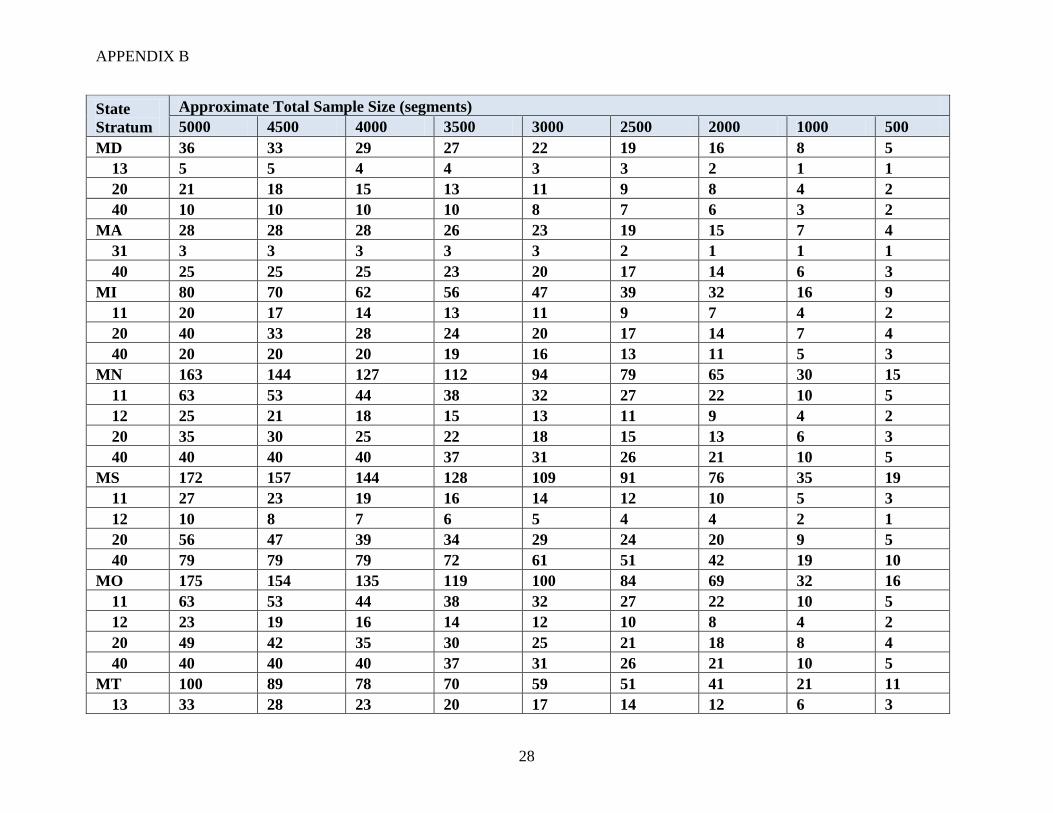
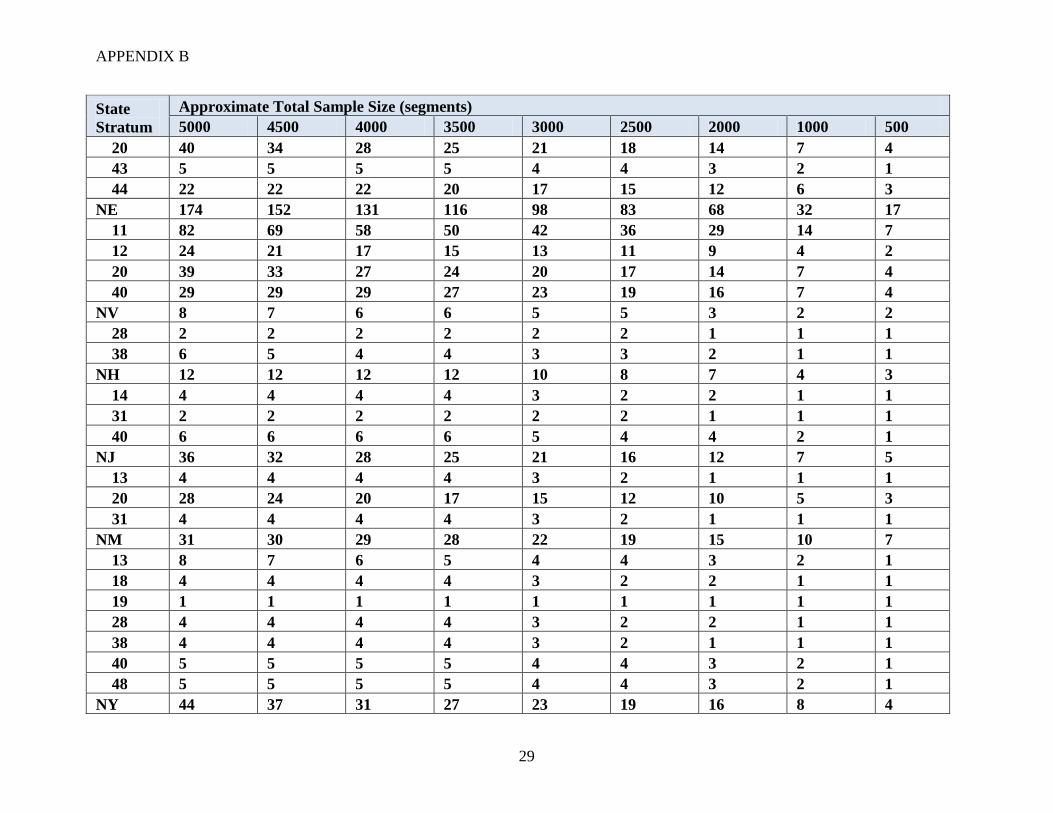
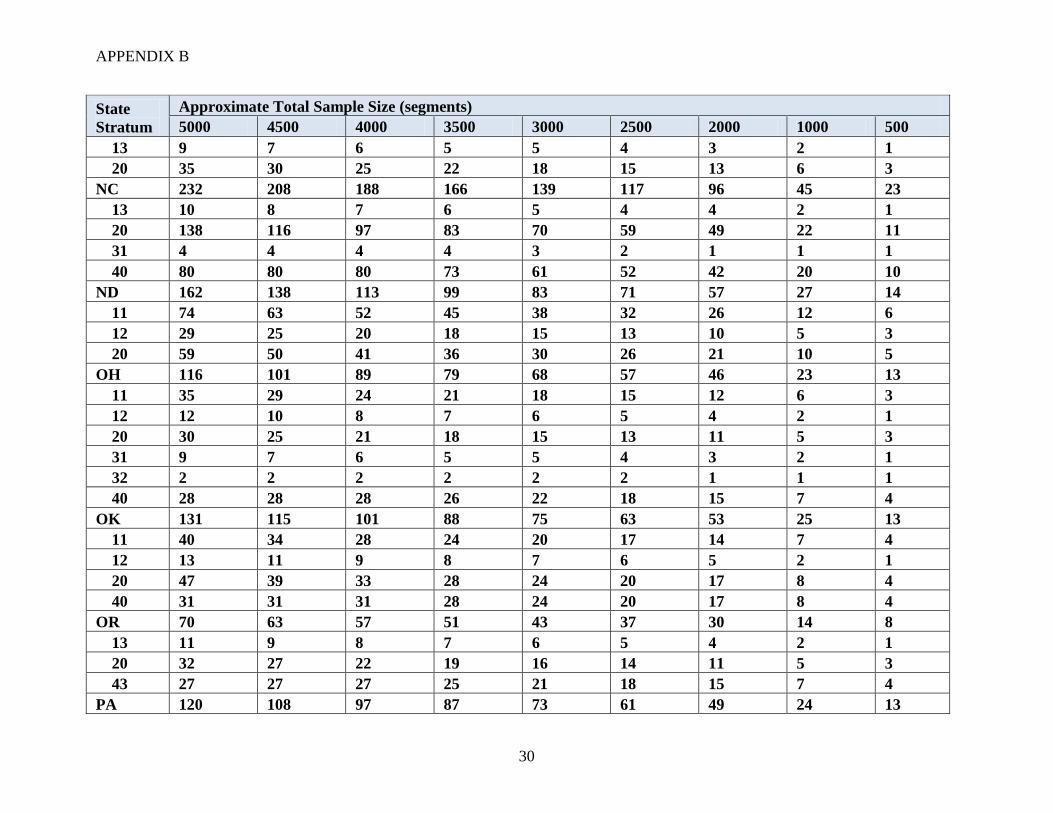
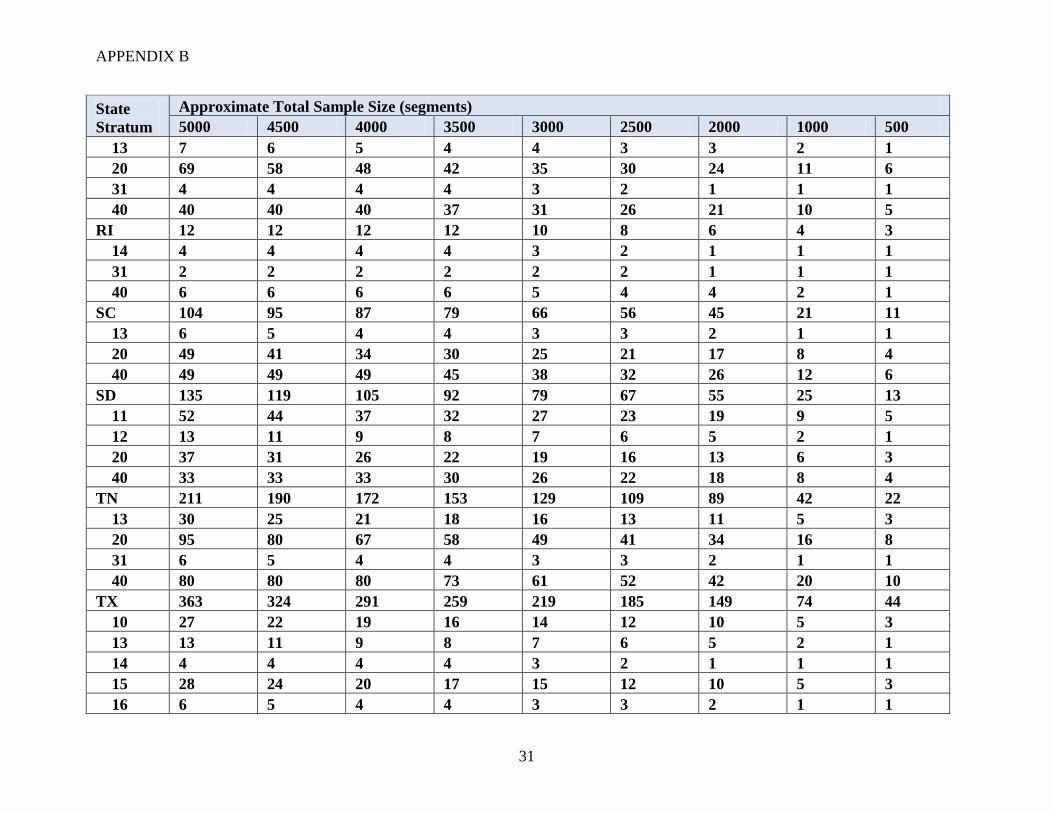
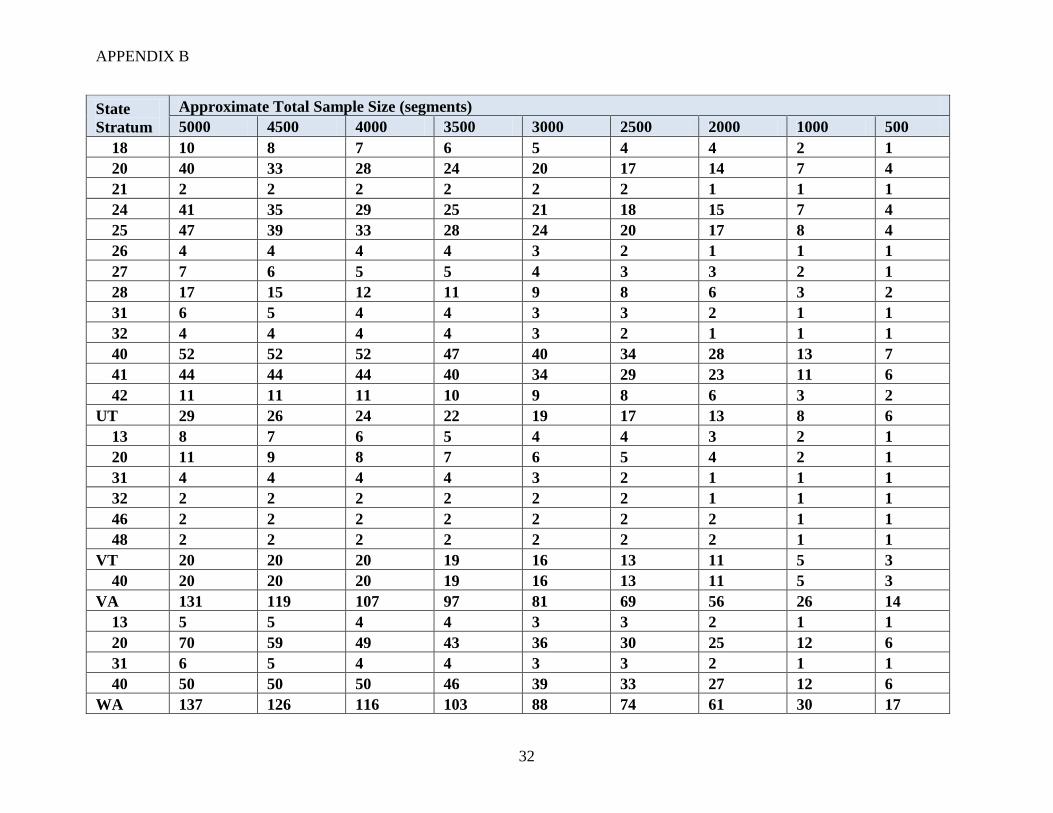
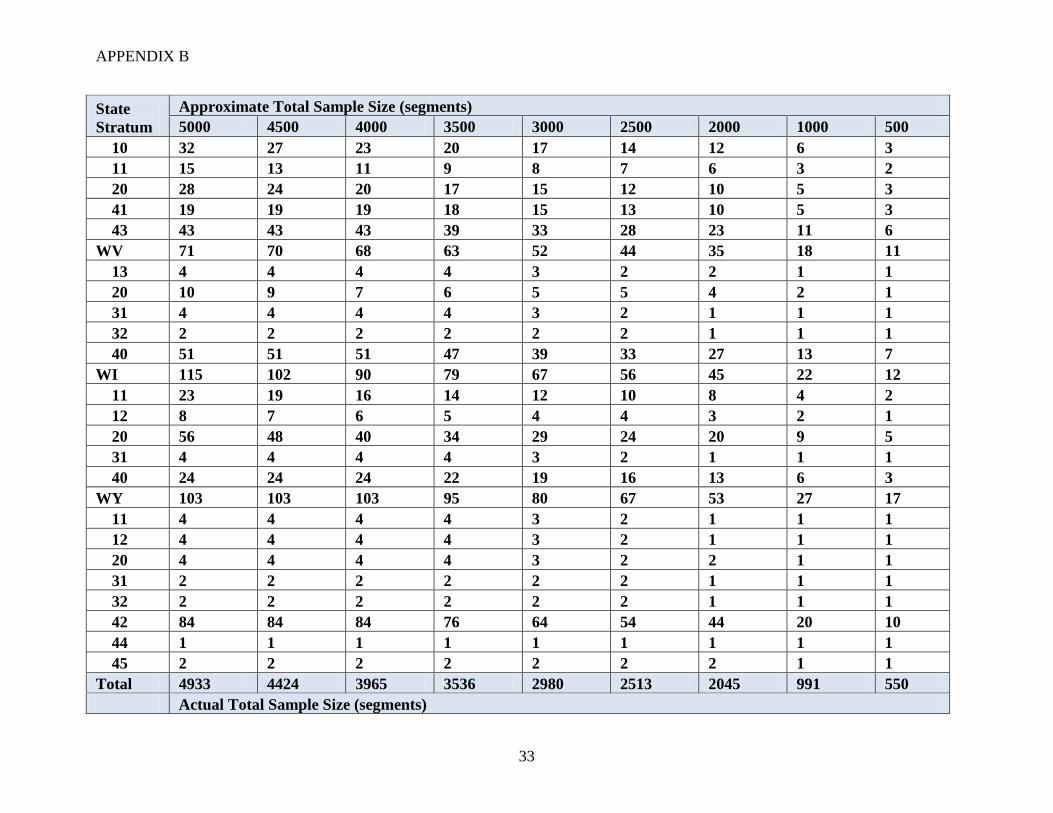
stratum, then the allocation was reduced. The example allocations considered are presented in
Appendix B. In practice, these allocations would need to be adjusted at least slightly each year
based on the JAS data and resulting ALUS population sizes. In addition, any stratum that had a
sample size of zero in FNRP was not included in the example allocations. This was done for
estimation purposes and is not recommended for actual ALUS allocations.
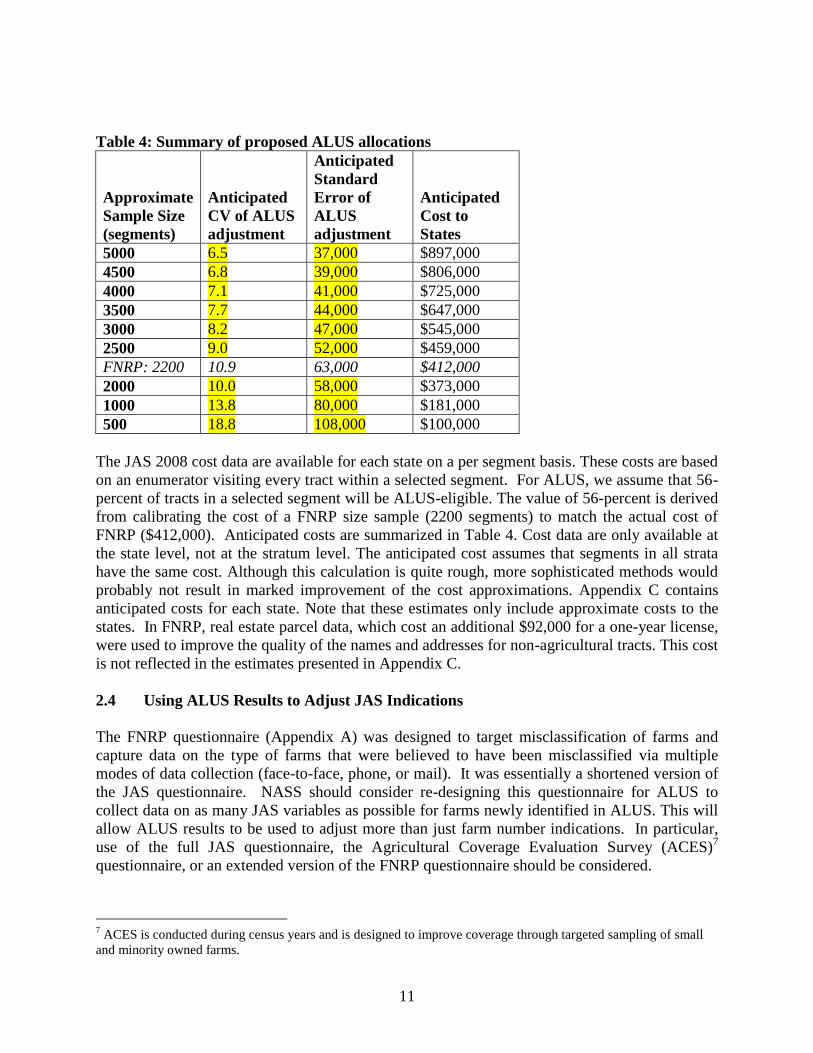
Table 4 summarizes the anticipated results and costs of each sample size. The anticipated
national-level coefficient of variation (CV) and standard error on the number of farms
adjustment are calculated following the method used for FNRP. That is, the appropriate formulae
for follow-on surveys were used (Kott, 1990).
11
Table 4: Summary of proposed ALUS allocations
Approximate
Sample Size
(segments)
Anticipated
CV of ALUS
adjustment
Anticipated
Standard
Error of
ALUS
adjustment
Anticipated
Cost to
States
5000 6.5 37,000 $897,000
4500 6.8 39,000 $806,000
4000 7.1 41,000 $725,000
3500 7.7 44,000 $647,000
3000 8.2 47,000 $545,000
2500 9.0 52,000 $459,000
FNRP: 2200 10.9 63,000 $412,000
2000 10.0 58,000 $373,000
1000 13.8 80,000 $181,000
500 18.8 108,000 $100,000
The JAS 2008 cost data are available for each state on a per segment basis. These costs are based
on an enumerator visiting every tract within a selected segment. For ALUS, we assume that 56-
percent of tracts in a selected segment will be ALUS-eligible. The value of 56-percent is derived
from calibrating the cost of a FNRP size sample (2200 segments) to match the actual cost of
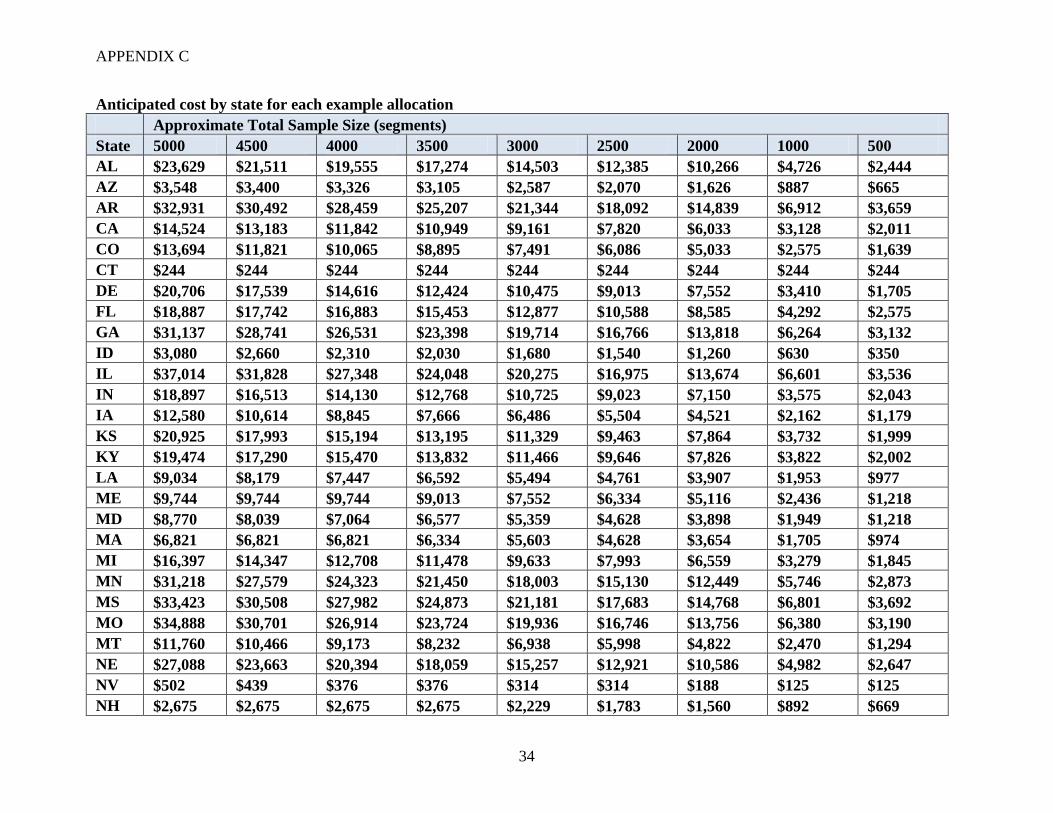
FNRP ($412,000). Anticipated costs are summarized in Table 4. Cost data are only available at
the state level, not at the stratum level. The anticipated cost assumes that segments in all strata
have the same cost. Although this calculation is quite rough, more sophisticated methods would
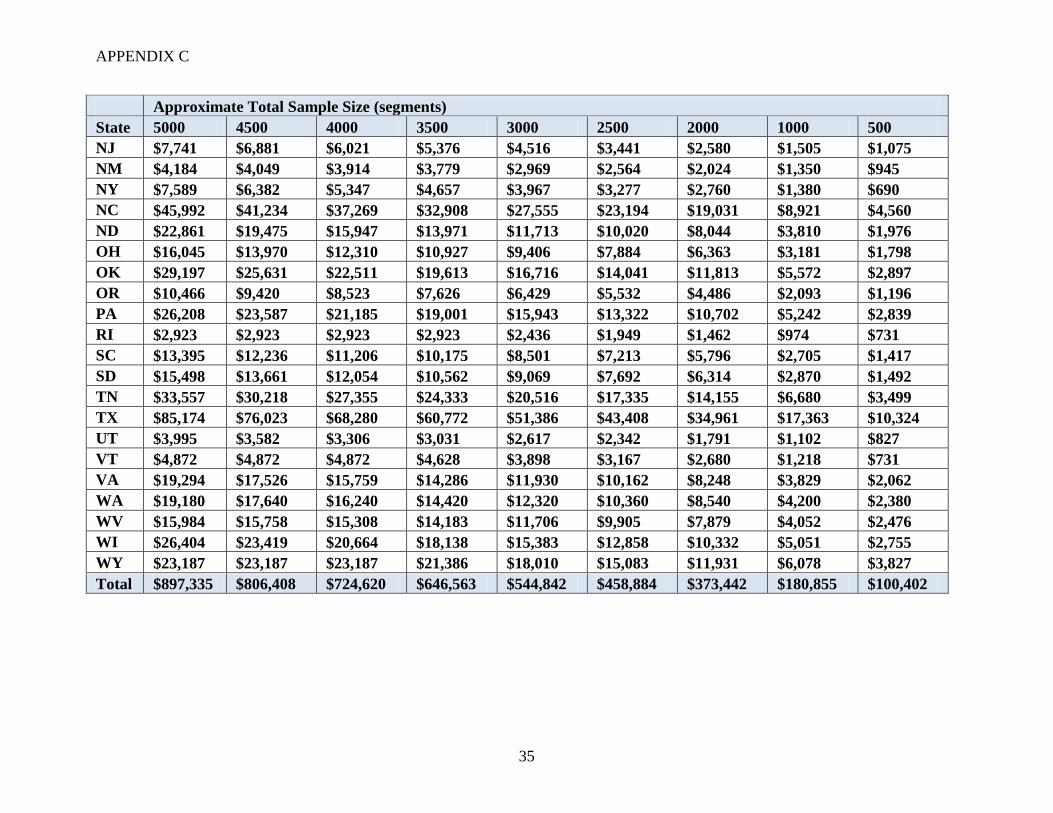
probably not result in marked improvement of the cost approximations. Appendix C contains
anticipated costs for each state. Note that these estimates only include approximate costs to the
states. In FNRP, real estate parcel data, which cost an additional $92,000 for a one-year license,
were used to improve the quality of the names and addresses for non-agricultural tracts. This cost
is not reflected in the estimates presented in Appendix C.
2.4 Using ALUS Results to Adjust JAS Indications
The FNRP questionnaire (Appendix A) was designed to target misclassification of farms and
capture data on the type of farms that were believed to have been misclassified via multiple
modes of data collection (face-to-face, phone, or mail). It was essentially a shortened version of
the JAS questionnaire. NASS should consider re-designing this questionnaire for ALUS to
collect data on as many JAS variables as possible for farms newly identified in ALUS. This will
allow ALUS results to be used to adjust more than just farm number indications. In particular,
use of the full JAS questionnaire, the Agricultural Coverage Evaluation Survey (ACES)7
questionnaire, or an extended version of the FNRP questionnaire should be considered.
7 ACES is conducted during census years and is designed to improve coverage through targeted sampling of small
and minority owned farms.
12
The combination of JAS and ALUS can be considered a two-phase sample. JAS is the first phase
of the sample; then a sub-sample of JAS segments are selected for ALUS. Provided that each
phase makes use of a probability sampling design for which the inclusion probabilities are
known, standard results can be used to construct a design-based estimator (Sarndal and
Swensson, 1987). It is expected that misclassification and non-response will still occur in ALUS.
However, this follow-up survey will provide valuable information for adjusting estimates and
should reduce the amount of non-response.
This methodology can be applied not only to estimates of number of farms but to all variables
collected in the ALUS. Thus, although the primary impetus for this work is to improve estimates
of the number of farms, it can improve estimates of other important variables. In particular,
farms that are “missed” in JAS will not have values for many JAS variables. Those that are
newly identified in ALUS will have accompanying data that can be used to adjust any variables
common to both ALUS and JAS. For this reason, the FNRP questionnaire should be reviewed
within NASS to determine whether other information should be gathered during ALUS.
3 ALUS METHODOLOGY
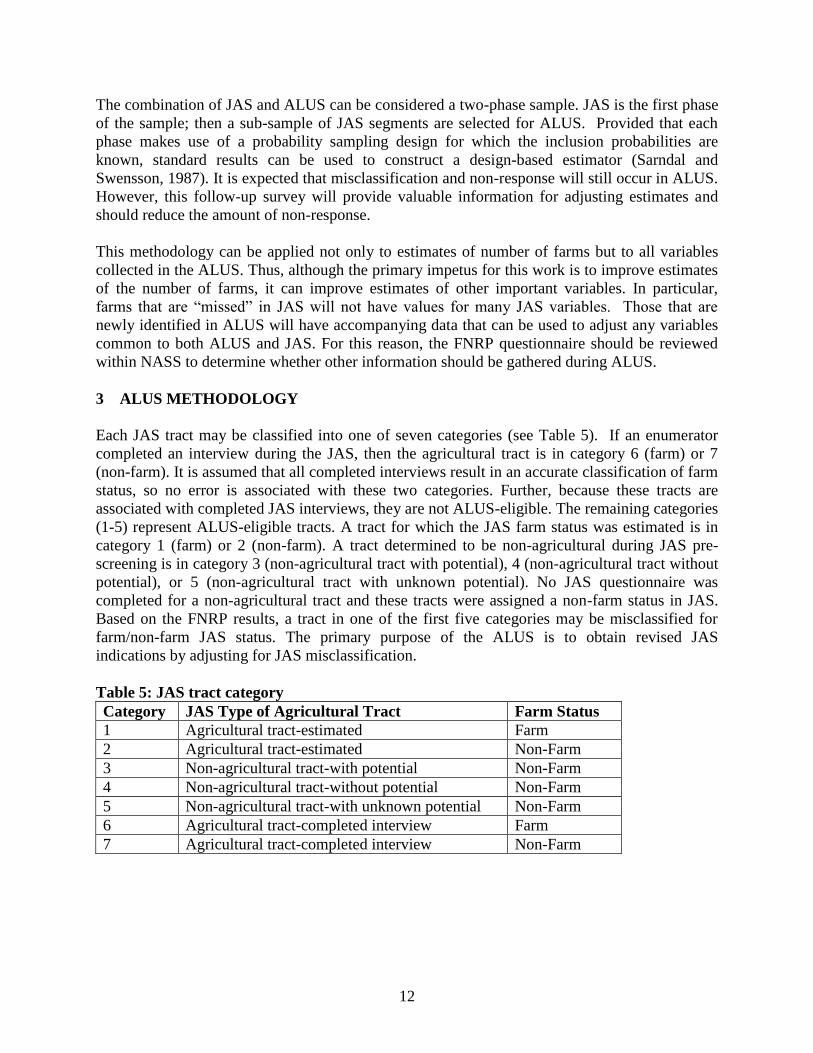
Each JAS tract may be classified into one of seven categories (see Table 5). If an enumerator
completed an interview during the JAS, then the agricultural tract is in category 6 (farm) or 7
(non-farm). It is assumed that all completed interviews result in an accurate classification of farm
status, so no error is associated with these two categories. Further, because these tracts are
associated with completed JAS interviews, they are not ALUS-eligible. The remaining categories
(1-5) represent ALUS-eligible tracts. A tract for which the JAS farm status was estimated is in
category 1 (farm) or 2 (non-farm). A tract determined to be non-agricultural during JAS pre-
screening is in category 3 (non-agricultural tract with potential), 4 (non-agricultural tract without
potential), or 5 (non-agricultural tract with unknown potential). No JAS questionnaire was
completed for a non-agricultural tract and these tracts were assigned a non-farm status in JAS.
Based on the FNRP results, a tract in one of the first five categories may be misclassified for
farm/non-farm JAS status. The primary purpose of the ALUS is to obtain revised JAS
indications by adjusting for JAS misclassification.
Table 5: JAS tract category
Category JAS Type of Agricultural Tract Farm Status
1 Agricultural tract-estimated Farm
2 Agricultural tract-estimated Non-Farm
3 Non-agricultural tract-with potential Non-Farm
4 Non-agricultural tract-without potential Non-Farm
5 Non-agricultural tract-with unknown potential Non-Farm
6 Agricultural tract-completed interview Farm
7 Agricultural tract-completed interview Non-Farm
13
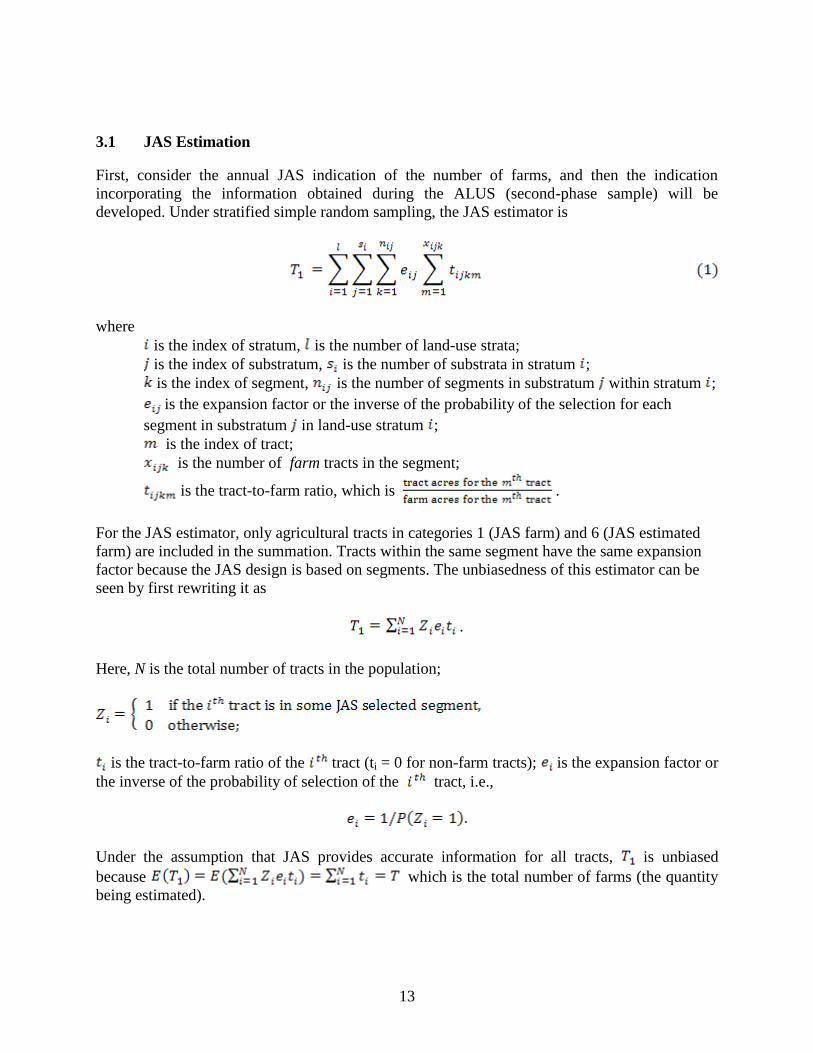
3.1 JAS Estimation
First, consider the annual JAS indication of the number of farms, and then the indication
incorporating the information obtained during the ALUS (second-phase sample) will be
developed. Under stratified simple random sampling, the JAS estimator is
where
is the index of stratum, is the number of land-use strata;
is the index of substratum, is the number of substrata in stratum ;
is the index of segment, is the number of segments in substratum within stratum ;
is the expansion factor or the inverse of the probability of the selection for each
segment in substratum in land-use stratum ;
is the index of tract;
is the number of farm tracts in the segment;
is the tract-to-farm ratio, which is .
For the JAS estimator, only agricultural tracts in categories 1 (JAS farm) and 6 (JAS estimated
farm) are included in the summation. Tracts within the same segment have the same expansion
factor because the JAS design is based on segments. The unbiasedness of this estimator can be
seen by first rewriting it as
.
Here, N is the total number of tracts in the population;
is the tract-to-farm ratio of the tract (ti = 0 for non-farm tracts); is the expansion factor or
the inverse of the probability of selection of the tract, i.e.,
Under the assumption that JAS provides accurate information for all tracts, is unbiased
because which is the total number of farms (the quantity
being estimated).
14
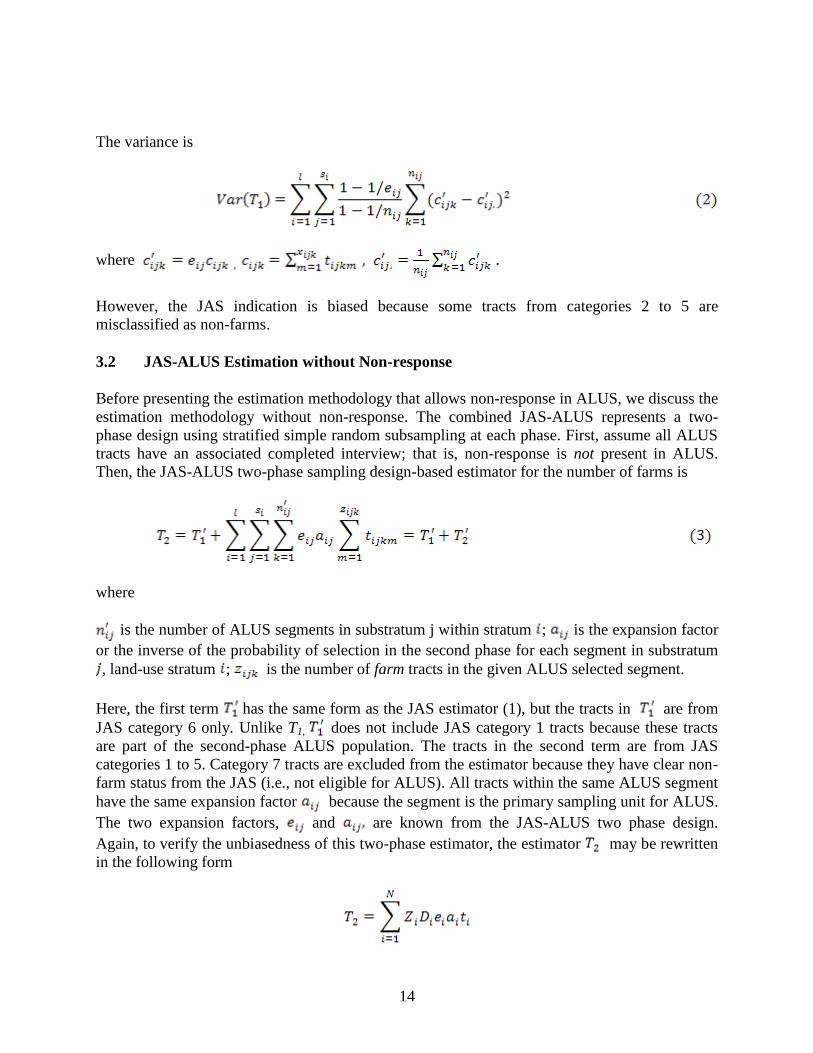
The variance is
where
However, the JAS indication is biased because some tracts from categories 2 to 5 are
misclassified as non-farms.
3.2 JAS-ALUS Estimation without Non-response
Before presenting the estimation methodology that allows non-response in ALUS, we discuss the
estimation methodology without non-response. The combined JAS-ALUS represents a two-
phase design using stratified simple random subsampling at each phase. First, assume all ALUS
tracts have an associated completed interview; that is, non-response is not present in ALUS.
Then, the JAS-ALUS two-phase sampling design-based estimator for the number of farms is
where
is the number of ALUS segments in substratum j within stratum ; is the expansion factor
or the inverse of the probability of selection in the second phase for each segment in substratum
, land-use stratum ; is the number of farm tracts in the given ALUS selected segment.
Here, the first term has the same form as the JAS estimator (1), but the tracts in are from
JAS category 6 only. Unlike T1, does not include JAS category 1 tracts because these tracts
are part of the second-phase ALUS population. The tracts in the second term are from JAS
categories 1 to 5. Category 7 tracts are excluded from the estimator because they have clear non-
farm status from the JAS (i.e., not eligible for ALUS). All tracts within the same ALUS segment
have the same expansion factor because the segment is the primary sampling unit for ALUS.
The two expansion factors, and are known from the JAS-ALUS two phase design.
Again, to verify the unbiasedness of this two-phase estimator, the estimator may be rewritten
in the following form
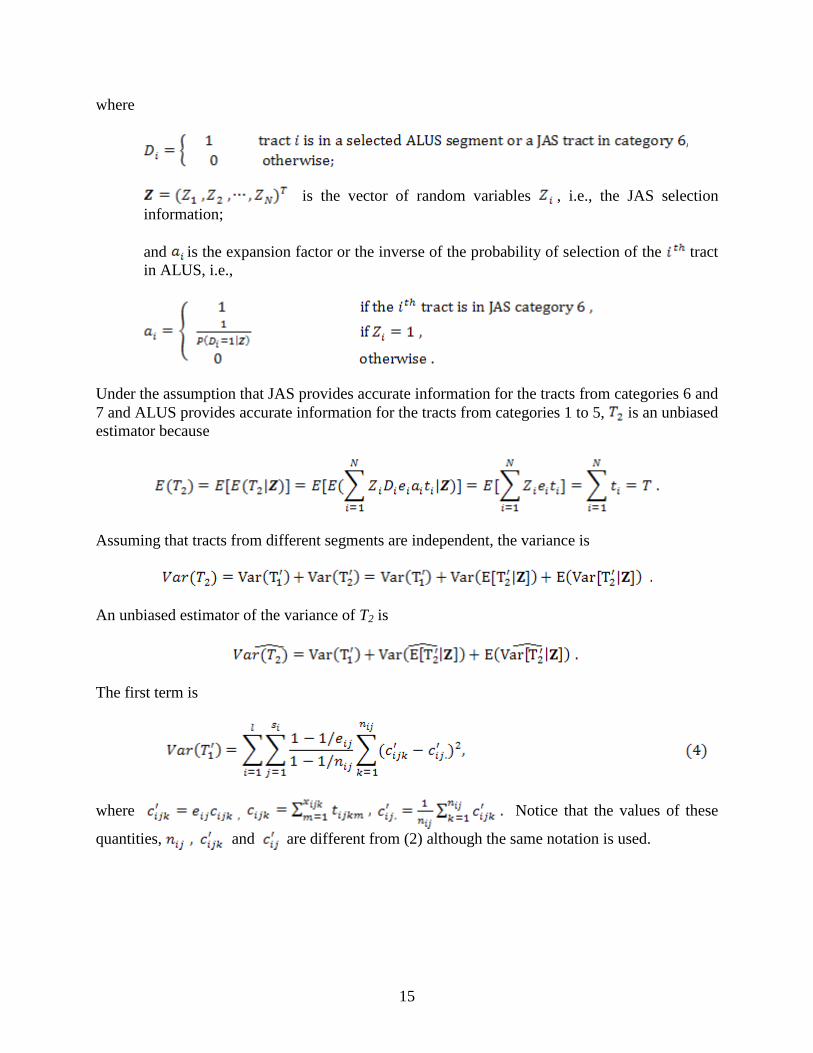
15
where
is the vector of random variables , i.e., the JAS selection
information;
and is the expansion factor or the inverse of the probability of selection of the tract
in ALUS, i.e.,
Under the assumption that JAS provides accurate information for the tracts from categories 6 and
7 and ALUS provides accurate information for the tracts from categories 1 to 5, is an unbiased
estimator because
Assuming that tracts from different segments are independent, the variance is
An unbiased estimator of the variance of T2 is
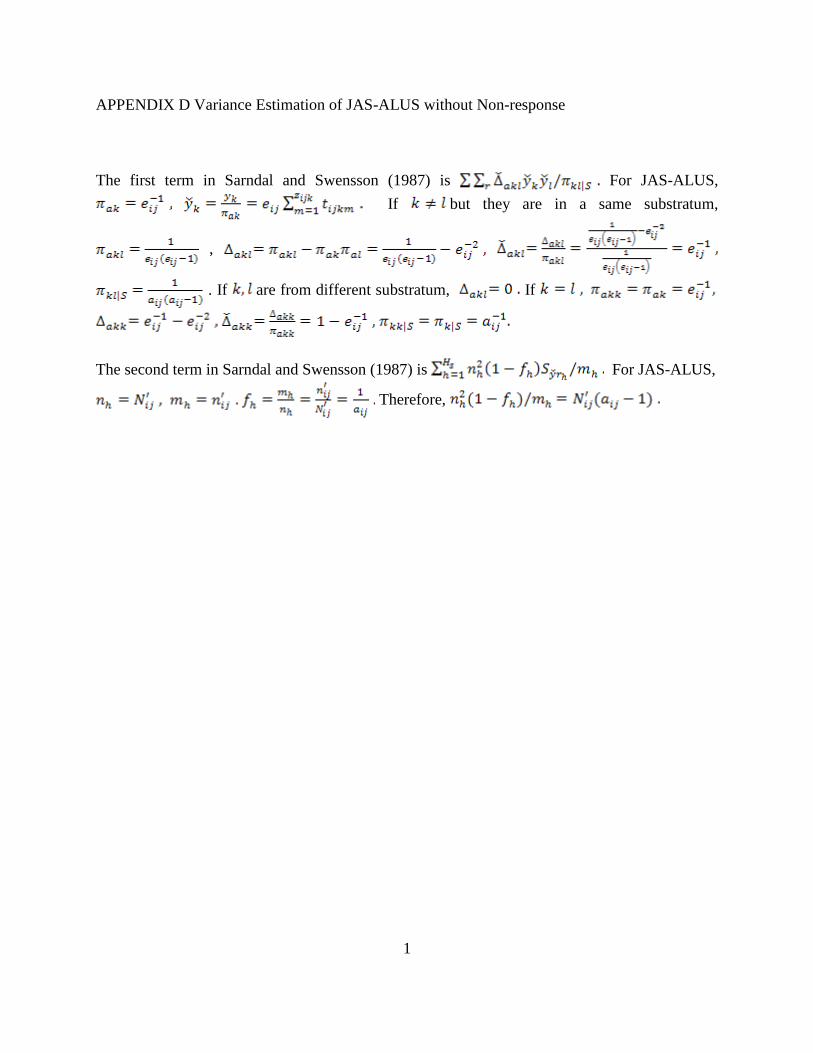
The first term is
where Notice that the values of these
quantities, and are different from (2) although the same notation is used.
16
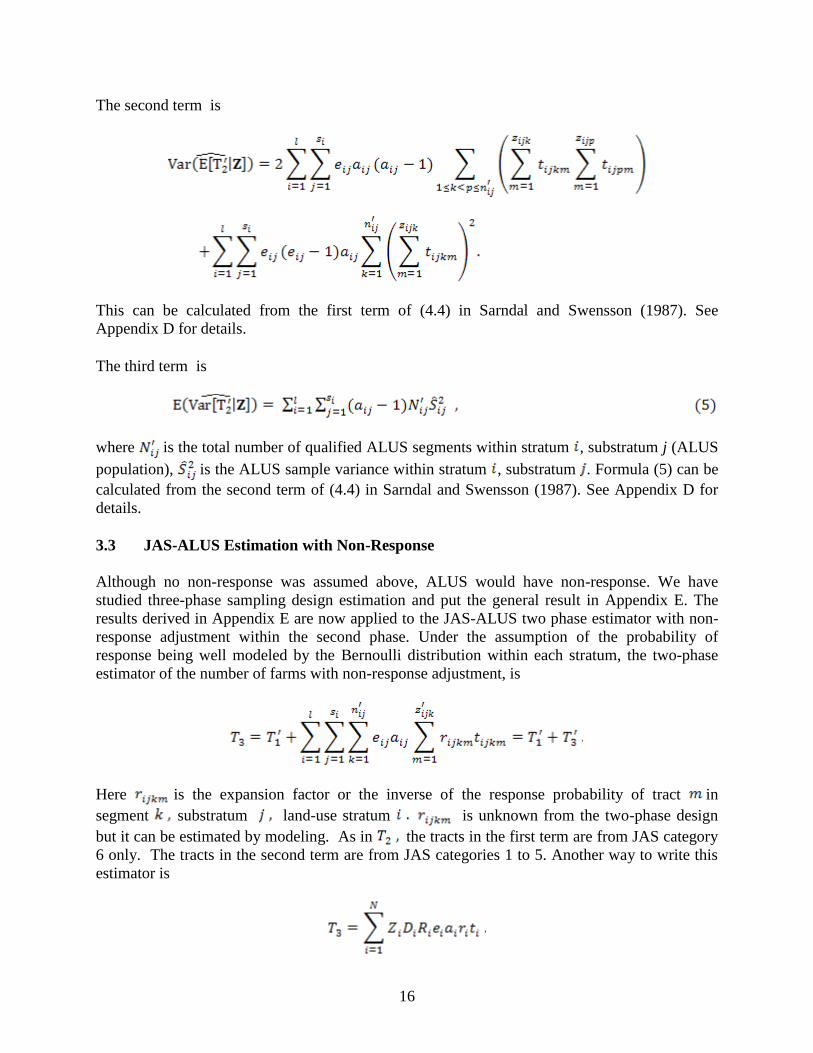
The second term is
This can be calculated from the first term of (4.4) in Sarndal and Swensson (1987). See
Appendix D for details.
The third term is
where is the total number of qualified ALUS segments within stratum , substratum j (ALUS
population), is the ALUS sample variance within stratum , substratum . Formula (5) can be
calculated from the second term of (4.4) in Sarndal and Swensson (1987). See Appendix D for
details.
3.3 JAS-ALUS Estimation with Non-Response
Although no non-response was assumed above, ALUS would have non-response. We have
studied three-phase sampling design estimation and put the general result in Appendix E. The
results derived in Appendix E are now applied to the JAS-ALUS two phase estimator with non-
response adjustment within the second phase. Under the assumption of the probability of
response being well modeled by the Bernoulli distribution within each stratum, the two-phase
estimator of the number of farms with non-response adjustment, is
Here is the expansion factor or the inverse of the response probability of tract in
segment substratum land-use stratum is unknown from the two-phase design
but it can be estimated by modeling. As in the tracts in the first term are from JAS category
6 only. The tracts in the second term are from JAS categories 1 to 5. Another way to write this
estimator is
17
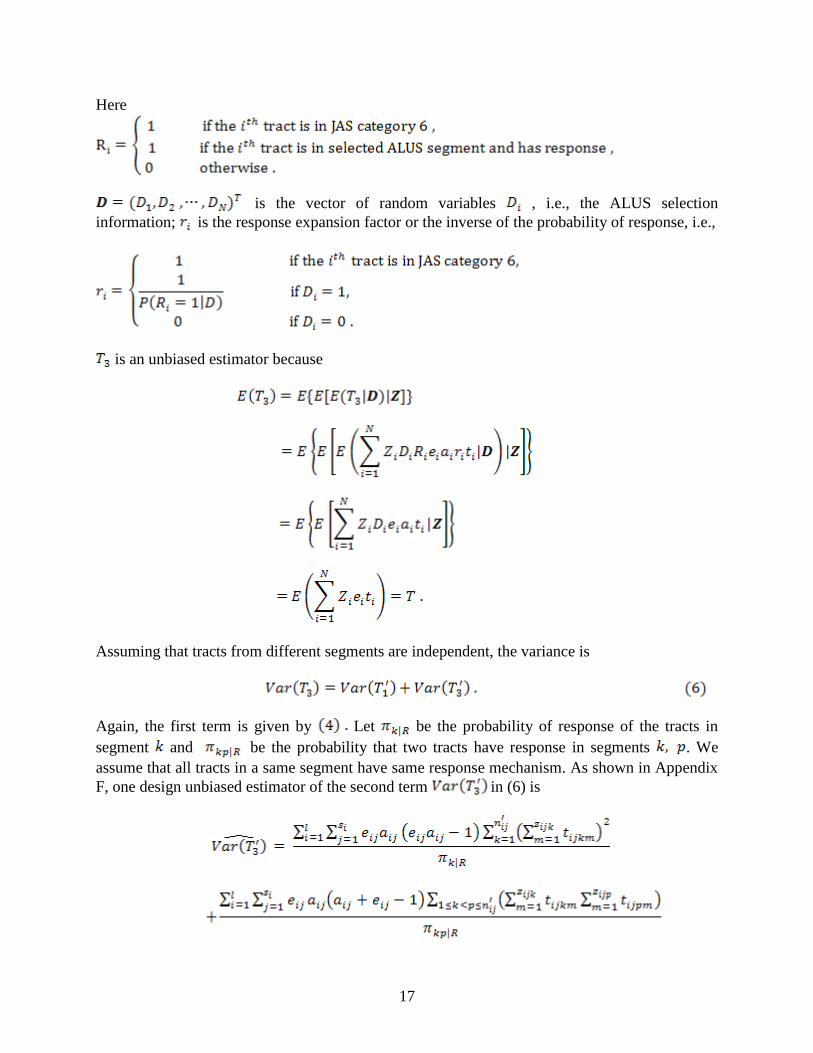
Here
is the vector of random variables , i.e., the ALUS selection
information; is the response expansion factor or the inverse of the probability of response, i.e.,
is an unbiased estimator because
Assuming that tracts from different segments are independent, the variance is
Again, the first term is given by Let be the probability of response of the tracts in
segment and be the probability that two tracts have response in segments . We
assume that all tracts in a same segment have same response mechanism. As shown in Appendix
F, one design unbiased estimator of the second term in (6) is
18
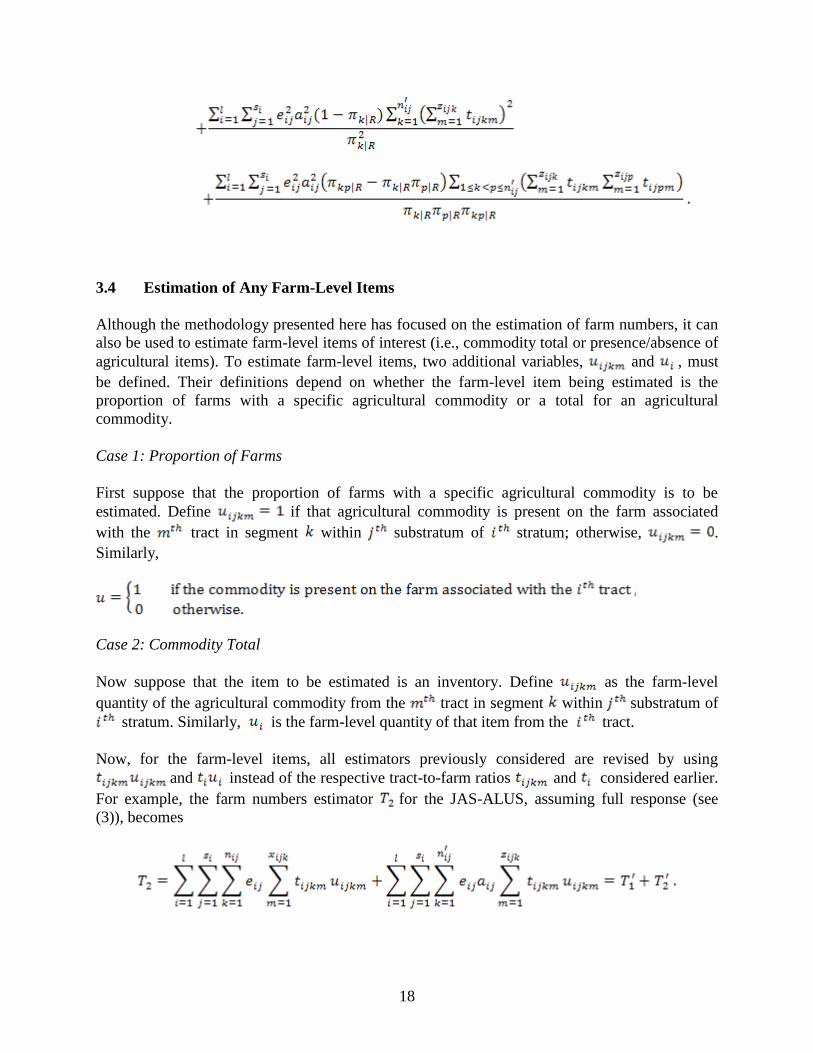
3.4 Estimation of Any Farm-Level Items
Although the methodology presented here has focused on the estimation of farm numbers, it can
also be used to estimate farm-level items of interest (i.e., commodity total or presence/absence of
agricultural items). To estimate farm-level items, two additional variables, and , must
be defined. Their definitions depend on whether the farm-level item being estimated is the
proportion of farms with a specific agricultural commodity or a total for an agricultural
commodity.
Case 1: Proportion of Farms
First suppose that the proportion of farms with a specific agricultural commodity is to be
estimated. Define if that agricultural commodity is present on the farm associated
with the tract in segment within substratum of stratum; otherwise, .
Similarly,
Case 2: Commodity Total
Now suppose that the item to be estimated is an inventory. Define as the farm-level
quantity of the agricultural commodity from the tract in segment within substratum of
stratum. Similarly, is the farm-level quantity of that item from the tract.
Now, for the farm-level items, all estimators previously considered are revised by using
and instead of the respective tract-to-farm ratios and considered earlier.
For example, the farm numbers estimator for the JAS-ALUS, assuming full response (see
(3)), becomes
19
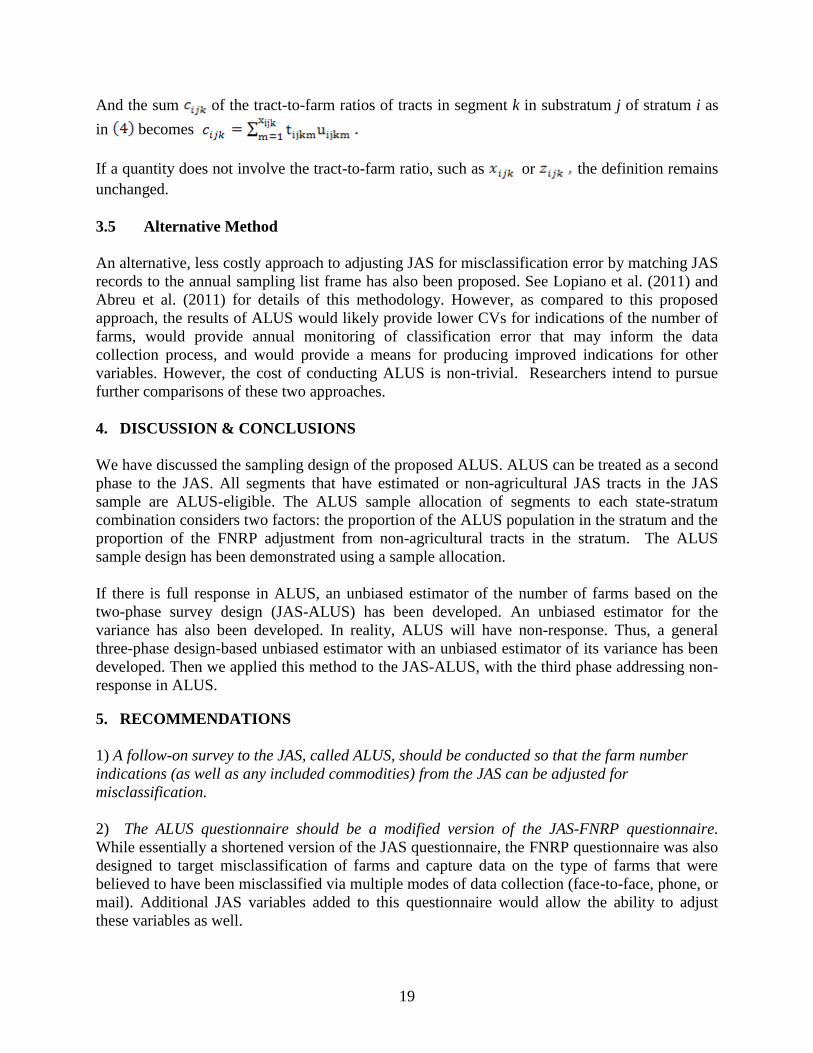
And the sum of the tract-to-farm ratios of tracts in segment k in substratum j of stratum i as
in becomes
If a quantity does not involve the tract-to-farm ratio, such as or the definition remains
unchanged.
3.5 Alternative Method
An alternative, less costly approach to adjusting JAS for misclassification error by matching JAS
records to the annual sampling list frame has also been proposed. See Lopiano et al. (2011) and
Abreu et al. (2011) for details of this methodology. However, as compared to this proposed
approach, the results of ALUS would likely provide lower CVs for indications of the number of
farms, would provide annual monitoring of classification error that may inform the data
collection process, and would provide a means for producing improved indications for other
variables. However, the cost of conducting ALUS is non-trivial. Researchers intend to pursue
further comparisons of these two approaches.
4. DISCUSSION & CONCLUSIONS
We have discussed the sampling design of the proposed ALUS. ALUS can be treated as a second
phase to the JAS. All segments that have estimated or non-agricultural JAS tracts in the JAS
sample are ALUS-eligible. The ALUS sample allocation of segments to each state-stratum
combination considers two factors: the proportion of the ALUS population in the stratum and the
proportion of the FNRP adjustment from non-agricultural tracts in the stratum. The ALUS
sample design has been demonstrated using a sample allocation.
If there is full response in ALUS, an unbiased estimator of the number of farms based on the
two-phase survey design (JAS-ALUS) has been developed. An unbiased estimator for the
variance has also been developed. In reality, ALUS will have non-response. Thus, a general
three-phase design-based unbiased estimator with an unbiased estimator of its variance has been
developed. Then we applied this method to the JAS-ALUS, with the third phase addressing non-
response in ALUS.
5. RECOMMENDATIONS
1) A follow-on survey to the JAS, called ALUS, should be conducted so that the farm number
indications (as well as any included commodities) from the JAS can be adjusted for
misclassification.
2) The ALUS questionnaire should be a modified version of the JAS-FNRP questionnaire.
While essentially a shortened version of the JAS questionnaire, the FNRP questionnaire was also
designed to target misclassification of farms and capture data on the type of farms that were
believed to have been misclassified via multiple modes of data collection (face-to-face, phone, or
mail). Additional JAS variables added to this questionnaire would allow the ability to adjust
these variables as well.
20
3). The methodology for a two-phase study with nonresponse considered to be a third phase, as
developed in this report, should be used for the analysis of the JAS-ALUS.
Note: The recommendations above were discussed at the January 2011 Senior Executive Team
meeting where the decision was made to not conduct the ALUS in 2011 due to budget
constraints.
6. REFERENCE
Abreu, Denise A., Andrea C. Lamas, Hailin Sang, Kenneth K. Lopiano, Pam Arroway, Linda J.
Young (2011). On the Feasibility of Using NASS’s Sampling List Frame to Evaluate
Misclassification Errors of the June Area Survey. Research and Development Division. RDD
Research Report # RDD-11-01.
Abreu, Denise A., J. S. McCarthy, L. A. Colburn (2010). Impact of the Screening Procedures of
the June Area Survey on the Number of Farms Estimates. Research and Development Division.
RDD Research Report # RDD-10-03.
Kott, P. S. (1990). Mathematical Formulae for the 1989 Survey Processing System (SPS)
Summary. NASS Staff Report, SRB-90-08, National Agricultural Statistics Service, USDA.
Lopiano, Kenneth K., Andrea C. Lamas, Denise A. Abreu, Hailin Sang, Pam Arroway, Young J.
Linda (2011). Proposal for Using the List Frame to Adjust for Misclassification in the June Area
Survey. Research and Development Division. RDD Research Report # RDD-11-YY.
Sarndal, C-E. and B. Swensson (1987). A General View of Estimation for Two Phases of
Selection with Applications to Two-Phase Sampling and Nonresponse. International Statistical
Review. v 55(3):279-294
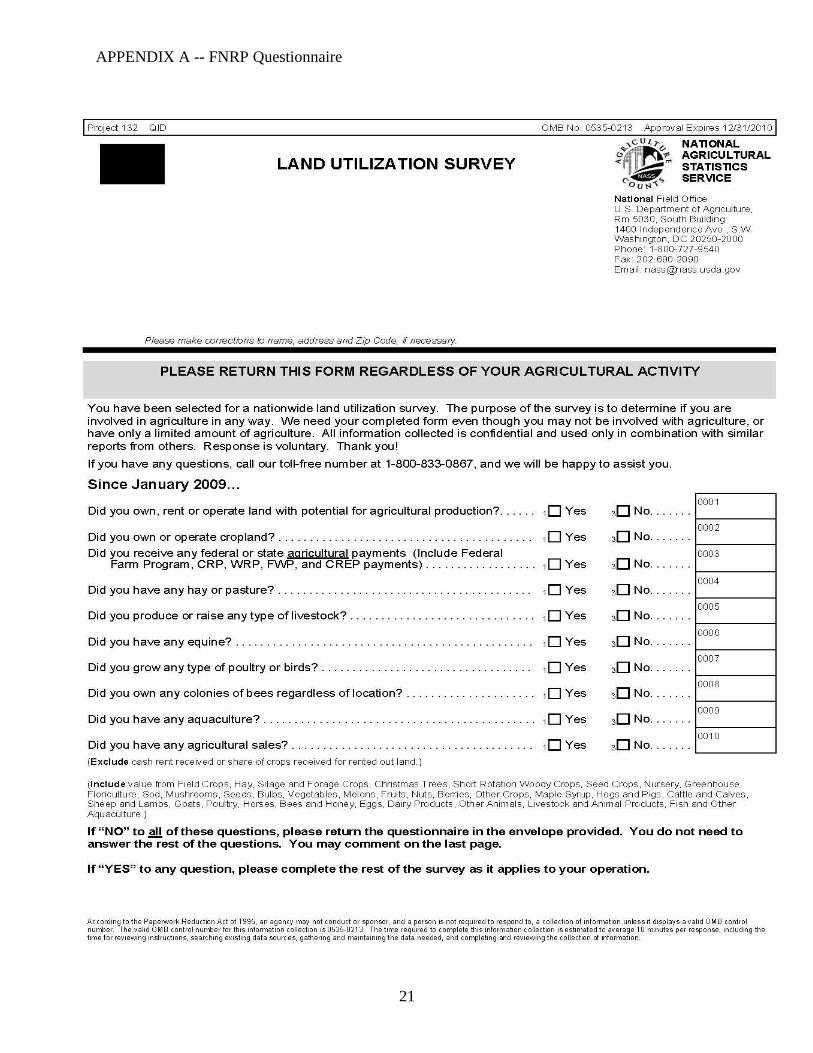
APPENDIX A -- FNRP Questionnaire
21
APPENDIX A -- FNRP Questionnaire
22
APPENDIX A -- FNRP Questionnaire
23
APPENDIX A -- FNRP Questionnaire
24

APPENDIX B
25
Example allocations by state and stratum using 2010 JAS data
State
Stratum
Approximate Total Sample Size (segments)
5000 4500 4000 3500 3000 2500 2000 1000 500
AL 145 132 120 106 89 76 63 29 15
13 24 20 17 14 12 10 9 4 2
20 61 52 43 37 31 27 22 10 5
40 60 60 60 55 46 39 32 15 8
AZ 48 46 45 42 35 28 22 12 9
13 10 8 7 6 5 4 4 2 1
14 4 4 4 4 3 2 1 1 1
18 4 4 4 4 3 2 2 1 1
28 4 4 4 4 3 2 2 1 1
38 4 4 4 4 3 2 1 1 1
42 11 11 11 10 9 8 6 3 2
43 11 11 11 10 9 8 6 3 2
AR 162 150 140 124 105 89 73 34 18
11 52 44 37 32 27 23 19 9 5
21 26 22 19 16 14 12 10 5 3
42 84 84 84 76 64 54 44 20 10
CA 65 59 53 49 41 35 27 14 9
11 4 4 4 4 3 2 1 1 1
21 40 34 28 25 21 18 14 7 4
41 19 19 19 18 15 13 10 5 3
45 2 2 2 2 2 2 2 1 1
CO 117 101 86 76 64 52 43 22 14
13 4 4 4 4 3 2 2 1 1
15 28 24 20 17 15 12 10 5 3
20 4 4 4 4 3 2 2 1 1
25 47 39 33 28 24 20 17 8 4
APPENDIX B
26
State
Stratum
Approximate Total Sample Size (segments)
5000 4500 4000 3500 3000 2500 2000 1000 500
28 17 15 12 11 9 8 6 3 2
34 7 6 5 4 4 3 3 2 1
35 6 5 4 4 3 3 2 1 1
38 4 4 4 4 3 2 1 1 1
49 0 0 0 0 0 0 0 0 0
CT 1 1 1 1 1 1 1 1 1
40 1 1 1 1 1 1 1 1 1
DE 85 72 60 51 43 37 31 14 7
13 24 20 17 14 12 10 9 4 2
20 61 52 43 37 31 27 22 10 5
FL 66 62 59 54 45 37 30 15 9
13 24 20 17 14 12 10 9 4 2
21 4 4 4 4 3 2 2 1 1
31 4 4 4 4 3 2 1 1 1
40 15 15 15 14 12 10 8 4 2
42 19 19 19 18 15 13 10 5 3
GA 169 156 144 127 107 91 75 34 17
13 24 20 17 14 12 10 9 4 2
20 61 52 43 37 31 27 22 10 5
40 84 84 84 76 64 54 44 20 10
ID 44 38 33 29 24 22 18 9 5
10 10 9 7 6 5 5 4 2 1
15 18 15 13 11 9 8 7 3 2
22 11 9 8 7 6 5 4 2 1
43 5 5 5 5 4 4 3 2 1
IL 157 135 116 102 86 72 58 28 15
11 80 67 56 48 41 35 28 13 7
12 23 19 16 14 12 10 8 4 2
APPENDIX B
27
State
Stratum
Approximate Total Sample Size (segments)
5000 4500 4000 3500 3000 2500 2000 1000 500
20 35 30 25 22 18 15 13 6 3
31 4 4 4 4 3 2 1 1 1
40 15 15 15 14 12 10 8 4 2
IN 111 97 83 75 63 53 42 21 12
11 40 34 28 25 21 18 14 7 4
12 13 11 9 8 7 6 5 2 1
20 39 33 27 24 20 17 14 7 4
31 4 4 4 4 3 2 1 1 1
40 15 15 15 14 12 10 8 4 2
IA 64 54 45 39 33 28 23 11 6
13 24 20 17 14 12 10 9 4 2
20 40 34 28 25 21 18 14 7 4
KS 157 135 114 99 85 71 59 28 15
11 58 49 41 35 30 25 21 10 5
12 28 24 20 17 15 12 10 5 3
20 59 50 41 36 30 26 21 10 5
40 12 12 12 11 10 8 7 3 2
KY 107 95 85 76 63 53 43 21 11
13 24 20 17 14 12 10 9 4 2
20 49 41 34 30 25 21 17 8 4
31 4 4 4 4 3 2 1 1 1
40 30 30 30 28 23 20 16 8 4
LA 74 67 61 54 45 39 32 16 8
13 24 20 17 14 12 10 9 4 2
20 20 17 14 12 10 9 7 4 2
40 30 30 30 28 23 20 16 8 4
ME 40 40 40 37 31 26 21 10 5
40 40 40 40 37 31 26 21 10 5
APPENDIX B
28
State
Stratum
Approximate Total Sample Size (segments)
5000 4500 4000 3500 3000 2500 2000 1000 500
MD 36 33 29 27 22 19 16 8 5
13 5 5 4 4 3 3 2 1 1
20 21 18 15 13 11 9 8 4 2
40 10 10 10 10 8 7 6 3 2
MA 28 28 28 26 23 19 15 7 4
31 3 3 3 3 3 2 1 1 1
40 25 25 25 23 20 17 14 6 3
MI 80 70 62 56 47 39 32 16 9
11 20 17 14 13 11 9 7 4 2
20 40 33 28 24 20 17 14 7 4
40 20 20 20 19 16 13 11 5 3
MN 163 144 127 112 94 79 65 30 15
11 63 53 44 38 32 27 22 10 5
12 25 21 18 15 13 11 9 4 2
20 35 30 25 22 18 15 13 6 3
40 40 40 40 37 31 26 21 10 5
MS 172 157 144 128 109 91 76 35 19
11 27 23 19 16 14 12 10 5 3
12 10 8 7 6 5 4 4 2 1
20 56 47 39 34 29 24 20 9 5
40 79 79 79 72 61 51 42 19 10
MO 175 154 135 119 100 84 69 32 16
11 63 53 44 38 32 27 22 10 5
12 23 19 16 14 12 10 8 4 2
20 49 42 35 30 25 21 18 8 4
40 40 40 40 37 31 26 21 10 5
MT 100 89 78 70 59 51 41 21 11
13 33 28 23 20 17 14 12 6 3
APPENDIX B
29
State
Stratum
Approximate Total Sample Size (segments)
5000 4500 4000 3500 3000 2500 2000 1000 500
20 40 34 28 25 21 18 14 7 4
43 5 5 5 5 4 4 3 2 1
44 22 22 22 20 17 15 12 6 3
NE 174 152 131 116 98 83 68 32 17
11 82 69 58 50 42 36 29 14 7
12 24 21 17 15 13 11 9 4 2
20 39 33 27 24 20 17 14 7 4
40 29 29 29 27 23 19 16 7 4
NV 8 7 6 6 5 5 3 2 2
28 2 2 2 2 2 2 1 1 1
38 6 5 4 4 3 3 2 1 1
NH 12 12 12 12 10 8 7 4 3
14 4 4 4 4 3 2 2 1 1
31 2 2 2 2 2 2 1 1 1
40 6 6 6 6 5 4 4 2 1
NJ 36 32 28 25 21 16 12 7 5
13 4 4 4 4 3 2 1 1 1
20 28 24 20 17 15 12 10 5 3
31 4 4 4 4 3 2 1 1 1
NM 31 30 29 28 22 19 15 10 7
13 8 7 6 5 4 4 3 2 1
18 4 4 4 4 3 2 2 1 1
19 1 1 1 1 1 1 1 1 1
28 4 4 4 4 3 2 2 1 1
38 4 4 4 4 3 2 1 1 1
40 5 5 5 5 4 4 3 2 1
48 5 5 5 5 4 4 3 2 1
NY 44 37 31 27 23 19 16 8 4
APPENDIX B
30
State
Stratum
Approximate Total Sample Size (segments)
5000 4500 4000 3500 3000 2500 2000 1000 500
13 9 7 6 5 5 4 3 2 1
20 35 30 25 22 18 15 13 6 3
NC 232 208 188 166 139 117 96 45 23
13 10 8 7 6 5 4 4 2 1
20 138 116 97 83 70 59 49 22 11
31 4 4 4 4 3 2 1 1 1
40 80 80 80 73 61 52 42 20 10
ND 162 138 113 99 83 71 57 27 14
11 74 63 52 45 38 32 26 12 6
12 29 25 20 18 15 13 10 5 3
20 59 50 41 36 30 26 21 10 5
OH 116 101 89 79 68 57 46 23 13
11 35 29 24 21 18 15 12 6 3
12 12 10 8 7 6 5 4 2 1
20 30 25 21 18 15 13 11 5 3
31 9 7 6 5 5 4 3 2 1
32 2 2 2 2 2 2 1 1 1
40 28 28 28 26 22 18 15 7 4
OK 131 115 101 88 75 63 53 25 13
11 40 34 28 24 20 17 14 7 4
12 13 11 9 8 7 6 5 2 1
20 47 39 33 28 24 20 17 8 4
40 31 31 31 28 24 20 17 8 4
OR 70 63 57 51 43 37 30 14 8
13 11 9 8 7 6 5 4 2 1
20 32 27 22 19 16 14 11 5 3
43 27 27 27 25 21 18 15 7 4
PA 120 108 97 87 73 61 49 24 13
APPENDIX B
31
State
Stratum
Approximate Total Sample Size (segments)
5000 4500 4000 3500 3000 2500 2000 1000 500
13 7 6 5 4 4 3 3 2 1
20 69 58 48 42 35 30 24 11 6
31 4 4 4 4 3 2 1 1 1
40 40 40 40 37 31 26 21 10 5
RI 12 12 12 12 10 8 6 4 3
14 4 4 4 4 3 2 1 1 1
31 2 2 2 2 2 2 1 1 1
40 6 6 6 6 5 4 4 2 1
SC 104 95 87 79 66 56 45 21 11
13 6 5 4 4 3 3 2 1 1
20 49 41 34 30 25 21 17 8 4
40 49 49 49 45 38 32 26 12 6
SD 135 119 105 92 79 67 55 25 13
11 52 44 37 32 27 23 19 9 5
12 13 11 9 8 7 6 5 2 1
20 37 31 26 22 19 16 13 6 3
40 33 33 33 30 26 22 18 8 4
TN 211 190 172 153 129 109 89 42 22
13 30 25 21 18 16 13 11 5 3
20 95 80 67 58 49 41 34 16 8
31 6 5 4 4 3 3 2 1 1
40 80 80 80 73 61 52 42 20 10
TX 363 324 291 259 219 185 149 74 44
10 27 22 19 16 14 12 10 5 3
13 13 11 9 8 7 6 5 2 1
14 4 4 4 4 3 2 1 1 1
15 28 24 20 17 15 12 10 5 3
16 6 5 4 4 3 3 2 1 1
APPENDIX B
32
State
Stratum
Approximate Total Sample Size (segments)
5000 4500 4000 3500 3000 2500 2000 1000 500
18 10 8 7 6 5 4 4 2 1
20 40 33 28 24 20 17 14 7 4
21 2 2 2 2 2 2 1 1 1
24 41 35 29 25 21 18 15 7 4
25 47 39 33 28 24 20 17 8 4
26 4 4 4 4 3 2 1 1 1
27 7 6 5 5 4 3 3 2 1
28 17 15 12 11 9 8 6 3 2
31 6 5 4 4 3 3 2 1 1
32 4 4 4 4 3 2 1 1 1
40 52 52 52 47 40 34 28 13 7
41 44 44 44 40 34 29 23 11 6
42 11 11 11 10 9 8 6 3 2
UT 29 26 24 22 19 17 13 8 6
13 8 7 6 5 4 4 3 2 1
20 11 9 8 7 6 5 4 2 1
31 4 4 4 4 3 2 1 1 1
32 2 2 2 2 2 2 1 1 1
46 2 2 2 2 2 2 2 1 1
48 2 2 2 2 2 2 2 1 1
VT 20 20 20 19 16 13 11 5 3
40 20 20 20 19 16 13 11 5 3
VA 131 119 107 97 81 69 56 26 14
13 5 5 4 4 3 3 2 1 1
20 70 59 49 43 36 30 25 12 6
31 6 5 4 4 3 3 2 1 1
40 50 50 50 46 39 33 27 12 6
WA 137 126 116 103 88 74 61 30 17
APPENDIX B
33
State
Stratum
Approximate Total Sample Size (segments)
5000 4500 4000 3500 3000 2500 2000 1000 500
10 32 27 23 20 17 14 12 6 3
11 15 13 11 9 8 7 6 3 2
20 28 24 20 17 15 12 10 5 3
41 19 19 19 18 15 13 10 5 3
43 43 43 43 39 33 28 23 11 6
WV 71 70 68 63 52 44 35 18 11
13 4 4 4 4 3 2 2 1 1
20 10 9 7 6 5 5 4 2 1
31 4 4 4 4 3 2 1 1 1
32 2 2 2 2 2 2 1 1 1
40 51 51 51 47 39 33 27 13 7
WI 115 102 90 79 67 56 45 22 12
11 23 19 16 14 12 10 8 4 2
12 8 7 6 5 4 4 3 2 1
20 56 48 40 34 29 24 20 9 5
31 4 4 4 4 3 2 1 1 1
40 24 24 24 22 19 16 13 6 3
WY 103 103 103 95 80 67 53 27 17
11 4 4 4 4 3 2 1 1 1
12 4 4 4 4 3 2 1 1 1
20 4 4 4 4 3 2 2 1 1
31 2 2 2 2 2 2 1 1 1
32 2 2 2 2 2 2 1 1 1
42 84 84 84 76 64 54 44 20 10
44 1 1 1 1 1 1 1 1 1
45 2 2 2 2 2 2 2 1 1
Total 4933 4424 3965 3536 2980 2513 2045 991 550
Actual Total Sample Size (segments)
APPENDIX C
34
Anticipated cost by state for each example allocation
Approximate Total Sample Size (segments)
State 5000 4500 4000 3500 3000 2500 2000 1000 500
AL $23,629 $21,511 $19,555 $17,274 $14,503 $12,385 $10,266 $4,726 $2,444
AZ $3,548 $3,400 $3,326 $3,105 $2,587 $2,070 $1,626 $887 $665
AR $32,931 $30,492 $28,459 $25,207 $21,344 $18,092 $14,839 $6,912 $3,659
CA $14,524 $13,183 $11,842 $10,949 $9,161 $7,820 $6,033 $3,128 $2,011
CO $13,694 $11,821 $10,065 $8,895 $7,491 $6,086 $5,033 $2,575 $1,639
CT $244 $244 $244 $244 $244 $244 $244 $244 $244
DE $20,706 $17,539 $14,616 $12,424 $10,475 $9,013 $7,552 $3,410 $1,705
FL $18,887 $17,742 $16,883 $15,453 $12,877 $10,588 $8,585 $4,292 $2,575
GA $31,137 $28,741 $26,531 $23,398 $19,714 $16,766 $13,818 $6,264 $3,132
ID $3,080 $2,660 $2,310 $2,030 $1,680 $1,540 $1,260 $630 $350
IL $37,014 $31,828 $27,348 $24,048 $20,275 $16,975 $13,674 $6,601 $3,536
IN $18,897 $16,513 $14,130 $12,768 $10,725 $9,023 $7,150 $3,575 $2,043
IA $12,580 $10,614 $8,845 $7,666 $6,486 $5,504 $4,521 $2,162 $1,179
KS $20,925 $17,993 $15,194 $13,195 $11,329 $9,463 $7,864 $3,732 $1,999
KY $19,474 $17,290 $15,470 $13,832 $11,466 $9,646 $7,826 $3,822 $2,002
LA $9,034 $8,179 $7,447 $6,592 $5,494 $4,761 $3,907 $1,953 $977
ME $9,744 $9,744 $9,744 $9,013 $7,552 $6,334 $5,116 $2,436 $1,218
MD $8,770 $8,039 $7,064 $6,577 $5,359 $4,628 $3,898 $1,949 $1,218
MA $6,821 $6,821 $6,821 $6,334 $5,603 $4,628 $3,654 $1,705 $974
MI $16,397 $14,347 $12,708 $11,478 $9,633 $7,993 $6,559 $3,279 $1,845
MN $31,218 $27,579 $24,323 $21,450 $18,003 $15,130 $12,449 $5,746 $2,873
MS $33,423 $30,508 $27,982 $24,873 $21,181 $17,683 $14,768 $6,801 $3,692
MO $34,888 $30,701 $26,914 $23,724 $19,936 $16,746 $13,756 $6,380 $3,190
MT $11,760 $10,466 $9,173 $8,232 $6,938 $5,998 $4,822 $2,470 $1,294
NE $27,088 $23,663 $20,394 $18,059 $15,257 $12,921 $10,586 $4,982 $2,647
NV $502 $439 $376 $376 $314 $314 $188 $125 $125
NH $2,675 $2,675 $2,675 $2,675 $2,229 $1,783 $1,560 $892 $669
APPENDIX C
35
Approximate Total Sample Size (segments)
State 5000 4500 4000 3500 3000 2500 2000 1000 500
NJ $7,741 $6,881 $6,021 $5,376 $4,516 $3,441 $2,580 $1,505 $1,075
NM $4,184 $4,049 $3,914 $3,779 $2,969 $2,564 $2,024 $1,350 $945
NY $7,589 $6,382 $5,347 $4,657 $3,967 $3,277 $2,760 $1,380 $690
NC $45,992 $41,234 $37,269 $32,908 $27,555 $23,194 $19,031 $8,921 $4,560
ND $22,861 $19,475 $15,947 $13,971 $11,713 $10,020 $8,044 $3,810 $1,976
OH $16,045 $13,970 $12,310 $10,927 $9,406 $7,884 $6,363 $3,181 $1,798
OK $29,197 $25,631 $22,511 $19,613 $16,716 $14,041 $11,813 $5,572 $2,897
OR $10,466 $9,420 $8,523 $7,626 $6,429 $5,532 $4,486 $2,093 $1,196
PA $26,208 $23,587 $21,185 $19,001 $15,943 $13,322 $10,702 $5,242 $2,839
RI $2,923 $2,923 $2,923 $2,923 $2,436 $1,949 $1,462 $974 $731
SC $13,395 $12,236 $11,206 $10,175 $8,501 $7,213 $5,796 $2,705 $1,417
SD $15,498 $13,661 $12,054 $10,562 $9,069 $7,692 $6,314 $2,870 $1,492
TN $33,557 $30,218 $27,355 $24,333 $20,516 $17,335 $14,155 $6,680 $3,499
TX $85,174 $76,023 $68,280 $60,772 $51,386 $43,408 $34,961 $17,363 $10,324
UT $3,995 $3,582 $3,306 $3,031 $2,617 $2,342 $1,791 $1,102 $827
VT $4,872 $4,872 $4,872 $4,628 $3,898 $3,167 $2,680 $1,218 $731
VA $19,294 $17,526 $15,759 $14,286 $11,930 $10,162 $8,248 $3,829 $2,062
WA $19,180 $17,640 $16,240 $14,420 $12,320 $10,360 $8,540 $4,200 $2,380
WV $15,984 $15,758 $15,308 $14,183 $11,706 $9,905 $7,879 $4,052 $2,476
WI $26,404 $23,419 $20,664 $18,138 $15,383 $12,858 $10,332 $5,051 $2,755
WY $23,187 $23,187 $23,187 $21,386 $18,010 $15,083 $11,931 $6,078 $3,827
Total $897,335 $806,408 $724,620 $646,563 $544,842 $458,884 $373,442 $180,855 $100,402
APPENDIX D Variance Estimation of JAS-ALUS without Non-response
1
The first term in Sarndal and Swensson (1987) is For JAS-ALUS,
If but they are in a same substratum,
,
. If are from different substratum, If
The second term in Sarndal and Swensson (1987) is For JAS-ALUS,
Therefore,
APPENDIX E Variance of a General Three-Phase Sampling Design Estimation
2
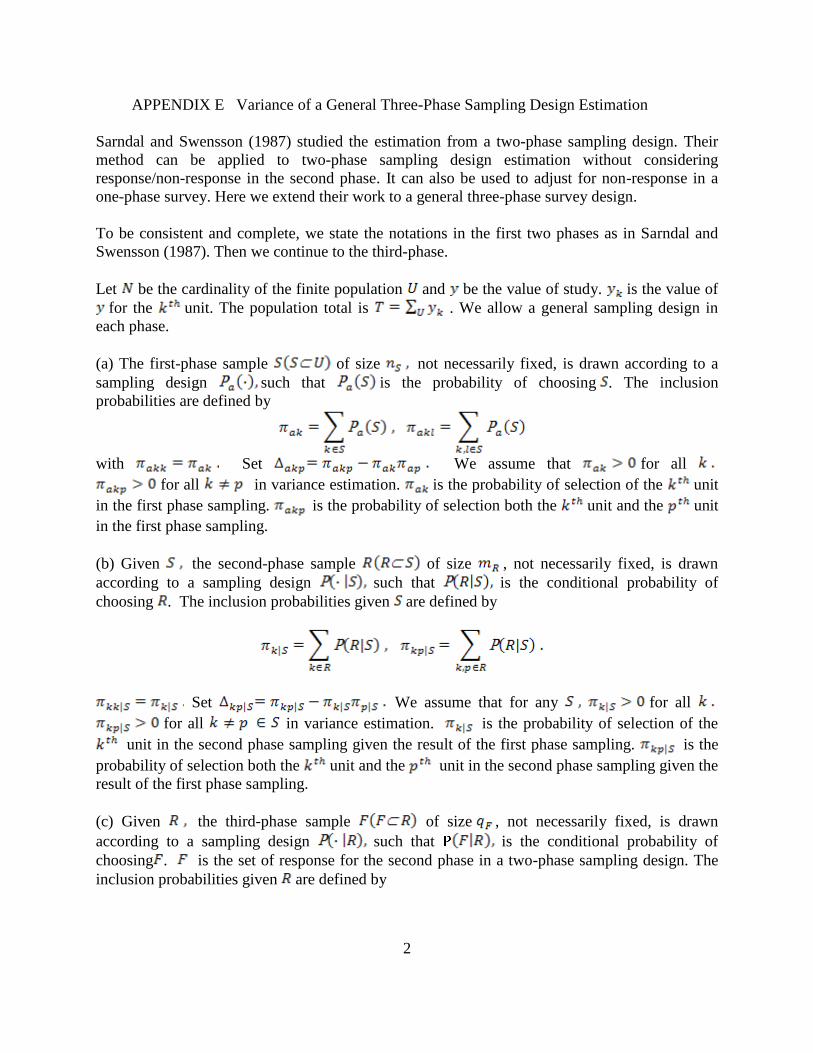
Sarndal and Swensson (1987) studied the estimation from a two-phase sampling design. Their
method can be applied to two-phase sampling design estimation without considering
response/non-response in the second phase. It can also be used to adjust for non-response in a
one-phase survey. Here we extend their work to a general three-phase survey design.
To be consistent and complete, we state the notations in the first two phases as in Sarndal and
Swensson (1987). Then we continue to the third-phase.
Let be the cardinality of the finite population and be the value of study. is the value of
for the unit. The population total is . We allow a general sampling design in
each phase.
(a) The first-phase sample of size not necessarily fixed, is drawn according to a
sampling design such that is the probability of choosing . The inclusion
probabilities are defined by
with Set We assume that for all
for all in variance estimation. is the probability of selection of the unit
in the first phase sampling. is the probability of selection both the unit and the unit
in the first phase sampling.
(b) Given the second-phase sample of size , not necessarily fixed, is drawn
according to a sampling design such that is the conditional probability of
choosing . The inclusion probabilities given are defined by
Set We assume that for any for all
for all in variance estimation. is the probability of selection of the
unit in the second phase sampling given the result of the first phase sampling. is the
probability of selection both the unit and the unit in the second phase sampling given the
result of the first phase sampling.
(c) Given the third-phase sample of size , not necessarily fixed, is drawn
according to a sampling design such that is the conditional probability of
choosing . is the set of response for the second phase in a two-phase sampling design. The
inclusion probabilities given are defined by
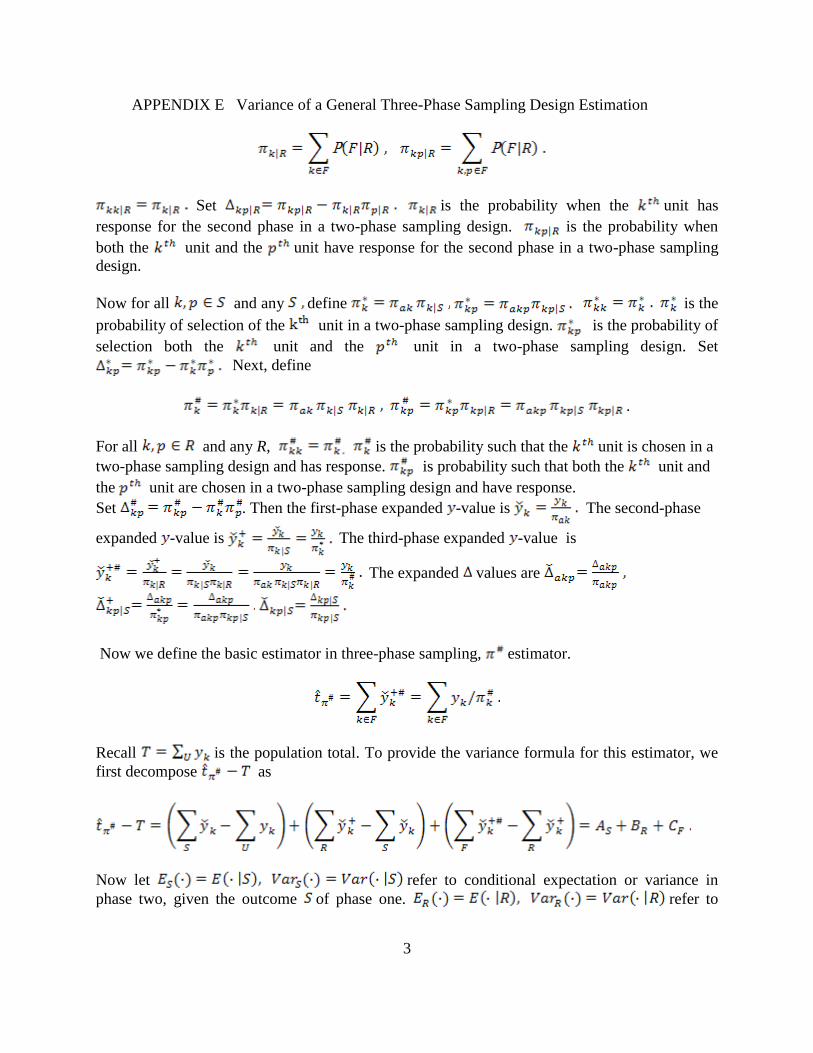
APPENDIX E Variance of a General Three-Phase Sampling Design Estimation
3
Set is the probability when the unit has
response for the second phase in a two-phase sampling design. is the probability when
both the unit and the unit have response for the second phase in a two-phase sampling
design.
Now for all and any define is the
probability of selection of the unit in a two-phase sampling design. is the probability of
selection both the unit and the unit in a two-phase sampling design. Set
Next, define
.
For all and any R, is the probability such that the unit is chosen in a
two-phase sampling design and has response. is probability such that both the unit and
the unit are chosen in a two-phase sampling design and have response.
Set . Then the first-phase expanded -value is The second-phase
expanded -value is The third-phase expanded -value is
The expanded values are
Now we define the basic estimator in three-phase sampling, estimator.
Recall is the population total. To provide the variance formula for this estimator, we
first decompose as
Now let refer to conditional expectation or variance in
phase two, given the outcome of phase one. refer to
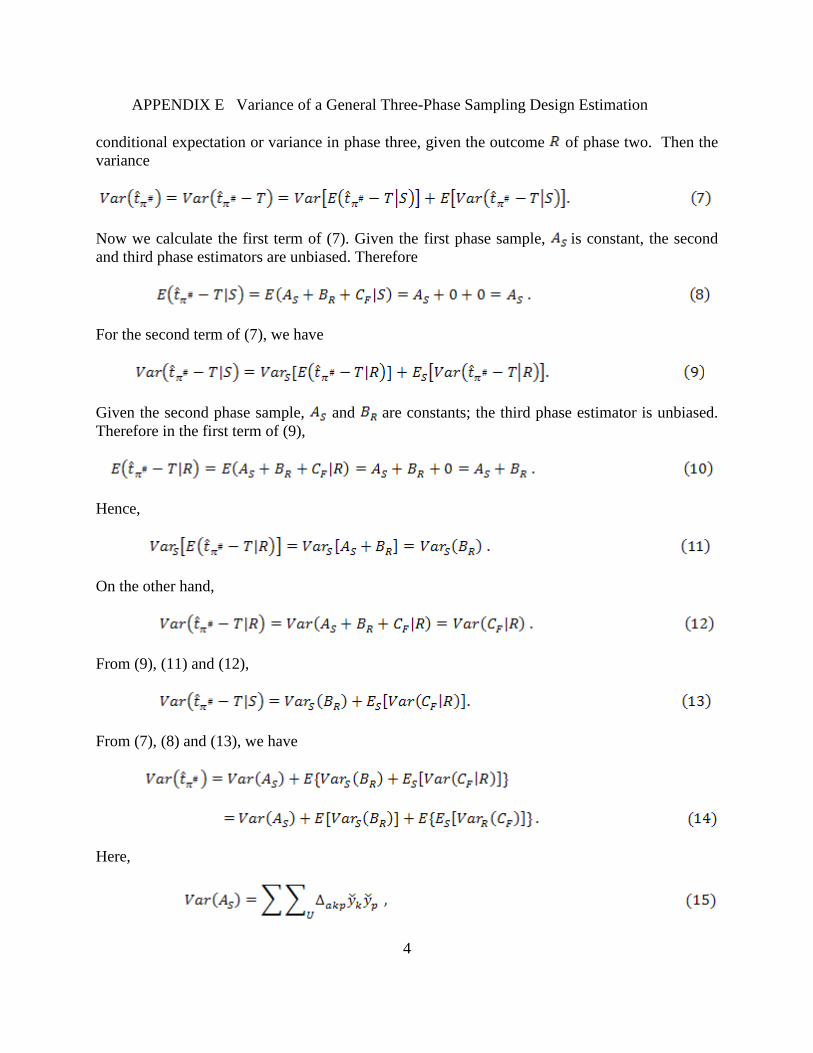
APPENDIX E Variance of a General Three-Phase Sampling Design Estimation
4
conditional expectation or variance in phase three, given the outcome of phase two. Then the
variance
Now we calculate the first term of (7). Given the first phase sample, is constant, the second
and third phase estimators are unbiased. Therefore
For the second term of (7), we have
Given the second phase sample, and are constants; the third phase estimator is unbiased.
Therefore in the first term of (9),
Hence,
On the other hand,
From (9), (11) and (12),
From (7), (8) and (13), we have
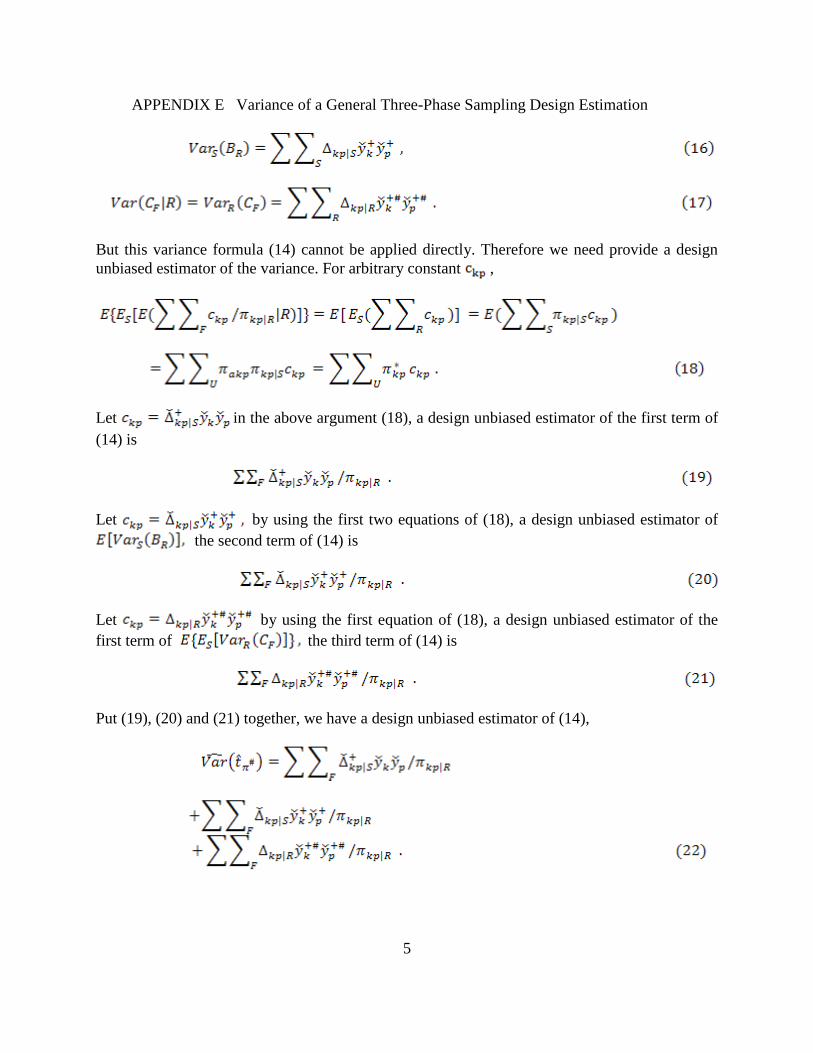
Here,
APPENDIX E Variance of a General Three-Phase Sampling Design Estimation
5
But this variance formula (14) cannot be applied directly. Therefore we need provide a design
unbiased estimator of the variance. For arbitrary constant ,
Let in the above argument (18), a design unbiased estimator of the first term of
(14) is
Let by using the first two equations of (18), a design unbiased estimator of
the second term of (14) is
Let by using the first equation of (18), a design unbiased estimator of the
first term of the third term of (14) is
Put (19), (20) and (21) together, we have a design unbiased estimator of (14),
APPENDIX F Variance Estimation of JAS-ALUS with Non-response
1
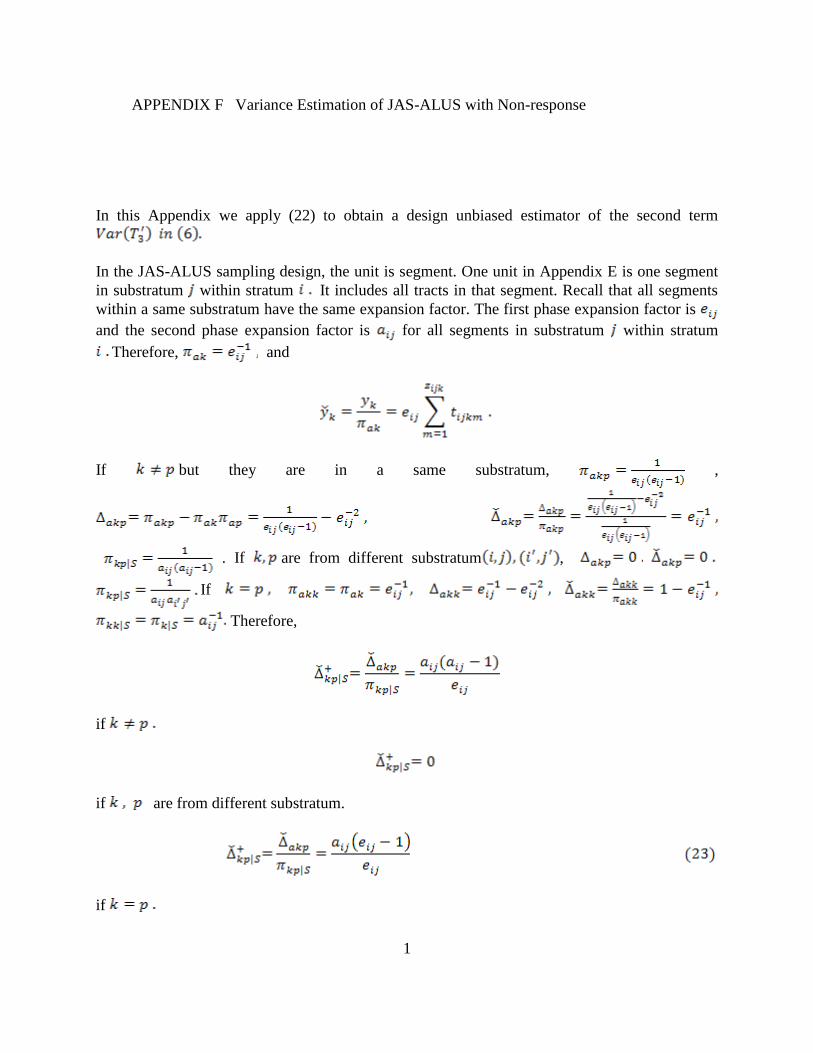
In this Appendix we apply (22) to obtain a design unbiased estimator of the second term
In the JAS-ALUS sampling design, the unit is segment. One unit in Appendix E is one segment
in substratum within stratum It includes all tracts in that segment. Recall that all segments
within a same substratum have the same expansion factor. The first phase expansion factor is
and the second phase expansion factor is for all segments in substratum within stratum
Therefore, and
If but they are in a same substratum, ,
. If are from different substratum ,
If
Therefore,
if
if are from different substratum.
if
APPENDIX F Variance Estimation of JAS-ALUS with Non-response
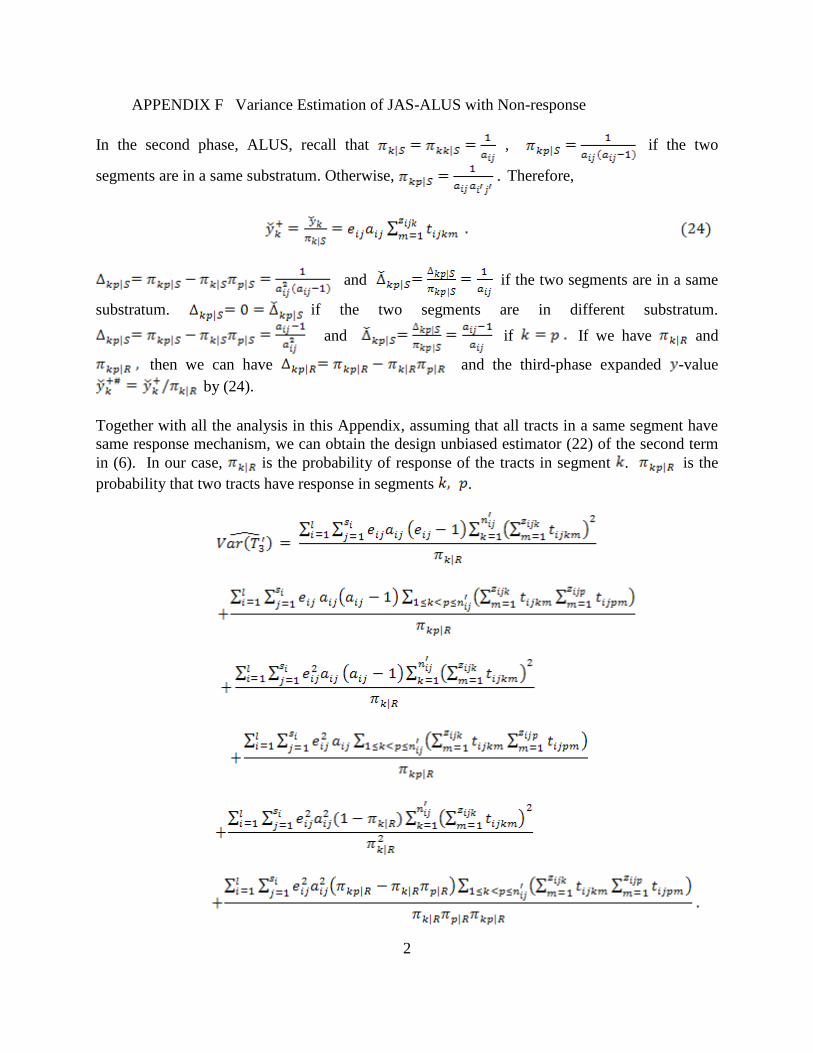
2
In the second phase, ALUS, recall that , if the two
segments are in a same substratum. Otherwise, Therefore,
and if the two segments are in a same
substratum. if the two segments are in different substratum.
and if If we have and
then we can have and the third-phase expanded -value
by (24).
Together with all the analysis in this Appendix, assuming that all tracts in a same segment have
same response mechanism, we can obtain the design unbiased estimator (22) of the second term
in (6). In our case, is the probability of response of the tracts in segment . is the
probability that two tracts have response in segments .
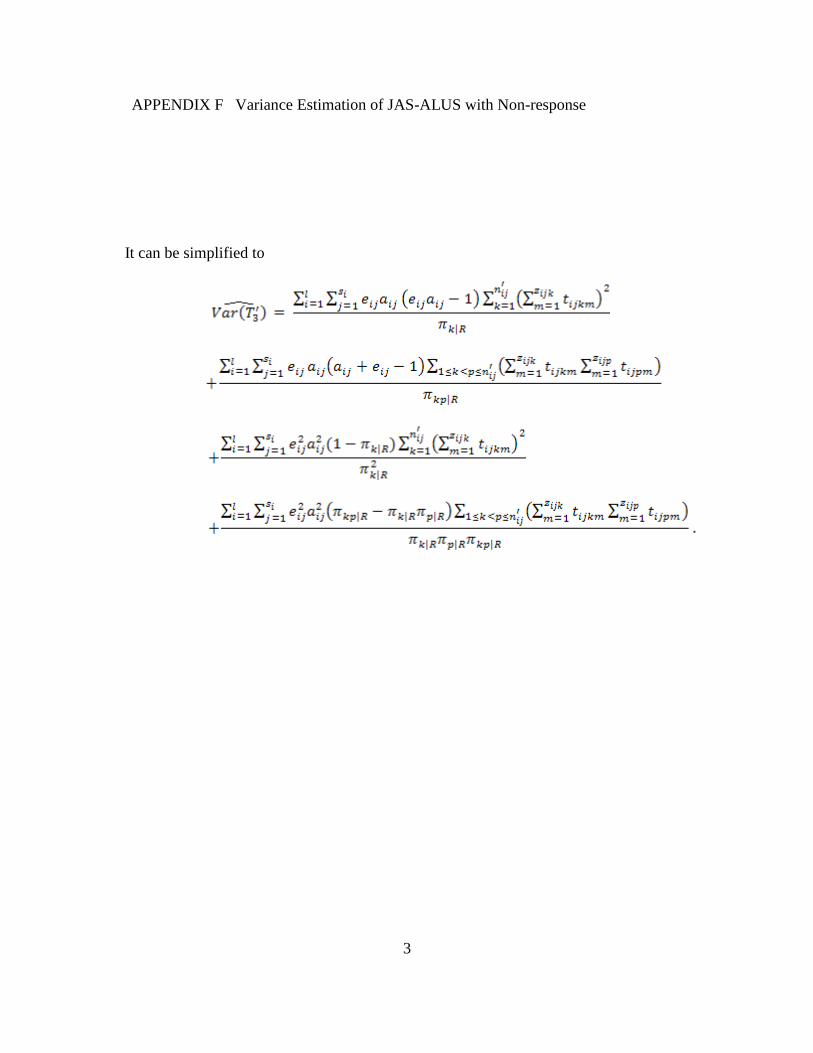
APPENDIX F Variance Estimation of JAS-ALUS with Non-response
3
It can be simplified to