Embed Size (px)
Citation preview
AnnualR
eport2003
YearEnded
March
312003
Annual Report 2003Year Ended March 31, 2003
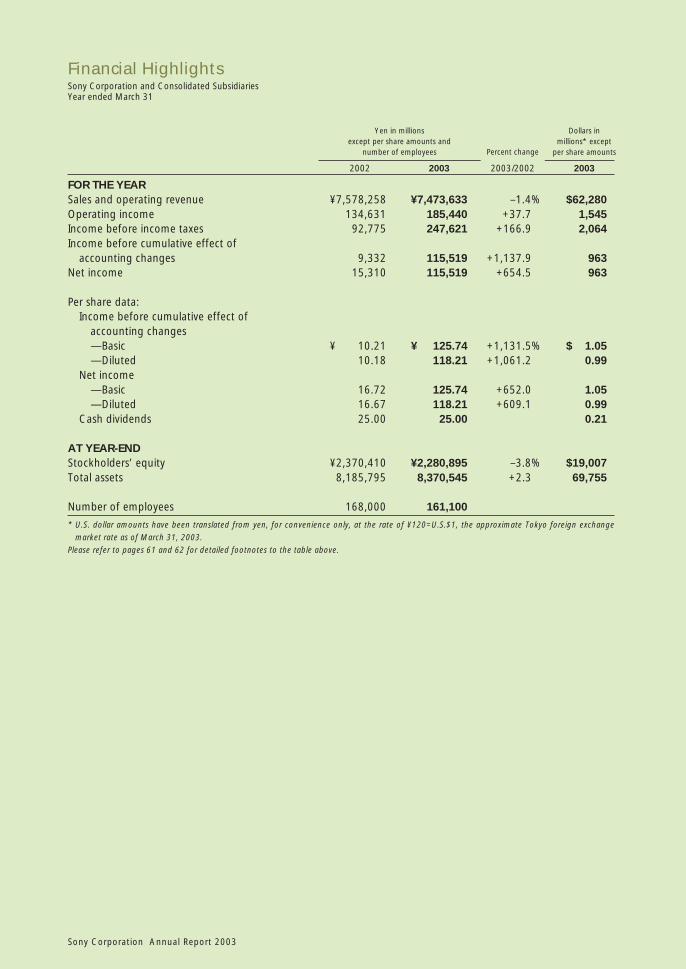
Financial HighlightsSony Corporation and Consolidated SubsidiariesYear ended March 31
Sony Corporation Annual Report 2003
Yen in millions Dollars inexcept per share amounts and millions* except
number of employees per share amounts
2002 2003 2003/2002 2003
FOR THE YEARSales and operating revenue ¥7,578,258 ¥7,473,633 –1.4% $62,280Operating income 134,631 185,440 +37.7 1,545Income before income taxes 92,775 247,621 +166.9 2,064Income before cumulative effect of
accounting changes 9,332 115,519 +1,137.9 963Net income 15,310 115,519 +654.5 963
Per share data:Income before cumulative effect of
accounting changes—Basic ¥ 10.21 ¥ 125.74 +1,131.5% $ 1.05—Diluted 10.18 118.21 +1,061.2 0.99
Net income—Basic 16.72 125.74 +652.0 1.05—Diluted 16.67 118.21 +609.1 0.99
Cash dividends 25.00 25.00 0.21
AT YEAR-ENDStockholders’ equity ¥2,370,410 ¥2,280,895 –3.8% $19,007Total assets 8,185,795 8,370,545 +2.3 69,755
Number of employees 168,000 161,100
* U.S. dollar amounts have been translated from yen, for convenience only, at the rate of ¥120=U.S.$1, the approximate Tokyo foreign exchangemarket rate as of March 31, 2003.
Please refer to pages 61 and 62 for detailed footnotes to the table above.
Percent change
Sony Corporation Annual Report 2003 1
To Our Shareholders . . . . . . . . . . . . . . . . . . . . . . . . . . . . . . . . . . . . . . . . . . . . . . . . 2
Management Discusses Key Issues . . . . . . . . . . . . . . . . . . . . . . . . . . . . . . . . . . . . . . 5
At a Glance . . . . . . . . . . . . . . . . . . . . . . . . . . . . . . . . . . . . . . . . . . . . . . . . . . . . . . . 18
Sony World . . . . . . . . . . . . . . . . . . . . . . . . . . . . . . . . . . . . . . . . . . . . . . . . . . . . . . . 22
Research and Development . . . . . . . . . . . . . . . . . . . . . . . . . . . . . . . . . . . . . . . . . . . 45
Corporate Social Responsibility . . . . . . . . . . . . . . . . . . . . . . . . . . . . . . . . . . . . . . . . 48
Management (Fiscal Year Ended March 31, 2003) . . . . . . . . . . . . . . . . . . . . . . . . . . 49
Financial Section . . . . . . . . . . . . . . . . . . . . . . . . . . . . . . . . . . . . . . . . . . . . . . . . . . . 51
Fact Sheets . . . . . . . . . . . . . . . . . . . . . . . . . . . . . . . . . . . . . . . . . . . . . . . . . . . . . . . . 69
Stock Information . . . . . . . . . . . . . . . . . . . . . . . . . . . . . . . . . . . . . . . . . . . . . . . . . . 73
Corporate Governance . . . . . . . . . . . . . . . . . . . . . . . . . . . . . . . . . . . . . . . . . . . . . . 74
New Members of the Board . . . . . . . . . . . . . . . . . . . . . . . . . . . . . . . . . . . . . . . . . . . 77
New Corporate Executive Officers . . . . . . . . . . . . . . . . . . . . . . . . . . . . . . . . . . . . . . 80
Investor Information . . . . . . . . . . . . . . . . . . . . . . . . . . . . . . . . . . . . . . . . . . . . . . . . 81
Cautionary StatementStatements made in this annual report with respect to Sony’s current plans, estimates, strategies and beliefsand other statements that are not historical facts are forward-looking statements about the future perfor-mance of Sony. Forward-looking statements include but are not limited to those statements using wordssuch as “believe,” “expect,” “plans,” “strategy,” “prospects,” “forecast,” “estimate,” “project,” “anticipate,”“may” or “might” and words of similar meaning in connection with a discussion of future operations,financial performance, events or conditions. From time to time, oral or written forward-looking statementsmay also be included in other materials released to the public. These statements are based on management’sassumptions and beliefs in light of the information currently available to it. Sony cautions you that a numberof important risks and uncertainties could cause actual results to differ materially from those discussed inthe forward-looking statements, and therefore you should not place undue reliance on them. You alsoshould not rely on any obligation of Sony to update or revise any forward-looking statements, whether as aresult of new information, future events or otherwise. Sony disclaims any such obligation. Risks anduncertainties that might affect Sony include, but are not limited to (i) the global economic environment inwhich Sony operates, as well as the economic conditions in Sony’s markets, particularly levels of consumerspending; (ii) exchange rates, particularly between the yen and the U.S. dollar, euro, and other currencies inwhich Sony makes significant sales or in which Sony’s assets and liabilities are denominated; (iii) Sony’sability to continue to design and develop and win acceptance of its products and services, which are offeredin highly competitive markets characterized by continual new product introductions, rapid development intechnology, and subjective and changing consumer preferences (particularly in the Electronics, Game, Musicand Pictures segments); (iv) Sony’s ability to implement successfully personnel reduction and other businessreorganization activities in its Electronics and Music segments, (v) Sony’s ability to implement successfully itsnetwork strategy for its Electronics, Music, Pictures and Other segments and to develop and implementsuccessful sales and distribution strategies in its Music and Pictures segments in light of the Internet andother technological developments; (vi) Sony’s continued ability to devote sufficient resources to researchand development and, with respect to capital expenditures, to correctly prioritize investments (particularly inthe Electronics segment); and (vii) the success of Sony’s joint ventures and alliances. Risks and uncertaintiesalso include the impact of any future events with material unforeseen impacts.
Contents
Sony Corporation Annual Report 20032
To Our Shareholders
Operating Results for the Fiscal Year Ended March 2003
The business environment during the fiscal year ended March 31, 2003 was
extremely difficult, with continued weakness in consumer spending caused by the
unstable international situation and other factors, and a worldwide intensification
of pricing pressure.
Consolidated sales decreased 1.4% year on year to 7,473.6 billion yen,
primarily due to lower sales in the core segment of Electronics, while sales in the
Pictures segment increased significantly, reaching a record high. Consolidated
operating income increased 50.8 billion yen year on year to 185.4 billion yen,
with the Electronics, Game and Pictures segments the primary contributors.
In the Electronics segment, operating income improved significantly, due
primarily to the strong performance of products such as digital still cameras and
charge-coupled devices (CCDs), as well as the benefit of restructuring. Never-
theless, this segment suffered a significant operating loss in the fourth quarter
(January to March) that was greater than that in the same quarter of the prior
year because of a reduction in inventories, an increase in patent related expenses,
lower sales and other factors.
Nobuyuki IdeiChairman and Group Chief Executive Officer
Sony Corporation Annual Report 2003 3
In the Game segment, operating income increased due to higher software unit
sales and the benefit of continued reductions in hardware manufacturing costs.
The Pictures segment also reported higher operating income, due primarily to
the strength of releases such as Spider-Man, Men in Black II, xXx and Mr. Deeds.
The Music segment, on the other hand, recorded an operating loss as
restructuring expenses increased and music product sales decreased.
As for restructuring, which we have been undertaking since the fiscal year
ended March 31, 2000, on a consolidated basis, Sony recorded approximately
100 billion yen in charges during the fiscal year ended March 31, 2003, the brunt
of which were incurred in the Electronics and Music segments. As a part of this
restructuring in the Electronics segment, Aiwa Co., Ltd. was merged with Sony
in December 2002, headcount was reduced, and businesses, primarily in the
component category, were downsized or eliminated. In the Music segment, Sony
Music Entertainment Inc., which conducts business in every area of the globe
except Japan, reduced its headcount by more than 10% in order to cut costs and
improve operational efficiency.
Kunitake AndoPresident and Group Chief Operating Officer
Sony Corporation Annual Report 20034
Looking Towards the Future
Sony plans to continue inspiring our customers with dreams and impressions in
the broadband era through the convergence of electronics and entertainment.
However, with the environment in which Sony operates changing at a pace
beyond our expectations, we believe it is necessary to transform Sony into an
organization in step with the 21st Century through a series of new reforms that
build on those undertaken so far, but are not merely linear extensions of them.
In order to do so, as a second phase of restructuring building on the first
phase begun in the fiscal year ended March 31, 2000, over the three years
starting in the fiscal year ending March 31, 2004, we will reduce fixed costs by
further concentrating managerial resources into strategic businesses, reorganiz-
ing our global production structure and improving the productivity of back
office support functions. Furthermore, to accelerate growth in our Electronics
and Game segments, we are planning to invest in semiconductors, which hold
the key to differentiation of our products, introduce products that integrate
Electronics and Game technologies and invest in mid- to long-term technology
development so as to strengthen the attractiveness of our products.
In addition, as a part of the reorganization of our group operating structure,
after voluntarily adding additional rules to assure good governance – such as the
separation of the Chairman of the Board and head of business execution and the
addition of certain qualifications for Board membership – we chose to adopt the
“Company with Committees” structure, a management system made possible by
revisions to Japan’s Commercial Code that became effective on April 1, 2003 (for
more information see page 74).
Through the implementation of such initiatives, we aim to transform Sony
into a 21st Century enterprise, build a highly profitable business structure, and
continue to pursue the goal of making Sony the strongest consumer brand.
April 24, 2003
Nobuyuki IdeiChairman and Group CEO
Kunitake AndoPresident and Group COO
Sony Corporation Annual Report 2003 5
Management Discusses Key Issues
Sony Corporation Annual Report 2003 5
Solidifying Sony as the Strongest Consumer
Brand through the Convergence of Electronics
and Content
As the broadband era unfolds, Sony will continue to
assist customers in realizing their dreams and experienc-
ing everlasting emotions through a variety of hardware,
content and services. Sony will also continue to pursue
our vision – that of being the strongest consumer brand –
as we promote the convergence of Electronics and
Game, Music and Pictures.
Working to Transform Sony into a 21st Century
Enterprise
While our goals and vision remain the same, Sony’s op-
erating environment is undergoing a dramatic change.
Breathtaking advances in semiconductor and communi-
cations network technology are sparking far-reaching
structural change, not only in the electronics industry,
but also in industries as diverse as communications and
financial services. Across the electronics industry, com-
panies from countries with lower manufacturing costs
have emerged as prominent market players, and this
trend is rapidly causing many products to become mere
commodities. To succeed in this environment, Sony must
reexamine the very essence of the business structure
that underpinned our accomplishments in the past
century. We must go beyond the restructuring we have
enacted so far to transform Sony into an organization in
step with the 21st Century.
At our Corporate Strategy Meeting in May 2003, we
set a target for 2006, the year in which we will cel-
ebrate our 60th anniversary. By that year, we aim for
Sony to have a highly profitable business structure simi-
lar to the world’s leading multinationals. That means
that, for the fiscal year ending March 31, 2007, we aim
to build a structure which can achieve an operating
income margin of 10% for Sony Group consolidated,
excluding the Financial Services segment. In order to
reach this target, significant restructuring is essential, as
is the reinforcement of our products and the consistent
execution of a strategy to spur growth. Accompanying
these moves will be more rigorous control of our balance
sheet and aggressive asset management.
2nd Phase of Restructuring
Since 1999, Sony has been working to withdraw from
certain businesses while concentrating resources in other
businesses. At the same time, we have streamlined our
manufacturing facilities. Through the establishment of
Sony EMCS Corporation, an engineering and manufac-
turing platform with horizontal oversight over numerous
manufacturing facilities, we have built a more flexible and
efficient supply chain management system (that extends
from raw material procurement to end-customer sale).
This is just one of the ways in which we have made our
manufacturing facilities more competitive. Through the
steady implementation of these initiatives, the number
of manufacturing facilities at the end of March 2003
Sony Corporation Annual Report 20036
decreased to 52 from the 70 we had at the end of
March 1999. Better supply chain management has
yielded significant inventory reductions. And withdraw-
ing from unprofitable businesses, merging with Aiwa
Co., Ltd. and other initiatives have led to considerable
success in fixed cost reduction. Actions such as these
contributed to our ability to report increased profit in
the fiscal year ended March 31, 2003.
Nevertheless, we are concerned that the pace of
change in our markets is overtaking the speed of our
reforms. Thus, we have decided to accelerate the pace
of reform by positioning the fiscal year ending March
31, 2004 as the beginning of a three-year, second phase
of restructuring that builds on the success of the first
phase of restructuring undertaken from April 1999 to
March 2003.
There are several elements to this restructuring plan.
One is the concentration of resources in those busi-
nesses that have strategic importance. Another is the
optimization, from a global perspective, of our manu-
facturing infrastructure. Yet another is the reduction of
fixed costs primarily through an increase in productivity
of administrative functions, mainly in Japan. These and
other initiatives are expected to result in consolidated
costs of approximately 300 billion yen during the three-
year period ending March 31, 2006.
Of these expenses, approximately 280 billion yen is
earmarked for the Electronics segment. This second stage
of restructuring is not merely an extension of the restruc-
turing undertaken to date. It is an entirely new initiative.
We are committed to its implementation because it will
provide Sony with the basis for further growth.
Strategies to Bolster Our Products and Spur Growth
In the Electronics segment, we are targeting further
growth by creating new, exceptional products and by
building a profit model that can consistently generate
earnings in each of four core categories. The first is audio
and visual (AV) products, where we plan to solidify our
number one position. Second is the creation of an
entirely new category through the combination of
Electronics and Game. Third is information technology
(IT) and communications, where we expect to heighten
our stature. And fourth is semiconductors, another field
where we plan to grow even stronger. Semiconductors
are the key to creating truly distinctive hardware. That is
why we plan to invest approximately 500 billion yen in
these devices during the three years starting in the fiscal
year ending March 31, 2004. Other plans include an
investment of approximately 500 billion yen in mid- to
long-term technology development over the same three
years for, among other things, key devices that are
essential to making our products appealing.
Core Initiatives
Initiative 1: Solidify Sony’s number one position in
AV products
In our effort to reach our goals for the fiscal year ending
March 31, 2007, we will enhance even further the
profitability of AV products, products which are at the
center of the Sony Group’s core Electronics segment.
This is to be accomplished through three measures. One
is making careful choices as to which businesses to focus
on. Another is cutting fixed costs through the second
phase of restructuring. The third is creating a more
attractive product line-up in growing market sectors.
Regarding the third measure, we aim to solidify our
number one position in the AV market through the
introduction of captivating products in high-growth
markets. Examples of such high-growth markets include
plasma display panel (PDP), liquid crystal display (LCD)
and other flat-panel televisions, optical disc and hard
disk drive recorders, and digital imaging products such
as video cameras and digital still cameras. Another
theme will be expanding our line of high definition
products such as Blu-ray Disc recorders, high definition
Wega televisions and high definition camcorders.
Sony Corporation Annual Report 2003 7
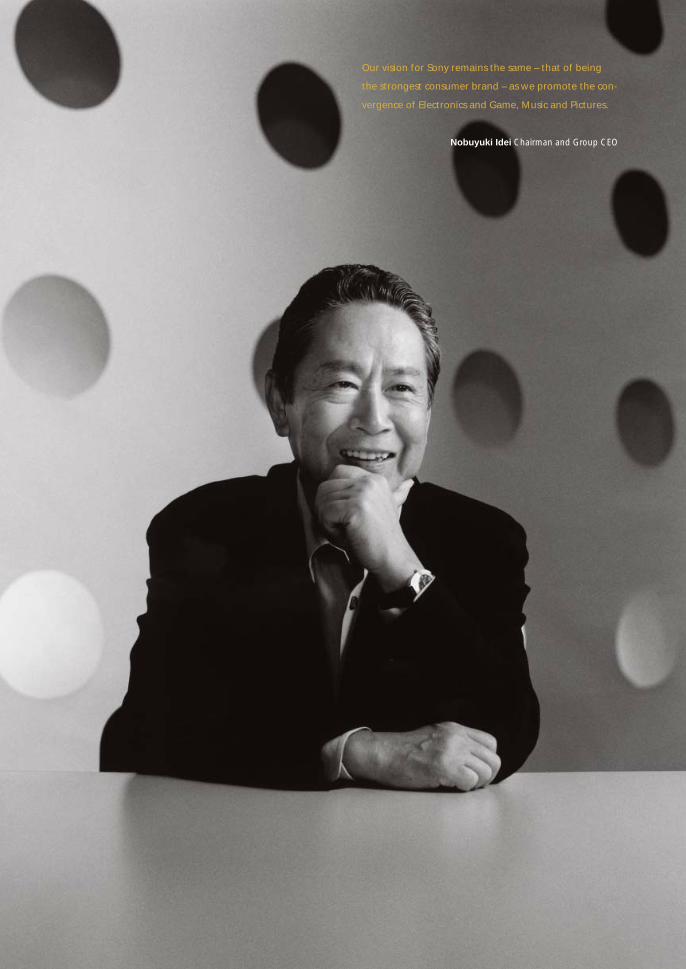
Our vision for Sony remains the same – that of being
the strongest consumer brand – as we promote the con-
vergence of Electronics and Game, Music and Pictures.
Nobuyuki Idei Chairman and Group CEO

Sony Corporation Annual Report 20038
While building a highly profitable
structure through significant restruc-
turing, we will work to improve the
strength of our products and create
new sources of growth.
Kunitake Ando President and Group COO
Sony Corporation Annual Report 2003 9
We will be upgrading the key devices that are critical
to making these products attractive. One area we plan
to augment is digital imaging components such as those
used in video cameras and digital still cameras, two
product lines where Sony is highly competitive. Here, we
have used leading-edge Sony technology and devices
such as CCDs, camera modules and low-temperature
polysilicon LCDs to build a vertically integrated business
model capable of adding considerable value and pro-
ducing highly distinctive products. Best illustrating our
strengths is the CCD, where Sony leads the industry in
technological innovation and market share. We plan to
fabricate a greater share of key devices internally, giving
our products an even greater edge over our rivals.
Until now, for strategic reasons, Sony has purchased
LCDs, PDPs and other flat panel displays for televisions
from external suppliers. In recent years, however, we
have seen rapid growth in demand for flat panel televi-
sions, mostly those using LCDs, and have concluded
that the time has come to complement external sourc-
ing of LCDs with proactive investment on our own, or
through alliances with other companies. We are currently
examining possibilities. As before, we are continuing
our own research into organic electroluminescence
and field-emission displays, two candidates for next-
generation displays.
Initiative 2: Create an entirely new category
through the combination of Electronics and Game
In May 2003, Sony announced plans to sell PSX, the first
commercial product in which Electronics and Game con-
verge. Combining DVD and hard disk drive recorders,
PSX will spawn a completely new product category. PSX
will be based on the operating system and semiconduc-
tors used in PlayStation 2 (PS2), will have a television and
broadcast satellite tuner inside, and will be compatible
with PlayStation and PS2 games. Recording and playback
of television programs is just one of its many functions.
Users can also view still and moving images from digital
still and video cameras as well as enjoy music CDs. The
unit accepts a variety of home-use disc-based media as
well as the Memory Stick, and it can be linked to an
Ethernet network. PSX is slated to go on sale in Japan
late in 2003 and in the U.S. and Europe in 2004.
Inside PSX is technology from the Game and
Electronics segments. PS2 technology includes the
EmotionEngine and Graphics Synthesizer semiconduc-
tors as well as PS2’s operating system. Our Electronics
segment is the source of the semiconductor laser,
recordable DVD drive, codec (coding and decoding)
technology and many other sophisticated technologies
at the heart of PSX.
PSX is a fresh idea for an entirely new type of plat-
form where Electronics and Game technologies coalesce.
The incorporation of a DVD-Video playback capability in
PS2 has made the DVD format even more widely used
worldwide, sparking explosive growth in the DVD soft-
ware market. We expect that the DVD recorder inside
PSX will trigger similar growth in demand in the record-
able DVD market.
At the E3 (Electronic Entertainment Exposition), the
world’s largest game exhibition, held in Los Angeles in
May 2003, we announced our plan to sell PSP, a portable
entertainment system that is, in effect, a 21st Century
Walkman. PSP will be launched at a similar time in Japan,
the U.S. and Europe in late 2004. Sony Group’s leading-
edge semiconductor technology will, of course, be
instrumental to the development of PSP. This product
will also feature three dimensional computer graphics,
three dimensional audio, codec and other sophisticated
technologies and will be compatible with the Memory
Stick and other Sony products. Data will be stored on a
Universal Media Disc (UMD), a new technology devel-
oped by Sony. Each 60mm-diameter disc has a capacity
of 1.8GB. Over the years, our development of optical
disc technology has played a major role in expanding
markets for discs such as the CD, MD and DVD. The
UMD is our latest disc media, and we fully intend to
Sony Corporation Annual Report 200310
develop the market for it as well. Compatible with
MPEG-4 and other codec technology, the UMD can
hold about two hours of programming with DVD-Video
grade picture quality. Sophisticated copyright protection
technology is also incorporated. As a result, a variety of
content, not only game software, but also motion
picture and music content, can be used. PSP and UMD
have naturally sparked strong interest within the game
industry, but the same has also been the case in the
motion picture and music industries.
With PSX and PSP, we have the means to build an
immense, multidimensional platform supported by
advanced devices from Electronics and leading-edge
semiconductors developed for Game. We plan to create
a completely new market on this platform, one that
extends to the latest available content in the game,
video and music arenas.
Initiative 3: Heighten Sony’s stature in IT and
communications
The global IT and communications market is massive;
annual revenues for calendar 2002 reached approxi-
mately 90 trillion yen. We plan to achieve significant
growth through the strengthening of our VAIO PC
business and our mobile phone business, which is
conducted by Sony Ericsson Mobile Communications
AB (SEMC).
Since its launch, the VAIO has capitalized on its
unique AV/IT applications and attractive styling to create
an entirely new concept in the home PC market. In the
fiscal year ended March 31, 2003, Sony’s VAIO business
endured extremely difficult conditions as the PC market
was battered by intense price-based competition. In the
fiscal year ending March 31, 2004, we will once again
stress the defining elements of the VAIO: its excellent
craftsmanship and unique applications. Networking
functions, such as home network and wireless LAN
technology, as well as recordable DVD drives and other
features will be installed in VAIOs in an effort to take
the convergence of AV and IT to an even higher plane.
New styles will continue to be introduced, too, as we
reignite the spirit of innovation that accompanied the
VAIO at its launch.
On the operations side, we will improve design,
manufacturing and sales efficiency while expanding the
Internet sales channel, all in an effort to improve profit-
ability. We foresee significant growth in two regions.
One is Europe, where we will begin promoting the VAIO
in earnest. The other is China, where we will, among
other things, increase local production.
Our plans include extending the VAIO brand to new
concept products that utilize PC technology and to
other PC related products. This will transform VAIO from
a brand representing a product to one that represents
an entire business, contributing to the growth of all
VAIO-related activities.
In October 2001, Sony and Sweden’s Ericsson jointly
established SEMC. Since its inception, this company has
worked to develop unique products that utilize the
inherent strengths of both parent companies – AV
technology and communications technology. From the
fiscal year ending March 31, 2004, SEMC will introduce,
in earnest, products that capitalize on these strengths.
In the GSM/UMTS market, which is a mobile phone
network standard dominant in Europe and Asia and
spreading around the world, SEMC has already gained
attention for its high value added products that feature
imaging, game, music distribution and other functions
and services. In the Japanese market, SEMC will intro-
duce products that can be differentiated from competi-
tors’ products based on design and ease of use. On the
operations side of the business, SEMC is more closely
linking design, manufacturing and sales functions on a
global basis so that new products can be launched
faster and the company as a whole can become more
cost competitive. At a time when mobile phone industry
players are working to add information and entertain-
ment service functionality to the telephony capability of
Sony Corporation Annual Report 2003 11
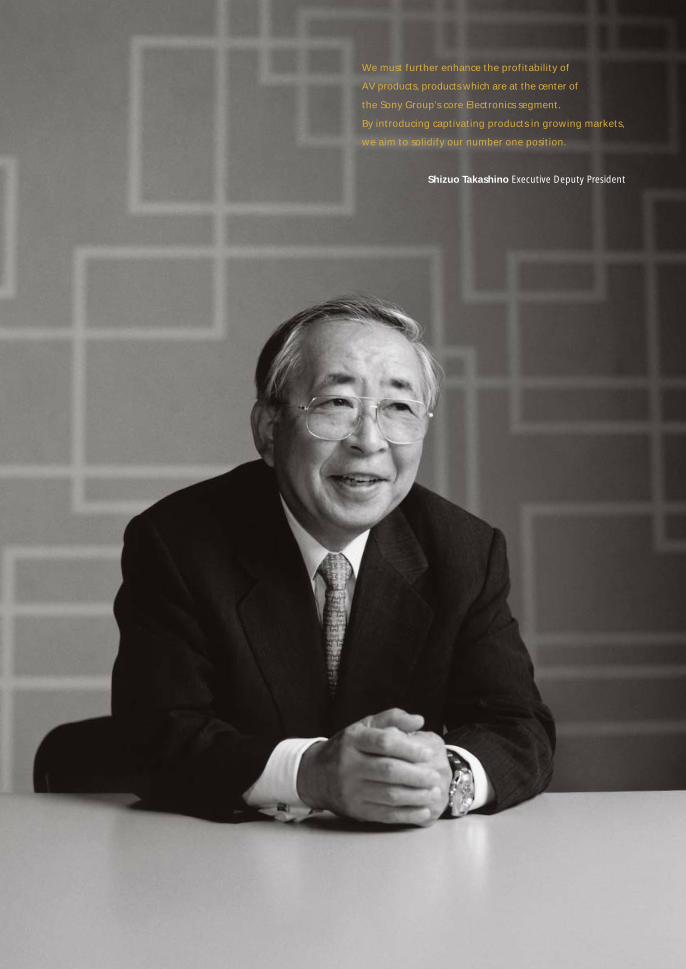
We must further enhance the profitability of
AV products, products which are at the center of
the Sony Group’s core Electronics segment.
By introducing captivating products in growing markets,
we aim to solidify our number one position.
Shizuo Takashino Executive Deputy President

Sony Corporation Annual Report 200312
Convergence of Electronics and Game
has finally begun with PSX.
Convergence will yield a new line of
high-grade digital home appliances that
have dramatically accelerated processing
capability thanks to Game’s advanced
semiconductor process technology and
real time operating system.
Ken Kutaragi Executive Deputy President
Sony Corporation Annual Report 2003 13
their phones, SEMC is confident that it can secure a
strong market position through the introduction of
attractive products and applications.
Mobile products harbor considerable potential in
terms of both their market size and growth rates, and
Sony is extremely skilled when it comes to them. We will
continue to create captivating mobile products that are
distinct to Sony. We will leverage our advantage as a
producer of the key devices that are critical to the com-
petitiveness of mobile products in order to vertically
integrate devices and end-use products. This will enable
us to make our products even more appealing and add
still more value.
Initiative 4: Become even stronger in the semicon-
ductor field
In the semiconductor business, the Sony Group has
been making investments and bolstering production
capacity to support the Electronics and Game segments.
As mentioned earlier, we plan to make capital expendi-
tures in semiconductors totaling approximately 500
billion yen during the three-year period beginning with
the fiscal year ending March 31, 2004.
To meet the growing demand for imaging sensors in
digital still cameras and camera-equipped mobile phones,
we are planning to begin production of imaging sensors
at the semiconductor fabrication facilities owned by
Sony Computer Entertainment (SCE). SCE currently pro-
duces chips for the PS2 at these facilities using 180 to
150 nanometer process technology. By the summer of
2003, our monthly output of CCDs will exceed 7 million
units, helping us to obtain the top share in the market
for imaging devices.
At the production facilities owned by SCE where we
have begun introduction of 90 nanometer process
technology, we plan not only to produce semiconduc-
tors that combine the EmotionEngine and Graphics
Synthesizer into one chip and other semiconductors for
PSX, but also semiconductor devices for electronics
products. To prepare for the production of the next-
generation microprocessor called Cell and other next-
generation microprocessors, we are currently installing
65 nanometer process technology for use on 300mm
wafers. Through these activities, the advanced semi-
conductor process technology used to produce high-
performance chips for the PS2 is beginning to be used
by the Electronics segment as well.
Through these four initiatives we will gather together
the collective strength of the Sony Group to create
new markets in the broadband era and bring to life a
powerful force for growth known as the Ubiquitous
“Value” Network.
Sony’s Entertainment Companies: Focusing on
Profitability and Emerging Opportunities
Sony’s efforts to become a 21st Century enterprise extend
beyond Electronics and Game to encompass our content
businesses as well. Sony’s entertainment companies are
focused both on the profitability of their core businesses
and on pursuing emerging opportunities, particularly in
new avenues of content distribution. To bolster profit-
ability, we have implemented Project USA, an ongoing
restructuring of our entertainment and U.S. electronics
businesses, gaining substantial savings and efficiencies
through implementation of overhead reductions, shared
services and consolidated buying opportunities. Shared
services also strengthen collaboration across our divisions.
This enables Sony to leverage its unique position and
expertise in both devices and content to create new
digital consumer offerings.
Our entertainment companies are utilizing their
content libraries in fresh and exciting ways to develop
new business opportunities. New revenue sources at
Sony Pictures Entertainment (SPE) include selling down-
loads of television soap operas through our SoapCity
on-demand broadband service; publishing online games
such as Charlie’s Angels: Angel X, based on our motion
Sony Corporation Annual Report 200314
picture; and delivering fee-based secure digital down-
loads of films via the Internet through Movielink, a
video-on-demand service developed by Sony Pictures
Digital along with four other motion picture studios.
Similarly, Sony Music Entertainment Inc. (SMEI) is licens-
ing its publishing copyrights and songs to the burgeon-
ing cell phone ringtones market. SMEI also provides cell
phone subscribers with news, pictures, tour dates, album
releases and more, all displayed with one of the richest
graphic interfaces available on wireless phones today.
We also look forward to generating additional
revenue opportunities by converting our content libraries
to new entertainment formats. These include the Blu-ray
Disc, which will hold more than two hours of high defini-
tion video on a single disc, and SCE’s PSP entertainment
system, which will use the UMD format, and provide
portable enjoyment of games, movies and music.
SMEI
Under the direction of its new Chairman and CEO
Andrew Lack, SMEI has a clear and comprehensive
strategy for dealing with the challenges and opportuni-
ties of the current global music marketplace.
SMEI has intensified its focus on discovering and
developing artists. As part of this effort, SMEI has
recently formed the Sony Urban Music division, which is
dedicated to developing the best urban talent. SMEI is
also redoubling its successful strategy of identifying
and cultivating local talent throughout the world, and
building their international appeal in the U.S. and other
major markets. This effort has already met with great
success with artists such as Celine Dion, Ricky Martin,
Shakira and Las Ketchup.
The company will also create additional revenue
streams through expanded digital distribution and the
licensing of content to a growing number of digital music
services; enhanced personalized offerings such as
custommixcd.com, which allows users to create their
own compilation CDs; and new commercial relationships
with a variety of corporate partners such as Pepsi and
Chrysler, which also provide SMEI artists more opportuni-
ties to extend the reach of their brands and imagery.
SPE
SPE in the coming years will continue to build and expand
its motion picture catalog, helping to enhance the value of
its vast library of films and television programs; capitalize
on the explosive growth of the DVD market; and develop
additional content distribution platforms.
SPE’s motion picture strategy, which resulted in a
record performance in the fiscal year ended March 31,
2003, is to distribute a diversified portfolio of motion
pictures, blending event, star-driven and targeted films.
Notable films in 2003 include Will Smith in Bad Boys II;
S.W.A.T.; Something’s Gotta Give starring Jack Nicholson;
and Tim Burton’s Big Fish. Next year, Spider-Man 2, based
on our 2002 record-breaking blockbuster, will be a key
2004 theatrical release. Additionally, we are developing
computer-generated animated films from the newly
formed Sony Pictures Animation division.
In television production, we remain dedicated to an
economic approach relying on stable, profitable game
shows and daytime franchises, cable series, and selective
network primetime production including the upcoming
Stephen King miniseries Kingdom Hospital. We will also
concentrate on international production and on the ex-
pansion of our international cable channels. We already
have formed or invested in 30 television channels around
the world that create significant asset value for Sony.
In addition, building on our pioneering success with
the massively multiplayer paid subscription game
EverQuest, we recently launched Planetside and plan to
introduce EverQuest II and Lucas Arts’ Star Wars Galaxies,
creating exciting new vistas in online gameplay.
Sony Corporation Annual Report 2003 15
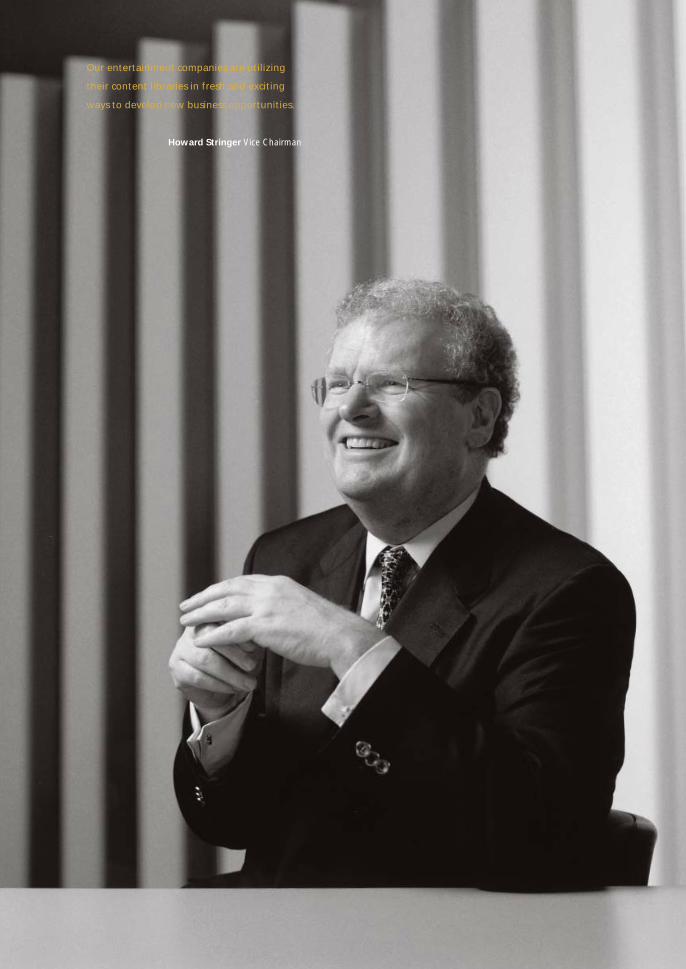
Our entertainment companies are utilizing
their content libraries in fresh and exciting
ways to develop new business opportunities.
Howard Stringer Vice Chairman
Sony Corporation Annual Report 200316
Building a strong financial position is essential to
transforming Sony into a 21st Century enterprise.
This requires precise management of our balance sheet,
not just a focus on profit performance.
Teruhisa Tokunaka Executive Deputy President and
Group CSO (Chief Strategy Officer)
Sony Corporation Annual Report 2003 17
New Operational Organization
A sound operating organization is essential to enacting
the reforms we have planned.
On April 1, 2003, we formed a new framework that
includes eight business units. Within the framework are
four network companies: Home Network Company, IT
and Mobile Solutions Network Company, Broadband
Network Company and Micro Systems Network
Company. Also included are the Game Business Group,
Entertainment Business Group and Personal Solutions
Business Group. The eighth unit is SEMC. Each of these
business units has been given even more autonomy to
operate in a self-reliant manner to achieve mid- to long-
term goals. This autonomy, along with aggressive and
effective investment by each business unit, is expected
to contribute to profitability.
In conjunction with this delegation of authority, we
named chief financial officers for each of the network
companies, while retaining a chief financial officer for the
entire group. This will better enable the comprehensive
oversight of the operations of each network company.
As they conduct largely autonomous and self-reliant
operations, the network companies will work even more
closely with the Global Hub, our group headquarters.
At the same time, we have established an organization
in which the group’s senior management can quickly
monitor the current status of operations.
To strengthen regional strategies for East Asia, the
Americas and Europe, a representative has been named
for each of these regions. In addition, in June 2003, we
plan to adopt the “Company with Committees” system,
a new option under the Japanese Commercial Code, for
the purpose of reforming the group’s management
structure in order to enhance corporate governance (for
more information see page 74).
Balance Sheet Management
Finally, we believe that building a strong financial posi-
tion is also essential to transforming Sony into a 21st
Century enterprise. This requires precise management of
our balance sheet, not just a focus on profit performance.
The Sony Group has always managed and invested its
assets in an efficient and appropriate manner, but our
consolidated assets have been climbing, with much of
this growth coming from our Financial Services segment.
When the Financial Services segment is excluded from
the balance sheet, the remaining figures show that assets
have decreased, and that the decline is mainly attribut-
able to a steady reduction in inventories in the Electronics
segment. On the other hand, due to the asset-oriented
nature of the Financial Services segment, growth in
assets tends to correspond to success. This is fundamen-
tally different from the nature of the Electronics segment.
Consequently, Sony will increase measures to manage
its balance sheet by creating separate balance sheets for
the Financial Services segment and for all other seg-
ments, thus making apparent the value of these two
types of businesses. In the Financial Services segment, the
public service nature of operations is high and we must
fulfill our obligations to the customers whose assets we
hold. The Sony Group will seek the best course of action
to take concerning these businesses from the vantage
point of the entire Group, including possible alliances
with other companies or public offerings of equity.
Through these strategies and measures, Sony plans to
further enhance its overall competitive position as we
approach our 60th anniversary in 2006. Our aim is to
build a framework capable of achieving a consolidated
operating income margin of 10% in the fiscal year end-
ing March 31, 2007 (excluding the Financial Services
segment), firmly positioning Sony as a global media and
technology company with the world’s strongest con-
sumer brand.
(May 2003)
Sony Corporation Annual Report 200318
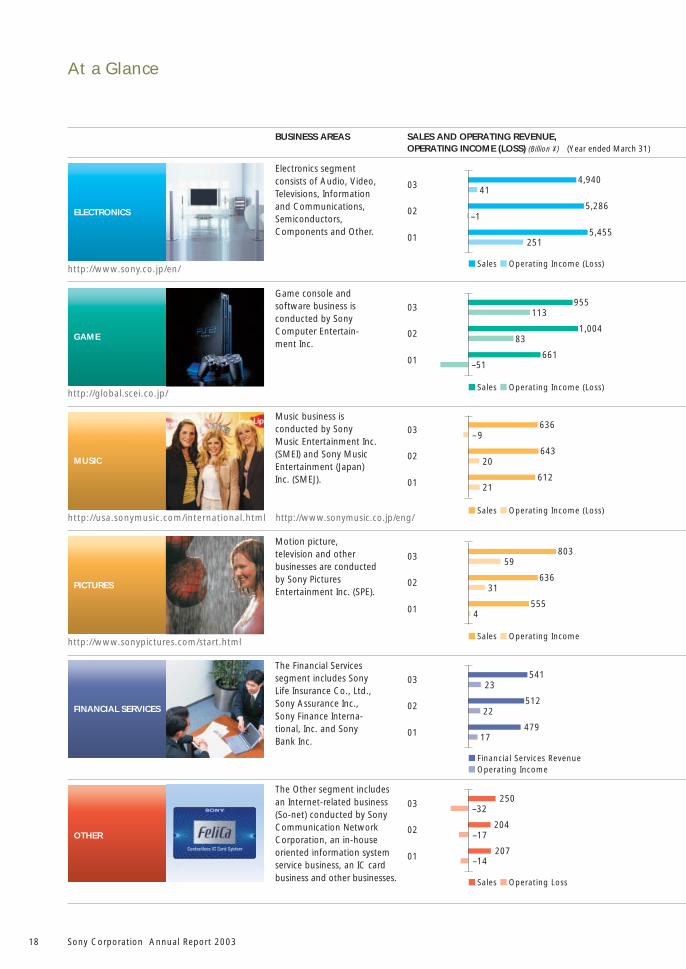
At a Glance
Electronics segmentconsists of Audio, Video,Televisions, Informationand Communications,Semiconductors,Components and Other.
SALES AND OPERATING REVENUE,OPERATING INCOME (LOSS) (Billion ¥) (Year ended March 31)
BUSINESS AREAS
The Other segment includesan Internet-related business(So-net) conducted by SonyCommunication NetworkCorporation, an in-houseoriented information systemservice business, an IC cardbusiness and other businesses.
The Financial Servicessegment includes SonyLife Insurance Co., Ltd.,Sony Assurance Inc.,Sony Finance Interna-tional, Inc. and SonyBank Inc.
Motion picture,television and otherbusinesses are conductedby Sony PicturesEntertainment Inc. (SPE).
Music business isconducted by SonyMusic Entertainment Inc.(SMEI) and Sony MusicEntertainment (Japan)Inc. (SMEJ).
Game console andsoftware business isconducted by SonyComputer Entertain-ment Inc.
FINANCIAL SERVICES
03
02
01
4,940
2515,455
–15,286
41
■ Sales ■ Operating Income (Loss)
955
–51661
831,004
11303
02
01
■ Sales ■ Operating Income (Loss)
636
21612
20643
–903
02
01
■ Sales ■ Operating Income (Loss)
803
4555
31636
5903
02
01
■ Sales ■ Operating Income
03
02
01
541
17479
22512
23
■ Financial Services Revenue■ Operating Income
250
–14207
–17204
–3203
02
01
■ Sales ■ Operating Loss
http://www.sony.co.jp/en/
http://global.scei.co.jp/
http://usa.sonymusic.com/international.html http://www.sonymusic.co.jp/eng/
http://www.sonypictures.com/start.html
ELECTRONICS
GAME
MUSIC
PICTURES
OTHER
Sony Corporation Annual Report 2003 19
DIRECTIONS AND PLANS FOR NEXTFISCAL YEAR
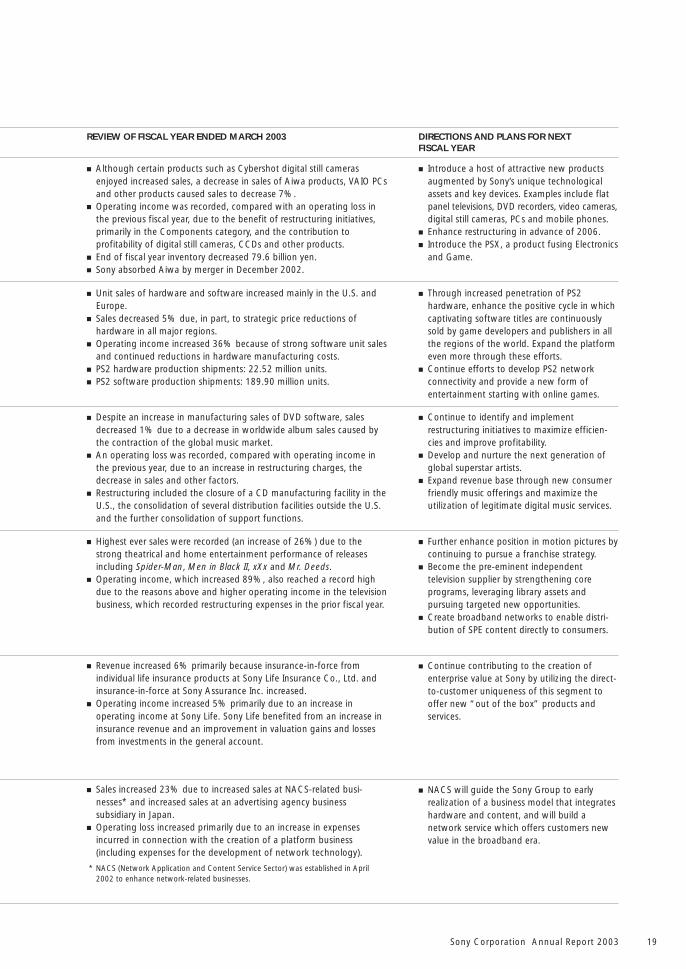
■ Although certain products such as Cybershot digital still camerasenjoyed increased sales, a decrease in sales of Aiwa products, VAIO PCsand other products caused sales to decrease 7%.
■ Operating income was recorded, compared with an operating loss inthe previous fiscal year, due to the benefit of restructuring initiatives,primarily in the Components category, and the contribution toprofitability of digital still cameras, CCDs and other products.
■ End of fiscal year inventory decreased 79.6 billion yen.■ Sony absorbed Aiwa by merger in December 2002.
REVIEW OF FISCAL YEAR ENDED MARCH 2003
■ Introduce a host of attractive new productsaugmented by Sony’s unique technologicalassets and key devices. Examples include flatpanel televisions, DVD recorders, video cameras,digital still cameras, PCs and mobile phones.
■ Enhance restructuring in advance of 2006.■ Introduce the PSX, a product fusing Electronics
and Game.
■ Sales increased 23% due to increased sales at NACS-related busi-nesses* and increased sales at an advertising agency businesssubsidiary in Japan.
■ Operating loss increased primarily due to an increase in expensesincurred in connection with the creation of a platform business(including expenses for the development of network technology).
* NACS (Network Application and Content Service Sector) was established in April2002 to enhance network-related businesses.
■ Revenue increased 6% primarily because insurance-in-force fromindividual life insurance products at Sony Life Insurance Co., Ltd. andinsurance-in-force at Sony Assurance Inc. increased.
■ Operating income increased 5% primarily due to an increase inoperating income at Sony Life. Sony Life benefited from an increase ininsurance revenue and an improvement in valuation gains and lossesfrom investments in the general account.
■ Highest ever sales were recorded (an increase of 26%) due to thestrong theatrical and home entertainment performance of releasesincluding Spider-Man, Men in Black II, xXx and Mr. Deeds.
■ Operating income, which increased 89%, also reached a record highdue to the reasons above and higher operating income in the televisionbusiness, which recorded restructuring expenses in the prior fiscal year.
■ Despite an increase in manufacturing sales of DVD software, salesdecreased 1% due to a decrease in worldwide album sales caused bythe contraction of the global music market.
■ An operating loss was recorded, compared with operating income inthe previous year, due to an increase in restructuring charges, thedecrease in sales and other factors.
■ Restructuring included the closure of a CD manufacturing facility in theU.S., the consolidation of several distribution facilities outside the U.S.and the further consolidation of support functions.
■ Unit sales of hardware and software increased mainly in the U.S. andEurope.
■ Sales decreased 5% due, in part, to strategic price reductions ofhardware in all major regions.
■ Operating income increased 36% because of strong software unit salesand continued reductions in hardware manufacturing costs.
■ PS2 hardware production shipments: 22.52 million units.■ PS2 software production shipments: 189.90 million units.
■ NACS will guide the Sony Group to earlyrealization of a business model that integrateshardware and content, and will build anetwork service which offers customers newvalue in the broadband era.
■ Continue to identify and implementrestructuring initiatives to maximize efficien-cies and improve profitability.
■ Develop and nurture the next generation ofglobal superstar artists.
■ Expand revenue base through new consumerfriendly music offerings and maximize theutilization of legitimate digital music services.
■ Through increased penetration of PS2hardware, enhance the positive cycle in whichcaptivating software titles are continuouslysold by game developers and publishers in allthe regions of the world. Expand the platformeven more through these efforts.
■ Continue efforts to develop PS2 networkconnectivity and provide a new form ofentertainment starting with online games.
■ Continue contributing to the creation ofenterprise value at Sony by utilizing the direct-to-customer uniqueness of this segment tooffer new “out of the box” products andservices.
■ Further enhance position in motion pictures bycontinuing to pursue a franchise strategy.
■ Become the pre-eminent independenttelevision supplier by strengthening coreprograms, leveraging library assets andpursuing targeted new opportunities.
■ Create broadband networks to enable distri-bution of SPE content directly to consumers.
Sony Corporation Annual Report 200320
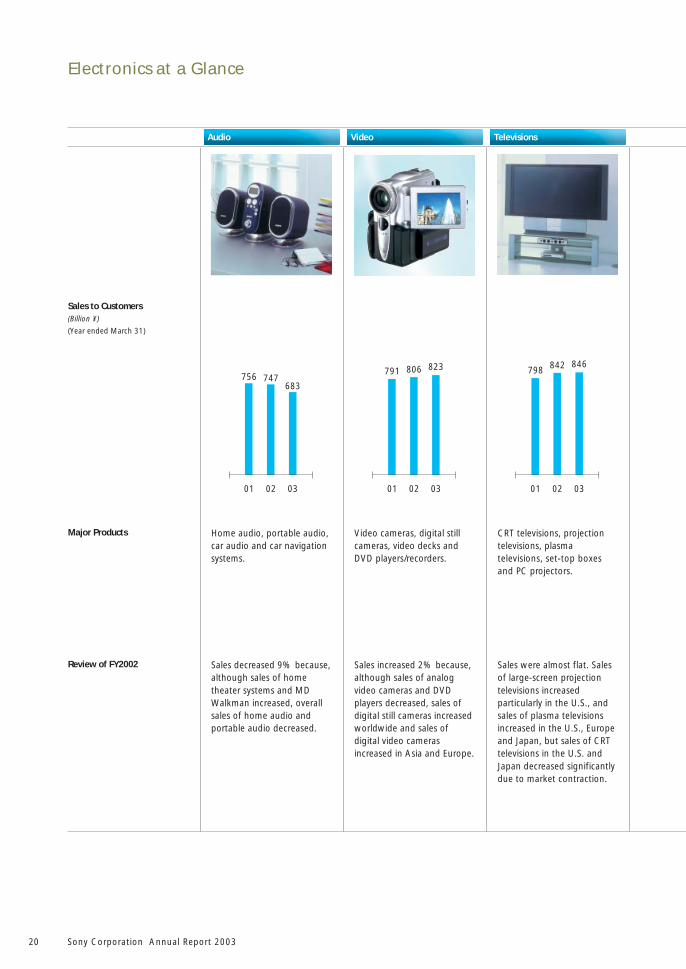
Electronics at a Glance
Home audio, portable audio,car audio and car navigationsystems.
Audio
Major Products
Video
Video cameras, digital stillcameras, video decks andDVD players/recorders.
Televisions
CRT televisions, projectiontelevisions, plasmatelevisions, set-top boxesand PC projectors.
Review of FY2002 Sales increased 2% because,although sales of analogvideo cameras and DVDplayers decreased, sales ofdigital still cameras increasedworldwide and sales ofdigital video camerasincreased in Asia and Europe.
Sales were almost flat. Salesof large-screen projectiontelevisions increasedparticularly in the U.S., andsales of plasma televisionsincreased in the U.S., Europeand Japan, but sales of CRTtelevisions in the U.S. andJapan decreased significantlydue to market contraction.
Sales decreased 9% because,although sales of hometheater systems and MDWalkman increased, overallsales of home audio andportable audio decreased.
Sales to Customers(Billion ¥)
(Year ended March 31)
01
756
02
747
03
683
798 842 846
01 02 03
791 806 823
01 02 03
Sony Corporation Annual Report 2003 21
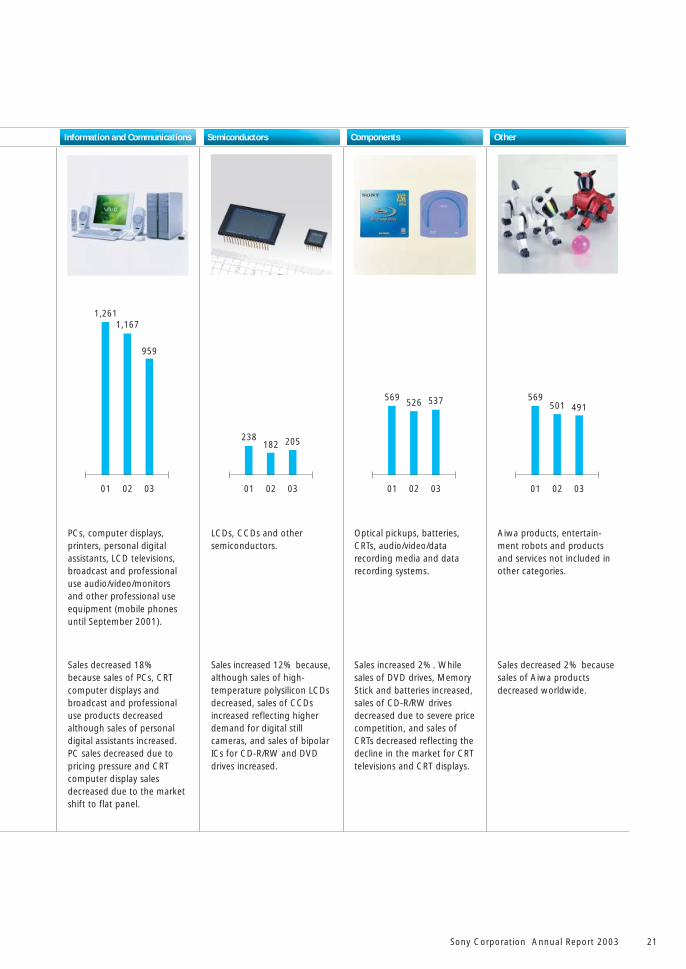
Information and Communications
PCs, computer displays,printers, personal digitalassistants, LCD televisions,broadcast and professionaluse audio/video/monitorsand other professional useequipment (mobile phonesuntil September 2001).
Semiconductors
LCDs, CCDs and othersemiconductors.
Components
Optical pickups, batteries,CRTs, audio/video/datarecording media and datarecording systems.
Other
Aiwa products, entertain-ment robots and productsand services not included inother categories.
Sales decreased 18%because sales of PCs, CRTcomputer displays andbroadcast and professionaluse products decreasedalthough sales of personaldigital assistants increased.PC sales decreased due topricing pressure and CRTcomputer display salesdecreased due to the marketshift to flat panel.
Sales increased 12% because,although sales of high-temperature polysilicon LCDsdecreased, sales of CCDsincreased reflecting higherdemand for digital stillcameras, and sales of bipolarICs for CD-R/RW and DVDdrives increased.
Sales increased 2%. Whilesales of DVD drives, MemoryStick and batteries increased,sales of CD-R/RW drivesdecreased due to severe pricecompetition, and sales ofCRTs decreased reflecting thedecline in the market for CRTtelevisions and CRT displays.
Sales decreased 2% becausesales of Aiwa productsdecreased worldwide.
569501 491
01 02 03
569 526 537
01 02 03
238182 205
01 02 03
1,2611,167
959
01 02 03
Sony Corporation Annual Report 200322
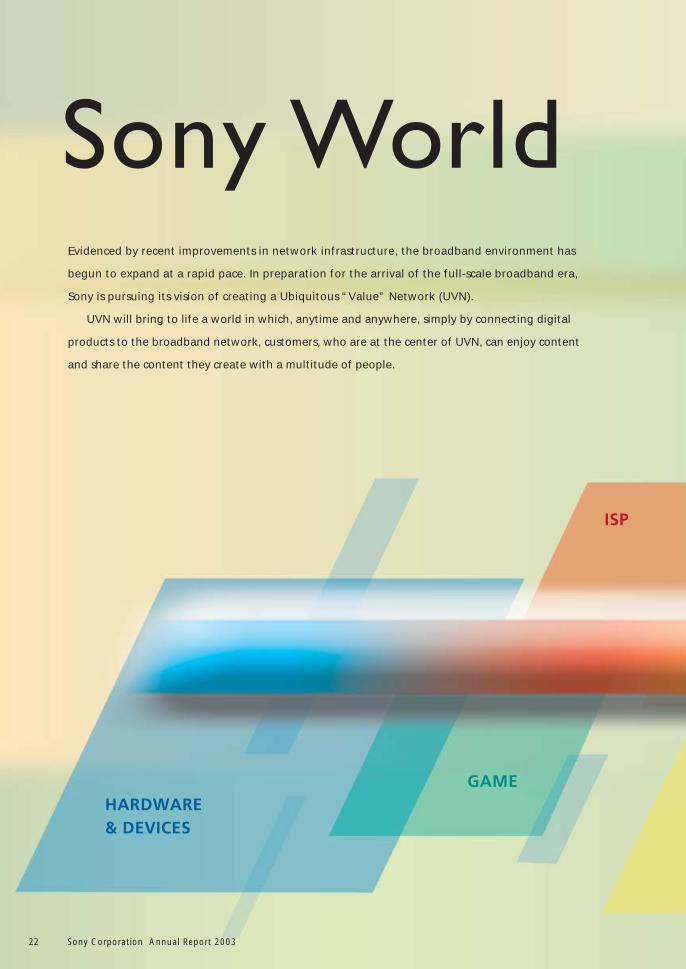
Evidenced by recent improvements in network infrastructure, the broadband environment has
begun to expand at a rapid pace. In preparation for the arrival of the full-scale broadband era,
Sony is pursuing its vision of creating a Ubiquitous “Value” Network (UVN).
UVN will bring to life a world in which, anytime and anywhere, simply by connecting digital
products to the broadband network, customers, who are at the center of UVN, can enjoy content
and share the content they create with a multitude of people.
Sony Corporation Annual Report 200322
Sony Corporation Annual Report 2003 23
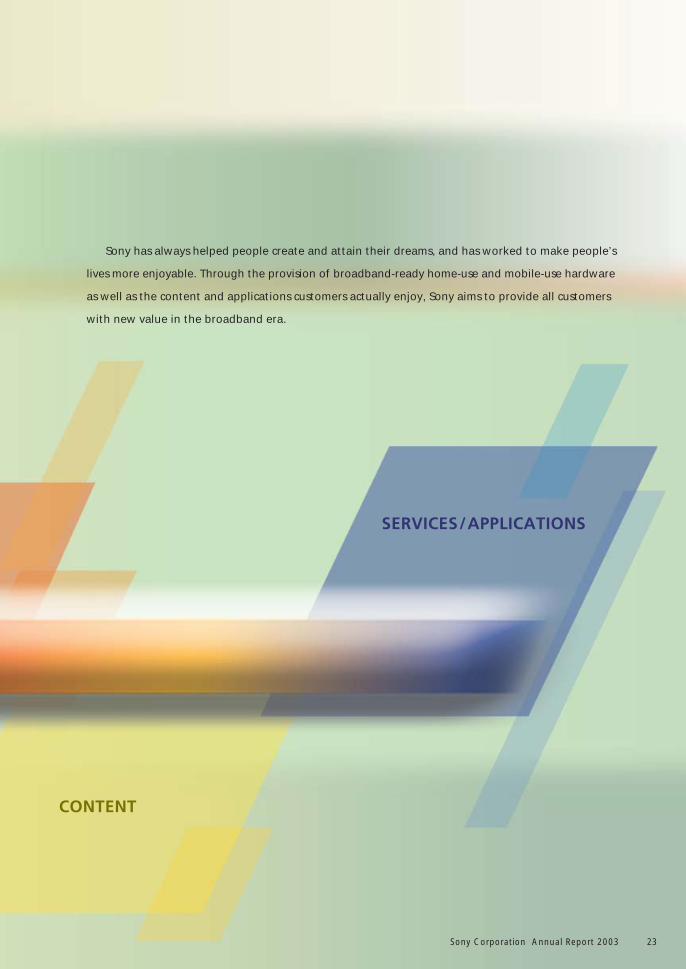
Sony has always helped people create and attain their dreams, and has worked to make people’s
lives more enjoyable. Through the provision of broadband-ready home-use and mobile-use hardware
as well as the content and applications customers actually enjoy, Sony aims to provide all customers
with new value in the broadband era.
Sony Corporation Annual Report 2003 23
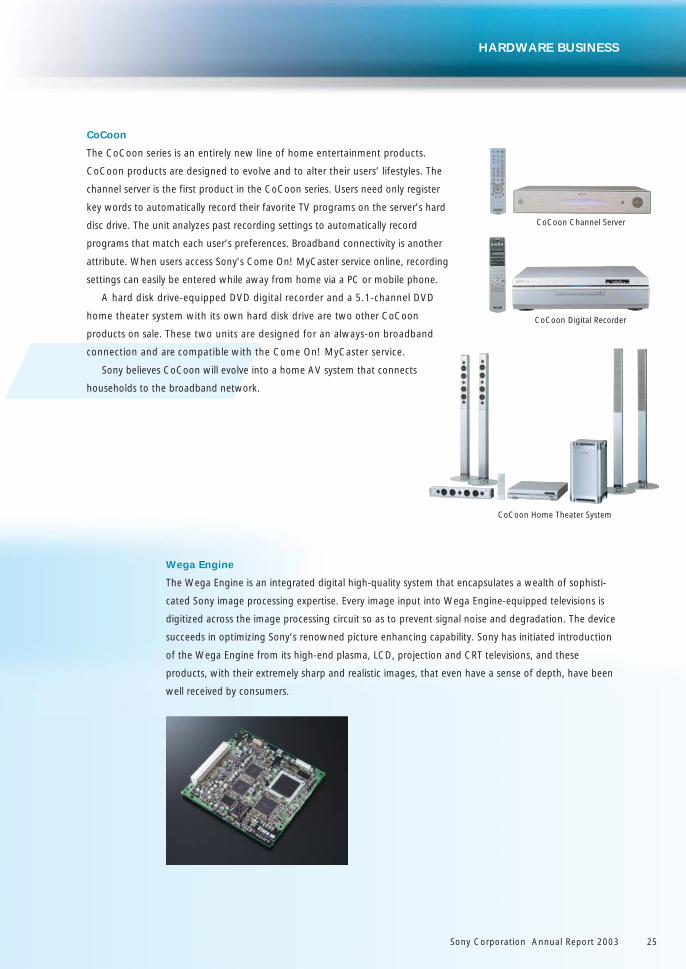
Televisions
Televisions are a vital part of the home network, essential to people’s enjoyment due to
their connection to recording devices such as channel servers, DVD recorders and
Handycam video cameras, and to other products like PlayStation.
Sony has a long history of leadership in the television market, including the 1996
introduction of a television with a flat-surface CRT. Sony also has an extensive and
expanding line of other televisions in such growing market sectors as plasma, LCD and
projection televisions.
The Plasma Wega pictured here features the Wega Engine, a device that represents
the pinnacle of Sony’s digital display technology. This engine ensures that video input
signals from a variety of sources are reproduced with outstanding sharpness and realism.
The LCD Wega pictured here employs a newly developed panel driver to dramati-
cally reduce residual imaging during scenes containing rapid movements. Drawing on
Wega Engine technology, this driver keeps the picture sharp and clear even during
fast-paced sporting events.
The Grand Wega pictured here is a projection television built around digital high
definition LCD panels in its optics unit.
Even in the network era, Sony will continue to uphold the highest standards for
picture quality in its televisions, the centerpiece of AV products in the home.
Home Networks
Sony Corporation Annual Report 200324
Plasma Wega
LCD Wega
Grand Wega
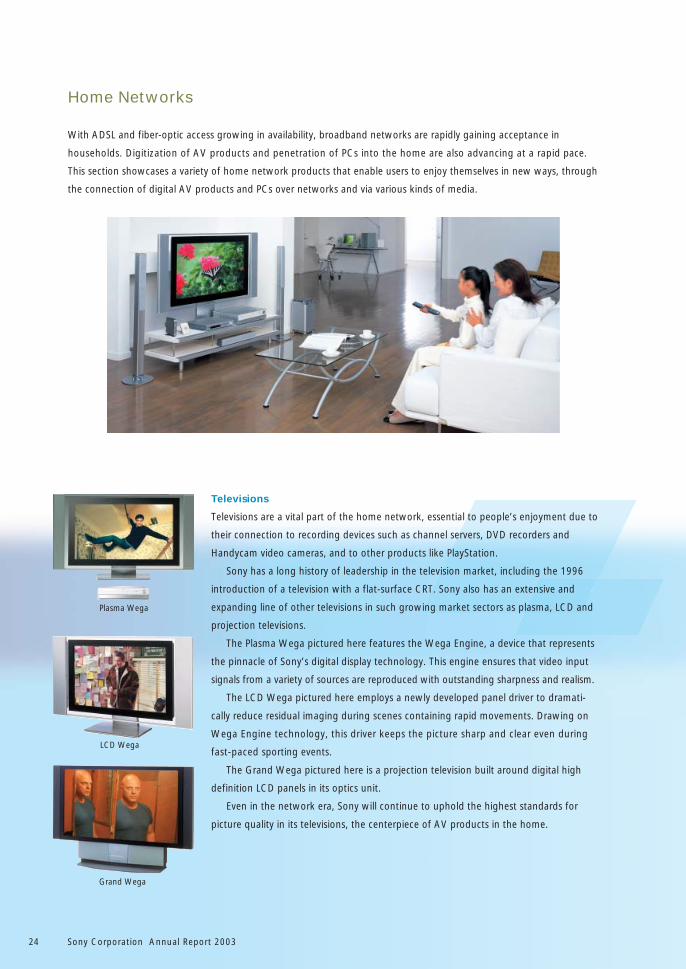
With ADSL and fiber-optic access growing in availability, broadband networks are rapidly gaining acceptance in
households. Digitization of AV products and penetration of PCs into the home are also advancing at a rapid pace.
This section showcases a variety of home network products that enable users to enjoy themselves in new ways, through
the connection of digital AV products and PCs over networks and via various kinds of media.
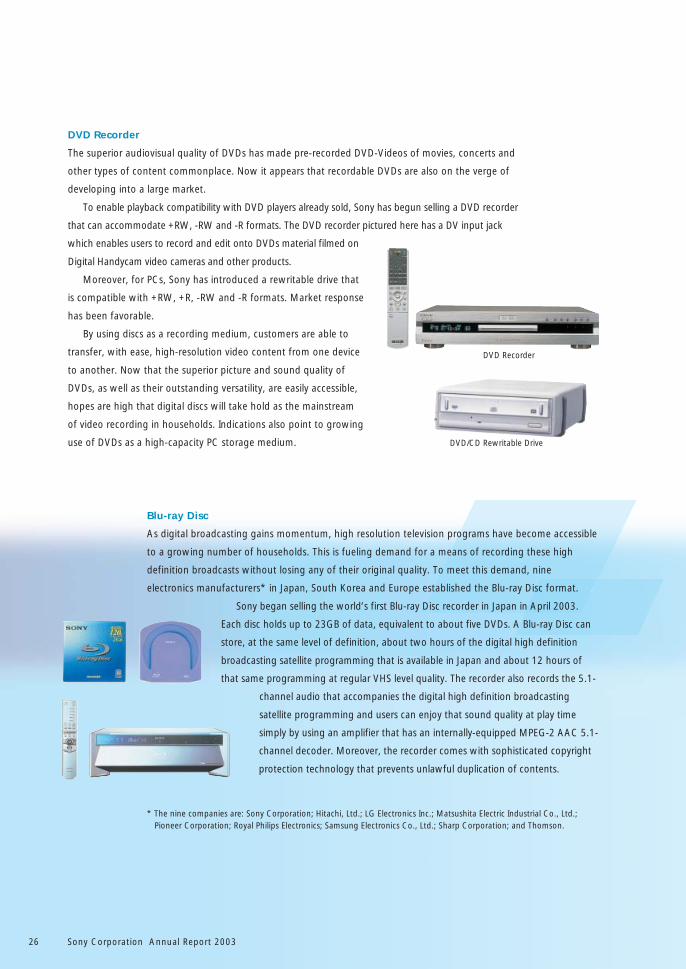
CoCoon
The CoCoon series is an entirely new line of home entertainment products.
CoCoon products are designed to evolve and to alter their users’ lifestyles. The
channel server is the first product in the CoCoon series. Users need only register
key words to automatically record their favorite TV programs on the server’s hard
disc drive. The unit analyzes past recording settings to automatically record
programs that match each user’s preferences. Broadband connectivity is another
attribute. When users access Sony’s Come On! MyCaster service online, recording
settings can easily be entered while away from home via a PC or mobile phone.
A hard disk drive-equipped DVD digital recorder and a 5.1-channel DVD
home theater system with its own hard disk drive are two other CoCoon
products on sale. These two units are designed for an always-on broadband
connection and are compatible with the Come On! MyCaster service.
Sony believes CoCoon will evolve into a home AV system that connects
households to the broadband network.
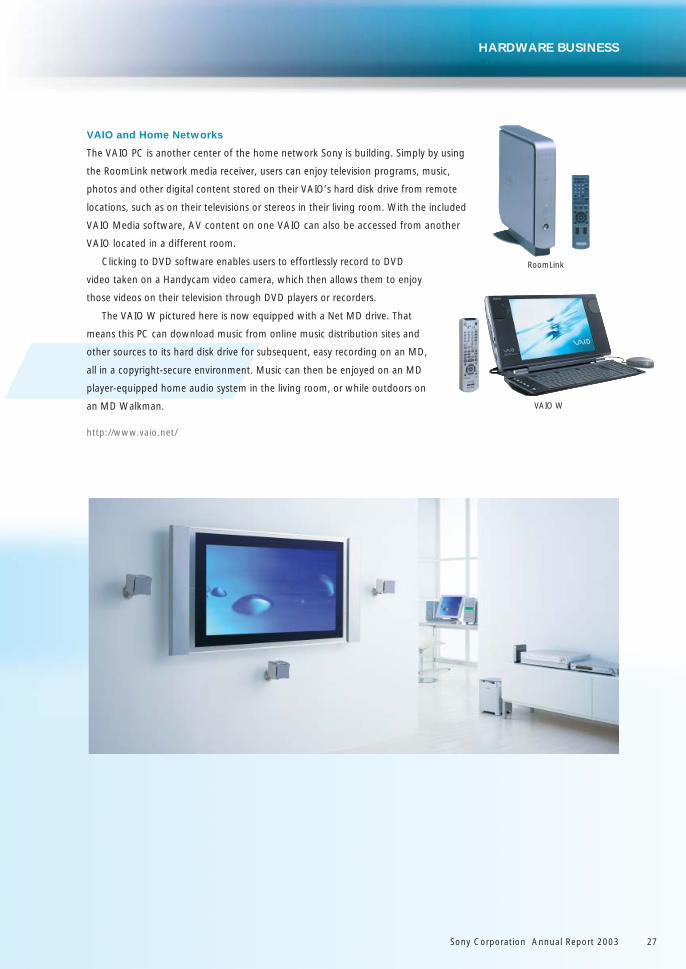
Wega Engine
The Wega Engine is an integrated digital high-quality system that encapsulates a wealth of sophisti-
cated Sony image processing expertise. Every image input into Wega Engine-equipped televisions is
digitized across the image processing circuit so as to prevent signal noise and degradation. The device
succeeds in optimizing Sony’s renowned picture enhancing capability. Sony has initiated introduction
of the Wega Engine from its high-end plasma, LCD, projection and CRT televisions, and these
products, with their extremely sharp and realistic images, that even have a sense of depth, have been
well received by consumers.
HARDWARE BUSINESS
Sony Corporation Annual Report 2003 25
CoCoon Channel Server
CoCoon Digital Recorder
CoCoon Home Theater System
DVD Recorder
The superior audiovisual quality of DVDs has made pre-recorded DVD-Videos of movies, concerts and
other types of content commonplace. Now it appears that recordable DVDs are also on the verge of
developing into a large market.
To enable playback compatibility with DVD players already sold, Sony has begun selling a DVD recorder
that can accommodate +RW, -RW and -R formats. The DVD recorder pictured here has a DV input jack
which enables users to record and edit onto DVDs material filmed on
Digital Handycam video cameras and other products.
Moreover, for PCs, Sony has introduced a rewritable drive that
is compatible with +RW, +R, -RW and -R formats. Market response
has been favorable.
By using discs as a recording medium, customers are able to
transfer, with ease, high-resolution video content from one device
to another. Now that the superior picture and sound quality of
DVDs, as well as their outstanding versatility, are easily accessible,
hopes are high that digital discs will take hold as the mainstream
of video recording in households. Indications also point to growing
use of DVDs as a high-capacity PC storage medium.
Blu-ray Disc
As digital broadcasting gains momentum, high resolution television programs have become accessible
to a growing number of households. This is fueling demand for a means of recording these high
definition broadcasts without losing any of their original quality. To meet this demand, nine
electronics manufacturers* in Japan, South Korea and Europe established the Blu-ray Disc format.
Sony began selling the world’s first Blu-ray Disc recorder in Japan in April 2003.
Each disc holds up to 23GB of data, equivalent to about five DVDs. A Blu-ray Disc can
store, at the same level of definition, about two hours of the digital high definition
broadcasting satellite programming that is available in Japan and about 12 hours of
that same programming at regular VHS level quality. The recorder also records the 5.1-
channel audio that accompanies the digital high definition broadcasting
satellite programming and users can enjoy that sound quality at play time
simply by using an amplifier that has an internally-equipped MPEG-2 AAC 5.1-
channel decoder. Moreover, the recorder comes with sophisticated copyright
protection technology that prevents unlawful duplication of contents.
* The nine companies are: Sony Corporation; Hitachi, Ltd.; LG Electronics Inc.; Matsushita Electric Industrial Co., Ltd.;Pioneer Corporation; Royal Philips Electronics; Samsung Electronics Co., Ltd.; Sharp Corporation; and Thomson.
Sony Corporation Annual Report 200326
DVD Recorder
DVD/CD Rewritable Drive
Sony Corporation Annual Report 2003 27
HARDWARE BUSINESS
VAIO and Home Networks
The VAIO PC is another center of the home network Sony is building. Simply by using
the RoomLink network media receiver, users can enjoy television programs, music,
photos and other digital content stored on their VAIO’s hard disk drive from remote
locations, such as on their televisions or stereos in their living room. With the included
VAIO Media software, AV content on one VAIO can also be accessed from another
VAIO located in a different room.
Clicking to DVD software enables users to effortlessly record to DVD
video taken on a Handycam video camera, which then allows them to enjoy
those videos on their television through DVD players or recorders.
The VAIO W pictured here is now equipped with a Net MD drive. That
means this PC can download music from online music distribution sites and
other sources to its hard disk drive for subsequent, easy recording on an MD,
all in a copyright-secure environment. Music can then be enjoyed on an MD
player-equipped home audio system in the living room, or while outdoors on
an MD Walkman.
http://www.vaio.net/
RoomLink
VAIO W
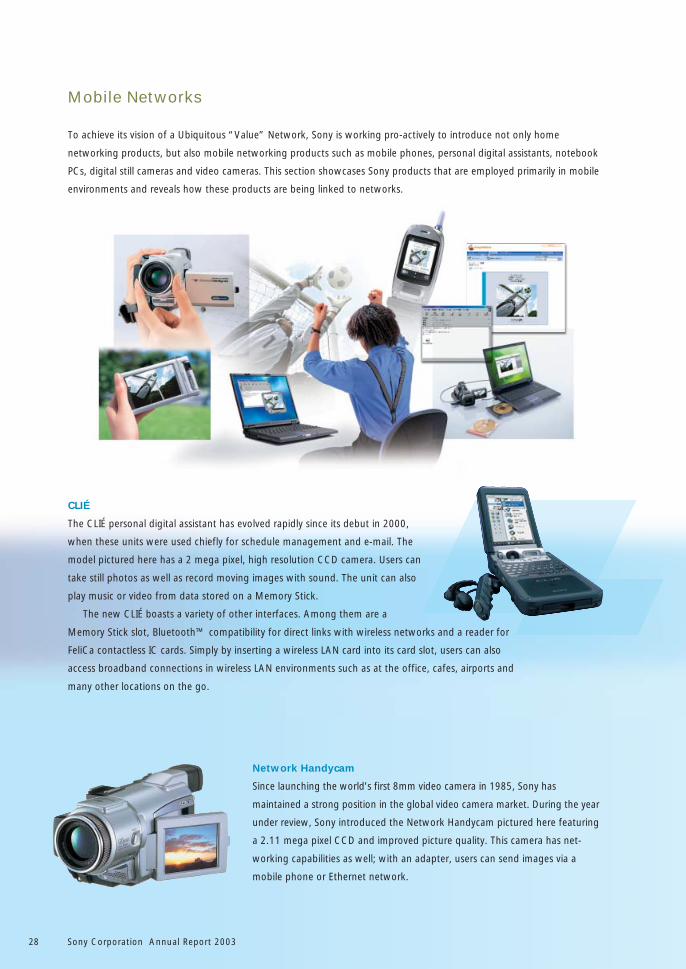
To achieve its vision of a Ubiquitous “Value” Network, Sony is working pro-actively to introduce not only home
networking products, but also mobile networking products such as mobile phones, personal digital assistants, notebook
PCs, digital still cameras and video cameras. This section showcases Sony products that are employed primarily in mobile
environments and reveals how these products are being linked to networks.
CLIÉ
The CLIÉ personal digital assistant has evolved rapidly since its debut in 2000,
when these units were used chiefly for schedule management and e-mail. The
model pictured here has a 2 mega pixel, high resolution CCD camera. Users can
take still photos as well as record moving images with sound. The unit can also
play music or video from data stored on a Memory Stick.
The new CLIÉ boasts a variety of other interfaces. Among them are a
Memory Stick slot, Bluetooth™ compatibility for direct links with wireless networks and a reader for
FeliCa contactless IC cards. Simply by inserting a wireless LAN card into its card slot, users can also
access broadband connections in wireless LAN environments such as at the office, cafes, airports and
many other locations on the go.
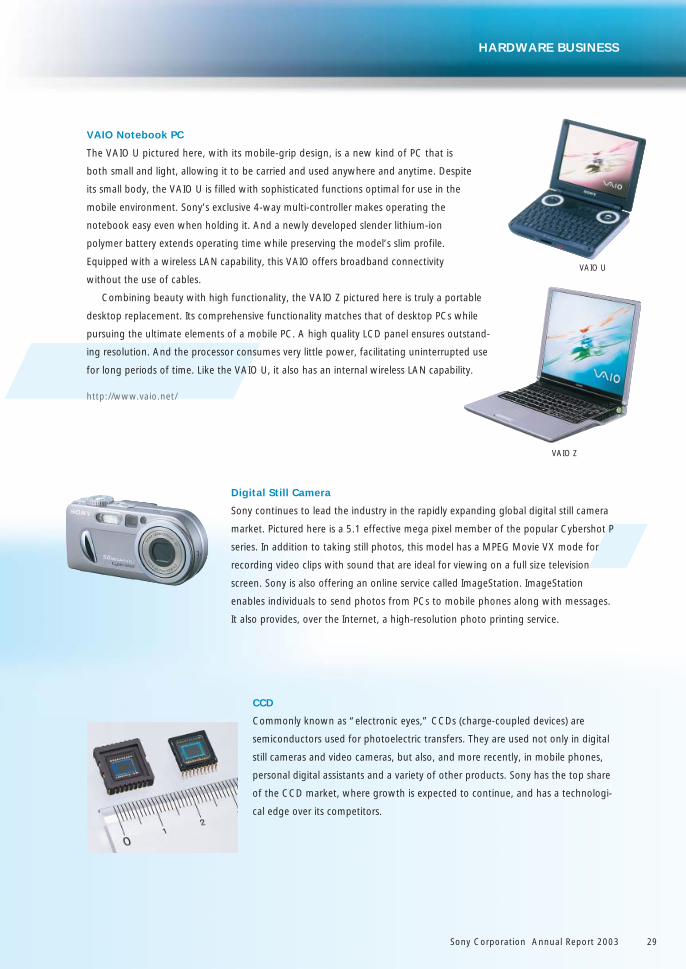
Network Handycam
Since launching the world’s first 8mm video camera in 1985, Sony has
maintained a strong position in the global video camera market. During the year
under review, Sony introduced the Network Handycam pictured here featuring
a 2.11 mega pixel CCD and improved picture quality. This camera has net-
working capabilities as well; with an adapter, users can send images via a
mobile phone or Ethernet network.
Mobile Networks
Sony Corporation Annual Report 200328
VAIO Notebook PC
The VAIO U pictured here, with its mobile-grip design, is a new kind of PC that is
both small and light, allowing it to be carried and used anywhere and anytime. Despite
its small body, the VAIO U is filled with sophisticated functions optimal for use in the
mobile environment. Sony’s exclusive 4-way multi-controller makes operating the
notebook easy even when holding it. And a newly developed slender lithium-ion
polymer battery extends operating time while preserving the model’s slim profile.
Equipped with a wireless LAN capability, this VAIO offers broadband connectivity
without the use of cables.
Combining beauty with high functionality, the VAIO Z pictured here is truly a portable
desktop replacement. Its comprehensive functionality matches that of desktop PCs while
pursuing the ultimate elements of a mobile PC. A high quality LCD panel ensures outstand-
ing resolution. And the processor consumes very little power, facilitating uninterrupted use
for long periods of time. Like the VAIO U, it also has an internal wireless LAN capability.
http://www.vaio.net/
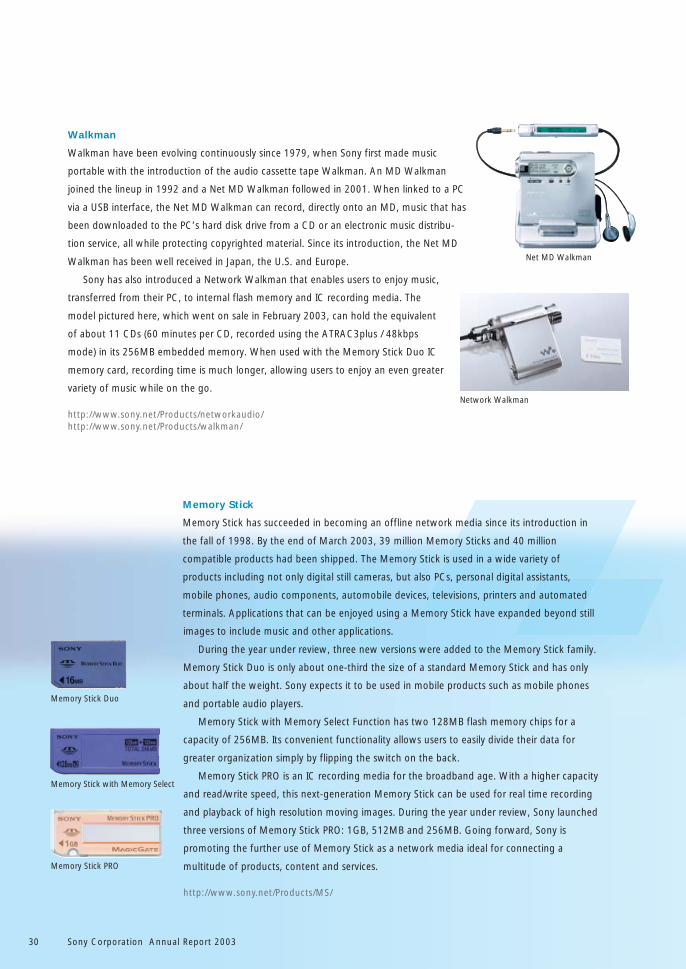
Digital Still Camera
Sony continues to lead the industry in the rapidly expanding global digital still camera
market. Pictured here is a 5.1 effective mega pixel member of the popular Cybershot P
series. In addition to taking still photos, this model has a MPEG Movie VX mode for
recording video clips with sound that are ideal for viewing on a full size television
screen. Sony is also offering an online service called ImageStation. ImageStation
enables individuals to send photos from PCs to mobile phones along with messages.
It also provides, over the Internet, a high-resolution photo printing service.
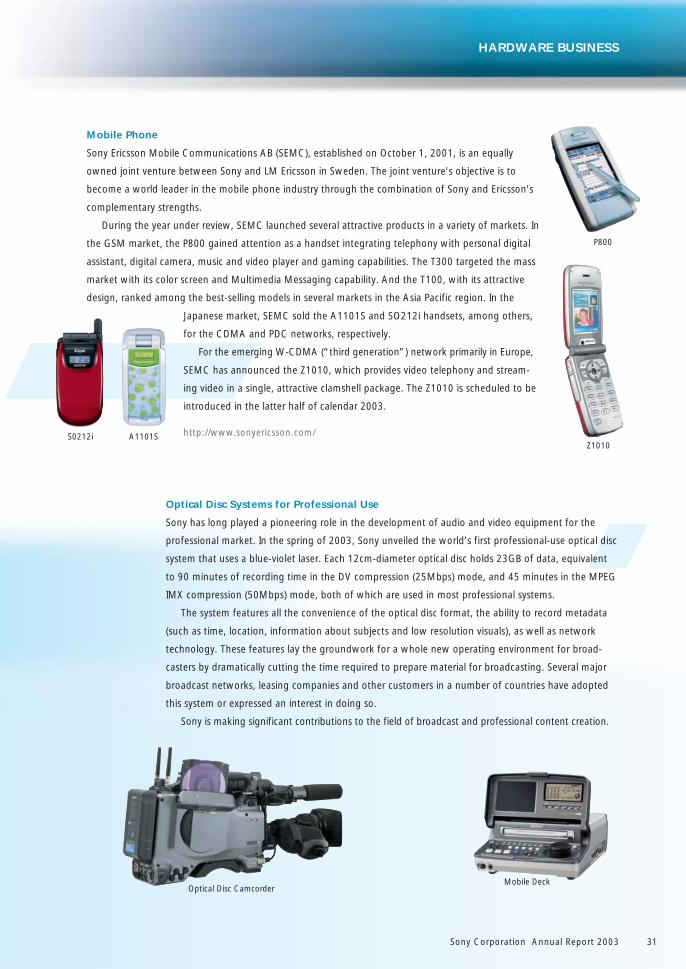
CCD
Commonly known as “electronic eyes,” CCDs (charge-coupled devices) are
semiconductors used for photoelectric transfers. They are used not only in digital
still cameras and video cameras, but also, and more recently, in mobile phones,
personal digital assistants and a variety of other products. Sony has the top share
of the CCD market, where growth is expected to continue, and has a technologi-
cal edge over its competitors.
Sony Corporation Annual Report 2003 29
HARDWARE BUSINESS
VAIO Z
VAIO U
Walkman
Walkman have been evolving continuously since 1979, when Sony first made music
portable with the introduction of the audio cassette tape Walkman. An MD Walkman
joined the lineup in 1992 and a Net MD Walkman followed in 2001. When linked to a PC
via a USB interface, the Net MD Walkman can record, directly onto an MD, music that has
been downloaded to the PC’s hard disk drive from a CD or an electronic music distribu-
tion service, all while protecting copyrighted material. Since its introduction, the Net MD
Walkman has been well received in Japan, the U.S. and Europe.
Sony has also introduced a Network Walkman that enables users to enjoy music,
transferred from their PC, to internal flash memory and IC recording media. The
model pictured here, which went on sale in February 2003, can hold the equivalent
of about 11 CDs (60 minutes per CD, recorded using the ATRAC3plus / 48kbps
mode) in its 256MB embedded memory. When used with the Memory Stick Duo IC
memory card, recording time is much longer, allowing users to enjoy an even greater
variety of music while on the go.
http://www.sony.net/Products/networkaudio/http://www.sony.net/Products/walkman/
Memory Stick
Memory Stick has succeeded in becoming an offline network media since its introduction in
the fall of 1998. By the end of March 2003, 39 million Memory Sticks and 40 million
compatible products had been shipped. The Memory Stick is used in a wide variety of
products including not only digital still cameras, but also PCs, personal digital assistants,
mobile phones, audio components, automobile devices, televisions, printers and automated
terminals. Applications that can be enjoyed using a Memory Stick have expanded beyond still
images to include music and other applications.
During the year under review, three new versions were added to the Memory Stick family.
Memory Stick Duo is only about one-third the size of a standard Memory Stick and has only
about half the weight. Sony expects it to be used in mobile products such as mobile phones
and portable audio players.
Memory Stick with Memory Select Function has two 128MB flash memory chips for a
capacity of 256MB. Its convenient functionality allows users to easily divide their data for
greater organization simply by flipping the switch on the back.
Memory Stick PRO is an IC recording media for the broadband age. With a higher capacity
and read/write speed, this next-generation Memory Stick can be used for real time recording
and playback of high resolution moving images. During the year under review, Sony launched
three versions of Memory Stick PRO: 1GB, 512MB and 256MB. Going forward, Sony is
promoting the further use of Memory Stick as a network media ideal for connecting a
multitude of products, content and services.
http://www.sony.net/Products/MS/
Memory Stick PRO
Memory Stick with Memory Select
Memory Stick Duo
Sony Corporation Annual Report 200330
Net MD Walkman
Network Walkman
Sony Corporation Annual Report 2003 31
Optical Disc Systems for Professional Use
Sony has long played a pioneering role in the development of audio and video equipment for the
professional market. In the spring of 2003, Sony unveiled the world’s first professional-use optical disc
system that uses a blue-violet laser. Each 12cm-diameter optical disc holds 23GB of data, equivalent
to 90 minutes of recording time in the DV compression (25Mbps) mode, and 45 minutes in the MPEG
IMX compression (50Mbps) mode, both of which are used in most professional systems.
The system features all the convenience of the optical disc format, the ability to record metadata
(such as time, location, information about subjects and low resolution visuals), as well as network
technology. These features lay the groundwork for a whole new operating environment for broad-
casters by dramatically cutting the time required to prepare material for broadcasting. Several major
broadcast networks, leasing companies and other customers in a number of countries have adopted
this system or expressed an interest in doing so.
Sony is making significant contributions to the field of broadcast and professional content creation.
Mobile Phone
Sony Ericsson Mobile Communications AB (SEMC), established on October 1, 2001, is an equally
owned joint venture between Sony and LM Ericsson in Sweden. The joint venture’s objective is to
become a world leader in the mobile phone industry through the combination of Sony and Ericsson’s
complementary strengths.
During the year under review, SEMC launched several attractive products in a variety of markets. In
the GSM market, the P800 gained attention as a handset integrating telephony with personal digital
assistant, digital camera, music and video player and gaming capabilities. The T300 targeted the mass
market with its color screen and Multimedia Messaging capability. And the T100, with its attractive
design, ranked among the best-selling models in several markets in the Asia Pacific region. In the
Japanese market, SEMC sold the A1101S and SO212i handsets, among others,
for the CDMA and PDC networks, respectively.
For the emerging W-CDMA (“third generation”) network primarily in Europe,
SEMC has announced the Z1010, which provides video telephony and stream-
ing video in a single, attractive clamshell package. The Z1010 is scheduled to be
introduced in the latter half of calendar 2003.
http://www.sonyericsson.com/
HARDWARE BUSINESS
S0212i A1101SZ1010
P800
Optical Disc CamcorderMobile Deck
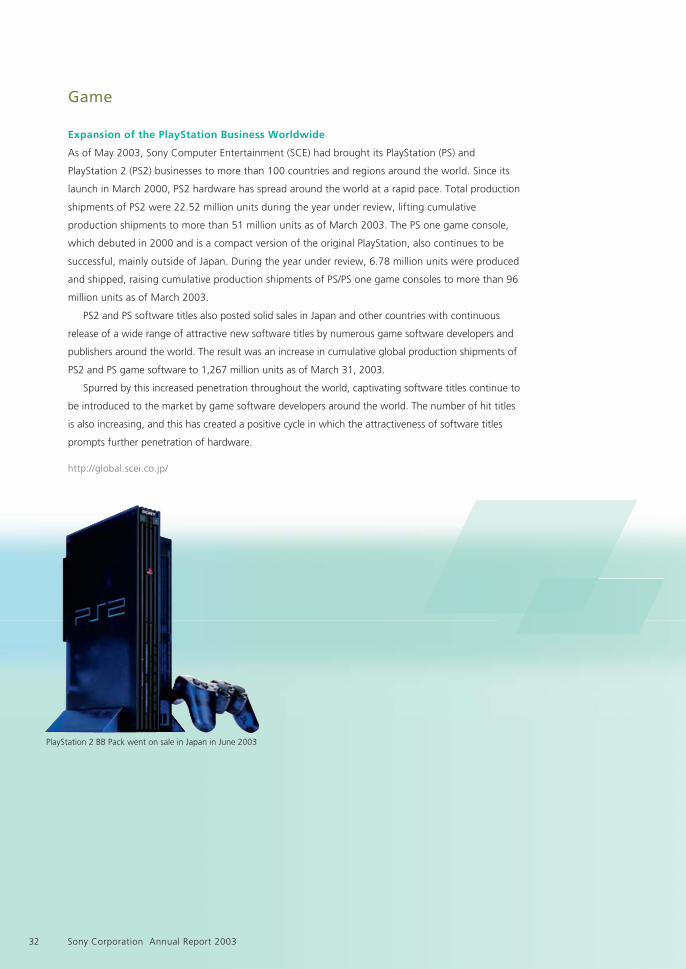
Expansion of the PlayStation Business Worldwide
As of May 2003, Sony Computer Entertainment (SCE) had brought its PlayStation (PS) and
PlayStation 2 (PS2) businesses to more than 100 countries and regions around the world. Since its
launch in March 2000, PS2 hardware has spread around the world at a rapid pace. Total production
shipments of PS2 were 22.52 million units during the year under review, lifting cumulative
production shipments to more than 51 million units as of March 2003. The PS one game console,
which debuted in 2000 and is a compact version of the original PlayStation, also continues to be
successful, mainly outside of Japan. During the year under review, 6.78 million units were produced
and shipped, raising cumulative production shipments of PS/PS one game consoles to more than 96
million units as of March 2003.
PS2 and PS software titles also posted solid sales in Japan and other countries with continuous
release of a wide range of attractive new software titles by numerous game software developers and
publishers around the world. The result was an increase in cumulative global production shipments of
PS2 and PS game software to 1,267 million units as of March 31, 2003.
Spurred by this increased penetration throughout the world, captivating software titles continue to
be introduced to the market by game software developers around the world. The number of hit titles
is also increasing, and this has created a positive cycle in which the attractiveness of software titles
prompts further penetration of hardware.
http://global.scei.co.jp/
Game
Sony Corporation Annual Report 200332
PlayStation 2 BB Pack went on sale in Japan in June 2003
GAME BUSINESS
Continued Robust Growth in Software Unit Sales
Many PS2 and PS software became hits during the year under review. In Japan, hits included Final
Fantasy X-2 from former Square Co., Ltd. (Square Enix Co., Ltd.); WORLD SOCCER WINNING ELEVEN
6 by KONAMI CORPORATION; and Dynasty Warriors 4 by KOEI Co., Ltd. A number of mega hits
emerged in both North America and Europe: Grand Theft Auto: Vice City by Take-Two Interactive
Software Inc.; Medal of Honor: Frontline, Madden NFL 2003 and The Lord of the Rings, The Two
Towers by Electronic Arts Inc.; and Kingdom Hearts by former Square Electronic Arts L.L.C. (Square
Enix U.S.A. Inc.). Among SCE’s own titles, Gran Turismo 3 A-spec, which was released in 2001, shipped
more than three million units during the year under review alone with cumulative shipments topping
11 million units worldwide. The Getaway, another SCE hit, saw its shipments surpass two million units.
Sony Corporation Annual Report 2003 33
Minna no GOLF online
PS2’s Foray into Broadband
SCE is building a world in which users can enjoy online games and other network services by
connecting PS2 to a broadband network.
In Japan, SCE started the PlayStation BB service in May 2002, enabling users to play online games
and access other services on televisions by connecting PS2 to a broadband network. In June 2003, to
make this service even more popular, SCE began selling, through a wider range of channels, the
accessories necessary for connecting PS2 to networks. About 40 online game titles are planned for
release during the fiscal year ending March 31, 2004.
In North America, in August 2002, SCE launched Network Adaptor, a device designed specifically
to connect PS2 to networks. By the end of March 2003, more than one million units had been
shipped, contributing to a surge in the number of online gamers. In Europe and South Korea, a trial
online game service using Network Adaptor started in April 2003. Full-scale sales of Network Adaptor
are expected soon.
Working together with game developers and publishers and other companies, SCE will continue to
offer new forms of entertainment through networks.
Sony Corporation Annual Report 200334
In-House Production of Advanced LSIs
Advanced LSIs, such as the EmotionEngine (EE) and Graphics Synthesizer (GS), used in the PS2 as its CPU
and graphics rendering processor, are produced by SCE at in-house semiconductor fabrication facilities.
Since 1999, SCE has invested approximately 300 billion yen, starting with an investment in 180
nanometer process fabrication capacity and moving to the introduction of a 90 nanometer process
fabrication line. Through the use of this cutting edge technology, SCE will begin production during
the fiscal year ending March 31, 2004 of a super LSI that combines EE and GS on a single chip.
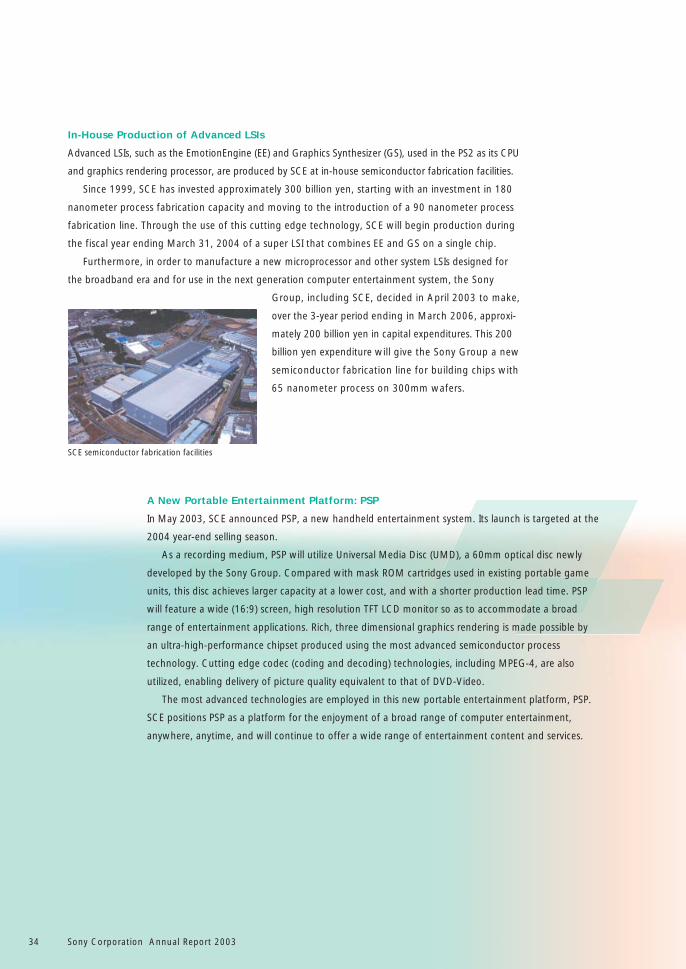
Furthermore, in order to manufacture a new microprocessor and other system LSIs designed for
the broadband era and for use in the next generation computer entertainment system, the Sony
Group, including SCE, decided in April 2003 to make,
over the 3-year period ending in March 2006, approxi-
mately 200 billion yen in capital expenditures. This 200
billion yen expenditure will give the Sony Group a new
semiconductor fabrication line for building chips with
65 nanometer process on 300mm wafers.
A New Portable Entertainment Platform: PSP
In May 2003, SCE announced PSP, a new handheld entertainment system. Its launch is targeted at the
2004 year-end selling season.
As a recording medium, PSP will utilize Universal Media Disc (UMD), a 60mm optical disc newly
developed by the Sony Group. Compared with mask ROM cartridges used in existing portable game
units, this disc achieves larger capacity at a lower cost, and with a shorter production lead time. PSP
will feature a wide (16:9) screen, high resolution TFT LCD monitor so as to accommodate a broad
range of entertainment applications. Rich, three dimensional graphics rendering is made possible by
an ultra-high-performance chipset produced using the most advanced semiconductor process
technology. Cutting edge codec (coding and decoding) technologies, including MPEG-4, are also
utilized, enabling delivery of picture quality equivalent to that of DVD-Video.
The most advanced technologies are employed in this new portable entertainment platform, PSP.
SCE positions PSP as a platform for the enjoyment of a broad range of computer entertainment,
anywhere, anytime, and will continue to offer a wide range of entertainment content and services.
SCE semiconductor fabrication facilities
INTERNET SERVICE PROVIDER
So-net
Since launching its service in January 1996, Sony Communication Network Corporation (SCN), the provider of the So-net
Internet service, has delivered a variety of services including high quality connectivity and the distribution of unique
and attractive content.
In the year under review, although the trend toward always-on broadband service continued to evolve, thereby
expanding the opportunity to do business, pricing and service competition among service providers intensified.
In response, SCN enlarged the menu of services available through So-net to include ADSL, FTTH (Fiber-to-the-Home)
and mobile (wireless connection) network access. In the content domain, SCN started a number of services such as the
provision of broadband content including EverQuest, a popular online game, and So-net TV, a 24-hour streaming video
channel. Tie-ups with other Sony Group companies were also initiated. One was the sale to So-net subscribers of a
broadband AV router, integral to making the home network a reality. Another was the provision of discounts to
subscribers holding the My Sony Card. Thanks to these activities, the number of registered So-net users reached 2.3
million at the end of March 2003, with the number of broadband service subscribers among those reaching 420,000.
Going forward, SCN will strengthen partnerships within the Sony Group (with the Electronics, Game, Music,
Pictures and Financial Services segments) to heighten Sony’s profile as a premier provider of broadband services, all in
an attempt to link the Sony name with user enjoyment of broadband networks.
Sony Corporation Annual Report 2003 35
Internet Service Provider
©2003 Sony Communication Network Corporation

Music
Sony Corporation Annual Report 200336
Dixie Chicks Celine Dion Shakira Jennifer Lopez
Las Ketchup Bruce Springsteen John Mayer Audioslave
Sony Music Entertainment Overview
During the year under review, Sony Music Entertainment Inc. (SMEI) continued worldwide restructur-
ing efforts designed to reduce costs and streamline the organization. At the direction of its newly
appointed Chairman and CEO, Andrew Lack, these efforts were dramatically accelerated. SMEI has
created a new shared services model for its various labels and business units by consolidating
functions such as sales, international marketing services, licensing activities and financial and
administrative services.
With a global market share of 16.5%, SMEI remained the world’s second largest producer,
manufacturer and marketer of recorded music and video. SMEI sold more than 330 million units
worldwide, led by multimillion sales of recordings by the Dixie Chicks, Celine Dion, Jennifer Lopez,
Bruce Springsteen and John Mayer. Fifty other albums, 20% by debut artists, sold between 500,000
and two million units.
http://usa.sonymusic.com/international.html
Sony Music’s Measures to Counteract Piracy
Worldwide sales of recorded music fell 7% in value (to 32 billion U.S. dollars) and 8% in units during
calendar 2002 due to piracy, unauthorized file sharing and CD burning, the third consecutive year of
declining sales for the industry.
The music industry responded with a variety of education campaigns, alerting the corporate and
university communities to the use of their networks for illegal online file trading, and utilizing Instant
Messaging (IM) capabilities on unauthorized file trading networks to notify individuals of the potential
legal consequences of illegally downloading music files. The industry also expanded ongoing
enforcement and litigation efforts.
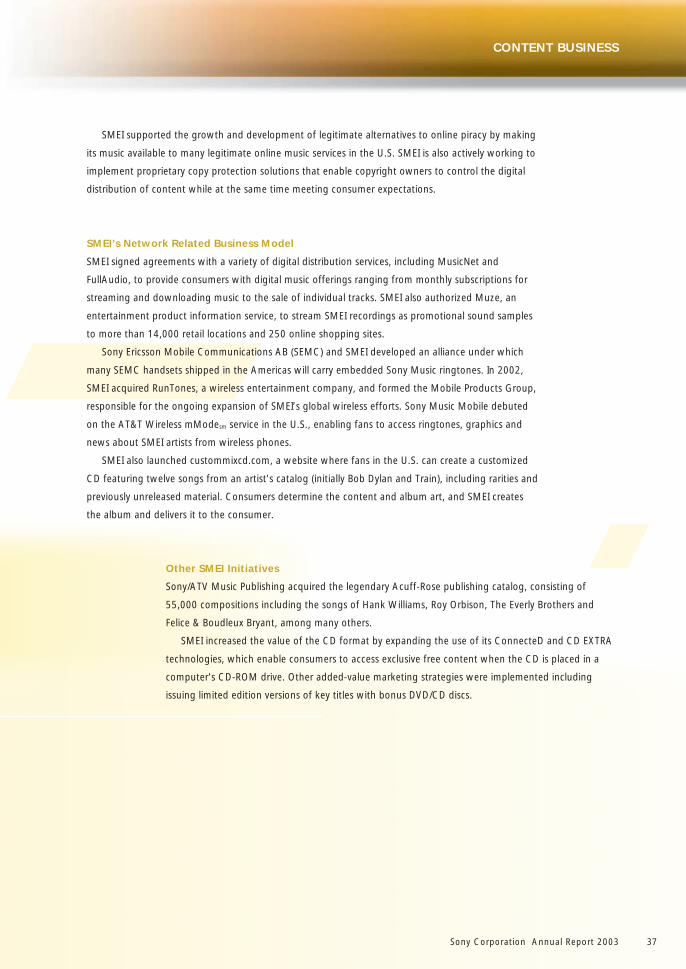
SMEI supported the growth and development of legitimate alternatives to online piracy by making
its music available to many legitimate online music services in the U.S. SMEI is also actively working to
implement proprietary copy protection solutions that enable copyright owners to control the digital
distribution of content while at the same time meeting consumer expectations.
SMEI’s Network Related Business Model
SMEI signed agreements with a variety of digital distribution services, including MusicNet and
FullAudio, to provide consumers with digital music offerings ranging from monthly subscriptions for
streaming and downloading music to the sale of individual tracks. SMEI also authorized Muze, an
entertainment product information service, to stream SMEI recordings as promotional sound samples
to more than 14,000 retail locations and 250 online shopping sites.
Sony Ericsson Mobile Communications AB (SEMC) and SMEI developed an alliance under which
many SEMC handsets shipped in the Americas will carry embedded Sony Music ringtones. In 2002,
SMEI acquired RunTones, a wireless entertainment company, and formed the Mobile Products Group,
responsible for the ongoing expansion of SMEI’s global wireless efforts. Sony Music Mobile debuted
on the AT&T Wireless mModesm service in the U.S., enabling fans to access ringtones, graphics and
news about SMEI artists from wireless phones.
SMEI also launched custommixcd.com, a website where fans in the U.S. can create a customized
CD featuring twelve songs from an artist’s catalog (initially Bob Dylan and Train), including rarities and
previously unreleased material. Consumers determine the content and album art, and SMEI creates
the album and delivers it to the consumer.
CONTENT BUSINESS
Sony Corporation Annual Report 2003 37
Other SMEI Initiatives
Sony/ATV Music Publishing acquired the legendary Acuff-Rose publishing catalog, consisting of
55,000 compositions including the songs of Hank Williams, Roy Orbison, The Everly Brothers and
Felice & Boudleux Bryant, among many others.
SMEI increased the value of the CD format by expanding the use of its ConnecteD and CD EXTRA
technologies, which enable consumers to access exclusive free content when the CD is placed in a
computer’s CD-ROM drive. Other added-value marketing strategies were implemented including
issuing limited edition versions of key titles with bonus DVD/CD discs.

Sony Music Entertainment (Japan) (SMEJ)
Even as Japan’s recorded music market continued to shrink, SMEJ kept its number-one position.
Highlighting the year’s accomplishments were dramatic successes in the development of new artists.
CHEMISTRY’s Second to None was Japan’s best-selling album of the year, while Mika Nakashima’s
first album, TRUE, hit the million mark shortly following its release. Furthermore, Chitose Hajime, said
to have a voice that only comes along once in a century, has been generating strong sales for a long
time with her debut album, Wadatsumi no Ki.
SMEJ also retained an aggressive stance regarding new business development. In 1999, SMEJ was
first in its industry to launch an Internet music download site, using the brand name “bitmusic,” that
protects copyrighted material. Sales through “bitmusic” have been rising in step with the growth of
broadband services in Japan. Building upon this network-based music distribution service, in January
2003, SMEJ began selling Labelgate CDs designed specifically for the demands of a network-based
society. Breaking new ground again, SMEJ in December 2002 launched Chaku-Uta, the world’s first
service dedicated to selling music created by artists specifically for the ringtones of mobile phones.
Downloads of SMEJ songs from this site cumulative to March 31, 2003 surpassed 1.5 million. The
success of this service has attracted attention not only from other members of the music industry but
from the IT industry as well.
http://www.sonymusic.co.jp/eng/
Sony Corporation Annual Report 200338
CHEMISTRY Chitose Hajime Mika Nakashima
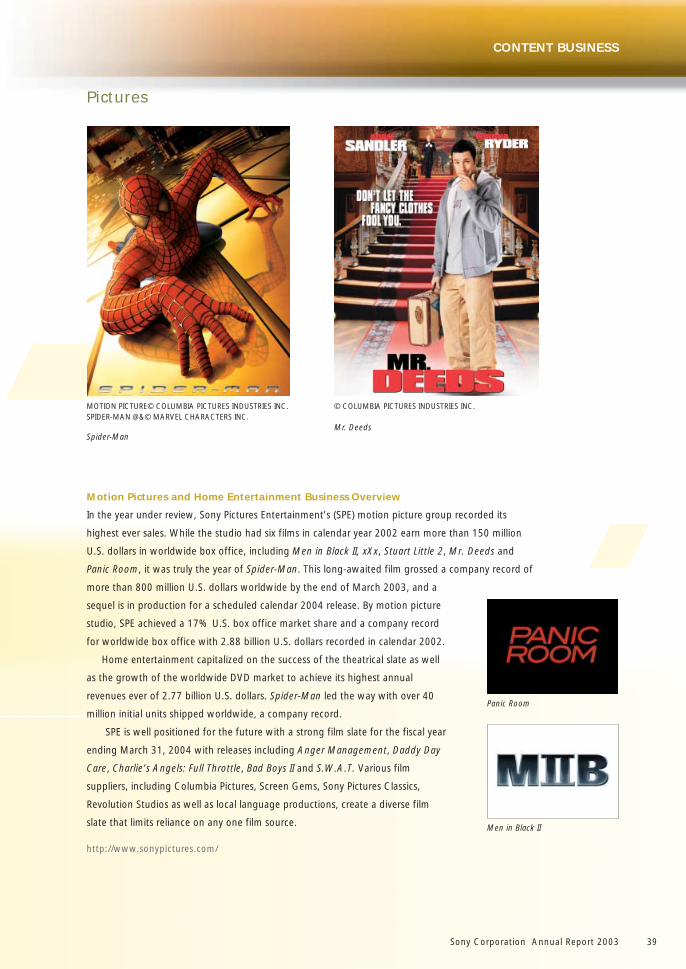
Motion Pictures and Home Entertainment Business Overview
In the year under review, Sony Pictures Entertainment’s (SPE) motion picture group recorded its
highest ever sales. While the studio had six films in calendar year 2002 earn more than 150 million
U.S. dollars in worldwide box office, including Men in Black II, xXx, Stuart Little 2, Mr. Deeds and
Panic Room, it was truly the year of Spider-Man. This long-awaited film grossed a company record of
more than 800 million U.S. dollars worldwide by the end of March 2003, and a
sequel is in production for a scheduled calendar 2004 release. By motion picture
studio, SPE achieved a 17% U.S. box office market share and a company record
for worldwide box office with 2.88 billion U.S. dollars recorded in calendar 2002.
Home entertainment capitalized on the success of the theatrical slate as well
as the growth of the worldwide DVD market to achieve its highest annual
revenues ever of 2.77 billion U.S. dollars. Spider-Man led the way with over 40
million initial units shipped worldwide, a company record.
SPE is well positioned for the future with a strong film slate for the fiscal year
ending March 31, 2004 with releases including Anger Management, Daddy Day
Care, Charlie’s Angels: Full Throttle, Bad Boys II and S.W.A.T. Various film
suppliers, including Columbia Pictures, Screen Gems, Sony Pictures Classics,
Revolution Studios as well as local language productions, create a diverse film
slate that limits reliance on any one film source.
http://www.sonypictures.com/
Pictures
Sony Corporation Annual Report 2003 39
CONTENT BUSINESS
Spider-ManMr. Deeds
MOTION PICTURE© COLUMBIA PICTURES INDUSTRIES INC.SPIDER-MAN @&© MARVEL CHARACTERS INC.
Panic Room
Men in Black II
© COLUMBIA PICTURES INDUSTRIES INC.
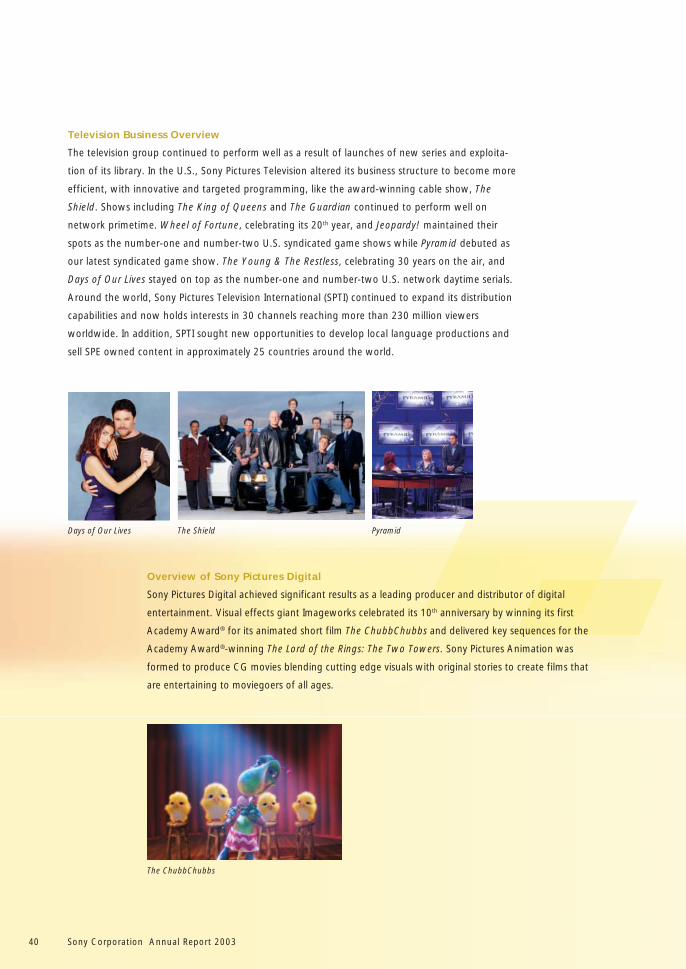
Television Business Overview
The television group continued to perform well as a result of launches of new series and exploita-
tion of its library. In the U.S., Sony Pictures Television altered its business structure to become more
efficient, with innovative and targeted programming, like the award-winning cable show, The
Shield. Shows including The King of Queens and The Guardian continued to perform well on
network primetime. Wheel of Fortune, celebrating its 20th year, and Jeopardy! maintained their
spots as the number-one and number-two U.S. syndicated game shows while Pyramid debuted as
our latest syndicated game show. The Young & The Restless, celebrating 30 years on the air, and
Days of Our Lives stayed on top as the number-one and number-two U.S. network daytime serials.
Around the world, Sony Pictures Television International (SPTI) continued to expand its distribution
capabilities and now holds interests in 30 channels reaching more than 230 million viewers
worldwide. In addition, SPTI sought new opportunities to develop local language productions and
sell SPE owned content in approximately 25 countries around the world.
Overview of Sony Pictures Digital
Sony Pictures Digital achieved significant results as a leading producer and distributor of digital
entertainment. Visual effects giant Imageworks celebrated its 10th anniversary by winning its first
Academy Award® for its animated short film The ChubbChubbs and delivered key sequences for the
Academy Award®-winning The Lord of the Rings: The Two Towers. Sony Pictures Animation was
formed to produce CG movies blending cutting edge visuals with original stories to create films that
are entertaining to moviegoers of all ages.
Sony Corporation Annual Report 200340
Days of Our Lives The Shield Pyramid
The ChubbChubbs
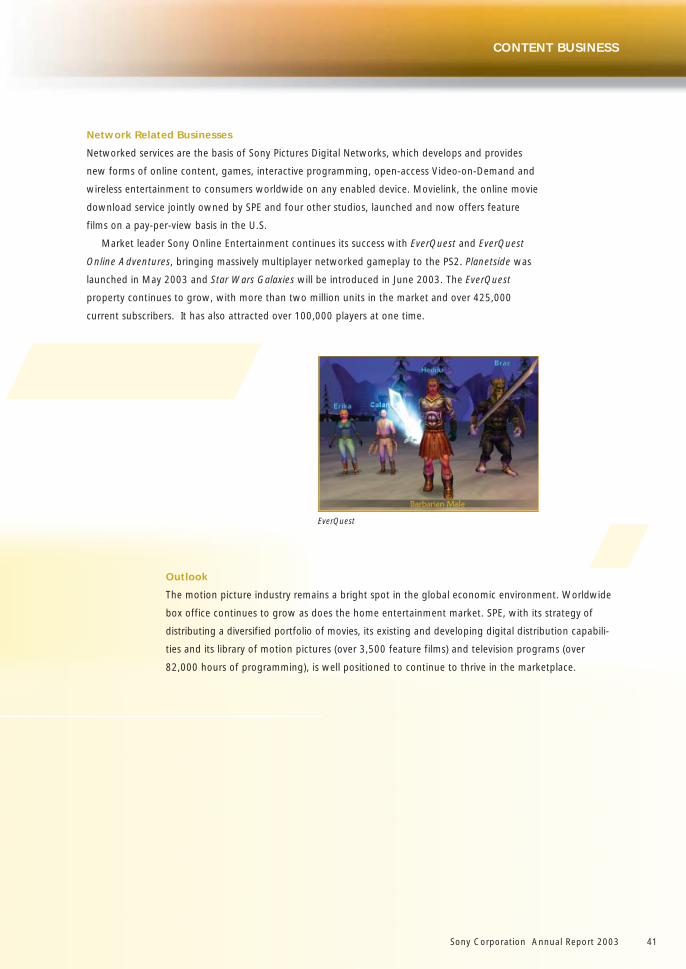
Network Related Businesses
Networked services are the basis of Sony Pictures Digital Networks, which develops and provides
new forms of online content, games, interactive programming, open-access Video-on-Demand and
wireless entertainment to consumers worldwide on any enabled device. Movielink, the online movie
download service jointly owned by SPE and four other studios, launched and now offers feature
films on a pay-per-view basis in the U.S.
Market leader Sony Online Entertainment continues its success with EverQuest and EverQuest
Online Adventures, bringing massively multiplayer networked gameplay to the PS2. Planetside was
launched in May 2003 and Star Wars Galaxies will be introduced in June 2003. The EverQuest
property continues to grow, with more than two million units in the market and over 425,000
current subscribers. It has also attracted over 100,000 players at one time.
Sony Corporation Annual Report 2003 41
CONTENT BUSINESS
Outlook
The motion picture industry remains a bright spot in the global economic environment. Worldwide
box office continues to grow as does the home entertainment market. SPE, with its strategy of
distributing a diversified portfolio of movies, its existing and developing digital distribution capabili-
ties and its library of motion pictures (over 3,500 feature films) and television programs (over
82,000 hours of programming), is well positioned to continue to thrive in the marketplace.
EverQuest
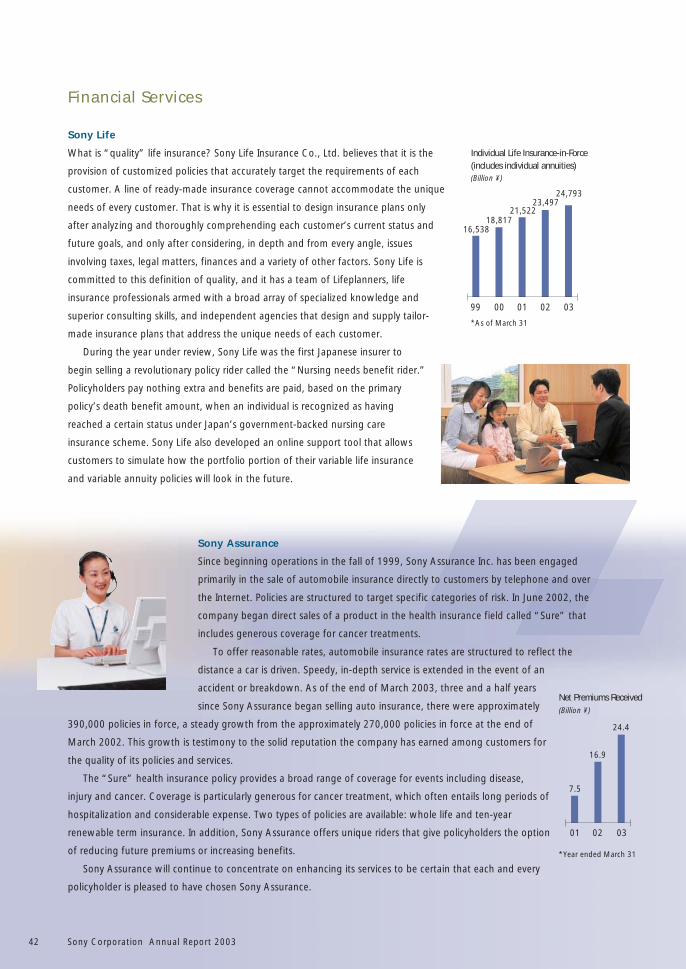
Sony Life
What is “quality” life insurance? Sony Life Insurance Co., Ltd. believes that it is the
provision of customized policies that accurately target the requirements of each
customer. A line of ready-made insurance coverage cannot accommodate the unique
needs of every customer. That is why it is essential to design insurance plans only
after analyzing and thoroughly comprehending each customer’s current status and
future goals, and only after considering, in depth and from every angle, issues
involving taxes, legal matters, finances and a variety of other factors. Sony Life is
committed to this definition of quality, and it has a team of Lifeplanners, life
insurance professionals armed with a broad array of specialized knowledge and
superior consulting skills, and independent agencies that design and supply tailor-
made insurance plans that address the unique needs of each customer.
During the year under review, Sony Life was the first Japanese insurer to
begin selling a revolutionary policy rider called the “Nursing needs benefit rider.”
Policyholders pay nothing extra and benefits are paid, based on the primary
policy’s death benefit amount, when an individual is recognized as having
reached a certain status under Japan’s government-backed nursing care
insurance scheme. Sony Life also developed an online support tool that allows
customers to simulate how the portfolio portion of their variable life insurance
and variable annuity policies will look in the future.
Sony Assurance
Since beginning operations in the fall of 1999, Sony Assurance Inc. has been engaged
primarily in the sale of automobile insurance directly to customers by telephone and over
the Internet. Policies are structured to target specific categories of risk. In June 2002, the
company began direct sales of a product in the health insurance field called “Sure” that
includes generous coverage for cancer treatments.
To offer reasonable rates, automobile insurance rates are structured to reflect the
distance a car is driven. Speedy, in-depth service is extended in the event of an
accident or breakdown. As of the end of March 2003, three and a half years
since Sony Assurance began selling auto insurance, there were approximately
390,000 policies in force, a steady growth from the approximately 270,000 policies in force at the end of
March 2002. This growth is testimony to the solid reputation the company has earned among customers for
the quality of its policies and services.
The “Sure” health insurance policy provides a broad range of coverage for events including disease,
injury and cancer. Coverage is particularly generous for cancer treatment, which often entails long periods of
hospitalization and considerable expense. Two types of policies are available: whole life and ten-year
renewable term insurance. In addition, Sony Assurance offers unique riders that give policyholders the option
of reducing future premiums or increasing benefits.
Sony Assurance will continue to concentrate on enhancing its services to be certain that each and every
policyholder is pleased to have chosen Sony Assurance.
Financial Services
Sony Corporation Annual Report 200342
Individual Life Insurance-in-Force(includes individual annuities)(Billion ¥)
99 00 01 02 03
21,522
24,79323,497
18,81716,538
01 02 03
7.5
24.4
16.9
Net Premiums Received(Billion ¥)
*As of March 31
*Year ended March 31
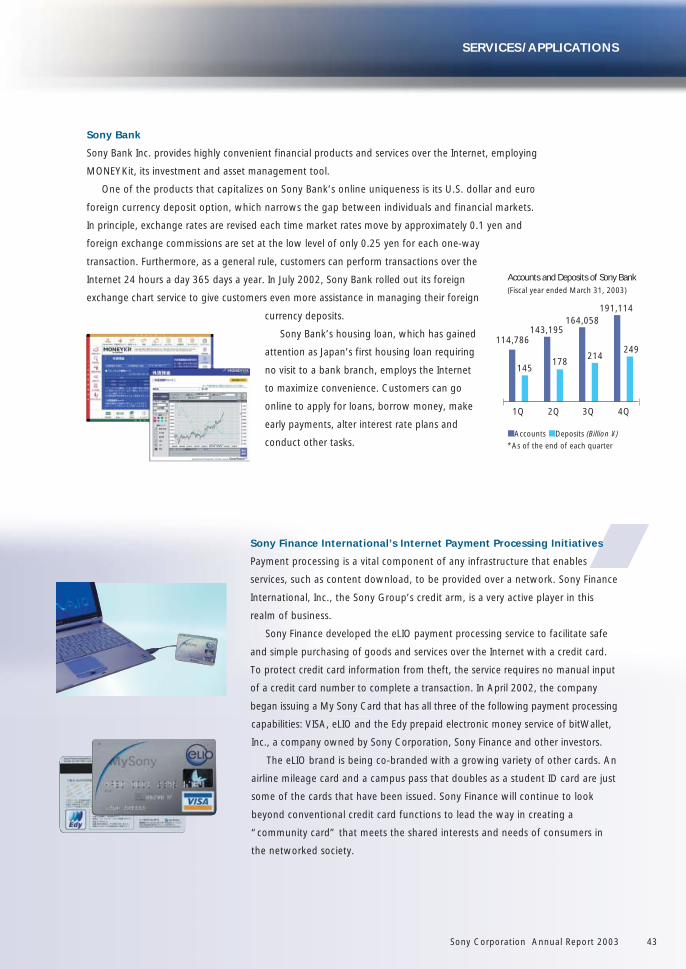
Sony Bank
Sony Bank Inc. provides highly convenient financial products and services over the Internet, employing
MONEYKit, its investment and asset management tool.
One of the products that capitalizes on Sony Bank’s online uniqueness is its U.S. dollar and euro
foreign currency deposit option, which narrows the gap between individuals and financial markets.
In principle, exchange rates are revised each time market rates move by approximately 0.1 yen and
foreign exchange commissions are set at the low level of only 0.25 yen for each one-way
transaction. Furthermore, as a general rule, customers can perform transactions over the
Internet 24 hours a day 365 days a year. In July 2002, Sony Bank rolled out its foreign
exchange chart service to give customers even more assistance in managing their foreign
currency deposits.
Sony Bank’s housing loan, which has gained
attention as Japan’s first housing loan requiring
no visit to a bank branch, employs the Internet
to maximize convenience. Customers can go
online to apply for loans, borrow money, make
early payments, alter interest rate plans and
conduct other tasks.
Sony Finance International’s Internet Payment Processing Initiatives
Payment processing is a vital component of any infrastructure that enables
services, such as content download, to be provided over a network. Sony Finance
International, Inc., the Sony Group’s credit arm, is a very active player in this
realm of business.
Sony Finance developed the eLIO payment processing service to facilitate safe
and simple purchasing of goods and services over the Internet with a credit card.
To protect credit card information from theft, the service requires no manual input
of a credit card number to complete a transaction. In April 2002, the company
began issuing a My Sony Card that has all three of the following payment processing
capabilities: VISA, eLIO and the Edy prepaid electronic money service of bitWallet,
Inc., a company owned by Sony Corporation, Sony Finance and other investors.
The eLIO brand is being co-branded with a growing variety of other cards. An
airline mileage card and a campus pass that doubles as a student ID card are just
some of the cards that have been issued. Sony Finance will continue to look
beyond conventional credit card functions to lead the way in creating a
“community card” that meets the shared interests and needs of consumers in
the networked society.
SERVICES/APPLICATIONS
Accounts and Deposits of Sony Bank(Fiscal year ended March 31, 2003)
■ Accounts ■ Deposits (Billion ¥)
*As of the end of each quarter
1Q 4Q3Q2Q
114,786
191,114164,058
143,195
145
249214
178
Sony Corporation Annual Report 2003 43

Sony Corporation Annual Report 200344
SERVICES/APPLICATIONS
Internet Applications
Sony is providing both hardware and Internet-based applications to cater to a broad range of
consumer needs in the broadband age.
Illustrating this posture is ImageStation, an online imaging service. This service enables users to
upload to the Internet photos taken on digital still cameras, order prints over the Internet, and create
a photo album online so that friends and family can view it. When using a network-enabled CLIÉ
personal digital assistant or Handycam video camera, photos can be sent to the ImageStation site over
mobile phones and other devices from the place where they are taken.
During the year under review, Sony and three other Japanese audio product manufacturers agreed
to jointly establish Any Music Planning, Inc., laying the groundwork for the Any Music service that,
from the fiscal year ending March 31, 2004, will send music over the Internet directly to audio
components and similar devices. Any Music will allow individuals to sample, purchase and enjoy with
ease high quality music from any compatible home audio component. And it will enable them to
transfer downloaded music to portable devices such as a Net MD device or any product that has a
Memory Stick slot.
As for the identification numbers that consumers need to use certain Sony products and services,
Sony has begun to move away from the system in which every entity in the Sony Group has its own ID
to a common, My Sony ID, across the Group. Unification of this customer authentication system
maximizes convenience while protecting customers’ personal information. It also forms the foundation
for development of a business model that links all the products and services across the Sony Group.For more information, see the My Sony home page at https://www.my.sony.com/
Internet Applications
Sony Corporation Annual Report 200344
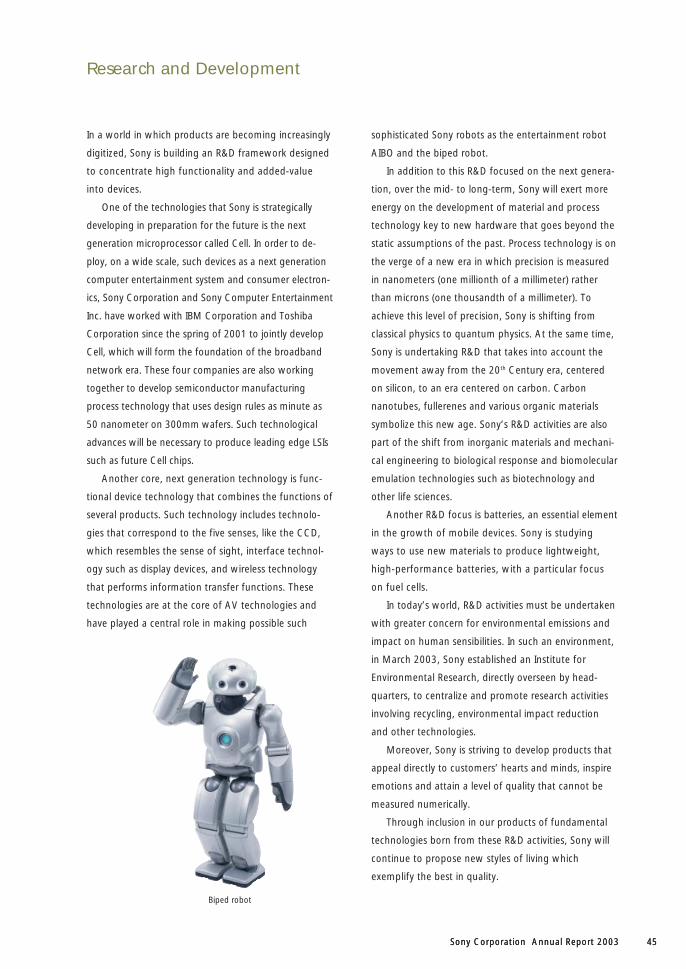
Sony Corporation Annual Report 2003 45Sony Corporation Annual Report 2003 45
Research and Development
In a world in which products are becoming increasingly
digitized, Sony is building an R&D framework designed
to concentrate high functionality and added-value
into devices.
One of the technologies that Sony is strategically
developing in preparation for the future is the next
generation microprocessor called Cell. In order to de-
ploy, on a wide scale, such devices as a next generation
computer entertainment system and consumer electron-
ics, Sony Corporation and Sony Computer Entertainment
Inc. have worked with IBM Corporation and Toshiba
Corporation since the spring of 2001 to jointly develop
Cell, which will form the foundation of the broadband
network era. These four companies are also working
together to develop semiconductor manufacturing
process technology that uses design rules as minute as
50 nanometer on 300mm wafers. Such technological
advances will be necessary to produce leading edge LSIs
such as future Cell chips.
Another core, next generation technology is func-
tional device technology that combines the functions of
several products. Such technology includes technolo-
gies that correspond to the five senses, like the CCD,
which resembles the sense of sight, interface technol-
ogy such as display devices, and wireless technology
that performs information transfer functions. These
technologies are at the core of AV technologies and
have played a central role in making possible such
sophisticated Sony robots as the entertainment robot
AIBO and the biped robot.
In addition to this R&D focused on the next genera-
tion, over the mid- to long-term, Sony will exert more
energy on the development of material and process
technology key to new hardware that goes beyond the
static assumptions of the past. Process technology is on
the verge of a new era in which precision is measured
in nanometers (one millionth of a millimeter) rather
than microns (one thousandth of a millimeter). To
achieve this level of precision, Sony is shifting from
classical physics to quantum physics. At the same time,
Sony is undertaking R&D that takes into account the
movement away from the 20th Century era, centered
on silicon, to an era centered on carbon. Carbon
nanotubes, fullerenes and various organic materials
symbolize this new age. Sony’s R&D activities are also
part of the shift from inorganic materials and mechani-
cal engineering to biological response and biomolecular
emulation technologies such as biotechnology and
other life sciences.
Another R&D focus is batteries, an essential element
in the growth of mobile devices. Sony is studying
ways to use new materials to produce lightweight,
high-performance batteries, with a particular focus
on fuel cells.
In today’s world, R&D activities must be undertaken
with greater concern for environmental emissions and
impact on human sensibilities. In such an environment,
in March 2003, Sony established an Institute for
Environmental Research, directly overseen by head-
quarters, to centralize and promote research activities
involving recycling, environmental impact reduction
and other technologies.
Moreover, Sony is striving to develop products that
appeal directly to customers’ hearts and minds, inspire
emotions and attain a level of quality that cannot be
measured numerically.
Through inclusion in our products of fundamental
technologies born from these R&D activities, Sony will
continue to propose new styles of living which
exemplify the best in quality.
Biped robot
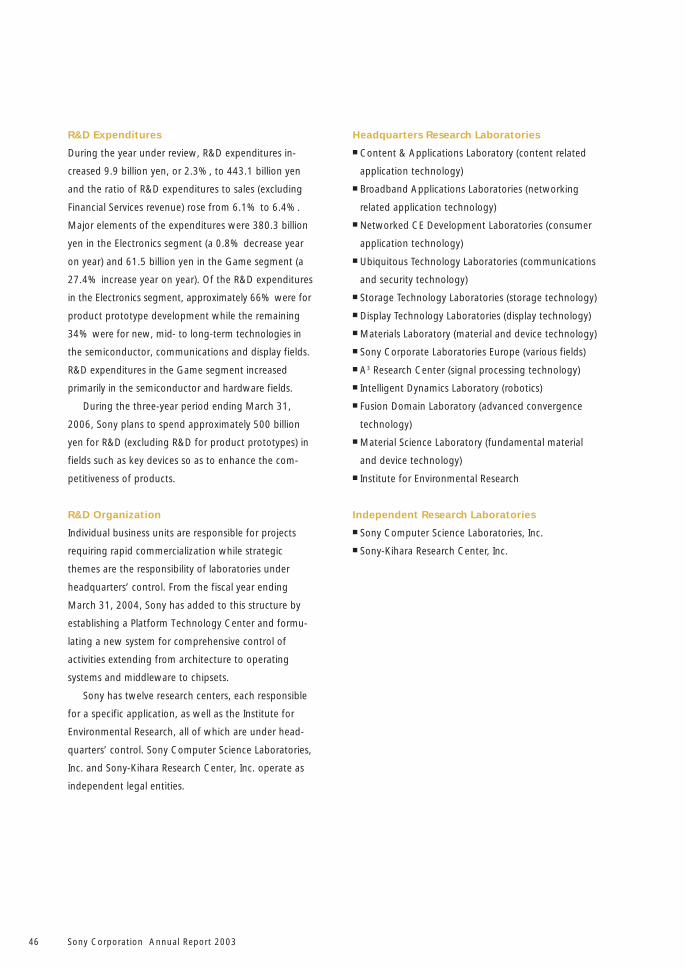
Sony Corporation Annual Report 200346
R&D Expenditures
During the year under review, R&D expenditures in-
creased 9.9 billion yen, or 2.3%, to 443.1 billion yen
and the ratio of R&D expenditures to sales (excluding
Financial Services revenue) rose from 6.1% to 6.4%.
Major elements of the expenditures were 380.3 billion
yen in the Electronics segment (a 0.8% decrease year
on year) and 61.5 billion yen in the Game segment (a
27.4% increase year on year). Of the R&D expenditures
in the Electronics segment, approximately 66% were for
product prototype development while the remaining
34% were for new, mid- to long-term technologies in
the semiconductor, communications and display fields.
R&D expenditures in the Game segment increased
primarily in the semiconductor and hardware fields.
During the three-year period ending March 31,
2006, Sony plans to spend approximately 500 billion
yen for R&D (excluding R&D for product prototypes) in
fields such as key devices so as to enhance the com-
petitiveness of products.
R&D Organization
Individual business units are responsible for projects
requiring rapid commercialization while strategic
themes are the responsibility of laboratories under
headquarters’ control. From the fiscal year ending
March 31, 2004, Sony has added to this structure by
establishing a Platform Technology Center and formu-
lating a new system for comprehensive control of
activities extending from architecture to operating
systems and middleware to chipsets.
Sony has twelve research centers, each responsible
for a specific application, as well as the Institute for
Environmental Research, all of which are under head-
quarters’ control. Sony Computer Science Laboratories,
Inc. and Sony-Kihara Research Center, Inc. operate as
independent legal entities.
Headquarters Research Laboratories
■ Content & Applications Laboratory (content related
application technology)
■ Broadband Applications Laboratories (networking
related application technology)
■ Networked CE Development Laboratories (consumer
application technology)
■ Ubiquitous Technology Laboratories (communications
and security technology)
■ Storage Technology Laboratories (storage technology)
■ Display Technology Laboratories (display technology)
■ Materials Laboratory (material and device technology)
■ Sony Corporate Laboratories Europe (various fields)
■ A3 Research Center (signal processing technology)
■ Intelligent Dynamics Laboratory (robotics)
■ Fusion Domain Laboratory (advanced convergence
technology)
■ Material Science Laboratory (fundamental material
and device technology)
■ Institute for Environmental Research
Independent Research Laboratories
■ Sony Computer Science Laboratories, Inc.
■ Sony-Kihara Research Center, Inc.
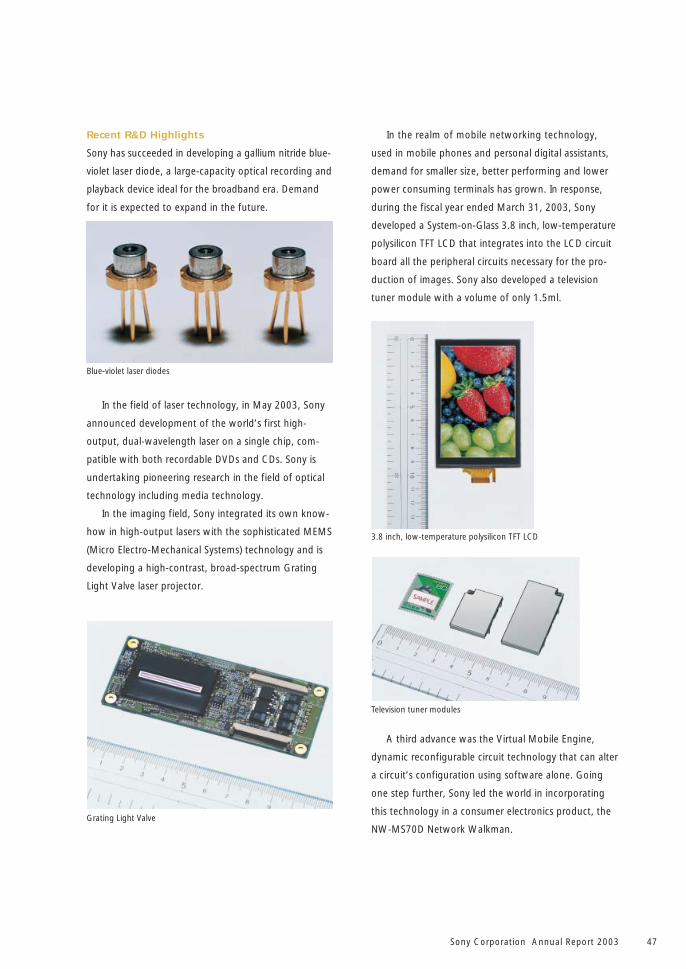
Sony Corporation Annual Report 2003 47
Blue-violet laser diodes
Grating Light Valve
Television tuner modules
Recent R&D Highlights
Sony has succeeded in developing a gallium nitride blue-
violet laser diode, a large-capacity optical recording and
playback device ideal for the broadband era. Demand
for it is expected to expand in the future.
In the realm of mobile networking technology,
used in mobile phones and personal digital assistants,
demand for smaller size, better performing and lower
power consuming terminals has grown. In response,
during the fiscal year ended March 31, 2003, Sony
developed a System-on-Glass 3.8 inch, low-temperature
polysilicon TFT LCD that integrates into the LCD circuit
board all the peripheral circuits necessary for the pro-
duction of images. Sony also developed a television
tuner module with a volume of only 1.5ml.
In the field of laser technology, in May 2003, Sony
announced development of the world’s first high-
output, dual-wavelength laser on a single chip, com-
patible with both recordable DVDs and CDs. Sony is
undertaking pioneering research in the field of optical
technology including media technology.
In the imaging field, Sony integrated its own know-
how in high-output lasers with the sophisticated MEMS
(Micro Electro-Mechanical Systems) technology and is
developing a high-contrast, broad-spectrum Grating
Light Valve laser projector.
3.8 inch, low-temperature polysilicon TFT LCD
A third advance was the Virtual Mobile Engine,
dynamic reconfigurable circuit technology that can alter
a circuit’s configuration using software alone. Going
one step further, Sony led the world in incorporating
this technology in a consumer electronics product, the
NW-MS70D Network Walkman.
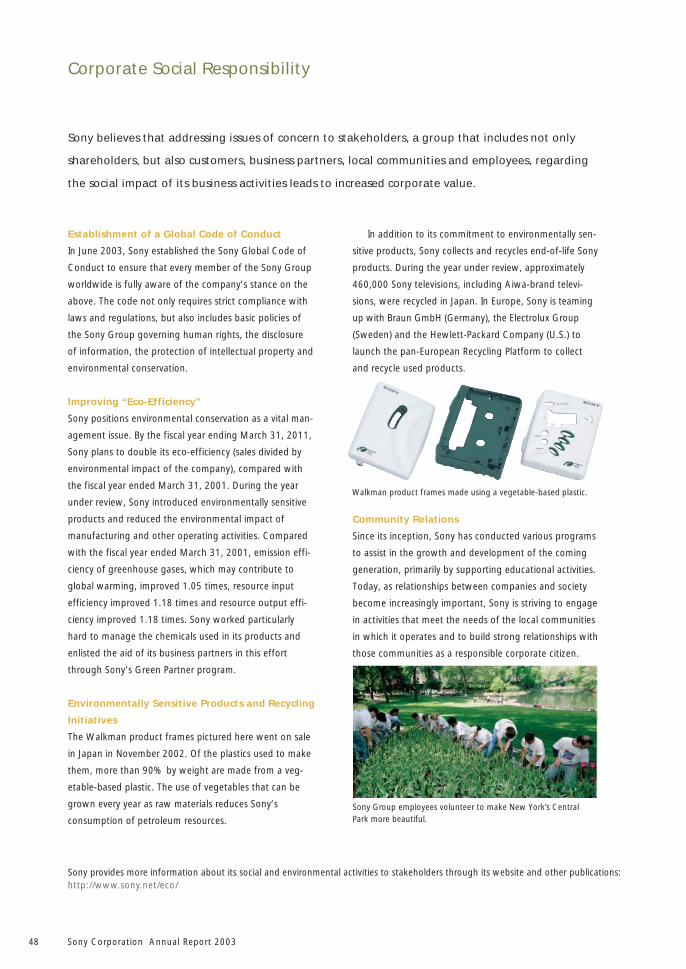
Sony Corporation Annual Report 200348
In addition to its commitment to environmentally sen-
sitive products, Sony collects and recycles end-of-life Sony
products. During the year under review, approximately
460,000 Sony televisions, including Aiwa-brand televi-
sions, were recycled in Japan. In Europe, Sony is teaming
up with Braun GmbH (Germany), the Electrolux Group
(Sweden) and the Hewlett-Packard Company (U.S.) to
launch the pan-European Recycling Platform to collect
and recycle used products.
Establishment of a Global Code of Conduct
In June 2003, Sony established the Sony Global Code of
Conduct to ensure that every member of the Sony Group
worldwide is fully aware of the company’s stance on the
above. The code not only requires strict compliance with
laws and regulations, but also includes basic policies of
the Sony Group governing human rights, the disclosure
of information, the protection of intellectual property and
environmental conservation.
Improving “Eco-Efficiency”
Sony positions environmental conservation as a vital man-
agement issue. By the fiscal year ending March 31, 2011,
Sony plans to double its eco-efficiency (sales divided by
environmental impact of the company), compared with
the fiscal year ended March 31, 2001. During the year
under review, Sony introduced environmentally sensitive
products and reduced the environmental impact of
manufacturing and other operating activities. Compared
with the fiscal year ended March 31, 2001, emission effi-
ciency of greenhouse gases, which may contribute to
global warming, improved 1.05 times, resource input
efficiency improved 1.18 times and resource output effi-
ciency improved 1.18 times. Sony worked particularly
hard to manage the chemicals used in its products and
enlisted the aid of its business partners in this effort
through Sony’s Green Partner program.
Environmentally Sensitive Products and Recycling
Initiatives
The Walkman product frames pictured here went on sale
in Japan in November 2002. Of the plastics used to make
them, more than 90% by weight are made from a veg-
etable-based plastic. The use of vegetables that can be
grown every year as raw materials reduces Sony’s
consumption of petroleum resources.
Walkman product frames made using a vegetable-based plastic.
Sony Group employees volunteer to make New York’s CentralPark more beautiful.
Corporate Social Responsibility
Sony provides more information about its social and environmental activities to stakeholders through its website and other publications:http://www.sony.net/eco/
Sony believes that addressing issues of concern to stakeholders, a group that includes not only
shareholders, but also customers, business partners, local communities and employees, regarding
the social impact of its business activities leads to increased corporate value.
Community Relations
Since its inception, Sony has conducted various programs
to assist in the growth and development of the coming
generation, primarily by supporting educational activities.
Today, as relationships between companies and society
become increasingly important, Sony is striving to engage
in activities that meet the needs of the local communities
in which it operates and to build strong relationships with
those communities as a responsible corporate citizen.
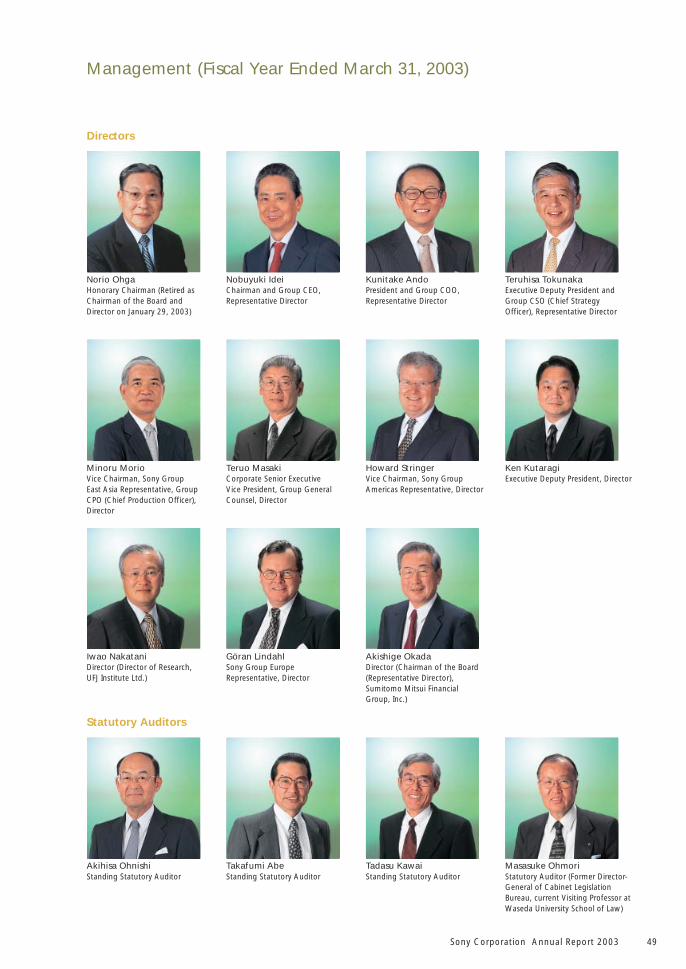
Sony Corporation Annual Report 2003 49
Management (Fiscal Year Ended March 31, 2003)
Directors
Norio OhgaHonorary Chairman (Retired asChairman of the Board andDirector on January 29, 2003)
Nobuyuki IdeiChairman and Group CEO,Representative Director
Kunitake AndoPresident and Group COO,Representative Director
Teruhisa TokunakaExecutive Deputy President andGroup CSO (Chief StrategyOfficer), Representative Director
Minoru MorioVice Chairman, Sony GroupEast Asia Representative, GroupCPO (Chief Production Officer),Director
Teruo MasakiCorporate Senior ExecutiveVice President, Group GeneralCounsel, Director
Howard StringerVice Chairman, Sony GroupAmericas Representative, Director
Ken KutaragiExecutive Deputy President, Director
Iwao NakataniDirector (Director of Research,UFJ Institute Ltd.)
Göran LindahlSony Group EuropeRepresentative, Director
Masasuke OhmoriStatutory Auditor (Former Director-General of Cabinet LegislationBureau, current Visiting Professor atWaseda University School of Law)
Akihisa OhnishiStanding Statutory Auditor
Takafumi AbeStanding Statutory Auditor
Statutory Auditors
Akishige OkadaDirector (Chairman of the Board(Representative Director),Sumitomo Mitsui FinancialGroup, Inc.)
Tadasu KawaiStanding Statutory Auditor
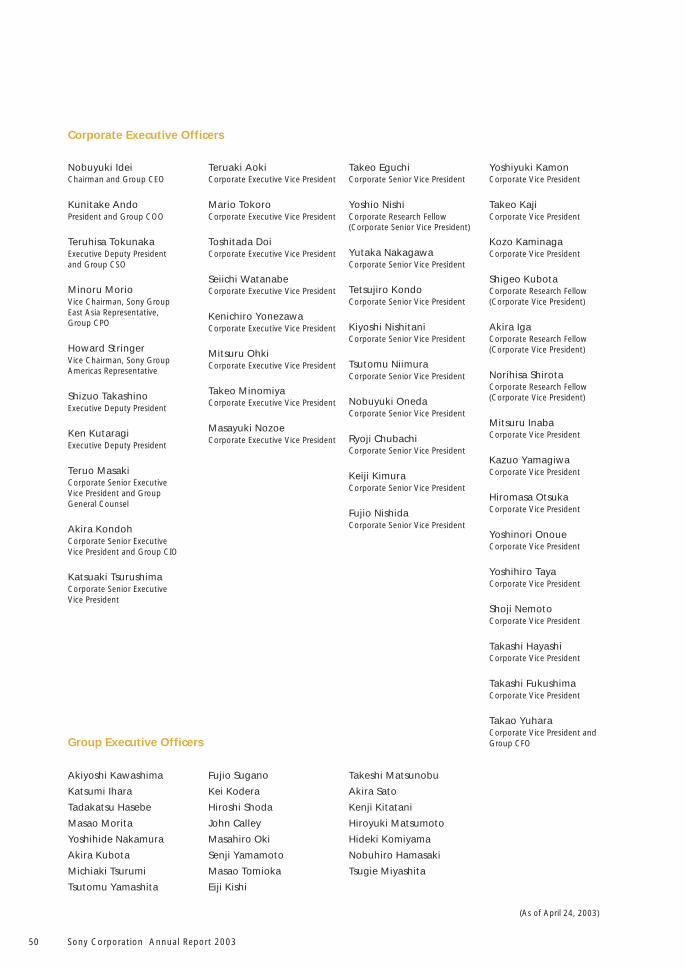
Sony Corporation Annual Report 200350
Corporate Executive Officers
Akiyoshi Kawashima
Katsumi Ihara
Tadakatsu Hasebe
Masao Morita
Yoshihide Nakamura
Akira Kubota
Michiaki Tsurumi
Tsutomu Yamashita
Fujio Sugano
Kei Kodera
Hiroshi Shoda
John Calley
Masahiro Oki
Senji Yamamoto
Masao Tomioka
Eiji Kishi
Group Executive Officers
(As of April 24, 2003)
Nobuyuki IdeiChairman and Group CEO
Kunitake AndoPresident and Group COO
Teruhisa TokunakaExecutive Deputy Presidentand Group CSO
Minoru MorioVice Chairman, Sony GroupEast Asia Representative,Group CPO
Howard StringerVice Chairman, Sony GroupAmericas Representative
Shizuo TakashinoExecutive Deputy President
Ken KutaragiExecutive Deputy President
Teruo MasakiCorporate Senior ExecutiveVice President and GroupGeneral Counsel
Akira KondohCorporate Senior ExecutiveVice President and Group CIO
Katsuaki TsurushimaCorporate Senior ExecutiveVice President
Teruaki AokiCorporate Executive Vice President
Mario TokoroCorporate Executive Vice President
Toshitada DoiCorporate Executive Vice President
Seiichi WatanabeCorporate Executive Vice President
Kenichiro YonezawaCorporate Executive Vice President
Mitsuru OhkiCorporate Executive Vice President
Takeo MinomiyaCorporate Executive Vice President
Masayuki NozoeCorporate Executive Vice President
Takeo EguchiCorporate Senior Vice President
Yoshio NishiCorporate Research Fellow(Corporate Senior Vice President)
Yutaka NakagawaCorporate Senior Vice President
Tetsujiro KondoCorporate Senior Vice President
Kiyoshi NishitaniCorporate Senior Vice President
Tsutomu NiimuraCorporate Senior Vice President
Nobuyuki OnedaCorporate Senior Vice President
Ryoji ChubachiCorporate Senior Vice President
Keiji KimuraCorporate Senior Vice President
Fujio NishidaCorporate Senior Vice President
Yoshiyuki KamonCorporate Vice President
Takeo KajiCorporate Vice President
Kozo KaminagaCorporate Vice President
Shigeo KubotaCorporate Research Fellow(Corporate Vice President)
Akira IgaCorporate Research Fellow(Corporate Vice President)
Norihisa ShirotaCorporate Research Fellow(Corporate Vice President)
Mitsuru InabaCorporate Vice President
Kazuo YamagiwaCorporate Vice President
Hiromasa OtsukaCorporate Vice President
Yoshinori OnoueCorporate Vice President
Yoshihiro TayaCorporate Vice President
Shoji NemotoCorporate Vice President
Takashi HayashiCorporate Vice President
Takashi FukushimaCorporate Vice President
Takao YuharaCorporate Vice President andGroup CFO
Takeshi Matsunobu
Akira Sato
Kenji Kitatani
Hiroyuki Matsumoto
Hideki Komiyama
Nobuhiro Hamasaki
Tsugie Miyashita
Sony Corporation Annual Report 2003 51
Financial Section
Consolidated Balance Sheets . . . . . . . . . . . . . . . . . . . . . . . . . . . . . . . . . . . . . . . . . . . 52
Consolidated Statements of Income . . . . . . . . . . . . . . . . . . . . . . . . . . . . . . . . . . . . . 54
Consolidated Statements of Cash Flows . . . . . . . . . . . . . . . . . . . . . . . . . . . . . . . . . . 56
Consolidated Statements of Changes in Stockholders’ Equity . . . . . . . . . . . . . . . . . 58
Quarterly Financial and Stock Information . . . . . . . . . . . . . . . . . . . . . . . . . . . . . . . 61
Five-Year Summary of Selected Financial Data . . . . . . . . . . . . . . . . . . . . . . . . . . . . . 63
Segment Information . . . . . . . . . . . . . . . . . . . . . . . . . . . . . . . . . . . . . . . . . . . . . . . . . 65
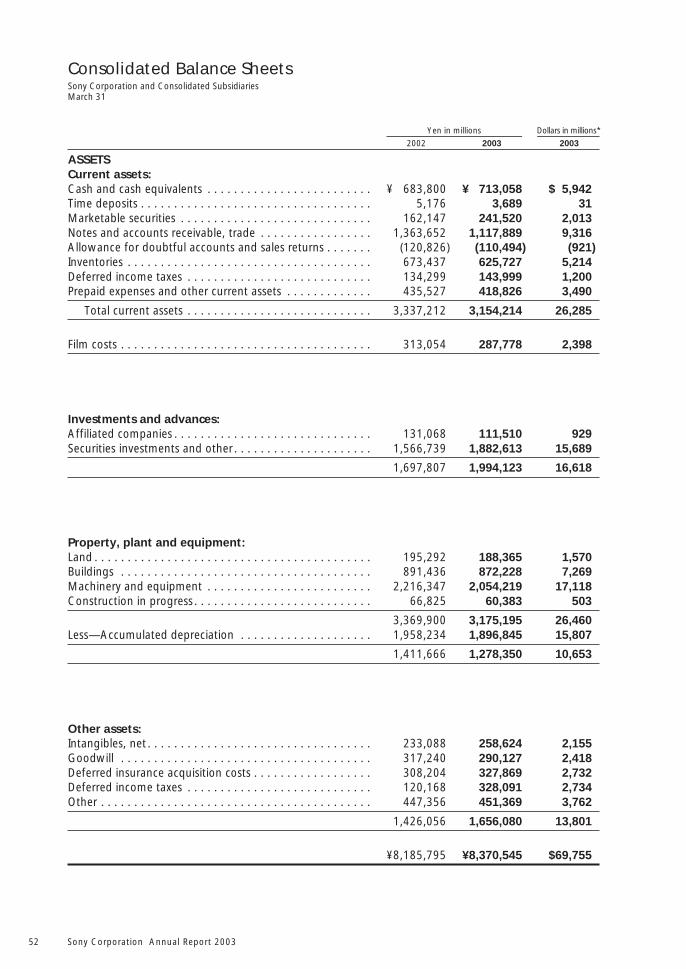
Sony Corporation Annual Report 200352
Consolidated Balance SheetsSony Corporation and Consolidated SubsidiariesMarch 31
Yen in millions Dollars in millions*
2002 2003 2003
ASSETSCurrent assets:Cash and cash equivalents . . . . . . . . . . . . . . . . . . . . . . . . . ¥ 683,800 ¥ 713,058 $ 5,942Time deposits . . . . . . . . . . . . . . . . . . . . . . . . . . . . . . . . . . . 5,176 3,689 31Marketable securities . . . . . . . . . . . . . . . . . . . . . . . . . . . . . 162,147 241,520 2,013Notes and accounts receivable, trade . . . . . . . . . . . . . . . . . 1,363,652 1,117,889 9,316Allowance for doubtful accounts and sales returns . . . . . . . (120,826) (110,494) (921)Inventories . . . . . . . . . . . . . . . . . . . . . . . . . . . . . . . . . . . . . 673,437 625,727 5,214Deferred income taxes . . . . . . . . . . . . . . . . . . . . . . . . . . . . 134,299 143,999 1,200Prepaid expenses and other current assets . . . . . . . . . . . . . 435,527 418,826 3,490
Total current assets . . . . . . . . . . . . . . . . . . . . . . . . . . . . 3,337,212 3,154,214 26,285
Film costs . . . . . . . . . . . . . . . . . . . . . . . . . . . . . . . . . . . . . . 313,054 287,778 2,398
Investments and advances:Affiliated companies . . . . . . . . . . . . . . . . . . . . . . . . . . . . . . 131,068 111,510 929Securities investments and other . . . . . . . . . . . . . . . . . . . . . 1,566,739 1,882,613 15,689
1,697,807 1,994,123 16,618
Property, plant and equipment:Land . . . . . . . . . . . . . . . . . . . . . . . . . . . . . . . . . . . . . . . . . . 195,292 188,365 1,570Buildings . . . . . . . . . . . . . . . . . . . . . . . . . . . . . . . . . . . . . . 891,436 872,228 7,269Machinery and equipment . . . . . . . . . . . . . . . . . . . . . . . . . 2,216,347 2,054,219 17,118Construction in progress . . . . . . . . . . . . . . . . . . . . . . . . . . . 66,825 60,383 503
3,369,900 3,175,195 26,460Less—Accumulated depreciation . . . . . . . . . . . . . . . . . . . . 1,958,234 1,896,845 15,807
1,411,666 1,278,350 10,653
Other assets:Intangibles, net . . . . . . . . . . . . . . . . . . . . . . . . . . . . . . . . . . 233,088 258,624 2,155Goodwill . . . . . . . . . . . . . . . . . . . . . . . . . . . . . . . . . . . . . . 317,240 290,127 2,418Deferred insurance acquisition costs . . . . . . . . . . . . . . . . . . 308,204 327,869 2,732Deferred income taxes . . . . . . . . . . . . . . . . . . . . . . . . . . . . 120,168 328,091 2,734Other . . . . . . . . . . . . . . . . . . . . . . . . . . . . . . . . . . . . . . . . . 447,356 451,369 3,762
1,426,056 1,656,080 13,801
¥8,185,795 ¥8,370,545 $69,755
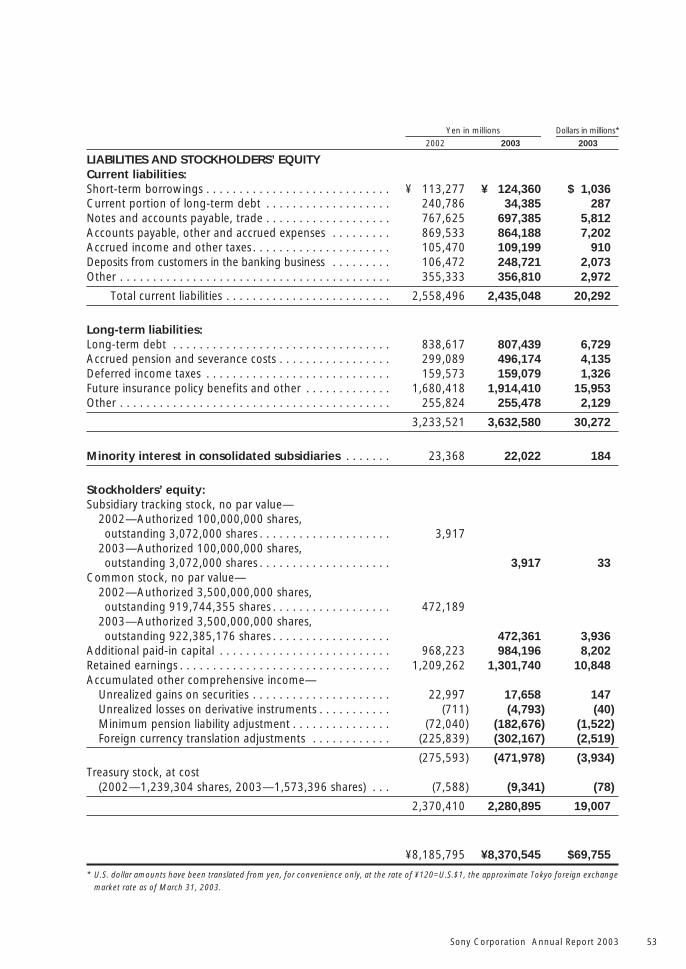
Sony Corporation Annual Report 2003 53
Yen in millions Dollars in millions*
2002 2003 2003
LIABILITIES AND STOCKHOLDERS’ EQUITYCurrent liabilities:Short-term borrowings . . . . . . . . . . . . . . . . . . . . . . . . . . . . ¥ 113,277 ¥ 124,360 $ 1,036Current portion of long-term debt . . . . . . . . . . . . . . . . . . . 240,786 34,385 287Notes and accounts payable, trade . . . . . . . . . . . . . . . . . . . 767,625 697,385 5,812Accounts payable, other and accrued expenses . . . . . . . . . 869,533 864,188 7,202Accrued income and other taxes . . . . . . . . . . . . . . . . . . . . . 105,470 109,199 910Deposits from customers in the banking business . . . . . . . . . 106,472 248,721 2,073Other . . . . . . . . . . . . . . . . . . . . . . . . . . . . . . . . . . . . . . . . . 355,333 356,810 2,972
Total current liabilities . . . . . . . . . . . . . . . . . . . . . . . . . 2,558,496 2,435,048 20,292
Long-term liabilities:Long-term debt . . . . . . . . . . . . . . . . . . . . . . . . . . . . . . . . . 838,617 807,439 6,729Accrued pension and severance costs . . . . . . . . . . . . . . . . . 299,089 496,174 4,135Deferred income taxes . . . . . . . . . . . . . . . . . . . . . . . . . . . . 159,573 159,079 1,326Future insurance policy benefits and other . . . . . . . . . . . . . 1,680,418 1,914,410 15,953Other . . . . . . . . . . . . . . . . . . . . . . . . . . . . . . . . . . . . . . . . . 255,824 255,478 2,129
3,233,521 3,632,580 30,272
Minority interest in consolidated subsidiaries . . . . . . . 23,368 22,022 184
Stockholders’ equity:Subsidiary tracking stock, no par value—
2002—Authorized 100,000,000 shares,outstanding 3,072,000 shares . . . . . . . . . . . . . . . . . . . . 3,917
2003—Authorized 100,000,000 shares,outstanding 3,072,000 shares . . . . . . . . . . . . . . . . . . . . 3,917 33
Common stock, no par value—2002—Authorized 3,500,000,000 shares,outstanding 919,744,355 shares . . . . . . . . . . . . . . . . . . 472,189
2003—Authorized 3,500,000,000 shares,outstanding 922,385,176 shares . . . . . . . . . . . . . . . . . . 472,361 3,936
Additional paid-in capital . . . . . . . . . . . . . . . . . . . . . . . . . . 968,223 984,196 8,202Retained earnings . . . . . . . . . . . . . . . . . . . . . . . . . . . . . . . . 1,209,262 1,301,740 10,848Accumulated other comprehensive income—
Unrealized gains on securities . . . . . . . . . . . . . . . . . . . . . 22,997 17,658 147Unrealized losses on derivative instruments . . . . . . . . . . . (711) (4,793) (40)Minimum pension liability adjustment . . . . . . . . . . . . . . . (72,040) (182,676) (1,522)Foreign currency translation adjustments . . . . . . . . . . . . (225,839) (302,167) (2,519)
(275,593) (471,978) (3,934)Treasury stock, at cost
(2002—1,239,304 shares, 2003—1,573,396 shares) . . . (7,588) (9,341) (78)
2,370,410 2,280,895 19,007
¥8,185,795 ¥8,370,545 $69,755
* U.S. dollar amounts have been translated from yen, for convenience only, at the rate of ¥120=U.S.$1, the approximate Tokyo foreign exchangemarket rate as of March 31, 2003.
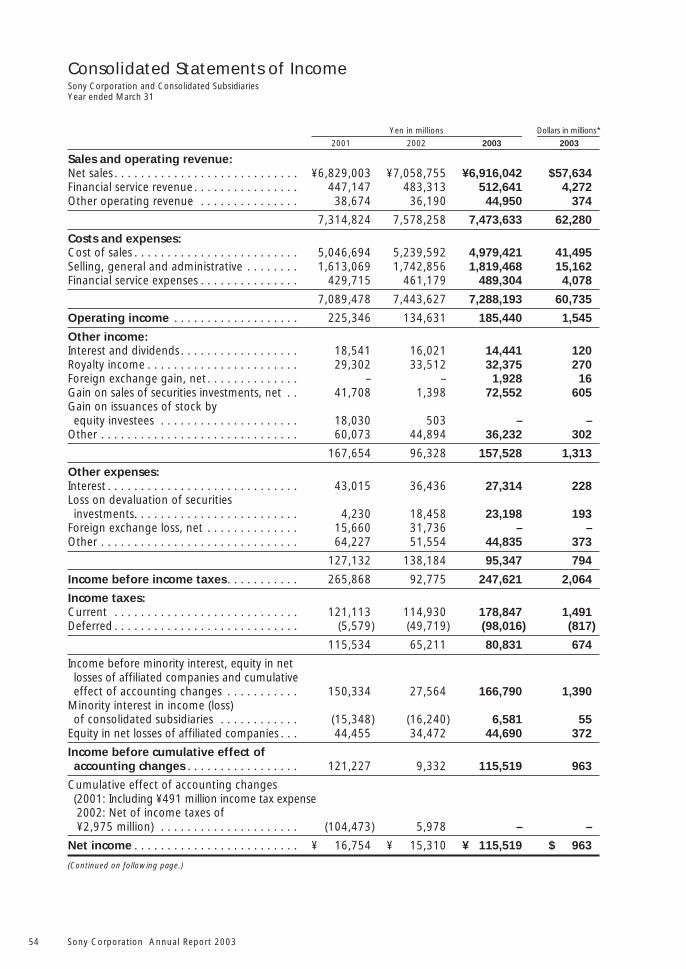
Sony Corporation Annual Report 200354
Consolidated Statements of IncomeSony Corporation and Consolidated SubsidiariesYear ended March 31
Yen in millions Dollars in millions*
2001 2002 2003 2003
Sales and operating revenue:Net sales . . . . . . . . . . . . . . . . . . . . . . . . . . . . ¥6,829,003 ¥7,058,755 ¥6,916,042 $57,634Financial service revenue. . . . . . . . . . . . . . . . 447,147 483,313 512,641 4,272Other operating revenue . . . . . . . . . . . . . . . 38,674 36,190 44,950 374
7,314,824 7,578,258 7,473,633 62,280
Costs and expenses:Cost of sales . . . . . . . . . . . . . . . . . . . . . . . . . 5,046,694 5,239,592 4,979,421 41,495Selling, general and administrative . . . . . . . . 1,613,069 1,742,856 1,819,468 15,162Financial service expenses . . . . . . . . . . . . . . . 429,715 461,179 489,304 4,078
7,089,478 7,443,627 7,288,193 60,735
Operating income . . . . . . . . . . . . . . . . . . . 225,346 134,631 185,440 1,545
Other income:Interest and dividends. . . . . . . . . . . . . . . . . . 18,541 16,021 14,441 120Royalty income . . . . . . . . . . . . . . . . . . . . . . . 29,302 33,512 32,375 270Foreign exchange gain, net . . . . . . . . . . . . . . – – 1,928 16Gain on sales of securities investments, net . . 41,708 1,398 72,552 605Gain on issuances of stock byequity investees . . . . . . . . . . . . . . . . . . . . . 18,030 503 – –
Other . . . . . . . . . . . . . . . . . . . . . . . . . . . . . . 60,073 44,894 36,232 302
167,654 96,328 157,528 1,313
Other expenses:Interest . . . . . . . . . . . . . . . . . . . . . . . . . . . . . 43,015 36,436 27,314 228Loss on devaluation of securitiesinvestments. . . . . . . . . . . . . . . . . . . . . . . . . 4,230 18,458 23,198 193
Foreign exchange loss, net . . . . . . . . . . . . . . 15,660 31,736 – –Other . . . . . . . . . . . . . . . . . . . . . . . . . . . . . . 64,227 51,554 44,835 373
127,132 138,184 95,347 794
Income before income taxes . . . . . . . . . . . 265,868 92,775 247,621 2,064
Income taxes:Current . . . . . . . . . . . . . . . . . . . . . . . . . . . . 121,113 114,930 178,847 1,491Deferred . . . . . . . . . . . . . . . . . . . . . . . . . . . . (5,579) (49,719) (98,016) (817)
115,534 65,211 80,831 674
Income before minority interest, equity in netlosses of affiliated companies and cumulativeeffect of accounting changes . . . . . . . . . . . 150,334 27,564 166,790 1,390
Minority interest in income (loss)of consolidated subsidiaries . . . . . . . . . . . . (15,348) (16,240) 6,581 55
Equity in net losses of affiliated companies . . . 44,455 34,472 44,690 372
Income before cumulative effect ofaccounting changes . . . . . . . . . . . . . . . . . 121,227 9,332 115,519 963
Cumulative effect of accounting changes(2001: Including ¥491 million income tax expense2002: Net of income taxes of¥2,975 million) . . . . . . . . . . . . . . . . . . . . . (104,473) 5,978 – –
Net income . . . . . . . . . . . . . . . . . . . . . . . . . ¥ 16,754 ¥ 15,310 ¥ 115,519 $ 963
(Continued on following page.)
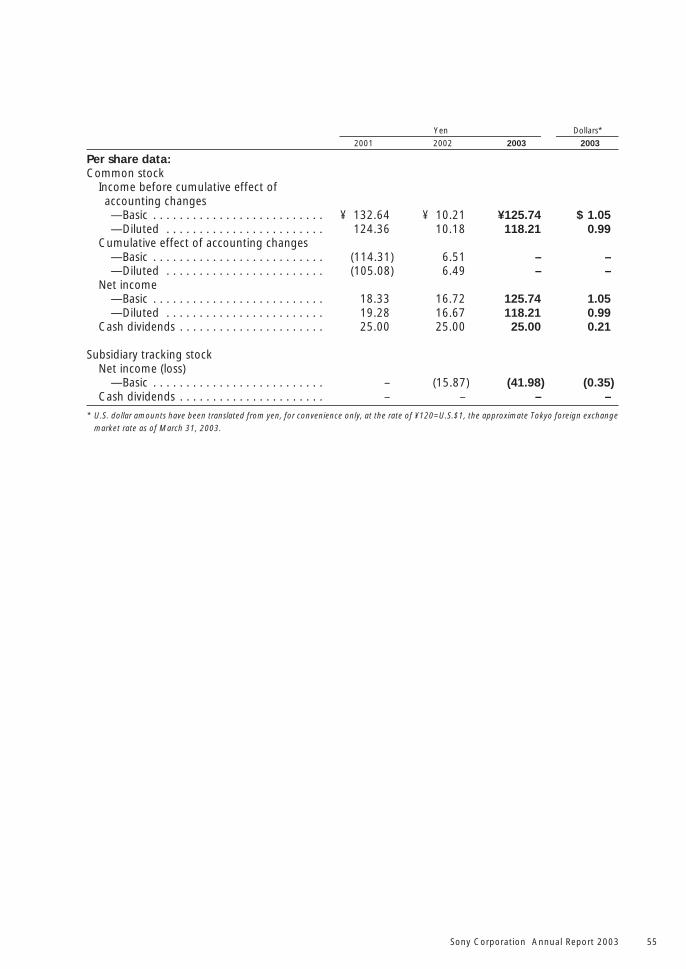
Sony Corporation Annual Report 2003 55
Yen Dollars*
2001 2002 2003 2003
Per share data:Common stock
Income before cumulative effect ofaccounting changes—Basic . . . . . . . . . . . . . . . . . . . . . . . . . . ¥ 132.64 ¥ 10.21 ¥125.74 $ 1.05—Diluted . . . . . . . . . . . . . . . . . . . . . . . . 124.36 10.18 118.21 0.99
Cumulative effect of accounting changes—Basic . . . . . . . . . . . . . . . . . . . . . . . . . . (114.31) 6.51 – –—Diluted . . . . . . . . . . . . . . . . . . . . . . . . (105.08) 6.49 – –
Net income—Basic . . . . . . . . . . . . . . . . . . . . . . . . . . 18.33 16.72 125.74 1.05—Diluted . . . . . . . . . . . . . . . . . . . . . . . . 19.28 16.67 118.21 0.99
Cash dividends . . . . . . . . . . . . . . . . . . . . . . 25.00 25.00 25.00 0.21
Subsidiary tracking stockNet income (loss)
—Basic . . . . . . . . . . . . . . . . . . . . . . . . . . – (15.87) (41.98) (0.35)Cash dividends . . . . . . . . . . . . . . . . . . . . . . – – – –
* U.S. dollar amounts have been translated from yen, for convenience only, at the rate of ¥120=U.S.$1, the approximate Tokyo foreign exchangemarket rate as of March 31, 2003.
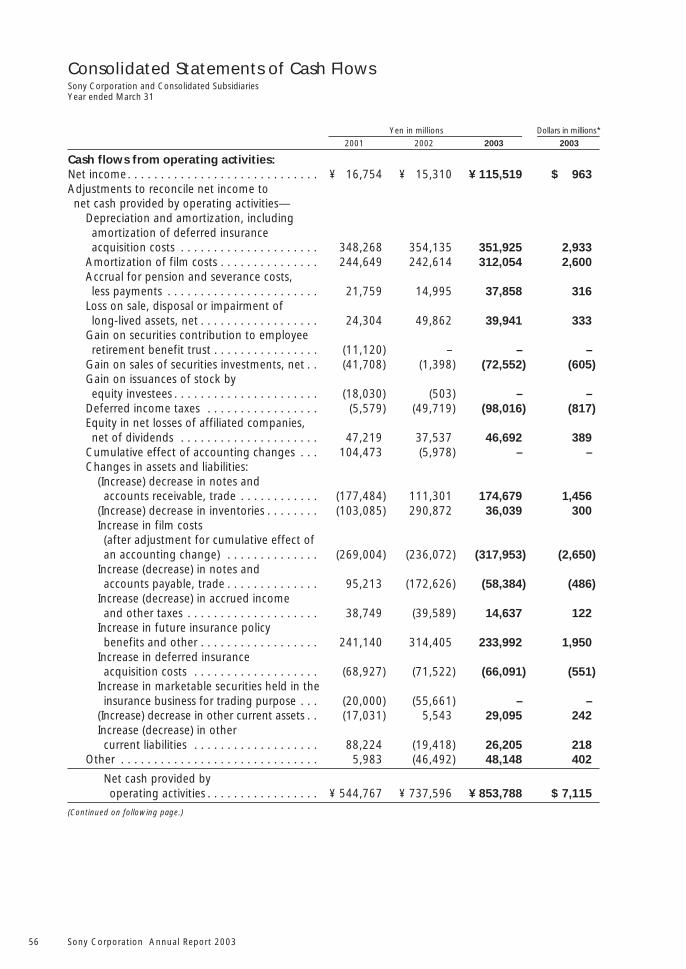
Sony Corporation Annual Report 200356
Yen in millions Dollars in millions*
2001 2002 2003 2003
Cash flows from operating activities:Net income. . . . . . . . . . . . . . . . . . . . . . . . . . . . . ¥ 16,754 ¥ 15,310 ¥ 115,519 $ 963Adjustments to reconcile net income tonet cash provided by operating activities—
Depreciation and amortization, includingamortization of deferred insuranceacquisition costs . . . . . . . . . . . . . . . . . . . . . 348,268 354,135 351,925 2,933
Amortization of film costs . . . . . . . . . . . . . . . 244,649 242,614 312,054 2,600Accrual for pension and severance costs,less payments . . . . . . . . . . . . . . . . . . . . . . . 21,759 14,995 37,858 316
Loss on sale, disposal or impairment oflong-lived assets, net . . . . . . . . . . . . . . . . . . 24,304 49,862 39,941 333
Gain on securities contribution to employeeretirement benefit trust . . . . . . . . . . . . . . . . (11,120) – – –
Gain on sales of securities investments, net . . (41,708) (1,398) (72,552) (605)Gain on issuances of stock byequity investees . . . . . . . . . . . . . . . . . . . . . . (18,030) (503) – –
Deferred income taxes . . . . . . . . . . . . . . . . . (5,579) (49,719) (98,016) (817)Equity in net losses of affiliated companies,net of dividends . . . . . . . . . . . . . . . . . . . . . 47,219 37,537 46,692 389
Cumulative effect of accounting changes . . . 104,473 (5,978) – –Changes in assets and liabilities:
(Increase) decrease in notes andaccounts receivable, trade . . . . . . . . . . . . (177,484) 111,301 174,679 1,456
(Increase) decrease in inventories . . . . . . . . (103,085) 290,872 36,039 300Increase in film costs(after adjustment for cumulative effect ofan accounting change) . . . . . . . . . . . . . . (269,004) (236,072) (317,953) (2,650)
Increase (decrease) in notes andaccounts payable, trade . . . . . . . . . . . . . . 95,213 (172,626) (58,384) (486)
Increase (decrease) in accrued incomeand other taxes . . . . . . . . . . . . . . . . . . . . 38,749 (39,589) 14,637 122
Increase in future insurance policybenefits and other . . . . . . . . . . . . . . . . . . 241,140 314,405 233,992 1,950
Increase in deferred insuranceacquisition costs . . . . . . . . . . . . . . . . . . . (68,927) (71,522) (66,091) (551)
Increase in marketable securities held in theinsurance business for trading purpose . . . (20,000) (55,661) – –
(Increase) decrease in other current assets . . (17,031) 5,543 29,095 242Increase (decrease) in othercurrent liabilities . . . . . . . . . . . . . . . . . . . 88,224 (19,418) 26,205 218
Other . . . . . . . . . . . . . . . . . . . . . . . . . . . . . . 5,983 (46,492) 48,148 402
Net cash provided byoperating activities . . . . . . . . . . . . . . . . . ¥ 544,767 ¥ 737,596 ¥ 853,788 $ 7,115
(Continued on following page.)
Consolidated Statements of Cash FlowsSony Corporation and Consolidated SubsidiariesYear ended March 31
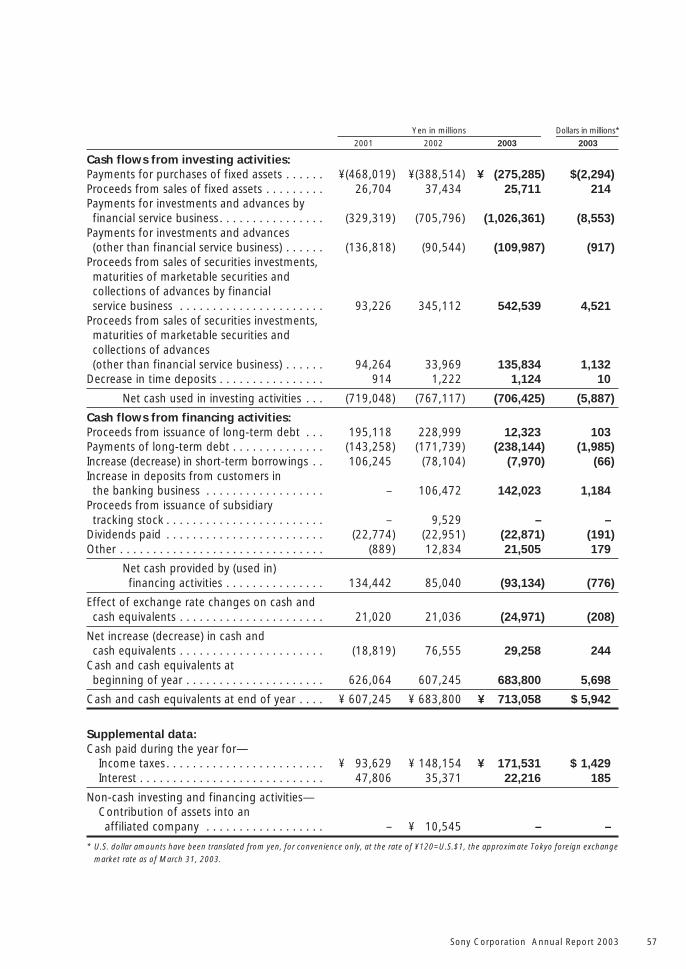
Sony Corporation Annual Report 2003 57
Yen in millions Dollars in millions*
2001 2002 2003 2003
Cash flows from investing activities:Payments for purchases of fixed assets . . . . . . ¥(468,019) ¥(388,514) ¥ (275,285) $(2,294)Proceeds from sales of fixed assets . . . . . . . . . 26,704 37,434 25,711 214Payments for investments and advances byfinancial service business . . . . . . . . . . . . . . . . (329,319) (705,796) (1,026,361) (8,553)
Payments for investments and advances(other than financial service business) . . . . . . (136,818) (90,544) (109,987) (917)
Proceeds from sales of securities investments,maturities of marketable securities andcollections of advances by financialservice business . . . . . . . . . . . . . . . . . . . . . . 93,226 345,112 542,539 4,521
Proceeds from sales of securities investments,maturities of marketable securities andcollections of advances(other than financial service business) . . . . . . 94,264 33,969 135,834 1,132
Decrease in time deposits . . . . . . . . . . . . . . . . 914 1,222 1,124 10
Net cash used in investing activities . . . (719,048) (767,117) (706,425) (5,887)
Cash flows from financing activities:Proceeds from issuance of long-term debt . . . 195,118 228,999 12,323 103Payments of long-term debt . . . . . . . . . . . . . . (143,258) (171,739) (238,144) (1,985)Increase (decrease) in short-term borrowings . . 106,245 (78,104) (7,970) (66)Increase in deposits from customers inthe banking business . . . . . . . . . . . . . . . . . . – 106,472 142,023 1,184
Proceeds from issuance of subsidiarytracking stock . . . . . . . . . . . . . . . . . . . . . . . . – 9,529 – –
Dividends paid . . . . . . . . . . . . . . . . . . . . . . . . (22,774) (22,951) (22,871) (191)Other . . . . . . . . . . . . . . . . . . . . . . . . . . . . . . . (889) 12,834 21,505 179
Net cash provided by (used in)financing activities . . . . . . . . . . . . . . . 134,442 85,040 (93,134) (776)
Effect of exchange rate changes on cash andcash equivalents . . . . . . . . . . . . . . . . . . . . . . 21,020 21,036 (24,971) (208)
Net increase (decrease) in cash andcash equivalents . . . . . . . . . . . . . . . . . . . . . . (18,819) 76,555 29,258 244
Cash and cash equivalents atbeginning of year . . . . . . . . . . . . . . . . . . . . . 626,064 607,245 683,800 5,698
Cash and cash equivalents at end of year . . . . ¥ 607,245 ¥ 683,800 ¥ 713,058 $ 5,942
Supplemental data:Cash paid during the year for—
Income taxes . . . . . . . . . . . . . . . . . . . . . . . . ¥ 93,629 ¥ 148,154 ¥ 171,531 $ 1,429Interest . . . . . . . . . . . . . . . . . . . . . . . . . . . . 47,806 35,371 22,216 185
Non-cash investing and financing activities—Contribution of assets into anaffiliated company . . . . . . . . . . . . . . . . . . – ¥ 10,545 – –
* U.S. dollar amounts have been translated from yen, for convenience only, at the rate of ¥120=U.S.$1, the approximate Tokyo foreign exchangemarket rate as of March 31, 2003.
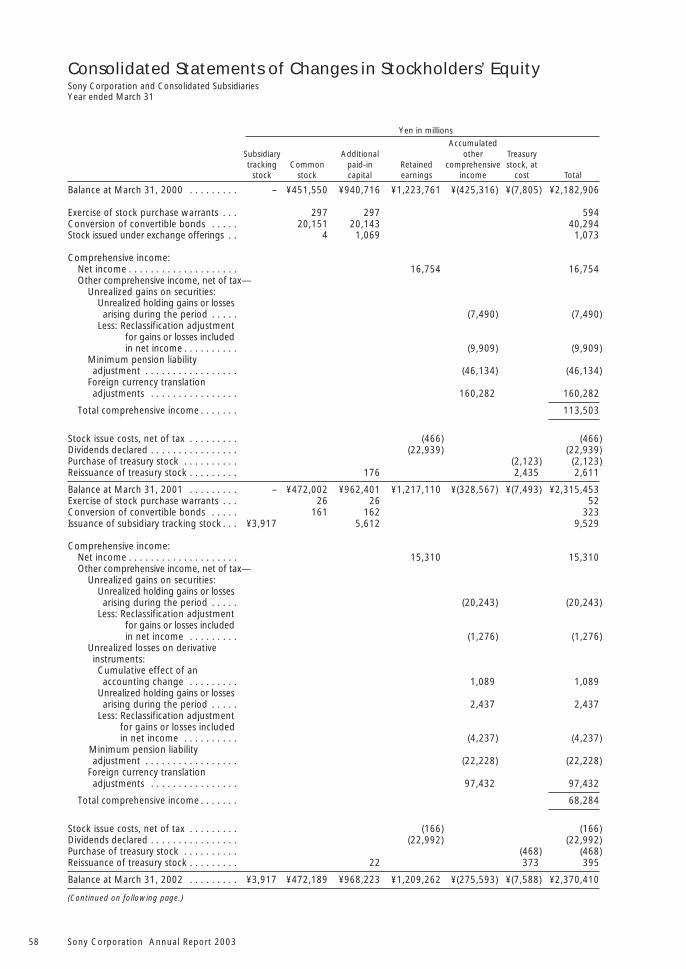
Sony Corporation Annual Report 200358
Yen in millions
AccumulatedSubsidiary Additional other Treasurytracking Common paid-in Retained comprehensive stock, at
stock stock capital earnings income cost Total
Balance at March 31, 2000 . . . . . . . . . – ¥451,550 ¥940,716 ¥1,223,761 ¥(425,316) ¥(7,805) ¥2,182,906
Exercise of stock purchase warrants . . . 297 297 594Conversion of convertible bonds . . . . . 20,151 20,143 40,294Stock issued under exchange offerings . . 4 1,069 1,073
Comprehensive income:Net income . . . . . . . . . . . . . . . . . . . . 16,754 16,754Other comprehensive income, net of tax—
Unrealized gains on securities:Unrealized holding gains or lossesarising during the period . . . . . (7,490) (7,490)
Less: Reclassification adjustmentfor gains or losses includedin net income . . . . . . . . . . (9,909) (9,909)
Minimum pension liabilityadjustment . . . . . . . . . . . . . . . . . (46,134) (46,134)
Foreign currency translationadjustments . . . . . . . . . . . . . . . . 160,282 160,282
Total comprehensive income . . . . . . . 113,503
Stock issue costs, net of tax . . . . . . . . . (466) (466)Dividends declared . . . . . . . . . . . . . . . . (22,939) (22,939)Purchase of treasury stock . . . . . . . . . . (2,123) (2,123)Reissuance of treasury stock . . . . . . . . . 176 2,435 2,611
Balance at March 31, 2001 . . . . . . . . . – ¥472,002 ¥962,401 ¥1,217,110 ¥(328,567) ¥(7,493) ¥2,315,453Exercise of stock purchase warrants . . . 26 26 52Conversion of convertible bonds . . . . . 161 162 323Issuance of subsidiary tracking stock . . . ¥3,917 5,612 9,529
Comprehensive income:Net income . . . . . . . . . . . . . . . . . . . . 15,310 15,310Other comprehensive income, net of tax—
Unrealized gains on securities:Unrealized holding gains or lossesarising during the period . . . . . (20,243) (20,243)
Less: Reclassification adjustmentfor gains or losses includedin net income . . . . . . . . . (1,276) (1,276)
Unrealized losses on derivativeinstruments:Cumulative effect of anaccounting change . . . . . . . . . 1,089 1,089
Unrealized holding gains or lossesarising during the period . . . . . 2,437 2,437
Less: Reclassification adjustmentfor gains or losses includedin net income . . . . . . . . . . (4,237) (4,237)
Minimum pension liabilityadjustment . . . . . . . . . . . . . . . . . (22,228) (22,228)
Foreign currency translationadjustments . . . . . . . . . . . . . . . . 97,432 97,432
Total comprehensive income . . . . . . . 68,284
Stock issue costs, net of tax . . . . . . . . . (166) (166)Dividends declared . . . . . . . . . . . . . . . . (22,992) (22,992)Purchase of treasury stock . . . . . . . . . . (468) (468)Reissuance of treasury stock . . . . . . . . . 22 373 395
Balance at March 31, 2002 . . . . . . . . . ¥3,917 ¥472,189 ¥968,223 ¥1,209,262 ¥(275,593) ¥(7,588) ¥2,370,410
(Continued on following page.)
Consolidated Statements of Changes in Stockholders’ EquitySony Corporation and Consolidated SubsidiariesYear ended March 31
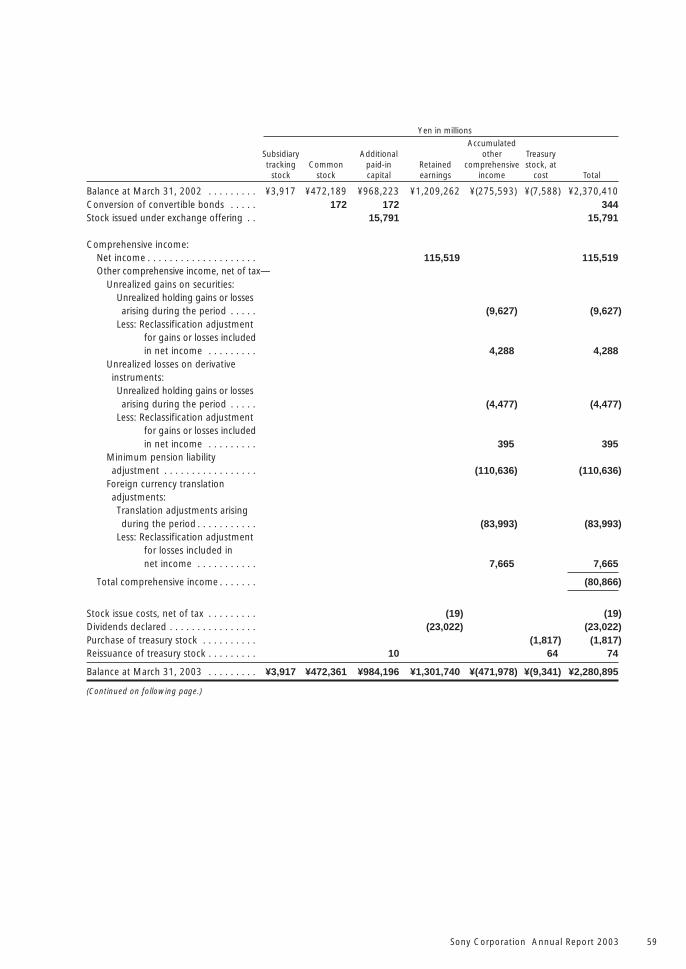
Sony Corporation Annual Report 2003 59
Yen in millions
AccumulatedSubsidiary Additional other Treasurytracking Common paid-in Retained comprehensive stock, at
stock stock capital earnings income cost Total
Balance at March 31, 2002 . . . . . . . . . ¥3,917 ¥472,189 ¥968,223 ¥1,209,262 ¥(275,593) ¥(7,588) ¥2,370,410Conversion of convertible bonds . . . . . 172 172 344Stock issued under exchange offering . . 15,791 15,791
Comprehensive income:Net income . . . . . . . . . . . . . . . . . . . . 115,519 115,519Other comprehensive income, net of tax—
Unrealized gains on securities:Unrealized holding gains or lossesarising during the period . . . . . (9,627) (9,627)
Less: Reclassification adjustmentfor gains or losses includedin net income . . . . . . . . . 4,288 4,288
Unrealized losses on derivativeinstruments:Unrealized holding gains or lossesarising during the period . . . . . (4,477) (4,477)
Less: Reclassification adjustmentfor gains or losses includedin net income . . . . . . . . . 395 395
Minimum pension liabilityadjustment . . . . . . . . . . . . . . . . . (110,636) (110,636)
Foreign currency translationadjustments:Translation adjustments arisingduring the period . . . . . . . . . . . (83,993) (83,993)
Less: Reclassification adjustmentfor losses included innet income . . . . . . . . . . . 7,665 7,665
Total comprehensive income . . . . . . . (80,866)
Stock issue costs, net of tax . . . . . . . . . (19) (19)Dividends declared . . . . . . . . . . . . . . . . (23,022) (23,022)Purchase of treasury stock . . . . . . . . . . (1,817) (1,817)Reissuance of treasury stock . . . . . . . . . 10 64 74
Balance at March 31, 2003 . . . . . . . . . ¥3,917 ¥472,361 ¥984,196 ¥1,301,740 ¥(471,978) ¥(9,341) ¥2,280,895
(Continued on following page.)
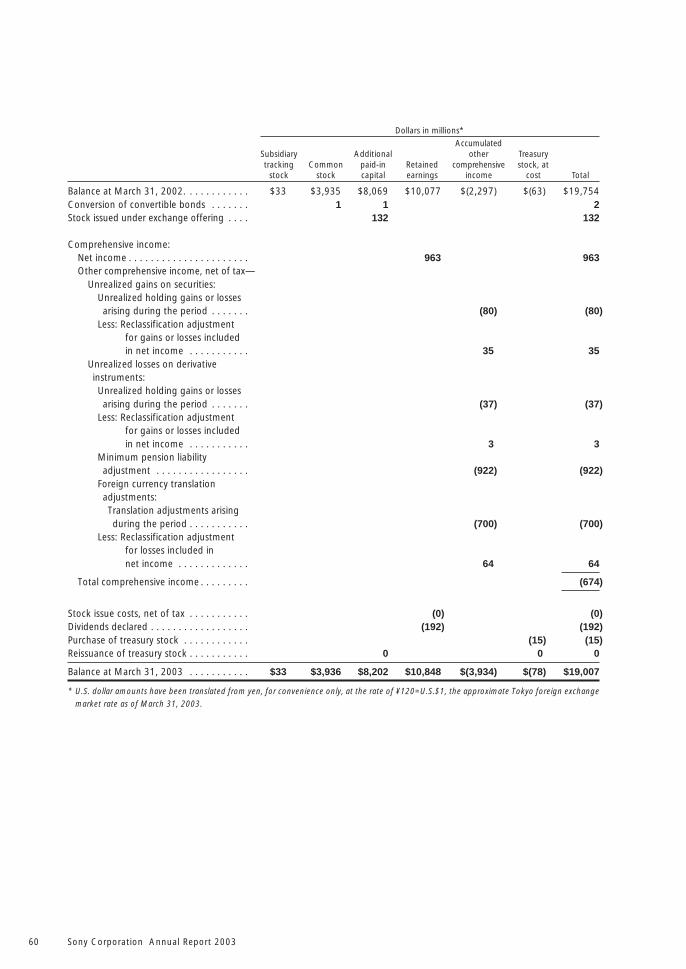
Sony Corporation Annual Report 200360
Dollars in millions*
AccumulatedSubsidiary Additional other Treasurytracking Common paid-in Retained comprehensive stock, at
stock stock capital earnings income cost Total
Balance at March 31, 2002. . . . . . . . . . . . $33 $3,935 $8,069 $10,077 $(2,297) $(63) $19,754Conversion of convertible bonds . . . . . . . 1 1 2Stock issued under exchange offering . . . . 132 132
Comprehensive income:Net income . . . . . . . . . . . . . . . . . . . . . . 963 963Other comprehensive income, net of tax—
Unrealized gains on securities:Unrealized holding gains or lossesarising during the period . . . . . . . (80) (80)
Less: Reclassification adjustmentfor gains or losses includedin net income . . . . . . . . . . . 35 35
Unrealized losses on derivativeinstruments:Unrealized holding gains or lossesarising during the period . . . . . . . (37) (37)
Less: Reclassification adjustmentfor gains or losses includedin net income . . . . . . . . . . . 3 3
Minimum pension liabilityadjustment . . . . . . . . . . . . . . . . . (922) (922)
Foreign currency translationadjustments:Translation adjustments arisingduring the period . . . . . . . . . . . (700) (700)
Less: Reclassification adjustmentfor losses included innet income . . . . . . . . . . . . . 64 64
Total comprehensive income . . . . . . . . . (674)
Stock issue costs, net of tax . . . . . . . . . . . (0) (0)Dividends declared . . . . . . . . . . . . . . . . . . (192) (192)Purchase of treasury stock . . . . . . . . . . . . (15) (15)Reissuance of treasury stock . . . . . . . . . . . 0 0 0
Balance at March 31, 2003 . . . . . . . . . . . $33 $3,936 $8,202 $10,848 $(3,934) $(78) $19,007
* U.S. dollar amounts have been translated from yen, for convenience only, at the rate of ¥120=U.S.$1, the approximate Tokyo foreign exchangemarket rate as of March 31, 2003.
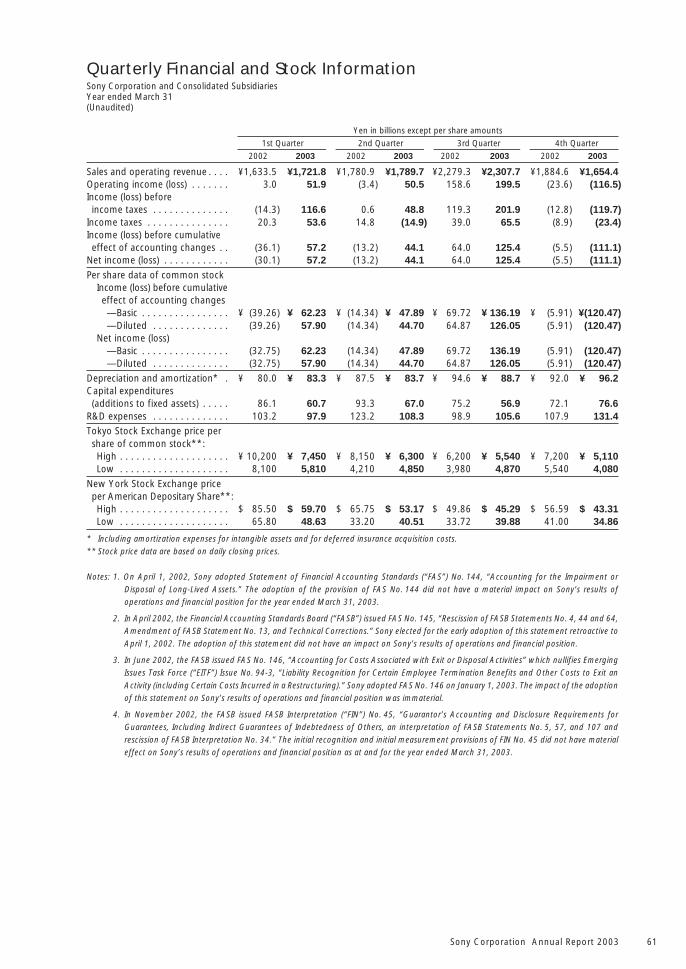
Sony Corporation Annual Report 2003 61
Yen in billions except per share amounts
1st Quarter 2nd Quarter 3rd Quarter 4th Quarter
2002 2003 2002 2003 2002 2003 2002 2003
Sales and operating revenue . . . . ¥1,633.5 ¥1,721.8 ¥1,780.9 ¥1,789.7 ¥2,279.3 ¥2,307.7 ¥1,884.6 ¥1,654.4Operating income (loss) . . . . . . . 3.0 51.9 (3.4) 50.5 158.6 199.5 (23.6) (116.5)Income (loss) beforeincome taxes . . . . . . . . . . . . . . (14.3) 116.6 0.6 48.8 119.3 201.9 (12.8) (119.7)
Income taxes . . . . . . . . . . . . . . . 20.3 53.6 14.8 (14.9) 39.0 65.5 (8.9) (23.4)Income (loss) before cumulativeeffect of accounting changes . . (36.1) 57.2 (13.2) 44.1 64.0 125.4 (5.5) (111.1)
Net income (loss) . . . . . . . . . . . . (30.1) 57.2 (13.2) 44.1 64.0 125.4 (5.5) (111.1)
Per share data of common stockIncome (loss) before cumulativeeffect of accounting changes—Basic . . . . . . . . . . . . . . . . ¥ (39.26) ¥ 62.23 ¥ (14.34) ¥ 47.89 ¥ 69.72 ¥ 136.19 ¥ (5.91) ¥(120.47)—Diluted . . . . . . . . . . . . . . (39.26) 57.90 (14.34) 44.70 64.87 126.05 (5.91) (120.47)
Net income (loss)—Basic . . . . . . . . . . . . . . . . (32.75) 62.23 (14.34) 47.89 69.72 136.19 (5.91) (120.47)—Diluted . . . . . . . . . . . . . . (32.75) 57.90 (14.34) 44.70 64.87 126.05 (5.91) (120.47)
Depreciation and amortization* . ¥ 80.0 ¥ 83.3 ¥ 87.5 ¥ 83.7 ¥ 94.6 ¥ 88.7 ¥ 92.0 ¥ 96.2Capital expenditures(additions to fixed assets) . . . . . 86.1 60.7 93.3 67.0 75.2 56.9 72.1 76.6
R&D expenses . . . . . . . . . . . . . . 103.2 97.9 123.2 108.3 98.9 105.6 107.9 131.4Tokyo Stock Exchange price pershare of common stock**:High . . . . . . . . . . . . . . . . . . . . ¥ 10,200 ¥ 7,450 ¥ 8,150 ¥ 6,300 ¥ 6,200 ¥ 5,540 ¥ 7,200 ¥ 5,110Low . . . . . . . . . . . . . . . . . . . . 8,100 5,810 4,210 4,850 3,980 4,870 5,540 4,080
New York Stock Exchange priceper American Depositary Share**:High . . . . . . . . . . . . . . . . . . . . $ 85.50 $ 59.70 $ 65.75 $ 53.17 $ 49.86 $ 45.29 $ 56.59 $ 43.31Low . . . . . . . . . . . . . . . . . . . . 65.80 48.63 33.20 40.51 33.72 39.88 41.00 34.86
* Including amortization expenses for intangible assets and for deferred insurance acquisition costs.** Stock price data are based on daily closing prices.
Notes: 1. On April 1, 2002, Sony adopted Statement of Financial Accounting Standards (“FAS”) No. 144, “Accounting for the Impairment orDisposal of Long-Lived Assets.” The adoption of the provision of FAS No. 144 did not have a material impact on Sony’s results ofoperations and financial position for the year ended March 31, 2003.
2. In April 2002, the Financial Accounting Standards Board (“FASB”) issued FAS No. 145, “Rescission of FASB Statements No. 4, 44 and 64,Amendment of FASB Statement No. 13, and Technical Corrections.” Sony elected for the early adoption of this statement retroactive toApril 1, 2002. The adoption of this statement did not have an impact on Sony’s results of operations and financial position.
3. In June 2002, the FASB issued FAS No. 146, “Accounting for Costs Associated with Exit or Disposal Activities” which nullifies EmergingIssues Task Force (“EITF”) Issue No. 94-3, “Liability Recognition for Certain Employee Termination Benefits and Other Costs to Exit an
Activity (including Certain Costs Incurred in a Restructuring).” Sony adopted FAS No. 146 on January 1, 2003. The impact of the adoptionof this statement on Sony’s results of operations and financial position was immaterial.
4. In November 2002, the FASB issued FASB Interpretation (“FIN”) No. 45, “Guarantor’s Accounting and Disclosure Requirements forGuarantees, Including Indirect Guarantees of Indebtedness of Others, an interpretation of FASB Statements No. 5, 57, and 107 andrescission of FASB Interpretation No. 34.” The initial recognition and initial measurement provisions of FIN No. 45 did not have materialeffect on Sony’s results of operations and financial position as at and for the year ended March 31, 2003.
Quarterly Financial and Stock InformationSony Corporation and Consolidated SubsidiariesYear ended March 31(Unaudited)
Sony Corporation Annual Report 200362
5. In December 2002, the FASB issued FAS No. 148, “Accounting for Stock-Based Compensation — Transition and Disclosure — anAmendment of FASB Statement No. 123.” Sony has accounted for its employee stock-based compensation in accordance with Account-ing Principles Board Opinion (“APB”) No. 25, “Accounting for Stock Issued to Employees” and, therefore, the adoption of the provisionsof FAS No. 148 did not have an impact on Sony’s results of operations and financial position.
6. In January 2003, the FASB issued FIN No. 46, “Consolidation of Variable Interest Entities — an Interpretation of ARB No. 51.” Thisinterpretation addresses consolidation by a primary beneficiary of a variable interest entity (“VIE”). FIN No. 46 is effective immediately for
all new variable interest entities created or acquired after January 31, 2003. For variable interest entities created or acquired prior toFebruary 1, 2003, the provisions of FIN No. 46 become effective for Sony during the second quarter of the year ending March 31, 2004.Sony did not enter into any new arrangements with VIEs during the period February 1, 2003 through March 31, 2003.
7. On April 1, 2001, Sony adopted FAS No. 133, “Accounting for Derivative Instruments and Hedging Activities” as amended by FASNo. 138 “Accounting for Certain Derivative Instruments and Certain Hedging Activities — an Amendment of FASB Statement No. 133.”As a result, Sony’s operating income, income before income taxes and net income for the year ended March 31, 2002 decreased by ¥3.0billion, ¥3.4 billion and ¥2.2 billion, respectively. Additionally, Sony recorded a one-time non-cash after-tax unrealized gain of ¥1.1billion in accumulated other comprehensive income in the consolidated balance sheet, as well as an after-tax gain of ¥6.0 billion in the
cumulative effect of accounting changes in the consolidated statement of income.
8. In July 2001, the FASB issued FAS No. 142, “Goodwill and Other Intangible Assets.” Sony adopted FAS No. 142 retroactive to April 1,2001. As a result, Sony’s operating income and income before income taxes for the year ended March 31, 2002 increased by ¥20.1billion and income before cumulative effect of accounting changes as well as net income for the year ended March 31, 2002 increasedby ¥18.9 billion.
9. In the fourth quarter of the year ended March 31, 2002, Sony adopted “EITF” Issue No. 00-25, “Vendor Income Statement Characterizationof Consideration Paid to a Reseller of the Vendor’s Products,” which was later codified along with other similar issues into EITF IssueNo. 01-09, “Accounting for Consideration Given by a Vendor to a Customer or Reseller of the Vendor’s Products,” retroactive to April 1,2001. As a result, Sony has restated sales and operating revenue for the first three quarters of the year ended March 31, 2002.
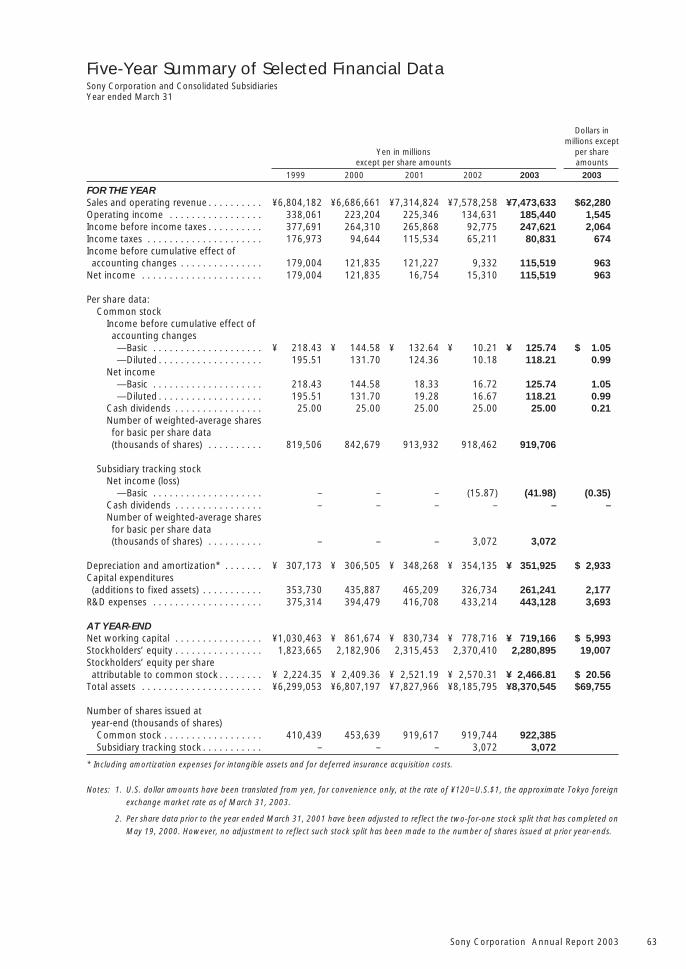
Sony Corporation Annual Report 2003 63
Dollars inmillions except
Yen in millions per shareexcept per share amounts amounts
1999 2000 2001 2002 2003 2003
FOR THE YEARSales and operating revenue . . . . . . . . . . ¥6,804,182 ¥6,686,661 ¥7,314,824 ¥7,578,258 ¥7,473,633 $62,280Operating income . . . . . . . . . . . . . . . . . 338,061 223,204 225,346 134,631 185,440 1,545Income before income taxes . . . . . . . . . . 377,691 264,310 265,868 92,775 247,621 2,064Income taxes . . . . . . . . . . . . . . . . . . . . . 176,973 94,644 115,534 65,211 80,831 674Income before cumulative effect ofaccounting changes . . . . . . . . . . . . . . . 179,004 121,835 121,227 9,332 115,519 963
Net income . . . . . . . . . . . . . . . . . . . . . . 179,004 121,835 16,754 15,310 115,519 963
Per share data:Common stock
Income before cumulative effect ofaccounting changes—Basic . . . . . . . . . . . . . . . . . . . . ¥ 218.43 ¥ 144.58 ¥ 132.64 ¥ 10.21 ¥ 125.74 $ 1.05—Diluted . . . . . . . . . . . . . . . . . . . 195.51 131.70 124.36 10.18 118.21 0.99
Net income—Basic . . . . . . . . . . . . . . . . . . . . 218.43 144.58 18.33 16.72 125.74 1.05—Diluted . . . . . . . . . . . . . . . . . . . 195.51 131.70 19.28 16.67 118.21 0.99
Cash dividends . . . . . . . . . . . . . . . . 25.00 25.00 25.00 25.00 25.00 0.21Number of weighted-average sharesfor basic per share data(thousands of shares) . . . . . . . . . . 819,506 842,679 913,932 918,462 919,706
Subsidiary tracking stockNet income (loss)
—Basic . . . . . . . . . . . . . . . . . . . . – – – (15.87) (41.98) (0.35)Cash dividends . . . . . . . . . . . . . . . . – – – – – –Number of weighted-average sharesfor basic per share data(thousands of shares) . . . . . . . . . . – – – 3,072 3,072
Depreciation and amortization* . . . . . . . ¥ 307,173 ¥ 306,505 ¥ 348,268 ¥ 354,135 ¥ 351,925 $ 2,933Capital expenditures(additions to fixed assets) . . . . . . . . . . . 353,730 435,887 465,209 326,734 261,241 2,177
R&D expenses . . . . . . . . . . . . . . . . . . . . 375,314 394,479 416,708 433,214 443,128 3,693
AT YEAR-ENDNet working capital . . . . . . . . . . . . . . . . ¥1,030,463 ¥ 861,674 ¥ 830,734 ¥ 778,716 ¥ 719,166 $ 5,993Stockholders’ equity . . . . . . . . . . . . . . . . 1,823,665 2,182,906 2,315,453 2,370,410 2,280,895 19,007Stockholders’ equity per shareattributable to common stock . . . . . . . . ¥ 2,224.35 ¥ 2,409.36 ¥ 2,521.19 ¥ 2,570.31 ¥ 2,466.81 $ 20.56
Total assets . . . . . . . . . . . . . . . . . . . . . . ¥6,299,053 ¥6,807,197 ¥7,827,966 ¥8,185,795 ¥8,370,545 $69,755
Number of shares issued atyear-end (thousands of shares)Common stock . . . . . . . . . . . . . . . . . . 410,439 453,639 919,617 919,744 922,385Subsidiary tracking stock . . . . . . . . . . . – – – 3,072 3,072
* Including amortization expenses for intangible assets and for deferred insurance acquisition costs.
Notes: 1. U.S. dollar amounts have been translated from yen, for convenience only, at the rate of ¥120=U.S.$1, the approximate Tokyo foreignexchange market rate as of March 31, 2003.
2. Per share data prior to the year ended March 31, 2001 have been adjusted to reflect the two-for-one stock split that has completed onMay 19, 2000. However, no adjustment to reflect such stock split has been made to the number of shares issued at prior year-ends.
Five-Year Summary of Selected Financial DataSony Corporation and Consolidated SubsidiariesYear ended March 31
Sony Corporation Annual Report 200364
3. On April 1, 2001, Sony adopted FAS No. 133, “Accounting for Derivative Instruments and Hedging Activities” as amended by FASNo. 138 “Accounting for Certain Derivative Instruments and Certain Hedging Activities — an Amendment of FASB Statement No. 133.”As a result, Sony’s operating income, income before income taxes and net income for the year ended March 31, 2002 decreased by ¥3.0billion, ¥3.4 billion and ¥2.2 billion, respectively. Additionally, Sony recorded a one-time non-cash after-tax unrealized gain of ¥1.1billion in accumulated other comprehensive income in the consolidated balance sheet, as well as an after-tax gain of ¥6.0 billion in the
cumulative effect of accounting changes in the consolidated statement of income.
4. In July 2001, the FASB issued FAS No. 142, “Goodwill and Other Intangible Assets.” Sony adopted FAS No. 142 retroactive to April 1,2001. As a result, Sony’s operating income and income before income taxes for the year ended March 31, 2002 increased by ¥20.1billion and income before cumulative effect of accounting changes as well as net income for the year ended March 31, 2002 increasedby ¥18.9 billion.
5. In June 2000, the Accounting Standards Executive Committee of the American Institute of Certified Public Accountants issued Statementof Position (“SOP”) 00-2, “Accounting by Producers or Distributors of Films.” Sony adopted SOP 00-2 retroactive to April 1, 2000. As aresult, Sony’s net income for the year ended March 31, 2001 included a one-time, non-cash charge with no tax effect of ¥101.7 billion,primarily to reduce the carrying value of its film inventory.
6. In December 1999, the Securities and Exchange Commission issued Staff Accounting Bulletin (“SAB”) No. 101, “Revenue Recognition in
Financial Statements.” Sony adopted SAB No. 101 in the fourth quarter ended March 31, 2001 retroactive to April 1, 2000. As a result,a one-time no-cash cumulative effect adjustment of ¥2.8 billion was recorded in the income statement directly above the caption of“net income” for a change in accounting principle.
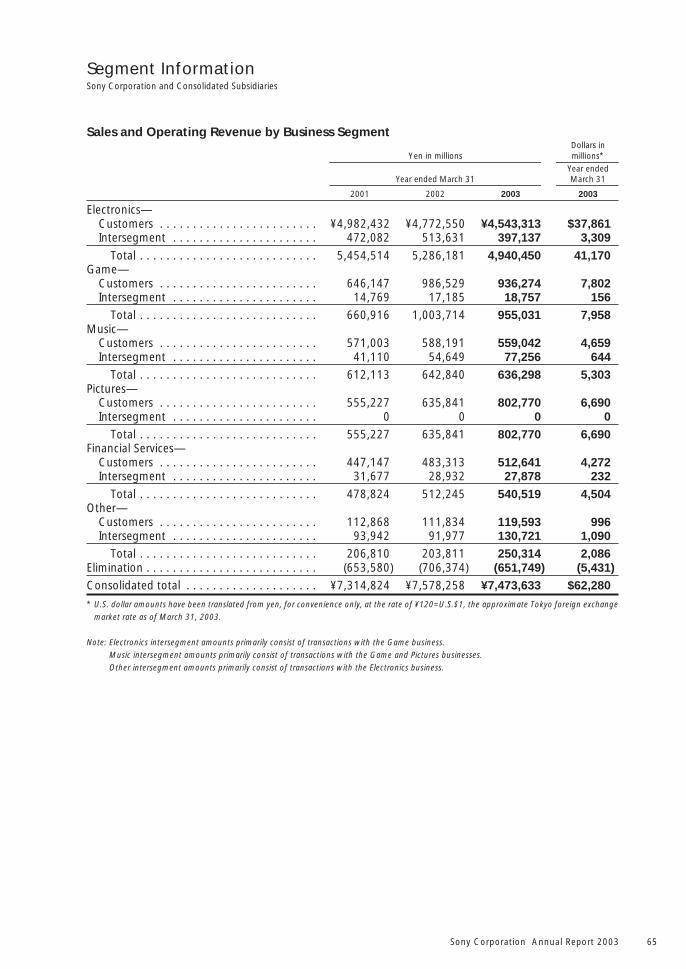
Sony Corporation Annual Report 2003 65
Sales and Operating Revenue by Business SegmentDollars in
Yen in millions millions*
Year endedYear ended March 31 March 31
2001 2002 2003 2003
Electronics—Customers . . . . . . . . . . . . . . . . . . . . . . . . ¥4,982,432 ¥4,772,550 ¥4,543,313 $37,861Intersegment . . . . . . . . . . . . . . . . . . . . . . 472,082 513,631 397,137 3,309
Total . . . . . . . . . . . . . . . . . . . . . . . . . . . 5,454,514 5,286,181 4,940,450 41,170Game—
Customers . . . . . . . . . . . . . . . . . . . . . . . . 646,147 986,529 936,274 7,802Intersegment . . . . . . . . . . . . . . . . . . . . . . 14,769 17,185 18,757 156
Total . . . . . . . . . . . . . . . . . . . . . . . . . . . 660,916 1,003,714 955,031 7,958Music—
Customers . . . . . . . . . . . . . . . . . . . . . . . . 571,003 588,191 559,042 4,659Intersegment . . . . . . . . . . . . . . . . . . . . . . 41,110 54,649 77,256 644
Total . . . . . . . . . . . . . . . . . . . . . . . . . . . 612,113 642,840 636,298 5,303Pictures—
Customers . . . . . . . . . . . . . . . . . . . . . . . . 555,227 635,841 802,770 6,690Intersegment . . . . . . . . . . . . . . . . . . . . . . 0 0 0 0
Total . . . . . . . . . . . . . . . . . . . . . . . . . . . 555,227 635,841 802,770 6,690Financial Services—
Customers . . . . . . . . . . . . . . . . . . . . . . . . 447,147 483,313 512,641 4,272Intersegment . . . . . . . . . . . . . . . . . . . . . . 31,677 28,932 27,878 232
Total . . . . . . . . . . . . . . . . . . . . . . . . . . . 478,824 512,245 540,519 4,504Other—
Customers . . . . . . . . . . . . . . . . . . . . . . . . 112,868 111,834 119,593 996Intersegment . . . . . . . . . . . . . . . . . . . . . . 93,942 91,977 130,721 1,090
Total . . . . . . . . . . . . . . . . . . . . . . . . . . . 206,810 203,811 250,314 2,086Elimination . . . . . . . . . . . . . . . . . . . . . . . . . . (653,580) (706,374) (651,749) (5,431)Consolidated total . . . . . . . . . . . . . . . . . . . . ¥7,314,824 ¥7,578,258 ¥7,473,633 $62,280
* U.S. dollar amounts have been translated from yen, for convenience only, at the rate of ¥120=U.S.$1, the approximate Tokyo foreign exchangemarket rate as of March 31, 2003.
Note: Electronics intersegment amounts primarily consist of transactions with the Game business.Music intersegment amounts primarily consist of transactions with the Game and Pictures businesses.Other intersegment amounts primarily consist of transactions with the Electronics business.
Segment InformationSony Corporation and Consolidated Subsidiaries
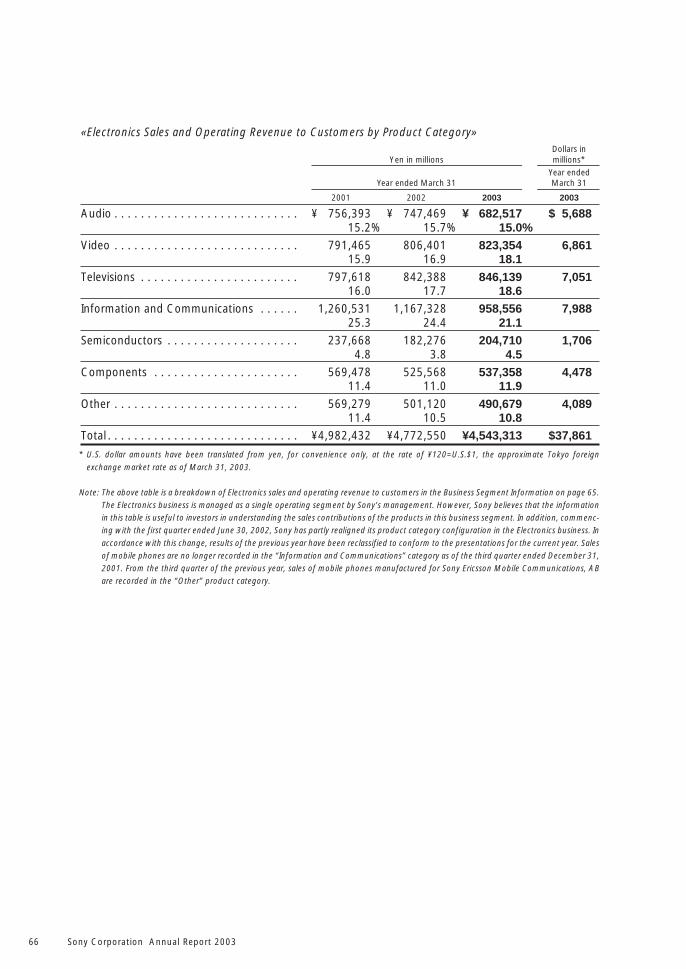
Sony Corporation Annual Report 200366
«Electronics Sales and Operating Revenue to Customers by Product Category»Dollars in
Yen in millions millions*
Year endedYear ended March 31 March 31
2001 2002 2003 2003
Audio . . . . . . . . . . . . . . . . . . . . . . . . . . . . ¥ 756,393 ¥ 747,469 ¥ 682,517 $ 5,68815.2% 15.7% 15.0%
Video . . . . . . . . . . . . . . . . . . . . . . . . . . . . 791,465 806,401 823,354 6,86115.9 16.9 18.1
Televisions . . . . . . . . . . . . . . . . . . . . . . . . 797,618 842,388 846,139 7,05116.0 17.7 18.6
Information and Communications . . . . . . 1,260,531 1,167,328 958,556 7,98825.3 24.4 21.1
Semiconductors . . . . . . . . . . . . . . . . . . . . 237,668 182,276 204,710 1,7064.8 3.8 4.5
Components . . . . . . . . . . . . . . . . . . . . . . 569,478 525,568 537,358 4,47811.4 11.0 11.9
Other . . . . . . . . . . . . . . . . . . . . . . . . . . . . 569,279 501,120 490,679 4,08911.4 10.5 10.8
Total . . . . . . . . . . . . . . . . . . . . . . . . . . . . . ¥4,982,432 ¥4,772,550 ¥4,543,313 $37,861
* U.S. dollar amounts have been translated from yen, for convenience only, at the rate of ¥120=U.S.$1, the approximate Tokyo foreign
exchange market rate as of March 31, 2003.
Note: The above table is a breakdown of Electronics sales and operating revenue to customers in the Business Segment Information on page 65.The Electronics business is managed as a single operating segment by Sony’s management. However, Sony believes that the informationin this table is useful to investors in understanding the sales contributions of the products in this business segment. In addition, commenc-ing with the first quarter ended June 30, 2002, Sony has partly realigned its product category configuration in the Electronics business. In
accordance with this change, results of the previous year have been reclassified to conform to the presentations for the current year. Salesof mobile phones are no longer recorded in the “Information and Communications” category as of the third quarter ended December 31,2001. From the third quarter of the previous year, sales of mobile phones manufactured for Sony Ericsson Mobile Communications, ABare recorded in the “Other” product category.
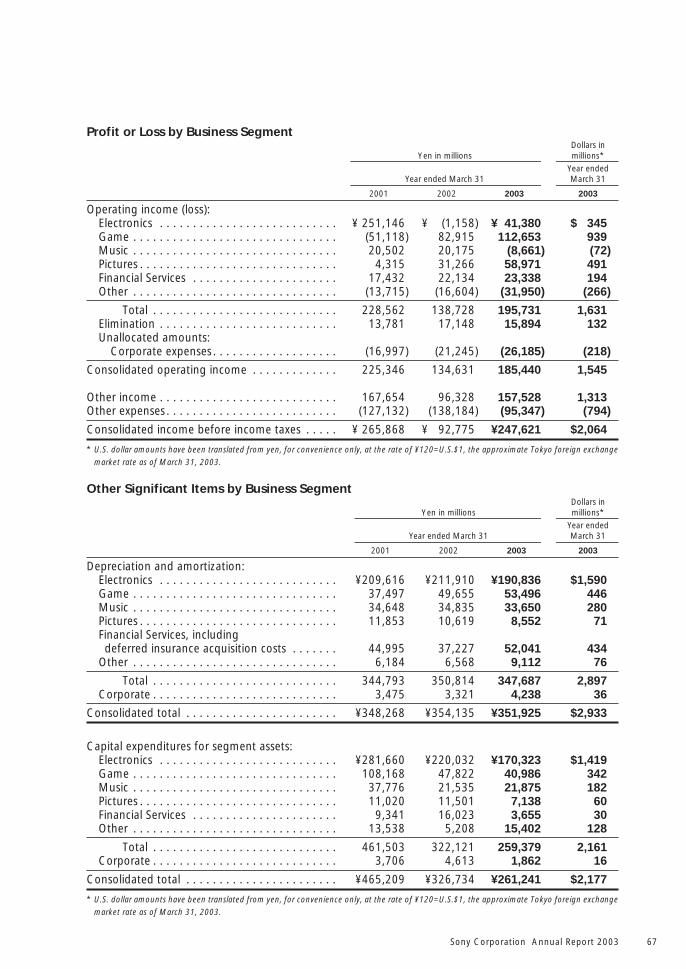
Sony Corporation Annual Report 2003 67
Other Significant Items by Business SegmentDollars in
Yen in millions millions*
Year endedYear ended March 31 March 31
2001 2002 2003 2003
Depreciation and amortization:Electronics . . . . . . . . . . . . . . . . . . . . . . . . . . . ¥209,616 ¥211,910 ¥190,836 $1,590Game . . . . . . . . . . . . . . . . . . . . . . . . . . . . . . . 37,497 49,655 53,496 446Music . . . . . . . . . . . . . . . . . . . . . . . . . . . . . . . 34,648 34,835 33,650 280Pictures . . . . . . . . . . . . . . . . . . . . . . . . . . . . . . 11,853 10,619 8,552 71Financial Services, includingdeferred insurance acquisition costs . . . . . . . 44,995 37,227 52,041 434
Other . . . . . . . . . . . . . . . . . . . . . . . . . . . . . . . 6,184 6,568 9,112 76
Total . . . . . . . . . . . . . . . . . . . . . . . . . . . . 344,793 350,814 347,687 2,897Corporate . . . . . . . . . . . . . . . . . . . . . . . . . . . . 3,475 3,321 4,238 36
Consolidated total . . . . . . . . . . . . . . . . . . . . . . . ¥348,268 ¥354,135 ¥351,925 $2,933
Capital expenditures for segment assets:Electronics . . . . . . . . . . . . . . . . . . . . . . . . . . . ¥281,660 ¥220,032 ¥170,323 $1,419Game . . . . . . . . . . . . . . . . . . . . . . . . . . . . . . . 108,168 47,822 40,986 342Music . . . . . . . . . . . . . . . . . . . . . . . . . . . . . . . 37,776 21,535 21,875 182Pictures . . . . . . . . . . . . . . . . . . . . . . . . . . . . . . 11,020 11,501 7,138 60Financial Services . . . . . . . . . . . . . . . . . . . . . . 9,341 16,023 3,655 30Other . . . . . . . . . . . . . . . . . . . . . . . . . . . . . . . 13,538 5,208 15,402 128
Total . . . . . . . . . . . . . . . . . . . . . . . . . . . . 461,503 322,121 259,379 2,161Corporate . . . . . . . . . . . . . . . . . . . . . . . . . . . . 3,706 4,613 1,862 16
Consolidated total . . . . . . . . . . . . . . . . . . . . . . . ¥465,209 ¥326,734 ¥261,241 $2,177
* U.S. dollar amounts have been translated from yen, for convenience only, at the rate of ¥120=U.S.$1, the approximate Tokyo foreign exchangemarket rate as of March 31, 2003.
Profit or Loss by Business SegmentDollars in
Yen in millions millions*
Year endedYear ended March 31 March 31
2001 2002 2003 2003
Operating income (loss):Electronics . . . . . . . . . . . . . . . . . . . . . . . . . . . ¥ 251,146 ¥ (1,158) ¥ 41,380 $ 345Game . . . . . . . . . . . . . . . . . . . . . . . . . . . . . . . (51,118) 82,915 112,653 939Music . . . . . . . . . . . . . . . . . . . . . . . . . . . . . . . 20,502 20,175 (8,661) (72)Pictures . . . . . . . . . . . . . . . . . . . . . . . . . . . . . . 4,315 31,266 58,971 491Financial Services . . . . . . . . . . . . . . . . . . . . . . 17,432 22,134 23,338 194Other . . . . . . . . . . . . . . . . . . . . . . . . . . . . . . . (13,715) (16,604) (31,950) (266)
Total . . . . . . . . . . . . . . . . . . . . . . . . . . . . 228,562 138,728 195,731 1,631Elimination . . . . . . . . . . . . . . . . . . . . . . . . . . . 13,781 17,148 15,894 132Unallocated amounts:
Corporate expenses . . . . . . . . . . . . . . . . . . . (16,997) (21,245) (26,185) (218)
Consolidated operating income . . . . . . . . . . . . . 225,346 134,631 185,440 1,545
Other income . . . . . . . . . . . . . . . . . . . . . . . . . . . 167,654 96,328 157,528 1,313Other expenses . . . . . . . . . . . . . . . . . . . . . . . . . . (127,132) (138,184) (95,347) (794)
Consolidated income before income taxes . . . . . ¥ 265,868 ¥ 92,775 ¥247,621 $2,064
* U.S. dollar amounts have been translated from yen, for convenience only, at the rate of ¥120=U.S.$1, the approximate Tokyo foreign exchangemarket rate as of March 31, 2003.
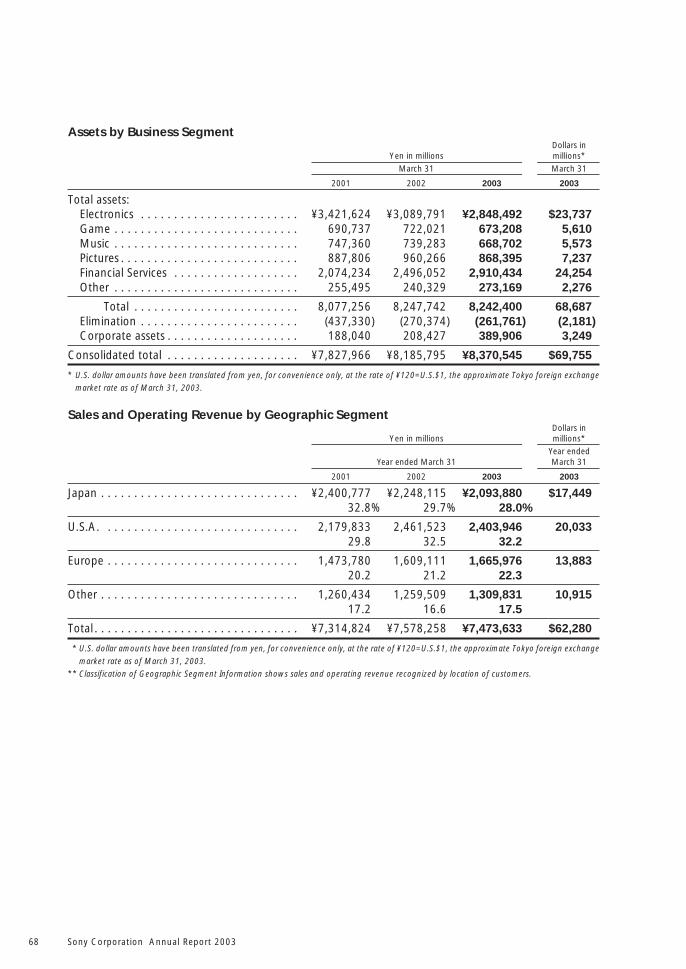
Sony Corporation Annual Report 200368
Assets by Business SegmentDollars in
Yen in millions millions*
March 31 March 31
2001 2002 2003 2003
Total assets:Electronics . . . . . . . . . . . . . . . . . . . . . . . . ¥3,421,624 ¥3,089,791 ¥2,848,492 $23,737Game . . . . . . . . . . . . . . . . . . . . . . . . . . . . 690,737 722,021 673,208 5,610Music . . . . . . . . . . . . . . . . . . . . . . . . . . . . 747,360 739,283 668,702 5,573Pictures . . . . . . . . . . . . . . . . . . . . . . . . . . . 887,806 960,266 868,395 7,237Financial Services . . . . . . . . . . . . . . . . . . . 2,074,234 2,496,052 2,910,434 24,254Other . . . . . . . . . . . . . . . . . . . . . . . . . . . . 255,495 240,329 273,169 2,276
Total . . . . . . . . . . . . . . . . . . . . . . . . . 8,077,256 8,247,742 8,242,400 68,687Elimination . . . . . . . . . . . . . . . . . . . . . . . . (437,330) (270,374) (261,761) (2,181)Corporate assets . . . . . . . . . . . . . . . . . . . . 188,040 208,427 389,906 3,249
Consolidated total . . . . . . . . . . . . . . . . . . . . ¥7,827,966 ¥8,185,795 ¥8,370,545 $69,755
* U.S. dollar amounts have been translated from yen, for convenience only, at the rate of ¥120=U.S.$1, the approximate Tokyo foreign exchangemarket rate as of March 31, 2003.
Sales and Operating Revenue by Geographic SegmentDollars in
Yen in millions millions*
Year endedYear ended March 31 March 31
2001 2002 2003 2003
Japan . . . . . . . . . . . . . . . . . . . . . . . . . . . . . . ¥2,400,777 ¥2,248,115 ¥2,093,880 $17,44932.8% 29.7% 28.0%
U.S.A. . . . . . . . . . . . . . . . . . . . . . . . . . . . . . 2,179,833 2,461,523 2,403,946 20,03329.8 32.5 32.2
Europe . . . . . . . . . . . . . . . . . . . . . . . . . . . . . 1,473,780 1,609,111 1,665,976 13,88320.2 21.2 22.3
Other . . . . . . . . . . . . . . . . . . . . . . . . . . . . . . 1,260,434 1,259,509 1,309,831 10,91517.2 16.6 17.5
Total . . . . . . . . . . . . . . . . . . . . . . . . . . . . . . . ¥7,314,824 ¥7,578,258 ¥7,473,633 $62,280
* U.S. dollar amounts have been translated from yen, for convenience only, at the rate of ¥120=U.S.$1, the approximate Tokyo foreign exchange
market rate as of March 31, 2003.** Classification of Geographic Segment Information shows sales and operating revenue recognized by location of customers.
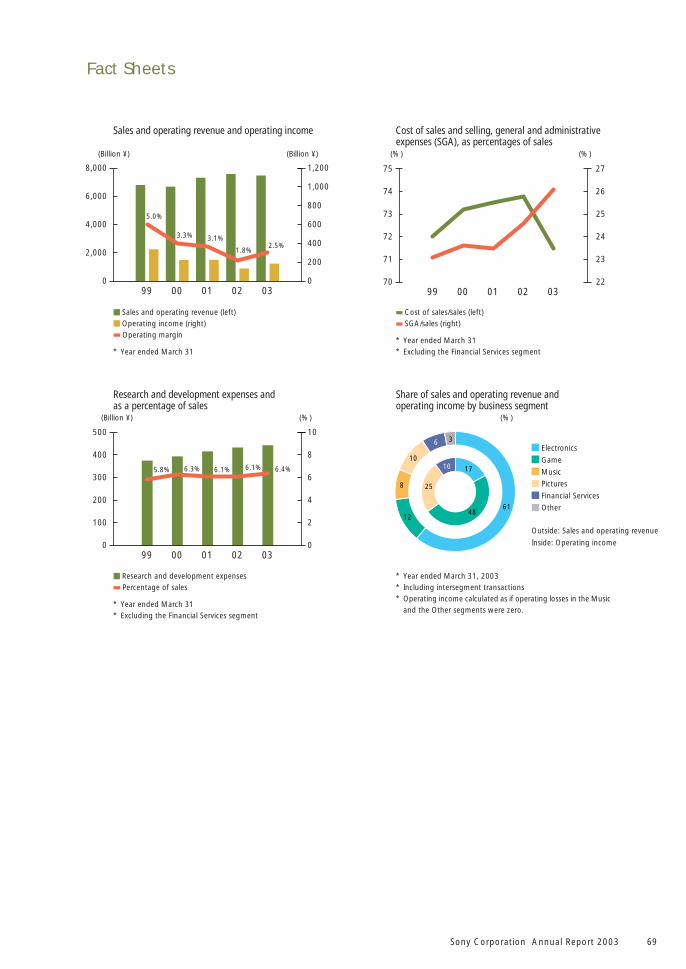
Sony Corporation Annual Report 2003 69
* Year ended March 31, 2003* Including intersegment transactions* Operating income calculated as if operating losses in the Music
and the Other segments were zero.
■ Sales and operating revenue (left)
■ Operating income (right)■ Operating margin
* Year ended March 31
■ Cost of sales/sales (left)■ SGA/sales (right)
* Year ended March 31* Excluding the Financial Services segment
■ Research and development expenses■ Percentage of sales
* Year ended March 31* Excluding the Financial Services segment
(%)
(%) (%)
(Billion ¥) (%)
Electronics
Game
Music
Pictures
Financial Services
Other
Outside: Sales and operating revenue
Inside: Operating income
Fact Sheets
Share of sales and operating revenue andoperating income by business segment
Sales and operating revenue and operating income Cost of sales and selling, general and administrativeexpenses (SGA), as percentages of sales
Research and development expenses andas a percentage of sales
(Billion ¥) (Billion ¥)
0
2,000
4,000
6,000
8,000
0
200
400
600
800
1,000
1,200
99 00 01 02 03
1.8%
3.1%3.3%
5.0%
2.5%
99 00 01 02 0370
71
72
73
74
75
22
23
24
25
26
27
0
100
200
300
400
500
99 00 01 02 030
2
4
6
8
10
6.1%6.1%6.3%5.8% 6.4%
6112
8
10
6 3
17
48
25
10
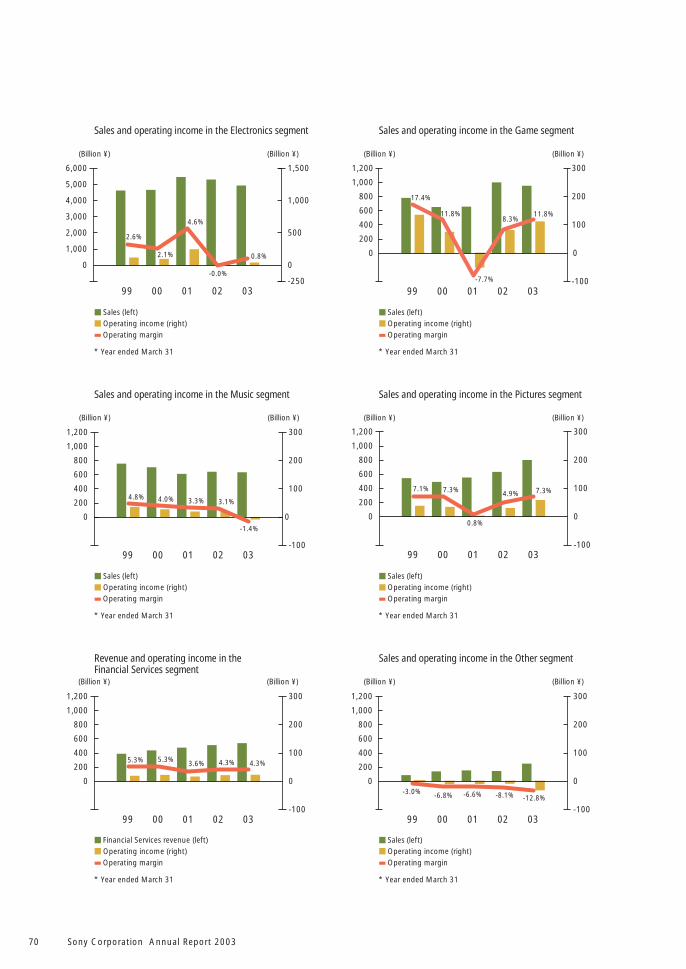
Sony Corporation Annual Report 200370
■ Sales (left)
■ Operating income (right)■ Operating margin
* Year ended March 31
■ Sales (left)
■ Operating income (right)■ Operating margin
* Year ended March 31
■ Sales (left)
■ Operating income (right)■ Operating margin
* Year ended March 31
■ Sales (left)
■ Operating income (right)■ Operating margin
* Year ended March 31
■ Financial Services revenue (left)
■ Operating income (right)■ Operating margin
* Year ended March 31
■ Sales (left)
■ Operating income (right)■ Operating margin
* Year ended March 31
(Billion ¥) (Billion ¥) (Billion ¥) (Billion ¥)
(Billion ¥) (Billion ¥) (Billion ¥) (Billion ¥)
(Billion ¥) (Billion ¥) (Billion ¥) (Billion ¥)
Sales and operating income in the Electronics segment Sales and operating income in the Game segment
Sales and operating income in the Music segment Sales and operating income in the Pictures segment
Revenue and operating income in theFinancial Services segment
Sales and operating income in the Other segment
0
1,000
2,000
3,000
4,000
5,000
6,000
-250
0
500
1,000
1,500
99 00 01 02 03
-0.0%
4.6%
2.1%
2.6%
0.8% 0
200
400
600
800
1,000
1,200
-100
0
100
200
300
99 00 01 02 03
8.3%
-7.7%
11.8%
17.4%
11.8%
0
200
400
600
800
1,000
1,200
-100
0
100
200
300
99 00 01 02 03
3.1%3.3%4.0%4.8%
-1.4%
0
200
400
600
800
1,000
1,200
-100
0
100
200
300
99 00 01 02 03
4.9%
0.8%
7.3%7.1% 7.3%
0
200
400
600
800
1,000
1,200
-100
0
100
200
300
99 00 01 02 03
4.3%3.6%5.3%5.3% 4.3%
0
200
400
600
800
1,000
1,200
-100
0
100
200
300
99 00 01 02 03
-8.1%-6.6%-6.8%-3.0%-12.8%
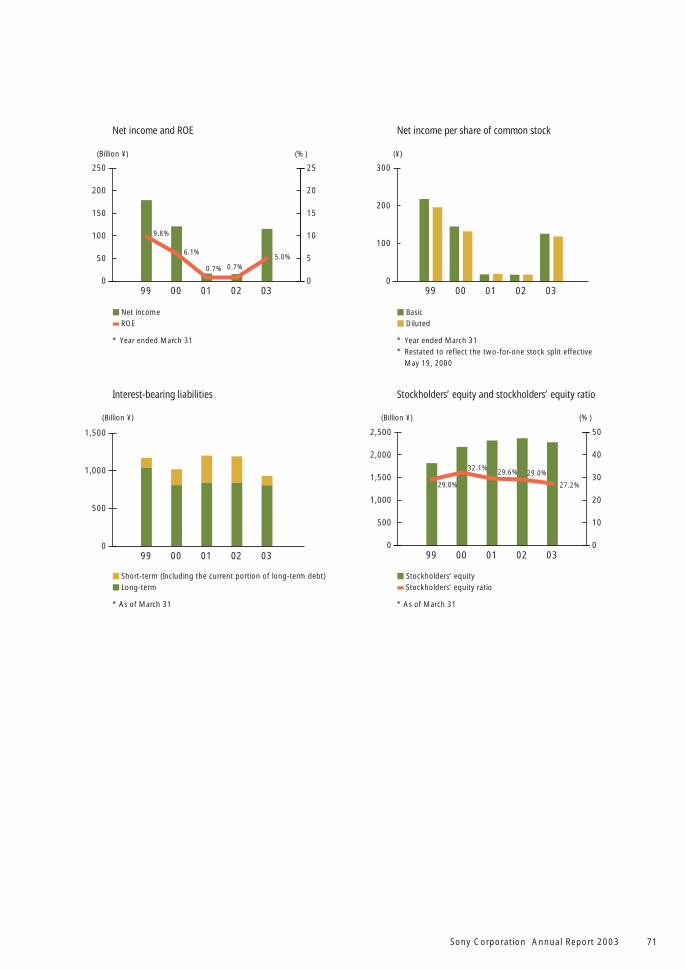
Sony Corporation Annual Report 2003 71
■ Net income■ ROE
* Year ended March 31
■ Basic
■ Diluted
* Year ended March 31* Restated to reflect the two-for-one stock split effective
May 19, 2000
■ Short-term (Including the current portion of long-term debt)
■ Long-term
* As of March 31
■ Stockholders’ equity■ Stockholders’ equity ratio
* As of March 31
(Billion ¥) (Billion ¥) (%)
(Billion ¥) (%) (¥)
Stockholders’ equity and stockholders’ equity ratio
Net income and ROE Net income per share of common stock
Interest-bearing liabilities
99 00 01 02 030
50
100
150
200
250
0
5
10
15
20
25
0.7%0.7%
6.1%
9.8%
5.0%
0
100
200
300
99 00 01 02 03
99 00 01 02 030
500
1,000
1,500
99 00 01 02 030
500
1,000
1,500
2,000
2,500
0
10
20
30
40
50
29.0%29.6%32.1%
29.0% 27.2%
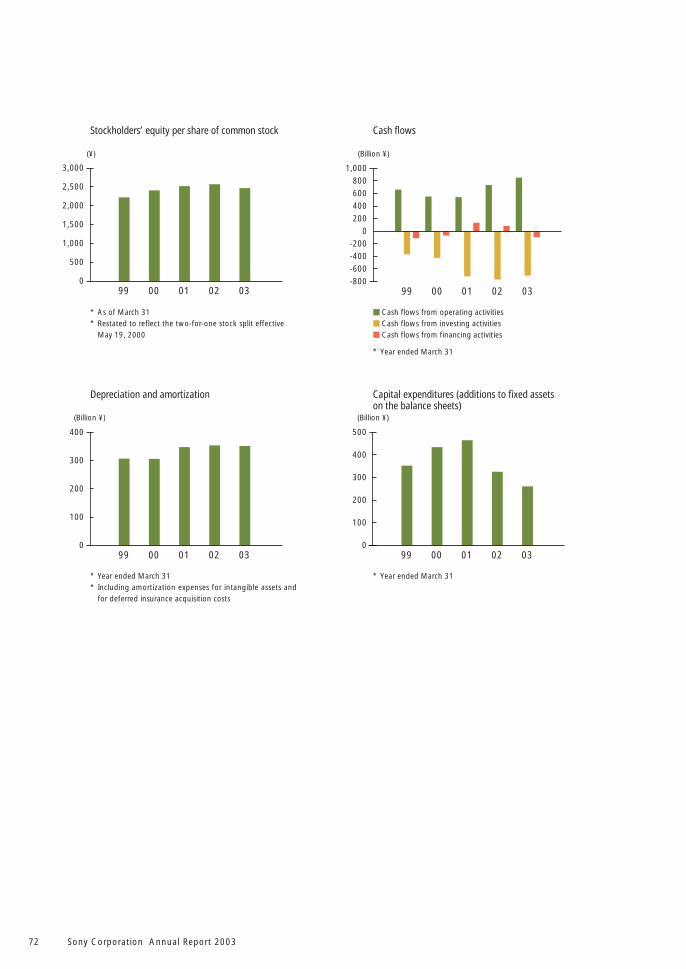
Sony Corporation Annual Report 200372
* Year ended March 31
* As of March 31* Restated to reflect the two-for-one stock split effective
May 19, 2000
■ Cash flows from operating activities
■ Cash flows from investing activities
■ Cash flows from financing activities
* Year ended March 31
* Year ended March 31* Including amortization expenses for intangible assets and
for deferred insurance acquisition costs
(Billion ¥) (Billion ¥)
(¥) (Billion ¥)
Stockholders’ equity per share of common stock Cash flows
Depreciation and amortization Capital expenditures (additions to fixed assetson the balance sheets)
99 00 01 02 030
500
1,000
1,500
2,000
2,500
3,000
-800
-600
-400
-200
0
200
400
600
800
1,000
99 00 01 02 03
99 00 01 02 030
100
200
300
400
99 00 01 02 030
100
200
300
400
500
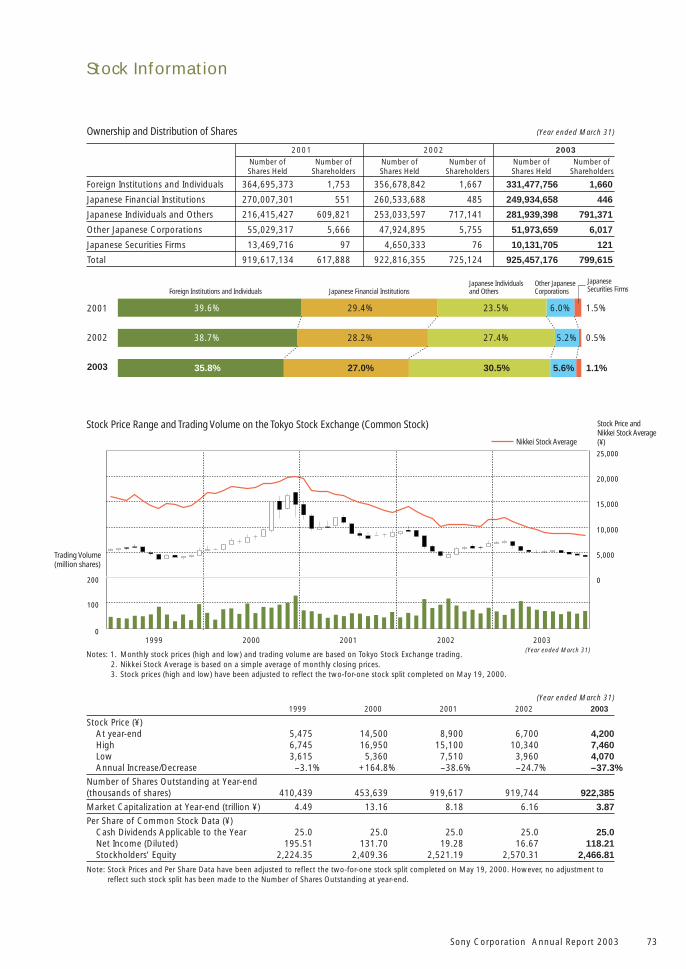
Sony Corporation Annual Report 2003 73
200
100
0
0
5,000
10,000
15,000
20,000
25,000
2001
2002
2003
39.6%
38.7%
35.8%
29.4%
28.2%
27.0%
23.5%
27.4%
30.5%
6.0%
5.2%
5.6%
1.5%
0.5%
1.1%
Stock Information
Stock Price Range and Trading Volume on the Tokyo Stock Exchange (Common Stock)
Notes: 1. Monthly stock prices (high and low) and trading volume are based on Tokyo Stock Exchange trading.2. Nikkei Stock Average is based on a simple average of monthly closing prices.3. Stock prices (high and low) have been adjusted to reflect the two-for-one stock split completed on May 19, 2000.
JapaneseSecurities Firms
Other JapaneseCorporations
Japanese Individualsand OthersJapanese Financial InstitutionsForeign Institutions and Individuals
Trading Volume(million shares)
Stock Price andNikkei Stock Average(¥)Nikkei Stock Average
2001 2002 2003Number of Number of Number of Number of Number of Number ofShares Held Shareholders Shares Held Shareholders Shares Held Shareholders
Foreign Institutions and Individuals 364,695,373 1,753 356,678,842 1,667 331,477,756 1,660
Japanese Financial Institutions 270,007,301 551 260,533,688 485 249,934,658 446
Japanese Individuals and Others 216,415,427 609,821 253,033,597 717,141 281,939,398 791,371
Other Japanese Corporations 55,029,317 5,666 47,924,895 5,755 51,973,659 6,017
Japanese Securities Firms 13,469,716 97 4,650,333 76 10,131,705 121
Total 919,617,134 617,888 922,816,355 725,124 925,457,176 799,615
Ownership and Distribution of Shares (Year ended March 31)
(Year ended March 31)1999 2000 2001 2002 2003
Stock Price (¥)At year-end 5,475 14,500 8,900 6,700 4,200High 6,745 16,950 15,100 10,340 7,460Low 3,615 5,360 7,510 3,960 4,070Annual Increase/Decrease –3.1% +164.8% –38.6% –24.7% –37.3%
Number of Shares Outstanding at Year-end(thousands of shares) 410,439 453,639 919,617 919,744 922,385
Market Capitalization at Year-end (trillion ¥) 4.49 13.16 8.18 6.16 3.87
Per Share of Common Stock Data (¥)Cash Dividends Applicable to the Year 25.0 25.0 25.0 25.0 25.0Net Income (Diluted) 195.51 131.70 19.28 16.67 118.21Stockholders’ Equity 2,224.35 2,409.36 2,521.19 2,570.31 2,466.81
Note: Stock Prices and Per Share Data have been adjusted to reflect the two-for-one stock split completed on May 19, 2000. However, no adjustment toreflect such stock split has been made to the Number of Shares Outstanding at year-end.
(Year ended March 31)1999 2000 2001 2002 2003
Sony Corporation Annual Report 200374
Revolutionizing Corporate Governance
At the Ordinary General Meeting of Shareholders held
on June 20, 2003, shareholders approved an amend-
ment to Sony Corporation’s Articles of Incorporation
transforming Sony into a “Company with Committees,”
a new corporate governance system under the
Japanese Commercial Code. As a result, Sony has
terminated its Statutory Auditors and Board of Statutory
Auditors system. In its place, Sony has established three
committees (the Nominating Committee, Audit
Committee and Compensation Committee) each of
which consists of a majority of outside Directors.
At the Ordinary General Meeting of Shareholders,
17 Directors, including eight outside Directors, were
elected. Immediately after the meeting, the newly
elected Directors met to name members of the three
committees and twelve Corporate Executive Officers,
three of whom are Representative Corporate Executive
Officers. At this board meeting, the Directors also
adopted regulations, including Sony’s own rules for
bolstering corporate governance, for the Board of
Directors and its committees.
These revisions to Sony’s corporate governance are
aimed at strengthening the ability of the Board of
Directors to oversee operations while facilitating
delegation of greater authority and responsibility for
the execution of business activities. The objective of
these changes is to manage the Sony Group with
greater soundness, transparency and speed.
Corporate Governance
Reforms to Strengthen Corporate Governance
Adoption of the “Company with Committees”
System: From time to time in the past, Sony has taken
measures on its own within the scope of Japan’s
Commercial Code to clearly separate the roles of
corporate oversight and business execution and to
enhance its unique corporate governance scheme. One
example was the introduction of Sony’s own corporate
executive officer (“Shikko-yakuin”) system. The previous
Commercial Code was structured under the premise
that directors would also serve as management in
charge of certain business operations. An amendment
to the Commercial Code, which took effect on April 1,
2003, gave companies the option of adopting a
“Company with Committees” system under which the
Board of Directors was clearly positioned as a supervisory
body, while the corporate executive officer (“Shikko-
yaku”) position was officially established for the execu-
tion of business activities. Consistent with corporate
governance measures taken thus far, Sony decided that
adopting the “Company with Committees” system
would be the best means to strengthen the supervisory
role of the Board of Directors and delegate greater
authority and responsibility to executives in charge of
business operations.
Significant Corporate Governance Measures
1970 Established outside Director system1976 Adopted position of Chief Executive Officer1983 Adopted business unit system1991 Elected first non-Japanese (outside) Director1994 Adopted in-house company system1997 Introduced corporate executive officer (“Shikko-
yakuin”) system1998 Established compensation and nominating
committees1999 Established network company system2000 Separated the duties of the Chairman of the
Board and the head of corporate executiveofficers
2002 Established Advisory Board2003 Moved to the “Company with Committees”
system
Sony Corporation Annual Report 2003 75
Addition of Sony’s Own Rules to Strengthen
Governance: In addition to the requirements of the
Commercial Code, Sony has established rules regarding
the operation of the Board of Directors and its
committees. These rules are designed to ensure the
independence of the Board of Directors from the
execution of business operations and provide a
framework for the adequate functioning and decision-
making of the committees, each of which operates
with fewer members than the Board of Directors.
< Primary Rules for Ensuring Independence of the
Board of Directors >■ Rule regarding separation of the roles of Chairman of
the Board, Vice Chairman of the Board and Represen-
tative Corporate Executive Officers■ Rule limiting number of times outside Directors can
be re-elected and establishing a rotation system for
committee members■ Rule mandating that outside Directors must be
selected as the chairmen of committees
< Primary Rules for Ensuring the AdequateFunctioning and Decision-making of Committees >■ Rule establishing a maximum and minimum number
of Directors■ Rule establishing criteria for directors to avoid
conflicts of interest and ensure independence■ Rule establishing regulations for the fundamental
composition of each committee, including a minimum
required number of Nominating Committee members
(at least five), prohibition of the Group CEO and COO
becoming a member of the Compensation Committee,
and prohibition, as a general rule, of an Audit
Committee member concurrently being a member of
any other committee
Due to requirements imposed by various U.S.
securities regulations, all members of the Audit
Committee are chosen from Directors who qualify as
“independent directors” as stipulated by U.S. regula-
tions. Furthermore, this committee also includes an
individual who is qualified as a financial expert and, to
ensure an adequate auditing function, there is one
committee member who is assigned to this position on
a full-time basis. In addition, Sony has established a
support staff for the Audit Committee that is indepen-
dent from the company’s business operations.
Roles of Each Corporate Governance Body
Board of Directors and Three Committees: The
newly organized Board of Directors and its three
committees, together with the Board, perform certain
oversight functions. Their duties include the determina-
tion of fundamental management policies for the Sony
Group as well as ensuring that the Sony Group is
managed legally and properly. The primary roles of the
Board are as follows.
< Board of Directors >
(1) Determination of fundamental management policies
for the Sony Group
(2) Determination of Directors comprising each
committee
(3) Appointment and dismissal of Corporate Executive
Officers
(4) Supervision of execution of Sony Group’s business
operations
< Committees of the Board of Directors >Nominating Committee: Proposes nomination and
dismissal of Directors
Audit Committee: Audits the execution of duties of
Directors and Corporate Executive Officers, determines
proposals to nominate and dismiss the independent
auditors
Compensation Committee: Determines the individual
compensation of each Director and Corporate
Executive Officer
Corporate Executive Officers and Executive Board:
The Corporate Executive Officers (“Shikko-yaku”) are
responsible for conducting all the business operations
of the Sony Group within the scope of authority
delegated by the Board of Directors. Their objective is
to increase the Sony Group’s corporate value. Signifi-
cant decision-making authority has been transferred to
the Executive Board, which is made up of all Corporate
Executive Officers, and to each Corporate Executive
Officer with regard to investments, business alliances
and other actions related to the execution of business
operations. It is expected that this delegation of
authority will enable the Sony Group to be managed in
a more dynamic and speedy manner than in the past.
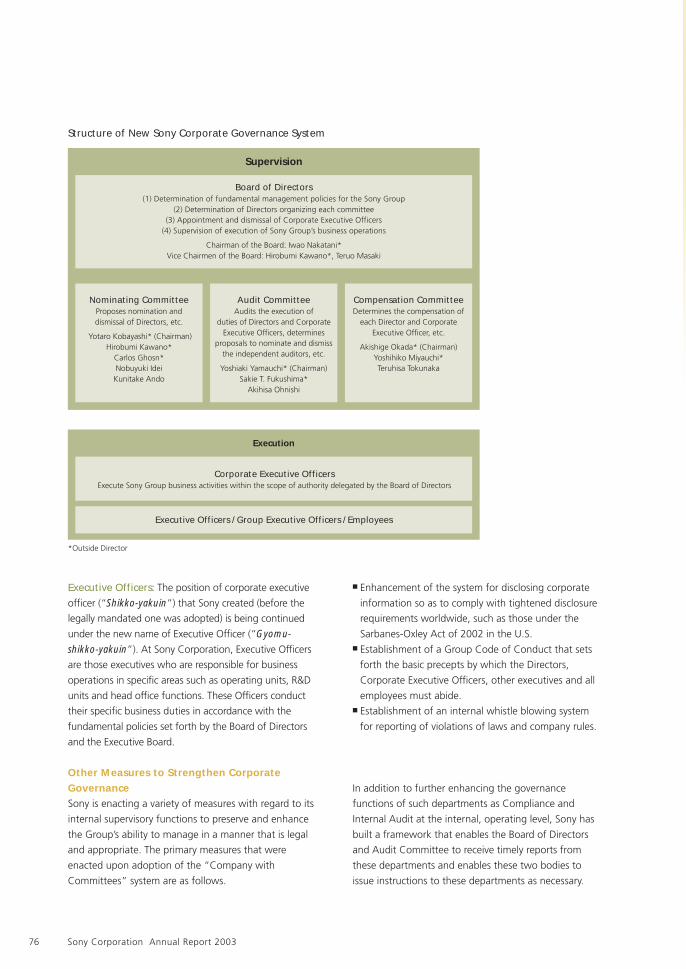
Sony Corporation Annual Report 200376
Executive Officers: The position of corporate executive
officer (“Shikko-yakuin”) that Sony created (before the
legally mandated one was adopted) is being continued
under the new name of Executive Officer (“Gyomu-
shikko-yakuin”). At Sony Corporation, Executive Officers
are those executives who are responsible for business
operations in specific areas such as operating units, R&D
units and head office functions. These Officers conduct
their specific business duties in accordance with the
fundamental policies set forth by the Board of Directors
and the Executive Board.
Other Measures to Strengthen Corporate
GovernanceSony is enacting a variety of measures with regard to its
internal supervisory functions to preserve and enhance
the Group’s ability to manage in a manner that is legal
and appropriate. The primary measures that were
enacted upon adoption of the “Company with
Committees” system are as follows.
■ Enhancement of the system for disclosing corporate
information so as to comply with tightened disclosure
requirements worldwide, such as those under the
Sarbanes-Oxley Act of 2002 in the U.S.■ Establishment of a Group Code of Conduct that sets
forth the basic precepts by which the Directors,
Corporate Executive Officers, other executives and all
employees must abide.■ Establishment of an internal whistle blowing system
for reporting of violations of laws and company rules.
In addition to further enhancing the governance
functions of such departments as Compliance and
Internal Audit at the internal, operating level, Sony has
built a framework that enables the Board of Directors
and Audit Committee to receive timely reports from
these departments and enables these two bodies to
issue instructions to these departments as necessary.
*Outside Director
Structure of New Sony Corporate Governance System
Board of Directors(1) Determination of fundamental management policies for the Sony Group
(2) Determination of Directors organizing each committee(3) Appointment and dismissal of Corporate Executive Officers
(4) Supervision of execution of Sony Group’s business operations
Chairman of the Board: Iwao Nakatani*Vice Chairmen of the Board: Hirobumi Kawano*, Teruo Masaki
Nominating CommitteeProposes nomination anddismissal of Directors, etc.
Yotaro Kobayashi* (Chairman)Hirobumi Kawano*
Carlos Ghosn*Nobuyuki Idei
Kunitake Ando
Audit CommitteeAudits the execution of
duties of Directors and CorporateExecutive Officers, determines
proposals to nominate and dismissthe independent auditors, etc.
Yoshiaki Yamauchi* (Chairman)Sakie T. Fukushima*
Akihisa Ohnishi
Compensation CommitteeDetermines the compensation of
each Director and CorporateExecutive Officer, etc.
Akishige Okada* (Chairman)Yoshihiko Miyauchi*Teruhisa Tokunaka
Corporate Executive OfficersExecute Sony Group business activities within the scope of authority delegated by the Board of Directors
Executive Officers / Group Executive Officers / Employees
Supervision
Execution
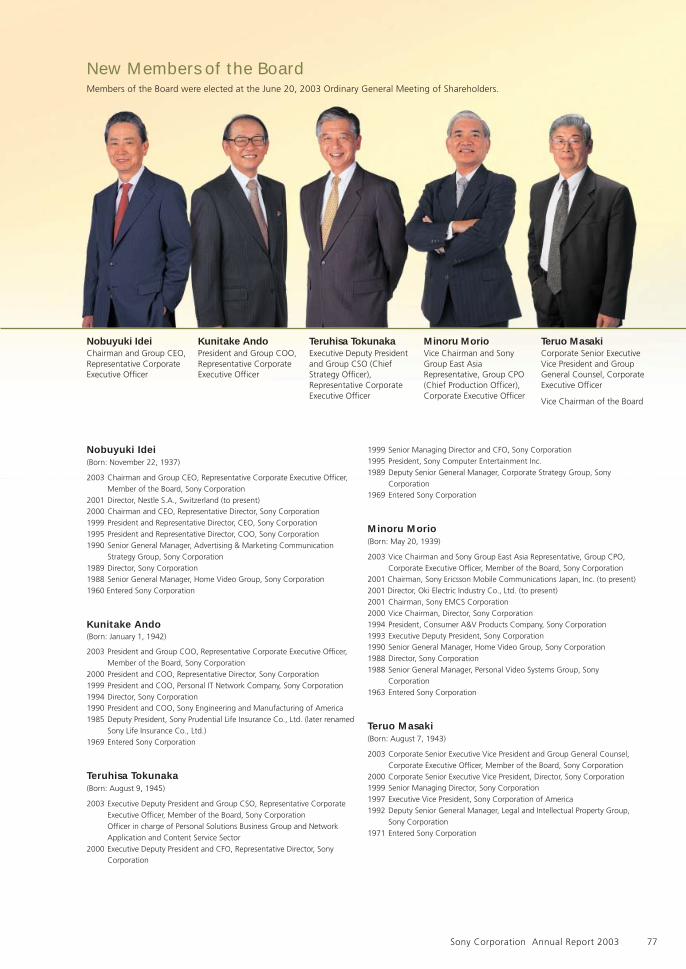
Sony Corporation Annual Report 2003 77
New Members of the BoardMembers of the Board were elected at the June 20, 2003 Ordinary General Meeting of Shareholders.
Nobuyuki IdeiChairman and Group CEO,Representative CorporateExecutive Officer
Kunitake AndoPresident and Group COO,Representative CorporateExecutive Officer
Teruhisa TokunakaExecutive Deputy Presidentand Group CSO (ChiefStrategy Officer),Representative CorporateExecutive Officer
Minoru MorioVice Chairman and SonyGroup East AsiaRepresentative, Group CPO(Chief Production Officer),Corporate Executive Officer
Teruo MasakiCorporate Senior ExecutiveVice President and GroupGeneral Counsel, CorporateExecutive Officer
Vice Chairman of the Board
Nobuyuki Idei(Born: November 22, 1937)
2003 Chairman and Group CEO, Representative Corporate Executive Officer,Member of the Board, Sony Corporation
2001 Director, Nestle S.A., Switzerland (to present)2000 Chairman and CEO, Representative Director, Sony Corporation1999 President and Representative Director, CEO, Sony Corporation1995 President and Representative Director, COO, Sony Corporation1990 Senior General Manager, Advertising & Marketing Communication
Strategy Group, Sony Corporation1989 Director, Sony Corporation1988 Senior General Manager, Home Video Group, Sony Corporation1960 Entered Sony Corporation
Kunitake Ando(Born: January 1, 1942)
2003 President and Group COO, Representative Corporate Executive Officer,Member of the Board, Sony Corporation
2000 President and COO, Representative Director, Sony Corporation1999 President and COO, Personal IT Network Company, Sony Corporation1994 Director, Sony Corporation1990 President and COO, Sony Engineering and Manufacturing of America1985 Deputy President, Sony Prudential Life Insurance Co., Ltd. (later renamed
Sony Life Insurance Co., Ltd.)1969 Entered Sony Corporation
Teruhisa Tokunaka(Born: August 9, 1945)
2003 Executive Deputy President and Group CSO, Representative CorporateExecutive Officer, Member of the Board, Sony CorporationOfficer in charge of Personal Solutions Business Group and NetworkApplication and Content Service Sector
2000 Executive Deputy President and CFO, Representative Director, SonyCorporation
1999 Senior Managing Director and CFO, Sony Corporation1995 President, Sony Computer Entertainment Inc.1989 Deputy Senior General Manager, Corporate Strategy Group, Sony
Corporation1969 Entered Sony Corporation
Minoru Morio(Born: May 20, 1939)
2003 Vice Chairman and Sony Group East Asia Representative, Group CPO,Corporate Executive Officer, Member of the Board, Sony Corporation
2001 Chairman, Sony Ericsson Mobile Communications Japan, Inc. (to present)2001 Director, Oki Electric Industry Co., Ltd. (to present)2001 Chairman, Sony EMCS Corporation2000 Vice Chairman, Director, Sony Corporation1994 President, Consumer A&V Products Company, Sony Corporation1993 Executive Deputy President, Sony Corporation1990 Senior General Manager, Home Video Group, Sony Corporation1988 Director, Sony Corporation1988 Senior General Manager, Personal Video Systems Group, Sony
Corporation1963 Entered Sony Corporation
Teruo Masaki(Born: August 7, 1943)
2003 Corporate Senior Executive Vice President and Group General Counsel,Corporate Executive Officer, Member of the Board, Sony Corporation
2000 Corporate Senior Executive Vice President, Director, Sony Corporation1999 Senior Managing Director, Sony Corporation1997 Executive Vice President, Sony Corporation of America1992 Deputy Senior General Manager, Legal and Intellectual Property Group,
Sony Corporation1971 Entered Sony Corporation
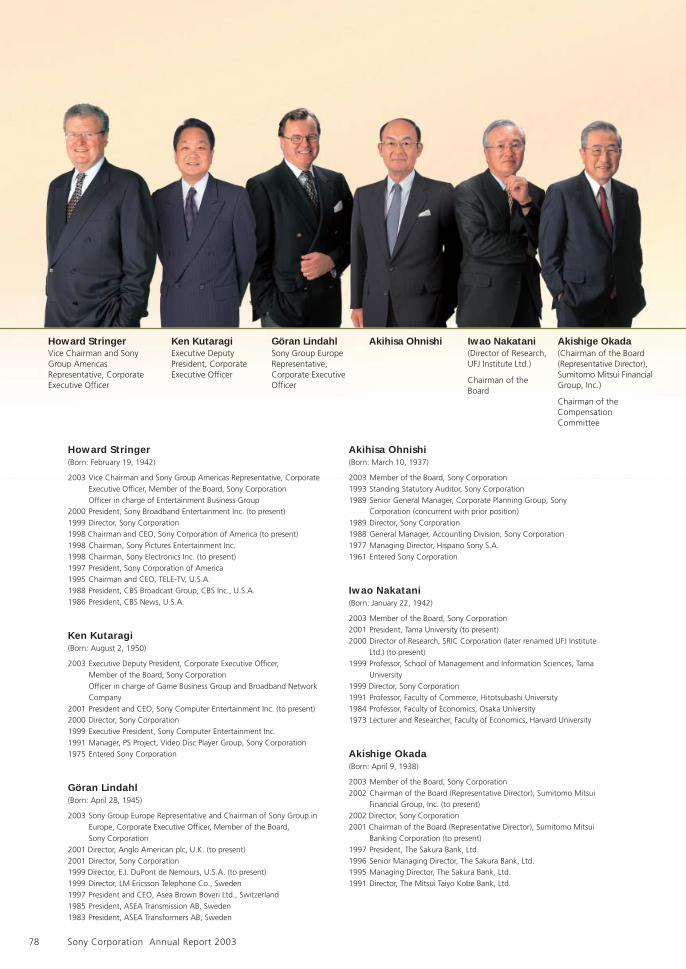
Sony Corporation Annual Report 200378
Ken KutaragiExecutive DeputyPresident, CorporateExecutive Officer
Göran LindahlSony Group EuropeRepresentative,Corporate ExecutiveOfficer
Akihisa Ohnishi Iwao Nakatani(Director of Research,UFJ Institute Ltd.)
Chairman of theBoard
Howard StringerVice Chairman and SonyGroup AmericasRepresentative, CorporateExecutive Officer
Akishige Okada(Chairman of the Board(Representative Director),Sumitomo Mitsui FinancialGroup, Inc.)
Chairman of theCompensationCommittee
Howard Stringer(Born: February 19, 1942)
2003 Vice Chairman and Sony Group Americas Representative, CorporateExecutive Officer, Member of the Board, Sony CorporationOfficer in charge of Entertainment Business Group
2000 President, Sony Broadband Entertainment Inc. (to present)1999 Director, Sony Corporation1998 Chairman and CEO, Sony Corporation of America (to present)1998 Chairman, Sony Pictures Entertainment Inc.1998 Chairman, Sony Electronics Inc. (to present)1997 President, Sony Corporation of America1995 Chairman and CEO, TELE-TV, U.S.A.1988 President, CBS Broadcast Group, CBS Inc., U.S.A.1986 President, CBS News, U.S.A.
Ken Kutaragi(Born: August 2, 1950)
2003 Executive Deputy President, Corporate Executive Officer,Member of the Board, Sony CorporationOfficer in charge of Game Business Group and Broadband NetworkCompany
2001 President and CEO, Sony Computer Entertainment Inc. (to present)2000 Director, Sony Corporation1999 Executive President, Sony Computer Entertainment Inc.1991 Manager, PS Project, Video Disc Player Group, Sony Corporation1975 Entered Sony Corporation
Göran Lindahl(Born: April 28, 1945)
2003 Sony Group Europe Representative and Chairman of Sony Group inEurope, Corporate Executive Officer, Member of the Board,Sony Corporation
2001 Director, Anglo American plc, U.K. (to present)2001 Director, Sony Corporation1999 Director, E.I. DuPont de Nemours, U.S.A. (to present)1999 Director, LM Ericsson Telephone Co., Sweden1997 President and CEO, Asea Brown Boveri Ltd., Switzerland1985 President, ASEA Transmission AB, Sweden1983 President, ASEA Transformers AB, Sweden
Akihisa Ohnishi(Born: March 10, 1937)
2003 Member of the Board, Sony Corporation1993 Standing Statutory Auditor, Sony Corporation1989 Senior General Manager, Corporate Planning Group, Sony
Corporation (concurrent with prior position)1989 Director, Sony Corporation1988 General Manager, Accounting Division, Sony Corporation1977 Managing Director, Hispano Sony S.A.1961 Entered Sony Corporation
Iwao Nakatani(Born: January 22, 1942)
2003 Member of the Board, Sony Corporation2001 President, Tama University (to present)2000 Director of Research, SRIC Corporation (later renamed UFJ Institute
Ltd.) (to present)1999 Professor, School of Management and Information Sciences, Tama
University1999 Director, Sony Corporation1991 Professor, Faculty of Commerce, Hitotsubashi University1984 Professor, Faculty of Economics, Osaka University1973 Lecturer and Researcher, Faculty of Economics, Harvard University
Akishige Okada(Born: April 9, 1938)
2003 Member of the Board, Sony Corporation2002 Chairman of the Board (Representative Director), Sumitomo Mitsui
Financial Group, Inc. (to present)2002 Director, Sony Corporation2001 Chairman of the Board (Representative Director), Sumitomo Mitsui
Banking Corporation (to present)1997 President, The Sakura Bank, Ltd.1996 Senior Managing Director, The Sakura Bank, Ltd.1995 Managing Director, The Sakura Bank, Ltd.1991 Director, The Mitsui Taiyo Kobe Bank, Ltd.
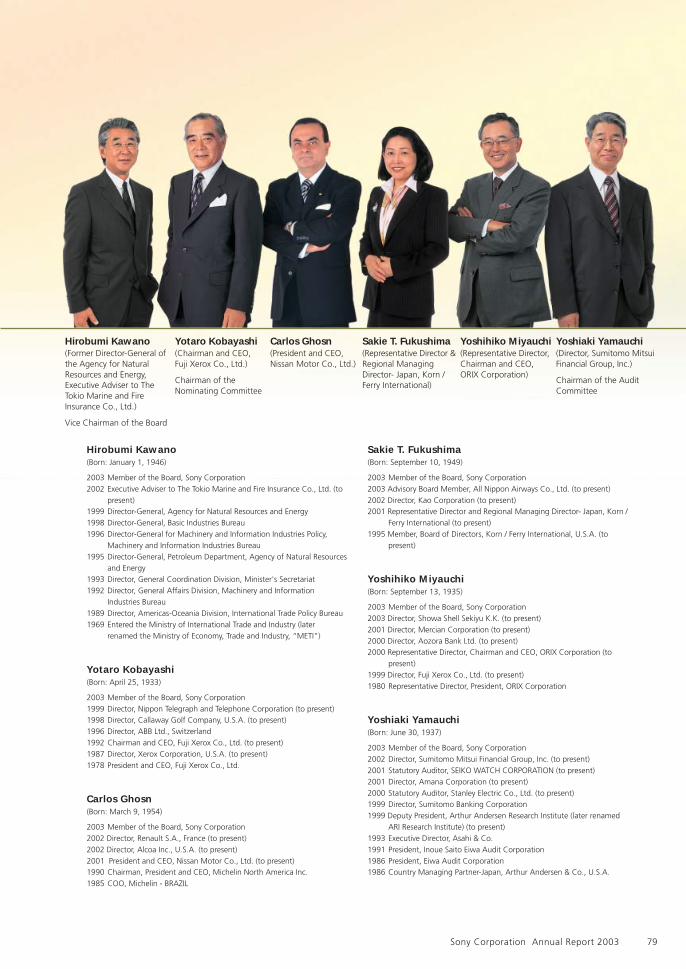
Sony Corporation Annual Report 2003 79
Hirobumi Kawano(Born: January 1, 1946)
2003 Member of the Board, Sony Corporation2002 Executive Adviser to The Tokio Marine and Fire Insurance Co., Ltd. (to
present)1999 Director-General, Agency for Natural Resources and Energy1998 Director-General, Basic Industries Bureau1996 Director-General for Machinery and Information Industries Policy,
Machinery and Information Industries Bureau1995 Director-General, Petroleum Department, Agency of Natural Resources
and Energy1993 Director, General Coordination Division, Minister's Secretariat1992 Director, General Affairs Division, Machinery and Information
Industries Bureau1989 Director, Americas-Oceania Division, International Trade Policy Bureau1969 Entered the Ministry of International Trade and Industry (later
renamed the Ministry of Economy, Trade and Industry, “METI”)
Yotaro Kobayashi(Born: April 25, 1933)
2003 Member of the Board, Sony Corporation1999 Director, Nippon Telegraph and Telephone Corporation (to present)1998 Director, Callaway Golf Company, U.S.A. (to present)1996 Director, ABB Ltd., Switzerland1992 Chairman and CEO, Fuji Xerox Co., Ltd. (to present)1987 Director, Xerox Corporation, U.S.A. (to present)1978 President and CEO, Fuji Xerox Co., Ltd.
Carlos Ghosn(Born: March 9, 1954)
2003 Member of the Board, Sony Corporation2002 Director, Renault S.A., France (to present)2002 Director, Alcoa Inc., U.S.A. (to present)2001 President and CEO, Nissan Motor Co., Ltd. (to present)1990 Chairman, President and CEO, Michelin North America Inc.1985 COO, Michelin - BRAZIL
Sakie T. Fukushima(Born: September 10, 1949)
2003 Member of the Board, Sony Corporation2003 Advisory Board Member, All Nippon Airways Co., Ltd. (to present)2002 Director, Kao Corporation (to present)2001 Representative Director and Regional Managing Director- Japan, Korn /
Ferry International (to present)1995 Member, Board of Directors, Korn / Ferry International, U.S.A. (to
present)
Yoshihiko Miyauchi(Born: September 13, 1935)
2003 Member of the Board, Sony Corporation2003 Director, Showa Shell Sekiyu K.K. (to present)2001 Director, Mercian Corporation (to present)2000 Director, Aozora Bank Ltd. (to present)2000 Representative Director, Chairman and CEO, ORIX Corporation (to
present)1999 Director, Fuji Xerox Co., Ltd. (to present)1980 Representative Director, President, ORIX Corporation
Yoshiaki Yamauchi(Born: June 30, 1937)
2003 Member of the Board, Sony Corporation2002 Director, Sumitomo Mitsui Financial Group, Inc. (to present)2001 Statutory Auditor, SEIKO WATCH CORPORATION (to present)2001 Director, Amana Corporation (to present)2000 Statutory Auditor, Stanley Electric Co., Ltd. (to present)1999 Director, Sumitomo Banking Corporation1999 Deputy President, Arthur Andersen Research Institute (later renamed
ARI Research Institute) (to present)1993 Executive Director, Asahi & Co.1991 President, Inoue Saito Eiwa Audit Corporation1986 President, Eiwa Audit Corporation1986 Country Managing Partner-Japan, Arthur Andersen & Co., U.S.A.
Hirobumi Kawano(Former Director-General ofthe Agency for NaturalResources and Energy,Executive Adviser to TheTokio Marine and FireInsurance Co., Ltd.)
Vice Chairman of the Board
Yotaro Kobayashi(Chairman and CEO,Fuji Xerox Co., Ltd.)
Chairman of theNominating Committee
Carlos Ghosn(President and CEO,Nissan Motor Co., Ltd.)
Sakie T. Fukushima(Representative Director &Regional ManagingDirector- Japan, Korn /Ferry International)
Yoshihiko Miyauchi(Representative Director,Chairman and CEO,ORIX Corporation)
Yoshiaki Yamauchi(Director, Sumitomo MitsuiFinancial Group, Inc.)
Chairman of the AuditCommittee
Sony Corporation Annual Report 200380
Nobuyuki IdeiChairman and Group CEO,Representative Corporate Executive Officer
Kunitake AndoPresident and Group COO,Representative Corporate Executive Officer
Teruhisa TokunakaExecutive Deputy President and Group CSO (Chief StrategyOfficer), Representative Corporate Executive Officer,Officer in charge of Personal Solutions Business Groupand Network Application and Content Service Sector
Minoru MorioVice Chairman and Sony Group East Asia Representative,Group CPO (Chief Production Officer), CorporateExecutive Officer
Howard StringerVice Chairman and Sony Group AmericasRepresentative, Corporate Executive Officer,Officer in charge of Entertainment Business Group
Shizuo TakashinoExecutive Deputy President, Corporate ExecutiveOfficer, Officer in charge of IT and Mobile SolutionsNetwork Company and Home Network Company
Ken KutaragiExecutive Deputy President, Corporate ExecutiveOfficer, Officer in charge of Game Business Group andBroadband Network Company
Teruo MasakiCorporate Senior Executive Vice President andGroup General Counsel, Corporate Executive Officer
Akira KondohCorporate Senior Executive Vice President andGroup CIO (Chief Information Officer), CorporateExecutive Officer
Takao YuharaCorporate Senior Vice President and Group CFO,Corporate Executive Officer
Göran LindahlSony Group Europe Representative and Chairman ofSony Group in Europe,Corporate Executive Officer
Nicole SeligmanGroup Deputy General Counsel,Corporate Executive Officer
(As of June 20, 2003)
New Corporate Executive Officers
SONY CORPORATION7-35, Kitashinagawa 6-chome, Shinagawa-ku,Tokyo 141-0001, JapanPhone: 81-(0)3-5448-2111Facsimile: 81-(0)3-5448-2244
INVESTOR RELATIONS OFFICESIf you have any questions or would like a copy of ourForm 20-F, filed with the U.S. Securities and ExchangeCommission, or Annual Report to shareholders,please direct your request to:
JapanSONY CORPORATIONIR Office7-35, Kitashinagawa 6-chome, Shinagawa-ku,Tokyo 141-0001Phone: 81-(0)3-5448-2180Facsimile: 81-(0)3-5448-2183
U.S.A.SONY CORPORATION OF AMERICAInvestor Relations550 Madison Avenue, 27th Floor,New York, NY 10022-3211Phone: U.S. and Canada 800-556-3411
International 1-402-573-9867Facsimile: 1-212-833-6938
U.K.SONY GLOBAL TREASURY SERVICES PLC.Investor RelationsSt. Helens, 1 Undershaft,London EC3A 8EEPhone: 44-(0)20-7444-9713Facsimile: 44-(0)20-7444-9763
SONY ON THE INTERNETSony’s Investor Relations Home Pages on the WorldWide Web offer a wealth of corporate information,including the latest annual report and financial results.http://www.sony.net/IR/
ORDINARY GENERAL MEETING OF SHAREHOLDERSThe Ordinary General Meeting of Shareholders is held inJune in one of the wards of Tokyo or in the City ofYokohama in Kanagawa Prefecture, Japan.
INDEPENDENT ACCOUNTANTSPricewaterhouseCoopersTokyo, Japan
DEPOSITARY, TRANSFER AGENT AND REGISTRAR FORAMERICAN DEPOSITARY RECEIPTSJPMorgan Chase Bank270 Park Avenue,New York, NY 10017-2070
Contact Address:JPMorgan Service CenterJPMorgan Chase BankP.O. Box 43013Providence, RI 02940-3013, U.S.A.Phone: U.S. 800-360-4522
International 1-781-575-4328
CO-TRANSFER AND CO-REGISTRAR AGENTCIBC Mellon Trust Company2001 University Street, 16th Floor,Montreal, Quebec, H3A 2A6, CanadaPhone: 1-514-285-3600
TRANSFER AGENT OF COMMON SHARES HANDLINGOFFICEUFJ Trust Bank LimitedCorporate Agency Department10-11, Higashisuna 7-chome, Koto-ku,Tokyo 137-8081, JapanPhone: 81-(0)3-5683-5111
OVERSEAS STOCK EXCHANGE LISTINGSNew York, Pacific, Chicago, Toronto, London, Paris,Frankfurt, Düsseldorf, Brussels, Vienna and Swissstock exchanges
JAPANESE STOCK EXCHANGE LISTINGSTokyo, Osaka, Nagoya, Fukuoka and Sapporostock exchanges
NUMBER OF SHAREHOLDERS(As of March 31, 2003)
799,615
CSR REPORT (Reporting on Social and Environmental Activities)If you would like a copy of the above report, please directyour request to: Sony Corporation Corporate Social andEnvironmental AffairsPhone: 81-(0)3-5448-3533Facsimile: 81-(0)3-5448-7838This report is also available on the World Wide Web.Sony’s environmental showroom, “Sony Eco Plaza,” can bevisited at the same URL:http://www.sony.net/eco/
Investor Information
Detailed discussion of results and financial statements are published as a separate document: “Consolidated Financial Information 2003.”A copy of this publication can be requested from the IR contact addresses in the left-hand column above, or alternatively viewed on ourwebsite at http://www.sony.net/IR/. Please note that Sony’s Annual Report 2003 does include consolidated balance sheets, statements ofincome and other financial data.
Printed on 100% recycled paper.Printed using VOC (volatile organic compound)-freevegetable oil based ink.
Sony Corporation Annual Report 2003 81
Annual R
eport 2003 Year Ended M
arch 31, 2003
Printed in Japan
Sony Corporation
Consolidated Financial Information 2003
Year Ended March 31, 2003
Consolidated Financial Inform
ation 2003 Year Ended M
arch 31, 2003

Consolidated Financial Information 2003
1
Contents Operating and Financial Review and Prospects . . . . . . . . . . . . . . . . . . . . . . . 2
Quarterly Financial and Stock Information . . . . . . . . . . . . . . . . . . . . . . . . . . . . 54
Five-Year Summary of Selected Financial Data . . . . . . . . . . . . . . . . . . . . . . . . 56
Segment Information . . . . . . . . . . . . . . . . . . . . . . . . . . . . . . . . . 58
Consolidated Balance Sheets . . . . . . . . . . . . . . . . . . . . . . . . . . . . . . . . . . . . . . 62
Consolidated Statements of Income . . . . . . . . . . . . . . . . . . . . . . . . . . . . . . . . . 64
Consolidated Statements of Cash Flows . . . . . . . . . . . . . . . . . . . . . . . . . . . . . . 66
Consolidated Statements of Changes in Stockholders’ Equity . . . . . . . . . . . . 68
Index to Notes to Consolidated Financial Statements . . . . . . . . . . . . . . . . . . . 72
Notes to Consolidated Financial Statements . . . . . . . . . . . . . . . . . . . . . . . . . . 73
Report of Independent Accountants . . . . . . . . . . . . . . . . . . . . . . . . . . . . . . . . . 145
Consolidated Financial Information 2003
2
Operating and Financial Review and Prospects
The following “Operating and Financial Review and Prospects” is based on information known to management as of
August 26, 2003.
Operating Results
Overview
Although the global economy showed some signs of growth in the fiscal year ended March 31, 2003, military
action in Iraq contributed to increased economic uncertainty in the second half of the year, particularly in the U.S., and
the year ended without any indications of a sustained recovery. In Japan, in addition to stagnant consumer demand
and an increase in unemployment, declines in the stock market contributed to the unfavorable economic climate.
Under such difficult market conditions and reflecting the impact of the translation of financial results into yen in
accordance with Generally Accepted Accounting Principles in the U.S. (“U.S. GAAP”), the currency in which Sony’s
financial statements are prepared, Sony’s sales and operating revenue (“sales”) for the fiscal year ended March 31,
2003 decreased 1.4 percent compared with the previous fiscal year. This decrease was principally due to
industry-wide declines in personal consumption in the Electronics segment, and also increased price competition in
certain markets, including the PC, DVD-Video player and home-use video camera markets. However, operating
income increased 37.7 percent compared with the previous fiscal year due to the beneficial effect of the depreciation
of the yen against the euro, as well as increased profitability of the Electronics segment, resulting from restructuring
initiatives in previous fiscal years, of the Game segment, due to increased software sales and decreased production
costs, and of the Pictures segment, due to strong worldwide performance of certain releases in the current year.
On a local currency basis, (refer to “Foreign Exchange Fluctuations and Risk Hedging” below), Sony’s sales for
the fiscal year ended March 31, 2003 decreased approximately 2 percent and operating income decreased
approximately 5 percent compared with the previous fiscal year.
Restructuring
Restructuring expenses for the fiscal year ended March 31, 2003 amounted to 106.3 billion yen, compared to
107.0 billion yen in the previous fiscal year. The primary restructuring activities were in the Electronics and Music
segments.
Electronics
Restructuring charges in the Electronics segment for the fiscal year ended March 31, 2003, were 72.5 billion yen,
compared to 86.9 billion yen in the previous fiscal year, but exceeded the 60.0 billion yen total that was estimated at
the beginning of the year.
Consolidated Financial Information 2003
3
In the year ended March 31, 2003, a decision was made to reduce production capacity of CRT computer display
manufacturing facilities in Japan and Southeast Asia, in response to market contraction resulting from the demand
shift from CRT computer displays to flat panel displays such as LCDs. Although the worldwide market for CRT
computer displays in the year ended March 31, 2002 was approximately 96.0 million units, in the year ended March
31, 2003 it had fallen to approximately 81.0 million units. In order to restore the profitability of the CRT computer
display business, which, due to the decrease in demand, had been suffering from low utilization ratios at
manufacturing facilities, higher ratios of fixed costs to sales and lower operating income margins, Sony decided to
close under-utilized manufacturing facilities. The resulting charges totaled 6.9 billion yen, of which 1.3 billion yen was
recorded in cost of sales, and 5.6 billion yen was recorded in selling, general and administrative expenses.
The restructuring program implemented in the previous fiscal year was accelerated at Aiwa Co., Ltd. and its
subsidiaries (“Aiwa”) in response to a continued decline in operating performance, caused by further declines in the
worldwide market for audio products, which form the majority of Aiwa’s sales. After further reductions in personnel
and reductions in the number of unprofitable product lines which resulted in the closure of all of Aiwa’s manufacturing
facilities, Aiwa’s operations were integrated with those of Sony. (Aiwa was made a wholly-owned subsidiary of Sony
Corporation in October 2002, and merged into Sony Corporation on December 1, 2002.) Charges resulting from the
restructuring of Aiwa totaled 23.0 billion yen, of which 13.8 billion yen was recorded in cost of sales, and 9.2 billion
yen was recorded in selling, general and administrative expenses.
In the fourth quarter of the year ended March 31, 2003, Sony decided to close a semiconductor plant in the U.S.
that produced semiconductor wafers for both internal use and the original equipment manufacturer (OEM) market.
This closure was both a response to a significant decline in the business conditions of the semiconductor industry in
the U.S., and the result of a shift in Sony’s semiconductor strategy. Sony’s semiconductor manufacturing for internal
use is moving toward an emphasis on high-end, network-centric devices and components because Sony is focusing
its efforts on broadband and network-related businesses in response to rapid increases in broadband Internet access.
The restructuring activity is expected to be completed in the year ending March 31, 2004, and the total estimated cost
of this restructuring is 8.1 billion yen, of which 5.9 billion yen was incurred through March 31, 2003. These charges
were all recorded in cost of sales.
In addition to these restructuring activities, Sony has continued to reduce headcount through the implementation
of several early retirement programs in Japan to further reduce costs in the Electronics segment. The resulting
charges totaled 10.9 billion yen, compared to 12.3 billion yen in the previous fiscal year. These charges were
recorded in selling, general and administrative expenses.
The above restructuring initiatives are expected to decrease costs in the Electronics segment by approximately
50.0 billion yen in the fiscal year ending March 31, 2004.
Music
In response to the continued contraction of the worldwide music market due to slow worldwide economic growth,
the saturation of the CD market, the effects of piracy and other illegal duplication, parallel imports, pricing pressures
and the diversification of customer preferences brought on by increased competition from other entertainment
Consolidated Financial Information 2003
4
sectors, Sony has been actively repositioning the Music segment for the future by looking to create a more effective
and profitable business model. As a result, the Music segment has undergone a worldwide restructuring program
since the fiscal year ended March 31, 2001 to reduce staffing and other costs through the consolidation and
rationalization of facilities worldwide. Under this worldwide restructuring program, Sony Music Entertainment Inc.
(“SMEI”), a U.S. based subsidiary, incurred restructuring charges of 22.4 billion yen for the year ended March 31,
2003, compared to 8.6 billion yen in the previous fiscal year. This exceeded the estimate made in January 2003, as
certain restructuring initiatives originally expected to be undertaken in the fiscal year ending March 31, 2004 were
accelerated as a result of a management change and the continued decline in the worldwide music market.
Restructuring activities included the further consolidation of operations through the shutdown of a CD and
cassette manufacturing and distribution center in Holland, the shutdown of a CD manufacturing facility in the U.S.,
which was announced on April 2, 2003, although the decision to shut down the facility was made during the fiscal year
ended March 31, 2003, as well as further staff reductions to consolidate various support functions across labels and
operating units. These restructuring activities resulted in the termination of over 1,400 jobs during the fiscal year
ended March 31, 2003, of which approximately 600 were in the U.S. Resulting charges were included in selling,
general and administrative expenses. Total restructuring charges in the Music segment, including Sony Music
Entertainment (Japan) Inc. (“SMEJ”), were 23.9 billion yen.
Note that losses on sales, disposal or impairment of long-lived assets are recorded in selling, general and
administrative expenses. Refer to “Cost of Sales and Selling, General and Administrative Expenses” below and to
Note 18 of Notes to Consolidated Financial Statements.
The following table summarizes major restructuring activities for which charges of over 5 billion yen were
recorded during the fiscal year ended March 31, 2003.
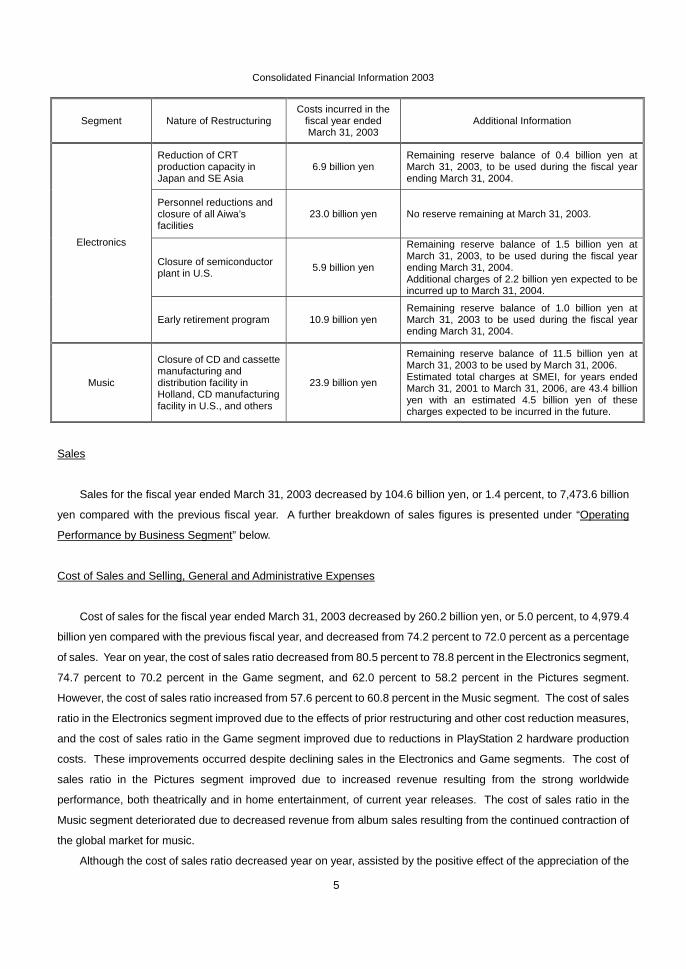
Consolidated Financial Information 2003
5
Sales
Sales for the fiscal year ended March 31, 2003 decreased by 104.6 billion yen, or 1.4 percent, to 7,473.6 billion
yen compared with the previous fiscal year. A further breakdown of sales figures is presented under “Operating
Performance by Business Segment” below.
Cost of Sales and Selling, General and Administrative Expenses
Cost of sales for the fiscal year ended March 31, 2003 decreased by 260.2 billion yen, or 5.0 percent, to 4,979.4
billion yen compared with the previous fiscal year, and decreased from 74.2 percent to 72.0 percent as a percentage
of sales. Year on year, the cost of sales ratio decreased from 80.5 percent to 78.8 percent in the Electronics segment,
74.7 percent to 70.2 percent in the Game segment, and 62.0 percent to 58.2 percent in the Pictures segment.
However, the cost of sales ratio increased from 57.6 percent to 60.8 percent in the Music segment. The cost of sales
ratio in the Electronics segment improved due to the effects of prior restructuring and other cost reduction measures,
and the cost of sales ratio in the Game segment improved due to reductions in PlayStation 2 hardware production
costs. These improvements occurred despite declining sales in the Electronics and Game segments. The cost of
sales ratio in the Pictures segment improved due to increased revenue resulting from the strong worldwide
performance, both theatrically and in home entertainment, of current year releases. The cost of sales ratio in the
Music segment deteriorated due to decreased revenue from album sales resulting from the continued contraction of
the global market for music.
Although the cost of sales ratio decreased year on year, assisted by the positive effect of the appreciation of the
Segment Nature of Restructuring Costs incurred in the
fiscal year ended March 31, 2003
Additional Information
Reduction of CRT production capacity in Japan and SE Asia
6.9 billion yen Remaining reserve balance of 0.4 billion yen at March 31, 2003, to be used during the fiscal year ending March 31, 2004.
Personnel reductions and closure of all Aiwa’s facilities
23.0 billion yen No reserve remaining at March 31, 2003.
Closure of semiconductor plant in U.S. 5.9 billion yen
Remaining reserve balance of 1.5 billion yen at March 31, 2003, to be used during the fiscal year ending March 31, 2004. Additional charges of 2.2 billion yen expected to be incurred up to March 31, 2004.
Electronics
Early retirement program 10.9 billion yen Remaining reserve balance of 1.0 billion yen at March 31, 2003 to be used during the fiscal year ending March 31, 2004.
Music
Closure of CD and cassette manufacturing and distribution facility in Holland, CD manufacturing facility in U.S., and others
23.9 billion yen
Remaining reserve balance of 11.5 billion yen at March 31, 2003 to be used by March 31, 2006. Estimated total charges at SMEI, for years ended March 31, 2001 to March 31, 2006, are 43.4 billion yen with an estimated 4.5 billion yen of these charges expected to be incurred in the future.
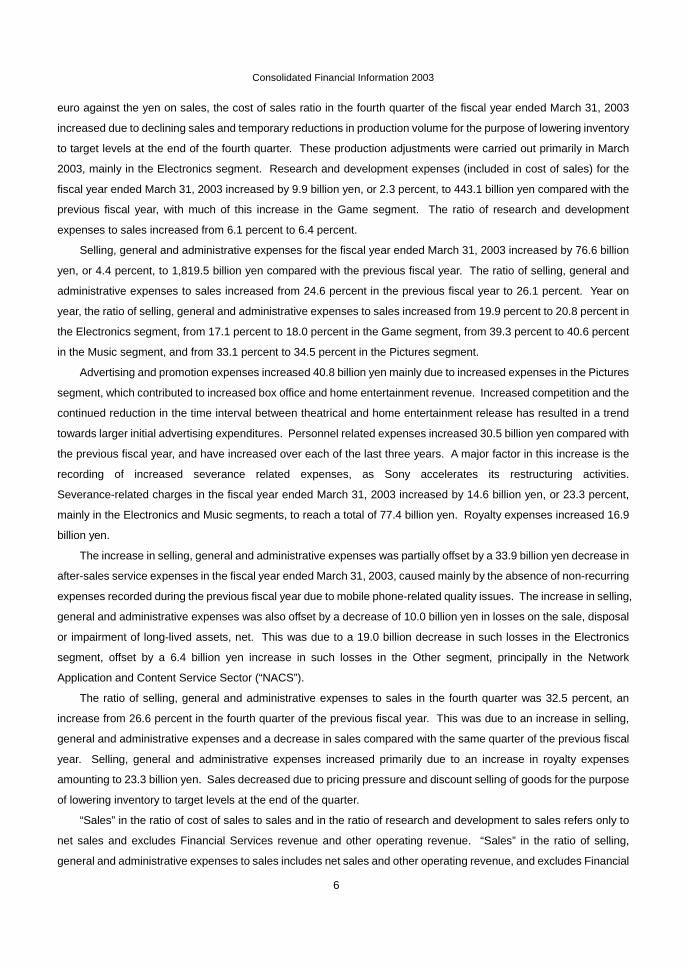
Consolidated Financial Information 2003
6
euro against the yen on sales, the cost of sales ratio in the fourth quarter of the fiscal year ended March 31, 2003
increased due to declining sales and temporary reductions in production volume for the purpose of lowering inventory
to target levels at the end of the fourth quarter. These production adjustments were carried out primarily in March
2003, mainly in the Electronics segment. Research and development expenses (included in cost of sales) for the
fiscal year ended March 31, 2003 increased by 9.9 billion yen, or 2.3 percent, to 443.1 billion yen compared with the
previous fiscal year, with much of this increase in the Game segment. The ratio of research and development
expenses to sales increased from 6.1 percent to 6.4 percent.
Selling, general and administrative expenses for the fiscal year ended March 31, 2003 increased by 76.6 billion
yen, or 4.4 percent, to 1,819.5 billion yen compared with the previous fiscal year. The ratio of selling, general and
administrative expenses to sales increased from 24.6 percent in the previous fiscal year to 26.1 percent. Year on
year, the ratio of selling, general and administrative expenses to sales increased from 19.9 percent to 20.8 percent in
the Electronics segment, from 17.1 percent to 18.0 percent in the Game segment, from 39.3 percent to 40.6 percent
in the Music segment, and from 33.1 percent to 34.5 percent in the Pictures segment.
Advertising and promotion expenses increased 40.8 billion yen mainly due to increased expenses in the Pictures
segment, which contributed to increased box office and home entertainment revenue. Increased competition and the
continued reduction in the time interval between theatrical and home entertainment release has resulted in a trend
towards larger initial advertising expenditures. Personnel related expenses increased 30.5 billion yen compared with
the previous fiscal year, and have increased over each of the last three years. A major factor in this increase is the
recording of increased severance related expenses, as Sony accelerates its restructuring activities.
Severance-related charges in the fiscal year ended March 31, 2003 increased by 14.6 billion yen, or 23.3 percent,
mainly in the Electronics and Music segments, to reach a total of 77.4 billion yen. Royalty expenses increased 16.9
billion yen.
The increase in selling, general and administrative expenses was partially offset by a 33.9 billion yen decrease in
after-sales service expenses in the fiscal year ended March 31, 2003, caused mainly by the absence of non-recurring
expenses recorded during the previous fiscal year due to mobile phone-related quality issues. The increase in selling,
general and administrative expenses was also offset by a decrease of 10.0 billion yen in losses on the sale, disposal
or impairment of long-lived assets, net. This was due to a 19.0 billion decrease in such losses in the Electronics
segment, offset by a 6.4 billion yen increase in such losses in the Other segment, principally in the Network
Application and Content Service Sector (“NACS”).
The ratio of selling, general and administrative expenses to sales in the fourth quarter was 32.5 percent, an
increase from 26.6 percent in the fourth quarter of the previous fiscal year. This was due to an increase in selling,
general and administrative expenses and a decrease in sales compared with the same quarter of the previous fiscal
year. Selling, general and administrative expenses increased primarily due to an increase in royalty expenses
amounting to 23.3 billion yen. Sales decreased due to pricing pressure and discount selling of goods for the purpose
of lowering inventory to target levels at the end of the quarter.
“Sales” in the ratio of cost of sales to sales and in the ratio of research and development to sales refers only to
net sales and excludes Financial Services revenue and other operating revenue. “Sales” in the ratio of selling,
general and administrative expenses to sales includes net sales and other operating revenue, and excludes Financial
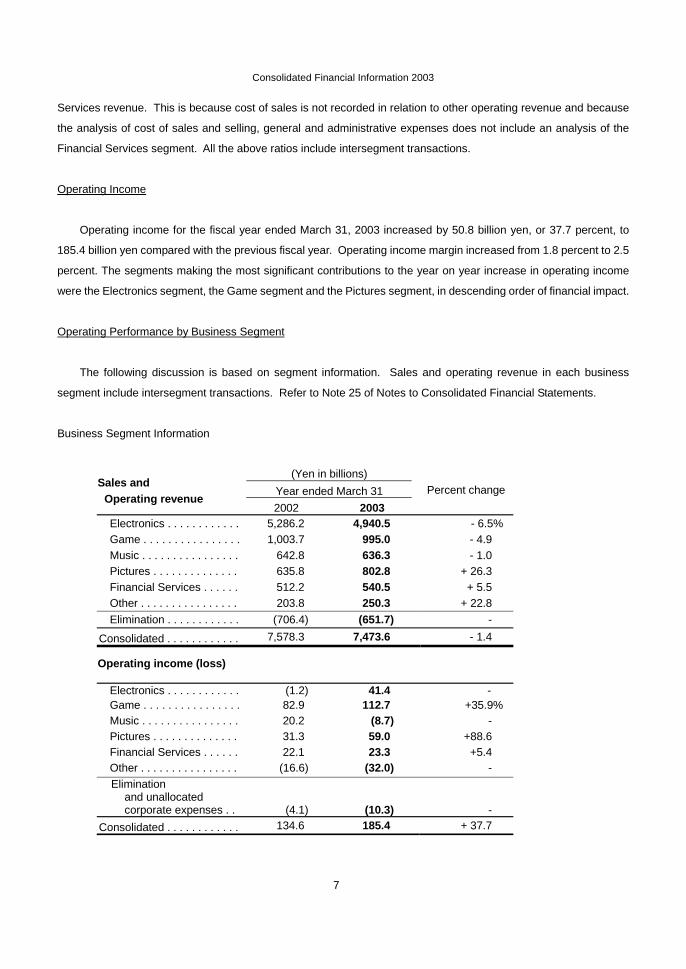
Consolidated Financial Information 2003
7
Services revenue. This is because cost of sales is not recorded in relation to other operating revenue and because
the analysis of cost of sales and selling, general and administrative expenses does not include an analysis of the
Financial Services segment. All the above ratios include intersegment transactions.
Operating Income
Operating income for the fiscal year ended March 31, 2003 increased by 50.8 billion yen, or 37.7 percent, to
185.4 billion yen compared with the previous fiscal year. Operating income margin increased from 1.8 percent to 2.5
percent. The segments making the most significant contributions to the year on year increase in operating income
were the Electronics segment, the Game segment and the Pictures segment, in descending order of financial impact.
Operating Performance by Business Segment
The following discussion is based on segment information. Sales and operating revenue in each business
segment include intersegment transactions. Refer to Note 25 of Notes to Consolidated Financial Statements.
Business Segment Information
(Yen in billions)
Year ended March 31 Sales and
Operating revenue 2002 2003
Percent change
Electronics . . . . . . . . . . . . 5,286.2 4,940.5 - 6.5% Game . . . . . . . . . . . . . . . . 1,003.7 995.0 - 4.9 Music . . . . . . . . . . . . . . . . 642.8 636.3 - 1.0 Pictures . . . . . . . . . . . . . . 635.8 802.8 + 26.3 Financial Services . . . . . . 512.2 540.5 + 5.5 Other . . . . . . . . . . . . . . . . 203.8 250.3 + 22.8 Elimination . . . . . . . . . . . . (706.4) (651.7) -
Consolidated . . . . . . . . . . . . 7,578.3 7,473.6 - 1.4
Operating income (loss)
Electronics . . . . . . . . . . . . (1.2) 41.4 - Game . . . . . . . . . . . . . . . . 82.9 112.7 +35.9% Music . . . . . . . . . . . . . . . . 20.2 (8.7) - Pictures . . . . . . . . . . . . . . 31.3 59.0 +88.6 Financial Services . . . . . . 22.1 23.3 +5.4 Other . . . . . . . . . . . . . . . . (16.6) (32.0) - Elimination
and unallocated corporate expenses . .
(4.1)
(10.3)
- Consolidated . . . . . . . . . . . . 134.6 185.4 + 37.7
Consolidated Financial Information 2003
8
Commencing with the first quarter ended June 30, 2002, Sony partly realigned its business segment
configuration and Electronics segment product category configuration. In accordance with this realignment, results of
the previous fiscal year have been reclassified to conform to the presentation for the current fiscal year. Sales of
related businesses in the NACS, established in April 2002 to enhance network businesses, are included in the
“Other” segment. In addition to Sony Communication Network Corporation (“SCN”), which was originally contained in
the “Other” segment, NACS-related businesses include an in-house oriented information system service business
and an Integrated Circuit (“IC”) card business formerly contained in the “Other” category of the Electronics segment.
Electronics
Sales for the fiscal year ended March 31, 2003 decreased by 345.7 billion yen, or 6.5 percent, to 4,940.5 billion
yen compared with the previous fiscal year. Operating income of 41.4 billion yen was recorded compared to an
operating loss of 1.2 billion yen in the previous fiscal year. The year on year decrease in sales was due to the
continued industry-wide effects of falling consumption in markets for certain products in the Electronics segment,
increased price competition worldwide, and the impact of business withdrawals and rationalization of product lines
(refer to Note 18 of Notes to Consolidated Financial Statements).
Regarding sales by geographic area, sales decreased by 12 percent in the U.S. and by 9 percent in Japan, but
sales increased by 2 percent in Europe and non-Japan Asia and other geographic areas (“Other Areas”), respectively.
Sales decreased in the U.S. over a wide range of products including, in descending order of financial impact, PCs,
computer displays, Aiwa products, CRT televisions, DVD-Video players, home-use video cameras, home audio and
CD-R/RW drives. Sales in the U.S. were also negatively impacted by Sony’s withdrawal from the home telephone
business in 2001. Products with increased sales in the U.S. included personal digital assistants, projection
televisions and digital still cameras. In Japan, overall demand decreased substantially, with PCs, Aiwa products,
home-use video cameras and CRT televisions showing year on year sales declines; however, sales of
semiconductors increased. In Europe, sales of PCs, digital still cameras and digital home-use video cameras
showed strong sales growth, while sales of Aiwa products and computer displays decreased. Sales in Europe were
also positively impacted by the strength of the euro against the yen in the second half of the year. In Other Areas,
sales of digital still cameras, home-use video cameras and PCs increased while sales of Aiwa products and
broadcast- and professional-use products decreased. The transfer of Sony’s mobile phone business to Sony
Ericsson Mobile Communications, AB (“SEMC”), an affiliate accounted for under the equity method since October
2001, also had a negative impact on sales, particularly in Japan and Europe. This was because before the transfer of
the business to SEMC, Sony handled all aspects of the mobile phone operation from manufacturing through to sales,
while now Sony only manufactures handsets on consignment from SEMC and SEMC is responsible for the remainder
of the operation. These consignment sales are recorded in the Electronics segment.
The sales decrease during the fiscal year ended March 31, 2003, accelerated in the fourth quarter, as sales
decreased by 227.0 billion yen, or 18.1 percent, to 1,025.3 billion yen compared to the fourth quarter of the previous
fiscal year. This was principally due to declines in sales, in descending order of financial impact, of PCs, CRT
televisions, Aiwa products, computer displays, home-use video cameras and home audio.
Consolidated Financial Information 2003
9
Performance by product category
Sales and operating revenue by product category discussed below represent sales to customers, which do not
include intersegment transactions. Refer to Note 25 of Notes to Consolidated Financial Statements.
“Audio” sales decreased by 65.0 billion yen, or 8.7 percent, to 682.5 billion yen. Sales of home audio declined in
all geographic areas, although sales of home theater systems increased principally in Europe and the U.S.
Regarding headphone stereos, MD format sales increased due to rapid market growth particularly in the U.S.
However, CD format headphone stereos sales decreased overall due to the contraction of the U.S. market, although
such sales rose strongly in Europe aided by continued market expansion and the depreciation of the yen against the
euro. Sales of both formats declined in Japan. Overall sales for the cassette format decreased due to the continued
contraction of the market in all areas. Worldwide shipments of MD format headphone stereos increased by
approximately 370,000 units to approximately 3,320,000 units. Worldwide shipments of CD format headphone
stereos increased by approximately 250,000 units to approximately 10,720,000 units. Sales of home telephones
declined because of Sony’s withdrawal from the home telephone business in the U.S. and Japan in the previous fiscal
year.
“Video” sales increased by 17.0 billion yen, or 2.1 percent, to 823.4 billion yen. The increase was principally due
to higher sales of digital still cameras in all areas and digital home-use video cameras in Other Areas, particularly
Asia, and Europe. Worldwide shipments of digital still cameras increased by approximately 2,200,000 units to
approximately 5,600,000 units. Worldwide shipments of home-use video cameras, both analog and digital, increased
by approximately 350,000 units to approximately 5,750,000 units. However, analog home-use video camera sales
decreased due to lower demand, particularly in the U.S. Overall sales of home-use video cameras decreased in
Japan and the U.S. due to increased price competition. DVD-Video player sales decreased primarily in the U.S.
where pricing pressure was severe, although the market expanded.
“Televisions” sales increased by 3.8 billion yen, or 0.4 percent, to 846.1 billion yen. The increase was primarily
due to higher sales of large-screen projection televisions, particularly in the U.S., and plasma televisions, in the U.S.,
Europe and Japan. This increase was partially offset by a substantial decline in CRT televisions sales in the U.S. and
Japan as a result of market contraction. However, sales of CRT televisions increased in Europe aided by the
appreciation of the euro against the yen. Worldwide shipments of CRT televisions were approximately 10,000,000
units, almost flat compared with the previous fiscal year. Sales revenue from set-top boxes decreased due to a
decline in unit sales in the U.S. and Europe.
“Information and Communications” sales decreased by 208.8 billion yen, or 17.9 percent, to 958.6 billion yen.
The decrease was primarily due to lower sales of PCs, CRT computer displays and broadcast- and professional-use
products. Further, since October 2001, when Sony began recording mobile phone handset sales as consignment
sales to SEMC in “Other”, no sales of mobile phone handsets have been recorded under “Information and
Consolidated Financial Information 2003
10
Communications”. Sales of PCs decreased in Japan and the U.S. due to increased price competition. Worldwide
shipments of PCs decreased by approximately 400,000 units to approximately 3,100,000 units. Sales of personal
digital assistants increased significantly, particularly in the U.S. and Europe, as the market for these products
expanded. Sales of CRT based computer displays continued to decrease in the U.S., Europe and Japan due to the
demand shift towards flat panel displays. As a result, sales of flat panel displays (which include LCD televisions)
increased significantly in all areas. Sales of broadcast- and professional-use products decreased as many
broadcasters postponed the installation of new systems due to economic uncertainty.
“Semiconductors” sales increased by 22.4 billion yen, or 12.3 percent, to 204.7 billion yen. The increase was
primarily due to a significant increase in sales of CCDs, particularly in Japan and Other Areas, reflecting higher
demand for digital still cameras, and a significant increase in sales of bipolar integrated circuits for CD-R/RW and
DVD drives, particularly in Japan. Partially offsetting the above increase was a decrease in sales revenue from high
temperature LCDs in all geographic areas due to pricing pressure.
“Components” sales increased by 11.8 billion yen, or 2.2 percent, to 537.4 billion yen. The increase was
primarily due to significant increases in sales of DVD drives, Memory Stick and batteries. DVD drive sales increased
as the strong performance of Sony branded products, particularly in the U.S., allowed Sony to avoid unit price
reductions. Memory Stick sales increased due to continued demand for digital still cameras, with worldwide
shipments of Memory Stick increasing by approximately 8,000,000 units to approximately 19,000,000 units. At the
end of the fiscal year ended March 31, 2003, Sony’s cumulative shipments of Memory Stick had reached 39,000,000
units. Regarding batteries, the growing market for lithium-ion batteries led to strong revenue growth despite declines
in the average selling price. On the other hand, sales of CD-R/RW drives decreased due to severe price competition.
Sales of CRTs also decreased reflecting the decline in the market for CRT televisions and CRT computer displays.
“Other” sales decreased by 10.4 billion yen, or 2.1 percent, to 490.7 billion yen, primarily due to lower sales of
Aiwa products in all geographic areas. This decrease was partially offset by the sales of mobile phone handsets
which were transferred from “Information and Communications” to “Other” in October 2001, as a result of their
becoming consignment sales to SEMC.
In the Electronics segment, cost of sales for the fiscal year ended March 31, 2003 decreased by 368.5 billion yen,
or 8.7 percent to 3,869.2 billion yen compared with the previous fiscal year. This decrease was due to the effects of
restructuring carried out in the previous fiscal year in CRTs and other products, the increased profitability as a result
of increased sales in semiconductors, batteries and other products, and the favorable impact of the appreciation of
the euro against the yen. A majority of goods sold in Europe are imported from other regions; therefore an
appreciation of the euro causes increased sales without a corresponding increase in the cost of sales. Research and
development expenses were 380.3 billion yen, almost flat year on year. The cost of sales ratio decreased from 80.5
percent to 78.8 percent.
Selling, general and administrative expenses decreased by 19.8 billion yen, or 1.9 percent to 1,029.9 billion yen
Consolidated Financial Information 2003
11
compared with the previous fiscal year. After-sales service expenses decreased by 36.5 billion yen, partially because
of the absence of mobile phone-related after-sales service expenses recorded in the previous fiscal year. Loss on
sales, disposal or impairment of long-lived assets, net also decreased, by 19.0 billion yen, primarily because of a
decrease in restructuring charges related to reductions in CRT computer display manufacturing capacity, mainly in
the U.S. In the current fiscal year, due to CRT computer display related restructuring in Japan and South-East Asia,
a restructuring charge of 5.6 billion yen was recorded in selling, general and administrative expenses. Royalty
expenses increased 16.9 billion yen. The ratio of selling, general and administrative expenses to sales increased
from 19.9 percent to 20.8 percent due to the decrease in sales.
Regarding profit performance by product compared with the previous fiscal year, the largest gains in operating
income were recorded in CRTs, portable audio, batteries, CRT televisions, recording media and digital still cameras.
Increased demand for semiconductors resulted in a substantial decrease in the size of losses. On the other hand,
losses increased in PCs and Aiwa products. Restructuring carried out in the previous fiscal year also led to improved
profitability in several component businesses, including CRTs and recording media, as a result of the reduction of
fixed costs and the concentration of resources toward successful products. Also contributing to the increase in
profitability was the withdrawal from the loss-making home telephone business and the transfer, in October 2001, of
Sony’s mobile handset business, which was recording a loss, to SEMC. Further, operating income benefited from the
depreciation of the yen against the euro, which exceeded the negative impact of the appreciation of the yen against
the U.S. dollar.
Partially offsetting the increase in profitability were losses recorded in PCs, where sales declined due to
increased competition from lower priced products. Large operating losses were also recorded by Aiwa in almost all
geographic areas as a result of reduced sales because of a decline in the competitiveness of Aiwa’s mainstay
products such as audio, restructuring expenses including costs of headcount reductions, inventory write-downs
brought about by the elimination of product lines, and the sale and disposal of production facilities. Sony Corporation
absorbed Aiwa by merger on December 1, 2002.
In the past Sony has recorded losses in the fourth quarter, due to a seasonal decline in demand for electronics
products. However, the loss in the fourth quarter of the fiscal year ended March 31, 2003 increased substantially due
to, in descending order of financial impact, a decline in sales, an increase in selling, general and administrative
expenses associated with an increase in patent-related and other expenses, and a deterioration in the cost of sales
ratio due to reductions in production undertaken to lower inventory to target levels and pricing pressure. Fourth
quarter operating losses in the Electronics segment totaled 116.1 billion yen compared with an operating loss of 51.3
billion yen in the same quarter of the previous fiscal year. Significant losses were recorded by products including
Aiwa products, semiconductors, digital still cameras and home audio. An approximate 5.9 billion yen restructuring
charge for the closure of a semiconductor plant in the U.S. impacted the loss in the semiconductor business.
Manufacturing by Geographic Area
Regarding the geographic breakdown of total annual production in the Electronics segment (including the
assembly of PlayStation 2 for the Game segment), and the final destination of such production, half of total production
Consolidated Financial Information 2003
12
was in Japan, including production of digital still cameras, semiconductors, personal digital assistants, components
(including batteries and Memory Stick), and plasma televisions. Approximately 55 percent of production in Japan
was destined for other regions. Asia, here excluding Japan and China, accounted for more than 15 percent of total
production, more than 60 percent of which was destined for Japan, the U.S. and Europe. China accounted for less
than 10 percent of total production, more than 70 percent of which was destined for Japan, the U.S. and Europe. The
Americas and Europe together accounted for the remaining quarter of total production, most of which was sold in the
area where it was produced.
Comparison of Results on a Local Currency Basis and Results on a Yen Basis
Results in the Electronics segment, on a yen basis, were positively impacted overall by the appreciation of the
euro against the yen, although this impact was partially offset by the negative impact of the depreciation of the U.S.
dollar against the yen. On a local currency basis, sales for the fiscal year ended March 31, 2003 decreased by
approximately 7 percent compared with the previous fiscal year and an operating income was recorded where an
operating loss had been recorded in the previous fiscal year.
Due to the negative impact of the depreciation of the U.S. dollar against the yen, year on year increases in sales
of products in the U.S. were generally smaller, and decreases generally larger, when stated in yen than when stated
on a local currency basis. However, no products which recorded a sales increase on a local currency basis recorded
a sales decrease on a yen basis.
Sales in Europe were positively affected by currency fluctuations, in particular the appreciation of the euro
against the yen. Year on year increases in sales of products in Europe were generally larger, and decreases
generally smaller, when stated in yen than when stated on a local currency basis. Regarding significant differences
between results on a yen basis and results on a local currency basis, CRT televisions and home-use video cameras
recorded an increase in sales on a yen basis but a decrease in sales on a local currency basis while portable audio
and batteries, which all recorded increases in sales on a yen basis, were flat year on year on a local currency basis.
The net effect of currency fluctuations on product sales in Other Areas was negative. Sales increases were
generally smaller, and decreases larger, when stated in yen than when stated on a local currency basis. Regarding
significant differences between results on a yen basis and results on a local currency basis, sales of CRT televisions
were flat year on year on a local currency basis but showed a slight decrease on a yen basis. Sales trends for other
products were not significantly different on a local currency basis or a yen basis.
Game
Sales for the fiscal year ended March 31, 2003 decreased by 48.7 billion yen, or 4.9 percent, to 955.0 billion yen
compared with the previous fiscal year. Operating income increased by 29.7 billion yen, or 35.9 percent, to 112.7
billion yen compared with the previous fiscal year, and the operating income margin increased from 8.3 percent to
11.8 percent.
Sales in the Game segment were positively impacted by the yen’s depreciation against the euro. On a local
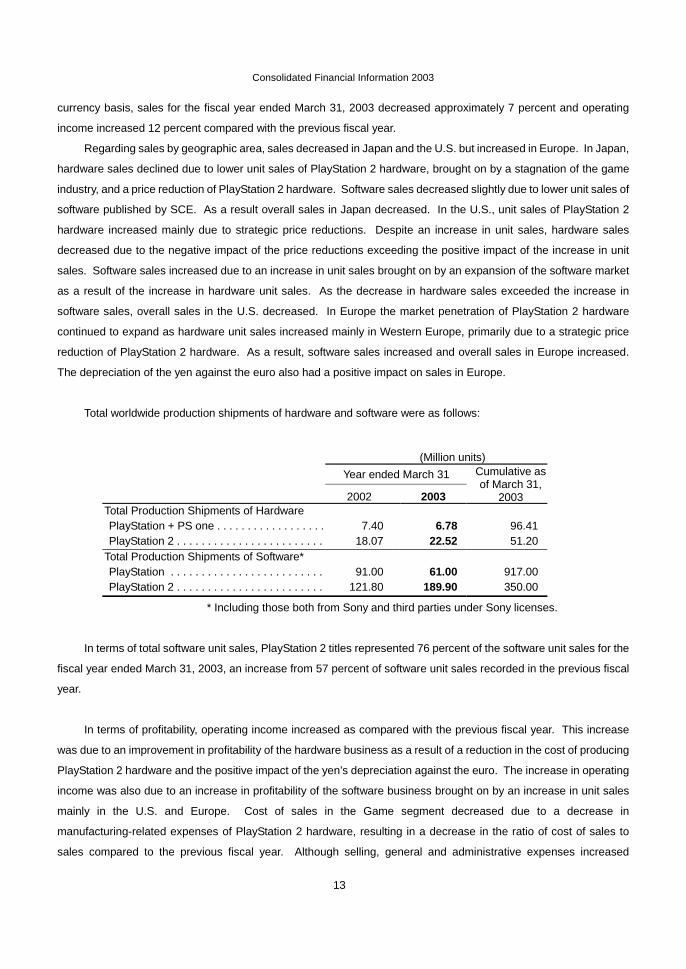
Consolidated Financial Information 2003
13
currency basis, sales for the fiscal year ended March 31, 2003 decreased approximately 7 percent and operating
income increased 12 percent compared with the previous fiscal year.
Regarding sales by geographic area, sales decreased in Japan and the U.S. but increased in Europe. In Japan,
hardware sales declined due to lower unit sales of PlayStation 2 hardware, brought on by a stagnation of the game
industry, and a price reduction of PlayStation 2 hardware. Software sales decreased slightly due to lower unit sales of
software published by SCE. As a result overall sales in Japan decreased. In the U.S., unit sales of PlayStation 2
hardware increased mainly due to strategic price reductions. Despite an increase in unit sales, hardware sales
decreased due to the negative impact of the price reductions exceeding the positive impact of the increase in unit
sales. Software sales increased due to an increase in unit sales brought on by an expansion of the software market
as a result of the increase in hardware unit sales. As the decrease in hardware sales exceeded the increase in
software sales, overall sales in the U.S. decreased. In Europe the market penetration of PlayStation 2 hardware
continued to expand as hardware unit sales increased mainly in Western Europe, primarily due to a strategic price
reduction of PlayStation 2 hardware. As a result, software sales increased and overall sales in Europe increased.
The depreciation of the yen against the euro also had a positive impact on sales in Europe.
Total worldwide production shipments of hardware and software were as follows:
(Million units) Year ended March 31
2002 2003
Cumulative as of March 31,
2003 Total Production Shipments of Hardware PlayStation + PS one . . . . . . . . . . . . . . . . . . 7.40 6.78 96.41 PlayStation 2 . . . . . . . . . . . . . . . . . . . . . . . . 18.07 22.52 51.20 Total Production Shipments of Software* PlayStation . . . . . . . . . . . . . . . . . . . . . . . . . 91.00 61.00 917.00 PlayStation 2 . . . . . . . . . . . . . . . . . . . . . . . . 121.80 189.90 350.00
* Including those both from Sony and third parties under Sony licenses.
In terms of total software unit sales, PlayStation 2 titles represented 76 percent of the software unit sales for the
fiscal year ended March 31, 2003, an increase from 57 percent of software unit sales recorded in the previous fiscal
year.
In terms of profitability, operating income increased as compared with the previous fiscal year. This increase
was due to an improvement in profitability of the hardware business as a result of a reduction in the cost of producing
PlayStation 2 hardware and the positive impact of the yen’s depreciation against the euro. The increase in operating
income was also due to an increase in profitability of the software business brought on by an increase in unit sales
mainly in the U.S. and Europe. Cost of sales in the Game segment decreased due to a decrease in
manufacturing-related expenses of PlayStation 2 hardware, resulting in a decrease in the ratio of cost of sales to
sales compared to the previous fiscal year. Although selling, general and administrative expenses increased
Consolidated Financial Information 2003
14
primarily due to an increase in advertising and promotion expenses in conjunction with the increase in units sold, the
ratio of selling, general and administrative expenses to sales decreased as compared to the previous fiscal year.
Music
Sales for the fiscal year ended March 31, 2003 decreased by 6.5 billion yen, or 1.0 percent, to 636.3 billion yen
compared with the previous fiscal year. Compared to operating income of 20.2 billion yen in the previous fiscal year,
an operating loss of 8.7 billion yen was recorded this year.
On a local currency basis, sales in the Music segment increased by 1 percent while the Music segment incurred
an operating loss as compared to operating income in the previous fiscal year.
Sales at SMEI increased approximately 6 percent on a U.S. dollar basis (refer to “Foreign Exchange
Fluctuations and Risk Hedging” below). In terms of profitability, SMEI incurred an operating loss in the current year
as compared to operating income in the previous fiscal year. The increase in sales was primarily due to an increase
in sales of DVD software, manufactured in the Music segment, to the Pictures and Game segments. Sales to the
Pictures segment increased as a result of the greater popularity of DVD media in the home entertainment market and
sales to the Game segment increased due to higher unit sales of PlayStation 2 software titles, which are packaged on
DVDs. Partially offsetting the increase in sales at SMEI was a decline in album sales in many regions worldwide.
Album sales at SMEI have been declining due to the continued contraction of the global market for music.
Industry-wide album unit sales in the U.S. decreased for 19 consecutive months up to and including March 2003.
Such sales in the fiscal year ended March 31, 2003 were 10 percent lower than in the previous fiscal year. This
contraction trend has been caused by slow economic growth, the saturation of the CD market, the effects of digital
piracy and other illegal duplication, parallel imports, pricing pressures and a diversification of customer preferences
brought on by increased competition from other entertainment sectors.
The decline in profitability resulting in an operating loss at SMEI primarily resulted from a 120 million U.S. dollar
year on year increase in restructuring charges undertaken to reduce costs in response to the downward trend of the
market. The total cost of restructuring for the fiscal year ended March 31, 2003, was approximately 190 million U.S.
dollars, or 22.4 billion yen (refer to “Restructuring” for details) net of a reversal of an expense of 30.8 million U.S.
dollars accrued in previous fiscal years as a result of reduced compensation expense. The second largest factor
leading to the operating loss was a decrease in gross profit brought about by the decrease in album sales. The third
factor leading to operating loss was an increase in talent-related expenses, primarily because the continued decline
in album sales led to an increase in impairments of capitalized advances paid to artists. Partially offsetting the decline
in operating profitability, in descending order of magnitude, were a decrease in advertising and promotion expenses,
savings realized from previously implemented restructuring initiatives and higher income generated by the increase
in DVD software manufacturing activity. Although restructuring expenses increased significantly compared with the
previous fiscal year, the decrease in advertising and promotion expenses and savings realized from previously
implemented restructuring initiatives caused a decrease in selling, general and administrative expenses for the year
and an improvement in the ratio of selling, general and administrative expenses to sales.
Regarding the results of SMEJ, sales decreased by 10 percent and operating income decreased 81 percent
Consolidated Financial Information 2003
15
year on year. Sales decreased due to the continued contraction of the music industry. The decrease in operating
income resulted from the decrease in sales and, to a lesser extent, an increase in severance-related expenses
incurred from restructuring. Restructuring activity at SMEJ during the fiscal year centered on headcount reductions.
On a yen basis, 72 percent of the Music segment’s sales were generated by SMEI while 28 percent were
generated by SMEJ.
Pictures
Sales for the fiscal year ended March 31, 2003 increased by 167.0 billion yen, or 26.3 percent, to 802.8 billion
yen compared with the previous fiscal year. Operating income increased by 27.7 billion yen, or 88.6 percent, to 59.0
billion yen and the operating income margin increased from 4.9 percent to 7.3 percent. The results in the Pictures
segment consist of the results of Sony Pictures Entertainment (“SPE”), a U.S. based subsidiary.
On a U.S. dollar basis, sales for the fiscal year in the Pictures segment increased approximately 30 percent and
operating income increased approximately 92 percent. The increase in sales was due to the strong worldwide
performance, both theatrically and in home entertainment, of current year releases including Spider-Man, the highest
grossing film in SPE’s history, Men in Black II, xXx and Mr. Deeds. The increased worldwide popularity of DVDs also
contributed to the higher home entertainment revenues. As a result of these factors, sales for the current year
release slate increased 1.6 billion U.S. dollars compared with the previous fiscal year. Operating income for the
segment increased significantly due to the higher theatrical and home entertainment revenues for the current year
release slate, partially offset by the aggregate disappointing performance of several films including I Spy and Stuart
Little 2, resulting in an increase of 221 million U.S. dollars, the benefit of restructuring initiatives undertaken in the
previous fiscal year, resulting in an increase of 52 million U.S. dollars, and, less significantly, increased operating
income in the television business due to higher revenues from the game show, Wheel of Fortune. The primary benefit
of the restructuring undertaken in the previous fiscal year was a reduction in losses recorded on the production of new
network television shows and pilots. Losses declined because the number of new shows and pilots was reduced and
because production expenses per new show and pilot were reduced. Operating income for the segment was also
higher because the 67 million U.S. dollar, or 8.5 billion yen, restructuring charge recorded in the previous fiscal year
was not recorded this year (refer to “Restructuring” for details). Partially offsetting the increase in operating income
was an additional provision of 66 million U.S. dollars, an increase of 26 million U.S. dollars over the previous fiscal
year, with respect to previously recorded revenue from KirchMedia, an insolvent licensee in Germany of SPE’s
feature film and television product, and related adjustments to ultimate film income.
As of March 31, 2003, unrecognized license fee revenue at SPE was approximately 1.3 billion U.S. dollars.
SPE expects to record this amount in the future having entered into contracts with television broadcasters to provide
those broadcasters with completed motion picture and television product. The license fee revenue will be recognized
in the year that the product is available for broadcast.
Consolidated Financial Information 2003
16
Financial Services
Financial Services revenue for the fiscal year ended March 31, 2003 increased by 28.3 billion yen, or 5.5
percent, to 540.5 billion yen compared with the previous fiscal year. Operating income increased by 1.2 billion yen, or
5.4 percent, to 23.3 billion yen and the operating income margin was flat, compared with the previous fiscal year, at
4.3 percent.
At Sony Life Insurance Co., Ltd. (“Sony Life”), revenue increased by 19.5 billion yen, or 4.4 percent, to 466.6
billion yen and operating income increased by 1.8 billion yen, or 6.4 percent, to 29.6 billion yen compared with the
previous fiscal year*. Insurance revenue increased as insurance-in-force from individual life insurance products
increased due to the maintenance of a lower than industry average rate of contract cancellation, despite a decrease
in newly acquired insurance-in-force brought about by a decrease in disposable family incomes due to continued
weak economic conditions. The increase in revenue also resulted from an improvement in the valuation gains and
losses from investments in the general account which occurred because loss recorded due to the devaluation of
Argentine government bonds held in that account decreased significantly compared with the previous fiscal year. On
the other hand, the increase in Sony Life’s revenue was partially offset by a deterioration of valuation gains and
losses from investments in the separate account, which resulted from the stock market downturn. Operating income
increased because of the increase in insurance revenue that accompanied the increase in insurance-in-force from
individual life insurance products and the improvement in valuation gains and losses from investments in the general
account mentioned above. Valuation gains and losses from investments in the separate account accrue directly to
the account of policyholders and, therefore, do not affect operating income.
At Sony Assurance Inc. (“Sony Assurance”), revenue increased due to higher insurance revenue brought about
by an expansion in automobile insurance-in-force reflecting greater customer awareness of the benefit of flexible
insurance policies which take into account mileage driven. Regarding profit performance, an operating loss was
recorded in the fiscal year ended March 31, 2003, as was the case in each of the previous three fiscal years. The loss
was recorded because essential investments necessary for the expansion of the business put pressure on profitability.
These investments were for advertising and for computer systems necessary to develop new products and establish
customer claims service centers. However, an increase in insurance revenue and a decrease in the expense ratio
(the ratio of operating expenses to premiums) and the loss ratio (the ratio of insurance payouts to premiums) caused
losses to decrease.
At Sony Finance International, Inc. (“Sony Finance”), a leasing and credit financing business subsidiary in
Japan, revenue decreased slightly due to a decrease in rent revenue despite an increase in leasing revenue. In
terms of profitability, a loss was recorded, compared with an operating income in the previous fiscal year, due to an
increase in operating expenses in connection with the issuance of credit cards that utilize contact-free IC card
technology.
Sony Bank Inc. (“Sony Bank”), which started business in June 2001, recorded a loss, as was also recorded in
the previous fiscal year, primarily due to start-up expenses.
*The revenue and operating income at Sony Life reported here are calculated on a U.S. GAAP basis. Therefore, they
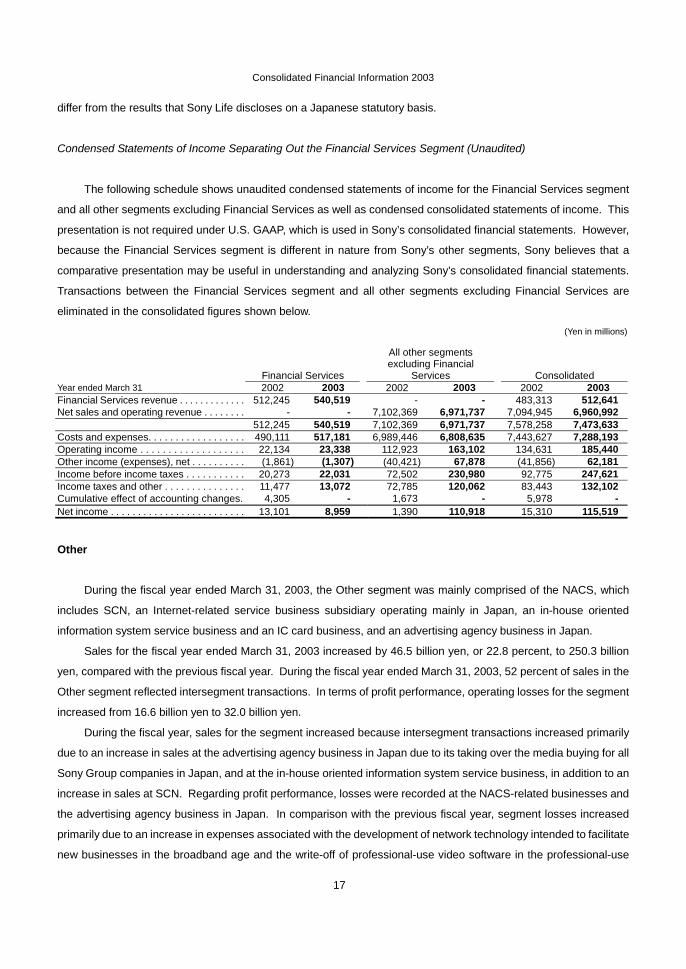
Consolidated Financial Information 2003
17
differ from the results that Sony Life discloses on a Japanese statutory basis.
Condensed Statements of Income Separating Out the Financial Services Segment (Unaudited)
The following schedule shows unaudited condensed statements of income for the Financial Services segment
and all other segments excluding Financial Services as well as condensed consolidated statements of income. This
presentation is not required under U.S. GAAP, which is used in Sony’s consolidated financial statements. However,
because the Financial Services segment is different in nature from Sony’s other segments, Sony believes that a
comparative presentation may be useful in understanding and analyzing Sony’s consolidated financial statements.
Transactions between the Financial Services segment and all other segments excluding Financial Services are
eliminated in the consolidated figures shown below.
(Yen in millions)
Financial Services
All other segments excluding Financial
Services Consolidated Year ended March 31 2002 2003 2002 2003 2002 2003 Financial Services revenue . . . . . . . . . . . . . 512,245 540,519 - - 483,313 512,641 Net sales and operating revenue . . . . . . . . - - 7,102,369 6,971,737 7,094,945 6,960,992
512,245 540,519 7,102,369 6,971,737 7,578,258 7,473,633 Costs and expenses. . . . . . . . . . . . . . . . . . 490,111 517,181 6,989,446 6,808,635 7,443,627 7,288,193 Operating income . . . . . . . . . . . . . . . . . . . 22,134 23,338 112,923 163,102 134,631 185,440 Other income (expenses), net . . . . . . . . . . (1,861) (1,307) (40,421) 67,878 (41,856) 62,181 Income before income taxes . . . . . . . . . . . 20,273 22,031 72,502 230,980 92,775 247,621 Income taxes and other . . . . . . . . . . . . . . . 11,477 13,072 72,785 120,062 83,443 132,102 Cumulative effect of accounting changes. 4,305 - 1,673 - 5,978 - Net income . . . . . . . . . . . . . . . . . . . . . . . . . 13,101 8,959 1,390 110,918 15,310 115,519
Other
During the fiscal year ended March 31, 2003, the Other segment was mainly comprised of the NACS, which
includes SCN, an Internet-related service business subsidiary operating mainly in Japan, an in-house oriented
information system service business and an IC card business, and an advertising agency business in Japan.
Sales for the fiscal year ended March 31, 2003 increased by 46.5 billion yen, or 22.8 percent, to 250.3 billion
yen, compared with the previous fiscal year. During the fiscal year ended March 31, 2003, 52 percent of sales in the
Other segment reflected intersegment transactions. In terms of profit performance, operating losses for the segment
increased from 16.6 billion yen to 32.0 billion yen.
During the fiscal year, sales for the segment increased because intersegment transactions increased primarily
due to an increase in sales at the advertising agency business in Japan due to its taking over the media buying for all
Sony Group companies in Japan, and at the in-house oriented information system service business, in addition to an
increase in sales at SCN. Regarding profit performance, losses were recorded at the NACS-related businesses and
the advertising agency business in Japan. In comparison with the previous fiscal year, segment losses increased
primarily due to an increase in expenses associated with the development of network technology intended to facilitate
new businesses in the broadband age and the write-off of professional-use video software in the professional-use
Consolidated Financial Information 2003
18
video software business due to a discontinuation of that business. Operating losses for the Other segment increased
despite the fact that operating income was recorded at SCN, as compared to an operating loss in the previous fiscal
year. SCN recorded operating income due to an increase in sales resulting from a rise in broadband subscribers and
a reduction in costs associated with communication line usage.
Other Income and Expenses
In the consolidated results for the fiscal year ended March 31, 2003, other income increased by 61.2 billion yen,
or 63.5 percent, to 157.5 billion yen, while other expenses decreased by 42.8 billion yen, or 31.0 percent, to 95.3
billion yen, compared with the previous fiscal year. The net amount of other income and other expenses was net
income of 62.2 billion yen compared to net expense of 41.9 billion yen in the previous fiscal year.
The increase in other income was primarily due to the recording of a 72.6 billion yen gain on sales of securities
investments and other, net, for the year ended March 31, 2003. This was mostly due to a 66.5 billion yen gain on the
sale, in April 2002, of Sony’s equity interest in Telemundo Communications Group, Inc. and its subsidiaries
(“Telemundo”), a U.S. based Spanish language television network and station group that was accounted for under the
equity method. In addition, Sony deferred an approximate 6.0 billion yen gain on this sale due to provisions in the
sale agreement that required a partial refund of the purchase price for certain losses or claims as defined in the
agreement. The right of the acquirer to claim such refunds expired in April 2003 without any such claim being made.
Therefore, Sony recorded an additional gain of 6.0 billion yen in April 2003. Gains were also recorded on the sale of
the equity interest in Sony Tektronix Inc., which develops, manufactures and sells electronic measuring instruments
and related devices, and Columbia House Company (“CHC”), a direct marketer of music and videos. Other income
was positively impacted by a net foreign exchange gain of 1.9 billion yen recorded during the year, compared with a
net foreign exchange loss of 31.7 billion yen recorded in the previous fiscal year. The net foreign exchange gain
recorded during the year was primarily due to gains incurred on foreign exchange forward contracts and foreign
currency option contracts, which Sony employs to hedge the risk from exchange rate fluctuations, while the foreign
exchange losses recorded during the previous fiscal year were due to losses incurred on such contracts due to the
rapid depreciation of the yen between December 2001 and March 2002. Compared to the previous fiscal year,
interest and dividends decreased from 16.0 billion yen in the previous fiscal year to 14.4 billion yen, primarily due to
lower interest earned from investments.
The decrease in other expenses was primarily due to the absence of the net foreign exchange loss recorded in
the previous fiscal year as noted above. Interest expense also decreased by 9.1 billion yen, or 25.0 percent, to 27.3
billion yen, primarily due to lower average balances of short-term borrowings and lower interest rates. As a result, the
amount of income from interest and dividends less interest expense improved to a net expense of 12.9 billion yen,
compared with a net expense of 20.4 billion yen in the previous fiscal year. Partially offsetting the decrease in other
expenses was an increase of 4.7 billion yen, or 25.7 percent, to 23.2 billion yen, in losses on the devaluation of
securities investments, including securities issued by companies in the U.S. and Europe with which Sony has
strategic relationships for the purpose of developing and marketing new technologies. Such companies include
Canal+ Technologies, a developer of middleware and conditional access technologies for digital broadcasting, TIVO
Consolidated Financial Information 2003
19
Inc., a marketer of digital video recorders, and Transmeta Corporation, a chip manufacturer.
Income before Income Taxes
Income before income taxes for the fiscal year ended March 31, 2003 increased by 154.8 billion yen, or 167
percent, to 247.6 billion yen compared with the previous fiscal year. Significant contributors to the year on year
increase in income before income taxes, in descending order of significance, were the increase in operating income,
the increase in gains on sales of securities investments and other, net, and the absence of the foreign exchange loss
recorded in the previous fiscal year.
Income Taxes
Income taxes for the fiscal year ended March 31, 2003 increased by 15.6 billion yen, or 24.0 percent, to 80.8
billion yen. The increase in income tax was principally due to the increase in income before income taxes described
above, although this increase was partially offset by a tax benefit of 51.9 billion yen recorded due to the reversal of
valuation allowances on deferred tax assets held by Aiwa as these assets became recoverable as a result of Sony’s
decision to merge with Aiwa.
The ratio of income taxes to income before income taxes (the effective tax rate) decreased from 70.3 percent in
the previous fiscal year to 32.6 percent.
Results of Affiliated Companies Accounted for under the Equity Method
During the year, equity in net losses of affiliated companies increased from 34.5 billion yen in the previous fiscal
year to 44.7 billion yen. SEMC, a joint venture focused on mobile phone handsets recorded 20.8 billion yen losses.
In addition, equity affiliates recording losses included S.T. Liquid Crystal Display Corporation (“ST-LCD”), an LCD
joint venture in Japan, Crosswave Communications Inc. (“Crosswave”), a data communications carrier offering
customers broadband networks and network services in Japan, and BE-ST Bellevuestrasse Development GmbH &
Co. First Real Estate KG, Berlin (“BE-ST KG”), a real estate business in Germany. Regarding the significant losses at
SEMC, no year on year comparison is available because SEMC was established in October 2001. However, the loss
of 10.7 billion yen recorded due to SEMC in the second half of the fiscal year ended March 31, 2003 was greater than
the 7.4 billion yen loss recorded in the second half of the fiscal year ended March 31, 2002. This increase in losses
was due to the following factors: decreased sales in the fourth quarter ended March 31, 2003, compared to the fourth
quarter ended March 31, 2002, due to increased pricing pressure; increased expenses due to the phase-in of new
products in the GSM and Japanese markets; and the recording of an operating loss in the fourth quarter ended March
31, 2003 compared to income in the fourth quarter ended March 31, 2002, which benefited from the successful
introduction of two high-end models in the Japanese and European markets. In January 2003, Sony and
Telefonaktiebolaget LM Ericsson announced that they will each invest an additional 150 million euro in SEMC to
strengthen its financial position (refer to “Electronics”, above).
Consolidated Financial Information 2003
20
In the first quarter of the fiscal year ended March 31, 2003, SPE and other non-Sony investors sold Telemundo to
NBC, a media company owned by the General Electric Company. In the same quarter, SMEI and AOL Time Warner
Inc.’s Warner Music Group each sold the majority of their holding in CHC to Blackstone Capital Partners, an affiliate of
The Blackstone Group, an investment bank. The Chairman of the Blackstone Group was a director of Sony until June
2002.
In August 2003, Crosswave, 23.9 percent of the equity of which Sony Corporation owns, applied for
commencement of reorganization proceedings under the Corporate Reorganization Law of Japan. Sony has
outstanding loans and leases certain fixed assets to Crosswave. Sony estimates that the commencement of such
reorganization proceedings under the Corporate Reorganization Law will result in a maximum decrease to
consolidated income before income taxes of approximately 6.0 billion yen.
Minority Interest in Income (Loss) of Consolidated Subsidiaries
In the fiscal year ended March 31, 2003, minority interest in the income of consolidated subsidiaries, which is
excluded from income before income taxes, was 6.6 billion yen, compared to a 16.2 billion yen minority interest in the
loss of consolidated subsidiaries recorded in the previous fiscal year. This change was principally due to the reversal
of valuation allowances on deferred tax assets held by Aiwa and because Sony no longer recorded a minority interest
in Aiwa’s losses as Sony took Aiwa private in October 2002.
Net Income
Net income for the fiscal year ended March 31, 2003 increased by 100.2 billion yen, or 654.5 percent, to 115.5
billion yen compared with the previous fiscal year. As a percentage of sales, net income increased from 0.2 percent
to 1.5 percent. The most significant contribution to the year on year increase in net income was the increase in
income before income taxes. However the effect of the minority interest in the income of consolidated subsidiaries,
the absolute increase in income taxes, and the increase in losses in equity of affiliated companies caused net income
to be 132.1 billion yen less than income before income taxes, compared to a difference of 77.5 billion yen in the
previous fiscal year.
The return on stockholders’ equity increased from 0.7 percent to 5.0 percent. (This ratio is calculated by dividing
net income by the simple average of stockholders’ equity at the end of the previous fiscal year and at the end of the
current fiscal year.)
Basic net income per share was 125.74 yen compared with 16.72 yen in the previous fiscal year, and diluted net
income per share was 118.21 yen compared with 16.67 yen in the previous fiscal year. Refer to Notes 2 and 22 of
Notes to Consolidated Financial Statements.
Foreign Exchange Fluctuations and Risk Hedging
During the fiscal year ended March 31, 2003, the average value of the yen was 120.9 yen against the U.S. dollar,
Consolidated Financial Information 2003
21
and 119.5 yen against the euro, which was 2.6 percent higher against the U.S. dollar and 8.8 percent lower against
the euro, respectively, compared with the average of the previous fiscal year. Operating results on a local currency
basis described herein show results of sales and operating revenue (“sales”) and operating income obtained by
applying the yen’s monthly average exchange rate in the previous fiscal year to monthly local currency-denominated
sales, cost of sales, and selling, general and administrative expenses for the fiscal year ended March 31, 2003, as if
the value of the yen had remained constant. In the Music segment, Sony consolidates the yen-translated results of
SMEI (a U.S. based operation that aggregates the results of its worldwide subsidiaries on a U.S. dollar basis) and the
results of SMEJ (a Japan based operation that aggregates the results of its operations in yen). In the Pictures
segment, Sony translates into yen the U.S. dollar consolidated results of SPE, (a U.S. based operation that has
worldwide subsidiaries). Therefore, in the results of SMEI and SPE, analysis and discussion of certain portions of
their operating results are specified as being on “a U.S. dollar basis.” Results on a local currency basis and results on
a U.S. dollar basis are not on the same basis as Sony’s consolidated financial statements and do not conform with
U.S. GAAP. In addition, Sony does not believe that these measures are a substitute for U.S. GAAP measures.
However, Sony believes that local currency basis results provide additional useful information to investors regarding
operating performance.
Sony's consolidated results are subject to foreign currency fluctuations mainly derived from the fact that the
countries where manufacturing takes place may be different from those where such products are sold. In order to
reduce the risk caused by such fluctuations, Sony employs derivatives, including foreign exchange forward contracts
and foreign currency option contracts, in accordance with a consistent risk management strategy. Such derivatives
are used primarily to mitigate the effect of foreign currency exchange rate fluctuations on cash flows generated by
anticipated intercompany transactions and intercompany accounts receivable and payable denominated in foreign
currencies.
In 2001, Sony Global Treasury Services plc (“SGTS”) was established in London for the purpose of providing
integrated treasury services for Sony Corporation and its subsidiaries. Sony's policy is that Sony Corporation and all
subsidiaries with foreign exchange exposures should enter into commitments with SGTS for hedging their exposures.
Sony Corporation and most of Sony's subsidiaries utilize SGTS for this purpose. The concentration of foreign
exchange exposures at SGTS means that, in effect, SGTS hedges the net foreign exchange exposure of Sony
Corporation and its subsidiaries. SGTS in turn enters into foreign exchange transactions with creditworthy third-party
financial institutions. Most of the transactions are entered into against projected exposures before the actual export
and import transactions take place. In particular SGTS hedges the exposures of major currency pairs such as U.S.
dollar against Japanese yen, euro against Japanese yen and euro against U.S. dollar, on average three months
before the actual transactions take place. In the case of emerging market currencies, such as Brazil, with high
inflation and high interest rates, projected exposures are hedged one month before the actual transactions take place
due to cost effectiveness considerations. Sony enters into foreign exchange transactions with financial institutions
only for hedging purposes and does not undertake speculative transactions.
To minimize the adverse effects of foreign exchange fluctuations on its financial results, particularly in the
Electronics segment, Sony seeks, when appropriate, to localize material and parts procurement, design, and
manufacturing operations in areas outside of Japan.
Consolidated Financial Information 2003
22
Changes in the fair value of derivatives designated as cash flow hedges, including foreign exchange forward
contracts and foreign currency option contracts, are initially recorded in other comprehensive income and reclassified
into earnings when the hedged transaction affects earnings. Foreign exchange forward contracts, foreign currency
option contracts and other derivatives that do not qualify as hedges are marked-to-market with changes in value
recognized in Other Income and Expenses. The notional amount of foreign exchange forward contracts, currency
option contracts purchased and currency option contracts written as of March 31, 2003 are 1,139.3 billion yen, 484.5
billion yen and 238.8 billion yen, respectively.
Liquidity and Capital Resources
Liquidity Management
Sony’s financial policy is to secure adequate liquidity and financing for its operations and to maintain the
strength of its balance sheet. Sony defines liquidity sources as (a) cash, cash equivalents and time deposits, and (b)
committed lines of credit contracted with banks rated "C" or above in Moody's Bank Financial Strength ratings.
Sony’s basic policy is to keep liquidity equal to at least 100 percent of the sum of the amount of average monthly sales
and the amount of the largest expected monthly debt redemption during the fiscal year. Although its working capital
needs have a general tendency to grow in the third quarter (from October 1 to December 31), Sony believes that this
policy satisfies Sony’s working capital requirements throughout the year.
On March 31, 2003, the total amount of liquidity sources for Sony Group excluding Sony Life, Sony Assurance
and Sony Bank was 1,060.3 billion yen which was comprised of (a) 440.3 billion yen in cash, cash equivalents and
time deposits and (b) approximately 620.0 billion yen in contracts for committed lines from banks rated “C” or above.
The committed lines were entirely unused. Due to operational necessities, Sony also has approximately 286.0 billion
yen in additional committed lines with banks that have a Moody’s financial strength rating below “C”. Refer to Note 12
of Notes to Consolidated Financial Statements for the total amount of committed lines with banks regardless of
Moody’s financial strength rating for the fiscal year ended March 31, 2003.
In general, there are no restrictions on how Sony’s borrowings can be used except that, in compliance with
Federal Reserve Board regulations, some borrowings in the U.S. may not be used for hostile corporate takeovers. In
addition, there are no provisions in any of Sony’s material financing agreements that would cause an acceleration of
repayment in the event of a downgrade in Sony’s credit ratings.
Finance and Capital Resources
Sony Corporation and its finance subsidiaries around the world engage in activities to acquire funds, when
necessary, through the issuance of stocks and bonds, borrowings from financial institutions, and other financial
instruments. In order to meet funding requirements around the world, Sony maintains commercial paper (“CP”)
programs and medium-term note (“MTN”) programs.
SGTS, a Sony finance subsidiary in the U.K., maintains a CP program in both the U.S. and Euro CP markets,
Consolidated Financial Information 2003
23
and a CP program in the Japanese CP market. Furthermore, a Sony finance subsidiary in the U.S. maintains a U.S.
CP program. At March 31, 2003, the total amount of the CP programs was 2,060 billion yen. During the fiscal year
ended March 31, 2003, the largest month-end outstanding balance of CP at Sony was 52.8 billion yen. The total
outstanding balance of CP as of March 31, 2003 was 52.8 billion yen.
In addition to the above CP programs, SGTS maintains a Euro MTN program, while Sony’s finance subsidiary
in the U.S. maintains a Rule 144A U.S. MTN program targeted at the U.S. capital markets and a Euro MTN program.
At March 31, 2003, the total amount of the MTN programs was 1,200.0 billion yen, and the total outstanding balance
was approximately 78.0 billion yen.
Sony believes that, in order to fund investments for future growth, redemption of bonds and working capital
needs, it is able to secure adequate resources through its access to financial and capital markets.
Ratings
In order to facilitate access to global capital markets, Sony obtains credit ratings from two rating agencies,
Moody’s Investors Services, Inc. (“Moody’s”) and Standard and Poor’s Rating Services (“S&P”). In addition, Sony
maintains a rating from Rating and Investment Information, Inc. (“R&I”), a rating agency in Japan, for access to the
Japanese capital market.
Sony’s current debt ratings (long-term/short-term) are: Moody’s: A1 (outlook: negative)/P-1; S&P: A+ (outlook:
negative)/A-1; and R&I: AA/a-1+.
On June 25, 2003, Moody’s downgraded Sony’s long-term debt rating from Aa3 to A1 (outlook: negative). R&I
downgraded Sony’s long-term debt rating from AA+ to AA on June 16, 2003. These rating actions reflected concerns
of the two agencies that Sony may take longer than expected to regain previous profit and cash flow levels as Sony’s
profitability, particularly in the Electronics segment, has been under pressure due to strong competition and
deflationary trends. Sony’s short-term debt ratings from Moody’s and R&I have been unaffected.
Despite the downgrading of Sony’s long-term debt rating by Moody’s and R&I, Sony believes that its access to
the global capital markets will remain sufficient for its financing needs going forward, and that it will retain its ability to
issue CP to meet its working capital needs.
Sony seeks to maintain a stable credit rating in order to ensure financial flexibility for liquidity and capital
management, and to continue to maintain access to sufficient funding resources through financial and capital
markets.
Cash Management
Sony is centralizing and making more efficient its global cash management through SGTS. The excess or
shortage of cash at most of its subsidiaries in Japan is invested or funded by SGTS after having been netted out. In
addition, a cash concentration system has been introduced in which proxy payments are carried out for Japanese
subsidiaries. In order to improve the efficiency of its cash management, Sony manages uneven cash distribution
directly and indirectly through SGTS when surplus funds are generated at subsidiaries so that Sony can reduce
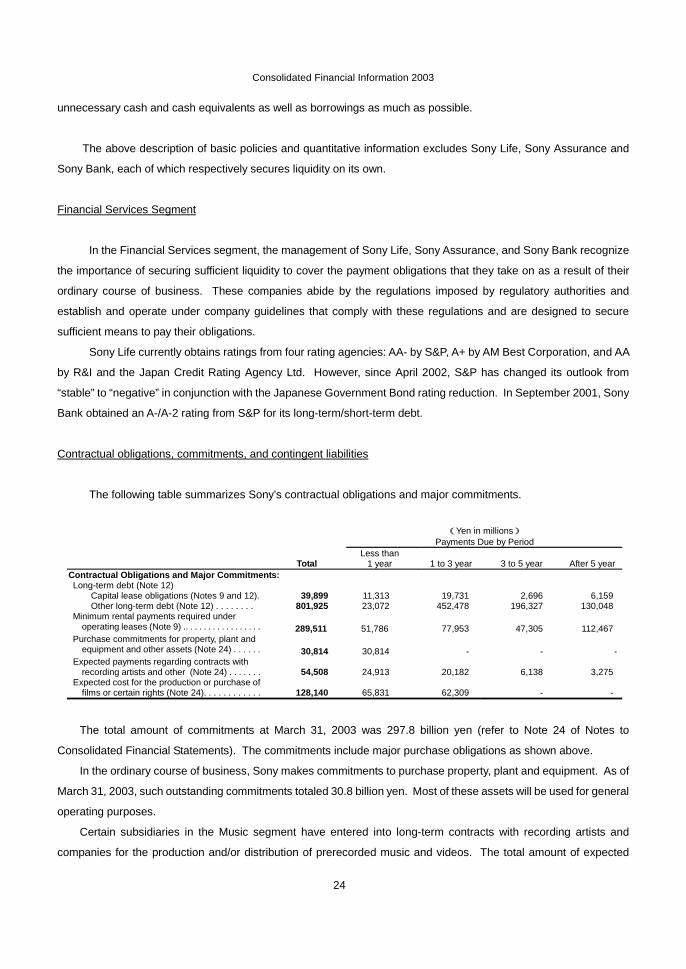
Consolidated Financial Information 2003
24
unnecessary cash and cash equivalents as well as borrowings as much as possible.
The above description of basic policies and quantitative information excludes Sony Life, Sony Assurance and
Sony Bank, each of which respectively secures liquidity on its own.
Financial Services Segment
In the Financial Services segment, the management of Sony Life, Sony Assurance, and Sony Bank recognize
the importance of securing sufficient liquidity to cover the payment obligations that they take on as a result of their
ordinary course of business. These companies abide by the regulations imposed by regulatory authorities and
establish and operate under company guidelines that comply with these regulations and are designed to secure
sufficient means to pay their obligations.
Sony Life currently obtains ratings from four rating agencies: AA- by S&P, A+ by AM Best Corporation, and AA
by R&I and the Japan Credit Rating Agency Ltd. However, since April 2002, S&P has changed its outlook from
“stable” to “negative” in conjunction with the Japanese Government Bond rating reduction. In September 2001, Sony
Bank obtained an A-/A-2 rating from S&P for its long-term/short-term debt.
Contractual obligations, commitments, and contingent liabilities
The following table summarizes Sony’s contractual obligations and major commitments.
(Yen in millions) Payments Due by Period
Total Less than
1 year 1 to 3 year 3 to 5 year After 5 year Contractual Obligations and Major Commitments: Long-term debt (Note 12)
Capital lease obligations (Notes 9 and 12). 39,899 11,313 19,731 2,696 6,159 Other long-term debt (Note 12) . . . . . . . . 801,925 23,072 452,478 196,327 130,048
Minimum rental payments required under operating leases (Note 9) .. . . . . . . . . . . . . . . . . 289,511
51,786 77,953 47,305 112,467
Purchase commitments for property, plant and equipment and other assets (Note 24) . . . . . . 30,814 30,814 - - -
Expected payments regarding contracts with recording artists and other (Note 24) . . . . . . . 54,508 24,913 20,182 6,138 3,275
Expected cost for the production or purchase of films or certain rights (Note 24). . . . . . . . . . . . 128,140 65,831 62,309 - -
The total amount of commitments at March 31, 2003 was 297.8 billion yen (refer to Note 24 of Notes to
Consolidated Financial Statements). The commitments include major purchase obligations as shown above.
In the ordinary course of business, Sony makes commitments to purchase property, plant and equipment. As of
March 31, 2003, such outstanding commitments totaled 30.8 billion yen. Most of these assets will be used for general
operating purposes.
Certain subsidiaries in the Music segment have entered into long-term contracts with recording artists and
companies for the production and/or distribution of prerecorded music and videos. The total amount of expected
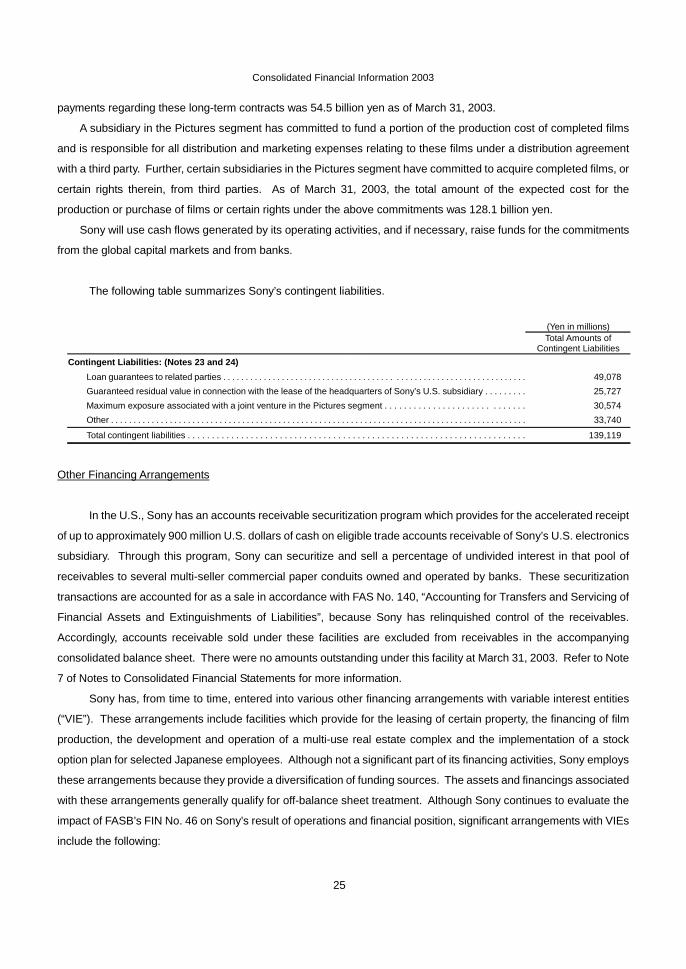
Consolidated Financial Information 2003
25
payments regarding these long-term contracts was 54.5 billion yen as of March 31, 2003.
A subsidiary in the Pictures segment has committed to fund a portion of the production cost of completed films
and is responsible for all distribution and marketing expenses relating to these films under a distribution agreement
with a third party. Further, certain subsidiaries in the Pictures segment have committed to acquire completed films, or
certain rights therein, from third parties. As of March 31, 2003, the total amount of the expected cost for the
production or purchase of films or certain rights under the above commitments was 128.1 billion yen.
Sony will use cash flows generated by its operating activities, and if necessary, raise funds for the commitments
from the global capital markets and from banks.
The following table summarizes Sony’s contingent liabilities.
(Yen in millions) Total Amounts of
Contingent Liabilities Contingent Liabilities: (Notes 23 and 24) Loan guarantees to related parties . . . . . . . . . . . . . . . . . . . . . . . . . . . . . . . . . . . . . . . . . . . . . . . . . . . . . . . . . . . . . . . . . . . 49,078 Guaranteed residual value in connection with the lease of the headquarters of Sony’s U.S. subsidiary . . . . . . . . . 25,727 Maximum exposure associated with a joint venture in the Pictures segment . . . . . . . . . . . . . . . . . . . . . . . . . . . . . 30,574 Other . . . . . . . . . . . . . . . . . . . . . . . . . . . . . . . . . . . . . . . . . . . . . . . . . . . . . . . . . . . . . . . . . . . . . . . . . . . . . . . . . . . . . . . . . . . . 33,740
Total contingent liabilities . . . . . . . . . . . . . . . . . . . . . . . . . . . . . . . . . . . . . . . . . . . . . . . . . . . . . . . . . . . . . . . . . . . . . . 139,119
Other Financing Arrangements
In the U.S., Sony has an accounts receivable securitization program which provides for the accelerated receipt
of up to approximately 900 million U.S. dollars of cash on eligible trade accounts receivable of Sony’s U.S. electronics
subsidiary. Through this program, Sony can securitize and sell a percentage of undivided interest in that pool of
receivables to several multi-seller commercial paper conduits owned and operated by banks. These securitization
transactions are accounted for as a sale in accordance with FAS No. 140, “Accounting for Transfers and Servicing of
Financial Assets and Extinguishments of Liabilities”, because Sony has relinquished control of the receivables.
Accordingly, accounts receivable sold under these facilities are excluded from receivables in the accompanying
consolidated balance sheet. There were no amounts outstanding under this facility at March 31, 2003. Refer to Note
7 of Notes to Consolidated Financial Statements for more information.
Sony has, from time to time, entered into various other financing arrangements with variable interest entities
(“VIE”). These arrangements include facilities which provide for the leasing of certain property, the financing of film
production, the development and operation of a multi-use real estate complex and the implementation of a stock
option plan for selected Japanese employees. Although not a significant part of its financing activities, Sony employs
these arrangements because they provide a diversification of funding sources. The assets and financings associated
with these arrangements generally qualify for off-balance sheet treatment. Although Sony continues to evaluate the
impact of FASB’s FIN No. 46 on Sony’s result of operations and financial position, significant arrangements with VIEs
include the following:
Consolidated Financial Information 2003
26
During the fiscal year ended March 31, 2002, Sony Corporation of America (“SCA”) entered into a financing
arrangement with a VIE to lease its headquarters, which qualified for off-balance sheet treatment. The total
obligation of the VIE under this arrangement is 255 million U.S. dollars. Upon the maturity of this lease
arrangement in December 2008, SCA has guaranteed a residual value totaling 214 million U.S. dollars if SCA
decides to forgo the purchase of the building or renewal of the lease. Upon Sony’s adoption of FASB’s FIN 46,
“Consolidation of Variable Interest Entities”, Sony will begin consolidation of the special purpose entity.
In the fiscal year ended March 31, 2000, SPE entered into a joint venture agreement with a VIE for the purpose
of funding certain film production and acquisition costs. The joint venture allows SPE to utilize its existing
international distribution capabilities while sharing the possible risks of financing the increased acquisition and
distribution activities with third party investors. SPE contributed 11 million U.S. dollars of the VIE’s total equity
capitalization of 106 million U.S. dollars. Additionally, the VIE has a 300 million U.S. dollar bank credit facility of
which 11.2 million U.S. dollars was outstanding as of March 31, 2003. Under this financing arrangement, SPE is
obligated to acquire international distribution rights, as defined, for twelve pictures meeting certain minimum
requirements within a 3.5- to 4.5-year period and transfer those rights to the VIE at cost plus a 5 percent fee.
SPE is required to distribute the product internationally, for contractually defined fees determined as
percentages of gross receipts, as defined, and is responsible for all distribution and marketing expenses which
are recouped from such distribution fees. Under the agreement, SPE will bear all losses incurred by the VIE of
less than or equal to 30 million U.S. dollars as SPE’s 11 million U.S. dollar equity investment in the VIE is the last
equity to be repaid, and as SPE must use a portion of its distribution fees to repay third party investors up to 19
million U.S. dollars of any losses they incur. If losses incurred by the VIE exceed 30 million U.S. dollars, third
party investors will bear the remainder of the losses. If the venture is profitable, all parties will share in any net
proceeds, as defined, remaining after the third party investors’ equity has been repaid. If, and only if, SPE fails to
deliver twelve pictures meeting the minimum requirements to the VIE and the bank credit facility or the
third-party equity investors are not paid in full by March 10, 2008 (or earlier upon the occurrence of certain
events), SPE is required to reimburse the VIE to the extent necessary to repay the bank credit facility in full and
pay certain minimum returns to the third party equity investors. As of March 31, 2003, the maximum exposure
amount was 255 million U.S. dollars. Sony guarantees all of the financial obligations of SPE under this financing
arrangement. Sony does not reflect in its balance sheet the production costs of the films acquired by the VIE, the
VIE’s bank credit facility debt, or the third-party equity investment. Upon adoption of FASB’s FIN 46, SPE will
begin consolidation of the VIE.
During the fiscal years ended March 31, 1995 and 1997, Sony made an investment in a VIE which has been
accounted for under the equity method by Sony, for the purpose of erecting and operating a multi-use real estate
complex in Berlin, Germany. The VIE was initially capitalized with 90.8 billion yen of total funding, 32.6 billion
yen was provided by the equity investors with the remaining funding of 58.2 billion yen being provided through a
syndicated bank loan which matures in November 2004. The syndicated bank loan is secured by the multi-use
real estate complex. Should the VIE be unable to meet its obligations under the syndicated bank loan, Sony
Consolidated Financial Information 2003
27
would be exposed to the potential impairment of its investment in the VIE which was 12.8 billion yen at March 31,
2003. Upon Sony’s adoption of FASB’s FIN 46, Sony will begin consolidation of the special purpose entity.
During the fiscal year ended March 31, 1998, Sony established a VIE to implement a stock option plan for
selected Japanese employees. The VIE has been consolidated by Sony since its establishment. Accordingly,
there will be no impact to Sony’s results of operations and financial position upon the adoption of FIN No. 46.
Under the terms of the stock option plan, upon exercise, Japanese employees receive cash equal to the amount
that the market price of Sony Corporation’s common stock exceeds the strike price of the plan. In order to
minimize cash flow exposure associated with the plan, Sony holds treasury stock through the VIE. The VIE
purchased the common stock with funding provided by the employee’s cash contribution and a bank loan which
has been guaranteed by Sony Corporation. If the market value of common stock is below the price that Sony
acquired the treasury stock for at the time of settlement of the stock option plan, Sony is required to reimburse
the VIE for repayment of the bank loan. At March 31, 2003, the balance of the bank loan was 6.9 billion yen.
Assets, Liabilities and Stockholders’ Equity
Assets
Total assets on March 31, 2003 increased by 184.8 billion yen, or 2.3 percent, to 8,370.5 billion yen, compared
with the previous fiscal year-end. (Total assets on March 31, 2003 would have increased by approximately 5 percent
compared with the previous fiscal year-end if the value of the yen had remained the same on March 31, 2003 as it
was on March 31, 2002.) Total assets on March 31, 2003 in all segments excluding the Financial Services segment
decreased by 251.1 billion yen, or 4.1 percent, to 5,815.8 billion yen and total assets on March 31, 2003 in the
Financial Services segment increased by 414.4 billion yen, or 16.6 percent, to 2,910.4 billion yen, compared with the
previous fiscal year-end.
Current Assets
Current assets on March 31, 2003 decreased by 183.0 billion yen, or 5.5 percent, to 3,154.2 billion yen
compared with the previous fiscal year-end.
Current assets on March 31, 2003 in all segments excluding the Financial Services segment decreased by
273.2 billion yen, or 9.8 percent, to 2,501.0 billion yen. This decrease was primarily attributable to a 236.5 billion yen,
or 20.1 percent, decrease to 942.2 billion yen in notes and accounts receivable due to a decrease in sales for the
fourth quarter ended March 31, 2003 compared with the same quarter of the previous fiscal year. Inventories on
March 31, 2003 decreased by 47.7 billion yen, or 7.1 percent, to 625.7 billion yen compared with the previous fiscal
year-end. The inventory to cost of sales turn-over ratio (based on the average of inventories at the end of each fiscal
year and previous fiscal year) was 1.57 months, a decrease of 0.28 months from the end of the previous fiscal year.
Inventories in the Electronics segment decreased by 79.6 billion yen, or 15.6 percent, to 432.4 billion yen due to
Consolidated Financial Information 2003
28
worldwide efforts to strengthen inventory control. On a product category basis, inventories decreased in the
Televisions, Video and Audio categories. In the Game segment, overall inventories increased 24.4 billion yen, or 20.5
percent, to 143.4 billion yen due to an increase in PlayStation 2 hardware inventories and an increase in inventories
of semiconductors brought on by the establishment of increased production capacity during the fiscal year.
Current assets on March 31, 2003 in the Financial Services segment increased by 61.2 billion yen, or 9.8
percent, to 687.9 billion yen, compared with the previous fiscal year-end. The increase was primarily attributable to
an increase in the value of investment assets in marketable securities held by the banking business.
Investments and Advances
Investments and advances on March 31, 2003 increased by 296.3 billion yen, or 17.5 percent, to 1,994.1 billion
yen, compared with the previous fiscal year.
Investments and advances on March 31, 2003 in all segments excluding the Financial Services segment
decreased by 47.6 billion yen, or 11.3 percent, to 372.7 billion yen. This decrease was mainly due to the recognition
of equity in net losses of affiliated companies such as SEMC.
Investments and advances on March 31, 2003 in the Financial Services segment increased by 353.2 billion yen,
or 25.4 percent, to 1,741.7 billion yen, compared with the previous fiscal year-end. This increase was primarily due to
an increase in investment assets in securities investments and other held by Sony Life.
Sony regularly evaluates its investment portfolio to identify other-than-temporary impairments of individual
securities. Factors that are considered by Sony in determining whether an other-than-temporary decline in value has
occurred include: the length of time and extent to which the market value of the security has been less than its original
cost, the financial condition, operating results, business plans and estimated future cash flows of the issuer of the
security, other specific factors affecting the market value, deterioration of issuer’s credit condition, sovereign risk, and
whether or not Sony is able to retain the investment for a period of time sufficient to allow for the anticipated recovery
in market value.
In evaluating the factors for available-for-sale securities whose fair values are readily determinable,
management presumes a decline in value to be other-than-temporary if the fair value of the security is 20 percent or
more below its original cost for an extended period of time (generally a period of up to six to twelve months). This
criteria is employed as a threshold to identify securities which may have a decline in value that is
other-than-temporary. The presumption of an other-than-temporary impairment in such cases may be overcome if
there is evidence to support that the decline is temporary in nature due to the existence of other factors which
overcome the duration or magnitude of the decline. On the other hand, there may be cases where impairment losses
are recognized when the decline in the fair value of the security is not more than 20 percent or such decline has not
existed for an extended period of time, as a result of considering specific factors which may indicate the decline in the
fair value is other-than-temporary.
The assessment of whether a decline in the value of an investment is other-than-temporary is often judgmental
in nature and involves certain assumptions and estimates concerning the expected operating results, business plans
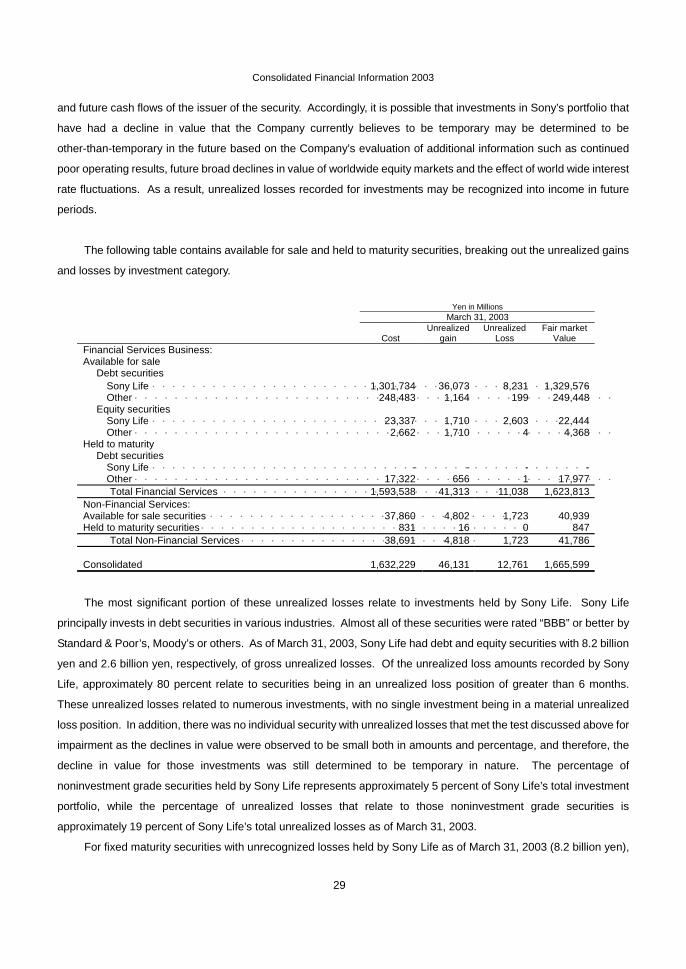
Consolidated Financial Information 2003
29
and future cash flows of the issuer of the security. Accordingly, it is possible that investments in Sony’s portfolio that
have had a decline in value that the Company currently believes to be temporary may be determined to be
other-than-temporary in the future based on the Company’s evaluation of additional information such as continued
poor operating results, future broad declines in value of worldwide equity markets and the effect of world wide interest
rate fluctuations. As a result, unrealized losses recorded for investments may be recognized into income in future
periods.
The following table contains available for sale and held to maturity securities, breaking out the unrealized gains
and losses by investment category.
Yen in Millions March 31, 2003
Cost Unrealized
gain Unrealized
Loss Fair market
Value Financial Services Business: Available for sale
Debt securities Sony Life ・・・・・・・・・・・・・・・・・・・・・・・・・・・・・・・・・・・・・・・・・・・・ 1,301,734 36,073 8,231 1,329,576 Other・・・・・・・・・・・・・・・・・・・・・・・・・・・・・・・・・・・・・・・・・・・・・・・・ 248,483 1,164 199 249,448
Equity securities Sony Life ・・・・・・・・・・・・・・・・・・・・・・・・・・・・・・・・・・・・・・・・・・・・ 23,337 1,710 2,603 22,444 Other・・・・・・・・・・・・・・・・・・・・・・・・・・・・・・・・・・・・・・・・・・・・・・・・ 2,662 1,710 4 4,368
Held to maturity Debt securities
Sony Life ・・・・・・・・・・・・・・・・・・・・・・・・・・・・・・・・・・・・・・・・・・・・ - - - - Other・・・・・・・・・・・・・・・・・・・・・・・・・・・・・・・・・・・・・・・・・・・・・・・・ 17,322 656 1 17,977 Total Financial Services ・・・・・・・・・・・・・・・・・・・・・・・・・・・・ 1,593,538 41,313 11,038 1,623,813
Non-Financial Services: Available for sale securities ・・・・・・・・・・・・・・・・・・・・・・・・・・・・・・・ 37,860 4,802 1,723 40,939 Held to maturity securities・・・・・・・・・・・・・・・・・・・・・・・・・・・・・・・・・ 831 16 0 847
Total Non-Financial Services・・・・・・・・・・・・・・・・・・・・・・・・ 38,691 4,818 1,723 41,786
Consolidated 1,632,229 46,131 12,761 1,665,599
The most significant portion of these unrealized losses relate to investments held by Sony Life. Sony Life
principally invests in debt securities in various industries. Almost all of these securities were rated “BBB” or better by
Standard & Poor’s, Moody’s or others. As of March 31, 2003, Sony Life had debt and equity securities with 8.2 billion
yen and 2.6 billion yen, respectively, of gross unrealized losses. Of the unrealized loss amounts recorded by Sony
Life, approximately 80 percent relate to securities being in an unrealized loss position of greater than 6 months.
These unrealized losses related to numerous investments, with no single investment being in a material unrealized
loss position. In addition, there was no individual security with unrealized losses that met the test discussed above for
impairment as the declines in value were observed to be small both in amounts and percentage, and therefore, the
decline in value for those investments was still determined to be temporary in nature. The percentage of
noninvestment grade securities held by Sony Life represents approximately 5 percent of Sony Life’s total investment
portfolio, while the percentage of unrealized losses that relate to those noninvestment grade securities is
approximately 19 percent of Sony Life’s total unrealized losses as of March 31, 2003.
For fixed maturity securities with unrecognized losses held by Sony Life as of March 31, 2003 (8.2 billion yen),
Consolidated Financial Information 2003
30
maturity dates vary as follows:
・ Within 1 year: 22 percent
・ 1 to 5 years: 47 percent
・ 5 to 10 years: 31 percent
Sony also maintains long-term investment securities issued by a number of non-public companies. The
aggregate carrying amount of the investments in non-public companies at March 31, 2003, which were valued at the
lower of cost or fair value, was 69.6 billion yen.
For the years ended March 31, 2001, 2002 and 2003, total impairment losses were 4.2 billion yen, 27.6 billion
yen and 25.5 billion yen of which none, 9.2 billion yen and 2.3 billion yen, respectively, were recorded by Sony Life in
Financial Services revenue (refer to “Financial Services” under “Operating Performance by Business Segment”).
The remaining losses in each of the three years were reflected in non-operating expenses and primarily relate to the
certain strategic investments in non- financial services businesses. These investments primarily relate to companies
in the U.S. and Europe with which Sony has strategic relationships for the purpose of developing and marketing new
technologies and the impairment losses recorded for each of the three years primarily reflect the inability of these
companies to successfully develop and market such technology. None of these impairment losses was individually
material to Sony, except for the devaluation of securities explained in “Other Income and Expenses” for the fiscal year
ended March 31, 2003. Upon determination that the value of an investment is impaired, the value of the investment
is written down to its fair value. For publicly traded investments, fair value is determined by the closing stock price as
of the date on which the impairment determination is made. For non-public investments, fair value is determined
through the use of such methodologies as discounted cash flows, valuation of recent financings and comparable
valuations of similar companies. The impairment losses that were recorded in each of the three years related to the
unique facts and circumstances of each individual investment and did not significantly impact other investments.
Sony Life and Sony Bank’s investments constitute the majority of the investments in the Financial Services
segment. Sony Life and Sony Bank account for approximately 84 percent and 14 percent of the investments of the
Financial Services segment, respectively.
Sony Life’s basic investment policy is to take both expected returns and investment risks into account in order to
maintain sound asset quality, structuring its asset management portfolio to ensure steady medium- and long-term
returns by investing assets in an efficient manner and responding flexibly to changes in financial conditions and the
investment environment. Moreover, the company analyzes the character of future insurance policy benefits by
utilizing Asset Liability Management (“ALM”), a method of managing interest rate fluctuation risk through the
comprehensive identification of the mismatches of duration and cash flows between assets and liabilities.
Government bonds and corporate bonds constitute a majority of Sony Life’s current portfolio. Sony Life invests in
various types of government and corporate bonds in many countries, companies and industries, to diversify
associated risks. Further, as stocks accounted for approximately 1.7 percent of such securities, the financial
structure of the company is not greatly influenced by stock prices.
Sony Bank operates using the same basic investment policy as Sony Life, taking expected returns and
Consolidated Financial Information 2003
31
investment risks into account in order to disperse associated risks, and structuring its asset portfolio to ensure steady
returns from investments. In addition, the company is careful to match the duration of its asset portfolio with the
duration of liabilities resulting from customer deposits, in order to ensure that significant discrepancies do not occur.
Government bonds and corporate bonds constitute a majority of Sony Bank’s current portfolio. The company invests
in various types of government and corporate bonds in many countries, companies and industries, to diversify
associated risks. To safeguard its assets the company does not lend its assets to corporations or invest in equity
securities.
Tangible fixed assets (after deduction of accumulated depreciation)
Tangible fixed assets on March 31, 2003 decreased by 133.3 billion yen, or 9.4 percent, to 1,278.4 billion yen,
compared with the previous fiscal year-end.
Tangible fixed assets on March 31, 2003 in all segments excluding the Financial Services segment decreased
by 129.2 billion yen, or 9.5 percent, to 1,232.4 billion yen, compared with the previous fiscal year-end. The decrease
was due to a reduced level of capital expenditures, primarily in the Electronics segment, during the fiscal year.
Tangible fixed assets on March 31, 2003 in the Financial Services segment decreased by 4.1 billion yen, or 8.2
percent, to 46.0 billion yen, compared with the previous fiscal year-end.
Capital expenditures (additions to fixed assets) for the fiscal year ended March 31, 2003 decreased by 65.5
billion yen, or 20.0 percent, to 261.2 billion yen compared with the previous fiscal year. The largest decreases were in
the Electronics segment, where capital expenditures declined by 49.7 billion yen, or 22.6 percent year on year, to
170.3 billion yen, and in the Financial Services segment, where capital expenditures declined by 12.4 billion yen, or
77.2 percent, to 3.7 billion yen. Capital expenditures in the Electronics segment decreased year on year because
investments were reduced in response to the deterioration of the market environment, and because large
investments related to the construction of device manufacturing facilities, principally for semiconductors, were
recorded in the previous fiscal year. Capital expenditures in the Financial Services segment decreased year on year
because investments related to the start-up of Sony Bank were recorded in the previous fiscal year. On the other
hand, capital expenditures in the Other segment increased by 10.2 billion yen, or 195.7 percent, to 15.4 billion yen
because large investments related to the development of network technology intended to facilitate new businesses in
the broadband age were recorded in this fiscal year.
Capital expenditures in the Game segment decreased by 6.8 billion yen, or 14.3 percent, to 41.0 billion yen;
capital expenditures in the Pictures segment decreased by 4.4 billion yen, or 37.9 percent, to 7.1 billion yen and
capital expenditures in the Music segment increased by 0.3 billion yen, or 1.6 percent, to 21.9 billion yen.
Other Assets
Other assets on March 31, 2003 increased by 230.0 billion yen, or 16.1 percent, to 1,656.1 billion yen,
compared with the previous fiscal year-end.
Consolidated Financial Information 2003
32
Other assets on March 31, 2003 in all segments excluding the Financial Services segment increased by 224.1
billion yen, or 21.8 percent, to 1,251.8 billion yen. This was mainly due to an increase in deferred tax assets. The
increase in deferred tax assets occurred due to an increase in the minimum pension liability adjustment and the
reversal of valuation allowances on deferred tax assets held by Aiwa because these assets became recoverable as a
result of Sony’s decision to merge with Aiwa.
Other assets on March 31, 2003 in the Financial Services segment increased by 4.0 billion yen, or 0.9 percent,
to 434.8 billion yen, compared with the previous fiscal year-end.
Liabilities
Total current and long-term liabilities on March 31, 2003, increased by 275.6 billion yen, or 4.8 percent, to
6,067.6 billion yen compared with the previous fiscal year-end. (Total liabilities on March 31, 2003 would have
increased by approximately 7 percent compared with the previous fiscal year-end if the value of the yen had
remained the same on March 31, 2003 as it was on March 31 of the previous fiscal year.) Total current and long-term
liabilities on March 31, 2003 in all segments excluding the Financial Services segment decreased by 156.4 billion yen,
or 4.1 percent, to 3,662.0 billion yen. Total current and long-term liabilities on March 31, 2003, in the Financial
Services segment increased by 410.9 billion yen, or 18.9 percent, to 2,588.7 billion yen, compared with the previous
fiscal year-end.
Current Liabilities
Current liabilities on March 31, 2003 increased by 123.4 billion yen, or 4.8 percent, to 2,435.0 billion yen
compared with the previous fiscal year-end.
Current liabilities on March 31, 2003 in all segments excluding the Financial Services segment decreased by
305.9 billion yen, or 12.9 percent, to 2,061.5 billion yen. This was due to a 203.3 billion yen, or 61.6 percent,
decrease in short-term liabilities, which include the current portion of long-term debt, to 126.7 billion yen and a 82.1
billion yen, or 10.6 percent, decrease in notes and accounts payable, trade to 693.3 billion yen. The decrease in
notes and accounts payable, trade was primarily due to a decrease in purchases that resulted from adjustments in
production in the Electronics segment in the fourth quarter of the fiscal year ended March 31, 2003.
Current liabilities on March 31, 2003 in the Financial Services segment increased by 165.5 billion yen, or 65.0
percent, to 420.2 billion yen. Deposits from customers in the banking business increased by 142.2 billion yen, or
133.6 percent, to 248.7 billion yen, due to the expansion of the banking business.
Long-term Liabilities
Long-term liabilities on March 31, 2003 increased by 399.1 billion yen, or 12.3 percent, to 3,632.6 billion yen
compared with the previous fiscal year-end.
Long-term liabilities on March 31, 2003 in all segments excluding the Financial Services segment increased by
Consolidated Financial Information 2003
33
149.5 billion yen, or 10.3 percent, to 1,600.5 billion yen. Among long-term liabilities, accrued pension and severance
costs increased 195.8 billion yen, or 67.1 percent, to 487.4 billion yen. The increase was primarily due to an increase
in benefit obligations due to a review of discount rates and other factors used to calculate benefit obligations, as well
as an additional minimum pension liability that was recorded due to decreases in the current value of pension plan
assets held by Sony Corporation, reflecting sluggish stock market conditions in Japan during the fiscal year.
Long-term liabilities on March 31, 2003 in the Financial Services segment increased by 245.4 billion yen, or
12.8 percent, to 2,168.5 billion yen. This was due to an increase in insurance-in-force in the life insurance business
which resulted in an increase in future insurance policy benefits and other of 234.0 billion yen, or 13.9 percent, to
1,914.4 billion yen.
Total Interest-bearing Debt
Total interest-bearing debt (the total of short-term borrowings and long-term debt) on March 31, 2003 decreased
by 226.5 billion yen, or 19.0 percent, to 966.2 billion yen, compared with the previous fiscal year-end.
Total interest-bearing debt on March 31, 2003 in all segments excluding the Financial Services segment
decreased by 213.9 billion yen, or 18.7 percent, to 929.6 billion yen. As a result of repayment of debt including 1.5
billion U.S. dollars of U.S. dollar notes redeemed on March 4, 2003, long-term debt decreased by 10.6 billion yen, or
1.3 percent, to 802.9 billion yen and short-term debt decreased by 203.3 billion yen, or 61.6 percent, to 126.7 billion
yen, compared with the previous fiscal year-end.
Stockholders’ Equity
Stockholders’ equity on March 31, 2003 decreased by 89.5 billion yen, or 3.8 percent, to 2,280.9 billion yen
compared with the previous fiscal year-end. Stockholders’ equity decreased because the amount of stockholders’
equity that was deducted for minimum pension liability adjustments increased from 72.0 billion yen at the end of the
previous fiscal year to 182.7 billion yen, reflecting sluggish stock market conditions in Japan during the fiscal year.
Also, the amount of stockholders’ equity that was deducted for foreign currency translation adjustments increased
from 225.8 billion yen at the end of the previous fiscal year to 302.2 billion yen, due to the appreciation of the yen
against the U.S. dollar. Stockholders’ equity on March 31, 2003 in all segments excluding the Financial Services
segment decreased by 94.2 billion yen, or 4.2 percent, to 2,138.1 billion yen compared with the previous fiscal
year-end. Stockholders’ equity on March 31, 2003 in the Financial Services segment increased by 3.5 billion yen, or
1.1 percent, to 321.7 billion yen compared with the previous fiscal year-end. The ratio of stockholders’ equity to total
assets decreased from 29.0 percent to 27.2 percent.
Condensed Balance Sheets Separating Out the Financial Services Segment (Unaudited)
The following schedule shows an unaudited condensed balance sheet for the Financial Services segment and
all other segments excluding the Financial Services as well as the condensed consolidated balance sheet. This
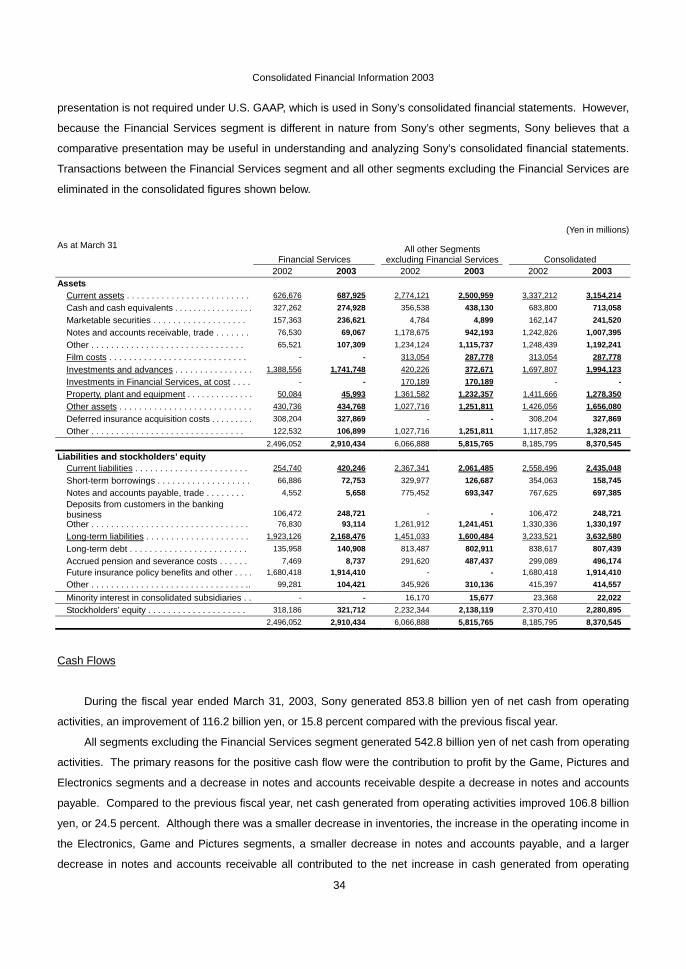
Consolidated Financial Information 2003
34
presentation is not required under U.S. GAAP, which is used in Sony’s consolidated financial statements. However,
because the Financial Services segment is different in nature from Sony’s other segments, Sony believes that a
comparative presentation may be useful in understanding and analyzing Sony’s consolidated financial statements.
Transactions between the Financial Services segment and all other segments excluding the Financial Services are
eliminated in the consolidated figures shown below.
(Yen in millions) As at March 31
Financial Services All other Segments
excluding Financial Services Consolidated 2002 2003 2002 2003 2002 2003 Assets
Current assets . . . . . . . . . . . . . . . . . . . . . . . . . 626,676 687,925 2,774,121 2,500,959 3,337,212 3,154,214 Cash and cash equivalents . . . . . . . . . . . . . . . . . 327,262 274,928 356,538 438,130 683,800 713,058 Marketable securities . . . . . . . . . . . . . . . . . . . 157,363 236,621 4,784 4,899 162,147 241,520 Notes and accounts receivable, trade . . . . . . . 76,530 69,067 1,178,675 942,193 1,242,826 1,007,395 Other . . . . . . . . . . . . . . . . . . . . . . . . . . . . . . . 65,521 107,309 1,234,124 1,115,737 1,248,439 1,192,241 Film costs . . . . . . . . . . . . . . . . . . . . . . . . . . . . - - 313,054 287,778 313,054 287,778 Investments and advances . . . . . . . . . . . . . . . . 1,388,556 1,741,748 420,226 372,671 1,697,807 1,994,123 Investments in Financial Services, at cost . . . . - - 170,189 170,189 - - Property, plant and equipment . . . . . . . . . . . . . . 50,084 45,993 1,361,582 1,232,357 1,411,666 1,278,350 Other assets . . . . . . . . . . . . . . . . . . . . . . . . . . . 430,736 434,768 1,027,716 1,251,811 1,426,056 1,656,080 Deferred insurance acquisition costs . . . . . . . . . 308,204 327,869 - - 308,204 327,869 Other . . . . . . . . . . . . . . . . . . . . . . . . . . . . . . . 122,532 106,899 1,027,716 1,251,811 1,117,852 1,328,211 2,496,052 2,910,434 6,066,888 5,815,765 8,185,795 8,370,545
Liabilities and stockholders’ equity Current liabilities . . . . . . . . . . . . . . . . . . . . . . . 254,740 420,246 2,367,341 2,061,485 2,558,496 2,435,048 Short-term borrowings . . . . . . . . . . . . . . . . . . . 66,886 72,753 329,977 126,687 354,063 158,745 Notes and accounts payable, trade . . . . . . . . 4,552 5,658 775,452 693,347 767,625 697,385
Deposits from customers in the banking business 106,472 248,721 - - 106,472 248,721
Other . . . . . . . . . . . . . . . . . . . . . . . . . . . . . . . . 76,830 93,114 1,261,912 1,241,451 1,330,336 1,330,197 Long-term liabilities . . . . . . . . . . . . . . . . . . . . . 1,923,126 2,168,476 1,451,033 1,600,484 3,233,521 3,632,580 Long-term debt . . . . . . . . . . . . . . . . . . . . . . . . 135,958 140,908 813,487 802,911 838,617 807,439 Accrued pension and severance costs . . . . . . 7,469 8,737 291,620 487,437 299,089 496,174 Future insurance policy benefits and other . . . . 1,680,418 1,914,410 - - 1,680,418 1,914,410
Other . . . . . . . . . . . . . . . . . . . . . . . . . . . . . . . .. 99,281 104,421 345,926 310,136 415,397 414,557 Minority interest in consolidated subsidiaries . . - - 16,170 15,677 23,368 22,022
Stockholders’ equity . . . . . . . . . . . . . . . . . . . . 318,186 321,712 2,232,344 2,138,119 2,370,410 2,280,895 2,496,052 2,910,434 6,066,888 5,815,765 8,185,795 8,370,545
Cash Flows
During the fiscal year ended March 31, 2003, Sony generated 853.8 billion yen of net cash from operating
activities, an improvement of 116.2 billion yen, or 15.8 percent compared with the previous fiscal year.
All segments excluding the Financial Services segment generated 542.8 billion yen of net cash from operating
activities. The primary reasons for the positive cash flow were the contribution to profit by the Game, Pictures and
Electronics segments and a decrease in notes and accounts receivable despite a decrease in notes and accounts
payable. Compared to the previous fiscal year, net cash generated from operating activities improved 106.8 billion
yen, or 24.5 percent. Although there was a smaller decrease in inventories, the increase in the operating income in
the Electronics, Game and Pictures segments, a smaller decrease in notes and accounts payable, and a larger
decrease in notes and accounts receivable all contributed to the net increase in cash generated from operating
Consolidated Financial Information 2003
35
activities compared with the previous fiscal year.
The Financial Services segment generated 316.0 billion yen of net cash from operating activities. While cash
declined primarily as a result of an increase in deferred insurance acquisition costs, an increase in future insurance
policy benefits and other as a result of an increase in insurance-in-force resulted in cash generated from operating
activities exceeding expenditures. Compared with the previous fiscal year, cash generated from operating activities
in the Financial Services segment improved by 14.3 billion yen, or 4.8 percent.
During the fiscal year, 706.4 billion yen in cash was used in investing activities (a decrease of 60.7 billion yen, or
7.9 percent compared with the previous fiscal year).
In all segments excluding the Financial Services segment, 185.2 billion yen in cash was used in investing
activities. During the fiscal year, cash was used to purchase fixed assets mainly in the Electronics segment. Cash
proceeds of 135.8 billion yen were generated from sales of securities investments, maturities of marketable securities
and collections of advances, including 88.4 billion yen from the sale of Telemundo. Compared with the previous fiscal
year, cash used in investing activities decreased by 183.8 billion yen, or 49.8 percent. As a result of a reduction in
capital expenditures mainly in the Electronics segment, cash used to purchase fixed assets decreased compared
with the previous fiscal year.
In the Financial Services segment, 517.4 billion yen in cash was used in investing activities (an increase of
115.5 billion yen, or 28.7 percent compared with the previous fiscal year). The use of cash derived primarily from the
fact that investments and advances of 1,026.4 billion yen exceeded sales of securities investments, maturities of
marketable securities and collections of advances of 542.5 billion yen, reflecting an increase in assets under
management in the Financial Services segment.
As a result of these factors, net cash flow (the difference between cash generated from operating activities and
cash used in investing activities) was a positive 147.4 billion yen for the fiscal year, an improvement of 176.9 billion
yen compared with the previous fiscal year (in the previous fiscal year, net cash flow was a negative 29.5 billion yen).
In terms of net cash flow from all segments excluding the Financial Services segment, net cash flow was a positive
357.7 billion yen for the fiscal year, an improvement of 290.6 billon yen, or 433.0 percent, compared with the previous
fiscal year. Net cash flow from the Financial Services segment was a negative 201.4 billion yen, a deterioration of
101.2 billion yen compared with the previous fiscal year.
During the fiscal year ended March 31, 2003, 93.1 billion yen of net cash was used in financing activities
compared to 85.0 billion yen of cash provided by financing activities. 22.9 billion yen in cash was used for the
payment of dividends.
In all segments excluding the Financial Services segment, 251.1 billion yen of net cash was used in financing
activities compared to 31.6 billion yen of cash used in financing activities. Cash was used during the fiscal year for
repayments of long-term debt including 1.5 billion U.S. dollars of U.S. dollar notes redeemed on March 4, 2003.
These repayments caused cash used in financing activities to exceed cash generated by financing activities.
In the Financial Services segment, 149.1 billion yen of net cash was provided by financing activities compared
to 120.3 billion yen provided by financing activities. This was due to a 142.2 billion yen, or 133.6 percent, increase in
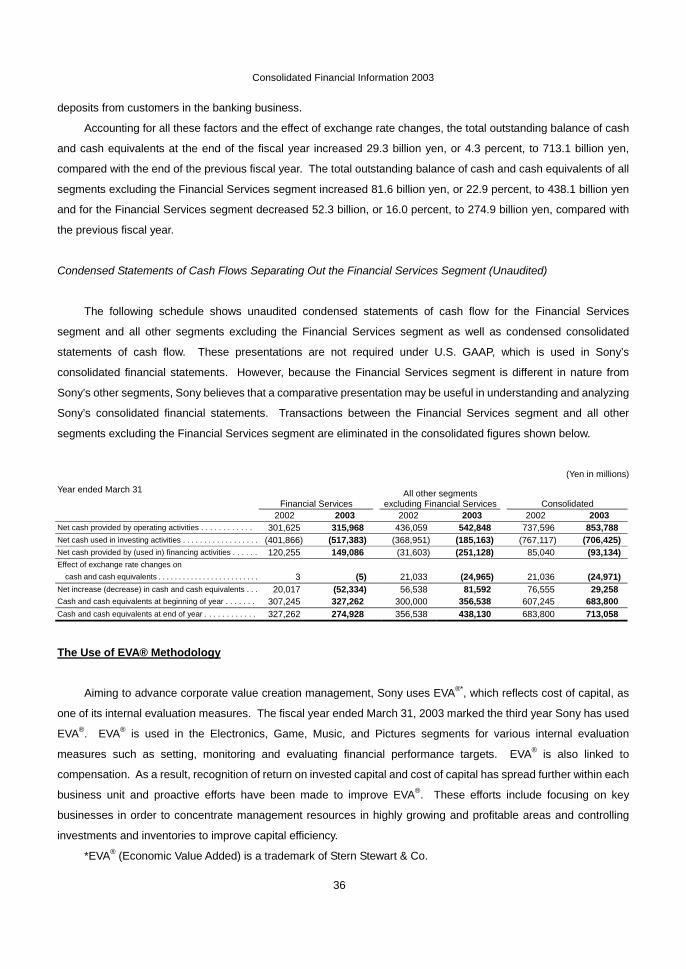
Consolidated Financial Information 2003
36
deposits from customers in the banking business.
Accounting for all these factors and the effect of exchange rate changes, the total outstanding balance of cash
and cash equivalents at the end of the fiscal year increased 29.3 billion yen, or 4.3 percent, to 713.1 billion yen,
compared with the end of the previous fiscal year. The total outstanding balance of cash and cash equivalents of all
segments excluding the Financial Services segment increased 81.6 billion yen, or 22.9 percent, to 438.1 billion yen
and for the Financial Services segment decreased 52.3 billion, or 16.0 percent, to 274.9 billion yen, compared with
the previous fiscal year.
Condensed Statements of Cash Flows Separating Out the Financial Services Segment (Unaudited)
The following schedule shows unaudited condensed statements of cash flow for the Financial Services
segment and all other segments excluding the Financial Services segment as well as condensed consolidated
statements of cash flow. These presentations are not required under U.S. GAAP, which is used in Sony’s
consolidated financial statements. However, because the Financial Services segment is different in nature from
Sony’s other segments, Sony believes that a comparative presentation may be useful in understanding and analyzing
Sony’s consolidated financial statements. Transactions between the Financial Services segment and all other
segments excluding the Financial Services segment are eliminated in the consolidated figures shown below.
(Yen in millions) Year ended March 31
Financial Services All other segments
excluding Financial Services Consolidated 2002 2003 2002 2003 2002 2003
Net cash provided by operating activities . . . . . . . . . . . . 301,625 315,968 436,059 542,848 737,596 853,788 Net cash used in investing activities . . . . . . . . . . . . . . . . . . (401,866) (517,383) (368,951) (185,163) (767,117) (706,425) Net cash provided by (used in) financing activities . . . . . . 120,255 149,086 (31,603) (251,128) 85,040 (93,134) Effect of exchange rate changes on
cash and cash equivalents . . . . . . . . . . . . . . . . . . . . . . . . . 3 (5) 21,033 (24,965) 21,036 (24,971) Net increase (decrease) in cash and cash equivalents . . . 20,017 (52,334) 56,538 81,592 76,555 29,258 Cash and cash equivalents at beginning of year . . . . . . . 307,245 327,262 300,000 356,538 607,245 683,800 Cash and cash equivalents at end of year . . . . . . . . . . . . 327,262 274,928 356,538 438,130 683,800 713,058
The Use of EVA® Methodology
Aiming to advance corporate value creation management, Sony uses EVA®*, which reflects cost of capital, as
one of its internal evaluation measures. The fiscal year ended March 31, 2003 marked the third year Sony has used
EVA®. EVA® is used in the Electronics, Game, Music, and Pictures segments for various internal evaluation
measures such as setting, monitoring and evaluating financial performance targets. EVA® is also linked to
compensation. As a result, recognition of return on invested capital and cost of capital has spread further within each
business unit and proactive efforts have been made to improve EVA®. These efforts include focusing on key
businesses in order to concentrate management resources in highly growing and profitable areas and controlling
investments and inventories to improve capital efficiency.
*EVA® (Economic Value Added) is a trademark of Stern Stewart & Co.
Consolidated Financial Information 2003
37
Research and Development
Recognizing that research and development are indispensable for business growth, Sony actively pursues
various technical themes, including technologies that support current services and those that will create new markets.
Themes that require rapid commercialization are handled individually by each business unit; themes that have the
potential for commercialization within two to three years are pursued by the development divisions of network
companies; and strategic future-oriented themes are handled by corporate laboratories under the direct management
of Sony Corporate headquarters. This arrangement increases the ability of Sony to react in a rapid and flexible
manner to changes in the operating environment.
Sony’s thirteen corporate laboratories are listed below:
Content & Applications Laboratory (content related application technology)
Broadband Applications Laboratories (networking related application technology)
Networked CE Development Laboratories (consumer application technology)
Ubiquitous Technology Laboratories (communications and security technology)
Storage Technology Laboratories (storage technology)
Display Technology Laboratories (display technology)
Materials Laboratories (materials and device technology)
Sony Corporate Laboratories Europe (various fields)
A3 Research Center (signal processing technology)
Intelligent Dynamics Laboratory (robotics)
Fusion Domain Laboratory (advanced convergence technology)
Material Science Laboratory (fundamental materials and device technology)
Institute of Environmental Research
In addition, research and development is carried out in close conjunction with two independent research
laboratories: Sony Computer Science Laboratories, Inc. (fundamental research and user interface research) and
Sony-Kihara Research Center, Inc. (three-dimensional computer graphics and image processing technologies).
Research and development expenses for the fiscal year ended March 31, 2003 increased 9.9 billion yen, or 2.3
percent, to 443.1 billion yen, compared with the previous fiscal year. The ratio of research and development
expenses to sales (excluding the Financial Services segment) increased from 6.1 percent to 6.4 percent. The bulk of
research and development expenses were incurred in the Electronics and Game segments; expenses in the
Electronics segment decreased 3.1 billion yen, or 0.8 percent, to 380.3 billion yen, and expenses in the Game
segment increased 13.2 billion yen, or 27.4 percent, to 61.5 billion yen. In the Electronics segment, approximately 66
percent of expenses were for the development of new product prototypes while the remaining approximately 34
percent were for the development of mid- to long-term new technologies in such areas as semiconductors,
Consolidated Financial Information 2003
38
communications, and displays. Research and development expenses in the Game segment increased primarily in
the semiconductor and hardware field.
Employees
As of March 31, 2003, Sony had approximately 161,100 employees, including fixed-term employees, a
decrease of approximately 6,900 from the number as of March 31, 2002. The decrease is attributable to a reduction
of the number of employees, primarily in the Electronics and Music segments.
Dividend Policy
A year-end cash dividend of 12.5 yen per share of Sony Corporation common stock was approved at the
General Meeting of Shareholders, which was held on June 20, 2003. Sony Corporation had already paid 12.5 yen
per share to each shareholder; accordingly the annual cash dividend per share was 25.0 yen.
Sony believes that by continuously increasing corporate value, its shareholders can be rewarded. Accordingly,
as for retained earnings, Sony plans to utilize them to carry out various investments that are indispensable for
ensuring future growth and strengthening competitiveness.
Trend Information
Strategic Developments and Forecast
This section, including the Forecast of Consolidated Results, contains forward-looking statements about the
possible future performance of Sony and should be read in light of the cautionary statement on that subject, which
appears on the inside front cover page and which applies to this entire document.
The following is a summary of certain recent strategic developments and Sony’s forecast for its fiscal year
ending March 31, 2004.
Management’s Recognition of Issues and Policy Going Forward
Sony’s management endeavors to develop the best possible management strategy given the current operating
environment and information available to it.
Over the last few years, the global business environment in which Sony operates continued to be stagnant,
reflecting the economic slowdown, weak growth in personal consumption and price competition.
In the Electronics segment, which holds a very strong position in the worldwide consumer AV products market,
price competition has increased further across a wide range of products including CRT televisions and DVD players
which have been commoditized, as well as products previously considered to have comparatively high added value,
such as video cameras. To respond to this changing environment, in addition to reducing manufacturing costs and
Consolidated Financial Information 2003
39
supplying more attractive new products to the consumer, Sony’s goal is to increase its competitive edge by
strengthening the in-house production of semiconductors and other devices to raise the added value of its products.
In the television business and home video business, demand for new products including flat panel displays, such as
plasma and LCD displays, and demand for DVD recorders is currently increasing rapidly, and Sony is expanding its
product line-up to meet this increase in demand.
In the Game segment, PlayStation 2 holds an exceptionally high share of the global game console market, and
Sony believes that the PlayStation 2 business is still in the harvest stage. Going forward, Sony will invest heavily in
semiconductors for next-generation computer entertainment systems.
In the Music segment, slow worldwide economic growth and the effects of digital piracy and other illegal
duplication have led to industry-wide difficulties. In addition to the reduction of fixed costs through the acceleration of
restructuring initiatives, Sony is also developing new business models to generate profits through the digital
distribution of content.
In the Pictures segment, Sony plans to continue to maximize global motion picture revenues through its strategy
of distributing a diversified portfolio of motion pictures. The expanding DVD home entertainment market is becoming
a more significant source of revenues and profits, both for current releases and for library product. Additionally, to
differentiate itself in the marketplace and to pro-actively address risks of digital piracy, Sony Pictures Digital is
developing broadband network strategies to facilitate the integration between Sony’s hardware and content products
and create protected revenue-generating alternatives.
In the Financial Services segment, Sony Life has recorded satisfactory growth due to an increase in
insurance-in-force, and will continue to provide new products and services to meet the individual needs and
preferences of customers.
In 2006, Sony will celebrate its 60th anniversary. In the next three years leading up to this landmark date, Sony
will invest a total of 1.3 trillion yen in the following initiatives as it establishes a new profit model and accelerates its
transformation into a knowledge- and capital-intensive company.
1) Sony will strengthen its semiconductor business with investments of approximately 500 billion yen over the next
three years. The investments will drive the development and manufacture of key devices such as imaging devices,
a market for which Sony foresees significant growth, and semiconductors, which make use of the latest process
technology, to help form the foundation of its competitive strength in the broadband network era.
2) Sony will increase investment in research and development to enhance the competitiveness of products and will
create a new laboratory to further stimulate content distribution. Investment in the development of mid- to
long-term new technologies over the next three years will total 500 billion yen (excludes expenses for the
development of new product prototypes).
3) In order to transform Sony into a more profitable company, over the next three years Sony expects to incur
approximately 300 billion yen in restructuring costs for a variety of initiatives, including the further pursuit of
Consolidated Financial Information 2003
40
downsizing and withdrawal from selected businesses and the continued implementation of fixed cost reductions.
In addition, Sony will continue to strengthen its potential for growth, competitiveness, and earnings capacity in the
middle to long term through strategic alliances and other endeavors.
Recent Strategic Developments and Business Alliances
In an environment of rapidly advancing technology, Sony is engaging in alliances with other companies to quickly
and efficiently expand its business given limited resources.
Sony believes that its future growth is dependent upon the creation of a new market which combines the latest
content (including game, video and music) over an integrated platform that builds upon advanced devices in the
Electronics segment and leading-edge semiconductor technology adopted by the Game segment.
In the area of semiconductors and devices, in April 2003, Sony Computer Entertainment Inc. (“SCEI”) and Sony
Corporation announced that together they will invest a total of approximately 200 billion yen during the next three
fiscal years, beginning with the fiscal year ending March 31, 2004. This amount includes 73 billion yen to be invested
during the fiscal year ending March 31, 2004 for the installation of a semiconductor fabrication line to build chips with
65 nanometer line width on 300 mm wafers. With this investment, SCEI will be able to manufacture a new
microprocessor for the broadband era, as well as other system LSIs for the broadband era, which will be used in a
next generation computer entertainment system. This investment serves an important role in developing future
broadband network businesses, not only for SCEI, but also for Sony as a whole. Since the spring of 2001, SCEI has
been engaged, together with IBM Corporation and Toshiba Corporation, in the development of new microprocessors
for the broadband era. Since the spring of 2002, Sony Corporation has participated in this three-company alliance for
the development of advanced semiconductor process technologies. Research and development of digital signal
processing technologies for broadband applications are also underway. By means of this investment, SCEI and Sony
Corporation aim to effectively conduct test production and to quickly establish a mass production system with a 65
nanometer embedded DRAM process.
Regarding the convergence of Electronics and Game, in May 2003, Sony announced plans to sell PSX, the first
commercial product in which Electronics and Game converge. Combining DVD and hard disk drive recorders, PSX
will spawn a completely new product category. PSX will be based on the operating system and semiconductors used
in PlayStation 2, will have a television and broadcast satellite tuner inside, and will be compatible with PlayStation and
PlayStation 2 games. Recording and playback of television programs is just one of its many functions. Users can
also view still and moving images from digital still and video cameras as well as enjoy music CDs and video games.
The unit accepts a variety of home-use disc-based media as well as the Memory Stick, and it can be linked to an
Ethernet network. PSX is slated to go on sale in Japan late in 2003 and in Europe and the U.S. in 2004. Inside PSX
is technology from the Game and Electronics segments. PlayStation 2 technology includes the EmotionEngine and
Graphics Synthesizer semiconductors as well as PlayStation 2’s operating system. Our Electronics segment is the
source of the semiconductor laser, recordable DVD drive, codec (data compression and decompression) technology
and many other sophisticated technologies at the heart of PSX.
Consolidated Financial Information 2003
41
Also, SCEI plans to introduce a new, all-in-one portable entertainment platform, PSP, which utilizes a newly
developed small optical disc, scheduling a release for the third quarter ending December 31, 2004. The foundation of
this new platform is the Universal Media Disc (UMD), which is comprised of a 60mm optical disc (1.8 GB) in a
cartridge developed by Sony utilizing its latest disc technologies. Compared to the mask ROM cartridge, the optical
disc has significant advantages such as shorter turn around time for manufacturing, larger data capacity and lower
media costs. The latest copy-protection technology will be applied to offer content developers and publishers a safe
and copy-protected environment.
To establish business models which combine hardware with networks, in November 2002, Sony Corporation of
America, a subsidiary of Sony Corporation, together with other investors, executed a definitive agreement to acquire
all of the outstanding common stock of InterTrust for approximately 453 million U.S. dollars. In January 2003, the
acquisition of InterTrust by Sony Corporation of America, Koninklijke Philips Electronics N.V. of Holland, and another
investor was successfully completed. InterTrust is a leading holder of intellectual property in digital rights
management. This transaction fits with Sony’s network strategy which is to enable wide access to secure digital
content through networks.
In order to further expand its music catalogue, in August 2002, SMEI’s joint venture publishing company
Sony/ATV Music Publishing LLC purchased from Gaylord Entertainment Company the music publishing catalogue
and real estate of Acuff-Rose, a music publishing business, for 157 million U.S. dollars in cash.
Forecast of Consolidated Results
Factors which may affect Sony’s financial performance include the following: market conditions, including
general economic conditions, in major areas where Sony conducts its businesses, levels of consumer spending,
foreign exchange fluctuations, Sony’s ability to continue to design, develop, manufacture, sell, and win acceptance of
its products and services, Sony’s ability to continue to implement personnel reduction and other business
reorganization activities, Sony’s ability to implement its network strategy, and implement successful sales and
distribution strategies in the light of the Internet and other technological developments, Sony’s ability to devote
sufficient resources to research and development, Sony’s ability to prioritize capital expenditures, and the success of
Sony’s joint ventures and alliances. Risks and uncertainties also include the impact of any future events with material
unforeseen impacts.
Regarding the forecast of consolidated results for the fiscal year ending March 31, 2004, Sony expects the
uncertain economic environment to continue in this fiscal year, with personal consumption declining and price
competition intensifying. As a result, Sony’s consolidated sales, operating income, income before income taxes, and
net income are expected to decrease compared with the fiscal year ended March 31, 2003. This forecast assumes
that the yen for the fiscal year ending March 31, 2004 will strengthen against the U.S. dollar and will weaken against
the euro, in each case compared with the fiscal year ended March 31, 2003.
In response to this uncertain environment, Sony has decided to implement a restructuring program, primarily in
the Electronics segment, which will be even more aggressive than the one it implemented in the fiscal year just ended.
Consolidated Financial Information 2003
42
As a result, Sony expects to record restructuring charges of approximately 140 billion yen across the Sony Group,
which will result in a decrease in consolidated operating income. One of the reasons for the expected decrease in
income before income taxes is the gain of 66.5 billion yen recorded in the fiscal year ended March 31, 2003, due to
the sale of Sony’s equity interest in Telemundo.
Electronics
Although sales from plasma televisions, LCD televisions, digital still cameras, personal digital assistants, CCDs,
and other products are expected to increase, Sony expects segment sales to decrease because an increase in the
percentage of PlayStation 2 hardware production outsourced to third parties will result in a decrease in intersegment
sales to the Game segment and the net effect of foreign exchange rates is likely to negatively impact results.
Operating income is also expected to decrease due to increased restructuring expenses.
Game
Although strong sales of software for the PlayStation 2 will continue, Sony expects segment sales to decrease.
Sony has set a cautious forecast of 20 million units for PlayStation 2 hardware production shipments due to concern
that the global economy will contract, and Sony expects PS one units to decrease year on year. Regarding operating
income, although growth in PlayStation 2 software sales and other factors will positively influence profitability, the
effect of the aforementioned decrease in sales, combined with the start, in earnest, of investments in next-generation
computer entertainment systems (including research and development expenses), leads Sony to anticipate a drop in
operating income.
Music
Sony expects sales to decrease due to the expected continued contraction in the music industry and a reduction
in the unit price of DVDs in the manufacturing division. However, a decrease in restructuring expenses, the benefits
of restructuring activities already carried out, and a decrease in talent-related expenses are projected to return the
segment to profitability.
Pictures
Sony forecasts that sales and operating income will decrease compared with the fiscal year ended March 31,
2003 because record sales and operating income were recorded in the fiscal year ended March 31, 2003 due to the
success of box office hits such as Spider-Man.
Consolidated Financial Information 2003
43
Financial Services
Although increased revenue is anticipated in the life and automobile insurance businesses, due to the planned
expansion of these businesses, increased expenses, such as expenses resulting from the planned expansion of
Sony Finance International Inc.’s credit card business and other factors, are expected to lead to a decrease in
operating income.
Capital Expenditures
Sony will strengthen its semiconductor business with investments of approximately 500 billion yen over the next
three years. Over the next three years Sony is planning to invest approximately 200 billion yen of this 500 billion yen
in semiconductor production facilities for next-generation broadband processors, of which approximately 73 billion
yen is expected to be invested in the fiscal year ending March 31, 2004. Across the Sony Group, Sony expects
capital expenditures for the fiscal year ending March 31, 2004 to amount to approximately 350 billion yen.
Depreciation Expenses
In the fiscal year ending March 31, 2004, expenses for depreciation and amortization, which includes the
amortization of intangible assets and the amortization of deferred insurance acquisition costs, are expected to be
approximately 390 billion yen, an increase of 38.0 billion yen, or 11 percent. This is because expenses for the
amortization of deferred insurance acquisition costs in the Financial Services segment are expected to increase
although expenses for depreciation and amortization are expected to be flat in the Electronics segment.
Research and Development
Sony expects research and development expenses (total of expenses for the development of new product
prototypes and expenses for the development of mid- to long-term new technologies) for the fiscal year ending March
31, 2004 to increase slightly compared with the fiscal year ended March 31, 2003. In the Electronics segment, Sony
anticipates research and development expenses to center around the introduction of new products and
communications technology, next generation displays, optical and magnetic storage media and semiconductor
technology. In the Game segment, the main expenses are expected to be for the development of semiconductor
technology, the development of software for the PlayStation 2, and research and development for next-generation
computer entertainment systems. Sony expects that investment in development of mid- to long-term new
technologies over the next three years will total 500 billion yen (excluding expenses for the development of new
product prototypes).
Consolidated Financial Information 2003
44
Critical Accounting Policies
The preparation of the consolidated financial statements in conformity with U.S. GAAP requires management to
make estimates and assumptions that affect the reported amounts of assets and liabilities, disclosure of contingent
assets and liabilities at the date of the financial statements and the reported amounts of revenues and expenses
during the reporting period. On an ongoing basis, Sony evaluates its estimates which are based on historical
experience and on various other assumptions that are believed to be reasonable under the circumstances. The
results of these evaluations form the basis for making judgments about the carrying values of assets and liabilities
and the reported amounts of expenses that are not readily apparent from other sources. Actual results may differ
from these estimates under different assumptions. Sony believes that the following represent critical accounting
policies of the company that require significant management judgments and estimates.
Impairment of long-lived assets
Sony reviews the carrying value of its long-lived assets held and used and long-lived assets to be disposed of
whenever events or changes in circumstances indicate that the carrying value of the assets may not be recoverable.
This review is performed using estimates of future cash flows by product category (e.g. 15 inch computer display
CRT) or entity (e.g. semiconductor manufacturing division in the U.S.). If the carrying value of the asset is considered
impaired, an impairment charge is recorded for the amount by which the carrying value of the asset exceeds its fair
value. Fair value is determined using the present value of estimated net cash flows or comparable market values.
Management believes that the estimates of future cash flows and fair value are reasonable; however, changes in
estimates resulting in lower future cash flows and fair value due to unforeseen changes in business assumptions
such as a drastic decline of demand for computer display CRTs due to a change in the tastes of consumers could
negatively affect the valuations of those long-lived assets.
In the year ended March 31, 2003, Sony recorded impairment charges for long-lived assets totaling 12.4 billion
yen. It included 8.1 billion yen for the impairment of semiconductor and computer display CRT manufacturing
equipment to be abandoned or sold in connection with certain Electronics restructuring activities. It also included 2.7
billion yen for the impairment of a CD manufacturing facility in the U.S., of which the fair value was estimated by using
such methods as a survey of the local real estate market.
Goodwill and other intangible assets
Goodwill and other intangible assets that are determined to have an indefinite life are not amortized and are
tested for impairment in accordance with FAS No. 142 on an annual basis and between annual tests if an event
occurs or circumstances change that would more likely than not reduce the fair value of these assets below their
carrying value. Such an event would include unfavorable variances from established business plans or significant
changes in forecasted results, which are periodically reviewed by management. Specifically, goodwill impairment is
determined using a two-step process. The first step of the goodwill impairment test is used to identify potential
Consolidated Financial Information 2003
45
impairment by comparing the fair value of a reporting unit (generally, Sony’s operating segments) with its carrying
amount, including goodwill. If the fair value of a reporting unit exceeds its carrying amount, goodwill of the reporting
unit is considered not impaired and the second step of the impairment test is unnecessary. If the carrying amount of
a reporting unit exceeds its fair value, the second step of the goodwill impairment test is performed to measure the
amount of impairment loss, if any. The second step of the goodwill impairment test compares the implied fair value of
the reporting unit’s goodwill with the carrying amount of that goodwill. If the carrying amount of the reporting unit’s
goodwill exceeds the implied fair value of that goodwill, an impairment loss is recognized in an amount equal to that
excess. The implied fair value of goodwill is determined in the same manner as the amount of goodwill recognized in
a business combination. That is, the fair value of the reporting unit is allocated to all of the assets and liabilities of that
unit (including any unrecognized intangible assets) as if the reporting unit had been acquired in a business
combination and the fair value of the reporting unit was the purchase price paid to acquire the reporting unit. The
impairment test for other intangible assets consists of a comparison of the fair value of the intangible asset with its
carrying value. If the carrying value of the intangible asset exceeds its fair value, an impairment loss is recognized in
an amount equal to that excess.
Determining the fair value of a reporting unit under the first step of the goodwill impairment test and determining
the fair value of individual assets and liabilities of a reporting unit (including unrecognized intangible assets) under the
second step of the goodwill impairment test is judgmental in nature and often involves the use of significant estimates
and assumptions. Similarly, estimates and assumptions are used in determining the fair value of other intangible
assets. These estimates and assumptions could have a significant impact on whether or not an impairment charge is
recognized and also the magnitude of any such charge. In its impairment review, Sony performs internal valuation
analyses and considers other market information that is publicly available. Estimates of fair value are primarily
determined using discounted cash flows. This approach uses significant estimates and assumptions including
projected future cash flows, timing of such cash flows, discount rates reflecting the risk inherent in future cash flows,
perpetual growth rates, determination of appropriate market comparables and the determination of whether a
premium or discount should be applied to comparables. Since the adoption of FAS No. 142, Sony has performed
internal valuation analyses on an annual basis and no material impairment loss has been recognized. Management
believes that the estimates of future cash flows and fair value are reasonable; however, changes in estimates
resulting in lower future cash flows and fair value due to unforeseen changes in business assumptions could
negatively affect the valuations, which may result in Sony recognizing the impairment of goodwill and other intangible
assets in the future. As of March 31, 2003, a 10% decrease in the fair value of each of Sony’s reporting units would
not have resulted in a material impairment charge.
Investments
Sony’s investments are comprised of debt and equity securities accounted for under both the cost and equity
method of accounting. If it has been determined that an investment has sustained an other-than-temporary decline in
its value, the investment is written down to its fair value by a charge to earnings. Sony regularly evaluates its
Consolidated Financial Information 2003
46
investment portfolio to identify other-than-temporary impairments of individual securities. Factors that are considered
by Sony in determining whether an other-than-temporary decline in value has occurred include: the length of time and
extent to which the market value of the security has been less than its original cost, the financial condition, operating
results, business plans and estimated future cash flows of the issuer of the security, other specific factors affecting
the market value, deterioration of credit condition of the issuers, sovereign risk, and ability to retain the investment for
a period of time sufficient to allow for the anticipated recovery in market value.
In evaluating the factors for available-for-sale securities whose fair values are readily determinable,
management presumes a decline in value to be other-than-temporary if the fair value of the security is 20 percent or
more below its original cost for an extended period of time (generally a period of up to six to twelve months). This
criteria is employed as a threshold to identify securities which may have a decline in value that is
other-than-temporary. The presumption of an other-than-temporary impairment in such cases may be overcome if
there is evidence to support that the decline is temporary in nature due to the existence of other factors which
overcome the duration or magnitude of the decline. On the other hand, there may be cases where impairment losses
are recognized when the decline in the fair value of the security is not more than 20 percent or such decline has not
existed for an extended period of time, as a result of considering specific factors which may indicate the decline in the
fair value is other-than-temporary.
The assessment of whether a decline in the value of an invest is other-than-temporary is often judgmental in
nature and involves certain assumptions and estimates concerning the expected operating results, business plans
and future cash flows of the issuer of the security. Accordingly, it is possible that investments in Sony’s portfolio that
have had a decline in value that the Company currently believes to be temporary may determine to be
other-than-temporary in the future based on the Company’s evaluation of additional information such as continued
poor operating results, future broad declines in value of worldwide equity markets or circumstances in worldwide
interest rate fluctuations. As a result, unrealized losses recorded for investments may be recognized into income in
future periods.
Pension benefits costs
Employee pension benefit costs and obligations are dependent on certain assumptions including discount rates,
retirement rates and mortality rates, which are based upon current statistical data, as well as expected long-term rate
of return on plan assets and other factors. Specifically, the discount rate and expected long-term rate of return on
assets are two critical assumptions in the determination of periodic pension costs and pension liabilities.
Assumptions are evaluated at least annually, and events may occur or circumstances change which may have a
significant effect on critical assumptions. In accordance with U.S. GAAP, actual results that differ from the
assumptions are accumulated and amortized over future periods. Therefore, actual results generally affect
recognized expenses and the recorded obligations for pensions in future periods. While management believes that
the assumptions used are appropriate, differences in actual experience or changes in assumptions may affect Sony’s
pension obligations and future expense.
Sony’s principal pension plans are its Japanese pension plans. Foreign pension plans are not significant
Consolidated Financial Information 2003
47
individually with total assets and pension obligation amounting to less than 10% of those of the Japanese plans.
Sony used a discount rate of 1.9% for its Japanese pension plan as of March 31, 2003. The discount rate was
determined by using available information about rates of return on high-quality fixed-income investments currently
available and expected to be available during the period to maturity of the pension benefit. The 1.9% discount rate
represents a 50 basis point reduction from the 2.4% discount rate used for the fiscal year ended March 31, 2002 and
reflects market interest rate conditions. For Japanese plans, a 50 basis point decrease in the discount rate would
increase pension expenses by approximately 12.0 billion yen, compared to the year ended March 31, 2003.
To determine the expected long-term rate of return on pension plan assets, Sony considers the current and
expected asset allocations, as well as historical and expected long-term rate of returns on various categories of plan
assets. For Japanese pension plans, the expected long-term rate of return on pension plan assets was 4.0% as of
March 31, 2002 and March 31, 2003. The actual return on pension plan assets for the year ending March 31, 2003
was a negative return of 14.6%. Consistent with U.S. GAAP, actual results that differ from the expected return on
plan assets are accumulated and amortized as a component of pension expense over the average future service
period, thereby reducing the year-to-year volatility in pension expense. At March 31, 2002 and 2003, Sony had
unrecognized actuarial losses of 325.6 billion yen and 513.0 billion yen, respectively, including losses related to plan
assets. The unrecognized actuarial losses reflect the unfavorable performance of equity markets over the past two
years and will result in an increase in pension expense as they are recognized.
Sony recorded a liability for the unfunded accumulated benefit obligation for Japanese pension plans of 148.0
billion yen and 308.7 billion yen as of March 31, 2002 and 2003, respectively. This liability represents the excess of
the accumulated benefit obligation under Sony’s qualified defined benefit pension plans over the fair value of the
plans’ assets. In accordance with U.S. GAAP, this liability was established by a charge to stockholders’ equity,
resulting in no impact to the accompanying consolidated statement of income.
The following table illustrates the sensitivity to a change in the discount rate and the expected return on pension
plan assets, while holding all other assumptions constant, for Japanese pension plans as of March 31, 2003:
Pre-Tax Pension Equity
Change in Assumption PBO Expense (Net of Tax)
(Yen in billions) --------------------------------------------------------------------------------------------------------
25 basis point increase / decrease in discount rate -/+ 50.0 -/+ 6.0 +/- 3.1 25 basis point increase / decrease in expected - -/+ 1.0 +/- 0.6 return on assets
Future insurance policy benefits
Long-term liabilities for future policy benefits are established in amounts adequate to meet the estimated future
obligations of policies in force. These liabilities are computed by the net level premium method based upon estimates
Consolidated Financial Information 2003
48
as to future investment yield, mortality, morbidity, withdrawals and other factors. Future policy benefits are computed
using interest rates ranging from approximately 1.00% to 5.50%. Mortality, morbidity and withdrawal assumptions for
all policies are based on either the life insurance subsidiary’s own experience or various actuarial tables. Generally
these assumptions are “locked-in” upon the issuance of new insurance. While management believes that the
assumptions used are appropriate, differences in actual experience or changes in assumptions may affect Sony’s
future insurance policy benefits.
Tax asset valuation
In establishing the appropriate valuation reserve for tax loss carry-forwards, all available evidence, both positive
and negative, is considered. Information on historical results is supplemented by all currently available information
on future years, as realization of tax loss carry-forwards is dependent on each company or tax filing unit generating
sufficient taxable income prior to expiration of the loss carryforwards. The estimates and assumptions used in
determining future taxable income are consistent with those used in Sony’s approved forecasts of future operations.
Although realization is not assured, management believes it is more likely than not that all of the deferred tax assets,
less valuation allowance, will be realized. The amount of such net deferred tax assets which are considered
realizable, however, could change in the near term if estimates of future taxable income during the carryforward
period are changed. A decrease in the amount of deferred tax assets considered realizable due to a change in the
estimate of future taxable income may result in higher income tax expense in future periods.
Film accounting
An aspect of film accounting that requires the exercise of judgment relates to the process of estimating the total
revenues to be received throughout a film's life cycle. Such estimate of a film's ultimate revenue is important for two
reasons. First, while a film is being produced and the related costs are being capitalized, it is necessary for
management to estimate the ultimate revenue, less additional costs to be incurred, including exploitation costs which
are expensed as incurred, in order to determine whether the value of a film has been impaired and thus requires an
immediate write off of unrecoverable film costs. Second, the amount of film costs recognized as cost of sales for a
given film as it is exhibited in various markets throughout its life cycle is based upon the proportion that current period
actual revenues bear to the estimated ultimate total revenues.
Management bases its estimates of ultimate revenue for each film on several factors including the historical
performance of similar genre films, the star power of the lead actors and actresses, the expected number of theaters
at which the film will be released, anticipated performance in the home entertainment, television and other ancillary
markets, and agreements for future sales. Management updates such estimates based on the actual results to date
of each film. For example, a film that has resulted in lower than expected theatrical revenues in its initial weeks of
release would generally have its theatrical, home video and distribution ultimate revenues adjusted downward; a
failure to do so would result in the understatement of amortized film costs for the period. Since the total film cost to be
amortized for a given film is fixed, the estimate of ultimate revenues impacts only the timing of film cost amortization.
Consolidated Financial Information 2003
49
For a summary of Sony's significant accounting policies, including the critical accounting policies discussed
above, please see Note 2 of Notes to the Consolidated Financial Statements.
Recently Adopted Accounting Standards
Impairment or Disposal of Long-Lived Assets
On April 1, 2002, Sony adopted Statement of Financial Accounting Standards (“FAS”) No. 144, “Accounting for
the Impairment or Disposal of Long-Lived Assets”. FAS No. 144 supersedes FAS No. 121 “Accounting for the
Impairment of Long-Lived Assets and for Long-Lived Assets to be Disposed of” and the accounting and reporting
provisions of Accounting Principles Board Opinion (“APB”) No. 30 “Reporting the results of Operations – Reporting
the Effects of Disposal of a Segment of a Business, and Extraordinary, Unusual and Infrequently Occurring Events
and Transactions” for the disposal of segments of a business. FAS No. 144 addresses financial accounting and
reporting for the impairment or disposal of long-lived assets. FAS No. 144 establishes a single accounting model for
long-lived assets to be disposed of by sale and modifies the accounting and disclosure rules for discontinued
operations. The adoption of the provision of FAS No. 144 did not have a material impact on Sony’s results of
operations and financial position for the year ended March 31, 2003.
Rescission of FASB Statements No. 4, 44 and 64, Amendment of FASB Statement No. 13, and Technical Corrections
In April 2002, the Financial Accounting Standards Board (“FASB”) issued FAS No. 145, “Rescission of FASB
Statements No. 4, 44 and 64, Amendment of FASB Statement No. 13, and Technical Corrections”. This statement
rescinds certain authoritative pronouncements and amends, clarifies or describes the applicability of others, effective
for fiscal years beginning or transactions occurring after May 15, 2002, with early adoption encouraged. Sony elected
early adoption of this statement retroactive to April 1, 2002. The adoption of this statement did not have an impact on
Sony’s results of operations and financial position.
Accounting for Costs Associated with Exit or Disposal Activities
In June 2002, the FASB issued FAS No. 146, “Accounting for Costs Associated with Exit or Disposal Activities”,
which nullifies Emerging Issues Task Force (“EITF”) Issue No. 94-3, “Liability Recognition for Certain Employee
Termination Benefits and Other Costs to Exit an Activity (including Certain Costs Incurred in a Restructuring)”. FAS
No. 146 is effective for exit or disposal activities that are initiated after December 31, 2002. FAS No. 146 addresses
financial accounting and reporting for costs associated with exit or disposal activities. FAS No. 146 requires that a
liability for a cost associated with an exit or disposal activity be recognized and measured initially at fair value only
when the liability is incurred, rather than the date of an entity’s commitment to an exit plan. Sony adopted FAS No.
146 on January 1, 2003. The adoption of this statement did not have a material effect on Sony’s results of operations
and financial position.
Consolidated Financial Information 2003
50
Guarantor’s Accounting and Disclosure Requirements for Guarantees, Including Indirect Guarantees of
Indebtedness of Others
In November 2002, the FASB issued FASB Interpretation (“FIN”) No. 45, “Guarantor’s Accounting and
Disclosure Requirements for Guarantees, Including Indirect Guarantees of Indebtedness of Others, an interpretation
of FASB Statements No. 5, 57, and 107 and rescission of FASB Interpretation No. 34”. The interpretation elaborates
on the existing disclosure requirements for most guarantees. It also clarifies that at the time a company issues a
guarantee, the company must recognize an initial liability for the fair value of the obligations it assumes under the
guarantee. The provisions related to recognizing a liability at inception of the guarantee for the fair value of the
guarantor’s obligations do not apply to product warranties or to guarantees accounted for as derivatives. The initial
recognition and initial measurement provisions of FIN No. 45 are applicable on a prospective basis to guarantees
issued or modified after December 31, 2002. The initial recognition and initial measurement provisions of FIN No. 45
did not have a material effect on Sony’s results of operations and financial position as at and for the fiscal year ended
March 31, 2003. The disclosure provisions, which increase the required disclosure related to guarantees, have been
adopted in the consolidated financial statements.
Accounting for Stock-Based Compensation - Transition and Disclosure
In December 2002, the FASB issued FAS No. 148, ‘‘Accounting for Stock-Based Compensation - Transition and
Disclosure - an Amendment of FASB Statement No. 123’’. FAS No. 148 amends FAS No. 123, ‘‘Accounting for
Stock-Based Compensation’’, to provide alternative methods of transition for a voluntary change to the fair value
based method of accounting for stock-based employee compensation. FAS No. 148 also requires that disclosures of
the pro forma effect of using the fair value method of accounting for stock-based employee compensation be
displayed more prominently and in a tabular format. For Sony, the transition and annual disclosure requirements of
FAS No. 148 are effective for the year ended March 31, 2003. Sony has accounted for its employee stock-based
compensation in accordance with APB No. 25, “Accounting for Stock Issued to Employees” and, therefore, the
adoption of the provisions of FAS No. 148 did not have an impact on Sony’s results of operations and financial
position. Sony has adopted the disclosure-only requirements in accordance with FAS No. 148.
Consolidation of Variable Interest Entities
In January 2003, the FASB issued FIN No. 46, “Consolidation of Variable Interest Entities – an Interpretation of
ARB No. 51”. This interpretation addresses consolidation by a primary beneficiary of a variable interest entity (“VIE”).
FIN No. 46 is effective immediately for all new VIEs created or acquired after January 31, 2003. For VIEs created or
acquired prior to February 1, 2003, the provisions of FIN No. 46 become effective for Sony during the second quarter
of the year ending March 31, 2004. For VIEs acquired prior to February 1, 2003, any difference between the net
amount added to the balance sheet and the amount of any previously recognized interest in the VIE will be
recognized as a cumulative effect of an accounting change.
Consolidated Financial Information 2003
51
Sony continues to evaluate the impact of FIN No. 46 on Sony’s results of operations and financial position.
However, Sony has identified potential VIEs created prior to February 1, 2003, which may be consolidated upon the
adoption of FIN No. 46. If these potential VIEs are consolidated, Sony would record a charge of approximately 1.8
billion yen as a cumulative effect of accounting change and an increase in assets and liabilities of approximately 97.3
billion yen. Refer to Note 23 of Notes to Consolidated Financial Statements and “Other Financing Arrangements” for
further discussion on the VIEs that are used by Sony. Sony did not enter into any new arrangements with VIEs during
the period February 1, 2003 through March 31, 2003.
Recent Pronouncements
Accounting for Asset Retirement Obligations
In June 2001, the FASB issued FAS No. 143, “Accounting for Asset Retirement Obligations”. This statement
addresses financial accounting and reporting for obligations associated with the retirement of tangible long-lived
assets and the associated asset retirement costs. Sony adopted FAS No. 143 on April 1, 2003. The adoption of FAS
No. 143 did not have a material impact on Sony’s results of operations and financial position.
Multiple Element Arrangements
In November 2002, the FASB issued EITF Issue No. 00-21, “Accounting for Revenue Arrangements with Multiple
Deliverables”. EITF Issue No. 00-21 provides guidance on when and how to account for arrangements that involve
the delivery or performance of multiple products, services and/or rights to use assets. The provisions of EITF Issue
No. 00-21 will apply to revenue arrangements entered into in fiscal periods beginning after June 15, 2003. Sony is
currently evaluating the impact of adopting this guidance.
Derivative Instruments and Hedging Activities
In April 2003, the FASB issued FAS No. 149, “Amendment of Statement 133 on Derivative Instruments and
Hedging Activities”. This statement amends and clarifies financial accounting and reporting for derivative instruments,
including derivative instruments embedded in other contracts and for hedging activities under FAS No. 133. Sony is
currently evaluating the impact of adopting this new pronouncement.
Accounting for Certain Financial Instruments with Characteristics of both Liabilities and Equity
In May 2003, the FASB issued FAS No. 150, “Accounting for Certain Financial Instruments with Characteristics
of both Liabilities and Equity”. FAS No. 150 establishes standards for how certain financial instruments with
characteristics of both liabilities and equity shall be classified and measured. This statement is effective for financial
instruments entered into or modified after May 31, 2003, and otherwise is effective at the beginning of the first interim
Consolidated Financial Information 2003
52
period beginning after June 15, 2003. Sony adopted FAS No. 150 during the first quarter of the year ending March
31, 2004. The adoption of FAS No. 150 did not have an impact on Sony’s results of operations and financial position.
August 26, 2003
Teruhisa Tokunaka
Executive Deputy President and Group CSO, Representative Corporate Executive Officer, Director
Takao Yuhara
Senior Vice President and Group CFO, Corporate Executive Officer

Consolidated Financial Information 2003
53
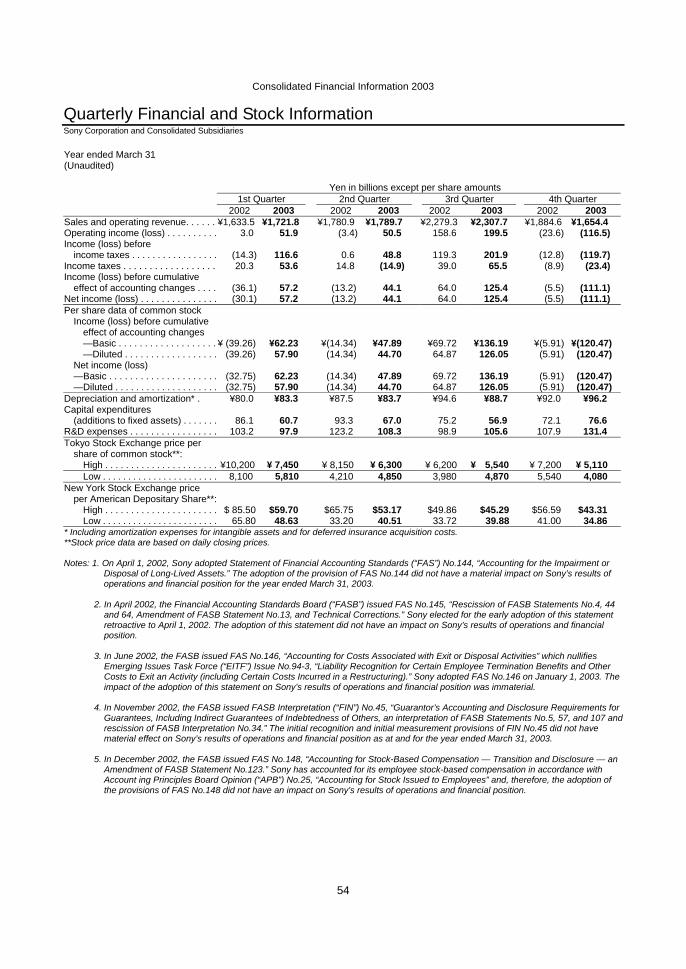
Consolidated Financial Information 2003
54
Quarterly Financial and Stock Information Sony Corporation and Consolidated Subsidiaries Year ended March 31 (Unaudited) Yen in billions except per share amounts 1st Quarter 2nd Quarter 3rd Quarter 4th Quarter 2002 2003 2002 2003 2002 2003 2002 2003 Sales and operating revenue. . . . . . ¥1,633.5 ¥1,721.8 ¥1,780.9 ¥1,789.7 ¥2,279.3 ¥2,307.7 ¥1,884.6 ¥1,654.4 Operating income (loss) . . . . . . . . . . 3.0 51.9 (3.4) 50.5 158.6 199.5 (23.6) (116.5) Income (loss) before
income taxes . . . . . . . . . . . . . . . . . (14.3) 116.6 0.6 48.8 119.3 201.9 (12.8) (119.7) Income taxes . . . . . . . . . . . . . . . . . . 20.3 53.6 14.8 (14.9) 39.0 65.5 (8.9) (23.4) Income (loss) before cumulative
effect of accounting changes . . . . (36.1) 57.2 (13.2) 44.1 64.0 125.4 (5.5) (111.1) Net income (loss) . . . . . . . . . . . . . . . (30.1) 57.2 (13.2) 44.1 64.0 125.4 (5.5) (111.1) Per share data of common stock
Income (loss) before cumulative effect of accounting changes —Basic . . . . . . . . . . . . . . . . . . . ¥ (39.26) ¥62.23 ¥(14.34) ¥47.89 ¥69.72 ¥136.19 ¥(5.91) ¥(120.47) —Diluted . . . . . . . . . . . . . . . . . . (39.26) 57.90 (14.34) 44.70 64.87 126.05 (5.91) (120.47)
Net income (loss) —Basic . . . . . . . . . . . . . . . . . . . . . (32.75) 62.23 (14.34) 47.89 69.72 136.19 (5.91) (120.47) —Diluted . . . . . . . . . . . . . . . . . . . . (32.75) 57.90 (14.34) 44.70 64.87 126.05 (5.91) (120.47)
Depreciation and amortization* . ¥80.0 ¥83.3 ¥87.5 ¥83.7 ¥94.6 ¥88.7 ¥92.0 ¥96.2 Capital expenditures
(additions to fixed assets) . . . . . . . 86.1 60.7 93.3 67.0 75.2 56.9 72.1 76.6 R&D expenses . . . . . . . . . . . . . . . . . 103.2 97.9 123.2 108.3 98.9 105.6 107.9 131.4 Tokyo Stock Exchange price per
share of common stock**: High . . . . . . . . . . . . . . . . . . . . . . ¥10,200 ¥ 7,450 ¥ 8,150 ¥ 6,300 ¥ 6,200 ¥ 5,540 ¥ 7,200 ¥ 5,110 Low . . . . . . . . . . . . . . . . . . . . . . . 8,100 5,810 4,210 4,850 3,980 4,870 5,540 4,080
New York Stock Exchange price per American Depositary Share**:
High . . . . . . . . . . . . . . . . . . . . . . $ 85.50 $59.70 $65.75 $53.17 $49.86 $45.29 $56.59 $43.31 Low . . . . . . . . . . . . . . . . . . . . . . . 65.80 48.63 33.20 40.51 33.72 39.88 41.00 34.86
* Including amortization expenses for intangible assets and for deferred insurance acquisition costs. **Stock price data are based on daily closing prices. Notes: 1. On April 1, 2002, Sony adopted Statement of Financial Accounting Standards (“FAS”) No.144, “Accounting for the Impairment or
Disposal of Long-Lived Assets.” The adoption of the provision of FAS No.144 did not have a material impact on Sony’s results of operations and financial position for the year ended March 31, 2003.
2. In April 2002, the Financial Accounting Standards Board (“FASB”) issued FAS No.145, “Rescission of FASB Statements No.4, 44 and 64, Amendment of FASB Statement No.13, and Technical Corrections.” Sony elected for the early adoption of this statement retroactive to April 1, 2002. The adoption of this statement did not have an impact on Sony’s results of operations and financial position.
3. In June 2002, the FASB issued FAS No.146, “Accounting for Costs Associated with Exit or Disposal Activities” which nullifies Emerging Issues Task Force (“EITF”) Issue No.94-3, “Liability Recognition for Certain Employee Termination Benefits and Other Costs to Exit an Activity (including Certain Costs Incurred in a Restructuring).” Sony adopted FAS No.146 on January 1, 2003. The impact of the adoption of this statement on Sony’s results of operations and financial position was immaterial.
4. In November 2002, the FASB issued FASB Interpretation (“FIN”) No.45, “Guarantor’s Accounting and Disclosure Requirements for Guarantees, Including Indirect Guarantees of Indebtedness of Others, an interpretation of FASB Statements No.5, 57, and 107 and rescission of FASB Interpretation No.34.” The initial recognition and initial measurement provisions of FIN No.45 did not have material effect on Sony’s results of operations and financial position as at and for the year ended March 31, 2003.
5. In December 2002, the FASB issued FAS No.148, “Accounting for Stock-Based Compensation — Transition and Disclosure — an
Amendment of FASB Statement No.123.” Sony has accounted for its employee stock-based compensation in accordance with Account ing Principles Board Opinion (“APB”) No.25, “Accounting for Stock Issued to Employees” and, therefore, the adoption of the provisions of FAS No.148 did not have an impact on Sony’s results of operations and financial position.
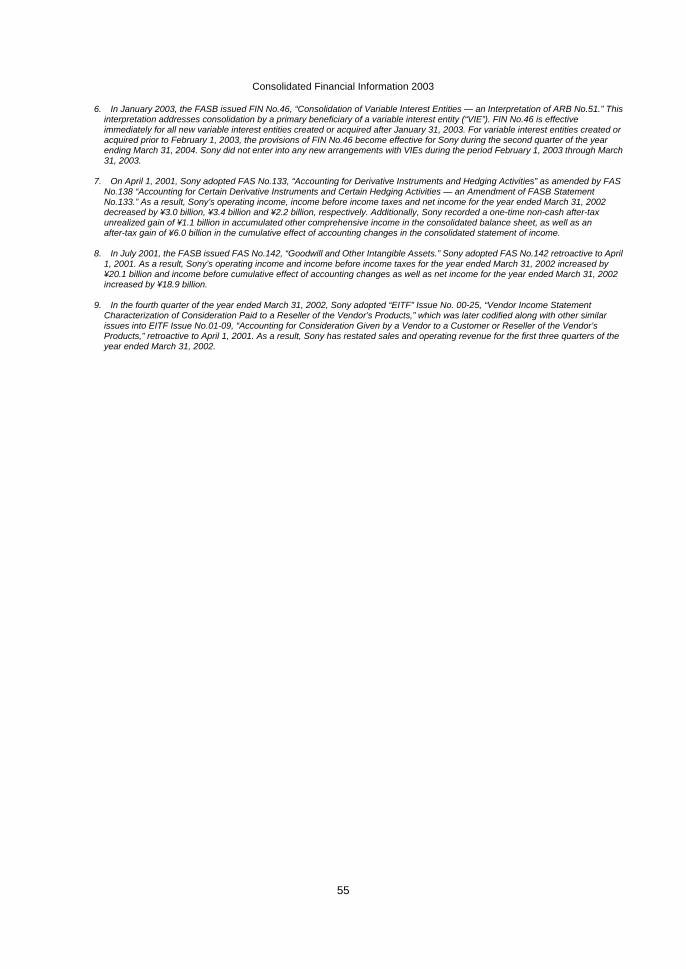
Consolidated Financial Information 2003
55
6. In January 2003, the FASB issued FIN No.46, “Consolidation of Variable Interest Entities — an Interpretation of ARB No.51.” This interpretation addresses consolidation by a primary beneficiary of a variable interest entity (“VIE”). FIN No.46 is effective immediately for all new variable interest entities created or acquired after January 31, 2003. For variable interest entities created or acquired prior to February 1, 2003, the provisions of FIN No.46 become effective for Sony during the second quarter of the year ending March 31, 2004. Sony did not enter into any new arrangements with VIEs during the period February 1, 2003 through March 31, 2003.
7. On April 1, 2001, Sony adopted FAS No.133, “Accounting for Derivative Instruments and Hedging Activities” as amended by FAS
No.138 “Accounting for Certain Derivative Instruments and Certain Hedging Activities — an Amendment of FASB Statement No.133.” As a result, Sony’s operating income, income before income taxes and net income for the year ended March 31, 2002 decreased by ¥3.0 billion, ¥3.4 billion and ¥2.2 billion, respectively. Additionally, Sony recorded a one-time non-cash after-tax unrealized gain of ¥1.1 billion in accumulated other comprehensive income in the consolidated balance sheet, as well as an after-tax gain of ¥6.0 billion in the cumulative effect of accounting changes in the consolidated statement of income.
8. In July 2001, the FASB issued FAS No.142, “Goodwill and Other Intangible Assets.” Sony adopted FAS No.142 retroactive to April
1, 2001. As a result, Sony’s operating income and income before income taxes for the year ended March 31, 2002 increased by ¥20.1 billion and income before cumulative effect of accounting changes as well as net income for the year ended March 31, 2002 increased by ¥18.9 billion.
9. In the fourth quarter of the year ended March 31, 2002, Sony adopted “EITF” Issue No. 00-25, “Vendor Income Statement
Characterization of Consideration Paid to a Reseller of the Vendor’s Products,” which was later codified along with other similar issues into EITF Issue No.01-09, “Accounting for Consideration Given by a Vendor to a Customer or Reseller of the Vendor’s Products,” retroactive to April 1, 2001. As a result, Sony has restated sales and operating revenue for the first three quarters of the year ended March 31, 2002.
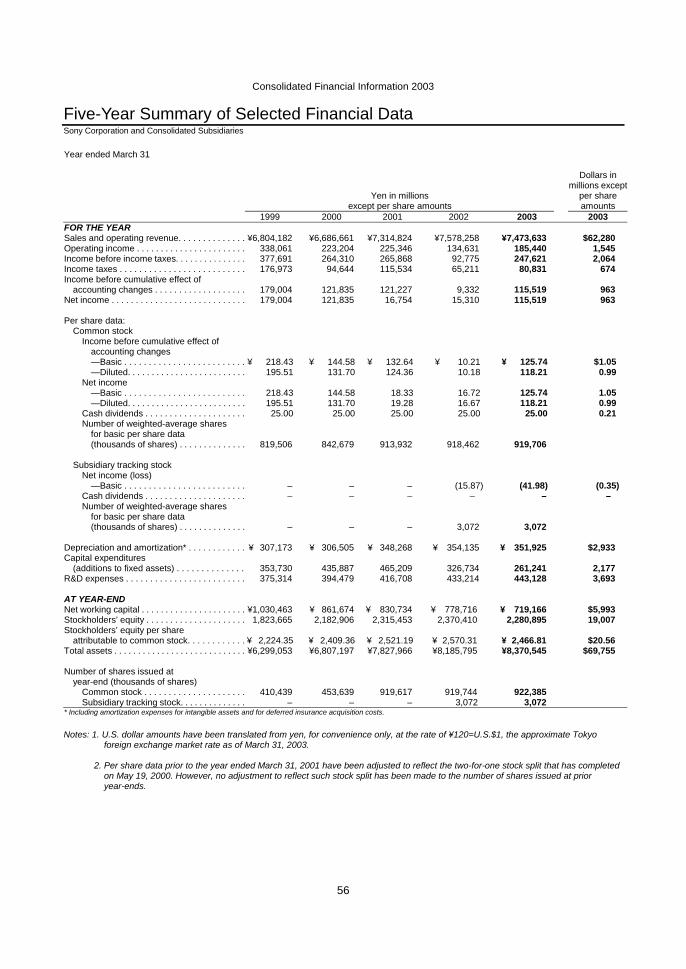
Consolidated Financial Information 2003
56
Five-Year Summary of Selected Financial Data Sony Corporation and Consolidated Subsidiaries Year ended March 31 Dollars in millions except Yen in millions per share except per share amounts amounts 1999 2000 2001 2002 2003 2003 FOR THE YEAR Sales and operating revenue. . . . . . . . . . . . . . ¥6,804,182 ¥6,686,661 ¥7,314,824 ¥7,578,258 ¥7,473,633 $62,280 Operating income . . . . . . . . . . . . . . . . . . . . . . . 338,061 223,204 225,346 134,631 185,440 1,545 Income before income taxes. . . . . . . . . . . . . . . 377,691 264,310 265,868 92,775 247,621 2,064 Income taxes . . . . . . . . . . . . . . . . . . . . . . . . . . 176,973 94,644 115,534 65,211 80,831 674 Income before cumulative effect of
accounting changes . . . . . . . . . . . . . . . . . . . 179,004 121,835 121,227 9,332 115,519 963 Net income . . . . . . . . . . . . . . . . . . . . . . . . . . . . 179,004 121,835 16,754 15,310 115,519 963 Per share data:
Common stock Income before cumulative effect of
accounting changes —Basic . . . . . . . . . . . . . . . . . . . . . . . . . ¥ 218.43 ¥ 144.58 ¥ 132.64 ¥ 10.21 ¥ 125.74 $1.05 —Diluted. . . . . . . . . . . . . . . . . . . . . . . . . 195.51 131.70 124.36 10.18 118.21 0.99
Net income —Basic . . . . . . . . . . . . . . . . . . . . . . . . . 218.43 144.58 18.33 16.72 125.74 1.05 —Diluted. . . . . . . . . . . . . . . . . . . . . . . . . 195.51 131.70 19.28 16.67 118.21 0.99
Cash dividends . . . . . . . . . . . . . . . . . . . . . 25.00 25.00 25.00 25.00 25.00 0.21 Number of weighted-average shares
for basic per share data (thousands of shares) . . . . . . . . . . . . . . 819,506 842,679 913,932 918,462 919,706
Subsidiary tracking stock
Net income (loss) —Basic . . . . . . . . . . . . . . . . . . . . . . . . . – – – (15.87) (41.98) (0.35)
Cash dividends . . . . . . . . . . . . . . . . . . . . . – – – – – – Number of weighted-average shares
for basic per share data (thousands of shares) . . . . . . . . . . . . . . – – – 3,072 3,072
Depreciation and amortization* . . . . . . . . . . . . ¥ 307,173 ¥ 306,505 ¥ 348,268 ¥ 354,135 ¥ 351,925 $2,933 Capital expenditures
(additions to fixed assets) . . . . . . . . . . . . . . 353,730 435,887 465,209 326,734 261,241 2,177 R&D expenses . . . . . . . . . . . . . . . . . . . . . . . . . 375,314 394,479 416,708 433,214 443,128 3,693 AT YEAR-END Net working capital . . . . . . . . . . . . . . . . . . . . . . ¥1,030,463 ¥ 861,674 ¥ 830,734 ¥ 778,716 ¥ 719,166 $5,993 Stockholders’ equity . . . . . . . . . . . . . . . . . . . . . 1,823,665 2,182,906 2,315,453 2,370,410 2,280,895 19,007 Stockholders’ equity per share
attributable to common stock. . . . . . . . . . . . ¥ 2,224.35 ¥ 2,409.36 ¥ 2,521.19 ¥ 2,570.31 ¥ 2,466.81 $20.56 Total assets . . . . . . . . . . . . . . . . . . . . . . . . . . . . ¥6,299,053 ¥6,807,197 ¥7,827,966 ¥8,185,795 ¥8,370,545 $69,755 Number of shares issued at
year-end (thousands of shares) Common stock . . . . . . . . . . . . . . . . . . . . . 410,439 453,639 919,617 919,744 922,385 Subsidiary tracking stock. . . . . . . . . . . . . . – – – 3,072 3,072
* Including amortization expenses for intangible assets and for deferred insurance acquisition costs. Notes: 1. U.S. dollar amounts have been translated from yen, for convenience only, at the rate of ¥120=U.S.$1, the approximate Tokyo
foreign exchange market rate as of March 31, 2003.
2. Per share data prior to the year ended March 31, 2001 have been adjusted to reflect the two-for-one stock split that has completed on May 19, 2000. However, no adjustment to reflect such stock split has been made to the number of shares issued at prior year-ends.
Consolidated Financial Information 2003
57
3. On April 1, 2001, Sony adopted FAS No.133, “Accounting for Derivative Instruments and Hedging Activities” as amended by FAS No.138 “Accounting for Certain Derivative Instruments and Certain Hedging Activities — an Amendment of FASB Statement No.133.” As a result, Sony’s operating income, income before income taxes and net income for the year ended March 31, 2002 decreased by ¥3.0 billion, ¥3.4 billion and ¥2.2 billion, respectively. Additionally, Sony recorded a one-time non-cash after-tax unrealized gain of ¥1.1 billion in accumulated other comprehensive income in the consolidated balance sheet, as well as an after-tax gain of ¥6.0 billion in the cumulative effect of accounting changes in the consolidated statement of income.
4. In July 2001, the FASB issued FAS No. 142, “Goodwill and Other Intangible Assets.” Sony adopted FAS No. 142 retroactive to April
1, 2001. As a result, Sony’s operating income and income before income taxes for the year ended March 31, 2002 increased by ¥20.1 billion and income before cumulative effect of accounting changes as well as net income for the year ended March 31, 2002 increased by ¥18.9 billion.
5. In June 2000, the Accounting Standards Executive Committee of the American Institute of Certified Public Accountants issued
Statement of Position (“SOP”) 00-2, “Accounting by Producers or Distributors of Films.” Sony adopted SOP 00-2 retroactive to April 1, 2000. As a result, Sony’s net income for the year ended March 31, 2001 included a one-time, non-cash charge with no tax effect of ¥101.7 billion, primarily to reduce the carrying value of its film inventory.
6. In December 1999, the Securities and Exchange Commission issued Staff Accounting Bulletin (“SAB”) No. 101, “Revenue
Recognition in Financial Statements.” Sony adopted SAB No.101 in the fourth quarter ended March 31, 2001 retroactive to April 1, 2000. As a result, a one-time no-cash cumulative effect adjustment of ¥2.8 billion was recorded in the income statement directly above the caption of “net income” for a change in accounting principle.
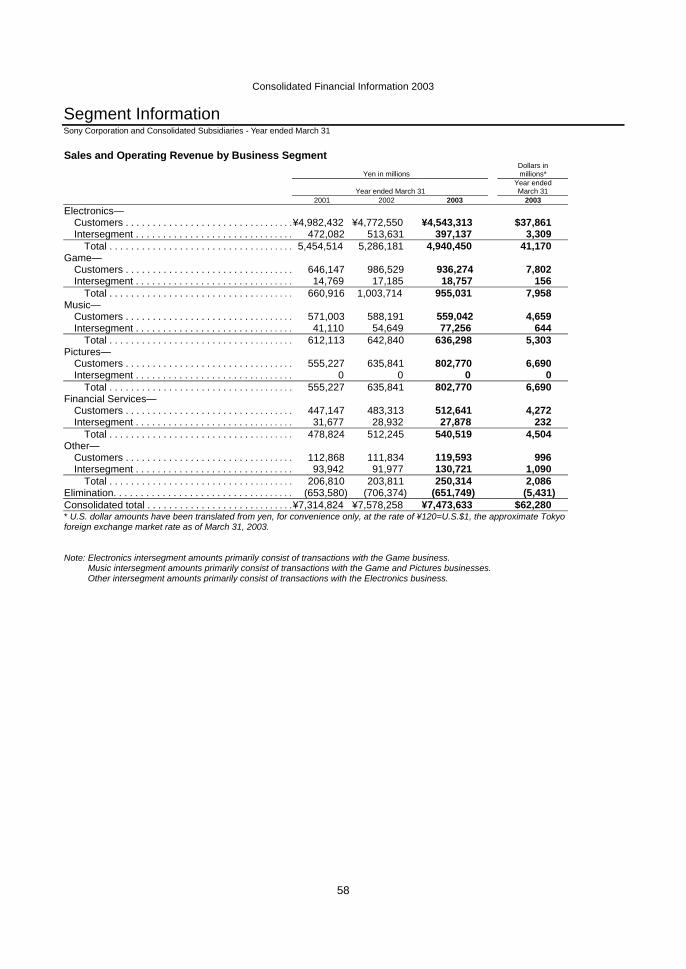
Consolidated Financial Information 2003
58
Segment Information Sony Corporation and Consolidated Subsidiaries - Year ended March 31 Sales and Operating Revenue by Business Segment
Dollars in Yen in millions millions* Year ended Year ended March 31 March 31 2001 2002 2003 2003 Electronics—
Customers . . . . . . . . . . . . . . . . . . . . . . . . . . . . . . . . ¥4,982,432 ¥4,772,550 ¥4,543,313 $37,861 Intersegment . . . . . . . . . . . . . . . . . . . . . . . . . . . . . . 472,082 513,631 397,137 3,309
Total . . . . . . . . . . . . . . . . . . . . . . . . . . . . . . . . . . . 5,454,514 5,286,181 4,940,450 41,170 Game—
Customers . . . . . . . . . . . . . . . . . . . . . . . . . . . . . . . . 646,147 986,529 936,274 7,802 Intersegment . . . . . . . . . . . . . . . . . . . . . . . . . . . . . . 14,769 17,185 18,757 156
Total . . . . . . . . . . . . . . . . . . . . . . . . . . . . . . . . . . . 660,916 1,003,714 955,031 7,958 Music—
Customers . . . . . . . . . . . . . . . . . . . . . . . . . . . . . . . . 571,003 588,191 559,042 4,659 Intersegment . . . . . . . . . . . . . . . . . . . . . . . . . . . . . . 41,110 54,649 77,256 644
Total . . . . . . . . . . . . . . . . . . . . . . . . . . . . . . . . . . . 612,113 642,840 636,298 5,303 Pictures—
Customers . . . . . . . . . . . . . . . . . . . . . . . . . . . . . . . . 555,227 635,841 802,770 6,690 Intersegment . . . . . . . . . . . . . . . . . . . . . . . . . . . . . . 0 0 0 0
Total . . . . . . . . . . . . . . . . . . . . . . . . . . . . . . . . . . . 555,227 635,841 802,770 6,690 Financial Services—
Customers . . . . . . . . . . . . . . . . . . . . . . . . . . . . . . . . 447,147 483,313 512,641 4,272 Intersegment . . . . . . . . . . . . . . . . . . . . . . . . . . . . . . 31,677 28,932 27,878 232
Total . . . . . . . . . . . . . . . . . . . . . . . . . . . . . . . . . . . 478,824 512,245 540,519 4,504 Other—
Customers . . . . . . . . . . . . . . . . . . . . . . . . . . . . . . . . 112,868 111,834 119,593 996 Intersegment . . . . . . . . . . . . . . . . . . . . . . . . . . . . . . 93,942 91,977 130,721 1,090
Total . . . . . . . . . . . . . . . . . . . . . . . . . . . . . . . . . . . 206,810 203,811 250,314 2,086 Elimination. . . . . . . . . . . . . . . . . . . . . . . . . . . . . . . . . . (653,580) (706,374) (651,749) (5,431) Consolidated total . . . . . . . . . . . . . . . . . . . . . . . . . . . . ¥7,314,824 ¥7,578,258 ¥7,473,633 $62,280 * U.S. dollar amounts have been translated from yen, for convenience only, at the rate of ¥120=U.S.$1, the approximate Tokyo foreign exchange market rate as of March 31, 2003. * Note: Electronics intersegment amounts primarily consist of transactions with the Game business. Note: Music intersegment amounts primarily consist of transactions with the Game and Pictures businesses. Note: Other intersegment amounts primarily consist of transactions with the Electronics business.
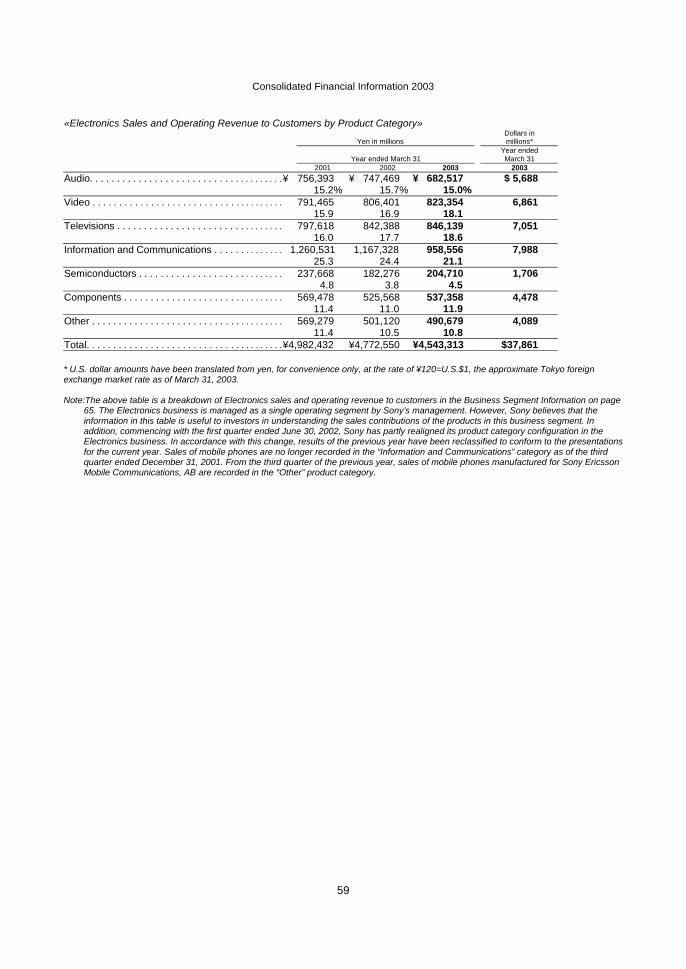
Consolidated Financial Information 2003
59
«Electronics Sales and Operating Revenue to Customers by Product Category» Dollars in Yen in millions millions* Year ended Year ended March 31 March 31 2001 2002 2003 2003 Audio. . . . . . . . . . . . . . . . . . . . . . . . . . . . . . . . . . . . .¥ 756,393 ¥ 747,469 ¥ 682,517 $ 5,688 15.2% 15.7% 15.0%
Video . . . . . . . . . . . . . . . . . . . . . . . . . . . . . . . . . . . . . 791,465 806,401 823,354 6,861 15.9 16.9 18.1
Televisions . . . . . . . . . . . . . . . . . . . . . . . . . . . . . . . . 797,618 842,388 846,139 7,051 16.0 17.7 18.6 Information and Communications . . . . . . . . . . . . . . 1,260,531 1,167,328 958,556 7,988 25.3 24.4 21.1 Semiconductors . . . . . . . . . . . . . . . . . . . . . . . . . . . . 237,668 182,276 204,710 1,706 4.8 3.8 4.5 Components . . . . . . . . . . . . . . . . . . . . . . . . . . . . . . . 569,478 525,568 537,358 4,478 11.4 11.0 11.9 Other . . . . . . . . . . . . . . . . . . . . . . . . . . . . . . . . . . . . . 569,279 501,120 490,679 4,089 11.4 10.5 10.8 Total. . . . . . . . . . . . . . . . . . . . . . . . . . . . . . . . . . . . . .¥4,982,432 ¥4,772,550 ¥4,543,313 $37,861 * U.S. dollar amounts have been translated from yen, for convenience only, at the rate of ¥120=U.S.$1, the approximate Tokyo foreign exchange market rate as of March 31, 2003. Note:The above table is a breakdown of Electronics sales and operating revenue to customers in the Business Segment Information on page
65. The Electronics business is managed as a single operating segment by Sony’s management. However, Sony believes that the information in this table is useful to investors in understanding the sales contributions of the products in this business segment. In addition, commencing with the first quarter ended June 30, 2002, Sony has partly realigned its product category configuration in the Electronics business. In accordance with this change, results of the previous year have been reclassified to conform to the presentations for the current year. Sales of mobile phones are no longer recorded in the “Information and Communications” category as of the third quarter ended December 31, 2001. From the third quarter of the previous year, sales of mobile phones manufactured for Sony Ericsson Mobile Communications, AB are recorded in the “Other” product category.
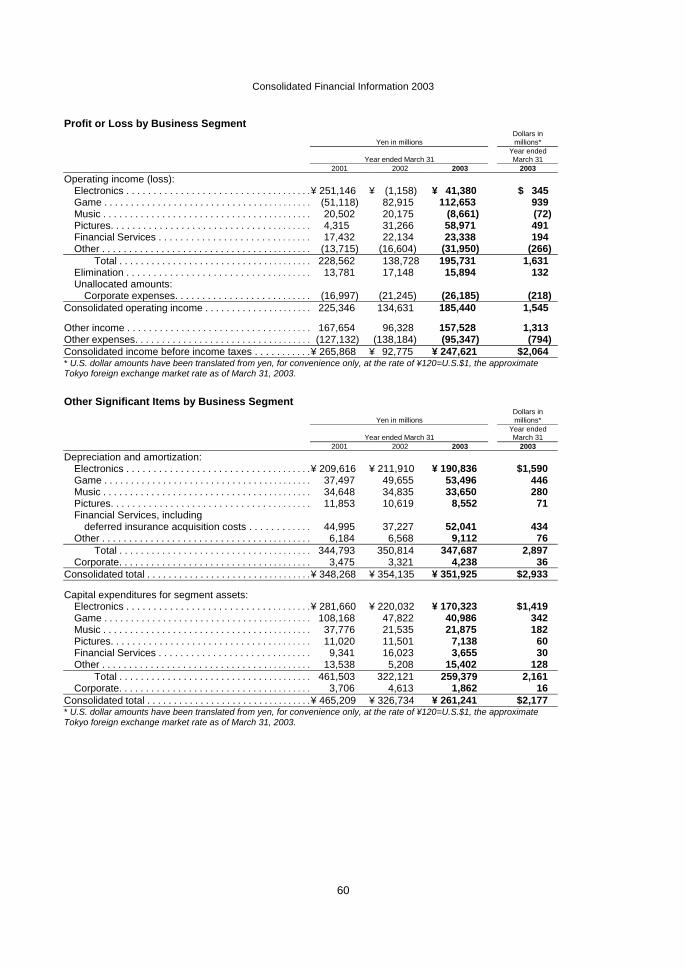
Consolidated Financial Information 2003
60
Profit or Loss by Business Segment
Dollars in Yen in millions millions* Year ended Year ended March 31 March 31 2001 2002 2003 2003 Operating income (loss):
Electronics . . . . . . . . . . . . . . . . . . . . . . . . . . . . . . . . . . .¥ 251,146 ¥ (1,158) ¥ 41,380 $ 345 Game . . . . . . . . . . . . . . . . . . . . . . . . . . . . . . . . . . . . . . . . (51,118) 82,915 112,653 939 Music . . . . . . . . . . . . . . . . . . . . . . . . . . . . . . . . . . . . . . . . 20,502 20,175 (8,661) (72) Pictures. . . . . . . . . . . . . . . . . . . . . . . . . . . . . . . . . . . . . . 4,315 31,266 58,971 491 Financial Services . . . . . . . . . . . . . . . . . . . . . . . . . . . . . 17,432 22,134 23,338 194 Other . . . . . . . . . . . . . . . . . . . . . . . . . . . . . . . . . . . . . . . . (13,715) (16,604) (31,950) (266)
Total . . . . . . . . . . . . . . . . . . . . . . . . . . . . . . . . . . . . . 228,562 138,728 195,731 1,631 Elimination . . . . . . . . . . . . . . . . . . . . . . . . . . . . . . . . . . . 13,781 17,148 15,894 132 Unallocated amounts:
Corporate expenses. . . . . . . . . . . . . . . . . . . . . . . . . . (16,997) (21,245) (26,185) (218) Consolidated operating income . . . . . . . . . . . . . . . . . . . . . 225,346 134,631 185,440 1,545 Other income . . . . . . . . . . . . . . . . . . . . . . . . . . . . . . . . . . . 167,654 96,328 157,528 1,313 Other expenses. . . . . . . . . . . . . . . . . . . . . . . . . . . . . . . . . . (127,132) (138,184) (95,347) (794) Consolidated income before income taxes . . . . . . . . . . .¥ 265,868 ¥ 92,775 ¥ 247,621 $2,064 * U.S. dollar amounts have been translated from yen, for convenience only, at the rate of ¥120=U.S.$1, the approximate Tokyo foreign exchange market rate as of March 31, 2003. Other Significant Items by Business Segment
Dollars in Yen in millions millions* Year ended Year ended March 31 March 31 2001 2002 2003 2003 Depreciation and amortization:
Electronics . . . . . . . . . . . . . . . . . . . . . . . . . . . . . . . . . . .¥ 209,616 ¥ 211,910 ¥ 190,836 $1,590 Game . . . . . . . . . . . . . . . . . . . . . . . . . . . . . . . . . . . . . . . . 37,497 49,655 53,496 446 Music . . . . . . . . . . . . . . . . . . . . . . . . . . . . . . . . . . . . . . . . 34,648 34,835 33,650 280 Pictures. . . . . . . . . . . . . . . . . . . . . . . . . . . . . . . . . . . . . . 11,853 10,619 8,552 71 Financial Services, including
deferred insurance acquisition costs . . . . . . . . . . . . 44,995 37,227 52,041 434 Other . . . . . . . . . . . . . . . . . . . . . . . . . . . . . . . . . . . . . . . . 6,184 6,568 9,112 76
Total . . . . . . . . . . . . . . . . . . . . . . . . . . . . . . . . . . . . . 344,793 350,814 347,687 2,897 Corporate. . . . . . . . . . . . . . . . . . . . . . . . . . . . . . . . . . . . . 3,475 3,321 4,238 36
Consolidated total . . . . . . . . . . . . . . . . . . . . . . . . . . . . . . . .¥ 348,268 ¥ 354,135 ¥ 351,925 $2,933 Capital expenditures for segment assets:
Electronics . . . . . . . . . . . . . . . . . . . . . . . . . . . . . . . . . . .¥ 281,660 ¥ 220,032 ¥ 170,323 $1,419 Game . . . . . . . . . . . . . . . . . . . . . . . . . . . . . . . . . . . . . . . . 108,168 47,822 40,986 342 Music . . . . . . . . . . . . . . . . . . . . . . . . . . . . . . . . . . . . . . . . 37,776 21,535 21,875 182 Pictures. . . . . . . . . . . . . . . . . . . . . . . . . . . . . . . . . . . . . . 11,020 11,501 7,138 60 Financial Services . . . . . . . . . . . . . . . . . . . . . . . . . . . . . 9,341 16,023 3,655 30 Other . . . . . . . . . . . . . . . . . . . . . . . . . . . . . . . . . . . . . . . . 13,538 5,208 15,402 128
Total . . . . . . . . . . . . . . . . . . . . . . . . . . . . . . . . . . . . . 461,503 322,121 259,379 2,161 Corporate. . . . . . . . . . . . . . . . . . . . . . . . . . . . . . . . . . . . . 3,706 4,613 1,862 16
Consolidated total . . . . . . . . . . . . . . . . . . . . . . . . . . . . . . . .¥ 465,209 ¥ 326,734 ¥ 261,241 $2,177 * U.S. dollar amounts have been translated from yen, for convenience only, at the rate of ¥120=U.S.$1, the approximate Tokyo foreign exchange market rate as of March 31, 2003.
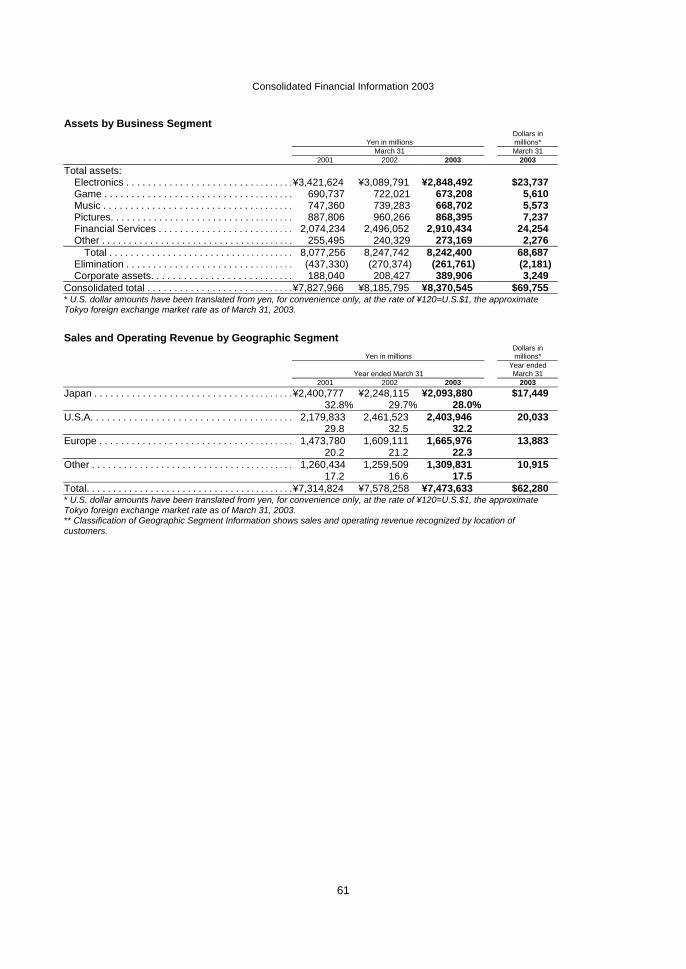
Consolidated Financial Information 2003
61
Assets by Business Segment
Dollars in Yen in millions millions* March 31 March 31 2001 2002 2003 2003 Total assets:
Electronics . . . . . . . . . . . . . . . . . . . . . . . . . . . . . . . . ¥3,421,624 ¥3,089,791 ¥2,848,492 $23,737 Game . . . . . . . . . . . . . . . . . . . . . . . . . . . . . . . . . . . . 690,737 722,021 673,208 5,610 Music . . . . . . . . . . . . . . . . . . . . . . . . . . . . . . . . . . . . 747,360 739,283 668,702 5,573 Pictures. . . . . . . . . . . . . . . . . . . . . . . . . . . . . . . . . . . 887,806 960,266 868,395 7,237 Financial Services . . . . . . . . . . . . . . . . . . . . . . . . . . 2,074,234 2,496,052 2,910,434 24,254 Other . . . . . . . . . . . . . . . . . . . . . . . . . . . . . . . . . . . . . 255,495 240,329 273,169 2,276
Total . . . . . . . . . . . . . . . . . . . . . . . . . . . . . . . . . . . . 8,077,256 8,247,742 8,242,400 68,687 Elimination . . . . . . . . . . . . . . . . . . . . . . . . . . . . . . . . (437,330) (270,374) (261,761) (2,181) Corporate assets. . . . . . . . . . . . . . . . . . . . . . . . . . . 188,040 208,427 389,906 3,249
Consolidated total . . . . . . . . . . . . . . . . . . . . . . . . . . . . ¥7,827,966 ¥8,185,795 ¥8,370,545 $69,755 * U.S. dollar amounts have been translated from yen, for convenience only, at the rate of ¥120=U.S.$1, the approximate Tokyo foreign exchange market rate as of March 31, 2003. Sales and Operating Revenue by Geographic Segment
Dollars in Yen in millions millions* Year ended Year ended March 31 March 31 2001 2002 2003 2003 Japan . . . . . . . . . . . . . . . . . . . . . . . . . . . . . . . . . . . . . . ¥2,400,777 ¥2,248,115 ¥2,093,880 $17,449 32.8% 29.7% 28.0%
U.S.A. . . . . . . . . . . . . . . . . . . . . . . . . . . . . . . . . . . . . . 2,179,833 2,461,523 2,403,946 20,033 29.8 32.5 32.2
Europe . . . . . . . . . . . . . . . . . . . . . . . . . . . . . . . . . . . . . 1,473,780 1,609,111 1,665,976 13,883 20.2 21.2 22.3
Other . . . . . . . . . . . . . . . . . . . . . . . . . . . . . . . . . . . . . . . 1,260,434 1,259,509 1,309,831 10,915 17.2 16.6 17.5
Total. . . . . . . . . . . . . . . . . . . . . . . . . . . . . . . . . . . . . . . .¥7,314,824 ¥7,578,258 ¥7,473,633 $62,280 * U.S. dollar amounts have been translated from yen, for convenience only, at the rate of ¥120=U.S.$1, the approximate Tokyo foreign exchange market rate as of March 31, 2003. ** Classification of Geographic Segment Information shows sales and operating revenue recognized by location of customers.
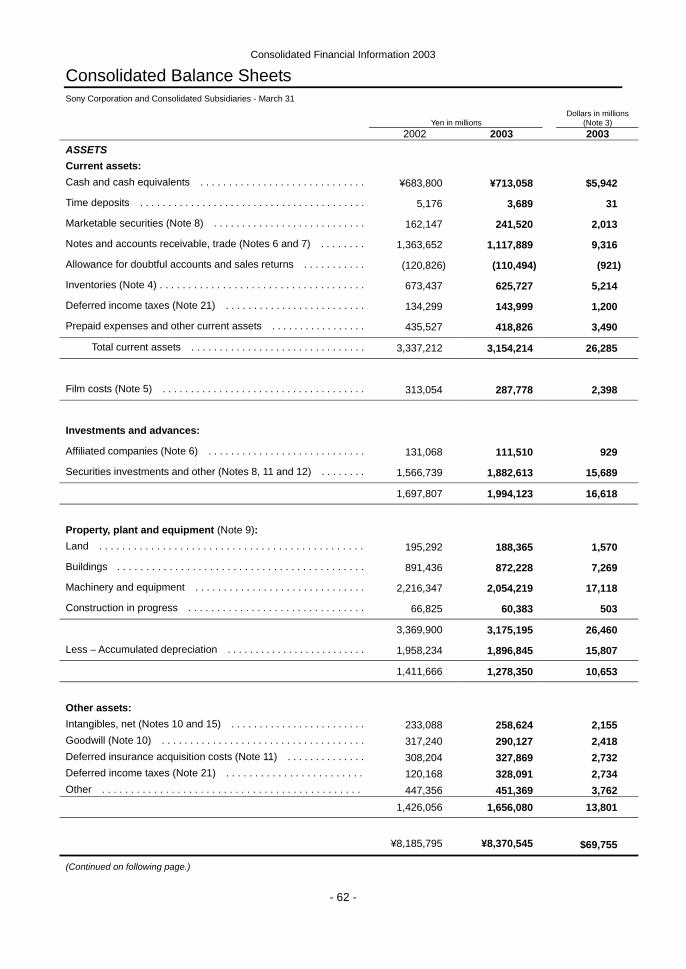
Consolidated Financial Information 2003
- 62 -
Consolidated Balance Sheets Sony Corporation and Consolidated Subsidiaries - March 31
Dollars in millions Yen in millions (Note 3) 2002 2003 2003 ASSETS Current assets: Cash and cash equivalents . . . . . . . . . . . . . . . . . . . . . . . . . . . . . ¥683,800 ¥713,058 $5,942
Time deposits . . . . . . . . . . . . . . . . . . . . . . . . . . . . . . . . . . . . . . . . 5,176 3,689 31
Marketable securities (Note 8) . . . . . . . . . . . . . . . . . . . . . . . . . . . 162,147 241,520 2,013
Notes and accounts receivable, trade (Notes 6 and 7) . . . . . . . . 1,363,652 1,117,889 9,316
Allowance for doubtful accounts and sales returns . . . . . . . . . . . (120,826) (110,494) (921)
Inventories (Note 4) . . . . . . . . . . . . . . . . . . . . . . . . . . . . . . . . . . . . 673,437 625,727 5,214
Deferred income taxes (Note 21) . . . . . . . . . . . . . . . . . . . . . . . . . 134,299 143,999 1,200
Prepaid expenses and other current assets . . . . . . . . . . . . . . . . . 435,527 418,826 3,490
Total current assets . . . . . . . . . . . . . . . . . . . . . . . . . . . . . . . 3,337,212 3,154,214 26,285
Film costs (Note 5) . . . . . . . . . . . . . . . . . . . . . . . . . . . . . . . . . . . . 313,054 287,778 2,398
Investments and advances:
Affiliated companies (Note 6) . . . . . . . . . . . . . . . . . . . . . . . . . . . . 131,068 111,510 929
Securities investments and other (Notes 8, 11 and 12) . . . . . . . . 1,566,739 1,882,613 15,689
1,697,807 1,994,123 16,618
Property, plant and equipment (Note 9): Land . . . . . . . . . . . . . . . . . . . . . . . . . . . . . . . . . . . . . . . . . . . . . . 195,292 188,365 1,570
Buildings . . . . . . . . . . . . . . . . . . . . . . . . . . . . . . . . . . . . . . . . . . . 891,436 872,228 7,269
Machinery and equipment . . . . . . . . . . . . . . . . . . . . . . . . . . . . . . 2,216,347 2,054,219 17,118
Construction in progress . . . . . . . . . . . . . . . . . . . . . . . . . . . . . . . 66,825 60,383 503
3,369,900 3,175,195 26,460
Less – Accumulated depreciation . . . . . . . . . . . . . . . . . . . . . . . . . 1,958,234 1,896,845 15,807
1,411,666 1,278,350 10,653
Other assets: Intangibles, net (Notes 10 and 15) . . . . . . . . . . . . . . . . . . . . . . . . 233,088 258,624 2,155 Goodwill (Note 10) . . . . . . . . . . . . . . . . . . . . . . . . . . . . . . . . . . . . 317,240 290,127 2,418 Deferred insurance acquisition costs (Note 11) . . . . . . . . . . . . . . 308,204 327,869 2,732 Deferred income taxes (Note 21) . . . . . . . . . . . . . . . . . . . . . . . . 120,168 328,091 2,734 Other . . . . . . . . . . . . . . . . . . . . . . . . . . . . . . . . . . . . . . . . . . . . . 447,356 451,369 3,762 1,426,056 1,656,080 13,801
¥8,185,795 ¥8,370,545 $69,755
(Continued on following page.)
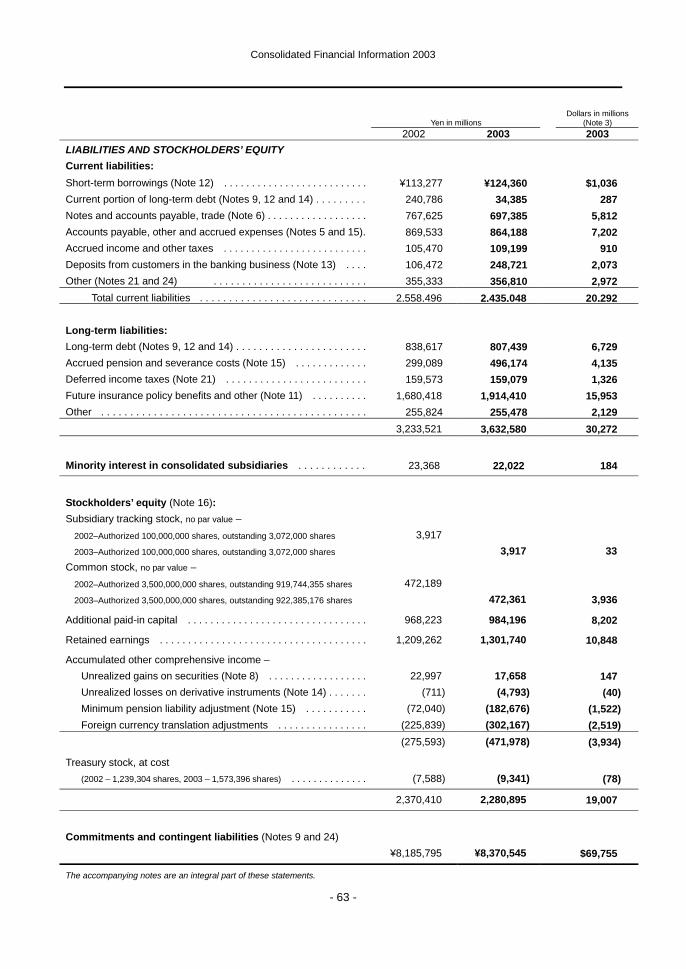
Consolidated Financial Information 2003
- 63 -
Dollars in millions Yen in millions (Note 3) 2002 2003 2003 LIABILITIES AND STOCKHOLDERS’ EQUITY Current liabilities: Short-term borrowings (Note 12) . . . . . . . . . . . . . . . . . . . . . . . . . . ¥113,277 ¥124,360 $1,036 Current portion of long-term debt (Notes 9, 12 and 14) . . . . . . . . . 240,786 34,385 287 Notes and accounts payable, trade (Note 6) . . . . . . . . . . . . . . . . . . 767,625 697,385 5,812 Accounts payable, other and accrued expenses (Notes 5 and 15). 869,533 864,188 7,202 Accrued income and other taxes . . . . . . . . . . . . . . . . . . . . . . . . . . 105,470 109,199 910 Deposits from customers in the banking business (Note 13) . . . . 106,472 248,721 2,073 Other (Notes 21 and 24) . . . . . . . . . . . . . . . . . . . . . . . . . . . 355,333 356,810 2,972 Total current liabilities . . . . . . . . . . . . . . . . . . . . . . . . . . . . . 2,558,496 2,435,048 20,292 Long-term liabilities: Long-term debt (Notes 9, 12 and 14) . . . . . . . . . . . . . . . . . . . . . . . 838,617 807,439 6,729 Accrued pension and severance costs (Note 15) . . . . . . . . . . . . . 299,089 496,174 4,135 Deferred income taxes (Note 21) . . . . . . . . . . . . . . . . . . . . . . . . . 159,573 159,079 1,326 Future insurance policy benefits and other (Note 11) . . . . . . . . . . 1,680,418 1,914,410 15,953 Other . . . . . . . . . . . . . . . . . . . . . . . . . . . . . . . . . . . . . . . . . . . . . . 255,824 255,478 2,129 3,233,521 3,632,580 30,272
Minority interest in consolidated subsidiaries . . . . . . . . . . . . 23,368 22,022 184
Stockholders’ equity (Note 16): Subsidiary tracking stock, no par value –
2002–Authorized 100,000,000 shares, outstanding 3,072,000 shares
2003–Authorized 100,000,000 shares, outstanding 3,072,000 shares
Common stock, no par value –
2002–Authorized 3,500,000,000 shares, outstanding 919,744,355 shares
2003–Authorized 3,500,000,000 shares, outstanding 922,385,176 shares
3,917
472,189
3,917
472,361
33
3,936
Additional paid-in capital . . . . . . . . . . . . . . . . . . . . . . . . . . . . . . . . 968,223 984,196 8,202
Retained earnings . . . . . . . . . . . . . . . . . . . . . . . . . . . . . . . . . . . . . 1,209,262 1,301,740 10,848
Accumulated other comprehensive income – Unrealized gains on securities (Note 8) . . . . . . . . . . . . . . . . . . 22,997 17,658 147
Unrealized losses on derivative instruments (Note 14) . . . . . . . (711) (4,793) (40) Minimum pension liability adjustment (Note 15) . . . . . . . . . . . (72,040) (182,676) (1,522) Foreign currency translation adjustments . . . . . . . . . . . . . . . . (225,839) (302,167) (2,519) (275,593) (471,978) (3,934)
Treasury stock, at cost (2002 – 1,239,304 shares, 2003 – 1,573,396 shares) . . . . . . . . . . . . . . (7,588) (9,341) (78)
2,370,410 2,280,895 19,007
Commitments and contingent liabilities (Notes 9 and 24) ¥8,185,795 ¥8,370,545 $69,755
The accompanying notes are an integral part of these statements.
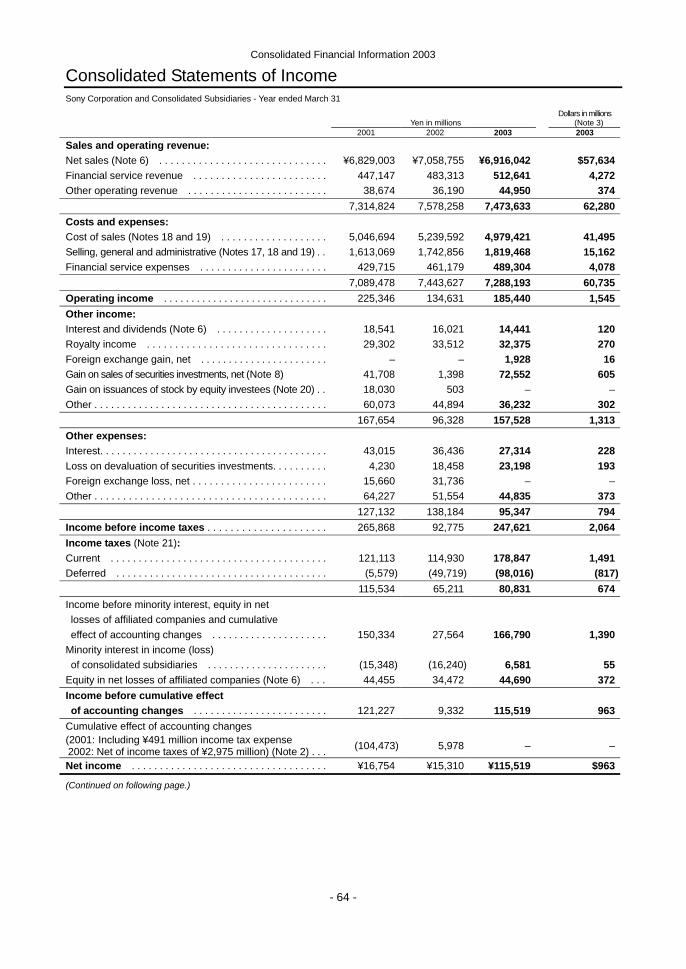
Consolidated Financial Information 2003
- 64 -
Consolidated Statements of Income Sony Corporation and Consolidated Subsidiaries - Year ended March 31
Yen in millions
Dollars in millions (Note 3)
2001 2002 2003 2003 Sales and operating revenue: Net sales (Note 6) . . . . . . . . . . . . . . . . . . . . . . . . . . . . . . ¥6,829,003 ¥7,058,755 ¥6,916,042 $57,634 Financial service revenue . . . . . . . . . . . . . . . . . . . . . . . . 447,147 483,313 512,641 4,272 Other operating revenue . . . . . . . . . . . . . . . . . . . . . . . . . 38,674 36,190 44,950 374 7,314,824 7,578,258 7,473,633 62,280 Costs and expenses: Cost of sales (Notes 18 and 19) . . . . . . . . . . . . . . . . . . . 5,046,694 5,239,592 4,979,421 41,495 Selling, general and administrative (Notes 17, 18 and 19) . . 1,613,069 1,742,856 1,819,468 15,162 Financial service expenses . . . . . . . . . . . . . . . . . . . . . . . 429,715 461,179 489,304 4,078 7,089,478 7,443,627 7,288,193 60,735 Operating income . . . . . . . . . . . . . . . . . . . . . . . . . . . . . . 225,346 134,631 185,440 1,545 Other income: Interest and dividends (Note 6) . . . . . . . . . . . . . . . . . . . . 18,541 16,021 14,441 120 Royalty income . . . . . . . . . . . . . . . . . . . . . . . . . . . . . . . . 29,302 33,512 32,375 270 Foreign exchange gain, net . . . . . . . . . . . . . . . . . . . . . . . – – 1,928 16 Gain on sales of securities investments, net (Note 8) 41,708 1,398 72,552 605 Gain on issuances of stock by equity investees (Note 20) . . 18,030 503 – – Other . . . . . . . . . . . . . . . . . . . . . . . . . . . . . . . . . . . . . . . . . . 60,073 44,894 36,232 302 167,654 96,328 157,528 1,313 Other expenses: Interest. . . . . . . . . . . . . . . . . . . . . . . . . . . . . . . . . . . . . . . . . 43,015 36,436 27,314 228 Loss on devaluation of securities investments. . . . . . . . . . 4,230 18,458 23,198 193 Foreign exchange loss, net . . . . . . . . . . . . . . . . . . . . . . . . 15,660 31,736 – – Other . . . . . . . . . . . . . . . . . . . . . . . . . . . . . . . . . . . . . . . . . 64,227 51,554 44,835 373 127,132 138,184 95,347 794 Income before income taxes . . . . . . . . . . . . . . . . . . . . . 265,868 92,775 247,621 2,064 Income taxes (Note 21): Current . . . . . . . . . . . . . . . . . . . . . . . . . . . . . . . . . . . . . . . 121,113 114,930 178,847 1,491 Deferred . . . . . . . . . . . . . . . . . . . . . . . . . . . . . . . . . . . . . . (5,579) (49,719) (98,016) (817) 115,534 65,211 80,831 674 Income before minority interest, equity in net losses of affiliated companies and cumulative effect of accounting changes . . . . . . . . . . . . . . . . . . . . . 150,334 27,564 166,790 1,390 Minority interest in income (loss) of consolidated subsidiaries . . . . . . . . . . . . . . . . . . . . . . (15,348) (16,240) 6,581 55 Equity in net losses of affiliated companies (Note 6) . . . 44,455 34,472 44,690 372 Income before cumulative effect of accounting changes . . . . . . . . . . . . . . . . . . . . . . . . 121,227 9,332 115,519 963 Cumulative effect of accounting changes (2001: Including ¥491 million income tax expense 2002: Net of income taxes of ¥2,975 million) (Note 2) . . . (104,473) 5,978 – –
Net income . . . . . . . . . . . . . . . . . . . . . . . . . . . . . . . . . . . ¥16,754 ¥15,310 ¥115,519 $963
(Continued on following page.)
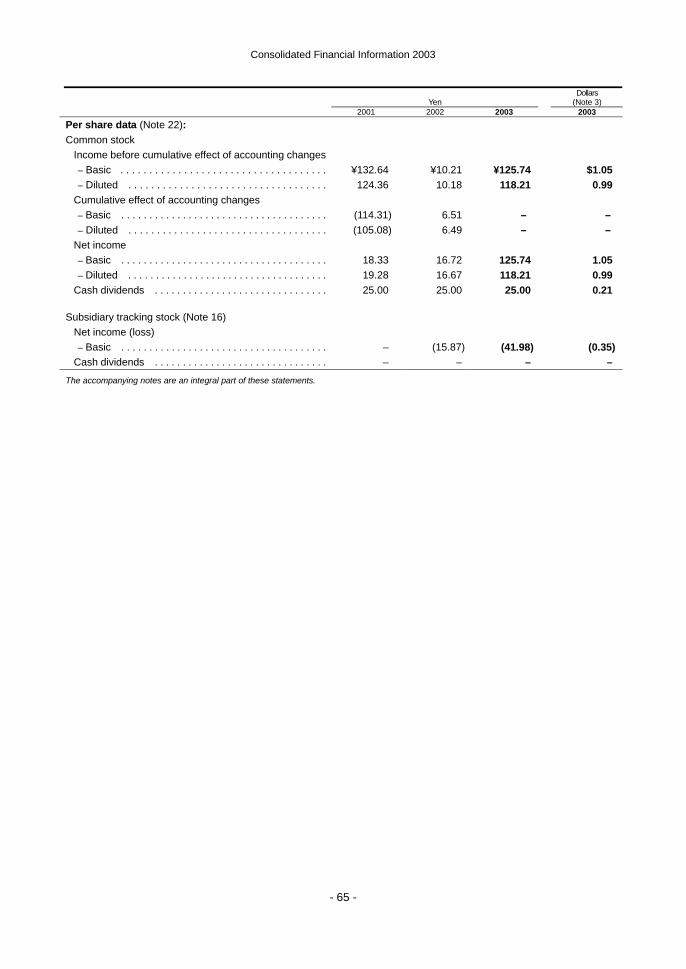
Consolidated Financial Information 2003
- 65 -
Yen
Dollars (Note 3)
2001 2002 2003 2003 Per share data (Note 22): Common stock
Income before cumulative effect of accounting changes – Basic . . . . . . . . . . . . . . . . . . . . . . . . . . . . . . . . . . . . ¥132.64 ¥10.21 ¥125.74 $1.05 – Diluted . . . . . . . . . . . . . . . . . . . . . . . . . . . . . . . . . . . 124.36 10.18 118.21 0.99
Cumulative effect of accounting changes – Basic . . . . . . . . . . . . . . . . . . . . . . . . . . . . . . . . . . . . . (114.31) 6.51 – – – Diluted . . . . . . . . . . . . . . . . . . . . . . . . . . . . . . . . . . . (105.08) 6.49 – –
Net income – Basic . . . . . . . . . . . . . . . . . . . . . . . . . . . . . . . . . . . . . 18.33 16.72 125.74 1.05 – Diluted . . . . . . . . . . . . . . . . . . . . . . . . . . . . . . . . . . . . 19.28 16.67 118.21 0.99
Cash dividends . . . . . . . . . . . . . . . . . . . . . . . . . . . . . . . 25.00 25.00 25.00 0.21 Subsidiary tracking stock (Note 16)
Net income (loss) – Basic . . . . . . . . . . . . . . . . . . . . . . . . . . . . . . . . . . . . . – (15.87) (41.98) (0.35)
Cash dividends . . . . . . . . . . . . . . . . . . . . . . . . . . . . . . . – – – – The accompanying notes are an integral part of these statements.
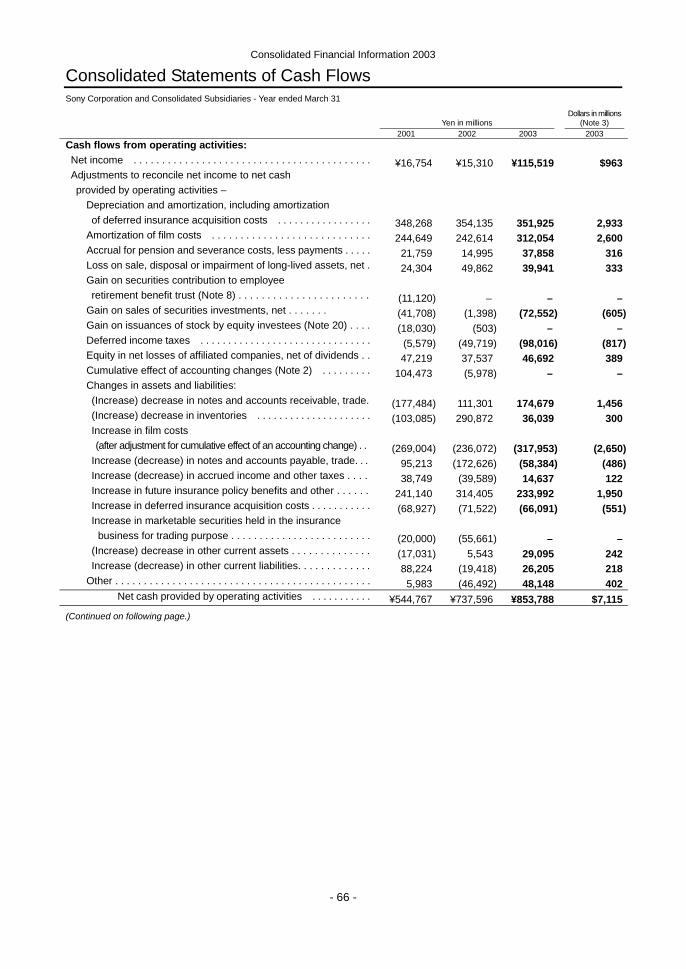
Consolidated Financial Information 2003
- 66 -
Consolidated Statements of Cash Flows Sony Corporation and Consolidated Subsidiaries - Year ended March 31
Dollars in millions Yen in millions (Note 3)
2001 2002 2003 2003 Cash flows from operating activities: Net income . . . . . . . . . . . . . . . . . . . . . . . . . . . . . . . . . . . . . . . . . . ¥16,754 ¥15,310 ¥115,519 $963 Adjustments to reconcile net income to net cash
provided by operating activities – Depreciation and amortization, including amortization
of deferred insurance acquisition costs . . . . . . . . . . . . . . . . . 348,268 354,135 351,925 2,933 Amortization of film costs . . . . . . . . . . . . . . . . . . . . . . . . . . . . 244,649 242,614 312,054 2,600
Accrual for pension and severance costs, less payments . . . . . 21,759 14,995 37,858 316 Loss on sale, disposal or impairment of long-lived assets, net . 24,304 49,862 39,941 333 Gain on securities contribution to employee retirement benefit trust (Note 8) . . . . . . . . . . . . . . . . . . . . . . . (11,120) – – – Gain on sales of securities investments, net . . . . . . . (41,708) (1,398) (72,552) (605) Gain on issuances of stock by equity investees (Note 20) . . . . (18,030) (503) – – Deferred income taxes . . . . . . . . . . . . . . . . . . . . . . . . . . . . . . . (5,579) (49,719) (98,016) (817) Equity in net losses of affiliated companies, net of dividends . . 47,219 37,537 46,692 389 Cumulative effect of accounting changes (Note 2) . . . . . . . . . 104,473 (5,978) – – Changes in assets and liabilities: (Increase) decrease in notes and accounts receivable, trade. (177,484) 111,301 174,679 1,456 (Increase) decrease in inventories . . . . . . . . . . . . . . . . . . . . . (103,085) 290,872 36,039 300 Increase in film costs (after adjustment for cumulative effect of an accounting change) . . (269,004) (236,072) (317,953) (2,650) Increase (decrease) in notes and accounts payable, trade. . . 95,213 (172,626) (58,384) (486) Increase (decrease) in accrued income and other taxes . . . . 38,749 (39,589) 14,637 122 Increase in future insurance policy benefits and other . . . . . . 241,140 314,405 233,992 1,950 Increase in deferred insurance acquisition costs . . . . . . . . . . . (68,927) (71,522) (66,091) (551) Increase in marketable securities held in the insurance
business for trading purpose . . . . . . . . . . . . . . . . . . . . . . . . . (20,000) (55,661) – – (Increase) decrease in other current assets . . . . . . . . . . . . . . (17,031) 5,543 29,095 242 Increase (decrease) in other current liabilities. . . . . . . . . . . . . 88,224 (19,418) 26,205 218 Other . . . . . . . . . . . . . . . . . . . . . . . . . . . . . . . . . . . . . . . . . . . . . 5,983 (46,492) 48,148 402 Net cash provided by operating activities . . . . . . . . . . . ¥544,767 ¥737,596 ¥853,788 $7,115 (Continued on following page.)
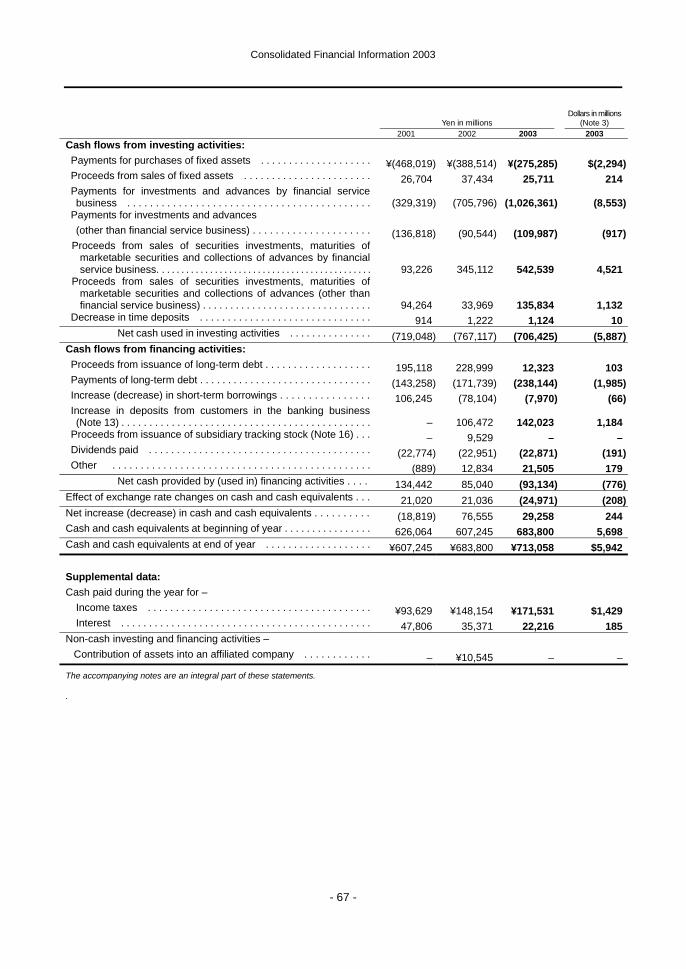
Consolidated Financial Information 2003
- 67 -
Dollars in millions Yen in millions (Note 3)
2001 2002 2003 2003 Cash flows from investing activities: Payments for purchases of fixed assets . . . . . . . . . . . . . . . . . . . . ¥(468,019) ¥(388,514) ¥(275,285) $(2,294) Proceeds from sales of fixed assets . . . . . . . . . . . . . . . . . . . . . . . 26,704 37,434 25,711 214 Payments for investments and advances by financial service
business . . . . . . . . . . . . . . . . . . . . . . . . . . . . . . . . . . . . . . . . . . . (329,319) (705,796) (1,026,361) (8,553) Payments for investments and advances
(other than financial service business) . . . . . . . . . . . . . . . . . . . . . (136,818) (90,544) (109,987) (917) Proceeds from sales of securities investments, maturities of
marketable securities and collections of advances by financial service business. . . . . . . . . . . . . . . . . . . . . . . . . . . . . . . . . . . . . . . . . . . . . 93,226 345,112 542,539 4,521
Proceeds from sales of securities investments, maturities of marketable securities and collections of advances (other than financial service business) . . . . . . . . . . . . . . . . . . . . . . . . . . . . . . . 94,264 33,969 135,834 1,132
Decrease in time deposits . . . . . . . . . . . . . . . . . . . . . . . . . . . . . . . 914 1,222 1,124 10 Net cash used in investing activities . . . . . . . . . . . . . . . (719,048) (767,117) (706,425) (5,887) Cash flows from financing activities: Proceeds from issuance of long-term debt . . . . . . . . . . . . . . . . . . . 195,118 228,999 12,323 103 Payments of long-term debt . . . . . . . . . . . . . . . . . . . . . . . . . . . . . . . (143,258) (171,739) (238,144) (1,985) Increase (decrease) in short-term borrowings . . . . . . . . . . . . . . . . 106,245 (78,104) (7,970) (66) Increase in deposits from customers in the banking business
(Note 13) . . . . . . . . . . . . . . . . . . . . . . . . . . . . . . . . . . . . . . . . . . . . . – 106,472 142,023 1,184 Proceeds from issuance of subsidiary tracking stock (Note 16) . . . – 9,529 – – Dividends paid . . . . . . . . . . . . . . . . . . . . . . . . . . . . . . . . . . . . . . . . (22,774) (22,951) (22,871) (191) Other . . . . . . . . . . . . . . . . . . . . . . . . . . . . . . . . . . . . . . . . . . . . . . (889) 12,834 21,505 179 Net cash provided by (used in) financing activities . . . . 134,442 85,040 (93,134) (776) Effect of exchange rate changes on cash and cash equivalents . . . 21,020 21,036 (24,971) (208) Net increase (decrease) in cash and cash equivalents . . . . . . . . . . (18,819) 76,555 29,258 244 Cash and cash equivalents at beginning of year . . . . . . . . . . . . . . . . 626,064 607,245 683,800 5,698 Cash and cash equivalents at end of year . . . . . . . . . . . . . . . . . . . ¥607,245 ¥683,800 ¥713,058 $5,942 Supplemental data: Cash paid during the year for –
Income taxes . . . . . . . . . . . . . . . . . . . . . . . . . . . . . . . . . . . . . . . . ¥93,629 ¥148,154 ¥171,531 $1,429 Interest . . . . . . . . . . . . . . . . . . . . . . . . . . . . . . . . . . . . . . . . . . . . . 47,806 35,371 22,216 185 Non-cash investing and financing activities –
Contribution of assets into an affiliated company . . . . . . . . . . . . – ¥10,545 – –
The accompanying notes are an integral part of these statements.
.
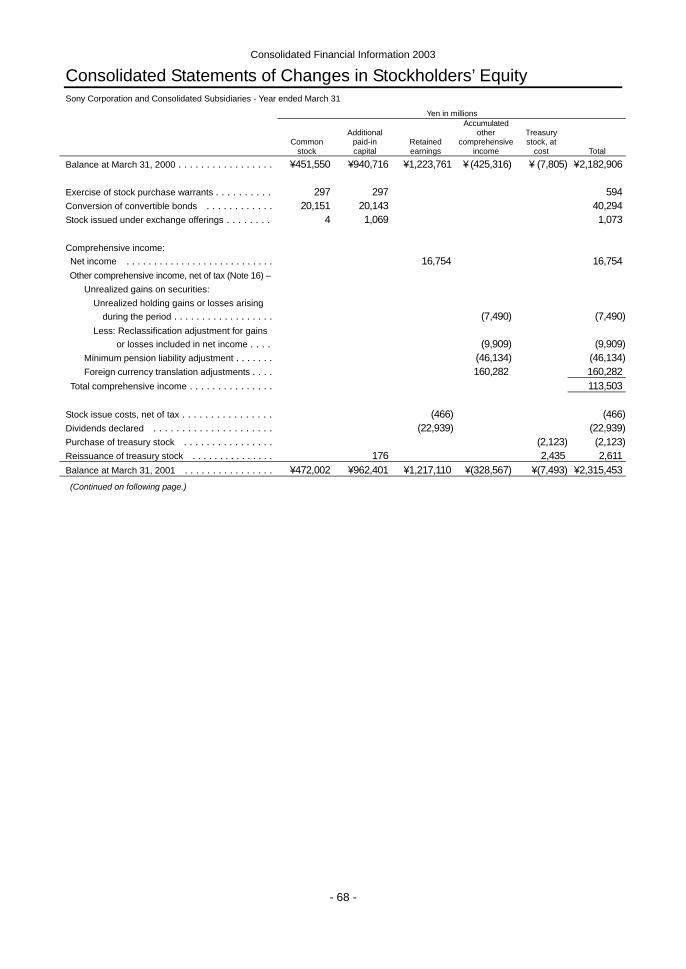
Consolidated Financial Information 2003
- 68 -
Consolidated Statements of Changes in Stockholders’ Equity Sony Corporation and Consolidated Subsidiaries - Year ended March 31
Yen in millions Accumulated Additional other Treasury Common paid-in Retained comprehensive stock, at stock capital earnings income cost Total
Balance at March 31, 2000 . . . . . . . . . . . . . . . . . ¥451,550 ¥940,716 ¥1,223,761 ¥ (425,316) ¥ (7,805) ¥ 2,182,906 Exercise of stock purchase warrants . . . . . . . . . . 297 297 594 Conversion of convertible bonds . . . . . . . . . . . . 20,151 20,143 40,294 Stock issued under exchange offerings . . . . . . . . 4 1,069 1,073 Comprehensive income: Net income . . . . . . . . . . . . . . . . . . . . . . . . . . . 16,754 16,754 Other comprehensive income, net of tax (Note 16) – Unrealized gains on securities: Unrealized holding gains or losses arising during the period . . . . . . . . . . . . . . . . . . (7,490) (7,490) Less: Reclassification adjustment for gains or losses included in net income . . . . (9,909) (9,909) Minimum pension liability adjustment . . . . . . . (46,134) (46,134) Foreign currency translation adjustments . . . . 160,282 160,282 Total comprehensive income . . . . . . . . . . . . . . . 113,503 Stock issue costs, net of tax . . . . . . . . . . . . . . . . (466) (466) Dividends declared . . . . . . . . . . . . . . . . . . . . . (22,939) (22,939) Purchase of treasury stock . . . . . . . . . . . . . . . . (2,123) (2,123) Reissuance of treasury stock . . . . . . . . . . . . . . . 176 2,435 2,611 Balance at March 31, 2001 . . . . . . . . . . . . . . . . ¥472,002 ¥962,401 ¥1,217,110 ¥(328,567) ¥(7,493) ¥2,315,453 (Continued on following page.)
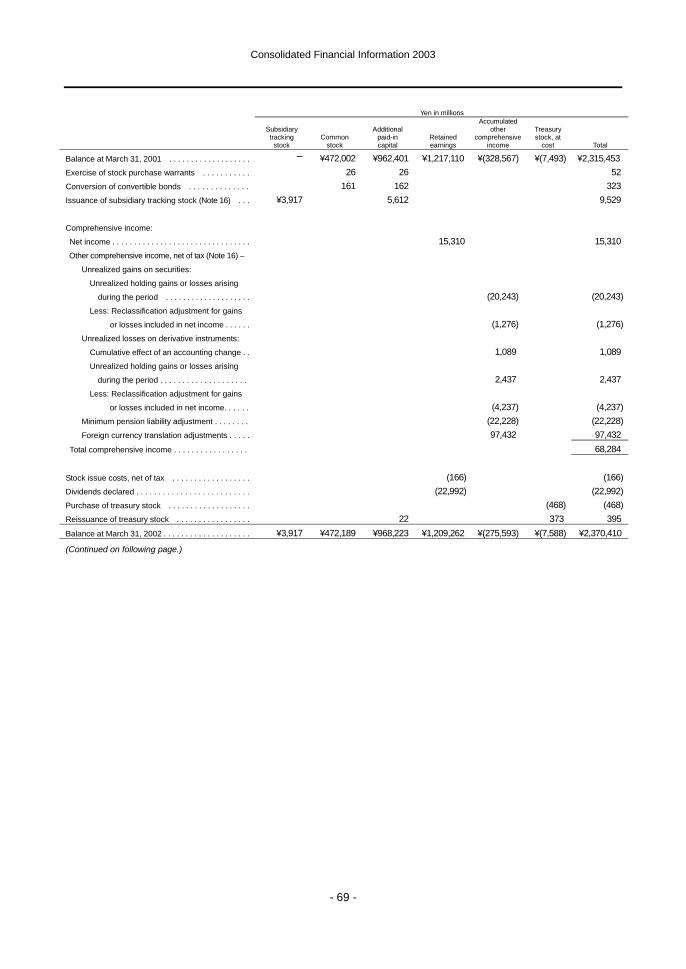
Consolidated Financial Information 2003
- 69 -
Yen in millions Accumulated Subsidiary Additional other Treasury tracking Common paid-in Retained comprehensive stock, at stock stock capital earnings income cost Total
Balance at March 31, 2001 . . . . . . . . . . . . . . . . . . . – ¥472,002 ¥962,401 ¥1,217,110 ¥(328,567) ¥(7,493) ¥2,315,453 Exercise of stock purchase warrants . . . . . . . . . . . 26 26 52 Conversion of convertible bonds . . . . . . . . . . . . . . 161 162 323 Issuance of subsidiary tracking stock (Note 16) . . . ¥3,917 5,612 9,529 Comprehensive income: Net income . . . . . . . . . . . . . . . . . . . . . . . . . . . . . . . . 15,310 15,310 Other comprehensive income, net of tax (Note 16) –
Unrealized gains on securities:
Unrealized holding gains or losses arising
during the period . . . . . . . . . . . . . . . . . . . . (20,243) (20,243) Less: Reclassification adjustment for gains
or losses included in net income . . . . . . (1,276) (1,276) Unrealized losses on derivative instruments:
Cumulative effect of an accounting change . . 1,089 1,089 Unrealized holding gains or losses arising
during the period . . . . . . . . . . . . . . . . . . . . 2,437 2,437 Less: Reclassification adjustment for gains
or losses included in net income. . . . . . (4,237) (4,237) Minimum pension liability adjustment . . . . . . . . (22,228) (22,228) Foreign currency translation adjustments . . . . . 97,432 97,432 Total comprehensive income . . . . . . . . . . . . . . . . . 68,284 Stock issue costs, net of tax . . . . . . . . . . . . . . . . . . (166) (166) Dividends declared . . . . . . . . . . . . . . . . . . . . . . . . . . (22,992) (22,992) Purchase of treasury stock . . . . . . . . . . . . . . . . . . . (468) (468) Reissuance of treasury stock . . . . . . . . . . . . . . . . . 22 373 395 Balance at March 31, 2002 . . . . . . . . . . . . . . . . . . . . ¥3,917 ¥472,189 ¥968,223 ¥1,209,262 ¥(275,593) ¥(7,588) ¥2,370,410
(Continued on following page.)
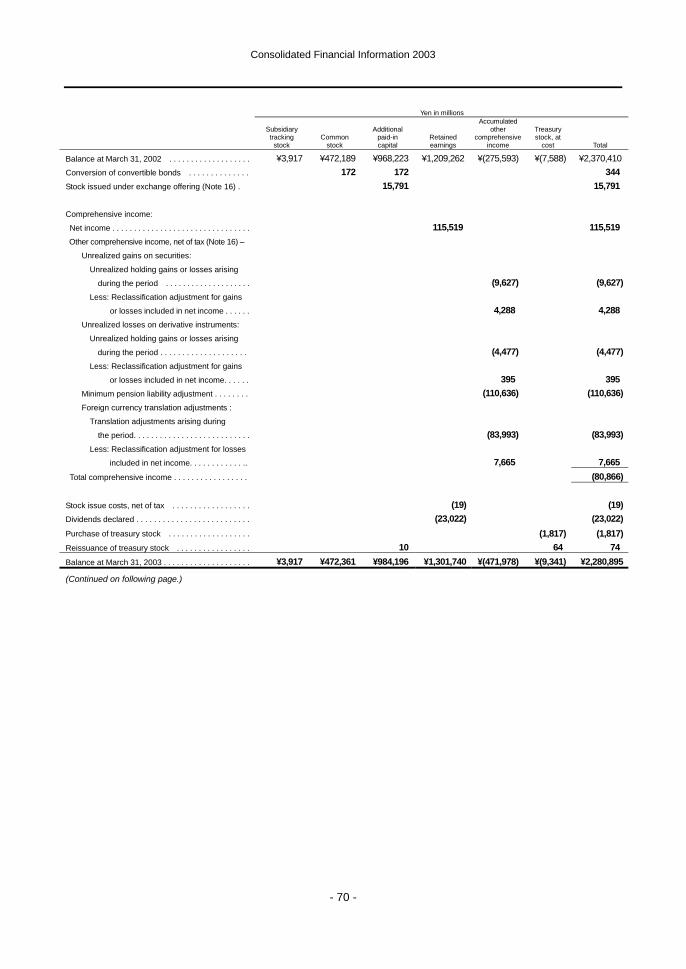
Consolidated Financial Information 2003
- 70 -
Yen in millions Accumulated Subsidiary Additional other Treasury tracking Common paid-in Retained comprehensive stock, at stock stock capital earnings income cost Total
Balance at March 31, 2002 . . . . . . . . . . . . . . . . . . . ¥3,917 ¥472,189 ¥968,223 ¥1,209,262 ¥(275,593) ¥(7,588) ¥2,370,410 Conversion of convertible bonds . . . . . . . . . . . . . . 172 172 344 Stock issued under exchange offering (Note 16) . 15,791 15,791 Comprehensive income: Net income . . . . . . . . . . . . . . . . . . . . . . . . . . . . . . . . 115,519 115,519 Other comprehensive income, net of tax (Note 16) –
Unrealized gains on securities:
Unrealized holding gains or losses arising
during the period . . . . . . . . . . . . . . . . . . . . (9,627) (9,627) Less: Reclassification adjustment for gains
or losses included in net income . . . . . . 4,288 4,288 Unrealized losses on derivative instruments:
Unrealized holding gains or losses arising
during the period . . . . . . . . . . . . . . . . . . . . (4,477) (4,477) Less: Reclassification adjustment for gains
or losses included in net income. . . . . . 395 395 Minimum pension liability adjustment . . . . . . . . (110,636) (110,636) Foreign currency translation adjustments :
Translation adjustments arising during the period. . . . . . . . . . . . . . . . . . . . . . . . . . . (83,993) (83,993)
Less: Reclassification adjustment for losses included in net income. . . . . . . . . . . . .. 7,665 7,665 Total comprehensive income . . . . . . . . . . . . . . . . . (80,866) Stock issue costs, net of tax . . . . . . . . . . . . . . . . . . (19) (19) Dividends declared . . . . . . . . . . . . . . . . . . . . . . . . . . (23,022) (23,022) Purchase of treasury stock . . . . . . . . . . . . . . . . . . . (1,817) (1,817) Reissuance of treasury stock . . . . . . . . . . . . . . . . . 10 64 74
Balance at March 31, 2003 . . . . . . . . . . . . . . . . . . . . ¥3,917 ¥472,361 ¥984,196 ¥1,301,740 ¥(471,978) ¥(9,341) ¥2,280,895
(Continued on following page.)
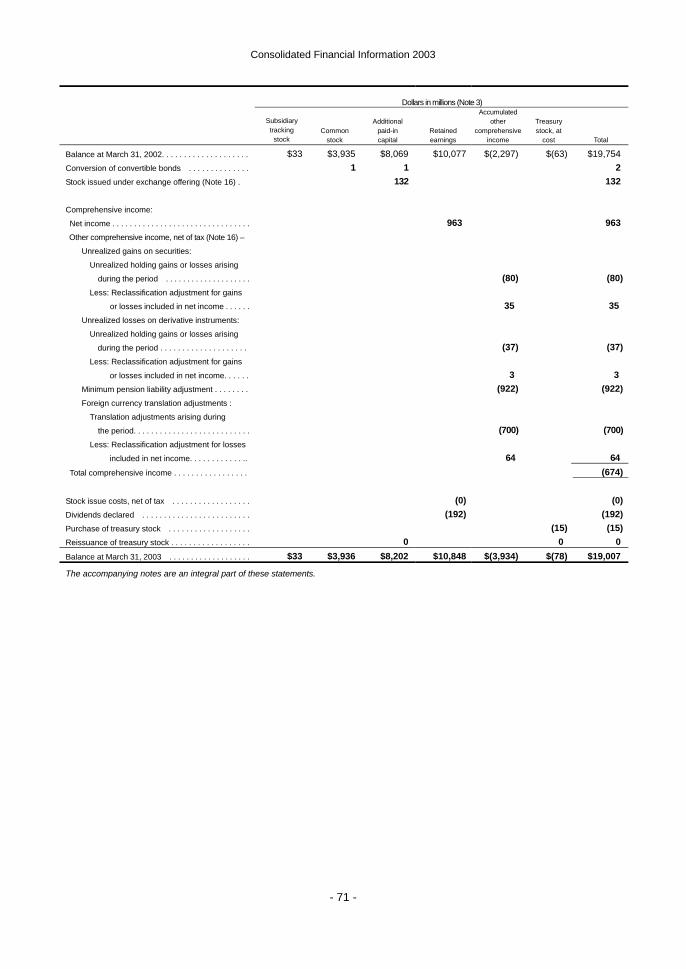
Consolidated Financial Information 2003
- 71 -
Dollars in millions (Note 3) Accumulated Subsidiary Additional other Treasury tracking Common paid-in Retained comprehensive stock, at stock stock capital earnings income cost Total
Balance at March 31, 2002. . . . . . . . . . . . . . . . . . . . $33 $3,935 $8,069 $10,077 $(2,297) $(63) $19,754 Conversion of convertible bonds . . . . . . . . . . . . . . 1 1 2 Stock issued under exchange offering (Note 16) . 132 132 Comprehensive income: Net income . . . . . . . . . . . . . . . . . . . . . . . . . . . . . . . . 963 963 Other comprehensive income, net of tax (Note 16) – Unrealized gains on securities: Unrealized holding gains or losses arising during the period . . . . . . . . . . . . . . . . . . . . (80) (80) Less: Reclassification adjustment for gains or losses included in net income . . . . . . 35 35 Unrealized losses on derivative instruments: Unrealized holding gains or losses arising during the period . . . . . . . . . . . . . . . . . . . . (37) (37) Less: Reclassification adjustment for gains or losses included in net income. . . . . . 3 3 Minimum pension liability adjustment . . . . . . . . (922) (922) Foreign currency translation adjustments :
Translation adjustments arising during the period. . . . . . . . . . . . . . . . . . . . . . . . . . . (700) (700)
Less: Reclassification adjustment for losses included in net income. . . . . . . . . . . . .. 64 64 Total comprehensive income . . . . . . . . . . . . . . . . . (674) Stock issue costs, net of tax . . . . . . . . . . . . . . . . . . (0) (0) Dividends declared . . . . . . . . . . . . . . . . . . . . . . . . . (192) (192) Purchase of treasury stock . . . . . . . . . . . . . . . . . . . (15) (15) Reissuance of treasury stock . . . . . . . . . . . . . . . . . . 0 0 0 Balance at March 31, 2003 . . . . . . . . . . . . . . . . . . . $33 $3,936 $8,202 $10,848 $(3,934) $(78) $19,007
The accompanying notes are an integral part of these statements.
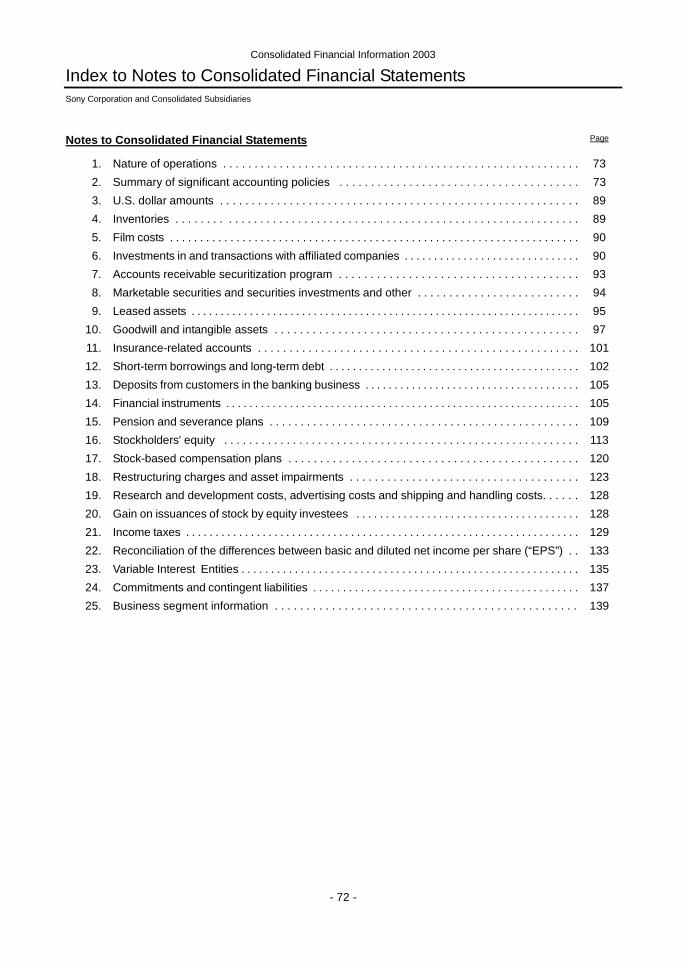
Consolidated Financial Information 2003
- 72 -
Index to Notes to Consolidated Financial Statements Sony Corporation and Consolidated Subsidiaries
Notes to Consolidated Financial Statements Page
1. Nature of operations . . . . . . . . . . . . . . . . . . . . . . . . . . . . . . . . . . . . . . . . . . . . . . . . . . . . . . . . . 73 2. Summary of significant accounting policies . . . . . . . . . . . . . . . . . . . . . . . . . . . . . . . . . . . . . . 73 3. U.S. dollar amounts . . . . . . . . . . . . . . . . . . . . . . . . . . . . . . . . . . . . . . . . . . . . . . . . . . . . . . . . . 89 4. Inventories . . . . . . . . . . . . . . . . . . . . . . . . . . . . . . . . . . . . . . . . . . . . . . . . . . . . . . . . . . . . . . . . 89 5. Film costs . . . . . . . . . . . . . . . . . . . . . . . . . . . . . . . . . . . . . . . . . . . . . . . . . . . . . . . . . . . . . . . . . . . . 90 6. Investments in and transactions with affiliated companies . . . . . . . . . . . . . . . . . . . . . . . . . . . . . . 90 7. Accounts receivable securitization program . . . . . . . . . . . . . . . . . . . . . . . . . . . . . . . . . . . . . . 93 8. Marketable securities and securities investments and other . . . . . . . . . . . . . . . . . . . . . . . . . . 94 9. Leased assets . . . . . . . . . . . . . . . . . . . . . . . . . . . . . . . . . . . . . . . . . . . . . . . . . . . . . . . . . . . . . . . . . . . 95 10. Goodwill and intangible assets . . . . . . . . . . . . . . . . . . . . . . . . . . . . . . . . . . . . . . . . . . . . . . . . 97 11. Insurance-related accounts . . . . . . . . . . . . . . . . . . . . . . . . . . . . . . . . . . . . . . . . . . . . . . . . . . . 101 12. Short-term borrowings and long-term debt . . . . . . . . . . . . . . . . . . . . . . . . . . . . . . . . . . . . . . . . . . . 102 13. Deposits from customers in the banking business . . . . . . . . . . . . . . . . . . . . . . . . . . . . . . . . . . . . . 105 14. Financial instruments . . . . . . . . . . . . . . . . . . . . . . . . . . . . . . . . . . . . . . . . . . . . . . . . . . . . . . . . . . . . . 105 15. Pension and severance plans . . . . . . . . . . . . . . . . . . . . . . . . . . . . . . . . . . . . . . . . . . . . . . . . . . 109 16. Stockholders' equity . . . . . . . . . . . . . . . . . . . . . . . . . . . . . . . . . . . . . . . . . . . . . . . . . . . . . . . . . 113 17. Stock-based compensation plans . . . . . . . . . . . . . . . . . . . . . . . . . . . . . . . . . . . . . . . . . . . . . . 120 18. Restructuring charges and asset impairments . . . . . . . . . . . . . . . . . . . . . . . . . . . . . . . . . . . . . 123 19. Research and development costs, advertising costs and shipping and handling costs. . . . . . 128 20. Gain on issuances of stock by equity investees . . . . . . . . . . . . . . . . . . . . . . . . . . . . . . . . . . . . . . 128 21. Income taxes . . . . . . . . . . . . . . . . . . . . . . . . . . . . . . . . . . . . . . . . . . . . . . . . . . . . . . . . . . . . . . . . . . . 129 22. Reconciliation of the differences between basic and diluted net income per share (“EPS”) . . 133 23. Variable Interest Entities . . . . . . . . . . . . . . . . . . . . . . . . . . . . . . . . . . . . . . . . . . . . . . . . . . . . . . . . . 135 24. Commitments and contingent liabilities . . . . . . . . . . . . . . . . . . . . . . . . . . . . . . . . . . . . . . . . . . . . . 137 25. Business segment information . . . . . . . . . . . . . . . . . . . . . . . . . . . . . . . . . . . . . . . . . . . . . . . . 139
Consolidated Financial Information 2003
- 73 -
Notes to Consolidated Financial Statements Sony Corporation and Consolidated Subsidiaries
1. Nature of operations
Sony Corporation and consolidated subsidiaries (hereinafter collectively referred to as “Sony”) are engaged in
the development, design, manufacture, and sale of various kinds of electronic equipment, instruments, and
devices for consumer and industrial markets. Sony also develops, produces, manufactures, and markets
home-use game consoles and software. Sony’s principal manufacturing facilities are located in Japan, the
United States of America, Europe, and Asia. Its electronic products are marketed throughout the world and
game products are marketed mainly in Japan, the United States of America and Europe by sales subsidiaries
and unaffiliated local distributors as well as direct sales via the Internet. Sony is engaged in the development,
production, manufacture, and distribution of recorded music, in all commercial formats and musical genres.
Sony is also engaged in the development, production, manufacture, marketing, distribution and broadcasting
of image-based software, including film, video and television. Further, Sony is engaged in various financial
service businesses including insurance operations through a Japanese life insurance subsidiary and non-life
insurance subsidiaries, banking operations through a Japanese internet-based banking subsidiary and leasing
and credit financing operations in Japan. In addition to the above, Sony is engaged in Internet-related
businesses and an advertising agency business in Japan.
2. Summary of significant accounting policies
Sony Corporation and its subsidiaries in Japan maintain their records and prepare their financial statements in
accordance with accounting principles generally accepted in Japan while its foreign subsidiaries maintain their
records and prepare their financial statements in conformity with accounting principles generally accepted in
the countries of their domiciles. Certain adjustments and reclassifications have been incorporated in the
accompanying consolidated financial statements to conform with accounting principles generally accepted in
the United States of America (“U.S. GAAP”). These adjustments were not recorded in the statutory books of
account.
(1) Accounting changes:
Impairment or Disposal of Long-Lived Assets -
On April 1, 2002, Sony adopted Statement of Financial Accounting Standards (“FAS”) No. 144, “Accounting
for the Impairment or Disposal of Long-Lived Assets”. FAS No. 144 supersedes FAS No. 121 “Accounting
for the Impairment of Long-Lived Assets and for Long-Lived Assets to be Disposed of” and the accounting
and reporting provisions of Accounting Principles Board Opinion (“APB”) No. 30 “Reporting the results of
Operations – Reporting the Effects of Disposal of a Segment of a Business, and Extraordinary, Unusual
and Infrequently Occurring Events and Transactions” for the disposal of segments of a business. FAS No.
Consolidated Financial Information 2003
- 74 -
144 addresses financial accounting and reporting for the impairment or disposal of long-lived assets. FAS
No. 144 establishes a single accounting model for long-lived assets to be disposed of by sale and modifies
the accounting and disclosure rules for discontinued operations. The adoption of the provision of FAS No.
144 did not have a material impact on Sony’s results of operations and financial position for the year ended
March 31, 2003.
Rescission of FASB Statements No. 4, 44 and 64, Amendment of FASB Statement No. 13, and
Technical Corrections -
In April 2002, the Financial Accounting Standards Board (“FASB”) issued FAS No. 145, “Rescission of
FASB Statements No. 4, 44 and 64, Amendment of FASB Statement No. 13, and Technical Corrections”.
This statement rescinds certain authoritative pronouncements and amends, clarifies or describes the
applicability of others, effective for fiscal years beginning or transactions occurring after May 15, 2002, with
early adoption encouraged. Sony elected early adoption of this statement retroactive to April 1, 2002. The
adoption of this statement did not have an impact on Sony’s results of operations and financial position.
Accounting for Costs Associated with Exit or Disposal Activities -
In June 2002, the FASB issued FAS No. 146, “Accounting for Costs Associated with Exit or Disposal
Activities”, which nullifies Emerging Issues Task Force (“EITF”) Issue No. 94-3, “Liability Recognition for
Certain Employee Termination Benefits and Other Costs to Exit an Activity (including Certain Costs
Incurred in a Restructuring)”. FAS No. 146 is effective for exit or disposal activities that are initiated after
December 31, 2002. FAS No. 146 addresses financial accounting and reporting for costs associated with
exit or disposal activities. FAS No. 146 requires that a liability for a cost associated with an exit or disposal
activity be recognized and measured initially at fair value only when the liability is incurred, rather than the
date of an entity’s commitment to an exit plan. Sony adopted FAS No. 146 on January 1, 2003. The
adoption of this statement did not have a material effect on Sony’s results of operations and financial
position.
Guarantor’s Accounting and Disclosure Requirements for Guarantees, Including Indirect
Guarantees of Indebtedness of Others -
In November 2002, the FASB issued FASB Interpretation (“FIN”) No. 45, “Guarantor’s Accounting and
Disclosure Requirements for Guarantees, Including Indirect Guarantees of Indebtedness of Others, an
interpretation of FASB Statements No. 5, 57, and 107 and rescission of FASB Interpretation No. 34”. The
interpretation elaborates on the existing disclosure requirements for most guarantees. It also clarifies that
at the time a company issues a guarantee, the company must recognize an initial liability for the fair value of
the obligations it assumes under the guarantee. The provisions related to recognizing a liability at inception
of the guarantee for the fair value of the guarantor’s obligations do not apply to product warranties or to
Consolidated Financial Information 2003
- 75 -
guarantees accounted for as derivatives. The initial recognition and initial measurement provisions of FIN
No. 45 are applicable on a prospective basis to guarantees issued or modified after December 31, 2002.
The initial recognition and initial measurement provisions of FIN No. 45 did not have a material effect on
Sony’s results of operations and financial position as at and for the year ended March 31, 2003. The
disclosure provisions, which increase the required disclosure related to guarantees, have been adopted in
the consolidated financial statements.
Accounting for Stock-Based Compensation - Transition and Disclosure -
In December 2002, the FASB issued FAS No. 148, ‘‘Accounting for Stock-Based Compensation - Transition
and Disclosure - an Amendment of FASB Statement No. 123’’. FAS No. 148 amends FAS No. 123,
‘‘Accounting for Stock-Based Compensation’’, to provide alternative methods of transition for a voluntary
change to the fair value based method of accounting for stock-based employee compensation. FAS No.
148 also requires that disclosures of the pro forma effect of using the fair value method of accounting for
stock-based employee compensation be displayed more prominently and in a tabular format. For Sony, the
transition and annual disclosure requirements of FAS No. 148 are effective for the year ended March 31,
2003. Sony has accounted for its employee stock-based compensation in accordance with APB No. 25,
“Accounting for Stock Issued to Employees” and, therefore, the adoption of the provisions of FAS No. 148
did not have an impact on Sony’s results of operations and financial position. Sony has adopted the
disclosure-only requirements in accordance with FAS No. 148.
Consolidation of Variable Interest Entities -
In January 2003, the FASB issued FIN No. 46, “Consolidation of Variable Interest Entities – an
Interpretation of ARB No. 51”. This interpretation addresses consolidation by a primary beneficiary of a
variable interest entity (“VIE”). FIN No. 46 is effective immediately for all new VIEs created or acquired after
January 31, 2003. For VIEs created or acquired prior to February 1, 2003, the provisions of FIN No. 46
become effective for Sony during the second quarter of the year ending March 31, 2004. For VIEs acquired
prior to February 1, 2003, any difference between the net amount added to the balance sheet and the
amount of any previously recognized interest in the VIE will be recognized as a cumulative effect of an
accounting change.
Sony continues to evaluate the impact of FIN No. 46 on Sony’s results of operations and financial
position. However, Sony has identified potential VIEs created prior to February 1, 2003, which may be
consolidated upon the adoption of FIN No. 46. If these potential VIEs are consolidated, Sony would record
a charge of approximately ¥1,800 million ($15 million) as a cumulative effect of accounting change and an
increase in assets and liabilities of approximately ¥97,342 million ($811 million). See Note 23 for further
discussion on the VIEs that are used by Sony. Sony did not enter into any new arrangements with VIEs
during the period February 1, 2003 through March 31, 2003.
Consolidated Financial Information 2003
- 76 -
Derivative instruments and hedging activities -
On April 1, 2001, Sony adopted FAS No. 133, “Accounting for Derivative Instruments and Hedging
Activities” as amended by FAS No. 138, “Accounting for Certain Derivative Instruments and Certain
Hedging Activities - an Amendment of FASB statement No. 133”. FAS No. 133, as amended, establishes
accounting and reporting standards for derivative instruments. Specifically, FAS No. 133 requires an entity
to recognize all derivatives, including certain derivative instruments embedded in other contracts, as either
assets or liabilities in the balance sheet and to measure those instruments at fair value. Additionally, the fair
value adjustments will affect either stockholders’ equity or net income depending on whether the derivative
instruments qualifies as a hedge for accounting purposes and, if so, the nature of the hedging activity.
As a result of the adoption of the new standards, Sony’s operating income, income before income taxes
and net income for the year ended March 31, 2002 decreased by ¥3,007 million, ¥3,441 million and ¥2,167
million, respectively. Additionally, on April 1, 2001, Sony recorded a one-time non-cash after-tax unrealized
gain of ¥1,089 million in accumulated other comprehensive income in the consolidated balance sheet, as
well as an after-tax gain of ¥5,978 million in the cumulative effect of accounting changes in the consolidated
statement of income. This after-tax gain was primarily attributable to fair value adjustments of convertible
rights embedded in convertible bonds held by Sony’s life insurance subsidiary as available-for-sale debt
securities.
Goodwill and other intangible assets -
In July 2001, Sony elected early adoption, retroactive to April 1, 2001, of FAS No. 142, “Goodwill and Other
Intangible Assets” which superseded APB No. 17, “Intangible Assets”. FAS No. 142 addresses the
accounting for acquired goodwill and other intangible assets. Under FAS No. 142, goodwill and certain
other intangible assets that are determined to have an indefinite life are no longer amortized, but rather are
tested for impairment on an annual basis and between annual tests if an event occurs or circumstances
change that would more likely than not reduce the fair value below its carrying amount. Prior to the
adoption of FAS No. 142, goodwill recognized in acquisitions accounted for as purchases was amortized
on a straight-line basis principally over a 20 or 40-year period. As a result of the adoption of FAS No. 142,
Sony’s operating income and income before income taxes for the year ended March 31, 2002 increased by
¥20,114 million and income before cumulative effect of accounting changes as well as net income for the
year ended March 31, 2002 increased by ¥18,932 million.
Accounting for consideration paid to a reseller -
In the fourth quarter of the year ended March 31, 2002, Sony adopted retroactive to April 1, 2001 EITF
Issue No. 00-25, “Vendor Income Statement Characterization of Consideration Paid to a Reseller of the
Vendor’s Products”, which was later codified along with other similar issues into EITF Issue No. 01-09,
“Accounting for Consideration Given by a Vendor to a Customer or Reseller of the Vendor’s Products”.
Consolidated Financial Information 2003
- 77 -
EITF Issue No. 01-09 clarifies the income statement classification of costs incurred by a vendor in
connection with the reseller’s purchase or promotion of the vendor’s products, resulting in certain
cooperative advertising and product placement costs previously classified as selling, general and
administrative expenses to be reflected as a reduction of revenues earned from that activity. The
accounting change did not have any effect on operating income or a material effect on net sales and selling,
general and administrative expenses for the year ended March 31, 2002. Sony has not reclassified the
financial statements for the year ended March 31, 2001 due to immateriality.
Film accounting -
In June 2000, Sony elected early adoption of Statement of Position (“SOP”) 00-2, “Accounting by
Producers or Distributors of Films”, issued by the Accounting Standards Executive Committee of the
American Institute of Certified Public Accountants. SOP 00-2 established new film accounting standards,
including changes in revenue recognition and accounting for advertising, development and overhead costs.
Specifically, SOP 00-2 requires all exploitation costs, such as advertising expenses and marketing costs,
for theatrical and television product to be expensed as incurred. This compares to Sony’s previous policy
of first capitalizing and then expensing advertising costs for theatrical and television product over the
related revenue streams. In addition, SOP 00-2 requires development costs for abandoned projects and
certain indirect overhead costs to be charged directly to expense, instead of those costs being capitalized
to film costs, which was required under the previous accounting standards. SOP 00-2 also requires all film
costs to be classified in the balance sheet as non-current assets. The provisions of SOP 00-2 in other
areas, such as revenue recognition, generally are consistent with Sony’s existing accounting policies.
Sony adopted SOP 00-2 retroactive to April 1, 2000. As a result, Sony’s net income for the year ended
March 31, 2001 included a one-time, non-cash charge with no tax effect of ¥101,653 million, primarily to
reduce the carrying value of its film inventory. The charge has been reflected as a cumulative effect of an
accounting change in the accompanying consolidated statements of income.
Revenue recognition -
In the fourth quarter of the year ended March 31, 2001, Sony adopted Staff Accounting Bulletin (“SAB”) No.
101, “Revenue Recognition in Financial Statements”, issued by the United States of America Securities and
Exchange Commission retroactive to April 1, 2000. As a result, Sony changed its method of accounting for
revenues from electronics, game and music sales. Revenues from electronics, game and music sales are
recognized upon delivery which is considered to have occurred when the customer has taken title to the
product and the risk and rewards of ownership have been substantively transferred. Following SAB No.
101, revenues are recognized when the product is delivered to the customer delivery site. Previously Sony
followed the guidance of FASB Statement of Financial Accounting Concept (“SFAC”) No. 5 “Recognition
and Measurement in Financial Statements of Business Enterprises” in which revenues were recognized
when Sony had substantially completed all of its obligations pursuant to the terms of the sales contract.
Under the guidance of SFAC No. 5, Sony viewed its obligation under the sales contract to be substantially
Consolidated Financial Information 2003
- 78 -
completed when products were shipped and recognized revenues at that time. In accordance with SAB No.
101, Sony has recorded a one-time non-cash charge of ¥2,821 million, including ¥491 million income tax
expense, which represents the net impact of sales that were previously recognized in the year ended
March 31, 2000. These sales were subsequently recognized in the year ended March 31, 2001 due to the
adoption of SAB No. 101. The charge has been reflected as a cumulative effect of an accounting change in
the accompanying consolidated statements of income. The accounting change did not have a material
effect on Sony’s consolidated statements of income for the year ended March 31, 2001.
(2) Significant accounting policies:
Basis of consolidation and accounting for investments in affiliated companies -
The consolidated financial statements include the accounts of Sony Corporation and those of its
majority-owned subsidiary companies. All intercompany transactions and accounts are eliminated.
Investments in which Sony has significant influence or ownership of 20% or more but less than or equal to
50% are accounted for under the equity method. In addition, all investments in limited partnerships and
general partnerships are also accounted for under the equity method. Under the equity method,
investments are stated at cost plus/minus Sony’s equity in undistributed earnings or losses. Consolidated
net income includes Sony’s equity in current earnings or losses of such companies, after elimination of
unrealized intercompany profits. If the value of an investment has declined and is judged to be other than
temporary, the investment is written down to its fair value.
On occasion, a consolidated subsidiary or affiliated company accounted for by the equity method may
issue its shares to third parties as either a public or private offering or upon conversion of convertible debt to
common stock at amounts per share in excess of or less than Sony’s average per share carrying value.
With respect to such transactions, where the sale of such shares is not part of a broader corporate
reorganization and the reacquisition of such shares is not contemplated at the time of issuance, the
resulting gains or losses arising from the change in interest are recorded in income for the year the change
in interest transaction occurs. If the sale of such shares is part of a broader corporate reorganization, the
reacquisition of such shares is contemplated at the time of issuance or realization of such gain is not
reasonably assured (i.e., the entity is newly formed, non-operating, a research and development or
start-up/development stage entity, or where the entity's ability to continue in existence is in question), the
transaction is accounted for as a capital transaction.
The excess of the cost over the underlying net equity of investments in consolidated subsidiaries and
affiliated companies accounted for on an equity basis is allocated to identifiable assets and liabilities based
on fair values at the date of acquisition. The unassigned residual value of the excess of the cost over the
underlying net equity is recognized as goodwill.
Use of estimates -
The preparation of the consolidated financial statements in conformity with U.S. GAAP requires
Consolidated Financial Information 2003
- 79 -
management to make estimates and assumptions that affect the reported amounts of assets and liabilities
and disclosure of contingent assets and liabilities at the date of the financial statements and the reported
amounts of revenues and expenses during the reporting period. Actual results could differ from those
estimates.
Translation of foreign currencies -
All asset and liability accounts of foreign subsidiaries and affiliates are translated into Japanese yen at
appropriate year-end current rates and all income and expense accounts are translated at rates that
approximate those rates prevailing at the time of the transactions. The resulting translation adjustments
are accumulated as a component of accumulated other comprehensive income.
Foreign currency receivables and payables are translated at appropriate year-end current rates and the
resulting translation gains or losses are taken into income currently.
Cash and cash equivalents -
Cash and cash equivalents include all highly liquid investments, generally with original maturities of three
months or less, that are readily convertible to known amounts of cash and are so near maturity that they
present insignificant risk of changes in value because of changes in interest rates.
Marketable debt and equity securities -
Debt securities and equity securities designated as available-for-sale, whose fair values are readily
determinable, are carried at fair value with unrealized gains or losses included as a component of
accumulated other comprehensive income, net of applicable taxes. Debt and equity securities classified as
trading securities are carried at fair value with unrealized gains or losses included in income. Debt
securities that are expected to be held-to-maturity are carried at amortized cost. Individual securities
classified as either available-for-sale or held-to-maturity are reduced to net realizable value by a charge to
income for other than temporary declines in fair value. Realized gains and losses are determined on the
average cost method and are reflected in income.
Equity securities in non-public companies -
Equity securities in non-public companies are carried at cost as fair value is not readily determinable. If the
value of a non-public equity investment is estimated to have declined and such decline is judged to be other
than temporary, Sony recognizes the impairment of the investment and the carrying value is reduced to its
fair value. Determination of impairment is based on the consideration of such factors as operating results,
business plans and estimated future cash flows. Fair value is determined through the use of such
methodologies as discounted cash flows, valuation of recent financings and comparable valuations of
similar companies.
Consolidated Financial Information 2003
- 80 -
Inventories -
Inventories in electronics, game and music as well as non-film inventories for pictures are valued at cost,
not in excess of market, cost being determined on the “average cost” basis except for the cost of finished
products carried by certain subsidiary companies which is determined on the “first-in, first-out” basis.
Film costs -
Film costs related to theatrical and television product (which includes direct production costs, production
overhead and acquisition costs) are stated at the lower of unamortized cost or estimated fair value and
classified as non-current assets. Film costs are amortized, and the estimated liabilities for residuals and
participations are accrued, for an individual product based on the proportion that current period actual
revenues bear to the estimated remaining total lifetime revenues. These estimates are reviewed on a
periodic basis.
Property, plant and equipment and depreciation -
Property, plant and equipment are stated at cost. Depreciation of property, plant and equipment is primarily
computed on the declining-balance method for Sony Corporation and Japanese subsidiaries, except for
certain semiconductor manufacturing facilities whose depreciation is computed on the straight-line method,
and on the straight-line method for foreign subsidiaries at rates based on estimated useful lives of the
assets, principally, ranging from 15 years up to 50 years for buildings and from 2 years up to 10 years for
machinery and equipment. Significant renewals and additions are capitalized at cost. Maintenance and
repairs, and minor renewals and betterments are charged to income as incurred.
Goodwill and other intangible assets -
As a result of the adoption of FAS No. 142, goodwill and certain other intangible assets that are determined
to have an indefinite life are not amortized and are tested for impairment on an annual basis and between
annual tests if an event occurs or circumstances change that would more likely than not reduce the fair
value below its carrying amount. Fair value for those assets is generally determined using a discounted
cash flow analysis. Prior to the adoption of FAS No. 142, in accordance with APB No. 17, goodwill was
amortized on a straight-line basis principally over a 20 or 40 year period and indefinite-lived intangible
assets were also amortized on a straight-line basis principally over a 20 year period.
Intangible assets that are determined not to have an indefinite life mainly consist of artist contracts,
music catalogs, acquired patent rights and software to be sold, leased or otherwise marketed. Artist
contracts and music catalogs are amortized on a straight-line basis principally over a period of up to 40
years. Acquired patent rights and software to be sold, leased or otherwise marketed are amortized on a
straight-line basis over 3 to 10 years.
Consolidated Financial Information 2003
- 81 -
Accounting for computer software to be sold -
Sony accounts for software development costs in accordance with FAS No. 86, “Accounting for the Costs of
Computer Software to Be Sold, Leased, or Otherwise Marketed”.
In the Electronics business, costs related to establishing the technological feasibility of a software
product are expensed as incurred as a part of research and development in cost of sales. Costs that are
incurred to produce the finished product after technological feasibility is established are capitalized and
amortized over the estimated economic life of the product, which is generally three years. Sony performs
periodic reviews to ensure that unamortized program costs remain recoverable from future revenue.
In the Game business, technological feasibility of the underlying software is reached shortly before the
products are released to manufacturing. Costs incurred after technological feasibility is established are not
material, and accordingly, Sony expenses software development costs for the Game business as incurred
as a part of research and development in cost of sales.
Deferred insurance acquisition costs -
Costs that vary with and are primarily related to acquiring new insurance policies are deferred as long as
they are recoverable. The deferred insurance acquisition costs are being amortized mainly over the
premium-paying period of the related insurance policies using assumptions consistent with those used in
computing policy reserves.
Product warranty -
Sony provides for the estimated cost of product warranties at the time revenue is recognized by either
product category group or individual product. The product warranty is calculated based upon product sales,
estimated probability of failure and estimated cost per claim. The variables used in the calculation of the
provision are reviewed on a periodic basis.
Certain subsidiaries in the Electronics business offer extended warranty programs. The consideration
received through extended warranty service is deferred and amortized on a straight-line basis over the term
of the extended warranty.
Future insurance policy benefits -
Future insurance policy benefits are computed based on actuarial assumptions.
Accounting for the impairment of long-lived assets -
Sony periodically reviews the carrying value of its long-lived assets held and used, other than goodwill and
intangible assets with indefinite lives, and assets to be disposed of, whenever events or changes in
Consolidated Financial Information 2003
- 82 -
circumstances indicated that the carrying amount may not be recoverable. Long-lived assets to be held
and used are reviewed for impairment by comparing the carrying value of the assets with their estimated
future undiscounted cash flows. If it is determined that an impairment loss has occurred, the loss would be
recognized during the period. The impairment loss would be calculated as the difference between asset
carrying value and the present value of estimated net cash flows or comparable market values, giving
consideration to recent operating performance. Long-lived assets that are to be disposed of other than by
sale are considered held and used until they are disposed of. Long-lived assets that are to be disposed of
by sale are reported at the lower of their carrying value or fair value less cost to sell. Reductions in carrying
value are recognized in the period in which the long-lived assets are classified as held for sale.
Derivative financial instruments -
All derivatives, including certain derivative financial instruments embedded in other contracts, are
recognized as either assets or liabilities in the balance sheet at fair value. Changes in the fair value of
derivative financial instruments are either recognized periodically in income or stockholders’ equity (as a
component of accumulated other comprehensive income), depending on whether the derivative financial
instrument qualifies as a hedge and the derivative is being used to hedge changes in fair value or cash
flows.
In accordance with FAS No. 133, the derivative financial instruments held by Sony are classified and
accounted as below.
Fair value hedges
Changes in the fair value of derivatives designated and effective as fair value hedges for recognized assets
or liabilities or unrecognized firm commitments are recognized in earnings as offsets to changes in the fair
value of the related hedged assets or liabilities.
Cash flow hedges
Changes in the fair value of derivatives designated and effective as cash flow hedges for forecasted
transactions or exposures associated with recognized assets or liabilities are initially recorded in other
comprehensive income and reclassified into earnings when the hedged transaction affects earnings.
Changes in the fair value of the ineffective portion are recognized in current period earnings.
Derivatives not designated as hedges
Changes in the fair value of derivatives that are not designated as hedges under FAS No. 133 are
recognized in current period earnings.
Sony formally documents all hedging relationships between the derivatives designated as hedges and
hedged items, as well as its risk management objectives and strategies for undertaking various hedging
Consolidated Financial Information 2003
- 83 -
activities. Sony links all hedges that are designated as fair value or cash flow hedges to specific assets or
liabilities on the balance sheet or to the specific forecasted transaction. Sony also assesses, both at the
inception of the hedge and on an on-going basis, whether the derivatives that are designated as hedges
are highly effective in offsetting changes in fair value or cash flows of hedged items. When it is determined
that a derivative is not highly effective as a hedge, Sony discontinues hedge accounting.
Stock-based compensation -
Sony follows the disclosure-only provisions of FAS No. 148 and has elected to apply APB No. 25 in
accounting for its stock-based compensation plans. In accordance with APB No. 25, stock-based
compensation cost is recognized in income based on the excess, if any, of the quoted market price of the
common stock or subsidiary tracking stock of Sony Corporation at the grant date of the award or other
measurement date over the stated exercise price of the award. As the exercise prices for Sony’s
stock-based compensation plans are generally determined based on the prevailing market price shortly
before the date of grant, the compensation expense for these plans is not significant. For awards that
generate compensation expense as defined under APB No. 25, Sony calculates the amount of
compensation expense and recognizes the expense over the vesting period of the award.
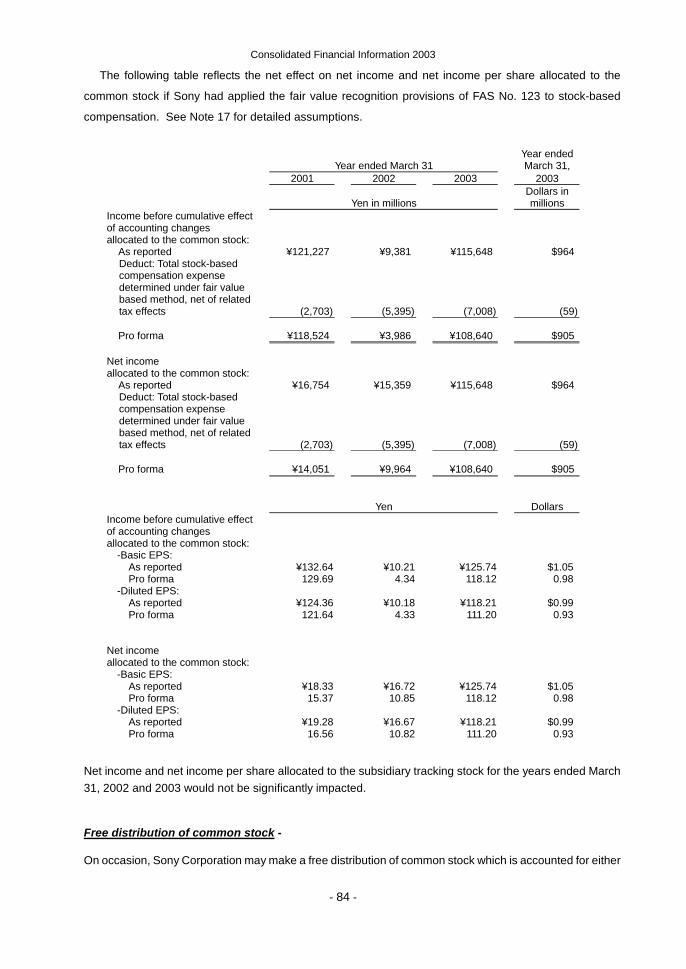
Consolidated Financial Information 2003
- 84 -
The following table reflects the net effect on net income and net income per share allocated to the
common stock if Sony had applied the fair value recognition provisions of FAS No. 123 to stock-based
compensation. See Note 17 for detailed assumptions.
Year ended March 31 Year ended
March 31, 2001 2002 2003 2003
Yen in millions Dollars in
millions Income before cumulative effect of accounting changes allocated to the common stock:
As reported ¥121,227 ¥9,381 ¥115,648 $964
Deduct: Total stock-based compensation expense determined under fair value based method, net of related tax effects
(2,703)
(5,395)
(7,008)
(59) Pro forma ¥118,524 ¥3,986 ¥108,640 $905
Net income allocated to the common stock:
As reported ¥16,754 ¥15,359 ¥115,648 $964
Deduct: Total stock-based compensation expense determined under fair value based method, net of related tax effects
(2,703)
(5,395)
(7,008)
(59) Pro forma ¥14,051 ¥9,964 ¥108,640 $905
Yen Dollars Income before cumulative effect of accounting changes allocated to the common stock:
-Basic EPS:
As reported ¥132.64 ¥10.21 ¥125.74 $1.05 Pro forma 129.69 4.34 118.12 0.98
-Diluted EPS: As reported ¥124.36 ¥10.18 ¥118.21 $0.99 Pro forma 121.64 4.33 111.20 0.93
Net income allocated to the common stock:
-Basic EPS: As reported ¥18.33 ¥16.72 ¥125.74 $1.05 Pro forma 15.37 10.85 118.12 0.98
-Diluted EPS: As reported ¥19.28 ¥16.67 ¥118.21 $0.99 Pro forma 16.56 10.82 111.20 0.93
Net income and net income per share allocated to the subsidiary tracking stock for the years ended March 31, 2002 and 2003 would not be significantly impacted.
Free distribution of common stock -
On occasion, Sony Corporation may make a free distribution of common stock which is accounted for either
Consolidated Financial Information 2003
- 85 -
by a transfer from additional paid-in capital to the common stock account or with no entry if free shares are
distributed from the portion of previously issued shares in the common stock account.
Under the Japanese Commercial Code, a stock dividend can be effected by an appropriation of retained
earnings to the common stock account by resolution of the general meeting of shareholders, followed by a
free share distribution with respect to the amount appropriated by resolution of the Board of Directors’
meeting.
Free distribution of common stock is recorded in the consolidated financial statements only when it
becomes effective, except for the calculation and presentation of per share amounts.
Stock issue costs -
Stock issue costs are directly charged to retained earnings, net of tax, in the accompanying consolidated
financial statements as the Japanese Commercial Code prohibits charging such stock issue costs to capital
accounts which is the prevailing practice in the United States of America.
Revenue recognition -
In accordance with SAB No. 101, revenues from electronics, game and music sales are recognized upon
delivery which is considered to have occurred when the customer has taken title to the product and the risk
and rewards of ownership have been substantively transferred. If the sales contract contains a customer
acceptance provision, then sales are recognized after customer acceptance occurs or the acceptance
provisions lapse.
Revenues from the theatrical exhibition of motion pictures are recognized as the customer exhibits the
film. Revenues from the licensing of feature films and television programming are recorded when the
material is available for telecast by the licensee and when any restrictions regarding the exhibition or
exploitation of the product lapse. Revenues from the sale of home videocassettes and DVDs are
recognized upon availability of sale to the public.
Life insurance policies that the life insurance subsidiary writes, most of which are categorized as
long-duration contracts, mainly consist of whole life, term life and accident and health insurance contracts.
Premiums from these policies are reported as revenue when due from policyholders.
Property and casualty insurance policies that the non-life insurance subsidiary writes are primarily
automotive insurance contracts which are categorized as short-duration contracts. Premiums from these
policies are reported as revenue over the period of the contract in proportion to the amount of insurance
protection provided.
Accounting for consideration paid to a reseller -
In accordance with EITF Issue No. 01-09, cash consideration paid to a reseller including payments for
buydowns, slotting fees and cooperative advertising programs, is accounted for as a reduction of revenue
Consolidated Financial Information 2003
- 86 -
unless Sony receives an identifiable benefit (goods or services) in exchange for the consideration, can
reasonably estimate the fair value of this benefit and receives documentation from the reseller to support
the amounts spent. Any payments meeting these criteria are treated as selling, general and administrative
expense. For the years ended March 31, 2002 and 2003, reseller payments, primarily for cooperative
advertising programs, included in selling, general and administrative expense totaled ¥ 28,683 million and
¥ 29,135 million ($ 243 million), respectively.
Cost of sales -
Costs classified as cost of sales relate to the producing and manufacturing of products and include such
items as material cost, subcontractor cost, depreciation of fixed assets, personnel expenses, research and
development costs, and amortization of film cost related to theatrical and television products.
Research and development costs -
Research and development costs are expensed as incurred.
Selling, general and administrative -
Costs classified as selling expense relate to the promoting and selling of products and include such items
as advertising, promotion, shipping, and warranty expenses.
General and administrative expenses include operating items such as officer's salaries, personnel
expenses, depreciation of fixed assets, office rental for sales, marketing and administrative divisions, a
provision for doubtful accounts and amortization of intangible assets.
Financial service expenses -
Financial service expenses include provision for policy reserves and amortization of deferred insurance
acquisition cost, and all other operating costs such as personnel expenses, depreciation of fixed assets,
office rental of subsidiaries in the Financial Services segment.
Advertising costs -
Advertising costs are expensed when the advertisement or commercial appears in the selected media,
except for advertising costs for acquiring new insurance policies which are deferred and amortized as part
of insurance acquisition costs.
Consolidated Financial Information 2003
- 87 -
Shipping and handling costs -
The majority of shipping and handling, warehousing and internal transfer costs for finished goods are
included in selling, general and administrative expenses. An exception to this is in the Pictures business
where such costs are charged to cost of sales as it is an integral part of producing and distributing the film
under SOP 00-2. All other costs related to Sony's distribution network are included in cost of sales,
including inbound freight charges, purchasing and receiving costs, inspection costs and warehousing
costs for raw materials and in-process inventory. In addition, amounts paid by customers for shipping and
handling costs are included in net sales.
Income taxes -
The provision for income taxes is computed based on the pretax income included in the consolidated
statements of income. The asset and liability approach is used to recognize deferred tax assets and
liabilities for the expected future tax consequences of temporary differences between the carrying amounts
and the tax bases of assets and liabilities.
Net income per share -
Sony calculates and presents per share data separately for Sony’s common stock and for the subsidiary
tracking stock, based on FAS No. 128, “Earnings per Share”. The holders of the subsidiary tracking stock
have the right to participate in earnings, together with common stock holders. Accordingly, Sony calculates
per share data by the “two-class” method based on FAS No. 128. Under this method, basic net income per
share (“EPS”) for each class of stock is calculated based on the earnings allocated to each class of stock
for the applicable period, divided by the weighted-average number of outstanding shares in each class
during the applicable period.
The earnings allocated to the subsidiary tracking stock are determined based on the subsidiary tracking
stock holders’ economic interest in the targeted subsidiary’s earnings available for dividends. As defined
by Sony Corporation’s articles of incorporation, the amount distributable to the subsidiary tracking stock
holders is based on the declared dividends of the targeted subsidiary, which only may be declared from the
amounts available for dividends of the targeted subsidiary. The targeted subsidiary’s earnings available for
dividends are, as stipulated by the Japanese Commercial Code, not including those of the targeted
subsidiary’s subsidiaries. If the targeted subsidiary has accumulated losses, a change in accumulated
losses is also allocated to the subsidiary tracking stock. The subsidiary tracking stock holders’ economic
interest is calculated as the number of the subsidiary tracking stock outstanding (3,072,000 shares) divided
by the number of the targeted subsidiary’s common stock outstanding (235,520 shares), subject to
multiplying by the Standard Ratio (tracking stock : subsidiary’s common stock = 1 : 100, as defined in the
articles of incorporation). The earnings allocated to the common stock are calculated by subtracting the
earnings allocated to the subsidiary tracking stock from Sony’s net income for the period.
The computation of diluted net income per common stock reflects the maximum possible dilution from
Consolidated Financial Information 2003
- 88 -
conversion, exercise, or contingent issuance of securities.
There are no potentially dilutive securities for net income per subsidiary tracking stock, as tracking stock
shares outstanding are increased upon potential subsidiary tracking stocks’ being exercised, which results
in a proportionate increase in earnings allocated to the subsidiary tracking stock. However, they could have
a dilutive effect on net income per common stock, as earnings allocated to the common stock would be
decreased.
EPS for all periods is appropriately adjusted for any free distributions of common stock which have been
completed.
(3) Recent Pronouncements
Accounting for Asset Retirement Obligations -
In June 2001, the FASB issued FAS No. 143, “Accounting for Asset Retirement Obligations”. This
statement addresses financial accounting and reporting for obligations associated with the retirement of
tangible long-lived assets and the associated asset retirement costs. This statement shall be effective for
fiscal years beginning after June 15, 2002. Sony adopted FAS No. 143 on April 1, 2003. The adoption of
FAS No. 143 did not have a material impact on Sony’s results of operations and financial position.
Multiple Element Arrangements -
In November 2002, the FASB issued EITF Issue No. 00-21, “Accounting for Revenue Arrangements with
Multiple Deliverables”. EITF Issue No. 00-21 provides guidance on when and how to account for
arrangements that involve the delivery or performance of multiple products, services and/or rights to use
assets. The provisions of EITF Issue No. 00-21 will apply to revenue arrangements entered into in fiscal
periods beginning after June 15, 2003. Sony is currently evaluating the impact of adopting this guidance.
Derivative Instruments and Hedging Activities -
In April 2003, the FASB issued FAS No. 149, “Amendment of Statement 133 on Derivative Instruments and
Hedging Activities”. This statement amends and clarifies financial accounting and reporting for derivative
instruments, including derivative instruments embedded in other contracts and for hedging activities under
FAS No. 133. Sony is currently evaluating the impact of adopting this new pronouncement.
Accounting for Certain Financial Instruments with Characteristics of both Liabilities and Equity -
In May 2003, the FASB issued FAS No. 150, “Accounting for Certain Financial Instruments with
Characteristics of both Liabilities and Equity”. FAS No. 150 establishes standards for how certain financial
instruments with characteristics of both liabilities and equity shall be classified and measured. This
statement is effective for financial instruments entered into or modified after May 31, 2003, and otherwise is
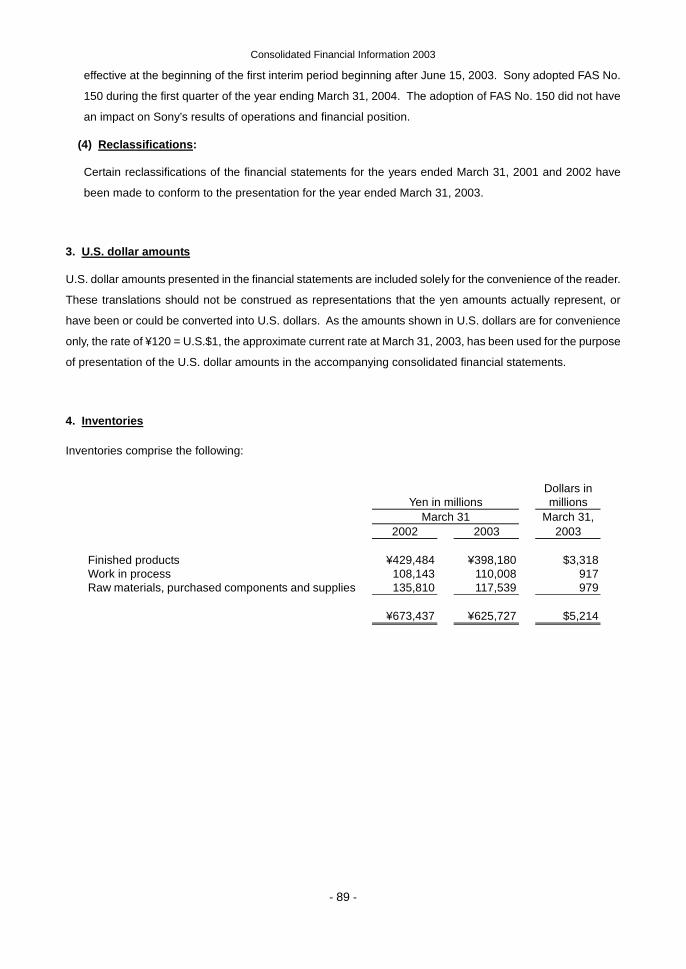
Consolidated Financial Information 2003
- 89 -
effective at the beginning of the first interim period beginning after June 15, 2003. Sony adopted FAS No.
150 during the first quarter of the year ending March 31, 2004. The adoption of FAS No. 150 did not have
an impact on Sony’s results of operations and financial position.
(4) Reclassifications:
Certain reclassifications of the financial statements for the years ended March 31, 2001 and 2002 have
been made to conform to the presentation for the year ended March 31, 2003.
3. U.S. dollar amounts
U.S. dollar amounts presented in the financial statements are included solely for the convenience of the reader.
These translations should not be construed as representations that the yen amounts actually represent, or
have been or could be converted into U.S. dollars. As the amounts shown in U.S. dollars are for convenience
only, the rate of ¥120 = U.S.$1, the approximate current rate at March 31, 2003, has been used for the purpose
of presentation of the U.S. dollar amounts in the accompanying consolidated financial statements.
4. Inventories
Inventories comprise the following:
Yen in millions
Dollars in millions
March 31 March 31, 2002 2003 2003
Finished products ¥429,484 ¥398,180 $3,318 Work in process 108,143 110,008 917 Raw materials, purchased components and supplies 135,810 117,539 979
¥673,437 ¥625,727 $5,214
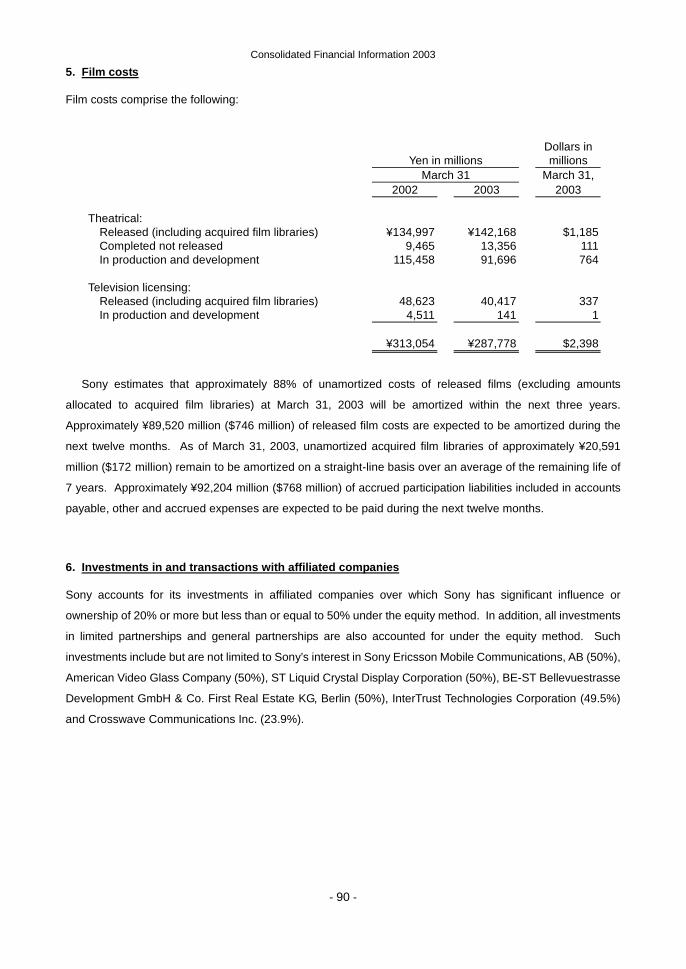
Consolidated Financial Information 2003
- 90 -
5. Film costs
Film costs comprise the following:
Sony estimates that approximately 88% of unamortized costs of released films (excluding amounts
allocated to acquired film libraries) at March 31, 2003 will be amortized within the next three years.
Approximately ¥89,520 million ($746 million) of released film costs are expected to be amortized during the
next twelve months. As of March 31, 2003, unamortized acquired film libraries of approximately ¥20,591
million ($172 million) remain to be amortized on a straight-line basis over an average of the remaining life of
7 years. Approximately ¥92,204 million ($768 million) of accrued participation liabilities included in accounts
payable, other and accrued expenses are expected to be paid during the next twelve months.
6. Investments in and transactions with affiliated companies
Sony accounts for its investments in affiliated companies over which Sony has significant influence or
ownership of 20% or more but less than or equal to 50% under the equity method. In addition, all investments
in limited partnerships and general partnerships are also accounted for under the equity method. Such
investments include but are not limited to Sony’s interest in Sony Ericsson Mobile Communications, AB (50%),
American Video Glass Company (50%), ST Liquid Crystal Display Corporation (50%), BE-ST Bellevuestrasse
Development GmbH & Co. First Real Estate KG, Berlin (50%), InterTrust Technologies Corporation (49.5%)
and Crosswave Communications Inc. (23.9%).
Yen in millions
Dollars in millions
March 31 March 31, 2002 2003 2003
Theatrical:
Released (including acquired film libraries) ¥134,997 ¥142,168 $1,185 Completed not released 9,465 13,356 111 In production and development 115,458 91,696 764
Television licensing:
Released (including acquired film libraries) 48,623 40,417 337 In production and development 4,511 141 1
¥313,054 ¥287,778 $2,398
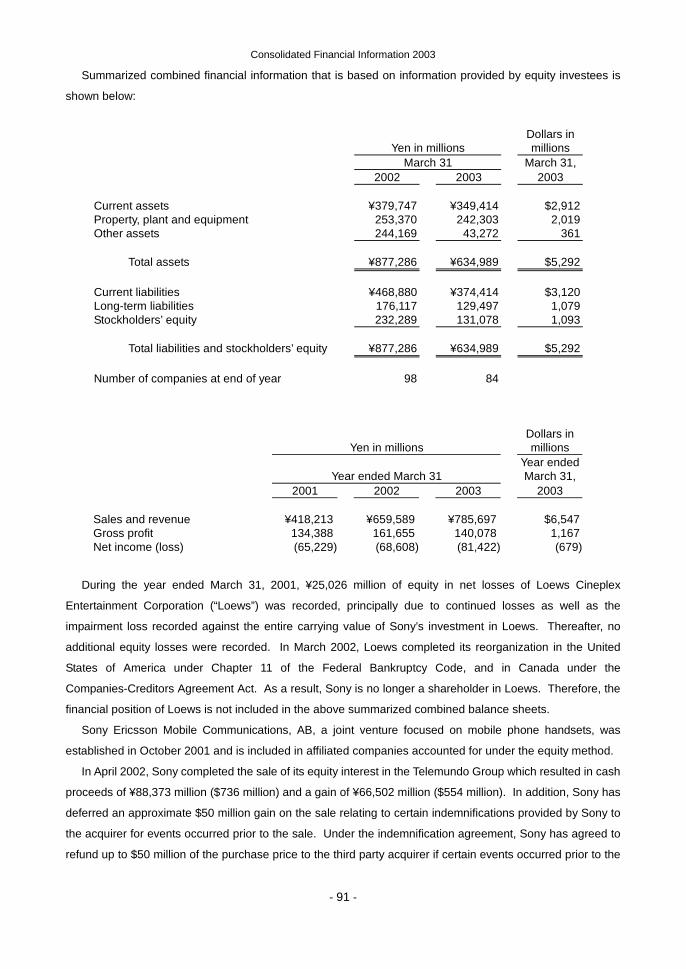
Consolidated Financial Information 2003
- 91 -
Summarized combined financial information that is based on information provided by equity investees is
shown below:
Yen in millions Dollars in
millions March 31 March 31, 2002 2003 2003 Current assets ¥379,747 ¥349,414 $2,912 Property, plant and equipment 253,370 242,303 2,019 Other assets 244,169 43,272 361
Total assets ¥877,286 ¥634,989 $5,292
Current liabilities ¥468,880 ¥374,414 $3,120 Long-term liabilities 176,117 129,497 1,079 Stockholders’ equity 232,289 131,078 1,093
Total liabilities and stockholders’ equity ¥877,286 ¥634,989 $5,292 Number of companies at end of year 98 84
Yen in millions Dollars in
millions
Year ended March 31 Year ended
March 31, 2001 2002 2003 2003 Sales and revenue ¥418,213 ¥659,589 ¥785,697 $6,547 Gross profit 134,388 161,655 140,078 1,167 Net income (loss) (65,229) (68,608) (81,422) (679)
During the year ended March 31, 2001, ¥25,026 million of equity in net losses of Loews Cineplex
Entertainment Corporation (“Loews”) was recorded, principally due to continued losses as well as the
impairment loss recorded against the entire carrying value of Sony’s investment in Loews. Thereafter, no
additional equity losses were recorded. In March 2002, Loews completed its reorganization in the United
States of America under Chapter 11 of the Federal Bankruptcy Code, and in Canada under the
Companies-Creditors Agreement Act. As a result, Sony is no longer a shareholder in Loews. Therefore, the
financial position of Loews is not included in the above summarized combined balance sheets.
Sony Ericsson Mobile Communications, AB, a joint venture focused on mobile phone handsets, was
established in October 2001 and is included in affiliated companies accounted for under the equity method.
In April 2002, Sony completed the sale of its equity interest in the Telemundo Group which resulted in cash
proceeds of ¥88,373 million ($736 million) and a gain of ¥66,502 million ($554 million). In addition, Sony has
deferred an approximate $50 million gain on the sale relating to certain indemnifications provided by Sony to
the acquirer for events occurred prior to the sale. Under the indemnification agreement, Sony has agreed to
refund up to $50 million of the purchase price to the third party acquirer if certain events occurred prior to the
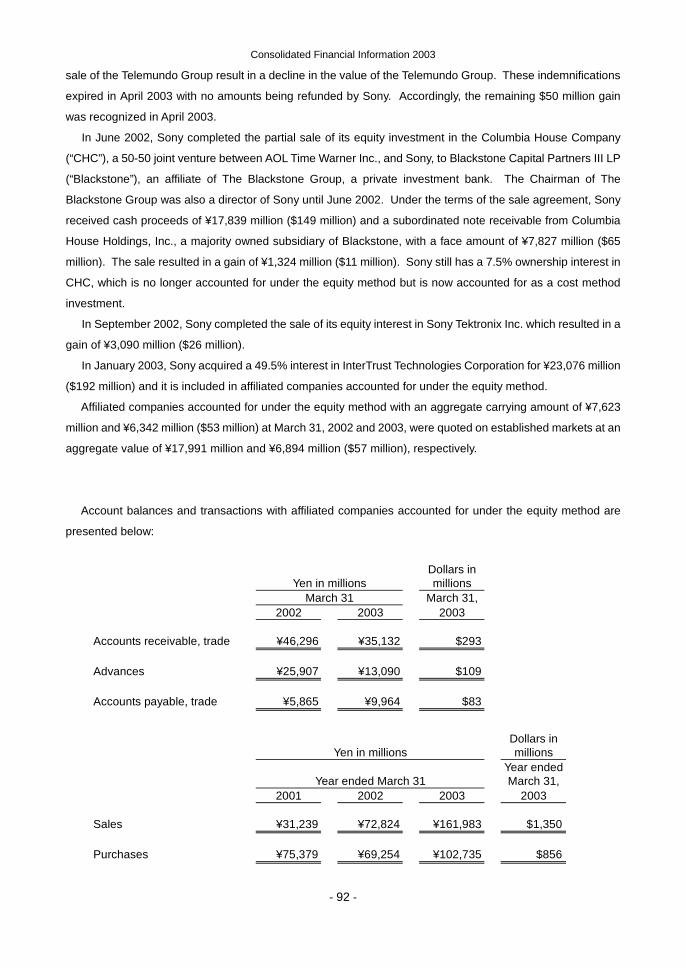
Consolidated Financial Information 2003
- 92 -
sale of the Telemundo Group result in a decline in the value of the Telemundo Group. These indemnifications
expired in April 2003 with no amounts being refunded by Sony. Accordingly, the remaining $50 million gain
was recognized in April 2003.
In June 2002, Sony completed the partial sale of its equity investment in the Columbia House Company
(“CHC”), a 50-50 joint venture between AOL Time Warner Inc., and Sony, to Blackstone Capital Partners III LP
(“Blackstone”), an affiliate of The Blackstone Group, a private investment bank. The Chairman of The
Blackstone Group was also a director of Sony until June 2002. Under the terms of the sale agreement, Sony
received cash proceeds of ¥17,839 million ($149 million) and a subordinated note receivable from Columbia
House Holdings, Inc., a majority owned subsidiary of Blackstone, with a face amount of ¥7,827 million ($65
million). The sale resulted in a gain of ¥1,324 million ($11 million). Sony still has a 7.5% ownership interest in
CHC, which is no longer accounted for under the equity method but is now accounted for as a cost method
investment.
In September 2002, Sony completed the sale of its equity interest in Sony Tektronix Inc. which resulted in a
gain of ¥3,090 million ($26 million).
In January 2003, Sony acquired a 49.5% interest in InterTrust Technologies Corporation for ¥23,076 million
($192 million) and it is included in affiliated companies accounted for under the equity method.
Affiliated companies accounted for under the equity method with an aggregate carrying amount of ¥7,623
million and ¥6,342 million ($53 million) at March 31, 2002 and 2003, were quoted on established markets at an
aggregate value of ¥17,991 million and ¥6,894 million ($57 million), respectively.
Account balances and transactions with affiliated companies accounted for under the equity method are
presented below:
Yen in millions Dollars in
millions March 31 March 31, 2002 2003 2003
Accounts receivable, trade ¥46,296 ¥35,132 $293
Advances ¥25,907 ¥13,090 $109
Accounts payable, trade ¥5,865 ¥9,964 $83
Yen in millions Dollars in
millions
Year ended March 31 Year ended
March 31, 2001 2002 2003 2003
Sales ¥31,239 ¥72,824 ¥161,983 $1,350
Purchases ¥75,379 ¥69,254 ¥102,735 $856
Consolidated Financial Information 2003
- 93 -
Dividends from affiliated companies accounted for under the equity method for the years ended March 31,
2001, 2002 and 2003 were ¥2,764 million, ¥3,065 million and ¥2,002 million ($17 million), respectively.
7. Accounts receivable securitization program
In the United States of America, Sony set up an accounts receivable securitization program whereby Sony can
sell interests in up to $900 million of eligible trade accounts receivable, as defined. Through this program,
Sony can securitize and sell a percentage of undivided interest in that pool of receivables to several multi-seller
commercial paper conduits owned and operated by banks. Sony can sell receivables in which the agreed
upon original due dates are no more than 90 days after the invoice dates. The value assigned to undivided
interests retained in securitized trade receivables is based on the relative fair values of the interest retained
and sold in the securitization. Sony has assumed that the fair value of the retained interest is equivalent to its
carrying value as the receivables are short-term in nature, high quality and have appropriate reserves for bad
debt incidence. The initial sale of the receivables was in October 2001 and the maximum amount funded was
¥109,060 million for the fiscal year ended March 31, 2002. There was no sale of receivables for the fiscal year
ended March 31, 2003. There were no outstanding amounts due at March 31, 2002 and 2003 relating to the
existing undivided interests in the pool of receivables that had been sold. Losses from these transactions were
insignificant.
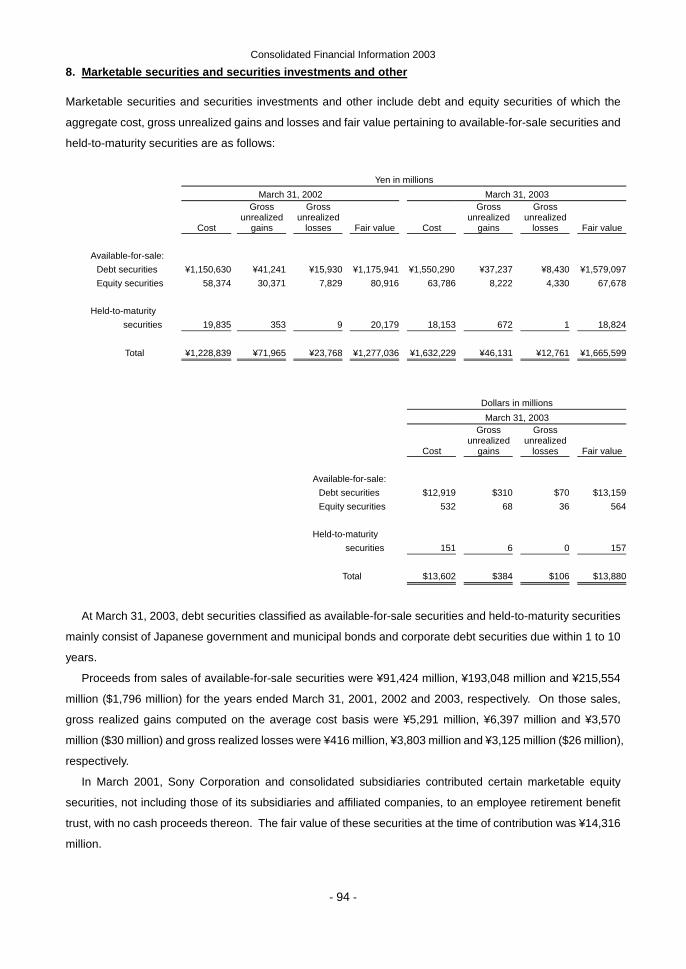
Consolidated Financial Information 2003
- 94 -
8. Marketable securities and securities investments and other
Marketable securities and securities investments and other include debt and equity securities of which the
aggregate cost, gross unrealized gains and losses and fair value pertaining to available-for-sale securities and
held-to-maturity securities are as follows:
Yen in millions March 31, 2002 March 31, 2003
Cost
Gross unrealized
gains
Gross unrealized
losses Fair value Cost
Gross unrealized
gains
Gross unrealized
losses Fair value Available-for-sale:
Debt securities ¥1,150,630 ¥41,241 ¥15,930 ¥1,175,941 ¥1,550,290 ¥37,237 ¥8,430 ¥1,579,097Equity securities 58,374 30,371 7,829 80,916 63,786 8,222 4,330 67,678
Held-to-maturity
securities 19,835 353 9 20,179 18,153 672 1 18,824
Total ¥1,228,839 ¥71,965 ¥23,768 ¥1,277,036 ¥1,632,229 ¥46,131 ¥12,761 ¥1,665,599
Dollars in millions March 31, 2003
Cost
Gross unrealized
gains
Gross unrealized
losses Fair value
Available-for-sale: Debt securities $12,919 $310 $70 $13,159Equity securities 532 68 36 564
Held-to-maturity
securities 151 6 0 157
Total $13,602 $384 $106 $13,880
At March 31, 2003, debt securities classified as available-for-sale securities and held-to-maturity securities
mainly consist of Japanese government and municipal bonds and corporate debt securities due within 1 to 10
years.
Proceeds from sales of available-for-sale securities were ¥91,424 million, ¥193,048 million and ¥215,554
million ($1,796 million) for the years ended March 31, 2001, 2002 and 2003, respectively. On those sales,
gross realized gains computed on the average cost basis were ¥5,291 million, ¥6,397 million and ¥3,570
million ($30 million) and gross realized losses were ¥416 million, ¥3,803 million and ¥3,125 million ($26 million),
respectively.
In March 2001, Sony Corporation and consolidated subsidiaries contributed certain marketable equity
securities, not including those of its subsidiaries and affiliated companies, to an employee retirement benefit
trust, with no cash proceeds thereon. The fair value of these securities at the time of contribution was ¥14,316
million.
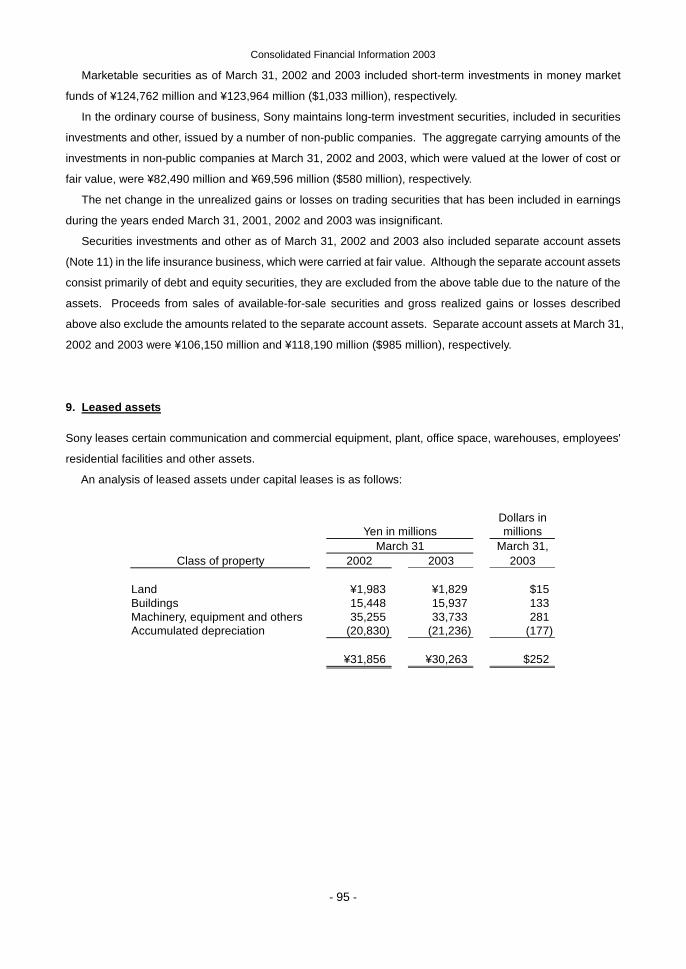
Consolidated Financial Information 2003
- 95 -
Marketable securities as of March 31, 2002 and 2003 included short-term investments in money market
funds of ¥124,762 million and ¥123,964 million ($1,033 million), respectively.
In the ordinary course of business, Sony maintains long-term investment securities, included in securities
investments and other, issued by a number of non-public companies. The aggregate carrying amounts of the
investments in non-public companies at March 31, 2002 and 2003, which were valued at the lower of cost or
fair value, were ¥82,490 million and ¥69,596 million ($580 million), respectively.
The net change in the unrealized gains or losses on trading securities that has been included in earnings
during the years ended March 31, 2001, 2002 and 2003 was insignificant.
Securities investments and other as of March 31, 2002 and 2003 also included separate account assets
(Note 11) in the life insurance business, which were carried at fair value. Although the separate account assets
consist primarily of debt and equity securities, they are excluded from the above table due to the nature of the
assets. Proceeds from sales of available-for-sale securities and gross realized gains or losses described
above also exclude the amounts related to the separate account assets. Separate account assets at March 31,
2002 and 2003 were ¥106,150 million and ¥118,190 million ($985 million), respectively.
9. Leased assets
Sony leases certain communication and commercial equipment, plant, office space, warehouses, employees'
residential facilities and other assets.
An analysis of leased assets under capital leases is as follows:
Yen in millions Dollars in
millions March 31 March 31,
Class of property 2002 2003 2003
Land ¥1,983 ¥1,829 $15 Buildings 15,448 15,937 133 Machinery, equipment and others 35,255 33,733 281 Accumulated depreciation (20,830) (21,236) (177)
¥31,856 ¥30,263 $252
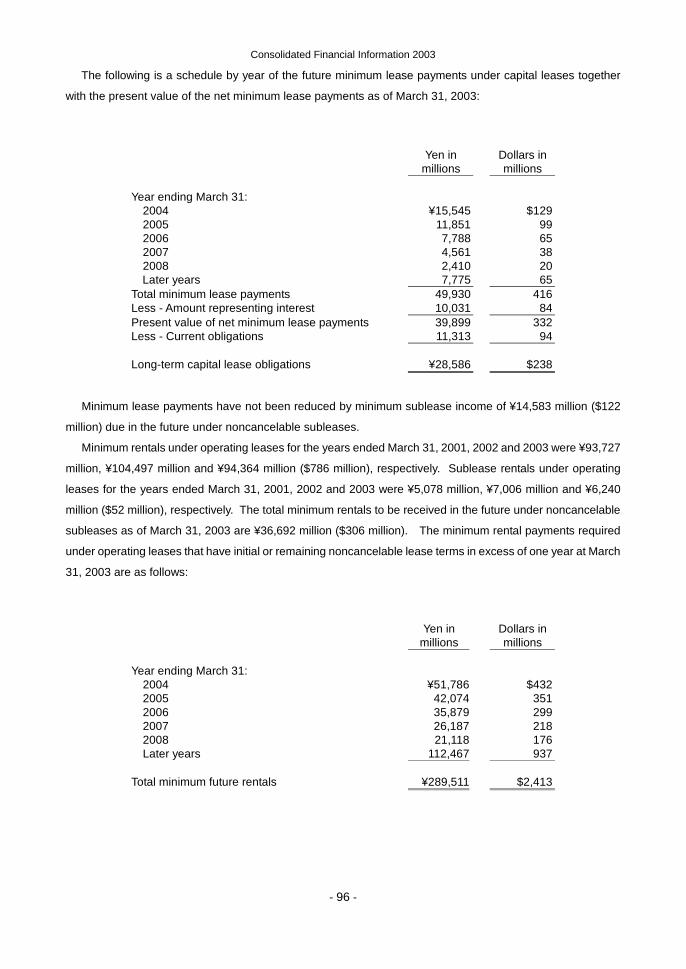
Consolidated Financial Information 2003
- 96 -
The following is a schedule by year of the future minimum lease payments under capital leases together
with the present value of the net minimum lease payments as of March 31, 2003:
Yen in
millions Dollars in
millions
Year ending March 31: 2004 ¥15,545 $129 2005 11,851 99 2006 7,788 65 2007 4,561 38 2008 2,410 20 Later years 7,775 65
Total minimum lease payments 49,930 416 Less - Amount representing interest 10,031 84 Present value of net minimum lease payments 39,899 332 Less - Current obligations 11,313 94
Long-term capital lease obligations ¥28,586 $238
Minimum lease payments have not been reduced by minimum sublease income of ¥14,583 million ($122
million) due in the future under noncancelable subleases.
Minimum rentals under operating leases for the years ended March 31, 2001, 2002 and 2003 were ¥93,727
million, ¥104,497 million and ¥94,364 million ($786 million), respectively. Sublease rentals under operating
leases for the years ended March 31, 2001, 2002 and 2003 were ¥5,078 million, ¥7,006 million and ¥6,240
million ($52 million), respectively. The total minimum rentals to be received in the future under noncancelable
subleases as of March 31, 2003 are ¥36,692 million ($306 million). The minimum rental payments required
under operating leases that have initial or remaining noncancelable lease terms in excess of one year at March
31, 2003 are as follows:
Yen in
millions Dollars in
millions
Year ending March 31: 2004 ¥51,786 $432 2005 42,074 351 2006 35,879 299 2007 26,187 218 2008 21,118 176 Later years 112,467 937
Total minimum future rentals ¥289,511 $2,413
Consolidated Financial Information 2003
- 97 -
10. Goodwill and intangible assets
As discussed in Note 2, Sony elected early adoption of FAS No. 142, retroactive to April 1, 2001. Upon the
adoption of this statement, Sony reassessed the useful lives of its intangible assets and determined that certain
intangible assets including trademarks have indefinite lives and, as a result, will no longer be amortized. At
April 1, 2001, intangible assets having an indefinite life totaled ¥76,029 million. Sony performed the transitional
impairment test for these intangible assets and determined that the fair value of these assets was in excess of
the current carrying amount. Accordingly, no impairment loss was recorded for intangible assets upon the
adoption of FAS No. 142.
Intangible assets acquired during the year ended March 31, 2003 totaled ¥54,404 million ($453 million),
which are subject to amortization and primarily consist of music catalogs of ¥24,058 million ($200 million),
acquired patent rights of ¥13,114 million ($109 million) and software to be sold, leased or otherwise marketed
of ¥6,412 million ($53 million). The weighted average amortization period for music catalogs, acquired patent
rights and software to be sold, leased or otherwise marketed is 37 years, 8 years and 3 years, respectively.
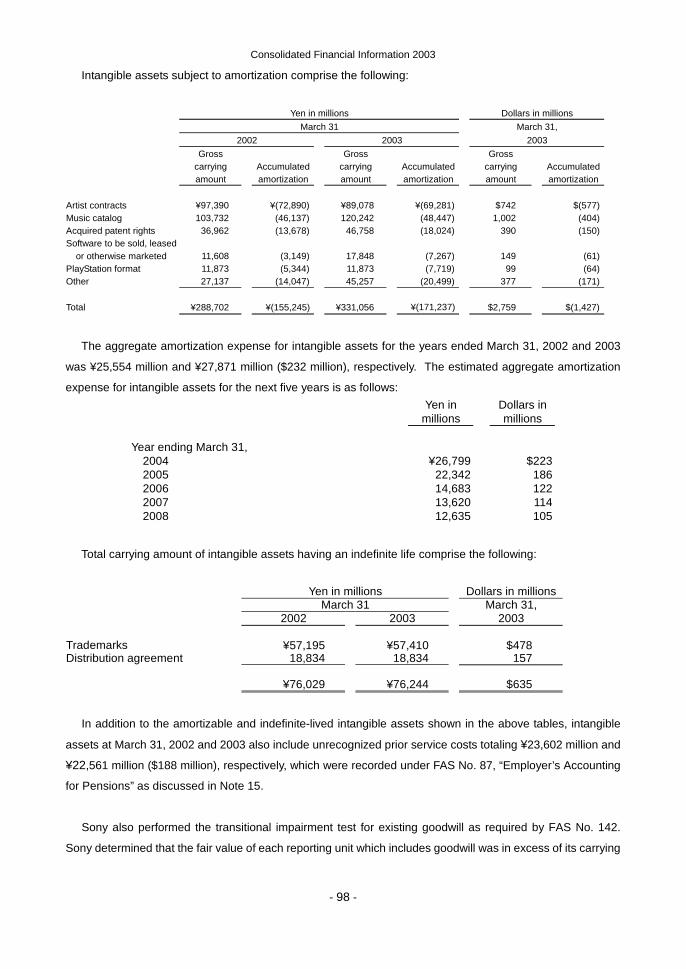
Consolidated Financial Information 2003
- 98 -
Intangible assets subject to amortization comprise the following:
Yen in millions Dollars in millions March 31 March 31, 2002 2003 2003 Gross
carrying amount
Accumulated amortization
Gross carrying amount
Accumulatedamortization
Gross carrying amount
Accumulated amortization
Artist contracts ¥97,390 ¥(72,890) ¥89,078 ¥(69,281) $742 $(577) Music catalog 103,732 (46,137) 120,242 (48,447) 1,002 (404) Acquired patent rights 36,962 (13,678) 46,758 (18,024) 390 (150) Software to be sold, leased
or otherwise marketed 11,608 (3,149)
17,848 (7,267) 149 (61) PlayStation format 11,873 (5,344) 11,873 (7,719) 99 (64) Other 27,137 (14,047) 45,257 (20,499) 377 (171) Total ¥288,702 ¥(155,245)
¥331,056 ¥(171,237) $2,759 $(1,427)
The aggregate amortization expense for intangible assets for the years ended March 31, 2002 and 2003
was ¥25,554 million and ¥27,871 million ($232 million), respectively. The estimated aggregate amortization
expense for intangible assets for the next five years is as follows: Yen in
millions Dollars in
millions
Year ending March 31, 2004 ¥26,799 $223 2005 22,342 186 2006 14,683 122 2007 13,620 114 2008 12,635 105
Total carrying amount of intangible assets having an indefinite life comprise the following:
Yen in millions Dollars in millions March 31 March 31, 2002 2003 2003 Trademarks ¥57,195 ¥57,410 $478 Distribution agreement 18,834 18,834 157 ¥76,029 ¥76,244 $635
In addition to the amortizable and indefinite-lived intangible assets shown in the above tables, intangible
assets at March 31, 2002 and 2003 also include unrecognized prior service costs totaling ¥23,602 million and
¥22,561 million ($188 million), respectively, which were recorded under FAS No. 87, “Employer’s Accounting
for Pensions” as discussed in Note 15.
Sony also performed the transitional impairment test for existing goodwill as required by FAS No. 142.
Sony determined that the fair value of each reporting unit which includes goodwill was in excess of its carrying
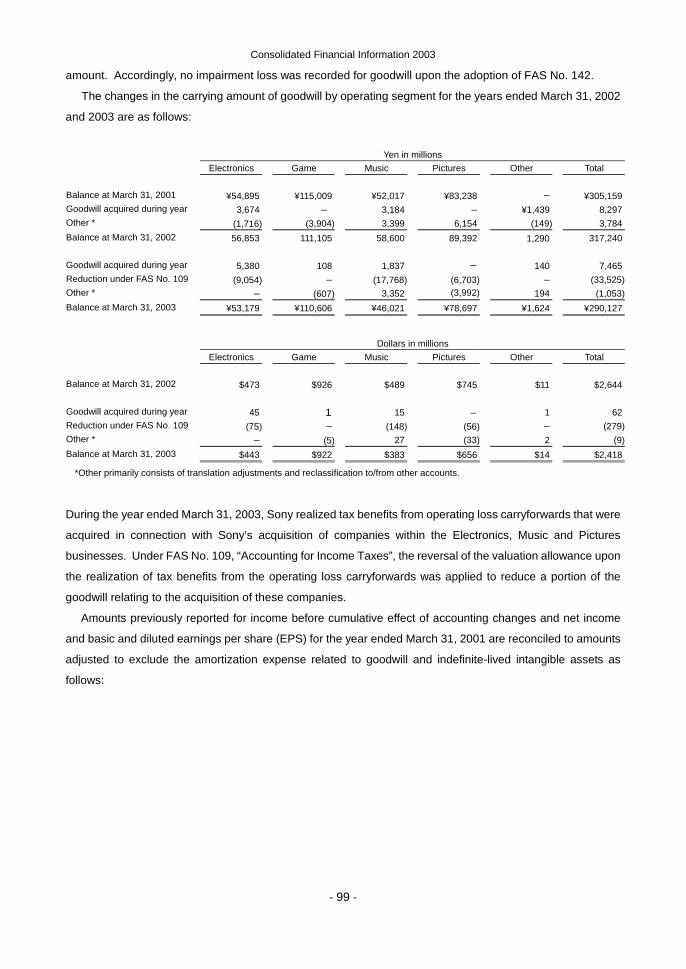
Consolidated Financial Information 2003
- 99 -
amount. Accordingly, no impairment loss was recorded for goodwill upon the adoption of FAS No. 142.
The changes in the carrying amount of goodwill by operating segment for the years ended March 31, 2002
and 2003 are as follows:
Yen in millions Electronics Game Music Pictures Other Total Balance at March 31, 2001 ¥54,895 ¥115,009 ¥52,017 ¥83,238 – ¥305,159 Goodwill acquired during year 3,674 – 3,184 – ¥1,439 8,297 Other * (1,716) (3,904) 3,399 6,154 (149) 3,784 Balance at March 31, 2002 56,853 111,105 58,600 89,392 1,290 317,240 Goodwill acquired during year 5,380 108 1,837 – 140 7,465 Reduction under FAS No. 109 (9,054) – (17,768) (6,703) – (33,525)Other * – (607) 3,352 (3,992) 194 (1,053)Balance at March 31, 2003 ¥53,179 ¥110,606 ¥46,021 ¥78,697 ¥1,624 ¥290,127
Dollars in millions Electronics Game Music Pictures Other Total Balance at March 31, 2002 $473 $926 $489 $745 $11 $2,644 Goodwill acquired during year 45 1 15 – 1 62 Reduction under FAS No. 109 (75) – (148) (56) – (279)Other * – (5) 27 (33) 2 (9)Balance at March 31, 2003 $443 $922 $383 $656 $14 $2,418
*Other primarily consists of translation adjustments and reclassification to/from other accounts.
During the year ended March 31, 2003, Sony realized tax benefits from operating loss carryforwards that were
acquired in connection with Sony’s acquisition of companies within the Electronics, Music and Pictures
businesses. Under FAS No. 109, “Accounting for Income Taxes”, the reversal of the valuation allowance upon
the realization of tax benefits from the operating loss carryforwards was applied to reduce a portion of the
goodwill relating to the acquisition of these companies.
Amounts previously reported for income before cumulative effect of accounting changes and net income
and basic and diluted earnings per share (EPS) for the year ended March 31, 2001 are reconciled to amounts
adjusted to exclude the amortization expense related to goodwill and indefinite-lived intangible assets as
follows:
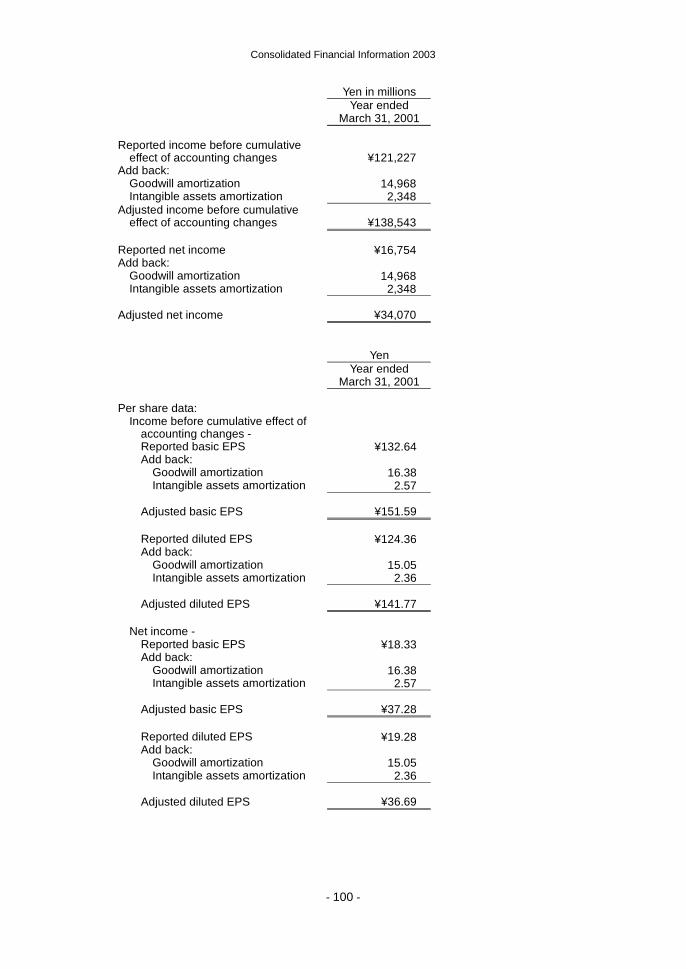
Consolidated Financial Information 2003
- 100 -
Yen in millions Year ended March 31, 2001 Reported income before cumulative
effect of accounting changes ¥121,227 Add back:
Goodwill amortization 14,968 Intangible assets amortization 2,348
Adjusted income before cumulative effect of accounting changes ¥138,543
Reported net income ¥16,754 Add back:
Goodwill amortization 14,968 Intangible assets amortization 2,348
Adjusted net income ¥34,070 Yen Year ended March 31, 2001 Per share data:
Income before cumulative effect of accounting changes - Reported basic EPS ¥132.64 Add back:
Goodwill amortization 16.38 Intangible assets amortization 2.57
Adjusted basic EPS ¥151.59
Reported diluted EPS ¥124.36 Add back:
Goodwill amortization 15.05 Intangible assets amortization 2.36
Adjusted diluted EPS ¥141.77
Net income -
Reported basic EPS ¥18.33 Add back:
Goodwill amortization 16.38 Intangible assets amortization 2.57
Adjusted basic EPS ¥37.28
Reported diluted EPS ¥19.28 Add back:
Goodwill amortization 15.05 Intangible assets amortization 2.36
Adjusted diluted EPS ¥36.69
Consolidated Financial Information 2003
- 101 -
11. Insurance-related accounts
Sony’s life and non-life insurance subsidiaries in Japan maintain their accounting records as described in Note
2 in accordance with the accounting principles and practices generally accepted in Japan, which vary in some
respects from U.S. GAAP.
Those differences are mainly that insurance acquisition costs are charged to income when incurred in
Japan whereas in the United States of America those costs are deferred and amortized generally over the
premium-paying period of the insurance policies, and that future policy benefits calculated locally under the
authorization of the supervisory administrative agencies are comprehensively adjusted to a net level premium
method with certain adjustments of actuarial assumptions for U.S. GAAP purposes. For purposes of preparing
the consolidated financial statements, appropriate adjustments have been made to reflect such items in
accordance with U.S. GAAP.
The amounts of statutory net equity of the subsidiaries as of March 31, 2002 and 2003 were ¥101,989
million and ¥100,441 million ($837 million), respectively.
(1) Insurance policies:
Life insurance policies that the life insurance subsidiary writes, most of which are categorized as
long-duration contracts, mainly consist of whole life, term life and accident and health insurance contracts.
The life insurance revenues for the years ended March 31, 2001, 2002 and 2003 were ¥393,432 million,
¥430,019 million and ¥450,363 million ($3,753 million), respectively. Property and casualty insurance
policies that the non-life insurance subsidiary writes are primarily automotive insurance contracts which are
categorized as short-duration contracts. The non-life insurance revenues for the years ended March 31,
2001, 2002 and 2003 were ¥4,545 million, ¥13,164 million and ¥21,269 million ($177 million), respectively.
(2) Deferred insurance acquisition costs:
Insurance acquisition costs, such as commission expenses, medical examination and inspection report fees,
advertising costs, etc., that vary with and are primarily related to acquiring new insurance policies are
deferred as long as they are recoverable. The deferred insurance acquisition costs are amortized mainly
over the premium-paying period of the related insurance policies using assumptions consistent with those
used in computing policy reserves. Amortization charged to income for the years ended March 31, 2001,
2002 and 2003 amounted to ¥38,886 million, ¥31,000 million and ¥44,578 million ($371 million),
respectively.
(3) Future insurance policy benefits:
Liabilities for future policy benefits are established in amounts adequate to meet the estimated future
obligations of policies in force. These liabilities are computed by the net level premium method based upon
estimates as to future investment yield, mortality and withdrawals. Future policy benefits are computed
using interest rates ranging from approximately 1.00% to 5.50%. Mortality, morbidity and withdrawal
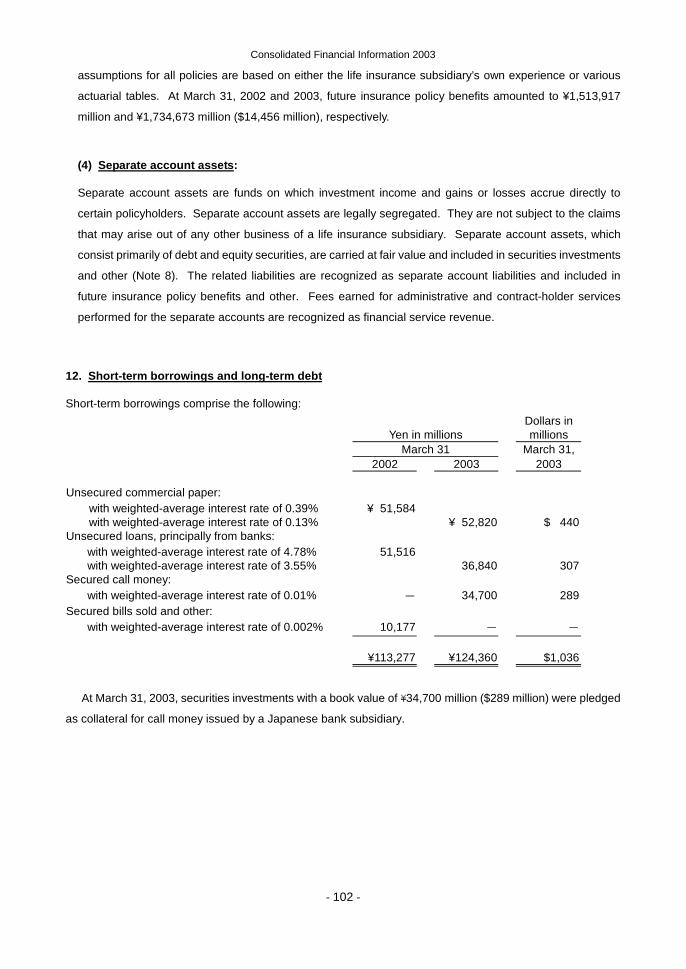
Consolidated Financial Information 2003
- 102 -
assumptions for all policies are based on either the life insurance subsidiary’s own experience or various
actuarial tables. At March 31, 2002 and 2003, future insurance policy benefits amounted to ¥1,513,917
million and ¥1,734,673 million ($14,456 million), respectively.
(4) Separate account assets:
Separate account assets are funds on which investment income and gains or losses accrue directly to
certain policyholders. Separate account assets are legally segregated. They are not subject to the claims
that may arise out of any other business of a life insurance subsidiary. Separate account assets, which
consist primarily of debt and equity securities, are carried at fair value and included in securities investments
and other (Note 8). The related liabilities are recognized as separate account liabilities and included in
future insurance policy benefits and other. Fees earned for administrative and contract-holder services
performed for the separate accounts are recognized as financial service revenue.
12. Short-term borrowings and long-term debt
Short-term borrowings comprise the following:
Yen in millions Dollars in millions
March 31 March 31, 2002 2003 2003 Unsecured commercial paper:
with weighted-average interest rate of 0.39% with weighted-average interest rate of 0.13%
¥ 51,584 ¥ 52,820
$ 440
Unsecured loans, principally from banks: with weighted-average interest rate of 4.78% with weighted-average interest rate of 3.55%
51,516 36,840
307
Secured call money: with weighted-average interest rate of 0.01% - 34,700 289
Secured bills sold and other: with weighted-average interest rate of 0.002% 10,177 - -
¥113,277 ¥124,360 $1,036
At March 31, 2003, securities investments with a book value of ¥34,700 million ($289 million) were pledged
as collateral for call money issued by a Japanese bank subsidiary.
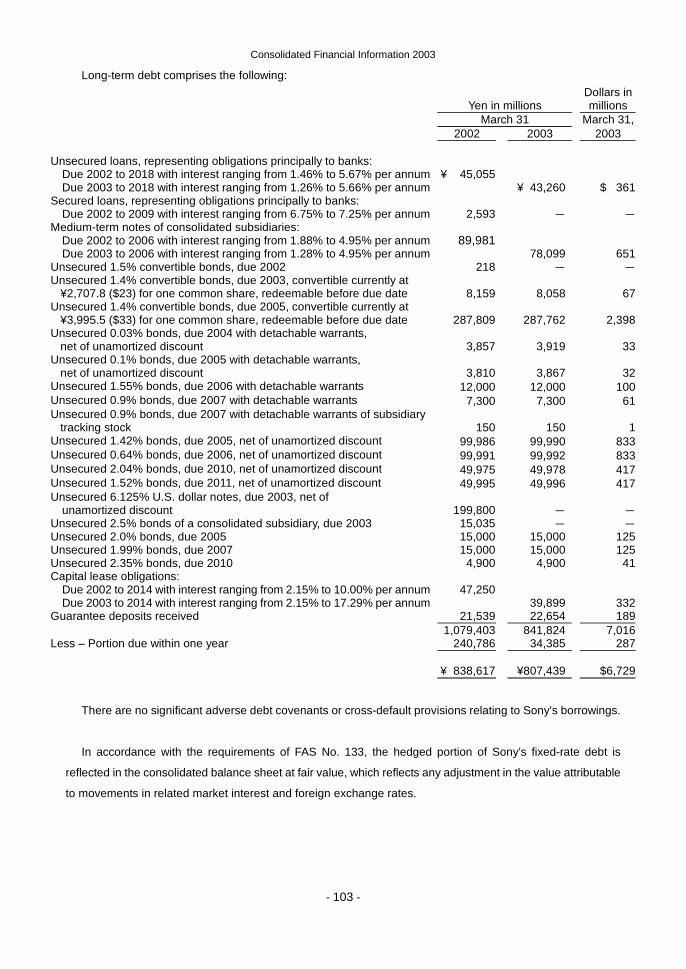
Consolidated Financial Information 2003
- 103 -
Long-term debt comprises the following:
Yen in millions Dollars in
millions March 31 March 31, 2002 2003 2003
Unsecured loans, representing obligations principally to banks:
Due 2002 to 2018 with interest ranging from 1.46% to 5.67% per annum ¥ 45,055 Due 2003 to 2018 with interest ranging from 1.26% to 5.66% per annum ¥ 43,260 $ 361
Secured loans, representing obligations principally to banks: Due 2002 to 2009 with interest ranging from 6.75% to 7.25% per annum 2,593 - -
Medium-term notes of consolidated subsidiaries: Due 2002 to 2006 with interest ranging from 1.88% to 4.95% per annum 89,981 Due 2003 to 2006 with interest ranging from 1.28% to 4.95% per annum 78,099 651
Unsecured 1.5% convertible bonds, due 2002 218 - -Unsecured 1.4% convertible bonds, due 2003, convertible currently at
¥2,707.8 ($23) for one common share, redeemable before due date 8,159 8,058 67Unsecured 1.4% convertible bonds, due 2005, convertible currently at
¥3,995.5 ($33) for one common share, redeemable before due date 287,809 287,762 2,398Unsecured 0.03% bonds, due 2004 with detachable warrants,
net of unamortized discount 3,857 3,919 33Unsecured 0.1% bonds, due 2005 with detachable warrants,
net of unamortized discount 3,810 3,867 32Unsecured 1.55% bonds, due 2006 with detachable warrants 12,000 12,000 100Unsecured 0.9% bonds, due 2007 with detachable warrants 7,300 7,300 61Unsecured 0.9% bonds, due 2007 with detachable warrants of subsidiary
tracking stock 150 150 1Unsecured 1.42% bonds, due 2005, net of unamortized discount 99,986 99,990 833Unsecured 0.64% bonds, due 2006, net of unamortized discount 99,991 99,992 833Unsecured 2.04% bonds, due 2010, net of unamortized discount 49,975 49,978 417Unsecured 1.52% bonds, due 2011, net of unamortized discount 49,995 49,996 417Unsecured 6.125% U.S. dollar notes, due 2003, net of
unamortized discount 199,800 - -Unsecured 2.5% bonds of a consolidated subsidiary, due 2003 15,035 - -Unsecured 2.0% bonds, due 2005 15,000 15,000 125Unsecured 1.99% bonds, due 2007 15,000 15,000 125Unsecured 2.35% bonds, due 2010 4,900 4,900 41Capital lease obligations:
Due 2002 to 2014 with interest ranging from 2.15% to 10.00% per annum 47,250 Due 2003 to 2014 with interest ranging from 2.15% to 17.29% per annum 39,899 332
Guarantee deposits received 21,539 22,654 189 1,079,403 841,824 7,016Less – Portion due within one year 240,786 34,385 287 ¥ 838,617 ¥807,439 $6,729
There are no significant adverse debt covenants or cross-default provisions relating to Sony’s borrowings.
In accordance with the requirements of FAS No. 133, the hedged portion of Sony’s fixed-rate debt is
reflected in the consolidated balance sheet at fair value, which reflects any adjustment in the value attributable
to movements in related market interest and foreign exchange rates.
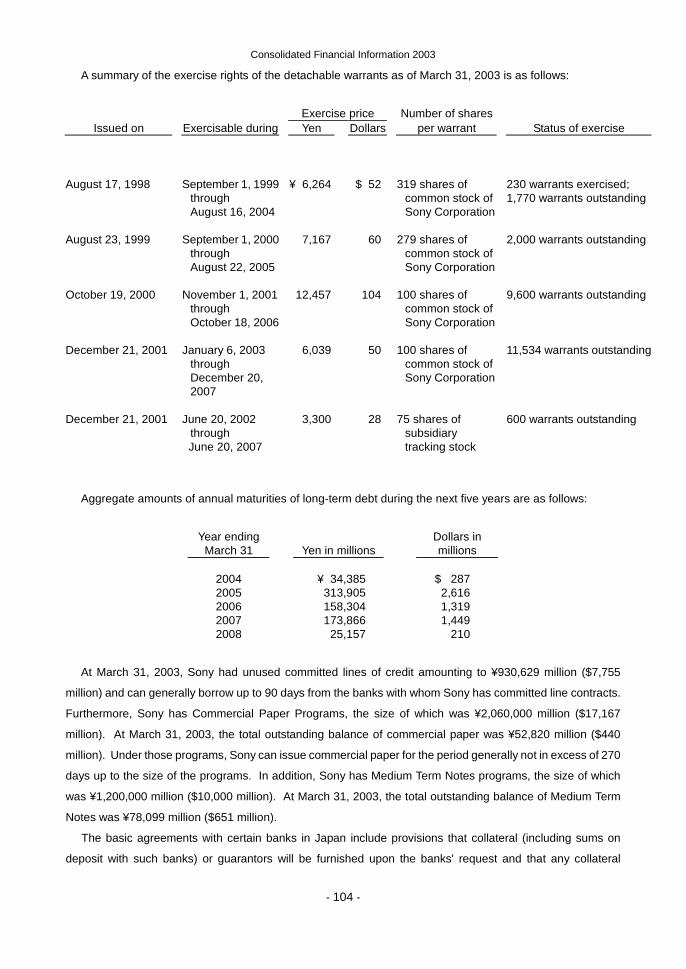
Consolidated Financial Information 2003
- 104 -
A summary of the exercise rights of the detachable warrants as of March 31, 2003 is as follows:
Exercise price Number of shares
Issued on Exercisable during Yen Dollars per warrant Status of exercise August 17, 1998 September 1, 1999
through August 16, 2004
¥ 6,264 $ 52 319 shares of common stock of Sony Corporation
230 warrants exercised; 1,770 warrants outstanding
August 23, 1999 September 1, 2000
through August 22, 2005
7,167 60 279 shares of common stock of Sony Corporation
2,000 warrants outstanding
October 19, 2000 November 1, 2001
through October 18, 2006
12,457 104 100 shares of common stock of Sony Corporation
9,600 warrants outstanding
December 21, 2001 January 6, 2003
through December 20, 2007
6,039 50 100 shares of common stock of Sony Corporation
11,534 warrants outstanding
December 21, 2001 June 20, 2002
through June 20, 2007
3,300 28 75 shares of subsidiary tracking stock
600 warrants outstanding
Aggregate amounts of annual maturities of long-term debt during the next five years are as follows:
Year ending
March 31
Yen in millions Dollars in
millions
2004 ¥ 34,385 $ 287 2005 313,905 2,616 2006 158,304 1,319 2007 173,866 1,449 2008 25,157 210
At March 31, 2003, Sony had unused committed lines of credit amounting to ¥930,629 million ($7,755
million) and can generally borrow up to 90 days from the banks with whom Sony has committed line contracts.
Furthermore, Sony has Commercial Paper Programs, the size of which was ¥2,060,000 million ($17,167
million). At March 31, 2003, the total outstanding balance of commercial paper was ¥52,820 million ($440
million). Under those programs, Sony can issue commercial paper for the period generally not in excess of 270
days up to the size of the programs. In addition, Sony has Medium Term Notes programs, the size of which
was ¥1,200,000 million ($10,000 million). At March 31, 2003, the total outstanding balance of Medium Term
Notes was ¥78,099 million ($651 million).
The basic agreements with certain banks in Japan include provisions that collateral (including sums on
deposit with such banks) or guarantors will be furnished upon the banks' request and that any collateral
Consolidated Financial Information 2003
- 105 -
furnished, pursuant to such agreements or otherwise, will be applicable to all present or future indebtedness to
such banks. 13. Deposits from customers in the banking business
All deposits from customers in the banking business are interest bearing deposits, and are owned by a
Japanese bank subsidiary which was established as an Online Internet bank for individuals. At March 31, 2002
and 2003, the balance of time deposits issued in amounts of ¥10 million ($83 thousand) or more was ¥24,045
million and ¥39,620 million ($330 million), respectively.
At March 31, 2003, aggregate amounts of annual maturities of time deposits with a remaining term of more
than one year include ¥9,802 million ($82 million) and ¥21,010 million ($175 million) for the years ending March
31, 2005 and 2006, respectively. There are no deposits having a maturity date after March 31, 2006.
14. Financial instruments
(1) Derivative instruments and hedging activities:
Sony has certain financial instruments including financial assets and liabilities incurred in the normal course
of business. Such financial instruments are exposed to market risk arising from the changes of foreign
currency exchange rates and interest rates. In applying a consistent risk management strategy for the
purpose of reducing such risk, Sony uses derivative financial instruments, which include foreign exchange
forward contracts, foreign currency option contracts, and interest rate and currency swap agreements. Sony
does not use derivative financial instruments for trading or speculative purposes. Foreign exchange forward
contracts and foreign currency option contracts are utilized primarily to limit the exposure affected by
changes in foreign currency exchange rates on cash flows generated by anticipated intercompany
transactions and intercompany accounts receivable and payable denominated in foreign currencies. Interest
rate and currency swap agreements are utilized primarily to lower funding costs, to diversify sources of
funding and to limit Sony’s exposure associated with underlying debt instruments resulting from adverse
fluctuations in interest rates and/or foreign currency exchange rates.
These instruments are executed with creditworthy financial institutions, and virtually all foreign currency
contracts are denominated in U.S. dollars, euros and other currencies of major countries. Although Sony
may be exposed to losses in the event of nonperformance by counterparties or unfavorable interest and
currency rate movements, it does not anticipate significant losses due to the nature of Sony’s counterparties
or the hedging arrangements.
Derivative financial instruments held by Sony are classified and accounted for as described below
pursuant to FAS No. 133.
Consolidated Financial Information 2003
- 106 -
Fair value hedges
The derivatives designated as fair value hedges include interest rate and currency swap agreements.
Both the derivatives designated as fair value hedge and hedged items are reflected at fair value in the
consolidated balance sheet. Changes in the fair value of the derivatives designated as fair value hedge as
well as offsetting changes in the carrying value of the underlying hedged items are recognized in income
currently.
The amount of ineffectiveness of these fair value hedges, that was reflected in earnings, was not
material for the years ended March 31, 2002 and 2003. In addition, there were no amounts excluded from
the assessment of hedge effectiveness of fair value hedges.
Cash flow hedges
The derivatives designated as cash flow hedges include foreign exchange forward contracts, foreign
currency option contracts and interest rate and currency swap agreements.
Changes in the fair value of derivatives designated as cash flow hedges are initially recorded in other
comprehensive income and reclassified into earnings when the hedged transaction affects earnings.
For the years ended March 31, 2002 and 2003, these cash flow hedges were fully effective. In addition,
there were no amounts excluded from the assessment of hedge effectiveness of cash flow hedges. At
March 31, 2003, amounts related to derivatives qualifying as cash flow hedges amounted to a reduction of
equity of ¥4,793 million ($40 million), of which ¥2,213 million ($18 million) is expected to be reclassified into
earnings within the next twelve months. For the year ended March 31, 2003, there were no forecasted
transactions that failed to occur which resulted in the discontinuance of cash flow hedges.
Derivatives not designated as hedges
The derivatives not designated as hedges under FAS No. 133 include foreign exchange forward contracts,
foreign currency option contracts, interest rate and currency swap agreements, convertible rights included
in convertible bonds and other.
Changes in the fair value of derivatives not designated as hedges are recognized in income currently.
A description of the purpose and classification of the derivative financial instruments held by Sony follows:
Foreign exchange forward contracts and foreign currency option contracts
Sony enters into foreign exchange forward contracts and purchased and written foreign currency option
contracts primarily to fix the cash flows from intercompany accounts receivable and payable and
forecasted transactions denominated in functional currencies (Japanese yen, U.S. dollars and euros) of
Sony’s major operating units. The majority of written foreign currency option contracts are a part of range
forward contract arrangements and expire in the same month with the corresponding purchased foreign
currency option contracts.
Since July 1, 2002, certain foreign currency option contracts have been designated as hedges of
Consolidated Financial Information 2003
- 107 -
forecasted intercompany transactions in line with changes of hedging scheme regarding Sony’s derivative
activities, under which such derivative transactions meet the requirements for hedge accounting, including
correlation, as stipulated under FAS No. 133 and 138.
Sony also enters into foreign exchange forward contracts, which effectively fix the cash flows from
foreign currency denominated debt. Accordingly, these derivatives have been designated as cash flow
hedges in accordance with FAS No. 133.
Foreign exchange forward contracts and foreign currency option contracts that do not qualify as hedges
are marked-to-market with changes in value recognized in other income and expense.
These derivatives generally mature or expire within five months after the balance sheet date.
Interest rate and currency swap agreements
Sony enters into interest rate and currency swap agreements, which are used for reducing the risk arising
from the changes in the fair value of fixed rate debt and available-for-sale debt securities. For example,
Sony enters into interest rate and currency swap agreements, which effectively swap foreign currency
denominated fixed rate debt for functional currency denominated variable rate debt. These derivatives are
considered to be a hedge against changes in the fair value of Sony’s foreign denominated fixed-rate
obligations. Accordingly, these derivatives have been designated as fair value hedges in accordance with
FAS No. 133.
Sony also enters into interest rate and currency swap agreements that are used for reducing the risk
arising from the changes in anticipated cash flow of variable rate debt and foreign currency denominated
debt. For example, Sony enters into interest rate and currency swap agreements, which effectively swap
foreign currency denominated variable rate debt for functional currency denominated fixed rate debt.
These derivatives are considered to be a hedge against changes in the anticipated cash flow of Sony’s
foreign denominated variable rate obligations. Accordingly, these derivatives have been designated as
cash flow hedges in accordance with FAS No. 133.
Any other interest rate and currency swap agreements that do not qualify as hedges, which are used for
reducing the risk arising from changes of variable rate and foreign currency dominated intercompany debt,
are marked-to-market with changes in value recognized in other income and expense.
Embedded derivatives
The embedded derivatives that must be separated from the host contracts and accounted for as derivative
instruments under FAS No. 133 are recognized in income currently. For example, the convertible rights
included in convertible bonds held by Sony’s life insurance subsidiary, which are classified as
available-for-sale debt securities, are considered embedded derivatives and are marked-to-market with
changes in value recognized in financial service revenue.
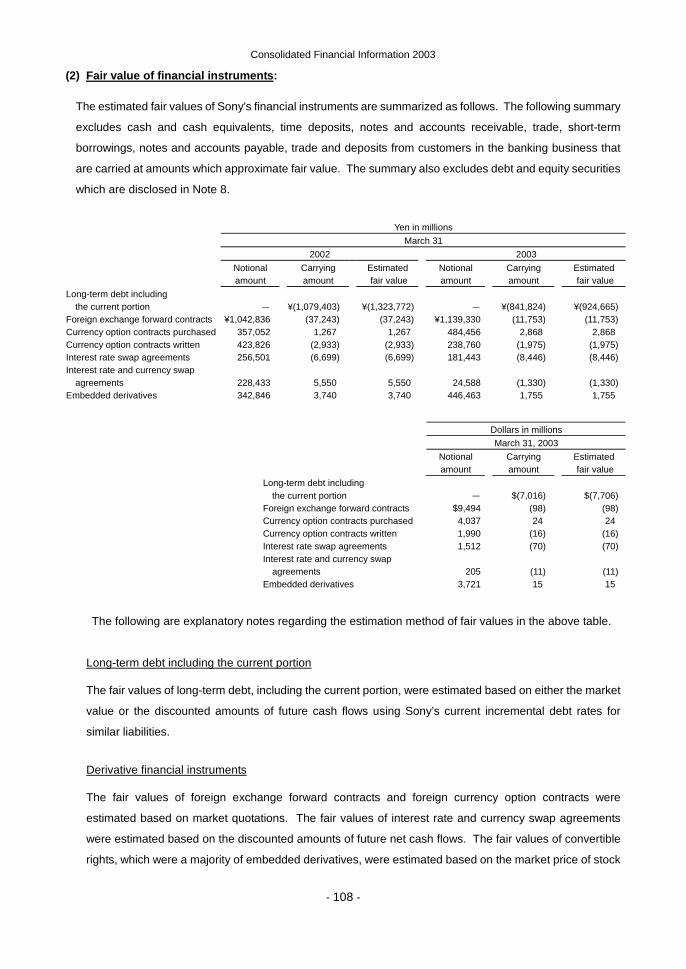
Consolidated Financial Information 2003
- 108 -
(2) Fair value of financial instruments:
The estimated fair values of Sony’s financial instruments are summarized as follows. The following summary
excludes cash and cash equivalents, time deposits, notes and accounts receivable, trade, short-term
borrowings, notes and accounts payable, trade and deposits from customers in the banking business that
are carried at amounts which approximate fair value. The summary also excludes debt and equity securities
which are disclosed in Note 8.
Yen in millions March 31 2002 2003 Notional
amount Carrying amount
Estimated fair value
Notional amount
Carrying amount
Estimated fair value
Long-term debt including the current portion - ¥(1,079,403) ¥(1,323,772) - ¥(841,824) ¥(924,665)
Foreign exchange forward contracts ¥1,042,836 (37,243) (37,243) ¥1,139,330 (11,753) (11,753) Currency option contracts purchased 357,052 1,267 1,267 484,456 2,868 2,868 Currency option contracts written 423,826 (2,933) (2,933) 238,760 (1,975) (1,975) Interest rate swap agreements 256,501 (6,699) (6,699) 181,443 (8,446) (8,446) Interest rate and currency swap
agreements 228,433 5,550 5,550 24,588 (1,330) (1,330) Embedded derivatives 342,846 3,740 3,740 446,463 1,755 1,755
Dollars in millions March 31, 2003 Notional
amount Carrying amount
Estimated fair value
Long-term debt including the current portion - $(7,016) $(7,706)
Foreign exchange forward contracts $9,494 (98) (98) Currency option contracts purchased 4,037 24 24 Currency option contracts written 1,990 (16) (16) Interest rate swap agreements 1,512 (70) (70) Interest rate and currency swap
agreements 205 (11) (11) Embedded derivatives 3,721 15 15
The following are explanatory notes regarding the estimation method of fair values in the above table.
Long-term debt including the current portion
The fair values of long-term debt, including the current portion, were estimated based on either the market
value or the discounted amounts of future cash flows using Sony’s current incremental debt rates for
similar liabilities.
Derivative financial instruments
The fair values of foreign exchange forward contracts and foreign currency option contracts were
estimated based on market quotations. The fair values of interest rate and currency swap agreements
were estimated based on the discounted amounts of future net cash flows. The fair values of convertible
rights, which were a majority of embedded derivatives, were estimated based on the market price of stock
Consolidated Financial Information 2003
- 109 -
which will be acquired by the exercise.
15. Pension and severance plans
Upon terminating employment, employees of Sony Corporation and its subsidiaries in Japan are entitled,
under most circumstances, to lump-sum indemnities or pension payments as described below. For employees
voluntarily retiring, under normal circumstances, minimum payment is an amount based on current rates of pay
and lengths of service. In calculating the minimum payment for employees involuntarily retiring, including
employees retiring due to meeting mandatory retirement age requirements, Sony may grant additional benefits.
With respect to directors' and statutory auditors’ resignations, lump-sum severance indemnities are calculated
using a similar formula and are normally paid subject to the approval of Sony’s shareholders.
Sony Corporation and most of its subsidiaries in Japan have contributory funded defined benefit pension
plans, which are pursuant to the Japanese Welfare Pension Insurance Law. The contributory pension plans
cover a portion of the governmental welfare pension program, under which the contributions are made by the
companies and their employees, and an additional portion representing the substituted noncontributory
pension plans. Under the contributory pension plans, the defined benefits representing the noncontributory
portion of the plans, in general, cover 60% of the indemnities under the existing regulations to employees. The
remaining indemnities are covered by severance payments by the companies. The pension benefits are
determined based on years of service and the compensation amounts, as stipulated in the aforementioned
regulations, are payable at the option of the retiring employee in a lump-sum amount or on a monthly pension.
Contributions to the plans are funded through several financial institutions in accordance with the applicable
laws and regulations.
Many of foreign subsidiaries have defined benefit pension plans or severance indemnity plans which
substantially cover all of their employees, under which the cost of benefits is currently funded or accrued.
Benefits awarded under these plans are based primarily on the current rate of pay and length of service.
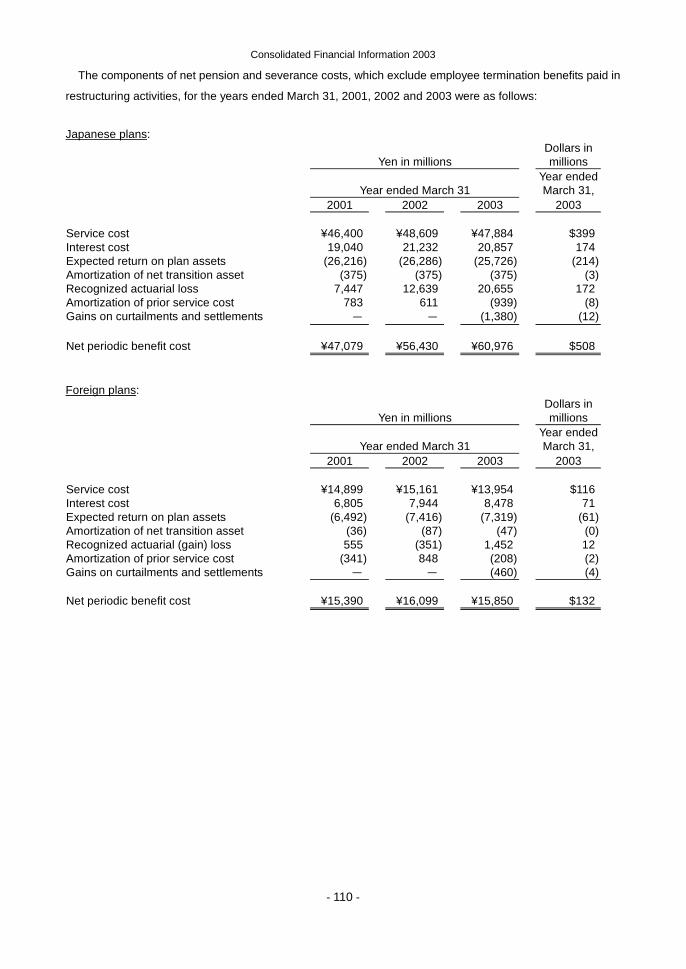
Consolidated Financial Information 2003
- 110 -
The components of net pension and severance costs, which exclude employee termination benefits paid in
restructuring activities, for the years ended March 31, 2001, 2002 and 2003 were as follows:
Japanese plans:
Yen in millions
Dollars in millions
Year ended March 31
Year ended March 31,
2001 2002 2003 2003 Service cost ¥46,400 ¥48,609 ¥47,884 $399 Interest cost 19,040 21,232 20,857 174 Expected return on plan assets (26,216) (26,286) (25,726) (214) Amortization of net transition asset (375) (375) (375) (3) Recognized actuarial loss 7,447 12,639 20,655 172 Amortization of prior service cost 783 611 (939) (8) Gains on curtailments and settlements - - (1,380) (12) Net periodic benefit cost ¥47,079 ¥56,430 ¥60,976 $508 Foreign plans:
Yen in millions
Dollars in millions
Year ended March 31
Year ended March 31,
2001 2002 2003 2003 Service cost ¥14,899 ¥15,161 ¥13,954 $116 Interest cost 6,805 7,944 8,478 71 Expected return on plan assets (6,492) (7,416) (7,319) (61) Amortization of net transition asset (36) (87) (47) (0) Recognized actuarial (gain) loss 555 (351) 1,452 12 Amortization of prior service cost (341) 848 (208) (2) Gains on curtailments and settlements - - (460) (4) Net periodic benefit cost ¥15,390 ¥16,099 ¥15,850 $132
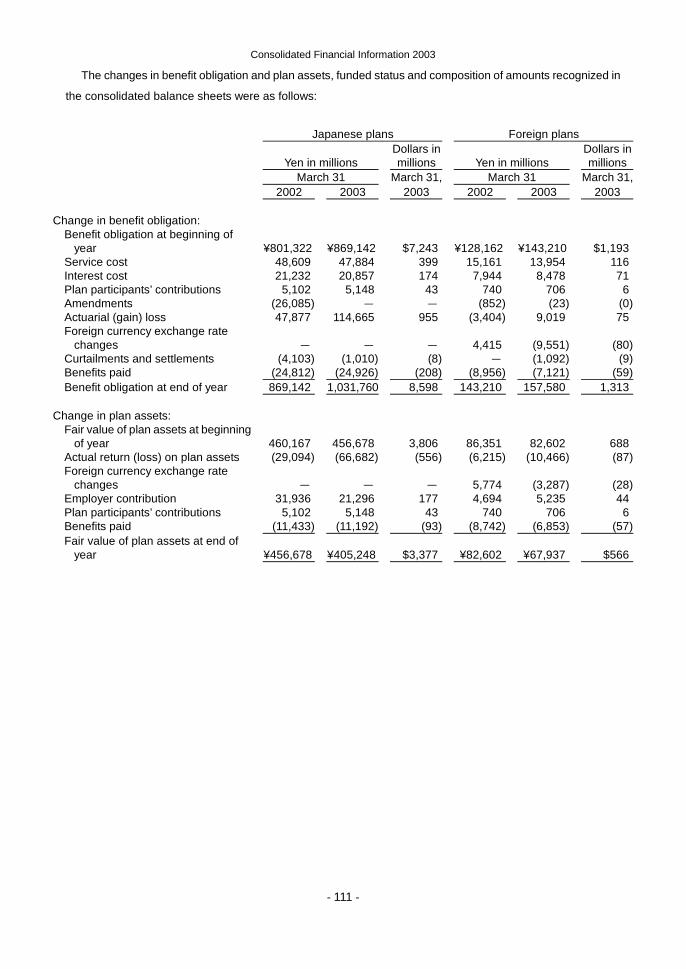
Consolidated Financial Information 2003
- 111 -
The changes in benefit obligation and plan assets, funded status and composition of amounts recognized in
the consolidated balance sheets were as follows:
Japanese plans Foreign plans
Yen in millions Dollars in
millions
Yen in millions Dollars in
millions March 31 March 31, March 31 March 31, 2002 2003 2003 2002 2003 2003
Change in benefit obligation:
Benefit obligation at beginning of year
¥801,322 ¥869,142 $7,243 ¥128,162 ¥143,210 $1,193
Service cost 48,609 47,884 399 15,161 13,954 116 Interest cost 21,232 20,857 174 7,944 8,478 71 Plan participants’ contributions 5,102 5,148 43 740 706 6 Amendments (26,085) - - (852) (23) (0) Actuarial (gain) loss 47,877 114,665 955 (3,404) 9,019 75 Foreign currency exchange rate
changes
- - - 4,415 (9,551) (80) Curtailments and settlements (4,103) (1,010) (8) - (1,092) (9) Benefits paid (24,812) (24,926) (208) (8,956) (7,121) (59) Benefit obligation at end of year 869,142 1,031,760 8,598 143,210 157,580 1,313
Change in plan assets:
Fair value of plan assets at beginning of year
460,167 456,678 3,806 86,351 82,602 688
Actual return (loss) on plan assets (29,094) (66,682) (556) (6,215) (10,466) (87) Foreign currency exchange rate
changes
- - - 5,774 (3,287) (28) Employer contribution 31,936 21,296 177 4,694 5,235 44 Plan participants’ contributions 5,102 5,148 43 740 706 6 Benefits paid (11,433) (11,192) (93) (8,742) (6,853) (57) Fair value of plan assets at end of
year
¥456,678 ¥405,248 $3,377 ¥82,602 ¥67,937 $566
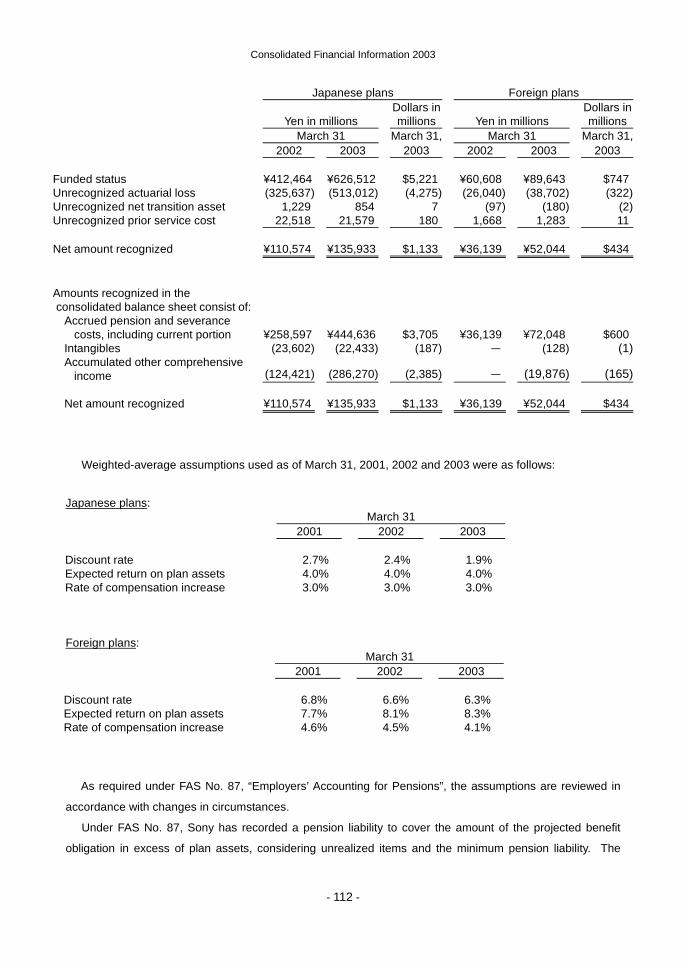
Consolidated Financial Information 2003
- 112 -
Japanese plans Foreign plans
Yen in millions Dollars in
millions
Yen in millions Dollars in
millions March 31 March 31, March 31 March 31, 2002 2003 2003 2002 2003 2003
Funded status ¥412,464 ¥626,512 $5,221 ¥60,608 ¥89,643 $747 Unrecognized actuarial loss (325,637) (513,012) (4,275) (26,040) (38,702) (322) Unrecognized net transition asset 1,229 854 7 (97) (180) (2) Unrecognized prior service cost 22,518 21,579 180 1,668 1,283 11
Net amount recognized ¥110,574 ¥135,933 $1,133 ¥36,139 ¥52,044 $434 Amounts recognized in the consolidated balance sheet consist of:
Accrued pension and severance costs, including current portion
¥258,597 ¥444,636 $3,705 ¥36,139 ¥72,048 $600
Intangibles (23,602) (22,433) (187) - (128) (1) Accumulated other comprehensive
income
(124,421) (286,270) (2,385) - (19,876) (165) Net amount recognized ¥110,574 ¥135,933 $1,133 ¥36,139 ¥52,044 $434
Weighted-average assumptions used as of March 31, 2001, 2002 and 2003 were as follows:
Japanese plans: March 31 2001 2002 2003 Discount rate 2.7% 2.4% 1.9% Expected return on plan assets 4.0% 4.0% 4.0% Rate of compensation increase 3.0% 3.0% 3.0%
Foreign plans: March 31 2001 2002 2003 Discount rate 6.8% 6.6% 6.3% Expected return on plan assets 7.7% 8.1% 8.3% Rate of compensation increase 4.6% 4.5% 4.1%
As required under FAS No. 87, “Employers’ Accounting for Pensions”, the assumptions are reviewed in
accordance with changes in circumstances.
Under FAS No. 87, Sony has recorded a pension liability to cover the amount of the projected benefit
obligation in excess of plan assets, considering unrealized items and the minimum pension liability. The
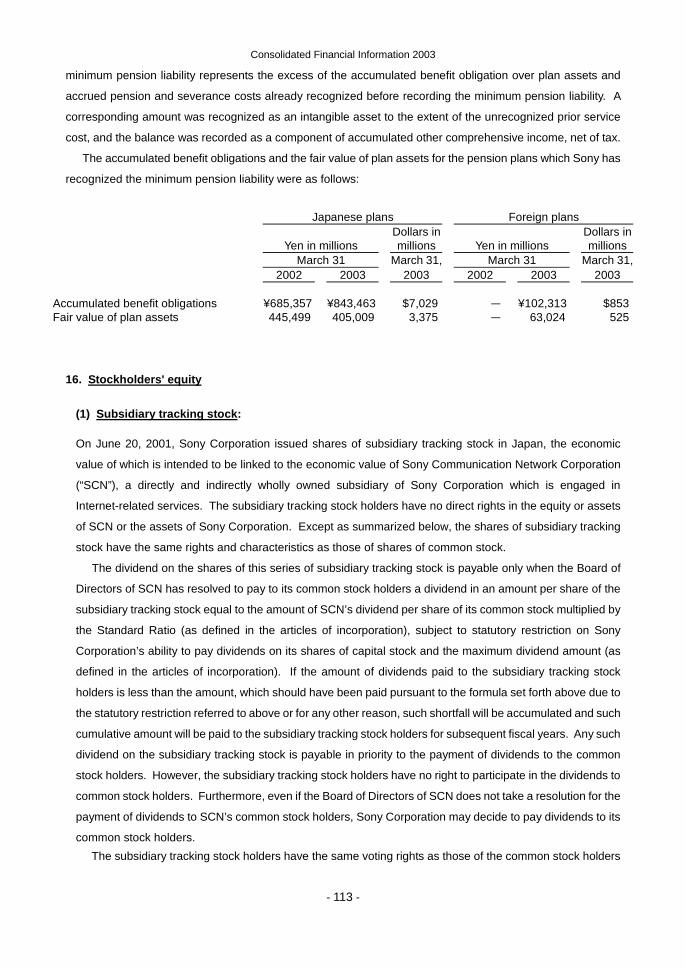
Consolidated Financial Information 2003
- 113 -
minimum pension liability represents the excess of the accumulated benefit obligation over plan assets and
accrued pension and severance costs already recognized before recording the minimum pension liability. A
corresponding amount was recognized as an intangible asset to the extent of the unrecognized prior service
cost, and the balance was recorded as a component of accumulated other comprehensive income, net of tax.
The accumulated benefit obligations and the fair value of plan assets for the pension plans which Sony has
recognized the minimum pension liability were as follows:
Japanese plans Foreign plans
Yen in millions Dollars in
millions
Yen in millions Dollars in
millions March 31 March 31, March 31 March 31, 2002 2003 2003 2002 2003 2003
Accumulated benefit obligations ¥685,357 ¥843,463 $7,029 - ¥102,313 $853 Fair value of plan assets 445,499 405,009 3,375 - 63,024 525
16. Stockholders' equity
(1) Subsidiary tracking stock:
On June 20, 2001, Sony Corporation issued shares of subsidiary tracking stock in Japan, the economic
value of which is intended to be linked to the economic value of Sony Communication Network Corporation
(“SCN”), a directly and indirectly wholly owned subsidiary of Sony Corporation which is engaged in
Internet-related services. The subsidiary tracking stock holders have no direct rights in the equity or assets
of SCN or the assets of Sony Corporation. Except as summarized below, the shares of subsidiary tracking
stock have the same rights and characteristics as those of shares of common stock.
The dividend on the shares of this series of subsidiary tracking stock is payable only when the Board of
Directors of SCN has resolved to pay to its common stock holders a dividend in an amount per share of the
subsidiary tracking stock equal to the amount of SCN’s dividend per share of its common stock multiplied by
the Standard Ratio (as defined in the articles of incorporation), subject to statutory restriction on Sony
Corporation’s ability to pay dividends on its shares of capital stock and the maximum dividend amount (as
defined in the articles of incorporation). If the amount of dividends paid to the subsidiary tracking stock
holders is less than the amount, which should have been paid pursuant to the formula set forth above due to
the statutory restriction referred to above or for any other reason, such shortfall will be accumulated and such
cumulative amount will be paid to the subsidiary tracking stock holders for subsequent fiscal years. Any such
dividend on the subsidiary tracking stock is payable in priority to the payment of dividends to the common
stock holders. However, the subsidiary tracking stock holders have no right to participate in the dividends to
common stock holders. Furthermore, even if the Board of Directors of SCN does not take a resolution for the
payment of dividends to SCN’s common stock holders, Sony Corporation may decide to pay dividends to its
common stock holders. The subsidiary tracking stock holders have the same voting rights as those of the common stock holders
Consolidated Financial Information 2003
- 114 -
and, thus, are entitled to participate and vote at any General Meeting of Shareholders in the same way as the
common stock holders. In addition, as each series of subsidiary tracking stock is a separate class of stock
different from common stock, if any resolution of the General Meeting of Shareholders would adversely affect
the rights of the shareholders of a particular class of subsidiary tracking stock, the shareholders of each class
of subsidiary tracking stock will have the right to approve or disapprove such resolution by a special
resolution of the meeting of shareholders of that class of subsidiary tracking stock.
In the event of distribution of residual assets to the shareholders of Sony Corporation where, as long as
such assets include shares of common stock of SCN, the number of shares of SCN common stock obtained
by multiplying the number of shares of the subsidiary tracking stock held by each holder by the Standard
Ratio or the net proceeds from the sale of the shares of SCN common stock so to be distributed will be
distributed to the holders of the subsidiary tracking stock.
The shares of subsidiary tracking stock may be subject to repurchase and retirement in the same manner
and under the same restriction as the shares of common stock. In addition, at any time after the passage of
three years from the date of the initial issuance of shares of a series of subsidiary tracking stock, it may retire
the entire amount of all outstanding shares of that series of subsidiary tracking stock upon paying to the
shareholders thereof an amount equal to the current market price of the subsidiary tracking stock out of Sony
Corporation’s retained earnings available for dividend payments. Sony Corporation may also retire the
shares of a series of subsidiary tracking stock in their entirety pursuant to the procedures prescribed by the
Japanese Commercial Code for the reduction of capital upon payment to the subsidiary tracking stock
holders an amount equal to the market value thereof as set forth above.
At any time after the passage of three years from the date of the initial issuance of shares of a series of
subsidiary tracking stock, it may convert the entire amount of all outstanding shares of the subsidiary tracking
stock into the shares of Sony Corporation’s common stock at the rate of the multiple of 1.1 of the market
value (as defined in the articles of incorporation) of shares of the subsidiary tracking stock divided by the
market value (as similarly defined) of the shares of Sony Corporation’s common stock.
If any events (as defined in the articles of incorporation) occur, the entire amount of all outstanding shares
of the subsidiary tracking stock will be either retired or converted into shares of Sony Corporation’s common
stock at the price or rate set forth above.
The number of shares of the subsidiary tracking stock issued and outstanding at March 31, 2003 was
3,072,000. At March 31, 2003, 90,500 shares of the subsidiary tracking stock would be issued upon exercise
of warrants and stock acquisition rights outstanding.
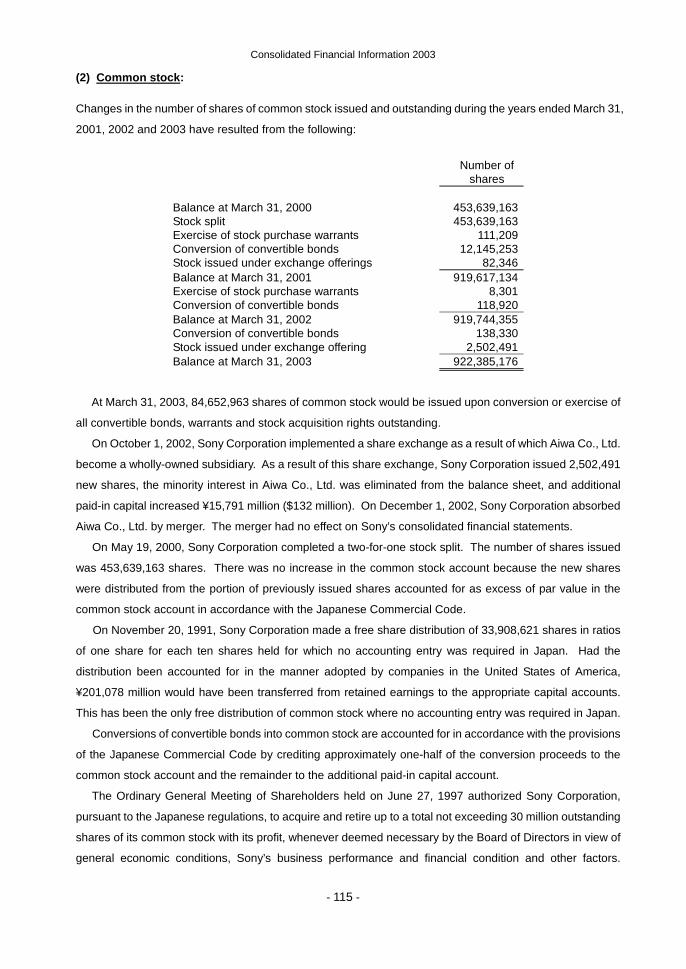
Consolidated Financial Information 2003
- 115 -
(2) Common stock:
Changes in the number of shares of common stock issued and outstanding during the years ended March 31,
2001, 2002 and 2003 have resulted from the following:
Number of shares
Balance at March 31, 2000 453,639,163 Stock split 453,639,163 Exercise of stock purchase warrants 111,209 Conversion of convertible bonds 12,145,253 Stock issued under exchange offerings 82,346 Balance at March 31, 2001 919,617,134 Exercise of stock purchase warrants 8,301 Conversion of convertible bonds 118,920 Balance at March 31, 2002 919,744,355 Conversion of convertible bonds 138,330 Stock issued under exchange offering 2,502,491 Balance at March 31, 2003 922,385,176
At March 31, 2003, 84,652,963 shares of common stock would be issued upon conversion or exercise of
all convertible bonds, warrants and stock acquisition rights outstanding.
On October 1, 2002, Sony Corporation implemented a share exchange as a result of which Aiwa Co., Ltd.
become a wholly-owned subsidiary. As a result of this share exchange, Sony Corporation issued 2,502,491
new shares, the minority interest in Aiwa Co., Ltd. was eliminated from the balance sheet, and additional
paid-in capital increased ¥15,791 million ($132 million). On December 1, 2002, Sony Corporation absorbed
Aiwa Co., Ltd. by merger. The merger had no effect on Sony’s consolidated financial statements.
On May 19, 2000, Sony Corporation completed a two-for-one stock split. The number of shares issued
was 453,639,163 shares. There was no increase in the common stock account because the new shares
were distributed from the portion of previously issued shares accounted for as excess of par value in the
common stock account in accordance with the Japanese Commercial Code.
On November 20, 1991, Sony Corporation made a free share distribution of 33,908,621 shares in ratios
of one share for each ten shares held for which no accounting entry was required in Japan. Had the
distribution been accounted for in the manner adopted by companies in the United States of America,
¥201,078 million would have been transferred from retained earnings to the appropriate capital accounts.
This has been the only free distribution of common stock where no accounting entry was required in Japan.
Conversions of convertible bonds into common stock are accounted for in accordance with the provisions
of the Japanese Commercial Code by crediting approximately one-half of the conversion proceeds to the
common stock account and the remainder to the additional paid-in capital account.
The Ordinary General Meeting of Shareholders held on June 27, 1997 authorized Sony Corporation,
pursuant to the Japanese regulations, to acquire and retire up to a total not exceeding 30 million outstanding
shares of its common stock with its profit, whenever deemed necessary by the Board of Directors in view of
general economic conditions, Sony’s business performance and financial condition and other factors.
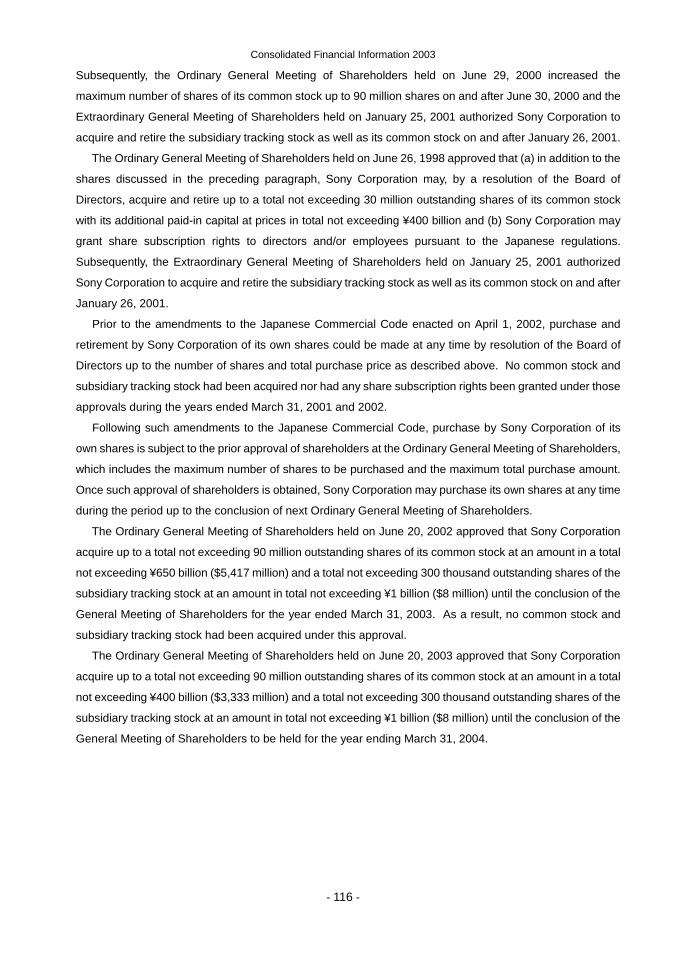
Consolidated Financial Information 2003
- 116 -
Subsequently, the Ordinary General Meeting of Shareholders held on June 29, 2000 increased the
maximum number of shares of its common stock up to 90 million shares on and after June 30, 2000 and the
Extraordinary General Meeting of Shareholders held on January 25, 2001 authorized Sony Corporation to
acquire and retire the subsidiary tracking stock as well as its common stock on and after January 26, 2001.
The Ordinary General Meeting of Shareholders held on June 26, 1998 approved that (a) in addition to the
shares discussed in the preceding paragraph, Sony Corporation may, by a resolution of the Board of
Directors, acquire and retire up to a total not exceeding 30 million outstanding shares of its common stock
with its additional paid-in capital at prices in total not exceeding ¥400 billion and (b) Sony Corporation may
grant share subscription rights to directors and/or employees pursuant to the Japanese regulations.
Subsequently, the Extraordinary General Meeting of Shareholders held on January 25, 2001 authorized
Sony Corporation to acquire and retire the subsidiary tracking stock as well as its common stock on and after
January 26, 2001.
Prior to the amendments to the Japanese Commercial Code enacted on April 1, 2002, purchase and
retirement by Sony Corporation of its own shares could be made at any time by resolution of the Board of
Directors up to the number of shares and total purchase price as described above. No common stock and
subsidiary tracking stock had been acquired nor had any share subscription rights been granted under those
approvals during the years ended March 31, 2001 and 2002.
Following such amendments to the Japanese Commercial Code, purchase by Sony Corporation of its
own shares is subject to the prior approval of shareholders at the Ordinary General Meeting of Shareholders,
which includes the maximum number of shares to be purchased and the maximum total purchase amount.
Once such approval of shareholders is obtained, Sony Corporation may purchase its own shares at any time
during the period up to the conclusion of next Ordinary General Meeting of Shareholders.
The Ordinary General Meeting of Shareholders held on June 20, 2002 approved that Sony Corporation
acquire up to a total not exceeding 90 million outstanding shares of its common stock at an amount in a total
not exceeding ¥650 billion ($5,417 million) and a total not exceeding 300 thousand outstanding shares of the
subsidiary tracking stock at an amount in total not exceeding ¥1 billion ($8 million) until the conclusion of the
General Meeting of Shareholders for the year ended March 31, 2003. As a result, no common stock and
subsidiary tracking stock had been acquired under this approval.
The Ordinary General Meeting of Shareholders held on June 20, 2003 approved that Sony Corporation
acquire up to a total not exceeding 90 million outstanding shares of its common stock at an amount in a total
not exceeding ¥400 billion ($3,333 million) and a total not exceeding 300 thousand outstanding shares of the
subsidiary tracking stock at an amount in total not exceeding ¥1 billion ($8 million) until the conclusion of the
General Meeting of Shareholders to be held for the year ending March 31, 2004.
Consolidated Financial Information 2003
- 117 -
(3) Retained earnings:
The amount of statutory retained earnings of Sony Corporation available for the payments of dividends to
shareholders as of March 31, 2003 was ¥650,705 million ($5,423 million). The appropriation of retained
earnings for the year ended March 31, 2003 including cash dividends for the six-month period ended March
31, 2003 has been incorporated in the accompanying consolidated financial statements. This appropriation
of retained earnings was approved at the Ordinary General Meeting of Shareholders held on June 20, 2003.
Retained earnings include Sony’s equity in undistributed earnings of affiliated companies accounted for
by the equity method in the amount of ¥9,259 million and ¥2,967 million ($25 million) at March 31, 2002 and
2003, respectively.
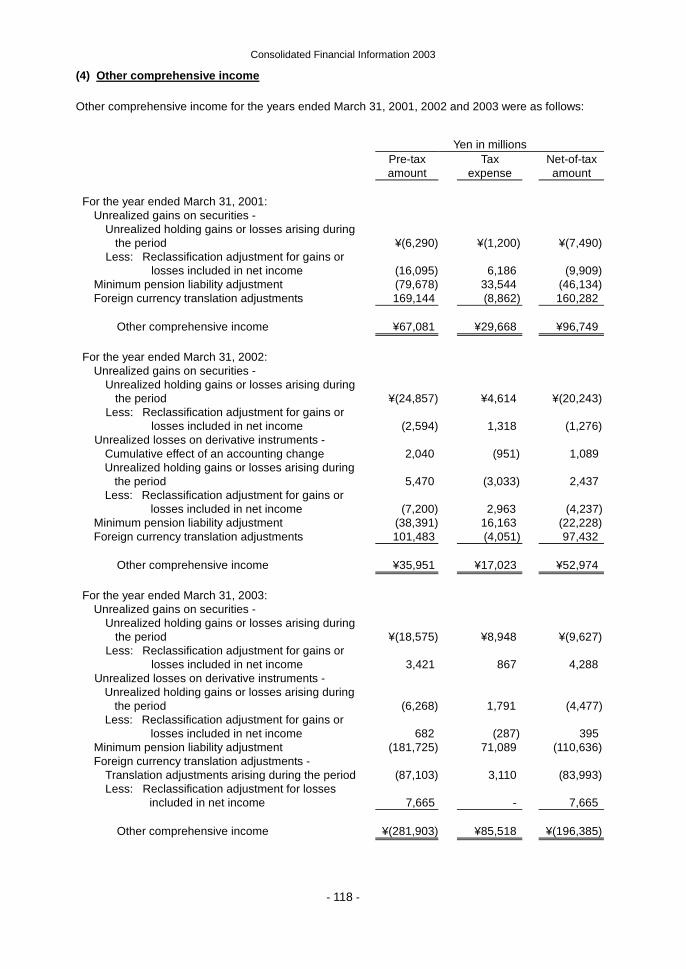
Consolidated Financial Information 2003
- 118 -
(4) Other comprehensive income
Other comprehensive income for the years ended March 31, 2001, 2002 and 2003 were as follows:
Yen in millions Pre-tax
amount Tax
expense Net-of-tax
amount For the year ended March 31, 2001:
Unrealized gains on securities - Unrealized holding gains or losses arising during
the period
¥(6,290) ¥(1,200) ¥(7,490) Less: Reclassification adjustment for gains or
losses included in net income
(16,095) 6,186 (9,909) Minimum pension liability adjustment (79,678) 33,544 (46,134) Foreign currency translation adjustments 169,144 (8,862) 160,282
Other comprehensive income ¥67,081 ¥29,668 ¥96,749 For the year ended March 31, 2002:
Unrealized gains on securities - Unrealized holding gains or losses arising during
the period
¥(24,857) ¥4,614 ¥(20,243) Less: Reclassification adjustment for gains or
losses included in net income
(2,594) 1,318 (1,276) Unrealized losses on derivative instruments -
Cumulative effect of an accounting change 2,040 (951) 1,089 Unrealized holding gains or losses arising during
the period
5,470
(3,033)
2,437 Less: Reclassification adjustment for gains or
losses included in net income
(7,200)
2,963
(4,237) Minimum pension liability adjustment (38,391) 16,163 (22,228) Foreign currency translation adjustments 101,483 (4,051) 97,432
Other comprehensive income ¥35,951 ¥17,023 ¥52,974 For the year ended March 31, 2003:
Unrealized gains on securities - Unrealized holding gains or losses arising during
the period
¥(18,575) ¥8,948 ¥(9,627) Less: Reclassification adjustment for gains or
losses included in net income
3,421 867 4,288 Unrealized losses on derivative instruments -
Unrealized holding gains or losses arising during the period
(6,268)
1,791
(4,477)
Less: Reclassification adjustment for gains or losses included in net income
682
(287)
395
Minimum pension liability adjustment (181,725) 71,089 (110,636) Foreign currency translation adjustments -
Translation adjustments arising during the period (87,103) 3,110 (83,993) Less: Reclassification adjustment for losses
included in net income
7,665 - 7,665
Other comprehensive income ¥(281,903) ¥85,518 ¥(196,385)
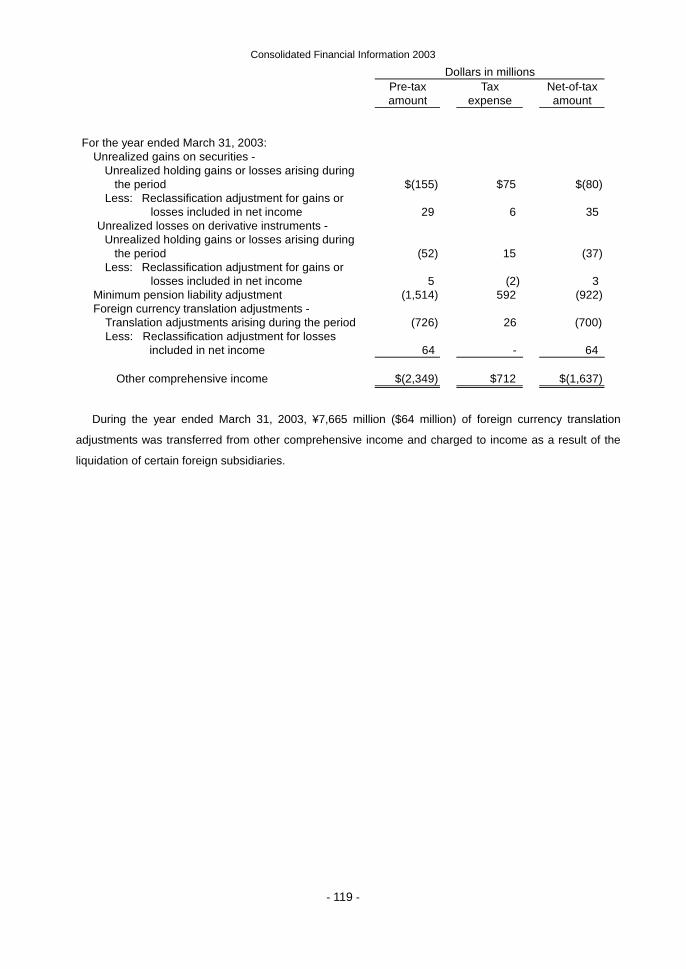
Consolidated Financial Information 2003
- 119 -
Dollars in millions Pre-tax
amount Tax
expense Net-of-tax
amount For the year ended March 31, 2003:
Unrealized gains on securities - Unrealized holding gains or losses arising during
the period
$(155) $75 $(80) Less: Reclassification adjustment for gains or
losses included in net income
29 6 35 Unrealized losses on derivative instruments -
Unrealized holding gains or losses arising during the period
(52)
15
(37)
Less: Reclassification adjustment for gains or losses included in net income
5
(2)
3
Minimum pension liability adjustment (1,514) 592 (922) Foreign currency translation adjustments -
Translation adjustments arising during the period (726) 26 (700) Less: Reclassification adjustment for losses
included in net income
64 - 64
Other comprehensive income $(2,349) $712 $(1,637)
During the year ended March 31, 2003, ¥7,665 million ($64 million) of foreign currency translation
adjustments was transferred from other comprehensive income and charged to income as a result of the
liquidation of certain foreign subsidiaries.
Consolidated Financial Information 2003
- 120 -
17. Stock-based compensation plans
Sony has four types of stock-based compensation plans as incentive plans for directors and selected
employees.
(1) Warrant plan:
Upon issuance of unsecured bonds with detachable warrants which are described in Note 12, Sony
Corporation has purchased all of the detachable warrants and distributed them to the directors and selected
employees of Sony. By exercising a warrant, directors and selected employees can purchase the common
stock or subsidiary tracking stock of Sony Corporation, the number of which is designated by each plan. The
warrants generally vest ratably over a period of three years, and are generally exercisable up to six years
from the date of grant.
(2) Convertible Bond plan:
In April 2000, Sony adopted an equity-based compensation plan for selected executives of Sony’s United
States of America subsidiaries using U.S. dollar-denominated non-interest bearing convertible bonds which
have characteristics similar to that of an option plan. Each convertible bond can be converted into 100
shares of the common stock of Sony Corporation at an exercise price based on the prevailing market rate
shortly before the date of grant. The convertible bonds vest ratably over a three-year period and are
exercisable up to ten years from the date of grant. As the convertible bonds were issued in exchange for a
non-interest bearing employee loan, no accounting recognition was given to either the convertible bonds or
the employee loans in Sony’s consolidated balance sheet as a right of offset exists between the convertible
bonds and the employee loans.
(3) Stock Acquisition Rights:
During the year ended March 31, 2003, Sony adopted an equity-based compensation plan that issues
common stock acquisition rights for the purpose of granting stock options to the directors and selected
employees of Sony, and subsidiary tracking stock acquisition rights for the purpose of granting stock options
to the directors and selected employees of Sony Communication Network Corporation, pursuant to the
Commercial Code of Japan. The stock acquisition rights generally vest ratably over a three-year period and
are exercisable up to ten years from the date of grant.
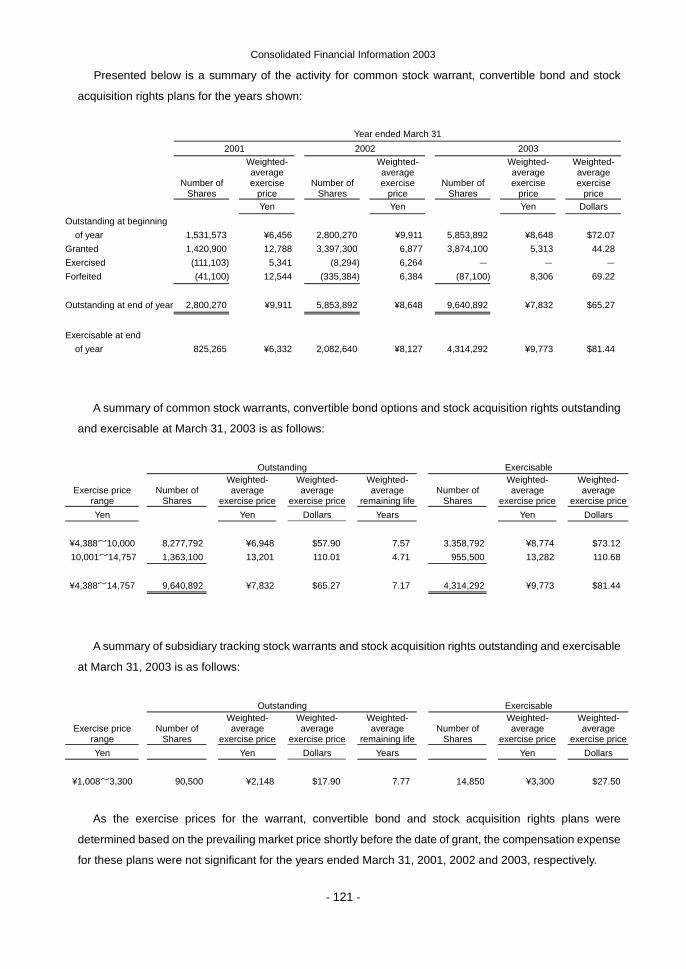
Consolidated Financial Information 2003
- 121 -
Presented below is a summary of the activity for common stock warrant, convertible bond and stock
acquisition rights plans for the years shown:
Year ended March 31 2001 2002 2003
Number of
Shares
Weighted- average exercise
price
Number of Shares
Weighted-average exercise
price Number of
Shares
Weighted- average exercise
price
Weighted- average exercise
price Yen Yen Yen Dollars Outstanding at beginning
of year 1,531,573 ¥6,456
2,800,270 ¥9,911 5,853,892 ¥8,648
$72.07 Granted 1,420,900 12,788 3,397,300 6,877 3,874,100 5,313 44.28 Exercised (111,103) 5,341 (8,294) 6,264 - - - Forfeited (41,100) 12,544 (335,384) 6,384 (87,100) 8,306 69.22 Outstanding at end of year 2,800,270 ¥9,911 5,853,892 ¥8,648 9,640,892 ¥7,832 $65.27
Exercisable at end
of year 825,265 ¥6,332
2,082,640 ¥8,127 4,314,292 ¥9,773
$81.44
A summary of common stock warrants, convertible bond options and stock acquisition rights outstanding
and exercisable at March 31, 2003 is as follows:
Outstanding Exercisable
Exercise price range
Number of Shares
Weighted-average
exercise price
Weighted-average
exercise price
Weighted-average
remaining lifeNumber of
Shares
Weighted- average
exercise price
Weighted- average
exercise price Yen Yen Dollars Years Yen Dollars
¥4,388~10,000 8,277,792 ¥6,948 $57.90 7.57 3,358,792 ¥8,774 $73.12 10,001~14,757 1,363,100 13,201 110.01 4.71 955,500 13,282 110.68
¥4,388~14,757 9,640,892 ¥7,832 $65.27 7.17 4,314,292 ¥9,773 $81.44
A summary of subsidiary tracking stock warrants and stock acquisition rights outstanding and exercisable
at March 31, 2003 is as follows:
Outstanding Exercisable
Exercise price range
Number of Shares
Weighted-average
exercise price
Weighted-average
exercise price
Weighted-average
remaining lifeNumber of
Shares
Weighted- average
exercise price
Weighted- average
exercise price Yen Yen Dollars Years Yen Dollars
¥1,008~3,300 90,500 ¥2,148 $17.90 7.77 14,850 ¥3,300 $27.50
As the exercise prices for the warrant, convertible bond and stock acquisition rights plans were
determined based on the prevailing market price shortly before the date of grant, the compensation expense
for these plans were not significant for the years ended March 31, 2001, 2002 and 2003, respectively.
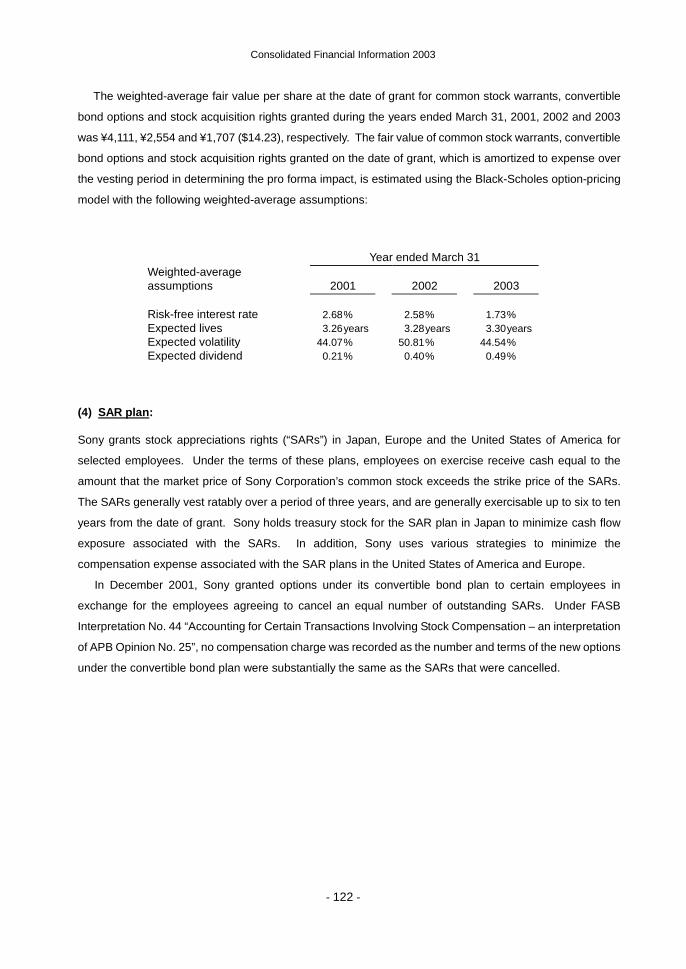
Consolidated Financial Information 2003
- 122 -
The weighted-average fair value per share at the date of grant for common stock warrants, convertible
bond options and stock acquisition rights granted during the years ended March 31, 2001, 2002 and 2003
was ¥4,111, ¥2,554 and ¥1,707 ($14.23), respectively. The fair value of common stock warrants, convertible
bond options and stock acquisition rights granted on the date of grant, which is amortized to expense over
the vesting period in determining the pro forma impact, is estimated using the Black-Scholes option-pricing
model with the following weighted-average assumptions:
Year ended March 31 Weighted-average assumptions
2001
2002
2003
Risk-free interest rate 2.68% 2.58% 1.73% Expected lives 3.26years 3.28years 3.30years Expected volatility 44.07% 50.81% 44.54% Expected dividend 0.21% 0.40% 0.49%
(4) SAR plan:
Sony grants stock appreciations rights (“SARs”) in Japan, Europe and the United States of America for
selected employees. Under the terms of these plans, employees on exercise receive cash equal to the
amount that the market price of Sony Corporation’s common stock exceeds the strike price of the SARs.
The SARs generally vest ratably over a period of three years, and are generally exercisable up to six to ten
years from the date of grant. Sony holds treasury stock for the SAR plan in Japan to minimize cash flow
exposure associated with the SARs. In addition, Sony uses various strategies to minimize the
compensation expense associated with the SAR plans in the United States of America and Europe.
In December 2001, Sony granted options under its convertible bond plan to certain employees in
exchange for the employees agreeing to cancel an equal number of outstanding SARs. Under FASB
Interpretation No. 44 “Accounting for Certain Transactions Involving Stock Compensation – an interpretation
of APB Opinion No. 25”, no compensation charge was recorded as the number and terms of the new options
under the convertible bond plan were substantially the same as the SARs that were cancelled.
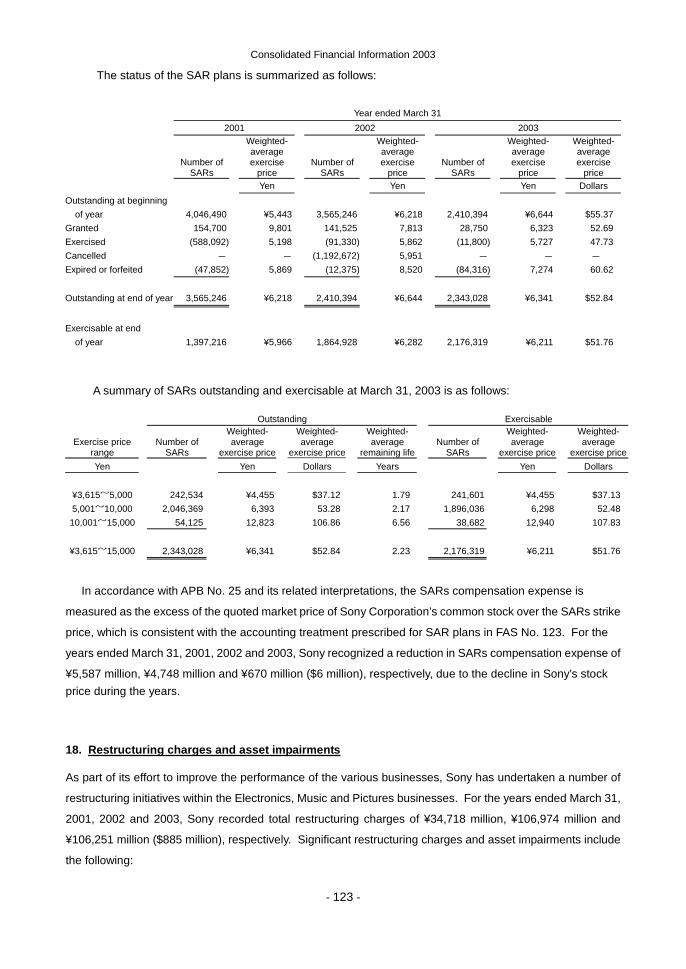
Consolidated Financial Information 2003
- 123 -
The status of the SAR plans is summarized as follows:
Year ended March 31 2001 2002 2003
Number of
SARs
Weighted- average exercise
price
Number of SARs
Weighted-average exercise
price Number of
SARs
Weighted- average exercise
price
Weighted- average exercise
price Yen Yen Yen Dollars Outstanding at beginning
of year 4,046,490 ¥5,443
3,565,246 ¥6,218 2,410,394 ¥6,644
$55.37 Granted 154,700 9,801 141,525 7,813 28,750 6,323 52.69 Exercised (588,092) 5,198 (91,330) 5,862 (11,800) 5,727 47.73 Cancelled - - (1,192,672) 5,951 - - - Expired or forfeited (47,852) 5,869 (12,375) 8,520 (84,316) 7,274 60.62 Outstanding at end of year 3,565,246 ¥6,218 2,410,394 ¥6,644 2,343,028 ¥6,341 $52.84
Exercisable at end
of year 1,397,216 ¥5,966
1,864,928 ¥6,282 2,176,319 ¥6,211
$51.76
A summary of SARs outstanding and exercisable at March 31, 2003 is as follows:
Outstanding Exercisable
Exercise price range
Number of SARs
Weighted-average
exercise price
Weighted-average
exercise price
Weighted-average
remaining lifeNumber of
SARs
Weighted- average
exercise price
Weighted- average
exercise price Yen Yen Dollars Years Yen Dollars
¥3,615~5,000 242,534 ¥4,455 $37.12 1.79 241,601 ¥4,455 $37.13 5,001~10,000 2,046,369 6,393 53.28 2.17 1,896,036 6,298 52.48 10,001~15,000 54,125 12,823 106.86 6.56 38,682 12,940 107.83
¥3,615~15,000 2,343,028 ¥6,341 $52.84 2.23 2,176,319 ¥6,211 $51.76
In accordance with APB No. 25 and its related interpretations, the SARs compensation expense is
measured as the excess of the quoted market price of Sony Corporation’s common stock over the SARs strike
price, which is consistent with the accounting treatment prescribed for SAR plans in FAS No. 123. For the
years ended March 31, 2001, 2002 and 2003, Sony recognized a reduction in SARs compensation expense of
¥5,587 million, ¥4,748 million and ¥670 million ($6 million), respectively, due to the decline in Sony’s stock price during the years.
18. Restructuring charges and asset impairments
As part of its effort to improve the performance of the various businesses, Sony has undertaken a number of
restructuring initiatives within the Electronics, Music and Pictures businesses. For the years ended March 31,
2001, 2002 and 2003, Sony recorded total restructuring charges of ¥34,718 million, ¥106,974 million and
¥106,251 million ($885 million), respectively. Significant restructuring charges and asset impairments include
the following:
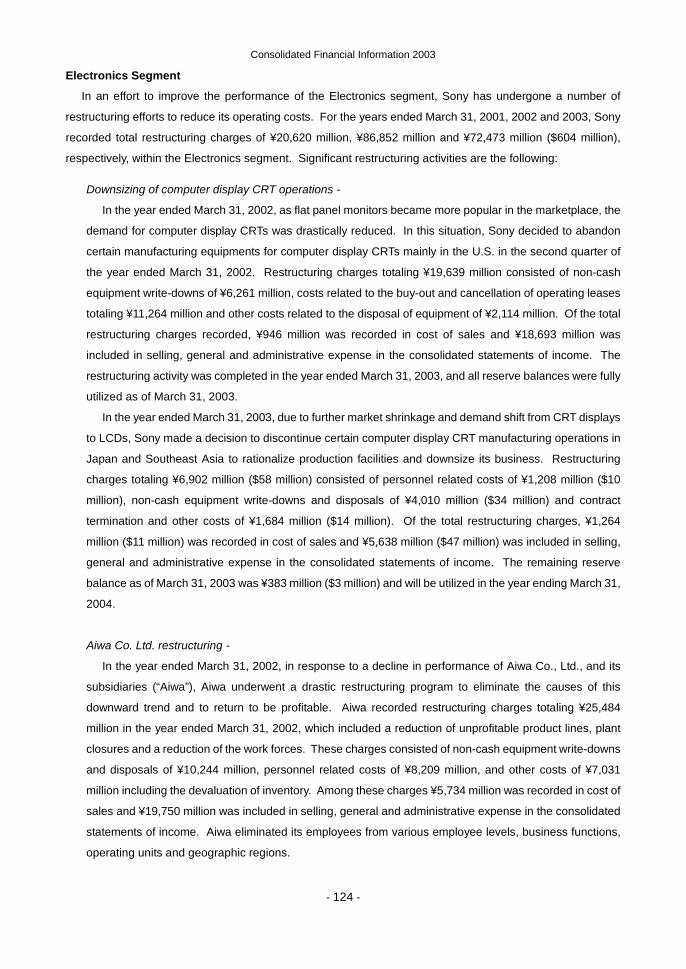
Consolidated Financial Information 2003
- 124 -
Electronics Segment
In an effort to improve the performance of the Electronics segment, Sony has undergone a number of
restructuring efforts to reduce its operating costs. For the years ended March 31, 2001, 2002 and 2003, Sony
recorded total restructuring charges of ¥20,620 million, ¥86,852 million and ¥72,473 million ($604 million),
respectively, within the Electronics segment. Significant restructuring activities are the following:
Downsizing of computer display CRT operations -
In the year ended March 31, 2002, as flat panel monitors became more popular in the marketplace, the
demand for computer display CRTs was drastically reduced. In this situation, Sony decided to abandon
certain manufacturing equipments for computer display CRTs mainly in the U.S. in the second quarter of
the year ended March 31, 2002. Restructuring charges totaling ¥19,639 million consisted of non-cash
equipment write-downs of ¥6,261 million, costs related to the buy-out and cancellation of operating leases
totaling ¥11,264 million and other costs related to the disposal of equipment of ¥2,114 million. Of the total
restructuring charges recorded, ¥946 million was recorded in cost of sales and ¥18,693 million was
included in selling, general and administrative expense in the consolidated statements of income. The
restructuring activity was completed in the year ended March 31, 2003, and all reserve balances were fully
utilized as of March 31, 2003.
In the year ended March 31, 2003, due to further market shrinkage and demand shift from CRT displays
to LCDs, Sony made a decision to discontinue certain computer display CRT manufacturing operations in
Japan and Southeast Asia to rationalize production facilities and downsize its business. Restructuring
charges totaling ¥6,902 million ($58 million) consisted of personnel related costs of ¥1,208 million ($10
million), non-cash equipment write-downs and disposals of ¥4,010 million ($34 million) and contract
termination and other costs of ¥1,684 million ($14 million). Of the total restructuring charges, ¥1,264
million ($11 million) was recorded in cost of sales and ¥5,638 million ($47 million) was included in selling,
general and administrative expense in the consolidated statements of income. The remaining reserve
balance as of March 31, 2003 was ¥383 million ($3 million) and will be utilized in the year ending March 31,
2004.
Aiwa Co. Ltd. restructuring -
In the year ended March 31, 2002, in response to a decline in performance of Aiwa Co., Ltd., and its
subsidiaries (“Aiwa”), Aiwa underwent a drastic restructuring program to eliminate the causes of this
downward trend and to return to be profitable. Aiwa recorded restructuring charges totaling ¥25,484
million in the year ended March 31, 2002, which included a reduction of unprofitable product lines, plant
closures and a reduction of the work forces. These charges consisted of non-cash equipment write-downs
and disposals of ¥10,244 million, personnel related costs of ¥8,209 million, and other costs of ¥7,031
million including the devaluation of inventory. Among these charges ¥5,734 million was recorded in cost of
sales and ¥19,750 million was included in selling, general and administrative expense in the consolidated
statements of income. Aiwa eliminated its employees from various employee levels, business functions,
operating units and geographic regions.
Consolidated Financial Information 2003
- 125 -
Due to the continued decline in the operating results of Aiwa, the restructuring program that was
initiated in the year ended March 31, 2002 was accelerated and additional restructuring charges of
¥23,007 million ($192 million) were recorded in the year ended March 31, 2003. Additional restructuring
included further cuts in staffing levels and shutdown of remaining production facilities. These charges
consisted of non-cash equipment write-downs and disposals of ¥3,504 million ($29 million), personnel
related costs of ¥7,647 million ($64 million), devaluation of inventory of ¥6,144 million ($51 million),
operating lease termination costs of ¥3,823 million ($32 million) and other costs of ¥1,889 million ($16
million). Among these charges ¥13,791 million ($115 million) was recorded in cost of sales and ¥9,216
million ($77 million) was included in selling, general and administrative expense in the consolidated
statements of income. The restructuring program was completed in the year ended March 31, 2003 and
no reserve existed as of March 31, 2003. Aiwa Co., Ltd. was merged into Sony Corporation as of
December 1, 2002. No further costs are expected to be incurred for the Aiwa restructuring.
Closing of a semiconductor plant in the U.S. -
Due to a significant decline in the business conditions of the U.S. semiconductor industry, Sony made a
decision in the fourth quarter of the year ended March 31, 2003, to close a semiconductor plant in the U.S.
The total estimated cost of the restructuring program is ¥8,148 million ($68 million), of which ¥5,856 million
($49 million) was incurred through March 31, 2003. These restructuring charges consisted of accelerated
depreciation of equipments of ¥3,128 million ($26 million), personnel related costs of ¥1,329 million ($11
million), the devaluation of inventory and other costs of ¥1,399 million ($12 million). These charges were
all recorded in cost of sales in the consolidated statements of income. This restructuring activity is
expected to complete in the year ending March 31, 2004. The remaining reserve balance as of March 31,
2003 was ¥1,452 million ($12 million).
Early retirement program in Japan -
In addition to the restructuring efforts disclosed above, Sony has undergone several headcount
reduction programs to further reduce operating costs in the Electronics segment. As a result of these
programs, Sony recorded restructuring charges totaling ¥14,440 million, ¥12,252 million and ¥10,932
million ($91 million) for the years ended March 31, 2001, 2002 and 2003, respectively, and these charges
were included in selling, general and administrative expense in the consolidated statements of income.
These staff reductions were achieved through the implementation of early retirement programs in Japan.
The remaining reserve balance as of March 31, 2003 was ¥1,009 million ($8 million) and will be utilized
through the year ending March 31, 2004.
Music Segment
Due to the continued contraction of the worldwide music market due to slow worldwide economic growth,
the saturation of the CD market, the effects of piracy and other illegal duplication, parallel imports, pricing
pressures and the diversification of customer preferences, Sony has been actively repositioning the Music
segment for the future by looking to create a more effective and profitable business model. As a result, the
Consolidated Financial Information 2003
- 126 -
Music segment has undergone a worldwide restructuring program to reduce staffing and other costs through
the consolidation and rationalization of facilities worldwide. For the years ended March 31, 2001, 2002 and
2003, Sony recorded total restructuring charges of ¥7,908 million, ¥8,599 million and ¥22,350 million ($186
million), respectively, within the Music segment excluding Japan. The total estimated costs of the worldwide
restructuring program are ¥43,371 million ($361 million), of which ¥38,857 million ($324 million) was incurred
through March 31, 2003. At March 31, 2003, the remaining reserve balance was ¥11,522 million ($96 million).
This reserve balance will be utilized over the next two to three years, with most of the payments being made
during the year ending March 31, 2004. The worldwide restructuring program is expected to complete by the
year ending March 31, 2006. In addition to the above, Sony also recorded restructuring charges of ¥1,519
million ($13 million) in Japan which were personnel related costs included in selling, general and administrative
expense in the consolidated statement of income, in the year ended March 31, 2003. Significant restructuring
activities included the following:
In the year ended March 31, 2001, the Music segment initiated its worldwide restructuring program with
the shutdown of a CD and audio cassette manufacturing plant in the U.S., as part of its effort to consolidate
manufacturing operations, and staff reductions in other areas. As a result, Sony recorded restructuring
charges totaling ¥7,908 million in the year ended March 31, 2001. The restructuring charges consisted of
personnel related costs of ¥3,540 million, non-cash asset write-downs and disposals of ¥3,160 million and
other costs of ¥1,208 million including lease termination costs. Of the total restructuring charges, ¥779
million was recorded in cost of sales and ¥7,129 million was included in selling, general and administrative
expense in the consolidated statements of income.
In the year ended March 31, 2002, Sony recorded additional restructuring charges totaling ¥8,599
million. Restructuring activities included the rationalization of digital media initiative and portfolio
investment businesses in order to focus on core music activities and staff reductions. Charges incurred in
the year ended March 31, 2002 consisted of personnel related costs of ¥5,100 million, non-cash asset
write-downs and disposals of ¥787 million, and other costs of ¥2,712 million including lease termination
costs. These charges were included in selling, general and administrative expense in the consolidated
statements of income.
In the year ended March 31, 2003, restructuring charges related to the worldwide restructuring of the
Music segment totaled ¥22,350 million ($186 million). Restructuring activities included the further
consolidation of operations through the shutdown of a cassette and CD manufacturing and distribution
center in Holland and a second CD manufacturing facility in the U.S. as well as further staff reductions in
other areas. The restructuring charges consisted of personnel related costs of ¥14,932 million ($124
million), non-cash asset write-downs and disposals of ¥3,256 million ($27 million) and other costs of
¥ 4,162 million ($35 million) including lease termination costs. These charges were included in selling,
general and administrative expense in the consolidated statements of income. Employees were
eliminated across various employee levels, business functions, operating units, and geographic regions
during this phase of the worldwide restructuring program.
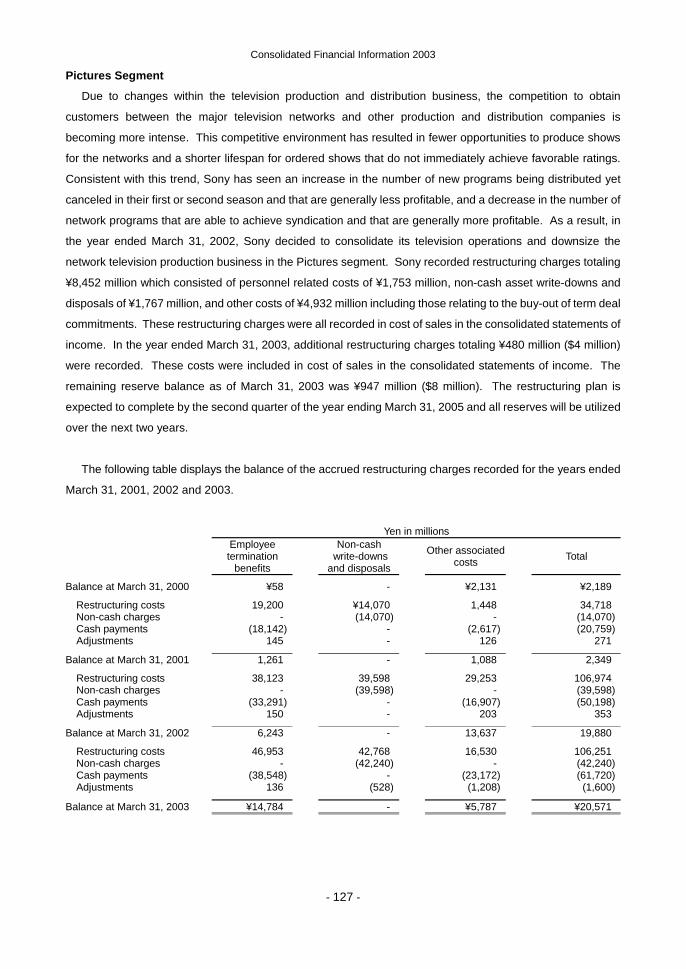
Consolidated Financial Information 2003
- 127 -
Pictures Segment
Due to changes within the television production and distribution business, the competition to obtain
customers between the major television networks and other production and distribution companies is
becoming more intense. This competitive environment has resulted in fewer opportunities to produce shows
for the networks and a shorter lifespan for ordered shows that do not immediately achieve favorable ratings.
Consistent with this trend, Sony has seen an increase in the number of new programs being distributed yet
canceled in their first or second season and that are generally less profitable, and a decrease in the number of
network programs that are able to achieve syndication and that are generally more profitable. As a result, in
the year ended March 31, 2002, Sony decided to consolidate its television operations and downsize the
network television production business in the Pictures segment. Sony recorded restructuring charges totaling
¥8,452 million which consisted of personnel related costs of ¥1,753 million, non-cash asset write-downs and
disposals of ¥1,767 million, and other costs of ¥4,932 million including those relating to the buy-out of term deal
commitments. These restructuring charges were all recorded in cost of sales in the consolidated statements of
income. In the year ended March 31, 2003, additional restructuring charges totaling ¥480 million ($4 million)
were recorded. These costs were included in cost of sales in the consolidated statements of income. The
remaining reserve balance as of March 31, 2003 was ¥947 million ($8 million). The restructuring plan is
expected to complete by the second quarter of the year ending March 31, 2005 and all reserves will be utilized
over the next two years.
The following table displays the balance of the accrued restructuring charges recorded for the years ended
March 31, 2001, 2002 and 2003.
Yen in millions
Employee termination
benefits
Non-cash write-downs and disposals
Other associated costs
Total
Balance at March 31, 2000 ¥58 - ¥2,131 ¥2,189
Restructuring costs 19,200 ¥14,070 1,448 34,718 Non-cash charges - (14,070) - (14,070) Cash payments (18,142) - (2,617) (20,759) Adjustments 145 - 126 271
Balance at March 31, 2001 1,261 - 1,088 2,349
Restructuring costs 38,123 39,598 29,253 106,974 Non-cash charges - (39,598) - (39,598) Cash payments (33,291) - (16,907) (50,198) Adjustments 150 - 203 353
Balance at March 31, 2002 6,243 - 13,637 19,880
Restructuring costs 46,953 42,768 16,530 106,251 Non-cash charges - (42,240) - (42,240) Cash payments (38,548) - (23,172) (61,720) Adjustments 136 (528) (1,208) (1,600)
Balance at March 31, 2003 ¥14,784 - ¥5,787 ¥20,571
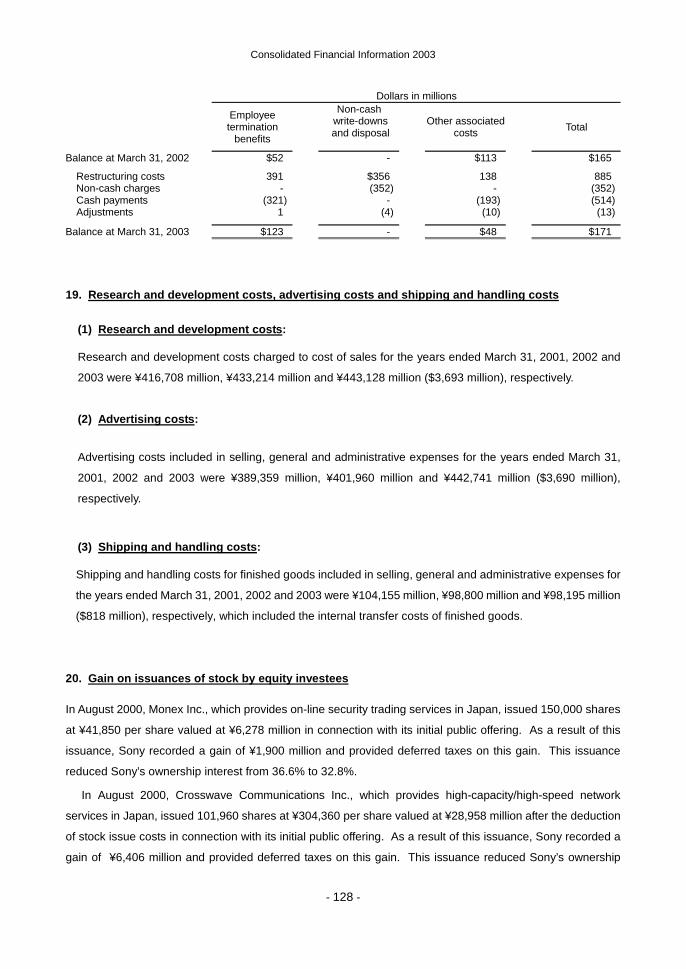
Consolidated Financial Information 2003
- 128 -
Dollars in millions
Employee termination
benefits
Non-cash write-downs and disposal
Other associated
costs
Total
Balance at March 31, 2002 $52 - $113 $165
Restructuring costs 391 $356 138 885 Non-cash charges - (352) - (352) Cash payments (321) - (193) (514) Adjustments 1 (4) (10) (13)
Balance at March 31, 2003 $123 - $48 $171
19. Research and development costs, advertising costs and shipping and handling costs
(1) Research and development costs:
Research and development costs charged to cost of sales for the years ended March 31, 2001, 2002 and
2003 were ¥416,708 million, ¥433,214 million and ¥443,128 million ($3,693 million), respectively.
(2) Advertising costs:
Advertising costs included in selling, general and administrative expenses for the years ended March 31,
2001, 2002 and 2003 were ¥389,359 million, ¥401,960 million and ¥442,741 million ($3,690 million),
respectively.
(3) Shipping and handling costs:
Shipping and handling costs for finished goods included in selling, general and administrative expenses for
the years ended March 31, 2001, 2002 and 2003 were ¥104,155 million, ¥98,800 million and ¥98,195 million
($818 million), respectively, which included the internal transfer costs of finished goods.
20. Gain on issuances of stock by equity investees
In August 2000, Monex Inc., which provides on-line security trading services in Japan, issued 150,000 shares
at ¥41,850 per share valued at ¥6,278 million in connection with its initial public offering. As a result of this
issuance, Sony recorded a gain of ¥1,900 million and provided deferred taxes on this gain. This issuance
reduced Sony’s ownership interest from 36.6% to 32.8%.
In August 2000, Crosswave Communications Inc., which provides high-capacity/high-speed network
services in Japan, issued 101,960 shares at ¥304,360 per share valued at ¥28,958 million after the deduction
of stock issue costs in connection with its initial public offering. As a result of this issuance, Sony recorded a
gain of ¥6,406 million and provided deferred taxes on this gain. This issuance reduced Sony’s ownership
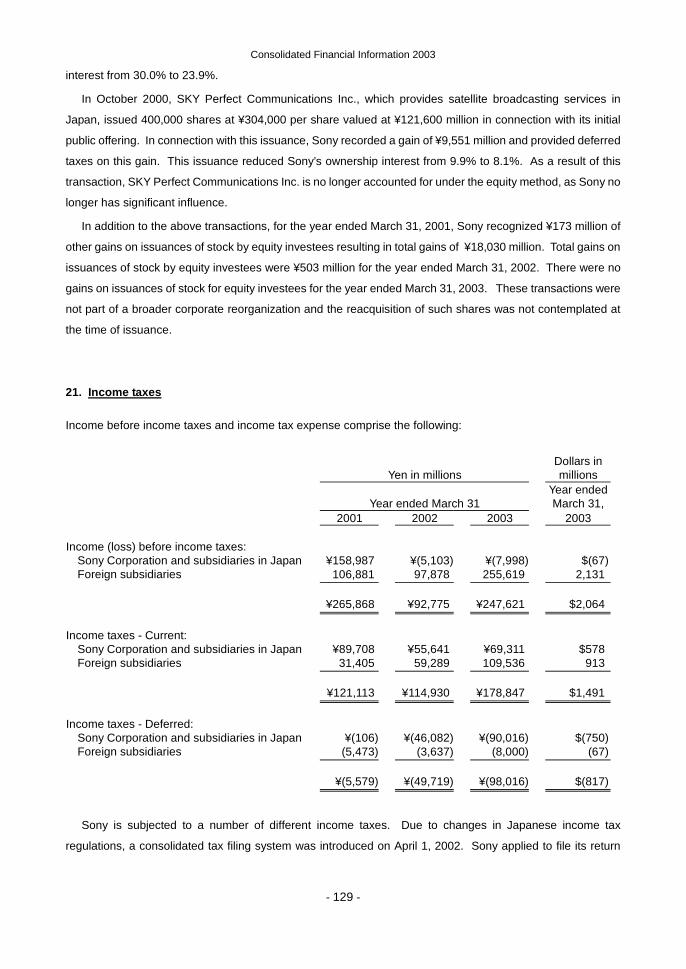
Consolidated Financial Information 2003
- 129 -
interest from 30.0% to 23.9%.
In October 2000, SKY Perfect Communications Inc., which provides satellite broadcasting services in
Japan, issued 400,000 shares at ¥304,000 per share valued at ¥121,600 million in connection with its initial
public offering. In connection with this issuance, Sony recorded a gain of ¥9,551 million and provided deferred
taxes on this gain. This issuance reduced Sony’s ownership interest from 9.9% to 8.1%. As a result of this
transaction, SKY Perfect Communications Inc. is no longer accounted for under the equity method, as Sony no
longer has significant influence.
In addition to the above transactions, for the year ended March 31, 2001, Sony recognized ¥173 million of
other gains on issuances of stock by equity investees resulting in total gains of ¥18,030 million. Total gains on
issuances of stock by equity investees were ¥503 million for the year ended March 31, 2002. There were no
gains on issuances of stock for equity investees for the year ended March 31, 2003. These transactions were
not part of a broader corporate reorganization and the reacquisition of such shares was not contemplated at
the time of issuance.
21. Income taxes
Income before income taxes and income tax expense comprise the following:
Yen in millions Dollars in
millions
Year ended March 31 Year ended
March 31, 2001 2002 2003 2003 Income (loss) before income taxes:
Sony Corporation and subsidiaries in Japan ¥158,987 ¥(5,103) ¥(7,998) $(67) Foreign subsidiaries 106,881 97,878 255,619 2,131
¥265,868 ¥92,775 ¥247,621 $2,064 Income taxes - Current:
Sony Corporation and subsidiaries in Japan ¥89,708 ¥55,641 ¥69,311 $578 Foreign subsidiaries 31,405 59,289 109,536 913
¥121,113 ¥114,930 ¥178,847 $1,491 Income taxes - Deferred:
Sony Corporation and subsidiaries in Japan ¥(106) ¥(46,082) ¥(90,016) $(750) Foreign subsidiaries (5,473) (3,637) (8,000) (67)
¥(5,579) ¥(49,719) ¥(98,016) $(817)
Sony is subjected to a number of different income taxes. Due to changes in Japanese income tax
regulations, a consolidated tax filing system was introduced on April 1, 2002. Sony applied to file its return

Consolidated Financial Information 2003
- 130 -
under the consolidated tax filing system beginning with the year ending March 31, 2004. Under the Japanese
consolidated tax filing system, a 2% surtax will be imposed only for the year ending March 31, 2004. As a
result, the statutory tax rate will be approximately 44% for the year ending March 31, 2004.
For the year ending March 31, 2005, a corporation size-based enterprise tax will be introduced which will
supersede the current enterprise tax. As a result, the statutory tax rate for the year ending March 31, 2005 will
be approximately 41% effective April 1, 2004. The respective newly enacted rates were used in calculating the
future expected tax effects of temporary differences as of March 31, 2003. The effect of the changes in the tax
rates on the balance of deferred tax assets and liabilities was insignificant.
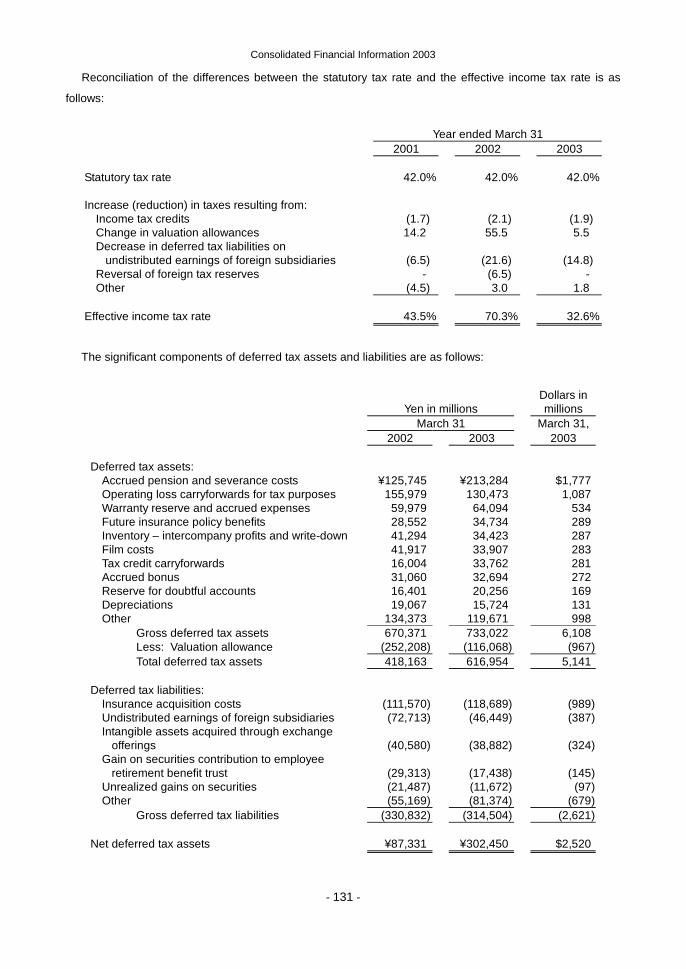
Consolidated Financial Information 2003
- 131 -
Reconciliation of the differences between the statutory tax rate and the effective income tax rate is as
follows:
Year ended March 31 2001 2002 2003
Statutory tax rate 42.0% 42.0% 42.0%
Increase (reduction) in taxes resulting from: Income tax credits (1.7) (2.1) (1.9) Change in valuation allowances 14.2 55.5 5.5 Decrease in deferred tax liabilities on undistributed earnings of foreign subsidiaries
(6.5) (21.6) (14.8)
Reversal of foreign tax reserves - (6.5) - Other (4.5) 3.0 1.8
Effective income tax rate 43.5% 70.3% 32.6%
The significant components of deferred tax assets and liabilities are as follows:
Yen in millions Dollars in
millions March 31 March 31, 2002 2003 2003
Deferred tax assets:
Accrued pension and severance costs ¥125,745 ¥213,284 $1,777 Operating loss carryforwards for tax purposes 155,979 130,473 1,087 Warranty reserve and accrued expenses 59,979 64,094 534 Future insurance policy benefits 28,552 34,734 289 Inventory – intercompany profits and write-down 41,294 34,423 287 Film costs 41,917 33,907 283 Tax credit carryforwards 16,004 33,762 281 Accrued bonus 31,060 32,694 272 Reserve for doubtful accounts 16,401 20,256 169 Depreciations 19,067 15,724 131 Other 134,373 119,671 998
Gross deferred tax assets 670,371 733,022 6,108 Less: Valuation allowance (252,208) (116,068) (967) Total deferred tax assets 418,163 616,954 5,141
Deferred tax liabilities:
Insurance acquisition costs (111,570) (118,689) (989) Undistributed earnings of foreign subsidiaries (72,713) (46,449) (387) Intangible assets acquired through exchange
offerings
(40,580) (38,882) (324) Gain on securities contribution to employee
retirement benefit trust
(29,313) (17,438) (145) Unrealized gains on securities Other
(21,487)(55,169)
(11,672) (81,374)
(97) (679)
Gross deferred tax liabilities (330,832) (314,504) (2,621)
Net deferred tax assets ¥87,331 ¥302,450 $2,520
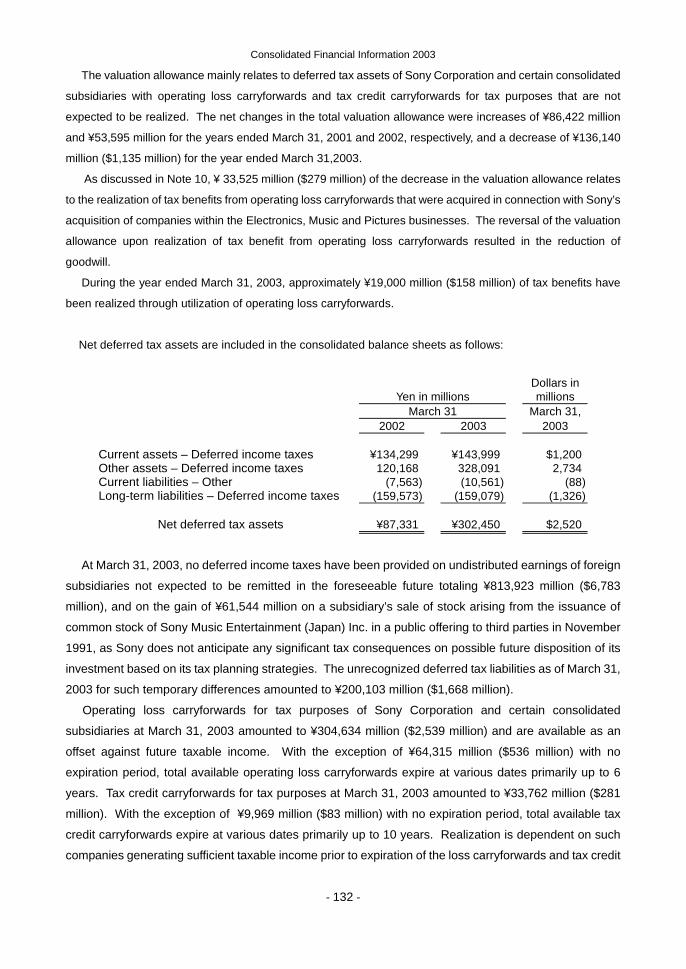
Consolidated Financial Information 2003
- 132 -
The valuation allowance mainly relates to deferred tax assets of Sony Corporation and certain consolidated
subsidiaries with operating loss carryforwards and tax credit carryforwards for tax purposes that are not
expected to be realized. The net changes in the total valuation allowance were increases of ¥86,422 million
and ¥53,595 million for the years ended March 31, 2001 and 2002, respectively, and a decrease of ¥136,140
million ($1,135 million) for the year ended March 31,2003.
As discussed in Note 10, ¥ 33,525 million ($279 million) of the decrease in the valuation allowance relates
to the realization of tax benefits from operating loss carryforwards that were acquired in connection with Sony’s
acquisition of companies within the Electronics, Music and Pictures businesses. The reversal of the valuation
allowance upon realization of tax benefit from operating loss carryforwards resulted in the reduction of
goodwill.
During the year ended March 31, 2003, approximately ¥19,000 million ($158 million) of tax benefits have
been realized through utilization of operating loss carryforwards.
Net deferred tax assets are included in the consolidated balance sheets as follows:
Yen in millions Dollars in
millions March 31 March 31, 2002 2003 2003
Current assets – Deferred income taxes ¥134,299 ¥143,999 $1,200 Other assets – Deferred income taxes 120,168 328,091 2,734 Current liabilities – Other (7,563) (10,561) (88) Long-term liabilities – Deferred income taxes (159,573) (159,079) (1,326)
Net deferred tax assets ¥87,331 ¥302,450 $2,520
At March 31, 2003, no deferred income taxes have been provided on undistributed earnings of foreign
subsidiaries not expected to be remitted in the foreseeable future totaling ¥813,923 million ($6,783
million), and on the gain of ¥61,544 million on a subsidiary’s sale of stock arising from the issuance of
common stock of Sony Music Entertainment (Japan) Inc. in a public offering to third parties in November
1991, as Sony does not anticipate any significant tax consequences on possible future disposition of its
investment based on its tax planning strategies. The unrecognized deferred tax liabilities as of March 31,
2003 for such temporary differences amounted to ¥200,103 million ($1,668 million).
Operating loss carryforwards for tax purposes of Sony Corporation and certain consolidated
subsidiaries at March 31, 2003 amounted to ¥304,634 million ($2,539 million) and are available as an
offset against future taxable income. With the exception of ¥64,315 million ($536 million) with no
expiration period, total available operating loss carryforwards expire at various dates primarily up to 6
years. Tax credit carryforwards for tax purposes at March 31, 2003 amounted to ¥33,762 million ($281
million). With the exception of ¥9,969 million ($83 million) with no expiration period, total available tax
credit carryforwards expire at various dates primarily up to 10 years. Realization is dependent on such
companies generating sufficient taxable income prior to expiration of the loss carryforwards and tax credit
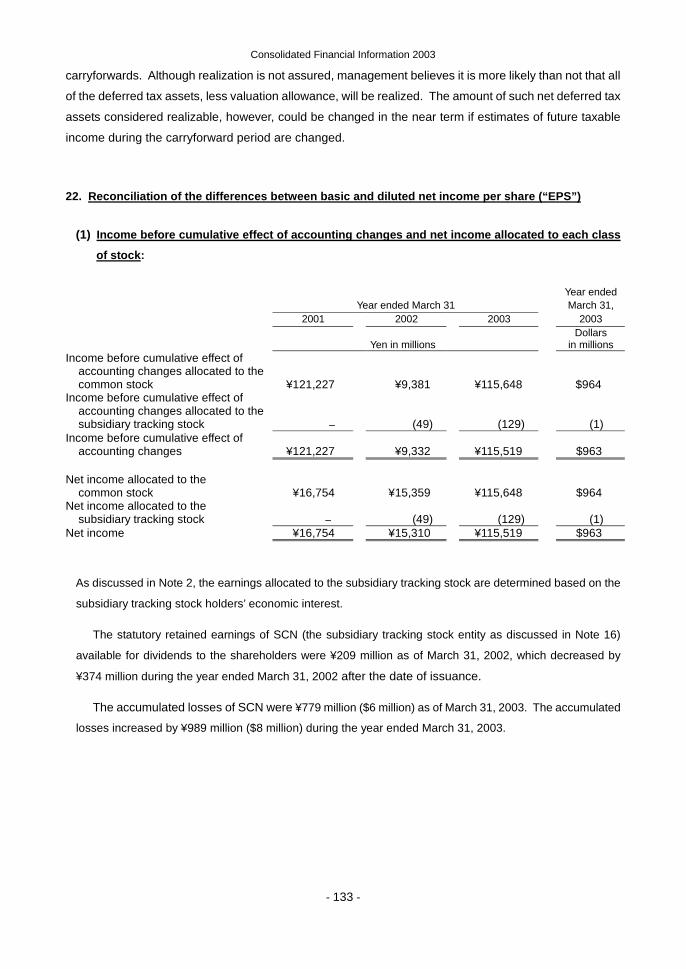
Consolidated Financial Information 2003
- 133 -
carryforwards. Although realization is not assured, management believes it is more likely than not that all
of the deferred tax assets, less valuation allowance, will be realized. The amount of such net deferred tax
assets considered realizable, however, could be changed in the near term if estimates of future taxable
income during the carryforward period are changed.
22. Reconciliation of the differences between basic and diluted net income per share (“EPS”)
(1) Income before cumulative effect of accounting changes and net income allocated to each class
of stock:
Year ended Year ended March 31 March 31, 2001 2002 2003 2003
Yen in millions Dollars
in millions Income before cumulative effect of accounting changes allocated to the common stock ¥121,227 ¥9,381 ¥115,648 $964 Income before cumulative effect of accounting changes allocated to the subsidiary tracking stock
– (49) (129) (1)
Income before cumulative effect of accounting changes ¥121,227 ¥9,332 ¥115,519 $963 Net income allocated to the common stock ¥16,754 ¥15,359 ¥115,648 $964 Net income allocated to the subsidiary tracking stock
– (49) (129) (1)
Net income ¥16,754 ¥15,310 ¥115,519 $963
As discussed in Note 2, the earnings allocated to the subsidiary tracking stock are determined based on the
subsidiary tracking stock holders’ economic interest.
The statutory retained earnings of SCN (the subsidiary tracking stock entity as discussed in Note 16)
available for dividends to the shareholders were ¥209 million as of March 31, 2002, which decreased by
¥374 million during the year ended March 31, 2002 after the date of issuance.
The accumulated losses of SCN were ¥779 million ($6 million) as of March 31, 2003. The accumulated
losses increased by ¥989 million ($8 million) during the year ended March 31, 2003.
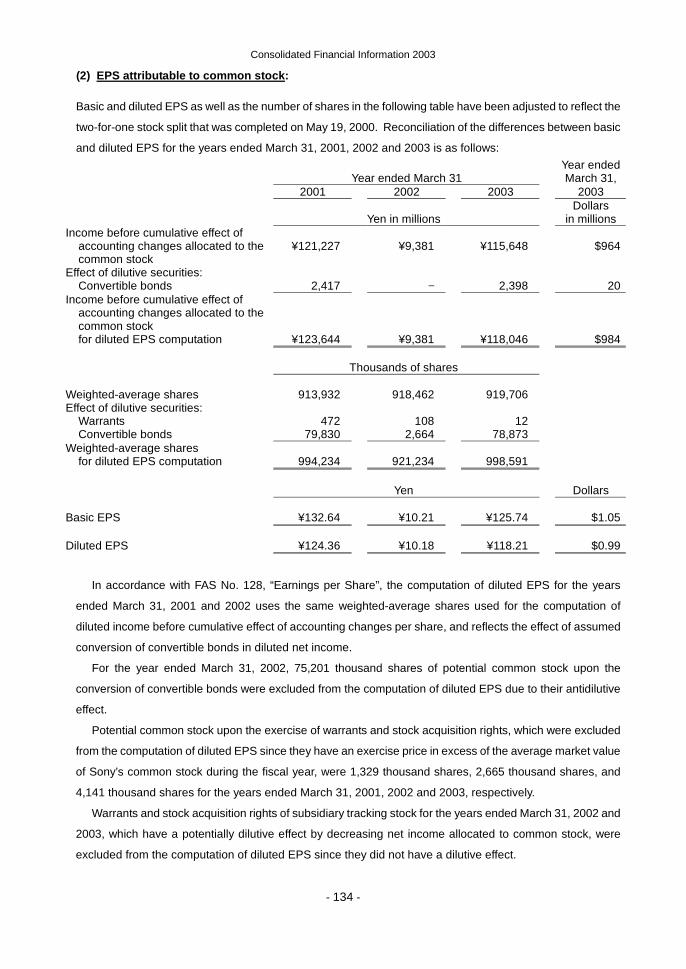
Consolidated Financial Information 2003
- 134 -
(2) EPS attributable to common stock:
Basic and diluted EPS as well as the number of shares in the following table have been adjusted to reflect the
two-for-one stock split that was completed on May 19, 2000. Reconciliation of the differences between basic
and diluted EPS for the years ended March 31, 2001, 2002 and 2003 is as follows: Year ended Year ended March 31 March 31, 2001 2002 2003 2003
Yen in millions Dollars
in millions Income before cumulative effect of accounting changes allocated to the common stock
¥121,227
¥9,381
¥115,648
$964
Effect of dilutive securities: Convertible bonds 2,417 – 2,398 20 Income before cumulative effect of accounting changes allocated to the common stock for diluted EPS computation
¥123,644
¥9,381
¥118,046
$984 Thousands of shares Weighted-average shares 913,932 918,462 919,706 Effect of dilutive securities: Warrants 472 108 12 Convertible bonds 79,830 2,664 78,873 Weighted-average shares for diluted EPS computation
994,234
921,234
998,591
Yen Dollars Basic EPS ¥132.64 ¥10.21 ¥125.74 $1.05 Diluted EPS ¥124.36 ¥10.18 ¥118.21 $0.99
In accordance with FAS No. 128, “Earnings per Share”, the computation of diluted EPS for the years
ended March 31, 2001 and 2002 uses the same weighted-average shares used for the computation of
diluted income before cumulative effect of accounting changes per share, and reflects the effect of assumed
conversion of convertible bonds in diluted net income.
For the year ended March 31, 2002, 75,201 thousand shares of potential common stock upon the
conversion of convertible bonds were excluded from the computation of diluted EPS due to their antidilutive
effect.
Potential common stock upon the exercise of warrants and stock acquisition rights, which were excluded
from the computation of diluted EPS since they have an exercise price in excess of the average market value
of Sony’s common stock during the fiscal year, were 1,329 thousand shares, 2,665 thousand shares, and
4,141 thousand shares for the years ended March 31, 2001, 2002 and 2003, respectively.
Warrants and stock acquisition rights of subsidiary tracking stock for the years ended March 31, 2002 and
2003, which have a potentially dilutive effect by decreasing net income allocated to common stock, were
excluded from the computation of diluted EPS since they did not have a dilutive effect.
Consolidated Financial Information 2003
- 135 -
Stock options issued by affiliated companies accounted for under the equity method for the years ended
March 31, 2001, 2002 and 2003, which have a potentially dilutive effect by decreasing net income allocated
to common stock, were excluded from the computation of diluted EPS since such stock option did not have a
dilutive effect.
On October 1, 2002, Sony implemented a share exchange as a result of which Aiwa Co., Ltd. became a
wholly-owned subsidiary. As a result of this share exchange, Sony issued 2,502 thousand shares. The
shares were included in the computation of basic and diluted EPS.
(3) EPS attributable to subsidiary tracking stock:
Weighted-average shares used for computation of EPS attributable to subsidiary tracking stock for the years
ended March 31, 2002 and 2003 were 3,072 thousand shares. As discussed in Note 2, there were no
potentially dilutive securities for EPS of subsidiary tracking stock outstanding at March 31, 2002 and 2003.
23. Variable Interest Entities
Sony has, from time to time, entered into various arrangements with VIEs. These arrangements consist of
facilities which provide for the leasing of certain property, the financing of film production, the development and
operation of a multi-use real estate complex and the implementation of a stock option plan for Japanese
selected employees. As discussed below, certain of these entities are currently not consolidated by Sony. As
described in Note 2, the FASB issued FIN No. 46, which will require the consolidation or disclosure of VIEs.
Although Sony continues to evaluate the impact of FIN No. 46 on Sony’s results of operations and financial
position, the potential VIEs that may be consolidated or disclosed are described as follows:
Sony leases the headquarters of its U.S. subsidiary from a VIE, which was not consolidated by Sony at
March 31, 2002 and 2003. Effective July 1, 2003, Sony will be required to consolidate the VIE. Upon
consolidation of the VIE, assets and liabilities are expected to increase by approximately ¥30,600 million ($255
million) and Sony will record a charge of approximately ¥1,800 million ($15 million) as a cumulative effect of
accounting change. The impact on net income for the year ending March 31, 2004 will be a decrease of ¥840
million ($7 million). Sony has the option to purchase the building at any time during the lease term which
expires in December 2008 for ¥30,600 million ($255 million). At the end of the lease term, Sony has agreed to
either renew the lease, purchase the building or remarket it to a third party on behalf of the owner. If the sales
price is less than ¥30,600 million ($255 million), Sony is obligated to make up the lesser of the shortfall or
¥25,727 million ($214 million). At March 31, 2003, the fair value of the building exceeded ¥30,600 million
($255 million).
A subsidiary in the Pictures business entered into a joint venture agreement with a VIE for the purpose of
funding the acquisition of certain international film rights. The subsidiary is required to distribute the
Consolidated Financial Information 2003
- 136 -
product internationally, for contractually defined fees determined as percentages of gross receipts, as
defined, and is responsible for all distribution and marketing expenses, which are recouped from such
distribution fees. The VIE was capitalized with total financing of ¥48,720 million ($406 million). Of this
amount, ¥1,320 million ($11 million) was contributed by the subsidiary, ¥11,400 million ($95 million) was
provided by unrelated third party investors and the remaining funding is provided through a ¥36,000 million
($300 million) bank credit facility of which ¥1,320 million ($11 million) was outstanding as of March 31, 2003.
Effective July 1, 2003, Sony will be required to consolidate this entity. Upon consolidation of the VIE, assets
and liabilities are expected to increase by ¥7,080 million ($59 million); however, there will be no impact to net
income. Under the agreement, the subsidiary’s ¥1,320 million ($11 million) equity investment is the last equity
to be repaid. Additionally, it must pay to the third party investors up to ¥2,280 million ($19 million) of any losses
out of a portion of its distribution fees. Any losses incurred by the VIE over and above the ¥3,600 million
($30 million) will be shared by the other investors. The subsidiary is obligated to acquire the international
distribution rights, as defined, for twelve pictures meeting certain minimum requirements within a 3.5 to
4.5 year period and transfer those rights to the VIE at cost plus a 5 percent fee. If the subsidiary is unable
to deliver twelve pictures to the VIE and the bank credit facility or the third party equity investors are not
paid in full by March 10, 2008 (or earlier upon the occurrence of certain events), the subsidiary is required
to reimburse the VIE to the extent necessary to repay the bank credit facility in full and pay certain
minimum returns to the third party equity investors. At March 31, 2003, the maximum exposure amount is
¥30,574 million ($255 million).
Sony has utilized a VIE to erect and operate a multi-use real estate complex in Berlin, Germany, which
was accounted for under the equity method by Sony at March 31, 2002 and 2003. Effective July 1, 2003,
Sony will be required to consolidate this entity. Upon consolidation of the VIE, assets and liabilities are
expected to increase by ¥59,662 million ($497 million). However, there will be no impact to Sony’s net
income. The VIE was initially capitalized with ¥90,790 million ($757 million) of total funding, ¥32,561
million ($271 million) was provided by the equity investors with the remaining funding of ¥58,229 million
($486 million) being provided through a syndicated bank loan which matures in November 2004. The
syndicated bank loan is secured by the multi-use real estate complex. Should the VIE be unable to meet
its obligations under the syndicated bank loan, Sony would be exposed to the potential impairment of its
investment in the VIE which was ¥12,840 million ($107 million) at March 31, 2003.
Sony has utilized a VIE to implement a stock option plan for Japanese selected employees. The VIE has
been consolidated by Sony since its establishment. There will be no impact to Sony’s results of operations and
financial position upon the adoption of FIN No. 46. Under the terms of the stock option plan, upon exercise,
Japanese employees receive cash equal to the amount that the market price of Sony Corporation’s common
stock exceeds the strike price of the plan. In order to minimize cash flow exposure associated with the plan,
Sony holds treasury stock through the VIE. The VIE purchased the common stock with funding provided by the
employee’s cash contribution and a bank loan which has been guaranteed by Sony Corporation. If the market
value of common stock is below the price that Sony acquired the treasury stock for at the time of
Consolidated Financial Information 2003
- 137 -
settlement of stock option plan, Sony is required to reimburse the VIE for repayment of the bank loan. At
March 31, 2003, the maximum exposure amount associated with the bank loan is ¥6,938 million ($58 million).
24. Commitments and contingent liabilities
(1) Commitments:
Commitments outstanding at March 31, 2003 amounted to ¥297,768 million ($2,481 million). The major
components of the commitments are as follows:
In the ordinary course of business, Sony makes commitments for the purchase of property, plant and
equipment. As of March 31, 2003, such commitments outstanding were ¥30,814 million ($257 million).
Certain subsidiaries in the Music business have entered into long-term contracts with recording artists
and companies for the production and/or distribution of prerecorded music and videos. These contracts
cover various periods mainly through March 31, 2006. As of March 31, 2003, these subsidiaries were
committed to make payments under such long-term contracts of ¥54,508 million ($454 million).
Certain subsidiaries in the Pictures business have entered into agreements under which the subsidiaries
acquire completed films, or certain rights therein, from third parties. These agreements cover various
periods through March 31, 2005. As of March 31, 2003, these subsidiaries were committed to make
payments under such contracts of ¥40,116 million ($334 million).
A subsidiary in the Pictures business has also entered into a distribution agreement with a third party to
distribute, in certain markets and territories, all feature length films produced or acquired by the third party
during the term of the agreement. The distribution agreement expires on December 31, 2006 if a minimum of
36 films have been delivered as of that date. If 36 films have not been delivered by December 31, 2006, the
distribution agreement expires on the earlier of the delivery of the 36th film or May 25, 2007. The subsidiary
has the right to distribute the films for 15 years from the initial theatrical release of the film. Under the terms
of the distribution agreement, the subsidiary must fund a portion of the production cost and is responsible for
all distribution and marketing expenses. As of March 31, 2003, 17 films have been released or funded by the
subsidiary. The subsidiary’s estimated commitment to fund the production of the remaining films under this
agreement is ¥88,024 million ($734 million).
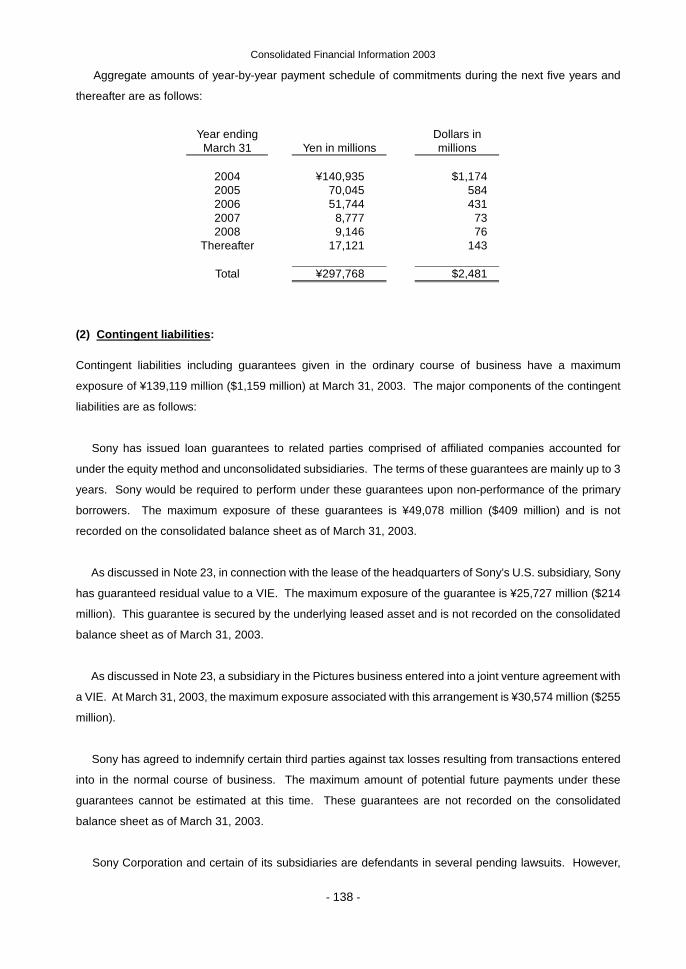
Consolidated Financial Information 2003
- 138 -
Aggregate amounts of year-by-year payment schedule of commitments during the next five years and
thereafter are as follows:
Year ending
March 31
Yen in millions Dollars in
millions
2004 ¥140,935 $1,174 2005 70,045 584 2006 51,744 431 2007 8,777 73 2008 9,146 76
Thereafter 17,121 143
Total ¥297,768 $2,481
(2) Contingent liabilities:
Contingent liabilities including guarantees given in the ordinary course of business have a maximum
exposure of ¥139,119 million ($1,159 million) at March 31, 2003. The major components of the contingent
liabilities are as follows:
Sony has issued loan guarantees to related parties comprised of affiliated companies accounted for
under the equity method and unconsolidated subsidiaries. The terms of these guarantees are mainly up to 3
years. Sony would be required to perform under these guarantees upon non-performance of the primary
borrowers. The maximum exposure of these guarantees is ¥49,078 million ($409 million) and is not
recorded on the consolidated balance sheet as of March 31, 2003.
As discussed in Note 23, in connection with the lease of the headquarters of Sony’s U.S. subsidiary, Sony
has guaranteed residual value to a VIE. The maximum exposure of the guarantee is ¥25,727 million ($214
million). This guarantee is secured by the underlying leased asset and is not recorded on the consolidated
balance sheet as of March 31, 2003.
As discussed in Note 23, a subsidiary in the Pictures business entered into a joint venture agreement with
a VIE. At March 31, 2003, the maximum exposure associated with this arrangement is ¥30,574 million ($255
million).
Sony has agreed to indemnify certain third parties against tax losses resulting from transactions entered
into in the normal course of business. The maximum amount of potential future payments under these
guarantees cannot be estimated at this time. These guarantees are not recorded on the consolidated
balance sheet as of March 31, 2003.
Sony Corporation and certain of its subsidiaries are defendants in several pending lawsuits. However,
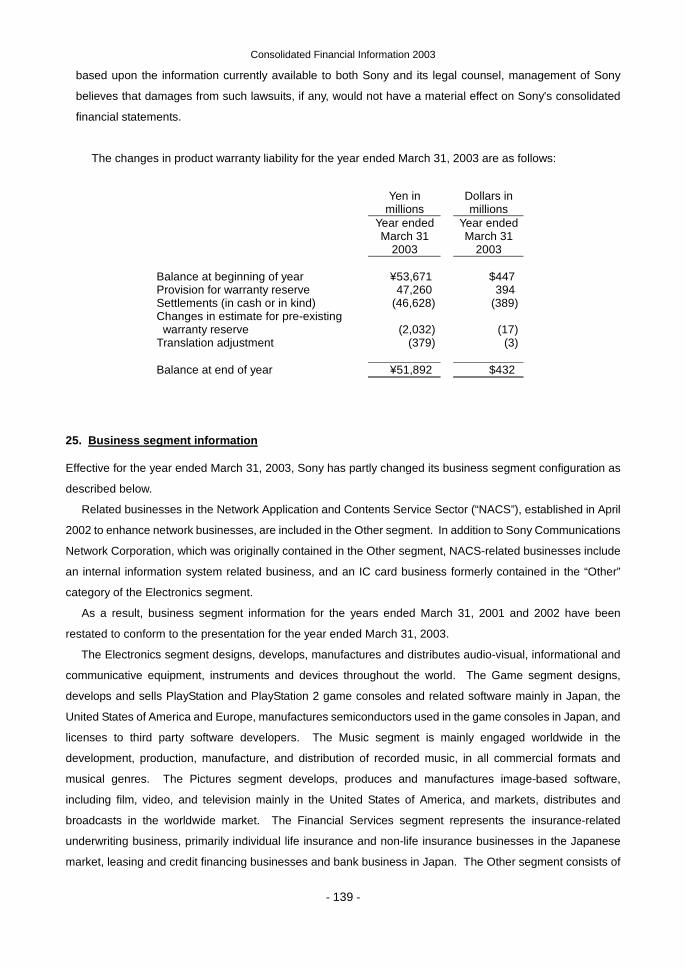
Consolidated Financial Information 2003
- 139 -
based upon the information currently available to both Sony and its legal counsel, management of Sony
believes that damages from such lawsuits, if any, would not have a material effect on Sony's consolidated
financial statements.
The changes in product warranty liability for the year ended March 31, 2003 are as follows:
Yen in
millions Dollars in millions
Year ended March 31
Year ended March 31
2003 2003 Balance at beginning of year ¥53,671 $447 Provision for warranty reserve 47,260 394 Settlements (in cash or in kind) (46,628) (389) Changes in estimate for pre-existing warranty reserve (2,032)
(17)
Translation adjustment (379) (3) Balance at end of year ¥51,892 $432
25. Business segment information
Effective for the year ended March 31, 2003, Sony has partly changed its business segment configuration as
described below.
Related businesses in the Network Application and Contents Service Sector (“NACS”), established in April
2002 to enhance network businesses, are included in the Other segment. In addition to Sony Communications
Network Corporation, which was originally contained in the Other segment, NACS-related businesses include
an internal information system related business, and an IC card business formerly contained in the “Other”
category of the Electronics segment.
As a result, business segment information for the years ended March 31, 2001 and 2002 have been
restated to conform to the presentation for the year ended March 31, 2003.
The Electronics segment designs, develops, manufactures and distributes audio-visual, informational and
communicative equipment, instruments and devices throughout the world. The Game segment designs,
develops and sells PlayStation and PlayStation 2 game consoles and related software mainly in Japan, the
United States of America and Europe, manufactures semiconductors used in the game consoles in Japan, and
licenses to third party software developers. The Music segment is mainly engaged worldwide in the
development, production, manufacture, and distribution of recorded music, in all commercial formats and
musical genres. The Pictures segment develops, produces and manufactures image-based software,
including film, video, and television mainly in the United States of America, and markets, distributes and
broadcasts in the worldwide market. The Financial Services segment represents the insurance-related
underwriting business, primarily individual life insurance and non-life insurance businesses in the Japanese
market, leasing and credit financing businesses and bank business in Japan. The Other segment consists of
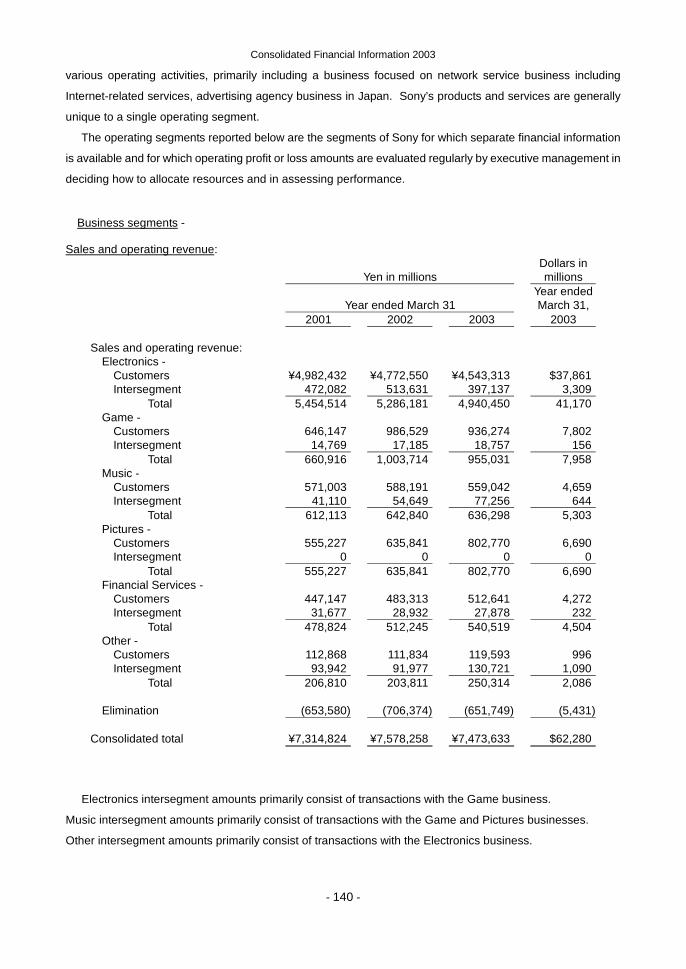
Consolidated Financial Information 2003
- 140 -
various operating activities, primarily including a business focused on network service business including
Internet-related services, advertising agency business in Japan. Sony’s products and services are generally
unique to a single operating segment.
The operating segments reported below are the segments of Sony for which separate financial information
is available and for which operating profit or loss amounts are evaluated regularly by executive management in
deciding how to allocate resources and in assessing performance.
Business segments -
Sales and operating revenue:
Yen in millions Dollars in
millions
Year ended March 31 Year ended
March 31, 2001 2002 2003 2003 Sales and operating revenue:
Electronics - Customers ¥4,982,432 ¥4,772,550 ¥4,543,313 $37,861 Intersegment 472,082 513,631 397,137 3,309
Total 5,454,514 5,286,181 4,940,450 41,170 Game -
Customers 646,147 986,529 936,274 7,802 Intersegment 14,769 17,185 18,757 156
Total 660,916 1,003,714 955,031 7,958 Music -
Customers 571,003 588,191 559,042 4,659 Intersegment 41,110 54,649 77,256 644
Total 612,113 642,840 636,298 5,303 Pictures -
Customers 555,227 635,841 802,770 6,690 Intersegment 0 0 0 0
Total 555,227 635,841 802,770 6,690 Financial Services -
Customers 447,147 483,313 512,641 4,272 Intersegment 31,677 28,932 27,878 232
Total 478,824 512,245 540,519 4,504 Other -
Customers 112,868 111,834 119,593 996 Intersegment 93,942 91,977 130,721 1,090
Total 206,810 203,811 250,314 2,086
Elimination (653,580) (706,374) (651,749) (5,431) Consolidated total ¥7,314,824 ¥7,578,258 ¥7,473,633 $62,280
Electronics intersegment amounts primarily consist of transactions with the Game business.
Music intersegment amounts primarily consist of transactions with the Game and Pictures businesses.
Other intersegment amounts primarily consist of transactions with the Electronics business.
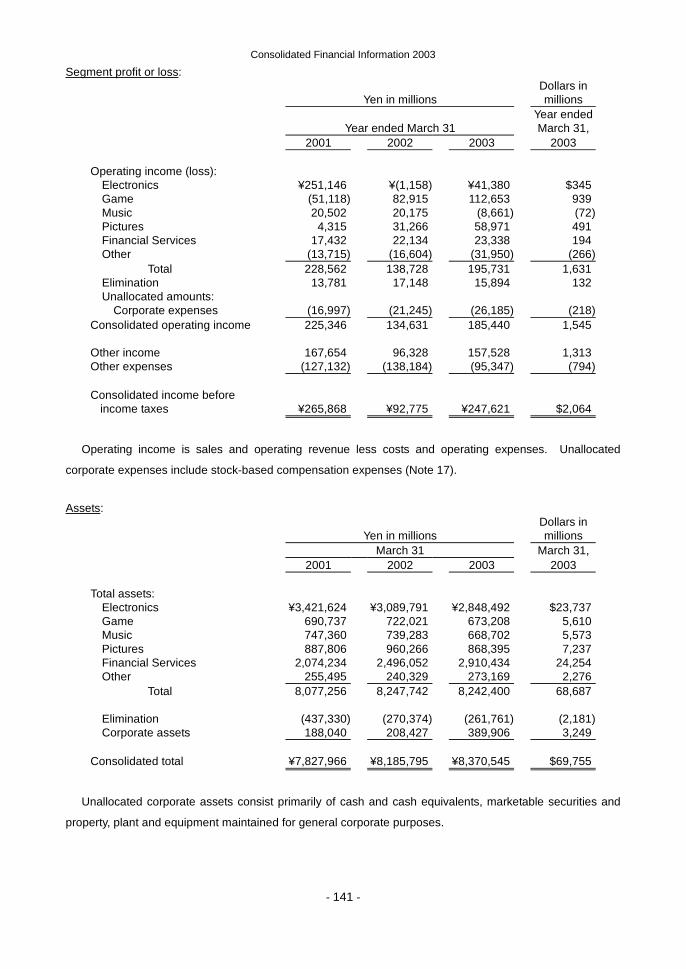
Consolidated Financial Information 2003
- 141 -
Segment profit or loss:
Yen in millions Dollars in
millions
Year ended March 31 Year ended
March 31, 2001 2002 2003 2003 Operating income (loss):
Electronics ¥251,146 ¥(1,158) ¥41,380 $345 Game (51,118) 82,915 112,653 939 Music 20,502 20,175 (8,661) (72) Pictures 4,315 31,266 58,971 491 Financial Services 17,432 22,134 23,338 194 Other (13,715) (16,604) (31,950) (266)
Total 228,562 138,728 195,731 1,631 Elimination 13,781 17,148 15,894 132 Unallocated amounts:
Corporate expenses (16,997) (21,245) (26,185) (218) Consolidated operating income 225,346 134,631 185,440 1,545 Other income 167,654 96,328 157,528 1,313 Other expenses (127,132) (138,184) (95,347) (794) Consolidated income before
income taxes
¥265,868
¥92,775
¥247,621
$2,064
Operating income is sales and operating revenue less costs and operating expenses. Unallocated
corporate expenses include stock-based compensation expenses (Note 17).
Assets:
Yen in millions
Dollars in millions
March 31 March 31, 2001 2002 2003 2003 Total assets:
Electronics ¥3,421,624 ¥3,089,791 ¥2,848,492 $23,737 Game 690,737 722,021 673,208 5,610 Music 747,360 739,283 668,702 5,573 Pictures 887,806 960,266 868,395 7,237 Financial Services 2,074,234 2,496,052 2,910,434 24,254 Other 255,495 240,329 273,169 2,276
Total 8,077,256 8,247,742 8,242,400 68,687
Elimination (437,330) (270,374) (261,761) (2,181) Corporate assets 188,040 208,427 389,906 3,249
Consolidated total ¥7,827,966 ¥8,185,795 ¥8,370,545 $69,755
Unallocated corporate assets consist primarily of cash and cash equivalents, marketable securities and
property, plant and equipment maintained for general corporate purposes.
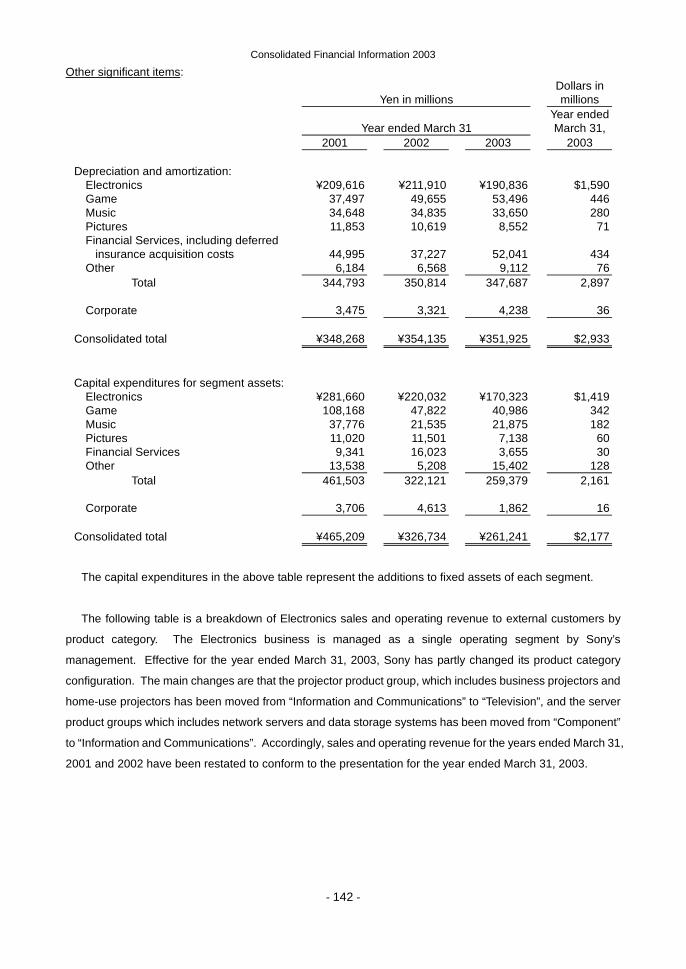
Consolidated Financial Information 2003
- 142 -
Other significant items:
Yen in millions Dollars in
millions
Year ended March 31 Year ended
March 31, 2001 2002 2003 2003 Depreciation and amortization:
Electronics ¥209,616 ¥211,910 ¥190,836 $1,590 Game 37,497 49,655 53,496 446 Music 34,648 34,835 33,650 280 Pictures 11,853 10,619 8,552 71 Financial Services, including deferred
insurance acquisition costs
44,995
37,227
52,041
434 Other 6,184 6,568 9,112 76
Total 344,793 350,814 347,687 2,897
Corporate 3,475 3,321 4,238 36 Consolidated total ¥348,268 ¥354,135 ¥351,925 $2,933 Capital expenditures for segment assets:
Electronics ¥281,660 ¥220,032 ¥170,323 $1,419 Game 108,168 47,822 40,986 342 Music 37,776 21,535 21,875 182 Pictures 11,020 11,501 7,138 60 Financial Services 9,341 16,023 3,655 30 Other 13,538 5,208 15,402 128
Total 461,503 322,121 259,379 2,161
Corporate 3,706 4,613 1,862 16 Consolidated total ¥465,209 ¥326,734 ¥261,241 $2,177
The capital expenditures in the above table represent the additions to fixed assets of each segment.
The following table is a breakdown of Electronics sales and operating revenue to external customers by
product category. The Electronics business is managed as a single operating segment by Sony’s
management. Effective for the year ended March 31, 2003, Sony has partly changed its product category
configuration. The main changes are that the projector product group, which includes business projectors and
home-use projectors has been moved from “Information and Communications” to “Television”, and the server
product groups which includes network servers and data storage systems has been moved from “Component”
to “Information and Communications”. Accordingly, sales and operating revenue for the years ended March 31,
2001 and 2002 have been restated to conform to the presentation for the year ended March 31, 2003.
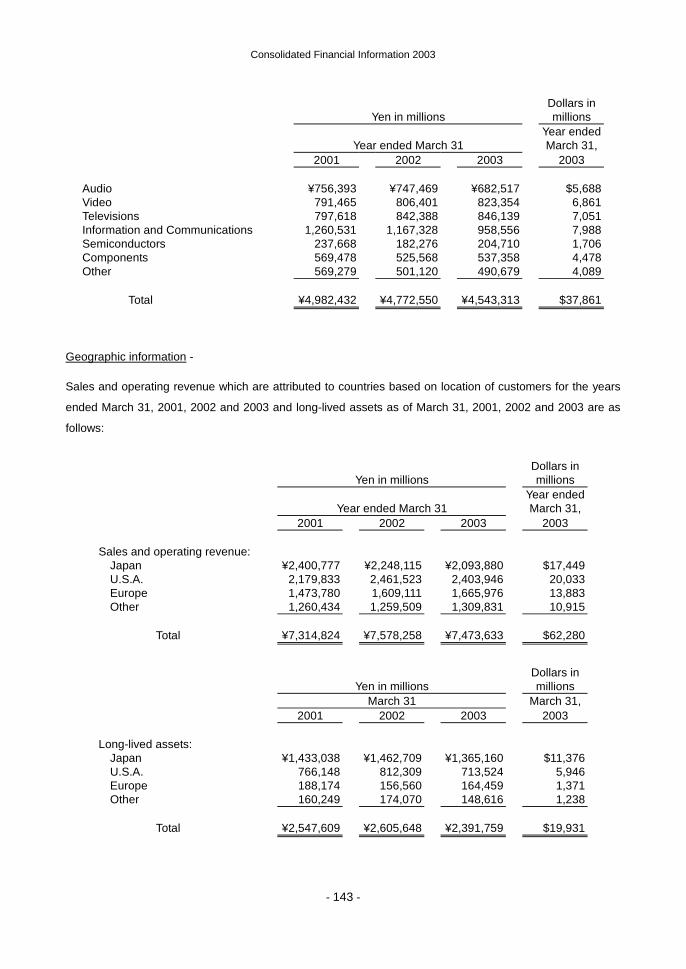
Consolidated Financial Information 2003
- 143 -
Yen in millions
Dollars in millions
Year ended March 31
Year ended March 31,
2001 2002 2003 2003 Audio ¥756,393 ¥747,469 ¥682,517 $5,688 Video 791,465 806,401 823,354 6,861 Televisions 797,618 842,388 846,139 7,051 Information and Communications 1,260,531 1,167,328 958,556 7,988 Semiconductors 237,668 182,276 204,710 1,706 Components 569,478 525,568 537,358 4,478 Other 569,279 501,120 490,679 4,089
Total ¥4,982,432 ¥4,772,550 ¥4,543,313 $37,861
Geographic information -
Sales and operating revenue which are attributed to countries based on location of customers for the years
ended March 31, 2001, 2002 and 2003 and long-lived assets as of March 31, 2001, 2002 and 2003 are as
follows:
Yen in millions Dollars in
millions
Year ended March 31 Year ended
March 31, 2001 2002 2003 2003 Sales and operating revenue:
Japan ¥2,400,777 ¥2,248,115 ¥2,093,880 $17,449 U.S.A. 2,179,833 2,461,523 2,403,946 20,033 Europe 1,473,780 1,609,111 1,665,976 13,883 Other 1,260,434 1,259,509 1,309,831 10,915
Total ¥7,314,824 ¥7,578,258 ¥7,473,633 $62,280
Yen in millions Dollars in
millions March 31 March 31, 2001 2002 2003 2003 Long-lived assets:
Japan ¥1,433,038 ¥1,462,709 ¥1,365,160 $11,376 U.S.A. 766,148 812,309 713,524 5,946 Europe 188,174 156,560 164,459 1,371 Other 160,249 174,070 148,616 1,238
Total ¥2,547,609 ¥2,605,648 ¥2,391,759 $19,931
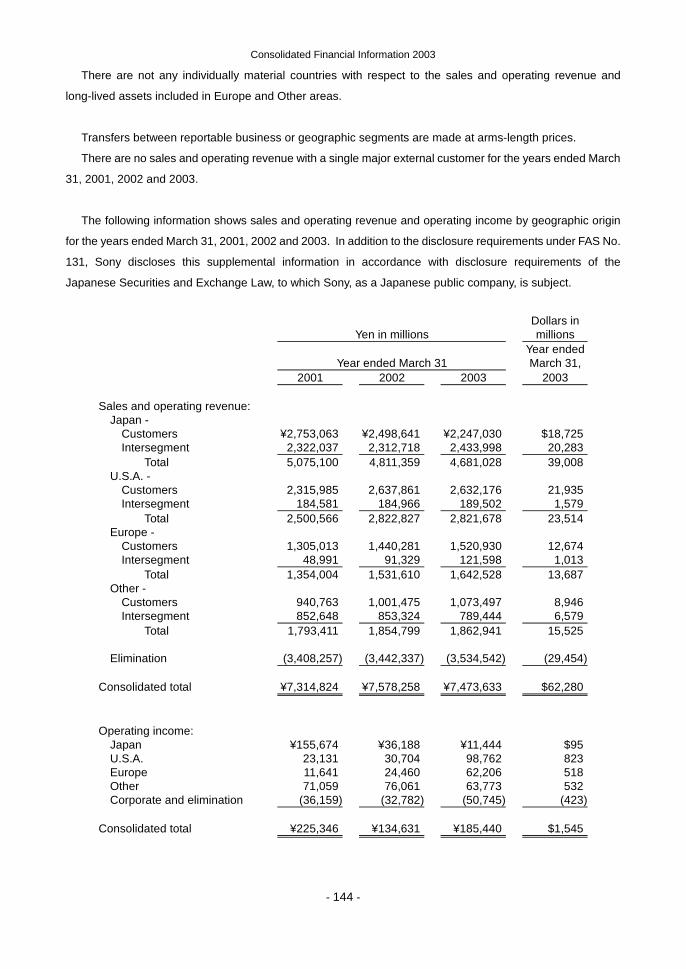
Consolidated Financial Information 2003
- 144 -
There are not any individually material countries with respect to the sales and operating revenue and
long-lived assets included in Europe and Other areas.
Transfers between reportable business or geographic segments are made at arms-length prices.
There are no sales and operating revenue with a single major external customer for the years ended March
31, 2001, 2002 and 2003.
The following information shows sales and operating revenue and operating income by geographic origin
for the years ended March 31, 2001, 2002 and 2003. In addition to the disclosure requirements under FAS No.
131, Sony discloses this supplemental information in accordance with disclosure requirements of the
Japanese Securities and Exchange Law, to which Sony, as a Japanese public company, is subject.
Yen in millions Dollars in
millions
Year ended March 31 Year ended
March 31, 2001 2002 2003 2003 Sales and operating revenue:
Japan - Customers ¥2,753,063 ¥2,498,641 ¥2,247,030 $18,725 Intersegment 2,322,037 2,312,718 2,433,998 20,283
Total 5,075,100 4,811,359 4,681,028 39,008 U.S.A. -
Customers 2,315,985 2,637,861 2,632,176 21,935 Intersegment 184,581 184,966 189,502 1,579
Total 2,500,566 2,822,827 2,821,678 23,514 Europe -
Customers 1,305,013 1,440,281 1,520,930 12,674 Intersegment 48,991 91,329 121,598 1,013
Total 1,354,004 1,531,610 1,642,528 13,687 Other -
Customers 940,763 1,001,475 1,073,497 8,946 Intersegment 852,648 853,324 789,444 6,579
Total 1,793,411 1,854,799 1,862,941 15,525
Elimination (3,408,257) (3,442,337) (3,534,542) (29,454) Consolidated total ¥7,314,824 ¥7,578,258 ¥7,473,633 $62,280 Operating income:
Japan ¥155,674 ¥36,188 ¥11,444 $95 U.S.A. 23,131 30,704 98,762 823 Europe 11,641 24,460 62,206 518 Other 71,059 76,061 63,773 532 Corporate and elimination (36,159) (32,782) (50,745) (423)
Consolidated total ¥225,346 ¥134,631 ¥185,440 $1,545
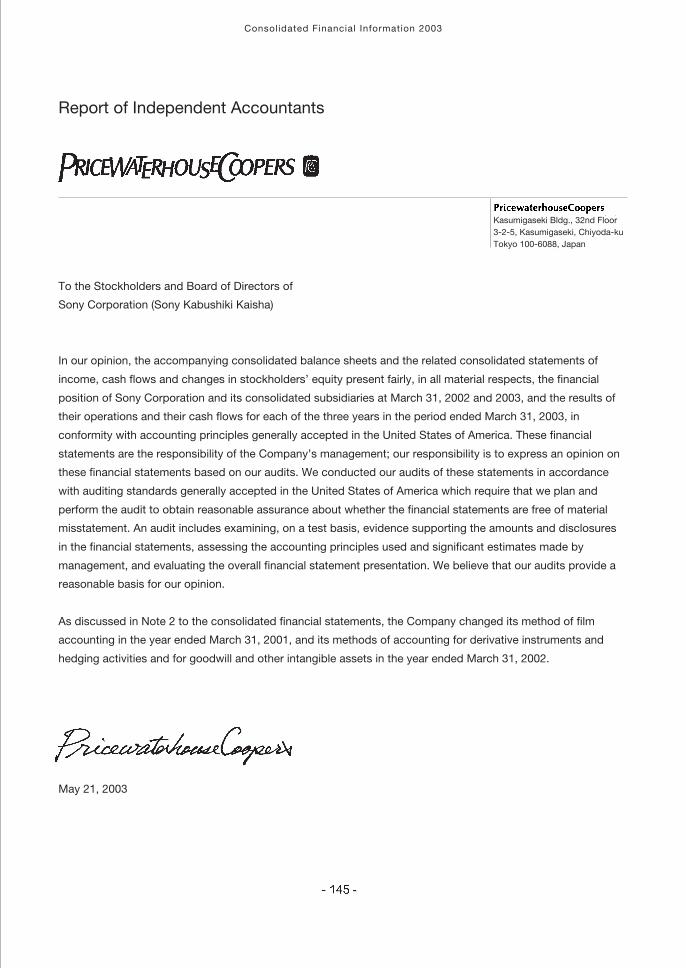
Consolidated Financial Information 2003
Report of Independent Accountants
To the Stockholders and Board of Directors of
Sony Corporation (Sony Kabushiki Kaisha)
In our opinion, the accompanying consolidated balance sheets and the related consolidated statements of
income, cash flows and changes in stockholders’ equity present fairly, in all material respects, the financial
position of Sony Corporation and its consolidated subsidiaries at March 31, 2002 and 2003, and the results of
their operations and their cash flows for each of the three years in the period ended March 31, 2003, in
conformity with accounting principles generally accepted in the United States of America. These financial
statements are the responsibility of the Company’s management; our responsibility is to express an opinion on
these financial statements based on our audits. We conducted our audits of these statements in accordance
with auditing standards generally accepted in the United States of America which require that we plan and
perform the audit to obtain reasonable assurance about whether the financial statements are free of material
misstatement. An audit includes examining, on a test basis, evidence supporting the amounts and disclosures
in the financial statements, assessing the accounting principles used and significant estimates made by
management, and evaluating the overall financial statement presentation. We believe that our audits provide a
reasonable basis for our opinion.
As discussed in Note 2 to the consolidated financial statements, the Company changed its method of film
accounting in the year ended March 31, 2001, and its methods of accounting for derivative instruments and
hedging activities and for goodwill and other intangible assets in the year ended March 31, 2002.
May 21, 2003
Kasumigaseki Bldg., 32nd Floor3-2-5, Kasumigaseki, Chiyoda-kuTokyo 100-6088, Japan

Printed on 100% recycled paper
Printed in Japan
Sony Corporation
Consolidated Financial Inform
ation 2003 Year Ended M
arch 31, 2003