Embed Size (px)
Citation preview
A n n u a lr e p o r t2 0 1 0

A n n u a l r e p o r t 2 0 1 0
2 Management report
116 Consolidated financial statements
238 Annual financial statements
261 Additional information
M a n a g e m e n t r e p o r t
4 Group profile
8 Message from the chairmen
10 2010 and early 2011 highlights
13 Update on the transformation plan
17 Strategy
20 Declaration of corporate governance
68 Shareholder information
71 Human Resources
75 Sustainable development
77 Risk management
95 Capital management
99 Financial results
103 Activity and results of the business lines
M a n a g e m e n t r e p o r t
4 Dexia Annual report 2010
Group profile
Man
agem
ent
repo
rtA
dditi
onal
info
rmat
ion
Ann
ual fi
nanc
ial s
tate
men
tsC
onso
lidat
ed
finan
cial
sta
tem
ents
Group’s total income, including approximately 27% from Turkey) and to achieve a client base of 10 million (4 million in Belgium and Luxembourg, 6 million in Turkey) by 2014.
Public and Wholesale Banking
Dexia plays a major role in the financing of local facilities and infrastructures, the health and social housing sectors and the social economy, principally in Belgium and France. Dexia is also active:• in the field of project finance, adopting a selective approach and in sectors such as infrastructures and renewable energies, both in Europe and North America;• in the field of corporate banking in Belgium, where Dexia focuses on medium-sized corporates, whilst maintaining an opportunist presence with large corporates.In addition, the Group is established in Germany, with an access to the Pfandbriefe market.Close to its clients and fully in tune with their requirements, Dexia is constantly developing and widening its range of products and services. The aim is to go well beyond the role of specialist lender, offering clients of the business line integrated solutions (treasury management, budget optimisation, IT solutions and so on) most suited to their needs.
Asset Management and Services
This business line consists of three activities (asset management, investor services and insurance), characterised by attractive growth outlook based on a diversified clientele and strong collaboration with the Group’s other commercial franchises. With EUR 86.4 billion of assets under management as at 31 December 2010, Dexia Asset Management is the Group’s asset management centre. Its four management centres (in Belgium, France, Luxembourg and Australia) serve a broad client base. The investor services business is conducted by RBC Dexia Investor Services, a joint venture with Royal Bank of Canada, which offers its expertise in global custody, fund and pension administration and shareholder services to institutions all around the world. Total assets under administration amounted to EUR 2,101 billion as at 31 December 2010. Dexia’s insurance activities are mainly concentrated on the Belgian and Luxembourg markets. The Group offers a complete range of life and non-life insurance products to retail, commercial and private banking clients as well as to Dexia’s public and semi-public clients, through a banking-insurance approach and through a network of tied agents.
Dexia is a European banking group, with about 35,200 members of staff and core shareholders’ equity of EUR 19.2 billion as at 31 December 2010. The Group carries out its activities principally in Belgium, Luxembourg, France and Turkey.The Dexia share is listed on Euronext Brussels and Paris and the Luxembourg Stock Exchange, and is included in the BEL20, reference index of the Brussels Stock Exchange, and the Dow Jones Euro Stoxx Banks.
Dexia 2014: a retail bank serving 10 million customersThe Dexia Group has posted clear strategic ambitions for 2014 and fixed as objectives:• to complete its financial restructuring, giving precedence to income from its commercial franchises;• to consolidate and to develop its strong commercial franchises, rebalancing its business line portfolio around retail banking, and tapping growth opportunities offered by the market in Turkey;• to adopt an optimised operational model, supported by the search for synergies and efficiency gains.This return to the essence resulting from the Group’s strategic repositioning is reflected in Dexia’s values, whereby members of staff share three aims: respect, excellence and agility.
Business lines
Retail and Commercial Banking
Dexia offers a wide range of retail, commercial and private banking services to over 8 million customers.Dexia ranks among the three largest banks in Belgium and Luxembourg. In Belgium, Dexia serves its 4 million customers through a network of approximately 850 branches. The Luxembourg operation is the international wealth management centre within the Group; it also covers the country with a nationwide network of branches. Dexia also holds a strong position in Turkey, through DenizBank, which currently stands in sixth position among privately-held banks and serves its customers through a nationwide network of some 500 branches. Besides the retail and commercial banking activities, DenizBank is a fully-fledged bank, with a significant corporate activity and offering its clients asset management services and insurance products.The Group aims to continue developing its commercial franchises in Belgium and Luxembourg and to capture the significant growth potential of Turkey. The objective is to increase the proportion of income from its retail and commercial banking activities (approximately 60% of the
5Annual report 2010 Dexia
Group profile
Man
agem
ent
repo
rtA
dditi
onal
info
rmat
ion
Ann
ual fi
nanc
ial s
tate
men
tsC
onso
lidat
ed
finan
cial
sta
tem
ents
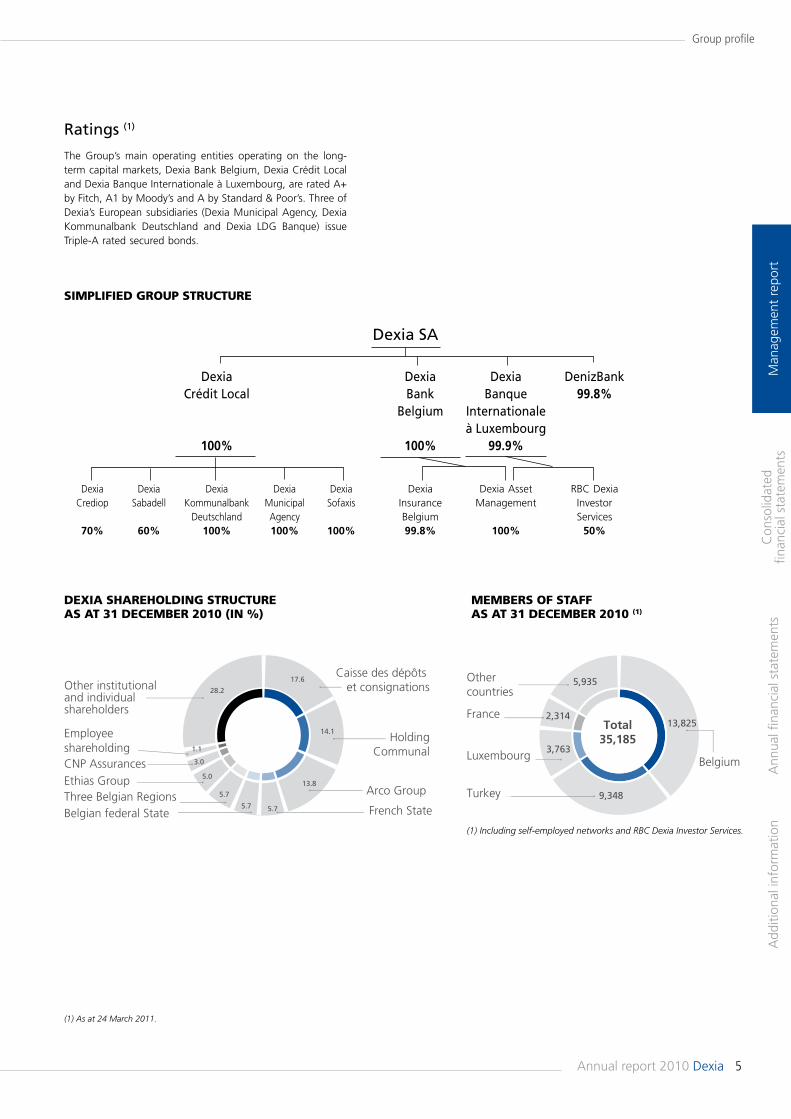
Ratings (1)
The Group’s main operating entities operating on the long-term capital markets, Dexia Bank Belgium, Dexia Crédit Local and Dexia Banque Internationale à Luxembourg, are rated A+ by Fitch, A1 by Moody’s and A by Standard & Poor’s. Three of Dexia’s European subsidiaries (Dexia Municipal Agency, Dexia Kommunalbank Deutschland and Dexia LDG Banque) issue Triple-A rated secured bonds.
(1) As at 24 March 2011.
SIMPLIFIED GROUP STRUCTURE
MEMBERS OF STAFFAS AT 31 DECEMBER 2010 (1)
DEXIA SHAREHOLDING STRUCTUREAS AT 31 DECEMBER 2010 (IN %)
Dexia SA
Dexia Crédit Local
100%
Dexia Bank
Belgium
100%
Dexia Banque
Internationale à Luxembourg
99.9%
DenizBank 99.8%
Dexia Crediop
70%
Dexia Sabadell
60%
Dexia Kommunalbank
Deutschland 100%
Dexia Municipal Agency 100%
Dexia Sofaxis
100%
Dexia Insurance Belgium 99.8%
Dexia Asset Management
100%
RBC Dexia Investor Services
50%
5,935
2,314
3,763
9,348
13,825
35,185
28.2
3.0
5.0
5.7
5.7 5.7
13.8
14.1
17.6
(1) Including self-employed networks and RBC Dexia Investor Services..
Belgium
Turkey
Luxembourg
France
Other countries
1.1
Total
Other institutionaland individualshareholders
Caisse des dépôts et consignations
HoldingCommunal
Arco Group
French StateBelgian federal StateThree Belgian RegionsEthias Group CNP Assurances
Employeeshareholding
6 Dexia Annual report 2010
Group profile
Man
agem
ent
repo
rtA
dditi
onal
info
rmat
ion
Ann
ual fi
nanc
ial s
tate
men
tsC
onso
lidat
ed
finan
cial
sta
tem
ents
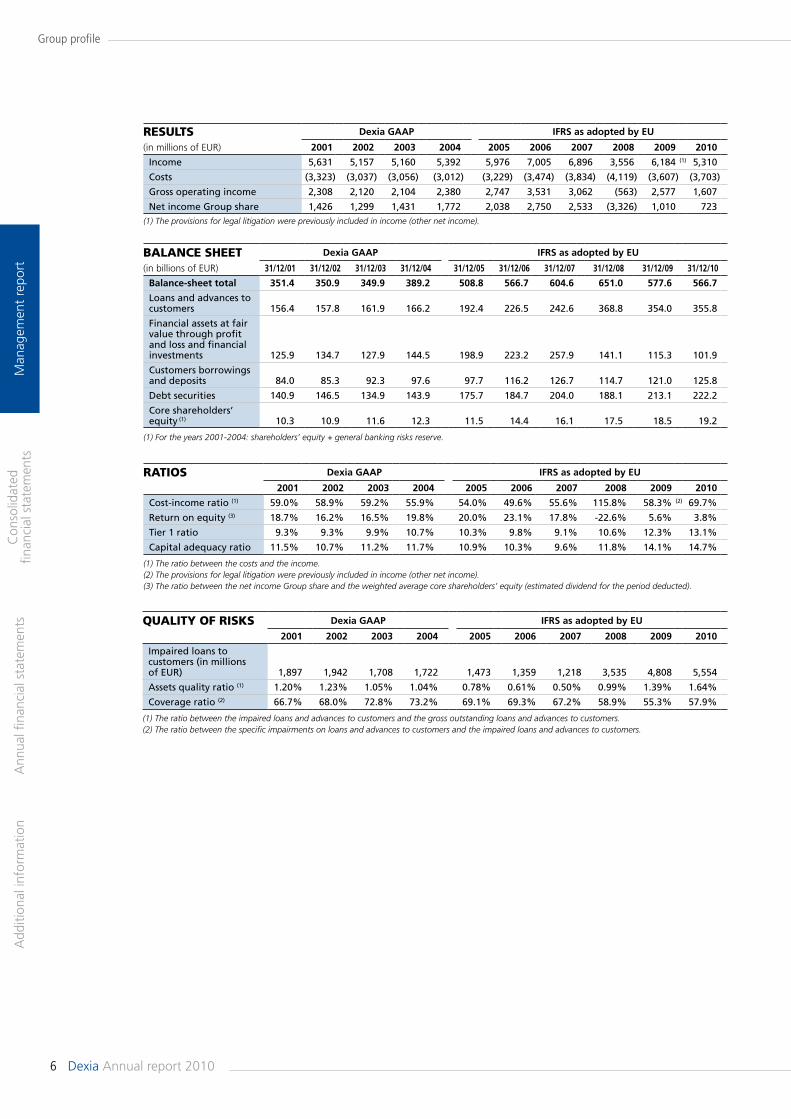
RESULTS Dexia GAAP IFRS as adopted by EU
(in millions of EUR) 2001 2002 2003 2004 2005 2006 2007 2008 2009 2010
Income 5,631 5,157 5,160 5,392 5,976 7,005 6,896 3,556 6,184 (1) 5,310
Costs (3,323) (3,037) (3,056) (3,012) (3,229) (3,474) (3,834) (4,119) (3,607) (3,703)
Gross operating income 2,308 2,120 2,104 2,380 2,747 3,531 3,062 (563) 2,577 1,607
Net income Group share 1,426 1,299 1,431 1,772 2,038 2,750 2,533 (3,326) 1,010 723(1) The provisions for legal litigation were previously included in income (other net income).
QUALITY OF RISKS Dexia GAAP IFRS as adopted by EU
2001 2002 2003 2004 2005 2006 2007 2008 2009 2010
Impaired loans to customers (in millions of EUR) 1,897 1,942 1,708 1,722 1,473 1,359 1,218 3,535 4,808 5,554
Assets quality ratio (1) 1.20% 1.23% 1.05% 1.04% 0.78% 0.61% 0.50% 0.99% 1.39% 1.64%
Coverage ratio (2) 66.7% 68.0% 72.8% 73.2% 69.1% 69.3% 67.2% 58.9% 55.3% 57.9%
(1) The ratio between the impaired loans and advances to customers and the gross outstanding loans and advances to customers. (2) The ratio between the specific impairments on loans and advances to customers and the impaired loans and advances to customers.
RATIOS Dexia GAAP IFRS as adopted by EU
2001 2002 2003 2004 2005 2006 2007 2008 2009 2010
Cost-income ratio (1) 59.0% 58.9% 59.2% 55.9% 54.0% 49.6% 55.6% 115.8% 58.3% (2) 69.7%
Return on equity (3) 18.7% 16.2% 16.5% 19.8% 20.0% 23.1% 17.8% -22.6% 5.6% 3.8%
Tier 1 ratio 9.3% 9.3% 9.9% 10.7% 10.3% 9.8% 9.1% 10.6% 12.3% 13.1%
Capital adequacy ratio 11.5% 10.7% 11.2% 11.7% 10.9% 10.3% 9.6% 11.8% 14.1% 14.7%
(1) The ratio between the costs and the income.(2) The provisions for legal litigation were previously included in income (other net income). (3) The ratio between the net income Group share and the weighted average core shareholders’ equity (estimated dividend for the period deducted).
BALANCE SHEET Dexia GAAP IFRS as adopted by EU
(in billions of EUR) 31/12/01 31/12/02 31/12/03 31/12/04 31/12/05 31/12/06 31/12/07 31/12/08 31/12/09 31/12/10
Balance-sheet total 351.4 350.9 349.9 389.2 508.8 566.7 604.6 651.0 577.6 566.7
Loans and advances to customers 156.4 157.8 161.9 166.2 192.4 226.5 242.6 368.8 354.0 355.8
Financial assets at fair value through profit and loss and financial investments 125.9 134.7 127.9 144.5 198.9 223.2 257.9 141.1 115.3 101.9
Customers borrowings and deposits 84.0 85.3 92.3 97.6 97.7 116.2 126.7 114.7 121.0 125.8
Debt securities 140.9 146.5 134.9 143.9 175.7 184.7 204.0 188.1 213.1 222.2
Core shareholders’ equity (1) 10.3 10.9 11.6 12.3 11.5 14.4 16.1 17.5 18.5 19.2
(1) For the years 2001-2004: shareholders’ equity + general banking risks reserve.
7Annual report 2010 Dexia
Group profile
Man
agem
ent
repo
rtA
dditi
onal
info
rmat
ion
Ann
ual fi
nanc
ial s
tate
men
tsC
onso
lidat
ed
finan
cial
sta
tem
ents
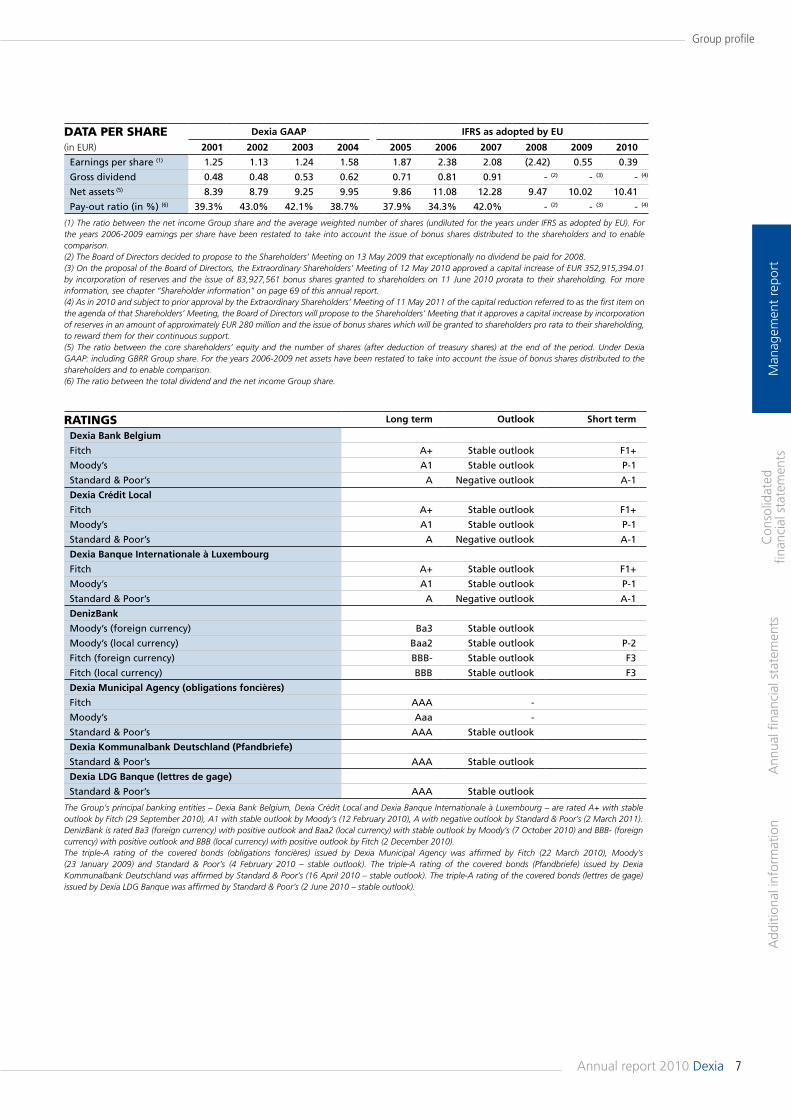
DATA PER SHARE Dexia GAAP IFRS as adopted by EU
(in EUR) 2001 2002 2003 2004 2005 2006 2007 2008 2009 2010
Earnings per share (1) 1.25 1.13 1.24 1.58 1.87 2.38 2.08 (2.42) 0.55 0.39
Gross dividend 0.48 0.48 0.53 0.62 0.71 0.81 0.91 - (2) - (3) - (4)
Net assets (5) 8.39 8.79 9.25 9.95 9.86 11.08 12.28 9.47 10.02 10.41
Pay-out ratio (in %) (6) 39.3% 43.0% 42.1% 38.7% 37.9% 34.3% 42.0% - (2) - (3) - (4)
(1) The ratio between the net income Group share and the average weighted number of shares (undiluted for the years under IFRS as adopted by EU). For the years 2006-2009 earnings per share have been restated to take into account the issue of bonus shares distributed to the shareholders and to enable comparison.(2) The Board of Directors decided to propose to the Shareholders’ Meeting on 13 May 2009 that exceptionally no dividend be paid for 2008.(3) On the proposal of the Board of Directors, the Extraordinary Shareholders’ Meeting of 12 May 2010 approved a capital increase of EUR 352,915,394.01 by incorporation of reserves and the issue of 83,927,561 bonus shares granted to shareholders on 11 June 2010 prorata to their shareholding. For more information, see chapter “Shareholder information” on page 69 of this annual report.(4) As in 2010 and subject to prior approval by the Extraordinary Shareholders’ Meeting of 11 May 2011 of the capital reduction referred to as the first item on the agenda of that Shareholders’ Meeting, the Board of Directors will propose to the Shareholders’ Meeting that it approves a capital increase by incorporation of reserves in an amount of approximately EUR 280 million and the issue of bonus shares which will be granted to shareholders pro rata to their shareholding, to reward them for their continuous support.(5) The ratio between the core shareholders’ equity and the number of shares (after deduction of treasury shares) at the end of the period. Under Dexia GAAP: including GBRR Group share. For the years 2006-2009 net assets have been restated to take into account the issue of bonus shares distributed to the shareholders and to enable comparison.(6) The ratio between the total dividend and the net income Group share.
RATINGS Long term Outlook Short term
Dexia Bank Belgium
Fitch A+ Stable outlook F1+
Moody’s A1 Stable outlook P-1
Standard & Poor’s A Negative outlook A-1
Dexia Crédit Local
Fitch A+ Stable outlook F1+
Moody’s A1 Stable outlook P-1
Standard & Poor’s A Negative outlook A-1
Dexia Banque Internationale à Luxembourg
Fitch A+ Stable outlook F1+
Moody’s A1 Stable outlook P-1
Standard & Poor’s A Negative outlook A-1
DenizBank
Moody’s (foreign currency) Ba3 Stable outlook
Moody’s (local currency) Baa2 Stable outlook P-2
Fitch (foreign currency) BBB- Stable outlook F3
Fitch (local currency) BBB Stable outlook F3
Dexia Municipal Agency (obligations foncières)
Fitch AAA -
Moody’s Aaa -
Standard & Poor’s AAA Stable outlook
Dexia Kommunalbank Deutschland (Pfandbriefe)
Standard & Poor’s AAA Stable outlook
Dexia LDG Banque (lettres de gage)
Standard & Poor’s AAA Stable outlook
The Group’s principal banking entities – Dexia Bank Belgium, Dexia Crédit Local and Dexia Banque Internationale à Luxembourg – are rated A+ with stable outlook by Fitch (29 September 2010), A1 with stable outlook by Moody’s (12 February 2010), A with negative outlook by Standard & Poor’s (2 March 2011). DenizBank is rated Ba3 (foreign currency) with positive outlook and Baa2 (local currency) with stable outlook by Moody’s (7 October 2010) and BBB- (foreign currency) with positive outlook and BBB (local currency) with positive outlook by Fitch (2 December 2010).The triple-A rating of the covered bonds (obligations foncières) issued by Dexia Municipal Agency was affirmed by Fitch (22 March 2010), Moody’s (23 January 2009) and Standard & Poor’s (4 February 2010 – stable outlook). The triple-A rating of the covered bonds (Pfandbriefe) issued by Dexia Kommunalbank Deutschland was affirmed by Standard & Poor’s (16 April 2010 – stable outlook). The triple-A rating of the covered bonds (lettres de gage) issued by Dexia LDG Banque was affirmed by Standard & Poor’s (2 June 2010 – stable outlook).
8 Dexia Annual report 2010
Message from the Chairmen
Man
agem
ent
repo
rtA
dditi
onal
info
rmat
ion
Ann
ual fi
nanc
ial s
tate
men
tsC
onso
lidat
ed
finan
cial
sta
tem
ents
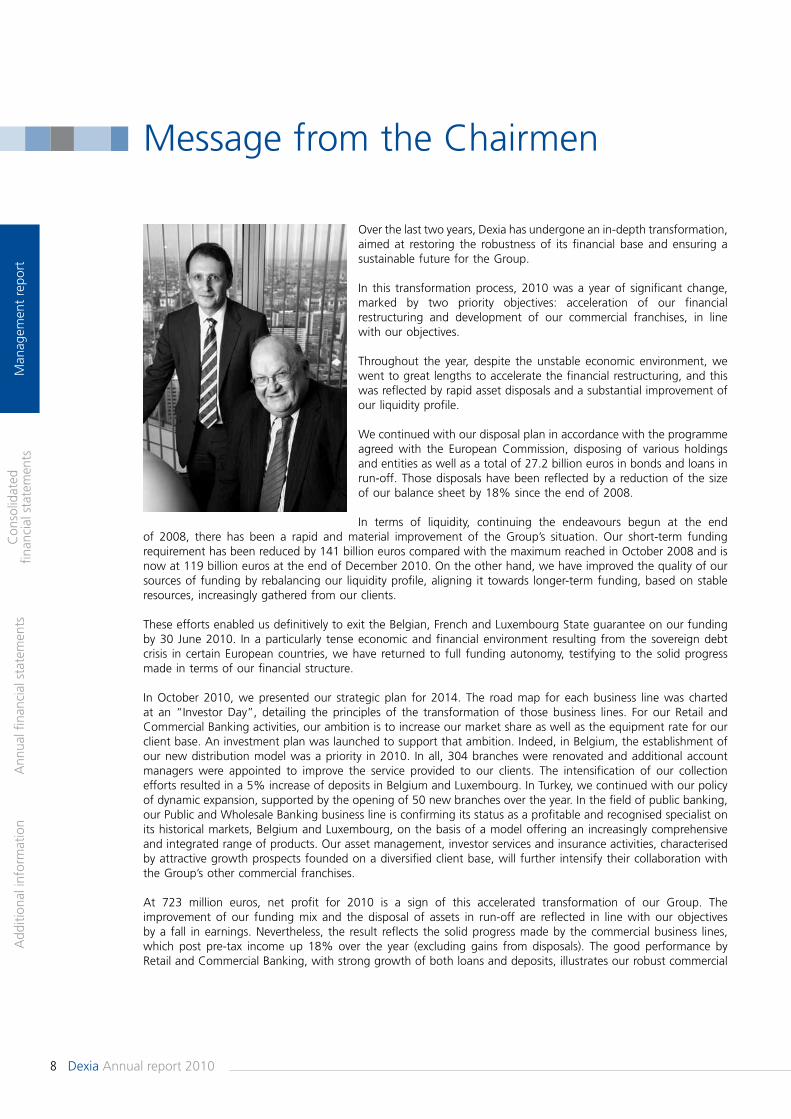
Over the last two years, Dexia has undergone an in-depth transformation, aimed at restoring the robustness of its financial base and ensuring a sustainable future for the Group.
In this transformation process, 2010 was a year of significant change, marked by two priority objectives: acceleration of our financial restructuring and development of our commercial franchises, in line with our objectives.
Throughout the year, despite the unstable economic environment, we went to great lengths to accelerate the financial restructuring, and this was reflected by rapid asset disposals and a substantial improvement of our liquidity profile.
We continued with our disposal plan in accordance with the programme agreed with the European Commission, disposing of various holdings and entities as well as a total of 27.2 billion euros in bonds and loans in run-off. Those disposals have been reflected by a reduction of the size of our balance sheet by 18% since the end of 2008.
In terms of liquidity, continuing the endeavours begun at the end of 2008, there has been a rapid and material improvement of the Group’s situation. Our short-term funding requirement has been reduced by 141 billion euros compared with the maximum reached in October 2008 and is now at 119 billion euros at the end of December 2010. On the other hand, we have improved the quality of our sources of funding by rebalancing our liquidity profile, aligning it towards longer-term funding, based on stable resources, increasingly gathered from our clients.
These efforts enabled us definitively to exit the Belgian, French and Luxembourg State guarantee on our funding by 30 June 2010. In a particularly tense economic and financial environment resulting from the sovereign debt crisis in certain European countries, we have returned to full funding autonomy, testifying to the solid progress made in terms of our financial structure.
In October 2010, we presented our strategic plan for 2014. The road map for each business line was charted at an “Investor Day”, detailing the principles of the transformation of those business lines. For our Retail and Commercial Banking activities, our ambition is to increase our market share as well as the equipment rate for our client base. An investment plan was launched to support that ambition. Indeed, in Belgium, the establishment of our new distribution model was a priority in 2010. In all, 304 branches were renovated and additional account managers were appointed to improve the service provided to our clients. The intensification of our collection efforts resulted in a 5% increase of deposits in Belgium and Luxembourg. In Turkey, we continued with our policy of dynamic expansion, supported by the opening of 50 new branches over the year. In the field of public banking, our Public and Wholesale Banking business line is confirming its status as a profitable and recognised specialist on its historical markets, Belgium and Luxembourg, on the basis of a model offering an increasingly comprehensive and integrated range of products. Our asset management, investor services and insurance activities, characterised by attractive growth prospects founded on a diversified client base, will further intensify their collaboration with the Group’s other commercial franchises.
At 723 million euros, net profit for 2010 is a sign of this accelerated transformation of our Group. The improvement of our funding mix and the disposal of assets in run-off are reflected in line with our objectives by a fall in earnings. Nevertheless, the result reflects the solid progress made by the commercial business lines, which post pre-tax income up 18% over the year (excluding gains from disposals). The good performance by Retail and Commercial Banking, with strong growth of both loans and deposits, illustrates our robust commercial
9Annual report 2010 Dexia
Man
agem
ent
repo
rtA
dditi
onal
info
rmat
ion
Ann
ual fi
nanc
ial s
tate
men
tsC
onso
lidat
ed
finan
cial
sta
tem
ents
position on our main markets. Our Public and Wholesale Banking activities, refocused on our historical markets, particularly in Belgium and France, demonstrated their resistance and their profitability throughout the year and our expertise in project finance was confirmed by the granting of numerous mandates and the presentation of many awards. The contribution by Asset Management and Services to results doubled over the year, with the excellent performance of our insurance activity, whilst the recovery of the financial markets was beneficial to our asset management and investor services activities.
In addition, the gradual improvement of the credit environment, particularly in Turkey, enabled the cost of risk to be improved for our commercial business lines. At the same time, we were led however to make additional impairments on our Financial Products portfolio, to take account of more conservative assumptions as to the evolution of the US RMBS market. Those impairments are nonetheless without impact on our solvency ratios, which are protected from any loss or additional impairment on the Financial Products portfolio following the State guarantee mechanism.
With a Tier 1 ratio at 13.1%, our solvency remains excellent and enables us to view future regulatory developments with confidence.
We can be proud of our achievements in 2010 and our successes, which are the fruit of the commitment of everyone, members of staff, shareholders and clients alike. In two years we have implemented two thirds of our transformation plan. We would therefore like to thank our shareholders for their support and have them benefit from the year’s result with the issue to them of new shares in an amount of approximately 280 million euros.
Transformation will remain on the agenda for 2011 and we are concentrating even more on the strategic development of our commercial franchises. We are entirely confident in the Group’s ability to achieve the objectives set for 2014.
Jean-Luc Dehaene
Chairman of the Board of Directors
Pierre Mariani
Chief Executive Officer
10 Dexia Annual report 2010
2010 and early 2011 highlights
Man
agem
ent
repo
rtA
dditi
onal
info
rmat
ion
Ann
ual fi
nanc
ial s
tate
men
tsC
onso
lidat
ed
finan
cial
sta
tem
ents
June
Dexia fully exits State guarantee support for its future fundingOn 30 June 2010, Dexia fully exited the State guarantee liquidity framework put in place in October 2008. Considering the improvement of its liquidity situation and in line with the undertakings it made to the European Commission, the Group ceased to issue guaranteed debt four months earlier than the agreed expiry date of 30 October 2010. The exit process was conducted gradually, Dexia waiving the benefit of the guarantee for contracts with a maturity of up to one month and contracts with no fixed maturity as early as October 2009. Then the Group ceased to use the guarantee for its deposit contracts, particularly interbank deposits, from 1 March 2010, finally to cease all recourse to that funding at less than one year on 31 May 2010 and for its medium and long-term funding on 30 June 2010. All outstanding instruments issued under the government guarantee framework before 30 June 2010 will continue to benefit from the government guarantee in accordance with their terms and conditions. Guaranteed outstanding will be fully written down in 2014.More detailed information on the State guarantee is provided in the note 9.4.C. to the consolidated financial statements in this Annual Report (page 184).
Dexia disposes of its stake in SPEDexia concluded an agreement with EDF on the sale of its 6.13% stake in SPE, a company operating in the energy sector in Belgium. The capital gain on this transaction amounted to EUR 69 million after taxes. This transaction was part of the agreement with the European Commission providing for disposal of this holding by 31 December 2010.
Dexia sells its holding in AdInfoDexia concluded an agreement with Network Research Belgium, a Belgian IT service provider, on the sale of its 51% stake in AdInfo, a company active in IT services for Belgian local authorities. The capital gain on this transaction amounted to EUR 14 million after taxes. The transaction was part of the agreement with the European Commission providing for disposal of this holding before 31 December 2010.
2010
February
Agreement of the European Commission to the Dexia restructuring planOn 5 February 2010, the Belgian, French and Luxembourg governments and the European Commission concluded an agreement in principle on the Dexia Group restructuring plan which was definitively ratified by the new Commission on 26 February 2010. This agreement, which falls fully within the dynamic of the Group transformation plan, enables Dexia to continue to develop its core business lines on its historical markets, France, Belgium and Luxembourg, as well as in Turkey.More detailed information is provided in the chapter “Update on the transformation plan” in this Annual Report (page 13).
March
Disposal of the Assured Guaranty sharesOn 11 March 2010, Dexia finalised a secondary public offering of 21,848,934 common shares in Assured Guaranty, in its possession since the sale of the insurance activities of FSA to Assured Guaranty. The shares sold represent all the common Assured shares held by Dexia. The transaction generated a pre-tax gain of EUR 153 million.
April
Closing of the sale of Dexia Épargne PensionDexia closed the sale to BNP Paribas Assurances of Dexia Épargne Pension, its subsidiary specialising in life insurance in France, following the sale agreement signed in December 2009.
May
Judgement by the Court of First Instance in Bratislava on Dexia banka SlovenskoAt the end of the hearing held on 17 May 2010, the Court of First Instance in Bratislava passed a judgement ordering Dexia banka Slovensko, the Slovakian subsidiary of the Dexia Group, to pay the sum of EUR 138 million in principal, following an action brought by a professional client in 2008. The appeal filed by Dexia lead to the cancellation of this first instance judgement in January 2011 (see hereafter).
11Annual report 2010 Dexia
2010 and early 2011 highlights
Man
agem
ent
repo
rtA
dditi
onal
info
rmat
ion
Ann
ual fi
nanc
ial s
tate
men
tsC
onso
lidat
ed
finan
cial
sta
tem
ents
The Dexia share leaves the CAC 40The Scientific Panel of Indices, the board that decides on which shares are included in the CAC 40, the main share index on the Paris Stock Exchange, announced on 3 September 2010 that the Dexia share would be leaving the index as from the Stock Exchange trading session on Monday 20 September 2010. Dexia joined the CAC Next 20, the index calculated and published by NYSE Euronext Paris, and will remain listed on the BEL20, the main share index on the Brussels Stock Exchange of which it is one of the leading shares. Leaving the CAC 40 does not mean that the Dexia share is excluded from Euro Stoxx or Stoxx Banks.More detailed information on the Dexia share is provided in the chapter “Shareholder information” in this Annual Report (page 68).
October
Dexia announces its “Dexia 2014” strategy: a retail bank serving 10 million customersAt its “Investor Day”, held on 12 October 2010, the Dexia Group presented its “Dexia 2014” strategy. Dexia set itself the objective:• to complete its financial restructuring, giving precedence to income from its commercial franchises;• to consolidate and to develop its strong commercial franchises, rebalancing its business line portfolio around retail banking, tapping the growth opportunities offered by the market in Turkey;• to reshape its operating model, seeking synergies and efficiency gains.More detailed information is provided in the chapter “Strategy” in this Annual Report (page 17).
November
Dexia sells its subsidiary Dexia banka SlovenskoDexia concluded an agreement with the Central European investment group Penta Investments Ltd, on the sale of its 88.71% stake in Dexia banka Slovensko. The transaction is part of the agreement with the European Commission that provides for the disposal of Dexia banka Slovensko by Dexia before 31 October 2012. The transaction should be finalised during the first half of 2011.
Turkish Post and DenizBank merge their forces for PTT cardsOn 30 November 2010, DenizBank and the Turkish Post (PTT) announced a major cooperation agreement. Thanks to the cooperation established between the two institutions, PTT cards will be equipped with Visa/MasterCard features. Through this project, PTT customers will have access to international card payment systems and DenizBank will add a potential of 3 million new customers to its client base.
July
CEBS stress tests confirm that Dexia does not require additional capital to withstand adverse scenarios Like 91 other European institutions, Dexia was subject to the 2010 EU-wide stress testing exercise coordinated by the Committee of European Banking Supervisors (CEBS). The conclusion of this stress test, based on different scenarios of credit quality deterioration (1), is that Dexia does not require additional capital to withstand the CEBS two-year adverse scenario, including the additional sovereign shock.More detailed information is provided in the part dedicated to the stress tests in the chapter “Risk management” in this Annual Report (page 93).
September
Dexia continues its commercial deployment and cost-cutting planDexia announced new restructuring and cost-reduction measures, which will contribute to strengthening Group integration and will enable EUR 160 million in savings to be achieved, particularly through mutualisation or optimisation measures relating specifically to IT functions, purchasing policy and market activities. These measures are reflected by the loss of 665 full-time equivalent jobs, of which 385 in Belgium, 70 in France, 140 in Luxembourg and 70 inter-nationally.
Industrial partnership with Crédit MutuelDexia signed a letter of commitment to establish an industrial partnership with the Crédit Mutuel group. This partnership relates to the commercial banking activity of Dexia Crédit Local with its local public sector clients in France and concerns the provision by the Crédit Mutuel group from January 2013 of a commercial banking platform and associated functionalities. Through the industrial platform of the Crédit Mutuel-CIC group, the Dexia Group will receive first-class banking services enabling it to provide its clients with an extended and highly efficient range of services.
Dexia Bank acquitted in the Lernout & Hauspie caseOn 20 September 2010, the Court of Appeal in Ghent acquitted Dexia Bank and Mr Geert Dauwe, a former member of the management of Artesia Bank, on all the charges against them in the Lernout & Hauspie case. No party has filed an appeal to the Supreme Court of Appeal against this acquittal of Dexia Bank and Mr Geert Dauwe, so that their acquittal is definitive.More detailed information is provided in the part dedicated to legal risk in the chapter “Risk management” in this Annual Report (page 90).
(1) The exercise was performed according to the scenarios, methodology and hypotheses provided by the CEBS, detailed in the global report published on the CEBS website: http://www.c-ebs.org/EU-wide-stress-testing.aspx
12 Dexia Annual report 2010
2010 and early 2011 highlights
Man
agem
ent
repo
rtA
dditi
onal
info
rmat
ion
Ann
ual fi
nanc
ial s
tate
men
tsC
onso
lidat
ed
finan
cial
sta
tem
ents
December
A reinforced management team to implement the “Dexia 2014” strategic planDexia announced that it was going to strengthen its Management Board as from 1 January 2011. The new team is enlarged to include ten members, in order to provide the essential skills enabling the Dexia Group to achieve the objectives of its strategic plan.More detailed information is provided in the part dedicated to the Management Board in the chapter “Declaration of corporate governance” in this Annual Report (page 42).
DenizBank opens 50 new branches in 2010Benefiting from a solid economic environment, DenizBank continued to expand its customer franchise in 2010 and opened 50 new branches, bringing the total to 500 at the end of December 2010. The bank also made 346 extra ATMs available to its clientele and gained 425,000 new retail and business customers over the year.
2011
January
Decision of the Bratislava Appeal Court in favour of DexiaOn 25 January 2011, the Court of Appeal of Bratislava rendered a judgement in favour of Dexia, cancelling the first-instance judgement of May 2010 by which Dexia banka Slovensko was ordered to pay an amount in principal of EUR 138 million. As a result the case will revert back to the First-Instance Court of Bratislava which will have to render a new judgement taking into account the legal evaluation of the Court of Appeal. More detailed information is provided in the part dedicated to legal risk in the chapter “Risk management” in this Annual Report (page 92).
13Annual report 2010 Dexia
Update on the transformation plan
Man
agem
ent
repo
rtA
dditi
onal
info
rmat
ion
Ann
ual fi
nanc
ial s
tate
men
tsC
onso
lidat
ed
finan
cial
sta
tem
ents
In November 2010, Dexia concluded an agreement with Penta Investments Ltd, a Central European investment group, on the sale of its 88.71% stake in Dexia banka Slovensko. The transaction is part of the agreement with the European Commission that provides for the disposal of Dexia banka Slovensko by Dexia before 31 October 2012. The transaction should be finalised during the first half of 2011.Dexia also launched the process for disposal or floating of DenizEmeklilik, the insurance subsidiary of DenizBank in Turkey, in line with the agreement with the European Commission to make the sale before 31 October 2012. Non-binding offers have already been received.Finally, Dexia also undertook to sell its 70% holding in Dexia Crediop (Italy) before 31 October 2012 and its 60% holding in Dexia Sabadell (Spain) before 31 December 2013.
Creation of the Legacy Division
Since the beginning of 2010, Dexia has regrouped its portfolios in run-off as well as some Public and Wholesale Banking non-core loans and off-balance-sheet commitments in a specific division, named Legacy Portfolio Management Division (Legacy Division) alongside the core business lines, now brought together in the Core Division.The Legacy Division contains:• the bond portfolio in run-off;• the Financial Products portfolio;• non-core public sector loans.The assets of the Legacy Division remain on the Group balance sheet and benefit from clearly identified and allocated funding, as illustrated in the table hereafter (page 14). Government-guaranteed funding is entirely allocated to this division.The division also includes off-balance-sheet commitments of the Public and Wholesale Banking business line in the United States, corresponding principally to undrawn liquidity lines in run-off.This new analytical segmentation, in line with undertakings made to the European Commission, enables Dexia to improve considerably the visibility of its core business lines.
The year 2010 was dominated by the Dexia transformation plan. It began with the European Commission acknowledging the progress made since the launch of the plan in November 2008. On 5 February 2010, the Belgian, French and Luxembourg governments and the European Commission concluded an agreement in principle on the Dexia Group restructuring plan which was definitively confirmed by the new commission on 26 February 2010.The commitments made to the European Commission, as well as the progress made in 2010 are detailed below. The Dexia restructuring plan is being monitored by an independent expert commissioned by Dexia and the European Commission. The extent to which the objectives are being met will be concluded from the report to be issued by the expert by 30 April 2011. With regard to the commitments related to the balance sheet, accounting data as at 31 December 2010 will be restated, in compliance with the measures outlined in the Commission’s decision. Throughout the year, the Group continued successfully to implement its transformation plan, reducing its short-term funding requirement and thus its risk profile, despite a turbulent economic environment.
Disposals
The Group continued to refocus on its main franchises and its historical markets, and this was reflected by several disposals.On 11 March 2010, Dexia finalised a secondary public offering of 21,848,934 common shares in Assured Guaranty, in its possession since the sale of the insurance activities of FSA to Assured Guaranty. The shares sold represent all the common Assured Guaranty shares held by Dexia. The transaction generated a gross capital gain of EUR 153 million.In the first half of 2010, the Group also finalised the sale of its subsidiary Dexia Épargne Pension.In June 2010, Dexia concluded an agreement with EDF in relation to the sale of its 6.13% holding in SPE, a company operating in the energy sector in Belgium, as well as an agreement with Network Research Belgium, a Belgian IT service provider, in relation to the sale of its 51% holding in AdInfo, a company active in the field of IT services to Belgian local authorities. The gains from these disposals amounted respectively to EUR 69 million after taxes for SPE and EUR 14 mil-lion after taxes for AdInfo. These two transactions are in line with the agreement with the European Commission providing for disposal of these holdings before 31 December 2010.
14 Dexia Annual report 2010
Update on the transformation plan
Man
agem
ent
repo
rtA
dditi
onal
info
rmat
ion
Ann
ual fi
nanc
ial s
tate
men
tsC
onso
lidat
ed
finan
cial
sta
tem
ents
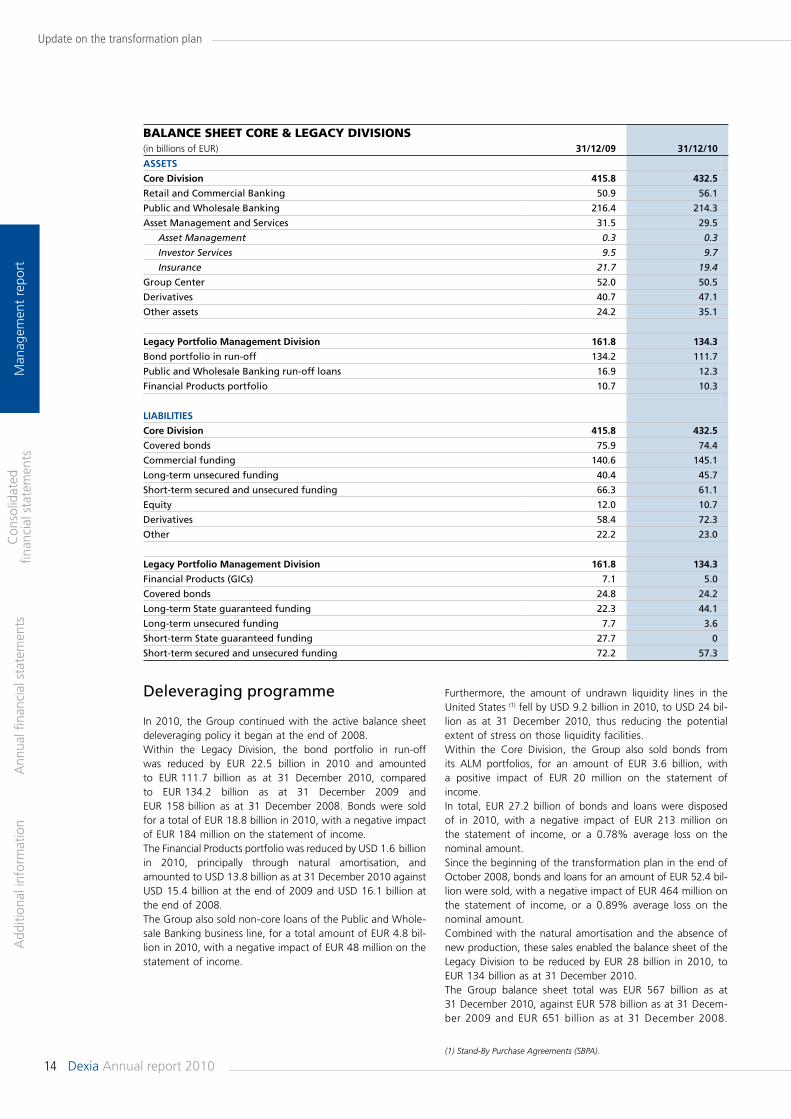
BALANCE SHEET CORE & LEGACY DIvISIONS(in billions of EUR) 31/12/09 31/12/10
ASSETS
Core Division 415.8 432.5
Retail and Commercial Banking 50.9 56.1
Public and Wholesale Banking 216.4 214.3
Asset Management and Services 31.5 29.5
Asset Management 0.3 0.3
Investor Services 9.5 9.7
Insurance 21.7 19.4
Group Center 52.0 50.5
Derivatives 40.7 47.1
Other assets 24.2 35.1
Legacy Portfolio Management Division 161.8 134.3
Bond portfolio in run-off 134.2 111.7
Public and Wholesale Banking run-off loans 16.9 12.3
Financial Products portfolio 10.7 10.3
LIABILITIES
Core Division 415.8 432.5
Covered bonds 75.9 74.4
Commercial funding 140.6 145.1
Long-term unsecured funding 40.4 45.7
Short-term secured and unsecured funding 66.3 61.1
Equity 12.0 10.7
Derivatives 58.4 72.3
Other 22.2 23.0
Legacy Portfolio Management Division 161.8 134.3
Financial Products (GICs) 7.1 5.0
Covered bonds 24.8 24.2
Long-term State guaranteed funding 22.3 44.1
Long-term unsecured funding 7.7 3.6
Short-term State guaranteed funding 27.7 0
Short-term secured and unsecured funding 72.2 57.3
Deleveraging programme
In 2010, the Group continued with the active balance sheet deleveraging policy it began at the end of 2008. Within the Legacy Division, the bond portfolio in run-off was reduced by EUR 22.5 billion in 2010 and amounted to EUR 111.7 billion as at 31 December 2010, compared to EUR 134.2 billion as at 31 December 2009 and EUR 158 billion as at 31 December 2008. Bonds were sold for a total of EUR 18.8 billion in 2010, with a negative impact of EUR 184 million on the statement of income. The Financial Products portfolio was reduced by USD 1.6 billion in 2010, principally through natural amortisation, and amounted to USD 13.8 billion as at 31 December 2010 against USD 15.4 billion at the end of 2009 and USD 16.1 billion at the end of 2008.The Group also sold non-core loans of the Public and Whole-sale Banking business line, for a total amount of EUR 4.8 bil-lion in 2010, with a negative impact of EUR 48 million on the statement of income.
Furthermore, the amount of undrawn liquidity lines in the United States (1) fell by USD 9.2 billion in 2010, to USD 24 bil-lion as at 31 December 2010, thus reducing the potential extent of stress on those liquidity facilities.Within the Core Division, the Group also sold bonds from its ALM portfolios, for an amount of EUR 3.6 billion, with a positive impact of EUR 20 million on the statement of income. In total, EUR 27.2 billion of bonds and loans were disposed of in 2010, with a negative impact of EUR 213 million on the statement of income, or a 0.78% average loss on the nominal amount.Since the beginning of the transformation plan in the end of October 2008, bonds and loans for an amount of EUR 52.4 bil-lion were sold, with a negative impact of EUR 464 million on the statement of income, or a 0.89% average loss on the nominal amount.Combined with the natural amortisation and the absence of new production, these sales enabled the balance sheet of the Legacy Division to be reduced by EUR 28 billion in 2010, to EUR 134 billion as at 31 December 2010.The Group balance sheet total was EUR 567 billion as at 31 December 2010, against EUR 578 billion as at 31 Decem-ber 2009 and EUR 651 billion as at 31 December 2008.
(1) Stand-By Purchase Agreements (SBPA).
15Annual report 2010 Dexia
Update on the transformation plan
Man
agem
ent
repo
rtA
dditi
onal
info
rmat
ion
Ann
ual fi
nanc
ial s
tate
men
tsC
onso
lidat
ed
finan
cial
sta
tem
ents
process was conducted gradually, Dexia waiving the benefit of the guarantee for contracts with a maturity of up to one month and contracts with no fixed maturity as early as October 2009. Then the Group ceased to use the guarantee for its deposit contracts, particularly interbank deposits, from 1 March 2010, and finally stopped the issuance of short-term guaranteed instruments on 31 May 2010 and of all medium and long-term guaranteed debt on 30 June 2010. All outstanding instruments issued under the government guarantee framework before 30 June 2010 will continue to benefit from the government guarantee in accordance with their terms and conditions. Total outstanding guaranteed debt amounted to EUR 44.4 billion as at 31 December 2010 (against EUR 50.4 billion as at 31 December 2009). This guaranteed outstanding will be fully written down in 2014, of which approximately 40% in 2011.More detailed information on the government guarantee is provided in the note 9.4.C. to the consolidated financial statements in this Annual Report (page 184).
Cost reduction
In order to maintain profitability of the Group refocused on its main franchises, in 2008 Dexia announced a target reduction to its cost base of 15% in three years, or EUR 600 million by the end of 2011.As at 31 December 2010, costs were EUR 3,703 million, down 10% on the end of December 2008. 2010 costs were severely impacted by restructuring charges in an amount of EUR 145 million.
Other undertakings
Undertakings with regard to the business lines
Dexia undertook to align the loan activity of the Public and Wholesale Banking business line with its covered bond issue capacity and to observe a level of risk-adjusted return on capital (RAROC) at a minimum 10%. In 2010, new undertakings amounted to EUR 10.3 billion and, for the entire business line, the level of 10% was respected.
Restrictions on dividends and hybrid instruments
The agreement with the European Commission provides certain restrictions on dividends and hybrid instruments.Until the end of 2011, Dexia can only pay dividends on ordinary shares in the form of new shares. During that period, the amount of dividend in shares may not be more than 40% of Dexia net income Group share over the financial year to which the dividend relates.Dexia may only pay coupons on its subordinated debt instruments and hybrid capital if there is a contractual obligation and will make no call until the end of 2011.On the other hand, and until 31 December 2014, Dexia will limit any form of dividend on its ordinary shares and any call or discretionary payment of a coupon on subordinated debt instruments and hybrid capital so that, after the payment, the Group’s core Tier 1 ratio remains above or equal to:• 10.6% as at 31 December 2010 and then decreasing each year to 10.2% as at 31 December 2014;• the sum 12.5% of the weighted risks of the Legacy Division and 9.5% of the weighted risks of the other business lines.
In 2010, the evolution of the balance sheet was very severely affected by the volatility of interest rates and exchange rates. A consequence of the fall in interest rates was an apprecia-tion of the fair value of derivatives and an increase of the amount of cash collateral. Without the impact associated with the variation of the fair value of derivatives and the increase of cash collateral posted, the balance sheet total fell by 9% in 2010, to EUR 448 billion (1).
Improvement to the liquidity profile
In 2010, the Group raised EUR 44.4 billion of wholesale medium and long-term funding. The funds raised consist of EUR 23.2 billion in government-guaranteed debt, EUR 13.6 billion in covered bonds, EUR 4.4 billion in long-term secured funding other than covered bonds and EUR 3.2 billion in senior non-secured funding. The Group made considerable progress in reducing its short-term liquidity gap. Short-term funding requirements fell by EUR 48 billion in 2010, to EUR 119 billion as at 31 December 2010. This represents a decrease of EUR 141 billion since the peak reached in October 2008.This significant reduction of the short-term funding requirement was under unfavourable interest-rate conditions resulting in an increase of the amount of cash collateral of EUR 8 billion in 2010 despite a very turbulent macroeconomic environment, marked by the sovereign crisis which weighed heavily on the funding of many European banks.This good performance was achieved by virtue of:• the sustained pace of the balance sheet deleveraging programme. EUR 27.2 billion of bonds and Public and Wholesale Banking run-off loans were sold in 2010 (cf. section on “Deleveraging programme” above);• the swift execution of the long-term funding programme;• the reduction of the Public and Wholesale Banking lending activity, this being aligned to the Group’s long-term funding capacity;• the increase in retail deposits, particularly in Belgium and in Turkey. They were EUR 87.7 billion as at 31 December 2010, against EUR 81.5 billion at the end of 2009.All this contributed to rebalance the Group’s funding profile, by reducing short-term funding, and by increasing the share funded by stable resources (particularly commercial deposits), in accordance with the undertakings to the European Commission.In addition, Dexia also considerably improved its short-term funding mix. Indeed, Dexia accelerated the cutback of central bank borrowings (EUR -32 billion compared to the end of December 2009) and since October 2010 was no longer funded by short-term guaranteed debt, in view of the repayment of the short-term loans. The shift towards longer-term bilateral and tri-party repos was confirmed in 2010. As at 31 December 2010, the total amount of central bank eligible securities was EUR 108 billion (of which EUR 42 billion were unencumbered), allowing for a major liquidity buffer despite the Group’s active balance sheet deleverage policy.In June 2010, Dexia fully exited the government guaranteed mechanism for its funding, put in place in October 2008. Considering the improvement of its liquidity situation and in line with its undertakings to the European Commission, the Group stopped to issue guaranteed debt four months before the formal end date of 30 October 2010. The exit
(1) Unaudited pro forma figures.
16 Dexia Annual report 2010
Update on the transformation plan
Man
agem
ent
repo
rtA
dditi
onal
info
rmat
ion
Ann
ual fi
nanc
ial s
tate
men
tsC
onso
lidat
ed
finan
cial
sta
tem
ents
These restrictions apply in particular to Tier 1 hybrid capital instruments issued by Dexia Banque Internationale à Luxembourg, Dexia Crédit Local and Dexia Funding Luxembourg. The characteristics of these loans are detailed in the “Solvency” section in the chapter “Capital management” in this Annual Report (page 95).Considering the undertakings described above:• the coupon linked to the Dexia Banque Internationale à Luxembourg 6.821% Tier 1 issue was paid on 6 July 2010;• the coupon linked to the Dexia Crédit Local 4.30% Tier 1 issue was not paid;• the coupon linked to the Dexia Funding Luxembourg 4.892% Tier 1 issue was paid on 6 November 2010 as a consequence of the resolution of the Extraordinary Shareholders' Meeting of Dexia SA to increase the capital by incorporation of available reserves and with the issue of bonus shares which were attributed to shareholders.
17Annual report 2010 Dexia
Strategy
Man
agem
ent
repo
rtA
dditi
onal
info
rmat
ion
Ann
ual fi
nanc
ial s
tate
men
tsC
onso
lidat
ed
finan
cial
sta
tem
ents
The cost of risk should improve for Public and Wholesale Banking and Retail and Commercial Banking, including Turkey where it could nonetheless be subject to volatility. This should lead the Group to achieve pre-tax income of about EUR 1.8 billion in 2014.The fall of weighted risks, via a reduction of assets managed in run-off as well as the disposal of entities together with its capacity for organic capital generation will enable the Group to maintain robust solvency with a Core Tier 1 Ratio of around 15% (Basel II standards), and a ratio above the new Basel III standards.
A business line portfolio rebalanced around retail banking and founded on solid franchises
Retail and Commercial Banking (RCB)Dexia intends to increase the proportion of income from its Retail and Commercial Banking activities. By 2014, these will represent about 60% of the Group’s total income (of which 27% from Turkey), against 36% in 2007. Dexia will have a base of some 10 million customers (4 million in Belgium and Luxembourg, 6 million in Turkey).
Retail and Commercial Banking in Belgium and LuxembourgResting upon solid foundations, the aim of Retail and Commercial banking activity is to increase its market share as well as the equipment rate for its customer base in Belgium and Luxembourg. In Belgium, Dexia is positioned among the Top 3 retail and commercial banks: its network of 846 branches at the end of December 2010 covers the whole territory and the bank occupies a prime position in private banking activity. Notwithstanding the good resistance of the franchise during the crisis, the activity posts a relatively low equipment rate and income per customer compared to its peers. In a renewed competitive environment, Dexia’s ambition for RCB Belgium by 2014 is:• to increase cross-selling and revenue from its client base by approaching the client proactively at key moments;• to gain market shares, particularly on private banking and SME segments;• to become a reference bank in terms of customer satisfaction. In order to sustain that ambition, a plan to invest EUR 350 mil-lion was launched in 2009. It is composed of several parts:
In October 2010, within the context of an Investor Day organised in Brussels, Dexia presented its financial and commercial targets by 2014.The strategy described in the present chapter was established taking account of the financial and economic environment and information available at the time it was established. It may be altered in particular when material changes occur to market conditions as well as to legislation, regulation (inter alia accounting principles) and prudential control.
Dexia 2014: an ambitious plan
Dexia has posted clear strategic ambitions for 2014 and fixed as objectives:• to complete its financial restructuring, giving precedence to income from its commercial franchises;• to consolidate and to develop its strong commercial franchises, rebalancing its business line portfolio (Retail and Commercial Banking, Public and Wholesale Banking and Asset Management and Services) around retail banking, tapping the growth opportunities offered by the market in Turkey;• to reshape its operating model, seeking for more synergies and efficiency gains.
A bank with a robust financial structure
By 2014, the Group targets to reduce the size of its balance sheet by 35% to less than EUR 430 billion and to complete an in-depth modification of its funding structure in order to achieve a maximum of 11% of short-term funding. As a result the Group will be for the most part funded long-term, via deposits collected by the business lines, by covered bond issues and via opportunist access to the unsecured senior segment. Its annual long-term funding programme will be in a range of EUR 10 to 15 billion, in line with Group requirements and market appetite.Assets managed in run-off will represent less than EUR 80 billion thanks to the ongoing asset deleverage plan implemented by dedicated teams since the end of 2008.More details on the deleverage plan and on the liquidity profile are given in the chapter “Update on the transformation plan” on pages 14-15 of this annual report.Dexia will have improved the quality of its income by reducing the share stemming from financial activities (revenues from transformation activities and from investment portfolios) and by developing commercial income which will represent 95% of total estimated income.The Group will continue its efforts to reduce costs in order to achieve a cost-income ratio lower than 65% in 2014.
18 Dexia Annual report 2010
Strategy
Man
agem
ent
repo
rtA
dditi
onal
info
rmat
ion
Ann
ual fi
nanc
ial s
tate
men
tsC
onso
lidat
ed
finan
cial
sta
tem
ents
In 2014, although still not having reached its full potential, this strategy should enable DenizBank: • to have a base of some 6 million customers, of which 2 million new customers;• to see its market share in the number of branches rise from 5% to 7% between 2010 and 2014 with a specific focus on large towns and rural areas;• to raise the proportion of deposits on its balance sheet total to reach approximately 70% in 2014.Its development ambitions should be reflected by the following financial targets going forward to 2014:• a pre-tax income of approximately TRY 1.2 billion (EUR 600 million);• a cost-income ratio of approximately 51%;• a ROE of approximately 14%.
Public and Wholesale Banking (PWB)Within the context of the transformation plan implemented from the end of 2008, the Public and Wholesale Banking business line has refocused on its historical markets in France and in Belgium. The aim of this refocusing was to align the volume of loans granted to customers to the business line’s funding capacity, and to make profitability a priority.This redefinition is reflected in a drastic reduction of the volumes of new commitments, which have been divided by five between 2007 and 2010-2011, as well as in a significant reduction of the cost base over the same period. Within the limits of its geographical refocusing and subject to the observance of strict profitability standards, the PWB business line certainly has its place within the Dexia Group, where it should represent about 18% of total income by 2014. Its refinancing will principally be through the issue of covered bonds as well as deposits collected by the business line.
For 2014, Dexia has four main ambitions for PWB.• In public banking France: to be a selective, profitable and acknowledged specialist, with a base of some 2,500 strategic customers, and a widened range of products (thanks, in particular, to developments in insurance, asset management, deposits…). This target is substantiated by the situation already prevailing in 2010, with annual production divided by 2.5 between 2008 and 2010, when, at the same time, commercial margins rose by more than 50%. Regarding structured loans, Dexia has proactively adopted a process of clarification and transparency of commercial rules towards its customers. • In public banking Belgium: Dexia, which benefits from the best scores in terms of customer recognition, intends to confirm its position as the leader on the basis of a model offering a complete range of products and a high-performance network. • In corporate banking Belgium: the aim is to focus on medium-sized corporates (turnover or balance sheet ≥ EUR 10 million and < EUR 1 billion), whilst maintaining an opportunist presence with large corporates (turnover or balance sheet ≥ EUR 1 billion).• In project finance: to consolidate the franchise Dexia has in the sectors of public-private partnerships, transport, energy and the environment.
In 2014, PWB financial targets are as follows:• an income of approximately EUR 1.2 billion;• a cost-income ratio of approximately 42%;• a pre-tax income of approximately EUR 600 million.
• the deployment of a new distribution model based on the “open branch” concept which enables the specialist service of a branch to be improved thanks to state-of-the-art technology;• a new commercial approach adapted to the specific needs of customers and relying on specialised account management;• development of a “direct sales” approach (web and call service offer);• the repositioning of the Dexia brand with a particular focus on transparency, both with regards to product and commercial relationship, together with a refined customer segmentation.This investment plan is expected to generate EUR 250 million in additional income by 2014.
In Luxembourg, Dexia is the third largest market operator both for individual customers and for professionals, with a strong positioning with affluent customers. Thanks to its commercial stamina the Group has recovered the trust of its customers and posts since the first half of 2010 net positive deposit collection figures for both local and international business.Dexia’s ambition for RCB Luxembourg by 2014 is:• to increase market share as the main banker for Luxembourg individual customers to 15%;• to consolidate the bank’s positioning among the Top 3 in Luxembourg in the professionals segment;• to foster up-selling and increase the average size of the most affluent customers’ assets thanks to a service offer tailored to their needs;• to reinforce the expertise in private banking and by doing so establish the position of the Group as a benchmark for international private banking.
Efforts will be ongoing to reduce the cost base in Belgium and in Luxembourg. The implementation of this strategy for RCB Belgium and Luxembourg should be reflected by the following financial targets:• a pre-tax income of approximately EUR 600 million in 2014 (against EUR 400 million in 2009);• a reduction of the cost-income ratio from 74% to around 66% between 2009 and 2014.
Retail and Commercial Banking in TurkeyOver the last ten years, DenizBank has constantly out-performed the market both in terms of asset growth and in terms of profitability, pulling itself from the 81st to 9th rank by total of balance sheet whilst posting a ROE of 20% in 2009.Benefiting from a solid economic environment which offers a significant growth potential, particularly in Retail and Commercial banking, DenizBank’s ambition is to become the principal alternative to the major banks whilst retaining its profitable growth model.Relying on a very flexible operating model, a state-of-the-art IT infrastructure, a culture of efficiency and cost control as well as cautious risk management, DenizBank will accelerate the pace at which it opens branches, to reach 800 branches by 2014. The contribution from retail banking to the activity mix will increase, and DenizBank will keep a specific focus on attractive niches, such as agriculture, as well as the collection of deposits. DenizBank will also strengthen its position as a commercial bank which, in line with its model, will feed the other business lines.
19Annual report 2010 Dexia
Strategy
Man
agem
ent
repo
rtA
dditi
onal
info
rmat
ion
Ann
ual fi
nanc
ial s
tate
men
tsC
onso
lidat
ed
finan
cial
sta
tem
ents
Dexia Insurance Services will moreover continue its efforts to reduce costs.These ambitions should be reflected by a pre-tax income of approximately EUR 220 million in 2014 supported by a cost-income ratio lower than 55% and a control of the combined ratio in non-life.
A deeply transformed operational model
Refocused on its core markets, the Dexia Group is committed to an ongoing reinforcement of its operational efficiency along three lines: the search for efficiency gains, the development of internal synergies and the industrialisation of its processes. By 2014, the improvement of the operational efficiency of the different business lines will remain a priority and the Group will continue the strict management of its costs in order to achieve a cost-income ratio lower than 65% in 2014.
Asset Management and Services (AMS)Asset Management and Services consists of a portfolio of three profitable activities which main characteristics are modest capital consumption, attractive growth outlook based on a diversified customer base and strong collaboration with the other commercial franchises of the Group. In 2014, these activities should contribute about 21% of Group income.
Asset ManagementAs a recognised and well diversified asset manager, the ambition of Dexia Asset Management is to increase its customer franchise by capitalising on its client centric competitive edge and on its long standing investment expertise. Dexia Asset Management furthermore benefits from a relatively greater efficiency than its peers (35% operating margin and 15 basis points of costs on average assets under management).
The targets of Dexia Asset Management for 2014 are:• assets under management of approximately EUR 130 bil-lion;• EUR 30 billion of net positive collection over 2011-2014 of which 70% from non-captive customers (one third internationally);• an operating margin of 48%.This should be reflected by a pre-tax income of EUR 140 million in 2014.
Investor ServicesInvestor Services activities are performed via the joint venture RBC Dexia Investor Services. It ranks amongst the Top 10 global custodians. The ambitions for this business line going forward to 2014 revolve around two axes:• the increase of its franchise, in particular by a constant strengthening of the customer relationship (retention, cross selling, incease of both the number and size of mandates) and a reinforcement of its presence in countries with strong growth potential (UK, Australia, Italy, Switzerland);• the widening of its range of products and services.
On the other hand, RBC Dexia will continue to seek efficiency gains to reduce costs and better serve its clients.By 2014, this should be reflected by:• an average annual growth of assets under administration from 8% to 10% (approximately EUR 2.7 billion);• an average annual growth of income from 9% to 12%;• an average annual growth of costs from 4% to 6%.
InsuranceDexia Insurance Services creates value for Dexia through its strategy of multi-channel distribution. This strategy aims at developing its own distribution channels but also at fostering the collaboration with the other Dexia networks and seeking synergies accordingly. Ambitions for each of its distribution channels are as follows.In Belgium:• regaining life insurance market share in the banking and insurance segment: +6% to reach approximately 15% at the end of 2014;• an annual increase in premiums collected of approximately 15% by 2012, then 10% between 2012 and 2014 via DVV Insurance.In Luxembourg:• EUR 1 billion in premiums by 2014 for Dexia Life & Pensions.
20 Dexia Annual report 2010
Declaration of corporate governance
Man
agem
ent
repo
rtA
dditi
onal
info
rmat
ion
Ann
ual fi
nanc
ial s
tate
men
tsC
onso
lidat
ed
finan
cial
sta
tem
ents
Dexia practice goes beyond the Code in relation to the number of independent directors within the Board of Directors: the Board of Directors of Dexia SA includes seven independent directors, whilst the Belgian Code of Corporate Governance (provision 2.3) recommends a minimum of three independent directors.
Corporate Governance Charter
At its meeting on 3 February 2005, the Board of Directors of Dexia SA created a “corporate governance” committee within the Board (composed of directors of Dexia SA), in charge of conducting a study and formulating recommendations on the various governance issues treated by the Belgian Code of corporate governance and on any adaptations for the existing situation at Dexia.The work of this committee resulted notably in the development of a corporate governance charter, internal rules for the Audit Committee and a revision of the internal rules of the Board of Directors and the Management Board.At its meeting on 13 November 2008, the Board of Directors of Dexia SA amended its internal rules in order to strengthen its governance and risk management even more. On the one hand, the Audit Committee was split into two specialist committees: the Accounts Committee and the Internal Control, Risks and Compliance Committee. These two committees together form the Audit Committee, in accordance with the law of 17 December 2008 in particular instituting an audit committee in publicly traded companies and financial establishments. On the other hand, the Appointment Committee and the Compensation Committee were combined in one single committee. In 2009, the internal rules of the Board of Directors were further amended in order in particular to align the criteria of directors’ independence retained by Dexia SA with the new legal criteria defined by the Company Code, and to strengthen the rules applicable to the executives of Dexia SA involved in proprietary trading in Dexia shares.In 2010, the regulation was adapted in order to implement the provisions of the Law of 6 April 2010 aimed in particular at strengthening corporate governance in listed companies and autonomous public enterprises: on this occasion, the regulation provides that the Appointment and Compensation Committee consists of a majority of independent non-executive directors.The Corporate Governance Charter of Dexia SA (hereafter the “Charter”) gives a detailed overview of the principal governance aspects of the company. This document, which the Board of Directors wanted to be complete and transparent, contains five sections. The first section deals with the structure and organisational chart for the Dexia Group. It also contains
IntroductionReference CodeThe Belgian Code of corporate governance, which replaces the recommendations made on this issue by the Banking, Finance and Insurance Commission, the Federation of Enterprises in Belgium and Euronext Brussels became effective on 1 January 2005, and was revised for the first time on 12 March 2009 in order to take account, in particular, of recent developments in the regulatory environment in Belgium and Europe, as well as the new aspirations of civil society and stakeholders as to the conduct of companies and their executives.This code is the reference for Dexia within the meaning of Article 96, § 2 (1) of the Company Code. It is available on the Belgian Gazette internet site as well as on the internet site www.corporategovernancecommittee.be.The Belgian Code of corporate governance contains nine mandatory principles for publicly traded companies. Dexia respects those nine principles.Considering its governance structure, Dexia wished to depart from the following specific provisions of the Code:• provision 5.2.4, which recommends that the Audit Committee be composed of a majority of independent directors: the Dexia Audit Committee, consisting of the Accounts Committee and the Internal Control, Risks and Compliance Committee, consists of seven non-executive directors, of which three are independent. Dexia considers that the most pertinent criterion in the choice of members of that committee is one of competence. Furthermore, Dexia practice goes beyond the legal prescriptions applicable to listed companies, those provisions stating that the committee must contain at least one independent director, and the Accounts Committee consists of a majority of independent directors (three directors out of a total of five members). Finally, the two committees constituting the Audit Committee are chaired by an independent director;• provision 8.8, which proposes the fixing of a threshold from which a shareholder may submit proposals to the general meeting at 5% of the company’s equity: Dexia has chosen to comply with applicable legal provisions, which is currently a 20%-threshold, considering its shareholder structure and awaiting the forthcoming transposition into Belgian Law of the European Directive in relation to the protection of shareholders’ rights.
21Annual report 2010 Dexia
Declaration of corporate governance
Man
agem
ent
repo
rtA
dditi
onal
info
rmat
ion
Ann
ual fi
nanc
ial s
tate
men
tsC
onso
lidat
ed
finan
cial
sta
tem
ents
As at 31 December 2010, Dexia SA directly or indirectly held 0.02% of its own shares. Dexia Group members of staff held 1.07% of the capital of the company.At that same date, and to the knowledge of the company, no individual shareholder, with the exception of Arco Group, Holding Communal, Caisse des dépôts et consignations, Ethias Group, Société de prise de participation de l’État, Société fédérale de participations et d’investissement, CNP Assurances, the Flemish Region (through Vlaams Toekomstfonds) and the Walloon Region, held 1% or more of the capital of Dexia SA.Also as at 31 December 2010, the directors of Dexia SA held 13,350 shares in the company.
Relations among shareholders
On 30 August 2007, Dexia SA was informed of the conclusion by some of its shareholders (Arcofin, Holding Communal, Caisse des dépôts et consignations, Ethias and CNP Assurances) of an agreement to consult each other on certain occasions whilst each retained the right to decide freely on the resolutions to be passed with regard to the company.This agreement was the subject of a communication to Dexia SA, in accordance with Article 74, § 7 of the Law of 1 April 2007 relating to tender offers (cf. “General Information” section in this chapter on page 66).This agreement does not undermine the principles of governance in force within Dexia SA, including the role and functioning of the Shareholders’ Meeting and of the Board of Directors, the latter retaining its autonomy in establishing the strategy and general policy of the Dexia Group.
Relations with shareholders
Dexia is attentive to the quality of the relations it has with its shareholders, both individual and institutional, and remains eager to strengthen dialogue and transparency in their regard.
Relations with individual shareholdersDexia maintains regular relations with its individual shareholders, with a Shareholders’ Meeting held on the second Wednesday of May each year in Brussels. In addition to the meeting, over the years Dexia has developed a strict, regular and interactive mechanism for the provision of information to its shareholders, revolving around the European Club for Individual Shareholders and the European Advisory Board of Individual Shareholders. Individual shareholders also have the benefit of a call centre and dedicated sections on the internet site.
Dexia SA Shareholders’ MeetingA key moment in the life of the company, the annual Shareholders’ Meeting benefits from a special information system: in official notices published in the Belgian Gazette and in the legal announcement bulletin, the BALO, in France; in notices published in the national financial press media in Belgium, France and Luxembourg; with information provided by the toll-free number; in an invitation to attend the meeting available in English, French and Dutch that can also be downloaded from the internet.Shareholders’ Meetings are broadcast live on the internet, allowing shareholders who cannot attend to follow the debates and resolutions at the meetings.
a short history of the Group since its creation in 1996. The second section describes the structure of Dexia’s governance. It contains all the necessary information on the composition, attributions and modes of operation of the decision-making bodies which are the Shareholders’ Meeting, the Board of Directors and the Management Board. The internal rules of the Board of Directors and of the Management Board are also provided in their entirety. This part of the Charter also describes the competences of general management at Group level, and the central functions of Dexia SA. The third section discusses the shareholders and the Dexia share. It describes Dexia’s relations with its shareholders and summarises the features of Dexia capital and shares. The fourth section summarises the control exercised over and within the Dexia Group. The “internal control” part of this section contains information relating to internal audit, professional ethics and compliance. The “external control” section deals with the Statutory Auditor’s tasks and the protocol concerning prudential management of the Dexia Group signed with the Banking, Finance and Insurance Commission. The final section of the Charter describes Dexia’s compensation policy for directors of the company and members of the Management Board.Several elements of the Corporate Governance Charter are restated, as recommended by the Belgian Code of corporate governance, in this chapter of the annual report of Dexia SA.Pursuant to the Belgian Code of corporate governance, the Charter has been available since 31 December 2005 on the company’s website (www.dexia.com) and is updated on a regular basis.
Relations with shareholders
Shareholder base
The following table shows the principal shareholders of Dexia SA (as at 31 December 2010):
NAME OF SHAREHOLDER Percentage of Dexia SA’s existing
shares held as at 31 December 2010
Caisse des dépôts et consignations 17.61%
Holding Communal 14.14%
Arco Group 13.81%
Belgian federal government through Société fédérale de participations et d’investissement 5.73%
French government through Société de prise de participation de l’État 5.73%
Ethias Group 5.04%
CNP Assurances 2.96%
Flemish Region through Vlaams Toekomstfonds 2.87%
Walloon Region 2.01%
Brussels-Capital Region 0.86%
22 Dexia Annual report 2010
Declaration of corporate governance
Man
agem
ent
repo
rtA
dditi
onal
info
rmat
ion
Ann
ual fi
nanc
ial s
tate
men
tsC
onso
lidat
ed
finan
cial
sta
tem
ents
Contact with institutional shareholdersAfter each presentation of results or in other circumstances justifying them, road shows are organised with the main institutional investors. This enables the latter to ask members of the Dexia Management Board direct questions concerning Group results or strategy.
Information channels
Regular information channelsDuring the year, Dexia regularly publishes information through theme presentations and press releases on the business, financial results and Group news. When the results are published, Dexia also provides quarterly, half-yearly and annual reports. All this information is available as from publication on the website www.dexia.com on the section “Shareholders/Investors”. It can also be obtained by e-mail.
The internet site (www.dexia.com)With an average of 94,500 visitors a month, the site www.dexia.com confirms its important role as a vector of information for the Dexia Group among individual shareholders, journalists and institutional investors. Trilingual English, Dutch and French, the site provides rapid access to all the information concerning the life of the Group, its publications, activities, news and Dexia share prices. It is consulted for the most part by European surfers, principally Belgian and French.In 2010, www.dexia.com received almost 110,000 visitors to its section “Shareholders/Investors”.
Other supportsSeveral times a year, Dexia publishes a Letter to the Shareholders in English, French and Dutch. Individual shareholders are thus kept regularly informed of Group developments, news, results and minutes of the Dexia SA Shareholders’ Meetings.The Letter to the Shareholders issues are sent to members of the Club and to shareholders who request it, and are also available on the internet site.In 2010, 4 letters were published, including a “European Commission Special Letter”.Dexia publishes complete annual information for shareholders and investors. The Dexia annual report is available in three languages: English, Dutch and French. The risk report is only available in English on the internet site. Finally, Dexia publishes a sustainable development report in French, Dutch and English on its site.
Circular FMI/2007-02 from the Banking, Finance and Insurance Commission
A Royal Decree of 14 November 2007 concerning the obligations of issuers of financial instruments listed for trading on a Belgian regulated market stipulates the obligations of issuers with regard to the information to be provided to the public and their obligations to holders of financial instruments. In December 2007, the Banking, Finance and Insurance Commission published a circular explaining this Royal Decree. In accordance with this regulation, Dexia SA has decided since 2003 to use its internet site to meet its obligations to publish the information stipulated by the decree and the circular.
As requested by the Belgian Company Code, the level of shareholding for the subtask of proposals during a Shareholders’ Meeting by a shareholder is 20%.The Ordinary Shareholders’ Meeting was held on 12 May 2010 in Brussels, directly followed by an Extraordinary Shareholders’ Meeting.
The European Club for Individual ShareholdersThe European Club for Individual Shareholders today has nearly 13,000 members, primarily Belgian and French shareholders. The club is a centre for the distribution of the financial information to shareholders who want to follow the evolutions in the Group through publications and documents designed specifically for them. Registration for the European Club of Dexia Shareholders can be made by telephone, e-mail or through the website www.dexia.com.
The European Advisory Board of Individual ShareholdersEstablished in June 2001, the European Advisory Board of Dexia took over from the Dexia France Advisory Board, created in 1997. Its composition reflects the Group’s European identity: the Board is currently composed of four Belgian shareholders, five French shareholders and two Luxembourg shareholders. As from November 2010, the Advisory Board has been enhanced by the presence of an additional member, representing the Dexia Group Employee Shareholders Association. The Board’s role is to advise the Group on its policy for communication to individual shareholders.In 2010, the Advisory Board met twice, once in March, to consider the Group’s 2009 annual results, and on a second occasion in November. That second meeting received two presentations: one on the Group’s half-yearly results and one on the major lines of its “Dexia 2014” strategy, which was the central theme of the “Investor Day” held on 12 October 2010.In 2011, the Board will be partially renewed, as the mandates of certain members (3 years, non-renewable) will expire.
Telephone information service for individual shareholdersThis service is accessible from France, free of charge, on 0800 355 000, from Monday to Friday and from 09.00 to 19.00.It is also accessible from Belgium and Luxembourg via a bilingual (French/Dutch) toll-free number 00 800 33 942 942, during the same times (only from a fixed-line telephone).This service is regularly called by shareholders with any questions relating to Dexia and to its organisation in general, but also for more specific questions regarding the share price, taxation of shares, dividend amounts, its mode of taxation, VVPR strips and Dexia SA’s Shareholders’ Meetings. This year, that service was particularly well used concerning the attribution of bonus shares.
Relations with institutional shareholdersRelations with institutional shareholders, who hold almost 15% of the capital, are extremely important to Dexia. For this purpose, a team based partly in Brussels and partly in Paris is specifically responsible for relations with investors and analysts.
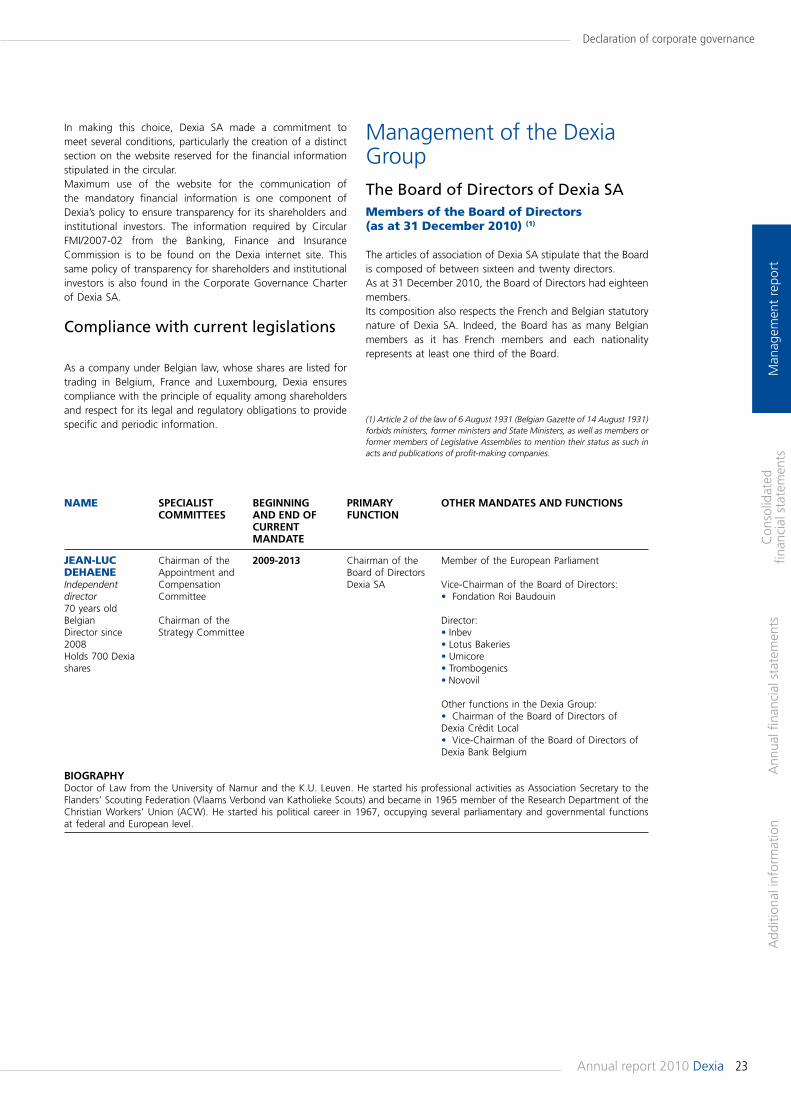
23Annual report 2010 Dexia
Declaration of corporate governance
Man
agem
ent
repo
rtA
dditi
onal
info
rmat
ion
Ann
ual fi
nanc
ial s
tate
men
tsC
onso
lidat
ed
finan
cial
sta
tem
ents
Management of the Dexia GroupThe Board of Directors of Dexia SAMembers of the Board of Directors (as at 31 December 2010) (1)
The articles of association of Dexia SA stipulate that the Board is composed of between sixteen and twenty directors.As at 31 December 2010, the Board of Directors had eighteen members.Its composition also respects the French and Belgian statutory nature of Dexia SA. Indeed, the Board has as many Belgian members as it has French members and each nationality represents at least one third of the Board.
(1) Article 2 of the law of 6 August 1931 (Belgian Gazette of 14 August 1931) forbids ministers, former ministers and State Ministers, as well as members or former members of Legislative Assemblies to mention their status as such in acts and publications of profit-making companies.
In making this choice, Dexia SA made a commitment to meet several conditions, particularly the creation of a distinct section on the website reserved for the financial information stipulated in the circular.Maximum use of the website for the communication of the mandatory financial information is one component of Dexia’s policy to ensure transparency for its shareholders and institutional investors. The information required by Circular FMI/2007-02 from the Banking, Finance and Insurance Commission is to be found on the Dexia internet site. This same policy of transparency for shareholders and institutional investors is also found in the Corporate Governance Charter of Dexia SA.
Compliance with current legislations
As a company under Belgian law, whose shares are listed for trading in Belgium, France and Luxembourg, Dexia ensures compliance with the principle of equality among shareholders and respect for its legal and regulatory obligations to provide specific and periodic information.
NAME SPECIALIST BEGINNING PRIMARY OTHER MANDATES AND FUNCTIONS COMMITTEES AND END OF FUNCTION CURRENT MANDATE
JEAN-LUC Chairman of the 2009-2013 Chairman of the Member of the European ParliamentDEHAENE Appointment and Board of DirectorsIndependent Compensation Dexia SA Vice-Chairman of the Board of Directors:director Committee • Fondation Roi Baudouin70 years oldBelgian Chairman of the Director:Director since Strategy Committee • Inbev2008 • Lotus BakeriesHolds 700 Dexia • Umicoreshares • Trombogenics • Novovil
Other functions in the Dexia Group: • Chairman of the Board of Directors of Dexia Crédit Local • Vice-Chairman of the Board of Directors of Dexia Bank Belgium
BIOGRAPHYDoctor of Law from the University of Namur and the K.U. Leuven. He started his professional activities as Association Secretary to the Flanders’ Scouting Federation (Vlaams Verbond van Katholieke Scouts) and became in 1965 member of the Research Department of the Christian Workers’ Union (ACW). He started his political career in 1967, occupying several parliamentary and governmental functions at federal and European level.
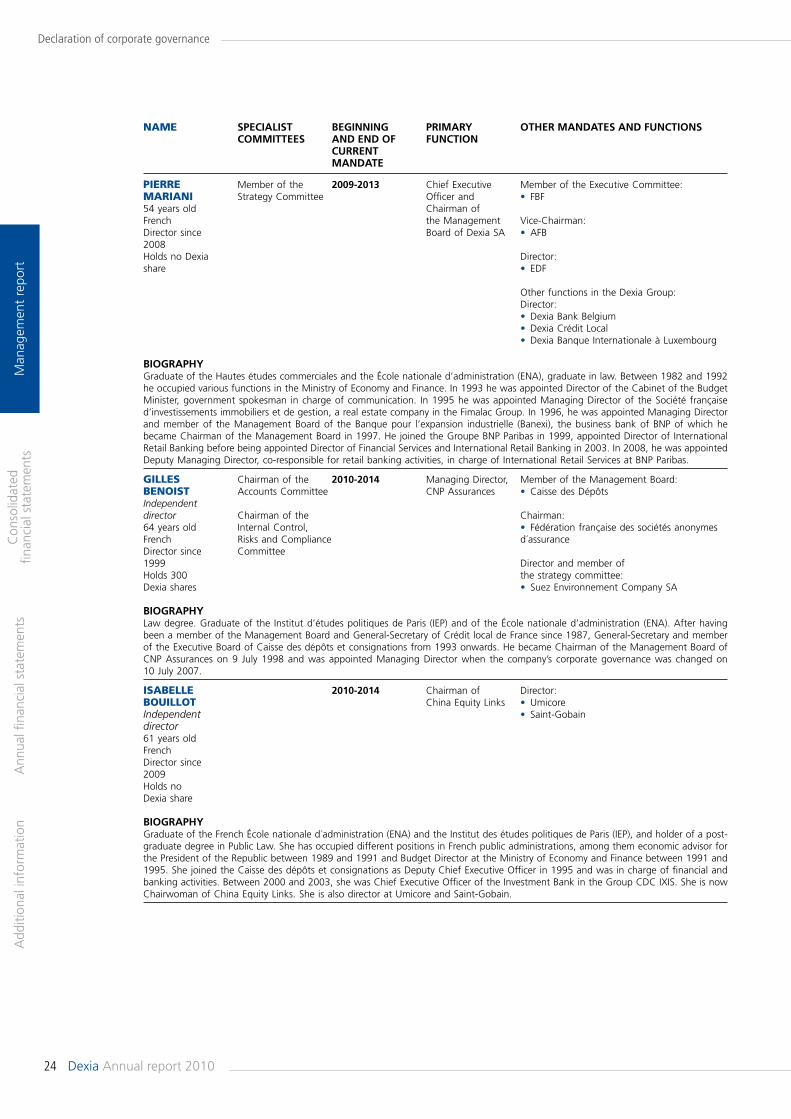
24 Dexia Annual report 2010
Declaration of corporate governance
Man
agem
ent
repo
rtA
dditi
onal
info
rmat
ion
Ann
ual fi
nanc
ial s
tate
men
tsC
onso
lidat
ed
finan
cial
sta
tem
ents
NAME SPECIALIST BEGINNING PRIMARY OTHER MANDATES AND FUNCTIONS COMMITTEES AND END OF FUNCTION CURRENT MANDATE
PIERRE Member of the 2009-2013 Chief Executive Member of the Executive Committee:MARIANI Strategy Committee Officer and • FBF54 years old Chairman of French the Management Vice-Chairman:Director since Board of Dexia SA • AFB2008Holds no Dexia Director:share • EDF
Other functions in the Dexia Group: Director: • Dexia Bank Belgium • Dexia Crédit Local • Dexia Banque Internationale à Luxembourg
BIOGRAPHYGraduate of the Hautes études commerciales and the École nationale d’administration (ENA), graduate in law. Between 1982 and 1992 he occupied various functions in the Ministry of Economy and Finance. In 1993 he was appointed Director of the Cabinet of the Budget Minister, government spokesman in charge of communication. In 1995 he was appointed Managing Director of the Société française d’investissements immobiliers et de gestion, a real estate company in the Fimalac Group. In 1996, he was appointed Managing Director and member of the Management Board of the Banque pour l’expansion industrielle (Banexi), the business bank of BNP of which he became Chairman of the Management Board in 1997. He joined the Groupe BNP Paribas in 1999, appointed Director of International Retail Banking before being appointed Director of Financial Services and International Retail Banking in 2003. In 2008, he was appointed Deputy Managing Director, co-responsible for retail banking activities, in charge of International Retail Services at BNP Paribas.
GILLES Chairman of the 2010-2014 Managing Director, Member of the Management Board:BENOIST Accounts Committee CNP Assurances • Caisse des DépôtsIndependent director Chairman of the Chairman:64 years old Internal Control, • Fédération française des sociétés anonymes French Risks and Compliance d´assuranceDirector since Committee 1999 Director and member of Holds 300 the strategy committee:Dexia shares • Suez Environnement Company SA
BIOGRAPHYLaw degree. Graduate of the Institut d’études politiques de Paris (IEP) and of the École nationale d’administration (ENA). After having been a member of the Management Board and General-Secretary of Crédit local de France since 1987, General-Secretary and member of the Executive Board of Caisse des dépôts et consignations from 1993 onwards. He became Chairman of the Management Board of CNP Assurances on 9 July 1998 and was appointed Managing Director when the company’s corporate governance was changed on 10 July 2007.
ISABELLE 2010-2014 Chairman of Director:BOUILLOT China Equity Links • UmicoreIndependent • Saint-Gobaindirector61 years oldFrenchDirector since2009Holds no Dexia share
BIOGRAPHYGraduate of the French École nationale d´administration (ENA) and the Institut des études politiques de Paris (IEP), and holder of a post-graduate degree in Public Law. She has occupied different positions in French public administrations, among them economic advisor for the President of the Republic between 1989 and 1991 and Budget Director at the Ministry of Economy and Finance between 1991 and 1995. She joined the Caisse des dépôts et consignations as Deputy Chief Executive Officer in 1995 and was in charge of financial and banking activities. Between 2000 and 2003, she was Chief Executive Officer of the Investment Bank in the Group CDC IXIS. She is now Chairwoman of China Equity Links. She is also director at Umicore and Saint-Gobain.
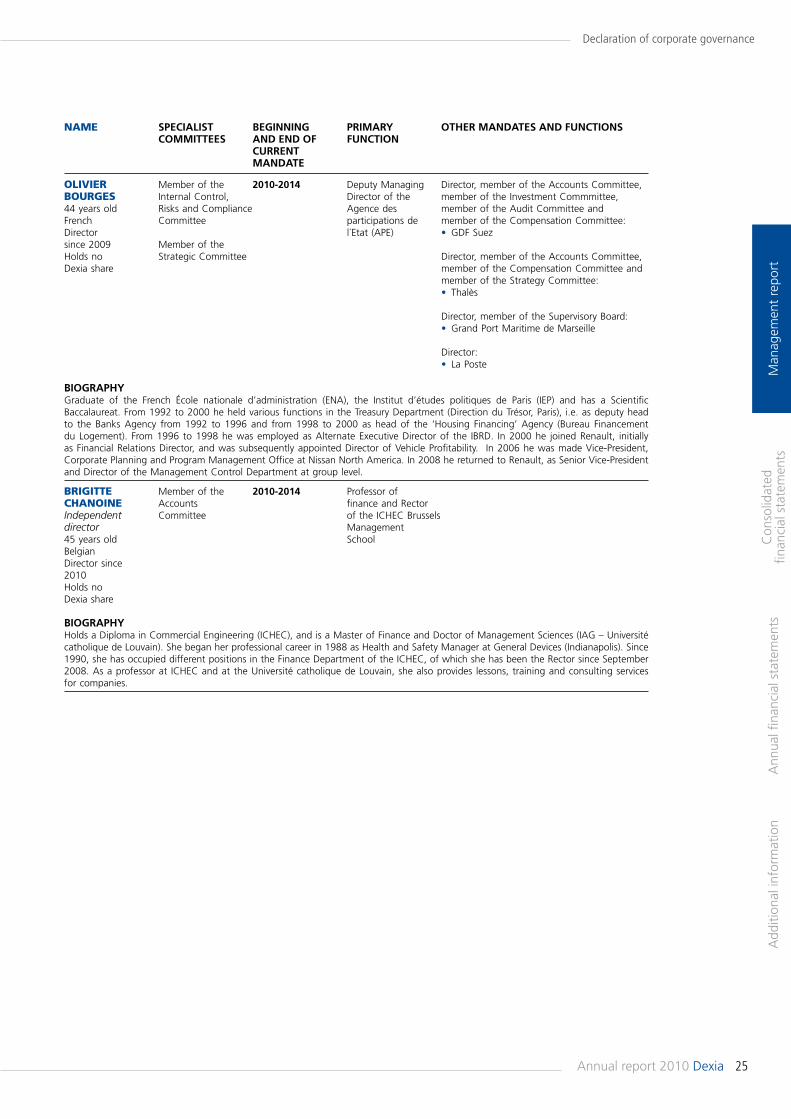
25Annual report 2010 Dexia
Declaration of corporate governance
Man
agem
ent
repo
rtA
dditi
onal
info
rmat
ion
Ann
ual fi
nanc
ial s
tate
men
tsC
onso
lidat
ed
finan
cial
sta
tem
ents
NAME SPECIALIST BEGINNING PRIMARY OTHER MANDATES AND FUNCTIONS COMMITTEES AND END OF FUNCTION CURRENT MANDATE
OLIvIER Member of the 2010-2014 Deputy Managing Director, member of the Accounts Committee,BOURGES Internal Control, Director of the member of the Investment Commmittee,44 years old Risks and Compliance Agence des member of the Audit Committee andFrench Committee participations de member of the Compensation Committee:Director l´Etat (APE) • GDF Suezsince 2009 Member of the Holds no Strategic Committee Director, member of the Accounts Committee, Dexia share member of the Compensation Committee and member of the Strategy Committee: • Thalès
Director, member of the Supervisory Board: • Grand Port Maritime de Marseille
Director: • La Poste
BIOGRAPHYGraduate of the French École nationale d’administration (ENA), the Institut d’études politiques de Paris (IEP) and has a Scientific Baccalaureat. From 1992 to 2000 he held various functions in the Treasury Department (Direction du Trésor, Paris), i.e. as deputy head to the Banks Agency from 1992 to 1996 and from 1998 to 2000 as head of the ‘Housing Financing’ Agency (Bureau Financement du Logement). From 1996 to 1998 he was employed as Alternate Executive Director of the IBRD. In 2000 he joined Renault, initially as Financial Relations Director, and was subsequently appointed Director of Vehicle Profitability. In 2006 he was made Vice-President, Corporate Planning and Program Management Office at Nissan North America. In 2008 he returned to Renault, as Senior Vice-President and Director of the Management Control Department at group level.
BRIGITTE Member of the 2010-2014 Professor of CHANOINE Accounts finance and Rector Independent Committee of the ICHEC Brusselsdirector Management45 years old SchoolBelgian Director since 2010Holds no Dexia share
BIOGRAPHYHolds a Diploma in Commercial Engineering (ICHEC), and is a Master of Finance and Doctor of Management Sciences (IAG – Université catholique de Louvain). She began her professional career in 1988 as Health and Safety Manager at General Devices (Indianapolis). Since 1990, she has occupied different positions in the Finance Department of the ICHEC, of which she has been the Rector since September 2008. As a professor at ICHEC and at the Université catholique de Louvain, she also provides lessons, training and consulting services for companies.
26 Dexia Annual report 2010
Declaration of corporate governance
Man
agem
ent
repo
rtA
dditi
onal
info
rmat
ion
Ann
ual fi
nanc
ial s
tate
men
tsC
onso
lidat
ed
finan
cial
sta
tem
ents
NAME SPECIALIST BEGINNING PRIMARY OTHER MANDATES AND FUNCTIONS COMMITTEES AND END OF FUNCTION CURRENT MANDATE
STEFAAN 2010-2014 Member of the Member of the Advisory Board:DECRAENE Management Board • Ethias Droit Commun46 years old of Dexia SABelgian Chairman of the Board of Directors:Director since Chairman of the • Febelfin2009 Management Board Holds 3,034 of Dexia Bank Member of the Management Board:Dexia shares Belgium • het Verbond van Belgische Ondernemingen
Director: • VOKA
Member of the Management Committee: • Deposit and Financial Instrument Protection Fund
Other functions in the Dexia Group: Director: • Dexia Bank Belgium • Dexia Banque Internationale à Luxembourg • Dexia Insurance Belgium • Dexia banka Slovensko • DenizBank • RBC Dexia Investor Services
Chairman of the Board of Directors: • Dexia AM Luxembourg • Dexia Participation Luxembourg
Member of the Council of Auditors: • Dexia Nederland BV
BIOGRAPHYGraduate in applied economics specialising in international relations from the K.U. Leuven. The first part of his career was spent in corporate banking and investment banking in Belgium. In 2001, he was appointed Chairman of the Management Board of Banque Artesia Nederland. In 2002, he joined Dexia Bank Nederland as a member of the Management Board. In 2003 he became member of the Management Board of Dexia Bank Belgium, in charge of Insurance and Development of International Retail activities, and from 2004 in charge of Public and Wholesale Banking. Since January 2006, he has been Chairman of the Management Board of Dexia Bank Belgium. In 2008 he was appointed member of the Management Board of Dexia SA.
AUGUSTIN Member of the 2007-2011 Managing Director Director:DE ROMANET Appointment and of the Caisse des • CDC EntreprisesDE BEAUNE Compensation dépôts et • CNP Assurances49 years old Committee consignations • IcadeFrench • Veolia EnvironnementDirector since Member of the 2007 Strategy Committee Chairman of the Supervisory Board:Holds no • Société nationale immobilièreDexia share Chairman of the Board of Directors: • Fonds stratégique d´investissement
BIOGRAPHYGraduate of the Institut d´études politiques de Paris (IEP) and of the École nationale d´administration (ENA). He was in particular Financial Attaché to the Permanent Representation of France to the European Community in Brussels, Director of the Office of the Budget Ministry, Director of the Office of the Ministry of Employment and Associate Manager of Oddo Pinatton Corporate. He was then appointed Deputy General-Secretary to the Presidency of the Republic of France before being appointed Deputy Director of Finance and Strategy and a member of the Executive Committee of Crédit Agricole SA.
27Annual report 2010 Dexia
Declaration of corporate governance
Man
agem
ent
repo
rtA
dditi
onal
info
rmat
ion
Ann
ual fi
nanc
ial s
tate
men
tsC
onso
lidat
ed
finan
cial
sta
tem
ents
NAME SPECIALIST BEGINNING PRIMARY OTHER MANDATES AND FUNCTIONS COMMITTEES AND END OF FUNCTION CURRENT MANDATE
ROBERT Member of the 2010-2014 Executive director Member of the Conseil de surveillance de:DE METZ Accounts de La Fayette • Canal+ FranceIndependent Committee Management Ltddirector Director:58 years old • Média-Participations (Paris-Bruxelles)French • L.A. Finances (Paris)Director since 2009 Chief Executive Officer:Holds no • Bee2Bees SA (Brussels)Dexia share Member of the Executive Committee: • Fondation Demeure Historique pour l´avenir du patrimoine
BIOGRAPHYGraduate of the Institut d’études politiques de Paris (IEP) and of the École nationale d’administration (ENA), he began his career in the General Finance Inspectorate. He joined Banque Indosuez in 1983 occupying posts in Hong Kong and France before joining Demachy Worms & Cie. Active with Paribas from 1991, he performed numerous tasks, particularly mergers-acquisitions, before his appointment as a member of the Management Board, responsible from London for fixed income, exchange and derivatives markets. He was a director at Cobepa from 1993 to 1999. Between 2002 and 2007, he was Deputy Director General of the Vivendi Group in charge of mergers-acquisitions and strategy.
CHRISTIAN Member of the 2010-2014 Chairman of the GIACOMOTTO Appointment and Management Board Independent Compensation of Gimar FinanceDirector Committee70 years oldFrenchDirector since2009Holds no Dexia share
BIOGRAPHYGraduate in law, of the Institut d’études politiques de Paris (IEP) and of the New York University (American Finance), he is Chairman of the Management Board of Gimar Finance. He began his career at the Bank of the European Union before becoming Deputy Director General of the CIC in 1982. In 1987 he created the Arjil Bank, of which he became Chairman of the Management Board before holding various managerial posts and directorships with the Lagardère Group, then Kleinwort Benson in London, the bank with which he founded Kleinwort Benson, Gimar & Cie in Paris in 1994. He is Vice-Chairman of the National Museums Association. He is a Commander of the Legion of Honour and Commander of the Order of Arts and Letters.
ANTOINE Member of the 2010- Deputy Managing Director:GOSSET- Accounts Director of the • CNP Assurances SAGRAINvILLE Committee Caisse des dépôts • Compagnie des Alpes SA44 years old et consignationsFrench Permanent representative ofDirector since Caisse des dépôts et consignations and 2010 Director:Holds no • Fonds stratégique d’investissement SADexia share
BIOGRAPHYGraduate of the École nationale d’administration (ENA), the University of Paris Dauphine and the Institut d’études politiques de Paris (IEP). He began his career with the Inspection Générale des Finances. Then he became Deputy Secretary General of the Economic and Finance Committee of the European Union, and then advisor in economic and industrial affairs to the office of the Trade Commissioner of the European Commission. From 2002 to 2007 he was a partner with Cabinet Gide Loyrette Nouel in Brussels. Until 2010, he was Deputy Director of the Office of the French Prime Minister. At present he is Deputy Managing Director of the Caisse des dépôts et consignations.
28 Dexia Annual report 2010
Declaration of corporate governance
Man
agem
ent
repo
rtA
dditi
onal
info
rmat
ion
Ann
ual fi
nanc
ial s
tate
men
tsC
onso
lidat
ed
finan
cial
sta
tem
ents
NAME SPECIALIST BEGINNING PRIMARY OTHER MANDATES AND FUNCTIONS COMMITTEES AND END OF FUNCTION CURRENT MANDATE
CATHERINE Member of the 2008-2012 Director:KOPP Appointment and • Schneider ElectricIndependent Compensation director Committee61 years oldFrenchDirector since2008Holds 250 Dexia shares
BIOGRAPHYAfter studying mathematics, she worked for the IBM Group, where she held several management positions (human resources, marketing and sales) before becoming Managing Director and later Chairman and Managing Director of IBM France. From 2001 to 2002, she was head of Human Resources and member of the Executive Committee of the LVMH Group. From 2002 to 2010, she has been Managing Director Human Resources of the Accor Group and member of the Executive Committee. Catherine Kopp is also member of the Board of Directors of Schneider Electric. In 2006, the French Prime Minister appointed her member of the High Authority for the Fight Against Discriminations and Equality. Within the Mouvement des Entreprises de France (MEDEF) she led the cross-sector negotiations on Diversity (2006) and on Modernisation of the Labour Market (2008), which both resulted in an agreement. In 2009 she was appointed by the French Prime Minister as a member of the High Council for Integration. Catherine Kopp is Knight of the National Order of the Legion of Honour and Officer of the National Order of Merit.
SERGE KUBLA 2010-2014 Mayor of Other function in the Dexia Group:63 years old Waterloo Director:Belgian • Dexia Bank BelgiumDirector since2005Holds no Dexia share
BIOGRAPHYSolvay Business School. From 1976 a councillor for Waterloo, where he was alderman with responsibility for sports and then, from 1982, mayor. Since 1977, he has been active in regional and national politics. In 2002, for half the year he chaired the European Council of Industry. Since 2004, he has been active in regional politics.
29Annual report 2010 Dexia
Declaration of corporate governance
Man
agem
ent
repo
rtA
dditi
onal
info
rmat
ion
Ann
ual fi
nanc
ial s
tate
men
tsC
onso
lidat
ed
finan
cial
sta
tem
ents
NAME SPECIALIST BEGINNING PRIMARY OTHER MANDATES AND FUNCTIONS COMMITTEES AND END OF FUNCTION CURRENT MANDATE
FRANCINE Member of the 2008-2012 Chairman of the Director and Chairman of the SWIGGERS Appointment and Management Board, Management Board:58 years old Compensation Arco Group • ArcoplusBelgian Committee (Arcofin, Arcopar, • ArcoparDirector since Arcoplus) • Arcofin2007 Member of the • ArcosynHolds no Strategy Dexia share Committee Chairman of the Board of Directors • Procura vzw • Auxipar • Arcoplus • Interfinance • Arcosyn
Director: • Arcopar • Arcofin • Aquafin (and member of the Audit Committee) • De Warande vzw • Hogeschool Universiteit Brussel • L´Économie Populaire • Sociaal en Familiaal Toerisme vzw
Director and member of the Audit Committee: • VDK Spaarbank
Member of the College of Principals: • Belgian National Bank
Other functions in the Dexia Group: Director: • Dexia Crédit Local • Dexia Bank Belgium
BIOGRAPHYGraduate in Applied Economics and Master of Business Administration (K.U. Leuven). She has been a member of the Management Board of the Arco Group since 1997 and Chairman of this Board since 2007. Previously she had a career of 20 years at BACOB Bank where she was Head of Strategic Planning from 1995.
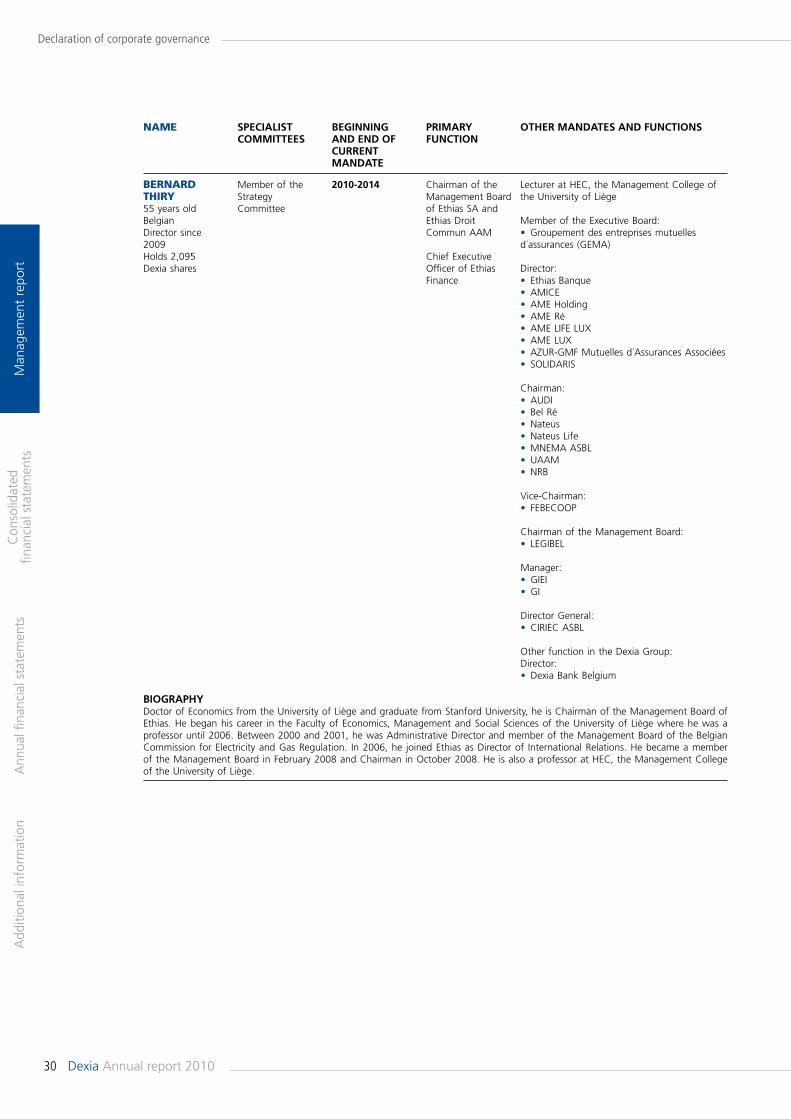
30 Dexia Annual report 2010
Declaration of corporate governance
Man
agem
ent
repo
rtA
dditi
onal
info
rmat
ion
Ann
ual fi
nanc
ial s
tate
men
tsC
onso
lidat
ed
finan
cial
sta
tem
ents
NAME SPECIALIST BEGINNING PRIMARY OTHER MANDATES AND FUNCTIONS COMMITTEES AND END OF FUNCTION CURRENT MANDATE
BERNARD Member of the 2010-2014 Chairman of the Lecturer at HEC, the Management College ofTHIRY Strategy Management Board the University of Liège55 years old Committee of Ethias SA and Belgian Ethias Droit Member of the Executive Board:Director since Commun AAM • Groupement des entreprises mutuelles2009 d´assurances (GEMA)Holds 2,095 Chief ExecutiveDexia shares Officer of Ethias Director: Finance • Ethias Banque • AMICE • AME Holding • AME Ré • AME LIFE LUX • AME LUX • AZUR-GMF Mutuelles d´Assurances Associées • SOLIDARIS
Chairman: • AUDI • Bel Ré • Nateus • Nateus Life • MNEMA ASBL • UAAM • NRB
Vice-Chairman: • FEBECOOP
Chairman of the Management Board: • LEGIBEL
Manager: • GIEI • GI
Director General: • CIRIEC ASBL
Other function in the Dexia Group: Director: • Dexia Bank Belgium
BIOGRAPHYDoctor of Economics from the University of Liège and graduate from Stanford University, he is Chairman of the Management Board of Ethias. He began his career in the Faculty of Economics, Management and Social Sciences of the University of Liège where he was a professor until 2006. Between 2000 and 2001, he was Administrative Director and member of the Management Board of the Belgian Commission for Electricity and Gas Regulation. In 2006, he joined Ethias as Director of International Relations. He became a member of the Management Board in February 2008 and Chairman in October 2008. He is also a professor at HEC, the Management College of the University of Liège.
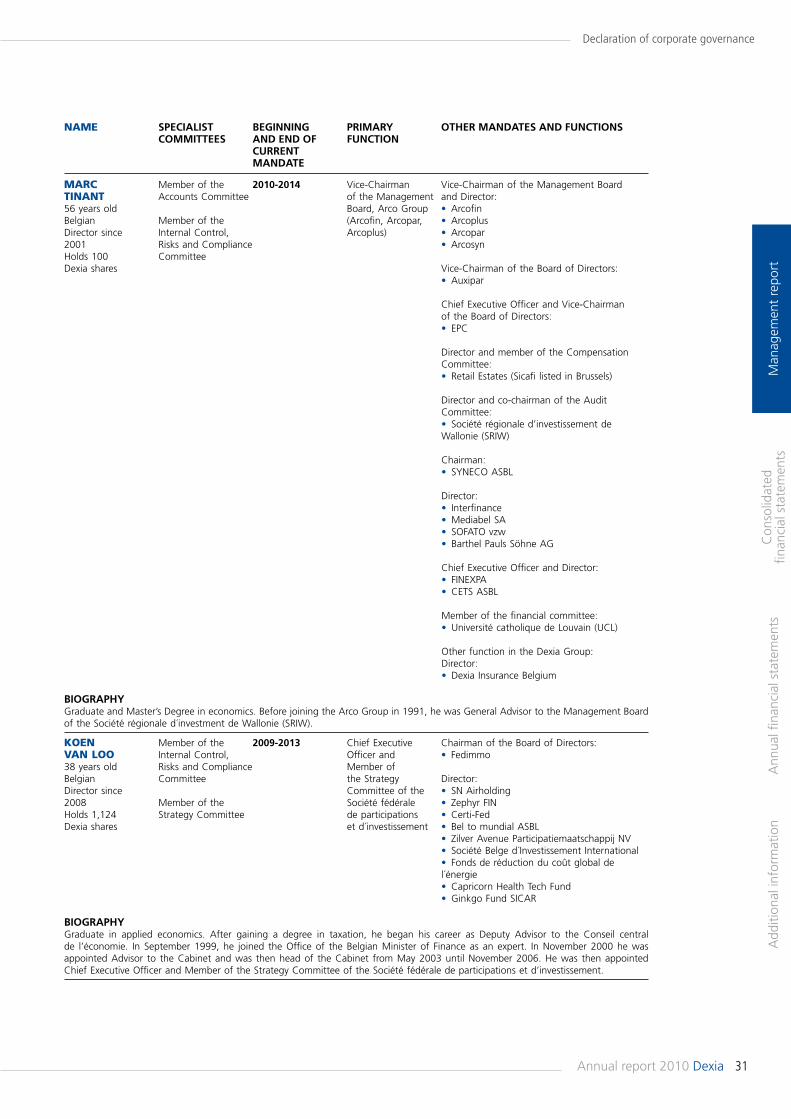
31Annual report 2010 Dexia
Declaration of corporate governance
Man
agem
ent
repo
rtA
dditi
onal
info
rmat
ion
Ann
ual fi
nanc
ial s
tate
men
tsC
onso
lidat
ed
finan
cial
sta
tem
ents
NAME SPECIALIST BEGINNING PRIMARY OTHER MANDATES AND FUNCTIONS COMMITTEES AND END OF FUNCTION CURRENT MANDATE
MARC Member of the 2010-2014 Vice-Chairman Vice-Chairman of the Management BoardTINANT Accounts Committee of the Management and Director:56 years old Board, Arco Group • ArcofinBelgian Member of the (Arcofin, Arcopar, • ArcoplusDirector since Internal Control, Arcoplus) • Arcopar2001 Risks and Compliance • ArcosynHolds 100 Committee Dexia shares Vice-Chairman of the Board of Directors: • Auxipar
Chief Executive Officer and Vice-Chairman of the Board of Directors: • EPC
Director and member of the Compensation Committee: • Retail Estates (Sicafi listed in Brussels)
Director and co-chairman of the Audit Committee: • Société régionale d’investissement de Wallonie (SRIW)
Chairman: • SYNECO ASBL
Director: • Interfinance • Mediabel SA • SOFATO vzw • Barthel Pauls Söhne AG
Chief Executive Officer and Director: • FINEXPA • CETS ASBL
Member of the financial committee: • Université catholique de Louvain (UCL)
Other function in the Dexia Group: Director: • Dexia Insurance Belgium
BIOGRAPHYGraduate and Master’s Degree in economics. Before joining the Arco Group in 1991, he was General Advisor to the Management Board of the Société régionale d´investment de Wallonie (SRIW).
KOEN Member of the 2009-2013 Chief Executive Chairman of the Board of Directors:vAN LOO Internal Control, Officer and • Fedimmo38 years old Risks and Compliance Member of Belgian Committee the Strategy Director:Director since Committee of the • SN Airholding2008 Member of the Société fédérale • Zephyr FINHolds 1,124 Strategy Committee de participations • Certi-FedDexia shares et d´investissement • Bel to mundial ASBL • Zilver Avenue Participatiemaatschappij NV • Société Belge d´Investissement International • Fonds de réduction du coût global de l´énergie • Capricorn Health Tech Fund • Ginkgo Fund SICAR BIOGRAPHYGraduate in applied economics. After gaining a degree in taxation, he began his career as Deputy Advisor to the Conseil central de l’économie. In September 1999, he joined the Office of the Belgian Minister of Finance as an expert. In November 2000 he was appointed Advisor to the Cabinet and was then head of the Cabinet from May 2003 until November 2006. He was then appointed Chief Executive Officer and Member of the Strategy Committee of the Société fédérale de participations et d’investissement.
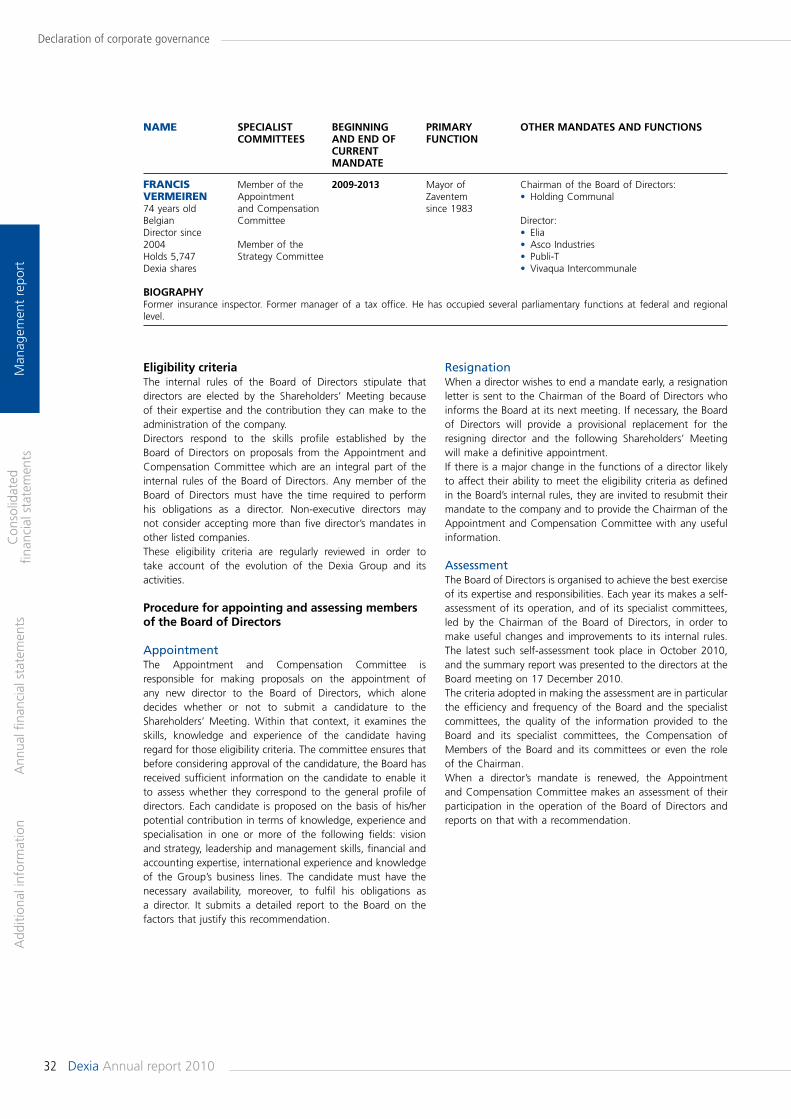
32 Dexia Annual report 2010
Declaration of corporate governance
Man
agem
ent
repo
rtA
dditi
onal
info
rmat
ion
Ann
ual fi
nanc
ial s
tate
men
tsC
onso
lidat
ed
finan
cial
sta
tem
ents
Eligibility criteriaThe internal rules of the Board of Directors stipulate that directors are elected by the Shareholders’ Meeting because of their expertise and the contribution they can make to the administration of the company.Directors respond to the skills profile established by the Board of Directors on proposals from the Appointment and Compensation Committee which are an integral part of the internal rules of the Board of Directors. Any member of the Board of Directors must have the time required to perform his obligations as a director. Non-executive directors may not consider accepting more than five director’s mandates in other listed companies.These eligibility criteria are regularly reviewed in order to take account of the evolution of the Dexia Group and its activities.
Procedure for appointing and assessing members of the Board of Directors
AppointmentThe Appointment and Compensation Committee is responsible for making proposals on the appointment of any new director to the Board of Directors, which alone decides whether or not to submit a candidature to the Shareholders’ Meeting. Within that context, it examines the skills, knowledge and experience of the candidate having regard for those eligibility criteria. The committee ensures that before considering approval of the candidature, the Board has received sufficient information on the candidate to enable it to assess whether they correspond to the general profile of directors. Each candidate is proposed on the basis of his/her potential contribution in terms of knowledge, experience and specialisation in one or more of the following fields: vision and strategy, leadership and management skills, financial and accounting expertise, international experience and knowledge of the Group’s business lines. The candidate must have the necessary availability, moreover, to fulfil his obligations as a director. It submits a detailed report to the Board on the factors that justify this recommendation.
ResignationWhen a director wishes to end a mandate early, a resignation letter is sent to the Chairman of the Board of Directors who informs the Board at its next meeting. If necessary, the Board of Directors will provide a provisional replacement for the resigning director and the following Shareholders’ Meeting will make a definitive appointment.If there is a major change in the functions of a director likely to affect their ability to meet the eligibility criteria as defined in the Board’s internal rules, they are invited to resubmit their mandate to the company and to provide the Chairman of the Appointment and Compensation Committee with any useful information.
AssessmentThe Board of Directors is organised to achieve the best exercise of its expertise and responsibilities. Each year its makes a self-assessment of its operation, and of its specialist committees, led by the Chairman of the Board of Directors, in order to make useful changes and improvements to its internal rules. The latest such self-assessment took place in October 2010, and the summary report was presented to the directors at the Board meeting on 17 December 2010.The criteria adopted in making the assessment are in particular the efficiency and frequency of the Board and the specialist committees, the quality of the information provided to the Board and its specialist committees, the Compensation of Members of the Board and its committees or even the role of the Chairman.When a director’s mandate is renewed, the Appointment and Compensation Committee makes an assessment of their participation in the operation of the Board of Directors and reports on that with a recommendation.
NAME SPECIALIST BEGINNING PRIMARY OTHER MANDATES AND FUNCTIONS COMMITTEES AND END OF FUNCTION CURRENT MANDATE
FRANCIS Member of the 2009-2013 Mayor of Chairman of the Board of Directors:vERMEIREN Appointment Zaventem • Holding Communal74 years old and Compensation since 1983Belgian Committee Director:Director since • Elia2004 Member of the • Asco IndustriesHolds 5,747 Strategy Committee • Publi-TDexia shares • Vivaqua Intercommunale
BIOGRAPHYFormer insurance inspector. Former manager of a tax office. He has occupied several parliamentary functions at federal and regional level.
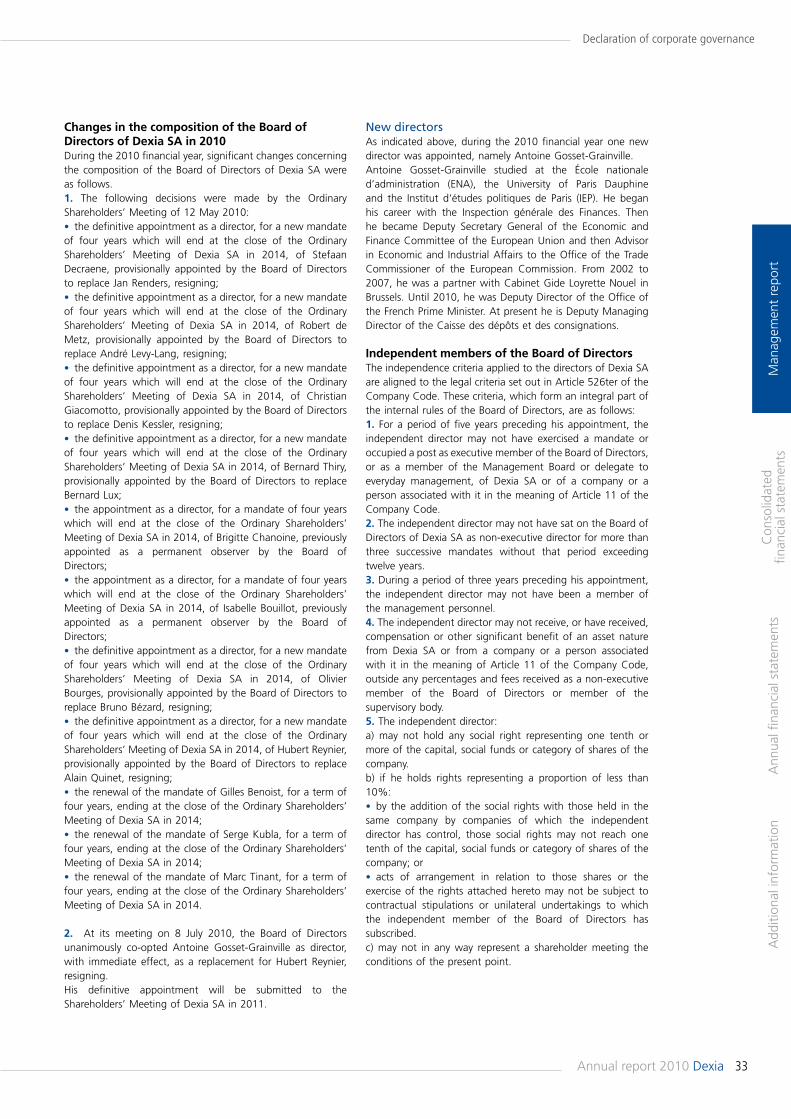
33Annual report 2010 Dexia
Declaration of corporate governance
Man
agem
ent
repo
rtA
dditi
onal
info
rmat
ion
Ann
ual fi
nanc
ial s
tate
men
tsC
onso
lidat
ed
finan
cial
sta
tem
ents
New directorsAs indicated above, during the 2010 financial year one new director was appointed, namely Antoine Gosset-Grainville.Antoine Gosset-Grainville studied at the École nationale d’administration (ENA), the University of Paris Dauphine and the Institut d‘études politiques de Paris (IEP). He began his career with the Inspection générale des Finances. Then he became Deputy Secretary General of the Economic and Finance Committee of the European Union and then Advisor in Economic and Industrial Affairs to the Office of the Trade Commissioner of the European Commission. From 2002 to 2007, he was a partner with Cabinet Gide Loyrette Nouel in Brussels. Until 2010, he was Deputy Director of the Office of the French Prime Minister. At present he is Deputy Managing Director of the Caisse des dépôts et des consignations.
Independent members of the Board of DirectorsThe independence criteria applied to the directors of Dexia SA are aligned to the legal criteria set out in Article 526ter of the Company Code. These criteria, which form an integral part of the internal rules of the Board of Directors, are as follows:1. For a period of five years preceding his appointment, the independent director may not have exercised a mandate or occupied a post as executive member of the Board of Directors, or as a member of the Management Board or delegate to everyday management, of Dexia SA or of a company or a person associated with it in the meaning of Article 11 of the Company Code.2. The independent director may not have sat on the Board of Directors of Dexia SA as non-executive director for more than three successive mandates without that period exceeding twelve years.3. During a period of three years preceding his appointment, the independent director may not have been a member of the management personnel.4. The independent director may not receive, or have received, compensation or other significant benefit of an asset nature from Dexia SA or from a company or a person associated with it in the meaning of Article 11 of the Company Code, outside any percentages and fees received as a non-executive member of the Board of Directors or member of the supervisory body.5. The independent director:a) may not hold any social right representing one tenth or more of the capital, social funds or category of shares of the company.b) if he holds rights representing a proportion of less than 10%:• by the addition of the social rights with those held in the same company by companies of which the independent director has control, those social rights may not reach one tenth of the capital, social funds or category of shares of the company; or• acts of arrangement in relation to those shares or the exercise of the rights attached hereto may not be subject to contractual stipulations or unilateral undertakings to which the independent member of the Board of Directors has subscribed.c) may not in any way represent a shareholder meeting the conditions of the present point.
Changes in the composition of the Board of Directors of Dexia SA in 2010During the 2010 financial year, significant changes concerning the composition of the Board of Directors of Dexia SA were as follows.1. The following decisions were made by the Ordinary Shareholders’ Meeting of 12 May 2010:• the definitive appointment as a director, for a new mandate of four years which will end at the close of the Ordinary Shareholders’ Meeting of Dexia SA in 2014, of Stefaan Decraene, provisionally appointed by the Board of Directors to replace Jan Renders, resigning;• the definitive appointment as a director, for a new mandate of four years which will end at the close of the Ordinary Shareholders’ Meeting of Dexia SA in 2014, of Robert de Metz, provisionally appointed by the Board of Directors to replace André Levy-Lang, resigning;• the definitive appointment as a director, for a new mandate of four years which will end at the close of the Ordinary Shareholders’ Meeting of Dexia SA in 2014, of Christian Giacomotto, provisionally appointed by the Board of Directors to replace Denis Kessler, resigning;• the definitive appointment as a director, for a new mandate of four years which will end at the close of the Ordinary Shareholders’ Meeting of Dexia SA in 2014, of Bernard Thiry, provisionally appointed by the Board of Directors to replace Bernard Lux;• the appointment as a director, for a mandate of four years which will end at the close of the Ordinary Shareholders’ Meeting of Dexia SA in 2014, of Brigitte Chanoine, previously appointed as a permanent observer by the Board of Directors;• the appointment as a director, for a mandate of four years which will end at the close of the Ordinary Shareholders’ Meeting of Dexia SA in 2014, of Isabelle Bouillot, previously appointed as a permanent observer by the Board of Directors;• the definitive appointment as a director, for a new mandate of four years which will end at the close of the Ordinary Shareholders’ Meeting of Dexia SA in 2014, of Olivier Bourges, provisionally appointed by the Board of Directors to replace Bruno Bézard, resigning; • the definitive appointment as a director, for a new mandate of four years which will end at the close of the Ordinary Shareholders’ Meeting of Dexia SA in 2014, of Hubert Reynier, provisionally appointed by the Board of Directors to replace Alain Quinet, resigning;• the renewal of the mandate of Gilles Benoist, for a term of four years, ending at the close of the Ordinary Shareholders’ Meeting of Dexia SA in 2014;• the renewal of the mandate of Serge Kubla, for a term of four years, ending at the close of the Ordinary Shareholders’ Meeting of Dexia SA in 2014;• the renewal of the mandate of Marc Tinant, for a term of four years, ending at the close of the Ordinary Shareholders’ Meeting of Dexia SA in 2014.
2. At its meeting on 8 July 2010, the Board of Directors unanimously co-opted Antoine Gosset-Grainville as director, with immediate effect, as a replacement for Hubert Reynier, resigning.His definitive appointment will be submitted to the Shareholders’ Meeting of Dexia SA in 2011.
34 Dexia Annual report 2010
Declaration of corporate governance
Man
agem
ent
repo
rtA
dditi
onal
info
rmat
ion
Ann
ual fi
nanc
ial s
tate
men
tsC
onso
lidat
ed
finan
cial
sta
tem
ents
Non-executive membersA non-executive member of the Board of Directors is a member who does not exercise management functions in a company of the Dexia Group. The internal rules of the Board of Directors of Dexia SA provide that at least one half of the Board of Directors must be non-executive directors and at least three of the non-executive directors must be independent. It is to be noted that with the exception of Pierre Mariani and Stefaan Decraene, respectively Chairman and member of the Management Board, all the members of the Board of Directors of Dexia SA are non-executive directors.The non-executive members of the Board of Directors are entitled to obtain any information necessary for them to perform their mandate properly and may ask management for that information.
Separation of the functions of Chairman of the Board of Directors and Chief Executive OfficerThere is a clear separation of responsibilities at the head of the Group between on the one hand the responsibility to lead the Board of Directors and on the other hand the executive responsibility to lead activities. The articles of association of Dexia SA as well as the internal rules of the Board of Directors of Dexia SA expressly indicate that the Chief Executive Officer cannot perform the tasks of the Chairman of the Board. Moreover, the Chairman of the Board, or the person replacing him in his absence, must be of a different nationality to the Chief Executive Officer.
Term of officeThe mandates of members of the Board of Directors are for a maximum term of four years. Board members can be re-elected.The number of renewals of mandate of a non-executive director of the company is limited to two. The age limit for directors is 72. The directors concerned resign with effect from the date of the Ordinary Shareholders’ Meeting following their birthday. The Board of Directors is entitled to deviate from the above rules when it deems it to be in the interests of the company.
The competences and responsibilities of the Board of Directors
The internal rules of the Board of Directors describe the expertise and responsibilities of the Board of Directors in three areas:• strategy and general policy;• management control and risk management;• relations with shareholders.
Strategy and general policyRegarding principles, the Board of Directors of Dexia defines the Group’s strategy and standards and sees to the implementation of that strategy at level of the Group, Dexia Bank Belgium, Dexia Crédit Local and Dexia Banque Internationale à Luxembourg.
The Board´s actions are guided solely by the interest of the company with respect to the shareholders, customers and members of staff. The Board ensures that the principles of good governance are observed, including recognition of the corporate interest of Dexia Bank Belgium, Dexia Crédit Local and Dexia Banque Internationale à Luxembourg.
6. The independent director may not have entered into or maintained a significant business relationship with Dexia SA or with a company or person associated with it in the meaning of Article 11 of the Company Code over the last financial year, either directly or as a partner, shareholder, member of the Board of Directors or member of management staff of a company or person entering into such a relationship.7. The independent director may not over the last three years have been a partner or employee of a current or previous auditor of Dexia SA or an associated company or person associated with it in the meaning of Article 11 of the Company Code.8. The independent director may not be an executive member of the Board of Directors of another company in which an executive director of Dexia SA is a non-executive member of the Board of Directors or a member of the supervisory body, and may not have other significant ties with the executive directors of Dexia SA through posts held in other companies or bodies.9. The independent director may not, either within Dexia SA or within a company or person associated with it in the meaning of Article 11 of the Company Code, have either his or her spouse, or the person with whom he or she lives under a common law marriage, or an immediate family member or a relative up to two removes exercising a mandate as member or the Board of Directors, delegate to everyday management or member of the management staff, or in one of the other cases defined in points 1 to 8.
These criteria are applicable to any director appointed for the first time within the Board of Directors of Dexia SA as an independent director from 29 January 2009.
They are not applicable to directors who were qualified as independent before 29 January 2009, on the basis of the criteria previously fixed by the Board of Directors of Dexia SA. These independent directors may continue to sit on the Board of Directors as independent directors until 1 July 2011, when they must meet the present criteria of independence to be able to continue to sit in that capacity. These criteria will nonetheless be applicable to them in the case of renewal of their mandate as director before 1 July 2011. Any loss of status as independent director at the end of this transitional period will not be an obstacle to renewal of the mandate as non-independent director.The independent director of Dexia who no longer meets one of the said criteria, particularly following a major change of his functions, will immediately inform the Chairman of the Board of Directors who will inform the Appointment and Compensation Committee; the Appointment and Compensation Committee will inform the Board of Directors and if necessary formulate an opinion.
Considering these criteria, the Board of Directors of Dexia SA has seven independent directors as at 31 December 2010.
They are:• Jean-Luc Dehaene;• Gilles Benoist;• Christian Giacomotto;• Catherine Kopp;• Robert de Metz;• Brigitte Chanoine;• Isabelle Bouillot.
35Annual report 2010 Dexia
Declaration of corporate governance
Man
agem
ent
repo
rtA
dditi
onal
info
rmat
ion
Ann
ual fi
nanc
ial s
tate
men
tsC
onso
lidat
ed
finan
cial
sta
tem
ents
Operation of the Board of Directors
Articles of associationThe company’s articles of association set forth the following rules that govern the operation of the Board of Directors:• All deliberations require the presence or representation of at least half of the members of the Board;• Decisions are adopted by a majority vote of all members present or represented. If there is a tie vote, the Chairman or the member replacing him shall cast the deciding vote;• Decisions concerning the operations described below require the presence or representation of at least two thirds of the members of the Board, and a two thirds majority of all the members present or represented:- any decision to employ authorised capital or to submit to the Shareholders’ Meeting a resolution to approve the issue of shares, bonds convertible or redeemable in shares, warrants or other financial instruments eventually conferring the right to shares, when the amount of the capital increases which would result from the issue of these shares or the conversion or redemption of these bonds or the exercise of these warrants or other financial instruments exceeds 10% of the amount of equity existing prior to these decisions;- any decision relating to the acquisition or sale of assets representing more than 10% of the company’s equity;- any decision to submit to the Shareholders’ Meeting a resolution to amend the company’s articles of association;- any decision relating to the appointment or dismissal of the Chairman of the Board of Directors and the Chief Executive Officer.
The Board of Directors may, on an ad hoc basis or generally, invite observers to attend its meetings. These observers do not have a deliberative vote and are bound by the same obligations, particularly of confidentiality, as the directors.In accordance with Article 11 of the company’s articles of association, any proposal to amend the articles of association to be submitted to the Shareholders’ Meeting requires a decision by the Board of Directors taken by a two-thirds majority of the votes of all the members present or represented, and provided at least two thirds of the members are present or represented.
Internal rules of the Board of Directors of Dexia SAThe internal rules of the Board of Directors of Dexia SA, which have existed since 1999, codify all the rules aimed at enabling the Board fully to exercise its competences and at increasing the effectiveness of each director’s contribution.
General organisational principlesThe Board of Directors is organised to achieve the best exercise of its expertise and responsibilities.The meetings of the Board are frequent enough to allow the Board to perform its tasks. Board members agree to participate actively in the work of the Board and the committees on which they sit. Attendance at meetings of the Board and committees is the first condition of this participation and effective attendance at three quarters of the meetings at least is desired.
Dexia’s internal rules therefore require that the Board of Directors:• meets at least once a year in order to assess the challenges and the strategic issues facing Dexia and its various business lines;• examine strategic proposals made by the Management Board and presented to it by the Chief Executive Officer;• decides on the strategy of Dexia and its various business lines to be implemented by the Management Board, sets priorities, approves the annual budget and, more generally, sees that the chosen strategy and the human and financial means committed are appropriate;• defines the values of the Dexia Group after receiving the opinion of the Management Board.The internal rules give the Board specific responsibilities for acquisitions and disposals of major assets. Any acquisition or disposal of a holding in a commercial company departing from the normal management of a portfolio by the Dexia Group (Dexia SA or a company directly or indirectly controlled by Dexia SA) for an amount equal to or more than EUR 100 million and guarantees given to a third party associated with the Dexia Group must be subject to prior authorisation from the Board of Directors.
Management control and risk managementThe Board of Directors controls and directs the management of the company and of the Group and monitors risks.For this purpose, the internal rules of the Dexia Board of Directors provide that the Board:• assesses the implementation, by the Group and Dexia Bank Belgium, Dexia Crédit Local and Dexia Banque Internationale à Luxembourg, of strong and independent control functions, which include risk management, internal audit and compliance procedures on a centralised basis;• takes measures necessary to ensure the integrity of the financial statements;• assesses the performances of members of the Management Board;• supervises the performances of the Statutory Auditor and internal auditors;• defines the organisation of the Management Board in terms of its composition, operation and obligations on the recommendation of the Chief Executive Officer;• sets the Compensation for the members of the Management Board on the recommendation of the Appointment and compensation Committee and the recommendation of the Chief Executive Officer for members of the Management Board other than the Chief Executive Officer.
The role of the Board of Directors towards the company shareholdersThe Board’s actions are guided solely by the interest of the company with respect to the shareholders, customers and members of staff.The Board ensures that its obligations towards all its shareholders are understood and met and reports to the shareholders on the performance of its duties.
36 Dexia Annual report 2010
Declaration of corporate governance
Man
agem
ent
repo
rtA
dditi
onal
info
rmat
ion
Ann
ual fi
nanc
ial s
tate
men
tsC
onso
lidat
ed
finan
cial
sta
tem
ents
The agenda lists the items to be discussed and specifies if they are listed for information purposes, for discussion, or for a vote.The minutes report discussions and record the decisions made, specifying reservations issued by some directors, if applicable.
Obligation of confidentialityThe information provided to the directors in the performance of their duties, during Board meetings, meetings of the specialist committees, or during private interviews, is provided intuitu personæ; they shall ensure that the confidentiality of such information is strictly maintained.The knowledge of privileged information leads to the prohibition against executing, on his own behalf or on behalf of third parties, transactions on the securities of the companies in question and a ban on disclosing this information to third parties.
Training of Board membersIn order to acquire a solid understanding of the Dexia Group, the new members of the Board of Directors are invited, when they take office, to one or two days of contacts and visits within the Group.The Board members who sit on the specialist committees are chosen on the basis of their specific skills. They are assisted by outside experts as needed. The tasks of these specialist committees are clearly defined in the internal rules of the Board of Directors, and in the specific internal rules of the Accounts Committee and the Internal Control, Risks and Compliance Committee.
Conflicts of interestDirectors make sure that their participation in the Board of Directors is not a source of direct or indirect conflict of interest, either personally or because of the professional interests they represent.They must ensure that their participation in the Board reflects complete independence from interests outside the company itself. In particular, cross-exchanges of directors are to be avoided.Directors submit their mandate to the Board if there is a significant change in their duties and the Board decides whether to accept their resignation in such cases, after an opinion from the Appointment and Compensation Committee. They must resign if a change in their situation creates an incompatibility with their office as a Dexia director.If a director directly or indirectly has a conflicting financial interest in a decision or operation to be decided by the Board of Directors, he must inform the other members of the Board before they deliberate. His declaration, including the reasons for his conflicting financial interest, must be recorded in the minutes of the Board meeting that must make the decision. In addition, he must inform the company’s auditors. He may not participate in the deliberations of the Board of Directors in relation to the transactions or decisions concerned, or vote on them.For publication in the annual management report, the Board of Directors describes in the minutes the type of decision or operation in question and the reasons for the decision made and the financial consequences for the company. The management report contains copy of the minutes described above.
Transactions between a company of the Dexia Group and Board membersThe internal rules of the Board of Directors provide that transactions between a company of the Dexia Group and the directors must be concluded under normal market conditions.
Transactions on Dexia financial instrumentsIn order to promote the transparency of transactions in the Dexia financial instruments, the internal rules, amended by the Board of Directors at its meeting on 26 August 2009, stipulate that all the directors of Dexia SA have the status of “permanent insider” in view of their regular access to inside information on Dexia. Executive directors, as well as some non-executive directors who, have access to the estimated consolidated results of Dexia, are thus entered in the list of “estimated consolidated results insiders”. Moreover, within the context of certain specific projects, directors may have access to inside information on Dexia in relation to its projects, and they are entered in the list of “occasional insiders”.In view of their “permanent insider” status, directors:• will refrain from carrying out any transaction on Dexia financial instruments during the period of one month prior to the announcement of the quarterly, half-yearly or annual results;• must obtain prior authorisation from the Group Chief Compliance Officer before any transaction on Dexia financial instruments.Directors with the status of “estimated consolidated results insiders” are subject for a statutory restriction period associated with estimated results and will refrain from carrying out any transaction on Dexia financial instruments during a negative intervention period beginning on D-15 of the account closing date and ending on the date of publication of the results. They must moreover obtain authorisation from the Group Chief Compliance Officer before any transaction in view of their status of “permanent insider”.Directors entered in the list of “occasional insiders” may not, during the time they are in the list, carry out any transaction on Dexia financial instruments.As for stock options, and having regard to their terms, it is possible to uncouple the initiation of the order from its execution. Applying this principle, a director may give an instruction in relation to the exercise of stock options during a positive intervention period with a view to their execution if necessary during a negative period. This uncoupling is only possible if the order given is irrevocable and has a floor price limit.
37Annual report 2010 Dexia
Declaration of corporate governance
Man
agem
ent
repo
rtA
dditi
onal
info
rmat
ion
Ann
ual fi
nanc
ial s
tate
men
tsC
onso
lidat
ed
finan
cial
sta
tem
ents
• monitoring implementation of the Group transformation plan;• progress made in social negotiations; • Dexia Group Compensation policy, and the compensation of Group executives and market professionals;• sale of Assured Guaranty shares acquired by Dexia on the disposal of FSA; • Dexia Group budget for 2009, 2010 and 2011;• Dexia strategy in Turkey;• Dexia’s risk appetite policy;• creation of a new analytical division called Legacy Portfolio Management Division alongside the Core Division; • stress tests on the solvency of European banking institutions and publication of exposures to Member States of the euro zone;• strategic review of the Group and its different business lines;• monitoring the litigation between Dexia banka Slovensko and Ritro;• monitoring the Lernout & Hauspie litigation;• the Group’s liquidity situation and deleveraging;• exposure to sovereign debt;• disposal of Dexia banka Slovensko;• impact of Basel III on Dexia;• new IFRS9 rules;• Investor Day;• Dexia Group Memorandum of Governance, intended for the Banking, Finance and Insurance Commission;• credit risk on Financial Products portfolio.
Conflicts of interest in 2010As indicated above, if a director directly or indirectly has a conflicting financial interest in a decision or operation to be decided by the Board of Directors, he must inform the other members of the Board before they deliberate. In addition, his declaration, including the reasons for his conflicting financial interest, must be recorded in the minutes of the Board meeting that must make the decision.
At the meeting on 31 March 2010, the Board dealt with setting the compensation of members of the Management Board. As Pierre Mariani and Stefaan Decraene are respectively Chairman and Member of the Management Board, they abstained (in accordance with Article 523 of the Company Code) from participating in the deliberations and vote by the Board of Directors on their compensation. The extract from the minutes relating to the points concerning Pierre Mariani on the one hand and Stefaan Decraene on the other are reproduced below.
Extract from the minutes of the meeting of the Board of Directors of Dexia SA held on 31 March 2010
J-L DEHAENE presents the report of the Appointments and Compensation Committee dated 18 March 2010, the minutes of which are included in the file for the Board and the meeting of the Appointments and Compensation Committee held on 31 March prior to the meeting of the Board.
These meetings were dedicated essentially to the compensation of members of the Dexia Executive Committee and top management (cf. Point 2.1. and 2.2. infra).
(…)
Directors and persons who are closely associated with them are obliged to notify the CBFA of transactions on Dexia financial instruments carried out on their own account. Transactions notified are automatically published by the CBFA on its internet site.
Directors must declare to the Group Chief Compliance Officer:• at the time of their entry into office, all the Dexia financial instruments they hold;• at the end of each year, an update of the list of Dexia financial instruments they hold.
The rules and restrictions relating to transactions on Dexia financial instruments described above are applicable to directors and to persons closely associated with them. They also apply to observers as defined in the articles of association of Dexia SA.
Operation and activities of the Board of Directors of Dexia SA during the 2010 financial year
Attendance by Board membersThe Board of Directors met on eleven occasions in 2010. The directors’ attendance rate at Board meetings was 92%.
ATTENDANCE RATE OF EACH DIRECTOR AT MEETINGS OF THE BOARD OF DIRECTORSJean-Luc Dehaene 10 of 11
Pierre Mariani 11 of 11
Gilles Benoist 9 of 11
Isabelle Bouillot 8 of 11
Olivier Bourges 11 of 11
Brigitte Chanoine 11 of 11
Stefaan Decraene 11 of 11
Robert de Metz 11 of 11
Augustin de Romanet de Beaune 7 of 11
Christian Giacomotto 11 of 11
Antoine Gosset-Grainville 6 of 7
Catherine Kopp 11 of 11
Serge Kubla 9 of 11
Francine Swiggers 11 of 11
Bernard Thiry 10 of 11
Marc Tinant 10 of 11
Koen Van Loo 11 of 11
Francis Vermeiren 11 of 11
Activities of the Board of DirectorsIn addition to matters falling within the normal competence of the Board of Directors (result monitoring, budget approval, appointment and compensation of members of the Management Board, convocation to Ordinary and Extraordinary Shareholders’ Meetings, minutes of meetings of specialist committees), the Board also dealt with the following files:• decision by the European Commission within the context of examining assistance granted to Dexia by the French, Belgian and Luxembourg governments;• approval of the 2009 financial statements; • allocation of the 2009 result and proposal to issue bonus shares in favour of shareholders;
38 Dexia Annual report 2010
Declaration of corporate governance
Man
agem
ent
repo
rtA
dditi
onal
info
rmat
ion
Ann
ual fi
nanc
ial s
tate
men
tsC
onso
lidat
ed
finan
cial
sta
tem
ents
b) the Board of Directors decides unanimously to increase the fixed compensation of S. DECRAENE from EUR 450,000 to EUR 500,000 as from 1 January 2010.
(…)
Specialist committees created by the Board of Directors
In order to make an in-depth examination of the files submitted to it, the Board of Directors created four specialist committees, namely: • the Strategy Committee;• the Audit Committee which since 13 November 2008 has been divided into an Internal Control, Risks and Compliance Committee and an Accounts Committee;• the Appointment and Compensation Committee, the result of the merger of the Compensation Committee and the Appointment Committee on 13 November 2008.
These committees are charged with preparing Board decisions, the latter remaining solely its responsibility. Unless they have been specially delegated by the Board, the specialist committees have indeed no decision-making powers.These committees are composed of three to eight Board members appointed by the Board of Directors for a period of two years, which may be renewed. After each meeting, a report on the committee’s work is submitted to the Board of Directors
Strategy Committee
CompositionThe Strategy Committee is composed of eight directors, including the Chairman of the Board of Directors, who chairs the committee, and the Chief Executive Officer.Members of the Strategy Committee are (as at 31 December 2010):• Jean-Luc Dehaene, Chairman of the Board of Directors, independent director, Chairman of the Committee;• Pierre Mariani, Chief Executive Officer;• Bernard Thiry, director;• Francine Swiggers, director;• Francis Vermeiren, director;• Koen Van Loo, director;• Olivier Bourges, director;• Antoine Gosset-Grainville, director (1).
Responsibilities (as at 31 December 2010):The Strategy Committee meets as required, on the initiative of the Chief Executive Officer, to examine the strategic positioning of the Dexia Group, considering the evolution of the Group’s environment and its markets as well as its development lines in the medium term, and to study important files, prior to their examination by the Board of Directors, if they require particular confidentiality by virtue in particular of their repercussions on the financial markets.Any of its members may also request a meeting of the Strategy Committee.
(1) Antoine Gosset-Grainville was appointed a member of the Strategy Committee on 31 January 2011 replacing Augustin de Romanet de Beaune.
2.1 Compensation of members of the Management Board (other than P. MARIANI)
(…)
J-L DEHAENE recalls the principles applied to the granting of variable compensation to members of the Management Board and top management which are detailed in the documents appended to the file for the Board, that is to say, with regard to the variable compensation for services rendered in 2009, the principle of spread payment subject to certain conditions being met (including the maintenance of a level of performance) over a period of three years.
This principle was applied by Dexia to the variable compensation of members of the Management Board and top management prior to Belgian legislation in this regard entering into force.
S. DECRAENE leaves the room for discussion on proposals regarding his fixed and variable compensation.
Considering these factors, the Appointments and Compensation Committee proposes that the Board of Directors fix the variable compensation of members of the Management Board (other than P. Mariani) as follows:
- S. DECRAENE: EUR 300,000(…)
Furthermore, it is also proposed to increase the fixed compensation of S. DECRAENE as from 1 January 2010 from EUR 450,000 to EUR 500,000.
2.2 Compensation of P. MARIANI
P. MARIANI leaves the room for discussion on proposals regarding his fixed and variable compensation.
J-L DEHAENE indicates that the Compensation Committee proposes to grant P. MARIANI variable compensation of EUR 800,000, payment of which shall be spread over time in accordance with the principles stated in Point 2.1 above.
Decisions:
1) On proposals by the Appointments and Compensation Committee, the Board of Directors takes the following decisions unanimously, subject to P. MARIANI and S. DECRAENE abstaining from participating in the deliberations and vote in relation to their own compensation:
a) the Board of Directors decides to grant the following variable compensation to members of the Management Board for the year 2009:
- P. MARIANI: EUR 800,000 - S. DECRAENE: EUR 300,000 (…)
Payment of this variable compensation will be subject to the terms and conditions described above.
39Annual report 2010 Dexia
Declaration of corporate governance
Man
agem
ent
repo
rtA
dditi
onal
info
rmat
ion
Ann
ual fi
nanc
ial s
tate
men
tsC
onso
lidat
ed
finan
cial
sta
tem
ents
The members of the Accounts Committee are (as at 31 December 2010):• Gilles Benoist, independent director and Chairman of the Committee;• Marc Tinant, director;• Robert de Metz, independent director;• Brigitte Chanoine, independent director (1);• Olivier Mareuse, director (2).
Responsibilities (as at 31 December 2010)Regarding accounts and financial informationThe Accounts Committee examines draft annual, half-yearly and quarterly social and consolidated financial statements of the Group, which must then be presented, approved and published by the Board of Directors.It examines all questions in relation to the accounts and the financial statements and in particular, from the documents submitted to it, checks the conditions of their establishment, the choice of accounting guidelines, the provisions, the respect of prudential standards, the pertinence and permanence of the accounting principles and methods applied and the appropriateness of the consolidation scope adopted.It advises the Board of Directors regarding the financial communication of the quarterly results and regarding delicate and sensitive matters which might have a significant impact on the financial statements.
Regarding external auditThe Accounts Committee ensures the adequacy of the external audit for the needs of the Group, and in that regard it ensures observance of the policy of independence of the auditors.
Operation of the Accounts CommitteeThe Accounts Committee meets at least four times a year, each of these meetings taking place prior to the Board of Directors’ meetings examining and approving the financial statements. It may meet at any time at the request of one of its members, or the Chairman of the Board of Directors. The competences and the mode of operation of the Accounts Committee are described in the internal rules of that Committee.The member of the Management Board responsible for Finance attends meetings of the Accounts Committee. Other members of the Management Board may be invited to attend meetings, and likewise the General Auditor and the external auditors. The Accounts Committee may be assisted, if necessary, by an expert.
Activities of the Accounts Committee during the 2010 financial yearThe Accounts Committee met seven times in 2010 and dealt in particular with the following subjects:• examination of the results for the fourth quarter 2009 and the first, second and third quarters 2010;• approval and certification of the 2009 financial state-ments;• 2010 and 2011 budgets;
(1) Brigitte Chanoine was appointed a member of the Accounts Committee on 8 July 2010.(2) Olivier Mareuse was appointed a member of the Accounts Committee on 31 january 2011 replacing Antoine Gosset-Grainville.
The Group’s strategy is developed on the basis of the following principles:• it is the responsibility of the Management Board to take the initiative to study and propose projects of a strategic nature to the Strategy Committee and to the Board of Directors;• the Board of Directors and the Strategy Committee formed within it may ask the Management Board to study a strategic option;• considered in particular to be of a strategic nature are projects responding to at least one of the following criteria:- a project of acquisition or disposal of assets for an amount equal to or greater than EUR 300 million;- a project of joint venture, consortium or partnership with a third party that could have a significant impact on the scope of consolidation of the Group and/or on its results or the results of one of its business lines;- a project of alliance or partnership that implies a significant change in the shareholding structure of Dexia SA.
Operation and activities during the 2010 financial yearThe Strategy Committee met twice in 2010 and dealt in particular with the following subjects:• The strategy of the Group and its different business lines;• Publication of the stress tests;• Monitoring deleveraging and managing Group liquidity;• Disposal of subsidiaries and certain assets;• Cost reductions and improvements to the cost/income ratio.
Attendance of each individual director at meetings of the Strategy CommitteeThe individual attendance rates of directors at meetings of this committee was 100% in 2010, except for Olivier Bourges who was excused from attending the meeting on 22 June 2010 and for Augustin de Romanet de Beaune who was excused from attending the meeting on 12 December 2010.
Audit CommitteeAt its meeting on 13 November 2008 the Board of Directors decided to change the operation of the Audit Committee in order in particular to strengthen governance and risk monitoring. The committee was therefore split into two specialist committees: the Accounts Committee and the Internal Control, Risks and Compliance Committee. These two committees, which together form the Audit Committee, in accordance with the law of 17 December 2008 in particular establishing an audit committee in listed companies and financial institutions, meet in plenary session once a year before the financial statements are approved. The Audit Committee consists exclusively of non-executive directors among which at least one independent director answering to the criteria set out in Article 526ter of the Company Code and a director competent in accounting and audit matters.
• The Accounts Committee
CompositionThe Accounts Committee consists of three to five directors, all non-executive, including at least one independent director. The Chairman of the Board of Directors may attend meetings of the Accounts Committee. The Chief Executive Officer may attend, but may not be a member of the Accounts Committee.
40 Dexia Annual report 2010
Declaration of corporate governance
Man
agem
ent
repo
rtA
dditi
onal
info
rmat
ion
Ann
ual fi
nanc
ial s
tate
men
tsC
onso
lidat
ed
finan
cial
sta
tem
ents
• evolution of the balance sheet and the funding ratio on the basis of the 2014 business plan;• amendments to the IAS39 standards and the new IFRS9 rules;• balance sheet deleveraging;• exit from the government guarantee mechanism and regular reporting to the European Commission;• Legacy Portfolio Management Division, • exposure to sovereigns and impact of the Greek crisis;• impairments on the Financial Products portfolio;• monitoring the litigation between Dexia banka Slovensko and Ritro;• monitoring the Lernout & Hauspie litigation;• distribution of bonus shares to shareholders;• liquidity situation;• analysis of the impact of IFRS and Basel III on the Dexia Group; • sale of Dexia Banka Slovenko.
Presence of each individual director at meetings of the Accounts CommitteeThe individual attendance rate of directors at meetings of this committee was 100% in 2010.For Hubert Reynier, who left the committee on 8 July 2010, the attendance rate was 25%. For Antoine Gosset-Grainville, who joined the committee on 8 July 2010, the attendance rate was 67%.
• The Internal Control, Risks and Compliance Committee
CompositionThe committee consists of three to five directors, all non-executive, including at least one independent director. The Chairman of the Board of Directors may attend the Internal Control, Risks and Compliance Committee. The Chief Executive Officer may attend but may not be a member of the Internal Control, Risks and Compliance Committee.The members of the Internal Control, Risks and Compliance Committee are (as at 31 December 2010):• Gilles Benoist, independent director and Chairman of the Committee;• Marc Tinant, director;• Koen Van Loo, director;• Olivier Bourges, director.
Responsibilities (as at 31 December 2010)Regarding internal audit and risk managementThe Committee has the task of supervising the performance of the internal control system put in place by the Management Board and the risk management system regarding the risks to which the entire Group is exposed by virtue of its activities. The committee also examines the reports presented by the head of the Compliance, Legal & Tax support line on the Group’s legal and tax risks.
Regarding internal auditThe Committee ensures the performance and the independence of the operations of the Internal Audit department, both for Dexia SA and the Group as a whole.
Regarding complianceThe committee ensures the performance and the operational independence of the Compliance department.
Operation of the Internal Control, Risks and Compliance CommitteeThe Committee meets at least four times a year, each of these meetings taking place prior to the Board of Directors’ meetings examining and approving the quarterly, half-yearly or annual financial statements as the case may be. It may meet at any time at the request of one of its members, or the Chairman of the Board of Directors.The competences and operating mode of the Internal Control, Risks and Compliance Committee are described in the internal rules of that Committee.The member of the Management Board responsible for risk management, the General Auditor and the head of the Legal, Compliance and Tax support line attend the meetings of the Internal Control, Risks and Compliance Committee. The Chief Compliance Officer is present to deal with all items in relation to compliance.
Operation of the Internal Control, Risks and Compliance Committee during the 2010 financial yearThe committee met seven times in 2010 and dealt in particular with the following subjects:• reporting on MiFID monitoring as at 31 December 2009;• audit plan 2009 and 2010 and examination of the monitoring of audit recommendations;• report on the assessment of internal audit by the effective management intended for the CBFA;• progress made on the IT security study;• assessment of the risks on FSA – Assured;• risk appetite policy;• activity report 2009 from the Legal and Tax support line and action plan 2010;• activity report 2009 from the Compliance support line and action plan 2010;• progress made on introducing a permanent audit process; • monitoring implementation of the transformation plan and exchanges of correspondence with the regulators;• structured credits to the French public sector;• the internal audit and investigation charter.
Presence of each individual director at meetings of the Internal Control, Risks and Compliance CommitteeThe individual attendance rate of directors at meetings of the committee was 100% in 2010, except for Olivier Bourges whose attendance rate was 71%.
41Annual report 2010 Dexia
Declaration of corporate governance
Man
agem
ent
repo
rtA
dditi
onal
info
rmat
ion
Ann
ual fi
nanc
ial s
tate
men
tsC
onso
lidat
ed
finan
cial
sta
tem
ents
The Appointment and Compensation Committee
CompositionThe Appointment and Compensation Committee is composed of three to seven non-executive directors, including the Chairman of the Board of Directors, and has a majority of independent directors. The committee has the necessary expertise in Compensation policy. The Chief Executive Officer may attend but he may not be a member of the Appointment and Compensation Committee (as he is not a non-executive director).The members of the Appointment and Compensation Committee are (as at 31 December 2010):• Jean-Luc Dehaene, Chairman of the Board of Directors, independent director and chairman of the committee;• Christian Giacomotto, independent director; • Francine Swiggers, director;• Antoine Gosset-Grainville, director (1);• Francis Vermeiren, director;• Catherine Kopp, independent director (2);• Robert de Metz, independent director (3).
Responsibilities (as at 31 December 2010):Regarding CompensationThe Committee proposes: • the Compensation for the Chairman of the Board and the Chief Executive Officer and, based on the Chief Executive Officer’s recommendation, the Compensation for the members of the Management Board;• the granting of stock options in application of the general principles defined by the Board of Directors.
It is consulted moreover on the policy of compensation and incentives for top executives of the Group, as well as the policy regarding employee share plans.
It also makes recommendations on the fees paid to directors and the allocation of those fees to directors.
Within the context of these tasks, the committee complies with recommendations, circulars and all other international, French and Belgian regulations on compensation and corporate governance.
(1) Antoine Gosset-Grainville was appointed a member of the Appointment and Compensation Committee on 31 January 2011 replacing Augustin de Romanet de Beaune.(2) Catherine Kopp was appointed a member of the Appointment and Compensation Committee on 24 February 2010.(3) Robert de Metz was appointed a member of the Appointment and Compensation Committee on 31 January 2011.
Regarding appointmentThe Appointment Committee prepares decisions for the Board of Directors relating to: • proposals for the appointment and renewal of the mandate of directors made by the Board to the Shareholders’ Meeting, as well as proposals for co-opting directors; • determination of independence criteria enabling a director to be qualified as "independent"; • qualification of an existing member or a new member of the Board of Directors as an independent director; • appointment of members of the specialist committees of the Board of Directors and their chairmen; • appointment and renewal of the mandate of the Chief Executive Officer; • appointment and renewal of the mandate of the Chairman of the Board; • proposals from the Chief Executive Officer concerning the composition, organisation and operating mode of the Management Board of Dexia SA; • amendments to the internal rules of the Board of Directors. For these purposes, the Committee is responsible for monitoring procedures adopted by major listed companies in terms of composition and operation of Boards of Directors.
Operation and activities during the 2010 financial yearThe Appointment and Compensation Committee met five times in 2010 and dealt in particular with the following subjects: • composition of the Board of Directors; • composition of the specialist committees; • leaving packages for certain former executives; • policy regarding compensation of directors of Dexia SA and its main subsidiaries; • policy regarding compensation of trading room professionals;• policy regarding compensation of management;• variable Compensation of members of the Management Board and the Executive Committee; • report on “Integration of Compensation policy in governance” intended for the CBFA;• appointment of a new director of Human Resources;• composition of the Appointment and Compensation Committee;• adaptation of the internal rules of the Board of Directors.
Presence of each individual director at meetings of the Appointment and Compensation CommitteeThe individual attendance rate of directors at meetings of these committees was 100% in 2010, except for Augustin de Romanet de Beaune whose attendance rate was 60%.
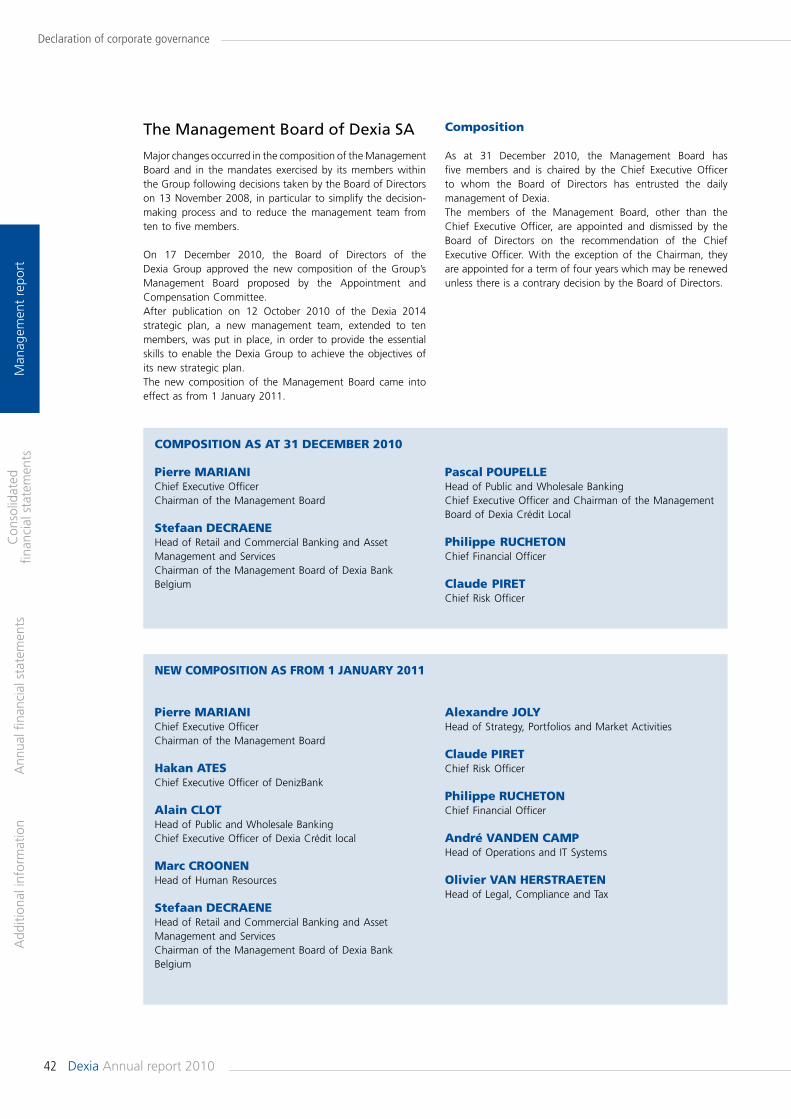
42 Dexia Annual report 2010
Declaration of corporate governance
Man
agem
ent
repo
rtA
dditi
onal
info
rmat
ion
Ann
ual fi
nanc
ial s
tate
men
tsC
onso
lidat
ed
finan
cial
sta
tem
ents
COMPOSITION AS AT 31 DECEMBER 2010
Pierre MARIANIChief Executive OfficerChairman of the Management Board
Stefaan DECRAENEHead of Retail and Commercial Banking and Asset Management and ServicesChairman of the Management Board of Dexia Bank Belgium
Pascal POUPELLEHead of Public and Wholesale BankingChief Executive Officer and Chairman of the Management Board of Dexia Crédit Local
Philippe RUCHETONChief Financial Officer
Claude PIRETChief Risk Officer
NEW COMPOSITION AS FROM 1 JANUARY 2011
Pierre MARIANIChief Executive OfficerChairman of the Management Board
Hakan ATESChief Executive Officer of DenizBank
Alain CLOTHead of Public and Wholesale BankingChief Executive Officer of Dexia Crédit local
Marc CROONENHead of Human Resources
Stefaan DECRAENEHead of Retail and Commercial Banking and Asset Management and ServicesChairman of the Management Board of Dexia Bank Belgium
Alexandre JOLYHead of Strategy, Portfolios and Market Activities
Claude PIRETChief Risk Officer
Philippe RUCHETONChief Financial Officer
André vANDEN CAMPHead of Operations and IT Systems
Olivier vAN HERSTRAETENHead of Legal, Compliance and Tax
The Management Board of Dexia SA
Major changes occurred in the composition of the Management Board and in the mandates exercised by its members within the Group following decisions taken by the Board of Directors on 13 November 2008, in particular to simplify the decision-making process and to reduce the management team from ten to five members.
On 17 December 2010, the Board of Directors of the Dexia Group approved the new composition of the Group’s Management Board proposed by the Appointment and Compensation Committee. After publication on 12 October 2010 of the Dexia 2014 strategic plan, a new management team, extended to ten members, was put in place, in order to provide the essential skills to enable the Dexia Group to achieve the objectives of its new strategic plan.The new composition of the Management Board came into effect as from 1 January 2011.
Composition
As at 31 December 2010, the Management Board has five members and is chaired by the Chief Executive Officer to whom the Board of Directors has entrusted the daily management of Dexia.The members of the Management Board, other than the Chief Executive Officer, are appointed and dismissed by the Board of Directors on the recommendation of the Chief Executive Officer. With the exception of the Chairman, they are appointed for a term of four years which may be renewed unless there is a contrary decision by the Board of Directors.
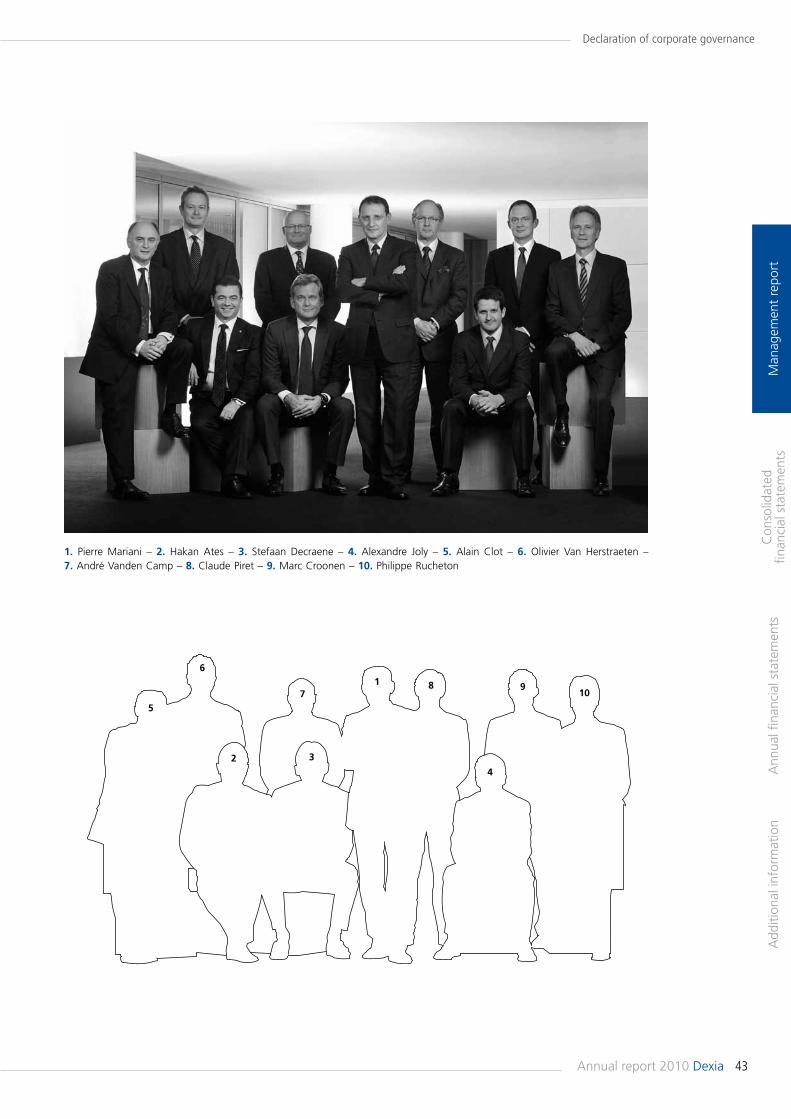
43Annual report 2010 Dexia
Declaration of corporate governance
Man
agem
ent
repo
rtA
dditi
onal
info
rmat
ion
Ann
ual fi
nanc
ial s
tate
men
tsC
onso
lidat
ed
finan
cial
sta
tem
ents
1
5
6
2
7
3
8
4
910
1. Pierre Mariani – 2. Hakan Ates – 3. Stefaan Decraene – 4. Alexandre Joly – 5. Alain Clot – 6. Olivier Van Herstraeten – 7. André Vanden Camp – 8. Claude Piret – 9. Marc Croonen – 10. Philippe Rucheton
44 Dexia Annual report 2010
Declaration of corporate governance
Man
agem
ent
repo
rtA
dditi
onal
info
rmat
ion
Ann
ual fi
nanc
ial s
tate
men
tsC
onso
lidat
ed
finan
cial
sta
tem
ents
the agenda which is set by the Chairman. On the decision of its Chairman, the Management Board may also meet in the form of a Group Executive Committee to deal with transversal subjects of a certain importance.
• Conflicts of interestIf a member of the Management Board directly or indirectly has a conflicting financial interest in a decision or operation to be decided by the Board, he must inform the other members of the Board before they deliberate. His declaration, including the reasons for his conflicting financial interest, must be recorded in the minutes of the Management Board meeting that must make the decision. In addition, the member of the Management Board must inform the company’s auditors. He may not participate in the deliberations of the Management Board in relation to the transactions or decisions concerned, or vote on them.
• Transactions between members of the Management Board and Group companiesTransactions between companies of the Dexia Group and members of the Management Board must be concluded under normal market conditions.
• Transactions on Dexia financial instrumentsIn 2009, the internal rules of the Management Board were amended in order to update the rules relating to the prevention of insider trading in relation to Dexia financial instruments.
Compensation reportCompensation of the directors of Dexia SA for 2010
Review of the principles applied
Dexia SA’s 2006 Ordinary Shareholders’ Meeting decided to pay an annual maximum global compensation amount of EUR 1,300,000 to the directors for their services, effective 1 January 2005.This meeting also authorised the Board to determine the practical procedures of this compensation and its allocation which comprises a fixed amount and fees.At its meeting on 23 May 2002, the Board of Directors decided to grant each director a fixed annual compensation of EUR 20,000 (or fixed amount of EUR 5,000 per quarter), and directors’ fees of EUR 2,000 per Board meeting or specialist committee meeting. Directors who have been in office for less than one full year shall earn a proportion of the fixed fee based on the number of quarters during which they have effectively been in office.For the Dexia transformation plan, the directors decided to temporary reduce the fixed amount of their compensation for 2009. At its meeting on 29 January 2009, the Board of Directors decided to grant each director a fixed annual amount of EUR 10,000 (or an amount of EUR 2,500 instead of EUR 5,000 per quarter). This measure was maintained in 2010.
Responsibilities
The Management Board is entrusted with the management of the company and of the Dexia Group, for which it manages and coordinates the different business lines, in the context of the strategic objectives and the general policy defined by the Board of Directors. In addition, it ensures the execution of the decisions taken by the Board of Directors.
Operation
Since the creation of Dexia SA in 1999, the Management Board has had its own internal regulations (the “Regulations”), amended on several occasions, determining its responsibilities and its modes of operation. The collegial decision-making process, the Board’s powers and certain rules governing the status of members are also subject to specific provisions in the protocol on the prudential structure of the Dexia Group signed with the Belgian Banking, Finance and Insurance Commission.In addition to rules governing the composition of the Management Board (see above), the Regulations include the following rules.
• Rules relating to the responsibilities of the Management Board in its dealings with the Board of DirectorsThe Regulations first define the responsibilities of the Management Board in its dealings with the Board of Directors. The Management Board must formulate a preliminary opinion regarding any proposals debated by the Board of Directors or the Strategy Committee in terms of strategy or general policy of the Group. It may make recommendations to the Board of Directors through the Chief Executive Officer.If the Chief Executive Officer takes part in discussions by the Board of Directors or its specialist committees, for which the Management Board has an acknowledged right of opinion or initiative, the Chief Executive Officer presents to and defends with the Board of Directors the points of view previously debated by the Management Board.
• Rules relating to decision-makingThe Management Board operates in a collegial manner and its decisions result from a consensus of its members. It assumes joint responsibility for such decisions. If applicable, the Chairman of the Management Board may, on his own initiative or on request from two other members, submit the issue under debate to a vote. Resolutions are adopted by a majority vote of all members present or represented. In the event of a tie vote, the Chairman shall cast the deciding vote. In exceptional cases, decisions may be taken by the Management Board in writing with the unanimous consent of its members.
• Rules relating to meetingsManagement Board meetings are convened by its Chairman, in principle once a week. If necessary, meetings can be convened at any time by the Chairman or if two or more members so desire. Any member of the Management Board who is unable to attend may be represented by another member of the Board, but a member may not represent more than one other member. Each member of the Board may propose an item for
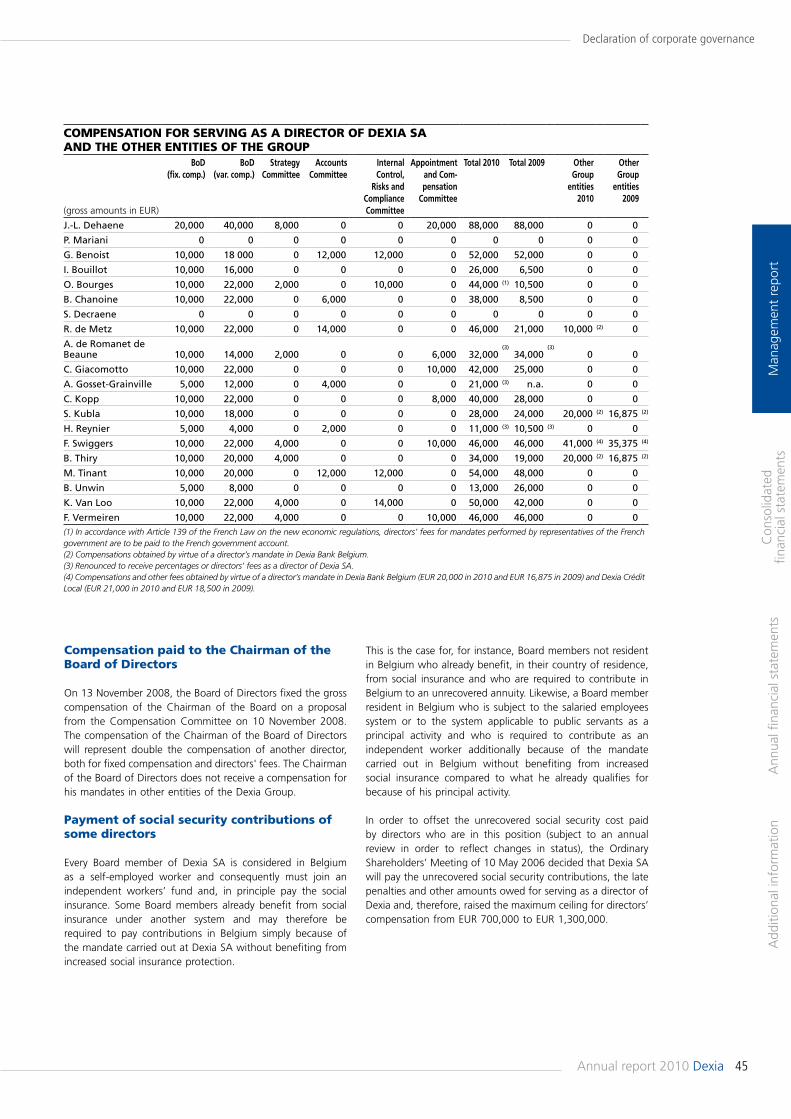
45Annual report 2010 Dexia
Declaration of corporate governance
Man
agem
ent
repo
rtA
dditi
onal
info
rmat
ion
Ann
ual fi
nanc
ial s
tate
men
tsC
onso
lidat
ed
finan
cial
sta
tem
ents
This is the case for, for instance, Board members not resident in Belgium who already benefit, in their country of residence, from social insurance and who are required to contribute in Belgium to an unrecovered annuity. Likewise, a Board member resident in Belgium who is subject to the salaried employees system or to the system applicable to public servants as a principal activity and who is required to contribute as an independent worker additionally because of the mandate carried out in Belgium without benefiting from increased social insurance compared to what he already qualifies for because of his principal activity.
In order to offset the unrecovered social security cost paid by directors who are in this position (subject to an annual review in order to reflect changes in status), the Ordinary Shareholders’ Meeting of 10 May 2006 decided that Dexia SA will pay the unrecovered social security contributions, the late penalties and other amounts owed for serving as a director of Dexia and, therefore, raised the maximum ceiling for directors’ compensation from EUR 700,000 to EUR 1,300,000.
Compensation paid to the Chairman of the Board of Directors
On 13 November 2008, the Board of Directors fixed the gross compensation of the Chairman of the Board on a proposal from the Compensation Committee on 10 November 2008. The compensation of the Chairman of the Board of Directors will represent double the compensation of another director, both for fixed compensation and directors' fees. The Chairman of the Board of Directors does not receive a compensation for his mandates in other entities of the Dexia Group.
Payment of social security contributions of some directors
Every Board member of Dexia SA is considered in Belgium as a self-employed worker and consequently must join an independent workers’ fund and, in principle pay the social insurance. Some Board members already benefit from social insurance under another system and may therefore be required to pay contributions in Belgium simply because of the mandate carried out at Dexia SA without benefiting from increased social insurance protection.
COMPENSATION FOR SERvING AS A DIRECTOR OF DEXIA SA AND THE OTHER ENTITIES OF THE GROUP
(gross amounts in EUR)
BoD (fix. comp.)
BoD (var. comp.)
Strategy Committee
Accounts Committee
Internal Control,
Risks and Compliance Committee
Appointment and Com-pensation
Committee
Total 2010 Total 2009 Other Group
entities 2010
Other Group
entities 2009
J.-L. Dehaene 20,000 40,000 8,000 0 0 20,000 88,000 88,000 0 0
P. Mariani 0 0 0 0 0 0 0 0 0 0
G. Benoist 10,000 18 000 0 12,000 12,000 0 52,000 52,000 0 0
I. Bouillot 10,000 16,000 0 0 0 0 26,000 6,500 0 0
O. Bourges 10,000 22,000 2,000 0 10,000 0 44,000 (1) 10,500 0 0
B. Chanoine 10,000 22,000 0 6,000 0 0 38,000 8,500 0 0
S. Decraene 0 0 0 0 0 0 0 0 0 0
R. de Metz 10,000 22,000 0 14,000 0 0 46,000 21,000 10,000 (2) 0
A. de Romanet de Beaune 10,000 14,000 2,000 0 0 6,000 32,000
(3)
34,000(3)
0 0
C. Giacomotto 10,000 22,000 0 0 0 10,000 42,000 25,000 0 0
A. Gosset-Grainville 5,000 12,000 0 4,000 0 0 21,000 (3) n.a. 0 0
C. Kopp 10,000 22,000 0 0 0 8,000 40,000 28,000 0 0
S. Kubla 10,000 18,000 0 0 0 0 28,000 24,000 20,000 (2) 16,875 (2)
H. Reynier 5,000 4,000 0 2,000 0 0 11,000 (3) 10,500 (3) 0 0
F. Swiggers 10,000 22,000 4,000 0 0 10,000 46,000 46,000 41,000 (4) 35,375 (4)
B. Thiry 10,000 20,000 4,000 0 0 0 34,000 19,000 20,000 (2) 16,875 (2)
M. Tinant 10,000 20,000 0 12,000 12,000 0 54,000 48,000 0 0
B. Unwin 5,000 8,000 0 0 0 0 13,000 26,000 0 0
K. Van Loo 10,000 22,000 4,000 0 14,000 0 50,000 42,000 0 0
F. Vermeiren 10,000 22,000 4,000 0 0 10,000 46,000 46,000 0 0(1) In accordance with Article 139 of the French Law on the new economic regulations, directors’ fees for mandates performed by representatives of the French government are to be paid to the French government account. (2) Compensations obtained by virtue of a director’s mandate in Dexia Bank Belgium.(3) Renounced to receive percentages or directors’ fees as a director of Dexia SA.(4) Compensations and other fees obtained by virtue of a director’s mandate in Dexia Bank Belgium (EUR 20,000 in 2010 and EUR 16,875 in 2009) and Dexia Crédit Local (EUR 21,000 in 2010 and EUR 18,500 in 2009).
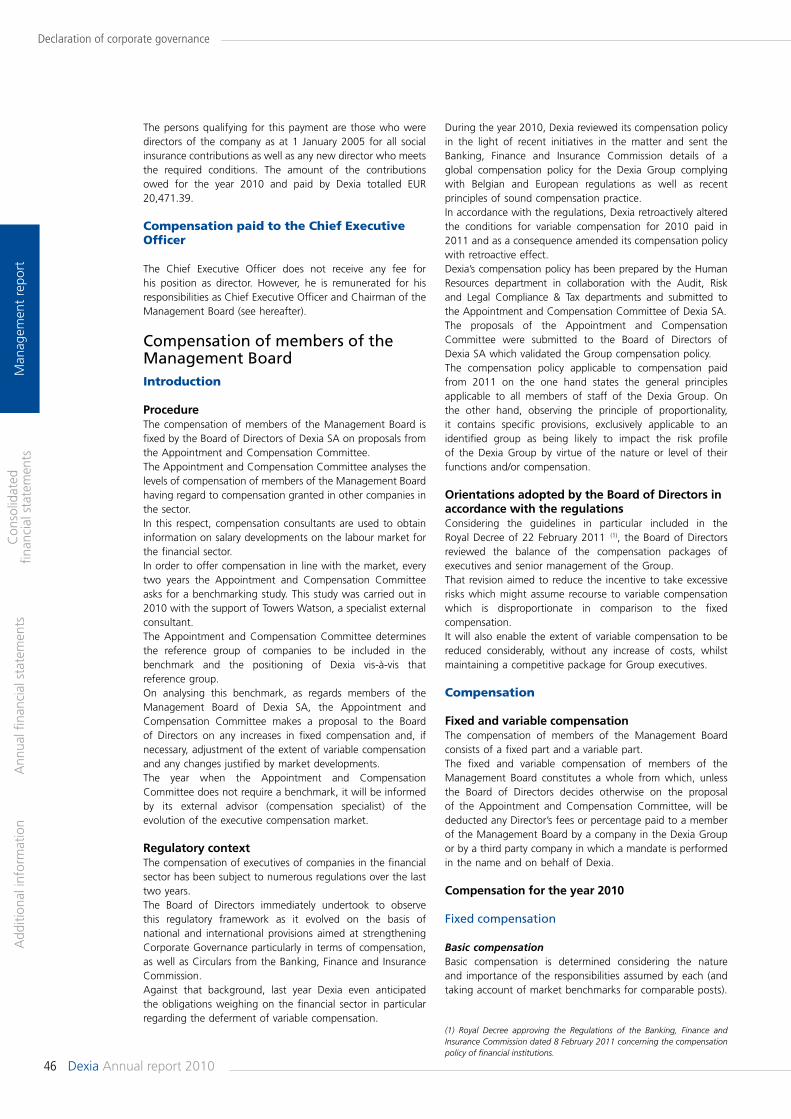
46 Dexia Annual report 2010
Declaration of corporate governance
Man
agem
ent
repo
rtA
dditi
onal
info
rmat
ion
Ann
ual fi
nanc
ial s
tate
men
tsC
onso
lidat
ed
finan
cial
sta
tem
ents
The persons qualifying for this payment are those who were directors of the company as at 1 January 2005 for all social insurance contributions as well as any new director who meets the required conditions. The amount of the contributions owed for the year 2010 and paid by Dexia totalled EUR 20,471.39.
Compensation paid to the Chief Executive Officer
The Chief Executive Officer does not receive any fee for his position as director. However, he is remunerated for his responsibilities as Chief Executive Officer and Chairman of the Management Board (see hereafter).
Compensation of members of the Management Board Introduction
ProcedureThe compensation of members of the Management Board is fixed by the Board of Directors of Dexia SA on proposals from the Appointment and Compensation Committee. The Appointment and Compensation Committee analyses the levels of compensation of members of the Management Board having regard to compensation granted in other companies in the sector.In this respect, compensation consultants are used to obtain information on salary developments on the labour market for the financial sector. In order to offer compensation in line with the market, every two years the Appointment and Compensation Committee asks for a benchmarking study. This study was carried out in 2010 with the support of Towers Watson, a specialist external consultant. The Appointment and Compensation Committee determines the reference group of companies to be included in the benchmark and the positioning of Dexia vis-à-vis that reference group.On analysing this benchmark, as regards members of the Management Board of Dexia SA, the Appointment and Compensation Committee makes a proposal to the Board of Directors on any increases in fixed compensation and, if necessary, adjustment of the extent of variable compensation and any changes justified by market developments.The year when the Appointment and Compensation Committee does not require a benchmark, it will be informed by its external advisor (compensation specialist) of the evolution of the executive compensation market.
Regulatory contextThe compensation of executives of companies in the financial sector has been subject to numerous regulations over the last two years.The Board of Directors immediately undertook to observe this regulatory framework as it evolved on the basis of national and international provisions aimed at strengthening Corporate Governance particularly in terms of compensation, as well as Circulars from the Banking, Finance and Insurance Commission. Against that background, last year Dexia even anticipated the obligations weighing on the financial sector in particular regarding the deferment of variable compensation.
During the year 2010, Dexia reviewed its compensation policy in the light of recent initiatives in the matter and sent the Banking, Finance and Insurance Commission details of a global compensation policy for the Dexia Group complying with Belgian and European regulations as well as recent principles of sound compensation practice. In accordance with the regulations, Dexia retroactively altered the conditions for variable compensation for 2010 paid in 2011 and as a consequence amended its compensation policy with retroactive effect.Dexia’s compensation policy has been prepared by the Human Resources department in collaboration with the Audit, Risk and Legal Compliance & Tax departments and submitted to the Appointment and Compensation Committee of Dexia SA.The proposals of the Appointment and Compensation Committee were submitted to the Board of Directors of Dexia SA which validated the Group compensation policy.The compensation policy applicable to compensation paid from 2011 on the one hand states the general principles applicable to all members of staff of the Dexia Group. On the other hand, observing the principle of proportionality, it contains specific provisions, exclusively applicable to an identified group as being likely to impact the risk profile of the Dexia Group by virtue of the nature or level of their functions and/or compensation.
Orientations adopted by the Board of Directors in accordance with the regulationsConsidering the guidelines in particular included in the Royal Decree of 22 February 2011 (1), the Board of Directors reviewed the balance of the compensation packages of executives and senior management of the Group.That revision aimed to reduce the incentive to take excessive risks which might assume recourse to variable compensation which is disproportionate in comparison to the fixed compensation.It will also enable the extent of variable compensation to be reduced considerably, without any increase of costs, whilst maintaining a competitive package for Group executives.
Compensation
Fixed and variable compensation The compensation of members of the Management Board consists of a fixed part and a variable part.The fixed and variable compensation of members of the Management Board constitutes a whole from which, unless the Board of Directors decides otherwise on the proposal of the Appointment and Compensation Committee, will be deducted any Director’s fees or percentage paid to a member of the Management Board by a company in the Dexia Group or by a third party company in which a mandate is performed in the name and on behalf of Dexia.
Compensation for the year 2010
Fixed compensation
Basic compensation Basic compensation is determined considering the nature and importance of the responsibilities assumed by each (and taking account of market benchmarks for comparable posts).
(1) Royal Decree approving the Regulations of the Banking, Finance and Insurance Commission dated 8 February 2011 concerning the compensation policy of financial institutions.
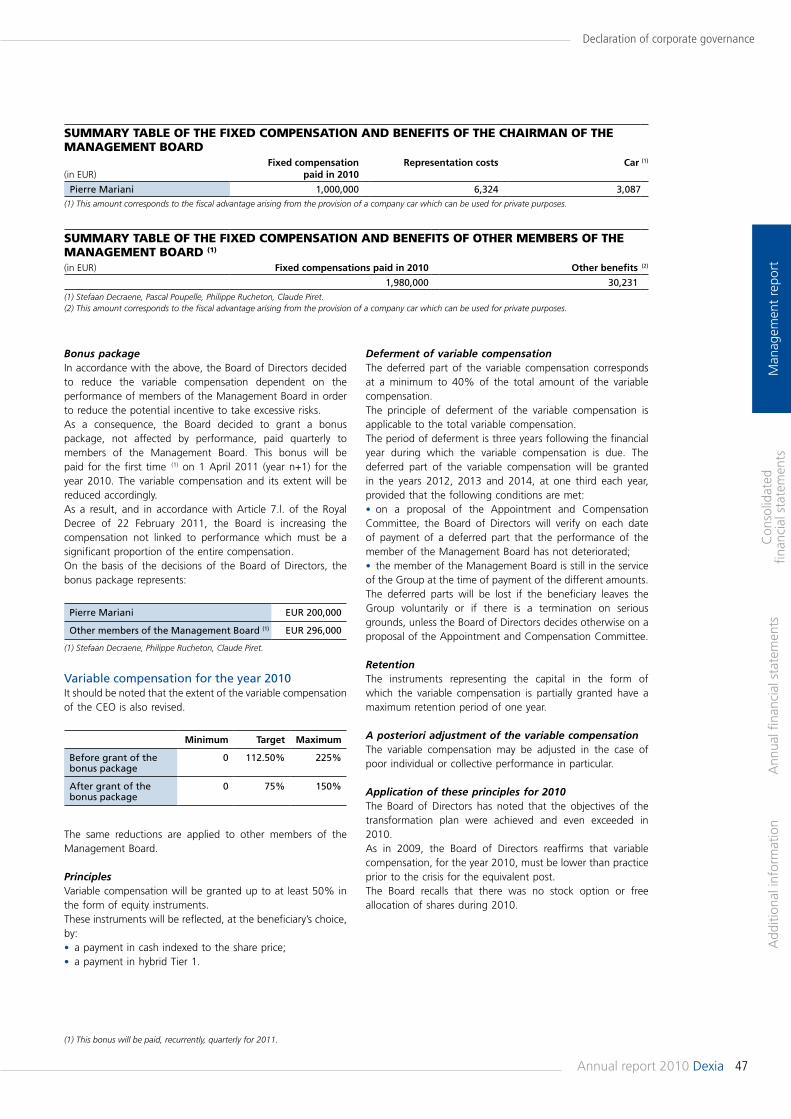
47Annual report 2010 Dexia
Declaration of corporate governance
Man
agem
ent
repo
rtA
dditi
onal
info
rmat
ion
Ann
ual fi
nanc
ial s
tate
men
tsC
onso
lidat
ed
finan
cial
sta
tem
ents
Bonus packageIn accordance with the above, the Board of Directors decided to reduce the variable compensation dependent on the performance of members of the Management Board in order to reduce the potential incentive to take excessive risks. As a consequence, the Board decided to grant a bonus package, not affected by performance, paid quarterly to members of the Management Board. This bonus will be paid for the first time (1) on 1 April 2011 (year n+1) for the year 2010. The variable compensation and its extent will be reduced accordingly. As a result, and in accordance with Article 7.l. of the Royal Decree of 22 February 2011, the Board is increasing the compensation not linked to performance which must be a significant proportion of the entire compensation.On the basis of the decisions of the Board of Directors, the bonus package represents:
Pierre Mariani EUR 200,000
Other members of the Management Board (1) EUR 296,000
(1) Stefaan Decraene, Philippe Rucheton, Claude Piret.
Variable compensation for the year 2010It should be noted that the extent of the variable compensation of the CEO is also revised.
Minimum Target Maximum
Before grant of the bonus package
0 112.50% 225%
After grant of the bonus package
0 75% 150%
The same reductions are applied to other members of the Management Board.
Principles Variable compensation will be granted up to at least 50% in the form of equity instruments. These instruments will be reflected, at the beneficiary’s choice, by: • a payment in cash indexed to the share price; • a payment in hybrid Tier 1.
(1) This bonus will be paid, recurrently, quarterly for 2011.
Deferment of variable compensation The deferred part of the variable compensation corresponds at a minimum to 40% of the total amount of the variable compensation. The principle of deferment of the variable compensation is applicable to the total variable compensation.The period of deferment is three years following the financial year during which the variable compensation is due. The deferred part of the variable compensation will be granted in the years 2012, 2013 and 2014, at one third each year, provided that the following conditions are met:• on a proposal of the Appointment and Compensation Committee, the Board of Directors will verify on each date of payment of a deferred part that the performance of the member of the Management Board has not deteriorated;• the member of the Management Board is still in the service of the Group at the time of payment of the different amounts. The deferred parts will be lost if the beneficiary leaves the Group voluntarily or if there is a termination on serious grounds, unless the Board of Directors decides otherwise on a proposal of the Appointment and Compensation Committee.
RetentionThe instruments representing the capital in the form of which the variable compensation is partially granted have a maximum retention period of one year.
A posteriori adjustment of the variable compensation The variable compensation may be adjusted in the case of poor individual or collective performance in particular.
Application of these principles for 2010The Board of Directors has noted that the objectives of the transformation plan were achieved and even exceeded in 2010.As in 2009, the Board of Directors reaffirms that variable compensation, for the year 2010, must be lower than practice prior to the crisis for the equivalent post.The Board recalls that there was no stock option or free allocation of shares during 2010.
SUMMARY TABLE OF THE FIXED COMPENSATION AND BENEFITS OF THE CHAIRMAN OF THE MANAGEMENT BOARD
(in EUR)Fixed compensation
paid in 2010Representation costs Car (1)
Pierre Mariani 1,000,000 6,324 3,087(1) This amount corresponds to the fiscal advantage arising from the provision of a company car which can be used for private purposes.
SUMMARY TABLE OF THE FIXED COMPENSATION AND BENEFITS OF OTHER MEMBERS OF THE MANAGEMENT BOARD (1)
(in EUR) Fixed compensations paid in 2010 Other benefits (2)
1,980,000 30,231(1) Stefaan Decraene, Pascal Poupelle, Philippe Rucheton, Claude Piret.(2) This amount corresponds to the fiscal advantage arising from the provision of a company car which can be used for private purposes.
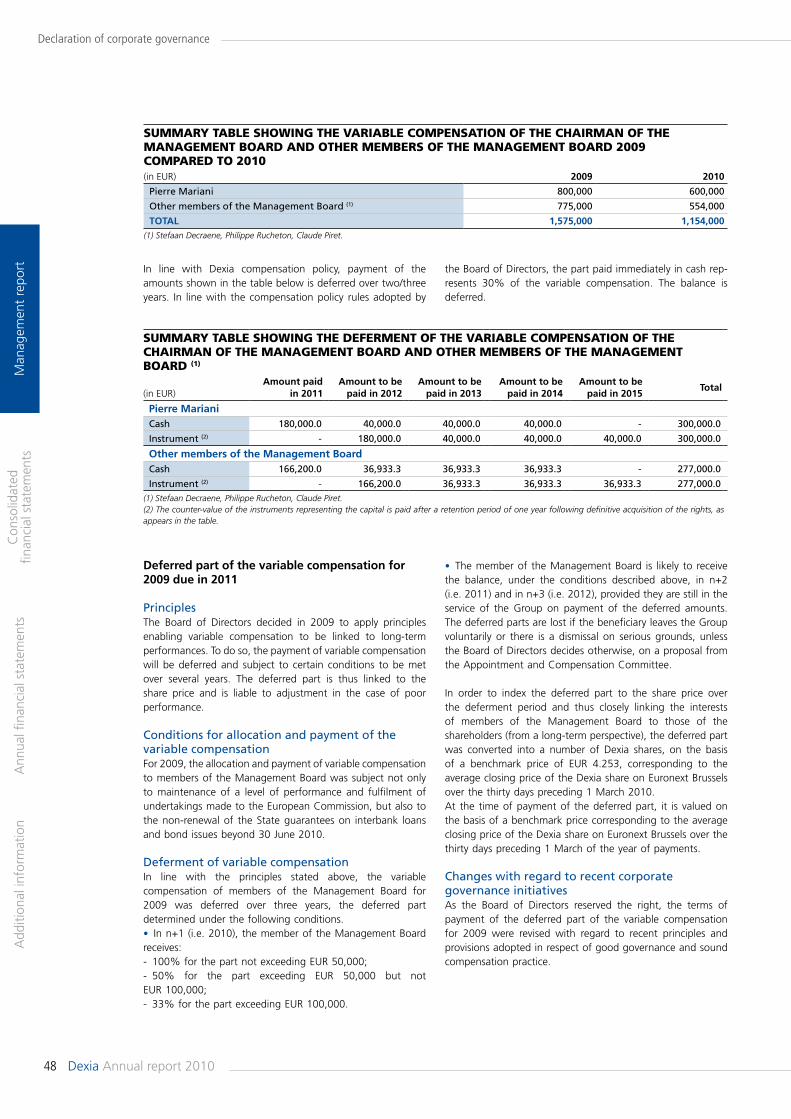
48 Dexia Annual report 2010
Declaration of corporate governance
Man
agem
ent
repo
rtA
dditi
onal
info
rmat
ion
Ann
ual fi
nanc
ial s
tate
men
tsC
onso
lidat
ed
finan
cial
sta
tem
ents
Deferred part of the variable compensation for 2009 due in 2011
PrinciplesThe Board of Directors decided in 2009 to apply principles enabling variable compensation to be linked to long-term performances. To do so, the payment of variable compensation will be deferred and subject to certain conditions to be met over several years. The deferred part is thus linked to the share price and is liable to adjustment in the case of poor performance.
Conditions for allocation and payment of the variable compensationFor 2009, the allocation and payment of variable compensation to members of the Management Board was subject not only to maintenance of a level of performance and fulfilment of undertakings made to the European Commission, but also to the non-renewal of the State guarantees on interbank loans and bond issues beyond 30 June 2010.
Deferment of variable compensationIn line with the principles stated above, the variable compensation of members of the Management Board for 2009 was deferred over three years, the deferred part determined under the following conditions.• In n+1 (i.e. 2010), the member of the Management Board receives:- 100% for the part not exceeding EUR 50,000;- 50% for the part exceeding EUR 50,000 but not EUR 100,000;- 33% for the part exceeding EUR 100,000.
• The member of the Management Board is likely to receive the balance, under the conditions described above, in n+2 (i.e. 2011) and in n+3 (i.e. 2012), provided they are still in the service of the Group on payment of the deferred amounts. The deferred parts are lost if the beneficiary leaves the Group voluntarily or there is a dismissal on serious grounds, unless the Board of Directors decides otherwise, on a proposal from the Appointment and Compensation Committee.
In order to index the deferred part to the share price over the deferment period and thus closely linking the interests of members of the Management Board to those of the shareholders (from a long-term perspective), the deferred part was converted into a number of Dexia shares, on the basis of a benchmark price of EUR 4.253, corresponding to the average closing price of the Dexia share on Euronext Brussels over the thirty days preceding 1 March 2010. At the time of payment of the deferred part, it is valued on the basis of a benchmark price corresponding to the average closing price of the Dexia share on Euronext Brussels over the thirty days preceding 1 March of the year of payments.
Changes with regard to recent corporate governance initiatives As the Board of Directors reserved the right, the terms of payment of the deferred part of the variable compensation for 2009 were revised with regard to recent principles and provisions adopted in respect of good governance and sound compensation practice.
SUMMARY TABLE SHOWING THE vARIABLE COMPENSATION OF THE CHAIRMAN OF THE MANAGEMENT BOARD AND OTHER MEMBERS OF THE MANAGEMENT BOARD 2009 COMPARED TO 2010(in EUR) 2009 2010
Pierre Mariani 800,000 600,000
Other members of the Management Board (1) 775,000 554,000
TOTAL 1,575,000 1,154,000 (1) Stefaan Decraene, Philippe Rucheton, Claude Piret.
SUMMARY TABLE SHOWING THE DEFERMENT OF THE vARIABLE COMPENSATION OF THE CHAIRMAN OF THE MANAGEMENT BOARD AND OTHER MEMBERS OF THE MANAGEMENT BOARD (1)
(in EUR)Amount paid
in 2011Amount to be
paid in 2012Amount to be
paid in 2013Amount to be
paid in 2014Amount to be
paid in 2015Total
Pierre MarianiCash 180,000.0 40,000.0 40,000.0 40,000.0 - 300,000.0
Instrument (2) - 180,000.0 40,000.0 40,000.0 40,000.0 300,000.0
Other members of the Management BoardCash 166,200.0 36,933.3 36,933.3 36,933.3 - 277,000.0
Instrument (2) - 166,200.0 36,933.3 36,933.3 36,933.3 277,000.0(1) Stefaan Decraene, Philippe Rucheton, Claude Piret.(2) The counter-value of the instruments representing the capital is paid after a retention period of one year following definitive acquisition of the rights, as appears in the table.
In line with Dexia compensation policy, payment of the amounts shown in the table below is deferred over two/three years. In line with the compensation policy rules adopted by
the Board of Directors, the part paid immediately in cash rep-resents 30% of the variable compensation. The balance is deferred.
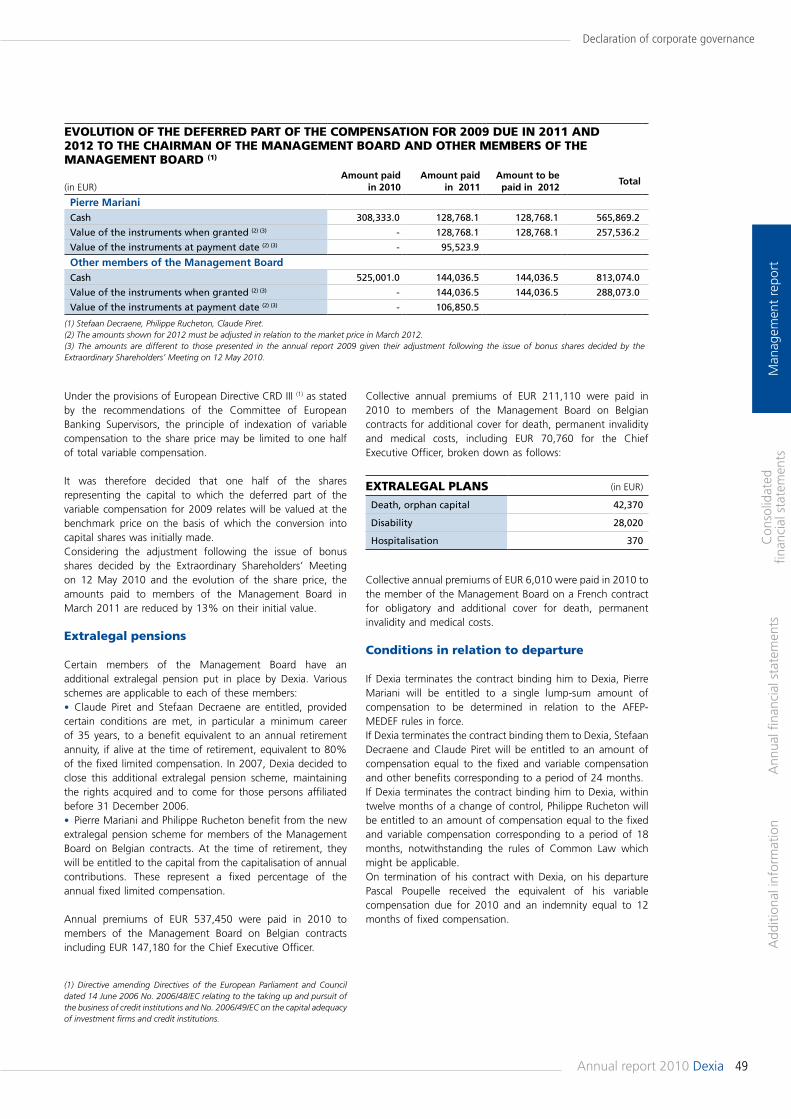
49Annual report 2010 Dexia
Declaration of corporate governance
Man
agem
ent
repo
rtA
dditi
onal
info
rmat
ion
Ann
ual fi
nanc
ial s
tate
men
tsC
onso
lidat
ed
finan
cial
sta
tem
ents
Under the provisions of European Directive CRD III (1) as stated by the recommendations of the Committee of European Banking Supervisors, the principle of indexation of variable compensation to the share price may be limited to one half of total variable compensation.
It was therefore decided that one half of the shares representing the capital to which the deferred part of the variable compensation for 2009 relates will be valued at the benchmark price on the basis of which the conversion into capital shares was initially made. Considering the adjustment following the issue of bonus shares decided by the Extraordinary Shareholders’ Meeting on 12 May 2010 and the evolution of the share price, the amounts paid to members of the Management Board in March 2011 are reduced by 13% on their initial value.
Extralegal pensions
Certain members of the Management Board have an additional extralegal pension put in place by Dexia. Various schemes are applicable to each of these members:• Claude Piret and Stefaan Decraene are entitled, provided certain conditions are met, in particular a minimum career of 35 years, to a benefit equivalent to an annual retirement annuity, if alive at the time of retirement, equivalent to 80% of the fixed limited compensation. In 2007, Dexia decided to close this additional extralegal pension scheme, maintaining the rights acquired and to come for those persons affiliated before 31 December 2006.• Pierre Mariani and Philippe Rucheton benefit from the new extralegal pension scheme for members of the Management Board on Belgian contracts. At the time of retirement, they will be entitled to the capital from the capitalisation of annual contributions. These represent a fixed percentage of the annual fixed limited compensation.
Annual premiums of EUR 537,450 were paid in 2010 to members of the Management Board on Belgian contracts including EUR 147,180 for the Chief Executive Officer.
(1) Directive amending Directives of the European Parliament and Council dated 14 June 2006 No. 2006/48/EC relating to the taking up and pursuit of the business of credit institutions and No. 2006/49/EC on the capital adequacy of investment firms and credit institutions.
EvOLUTION OF THE DEFERRED PART OF THE COMPENSATION FOR 2009 DUE IN 2011 AND 2012 TO THE CHAIRMAN OF THE MANAGEMENT BOARD AND OTHER MEMBERS OF THE MANAGEMENT BOARD (1)
(in EUR)Amount paid
in 2010Amount paid
in 2011Amount to be paid in 2012
Total
Pierre MarianiCash 308,333.0 128,768.1 128,768.1 565,869.2
Value of the instruments when granted (2) (3) - 128,768.1 128,768.1 257,536.2
Value of the instruments at payment date (2) (3) - 95,523.9
Other members of the Management BoardCash 525,001.0 144,036.5 144,036.5 813,074.0
Value of the instruments when granted (2) (3) - 144,036.5 144,036.5 288,073.0
Value of the instruments at payment date (2) (3) - 106,850.5
(1) Stefaan Decraene, Philippe Rucheton, Claude Piret.(2) The amounts shown for 2012 must be adjusted in relation to the market price in March 2012.(3) The amounts are different to those presented in the annual report 2009 given their adjustment following the issue of bonus shares decided by the Extraordinary Shareholders’ Meeting on 12 May 2010.
Collective annual premiums of EUR 211,110 were paid in 2010 to members of the Management Board on Belgian contracts for additional cover for death, permanent invalidity and medical costs, including EUR 70,760 for the Chief Executive Officer, broken down as follows:
EXTRALEGAL PLANS (in EUR) Death, orphan capital 42,370
Disability 28,020
Hospitalisation 370
Collective annual premiums of EUR 6,010 were paid in 2010 to the member of the Management Board on a French contract for obligatory and additional cover for death, permanent invalidity and medical costs.
Conditions in relation to departure
If Dexia terminates the contract binding him to Dexia, Pierre Mariani will be entitled to a single lump-sum amount of compensation to be determined in relation to the AFEP-MEDEF rules in force.If Dexia terminates the contract binding them to Dexia, Stefaan Decraene and Claude Piret will be entitled to an amount of compensation equal to the fixed and variable compensation and other benefits corresponding to a period of 24 months.If Dexia terminates the contract binding him to Dexia, within twelve months of a change of control, Philippe Rucheton will be entitled to an amount of compensation equal to the fixed and variable compensation corresponding to a period of 18 months, notwithstanding the rules of Common Law which might be applicable.On termination of his contract with Dexia, on his departure Pascal Poupelle received the equivalent of his variable compensation due for 2010 and an indemnity equal to 12 months of fixed compensation.

50 Dexia Annual report 2010
Declaration of corporate governance
Man
agem
ent
repo
rtA
dditi
onal
info
rmat
ion
Ann
ual fi
nanc
ial s
tate
men
tsC
onso
lidat
ed
finan
cial
sta
tem
ents
particular regarding corporate governance, compliance and sustainable development. The internal control system aims to ensure observance of those principles.
4. Improving the Group’s operation whilst ensuring the efficient management of available means It must be possible to put the decisions taken to that end by the Management Board into practice rapidly throughout the Group. The internal control procedures aim to ensure the integrity of information flows, the compliance of the actions introduced and the monitoring of results.
5. Ensuring the operational effectiveness and efficiency of all the business linesThe proper functioning of operational circuits is a constant concern at all decision-making levels. Many initiatives are taken in this regard in constant collaboration between the Business and Support functions which also measure them via indicators and regular reporting. The internal control system assesses the effectiveness of the operational processes and monitoring mechanisms.
General architecture of the mechanism
The general architecture of the mechanism relies on the basic principles declined in all activity lines and all support processes.
The Dexia Group internal control system relies on activities integrated in all operational, support and accounting processes, the surveillance of which is a constant responsibility of management with successive levels of control.
Within the context of a project common to the so-called control support lines (risk, compliance, audit), Dexia has progressively completed risk and control guidelines.
The latter revolves around five points: control environment, risk analysis, control activities, information and communication and finally monitoring. In terms of control environment, a clear separation of functions has been conceived to maintain and to ensure a clear distinction between operators undertaking an action or a transaction and those responsible for their validation, their monitoring and their completion. In addition, a series of consistent and clear instructions, consisting of charters, codes, lines of conduct and procedures has been put in place in order, inter alia, to ensure that all the internal control operators can be coordinated.
In that logic, the general architecture of the Dexia Group internal control system is based on an organisation split into three levels:
1. The first control level is performed by each member of staff and their superior, in relation to the responsibilities expressly delegated to them, procedures applicable to their activity and instructions given.
2. The second control level is for specialist functions, irrespective of their activities and reporting directly to the Management Board. This second level may also be the responsibility of specialist committees, composed of members
Internal control and risk management systemPrincipal characteristics of the internal control and risk management system
Framework and tasks of internal control
In March 2001, Dexia SA, a financial company under Belgian law, concluded a protocol on the prudential structure with the Banking, Finance and Insurance Commission.
Within that context, Dexia SA voluntarily complies with operating standards equivalent to those applicable to Belgian credit institutions which are parent companies. That condition includes on the one hand the introduction within Dexia SA of an appropriate collegial management structure and on the other hand, in addition to the legal provisions arising from the status of financial company, Dexia SA is subject to certain prudential framework provisions inspired by those legally applicable to credit institutions under Belgian law, including in particular the Law of 22 March 1993 relating to the status and control of credit institutions and the Banking, Finance and Insurance Commission Circular of 30 June 1997 on internal control and internal audit.
Internal control is a process providing a reasonable assurance that the objectives of the organisation, the effectiveness and efficiency of operations, the reliability of financial information and compliance with the laws and regulations will be achieved at the desired level. Like any control system, it is designed to reduce residual risk to a level accepted by the requirements of Dexia.
More specifically, the tasks assigned to internal control in force within the Dexia Group can be grouped in five principal lines:
1. Checking the effectiveness of the risk management mechanism Risk management is at the core of banking activity. The Dexia Group has introduced an internal control mechanism with the objective, in relation to the main activities of the Group, to guarantee that the risks taken are appropriate for the accepted level.
2. Ensuring the reliability and pertinence of accounting and financial information The principal objective of financial information is to give a true picture of the situation of the Dexia Group on a regular, complete and transparent basis. The internal control system is focussed on achieving that objective.
3. Ensuring observance of the regulations as well as the rules of professional ethics and compliance, both internally and externally The good operation of the Dexia Group involves strict fulfilment of legislative and regulatory obligations in each of the countries where it has establishments, as well as the standards it has fixed for itself, beyond those obligations, in
51Annual report 2010 Dexia
Declaration of corporate governance
Man
agem
ent
repo
rtA
dditi
onal
info
rmat
ion
Ann
ual fi
nanc
ial s
tate
men
tsC
onso
lidat
ed
finan
cial
sta
tem
ents
• The Permanent Control, in place within the Dexia Group since the last quarter 2009 under the responsibility of the Chief Compliance Officer, guides and monitors the gathering of information on the permanent control plans for the Dexia Group. That guidance relies on decentralised means within the divisions, as well as within the subsidiaries and branches. On 1 March 2011, the Permanent Control team was transferred under the responsibility of the Head of Operational Management, another important internal control actor.
• The Internal Audit, reporting directly to the Chief Executive Officer, Chairman of the Management Board, defines the methodology used in the Group, defines the Group audit plan, coordinates, runs and performs audit tasks, and monitors action plans associated with recommendations.
In its internal control surveillance task, the Board of Directors of Dexia SA has relied since November 2008 on an Audit Committee itself divided into an Internal Control, Risks and Compliance Committee composed of four directors, all non-executive of whom two are independent directors, and an Accounts Committee composed of five directors, all non-executive of whom three are independent directors. Two of the five members of the Accounts Committee are also members of the Internal Control, Risks and Compliance Committee. The Chairman of the Board of Directors may attend this Committee, and also the Chief Executive Officer.
The Accounts Committee and the Internal Control, Risks and Compliance Committee each meet at least four times per annum. Two of those meetings are held before the meetings of the Boards of Directors examining the annual or half-yearly accounts. They can also meet on the request of their members, or the Chairman of the Board of Directors.
The two sub-committees meet at least once per annum, in the extended form of the Audit Committee, before the annual financial statements are approved, in order to deal with joint matters relating to Group risk and provisioning policies and their impacts on the accounts or any other topical subject. That meeting is chaired jointly by the Chairman of the Accounts Committee and the Chairman of the Internal Control, Risks and Compliance Committee.
In order to achieve optimum performance of their tasks, the members of that committee may benefit, on their request and at the company’s cost, from specific training taking account of Group features and in particular its internal control.
The competences and the mode of operation of the Audit Committee (and its two sub-committees) are described in their internal rules.
of staff in operational, support and audit posts, chaired by a member of the Management Board. The fields concerned are for instance compliance, permanent control (the function monitoring audits) and risk management.
3. The third control level is for the Dexia Group audit support line which has the task, through periodic audits to supervise the performance and the effective application of the two audit levels defined above, in the parent company and all its subsidiaries and branches.
For risk analysis and audit activities, each level/department/function performs its own risk diagnosis and puts checks in place as it deems fit. Audit mechanisms are implemented at the level of the activities of each business line process and at the level of the support functions including IT. As a component of Dexia management, activity monitoring is organised at each level and additionally revolves around the operational entities of Dexia SA. Internal and external information and communication are priorities. In addition to the internal communication mechanism of e-mail, intranet and within specialist departments, there are procedures in this regard. The organisation of the Dexia Group also generates transversal communication to all operational entities. There is differing reporting such as the Activity Report established by Strategic Planning and Controlling and the Quarterly Risk Report drawn up by Risk Management. External communication and Financial Communication aim for the transparency and pertinence of information transmitted outside Dexia.
The main internal control actors
In order to ensure the proper functioning and the development of the Dexia Group, its Management Board is responsible in the last resort for the introduction and maintenance of an appropriate internal audit system. It defines and coordinates the management policy of the Dexia Group within the context of the strategy defined by the Board of Directors. It allocates the means and sets the deadlines for the implementation of actions decided within the framework of that policy. It checks that the given objectives are achieved and that the internal audit system is appropriate for all requirements. Finally, it adjusts those requirements in relation to internal and external developments observed.
The teams more specifically concerned by the internal audit are as follows:• The Risk Management team, under the responsibility of the Chief Risk Officer, a member of the Management Board, under his direction supervises risk management policy. It establishes lines of conduct for limits and delegations, controls and measures risks aggregated at Group level and puts harmonised methods in place in the different entities (cf. chapter “Risk management” pages 77-94).
• The Chief Compliance Officer reporting to the member of the Executive Committee in charge of Legal, Compliance and Tax from November 2008, guides the support line of compliance officers in the different entities and ensures observance of the integrity policy and the development of a culture of professional ethics.
52 Dexia Annual report 2010
Declaration of corporate governance
Man
agem
ent
repo
rtA
dditi
onal
info
rmat
ion
Ann
ual fi
nanc
ial s
tate
men
tsC
onso
lidat
ed
finan
cial
sta
tem
ents
• Access to information: in performing its task, internal audit has access to all information, documents, premises, systems or persons of the entity for which it is responsible, including information regarding management, minutes and files from consultative and decision-making bodies. Within that context, audit management has access to all information in all Group entities.• Confidentiality: each auditor is bound by a strict duty of reservation and discretion. In particular it must ensure fulfilment of the obligations of professional secrecy arising from the regulations.• Competence: each auditor must demonstrate the greatest professionalism and have constant training to ensure mastery of the rapid developments of audit techniques, banking, financial and IT techniques and fraud techniques. Training requirements are assessed at annual appraisals.• Common methodology: auditors use the same methodology and document their work in an identical manner in order to ensure consistent quality of interventions and the traceability of investigations by internal audit in the Group and to foster a consolidated perception of risks and their control.
Internal audit receives the means necessary to perform its tasks from the Management Boards of the Dexia Group so that it can respond constantly to the evolution of structures and the environment of the Group.
Scope of interventionAll activities, processes, systems and entities of the Dexia Group are within the scope of action of internal audit, without reservation or exception. The scope of intervention includes all processes, whether operational, support, management, corporate governance and risk management and control processes.In principle it does not cover the activities of companies in which the Dexia Group only has a minority holding, apart from exceptions associated in particular with requests from the supervisory authorities.
Organisation of the functionThe first half-year 2010 was marked by the continuation of the transformation plan and by the effective introduction of the changes provided by the audit transformation plan, particularly in terms of organisation of the support line and the evolution of methodology.
1. PrinciplesThe Dexia Group internal audit support line operates in accordance with a directive model by which all the General Auditors of the entities run directly by Dexia SA report directly to the General Auditor of Dexia SA, and this has an impact principally on the fixing of objectives and the assessment of the General Auditors of the entities reporting to the Dexia SA General Auditor. Within this context, the heads of internal audit in the branches report hierarchically to the General Auditor of their parent company and the heads of internal audit in the support lines of the parent companies report to them operationally.
Internal Audit
Organisation and governance
Internal audit taskInternal Audit is an independent and objective activity which has the task of giving the Dexia Group an assurance on the degree of risk control.
To that end, internal audit grasps all the objectives of the organisation, analyses the risks associated with those objectives and periodically assesses the robustness of the controls put in place to manage those risks. Internal audit then submits an assessment of the residual risks to management so that the latter can validate their adequacy to the global risk profile desired by the Dexia Group and for Dexia SA, and if necessary puts forward actions to management to increase the effectiveness of controls.Moreover, via audit committees, internal audit supports the Group Boards of Directors in their surveillance role.
In accordance with international standards, a joint audit charter sets out the fundamental principles governing the internal audit function in the Dexia Group, describing its objectives, its role, its responsibilities and its modes of operation. Following the transformation of the Dexia Group, the audit charter was adapted so as to reflect the changes arising within the internal audit support line. The new charter was presented to and approved by the Management Board on 27 July 2010 and by the Audit Committee of Dexia SA on 4 August 2010. So that each member of staff of the Dexia Group can grasp the importance of the function in the internal control mechanisms and aids to the management of the Dexia Group, the audit charter will be published on the Dexia internet site (wwww.dexia.com) as well as on the Dexia SA intranet site during the first half-year 2011.
Guiding principlesThe strategy, the level of requirement and the rules of operation of internal audit in the Dexia Group are fixed by the Management Board of Dexia SA, within the framework approved by the Board of Directors of Dexia SA, via its Audit Committee. That framework takes account of the requirements, legislation and local regulations and instructions from the prudential control authorities.In line with professional and ethical standards, the following general principles underlie the performance of the tasks of the internal audit support line and are compulsory for all auditors:• Objectivity: the objectivity of audits is guaranteed by several elements: the allocation of auditors, the objectification of audit conclusions via a documented methodical approach, the supervision of tasks and taking account of the point of view of the party audited through a process in which both sides take part.• Independence: independence is ensured by aligning each audit department to the highest hierarchical level of the entity for which it is responsible. • Impartiality: internal audit is not involved in the operational organisation of Group entities. Group Management Boards may however call on them for an opinion, advice or assistance. This type of intervention by internal audit must remain exceptional, particularly with regard to the elaboration and introduction of internal control procedures.
53Annual report 2010 Dexia
Declaration of corporate governance
Man
agem
ent
repo
rtA
dditi
onal
info
rmat
ion
Ann
ual fi
nanc
ial s
tate
men
tsC
onso
lidat
ed
finan
cial
sta
tem
ents
Auditor of Dexia Bank Belgium and the post of head of audit for the Private Banking segment with that of General Auditor of Dexia Banque Internationale à Luxembourg. • The human means of the audit support line were regrouped in shared service centres (IT, Belgium, France, Luxembourg, Turkey), the scope of action of which is not limited to the borders of their respective countries. • A single audit plan was introduced for the Group and the monitoring of audits is ensured by segment in a transversal manner for the entire Group.As the internal audit support line is integrated, the management and guidance of that support line relies on two structures, the Audit Management Committee (AMC) and the Internal Audit Executive Committee (IAEC), as well as on a “support” team.
Composed of the General Auditor of Dexia SA, who chairs it, and the General Auditors of the main entities (Dexia Bank Belgium, Dexia Crédit Local and Dexia Banque Internationale à Luxembourg), the General Auditor of DenizBank and the head of audit in charge of IT systems and other support functions, the AMC manages audit strategy and its financial and human means. For its part, the IAEC is composed of the members of the AMC, plus segment heads of audit as well as the head of Audit Process Management and Organisation (APMO) who chairs it. This committee defines the audit universe and updates it regularly, validates the risk map prepared by each of the segment heads, defines the Group’s global audit plan, ensures the optimum planning of audit tasks, proposes necessary developments in terms of means of the support line, methodology and tools, defines audit team training policy, analyses results from monitoring the performance of the support line and validates internal and external reporting.
The Audit Process Management and Organisation (APMO) unit has the role of supporting the audit support line. It thus has the objectives of defining and updating methodology and the audit process, elaborating and/or coordinating the different activity reports produced by the support line (internally and externally), implementing and maintaining the tools necessary for the proper functioning of the audit support line, coordinating the work with operational risk and compliance teams, producing performance indicators for the realisation of tasks and organising the auditor training plan as well as quality reviews in order to ensure correct application of the audit method and processes. The APMO unit organises and also participates in the Audit Committee and, in an effort to strengthen control of subsidiaries and branches, monitors the surveillance bodies of the entities and their subsidiaries/branches as well as the tasks performed by the local regulators. Finally, the APMO unit is responsible for management of the audit plan, which means that it plans all the tasks under the audit plan as well as any tasks outside the plan.
Audit workThe work of internal audit rests on tried and tested methods translated directly from international good audit practices. Both the audit tasks and risk analysis through all the entities of Dexia rely on common methodologies. These are regularly adapted to reflect both the evolution of standards and returns of experience on the ground and the evolutions of structures.
2. Organisation of an audit functionWhen Dexia SA controls a subsidiary or, if there is no such audit, when the prudential control authorities expressly ask for one, an audit function is established in that subsidiary. If the creation of an audit function is not considered pertinent, Dexia SA assumes the function of local audit and if necessary a service level agreement is concluded between Dexia SA and the subsidiary concerned.
3. Role of Dexia SA audit departmentDexia SA audit department is charged with ensuring the adequacy of the organisation of internal audit put in place throughout the Dexia Group and the quality of its operation. Dexia SA audit department is responsible for:• audit strategy and its appropriate implementation in all audit departments within the Dexia Group;• definition and application of a common risk analysis methodology;• definition and application of a common audit methodology;• definition and application of a common recommendation follow-up methodology;• optimum allocation of competences within the function;• determination of the level of training required of auditors throughout the Group;• coordination and assessment of training programmes; • circulation of necessary information within the function;• implementation of quality control;• management of central projects and the provision of audit tools;• attribution and monitoring of the operating budget of each local audit department.
4. GovernanceThe organisational structure of internal audit is aligned to the organisation of the Dexia Group by business lines and support functions. Each “segment” thus defined is run by a Group Head of Audit who is responsible, in liaison with the operational directors concerned, for the identification and surveillance of risks relating to the segment with which he is entrusted, as well as supervision of all the audit tasks in relation to that segment.The segments are as follows:• Public and Wholesale Banking • Retail and Commercial Banking, Asset Management and Investor Services• Private Banking• Market activities, Balance Sheet Management, Risk et Finance• Operations, IT and other support functionsThis organisation, by transversal segment, is superimposed on the organisation by entity, so as to maintain a global view of risks. The General Auditor of Dexia SA sees to the adequate cover of risks over the entire scope of the Dexia Group: head office, subsidiaries and branches. It also plays an interface role with the management of Dexia SA and the Regulator. Compared to 2009, final implementation of the transformation plan within the audit support line resulted in the following changes:• The post of head of audit for the Public and Wholesale Banking segment was combined with that of General Auditor of Dexia Crédit Local, the post of head of audit for the Retail and Commercial Banking segment with that of General
54 Dexia Annual report 2010
Declaration of corporate governance
Man
agem
ent
repo
rtA
dditi
onal
info
rmat
ion
Ann
ual fi
nanc
ial s
tate
men
tsC
onso
lidat
ed
finan
cial
sta
tem
ents
• transversal tasks which are performed on the same sphere of activity in several entities at the same time and relate principally to one of the processes with a relatively high degree of integration;• joint tasks which are performed jointly within an entity by local audit teams (if available), with the participation of one or more auditors from a shared service centre;• local tasks which only relate to a single entity.
2. Method of performing audit tasks The method of performing audit tasks is common to all entities of the Dexia Group. The different phases of the process are presented in a procedure which describes the different phases to be followed in performing an internal audit task (preparation, realisation, audit report, recommendation monitoring...) as well as the formats of documents expected at each phase. The procedure also determines the roles and responsibilities and modes of review and approval and the archiving of documents.The Dexia audit methodology revolves around four principal phases.• The preparation phase: after studying the activity sector to be audited, when the aim is to gather and to analyse available information which might prove useful in properly understanding the activity, the audit team prepares a work programme which in particular includes the processes, risks, controls expected to cover the identified risks and tests to be performed in order to give an opinion on the concept and effectiveness of the controls in place to cover identified risks. A task letter informs those concerned as well as the members of the management boards of the entities involved of the scope, objectives and programme for the task• The realisation phase: each task must be performed on the basis of working documents established on a determined basis and organised in audit files. They clearly reflect the work carried out and the techniques and methods of work used to reach a substantiated conclusion. The audit opinion is expressed on the capacity of the controls to provide appropriate cover of identified risks. A causal analysis is performed of weaknesses revealed and residual risk is assessed.• The conclusion phase: each task is subject to a written report, established in the presence of all concerned, intended for the parties audited as well as management. The report contains an assessment of the ability of the internal control system to cover risks (positive and negative points), but also recommendations on measures enabling the risk level to be improved. Then action plans are established by the parties audited and discussed with audit. Each action plan is defined by an operational member of staff who assumes responsibility for it and the date completion. The audit attributes a critical level to each of the recommendations made. Finally, each audited process is given a rating expressing the degree of risk control. Throughout the task, a constant and constructive dialogue is established with the audited parties and management. Each report is then presented to the Management Board which rules on the recommendations, action plans and their completion.• Recommendation monitoring: each task results in recommendations being made from the action plans defined by the audited parties with an undertaking on their part as to the date of completion. The aim of these is to remedy any weaknesses revealed by the audit tasks, in order to consolidate the internal control system. The implementation of each action
Indeed, in 2010, the risk methodology and establishment of the audit plan, which were reviewed in 2009, were subject to improvements and simplifications (particularly for the subsidiaries), as well as the computerisation of the principal stages.The methodology first of all identifies the objectives of the business lines and the support processes in order then to quantify the impact of major risks which might adversely affect the achievement of those objectives. Then the audit tasks are targeted on the more critical subjects in terms of impact and probability of occurrence. The methods used structure the audit activity as a support to corporate governance in terms of risk control.The global risk universe approach, the common audit methodology, the performance of “transversal” tasks if necessary, if not local and jointly depending on needs, and the terms of accounting and monitoring at the level of the Group parent structure contribute to assessing whether the Dexia internal audit system is integrated and efficient and, if necessary, to asking for improvements.
1. Process of risk analysis and planning audit tasks and resourcesInternal audit at Dexia SA exercises its function on the basis of a single audit plan for the Group defined by the IAEC, approved by the Management Board and then by the Audit Committee and/or the Board of Directors. This plan is constructed from an annual risk analysis performed independently by audit in compliance with best practices presented by the Institute of Internal Audit. The principal stages leading audit to elaborate its audit plan are as follows:• identification of potential critical risks which might be contrary to the outcome of business line objectives by business line and support process;• evaluation of the degree of vulnerability of Dexia SA in relation to those critical risks, via a measure of the impact and probability of occurrence. The results of that evaluation enable more significant risks to be identified;• identification of audit units and audit universes which are either at the origin of risks or responsible for anticipating them, leading to a risk score per audit unit, a score from which a frequency of audit review is deducted;• listing of tasks performed in the past (the last three years) on audit units (back testing);• selection of tasks on risky audit units taking account of tasks performed in the past and possible regulatory requirements in terms of frequency. With a desire for efficiency, the audit plan is targeted on the more risky audit units, namely those which, through all business lines and all support processes, carry the greatest number of risks and/or key controls for the achievement of objectives. The audit units which do not carry major risks are subjected to a simplified approach, responding to regulatory requirements to cover the audit universe. This perennial plan enables any resources requirement to be determined both from a quantitative and a qualitative point of view as well as training needs.The audit plan draws a distinction between several types of audit tasks:
55Annual report 2010 Dexia
Declaration of corporate governance
Man
agem
ent
repo
rtA
dditi
onal
info
rmat
ion
Ann
ual fi
nanc
ial s
tate
men
tsC
onso
lidat
ed
finan
cial
sta
tem
ents
• Introduction of a more robust tool for reporting on the state of progress made on action plans associated with recommendations, a tool which will be provided both to auditors and to the parties audited. This tool will permit the sharing of reporting between the internal audit support line and the operational support lines. It should be in operation at the end of 2011.• Recasting of the intranet site for the internal audit support line with more detailed access management rules. First of all, the site will enable the audit support line to obtain all necessary information on the audit methodology and also to gather in one single place all the audit reports and key documents for each of the phases of an audit task. Secondly, it will enable the flows of each audit task to be automated and therefore performance indicators to be automatically calculated on the good operation of the support line.• A self-assessment of internal audit in line with the Quality Assurance Review standards of the Institute of Internal Auditors, with the aim of preparing for external validation by an independent body. This process is recommended by international standards.
Activities in 2010
A major part of the Dexia Group audit plan was implemented in the form of “transversal tasks”, namely tasks performed simultaneously in Dexia SA and in the Group’s main operational entities: Dexia Crédit Local, Dexia Bank Belgium, Dexia Banque Internationale à Luxembourg and DenizBank as well as certain of their subsidiaries/branches, in relation to the subjects dealt with. In 2010, those tasks related in particular to risk management, the Finance, Balance Sheet Management, Operations and IT support lines as well as market activities. The other support functions were also the object of regular tasks.The audit tasks performed in 2010 gave rise to the establishment of plans to remedy weaknesses detected in the internal control system. Each action plan was approved by the Management Board of the entity concerned and, depending on its importance, reported to the Management Board of Dexia SA, and subject to regular monitoring, to ensure that the recommendations formulated are effectively implemented.In terms of implementation of the audit plan (number of tasks) over the year 2010, the performance rate of local and joint tasks is considered good, and slightly up on the rate for transversal tasks.The year 2010 was marked by a strengthening of the monitoring of contacts with the Regulators. In fact, contacts with the different Regulators of the Dexia Group, whether through inspection tasks or meetings, tended to be intensified, and this mobilised an increasing amount of the time of internal audit staff in 2010. When the Regulator performs a task within the Dexia Group, the role of audit consists of monitoring its progress ensuring that the elements requested are properly transmitted to the Inspectors, at the end of the task, coordinating the formulation of action plans responding to the recommendations by the Regulators (applying the principle of strengthening the role of audit in these matters), then to likewise monitoring the response to its own recommendations.
plan is regularly monitored by audit on the basis of a declared progress statement and supporting documents provided by the parties audited. Internal audit keeps a database of all recommendations arising from audit reports and has defined a consistent procedure for monitoring the implementation of those recommendations.
3. MonitoringTwice a year, the General Auditor of Dexia SA presents the Audit Committee and/or the Board of Directors with a report on the activities of internal audit. This report contains a summary of the principal observations made during audit tasks, an annotated statement of the completion of audit plans, particularly in the case of a significant departure from planning, and an assessment of the sufficiency of means (from a qualitative and quantitative point of view).To support the recommendation monitoring process, twice yearly monitoring of the action plans associated with the audit recommendations is presented to the management boards of the various Group entities, and any delay in completing the action plans responding to the recommendations is dealt with there. A new recommendation monitoring tool was commissioned successfully at the end of January 2010. This tool enables the auditors and the audited parties constantly to exchange views on the evolution of action plans responding to the audit recommendations. It is planned in 2011 to deploy the tool in the subsidiaries of the Dexia Group and to integrate recommendations from the Regulators.
TrainingIn addition to the training organised by human resources, an audit-specific training plan has been introduced. It has various sections to be followed depending on the role and seniority of the auditor. Furthermore, at a human risk control level, the organisation of internal audit into shared service centres will provide better cover for Group activities by mitigating the risk of a lack of means (both qualitative and quantitative) whilst ensuring the required reactivity in the case of urgency.
Projects for 2011In 2011, correspondents must allocate some of an even greater part of their time compared to 2010 to monitoring risks in the scope under their responsibility (including monitoring action plans responding to recommendations from internal audit, the regulators and the corporate auditors). In this way, the internal audit support line wishes clearly, beyond the completion of tasks enabling new risks to be identified, to place the emphasis on strengthened monitoring of the actions agreed with the audited parties at the end of the previous tasks and having to remedy risks identified in the past. This mechanism should, when it appears necessary, allow the triggering of a warning procedure from management on the areas of weakness which might appear significant and lasting.
Several methodological projects are provided for 2011, including:• Revision of the audit universe. This new revision will integrate the transformation plan as well as all the organisational changes and associated movements of members of staff. This revision of the universe will have an impact on the recommendation monitoring tool.
56 Dexia Annual report 2010
Declaration of corporate governance
Man
agem
ent
repo
rtA
dditi
onal
info
rmat
ion
Ann
ual fi
nanc
ial s
tate
men
tsC
onso
lidat
ed
finan
cial
sta
tem
ents
of intervention by the Investigation and Branch Audit team of Dexia SA vis-à-vis other entities of the Dexia Group taking account of the presence or not of local investigations teams. The Charter was presented to and approved by the Management Board of Dexia SA in June 2010 and a meeting of the Internal Control, Risks and Compliance Committee in August 2010.Operational implementation of the Charter involves the conclusion of various service level agreements between Dexia SA and its subsidiaries. These agreements should be finalised during the first quarter 2011.Publication of the Investigation and Branch Audit Charter and its communication to employees of the Group will be organised during the first half-year 2011. This will enable every member of staff to understand the importance of the function in the internal control mechanisms and to assist management of the Dexia Group.
Activities in 2010 Beyond the activities of elaborating and implementing the Investigation Charter, the activity of the Dexia SA Investigation and Branch Audit Unit was aligned in 2010 to the following lines:
1. Actions involving awareness of fraud risk(s)On the request of the Operations and IT Systems support line, the Dexia SA team cooperated in the organisation of a Fraud Awareness Workshop (presented by Deloitte) for the teams of that support line.
2. The performance of tasksIn 2010 the Investigation and Branch Audit Unit was involved in several tasks:• a transversal task, “Fleet Management”;• a joint task, performed in partnership between Dexia SA and Dexia Banque Internationale à Luxembourg, consisting of checking inter alia on advantages in kind, conflicts of interest, the operation of compliance functions and corporate governance;• a task concerning assistance in the analysis of accounts suppliers and more precisely the exposure to financial risk associated with double payments of supplier invoices;
3. Inquiries and information to the judicial authoritiesIn 2010, 20 inquiries were made by the Investigation and Branch Audit department in Dexia SA. According to the classification of fraud risks set out by the Basel II committee, the tasks performed or ongoing may be classified among the following risk categories: internal fraud (12 tasks), external fraud (4 tasks), clients, products and business practices (3 tasks) and employment practices and workplace safety (1 task).In addition to these inquiries, the team responded to several requests for information from entities and the judicial authorities.
At Dexia SA level, the tasks performed by the Regulators in 2010 related in particular to the following matters: ICAAP, Financial Products and Margin Calls. Moreover, regarding relations with the supervisory authorities and the corporate auditors, the audit departments of subsidiaries and branches of Dexia SA inform the audit department of Dexia SA of planned meetings on the audit operation, tasks performed by the prudential control authorities in their entities (throughout the task) and the matters deemed important arising from their regular meetings with the corporate auditors and the supervisory authorities and submit the minutes. The audit management of Dexia SA may attend these meetings when they so desire.
Creation of an investigation and branch audit unit
One of the guiding principles of the transformation of the audit support line was the creation in 2010 of an Investigation and Branch Audit unit within Dexia SA, responsible for the definition of transversal methodologies as well as investigations to be performed transversally (involving several entities of the Dexia Group) and the periodical inspection of the branch network.The task of Investigations is, independently and objectively, to contribute to controlling the risks of fraud. Indeed the unit participated in the establishment of a governance structure for the management of fraud risk. It intervenes in awareness and fraud prevention activities. It takes measures for the detection of fraud and deals with cases of fraud, and then it suggests and monitors the remedy.The task of Branch Audit is, independently and objectively, to give Dexia an assurance as to the degree of control of risks associated with activities in physical distribution channels. It systematically and methodically assesses the processes of risk management, control and governance in distribution channels.
Organisation and governanceIn terms of governance, the Investigation and Branch Audit unit is managed by the Group Head of Investigation and Branch Audit, reporting to the General Auditor of Dexia SA. It consists of:• an Investigation and Branch Audit unit reporting hierarchically and operationally to the Dexia SA audit department;• local Investigation and Branch Audit units reporting hierarchically to the audit departments of the entities but which nonetheless depend operationally on the Investigation and Branch Audit unit of Dexia SA.In order to manage and to steer the unit, it is coordinated by a so-called Investigation and Branch Audit Executive Committee (IBAEC). On the basis of a fraud risk analysis, this committee proposes the planning of joint activities, ensures optimum planning of transversal tasks, proposes necessary developments in terms of the unit’s means, methodology and tools, defines team training policy, analyses the results of transversal tasks and validates activity reports. It also decides on the temporary placement of inspectors among entities.An Investigation and Branch Audit Charter sets out the fundamental principles governing the function, describing its objectives, roles, powers, duties and responsibilities, modes of operation and basic rules. This document assists in fixing objectives for the unit and describes relations and conditions
57Annual report 2010 Dexia
Declaration of corporate governance
Man
agem
ent
repo
rtA
dditi
onal
info
rmat
ion
Ann
ual fi
nanc
ial s
tate
men
tsC
onso
lidat
ed
finan
cial
sta
tem
ents
• To the extent that it is required by local regulations, it communicates with the financial regulators or any other competent authority about any suspect incident or transaction.• It reports regularly to the Management Boards and Coordination Committees of Internal Control with regard to its activities and the status of any major shortcoming.
Organisation and positioning
The Group’s Chief Compliance Officer reports to the member of the Management Board of Dexia SA responsible for the Legal, Compliance and Tax support line. A cascading procedure is in place to guarantee the right of the Group Chief Compliance Officer to report directly to the Chairman of the Management Board of Dexia SA or to the Chairman of the Internal Control, Risks and Compliance Committee of Dexia SA on any significant incident.
This organisational mode was duplicated within the main entities.
Dexia SA Compliance was reorganised at the beginning of 2010, and is now composed of two divisions reporting to the Chief Compliance Officer of Dexia: • Permanent Control, the deployment of which began during the first quarter 2010 following the decision taken by the Management Board to extend this function to the entire Group. Since 1 March 2011, the team has been placed under the responsibility of the Head of Operational Risk;• Dexia SA Compliance, the head of which took up the post on 1 September 2010. Compliance is subdivided into two poles: - the “Policies and Guidelines” pole in charge of fields relating to regulatory surveillance of compliance, market abuse, conflicts of interest, client and private data protection, relations with entities directly reporting to Dexia SA (Dexia Technology Services and DenizBank), and determination of the compliance framework applicable to the different business lines;- the “Monitoring, Reporting and Tools” pole in charge of administration, global monitoring of the Compliance function and specific monitoring in particular regarding MiFID. This pole is also in charge of establishing the compliance risk map and coordination of the AML and CTF mechanisms in Group entities.
Guiding
The Dexia Group has a Compliance Committee the tasks of which are:• to distribute competences within the Group in compliance within business lines and competence centres;• to ensure an integrated approach is adopted.Its composition reflects all the activities and/or business lines within Dexia.Furthermore, there is periodic reporting by each Group subsidiary. A consolidated report is then drawn up and submitted to the Internal Control, Risks and Compliance Committee.
Compliance
The Compliance function is an independent and objective activity. It carries on its activities without influence, interference or restriction likely to affect its independence, its integrity, its impartiality and its objectivity.The role and fields falling within the Compliance function as well as the principles of governance underlying the approach adopted by Dexia regarding compliance are set out in the compliance policy which was approved and entered into force in 2009.
The compliance fields are as follows:• the fight against money laundering and the financing of terrorism;• market abuse and personal transactions;• the integrity of the markets in financial instruments;• integrity towards clients in all Dexia activities;• data protection and professional secrecy;• prevention of conflicts of interest;• external mandates;• the independence of the auditors;• whistleblowing;• prevention with regard to specific mechanisms (policy aimed at preventing specific mechanisms put in place for the purposes of tax evasion as provided, if such should be the case, by the applicable law);• any other field indicated by the Management Board or the Board of Directors.
In the fields of competence listed above, the Compliance function performs the following tasks:• It analyses legal and regulatory developments in order to anticipate and to assess possible consequences on Dexia activities. It ensures the correct interpretation of national and international legislation and regulations. It is also a first point of contact with the regulators.• It identifies, analyses and measures non-compliance risks and reputation risks which might arise from activities and financial products, in particular:- existing activities and products;- new activities/services;- new products/segmentations;- new entities;- any new geographic perimeter.• It provides assistance to business lines in the development and implementation of compliance procedures and other documents, for example compliance manuals, internal codes of conduct and practical guides. It assists and advises in order to ensure the correct interpretation and implementation as well as the observance of these procedures and other documents.• It develops and provides compliance training programs, adapted to the needs of business lines, promoting an appropriate compliance culture and an awareness and understanding of standards, procedures and lines of conduct.• It checks the fulfilment of compliance obligations, in particular taking account of risks incurred.
58 Dexia Annual report 2010
Declaration of corporate governance
Man
agem
ent
repo
rtA
dditi
onal
info
rmat
ion
Ann
ual fi
nanc
ial s
tate
men
tsC
onso
lidat
ed
finan
cial
sta
tem
ents
The global governance structure of that support line revolves around three pillars: • the monitoring function within Dexia SA which is responsible for definition of the methodology, guidelines and reporting, definition of the Group Permanent Control plan and its consolidation;• heads of Permanent Control in the Risk, Back Office TFM and IT Security support lines (as well as Compliance) which see to the application of Group guidelines in each entity for the support line;• heads of Permanent Control in the entities which are the guarantors of application, within their entity, of the methodology, references and procedures of the Group.
Permanent Control Managers of the entities report to the Group Head of Permanent Control and, with a few exceptions, operationally to the Head of Operational Risk of their entity.
A statement of progress in deploying the support line is presented regularly to the Internal Control Coordination Committee. The gradual establishment of the team at Dexia SA and entity level gave an assurance of the dissemination of standards, implementation of governance of the support line and entities over which Permanent Control is being deployed. The inventory of controls is currently being established and the monitoring of those controls will be developed over 2011.
Characteristics of internal control within the context of producing financial information
The Finance support line has the following five departments, reporting to the Chief Financial Officer, member of the Management Board:• Financial Management, including transversal services to the Finance Capital & Structuring, Finance Project Management, Finance Control & Finance Prudential Watch support line;• Accounting and Consolidation;• Strategic Planning and Controlling;• Balance Sheet Management (BSM);• Financial Communication.
Dexia’s scope of consolidation includes the following direct subsidiaries, also known as the operational entities:• Dexia Bank Belgium SA; • Dexia Crédit local SA; • Dexia Banque Internationale à Luxembourg SA;
and the following subsidiaries:• Dexia Holdings Inc. (holding company of Dexia Financial Products);• Dexia Participation Belgique SA (holding company holding DenizBank);• Dexia Nederland BV (result of the merger of Dexia Nederland Holding SA and Dexia Bank Nederland);• Associated Dexia Technology Services SA; • Dexia Management Services Ltd; • Dexia Participation Luxembourg SA;• Dexia Funding Luxembourg SA.
The new rules on the prevention of insider dealing in Dexia financial instruments approved at the end of 2009 were transposed at the beginning of 2010. These rules define the status attributed to members of staff in relation to the access to inside/sensitive information which they have or are likely to have in performing their tasks, and fix the restrictions/obligations associated with each status.The Code of Professional Ethics was revised and training courses were organised for members of staff of Dexia SA in order to remind them of key principles in terms of compliance. The new Code of Professional Ethics is gradually being transposed within the entities of the Group.The definition of a consistent control plan over all Group entities began in 2010. The aim of the exercise is to ensure the application of policies, guidelines and procedures, if necessary to trace malfunctions and to implement corrective actions in order to allow better guiding of the support line. The review and finalisation of compliance monitoring controls at Dexia SA level were performed in consultation with the Permanent Control team. The third edition of the compliance risk map was launched in 2010. The results of the map will be presented jointly with the action plans attributed to each major risk. The action plans will be monitored to check their implementation and synergy work has begun with Compliance monitoring in order to identify and deal best with the controls of the monitoring plan corresponding to the major risks of the map.The Legal, Compliance and Tax support line wishes to have a single IT tool allowing centralised guiding as well as transversal management of its processes and activities. The work of analysis in this direction began at the end of 2009 and continued in 2010.The needs of the Compliance support line currently covered by the e-Room collaborative tool will be included in the new software.
The quarterly consolidated MiFID report put in place in 2009 continues to be produced. The year 2010 saw the scope of MiFID monitoring extended gradually into the entities concerned with MiFID.This report contains the indicators and results of tests intended to measure the performance of procedures in relation to the European MiFID Directive. It is produced by Dexia SA on the basis of reports from the different entities subject to that Directive as well as on the basis of exchanges and discussions between the Dexia Group and the main entities. Once validated, the final report is presented by the Chief Compliance Officer to the Internal Audit Coordination Committee.
Concrete actions are put in place gradually in order to improve the supervision of subsidiaries and branches.Each main entity has the responsibility of organising contacts with its own network of subsidiaries. So Dexia SA Compliance maintains close relations with the entities reporting directly to it and with the main entities.
Deployment to the entire Group of the Permanent Control support line, decided by the Internal Control Coordination Committee in November 2009 continued in 2010. This support line ensures monitoring of the Group Permanent Control.

59Annual report 2010 Dexia
Declaration of corporate governance
Man
agem
ent
repo
rtA
dditi
onal
info
rmat
ion
Ann
ual fi
nanc
ial s
tate
men
tsC
onso
lidat
ed
finan
cial
sta
tem
ents
Consolidation processUnits gather databases using standardised frameworks, bundles. The Group accounting plan, integrated into the consolidation software, is common to all Dexia entities and subsidiaries. The amount of detail required from subsidiaries is defined at Group level.
The standardised bundles are adjustable to permit the gathering of specific data for a sub-group (or consolidation level).
The establishment of data intended for the annual report is divided into phases, and in particular this allows differentiated management in time depending upon the type of data. To that end, the following phases are distinguished:• AC: database (essentially headings and flows);• AI: interco-type data;• AX: data for notes to the accounts;• AT: fiscal data (movements and analysis of the origin of deferred taxes, proof of tax).
Bundled data is then subject to the appropriate consolidation processing, either via automatic processes managed by the consolidation software or by manual entries so as to result in consolidated data. Manual entries are managed by the Consolidation divisions of the entities and subsidiaries. Manual entries are also subject to defined checks in the software.
Reciprocal entries are reconciled automatically in Magnitude once the entities and subsidiaries have submitted their “AI” bundles of declarations of inter-company transactions. Magnitude enables statements to be restored presenting the declaration differences between the different Group entities (per account and per class of accounts). The restoration accounts may be edited per entity but also globally for the consolidation level. Reciprocal declarations are gathered in three stages: declarations, correction of differences, definitive arbitrages.
Monitoring reciprocal transactions In migrating to IFRS, hedging reciprocal transactions has been forbidden by Dexia, excepting specific exemptions.
The process of reconciling reciprocal transactions involves different divisions: • the Consolidation division, in charge of coordinating work (instructions, progress meetings...);• the Accounting division which deals with the declaration of reciprocal accounts in Magnitude for Dexia SA;• the Consolidation division of entities and subsidiaries intervening to advance the resolution of differences between two entities or subsidiaries, making the link with their respective Accounting divisions;• the trading rooms of Dexia Bank Belgium and Dexia Crédit Local New York with regard to off-setting. In fact, the Dexia Bank Belgium trading room, as a competence centre, ensures that internal derivatives are effectively turned over on the market.
Within the Consolidation division, reciprocal transactions are reconciled under management supervision. An operating mode details the rules relating to specific problems (securities issued by a Group entity, acquired by another Group subsidiary,
Production of the financial statements
The Accounting and Consolidation department produces the following financial statements:• the consolidated financial statements of the Dexia Group;• the periodic prudential reports;• the corporate financial statements of Dexia SA.
It also monitors and audits the accounting data of the permanent establishments of Dexia SA in France and Luxembourg and, within the context of the consolidation process, its direct subsidiaries.
In particular it checks that the information provided is consistent and complies with Group rules.It has four divisions: • Accounting Standards;• Consolidation;• Consolidation Information Systems;• General Accounting.
Dexia SA consolidated financial statementsDexia SA principally has holdings in Dexia Crédit Local, Dexia Banque Internationale à Luxembourg, Dexia Bank Belgium and DenizBank. Each of these entities prepares consolidated financial statements and these are consolidated with the financial statements of the holding company, Dexia SA, and directly associated subsidiaries.
The main adjustments booked by the Dexia Group Consolidation division relate to the elimination of reciprocal accounts and intra-Group transactions (acquisitions/asset disposals, dividends...). They also relate to the reprocessing of companies held by different Group entities.
If there is difficulty in interpreting the accounting principles, all entities may call on the Dexia SA Consolidation division. In collaboration with the Accounting Standards division, it gives an appropriate answer.
When the consolidated financial statements have been finalised, they are submitted for review to the Chief Financial Officer who has them approved by the Management Board. They are then presented to the Audit Committee (part of the Accounts Committee), and approved by the Board of Directors of Dexia SA. The consolidated financial statements prepared by the Dexia SA consolidators are presented for review to the Accounts Director of the entity, who validates them and has them approved by the Chief Financial Officer of the entity.
Consolidation toolConsolidation reporting uses the Magnitude software, a common tool deployed in all Dexia subsidiaries and branches. It operates via a common database, Dexia SA thus having access to all bundles. The shared use of this common database enables consolidated data to be established at Dexia level and at an operational entity level. The selection of data, for each entity or subsidiary, is managed on the basis of scopes of consolidation established by each consolidation level.
60 Dexia Annual report 2010
Declaration of corporate governance
Man
agem
ent
repo
rtA
dditi
onal
info
rmat
ion
Ann
ual fi
nanc
ial s
tate
men
tsC
onso
lidat
ed
finan
cial
sta
tem
ents
Manual of accounting principlesIn providing documents relating to standards, the Accounting Standards division produces or is involved in producing the following documents:• chart of accounts at Group level: accounting plan integrating the latest modifications of Magnitude;• Disclosure Manual: published and used for the production of appendices;• valuation rules included in the financial statements.
Validation committeeThe Dexia Accounting Standard Committee (DASC), on which sit the heads of Accounting Standards of each entity, is responsible for:• interpreting accounting standards; • defining and validating accounting options made by entities and subsidiaries.
Interpretations made and common positions taken by the DASC are validated by the auditors.
Monitoring points for attention raised by the auditors with regard to IFRSA formal debriefing on audit points is made by the auditors with the Accounts Committees. Any obstacles are resolved in an ongoing process of exchange with the auditors.
Training policyThe Group head of Accounting Standards is responsible for organising and chairing training sessions and seminars on Accounting Standards. Seminars organised internally are generally intended for exchanges on adopted accounting processes and their operational definition. Seminars organised with the support of an external service provider enable updates to be made on customary market practices and the progress of discussions of topical subjects (FVO, Day One, New IAS39...).
Periodic prudential reportingStandardised reporting (COREP) is sent to the Banking, Finance and Insurance Commission four times a year; regulatory ratios (CAD) are calculated quarterly for publication purposes; solvency margin calculations are sent half-yearly to the Banking, Finance and Insurance Commission.
Components of COREP reporting COREP reporting is realised with contributions from:• Finance (calculation of regulatory capital, floor calculation, calculation of consumption in market risk – standard method);• Credit Risk Management (calculation of capital requirement for credit risk – AIRBA method);• Market Risk Management (calculation of capital requirement for market risk – internal model);• Operational Risk Management (calculation of capital requirement for operational risk – standard method).
Capital requirements are calculated by different divisions of the Risk Management support line and are subject to checks defined within that same support line. Finance checks probability by comparison with requirements declared in the previous period.
reciprocal rate-hedged lending and borrowing, maintenance of hedge relations including intra-Group derivatives and differences in the valuation of derivatives).
Reciprocal transactions are entered in Magnitude semi-automatically. Later amendments are entered directly in Magnitude. Subsidiaries are made aware of their responsibility in resolving differences observed, following a pre-defined schedule. A process of transaction-reconciliation via the Intellimatch tool is being deployed within the Group.
Notes and appendices to the annual financial statementsSome of the notes and appendices to the annual accounts are not drawn up directly by the Accounting and Consolidation department, but come from the following departments:• Strategic Planning and Controlling (analysis per business line); • Risk Management (appendices on risks); • Legal (note relating to litigation);• Human Resources (transactions with management-related parties, stock options).
The planning for gathering this information and final responsibility for the content of the annual financial statements are assumed by the Finance division.
Dexia SA accountsDexia SA accounts are kept in Brussels and also in the permanent establishments in Paris and Luxembourg. These three establishments keep a separate accounting. On a monthly basis, all transactions recorded in the financial statements of the permanent establishments are integrated at the registered office in Brussels using the SAP tool.
Additional checks are made by teams in the Accounting division when drawing up the quarterly or annual financial statements. Balances and the principal evolutions must be justified.
Accounting Standards The Accounting Standards division has become the competence centre for the entire Group. Its task is:• to monitor, analyse and interpret IFRS/IAS/IFRIC/SIC accounting standards published and endorsed by the European Union;• to ensure compliance of the consolidated financial statements with those standards;• to analyse transactions proposed by the business, to determine their IFRS treatment and to assist entities and other departments on questions relating to standards, financial structures and new products;• to represent Dexia before external organisations such as EFRAG (European Financial Reporting Advisory Group), EBF (European Banking Federation), Febelfin (1) and so on;• to centralise updated documents relating to standards and to make them available to entities and subsidiaries.
(1) Febelfin is the “umbrella federation” of the Belgian financial sector.
61Annual report 2010 Dexia
Declaration of corporate governance
Man
agem
ent
repo
rtA
dditi
onal
info
rmat
ion
Ann
ual fi
nanc
ial s
tate
men
tsC
onso
lidat
ed
finan
cial
sta
tem
ents
such as Financial Communication, External Communication, Finance Capital & Structuring, Mergers & Acquisitions, Risk Management. This involves the following reports:• Activity monitoring;• Result per entity;• Analytical result;• Performance fees;• Use of capital;• Financial remarks;• Monitoring specific expenditure;• Transversal cost matrix.
In this context, it performs the following tasks:• Determining the conceptual framework of the analysis of the results and profitability of Group business lines and analytical entities;• Guiding the annual budget procedure;• Establishing periodic commercial and financial reports;• Making projections of periodic quarterly and annual results;• Making themed studies intended to analyse the profitability of certain sectors of activity or certain entities.
Consolidation toolsManagement information is produced via a multidimensional database enabling data to be stored and processed. It also enables targeted on-line analyses to be performed rapidly and is used for the management of all data relating to activities and profitability.
Planning reportingAs part of its planning task, the Strategic Planning and Controlling department establishes the following reports:• a guidance note, produced annually by the Chief Financial Officer;• a financial and budget plan: a note presenting global forecasts and forecasts per business line, produced annually at the end of the year;• basic standards and hypotheses for budget elaboration.
Financial and budget plans are produced entirely in the entities/subsidiaries, per business line.
When the entity’s budget is established, apart from its being in line with the guidance note, the Chief Executive Officer of the entity/subsidiary ensures the budget’s consistency as a whole, its feasibility from the points of view both of financial, capital and human resources and observance of any local constraint, and presents it to the member of the Dexia Management Board responsible for its scope. First-level challenging is by the latter, with the assistance of the Strategic Planning and Controlling, Organisation, Risk Management, Human Resources and Finance Capital & Structuring divisions. Its aim is to check it is in line with the guidance note. Budgets thus established are then presented to the Chief Executive Officer. They are then presented to the Management Board of Dexia SA before being submitted for approval to the Board of Directors.
COREP reporting is communicated electronically (XBRL and by mail); it consists of various documents falling within the responsibility of different services. Ratio assembly is the responsibility of Finance.
Calculation of regulatory capital Regulatory capital is calculated on the basis of:• consolidation of the financial statements on a prudential scope for capital elements, for the value of holdings to be deducted (by the equity method or not), for items to be deducted;• calculation of the fair value of subordinated loans by the different consolidation levels; compliance of the calculation base with the accounting balances is checked centrally; the result of the calculation is entered under a technical heading on the Magnitude consolidation software;• calculation provided by Risk Management regarding expected loss; the amount is entered under a technical heading on the Magnitude consolidation software.
The calculation of regulatory capital is stored in the Magnitude consolidation software.
Memorandum of UnderstandingThe process of elaboration and control of reporting established by virtue of the Memorandum of Understanding and any additional documents (1) is similar to those applicable to the Dexia consolidated financial statements. Dexia SA will be subject to new FINREP reporting which will replace the Memorandum of Understanding from 2011.
Producing management information
The main aim of management information is to give management reliable information as soon as possible on the activity and the profitability of business lines and analytical entities.
The financial statements sent by the Dexia Group to its shareholders and to the public are completed by other elements from detailed analyses such as activity reports and results per business line, which are integrated into the Financial Report or communicated at presentations to financial analysts. Most of this information requires a cross-referencing and aggregation of data from different sources, a breakdown of figures available globally or a reprocessing of accounting data in relation to management parameters. It is checked and provided to the editors of the Financial Report by the Strategic Planning and Controlling department.
Apart from this information intended for the public, the Strategic Planning and Controlling department establishes a series of management reports intended for Dexia’s management bodies. Management reports are established for the Dexia Management Board and heads of business lines. They are then sent wholly or in part to other departments,
(1) The reporting list is included in the appendix to the Memorandum of Understanding concluded on 11 September 2000 between the Banking, Finance and Insurance Commission (Belgium), the Banking Commission and the Credit Establishment and Investment Company Committee (France) and the Financial Sector Supervisory Commission (Luxembourg) on the control on a consolidated basis of the Dexia banking group, as revised on Dexia’s migration to IFRS.
62 Dexia Annual report 2010
Declaration of corporate governance
Man
agem
ent
repo
rtA
dditi
onal
info
rmat
ion
Ann
ual fi
nanc
ial s
tate
men
tsC
onso
lidat
ed
finan
cial
sta
tem
ents
Finance Control
The role and tasks of the Finance Control function cover the Finance support line for the entire Group. This team has the tasks of completing the internal control mechanism of the Dexia Group by aligning its work to the main entities (which are responsible for maintaining the quality of the internal audit in their respective group) and of representing the Finance support line in the general control mechanism within the Dexia Group.
Relying on risk maps and controls within the Finance functions to identify major risks, the Finance Control function concentrates its interventions on the consistent application of financial standards and principles (accounting, analytical, prudential and so on) of Dexia through the Group. The tasks may therefore relate also to audit of contributions other than Accounting/Management Control relating to the production financial information (ICAAP/Pillar 2 reporting and so on).
This team also has the task of contributing to a better alignment of control processes between the different entities of the Dexia Group. The performance of transversal tasks also comes within this rationale.
To summarise, its tasks break down as follows:• assessing the risks and the adequacy of control systems within the Finance support line (process/risk/control map);• performing transversal control tasks or those specific to an entity (in relation to a pre-established control plan);• coordinating the monitoring of recommendations on the Finance sphere (Control, Regulators, Internal and External Audit);• acting as Finance correspondent for any internal control question.
Relations with the Statutory Auditors
The Statutory Auditors make regular checks on the financial reporting of the various entities and subsidiaries of the Dexia Group. They are involved with the entire process of checking the financial and accounting information with a concern for efficiency and transparency. As part of their duties they analyse the accounting procedures and assess the internal audit systems necessary for reliably establishing the financial statements. They issue instructions to the auditors of the entities and ensure their work is centralised. They organise summary meetings on the results of their audits and assess the interpretation of standards. Finally, they check the consistency of accounting information between the management report and the financial statements. The performance of these duties enables them to obtain a reasonable assurance that, considering the legal and regulatory provisions governing them, the annual financial statements give a true picture of the assets, financial situation and results of the company and that the information given in the Notes is appropriate.
Analytical information for realisationAn operating chart, established quarterly, contains a series of key indicators (production and outstanding long and short-term funding, commissions, volumes of deposits and assets under management, gross present value originations and guaranteed premiums from credit enhancement activity...). It is drawn up with the support of information provided by the commercial services, on the basis of structures specific to each commercial business line and uniform across the Group, established by Strategic Planning and Controlling. The information provided is accompanied by comments made directly by the commercial services. It allows for any possible repositioning of results expected for the current year.
The Strategic Planning and Controlling support line checks the consistency of the information provided and compliance of the presentation with the standards established for all the entities of the Dexia Group.
This operating chart is presented by the head of business line to the Management Board prior to being sent to Financial Communication which sees to its transcription for the annual report and the quarterly Financial Report.
Determining results per business line in the profitability reports The elaboration of income per business line relies essentially on two types of analytical information, commercial margin on the one hand and other elements of the statement of income (commissions, general costs, value corrections...) on the other hand.
Aggregation of the interim balances over all business lines is subject to reconciliation of the accounting statement of income.
To summarise, all of these processes contribute to the elaboration of the statement of income for each business line, thus allowing an assessment of the profitability-risk ratio and the contribution to Dexia’s overall result.
The aggregation processThe aggregation process is described in the Manual of Procedures and Standards for Management Control, common to the entire Dexia Group.
The complete process is supervised by the Strategic Planning and Controlling department, which provides all the entities with standardised and secure collection tools, in order to make more accurate and to optimise the mechanism for gathering information. Finally, it also ensures global aggregation.
The process of information aggregation per business line is followed in parallel to the consolidation process guided by the Accounting and Consolidation division. In order to ensure the consistency of analytical and accounting information, consistency checks have been introduced.
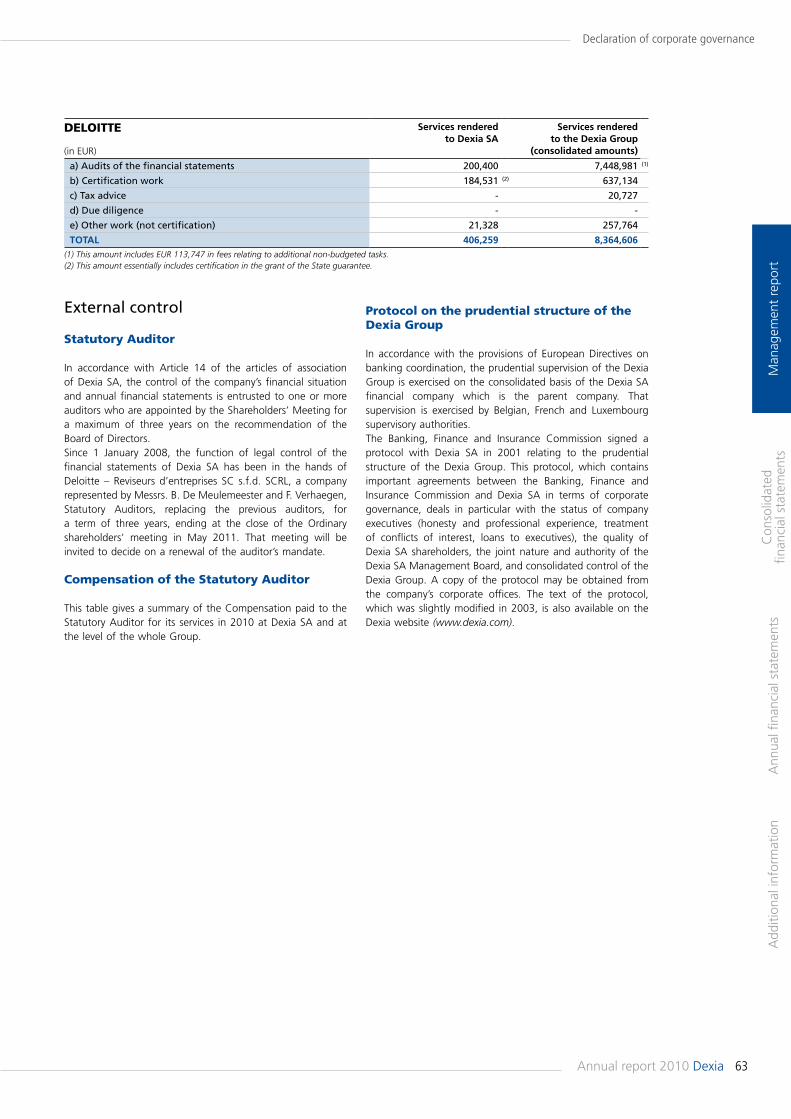
63Annual report 2010 Dexia
Declaration of corporate governance
Man
agem
ent
repo
rtA
dditi
onal
info
rmat
ion
Ann
ual fi
nanc
ial s
tate
men
tsC
onso
lidat
ed
finan
cial
sta
tem
ents
DELOITTE
(in EUR)
Services rendered to Dexia SA
Services rendered to the Dexia Group
(consolidated amounts)
a) Audits of the financial statements 200,400 7,448,981 (1)
b) Certification work 184,531 (2) 637,134
c) Tax advice - 20,727
d) Due diligence - -
e) Other work (not certification) 21,328 257,764
TOTAL 406,259 8,364,606(1) This amount includes EUR 113,747 in fees relating to additional non-budgeted tasks.(2) This amount essentially includes certification in the grant of the State guarantee.
Protocol on the prudential structure of the Dexia Group
In accordance with the provisions of European Directives on banking coordination, the prudential supervision of the Dexia Group is exercised on the consolidated basis of the Dexia SA financial company which is the parent company. That supervision is exercised by Belgian, French and Luxembourg supervisory authorities.The Banking, Finance and Insurance Commission signed a protocol with Dexia SA in 2001 relating to the prudential structure of the Dexia Group. This protocol, which contains important agreements between the Banking, Finance and Insurance Commission and Dexia SA in terms of corporate governance, deals in particular with the status of company executives (honesty and professional experience, treatment of conflicts of interest, loans to executives), the quality of Dexia SA shareholders, the joint nature and authority of the Dexia SA Management Board, and consolidated control of the Dexia Group. A copy of the protocol may be obtained from the company’s corporate offices. The text of the protocol, which was slightly modified in 2003, is also available on the Dexia website (www.dexia.com).
External control
Statutory Auditor
In accordance with Article 14 of the articles of association of Dexia SA, the control of the company’s financial situation and annual financial statements is entrusted to one or more auditors who are appointed by the Shareholders’ Meeting for a maximum of three years on the recommendation of the Board of Directors.Since 1 January 2008, the function of legal control of the financial statements of Dexia SA has been in the hands of Deloitte – Reviseurs d’entreprises SC s.f.d. SCRL, a company represented by Messrs. B. De Meulemeester and F. Verhaegen, Statutory Auditors, replacing the previous auditors, for a term of three years, ending at the close of the Ordinary shareholders' meeting in May 2011. That meeting will be invited to decide on a renewal of the auditor’s mandate.
Compensation of the Statutory Auditor
This table gives a summary of the Compensation paid to the Statutory Auditor for its services in 2010 at Dexia SA and at the level of the whole Group.
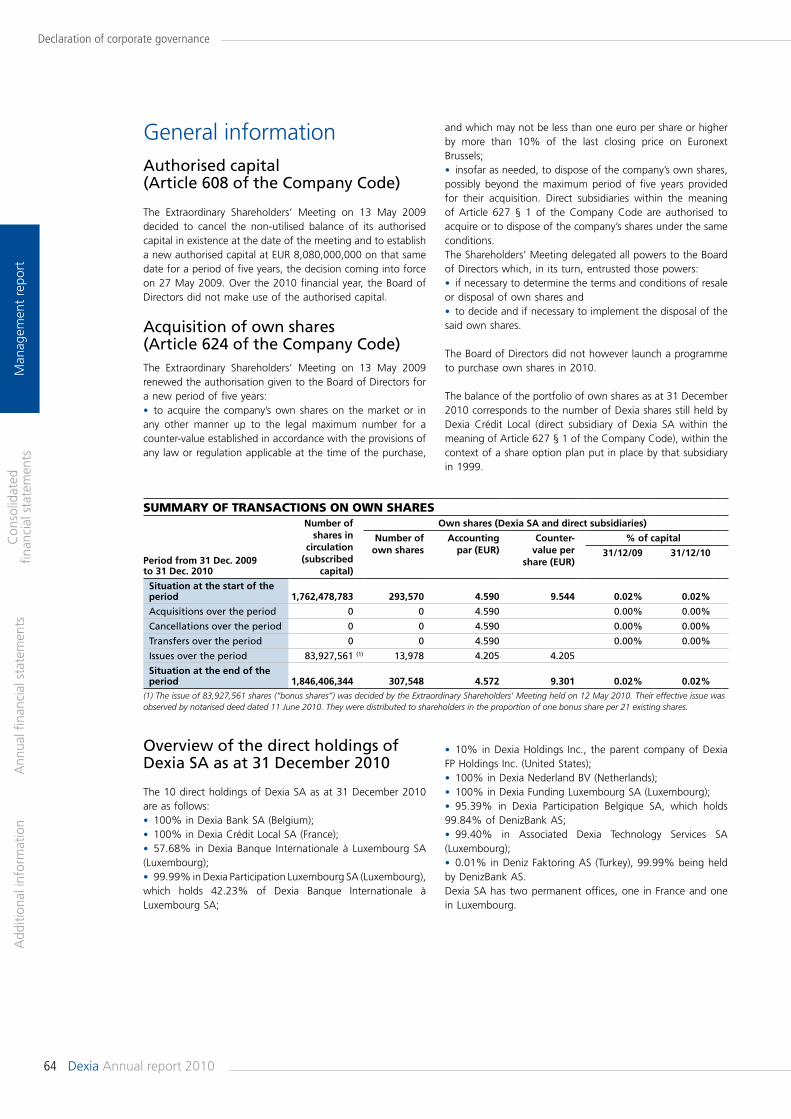
64 Dexia Annual report 2010
Declaration of corporate governance
Man
agem
ent
repo
rtA
dditi
onal
info
rmat
ion
Ann
ual fi
nanc
ial s
tate
men
tsC
onso
lidat
ed
finan
cial
sta
tem
ents
and which may not be less than one euro per share or higher by more than 10% of the last closing price on Euronext Brussels;• insofar as needed, to dispose of the company’s own shares, possibly beyond the maximum period of five years provided for their acquisition. Direct subsidiaries within the meaning of Article 627 § 1 of the Company Code are authorised to acquire or to dispose of the company’s shares under the same conditions.The Shareholders’ Meeting delegated all powers to the Board of Directors which, in its turn, entrusted those powers:• if necessary to determine the terms and conditions of resale or disposal of own shares and• to decide and if necessary to implement the disposal of the said own shares.
The Board of Directors did not however launch a programme to purchase own shares in 2010.
The balance of the portfolio of own shares as at 31 December 2010 corresponds to the number of Dexia shares still held by Dexia Crédit Local (direct subsidiary of Dexia SA within the meaning of Article 627 § 1 of the Company Code), within the context of a share option plan put in place by that subsidiary in 1999.
General informationAuthorised capital (Article 608 of the Company Code)
The Extraordinary Shareholders’ Meeting on 13 May 2009 decided to cancel the non-utilised balance of its authorised capital in existence at the date of the meeting and to establish a new authorised capital at EUR 8,080,000,000 on that same date for a period of five years, the decision coming into force on 27 May 2009. Over the 2010 financial year, the Board of Directors did not make use of the authorised capital.
Acquisition of own shares (Article 624 of the Company Code)The Extraordinary Shareholders’ Meeting on 13 May 2009 renewed the authorisation given to the Board of Directors for a new period of five years:• to acquire the company’s own shares on the market or in any other manner up to the legal maximum number for a counter-value established in accordance with the provisions of any law or regulation applicable at the time of the purchase,
SUMMARY OF TRANSACTIONS ON OWN SHARES
Period from 31 Dec. 2009 to 31 Dec. 2010
Number of shares in
circulation (subscribed
capital)
Own shares (Dexia SA and direct subsidiaries)
Number of own shares
Accounting par (EUR)
Counter- value per
share (EUR)
% of capital
31/12/09 31/12/10
Situation at the start of the period 1,762,478,783 293,570 4.590 9.544 0.02% 0.02%
Acquisitions over the period 0 0 4.590 0.00% 0.00%
Cancellations over the period 0 0 4.590 0.00% 0.00%
Transfers over the period 0 0 4.590 0.00% 0.00%
Issues over the period 83,927,561 (1) 13,978 4.205 4.205
Situation at the end of the period 1,846,406,344 307,548 4.572 9.301 0.02% 0.02%
(1) The issue of 83,927,561 shares (“bonus shares”) was decided by the Extraordinary Shareholders’ Meeting held on 12 May 2010. Their effective issue was observed by notarised deed dated 11 June 2010. They were distributed to shareholders in the proportion of one bonus share per 21 existing shares.
Overview of the direct holdings of Dexia SA as at 31 December 2010
The 10 direct holdings of Dexia SA as at 31 December 2010 are as follows: • 100% in Dexia Bank SA (Belgium);• 100% in Dexia Crédit Local SA (France);• 57.68% in Dexia Banque Internationale à Luxembourg SA (Luxembourg);• 99.99% in Dexia Participation Luxembourg SA (Luxembourg), which holds 42.23% of Dexia Banque Internationale à Luxembourg SA;
• 10% in Dexia Holdings Inc., the parent company of Dexia FP Holdings Inc. (United States);• 100% in Dexia Nederland BV (Netherlands);• 100% in Dexia Funding Luxembourg SA (Luxembourg);• 95.39% in Dexia Participation Belgique SA, which holds 99.84% of DenizBank AS;• 99.40% in Associated Dexia Technology Services SA (Luxembourg);• 0.01% in Deniz Faktoring AS (Turkey), 99.99% being held by DenizBank AS.Dexia SA has two permanent offices, one in France and one in Luxembourg.
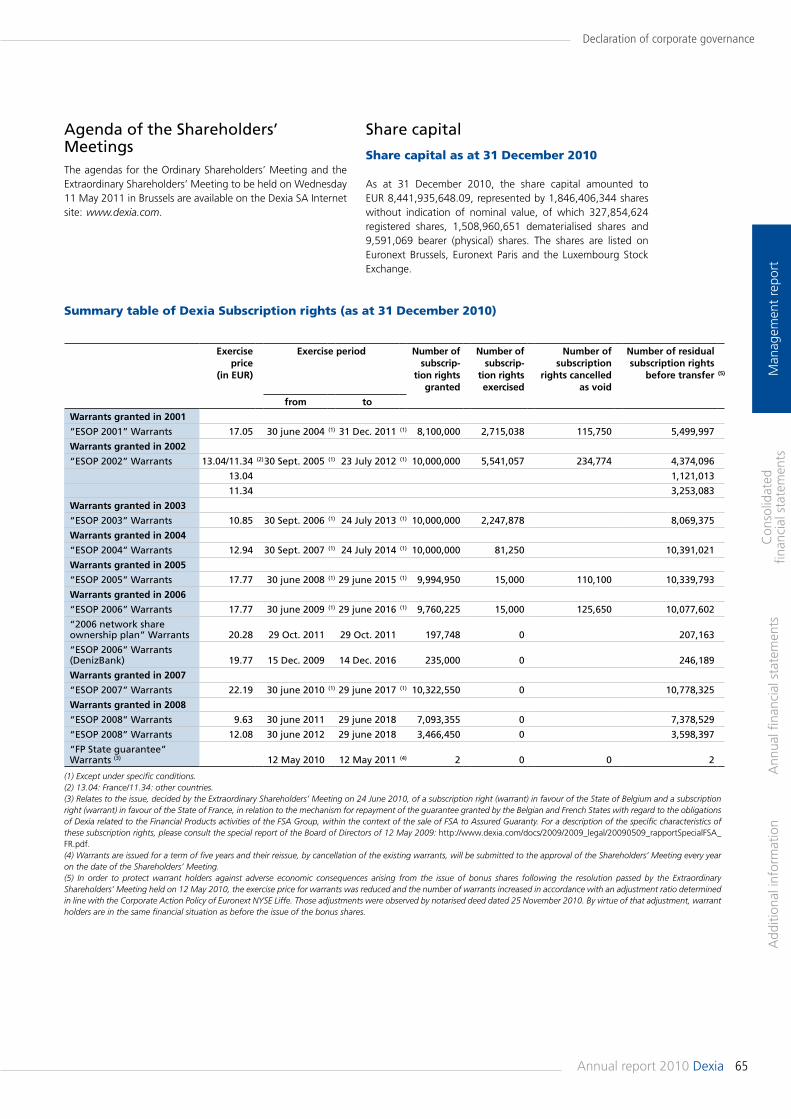
65Annual report 2010 Dexia
Declaration of corporate governance
Man
agem
ent
repo
rtA
dditi
onal
info
rmat
ion
Ann
ual fi
nanc
ial s
tate
men
tsC
onso
lidat
ed
finan
cial
sta
tem
ents
Exercise price
(in EUR)
Exercise period Number of subscrip-
tion rights granted
Number of subscrip-
tion rights exercised
Number of subscription
rights cancelled as void
Number of residual subscription rights
before transfer (5)
from to
Warrants granted in 2001
“ESOP 2001” Warrants 17.05 30 june 2004 (1) 31 Dec. 2011 (1) 8,100,000 2,715,038 115,750 5,499,997
Warrants granted in 2002
“ESOP 2002” Warrants 13.04/11.34 (2)30 Sept. 2005 (1) 23 July 2012 (1) 10,000,000 5,541,057 234,774 4,374,096
13.04 1,121,013
11.34 3,253,083
Warrants granted in 2003
“ESOP 2003” Warrants 10.85 30 Sept. 2006 (1) 24 July 2013 (1) 10,000,000 2,247,878 8,069,375
Warrants granted in 2004
“ESOP 2004” Warrants 12.94 30 Sept. 2007 (1) 24 July 2014 (1) 10,000,000 81,250 10,391,021
Warrants granted in 2005
“ESOP 2005” Warrants 17.77 30 june 2008 (1) 29 june 2015 (1) 9,994,950 15,000 110,100 10,339,793
Warrants granted in 2006
“ESOP 2006” Warrants 17.77 30 june 2009 (1) 29 june 2016 (1) 9,760,225 15,000 125,650 10,077,602
“2006 network share ownership plan” Warrants 20.28 29 Oct. 2011 29 Oct. 2011 197,748 0 207,163
“ESOP 2006” Warrants (DenizBank) 19.77 15 Dec. 2009 14 Dec. 2016 235,000 0 246,189
Warrants granted in 2007
“ESOP 2007” Warrants 22.19 30 june 2010 (1) 29 june 2017 (1) 10,322,550 0 10,778,325
Warrants granted in 2008
“ESOP 2008” Warrants 9.63 30 june 2011 29 june 2018 7,093,355 0 7,378,529
“ESOP 2008” Warrants 12.08 30 june 2012 29 june 2018 3,466,450 0 3,598,397
“FP State guarantee” Warrants (3) 12 May 2010 12 May 2011 (4) 2 0 0 2
(1) Except under specific conditions.(2) 13.04: France/11.34: other countries.(3) Relates to the issue, decided by the Extraordinary Shareholders’ Meeting on 24 June 2010, of a subscription right (warrant) in favour of the State of Belgium and a subscription right (warrant) in favour of the State of France, in relation to the mechanism for repayment of the guarantee granted by the Belgian and French States with regard to the obligations of Dexia related to the Financial Products activities of the FSA Group, within the context of the sale of FSA to Assured Guaranty. For a description of the specific characteristics of these subscription rights, please consult the special report of the Board of Directors of 12 May 2009: http://www.dexia.com/docs/2009/2009_legal/20090509_rapportSpecialFSA_FR.pdf.(4) Warrants are issued for a term of five years and their reissue, by cancellation of the existing warrants, will be submitted to the approval of the Shareholders’ Meeting every year on the date of the Shareholders’ Meeting.(5) In order to protect warrant holders against adverse economic consequences arising from the issue of bonus shares following the resolution passed by the Extraordinary Shareholders’ Meeting held on 12 May 2010, the exercise price for warrants was reduced and the number of warrants increased in accordance with an adjustment ratio determined in line with the Corporate Action Policy of Euronext NYSE Liffe. Those adjustments were observed by notarised deed dated 25 November 2010. By virtue of that adjustment, warrant holders are in the same financial situation as before the issue of the bonus shares.
Summary table of Dexia Subscription rights (as at 31 December 2010)
Agenda of the Shareholders’ MeetingsThe agendas for the Ordinary Shareholders’ Meeting and the Extraordinary Shareholders’ Meeting to be held on Wednesday 11 May 2011 in Brussels are available on the Dexia SA Internet site: www.dexia.com.
Share capital
Share capital as at 31 December 2010
As at 31 December 2010, the share capital amounted to EUR 8,441,935,648.09, represented by 1,846,406,344 shares without indication of nominal value, of which 327,854,624 registered shares, 1,508,960,651 dematerialised shares and 9,591,069 bearer (physical) shares. The shares are listed on Euronext Brussels, Euronext Paris and the Luxembourg Stock Exchange.
66 Dexia Annual report 2010
Declaration of corporate governance
Man
agem
ent
repo
rtA
dditi
onal
info
rmat
ion
Ann
ual fi
nanc
ial s
tate
men
tsC
onso
lidat
ed
finan
cial
sta
tem
ents
Notifications under the legislation on transparency
Under the terms of the Law of 2 May 2007 (the “Law”) relating to the publication of major holdings in issuers the shares of which are admitted for trading on a regulated market and the Royal Decree dealing with its execution dated 14 February 2008, which entered into force on 1 September 2008, and on the basis of Article 5 of the articles of association of Dexia SA, shareholders are obliged to notify their holding to the Banking, Finance and Insurance Commission and to Dexia, insofar as it reaches a threshold of 1%, 3%, then 5% or a multiple of 5%.
To calculate percentages of holdings, the numerator consists of the number of voting rights attached to shares conferring voting rights or not associated with shares, reduced or increased by the number of voting rights which may be acquired on the exercise of similar financial instruments held by the person making the declaration. The denominator consists of the total of existing voting rights in Dexia SA as published on the website.
Moreover, in application of the “Protocol on the prudential structure of the Dexia Group” (cf. “Corporate governance” on page 63), Dexia SA has asked its main shareholders to inform the company and the Banking, Finance and Insurance Commission as soon as possible prior to any of the aforementioned transactions.
During the year 2010, Dexia SA received various notifications from its shareholders, namely:• on 26 February 2010, a transparency notification was sent to BlackRock Inc. the holding of which exceeded the statutory threshold of 1% on 24 February 2010;• on 25 March 2010, BlackRock Inc. sent a new transparency notification according to which their holding passed back below the statutory threshold of 1% on 22 March 2010;• on 1 September 2010, the shareholders which had concluded an agreement under which they are deemed to constitute “persons acting in concert” (cf. point Legislation on tender offers hereafter) under the meaning of Belgian legislation relating to tender offers notified their holding in the capital of Dexia SA following the crossing by Ethias Group of the legal threshold of 5% on 26 August 2010;• on 17 September 2010 BlackRock Inc. notified its holding in the capital of Dexia SA above the statutory threshold of 1% on 13 September 2010;• on 3 November 2010, BlackRock Inc. sent a new transparency notification according to which their holding passed back below the statutory threshold of 1% on 28 October 2010.
All of these notifications are published in full on the Dexia SA internet site.
It emerges from these notifications that no shareholder, other than the reference shareholders listed in the table on page 21, holds more than 1% of the share capital of Dexia SA as at 31 December 2010.
Legislation on tender offers
“Grandfathering” regimeUnder the terms of Article 74 of the Law of 1 April 2007 relating to public takeover bids, persons which as at 1 September 2007, either alone or in concert, hold more than 30% of the voting securities of a Belgian company admitted to trading on a regulated market are not subject to the obligation to launch a public takeover bid on the shares of the said company provided in particular that for 21 February 2008 at the latest they have sent a notification to the Banking, Finance and Insurance Commission and a communication to the said company.
On 30 August 2007, Dexia SA was informed of the conclusion by certain of its shareholders (Arcofin, Holding Communal, Caisse des dépôts et consignations, Ethias and CNP Assurances) of an agreement under the terms of which they are deemed to constitute “persons acting in concert” within the meaning of the Law of 1 April 2007 relating to public takeover bids. The holding of the shareholders acting in concert in the capital of Dexia SA exceeds a threshold of 50%.
This agreement was the object of a notification to the CBFA and a communication to Dexia SA in accordance with Article 74 § 6 and 7 of the Law of 1 April 2007 relating to public takeover bids.
The principal elements of that communication are published on the Dexia SA internet site.Moreover, in accordance with Article 74 § 8 of the said Law, the parties acting in concert must annually notify any change to their holding which has taken place since 1 September 2007.
Within this context, each year Dexia SA receives an update listing the transactions carried out on Dexia shares by the different shareholders acting in concert (and associated parties) as well as, if such should be the case, any changes of control holding within the meaning of Article 74 § 8 of the said Law. The essential of the notifications received in 2010, which are available in full on the Dexia SA internet site under the heading “Legal Information/Belgian tender offer rules”, is listed in the following table.
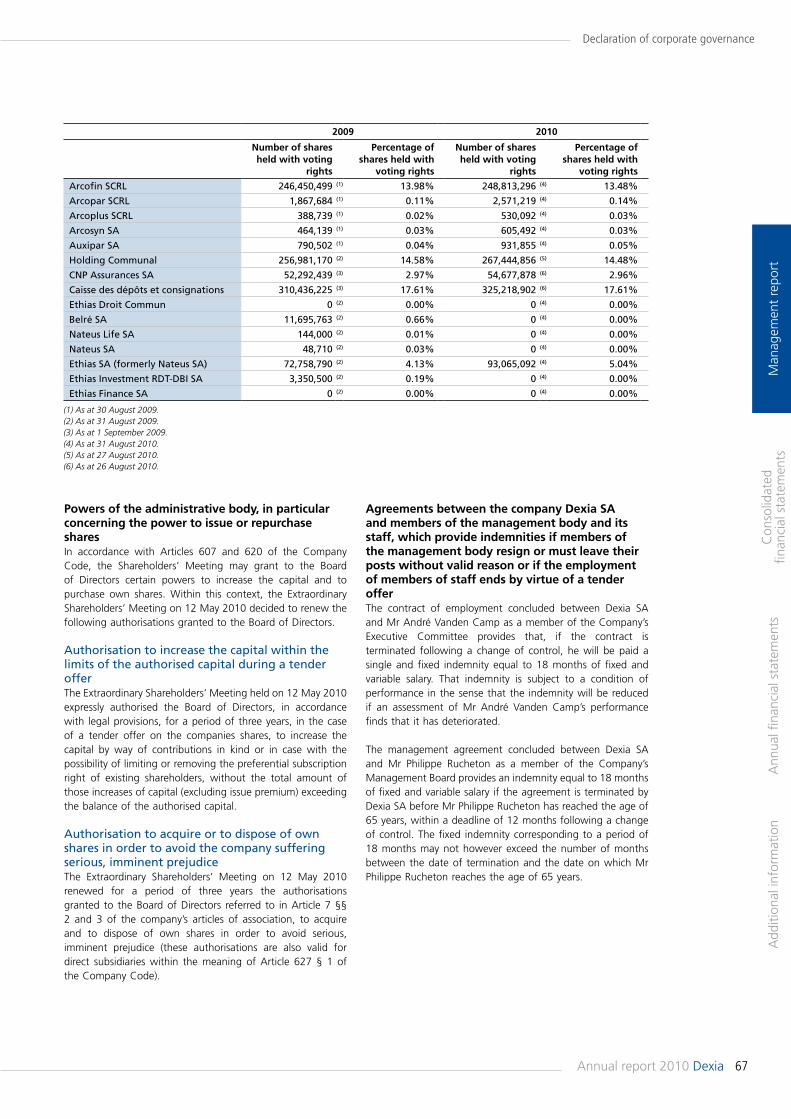
67Annual report 2010 Dexia
Declaration of corporate governance
Man
agem
ent
repo
rtA
dditi
onal
info
rmat
ion
Ann
ual fi
nanc
ial s
tate
men
tsC
onso
lidat
ed
finan
cial
sta
tem
ents
2009 2010
Number of shares held with voting
rights
Percentage of shares held with
voting rights
Number of shares held with voting
rights
Percentage of shares held with
voting rights
Arcofin SCRL 246,450,499 (1) 13.98% 248,813,296 (4) 13.48%
Arcopar SCRL 1,867,684 (1) 0.11% 2,571,219 (4) 0.14%
Arcoplus SCRL 388,739 (1) 0.02% 530,092 (4) 0.03%
Arcosyn SA 464,139 (1) 0.03% 605,492 (4) 0.03%
Auxipar SA 790,502 (1) 0.04% 931,855 (4) 0.05%
Holding Communal 256,981,170 (2) 14.58% 267,444,856 (5) 14.48%
CNP Assurances SA 52,292,439 (3) 2.97% 54,677,878 (6) 2.96%
Caisse des dépôts et consignations 310,436,225 (3) 17.61% 325,218,902 (6) 17.61%
Ethias Droit Commun 0 (2) 0.00% 0 (4) 0.00%
Belré SA 11,695,763 (2) 0.66% 0 (4) 0.00%
Nateus Life SA 144,000 (2) 0.01% 0 (4) 0.00%
Nateus SA 48,710 (2) 0.03% 0 (4) 0.00%
Ethias SA (formerly Nateus SA) 72,758,790 (2) 4.13% 93,065,092 (4) 5.04%
Ethias Investment RDT-DBI SA 3,350,500 (2) 0.19% 0 (4) 0.00%
Ethias Finance SA 0 (2) 0.00% 0 (4) 0.00%
(1) As at 30 August 2009.(2) As at 31 August 2009.(3) As at 1 September 2009.(4) As at 31 August 2010.(5) As at 27 August 2010.(6) As at 26 August 2010.
Powers of the administrative body, in particular concerning the power to issue or repurchase sharesIn accordance with Articles 607 and 620 of the Company Code, the Shareholders’ Meeting may grant to the Board of Directors certain powers to increase the capital and to purchase own shares. Within this context, the Extraordinary Shareholders’ Meeting on 12 May 2010 decided to renew the following authorisations granted to the Board of Directors.
Authorisation to increase the capital within the limits of the authorised capital during a tender offerThe Extraordinary Shareholders’ Meeting held on 12 May 2010 expressly authorised the Board of Directors, in accordance with legal provisions, for a period of three years, in the case of a tender offer on the companies shares, to increase the capital by way of contributions in kind or in case with the possibility of limiting or removing the preferential subscription right of existing shareholders, without the total amount of those increases of capital (excluding issue premium) exceeding the balance of the authorised capital.
Authorisation to acquire or to dispose of own shares in order to avoid the company suffering serious, imminent prejudiceThe Extraordinary Shareholders’ Meeting on 12 May 2010 renewed for a period of three years the authorisations granted to the Board of Directors referred to in Article 7 §§ 2 and 3 of the company’s articles of association, to acquire and to dispose of own shares in order to avoid serious, imminent prejudice (these authorisations are also valid for direct subsidiaries within the meaning of Article 627 § 1 of the Company Code).
Agreements between the company Dexia SA and members of the management body and its staff, which provide indemnities if members of the management body resign or must leave their posts without valid reason or if the employment of members of staff ends by virtue of a tender offerThe contract of employment concluded between Dexia SA and Mr André Vanden Camp as a member of the Company’s Executive Committee provides that, if the contract is terminated following a change of control, he will be paid a single and fixed indemnity equal to 18 months of fixed and variable salary. That indemnity is subject to a condition of performance in the sense that the indemnity will be reduced if an assessment of Mr André Vanden Camp’s performance finds that it has deteriorated.
The management agreement concluded between Dexia SA and Mr Philippe Rucheton as a member of the Company’s Management Board provides an indemnity equal to 18 months of fixed and variable salary if the agreement is terminated by Dexia SA before Mr Philippe Rucheton has reached the age of 65 years, within a deadline of 12 months following a change of control. The fixed indemnity corresponding to a period of 18 months may not however exceed the number of months between the date of termination and the date on which Mr Philippe Rucheton reaches the age of 65 years.
68 Dexia Annual report 2010
Shareholder information
Man
agem
ent
repo
rtA
dditi
onal
info
rmat
ion
Ann
ual fi
nanc
ial s
tate
men
tsC
onso
lidat
ed
finan
cial
sta
tem
ents
For Dexia, the year 2010 saw its market price fall 38.9%(1) over the period. The market year had however begun relatively well with an out-performance by the share in comparison to the sector until the first concerns arose on the sovereign debts of certain European States and regulatory uncertainties weighing on the financial sector. In that environment, the evolution of the Dexia share price was below market performance, in both falling and rising periods, with the exception of the period which followed the announcement of the results of European bank stress tests by the CEBS (Committee of European Banking Supervisors). Globally, the lack of visibility prior to the decision by the European Commission, the weight of the bond portfolio and fears as to sovereign exposure weighed on the share’s performance throughout the year. The number of share exchanges fell by more than 38% over the year, against the general background of investor disaffection with financial stocks. The exit of the Dexia share from the CAC 40, from 20 September 2010 on, again accentuated the trend. To recall, the Crédit local de France (currently Dexia Crédit Local) share joined the CAC 40 on 17 November 1993 before being replaced in the index by the Dexia share in November 1999, after the development of the relationship between Crédit local de France and Crédit Communal de Belgique (currently Dexia Bank Belgium) in 1996 and the Group's reorganisation in 1999.
(1) On the basis of the adjusted share price as at 31 December 2009 (EUR 4.257) to take the impact on the share price of the issue of bonus shares distributed to shareholders in 2010 into account.
Stock market evolution in 2010
The year 2010 did not see any continuation of the equity market rebound which began in 2009. This investment category was broadly relinquished in 2010 in favour of other more remunerative assets (real estate, gold, corporate bonds and so on) despite an “under-valuation” of some shares. As at 31 December 2010, the Euro Stoxx 50 had lost 5.4%, and the CAC 40 3.3%, whilst for its part the BEL20 had risen 2.7% by virtue of the very good performance of its first capitalisation.On the other side of the Atlantic, macroeconomic data, and particularly employment data, did nothing to reassure the markets as to the robustness and the recovery of the US economy, which might have triggered a recovery in Europe.Within the euro zone, against a background of weak growth in the economy, the third shock of the financial crisis (the sovereign debt crisis), first of all hit Greece and then, by contagion certain more fragile countries in the euro zone. The introduction of austerity plans, the fall of tax receipts, and additional expenditure associated with population ageing aggravated the debt situation of some European States, arousing fears among investors in the absence of strong economic growth. The mechanisms for support to States in difficulty put in place in May by the European Union, the IMF, the Eurogroup and the ECB, allowed a gradual return to calm. However, after the summer, renewed uncertainty hit the markets in view of the problems of the Irish banks, and dominated the fourth quarter.Against that background, the financial sector was particularly affected, and this was reflected by a fall of more than 26.5% on the Euro Stoxx Banks which includes banks in the euro zone. On top of the tensions on sovereign debts, which impacted bank portfolios, came a number of uncertainties of a regulatory or fiscal nature, such as the new Basel III solvency and liquidity standards.
STOCK EXCHANGE DATA 31/12/09 31/12/10
Share price (in EUR) 4.460 (1) 2.600
Stock market capitalisation (in millions of EUR) 7,861 4,801
2009 2010
Highest price/lowest price (in EUR) 7.060/1.100 4.868/2.540
Average daily transaction volume (in millions of EUR) 21,365 13,379
Daily number of shares exchanged (in thousands of shares) 4,640 3,802(1) Historical share price. The adjusted share price was EUR 4.257 as at 31 December 2009 and takes the impact of the issue of bonus shares distributed to shareholders in 2010 into account.
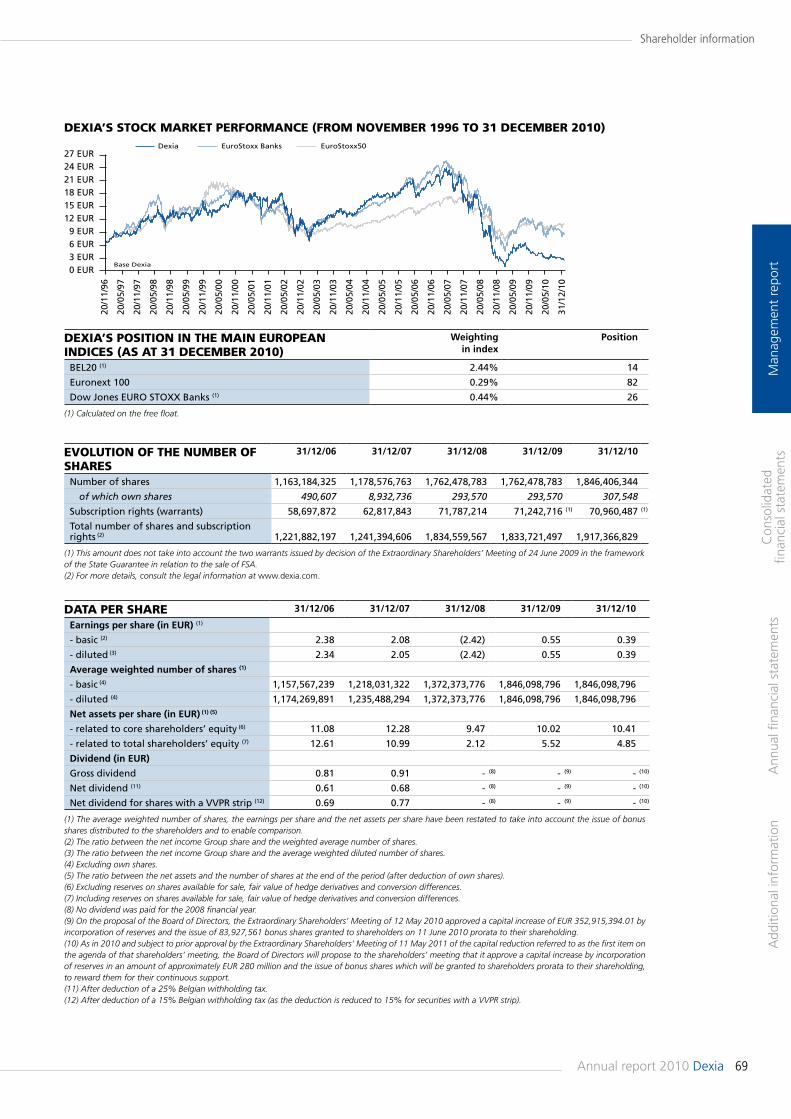
69Annual report 2010 Dexia
Shareholder information
Man
agem
ent
repo
rtA
dditi
onal
info
rmat
ion
Ann
ual fi
nanc
ial s
tate
men
tsC
onso
lidat
ed
finan
cial
sta
tem
ents
DEXIA’S POSITION IN THE MAIN EUROPEAN INDICES (AS AT 31 DECEMBER 2010)
Weighting in index
Position
BEL20 (1) 2.44% 14
Euronext 100 0.29% 82
Dow Jones EURO STOXX Banks (1) 0.44% 26
(1) Calculated on the free float.
EvOLUTION OF THE NUMBER OF SHARES
31/12/06 31/12/07 31/12/08 31/12/09 31/12/10
Number of shares 1,163,184,325 1,178,576,763 1,762,478,783 1,762,478,783 1,846,406,344
of which own shares 490,607 8,932,736 293,570 293,570 307,548
Subscription rights (warrants) 58,697,872 62,817,843 71,787,214 71,242,716 (1) 70,960,487 (1)
Total number of shares and subscription rights (2) 1,221,882,197 1,241,394,606 1,834,559,567 1,833,721,497 1,917,366,829
(1) This amount does not take into account the two warrants issued by decision of the Extraordinary Shareholders’ Meeting of 24 June 2009 in the framework of the State Guarantee in relation to the sale of FSA.(2) For more details, consult the legal information at www.dexia.com.
DATA PER SHARE 31/12/06 31/12/07 31/12/08 31/12/09 31/12/10
Earnings per share (in EUR) (1)
- basic (2) 2.38 2.08 (2.42) 0.55 0.39
- diluted (3) 2.34 2.05 (2.42) 0.55 0.39
Average weighted number of shares (1)
- basic (4) 1,157,567,239 1,218,031,322 1,372,373,776 1,846,098,796 1,846,098,796
- diluted (4) 1,174,269,891 1,235,488,294 1,372,373,776 1,846,098,796 1,846,098,796
Net assets per share (in EUR) (1) (5)
- related to core shareholders’ equity (6) 11.08 12.28 9.47 10.02 10.41
- related to total shareholders’ equity (7) 12.61 10.99 2.12 5.52 4.85
Dividend (in EUR)
Gross dividend 0.81 0.91 - (8) - (9) - (10)
Net dividend (11) 0.61 0.68 - (8) - (9) - (10)
Net dividend for shares with a VVPR strip (12) 0.69 0.77 - (8) - (9) - (10)
(1) The average weighted number of shares, the earnings per share and the net assets per share have been restated to take into account the issue of bonus shares distributed to the shareholders and to enable comparison.(2) The ratio between the net income Group share and the weighted average number of shares.(3) The ratio between the net income Group share and the average weighted diluted number of shares.(4) Excluding own shares.(5) The ratio between the net assets and the number of shares at the end of the period (after deduction of own shares).(6) Excluding reserves on shares available for sale, fair value of hedge derivatives and conversion differences.(7) Including reserves on shares available for sale, fair value of hedge derivatives and conversion differences.(8) No dividend was paid for the 2008 financial year.(9) On the proposal of the Board of Directors, the Extraordinary Shareholders’ Meeting of 12 May 2010 approved a capital increase of EUR 352,915,394.01 by incorporation of reserves and the issue of 83,927,561 bonus shares granted to shareholders on 11 June 2010 prorata to their shareholding.(10) As in 2010 and subject to prior approval by the Extraordinary Shareholders’ Meeting of 11 May 2011 of the capital reduction referred to as the first item on the agenda of that shareholders’ meeting, the Board of Directors will propose to the shareholders’ meeting that it approve a capital increase by incorporation of reserves in an amount of approximately EUR 280 million and the issue of bonus shares which will be granted to shareholders prorata to their shareholding, to reward them for their continuous support.(11) After deduction of a 25% Belgian withholding tax.(12) After deduction of a 15% Belgian withholding tax (as the deduction is reduced to 15% for securities with a VVPR strip).
27 EUR
0 EURBase Dexia
Dexia EuroStoxx Banks EuroStoxx50
3 EUR6 EUR9 EUR
12 EUR15 EUR18 EUR21 EUR24 EUR
20/1
1/96
20/0
5/97
20/1
1/97
20/0
5/98
20/1
1/98
20/0
5/99
20/0
5/00
20/0
5/01
20/0
5/02
20/0
5/03
20/0
5/04
20/0
5/05
20/0
5/06
20/0
5/07
20/0
5/08
20/0
5/09
20/0
5/10
20/1
1/99
20/1
1/00
20/1
1/01
20/1
1/02
20/1
1/03
20/1
1/04
20/1
1/05
20/1
1/06
20/1
1/07
20/1
1/08
20/1
1/09
31/1
2/10
DEXIA’S STOCK MARKET PERFORMANCE (FROM NOvEMBER 1996 TO 31 DECEMBER 2010)
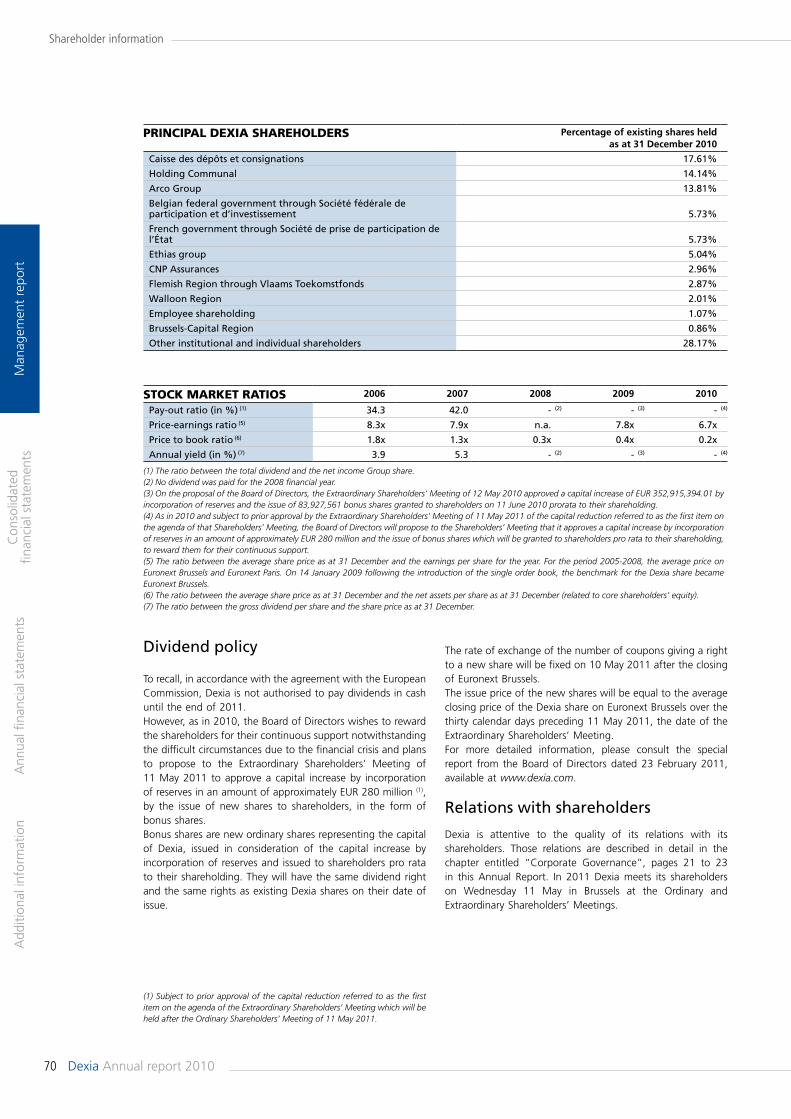
70 Dexia Annual report 2010
Shareholder information
Man
agem
ent
repo
rtA
dditi
onal
info
rmat
ion
Ann
ual fi
nanc
ial s
tate
men
tsC
onso
lidat
ed
finan
cial
sta
tem
ents
PRINCIPAL DEXIA SHAREHOLDERS Percentage of existing shares held as at 31 December 2010
Caisse des dépôts et consignations 17.61%
Holding Communal 14.14%
Arco Group 13.81%
Belgian federal government through Société fédérale de participation et d’investissement 5.73%
French government through Société de prise de participation de l’État 5.73%
Ethias group 5.04%
CNP Assurances 2.96%
Flemish Region through Vlaams Toekomstfonds 2.87%
Walloon Region 2.01%
Employee shareholding 1.07%
Brussels-Capital Region 0.86%
Other institutional and individual shareholders 28.17%
STOCK MARKET RATIOS 2006 2007 2008 2009 2010
Pay-out ratio (in %) (1) 34.3 42.0 - (2) - (3) - (4)
Price-earnings ratio (5) 8.3x 7.9x n.a. 7.8x 6.7x
Price to book ratio (6) 1.8x 1.3x 0.3x 0.4x 0.2x
Annual yield (in %) (7) 3.9 5.3 - (2) - (3) - (4)
(1) The ratio between the total dividend and the net income Group share.(2) No dividend was paid for the 2008 financial year.(3) On the proposal of the Board of Directors, the Extraordinary Shareholders’ Meeting of 12 May 2010 approved a capital increase of EUR 352,915,394.01 by incorporation of reserves and the issue of 83,927,561 bonus shares granted to shareholders on 11 June 2010 prorata to their shareholding.(4) As in 2010 and subject to prior approval by the Extraordinary Shareholders’ Meeting of 11 May 2011 of the capital reduction referred to as the first item on the agenda of that Shareholders’ Meeting, the Board of Directors will propose to the Shareholders’ Meeting that it approves a capital increase by incorporation of reserves in an amount of approximately EUR 280 million and the issue of bonus shares which will be granted to shareholders pro rata to their shareholding, to reward them for their continuous support.(5) The ratio between the average share price as at 31 December and the earnings per share for the year. For the period 2005-2008, the average price on Euronext Brussels and Euronext Paris. On 14 January 2009 following the introduction of the single order book, the benchmark for the Dexia share became Euronext Brussels.(6) The ratio between the average share price as at 31 December and the net assets per share as at 31 December (related to core shareholders’ equity).(7) The ratio between the gross dividend per share and the share price as at 31 December.
Dividend policy
To recall, in accordance with the agreement with the European Commission, Dexia is not authorised to pay dividends in cash until the end of 2011.However, as in 2010, the Board of Directors wishes to reward the shareholders for their continuous support notwithstanding the difficult circumstances due to the financial crisis and plans to propose to the Extraordinary Shareholders’ Meeting of 11 May 2011 to approve a capital increase by incorporation of reserves in an amount of approximately EUR 280 million (1), by the issue of new shares to shareholders, in the form of bonus shares.Bonus shares are new ordinary shares representing the capital of Dexia, issued in consideration of the capital increase by incorporation of reserves and issued to shareholders pro rata to their shareholding. They will have the same dividend right and the same rights as existing Dexia shares on their date of issue.
(1) Subject to prior approval of the capital reduction referred to as the first item on the agenda of the Extraordinary Shareholders’ Meeting which will be held after the Ordinary Shareholders’ Meeting of 11 May 2011.
The rate of exchange of the number of coupons giving a right to a new share will be fixed on 10 May 2011 after the closing of Euronext Brussels. The issue price of the new shares will be equal to the average closing price of the Dexia share on Euronext Brussels over the thirty calendar days preceding 11 May 2011, the date of the Extraordinary Shareholders’ Meeting. For more detailed information, please consult the special report from the Board of Directors dated 23 February 2011, available at www.dexia.com.
Relations with shareholders
Dexia is attentive to the quality of its relations with its shareholders. Those relations are described in detail in the chapter entitled “Corporate Governance”, pages 21 to 23 in this Annual Report. In 2011 Dexia meets its shareholders on Wednesday 11 May in Brussels at the Ordinary and Extraordinary Shareholders’ Meetings.
71Annual report 2010 Dexia
Human Resources
Man
agem
ent
repo
rtA
dditi
onal
info
rmat
ion
Ann
ual fi
nanc
ial s
tate
men
tsC
onso
lidat
ed
finan
cial
sta
tem
ents
decision-making processes and to achieve synergies. In addition, implementing the project to reorganise HR has also made it possible to identify a number of remaining operating inefficiencies, as well as the synergies not yet realised between the various entities.Furthermore, this change in the governance of HR will facilitate better consistency, visibility and control over spending and better-coordinated management of initiatives, especially transversal projects. The new organisation will also focus on industrialising the processes even more, simplifying the structures and sharing competences.The elaboration and implementation of this HR Transformation Plan will continue in 2011. In addition to its proper transformation, all competences will be mobilized in 2011 to succeed in the overall transformation of Dexia and to limit the impacts on teams as much as possible. Solutions will be sought via social dialogue and in line with Dexia’s Principles of Social Management.
Key figures
At the end of 2010, Dexia had 35,185 members of staff, of 68 different nationalities, in 34 countries (including RBC Dexia Investor Services and the independent networks in Belgium). • Seniority – More than 60% of members of staff joined the Group less than ten years ago and the average length of service of Group members of staff is 11 years.• Age – Group members of staff are young; in total, 41.2% of staff are less than 35 and 58.8% less than 40 years of age. The average age is 39.2 for men and 36.9 for women, and the overall average age is 38.• Men/women – The overall division of workforce between men and women is well balanced, at 50.5% and 49.5% respectively.• Turnover – 95.1% of workforce on indefinite-term contracts.• Part-time – 15% of Group members of staff work part-time.• Training days – The average number of training days per member of staff (Full Time Equivalent) rises to 1.9 days for the whole Group (more than 10% increase year-on-year).
As regards staff figures, the downward trend resulting from the transformation plan continued throughout 2010, in compliance with the objectives. It should, however, be noted that, at Group level, the fall was offset by the substantial growth in new hires at DenizBank, Dexia's Turkish subsidiary (not subject to the terms of the transformation plan).
Human Resources in transformation
In 2009, the refocusing of the Group was accompanied by a complete activity review and by a plan aiming at a tighter organization of all Group support lines (including Human Resources). The Human Resources transformation consisted in improving and optimising its operation from the point of view of alignment, increased responsibility and efficiency-seeking and therefore set a new target organisation for Human Resources to be implemented and rolled-out and that will change its modus operandi.
The four principles of the Human Resources reorganisation are:• the introduction of a common governance for Human Resources by the definition of a common approach in the operational management of activities, with global policies, rules, processes and tools and by a redefinition of the roles and responsibilities of committees;• the homogenisation of the support line in operational terms, by: - the definition and documentation of standard processes and tools for all the entities,- the establishment of consistency in the principal HR processes and tools for the whole Group whilst taking into account the specific local features imposed by the business mode, the legal or social framework,- the development of self-service in all the entities for basic HR operations, supported by a call centre and an integrated back office;• the optimisation of the distribution of HR services via the creation of “job pools”, ensuring a common management of the activities of recruitment and mobility, training administration and HR administration, for all the entities in the same country;• the mutualisation of key HR competences by:- the redefinition of the distribution of roles between the Group and the entities, and the elaboration of strategy for all the HR activities together for the Group,- the creation of mutualised competence centres for key processes.The Transformation Plan 2011-2013, presented on 15 September 2010, will shift HR from a strong functional model to a directive model (to be implemented in 2011). The aim is to improve the level of coordination and visibility, to simplify the organisational structures, to improve the
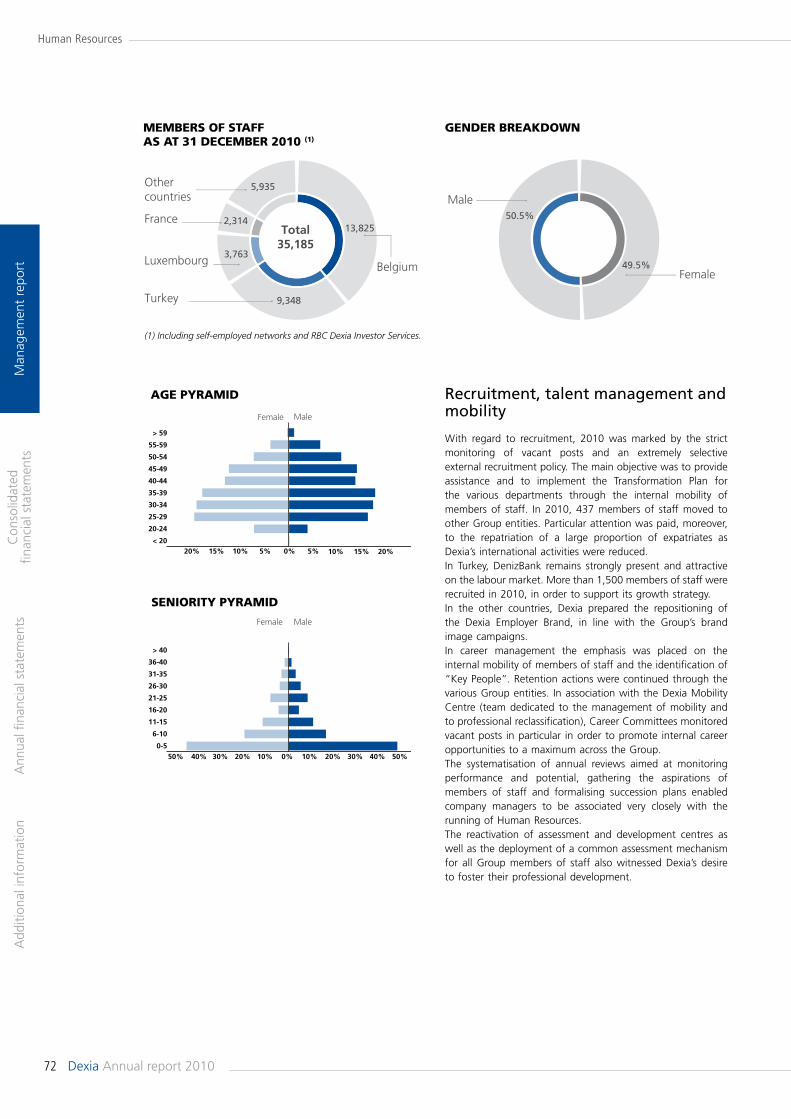
72 Dexia Annual report 2010
Human Resources
Man
agem
ent
repo
rtA
dditi
onal
info
rmat
ion
Ann
ual fi
nanc
ial s
tate
men
tsC
onso
lidat
ed
finan
cial
sta
tem
ents
Recruitment, talent management and mobility
With regard to recruitment, 2010 was marked by the strict monitoring of vacant posts and an extremely selective external recruitment policy. The main objective was to provide assistance and to implement the Transformation Plan for the various departments through the internal mobility of members of staff. In 2010, 437 members of staff moved to other Group entities. Particular attention was paid, moreover, to the repatriation of a large proportion of expatriates as Dexia’s international activities were reduced. In Turkey, DenizBank remains strongly present and attractive on the labour market. More than 1,500 members of staff were recruited in 2010, in order to support its growth strategy.In the other countries, Dexia prepared the repositioning of the Dexia Employer Brand, in line with the Group’s brand image campaigns.In career management the emphasis was placed on the internal mobility of members of staff and the identification of “Key People”. Retention actions were continued through the various Group entities. In association with the Dexia Mobility Centre (team dedicated to the management of mobility and to professional reclassification), Career Committees monitored vacant posts in particular in order to promote internal career opportunities to a maximum across the Group.The systematisation of annual reviews aimed at monitoring performance and potential, gathering the aspirations of members of staff and formalising succession plans enabled company managers to be associated very closely with the running of Human Resources.The reactivation of assessment and development centres as well as the deployment of a common assessment mechanism for all Group members of staff also witnessed Dexia’s desire to foster their professional development.
> 40
36-40
31-35
26-30
21-25
16-20
11-15
6-10
0-5
20% 15% 10% 5% 0% 5% 10% 15% 20%
> 59
55-59
50-54
45-49
40-44
35-39
30-34
25-29
20-24
< 20
MaleFemale
MaleFemale
SENIORITY PYRAMID
AGE PYRAMID
50% 20%40% 30% 10% 20% 0% 10% 30% 50%40%
5,935
2,314
3,763
9,348
13,825
35,185
28.2
3.0
5.0
5.7
5.7 5.7
13.8
14.1
17.6
(1) Including self-employed networks and RBC Dexia Investor Services..
Belgium
Turkey
Luxembourg
France
Other countries
1.1
Total
Other institutionaland individualshareholders
Caisse des dépôts et consignations
HoldingCommunal
Arco Group
French StateBelgian federal StateThree Belgian RegionsEthias Group CNP Assurances
Employeeshareholding
MEMBERS OF STAFF AS AT 31 DECEMBER 2010 (1)
50.5%
49.5%Female
Male
GENDER BREAKDOWN

73Annual report 2010 Dexia
Human Resources
Man
agem
ent
repo
rtA
dditi
onal
info
rmat
ion
Ann
ual fi
nanc
ial s
tate
men
tsC
onso
lidat
ed
finan
cial
sta
tem
ents
• Lead an Organisation: mini-MBA programme targeting senior managers• Discovering Dexia: the integration seminar for all new executives was re-launched in December 2010.• Dexia Mentoring Programme: a transversal programme to transfer knowledge and expertise throughout the organizationGlobally, the Dexia Corporate University has once again contributed to cascading the Group’s strategy. In that context, the University continued to support Dexia in change management through the following actions:• the ongoing offer of the University dedicated to change and uncertainty: Learning with Change, Dealing with Stress, Change and Team, among others;• a very specific offer to help team managers to deal with change: dynamic online manuals, workshops, and so on;• short or long-term individual coaching, designed for top executives and team managers;• team coaching, for managers and their teams;• training paths in project management.During 2010, the Dexia Corporate University has also worked on a number of initiatives which will be implemented in 2011: a harmonized “on-boarding” programme targeting new employees; a learning support to help employees to switch to new versions of software such as MS Office, Clarity or Business Object.In total 1,290 participants attended one of the training courses organized by the DCU in 2010.
Compensation
Recurrent projects continued in 2010. Indeed management of the exit from the 2005 share ownership plan enabled teams to continue the work of informing members of staff on the terms linked to its maturity.Furthermore, the Dexia Group compensation policy was impacted by new Belgian, French and even European regulations. The People Reward team took part in discussions with the regulators and sector federations and prepared the appropriate amendments to Dexia policy so as to comply with these issues.Regulatory aspects evolved strongly in 2010 and that trend is likely to continue throughout 2011 in order to continue aligning the sustainable development of the company and its risk profile with common practices in terms of compensation.Indeed, in accordance with the European “Capital Requi-rements Directive III” and associated guidelines from the Committee of European Banking Supervisors, in 2011 the Dexia Group will adapt its general compensation policy, the principles of which fall within the guidelines established by Europe. Similarly, Dexia has also adapted its policy to comply with the obligations arising from the Belgian Law of 6 April 2010 on corporate governance.Implementing the Transformation Plan and refocusing Dexia on its core franchises required the management of a large number of international and national moves and necessitated assistance in those internal moves from Human Resources departments.
Working conditions
Implementation of the Transformation Plan had major consequences on the evolution of the working conditions of members of staff. For a long time, the Group has been eager to give its employees the greatest possible visibility over their company and their evolution within it, to prevent and to detect stress situations, particularly with the introduction of a policy to prevent “mental risks”.There are many mechanisms to detect, prevent and manage stress, within the entities.Several information channels currently enable such risks to be detected in the entities (personnel representatives, work doctor, social assistants, internal and external advisory teams, recovery tools as part of the quality certification process, satisfaction surveys and so on).As for prevention, in addition to existing measures (preventive medical consultations, ergonomic advices, training of members of staff and managers and so on), there have been new large-scale training and coaching actions.Stress detection surveys were carried out in several entities with a view to averting psycho-social risks and reducing the stress with which members of staff might have to cope. In some entities, the survey also covered employee satisfaction with the performance of their tasks. The aim of these surveys is to implement action plans aimed at increasing staff motivation.Finally, declared stress situations are managed and assistance provided by various means: via the Human Resources division, internal and/or external experts, coaching measures, psychological hotlines, interviews, working time adjustments.The Dexia Corporate University also created new training courses aligned to the accompaniment of change and stress management for all: members of staff, managers, Human Resources teams and so on.
Training
Supporting the Dexia transformation plan was one of the major objective of the training department in 2010. Initiatives to support line management in their role as change agent were combined with coaching and training people confronted with a professional reorientation. Seminars were also organized to explain and discuss the evolution of the regulatory framework in different areas (risk, finance and financial markets). A major investment was also made in training for the commercial networks in order to further improve the customer orientation and satisfaction. In that framework, the Deniz Academy has been supporting the growth of DenziBank’s commercial network providing training for new hired sales staff, management trainings for new sales managers and sales programmes on "relationship banking strategy". In order to support people in their career opportunities, the Dexia Corporate University re-launched some of its strategic learning initiatives:• Marco Polo Programme: a programme for high potential that aims at promoting mobility within the Group and at contributing to the development of a Group culture. This program includes a 6-month assignment in a different country and a different entity.
74 Dexia Annual report 2010
Human Resources
Man
agem
ent
repo
rtA
dditi
onal
info
rmat
ion
Ann
ual fi
nanc
ial s
tate
men
tsC
onso
lidat
ed
finan
cial
sta
tem
ents
Finally, questions regarding compensation and the management of compensation aspects associated with performance were given particular attention, notably in order to ensure that variable compensation takes account, on the one hand, of the results achieved by the entities concerned and by the Group as a whole and, on the other hand, of the performance of members of staff.
Social dialogue
The European Works Council (EWC) at Dexia is composed of 30 permanent members from 13 different Dexia entities and 4 countries. This social body is competent to discuss any major transnational question with management.Considering the current situation and the information-consultation process in relation to the transformation plan, the social calendar was particularly full and numerous meetings were organised (5 meetings of the European Works Council, 11 meetings of the EWC Board) to provide information to staff representatives and to answer their questions.At a local level, social dialogue was intense in all Group entities. In fact, within their entities, social partners dealt with the information-consultation process arising from the third phase of the transformation plan.In order to implement earlier phases of the transformation plan within the Belgian job pool, social partners in the entities concerned held plenary sessions together to negotiate collective staff transfer agreements.
75Annual report 2010 Dexia
Sustainable development
Man
agem
ent
repo
rtA
dditi
onal
info
rmat
ion
Ann
ual fi
nanc
ial s
tate
men
tsC
onso
lidat
ed
finan
cial
sta
tem
ents
Principal themes of the report
Identity and strategy• Message from the Chairmen• Our strategy for sustainable development• Our key indicators
Priority 2011-2012: The energy performance in buildings• Background and issues• Providing a range of products and services suited to all our customers• Controlling energy consumption in our own buildings
Relevance• Fighting deprivation and social exclusion • Adapting our services to the diverse needs of our customers• Supporting the development of green growth
Essence• Incorporating environmental and social risks into our financing activities• Socially Responsible Investing• Conducting our business responsibly• Acting as a responsible business
Communication• Strengthening the dialogue with our stakeholders• Developing a relationship of trust with our customers
Evaluation• Reporting process• Auditor’s Report• Table of indicators• Table for correspondence of reference systems• Glossary
The 2010 Dexia Sustainable Development Report
Orientation of the 2010 report
Since 2009, Dexia has been undertaking an in-depth transformation of its activities, refocusing on its core business lines and its historical franchises and adapting its cost structure. In 2010 we wanted to increase the consistency of our sustainable development strategy with that transformation, realigning it to the vital question: in running our banking business line, how do we assist our clients in their sustainable development endeavours?
Our aim is to simplify our approach, making it more transparent, by articulating it around a definition of sustainable development and four fundamental principles common to the Group as a whole. We wanted to decline that renewed undertaking operationally by selecting a priority line of action for 2011-2012: energy performance in buildings.
This new alignment of our sustainable development approach naturally led us to establish our 2010 sustainable development report in line with the Group’s four fundamental principles – Relevance, Essence, Communication and Evaluation – giving priority to the issue of energy performance in buildings.
In order to limit its direct environmental impact, since 2008 Dexia has done without any paper printing of its sustainable development report, and for its 2010 report an exclusively dematerialised support has been adopted, available on its internet site at www.dexia.com.
76 Dexia Annual report 2010
Sustainable development
Man
agem
ent
repo
rtA
dditi
onal
info
rmat
ion
Ann
ual fi
nanc
ial s
tate
men
tsC
onso
lidat
ed
finan
cial
sta
tem
ents
Energy performance in buildings
In order to assist all of our clients to achieve their objectives regarding energy performance in buildings, over several years Dexia has developed an innovative range of dedicated products and services. In Belgium and Luxembourg, Dexia offers its individual clients loans intended to finance work to improve the energy performance of their homes (habitation eco-loans, housing loans and a range of ImmoPlus Green products). In France, since 2009 Dexia has offered a process to assist local public sector operators in their real estate energy renovation projects. This relies on the provision of software to audit and to simulate energy works, enabling public decision-makers to link a technical view with the financial perspective, as well as putting dedicated finance in place.Eager to set an example in managing its own buildings, since 2008 Dexia has been performing energy audits in its principal buildings. The Pachéco/Ommegang and Galilée buildings in Belgium were audited in 2008 and 2009. In 2010, an audit was also performed on the Dexia Towers in Brussels and Paris.
77Annual report 2010 Dexia
Risk management
Man
agem
ent
repo
rtA
dditi
onal
info
rmat
ion
Ann
ual fi
nanc
ial s
tate
men
tsC
onso
lidat
ed
finan
cial
sta
tem
ents
Dexia was subject to the 2010 European Union-wide stress testing exercise, coordinated by the Committee of European Banking Supervisors (CEBS). The conclusion of that stress test, based on various scenarios of credit quality deterioration (1), is that Dexia does not require additional capital to withstand the CEBS two-year adverse scenario, including the additional sovereign shock. More detailed information on the stress tests is provided in the section dedicated to stress tests (page 93) in this chapter.
Market activity monitoring was improved with the launch in 2010 of the “Market Risk Engine” project aimed at having an integrated system for the calculation of historical VaR over all risk factors. Considerable progress was also made in valuing structured instruments and back-to-back derivatives.
Dexia continued the development and implementation of various transversal projects:• new models were developed and will be gradually used for the calculation of regulatory capital;• Dexia put in place in 2010 an action plan related to stress-testing in 2010: the development of new governance enhancing and optimising the organisation in place was made a priority in 2010. Furthermore, Dexia participated actively in the regulatory exercises run by the CEBS, the first results of which were provided by Dexia in May 2010;• a formal framework of risk appetite indicators was put in place at Dexia SA level and will be gradually introduced in the main entities during 2011;• an action plan was put in place to answer the recom-mendations made by the Dexia regulators within the context of the Pillar 2 of Basel II mission;• potential impacts of the regulatory developments proposed by the BIS (Bank for International Settlements) were quantified, particularly regarding the definition of capital, leverage ratio and liquidity ratios;• Dexia took part in international consideration of the evolution of IFRS regulations on classification and provisioning, with presentation of the exposure draft in June 2010, as well as on the hedging of financial instruments.
(1) The test was conducted using the scenarios, methodology and key assumptions provided by the CEBS, detailed in the aggregate report published on the CEBS website: http://www.c-ebs.org/EU-wide-stress-testing.aspx
Introduction
In 2010, the Risk Management activities were severely impacted by a disrupted economic environment, marked by significant interest and exchange rates volatility as well as considerable investor distrust for some sovereign issuers in the euro zone. Despite this difficult context, Dexia continued to implement its transformation plan successfully, further reducing its short-term funding requirement and thus its risk profile.
This reduction of the Group’s risk profile continued in particular thanks to a voluntarist policy of reducing the portfolio in run-off since the end of 2008. In line with the agreement with the European Commission, the Group also disposed of various holdings in 2010 (cf. chapter “Update on the transformation plan” on page 13) which, combined with the reduction of the portfolio in run-off, is reflected by a fall of EUR 38.5 billion in the Group’s credit risk exposure compared to the end of 2009. Risk weighted assets naturally followed the same trend and decreased by EUR 2.3 billion over the year, despite the unfavourable impact of the price of the euro against the US dollar, whilst the Tier 1 ratio improved from 12.3% at year-end 2009 to 13.1% at year-end 2010. We can also notice a significant reduction of the cost of risk excluding the Financial Products portfolio which amounted to EUR 641 million in 2010 against EUR 1,096 million in 2009. The decrease would be higher by excluding the Financial Products portfolio.
Over the year, the Group considerably reduced its short-term liquidity gap and continued to improve the mix of its short-term funding sources. This improvement of its liquidity situation enabled Dexia to exit the State guarantee on its financing four months before the formal end date of 30 October 2010. In fact, on 30 June 2010, the Group stopped issuing guaran-teed debt, in line with its undertakings to the European Commission. More detailed information on the State guarantee is provided in the note to the consolidated financial state-ments 9.4.C. (page 184).

78 Dexia Annual report 2010
Risk management
Man
agem
ent
repo
rtA
dditi
onal
info
rmat
ion
Ann
ual fi
nanc
ial s
tate
men
tsC
onso
lidat
ed
finan
cial
sta
tem
ents
resort for larger credit files or those presenting a risk level deemed to be sensitive. For each file presented to the credit committee, an independent analysis is performed, presenting the main risk indicators, as well as a qualitative analysis of the transaction. Dexia updated credit granting procedures in accordance with the request by the European Commission to ensure a minimum RAROC of 10% for transactions of the PWB business line.
At the same time as monitoring the credit process, different committees are responsible for the supervision of specific risks. These committees are organised par expertise centre and per entity and meet quarterly.
“Watchlist” committees supervise assets deemed to be “sensitive” and placed on watchlist. Default committees qualify and monitor counterparties in default in accordance with Basel II regulations, applying rules prevailing at Dexia.Provision committees settle the amount of provisions allocated and monitor the cost of risk.Rating committees ensure the correct application of internal rating systems and the appropriateness of rating processes in relation to established principles and the consistency of those processes within the different entities.Credit Risk Management in each Group entity focuses on local credit risk management and is in charge of analysing and monitoring local counterparties. This also includes the development and the update of internal rating systems relative to these counterparties and the production of local reportings.
Market risk
Definition
Market risk comprises the Group’s exposure to adverse movements in market prices as a result of interest-rate risk, equity-price risk and foreign-exchange risk.
The interest-rate risk consists of a general interest-rate risk resulting from market evolution and a specific interest-rate risk (credit spread) linked to the issuer. The latter arises from variations in the spread of a specific signature within a rating class. The risk associated with the equity price represents the risk arising from the reduction in value of equity. As for foreign-exchange risk, this represents the potential decrease of the value due to currency exchange rate movements.
Organisation
Risk management and more particularly Financial Markets Risk Management (FMRM) oversees market risk under the supervision of the Management Board and specialist risk committees. FMRM is a support line integrated into the Risk support line. On the basis of its global risk management approach, it is responsible for identifying, analysing, monitoring and reporting on risks and results (including the valuation aspect) associated with financial market activities.
The policies, guidelines and procedures documenting and governing each of the activities are defined within Dexia SA and applied to all the entities of the Dexia Group. Central teams within expertise centres or transversal teams also have the responsibility to define methods of income statement
Governance
2010 was marked by the effective reorganisation of the Risk Management support line with the approach aligned to the general organisation of the Dexia Group and based on a directive model in which the local chief risk officer (CRO) reports directly to the Group CRO. In this context, the mission of the Risk Management support line was redefined: the main challenges are to define the Dexia risk appetite, to put in place independent and integrated risk measures for all types of risks, to manage all risks and proactively to identify and address any emerging risk.
The support line is now organised transversally by business line: “Retail and Commercial Banking” credit risk, “Public and Wholesale Banking” credit risks and risks linked to financial market activities. This organisation is based on competence centres on which local risk management can rely, in accordance with the Service Level Agreements (SLA) concluded in 2010.
Credit risk
Definition
Credit risk represents the potential loss (decrease of asset value or payment default) which Dexia may incur as a result of deterioration in the solvency of any counterparty.
Organisation
The Dexia risk management oversees Dexia credit risk, under the supervision of the Management Board and specialist committees. It is in charge of defining Group policy on credit risk, particularly the decision-making process for granting loans, and supervising the processes for rating counterparties, analysing credit files and monitoring exposure.
In 2010, in order to increase its efficiency and to make the most of Group competences, the Risk support line evolved towards an organisation by specialist expertise centres, in relation to the various Dexia business lines (Retail and Commercial Banking, Public and Wholesale Banking and financial market activities). Specialist risk committees were also set up per expertise centre, while coordination is provided by transversal teams and committees.
Transversal committeesThe Risk Policy Committee defines risk policies including the credit assigment rules for different sectors and types of counterparty.The Executive Risk Committee meets weekly to decide on the risk management strategy and the organisation of the support line.The Management Credit Committee, organised on a weekly basis, is in charge of undertaking decisions.
Committees specialising per expertise centreIn order to fluidify the decision-making process, the Management Credit Committee delegates its decision-making power to Credit Committees organised per entity and/or expertise centre. This delegation is based on specific rules, in relation to the type of counterparty, the level of counterparty rating and credit risk exposure. The Management Credit Committee remains the decision-making body of last
79Annual report 2010 Dexia
Risk management
Man
agem
ent
repo
rtA
dditi
onal
info
rmat
ion
Ann
ual fi
nanc
ial s
tate
men
tsC
onso
lidat
ed
finan
cial
sta
tem
ents
the role of BSM Risk is to define the risk framework in which management may be undertaken by BSM Finance (risk factors, limits, investment universe, guidelines), to validate models used in the effective management of that risk, to monitor exposure and to check compliance in relation to Group standards, to define the stress to be applied to different risk factors, to challenge the management of the risk performed by the Finance support line and to ensure compliance of the framework with external regulations in force throughout the Dexia Group.
CommitteesAll BSM risks are managed via the Dexia SA Assets & Liabilities Committee (ALCo) which meets monthly. ALCo decides on the global risk framework, fixes limits, ensures consistency of strategy and delegates its implementation to local ALCo. ALCo decides globally on the level of exposure in line with the risk appetite defined by the Management Board, and validates internal transfer price mechanisms within the Dexia Group. Local ALCo manage risks specific to their balance sheet within the framework defined by and under the responsibility of the Dexia SA ALCo.
The Funding and Liquidity Committee (FLC), by delegation from the Group ALCo, centralises and coordinates the decision-making process in relation to liquidity associated issues. The FLC is responsible for monitoring the Group’s liquidity position, its evolution and its cover by short, medium and long-term resources. It monitors the achievement of liquidity targets fixed by the Management Board and elaborates funding, disinvestment and structuring strategies which will enable the Group to overcome regulatory and internal stresses. Meeting bimonthly, the FLC takes all possible steps to improve the Group’s liquidity profile.
Operational risk
Definition
Dexia defines operational risk as follows: operational risk is the risk of financial or non-financial impact resulting from inadequate or failed internal processes, people and systems, or from external events. This definition includes IT, legal and compliance risks, but excludes strategic risk.
Dexia’s definition of operational risk is based on, but not restricted to, the one used by the Basel Committee, which focuses on losses (negative financial impacts). Dexia policy also requires the gathering of data on events generating financial gains.
Organisation
The Operational Risk Management framework relies on strong governance with clearly defined roles and responsibilities.
The Management Board, organised on a weekly basis, regularly reviews the evolution of the risk profile of the different Group activities and takes the required decisions.
The Risk Policy Committee, a strategic committee with representatives of the Management Board, approves Group-wide policies. This committee is organised on a quarterly basis.
calculation and risk measurement, as well as to guarantee consolidated measurement, reporting and monitoring of the risks and results of each of the activities for which they are responsible.
Established in the operational entities, local FMRM teams are responsible for day-to-day activity, namely and inter alia the implementation of policies and directives defined at Dexia SA level, but also local risk assessment and monitoring of risks at a local level (computation of risk indicators, control of the limits and triggers and so on), as well as reporting, reconciliation with local strategic planning, accounting and IT systems. Each operational entity is also responsible for monitoring and reporting to local supervisory and regulatory bodies.
CommitteesThe Market Risk and Guidelines Committee (MRGC) meets on a monthly basis and is responsible for a wide range of topics such as: risk and statement of income trigger reporting analysis (1) and related decisions, definition and revision of limits, proposals for the approval of new products, discussion of guidelines, risk governance and standards, risk concepts and measurement methodology and the quality of valuation processes.
Ad hoc MRGC are organised to decide on specific issues when required from a business and/or a risk management perspective.
In addition to the monthly MRGC, a specific MRGC meets each quarter to discuss risk and business reports associated with market activities.
Dexia Market Risk Committee (DMRC) meets bimonthly and acts as supervisory committee of the MRGC.
The Risk Policy Committee and Risk Management Executive Committee validate all major changes in risk profile or risk governance.
Balance Sheet Management
Definition
Balance Sheet Management (BSM) covers all the structural risks of the banking book, namely, interest-rate risk, foreign-exchange risk, equity risk and liquidity risk.
We refer to the part on Market Risks for detailed definitions of structural and specific interest-rate risk, foreign-exchange risk and equity risk.
Liquidity risk measures the ability of the Group to meet its current and future liquidity requirements, both expected and unexpected.
Organisation
Balance Sheet Management (BSM) is the responsibility of the Finance support line and involves management of the structural risks of the entire Group. Within Risk Management,
(1) Statement of income triggers warn of a deterioration of results and are expressed as a percentage of VaR limits: typically at 50%, 75% and 100% for triggers 1, 2 and 3 and stop the activity at 300% of VaR.
80 Dexia Annual report 2010
Risk management
Man
agem
ent
repo
rtA
dditi
onal
info
rmat
ion
Ann
ual fi
nanc
ial s
tate
men
tsC
onso
lidat
ed
finan
cial
sta
tem
ents
As to risk management of derivatives, Dexia closely monitors the conclusion of appropriate legal documentation relating to netting agreements and the exchange of collateral.
Fundamentals of Dexia credit risk in 2010
At a macroeconomic level, the year 2010 saw a gradual improvement of the economic environment in the majority of countries in Europe. However, the year was also marked by a crisis of confidence as to the ability of some European States to fulfil their financial obligations, resulting in tensions on the financial markets and difficulties for those countries to obtain financing. The crisis led all European countries to adopt financial austerity measures aimed at reducing their public debt.
Within Dexia, a clear slowdown was observed in the deterioration of the average rating of portfolios, reflecting the improvement of the economic situation. That more general trend is particularly visible on a certain number of sectors weakened by the financial crisis and on which collective provisions were booked in 2008 and 2009, in particular the harbour, textiles, motorway and shipping sectors, giving rise to write-backs of collective provisions.
With regard to Retail and Commercial Banking activities, an improvement is also to be noted. In Belgium, the persistence of mitigated macroeconomic indicators is reflected by new defaults which, although down compared to 2009, are still beyond pre-crisis levels. The mortgage loan portfolio has proved particularly resilient whilst professional loans did not escape certain granularity effects but presented a cost of risk down compared to 2009. In Turkey, the sharp economic rebound is reflected by sustained production volumes, a return of defaults to a pre-crisis level and significant recoveries. As a consequence, the cost of risk is well down on 2009, both for individual and for SME loan portfolios.
In order to cope with the crisis affecting the sovereign debt of some European States, principally Greece, Ireland, Portugal and Spain, Dexia not only blocked the granting of credit to the sovereigns concerned but also reduced those exposures via its asset cession programme (1). Dexia continues to monitor this issue, particularly the impact of interventions by the European Support Fund and the IMF to sustain those States experiencing difficulties.
Against that background, it is important not to extrapolate the sovereign default risk to that of local authorities. A certain number of elements enable relativisation of the risk of systemic contagion.• The prudential framework to the management of local authorities is constraining. In the majority of countries in which Dexia is active, local authorities are obliged to present balanced budgets. The contracting of debt is reserved for investment and not for operating expenditure, which is 80% guaranteed by grants and subsidies. The debt level is generally limited. As a consequence, although local authorities have seen their debt grow over the recent period, it remains at reasonable levels (8% deficit and 9% public debt in the European Union).
(1) More details on the Dexia exposures on these countries are given in the part dedicated to Credit risk exposure on page 82 of this chapter.
The Operational Risk Guidelines Committee, chaired on a quarterly basis by the Group Chief Risk Officer, reflects in detail the policy approved on recommendations suited to commercial activities. It transversally reviews operational risk events as well as analyses performed.
The Operational Risk Management Committee, chaired on a monthly basis by the Group head of operational risks, develops a consistent mechanism for the entire Group, including business continuity, crisis management, information security and insurance policy.
Dexia Group Middle Management is principally responsible for operational risk management. In its field of activity, it appoints a correspondent for operational risks whose role is to coordinate the gathering of data and the self-assessment of risks, with the support of the local operational risk management function.
Risk monitoringCredit risk
Dexia policy
Dexia Credit Risk Management (CRM) sets a global framework of policies and guidelines in coherence with the risk appetite of the bank, framework that guides CRM in its different functions of risk analysis, risk decision, and risk surveillance.CRM manages the credit granting process by giving delegations within the framework set by the top management of the bank, and by chairing credit committees. As a part of its credit surveillance function, CRM monitors the credit evolution of its portfolios by performing, on a regular basis, credit reviews and by updating ratings. CRM also defines and implements the impairment policy. As such it decides on specific impairments and qualifies defaults.
Risk measures
Credit risk measures rely principally on internal rating systems put in place by Dexia under Basel II. Each counterparty is rated by analysts in charge of credit risk or by dedicated scoring systems. This rating corresponds to a valuation of the counterparty’s level of default risk, expressed on an internal rating scale, and is a key element in the loan granting process by the credit committee or by automated granting systems. Ratings are reviewed at least annually, and this allows a proactive identification of counterparties requiring regular monitoring by the “watchlist” committee.
In order to control the Group’s general credit risk profile and to limit risk concentrations, credit risk limits are defined for each counterparty, fixing the maximum exposure to credit risk deemed acceptable for a given counterparty. Limits may also be imposed per economic sector and per product. The risk department proactively monitors these limits, in relation to the evolution of the perception of risks run by the Group. In order to take more recent events into consideration, specific limits may be frozen at any time by the Risk Management department.
81Annual report 2010 Dexia
Risk management
Man
agem
ent
repo
rtA
dditi
onal
info
rmat
ion
Ann
ual fi
nanc
ial s
tate
men
tsC
onso
lidat
ed
finan
cial
sta
tem
ents
in Europe, principally in Ireland and Spain. The bond portfolio remains nonetheless characterized by very good credit quality, with 95% at Investment Grade level.
In general, the good resistance shown by the Dexia asset base to the economic crisis confirms the low risk profile of the Group’s business lines.
Financial Products portfolio (1)
In 2010, the Financial Products portfolio was reduced by USD 1.6 billion, to USD 13.8 billion (nominal value), due to USD 0.4 billion asset sales and to the amortization of the portfolio. As at 31 December 2010, the expected average life of the portfolio is 9.2 years.
In a context characterized by a volatile economic environment and large stocks of homes which will continue to weigh heavily on the real estate market, at least in 2011, Dexia adapted its US RMBS scenario to take the following considerations into account.• During 2010, a high percentage of delinquent loans, in particular subprime loans, have been restructured by the servicers, and this has contributed to an improvement of the default rate on such assets. However, Dexia estimates that a proportion of these defaults could just be postponed in time.• Visibility on housing price recovery remains low due to the existing large stock of homes for sale and to other negative factors such as the impact of a potential foreclosure freeze.Dexia therefore proceeded to make some adjustments to its assumptions for US RMBS. In particular, to reflect the assessed impact of loan modifications, Dexia assumes that the current default rates will not improve within the next 3 years and might need 4 additional years to return to the levels observed before the crisis arose. Moreover, Dexia assumes that current severity rates (2) will not show any improvement until the end of the transactions.
Based on these elements, projected economic losses would increase to USD 1,796 million under Dexia’s “base case”. Such an estimate is made to the best of Dexia’s knowledge on the basis of market conditions as at the end of December 2010.As at 31 December 2010, total impairments amounted to USD 2.252 billion.
The modelling of the US RMBS portfolios is very sensitive to parameters such as the timing of defaults, loan modifications, the evolution of house prices and the length of the crisis. Therefore any changes of the parameters could lead to significant modifications to the projected economic results compared to the “base case”.• As an example, under a scenario based on deteriorated default rates against the “base case” (higher level of default during the whole period) coupled with a higher (5%) severity, expected losses would increase to USD 2.3 billion.• As another example, under a scenario based on a flat default rate curve “for ever”, expected economic losses would increase to USD 2.8 billion.
(1) More detailed information on the Financial Products portfolio is given in the note 12.2.A.3. to the consolidated financial statements in this annual report (page 211).(2) “Severity” refers to the loss expected on a property that would have been sold following a foreclosure process.
• Numerous mechanisms protect local authority debt holders (in France and Belgium, they are obliged to reserve the amounts necessary to service the debt; in Italy, creditors of public debt benefit from a priority right to tax revenues, and so on).
Local authorities have nonetheless been globally hit by the deterioration of the world economy, rather heterogeneously depending upon the country concerned. Indeed, Japan was somewhat sheltered from the crisis, local authorities not appearing to be significantly impacted. Turkey was not affected by the recession and most major metropolitan cities retain good savings capacity. The reactions and measures taken by governments play a significant role. Some authorities receive a major proportion of their receipts from central government. The increase of transfers, either ad hoc as in Poland or through the introduction of recovery plans as in the United States, offset the fall of tax receipts.
In Spain, a clear increase of the level of debt and a pronounced deterioration of gross savings levels are to be noted for some regions, whilst in view of land registry revisions the communes have posted an increase of receipts. In Italy, debt is likely to stabilise but pressures on health expenditure remain severe. In Eastern Europe, the impact of the crisis is rather marked in Bulgaria, the Czech Republic and Hungary through a fall in tax receipts but this is offset by increased government subsidies. No pronounced effect is observed at this stage in Romania. In Poland, the crisis is hardly visible on current authority receipts but savings are falling and investment remains sustained. In France, the sharp increase in transfer duty products has helped in coping with the slowdown of other operational resources. 2010 was a year of transition for direct local taxation, marked by the abolition of local business tax. Government grants hardly evolved at all and are likely to remain frozen for three years. Investment fell slightly but remains at a high level. There is a risk that the impact of these different measures will particularly affect Départements which on the one hand are deprived of the momentum of their fiscal resources and on the other hand must deal with a sustained increase in social action expenditure, particularly by virtue of Active Solidarity Income (Revenu de solidarité active, RSA), which will have a potential impact on their internal rating, although it will nonetheless remain sound. In Belgium, affected by the economic and financial crisis, budgets revealed a weakening in 2009 of the financial situation of numerous Belgian municipalities. Results demonstrate a relative stabilisation in 2010 compared to the situation in 2009. The rate of growth of receipts for the financial year (2.2%) is well above the forecast expenditure rate (1.6%). In general, local administrations have a funding structure which is relatively less directly sensitive to the evolution of the economic situation. In the USA, the federal States have budgets which are difficult to conclude but are more frequently obliged by the law to be balanced. Authorities have therefore made significant reductions to their expenditure.
Dexia pursued its bond cession programme in 2010, in line with the undertakings made to the European Commission, resulting mechanically in a reduction of the Group’s credit risk. On that portfolio, the impact of the crisis continued to weigh on the average rating level, although no clear deterioration was observed in terms of performance or expected loss. The deterioration is more pronounced in Residential Mortgage-Backed Securities (RMBS) segments in the United States and
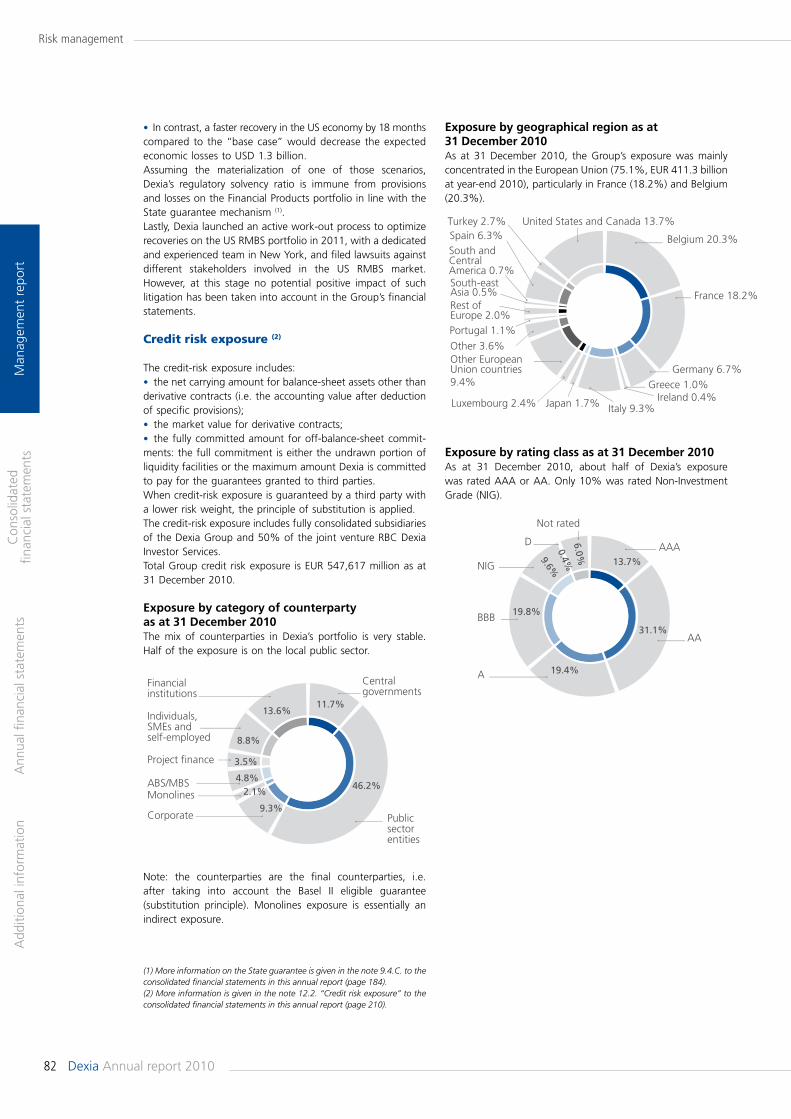
82 Dexia Annual report 2010
Risk management
Man
agem
ent
repo
rtA
dditi
onal
info
rmat
ion
Ann
ual fi
nanc
ial s
tate
men
tsC
onso
lidat
ed
finan
cial
sta
tem
ents
• In contrast, a faster recovery in the US economy by 18 months compared to the “base case” would decrease the expected economic losses to USD 1.3 billion. Assuming the materialization of one of those scenarios, Dexia’s regulatory solvency ratio is immune from provisions and losses on the Financial Products portfolio in line with the State guarantee mechanism (1).Lastly, Dexia launched an active work-out process to optimize recoveries on the US RMBS portfolio in 2011, with a dedicated and experienced team in New York, and filed lawsuits against different stakeholders involved in the US RMBS market. However, at this stage no potential positive impact of such litigation has been taken into account in the Group’s financial statements.
Credit risk exposure (2)
The credit-risk exposure includes:• the net carrying amount for balance-sheet assets other than derivative contracts (i.e. the accounting value after deduction of specific provisions);• the market value for derivative contracts;• the fully committed amount for off-balance-sheet commit-ments: the full commitment is either the undrawn portion of liquidity facilities or the maximum amount Dexia is committed to pay for the guarantees granted to third parties. When credit-risk exposure is guaranteed by a third party with a lower risk weight, the principle of substitution is applied.The credit-risk exposure includes fully consolidated subsidiaries of the Dexia Group and 50% of the joint venture RBC Dexia Investor Services.Total Group credit risk exposure is EUR 547,617 million as at 31 December 2010.
Exposure by category of counterparty as at 31 December 2010The mix of counterparties in Dexia’s portfolio is very stable. Half of the exposure is on the local public sector.
(1) More information on the State guarantee is given in the note 9.4.C. to the consolidated financial statements in this annual report (page 184).(2) More information is given in the note 12.2. “Credit risk exposure” to the consolidated financial statements in this annual report (page 210).
Exposure by geographical region as at 31 December 2010As at 31 December 2010, the Group’s exposure was mainly concentrated in the European Union (75.1%, EUR 411.3 billion at year-end 2010), particularly in France (18.2%) and Belgium (20.3%).
11.7%
46.2%
9.3%
2.1%4.8%
3.5%
8.8%
13.6%
Public sector entities
Central governments
Corporate
Financial institutions
Monolines
Project finance
ABS/MBS
Individuals, SMEs and self-employed
Italy 9.3%Luxembourg 2.4%
Other EuropeanOther 3.6%
Union countries9.4%
Rest of Europe 2.0%Portugal 1.1%
United States and Canada 13.7%
South and CentralAmerica 0.7%South-east Asia 0.5%
Spain 6.3% Belgium 20.3%
France 18.2%
Germany 6.7%Greece 1.0%
Ireland 0.4%
Turkey 2.7%
Japan 1.7%
13.7%
31.1%
19.4%
19.8%
9.6%0.4%
6.0%
AA
A
BBB
NIG
D
Not rated
AAAATION
Note: the counterparties are the final counterparties, i.e. after taking into account the Basel II eligible guarantee (substitution principle). Monolines exposure is essentially an indirect exposure.
Exposure by rating class as at 31 December 2010As at 31 December 2010, about half of Dexia’s exposure was rated AAA or AA. Only 10% was rated Non-Investment Grade (NIG).
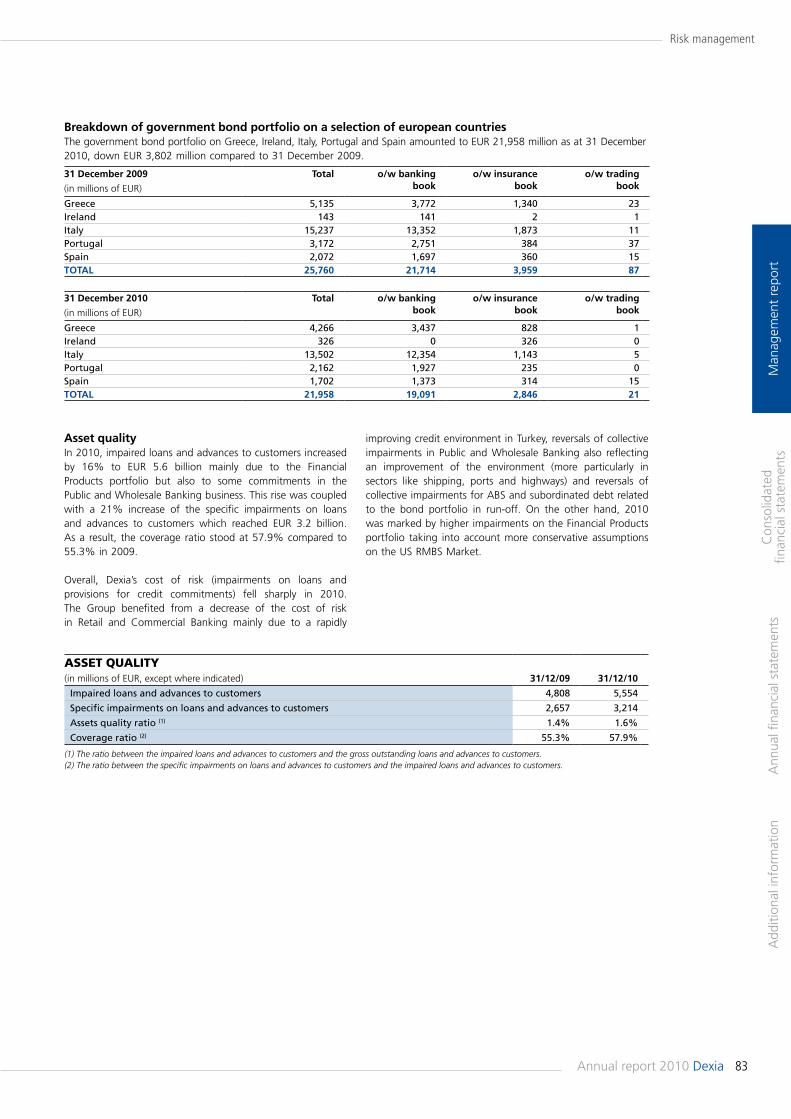
83Annual report 2010 Dexia
Risk management
Man
agem
ent
repo
rtA
dditi
onal
info
rmat
ion
Ann
ual fi
nanc
ial s
tate
men
tsC
onso
lidat
ed
finan
cial
sta
tem
ents
Breakdown of government bond portfolio on a selection of european countriesThe government bond portfolio on Greece, Ireland, Italy, Portugal and Spain amounted to EUR 21,958 million as at 31 December 2010, down EUR 3,802 million compared to 31 December 2009.
31 December 2009
(in millions of EUR)
Total o/w bankingbook
o/w insurance book
o/w tradingbook
Greece 5,135 3,772 1,340 23Ireland 143 141 2 1Italy 15,237 13,352 1,873 11Portugal 3,172 2,751 384 37Spain 2,072 1,697 360 15TOTAL 25,760 21,714 3,959 87
31 December 2010
(in millions of EUR)
Total o/w bankingbook
o/w insurance book
o/w tradingbook
Greece 4,266 3,437 828 1Ireland 326 0 326 0Italy 13,502 12,354 1,143 5Portugal 2,162 1,927 235 0Spain 1,702 1,373 314 15TOTAL 21,958 19,091 2,846 21
ASSET QUALITY(in millions of EUR, except where indicated) 31/12/09 31/12/10
Impaired loans and advances to customers 4,808 5,554
Specific impairments on loans and advances to customers 2,657 3,214
Assets quality ratio (1) 1.4% 1.6%
Coverage ratio (2) 55.3% 57.9%
(1) The ratio between the impaired loans and advances to customers and the gross outstanding loans and advances to customers.(2) The ratio between the specific impairments on loans and advances to customers and the impaired loans and advances to customers.
Asset qualityIn 2010, impaired loans and advances to customers increased by 16% to EUR 5.6 billion mainly due to the Financial Products portfolio but also to some commitments in the Public and Wholesale Banking business. This rise was coupled with a 21% increase of the specific impairments on loans and advances to customers which reached EUR 3.2 billion. As a result, the coverage ratio stood at 57.9% compared to 55.3% in 2009.
Overall, Dexia’s cost of risk (impairments on loans and provisions for credit commitments) fell sharply in 2010. The Group benefited from a decrease of the cost of risk in Retail and Commercial Banking mainly due to a rapidly
improving credit environment in Turkey, reversals of collective impairments in Public and Wholesale Banking also reflecting an improvement of the environment (more particularly in sectors like shipping, ports and highways) and reversals of collective impairments for ABS and subordinated debt related to the bond portfolio in run-off. On the other hand, 2010 was marked by higher impairments on the Financial Products portfolio taking into account more conservative assumptions on the US RMBS Market.
84 Dexia Annual report 2010
Risk management
Man
agem
ent
repo
rtA
dditi
onal
info
rmat
ion
Ann
ual fi
nanc
ial s
tate
men
tsC
onso
lidat
ed
finan
cial
sta
tem
ents
Market risk
Dexia policy
In order to have an integrated and sound market risk management, Dexia developed a framework based on the following components:• a comprehensive risk measurement approach, which constitutes an important part of the process of monitoring and controlling the Group’s risk profile;• a sound structure of limits and procedures that govern risk taking. The limit system must be consistent with the effectiveness of the organisation’s overall risk measurement and management process and with the adequacy of the capital position. These limits are integrated to the fullest extent possible;• a strong risk management organisation responsible for identifying, measuring, monitoring, controlling and reporting risk. The development of an enterprise-wide risk management framework must be responsive to the nature of the challenges the bank has to face. This approach provides the management with the assurance that risks are being managed in accordance with Dexia’s strategy and objectives and with the overall risk appetite framework.
Risk measures
The Dexia Group adopted the VaR (Value at Risk) measurement methodology as one of the leading risk indicators. The VaR is a measure of the potential loss that can be experienced with a 99% confidence level and for a holding period of 10 days. Dexia applies multiple VaR approaches based on their ability to measure market risk accurately in different market activities and portfolios.• General interest-rate and forex risks are measured through a parametric VaR approach.• Specific interest-rate risk, equity risk and other risks in trading books are moreover measured by means of a historical VaR approach.• Non-linear and particular risks are measured through specific and historical VaR methodologies with a view to a more appropriate measurement of the sensitivity to market volatilities.
Dexia exposure to market risk as measured in Value at Risk (VaR) terms stems mainly from general interest-rate risk and specific interest-rate (spread) risk reflecting today’s volatility in credit markets, while its market exposure arising from trading positions in equity, exchange and other risk factors remains much lower.
Dexia applies the internal VaR model for the regulatory capital requirement calculus on foreign exchange risk and general interest-rate risk within the trading scope.
The VaR methodologies are improved on an on-going basis. The “Market Risk Engine” project was launched in 2010. It aims for an historical VaR over all risk factors (with a complete revaluation on non-linear risk factors); a complete historical VaR which is confirmed as the standard in many banks will provide a consistent and more precise measure. In addition to VaR, the new tool will facilitate stress testing, the analysis of extreme values and so on. The first phase of the project has already been successfully implemented and
enabled existing historical VaR to be consolidated, historical VaR to be added on the basis of sensitivities and progress to be made on implementing the Stressed VaR as requested by the regulator.
In 2010 back-testing generated three exceptions for interest-rate risk and foreign-exchange risk (internal model), three within the equity risk scope and none on spread scope, which proves the quality of the tools used.
As a complement to VaR measures and statement of income triggers, Dexia applies a wide range of other risk measures in order to assess risks related to the different business lines and portfolios (nominal limits, maturity limits, market limits and limits on authorised products, sensitivity limits and Greeks and scenario analysis).
Stress-testing is becoming increasingly important for sound risk management as it explores a range of low-probability events outside the predictive capacity of VaR measurement techniques. As such, VaR measures assess market risk in a daily market environment, whereas stress-testing measures market risk in an abnormal market environment. In this context, the range of scenario assumptions was regularly revised and updated. The results of consolidated stress tests and the corresponding analyses are presented quarterly to the MRGC and the DMRC.
The bond portfolio on the banking books is not subject to VaR limits, given its different investment horizon. Following the Dexia transformation plan, this portfolio is largely in run-off.
Exposure to market risk (1)
Value at RiskThe detailed VaR use of market activities (bond portfolio in banking book not included) is disclosed in the table below. Average global Value at Risk amounted to EUR 44.6 million in 2010 (as compared to EUR 78.4 million in 2009).
Substantial limit reductions have been implemented, in line with the risk appetite reduction as included in the overall Dexia transformation plan. The global limit has been reduced from EUR 178 million in the third quarter of 2008 to EUR 130 million at the end of 2008 and to EUR 100 million since the beginning of 2009.
Bond portfolioDexia (excluded BSM portfolio and Financial Products, see below) manages bond portfolios, largely in run-off, amounting to EUR 138.5 billion as at 31 December 2010 (against EUR 165.5 billion as at 31 December 2009). The sensitivity in economic value of these bonds portfolios is very limited, as interest-rate risk is hedged.
An important part of the bond portfolios is classified in Loans & Receivables. The AFS reserve of these securities is insensitive to the market spread evolutions. Regarding the other bonds portfolios classified in AFS, the sensitivity in fair
(1) More information is given in the note 12.5. “Market risk & BSM” to the consolidated financial statements (page 225).
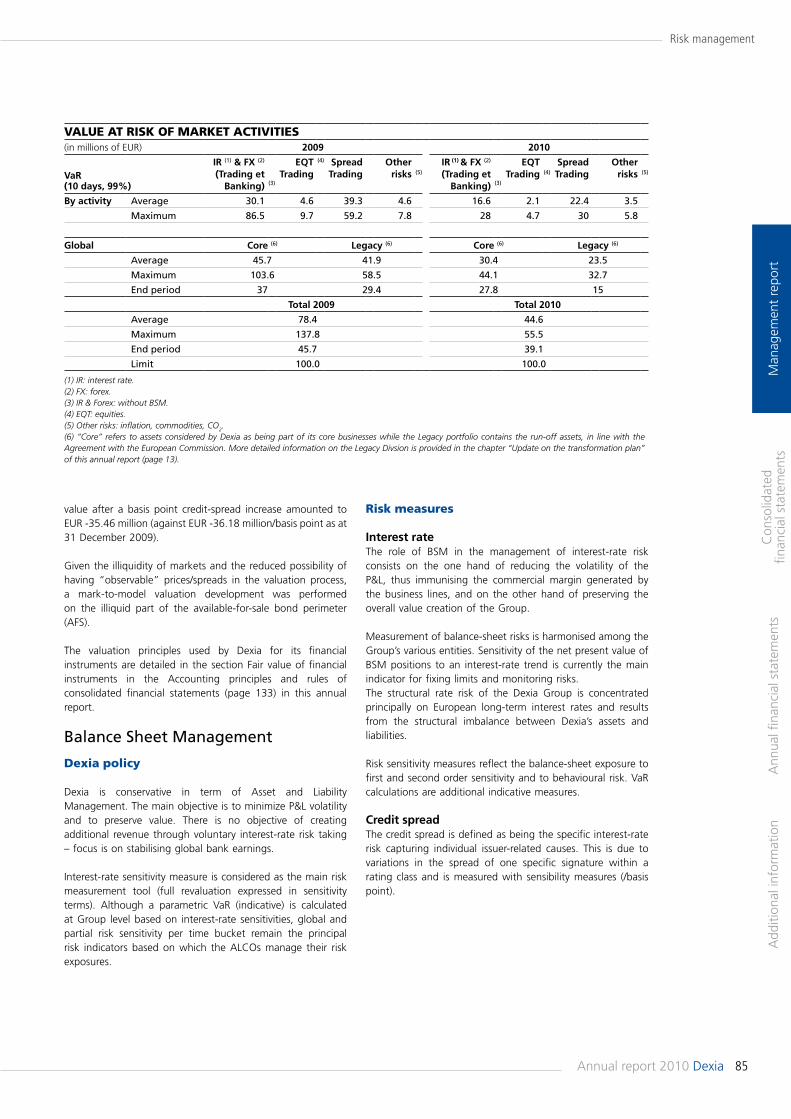
85Annual report 2010 Dexia
Risk management
Man
agem
ent
repo
rtA
dditi
onal
info
rmat
ion
Ann
ual fi
nanc
ial s
tate
men
tsC
onso
lidat
ed
finan
cial
sta
tem
ents
vALUE AT RISK OF MARKET ACTIvITIES(in millions of EUR) 2009 2010
VaR (10 days, 99%)
IR (1) & FX (2)
(Trading etBanking) (3)
EQT Trading
(4) Spread Trading
Other risks (5)
IR (1) & FX (2) (Trading et
Banking) (3)
EQT
Trading (4)
Spread Trading
Other risks (5)
By activity Average 30.1 4.6 39.3 4.6 16.6 2.1 22.4 3.5
Maximum 86.5 9.7 59.2 7.8 28 4.7 30 5.8
Global Core (6) Legacy (6) Core (6) Legacy (6)
Average 45.7 41.9 30.4 23.5
Maximum 103.6 58.5 44.1 32.7
End period 37 29.4 27.8 15
Total 2009 Total 2010
Average 78.4 44.6
Maximum 137.8 55.5
End period 45.7 39.1
Limit 100.0 100.0
(1) IR: interest rate.(2) FX: forex.(3) IR & Forex: without BSM.(4) EQT: equities.(5) Other risks: inflation, commodities, CO2.(6) “Core” refers to assets considered by Dexia as being part of its core businesses while the Legacy portfolio contains the run-off assets, in line with the Agreement with the European Commission. More detailed information on the Legacy Divsion is provided in the chapter “Update on the transformation plan” of this annual report (page 13).
Risk measures
Interest rateThe role of BSM in the management of interest-rate risk consists on the one hand of reducing the volatility of the P&L, thus immunising the commercial margin generated by the business lines, and on the other hand of preserving the overall value creation of the Group.
Measurement of balance-sheet risks is harmonised among the Group’s various entities. Sensitivity of the net present value of BSM positions to an interest-rate trend is currently the main indicator for fixing limits and monitoring risks.The structural rate risk of the Dexia Group is concentrated principally on European long-term interest rates and results from the structural imbalance between Dexia’s assets and liabilities.
Risk sensitivity measures reflect the balance-sheet exposure to first and second order sensitivity and to behavioural risk. VaR calculations are additional indicative measures.
Credit spreadThe credit spread is defined as being the specific interest-rate risk capturing individual issuer-related causes. This is due to variations in the spread of one specific signature within a rating class and is measured with sensibility measures (/basis point).
value after a basis point credit-spread increase amounted to EUR -35.46 million (against EUR -36.18 million/basis point as at 31 December 2009).
Given the illiquidity of markets and the reduced possibility of having “observable” prices/spreads in the valuation process, a mark-to-model valuation development was performed on the illiquid part of the available-for-sale bond perimeter (AFS).
The valuation principles used by Dexia for its financial instruments are detailed in the section Fair value of financial instruments in the Accounting principles and rules of consolidated financial statements (page 133) in this annual report.
Balance Sheet Management
Dexia policy
Dexia is conservative in term of Asset and Liability Management. The main objective is to minimize P&L volatility and to preserve value. There is no objective of creating additional revenue through voluntary interest-rate risk taking – focus is on stabilising global bank earnings.
Interest-rate sensitivity measure is considered as the main risk measurement tool (full revaluation expressed in sensitivity terms). Although a parametric VaR (indicative) is calculated at Group level based on interest-rate sensitivities, global and partial risk sensitivity per time bucket remain the principal risk indicators based on which the ALCOs manage their risk exposures.
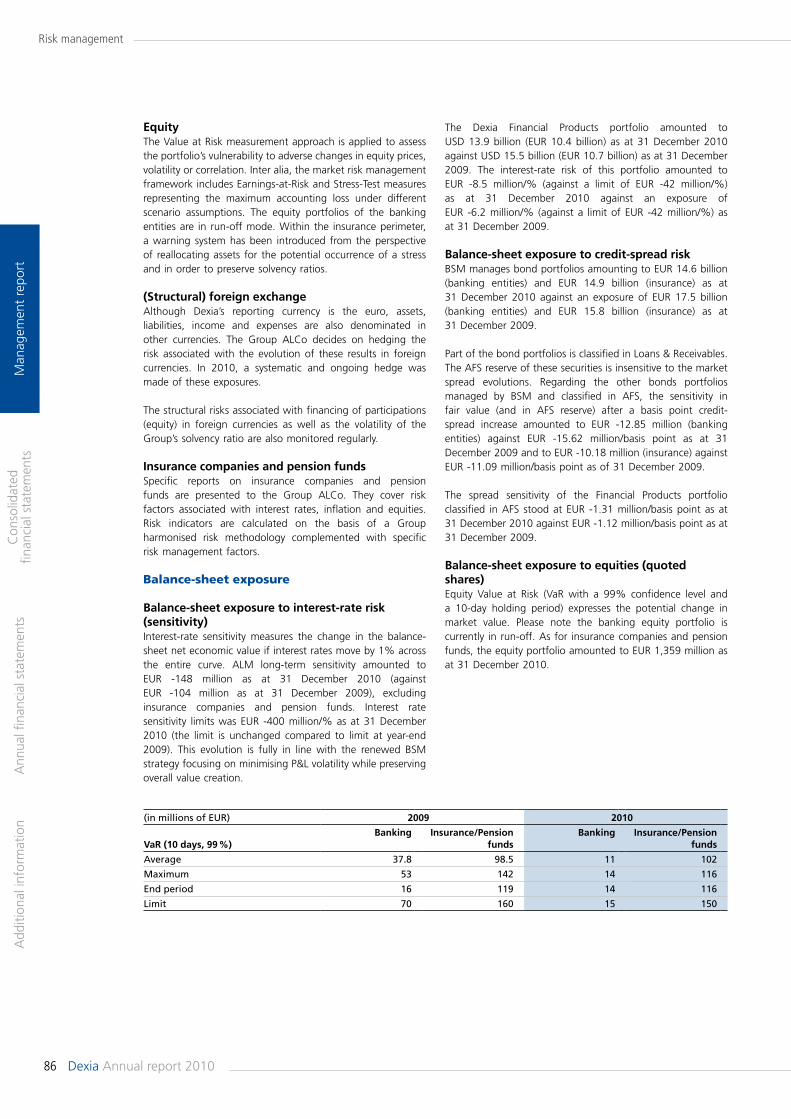
86 Dexia Annual report 2010
Risk management
Man
agem
ent
repo
rtA
dditi
onal
info
rmat
ion
Ann
ual fi
nanc
ial s
tate
men
tsC
onso
lidat
ed
finan
cial
sta
tem
ents
The Dexia Financial Products portfolio amounted to USD 13.9 billion (EUR 10.4 billion) as at 31 December 2010 against USD 15.5 billion (EUR 10.7 billion) as at 31 December 2009. The interest-rate risk of this portfolio amounted to EUR -8.5 million/% (against a limit of EUR -42 million/%) as at 31 December 2010 against an exposure of EUR -6.2 million/% (against a limit of EUR -42 million/%) as at 31 December 2009.
Balance-sheet exposure to credit-spread risk BSM manages bond portfolios amounting to EUR 14.6 billion (banking entities) and EUR 14.9 billion (insurance) as at 31 December 2010 against an exposure of EUR 17.5 billion (banking entities) and EUR 15.8 billion (insurance) as at 31 December 2009.
Part of the bond portfolios is classified in Loans & Receivables. The AFS reserve of these securities is insensitive to the market spread evolutions. Regarding the other bonds portfolios managed by BSM and classified in AFS, the sensitivity in fair value (and in AFS reserve) after a basis point credit-spread increase amounted to EUR -12.85 million (banking entities) against EUR -15.62 million/basis point as at 31 December 2009 and to EUR -10.18 million (insurance) against EUR -11.09 million/basis point as of 31 December 2009.
The spread sensitivity of the Financial Products portfolio classified in AFS stood at EUR -1.31 million/basis point as at 31 December 2010 against EUR -1.12 million/basis point as at 31 December 2009.
Balance-sheet exposure to equities (quoted shares)Equity Value at Risk (VaR with a 99% confidence level and a 10-day holding period) expresses the potential change in market value. Please note the banking equity portfolio is currently in run-off. As for insurance companies and pension funds, the equity portfolio amounted to EUR 1,359 million as at 31 December 2010.
EquityThe Value at Risk measurement approach is applied to assess the portfolio’s vulnerability to adverse changes in equity prices, volatility or correlation. Inter alia, the market risk management framework includes Earnings-at-Risk and Stress-Test measures representing the maximum accounting loss under different scenario assumptions. The equity portfolios of the banking entities are in run-off mode. Within the insurance perimeter, a warning system has been introduced from the perspective of reallocating assets for the potential occurrence of a stress and in order to preserve solvency ratios.
(Structural) foreign exchangeAlthough Dexia’s reporting currency is the euro, assets, liabilities, income and expenses are also denominated in other currencies. The Group ALCo decides on hedging the risk associated with the evolution of these results in foreign currencies. In 2010, a systematic and ongoing hedge was made of these exposures.
The structural risks associated with financing of participations (equity) in foreign currencies as well as the volatility of the Group’s solvency ratio are also monitored regularly.
Insurance companies and pension fundsSpecific reports on insurance companies and pension funds are presented to the Group ALCo. They cover risk factors associated with interest rates, inflation and equities. Risk indicators are calculated on the basis of a Group harmonised risk methodology complemented with specific risk management factors.
Balance-sheet exposure
Balance-sheet exposure to interest-rate risk (sensitivity) Interest-rate sensitivity measures the change in the balance-sheet net economic value if interest rates move by 1% across the entire curve. ALM long-term sensitivity amounted to EUR -148 million as at 31 December 2010 (against EUR -104 million as at 31 December 2009), excluding insurance companies and pension funds. Interest rate sensitivity limits was EUR -400 million/% as at 31 December 2010 (the limit is unchanged compared to limit at year-end 2009). This evolution is fully in line with the renewed BSM strategy focusing on minimising P&L volatility while preserving overall value creation.
(in millions of EUR) 2009 2010
VaR (10 days, 99 %) Banking Insurance/Pension
fundsBanking Insurance/Pension
funds
Average 37.8 98.5 11 102
Maximum 53 142 14 116
End period 16 119 14 116
Limit 70 160 15 150
87Annual report 2010 Dexia
Risk management
Man
agem
ent
repo
rtA
dditi
onal
info
rmat
ion
Ann
ual fi
nanc
ial s
tate
men
tsC
onso
lidat
ed
finan
cial
sta
tem
ents
The Group made considerable progress in reducing its short-term liquidity gap. Short-term funding requirements fell by EUR 48 billion in 2010, to EUR 119 billion as at the end of December 2010.
This good performance was achieved by virtue of:• the sustained pace of deleveraging programme. EUR 22.4 billion of bonds and EUR 4.8 billion of Public and Wholesale Banking run-off loans were sold in 2010. More detailed information on balance-sheet deleveraging is provided in the chapter “Update on the Transformation Plan” (page 14) in this annual report;• the swift execution of the long-term funding programme;• the reduction of the Public and Wholesale Banking lending activity, this being aligned to the Group’s long-term funding capacity;• the increase of retail deposits, particularly in Belgium and Turkey. These were EUR 87.7 billion at the end of 2010, against EUR 81.5 billion at the end of 2009.
Dexia also considerably improved its short-term funding mix. Indeed, Dexia accelerated the decrease of central bank borrowings (EUR -32 billion compared with the end of December 2009) and since June 2010 was no longer funded by short-term guaranteed debt, in view of the repayment of short-term guaranteed loans. The shift towards longer-term funding bilateral and tri-party repos was confirmed in 2010. As at 31 December 2010, the total amount of central bank eligible securities amounted to EUR 108 billion, of which EUR 42 billion were unencumbered allowing for a major liquidity buffer despite the Group’s active deleverage policy. With the reserves available within one month, EUR 66 billion are available to cover the one month liquidity gap. This significant reduction of the short-term funding requirement was under unfavourable interest-rate conditions resulting in an increase of the amount of cash collateral of EUR 8 billion in 2010 despite a very disrupted macroeconomic environment, marked by the sovereign crisis which weighed heavily on the funding of many European banks.
In 2010, Dexia also ended transactions guaranteed by the Belgian, French and Luxembourg governments. In fact, on 30 June 2010, considering the improvement of its liquidity situation and in line with its undertakings to the European Commission, the Group ceased to issue guaranteed debt four months before its formal end date of 30 October 2010. Total outstanding guaranteed debt amounted to EUR 44 billion as at 31 December 2010 (against EUR 50 billion at the end of December 2009). This guaranteed outstanding will be totally written down in 2014 of which about 40% in 2011.
More detailed information on Dexia’s liquidity profile is provided in the chapter “Update on the Transformation Plan” (page 15).
Liquidity
Dexia PolicyIn 2010, Dexia completely revised its internal process for managing liquidity risk, including its contingency funding plan.The new framework aims at providing more effective and coordinated liquidity management. The cornerstone of this new framework is the Funding and Liquidity Committee (FLC) (1), a central committee of all those parties concerned by liquidity and funding, coordinating their actions. Dexia ensures that it maintains liquidity reserves proportional to its future funding requirement under several scenarios, in a normal situation and in a stress situation. These liquidity reserves consist of assets eligible to refinancing with central banks to which Dexia has access (BCE, Fed and Central Bank of Turkey). Dexia’s expected funding requirements are assessed prudently, dynamically and fully, taking existing and planned on and off balance sheet transactions into consideration. The monitoring of short-term liquidity risk is organised on a daily basis whilst the supervision of long-term liquidity risk is on a quarterly basis. Furthermore, liquidity is at the centre of the definition of Dexia’s annual business plan.Globally, Dexia’s internal framework for managing liquidity risk allows a monitoring of short term liquidity on a daily baisis and a prospective view of long term liquidity.
The updated contingency funding plan modifies the governance structure to make it more reactive in the case of liquidity stress requiring rapid measures to be taken.
Risk measuresDexia’s new internal framework for managing liquidity risk also defines a certain number of liquidity indicators which, alongside regulatory liquidity indicators, guarantee Dexia’s resistance to liquidity risk. These indicators include but are not limited to normal “liquidity ratios” comparing liquidity reserves to liquidity deficits. They also include limits on the absolute size of liquidity deficits. All of these indicators are assessed according to different scenarios, in the principal currencies and at all relevant consolidation levels. They are part of the Dexia Risk Appetite framework and are communicated to the Management Board and to the Audit Committee on a regular basis.Dexia liquidity risk is also monitored by regulatory liquidity ratios. These ratios are communicated to the CBFA on a monthly basis and to the CREFS (Comité des Risques et Etablissements Financiers Systémiques) on an annual basis.
Exposure to liquidity riskIn 2010, the Group raised EUR 44.4 billion of medium and long-term wholesale funding. The funds raised consisted of EUR 23.2 billion in State guaranteed debt, EUR 13.6 billion in covered bonds, EUR 4.4 billion in long-term secured funding other than covered bonds and EUR 3.2 billion in senior unsecured funding.
(1) This committee is described in the part “Governance – Balance sheet management” of this chapter (page 79).
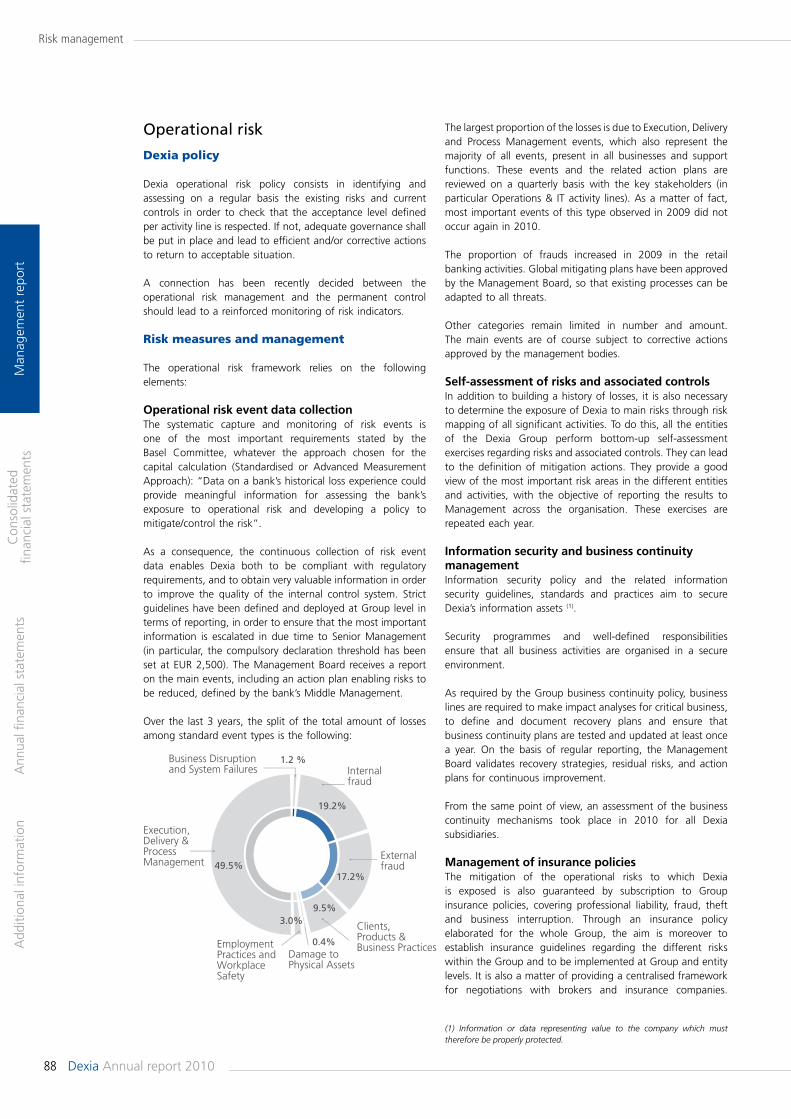
88 Dexia Annual report 2010
Risk management
Man
agem
ent
repo
rtA
dditi
onal
info
rmat
ion
Ann
ual fi
nanc
ial s
tate
men
tsC
onso
lidat
ed
finan
cial
sta
tem
ents
The largest proportion of the losses is due to Execution, Delivery and Process Management events, which also represent the majority of all events, present in all businesses and support functions. These events and the related action plans are reviewed on a quarterly basis with the key stakeholders (in particular Operations & IT activity lines). As a matter of fact, most important events of this type observed in 2009 did not occur again in 2010.
The proportion of frauds increased in 2009 in the retail banking activities. Global mitigating plans have been approved by the Management Board, so that existing processes can be adapted to all threats.
Other categories remain limited in number and amount. The main events are of course subject to corrective actions approved by the management bodies.
Self-assessment of risks and associated controlsIn addition to building a history of losses, it is also necessary to determine the exposure of Dexia to main risks through risk mapping of all significant activities. To do this, all the entities of the Dexia Group perform bottom-up self-assessment exercises regarding risks and associated controls. They can lead to the definition of mitigation actions. They provide a good view of the most important risk areas in the different entities and activities, with the objective of reporting the results to Management across the organisation. These exercises are repeated each year.
Information security and business continuity managementInformation security policy and the related information security guidelines, standards and practices aim to secure Dexia’s information assets (1).
Security programmes and well-defined responsibilities ensure that all business activities are organised in a secure environment.
As required by the Group business continuity policy, business lines are required to make impact analyses for critical business, to define and document recovery plans and ensure that business continuity plans are tested and updated at least once a year. On the basis of regular reporting, the Management Board validates recovery strategies, residual risks, and action plans for continuous improvement.
From the same point of view, an assessment of the business continuity mechanisms took place in 2010 for all Dexia subsidiaries.
Management of insurance policiesThe mitigation of the operational risks to which Dexia is exposed is also guaranteed by subscription to Group insurance policies, covering professional liability, fraud, theft and business interruption. Through an insurance policy elaborated for the whole Group, the aim is moreover to establish insurance guidelines regarding the different risks within the Group and to be implemented at Group and entity levels. It is also a matter of providing a centralised framework for negotiations with brokers and insurance companies.
(1) Information or data representing value to the company which must therefore be properly protected.
Operational risk
Dexia policy
Dexia operational risk policy consists in identifying and assessing on a regular basis the existing risks and current controls in order to check that the acceptance level defined per activity line is respected. If not, adequate governance shall be put in place and lead to efficient and/or corrective actions to return to acceptable situation.
A connection has been recently decided between the operational risk management and the permanent control should lead to a reinforced monitoring of risk indicators.
Risk measures and management
The operational risk framework relies on the following elements:
Operational risk event data collectionThe systematic capture and monitoring of risk events is one of the most important requirements stated by the Basel Committee, whatever the approach chosen for the capital calculation (Standardised or Advanced Measurement Approach): “Data on a bank’s historical loss experience could provide meaningful information for assessing the bank’s exposure to operational risk and developing a policy to mitigate/control the risk”.
As a consequence, the continuous collection of risk event data enables Dexia both to be compliant with regulatory requirements, and to obtain very valuable information in order to improve the quality of the internal control system. Strict guidelines have been defined and deployed at Group level in terms of reporting, in order to ensure that the most important information is escalated in due time to Senior Management (in particular, the compulsory declaration threshold has been set at EUR 2,500). The Management Board receives a report on the main events, including an action plan enabling risks to be reduced, defined by the bank’s Middle Management.
Over the last 3 years, the split of the total amount of losses among standard event types is the following:
19.2%
17.2
9.5%
0.4%
3.0%
%49.5%
1.2 %
Clients, Products & Business Practices
Damage to Physical Assets
Employment Practices and Workplace Safety
Execution, Delivery & Process Management
Externalfraud
Internalfraud
Business Disruption and System Failures
89Annual report 2010 Dexia
Risk management
Man
agem
ent
repo
rtA
dditi
onal
info
rmat
ion
Ann
ual fi
nanc
ial s
tate
men
tsC
onso
lidat
ed
finan
cial
sta
tem
ents
Legal riskLike many financial institutions, Dexia is subject to a number of regulatory investigations and litigations, including class action lawsuits in the US and Israel. The status of the most significant litigations and investigations as per 31 December 2010, and based on the information available to Dexia at such date is summarised below. On the basis of the information available to Dexia as per that date, other litigations and investigations are not expected to have a material impact on the Group’s financial situation or it is too early properly to assess whether they may have such an impact.As assessed by Dexia based on the information available to it as per the above referenced date, the consequences of the most significant litigations and investigations liable to have a material impact on the Group’s financial situation, its results or its business generally are provided for in the Group’s financial statements. Subject to the terms and conditions of the professional liability insurance and Directors’ liability insurance policies entered into by Dexia, the adverse financial consequences of all or certain litigations and investigations may be covered, in whole or in part, under such insurance policies entered into by Dexia, and, upon acceptance of such risks by the relevant insurers, be offset against any pay-out Dexia would receive pursuant thereto.
Dexia Nederland BV
Background
The difficulties linked to the share-leasing activities of the Bank Labouchere (now Dexia Nederland BV, hereinafter referred to as the Company) appeared at the time of the fast and severe fall of the Amsterdam stock market in late 2001. The value of the securities used as collateral against the loans granted by the Company proved insufficient in a large number of contracts, thus potentially ending with a residual debt instead of the gain initially hoped for.
Specific litigations
Duty of care casesAs stated in the previous annual report, on 5 June 2009 the Netherlands Supreme Court passed an important judgement with respect to the share-leasing contracts of the Company. Many allegations were rejected, including error, misleading advertising, abuse of circumstances, and the applicability of the Netherlands Consumer Credit Act. On the other hand the Supreme Court decided that a special duty of care should have been applied at the time of entering into a share-leasing contract. The Supreme Court made a distinction between two categories of clients: clients for whom the contract was a bearable financial burden and clients for whom the contract was an irresponsibly heavy financial burden.As also stated in the previous annual report, on 1 December 2009 the Amsterdam Court of Appeal subsequently passed four detailed judgements, in respect of the exact way the distinction of the Netherlands Supreme Court between the two categories of clients should be made. Clients stating to have been faced with an irresponsibly heavy financial burden have the obligation to furnish the facts. Furthermore, the Amsterdam Court of Appeal decided that profits from earlier
Against that background, a mapping of existing policies in each entity and subsidiary was realized in 2010, in order to improve effective cover.
Definition and follow-up of action plansThe bank’s Middle Management defines the corrective actions required by major incidents or notable risks identified. A regular follow-up and a quarterly reporting for all activities have been set up by Operational Risk Management. By virtue of this process, the internal control system is continuously improved and the main risks appropriately mitigated over time.
Increased coordination with other functions involved in the internal audit systemA new software tool was developed in 2009 aimed at covering most of the building blocks of the Operational Risk Management framework, and also offering some key functions for other central functions such as Internal Audit, Compliance, Permanent Control or Quality Control. The installation of this software in 2010 allows the use of one language and reference systems common to those functions, as well as the generation of consolidated information for the bank’s Middle Management, in particular regarding any type of action plan or recommendation to be followed up over time.
Calculation of regulatory capital requirementsDexia has decided to apply the Basel II Standardised Approach for the calculation of the capital requirement for operational risk management.
This approach mainly consists of applying a percentage (cal-led “Beta” factor, in a range between 12% and 18%) to a relevant indicator calculated for each of the eight business lines defined by the Basel Committee (Corporate Finance, Commercial Banking, Retail Banking, Trading and Sales, Asset Management, Agency Services, Retail Brokerage, Payment and Settlement).
The relevant indicator essentially consists of the operating income from the underlying activities which includes net inte-rest and net commission income. Income from insurance acti-vities is not taken into consideration, as they are not subject to Basel II regulation.
The total of regulatory capital for each business line is used to calculate total capital requirements for operational risk. This is an average over the last three years. The calculation is upda-ted at each year-end.
The capital requirement for the last calculation periods is the following:
CAPITAL REQUIREMENTS(in millions of EUR)
2009 2010
833.5 772
A decrease of the capital requirements of 7.4% can be observed between 2009 and 2010. This is linked to the fact that the 2007 gross income is replaced in the calculation by the 2010 gross income, which are lower due to the activity evolutions from the 2008 financial crisis.
90 Dexia Annual report 2010
Risk management
Man
agem
ent
repo
rtA
dditi
onal
info
rmat
ion
Ann
ual fi
nanc
ial s
tate
men
tsC
onso
lidat
ed
finan
cial
sta
tem
ents
Klachteninstituut Financiële Dienstverlening (KiFiD)
At the end of 2010, three share-lease related cases were still under consideration by the Klachteninstituut Financiële Dienstverlening (KiFiD), the Complaints Institute for Financial Services.
Provisions as at 31 December 2010
Provisions are updated every quarter and may be influenced by fluctuations in the value of the underlying equity portfolios of the share-leasing contracts, by client behaviour and by future judgements. At the end of 2010 the provisioning model was adapted to the most recent information about client behaviour as well as the most recent information about the effect of the “Court model”. The net financial impact thereof on Dexia’s 2010 financial statements was negligible.At the end of December 2010, total provisions amounted to EUR 177.5 million.
Lernout & Hauspie
Dexia Bank Belgium (Dexia Bank) was involved in various ways in the bankruptcy of Lernout & Hauspie Speech Products SA (LHSP) and the consequences thereof. This was described in detail in the 2007, 2008 and 2009 annual reports.The following important developments have taken place since the 2009 annual report.
Claim on Lernout & Hauspie Speech Products
At 31 December 2010, Dexia Bank has a claim in USD chargeable to the bankruptcy of LHSP for a principal sum of EUR 29.3 million (exchange rate USD/EUR 1.3399), for which an impairment of EUR 25.1 million has been booked. This claim originates in the share taken by the former Artesia Banking Corporation (ABC) in the syndicated loan of USD 430 million to LHSP on 5 May 2000. ABC’s share amounted to USD 50 million.Dexia Bank believes it will be able to recover the net accounting value of this claim.The liquidation of LHSP’s assets is subject to separate proceedings in Belgium and in the United States.According to the LHSP Belgian bankruptcy receivers, Dexia Bank and the other unsecured creditors are unlikely to receive any reimbursement from the Belgian liquidation of LHSP.In 2008, Dexia Bank waived its claim on the insolvency of LHSP in the United States, in exchange for a waiver by the American Litigation Trustee of LHSP of all its claims entered against Dexia Bank.
Prosecution of Dexia Bank in Belgium
On 4 May 2007, Dexia Bank was summoned, together with 20 other parties, to appear before the Court of Appeal in Ghent. According to the writ of summons, Dexia Bank was prosecuted by virtue of the former ABC being accused as an alleged accessory to the falsification of the financial statements of LHSP and other related offences among which forgery, securities fraud and market manipulation.
share-lease products should be taken into account when calculating damages and legal interest to be reimbursed is to be calculated from the termination date of a contract. Shortly after the judgements of the Amsterdam Court of Appeal were passed, cassation appeal against two of those judgements was filed by clients of the company and is still pending. The judgements of the Netherlands Supreme Court in these cases are expected by the end of the second quarter of 2011.The outcome of the judgement of the Amsterdam Court of Appeal forms the basis of the out-of-court settlement attempts by the Company (hereafter called the “Court model”).
Spousal consent casesUnlike the situation with regard to disputes with clients about duty of care issues, the situation with regard to “spousal consent” cases is less clear. On 28 March 2008 the Netherlands Supreme Court ruled by judgement that article 1:88 of the Dutch Civil Code is applicable to share-lease contracts. The applicability of this article means that the written consent of the spouse (or registered partner) of the lessee was necessary to enter into the lease contract, in the absence of which the spouse is permitted to annul the contract, meaning that all payments made under the contract should be reimbursed and any existing debt towards the Company resulting from the contract is extinguished. It has been well established in jurisprudence that the spouse or partner should annul the contract within three years after becoming aware of the existence of the contract. However, controversial questions remain concerning the nature of the evidence required to demonstrate the knowledge of the spouse.
Number of court cases
On 31 December 2010, the Company is still involved in about 2,000 civil court cases (compared to over 3,400 at the end of 2009). However, the vast majority of these court cases have been suspended. The vast majority of clients in proceedings (and especially those clients with complaints about breach of the duty of care) were offered out-of-court settlements on the basis of the so-called “Court model” during 2010. The number of clients in proceedings will decrease sharply in 2011 because of settlements expected after the judgements of the Supreme Court and the Amsterdam Court of Appeal. Proceedings related to “spousal cases” are still ongoing due to the interpretation issues.
Litigations in general
A number of disputes have arisen between the Company and its clients with respect to share-leasing products. Particularly with regard to the nature of these disputes, Dexia refers to its earlier reports and quarterly activity reports. Generally speaking, only the approximately 19,000 clients that have filed a so-called opt-out statement before 1 August 2007, and did not enter into any settlement since then, are entitled to start or continue proceedings against the Company. However, more than 1,800 cases have already been closed due to settlements with the Company or the closure of proceedings.

91Annual report 2010 Dexia
Risk management
Man
agem
ent
repo
rtA
dditi
onal
info
rmat
ion
Ann
ual fi
nanc
ial s
tate
men
tsC
onso
lidat
ed
finan
cial
sta
tem
ents
On 20 September 2010, the Court of Appeal of Ghent passed its judgement on the criminal case. It acquitted Dexia Bank and Mr G. Dauwe, former member of the Management Board of ABC, of all criminal charges on the basis of a very detailed analysis of the facts by the Court of Appeal.No party has filed an appeal to the Supreme Court of Appeal against this acquittal of Dexia Bank and Mr G. Dauwe, so that their acquittal is definitive.As a result of those acquittals, the Court of Appeal of Ghent is no longer competent to pronounce on the claims made in civil actions by the shareholders, creditors and receivers of LHSP against Dexia Bank and Mr G. Dauwe. Deminor and Dolor, together representing the majority of the individuals bringing civil actions, consider that they can only appeal when the Court of Appeal in Ghent has pronounced on the civil case. Dexia Bank and its counsel are of the opinion that this position is extremely contestable.Whatever the case, an appeal by a civil party will not throw back into question the acquittal of Dexia Bank and Mr G. Dauwe.Considering the comprehensively substantiated judgement, the risk of Dexia Bank being ordered to pay damages and interest to the receivers, creditors or shareholders of LHSP is particularly low.
Civil proceedings against Dexia Bank in Belgium
LHSP receivers’ claimIn July 2005, the Belgian receivers of LHSP filed a civil action before the Commercial Court of Ypres against twenty-one parties including Dexia Bank. They claim compensation for the net liabilities of LHSP in bankruptcy. According to the receivers’ provisional assessment of the claim, it would amount to approximately EUR 439 million. This claim, to a large extent duplicative of the claims introduced by the receivers in the criminal proceedings, has not developed since then. There is not likely to be any development until after the end of the criminal proceedings (still on hold before the Supreme Court of Appeal with regard to parties other than Dexia Bank) and settlement of the civil aspect before the Court of Appeal. Considering the acquittal of Dexia Bank and the reasoning for the order, the risk of that action being declared substantiated is considered extremely low.
Individual actions During the criminal proceedings, certain civil claims were filed before the Commercial Courts of Ypres and Brussels against various parties, including Dexia Bank. The main claim was filed by Deminor on behalf of 4,941 investors. Similarly, 151 investors affiliated to Spaarverlies (now named Dolor) and the liquidators of the company Velstra also commenced civil actions. These claims, to a large extent duplicative of the claims introduced in the criminal proceedings, have not developed since then. There is not likely to be any develop-ment until after the end of the criminal proceedings (still on hold before the Supreme Court of Appeal with regard to parties other than Dexia Bank) and settlement of the civil aspect before the Court of Appeal. Considering the acquittal of Dexia Bank and the reasoning for the order, the risk of that action being declared substantiated is considered extremely low.
L&H Holding
On 27 April 2004, the bankruptcy receiver of L&H Holding summoned Messrs Lernout, Hauspie and Willaert, along with Banque Artesia Nederland (BAN) and Dexia Bank, to return the Parvest shares (the value of which was estimated at USD 31.5 million as at 31 December 2010) or, in default, to pay the principal amount of USD 25 million. The case, pending before the Commercial Court of Ypres, has not developed since thenThis action is connected with a USD 25 million loan granted to Mr Bastiaens by BAN in July 2000 for the purposes of the acquisition by Mr Bastiaens of LHSP shares owned by L&H Holding. The selling price of USD 25 million was credited not to the account of L&H Holding but to three separate accounts opened by Messrs Lernout, Hauspie and Willaert. Taking the view that this money was due to L&H Holding, the L&H Holding bankruptcy receiver is claiming its repayment. The order by the Court of Appeal in Ghent on 20 September 2010 attributed the said Parvest shares to the bankruptcy receiver of L&H Holding.If the Parvest shares, on deposit in the Netherlands and seized by various parties, are restored to the bankruptcy receiver of L&H Holding, his action will have no object and in principle it will lapse.
Provisions
In view of its acquittal in the criminal case on the basis of the facts of the case, the risk that Dexia Bank will be ordered to pay damages and interest in the current civil proceedings is particularly low and no provision has been constituted in that regard.
Financial Security Assurance
Financial Security Assurance Holdings Ltd (FSA Holdings) and its subsidiary, Financial Security Assurance Inc. (now named Assured Guaranty Municipal Corp. and hereafter referred to as “AGM”), former subsidiaries of the Dexia Group, and many other banks, insurance companies and brokerage firms are being investigated in the United States by the Antitrust Division of the US Department of Justice, the US tax authorities and the US Securities and Exchange Commission (SEC) on the grounds that they violated certain laws and regulations in connection with bidding on and entering into municipal derivatives transactions, including guaranteed investment contracts (GICs) (1), with the issuers of municipal bonds. Several US states have initiated parallel, similar investigations.In addition to the governmental investigations described above, a large number of banks, insurance companies and brokerages, including in some cases FSA Holdings, Dexia and/or AGM, have been named as defendants in various civil actions relating to municipal GICs and municipal derivatives transactions. These civil lawsuits allege violations of antitrust and other laws and regulations. Substantially all these civil
(1) The guaranteed investment contracts (GICs) that are the subject of these investigations and lawsuits were issued by subsidiaries of FSA Holdings in exchange for an investment of funds by US municipal entities. Those subsidiaries also issued GICs to issuers of securitized debt securities. The GICs, which had varying terms and repayment conditions, entitle their holders to receive interest payments at a guaranteed rate (fixed or variable) along with a return of invested principal. Payments of principal and interest on the GICs were guaranteed by AGM, and remain so after the acquisition of that company by Assured Guaranty Ltd.
92 Dexia Annual report 2010
Risk management
Man
agem
ent
repo
rtA
dditi
onal
info
rmat
ion
Ann
ual fi
nanc
ial s
tate
men
tsC
onso
lidat
ed
finan
cial
sta
tem
ents
proceedings have been consolidated for pre-trial purposes in a single matter before the US District Court for the Southern District of New York. Under the terms of the sale of FSA Holdings and AGM to Assured Guaranty Ltd, Dexia retained the Financial Products business and agreed to indemnify AGM and Assured Guaranty Ltd for all losses related to this activity that they may incur as a result of the investigations and lawsuits mentioned above.On 27 July 2010, the Department of Justice (DOJ) indicted former FSA employee Steven Goldberg, together with two former colleagues of Goldberg at his previous employer in the bid rigging matter. The DOJ did not indict FSA or any entity within the Dexia FP Group as part of the Goldberg indictment.Dexia is not able at present reasonably to predict the duration and the outcome of the investigations and legal proceedings in progress, or their potential financial repercussions. In addition, due to the nature of the DOJ/SEC investigations and civil actions relating to the same subject matter, any indication whether a provision has been constituted in relation to these investigations or litigations or their subject matter and, if so, the amount thereof, could seriously prejudice Dexia’s legal position or its defence in the context of these legal actions or any related proceedings.
Investigations of alleged shortcomings in financial communicationIn 2009 a shareholder, Mr Robert Casanovas, lodged a complaint with the Public Prosecutors in Brussels and Paris alleging shortcomings in Dexia’s financial communication. These complaints had given rise to the opening of two preliminary investigations. Mr Casanovas and his wife, Mrs Marie Christine Guil, had also served direct summonses on the company Dexia SA and several former and current executives of the Group to appear before the Criminal Court in Paris. At the hearing in October 2009, Mr Casanovas and his wife withdrew their action against the company Dexia SA which acknowledged it. This withdrawal occurred after the Public Prosecutor in Paris dismissed the complaint filed by Mr Robert Casanovas and his wife. As to the complaint lodged in Brussels, the Public Prosecutor also dismissed the charges against Dexia.Nonetheless, in October 2010, Mr Casanovas and his wife re-filed an action against Dexia before the Civil Court of Perpignan on essentially the same grounds as the criminal complaints filed in 2009.Dexia denies any shortcomings in its financial communication and considers that the allegations made by Mr Casanovas and his wife are unfounded.No provision has been set up.
Dexia banka Slovensko
In June 2009, a client of Dexia banka Slovensko, which defaulted on its collateral posting obligations in respect of certain currency transactions, commenced a court action against the bank claiming EUR 162.4 million for non-compliance with legislation and contractual obligations. Dexia banka Slovensko, in turn, submitted a counterclaim for EUR 92.2 million.
On 17 May 2010 the District Court of Bratislava announced its judgement on the former client’s claim, ordering Dexia banka Slovensko to pay an amount in principal of EUR 138 million. By separate judgement, the District Court further ordered Dexia banka Slovensko to pay legal fees and costs in an amount of EUR 15.3 million. The bank appealed both decisions to the Court of Appeal of Bratislava and, in reaction to these decisions, withdrew its counterclaim still pending before the District Court and resubmitted it for a higher amount to the Permanent Arbitration Court of the Slovak Banking Association.On 25 January 2011, the Court of Appeal in Bratislava passed a judgement cancelling both judgements of the District Court of Bratislava. The case will now return to the court of first instance. In its decision, the Court of Appeal in Bratislava almost entirely dismissed the arguments adopted by the District Court and stated that it did not establish the facts of the case correctly and erred in its legal arguments. The reasoning of the Court of Appeal will be binding on the court of first instance in the renewed proceedings.This decision lead to the reversal of the provision of EUR 138 million set up in the second quarter of 2010. However a provision of EUR 39 million is still being maintained to cover potential charges related to this case.
Dexia Crediop
Dexia Crediop, like other banks in Italy, is involved in certain judicial proceedings with respect to hedging transactions concluded in the framework of debt refinancing for local authorities.Under Italian law, debt may be restructured only if it leads to a reduction in the cost borne by the community. The legal question raised is whether or not the cost to be taken into consideration includes the cost of hedging transactions.In November 2010, the Administrative Tribunal of the Region of Tuscany rendered a decision in a dispute between Dexia Crediop and the Province of Pisa according to which the hedging transaction must be taken into account when calculating the costs of the restructuring transaction. Dexia Crediop lodged an appeal against this decision before the State Council in January 2011.In addition, Dexia Crediop has filed several claims before civil and administrative courts to preserve its rights under certain hedging agreements.At this stage of the proceedings, Dexia is not in a position to forecast in a reasonable way the duration or the outcome of the disputes, nor their possible financial consequences. Therefore, only a provision of an amount of EUR 7 million appears in the accounts as at 31 December 2010 in order to cover the legal fees.
Dexia Banque Internationale à Luxembourg and Dexia Private Bank (Switzerland)Further to the Bernard Madoff Investment Securities (“BMIS”) bankruptcy, the trustee of the BMIS estate and certain trustees of Madoff-related investment funds launched proceedings against a large number of financial institutions and institutional investors that purchased Madoff securities and Madoff-linked investment products, claiming reimbursement of profits earned by and redemptions received on these investments
93Annual report 2010 Dexia
Risk management
Man
agem
ent
repo
rtA
dditi
onal
info
rmat
ion
Ann
ual fi
nanc
ial s
tate
men
tsC
onso
lidat
ed
finan
cial
sta
tem
ents
over a period of several years leading up to the discovery of the fraud scheme operated by, and the subsequent bankruptcy of BMIS (so-called clawback claims). Dexia Banque Internationale à Luxembourg and its affiliate Dexia Private Bank (Switzerland) have been named as defendants in certain civil actions based on these clawback claims for an estimated amount in principal of approximately USD 79 million. The major part of this amount relates to investments made by Dexia Banque Internationale à Luxembourg for the account of third party investors. Dexia is not able at present reasonably to predict the duration or the outcome of the legal proceedings in progress, or their potential financial repercussions. If and to the extent these clawback claims would be supported by the courts, Dexia Banque Internationale à Luxembourg intends to seek reimbursement of any amounts to which it would be condemned from the beneficiaries for whose account it acted. As at 31 December 2010, no provision has been set up with respect to the clawback claims.In addition, Dexia Banque Internationale à Luxembourg is a defendant in a limited number of proceedings brought by clients who invested in Madoff-linked products.
Dexia Asset Management
Dexia Asset Management is defendant in proceedings brought against it by a professional investor before the Irish Court, filed in December 2010, seeking unquantified damages for alleged breach of contract.The claims relate to investments made by this professional investor in two Irish funds managed by Dexia Asset Management.The proceedings have been commenced and served upon Dexia Asset Management, but have not yet been advanced by the claimant beyond the document initiating the proceedings.As at 31 December 2010, a provision in an amount of EUR 2 million has been set up to cover expected legal fees and costs in relation to the defence against these allegations.
Dexia Crédit Local
Early in 2011, claims have been filed against Dexia Crédit Local by two clients in relation to structured financings. Dexia is analysing these claims but at this stage, is not able reasonably to predict the duration and the outcome of these proceedings, or their potential financial repercussions.
Dexia Israel
In May 2002, a complaint was filed in relation to the purchase by Dexia of shares held by the State of Israel claiming non-compliance with company law. In April 2009, the Central District Court rejected the application for a class action formulated by the complainants. In June 2009, the latter appealed to the Supreme Court. The hearing was held in November 2010. The Court has not yet passed judgement.No provision has been set up.
Stress tests
Dexia put an action plan in place in 2010 regarding stress testing: the development of new governance enhancing and optimising the organisation in place was made a priority in 2010.
In terms of Pillar 1 stress tests (individual stress tests on Basel II internal rating models), Dexia maintains its target to cover more than 80% of weighted credit risks.
In terms of Pillar 2 stress tests (global stress tests), the stress test performed by Dexia on the basis of an expert scenario of economic recession led to the maintenance of a Tier 1 ratio at a level above 8%.
In addition to the “classic” stress tests for market and liquidity risks, Dexia now has a full range of stress tests (sensitivity analyses, the implementation of stress scenarios and potential vulnerability assessments), enabling it to assess the potential effects of a hypothetical event or combination of events on its financial health, and to obtain a global view of the possible deformation of elements of the statement of income or its capital ratios under stress. Such simulations were made in 2010 for ABS, Assured-FSA and local authorities in particular.
Finally, in 2010 Dexia was among 91 European establishments subjected by the Committee of European Banking Supervisors (CEBS) to a common stress test, built on different scenarios of credit quality deterioration (1). the conclusion of the stress tests is that Dexia does not require additional capital to withstand the CEBS two-year adverse scenario, including the additional sovereign shock. Dexia’s strong capital base would enable it to resist to the conservative set of assumptions of the stress tests over the next two years, while still maintaining strong capital ratios. More specifically, as a result of the assumed shock under the adverse scenario, the estimated consolidated Tier 1 ratio of the Group would change to 11.2% in 2011 compared to 12.3% by the end of December 2009. An additional sovereign risk scenario would have a further impact of 0.29 percentage point on the estimated Tier 1 ratio, bringing it to 10.9% at the end of 2011, compared with the regulatory minimum of 4%.
(1) The test was conducted using to the scenarios, methodology and key assumptions provided by the CEBS, detailed in the aggregate report published on the CEBS website: http://www.c-ebs.org/EU-wide-stress-testing.aspx
94 Dexia Annual report 2010
Risk management
Man
agem
ent
repo
rtA
dditi
onal
info
rmat
ion
Ann
ual fi
nanc
ial s
tate
men
tsC
onso
lidat
ed
finan
cial
sta
tem
ents
Evolution of the regulatory framework
Since 1 January 2008 the Dexia Group has used the Advanced Internal Rating Based Approach (AIRBA) for calculating its capital requirements and its solvency ratios. New models have been developed and will progressively be used for calculating regulatory capital as from 31 December 2011.
Pillar 2 was consolidated in 2010 following inspections by the college of regulators. This mechanism, applicable since 31 December 2008, requires banks to demonstrate to their regulators the adequacy of their risk profile and their capital. To do so, they must have internal systems for the calculation and management of their risks, capable of making a valid assessment of their economic capital needs (Internal Capital Adequacy Assessment Process − ICAAP). This process is thus based on three main processes: the analysis of risks by the Risk support line and the financial plan (including a capital allocation, an analysis of the evolution of the results of business lines and the internal capital supply) and an analysis of the economic adequacy of capital by the Finance support line.
The Board of Directors and the Management Board of Dexia SA have been kept closely informed of developments on Pillar 2. In May 2010 these two bodies approved Dexia’s global risk appetite policy (cf. section on the internal capital adequacy in the chapter “Capital Management” pages 97-98).
Pillar 3, which defines a range of qualitative and quantitative information in relation to risks distributed to market operators, is applicable at the highest consolidated level of the Dexia Group and has been part of the external communication of Dexia SA since 2008 (see the document Risk Report – Pillar 3 of Basel II published on Dexia’s website www.dexia.com).
Finally, Dexia is heavily involved and very closely monitors national and international consultations by participating in particular in the study of the impact of the Bank of International Settlements on Basel III reform regarding the definition of capital, leverage ratio, liquidity ratios and so on.
In this context, Dexia worked actively on application of the so-called “CRD 2” and “CRD 3” European directives.
Risk appetite
Risk appetite expresses the level of risk an institution is ready to take, given the expectations of the principal stakeholders (shareholders, creditors, regulators, rating agencies, clients and so on), in order to achieve its strategic and financial objectives.
In 2010, the Group worked on integration of its risk appetite approach in various strategic analyses, and began to implement it in the main subsidiaries.
Based on a global approach, risk appetite is a reference point to:• guide strategy and planning;• frame performance in terms of growth and value creation;• facilitate daily investment decisions.
A formalised framework was developed in 2009, and then validated in 2010, integrating a series of ratios constituting a key element in defining limits for major financial balances. The framework is based on a mix of accounting ratios (gearing), regulatory ratios (Tier 1, weighted risks), economic ratios (economic capital, earnings at risk), and naturally integrates liquidity and funding structure ratios as well as credit concentration limits.
Limits are defined on each of these ratios, and validated by the Board of Directors each year. The Group’s financial plan is analysed respecting the framework set for risk appetite. The Risk Management and Finance support lines are responsible for monitoring these ratios, and if necessary propose measures to the Management Board to ensure the limits are observed.
95Annual report 2010 Dexia
Capital management
Man
agem
ent
repo
rtA
dditi
onal
info
rmat
ion
Ann
ual fi
nanc
ial s
tate
men
tsC
onso
lidat
ed
finan
cial
sta
tem
ents
Solvency
Dexia monitors its solvency using rules and ratios established by the Basel Committee on Banking Supervision and the European Capital Requirements Directive.
These ratios, the capital adequacy ratio and the Tier 1 ratio, compare the amount of regulatory capital (in total and Tier 1) with total weighted risks. From a regulatory point of view, they should amount to a minimum 4% for the Tier 1 ratio and 8% for the capital adequacy ratio.
Another indicator used by Dexia to monitor its solvency is the Core Tier 1 ratio, which compares the amount of regulatory capital excluding hybrid capital, with total weighted risks.
The Banking, Finance and Insurance Commission (CBFA) requires Dexia to submit the calculation of capital necessary in performance of its activity in accordance with the prudential banking regulations on the one hand and in accordance with the prudential regulations on financial conglomerates on the other.
Dexia has complied with all regulatory capital rules for all periods reported.
Regulatory capital
Regulatory capital consists of:• Tier 1 capital consisting of share capital, share premiums, retained earnings including current year profit, hybrid capital, foreign currency translation and minority interests, less intangible assets, accrued dividends, net long positions in own shares and goodwill;• Tier 2 capital which includes the eligible part of subordinated long-term debt, less subordinated debt from and equities in financial institutions.
According to regulatory requirements:• AFS reserves on bonds and cash flow hedge reserves are not part of equity;• AFS reserves on shares are added to Tier 2 equity if positive, with a haircut, or deducted from Tier 1 equity if negative;• certain IFRS adjustments on subordinated debts, minority interests and debts must be reversed to reflect the characteristics of absorption of loss of those instruments;• other elements (SPV, deferred taxes, etc.) are also adjusted based on CBFA requirements.
Moreover, since 1 January 2007, according to the CRD regulation (Capital Requirement Directive), the CBFA adapted its definition of the regulatory capital. The most important point impacting Dexia is that the elements which were deducted from the total regulatory capital (banks accounted for by the equity method, participations in financial companies or subordinated loans issued by such a financial company) will be deducted for 50% from Tier 1 capital and for 50% from total regulatory capital. For these elements dealing with insurance companies, the new deduction rule will be implemented as from 1 January 2013.For regulatory purposes, insurance companies are accounted for by the equity method. Therefore, non-controlling interests differ from those published in the financial statements. Discretionary participation features only relate to insurance companies.
COMPARISON OF TOTAL EQUITY (FINANCIAL STATEMENTS) AND EQUITY CALCULATED FOR REGULATORY REQUIREMENTS 31/12/09 31/12/10
(in millions EUR)
Consolidated financial
statements
Regulatory purposes
Consolidated financial
statements
Regulatory purposes
Total shareholders’ equity 10,182 10,182 8,945 8,945
Non-controlling interests 1,806 1,796 1,783 1,773
of which Core equity 1,813 1,805 1,858 1,849
of which Gains and Losses not recognised in the statement of income (8) (9) (75) (76)
Discretionary participation features of insurance contracts 1 0 0 0
TOTAL EQUITY 11,988 11,978 10,728 10,718
96 Dexia Annual report 2010
Capital management
Man
agem
ent
repo
rtA
dditi
onal
info
rmat
ion
Ann
ual fi
nanc
ial s
tate
men
tsC
onso
lidat
ed
finan
cial
sta
tem
ents
REGULATORY CAPITAL 31/12/09 31/12/10
Regulatory capital (after profit appropriation) 20,251 20,636
Tier 1 capital 17,573 18,425
Core shareholders’ equity 18,498 19,214
Cumulative translation adjustments (Group share) (531) (361)
Prudential filters (111) (104)
Non-controlling interests eligible in Tier 1 613 660
Dividend payout (non-controlling interests) (9) (6)
Items to be deducted (2,308) (2,401)
Intangible assets and goodwill (2,163) (2,262)
Holdings > 10% in other credit and financial institutions (50%) (57) (54)
Subordinated claims and other items in other credit and financial institutions in which holdings > 10% (50%) (88) (85)
Innovative hybrid Tier 1 instruments 1,421 1,423
Tier 2 capital 2,678 2,211
Perpetuals 755 839
Subordinated debts 2,630 2,541
Available for sale reserve on equities (+) 435 308
IRB provision excess (+); IRB provision shortfall 50% (-) 157 0
Items to be deducted (1,298) (1,478)
Holdings > 10% in other credit and financial institutions (50%) (187) (186)
Subordinated claims and other items in other credit and financial institutions in which holdings > 10% (50%) (88) (85)
Participations in insurance undertakings (1,023) (1,206)
Issuer Booked amount (in millions of EUR)
Rate Call date Rate applicable after the call
Dexia Banque Internationale à Luxembourg SA 225 6.821% 06.07.11
Euribor 3 m + 230 bp
Dexia Crédit Local SA 700 4.30% 18.11.15Euribor 3 m
+ 173 bp
Dexia Funding Luxembourg SA 498 4.892% 02.11.16Euribor 3 m
+ 178 bp
At year-end 2010, Tier 1 capital amounted to EUR 18,425 million, up 5%. Excluding hybrid Tier 1 instruments in an amount of EUR 1,423 million, core Tier 1 capital amounted to EUR 17,002 million at year-end 2010. These hybrid Tier 1 instruments consist of three issuances:• a perpetual hybrid capital instrument of EUR 225 million issued by Dexia Banque Internationale à Luxembourg;• undated subordinated non-cumulative Notes for EUR 700 mil-lion, issued by Dexia Crédit Local;
• undated subordinated non-cumulative Notes for EUR 498 mil-lion, issued by Dexia Funding Luxembourg.The characteristics of the three issuances are as follows:The agreement with the European Commission provides certain restrictions in relation to the payment of coupons and calls on Dexia hybrid capital instruments. These restrictions are detailed in the chapter “Update on the transformation plan” in this annual report (page 15-16).
97Annual report 2010 Dexia
Capital management
Man
agem
ent
repo
rtA
dditi
onal
info
rmat
ion
Ann
ual fi
nanc
ial s
tate
men
tsC
onso
lidat
ed
finan
cial
sta
tem
ents
At year-end 2010, Dexia’s total weighted risks amounted to EUR 140.8 billion against EUR 143.2 billion at year-end 2009. This fall of EUR -2.3 billion is essentially due to deleveraging efforts (EUR -3.2 billion) and impairments on the Financial Products portfolio (EUR -4.2 billion), partially offset by exchange effects (EUR +3.2 billion) and the increased asset base (EUR +2.7 billion).
(in millions of EUR) 31/12/09 31/12/10
Weighted credit risks 129,758 128,240
Weighted market risks 2,993 2,945
Weighted operational risks 10,419 9,650
TOTAL 143,170 140,834
Solvency ratios
In 2010, Tier 1 ratio further improved by 81 bps to 13.1% supported by organic generation of Tier 1 capital of EUR 852 million (equivalent to 60 bps) and by a decrease of total weighted risks by EUR 2.3 billion (equivalent to 21 bps). The core Tier 1 ratio reached 12.1%, up by 79 bps compared to the end of 2009, illustrating the Group’s solid solvency situation.The capital adequacy ratio was 14.7% at the end of 2010, up 51 bps on the end of 2009.
Dexia was subject to the 2010 European Union-wide stress testing exercise, coordinated by the Committee of European Banking Supervisors (CEBS). The conclusion of that stress test, based on various scenarios of credit quality deterioration (1), was that Dexia does not require any additional capital to withstand the CEBS two-year adverse scenario, including the additional sovereign shock.More detailed information on the stress tests is provided in the section dedicated to stress tests in the chapter “Risk Management” of this Annual Report (page 93).
(1) The test was conducted using the scenarios, methodology and key assumptions provided by the CEBS, detailed in the aggregate report published on the CEBS website: http://www.c-ebs.org/EU-wide-stress-testing.aspx
31/12/09 31/12/10
Tier 1 ratio 12.3% 13.1%
Core Tier 1 ratio 11.3% 12.1%
Capital adequacy ratio 14.1% 14.7%
Internal capital adequacy
In 2010, Dexia had the Management Board and the Board of Directors validate its internal capital adequacy mechanism thus responding to the requirements of Pillar 2 of Basel II. Beyond those external requirements, this process is at the heart of management of the bank and responds to its capital adequacy target in line with its risk profile. It relies on a comparison between available financial resources and economic capital.
Weighted risks
Weighted risks consist of three elements: credit risk, market risk and operational risk. Each of these risks is described in the chapter “Risk Management” in this Annual Report (pages 78 to 80).
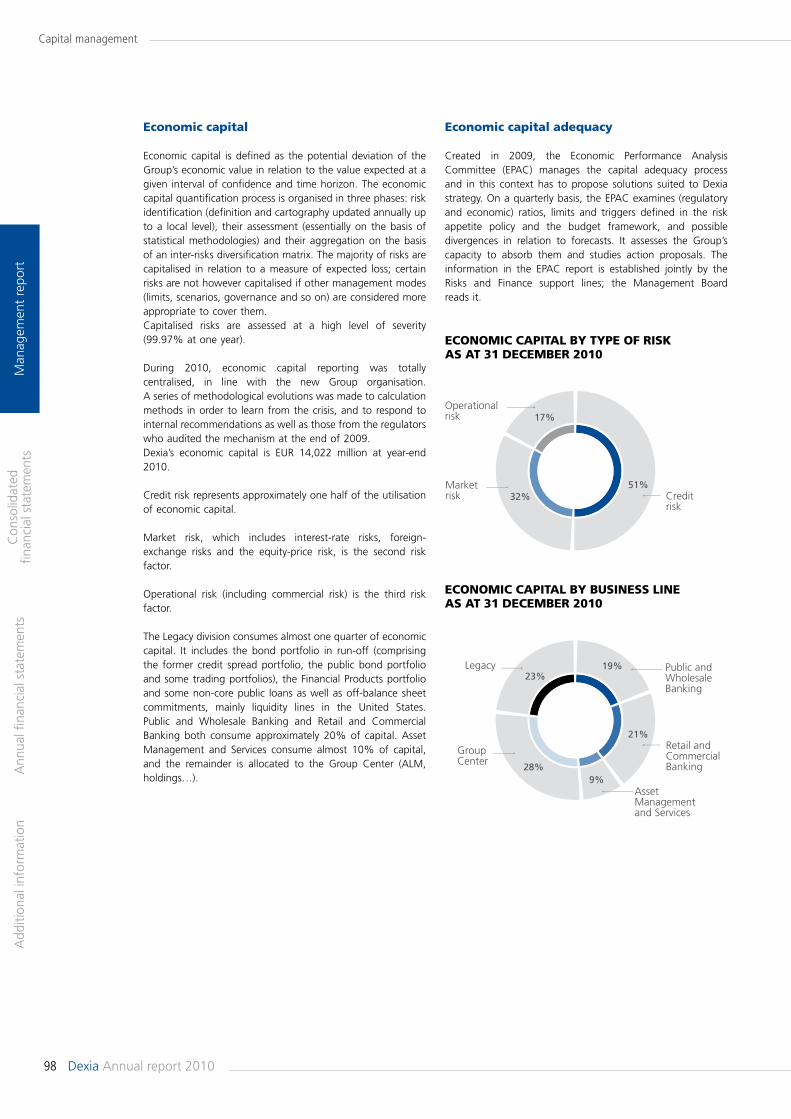
98
Capital management
Man
agem
ent
repo
rtA
dditi
onal
info
rmat
ion
Ann
ual fi
nanc
ial s
tate
men
tsC
onso
lidat
ed
finan
cial
sta
tem
ents
Dexia Annual report 2010
Economic capital adequacy
Created in 2009, the Economic Performance Analysis Committee (EPAC) manages the capital adequacy process and in this context has to propose solutions suited to Dexia strategy. On a quarterly basis, the EPAC examines (regulatory and economic) ratios, limits and triggers defined in the risk appetite policy and the budget framework, and possible divergences in relation to forecasts. It assesses the Group’s capacity to absorb them and studies action proposals. The information in the EPAC report is established jointly by the Risks and Finance support lines; the Management Board reads it.
Economic capital
Economic capital is defined as the potential deviation of the Group’s economic value in relation to the value expected at a given interval of confidence and time horizon. The economic capital quantification process is organised in three phases: risk identification (definition and cartography updated annually up to a local level), their assessment (essentially on the basis of statistical methodologies) and their aggregation on the basis of an inter-risks diversification matrix. The majority of risks are capitalised in relation to a measure of expected loss; certain risks are not however capitalised if other management modes (limits, scenarios, governance and so on) are considered more appropriate to cover them.Capitalised risks are assessed at a high level of severity (99.97% at one year).
During 2010, economic capital reporting was totally centralised, in line with the new Group organisation. A series of methodological evolutions was made to calculation methods in order to learn from the crisis, and to respond to internal recommendations as well as those from the regulators who audited the mechanism at the end of 2009.Dexia’s economic capital is EUR 14,022 million at year-end 2010.
Credit risk represents approximately one half of the utilisation of economic capital.
Market risk, which includes interest-rate risks, foreign-exchange risks and the equity-price risk, is the second risk factor.
Operational risk (including commercial risk) is the third risk factor.
The Legacy division consumes almost one quarter of economic capital. It includes the bond portfolio in run-off (comprising the former credit spread portfolio, the public bond portfolio and some trading portfolios), the Financial Products portfolio and some non-core public loans as well as off-balance sheet commitments, mainly liquidity lines in the United States. Public and Wholesale Banking and Retail and Commercial Banking both consume approximately 20% of capital. Asset Management and Services consume almost 10% of capital, and the remainder is allocated to the Group Center (ALM, holdings…).
19%
21%
9%28%
Public andWholesaleBanking
Retail andCommercialBanking
AssetManagementand Services
GroupCenter
23%Legacy
ECONOMIC CAPITAL BY BUSINESS LINEAS AT 31 DECEMBER 2010
17%
51%32%
Operationalrisk
Creditrisk
Marketrisk
ECONOMIC CAPITAL BY TYPE OF RISKAS AT 31 DECEMBER 2010
99Annual report 2010 Dexia
Financial results
Man
agem
ent
repo
rtA
dditi
onal
info
rmat
ion
Ann
ual fi
nanc
ial s
tate
men
tsC
onso
lidat
ed
finan
cial
sta
tem
ents
Preliminary notes to the consolidated financial statements
Changes in scope of consolidation
In 2009As from 1 April 2009, Dexia no longer consolidates the activities of Financial Security Assurance Holdings Ltd, sold to Assured Guaranty Ltd. FSA Insurance’s result for the first quarter 2009 is consolidated on a line-by-line basis and the net result is offset in “Net income on investments”. The sale was completed on 1 July 2009.
As from the fourth quarter 2009, Crédit du Nord is no longer included in Dexia’s consolidated financial statements pursuant to the agreement under which Société Générale buys Dexia’s 20% stake in Crédit du Nord. The first nine-month result for Crédit du Nord is considered in Dexia’s annual result 2009.
Simultaneously to this transaction Dexia purchased Crédit du Nord’s 20% stake in Dexia Crédit Local de France Banque. As a result of this acquisition, Dexia controls 100% of Dexia Crédit Local de France Banque.
On 9 December 2009, Dexia signed an agreement relating to the sale of Dexia Épargne Pension to BNP Paribas Assurance. Following the signing of the agreement, Dexia Épargne Pension was recorded in “Non current assets held for sale” and in “Liabilities included in disposal groups held for sale” as at 31 December 2009.
In 2010Following its sale in April 2010, Dexia Épargne Pension left the scope of consolidation. Its results for the first three months of 2010 have been consolidated.Dexia sold its 51% stake in AdInfo. AdInfo’s results for the first six months of 2010 have been consolidated.
Analytical treatment
Under the new segment reporting, introduced on 1 January 2010, Dexia’s business was split into two divisions:• The Core Division, composed of the following business lines:- Retail and Commercial Banking (segment 1);- Public and Wholesale Banking (segment 2);- Asset Management and Services, comprising the activities of Asset Management (segment 3), Investor Services (segment 4) and Insurance (segment 5);- Group Center (segment 6).
• The Legacy Portfolio Management Division (segment 7), which gathers the contributions of the bond portfolios in run-off (including the Financial Products portfolio) and the PWB run-off commitments.Those segments can be defined as being components of Dexia that engage in business activities from which the Group may earn income and incur expenses. They are regularly reviewed in order to assess performance and to make resource-allocation decisions.They are defined by using the management approach, which means that they reflect Dexia’s internal organizational structure and are used by management to make business decisions.The Legacy Portfolio Management Division remains on the balance sheet in a separate (non-core) unit with clearly identifiable and allocated funding. The State-guaranteed funding is allocated to this division.Interests allocated from the Group Center to the other business lines and to the Legacy Division are now related to the allocated equity which is:• the economic equity in the core business lines;• the normative equity (12.5% of the weighted risks) in the Legacy Division.“Return on allocated equity” measures the performance of the core business lines.“Tangible and intangible assets” are allocated to the Group Center except when they are directly managed by a commercial or financial business line.Relations between business lines and especially between commercial business lines, the financial markets division and “production and service centre” departments are subject to analytical transfers, governed by service level agreements based on normal commercial terms and market conditions. The results of each business line also include:• the commercial margin;• interest on economic capital: economic capital is allocated to the business lines for internal purposes and the return on economic capital is used to measure the performance of each business line.Although Dexia’s business segments are managed on a centralized basis, geographical segments with an income (in absolute terms) above 10% have been defined for compliance purposes. Geographic information is based on booking centres, being the country of the company recording the transaction and not the country of the customers.More information on segment reporting is given in the note 3 to the consolidated statements on page 144.

100
Financial results
Man
agem
ent
repo
rtA
dditi
onal
info
rmat
ion
Ann
ual fi
nanc
ial s
tate
men
tsC
onso
lidat
ed
finan
cial
sta
tem
ents
Dexia Annual report 2010
from losses and provisioning on the Financial Products port-folio following the Financial Products State Guarantee mechanism (1).
Impairments and provisions for litigations
Other impairments and provisions for legal litigations amounted to EUR 42 million.
Pre-tax income
Consequently, pre-tax income amounted to EUR 924 million against EUR 1,403 million in 2009.
Tax expenses
Tax expenses were EUR 127 million and the effective tax rate 14%, principally explained by EUR 143 million of one-off positive items: USD 51 million (EUR 39 million) of tax refunds in the US, EUR 78 million of reversals of Deferred Tax Assets (DTA) or tax provisions and tax impacts related to the closure of foreign entities. In 2010, EUR 21 million DTA on timing differences on the Financial Products portfolio were also recognized on provisions exceeding the economic loss assessment after deduction of the Own Credit Risk.
Net income Group share
After taking EUR 74 million of non-controlling interests into account, net income Group share amounted to EUR 723 million in 2010 against EUR 1,010 million in 2009.
Solvency
With a Tier 1 ratio of 13.1% (Core Tier 1 of 12.1%) at the end of December 2010, the Group enjoys robust solvency which was further strengthened in 2010 thanks to organic capital generation and by a decrease of total weighted risks. More information is given in the chapter “Capital management” of this annual report (page 95).
Return on Equity
Return on equity stood at 3.8% in 2010.
Earnings per share
Earnings per share amounted to EUR 0.39 for 2010 compared to EUR 0.55 for 2009.
Consolidated balance sheet
The consolidated balance-sheet total amounted to EUR 567 billion as at 31 December 2010, down by EUR 11 billion compared to 31 December 2009.The evolution of the total balance sheet reflected mainly:• the active balance-sheet deleveraging policy (EUR -27.2 billion);• the natural asset amortization (EUR -27.6 billion);• the new commercial production in line with the refocus on the core commercial franchises (EUR +22.3 billion);
(1) More detailed information on the State guarantee is provided in the note 9.4.C. to the consolidated financial statements in this Annual Report (page 184).
Consolidated statement of income
Income
At EUR 5,310 million, 2010 income was marked by acceleration of the Group’s transformation and in particular by the strengthening of its financial structure. Indeed, the sharp decrease of the liquidity gap and the Group’s active deleveraging programme, in line with Dexia’s targets, were reflected by a EUR 528 million decrease in Treasury revenues against 2009 record results and a EUR 283 million loss on margins on run-off assets. Although remaining contained, the cost of deleveraging also impacted revenues with a EUR 212 million loss for a total of EUR 27.2 billion of asset sales. The stronger contribution from the commercial business lines and the positive effects of the Legacy trading portfolio valuation (CDS linked to synthetic securitization and CVA on CDS intermediation) did not fully offset this impact. Consequently, income fell by 14% in 2010. Excluding FSA Insurance (deconsolidated as from 2Q 2009), the decrease was 9% compared to the FY 2009.
Expenses
Costs totalled EUR 3,703 million (+3% on 2009). Within the context of its restructuring plan, Dexia booked EUR 145 million of provisions for restructuring costs in 2010 against EUR 89 million in the previous year. Excluding those restructuring costs and bonus reversals, costs remained flat. In 2010, the cost base was also impacted by business-related costs in Turkey resulting from the network expansion (+50 branches in 2010) and by EUR 52 million of currency impact on RBC Dexia Investor Services and DenizBank. The cost-income ratio amounted to 69.7% for the full year 2010.
Gross operating income
Consequently, gross operating income amounted to EUR 1,607 million in 2010 compared to EUR 2,577 million in 2009.
Cost of risk
The cost of risk was down sharply on 2009 (-40%) at EUR 641 million. Excluding FSA Insurance, the cost of risk fell by EUR 183 million, reflecting diverging trends. On the one hand, the Group benefited from a decrease (EUR 104 million) of the cost of risk in Retail and Commercial Banking mainly due to a rapidly improving credit environment in Turkey, EUR 195 million reversals of impairments in Public and Wholesale Banking also reflecting an improvement of the environment and EUR 191 million reversals on collective impairments for ABS and subordinated debt booked in the bond portfolio in run-off following the disposal of assets. On the other hand, 2010 was marked by higher impairments on the Financial Products portfolio (EUR 559 million in 2010 versus EUR 231 million in 2009), particularly during the last quarter of the year in line with more conservative assumptions on the US RMBS market. These provisions have not however impacted Dexia’s regulatory solvency ratios which have been immune
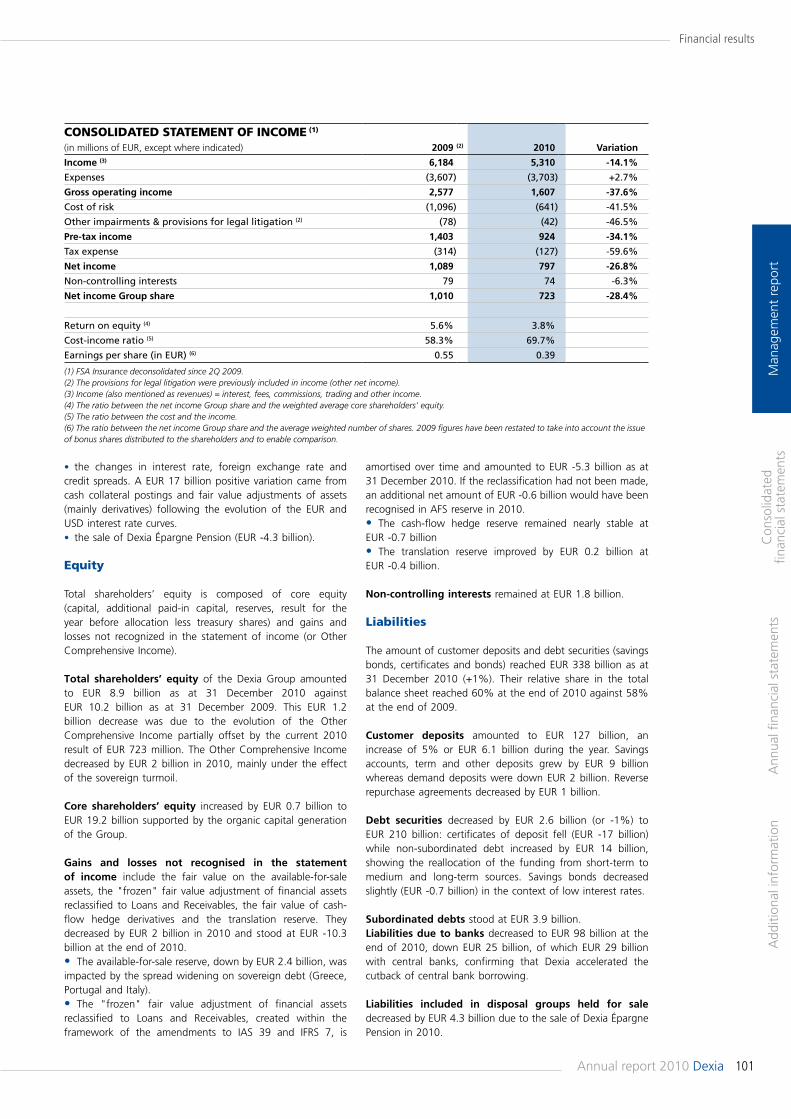
101Annual report 2010 Dexia
Financial results
Man
agem
ent
repo
rtA
dditi
onal
info
rmat
ion
Ann
ual fi
nanc
ial s
tate
men
tsC
onso
lidat
ed
finan
cial
sta
tem
ents
amortised over time and amounted to EUR -5.3 billion as at 31 December 2010. If the reclassification had not been made, an additional net amount of EUR -0.6 billion would have been recognised in AFS reserve in 2010. • The cash-flow hedge reserve remained nearly stable at EUR -0.7 billion• The translation reserve improved by EUR 0.2 billion at EUR -0.4 billion.
Non-controlling interests remained at EUR 1.8 billion.
Liabilities
The amount of customer deposits and debt securities (savings bonds, certificates and bonds) reached EUR 338 billion as at 31 December 2010 (+1%). Their relative share in the total balance sheet reached 60% at the end of 2010 against 58% at the end of 2009.
Customer deposits amounted to EUR 127 billion, an increase of 5% or EUR 6.1 billion during the year. Savings accounts, term and other deposits grew by EUR 9 billion whereas demand deposits were down EUR 2 billion. Reverse repurchase agreements decreased by EUR 1 billion.
Debt securities decreased by EUR 2.6 billion (or -1%) to EUR 210 billion: certificates of deposit fell (EUR -17 billion) while non-subordinated debt increased by EUR 14 billion, showing the reallocation of the funding from short-term to medium and long-term sources. Savings bonds decreased slightly (EUR -0.7 billion) in the context of low interest rates.
Subordinated debts stood at EUR 3.9 billion.Liabilities due to banks decreased to EUR 98 billion at the end of 2010, down EUR 25 billion, of which EUR 29 billion with central banks, confirming that Dexia accelerated the cutback of central bank borrowing.
Liabilities included in disposal groups held for sale decreased by EUR 4.3 billion due to the sale of Dexia Épargne Pension in 2010.
• the changes in interest rate, foreign exchange rate and credit spreads. A EUR 17 billion positive variation came from cash collateral postings and fair value adjustments of assets (mainly derivatives) following the evolution of the EUR and USD interest rate curves.• the sale of Dexia Épargne Pension (EUR -4.3 billion).
Equity
Total shareholders’ equity is composed of core equity (capital, additional paid-in capital, reserves, result for the year before allocation less treasury shares) and gains and losses not recognized in the statement of income (or Other Comprehensive Income).
Total shareholders’ equity of the Dexia Group amounted to EUR 8.9 billion as at 31 December 2010 against EUR 10.2 billion as at 31 December 2009. This EUR 1.2 billion decrease was due to the evolution of the Other Comprehensive Income partially offset by the current 2010 result of EUR 723 million. The Other Comprehensive Income decreased by EUR 2 billion in 2010, mainly under the effect of the sovereign turmoil.
Core shareholders’ equity increased by EUR 0.7 billion to EUR 19.2 billion supported by the organic capital generation of the Group.
Gains and losses not recognised in the statement of income include the fair value on the available-for-sale assets, the "frozen" fair value adjustment of financial assets reclassified to Loans and Receivables, the fair value of cash-flow hedge derivatives and the translation reserve. They decreased by EUR 2 billion in 2010 and stood at EUR -10.3 billion at the end of 2010.• The available-for-sale reserve, down by EUR 2.4 billion, was impacted by the spread widening on sovereign debt (Greece, Portugal and Italy).• The "frozen" fair value adjustment of financial assets reclassified to Loans and Receivables, created within the framework of the amendments to IAS 39 and IFRS 7, is
CONSOLIDATED STATEMENT OF INCOME (1)
(in millions of EUR, except where indicated) 2009 (2) 2010 Variation
Income (3) 6,184 5,310 -14.1%
Expenses (3,607) (3,703) +2.7%
Gross operating income 2,577 1,607 -37.6%
Cost of risk (1,096) (641) -41.5%
Other impairments & provisions for legal litigation (2) (78) (42) -46.5%
Pre-tax income 1,403 924 -34.1%
Tax expense (314) (127) -59.6%
Net income 1,089 797 -26.8%
Non-controlling interests 79 74 -6.3%
Net income Group share 1,010 723 -28.4%
Return on equity (4) 5.6% 3.8%
Cost-income ratio (5) 58.3% 69.7%
Earnings per share (in EUR) (6) 0.55 0.39
(1) FSA Insurance deconsolidated since 2Q 2009.(2) The provisions for legal litigation were previously included in income (other net income).(3) Income (also mentioned as revenues) = interest, fees, commissions, trading and other income.(4) The ratio between the net income Group share and the weighted average core shareholders’ equity.(5) The ratio between the cost and the income.(6) The ratio between the net income Group share and the average weighted number of shares. 2009 figures have been restated to take into account the issue of bonus shares distributed to the shareholders and to enable comparison.
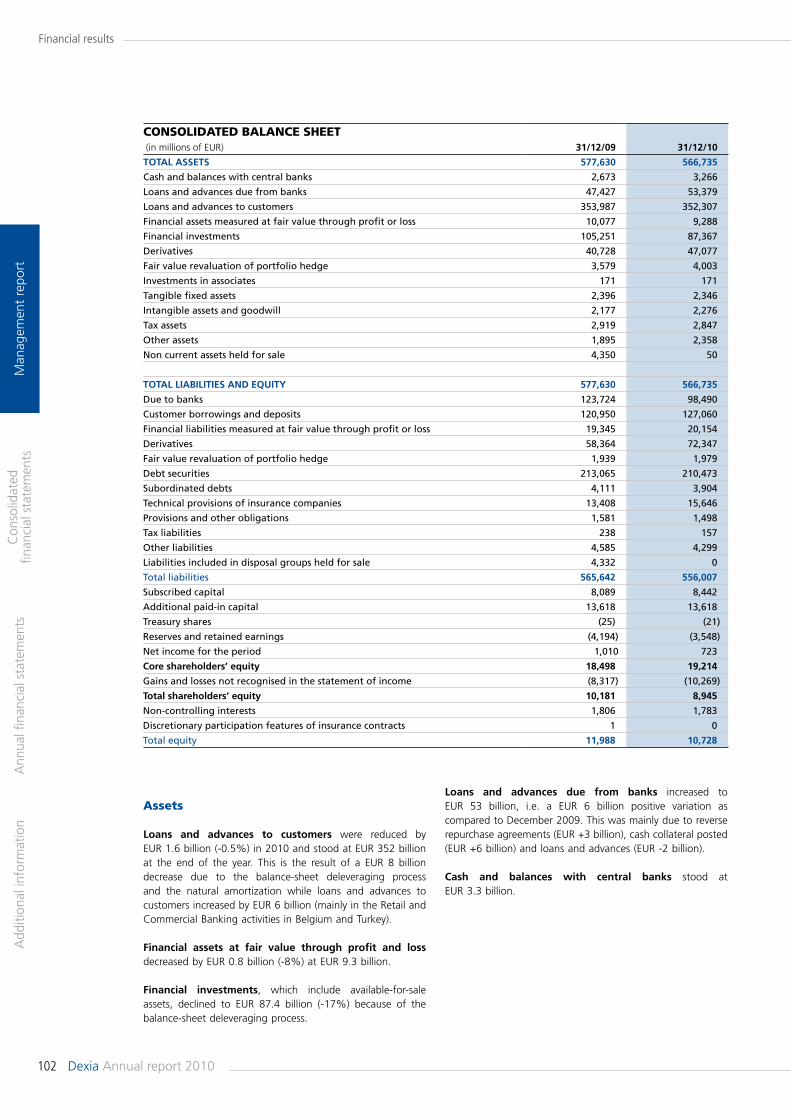
102
Financial results
Man
agem
ent
repo
rtA
dditi
onal
info
rmat
ion
Ann
ual fi
nanc
ial s
tate
men
tsC
onso
lidat
ed
finan
cial
sta
tem
ents
Dexia Annual report 2010
Loans and advances due from banks increased to EUR 53 billion, i.e. a EUR 6 billion positive variation as compared to December 2009. This was mainly due to reverse repurchase agreements (EUR +3 billion), cash collateral posted (EUR +6 billion) and loans and advances (EUR -2 billion).
Cash and balances with central banks stood at EUR 3.3 billion.
Assets
Loans and advances to customers were reduced by EUR 1.6 billion (-0.5%) in 2010 and stood at EUR 352 billion at the end of the year. This is the result of a EUR 8 billion decrease due to the balance-sheet deleveraging process and the natural amortization while loans and advances to customers increased by EUR 6 billion (mainly in the Retail and Commercial Banking activities in Belgium and Turkey).
Financial assets at fair value through profit and loss decreased by EUR 0.8 billion (-8%) at EUR 9.3 billion.
Financial investments, which include available-for-sale assets, declined to EUR 87.4 billion (-17%) because of the balance-sheet deleveraging process.
CONSOLIDATED BALANCE SHEET (in millions of EUR) 31/12/09 31/12/10
TOTAL ASSETS 577,630 566,735
Cash and balances with central banks 2,673 3,266
Loans and advances due from banks 47,427 53,379
Loans and advances to customers 353,987 352,307
Financial assets measured at fair value through profit or loss 10,077 9,288
Financial investments 105,251 87,367
Derivatives 40,728 47,077
Fair value revaluation of portfolio hedge 3,579 4,003
Investments in associates 171 171
Tangible fixed assets 2,396 2,346
Intangible assets and goodwill 2,177 2,276
Tax assets 2,919 2,847
Other assets 1,895 2,358
Non current assets held for sale 4,350 50
TOTAL LIABILITIES AND EQUITY 577,630 566,735
Due to banks 123,724 98,490
Customer borrowings and deposits 120,950 127,060
Financial liabilities measured at fair value through profit or loss 19,345 20,154
Derivatives 58,364 72,347
Fair value revaluation of portfolio hedge 1,939 1,979
Debt securities 213,065 210,473
Subordinated debts 4,111 3,904
Technical provisions of insurance companies 13,408 15,646
Provisions and other obligations 1,581 1,498
Tax liabilities 238 157
Other liabilities 4,585 4,299
Liabilities included in disposal groups held for sale 4,332 0
Total liabilities 565,642 556,007
Subscribed capital 8,089 8,442
Additional paid-in capital 13,618 13,618
Treasury shares (25) (21)
Reserves and retained earnings (4,194) (3,548)
Net income for the period 1,010 723
Core shareholders’ equity 18,498 19,214
Gains and losses not recognised in the statement of income (8,317) (10,269)
Total shareholders’ equity 10,181 8,945
Non-controlling interests 1,806 1,783
Discretionary participation features of insurance contracts 1 0
Total equity 11,988 10,728
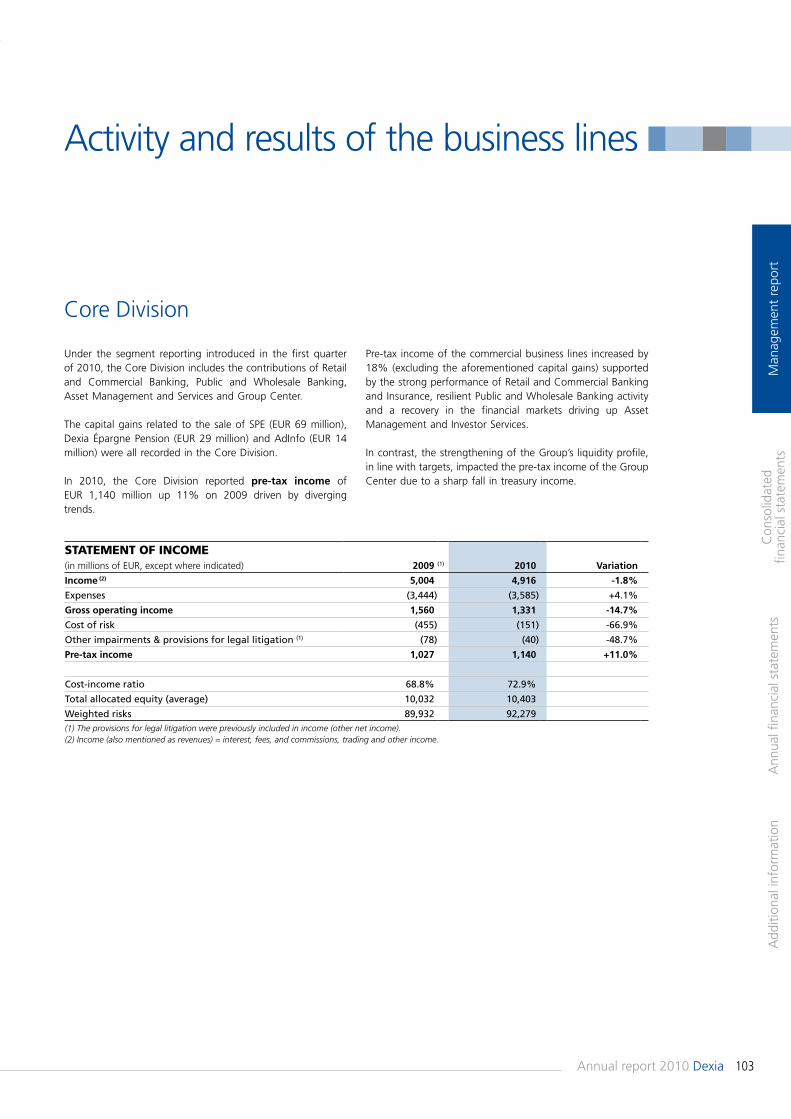
103Annual report 2010 Dexia
Activity and results of the business lines
Man
agem
ent
repo
rtA
dditi
onal
info
rmat
ion
Ann
ual fi
nanc
ial s
tate
men
tsC
onso
lidat
ed
finan
cial
sta
tem
ents
Core Division
Under the segment reporting introduced in the first quarter of 2010, the Core Division includes the contributions of Retail and Commercial Banking, Public and Wholesale Banking, Asset Management and Services and Group Center.
The capital gains related to the sale of SPE (EUR 69 million), Dexia Épargne Pension (EUR 29 million) and AdInfo (EUR 14 million) were all recorded in the Core Division.
In 2010, the Core Division reported pre-tax income of EUR 1,140 million up 11% on 2009 driven by diverging trends.
Pre-tax income of the commercial business lines increased by 18% (excluding the aforementioned capital gains) supported by the strong performance of Retail and Commercial Banking and Insurance, resilient Public and Wholesale Banking activity and a recovery in the financial markets driving up Asset Management and Investor Services.
In contrast, the strengthening of the Group’s liquidity profile, in line with targets, impacted the pre-tax income of the Group Center due to a sharp fall in treasury income.
STATEMENT OF INCOME(in millions of EUR, except where indicated) 2009 (1) 2010 Variation
Income (2) 5,004 4,916 -1.8%
Expenses (3,444) (3,585) +4.1%
Gross operating income 1,560 1,331 -14.7%
Cost of risk (455) (151) -66.9%
Other impairments & provisions for legal litigation (1) (78) (40) -48.7%
Pre-tax income 1,027 1,140 +11.0%
Cost-income ratio 68.8% 72.9%
Total allocated equity (average) 10,032 10,403
Weighted risks 89,932 92,279(1) The provisions for legal litigation were previously included in income (other net income).(2) Income (also mentioned as revenues) = interest, fees, and commissions, trading and other income.
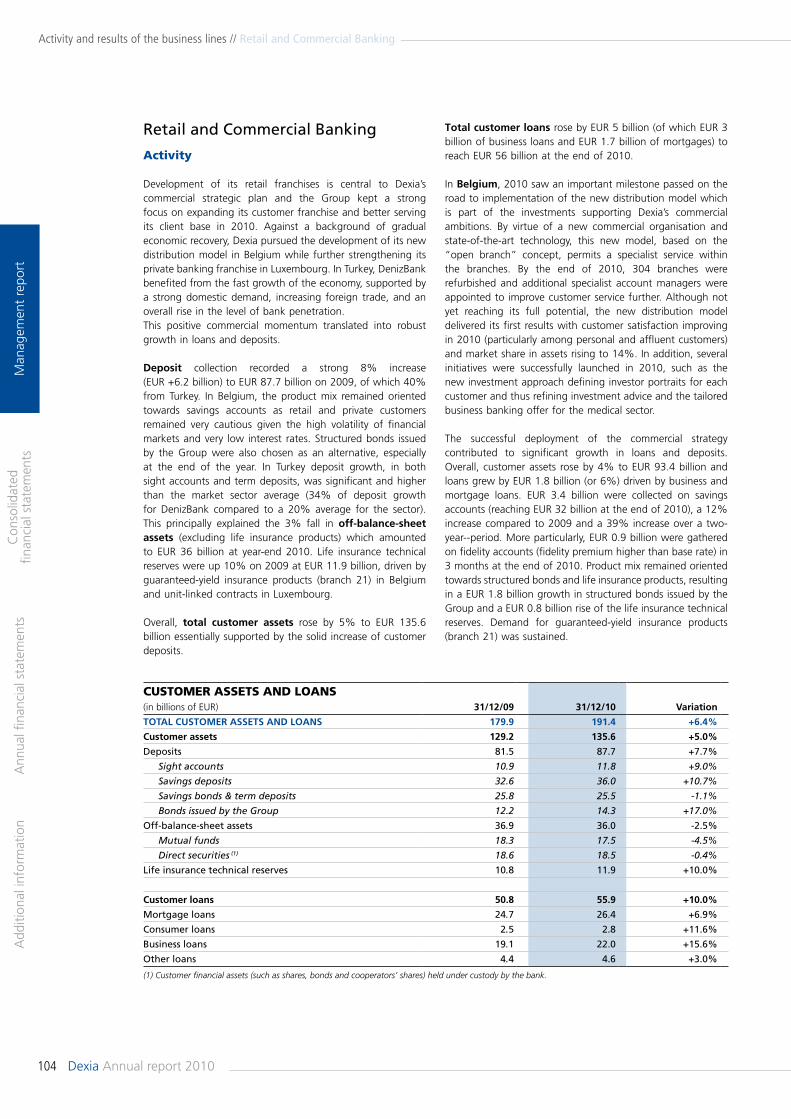
104 Dexia Annual report 2010
Man
agem
ent
repo
rtA
dditi
onal
info
rmat
ion
Ann
ual fi
nanc
ial s
tate
men
tsC
onso
lidat
ed
finan
cial
sta
tem
ents
Activity and results of the business lines // Retail and Commercial Banking
Total customer loans rose by EUR 5 billion (of which EUR 3 billion of business loans and EUR 1.7 billion of mortgages) to reach EUR 56 billion at the end of 2010.
In Belgium, 2010 saw an important milestone passed on the road to implementation of the new distribution model which is part of the investments supporting Dexia’s commercial ambitions. By virtue of a new commercial organisation and state-of-the-art technology, this new model, based on the “open branch” concept, permits a specialist service within the branches. By the end of 2010, 304 branches were refurbished and additional specialist account managers were appointed to improve customer service further. Although not yet reaching its full potential, the new distribution model delivered its first results with customer satisfaction improving in 2010 (particularly among personal and affluent customers) and market share in assets rising to 14%. In addition, several initiatives were successfully launched in 2010, such as the new investment approach defining investor portraits for each customer and thus refining investment advice and the tailored business banking offer for the medical sector.
The successful deployment of the commercial strategy contributed to significant growth in loans and deposits. Overall, customer assets rose by 4% to EUR 93.4 billion and loans grew by EUR 1.8 billion (or 6%) driven by business and mortgage loans. EUR 3.4 billion were collected on savings accounts (reaching EUR 32 billion at the end of 2010), a 12% increase compared to 2009 and a 39% increase over a two-year--period. More particularly, EUR 0.9 billion were gathered on fidelity accounts (fidelity premium higher than base rate) in 3 months at the end of 2010. Product mix remained oriented towards structured bonds and life insurance products, resulting in a EUR 1.8 billion growth in structured bonds issued by the Group and a EUR 0.8 billion rise of the life insurance technical reserves. Demand for guaranteed-yield insurance products (branch 21) was sustained.
Retail and Commercial Banking
Activity
Development of its retail franchises is central to Dexia’s commercial strategic plan and the Group kept a strong focus on expanding its customer franchise and better serving its client base in 2010. Against a background of gradual economic recovery, Dexia pursued the development of its new distribution model in Belgium while further strengthening its private banking franchise in Luxembourg. In Turkey, DenizBank benefited from the fast growth of the economy, supported by a strong domestic demand, increasing foreign trade, and an overall rise in the level of bank penetration. This positive commercial momentum translated into robust growth in loans and deposits.
Deposit collection recorded a strong 8% increase (EUR +6.2 billion) to EUR 87.7 billion on 2009, of which 40% from Turkey. In Belgium, the product mix remained oriented towards savings accounts as retail and private customers remained very cautious given the high volatility of financial markets and very low interest rates. Structured bonds issued by the Group were also chosen as an alternative, especially at the end of the year. In Turkey deposit growth, in both sight accounts and term deposits, was significant and higher than the market sector average (34% of deposit growth for DenizBank compared to a 20% average for the sector). This principally explained the 3% fall in off-balance-sheet assets (excluding life insurance products) which amounted to EUR 36 billion at year-end 2010. Life insurance technical reserves were up 10% on 2009 at EUR 11.9 billion, driven by guaranteed-yield insurance products (branch 21) in Belgium and unit-linked contracts in Luxembourg.
Overall, total customer assets rose by 5% to EUR 135.6 billion essentially supported by the solid increase of customer deposits.
CUSTOMER ASSETS AND LOANS(in billions of EUR) 31/12/09 31/12/10 Variation
TOTAL CUSTOMER ASSETS AND LOANS 179.9 191.4 +6.4%
Customer assets 129.2 135.6 +5.0%
Deposits 81.5 87.7 +7.7%
Sight accounts 10.9 11.8 +9.0%
Savings deposits 32.6 36.0 +10.7%
Savings bonds & term deposits 25.8 25.5 -1.1%
Bonds issued by the Group 12.2 14.3 +17.0%
Off-balance-sheet assets 36.9 36.0 -2.5%
Mutual funds 18.3 17.5 -4.5%
Direct securities (1) 18.6 18.5 -0.4%
Life insurance technical reserves 10.8 11.9 +10.0%
Customer loans 50.8 55.9 +10.0%
Mortgage loans 24.7 26.4 +6.9%
Consumer loans 2.5 2.8 +11.6%
Business loans 19.1 22.0 +15.6%
Other loans 4.4 4.6 +3.0%
(1) Customer financial assets (such as shares, bonds and cooperators’ shares) held under custody by the bank.
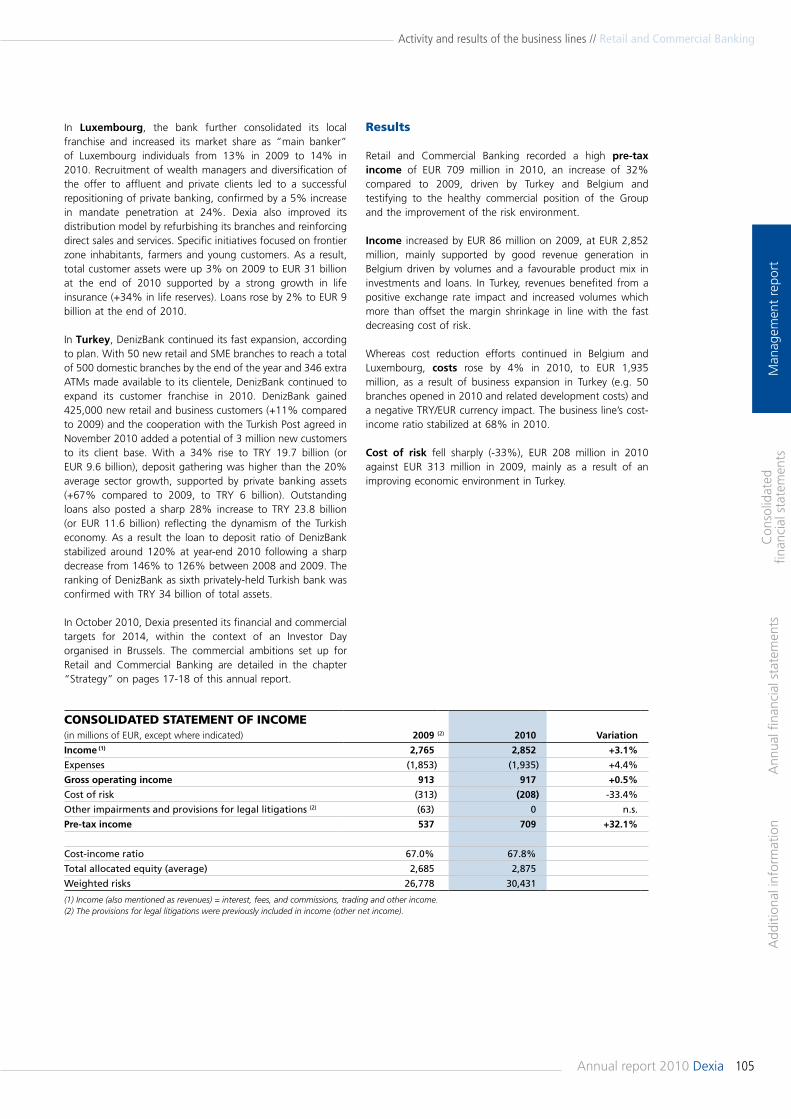
105Annual report 2010 Dexia
Man
agem
ent
repo
rtA
dditi
onal
info
rmat
ion
Ann
ual fi
nanc
ial s
tate
men
tsC
onso
lidat
ed
finan
cial
sta
tem
ents
Activity and results of the business lines // Retail and Commercial Banking
In Luxembourg, the bank further consolidated its local franchise and increased its market share as “main banker” of Luxembourg individuals from 13% in 2009 to 14% in 2010. Recruitment of wealth managers and diversification of the offer to affluent and private clients led to a successful repositioning of private banking, confirmed by a 5% increase in mandate penetration at 24%. Dexia also improved its distribution model by refurbishing its branches and reinforcing direct sales and services. Specific initiatives focused on frontier zone inhabitants, farmers and young customers. As a result, total customer assets were up 3% on 2009 to EUR 31 billion at the end of 2010 supported by a strong growth in life insurance (+34% in life reserves). Loans rose by 2% to EUR 9 billion at the end of 2010.
In Turkey, DenizBank continued its fast expansion, according to plan. With 50 new retail and SME branches to reach a total of 500 domestic branches by the end of the year and 346 extra ATMs made available to its clientele, DenizBank continued to expand its customer franchise in 2010. DenizBank gained 425,000 new retail and business customers (+11% compared to 2009) and the cooperation with the Turkish Post agreed in November 2010 added a potential of 3 million new customers to its client base. With a 34% rise to TRY 19.7 billion (or EUR 9.6 billion), deposit gathering was higher than the 20% average sector growth, supported by private banking assets (+67% compared to 2009, to TRY 6 billion). Outstanding loans also posted a sharp 28% increase to TRY 23.8 billion (or EUR 11.6 billion) reflecting the dynamism of the Turkish economy. As a result the loan to deposit ratio of DenizBank stabilized around 120% at year-end 2010 following a sharp decrease from 146% to 126% between 2008 and 2009. The ranking of DenizBank as sixth privately-held Turkish bank was confirmed with TRY 34 billion of total assets.
In October 2010, Dexia presented its financial and commercial targets for 2014, within the context of an Investor Day organised in Brussels. The commercial ambitions set up for Retail and Commercial Banking are detailed in the chapter “Strategy” on pages 17-18 of this annual report.
Results
Retail and Commercial Banking recorded a high pre-tax income of EUR 709 million in 2010, an increase of 32% compared to 2009, driven by Turkey and Belgium and testifying to the healthy commercial position of the Group and the improvement of the risk environment.
Income increased by EUR 86 million on 2009, at EUR 2,852 million, mainly supported by good revenue generation in Belgium driven by volumes and a favourable product mix in investments and loans. In Turkey, revenues benefited from a positive exchange rate impact and increased volumes which more than offset the margin shrinkage in line with the fast decreasing cost of risk.
Whereas cost reduction efforts continued in Belgium and Luxembourg, costs rose by 4% in 2010, to EUR 1,935 million, as a result of business expansion in Turkey (e.g. 50 branches opened in 2010 and related development costs) and a negative TRY/EUR currency impact. The business line’s cost-income ratio stabilized at 68% in 2010.
Cost of risk fell sharply (-33%), EUR 208 million in 2010 against EUR 313 million in 2009, mainly as a result of an improving economic environment in Turkey.
CONSOLIDATED STATEMENT OF INCOME(in millions of EUR, except where indicated) 2009 (2) 2010 Variation
Income (1) 2,765 2,852 +3.1%
Expenses (1,853) (1,935) +4.4%
Gross operating income 913 917 +0.5%
Cost of risk (313) (208) -33.4%
Other impairments and provisions for legal litigations (2) (63) 0 n.s.
Pre-tax income 537 709 +32.1%
Cost-income ratio 67.0% 67.8%
Total allocated equity (average) 2,685 2,875
Weighted risks 26,778 30,431
(1) Income (also mentioned as revenues) = interest, fees, and commissions, trading and other income. (2) The provisions for legal litigations were previously included in income (other net income).
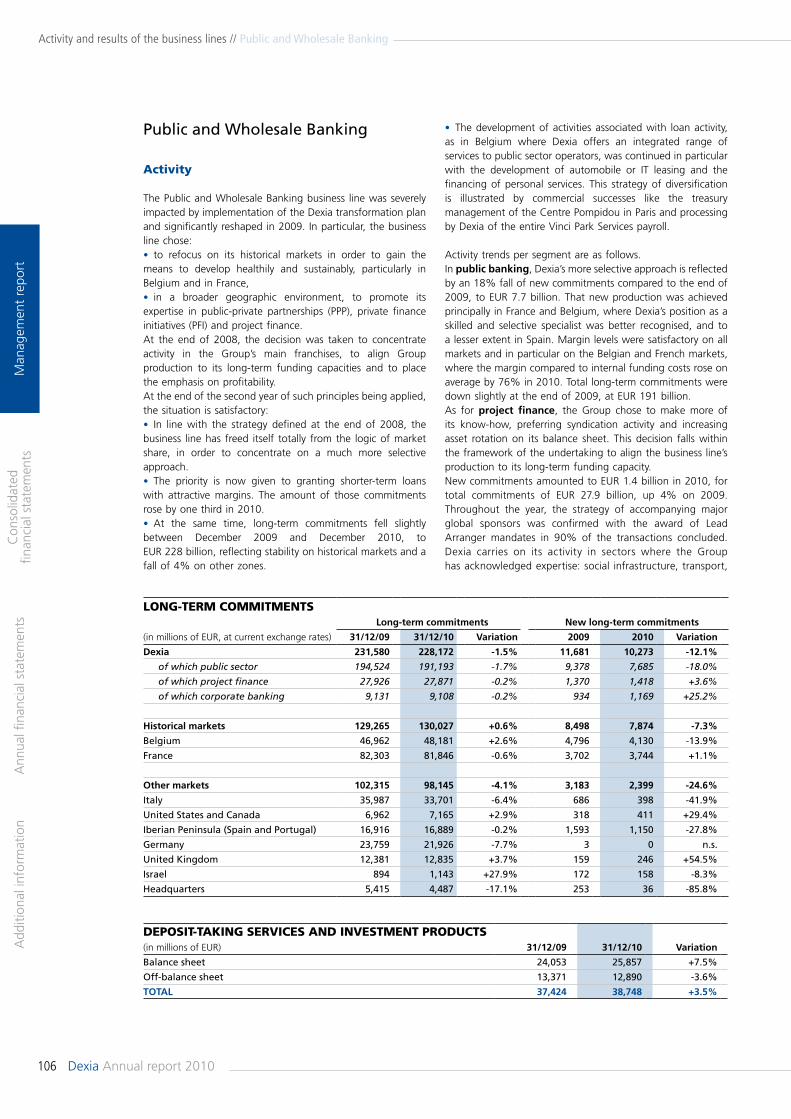
106 Dexia Annual report 2010
Man
agem
ent
repo
rtA
dditi
onal
info
rmat
ion
Ann
ual fi
nanc
ial s
tate
men
tsC
onso
lidat
ed
finan
cial
sta
tem
ents
Activity and results of the business lines // Public and Wholesale Banking
Public and Wholesale Banking
Activity
The Public and Wholesale Banking business line was severely impacted by implementation of the Dexia transformation plan and significantly reshaped in 2009. In particular, the business line chose:• to refocus on its historical markets in order to gain the means to develop healthily and sustainably, particularly in Belgium and in France,• in a broader geographic environment, to promote its expertise in public-private partnerships (PPP), private finance initiatives (PFI) and project finance. At the end of 2008, the decision was taken to concentrate activity in the Group’s main franchises, to align Group production to its long-term funding capacities and to place the emphasis on profitability. At the end of the second year of such principles being applied, the situation is satisfactory: • In line with the strategy defined at the end of 2008, the business line has freed itself totally from the logic of market share, in order to concentrate on a much more selective approach. • The priority is now given to granting shorter-term loans with attractive margins. The amount of those commitments rose by one third in 2010. • At the same time, long-term commitments fell slightly between December 2009 and December 2010, to EUR 228 billion, reflecting stability on historical markets and a fall of 4% on other zones.
LONG-TERM COMMITMENTSLong-term commitments New long-term commitments
(in millions of EUR, at current exchange rates) 31/12/09 31/12/10 Variation 2009 2010 Variation
Dexia 231,580 228,172 -1.5% 11,681 10,273 -12.1%
of which public sector 194,524 191,193 -1.7% 9,378 7,685 -18.0%
of which project finance 27,926 27,871 -0.2% 1,370 1,418 +3.6%
of which corporate banking 9,131 9,108 -0.2% 934 1,169 +25.2%
Historical markets 129,265 130,027 +0.6% 8,498 7,874 -7.3%
Belgium 46,962 48,181 +2.6% 4,796 4,130 -13.9%
France 82,303 81,846 -0.6% 3,702 3,744 +1.1%
Other markets 102,315 98,145 -4.1% 3,183 2,399 -24.6%
Italy 35,987 33,701 -6.4% 686 398 -41.9%
United States and Canada 6,962 7,165 +2.9% 318 411 +29.4%
Iberian Peninsula (Spain and Portugal) 16,916 16,889 -0.2% 1,593 1,150 -27.8%
Germany 23,759 21,926 -7.7% 3 0 n.s.
United Kingdom 12,381 12,835 +3.7% 159 246 +54.5%
Israel 894 1,143 +27.9% 172 158 -8.3%
Headquarters 5,415 4,487 -17.1% 253 36 -85.8%
• The development of activities associated with loan activity, as in Belgium where Dexia offers an integrated range of services to public sector operators, was continued in particular with the development of automobile or IT leasing and the financing of personal services. This strategy of diversification is illustrated by commercial successes like the treasury management of the Centre Pompidou in Paris and processing by Dexia of the entire Vinci Park Services payroll.
Activity trends per segment are as follows.In public banking, Dexia’s more selective approach is reflected by an 18% fall of new commitments compared to the end of 2009, to EUR 7.7 billion. That new production was achieved principally in France and Belgium, where Dexia’s position as a skilled and selective specialist was better recognised, and to a lesser extent in Spain. Margin levels were satisfactory on all markets and in particular on the Belgian and French markets, where the margin compared to internal funding costs rose on average by 76% in 2010. Total long-term commitments were down slightly at the end of 2009, at EUR 191 billion.As for project finance, the Group chose to make more of its know-how, preferring syndication activity and increasing asset rotation on its balance sheet. This decision falls within the framework of the undertaking to align the business line’s production to its long-term funding capacity. New commitments amounted to EUR 1.4 billion in 2010, for total commitments of EUR 27.9 billion, up 4% on 2009. Throughout the year, the strategy of accompanying major global sponsors was confirmed with the award of Lead Arranger mandates in 90% of the transactions concluded. Dexia carries on its activity in sectors where the Group has acknowledged expertise: social infrastructure, transport,
DEPOSIT-TAKING SERvICES AND INvESTMENT PRODUCTS(in millions of EUR) 31/12/09 31/12/10 Variation
Balance sheet 24,053 25,857 +7.5%
Off-balance sheet 13,371 12,890 -3.6%
TOTAL 37,424 38,748 +3.5%
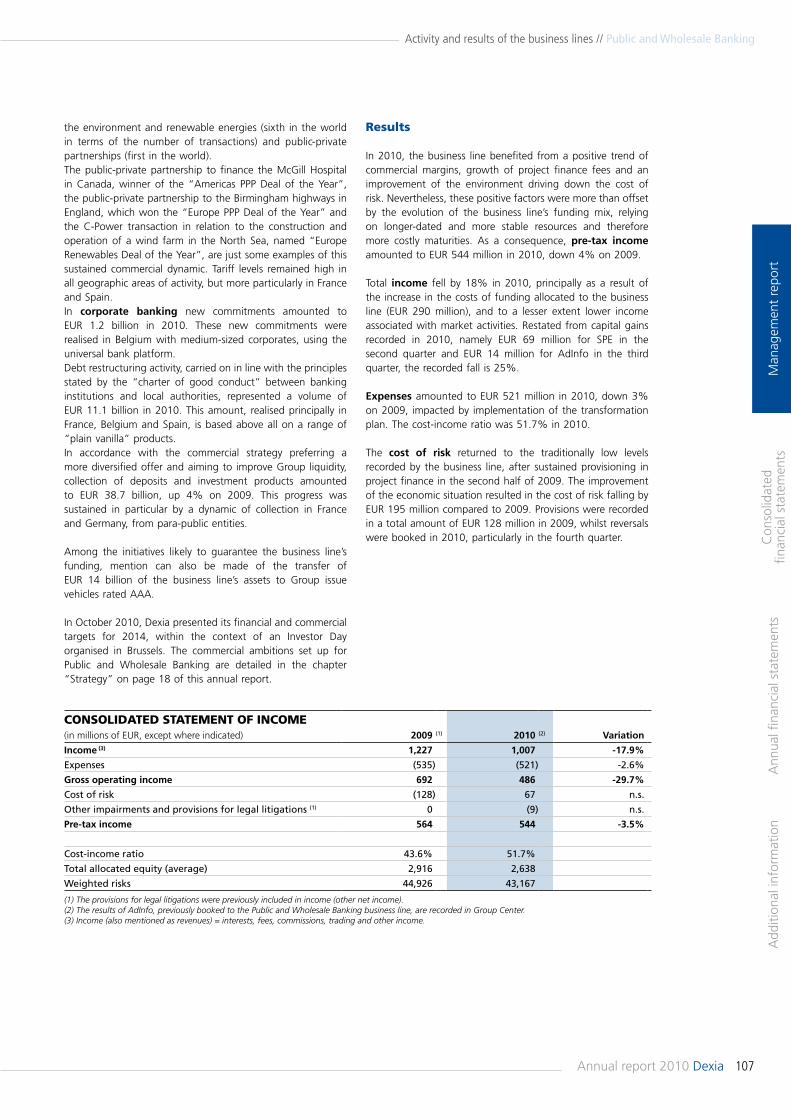
107Annual report 2010 Dexia
Man
agem
ent
repo
rtA
dditi
onal
info
rmat
ion
Ann
ual fi
nanc
ial s
tate
men
tsC
onso
lidat
ed
finan
cial
sta
tem
ents
Activity and results of the business lines // Public and Wholesale Banking
CONSOLIDATED STATEMENT OF INCOME(in millions of EUR, except where indicated) 2009 (1) 2010 (2) Variation
Income (3) 1,227 1,007 -17.9%
Expenses (535) (521) -2.6%
Gross operating income 692 486 -29.7%
Cost of risk (128) 67 n.s.
Other impairments and provisions for legal litigations (1) 0 (9) n.s.
Pre-tax income 564 544 -3.5%
Cost-income ratio 43.6% 51.7%
Total allocated equity (average) 2,916 2,638
Weighted risks 44,926 43,167
(1) The provisions for legal litigations were previously included in income (other net income).(2) The results of AdInfo, previously booked to the Public and Wholesale Banking business line, are recorded in Group Center.(3) Income (also mentioned as revenues) = interests, fees, commissions, trading and other income.
the environment and renewable energies (sixth in the world in terms of the number of transactions) and public-private partnerships (first in the world). The public-private partnership to finance the McGill Hospital in Canada, winner of the “Americas PPP Deal of the Year”, the public-private partnership to the Birmingham highways in England, which won the “Europe PPP Deal of the Year” and the C-Power transaction in relation to the construction and operation of a wind farm in the North Sea, named “Europe Renewables Deal of the Year”, are just some examples of this sustained commercial dynamic. Tariff levels remained high in all geographic areas of activity, but more particularly in France and Spain. In corporate banking new commitments amounted to EUR 1.2 billion in 2010. These new commitments were realised in Belgium with medium-sized corporates, using the universal bank platform. Debt restructuring activity, carried on in line with the principles stated by the “charter of good conduct” between banking institutions and local authorities, represented a volume of EUR 11.1 billion in 2010. This amount, realised principally in France, Belgium and Spain, is based above all on a range of “plain vanilla” products.In accordance with the commercial strategy preferring a more diversified offer and aiming to improve Group liquidity, collection of deposits and investment products amounted to EUR 38.7 billion, up 4% on 2009. This progress was sustained in particular by a dynamic of collection in France and Germany, from para-public entities.
Among the initiatives likely to guarantee the business line’s funding, mention can also be made of the transfer of EUR 14 billion of the business line’s assets to Group issue vehicles rated AAA.
In October 2010, Dexia presented its financial and commercial targets for 2014, within the context of an Investor Day organised in Brussels. The commercial ambitions set up for Public and Wholesale Banking are detailed in the chapter “Strategy” on page 18 of this annual report.
Results
In 2010, the business line benefited from a positive trend of commercial margins, growth of project finance fees and an improvement of the environment driving down the cost of risk. Nevertheless, these positive factors were more than offset by the evolution of the business line’s funding mix, relying on longer-dated and more stable resources and therefore more costly maturities. As a consequence, pre-tax income amounted to EUR 544 million in 2010, down 4% on 2009.
Total income fell by 18% in 2010, principally as a result of the increase in the costs of funding allocated to the business line (EUR 290 million), and to a lesser extent lower income associated with market activities. Restated from capital gains recorded in 2010, namely EUR 69 million for SPE in the second quarter and EUR 14 million for AdInfo in the third quarter, the recorded fall is 25%.
Expenses amounted to EUR 521 million in 2010, down 3% on 2009, impacted by implementation of the transformation plan. The cost-income ratio was 51.7% in 2010.
The cost of risk returned to the traditionally low levels recorded by the business line, after sustained provisioning in project finance in the second half of 2009. The improvement of the economic situation resulted in the cost of risk falling by EUR 195 million compared to 2009. Provisions were recorded in a total amount of EUR 128 million in 2009, whilst reversals were booked in 2010, particularly in the fourth quarter.
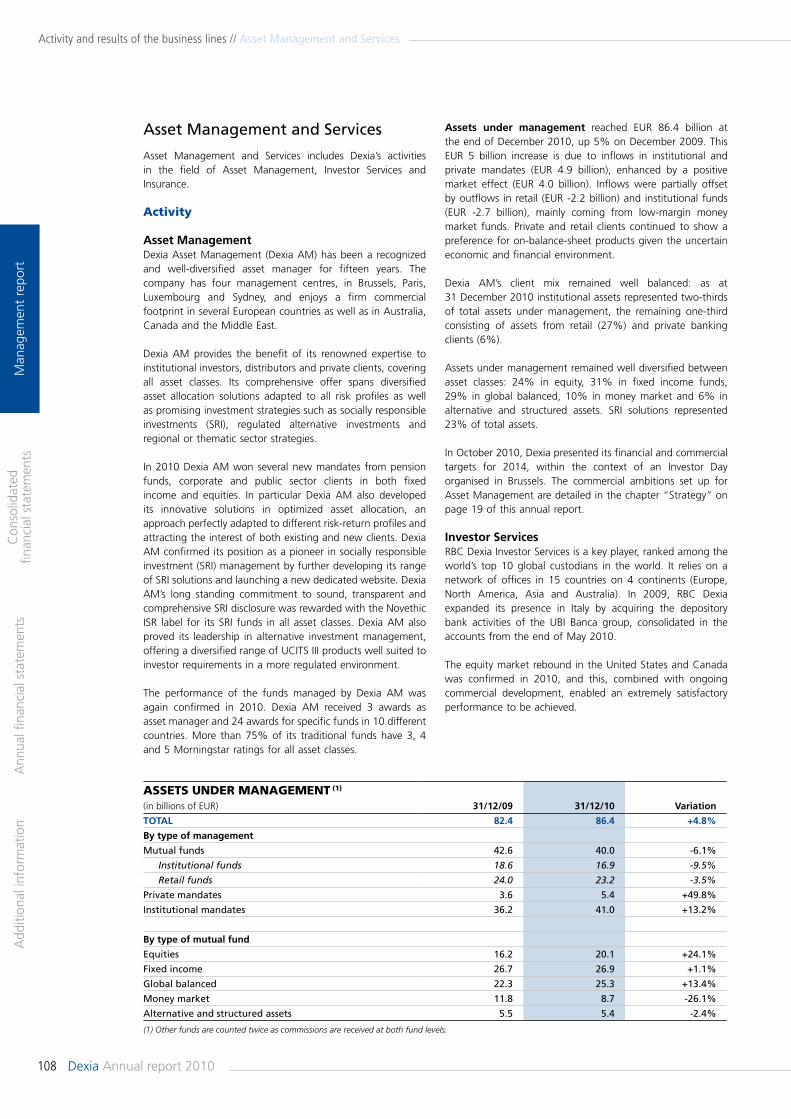
108 Dexia Annual report 2010
Man
agem
ent
repo
rtA
dditi
onal
info
rmat
ion
Ann
ual fi
nanc
ial s
tate
men
tsC
onso
lidat
ed
finan
cial
sta
tem
ents
Activity and results of the business lines // Asset Management and Services
Assets under management reached EUR 86.4 billion at the end of December 2010, up 5% on December 2009. This EUR 5 billion increase is due to inflows in institutional and private mandates (EUR 4.9 billion), enhanced by a positive market effect (EUR 4.0 billion). Inflows were partially offset by outflows in retail (EUR -2.2 billion) and institutional funds (EUR -2.7 billion), mainly coming from low-margin money market funds. Private and retail clients continued to show a preference for on-balance-sheet products given the uncertain economic and financial environment.
Dexia AM’s client mix remained well balanced: as at 31 December 2010 institutional assets represented two-thirds of total assets under management, the remaining one-third consisting of assets from retail (27%) and private banking clients (6%).
Assets under management remained well diversified between asset classes: 24% in equity, 31% in fixed income funds, 29% in global balanced, 10% in money market and 6% in alternative and structured assets. SRI solutions represented 23% of total assets.
In October 2010, Dexia presented its financial and commercial targets for 2014, within the context of an Investor Day organised in Brussels. The commercial ambitions set up for Asset Management are detailed in the chapter “Strategy” on page 19 of this annual report.
Investor ServicesRBC Dexia Investor Services is a key player, ranked among the world’s top 10 global custodians in the world. It relies on a network of offices in 15 countries on 4 continents (Europe, North America, Asia and Australia). In 2009, RBC Dexia expanded its presence in Italy by acquiring the depository bank activities of the UBI Banca group, consolidated in the accounts from the end of May 2010.
The equity market rebound in the United States and Canada was confirmed in 2010, and this, combined with ongoing commercial development, enabled an extremely satisfactory performance to be achieved.
Asset Management and Services
Asset Management and Services includes Dexia’s activities in the field of Asset Management, Investor Services and Insurance.
Activity
Asset ManagementDexia Asset Management (Dexia AM) has been a recognized and well-diversified asset manager for fifteen years. The company has four management centres, in Brussels, Paris, Luxembourg and Sydney, and enjoys a firm commercial footprint in several European countries as well as in Australia, Canada and the Middle East.
Dexia AM provides the benefit of its renowned expertise to institutional investors, distributors and private clients, covering all asset classes. Its comprehensive offer spans diversified asset allocation solutions adapted to all risk profiles as well as promising investment strategies such as socially responsible investments (SRI), regulated alternative investments and regional or thematic sector strategies.
In 2010 Dexia AM won several new mandates from pension funds, corporate and public sector clients in both fixed income and equities. In particular Dexia AM also developed its innovative solutions in optimized asset allocation, an approach perfectly adapted to different risk-return profiles and attracting the interest of both existing and new clients. Dexia AM confirmed its position as a pioneer in socially responsible investment (SRI) management by further developing its range of SRI solutions and launching a new dedicated website. Dexia AM’s long standing commitment to sound, transparent and comprehensive SRI disclosure was rewarded with the Novethic ISR label for its SRI funds in all asset classes. Dexia AM also proved its leadership in alternative investment management, offering a diversified range of UCITS III products well suited to investor requirements in a more regulated environment.
The performance of the funds managed by Dexia AM was again confirmed in 2010. Dexia AM received 3 awards as asset manager and 24 awards for specific funds in 10 different countries. More than 75% of its traditional funds have 3, 4 and 5 Morningstar ratings for all asset classes.
ASSETS UNDER MANAGEMENT (1)
(in billions of EUR) 31/12/09 31/12/10 Variation
TOTAL 82.4 86.4 +4.8%
By type of management
Mutual funds 42.6 40.0 -6.1%
Institutional funds 18.6 16.9 -9.5%
Retail funds 24.0 23.2 -3.5%
Private mandates 3.6 5.4 +49.8%
Institutional mandates 36.2 41.0 +13.2%
By type of mutual fund
Equities 16.2 20.1 +24.1%
Fixed income 26.7 26.9 +1.1%
Global balanced 22.3 25.3 +13.4%
Money market 11.8 8.7 -26.1%
Alternative and structured assets 5.5 5.4 -2.4%
(1) Other funds are counted twice as commissions are received at both fund levels.
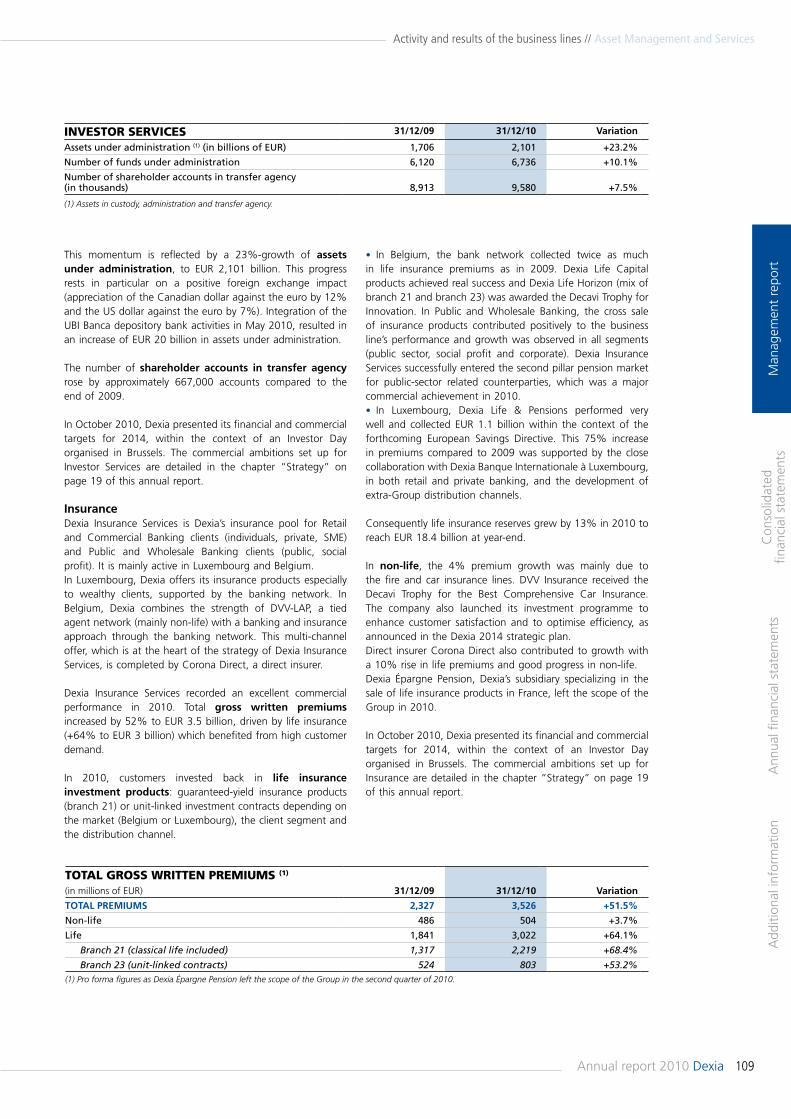
109Annual report 2010 Dexia
Man
agem
ent
repo
rtA
dditi
onal
info
rmat
ion
Ann
ual fi
nanc
ial s
tate
men
tsC
onso
lidat
ed
finan
cial
sta
tem
ents
Activity and results of the business lines // Asset Management and Services
INvESTOR SERvICES 31/12/09 31/12/10 Variation
Assets under administration (1) (in billions of EUR) 1,706 2,101 +23.2%
Number of funds under administration 6,120 6,736 +10.1%
Number of shareholder accounts in transfer agency (in thousands) 8,913 9,580 +7.5%
(1) Assets in custody, administration and transfer agency.
This momentum is reflected by a 23%-growth of assets under administration, to EUR 2,101 billion. This progress rests in particular on a positive foreign exchange impact (appreciation of the Canadian dollar against the euro by 12% and the US dollar against the euro by 7%). Integration of the UBI Banca depository bank activities in May 2010, resulted in an increase of EUR 20 billion in assets under administration.
The number of shareholder accounts in transfer agency rose by approximately 667,000 accounts compared to the end of 2009.
In October 2010, Dexia presented its financial and commercial targets for 2014, within the context of an Investor Day organised in Brussels. The commercial ambitions set up for Investor Services are detailed in the chapter “Strategy” on page 19 of this annual report.
InsuranceDexia Insurance Services is Dexia’s insurance pool for Retail and Commercial Banking clients (individuals, private, SME) and Public and Wholesale Banking clients (public, social profit). It is mainly active in Luxembourg and Belgium.In Luxembourg, Dexia offers its insurance products especially to wealthy clients, supported by the banking network. In Belgium, Dexia combines the strength of DVV-LAP, a tied agent network (mainly non-life) with a banking and insurance approach through the banking network. This multi-channel offer, which is at the heart of the strategy of Dexia Insurance Services, is completed by Corona Direct, a direct insurer.
Dexia Insurance Services recorded an excellent commercial performance in 2010. Total gross written premiums increased by 52% to EUR 3.5 billion, driven by life insurance (+64% to EUR 3 billion) which benefited from high customer demand.
In 2010, customers invested back in life insurance investment products: guaranteed-yield insurance products (branch 21) or unit-linked investment contracts depending on the market (Belgium or Luxembourg), the client segment and the distribution channel.
• In Belgium, the bank network collected twice as much in life insurance premiums as in 2009. Dexia Life Capital products achieved real success and Dexia Life Horizon (mix of branch 21 and branch 23) was awarded the Decavi Trophy for Innovation. In Public and Wholesale Banking, the cross sale of insurance products contributed positively to the business line’s performance and growth was observed in all segments (public sector, social profit and corporate). Dexia Insurance Services successfully entered the second pillar pension market for public-sector related counterparties, which was a major commercial achievement in 2010. • In Luxembourg, Dexia Life & Pensions performed very well and collected EUR 1.1 billion within the context of the forthcoming European Savings Directive. This 75% increase in premiums compared to 2009 was supported by the close collaboration with Dexia Banque Internationale à Luxembourg, in both retail and private banking, and the development of extra-Group distribution channels.
Consequently life insurance reserves grew by 13% in 2010 to reach EUR 18.4 billion at year-end.
In non-life, the 4% premium growth was mainly due to the fire and car insurance lines. DVV Insurance received the Decavi Trophy for the Best Comprehensive Car Insurance. The company also launched its investment programme to enhance customer satisfaction and to optimise efficiency, as announced in the Dexia 2014 strategic plan. Direct insurer Corona Direct also contributed to growth with a 10% rise in life premiums and good progress in non-life.Dexia Épargne Pension, Dexia’s subsidiary specializing in the sale of life insurance products in France, left the scope of the Group in 2010.
In October 2010, Dexia presented its financial and commercial targets for 2014, within the context of an Investor Day organised in Brussels. The commercial ambitions set up for Insurance are detailed in the chapter “Strategy” on page 19 of this annual report.
TOTAL GROSS WRITTEN PREMIUMS (1)
(in millions of EUR) 31/12/09 31/12/10 Variation
TOTAL PREMIUMS 2,327 3,526 +51.5%
Non-life 486 504 +3.7%
Life 1,841 3,022 +64.1%
Branch 21 (classical life included) 1,317 2,219 +68.4%
Branch 23 (unit-linked contracts) 524 803 +53.2%(1) Pro forma figures as Dexia Épargne Pension left the scope of the Group in the second quarter of 2010.
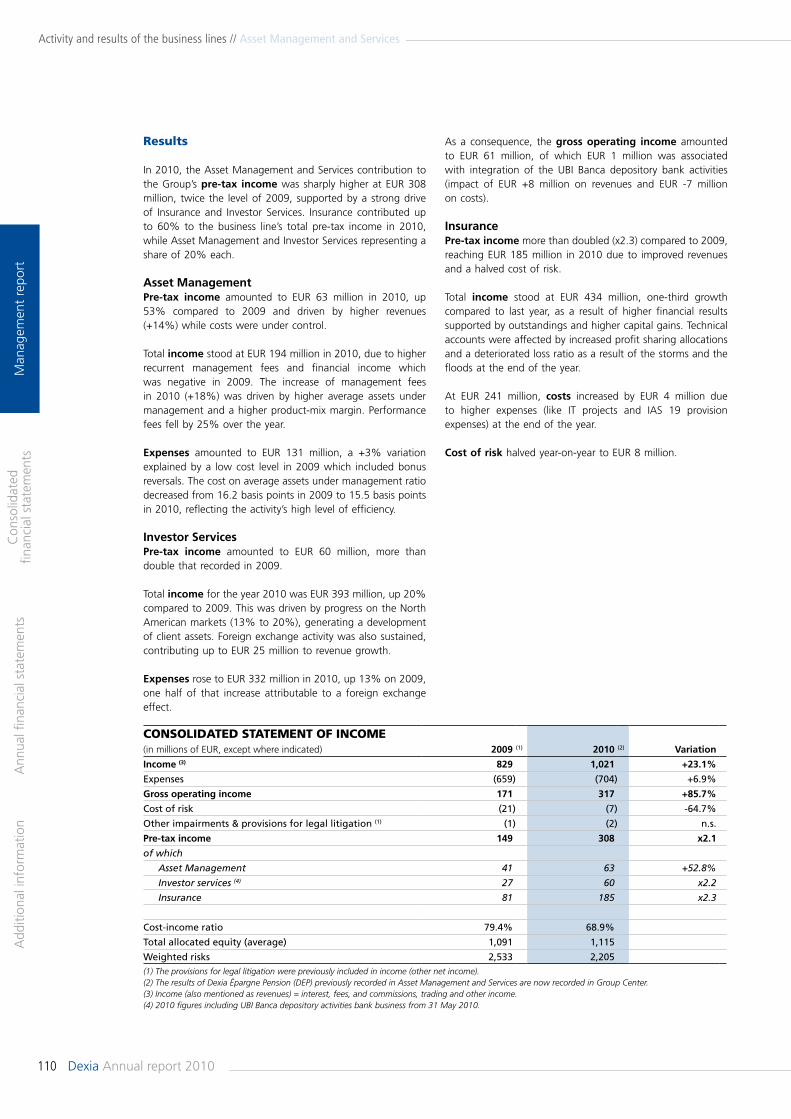
110 Dexia Annual report 2010
Man
agem
ent
repo
rtA
dditi
onal
info
rmat
ion
Ann
ual fi
nanc
ial s
tate
men
tsC
onso
lidat
ed
finan
cial
sta
tem
ents
Activity and results of the business lines // Asset Management and Services
As a consequence, the gross operating income amounted to EUR 61 million, of which EUR 1 million was associated with integration of the UBI Banca depository bank activities (impact of EUR +8 million on revenues and EUR -7 million on costs).
InsurancePre-tax income more than doubled (x2.3) compared to 2009, reaching EUR 185 million in 2010 due to improved revenues and a halved cost of risk.
Total income stood at EUR 434 million, one-third growth compared to last year, as a result of higher financial results supported by outstandings and higher capital gains. Technical accounts were affected by increased profit sharing allocations and a deteriorated loss ratio as a result of the storms and the floods at the end of the year.
At EUR 241 million, costs increased by EUR 4 million due to higher expenses (like IT projects and IAS 19 provision expenses) at the end of the year.
Cost of risk halved year-on-year to EUR 8 million.
Results
In 2010, the Asset Management and Services contribution to the Group’s pre-tax income was sharply higher at EUR 308 million, twice the level of 2009, supported by a strong drive of Insurance and Investor Services. Insurance contributed up to 60% to the business line’s total pre-tax income in 2010, while Asset Management and Investor Services representing a share of 20% each.
Asset ManagementPre-tax income amounted to EUR 63 million in 2010, up 53% compared to 2009 and driven by higher revenues (+14%) while costs were under control.
Total income stood at EUR 194 million in 2010, due to higher recurrent management fees and financial income which was negative in 2009. The increase of management fees in 2010 (+18%) was driven by higher average assets under management and a higher product-mix margin. Performance fees fell by 25% over the year.
Expenses amounted to EUR 131 million, a +3% variation explained by a low cost level in 2009 which included bonus reversals. The cost on average assets under management ratio decreased from 16.2 basis points in 2009 to 15.5 basis points in 2010, reflecting the activity’s high level of efficiency.
Investor ServicesPre-tax income amounted to EUR 60 million, more than double that recorded in 2009.
Total income for the year 2010 was EUR 393 million, up 20% compared to 2009. This was driven by progress on the North American markets (13% to 20%), generating a development of client assets. Foreign exchange activity was also sustained, contributing up to EUR 25 million to revenue growth.
Expenses rose to EUR 332 million in 2010, up 13% on 2009, one half of that increase attributable to a foreign exchange effect.
CONSOLIDATED STATEMENT OF INCOME(in millions of EUR, except where indicated) 2009 (1) 2010 (2) Variation
Income (3) 829 1,021 +23.1%
Expenses (659) (704) +6.9%
Gross operating income 171 317 +85.7%
Cost of risk (21) (7) -64.7%
Other impairments & provisions for legal litigation (1) (1) (2) n.s.
Pre-tax income 149 308 x2.1
of which
Asset Management 41 63 +52.8%
Investor services (4) 27 60 x2.2
Insurance 81 185 x2.3
Cost-income ratio 79.4% 68.9%
Total allocated equity (average) 1,091 1,115
Weighted risks 2,533 2,205(1) The provisions for legal litigation were previously included in income (other net income). (2) The results of Dexia Épargne Pension (DEP) previously recorded in Asset Management and Services are now recorded in Group Center. (3) Income (also mentioned as revenues) = interest, fees, and commissions, trading and other income.(4) 2010 figures including UBI Banca depository activities bank business from 31 May 2010.
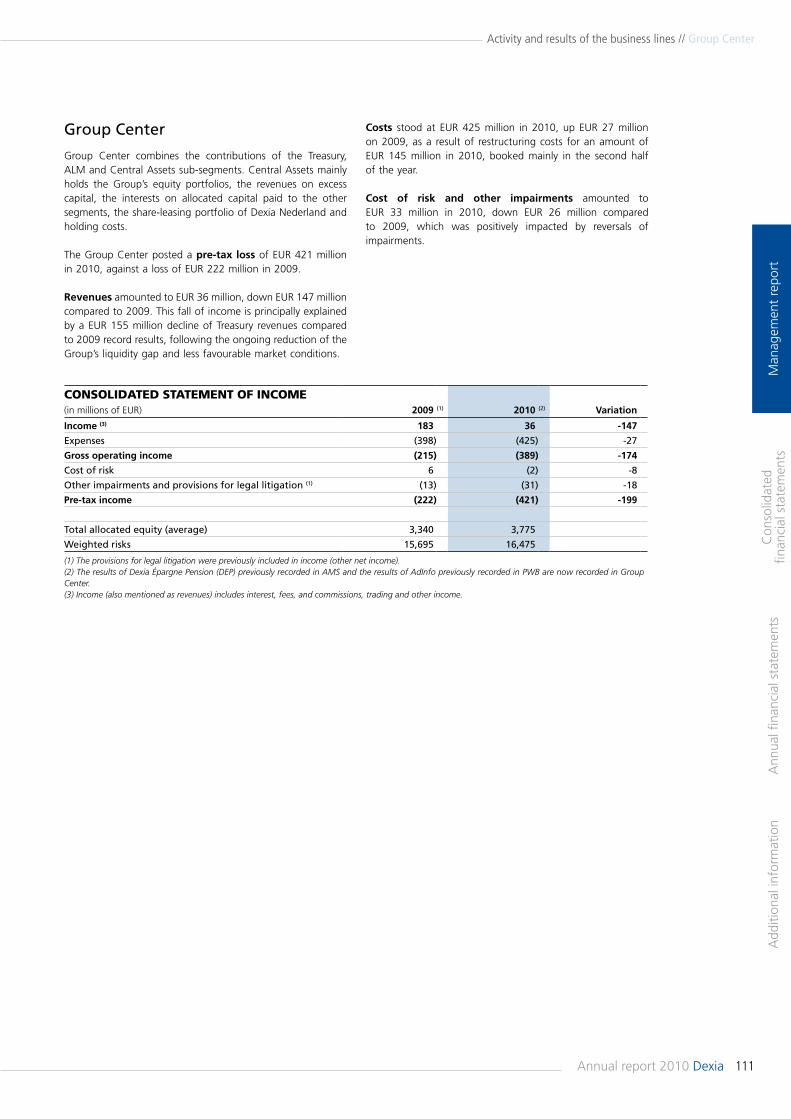
111Annual report 2010 Dexia
Man
agem
ent
repo
rtA
dditi
onal
info
rmat
ion
Ann
ual fi
nanc
ial s
tate
men
tsC
onso
lidat
ed
finan
cial
sta
tem
ents
Activity and results of the business lines // Group Center
Group Center
Group Center combines the contributions of the Treasury, ALM and Central Assets sub-segments. Central Assets mainly holds the Group’s equity portfolios, the revenues on excess capital, the interests on allocated capital paid to the other segments, the share-leasing portfolio of Dexia Nederland and holding costs.
The Group Center posted a pre-tax loss of EUR 421 million in 2010, against a loss of EUR 222 million in 2009.
Revenues amounted to EUR 36 million, down EUR 147 millioncompared to 2009. This fall of income is principally explained by a EUR 155 million decline of Treasury revenues compared to 2009 record results, following the ongoing reduction of the Group’s liquidity gap and less favourable market conditions.
Costs stood at EUR 425 million in 2010, up EUR 27 million on 2009, as a result of restructuring costs for an amount of EUR 145 million in 2010, booked mainly in the second half of the year.
Cost of risk and other impairments amounted to EUR 33 million in 2010, down EUR 26 million compared to 2009, which was positively impacted by reversals of impairments.
CONSOLIDATED STATEMENT OF INCOME(in millions of EUR) 2009 (1) 2010 (2) Variation
Income (3) 183 36 -147
Expenses (398) (425) -27
Gross operating income (215) (389) -174
Cost of risk 6 (2) -8
Other impairments and provisions for legal litigation (1) (13) (31) -18
Pre-tax income (222) (421) -199
Total allocated equity (average) 3,340 3,775
Weighted risks 15,695 16,475
(1) The provisions for legal litigation were previously included in income (other net income).(2) The results of Dexia Épargne Pension (DEP) previously recorded in AMS and the results of AdInfo previously recorded in PWB are now recorded in Group Center.(3) Income (also mentioned as revenues) includes interest, fees, and commissions, trading and other income.
112 Dexia Annual report 2010
Man
agem
ent
repo
rtA
dditi
onal
info
rmat
ion
Ann
ual fi
nanc
ial s
tate
men
tsC
onso
lidat
ed
finan
cial
sta
tem
ents
Activity and results of the business lines // Legacy Portfolio Management Division
13 March 2009 and provides for Dexia to cover a first loss of USD 4.5 billion. If final losses exceed USD 4.5 billion, Dexia can ask the States to fund the additional losses in exchange for Dexia common shares or profit shares. In addition to this scheme, the Guaranteed Investment Contracts (GICs), which amounted to USD 5.01 billion at the end of December 2010 and are partly funding the Financial Products portfolio, benefit from a State liquidity guarantee. Importantly, since the fourth quarter of 2008, Dexia’s Tier 1 is protected against all future potential losses on this portfolio as the entire USD 4.5 billion first loss has been fully accounted for in the Group’s regulatory solvency ratios (2).
Over 2010, the Financial Products portfolio was reduced by USD 1.6 billion supported by USD 0.4 billion asset sales and by the natural amortization of the portfolio. The expected weighted average life of the portfolio was 9.2 years at year-end 2010.
Public and Wholesale Banking run-off commitments amounted to EUR 31.5 billion as at 31 December 2010, down EUR 10.8 billion on 2009 and EUR 15.1 billion on 2008. They comprised non-core public sector loans in run-off, including loans in Japan, Switzerland, Sweden, Central and Eastern Europe, Australia, Mexico and the United States for an amount of EUR 12.7 billion as at 31 December 2010 as well as off-balance-sheet commitments, mainly undrawn liquidity lines in the United States for an amount of USD 24.0 billion (EUR 18.7 billion) at the end of 2010.
EUR 4.8 billion of non-core public sector loans, mainly booked in Japan, were sold in 2010. The accelerated pace of sales will enable the Group to bring forward the closure of some of its international entities in 2011.
The amount of undrawn liquidity lines in the United States fell by USD 9.2 billion (EUR 5.7 billion) in 2010, reducing the potential liquidity stress on those facilities.
(2) More detailed information on the State guarantee is provided in the note 9.4.C. to the consolidated financial statements in this Annual Report (page 184).
Legacy Portfolio Management Division
Activity
Since the first quarter of 2010, Dexia has regrouped its portfolios in run-off as well as some non-core Public and Wholesale Banking loans and off-balance sheet commitments within a specific division, the Legacy Portfolio Management Division (Legacy Division) alongside the core business lines, now brought together in the Core Division.The Legacy Division contains:• the bond portfolio in run-off;• the Financial Products portfolio;• non-core public sector loans and off-balance sheet commitments, mainly liquidity lines in the United States (1), referred to as Public and Wholesale Banking run-off commitments.
The Legacy Division is the subject of a voluntary asset disposal policy with the aim of reducing the Group’s short-term liquidity gap and limiting its risk profile. Dedicated and centralized teams are responsible for monitoring the division’s various portfolios and for implementing its asset sale programme. From EUR 227 billion at the end of 2008, the commitments of the Legacy Division (on and off-balance-sheet) were reduced to EUR 187 billion at the end of 2009. In 2010, Dexia accelerated its efforts to reduce those commitments, which amounted to EUR 153 billion as at 31 December 2010, after EUR 27.2 billion of asset disposal in 2010.
The bond portfolio in run-off amounted to EUR 111.7 billion at year-end 2010, a reduction of EUR 22.5 billion on 2009, and of EUR 46.3 billion on 2008. Thanks to the Group’s voluntary balance-sheet deleveraging, EUR 18.8 billion bonds were disposed of from this portfolio, with an impact on the statement of income of EUR 184 million, or a 1% average loss on the nominal amount. Over the year, EUR 8 billion of bonds were amortized and the size of the portfolio was inflated by a EUR 4.4 billion currency impact.
The portfolio is well diversified by asset class, sector, country and currency, and this enables Dexia to benefit from various disposal opportunities on the market. Sales made have enabled this diversification to be maintained and the portfolio remains of good credit quality, at 95% investment grade (against 97% at year-end 2009). Rating migrations were principally due to the impact of deleveraging and to the downgrade of the Greek Sovereign. The stock of impairments was down to EUR 884 million at year-end 2010, against EUR 956 million at year-end 2009.
At the end of 2008, Dexia also placed the Financial Products portfolio in run-off, amounting to USD 13.8 billion (EUR 10.3 billion) at the end of 2010. The majority of this portfolio consists of US RMBS (68%) and it is 40% investment grade compared to 43% by the end of 2009. The most sensitive assets of the Financial Products portfolio (about 75% of the total portfolio) are covered by a specific guarantee scheme, granted by the States of Belgium and France. That guarantee was approved by the European Commission on
(1) Stand-By Purchase Agreements (SBPA).
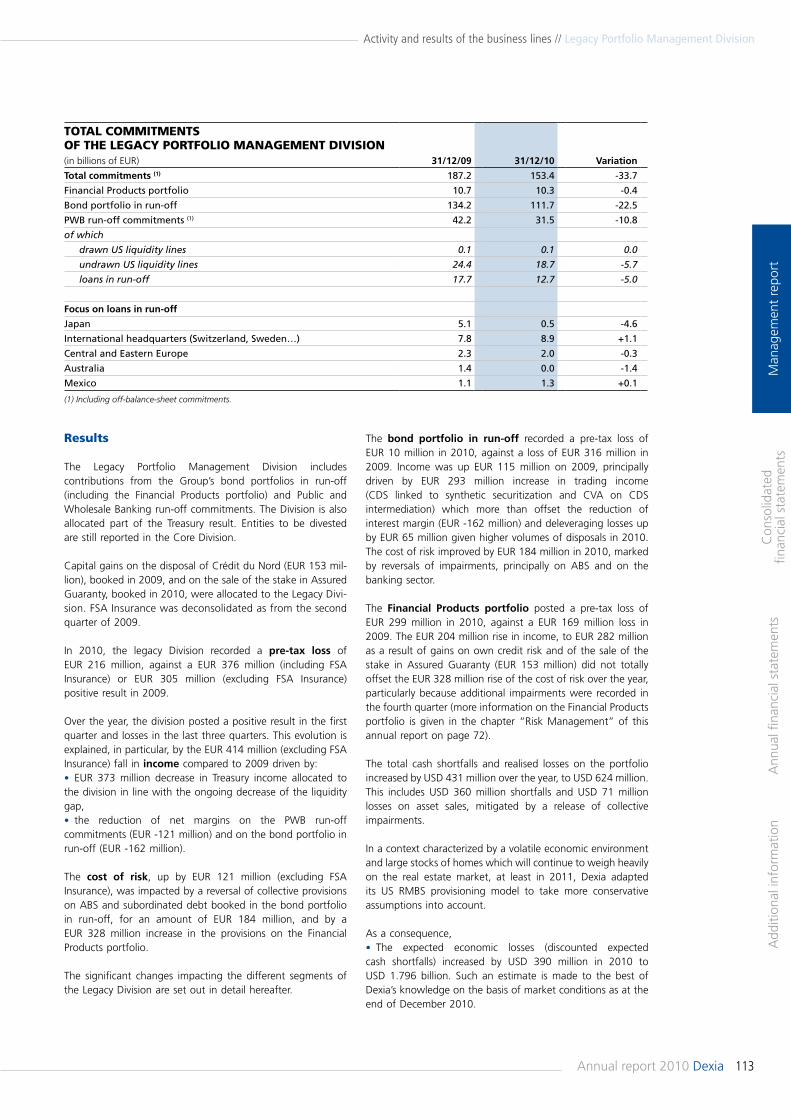
113Annual report 2010 Dexia
Man
agem
ent
repo
rtA
dditi
onal
info
rmat
ion
Ann
ual fi
nanc
ial s
tate
men
tsC
onso
lidat
ed
finan
cial
sta
tem
ents
Activity and results of the business lines // Legacy Portfolio Management Division
TOTAL COMMITMENTSOF THE LEGACY PORTFOLIO MANAGEMENT DIvISION(in billions of EUR) 31/12/09 31/12/10 Variation
Total commitments (1) 187.2 153.4 -33.7
Financial Products portfolio 10.7 10.3 -0.4
Bond portfolio in run-off 134.2 111.7 -22.5
PWB run-off commitments (1) 42.2 31.5 -10.8
of which
drawn US liquidity lines 0.1 0.1 0.0
undrawn US liquidity lines 24.4 18.7 -5.7
loans in run-off 17.7 12.7 -5.0
Focus on loans in run-off
Japan 5.1 0.5 -4.6
International headquarters (Switzerland, Sweden…) 7.8 8.9 +1.1
Central and Eastern Europe 2.3 2.0 -0.3
Australia 1.4 0.0 -1.4
Mexico 1.1 1.3 +0.1
(1) Including off-balance-sheet commitments.
Results
The Legacy Portfolio Management Division includes contributions from the Group’s bond portfolios in run-off (including the Financial Products portfolio) and Public and Wholesale Banking run-off commitments. The Division is also allocated part of the Treasury result. Entities to be divested are still reported in the Core Division.
Capital gains on the disposal of Crédit du Nord (EUR 153 mil-lion), booked in 2009, and on the sale of the stake in Assured Guaranty, booked in 2010, were allocated to the Legacy Divi-sion. FSA Insurance was deconsolidated as from the second quarter of 2009.
In 2010, the legacy Division recorded a pre-tax loss of EUR 216 million, against a EUR 376 million (including FSA Insurance) or EUR 305 million (excluding FSA Insurance) positive result in 2009.
Over the year, the division posted a positive result in the first quarter and losses in the last three quarters. This evolution is explained, in particular, by the EUR 414 million (excluding FSA Insurance) fall in income compared to 2009 driven by:• EUR 373 million decrease in Treasury income allocated to the division in line with the ongoing decrease of the liquidity gap,• the reduction of net margins on the PWB run-off commitments (EUR -121 million) and on the bond portfolio in run-off (EUR -162 million).
The cost of risk, up by EUR 121 million (excluding FSA Insurance), was impacted by a reversal of collective provisions on ABS and subordinated debt booked in the bond portfolio in run-off, for an amount of EUR 184 million, and by a EUR 328 million increase in the provisions on the Financial Products portfolio.
The significant changes impacting the different segments of the Legacy Division are set out in detail hereafter.
The bond portfolio in run-off recorded a pre-tax loss of EUR 10 million in 2010, against a loss of EUR 316 million in 2009. Income was up EUR 115 million on 2009, principally driven by EUR 293 million increase in trading income (CDS linked to synthetic securitization and CVA on CDS intermediation) which more than offset the reduction of interest margin (EUR -162 million) and deleveraging losses up by EUR 65 million given higher volumes of disposals in 2010. The cost of risk improved by EUR 184 million in 2010, marked by reversals of impairments, principally on ABS and on the banking sector.
The Financial Products portfolio posted a pre-tax loss of EUR 299 million in 2010, against a EUR 169 million loss in 2009. The EUR 204 million rise in income, to EUR 282 million as a result of gains on own credit risk and of the sale of the stake in Assured Guaranty (EUR 153 million) did not totally offset the EUR 328 million rise of the cost of risk over the year, particularly because additional impairments were recorded in the fourth quarter (more information on the Financial Products portfolio is given in the chapter “Risk Management” of this annual report on page 72).
The total cash shortfalls and realised losses on the portfolio increased by USD 431 million over the year, to USD 624 million. This includes USD 360 million shortfalls and USD 71 million losses on asset sales, mitigated by a release of collective impairments.
In a context characterized by a volatile economic environment and large stocks of homes which will continue to weigh heavily on the real estate market, at least in 2011, Dexia adapted its US RMBS provisioning model to take more conservative assumptions into account.
As a consequence, • The expected economic losses (discounted expected cash shortfalls) increased by USD 390 million in 2010 to USD 1.796 billion. Such an estimate is made to the best of Dexia’s knowledge on the basis of market conditions as at the end of December 2010.
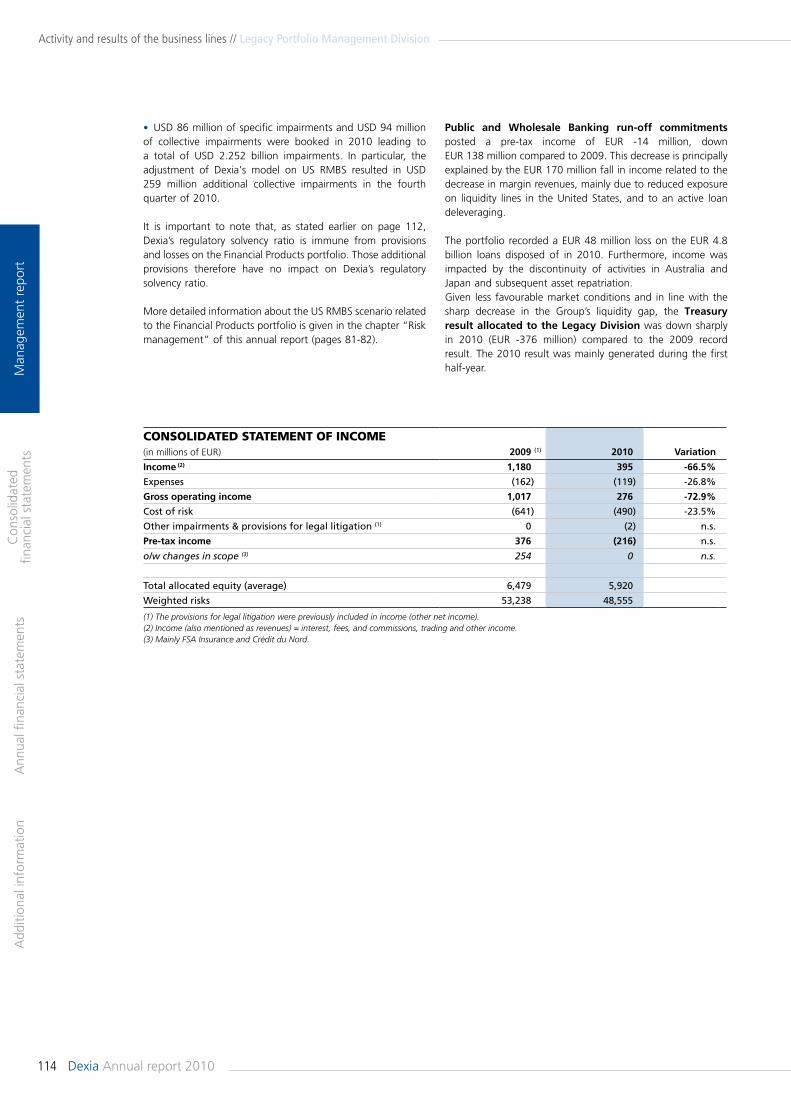
114 Dexia Annual report 2010
Man
agem
ent
repo
rtA
dditi
onal
info
rmat
ion
Ann
ual fi
nanc
ial s
tate
men
tsC
onso
lidat
ed
finan
cial
sta
tem
ents
Activity and results of the business lines // Legacy Portfolio Management Division
Public and Wholesale Banking run-off commitments posted a pre-tax income of EUR -14 million, down EUR 138 million compared to 2009. This decrease is principally explained by the EUR 170 million fall in income related to the decrease in margin revenues, mainly due to reduced exposure on liquidity lines in the United States, and to an active loan deleveraging.
The portfolio recorded a EUR 48 million loss on the EUR 4.8 billion loans disposed of in 2010. Furthermore, income was impacted by the discontinuity of activities in Australia and Japan and subsequent asset repatriation.Given less favourable market conditions and in line with the sharp decrease in the Group’s liquidity gap, the Treasury result allocated to the Legacy Division was down sharply in 2010 (EUR -376 million) compared to the 2009 record result. The 2010 result was mainly generated during the first half-year.
• USD 86 million of specific impairments and USD 94 million of collective impairments were booked in 2010 leading to a total of USD 2.252 billion impairments. In particular, the adjustment of Dexia's model on US RMBS resulted in USD 259 million additional collective impairments in the fourth quarter of 2010.
It is important to note that, as stated earlier on page 112, Dexia’s regulatory solvency ratio is immune from provisions and losses on the Financial Products portfolio. Those additional provisions therefore have no impact on Dexia’s regulatory solvency ratio.
More detailed information about the US RMBS scenario related to the Financial Products portfolio is given in the chapter “Risk management” of this annual report (pages 81-82).
CONSOLIDATED STATEMENT OF INCOME(in millions of EUR) 2009 (1) 2010 Variation
Income (2) 1,180 395 -66.5%
Expenses (162) (119) -26.8%
Gross operating income 1,017 276 -72.9%
Cost of risk (641) (490) -23.5%
Other impairments & provisions for legal litigation (1) 0 (2) n.s.
Pre-tax income 376 (216) n.s.
o/w changes in scope (3) 254 0 n.s.
Total allocated equity (average) 6,479 5,920
Weighted risks 53,238 48,555
(1) The provisions for legal litigation were previously included in income (other net income).(2) Income (also mentioned as revenues) = interest, fees, and commissions, trading and other income.(3) Mainly FSA Insurance and Crédit du Nord.

C o n s o l i d a t e d f i n a n c i a l s t a t e m e n t s
a s a t 3 1 d e c e m b e r 2 0 1 0
118 Consolidated balance sheet
120 Consolidated statement of income
121 Consolidated statement of change in equity
124 Consolidated statement of comprehensive income
125 Consolidated cash flow statement
126 Notes to the consolidated financial statements
126 Note 1. Accounting principles and rules of consolidated financial
statements
142 Note 2. Significant changes in scope of consolidation and list of main
subsidiaries and affiliated enterprises of the Dexia Group
144 Note 3. Business reporting
147 Note 4. Significant items included in the statement of income
147 Note 5. Post-balance-sheet events
147 Note 6. Litigations
148 Note 7. Notes on the assets of the consolidated balance sheet
165 Note 8. Notes on the liabilities of the consolidated balance sheet
174 Note 9. Other notes on the consolidated balance sheet
193 Note 10. Notes on the consolidated off-balance-sheet items
194 Note 11. Notes on the consolidated statement of income
204 Note 12. Notes on risk exposure
235 Statutory Auditor’s report
on the consolidated financial statements
for the year ended 31 December 2010
C o n s o l i d a t e d f i n a n c i a l s t a t e m e n t s
a s a t 3 1 d e c e m b e r 2 0 1 0
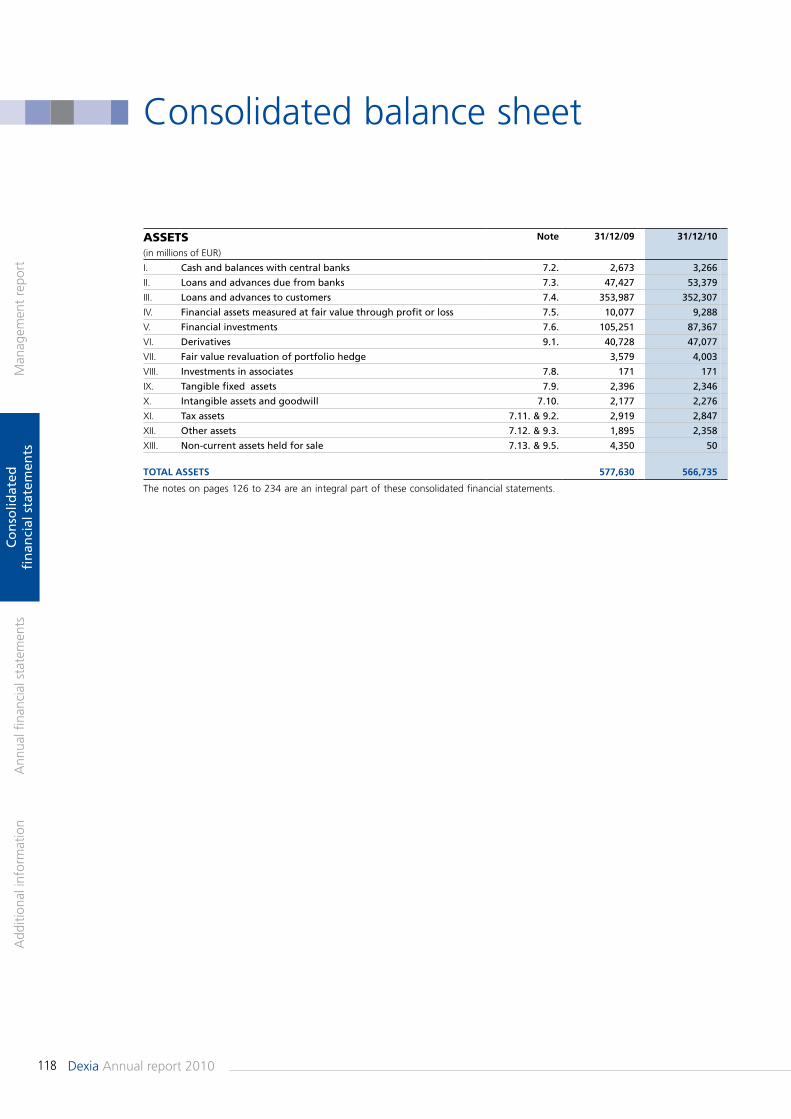
118
Consolidated balance sheet
Dexia Annual report 2010
Man
agem
ent
repo
rtA
dditi
onal
info
rmat
ion
Ann
ual fi
nanc
ial s
tate
men
tsC
on
solid
ated
fi
nan
cial
sta
tem
ents
Assets Note 31/12/09 31/12/10
(in millions of EUR)
I. Cash and balances with central banks 7.2. 2,673 3,266
II. Loans and advances due from banks 7.3. 47,427 53,379
III. Loans and advances to customers 7.4. 353,987 352,307
IV. Financial assets measured at fair value through profit or loss 7.5. 10,077 9,288
V. Financial investments 7.6. 105,251 87,367
VI. Derivatives 9.1. 40,728 47,077
VII. Fair value revaluation of portfolio hedge 3,579 4,003
VIII. Investments in associates 7.8. 171 171
IX. Tangible fixed assets 7.9. 2,396 2,346
X. Intangible assets and goodwill 7.10. 2,177 2,276
XI. Tax assets 7.11. & 9.2. 2,919 2,847
XII. Other assets 7.12. & 9.3. 1,895 2,358
XIII. Non-current assets held for sale 7.13. & 9.5. 4,350 50
ToTal asseTs 577,630 566,735
The notes on pages 126 to 234 are an integral part of these consolidated financial statements.
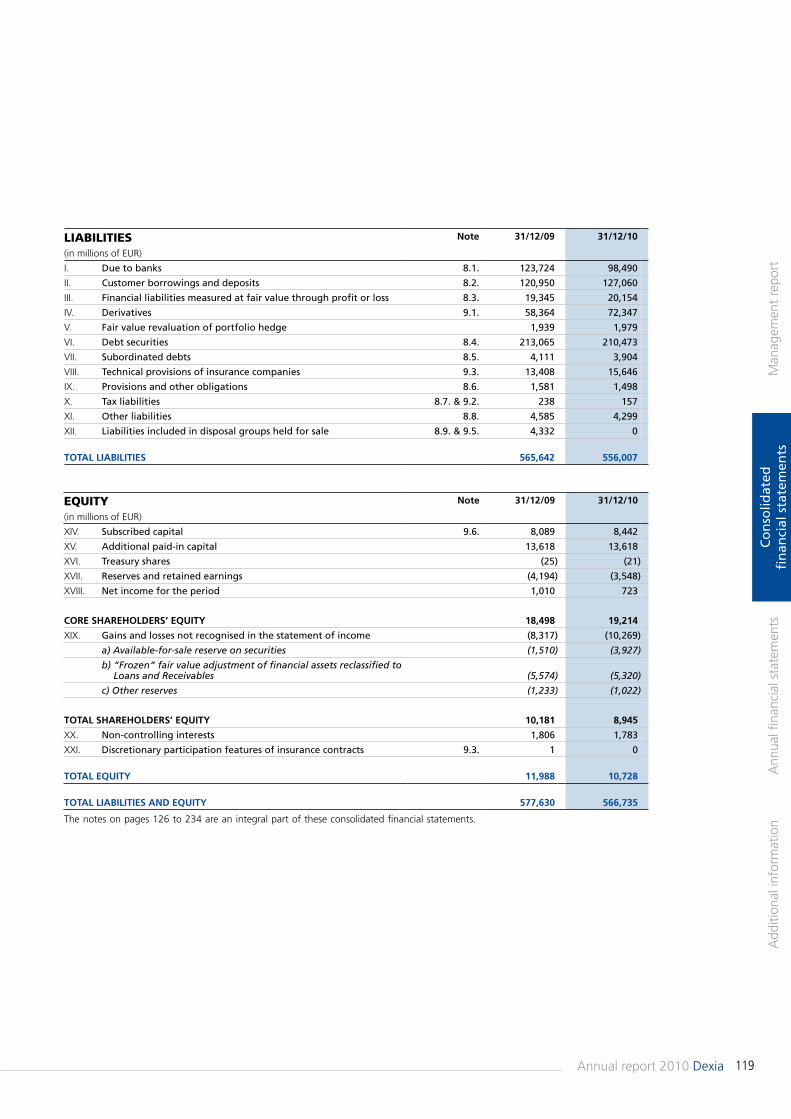
119Annual report 2010 Dexia
Man
agem
ent
repo
rtA
dditi
onal
info
rmat
ion
Ann
ual fi
nanc
ial s
tate
men
tsC
on
solid
ated
fi
nan
cial
sta
tem
ents
LiAbiLities Note 31/12/09 31/12/10
(in millions of EUR)
I. Due to banks 8.1. 123,724 98,490
II. Customer borrowings and deposits 8.2. 120,950 127,060
III. Financial liabilities measured at fair value through profit or loss 8.3. 19,345 20,154
IV. Derivatives 9.1. 58,364 72,347
V. Fair value revaluation of portfolio hedge 1,939 1,979
VI. Debt securities 8.4. 213,065 210,473
VII. Subordinated debts 8.5. 4,111 3,904
VIII. Technical provisions of insurance companies 9.3. 13,408 15,646
IX. Provisions and other obligations 8.6. 1,581 1,498
X. Tax liabilities 8.7. & 9.2. 238 157
XI. Other liabilities 8.8. 4,585 4,299
XII. Liabilities included in disposal groups held for sale 8.9. & 9.5. 4,332 0
ToTal liabiliTies 565,642 556,007
equity Note 31/12/09 31/12/10
(in millions of EUR)
XIV. Subscribed capital 9.6. 8,089 8,442
XV. Additional paid-in capital 13,618 13,618
XVI. Treasury shares (25) (21)
XVII. Reserves and retained earnings (4,194) (3,548)
XVIII. Net income for the period 1,010 723
Core shareholders’ equiTy 18,498 19,214
XIX. Gains and losses not recognised in the statement of income (8,317) (10,269)
a) Available-for-sale reserve on securities (1,510) (3,927)
b) “Frozen“ fair value adjustment of financial assets reclassified to Loans and Receivables (5,574) (5,320)
c) Other reserves (1,233) (1,022)
ToTal shareholders’ equiTy 10,181 8,945
XX. Non-controlling interests 1,806 1,783
XXI. Discretionary participation features of insurance contracts 9.3. 1 0
ToTal equiTy 11,988 10,728
ToTal liabiliTies aNd equiTy 577,630 566,735
The notes on pages 126 to 234 are an integral part of these consolidated financial statements.
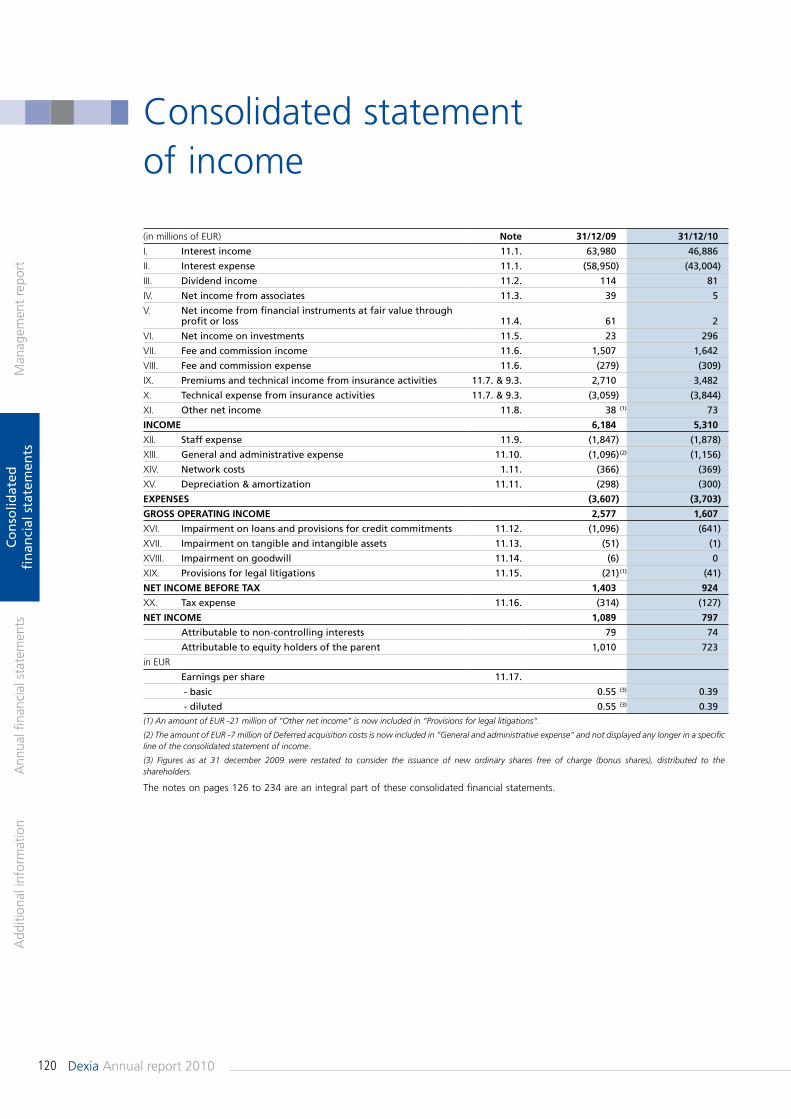
120 Dexia Annual report 2010
Man
agem
ent
repo
rtA
dditi
onal
info
rmat
ion
Ann
ual fi
nanc
ial s
tate
men
tsC
on
solid
ated
fi
nan
cial
sta
tem
ents
Consolidated statement of income
(in millions of EUR) Note 31/12/09 31/12/10
I. Interest income 11.1. 63,980 46,886
II. Interest expense 11.1. (58,950) (43,004)
III. Dividend income 11.2. 114 81
IV. Net income from associates 11.3. 39 5
V. Net income from financial instruments at fair value through profit or loss 11.4. 61 2
VI. Net income on investments 11.5. 23 296
VII. Fee and commission income 11.6. 1,507 1,642
VIII. Fee and commission expense 11.6. (279) (309)
IX. Premiums and technical income from insurance activities 11.7. & 9.3. 2,710 3,482
X. Technical expense from insurance activities 11.7. & 9.3. (3,059) (3,844)
XI. Other net income 11.8. 38 (1) 73
iNCome 6,184 5,310
XII. Staff expense 11.9. (1,847) (1,878)
XIII. General and administrative expense 11.10. (1,096)(2) (1,156)
XIV. Network costs 1.11. (366) (369)
XV. Depreciation & amortization 11.11. (298) (300)
expeNses (3,607) (3,703)
Gross operaTiNG iNCome 2,577 1,607
XVI. Impairment on loans and provisions for credit commitments 11.12. (1,096) (641)
XVII. Impairment on tangible and intangible assets 11.13. (51) (1)
XVIII. Impairment on goodwill 11.14. (6) 0
XIX. Provisions for legal litigations 11.15. (21)(1) (41)
NeT iNCome before Tax 1,403 924
XX. Tax expense 11.16. (314) (127)
NeT iNCome 1,089 797
Attributable to non-controlling interests 79 74
Attributable to equity holders of the parent 1,010 723
in EUR
Earnings per share 11.17.
- basic 0.55 (3) 0.39
- diluted 0.55 (3) 0.39(1) An amount of EUR -21 million of “Other net income“ is now included in “Provisions for legal litigations“.
(2) The amount of EUR -7 million of Deferred acquisition costs is now included in “General and administrative expense“ and not displayed any longer in a specific line of the consolidated statement of income.
(3) Figures as at 31 december 2009 were restated to consider the issuance of new ordinary shares free of charge (bonus shares), distributed to the shareholders.
The notes on pages 126 to 234 are an integral part of these consolidated financial statements.
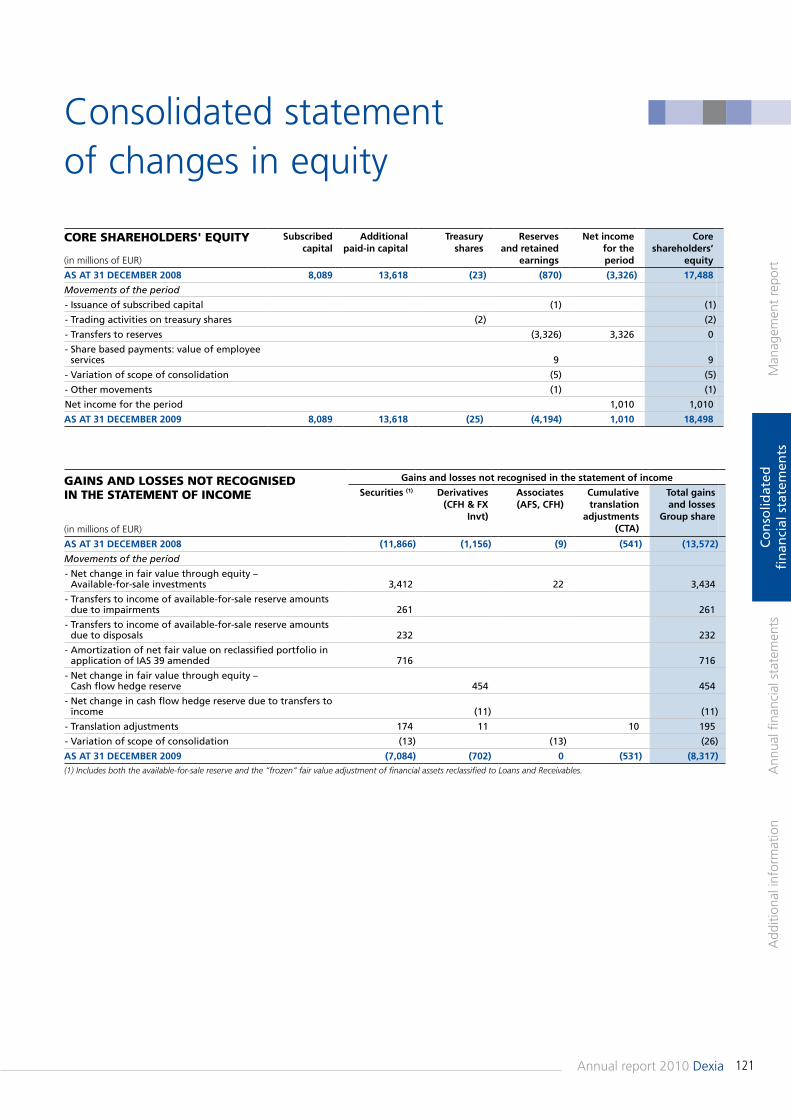
121Annual report 2010 Dexia
Man
agem
ent
repo
rtA
dditi
onal
info
rmat
ion
Ann
ual fi
nanc
ial s
tate
men
tsC
on
solid
ated
fi
nan
cial
sta
tem
ents
Consolidated statement of changes in equity
Core shArehoLders' equity subscribed capital
additional paid-in capital
Treasury shares
reserves and retained
earnings
Net income for the period
Core shareholders’
equity(in millions of EUR)
as aT 31 deCember 2008 8,089 13,618 (23) (870) (3,326) 17,488
Movements of the period
- Issuance of subscribed capital (1) (1)
- Trading activities on treasury shares (2) (2)
- Transfers to reserves (3,326) 3,326 0
- Share based payments: value of employee services 9 9
- Variation of scope of consolidation (5) (5)
- Other movements (1) (1)
Net income for the period 1,010 1,010
as aT 31 deCember 2009 8,089 13,618 (25) (4,194) 1,010 18,498
GAins And Losses not reCoGnised in the stAtement of inCome
Gains and losses not recognised in the statement of income
securities (1) derivatives (Cfh & fx
invt)
associates (afs, Cfh)
Cumulative translation
adjustments (CTa)
Total gains and losses
Group share(in millions of EUR)
as aT 31 deCember 2008 (11,866) (1,156) (9) (541) (13,572)
Movements of the period
- Net change in fair value through equity – Available-for-sale investments 3,412 22 3,434
- Transfers to income of available-for-sale reserve amounts due to impairments 261 261
- Transfers to income of available-for-sale reserve amounts due to disposals 232 232
- Amortization of net fair value on reclassified portfolio in application of IAS 39 amended 716 716
- Net change in fair value through equity – Cash flow hedge reserve 454 454
- Net change in cash flow hedge reserve due to transfers to income (11) (11)
- Translation adjustments 174 11 10 195
- Variation of scope of consolidation (13) (13) (26)
as aT 31 deCember 2009 (7,084) (702) 0 (531) (8,317)(1) Includes both the available-for-sale reserve and the “frozen“ fair value adjustment of financial assets reclassified to Loans and Receivables.
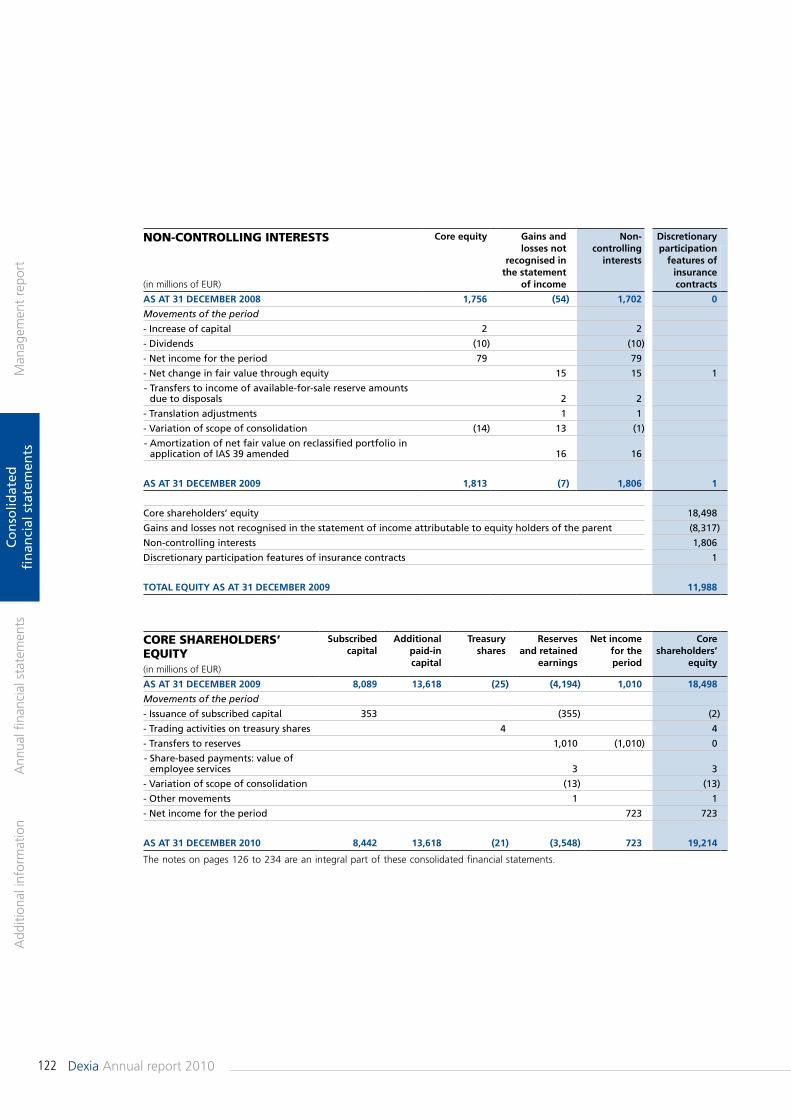
122 Dexia Annual report 2010
Man
agem
ent
repo
rtA
dditi
onal
info
rmat
ion
Ann
ual fi
nanc
ial s
tate
men
tsC
on
solid
ated
fi
nan
cial
sta
tem
ents
NoN-coNtrolliNg iNterests Core equity Gains and losses not
recognised in the statement
of income
Non- controlling
interests
Discretionary participation
features of insurance contracts(in millions of EUR)
As At 31 DeCember 2008 1,756 (54) 1,702 0
Movements of the period
- Increase of capital 2 2
- Dividends (10) (10)
- Net income for the period 79 79
- Net change in fair value through equity 15 15 1
- Transfers to income of available-for-sale reserve amounts due to disposals 2 2
- Translation adjustments 1 1
- Variation of scope of consolidation (14) 13 (1)
- Amortization of net fair value on reclassified portfolio in application of IAS 39 amended 16 16
As At 31 DeCember 2009 1,813 (7) 1,806 1
Core shareholders’ equity 18,498
Gains and losses not recognised in the statement of income attributable to equity holders of the parent (8,317)
Non-controlling interests 1,806
Discretionary participation features of insurance contracts 1
tOtAL eQUItY As At 31 DeCember 2009 11,988
core shareholders’ equity
subscribedcapital
Additionalpaid-incapital
treasuryshares
reserves and retained
earnings
Net income for the period
Core shareholders’
equity(in millions of EUR)
As At 31 DeCember 2009 8,089 13,618 (25) (4,194) 1,010 18,498
Movements of the period
- Issuance of subscribed capital 353 (355) (2)
- Trading activities on treasury shares 4 4
- Transfers to reserves 1,010 (1,010) 0
- Share-based payments: value of employee services 3 3
- Variation of scope of consolidation (13) (13)
- Other movements 1 1
- Net income for the period 723 723
As At 31 DeCember 2010 8,442 13,618 (21) (3,548) 723 19,214
The notes on pages 126 to 234 are an integral part of these consolidated financial statements.
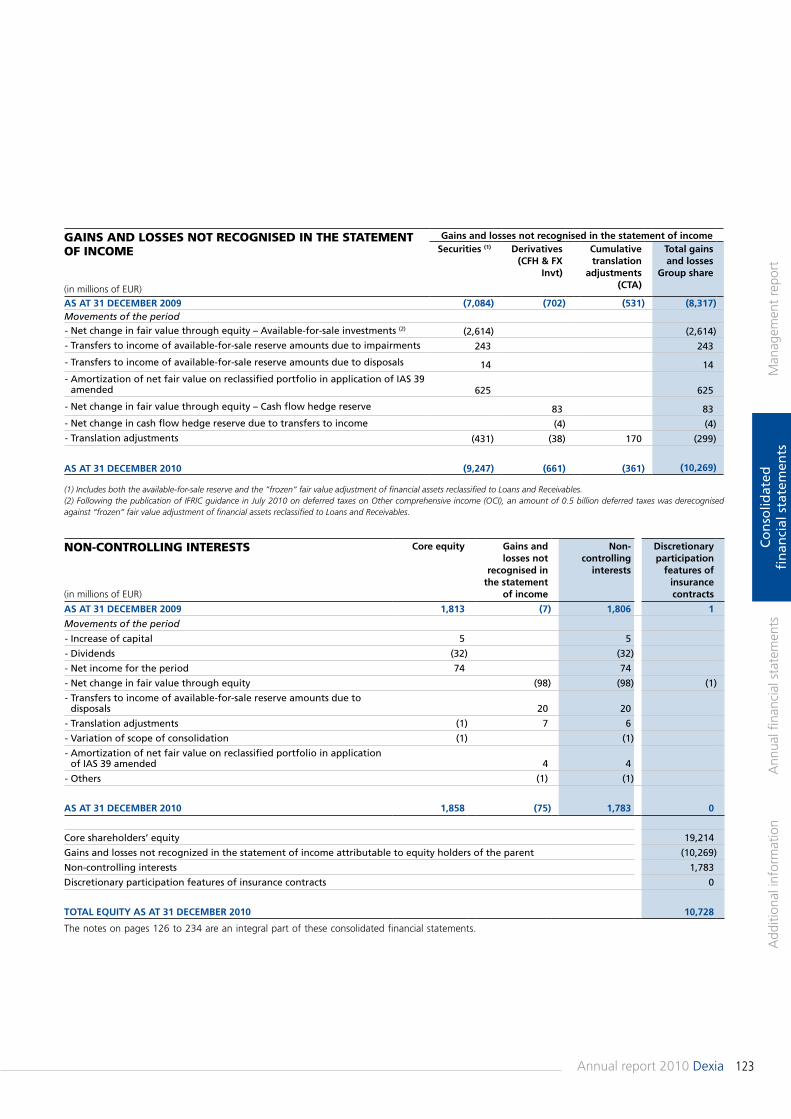
123Annual report 2010 Dexia
Man
agem
ent
repo
rtA
dditi
onal
info
rmat
ion
Ann
ual fi
nanc
ial s
tate
men
tsC
on
solid
ated
fi
nan
cial
sta
tem
ents
GAins And Losses not reCoGnised in the stAtement of inCome
Gains and losses not recognised in the statement of incomesecurities (1) derivatives
(Cfh & fx invt)
Cumulative translation
adjustments (CTa)
Total gains and losses
Group share
(in millions of EUR)as aT 31 deCember 2009 (7,084) (702) (531) (8,317)Movements of the period- Net change in fair value through equity – Available-for-sale investments (2) (2,614) (2,614)- Transfers to income of available-for-sale reserve amounts due to impairments 243 243
- Transfers to income of available-for-sale reserve amounts due to disposals 14 14- Amortization of net fair value on reclassified portfolio in application of IAS 39
amended 625 625
- Net change in fair value through equity – Cash flow hedge reserve 83 83- Net change in cash flow hedge reserve due to transfers to income (4) (4)- Translation adjustments (431) (38) 170 (299)
as aT 31 deCember 2010 (9,247) (661) (361) (10,269) (1) Includes both the available-for-sale reserve and the “frozen“ fair value adjustment of financial assets reclassified to Loans and Receivables.(2) Following the publication of IFRIC guidance in July 2010 on deferred taxes on Other comprehensive income (OCI), an amount of 0.5 billion deferred taxes was derecognised against “frozen“ fair value adjustment of financial assets reclassified to Loans and Receivables.
non-ControLLinG interests Core equity Gains and losses not
recognised in the statement
of income
Non- controlling
interests
discretionary participation
features of insurance contracts(in millions of EUR)
as aT 31 deCember 2009 1,813 (7) 1,806 1
Movements of the period
- Increase of capital 5 5
- Dividends (32) (32)
- Net income for the period 74 74
- Net change in fair value through equity (98) (98) (1)
- Transfers to income of available-for-sale reserve amounts due to disposals 20 20
- Translation adjustments (1) 7 6
- Variation of scope of consolidation (1) (1)
- Amortization of net fair value on reclassified portfolio in application of IAS 39 amended 4 4
- Others (1) (1)
as aT 31 deCember 2010 1,858 (75) 1,783 0
Core shareholders’ equity 19,214
Gains and losses not recognized in the statement of income attributable to equity holders of the parent (10,269)
Non-controlling interests 1,783
Discretionary participation features of insurance contracts 0
ToTal equiTy as aT 31 deCember 2010 10,728
The notes on pages 126 to 234 are an integral part of these consolidated financial statements.
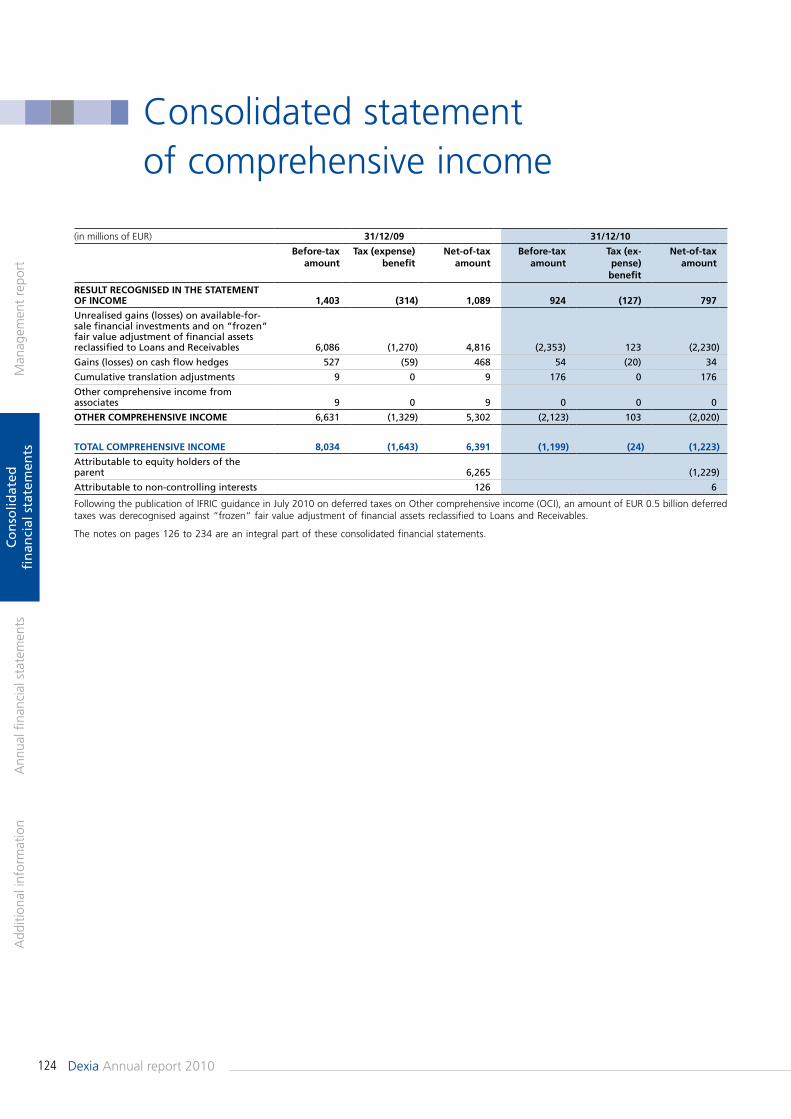
124 Dexia Annual report 2010
Man
agem
ent
repo
rtA
dditi
onal
info
rmat
ion
Ann
ual fi
nanc
ial s
tate
men
tsC
on
solid
ated
fi
nan
cial
sta
tem
ents
Consolidated statement of comprehensive income
(in millions of EUR) 31/12/09 31/12/10
before-tax
amountTax (expense)
benefitNet-of-tax
amountbefore-tax
amountTax (ex-pense)
benefit
Net-of-tax amount
resulT reCoGNised iN The sTaTemeNT of iNCome 1,403 (314) 1,089 924 (127) 797
Unrealised gains (losses) on available-for-sale financial investments and on “frozen“ fair value adjustment of financial assets reclassified to Loans and Receivables 6,086 (1,270) 4,816 (2,353) 123 (2,230)
Gains (losses) on cash flow hedges 527 (59) 468 54 (20) 34
Cumulative translation adjustments 9 0 9 176 0 176
Other comprehensive income from associates 9 0 9 0 0 0
oTher CompreheNsive iNCome 6,631 (1,329) 5,302 (2,123) 103 (2,020)
ToTal CompreheNsive iNCome 8,034 (1,643) 6,391 (1,199) (24) (1,223)
Attributable to equity holders of the parent 6,265 (1,229)
Attributable to non-controlling interests 126 6
Following the publication of IFRIC guidance in July 2010 on deferred taxes on Other comprehensive income (OCI), an amount of EUR 0.5 billion deferred taxes was derecognised against “frozen“ fair value adjustment of financial assets reclassified to Loans and Receivables.
The notes on pages 126 to 234 are an integral part of these consolidated financial statements.
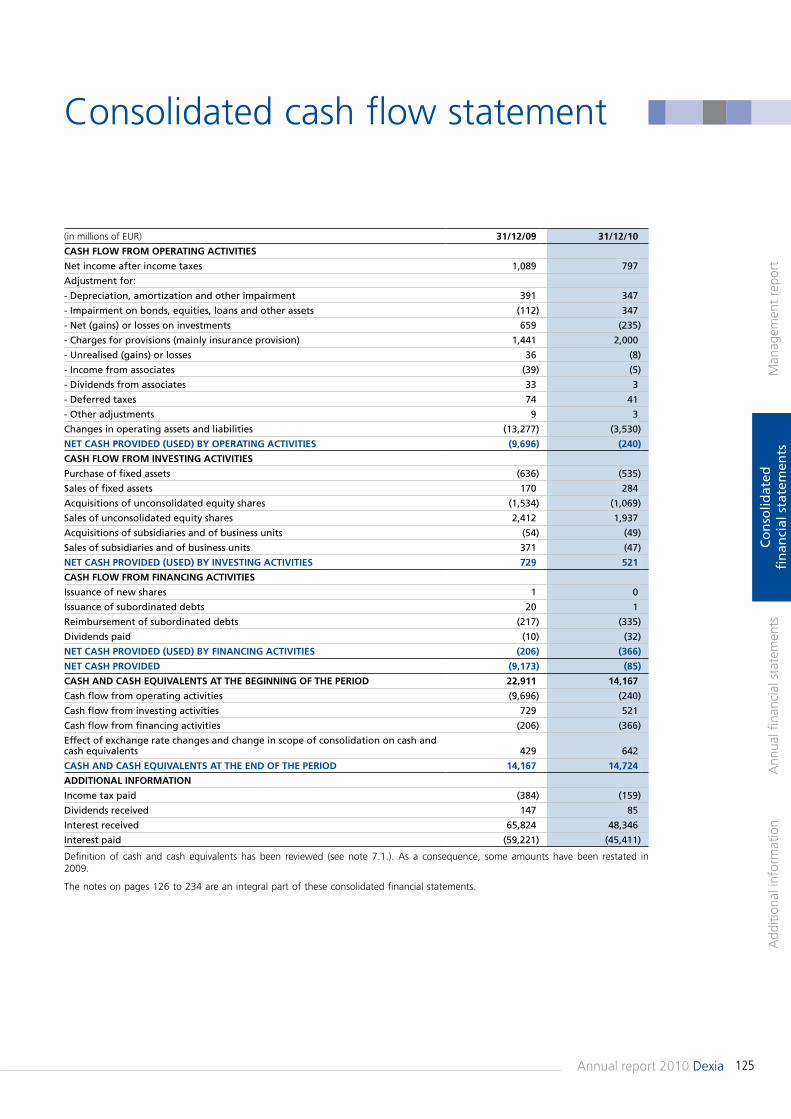
125Annual report 2010 Dexia
Man
agem
ent
repo
rtA
dditi
onal
info
rmat
ion
Ann
ual fi
nanc
ial s
tate
men
tsC
on
solid
ated
fi
nan
cial
sta
tem
ents
Consolidated cash flow statement
(in millions of EUR) 31/12/09 31/12/10
Cash flow from operaTiNG aCTiviTies
Net income after income taxes 1,089 797
Adjustment for:
- Depreciation, amortization and other impairment 391 347
- Impairment on bonds, equities, loans and other assets (112) 347
- Net (gains) or losses on investments 659 (235)
- Charges for provisions (mainly insurance provision) 1,441 2,000
- Unrealised (gains) or losses 36 (8)
- Income from associates (39) (5)
- Dividends from associates 33 3
- Deferred taxes 74 41
- Other adjustments 9 3
Changes in operating assets and liabilities (13,277) (3,530)
NeT Cash provided (used) by operaTiNG aCTiviTies (9,696) (240)
Cash flow from iNvesTiNG aCTiviTies
Purchase of fixed assets (636) (535)
Sales of fixed assets 170 284
Acquisitions of unconsolidated equity shares (1,534) (1,069)
Sales of unconsolidated equity shares 2,412 1,937
Acquisitions of subsidiaries and of business units (54) (49)
Sales of subsidiaries and of business units 371 (47)
NeT Cash provided (used) by iNvesTiNG aCTiviTies 729 521
Cash flow from fiNaNCiNG aCTiviTies
Issuance of new shares 1 0
Issuance of subordinated debts 20 1
Reimbursement of subordinated debts (217) (335)
Dividends paid (10) (32)
NeT Cash provided (used) by fiNaNCiNG aCTiviTies (206) (366)
NeT Cash provided (9,173) (85)
Cash aNd Cash equivaleNTs aT The beGiNNiNG of The period 22,911 14,167
Cash flow from operating activities (9,696) (240)
Cash flow from investing activities 729 521
Cash flow from financing activities (206) (366)
Effect of exchange rate changes and change in scope of consolidation on cash and cash equivalents 429 642
Cash aNd Cash equivaleNTs aT The eNd of The period 14,167 14,724
addiTioNal iNformaTioN
Income tax paid (384) (159)
Dividends received 147 85
Interest received 65,824 48,346
Interest paid (59,221) (45,411)
Definition of cash and cash equivalents has been reviewed (see note 7.1.). As a consequence, some amounts have been restated in 2009.
The notes on pages 126 to 234 are an integral part of these consolidated financial statements.
126 Dexia Annual report 2010
Man
agem
ent
repo
rtA
dditi
onal
info
rmat
ion
Ann
ual fi
nanc
ial s
tate
men
tsC
on
solid
ated
fi
nan
cial
sta
tem
ents
1. Accounting principles and rules of consolidated financial statementsGeneral information 1261.1. Basis of accounting 1271.2. Changes in accounting policies since the previous annual publication that may impact Dexia Group 1271.3. Consolidation 1281.4. Offsetting financial assets and financial liabilities 1301.5. Foreign currency translation and transactions 1301.6. Financial assets and liabilities 1301.7. Fair value of financial instruments 1331.8. Interest income and expense 1341.9. Fee and commission income and expense 1341.10. Insurance and reinsurance activities 1341.11. Network costs 1361.12. Hedging derivatives 1361.13. Hedge of the interest-rate risk exposure of a portfolio 1371.14. Day one profit or loss 137
Notes to consolidated financial statements
1.15. Tangible fixed assets 1371.16. Intangible assets 1381.17. Non-current assets held for sale and discontinued Operations 1381.18. Goodwill 1381.19. Other assets 1391.20. Leases 1391.21. Sale and repurchase agreements and lending Of securities 1391.22. Deferred income tax 1391.23. Employee benefits 1391.24. Provisions 1401.25. Share capital and treasury shares 1411.26. Fiduciary activities 1411.27. Cash and cash equivalents 1411.28. Earnings per share 141
GeNeral iNformaTioNThe Dexia Group focuses on Retail and Commercial Banking in Europe (mainly in Belgium, Luxembourg and Turkey) and on Public and Wholesale Banking, providing local public-finance operators with comprehensive banking and financial solutions. Asset Management & Services provides asset management, investor and insurance services, in particular to the clients of the other two business lines. The different business lines interact constantly in order to serve clients better and to support the Group's commercial activity.The parent company of the Group is Dexia SA, which is a limited liability company and is incorporated and domiciled in Belgium. Its registered office is located at: Place Rogier 11 – B-1210 Brussels (Belgium).Dexia is listed on the NYSE Euronext Stock Exchange in Brussels and also on the Luxembourg Stock Exchange. The shares are also traded on NYSE Euronext Paris.
These financial statements were authorised for issue by the Board of Directors on 23 February 2011.
The principal accounting policies adopted in the preparation of these consolidated financial statements are set out below.The common used abbreviations below are:• IASB: International Accounting Standards Board• IFRIC: International Financial Reporting Interpretations
Committee• IFRS: International Financial Reporting Standards.
127Annual report 2010 Dexia
Man
agem
ent
repo
rtA
dditi
onal
info
rmat
ion
Ann
ual fi
nanc
ial s
tate
men
tsC
on
solid
ated
fi
nan
cial
sta
tem
ents
Notes to the consolidated financial statements
1.1. bAsis of ACCountinG
1.1.1. GeneralDexia's consolidated financial statements are prepared in accordance with the IFRS adopted by the EU.The European Commission published Regulation EC 1606/2002 on 19 July 2002, requiring listed groups to apply IFRS as from 1 January 2005. This regulation has been updated several times since 2002.Dexia's financial statements have therefore been prepared “in accordance with all IFRSs as adopted by the EU“ and endorsed by the EC up to 31 December 2010, including the conditions of application of interest-rate portfolio hedging and the possibility to hedge core deposits.Our accounting principles include only elements where an IFRS text allows the possibility of choice.The consolidated financial statements are prepared on a “going-concern basis“ and are given in millions of euro (EUR) unless otherwise stated.
1.1.2. accounting estimates and judgementsIn preparing the consolidated financial statements, management is required to make estimates and assumptions that affect the amounts reported. To make these assumptions and estimates, management uses information available at the date of preparation of the financial statements and exercises its judgement. While management believes that it has considered all available information in developing these estimates, actual results may differ from the estimates and the differences could be material to the financial statements.
Judgements are made principally in the following areas:• Classification of financial instruments;• Determination of whether there is an active market or not;• Consolidation (control, including SPE);• Identification of non-current assets and disposal groups held for sale and discontinued operations (IFRS 5);• Hedge accounting;• Existence of a present obligation with probable outflows in the context of litigations;• Identification of impairment triggers.These judgements are entered in the corresponding sections of the accounting policies.
Estimates are principally made in the following areas:• Determination of the recoverable amount of impaired financial assets;• Determination of the useful life and the residual value of property, plant and equipment, investment property and intangible assets;• Measurement of liabilities for insurance contracts;• Actuarial assumptions related to the measurement of employee benefits obligations and plan assets;• Estimate of future taxable profit for the recognition and measurement of deferred tax assets;• Estimate of the recoverable amount of cash-generating units for goodwill impairment.
1.2. ChAnGes in ACCountinG PoLiCies sinCe the PreVious AnnuAL PubLiCAtion thAt mAy imPACt deXiA GrouPThe overview of the texts below is made until the reporting date of 31 December 2010.
1.2.1. iasb and ifriC texts endorsed by the european Commission and applied as from 1 January 2010The following standards, interpretations or amendments have been endorsed by the European Commission and are applied as from 1 January 2010.• “Improvements to IFRSs“ (issued by IASB in April 2009), which are a collection of amendments to existing standards and interpretations. Unless otherwise specified, the amendments are effective as from 1 January 2010. There is no impact for Dexia.• Amendments to “IFRS 2 Group Cash Settled Share-based Payment Transactions“. These amendments aim to clarify the scope of IFRS 2. There is no impact for Dexia.• Revised IFRS 1 “First-Time adoption of International Financial Reporting Standards“, which replaces the standard as issued in June 2003. The revision of this standard has no impact on Dexia, which is not a first-time adopter anymore.• Amendments to IFRS 1 “Additional Exemptions for First-time Adopters. The revision of this standard has no impact on Dexia, which is not a first-time adopter anymore.• “Revised IFRS 3 Business Combinations“, which is applied prospectively to business combinations for which the acquisition date is on or after 1 January 2010. There is no impact on Dexia because there were no new significant business combinations as from 1 January 2010.• Amendment to “IAS 39 Financial Instruments: Recognition and Measurement: Eligible Hedged Items“. There is no impact on Dexia.• Amendments to “IAS 27 Consolidated and separate financial statements. There is no impact on Dexia for the period ending 31 December 2010 other than relabelling “minority interest“ into “non-controlling interest“.• Amendments to “IFRS 5 Non-current Assets held for Sale and Discontinued Operations“ issued in May 2008 as part of the improvements to IFRSs. There is no impact on Dexia.• IFRIC 12 “Service Concession Arrangements“. This inter-pretation has no impact on Dexia.• IFRIC 15 “Agreement for the Construction of Real Estate“. This interpretation has no impact on Dexia.• IFRIC 16 “Hedges of a Net Investment in a Foreign Operation“. This interpretation has no impact on Dexia.• IFRIC 17 “Distributions of non-cash-assets to owners“. This inter pretation has no impact on Dexia.• IFRIC 18 “Transfers of assets from customers“. This inter-pretation has no impact on Dexia.
1.2.2. iasb and ifriC texts endorsed by the european Commission during the current year but not yet applicable as from 1 January 2010• Amendment to IFRS 1 “Limited Exemption from Comparative IFRS 7 Disclosures for First-time Adopters“ applicable as from
128 Dexia Annual report 2010
Man
agem
ent
repo
rtA
dditi
onal
info
rmat
ion
Ann
ual fi
nanc
ial s
tate
men
tsC
on
solid
ated
fi
nan
cial
sta
tem
ents
Notes to the consolidated financial statements
1 January 2011. This amendment will have no impact on Dexia, which is not a first-time adopter anymore.• Amendment to IFRIC 14 “Prepayments of a Minimum Funding Requirements“ applicable as from 1 January 2011. This amendment will not impact Dexia.• IAS 24 “Related Party Disclosures“ applicable as from 1 January 2011. This standard supersedes IAS 24 “Related Party Disclosures“ (as revised in 2003). This amendment will not significantly impact Dexia.• IFRIC 19 “Extinguishing Financial Liabilities with Equity Instruments“ applicable as from 1 January 2011. This interpretation has no impact on Dexia.
1.2.3. New ifrs standards, ifriC interpretations and amendments issued during the current year but not yet endorsed by the european Commission• Amendment to IAS 12 “Deferred Tax: Recovery of Underlying Assets“. There is no impact for Dexia as Dexia measures these assets at amortised cost.• Amendment to IFRS 1 “Severe Hyperinflation and Removal of Fixed Dates for First-time Adopters“. This amendment will have no impact on Dexia, which is not a first-time adopter anymore.• “IFRS 9 Financial Instruments“ – Phase I Classification and Measurement. Dexia performed several impact assessments and the main preliminary conclusions were the following:- Some structured loans, for which the embedded derivative are currently bifurcated and measured at fair value while the host contract is reported at amortised cost, will be measured at fair value through profit or loss.- Bonds currently classified as available-for-sale and thus reported at fair value through other comprehensive income, will be reported either at amortised cost or at fair value through profit or loss. Consequently the negative AFS reserve will either be reversed or reclassified to retained earnings.- For structured products (ABS, RMBS, …) a “look through“ approach should be applied under the new standard in order to determine the measurement model. As Dexia invested mostly in the highest tranche, these products could be measured at amortised cost under IFRS 9.- Some financial assets will probably be measured at fair value through profit or loss as the business model criteria (collecting the cash flows attached to the underlying instrument) for amortised cost are not respected.However, the outcome of these assessments is tentative and is subject to potentially important changes once the final policies on impairment and hedge accounting are known.• Amendment to IFRS 7 “IFRS Disclosures – Transfers of Financial Assets“. This amendment will impact Dexia by requiring more detailed disclosures on transferred assets which were not derecognised by Dexia.• “The Conceptual Framework for Financial Reporting 2010“ completes the first phase of the review and comprises Chapter 1 “The objective of general purpose financial reporting“ and Chapter 3 “Qualitative characteristics of useful financial information“. There is no impact for Dexia because Dexia
already complies with the principles of the Conceptual Framework.• “Improvements to IFRSs“ (issued by IASB in May 2010), which are a collection of amendments to existing International Financial Reporting Standards. These amendments are effective as from 1 January 2011 and the impact mainly relates to disclosures.The IASB also published “IFRS Practice Statement: Management Commentary: A Framework for presentation“. This Practice Statement is not an IFRS but provides a non-binding framework for the presentation of management commentary.
1.2.4. Changes in presentationDue to the sale of FSA insurance activities, the publication line XVI “Deferred Acquisition Costs“ became irrelevant and has been removed. Consequently, in the consolidated financial statements as at 31 December 2010 an amount of EUR -7 million of deferred acquisition costs has been reclassified to “General and administrative expense“.
Dexia has decided to report as from 30 June 2010 as a separate line item in statement of income all legal litigations in the line “Provisions for legal litigations“ below Gross operating income together with “Impairment on loans and provisions for credit commitments“, “Impairment on tangible and intangible assets“ and “Impairment on goodwill“. In Dexia's previous reporting, such legal litigations were reported in “Other net income“.
The IASB amended IAS 39 in October 2008. By this amendment, an entity is allowed to reclassify, if certain conditions are met, financial assets from “Held for Trading“ or “Available-for-Sale“ to “Loans and Receivables“ and from “Held for Trading“ to “Available-for-Sale“. Dexia mainly applied this amendment to reclassify a part of its “Available-for-Sale“ portfolio to “Loans and Receivables“. These assets were transferred at fair value on 1 October 2008, the date of reclassification. The amortization of the discount on the bond is compensated by the amortization of the “frozen“ fair value adjustment. The consequences were that (i) these assets are subject to the impairment procedure applicable for the category “Loans and Receivables“ and (ii) any subsequent change in fair value does no longer impact Dexia's financial statements. In order to distinct the “frozen“ fair value adjustments of reclassified assets from the fair value adjustments relating to the remaining “Available-for-Sale“ portfolio, Dexia decided to split these elements within its equity.
1.3. ConsoLidAtion1.3.1. business combinationsAcquisitions of businesses are accounted for using the acquisition method. The consideration transferred in a business combination is measured at fair value, which is calculated as the sum of the acquisition-date fair values of the assets transferred by Dexia, the liabilities incurred by Dexia to former owners of the acquiree and the equity interests
129Annual report 2010 Dexia
Man
agem
ent
repo
rtA
dditi
onal
info
rmat
ion
Ann
ual fi
nanc
ial s
tate
men
tsC
on
solid
ated
fi
nan
cial
sta
tem
ents
Notes to the consolidated financial statements
issued by Dexia in exchange for control of the acquiree. Acquisition-related costs are generally recognised in profit or loss as incurred. At the acquisition date, the identifiable assets acquired and the liabilities assumed are recognised at their fair value at the acquisition date.
Non-controlling interests may be initially measured either at fair value or at the non-controlling interest's proportionate share of the recognised amounts of the acquiree's identifiable net assets. The choice of measurement basis is made on a transaction-by-transaction basis. The equity and net income attributable to the non-controlling interests are shown separately in the balance sheet and statement of income respectively.When the consideration transferred by Dexia in a business combination includes assets or liabilities resulting from a contingent consideration arrangement, the contingent consideration is measured at its acquisition-date fair value and included as part of the consideration transferred in a business combination. Subsequent changes in the fair value of the contingent consideration are typically recognised in profit or loss.When a business combination is achieved in stages, Dexia's previously held equity interest in the acquiree is remeasured to fair value at the acquisition date (i.e. the date on which Dexia obtains control) and the resulting gain or loss, if any, is recognised in profit or loss. Amounts arising from interests in the acquiree prior to the acquisition date that have previously been recognised in other comprehensive income are reclassified to profit or loss where such treatment would be appropriate if that interest were disposed of.
1.3.2. subsidiariesSubsidiaries are those entities over whose financial and operating policies Dexia, directly or indirectly, may exercise control.Subsidiaries are fully consolidated as at the date on which effective control is transferred to Dexia and are no longer consolidated as at the date on which Dexia's control ceases. Intercompany transactions, balances and unrealised gains and losses on transactions among Dexia's companies have been eliminated. Where necessary, the accounting policies of the subsidiaries have been amended to ensure consistency with the policies adopted by Dexia.Changes in the Dexia's ownership interests in subsidiaries that do not result in the Group losing control over the subsidiaries are accounted for as equity transactions. The carrying amounts of the Group's interests and the non-controlling interests are adjusted to reflect the changes in their relative interests in the subsidiaries. Any difference between the amount by which the non-controlling interests are adjusted and the fair value of the consideration paid or received is recognised directly in equity.When Dexia loses control of a subsidiary, the profit or loss on disposal is calculated as the difference between:• the aggregate of the fair value of the consideration received and the fair value of any retained interest; and
• the previous carrying amount of the assets (including goodwill) and liabilities of the subsidiary and any non-controlling interests.The fair value of any investment retained in the former subsidiary at the date on which control is lost, is regarded as the fair value on initial recognition for subsequent accounting under IAS 39 “Financial Instruments: Recognition and Measurement“ or, where applicable, the cost on initial recognition of an investment in an associate or a jointly controlled entity.
1.3.3. Jointly controlled entitiesA joint venture (JV) is a contractual arrangement whereby two or more parties undertake an economic activity that is subject to joint control. Joint ventures are accounted for via the proportionate consolidation method. In the financial statements, joint ventures are integrated by combining their share of the assets, liabilities, income and expenses on a line-by-line basis.The same consolidation treatment as applied to subsidiaries, is applied to intercompany transactions. Where necessary, the accounting policies of the jointly controlled entities have been amended to ensure consistency with the policies adopted by Dexia.
1.3.4. associatesInvestments in associates are initially measured at cost and accounted for using the equity method. Associates are investments in which Dexia has significant influence, but does not exercise control. This is usually the case, when Dexia owns between 20% and 50% of the voting rights. The ownership share of net income for the year is recognised as income of associates, whereas the share in other comprehensive income of associates is carried on a separate line of the statement of comprehensive income and the investment is recorded in the balance sheet at an amount that reflects its share of the net assets increased with related goodwill.Gains on transactions between Dexia and its “equity method investments“ are eliminated to the extent of Dexia's interest. The recognition of losses from associates is discontinued when the carrying amount of the investment reaches zero, unless Dexia has incurred or guaranteed legal or constructive obligations in respect of the associates' undertakings. Where necessary, the accounting policies of the associates have been amended to ensure consistency with the policies adopted by Dexia.
1.3.5. special purpose entities (spe's)An SPE shall be consolidated when the substance of the relationship between Dexia and the SPE indicates that the SPE is controlled by Dexia.Control may arise through the predetermination of the activities of the SPE (operating on “autopilot“) or otherwise. The following circumstances may indicate a relationship in which Dexia controls an SPE (which it should consequently consolidate):• The activities of the SPE are being conducted on behalf of Dexia according to its specific business needs;
130 Dexia Annual report 2010
Man
agem
ent
repo
rtA
dditi
onal
info
rmat
ion
Ann
ual fi
nanc
ial s
tate
men
tsC
on
solid
ated
fi
nan
cial
sta
tem
ents
Notes to the consolidated financial statements
• Dexia has the decision-making powers or delegated these powers to obtain the majority of the benefits of the activities of the SPE;• Dexia has the right to obtain the majority of the benefits of the SPE and may be exposed to its risks; or• Dexia retains the majority of the residual or ownership risks related to the SPE or its assets in order to obtain benefits from its activities.
1.4. offsettinG finAnCiAL Assets And finAnCiAL LiAbiLitiesFinancial assets and financial liabilities are offset (and consequently, the net amount only is reported) when Dexia has a legally enforceable right to offset and intends either to settle on a net basis, or to realise the asset and settle the liability simultaneously.
1.5. foreiGn CurrenCy trAnsLAtion And trAnsACtions1.5.1. foreign currency translationOn consolidation, the statements of income and cash flow statements of foreign entities that have a functional currency different from Dexia's presentation currency are translated into Dexia's presentation currency (EUR) at the average exchange rates for the year (annual reporting) or the period (interim reporting) and their assets and liabilities are translated at the respective year-end or quarter-end exchange rates.Exchange differences arising from the translation of the net investment in foreign subsidiaries, associates, joint ventures and of borrowings and other currency instruments designated as hedges of such investments, are recorded as a cumulative translation adjustment within shareholders' equity. On disposal of a foreign entity, such exchange differences are recognised in the statement of income as part of the gain or loss on disposal.Goodwill and fair value adjustments arising from the acquisition of a foreign entity are treated as assets and liabilities of the foreign entity and are translated at the closing rate.
1.5.2. foreign currency transactionsFor individual Dexia entities, foreign currency transactions are accounted for using the approximate exchange rate at the date of the transaction. Outstanding balances denominated in foreign currencies at period- or year-end are translated at period or year-end exchange rates for monetary items and non-monetary items carried at fair value. Historical rates are used for non-monetary items carried at cost. The resulting exchange differences from monetary items are recorded in the consolidated statement of income; except for the foreign exchange impact related to fair value adjustments on available-for-sale bonds, which is recorded under “Other comprehensive income“. For non-monetary items carried at fair value, the exchange differences are governed by the same accounting treatment as for fair value adjustments.
1.6. finAnCiAL Assets And LiAbiLitiesManagement determines the appropriate classification of its investments at initial recognition. However, under certain conditions, financial assets could subsequently be reclassified.
1.6.1. recognition and derecognition of financial instrumentsDexia recognises and derecognises financial assets held for trading on trade date. For these financial assets, Dexia recognises in the statement of income and as at the trade date, any unrealised gains or losses arising from revaluing the contract to fair value at the reporting date. Dexia recognises these unrealised gains and losses under “Net income from financial instruments at fair value through profit or loss“.All other “regular way“ purchases and sales of financial assets are recognised and derecognised on the settlement date, which is the date of delivery to or by Dexia.Dexia recognises the financial liabilities on its balance sheet when it becomes party to the contractual provisions of the instrument. Dexia derecognises financial liabilities only when, it is extinguished, i.e. when the obligation specified in the contract is discharged or cancelled or expires.
1.6.2. loans and advances due from banks and customersDexia classifies non-derivative financial assets with fixed or determinable payments that are not quoted on an active market into this category (labelled by IAS 39 as Loans and Receivables – L&R) except for:• those that Dexia intends to sell immediately or in the near term, which are classified as held for trading, and those that Dexia, upon initial recognition, designates as being at fair value through profit or loss;• those that Dexia, upon initial recognition, designates as available-for-sale; or• those for which Dexia might not substantially recover all of its initial investment, other than because of credit deterioration, such L&R then being classified as available-for-sale.Dexia recognises interest-bearing loans and advances initially at fair value plus transaction costs and subsequently at amortised cost, less any allowance for impairment. Interest is calculated using the effective interest-rate method and recorded under “Net interest income“.The effective interest-rate is the rate that exactly discounts estimated future cash payments or receipts through the expected life of the financial instrument or, when appropriate, a shorter period to the net carrying amount of the financial asset.
1.6.3. financial instruments measured at fair value through profit or loss1.6.3.1. Loans and securities held for tradingDexia reports loans held for trading purposes in the line “Financial assets held for trading“ at their fair value, with unrealised gains and losses recorded in the statement of income under “Net income from financial instruments at fair

131Annual report 2010 Dexia
Man
agem
ent
repo
rtA
dditi
onal
info
rmat
ion
Ann
ual fi
nanc
ial s
tate
men
tsC
on
solid
ated
fi
nan
cial
sta
tem
ents
Notes to the consolidated financial statements
value through profit or loss“. Interest income is accrued using the effective interest-rate method and is recorded under “Net interest income“.Trading securities are securities acquired for generating a profit from short-term fluctuations in price or dealer's margins, or are securities included in a portfolio in which a pattern of short-term profit-taking exists. Dexia initially recognises trading securities at fair value and subsequently re-measures them at fair value. All realised and unrealised gains and losses are recorded under “Net income from financial instruments at fair value through profit or loss“. Interest earned is recorded under “Interest income“, and dividends received under “Dividend income“.
1.6.3.2. Liabilities held for tradingLiabilities held for trading are subject to the same accounting rules as those for “Loans and securities held for trading“.
1.6.3.3. Loans and securities designated at fair value through profit or loss (“FVO“)In some cases and if appropriately documented, Dexia can designate a financial asset, a financial liability or a group of financial instruments as “at fair value through profit or loss“ where:• such designation eliminates or significantly reduces a measurement or recognition inconsistency that would otherwise arise;• a group of financial assets, financial liabilities or both is managed and its performance is evaluated on a fair value basis, in accordance with a documented risk management or investment strategy;• an instrument contains a non-closely related embedded derivative:- that significantly modifies the cash flows that otherwise would be required by the contract; or- for which it is not clear, with little or no analysis, that the separation of the embedded derivative is prohibited.
1.6.3.4. Liabilities designated at fair value through profit or loss (FVO)For subsequent measurement, these financial liabilities are subject to the same accounting principles as described earlier under the heading “Financial instruments measured at fair value through profit or loss“.
1.6.3.5. Derivatives – Trading portfolioWhen a derivative is not designated in a hedge relationship, it is deemed to be held for trading. The main types of derivatives are the currency and the interest-rate derivatives. Dexia, which also makes use of credit derivatives and equity derivatives, initially and subsequently measures all derivatives at the fair value obtained from quoted market prices, discounted cash flow models or pricing models, as appropriate. All changes in fair value are recognised in the statement of income.Dexia reports derivatives as assets when fair value is positive and as liabilities when fair value is negative.
Dexia treats certain derivatives embedded in other financial instruments as separate derivatives:• when their risks and characteristics are not closely related to those of the host contract; and• when the hybrid contract is not carried at fair value with unrealised gains and losses reported in the statement of income.
1.6.4. financial investments1.6.4.1 Held-to-maturityDexia classifies the interest-bearing financial assets with fixed maturity quoted in an active market as held-to-maturity (HTM) when management has both the intent and the ability to hold the assets to maturity.
Dexia recognises such interest-bearing financial assets initially at fair value plus transaction costs and subsequently at amortised cost, less any allowance for impairment. Interest is recognised based on the effective interest-rate method and recorded under “Net interest income“.
1.6.4.2 Available-for-saleDexia classifies financial assets intended to be held for an indefinite period of time, but which may be sold in response to needs for liquidity or changes in interest-rates, exchange rates or equity prices, as available-for-sale (AFS).Dexia recognises financial assets initially at fair value plus transaction costs. Interest is recognised based on the effective interest-rate method and recorded under “Net interest income“. Dexia recognises dividend income from equities under “Dividend income“.Dexia subsequently re-measures available-for-sale financial assets at fair value (cf. I.7 Fair value of financial instruments). Unrealised gains and losses arising from changes in the fair value of financial assets classified as available-for-sale are recognised within equity under the heading “Gains and losses not recognised in the statement of income“. When securities are disposed of, or impaired, Dexia recycles the related accumulated fair value adjustments in the statement of income as “Net income on investments“.
1.6.5. impairments on financial assetsDexia records allowances for impairment losses when there is objective evidence that a financial asset or group of financial assets is impaired as a result of one or more events occurring after initial recognition and evidencing (a) a decline in the expected cash flows and (b) the impact on the estimated future cash flows that can be reliably estimated.
1.6.5.1. Financial assets valued at amortised costDexia first assesses whether objective evidence of impairment exists individually for financial assets. If no such evidence exists, the financial assets is included in a group of financial assets with similar credit risk characteristics and collectively assessed for impairment.
132 Dexia Annual report 2010
Man
agem
ent
repo
rtA
dditi
onal
info
rmat
ion
Ann
ual fi
nanc
ial s
tate
men
tsC
on
solid
ated
fi
nan
cial
sta
tem
ents
Notes to the consolidated financial statements
Determination of the impairment• Specific impairments – If there is objective evidence that loans or other receivables or financial assets classified as held-to-maturity are impaired, the amount of the impairment on specifically identified assets is calculated as the difference between the carrying amount and the recoverable amount, being the present value of expected cash flows, including amounts recoverable from guarantees and collateral, discounted at the financial instrument's original effective interest-rate (except for reclassified assets, see below). Assets with small balances that share similar risk characteristics follow the principles as described below.• Collective impairments – Collective impairments cover losses incurred where there is no specific impairment but objective evidence of losses in segments of the portfolio or other lending-related commitments at the balance-sheet date. Dexia estimates them based upon the historical patterns of losses in each segment, the credit ratings allocated to the borrowers and reflecting the current economic environment in which the borrowers operate. Dexia develops for that purpose credit-risk models using an approach that combines appropriate default probabilities and loss-given defaults that are subject to regular back-testing and are based on Basel II data and risk models, consistently with the “incurred-loss“ model.
Accounting treatment of the impairmentDexia recognises changes in the amount of impairment losses in the statement of income and reports them as “Impairment on loans and provisions for credit commitments“. The impairment losses are reversed through the statement of income if the increase in fair value relates objectively to an event occurring after the impairment was recognised.When an asset is determined by management to be uncollectable, the outstanding specific impairment is reversed via the statement of income under the heading “Impairment on loans and provisions for credit commitments“ and the net loss is recorded under the same heading. Subsequent recoveries are also accounted for under this heading.
1.6.5.2. Reclassified financial assetsIn rare circumstances, Dexia can reclassify financial assets initially classified as held for trading or available-for-sale into held-to-maturity or loans and receivables categories. In such circumstances, the fair value at the date of transfer becomes the new amortised cost of those financial assets. Any fair value adjustment previously recognised under “Other comprehensive income“ is “frozen“ and amortised on the residual maturity of the instrument. Regarding the calculation of impairment, reclassified financial assets are governed by the same accounting principles as financial assets initially valued at amortised cost. If there is objective evidence that reclassified financial assets are impaired, Dexia calculates the amount of the impairment on reclassified assets as the difference between the net carrying amount of the asset and the net present value of the expected cash-flows discounted at the recalculated effective yield at the time of reclassification. Any unamortised part of the “frozen” AFS reserve is recycled in the statement of income and reported
under the heading “Impairment on loans and provisions for credit commitments“ as a part of the impairment.
1.6.5.3. Available-for-sale assetsDexia recognises the impairment of available-for-sale assets on an individual basis if there is objective evidence of impairment as a result of one or more events occurring after initial recognition.
Determination of the impairment• Equities – For equities quoted in an active market, any significant decline in their price (more than 50% at reporting date) or a prolonged decline (5 years) compared to the acquisition price is considered as an objective evidence of impairment. In addition, management can decide to recognise impairment losses should other objective evidence be available.• Interest-bearing financial instruments – In the case of interest bearing financial instruments, impairment is triggered based on the same criteria as applied to individually impaired financial assets valued at amortised cost (see 1.6.5.1).
Accounting treatment of the impairmentWhen AFS financial assets are impaired, the total AFS reserve is recycled and these impairment losses are reported by Dexia in the statement of income as “Net income on investments“. Additional decline in fair value is recorded under the same heading for equity securities.When an impairment loss has been recognised on interest-bearing financial instruments, any subsequent decline in fair value is recognised in “Net income on investments“ if there is objective evidence of impairment. In all other cases, changes in fair value are recognised in “Other comprehensive income“.Impairments on equity securities cannot be reversed in the statement of income due to later recovery of quoted prices.Please refer to 12.2. Credit Risk for further information on how credit risk is monitored by Dexia.
1.6.5.4. Off-balance sheet exposuresDexia usually converts off-balance sheet exposures such as credit substitutes (e.g., guarantees and standby letters of credit) and loan commitments into on-balance sheet items when called. However, there may be circumstances such as uncertainty about the counterparty, where the off-balance sheet exposure should be regarded as impaired. Dexia classifies loan commitments as impaired if the credit worthiness of the client has deteriorated to such an extent as to make the repayment of any loan and associated interest payments doubtful.
1.6.6. borrowingsDexia recognises borrowings initially at fair value, being generally their issue proceeds, net of any transaction costs incurred. Subsequently, borrowings are stated at amortised cost. Dexia recognises any difference between their initial carrying amount and the redemption value in the statement
133Annual report 2010 Dexia
Man
agem
ent
repo
rtA
dditi
onal
info
rmat
ion
Ann
ual fi
nanc
ial s
tate
men
tsC
on
solid
ated
fi
nan
cial
sta
tem
ents
Notes to the consolidated financial statements
of income over the period of the borrowings using the effective interest-rate method.The distinction between interest-bearing instruments and equity instruments issued is based on the substance of their underlying contracts rather than their legal form.
1.7. fAir VALue of finAnCiAL instrumentsFair value is the amount for which an asset could be exchanged, or a liability settled, between knowledgeable, willing parties in an arm's-length transaction. Quoted market prices in an active market (such as a recognised stock exchange) are to be used as fair value, as they are the best evidence of the fair value of a financial instrument. Quoted market prices are not, however, available for a significant number of financial assets and liabilities held or issued by Dexia.If a financial instrument is not traded on an active market, recourse is provided by valuation models. A valuation model reflects what the transaction price would have been on the measurement date in an arm's length exchange motivated by normal business considerations, i.e. the price that would be received by the holder of the financial asset in an orderly transaction that is not a forced liquidation or forced sale.The valuation model should take into account all factors that market participants would consider when pricing the asset. Measuring the fair value of a financial instrument requires consideration of current market conditions. To the extent that observable inputs are available, they should be incorporated into the model.Dexia's approach to the valuation of its financial instruments (direct profit or loss, AFS and disclosures) can be summarised as follows:
1.7.1. financials instruments measured at fair value (Trading, fvo, afs, derivatives)1.7.1.1. Financial instruments measured at fair value for which reliable quoted market prices are availableIf the market is active – meaning that bid-offer prices are available representing effective transactions concluded on an arm's length basis between willing counterparties – these market prices provide for the most reliable evidence of fair value and therefore shall be used for valuation purposes.The use of market prices quoted in an active market for identical instruments with no adjustments qualifies for inclusion in level 1 within IFRS 7 fair value hierarchy, contrary to the use of quoted prices in inactive markets or the use of quoted spreads.
1.7.1.2. Financial instruments measured at fair value for which no reliable quoted market prices are available and for which valuations are obtained by means of valuation techniquesFinancial instruments for which no quoted market prices in active markets are available are valued by means of valuation techniques. The models that Dexia uses range from standard market models (discount models) to in-house developed valuation models.In order for a fair value to qualify for level 2 inclusion, only observable market data should be used. The market data that
Dexia incorporates in its valuation models are either directly observable data (prices), indirectly observable data (spreads) or own assumptions about unobservable market data. Fair value measurements that rely significantly on own assumptions qualify for level 3 disclosure.
For bonds for which no liquid market exists, these are valued using Dexia's Mark to Model approach. The valuation price is composed of a market price component and a model price component. The weight granted to the model price component reflects an assessment of the liquidity of the market considering the bond characteristics.
For its Mark-to-Model price, Dexia uses a discount cash-flow model, based on a discounted spread that incorporates both credit and liquidity risk. The credit spread is estimated from the security specific characteristics (sector, rating, Loss Given Defaut, …) and from the level of some liquid CDS indices. A liquidity component is added to the credit component to obtain the instrument's spread. The weight of the liquidity component depends on the instrument's central bank eligibility character.
Due to the financial crisis of 2008, many assets and liabilities for which quoted prices were available became illiquid. Risk Management developed models in 2008 to value those illiquid financial instruments. Risk Management adjusted its classification between fair value levels in 2009 based on the recommendations included in the amendment to IFRS 7 published in March 2009 and included in the Exposure Draft on Fair Value, published in May 2009.
Regarding structured derivatives, Risk Management together with the Modelling Team continue to implement the action plan validated by the Management Board, focussing on the development of internal valuation models, the conduct of a robust external price reconciliation process and the use of qualitative market data for its validations.
1.7.2. financial instruments measured at amortised cost (valuations in ifrs disclosures on fair value)1.7.2.1. Financial instruments reclassified from Trading or AFS to L&RAs a response to the financial crisis, the IASB issued on 13 October 2008 an amendment to IAS 39 permitting the reclassification of certain illiquid financial assets. Dexia decided to benefit from this opportunity to reclassify assets for which an active market, as well as reliable quoted prices, was no longer available.
134 Dexia Annual report 2010
Man
agem
ent
repo
rtA
dditi
onal
info
rmat
ion
Ann
ual fi
nanc
ial s
tate
men
tsC
on
solid
ated
fi
nan
cial
sta
tem
ents
Notes to the consolidated financial statements
The Modelling team developed and implemented new models on instruments that became and remained illiquid.
1.7.3. financial instruments classified in hTm and l&r since inception1.7.3.1. Loans and Receivables, including mortgages loans, are valued based on the following valuation principlesGeneral principles• the carrying amount of loans maturing within 12 months is assumed to reflect their fair value;• for bonds in HTM and L&R since inception, the valuation is done as for bonds classified in AFS.Interest-rate part• the fair value of fixed-rate loans and mortgages reflect interest-rate movements since inception;• embedded derivatives, like caps, floors and prepayment options are included in determining the fair value of loans and receivables;• the fair value of variable-rate loans is assumed to be approximated by their carrying amounts.Credit-risk part• for corporate loan and social profit portfolios, credit spread evolutions since inception are reflected in the fair value. For other sectors, mainly retail and public sector, the spread is kept unchanged as no reliable information is available for SME and no credit losses have been recognised on the public sector where Dexia is present.
1.8. interest inCome And eXPenseInterest income and expense are recognised in the statement of income for all interest bearing instruments on an accrual basis using the effective interest-rate method based on the initial carrying value (including transaction costs) for financial instruments not valued at fair value through P&L.Transaction costs are the incremental costs that are directly attributable to the acquisition of a financial asset or liability and are included in the calculation of the effective interest rate. An incremental cost is one that would not have been incurred if the entity had not acquired the financial instrument.Accrued interest is reported in the same line as the related financial asset or liability in the balance sheet.Once an interest bearing financial asset has been written down to its estimated recoverable amount, interest income is thereafter recognised based on the interest that was used to discount the future cash flows for measuring the recoverable amount.
1.9. fee And Commission inCome And eXPenseCommissions and fees arising from most of Dexia's activities are recognised on an accrual basis over the life of the underlying transaction.Commissions and fees arising from negotiating, or participating in the negotiation of a transaction for a third party, such as the arrangement of the acquisition of loans, equity securities or other securities or the purchase or sale of businesses, are recognised when the significant act has been completed.
For asset management operations, revenue consists principally of unit trust and mutual fund management and administration fees. Revenue from asset management is recognised as earned when the service is provided. Performance fees are recognised when all underlying conditions are met and thus acquired.Loan commitment fees are recognised as part of the effective interest-rate if the loan is granted, and recorded as revenue on expiry if no loan is granted.
1.10. insurAnCe And reinsurAnCe ACtiVities1.10.1. insuranceDexia is mainly active in banking products. Some insurance products sold by insurance companies have been requalified as financial instruments as they do not meet the requirements of insurance products under IFRS 4. IFRS 4 allows a company to account for insurance contracts under local GAAP if they qualify as such under IFRS 4. Hence, Dexia has elected to use the local accounting policies to evaluate the technical provisions for contracts that fall under IFRS 4 and investment contracts with discretionary participation features (DPF).A contract that complies with the conditions of an insurance contract remains an insurance contract until all rights and obligations cease to exist or expire. An insurance contract is a contract under which one party (the insurer) accepts significant insurance risk from another party (the policyholder) by agreeing to compensate the policyholder if a specified uncertain future event (the insured event) adversely affects the policyholder. A contract can start out as an investment contract and become an insurance contract when containing significant insurance components as time passes.The amounts received and paid relating to insurance products (including Non-life claims) are reported respectively under “Premiums and technical income from insurance activities“ or under “Technical expense from insurance activities“, whereas losses and changes in provisions for credit enhancement activities, which are similar to banking activities, are reported under “Impairment on loans and provision for credit commitments“.All other items arising from insurance activities are classified according to their nature in the balance sheet, except for technical provisions, which are identified under a separate heading.
Dexia's insurance activities are mainly performed by Dexia Insurance Services (DIS) for Life and Non-life products.
1.10.1.1. DIS activities: Life and Non-lifeDIS insurance products are recorded under Local GAAP. DIS comprises principally the Belgian and Luxembourg entities, which are governed by Local GAAP, if they are qualified as such under IFRS 4. However, provisions for catastrophes and equalisations are reversed.
The Life Insurance portfolio features:
135Annual report 2010 Dexia
Man
agem
ent
repo
rtA
dditi
onal
info
rmat
ion
Ann
ual fi
nanc
ial s
tate
men
tsC
on
solid
ated
fi
nan
cial
sta
tem
ents
Notes to the consolidated financial statements
• Insurance contracts, including reinsurance contracts, and the accepted reinsurance treaties, with the exception of the in-house-defined employee benefit plans;• Financial instruments issued with a discretionary profit-sharing (a discretionary participation feature (DPF));• Unit-linked (UL) contracts stipulating that the policyholder can switch at all times, at no expenses, to an investment product with a guaranteed interest-rate and a probable profit-sharing.
1.10.1.2. ClassificationClassification is done policy by policy, whereas, for group insurances, classification is done at employer level.The Non-life insurance portfolio features include only insurance contracts that contain significant insurance risk.
1.10.1.3. Shadow accountingInsurers are permitted, but not required, to change their accounting policies so that a recognised but unrealised gain or loss on an asset affects those measurements in the same way as a realised gain or loss does. The related adjustment to the insurance liability (or deferred acquisition costs or intangible assets) shall be recognised in equity if, and only if, the unrealised gains or losses are recognised directly in equity.Dexia will limit the application of shadow accounting, if under legal and/or contract conditions, the realisation of gains on an insurer's assets has a direct effect on the measurement of some or all of its DPF insurance contracts and investment contracts with discretionary participation features.
1.10.1.4. Shadow-loss adjustmentTo determine the need for a shadow-loss adjustment, Dexia first has to determine whether additional liabilities would be required, assuming current market-investment yields rather than the estimated return of the assets. If the level of liabilities required is higher than the total liabilities, then the deficiency should decrease the unrealised gains recorded in equity and increase the liabilities through a shadow premium deficiency adjustment.This requires the liability adequacy test (see I.10.1.9 Liability Adequacy Test – below) to be performed after all (if any) shadow adjustments. Should there be insufficient unrealised capital gains left in equity to accommodate the shadow loss adjustment, the additional liability increase should be charged to the statement of income.
1.10.1.5. Discretionary participation feature (DPF)Discretionary participation feature is a contractual right to receive, as a supplement to the guaranteed benefits, additional benefits:• that are likely to be a significant portion of the total contractual benefits;• whose amount or timing is contractually at the discretion of the issuer; and• that are contractually based on:
- the performance of a specified pool of contracts or a specified type of contract; or- realised and/or unrealised investment returns on a specified pool of assets held by the issuer; or- the profit or loss of the company, fund or other entity that issues the contract.All unrealised gains and losses coming from investments backing insurance contracts and investment contracts with DPF are categorised proportionally for the part related to the insurance contracts and investment contracts with DPF in a separate line of the equity.Proportional calculation is performed on the basis of the carried reserves and by separated management of the assets.
1.10.1.6. Insurance contracts with deposit component (unbundling)All unit-linked products that contain both an insurance contract and a deposit component will be unbundled. Accounting policies for insurance contracts are applied to the insurance component; accounting policies for financial instruments are applied to the deposit component. The unit-linked products that can be converted into a guaranteed investment product (branch 21) with profit sharing fall under IFRS 4 (investment with DPF) and will not be unbundled.
1.10.1.7. Embedded derivativesIAS 39 applies to derivatives embedded in an insurance contract unless the embedded derivative is itself an insurance contract. The requirements for insurance contracts with DPF also prevail for financial instruments with DPF elements.As an exception to the IAS 39 requirement, Dexia does not need to separate, and measure at fair value, a policyholder's option to surrender an insurance contract for a fixed amount (or for an amount based on a fixed amount and an interest-rate), even if the exercise price differs from the carrying amount of the host insurance liability. However, the IAS 39 requirement does apply to any put option or cash surrender option embedded in an insurance contract if the surrender value varies in response to a change in a financial variable (such as an equity or commodity price or index), or a non-financial variable that is not specific to a party to the contract.
1.10.1.8. DPF in financial instrumentsIf the issuer classifies part of, or the entire feature as a separate component of equity, the liability recognised for the whole contract shall not be less than the amount that would result from applying IAS 39 to the guaranteed element.At each reporting date, Dexia checks as to whether this minimum requirement has been met: if it has not, the corresponding liabilities are adjusted accordingly.
1.10.1.9. Liability Adequacy TestsAn insurer applies a liability adequacy test (LAT) to its insurance products and investment contracts with DPF. Dexia assesses at each reporting date whether its recognised insurance liabilities
136 Dexia Annual report 2010
Man
agem
ent
repo
rtA
dditi
onal
info
rmat
ion
Ann
ual fi
nanc
ial s
tate
men
tsC
on
solid
ated
fi
nan
cial
sta
tem
ents
Notes to the consolidated financial statements
are adequate, using current estimates of future cash flows under its insurance contracts. If that assessment (based on all individual Life and Non-life insurance portfolios) shows that the carrying amount of its insurance liabilities (less the related deferred acquisition costs and related intangible assets) is inadequate in the light of the estimated future cash flows, the entire deficiency shall be recognised in profit or loss.If an adequacy test of the life obligations imposed by the local authorities is available, it will show whether or not the insurance liabilities are sufficient.If this test is not available, a test such as the one described below will be carried out in order to examine if the current value of the future cash flows is covered by the concordant technical provision. Should this prove not to be the case, the entire deficiency would be recognised in profit or loss.
For Life insurance liabilities set up where no local LAT test is imposed by the authorities, an IFRS LAT test will be carried out using thefollowing parameters:• premiums: collected premiums plus contractually provided future premiums;• interest rate for actualisation cash flows: average OLO on 10 year during the last (consecutive) year until the 15th before closing;• mortality table: Assuralia experience table;• costs: calculation based on the latest tariff costs and the booked costs;• tariff costs take into account the inventory surcharges, commercial surcharges and fixed sums;• real assigned costs take into account management expenses, claims handling expenses and commissions. These costs are stipulated by product group and are indexed. Taking into account lapses, death and the expiry period the annual delta is stipulated as being somewhere between the tariff costs and the real assigned costs. Deltas are then actualised to the LAT-rate.For Non-life insurance, the LAT that examines whether the premium and claim provisions are sufficient to settle definitively the opened claim files and the claims that will occur within the contractual duration of the contracts to open and to settle definitively.All products are subject to LAT. The test is subdivided into two parts. Dexia first examines whether the built-up reserves for claim files already opened are sufficient, then makes an estimation of the expected loss burden for the insurance portfolios and examines whether the unearned premium reserves are sufficient.Regarding reserves for the files already opened, Dexia performs run-off calculations, using estimates for the claims-handling expenses.
1.10.2. reinsuranceDexia's reinsurance contracts with third parties that contain enough insurance risk to be classified as an insurance contract continue to be accounted for in accordance with Local GAAP.
A reinsurance asset is impaired if, and only if:• there is objective evidence, as a result of an event that occurred after initial recognition of the reinsurance asset, that the cedant may not receive all amounts due to it under the terms of the contract; and• that event has a reliably measurable impact on the amounts that the cedant will receive from the reinsurer.To measure the solvency of a reinsurer, Dexia refers to its attributed credit rating and the impairment rules.
1.11. netWorK CostsThis heading records the commission paid to intermediaries associated by exclusive sales mandate for drumming up business.
1.12. hedGinG deriVAtiVesHedging derivatives are categorised as either:• a hedge of the fair value of a recognised asset or liability or a firm commitment (fair value hedge); or• a hedge of a future cash flow attributable to a recognised asset or liability or a forecast transaction (cash flow hedge); or• a hedge of a net investment in a foreign operation.Dexia designates derivatives as hedging instruments if certain criteria are met:• formal documentation of the hedging instrument, hedged item, hedging objective, strategy and relationship is available before hedge accounting is applied;• the hedge is documented in such a way as to show that it is expected to be highly effective (within a range of 80% to 125%) in offsetting changes in the fair value or cash flows attributable to the hedged risk in the hedged item throughout the reporting period; and• the hedge is effective at inception and on an ongoing basis.Dexia records changes in the fair value of derivatives that are designated, and qualify, as fair value hedges in the statement of income, along with the corresponding change in fair value of the hedged assets or the liabilities that is attributable to that specific hedged risk.If the hedge no longer meets the criteria for a fair value hedge, Dexia amortises the adjustment to the carrying amount of a hedged interest-bearing financial instrument to the statement of income over the remaining life of the hedged or hedging instrument if shorter by an adjustment of the yield of the hedged item.Dexia recognises the effective part of the changes in the fair value of derivatives that are designated and qualify as cash flow hedges, in “Other comprehensive income“ under the heading “Gains and losses not recognised in the statement of income“ (see “Consolidated statement of changes in shareholders' equity“). Any non-effective portion of the changes in the fair value of the hedging instrument is recognised in the statement of income. Amounts deferred in equity are transferred to the statement of income and classified as revenue or expense in the periods during which
137Annual report 2010 Dexia
Man
agem
ent
repo
rtA
dditi
onal
info
rmat
ion
Ann
ual fi
nanc
ial s
tate
men
tsC
on
solid
ated
fi
nan
cial
sta
tem
ents
Notes to the consolidated financial statements
the hedged firm commitment or forecast transaction affects the statement of income.
1.13. hedGe of the interest-rAte risK eXPosure of A PortfoLioAs explained in 1.1.1 General, Dexia makes use of the provisions in IAS 39 as adopted by the European Union (“IAS 39 carve-out“) because it better reflects the way in which Dexia manages its financial instruments.Hedge accounting is intended to reduce the interest-rate risk exposure stemming from the selected category of assets or liabilities designated as the qualifying hedged items.Dexia performs a global analysis of interest-rate risk exposure. It consists in assessing fixed-rate exposure, taking into account all the exposure coming from balance sheet and off-balance sheet items. This global analysis may exclude certain components of the exposure, such as financial market activities, provided that the risk exposure stemming from the excluded activities is monitored on an activity-by-activity basis.Dexia applies the same methodology to select which assets and/or liabilities will be entered into the hedge of interest-rate risk exposure of the portfolio. Assets and liabilities are included in all the time buckets of the portfolio. Hence, when they are removed from the portfolio, they must be removed from all the time buckets in which they had an impact. Demand deposits and savings accounts may be included in the portfolio based on behavioural study for estimating expected maturity date. Dexia may designate as qualifying hedged items different categories of assets or liabilities such as available-for-sale assets or loan portfolios.On the basis of this gap analysis, which is realised on a net basis, Dexia defines, at inception, the risk exposure to be hedged, the length of the time-bucket, the test method and the frequency of the tests.The hedging instruments are a portfolio of derivatives, which may contain offsetting positions. Dexia recognises the hedging items at fair value with adjustments accounted for in the statement of income.Dexia reports hedged interest-rate risk revaluation of elements carried at amortised cost on the balance sheet under the line “Fair value revaluation of portfolio hedges“.
1.14. dAy one Profit or LossThe day one profit or loss is applicable to all transactions measured at fair value through profit or loss.
The day one profit or loss is the difference between:• the transaction price and the quoted market price; in cases where the transaction is quoted; or• the transaction price and the fair value determined by using a valuation technique, (mark-to-model) adjusted with some market value adjustments, such as a liquidity adjustment, model adjustment or credit adjustment in cases where the transaction is not quoted.If Dexia considers the main parameters of the model as observable and if Risk Management validates the model, the
day one profit or loss will be recognised immediately in the statement of income.If Dexia does not consider the main parameters as observable or if Risk Management does not validate the model, the day one profit or loss will be amortised linearly over the expected life of the transaction. However, if the data becomes observable subsequently, Dexia will recognise the remaining portion of day one profit or loss in the statement of income.In cases of early termination, the remaining portion of day one profit or loss will be recognised in the statement of income. In cases of partial early termination, Dexia will recognise in the statement of income the part of the day one profit or loss relating to the partial early termination.
1.15. tAnGibLe fiXed AssetsTangible fixed assets include property, plant & equipment and investment properties.
All property, plant & equipment are stated at their cost less accumulated depreciation and impairments. Subsequent costs are, where necessary, included in the carrying amount of the asset or recognised as a separate component, if it is probable that future economic benefits will flow to the Group and the cost of the asset can be reliably measured.
Depreciation is calculated using the straight-line method to write down the cost of such assets to their residual values over their estimated useful lives.The main useful lives are as follows:• Buildings (including acquisition costs and non deductible taxes): 20 to 50 years;• Computer equipment: 3 to 6 years;• Leasehold improvements, equipment and furniture: 2 to 12 years;• Vehicles: 2 to 5 years.An item of property, plant & equipment can be composed of significant parts with individually varying useful lives. In such a case, each part is depreciated separately over its estimated useful life. The following parts have been defined:• Structure of the building: 50 years;• Roof, and frontage: 30 years;• Technical installations: 10 to 20 years;• Fixtures and fittings: 10 to 20 years.As borrowing costs that are directly attributable to the acquisition, construction or production of a qualifying asset form part of the cost of that asset they are capitalised. Other borrowing costs are recognised as an expense.Tangible fixed assets are tested for impairment when an indication of impairment loss exists. Where the carrying amount of an asset is greater than its estimated recoverable amount, it is written down to its recoverable amount. Where the recoverable amount of an asset cannot be determined individually the Group determines the recoverable amount of the cash generating unit or group of cash generating units to which the asset belongs. Gains and losses on disposals of property and equipment are determined by reference to
138 Dexia Annual report 2010
Man
agem
ent
repo
rtA
dditi
onal
info
rmat
ion
Ann
ual fi
nanc
ial s
tate
men
tsC
on
solid
ated
fi
nan
cial
sta
tem
ents
Notes to the consolidated financial statements
their carrying amount and are included under “Net income on investments“.Investment properties are those properties held to earn rentals or for capital appreciation. Dexia may also partly use such properties. If the “own use“ portions can be sold separately or leased out separately under finance lease, then these portions are accounted for separately. If the “own use“ portions cannot be sold separately, the property will be considered as an investment property only if Dexia holds an insignificant portion for its own use.Investment properties are recorded at its cost less accumulated depreciation and impairments. The investment properties are depreciated over their useful lives on a straight-line basis. Depreciation on buildings and other assets given in operating lease are booked under “Other net income“.
1.16. intAnGibLe AssetsIntangible assets consist mainly of (a) internally generated and (b) acquired software. The costs associated with maintaining computer software programs are recognised as expense as incurred. However, expenditure that enhances or extends the benefits of computer software programs beyond one year is used to increase the original cost of the software. Computer software development costs recognised as assets are amortised using the straight-line method over their useful lives from the time the software is available for use. This amortisation period is usually between three and five years, except for core business applications, for which the amortisation period is can be up to 10 years.As borrowing costs that are directly attributable to the acquisition, construction or production of a qualifying asset form part of the cost of that asset they are capitalised. Other borrowing costs are recognised as an expense.Intangible assets (other than goodwill) are tested for impairment when an indication of impairment loss exists. Where the carrying amount of an asset is greater than its estimated recoverable amount, it is written down to its recoverable amount. Gains and losses on disposals of intangible assets are determined by reference to their carrying amount and are included under “Net income on investments“.
1.17. non-Current Assets heLd for sALe And disContinued oPerAtionsIf the carrying amount of a non-current asset (or disposal group) is recovered principally through a sale transaction, rather than through continuing use, it will be classified as “held for sale“.Dexia measures a non-current asset (or disposal group) classified as held for sale at its carrying amount or at its fair value less costs to sell (whichever is the lower). Non-current assets (or disposal groups) classified as held for sale are presented separately in the balance sheet, without restatement for previous periods. These assets are no longer depreciated once they qualify as assets (or disposal groups) held for sale.A discontinued operation is defined as a component of an entity that either has been disposed of or is classified as held
for sale and represents a separate major line of business or geographical area of operations. Post-tax profit or loss of discontinued operations is presented under a separate line in the statement of income.
1.18. GoodWiLL1.18.1. measurement of goodwillGoodwill is as an asset representing the future economic benefits arising from other assets acquired in a business combination that are not individually identified and separately recognised.
It is measured as the difference between• The sum of the following elements:- Consideration transferred,- Amount of any non-controlling interests in the acquiree, and- Fair value of the acquirer's previously held equity interest in the acquiree (if any) and is• Net of the acquisition-date amounts of the identifiable assets acquired and the liabilities assumed.If, after reassessment, this difference is negative (“negative goodwill“), it is recognised immediately in profit or loss as a bargain purchase gain.Variations in the percentage of ownership in fully-consolidated companies are considered as transactions with shareholders. Therefore neither fair value adjustments nor goodwill adjustments are made whenever percentage increases or decreases take place without any change in the consolidation method. The difference between the purchase or the sale of a net asset and the purchase or sale price is directly recorded in equity.
1.18.2. impairment of goodwillThe carrying amount of goodwill is reviewed at year-end. For the purpose of this impairment testing, Dexia allocates goodwill to cash-generating units (CGUs) or groups of such units.When circumstances or events indicate that there may be uncertainty about the carrying amount, goodwill is written down for impairment when the recoverable amount of the CGU or group of cash-generating units to which it has been allocated is lower than the carrying value.The recoverable amount is the “fair value less cost to sell“ or the “value in use“ (whichever is the higher). The “value in use“ is the sum of the future cash flows that are expected to be derived from a CGU Expected cash flows used by Dexia are those of the 3-year management-improved financial plan.The calculation of the “value in use“ shall also reflect the time value of money (current market risk-free rate of interest) adjusted for the price for bearing the uncertainty inherent in the asset. This is reflected in the discount rate.For subsidiaries operating in economically mature and financially stable markets, the discount rate used is the Cost of Equity of Dexia defined under a dividend discount model. For subsidiaries operating in emerging markets, a specific discount rate is applied on a case-by-case basis.

139Annual report 2010 Dexia
Man
agem
ent
repo
rtA
dditi
onal
info
rmat
ion
Ann
ual fi
nanc
ial s
tate
men
tsC
on
solid
ated
fi
nan
cial
sta
tem
ents
Notes to the consolidated financial statements
1.19. other AssetsOther assets mainly include accrued income (non-interest related), prepayments, operational taxes and other accounts receivable as well as insurance products (reinsurance, insurance premiums receivables, etc.), construction contracts, inventories, plan assets relating to employee benefit obligations. These other assets are measured in accordance with the applicable standard less any allowance for impairment if applicable or following the applicable standard. Plan assets are recognised in accordance with IAS 19 requirements.
1.20. LeAsesA finance lease is one that transfers substantially all the risks and rewards incidental to ownership of an asset. An operating lease is a lease other than a finance lease.
1.20.1. dexia is the lesseeDexia grants operating leases principally for the rental of equipment or real estate. Lease rentals are recognised in the statement of income on a straight-line basis over the lease term.When an operating lease is terminated before the lease period has expired, any payment to be made to the lessor by way of penalty is recognised as an expense in the period in which termination takes place.If the lease agreement substantially transfers the risk and rewards of ownership of the asset, the lease is recorded as a finance lease and the related asset is capitalised. At inception the asset is recorded as the the present value of the minimum lease payments or the fair value (whichever is the lower) and is depreciated over its estimated useful life unless the lease term is short and the title is not expected to be transferred to Dexia. Subsequent to initial recognition, the asset is accounted for in accordance with the accounting policies applicable to that asset. The corresponding rental obligations are recorded as borrowings and interest payments are recorded using the effective interest-rate method.
1.20.2. dexia is the lessorDexia grants both operating and finance leases.Revenue from operating leases is recognised in the statement of income on a straight-line basis over the lease term. The underlying asset is accounted for in accordance with the accounting policies applicable to this type of asset.For finance leases, Dexia recognises “leases receivable“ at an amount equal to the net investment in the lease, which can be different from the present value of minimum lease payments.The interest-rate implicit in the lease contract acts as the discount rate. Interest income is recognised over the term of the lease using the interest-rate implicit in the lease.
1.21. sALe And rePurChAse AGreements And LendinG of seCuritiesSecurities sold subject to a linked repurchase agreement (“repos“) are not derecognised and remain in their original category. The corresponding liability is entered under “Due
to banks“ or “Customer borrowings and deposits“, as appropriate. The asset is reported as “pledged“ in the notes.Securities purchased under agreements to resell (“reverse repos“) are recorded as off-balance sheet items and the corresponding loans recorded as “Loans and advances due from banks“ or “Loans and advances to customers“.The difference between the sale and repurchase price is treated as interest income or expense and is accrued over the life of the agreements using the effective interest-rate method.Securities lent to counterparties are not derecognised but, rather recorded in the financial statements in the same heading.Securities borrowed are not recognised in the financial statements.If they are sold to third parties, the gain or loss is entered under “Net income from financial instruments at fair value through profit or loss“ and the obligation to return them is recorded at fair value under “Financial liabilities measured at fair value through profit or loss“.
1.22. deferred inCome tAXDeferred income tax is recognised in full, using the liability method, on temporary differences arising between the tax bases of assets and liabilities and their carrying amounts in the financial statements.The principal temporary differences arise from the depreciation of property, plant & equipment, the revaluation of certain financial assets and liabilities (including derivative contracts, provisions for pensions and other post-retirement benefits), provisions for loan and other impairments and, in relation to acquisitions, from the difference between the fair value of the net assets acquired and their tax base. The rates enacted or substantively enacted at the balance-sheet date are used to determine the deferred income tax.Deferred tax assets and liabilities are not discounted. Deferred tax assets on deductible temporary differences and tax loss carry-forwards are recognised to the extent that it is probable that future taxable profit will be available against which the temporary differences and tax losses can be utilised.Deferred tax liability is provided on taxable temporary differences arising from investments in subsidiaries, associates and joint ventures, except where the timing of the reversal of the temporary difference can be controlled and it is probable that the difference will not reverse in the foreseeable future.Deferred tax related to the fair value remeasurement of available-for-sale investments and cash flow hedges, and other transactions recorded directly in equity, are also credited or charged directly to equity.
1.23. emPLoyee benefits1.23.1. short-term benefitsShort-term benefits, payable within 12 months of the service being rendered, are measured on an undiscounted basis and recognised as an expense.
140 Dexia Annual report 2010
Man
agem
ent
repo
rtA
dditi
onal
info
rmat
ion
Ann
ual fi
nanc
ial s
tate
men
tsC
on
solid
ated
fi
nan
cial
sta
tem
ents
Notes to the consolidated financial statements
1.23.2. post-employment benefitsIf Dexia has a legal or constructive obligation to pay post-employment benefits, the plan is either classified as “defined benefit“ or “defined contribution plan“. Dexia offers a number of defined benefit and defined contribution plans throughout the world, the assets of which are generally held by insurance companies or pension funds. The pension plans are generally funded by payments from both Dexia and its employees.In some cases, Dexia provides post-retirement health care benefits to its retirees.
1.23.2.1. Defined benefit plansEmployee benefit obligations are measured at the present value of the estimated future cash outflows using the interest-rates of AA-rated corporate bonds, which have terms to maturity approximating to the terms of the related liability. Assumptions on which assessment of pension expenses are based, among other things, on actuarial and demographic assumptions, and on the inflation rate.Pension costs are determined based on the Projected Unit Credit Method, under which each period of service gives rise to an additional unit of benefit entitlement and each unit is measured separately to built up the final obligation. Net cumulative unrecognised actuarial gains and losses exceeding the corridor (greater than 10% of the present value of the gross defined benefit obligation and 10% of the fair value of any plan assets) are recognised in income over the average remaining working lives of the plan participants.The amount recognised in the balance sheet is the present value of the defined benefit obligation (i.e., the present value of the expected future payments required to settle the obligation resulting from the employee service in the current and prior periods), as adjusted for unrecognised actuarial gains and losses and unrecognised past service cost, and reduced by the fair value of plan assets at the balance sheet date. The defined obligation is presented net of plan assets as a liability or an asset. Therefore an asset may arise where a plan has been overfunded and are recorded separately if those assets are held by a Group entity.Any asset recognised is limited to the total of any cumulative unrecognised net actuarial losses and past service cost, and the present value of any economic benefits available in the form of refunds from the plan or reductions in future contributions to the plan. Qualified internal and external actuaries carry out valuations of these obligations. All valuations assumptions and results are reviewed and validated by an external actuary for Dexia that ensures that all calculations are harmonised and calculated in compliance with IAS 19.
1.23.2.2. Defined contribution pension plansDexia's contributions to defined contribution pension plans are charged to the statement of income in the year to which they relate. Under such plans, Dexia's obligations are limited to the contributions that Dexia agrees to pay into the fund on behalf of its employees.
1.23.2.3. Post-employment medical careThe entitlement to these benefits is usually based on the employee remaining in service up to retirement age and the completion of a minimum service period. The expected costs of these benefits are accrued over the period of employment, using a methodology similar to that for defined benefit pension plans.
1.23.3. other long-term benefitsThese mainly includes provisions for jubilee premiums that employees receive after completion of specified periods of service.Unlike defined benefit plans, actuarial gains and losses relating to these benefits are immediately recognised. All past service costs are recognised immediately in the statement of income. Employee entitlement to annual leave or long-service leave is recognised when it is granted to the employee. A provision is made for the estimated liability for annual leave and long-service leave as a result of services rendered by employees up to the balance-sheet date.
1.23.4. Termination benefitsA termination benefit provision is only recorded when Dexia is obliged to terminate the employment before the normal date of retirement or to provide benefits as a result of an offer made in order to encourage voluntary redundancy. In such cases Dexia has a detailed formal plan and no realistic possibility of withdrawal.
1.23.5. share-based paymentDexia offers equity-settled share based payments like stock options plans (SOPs) and employee share purchase plans (ESPPs) and cash-settled share-based payments.The fair value of equity-settled plans is measured at grant date by reference to the fair value of the underlying equity instrument based on valuation techniques and on market data and takes into account market-based vesting conditions. The impact of other vesting conditions is reflected in the accounts via an adjustment of the number of equity instruments included in the measurement. The fair value, recognised as a remuneration expense, is credited against equity.In cash-settled share-based payments, the services received and the liability incurred, to pay for those services, are measured at the fair value of the liability. This fair value is measured at the grant date and at each reporting date until settled. The fair value is recognised as a remuneration expense with a corresponding increase in liabilities.
1.24. ProVisionsProvisions are mainly recognised for litigations claims, restructuring, and loan commitments.Provisions are measured at the present value of the expenditures expected to be required to settle the obligation. The discount rate is the pre-tax rate that reflects current market assessments of the time value of money.
141Annual report 2010 Dexia
Man
agem
ent
repo
rtA
dditi
onal
info
rmat
ion
Ann
ual fi
nanc
ial s
tate
men
tsC
on
solid
ated
fi
nan
cial
sta
tem
ents
Notes to the consolidated financial statements
Provisions are recognised when:• Dexia has a present legal or constructive obligation as a result of past events;• it is probable that an outflow of resources embodying economic benefits will be required to settle the obligation; and• a reliable estimate of the amount of the obligation can be made.Provisions on loan commitments are recognised when there is uncertainty about the creditworthiness of the counterparty.
1.25. shAre CAPitAL And treAsury shAres1.25.1. share issue costsExternal incremental costs directly attributable to the issue of new equity securities, other than as part of a business combination, are deducted from equity net of any related income tax.
1.25.2. dividends on dexia's ordinary sharesDexia recognises its dividends on its ordinary shares as a liability from the date on which they are declared. Any dividends for the year declared post-balance-sheet date are disclosed in the subsequent events note.
1.25.3. preferred sharesDexia classifies preferred shares that are non-redeemable and upon which dividends are declared at the discretion of the directors as equity.
1.25.4. Treasury sharesWhere Dexia or its subsidiaries purchase Dexia's share capital or is obliged to purchase a fixed number of treasury shares for a fixed amount of cash, the consideration paid, including any attributable transaction costs net of income taxes, is shown as a deduction from total shareholders' equity. Gains and losses on sales of own equity securities are charged or credited to the treasury share account in equity.
1.25.5. insurance discretionary participation featuresDexia classifies any unrealised gains and losses relating to assets classified as available-for-sale and backing insurance contracts with discretionary participation feature by the Group as follows:• as a liability in respect of the return guaranteed to the contract holders;• as a separate component of equity to the extent of that feature.
1.26. fiduCiAry ACtiVitiesAssets and income arising thereon, together with related undertakings to return such assets to customers, are excluded from these financial statements in cases where Dexia acts in a fiduciary capacity such as nominee, trustee or agent.
1.27. CAsh And CAsh equiVALentsFor the purposes of the statement of cash flows, cash and cash equivalents comprise balances with a maturity of less than 3 months maturity included within cash and balances with central banks, interbank loans and advances, financial assets available-for-sale.
1.28. eArninGs Per shAreThe “Basic earnings per share“ are calculated by dividing the net income available to ordinary shareholders by the weighted average number of ordinary shares in issue during the year, excluding the average number of ordinary shares purchased by Dexia and held as treasury shares.For the “Diluted earnings per share“, the weighted average number of ordinary shares in issue and the net income are adjusted to assume conversion of all dilutive potential ordinary shares, such as the convertible debt and share options granted to employees. Potential or contingent share issuances are treated as dilutive when the derivatives are “in the money“ and their conversion to shares would decrease net earnings per share.
142 Dexia Annual report 2010
Man
agem
ent
repo
rtA
dditi
onal
info
rmat
ion
Ann
ual fi
nanc
ial s
tate
men
tsC
on
solid
ated
fi
nan
cial
sta
tem
ents
Notes to the consolidated financial statements
Name head office % of capital held Consolidation method
direCT parTiCipaTioNs of dexia sa
Associated Dexia Technology Services SA (ADTS)
23, Atrium Business Park, z.a. Bourmicht, L-8070 Bertrange
100 fully
Dexia Funding Luxembourg SA 180, rue des Aubépines L-1145 Luxembourg
100 fully
Dexia Participations Belgique SA Place Rogier 11, B-1210 Bruxelles 100 fully
Dexia Participations Luxembourg SA 69, route d’Esch, L-2953 Luxembourg 100 fully
Group DenizBank AŞ Büyükdere Cad. No: 106 T-34394 Esentepe/Istanbul
99.85 fully
Group Dexia Nederland NV Piet Heinkade 55, NL-1019 GM Amsterdam 100 fully
dexia baNque belGique sa: maiN subsidiaries aNd affiliaTes
Dexia Auto Lease SA Place Rogier 11, B-1210 Bruxelles 100 fully
Dexia Bank Belgium SA Boulevard Pachéco 44, B-1000 Bruxelles 100 fully
Dexia Commercial Finance SA Place Rogier 11 - B-1210 Bruxelles 100 fully
Dexia Crédits Logement SA Boulevard Pachéco 44, B-1000 Bruxelles 100 fully
Dexia Funding Netherlands NV Strawinskylaan 3105 NL-1077 ZX Amsterdam
100 fully
Dexia Insurance Belgium SA Avenue Livingstone 6, B-1000 Bruxelles 99.79 fully
Dexia Insurance Belgium Invest SA Rue Joseph II 96, B-1000 Bruxelles 100 fully
Dexia Investment Company SA Boulevard Pachéco 44, B-1000 Bruxelles 100 fully
Dexia Investments Ireland SA 6 George’s Dock, IRL-IFSC Dublin 1 100 fully
Dexia Lease Belgium SA Place Rogier 11, B-1210 Bruxelles 100 fully
Dexia Lease Services SA Place Rogier 11, B-1210 Bruxelles 100 fully
Dexia Life and Pensions SA 2, rue Nicolas Bové, L-1253 Luxembourg 100 fully
DIS Finance SA 2, rue Nicolas Bové, L-1253 Luxembourg 100 fully
2. Significant changes in scope of consolidation and list of main subsidiaries and affiliated enterprises of the Dexia Group2.1. Significant changes in scope of consolidation
in 2009As from 1 April 2009, Dexia stopped consolidating the activities of Financial Security Assurance Holdings Ltd. (hereafter FSA Insurance) sold to Assured Guaranty Ltd. (Assured).FSA Insurance's result for the first quarter was consolidated on a line by line basis and the net result was offset in “Net income on Investments“.The sale was completed on 1 July 2009. The sales price of USD 816.5 million was partially paid in cash (USD 546 million) and partially with 21.85 million Assured shares. The shares were included in Available-for-sale Portfolio as Dexia did not have a significant influence in Assured.As from the fourth quarter 2009, Crédit du Nord is no longer included in Dexia's consolidated financial statements pursuant to the agreement under which Société Générale buys Dexia's 20%
stake in Crédit du Nord for a cash consideration consisting of EUR 676 million. The EUR 30 million first nine-month result of Crédit du Nord was considered in Dexia's annual result 2009.The transaction generated a capital gain of around EUR 153 mil-lion.Simultaneously to this transaction Dexia purchased Crédit du Nord's 20% stake in Dexia Crédit Local de France Banque for a cash consideration of EUR 13 million. As a result of this acquisition, Dexia controls 100% of Dexia Crédit Local de France Banque. As at 9 December 2009, Dexia signed an agreement relating to the sale of Dexia Epargne Pension (“DEP“) to BNP Paribas Assurance. Following the signing of the agreement, DEP was recorded in “Non current assets held for sale“ and in “Liabilities included in disposal groups held for sale“ for amounts around EUR 4.3 bil-lion as at 31 December 2009.
in 2010Following its sale in April 2010, Dexia Epargne Pension left the scope of consolidation. Its results of the first three months 2010 have been consolidated.Dexia sold its 51% stake in Adinfo. Adinfo's results for the first six months 2010 have been consolidated.
See also note 9.5. Acquisitions and disposals of consolidated companies.
2.2. Main subsidiaries and affiliated enterprises of the Dexia Group (1)
(1) Complete list available on request.
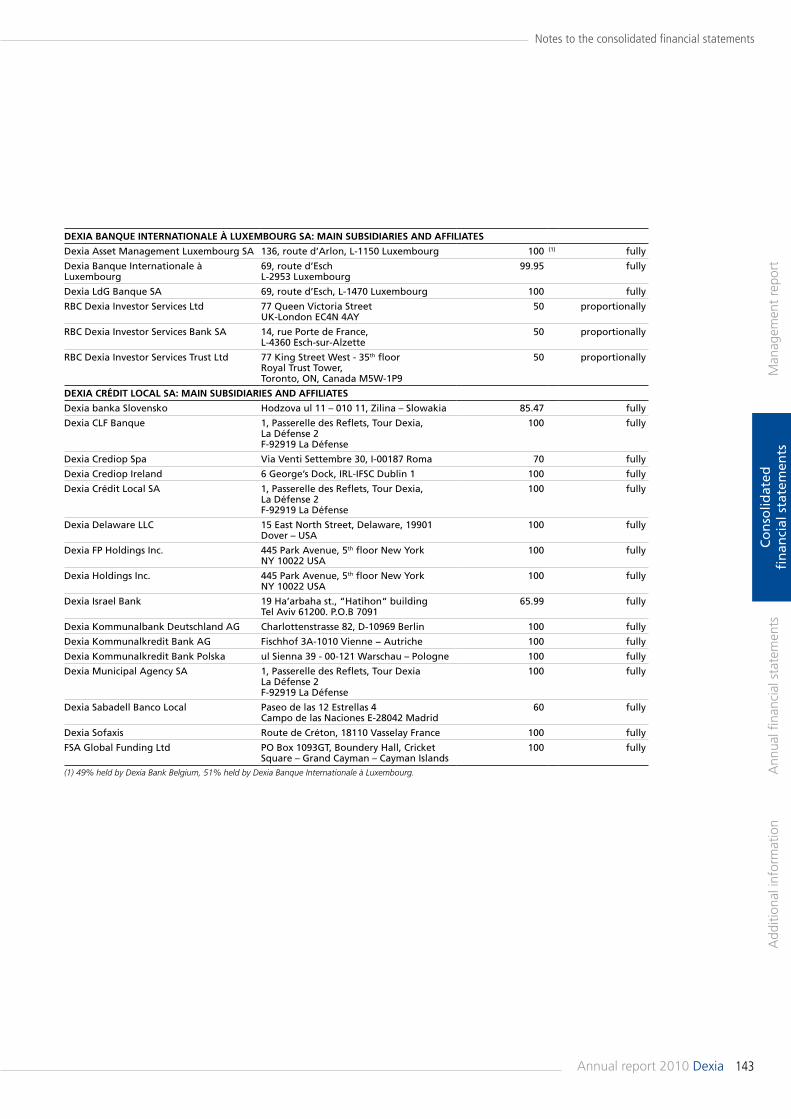
143Annual report 2010 Dexia
Man
agem
ent
repo
rtA
dditi
onal
info
rmat
ion
Ann
ual fi
nanc
ial s
tate
men
tsC
on
solid
ated
fi
nan
cial
sta
tem
ents
Notes to the consolidated financial statements
dexia baNque iNTerNaTioNale À luxembourG sa: maiN subsidiaries aNd affiliaTes
Dexia Asset Management Luxembourg SA 136, route d’Arlon, L-1150 Luxembourg 100 (1) fully
Dexia Banque Internationale à Luxembourg
69, route d’Esch L-2953 Luxembourg
99.95 fully
Dexia LdG Banque SA 69, route d’Esch, L-1470 Luxembourg 100 fully
RBC Dexia Investor Services Ltd 77 Queen Victoria Street UK-London EC4N 4AY
50 proportionally
RBC Dexia Investor Services Bank SA 14, rue Porte de France, L-4360 Esch-sur-Alzette
50 proportionally
RBC Dexia Investor Services Trust Ltd 77 King Street West - 35th floorRoyal Trust Tower, Toronto, ON, Canada M5W-1P9
50 proportionally
dexia CrÉdiT loCal sa: maiN subsidiaries aNd affiliaTes
Dexia banka Slovensko Hodzova ul 11 – 010 11, Zilina – Slowakia 85.47 fully
Dexia CLF Banque 1, Passerelle des Reflets, Tour Dexia, La Défense 2 F-92919 La Défense
100 fully
Dexia Crediop Spa Via Venti Settembre 30, I-00187 Roma 70 fully
Dexia Crediop Ireland 6 George’s Dock, IRL-IFSC Dublin 1 100 fully
Dexia Crédit Local SA 1, Passerelle des Reflets, Tour Dexia, La Défense 2 F-92919 La Défense
100 fully
Dexia Delaware LLC 15 East North Street, Delaware, 19901 Dover – USA
100 fully
Dexia FP Holdings Inc. 445 Park Avenue, 5th floor New YorkNY 10022 USA
100 fully
Dexia Holdings Inc. 445 Park Avenue, 5th floor New YorkNY 10022 USA
100 fully
Dexia Israel Bank 19 Ha’arbaha st., “Hatihon“ building Tel Aviv 61200. P.O.B 7091
65.99 fully
Dexia Kommunalbank Deutschland AG Charlottenstrasse 82, D-10969 Berlin 100 fully
Dexia Kommunalkredit Bank AG Fischhof 3A-1010 Vienne − Autriche 100 fully
Dexia Kommunalkredit Bank Polska ul Sienna 39 - 00-121 Warschau – Pologne 100 fully
Dexia Municipal Agency SA 1, Passerelle des Reflets, Tour Dexia La Défense 2 F-92919 La Défense
100 fully
Dexia Sabadell Banco Local Paseo de las 12 Estrellas 4 Campo de las Naciones E-28042 Madrid
60 fully
Dexia Sofaxis Route de Créton, 18110 Vasselay France 100 fully
FSA Global Funding Ltd PO Box 1093GT, Boundery Hall, Cricket Square – Grand Cayman – Cayman Islands
100 fully
(1) 49% held by Dexia Bank Belgium, 51% held by Dexia Banque Internationale à Luxembourg.
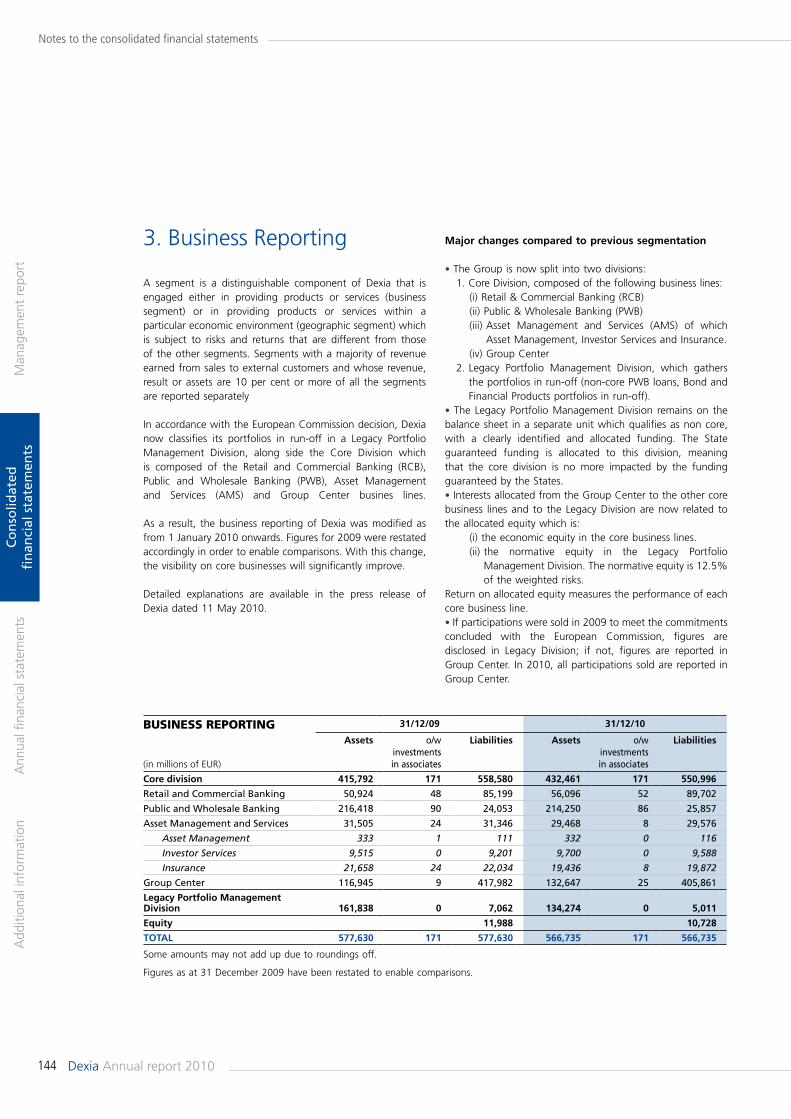
144 Dexia Annual report 2010
Man
agem
ent
repo
rtA
dditi
onal
info
rmat
ion
Ann
ual fi
nanc
ial s
tate
men
tsC
on
solid
ated
fi
nan
cial
sta
tem
ents
Notes to the consolidated financial statements
business rePortinG 31/12/09 31/12/10
(in millions of EUR)
assets o/w investments in associates
liabilities assets o/w investments in associates
liabilities
Core division 415,792 171 558,580 432,461 171 550,996
Retail and Commercial Banking 50,924 48 85,199 56,096 52 89,702
Public and Wholesale Banking 216,418 90 24,053 214,250 86 25,857
Asset Management and Services 31,505 24 31,346 29,468 8 29,576
Asset Management 333 1 111 332 0 116
Investor Services 9,515 0 9,201 9,700 0 9,588
Insurance 21,658 24 22,034 19,436 8 19,872
Group Center 116,945 9 417,982 132,647 25 405,861
legacy portfolio management division 161,838 0 7,062 134,274 0 5,011
equity 11,988 10,728
ToTal 577,630 171 577,630 566,735 171 566,735
Some amounts may not add up due to roundings off.
Figures as at 31 December 2009 have been restated to enable comparisons.
3. Business Reporting
A segment is a distinguishable component of Dexia that is engaged either in providing products or services (business segment) or in providing products or services within a particular economic environment (geographic segment) which is subject to risks and returns that are different from those of the other segments. Segments with a majority of revenue earned from sales to external customers and whose revenue, result or assets are 10 per cent or more of all the segments are reported separately
In accordance with the European Commission decision, Dexia now classifies its portfolios in run-off in a Legacy Portfolio Management Division, along side the Core Division which is composed of the Retail and Commercial Banking (RCB), Public and Wholesale Banking (PWB), Asset Management and Services (AMS) and Group Center busines lines.
As a result, the business reporting of Dexia was modified as from 1 January 2010 onwards. Figures for 2009 were restated accordingly in order to enable comparisons. With this change, the visibility on core businesses will significantly improve.
Detailed explanations are available in the press release of Dexia dated 11 May 2010.
major changes compared to previous segmentation
• The Group is now split into two divisions: 1. Core Division, composed of the following business lines: (i) Retail & Commercial Banking (RCB) (ii) Public & Wholesale Banking (PWB) (iii) Asset Management and Services (AMS) of which
Asset Management, Investor Services and Insurance. (iv) Group Center 2. Legacy Portfolio Management Division, which gathers
the portfolios in run-off (non-core PWB loans, Bond and Financial Products portfolios in run-off).
• The Legacy Portfolio Management Division remains on the balance sheet in a separate unit which qualifies as non core, with a clearly identified and allocated funding. The State guaranteed funding is allocated to this division, meaning that the core division is no more impacted by the funding guaranteed by the States.• Interests allocated from the Group Center to the other core business lines and to the Legacy Division are now related to the allocated equity which is: (i) the economic equity in the core business lines. (ii) the normative equity in the Legacy Portfolio
Management Division. The normative equity is 12.5% of the weighted risks.
Return on allocated equity measures the performance of each core business line.• If participations were sold in 2009 to meet the commitments concluded with the European Commission, figures are disclosed in Legacy Division; if not, figures are reported in Group Center. In 2010, all participations sold are reported in Group Center.
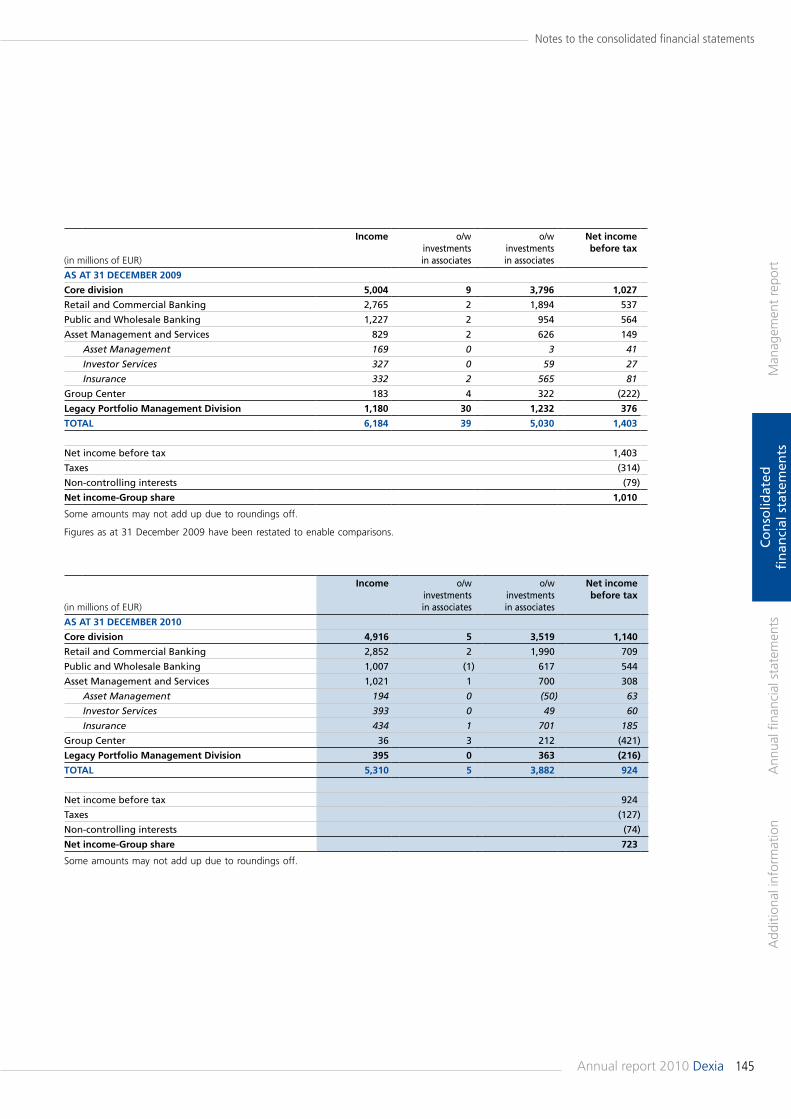
145Annual report 2010 Dexia
Man
agem
ent
repo
rtA
dditi
onal
info
rmat
ion
Ann
ual fi
nanc
ial s
tate
men
tsC
on
solid
ated
fi
nan
cial
sta
tem
ents
Notes to the consolidated financial statements
(in millions of EUR)
income o/w investments in associates
o/w investments in associates
Net income before tax
as aT 31 deCember 2009
Core division 5,004 9 3,796 1,027
Retail and Commercial Banking 2,765 2 1,894 537
Public and Wholesale Banking 1,227 2 954 564
Asset Management and Services 829 2 626 149
Asset Management 169 0 3 41
Investor Services 327 0 59 27
Insurance 332 2 565 81
Group Center 183 4 322 (222)
legacy portfolio management division 1,180 30 1,232 376
ToTal 6,184 39 5,030 1,403
Net income before tax 1,403
Taxes (314)
Non-controlling interests (79)
Net income-Group share 1,010
Some amounts may not add up due to roundings off.
Figures as at 31 December 2009 have been restated to enable comparisons.
(in millions of EUR)
income o/w investments in associates
o/w investments in associates
Net income before tax
as aT 31 deCember 2010
Core division 4,916 5 3,519 1,140
Retail and Commercial Banking 2,852 2 1,990 709
Public and Wholesale Banking 1,007 (1) 617 544
Asset Management and Services 1,021 1 700 308
Asset Management 194 0 (50) 63
Investor Services 393 0 49 60
Insurance 434 1 701 185
Group Center 36 3 212 (421)
legacy portfolio management division 395 0 363 (216)
ToTal 5,310 5 3,882 924
Net income before tax 924
Taxes (127)
Non-controlling interests (74)
Net income-Group share 723
Some amounts may not add up due to roundings off.
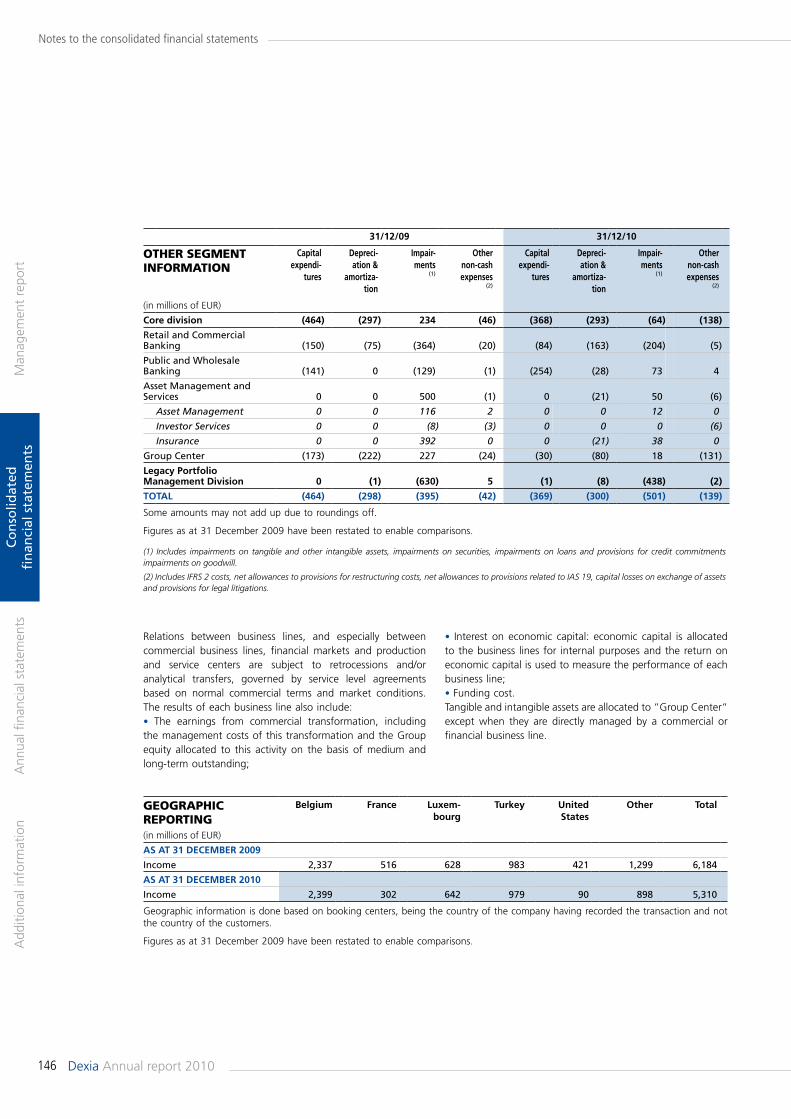
146 Dexia Annual report 2010
Man
agem
ent
repo
rtA
dditi
onal
info
rmat
ion
Ann
ual fi
nanc
ial s
tate
men
tsC
on
solid
ated
fi
nan
cial
sta
tem
ents
Notes to the consolidated financial statements
31/12/09 31/12/10
other seGment informAtion
Capital expendi-
tures
depreci-ation &
amortiza-tion
impair-ments
(1)
other non-cash expenses
(2)
Capital expendi-
tures
depreci-ation &
amortiza-tion
impair-ments
(1)
other non-cash expenses
(2)
(in millions of EUR)
Core division (464) (297) 234 (46) (368) (293) (64) (138)
Retail and Commercial Banking (150) (75) (364) (20) (84) (163) (204) (5)
Public and Wholesale Banking (141) 0 (129) (1) (254) (28) 73 4
Asset Management and Services 0 0 500 (1) 0 (21) 50 (6)
Asset Management 0 0 116 2 0 0 12 0
Investor Services 0 0 (8) (3) 0 0 0 (6)
Insurance 0 0 392 0 0 (21) 38 0
Group Center (173) (222) 227 (24) (30) (80) 18 (131)
legacy portfolio management division 0 (1) (630) 5 (1) (8) (438) (2)
ToTal (464) (298) (395) (42) (369) (300) (501) (139)
Some amounts may not add up due to roundings off.
Figures as at 31 December 2009 have been restated to enable comparisons.
(1) Includes impairments on tangible and other intangible assets, impairments on securities, impairments on loans and provisions for credit commitments impairments on goodwill.
(2) Includes IFRS 2 costs, net allowances to provisions for restructuring costs, net allowances to provisions related to IAS 19, capital losses on exchange of assets and provisions for legal litigations.
GeoGrAPhiC rePortinG
belgium france luxem-bourg
Turkey united states
other Total
(in millions of EUR)
as aT 31 deCember 2009
Income 2,337 516 628 983 421 1,299 6,184
as aT 31 deCember 2010
Income 2,399 302 642 979 90 898 5,310
Geographic information is done based on booking centers, being the country of the company having recorded the transaction and not the country of the customers.
Figures as at 31 December 2009 have been restated to enable comparisons.
Relations between business lines, and especially between commercial business lines, financial markets and production and service centers are subject to retrocessions and/or analytical transfers, governed by service level agreements based on normal commercial terms and market conditions. The results of each business line also include: • The earnings from commercial transformation, including the management costs of this transformation and the Group equity allocated to this activity on the basis of medium and long-term outstanding;
• Interest on economic capital: economic capital is allocated to the business lines for internal purposes and the return on economic capital is used to measure the performance of each business line;• Funding cost.Tangible and intangible assets are allocated to “Group Center“ except when they are directly managed by a commercial or financial business line.
147Annual report 2010 Dexia
Man
agem
ent
repo
rtA
dditi
onal
info
rmat
ion
Ann
ual fi
nanc
ial s
tate
men
tsC
on
solid
ated
fi
nan
cial
sta
tem
ents
Notes to the consolidated financial statements
4. Significant items included in the statement of incomeReported amounts are significant and/or unusual transactions and not only large transactions. The amounts mentioned are before tax and year-to-date.
The sale of 21.8 million Assured Guaranty Ltd common shares acquired by Dexia as part of the sales price in connection with the FSA transaction generated a positive result of EUR 153 mil-lion in VI. Net income on investments.
In 2010, the European Commission approved the State support provided by the Belgian, French and Luxembourg States to Dexia and Dexia undertook to restructure its activities.In order to comply with the commitments taken with the European Commission, Dexia continued to deleverage its balance sheet. Assets were sold for an amount of EUR 27.2 bil lion. In this context, a capital loss net of provision has been recognised for EUR -212.5 million. Dexia sold its stake in SPE, Dexia Epargne Pension and in Adinfo with a capital gain of respectively EUR 69 million, EUR 29 million and EUR 14 million disclosed in VI. Net income on investments.In the context of its restructuration plan, Dexia booked an amount of EUR -145.2 million as restructuration costs.A charge of EUR 380 million was recognised in interest margin for the retribution of the Belgian, French and Luxembourg states for the guarantee they give for Dexia's financing and another EUR 110 million interest charge was recognised for the guarantee received from the Belgian and French States for Financial Products' portfolio and the related GIC's liabilities.
Otherwise, Dexia recorded a charge of 73 million in II. Interest expense as contribution to the Belgian deposit guaranty mechanism.
The Group recorded in XI. Other net income an income amounting to EUR 44 million, as a compensation for losses which were incurred in the context of the fraud occured in the dealing room of Dexia Bank Belgium between 1998 and 2001, and which were fully accounted for between 2000 and 2004 (included).
The CDS purchased within the framework of the synthetic securitisations Dublin Oak and Wise, together with the CDS intermediation activity, led to a positive mark-to-market before tax of EUR 89.9 million in V. Net income from financial instruments at fair value through profit or loss.
Impairment on loans and provisions for credit commitments includes EUR -559 million in relation with Financial Products portfolio.
An amount of USD 35 million of deferred tax assets was recognised on temporary differences on the Financial Products portfolio and, following the new carry-back rules on the tax return in the US, a tax refund product of USD 51 million has been recorded in XX. Tax expense.
On 25 January 2011, the Regional Court of Bratislava rendered a judgment in favour of Dexia, cancelling the first-instance judgment of May 2010 by which Dexia banka Slovensko was condemned to pay an amount in principal of EUR 138 million. As a result the case will revert back to the First-Instance Court of Bratislava which will have to render a new judgment taking into account the legal evaluation of the Regional Court. This does not affect the sale of Dexia banka Slovensko in accordance with the agreement reached in November 2010.This decision lead to the reversal of the provision of EUR 138 mil-lion recognized in 2Q 2010 in XIX. Provisions for legal litigations. However, a provision of EUR 39 million is still being maintained to cover potential charges, related to the Ritro case.
For the significant items included in the statement of income of 2009, we refer to Dexia's Annual Report 2009.
5. Post-balance-sheet eventsNil.
6. LitigationsWe refer here to the chapter Risk Management – part Legal risk – presented in the Management report on page 89.
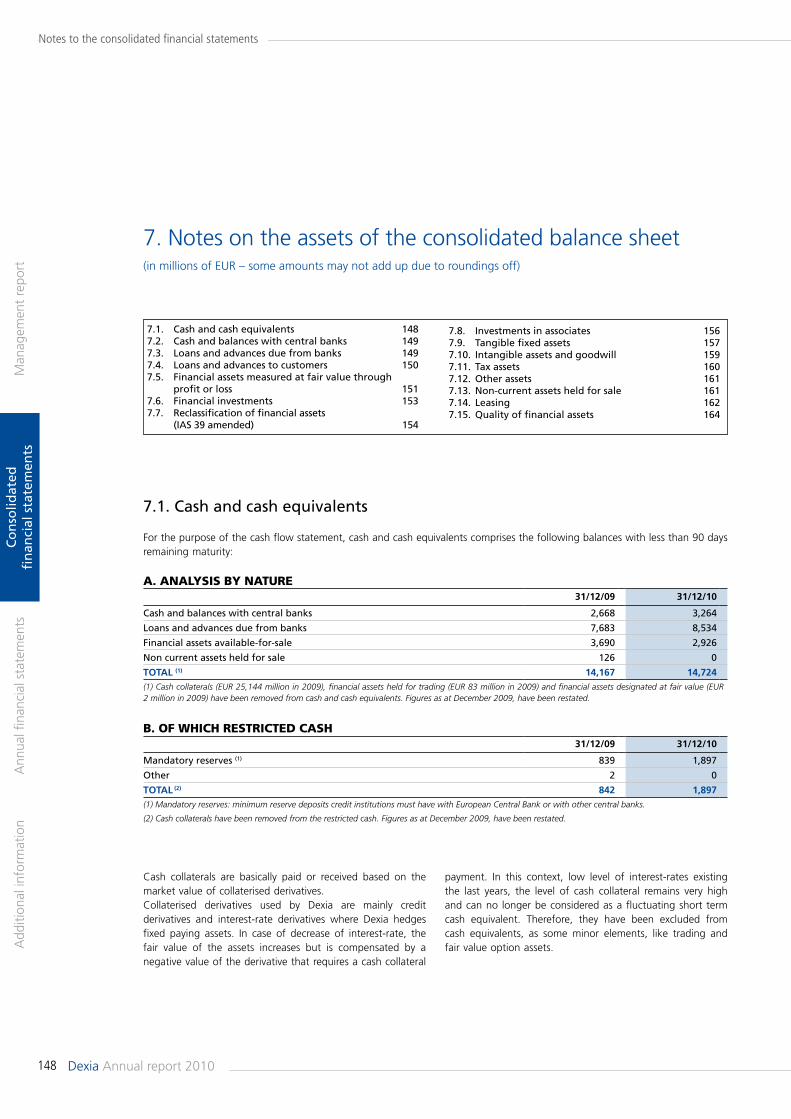
148 Dexia Annual report 2010
Man
agem
ent
repo
rtA
dditi
onal
info
rmat
ion
Ann
ual fi
nanc
ial s
tate
men
tsC
on
solid
ated
fi
nan
cial
sta
tem
ents
Notes to the consolidated financial statements
A. AnALysis by nAture31/12/09 31/12/10
Cash and balances with central banks 2,668 3,264
Loans and advances due from banks 7,683 8,534
Financial assets available-for-sale 3,690 2,926
Non current assets held for sale 126 0
ToTal (1) 14,167 14,724(1) Cash collaterals (EUR 25,144 million in 2009), financial assets held for trading (EUR 83 million in 2009) and financial assets designated at fair value (EUR 2 million in 2009) have been removed from cash and cash equivalents. Figures as at December 2009, have been restated.
b. of WhiCh restriCted CAsh 31/12/09 31/12/10
Mandatory reserves (1) 839 1,897
Other 2 0
ToTal (2) 842 1,897(1) Mandatory reserves: minimum reserve deposits credit institutions must have with European Central Bank or with other central banks.
(2) Cash collaterals have been removed from the restricted cash. Figures as at December 2009, have been restated.
7. Notes on the assets of the consolidated balance sheet(in millions of EUR – some amounts may not add up due to roundings off)
7.1. Cash and cash equivalents 1487.2. Cash and balances with central banks 1497.3. Loans and advances due from banks 1497.4. Loans and advances to customers 1507.5. Financial assets measured at fair value through profit or loss 1517.6. Financial investments 1537.7. Reclassification of financial assets (IAS 39 amended) 154
7.8. Investments in associates 1567.9. Tangible fixed assets 1577.10. Intangible assets and goodwill 1597.11. Tax assets 1607.12. Other assets 1617.13. Non-current assets held for sale 1617.14. Leasing 1627.15. Quality of financial assets 164
7.1. Cash and cash equivalents
For the purpose of the cash flow statement, cash and cash equivalents comprises the following balances with less than 90 days remaining maturity:
Cash collaterals are basically paid or received based on the market value of collaterised derivatives.Collaterised derivatives used by Dexia are mainly credit derivatives and interest-rate derivatives where Dexia hedges fixed paying assets. In case of decrease of interest-rate, the fair value of the assets increases but is compensated by a negative value of the derivative that requires a cash collateral
payment. In this context, low level of interest-rates existing the last years, the level of cash collateral remains very high and can no longer be considered as a fluctuating short term cash equivalent. Therefore, they have been excluded from cash equivalents, as some minor elements, like trading and fair value option assets.
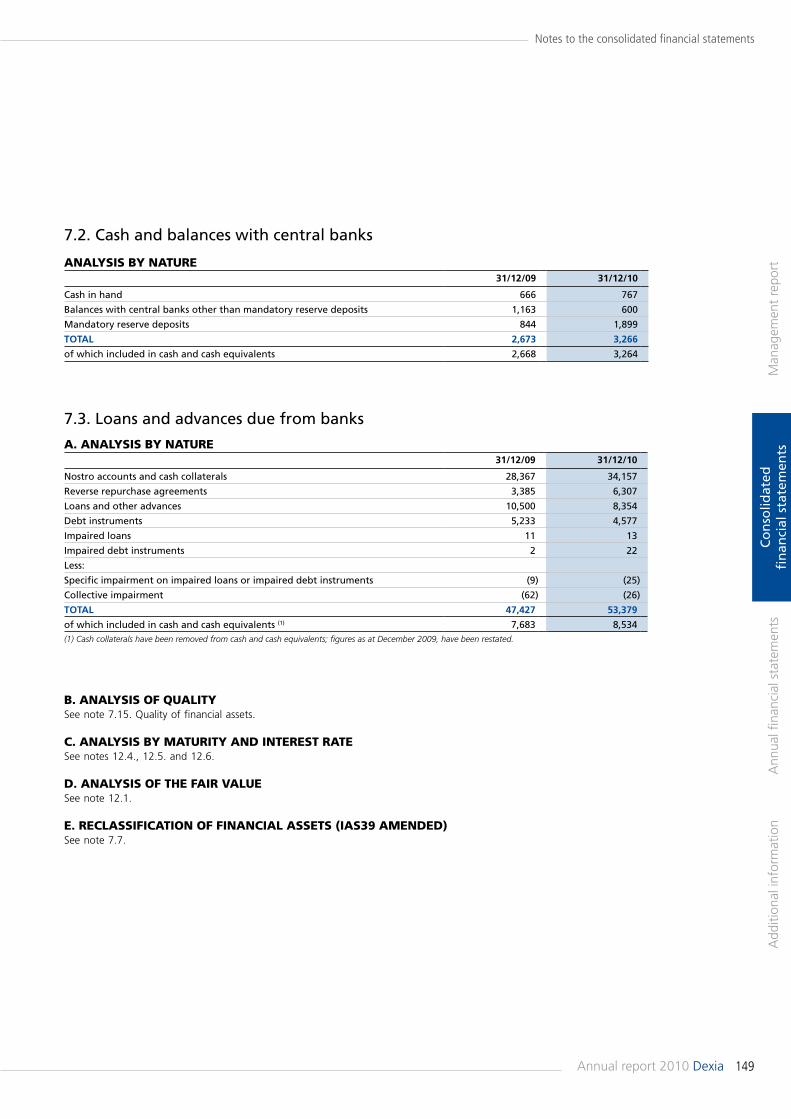
149Annual report 2010 Dexia
Man
agem
ent
repo
rtA
dditi
onal
info
rmat
ion
Ann
ual fi
nanc
ial s
tate
men
tsC
on
solid
ated
fi
nan
cial
sta
tem
ents
Notes to the consolidated financial statements
AnALysis by nAture31/12/09 31/12/10
Cash in hand 666 767
Balances with central banks other than mandatory reserve deposits 1,163 600
Mandatory reserve deposits 844 1,899
ToTal 2,673 3,266
of which included in cash and cash equivalents 2,668 3,264
7.3. Loans and advances due from banks
A. AnALysis by nAture31/12/09 31/12/10
Nostro accounts and cash collaterals 28,367 34,157
Reverse repurchase agreements 3,385 6,307
Loans and other advances 10,500 8,354
Debt instruments 5,233 4,577
Impaired loans 11 13
Impaired debt instruments 2 22
Less:
Specific impairment on impaired loans or impaired debt instruments (9) (25)
Collective impairment (62) (26)
ToTal 47,427 53,379
of which included in cash and cash equivalents (1) 7,683 8,534(1) Cash collaterals have been removed from cash and cash equivalents; figures as at December 2009, have been restated.
7.2. Cash and balances with central banks
b. AnALysis of quALity See note 7.15. Quality of financial assets.
C. AnALysis by mAturity And interest rAte See notes 12.4., 12.5. and 12.6.
d. AnALysis of the fAir VALue See note 12.1.
e. reCLAssifiCAtion of finAnCiAL Assets (iAs39 Amended)See note 7.7.
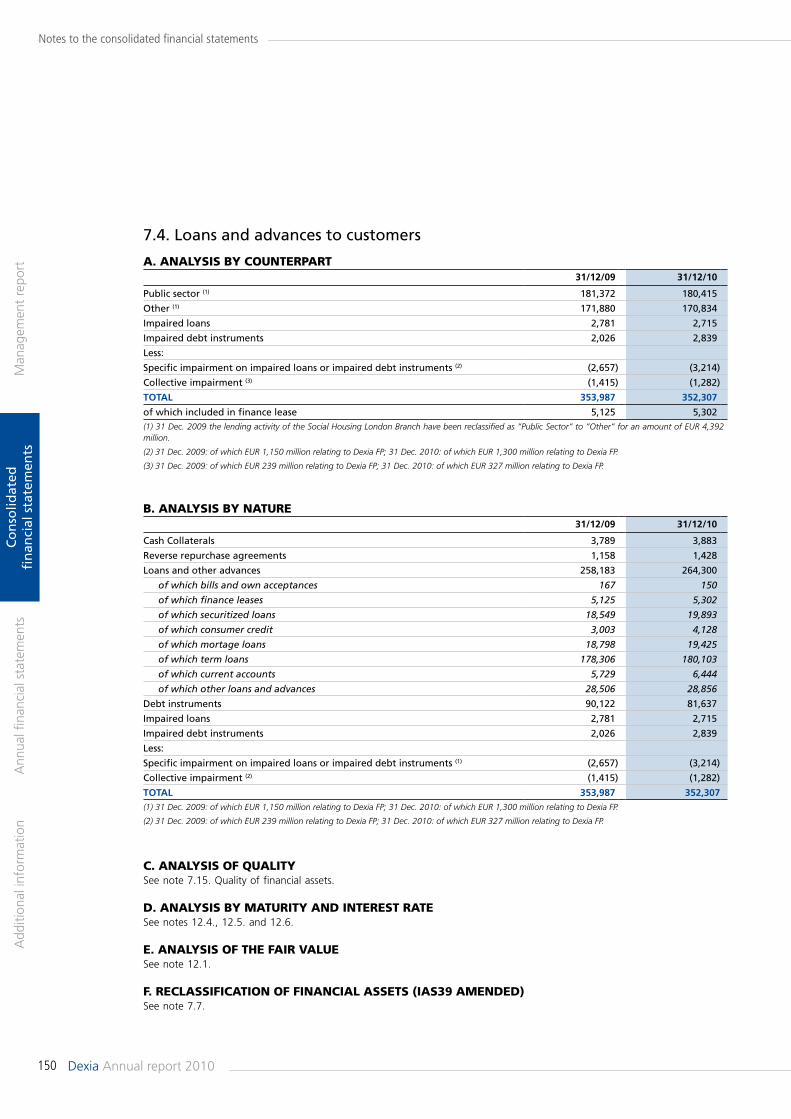
150 Dexia Annual report 2010
Man
agem
ent
repo
rtA
dditi
onal
info
rmat
ion
Ann
ual fi
nanc
ial s
tate
men
tsC
on
solid
ated
fi
nan
cial
sta
tem
ents
Notes to the consolidated financial statements
b. AnALysis by nAture31/12/09 31/12/10
Cash Collaterals 3,789 3,883
Reverse repurchase agreements 1,158 1,428
Loans and other advances 258,183 264,300
of which bills and own acceptances 167 150
of which finance leases 5,125 5,302
of which securitized loans 18,549 19,893
of which consumer credit 3,003 4,128
of which mortage loans 18,798 19,425
of which term loans 178,306 180,103
of which current accounts 5,729 6,444
of which other loans and advances 28,506 28,856
Debt instruments 90,122 81,637
Impaired loans 2,781 2,715
Impaired debt instruments 2,026 2,839
Less:
Specific impairment on impaired loans or impaired debt instruments (1) (2,657) (3,214)
Collective impairment (2) (1,415) (1,282)
ToTal 353,987 352,307(1) 31 Dec. 2009: of which EUR 1,150 million relating to Dexia FP; 31 Dec. 2010: of which EUR 1,300 million relating to Dexia FP.
(2) 31 Dec. 2009: of which EUR 239 million relating to Dexia FP; 31 Dec. 2010: of which EUR 327 million relating to Dexia FP.
C. AnALysis of quALitySee note 7.15. Quality of financial assets.
d. AnALysis by mAturity And interest rAte See notes 12.4., 12.5. and 12.6.
e. AnALysis of the fAir VALue See note 12.1.
f. reCLAssifiCAtion of finAnCiAL Assets (iAs39 Amended)See note 7.7.
A. AnALysis by CounterPArt31/12/09 31/12/10
Public sector (1) 181,372 180,415
Other (1) 171,880 170,834
Impaired loans 2,781 2,715
Impaired debt instruments 2,026 2,839
Less:
Specific impairment on impaired loans or impaired debt instruments (2) (2,657) (3,214)
Collective impairment (3) (1,415) (1,282)
ToTal 353,987 352,307
of which included in finance lease 5,125 5,302(1) 31 Dec. 2009 the lending activity of the Social Housing London Branch have been reclassified as “Public Sector“ to “Other“ for an amount of EUR 4,392 million.
(2) 31 Dec. 2009: of which EUR 1,150 million relating to Dexia FP; 31 Dec. 2010: of which EUR 1,300 million relating to Dexia FP.
(3) 31 Dec. 2009: of which EUR 239 million relating to Dexia FP; 31 Dec. 2010: of which EUR 327 million relating to Dexia FP.
7.4. Loans and advances to customers
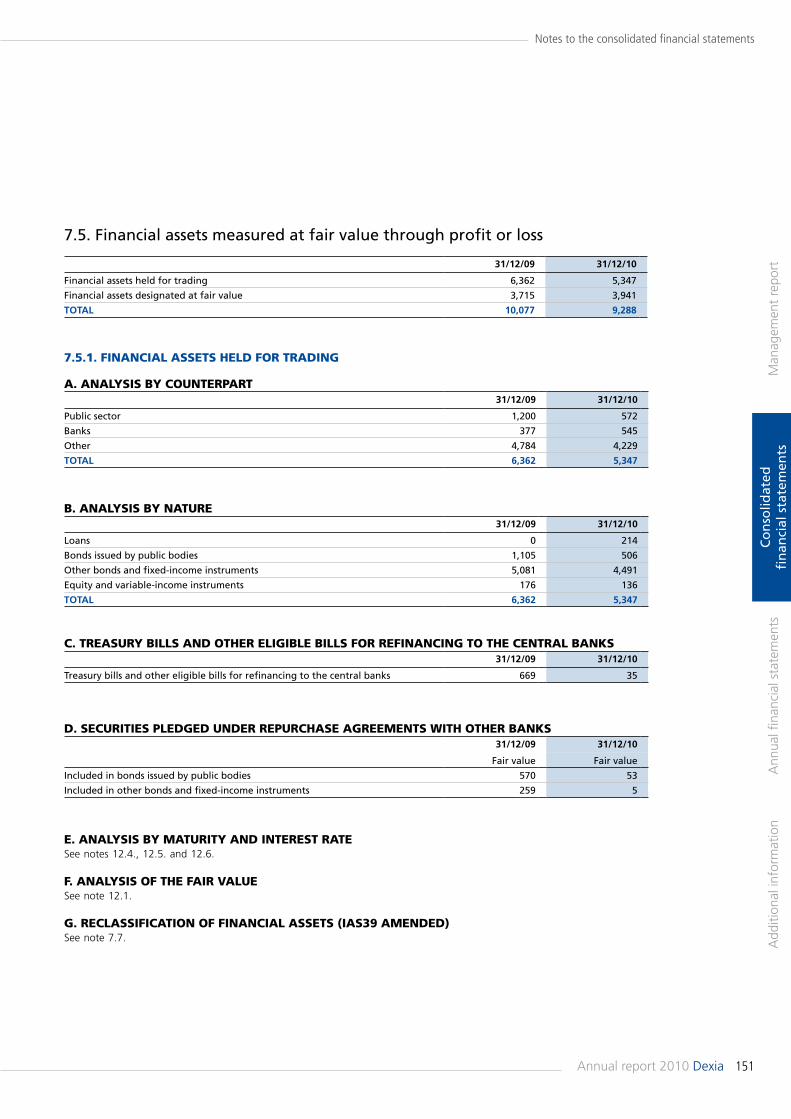
151Annual report 2010 Dexia
Man
agem
ent
repo
rtA
dditi
onal
info
rmat
ion
Ann
ual fi
nanc
ial s
tate
men
tsC
on
solid
ated
fi
nan
cial
sta
tem
ents
Notes to the consolidated financial statements
31/12/09 31/12/10
Financial assets held for trading 6,362 5,347
Financial assets designated at fair value 3,715 3,941
ToTal 10,077 9,288
A. AnALysis by CounterPArt31/12/09 31/12/10
Public sector 1,200 572
Banks 377 545
Other 4,784 4,229
ToTal 6,362 5,347
b. AnALysis by nAture31/12/09 31/12/10
Loans 0 214
Bonds issued by public bodies 1,105 506
Other bonds and fixed-income instruments 5,081 4,491
Equity and variable-income instruments 176 136
ToTal 6,362 5,347
C. treAsury biLLs And other eLiGibLe biLLs for refinAnCinG to the CentrAL bAnKs31/12/09 31/12/10
Treasury bills and other eligible bills for refinancing to the central banks 669 35
d. seCurities PLedGed under rePurChAse AGreements With other bAnKs31/12/09 31/12/10
Fair value Fair value
Included in bonds issued by public bodies 570 53
Included in other bonds and fixed-income instruments 259 5
7.5. Financial assets measured at fair value through profit or loss
7.5.1. finAnCiAL Assets heLd for trAdinG
e. AnALysis by mAturity And interest rAte See notes 12.4., 12.5. and 12.6.
f. AnALysis of the fAir VALue See note 12.1.
G. reCLAssifiCAtion of finAnCiAL Assets (iAs39 Amended)See note 7.7.
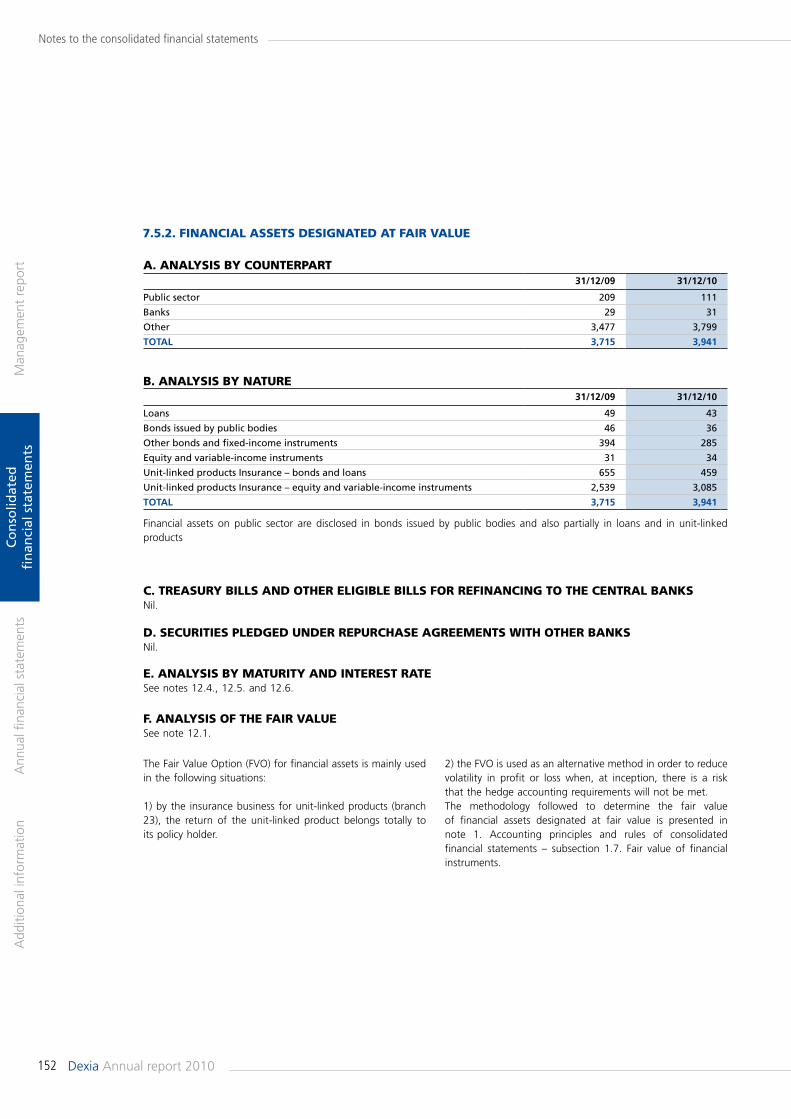
152 Dexia Annual report 2010
Man
agem
ent
repo
rtA
dditi
onal
info
rmat
ion
Ann
ual fi
nanc
ial s
tate
men
tsC
on
solid
ated
fi
nan
cial
sta
tem
ents
Notes to the consolidated financial statements
A. AnALysis by CounterPArt31/12/09 31/12/10
Public sector 209 111
Banks 29 31
Other 3,477 3,799
ToTal 3,715 3,941
b. AnALysis by nAture31/12/09 31/12/10
Loans 49 43
Bonds issued by public bodies 46 36
Other bonds and fixed-income instruments 394 285
Equity and variable-income instruments 31 34
Unit-linked products Insurance – bonds and loans 655 459
Unit-linked products Insurance – equity and variable-income instruments 2,539 3,085
ToTal 3,715 3,941
Financial assets on public sector are disclosed in bonds issued by public bodies and also partially in loans and in unit-linked products
7.5.2. finAnCiAL Assets desiGnAted At fAir VALue
f. AnALysis of the fAir VALue See note 12.1.
The Fair Value Option (FVO) for financial assets is mainly used in the following situations:
1) by the insurance business for unit-linked products (branch 23), the return of the unit-linked product belongs totally to its policy holder.
2) the FVO is used as an alternative method in order to reduce volatility in profit or loss when, at inception, there is a risk that the hedge accounting requirements will not be met.The methodology followed to determine the fair value of financial assets designated at fair value is presented in note 1. Accounting principles and rules of consolidated financial statements – subsection 1.7. Fair value of financial instruments.
e. AnALysis by mAturity And interest rAte See notes 12.4., 12.5. and 12.6.
C. treAsury biLLs And other eLiGibLe biLLs for refinAnCinG to the CentrAL bAnKsNil.
d. seCurities PLedGed under rePurChAse AGreements With other bAnKsNil.
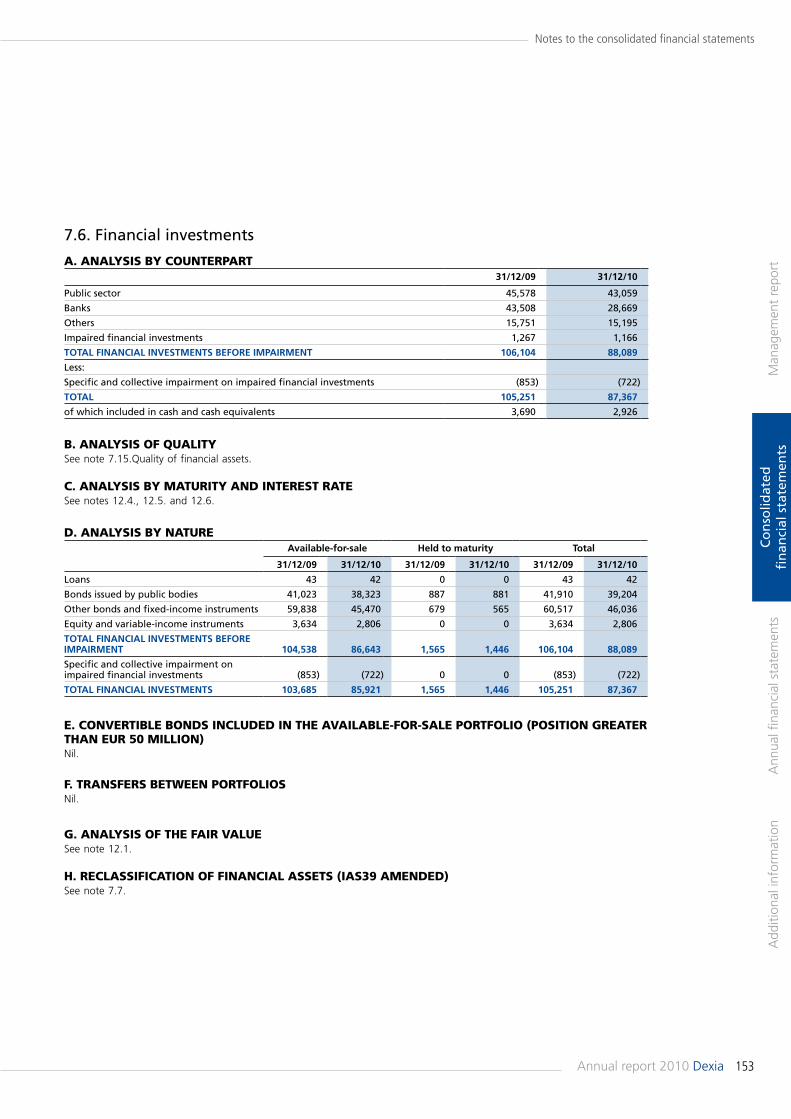
153Annual report 2010 Dexia
Man
agem
ent
repo
rtA
dditi
onal
info
rmat
ion
Ann
ual fi
nanc
ial s
tate
men
tsC
on
solid
ated
fi
nan
cial
sta
tem
ents
Notes to the consolidated financial statements
A. AnALysis by CounterPArt31/12/09 31/12/10
Public sector 45,578 43,059
Banks 43,508 28,669
Others 15,751 15,195
Impaired financial investments 1,267 1,166
ToTal fiNaNCial iNvesTmeNTs before impairmeNT 106,104 88,089
Less:
Specific and collective impairment on impaired financial investments (853) (722)
ToTal 105,251 87,367
of which included in cash and cash equivalents 3,690 2,926
d. AnALysis by nAtureavailable-for-sale held to maturity Total
31/12/09 31/12/10 31/12/09 31/12/10 31/12/09 31/12/10
Loans 43 42 0 0 43 42
Bonds issued by public bodies 41,023 38,323 887 881 41,910 39,204
Other bonds and fixed-income instruments 59,838 45,470 679 565 60,517 46,036
Equity and variable-income instruments 3,634 2,806 0 0 3,634 2,806
ToTal fiNaNCial iNvesTmeNTs before impairmeNT 104,538 86,643 1,565 1,446 106,104 88,089
Specific and collective impairment on impaired financial investments (853) (722) 0 0 (853) (722)
ToTal fiNaNCial iNvesTmeNTs 103,685 85,921 1,565 1,446 105,251 87,367
7.6. Financial investments
b. AnALysis of quALity See note 7.15.Quality of financial assets.
C. AnALysis by mAturity And interest rAte See notes 12.4., 12.5. and 12.6.
e. ConVertibLe bonds inCLuded in the AVAiLAbLe-for-sALe PortfoLio (Position GreAter thAn eur 50 miLLion)Nil.
G. AnALysis of the fAir VALue See note 12.1.
h. reCLAssifiCAtion of finAnCiAL Assets (iAs39 Amended)See note 7.7.
f. trAnsfers betWeen PortfoLiosNil.
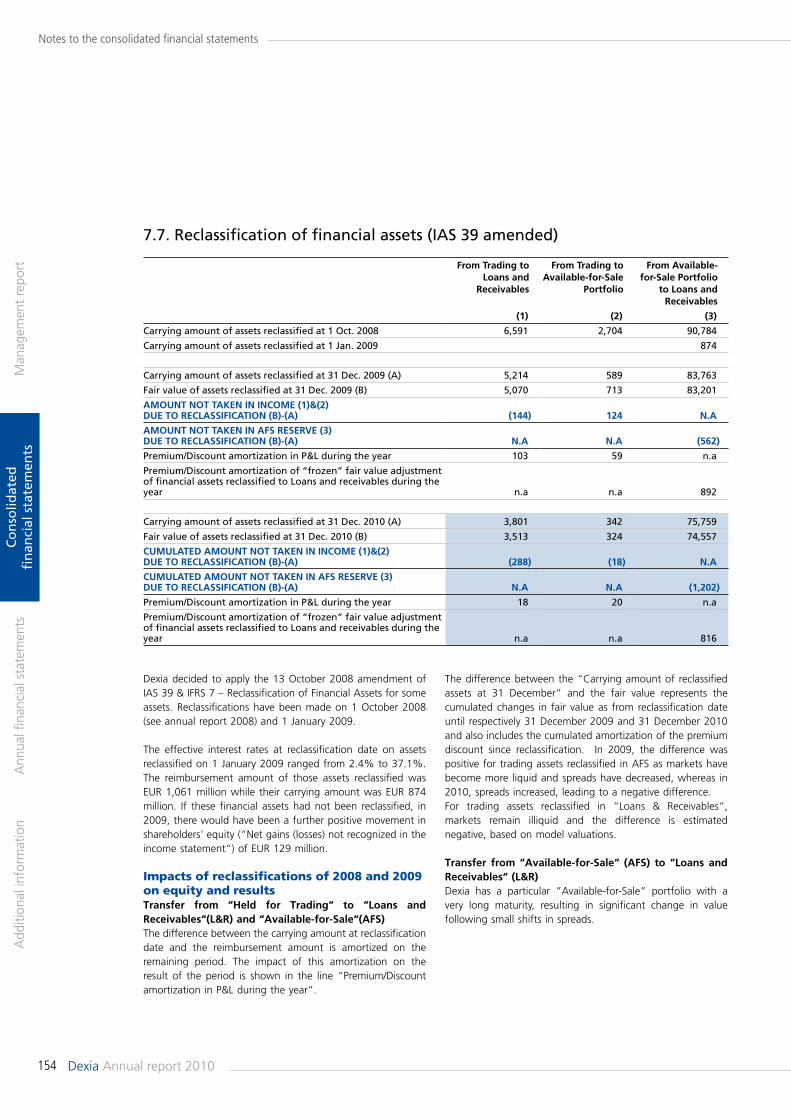
154 Dexia Annual report 2010
Man
agem
ent
repo
rtA
dditi
onal
info
rmat
ion
Ann
ual fi
nanc
ial s
tate
men
tsC
on
solid
ated
fi
nan
cial
sta
tem
ents
Notes to the consolidated financial statements
from Trading to loans and
receivables
from Trading to available-for-sale
portfolio
from available-for-sale portfolio
to loans and receivables
(1) (2) (3)
Carrying amount of assets reclassified at 1 Oct. 2008 6,591 2,704 90,784
Carrying amount of assets reclassified at 1 Jan. 2009 874
Carrying amount of assets reclassified at 31 Dec. 2009 (A) 5,214 589 83,763
Fair value of assets reclassified at 31 Dec. 2009 (B) 5,070 713 83,201
amouNT NoT TakeN iN iNCome (1)&(2) due To reClassifiCaTioN (b)-(a) (144) 124 N.a
amouNT NoT TakeN iN afs reserve (3) due To reClassifiCaTioN (b)-(a) N.a N.a (562)
Premium/Discount amortization in P&L during the year 103 59 n.a
Premium/Discount amortization of “frozen” fair value adjustment of financial assets reclassified to Loans and receivables during the year n.a n.a 892
Carrying amount of assets reclassified at 31 Dec. 2010 (A) 3,801 342 75,759
Fair value of assets reclassified at 31 Dec. 2010 (B) 3,513 324 74,557
CumulaTed amouNT NoT TakeN iN iNCome (1)&(2) due To reClassifiCaTioN (b)-(a) (288) (18) N.a
CumulaTed amouNT NoT TakeN iN afs reserve (3) due To reClassifiCaTioN (b)-(a) N.a N.a (1,202)
Premium/Discount amortization in P&L during the year 18 20 n.a
Premium/Discount amortization of “frozen” fair value adjustment of financial assets reclassified to Loans and receivables during the year n.a n.a 816
7.7. Reclassification of financial assets (IAS 39 amended)
Dexia decided to apply the 13 October 2008 amendment of IAS 39 & IFRS 7 – Reclassification of Financial Assets for some assets. Reclassifications have been made on 1 October 2008 (see annual report 2008) and 1 January 2009.
The effective interest rates at reclassification date on assets reclassified on 1 January 2009 ranged from 2.4% to 37.1%. The reimbursement amount of those assets reclassified was EUR 1,061 million while their carrying amount was EUR 874 million. If these financial assets had not been reclassified, in 2009, there would have been a further positive movement in shareholders' equity (“Net gains (losses) not recognized in the income statement“) of EUR 129 million.
impacts of reclassifications of 2008 and 2009 on equity and resultsTransfer from “held for Trading“ to “loans and receivables“(l&r) and “available-for-sale“(afs)The difference between the carrying amount at reclassification date and the reimbursement amount is amortized on the remaining period. The impact of this amortization on the result of the period is shown in the line “Premium/Discount amortization in P&L during the year“.
The difference between the “Carrying amount of reclassified assets at 31 December“ and the fair value represents the cumulated changes in fair value as from reclassification date until respectively 31 December 2009 and 31 December 2010 and also includes the cumulated amortization of the premium discount since reclassification. In 2009, the difference was positive for trading assets reclassified in AFS as markets have become more liquid and spreads have decreased, whereas in 2010, spreads increased, leading to a negative difference. For trading assets reclassified in “Loans & Receivables“, markets remain illiquid and the difference is estimated negative, based on model valuations.
Transfer from “available-for-sale“ (afs) to “loans and receivables“ (l&r)Dexia has a particular “Available-for-Sale“ portfolio with a very long maturity, resulting in significant change in value following small shifts in spreads.
155Annual report 2010 Dexia
Man
agem
ent
repo
rtA
dditi
onal
info
rmat
ion
Ann
ual fi
nanc
ial s
tate
men
tsC
on
solid
ated
fi
nan
cial
sta
tem
ents
Notes to the consolidated financial statements
The impact on the result regarding the “cost of risk“ is the net of allocation and use of collective impairment and specific impairments. In 2009, the net impact was estimated to an additional charge of EUR 108 millions before tax while in 2010, the net impact was estimated to reduce the cost of risk by EUR 13 million.
If there is objective evidence of impairment for a financial asset initially classified as “Available-for-sale“ but reclassified to “Loans and receivables“ in accordance with the amended IAS39, any difference between the net present value of expected future cash flows, discounted at the effective interest rate at date of reclassification, and the carrying amount is recognised as an impairment loss. Consequently, any non-amortised outstanding amount recognised in the “frozen“ fair value adjustment of financial assets reclassified to Loans and Receivables is recognised as an impairment loss as well.
The decrease of the carrying amount of the reclassified assets comes from repayments, prepayments or opportunistic sale of bonds in the context of balance sheet management and also from bonds on which an impairment has been recorded.
In comparison with 2009, the increase of the difference between the carrying amount of reclassified asset and its fair value reflects the increase of the carrying amount during the period by the effect of the amortization of the premium/discount for the year (EUR 816 million) and the changes due to the variations of credit and liquidity spreads on the markets.
impact on interest marginFor assets transferred from AFS to L&R, the amortization of the premium discount on the bond is compensated by the amortization of the "frozen" AFS reserve, so that the net impact on result is zero. For assets transferred from trading to AFS and L&R, the impact on the interest margin of the amortization of the negative mark-to-market of previous periods amounted to EUR 162 million in 2009 and to EUR 38 million in 2010.
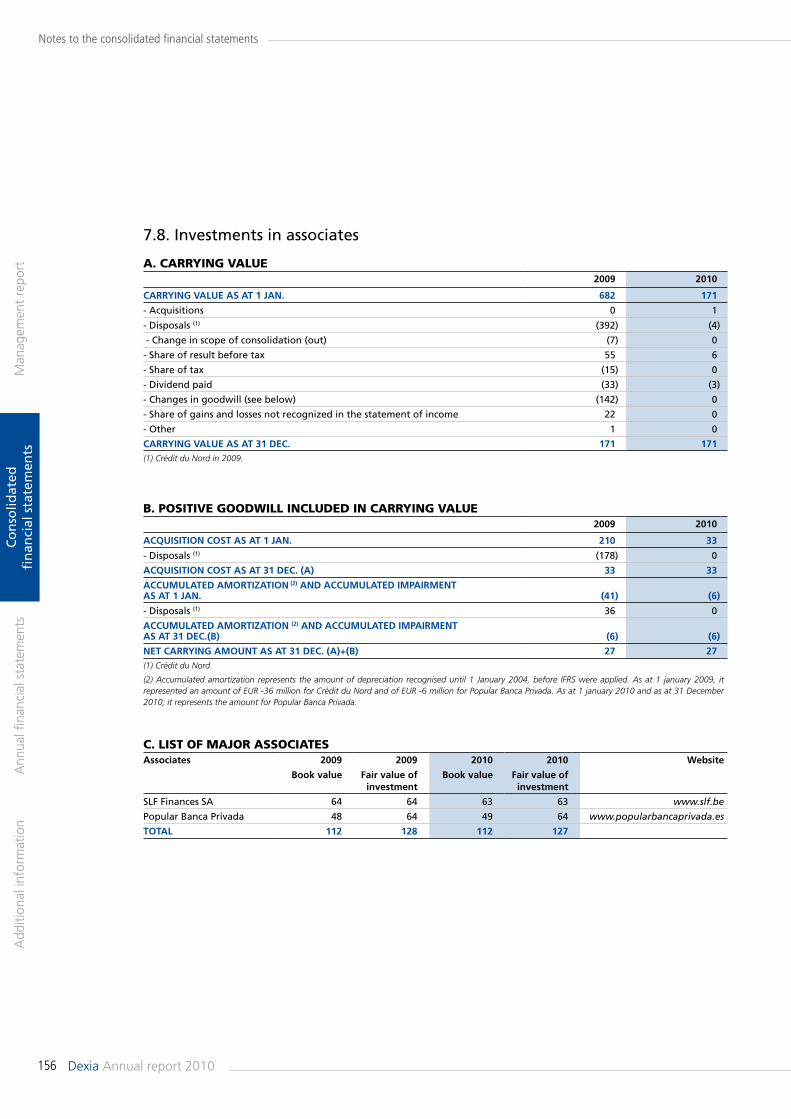
156 Dexia Annual report 2010
Man
agem
ent
repo
rtA
dditi
onal
info
rmat
ion
Ann
ual fi
nanc
ial s
tate
men
tsC
on
solid
ated
fi
nan
cial
sta
tem
ents
Notes to the consolidated financial statements
A. CArryinG VALue2009 2010
CarryiNG value as aT 1 JaN. 682 171
- Acquisitions 0 1
- Disposals (1) (392) (4)
- Change in scope of consolidation (out) (7) 0
- Share of result before tax 55 6
- Share of tax (15) 0
- Dividend paid (33) (3)
- Changes in goodwill (see below) (142) 0
- Share of gains and losses not recognized in the statement of income 22 0
- Other 1 0
CarryiNG value as aT 31 deC. 171 171(1) Crédit du Nord in 2009.
b. PositiVe GoodWiLL inCLuded in CArryinG VALue2009 2010
aCquisiTioN CosT as aT 1 JaN. 210 33
- Disposals (1) (178) 0
aCquisiTioN CosT as aT 31 deC. (a) 33 33
aCCumulaTed amorTizaTioN (2) aNd aCCumulaTed impairmeNT as aT 1 JaN. (41) (6)
- Disposals (1) 36 0
aCCumulaTed amorTizaTioN (2) aNd aCCumulaTed impairmeNT as aT 31 deC.(b) (6) (6)
NeT CarryiNG amouNT as aT 31 deC. (a)+(b) 27 27(1) Crédit du Nord.
(2) Accumulated amortization represents the amount of depreciation recognised until 1 January 2004, before IFRS were applied. As at 1 january 2009, it represented an amount of EUR -36 million for Crédit du Nord and of EUR -6 million for Popular Banca Privada. As at 1 january 2010 and as at 31 December 2010, it represents the amount for Popular Banca Privada.
C. List of mAjor AssoCiAtes associates 2009 2009 2010 2010 website
book value fair value of investment
book value fair value of investment
SLF Finances SA 64 64 63 63 www.slf.be
Popular Banca Privada 48 64 49 64 www.popularbancaprivada.es
ToTal 112 128 112 127
7.8. Investments in associates
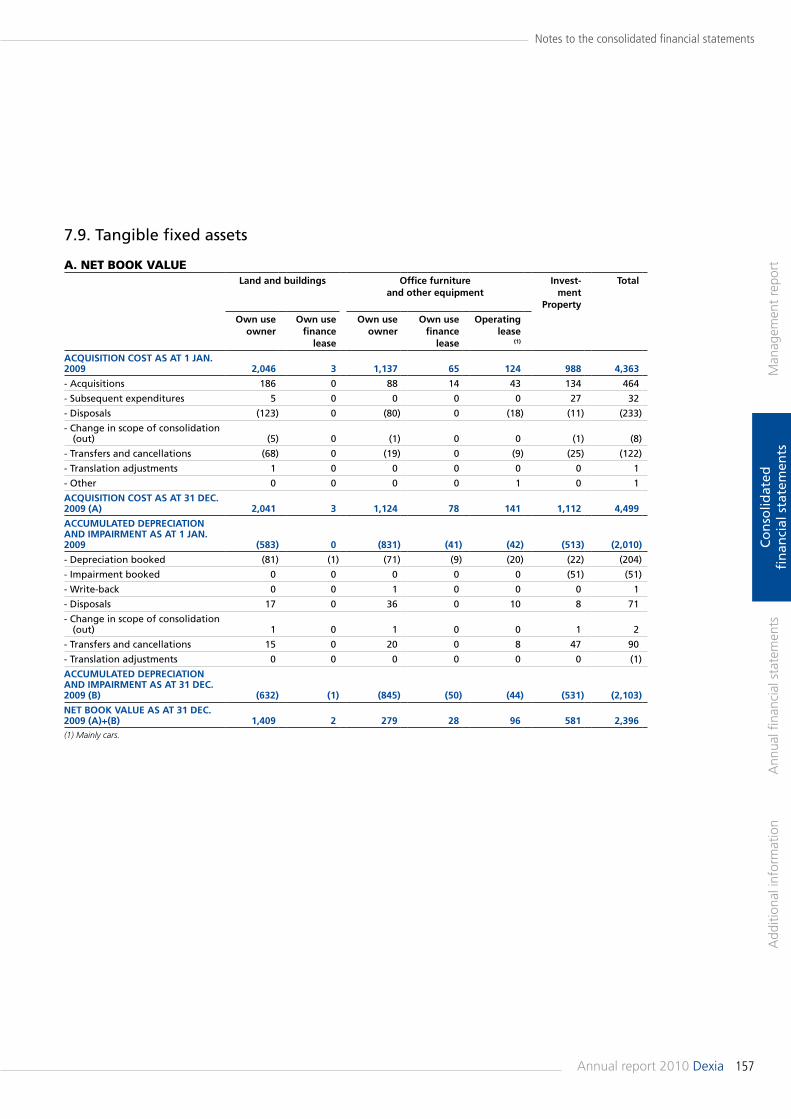
157Annual report 2010 Dexia
Man
agem
ent
repo
rtA
dditi
onal
info
rmat
ion
Ann
ual fi
nanc
ial s
tate
men
tsC
on
solid
ated
fi
nan
cial
sta
tem
ents
Notes to the consolidated financial statements
A. net booK VALueland and buildings office furniture
and other equipmentinvest-
ment property
Total
own use owner
own use finance
lease
own use owner
own use finance
lease
operating lease
(1)
aCquisiTioN CosT as aT 1 JaN. 2009 2,046 3 1,137 65 124 988 4,363
- Acquisitions 186 0 88 14 43 134 464
- Subsequent expenditures 5 0 0 0 0 27 32
- Disposals (123) 0 (80) 0 (18) (11) (233)
- Change in scope of consolidation (out) (5) 0 (1) 0 0 (1) (8)
- Transfers and cancellations (68) 0 (19) 0 (9) (25) (122)
- Translation adjustments 1 0 0 0 0 0 1
- Other 0 0 0 0 1 0 1
aCquisiTioN CosT as aT 31 deC. 2009 (a) 2,041 3 1,124 78 141 1,112 4,499
aCCumulaTed depreCiaTioN aNd impairmeNT as aT 1 JaN. 2009 (583) 0 (831) (41) (42) (513) (2,010)
- Depreciation booked (81) (1) (71) (9) (20) (22) (204)
- Impairment booked 0 0 0 0 0 (51) (51)
- Write-back 0 0 1 0 0 0 1
- Disposals 17 0 36 0 10 8 71
- Change in scope of consolidation (out) 1 0 1 0 0 1 2
- Transfers and cancellations 15 0 20 0 8 47 90
- Translation adjustments 0 0 0 0 0 0 (1)
aCCumulaTed depreCiaTioN aNd impairmeNT as aT 31 deC. 2009 (b) (632) (1) (845) (50) (44) (531) (2,103)
NeT book value as aT 31 deC. 2009 (a)+(b) 1,409 2 279 28 96 581 2,396(1) Mainly cars.
7.9. Tangible fixed assets
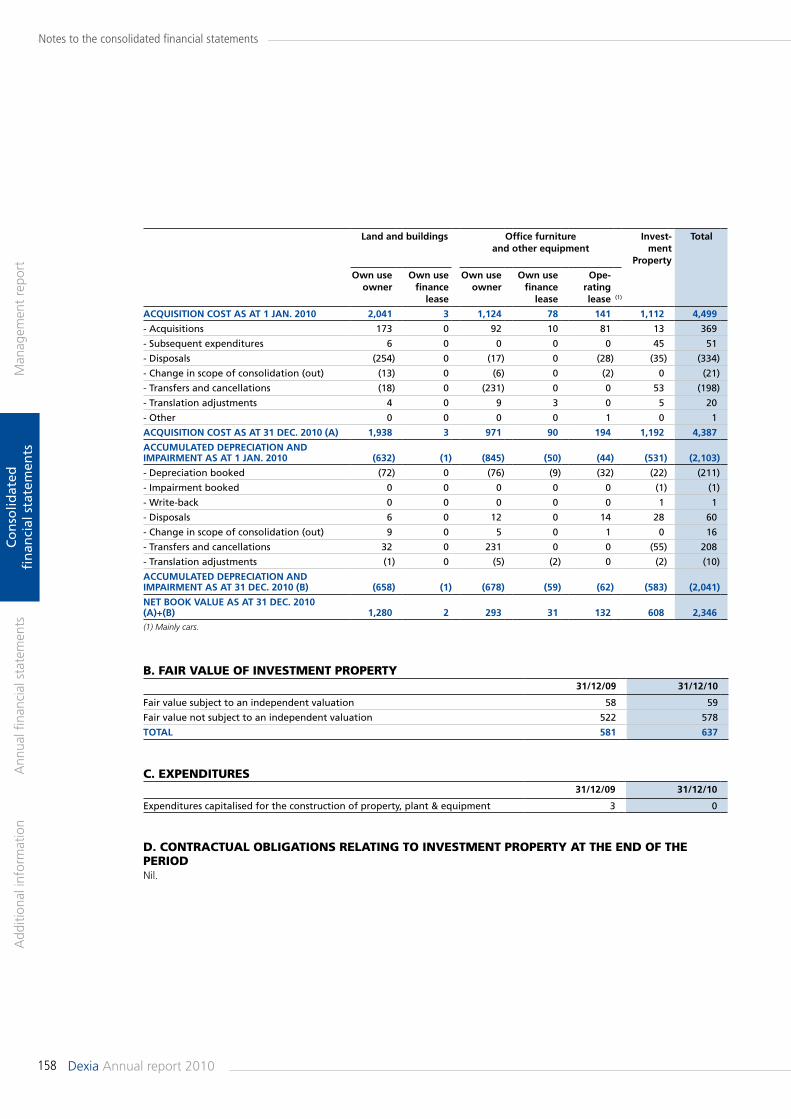
158 Dexia Annual report 2010
Man
agem
ent
repo
rtA
dditi
onal
info
rmat
ion
Ann
ual fi
nanc
ial s
tate
men
tsC
on
solid
ated
fi
nan
cial
sta
tem
ents
Notes to the consolidated financial statements
land and buildings office furniture and other equipment
invest-ment
property
Total
own use owner
own use finance
lease
own use owner
own use finance
lease
ope-rating lease (1)
aCquisiTioN CosT as aT 1 JaN. 2010 2,041 3 1,124 78 141 1,112 4,499
- Acquisitions 173 0 92 10 81 13 369
- Subsequent expenditures 6 0 0 0 0 45 51
- Disposals (254) 0 (17) 0 (28) (35) (334)
- Change in scope of consolidation (out) (13) 0 (6) 0 (2) 0 (21)
- Transfers and cancellations (18) 0 (231) 0 0 53 (198)
- Translation adjustments 4 0 9 3 0 5 20
- Other 0 0 0 0 1 0 1
aCquisiTioN CosT as aT 31 deC. 2010 (a) 1,938 3 971 90 194 1,192 4,387
aCCumulaTed depreCiaTioN aNd impairmeNT as aT 1 JaN. 2010 (632) (1) (845) (50) (44) (531) (2,103)
- Depreciation booked (72) 0 (76) (9) (32) (22) (211)
- Impairment booked 0 0 0 0 0 (1) (1)
- Write-back 0 0 0 0 0 1 1
- Disposals 6 0 12 0 14 28 60
- Change in scope of consolidation (out) 9 0 5 0 1 0 16
- Transfers and cancellations 32 0 231 0 0 (55) 208
- Translation adjustments (1) 0 (5) (2) 0 (2) (10)
aCCumulaTed depreCiaTioN aNd impairmeNT as aT 31 deC. 2010 (b) (658) (1) (678) (59) (62) (583) (2,041)
NeT book value as aT 31 deC. 2010 (a)+(b) 1,280 2 293 31 132 608 2,346(1) Mainly cars.
b. fAir VALue of inVestment ProPerty31/12/09 31/12/10
Fair value subject to an independent valuation 58 59
Fair value not subject to an independent valuation 522 578
ToTal 581 637
C. eXPenditures31/12/09 31/12/10
Expenditures capitalised for the construction of property, plant & equipment 3 0
d. ContrACtuAL obLiGAtions reLAtinG to inVestment ProPerty At the end of the PeriodNil.
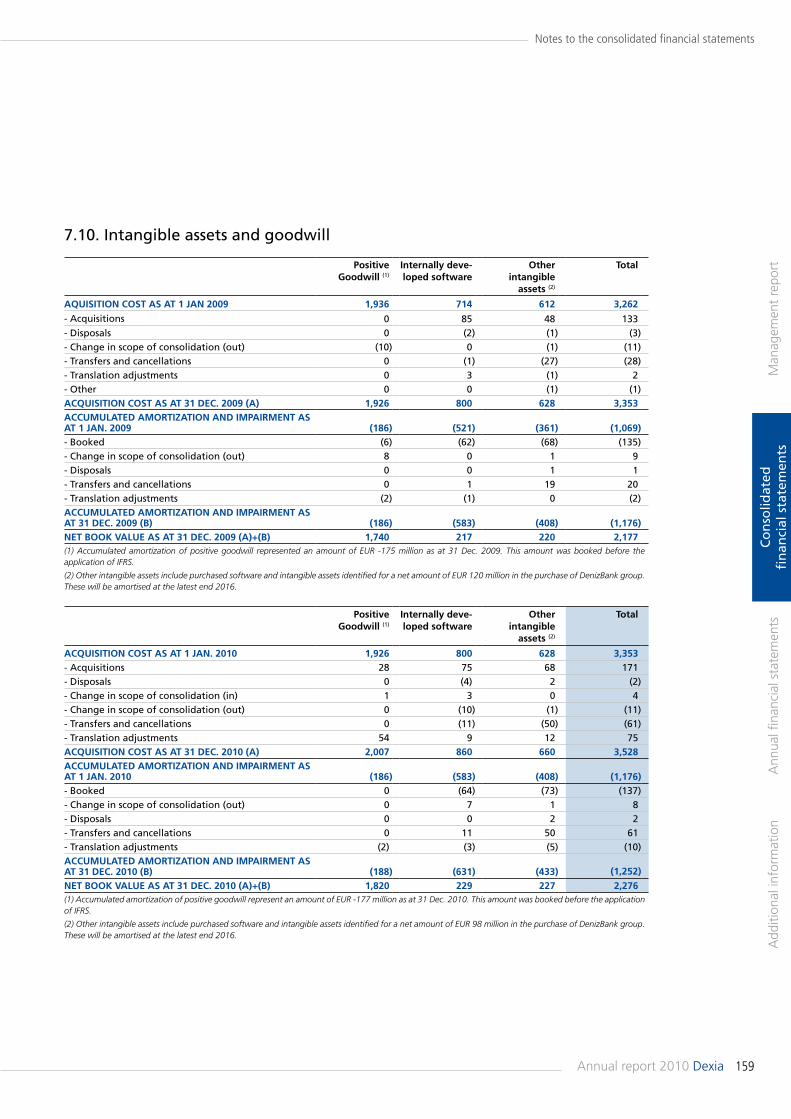
159Annual report 2010 Dexia
Man
agem
ent
repo
rtA
dditi
onal
info
rmat
ion
Ann
ual fi
nanc
ial s
tate
men
tsC
on
solid
ated
fi
nan
cial
sta
tem
ents
Notes to the consolidated financial statements
positive Goodwill (1)
internally deve-loped software
other intangible
assets (2)
Total
aquisiTioN CosT as aT 1 JaN 2009 1,936 714 612 3,262
- Acquisitions 0 85 48 133- Disposals 0 (2) (1) (3)- Change in scope of consolidation (out) (10) 0 (1) (11)- Transfers and cancellations 0 (1) (27) (28)- Translation adjustments 0 3 (1) 2- Other 0 0 (1) (1)aCquisiTioN CosT as aT 31 deC. 2009 (a) 1,926 800 628 3,353aCCumulaTed amorTizaTioN aNd impairmeNT as aT 1 JaN. 2009 (186) (521) (361) (1,069)- Booked (6) (62) (68) (135)- Change in scope of consolidation (out) 8 0 1 9- Disposals 0 0 1 1- Transfers and cancellations 0 1 19 20- Translation adjustments (2) (1) 0 (2)aCCumulaTed amorTizaTioN aNd impairmeNT as aT 31 deC. 2009 (b) (186) (583) (408) (1,176)NeT book value as aT 31 deC. 2009 (a)+(b) 1,740 217 220 2,177(1) Accumulated amortization of positive goodwill represented an amount of EUR -175 million as at 31 Dec. 2009. This amount was booked before the application of IFRS.
(2) Other intangible assets include purchased software and intangible assets identified for a net amount of EUR 120 million in the purchase of DenizBank group. These will be amortised at the latest end 2016.
7.10. Intangible assets and goodwill
positive Goodwill (1)
internally deve-loped software
other intangible
assets (2)
Total
aCquisiTioN CosT as aT 1 JaN. 2010 1,926 800 628 3,353- Acquisitions 28 75 68 171- Disposals 0 (4) 2 (2)- Change in scope of consolidation (in) 1 3 0 4- Change in scope of consolidation (out) 0 (10) (1) (11)- Transfers and cancellations 0 (11) (50) (61)- Translation adjustments 54 9 12 75aCquisiTioN CosT as aT 31 deC. 2010 (a) 2,007 860 660 3,528aCCumulaTed amorTizaTioN aNd impairmeNT as aT 1 JaN. 2010 (186) (583) (408) (1,176)- Booked 0 (64) (73) (137)- Change in scope of consolidation (out) 0 7 1 8- Disposals 0 0 2 2- Transfers and cancellations 0 11 50 61- Translation adjustments (2) (3) (5) (10)aCCumulaTed amorTizaTioN aNd impairmeNT as aT 31 deC. 2010 (b) (188) (631) (433) (1,252)
NeT book value as aT 31 deC. 2010 (a)+(b) 1,820 229 227 2,276(1) Accumulated amortization of positive goodwill represent an amount of EUR -177 million as at 31 Dec. 2010. This amount was booked before the application of IFRS.
(2) Other intangible assets include purchased software and intangible assets identified for a net amount of EUR 98 million in the purchase of DenizBank group. These will be amortised at the latest end 2016.
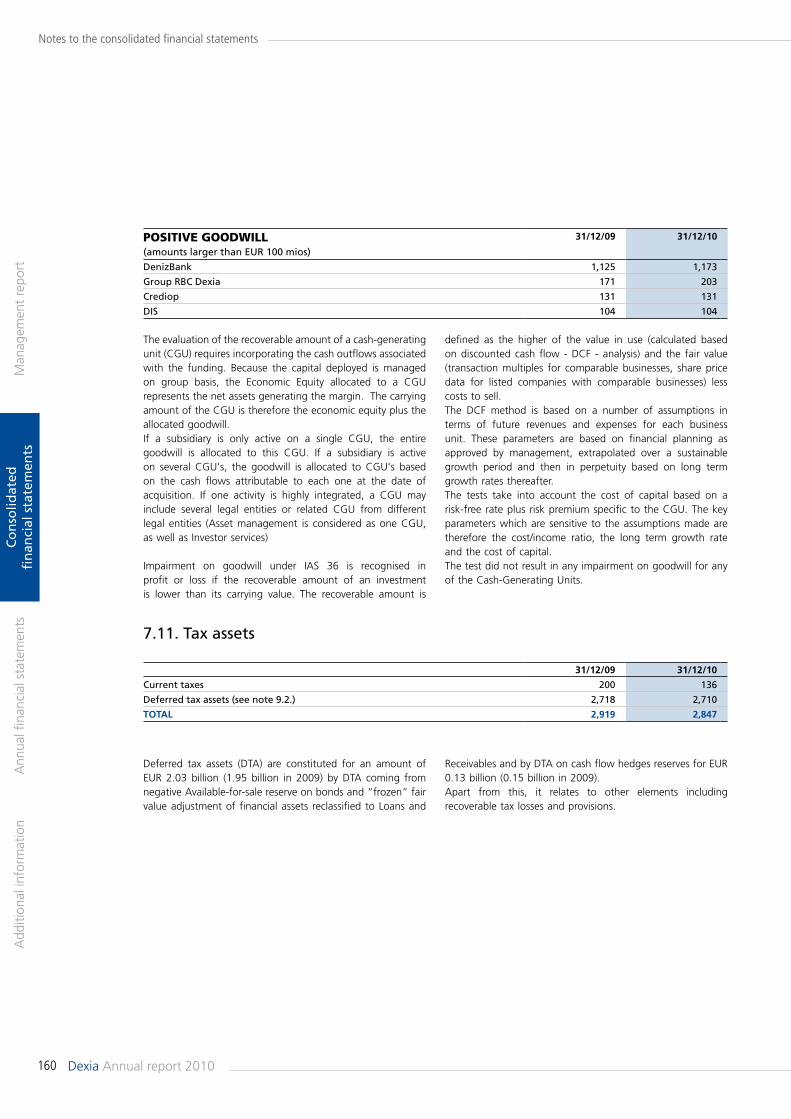
160 Dexia Annual report 2010
Man
agem
ent
repo
rtA
dditi
onal
info
rmat
ion
Ann
ual fi
nanc
ial s
tate
men
tsC
on
solid
ated
fi
nan
cial
sta
tem
ents
Notes to the consolidated financial statements
31/12/09 31/12/10
Current taxes 200 136
Deferred tax assets (see note 9.2.) 2,718 2,710
ToTal 2,919 2,847
7.11. Tax assets
Deferred tax assets (DTA) are constituted for an amount of EUR 2.03 billion (1.95 billion in 2009) by DTA coming from negative Available-for-sale reserve on bonds and “frozen“ fair value adjustment of financial assets reclassified to Loans and
Receivables and by DTA on cash flow hedges reserves for EUR 0.13 billion (0.15 billion in 2009). Apart from this, it relates to other elements including recoverable tax losses and provisions.
The evaluation of the recoverable amount of a cash-generating unit (CGU) requires incorporating the cash outflows associated with the funding. Because the capital deployed is managed on group basis, the Economic Equity allocated to a CGU represents the net assets generating the margin. The carrying amount of the CGU is therefore the economic equity plus the allocated goodwill.If a subsidiary is only active on a single CGU, the entire goodwill is allocated to this CGU. If a subsidiary is active on several CGU's, the goodwill is allocated to CGU's based on the cash flows attributable to each one at the date of acquisition. If one activity is highly integrated, a CGU may include several legal entities or related CGU from different legal entities (Asset management is considered as one CGU, as well as Investor services)
Impairment on goodwill under IAS 36 is recognised in profit or loss if the recoverable amount of an investment is lower than its carrying value. The recoverable amount is
defined as the higher of the value in use (calculated based on discounted cash flow - DCF - analysis) and the fair value (transaction multiples for comparable businesses, share price data for listed companies with comparable businesses) less costs to sell.The DCF method is based on a number of assumptions in terms of future revenues and expenses for each business unit. These parameters are based on financial planning as approved by management, extrapolated over a sustainable growth period and then in perpetuity based on long term growth rates thereafter.The tests take into account the cost of capital based on a risk-free rate plus risk premium specific to the CGU. The key parameters which are sensitive to the assumptions made are therefore the cost/income ratio, the long term growth rate and the cost of capital.The test did not result in any impairment on goodwill for any of the Cash-Generating Units.
PositiVe GoodWiLL (amounts larger than EUR 100 mios)
31/12/09 31/12/10
DenizBank 1,125 1,173
Group RBC Dexia 171 203
Crediop 131 131
DIS 104 104
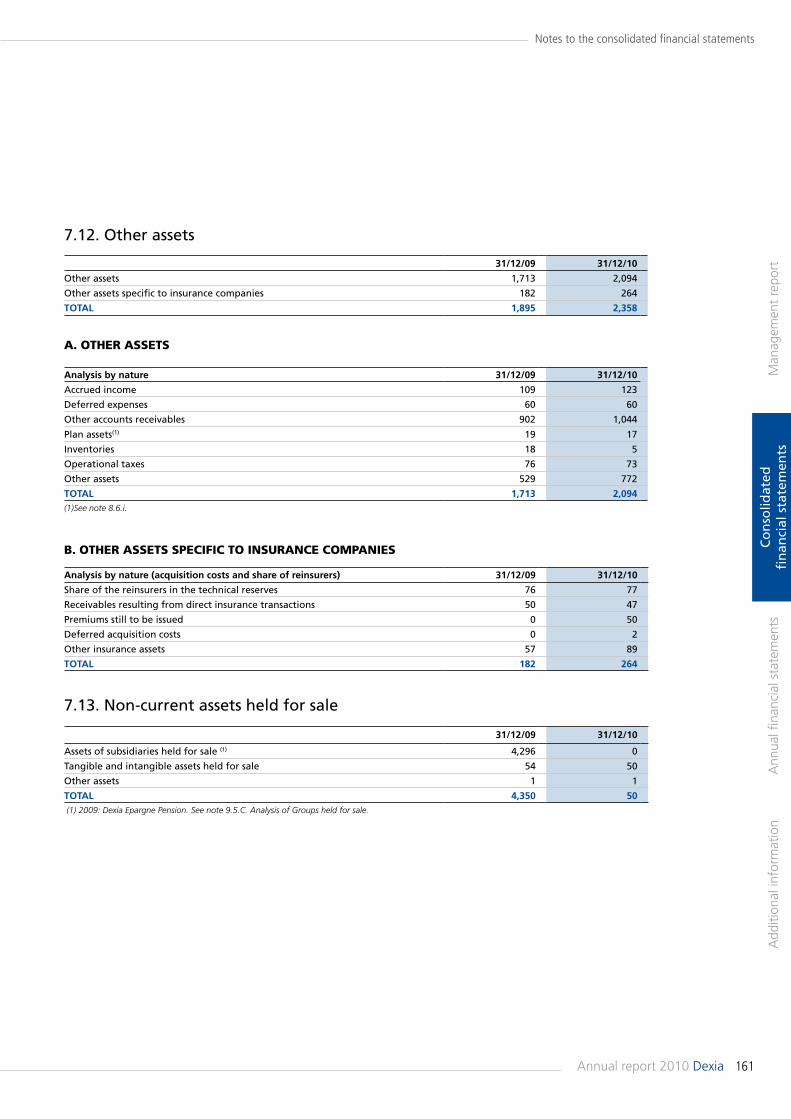
161Annual report 2010 Dexia
Man
agem
ent
repo
rtA
dditi
onal
info
rmat
ion
Ann
ual fi
nanc
ial s
tate
men
tsC
on
solid
ated
fi
nan
cial
sta
tem
ents
Notes to the consolidated financial statements
31/12/09 31/12/10
Other assets 1,713 2,094
Other assets specific to insurance companies 182 264
ToTal 1,895 2,358
analysis by nature 31/12/09 31/12/10
Accrued income 109 123
Deferred expenses 60 60
Other accounts receivables 902 1,044
Plan assets(1) 19 17
Inventories 18 5
Operational taxes 76 73
Other assets 529 772
ToTal 1,713 2,094(1)See note 8.6.i.
analysis by nature (acquisition costs and share of reinsurers) 31/12/09 31/12/10
Share of the reinsurers in the technical reserves 76 77
Receivables resulting from direct insurance transactions 50 47
Premiums still to be issued 0 50
Deferred acquisition costs 0 2
Other insurance assets 57 89
ToTal 182 264
7.12. Other assets
A. other Assets
b. other Assets sPeCifiC to insurAnCe ComPAnies
31/12/09 31/12/10
Assets of subsidiaries held for sale (1) 4,296 0
Tangible and intangible assets held for sale 54 50
Other assets 1 1
ToTal 4,350 50 (1) 2009: Dexia Epargne Pension. See note 9.5.C. Analysis of Groups held for sale.
7.13. Non-current assets held for sale
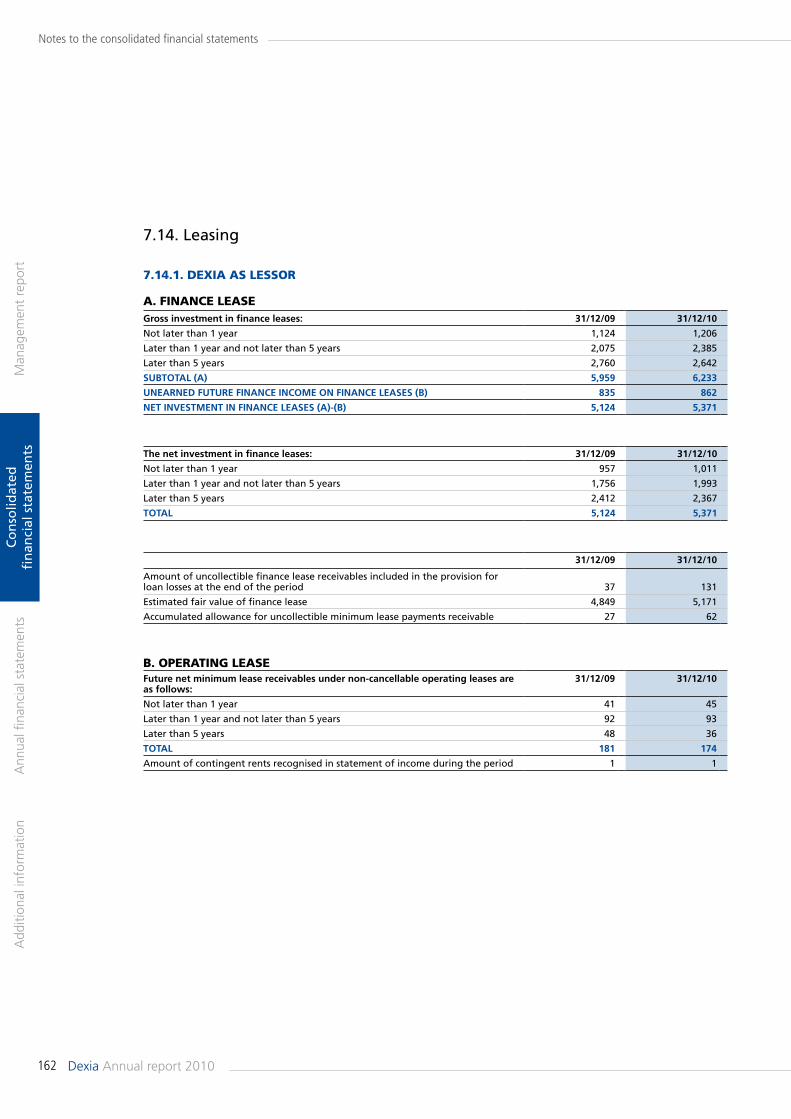
162 Dexia Annual report 2010
Man
agem
ent
repo
rtA
dditi
onal
info
rmat
ion
Ann
ual fi
nanc
ial s
tate
men
tsC
on
solid
ated
fi
nan
cial
sta
tem
ents
Notes to the consolidated financial statements
A. finAnCe LeAseGross investment in finance leases: 31/12/09 31/12/10
Not later than 1 year 1,124 1,206
Later than 1 year and not later than 5 years 2,075 2,385
Later than 5 years 2,760 2,642
subToTal (a) 5,959 6,233
uNearNed fuTure fiNaNCe iNCome oN fiNaNCe leases (b) 835 862
NeT iNvesTmeNT iN fiNaNCe leases (a)-(b) 5,124 5,371
The net investment in finance leases: 31/12/09 31/12/10
Not later than 1 year 957 1,011
Later than 1 year and not later than 5 years 1,756 1,993
Later than 5 years 2,412 2,367
ToTal 5,124 5,371
31/12/09 31/12/10
Amount of uncollectible finance lease receivables included in the provision for loan losses at the end of the period 37 131
Estimated fair value of finance lease 4,849 5,171
Accumulated allowance for uncollectible minimum lease payments receivable 27 62
b. oPerAtinG LeAsefuture net minimum lease receivables under non-cancellable operating leases are as follows:
31/12/09 31/12/10
Not later than 1 year 41 45
Later than 1 year and not later than 5 years 92 93
Later than 5 years 48 36
ToTal 181 174
Amount of contingent rents recognised in statement of income during the period 1 1
7.14. Leasing
7.14.1. deXiA As Lessor
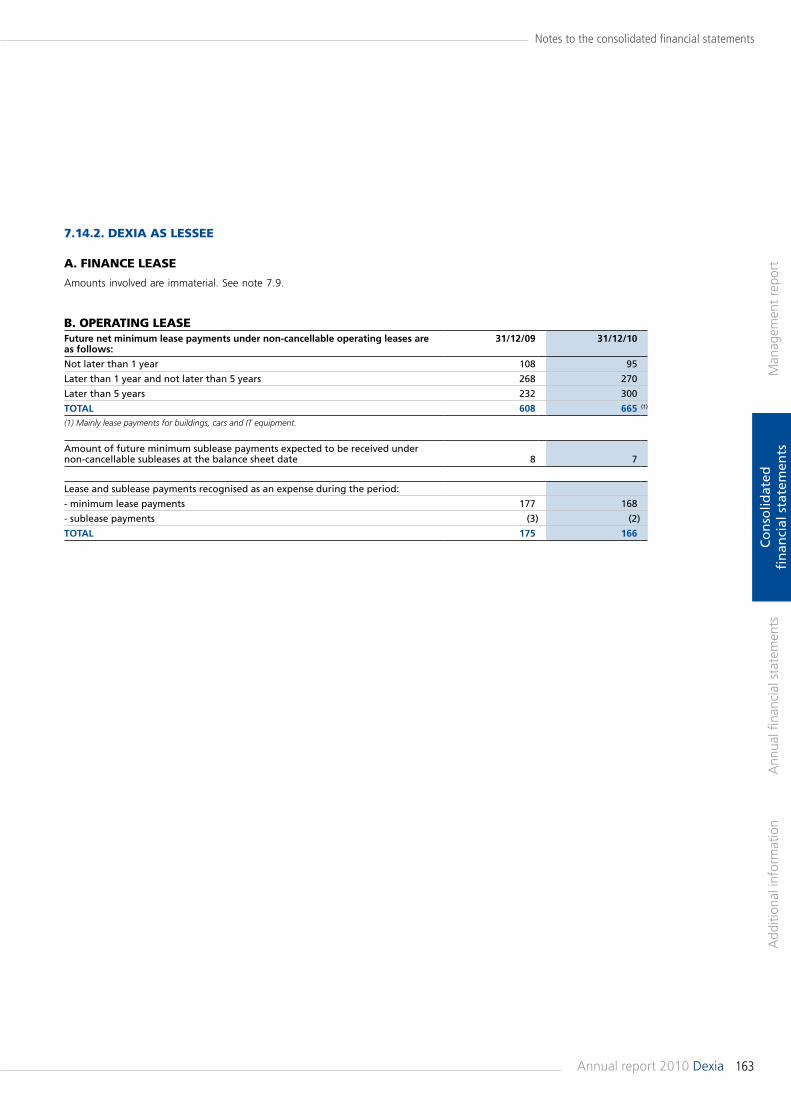
163Annual report 2010 Dexia
Man
agem
ent
repo
rtA
dditi
onal
info
rmat
ion
Ann
ual fi
nanc
ial s
tate
men
tsC
on
solid
ated
fi
nan
cial
sta
tem
ents
Notes to the consolidated financial statements
A. finAnCe LeAse
Amounts involved are immaterial. See note 7.9.
b. oPerAtinG LeAsefuture net minimum lease payments under non-cancellable operating leases are as follows:
31/12/09 31/12/10
Not later than 1 year 108 95
Later than 1 year and not later than 5 years 268 270
Later than 5 years 232 300
ToTal 608 665 (1)
(1) Mainly lease payments for buildings, cars and IT equipment.
Amount of future minimum sublease payments expected to be received under non-cancellable subleases at the balance sheet date 8 7
Lease and sublease payments recognised as an expense during the period:
- minimum lease payments 177 168
- sublease payments (3) (2)
ToTal 175 166
7.14.2. deXiA As Lessee
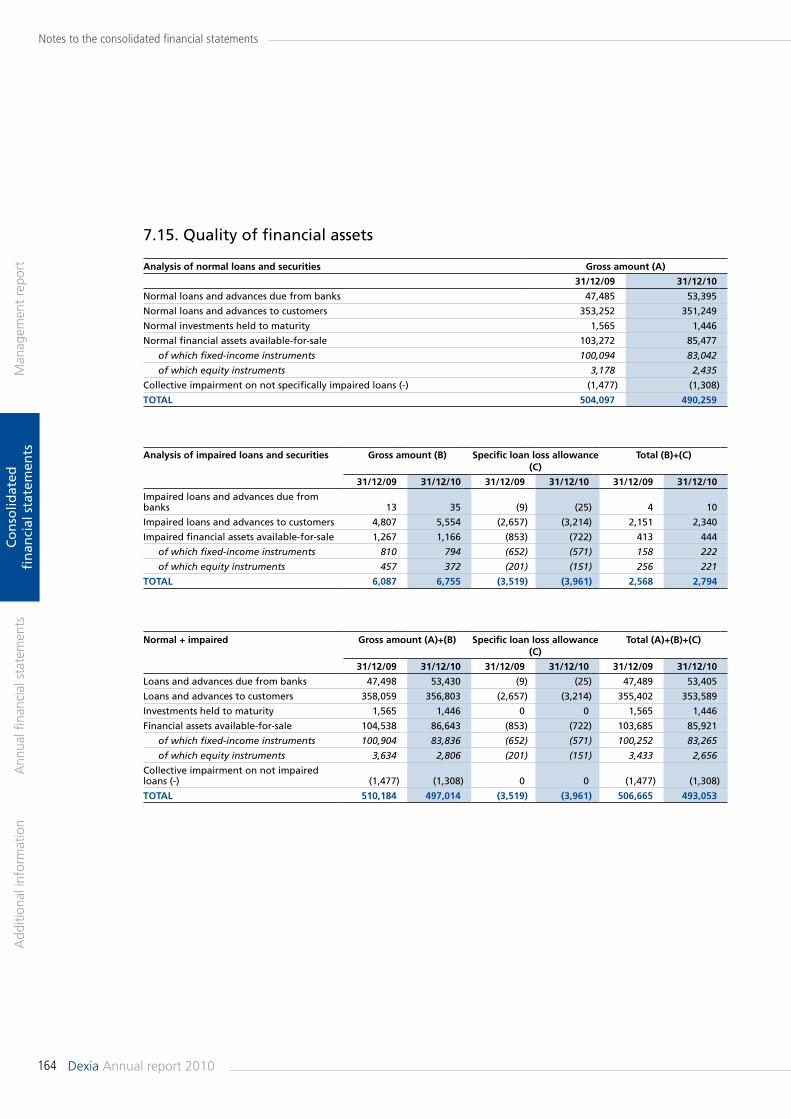
164 Dexia Annual report 2010
Man
agem
ent
repo
rtA
dditi
onal
info
rmat
ion
Ann
ual fi
nanc
ial s
tate
men
tsC
on
solid
ated
fi
nan
cial
sta
tem
ents
Notes to the consolidated financial statements
analysis of normal loans and securities Gross amount (a)
31/12/09 31/12/10
Normal loans and advances due from banks 47,485 53,395
Normal loans and advances to customers 353,252 351,249
Normal investments held to maturity 1,565 1,446
Normal financial assets available-for-sale 103,272 85,477
of which fixed-income instruments 100,094 83,042
of which equity instruments 3,178 2,435
Collective impairment on not specifically impaired loans (-) (1,477) (1,308)
ToTal 504,097 490,259
analysis of impaired loans and securities Gross amount (b) specific loan loss allowance (C)
Total (b)+(C)
31/12/09 31/12/10 31/12/09 31/12/10 31/12/09 31/12/10
Impaired loans and advances due from banks 13 35 (9) (25) 4 10
Impaired loans and advances to customers 4,807 5,554 (2,657) (3,214) 2,151 2,340
Impaired financial assets available-for-sale 1,267 1,166 (853) (722) 413 444
of which fixed-income instruments 810 794 (652) (571) 158 222
of which equity instruments 457 372 (201) (151) 256 221
ToTal 6,087 6,755 (3,519) (3,961) 2,568 2,794
Normal + impaired Gross amount (a)+(b) specific loan loss allowance (C)
Total (a)+(b)+(C)
31/12/09 31/12/10 31/12/09 31/12/10 31/12/09 31/12/10
Loans and advances due from banks 47,498 53,430 (9) (25) 47,489 53,405
Loans and advances to customers 358,059 356,803 (2,657) (3,214) 355,402 353,589
Investments held to maturity 1,565 1,446 0 0 1,565 1,446
Financial assets available-for-sale 104,538 86,643 (853) (722) 103,685 85,921
of which fixed-income instruments 100,904 83,836 (652) (571) 100,252 83,265
of which equity instruments 3,634 2,806 (201) (151) 3,433 2,656
Collective impairment on not impaired loans (-) (1,477) (1,308) 0 0 (1,477) (1,308)
ToTal 510,184 497,014 (3,519) (3,961) 506,665 493,053
7.15. Quality of financial assets
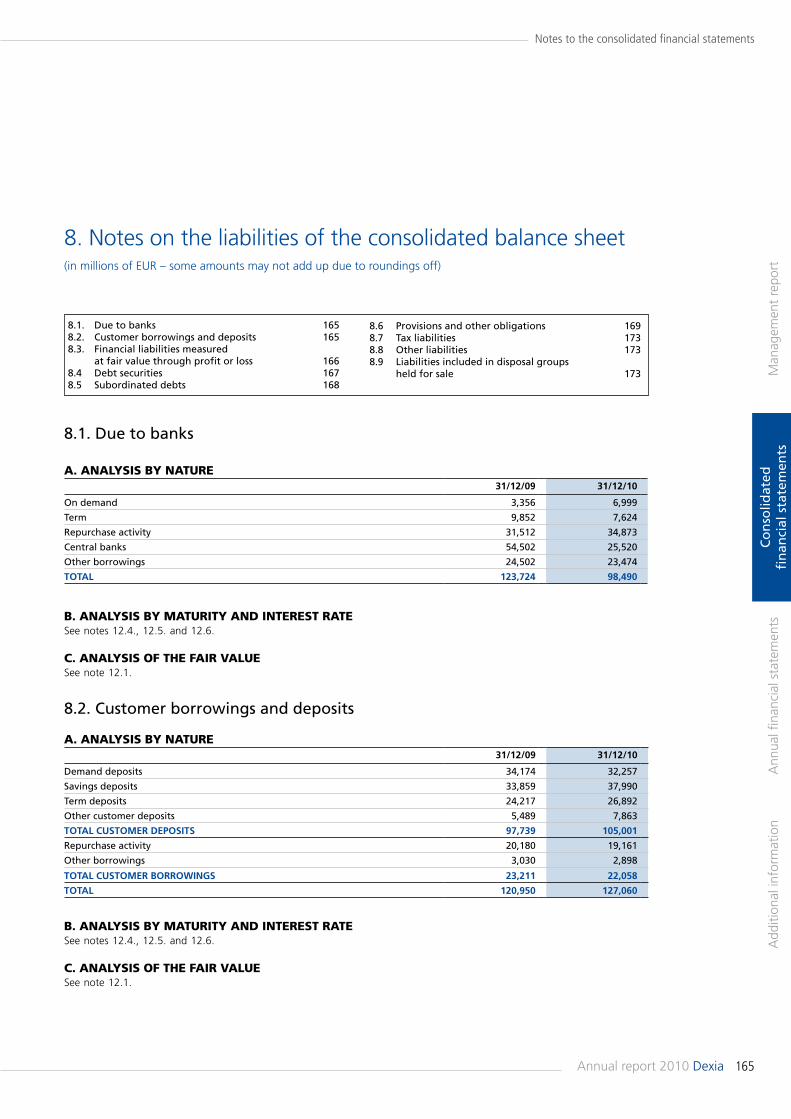
165Annual report 2010 Dexia
Man
agem
ent
repo
rtA
dditi
onal
info
rmat
ion
Ann
ual fi
nanc
ial s
tate
men
tsC
on
solid
ated
fi
nan
cial
sta
tem
ents
Notes to the consolidated financial statements
8. Notes on the liabilities of the consolidated balance sheet(in millions of EUR – some amounts may not add up due to roundings off)
A. AnALysis by nAture31/12/09 31/12/10
On demand 3,356 6,999
Term 9,852 7,624
Repurchase activity 31,512 34,873
Central banks 54,502 25,520
Other borrowings 24,502 23,474
ToTal 123,724 98,490
A. AnALysis by nAture31/12/09 31/12/10
Demand deposits 34,174 32,257
Savings deposits 33,859 37,990
Term deposits 24,217 26,892
Other customer deposits 5,489 7,863
ToTal CusTomer deposiTs 97,739 105,001
Repurchase activity 20,180 19,161
Other borrowings 3,030 2,898
ToTal CusTomer borrowiNGs 23,211 22,058
ToTal 120,950 127,060
8.1. Due to banks 1658.2. Customer borrowings and deposits 1658.3. Financial liabilities measured
at fair value through profit or loss 1668.4 Debt securities 1678.5 Subordinated debts 168
b. AnALysis by mAturity And interest rAteSee notes 12.4., 12.5. and 12.6.
C. AnALysis of the fAir VALueSee note 12.1.
8.2. Customer borrowings and deposits
b. AnALysis by mAturity And interest rAteSee notes 12.4., 12.5. and 12.6. C. AnALysis of the fAir VALueSee note 12.1.
8.6 Provisions and other obligations 1698.7 Tax liabilities 1738.8 Other liabilities 1738.9 Liabilities included in disposal groups held for sale 173
8.1. Due to banks
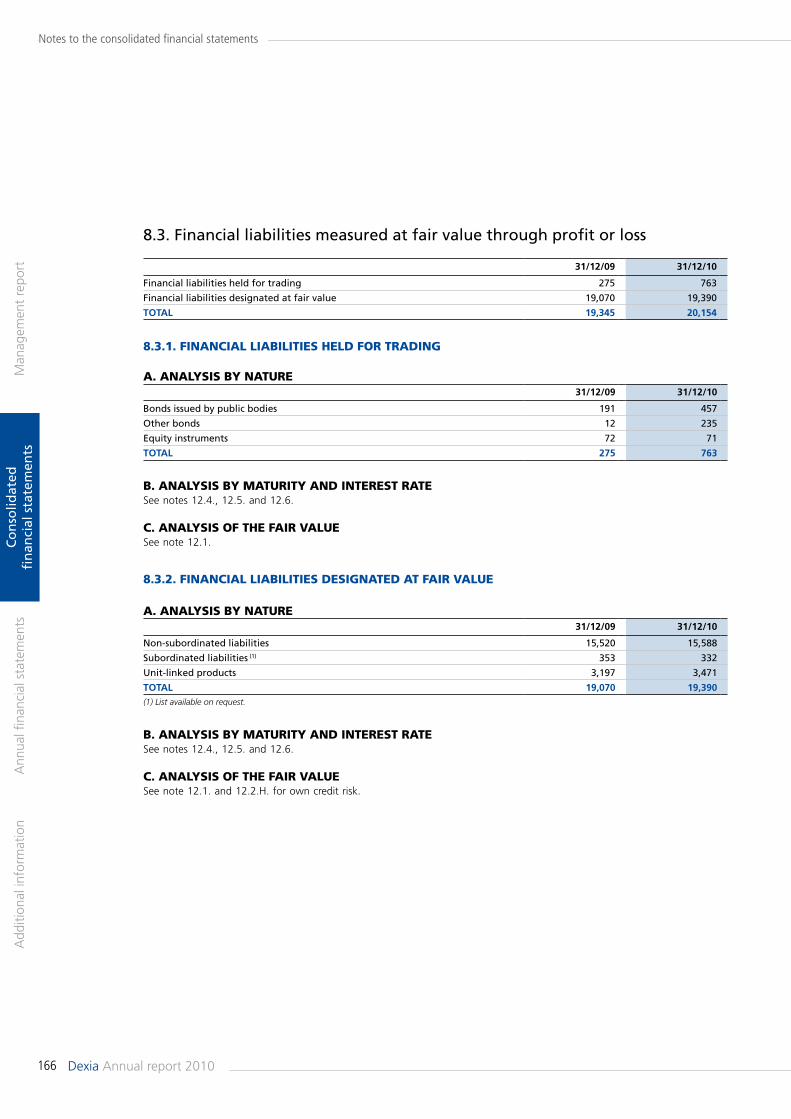
166 Dexia Annual report 2010
Man
agem
ent
repo
rtA
dditi
onal
info
rmat
ion
Ann
ual fi
nanc
ial s
tate
men
tsC
on
solid
ated
fi
nan
cial
sta
tem
ents
Notes to the consolidated financial statements
31/12/09 31/12/10
Financial liabilities held for trading 275 763
Financial liabilities designated at fair value 19,070 19,390
ToTal 19,345 20,154
A. AnALysis by nAture31/12/09 31/12/10
Bonds issued by public bodies 191 457
Other bonds 12 235
Equity instruments 72 71
ToTal 275 763
A. AnALysis by nAture31/12/09 31/12/10
Non-subordinated liabilities 15,520 15,588
Subordinated liabilities (1) 353 332
Unit-linked products 3,197 3,471
ToTal 19,070 19,390(1) List available on request.
8.3. Financial liabilities measured at fair value through profit or loss
8.3.1. finAnCiAL LiAbiLities heLd for trAdinG
b. AnALysis by mAturity And interest rAte See notes 12.4., 12.5. and 12.6.
C. AnALysis of the fAir VALueSee note 12.1.
8.3.2. finAnCiAL LiAbiLities desiGnAted At fAir VALue
b. AnALysis by mAturity And interest rAteSee notes 12.4., 12.5. and 12.6.
C. AnALysis of the fAir VALueSee note 12.1. and 12.2.H. for own credit risk.
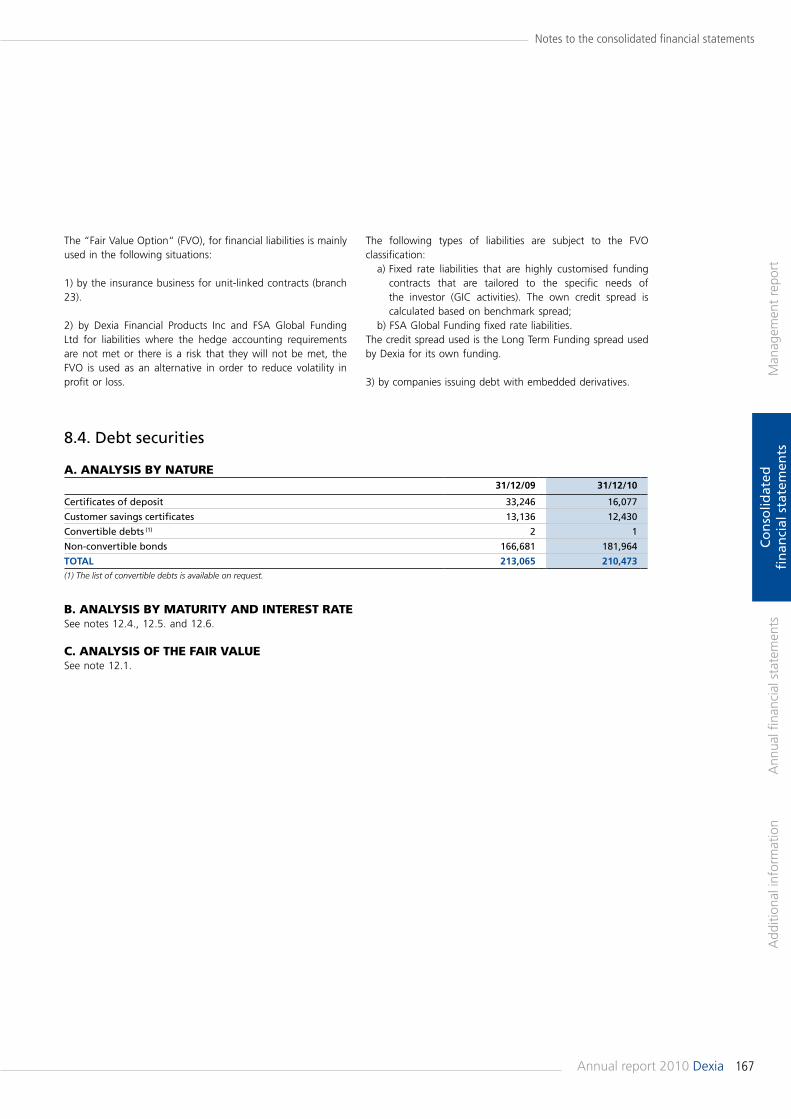
167Annual report 2010 Dexia
Man
agem
ent
repo
rtA
dditi
onal
info
rmat
ion
Ann
ual fi
nanc
ial s
tate
men
tsC
on
solid
ated
fi
nan
cial
sta
tem
ents
Notes to the consolidated financial statements
A. AnALysis by nAture31/12/09 31/12/10
Certificates of deposit 33,246 16,077
Customer savings certificates 13,136 12,430
Convertible debts (1) 2 1
Non-convertible bonds 166,681 181,964
ToTal 213,065 210,473(1) The list of convertible debts is available on request.
The “Fair Value Option“ (FVO), for financial liabilities is mainly used in the following situations:
1) by the insurance business for unit-linked contracts (branch 23).
2) by Dexia Financial Products Inc and FSA Global Funding Ltd for liabilities where the hedge accounting requirements are not met or there is a risk that they will not be met, the FVO is used as an alternative in order to reduce volatility in profit or loss.
The following types of liabilities are subject to the FVO classification:
a) Fixed rate liabilities that are highly customised funding contracts that are tailored to the specific needs of the investor (GIC activities). The own credit spread is calculated based on benchmark spread;
b) FSA Global Funding fixed rate liabilities.The credit spread used is the Long Term Funding spread used by Dexia for its own funding.
3) by companies issuing debt with embedded derivatives.
8.4. Debt securities
b. AnALysis by mAturity And interest rAteSee notes 12.4., 12.5. and 12.6.
C. AnALysis of the fAir VALueSee note 12.1.
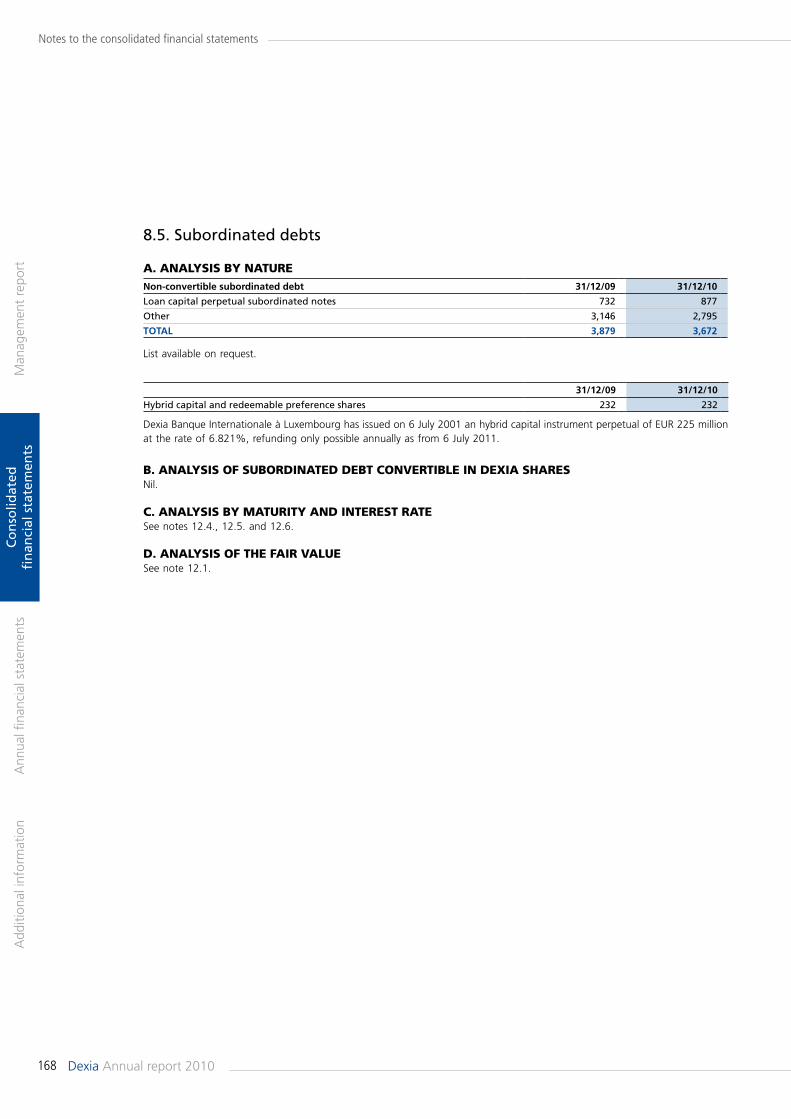
168 Dexia Annual report 2010
Man
agem
ent
repo
rtA
dditi
onal
info
rmat
ion
Ann
ual fi
nanc
ial s
tate
men
tsC
on
solid
ated
fi
nan
cial
sta
tem
ents
Notes to the consolidated financial statements
Non-convertible subordinated debt 31/12/09 31/12/10
Loan capital perpetual subordinated notes 732 877
Other 3,146 2,795
ToTal 3,879 3,672
List available on request.
31/12/09 31/12/10
Hybrid capital and redeemable preference shares 232 232
Dexia Banque Internationale à Luxembourg has issued on 6 July 2001 an hybrid capital instrument perpetual of EUR 225 million at the rate of 6.821%, refunding only possible annually as from 6 July 2011.
8.5. Subordinated debts
A. AnALysis by nAture
b. AnALysis of subordinAted debt ConVertibLe in deXiA shAresNil.
C. AnALysis by mAturity And interest rAteSee notes 12.4., 12.5. and 12.6. d. AnALysis of the fAir VALueSee note 12.1.
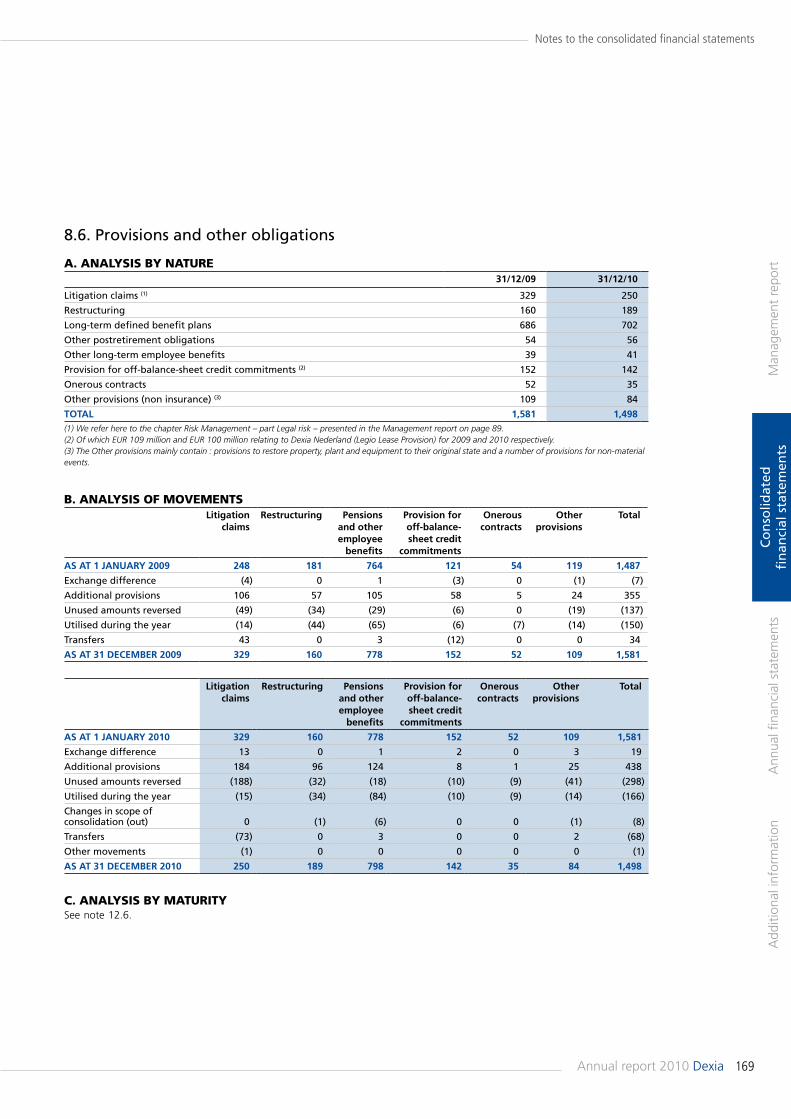
169Annual report 2010 Dexia
Man
agem
ent
repo
rtA
dditi
onal
info
rmat
ion
Ann
ual fi
nanc
ial s
tate
men
tsC
on
solid
ated
fi
nan
cial
sta
tem
ents
Notes to the consolidated financial statements
A. AnALysis by nAture31/12/09 31/12/10
Litigation claims (1) 329 250
Restructuring 160 189
Long-term defined benefit plans 686 702
Other postretirement obligations 54 56
Other long-term employee benefits 39 41
Provision for off-balance-sheet credit commitments (2) 152 142
Onerous contracts 52 35
Other provisions (non insurance) (3) 109 84
ToTal 1,581 1,498(1) We refer here to the chapter Risk Management – part Legal risk – presented in the Management report on page 89.(2) Of which EUR 109 million and EUR 100 million relating to Dexia Nederland (Legio Lease Provision) for 2009 and 2010 respectively.(3) The Other provisions mainly contain : provisions to restore property, plant and equipment to their original state and a number of provisions for non-material events.
b. AnALysis of moVementslitigation
claimsrestructuring pensions
and other employee
benefits
provision for off-balance-sheet credit
commitments
onerous contracts
other provisions
Total
as aT 1 JaNuary 2009 248 181 764 121 54 119 1,487
Exchange difference (4) 0 1 (3) 0 (1) (7)
Additional provisions 106 57 105 58 5 24 355
Unused amounts reversed (49) (34) (29) (6) 0 (19) (137)
Utilised during the year (14) (44) (65) (6) (7) (14) (150)
Transfers 43 0 3 (12) 0 0 34
as aT 31 deCember 2009 329 160 778 152 52 109 1,581
litigation claims
restructuring pensions and other employee
benefits
provision for off-balance-sheet credit
commitments
onerous contracts
other provisions
Total
as aT 1 JaNuary 2010 329 160 778 152 52 109 1,581
Exchange difference 13 0 1 2 0 3 19
Additional provisions 184 96 124 8 1 25 438
Unused amounts reversed (188) (32) (18) (10) (9) (41) (298)
Utilised during the year (15) (34) (84) (10) (9) (14) (166)
Changes in scope of consolidation (out) 0 (1) (6) 0 0 (1) (8)
Transfers (73) 0 3 0 0 2 (68)
Other movements (1) 0 0 0 0 0 (1)
as aT 31 deCember 2010 250 189 798 142 35 84 1,498
8.6. Provisions and other obligations
C. AnALysis by mAturity See note 12.6.
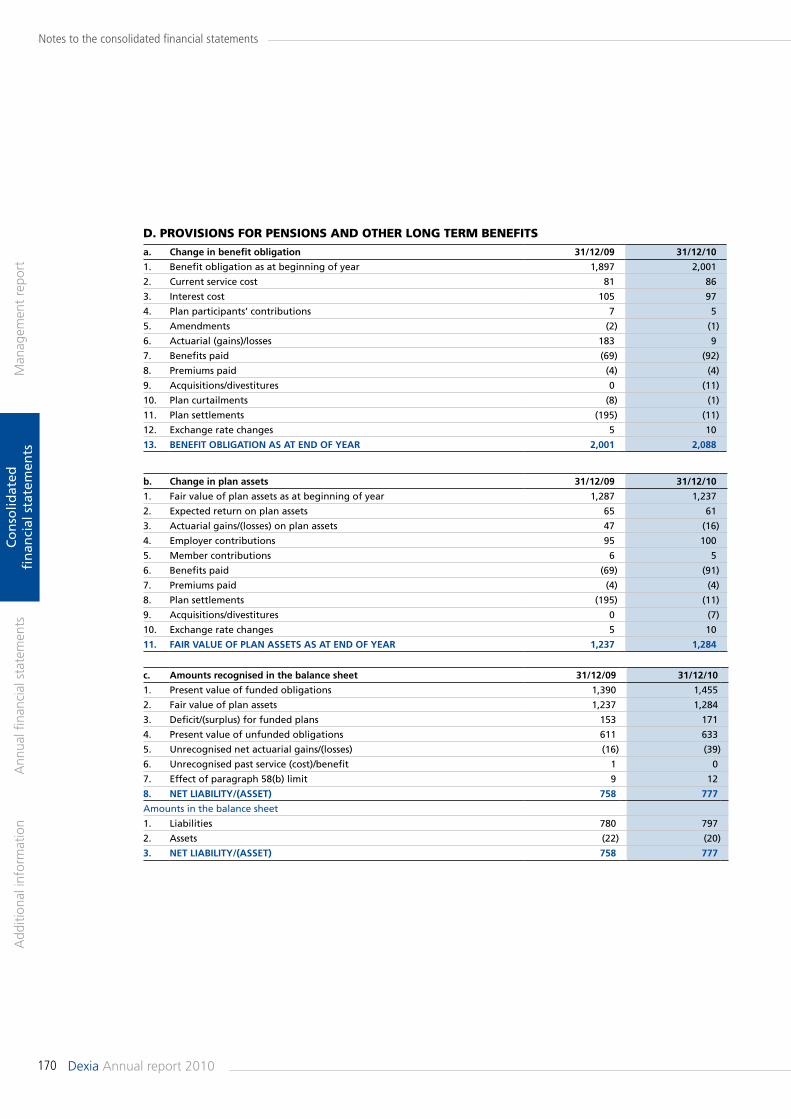
170 Dexia Annual report 2010
Man
agem
ent
repo
rtA
dditi
onal
info
rmat
ion
Ann
ual fi
nanc
ial s
tate
men
tsC
on
solid
ated
fi
nan
cial
sta
tem
ents
Notes to the consolidated financial statements
a. Change in benefit obligation 31/12/09 31/12/10
1. Benefit obligation as at beginning of year 1,897 2,001
2. Current service cost 81 86
3. Interest cost 105 97
4. Plan participants’ contributions 7 5
5. Amendments (2) (1)
6. Actuarial (gains)/losses 183 9
7. Benefits paid (69) (92)
8. Premiums paid (4) (4)
9. Acquisitions/divestitures 0 (11)
10. Plan curtailments (8) (1)
11. Plan settlements (195) (11)
12. Exchange rate changes 5 10
13. beNefiT obliGaTioN as aT eNd of year 2,001 2,088
b. Change in plan assets 31/12/09 31/12/10
1. Fair value of plan assets as at beginning of year 1,287 1,237
2. Expected return on plan assets 65 61
3. Actuarial gains/(losses) on plan assets 47 (16)
4. Employer contributions 95 100
5. Member contributions 6 5
6. Benefits paid (69) (91)
7. Premiums paid (4) (4)
8. Plan settlements (195) (11)
9. Acquisitions/divestitures 0 (7)
10. Exchange rate changes 5 10
11. fair value of plaN asseTs as aT eNd of year 1,237 1,284
c. amounts recognised in the balance sheet 31/12/09 31/12/10
1. Present value of funded obligations 1,390 1,455
2. Fair value of plan assets 1,237 1,284
3. Deficit/(surplus) for funded plans 153 171
4. Present value of unfunded obligations 611 633
5. Unrecognised net actuarial gains/(losses) (16) (39)
6. Unrecognised past service (cost)/benefit 1 0
7. Effect of paragraph 58(b) limit 9 12
8. NeT liabiliTy/(asseT) 758 777
Amounts in the balance sheet
1. Liabilities 780 797
2. Assets (22) (20)
3. NeT liabiliTy/(asseT) 758 777
d. ProVisions for Pensions And other LonG term benefits
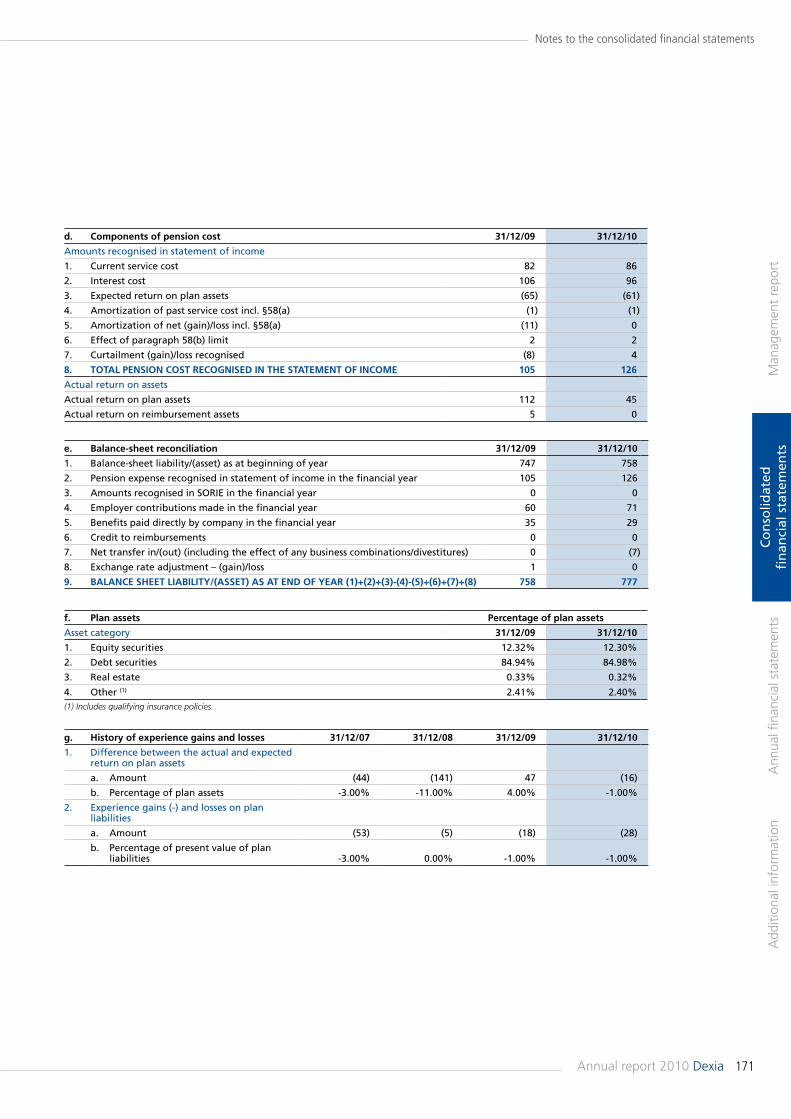
171Annual report 2010 Dexia
Man
agem
ent
repo
rtA
dditi
onal
info
rmat
ion
Ann
ual fi
nanc
ial s
tate
men
tsC
on
solid
ated
fi
nan
cial
sta
tem
ents
Notes to the consolidated financial statements
d. Components of pension cost 31/12/09 31/12/10
Amounts recognised in statement of income
1. Current service cost 82 86
2. Interest cost 106 96
3. Expected return on plan assets (65) (61)
4. Amortization of past service cost incl. §58(a) (1) (1)
5. Amortization of net (gain)/loss incl. §58(a) (11) 0
6. Effect of paragraph 58(b) limit 2 2
7. Curtailment (gain)/loss recognised (8) 4
8. ToTal peNsioN CosT reCoGNised iN The sTaTemeNT of iNCome 105 126
Actual return on assets
Actual return on plan assets 112 45
Actual return on reimbursement assets 5 0
e. balance-sheet reconciliation 31/12/09 31/12/10
1. Balance-sheet liability/(asset) as at beginning of year 747 758
2. Pension expense recognised in statement of income in the financial year 105 126
3. Amounts recognised in SORIE in the financial year 0 0
4. Employer contributions made in the financial year 60 71
5. Benefits paid directly by company in the financial year 35 29
6. Credit to reimbursements 0 0
7. Net transfer in/(out) (including the effect of any business combinations/divestitures) 0 (7)
8. Exchange rate adjustment – (gain)/loss 1 0
9. balaNCe sheeT liabiliTy/(asseT) as aT eNd of year (1)+(2)+(3)-(4)-(5)+(6)+(7)+(8) 758 777
f. plan assets percentage of plan assets
Asset category 31/12/09 31/12/10
1. Equity securities 12.32% 12.30%
2. Debt securities 84.94% 84.98%
3. Real estate 0.33% 0.32%
4. Other (1) 2.41% 2.40%(1) Includes qualifying insurance policies.
g. history of experience gains and losses 31/12/07 31/12/08 31/12/09 31/12/10
1. Difference between the actual and expected return on plan assets
a. Amount (44) (141) 47 (16)
b. Percentage of plan assets -3.00% -11.00% 4.00% -1.00%
2. Experience gains (-) and losses on plan liabilities
a. Amount (53) (5) (18) (28)
b. Percentage of present value of plan liabilities -3.00% 0.00% -1.00% -1.00%
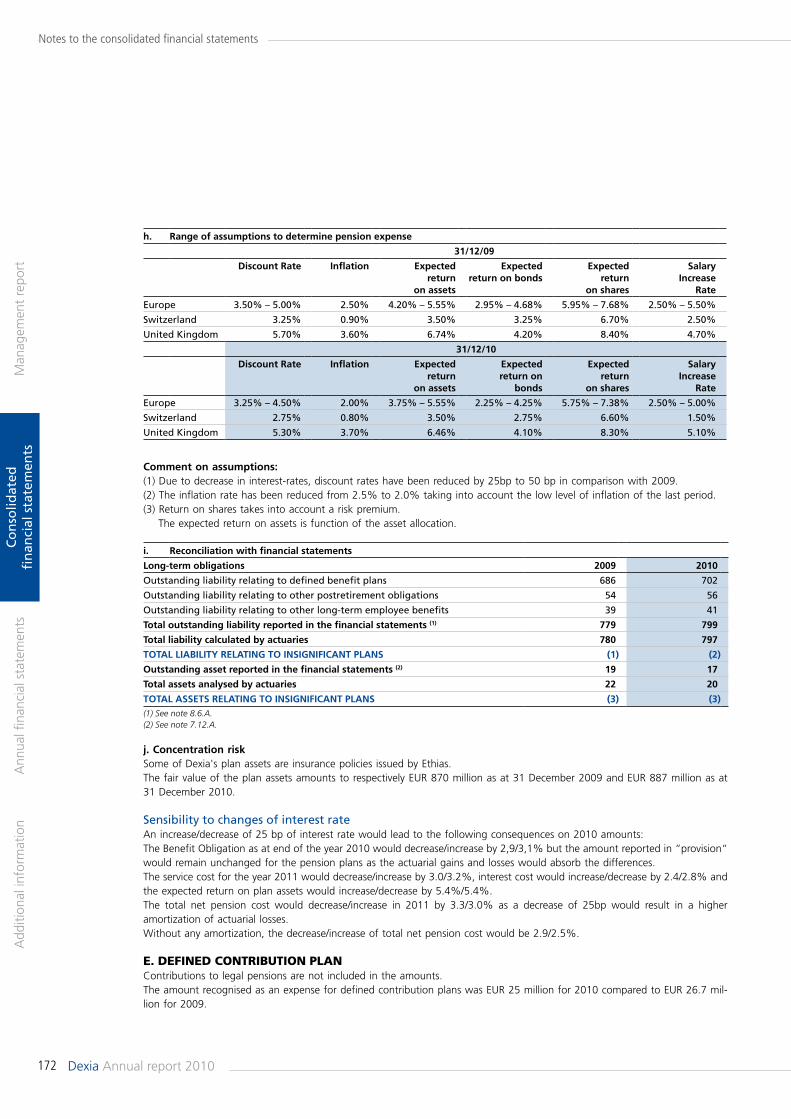
172 Dexia Annual report 2010
Man
agem
ent
repo
rtA
dditi
onal
info
rmat
ion
Ann
ual fi
nanc
ial s
tate
men
tsC
on
solid
ated
fi
nan
cial
sta
tem
ents
Notes to the consolidated financial statements
h. range of assumptions to determine pension expense
31/12/09
discount rate inflation expected return
on assets
expected return on bonds
expected return
on shares
salary increase
rate
Europe 3.50% – 5.00% 2.50% 4.20% – 5.55% 2.95% – 4.68% 5.95% – 7.68% 2.50% – 5.50%
Switzerland 3.25% 0.90% 3.50% 3.25% 6.70% 2.50%
United Kingdom 5.70% 3.60% 6.74% 4.20% 8.40% 4.70%
31/12/10
discount rate inflation expected return
on assets
expected return on
bonds
expected return
on shares
salary increase
rate
Europe 3.25% – 4.50% 2.00% 3.75% – 5.55% 2.25% – 4.25% 5.75% – 7.38% 2.50% – 5.00%
Switzerland 2.75% 0.80% 3.50% 2.75% 6.60% 1.50%
United Kingdom 5.30% 3.70% 6.46% 4.10% 8.30% 5.10%
i. reconciliation with financial statements
long-term obligations 2009 2010
Outstanding liability relating to defined benefit plans 686 702
Outstanding liability relating to other postretirement obligations 54 56
Outstanding liability relating to other long-term employee benefits 39 41
Total outstanding liability reported in the financial statements (1) 779 799
Total liability calculated by actuaries 780 797
ToTal liabiliTy relaTiNG To iNsiGNifiCaNT plaNs (1) (2)
outstanding asset reported in the financial statements (2) 19 17
Total assets analysed by actuaries 22 20
ToTal asseTs relaTiNG To iNsiGNifiCaNT plaNs (3) (3)(1) See note 8.6.A.(2) See note 7.12.A.
Comment on assumptions:(1) Due to decrease in interest-rates, discount rates have been reduced by 25bp to 50 bp in comparison with 2009.(2) The inflation rate has been reduced from 2.5% to 2.0% taking into account the low level of inflation of the last period.(3) Return on shares takes into account a risk premium.
The expected return on assets is function of the asset allocation.
j. Concentration risk Some of Dexia's plan assets are insurance policies issued by Ethias.The fair value of the plan assets amounts to respectively EUR 870 million as at 31 December 2009 and EUR 887 million as at 31 December 2010.
Sensibility to changes of interest rateAn increase/decrease of 25 bp of interest rate would lead to the following consequences on 2010 amounts:The Benefit Obligation as at end of the year 2010 would decrease/increase by 2,9/3,1% but the amount reported in “provision“ would remain unchanged for the pension plans as the actuarial gains and losses would absorb the differences.The service cost for the year 2011 would decrease/increase by 3.0/3.2%, interest cost would increase/decrease by 2.4/2.8% and the expected return on plan assets would increase/decrease by 5.4%/5.4%.The total net pension cost would decrease/increase in 2011 by 3.3/3.0% as a decrease of 25bp would result in a higher amortization of actuarial losses.Without any amortization, the decrease/increase of total net pension cost would be 2.9/2.5%.
e. defined Contribution PLAnContributions to legal pensions are not included in the amounts.The amount recognised as an expense for defined contribution plans was EUR 25 million for 2010 compared to EUR 26.7 mil-lion for 2009.
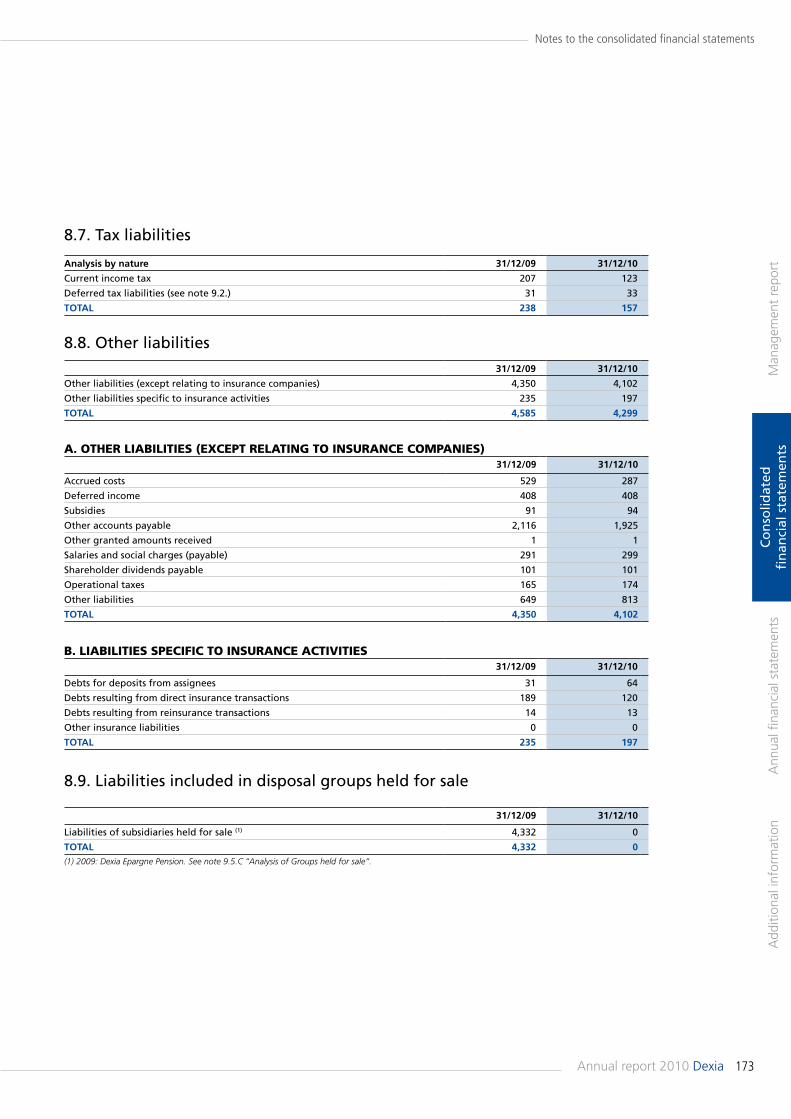
173Annual report 2010 Dexia
Man
agem
ent
repo
rtA
dditi
onal
info
rmat
ion
Ann
ual fi
nanc
ial s
tate
men
tsC
on
solid
ated
fi
nan
cial
sta
tem
ents
Notes to the consolidated financial statements
analysis by nature 31/12/09 31/12/10
Current income tax 207 123
Deferred tax liabilities (see note 9.2.) 31 33
ToTal 238 157
31/12/09 31/12/10
Other liabilities (except relating to insurance companies) 4,350 4,102
Other liabilities specific to insurance activities 235 197
ToTal 4,585 4,299
A. other LiAbiLities (eXCePt reLAtinG to insurAnCe ComPAnies)31/12/09 31/12/10
Accrued costs 529 287
Deferred income 408 408
Subsidies 91 94
Other accounts payable 2,116 1,925
Other granted amounts received 1 1
Salaries and social charges (payable) 291 299
Shareholder dividends payable 101 101
Operational taxes 165 174
Other liabilities 649 813
ToTal 4,350 4,102
b. LiAbiLities sPeCifiC to insurAnCe ACtiVities31/12/09 31/12/10
Debts for deposits from assignees 31 64
Debts resulting from direct insurance transactions 189 120
Debts resulting from reinsurance transactions 14 13
Other insurance liabilities 0 0
ToTal 235 197
31/12/09 31/12/10
Liabilities of subsidiaries held for sale (1) 4,332 0
ToTal 4,332 0(1) 2009: Dexia Epargne Pension. See note 9.5.C “Analysis of Groups held for sale“.
8.7. Tax liabilities
8.8. Other liabilities
8.9. Liabilities included in disposal groups held for sale
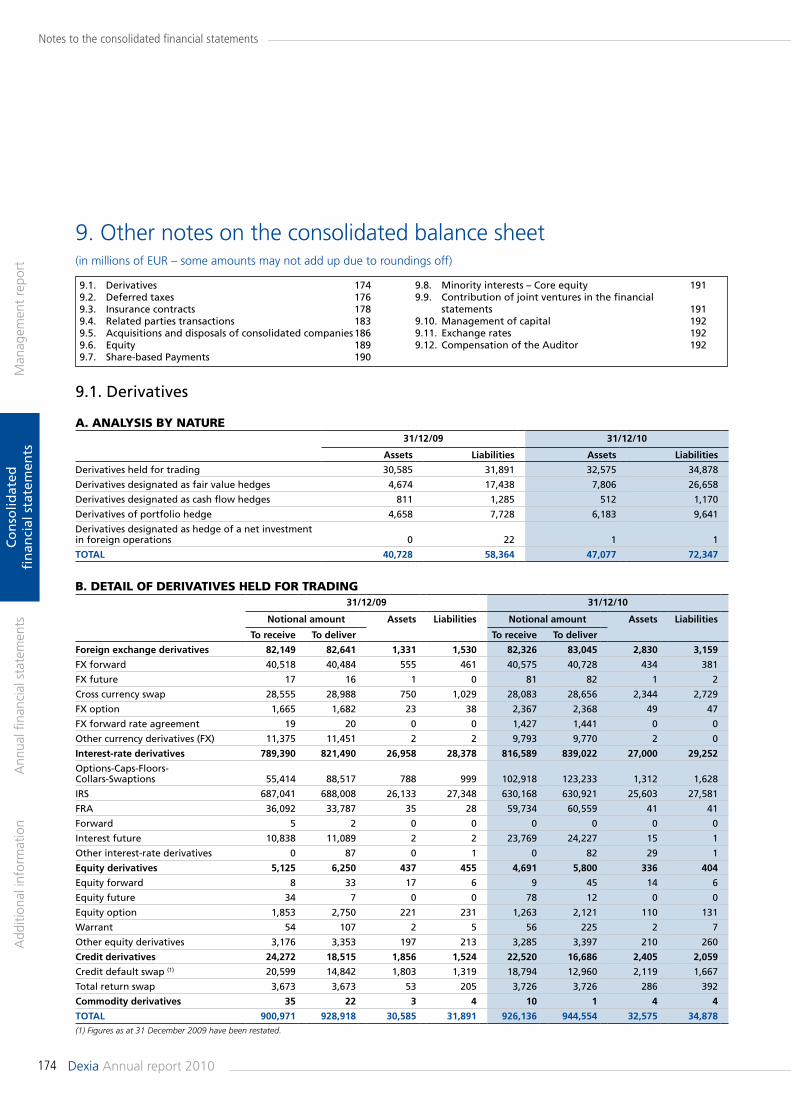
174 Dexia Annual report 2010
Man
agem
ent
repo
rtA
dditi
onal
info
rmat
ion
Ann
ual fi
nanc
ial s
tate
men
tsC
on
solid
ated
fi
nan
cial
sta
tem
ents
Notes to the consolidated financial statements
A. AnALysis by nAture31/12/09 31/12/10
assets liabilities assets liabilities
Derivatives held for trading 30,585 31,891 32,575 34,878
Derivatives designated as fair value hedges 4,674 17,438 7,806 26,658
Derivatives designated as cash flow hedges 811 1,285 512 1,170
Derivatives of portfolio hedge 4,658 7,728 6,183 9,641
Derivatives designated as hedge of a net investment in foreign operations 0 22 1 1
ToTal 40,728 58,364 47,077 72,347
b. detAiL of deriVAtiVes heLd for trAdinG 31/12/09 31/12/10
Notional amount assets liabilities Notional amount assets liabilities
To receive To deliver To receive To deliver
foreign exchange derivatives 82,149 82,641 1,331 1,530 82,326 83,045 2,830 3,159
FX forward 40,518 40,484 555 461 40,575 40,728 434 381
FX future 17 16 1 0 81 82 1 2
Cross currency swap 28,555 28,988 750 1,029 28,083 28,656 2,344 2,729
FX option 1,665 1,682 23 38 2,367 2,368 49 47
FX forward rate agreement 19 20 0 0 1,427 1,441 0 0
Other currency derivatives (FX) 11,375 11,451 2 2 9,793 9,770 2 0
interest-rate derivatives 789,390 821,490 26,958 28,378 816,589 839,022 27,000 29,252
Options-Caps-Floors- Collars-Swaptions 55,414 88,517 788 999 102,918 123,233 1,312 1,628
IRS 687,041 688,008 26,133 27,348 630,168 630,921 25,603 27,581
FRA 36,092 33,787 35 28 59,734 60,559 41 41
Forward 5 2 0 0 0 0 0 0
Interest future 10,838 11,089 2 2 23,769 24,227 15 1
Other interest-rate derivatives 0 87 0 1 0 82 29 1
equity derivatives 5,125 6,250 437 455 4,691 5,800 336 404
Equity forward 8 33 17 6 9 45 14 6
Equity future 34 7 0 0 78 12 0 0
Equity option 1,853 2,750 221 231 1,263 2,121 110 131
Warrant 54 107 2 5 56 225 2 7
Other equity derivatives 3,176 3,353 197 213 3,285 3,397 210 260
Credit derivatives 24,272 18,515 1,856 1,524 22,520 16,686 2,405 2,059
Credit default swap (1) 20,599 14,842 1,803 1,319 18,794 12,960 2,119 1,667
Total return swap 3,673 3,673 53 205 3,726 3,726 286 392
Commodity derivatives 35 22 3 4 10 1 4 4
ToTal 900,971 928,918 30,585 31,891 926,136 944,554 32,575 34,878(1) Figures as at 31 December 2009 have been restated.
9. Other notes on the consolidated balance sheet(in millions of EUR – some amounts may not add up due to roundings off)
9.1. Derivatives 1749.2. Deferred taxes 1769.3. Insurance contracts 1789.4. Related parties transactions 1839.5. Acquisitions and disposals of consolidated companies 1869.6. Equity 1899.7. Share-based Payments 190
9.8. Minority interests – Core equity 1919.9. Contribution of joint ventures in the financial statements 1919.10. Management of capital 1929.11. Exchange rates 1929.12. Compensation of the Auditor 192
9.1. Derivatives
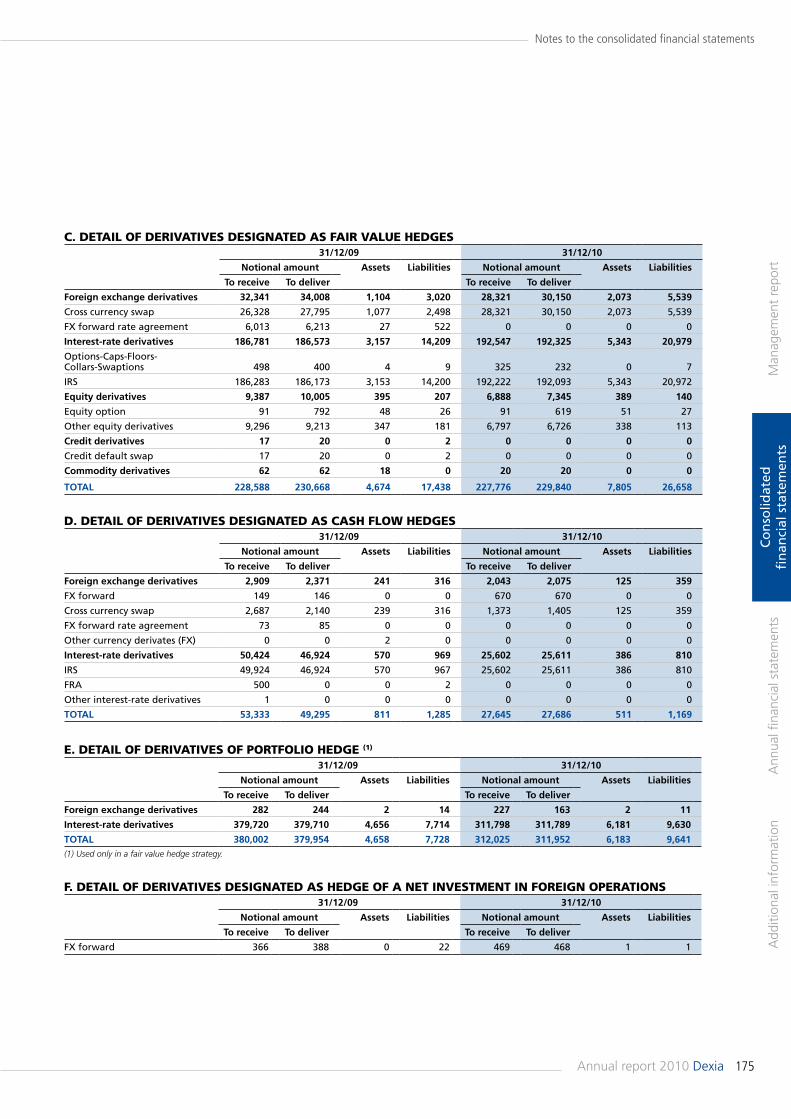
175Annual report 2010 Dexia
Man
agem
ent
repo
rtA
dditi
onal
info
rmat
ion
Ann
ual fi
nanc
ial s
tate
men
tsC
on
solid
ated
fi
nan
cial
sta
tem
ents
Notes to the consolidated financial statements
d. detAiL of deriVAtiVes desiGnAted As CAsh fLoW hedGes31/12/09 31/12/10
Notional amount assets liabilities Notional amount assets liabilities
To receive To deliver To receive To deliver
foreign exchange derivatives 2,909 2,371 241 316 2,043 2,075 125 359
FX forward 149 146 0 0 670 670 0 0
Cross currency swap 2,687 2,140 239 316 1,373 1,405 125 359
FX forward rate agreement 73 85 0 0 0 0 0 0
Other currency derivates (FX) 0 0 2 0 0 0 0 0
interest-rate derivatives 50,424 46,924 570 969 25,602 25,611 386 810
IRS 49,924 46,924 570 967 25,602 25,611 386 810
FRA 500 0 0 2 0 0 0 0
Other interest-rate derivatives 1 0 0 0 0 0 0 0
ToTal 53,333 49,295 811 1,285 27,645 27,686 511 1,169
C. detAiL of deriVAtiVes desiGnAted As fAir VALue hedGes31/12/09 31/12/10
Notional amount assets liabilities Notional amount assets liabilities
To receive To deliver To receive To deliver
foreign exchange derivatives 32,341 34,008 1,104 3,020 28,321 30,150 2,073 5,539
Cross currency swap 26,328 27,795 1,077 2,498 28,321 30,150 2,073 5,539
FX forward rate agreement 6,013 6,213 27 522 0 0 0 0
interest-rate derivatives 186,781 186,573 3,157 14,209 192,547 192,325 5,343 20,979
Options-Caps-Floors- Collars-Swaptions 498 400 4 9 325 232 0 7
IRS 186,283 186,173 3,153 14,200 192,222 192,093 5,343 20,972
equity derivatives 9,387 10,005 395 207 6,888 7,345 389 140
Equity option 91 792 48 26 91 619 51 27
Other equity derivatives 9,296 9,213 347 181 6,797 6,726 338 113
Credit derivatives 17 20 0 2 0 0 0 0
Credit default swap 17 20 0 2 0 0 0 0
Commodity derivatives 62 62 18 0 20 20 0 0
ToTal 228,588 230,668 4,674 17,438 227,776 229,840 7,805 26,658
e. detAiL of deriVAtiVes of PortfoLio hedGe (1)
31/12/09 31/12/10
Notional amount assets liabilities Notional amount assets liabilities
To receive To deliver To receive To deliver
foreign exchange derivatives 282 244 2 14 227 163 2 11
interest-rate derivatives 379,720 379,710 4,656 7,714 311,798 311,789 6,181 9,630
ToTal 380,002 379,954 4,658 7,728 312,025 311,952 6,183 9,641(1) Used only in a fair value hedge strategy.
f. detAiL of deriVAtiVes desiGnAted As hedGe of A net inVestment in foreiGn oPerAtions31/12/09 31/12/10
Notional amount assets liabilities Notional amount assets liabilities
To receive To deliver To receive To deliver
FX forward 366 388 0 22 469 468 1 1
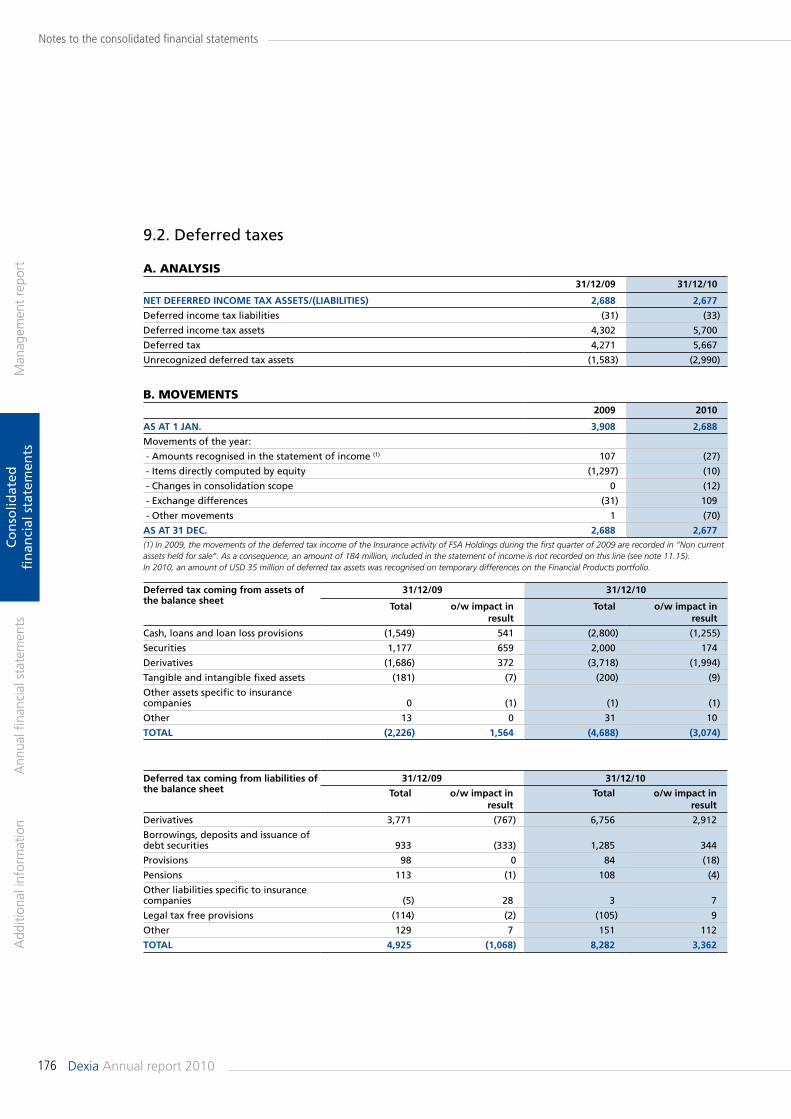
176 Dexia Annual report 2010
Man
agem
ent
repo
rtA
dditi
onal
info
rmat
ion
Ann
ual fi
nanc
ial s
tate
men
tsC
on
solid
ated
fi
nan
cial
sta
tem
ents
Notes to the consolidated financial statements
A. AnALysis31/12/09 31/12/10
NeT deferred iNCome Tax asseTs/(liabiliTies) 2,688 2,677
Deferred income tax liabilities (31) (33)
Deferred income tax assets 4,302 5,700
Deferred tax 4,271 5,667
Unrecognized deferred tax assets (1,583) (2,990)
b. moVements2009 2010
as aT 1 JaN. 3,908 2,688
Movements of the year:
- Amounts recognised in the statement of income (1) 107 (27)
- Items directly computed by equity (1,297) (10)
- Changes in consolidation scope 0 (12)
- Exchange differences (31) 109
- Other movements 1 (70)
as aT 31 deC. 2,688 2,677(1) In 2009, the movements of the deferred tax income of the Insurance activity of FSA Holdings during the first quarter of 2009 are recorded in “Non current assets held for sale“. As a consequence, an amount of 184 million, included in the statement of income is not recorded on this line (see note 11.15).In 2010, an amount of USD 35 million of deferred tax assets was recognised on temporary differences on the Financial Products portfolio.
deferred tax coming from assets of the balance sheet
31/12/09 31/12/10
Total o/w impact in result
Total o/w impact in result
Cash, loans and loan loss provisions (1,549) 541 (2,800) (1,255)
Securities 1,177 659 2,000 174
Derivatives (1,686) 372 (3,718) (1,994)
Tangible and intangible fixed assets (181) (7) (200) (9)
Other assets specific to insurance companies 0 (1) (1) (1)
Other 13 0 31 10
ToTal (2,226) 1,564 (4,688) (3,074)
deferred tax coming from liabilities of the balance sheet
31/12/09 31/12/10
Total o/w impact in result
Total o/w impact in result
Derivatives 3,771 (767) 6,756 2,912
Borrowings, deposits and issuance of debt securities 933 (333) 1,285 344
Provisions 98 0 84 (18)
Pensions 113 (1) 108 (4)
Other liabilities specific to insurance companies (5) 28 3 7
Legal tax free provisions (114) (2) (105) 9
Other 129 7 151 112
ToTal 4,925 (1,068) 8,282 3,362
9.2. Deferred taxes
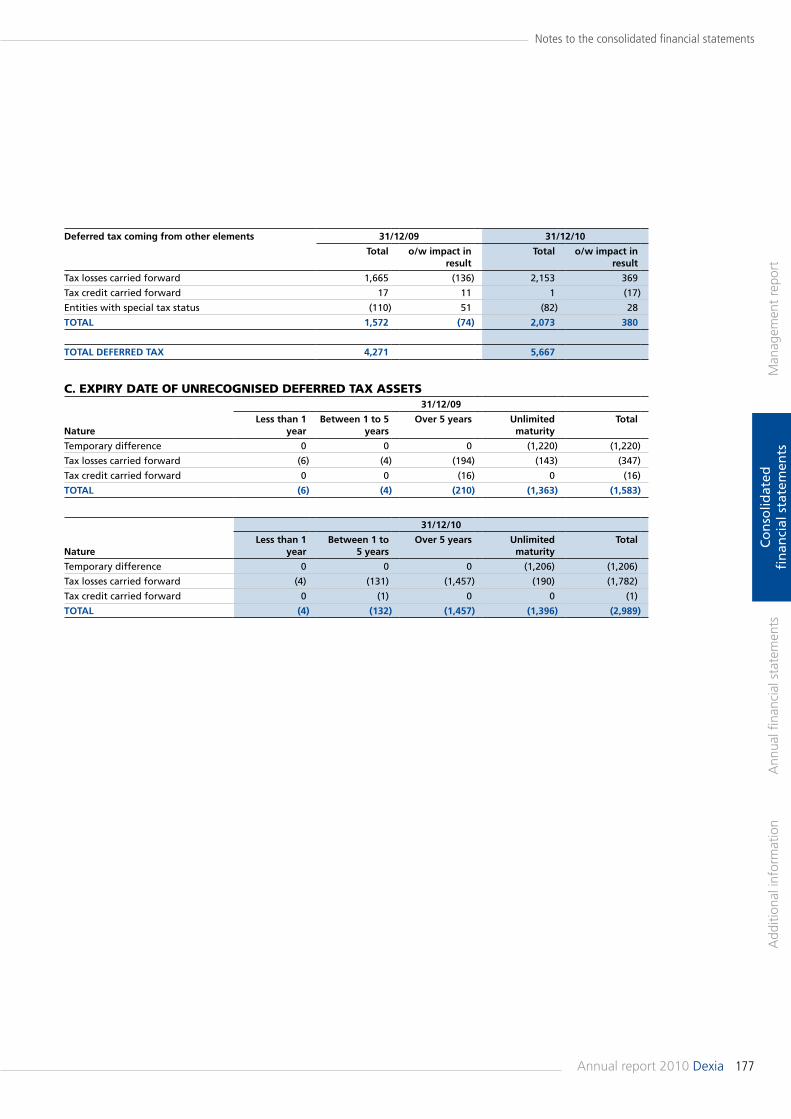
177Annual report 2010 Dexia
Man
agem
ent
repo
rtA
dditi
onal
info
rmat
ion
Ann
ual fi
nanc
ial s
tate
men
tsC
on
solid
ated
fi
nan
cial
sta
tem
ents
Notes to the consolidated financial statements
deferred tax coming from other elements 31/12/09 31/12/10
Total o/w impact in result
Total o/w impact in result
Tax losses carried forward 1,665 (136) 2,153 369
Tax credit carried forward 17 11 1 (17)
Entities with special tax status (110) 51 (82) 28
ToTal 1,572 (74) 2,073 380
ToTal deferred Tax 4,271 5,667
C. eXPiry dAte of unreCoGnised deferred tAX Assets31/12/09
Natureless than 1
yearbetween 1 to 5
yearsover 5 years unlimited
maturityTotal
Temporary difference 0 0 0 (1,220) (1,220)
Tax losses carried forward (6) (4) (194) (143) (347)
Tax credit carried forward 0 0 (16) 0 (16)
ToTal (6) (4) (210) (1,363) (1,583)
31/12/10
Natureless than 1
yearbetween 1 to
5 yearsover 5 years unlimited
maturityTotal
Temporary difference 0 0 0 (1,206) (1,206)
Tax losses carried forward (4) (131) (1,457) (190) (1,782)
Tax credit carried forward 0 (1) 0 0 (1)
ToTal (4) (132) (1,457) (1,396) (2,989)
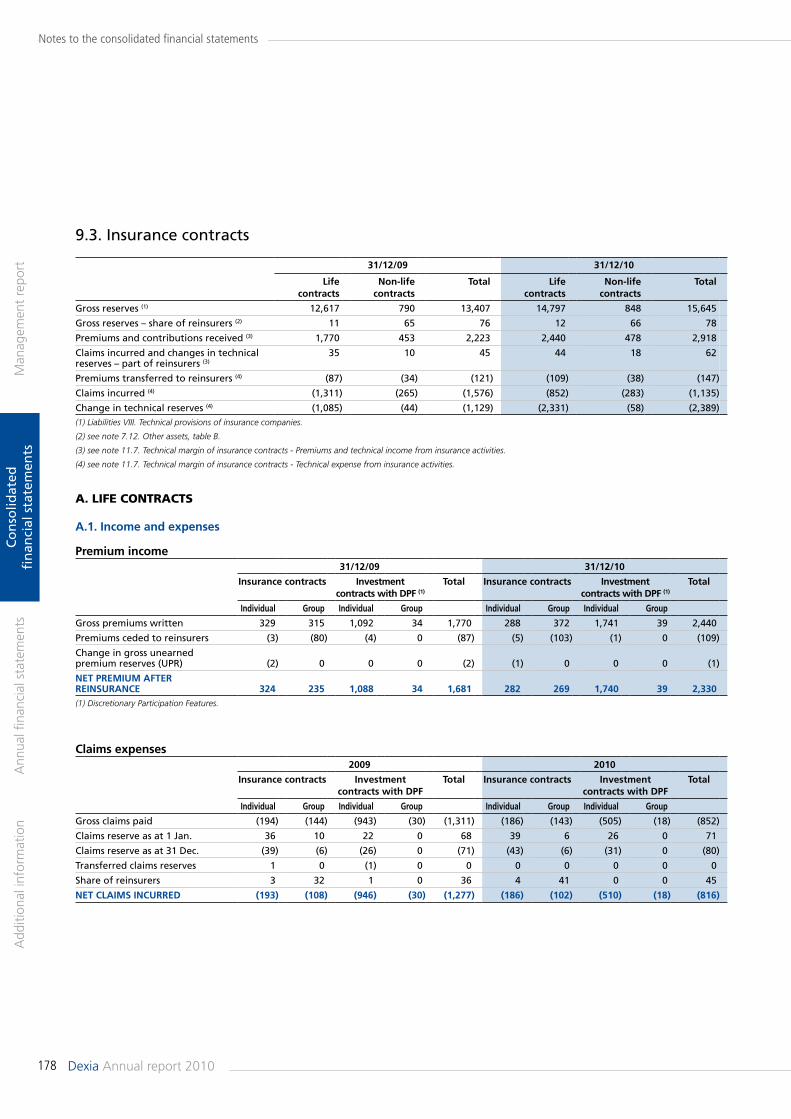
178 Dexia Annual report 2010
Man
agem
ent
repo
rtA
dditi
onal
info
rmat
ion
Ann
ual fi
nanc
ial s
tate
men
tsC
on
solid
ated
fi
nan
cial
sta
tem
ents
Notes to the consolidated financial statements
premium income31/12/09 31/12/10
insurance contracts investment contracts with dpf (1)
Total insurance contracts investment contracts with dpf (1)
Total
individual Group individual Group individual Group individual Group
Gross premiums written 329 315 1,092 34 1,770 288 372 1,741 39 2,440
Premiums ceded to reinsurers (3) (80) (4) 0 (87) (5) (103) (1) 0 (109)
Change in gross unearned premium reserves (UPR) (2) 0 0 0 (2) (1) 0 0 0 (1)
NeT premium afTer reiNsuraNCe 324 235 1,088 34 1,681 282 269 1,740 39 2,330(1) Discretionary Participation Features.
Claims expenses2009 2010
insurance contracts investment contracts with dpf
Total insurance contracts investment contracts with dpf
Total
individual Group individual Group individual Group individual Group
Gross claims paid (194) (144) (943) (30) (1,311) (186) (143) (505) (18) (852)
Claims reserve as at 1 Jan. 36 10 22 0 68 39 6 26 0 71
Claims reserve as at 31 Dec. (39) (6) (26) 0 (71) (43) (6) (31) 0 (80)
Transferred claims reserves 1 0 (1) 0 0 0 0 0 0 0
Share of reinsurers 3 32 1 0 36 4 41 0 0 45
NeT Claims iNCurred (193) (108) (946) (30) (1,277) (186) (102) (510) (18) (816)
31/12/09 31/12/10
life contracts
Non-life contracts
Total life contracts
Non-life contracts
Total
Gross reserves (1) 12,617 790 13,407 14,797 848 15,645
Gross reserves – share of reinsurers (2) 11 65 76 12 66 78
Premiums and contributions received (3) 1,770 453 2,223 2,440 478 2,918
Claims incurred and changes in technical reserves – part of reinsurers (3)
35 10 45 44 18 62
Premiums transferred to reinsurers (4) (87) (34) (121) (109) (38) (147)
Claims incurred (4) (1,311) (265) (1,576) (852) (283) (1,135)
Change in technical reserves (4) (1,085) (44) (1,129) (2,331) (58) (2,389)(1) Liabilities VIII. Technical provisions of insurance companies.
(2) see note 7.12. Other assets, table B.
(3) see note 11.7. Technical margin of insurance contracts - Premiums and technical income from insurance activities.
(4) see note 11.7. Technical margin of insurance contracts - Technical expense from insurance activities.
9.3. Insurance contracts
A. Life ContrACts
a.1. income and expenses
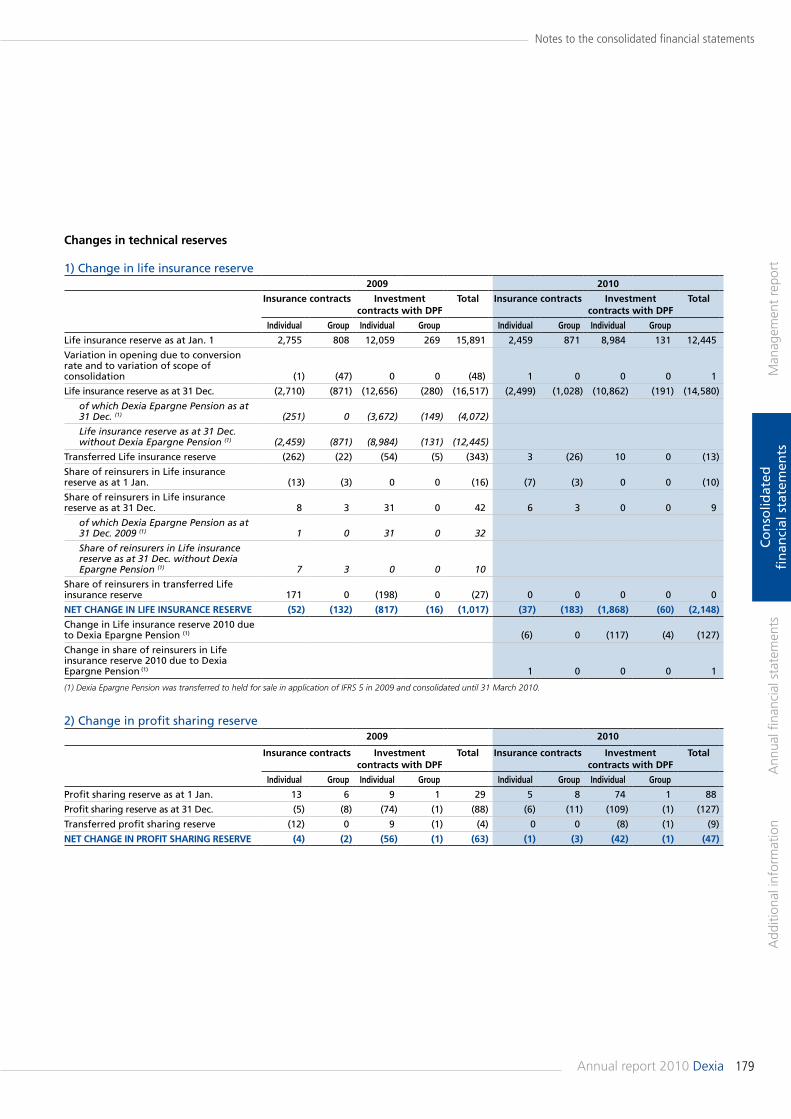
179Annual report 2010 Dexia
Man
agem
ent
repo
rtA
dditi
onal
info
rmat
ion
Ann
ual fi
nanc
ial s
tate
men
tsC
on
solid
ated
fi
nan
cial
sta
tem
ents
Notes to the consolidated financial statements
2) Change in profit sharing reserve2009 2010
insurance contracts investment contracts with dpf
Total insurance contracts investment contracts with dpf
Total
individual Group individual Group individual Group individual Group
Profit sharing reserve as at 1 Jan. 13 6 9 1 29 5 8 74 1 88
Profit sharing reserve as at 31 Dec. (5) (8) (74) (1) (88) (6) (11) (109) (1) (127)
Transferred profit sharing reserve (12) 0 9 (1) (4) 0 0 (8) (1) (9)
NeT ChaNGe iN profiT shariNG reserve (4) (2) (56) (1) (63) (1) (3) (42) (1) (47)
Changes in technical reserves
1) Change in life insurance reserve2009 2010
insurance contracts investment contracts with dpf
Total insurance contracts investment contracts with dpf
Total
individual Group individual Group individual Group individual Group
Life insurance reserve as at Jan. 1 2,755 808 12,059 269 15,891 2,459 871 8,984 131 12,445
Variation in opening due to conversion rate and to variation of scope of consolidation (1) (47) 0 0 (48) 1 0 0 0 1
Life insurance reserve as at 31 Dec. (2,710) (871) (12,656) (280) (16,517) (2,499) (1,028) (10,862) (191) (14,580)
of which Dexia Epargne Pension as at 31 Dec. (1) (251) 0 (3,672) (149) (4,072)
Life insurance reserve as at 31 Dec. without Dexia Epargne Pension (1) (2,459) (871) (8,984) (131) (12,445)
Transferred Life insurance reserve (262) (22) (54) (5) (343) 3 (26) 10 0 (13)
Share of reinsurers in Life insurance reserve as at 1 Jan. (13) (3) 0 0 (16) (7) (3) 0 0 (10)
Share of reinsurers in Life insurance reserve as at 31 Dec. 8 3 31 0 42 6 3 0 0 9
of which Dexia Epargne Pension as at 31 Dec. 2009 (1) 1 0 31 0 32
Share of reinsurers in Life insurance reserve as at 31 Dec. without Dexia Epargne Pension (1) 7 3 0 0 10
Share of reinsurers in transferred Life insurance reserve 171 0 (198) 0 (27) 0 0 0 0 0
NeT ChaNGe iN life iNsuraNCe reserve (52) (132) (817) (16) (1,017) (37) (183) (1,868) (60) (2,148)
Change in Life insurance reserve 2010 due to Dexia Epargne Pension (1) (6) 0 (117) (4) (127)
Change in share of reinsurers in Life insurance reserve 2010 due to Dexia Epargne Pension (1) 1 0 0 0 1 (1) Dexia Epargne Pension was transferred to held for sale in application of IFRS 5 in 2009 and consolidated until 31 March 2010.
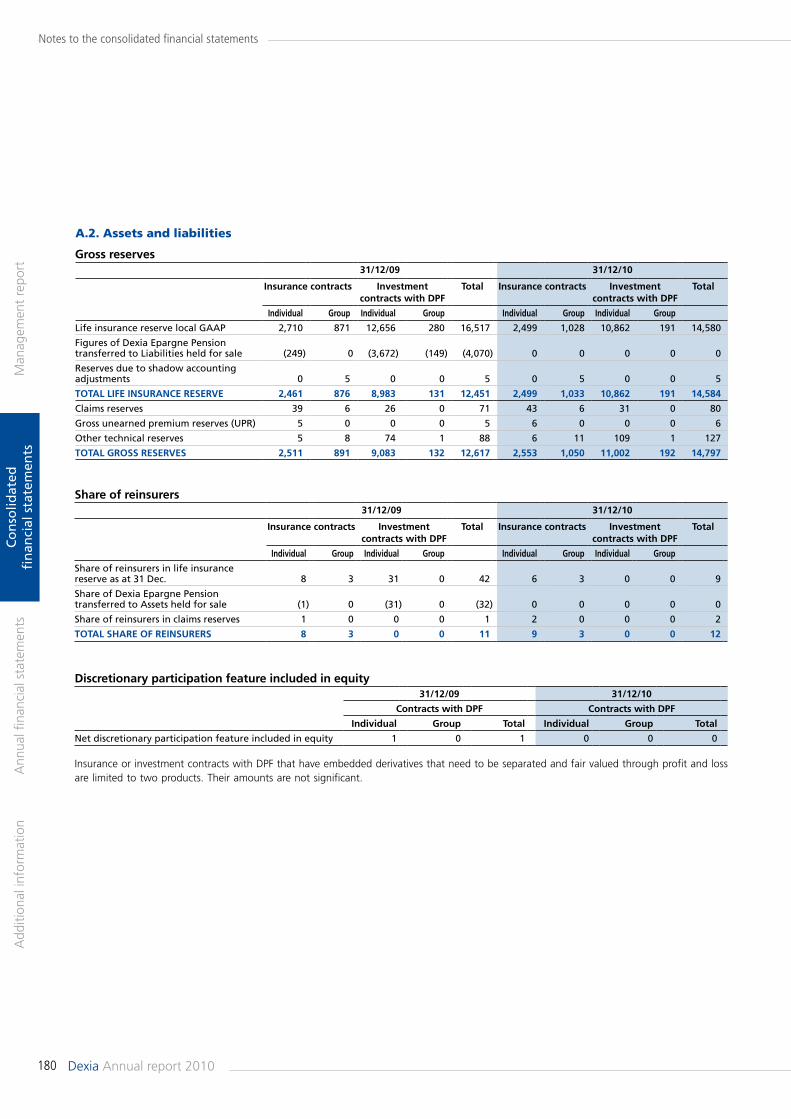
180 Dexia Annual report 2010
Man
agem
ent
repo
rtA
dditi
onal
info
rmat
ion
Ann
ual fi
nanc
ial s
tate
men
tsC
on
solid
ated
fi
nan
cial
sta
tem
ents
Notes to the consolidated financial statements
share of reinsurers 31/12/09 31/12/10
insurance contracts investment contracts with dpf
Total insurance contracts investment contracts with dpf
Total
individual Group individual Group individual Group individual Group
Share of reinsurers in life insurance reserve as at 31 Dec. 8 3 31 0 42 6 3 0 0 9
Share of Dexia Epargne Pension transferred to Assets held for sale (1) 0 (31) 0 (32) 0 0 0 0 0
Share of reinsurers in claims reserves 1 0 0 0 1 2 0 0 0 2
ToTal share of reiNsurers 8 3 0 0 11 9 3 0 0 12
discretionary participation feature included in equity31/12/09 31/12/10
Contracts with dpf Contracts with dpf
individual Group Total individual Group Total
Net discretionary participation feature included in equity 1 0 1 0 0 0
Insurance or investment contracts with DPF that have embedded derivatives that need to be separated and fair valued through profit and loss are limited to two products. Their amounts are not significant.
Gross reserves31/12/09 31/12/10
insurance contracts investment contracts with dpf
Total insurance contracts investment contracts with dpf
Total
individual Group individual Group individual Group individual Group
Life insurance reserve local GAAP 2,710 871 12,656 280 16,517 2,499 1,028 10,862 191 14,580
Figures of Dexia Epargne Pension transferred to Liabilities held for sale (249) 0 (3,672) (149) (4,070) 0 0 0 0 0
Reserves due to shadow accounting adjustments 0 5 0 0 5 0 5 0 0 5
ToTal life iNsuraNCe reserve 2,461 876 8,983 131 12,451 2,499 1,033 10,862 191 14,584
Claims reserves 39 6 26 0 71 43 6 31 0 80
Gross unearned premium reserves (UPR) 5 0 0 0 5 6 0 0 0 6
Other technical reserves 5 8 74 1 88 6 11 109 1 127
ToTal Gross reserves 2,511 891 9,083 132 12,617 2,553 1,050 11,002 192 14,797
A.2. Assets and liabilities
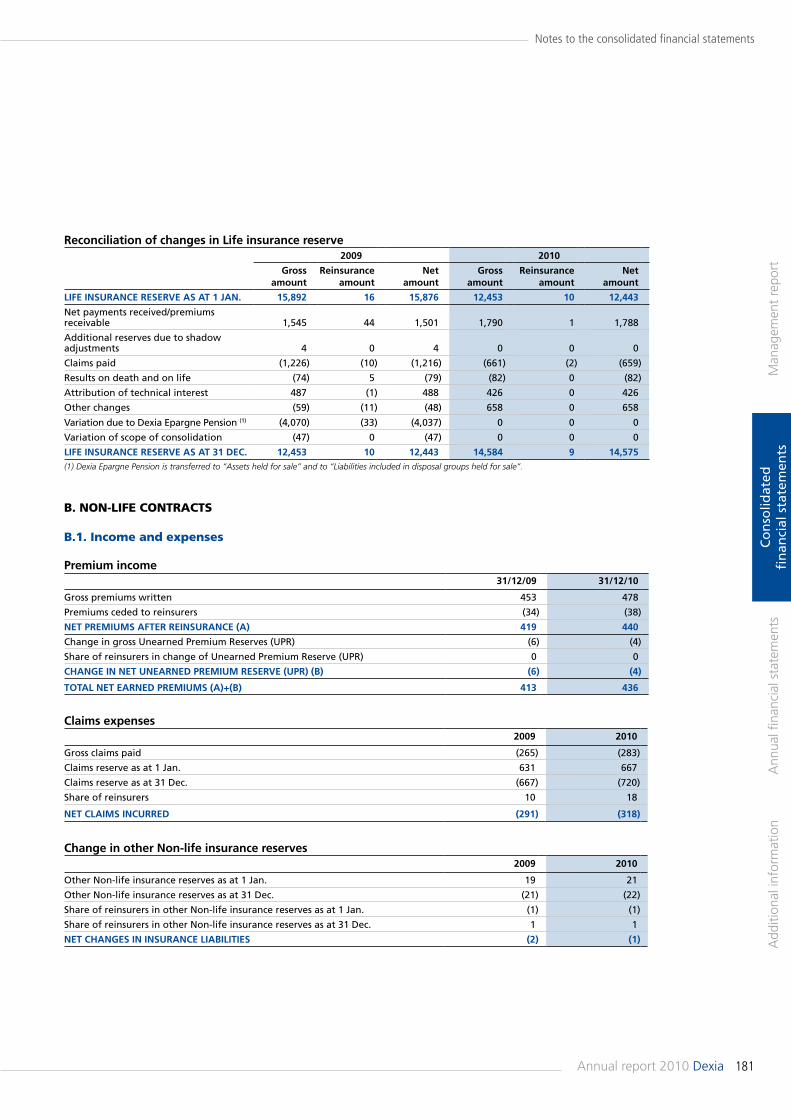
181Annual report 2010 Dexia
Man
agem
ent
repo
rtA
dditi
onal
info
rmat
ion
Ann
ual fi
nanc
ial s
tate
men
tsC
on
solid
ated
fi
nan
cial
sta
tem
ents
Notes to the consolidated financial statements
reconciliation of changes in life insurance reserve2009 2010
Gross amount
reinsurance amount
Net amount
Gross amount
reinsurance amount
Net amount
life iNsuraNCe reserve as aT 1 JaN. 15,892 16 15,876 12,453 10 12,443
Net payments received/premiums receivable 1,545 44 1,501 1,790 1 1,788
Additional reserves due to shadow adjustments 4 0 4 0 0 0
Claims paid (1,226) (10) (1,216) (661) (2) (659)
Results on death and on life (74) 5 (79) (82) 0 (82)
Attribution of technical interest 487 (1) 488 426 0 426
Other changes (59) (11) (48) 658 0 658
Variation due to Dexia Epargne Pension (1) (4,070) (33) (4,037) 0 0 0
Variation of scope of consolidation (47) 0 (47) 0 0 0
life iNsuraNCe reserve as aT 31 deC. 12,453 10 12,443 14,584 9 14,575(1) Dexia Epargne Pension is transferred to “Assets held for sale” and to “Liabilities included in disposal groups held for sale”.
premium income31/12/09 31/12/10
Gross premiums written 453 478
Premiums ceded to reinsurers (34) (38)
NeT premiums afTer reiNsuraNCe (a) 419 440
Change in gross Unearned Premium Reserves (UPR) (6) (4)
Share of reinsurers in change of Unearned Premium Reserve (UPR) 0 0
ChaNGe iN NeT uNearNed premium reserve (upr) (b) (6) (4)
ToTal NeT earNed premiums (a)+(b) 413 436
Claims expenses2009 2010
Gross claims paid (265) (283)
Claims reserve as at 1 Jan. 631 667
Claims reserve as at 31 Dec. (667) (720)
Share of reinsurers 10 18
NeT Claims iNCurred (291) (318)
Change in other Non-life insurance reserves2009 2010
Other Non-life insurance reserves as at 1 Jan. 19 21
Other Non-life insurance reserves as at 31 Dec. (21) (22)
Share of reinsurers in other Non-life insurance reserves as at 1 Jan. (1) (1)
Share of reinsurers in other Non-life insurance reserves as at 31 Dec. 1 1
NeT ChaNGes iN iNsuraNCe liabiliTies (2) (1)
b. non-Life ContrACts
b.1. income and expenses
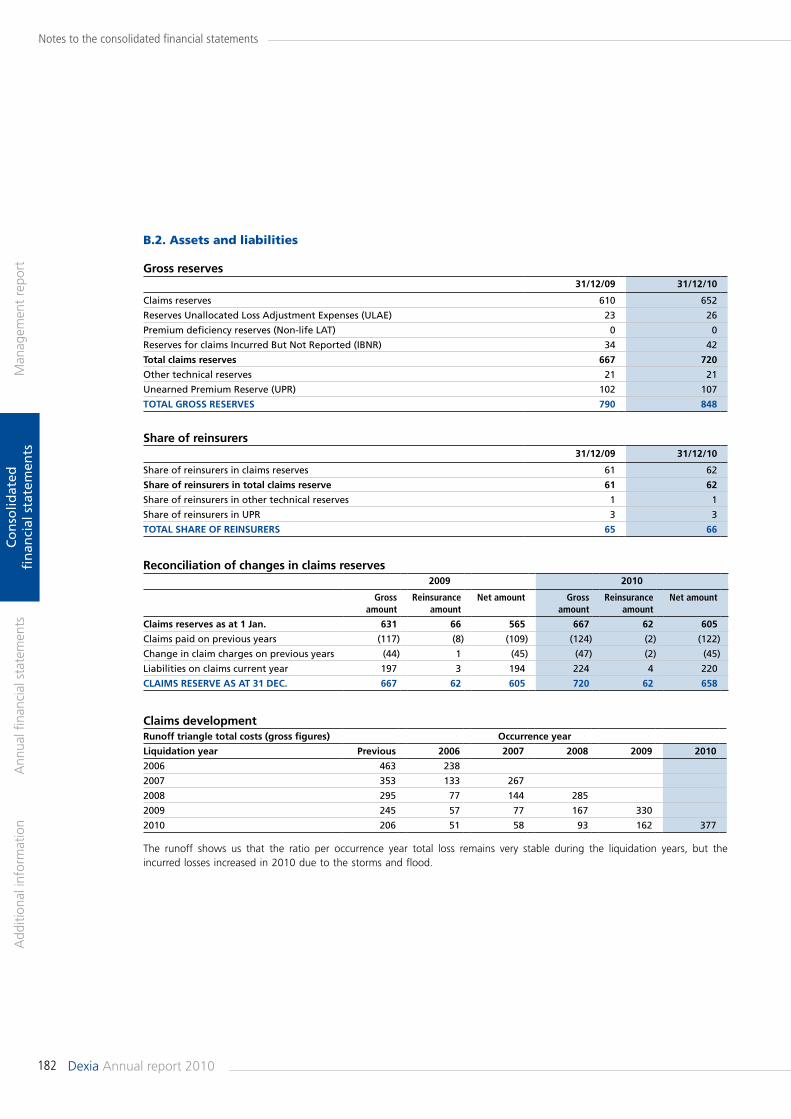
182 Dexia Annual report 2010
Man
agem
ent
repo
rtA
dditi
onal
info
rmat
ion
Ann
ual fi
nanc
ial s
tate
men
tsC
on
solid
ated
fi
nan
cial
sta
tem
ents
Notes to the consolidated financial statements
Gross reserves31/12/09 31/12/10
Claims reserves 610 652
Reserves Unallocated Loss Adjustment Expenses (ULAE) 23 26
Premium deficiency reserves (Non-life LAT) 0 0
Reserves for claims Incurred But Not Reported (IBNR) 34 42
Total claims reserves 667 720
Other technical reserves 21 21
Unearned Premium Reserve (UPR) 102 107
ToTal Gross reserves 790 848
share of reinsurers 31/12/09 31/12/10
Share of reinsurers in claims reserves 61 62
share of reinsurers in total claims reserve 61 62
Share of reinsurers in other technical reserves 1 1
Share of reinsurers in UPR 3 3
ToTal share of reiNsurers 65 66
reconciliation of changes in claims reserves2009 2010
Gross amount
Reinsurance amount
Net amount Gross amount
Reinsurance amount
Net amount
Claims reserves as at 1 Jan. 631 66 565 667 62 605
Claims paid on previous years (117) (8) (109) (124) (2) (122)
Change in claim charges on previous years (44) 1 (45) (47) (2) (45)
Liabilities on claims current year 197 3 194 224 4 220
Claims reserve as aT 31 deC. 667 62 605 720 62 658
Claims developmentrunoff triangle total costs (gross figures) occurrence year
liquidation year previous 2006 2007 2008 2009 2010
2006 463 238
2007 353 133 267
2008 295 77 144 285
2009 245 57 77 167 330
2010 206 51 58 93 162 377
b.2. Assets and liabilities
The runoff shows us that the ratio per occurrence year total loss remains very stable during the liquidation years, but the incurred losses increased in 2010 due to the storms and flood.
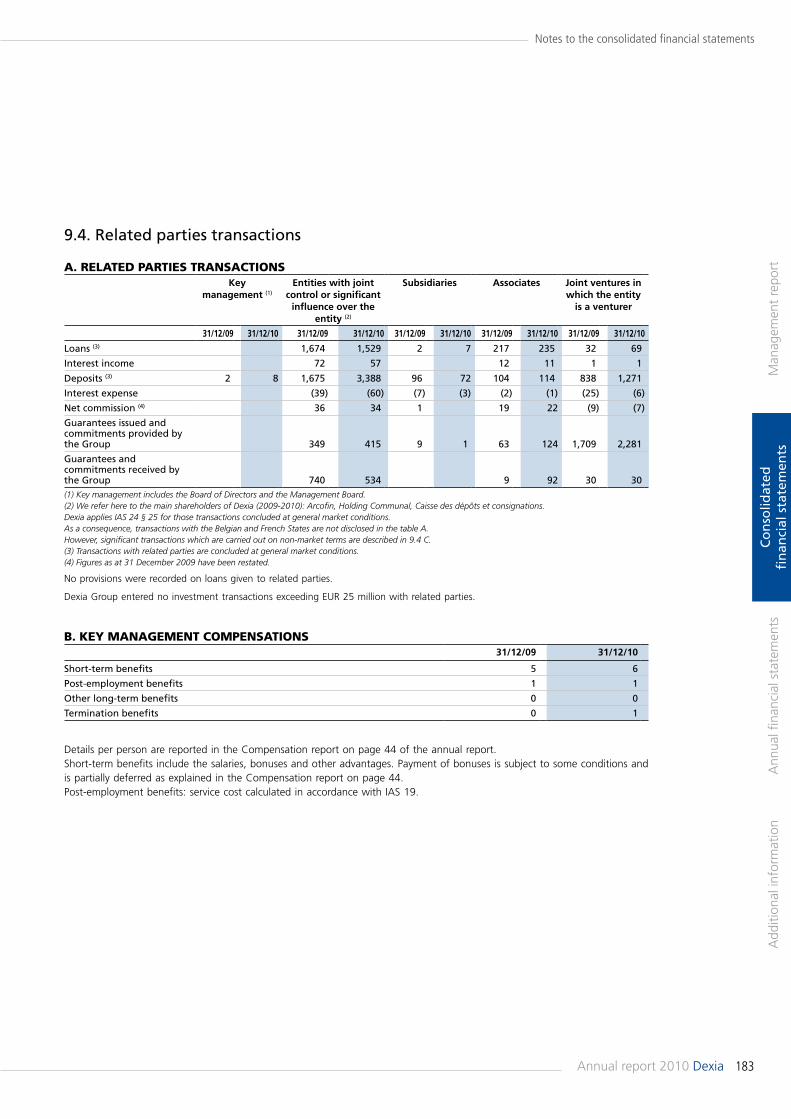
183Annual report 2010 Dexia
Man
agem
ent
repo
rtA
dditi
onal
info
rmat
ion
Ann
ual fi
nanc
ial s
tate
men
tsC
on
solid
ated
fi
nan
cial
sta
tem
ents
Notes to the consolidated financial statements
A. reLAted PArties trAnsACtionskey
management (1)
entities with joint control or significant
influence over the entity (2)
subsidiaries associates Joint ventures in which the entity
is a venturer
31/12/09 31/12/10 31/12/09 31/12/10 31/12/09 31/12/10 31/12/09 31/12/10 31/12/09 31/12/10
Loans (3) 1,674 1,529 2 7 217 235 32 69
Interest income 72 57 12 11 1 1
Deposits (3) 2 8 1,675 3,388 96 72 104 114 838 1,271
Interest expense (39) (60) (7) (3) (2) (1) (25) (6)
Net commission (4) 36 34 1 19 22 (9) (7)
Guarantees issued and commitments provided by the Group 349 415 9 1 63 124 1,709 2,281
Guarantees and commitments received by the Group 740 534 9 92 30 30(1) Key management includes the Board of Directors and the Management Board.(2) We refer here to the main shareholders of Dexia (2009-2010): Arcofin, Holding Communal, Caisse des dépôts et consignations.Dexia applies IAS 24 § 25 for those transactions concluded at general market conditions. As a consequence, transactions with the Belgian and French States are not disclosed in the table A.However, significant transactions which are carried out on non-market terms are described in 9.4 C.(3) Transactions with related parties are concluded at general market conditions.(4) Figures as at 31 December 2009 have been restated.
No provisions were recorded on loans given to related parties.
Dexia Group entered no investment transactions exceeding EUR 25 million with related parties.
b. Key mAnAGement ComPensAtions 31/12/09 31/12/10
Short-term benefits 5 6
Post-employment benefits 1 1
Other long-term benefits 0 0
Termination benefits 0 1
9.4. Related parties transactions
Details per person are reported in the Compensation report on page 44 of the annual report.Short-term benefits include the salaries, bonuses and other advantages. Payment of bonuses is subject to some conditions and is partially deferred as explained in the Compensation report on page 44.Post-employment benefits: service cost calculated in accordance with IAS 19.
184 Dexia Annual report 2010
Man
agem
ent
repo
rtA
dditi
onal
info
rmat
ion
Ann
ual fi
nanc
ial s
tate
men
tsC
on
solid
ated
fi
nan
cial
sta
tem
ents
Notes to the consolidated financial statements
C. trAnsACtions With the beLGiAn, frenCh And LuXembourG stAtes
Guarantee mechanism in favour of dexia's financing
On 9 December 2008, the French, Belgian and Luxembourg States and Dexia entered into a First Demand Guarantee Agreement implementing the principles set forth in the Protocol of 9 October 2008 between the three States and Dexia. Pursuant to this guarantee agreement, the three States' guarantee severally, but not jointly, the performance by Dexia SA, Dexia Banque Internationale à Luxembourg, Dexia Bank Belgium and Dexia Crédit Local (including certain of their branches and issuance vehicles) of their repayment obligations resulting from certain financings provided by central banks, credit institutions and other institutional or professional investors, provided that these financings were contracted or issued between 9 October 2008 and 31 October 2009 and maturing at the latest on 31 October 2011. The States' guarantee the repayment obligations in the following proportion:(i) 60.5% for the Belgian State; (ii) 36.5% for the French State; and (iii) 3.0% for the Luxembourg State.To supplement the Guarantee Agreement on operational and procedural aspects, the three States and Dexia have entered into an Operational Memorandum. This memorandum provides, among other things, for a monitoring process of the guaranteed financings on a daily basis, including a daily publication of the aggregate guaranteed amount and, with respect to guaranteed bond issues of Dexia, a system of eligibility certificates whereby the States issue, on Dexia's request, certificates confirming for each bond issue that it is covered by the Guarantee Agreement.
On 19 November 2008, the European Commission authorised this guarantee mechanism for a period of 6 months as from 3 October 2008, with an automatic extension until the Commission's definitive decision, on condition that a restructuring plan be filed with the Commission. In March 2009, the three States confirmed the extension of the guarantee in accordance with the decision of the European Commission of 13 March 2009.By an Addendum to the above-mentioned Guarantee Agreement of 9 December 2008, dated 14 October 2009, the Belgian, French and Luxembourg States and Dexia agreed to renew the guarantee scheme for a period of one year, covering financings contracted or issued at the latest on 31 October 2010. The parties also wished to effect certain changes to the guarantee in order to limit the States' intervention to a strict minimum and to allow an orderly exit out of the guarantee within a credible time-horizon. The changes include: (i) the decrease of the maximum of the total amount of guaranteed financings from EUR 150 billion to EUR 100 billion, with a commitment by Dexia to undertake its best efforts to limit this amount to EUR 80 billion;
(ii) the extension to 4 years of the maximum duration of the new financings contracted or issued; and(iii) the waiver by Dexia of the benefit of the guarantee, as from 16 October 2009, for all new contracts with a maturity of less than one month and all contracts with an indefinite term.
The Guarantee Agreements provided for the following remuneration to be paid by Dexia to the States:(i) for financings with a maturity of less than 12 months: 50 bps on an annual basis calculated on the average amount guaranteed financings outstanding; and(ii) for financings with a maturity of 12 months or more: 50 bps on an annual basis, increased by the lowest of (i) the median of the Dexia CDS 5 years spread calculated between 1 January 2007 and 31 August 2008 or (ii) the median of the 5 years CDS spreads of all credit institutions with a long-term credit rating equivalent to that of Dexia, calculated on the average amount guaranteed financings outstanding.The renewal and modifications as provided for in the Addendum of 14 October 2009 have been duly authorised by an interim decision of the European Commission for a period of 4 months as from 30 October 2009 (i.e., until 28 February 2010) or until the final decision – if such decision is adopted prior to 28 February 2010 – of the European Commission in the context of the State aid procedure opened on 13 March 2009.By separate agreement dated 17 March 2010, the Belgian, French and Luxembourg States and Dexia amended and supplemented the above-mentioned Addendum to the Guarantee Agreement of 14 October 2009 to reflect the terms of the final decision of the European Commission in the context of the State aid procedure of 26 February 2010. The changes include: (i) advancing the latest issue date for guaranteed financings to 31 May 2010 (for financings with a maturity of less than 12 months) resp. 30 June 2010 (for financings with a maturity of more than 12 months);(ii) advancing the expiry date of the guarantee on deposits (and equivalents) to 1 March 2010;(iii) a gradual increase of the remuneration payable by Dexia, pro rata temporis, if the outstanding amount of repayment obligations guaranteed by the States exceeds certain thresholds (by 50bps if and to the extent the amount exceeds EUR 60 billion but not higher than EUR 70 billion, 65bps if and to the extent the amount exceeds EUR 70 billion but not higher than EUR 80 billion, and 80bps above EUR 80 billion).
As at 30 June 2010, Dexia has fully exited the States' guarantee liquidity framework. All outstanding instruments issued under the government guarantee framework before 30 June 2010 will continue to benefit from the government guarantee in accordance with their terms and conditions.
185Annual report 2010 Dexia
Man
agem
ent
repo
rtA
dditi
onal
info
rmat
ion
Ann
ual fi
nanc
ial s
tate
men
tsC
on
solid
ated
fi
nan
cial
sta
tem
ents
Notes to the consolidated financial statements
As at 31 December 2010, the total outstanding amount of repayment obligations guaranteed by the States was EUR 44 billion and in 2010, Dexia paid a total remuneration of EUR 380 million to the States for this guarantee.All the above mentioned agreements, as well as the total outstanding amount of guaranteed repayment obligations and the list of securities for which the States have issued eligibility certificates are available on the website www.dexia.com.
Guarantee for the financial Products portfolio
Dexia entered into an agreement for the sale of the insurance activities of Financial Security Assurance (FSA) to Assured Guaranty Ltd (Assured) on 14 November 2008; the sale was completed on 1 July 2009. The Financial Products activity of FSA, managed by FSA Asset Management (FSAM), was carved out of the transaction and remains under Dexia's ownership. In that context, the Belgian and French States have agreed to provide a guarantee on the Financial Products assets portfolio.
The terms of this guarantee are set out in two agreements (the First Demand Guarantee Agreement relating to the “financial products“ portfolio of FSA Asset Management LLC and the Guarantee Reimbursement Agreement) entered into by the Belgian and French States and Dexia. The main relevant terms are the following:• Dexia SA and Dexia Crédit Local S.A. (“DCL“) entered into a put agreement whereby FSAM is entitled to sell to Dexia and/or DCL certain assets included in the FSAM portfolio as at 30 September 2008 upon the occurrence of certain trigger events (asset default, liquidity default, collateral default and insolvency of Dexia).• The Belgian and French States have each undertaken to guarantee, severally and not jointly, the obligations of Dexia SA pursuant to the put agreement up to an aggregate amount equal to USD 16.98 billion and up to 62.3711% for the Belgian State and 37.6289% for the French State. • The portfolio to which this put relates is the FSAM portfolio after deduction of certain “excluded assets“ for an amount of USD 4.5 billion, such that the par value of the assets included in the portfolio to which the put relates is equal to USD 9.7 billion as at 31 December 2010. Dexia will therefore cover a first loss tranche of USD 4.5 billion. • The States are entitled to recover from Dexia the amounts that they will have paid pursuant to their guarantee. This recourse of the States can be exercised either in cash or in the form of instruments representing Tier 1 capital of Dexia (ordinary shares or profit shares). • Dexia therefore issued subscription rights (warrants) to each of the States for a period of 5 years, to allow the States to be reimbursed through the issuance of new shares, following the contribution in kind to Dexia of their right of reimbursement. The cancellation and re-issuance of the existing warrants for a new period of 5 years will be submitted to the approval of the general meeting of shareholders every year. In case
of failure to re-issue the warrants, a penalty will be applied (500bps per annum for a period of two years, compounded on the guarantee commission). • Dexia may also issue profit shares at the request of the States instead of the shares. The profit shares would be issued for a price equal to the exercise price of the warrants, would not have voting rights, would be entitled to a special dividend and be convertible at the option of the States into ordinary Dexia shares, one for one. The terms of the profit shares have been approved by the Extraordinary Shareholders' Meeting of Dexia on 24 June 2009 and are set out in Article 4bis of the Articles of Association of Dexia.• Dexia must semi-annually pay to the States a guarantee fee at a rate of 1.13% per annum, calculated on the average outstanding nominal amount of the FSAM portfolio (excluding the excluded assets) over a 6 month-period, plus a fee of 0.32% per annum calculated on the lower of (i) the total amount of the liabilities pursuant to the Guaranteed Investment Contracts and (ii) the average outstanding nominal amount of the FSAM portfolio (excluding the excluded assets) over a 6 month-period.• The guarantee of the States pursuant to an asset default or the insolvency of Dexia expires in 2035, unless the parties decide to extend the guarantee. The guarantee pursuant to a liquidity or collateral default expires on 31 October 2011.
This guarantee was approved by the European Commission on 13 March 2009.As at 31 December 2010, Dexia recognised EUR 110 million interest charge for this guarantee.
For a more detailed description of the guarantee for the Financial Products portfolio, see the Special Board Report of 12 May 2009, as updated by the Special Board Report of 24 February 2010 relating to the first reissue of the warrants, both available on the website of Dexia (www.dexia.com).
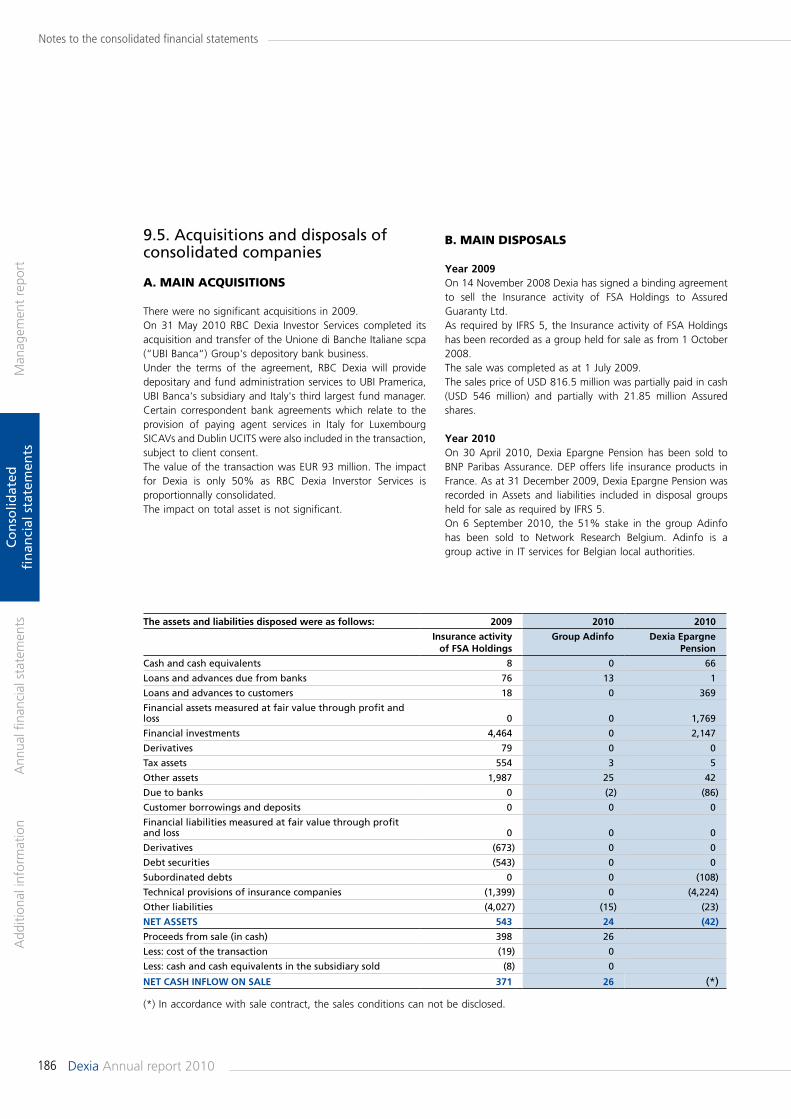
186 Dexia Annual report 2010
Man
agem
ent
repo
rtA
dditi
onal
info
rmat
ion
Ann
ual fi
nanc
ial s
tate
men
tsC
on
solid
ated
fi
nan
cial
sta
tem
ents
Notes to the consolidated financial statements
The assets and liabilities disposed were as follows: 2009 2010 2010
insurance activity of fsa holdings
Group adinfo dexia epargne pension
Cash and cash equivalents 8 0 66
Loans and advances due from banks 76 13 1
Loans and advances to customers 18 0 369
Financial assets measured at fair value through profit and loss 0 0 1,769
Financial investments 4,464 0 2,147
Derivatives 79 0 0
Tax assets 554 3 5
Other assets 1,987 25 42
Due to banks 0 (2) (86)
Customer borrowings and deposits 0 0 0
Financial liabilities measured at fair value through profit and loss 0 0 0
Derivatives (673) 0 0
Debt securities (543) 0 0
Subordinated debts 0 0 (108)
Technical provisions of insurance companies (1,399) 0 (4,224)
Other liabilities (4,027) (15) (23)
NeT asseTs 543 24 (42)
Proceeds from sale (in cash) 398 26
Less: cost of the transaction (19) 0
Less: cash and cash equivalents in the subsidiary sold (8) 0
NeT Cash iNflow oN sale 371 26 (*)
9.5. Acquisitions and disposals of consolidated companies
A. mAin ACquisitions
There were no significant acquisitions in 2009.On 31 May 2010 RBC Dexia Investor Services completed its acquisition and transfer of the Unione di Banche Italiane scpa (“UBI Banca“) Group's depository bank business. Under the terms of the agreement, RBC Dexia will provide depositary and fund administration services to UBI Pramerica, UBI Banca's subsidiary and Italy's third largest fund manager. Certain correspondent bank agreements which relate to the provision of paying agent services in Italy for Luxembourg SICAVs and Dublin UCITS were also included in the transaction, subject to client consent.The value of the transaction was EUR 93 million. The impact for Dexia is only 50% as RBC Dexia Inverstor Services is proportionnally consolidated.The impact on total asset is not significant.
(*) In accordance with sale contract, the sales conditions can not be disclosed.
b. mAin disPosALs
year 2009On 14 November 2008 Dexia has signed a binding agreement to sell the Insurance activity of FSA Holdings to Assured Guaranty Ltd.As required by IFRS 5, the Insurance activity of FSA Holdings has been recorded as a group held for sale as from 1 October 2008.The sale was completed as at 1 July 2009. The sales price of USD 816.5 million was partially paid in cash (USD 546 million) and partially with 21.85 million Assured shares.
year 2010On 30 April 2010, Dexia Epargne Pension has been sold to BNP Paribas Assurance. DEP offers life insurance products in France. As at 31 December 2009, Dexia Epargne Pension was recorded in Assets and liabilities included in disposal groups held for sale as required by IFRS 5.On 6 September 2010, the 51% stake in the group Adinfo has been sold to Network Research Belgium. Adinfo is a group active in IT services for Belgian local authorities.
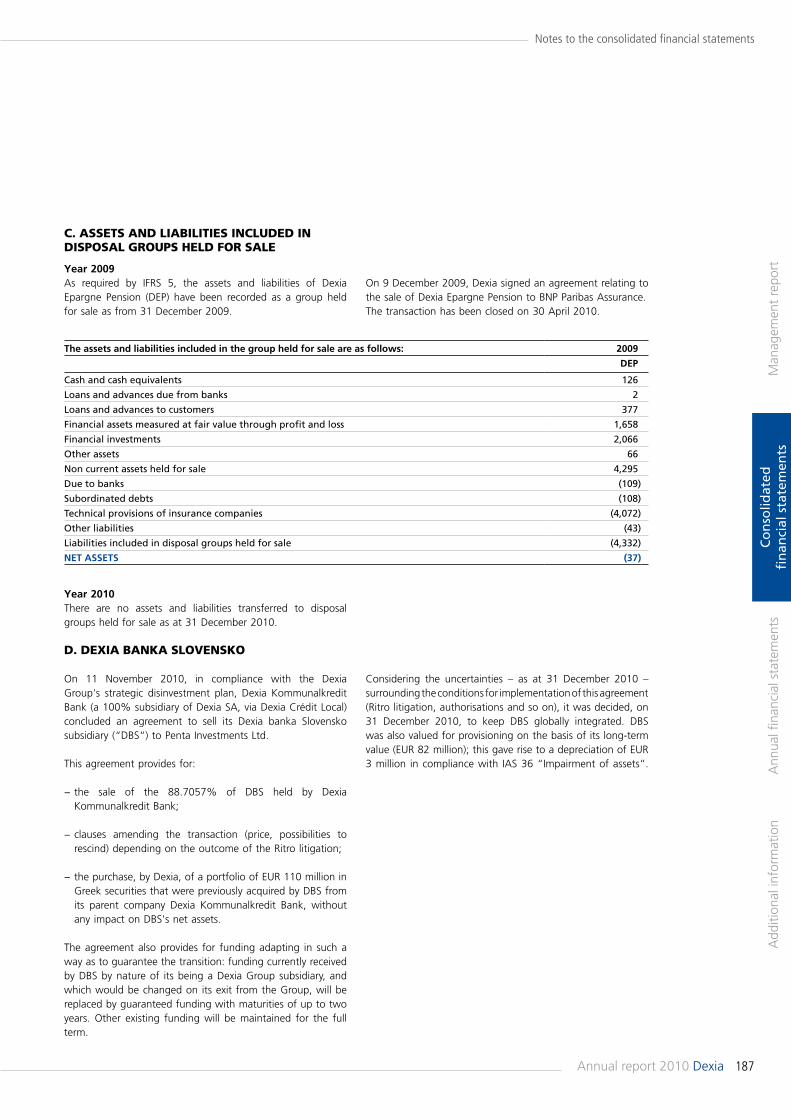
187Annual report 2010 Dexia
Man
agem
ent
repo
rtA
dditi
onal
info
rmat
ion
Ann
ual fi
nanc
ial s
tate
men
tsC
on
solid
ated
fi
nan
cial
sta
tem
ents
Notes to the consolidated financial statements
The assets and liabilities included in the group held for sale are as follows: 2009
dep
Cash and cash equivalents 126
Loans and advances due from banks 2
Loans and advances to customers 377
Financial assets measured at fair value through profit and loss 1,658
Financial investments 2,066
Other assets 66
Non current assets held for sale 4,295
Due to banks (109)
Subordinated debts (108)
Technical provisions of insurance companies (4,072)
Other liabilities (43)
Liabilities included in disposal groups held for sale (4,332)
NeT asseTs (37)
C. Assets And LiAbiLities inCLuded in disPosAL GrouPs heLd for sALe
year 2009As required by IFRS 5, the assets and liabilities of Dexia Epargne Pension (DEP) have been recorded as a group held for sale as from 31 December 2009.
On 9 December 2009, Dexia signed an agreement relating to the sale of Dexia Epargne Pension to BNP Paribas Assurance.The transaction has been closed on 30 April 2010.
year 2010There are no assets and liabilities transferred to disposal groups held for sale as at 31 December 2010.
d. deXiA bAnKA sLoVensKo
On 11 November 2010, in compliance with the Dexia Group's strategic disinvestment plan, Dexia Kommunalkredit Bank (a 100% subsidiary of Dexia SA, via Dexia Crédit Local) concluded an agreement to sell its Dexia banka Slovensko subsidiary (“DBS“) to Penta Investments Ltd.
This agreement provides for:
− the sale of the 88.7057% of DBS held by Dexia Kommunalkredit Bank;
− clauses amending the transaction (price, possibilities to rescind) depending on the outcome of the Ritro litigation;
− the purchase, by Dexia, of a portfolio of EUR 110 million in Greek securities that were previously acquired by DBS from its parent company Dexia Kommunalkredit Bank, without any impact on DBS's net assets.
The agreement also provides for funding adapting in such a way as to guarantee the transition: funding currently received by DBS by nature of its being a Dexia Group subsidiary, and which would be changed on its exit from the Group, will be replaced by guaranteed funding with maturities of up to two years. Other existing funding will be maintained for the full term.
Considering the uncertainties – as at 31 December 2010 – surrounding the conditions for implementation of this agreement (Ritro litigation, authorisations and so on), it was decided, on 31 December 2010, to keep DBS globally integrated. DBS was also valued for provisioning on the basis of its long-term value (EUR 82 million); this gave rise to a depreciation of EUR 3 million in compliance with IAS 36 “Impairment of assets“.
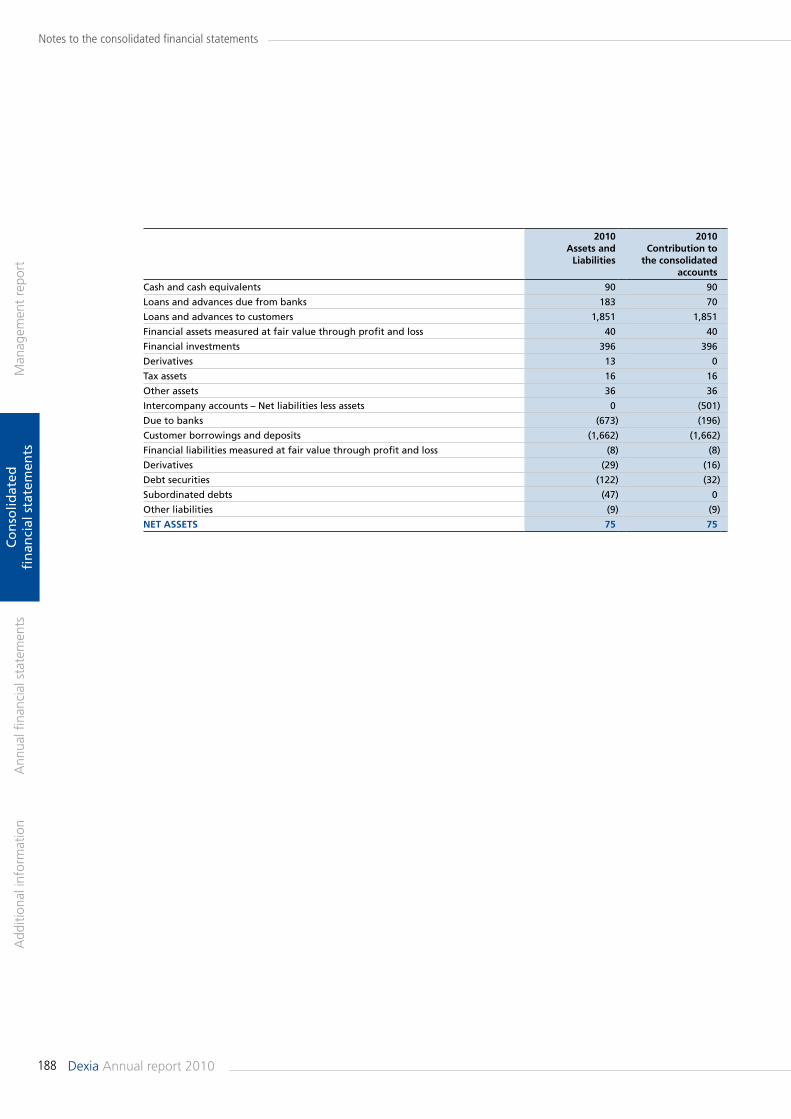
188 Dexia Annual report 2010
Man
agem
ent
repo
rtA
dditi
onal
info
rmat
ion
Ann
ual fi
nanc
ial s
tate
men
tsC
on
solid
ated
fi
nan
cial
sta
tem
ents
Notes to the consolidated financial statements
2010assets and
liabilities
2010Contribution to
the consolidated accounts
Cash and cash equivalents 90 90
Loans and advances due from banks 183 70
Loans and advances to customers 1,851 1,851
Financial assets measured at fair value through profit and loss 40 40
Financial investments 396 396
Derivatives 13 0
Tax assets 16 16
Other assets 36 36
Intercompany accounts – Net liabilities less assets 0 (501)
Due to banks (673) (196)
Customer borrowings and deposits (1,662) (1,662)
Financial liabilities measured at fair value through profit and loss (8) (8)
Derivatives (29) (16)
Debt securities (122) (32)
Subordinated debts (47) 0
Other liabilities (9) (9)
NeT asseTs 75 75
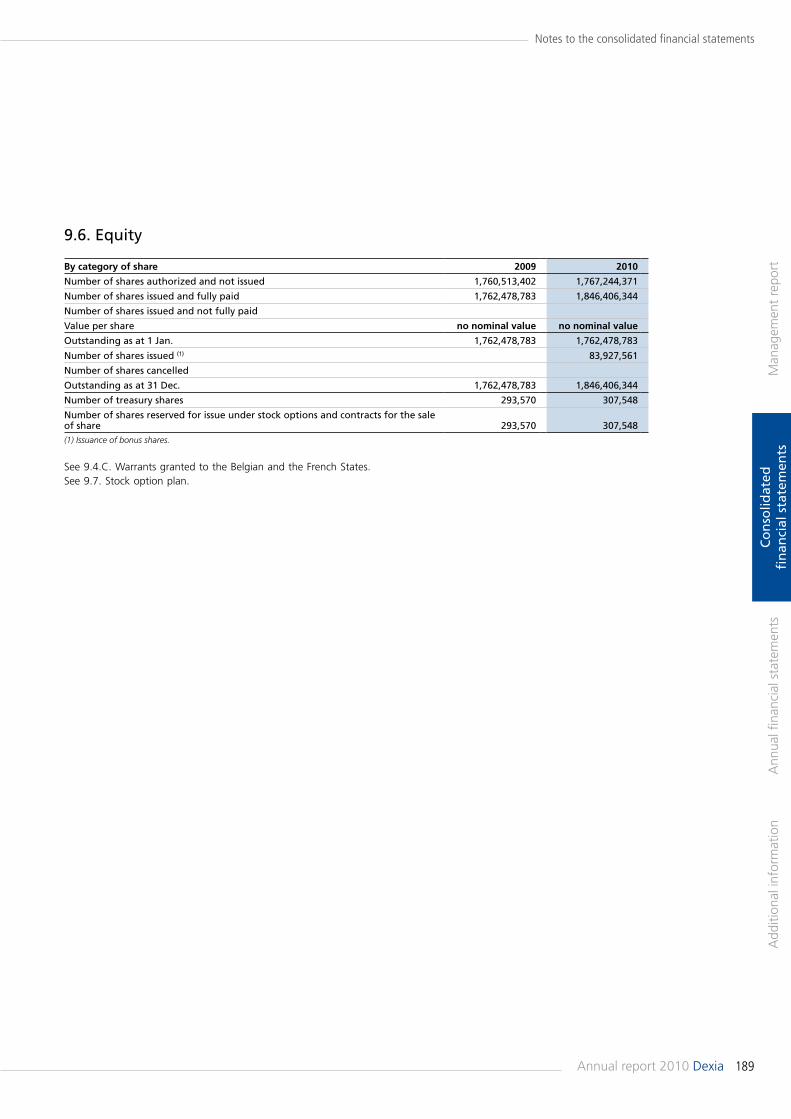
189Annual report 2010 Dexia
Man
agem
ent
repo
rtA
dditi
onal
info
rmat
ion
Ann
ual fi
nanc
ial s
tate
men
tsC
on
solid
ated
fi
nan
cial
sta
tem
ents
Notes to the consolidated financial statements
by category of share 2009 2010
Number of shares authorized and not issued 1,760,513,402 1,767,244,371
Number of shares issued and fully paid 1,762,478,783 1,846,406,344
Number of shares issued and not fully paid
Value per share no nominal value no nominal value
Outstanding as at 1 Jan. 1,762,478,783 1,762,478,783
Number of shares issued (1) 83,927,561
Number of shares cancelled
Outstanding as at 31 Dec. 1,762,478,783 1,846,406,344
Number of treasury shares 293,570 307,548
Number of shares reserved for issue under stock options and contracts for the sale of share 293,570 307,548(1) Issuance of bonus shares.
See 9.4.C. Warrants granted to the Belgian and the French States.See 9.7. Stock option plan.
9.6. Equity
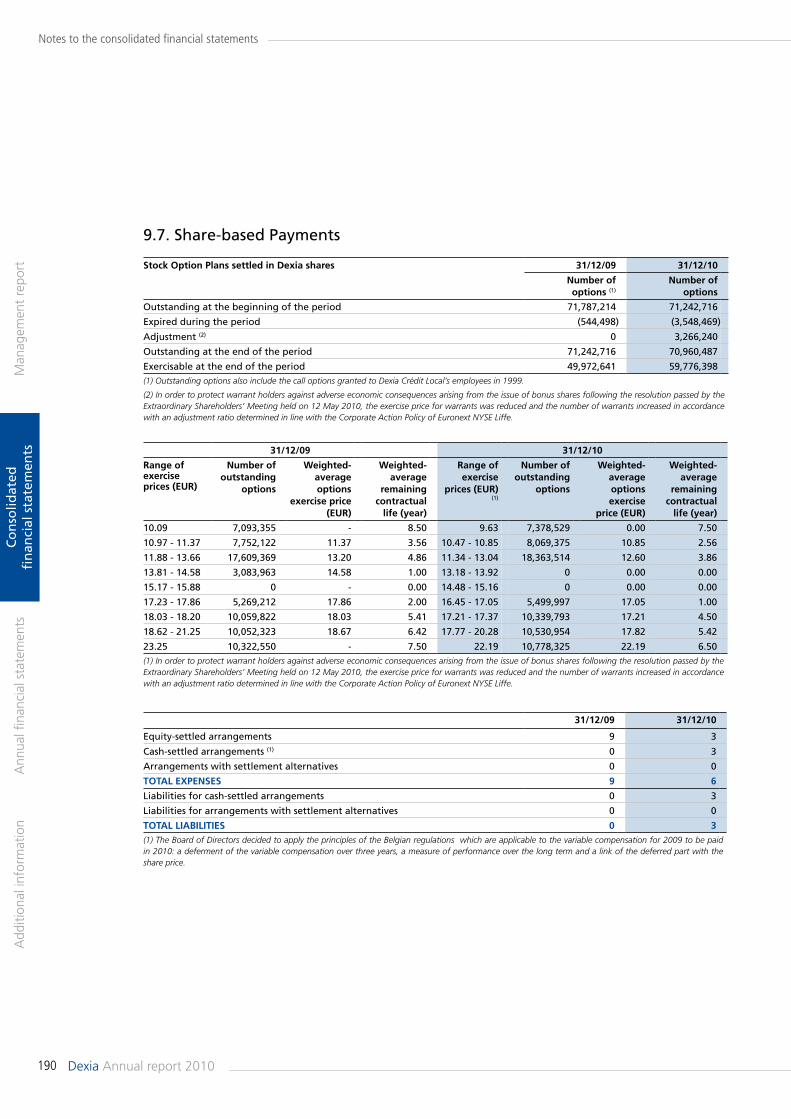
190 Dexia Annual report 2010
Man
agem
ent
repo
rtA
dditi
onal
info
rmat
ion
Ann
ual fi
nanc
ial s
tate
men
tsC
on
solid
ated
fi
nan
cial
sta
tem
ents
Notes to the consolidated financial statements
stock option plans settled in dexia shares 31/12/09 31/12/10
Number of options (1)
Number of options
Outstanding at the beginning of the period 71,787,214 71,242,716
Expired during the period (544,498) (3,548,469)
Adjustment (2) 0 3,266,240
Outstanding at the end of the period 71,242,716 70,960,487
Exercisable at the end of the period 49,972,641 59,776,398(1) Outstanding options also include the call options granted to Dexia Crédit Local’s employees in 1999.
(2) In order to protect warrant holders against adverse economic consequences arising from the issue of bonus shares following the resolution passed by the Extraordinary Shareholders’ Meeting held on 12 May 2010, the exercise price for warrants was reduced and the number of warrants increased in accordance with an adjustment ratio determined in line with the Corporate Action Policy of Euronext NYSE Liffe.
31/12/09 31/12/10
range of exercise prices (eur)
Number of outstanding
options
weighted-average options
exercise price (eur)
weighted-average
remaining contractual
life (year)
range of exercise
prices (eur) (1)
Number of outstanding
options
weighted-average options exercise
price (eur)
weighted-average
remaining contractual
life (year)
10.09 7,093,355 - 8.50 9.63 7,378,529 0.00 7.50
10.97 - 11.37 7,752,122 11.37 3.56 10.47 - 10.85 8,069,375 10.85 2.56
11.88 - 13.66 17,609,369 13.20 4.86 11.34 - 13.04 18,363,514 12.60 3.86
13.81 - 14.58 3,083,963 14.58 1.00 13.18 - 13.92 0 0.00 0.00
15.17 - 15.88 0 - 0.00 14.48 - 15.16 0 0.00 0.00
17.23 - 17.86 5,269,212 17.86 2.00 16.45 - 17.05 5,499,997 17.05 1.00
18.03 - 18.20 10,059,822 18.03 5.41 17.21 - 17.37 10,339,793 17.21 4.50
18.62 - 21.25 10,052,323 18.67 6.42 17.77 - 20.28 10,530,954 17.82 5.42
23.25 10,322,550 - 7.50 22.19 10,778,325 22.19 6.50(1) In order to protect warrant holders against adverse economic consequences arising from the issue of bonus shares following the resolution passed by the Extraordinary Shareholders’ Meeting held on 12 May 2010, the exercise price for warrants was reduced and the number of warrants increased in accordance with an adjustment ratio determined in line with the Corporate Action Policy of Euronext NYSE Liffe.
31/12/09 31/12/10
Equity-settled arrangements 9 3
Cash-settled arrangements (1) 0 3
Arrangements with settlement alternatives 0 0
ToTal expeNses 9 6
Liabilities for cash-settled arrangements 0 3
Liabilities for arrangements with settlement alternatives 0 0
ToTal liabiliTies 0 3(1) The Board of Directors decided to apply the principles of the Belgian regulations which are applicable to the variable compensation for 2009 to be paid in 2010: a deferment of the variable compensation over three years, a measure of performance over the long term and a link of the deferred part with the share price.
9.7. Share-based Payments
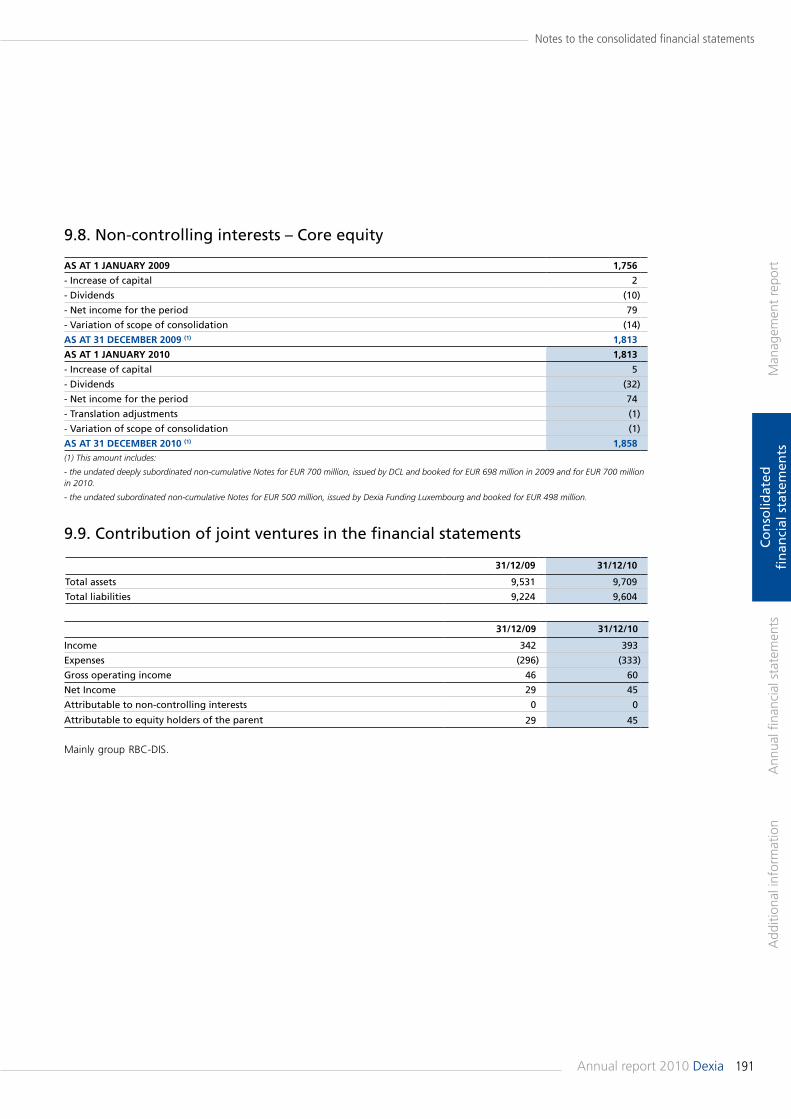
191Annual report 2010 Dexia
Man
agem
ent
repo
rtA
dditi
onal
info
rmat
ion
Ann
ual fi
nanc
ial s
tate
men
tsC
on
solid
ated
fi
nan
cial
sta
tem
ents
Notes to the consolidated financial statements
as aT 1 JaNuary 2009 1,756
- Increase of capital 2
- Dividends (10)
- Net income for the period 79
- Variation of scope of consolidation (14)
as aT 31 deCember 2009 (1) 1,813
as aT 1 JaNuary 2010 1,813
- Increase of capital 5
- Dividends (32)
- Net income for the period 74
- Translation adjustments (1)
- Variation of scope of consolidation (1)
as aT 31 deCember 2010 (1) 1,858(1) This amount includes:
- the undated deeply subordinated non-cumulative Notes for EUR 700 million, issued by DCL and booked for EUR 698 million in 2009 and for EUR 700 million in 2010.
- the undated subordinated non-cumulative Notes for EUR 500 million, issued by Dexia Funding Luxembourg and booked for EUR 498 million.
9.8. Non-controlling interests – Core equity
9.9. Contribution of joint ventures in the financial statements
31/12/09 31/12/10
Total assets 9,531 9,709
Total liabilities 9,224 9,604
31/12/09 31/12/10
Income 342 393
Expenses (296) (333)
Gross operating income 46 60
Net Income 29 45
Attributable to non-controlling interests 0 0
Attributable to equity holders of the parent 29 45
Mainly group RBC-DIS.
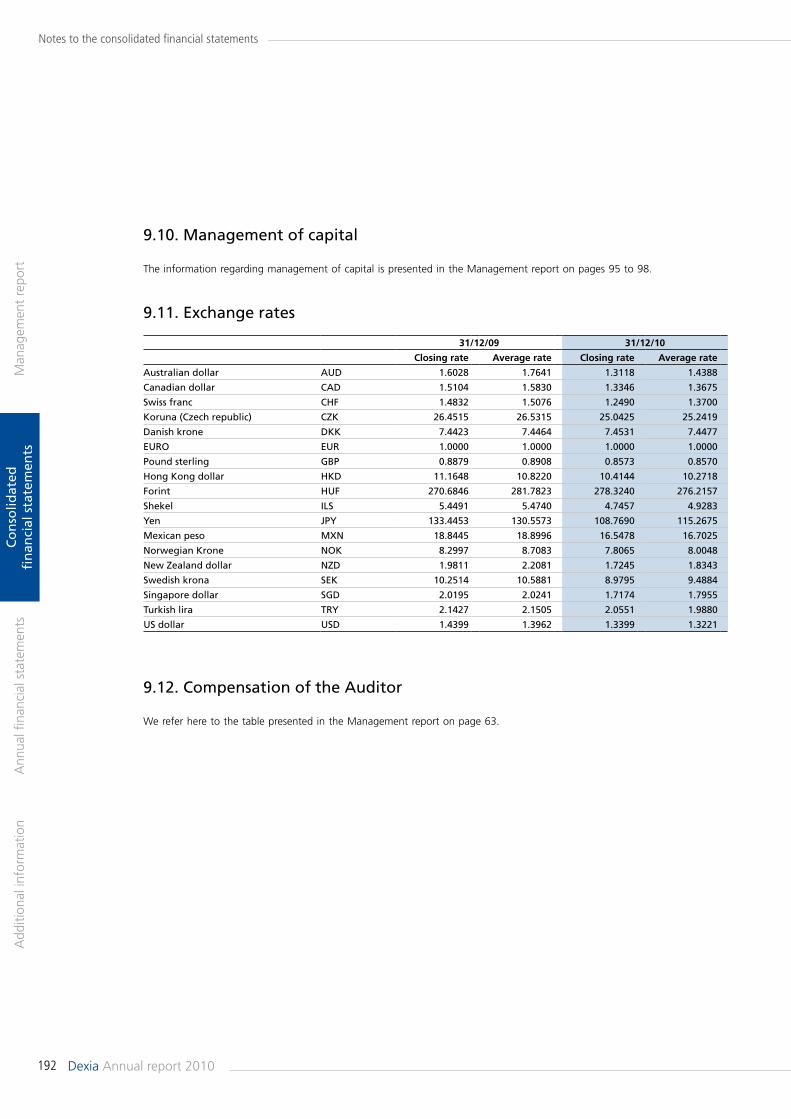
192 Dexia Annual report 2010
Man
agem
ent
repo
rtA
dditi
onal
info
rmat
ion
Ann
ual fi
nanc
ial s
tate
men
tsC
on
solid
ated
fi
nan
cial
sta
tem
ents
Notes to the consolidated financial statements
31/12/09 31/12/10
Closing rate average rate Closing rate average rate
Australian dollar AUD 1.6028 1.7641 1.3118 1.4388
Canadian dollar CAD 1.5104 1.5830 1.3346 1.3675
Swiss franc CHF 1.4832 1.5076 1.2490 1.3700
Koruna (Czech republic) CZK 26.4515 26.5315 25.0425 25.2419
Danish krone DKK 7.4423 7.4464 7.4531 7.4477
EURO EUR 1.0000 1.0000 1.0000 1.0000
Pound sterling GBP 0.8879 0.8908 0.8573 0.8570
Hong Kong dollar HKD 11.1648 10.8220 10.4144 10.2718
Forint HUF 270.6846 281.7823 278.3240 276.2157
Shekel ILS 5.4491 5.4740 4.7457 4.9283
Yen JPY 133.4453 130.5573 108.7690 115.2675
Mexican peso MXN 18.8445 18.8996 16.5478 16.7025
Norwegian Krone NOK 8.2997 8.7083 7.8065 8.0048
New Zealand dollar NZD 1.9811 2.2081 1.7245 1.8343
Swedish krona SEK 10.2514 10.5881 8.9795 9.4884
Singapore dollar SGD 2.0195 2.0241 1.7174 1.7955
Turkish lira TRY 2.1427 2.1505 2.0551 1.9880
US dollar USD 1.4399 1.3962 1.3399 1.3221
9.10. Management of capital
The information regarding management of capital is presented in the Management report on pages 95 to 98.
9.11. Exchange rates
9.12. Compensation of the Auditor
We refer here to the table presented in the Management report on page 63.
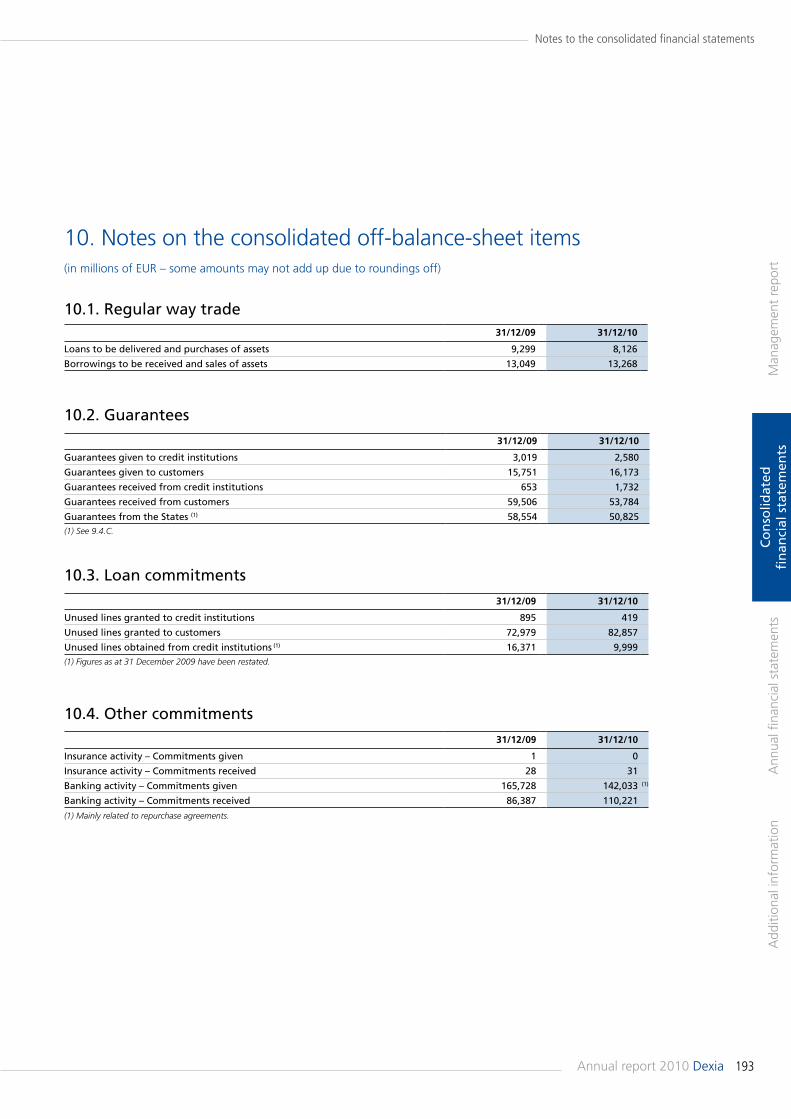
193Annual report 2010 Dexia
Man
agem
ent
repo
rtA
dditi
onal
info
rmat
ion
Ann
ual fi
nanc
ial s
tate
men
tsC
on
solid
ated
fi
nan
cial
sta
tem
ents
Notes to the consolidated financial statements
10. Notes on the consolidated off-balance-sheet items(in millions of EUR – some amounts may not add up due to roundings off)
31/12/09 31/12/10
Loans to be delivered and purchases of assets 9,299 8,126
Borrowings to be received and sales of assets 13,049 13,268
31/12/09 31/12/10
Guarantees given to credit institutions 3,019 2,580
Guarantees given to customers 15,751 16,173
Guarantees received from credit institutions 653 1,732
Guarantees received from customers 59,506 53,784
Guarantees from the States (1) 58,554 50,825(1) See 9.4.C.
10.2. Guarantees
10.3. Loan commitments
10.4. Other commitments
31/12/09 31/12/10
Unused lines granted to credit institutions 895 419
Unused lines granted to customers 72,979 82,857
Unused lines obtained from credit institutions (1) 16,371 9,999(1) Figures as at 31 December 2009 have been restated.
31/12/09 31/12/10
Insurance activity – Commitments given 1 0
Insurance activity – Commitments received 28 31
Banking activity – Commitments given 165,728 142,033 (1)
Banking activity – Commitments received 86,387 110,221
(1) Mainly related to repurchase agreements.
10.1. Regular way trade
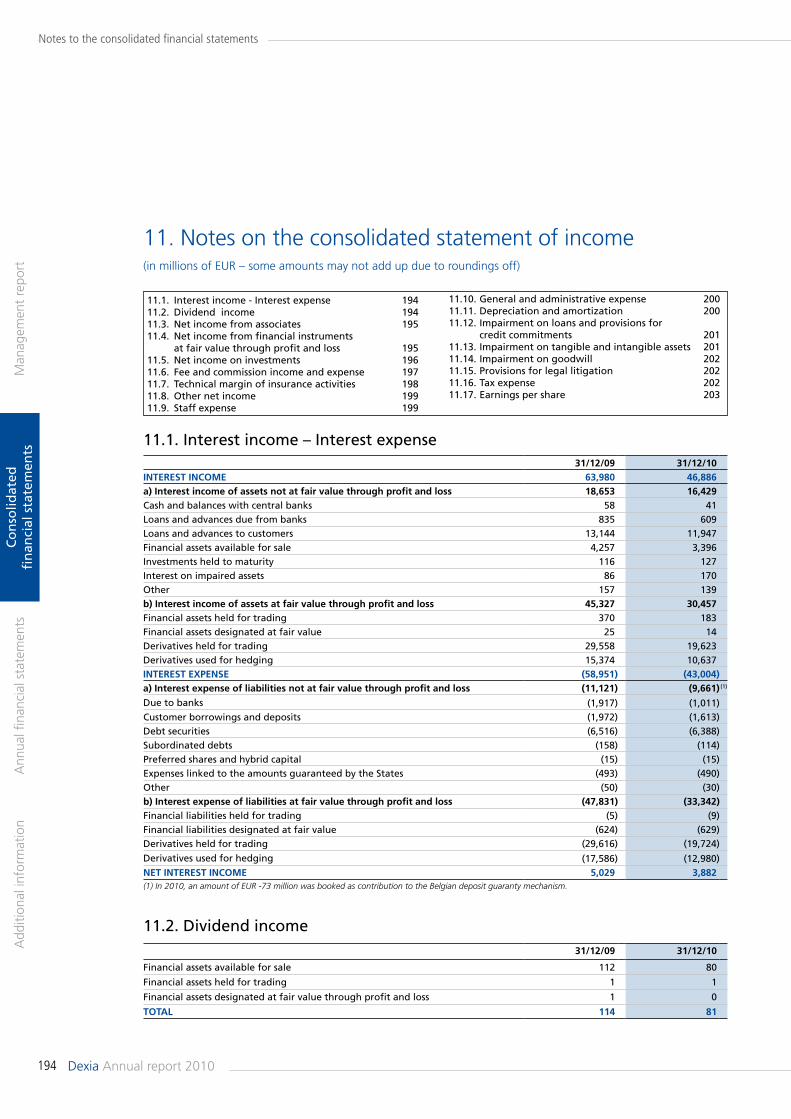
194 Dexia Annual report 2010
Man
agem
ent
repo
rtA
dditi
onal
info
rmat
ion
Ann
ual fi
nanc
ial s
tate
men
tsC
on
solid
ated
fi
nan
cial
sta
tem
ents
Notes to the consolidated financial statements
11. Notes on the consolidated statement of income(in millions of EUR – some amounts may not add up due to roundings off)
11.2. Dividend income
31/12/09 31/12/10iNTeresT iNCome 63,980 46,886a) interest income of assets not at fair value through profit and loss 18,653 16,429Cash and balances with central banks 58 41Loans and advances due from banks 835 609Loans and advances to customers 13,144 11,947Financial assets available for sale 4,257 3,396Investments held to maturity 116 127Interest on impaired assets 86 170Other 157 139b) interest income of assets at fair value through profit and loss 45,327 30,457Financial assets held for trading 370 183Financial assets designated at fair value 25 14Derivatives held for trading 29,558 19,623Derivatives used for hedging 15,374 10,637iNTeresT expeNse (58,951) (43,004)a) interest expense of liabilities not at fair value through profit and loss (11,121) (9,661) (1)
Due to banks (1,917) (1,011)Customer borrowings and deposits (1,972) (1,613)Debt securities (6,516) (6,388)Subordinated debts (158) (114)Preferred shares and hybrid capital (15) (15)Expenses linked to the amounts guaranteed by the States (493) (490)Other (50) (30)b) interest expense of liabilities at fair value through profit and loss (47,831) (33,342)Financial liabilities held for trading (5) (9)Financial liabilities designated at fair value (624) (629)Derivatives held for trading (29,616) (19,724)
Derivatives used for hedging (17,586) (12,980)NeT iNTeresT iNCome 5,029 3,882(1) In 2010, an amount of EUR -73 million was booked as contribution to the Belgian deposit guaranty mechanism.
31/12/09 31/12/10
Financial assets available for sale 112 80
Financial assets held for trading 1 1
Financial assets designated at fair value through profit and loss 1 0
ToTal 114 81
11.1. Interest income - Interest expense 19411.2. Dividend income 19411.3. Net income from associates 19511.4. Net income from financial instruments at fair value through profit and loss 19511.5. Net income on investments 19611.6. Fee and commission income and expense 19711.7. Technical margin of insurance activities 19811.8. Other net income 19911.9. Staff expense 199
11.10. General and administrative expense 20011.11. Depreciation and amortization 20011.12. Impairment on loans and provisions for credit commitments 20111.13. Impairment on tangible and intangible assets 20111.14. Impairment on goodwill 20211.15. Provisions for legal litigation 20211.16. Tax expense 20211.17. Earnings per share 203
11.1. Interest income – Interest expense

195Annual report 2010 Dexia
Man
agem
ent
repo
rtA
dditi
onal
info
rmat
ion
Ann
ual fi
nanc
ial s
tate
men
tsC
on
solid
ated
fi
nan
cial
sta
tem
ents
Notes to the consolidated financial statements
11.4. Net income from financial instruments at fair value through profit and loss
31/12/09 31/12/10
Income from associates before tax 55 6
Share of tax (15) 0
ToTal 39 5
31/12/09 31/12/10
Net trading income (96) (98)
Net result of hedge accounting (47) 3
Net result of financial instruments designated at fair value through profit or loss and result from the related derivatives (1) 70 (34)
Change in own credit risk (2) (154) (26)
Forex activity and exchange differences 289 157
ToTal 61 2
(1) Among which trading derivatives included in a fair value option strategy (240) 102(2) See also note 12.2.H. Credit-risk information about financial liabilities designated at fair value through profit or loss.
resuLt of hedGe ACCountinG31/12/09 31/12/10
Fair value hedges 7 34
Fair value changes of the hedged item attributable to the hedged risk (4,760) 6,081
Fair value changes of the hedging derivatives 4,768 (6,046)
Cash flow hedges (1) (2)
Fair value changes of the hedging derivatives – ineffective portion (1) (2)
Discontinuation of cash flow hedge accounting (Cash flows no longer expected to occur) 5 2
Hedges of net investments in a foreign operation 3 (48)
Fair value changes of the hedging derivatives – ineffective portion (1) 3 (48)
Portfolio hedge (61) 16
Fair value changes of the hedged item (1,383) 1,221
Fair value changes of the hedging derivatives 1,322 (1,204)
ToTal (47) 3
Discontinuation of cash flow hedge accounting (cash flows still expected to occur) – amounts recorded in interest margin 11 5(1) Dexia hedged its investment in Dexia Holding Investments (DHI), parent company of FSA group. As this company did a loss on the sale of FSA Inc. and on impairments on assets of Dexia Financial Products, the FSA GIC activity kept by Dexia, hedge became inefficient and was broken.
11.3. Net income from associates
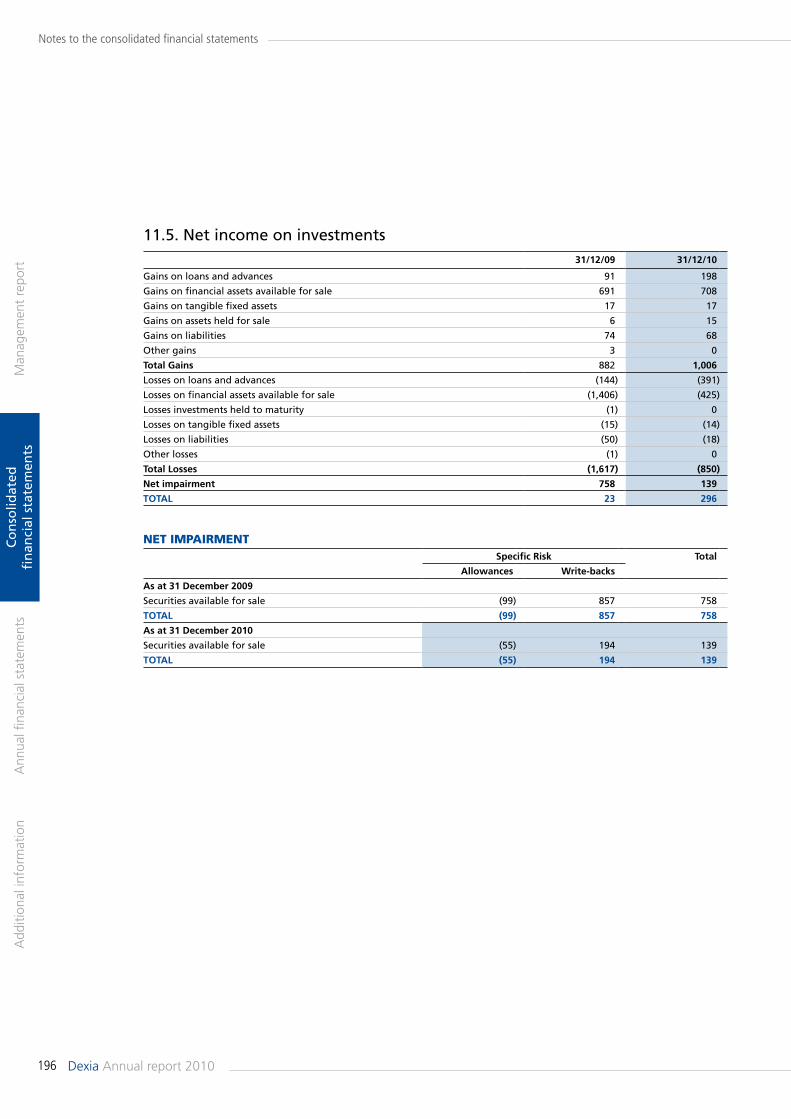
196 Dexia Annual report 2010
Man
agem
ent
repo
rtA
dditi
onal
info
rmat
ion
Ann
ual fi
nanc
ial s
tate
men
tsC
on
solid
ated
fi
nan
cial
sta
tem
ents
Notes to the consolidated financial statements
31/12/09 31/12/10
Gains on loans and advances 91 198
Gains on financial assets available for sale 691 708
Gains on tangible fixed assets 17 17
Gains on assets held for sale 6 15
Gains on liabilities 74 68
Other gains 3 0
Total Gains 882 1,006
Losses on loans and advances (144) (391)
Losses on financial assets available for sale (1,406) (425)
Losses investments held to maturity (1) 0
Losses on tangible fixed assets (15) (14)
Losses on liabilities (50) (18)
Other losses (1) 0
Total losses (1,617) (850)
Net impairment 758 139
ToTal 23 296
net imPAirmentspecific risk Total
allowances write-backs
as at 31 december 2009
Securities available for sale (99) 857 758
ToTal (99) 857 758
as at 31 december 2010
Securities available for sale (55) 194 139
ToTal (55) 194 139
11.5. Net income on investments
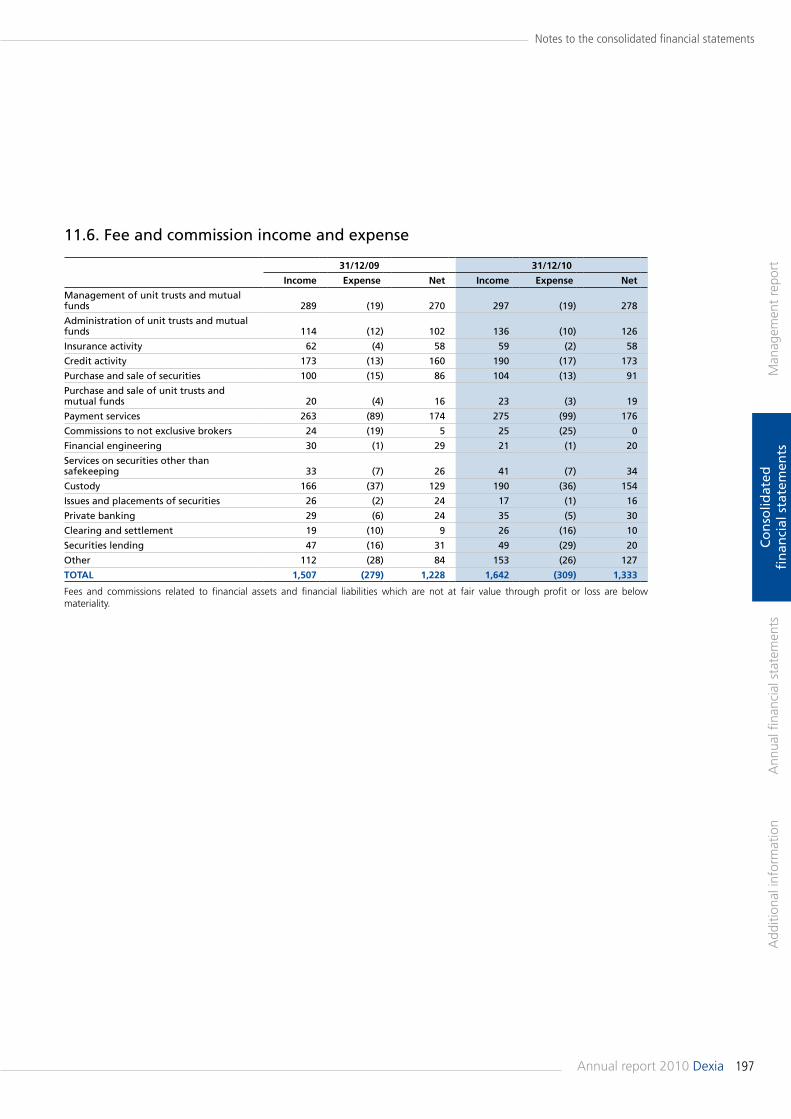
197Annual report 2010 Dexia
Man
agem
ent
repo
rtA
dditi
onal
info
rmat
ion
Ann
ual fi
nanc
ial s
tate
men
tsC
on
solid
ated
fi
nan
cial
sta
tem
ents
Notes to the consolidated financial statements
11.6. Fee and commission income and expense
31/12/09 31/12/10
income expense Net income expense Net
Management of unit trusts and mutual funds 289 (19) 270 297 (19) 278
Administration of unit trusts and mutual funds 114 (12) 102 136 (10) 126
Insurance activity 62 (4) 58 59 (2) 58
Credit activity 173 (13) 160 190 (17) 173
Purchase and sale of securities 100 (15) 86 104 (13) 91
Purchase and sale of unit trusts and mutual funds 20 (4) 16 23 (3) 19
Payment services 263 (89) 174 275 (99) 176
Commissions to not exclusive brokers 24 (19) 5 25 (25) 0
Financial engineering 30 (1) 29 21 (1) 20
Services on securities other than safekeeping 33 (7) 26 41 (7) 34
Custody 166 (37) 129 190 (36) 154
Issues and placements of securities 26 (2) 24 17 (1) 16
Private banking 29 (6) 24 35 (5) 30
Clearing and settlement 19 (10) 9 26 (16) 10
Securities lending 47 (16) 31 49 (29) 20
Other 112 (28) 84 153 (26) 127
ToTal 1,507 (279) 1,228 1,642 (309) 1,333
Fees and commissions related to financial assets and financial liabilities which are not at fair value through profit or loss are below materiality.
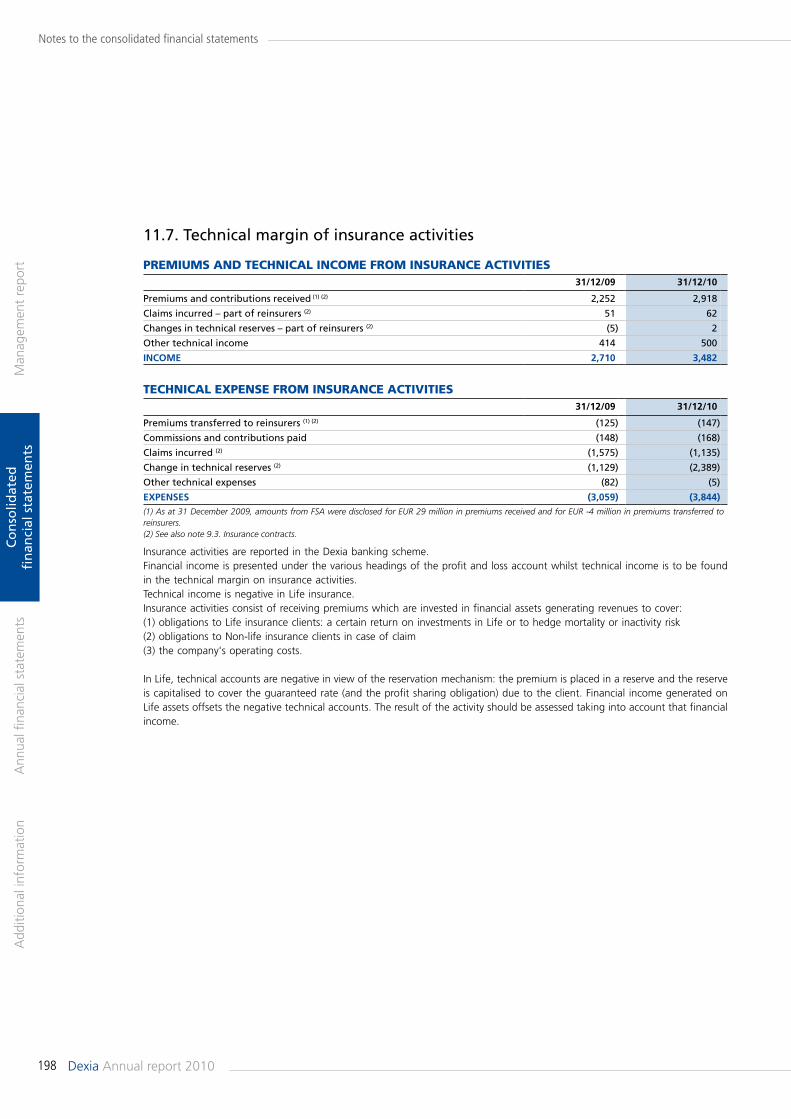
198 Dexia Annual report 2010
Man
agem
ent
repo
rtA
dditi
onal
info
rmat
ion
Ann
ual fi
nanc
ial s
tate
men
tsC
on
solid
ated
fi
nan
cial
sta
tem
ents
Notes to the consolidated financial statements
11.7. Technical margin of insurance activities
Premiums And teChniCAL inCome from insurAnCe ACtiVities31/12/09 31/12/10
Premiums and contributions received (1) (2) 2,252 2,918
Claims incurred – part of reinsurers (2) 51 62
Changes in technical reserves – part of reinsurers (2) (5) 2
Other technical income 414 500
iNCome 2,710 3,482
teChniCAL eXPense from insurAnCe ACtiVities31/12/09 31/12/10
Premiums transferred to reinsurers (1) (2) (125) (147)
Commissions and contributions paid (148) (168)
Claims incurred (2) (1,575) (1,135)
Change in technical reserves (2) (1,129) (2,389)
Other technical expenses (82) (5)
expeNses (3,059) (3,844)(1) As at 31 December 2009, amounts from FSA were disclosed for EUR 29 million in premiums received and for EUR -4 million in premiums transferred to reinsurers.(2) See also note 9.3. Insurance contracts.
Insurance activities are reported in the Dexia banking scheme. Financial income is presented under the various headings of the profit and loss account whilst technical income is to be found in the technical margin on insurance activities.Technical income is negative in Life insurance. Insurance activities consist of receiving premiums which are invested in financial assets generating revenues to cover: (1) obligations to Life insurance clients: a certain return on investments in Life or to hedge mortality or inactivity risk (2) obligations to Non-life insurance clients in case of claim(3) the company's operating costs.
In Life, technical accounts are negative in view of the reservation mechanism: the premium is placed in a reserve and the reserve is capitalised to cover the guaranteed rate (and the profit sharing obligation) due to the client. Financial income generated on Life assets offsets the negative technical accounts. The result of the activity should be assessed taking into account that financial income.
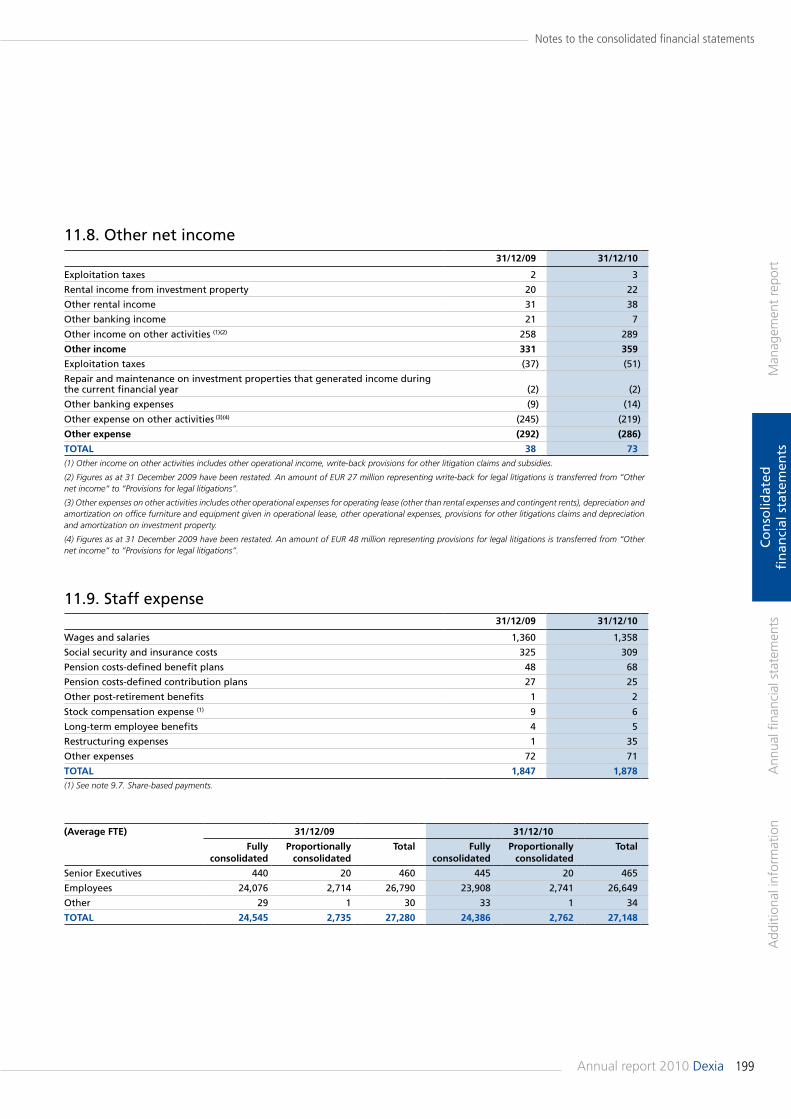
199Annual report 2010 Dexia
Man
agem
ent
repo
rtA
dditi
onal
info
rmat
ion
Ann
ual fi
nanc
ial s
tate
men
tsC
on
solid
ated
fi
nan
cial
sta
tem
ents
Notes to the consolidated financial statements
11.8. Other net income
11.9. Staff expense
31/12/09 31/12/10
Exploitation taxes 2 3
Rental income from investment property 20 22
Other rental income 31 38
Other banking income 21 7
Other income on other activities (1)(2) 258 289
other income 331 359
Exploitation taxes (37) (51)
Repair and maintenance on investment properties that generated income during the current financial year (2) (2)
Other banking expenses (9) (14)
Other expense on other activities (3)(4) (245) (219)
other expense (292) (286)
ToTal 38 73(1) Other income on other activities includes other operational income, write-back provisions for other litigation claims and subsidies.
(2) Figures as at 31 December 2009 have been restated. An amount of EUR 27 million representing write-back for legal litigations is transferred from “Other net income“ to “Provisions for legal litigations“.
(3) Other expenses on other activities includes other operational expenses for operating lease (other than rental expenses and contingent rents), depreciation and amortization on office furniture and equipment given in operational lease, other operational expenses, provisions for other litigations claims and depreciation and amortization on investment property.
(4) Figures as at 31 December 2009 have been restated. An amount of EUR 48 million representing provisions for legal litigations is transferred from “Other net income“ to “Provisions for legal litigations“.
31/12/09 31/12/10
Wages and salaries 1,360 1,358
Social security and insurance costs 325 309
Pension costs-defined benefit plans 48 68
Pension costs-defined contribution plans 27 25
Other post-retirement benefits 1 2
Stock compensation expense (1) 9 6
Long-term employee benefits 4 5
Restructuring expenses 1 35
Other expenses 72 71
ToTal 1,847 1,878(1) See note 9.7. Share-based payments.
(average fTe) 31/12/09 31/12/10
fully consolidated
proportionally consolidated
Total fully consolidated
proportionally consolidated
Total
Senior Executives 440 20 460 445 20 465
Employees 24,076 2,714 26,790 23,908 2,741 26,649
Other 29 1 30 33 1 34
ToTal 24,545 2,735 27,280 24,386 2,762 27,148
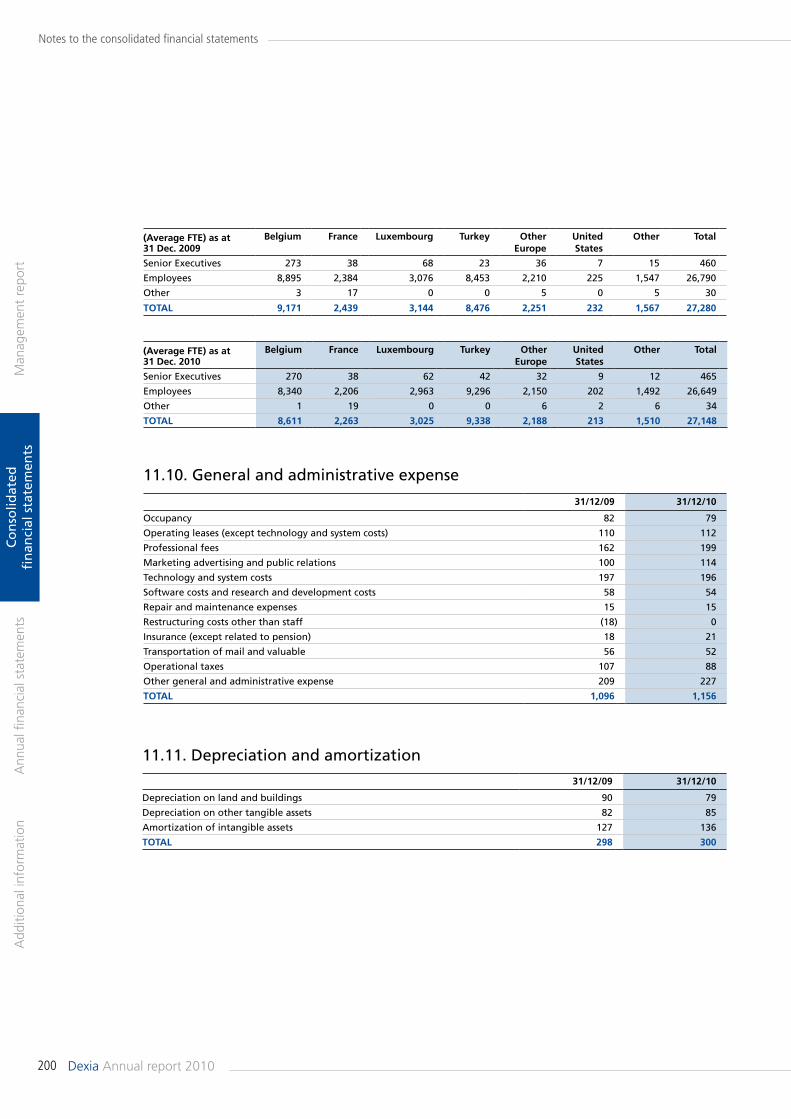
200 Dexia Annual report 2010
Man
agem
ent
repo
rtA
dditi
onal
info
rmat
ion
Ann
ual fi
nanc
ial s
tate
men
tsC
on
solid
ated
fi
nan
cial
sta
tem
ents
Notes to the consolidated financial statements
11.10. General and administrative expense
11.11. Depreciation and amortization
(average fTe) as at 31 dec. 2009
belgium france luxembourg Turkey other europe
united states
other Total
Senior Executives 273 38 68 23 36 7 15 460
Employees 8,895 2,384 3,076 8,453 2,210 225 1,547 26,790
Other 3 17 0 0 5 0 5 30
ToTal 9,171 2,439 3,144 8,476 2,251 232 1,567 27,280
(average fTe) as at 31 dec. 2010
belgium france luxembourg Turkey other europe
united states
other Total
Senior Executives 270 38 62 42 32 9 12 465
Employees 8,340 2,206 2,963 9,296 2,150 202 1,492 26,649
Other 1 19 0 0 6 2 6 34
ToTal 8,611 2,263 3,025 9,338 2,188 213 1,510 27,148
31/12/09 31/12/10
Occupancy 82 79
Operating leases (except technology and system costs) 110 112
Professional fees 162 199
Marketing advertising and public relations 100 114
Technology and system costs 197 196
Software costs and research and development costs 58 54
Repair and maintenance expenses 15 15
Restructuring costs other than staff (18) 0
Insurance (except related to pension) 18 21
Transportation of mail and valuable 56 52
Operational taxes 107 88
Other general and administrative expense 209 227
ToTal 1,096 1,156
31/12/09 31/12/10
Depreciation on land and buildings 90 79
Depreciation on other tangible assets 82 85
Amortization of intangible assets 127 136
ToTal 298 300
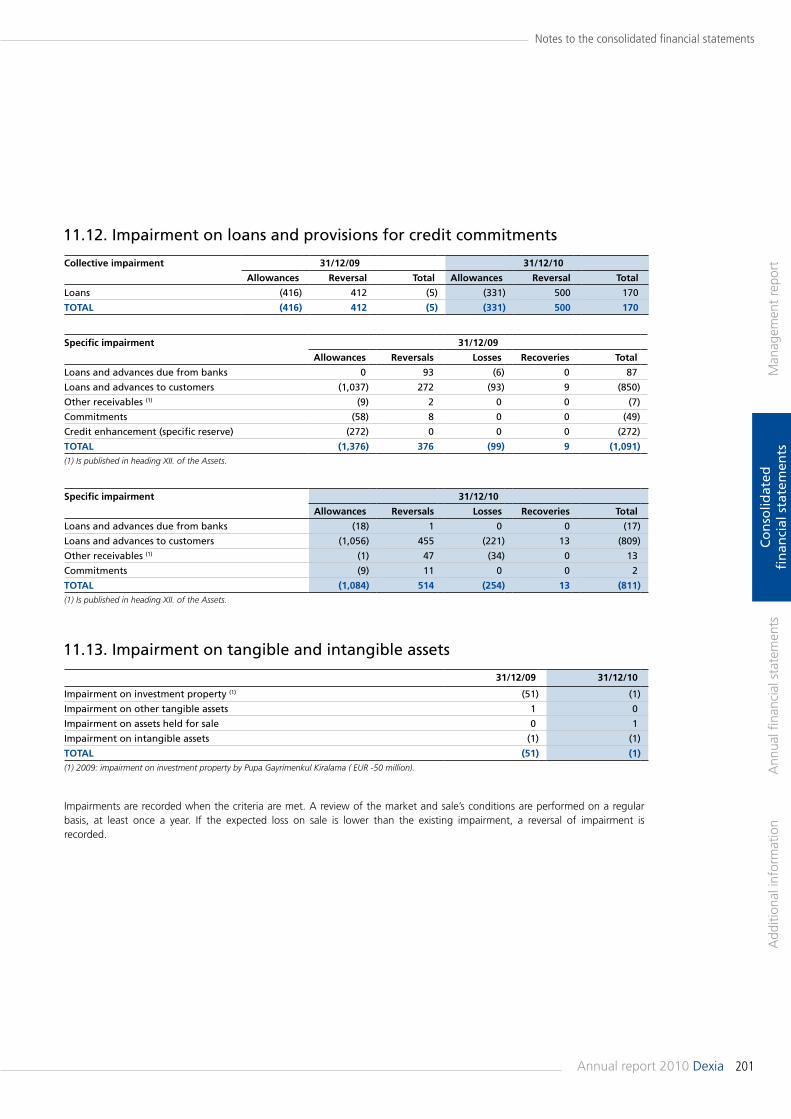
201Annual report 2010 Dexia
Man
agem
ent
repo
rtA
dditi
onal
info
rmat
ion
Ann
ual fi
nanc
ial s
tate
men
tsC
on
solid
ated
fi
nan
cial
sta
tem
ents
Notes to the consolidated financial statements
11.12. Impairment on loans and provisions for credit commitments
11.13. Impairment on tangible and intangible assets
Collective impairment 31/12/09 31/12/10
allowances reversal Total allowances reversal Total
Loans (416) 412 (5) (331) 500 170
ToTal (416) 412 (5) (331) 500 170
specific impairment 31/12/09
allowances reversals losses recoveries Total
Loans and advances due from banks 0 93 (6) 0 87
Loans and advances to customers (1,037) 272 (93) 9 (850)
Other receivables (1) (9) 2 0 0 (7)
Commitments (58) 8 0 0 (49)
Credit enhancement (specific reserve) (272) 0 0 0 (272)
ToTal (1,376) 376 (99) 9 (1,091)(1) Is published in heading XII. of the Assets.
specific impairment 31/12/10
allowances reversals losses recoveries Total
Loans and advances due from banks (18) 1 0 0 (17)
Loans and advances to customers (1,056) 455 (221) 13 (809)
Other receivables (1) (1) 47 (34) 0 13
Commitments (9) 11 0 0 2
ToTal (1,084) 514 (254) 13 (811)(1) Is published in heading XII. of the Assets.
31/12/09 31/12/10
Impairment on investment property (1) (51) (1)
Impairment on other tangible assets 1 0
Impairment on assets held for sale 0 1
Impairment on intangible assets (1) (1)
ToTal (51) (1)(1) 2009: impairment on investment property by Pupa Gayrimenkul Kiralama ( EUR -50 million).
Impairments are recorded when the criteria are met. A review of the market and sale’s conditions are performed on a regular basis, at least once a year. If the expected loss on sale is lower than the existing impairment, a reversal of impairment is recorded.
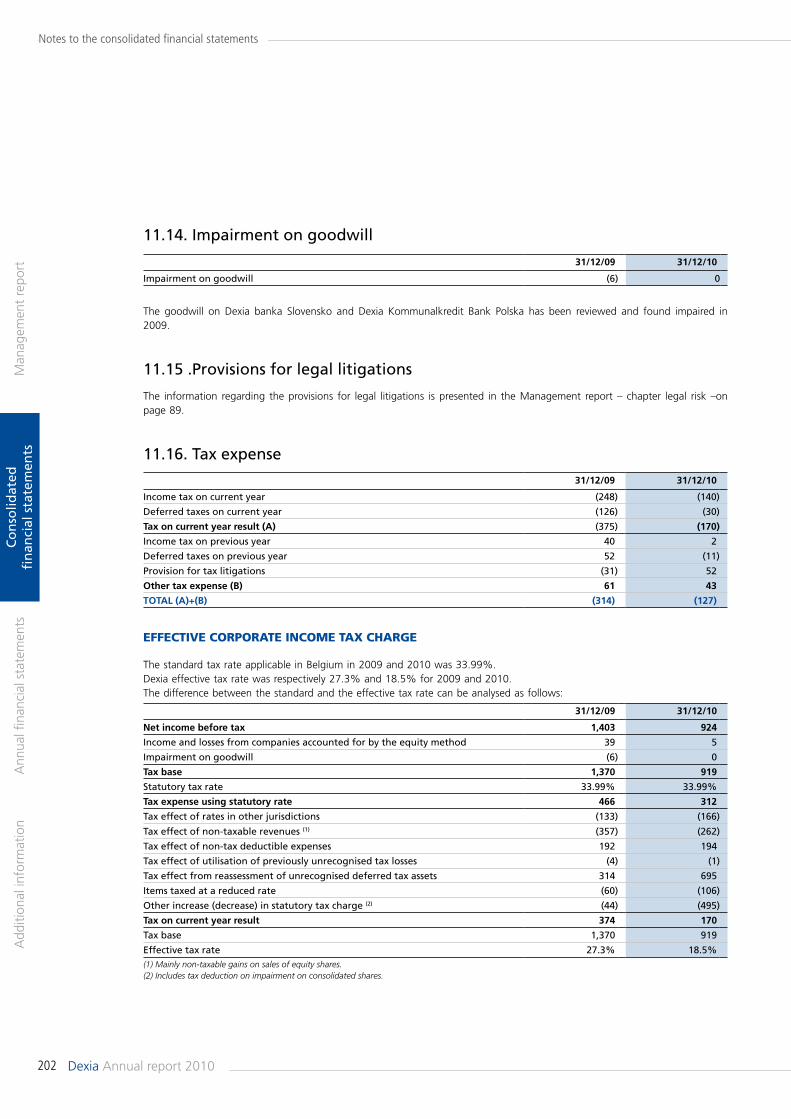
202 Dexia Annual report 2010
Man
agem
ent
repo
rtA
dditi
onal
info
rmat
ion
Ann
ual fi
nanc
ial s
tate
men
tsC
on
solid
ated
fi
nan
cial
sta
tem
ents
Notes to the consolidated financial statements
11.14. Impairment on goodwill
effeCtiVe CorPorAte inCome tAX ChArGe
The standard tax rate applicable in Belgium in 2009 and 2010 was 33.99%.Dexia effective tax rate was respectively 27.3% and 18.5% for 2009 and 2010.The difference between the standard and the effective tax rate can be analysed as follows:
31/12/09 31/12/10
Impairment on goodwill (6) 0
31/12/09 31/12/10
Income tax on current year (248) (140)
Deferred taxes on current year (126) (30)
Tax on current year result (a) (375) (170)
Income tax on previous year 40 2
Deferred taxes on previous year 52 (11)
Provision for tax litigations (31) 52
other tax expense (b) 61 43
ToTal (a)+(b) (314) (127)
31/12/09 31/12/10
Net income before tax 1,403 924
Income and losses from companies accounted for by the equity method 39 5
Impairment on goodwill (6) 0
Tax base 1,370 919
Statutory tax rate 33.99% 33.99%
Tax expense using statutory rate 466 312
Tax effect of rates in other jurisdictions (133) (166)
Tax effect of non-taxable revenues (1) (357) (262)
Tax effect of non-tax deductible expenses 192 194
Tax effect of utilisation of previously unrecognised tax losses (4) (1)
Tax effect from reassessment of unrecognised deferred tax assets 314 695
Items taxed at a reduced rate (60) (106)
Other increase (decrease) in statutory tax charge (2) (44) (495)
Tax on current year result 374 170
Tax base 1,370 919
Effective tax rate 27.3% 18.5%(1) Mainly non-taxable gains on sales of equity shares.(2) Includes tax deduction on impairment on consolidated shares.
The goodwill on Dexia banka Slovensko and Dexia Kommunalkredit Bank Polska has been reviewed and found impaired in 2009.
11.15 .Provisions for legal litigations
The information regarding the provisions for legal litigations is presented in the Management report – chapter legal risk –on page 89.
11.16. Tax expense
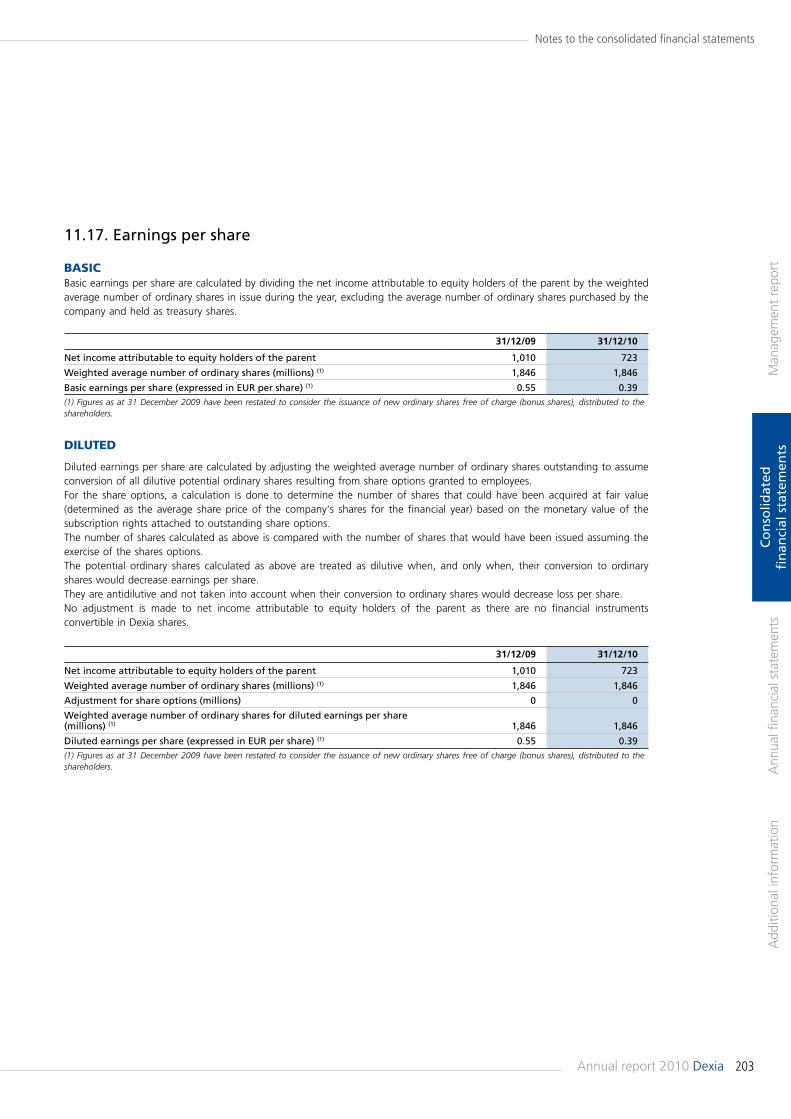
203Annual report 2010 Dexia
Man
agem
ent
repo
rtA
dditi
onal
info
rmat
ion
Ann
ual fi
nanc
ial s
tate
men
tsC
on
solid
ated
fi
nan
cial
sta
tem
ents
Notes to the consolidated financial statements
31/12/09 31/12/10
Net income attributable to equity holders of the parent 1,010 723
Weighted average number of ordinary shares (millions) (1) 1,846 1,846
Basic earnings per share (expressed in EUR per share) (1) 0.55 0.39(1) Figures as at 31 December 2009 have been restated to consider the issuance of new ordinary shares free of charge (bonus shares), distributed to the shareholders.
31/12/09 31/12/10
Net income attributable to equity holders of the parent 1,010 723
Weighted average number of ordinary shares (millions) (1) 1,846 1,846
Adjustment for share options (millions) 0 0
Weighted average number of ordinary shares for diluted earnings per share (millions) (1) 1,846 1,846
Diluted earnings per share (expressed in EUR per share) (1) 0.55 0.39(1) Figures as at 31 December 2009 have been restated to consider the issuance of new ordinary shares free of charge (bonus shares), distributed to the shareholders.
11.17. Earnings per share bAsiCBasic earnings per share are calculated by dividing the net income attributable to equity holders of the parent by the weighted average number of ordinary shares in issue during the year, excluding the average number of ordinary shares purchased by the company and held as treasury shares.
diLuted
Diluted earnings per share are calculated by adjusting the weighted average number of ordinary shares outstanding to assume conversion of all dilutive potential ordinary shares resulting from share options granted to employees.For the share options, a calculation is done to determine the number of shares that could have been acquired at fair value (determined as the average share price of the company's shares for the financial year) based on the monetary value of the subscription rights attached to outstanding share options.The number of shares calculated as above is compared with the number of shares that would have been issued assuming the exercise of the shares options.The potential ordinary shares calculated as above are treated as dilutive when, and only when, their conversion to ordinary shares would decrease earnings per share.They are antidilutive and not taken into account when their conversion to ordinary shares would decrease loss per share.No adjustment is made to net income attributable to equity holders of the parent as there are no financial instruments convertible in Dexia shares.
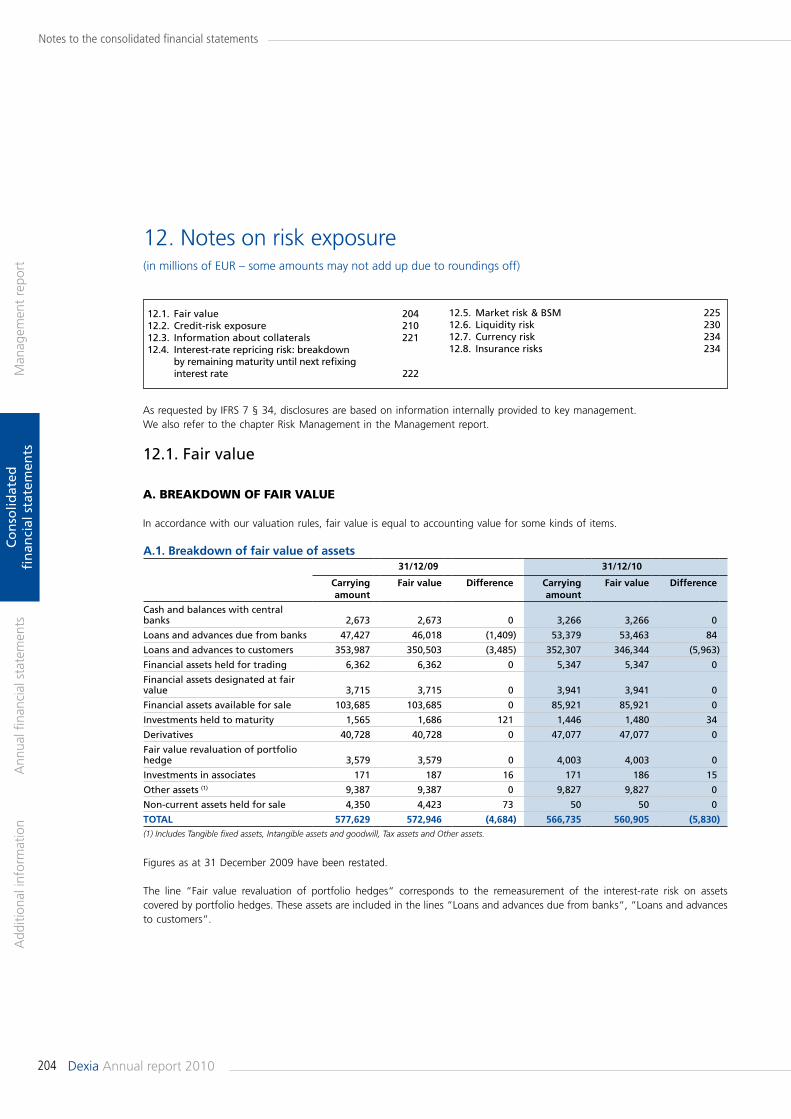
204 Dexia Annual report 2010
Man
agem
ent
repo
rtA
dditi
onal
info
rmat
ion
Ann
ual fi
nanc
ial s
tate
men
tsC
on
solid
ated
fi
nan
cial
sta
tem
ents
Notes to the consolidated financial statements
12. Notes on risk exposure(in millions of EUR – some amounts may not add up due to roundings off)
a.1. breakdown of fair value of assets31/12/09 31/12/10
Carrying amount
fair value difference Carrying amount
fair value difference
Cash and balances with central banks 2,673 2,673 0 3,266 3,266 0
Loans and advances due from banks 47,427 46,018 (1,409) 53,379 53,463 84
Loans and advances to customers 353,987 350,503 (3,485) 352,307 346,344 (5,963)
Financial assets held for trading 6,362 6,362 0 5,347 5,347 0
Financial assets designated at fair value 3,715 3,715 0 3,941 3,941 0
Financial assets available for sale 103,685 103,685 0 85,921 85,921 0
Investments held to maturity 1,565 1,686 121 1,446 1,480 34
Derivatives 40,728 40,728 0 47,077 47,077 0
Fair value revaluation of portfolio hedge 3,579 3,579 0 4,003 4,003 0
Investments in associates 171 187 16 171 186 15
Other assets (1) 9,387 9,387 0 9,827 9,827 0
Non-current assets held for sale 4,350 4,423 73 50 50 0
ToTal 577,629 572,946 (4,684) 566,735 560,905 (5,830)(1) Includes Tangible fixed assets, Intangible assets and goodwill, Tax assets and Other assets.
12.1. Fair value 20412.2. Credit-risk exposure 21012.3. Information about collaterals 22112.4. Interest-rate repricing risk: breakdown by remaining maturity until next refixing interest rate 222
Figures as at 31 December 2009 have been restated.
The line “Fair value revaluation of portfolio hedges“ corresponds to the remeasurement of the interest-rate risk on assets covered by portfolio hedges. These assets are included in the lines “Loans and advances due from banks“, “Loans and advances to customers“.
12.5. Market risk & BSM 22512.6. Liquidity risk 23012.7. Currency risk 23412.8. Insurance risks 234
As requested by IFRS 7 § 34, disclosures are based on information internally provided to key management.We also refer to the chapter Risk Management in the Management report.
12.1. Fair value
A. breAKdoWn of fAir VALue
In accordance with our valuation rules, fair value is equal to accounting value for some kinds of items.
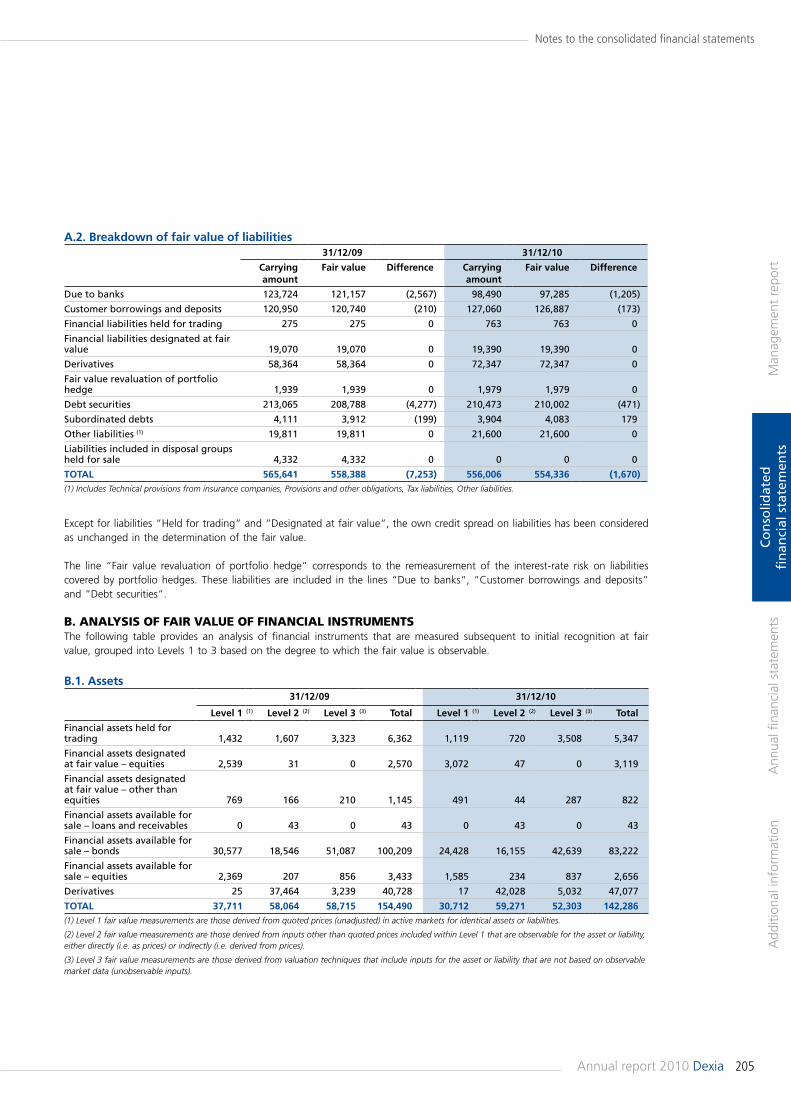
205Annual report 2010 Dexia
Man
agem
ent
repo
rtA
dditi
onal
info
rmat
ion
Ann
ual fi
nanc
ial s
tate
men
tsC
on
solid
ated
fi
nan
cial
sta
tem
ents
Notes to the consolidated financial statements
a.2. breakdown of fair value of liabilities31/12/09 31/12/10
Carrying amount
fair value difference Carrying amount
fair value difference
Due to banks 123,724 121,157 (2,567) 98,490 97,285 (1,205)
Customer borrowings and deposits 120,950 120,740 (210) 127,060 126,887 (173)
Financial liabilities held for trading 275 275 0 763 763 0
Financial liabilities designated at fair value 19,070 19,070 0 19,390 19,390 0
Derivatives 58,364 58,364 0 72,347 72,347 0
Fair value revaluation of portfolio hedge 1,939 1,939 0 1,979 1,979 0
Debt securities 213,065 208,788 (4,277) 210,473 210,002 (471)
Subordinated debts 4,111 3,912 (199) 3,904 4,083 179
Other liabilities (1) 19,811 19,811 0 21,600 21,600 0
Liabilities included in disposal groups held for sale 4,332 4,332 0 0 0 0
ToTal 565,641 558,388 (7,253) 556,006 554,336 (1,670)(1) Includes Technical provisions from insurance companies, Provisions and other obligations, Tax liabilities, Other liabilities.
b.1. assets 31/12/09 31/12/10
level 1 (1) level 2 (2) level 3 (3) Total level 1 (1) level 2 (2) level 3 (3) Total
Financial assets held for trading 1,432 1,607 3,323 6,362 1,119 720 3,508 5,347
Financial assets designated at fair value – equities 2,539 31 0 2,570 3,072 47 0 3,119
Financial assets designated at fair value – other than equities 769 166 210 1,145 491 44 287 822
Financial assets available for sale – loans and receivables 0 43 0 43 0 43 0 43
Financial assets available for sale – bonds 30,577 18,546 51,087 100,209 24,428 16,155 42,639 83,222
Financial assets available for sale – equities 2,369 207 856 3,433 1,585 234 837 2,656
Derivatives 25 37,464 3,239 40,728 17 42,028 5,032 47,077
ToTal 37,711 58,064 58,715 154,490 30,712 59,271 52,303 142,286(1) Level 1 fair value measurements are those derived from quoted prices (unadjusted) in active markets for identical assets or liabilities.
(2) Level 2 fair value measurements are those derived from inputs other than quoted prices included within Level 1 that are observable for the asset or liability, either directly (i.e. as prices) or indirectly (i.e. derived from prices).
(3) Level 3 fair value measurements are those derived from valuation techniques that include inputs for the asset or liability that are not based on observable market data (unobservable inputs).
Except for liabilities “Held for trading“ and “Designated at fair value“, the own credit spread on liabilities has been considered as unchanged in the determination of the fair value.
The line “Fair value revaluation of portfolio hedge“ corresponds to the remeasurement of the interest-rate risk on liabilities covered by portfolio hedges. These liabilities are included in the lines “Due to banks“, “Customer borrowings and deposits“ and “Debt securities“.
b. AnALysis of fAir VALue of finAnCiAL instrumentsThe following table provides an analysis of financial instruments that are measured subsequent to initial recognition at fair value, grouped into Levels 1 to 3 based on the degree to which the fair value is observable.
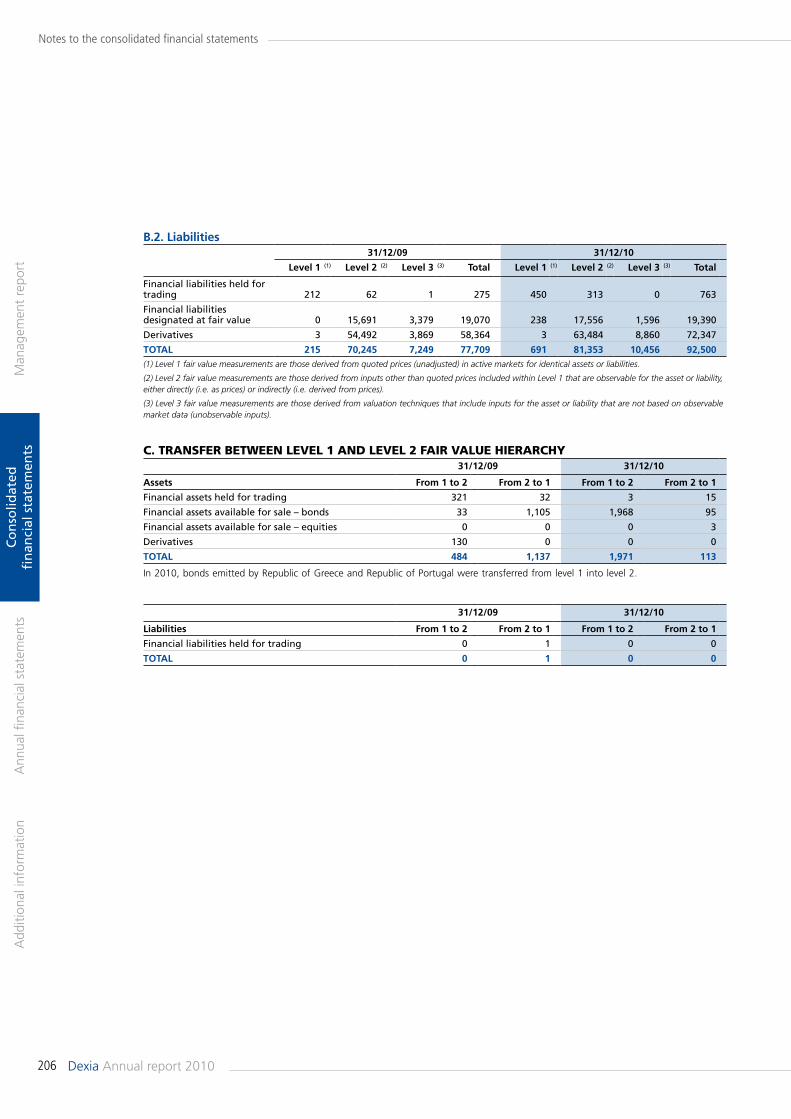
206 Dexia Annual report 2010
Man
agem
ent
repo
rtA
dditi
onal
info
rmat
ion
Ann
ual fi
nanc
ial s
tate
men
tsC
on
solid
ated
fi
nan
cial
sta
tem
ents
Notes to the consolidated financial statements
b.2. liabilities31/12/09 31/12/10
level 1 (1) level 2 (2) level 3 (3) Total level 1 (1) level 2 (2) level 3 (3) Total
Financial liabilities held for trading 212 62 1 275 450 313 0 763
Financial liabilities designated at fair value 0 15,691 3,379 19,070 238 17,556 1,596 19,390
Derivatives 3 54,492 3,869 58,364 3 63,484 8,860 72,347
ToTal 215 70,245 7,249 77,709 691 81,353 10,456 92,500(1) Level 1 fair value measurements are those derived from quoted prices (unadjusted) in active markets for identical assets or liabilities.
(2) Level 2 fair value measurements are those derived from inputs other than quoted prices included within Level 1 that are observable for the asset or liability, either directly (i.e. as prices) or indirectly (i.e. derived from prices).
(3) Level 3 fair value measurements are those derived from valuation techniques that include inputs for the asset or liability that are not based on observable market data (unobservable inputs).
C. trAnsfer betWeen LeVeL 1 And LeVeL 2 fAir VALue hierArChy31/12/09 31/12/10
assets from 1 to 2 from 2 to 1 from 1 to 2 from 2 to 1
Financial assets held for trading 321 32 3 15
Financial assets available for sale – bonds 33 1,105 1,968 95
Financial assets available for sale – equities 0 0 0 3
Derivatives 130 0 0 0
ToTal 484 1,137 1,971 113
In 2010, bonds emitted by Republic of Greece and Republic of Portugal were transferred from level 1 into level 2.
31/12/09 31/12/10
liabilities from 1 to 2 from 2 to 1 from 1 to 2 from 2 to 1
Financial liabilities held for trading 0 1 0 0
ToTal 0 1 0 0
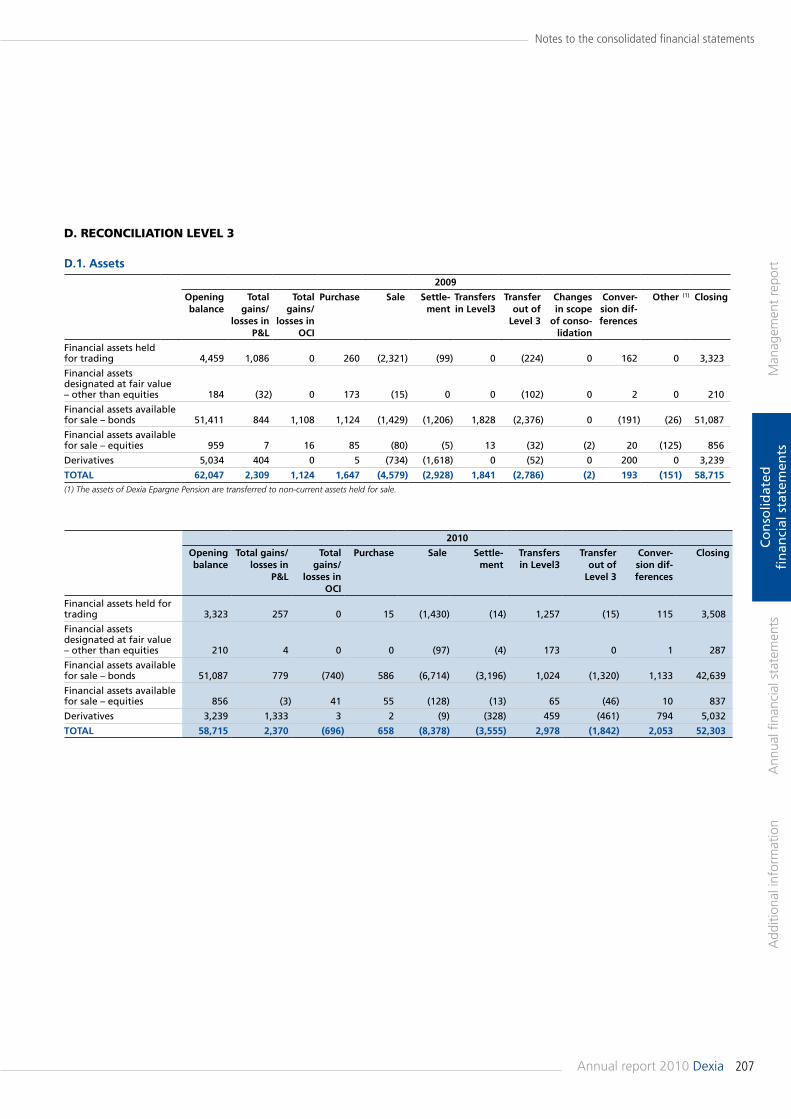
207Annual report 2010 Dexia
Man
agem
ent
repo
rtA
dditi
onal
info
rmat
ion
Ann
ual fi
nanc
ial s
tate
men
tsC
on
solid
ated
fi
nan
cial
sta
tem
ents
Notes to the consolidated financial statements
d.1. assets
2009
opening balance
Total gains/
losses in p&l
Total gains/
losses in oCi
purchase sale settle-ment
Transfers in level3
Transfer out of
level 3
Changes in scope
of conso-lidation
Conver-sion dif-ferences
other (1) Closing
Financial assets held for trading 4,459 1,086 0 260 (2,321) (99) 0 (224) 0 162 0 3,323
Financial assets designated at fair value – other than equities 184 (32) 0 173 (15) 0 0 (102) 0 2 0 210
Financial assets available for sale – bonds 51,411 844 1,108 1,124 (1,429) (1,206) 1,828 (2,376) 0 (191) (26) 51,087
Financial assets available for sale – equities 959 7 16 85 (80) (5) 13 (32) (2) 20 (125) 856
Derivatives 5,034 404 0 5 (734) (1,618) 0 (52) 0 200 0 3,239
ToTal 62,047 2,309 1,124 1,647 (4,579) (2,928) 1,841 (2,786) (2) 193 (151) 58,715(1) The assets of Dexia Epargne Pension are transferred to non-current assets held for sale.
d. reConCiLiAtion LeVeL 3
2010
opening balance
Total gains/losses in
p&l
Total gains/
losses in oCi
purchase sale settle-ment
Transfers in level3
Transfer out of
level 3
Conver-sion dif-ferences
Closing
Financial assets held for trading 3,323 257 0 15 (1,430) (14) 1,257 (15) 115 3,508
Financial assets designated at fair value – other than equities 210 4 0 0 (97) (4) 173 0 1 287
Financial assets available for sale – bonds 51,087 779 (740) 586 (6,714) (3,196) 1,024 (1,320) 1,133 42,639
Financial assets available for sale – equities 856 (3) 41 55 (128) (13) 65 (46) 10 837
Derivatives 3,239 1,333 3 2 (9) (328) 459 (461) 794 5,032
ToTal 58,715 2,370 (696) 658 (8,378) (3,555) 2,978 (1,842) 2,053 52,303
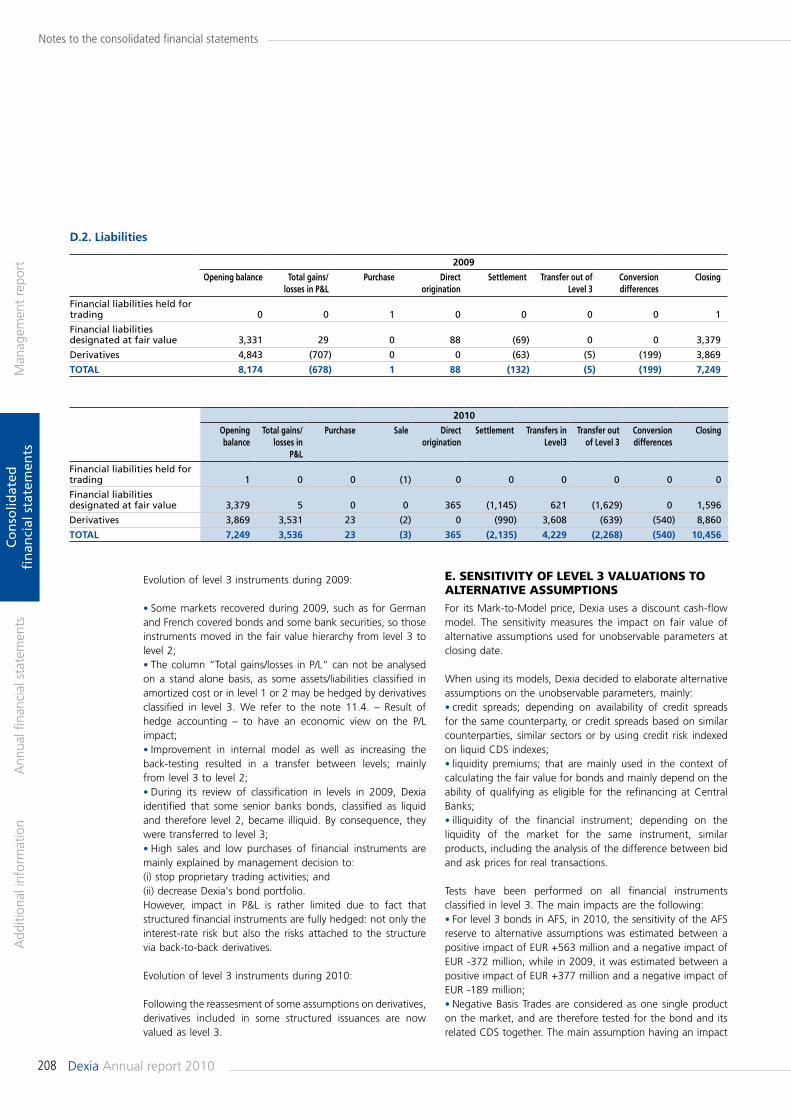
208 Dexia Annual report 2010
Man
agem
ent
repo
rtA
dditi
onal
info
rmat
ion
Ann
ual fi
nanc
ial s
tate
men
tsC
on
solid
ated
fi
nan
cial
sta
tem
ents
Notes to the consolidated financial statements
Evolution of level 3 instruments during 2009:
• Some markets recovered during 2009, such as for German and French covered bonds and some bank securities, so those instruments moved in the fair value hierarchy from level 3 to level 2;• The column “Total gains/losses in P/L“ can not be analysed on a stand alone basis, as some assets/liabilities classified in amortized cost or in level 1 or 2 may be hedged by derivatives classified in level 3. We refer to the note 11.4. – Result of hedge accounting – to have an economic view on the P/L impact;• Improvement in internal model as well as increasing the back-testing resulted in a transfer between levels; mainly from level 3 to level 2;• During its review of classification in levels in 2009, Dexia identified that some senior banks bonds, classified as liquid and therefore level 2, became illiquid. By consequence, they were transferred to level 3;• High sales and low purchases of financial instruments are mainly explained by management decision to: (i) stop proprietary trading activities; and (ii) decrease Dexia's bond portfolio. However, impact in P&L is rather limited due to fact that structured financial instruments are fully hedged: not only the interest-rate risk but also the risks attached to the structure via back-to-back derivatives.
Evolution of level 3 instruments during 2010:
Following the reassesment of some assumptions on derivatives, derivatives included in some structured issuances are now valued as level 3.
e. sensitiVity of LeVeL 3 VALuAtions to ALternAtiVe AssumPtionsFor its Mark-to-Model price, Dexia uses a discount cash-flow model. The sensitivity measures the impact on fair value of alternative assumptions used for unobservable parameters at closing date.
When using its models, Dexia decided to elaborate alternative assumptions on the unobservable parameters, mainly:• credit spreads; depending on availability of credit spreads for the same counterparty, or credit spreads based on similar counterparties, similar sectors or by using credit risk indexed on liquid CDS indexes;• liquidity premiums; that are mainly used in the context of calculating the fair value for bonds and mainly depend on the ability of qualifying as eligible for the refinancing at Central Banks; • illiquidity of the financial instrument; depending on the liquidity of the market for the same instrument, similar products, including the analysis of the difference between bid and ask prices for real transactions.
Tests have been performed on all financial instruments classified in level 3. The main impacts are the following:• For level 3 bonds in AFS, in 2010, the sensitivity of the AFS reserve to alternative assumptions was estimated between a positive impact of EUR +563 million and a negative impact of EUR -372 million, while in 2009, it was estimated between a positive impact of EUR +377 million and a negative impact of EUR -189 million; • Negative Basis Trades are considered as one single product on the market, and are therefore tested for the bond and its related CDS together. The main assumption having an impact
d.2. liabilities
2009
opening balance Total gains/losses in p&l
purchase direct origination
settlement Transfer out of level 3
Conversion differences
Closing
Financial liabilities held for trading 0 0 1 0 0 0 0 1
Financial liabilities designated at fair value 3,331 29 0 88 (69) 0 0 3,379
Derivatives 4,843 (707) 0 0 (63) (5) (199) 3,869
ToTal 8,174 (678) 1 88 (132) (5) (199) 7,249
2010
opening balance
Total gains/losses in
p&l
purchase sale direct origination
settlement Transfers in level3
Transfer out of level 3
Conversion differences
Closing
Financial liabilities held for trading 1 0 0 (1) 0 0 0 0 0 0
Financial liabilities designated at fair value 3,379 5 0 0 365 (1,145) 621 (1,629) 0 1,596
Derivatives 3,869 3,531 23 (2) 0 (990) 3,608 (639) (540) 8,860
ToTal 7,249 3,536 23 (3) 365 (2,135) 4,229 (2,268) (540) 10,456
209Annual report 2010 Dexia
Man
agem
ent
repo
rtA
dditi
onal
info
rmat
ion
Ann
ual fi
nanc
ial s
tate
men
tsC
on
solid
ated
fi
nan
cial
sta
tem
ents
Notes to the consolidated financial statements
on their fair value is the unwinding (bid-ask spread) impact. In 2010, based on the important number of unwinds performed by Dexia since 2009, and taking into account the stock of remaining NBT transactions, the positive impact (unwind premium of 2009) was EUR +7 million whereas the negative impact (unwind premium of 2010) gave an impact of EUR -52 million. For 2009, the positive impact (median unwind premium of 2009) was EUR +5 million whereas the negative impact (highest unwind premium of 2009) gave an impact of EUR -18 million.
Dexia tested the impact of different unobservable parameters for its derivatives, like exotic currencies, interest-rate volatility (unobservable vega and smile) and correlation, model uncertainties, extrapolation for long term periods, equities' sensitivities (unobservable vega, dividend volatility, correlation, etc). The main impacts relate to credit spread on CDS, where the impact in 2010 was estimated at EUR +8.8 million (positive scenario) versus EUR -9 million (negative scenario) before tax, while in 2009, it was estimated at EUR +32 million (positive scenario) or EUR -28 million (negative scenario) before tax.
f. disCLosure of differenCe betWeen trAnsACtion PriCes And modeLed VALues (deferred dAy one Profit) No significant amounts are recognised as deferred Day One Profit (DOP) as at 31 December 2009 nor as at 31 December 2010.DOP is recognised up-front on simple products, like Interest-Rate Swaps (IRS) or complex products (like structured transactions) that are backed-to-back.Day one profit taken up-front amounted respectively EUR 23 million and EUR 28 million as at 31 December 2009 and as at 31 December 2010. The amounts are recognised in Net trading income (disclosure 11.4.).
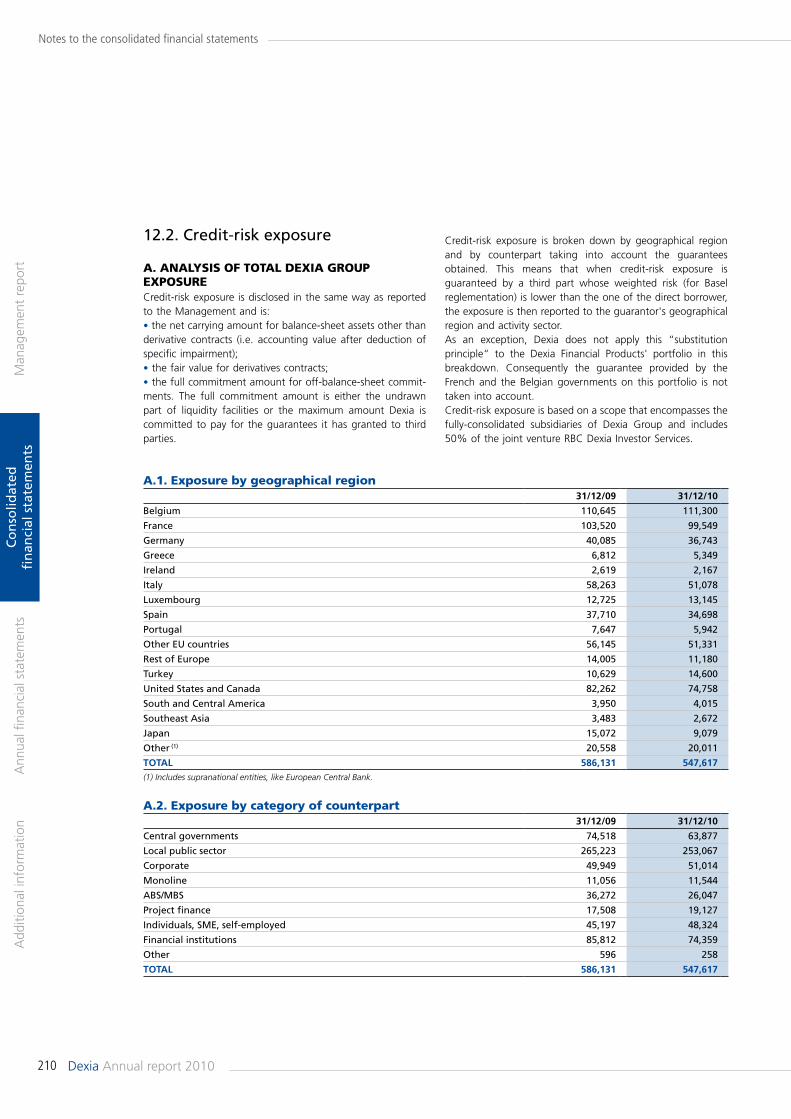
210 Dexia Annual report 2010
Man
agem
ent
repo
rtA
dditi
onal
info
rmat
ion
Ann
ual fi
nanc
ial s
tate
men
tsC
on
solid
ated
fi
nan
cial
sta
tem
ents
Notes to the consolidated financial statements
A.2. exposure by category of counterpart31/12/09 31/12/10
Central governments 74,518 63,877
Local public sector 265,223 253,067
Corporate 49,949 51,014
Monoline 11,056 11,544
ABS/MBS 36,272 26,047
Project finance 17,508 19,127
Individuals, SME, self-employed 45,197 48,324
Financial institutions 85,812 74,359
Other 596 258
ToTal 586,131 547,617
12.2. Credit-risk exposure
A. AnALysis of totAL deXiA GrouP eXPosureCredit-risk exposure is disclosed in the same way as reported to the Management and is:• the net carrying amount for balance-sheet assets other than derivative contracts (i.e. accounting value after deduction of specific impairment);• the fair value for derivatives contracts;• the full commitment amount for off-balance-sheet commit-ments. The full commitment amount is either the undrawn part of liquidity facilities or the maximum amount Dexia is committed to pay for the guarantees it has granted to third parties.
Credit-risk exposure is broken down by geographical region and by counterpart taking into account the guarantees obtained. This means that when credit-risk exposure is guaranteed by a third part whose weighted risk (for Basel reglementation) is lower than the one of the direct borrower, the exposure is then reported to the guarantor's geographical region and activity sector.As an exception, Dexia does not apply this “substitution principle“ to the Dexia Financial Products' portfolio in this breakdown. Consequently the guarantee provided by the French and the Belgian governments on this portfolio is not taken into account.Credit-risk exposure is based on a scope that encompasses the fully-consolidated subsidiaries of Dexia Group and includes 50% of the joint venture RBC Dexia Investor Services.
A.1. exposure by geographical region31/12/09 31/12/10
Belgium 110,645 111,300
France 103,520 99,549
Germany 40,085 36,743
Greece 6,812 5,349
Ireland 2,619 2,167
Italy 58,263 51,078
Luxembourg 12,725 13,145
Spain 37,710 34,698
Portugal 7,647 5,942
Other EU countries 56,145 51,331
Rest of Europe 14,005 11,180
Turkey 10,629 14,600
United States and Canada 82,262 74,758
South and Central America 3,950 4,015
Southeast Asia 3,483 2,672
Japan 15,072 9,079
Other (1) 20,558 20,011
ToTal 586,131 547,617(1) Includes supranational entities, like European Central Bank.
211Annual report 2010 Dexia
Man
agem
ent
repo
rtA
dditi
onal
info
rmat
ion
Ann
ual fi
nanc
ial s
tate
men
tsC
on
solid
ated
fi
nan
cial
sta
tem
ents
Notes to the consolidated financial statements
A.3. Credit quality of dexia financial Products' financial assets
a.3.1. history and nature of the portfolio On 14 November 2008, Dexia entered into a sale and purchase agreement with Assured Guaranty (Assured) relating to the sale of Financial Security Assurance Holdings Ltd (hereafter FSA Insurance), excluding its Financial Products activity (hereafter Dexia FP). The Dexia FP activity consisted, in substance, in (i) taking deposits from third parties (in general from issuers – local authorities or ABS issuers of instruments which where enhanced by FSA Inc.) in favor of whom Dexia FP undertakes to remunerate such deposits at a determined level, pursuant to Guaranteed Investment Contracts, (“GICs”) and (ii) the reinvestment of these deposits, with the objective of generating a net positive interest rate margin.Even though its initial rating was mostly AAA, Dexia FP’s asset portfolio includes a substantial proportion of instruments directly or indirectly linked to the American real-estate sector with a rating and/or a market value that have significantly deteriorated because of the sub-prime crisis and the global financial crisis.
a.3.2. Consequences of the exclusion of the fp and states’ guaranteeThe FP activity was excluded from the sale to Assured. However, to the extent that FSA Inc. (the former subsidiary of FSAH, renamed Assured Guaranty Municipal Holdings Inc. which provides, directly or through its subsidiaries, the credit enhancement activities of the Group) guarantees assets and liabilities of the FP activity, the exclusions of this activity from the scope of the sale necessarily means that the Dexia Group must guarantee the FP activities, so that guarantees given by FSA Inc. are not called upon. Given the financial situation of the Dexia Group, and to the maximum theoretical amount of the guarantee given by Dexia, it was considered vital by the purchaser, that Dexia be itself guaranteed by the Belgian and French States. The share sale agreement entered into with Assured therefore stipulated as a condition to the sale that either Dexia should post collateral (e.g. cash securities or eligible instruments), but in excessive proportions, at the time of the signature of the agreement, or that a state guarantee should be given.
The Belgian and French States consented to giving this guarantee, and agreed with Dexia, under certain conditions, that their recourse against Dexia under this guarantee would be converted into Dexia shares. That conversion right is organized through the subscription rights.
For a more detailed description of the guarantee, we refer to the note 9.4.C. to the consolidated financial statements, Related parties transactions – Transactions with the Belgian, French and Luxembourg States
The main conditions of the Guarantee Agreement and the Guarantee Reimbursement Agreement are, in substance, the following:
• Dexia FP put. Dexia SA and Dexia Crédit Local SA (“DCL”) (Dexia and DCL are hereafter referred to as the “Dexia Guarantors”) entered into a put agreement whereby Dexia FP is entitled to sell to Dexia and/or DCL certain assets included in the Dexia FP portfolio existing at the signature of the guarantee upon the occurrence of certain trigger events.
• States’ guarantee. The Belgian and French States each undertook to guarantee, severally and not jointly, the obligations of Dexia SA pursuant to the put agreement up to an amount equal to USD 16.98 billion and up to 62.3711% for the Belgian State and 37.6289% for the French State.
• Guaranteed portfolio. The portfolio to which this put relates is the Dexia FP portfolio after deduction of the “excluded assets” for a nominal amount of USD 4.5 billion, to the effect that the par value of the assets included in the portfolio to which the put relates is equal to USD 9.7 billion on 31 December 2010. The excluded assets are subject to a put contract between the Dexia Guarantors on the one hand and Dexia FP on the other, but the obligations of Dexia pursuant to this second put contract are not guaranteed by the States.
• Trigger events. Dexia FP has undertaken vis-à-vis Assured to exercise the put in certain situations in order to assure the effectiveness of the protection mechanism. These different situations are:
(i) an asset default, i.e. a failure to pay the principal or the interest due on the assets of the portfolio at the final maturity; in this case the put relates to those assets and the assets are sold to the Dexia Guarantors at their residual par value (i.e. face value) increased by the amount of interest due.(ii) a liquidity default, i.e. a failure by Dexia (at any date prior to 31 October 2011) to comply with its obligations pursuant to the liquidity agreement entered into or to be entered into in favor of Dexia FP; in this case the put relates to a number of assets whose residual par value is equal to the amount of the liquidity default, and the assets will be sold to the Dexia Guarantors at their residual par value increased by the amount of interest due.(iii) a collateral default, i.e. a failure by Dexia to provide, between 29 September and 31 October 2011, collateral to Dexia FP in an amount equal to the difference between the amount of the liabilities pursuant to the GICs and the market value of the assets of Dexia FP after applying a haircut to these assets; in this case, the put relates to a number of assets whose residual par value is equal to the amount of the collateral default and the assets are sold to Dexia at their residual par value increased by the amount of interest due.(iv) an insolvency of Dexia (a defined in the Guarantee Agreement) in which case the put relates to all the assets

212 Dexia Annual report 2010
Man
agem
ent
repo
rtA
dditi
onal
info
rmat
ion
Ann
ual fi
nanc
ial s
tate
men
tsC
on
solid
ated
fi
nan
cial
sta
tem
ents
Notes to the consolidated financial statements
of Dexia FP portfolio to which the put option relates or on a number of assets whose par value is equal to the total amount of the liabilities pursuant to the GICs if this amount is lower. The assets are sold at their residual par value increased by the amount of interest due.
a.3.3. Credit quality of assetsWithin the portfolio, the most sensitive exposures as at 31 December 2010, are mainly USD 9 billion of US RMBS
of which 89% are Non Investment Grade as well as USD 200 million of Triple-X exposures (Structured Finance positions) of which 50% are Non Investment Grade.
The expected weighted average life is around 9.2 years. A significant portion of the RMBS portfolio has contractual maturity after 2035 and up until 2057 for the longest maturity.
balance (in millions of USD)aaa aa a bbb bb b CCC&below ToTal
rmbs 185 573 182 55 348 398 7,300 9,041
Subprime 141 481 167 45 281 315 5,026 6,456
Alt-A 44 75 15 9 67 22 1,556 1,788
Option ARM - 11 - - - 11 475 497
CES - - - - - 9 113 122
HELOCs - 7 - - - 42 101 150
ABS CDO - - - - - - 30 30
oTher abs - 359 127 225 100 - - 811
CLO - 174 92 74 - - - 340
CMBS - - - 151 - - - 151
FSA Refi - 119 - - - - - 119
Triple-X - 65 35 - 100 - - 200
oTher asseTs 1,978 466 400 895 100 65 - 3,905
Corporate 125 - - - - - - 125
Demutualization - 63 - 25 - - - 88
Domestic IOU - - 68 14 - - - 82
Full Faith US 1,067 - - - - - - 1,067
Military Housing - - 59 504 - - - 563
Municipal - 392 77 225 100 65 - 858
Trust Preferreds - 11 - - - - - 11
UK Regulated Utility - - 196 129 - - - 325
US Agency 786 - - - - - - 786
ToTal deCember 2010 2,163 1,398 709 1,175 548 463 7,300 13,757
% ToTal 16% 10% 5% 9% 4% 3% 53% 100%
ToTal deCember 2009 2,464 1,644 1,400 1,161 1,071 1,435 6,213 15,387
% ToTal 16% 11% 9% 8% 7% 9% 40% 100%
The main macroeconomic evolutions and assumptions developed by Dexia’s economists that may impact the recovery of the portfolio are the following ones:
A volatile economic environment despite recent positive indicatorsAccording to Dexia’s economists, the economic situation in the US has recently evolved positively. After a difficult second and third quarter 2010, in the fourth quarter 2010 we observed an improvement in consumption, investment from corporations and GDP. This improvement in GDP is expected to continue in first quarter 2011 mainly driven by recent tax cuts.
As a whole since the beginning of the crisis, GDP has been very volatile and according to Dexia’s economists, this situation may not stabilize before 2013 and as long as the US households and the US states continue to re-balance their finances. GDP is expected to grow by 2.6% in 2011 versus 2.9% in 2010.
On the unemployment side, while new jobs are slowly being created, employment remains substandard, and the unemployment rate is likely to decline at a slow pace. Finally, due to the expectation of mild to low inflation, Dexia’s economists expect real term wages to improve in 2011, thus sustaining consumption.
213Annual report 2010 Dexia
Man
agem
ent
repo
rtA
dditi
onal
info
rmat
ion
Ann
ual fi
nanc
ial s
tate
men
tsC
on
solid
ated
fi
nan
cial
sta
tem
ents
Notes to the consolidated financial statements
The stock of homes will continue to weigh heavily on the US real estate market at least in 2011According to Realty Trac (1), foreclosures reached 1 million units in 2010 and should continue at this level into and beyond 2011. The US real estate market is still in the midst of a deep crisis and there remains a large stock of homes for sale. Based on the current level of housing stocks and the assessed shadow inventory (properties from borrowers in default on their loan and which are very likely to appear on the market for sale in the next few months) that may come to the market within the next 2 to 3 years, it could take 4 to 6 years before the real estate market normalizes. Therefore, Dexia’s economists expect a slight further decline in prices in 2011.
a.3.4. accounting value and treatmentThe Dexia FP portfolio has a net accounting value of USD 9.9 billion as at 31 December 2010. This amount is the net of a total portfolio at par of USD 14.3 billion, less collective and specific impairments amounting USD 2.2 billion and negative AFS reserves amounting USD 2.2 billion as well. Within the total portfolio of USD 14.3 billion, USD 0.4 billion are not guaranteed bonds (2) and interests accruals amounts USD 0.1 billion, giving the portfolio analyzed in point A.3.3. “Credit quality of assets”, of USD 13.8 billion.On 1 October 2008, in accordance with IAS 39, Dexia reclassified in Loans and Receivables (from the Available-for- Sale category) the illiquid part of the Dexia FP portfolio, which includes all instruments exposed to the US RMBS market. As a consequence of the reclassification, the Dexia FP portfolio is now composed of two parts:1/ Available-for-Sale assets, which are high quality liquid investments at fair value through other comprehensive income. The net accounting value of USD 2,742 million includes USD 408 million of highly liquid bonds not covered by the States’ guarantee.The net AFS portfolio includes a negative AFS reserve (before tax) of USD 0.2 billion. The AFS portfolio value varies with the evolution of the fair value of the underlying bonds. No collective impairment can be recorded on assets classified in AFS portfolio. In case of specific impairment, the AFS reserve is recorded in result of the period, and the difference between the recoverable amount and the net accounting value is recorded in the net interest income, based on the remaining life of the related asset (amortization using the effective interest rate). No impairment is recorded on this AFS portfolio.
2/ Reclassified Loans and Receivables which are illiquid investments and subject to both specific and collective impairments: net accounting value of USD 7,196 million as at 31 December 2010.The Loans & Receivables portfolio includes bonds that have been reclassified at fair value on 1 October 2008, due to the illiquidity of some markets. The negative AFS reserve from that date was “frozen” and is amortized on the remaining life of the related bonds via the effective interest rate, with recording in P&L this net negative AFS reserve in case of sale or of impairment. The negative AFS reserve (before tax) amounts USD 2 billion as at 31 December 2010. A collective impairment has been set up at the moment of reclassification and is updated on a quarterly basis based on the evolution of the not individually impaired portfolio. The collective impairment is based on different assumptions that may influence the level of impairments (see points A.3.3. and A.3.5.) and amounts USD 438 million as at 31 December 2010.Specific impairments amount to USD 1,742 million as at 31 December 2010. Specific impairments are decided by the Impairment Committee based on its evaluation of incurred losses. This evaluation takes into account the expected shortfall of payment of principal and/or interests, their probable realization in the near future and its own overall estimation of the situation of the underlying portfolio. Once a security is deemed impaired on a specific basis, all its future cash-flows are taken into account for the calculation of the impairment. According to IAS 39, for reclassified bonds in L&R, the interest rate used to calculate the Net Present Value of Cash Flows is not the original interest rate (at purchase date) but the effective interest rate at reclassification date, meaning that this interest rate may be high if the market value of the bond at reclassification date was low. This implies that the net unamortized “frozen” AFS reserve is recycled into result, in addition with expected missing cash flows. The difference between the recoverable amount and the net accounting amount after impairment is subsequently recorded in the net interest income, like for AFS bonds.
The total impairments amount therefore to USD 2,252 million on Reclassified Loans and Receivables which is composed of collective impairments of USD 438 million, specific impairment of USD 1,742 million and effect of the loss of USD 72 million recorded on the exchange of assets (commutation) .
(1) Founded in 1996, RealtyTrac® (www.realtytrac.com), is the leading online marketplace of foreclosure properties, with more than 1.5 million default, auction and bank-owned listings from over 2,200 U.S. counties, along with detailed property, loan and home sales data. The company’s mission is to make it easier for consumers, investors and real estate professionals to locate, evaluate, buy and sell properties. RealtyTrac collects and aggregates foreclosure data from more than 2,200 counties, covering more than 90 percent of U.S. households, appends the data with estimated property values, comparable sales, loan history, tax lien and bankruptcy records, trustee and lender information and property details and updates the entire database twice daily.
(2) Bonds purchased after the granting of the guarantee.
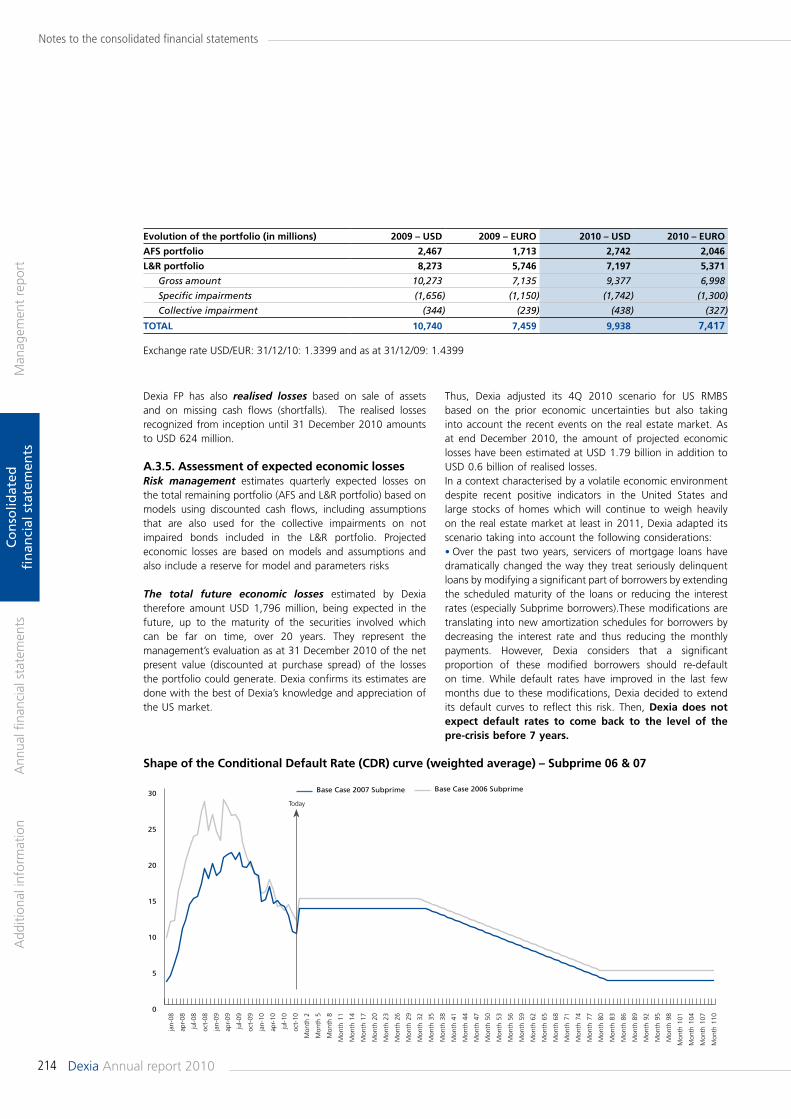
214 Dexia Annual report 2010
Man
agem
ent
repo
rtA
dditi
onal
info
rmat
ion
Ann
ual fi
nanc
ial s
tate
men
tsC
on
solid
ated
fi
nan
cial
sta
tem
ents
Notes to the consolidated financial statements
Base Case 2007 Subprime Base Case 2006 Subprime
0
5
10
15
20
25
30
jan-
08
apr-
08
jul-0
8
oct-
08
jan-
09
apr-
09
jul-0
9
oct-
09
jan-
10
apr-
10
jul-1
0
oct-
10
Mon
th 2
Mon
th 5
Mon
th 8
Mon
th 1
1
Mon
th 1
4
Mon
th 1
7
Mon
th 2
0
Mon
th 2
3
Mon
th 2
6
Mon
th 2
9
Mon
th 3
2
Mon
th 3
5
Mon
th 3
8
Mon
th 4
1
Mon
th 4
4
Mon
th 4
7
Mon
th 5
0
Mon
th 5
3
Mon
th 5
6
Mon
th 5
9
Mon
th 6
2
Mon
th 6
5
Mon
th 6
8
Mon
th 7
1
Mon
th 7
4
Mon
th 7
7
Mon
th 8
0
Mon
th 8
3
Mon
th 8
6
Mon
th 8
9
Mon
th 9
2
Mon
th 9
5
Mon
th 9
8
Mon
th 1
01
Mon
th 1
04
Mon
th 1
07
Mon
th 1
10
shape of the Conditional default rate (Cdr) curve (weighted average) – subprime 06 & 07
Today
Thus, Dexia adjusted its 4Q 2010 scenario for US RMBS based on the prior economic uncertainties but also taking into account the recent events on the real estate market. As at end December 2010, the amount of projected economic losses have been estimated at USD 1.79 billion in addition to USD 0.6 billion of realised losses.In a context characterised by a volatile economic environment despite recent positive indicators in the United States and large stocks of homes which will continue to weigh heavily on the real estate market at least in 2011, Dexia adapted its scenario taking into account the following considerations:• Over the past two years, servicers of mortgage loans have dramatically changed the way they treat seriously delinquent loans by modifying a significant part of borrowers by extending the scheduled maturity of the loans or reducing the interest rates (especially Subprime borrowers).These modifications are translating into new amortization schedules for borrowers by decreasing the interest rate and thus reducing the monthly payments. However, Dexia considers that a significant proportion of these modified borrowers should re-default on time. While default rates have improved in the last few months due to these modifications, Dexia decided to extend its default curves to reflect this risk. Then, dexia does not expect default rates to come back to the level of the pre-crisis before 7 years.
Dexia FP has also realised losses based on sale of assets and on missing cash flows (shortfalls). The realised losses recognized from inception until 31 December 2010 amounts to USD 624 million.
a.3.5. assessment of expected economic lossesRisk management estimates quarterly expected losses on the total remaining portfolio (AFS and L&R portfolio) based on models using discounted cash flows, including assumptions that are also used for the collective impairments on not impaired bonds included in the L&R portfolio. Projected economic losses are based on models and assumptions and also include a reserve for model and parameters risks
The total future economic losses estimated by Dexia therefore amount USD 1,796 million, being expected in the future, up to the maturity of the securities involved which can be far on time, over 20 years. They represent the management’s evaluation as at 31 December 2010 of the net present value (discounted at purchase spread) of the losses the portfolio could generate. Dexia confirms its estimates are done with the best of Dexia’s knowledge and appreciation of the US market.
Exchange rate USD/EUR: 31/12/10: 1.3399 and as at 31/12/09: 1.4399
evolution of the portfolio (in millions) 2009 – usd 2009 – euro 2010 – usd 2010 – euro
afs portfolio 2,467 1,713 2,742 2,046
l&r portfolio 8,273 5,746 7,197 5,371
Gross amount 10,273 7,135 9,377 6,998
Specific impairments (1,656) (1,150) (1,742) (1,300)
Collective impairment (344) (239) (438) (327)
ToTal 10,740 7,459 9,938 7,417
215Annual report 2010 Dexia
Man
agem
ent
repo
rtA
dditi
onal
info
rmat
ion
Ann
ual fi
nanc
ial s
tate
men
tsC
on
solid
ated
fi
nan
cial
sta
tem
ents
Notes to the consolidated financial statements
• In addition, the modifications have also been translated in the model into interest rate reductions between 100 and 300 bps (reducing the projected excess cash flow in our structures) and capitalization of the previously unpaid balances, both based on data observed over the previous 6 months.• At last, due to the weak visibility of home prices, the recent slight increase in observed severities, and trying to consider the potential impact “foreclosure freeze” could have on loss severity, dexia decided to take a more conservative severity assumption by applying a severity curve flat for life (previously in 3q 2010 it declined over time after two years).
At last an active workout process has been recently launched by Dexia to optimize recovery on the US RMBS portfolio:• In January 2011, Dexia filed lawsuit against certain parties relating to US RMBS purchased by Dexia during 2005, 2006 and 2007;• Full-time RMBS recovery activity with a dedicated experienced team in New York will be implemented in 2011;• however, at this stage dexia does not take into account any potential positive impacts of initiatives in the market but also within dexia related to put backs or litigation procedures(1).
a.3.6. sensitivity analysisAs at 31 December 2010, based on the recent evolution of the portfolio, Dexia Base Case Scenario showing a USD 1,796 million of projected economic losses assumes the following
key changes in the model parameters: (i) the current default rates used for projections (end November 2010) would not improve within the next 3 years and would need 4 additional years to go back to the levels which, in most cases, would stay above pre-crisis ones, (ii) current loss severity rates (loss expected on a property that would have been sold following a foreclosure process) would not show any improvement up until the end of the transactions.Dexia quarterly performs a sensitivity analysis on the estimation of economic losses. Key results of this analysis are the following:• For instance, under a scenario based on deteriorated default rates vs. the base case (more limited recovery of defaults within 7 years) coupled with a higher loss severity (+5% compared to the current levels) that would imply a futher deterioration in home prices with no improvement up until the end of the transactions, the expected economic losses would increase to USD 2.3 billion;• As another example, under a scenario based on a flat Credit Default Rates, severity loss rates and prepayments rates curves “for ever” starting from the current levels (thus assuming that the current levels for these key parameters would never improve up until the end of the transactions), the expected economic losses would increase to USD 2.8 billion;• A faster recovery in the US economy by 18 months compared to the Base Case (improvement expected in 30 months instead of 48 months in the Base Case), would decrease the expected economic losses to USD 1.3 billion.
(1) Recovery options to consider for every RMBS platform or CUSIP include (i) remedies based on the RMBS contracts, including the right to putback loans and (ii) non-contractual remedies, such as direct lawsuits against defendants such as the RMBS underwriters, originators, servicers and other parties based on fraud, securities law violations and other wrongdoing. Litigation can also result from pursuing contractual remedies, in the form of ‘breach of contract’ litigation (e.g., to force a party to honor its obligation to repurchase bad loans).
b. Credit-risK eXPosure by CLAss of finAnCiAL instruments 31/12/09 31/12/10
Financial assets available for sale (excluding variable income securities) 101,441 81,976
Financial assets designated at fair value (excluding variable income securities) 490 364
Financial assets held for trading (excluding variable income securities) 6,056 4,919
Loans and advances (at amortised cost) 359,846 349,310
Investments held to maturity 1,611 1,460
Derivatives 8,111 9,043
Other financial instruments 1,801 2,401
Loan commitments granted 68,624 57,397
Guarantee commitments granted 38,152 40,748
ToTal 586,131 547,617
216 Dexia Annual report 2010
Man
agem
ent
repo
rtA
dditi
onal
info
rmat
ion
Ann
ual fi
nanc
ial s
tate
men
tsC
on
solid
ated
fi
nan
cial
sta
tem
ents
Notes to the consolidated financial statements
Dexia holds financial collateral and physical collateral.The bulk of the financial collateral is composed of cash collaterals and term deposits, and to a lesser extent, of investment grade bonds (mainly AAA- AA sovereigns or banking issuers).Physical collateral is mainly composed of mortgages on
As Dexia rating methodology is not yet fully implemented in DenizBank's organization, and as few external ratings are available on Turkish exposures, Dexia reports DenizBank in a separate column. However, the preservation of the internal
31/12/09
aaa to aa- a+ to bbb- grade
Non investment
grade
unrated denizbank (1) Total
Financial assets available for sale (excluding variable income securities) 45,857 46,327 5,220 585 1,035 99,023
Financial assets designated at fair value (excluding variable income securities) 82 238 20 149 0 490
Financial assets held for trading (excluding variable income securities) 2,862 2,518 208 403 50 6,040
Loans and advances (at amortised cost) 176,716 132,982 31,579 8,316 9,038 358,633
Investments held to maturity 563 677 1 0 370 1,611
Derivatives 3,250 3,764 555 434 39 8,042
Other financial instruments 98 47 21 1,614 15 1,795
Loan commitments granted 41,828 18,059 4,292 1,768 2,393 68,340
Guarantee commitments granted 18,557 13,927 2,264 873 2,428 38,051
ToTal 289,813 218,539 44,161 14,143 15,368 582,024
31/12/10
aaa to aa- a+ to bbb- grade
Non investment
grade
unrated denizbank (1) Total
Financial assets available for sale (excluding variable income securities) 36,448 38,942 4,700 234 1,551 81,876
Financial assets designated at fair value (excluding variable income securities) 61 252 21 28 0 361
Financial assets held for trading (excluding variable income securities) 2,081 2,388 257 40 142 4,908
Loans and advances (at amortised cost) 157,062 134,928 35,897 5,973 11,895 345,755
Investments held to maturity 556 500 0 0 405 1,460
Derivatives 3,536 4,495 797 56 78 8,961
Other financial instruments 14 63 74 1,940 310 2,401
Loan commitments granted 34,335 15,629 4,592 984 1,639 57,178
Guarantee commitments granted 13,373 18,881 2,681 647 5,051 40,633
ToTal 247,465 216,077 49,020 9,901 21,071 543,534(1) As the DenizBank portfolio is composed of 90% of Turkish assets, the majority of the DenizBank financial assets are therefore in the “Non-Investment Grade“ category.
Ratings indicated are either internal or external ones. Indeed, Dexia applies the AIRBA (Advanced Internal Ratings Based Approach) for the calculation of capital requirements for credit risk within the context of Pillar I of Basel II. Except for ABS positions for which credit risk is calculated within the
Ratings based Approach, based on external ratings (Fitch, Standard & Poors or Moody's) and, part of its portfolio, mostly DenizBank, for which credit-risk exposure is calculated conforming the Basel II Standard method.
residential or small commercial real estate and pledges on various other assets (receivables, business goodwill).Only financial collateral eligible under Basel II and directly held by Dexia are considered.Collateral held mainly covers Loans and Advances and Off-balance-sheet commitments.
scorings of DenizBank and of the credit risk monitoring systems allowed to keep a complete view on DenizBank's portfolio risks.
C. Credit quALity of finAnCiAL Assets neither PAst due nor imPAired
217Annual report 2010 Dexia
Man
agem
ent
repo
rtA
dditi
onal
info
rmat
ion
Ann
ual fi
nanc
ial s
tate
men
tsC
on
solid
ated
fi
nan
cial
sta
tem
ents
Notes to the consolidated financial statements
Credit quality of denizbank's financial assetsAs Dexia rating methodology is not yet fully implemented in DenizBank's organisation, and as few external ratings are available on Turkish exposures, Dexia reports the credit quality in a separate column. The average credit quality of DenizBank's financial assets remains closely linked to the rating of the Turkish government (internal rating: BB+ stable (foreign currency) / BBB- stable (local currency)).
In 2010, the management and monitoring of DenizBank credit risks continued to be more integrated into Dexia's global credit risk management, particularly with the ongoing development of internal rating systems specific to Turkish counterparties aimed at covering the main asset categories, an increased participation in the different committees at Group level as well as the adaptation and integration of policies and guidelines of the Dexia Group.
The average credit quality of DenizBank financial assets remains closely linked to the rating – positive evolution in 2010 – of the Turkish sovereign (internal rating 2010: BB+ stable (foreign currency) / BBB- stable (local currency); internal rating 2009: BB- positive (foreign currency)/ BB+ positive (local currency)). In fact, a financial asset cannot have a higher rating than that of the State where it is issued. As the DenizBank portfolio is composed of 90% of Turkish assets, the majority of the DenizBank financial assets remain therefore in the “Non-Investment Grade“ category.
Detail on the credit quality of the most significant financial assets:• The Corporate & MidCorporate portfolio is entirely composed of Turkish counterparties or related to. The credit risk of this portfolio is therefore closely linked to the evolution of the Turkish economy. Each of these counterparts is rated annually with a Basel II compliant internal rating system, specifically developed for Turkish counterparts, the calibration of which is on the basis of an average rating BB- area (in 2009 it has been realised on the basis of an average rating between B+ et BB-);• DenizBank's financial assets on financial institutions as at the end of 2010 are mainly on “Investment Grade“ international banks. The remaining exposures are concentrated on Turkish banks with an average rating between BB and BBB (average rating of BB in 2009);• Exposure to the central government and assimilated to is solely associated with Turkish sovereign risk;• Exposure to the local public sector has a rating between B and BB+ (in 2009, the rating was between B and BB-), a consequence of the rules set by the Dexia credit committee for this type of assets;• The credit-risk profile of the Retail & PME portfolio is monitored by the Retail Expertise Centre of the Dexia Group and is also included in the quarterly risk reviews of this activity. Specific PD (Probability of Default) and LGD (Loss Given Default) models have been developed and are being developed for the Retail & PME parts (including agriculture) and will be completely deployed during the 2011 financial year.
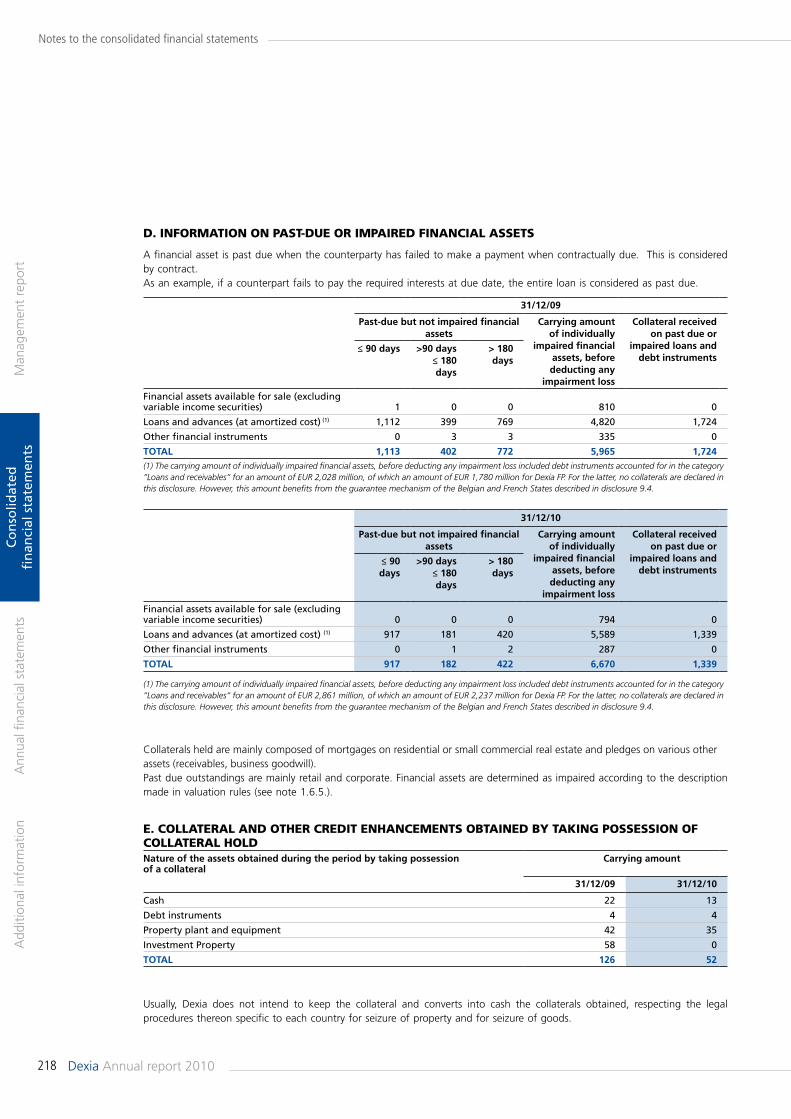
218 Dexia Annual report 2010
Man
agem
ent
repo
rtA
dditi
onal
info
rmat
ion
Ann
ual fi
nanc
ial s
tate
men
tsC
on
solid
ated
fi
nan
cial
sta
tem
ents
Notes to the consolidated financial statements
31/12/09
past-due but not impaired financial assets
Carrying amount of individually
impaired financial assets, before deducting any
impairment loss
Collateral received on past due or
impaired loans and debt instruments
≤ 90 days >90 days ≤ 180 days
> 180 days
Financial assets available for sale (excluding variable income securities) 1 0 0 810 0
Loans and advances (at amortized cost) (1) 1,112 399 769 4,820 1,724
Other financial instruments 0 3 3 335 0
ToTal 1,113 402 772 5,965 1,724(1) The carrying amount of individually impaired financial assets, before deducting any impairment loss included debt instruments accounted for in the category “Loans and receivables“ for an amount of EUR 2,028 million, of which an amount of EUR 1,780 million for Dexia FP. For the latter, no collaterals are declared in this disclosure. However, this amount benefits from the guarantee mechanism of the Belgian and French States described in disclosure 9.4.
31/12/10
past-due but not impaired financial assets
Carrying amount of individually
impaired financial assets, before deducting any
impairment loss
Collateral received on past due or
impaired loans and debt instruments
≤ 90 days
>90 days ≤ 180 days
> 180 days
Financial assets available for sale (excluding variable income securities) 0 0 0 794 0
Loans and advances (at amortized cost) (1) 917 181 420 5,589 1,339
Other financial instruments 0 1 2 287 0
ToTal 917 182 422 6,670 1,339
(1) The carrying amount of individually impaired financial assets, before deducting any impairment loss included debt instruments accounted for in the category “Loans and receivables“ for an amount of EUR 2,861 million, of which an amount of EUR 2,237 million for Dexia FP. For the latter, no collaterals are declared in this disclosure. However, this amount benefits from the guarantee mechanism of the Belgian and French States described in disclosure 9.4.
e. CoLLAterAL And other Credit enhAnCements obtAined by tAKinG Possession of CoLLAterAL hoLd Nature of the assets obtained during the period by taking possession of a collateral
Carrying amount
31/12/09 31/12/10
Cash 22 13
Debt instruments 4 4
Property plant and equipment 42 35
Investment Property 58 0
ToTal 126 52
Collaterals held are mainly composed of mortgages on residential or small commercial real estate and pledges on various other assets (receivables, business goodwill).Past due outstandings are mainly retail and corporate. Financial assets are determined as impaired according to the description made in valuation rules (see note 1.6.5.).
Usually, Dexia does not intend to keep the collateral and converts into cash the collaterals obtained, respecting the legal procedures thereon specific to each country for seizure of property and for seizure of goods.
d. informAtion on PAst-due or imPAired finAnCiAL Assets
A financial asset is past due when the counterparty has failed to make a payment when contractually due. This is considered by contract.As an example, if a counterpart fails to pay the required interests at due date, the entire loan is considered as past due.
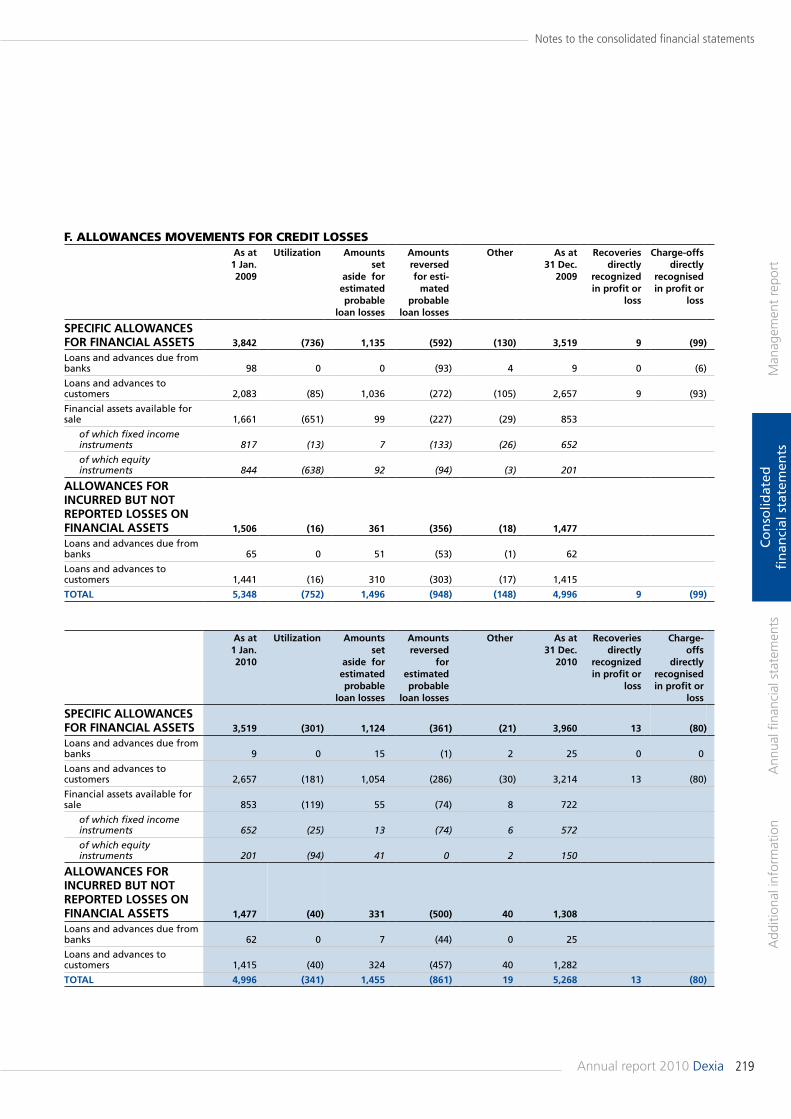
219Annual report 2010 Dexia
Man
agem
ent
repo
rtA
dditi
onal
info
rmat
ion
Ann
ual fi
nanc
ial s
tate
men
tsC
on
solid
ated
fi
nan
cial
sta
tem
ents
Notes to the consolidated financial statements
f. ALLoWAnCes moVements for Credit Losses as at
1 Jan. 2009
utilization amounts set
aside for estimated probable
loan losses
amounts reversed for esti-
mated probable
loan losses
other as at 31 dec.
2009
recoveries directly
recognized in profit or
loss
Charge-offs directly
recognised in profit or
loss
speCifiC allowaNCes for fiNaNCial asseTs 3,842 (736) 1,135 (592) (130) 3,519 9 (99)
Loans and advances due from banks 98 0 0 (93) 4 9 0 (6)
Loans and advances to customers 2,083 (85) 1,036 (272) (105) 2,657 9 (93)
Financial assets available for sale 1,661 (651) 99 (227) (29) 853
of which fixed income instruments 817 (13) 7 (133) (26) 652
of which equity instruments 844 (638) 92 (94) (3) 201
allowaNCes for iNCurred buT NoT reporTed losses oN fiNaNCial asseTs 1,506 (16) 361 (356) (18) 1,477
Loans and advances due from banks 65 0 51 (53) (1) 62
Loans and advances to customers 1,441 (16) 310 (303) (17) 1,415
ToTal 5,348 (752) 1,496 (948) (148) 4,996 9 (99)
as at 1 Jan. 2010
utilization amounts set
aside for estimated probable
loan losses
amounts reversed
for estimated probable
loan losses
other as at 31 dec.
2010
recoveries directly
recognized in profit or
loss
Charge-offs
directly recognised in profit or
loss
speCifiC allowaNCes for fiNaNCial asseTs 3,519 (301) 1,124 (361) (21) 3,960 13 (80)
Loans and advances due from banks 9 0 15 (1) 2 25 0 0
Loans and advances to customers 2,657 (181) 1,054 (286) (30) 3,214 13 (80)
Financial assets available for sale 853 (119) 55 (74) 8 722
of which fixed income instruments 652 (25) 13 (74) 6 572
of which equity instruments 201 (94) 41 0 2 150
allowaNCes for iNCurred buT NoT reporTed losses oN fiNaNCial asseTs 1,477 (40) 331 (500) 40 1,308
Loans and advances due from banks 62 0 7 (44) 0 25
Loans and advances to customers 1,415 (40) 324 (457) 40 1,282
ToTal 4,996 (341) 1,455 (861) 19 5,268 13 (80)
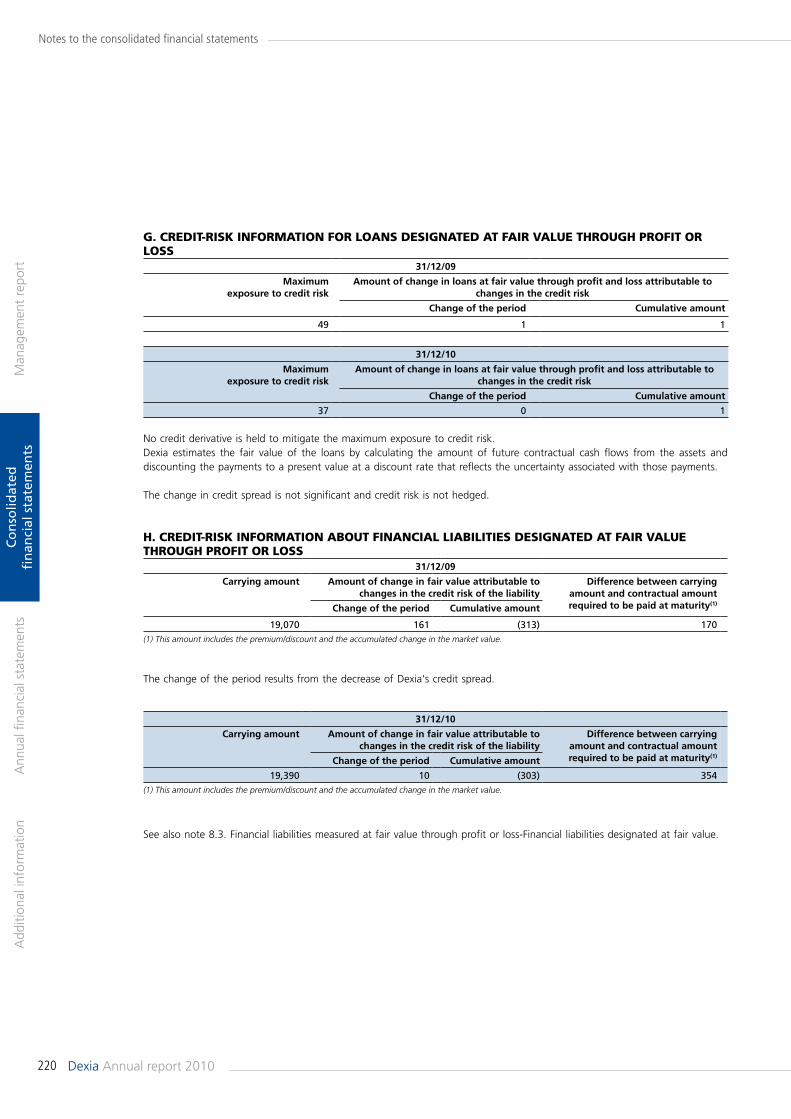
220 Dexia Annual report 2010
Man
agem
ent
repo
rtA
dditi
onal
info
rmat
ion
Ann
ual fi
nanc
ial s
tate
men
tsC
on
solid
ated
fi
nan
cial
sta
tem
ents
Notes to the consolidated financial statements
G. Credit-risK informAtion for LoAns desiGnAted At fAir VALue throuGh Profit or Loss
31/12/09
maximum exposure to credit risk
amount of change in loans at fair value through profit and loss attributable to changes in the credit risk
Change of the period Cumulative amount
49 1 1
31/12/10
maximum exposure to credit risk
amount of change in loans at fair value through profit and loss attributable to changes in the credit risk
Change of the period Cumulative amount
37 0 1
h. Credit-risK informAtion About finAnCiAL LiAbiLities desiGnAted At fAir VALue throuGh Profit or Loss
31/12/09
Carrying amount amount of change in fair value attributable to changes in the credit risk of the liability
difference between carrying amount and contractual amount required to be paid at maturity(1)
Change of the period Cumulative amount
19,070 161 (313) 170(1) This amount includes the premium/discount and the accumulated change in the market value.
31/12/10
Carrying amount amount of change in fair value attributable to changes in the credit risk of the liability
difference between carrying amount and contractual amount required to be paid at maturity(1)
Change of the period Cumulative amount
19,390 10 (303) 354(1) This amount includes the premium/discount and the accumulated change in the market value.
No credit derivative is held to mitigate the maximum exposure to credit risk.Dexia estimates the fair value of the loans by calculating the amount of future contractual cash flows from the assets and discounting the payments to a present value at a discount rate that reflects the uncertainty associated with those payments.
The change in credit spread is not significant and credit risk is not hedged.
The change of the period results from the decrease of Dexia's credit spread.
See also note 8.3. Financial liabilities measured at fair value through profit or loss-Financial liabilities designated at fair value.
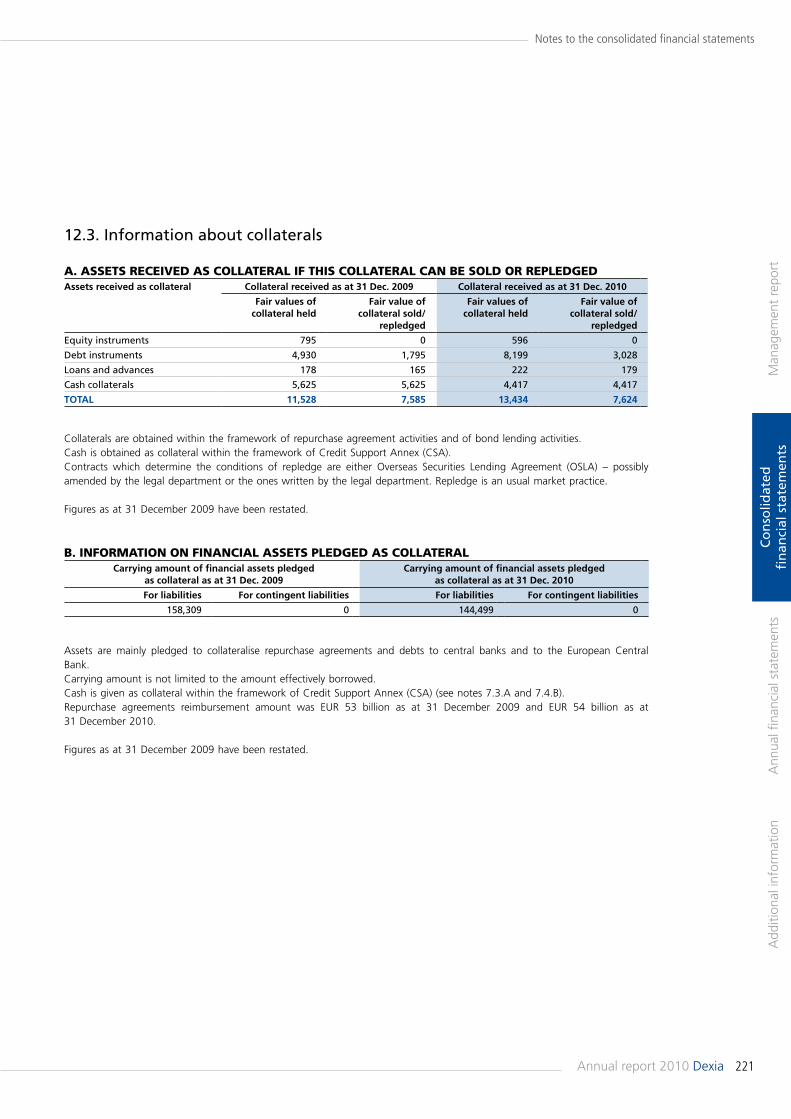
221Annual report 2010 Dexia
Man
agem
ent
repo
rtA
dditi
onal
info
rmat
ion
Ann
ual fi
nanc
ial s
tate
men
tsC
on
solid
ated
fi
nan
cial
sta
tem
ents
Notes to the consolidated financial statements
12.3. Information about collaterals
A. Assets reCeiVed As CoLLAterAL if this CoLLAterAL CAn be soLd or rePLedGed assets received as collateral Collateral received as at 31 dec. 2009 Collateral received as at 31 dec. 2010
fair values of collateral held
fair value of collateral sold/
repledged
fair values of collateral held
fair value of collateral sold/
repledged
Equity instruments 795 0 596 0
Debt instruments 4,930 1,795 8,199 3,028
Loans and advances 178 165 222 179
Cash collaterals 5,625 5,625 4,417 4,417
ToTal 11,528 7,585 13,434 7,624
b. informAtion on finAnCiAL Assets PLedGed As CoLLAterAL Carrying amount of financial assets pledged
as collateral as at 31 dec. 2009Carrying amount of financial assets pledged
as collateral as at 31 dec. 2010
for liabilities for contingent liabilities for liabilities for contingent liabilities
158,309 0 144,499 0
Collaterals are obtained within the framework of repurchase agreement activities and of bond lending activities.Cash is obtained as collateral within the framework of Credit Support Annex (CSA).Contracts which determine the conditions of repledge are either Overseas Securities Lending Agreement (OSLA) – possibly amended by the legal department or the ones written by the legal department. Repledge is an usual market practice.
Figures as at 31 December 2009 have been restated.
Assets are mainly pledged to collateralise repurchase agreements and debts to central banks and to the European Central Bank.Carrying amount is not limited to the amount effectively borrowed.Cash is given as collateral within the framework of Credit Support Annex (CSA) (see notes 7.3.A and 7.4.B).Repurchase agreements reimbursement amount was EUR 53 billion as at 31 December 2009 and EUR 54 billion as at 31 December 2010.
Figures as at 31 December 2009 have been restated.
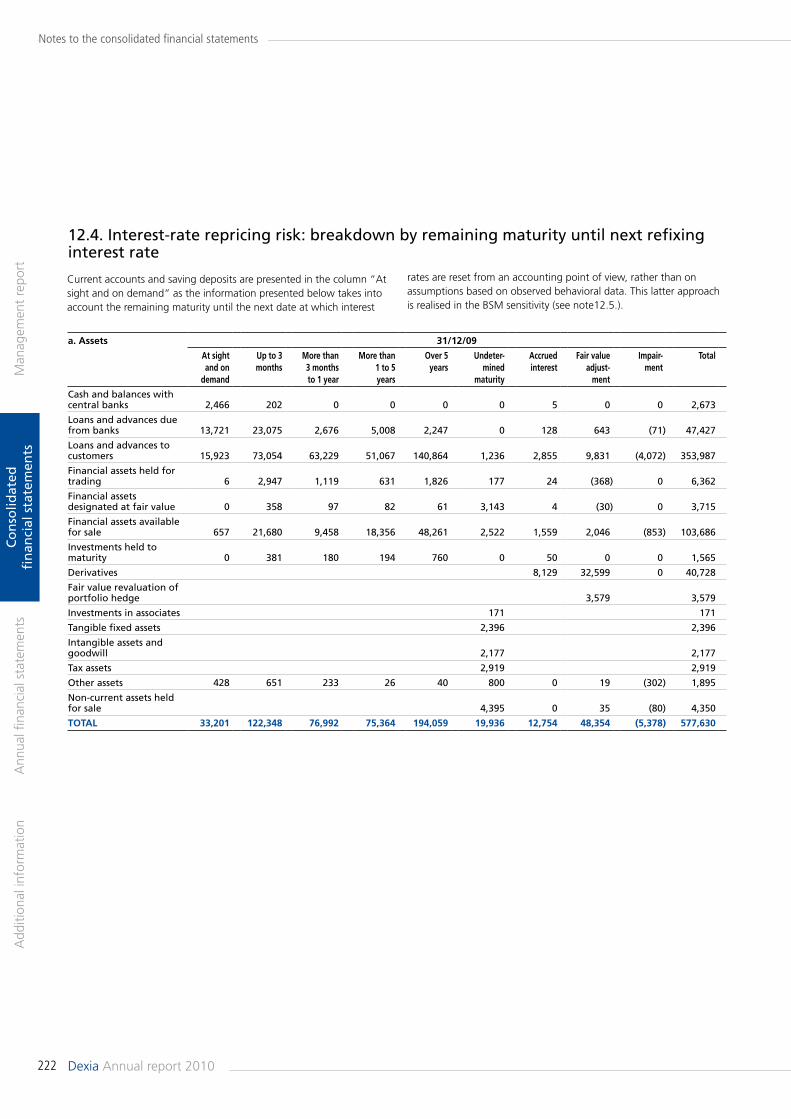
222 Dexia Annual report 2010
Man
agem
ent
repo
rtA
dditi
onal
info
rmat
ion
Ann
ual fi
nanc
ial s
tate
men
tsC
on
solid
ated
fi
nan
cial
sta
tem
ents
Notes to the consolidated financial statements
a. assets 31/12/09
at sight and on
demand
up to 3 months
more than 3 months to 1 year
more than 1 to 5 years
over 5 years
undeter-mined
maturity
accrued interest
fair value adjust-
ment
impair-ment
Total
Cash and balances with central banks 2,466 202 0 0 0 0 5 0 0 2,673
Loans and advances due from banks 13,721 23,075 2,676 5,008 2,247 0 128 643 (71) 47,427
Loans and advances to customers 15,923 73,054 63,229 51,067 140,864 1,236 2,855 9,831 (4,072) 353,987
Financial assets held for trading 6 2,947 1,119 631 1,826 177 24 (368) 0 6,362
Financial assets designated at fair value 0 358 97 82 61 3,143 4 (30) 0 3,715
Financial assets available for sale 657 21,680 9,458 18,356 48,261 2,522 1,559 2,046 (853) 103,686
Investments held to maturity 0 381 180 194 760 0 50 0 0 1,565
Derivatives 8,129 32,599 0 40,728
Fair value revaluation of portfolio hedge 3,579 3,579
Investments in associates 171 171
Tangible fixed assets 2,396 2,396
Intangible assets and goodwill 2,177 2,177
Tax assets 2,919 2,919
Other assets 428 651 233 26 40 800 0 19 (302) 1,895
Non-current assets held for sale 4,395 0 35 (80) 4,350
ToTal 33,201 122,348 76,992 75,364 194,059 19,936 12,754 48,354 (5,378) 577,630
12.4. Interest-rate repricing risk: breakdown by remaining maturity until next refixing interest rate
Current accounts and saving deposits are presented in the column “At sight and on demand“ as the information presented below takes into account the remaining maturity until the next date at which interest
rates are reset from an accounting point of view, rather than on assumptions based on observed behavioral data. This latter approach is realised in the BSM sensitivity (see note12.5.).
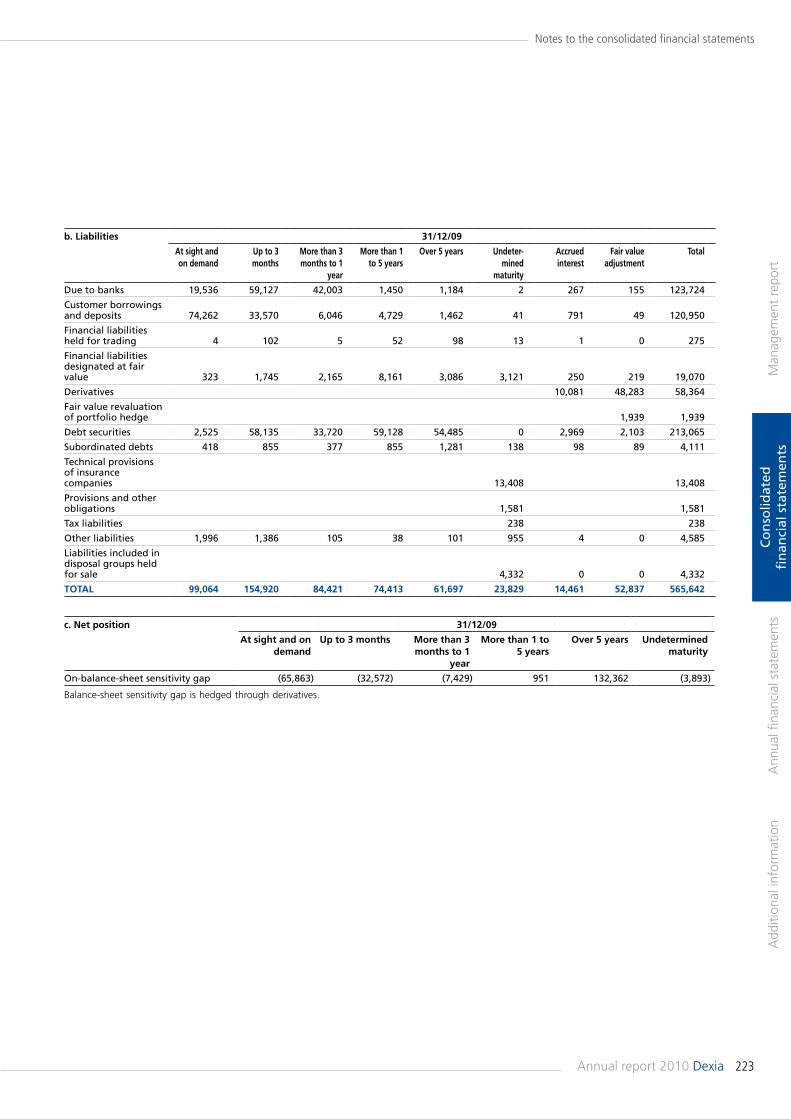
223Annual report 2010 Dexia
Man
agem
ent
repo
rtA
dditi
onal
info
rmat
ion
Ann
ual fi
nanc
ial s
tate
men
tsC
on
solid
ated
fi
nan
cial
sta
tem
ents
Notes to the consolidated financial statements
b. liabilities 31/12/09
at sight and on demand
up to 3 months
more than 3 months to 1
year
more than 1 to 5 years
over 5 years undeter-mined
maturity
accrued interest
fair value adjustment
Total
Due to banks 19,536 59,127 42,003 1,450 1,184 2 267 155 123,724
Customer borrowings and deposits 74,262 33,570 6,046 4,729 1,462 41 791 49 120,950
Financial liabilities held for trading 4 102 5 52 98 13 1 0 275
Financial liabilities designated at fair value 323 1,745 2,165 8,161 3,086 3,121 250 219 19,070
Derivatives 10,081 48,283 58,364
Fair value revaluation of portfolio hedge 1,939 1,939
Debt securities 2,525 58,135 33,720 59,128 54,485 0 2,969 2,103 213,065
Subordinated debts 418 855 377 855 1,281 138 98 89 4,111
Technical provisions of insurance companies 13,408 13,408
Provisions and other obligations 1,581 1,581
Tax liabilities 238 238
Other liabilities 1,996 1,386 105 38 101 955 4 0 4,585
Liabilities included in disposal groups held for sale 4,332 0 0 4,332
ToTal 99,064 154,920 84,421 74,413 61,697 23,829 14,461 52,837 565,642
c. Net position 31/12/09
at sight and on demand
up to 3 months more than 3 months to 1
year
more than 1 to 5 years
over 5 years undetermined maturity
On-balance-sheet sensitivity gap (65,863) (32,572) (7,429) 951 132,362 (3,893)
Balance-sheet sensitivity gap is hedged through derivatives.
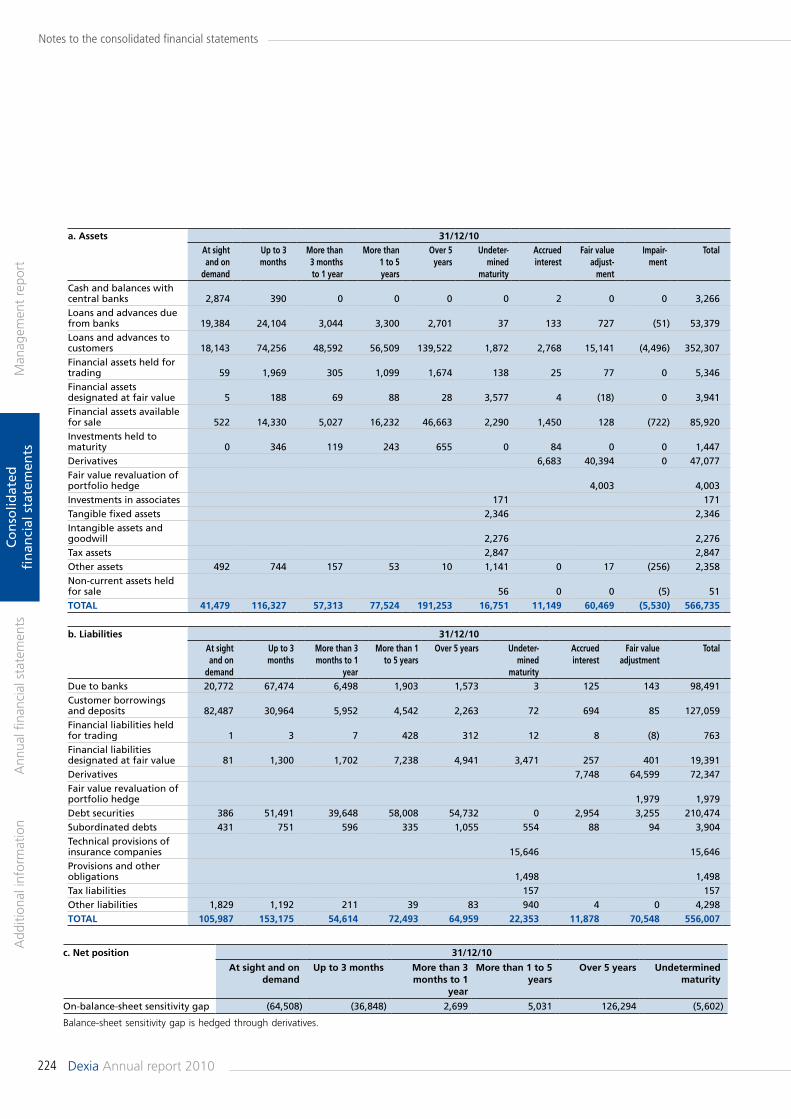
224 Dexia Annual report 2010
Man
agem
ent
repo
rtA
dditi
onal
info
rmat
ion
Ann
ual fi
nanc
ial s
tate
men
tsC
on
solid
ated
fi
nan
cial
sta
tem
ents
Notes to the consolidated financial statements
a. assets 31/12/10at sight and on
demand
up to 3 months
more than 3 months to 1 year
more than 1 to 5 years
over 5 years
undeter-mined
maturity
accrued interest
fair value adjust-
ment
impair-ment
Total
Cash and balances with central banks 2,874 390 0 0 0 0 2 0 0 3,266Loans and advances due from banks 19,384 24,104 3,044 3,300 2,701 37 133 727 (51) 53,379Loans and advances to customers 18,143 74,256 48,592 56,509 139,522 1,872 2,768 15,141 (4,496) 352,307Financial assets held for trading 59 1,969 305 1,099 1,674 138 25 77 0 5,346Financial assets designated at fair value 5 188 69 88 28 3,577 4 (18) 0 3,941Financial assets available for sale 522 14,330 5,027 16,232 46,663 2,290 1,450 128 (722) 85,920Investments held to maturity 0 346 119 243 655 0 84 0 0 1,447Derivatives 6,683 40,394 0 47,077Fair value revaluation of portfolio hedge 4,003 4,003Investments in associates 171 171Tangible fixed assets 2,346 2,346Intangible assets and goodwill 2,276 2,276Tax assets 2,847 2,847Other assets 492 744 157 53 10 1,141 0 17 (256) 2,358Non-current assets held for sale 56 0 0 (5) 51ToTal 41,479 116,327 57,313 77,524 191,253 16,751 11,149 60,469 (5,530) 566,735
b. liabilities 31/12/10at sight and on
demand
up to 3 months
more than 3 months to 1
year
more than 1 to 5 years
over 5 years undeter-mined
maturity
accrued interest
fair value adjustment
Total
Due to banks 20,772 67,474 6,498 1,903 1,573 3 125 143 98,491Customer borrowings and deposits 82,487 30,964 5,952 4,542 2,263 72 694 85 127,059Financial liabilities held for trading 1 3 7 428 312 12 8 (8) 763Financial liabilities designated at fair value 81 1,300 1,702 7,238 4,941 3,471 257 401 19,391Derivatives 7,748 64,599 72,347Fair value revaluation of portfolio hedge 1,979 1,979Debt securities 386 51,491 39,648 58,008 54,732 0 2,954 3,255 210,474Subordinated debts 431 751 596 335 1,055 554 88 94 3,904Technical provisions of insurance companies 15,646 15,646Provisions and other obligations 1,498 1,498Tax liabilities 157 157Other liabilities 1,829 1,192 211 39 83 940 4 0 4,298ToTal 105,987 153,175 54,614 72,493 64,959 22,353 11,878 70,548 556,007
c. Net position 31/12/10
at sight and on demand
up to 3 months more than 3 months to 1
year
more than 1 to 5 years
over 5 years undetermined maturity
On-balance-sheet sensitivity gap (64,508) (36,848) 2,699 5,031 126,294 (5,602)
Balance-sheet sensitivity gap is hedged through derivatives.
225Annual report 2010 Dexia
Man
agem
ent
repo
rtA
dditi
onal
info
rmat
ion
Ann
ual fi
nanc
ial s
tate
men
tsC
on
solid
ated
fi
nan
cial
sta
tem
ents
Notes to the consolidated financial statements
12.5. Market risk & BSMOverview
Market Risks' measures:
a) Treasury and Financial Market:• Trading book risks: general interest rate, foreign exchange,
equity, credit spread and other risks (inflation, CO²) which are managed within Value at Risk limits and adequate risk limits;
• Cash and Liquidity Management (CLM) – only banking – followed by means of Value at Risk (VaR) and interest-rate sensitivity limits;
• Bond portfolio spread risk – managed through credit spread sensitivities.
b) Balance-Sheet Management (BSM):• Interest-rate risk is followed within sensitivity limits and
indicate Value at risk (VaR) for BSM and for the Dexia FP activities;
• Credit spread risk is followed through spread sensitivities;• Equity exposure is followed within Value at Risk (VaR)
limits.
A. treAsury And finAnCiAL mArKet ACtiVities
Treasury and Financial Markets (TFM) activities of Dexia are oriented as a support function for the Group.TFM assumes trading activities as well as non-trading risk positions that arise from cash and liquidity management activities.Following the reorientation of TFM activities, the Risk Policy Committee on 7 November 2008 decided to reduce VaR limits of TFM.The global TFM limits have been reduced from EUR 178 to EUR 130 million in 4Q 2008 and since 1Q 2009 from EUR 130 to EUR 100 million.TFM also manages the Bond Portfolio securities on banking books which have been largely put in run-off.
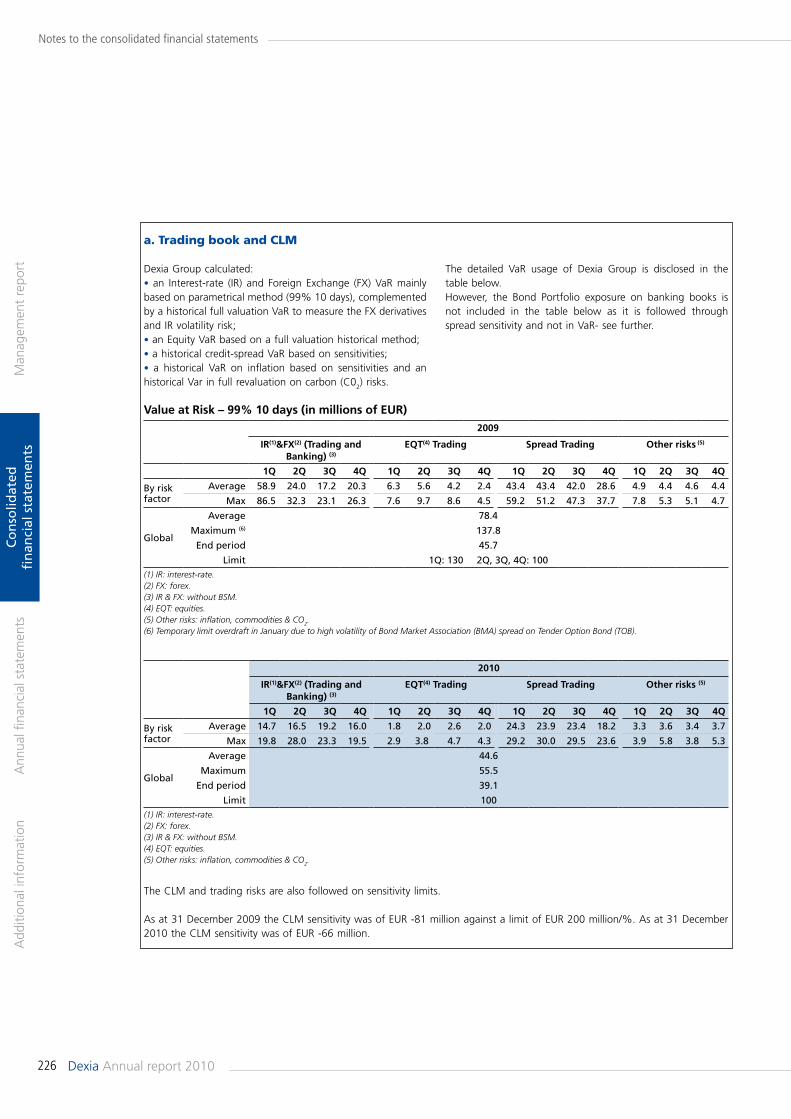
226 Dexia Annual report 2010
Man
agem
ent
repo
rtA
dditi
onal
info
rmat
ion
Ann
ual fi
nanc
ial s
tate
men
tsC
on
solid
ated
fi
nan
cial
sta
tem
ents
Notes to the consolidated financial statements
value at risk – 99% 10 days (in millions of eur) 2009
ir(1)&fx(2) (Trading and banking) (3)
eqT(4) Trading spread Trading other risks (5)
1q 2q 3q 4q 1q 2q 3q 4q 1q 2q 3q 4q 1q 2q 3q 4q
By risk factor
Average 58.9 24.0 17.2 20.3 6.3 5.6 4.2 2.4 43.4 43.4 42.0 28.6 4.9 4.4 4.6 4.4
Max 86.5 32.3 23.1 26.3 7.6 9.7 8.6 4.5 59.2 51.2 47.3 37.7 7.8 5.3 5.1 4.7
Global
Average 78.4
Maximum (6) 137.8
End period 45.7
Limit 1Q: 130 2Q, 3Q, 4Q: 100(1) IR: interest-rate.(2) FX: forex.(3) IR & FX: without BSM.(4) EQT: equities.(5) Other risks: inflation, commodities & CO2.(6) Temporary limit overdraft in January due to high volatility of Bond Market Association (BMA) spread on Tender Option Bond (TOB).
2010
ir(1)&fx(2) (Trading and banking) (3)
eqT(4) Trading spread Trading other risks (5)
1q 2q 3q 4q 1q 2q 3q 4q 1q 2q 3q 4q 1q 2q 3q 4q
By risk factor
Average 14.7 16.5 19.2 16.0 1.8 2.0 2.6 2.0 24.3 23.9 23.4 18.2 3.3 3.6 3.4 3.7
Max 19.8 28.0 23.3 19.5 2.9 3.8 4.7 4.3 29.2 30.0 29.5 23.6 3.9 5.8 3.8 5.3
Global
Average 44.6
Maximum 55.5
End period 39.1
Limit 100(1) IR: interest-rate.(2) FX: forex.(3) IR & FX: without BSM.(4) EQT: equities.(5) Other risks: inflation, commodities & CO2.
a. trading book and CLm Dexia Group calculated:• an Interest-rate (IR) and Foreign Exchange (FX) VaR mainly based on parametrical method (99% 10 days), complemented by a historical full valuation VaR to measure the FX derivatives and IR volatility risk;• an Equity VaR based on a full valuation historical method;• a historical credit-spread VaR based on sensitivities;• a historical VaR on inflation based on sensitivities and an historical Var in full revaluation on carbon (C02) risks.
The detailed VaR usage of Dexia Group is disclosed in the table below.However, the Bond Portfolio exposure on banking books is not included in the table below as it is followed through spread sensitivity and not in VaR- see further.
The CLM and trading risks are also followed on sensitivity limits.
As at 31 December 2009 the CLM sensitivity was of EUR -81 million against a limit of EUR 200 million/%. As at 31 December 2010 the CLM sensitivity was of EUR -66 million.
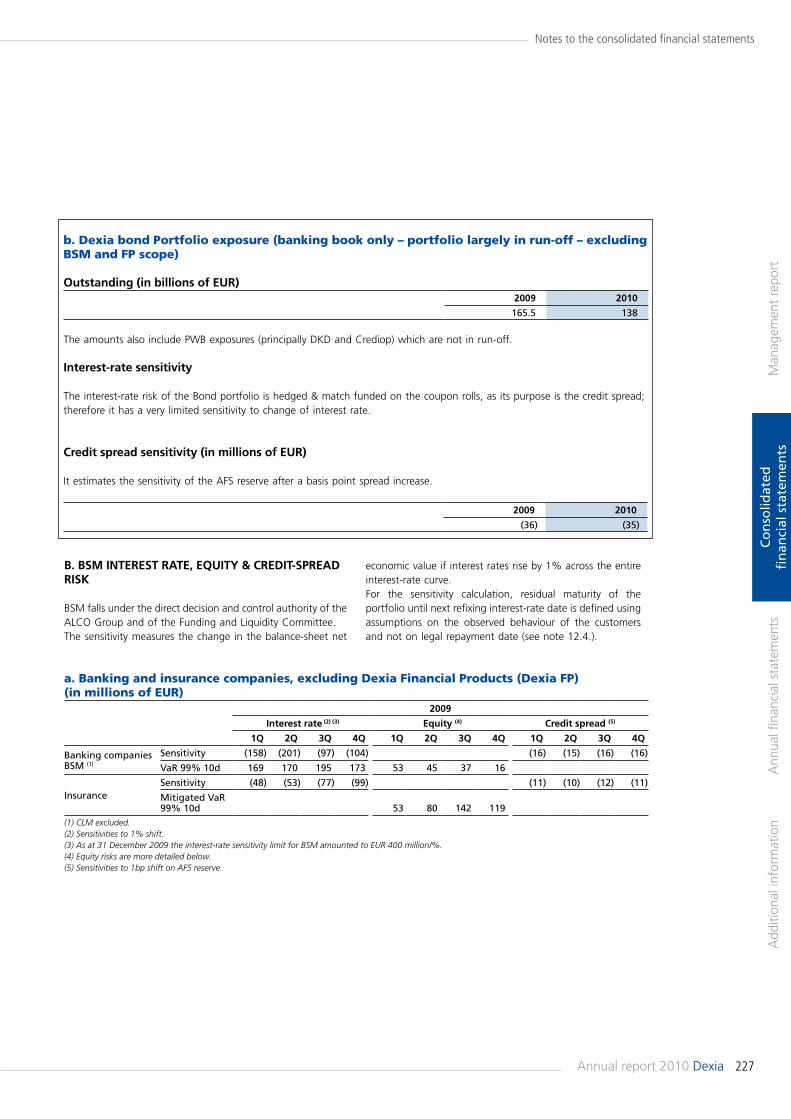
227Annual report 2010 Dexia
Man
agem
ent
repo
rtA
dditi
onal
info
rmat
ion
Ann
ual fi
nanc
ial s
tate
men
tsC
on
solid
ated
fi
nan
cial
sta
tem
ents
Notes to the consolidated financial statements
outstanding (in billions of eur)2009 2010
165.5 138
The amounts also include PWB exposures (principally DKD and Crediop) which are not in run-off.
interest-rate sensitivity
The interest-rate risk of the Bond portfolio is hedged & match funded on the coupon rolls, as its purpose is the credit spread; therefore it has a very limited sensitivity to change of interest rate.
Credit spread sensitivity (in millions of eur)
It estimates the sensitivity of the AFS reserve after a basis point spread increase.
2009 2010
(36) (35)
2009
interest rate (2) (3) equity (4) Credit spread (5)
1q 2q 3q 4q 1q 2q 3q 4q 1q 2q 3q 4q
Banking companies BSM (1)
Sensitivity (158) (201) (97) (104) (16) (15) (16) (16)
VaR 99% 10d 169 170 195 173 53 45 37 16
InsuranceSensitivity (48) (53) (77) (99) (11) (10) (12) (11)
Mitigated VaR 99% 10d 53 80 142 119
(1) CLM excluded.(2) Sensitivities to 1% shift.(3) As at 31 December 2009 the interest-rate sensitivity limit for BSM amounted to EUR 400 million/%.(4) Equity risks are more detailed below.(5) Sensitivities to 1bp shift on AFS reserve.
b. dexia bond Portfolio exposure (banking book only – portfolio largely in run-off – excluding bsm and fP scope)
b. bsm iNTeresT raTe, equiTy & CrediT-spread risk
BSM falls under the direct decision and control authority of the ALCO Group and of the Funding and Liquidity Committee.The sensitivity measures the change in the balance-sheet net
economic value if interest rates rise by 1% across the entire interest-rate curve. For the sensitivity calculation, residual maturity of the portfolio until next refixing interest-rate date is defined using assumptions on the observed behaviour of the customers and not on legal repayment date (see note 12.4.).
a. banking and insurance companies, excluding dexia financial Products (dexia fP) (in millions of eur)
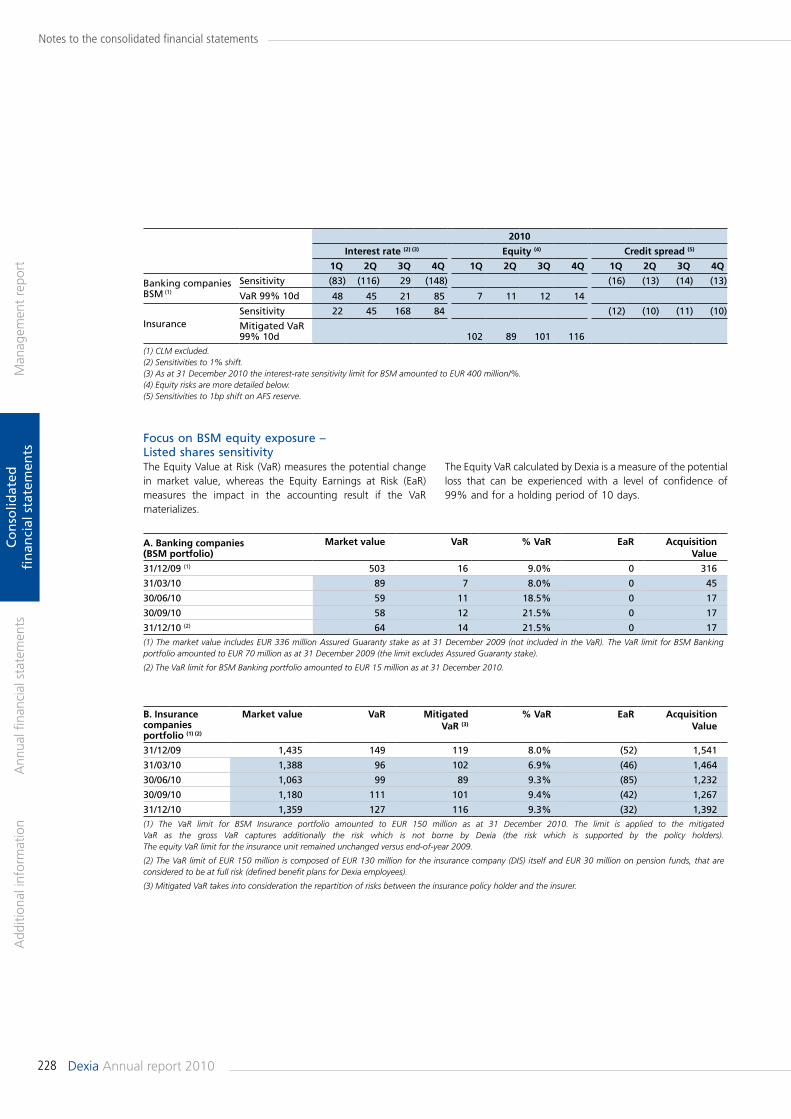
228 Dexia Annual report 2010
Man
agem
ent
repo
rtA
dditi
onal
info
rmat
ion
Ann
ual fi
nanc
ial s
tate
men
tsC
on
solid
ated
fi
nan
cial
sta
tem
ents
Notes to the consolidated financial statements
2010
interest rate (2) (3) equity (4) Credit spread (5)
1q 2q 3q 4q 1q 2q 3q 4q 1q 2q 3q 4q
Banking companies BSM (1)
Sensitivity (83) (116) 29 (148) (16) (13) (14) (13)
VaR 99% 10d 48 45 21 85 7 11 12 14
InsuranceSensitivity 22 45 168 84 (12) (10) (11) (10)
Mitigated VaR 99% 10d 102 89 101 116
(1) CLM excluded.(2) Sensitivities to 1% shift.(3) As at 31 December 2010 the interest-rate sensitivity limit for BSM amounted to EUR 400 million/%.(4) Equity risks are more detailed below.(5) Sensitivities to 1bp shift on AFS reserve.
a. banking companies(bsm portfolio)
market value var % var ear acquisition value
31/12/09 (1) 503 16 9.0% 0 316
31/03/10 89 7 8.0% 0 45
30/06/10 59 11 18.5% 0 17
30/09/10 58 12 21.5% 0 17
31/12/10 (2) 64 14 21.5% 0 17(1) The market value includes EUR 336 million Assured Guaranty stake as at 31 December 2009 (not included in the VaR). The VaR limit for BSM Banking portfolio amounted to EUR 70 million as at 31 December 2009 (the limit excludes Assured Guaranty stake).
(2) The VaR limit for BSM Banking portfolio amounted to EUR 15 million as at 31 December 2010.
b. insurance companies portfolio (1) (2)
market value var mitigated var (3)
% var ear acquisition value
31/12/09 1,435 149 119 8.0% (52) 1,541
31/03/10 1,388 96 102 6.9% (46) 1,464
30/06/10 1,063 99 89 9.3% (85) 1,232
30/09/10 1,180 111 101 9.4% (42) 1,267
31/12/10 1,359 127 116 9.3% (32) 1,392(1) The VaR limit for BSM Insurance portfolio amounted to EUR 150 million as at 31 December 2010. The limit is applied to the mitigated VaR as the gross VaR captures additionally the risk which is not borne by Dexia (the risk which is supported by the policy holders). The equity VaR limit for the insurance unit remained unchanged versus end-of-year 2009.
(2) The VaR limit of EUR 150 million is composed of EUR 130 million for the insurance company (DIS) itself and EUR 30 million on pension funds, that are considered to be at full risk (defined benefit plans for Dexia employees).
(3) Mitigated VaR takes into consideration the repartition of risks between the insurance policy holder and the insurer.
Focus on BSM equity exposure – Listed shares sensitivityThe Equity Value at Risk (VaR) measures the potential change in market value, whereas the Equity Earnings at Risk (EaR) measures the impact in the accounting result if the VaR materializes.
The Equity VaR calculated by Dexia is a measure of the potential loss that can be experienced with a level of confidence of 99% and for a holding period of 10 days.
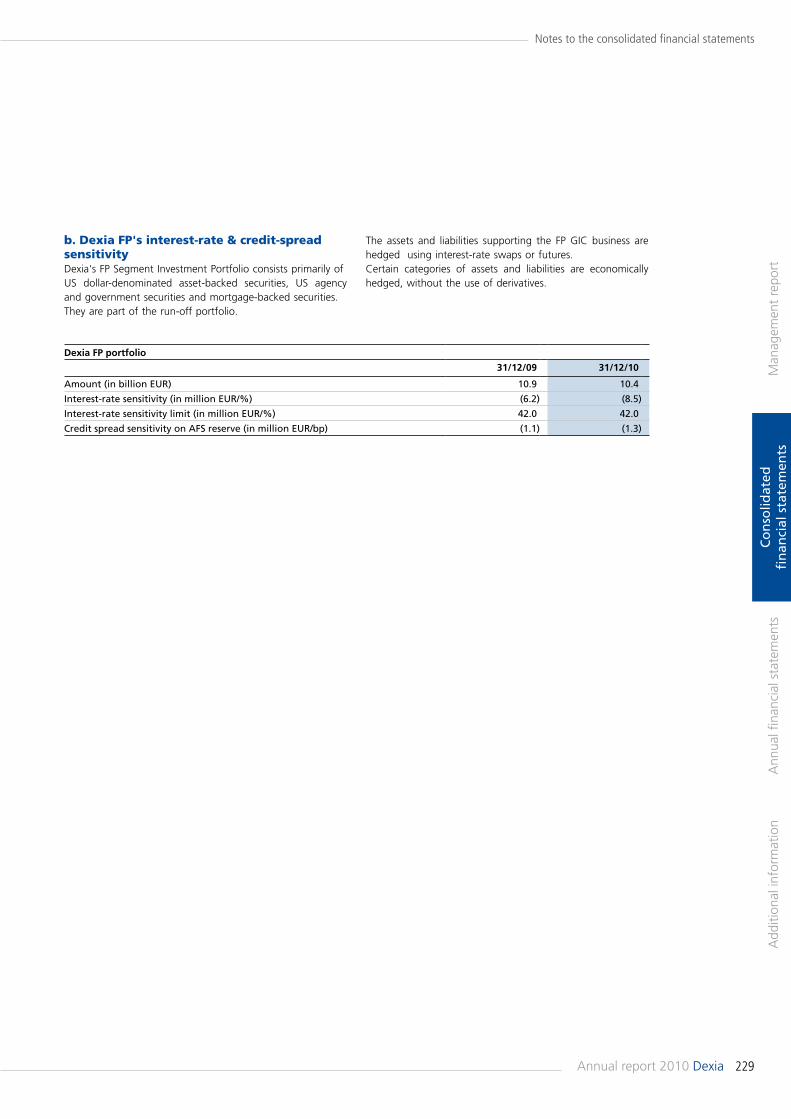
229Annual report 2010 Dexia
Man
agem
ent
repo
rtA
dditi
onal
info
rmat
ion
Ann
ual fi
nanc
ial s
tate
men
tsC
on
solid
ated
fi
nan
cial
sta
tem
ents
Notes to the consolidated financial statements
dexia fp portfolio
31/12/09 31/12/10
Amount (in billion EUR) 10.9 10.4
Interest-rate sensitivity (in million EUR/%) (6.2) (8.5)
Interest-rate sensitivity limit (in million EUR/%) 42.0 42.0
Credit spread sensitivity on AFS reserve (in million EUR/bp) (1.1) (1.3)
b. dexia fP's interest-rate & credit-spread sensitivityDexia's FP Segment Investment Portfolio consists primarily ofUS dollar-denominated asset-backed securities, US agency and government securities and mortgage-backed securities.They are part of the run-off portfolio.
The assets and liabilities supporting the FP GIC business are hedged using interest-rate swaps or futures.Certain categories of assets and liabilities are economically hedged, without the use of derivatives.
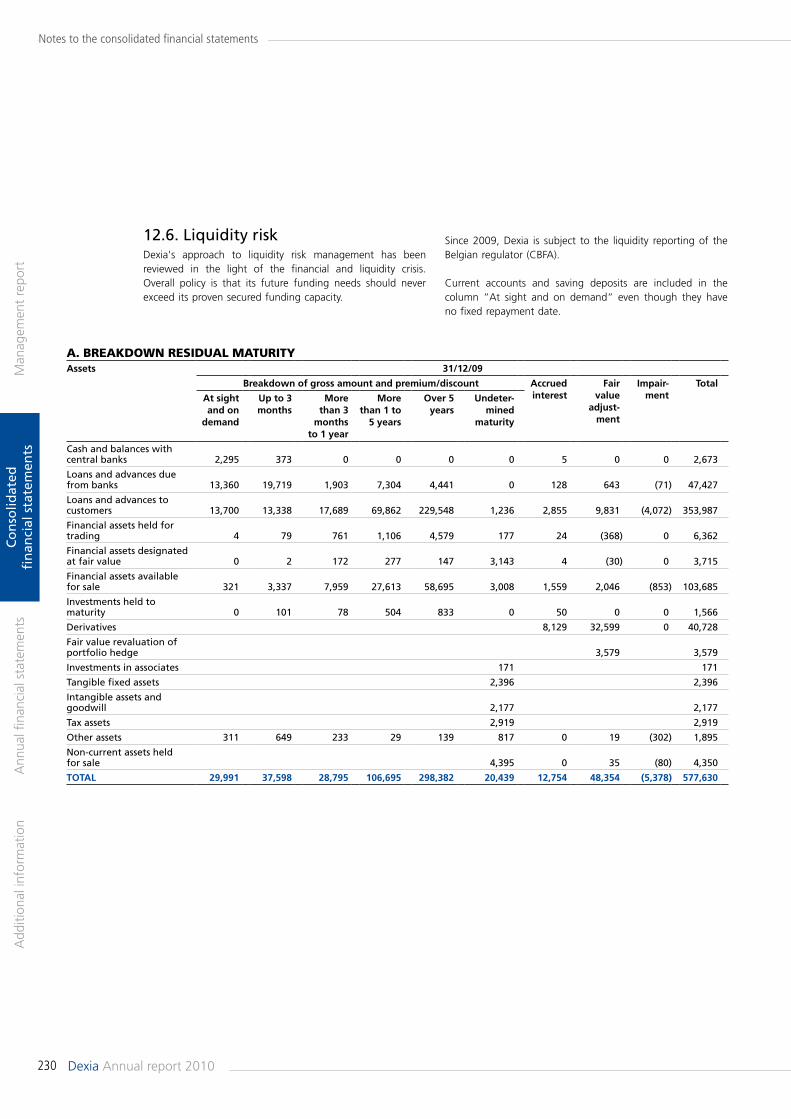
230 Dexia Annual report 2010
Man
agem
ent
repo
rtA
dditi
onal
info
rmat
ion
Ann
ual fi
nanc
ial s
tate
men
tsC
on
solid
ated
fi
nan
cial
sta
tem
ents
Notes to the consolidated financial statements
A. breAKdoWn residuAL mAturityassets 31/12/09
breakdown of gross amount and premium/discount accrued interest
fair value
adjust-ment
impair-ment
Total
at sight and on
demand
up to 3 months
more than 3
months to 1 year
more than 1 to
5 years
over 5 years
undeter-mined
maturity
Cash and balances with central banks 2,295 373 0 0 0 0 5 0 0 2,673
Loans and advances due from banks 13,360 19,719 1,903 7,304 4,441 0 128 643 (71) 47,427
Loans and advances to customers 13,700 13,338 17,689 69,862 229,548 1,236 2,855 9,831 (4,072) 353,987
Financial assets held for trading 4 79 761 1,106 4,579 177 24 (368) 0 6,362
Financial assets designated at fair value 0 2 172 277 147 3,143 4 (30) 0 3,715
Financial assets available for sale 321 3,337 7,959 27,613 58,695 3,008 1,559 2,046 (853) 103,685
Investments held to maturity 0 101 78 504 833 0 50 0 0 1,566
Derivatives 8,129 32,599 0 40,728
Fair value revaluation of portfolio hedge 3,579 3,579
Investments in associates 171 171
Tangible fixed assets 2,396 2,396
Intangible assets and goodwill 2,177 2,177
Tax assets 2,919 2,919
Other assets 311 649 233 29 139 817 0 19 (302) 1,895
Non-current assets held for sale 4,395 0 35 (80) 4,350
ToTal 29,991 37,598 28,795 106,695 298,382 20,439 12,754 48,354 (5,378) 577,630
12.6. Liquidity riskDexia's approach to liquidity risk management has been reviewed in the light of the financial and liquidity crisis. Overall policy is that its future funding needs should never exceed its proven secured funding capacity.
Since 2009, Dexia is subject to the liquidity reporting of the Belgian regulator (CBFA).
Current accounts and saving deposits are included in the column “At sight and on demand“ even though they have no fixed repayment date.
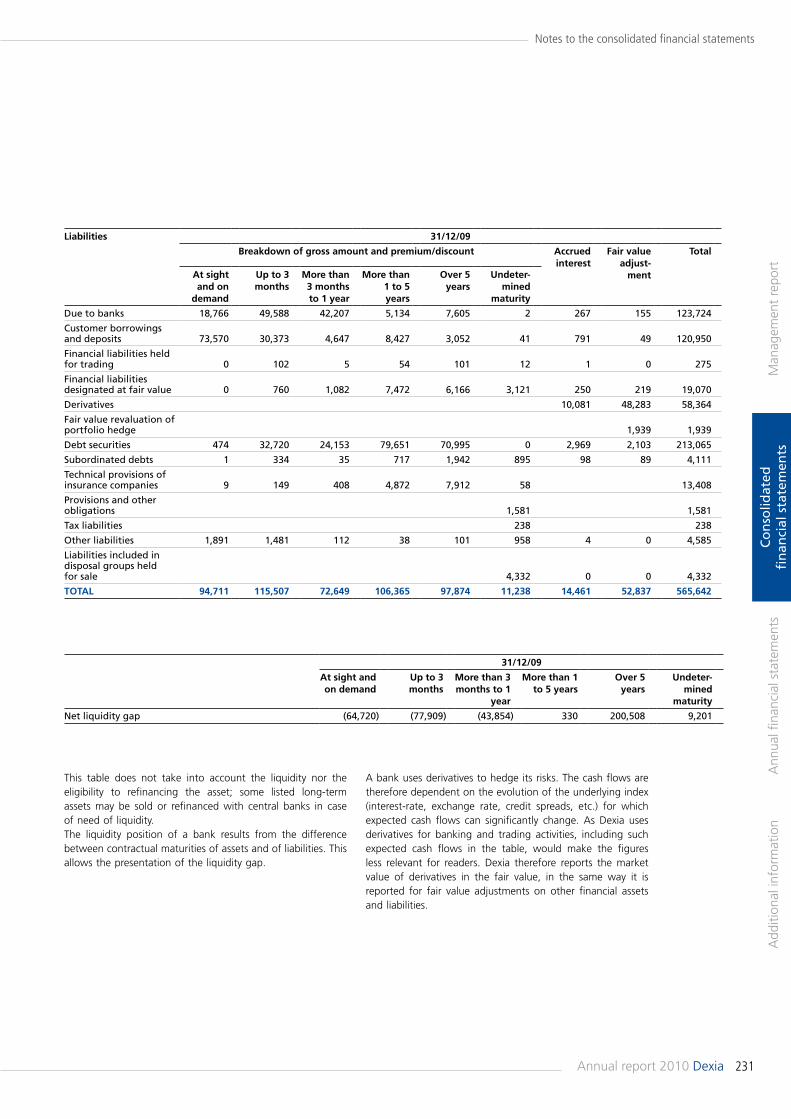
231Annual report 2010 Dexia
Man
agem
ent
repo
rtA
dditi
onal
info
rmat
ion
Ann
ual fi
nanc
ial s
tate
men
tsC
on
solid
ated
fi
nan
cial
sta
tem
ents
Notes to the consolidated financial statements
liabilities 31/12/09
breakdown of gross amount and premium/discount accrued interest
fair value adjust-
ment
Total
at sight and on
demand
up to 3 months
more than 3 months to 1 year
more than 1 to 5 years
over 5 years
undeter-mined
maturity
Due to banks 18,766 49,588 42,207 5,134 7,605 2 267 155 123,724
Customer borrowings and deposits 73,570 30,373 4,647 8,427 3,052 41 791 49 120,950
Financial liabilities held for trading 0 102 5 54 101 12 1 0 275
Financial liabilities designated at fair value 0 760 1,082 7,472 6,166 3,121 250 219 19,070
Derivatives 10,081 48,283 58,364
Fair value revaluation of portfolio hedge 1,939 1,939
Debt securities 474 32,720 24,153 79,651 70,995 0 2,969 2,103 213,065
Subordinated debts 1 334 35 717 1,942 895 98 89 4,111
Technical provisions of insurance companies 9 149 408 4,872 7,912 58 13,408
Provisions and other obligations 1,581 1,581
Tax liabilities 238 238
Other liabilities 1,891 1,481 112 38 101 958 4 0 4,585
Liabilities included in disposal groups held for sale 4,332 0 0 4,332
ToTal 94,711 115,507 72,649 106,365 97,874 11,238 14,461 52,837 565,642
31/12/09
at sight and on demand
up to 3 months
more than 3 months to 1
year
more than 1 to 5 years
over 5 years
undeter-mined
maturity
Net liquidity gap (64,720) (77,909) (43,854) 330 200,508 9,201
This table does not take into account the liquidity nor the eligibility to refinancing the asset; some listed long-term assets may be sold or refinanced with central banks in case of need of liquidity.The liquidity position of a bank results from the difference between contractual maturities of assets and of liabilities. This allows the presentation of the liquidity gap.
A bank uses derivatives to hedge its risks. The cash flows are therefore dependent on the evolution of the underlying index (interest-rate, exchange rate, credit spreads, etc.) for which expected cash flows can significantly change. As Dexia uses derivatives for banking and trading activities, including such expected cash flows in the table, would make the figures less relevant for readers. Dexia therefore reports the market value of derivatives in the fair value, in the same way it is reported for fair value adjustments on other financial assets and liabilities.
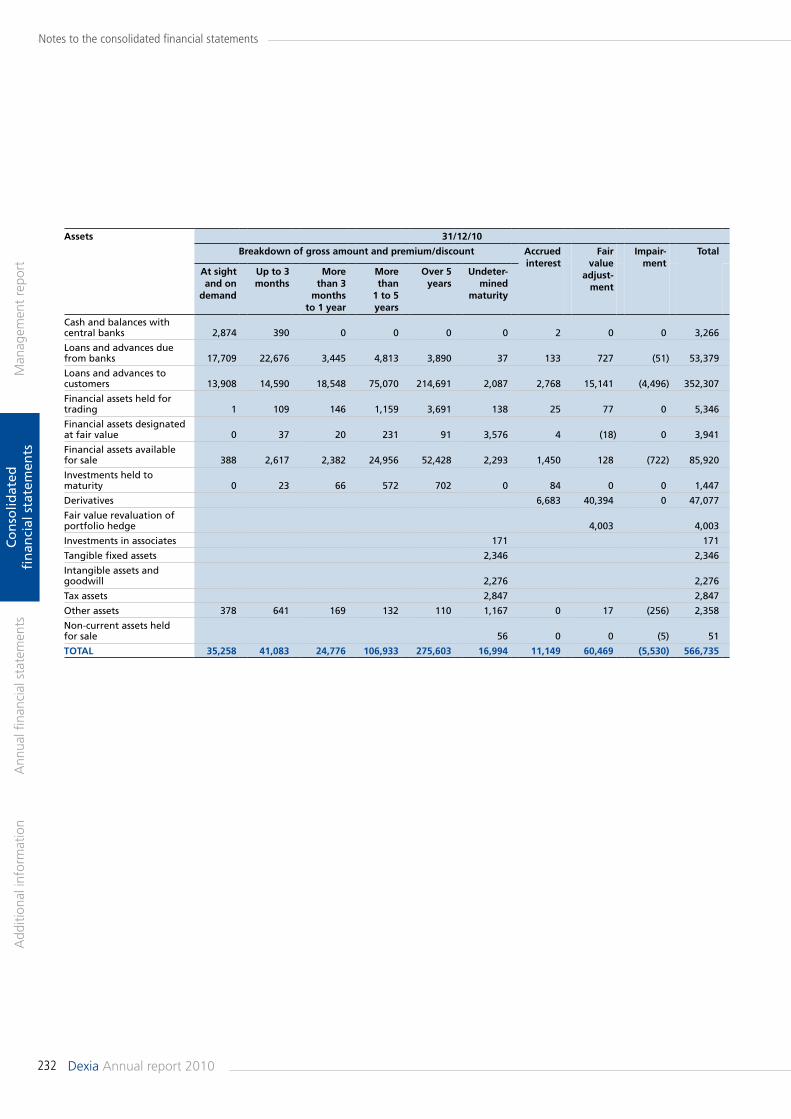
232 Dexia Annual report 2010
Man
agem
ent
repo
rtA
dditi
onal
info
rmat
ion
Ann
ual fi
nanc
ial s
tate
men
tsC
on
solid
ated
fi
nan
cial
sta
tem
ents
Notes to the consolidated financial statements
assets 31/12/10
breakdown of gross amount and premium/discount accrued interest
fair value
adjust-ment
impair-ment
Total
at sight and on
demand
up to 3 months
more than 3
months to 1 year
more than
1 to 5 years
over 5 years
undeter-mined
maturity
Cash and balances with central banks 2,874 390 0 0 0 0 2 0 0 3,266
Loans and advances due from banks 17,709 22,676 3,445 4,813 3,890 37 133 727 (51) 53,379
Loans and advances to customers 13,908 14,590 18,548 75,070 214,691 2,087 2,768 15,141 (4,496) 352,307
Financial assets held for trading 1 109 146 1,159 3,691 138 25 77 0 5,346
Financial assets designated at fair value 0 37 20 231 91 3,576 4 (18) 0 3,941
Financial assets available for sale 388 2,617 2,382 24,956 52,428 2,293 1,450 128 (722) 85,920
Investments held to maturity 0 23 66 572 702 0 84 0 0 1,447
Derivatives 6,683 40,394 0 47,077
Fair value revaluation of portfolio hedge 4,003 4,003
Investments in associates 171 171
Tangible fixed assets 2,346 2,346
Intangible assets and goodwill 2,276 2,276
Tax assets 2,847 2,847
Other assets 378 641 169 132 110 1,167 0 17 (256) 2,358
Non-current assets held for sale 56 0 0 (5) 51
ToTal 35,258 41,083 24,776 106,933 275,603 16,994 11,149 60,469 (5,530) 566,735
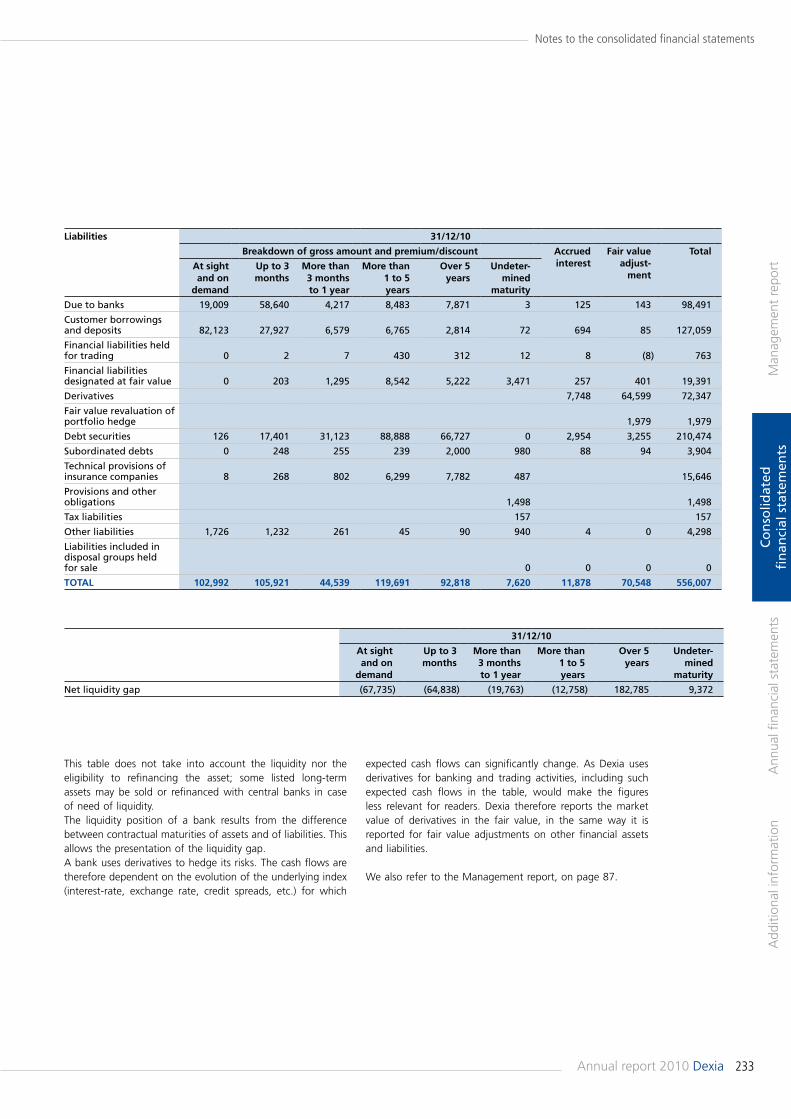
233Annual report 2010 Dexia
Man
agem
ent
repo
rtA
dditi
onal
info
rmat
ion
Ann
ual fi
nanc
ial s
tate
men
tsC
on
solid
ated
fi
nan
cial
sta
tem
ents
Notes to the consolidated financial statements
liabilities 31/12/10
breakdown of gross amount and premium/discount accrued interest
fair value adjust-
ment
Total
at sight and on
demand
up to 3 months
more than 3 months to 1 year
more than 1 to 5 years
over 5 years
undeter-mined
maturity
Due to banks 19,009 58,640 4,217 8,483 7,871 3 125 143 98,491
Customer borrowings and deposits 82,123 27,927 6,579 6,765 2,814 72 694 85 127,059
Financial liabilities held for trading 0 2 7 430 312 12 8 (8) 763
Financial liabilities designated at fair value 0 203 1,295 8,542 5,222 3,471 257 401 19,391
Derivatives 7,748 64,599 72,347
Fair value revaluation of portfolio hedge 1,979 1,979
Debt securities 126 17,401 31,123 88,888 66,727 0 2,954 3,255 210,474
Subordinated debts 0 248 255 239 2,000 980 88 94 3,904
Technical provisions of insurance companies 8 268 802 6,299 7,782 487 15,646
Provisions and other obligations 1,498 1,498
Tax liabilities 157 157
Other liabilities 1,726 1,232 261 45 90 940 4 0 4,298
Liabilities included in disposal groups held for sale 0 0 0 0
ToTal 102,992 105,921 44,539 119,691 92,818 7,620 11,878 70,548 556,007
31/12/10
at sight and on
demand
up to 3 months
more than 3 months to 1 year
more than 1 to 5 years
over 5 years
undeter-mined
maturity
Net liquidity gap (67,735) (64,838) (19,763) (12,758) 182,785 9,372
This table does not take into account the liquidity nor the eligibility to refinancing the asset; some listed long-term assets may be sold or refinanced with central banks in case of need of liquidity.The liquidity position of a bank results from the difference between contractual maturities of assets and of liabilities. This allows the presentation of the liquidity gap. A bank uses derivatives to hedge its risks. The cash flows are therefore dependent on the evolution of the underlying index (interest-rate, exchange rate, credit spreads, etc.) for which
expected cash flows can significantly change. As Dexia uses derivatives for banking and trading activities, including such expected cash flows in the table, would make the figures less relevant for readers. Dexia therefore reports the market value of derivatives in the fair value, in the same way it is reported for fair value adjustments on other financial assets and liabilities.
We also refer to the Management report, on page 87.
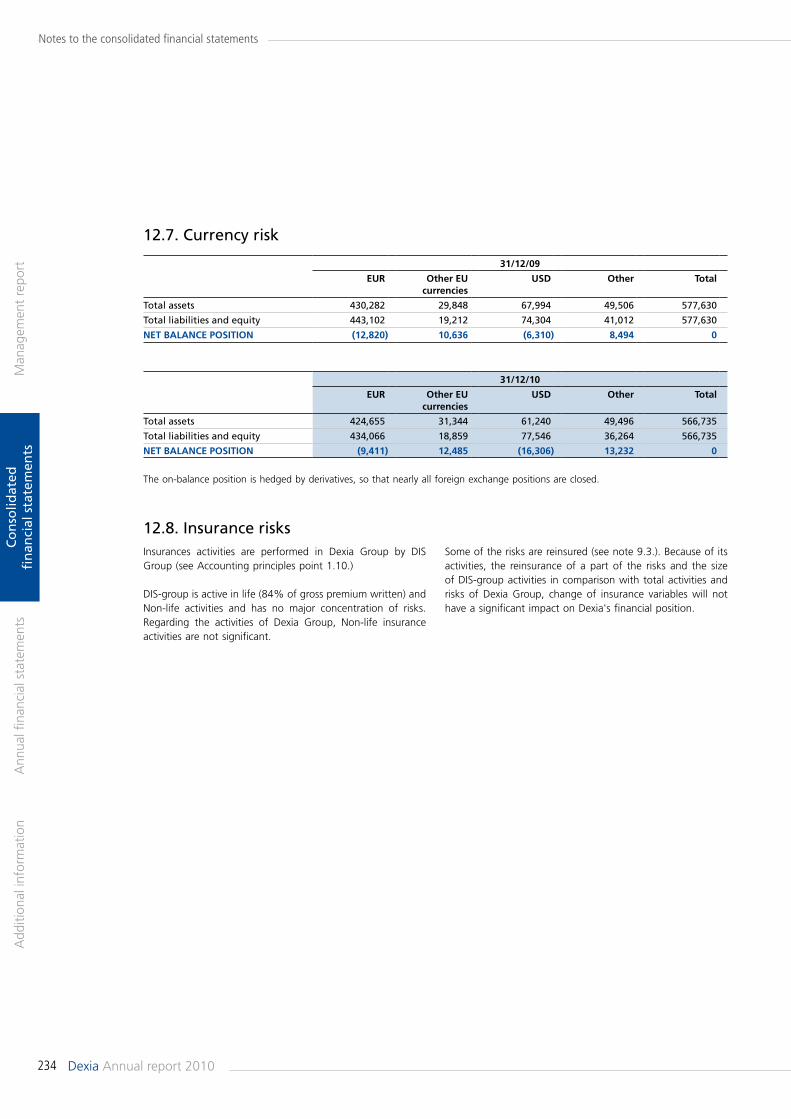
234 Dexia Annual report 2010
Man
agem
ent
repo
rtA
dditi
onal
info
rmat
ion
Ann
ual fi
nanc
ial s
tate
men
tsC
on
solid
ated
fi
nan
cial
sta
tem
ents
Notes to the consolidated financial statements
31/12/09
eur other eu currencies
usd other Total
Total assets 430,282 29,848 67,994 49,506 577,630
Total liabilities and equity 443,102 19,212 74,304 41,012 577,630
NeT balaNCe posiTioN (12,820) 10,636 (6,310) 8,494 0
31/12/10
eur other eu currencies
usd other Total
Total assets 424,655 31,344 61,240 49,496 566,735
Total liabilities and equity 434,066 18,859 77,546 36,264 566,735
NeT balaNCe posiTioN (9,411) 12,485 (16,306) 13,232 0
The on-balance position is hedged by derivatives, so that nearly all foreign exchange positions are closed.
12.7. Currency risk
12.8. Insurance risksInsurances activities are performed in Dexia Group by DIS Group (see Accounting principles point 1.10.)
DIS-group is active in life (84% of gross premium written) and Non-life activities and has no major concentration of risks. Regarding the activities of Dexia Group, Non-life insurance activities are not significant.
Some of the risks are reinsured (see note 9.3.). Because of its activities, the reinsurance of a part of the risks and the size of DIS-group activities in comparison with total activities and risks of Dexia Group, change of insurance variables will not have a significant impact on Dexia's financial position.
235Annual report 2010 Dexia
Man
agem
ent
repo
rtA
dditi
onal
info
rmat
ion
Ann
ual fi
nanc
ial s
tate
men
tsC
on
solid
ated
fi
nan
cial
sta
tem
ents
Dexia SA Statutory Auditor's report on the consolidated financial statements for the year ended 31 December 2010 to the Shareholders’ Meeting
To the shareholders
As required by law and the company’s articles of association, we are pleased to report to you on the audit assignment which you have entrusted to us. This report includes our opinion on the consolidated financial statements together with the required additional comment.
Unqualified audit opinion on the consolidated financial statementsWe have audited the accompanying consolidated financial statements of Dexia SA (“the company”) and its subsidiaries (jointly “the Group”), prepared in accordance with International Financial Reporting Standards as adopted by the European Union and with the legal and regulatory requirements applicable in Belgium. Those consolidated financial statements comprise the consolidated balance sheet as at 31 December 2010, the consolidated statement of income, the consolidated statement of changes in equity, the consolidated statement of comprehensive income and the consolidated cash flow statement for the year then ended, as well as the summary of significant accounting policies and other explanatory notes. The consolidated balance sheet shows total assets of 566,735 million EUR and the consolidated statement of income shows a consolidated profit (Group share) for the year then ended of 723 million EUR.
The Board of Directors of the company is responsible for the preparation of the consolidated financial statements. This responsibility includes among other things: designing, implementing and maintaining internal control relevant to the preparation and fair presentation of consolidated financial statements that are free from material misstatement, whether due to fraud or error, selecting and applying appropriate accounting policies, and making accounting estimates that are reasonable in the circumstances.
Our responsibility is to express an opinion on these consolidated financial statements based on our audit. We conducted our audit in accordance with legal requirements and auditing standards applicable in Belgium, as issued by the “Institut des Réviseurs d’Entreprises/Instituut van de Bedrijfsrevisoren”. Those standards require that we plan and perform the audit to obtain reasonable assurance whether the consolidated financial statements are free from material misstatement.
In accordance with these standards, we have performed procedures to obtain audit evidence about the amounts and disclosures in the consolidated financial statements. The procedures selected depend on our judgment, including the assessment of the risks of material misstatement of the consolidated financial statements, whether due to fraud or error. In making those risk assessments, we have considered internal control relevant to the Group’s preparation and fair presentation of the consolidated financial statements in order to design audit procedures that are appropriate in the circumstances but not for the purpose of expressing an opinion on the effectiveness of the Group’s internal control. We have assessed the basis of the accounting policies used, the reasonableness of accounting estimates made by the company and the presentation of the consolidated financial statements, taken as a whole. Finally, the Board of Directors and responsible officers of the company have replied to all our requests for explanations and information. We believe that the audit evidence we have obtained provides a reasonable basis for our opinion.
In our opinion, the consolidated financial statements give a true and fair view of the Group’s financial position as at 31 December 2010, and of its results and its cash flows for the year then ended, in accordance with International Financial Reporting Standards as adopted by the European Union and with the legal and regulatory requirements applicable in Belgium.
236 Dexia Annual report 2010
Man
agem
ent
repo
rtA
dditi
onal
info
rmat
ion
Ann
ual fi
nanc
ial s
tate
men
tsC
on
solid
ated
fi
nan
cial
sta
tem
ents
Statutory Auditor’s report
Additional commentThe preparation and the assessment of the information that should be included in the Directors’ report on the consolidated financial statements are the responsibility of the Board of Directors.
Our responsibility is to include in our report the following additional comment which does not change the scope of our audit opinion on the consolidated financial statements:
• The Directors’ report on the consolidated financial statements includes the information required by law and is in agreement with the consolidated financial statements. However, we are unable to express an opinion on the description of the principal risks and uncertainties confronting the Group, or on the status, future evolution, or significant
influence of certain factors on its future development. We can, nevertheless, confirm that the information given is not in obvious contradiction with any information obtained in the context of our appointment.
Diegem, 21 March 2011
The Statutory Auditor
DELOITTE Bedrijfsrevisoren / Reviseurs d’EntreprisesBV o.v.v.e. CVBA / SC s.f.d. SCRL
Represented by
Frank Verhaegen Bernard De Meulemeester

240 Balancesheet
241 Off-balance-sheetitems
242 Statementofincome
243 Notestotheannualfinancialstatements
259 StatutoryAuditor'sreport
fortheyearended31december2010
A n n u a l f i n a n c i a l s t a t e m e n t sF i n a n c i a l s t a t e m e n t s a s a t 3 1 D e c e m b e r 2 0 1 0
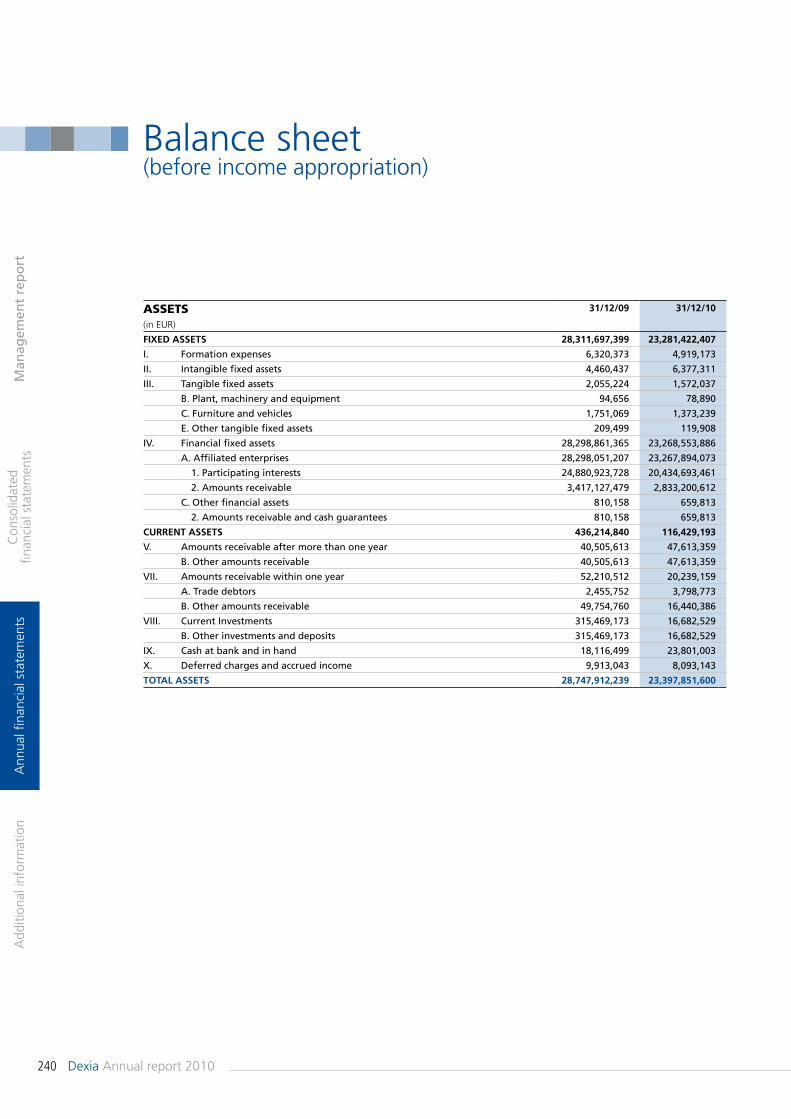
240 DexiaAnnualreport2010
Man
agem
ent
rep
ort
Add
ition
alin
form
atio
nA
nnua
lfina
ncia
lsta
tem
ents
Con
solid
ated
fin
anci
als
tate
men
ts
Balancesheet(beforeincomeappropriation)
Assets 31/12/09 31/12/10
(inEUR)
Fixed assets 28,311,697,399 23,281,422,407
I. Formation expenses 6,320,373 4,919,173
II. Intangible fixed assets 4,460,437 6,377,311
III. Tangible fixed assets 2,055,224 1,572,037
B. Plant, machinery and equipment 94,656 78,890
C. Furniture and vehicles 1,751,069 1,373,239
E. Other tangible fixed assets 209,499 119,908
IV. Financial fixed assets 28,298,861,365 23,268,553,886
A. Affiliated enterprises 28,298,051,207 23,267,894,073
1. Participating interests 24,880,923,728 20,434,693,461
2. Amounts receivable 3,417,127,479 2,833,200,612
C. Other financial assets 810,158 659,813
2. Amounts receivable and cash guarantees 810,158 659,813
Current assets 436,214,840 116,429,193
V. Amounts receivable after more than one year 40,505,613 47,613,359
B. Other amounts receivable 40,505,613 47,613,359
VII. Amounts receivable within one year 52,210,512 20,239,159
A. Trade debtors 2,455,752 3,798,773
B. Other amounts receivable 49,754,760 16,440,386
VIII. Current Investments 315,469,173 16,682,529
B. Other investments and deposits 315,469,173 16,682,529
IX. Cash at bank and in hand 18,116,499 23,801,003
X. Deferred charges and accrued income 9,913,043 8,093,143
total assets 28,747,912,239 23,397,851,600
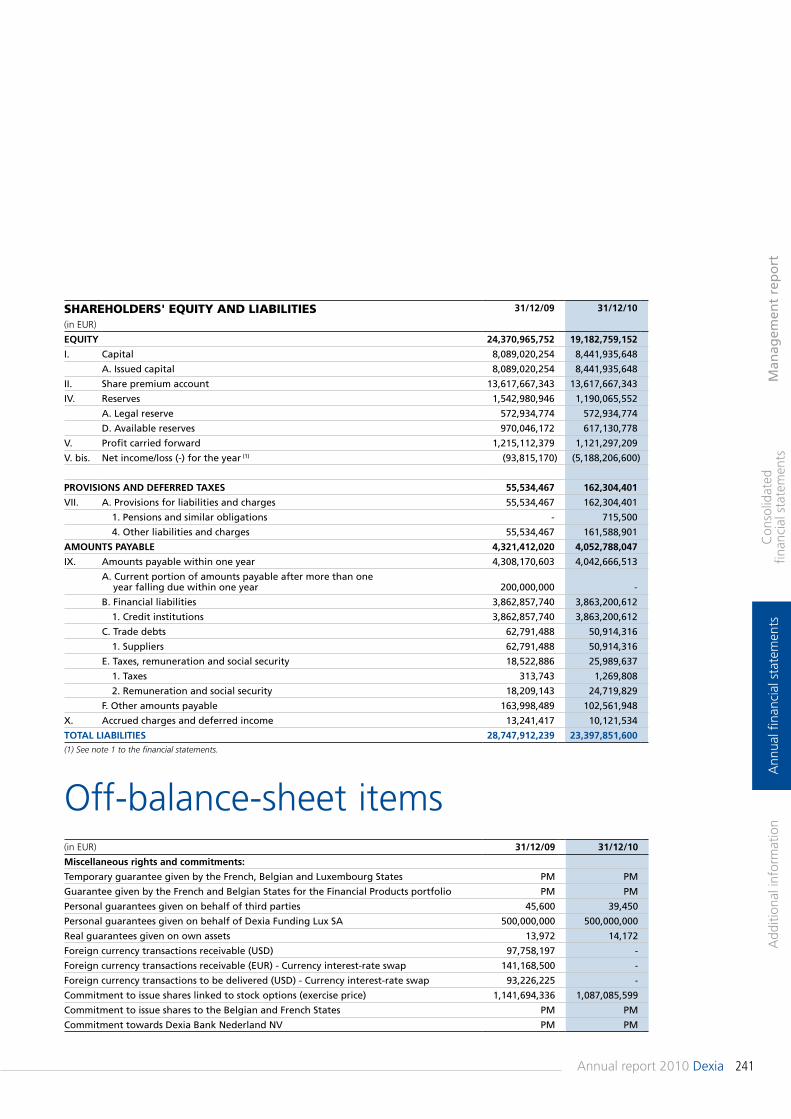
241Annualreport2010Dexia
Man
agem
ent
rep
ort
Add
ition
alin
form
atio
nA
nnua
lfina
ncia
lsta
tem
ents
Con
solid
ated
fin
anci
als
tate
men
ts
Off-balance-sheetitems
shAreholders' equity And liAbilities 31/12/09 31/12/10
(inEUR)
equity 24,370,965,752 19,182,759,152
I. Capital 8,089,020,254 8,441,935,648
A. Issued capital 8,089,020,254 8,441,935,648
II. Share premium account 13,617,667,343 13,617,667,343
IV. Reserves 1,542,980,946 1,190,065,552
A. Legal reserve 572,934,774 572,934,774
D. Available reserves 970,046,172 617,130,778
V. Profit carried forward 1,215,112,379 1,121,297,209
V. bis. Net income/loss (-) for the year (1) (93,815,170) (5,188,206,600)
Provisions and deFerred taxes 55,534,467 162,304,401
VII. A. Provisions for liabilities and charges 55,534,467 162,304,401
1. Pensions and similar obligations - 715,500
4. Other liabilities and charges 55,534,467 161,588,901
amounts Payable 4,321,412,020 4,052,788,047
IX. Amounts payable within one year 4,308,170,603 4,042,666,513
A. Current portion of amounts payable after more than one year falling due within one year 200,000,000 -
B. Financial liabilities 3,862,857,740 3,863,200,612
1. Credit institutions 3,862,857,740 3,863,200,612
C. Trade debts 62,791,488 50,914,316
1. Suppliers 62,791,488 50,914,316
E. Taxes, remuneration and social security 18,522,886 25,989,637
1. Taxes 313,743 1,269,808
2. Remuneration and social security 18,209,143 24,719,829
F. Other amounts payable 163,998,489 102,561,948
X. Accrued charges and deferred income 13,241,417 10,121,534
total liabilities 28,747,912,239 23,397,851,600 (1) See note 1 to the financial statements.
(inEUR) 31/12/09 31/12/10
miscellaneous rights and commitments:
Temporary guarantee given by the French, Belgian and Luxembourg States PM PM
Guarantee given by the French and Belgian States for the Financial Products portfolio PM PM
Personal guarantees given on behalf of third parties 45,600 39,450
Personal guarantees given on behalf of Dexia Funding Lux SA 500,000,000 500,000,000
Real guarantees given on own assets 13,972 14,172
Foreign currency transactions receivable (USD) 97,758,197 -
Foreign currency transactions receivable (EUR) - Currency interest-rate swap 141,168,500 -
Foreign currency transactions to be delivered (USD) - Currency interest-rate swap 93,226,225 -
Commitment to issue shares linked to stock options (exercise price) 1,141,694,336 1,087,085,599
Commitment to issue shares to the Belgian and French States PM PM
Commitment towards Dexia Bank Nederland NV PM PM
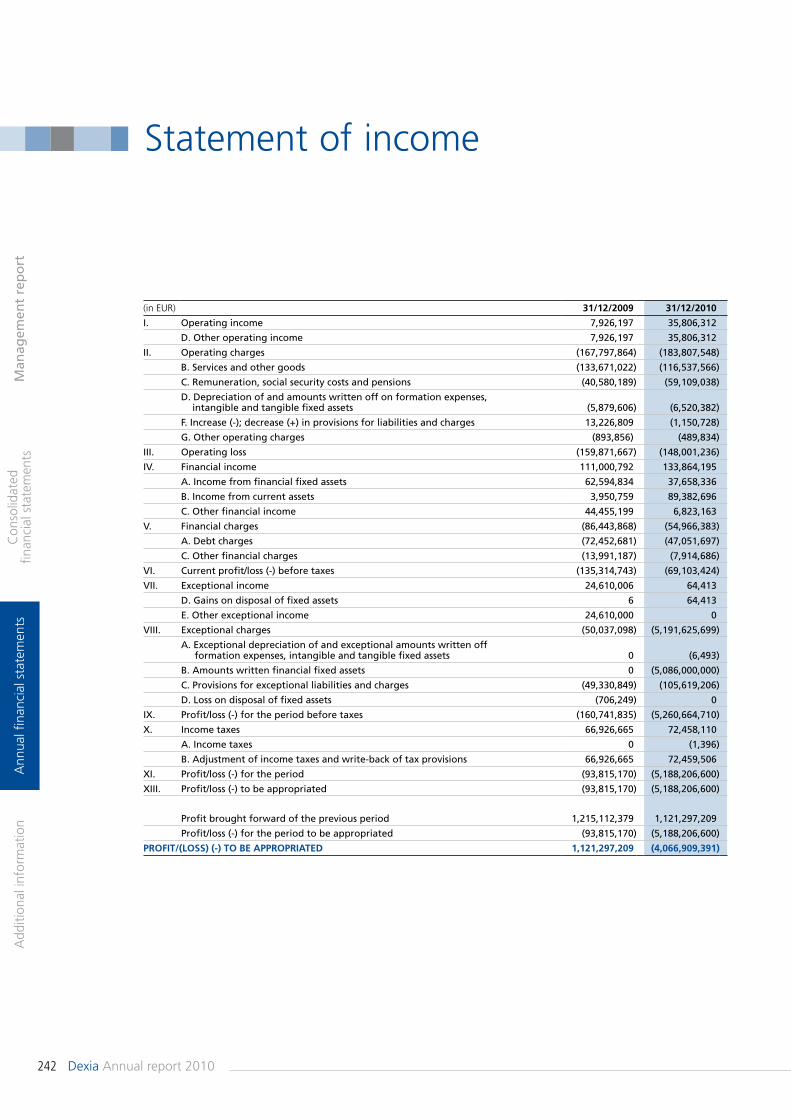
242 DexiaAnnualreport2010
Man
agem
ent
rep
ort
Add
ition
alin
form
atio
nA
nnua
lfina
ncia
lsta
tem
ents
Con
solid
ated
fin
anci
als
tate
men
ts
Statementofincome
(inEUR) 31/12/2009 31/12/2010
I. Operating income 7,926,197 35,806,312
D. Other operating income 7,926,197 35,806,312
II. Operating charges (167,797,864) (183,807,548)
B. Services and other goods (133,671,022) (116,537,566)
C. Remuneration, social security costs and pensions (40,580,189) (59,109,038)
D. Depreciation of and amounts written off on formation expenses, intangible and tangible fixed assets (5,879,606) (6,520,382)
F. Increase (-); decrease (+) in provisions for liabilities and charges 13,226,809 (1,150,728)
G. Other operating charges (893,856) (489,834)
III. Operating loss (159,871,667) (148,001,236)
IV. Financial income 111,000,792 133,864,195
A. Income from financial fixed assets 62,594,834 37,658,336
B. Income from current assets 3,950,759 89,382,696
C. Other financial income 44,455,199 6,823,163
V. Financial charges (86,443,868) (54,966,383)
A. Debt charges (72,452,681) (47,051,697)
C. Other financial charges (13,991,187) (7,914,686)
VI. Current profit/loss (-) before taxes (135,314,743) (69,103,424)
VII. Exceptional income 24,610,006 64,413
D. Gains on disposal of fixed assets 6 64,413
E. Other exceptional income 24,610,000 0
VIII. Exceptional charges (50,037,098) (5,191,625,699)
A. Exceptional depreciation of and exceptional amounts written off formation expenses, intangible and tangible fixed assets 0 (6,493)
B. Amounts written financial fixed assets 0 (5,086,000,000)
C. Provisions for exceptional liabilities and charges (49,330,849) (105,619,206)
D. Loss on disposal of fixed assets (706,249) 0
IX. Profit/loss (-) for the period before taxes (160,741,835) (5,260,664,710)
X. Income taxes 66,926,665 72,458,110
A. Income taxes 0 (1,396)
B. Adjustment of income taxes and write-back of tax provisions 66,926,665 72,459,506
XI. Profit/loss (-) for the period (93,815,170) (5,188,206,600)
XIII. Profit/loss (-) to be appropriated (93,815,170) (5,188,206,600)
Profit brought forward of the previous period 1,215,112,379 1,121,297,209
Profit/loss (-) for the period to be appropriated (93,815,170) (5,188,206,600)
ProFit/(loss) (-) to be aPProPriated 1,121,297,209 (4,066,909,391)
243Annualreport2010Dexia
Man
agem
ent
rep
ort
Add
ition
alin
form
atio
nA
nnua
lfina
ncia
lsta
tem
ents
Con
solid
ated
fin
anci
als
tate
men
ts
1.PresentationofthefinancialstatementsDexiaSApresentsitsfinancialstatementsbeforeappropriation.Thelossforthe2010financialyearamountstoEUR5,188.2million. The profit carried forward from the previous yearstands at EUR 1,121.3 million, making a total loss forappropriationofEUR4,066.9million.
2.Financialstatementsandchartofaccounts
DexiaSA,afinancialfirm,isacompanygovernedbyBelgianlawwhosefinancial instrumentsareauthorisedfortradinginaregulatedBelgianmarket,andit isthereforesubjecttotheobligationtopublishyearlyfinancialstatementsasprescribedby theBelgian CompanyCode and its decreeof applicationdated30January2001.The accounting plan is presented in accordance with theaccounting plan prescribed in the Royal Decree of 12September 1983. The items provided for in the accountingplanthatdonotapplytoDexiahavebeenexcluded.ThefinancialstatementsarepresentedinEUR.
3.Accountingpolicies3.1. General policies
3.1.1. leGislation
Accountingpoliciesare inconformitywith theRoyalDecreeof30January2001,inapplicationoftheBelgianCompanyCode.If legislation allows options or authorises a waiver, theaccountingpolicieshereaftershallmentiontheoptionchosenofwhethersuchawaiverhasbeenapplied.
3.1.2. ForeiGn CurrenCy translation into eur
Monetary assets, liabilities, rights and commitmentsdenominated in foreigncurrenciesare translated intoEURatthelastdayaverageyear-endexchangerate.Non-monetary itemsaretranslatedintoEURattheexchangeraterulingineffectonthetransactiondate.ForeigncurrencyincomeandexpensearetranslatedintoEURattheexchangeraterulingineffectonthedateonwhichtheincomeorexpenseisrecognisedinthestatementofincome.
3.2. Assets
3.2.1. Formation exPenses (item i.)
Formation expenses are recorded as an asset and amortisedonastraight-linebasisattherateofatleast20%peryear.
3.2.2. intanGible Fixed assets (item ii.)
Licenseacquisitions,externalcostslinkedtosoftwaredefinitionand to the development of the website of Dexia Group arerecordedasintangiblefixedassetswhentheacquisitionpriceisat leastequaltoEUR495.79per item,orwhendelivery isbrokendownintopartialshipmentsrepresentinglessthanEUR495.79eachbutthetotaldeliveryisatleastEUR495.79.Intangible fixedassets recorded in theassetsaredepreciatedoveramaximumoffiveyears.Furthermore,theinternalcostsrelatedtothedevelopmentofsoftwareandthewebsiteareentirelychargedinthefinancialyearinwhichtheyareexposed.
3.2.3. tanGible Fixed assets (item iii.)
Ifnecessary,exceptionaldepreciationswillberecordedtoaligntheaccountingvalueoffixedassetstotheirutilisationvalueforthe company to take intoaccount their alterationor changesofeconomicortechnologicalcircumstances.Exceptional depreciations are reversed if they are no longerjustified.
3.2.4. FinanCial assets (item iv.)
Participatinginterestsandsharesarestatedatacquisitioncostor contribution cost. Related transaction costs are recordeddirectlyinthestatementofincome.Impairments are recorded in the case of capital losses orlastingdepreciation.Theyaredeterminedbyreferencetothefinancialposition,profitabilityandprospectsof thecompanyinwhichsharesand/orequityinterestsareheld.Participatinginterestsandsharesmayalsoberevalued.Inthisit is therefore required that their value, determined on thebasis of their utility to the company, presents a certain andlastingsurplusinrelationtotheirbookvalue.Debts appearing under financial fixed assets are valuedaccording to the sameprinciples asdebts atmore thanoneyearanduptooneyear.
3.2.5. amounts reCeivable aFter more tHan one year and WitHin one year (items v. and vii.)
Receivablesarestatedattheirnominalvalue.Allowancesarebookedtocoveranyriskofnon-recovery.
Notestotheannualfinancialstatements
244 DexiaAnnualreport2010
Notes to the annual financial statements
Man
agem
ent
rep
ort
Add
ition
alin
form
atio
nA
nnua
lfina
ncia
lsta
tem
ents
Con
solid
ated
fin
anci
als
tate
men
ts
4.Notestotheannualfinancialstatements
Dexia SA is a cross-border holding company which has twopermanentestablishmentsinParisandLuxembourg.Fromanaccounting point of view, the financial statements of DexiaSA include the accounts of Brussels, the Dexia SA headoffice, and those of the permanent establishments in ParisandLuxembourg.
4.1. The balance-sheet total (before income appropriation)The balance-sheet total was EUR 23,397.9 million as at31 December 2010, against EUR 28,747.9 million as at31December2009,adecreaseof19%.
4.2. Assets
FiXed Assets
4.2.1. Formation exPenses
All theexpensesrelatedtothecapital increasesarerecordedintheassetsas“Formationexpenses”andareamortisedoveraperiodoffiveyears.The net book value of formation expenses amounts toEUR 4.9million.Formation expenses include the fees directly associated withcapital increases and expenditure associated with the shareownership plans of previous years aimed at all members ofstaff of the Group in the different countries in which theDexiaGroupisactive.
4.2.2. intanGible Fixed assets
IntangiblefixedassetstotalledEUR6.4millionandconcernedthe acquisition and the development of software as wellas external costs related to the development of the Dexiawebsite. These intangible fixed assets are depreciated on astraight-linebasisoveraperiodofthreeyears.
4.2.3. tanGible Fixed assets
Tangible fixed assets which have a net book value ofEUR 1.6 million have a gross acquisition value ofEUR8.5million.Property,plantandequipment contributeagrossacquisitionvalueofEUR3.3millionandaredepreciatedonastraight-linebasisoveraperiodoftenyears.Office and IT equipment represented a gross investment ofEUR4.7million,depreciatedonastraight-linebasisatarateof25%.Other tangible fixed assets involving the installation of theleased premises (gross acquisition value of EUR 0.5 million)depreciated on a straight-line basis over the period of theleasecontracts.
3.2.6. sHort-term investments and CasH assets (items viii. and ix.)
Cashisstatedatnominalvalue.Securitiesarestatedatacquisitioncost,while theaccessorialcostsare recorded in thestatementof income in theyear inwhichtheyareincurred.At balance-sheet date, impairments are recorded on short-term investmentsand liquidassets if their realisationvalue islowerthantheirbookvalue.Additional impairmentsarerecordedontheseassets inordertoreflecteitherachangeintheirrealisationormarketvalue,ortherisksinherentinthenatureoftheproductsconcernedortheactivitiesconducted.Nevertheless,ownsharesacquiredwithaviewtocancellationarevaluatedatcostastheymayonlybedestroyedfurthertotheagreementoftheShareholders’Meeting.
3.3. Liabilities
3.3.1. revaluation surPluses (item iii.)
Shares and participating interests that are recorded as long-terminvestmentsmayberevaluated inthecaseofacertain,permanent increase in their fair value for the companycomparedwiththeirbookvalue.Revaluationsurplusesaremaintainedinthisheadinguntiltherealisation of the assets concerned or their inclusion in thecapital.
3.3.2. Provisions For liabilities and CHarGes (item vii.)
At balance-sheet date, the Board of Directors, acting withprudence, sincerity and good faith, examines the provisionsto be built up in order to cover all possible risks or lossesthatmighthaveoccurredduringthefinancialyearorpreviousfinancialyears.Provisions relating to previous financial years are regularlyreviewedandreversediftheynolongerserveapurpose.
3.3.3. debts oF over one year and uP to one year (items viii. and ix.)
Debtsarestatedinthebalancesheetfortheirnominalvalue.
3.4. Off-balance-sheet items
Off-balance-sheetitemsarerecordedforthenominalvalueofthe rightsandcommitmentsmentioned in theagreementorfortheirassessedvalue.
245Annualreport2010Dexia
Notes to the annual financial statements
Man
agem
ent
rep
ort
Add
ition
alin
form
atio
nA
nnua
lfina
ncia
lsta
tem
ents
Con
solid
ated
fin
anci
als
tate
men
ts
Current Assets
4.2.5. reCeivables aFter more tHan one year
other amounts receivablesSince 2002, Dexia SA’s permanent establishment in ParishasheadedthetaxconsolidationgroupinFrance,whichasat31december2010includedthefollowingcompanies:•CBXGestion•CBXIA1•CBXIA2•CLFMarne-la-ValléeParticipation•CompagniepourleFoncieretl’Habitat(CFH)•DexiaBail•DexiaCLFAvenir•DexiaCLFBanque•DexiaCLFDéveloppement•DexiaCLFImmo•DexiaCLFOrganisation•DexiaCréditLocal•DexiaDSFormation•DexiaDSService•DexiaÉditions•DexiaÉtablissementStableParis•DexiaHabitat•DexiaFlobail•DexiaInvestissements•DexiaMunicipalAgency•DexiaProjets•Dexiarail•DexiaSofaxis•DexintDéveloppement•Floral•GenebusLease(formerlyDexiaCLFEnergia)•GuidePratiquedelaDécentralisation.•Publiservices
Because the commitments subscribed by Dexia Crédit Localand its subsidiaries allow Dexia, through its permanentestablishment,tolockintemporarytaxsavings,itwasagreedthattheresourcesproducedbythepermanentestablishmentwillbe lent tothetaxconsolidationGroup’ssubsidiaries thatmadeitpossibletorealisethesetaxsavingsthroughadvancescalled“taxdeferredadvances”.Taxdeferredadvancesgrantedbythepermanentestablishmentwithcontractualmaturityafter31December2011amountedtoEUR47.6millionasat31December2010..
4.2.6. amounts reCeivable WitHin one year
trade debtorsTheitem“Tradedebtors”relatestocommercialreceivablesforservicesrenderedtosubsidiariesoftheGroup(EUR3.5million),andnon-Groupreceivables(EUR0.3million)forthebalance.
4.2.4. FinanCial Fixed assets
Participating interests in affiliated companiesThe item“Participating interests”representingEUR24,880.9millionasat31December2009wasEUR20,434.7millionasat31December2010.Itincludesthefollowingequityinterests:EUR6,714.8million: 100%ofDexiaCréditLocalSA,Paris,
France.On22December2010,DexiaSA increasedthecapitalof itssubsidiaryDexiaCréditLocalbyEUR639.8millionwithacashcontribution.Inaddition,animpairmentofEUR4,039millionwasregisteredonDexiaCréditLocalattheendof2010.EUR7,950.0million: 100% of Dexia Bank Belgium SA,
Brussels,Belgium.On31December2010,an impairmentofEUR1,047millionwasnotedonDexiaBankBelgium.EUR2,644.4million: 95.39% of Dexia Participation
BelgiqueSA,Brussels,Belgium,whichowns99,84%ofDenizBankAS.
EUR1,751.8million: 57.68% of Dexia Banque Interna-tionaleàLuxembourgSA(DexiaBIL),Luxembourg.
EUR1,279.2million: 99.99% of Dexia ParticipationLuxembourgSA,Luxembourg,whichowns42.23%ofDexiaBIL.
EUR93.0million: 100% of Dexia Nederland BV,Amsterdam,TheNetherlands.
On 28 May 2010, Dexia Nederland Holding NV proceededwithamergerbyabsorptionofDexiaBankNederlandNVandchangeditsnametoDexiaNederlandBV.EUR1.5million: 99.40% of Associated Dexia
Technology Services SA (ADTS),Luxembourg.
PM: 10% of Dexia Holdings Inc. in NewYork,USA, aholding companywhichowns100%ofDexiaFPHoldingsInc.
An impairment of EUR 284.1 million was noted in 2008 ontheparticipatinginterestheldinDexiaHoldingsInc.PM: 100%ofDexiaFundingLuxembourg
SA,Luxembourg.PM: 0.01% of Deniz Faktoring, Istanbul,
Turkey.
On 9 July 2010, Dexia SA transferred to Dexia Crédit LocalSAitsparticipatinginterestofEUR0.02millionheldinDexiaManagementServicesLtd.Thissaleresulted inacapitalgainofEUR0.06million(cf.note4.5.3.).
receivables on affiliated companiesThis item only relates to subordinated loans granted toGroup entities. It decreased from EUR 3,417.1 million as at31December2009toEUR2,833.2millionasat31December2010due to the repaymentof two subordinated loans,oneof EUR 640 million granted to Dexia Crédit Local and theother of EUR 75 million in favour of Dexia Bank Nederland.TherewasalsoaloanrevaluationinUSD(+EUR131.1million)asaresultoftheappreciationofthatcurrency.
other financial assetsDexiaSApaidEUR0.7millionbywayofrentalguaranteeforthepremiseslocatedintheDexiaTower–CBX.
246 DexiaAnnualreport2010
Notes to the annual financial statements
Man
agem
ent
rep
ort
Add
ition
alin
form
atio
nA
nnua
lfina
ncia
lsta
tem
ents
Con
solid
ated
fin
anci
als
tate
men
ts
4.2.7. Current investments
other investments and depositsAsat31December2009,thepermanentestablishmentinParisheld aportfolioof shares inAssuredGuaranty Ltd at a valueofEUR256.6million.ThesesharesoriginatefromthedisposalofFinancialSecurityAssuranceHoldingsLtdbyDexiaHoldingsInc.toAssuredGuarantyLtdandwereresoldbyDexiaHoldingsInc.tothepermanentestablishmentofDexiaSAinParis.Theyweresoldon16March2010,achievingagrosscapitalgainofEUR87.9million(cf.note4.5.2.)aswellasaforeignexchangegainofEUR3.6million(cf.note4.5.2.).
This heading also includes a term deposit from the headoffice representing EUR 16.5 million and VVPR Dexia stripsworthEUR0.2million.
4.2.8. CasH at banK and in Hand
AvailablecashatbanksandinhandtotalledEUR23.8million.
4.2.9. deFerred CHarGes and aCCrued inCome
DeferredchargestotalledEUR0.4millionandaccruedincomewasEUR7.7million.Amongaccrued incomeare the interestpro ratasof interestrelatingtosubordinatedloansgrantedtoGroupentities(EUR7.1 million), to tax deferred advances (EUR 0.1 million) andservices rendered to other entities of the Group (EUR 0.5million).
4.3. Shareholders’ equity and liabilities
shAreholders’ equity
Asat31December2010,theholdingcompany’sshareholderequity including 2010 net result before profit appropriationtotalled EUR 19,182.8 million and is composed of thefollowingitems.
4.3.1. CaPital
As at 31 December 2010, subscribed capital totalledEUR 8,441.9 million against EUR 8,089 million as at31 December 2009. There was an increase of subscribedcapitalon11June2010followingthe issueofbonussharesdecided by the Extraordinary Shareholders’ Meeting held on12May2010.
As at 31 December 2010 the capital is thus represented by1,846,406,344 shares of which 9,591,069 bearer shares,1,508,960,651 dematerialised shares and 327,854,624registeredshares.ThetotalnumberofDexiaVVPRstripswas684,333,504.
4.3.2. sHare Premium aCCount
Each of the previous capital increases involved an issuepremium so the total of these premiums amount to EUR13,617.7millionasat31December2010.
other amounts receivablesIn 2000, the acquisition of the US group Financial SecurityAssurancebyheadofficewaspartiallyhedgedbyacurrencyand interest-rate swap contract concludedwithDexiaCréditLocalforanamountofUSD134.2millionagainstEUR141.2millionmaturedon12July2010.Following the value reduction on the holding in DexiaHoldingsInc.,shareholderoftheDexiaFPHoldingsgroupandin order to hedge the risk arising from that swap, the headofficeofDexia SA concludeda transaction topurchaseUSD134.2million forward forEUR97.8million,alsomaturedon12July2010.The receivable resulting from this specific hedge (EUR 43.4million)wasthereforesettledon12July2010.
ThepermanentestablishmentofDexiaSAinParisistheheadofthetaxconsolidationgroupinFrance.Inthisregarditissolelyliable for corporation tax and the lump-sumannual taxationduefromtheGroupinrelationto itsfiscal integration,giventhattaxesduefromcompanieswhichformpartofthefiscalconsolidationmustbepaid to thepermanentestablishment.Asat31December2010,thetaxreceivableofthepermanentestablishment in Paris to the French tax authorities as thehead of the tax consolidation group in France amounted toEUR1.4million.
Forsubsidiaries,belongingtothetaxconsolidationgrouphasa neutral effect in relation to the tax situation they mighthave in the absence of integration. Subsidiaries shouldthereforepaythepermanentestablishmenttheircontributiontothecorporatetaxofthefiscallyintegratedGroup.Asat31December2010,theamountduefromtheFrenchsubsidiarieswithregardtothetaxtheyowetheholdingcompanyisEUR7.9million.
Furthermore, as from 1 January 2007, the permanentestablishmentofDexiaSA inLuxembourg is theheadoftheGroup within the scope of tax integration in Luxembourg.As a consequence, it alone is also liable for corporation taxand local commercial tax on group companies integrated inLuxembourg.Thecompanies formingpartof theGroup fiscally integratedinLuxembourgare:•BILRéSA•DexiaBanqueInternationaleàLuxembourgSA•DexiaSA,Luxembourgbranch•DexiaParticipationLuxembourgSA•ExpertaCorporateandTrustServicesSA•SociétéLuxembourgeoisedeLeasingBILLease.
As at 31 december 2010, the permanent LuxembourgestablishmenthadaclaimofEUR1.9milliononthecompaniestaking part in the tax consolidation in Luxembourg, whichcorresponds to the tax due from those companies on theirshareoftheconsolidatedtaxresult.
For its part, the head office has a withholding tax claim(EUR 0.1 million). To this is added a tax claim of EUR 3.3 mil-lion on the Belgian fiscal authorities resulting from reliefsobtained after claims made as well as arrears interest ofEUR0.7million.
Theworkrulesstatethatsalaryistobepaidinadvance.TheserepresentaclaimofEUR1.1millionasat31december2010.
247Annualreport2010Dexia
Notes to the annual financial statements
Man
agem
ent
rep
ort
Add
ition
alin
form
atio
nA
nnua
lfina
ncia
lsta
tem
ents
Con
solid
ated
fin
anci
als
tate
men
ts
Consideringthisundertakingandtherisksoflossesorchargeswhich might arise, therefrom on 31 December 2010 DexiaSAmadeaprovision forother risks andexceptional chargesamounting to EUR 116 million, through an additional EUR66.6millionbookedtothe2010financialyear.
Moreover, as a matter of prudence, Dexia SA provisionedan exceptional charge of EUR 39 million with regard to itssubsidiary Dexia banka Slovensko. This provision does notraise any issue regarding the sale of Dexia banka Slovenskoto Penta Investments following an agreement concluded inNovember2010.
In view of the above, the balance of provisions for otherliabilities and charges as at 31 December 2010 amountsto EUR 161.6 million against EUR 55.5 million as at31December2009.
liAbilities
4.3.7. amounts Payable WitHin one year
Financial liabilitiesTheseliabilitiesrelatetoshort-termfinancingconcludedwithGroupcompaniesforanamountofEUR3,863.2million.
trade liabilitiesSuppliers’ invoices not yet paid amount to EUR 13.5 millionand invoices to be received EUR 37.4 million. Among tradeliabilitiesareinvoicesforintercompanyservicesforanamountofEUR14.2million.
taxes, remuneration and social securityThisitemincludes:•VATtobepaid(EUR0.7million);•professionalwithholdingtaxdue(EUR0.6million);•liabilities corresponding to compensation and socialcontributions(EUR24.7million).
other amounts payableThe balance of dividends remaining to be paid for previousfinancialyearsisEUR101.8million.The remainingbalanceofEUR0.8million is related toothervarious liabilities, including EUR 0.7 million due to otherGroupcompanies.
4.3.8. aCCrued CHarGes and deFerred inCome
This item is composedexclusivelyofexpenses tobeaccruedasfollows:•financialchargeslinkedtoloansduewithGroupcompanies(EUR9.8million);•pro rata operating expenditures attributable to the 2010fiscalyear(EUR0.3million).
4.3.3. reserves and retained earninGs
The heading “Reserves” includes the legal reserve (EUR 572.9million)andanavailablereserveamountingtoEUR617.1million.
TheattributionofbonussharesdecidedbytheExtraordinaryShareholders’ Meeting held on 12 May 2010 was realisedon 11 June 2010 by incorporation of the available reserveamountingtoEUR970millionasat31December2009uptoEUR352.9millioninthecapital.
The retainedearnings, takingaccountof thedistribution forthe 2009 financial year which showed a loss of EUR 93.8millionamountstoEUR1,121.3million.
4.3.4. net result oF tHe year
The loss for the year 2010 is EUR 5,188.2 million. Thisloss arises from the financial results (EUR +78.9 million),exceptionalresults(EUR-5,191.6million)andnettaxincome(EUR +72.5 million) from which are deducted the holdingcompany’snetoperatingexpenses(EUR-148million).
ProVisions And deFerred tAXes
4.3.5. Provisions For Pensions and similar obliGations
Within the context of the Group restructuring, individualagreements were signed in 2010, in accordance with thecollectiveagreementsnegotiatedwiththesocialpartners.Theseagreementsprovidethatcertainemployeeswillbeexemptfromfutureperformance,withorwithoutproportionalreductionoftheirremuneration.ConsequentlyDexiaSAsetasideprovisionsofEUR0.7million to cover thepaymentof remunerations tobepaidinthecontextoftheundertakingsmade.
4.3.6. Provisions For otHer liabilities and CHarGes
Succeeding Dexia Crédit Local at the head of the taxconsolidationgroup in France,Dexia, through its permanentestablishment, assumed vis-à-vis the former head of the taxconsolidationgroupcommitmentsinitiallysubscribedbyDexiaCrédit Local within the context of a tax leverage operationcarriedoutinFrancewiththeapprovalofFrenchtaxauthorities.For the 2010 financial year, these operations resulted in taxsavingsofEUR0.4million (immediatecashsavings) includedin the amount of EUR 67.9 million mentioned in the note4.5.4. “Corporate income tax”, and in an allowance in thesame amount. The total of these commitments amounts toEUR6.6millionasat31December2010.
On 1 February 2010, Dexia SA and Dexia Crédit Local SAconfirmed their intention in a letter of comfort to ensurethatDexiaHoldings Inc. is in aposition to fulfill its financialobligationstothirdparties.ThatletterofcomfortwasdrawninfavourofDexiaHoldingsInc.asadirectsubsidiaryofDexiaSA and Dexia Crédit Local, and Dexia Holdings Inc. is itssole beneficiary. Dexia SA and Dexia Crédit Local make thisundertakingindividuallyandnotjointly,inproportiontotheirdirectholding inDexiaHoldings Inc. (namely10%and90%respectively todate). Theeconomic losses expectedatDexiaHoldingsInc.aregreaterthanthetotalequityfunding.
248 DexiaAnnualreport2010
Notes to the annual financial statements
Man
agem
ent
rep
ort
Add
ition
alin
form
atio
nA
nnua
lfina
ncia
lsta
tem
ents
Con
solid
ated
fin
anci
als
tate
men
ts
4.4.5. transaCtions WitH tHe belGian, FrenCH and luxembourG states
WereferheretotheConsolidatedfinancialstatement-note9.4.C.oftheconsolidatedfinancialstatements.
DexiaSAcommits itselftotheissuersofguaranteedfundingto collect the fee payable under the Guarantee Agreementconcluded with the French, Belgian and Luxembourggovernmentsandforpayingittothosegovernments.
The same applies to the remuneration due to the Belgianand French governments for the guarantee of the FinancialProductsportfolioofFSAAssetManagementLLC.
4.4.6. litiGations
We refer here to the Management report – chapter RiskManagement–partLegalrisk–presentedonpage89.
4.5. Statement of income
The Dexia Group transformation plan provides for thetransformationofbusiness linesaswellasthereorganisationof support lines (Finance, Risks, Compliance, Legal and Tax,Human Resources, Communication and Brand, OperationsandITSystems,Audit).Oneoftheprincipalobjectivesofthisplanistoreinforcethetaskof steering theGroupand thedevelopmentof its rolesof impulseandcontrol.Thereforethe implementationofthisplanrequiredduringthesecondhalfof2010,thetransferofsome 152 employees of various Group entities to all threelocations (Brussels, Paris and Luxembourg) of the holdingcompanyDexiaSA.
4.5.1. oPeratinG result
Other operating income include services provided by DexiaSAduringthesecondhalfof2010aspartofitsnewmissioninthetransformationplan(EUR28.4million).ThetransferofemployeesfromotherGroupentitiestotheholdingcompanyresulted in payment by those entities of provisions for thepensionplanestablished inthoseentities,whichrepresentedan income of EUR 2.8 million. Also included in this item istherecoveryofcostsfromGroupcompanies(EUR4.3million)as well as structural reductions regarding the professionalwithholdingtax(EUR0.3million).
ServicesandothergoodsamountingtoEUR133.7millionasat31December2009fell13%toEUR116.5million,whichreflectsthecostreductiontargetsetbytheDexiaGroup.Thisitemincludesfeespaidtoconsultants,externalproviders,experts,auditorsandGroupsubsidiaries for their services,aswellascompensationsforthemembersoftheManagementBoard,orEUR46.6millionagainstEUR58.4millionin2009,correspondingtoareductionof20%.TheDexiaCorporateUniversity,whichis intendedtodeveloptop-leveltrainingprogramsformembersofstaffoftheentireDexia Group, generated a cost of EUR 1.1 million, againstEUR1millionin2009.
4.4. Off-balance-sheet items – commitments
DexiaSAhas significantcommitments thatare recordedoff-balancesheet:
4.4.1.On2November2006,DexiaSAissuedasubordinatedguaranteewithin the contextof a subordinated“hybridTier1” issue by Dexia Funding Luxembourg SA (DFL), a 100%subsidiary of Dexia SA (perpetual non-cumulative securitiesat a guaranteed fixed/floating rate, for a global amount ofEUR 500 million). This subordinated guarantee was issuedin favourof the security holderswho subscribed to the saidsecurities and cover the payment by DFL of (i) any couponwhich has not been waived in accordance with the issueconditions and (ii) the redemption price in the case of theliquidation or insolvency of DFL (or similar situations) or (iii)theredemptionpriceinthecaseofredemptioninaccordancewiththeissueconditions.
4.4.2. As at 31 December 2010, the number of optionsattributed to staff and management and not yet exercisedstoodat70,960,487.Takingexercisepricesintoaccount,thisoperation generates an off-balance sheet of EUR 1,087.1million. In order to protect warrant holders against adverseeconomic consequences arising from the issue of bonusshares following the resolution passed by the extraordinarygeneralmeetingheldon12May2010,theexercisepriceforwarrantswasreducedandthenumberofwarrantsincreasedin accordance with an adjustment ratio determined in linewiththeCorporateActionPolicyofEuronextNYSELiffe.
4.4.3. On 18 May 2005, Dexia SA purchased 100% of thesharesofDexiaNederlandHoldingNVfromDexiaFinancièreSAonthebasisofavaluationmadeoftheseatEUR93millionsubject toareturntobetter fortuneclausegrantedtoDexiaBIL and Dexia Bank, also shareholders of Dexia Financière,for the case where the value of Dexia Nederland Holding,includingtheDexiaBankNederland(DBnl),shouldberevisedupwardsasaconsequenceofdecisionsinfavourofDBnl.
4.4.4. On 5 December 2002, Dexia SA undertook vis-à-vis its subsidiary Dexia Bank Nederland NV and each of theentities which will result from the demerger of Dexia BankNederland, excluding any other entity, to ensure that DexiaBankNederlandortheentitiesareatanytimeinapositiontofulfiltheircommitmentsvis-à-visthirdpartiesandtocontinuetheir activities, including the maintenance of their relationswith account holders and other clients; in particular, theaim of this undertaking was to prevent third parties beingprejudiced by the demerger of Dexia Bank Nederland. Theamendment or withdrawal of this undertaking was subjecttoprioragreement fromDNB (DeNederlandscheBank). ThesaleofKempen&CoNVtoagroupoffinancialinvestorsandmanagement was finalized on 15 November 2004. Withinthe context of this sale, SA reconfirmed by letter dated thesame day its undertaking vis-à-vis Dexia Bank Nederland,which remains a 100% subsidiary of Dexia to the exclusionofanyotherentity.InadditiontotheusualguaranteesgiventopurchaserstowhichDexiaSAisalsobound,DexiaSAwillindemnify Kempen & Co against the risks relating to shareleasingcontracts soldbyDexiaBankNederlandNV, formerlyLabouchere, and undertakes to compensate Kempen & Cofor damage resulting from a limited and identified numberofelements.
249Annualreport2010Dexia
Notes to the annual financial statements
Man
agem
ent
rep
ort
Add
ition
alin
form
atio
nA
nnua
lfina
ncia
lsta
tem
ents
Con
solid
ated
fin
anci
als
tate
men
ts
4.5.3. exCePtional result
The sale of its participation interest in Dexia ManagementServices Ltd to Dexia Crédit Local generated a gain of EUR0.06million(cf.note4.2.4.).
Taking into account the rules of evaluation, it was decidedto perform exceptional value reductions on participations inDexia Crédit Local SA and Dexia Bank Belgium SA of EUR4,039 million and EUR 1,047 million respectively, in orderto align their value on the consolidated shareholders equityexcluding the non-realised losses and gains those sharesrepresent.
The exceptional charges include a provision for exceptionalrisksandchargesofEUR66.6millioninrelationtothedirectsubsidiary Dexia Holdings Inc., direct subsidiary of Dexia SAfor10%aswellasaprovisionofEUR39millionrelatedtoitssubsidiaryDexiabankaSlovensko(cf.note4.3.6.).
4.5.4. CorPorate inCome tax
DexiaSAobtainedtaxreliefofEUR3.3millionasaresultofclaimsmadepreviously.
Proceeds from other income taxes are explained by thefact that the permanent establishments in Paris and inLuxembourg are each head of the tax consolidation groupin their respective country. The tax savings realised by eachtax consolidation group are recorded in these permanentestablishmentsandconsideredasanimmediategain(EUR1.3millioninLuxembourgandEUR67.9millioninFrance).
4.5.5. loss For tHe FinanCial year
Consideringtheabove,the2010financialyearclosedwithalossofEUR5,188.2million.
The 2009 financial year also closed with a loss of EUR93.8 million, so it is necessary to justify application of thecontinuity accounting rules provided in Article 96, § 1,6° oftheCompaniesCode.
It should be stressed in this regard that the losses incurredbyDexiaSAover these last two financial yearsaroseon theonehandfromexceptionaleventsresultinginanon-recurrentcostofEUR5,191.5million in2010andEUR25.4million in2009,andontheotherhandfromthefactthattheholdingcompanyhasnotreceivedanydividendsfromitssubsidiariesamong other things due to the European Commission’srequirementsovertheselasttwofinancialyears.
We can nonetheless foresee a recovery of the results in the2011 financial year, and that is why we must continue toapplythecontinuityaccountingrules.
A proposal will be made to the Extraordinary Shareholders’Meeting convened for 11 May 2011 to reduce the sharecapital in order to discharge the loss carried forward as aresult of the allocation of the 2010 result, and if necessaryto enable Dexia SA to implement its dividend distributionpolicy.Thetechnical featurewhichwaschosen(sharecapitalreduction) todischarge thisaccounting lossdoesnot impactthevalueofDexiaSA'snetassets.
Otheroperatingcosts(leasingofpremises,telecommunications,travel,trainings,memberships,supplies,etc.)werereducedtoEUR30millionagainstEUR29.7millionin2009.Printingandadvertisingcostslinkedtocorporatepublicationswere EUR0.7million compared to EUR1.3million in 2009,whilst costs associated with the Group transformation planareEUR35.9million.Compensation paid to members of the Board of DirectorsamounttoEUR2.2million.
The cost of remuneration and social charges rose from EUR40.6 million in 2009 to EUR 59.1 million in 2010, up 46%.The payroll increase is associated with several factors: thereduction or loss of variable compensation for all membersof staff of Dexia SA in 2009, as well as the increase of theaveragenumberofpeopledirectlyemployedbyDexiain2010following the transfers due to the transformation plan (301FTEin2010against260FTEin2009),withthecorrespondingpayrollincrease.
Amortization of formation expenses represented EUR 3.4million,amortizationofintangiblefixedassetsEUR2.6millionanddepreciationoftangiblefixedassetsEUR0.5million.
Comments on provisions for risks and charges are to befoundundernote4.3.5.“Provisions forpensionsandsimilarobligations”, and note 4.3.6. “Provisions for other liabilitiesandcharges”.
4.5.2. FinanCial result
Financial income from financial fixed assets only consists ofinterestreceivedandearnedforsubordinatedloans(EUR37.7million).
Incomefromcurrentassetsincludestheinterestgeneratedbythe currency swap contracted with Dexia Crédit Local (EUR0.5 million), proceeds from tax deferred advances (EUR 0.2million) and dividends from shares in Assured Guaranty Ltdheld in the investmentportfoliountil their saleon16March2010 (EUR0.8million).The saleofAssuredGuaranty sharesgeneratedagainofEUR87.9million.
Other financial income results from net foreign exchangegains of EUR 3.1 million related to the appreciation of thedollaragainst theeuro, includingaprofitofEUR3.6milliononthesaleofAssuredGuarantyshares.To this isadded thearrears interest receivedbyDexiaSAontax relief obtained as a result of introduced claims (EUR 3.7million).
Interest paid and due in relation to the loans and advancesgrantedbyGroupentitiestotalledEUR42.8million.Financialcharges relating to the currency and interest rate swapwithDexia Crédit Local were EUR 4 million and other interestchargeswereEUR0.3million.
Other financial charges include the commission paid on thedisposalofAssuredGuarantyshares(EUR7.2million),chargeslinked to thequotationof theDexia share (EUR0.3million),servicecosts related to themanagementofactions (EUR0.2million)andotherfinancialcharges(EUR0.2million).
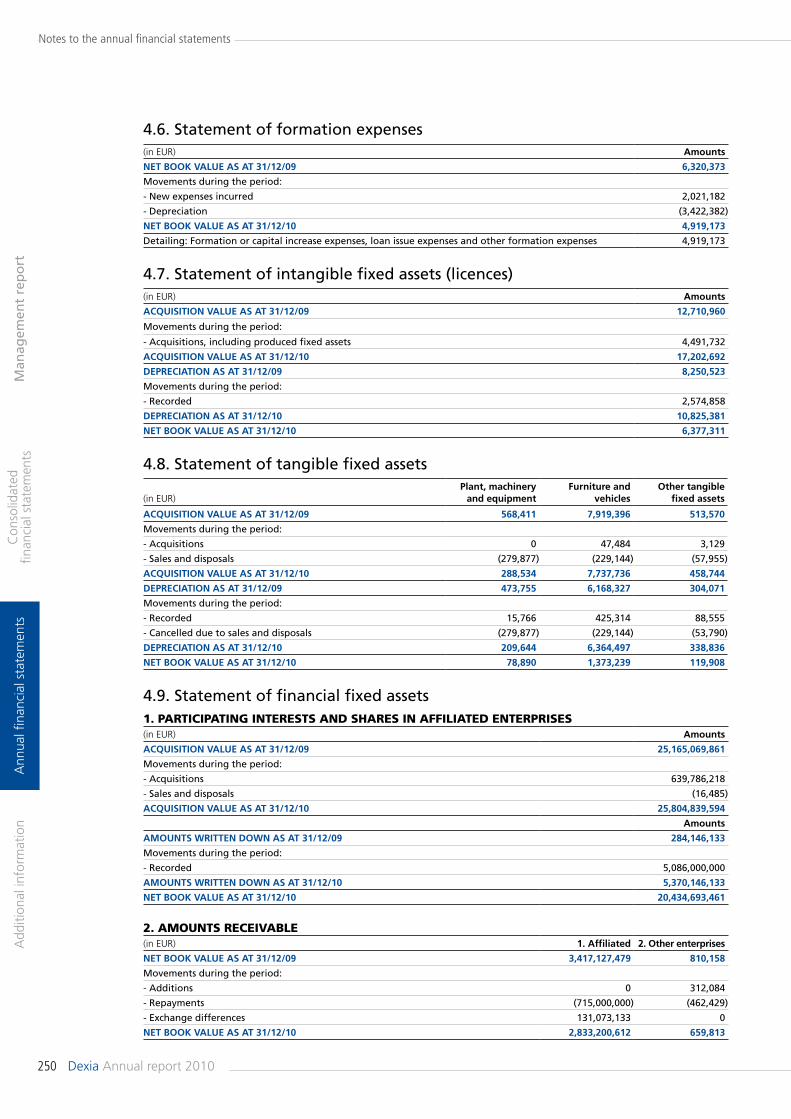
250 DexiaAnnualreport2010
Notes to the annual financial statements
Man
agem
ent
rep
ort
Add
ition
alin
form
atio
nA
nnua
lfina
ncia
lsta
tem
ents
Con
solid
ated
fin
anci
als
tate
men
ts
4.6. Statement of formation expenses(inEUR) amounts
net booK value as at 31/12/09 6,320,373
Movements during the period:
- New expenses incurred 2,021,182
- Depreciation (3,422,382)
net booK value as at 31/12/10 4,919,173
Detailing: Formation or capital increase expenses, loan issue expenses and other formation expenses 4,919,173
4.7. Statement of intangible fixed assets (licences)(inEUR) amounts
aCquisition value as at 31/12/09 12,710,960
Movements during the period:
- Acquisitions, including produced fixed assets 4,491,732
aCquisition value as at 31/12/10 17,202,692
dePreCiation as at 31/12/09 8,250,523
Movements during the period:
- Recorded 2,574,858
dePreCiation as at 31/12/10 10,825,381
net booK value as at 31/12/10 6,377,311
4.8. Statement of tangible fixed assets
(inEUR)Plant, machinery
and equipmentFurniture and
vehiclesother tangible
fixed assets
aCquisition value as at 31/12/09 568,411 7,919,396 513,570
Movements during the period:
- Acquisitions 0 47,484 3,129
- Sales and disposals (279,877) (229,144) (57,955)
aCquisition value as at 31/12/10 288,534 7,737,736 458,744
dePreCiation as at 31/12/09 473,755 6,168,327 304,071
Movements during the period:
- Recorded 15,766 425,314 88,555
- Cancelled due to sales and disposals (279,877) (229,144) (53,790)
dePreCiation as at 31/12/10 209,644 6,364,497 338,836
net booK value as at 31/12/10 78,890 1,373,239 119,908
4.9. Statement of financial fixed assets1. PArtiCiPAting interests And shAres in AFFiliAted enterPrises(inEUR) amounts
aCquisition value as at 31/12/09 25,165,069,861
Movements during the period:
- Acquisitions 639,786,218
- Sales and disposals (16,485)
aCquisition value as at 31/12/10 25,804,839,594
amounts
amounts Written doWn as at 31/12/09 284,146,133
Movements during the period:
- Recorded 5,086,000,000
amounts Written doWn as at 31/12/10 5,370,146,133
net booK value as at 31/12/10 20,434,693,461
2. Amounts reCeiVAble(inEUR) 1. affiliated 2. other enterprises
net booK value as at 31/12/09 3,417,127,479 810,158
Movements during the period:
- Additions 0 312,084
- Repayments (715,000,000) (462,429)
- Exchange differences 131,073,133 0
net booK value as at 31/12/10 2,833,200,612 659,813
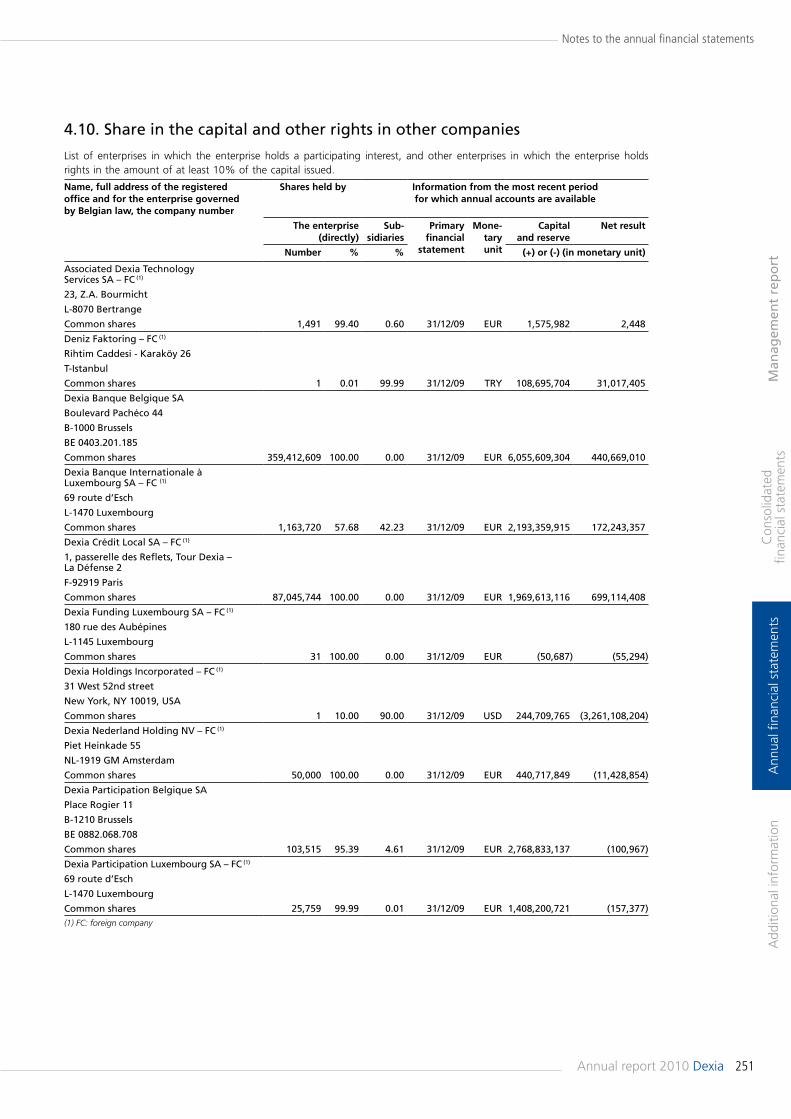
251Annualreport2010Dexia
Notes to the annual financial statements
Man
agem
ent
rep
ort
Add
ition
alin
form
atio
nA
nnua
lfina
ncia
lsta
tem
ents
Con
solid
ated
fin
anci
als
tate
men
ts
4.10. Share in the capital and other rights in other companies
List of enterprises in which the enterprise holds a participating interest, and other enterprises in which the enterprise holdsrightsintheamountofatleast10%ofthecapitalissued.
name, full address of the registered office and for the enterprise governed by belgian law, the company number
shares held by information from the most recent period for which annual accounts are available
the enterprise (directly)
sub-sidiaries
Primary financial
statement
mone-tary unit
Capital and reserve
net result
number % % (+) or (-) (in monetary unit)
Associated Dexia Technology Services SA – FC (1)
1,491 99.40 0.60 31/12/09 EUR 1,575,982 2,448
23, Z.A. Bourmicht
L-8070 Bertrange
Common shares
Deniz Faktoring – FC (1)
1 0.01 99.99 31/12/09 TRY 108,695,704 31,017,405
Rihtim Caddesi - Karaköy 26
T-Istanbul
Common shares
Dexia Banque Belgique SA
359,412,609 100.00 0.00 31/12/09 EUR 6,055,609,304 440,669,010
Boulevard Pachéco 44
B-1000 Brussels
BE 0403.201.185
Common shares
Dexia Banque Internationale à Luxembourg SA – FC (1)
1,163,720 57.68 42.23 31/12/09 EUR 2,193,359,915 172,243,357
69 route d’Esch
L-1470 Luxembourg
Common shares
Dexia Crédit Local SA – FC (1)
87,045,744 100.00 0.00 31/12/09 EUR 1,969,613,116 699,114,408
1, passerelle des Reflets, Tour Dexia – La Défense 2
F-92919 Paris
Common shares
Dexia Funding Luxembourg SA – FC (1)
31 100.00 0.00 31/12/09 EUR (50,687) (55,294)
180 rue des Aubépines
L-1145 Luxembourg
Common shares
Dexia Holdings Incorporated – FC (1)
1 10.00 90.00 31/12/09 USD 244,709,765 (3,261,108,204)
31 West 52nd street
New York, NY 10019, USA
Common shares
Dexia Nederland Holding NV – FC (1)
50,000 100.00 0.00 31/12/09 EUR 440,717,849 (11,428,854)
Piet Heinkade 55
NL-1919 GM Amsterdam
Common shares
Dexia Participation Belgique SA
103,515 95.39 4.61 31/12/09 EUR 2,768,833,137 (100,967)
Place Rogier 11
B-1210 Brussels
BE 0882.068.708
Common shares
Dexia Participation Luxembourg SA – FC (1)
25,759 99.99 0.01 31/12/09 EUR 1,408,200,721 (157,377)
69 route d’Esch
L-1470 Luxembourg
Common shares(1) FC: foreign company
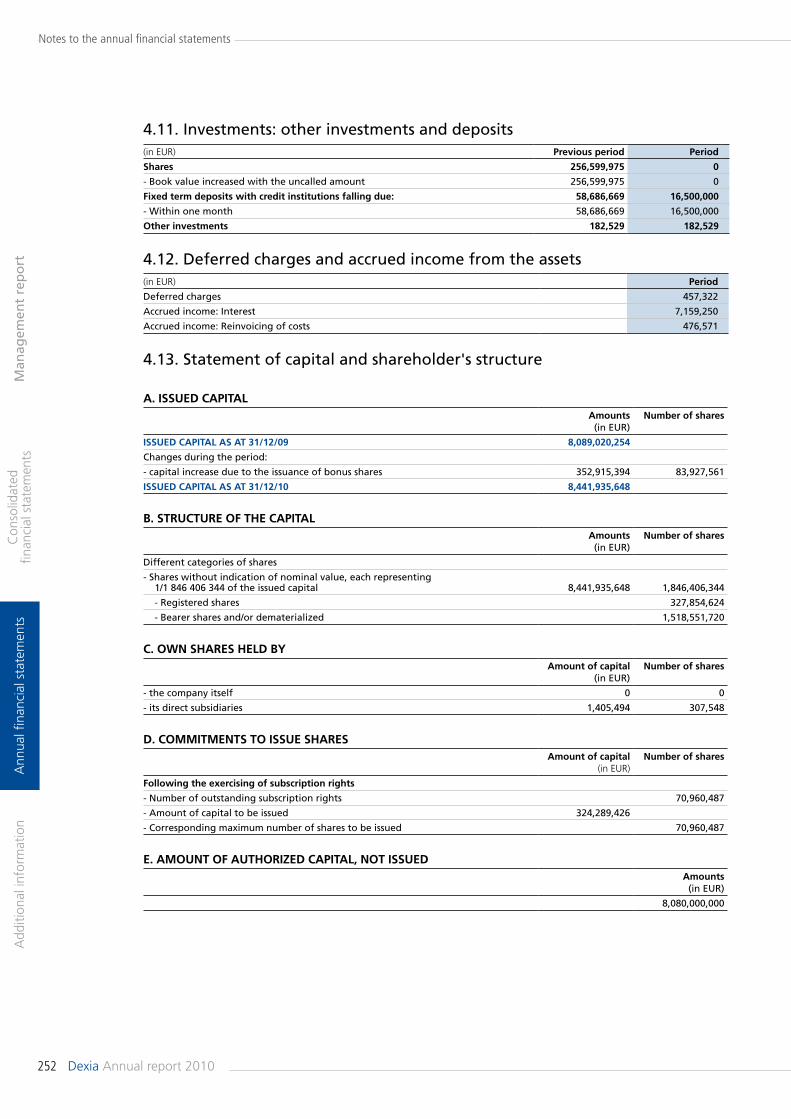
252 DexiaAnnualreport2010
Notes to the annual financial statements
Man
agem
ent
rep
ort
Add
ition
alin
form
atio
nA
nnua
lfina
ncia
lsta
tem
ents
Con
solid
ated
fin
anci
als
tate
men
ts
4.11. Investments: other investments and deposits(inEUR) Previous period Period
shares 256,599,975 0
- Book value increased with the uncalled amount 256,599,975 0
Fixed term deposits with credit institutions falling due: 58,686,669 16,500,000
- Within one month 58,686,669 16,500,000
other investments 182,529 182,529
4.12. Deferred charges and accrued income from the assets(inEUR) Period
Deferred charges 457,322
Accrued income: Interest 7,159,250
Accrued income: Reinvoicing of costs 476,571
4.13. Statement of capital and shareholder's structure
a. issued CaPitalamounts (in EUR)
number of shares
issued CaPital as at 31/12/09 8,089,020,254
Changes during the period:
- capital increase due to the issuance of bonus shares 352,915,394 83,927,561
issued CaPital as at 31/12/10 8,441,935,648
b. struCture oF tHe CaPitalamounts (in EUR)
number of shares
Different categories of shares
- Shares without indication of nominal value, each representing 1/1 846 406 344 of the issued capital 8,441,935,648 1,846,406,344
- Registered shares 327,854,624
- Bearer shares and/or dematerialized 1,518,551,720
C. oWn sHares Held byamount of capital
(in EUR)number of shares
- the company itself 0 0
- its direct subsidiaries 1,405,494 307,548
d. Commitments to issue sHaresamount of capital
(inEUR)number of shares
Following the exercising of subscription rights
- Number of outstanding subscription rights 70,960,487
- Amount of capital to be issued 324,289,426
- Corresponding maximum number of shares to be issued 70,960,487
e. amount oF autHorized CaPital, not issuedamounts (in EUR)
8,080,000,000
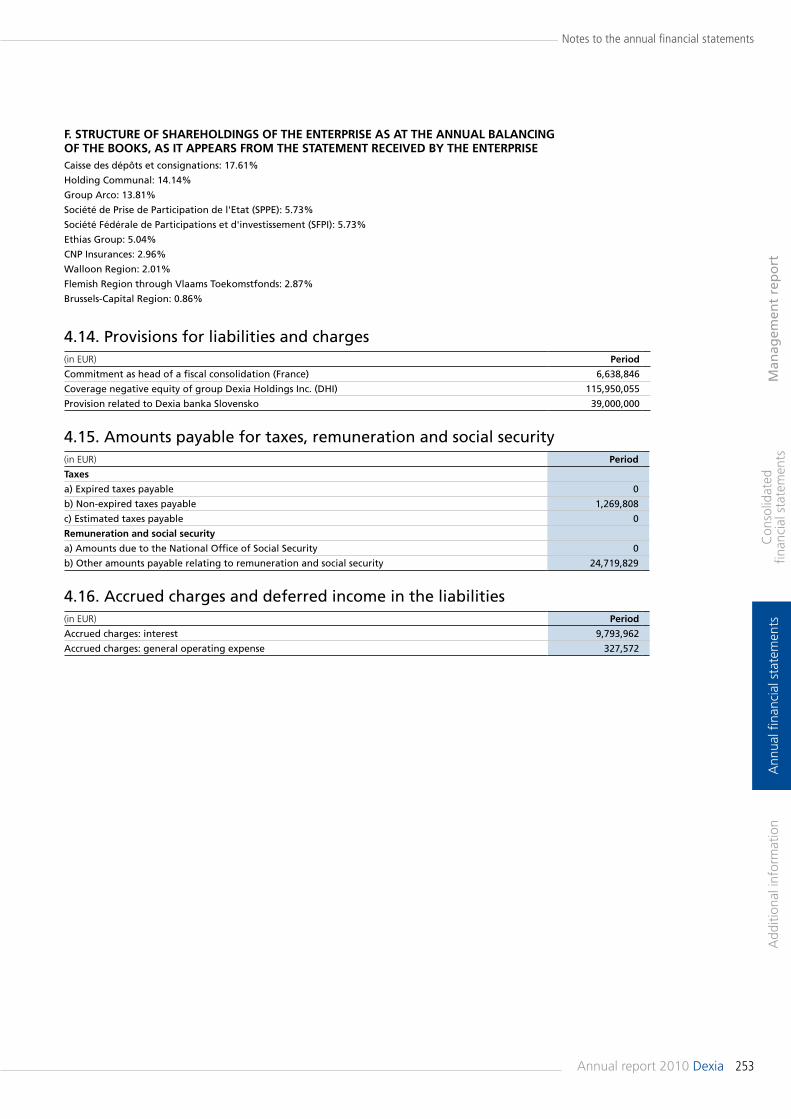
253Annualreport2010Dexia
Notes to the annual financial statements
Man
agem
ent
rep
ort
Add
ition
alin
form
atio
nA
nnua
lfina
ncia
lsta
tem
ents
Con
solid
ated
fin
anci
als
tate
men
ts
4.14. Provisions for liabilities and charges(inEUR) Period
Commitment as head of a fiscal consolidation (France) 6,638,846
Coverage negative equity of group Dexia Holdings Inc. (DHI) 115,950,055
Provision related to Dexia banka Slovensko 39,000,000
4.15. Amounts payable for taxes, remuneration and social security(inEUR) Period
taxes
a) Expired taxes payable 0
b) Non-expired taxes payable 1,269,808
c) Estimated taxes payable 0
remuneration and social security
a) Amounts due to the National Office of Social Security 0
b) Other amounts payable relating to remuneration and social security 24,719,829
4.16. Accrued charges and deferred income in the liabilities(inEUR) Period
Accrued charges: interest 9,793,962
Accrued charges: general operating expense 327,572
F. struCture oF sHareHoldinGs oF tHe enterPrise as at tHe annual balanCinG oF tHe booKs, as it aPPears From tHe statement reCeived by tHe enterPriseCaisse des dépôts et consignations: 17.61%
Holding Communal: 14.14%
Group Arco: 13.81%
Société de Prise de Participation de l'Etat (SPPE): 5.73%
Société Fédérale de Participations et d'investissement (SFPI): 5.73%
Ethias Group: 5.04%
CNP Insurances: 2.96%
Walloon Region: 2.01%
Flemish Region through Vlaams Toekomstfonds: 2.87%
Brussels-Capital Region: 0.86%
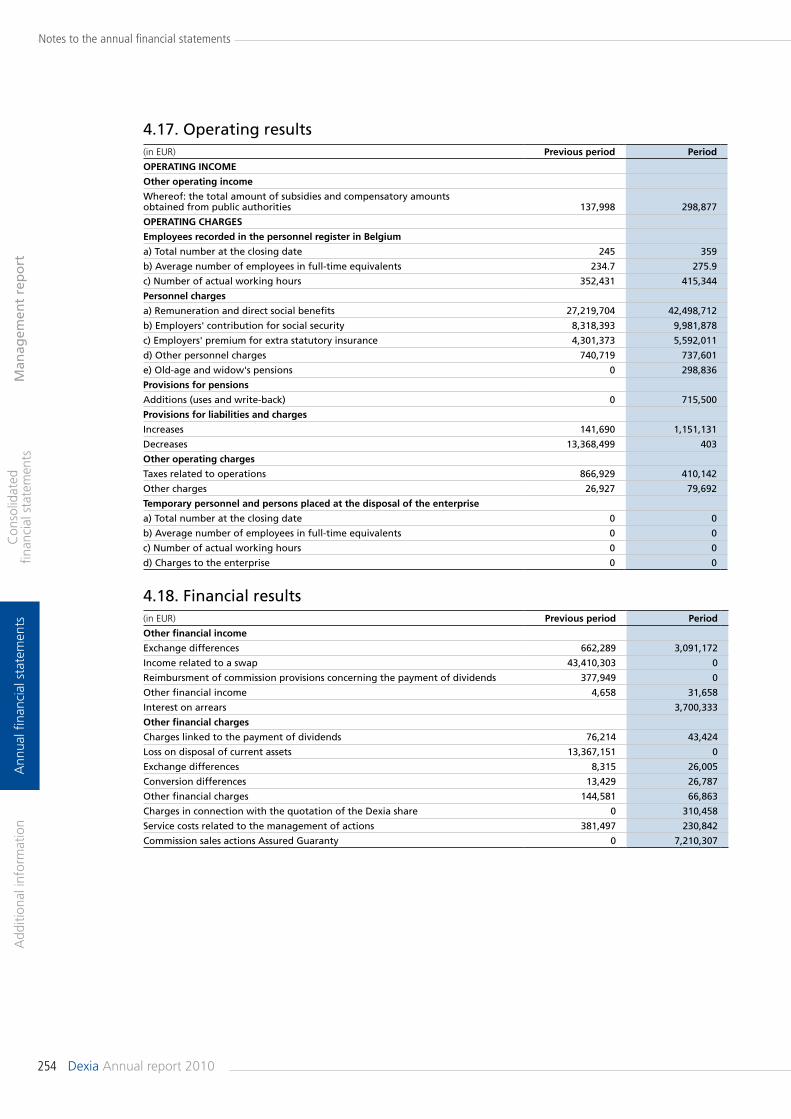
254 DexiaAnnualreport2010
Notes to the annual financial statements
Man
agem
ent
rep
ort
Add
ition
alin
form
atio
nA
nnua
lfina
ncia
lsta
tem
ents
Con
solid
ated
fin
anci
als
tate
men
ts
4.17. Operating results(inEUR) Previous period Period
oPeratinG inCome
other operating income
Whereof: the total amount of subsidies and compensatory amounts obtained from public authorities 137,998 298,877
oPeratinG CHarGes
employees recorded in the personnel register in belgium
a) Total number at the closing date 245 359
b) Average number of employees in full-time equivalents 234.7 275.9
c) Number of actual working hours 352,431 415,344
Personnel charges
a) Remuneration and direct social benefits 27,219,704 42,498,712
b) Employers' contribution for social security 8,318,393 9,981,878
c) Employers' premium for extra statutory insurance 4,301,373 5,592,011
d) Other personnel charges 740,719 737,601
e) Old-age and widow's pensions 0 298,836
Provisions for pensions
Additions (uses and write-back) 0 715,500
Provisions for liabilities and charges
Increases 141,690 1,151,131
Decreases 13,368,499 403
other operating charges
Taxes related to operations 866,929 410,142
Other charges 26,927 79,692
temporary personnel and persons placed at the disposal of the enterprise
a) Total number at the closing date 0 0
b) Average number of employees in full-time equivalents 0 0
c) Number of actual working hours 0 0
d) Charges to the enterprise 0 0
4.18. Financial results(inEUR) Previous period Period
other financial income
Exchange differences 662,289 3,091,172
Income related to a swap 43,410,303 0
Reimbursment of commission provisions concerning the payment of dividends 377,949 0
Other financial income 4,658 31,658
Interest on arrears 3,700,333
other financial charges
Charges linked to the payment of dividends 76,214 43,424
Loss on disposal of current assets 13,367,151 0
Exchange differences 8,315 26,005
Conversion differences 13,429 26,787
Other financial charges 144,581 66,863
Charges in connection with the quotation of the Dexia share 0 310,458
Service costs related to the management of actions 381,497 230,842
Commission sales actions Assured Guaranty 0 7,210,307
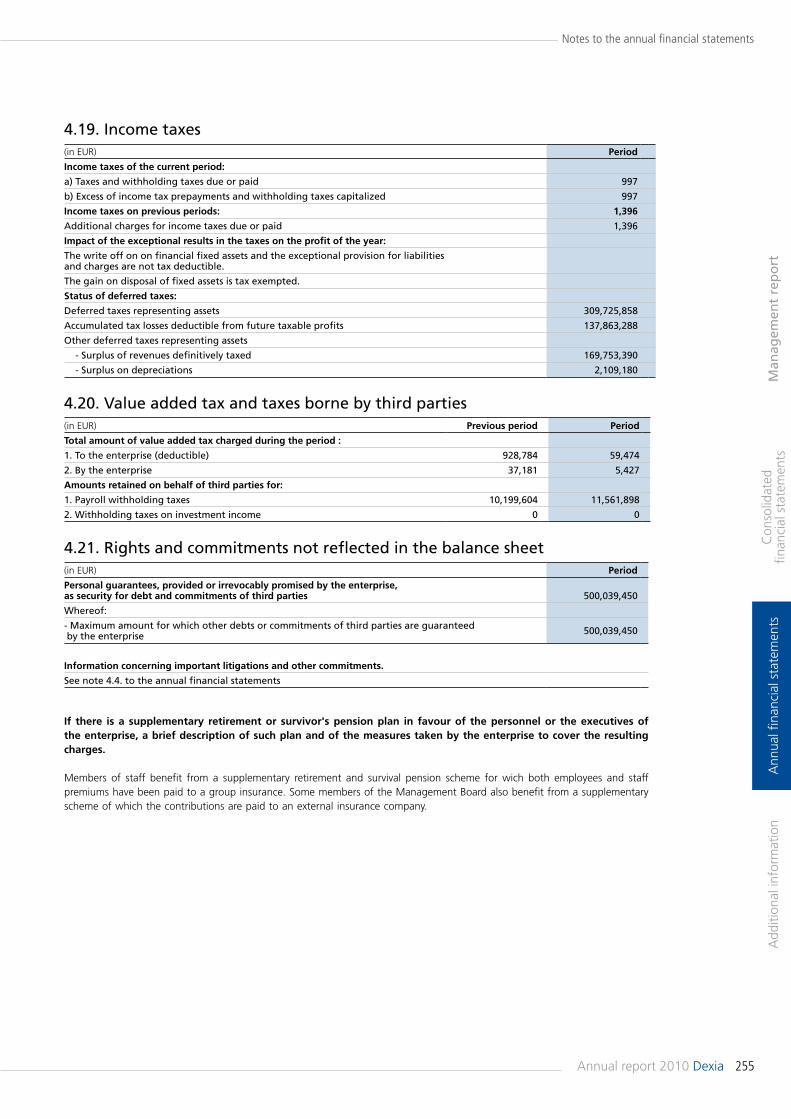
255Annualreport2010Dexia
Notes to the annual financial statements
Man
agem
ent
rep
ort
Add
ition
alin
form
atio
nA
nnua
lfina
ncia
lsta
tem
ents
Con
solid
ated
fin
anci
als
tate
men
ts
4.19. Income taxes (inEUR) Period
income taxes of the current period:
a) Taxes and withholding taxes due or paid 997
b) Excess of income tax prepayments and withholding taxes capitalized 997
income taxes on previous periods: 1,396
Additional charges for income taxes due or paid 1,396
impact of the exceptional results in the taxes on the profit of the year:
The write off on on financial fixed assets and the exceptional provision for liabilities and charges are not tax deductible.
The gain on disposal of fixed assets is tax exempted.
status of deferred taxes:
Deferred taxes representing assets 309,725,858
Accumulated tax losses deductible from future taxable profits 137,863,288
Other deferred taxes representing assets
- Surplus of revenues definitively taxed 169,753,390
- Surplus on depreciations 2,109,180
4.20. Value added tax and taxes borne by third parties (inEUR) Previous period Period
total amount of value added tax charged during the period :
1. To the enterprise (deductible) 928,784 59,474
2. By the enterprise 37,181 5,427
amounts retained on behalf of third parties for:
1. Payroll withholding taxes 10,199,604 11,561,898
2. Withholding taxes on investment income 0 0
4.21. Rights and commitments not reflected in the balance sheet(inEUR) Period
Personal guarantees, provided or irrevocably promised by the enterprise, as security for debt and commitments of third parties 500,039,450
Whereof:
- Maximum amount for which other debts or commitments of third parties are guaranteed by the enterprise 500,039,450
information concerning important litigations and other commitments.
See note 4.4. to the annual financial statements
if there is a supplementary retirement or survivor's pension plan in favour of the personnel or the executives of the enterprise, a brief description of such plan and of the measures taken by the enterprise to cover the resulting charges.
Members of staff benefit from a supplementary retirement and survival pension scheme for wich both employees and staffpremiumshavebeenpaidtoagroupinsurance.SomemembersoftheManagementBoardalsobenefitfromasupplementaryschemeofwhichthecontributionsarepaidtoanexternalinsurancecompany.
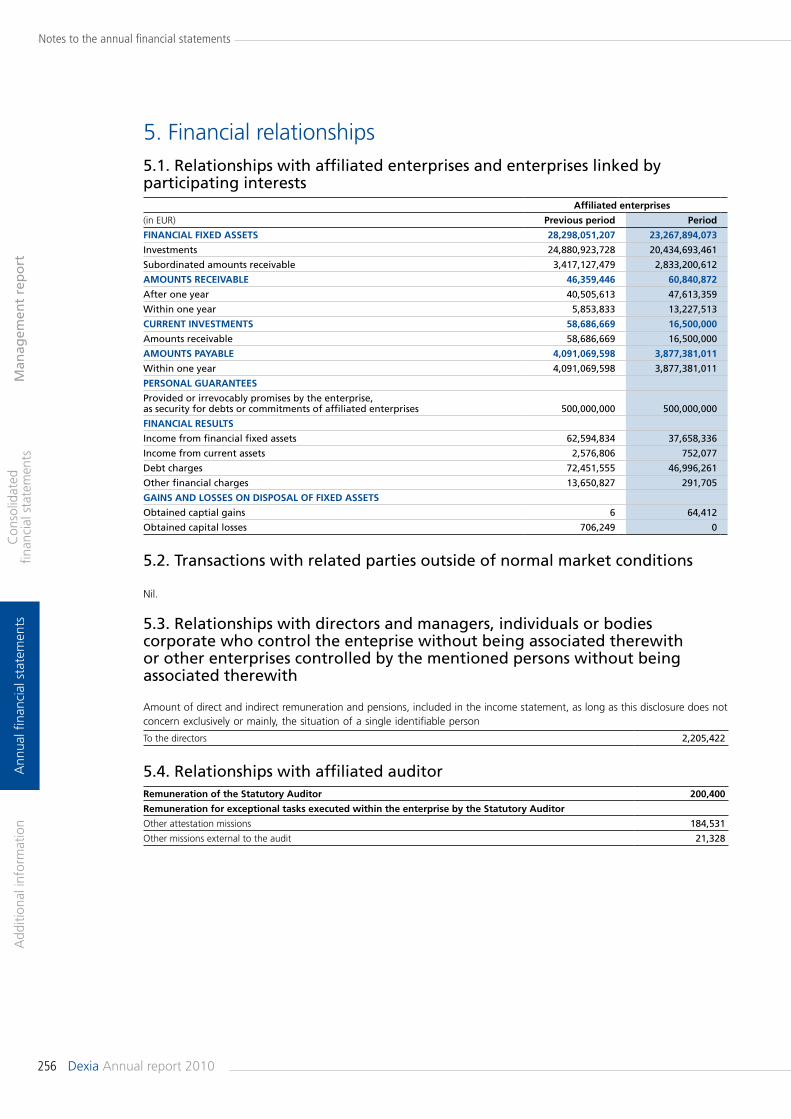
256 DexiaAnnualreport2010
Notes to the annual financial statements
Man
agem
ent
rep
ort
Add
ition
alin
form
atio
nA
nnua
lfina
ncia
lsta
tem
ents
Con
solid
ated
fin
anci
als
tate
men
ts
5.Financialrelationships5.1. Relationships with affiliated enterprises and enterprises linked by participating interests affiliated enterprises
(inEUR) Previous period Period
FinanCial Fixed assets 28,298,051,207 23,267,894,073
Investments 24,880,923,728 20,434,693,461
Subordinated amounts receivable 3,417,127,479 2,833,200,612
amounts reCeivable 46,359,446 60,840,872
After one year 40,505,613 47,613,359
Within one year 5,853,833 13,227,513
Current investments 58,686,669 16,500,000
Amounts receivable 58,686,669 16,500,000
amounts Payable 4,091,069,598 3,877,381,011
Within one year 4,091,069,598 3,877,381,011
Personal Guarantees
Provided or irrevocably promises by the enterprise, as security for debts or commitments of affiliated enterprises 500,000,000 500,000,000
FinanCial results
Income from financial fixed assets 62,594,834 37,658,336
Income from current assets 2,576,806 752,077
Debt charges 72,451,555 46,996,261
Other financial charges 13,650,827 291,705
Gains and losses on disPosal oF Fixed assets
Obtained captial gains 6 64,412
Obtained capital losses 706,249 0
5.2. Transactions with related parties outside of normal market conditions
Nil.
5.3. Relationships with directors and managers, individuals or bodies corporate who control the enteprise without being associated therewith or other enterprises controlled by the mentioned persons without being associated therewith
Amountofdirectandindirectremunerationandpensions,includedintheincomestatement,aslongasthisdisclosuredoesnotconcernexclusivelyormainly,thesituationofasingleidentifiableperson
Tothedirectors 2,205,422
5.4. Relationships with affiliated auditorremuneration of the statutory auditor 200,400
remuneration for exceptional tasks executed within the enterprise by the statutory auditor
Otherattestationmissions 184,531
Othermissionsexternaltotheaudit 21,328
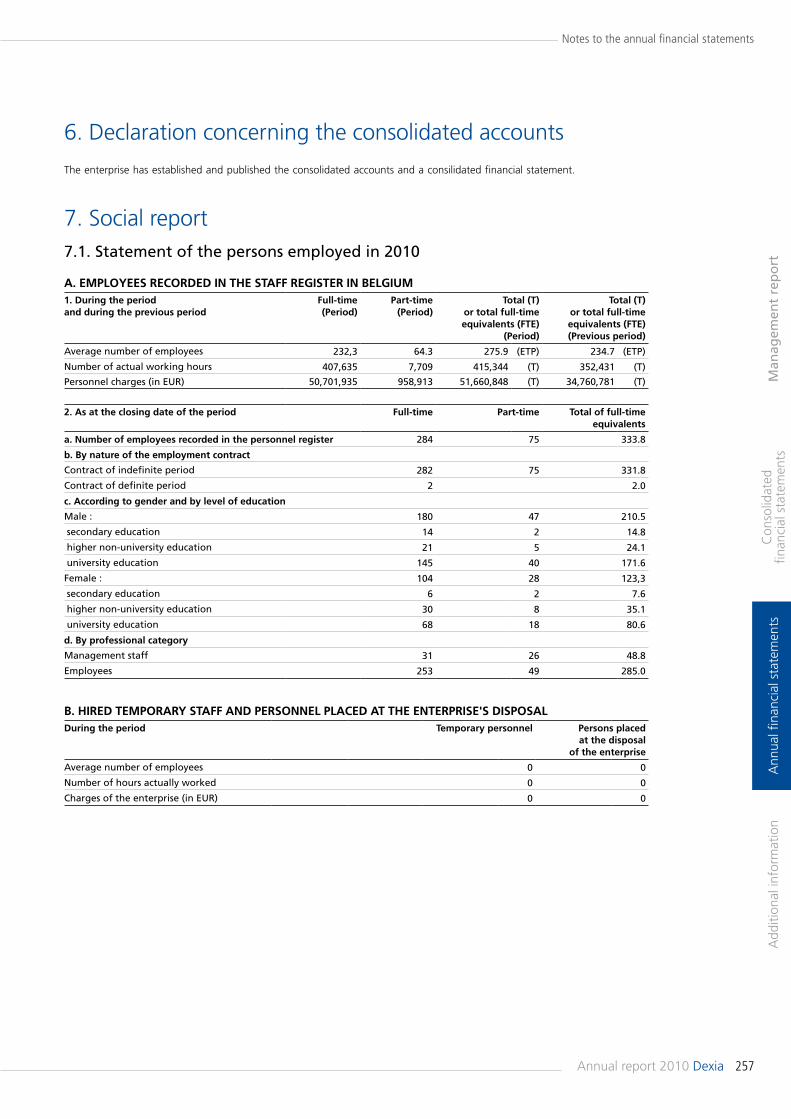
257Annualreport2010Dexia
Notes to the annual financial statements
Man
agem
ent
rep
ort
Add
ition
alin
form
atio
nA
nnua
lfina
ncia
lsta
tem
ents
Con
solid
ated
fin
anci
als
tate
men
ts
6.Declarationconcerningtheconsolidatedaccounts
Theenterprisehasestablishedandpublishedtheconsolidatedaccountsandaconsilidatedfinancialstatement.
7.Socialreport7.1. Statement of the persons employed in 2010
a. emPloyees reCorded in tHe staFF reGister in belGium1. during the period and during the previous period
Full-time (Period)
Part-time (Period)
total (t) or total full-time equivalents (Fte)
(Period)
total (t) or total full-time equivalents (Fte) (Previous period)
Average number of employees 232,3 64.3 275.9 (ETP) 234.7 (ETP)
Number of actual working hours 407,635 7,709 415,344 (T) 352,431 (T)
Personnel charges (in EUR) 50,701,935 958,913 51,660,848 (T) 34,760,781 (T)
2. as at the closing date of the period Full-time Part-time total of full-time equivalents
a. number of employees recorded in the personnel register 284 75 333.8
b. by nature of the employment contract
Contract of indefinite period 282 75 331.8
Contract of definite period 2 2.0
c. according to gender and by level of education
Male : 180 47 210.5
secondary education 14 2 14.8
higher non-university education 21 5 24.1
university education 145 40 171.6
Female : 104 28 123,3
secondary education 6 2 7.6
higher non-university education 30 8 35.1
university education 68 18 80.6
d. by professional category
Management staff 31 26 48.8
Employees 253 49 285.0
b. Hired temPorary staFF and Personnel PlaCed at tHe enterPrise's disPosal during the period temporary personnel Persons placed
at the disposal of the enterprise
Average number of employees 0 0
Number of hours actually worked 0 0
Charges of the enterprise (in EUR) 0 0
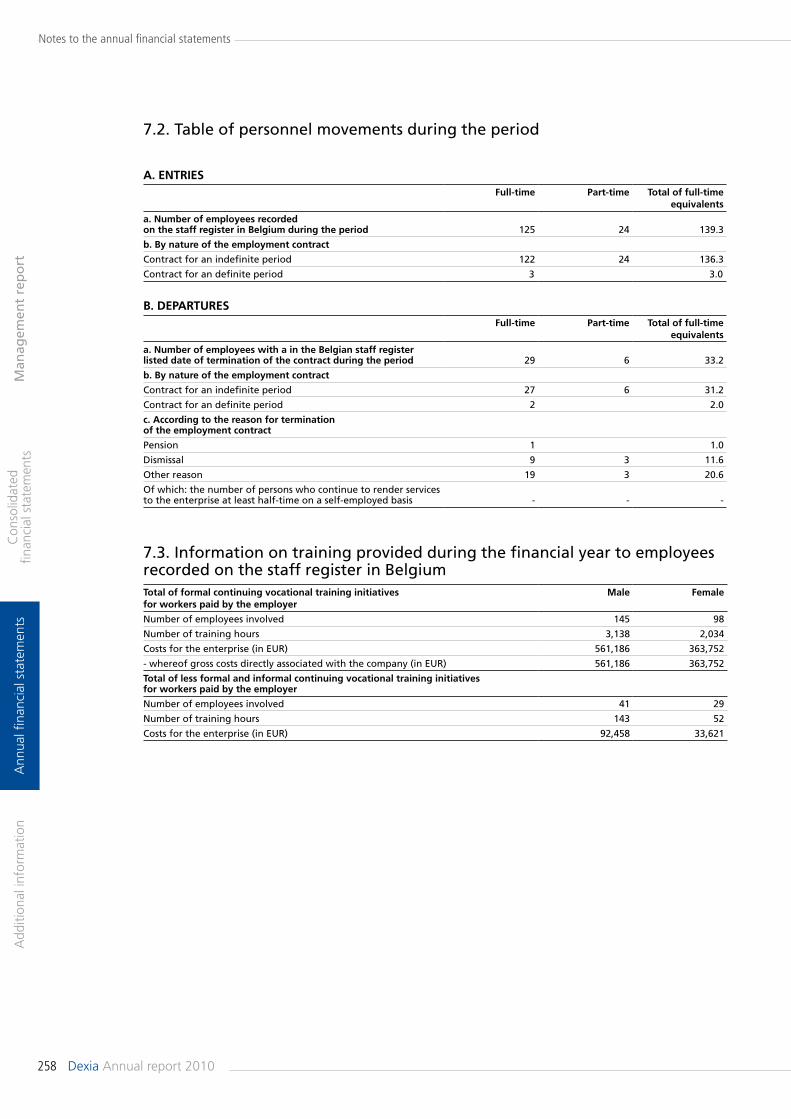
258 DexiaAnnualreport2010
Notes to the annual financial statements
Man
agem
ent
rep
ort
Add
ition
alin
form
atio
nA
nnua
lfina
ncia
lsta
tem
ents
Con
solid
ated
fin
anci
als
tate
men
ts
7.2. Table of personnel movements during the period
a. entriesFull-time Part-time total of full-time
equivalents
a. number of employees recorded on the staff register in belgium during the period 125 24 139.3
b. by nature of the employment contract
Contract for an indefinite period 122 24 136.3
Contract for an definite period 3 3.0
b. deParturesFull-time Part-time total of full-time
equivalents
a. number of employees with a in the belgian staff register listed date of termination of the contract during the period 29 6 33.2
b. by nature of the employment contract
Contract for an indefinite period 27 6 31.2
Contract for an definite period 2 2.0
c. according to the reason for termination of the employment contract
Pension 1 1.0
Dismissal 9 3 11.6
Other reason 19 3 20.6
Of which: the number of persons who continue to render services to the enterprise at least half-time on a self-employed basis - - -
7.3. Information on training provided during the financial year to employees recorded on the staff register in Belgium total of formal continuing vocational training initiatives for workers paid by the employer
male Female
Number of employees involved 145 98
Number of training hours 3,138 2,034
Costs for the enterprise (in EUR) 561,186 363,752
- whereof gross costs directly associated with the company (in EUR) 561,186 363,752
total of less formal and informal continuing vocational training initiatives for workers paid by the employer
Number of employees involved 41 29
Number of training hours 143 52
Costs for the enterprise (in EUR) 92,458 33,621
259Annualreport2010Dexia
Man
agem
ent
rep
ort
Add
ition
alin
form
atio
nA
nnua
lfina
ncia
lsta
tem
ents
Con
solid
ated
fin
anci
als
tate
men
ts
DexiaSAStatutoryAuditor’sreportfortheyearended31December2010totheShareholders’Meeting
Totheshareholders
Asrequiredbylawandthecompany’sarticlesofassociation,wearepleasedtoreporttoyouontheauditassignmentwhichyouhaveentrustedtous.Thisreportincludesouropiniononthefinancialstatementstogetherwiththerequiredadditionalcomments.
Unqualified audit opinion on the financial statements, with explanatory paragraphWehaveauditedthefinancialstatementsofDexiaSAfortheyearended31December2010,preparedinaccordancewiththeaccountingprinciples applicable inBelgium,which showtotalassetsof23,397,851,600EURandalossfortheyearof5,188,206,600EUR.
TheBoardofDirectorsofthecompany isresponsibleforthepreparation of the financial statements. This responsibilityincludes among other things: designing, implementing andmaintaining internal control relevant to the preparationand fair presentation of financial statements that are freefrom material misstatement, whether due to fraud or error,selecting and applying appropriate accounting policies, andmaking accounting estimates that are reasonable in thecircumstances.
Our responsibility is to express anopinionon these financialstatements based on our audit. We conducted our audit inaccordance with legal requirements and auditing standardsapplicableinBelgium,asissuedbythe“InstitutdesRéviseursd’Entreprises/Instituut van de Bedrijfsrevisoren”. Thosestandards require that we plan and perform the audit toobtainreasonableassurancewhetherthefinancialstatementsarefreefrommaterialmisstatement.
In accordance with these standards, we have performedprocedures to obtain audit evidence about the amounts
and disclosures in the financial statements. The proceduresselecteddependonour judgment, including the assessmentof the risks of material misstatement of the financialstatements, whether due to fraud or error. In making thoseriskassessments,wehaveconsideredinternalcontrolrelevantto the company’s preparation and fair presentation of thefinancial statements in order to design audit proceduresthat are appropriate in the circumstances but not for thepurposeofexpressinganopinionontheeffectivenessofthecompany’sinternalcontrol.Wehaveassessedthebasisoftheaccounting policies used, the reasonableness of accountingestimates made by the company and the presentation ofthefinancialstatements,takenasawhole.Finally,theBoardof Directors and responsible officers of the company havereplied to all our requests for explanations and information.We believe that the audit evidence that we have obtainedprovidesareasonablebasisforouropinion.
In our opinion, the financial statements as of 31 December2010 give a true and fair view of the company’s assets,liabilities,financialpositionandresultsinaccordancewiththeaccountingprinciplesapplicableinBelgium.
Despite the fact that the company has incurred significantlossesoverthelasttwoyearsthatimpactitsfinancialposition,the financial statements have been drafted using the goingconcern principle. This assumption is only justified to theextentthattheresultsofDexiaGroupcontinuetodemonstrateasustainablerecoveryandtakingintoaccounttheleveloftheshareholders’equityofthecompanyatclosingdate.
Without modifying the above unqualified opinion, wedraw your attention to the notes to the annual financialstatements, in which the Board of Directors, in accordancewith Belgian legal requirements, justifies the applicationof the going concern principle. No adjustments have beenrecordedwithrespecttothevaluationortheclassificationofcertainbalance-sheetitems,whichwouldberequired,shouldtheGroupnolongerbeabletocontinueitsoperations.
260 DexiaAnnualreport2010
Man
agem
ent
rep
ort
Add
ition
alin
form
atio
nA
nnua
lfina
ncia
lsta
tem
ents
Con
solid
ated
fin
anci
als
tate
men
tsStatutory Auditor's report
Additional comments Thepreparation and the assessmentof the information thatshouldbeincludedintheDirectors’reportandthecompany’scompliance with the requirements of the Companies Codeand its articles of association are the responsibility of theBoardofDirectors.
Our responsibility is to include in our report the followingadditionalcommentswhichdonotchange thescopeofourauditopiniononthefinancialstatements:
•The Directors’ report includes the information requiredby law and is in agreement with the financial statements.However, we are unable to express an opinion on thedescriptionoftheprincipalrisksanduncertaintiesconfrontingthecompany,oronthestatus,futureevolution,orsignificantinfluence of certain factors on its future development. Wecan, nevertheless, confirm that the information given is notinobviouscontradictionwithanyinformationobtainedinthecontextofourappointment.
•Without prejudice to certain formal aspects of minorimportance, the accounting records are maintained inaccordance with the legal and regulatory requirementsapplicableinBelgium.•No transactions have been undertaken or decisions takenin violation of the company’s articles of association or theCompanies Code such as we would be obliged to reportto you. The appropriation of the results proposed to theShareholders’Meetingisinaccordancewiththerequirementsofthelawandthecompany’sarticlesofassociation.
Diegem,21March2011TheStatutoryAuditor
DELOITTEBedrijfsrevisoren/Reviseursd’EntreprisesBVo.v.v.e.CVBA/SCs.f.d.SCRL
Representedby
FrankVerhaegen BernardDeMeulemeester
261Annualreport2010Dexia
Man
agem
ent
rep
ort
Con
solid
ated
fin
anci
als
tate
men
tsA
nnua
lfina
ncia
lsta
tem
ents
Ad
dit
ion
al in
form
atio
n
Additional information
Certificate from the responsible person
I the undersigned, Pierre Mariani, Chief Executive Officer and Chairman of the Management Board of Dexia SA, certify that to the best of my knowledge:
a) the financial statements, established in accordance with applicable accounting standards, present a true and fair view of the assets, the financial situation and the earnings of the company and of all the companies included in the consolidation;
b) the management report contains a true and fair view of changes in the revenues, earnings and financial position of the company and of all the companies included in the scope of consolidation and a description of the main risks and uncertainties to which they are exposed.
Brussels, 21 March 2011
For the Management Board
Pierre MarianiChief Executive Officer and Chairman of the Management Board
Dexia SA
262 DexiaAnnualreport2010
Man
agem
ent
rep
ort
Con
solid
ated
fin
anci
als
tate
men
tsA
nnua
lfina
ncia
lsta
tem
ents
Ad
dit
ion
al in
form
atio
n
Additional information
General data
NameThe company is called “Dexia”.
Registered officeThe registered office of the company is in Belgium at Place Rogier 11, 1210 Brussels (RPM Brussels VAT BE 0458.548.296).
Legal form, incorporation, durationThe company is a limited company under Belgian law that makes a public appeal for investment. It was incorporated on 15 July 1996 for an indefinite period. The company has two permanent offices located in France and in Luxembourg.
Corporate objectArticle 3 of the articles of association reads as follows:
“The company has the object, both in Belgium and in other countries, of:1. the acquisition, holding, management and sale, by what-ever means, of all equity interests in companies or any other legal entities, whatever their legal form, existing or to be created, which operate as credit institutions, insurance or reinsurance companies or which carry on financial, industrial, commercial or civil, administrative or technical activities, as well as all types of shares, bonds, public funds and any other financial instruments of whatever nature;
2. the provision of assistance or administrative, commercial and financial services and accomplishment of all research on behalf of third parties and in particular on behalf of compa-nies and other legal entities, whatever their legal form, in which it holds a direct or indirect equity interest, as well as the provision of loans, advances, guarantees or securities, in whatever form;3. the conducting of all movable property, real property, financial, industrial, commercial or civil transactions including the acquisition, management, leasing and sale of all movable and real property, related directly or indirectly to the realisa-tion of its corporate object or likely to contribute to such realisation.”
Places where the public may consult documentsThe articles of association of the company are available at the office of the Clerk to the Commercial Court of Brussels and at the company’s registered office. The annual reports as well as the annual financial statements and the consolidated financial statements are lodged with the National Bank of Belgium. These documents may also be obtained from the company’s registered office. Decisions in relation to appoint-ments and resignations of members of the Board of Directors are published in the Appendix to the Belgian Gazette. Finan-cial notices concerning the company are published on its website (www.dexia.com). The convocations to Shareholders’ Meetings are published on the website and in the financial newspapers, the daily press and periodicals.
FINANCIAL CALENDAR
Ordinary Shareholders’ Meeting for the 2010 financial year11 May 2011
Results as at 31 March 2011 11 May 2011
Results as at 30 June 20114 August 2011
Results as at 30 September 20119 November 2011
Results as at 31 December 201122 February 2012
Ordinary Shareholders’ Meeting for the 2011 financial year9 May 2012
Dexia SAPlace Rogier 11B-1210 Brussels
IBAN BE61-0682-1136-2017BIC GKCC BE BB
RPM Brussels VAT BE 0458.548.296
In Paris1, passerelle des Reflets
Tour Dexia – La Défense 2F-92919 La Défense Cedex
In Luxembourg69, route d’Esch
L-2953 Luxembourg
CONTACT
Press department E-mail: [email protected]
Phone Brussels: + 32 2 213 50 81Phone Paris: + 33 1 58 58 59 05
Investor RelationsE-mail: [email protected]
Phone Brussels: + 32 2 213 57 46Phone Paris: + 33 1 58 58 85 97
Websitewww.dexia.com
Dexia’s annual report 2010 has been published by the Financial Communication department of Dexia SA.This report is also available in Dutch and French. It just needs to be requested at the Dexia head office in Brussels
or in Paris or via the company website at www.dexia.com.


Photographs: page 8: C. LEBEDINSKY/Challenges-REA – page 43: Olivier Polet (www.polet.tv) – Printed by Antilope – Lier – Belgium

SDX
I 014
9-5
04-1
1