Embed Size (px)
Citation preview
Your Partner Bank
2
“Al Baraka Banking Group’s philosophy, in essence, is that Allah, The Almighty, grants mankind the power to inherit the land on this earth. As such Man is not the owner of wealth but he is responsible for it.
The purpose of Man, by the commandment of Allah, The Almighty, is to construct, embellish, create and build on this earth. Man is therefore also ordained to create jobs for others. Thus, the wealth bestowed upon us belongs to Allah, The Almighty.
Therefore, we must apply Shari’a rules related to the ownership of wealth in creating the wealth and in investing, exchanging, growing and spending the wealth.” – Shaikh Saleh Abdullah Kamel Chairman of Al Baraka Banking Group
Annual Report – 2011
3
ContentsFinancial Highlights 4Unified Corporate Identity 8Board of Directors and Shari’a Supervisory Board 12Executive Management 20Directors’ Report 24President & Chief Executive’s Report 28Corporate Governance 60Corporate Social Responsibility 73Unified Shari’a Supervisory Board Report 76Independent Auditors’ Report 78Consolidated Financial Statements 79Additional Public Disclosures 142Al Baraka Global Network 170
4
FinAnCiAl HigHligHts
2011 2010 2009 2008 2007
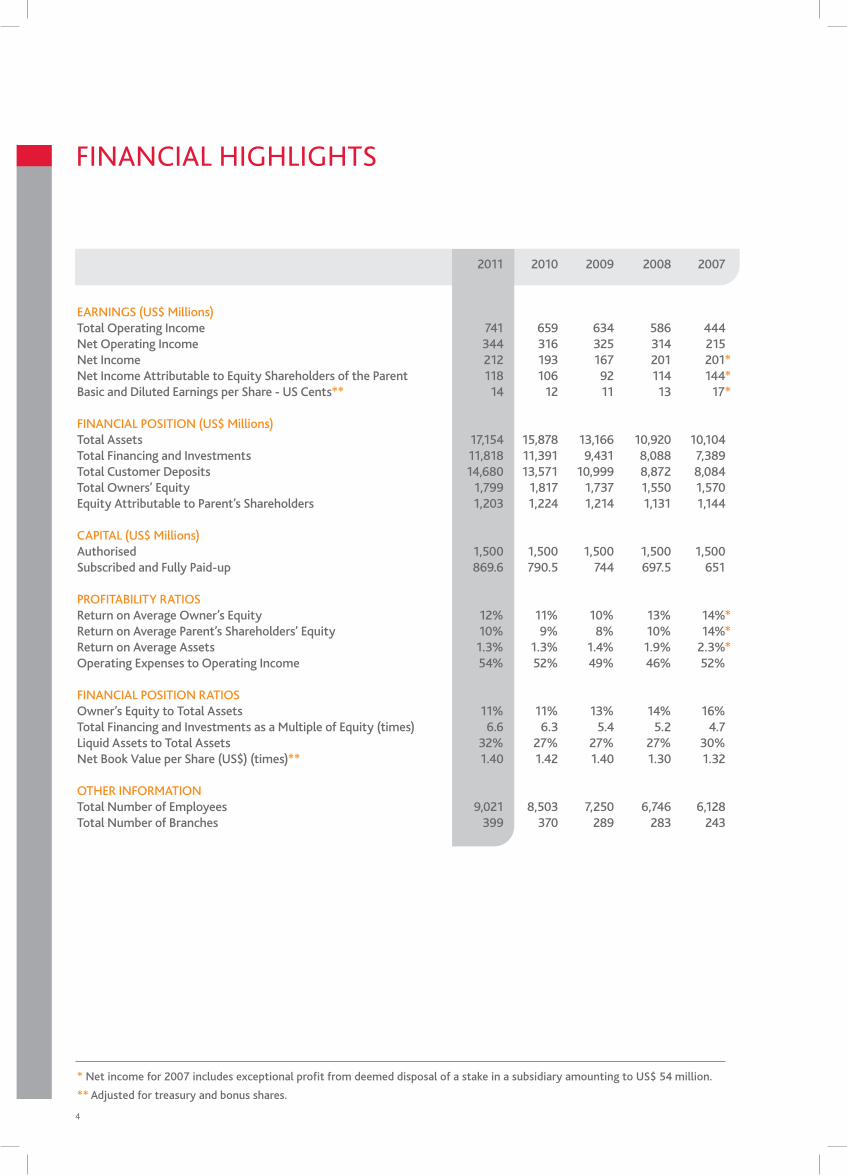
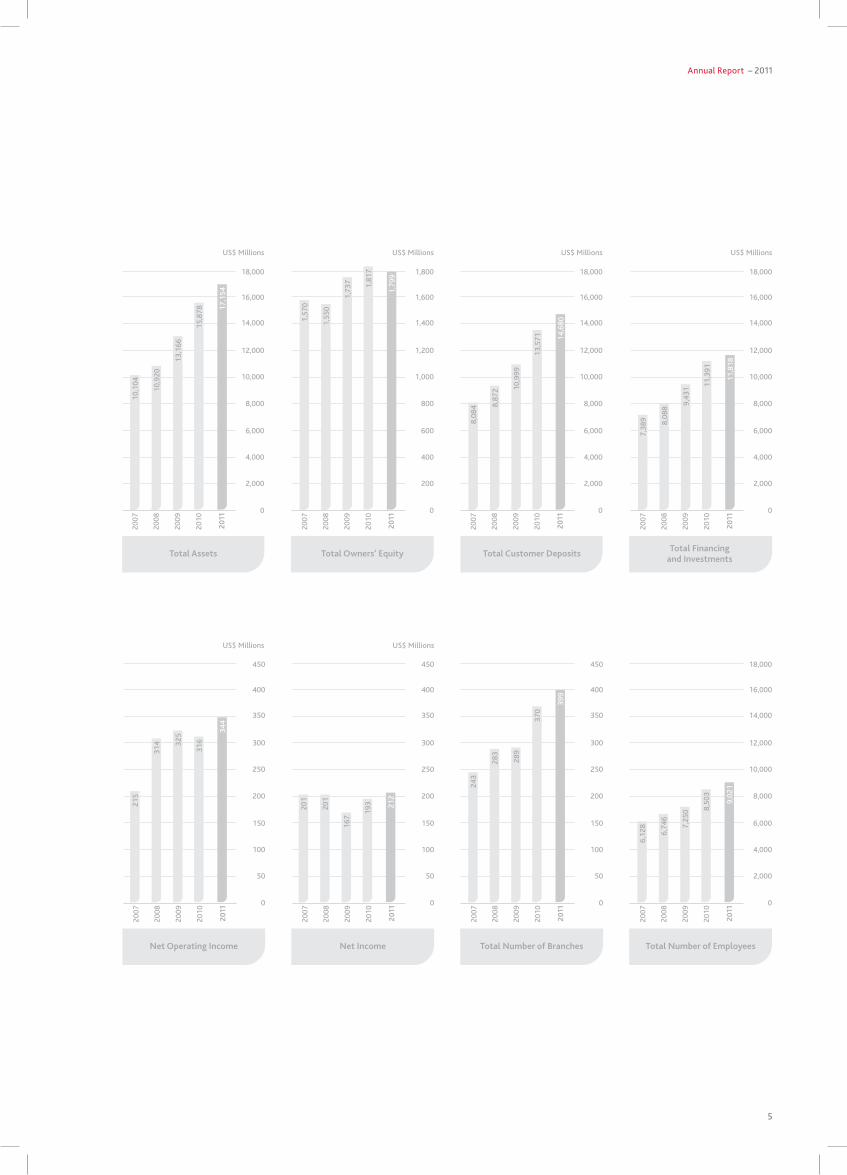
EARNINGS (US$ Millions)Total Operating Income 741 659 634 586 444 Net Operating Income 344 316 325 314 215Net Income 212 193 167 201 201*Net Income Attributable to Equity Shareholders of the Parent 118 106 92 114 144*Basic and Diluted Earnings per Share - US Cents** 14 12 11 13 17*
FINANCIAL POSITION (US$ Millions)Total Assets 17,154 15,878 13,166 10,920 10,104Total Financing and Investments 11,818 11,391 9,431 8,088 7,389Total Customer Deposits 14,680 13,571 10,999 8,872 8,084Total Owners’ Equity 1,799 1,817 1,737 1,550 1,570Equity Attributable to Parent’s Shareholders 1,203 1,224 1,214 1,131 1,144
CAPITAL (US$ Millions)Authorised 1,500 1,500 1,500 1,500 1,500Subscribed and Fully Paid-up 869.6 790.5 744 697.5 651
PROFITABILITY RATIOSReturn on Average Owner’s Equity 12% 11% 10% 13% 14%*Return on Average Parent’s Shareholders’ Equity 10% 9% 8% 10% 14%*Return on Average Assets 1.3% 1.3% 1.4% 1.9% 2.3%*Operating Expenses to Operating Income 54% 52% 49% 46% 52%
FINANCIAL POSITION RATIOSOwner’s Equity to Total Assets 11% 11% 13% 14% 16%Total Financing and Investments as a Multiple of Equity (times) 6.6 6.3 5.4 5.2 4.7Liquid Assets to Total Assets 32% 27% 27% 27% 30%Net Book Value per Share (US$) (times)** 1.40 1.42 1.40 1.30 1.32
OTHER INFORMATIONTotal Number of Employees 9,021 8,503 7,250 6,746 6,128Total Number of Branches 399 370 289 283 243
* Net income for 2007 includes exceptional profit from deemed disposal of a stake in a subsidiary amounting to US$ 54 million.
** Adjusted for treasury and bonus shares.
Annual Report – 2011
5
Total Assets
0
2,000
4,000
6,000
8,000
10,000
12,000
14,000
16,000
18,000
17,1
54
15,8
78
2011
2010
2009
2008
2007
13,1
66
10,9
20
10,1
04
0
200
400
600
800
1,000
1,200
1,400
1,600
1,800
2011
2010
2009
2008
2007
1,79
9
1,81
7
1,73
7
1,55
0
1,57
0
Total Owners’ Equity
0
2,000
4,000
6,000
8,000
10,000
12,000
14,000
16,000
18,000
2011
2010
2009
2008
2007
14,6
80
13,5
71
10,9
99
8,87
2
8,08
4
Total Customer Deposits
0
2,000
4,000
6,000
8,000
10,000
12,000
14,000
16,000
18,000
2011
2010
2009
2008
2007
11,8
18
11,3
91
9,43
1
8,08
8
7,38
9
Total Financing and Investments
2011
2010
2009
2008
2007
0
50
100
150
200
250
300
350
400
450
344
31632
5
314
215
Net Operating Income
2011
2010
2009
2008
2007
0
50
100
150
200
250
300
350
400
450
212
193
167
201
201
Net Income
2011
2010
2009
2008
2007
0
50
100
150
200
250
300
350
400
450
399
370
289
283
243
Total Number of Branches
0
2,000
4,000
6,000
8,000
10,000
12,000
14,000
16,000
18,000
2011
2010
2009
2008
2007
9,02
1
8,50
3
7,25
0
6,74
6
6,12
8
Total Number of Employees
US$ Millions
US$ Millions US$ Millions
US$ Millions US$ Millions US$ Millions
6
OUR SHARED BElIEFS CREATE STRONG BONDS THAT FORM THE BASIS OF lONG-TERM RElATIONSHIPS wITH CUSTOMERS AND STAFF.
PARTNERSHIP

77
Annual Report – 2011
8
UniFied CoRpoRAte identity
Early in 2009, Al Baraka Banking Group commenced the methodical rollout of its new Unified Corporate Identity to all parts of the Group, the launch of which was well received by the markets. while propelling the Al Baraka brand to the forefront of Islamic banking, and emphasising the Group’s commitment to becoming the natural global leader in Islamic banking, the new corporate identity is also a strong symbol of the uniting of all subsidiaries under a single banner. Today the Al Baraka Group stands apart as an institution, with its own unique and unified philosophy, regulations, procedures and corporate culture in place. The Unified Corporate Identity is not merely a cosmetic change to the logo, its aesthetics or consistency of colour, but goes far beyond that. It is nothing less than an attempt to link the philosophical dimension upon which Islamic banking is based - participation and partnership and the equitable sharing of risk and reward through the projection of a unified and modern identity. we see this re-launch of our brand as the first step on a journey, as we work towards the creation of a unified banking group whose many subsidiaries are focused jointly on a single unifying vision.
The unified identity has helped the Group to prioritise its values and ambitions, raising them above the mere attainment of corporate size or product range and delivery. Instead, we believe that as we build our customer relationship based on the spirit of true partnership, our growth will be both inevitable and natural.
we at Al Baraka believe that banking has, or ought to have, a crucial role to play in society, one in which as bankers we have an incredible responsibility of stewardship for the resources placed in our hands. To meet this responsibility and use these resources wisely, we rely on Shari’a principles to guide us as we participate in our customers’ successes, sharing in the social development of families, businesses and society at large. By ‘partnership’, therefore, we mean that our success and that of each of our customers are as intertwined as our jointly held beliefs. Taking part in the joint effort is therefore our reward. we view money as a means to capitalise on opportunities and create a better society for all. Money becomes the conduit by which we enter into new opportunities together and take part in common effort for mutual reward; as steward of the resources entrusted to us, our efforts contribute to building the community, both at home and in the wider world. we call this concept: “Beyond Banking.”
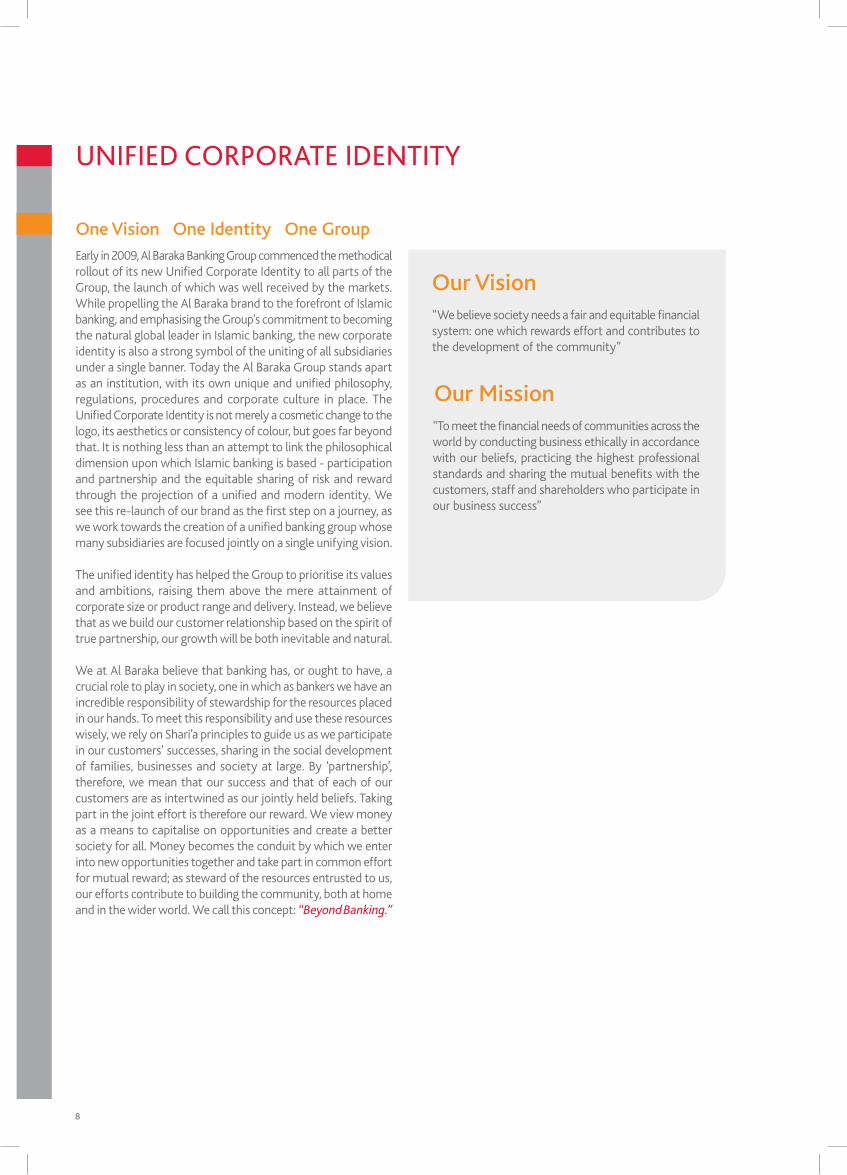
“we believe society needs a fair and equitable financial system: one which rewards effort and contributes to the development of the community”
“To meet the financial needs of communities across the world by conducting business ethically in accordance with our beliefs, practicing the highest professional standards and sharing the mutual benefits with the customers, staff and shareholders who participate in our business success”
One Vision One Identity One Group
Our Vision
Our Mission
Annual Report – 2011
9
oUR VAlUes
Partnership
Our shared beliefs create strong bonds that form the basis of long-term relationships with customers and staff.
Driven
we have the energy and perseverance it will take to make an impact in our customers’ lives and for the greater good of society.
Neighbourly
we value and respect the communities we serve. Our doors are always open; our customers always experience a warm-hearted, hospitable welcome and accommodating service.
Peace of mind
Our customers can rest assured that their financial interests are being managed by us to the highest ethical standards.
Social contribution
By banking with us our customers make a positive contribution to a better society; their growth and our growth will benefit the world around us.
Our basic strengths, which go back to the earliest days of our foundation over 30 years ago, and on which we have depended for moral sustenance throughout that time, may be summarised as:
• Adherence to Shari’a principles• Close customer relationships - a partnership of equals• Financial probity• A local bank first and foremost - but with international
reach
Al Baraka with its presence in 14 countries, can claim to have a wide geographical spread extending from Indonesia to Algeria, servicing its customers through a network of 399 branches. Our greatest strength is the enviable bond we have with our customers. Today we have a Unified Corporate Identity that reflects the core values and the intrinsic strengths of the organisation. we are continuously building our capacities and strengthening our resources to provide a fair and equitable financial system, not only in the countries we operate in, but also as we reach out to other parts of the world. Our promise “Your Partner Bank” is aimed at rewarding efforts and contributing to the development of society, thus making Al Baraka the brand of choice for financial services, internationally.
The future of our brand

10
wE HAvE THE ENERGy AND PERSEvERANCE IT wIll TAKE TOMAKE AN IMPACT IN OUR CUSTOMERS’ lIvES AND FOR THE GREATER GOOD OF SOCIETy.
DRIVEN

11
Annual Report – 2011
12
BoARd oF diReCtoRs & sHARi’A sUpeRVisoRy BoARd
shari’a supervisory Board
•Shaikh Dr. Abdul Sattar Abu Ghudah Chairman
•Shaikh Abdulla Bin Sulieman Al Mannea Member
•Shaikh Dr. Abdullatif Al Mahmood Member
•Shaikh Dr. Abdulaziz Bin Fowzan Al Fowzan Member
•Dr. Ahmed Mohiyeldin Ahmed Member
•Dr. Eltigani El Tayeb Mohammed Secretary to the Shari’a Supervisory Board
Board of directors
• Shaikh Saleh Abdullah Kamel Chairman
• Mr. Abdulla A. Saudi vice Chairman
•Mr. Abdullah Saleh Kamel vice Chairman
•Mr. Saleh Al Yousef Board Member
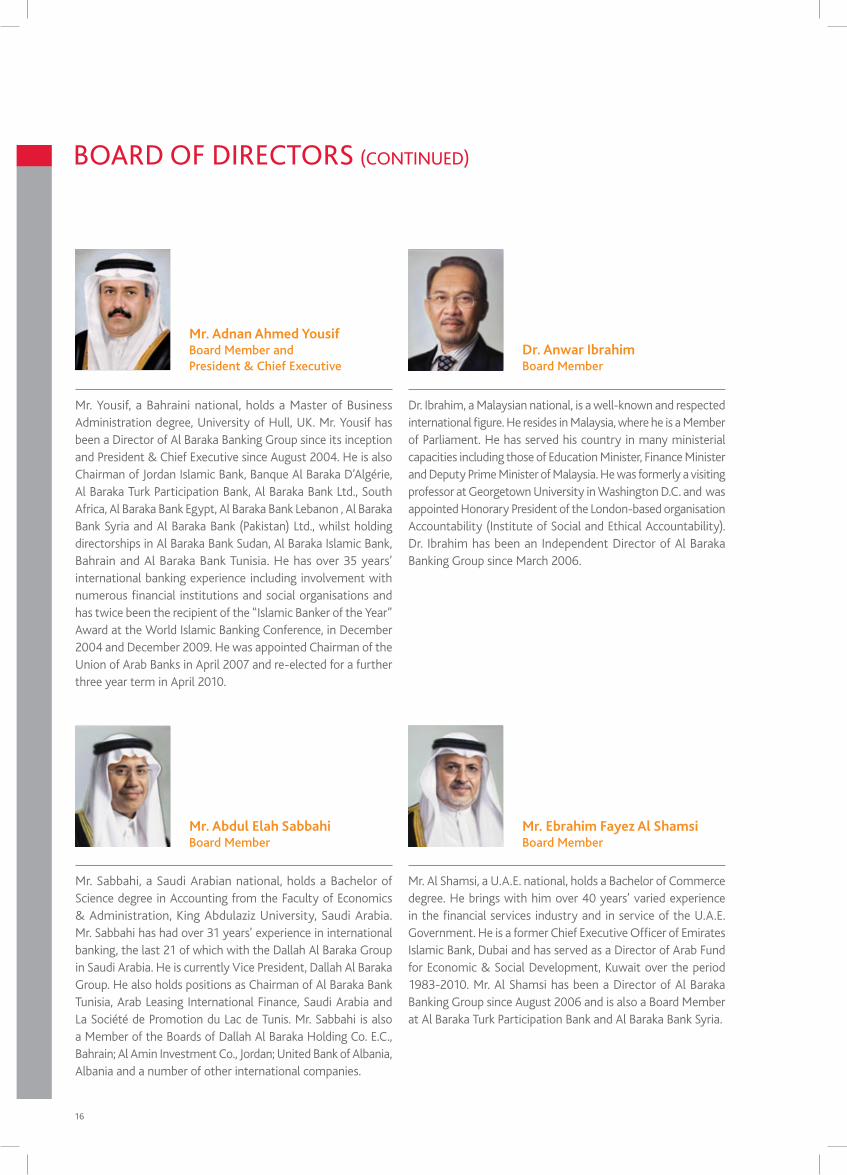
•Mr. Adnan Ahmed Yousif Board Member and President & Chief Executive
•Dr. Anwar Ibrahim Board Member
•Mr. Abdul Elah Sabbahi Board Member
•Mr. Ebrahim Fayez Al Shamsi Board Member
•Mr. Jamal Bin Ghalaita Board Member
•Mr. Yousef Ali Fadil Bin Fadil Board Member
•Dr. Bassem Awadallah Board Member
•Mr. Mohyedin Saleh Kamel Board Member
•Mr. Fahad Abdullah A. Al-Rajhi* Board Member
•Mr. Salah Abuzaid Secretary to the Board
independent directors
•Mr. Abdulla A. Saudi vice Chairman
•Mr. Saleh Al Yousef Board Member
•Dr. Anwar Ibrahim Board Member
•Mr. Ebrahim Fayez Al Shamsi Board Member
•Mr. Jamal Bin Ghalaita Board Member
•Dr. Bassem Awadallah Board Member
* In place of Mr. Samer Mohammed Farhoud with effect from 23 March 2011
Annual Report – 2011
13
Board executive Committee
•Mr. Abdullah Saleh Kamel Chairman
•Mr. Adnan Ahmed Yousif Member
•Mr. Abdul Elah Sabbahi Member
•Mr. Yousef Ali Fadil Bin Fadil Member
Board Affairs and Remuneration Committee
•Mr. Ebrahim Fayez Al Shamsi Chairman
•Mr. Jamal Bin Ghalaita Member
•Mr. Yousef Ali Fadil Bin Fadil Member
Board Audit and governance Committee
•Mr. Saleh Al Yousef Chairman
•Dr. Anwar Ibrahim Member
•Mr. Ebrahim Fayez Al Shamsi Member
•Dr. Bassem Awadallah Member
Board Risk Committee
•Mr. Abdul Elah Sabbahi Chairman
• Mr. Jamal Bin Ghalaita Member
•Mr. Mohyedin Saleh Kamel Member
•Mr. Fahad Abdullah A. Al-Rajhi* Member
BoARd Committees
* In place of Mr. Samer Mohammed Farhoud with effect from 23 March 2011
14
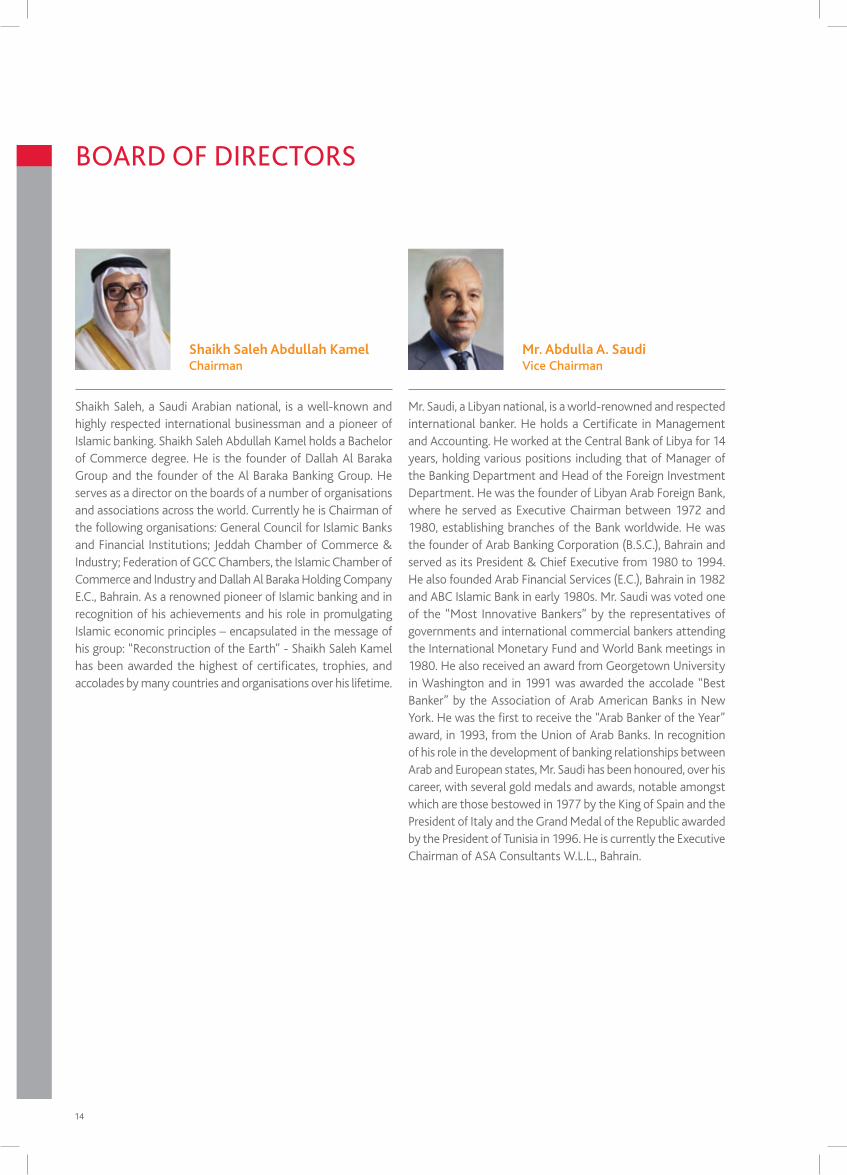
Shaikh Saleh, a Saudi Arabian national, is a well-known and highly respected international businessman and a pioneer of Islamic banking. Shaikh Saleh Abdullah Kamel holds a Bachelor of Commerce degree. He is the founder of Dallah Al Baraka Group and the founder of the Al Baraka Banking Group. He serves as a director on the boards of a number of organisations and associations across the world. Currently he is Chairman of the following organisations: General Council for Islamic Banks and Financial Institutions; Jeddah Chamber of Commerce & Industry; Federation of GCC Chambers, the Islamic Chamber of Commerce and Industry and Dallah Al Baraka Holding Company E.C., Bahrain. As a renowned pioneer of Islamic banking and in recognition of his achievements and his role in promulgating Islamic economic principles – encapsulated in the message of his group: “Reconstruction of the Earth” - Shaikh Saleh Kamel has been awarded the highest of certificates, trophies, and accolades by many countries and organisations over his lifetime.
Shaikh Saleh Abdullah KamelChairman
BoARd oF diReCtoRs
Mr. Saudi, a libyan national, is a world-renowned and respected international banker. He holds a Certificate in Management and Accounting. He worked at the Central Bank of libya for 14 years, holding various positions including that of Manager of the Banking Department and Head of the Foreign Investment Department. He was the founder of libyan Arab Foreign Bank, where he served as Executive Chairman between 1972 and 1980, establishing branches of the Bank worldwide. He was the founder of Arab Banking Corporation (B.S.C.), Bahrain and served as its President & Chief Executive from 1980 to 1994. He also founded Arab Financial Services (E.C.), Bahrain in 1982 and ABC Islamic Bank in early 1980s. Mr. Saudi was voted one of the “Most Innovative Bankers” by the representatives of governments and international commercial bankers attending the International Monetary Fund and world Bank meetings in 1980. He also received an award from Georgetown University in washington and in 1991 was awarded the accolade “Best Banker” by the Association of Arab American Banks in New york. He was the first to receive the “Arab Banker of the year” award, in 1993, from the Union of Arab Banks. In recognition of his role in the development of banking relationships between Arab and European states, Mr. Saudi has been honoured, over his career, with several gold medals and awards, notable amongst which are those bestowed in 1977 by the King of Spain and the President of Italy and the Grand Medal of the Republic awarded by the President of Tunisia in 1996. He is currently the Executive Chairman of ASA Consultants w.l.l., Bahrain.
Mr. Abdulla A. SaudiVice Chairman
Annual Report – 2011
15
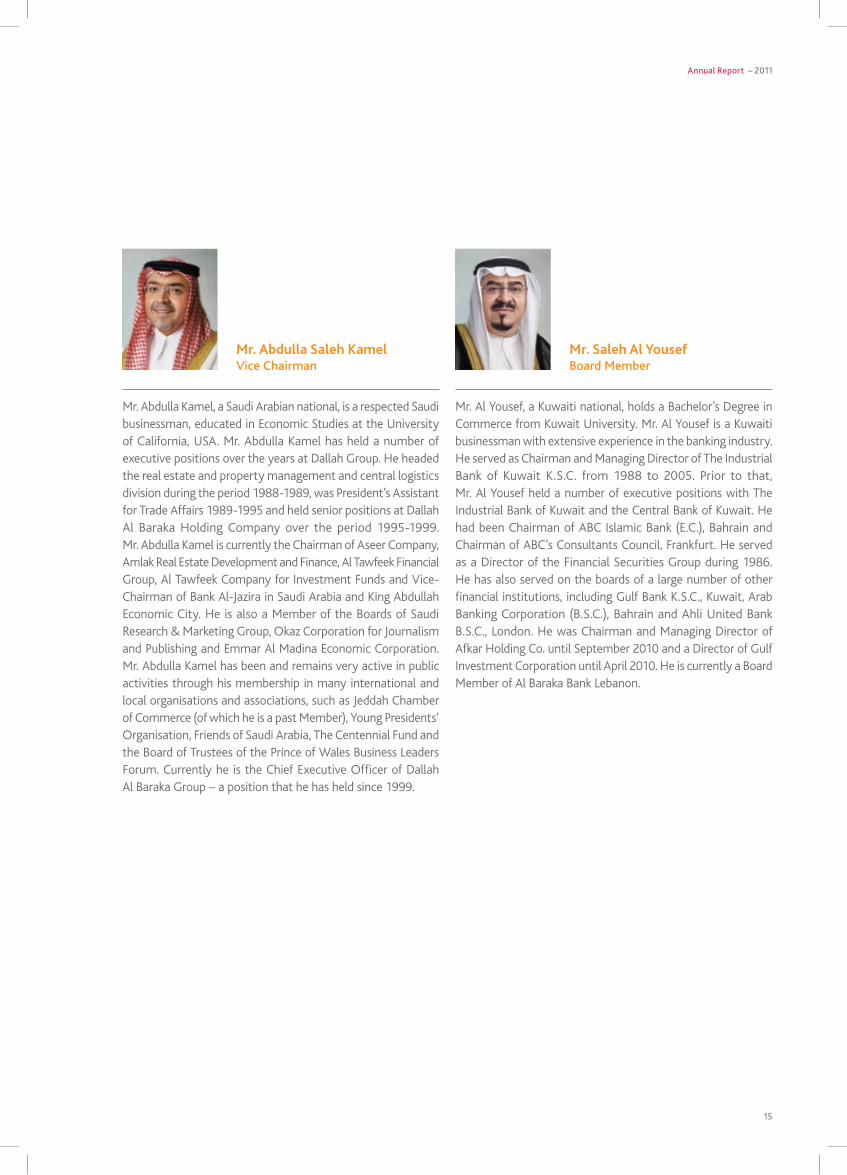
Mr. Abdulla Kamel, a Saudi Arabian national, is a respected Saudi businessman, educated in Economic Studies at the University of California, USA. Mr. Abdulla Kamel has held a number of executive positions over the years at Dallah Group. He headed the real estate and property management and central logistics division during the period 1988-1989, was President’s Assistant for Trade Affairs 1989-1995 and held senior positions at Dallah Al Baraka Holding Company over the period 1995-1999. Mr. Abdulla Kamel is currently the Chairman of Aseer Company, Amlak Real Estate Development and Finance, Al Tawfeek Financial Group, Al Tawfeek Company for Investment Funds and vice-Chairman of Bank Al-Jazira in Saudi Arabia and King Abdullah Economic City. He is also a Member of the Boards of Saudi Research & Marketing Group, Okaz Corporation for Journalism and Publishing and Emmar Al Madina Economic Corporation. Mr. Abdulla Kamel has been and remains very active in public activities through his membership in many international and local organisations and associations, such as Jeddah Chamber of Commerce (of which he is a past Member), young Presidents’ Organisation, Friends of Saudi Arabia, The Centennial Fund and the Board of Trustees of the Prince of wales Business leaders Forum. Currently he is the Chief Executive Officer of Dallah Al Baraka Group – a position that he has held since 1999.
Mr. Abdulla Saleh KamelVice Chairman
Mr. Al yousef, a Kuwaiti national, holds a Bachelor’s Degree in Commerce from Kuwait University. Mr. Al yousef is a Kuwaiti businessman with extensive experience in the banking industry. He served as Chairman and Managing Director of The Industrial Bank of Kuwait K.S.C. from 1988 to 2005. Prior to that, Mr. Al yousef held a number of executive positions with The Industrial Bank of Kuwait and the Central Bank of Kuwait. He had been Chairman of ABC Islamic Bank (E.C.), Bahrain and Chairman of ABC’s Consultants Council, Frankfurt. He served as a Director of the Financial Securities Group during 1986. He has also served on the boards of a large number of other financial institutions, including Gulf Bank K.S.C., Kuwait, Arab Banking Corporation (B.S.C.), Bahrain and Ahli United Bank B.S.C., london. He was Chairman and Managing Director of Afkar Holding Co. until September 2010 and a Director of Gulf Investment Corporation until April 2010. He is currently a Board Member of Al Baraka Bank lebanon.
Mr. Saleh Al YousefBoard Member
16
BoARd oF diReCtoRs (ContinUed)
Dr. Ibrahim, a Malaysian national, is a well-known and respected international figure. He resides in Malaysia, where he is a Member of Parliament. He has served his country in many ministerial capacities including those of Education Minister, Finance Minister and Deputy Prime Minister of Malaysia. He was formerly a visiting professor at Georgetown University in washington D.C. and was appointed Honorary President of the london-based organisation Accountability (Institute of Social and Ethical Accountability). Dr. Ibrahim has been an Independent Director of Al Baraka Banking Group since March 2006.
Dr. Anwar IbrahimBoard Member
Mr. Sabbahi, a Saudi Arabian national, holds a Bachelor of Science degree in Accounting from the Faculty of Economics & Administration, King Abdulaziz University, Saudi Arabia. Mr. Sabbahi has had over 31 years’ experience in international banking, the last 21 of which with the Dallah Al Baraka Group in Saudi Arabia. He is currently vice President, Dallah Al Baraka Group. He also holds positions as Chairman of Al Baraka Bank Tunisia, Arab leasing International Finance, Saudi Arabia and la Société de Promotion du lac de Tunis. Mr. Sabbahi is also a Member of the Boards of Dallah Al Baraka Holding Co. E.C., Bahrain; Al Amin Investment Co., Jordan; United Bank of Albania, Albania and a number of other international companies.
Mr. Abdul Elah SabbahiBoard Member
Mr. Al Shamsi, a U.A.E. national, holds a Bachelor of Commerce degree. He brings with him over 40 years’ varied experience in the financial services industry and in service of the U.A.E. Government. He is a former Chief Executive Officer of Emirates Islamic Bank, Dubai and has served as a Director of Arab Fund for Economic & Social Development, Kuwait over the period 1983-2010. Mr. Al Shamsi has been a Director of Al Baraka Banking Group since August 2006 and is also a Board Memberat Al Baraka Turk Participation Bank and Al Baraka Bank Syria.
Mr. Ebrahim Fayez Al ShamsiBoard Member
Mr. yousif, a Bahraini national, holds a Master of Business Administration degree, University of Hull, UK. Mr. yousif has been a Director of Al Baraka Banking Group since its inception and President & Chief Executive since August 2004. He is also Chairman of Jordan Islamic Bank, Banque Al Baraka D’Algérie, Al Baraka Turk Participation Bank, Al Baraka Bank ltd., South Africa, Al Baraka Bank Egypt, Al Baraka Bank lebanon , Al Baraka Bank Syria and Al Baraka Bank (Pakistan) ltd., whilst holding directorships in Al Baraka Bank Sudan, Al Baraka Islamic Bank, Bahrain and Al Baraka Bank Tunisia. He has over 35 years’ international banking experience including involvement with numerous financial institutions and social organisations and has twice been the recipient of the “Islamic Banker of the year” Award at the world Islamic Banking Conference, in December 2004 and December 2009. He was appointed Chairman of the Union of Arab Banks in April 2007 and re-elected for a further three year term in April 2010.
Mr. Adnan Ahmed YousifBoard Member and President & Chief Executive

Annual Report – 2011
17
Mr. Fadil, a UAE national, is an experienced banker with a Bachelor’s Degree in Mathematics & Computer Science from Gonzaga University, Spokane, washington State, USA. During the period 1984-1998, Mr. Fadil held a number of senior positions in the National Bank of Umm Al Qaiwain. He then served Dubai Islamic Bank as Executive Manager for Investment over the period 1999-2002. In 2003 Mr. Fadil was appointed General Manager of the Emirates Financial Company. Mr. Fadil has also served as member of the board of directors of several financial institutions including, amongst others, Union Insurance Company, UAE, Bahrain Islamic Bank and Bosnia International Bank. He is a Board Member in Al Baraka Islamic Bank, Bahrain, Ajman Bank, Dubai Islamic Insurance Company and Gulfa Mineral water.
Mr. Yousef Ali Fadil Bin FadilBoard Member
Mr. Ghalaita, a U.A.E. national, holds a Bachelor of Science and Business Administration degree from the University of Arizona, USA. His career as a Banker spans over 20 years with key roles in the corporate, retail, trade finance and human resources sectors at Emirates NBD Group. His significant achievements include the planning for the launch of Emirates Islamic Bank and the establishing of several new areas of business at Emirates NBD, including Private Banking, Asset Management and Emirates Money, in addition to overseeing the growth of the core Consumer Banking and wealth Management business. He is now the Chief Executive Officer, Emirates Islamic Bank, a position he moved into in October 2011 from his previous post as Group Deputy Chief Executive Officer and General Manager, Consumer Banking and wealth Management at Emirates NBD. He is also Chairman of Emirates Money Consumer Finance llC and Emirates Islamic Financial Brokerage llC and Board Member of Emirates NBD Capital ltd and SHUAA Capital PSC.
Mr. Jamal Bin GhalaitaBoard Member
Dr. Bassem AwadallahBoard Member
Dr. Awadallah, a Jordanian national, holds Ph.D. and M.Sc. degrees in Economics from the london School of Economics and Political Science, UK (1985 and 1988) and a Bachelor of Science in Foreign Service degree from Georgetown University, USA (1984). Dr. Awadallah worked in the investment banking field in the United Kingdom from 1986 to 1991. He then held a succession of positions in Jordan: as Economic Secretary to the Prime Minister (1992-1996); Economic Advisor to the Prime Minister (1996-1999); Director of the Economic Department at the Royal Hashemite Court (1999-2001); Minister of Planning and International Cooperation (October 2001-February 2005); Minister of Finance (April 2005-June 2005); Director of the Office of His Majesty King Abdullah II of Jordan (April 2006-November
2007) and as Chief of the Royal Hashemite Court (November 2007-September 2008). Dr. Awadallah was chosen as a lee Kuan yew Fellow in Singapore in 2004 and a young Global leader by the world Economic Forum in 2005, and is the recipient of the Al Hussein Medal for Distinguished Service of the Hashemite Kingdom of Jordan, the Al Kawkab Decoration of the First Order of the Hashemite Kingdom of Jordan and the Al Istiqlal Decoration of the First Order of the Hashemite Kingdom of Jordan. In addition he has been awarded a number of high decorations from several countries in Europe and Asia. Dr. Awadallah is currently the Chief Executive Officer of Tomoh Advisory, a financial and strategic advisory practice based in Dubai, UAE.
18
BoARd oF diReCtoRs (ContinUed)
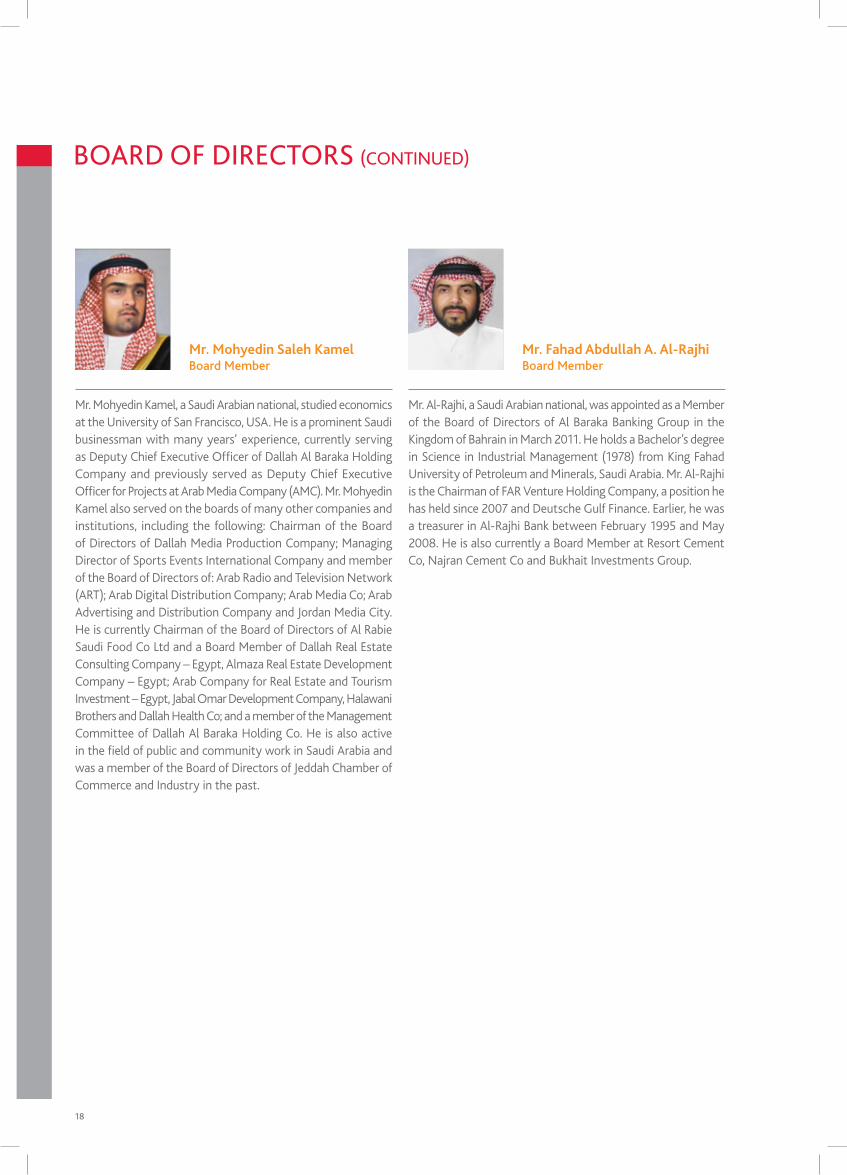
Mr. Al-Rajhi, a Saudi Arabian national, was appointed as a Member of the Board of Directors of Al Baraka Banking Group in the Kingdom of Bahrain in March 2011. He holds a Bachelor’s degree in Science in Industrial Management (1978) from King Fahad University of Petroleum and Minerals, Saudi Arabia. Mr. Al-Rajhi is the Chairman of FAR venture Holding Company, a position he has held since 2007 and Deutsche Gulf Finance. Earlier, he was a treasurer in Al-Rajhi Bank between February 1995 and May 2008. He is also currently a Board Member at Resort Cement Co, Najran Cement Co and Bukhait Investments Group.
Mr. Fahad Abdullah A. Al-RajhiBoard Member
Mr. Mohyedin Kamel, a Saudi Arabian national, studied economics at the University of San Francisco, USA. He is a prominent Saudi businessman with many years’ experience, currently serving as Deputy Chief Executive Officer of Dallah Al Baraka Holding Company and previously served as Deputy Chief Executive Officer for Projects at Arab Media Company (AMC). Mr. Mohyedin Kamel also served on the boards of many other companies and institutions, including the following: Chairman of the Board of Directors of Dallah Media Production Company; Managing Director of Sports Events International Company and member of the Board of Directors of: Arab Radio and Television Network (ART); Arab Digital Distribution Company; Arab Media Co; Arab Advertising and Distribution Company and Jordan Media City. He is currently Chairman of the Board of Directors of Al Rabie Saudi Food Co ltd and a Board Member of Dallah Real Estate Consulting Company – Egypt, Almaza Real Estate Development Company – Egypt; Arab Company for Real Estate and Tourism Investment – Egypt, Jabal Omar Development Company, Halawani Brothers and Dallah Health Co; and a member of the Management Committee of Dallah Al Baraka Holding Co. He is also active in the field of public and community work in Saudi Arabia and was a member of the Board of Directors of Jeddah Chamber of Commerce and Industry in the past.
Mr. Mohyedin Saleh KamelBoard Member
Annual Report – 2011
19
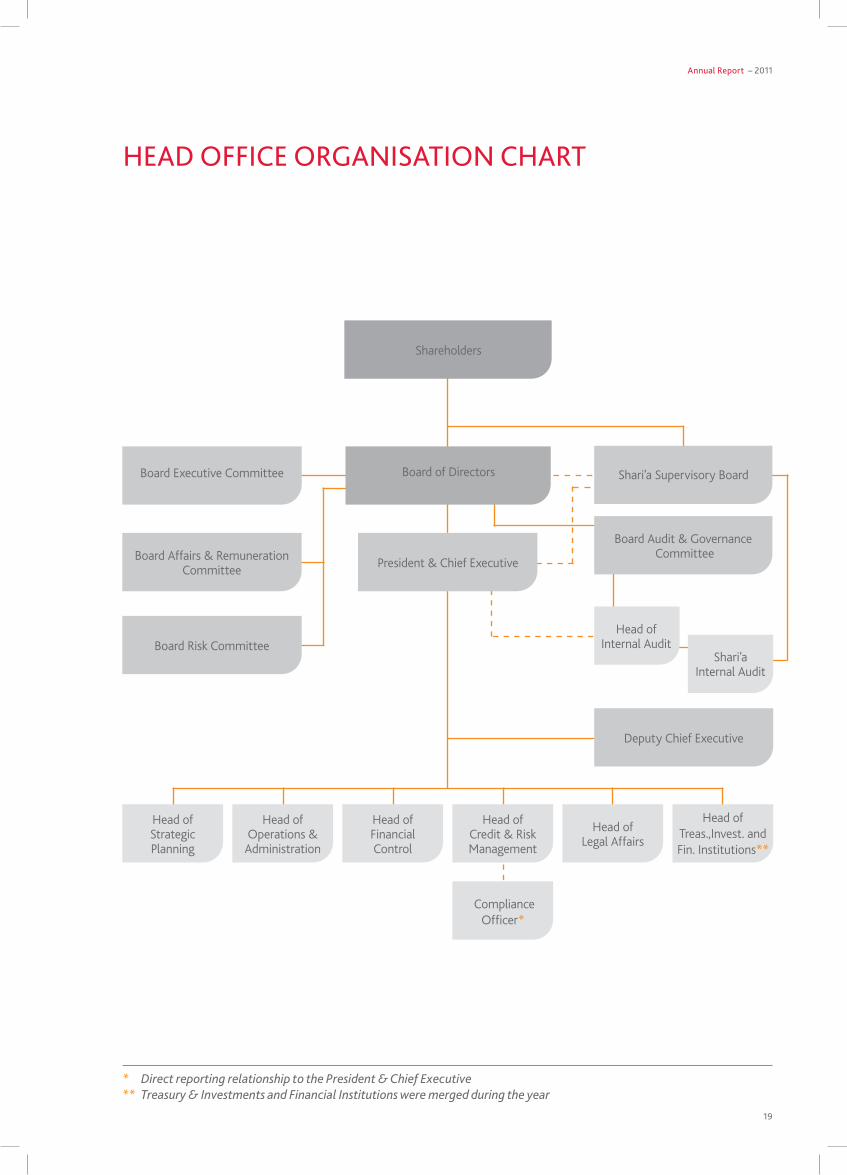
* Direct reporting relationship to the President & Chief Executive ** Treasury & Investments and Financial Institutions were merged during the year
HeAd oFFiCe oRgAnisAtion CHARt
Shareholders
Board of Directors
President & Chief Executive
Board Executive Committee
Board Audit & Governance CommitteeBoard Affairs & Remuneration
Committee
Board Risk Committee
Shari’a Supervisory Board
Deputy Chief Executive
Head of Internal Audit
Head of StrategicPlanning
Head of Legal Affairs
Head of Operations & Administration
Head of FinancialControl
Head of Credit & Risk Management
Compliance Officer*
Shari’a Internal Audit
Head of Treas.,Invest. and Fin. Institutions**
20
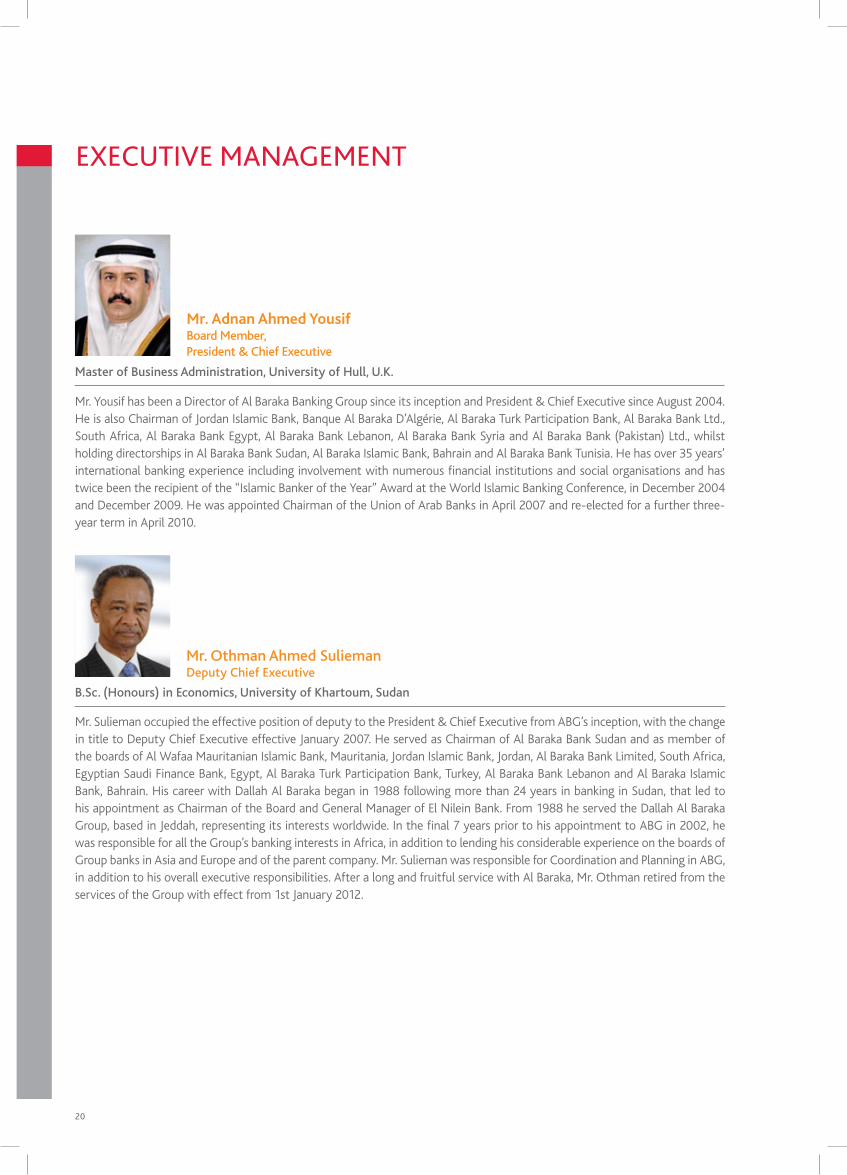
Mr. Adnan Ahmed YousifBoard Member,President & Chief Executive
Master of Business Administration, University of Hull, U.K.
Mr. yousif has been a Director of Al Baraka Banking Group since its inception and President & Chief Executive since August 2004. He is also Chairman of Jordan Islamic Bank, Banque Al Baraka D’Algérie, Al Baraka Turk Participation Bank, Al Baraka Bank ltd., South Africa, Al Baraka Bank Egypt, Al Baraka Bank lebanon, Al Baraka Bank Syria and Al Baraka Bank (Pakistan) ltd., whilst holding directorships in Al Baraka Bank Sudan, Al Baraka Islamic Bank, Bahrain and Al Baraka Bank Tunisia. He has over 35 years’ international banking experience including involvement with numerous financial institutions and social organisations and has twice been the recipient of the “Islamic Banker of the year” Award at the world Islamic Banking Conference, in December 2004 and December 2009. He was appointed Chairman of the Union of Arab Banks in April 2007 and re-elected for a further three-year term in April 2010.
exeCUtiVe mAnAgement
Mr. Sulieman occupied the effective position of deputy to the President & Chief Executive from ABG’s inception, with the change in title to Deputy Chief Executive effective January 2007. He served as Chairman of Al Baraka Bank Sudan and as member of the boards of Al wafaa Mauritanian Islamic Bank, Mauritania, Jordan Islamic Bank, Jordan, Al Baraka Bank limited, South Africa, Egyptian Saudi Finance Bank, Egypt, Al Baraka Turk Participation Bank, Turkey, Al Baraka Bank lebanon and Al Baraka Islamic Bank, Bahrain. His career with Dallah Al Baraka began in 1988 following more than 24 years in banking in Sudan, that led to his appointment as Chairman of the Board and General Manager of El Nilein Bank. From 1988 he served the Dallah Al Baraka Group, based in Jeddah, representing its interests worldwide. In the final 7 years prior to his appointment to ABG in 2002, he was responsible for all the Group’s banking interests in Africa, in addition to lending his considerable experience on the boards of Group banks in Asia and Europe and of the parent company. Mr. Sulieman was responsible for Coordination and Planning in ABG, in addition to his overall executive responsibilities. After a long and fruitful service with Al Baraka, Mr. Othman retired from the services of the Group with effect from 1st January 2012.
Mr. Othman Ahmed SuliemanDeputy Chief Executive
B.Sc. (Honours) in Economics, University of Khartoum, Sudan
Annual Report – 2011
21
Has over 31 years of international banking experience, mainly in audit and as Head of Operations. He began his career at Banque National de Paris in Bahrain in 1981 as Head of Operations, subsequently moving to Arab Banking Corporation (B.S.C.)’s Internal Audit Department in 1988 as an audit team leader, where he carried out audits of the Head Office departments and the bank’s branches and subsidiaries spread over Europe, the Americas, the Far East and across the Arab world. He joined ABG in 2000, when it was still under formation, to establish and head the internal audit department, which is responsible for reviewing the activities of all ABG’s subsidiary banks as well as the Group’s Head Office in Bahrain, in addition to the review of control of IT as well as its Shari’a aspects. Mr. Alawi reports directly to the Audit and Governance Committee of the Board of ABG, for whom he also acts as Secretary. He also participates as an observer member in the meetings of the Audit Committees of all ABG’s subsidiaries.
Mr. Majeed H. AlawiSenior Vice PresidentHead of Internal Audit
FCCA – Fellow of the Chartered Association of Certified Accountants, U.K.
Has over 35 years of experience in financial and management reporting, corporate and structured finance, credit, strategic planning, project management, equity research, fund management and administration. He has worked in the Middle East and in North America. After spending several years in the accountancy field in India and Bahrain, Mr. Krishnamoorthy joined Arab Banking Corporation (B.S.C.)’s investment banking subsidiary, where he served for 11 years before moving to the parent bank’s Treasury Department to manage its mutual fund investment portfolio and the Treasury Mid-Office. Following this he spent 2 years as a partner in a regional investment bank in the Gulf, and a further period heading the worldwide banking solutions business of a major Canadian IT solutions company in Toronto, Canada. In 2004 he took up his position at ABG, initially as Head of Financial Control followed in mid-2006 as Senior vice President - Head of Strategic Planning.
Mr. K. KrishnamoorthySenior Vice PresidentHead of Strategic Planning
ACA – Associate of the Institute of Chartered Accountants of India; B.Com., Osmania University, India

22
exeCUtiVe mAnAgement (ContinUed)
Has over 38 years of banking experience gained in senior positions with various international financial institutions, both Islamic and conventional. He commenced his career with Habib Bank ltd in 1973, later working at the Bahrain offices of Chase Manhattan Bank, Bank of America, American Express Bank and Bahrain Middle East Bank. After a successful career with Shamil Bank of Bahrain (formerly Faysal Islamic Bank of Bahrain), in 2002 he was appointed Assistant Chief Executive Officer – Operations at Bahrain Islamic Bank, subsequently joining ABG, in May 2006. Mr. Shehab is a Board Member of Banque Al Baraka D’Algérie and Al Baraka Bank (Pakistan) ltd.
Mr. Abdulrahman ShehabSenior Vice PresidentHead of Operations and Administration
Master of Business Administration, University of Hull, U.K.
Has over 36 years of international banking experience involving credit, risk management, commercial banking and trade finance. He commenced his banking career with Bank of Montreal, Canada in international banking and was later its Middle East Representative, initially in Beirut, lebanon and thereafter in london. He joined Gulf International Bank B.S.C. (GIB) in 1979 as Regional Marketing and Credit Officer for Central Europe based in london. He subsequently worked in various capacities in GIB within Credit and Business Development. In 2001, he was appointed Chief Credit Officer of GIB in Bahrain, responsible for credit administration, economics, legal and credit review. He was also a member of the Group Risk Committee. His most recent position with GIB was as Executive vice President, Head of International Banking with responsibility for commercial banking business outside the GCC. Mr. Szalay has been a member of ABG’s Executive Management team since September 2006.
Mr. Jozsef Peter SzalaySenior Vice PresidentHead of Credit and Risk Management
M.A. (Econ.) University of Budapest; Banking Certificate – The Institute of Canadian Bankers; Advanced Management Program – INSEAD France
Has over 18 years’ experience in financial control and auditing. Prior to joining ABG in February 2005, he worked at Shamil Bank as Senior Manager, Internal Audit. Prior to this role, he was a member of the Audit team at Arthur Andersen. He is the Deputy Chairman of the Accounting and Auditing Standards Board of the Accounting and Auditing Organization for Islamic Financial Institutions (AAOIFI). He is also a Board Member of Al Baraka Turk Participation Bank, Jordan Islamic Bank and Banque Al Baraka D’Algérie, in addition to serving as Chairman of the Board Risk Committee of Banque Al Baraka D’Algérie and of the Audit Committee of Al Baraka Turk Participation Bank, and member of the Audit Committees of Jordan Islamic Bank and Banque Al Baraka D’Algérie.
Mr. Hamad Abdulla Ali EqabSenior Vice PresidentHead of Financial Control
Certified Public Accountant (CPA)
Annual Report – 2011
23
Mr. Salah Othman AbuzaidSenior Vice PresidentHead of Legal Affairs
Mr. Khalid Al QattanFirst Vice PresidentHead of Treasury, Investments and Financial Institutions
Has over 28 years’ professional experience as a judge, practicing advocate and legal consultant serving a wide spectrum of local, regional and international clientele. After 20 years of practice in these various capacities in Sudan, he moved to the Sultanate of Oman in 2001 to work for an Omani law firm associated with an International law firm and was admitted to practice before all Omani courts by the Omani Advocates Admission Committee. In 2004, he moved to Bahrain to join Al Baraka Islamic Bank as Manager, legal Affairs, followed in 2007 by his move to ABG as First vice President - Head of legal Affairs & Compliance, from which position he was promoted to the position of Senior vice President. He also serves as Secretary to the Board of Directors of ABG.
Has over 26 years of banking experience in Treasury and Operations. He commenced his banking career at United Gulf Bank as an Operations Clerk in 1983. In 1988, he joined Shamil Bank as Operations Clerk and was subsequently promoted to Manager in charge of the bank’s Treasury operations. He was later appointed Treasury Manager at Eskan Bank and served as such between April 2006 and May 2007, where he was responsible for the overall liquidity management of the bank and also served on several management committees. In June 2007 he joined ABG as vice President and was promoted to the position of First vice President - Head of Treasury and Investments in 2008.
Master of Business Administration - University of Hull, UK
LLB, Faculty of Law - University of Khartoum

diReCtoRs’ RepoRt
24

Annual Report – 2011
25
26
Global and Regional Economies last year we noted that the whole developed world had begun speaking of a new ‘age of austerity’ and warning of ‘the largest synchronised budget contraction in more than 40 years’. we did not know what effect these actions would have on global demand, and thus growth, but hoped that it would be at worst a new global slowdown and not renewed recession. when we consider the relative strength with which the economies of the world seemed to bounce back from the 2009 recession, with global production growing by 5.0% in 2010 (as opposed to a -1.2% fall the previous year), it is then all the more disappointing that the recovery should appear to have run out of steam quite so quickly. In 2011 global growth retreated to 3.8%, with most of that growth coming from China, India and the developing countries, as the OECD countries contributed a mere 1.9% growth between them, with only a handful showing growth of 5.0% or more.
The prognosis for 2012 is also bleak, as global growth is forecasted to decline even further to 3.4%, with OECD growth at 1.6%, the eurozone’s at a virtual standstill at 0.2% and even China’s and India’s falling back to 8.1% and 6.3% respectively. Several countries are at risk of falling back into recession.
Although there continues to be much discussion as to the varied reasons behind the softness of this recovery, it seems clear that confidence, or rather the lack of it, plays a large part. Many large corporations in the major economies are holding significant cash reserves but are unwilling to invest at this time as they fear another recession, while consumers are spending less as the bite of the austerity measures, enacted to address the burden of debt and budget deficits run up by their governments in response to the recession in the first place, begin to be felt. Those countries that have tried quantitative easing, increased infrastructure spending or other measures to pump liquidity into their markets can do little more than wait for that liquidity to feed into the system or else to repeat the exercise.
One thing is certain: in time confidence will return and with it investment, production, trade and economic progress. Contributing to the process of recovery will be those economies which have not been as badly affected by the new slowdown and which will therefore continue to invest in infrastructure development and continue to buy goods and services from others. Amongst these are some of the regional economies in which ABG has a stake and will therefore be playing its part.
Of the countries in which ABG’s subsidiaries operate, one stands out in terms of economic growth in 2011: Turkey, whose economy grew by 7.8% through the maintenance of a low interest rate
(All figures in US dollars unless otherwise stated)
diReCtoRs’ RepoRt
environment. South Africa, despite the pressure on the Rand, managed to turn in a still creditable 3.1% rate of growth. Pakistan recorded a significantly reduced GDP growth rate of 2.4% in the aftermath of disastrous floods and resulting energy shortages due to damaged or destroyed generating plant. Jordan and lebanon also experienced reduced growth rates, of 2.5% and 1.5% respectively, a reflection of reduced inter-Arab trade flows following the events of the so-called ‘Arab Spring’. Egypt, Tunisia and Syria all suffered a severe curtailment of economic activity as the civil disturbances, in some cases leading to revolution, disrupted economic activity at least for part of the year, with growth ranging between -2.0% and 1.8% in their cases. Algeria’s economic growth, though down on previous years, remained moderately healthy at 2.9%, while Sudan, negatively affected by the secession of the southern part of the country to form the new state of South Sudan, suffered a -0.2% drop in GDP as the value of its currency plummeted against hard currencies leading to a steep rise in import prices.
Again, we have to say we cannot predict the future but, as ever, we continue to view it with cautious optimism, while at the same time remain determined to protect our shareholders’ investment through good stewardship and vigilance towards liquidity, credit quality and corporate governance.
2011 Review
The Group’s total income from jointly financed accounts and investments, together with its share as Mudarib, was $335.0 million, some 12% above that for 2010. Income from self financed contracts and investments and Mudarib share from managing off-balance sheet equity of investment account-holders was however 20% higher at $183.3 million. Including other operating income and revenues from banking services, the Group’s total operating income was $740.9 million, 13% higher than that for 2010. Higher operating expenses of $396.7 million therefore resulted in the net income before provisions and taxation reaching $344.2 million compared with $316.3 million in 2010. After allocating prudential provisions and taxation, the net income of the Group for the year was $212.3 million, a rise of 10% compared with the $193.2 million earned in 2010.
An 8% growth in the customer deposit base, which rose to $14.7 billion, together with other liabilities, funded an expansion of the Group’s banking assets in all categories other than the Mudaraba and Musharaka portfolios, and in its cash and balances with banks which ended the year 21% higher at $4.6 billion. The Group’s total assets consequently rose to $17.2 billion, an 8% increase over 2010.
Annual Report – 2011
27
we were pleased to note that, notwithstanding the decline in economic activity in many countries in which our units operate, in addition to a decline in some cases in the values of their local currencies relative to the US dollar with the resultant impact on their performance when stated in our base currency, most of them were able to report a positive result.
In light of the Group’s performance in 2011, the Board of Directors has recommended a cash dividend distribution to the shareholders of 3.5% of the paid up capital, amounting to $30.43 million, after a transfer of $11.84 million to the legal reserve and the remaining net income of $76.10 million being allocated to retained earnings. The Board has also recommended a bonus dividend of 1 share for every 6 shares held, to be allocated from Retained Earnings and amounting to $144.93 million. The Board has further recommended a remuneration distribution of $0.75 million, to be charged to expenses following the approval of shareholders at the Annual General Meeting.
Ownership of shares in ABG by Board Members and Executive Management (with the exception of that of the Chairman) is not material and no major trading of such shares took place during 2011. Details of shares held by Directors and members of the Executive Management are provided in the Notes to the Consolidated Financial Statements.
Looking Ahead...
ABG has emerged from 2011 with sound liquidity and a healthy core business. Although the events of 2011 have left their mark on local economies, we remain optimistic over our plans for ABG’s continuing growth and expansion through pursuance of our medium term strategic objectives:
• Planned geographical expansion: we remain committed to the markets in which we operate - strengthening our niche presence in each and thereby replicating our successes - while at the same time continuing our search for expansion opportunities outside our established markets. we have plans in place to increase our branch network throughout the Group during 2012, albeit conservatively. The merger of the branch operations of Al Baraka Islamic Bank in Pakistan with Emirates Global Islamic Bank created one of the largest Islamic banks in Pakistan which, under its new name of Al Baraka Bank (Pakistan) limited, is well on its way toward achieving business growth. The Group will continue to observe events in libya with the intention of obtaining official approvals to open a representative office there.
(All figures in US dollars unless otherwise stated)
• Increased profitability: In 2011, though a difficult year, we continued to strengthen our internal and external operation and business capabilities in order to achieve sustainable, increasing profitability.
• Product innovation: with our subsidiaries continuously introducing innovative new products and meeting customers’ needs, we are confident that we will remain in the forefront of cutting edge product development.
• Advanced IT systems and processes: State-of-the-art systems have been implemented in most operating units, designed to meet the Group’s demands into the next decade and achieve optimum management efficiency and customer satisfaction.
• Continuous strengthening of the risk management and corporate governance culture: Our risk management processes and corporate governance practices are continuously being reviewed and upgraded to ensure that they remain at the level of best industry practice.
we will continue to pursue our strategy of ensuring a strong liquidity base throughout the Group and maintaining a cautious approach to financing and cost discipline, whilst keeping faith with our retail and SME business model that has served us so well all these years.
It is with regret we advise that Mr. Othman Ahmed Sulieman, our erstwhile Deputy Chief Executive, who retired from the Group on January 1st, 2012 sadly passed away shortly afterwards. On behalf of the Board of Directors, Executive Management and all Al Baraka employees worldwide, I should like to record with gratitude our great appreciation for the eminent service and valuable contribution to the Group by Mr. Othman Ahmed Sulieman. He will be much missed by all who knew him. May Allah grant him peace and serenity.
In conclusion, I should like as always to take this opportunity to extend, on behalf of the Board and Executive Management, our appreciation to our Shari’a Supervisory Board, the Central Bank of Bahrain, the Ministry of Commerce and Industry and all of our subsidiaries’ regulatory authorities for their support and guidance during 2011.
For and on behalf of the Board of Directors
Saleh Abdullah KamelChairman

pResident & CHieF exeCUtiVe’s RepoRt
28

29
Annual Report – 2011
30
Despite the recent turmoil in some of the Group’s countries of operations, with consequential interruption to business activities there, 2011 saw a further expansion in the Group’s operational base as its total assets rose by 8%. while Mudaraba financing outstanding was 49% lower than, and Musharaka 2% below, 2010 levels, Ijarah Muntahia Bittamleek rose (by 28%), as did the investments (by 55%) and the values of property, equipment and other assets, reflecting the Group’s ongoing infrastructure programme, along with its liquid resources. This growth was naturally a corollary of similar growth in liabilities, as customer deposits including equity of investment account-holders (IAH) increased by 8% and other liabilities rose by 38%.
The expansion in both assets and customer deposits was essentially a broad-based one, with most subsidiaries reporting healthy increases, many of them in double digits.
At Al Baraka Turkey total assets rose by 2% in US dollar terms (24% in Turkish lira terms) reflecting the fall in the value of the lira over the year, despite the bank expanding its Murabaha business and Non-trading investments. Jordan Islamic Bank’s assets rose 11% on the back of 6% growth in its financings and investments portfolios, mainly on account of growth in Mudaraba and Ijarah Muntahia Bittamleek financings. Al Baraka Egypt’s assets expanded by 5% mainly on account of growth in non-trading investments. Al Baraka Algeria’s assets rose by 9%, despite Central Bank curbs on personal finance, as growth in its Ijarah Muntahia Bittamleek and Istisna’a portfolios compensated
for the drop in Salam and Murabaha. Al Baraka Bahrain’s 22% increase in assets arose chiefly from Murabaha, cash and banks’ balances and Ijarah Muntahia Bittamleek growth, while its own Pakistan subsidiary saw 14% asset growth as its financings and investments expanded by 23%, as a significant 63% increase in non-trading investments more than compensated for a fall in its Ijarah business. Al Baraka Tunisia meanwhile experienced 2% overall decline in the wake of the revolution as its financings and investments portfolios fell by 12% overall.
The South African unit’s assets rose by some 15% in local currency but, due to a substantial fall in the Rand against the US dollar, this was translated into a fall of 6% - nevertheless there was good growth witnessed in Musharaka and Murabaha. lebanon reported a 20% overall asset rise, mainly from expanding cash and banks’ balances, Mudaraba and Murabaha portfolios and investment in properties. Sudan’s 16% rise in total assets reflected a rise in non-trading investments, Musharaka and Murabaha. Al Baraka Syria managed almost to quadruple its assets in its first full year of operations, reflecting similar expansion in its financings and investments, mainly due to demand for its Murabaha and Mudaraba products.
Of the financing and investment portfolios, the largest increase in both absolute and relative terms was seen firstly in non-trading investments (which rose by 61%) and then in the Ijarah Muntahia Bittamleek portfolio.
pResident & CHieF exeCUtiVe’s RepoRt
Management Discussion and Analysis
(All figures in US dollars unless otherwise stated)
Annual Report – 2011
31
As mentioned by the Chairman in the Directors’ Report, we must sadly record that Mr. Othman Ahmed Sulieman, Deputy Chief Executive, who retired from the services of ABG on 1st January 2012, passed away suddenly on 6th January 2012. The whole Group owes an enormous debt of gratitude to Mr. Othman Ahmed Sulieman whose contribution, from the inception of the Group, was invaluable. He will be much missed and we commend him to the merciful care of Almighty Allah.
Review of Units
The following is a brief review of each of our subsidiaries, their activities and performance over the past year. Figures are stated in the US dollar equivalents of the audited local currency-based balance sheets and income statements, prepared in accordance with the Islamic Accounting Standards issued by the Accounting and Auditing Organisation for Islamic Financial Institutions (and IFRS, where AAOIFI was silent) and without any Group level consolidation adjustments.
Each unit is managed by its respective Board of Directors, whose reporting lines are ultimately to the Parent, ABG, but whose decision-making is decentralised within the Group’s overall strategic direction and in full compliance with the regulations of the respective countries’ Central Banks.
Growth was funded by an 8% increase in the Group’s customer deposits including equity of investment account-holders (IAH), which rose to $14.68 billion. IAH itself grew by 2% to $10.47 billion and equalled 71% of total customer deposits including IAH. Aggregate off-balance sheet IAH grew by 15% to $523 million, while contingencies and commitments grew by 6% to $4.70 billion.
Total operating income of the Group rose by 13% to $741 million. This result was affected by an estimated 4.8% as a result of the adverse movement of our subsidiaries’ respective local currencies against the US dollar. Total operating expenses, on the other hand, increased by 16% mainly on account of increases in staff and other operating costs in support of the Group’s branch network expansion, fully fledged operations in Syria and the first full year of operations in Pakistan post merger. The net operating income therefore increased by 9% to $344 million. Provisions of $51 million represented a reduction of 15% on those of 2010, while the taxation charge was increased by 28% to $81 million. The net income was therefore $212 million, a 10% increase over 2010.
In 2011 the Group received an award – for the second year in succession – at the Success in Digital Investor Relations conference held in Dubai for the best corporate website among companies listed on the Bahrain Bourse, following a technical evaluation by investors and analysts.
(All figures in US dollars unless otherwise stated)
32
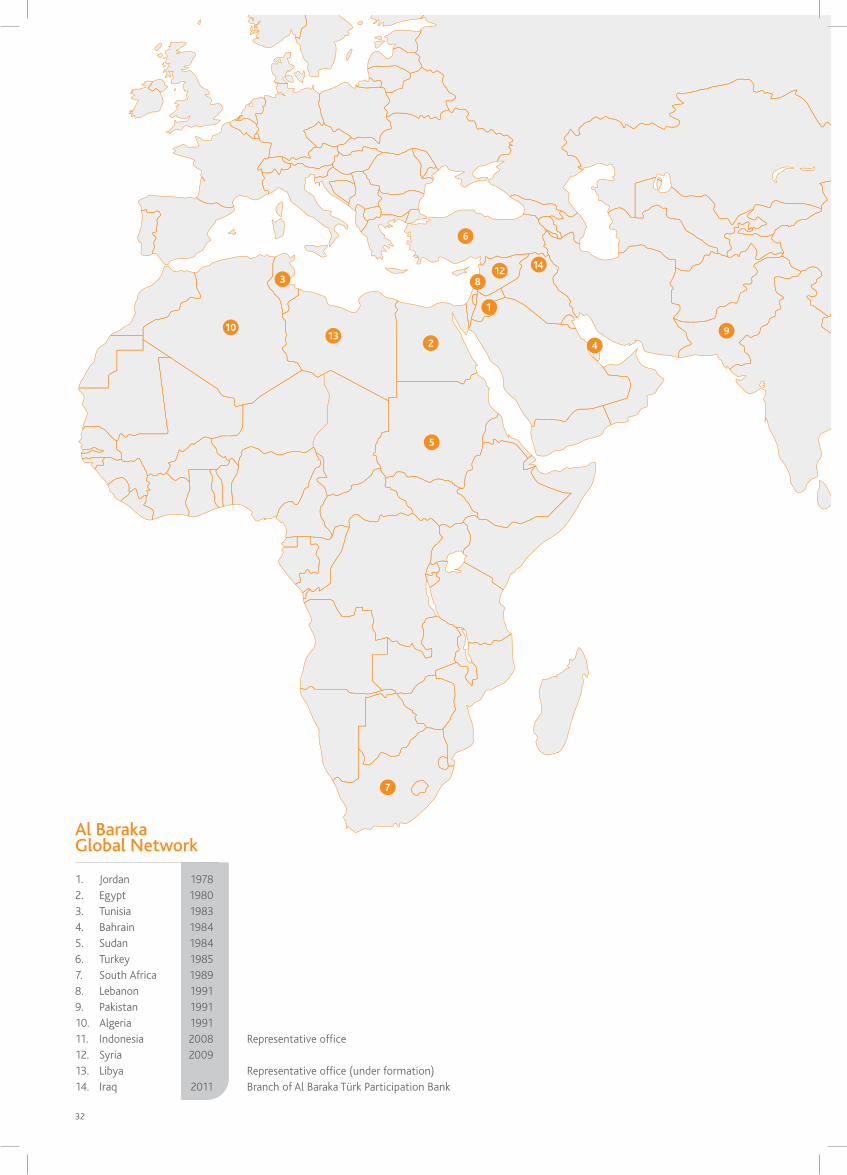
Representative office
Representative office (under formation)Branch of Al Baraka Türk Participation Bank
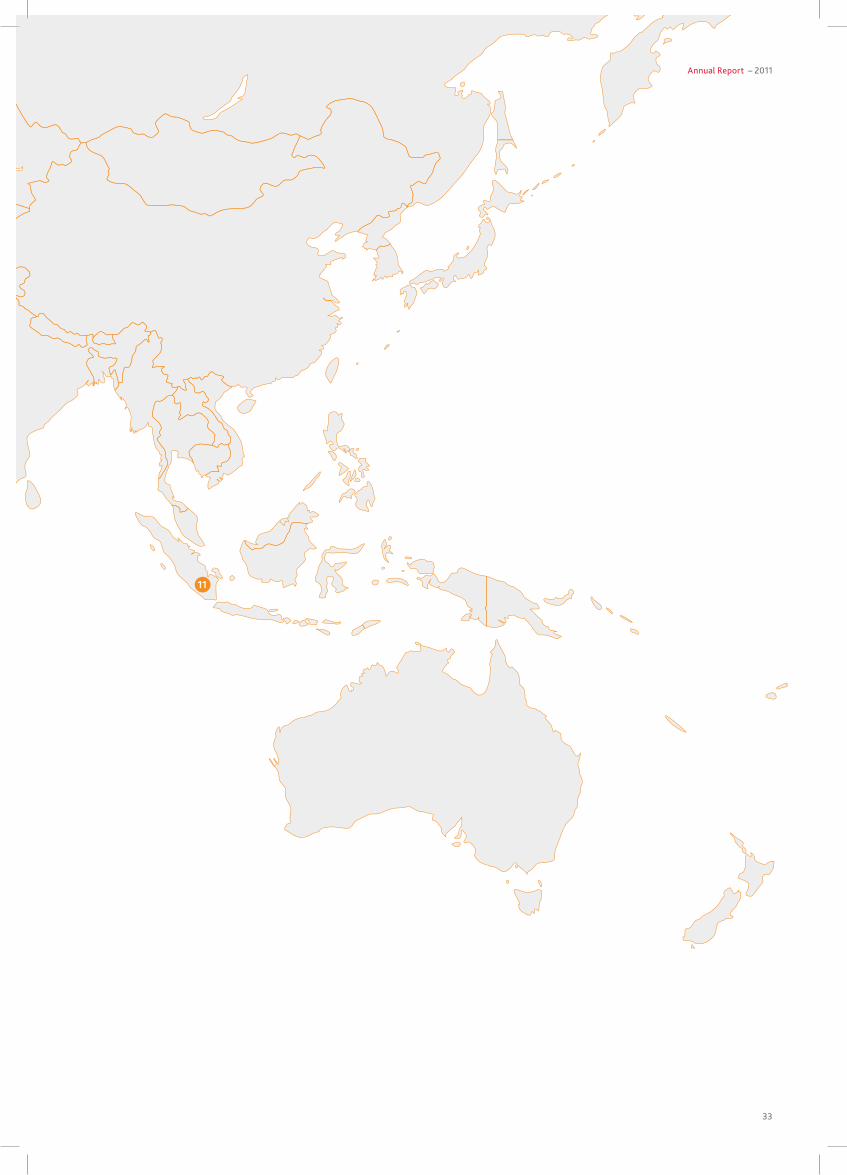
Al Baraka Global Network
1. Jordan 19782. Egypt 19803. Tunisia 19834. Bahrain 19845. Sudan 19846. Turkey 19857. South Africa 19898. lebanon 19919. Pakistan 199110. Algeria 199111. Indonesia 200812. Syria 200913. libya14. Iraq 2011
33
Annual Report – 2011
34
Al Baraka Türk Participation BankFounded 1985
pResident & CHieF exeCUtiVe’s RepoRt (ContinUed)
In 2011 the Turkish economy remained strong, recording a GDP growth rate of 7.8% compared with 8.9% in 2010. Inflation was slightly up at 6.5% compared with 6.4% the previous year. However, the continuing strong economic performance has primarily been fuelled by the low interest rate environment which has been maintained even in the teeth of threatening inflation – as a result the current account deficit has surged to -10.3% of GDP from -6.6% the year before, a worrying deterioration from the -2.0% seen in 2009 which itself was the result of a successful policy of downward management applied over several years. In spite of intervention by the Central Bank in the foreign exchange markets to minimise the volatility of the Turkish lira, the lira had fallen by some 20% over the year. However, fears of contagion from the euro zone crisis and global economic slowdown have so far proved unfounded.
In the face of these uncertainties, Al Baraka Turkey nevertheless managed to maintain its expansionary momentum, reporting asset growth of 24% over 2010. However, the decline in the value of the Turkish lira over the year translated into a minimal 2% increase in the bank’s total assets in US dollar terms, to $5.54 billion. Thus, total financings and investments grew by 16% in lira terms but fell by 5% in dollar terms to $4.13 billion. The small increase in the US dollar asset base was led by a 34% expansion in cash and banks’ balances, against reductions in the size of the Murabaha, Musharaka and Ijarah Muntahia Bittamleek portfolios.
Total income from jointly financed accounts and investments fell in 2011, by 3% to $308 million. After distribution to the equity of investment account-holders of their share of the income, amounting to $218 million, the bank’s share as fund owner and Mudarib of $90 million was 2% higher than that for 2010. Income from the bank’s self-funded activities grew by 27% to
$151 million. with the inclusion of revenues from banking services and other operating income, the total operating income, although in Turkish lira terms rising by 25%, in US dollar terms was 13% higher than in 2010 at $317 million. Operating expenses also grew in US dollar terms, by 25% to $159 million, partly attributable to higher staff expenses but mainly to a 58% increase in other operating expenses. After accounting for provisions - slightly lower than the previous year - and taxation charge, the net profit realised was $96 million, 2% above that of 2010.
The branch network continued its steady growth rate with the addition of 13 new branches including 1 branch in Erbil, Iraq - bringing the network up to 122 branches - and 14 more ATMs. Al Baraka Turkey continues to expand its range of products and services in order to meet customer demand and needs. Participation accounts are offered in a variety of different types, offering the customer a selection of profit rates in relation to different maturities. Having become an authorised agent and member of the Turkish private pension system, it now offers customers a variety of non-interest bearing pension funds as well as Shari’a compliant life insurance. In the credit card arena it has created a card especially for the use of Hajj and Umrah pilgrims, providing electronic access to their bank accounts whilst on Pilgrimage and has also commenced the introduction to the market of credit cards payable by instalments.
Other products under development include Silver current accounts and Gold participation accounts carrying additional benefits to holders, export credit agency programmes and precious metals credits and trading accounts. It also intends to initiate mobile banking, introduce a Platinum card and set up an investment fund. It will continue to expand its network, aiming to open 20 new branches a year over the next 4 years.
(All figures in US dollars unless otherwise stated)
Annual Report – 2011
35
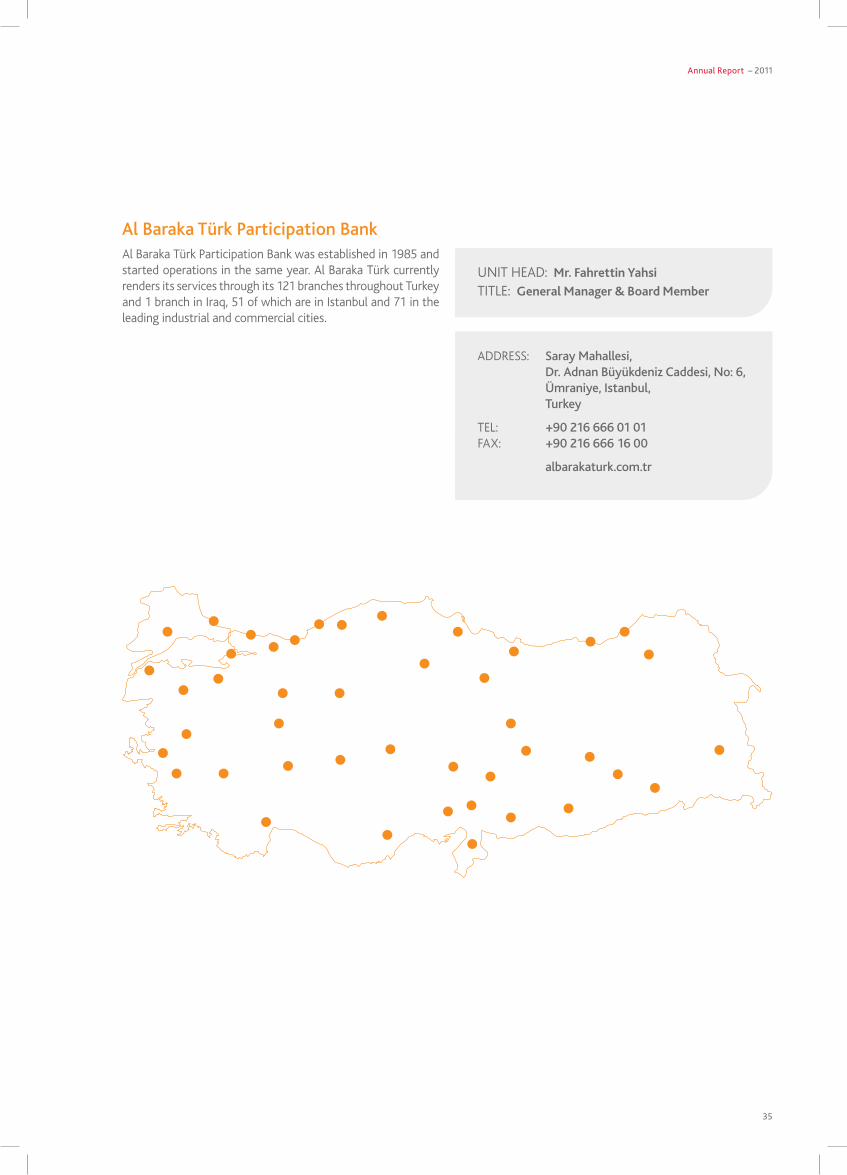
Al Baraka Türk Participation Bank was established in 1985 and started operations in the same year. Al Baraka Türk currently renders its services through its 121 branches throughout Turkey and 1 branch in Iraq, 51 of which are in Istanbul and 71 in the leading industrial and commercial cities.
Al Baraka Türk Participation Bank
UNIT HEAD: Mr. Fahrettin YahsiTITlE: General Manager & Board Member
ADDRESS: Saray Mahallesi, Dr. Adnan Büyükdeniz Caddesi, No: 6, Ümraniye, Istanbul, Turkey
TEl: +90 216 666 01 01FAx: +90 216 666 16 00
albarakaturk.com.tr
36
Jordan Islamic BankFounded 1978
pResident & CHieF exeCUtiVe’s RepoRt (ContinUed)
In 2011 the Jordanian economy, impacted by higher international prices, reduced trade flows between Jordan and several of the so-called ‘Arab Spring’ countries – Syria in particular – and a fall in tourism revenues and inward investment, grew only slightly from 2.3% in 2010 to an estimated 2.5%. The rate of inflation, which reached 6.1% in 2010, was roughly stable and is estimated to have ended the year at about 5.0%. The current account deficit and high level of public debt remain of concern, having increased to an estimated -6.7% from -4.9% of GDP in 2010.
However, the business of Jordan Islamic Bank (Al Baraka Jordan) was not overly affected by these developments, apart from the problem of having to place its excess liquidity in the market as it adopted a more cautious stance towards risk. Total assets at the bank increased by 11% over 2010 to reach $4.09 billion. Financings and investments grew by 6% to $2.19 billion, represented mainly by new Mudaraba business and a healthy increase in Ijarah Muntahia Bittamleek with a moderate increase in the Murabaha portfolio which is the largest constituent part. The growth was in turn funded by a 12% increase in customer deposits including equity of investment account-holders, which reached $3.70 billion in total.
The bank’s total income from jointly financed contracts and investments rose 9% to $155 million. After accounting for the investment account-holders for their share, which was 16% higher at $76 million, the balance earned by the bank including
its share as Mudarib was 3% higher than in 2010 at $79 million. The income earned from its own sales and investments (including a $7 million profit from the sale of the bank’s visa rights in August) added $8 million, Mudarib share from the off-balance sheet investment account-holders, revenue from banking services and other operating income contributed a further $34 million. Total operating income therefore grew by 11% to $113 million. Net operating income was 4% higher at $60 million, despite a 20% increase in total operating expenses emanating from substantial staff costs escalation due to a recent change in employees’ pay scales. After allocations for provisions and taxation, the resultant net profit was $42 million, 3% higher than the result for 2010.
Al Baraka Jordan expanded its branch network during the year by 2 new branches and 1 new cash office, bringing the total to 75 branches and cash offices. It also added 22 machines to its ATM network, which now numbers 107. Over the next 5 years it intends to further expand these networks, opening 3 more branches and 2 more cash offices in 2012 in step with its goal of reaching 96 branches and cash offices by 2016.
Al Baraka Jordan is continually expanding its already extensive product range and is currently planning the launch of a number of new credit products, aimed at financing customers’ students’ tuition fees, Hajj and Umrah associated costs and medical treatment. It also expects to open soon a new Contact Centre to assist customers and market the bank’s products and services.
(All figures in US dollars unless otherwise stated)
Annual Report – 2011
37
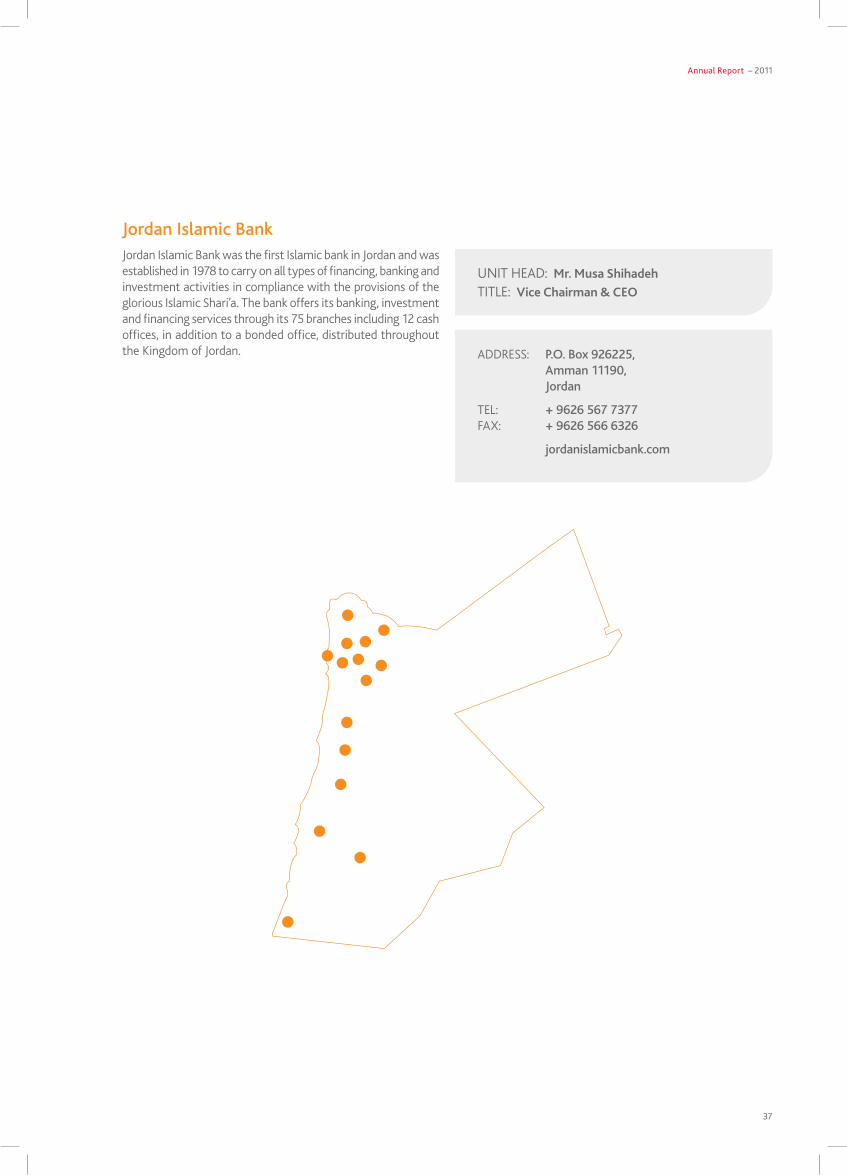
UNIT HEAD: Mr. Musa ShihadehTITlE: Vice Chairman & CEO
ADDRESS: P.O. Box 926225, Amman 11190, Jordan
TEl: + 9626 567 7377FAx: + 9626 566 6326
jordanislamicbank.com
Jordan Islamic Bank was the first Islamic bank in Jordan and was established in 1978 to carry on all types of financing, banking and investment activities in compliance with the provisions of the glorious Islamic Shari’a. The bank offers its banking, investment and financing services through its 75 branches including 12 cash offices, in addition to a bonded office, distributed throughout the Kingdom of Jordan.
Jordan Islamic Bank
38
Al Baraka Bank EgyptFounded 1980
pResident & CHieF exeCUtiVe’s RepoRt (ContinUed)
The events of February 2011 and the unrest which followed it had a clear impact on the Egyptian economy, as evidenced by a GDP growth rate estimated at a mere 1.8% compared with 5.1% in 2010. However it appears that inflation was well contained, at an estimated 10.2% year on year, compared with the rate of 10.7% the previous year. There was a steady decline in the Central Bank’s foreign exchange reserves, though, from $36 billion held in December 2010 to $20 billion in November 2011, as reserves were utilised to support the Egyptian pound in the foreign exchange markets and to combat inflation. The current account deficit, moreover, grew from a moderate -0.2% of GDP in 2010 to around -2.1% of GDP while the government’s budget deficit also expanded from -8.0% to an estimated -10.0%, exacerbated by a significant drop in inward remittances from expatriate Egyptians.
The downgrading of Egypt’s credit rating by several of the international rating agencies resulted in a drop in foreign direct investment and foreign trade as well as higher insurance costs.The efforts of the Ministry of Finance to cover the budget deficit through the issuance of volumes of debt instruments led to a rise in interest rates on treasury bills. However, base interest rates for overnight lending and deposits were maintained unchanged by the Central Bank right up till November 2011, when they were increased in an effort to support the weakening Egyptian pound and to avoid further negative impact on the economy; notwithstanding these efforts the heightened state of uncertainty and anxiety has impacted on all aspects of commercial life.
Al Baraka Egypt responded to the challenges presented by taking a number of pre-emptive measures to minimise any disruption to its operations, liaising with its larger customers and assisting them in operating as normally as possible and to service their debts and commercial obligations. Despite the turmoil, the bank’s asset base expanded by 9% in Egyptian pound terms and 5% in the US dollar equivalent, reaching $2.5 billion. Total financings and investments rose by 4% to $2.1 billion, mostly as a result of a greater than two fold increase in non-trading investments as funds were reallocated from government Mudaraba to government non-trading investments. Murabaha and non-trading investments formed the major portion of the portfolio, accounting for 94%. The increase in assets was funded in part by a 4% overall increase in customer deposits including equity of investment account-holders.
The bank’s total income from joint financings and investments rose by 21% to $201 million, of which the investors’ share amounted to $130 million. The bank’s share, including its share as Mudarib, amounted to $71 million, some 42% more than in 2010.
Including its income from fees and commissions, and other operating income, the total operating income increased by 32% to $85 million. Total operating expenses increased by some 14%, to $33 million as a 27% increase in staff costs due to an overall increase in salaries in the Egyptian market, partly in response to rising inflation, was compounded by a 2% rise in other operating expenses. Net operating income therefore increased by 46% to $52 million. However, provisioning rose significantly in response to the difficult times and this, in addition to a significantly higher taxation charge, resulted in a lower profit in comparison with that of 2010, causing the bank to conclude the year with a result of $18 million.
The bank opened one new branch during the year, in Orabi, bringing the total network to 26 branches and foreign exchange bureaus, while its ATM network was expanded to 21 from 20 the year before. Its newly launched Al Baraka Islamic Sukuk, a 10-year Egyptian pound issue offering a choice of yield payment intervals ranging from quarterly to final maturity date, was well received in the market, raising EGP125 million within 3 months. It has almost completed its preparations for the launch of its Internet and mobile banking services, only awaiting the full implementation of the second phase of its new core banking system. It also plans to announce the launch of an Islamic credit card in the next few months. During the year it achieved full compliance with the requirements of Basel II, in addition to strengthening its Anti Money laundering and ‘Know your Customer’ systems and procedures.
Al Baraka Egypt once again demonstrated its commitment to society by funding the establishment of a surgical unit specialising in brain, nerve and spinal column procedures at Al Shams University Hospital, an intensive care unit at the University of Cairo Hospital and a kidney dialysis unit at Mansoura University Hospital, along with contributions of foodstuff and basic commodities to the needy to mark the Holy month of Ramadan.
The bank again increased its issued share capital in 2011, by EGP80.3 million, by transferring an equivalent amount from dividends. It plans to raise its paid up capital to the authorised capital limit of EGP1 billion by 2013. Under its rolling strategic 5-year expansion plan, it intends to open a further 13 branches and foreign exchange bureaus to create a network of 39 by 2016. It plans to build on the credit card to be launched shortly - the Al Baraka Bronze Card – with the forthcoming launch of the Al Baraka Gold and Silver Cards.
(All figures in US dollars unless otherwise stated)
Annual Report – 2011
39
UNIT HEAD: Mr. Ashraf Al GhamrawiTITlE: Vice Chairman & CEO
ADDRESS: 60, Mohie Elddin Abu Elezz Street, P.O. Box 455, Dokki, Giza, Egypt
TEl: +2023 748 1222FAx: +2023 761 1436/7
albaraka-bank.com.eg
Al Baraka Bank Egypt commenced its activities in accordance with Shari’a principles over 21 years ago and has grown as an Islamic institution to become one of the foremost in the Egyptian market. It provides a variety of services, products and savings deposit options to suit different requirements and financing programmes to meet the requirements of various sectors of the Egyptian market, in addition to credit facilities for companies and joint financings for large and important national projects. The bank currently has 22 branches and 4 foreign exchange offices, spread across the major Egyptian cities.
Al Baraka Bank Egypt
40
Banque Al Baraka D’Algerie S.P.A.Founded 1991
pResident & CHieF exeCUtiVe’s RepoRt (ContinUed)
Algeria enjoyed a GDP growth rate estimated at 2.9% in 2011, compared with 3.3% in 2010. The rate of inflation remained largely unchanged at 4.5%. The current account surplus rose from 7.9% of GDP to an estimated 13.7% of GDP.
Algeria’s total oil and gas revenues continued to grow, increasing by an estimated 20% in 2011. with its huge reserves and ongoing hydrocarbon revenues, the government is maintaining its long term strategy of investing in projects benefiting the Algerian people and in particular reducing unemployment. Inward overseas investment also expanded, evidencing the country’s continuing stability. Projects being planned include a second gas pipeline between Algeria and Italy, a joint venture with Qatar to build a number of large steel plants with an annual 5 million tonnes capacity, and a major new car factory. The government has also relaxed certain aspects of its recently introduced regulations, permitting an increase to 40% in the proportion of the foreign currency proceeds of non-oil and mining exports which the exporters may retain and allowing manufacturing companies to utilise payment mechanisms other than letters of credit for their essential imports. On the banking front, the Central Bank has now permitted interbank foreign exchange trading irrespective of whether the funds are those of the banks or emanating from hard currency customer deposits. It has also increased market liquidity through open market bond purchases. while permitting interest rates to fall, it has however at the same time increased the banks’ capital adequacy ratio requirement to 21%. At Al Baraka Algeria, total assets rose by 9% to $1.8 billion, with increases in cash and banks’ balances, Ijarah Muntahia Bittamleek and Istisna’a balances compensating for the reduced balances in
the Murabaha, Musharaka and Salam portfolios. The 4% growth in total financings and investments and 19% increase in liquid assets were funded by a 12% increase in customer current and other accounts to $661 million and a 15% rise in the equity of investment account-holders’ to $707 million.
The bank’s joint income from sales receivables and jointly financed contracts and investments fell by 5% to an aggregate $59 million. After accounting for the investors’ share of this income, the bank’s own share including its share as Mudarib amounted to $37 million, 17% less than the previous year. However, income from banking services and other operating income each rose by 22% to $54 million and $20 million respectively, so that the bank’s total operating income for the year increased by 6% to $111 million. Increased staff and other costs contributed to a 12% rise in total operating expenses to $33 million, producing a net operating profit of $77 million, 3% higher than the previous year. Following lower loss provisions but increased taxation charges, the net profit arrived at was $52 million, 18% higher than in 2010.
Al Baraka Algeria’s branch network expanded in 2011 from 21 to 25 branches. Its successful micro finance facility product is meanwhile being extended throughout the country via its branch network. Once full installation and implementation of its core banking system is complete, it plans to introduce a variety of e-banking services to its customers, in addition to insurance products for the first time. Under its rolling 5-year strategic plan the bank intends to expand its network to 50 by 2016, with 4 earmarked for 2012.
(All figures in US dollars unless otherwise stated)
Annual Report – 2011
41
Banque Al Baraka D’Algerie S.P.A.Banque Al Baraka D’Algerie was incorporated in May 1991 as an Islamic Bank and operates under a commercial banking license issued by the Bank of Algeria. The main activities of the bank are retail and commercial banking. The Bank operates 25 branches.
UNIT HEAD: Mr. Mohamed Seddik HafidTITlE: Board Member & General Manager
ADDRESS: Hai Bouteldja Houidef, Villa No.1, Rocade Sud, Ben Aknoun, Algiers, Algeria
TEl: +213 21 91 64 50 to 55FAx: +213 21 91 64 58
albaraka-bank.com
42
Al Baraka Islamic Bank B.S.C.Founded 1984 – Bahrain
pResident & CHieF exeCUtiVe’s RepoRt (ContinUed)
The Bahrain economy suffered a sharp drop in its growth rate in 2011, from 4.1% recorded in 2010 to an estimated 1.5% in 2011. The rate of inflation however remained low at around 1.0%, down from 2.0% the previous year. In the wake of recent civil disturbances, the government remains committed to seeking greater stability and security for the country primarily through economic growth. Efforts continue to reduce the extent of dependency on the oil and gas sector and to bring down the country’s unemployment rate by encouraging greater direct overseas investment, particularly in the financial services industry which benefits from a sound grounding of legal and regulatory infrastructure second to none in the region. It is noteworthy that the banking sector in Bahrain was not directly impacted by the events, with banks being able to operate normally and transact business without interruption.
Al Baraka Bahrain operates in Bahrain under a retail banking licence from the Central Bank. It was one of the first Islamic banks to be established in the Kingdom, in 1984. In 2011 Al Baraka Bahrain’s total Bahrain-based assets expanded by 22% to reach $844 million. Total financings and investments rose by 15% to $701 million, of which Murabaha, Mudaraba, Musharaka, Ijarah Muntahia Bittamleek and Ijarah receivables accounted for the majority, offsetting decreases in non-trading investments and trading securities. Cash and banks’ balances also expanded, more than doubling to $125 million. Total customer deposits (including IAH) rose by 10% to $573 million.
Joint income from jointly financed contracts and investments rose by 16% to $22 million and, after accounting to the investors for their share, the bank’s share of income from this source including its fee as Mudarib rose by 22% to $11 million. The bank’s income from own sales and investments however fell to less than $1 million, compared with $12 million in 2010 (of which the major part was attributable to $9.8 million of profit from the merger of its Pakistan branches with those of EGIB) as the substantially increased income from non-trading investments was nevertheless insufficient to compensate for lower income from Mudaraba financing and investments. Thus operating income for the year was 32% lower than in 2010, at $18 million. Operating expenses increased slightly by 4% to $18 million, leading to a small operating loss which, after including a net provision recovery, resulted in a marginal net profit.
Under its new strategic plan for Bahrain expansion, the bank opened one new branch in 2011, increasing the network to 6 branches. Another branch is expected to be opened in 2012, when the installation of 4 new ATMs is also planned. The bank’s Taqseet (repayment by instalments) card, offering multiple Murabaha finance transactions through a single card, first introduced in 2010, continues to be well received. It is currently implementing mobile and e-banking services, with SMS services slated to be introduced during the next year. It is also planning to introduce prepaid cards in coordination with a strategic partner and, in the insurance field, to offer Takaful insurance products to its customers soon.
(All figures in US dollars unless otherwise stated)
Annual Report – 2011
43
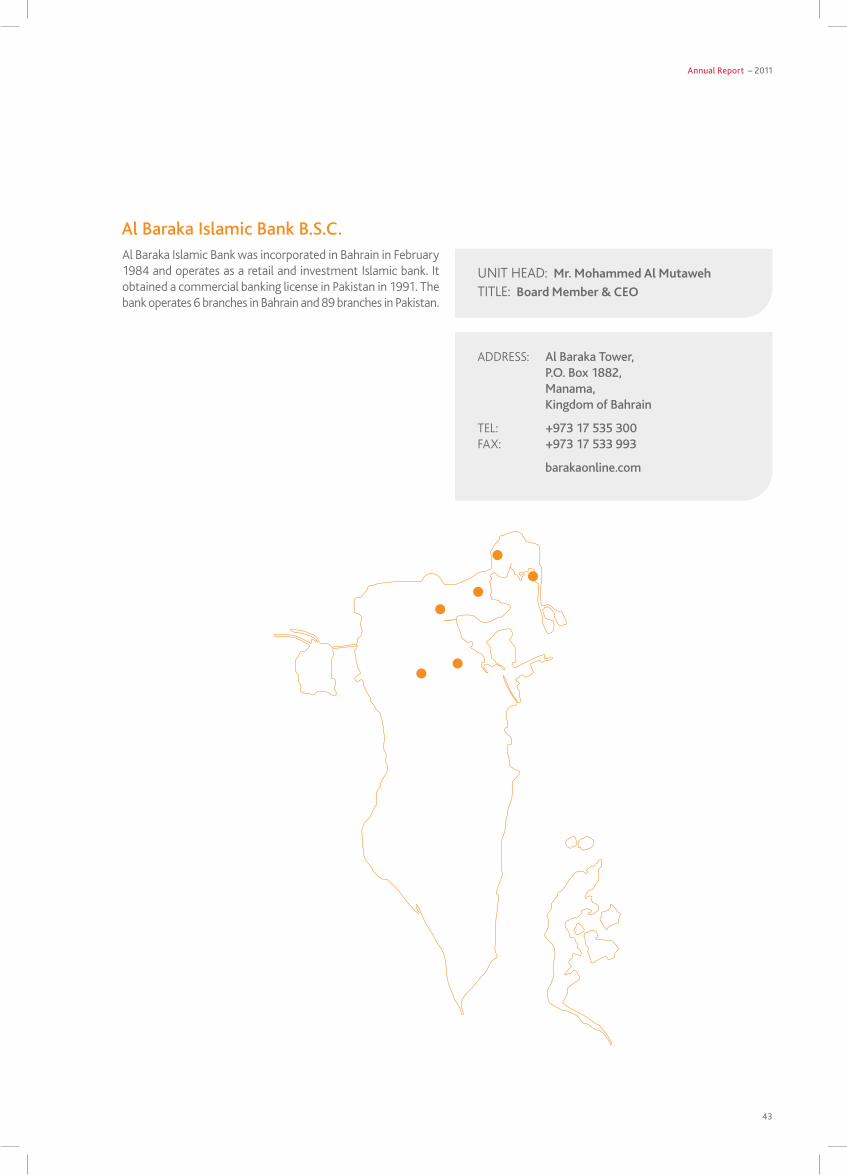
Al Baraka Islamic Bank B.S.C.Al Baraka Islamic Bank was incorporated in Bahrain in February 1984 and operates as a retail and investment Islamic bank. It obtained a commercial banking license in Pakistan in 1991. The bank operates 6 branches in Bahrain and 89 branches in Pakistan.
UNIT HEAD: Mr. Mohammed Al MutawehTITlE: Board Member & CEO
ADDRESS: Al Baraka Tower, P.O. Box 1882, Manama, Kingdom of Bahrain
TEl: +973 17 535 300FAx: +973 17 533 993
barakaonline.com
44
Al Baraka Islamic Bank B.S.C. (continued)
Al Baraka Bank (Pakistan) LimitedFounded 2010
pResident & CHieF exeCUtiVe’s RepoRt (ContinUed)
The Pakistan economy grew in 2011 by only around 2.4% compared with the stronger 3.8% growth exhibited the year before, as the country continued to try to deal with the aftermath of the devastating floods of 2010 and the power shortages that were the direct consequence of them. The acute energy crisis, which has led to riots in major cities by a frustrated populace and has particularly affected the manufacturing industries, reflects the failure of the government to achieve the rates of growth necessary to bring unemployment down. Although the key textiles industry, which accounts for 60% of the country’s exports, hit record revenues in the past fiscal year to June on the back of increased demand from OECD countries for cheaper garments, overall the future is uncertain. Inflation remains stubbornly high at an estimated 11.9% although it is an improvement over 2010’s 15.5%.
In an effort to stimulate the economy, the State Bank of Pakistan has steadily reduced its discount rate over the last year, so that three-month rates now currently stand about 2% lower than at the end of 2010, although government 10-year bonds now pay13.4% compared with 10.66% a year ago. The current account deficit has meanwhile risen to -1.3% of GDP from -0.9% at the close of 2010.
The bank that is now known as Al Baraka Bank (Pakistan) limited (Al Baraka Pakistan) first opened for business in 1991, with branches under the name of Al Baraka Islamic Bank B.S.C., Bahrain (Al Baraka Bahrain), registered as a foreign bank under a commercial banking licence granted by the State Bank of Pakistan. In October 2010 the Pakistan branches of Al Baraka Bahrain were sold and merged with those of Emirates Global Islamic Bank (EGIB) and a majority 64.64% stake in the merged entity was then purchased by Al Baraka Bahrain, creating one of the largest Islamic banks in Pakistan. The merged entity consolidated EGIB’s 60 branches with Al Baraka Bahrain’s existing 29 and added a further 34 ATM units to the existing network. The acquisition of EGIB and merger of its Pakistan branches represented an important part of the Group’s plans for expansion, in addition to demonstrating its ongoing commitment to the Pakistan market.
Al Baraka Pakistan’s assets grew in 2011 by 19% in Pakistan Rupee terms but by 14% in US dollar terms due to the change in exchange rates over the period. Total financings and investments increased by 23% to $611 million primarily due to a substantial increase in the bank’s non-trading investments portfolio which expanded by 63% to $298 million, while the Murabaha portfolio
remained stable and smaller increases in the Musharaka and Salam largely compensated for a 15% decline in the Ijarah Muntahia Bittamleek portfolio. This overall expansion was in turn funded by a 16% increase in customer deposits including IAH which itself rose by 15% to $610 million.
The merger of the much larger EGIB’s 60 branches with Al Baraka Bahrain’s 29 in the last quarter of 2010 means that the 2011 performance of the new entity is not directly comparable with that of 2010. However, as a consequence of this, total operating income was 84% higher at $26 million. The major contributors were the Murabaha, Musharaka, non-trading investments and Ijarah Muntahia Bittamleek portfolios, which produced $14 million. To this was added $6 million from own account non-trading investments which when added to other income produced a total operating income of $26 million. Operating expenses were 151% higher at $21 million, leaving a net operating income of $4 million. After provisions and taxation charge, the net profit for the year was $2 million.
The branch network at the end of the year was a total of 89 branches. Under its ambitious strategic plan, it plans to open a further 126 branches over the next 5 years, with 20 alone slated for 2012. The wAN (wide Area Network) system connecting the branches to Head Office was restructured so that all branches are now synchronised on a single network. A detailed post-merger integration plan has meanwhile been completed and is due for implementation over 2012. Meanwhile, as the new bank focuses on updating and developing its range of Shari’a compliant products, it plans the launch of a new visa debit card for use at Point of Sale terminals and ATM machines globally, in addition to interbank funds transfer facilities permitting customers to transfer funds between banks of their choice around the country. These new products will be introduced as soon as migration to the new core banking system has been fully implemented.
Al Baraka Pakistan’s social contribution includes supporting the Rising Sun Institute, which provides education, speech therapy and vocational training to more than 400 children with autism or cerebral palsy along with the CARE Foundation, which provides education and rehabilitation to underprivileged children, in addition to partnering Afzal Memorial Thalassemia Foundation in its effort to rid the country of this debilitating blood disorder and sponsoring the rehabilitation of the disabled and contributing towards children’s education through The Citizen’s Foundation.
(All figures in US dollars unless otherwise stated)
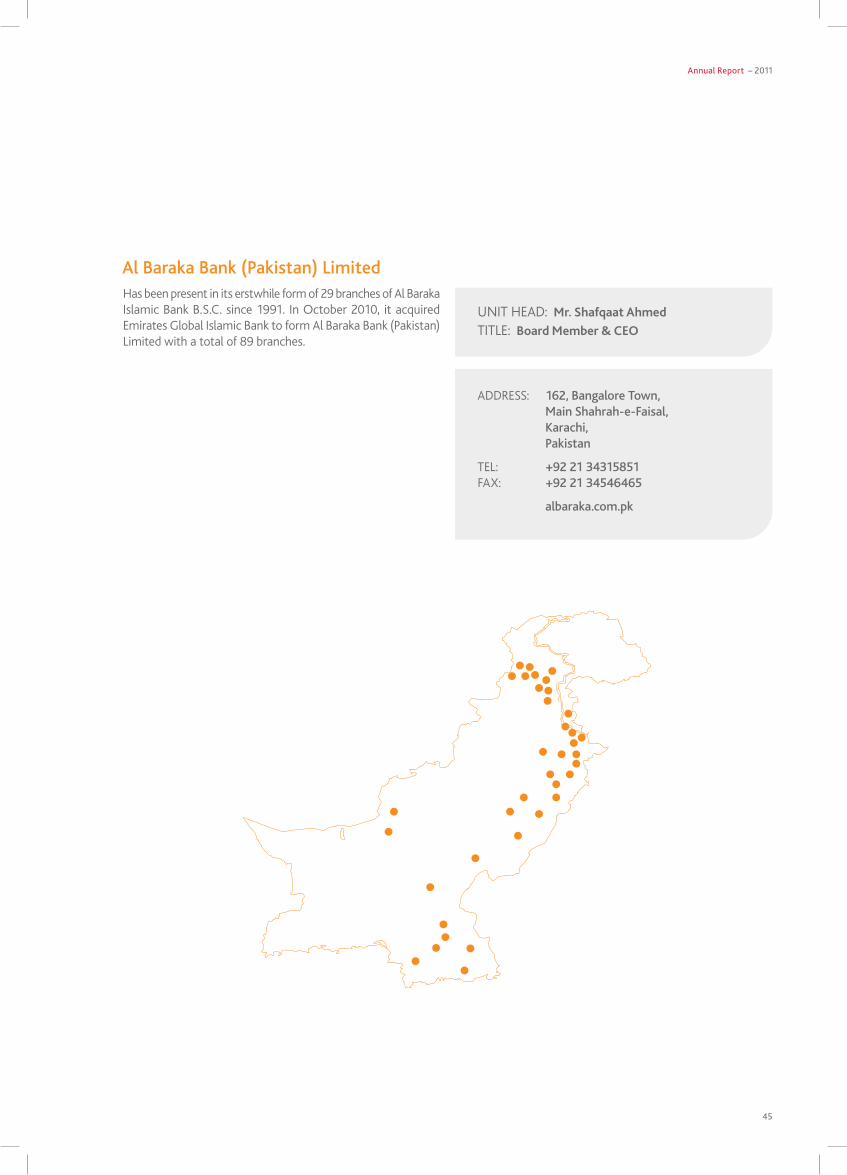
Annual Report – 2011
45
Al Baraka Bank (Pakistan) LimitedHas been present in its erstwhile form of 29 branches of Al Baraka Islamic Bank B.S.C. since 1991. In October 2010, it acquired Emirates Global Islamic Bank to form Al Baraka Bank (Pakistan) limited with a total of 89 branches.
UNIT HEAD: Mr. Shafqaat AhmedTITlE: Board Member & CEO
ADDRESS: 162, Bangalore Town, Main Shahrah-e-Faisal, Karachi, Pakistan
TEl: +92 21 34315851FAx: +92 21 34546465
albaraka.com.pk
46
Al Baraka Bank TunisiaFounded 1983
pResident & CHieF exeCUtiVe’s RepoRt (ContinUed)
Following the people’s revolution of January 2011, it remains to be seen whether the new government will continue to implement the policies of economic reform that were being followed by the last government and, indeed, to renew efforts to reduce unemployment and increase economic activity among small and medium sized businesses. Meanwhile, business has by and large reverted to normal, although the disruption did have an impact on the economy, as did the overthrow of the government in neighbouring libya, an important trading partner.
It is estimated that the economy contracted by over 3.0% in the first quarter when the people’s protests were at their peak, but picked up thereafter, so that current estimates are that is experienced zero overall growth for 2011, compared with 3.1% in 2010. The tourism industry was hit particularly hard as revenues halved in the absence of tourists, mainly European but also from the Arab world. Consumer prices are not reported as having greatly increased and the rate of inflation is estimated to have been around 3.5% compared with 2010’s 4.1%.
After falling initially during the first three quarters of the year, Al Baraka Tunisia’s total assets grew in the final quarter so that it ended the year down by 2% at $545 million as financings and
investments declined somewhat to $350 million, mostly on the back of the Mudaraba portfolio which fell by 49%. Murabaha outstanding at the end of the year were 8% higher at $266 million. The assets were funded primarily by $443 million of customer deposits (including IAH) which however fell by 2%. The joint income from sales receivables and jointly financed contracts and investments reached $19 million, resulting in a net return to the bank from this source of $13 million. Other sources of income contributed $6 million, mostly from Mudarib fees in respect of off-balance sheet IAH and banking services, so that the total operating income ended the year at $19 million, similar to 2010. Operating expenses, however, rose by 28% to $10 million and, after provision and taxation, the bank reported a net profit of $8 million, 26% lower than the previous year.
looking to the future, Al Baraka Tunisia’s strategy will be to leverage on its new state-of-the-art core banking systems in order to enhance the banking services offered to its customers, including e-banking. It also plans to launch a Gold Master Card. Its network will be expanded from the current 8 branches to 13 by 2016, in addition to the installation of ATMs at each of the new branches. A business centre at the main branch will be unveiled in 2012, to focus on the needs of businessmen and enterprises.
(All figures in US dollars unless otherwise stated)
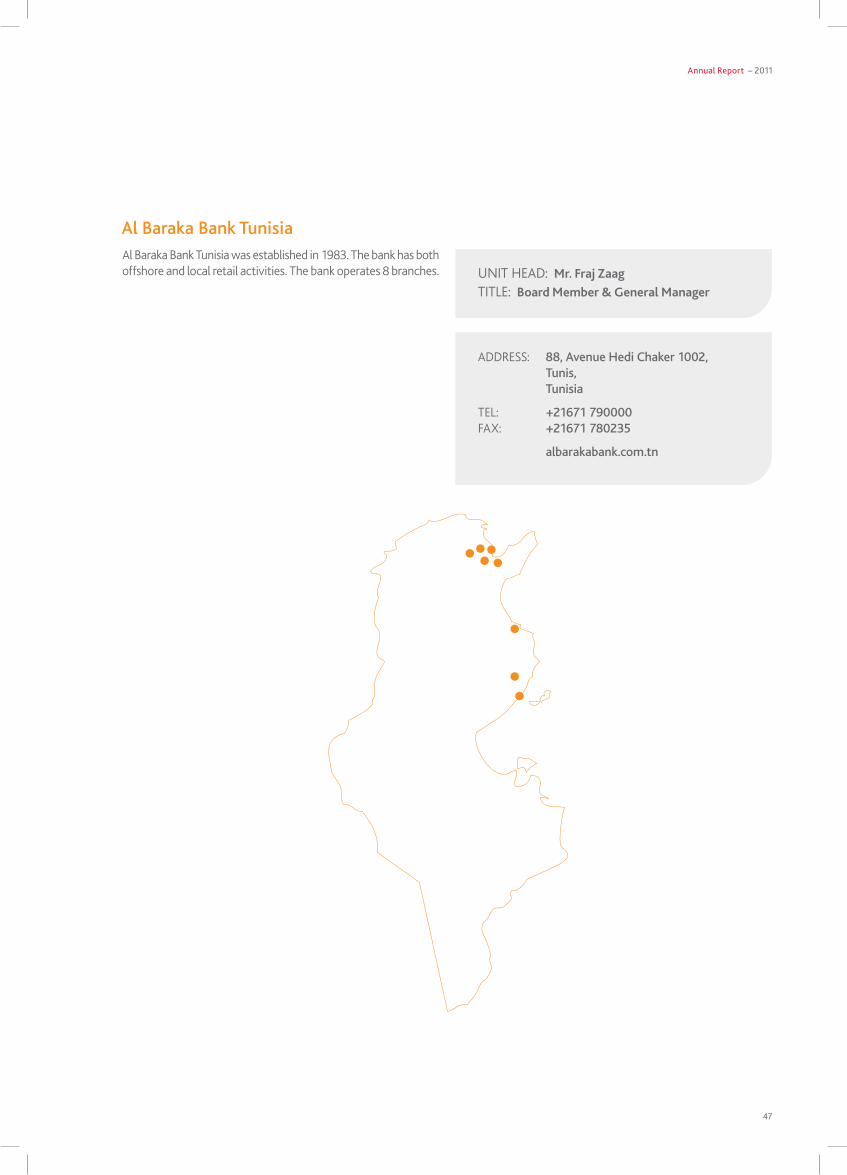
Annual Report – 2011
47
Al Baraka Bank TunisiaAl Baraka Bank Tunisia was established in 1983. The bank has both offshore and local retail activities. The bank operates 8 branches. UNIT HEAD: Mr. Fraj Zaag
TITlE: Board Member & General Manager
ADDRESS: 88, Avenue Hedi Chaker 1002, Tunis, Tunisia
TEl: +21671 790000FAx: +21671 780235
albarakabank.com.tn
48
Al Baraka Bank LimitedFounded 1989 – South Africa
pResident & CHieF exeCUtiVe’s RepoRt (ContinUed)
The South African economy grew by an estimated 3.1% in 2011, a relatively good performance compared with the 2.8% growth recorded in 2010. The decline of the Rand, though, which continued steadily through most of the year before beginning to recover in the fourth quarter, together with the increased price of imported crude oil, led to an estimated 5.1% increase in inflation over the year, compared with 3.5% inflation in 2010. The current account deficit was estimated at -4.1% in 2011. The Reserve Bank of South Africa has announced that Basel III is being adopted effective 1st January 2012. The impact on banks generally is expected to be an increase in liquidity and capital requirements; however it is not expected to materially affect Al Baraka South Africa.
In 2011 Al Baraka South Africa’s total assets increased by 15% in Rand terms but declined by 6% when translated into US dollars. The increase in assets in local currency reflected 18% growth in financings and investments, chiefly in Musharaka and Murabaha, although this translated into a 3% decline in US dollar terms. The increase in local currency assets was funded on the back of a capital injection of R105 million and 12% growth in customer deposits including IAH in Rand terms (8% decline in US dollars).
Although in Rand terms total operating income rose by 16% and in US dollar terms it rose by 18% to $17 million, reflecting
mainly a 14% increase in the bank’s share of its jointly financed portfolios after distribution to the IAH investors and increased revenues from banking services. Total operating expenses also increased in US dollar terms, by 9% to a little under $14 million. Net operating income was $4 million which, after accounting for provisions and taxation, resulted in a net profit for the year of $3 million or 71% higher than the 2010 result.
Following full implementation of the new Misys Islamic Equation banking system in 2010, the bank was able to commence offering e-banking products to its customers, particularly individuals, which were well received among its customers. Other recently introduced products include the selling of foreign exchange; a Hajj investment account which earns profit annually and is eligible for an annual draw for a return air ticket, and a diminishing Musharaka property financing facility. Other products in course of development and likely to be launched in the near term include a retail furnishing finance facility, an Ijarah product and a cheque account. The bank expects that its application to the authorities for a full foreign exchange licence will be granted shortly, enabling it to start trading in 2012. It plans to expand its presence in the Gauteng region in 2012 by opening an office geared to the needs of professionals and, under its rolling 5-year strategic plan, to open a further 3 new branches in the following 4 years to bring the network up to 14 branches by 2016.
(All figures in US dollars unless otherwise stated)
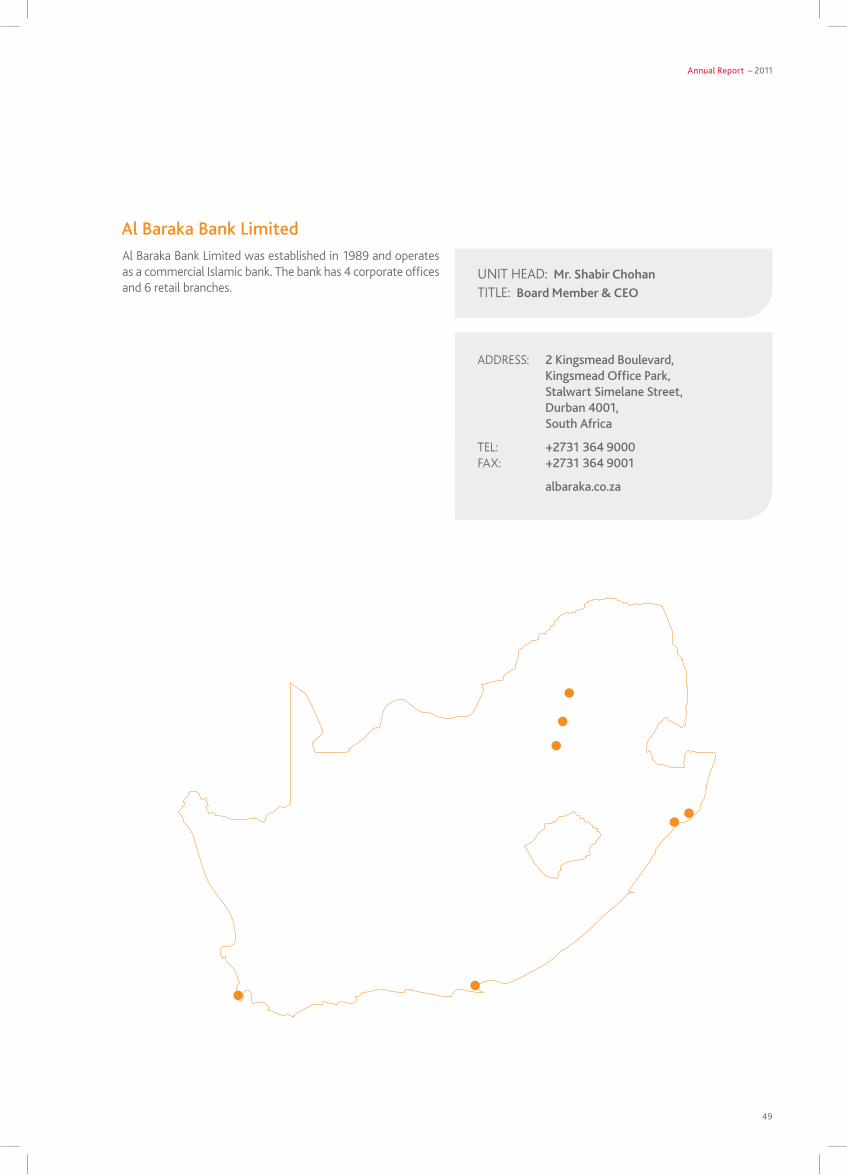
Annual Report – 2011
49
Al Baraka Bank LimitedAl Baraka Bank limited was established in 1989 and operates as a commercial Islamic bank. The bank has 4 corporate offices and 6 retail branches.
UNIT HEAD: Mr. Shabir ChohanTITlE: Board Member & CEO
ADDRESS: 2 Kingsmead Boulevard, Kingsmead Office Park, Stalwart Simelane Street, Durban 4001, South Africa
TEl: +2731 364 9000FAx: +2731 364 9001
albaraka.co.za
50
Al Baraka Bank SudanFounded 1984
pResident & CHieF exeCUtiVe’s RepoRt (ContinUed)
The secession of South Sudan in July from the rest of the country had a number of consequences in the north. Geographically, 26% of the land area was in the south and the north now no longer has any land borders with Uganda, Kenya and the Congo while the borders with Ethiopia and Central African Republic have shrunk; 22% of Sudan’s population resided in the south. Economically, there has been a significant division of natural resources, especially in crude oil deposits: whereas exploitation of Sudan’s oil reserves hitherto accounted for 50% of the state’s total revenues, 70% of the budget and 95% of foreign exchange earnings, the split has resulted in an estimated 75% fall in Sudan’s oil revenues. with distribution between the south and north markedly favouring the south, the result has been a sharp drop in growth and a fall in the value of the Sudanese pound, GDP is estimated to have fallen in 2011 by -0.2%. and a drop in Sudan’s money supply of some 2 billion Sudanese pounds. These worsening economic conditions have led to a surge in inflation, driven chiefly by high import costs, such that the annualised rate surged from 15.4% in 2010 to 21.0% by September 2011 and was projected to reach 22.0% by the end of the year, although the costs of some basic foodstuffs have more than doubled over the same period.
Although drilling operations are currently under way in north Sudan and it is hoped that these will lead to the identification of new oil reserves in economic quantities, it will take some time for the lost revenues to be replaced from this source. The government is therefore seeking to encourage non-oil production through increased privatisation of state-owned companies and support for non-oil mining industries such as gold mining and the development of known chromium reserves, in addition to the cotton, Arabic gum and livestock exporting industries. It is also seeking to reduce imports of certain non-essential goods by increasing duties thereon. It is hoped that these measures will lead to tangible improvement over the next 5 years.
Negotiations continue between Sudan and South Sudan, with the intention of regulating commerce between the two states. It will be necessary to determine the throughput fees to be paid by the latter to the former for the transport of crude oil through the former’s territory and for the use of its ports. It is currently estimated that these fees could aggregate some $1.8 billion a year, which would go some way to relieving the north of the effect of the sudden loss of revenues that followed the secession.
The Central Bank has also been overseeing the development and upgrading of the payment and settlement system – introducing real time settlement for the first time – in addition to a number of corporate governance measures and the introduction of a new bank audit system. The Central Bank is taking steps to enhance the inter-bank market and has also activated open market operations to manage liquidity. It is raising the minimum paid-up capital of banks to SP100 million from the current SP80 million.
The separation of South Sudan did not have a significant direct impact on the activities of Al Baraka Sudan as all of its operations are in the north. However the Sudanese pound depreciated by over 6% vis-à-vis the US dollar on the official market which did have some negative effect on the bank’s performance. Its total assets grew in 2011 by 24% in Sudanese pound terms and by 16% in US dollar terms, as did its customers deposits. Total financings and investments grew by 21% in Sudanese pounds and by 13% in US dollars. The major increase in financings and investments came from the non-trading investments, Musharaka and Murabaha, while the Mudaraba financing reached maturity and was fully repaid. Non-trading investments formed 59% of total financings and investments, while Murabaha formed 31%. The growth was funded by a 17% increase in customer deposits including IAH which itself grew by 21%.
Notwithstanding minimal growth in the Murabaha portfolio revenue and mostly on account of a 40% increase in income from non-trading investments, the total income from jointly financed contracts and investments was 19% higher than for 2010, at $24 million. After accounting to the investors for their share, the bank’s income from this source (including income as Mudarib) rose by 21% to $20 million. Increased income from banking services and other sources produced a total operating income of $30 million, 14% up on 2010. Operating expenses were unchanged at $20 million, leaving a net operating profit of $10 million and, in light of prudential provisions (compared with a net provision write back in 2010) and higher taxation, a net profit for the year of $7 million has been generated.
Al Baraka Sudan’s branch network was unchanged at 25 branches at the end of the year. Under its rolling 5-year strategic expansion plan it intends to increase the branch network by 6 to 31, beginning with 2 new offices in 2012. Over the course of the next year or two it also intends to launch a number of products to add to its quite extensive range: finance facilities aimed at assisting professionals and craftsmen, export finance and finance for the mining sector, Internet banking and SMS notification service, telephone bill payments and the purchase of electricity through mobile, ATM and POS (Point of Sale) methodologies to name but a few. It recently launched Ijarah Muntahia Bittamleek and Parallel Salam as 2 additional product offerings, along with Taqseet (instalment repayment), real estate finance and Takaful products. Establishment of a Call Centre is budgeted for 2012.
As part of its contribution to the social environment, the bank provides finance for productive projects initiated by women through its Zahra ladies branch, supports several social programmes under the sponsorship of the Sudanese Bank Union, supports health centres and hospitals and provides assistance for medical treatment to the poor and needy. It also provides educational support through the Al Baraka School and Ministry of Education courses, the Ahfad University for women, fees for training for university students, assistance for research and support for cultural and sports associations.
(All figures in US dollars unless otherwise stated)
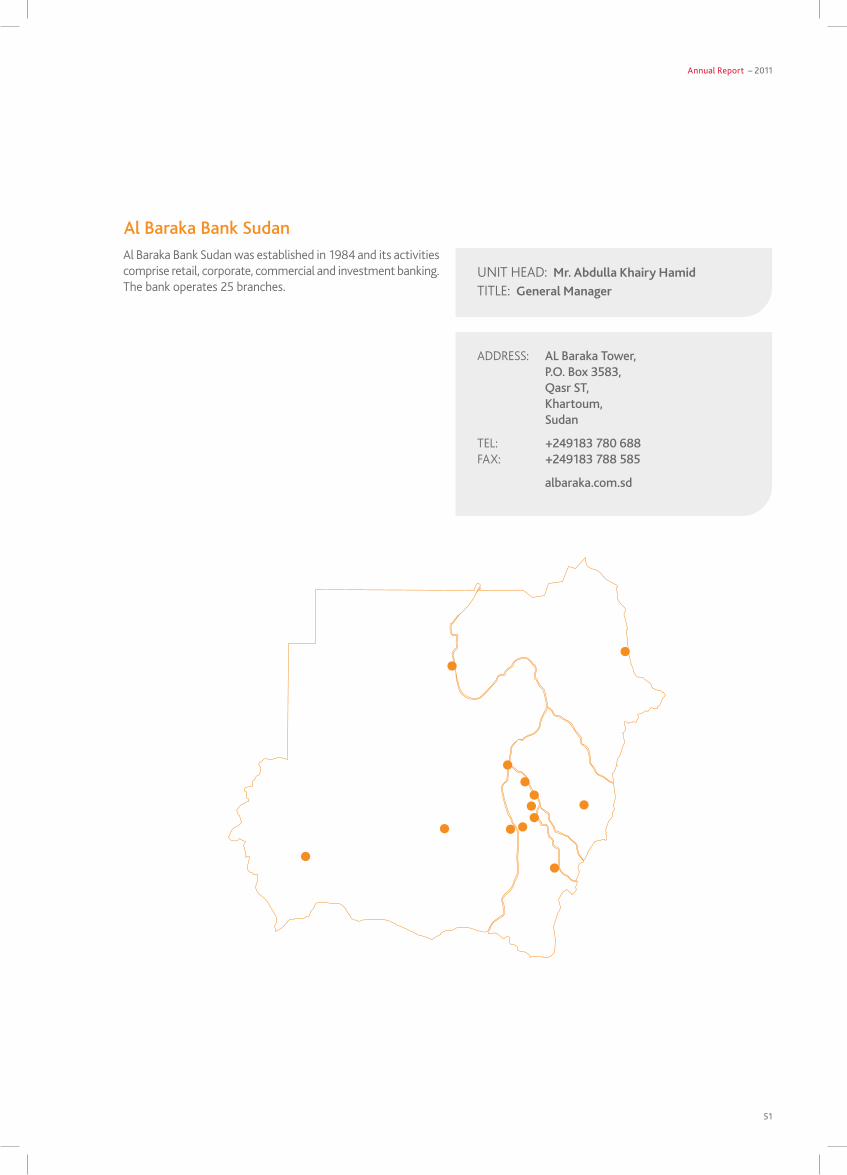
Annual Report – 2011
51
Al Baraka Bank SudanAl Baraka Bank Sudan was established in 1984 and its activities comprise retail, corporate, commercial and investment banking. The bank operates 25 branches.
UNIT HEAD: Mr. Abdulla Khairy HamidTITlE: General Manager
ADDRESS: AL Baraka Tower, P.O. Box 3583, Qasr ST, Khartoum, Sudan
TEl: +249183 780 688FAx: +249183 788 585
albaraka.com.sd
52
Al Baraka Bank Lebanon S.A.LFounded 1991
pResident & CHieF exeCUtiVe’s RepoRt (ContinUed)
The lebanese economy is closely tied in with that of Syria and has naturally therefore been affected by recent events and especially the impact of civil disruption and international sanctions on the Syrian economy. The negative impact on tourism and trade has been reflected in the rate of GDP growth which is estimated to have achieved only 1.5% in 2011, compared with 7.5% in 2010. The rate of inflation reached an estimated 5.7%, up from 2010’s 5.1%. The current account deficit, moreover, is thought to have increased from -10.9% of GDP in 2010 to -14.7% of GDP in 2011.
The Central Bank (BDl) is closely monitoring the situation and has taken steps to ensure that all lebanese banks remain highly liquid and adequately capitalised in compliance with Basel III capital adequacy standards. On the other hand, the effect on Al Baraka lebanon has been very limited, with growth in both customer deposits and financing and investments, an increase in underlying income trends and a reduction in operating expenses.
During the year the bank increased its assets by 20% to $240 million, of which total financings and investments grew by 11% to $136 million, evenly spread across most categories although investment in properties increased by 52%. The increase was funded by a 28% growth in customer deposits, including IAH.
The total operating income, compared with 2010, was 21% lower at $6 million, due partly to a fall in the bank’s share of income from the jointly financed portfolio and its Mudaraba financing business, and partly to the absence of non-recurring income from investments in property which it earned in the previous year. Operating expenses were 5% lower at a little under $8 million, leaving an operating loss of under $2 million which, after the application of provisions, resulted in a net loss of a little over $2 million compared with 2010’s net loss of $0.9 million.
Al Baraka lebanon offers a wide range of products and services to its customers, from house, car, school and university fees, Hajj and Umrah financing facilities to a variety of current and investment accounts and several different credit, debit and charge cards. In 2012 it plans to introduce a new facility to finance the purchase of environmentally friendly electric generating systems and a new current account entitling the customer to a basket of bank services free of charge in return for a monthly fee. It will also be launching a new Platinum Charge card and a Hajj prepaid card. The bank’s medium term network expansion strategy aims at increasing the number of branches from the present 7 offices to 12 by 2016, also expanding its ATM network at the same time.
(All figures in US dollars unless otherwise stated)
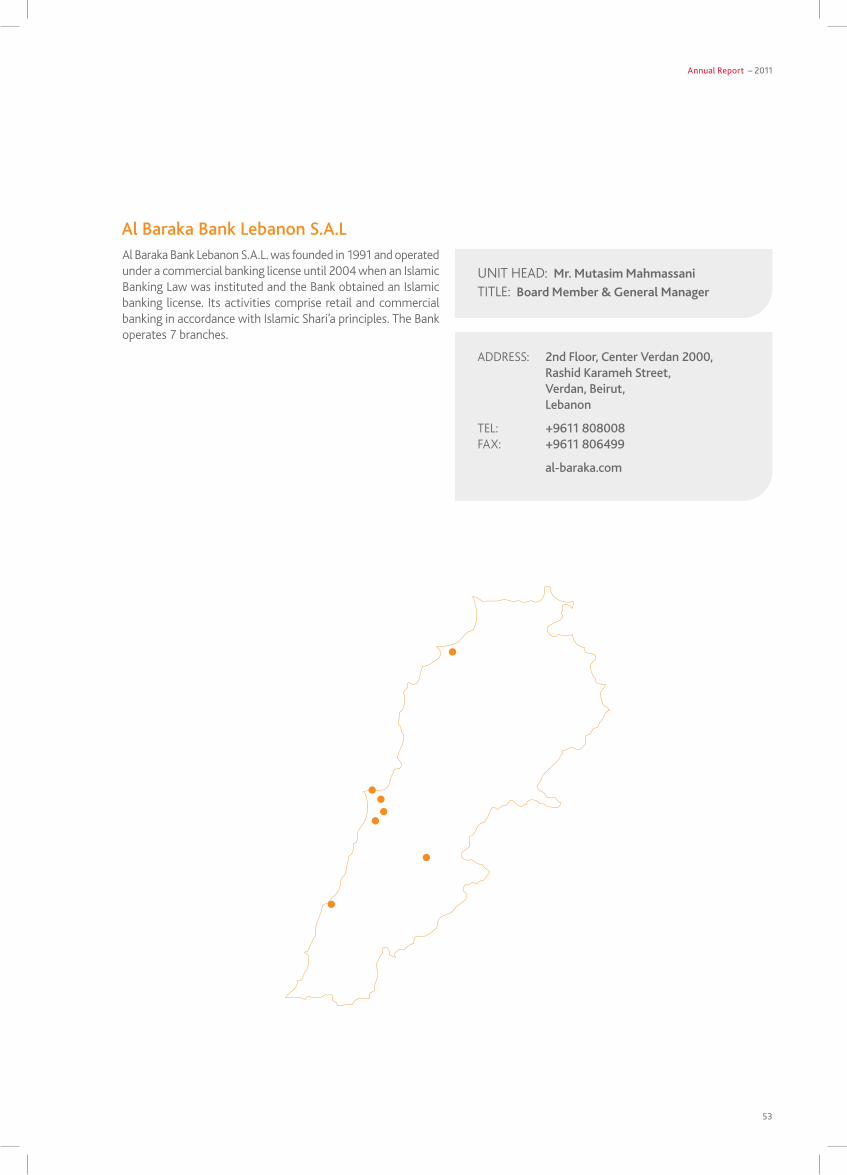
Annual Report – 2011
53
Al Baraka Bank Lebanon S.A.LAl Baraka Bank lebanon S.A.l. was founded in 1991 and operated under a commercial banking license until 2004 when an Islamic Banking law was instituted and the Bank obtained an Islamic banking license. Its activities comprise retail and commercial banking in accordance with Islamic Shari’a principles. The Bank operates 7 branches.
UNIT HEAD: Mr. Mutasim MahmassaniTITlE: Board Member & General Manager
ADDRESS: 2nd Floor, Center Verdan 2000, Rashid Karameh Street, Verdan, Beirut, Lebanon
TEl: +9611 808008FAx: +9611 806499
al-baraka.com
54
Al Baraka Bank Syria s.a.Founded 2009
pResident & CHieF exeCUtiVe’s RepoRt (ContinUed)
In 2011 Syria’s GDP slumped by an estimated -2.0% compared with around 3.2% growth in 2010. This was mainly attributable to the negative impact of international sanctions imposed following the civil disturbances, including the ban on Syrian oil exports to the EU (which had accounted for 12% of GDP in 2010) and the drop in tourism earnings.
Al Baraka Syria began commercial operations during the third quarter of 2010. Since then, and despite the turmoil in the country at present, it has been growing steadily. At the close of 2011 its total assets had risen to the equivalent of $427 million. Total financings and investments amounted to $237 million, with the Murabaha and Mudaraba portfolios showing the most significant growth. The bank also introduced Musharaka financings to the market, which made a good start. The growth was funded by customer deposits, including IAH, which together amounted to $344 million. Total operating income amounted to $11 million whilst operating expenses aggregated $8 million, producing
an operating profit of $3 million and, after provisions and a tax credit, a net profit of a little below $4 million, compared with a net loss of over $2 million in 2010, a commendable result for its first full year of operation.
The bank’s branch network, which stood at 2 branches in Damascus including its head office in the Saba Bahrat area of the city, grew to 9 over the course of the year.
The bank offers a range of corporate and retail facilities, treasury products and investment and deposit accounts, trade finance and electronic money transfer services and a spread of e-services including Internet banking and electronic debit cards. It plans to launch a credit card and Musawama (the purchase from retailers of specific goods at a discount which are then offered to consumers for payment over a period) facilities in 2012 and is also working on introducing SMS banking shortly. A Call Centre is to be established and it also intends to offer a money exchange.
(All figures in US dollars unless otherwise stated)
Annual Report – 2011
55
Al Baraka Bank Syria s.a.Al Baraka Bank Syria s.a. was formally incorporated in December 2009 and started commercial operations in 2010. Al Baraka Syria operates with a network of 9 branches.
UNIT HEAD: Mr. Mohammed HalabiTITlE: Chief Executive Officer
ADDRESS: Alshahbander Street, P.O. Box 100, Damascus, Syria
TEl: +963 11 443 78 20FAx: +963 11 443 78 10
albarakasyria.com
56
Al Baraka Banking GroupRepresentative Office, IndonesiaFounded 2008
pResident & CHieF exeCUtiVe’s RepoRt (ContinUed)
In 2011 the Indonesian economy grew by an estimated 6.5%, compared with a growth rate of 6.1% in 2010. The current account surplus was estimated to be standing at 0.4% of GDP (0.8% in 2010). The rate of inflation was slightly better at 5.3% as compared with 2010’s 5.7%.
The Indonesian government’s policy in recent years has been one of encouragement of Islamic banking in the country, with a long term target of increasing Islamic banking assets to 5% of total banking assets. Due to the favourable regulatory environment, the growing economy and having the largest Muslim population in the world, Indonesia offers a very attractive operating environment for Islamic banks.
ABG’s representative office serves as a base for the Group to conduct research on local banks and their potential for acquisition and for assessing the business potential of the country from the Group’s perspective. The representative office is also responsible for maintaining contact with regulators and major banking groups in Indonesia and for preserving the image and brand value of the Group. with trade flows between Indonesia and many of the countries where the Group operates growing rapidly, the Indonesia Representative Office pro-actively identifies business opportunities and generates leads that are directed towards ABG subsidiaries.
UNIT HEAD: Mr. Moesfian MokhtarTITlE: Chief Representative
ADDRESS: Ravindo Building, 10th Floor, Jalan Kebon Sirih, No. 75, Jakarta Pusat 10340, Indonesia
TEl: +62 21 316 1345FAx: +62 21 316 1074
albaraka.com
(All figures in US dollars unless otherwise stated)
Annual Report – 2011
57
(All figures in US dollars unless otherwise stated)
Al Baraka Banking GroupRepresentative Office, Libya(Under Formation)
As of the end of 2010, the Group was at an advanced stage in establishing a representative office in libya, one of its aims under its medium term expansion strategy. The country’s GDP – estimated at $74 billion for 2010 or $11,500 per capita – and the scope for economic expansion for the benefit of its population, renders it an attractive proposition for the Group.
whilst the revolution of 2011 has put a temporary hold on its plans to set up the representative office, ABG nevertheless fully intends to pursue its strategy in relation to libya and aims to participate in the libyan people’s future development and prosperity in the fullness of time.
UNIT HEAD: Mr. Wafik Al ShaterTITlE: Chief Representative
ADDRESS: Office No. 144, 14th Floor, Tower 1, Tripoli Tower, P.O. Box 93271, Tripoli, Libya
TEl: +218 (21) 336 2310 +218 (21) 336 2311
FAx: +218 (21) 336 2312
albarakalibya.com.ly
58
We value and respect the communities We serve. our doors are alWays open; our customers alWays experience a Warm-hearted, hospitable Welcome and accommodating service.
NEIGHBOURLY

Annual Report – 2011
59
60
The Board of Directors is responsible for the Group’s overall management and accountable to shareholders for the financial and operational performance of the Group. In particular, the Board is responsible for the Group’s business strategy, for the raising and allocation of capital, monitoring of operations and making critical business decisions. The Board ensures that the Group manages risk effectively, through approving and monitoring the Group’s risk appetite and identifying and guarding against the longer term strategic threats to the business.
Among other responsibilities the Board is responsible for setting and reviewing, not less frequently than annually, the Group’s overall strategy and for:
• setting and reassessing periodically the Group’s corporate goals and objectives;
• establishing policies to further the achievement of the Group’s corporate goals and objectives;
• establishing and regularly reviewing the management structure and responsibilities and monitoring the effectiveness of Executive Management including its ability to plan and execute strategies;
• holding Executive Management accountable for results;• putting in place adequate policies and processes for approving
budgets and reviewing performance against those budgets and key performance indicators;
• ensuring that an adequate, effective, comprehensive and transparent corporate governance framework is in place;
• establishing and approving policies and procedures designed to ensure ethical behaviour and compliance with laws and regulations, auditing and accounting standards and the Group’s own corporate governance policy;
• ensuring that ABG and its subsidiaries’ operations are supported by an appropriate control environment i.e. that compliance, risk management and financial control and reporting functions are well resourced and structured;
• recognising and communicating to Executive Management the importance of the internal audit function at ABG and its units, periodically reviewing internal control procedures and taking measures to enhance the function of internal audit and to act in a timely and effective manner on its findings;
• ensuring that the Group’s operations are supported by a reliable, sufficient and well integrated information system;
• approving the writing off of credit facilities and investments where appropriate, in accordance with the Group’s policies and procedures;
• approving strategic investments by ABG and/or its subsidiaries;• monitoring potential conflicts of interest and preventing
abusive related party transactions;• approving material transactions outside the normal course
of business or in excess of the limits of approval authority
The Board of Directorsdelegated to Executive Management;
• ensuring the preparation of financial statements which accurately disclose the Group’s financial position, on a regular and consistent basis and for reviewing and approving for dissemination its periodic financial statements and annual reports;
• approving all significant changes in the Group’s accounting and reporting policies;
• ensuring compliance at all times with all relevant requirements of Shari’a and Islamic Accounting Standards issued by the Accounting and Auditing Organisation for Islamic Financial Institutions (AAOIFI);
• ensuring that the Group establishes and maintains an approved employee Code of Conduct and is at all times in full compliance therewith;
• ensuring that the control environment maintains necessary client confidentiality and that clients’ rights and assets are properly safeguarded;
• convening and preparing the agenda for shareholder meetings; • ensuring the equitable treatment of all shareholders including
minority shareholders; and• performing any other functions required of the Board of
Directors under applicable laws and regulations.
In its regular review of the Group’s strategy, the Board reviews the Group’s business plans and the inherent level of risk in those plans; assesses the adequacy of capital to support the business risks of the Group; sets performance objectives; and oversees major capital expenditures, divestitures and acquisitions.
The Board of Directors has overall responsibility for the Group’s system of internal control and its effectiveness and for defining and enforcing standards of accountability that enable Executive Management to achieve the Group’s corporate objectives. The Board ensures that the systems and controls framework, the Board structure and the organisational structure of the Group are appropriate for the Group’s business and associated risks and regularly assesses the systems and controls framework to that end. There are established and ongoing procedures in place for identifying, evaluating and managing significant risks faced by the Group, which are regularly reviewed by the Board. The Group’s system of internal control provides for a documented and auditable trail of accountability and applies across its operations, is designed to ensure effective and efficient operation and compliance with all applicable laws and regulations, and seeks to manage risk with a view to avoiding material errors, losses and fraud.
In meeting its responsibility to ensure efficient governance in all matters related to ABG, the Board has established a written compliance policy governing the Group’s compliance with all laws and regulations, in particular those enunciated by the Central
CoRpoRAte goVeRnAnCe
Annual Report – 2011
61
Bank of Bahrain (CBB) and other local regulators. The Board has delegated responsibility for monitoring compliance to the President & Chief Executive, which responsibility is carried out through a dedicated Compliance Department, whose mandate covers all aspects of compliance including: formulation of effective policies and processes for the management of the Group’s compliance risk; assisting Executive Management and staff in managing risk; advising on laws and regulations and applicable standards; disseminating compliance policies and guidelines to ABG staff members; ensuring an effective compliance methodology; providing periodical reports to the Board in connection with compliance controls; and implementing operational controls, Know your Customer (KyC) and other Anti-Money laundering (AMl) methodologies. ABG is in the continuing process of enhancing compliance framework at the Group including ABG’s subsidiaries.
In October 2010 the CBB introduced new requirements to be met by all licensees under the respective Modules HC of volume 2 and volume 6 of its Rulebook with respect to corporate governance principles in line with the Principles relating to the Corporate Governance Code issued by the Ministry of Industry & Commerce of the Kingdom of Bahrain, international best practice corporate governance standards set by bodies such as the Basel Committee for Banking Supervision and related high level controls and policies. ABG conducts annual detailed internal assessments to ensure compliance with these new requirements and has set specific milestones for implementation of any identified shortfalls: the CBB, ABG’s shareholders, the Board of Directors and Executive Management have all been fully apprised of the amendments to the requirements and the milestones set. Accordingly, the appointment of the Chairman of the Board of Directors has been consented to by the CBB notwithstanding that he is not an independent director as defined in the CBB Rulebook, while the Board has directed that a scholar of the Shari’a Supervisory Board will attend at least one meeting per year of the Board Audit & Governance Committee to assist the Committee on Shari’a-related governance issues. ABG can also confirm that the minority shareholders of the Group are well represented on the Board of Directors, either directly or through the independent directors.
The Board of Directors meets regularly (at least four times a year) and has a formal schedule of matters reserved to it, considering key aspects of the Group’s affairs referred to it for decision. The Board reviews the Group’s strategy and financial plans, all proposed material changes to the Group’s policies, structure and organisation, reports provided to it on the operations of the Group (with emphasis on organisational development, risk management and information technology development) and the performance of Executive Management. All Directors attend all Board meetings whenever possible and in any event not less
than 75% of meetings in any year, and maintain informal contact between themselves in between meetings.
The Chairman is responsible for leadership of the Board and for its efficient functioning. He ensures that all members receive an agenda, minutes of prior meetings and background information in writing before each Board meeting and between meetings when necessary. The Board and its Committees are supplied with full and timely information to enable them to discharge their responsibilities. In this respect, the Board, its Committees and all Directors individually have access to Executive Management, external legal or other professional consultants and advisors at the Group’s expense, and to the Board Secretary, who is responsible for ensuring that the Board procedures and applicable rules and regulations are observed. The Board encourages participation by members of Executive Management at Board meetings if appropriate regarding matters which the Board is considering and where the President & Chief Executive believes management should have exposure to the Board.
Under ABG’s Articles of Association the Board of Directors shall consist of not less than five and not more than fifteen members. Members of the Board of Directors hold office for a three-year renewable term, although the term of office may be extended at the request of the Board for a period not exceeding six months with the approval of the Minister of Industry & Commerce of Bahrain.
There is no maximum age limit at which a Director must retire from the Board of Directors. Each Director’s membership of the Board shall terminate upon the expiry of his/her term, or upon the resolution of the shareholders in General Meeting, or as a result of one of a number of specified events or circumstances, including:
• the original appointment being found to be contrary to the provisions of ABG’s Articles of Association;
• abuse by the individual of his/her position as director; • the individual’s failure to attend three consecutive Board
meetings without lawful excuse notified in writing to the Board; or
• upon the individual’s formal resignation from the Board following reasonable prior notice; or occupation of any other remunerative office within ABG unless specifically approved by the Board of Directors.
when an announcement is made requesting nominations for the position of membership of the Board of Directors whose three year term is due to expire, such nominations must be submitted to the Chairman of the Board within the time frame provided in the announcement. As part of the nomination process, each
62
CoRpoRAte goVeRnAnCe (ContinUed)
nomination must comply with local rules and regulations and must be submitted to the CBB in order to ensure compliance with the CBB’s “Fit and Proper” criteria. The names of all nominated individuals so approved by the CBB are then submitted to the shareholders at the next AGM for election. Election of ABG Directors takes place in accordance with the rules and procedures set out in the Commercial Companies law and ABG’s Articles of Association.
There are currently thirteen Directors on the Board, who have varied backgrounds and experience and who are individually and collectively responsible for performing the responsibilities of the Board and for exercising independent and objective judgement. No individual Director or group of Directors has unfettered powers of decision making or dominates the Board’s decision making. Other than the President & Chief Executive all Directors are non-executive and fully independent of management and are individually responsible for scrutinising and challenging management decision making and performance. The posts of Chairman, vice Chairmen and President & Chief Executive are held by different Directors and the President & Chief Executive has separate, clearly defined responsibilities. The Board and its Committees are regularly assessed with respect to their size and composition, while individual Directors are assessed annually for their effectiveness, contribution and independence in light of interests disclosed and conduct.
ABG does not provide for any performance-linked stock incentives for the Board or Executive Management.
The Board of Directors has adopted a formal Code of Business Conduct and Ethics applicable to Directors and employees; details of the Code are provided in the Additional Public Disclosures section of this report.
In line with international best practice, the Board has adopted corporate governance guidelines covering the matters required under the CBB Rulebook and other matters required by the Board, and instituted corporate governance measures to ensure that the interests of the shareholders are protected, including the
appointment to the Board of six independent directors, defined as a person who is not:
• a controller of ABG as the term is defined by the Bahrain Bourse (BB);
• an associate of a Director or a member of Executive Management of ABG;
• a professional advisor to ABG (such as an external auditor);• a large depositor with or large borrower from ABG (i.e. one
whose deposits or borrowings exceed 10% of ABG’s capital base); or
• in a significant contractual or business relationship with ABG which could be seen to interfere materially with his/her capacity to act in an independent manner.
In 2011 the members of the Board were:
Non-Executive Directors1. Shaikh Saleh Abdullah Kamel – Chairman2. Mr. Abdullah Saleh Kamel – vice Chairman3. Mr. Abdul Elah Sabbahi4. Mr. yousef Ali Fadil Bin Fadil5. Mr. Mohyedin Saleh Kamel6. Mr. Fahad Abdullah A. Al-Rajhi*
* In place of Samer Mohammed Farhoud with effect from 23 March 2011
Independent Directors1. Mr. Abdulla A. Saudi – vice Chairman2. Mr. Saleh Al yousef3. Dr. Anwar Ibrahim4. Mr. Ebrahim Fayez Al Shamsi5. Mr. Jamal Bin Ghalaita 6. Dr. Bassem Awadallah
Executive DirectorMr. Adnan Ahmed yousif – President & Chief Executive
All current Directors were elected for a 3-year term on 23 March, 2011.
The Board of Directors (continued)
Annual Report – 2011
63
The Board has put in place a number of Board committees, membership of which is drawn from the Board Membership and to which it has delegated specific responsibilities. The principal Board committees are:
Board Executive CommitteeThe Board Executive Committee is chaired by Mr. Abdullah Saleh Kamel and the other members are Mr. Adnan Ahmed yousif, President & Chief Executive, Mr. Abdul Elah Sabbahi and Mr. yousef Ali Fadil Bin Fadil. The Board Executive Committee comprises a minimum of four Directors and meets at least two times a year. The Board has delegated to the Board Executive Committee, under a formal written charter adopted by it, the responsibility to make recommendations to the Board, for the Board’s approval, concerning the Group’s overall policies and procedures, strategies and business plan, or any significant change to them, or any major change to its capital or organisation structure, assets or investments. The Board Executive Committee’s primary purpose is to consider and recommend for approval of the Board the overall policies and procedures, strategies and business plan of the Group.
Board Affairs and Remuneration CommitteeThe Board Affairs and Remuneration Committee operates in accordance with a formal written charter adopted by it. The Committee is chaired by Mr. Ebrahim Fayez Al Shamsi and its other members are Mr. Jamal Bin Ghalaita and Mr. yousef Ali Fadil Bin Fadil. The Committee meets at least twice a year and considers all material elements relating to remuneration policy, including, inter alia, the approval of the remuneration of the Directors, based on their attendance at Board and Committee meetings, and recommendation to the Board of the level of remuneration of the Executive Management members and other ABG employees under an approved performance-linked incentive structure. The Committee also performs the role of a Nominations Committee.
The Committee conducts an annual evaluation of the performance of the Board, Board Committees and the President & Chief Executive. The 2011 evaluation results were entirely satisfactory. when an issue related to the personal interest of a director was discussed in the Committee, the interested director withdrew himself from the meeting and abstained from voting.
Board CommitteesIt is responsible for identifying persons qualified to become members of the Board or the chief executive officer, the chief financial officer, the Board Secretary and other executive officers considered appropriate (with the exception of the Head of the Internal Audit Department) and for making recommendations accordingly. It is also responsible for inducting, educating and orienting new Directors and for conducting seminars and other training programmes from time to time for Members of the Board all of which took place during the past year.
Board Audit and Governance CommitteeThe Board Audit and Governance Committee is chaired by Mr. Saleh Al yousef. Other members are Dr. Anwar Ibrahim, Mr. Ebrahim Fayez Al Shamsi and Dr. Bassem Awadallah. The Committee is governed by a formal written charter adopted by it and meets formally at least four times a year and external auditors attend at least one meeting annually. The external auditors, moreover, have unrestricted access to the Committee and its Chairman throughout the year.
The Board of Directors has delegated to the Board Audit and Governance Committee the responsibility for ensuring that an effective system of accounting and financial control is in place. The Committee achieves this through regular review of the Group’s accounting and financial policies, financial reporting and disclosure controls and procedures and the adequacy and effectiveness of the internal control procedures at the Head Office and in ABG’s subsidiaries. The Committee considers all matters relating to financial control and reporting, internal and external audits and their scope and results, risk management and compliance with regulatory and legal requirements, accounting standards and Shari’a requirements. It also considers and approves the annual audit plans, ensures coordination between the internal and external auditors, monitors the independence, qualifications, effectiveness and performance of the external auditors and their remuneration and makes recommendations to the Board regarding the appointment and retirement of the external auditors and the appointment of the Head of the Group’s Internal Audit Department.
The Committee reviews the Group’s annual and interim financial statements to recommend their approval to the Board of Directors, the adequacy of provisions and any reports by external consultants on specific investigative or advisory engagements.
64
CoRpoRAte goVeRnAnCe (ContinUed)
The Committee ensures that there are in place systems of control appropriate to the business of the Group and the information needs of the Board, including systems and functions for identifying and monitoring risk, the financial position of the Group and compliance with applicable laws, regulations and best practice standards and that all such information is produced on a timely basis. The various internal and financial controls and processes are subject to independent review by the Group’s Internal Audit Department, which reports directly to the Committee, and external auditors and regulators as appropriate. The reports of all these bodies are forwarded to the Board Audit and Governance Committee who, acting on behalf of the Board, ensures that appropriate corrective action is taken where required. The Committee is informed directly by Internal Audit’s reports submitted to it and by its discussions with external auditors of the work undertaken by them and their conclusions and recommendations.
The Committee also oversees and monitors the implementation of the corporate governance policy framework, providing the Board with reports and recommendations based on its findings.
The Board has adopted a ‘whistleblower’ programme under which employees can confidentially raise concerns about possible improprieties in financial or legal matters. Under the programme, concerns may be communicated directly to any member of the Board Audit and Governance Committee or alternatively to an identified officer or employee who in turn reports the matter to the Committee.
Board Risk CommitteeThe Board Risk Committee is chaired by Mr. Abdul Elah Sabbahi, with its other members being Mr. Jamal Bin Ghalaita, Mr. Mohyedin Saleh Kamel and Mr. Fahad A. Al-Rajhi. Membership of the Committee comprises a minimum of four Directors, all of whom must be non-executive directors. The Board Risk Committee meets formally at least twice a year but will meet more frequently at the request of the Chairman of the Committee. It can call for the attendance of the President & Chief Executive, Head of Credit and Risk Management and other senior executives of the Group at any of its meetings.
The Group’s risk appetite is determined by the Board based on the recommendations of the Board Risk Committee. The Board Risk Committee is responsible for setting acceptable levels of risks to which the Group may be exposed, for approving management’s strategy for the managing of risk and for ensuring that all necessary steps are taken by management to identify, measure, monitor and control risk. The Committee’s objective is to oversee the Group’s risk management systems, practices and procedures to ensure effective risk identification and management and compliance with internal guidelines and external requirements. The Committee reviews issues identified by the Internal Audit and Compliance departments of ABG and/or any of its subsidiaries, such as weaknesses or breakdowns in controls.
Board Committees (continued)
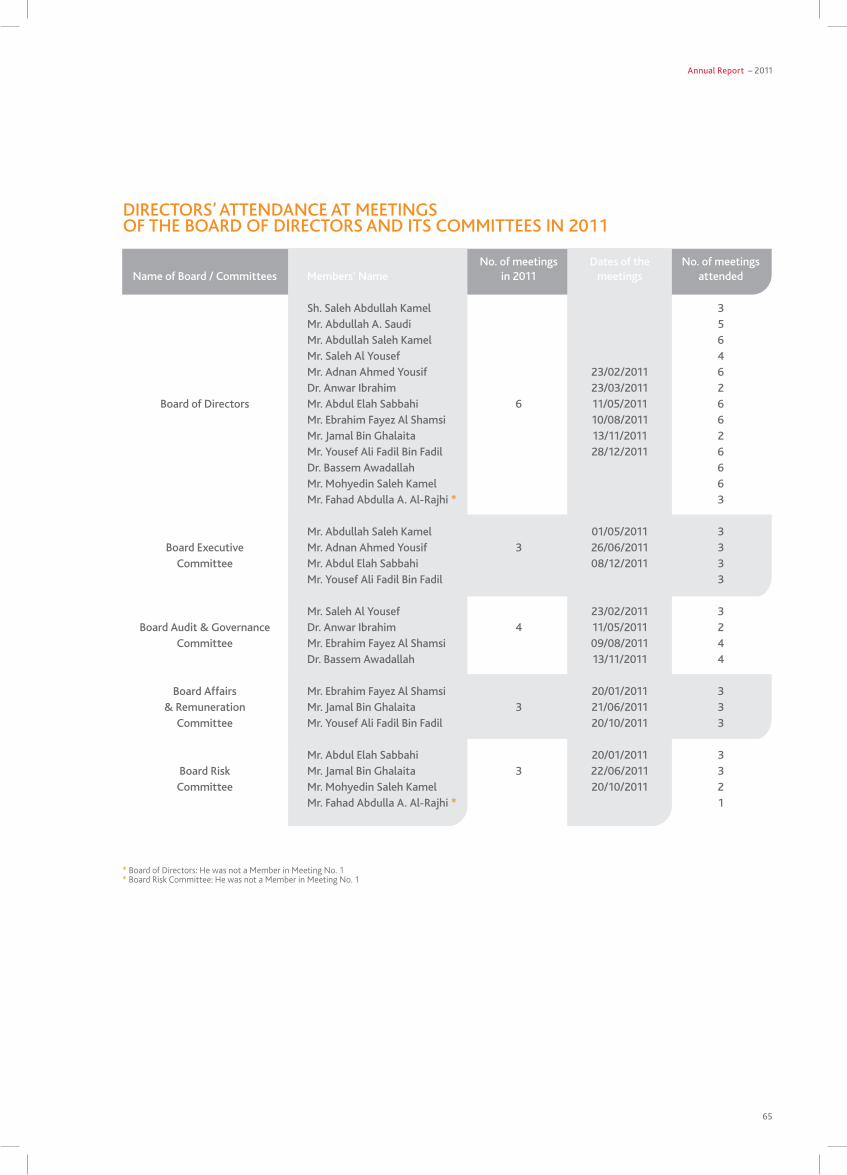
Annual Report – 2011
65
* Board of Directors: He was not a Member in Meeting No. 1* Board Risk Committee: He was not a Member in Meeting No. 1
DIRECTORS’ ATTENDANCE AT MEETINGS OF THE BOARD OF DIRECTORS AND ITS COMMITTEES IN 2011
No. of meetings Dates of the No. of meetings Name of Board / Committees Members’ Name in 2011 meetings attended
Sh. Saleh Abdullah Kamel 3 Mr. Abdullah A. Saudi 5 Mr. Abdullah Saleh Kamel 6 Mr. Saleh Al Yousef 4 Mr. Adnan Ahmed Yousif 23/02/2011 6 Dr. Anwar Ibrahim 23/03/2011 2 Board of Directors Mr. Abdul Elah Sabbahi 6 11/05/2011 6 Mr. Ebrahim Fayez Al Shamsi 10/08/2011 6 Mr. Jamal Bin Ghalaita 13/11/2011 2 Mr. Yousef Ali Fadil Bin Fadil 28/12/2011 6 Dr. Bassem Awadallah 6 Mr. Mohyedin Saleh Kamel 6 Mr. Fahad Abdulla A. Al-Rajhi * 3
Mr. Abdullah Saleh Kamel 01/05/2011 3 Board Executive Mr. Adnan Ahmed Yousif 3 26/06/2011 3 Committee Mr. Abdul Elah Sabbahi 08/12/2011 3 Mr. Yousef Ali Fadil Bin Fadil 3
Mr. Saleh Al Yousef 23/02/2011 3 Board Audit & Governance Dr. Anwar Ibrahim 4 11/05/2011 2 Committee Mr. Ebrahim Fayez Al Shamsi 09/08/2011 4 Dr. Bassem Awadallah 13/11/2011 4
Board Affairs Mr. Ebrahim Fayez Al Shamsi 20/01/2011 3 & Remuneration Mr. Jamal Bin Ghalaita 3 21/06/2011 3 Committee Mr. Yousef Ali Fadil Bin Fadil 20/10/2011 3
Mr. Abdul Elah Sabbahi 20/01/2011 3 Board Risk Mr. Jamal Bin Ghalaita 3 22/06/2011 3 Committee Mr. Mohyedin Saleh Kamel 20/10/2011 2 Mr. Fahad Abdulla A. Al-Rajhi * 1
66
CoRpoRAte goVeRnAnCe (ContinUed)
Executive ManagementThe Board of Directors has delegated to the Group’s Executive Management Team the primary responsibility for implementing the strategy of the Group, identifying and evaluating significant risks to the business of the Group and for the design and operation of appropriate internal controls. Its other responsibilities include: ensuring that resolutions of the Board of Directors are carried out; ensuring that the Group operates at all times in accordance with the principles of Shari’a and that the decisions and recommendations of the Shari’a Supervisory Board are carried out, providing the Board of Directors with analyses, assessments and recommendations regarding the Group’s activities and supplying the CBB with all information required under the CBB law and relevant regulations. In meeting these responsibilities, Executive Management has established a system for filtering down to Group units strategic and other central decisions taken at the parent level, thus ensuring the implementation of Groupwide policies and common operational processes and procedures.
As at the end of 2011, the Executive Management Team consisted of the President & Chief Executive, the Deputy Chief Executive and the Heads of Financial Control, Internal Audit, Strategic Planning, Credit and Risk Management, Treasury, Investment and Financial Institutions, Operations and Administration, legal Affairs and Compliance.
Executive Management also exercises control via the following Committees, which have the following specific responsibilities:
Executive Management CommitteeThe Executive Management Committee’s role is to oversee the implementation of the strategic objectives of the Group in relation to its business direction, operations, risk, expansion plans and overall policies and procedures. The Committee is chaired by the President & Chief Executive with the remaining membership comprising the Deputy Chief Executive and the Heads of Strategic Planning, Operations and Administration, Credit and Risk Management and Treasury, Investments and Financial Institutions, with the Heads of Financial Control, legal Affairs and Internal Audit as observer-members.
Assets and liability Committee The Asset and liability Committee’s mandate is to monitor the liquidity and capital adequacy of the Group and review the Group’s long term equity investments and its penetration into the different markets. The Committee reviews liquidity and cash flow of ABG and the Group and sets balance sheet growth targets, besides monitoring the distribution of profits to investors. The Committee is chaired by the President & Chief Executive and its remaining members are the Deputy Chief Executive, the Heads of Treasury, Investments and Financial Institutions, Credit and Risk Management, Strategic Planning, Financial Control
and Operations and Administration, together with a senior member from the Bahrain based subsidiary, Al Baraka Islamic Bank (Al Baraka Bahrain).
Head Office Credit CommitteeThe Head Office Credit Committee is the authority that approves credits and considers issues of Group credit policy and Group credit exposures, problem credits and provisioning levels. The Head Office Credit Committee is chaired by the President & Chief Executive, with the remaining membership being drawn from among the Executive Management. Management Risk CommitteeThe Management Risk Committee’s role is to assist the Board Risk Committee in managing and controlling risks and to introduce and support such measures which enhance the efficiency of risk management policies, procedures, practices and controls within the Group. It is chaired by the President & Chief Executive with remaining membership comprising the Heads of Credit and Risk Management, Operations and Administration and Financial Control and the Manager of Credit Review and Analysis.
Head Office IT Steering CommitteeThe Head Office IT Steering Committee’s role is to draw up the Group’s short and long term IT strategy and oversee and monitor its implementation throughout the Group with a view to effecting standardisation in information and operation management. The Committee is chaired by the Deputy Chief Executive with remaining membership comprising the Heads of Operations and Administration, Financial Control, Strategic Planning and Credit and Risk Management, together with senior support nominees drawn from the Group.
Human Resources & Compensation CommitteeThe role of the Human Resources & Compensation Committee is to review the Human Resources policies, management and planning at the Group’s Head Office. The Committee is chaired by the Deputy Chief Executive with the remaining membership comprising the Heads of Operations and Administration, Strategic Planning and Financial Control.
Head Office Insiders CommitteeThe Head Office Insiders Committee was set up in accordance with the guidelines issued by the CBB and the BB and is aimed at ensuring the maintenance of a fair, orderly and transparent securities market and enhancing and developing the practices relating to the risk management systems and internal controls within listed companies and other similar institutions. The Committee is responsible for monitoring and supervising issues relating to insiders in order to regulate their dealings in the Group’s securities and to ensure that Group insiders are acquainted with
Annual Report – 2011
67
and aware of the legal and administrative requirements regarding their holdings and dealings in the Group’s securities, in addition to preventing the abuse of inside information by such insiders. The Committee is chaired by the President & Chief Executive and the other members are the Deputy Chief Executive and the Heads of Internal Audit, legal Affairs, Operations and Administration and Investors’ Relations.
Brand Guardians The Brand Guardians are responsible for the introduction, implementation and management of the new Unified Identity and maintenance of a lasting positive image reflecting the dynamic and international nature of the Group’s businesses and activities. The Brand Guardians are the Deputy Chief Executive, the Heads of Operations and Administration and Strategic Planning, together with selected senior members of ABG Strategic Planning and a senior member of management from Al Baraka Bahrain.
Other CommitteesThe Executive Management forms ad hoc committees as and when required to address specific initiatives in which the Group may be engaged from time to time.
Compliance, Policies and Procedures
Group Disclosure PolicyThe Group communication strategy aims to help achieve the Group’s objective of keeping the market informed of material information. The Group’s communications with the market ensures compliance with the CBB’s directives as detailed in the Public Disclosure Module of its Rulebook, volume 2, Part A and the CBB Disclosure Standards as specified under the CBB Capital Markets Regulations.
Material information is any information, financial or non-financial, relating to the business and affairs of the Group and ABG’s subsidiaries that results in, or would reasonably be expected to result in, a significant change in the market price of the Group’s shares or in the decision of a prudent investor to sell, buy or hold the Group’s shares or cause to change a prudent investor’s decision to transact or refrain from transacting with the Group or its units. Material information consists of, but is not limited to, both material facts and material changes relating to the business and affairs of the Group and ABG’s subsidiaries.
Examples of information that may constitute material information are:• Changes in share ownership of the Group;• Changes in corporate structure of the Group, such as
reorganisations or mergers;
• Public or private sale of additional securities (such as Sukuk) or planned acquisition;
• Changes in the Group’s dividend policy or other material modifications to the rights of shareholders;
• Takeover bids;• Changes in the capital structure of the Group;• Borrowing or lending of a significant amount of funds;• Changes in rating agency decisions such as downgrades or
upgrades;• Development of new products that might consequently affect
the Group’s existing products or markets;• Changes in financial results, including significant increases
or decreases in near-term earnings prospects, including all the important financial indicators that affect the Group’s earnings, balance sheet, cash flow and liquidity;
• Material changes in accounting policies;• Significant changes in capital investment plans or the Group’s
corporate objectives and priorities;• Significant changes in the Group’s capital adequacy;• Changes in the Group’s Board of Directors or members of
Executive Management;• Commencement of, or developments in, material legal
proceedings or regulatory matters;• Major labour disputes;• Significant changes in the existing business models of the
subsidiaries;• Material negative changes of subsidiaries’ capital adequacy
ratios;• Material positive or negative earnings, or indicators of such
earnings, generated by the subsidiaries; and• Major economic or political events in one or more of the
subsidiaries’ countries of operations that the Group reasonably and prudently believes would have a material impact on the financial position of the Group.
The Group is committed to complying with the CBB’s rules and regulations with regard to the dissemination of the Group’s financial information and statements, on a quarterly, semi-annual and annual basis and as applicable to any ad hoc information requirement of the CBB. As a listed company on the BB and NASDAQ Dubai, ABG is committed to adhering on a timely basis to all periodic information dissemination requirements of the BB and NASDAQ Dubai, as stipulated in their respective directives and rulebooks in this respect.
Additionally, the Group will publicly disclose and broadly disseminate material information immediately upon becoming aware of circumstances or events that underlie such material information or when a decision to implement a material change is made by the Board of Directors or Executive Management of the Group.
68
The Group has in place effective procedures for dealing with complaints received from its shareholders and stakeholders. Different channels have been established to enable communication with investors including through the offices of the Registrar, an online query centre on the Group’s website and dedicated telephone and facsimile lines. All complaints received are transmitted to the concerned department, Executive Management and the Board. In accordance with the Central Bank of Bahrain’s disclosure requirements, the Group maintains at least three years’ financial information on its website.
RegulationThe Group complies with all the regulatory requirements governing Islamic Banks issued by the CBB, which include, inter alia, regulations governing the Group’s capital adequacy, asset quality and risk management, liquidity and fund management.
The CBB as the home supervisor sets and monitors ABG’s capital requirements on both a consolidated and an unconsolidated basis, while ABG’s individual banking subsidiaries are directly regulated by their local banking supervisors, who set and monitor their capital adequacy requirements.
The CBB requires each Bahrain-based bank or banking group to maintain a minimum ratio of total capital to on- and off-balance sheet risk-weighted assets of 8% on a single bank basis and 12% on a consolidated basis, which requirement exceeds the 8% minimum ratio guideline of the Basel Committee on Banking Supervision under its 1988 Capital Accord. However, a new Capital Accord (Basel II) was subsequently announced by the Basel Committee to replace the 1988 Accord, designed to achieve a more sophisticated degree of risk differentiation in establishing the amount of capital that banks should allocate to different categories of their credit risk exposure, in addition to including a capital charge for operational risk and incorporating an earlier guideline in relation to capital charges for market risk. Regulators now have wider discretion to increase or decrease capital requirements for banks according to their individual circumstances. The new rules also require greater transparency of published information relating to bank risk management.
The Group took all necessary steps to achieve in time the required degree of sophistication in risk assessment to enable it to comply with the requirements of Basel II as stipulated by the CBB. It has adopted the Standardised Approach applicable to Islamic Banks under the CBB’s Rulebook and the Group has been adhering solely to the requirements of the CBB under Basel II since July 2008.
CoRpoRAte goVeRnAnCe (ContinUed)
As a listed company, ABG adheres to a strict policy which delegates to certain specific individuals the authority to issue press releases or announce to the public information, financial or non-financial, on the Group. Only the following persons are authorised to make public information via the media:
• Chairman of the Board of Directors• vice-Chairmen of the Board of Directors• President & Chief Executive
In the event that any of the above mentioned persons is requested to make statements relating to the financial statements, financial indicators or general financial performance of the Group, that person will consult and/or confirm with the Head of Financial Control with regard to the accuracy, timeliness and reliability of the information prior to making any public announcements.
The Group mails its Financial Statements and Prudential Returns to the CBB, BB and NASDAQ Dubai on a quarterly and an annual basis, following which the Group makes this information available on its website.
Press releases are posted on the Group’s website and published in a minimum of one local newspaper either in Arabic or English. Persons authorised by the Group to make public disclosures will not make any announcement on a one-to-one basis before disseminating the information on the Group’s website or in local newspapers.
The Group is committed to adhering to all the requirements outlined in the CBB’s Rulebook, volume 2, Part A, Public Disclosure Requirements section.
In order for the Group to be in full compliance with the CBB disclosure requirements as specified in the above mentioned Rulebook, the Group will disclose all the required information in its published quarterly reviewed financial statements and its annual audited financial statements, which are the responsibility of its Financial Control Department. However, as some of the required information is generated by departments of the Group other than the Financial Control Department, all concerned departments responsible for producing information for the purpose of complying with the CBB’s disclosure requirements (for example, the Strategic Planning, Operations and Administration, Credit and Risk Management, legal Affairs, Compliance and the Internal Audit Departments) shall provide this information to the Financial Control Department on a timely basis in order for the latter to prepare the Group Financial Statements as stipulated by the CBB.
Compliance, Policies and Procedures (continued)
Annual Report – 2011
69
Pursuant to the Group’s Compliance Policy, which was approved and adopted by the Board of Directors in November 2009, ABG has appointed a Compliance Officer, whose role is to assist management to ensure the Group’s adherence to the Group Compliance Policy, in particular that all Group activities are conducted in conformity with all applicable laws and regulations and in accordance with best practice. The Compliance Officer’s position is currently held by a senior officer in the Credit and Risk Management Department.
Anti-Money launderingThe Group has implemented the CBB’s Anti-Money laundering regulations, including the appointment of a Group Money laundering Reporting Officer (MlRO) - which position is held by the Head of Operations and Administration - who also oversees the individual MlROs in each of the constituent banks. Groupwide overall policies for Know your Customer (KyC) and Anti-Money laundering at the Head Office level, complying with CBB regulations, have been disseminated to all subsidiaries for implementation.
Financial Performance MonitoringExecutive Management has in place various measures that help monitor and control the activities of the Group worldwide. A comprehensive financial consolidating procedure exists and is working effectively, whereunder all subsidiaries submit their financial data in a format that is compatible with Islamic Accounting Standards issued by AAOIFI and with International Financial Reporting Standards (IFRS). These are consolidated quarterly and a consolidated set of financial results is produced. Additionally, subsidiaries submit a monthly return to Group headquarters providing details of their financial performance, measured against approved budgets.
Risk Management
The Group is committed to complying with internationally established principles and policies in relation to risk management. In particular the Group fully subscribes to the guiding principles of risk management for Islamic financial services institutions set down by the Islamic Financial Services Board and the need for a comprehensive risk management and reporting process. ABG’s Head of Credit and Risk Management is responsible for formulating and monitoring the Group’s policies relating to all aspects of risk, developing the framework for risk measurement and coordinating with the Group subsidiaries all necessary steps for meeting the Basel II requirements under the CBB rules. He is also responsible for introducing and implementing risk measurement software, monitoring the Group’s compliance with risk measurement standards and providing Group management with reports on the various risks.
Risk management is an integral part of the Group’s decision-making process. The Board of Directors defines and sets the Group’s overall levels of risk appetite, risk diversification and asset allocation strategies including those for related parties’ transactions. The Management Risk Committee and other executive committees guide and assist with overall management of the Group’s balance sheet risks. The Group manages exposure by setting limits approved by the Board of Directors. These risks and the processes employed to mitigate them have not altered significantly over the past year.
The Group’s risk management has the following objectives:a. unified Groupwide risk management to enable the Group to
calculate risk adjusted return on capital;b. inculcation of a professional risk management culture throughout
the Group with a prudent, disciplined approach to risk-taking based on comprehensive Groupwide policies, processes and limits;
c. professionally qualified staff and ongoing credit training;d. investing in technology and systems enabling best practice
risk management;e. throughout the Group, strict segregation of duties and reporting
lines between personnel transacting business and personnel processing that business;
f. strict compliance with all Shari’a and legal requirements and regulatory directives; and
g. maintaining clear, well documented policies via a Group Risk Management Manual and Risk Management Manual in each of the subsidiaries, incorporating the uniform policies and procedures of the Group in addition to the local requirements.
Each of ABG’s subsidiaries is managed by its respective Board of Directors. Group subsidiaries follow documented credit policies and procedures which reflect Groupwide policies and thus ensure that sound risk management is in place in all ABG’s subsidiaries.
Following implementation during 2010 of a consolidating system for the calculation of capital adequacy taking into account credit, market and operational risk, all in accordance with Basel II requirements, the required data is now retrievable automatically at Head Office.
The Group has continued to make determined efforts to maintain the momentum towards achieving optimal risk management policies, practices and procedures, pursuing five key objectives:
1. Continuous improvement in credit and risk management practices and intensified efforts on collections, recoveries and settlement of outstanding debts to bring about ongoing improvement in the Group’s NPl ratio and provisioning coverage.
70
CoRpoRAte goVeRnAnCe (ContinUed)
liquidity Riskliquidity risk is the risk that the Group will be unable to meet its payment obligations when they fall due under normal or stressed circumstances.
ABG and its subsidiaries each has in place a liquidity management framework, taking into account its liquidity exposures in respect of its current and savings accounts, deposits from banks and other financial institutions and its restricted and unrestricted investment accounts, so as to ensure that it maintains liquid assets at prudential levels so that cash can quickly be made available to honour all its obligations. liquidity management also recognises the impact of potential cash outflows arising from irrevocable commitments to fund new assets, as well as the potential risk impact of withdrawals by large single depositors, ensuring that there is no reliance on any one customer or small group of customers. In addition to its own internal liquidity management policies, each subsidiary is further required to maintain cash deposits with its respective Central Bank equal to a percentage of its deposits as directed by that Central Bank – in most cases 20%. ABG additionally holds substantial liquid funds which are earmarked and available for its subsidiaries in the unlikely event that they should require assistance. liquidity management reporting conforms to all local regulations.
Equity Price RiskEquity price risk is the risk that the fair value of equities decreases as a result of changes in the levels of equity indices and the value of individual stocks. Each Group subsidiary has in place appropriate strategies, risk management and reporting processes in respect of the risk characteristics of equity investments, including Mudaraba, Musharaka and other investments. Based on Group policies, each subsidiary ensures that its valuation methodologies are appropriate and consistent, and assesses the potential impact of its methods on profit calculations and allocations mutually agreed between that subsidiary and its partners. Further, each subsidiary has defined and established appropriate exit strategies and risk management and reporting processes in respect of its equity investment activities.
Profit Rate Risk or Rate of Return RiskProfit rate risk or rate of return risk is the risk that the Group will incur a financial loss as a result of a mismatch in the profit rate on the Group’s assets and unrestricted investment accounts. The Group is not liable to pay any predetermined returns to investment account-holders.
2. All subsidiaries ensure that their non-performing loans provisioning policies are in line with both Group policies and local regulatory requirements.
3. Subsidiaries continue to strive to ensure a high degree of cooperation between their business arms and risk management departments through hiring and training of credit and risk management staff as an ongoing priority in each unit.
4. Each subsidiary has its own approved Credit and Risk Management Manual, covering credit, liquidity, market, operational, profit rate and reputation risk, which accords with Group policies and procedures.
5. All subsidiaries submit timely quarterly risk management reports to Head Office which fully meet regulatory requirements; reports continue to be expanded to provide Head Office with increasingly comprehensive data to meet its internal requirements.
A standard risk management framework has been established across the Group, reflected in operational manuals that closely adhere to Group policy as regards all the major categories of risk faced by the Group in carrying out its business. These major risks are Credit, liquidity, Market (including Equity, Profit Rate and Foreign Exchange risk), Operational and Shari’a Compliance risks, each of which is discussed below in turn.
Credit RiskCredit risk is the risk that one party to a financial contract will fail to discharge an obligation and cause the other party to incur a financial loss. It applies to the Group in its management of the financing exposures arising out of receivables and leases (for example, Murabaha and Ijarah) and working capital financing transactions (Salam, Istisna’a or Mudaraba).
Each Group subsidiary has in place a framework for credit risk management that includes identification, measurement, monitoring, reporting and control of credit risks. Each subsidiary controls credit risk through the process of initial approval and granting of credit, subsequent monitoring of counterparty creditworthiness and the active management of credit exposures. Authority to approve credits is delegated by the subsidiary’s Board of Directors to committees entrusted with the task of credit assessment and evaluation, under specific credit policies and operational procedures in place in that subsidiary.
Each subsidiary maintains an internal audit department responsible for carrying out reviews of credit exposures to counterparties and assessing their quality and adherence to laid down approval procedures. Each subsidiary also maintains policies and procedures in covering case by case approval of related party transactions.
Risk Management (continued)
Annual Report – 2011
71
Foreign Exchange RiskForeign exchange rate risk arises from the movement of the rate of exchange of one currency against another over a period of time, leading to an adverse impact on the Group’s earnings or shareholders’ equity. The Group is exposed to foreign exchange rate risk in that the value of a financial instrument, or its net investment in its foreign subsidiaries, may fluctuate due to changes in foreign exchange rates. The Group’s significant net foreign currency exposures as at 31 December 2011 are detailed in Note 25 to the Financial Statements.
Operational RiskOperational risk is the risk of financial loss or damage resulting from inadequate or failed internal processes, people and systems or from external events.
Operations risk is managed through internal procedures and monitoring mechanisms, while management of legal risk is through effective consultation with internal and external legal counsel. Other kinds of operational risk are managed by ensuring that trained and competent people and appropriate infrastructure, controls and systems are in place to ensure the identification, assessment and management of all substantial risks.
The Group is also exposed to risks relating to its fiduciary responsibilities towards fund providers. Fiduciary risk arises from the failure to perform in accordance with explicit and implicit standards applicable to an Islamic bank’s fiduciary responsibilities, leading to losses in investments or failure to safeguard the interests of the investment account-holders. Group subsidiaries have in place appropriate mechanisms to safeguard the interests of all fund providers. where investment account-holders’ funds are commingled with a Group subsidiary’s own funds, the respective Group subsidiary ensures that the bases for asset, revenue, expense and profit allocations are established, applied and reported in a manner consistent with the Group’s fiduciary responsibilities.
As mentioned above, Group policy dictates that the operational functions of booking, recording and monitoring of transactions are carried out by staff independent of the staff initiating the transactions. Group subsidiaries have primary responsibility for identifying and managing their own operational risks. Each subsidiary is guided by policies, procedures, and controls that are relevant for each function. Internal control policies and procedures dictate the segregation of duties, delegation of authorities, exceptions reporting, exposures management and reporting, and reconciliations, and are based on the submission of timely and reliable management reporting.
Separate Internal Control units carry out ongoing monitoring of day-to-day procedures and ensure adherence to key control functions. As the Group is rapidly updating its technology base, replacing its legacy systems with new, modern hardware and systems, it is now increasingly possible to integrate the required control functions into the new processing systems.
Shari’a Compliance RiskShari’a compliance risk arises from the failure to comply with the rules and principles of Shari’a and is therefore akin to reputation risk. Group subsidiaries have in place systems and controls, including their respective Shari’a Supervisory Boards, to ensure compliance with all Shari’a rules and principles. In accordance with CBB regulations and AAOIFI Standards, the Group has been certified by the Shari’a Supervisory Board to be in compliance with Shari’a Standards and Principles.
Capital Management/Capital Adequacy
Capital is managed at ABG with a view to achieving optimum utilisation in the course of carrying out its business, in accordance with its predetermined risk appetite and intended risk profile and with the ultimate aim of maximising shareholders’ returns. Capital management includes pro-actively making appropriate and necessary adjustments to reflect changes in the economic environment or in the degree or nature of risk associated with the Group’s activities, including adjustment to its dividend policy, issue of Tier 1 or Tier 2 securities by way of public issue or private placement, etc.
Optimum capital management also addresses such crucial issues as:
• ensuring that adequate capital is held at all times to meet unexpected calls occasioned by such events as sudden withdrawals by depositors, earlier than expected drawdown of facilities, or unexpected losses;
• achieving the Group’s return on capital objectives;• meeting capital adequacy ratio targets; and• maintaining the Group’s strong credit rating.
The Group’s capital adequacy ratio as at 31 December 2011 was 20.66%, comfortably above the CBB’s minimum regulatory requirement of 12%.
Each of ABG’s banking subsidiaries is directly regulated by its own home regulator, which stipulates a minimum capital adequacy ratio in respect of that subsidiary. ABG ensures that each subsidiary adheres to these local capital adequacy requirements.
72
CoRpoRAte goVeRnAnCe (ContinUed)
Information TechnologyThe role of the Head Office IT Steering Committee is to govern and support IT strategies, projects and initiatives across all ABG subsidiaries and to ensure that they are in line with the Group’s overall strategic aims as well as each subsidiary’s own strategies. The Group’s short, medium and long term IT strategies are now well established, standardised around a few carefully chosen core banking solutions for Groupwide implementation. The next stage of the Group’s IT strategy and governance framework is being developed in collaboration with the subsidiaries and with the assistance of a leading advisory firm.
ABG’s initial web-based financial consolidation and reporting application is now also used as a corporate performance measurement solution, utilising Key Performance Indicators (KPI) based on Group strategic objectives. It is used in setting performance benchmarks for each subsidiary and for monitoring their individual performances on a continuous basis and will gradually be integrated into all core system applications implemented throughout the Group.
The monthly, quarterly and annual consolidations, currently performed through the financial consolidation module, enables the collection, processing, reporting and analysing of data in multiple currencies as well as reporting on the effects of currency fluctuations. ABG’s Financial Control Department can now consolidate data from many business perspectives, for instance at the subsidiary level, by geographical region or Islamic product line, as well as by multiple structure versions such as year to date, current year’s results, previous year’s results and so on.
Following an intensive evaluation of the Group’s requirements for risk management systems from both Islamic and regulatory perspectives, the Risk Management team selected the most suitable system, which carried with it the additional weight that the product comes highly recommended by several other Islamic institutions using it, both in the Kingdom of Bahrain and abroad. The module relating to capital adequacy calculation based on credit, market and operational risk was implemented between 2010 and 2011 at the Head Office and at Al Baraka Islamic Bank Bahrain, with implementation being planned at the remaining subsidiaries throughout 2012 and beyond.
Careful selection by the IT Steering Committee of an approved list of core banking system solutions was followed by each subsidiary arriving at its own system choice to suit its individual requirements. Several subsidiaries chose the Equation Islamic core
banking system from Misys, while other subsidiaries, operating in different markets with different priorities, adopted iMAl from Path Solutions.
Five subsidiaries – Al Baraka Bahrain, Al Baraka South Africa, Al Baraka lebanon, Al Baraka Pakistan and Al Baraka Egypt – opted for the Equation Islamic system. Al Baraka Bahrain achieved full implementation in 2009 followed by Al Baraka lebanon and Al Baraka South Africa in 2011. Al Baraka Egypt and Al Baraka Pakistan anticipate going live in the first quarter of 2012.
Al Baraka Algeria chose iMAl from Path Solutions, with installation expected to go live in the first quarter 2012 and be fully completed later in the year. Implementation of Al Baraka Jordan’s choice of the NIBRAS Banking System as its core banking system was achieved in 2011 and full project completion is expected during 2012.
Al Baraka Sudan, who also selected iMAl as its new core banking system, is now live with the application and expects to achieve project sign off for all other optional modules by the first quarter of 2012. Al Baraka Tunisia has successfully upgraded its existing core banking system (TEMENOS-T24), which now incorporates e-banking services. Al Baraka Turkey, who employed an in-house solution some time ago which is working well, is however currently defining a strategy to move to a new core application in the future as part of an expansive “IT Transformation” project. Finally, Al Baraka Syria, who selected iMAl, has gone live with the application and the project is in the final stage of implementation of optional modules with the first quarter 2012 targeted for final sign off.
In 2009 the Group IT Department launched a new initiative to achieve “Business Excellence through IT” in partnership with leading IT advisory firms. Important milestones have been achieved under this initiative, which has increased the value of IT to the business and the level of collaboration among Group subsidiaries. ABG IT has also focused on establishing a standardised global Disaster Recovery Plan (DRP) throughout the Group. Once the new core applications have been fully implemented at all ABG subsidiaries in 2012, and both a global DR Centre and local DR centres have been established, each subsidiary will be fully protected against any sudden, unexpected service loss.
Annual Report – 2011
73
The success of the contemporary Islamic banking and finance movement owes much to the contribution and patronage of Sheikh Saleh Kamel, the founder of Al Baraka Banking Group. Although the Group is young as a single legal entity, its antecedents go back to the late 1960s, when Sheikh Kamel directed the devising of Islamic contracts for use in his business operations when dealing with conventional banks (there being no Islamic banks in existence at that time), which was his preferred route for doing business with them. This early insistence on strict adherence to fundamental Islamic principles was then quickly overtaken by the next stage of development when, in the early 1970s, Sheikh Kamel oversaw the establishment across the Arab world of a series of Islamic financial institutions bearing the Al Baraka name. Today, Al Baraka Banking Group brings together under one unified grouping the accumulated experience of 11 banks delivering Islamic products and services over three decades. we at ABG are proud to look back on this heritage, whilst at the same time we keenly look forward to the next stage in our development, as we gradually expand into new regions and new markets and build a wider customer base. As members of a banking group founded on Islamic principles and values, we at ABG believe that we have a particular obligation to society, through patronage and sponsorship of educational and social projects, to enhance the living conditions and quality of life of needful individuals in the local communities of which we are part. In meeting this commitment to society we make all possible effort to apply one of the important philosophical pillars of Islamic banking: the concept of “construction of land”, which means adding tangible value to assets. This concept has a direct relevance to the development of society and its social and economic progress and we seek to apply it through active investment mediation, which complements real and value-added production, and through the exchange of commodities and services, which enables us to offer practical alternatives to those financial intermediaries that provide no benefit to society at large. we consider the role of CSR in our organisation to be essential to the application of the principles derived from divine power and on which our business activities in all the countries in which we operate are based. All our subsidiaries embrace Islamic ethical principles and apply them to their banking operations and services.
These principles may be summarised as:
First:Investments may only be made in sectors and industries that meet ethical standards. The moral values of Islam dictate that Muslims must invest in the production of, and trade in, useful and beneficial goods only. They therefore forbid investment in such activities as, for example, contribute to the production of alcoholic beverages, tobacco or weapons, or are associated in any way with gambling, pornography or the abuse of children, women and minorities, or any other morally questionable practices.
Second:All Islamic banks and financial institutions eschew the payment of interest in their relations with depositors, consumers and businesses, as Islam prohibits the paying or charging of interest. Instead ABG’s banking subsidiaries, like all Islamic banks, accept deposits on an investment basis whereby depositors share with the bank in the actual results of the realisation of their investments. Financing is provided to businesses in turn mainly on the basis of instalment sale, leasing or equity participation. In this way, they and their depositors share the financial risk with the entrepreneurs and together they reap the benefits of the investments. The prohibition of interest is to be found in the Qur’an and is fundamental to the ethical standards and core values laid out therein. ABG’s subsidiaries, as Islamic banks, firmly adhere to these core values by disallowing the charging or paying of interest, an essential difference between Islamic and conventional banks. yet, customers of Islamic banks and other financial institutions generally share a similar experience to that of customers of conventional banks - who share profit with their depositors. The essential difference in Islam is that the practice of profit sharing is such that wealth creation is the result of a partnership between investors and entrepreneurs in which both the risks and the rewards are shared: returns on invested capital are based on profits actually generated rather than predetermined interest rates.
Third:All contracts entered into by ABG’s banking subsidiaries, and all their relations with businesses and depositors, must comply with the ethical standards of the Shari’a.
CoRpoRAte soCiAl ResponsiBility
74
OUR CUSTOMERS CAN REST ASSURED THAT THEIR FINANCIAl INTERESTS ARE BEING MANAGED By US TO THE HIGHEST ETHICAl STANDARDS.
PEACE OF MIND
7575
Annual Report – 2011
76
UniFied sHARi’A sUpeRVisoRy BoARd RepoRtFoR tHe yeAR ended 31 deCemBeR 2011
In the name of Allah, The Beneficent, The Merciful, Ever Merciful
Praise be to Allah and peace be upon our Prophet Mohammed, His Apostles and Companions
To: Al Baraka Banking Group Shareholders
May peace and God’s Mercy and Blessings Be upon you In accordance with Article (58) of the Articles of Association of Al Baraka Banking Group, we are required to submit the following report:
First:we have conducted six meetings during 2011, three of which were conducted at the premises of Al Baraka Banking Group’s subsidiaries in which we met the subsidiaries’ Shari’a Board members, Shari’a auditors and employees and conducted several small seminars and replied to many of the employees and customers’ inquiries. In addition, we have made sure that the operations of the transactions are conducted in compliance with Shari’a rules and principles.
The other three meetings were conducted at our premises in Jeddah, in which we studied Shari’a audit reports prepared by the Group’s Shari’a Audit for the year ended 31 December 2011 and gave few Shari’a related comments on those reports. These reports were rectified through coordination between Shari’a Audit and the relative local subsidiaries’ Shari’a Boards. In addition, the executive committee of the Unified Shari’a Supervisory Board conducted several meetings in which a number of commercial contracts and agreements signed by the Financial Institutions Department in the Group with the subsidiaries and other financial institutions and organizations has been reviewed. Second:we have reviewed the principles applied by the Group and reviewed the 2011 Shari’a reports issued by the Group Units’ Shari’a Supervisory Boards. we have also reviewed their financial statements when needed. In addition, we examined the Group’s financial position as of 31 December 2011 and Statement of Income and their notes. we have queried from some of the Technical’s on the points that need explanation and statement. we have also reviewed the process of calculating Zakah in accordance with the Shari’a Standard number (35) and the Financial Accounting Standard number (9) issued by the Accounting and Auditing Organization for Islamic Financial Institutions and according to what was approved by the Unified Shari’a Supervisory Board.
Third:The Group and Units’ management are responsible for the execution and implementation of the Unified Shari’a Supervisory Board resolutions and to bring to the attention of the Unified Shari’a Supervisory Board any transactions or issues that require Shari’a approval. The Unified Shari’a Supervisory Board is responsible for supervising the implementation of the resolution from a Shari’a point of view and issue opinion based on the Group and Units’ Shari’a reports and financial statements.
The Unit’s Shari’a Supervisory Boards, as is clear from their report, have supervised the Units’ business activities including examining on test basis documentations and procedures applied by the Group and its Units.
The Units’ Shari’a Supervisory Boards, as is clear from their reports, planned and performed reviews so as to obtain all the information and explanations they considered necessary in order to provide them with sufficient evidence to provide reasonable assurance that the Group and its Units have not violated Shari’a Rules and Principles.
In our opinion:1. The Contracts, transactions and dealings entered into by the Group and its Units during the year ended 31st December 2011
are made in compliance with Shari’a Rules and Principles.2. The allocation of profit and charging of losses relating to investment accounts conform to the basis that have been approved
by the Units’ Shari’a Supervisory Boards in accordance with Shari’a Rules and Principles.3. All earnings realized from sources or by means prohibited by Islamic Shari’a Rules and Principles have been committed by the
Management to dispose it off to Charitable Causes.
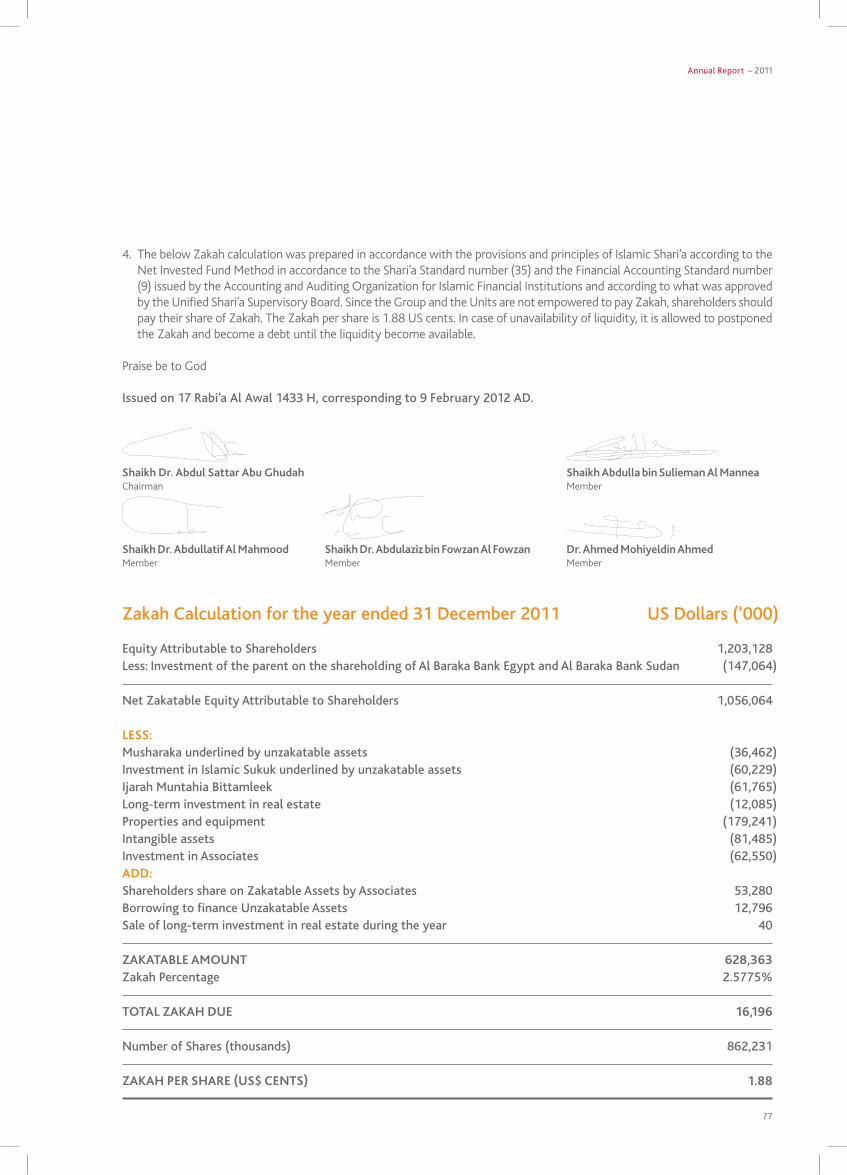
Annual Report – 2011
77
Zakah Calculation for the year ended 31 December 2011 US Dollars (‘000)
Equity Attributable to Shareholders 1,203,128Less: Investment of the parent on the shareholding of Al Baraka Bank Egypt and Al Baraka Bank Sudan (147,064)
Net Zakatable Equity Attributable to Shareholders 1,056,064
LESS: Musharaka underlined by unzakatable assets (36,462)Investment in Islamic Sukuk underlined by unzakatable assets (60,229)Ijarah Muntahia Bittamleek (61,765)Long-term investment in real estate (12,085)Properties and equipment (179,241)Intangible assets (81,485)Investment in Associates (62,550)ADD: Shareholders share on Zakatable Assets by Associates 53,280Borrowing to finance Unzakatable Assets 12,796Sale of long-term investment in real estate during the year 40
ZAKATABLE AMOuNT 628,363Zakah Percentage 2.5775%
TOTAL ZAKAH DuE 16,196
Number of Shares (thousands) 862,231
ZAKAH PER SHARE (uS$ CENTS) 1.88
4. The below Zakah calculation was prepared in accordance with the provisions and principles of Islamic Shari’a according to the Net Invested Fund Method in accordance to the Shari’a Standard number (35) and the Financial Accounting Standard number (9) issued by the Accounting and Auditing Organization for Islamic Financial Institutions and according to what was approved by the Unified Shari’a Supervisory Board. Since the Group and the Units are not empowered to pay Zakah, shareholders should pay their share of Zakah. The Zakah per share is 1.88 US cents. In case of unavailability of liquidity, it is allowed to postponed the Zakah and become a debt until the liquidity become available.
Praise be to God
Issued on 17 Rabi’a Al Awal 1433 H, corresponding to 9 February 2012 AD.
Shaikh Dr. Abdul Sattar Abu GhudahChairman
Shaikh Dr. Abdulaziz bin Fowzan Al FowzanMember
Dr. Ahmed Mohiyeldin AhmedMember
Shaikh Dr. Abdullatif Al MahmoodMember
Shaikh Abdulla bin Sulieman Al ManneaMember
78
independent AUditoRs’ RepoRt to tHe sHAReHoldeRs oF Al BARAkA BAnking gRoUp B.s.C.Report on the consolidated financial statementswe have audited the accompanying consolidated financial statements of Al Baraka Banking Group B.S.C. (“the Bank”) and its subsidiaries (“the Group”) which comprise the consolidated statement of financial position as at 31 December 2011 and the consolidated statements of income, cash flows, changes in owners’ equity and changes in off-balance sheet equity of investment account-holders for the year then ended, notes, comprising a summary of significant accounting policies and other explanatory information.
Board of Directors’ and management’s responsibility for the consolidated financial statements The Board of Directors and the management are responsible for the preparation and fair presentation of these consolidated financial statements in accordance with the Financial Accounting Standards issued by the Accounting and Auditing Organisation for Islamic Financial Institutions and for such internal control as the Board of Directors and the management determine is necessary to enable the preparation of consolidated financial statements that are free from material misstatement, whether due to fraud or error. In addition, the Board of Directors and the management are responsible for the Group’s undertaking to operate in accordance with Islamic Shari’a rules and principles.
Auditors’ responsibilityOur responsibility is to express an opinion on these consolidated financial statements based on our audit. we conducted our audit in accordance with both the Auditing Standards for Islamic Financial Institutions and International Standards on Auditing. Those standards require that we comply with relevant ethical requirements and plan and perform the audit to obtain reasonable assurance whether the consolidated financial statements are free from material misstatement.
An audit involves performing procedures to obtain audit evidence about the amounts and disclosures in the consolidated financial statements. The procedures selected depend on our judgment, including the assessment of the risks of material misstatement of the consolidated financial statements, whether due to fraud or error. In making those risk assessments, we consider internal control relevant to the entity’s preparation and fair presentation of the consolidated financial statements in order to design audit procedures that are appropriate in the circumstances, but not for the purpose of expressing an opinion on the effectiveness of the entity’s internal control. An audit also includes evaluating the appropriateness of accounting policies used and the reasonableness of accounting estimates made by the Board of Directors and management, as well as evaluating the overall presentation of the consolidated financial statements.
we believe that the audit evidence we have obtained is sufficient and appropriate to provide a basis for our audit opinion.
OpinionIn our opinion, the consolidated financial statements present fairly, in all material respects, the consolidated financial position of the Group as at 31 December 2011, and its consolidated financial performance and its consolidated cash flows for the year then ended in accordance with Financial Accounting Standards issued by the Accounting and Auditing Organisation for Islamic Financial Institutions.
Report on other regulatory requirementsAs required by the Bahrain Commercial Companies law and the Central Bank of Bahrain (CBB) Rule Book (volume 2), we report that: a. the Bank has maintained proper accounting records and the consolidated financial statements are in agreement therewith; andb. the financial information contained in the Report of the Board of Directors is consistent with the consolidated financial
statements.
we are not aware of any violations of the Bahrain Commercial Companies law, the Central Bank of Bahrain and Financial Institutions law, the CBB Rule Book (volume 2 and applicable provisions of volume 6) and CBB directives, regulations and associated resolutions, rules and procedures of the Bahrain Bourse or the terms of the Bank’s memorandum and articles of association during the year ended 31 December 2011 that might have had a material adverse effect on the business of the Bank or on its consolidated financial position. Satisfactory explanations and information have been provided to us by management in response to all our requests. The bank has also complied with the Islamic Shari’a Rules and Principles as determined by the Shari’a Supervisory Board of the Group.
23 February 2012Manama, Kingdom of Bahrain
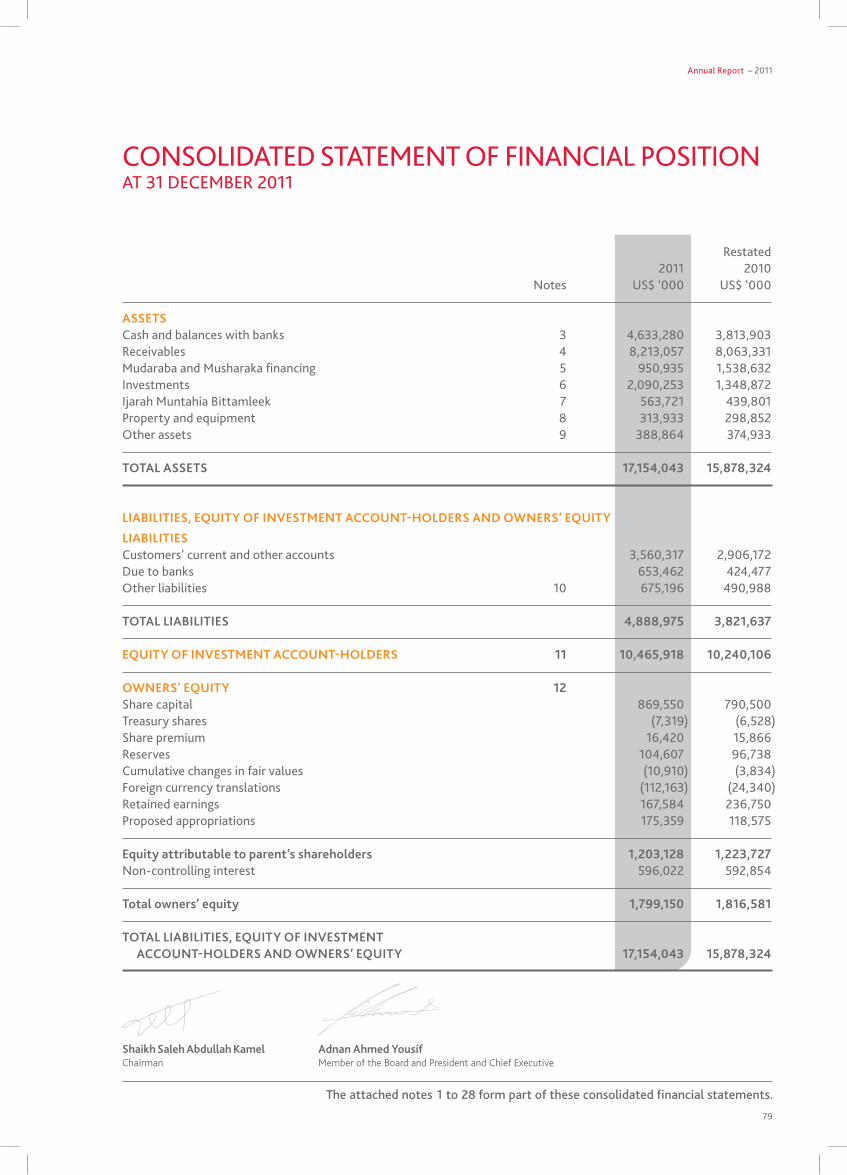
Annual Report – 2011
79
ConsolidAted stAtement oF FinAnCiAl positionAt 31 deCemBeR 2011
Restated 2011 2010 notes Us$ ‘000 Us$ ‘000
ASSETS Cash and balances with banks 3 4,633,280 3,813,903 Receivables 4 8,213,057 8,063,331 mudaraba and musharaka financing 5 950,935 1,538,632 investments 6 2,090,253 1,348,872 ijarah muntahia Bittamleek 7 563,721 439,801 property and equipment 8 313,933 298,852 other assets 9 388,864 374,933
TOTAL ASSETS 17,154,043 15,878,324
LIABILITIES, EQuITY OF INVESTMENT ACCOuNT-HOLDERS AND OWNERS’ EQuITY
LIABILITIES Customers’ current and other accounts 3,560,317 2,906,172 due to banks 653,462 424,477 other liabilities 10 675,196 490,988
TOTAL LIABILITIES 4,888,975 3,821,637
EQuITY OF INVESTMENT ACCOuNT-HOLDERS 11 10,465,918 10,240,106
OWNERS’ EQuITY 12 share capital 869,550 790,500 treasury shares (7,319) (6,528)share premium 16,420 15,866 Reserves 104,607 96,738 Cumulative changes in fair values (10,910) (3,834)Foreign currency translations (112,163) (24,340)Retained earnings 167,584 236,750proposed appropriations 175,359 118,575
Equity attributable to parent’s shareholders 1,203,128 1,223,727 non-controlling interest 596,022 592,854
Total owners’ equity 1,799,150 1,816,581
TOTAL LIABILITIES, EQuITY OF INVESTMENT ACCOuNT-HOLDERS AND OWNERS’ EQuITY 17,154,043 15,878,324
The attached notes 1 to 28 form part of these consolidated financial statements.
Shaikh Saleh Abdullah KamelChairman
Adnan Ahmed YousifMember of the Board and President and Chief Executive
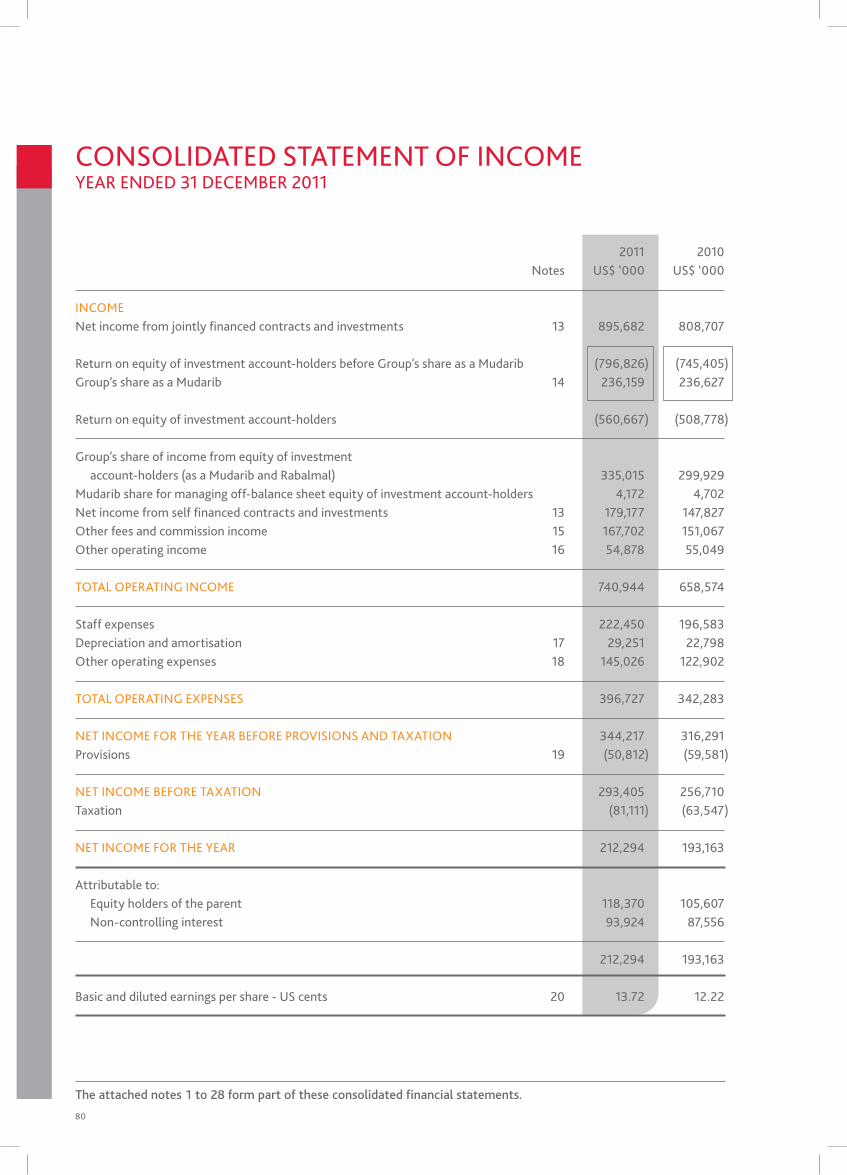
80
The attached notes 1 to 28 form part of these consolidated financial statements.
ConsolidAted stAtement oF inComeyeAR ended 31 deCemBeR 2011
2011 2010 notes Us$ ‘000 Us$ ‘000
inCome net income from jointly financed contracts and investments 13 895,682 808,707
Return on equity of investment account-holders before group’s share as a mudarib (796,826) (745,405)group’s share as a mudarib 14 236,159 236,627
Return on equity of investment account-holders (560,667) (508,778)
group’s share of income from equity of investment account-holders (as a mudarib and Rabalmal) 335,015 299,929 mudarib share for managing off-balance sheet equity of investment account-holders 4,172 4,702 net income from self financed contracts and investments 13 179,177 147,827 other fees and commission income 15 167,702 151,067 other operating income 16 54,878 55,049 totAl opeRAting inCome 740,944 658,574 staff expenses 222,450 196,583 depreciation and amortisation 17 29,251 22,798 other operating expenses 18 145,026 122,902
totAl opeRAting expenses 396,727 342,283
net inCome FoR tHe yeAR BeFoRe pRoVisions And tAxAtion 344,217 316,291 provisions 19 (50,812) (59,581)
net inCome BeFoRe tAxAtion 293,405 256,710 taxation (81,111) (63,547)
net inCome FoR tHe yeAR 212,294 193,163
Attributable to: equity holders of the parent 118,370 105,607 non-controlling interest 93,924 87,556
212,294 193,163
Basic and diluted earnings per share - Us cents 20 13.72 12.22
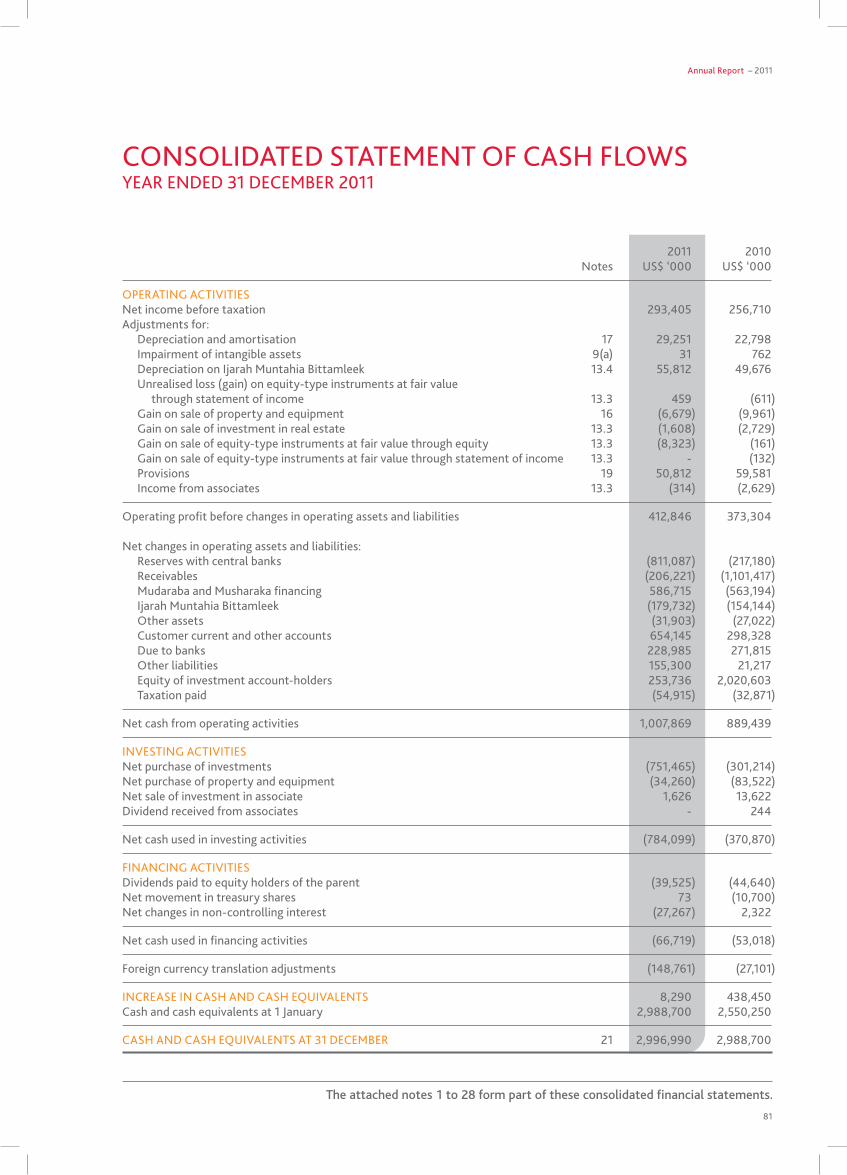
Annual Report – 2011
81
ConsolidAted stAtement oF CAsH FloWsyeAR ended 31 deCemBeR 2011
2011 2010 notes Us$ ‘000 Us$ ‘000
opeRAting ACtiVities net income before taxation 293,405 256,710 Adjustments for:
depreciation and amortisation 17 29,251 22,798 impairment of intangible assets 9(a) 31 762 depreciation on ijarah muntahia Bittamleek 13.4 55,812 49,676 Unrealised loss (gain) on equity-type instruments at fair value through statement of income 13.3 459 (611)gain on sale of property and equipment 16 (6,679) (9,961)gain on sale of investment in real estate 13.3 (1,608) (2,729)gain on sale of equity-type instruments at fair value through equity 13.3 (8,323) (161)gain on sale of equity-type instruments at fair value through statement of income 13.3 - (132)provisions 19 50,812 59,581 income from associates 13.3 (314) (2,629)
operating profit before changes in operating assets and liabilities 412,846 373,304
net changes in operating assets and liabilities: Reserves with central banks (811,087) (217,180)Receivables (206,221) (1,101,417)mudaraba and musharaka financing 586,715 (563,194)ijarah muntahia Bittamleek (179,732) (154,144)other assets (31,903) (27,022)Customer current and other accounts 654,145 298,328 due to banks 228,985 271,815 other liabilities 155,300 21,217 equity of investment account-holders 253,736 2,020,603 taxation paid (54,915) (32,871)
net cash from operating activities 1,007,869 889,439
inVesting ACtiVities net purchase of investments (751,465) (301,214)net purchase of property and equipment (34,260) (83,522)net sale of investment in associate 1,626 13,622 dividend received from associates - 244
net cash used in investing activities (784,099) (370,870)
FinAnCing ACtiVities dividends paid to equity holders of the parent (39,525) (44,640)net movement in treasury shares 73 (10,700)net changes in non-controlling interest (27,267) 2,322
net cash used in financing activities (66,719) (53,018)
Foreign currency translation adjustments (148,761) (27,101)
inCReAse in CAsH And CAsH eQUiVAlents 8,290 438,450 Cash and cash equivalents at 1 January 2,988,700 2,550,250
CAsH And CAsH eQUiVAlents At 31 deCemBeR 21 2,996,990 2,988,700
The attached notes 1 to 28 form part of these consolidated financial statements.
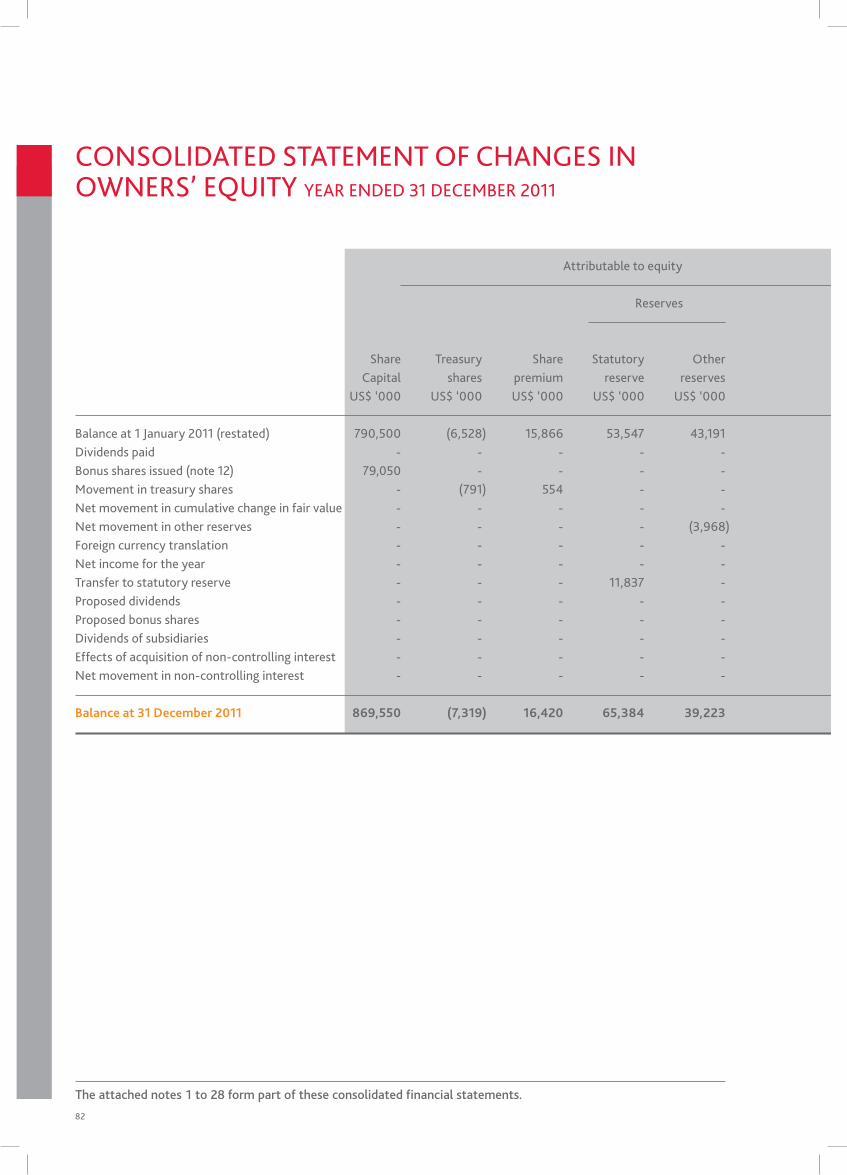
82
ConsolidAted stAtement oF CHAnges in oWneRs’ eQUity yeAR ended 31 deCemBeR 2011
Attributable to equity shareholders of the parent Reserves
Cumulative Foreign non- total share treasury share statutory other changes in currency Retained proposed controlling owner’s Capital shares premium reserve reserves fair values translations earnings appropriations total interest equity Us$ ‘000 Us$ ‘000 Us$ ‘000 Us$ ‘000 Us$ ‘000 Us$ ‘000 Us$ ‘000 Us$ ‘000 Us$ ‘000 Us$ ‘000 Us$ ‘000 Us$ ‘000 Balance at 1 January 2011 (restated) 790,500 (6,528) 15,866 53,547 43,191 (3,834) (24,340) 236,750 118,575 1,223,727 592,854 1,816,581 dividends paid - - - - - - - - (39,525) (39,525) - (39,525)Bonus shares issued (note 12) 79,050 - - - - - - - (79,050) - - -movement in treasury shares - (791) 554 - - - - 310 - 73 - 73 net movement in cumulative change in fair value - - - - - (7,076) - - - (7,076) (2,244) (9,320) net movement in other reserves - - - - (3,968) - - (957) - (4,925) (4,012) (8,937) Foreign currency translation - - - - - - (87,823) - - (87,823) (60,938) (148,761)net income for the year - - - - - - - 118,370 - 118,370 93,924 212,294transfer to statutory reserve - - - 11,837 - - - (11,837) - - - -proposed dividends - - - - - - - (30,434) 30,434 - - -proposed bonus shares - - - - - - - (144,925) 144,925 - - -dividends of subsidiaries - - - - - - - - - - (30,675) (30,675) effects of acquisition of non-controlling interest - - - - - - - 307 - 307 (307) -net movement in non-controlling interest - - - - - - - - - - 7,420 7,420 Balance at 31 December 2011 869,550 (7,319) 16,420 65,384 39,223 (10,910) (112,163) 167,584 175,359 1,203,128 596,022 1,799,150
The attached notes 1 to 28 form part of these consolidated financial statements.
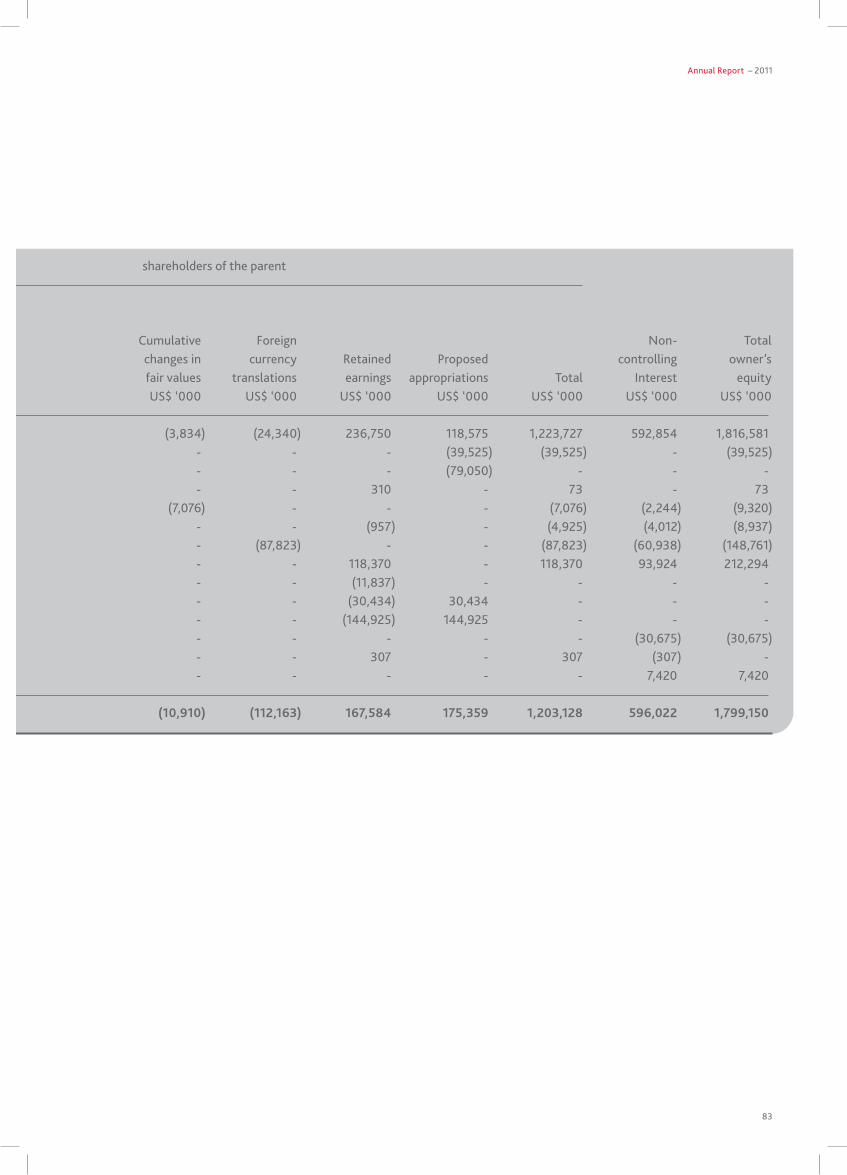
Annual Report – 2011
83
Attributable to equity shareholders of the parent Reserves
Cumulative Foreign non- total share treasury share statutory other changes in currency Retained proposed controlling owner’s Capital shares premium reserve reserves fair values translations earnings appropriations total interest equity Us$ ‘000 Us$ ‘000 Us$ ‘000 Us$ ‘000 Us$ ‘000 Us$ ‘000 Us$ ‘000 Us$ ‘000 Us$ ‘000 Us$ ‘000 Us$ ‘000 Us$ ‘000 Balance at 1 January 2011 (restated) 790,500 (6,528) 15,866 53,547 43,191 (3,834) (24,340) 236,750 118,575 1,223,727 592,854 1,816,581 dividends paid - - - - - - - - (39,525) (39,525) - (39,525)Bonus shares issued (note 12) 79,050 - - - - - - - (79,050) - - -movement in treasury shares - (791) 554 - - - - 310 - 73 - 73 net movement in cumulative change in fair value - - - - - (7,076) - - - (7,076) (2,244) (9,320) net movement in other reserves - - - - (3,968) - - (957) - (4,925) (4,012) (8,937) Foreign currency translation - - - - - - (87,823) - - (87,823) (60,938) (148,761)net income for the year - - - - - - - 118,370 - 118,370 93,924 212,294transfer to statutory reserve - - - 11,837 - - - (11,837) - - - -proposed dividends - - - - - - - (30,434) 30,434 - - -proposed bonus shares - - - - - - - (144,925) 144,925 - - -dividends of subsidiaries - - - - - - - - - - (30,675) (30,675) effects of acquisition of non-controlling interest - - - - - - - 307 - 307 (307) -net movement in non-controlling interest - - - - - - - - - - 7,420 7,420 Balance at 31 December 2011 869,550 (7,319) 16,420 65,384 39,223 (10,910) (112,163) 167,584 175,359 1,203,128 596,022 1,799,150
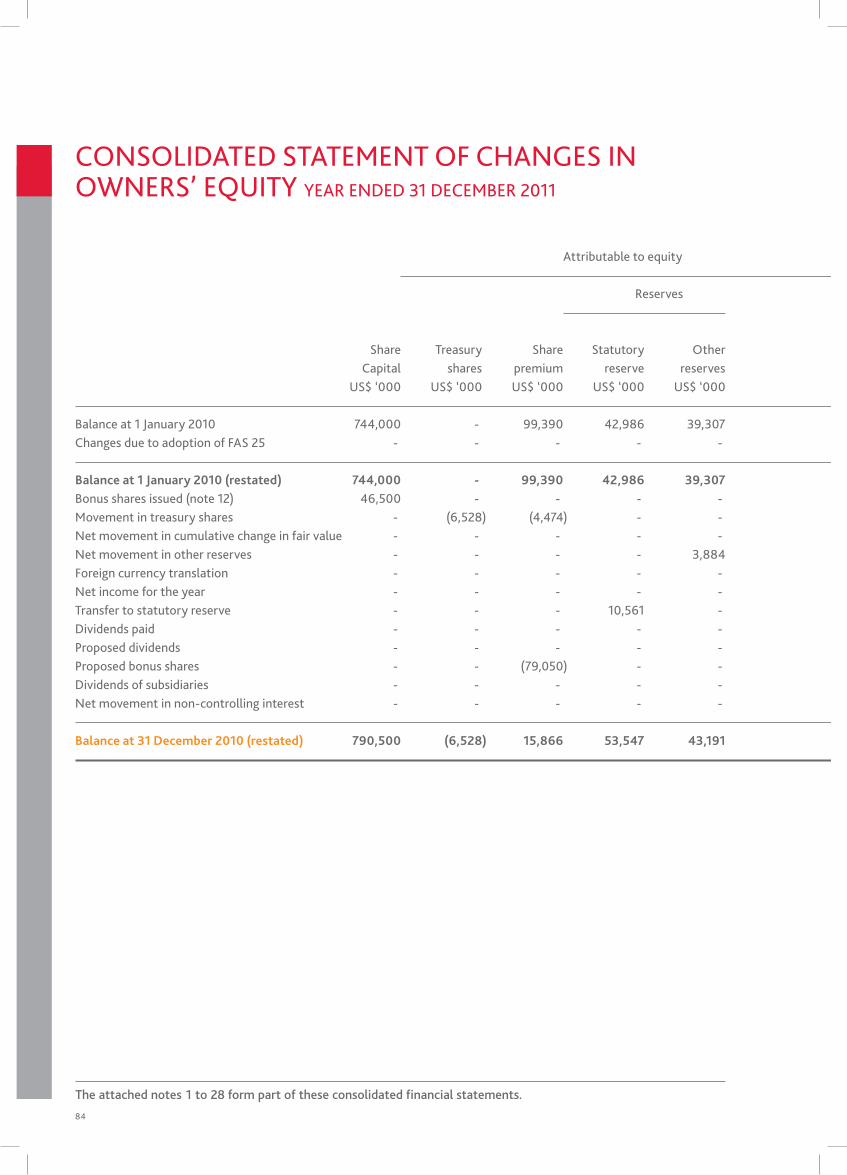
84
ConsolidAted stAtement oF CHAnges in oWneRs’ eQUity yeAR ended 31 deCemBeR 2011
Attributable to equity shareholders of the parent Reserves
Cumulative Foreign non- total share treasury share statutory other changes in currency Retained proposed controlling owner’s Capital shares premium reserve reserves fair values translations earnings appropriations total interest equity Us$ ‘000 Us$ ‘000 Us$ ‘000 Us$ ‘000 Us$ ‘000 Us$ ‘000 Us$ ‘000 Us$ ‘000 Us$ ‘000 Us$ ‘000 Us$ ‘000 Us$ ‘000 Balance at 1 January 2010 744,000 - 99,390 42,986 39,307 17,301 (9,165) 189,401 91,140 1,214,360 522,485 1,736,845 Changes due to adoption of FAs 25 - - - - - (2,000) (135) - - (2,135) (918) (3,053)
Balance at 1 January 2010 (restated) 744,000 - 99,390 42,986 39,307 15,301 (9,300) 189,401 91,140 1,212,225 521,567 1,733,792 Bonus shares issued (note 12) 46,500 - - - - - - - (46,500) - - - movement in treasury shares - (6,528) (4,474) - - - - 302 - (10,700) - (10,700)net movement in cumulative change in fair value - - - - - (19,135) - - - (19,135) (6,698) (25,833)net movement in other reserves - - - - 3,884 - - (8,474) - (4,590) (3,399) (7,989)Foreign currency translation - - - - - - (15,040) - - (15,040) (11,893) (26,933)net income for the year - - - - - - - 105,607 - 105,607 87,556 193,163 transfer to statutory reserve - - - 10,561 - - - (10,561) - - - - dividends paid - - - - - - - - (44,640) (44,640) - (44,640)proposed dividends - - - - - - - (39,525) 39,525 - - - proposed bonus shares - - (79,050) - - - - - 79,050 - - - dividends of subsidiaries - - - - - - - - - - (23,990) (23,990)net movement in non-controlling interest - - - - - - - - - - 29,711 29,711
Balance at 31 December 2010 (restated) 790,500 (6,528) 15,866 53,547 43,191 (3,834) (24,340) 236,750 118,575 1,223,727 592,854 1,816,581
The attached notes 1 to 28 form part of these consolidated financial statements.
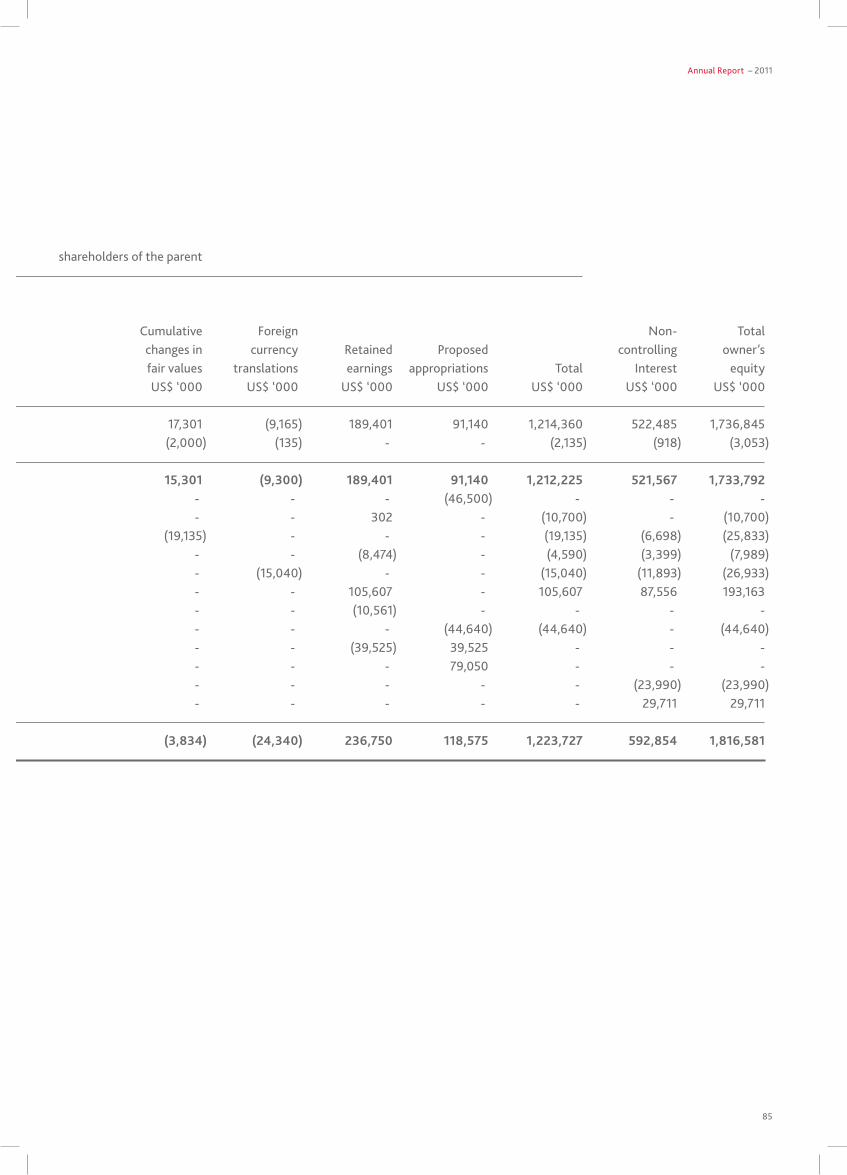
Annual Report – 2011
85
Attributable to equity shareholders of the parent Reserves
Cumulative Foreign non- total share treasury share statutory other changes in currency Retained proposed controlling owner’s Capital shares premium reserve reserves fair values translations earnings appropriations total interest equity Us$ ‘000 Us$ ‘000 Us$ ‘000 Us$ ‘000 Us$ ‘000 Us$ ‘000 Us$ ‘000 Us$ ‘000 Us$ ‘000 Us$ ‘000 Us$ ‘000 Us$ ‘000 Balance at 1 January 2010 744,000 - 99,390 42,986 39,307 17,301 (9,165) 189,401 91,140 1,214,360 522,485 1,736,845 Changes due to adoption of FAs 25 - - - - - (2,000) (135) - - (2,135) (918) (3,053)
Balance at 1 January 2010 (restated) 744,000 - 99,390 42,986 39,307 15,301 (9,300) 189,401 91,140 1,212,225 521,567 1,733,792 Bonus shares issued (note 12) 46,500 - - - - - - - (46,500) - - - movement in treasury shares - (6,528) (4,474) - - - - 302 - (10,700) - (10,700)net movement in cumulative change in fair value - - - - - (19,135) - - - (19,135) (6,698) (25,833)net movement in other reserves - - - - 3,884 - - (8,474) - (4,590) (3,399) (7,989)Foreign currency translation - - - - - - (15,040) - - (15,040) (11,893) (26,933)net income for the year - - - - - - - 105,607 - 105,607 87,556 193,163 transfer to statutory reserve - - - 10,561 - - - (10,561) - - - - dividends paid - - - - - - - - (44,640) (44,640) - (44,640)proposed dividends - - - - - - - (39,525) 39,525 - - - proposed bonus shares - - (79,050) - - - - - 79,050 - - - dividends of subsidiaries - - - - - - - - - - (23,990) (23,990)net movement in non-controlling interest - - - - - - - - - - 29,711 29,711
Balance at 31 December 2010 (restated) 790,500 (6,528) 15,866 53,547 43,191 (3,834) (24,340) 236,750 118,575 1,223,727 592,854 1,816,581
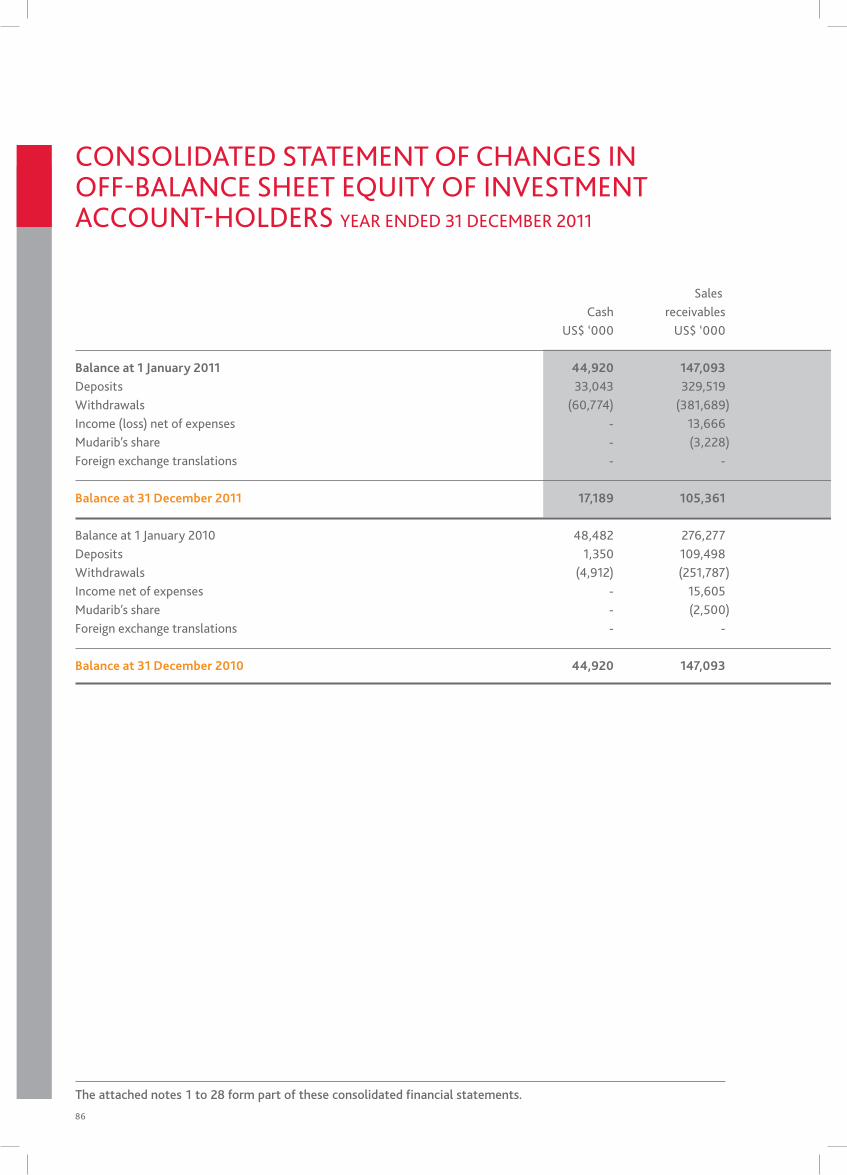
86
ConsolidAted stAtement oF CHAnges in oFF-BAlAnCe sHeet eQUity oF inVestment ACCoUnt-HoldeRs yeAR ended 31 deCemBeR 2011
sales mudaraba investment Cash receivables financing in real estate investments others total Us$ ‘000 Us$ ‘000 Us$ ‘000 Us$ ‘000 Us$ ‘000 Us$ ‘000 Us$ ‘000
Balance at 1 January 2011 44,920 147,093 46,411 28,255 112,057 76,602 455,338deposits 33,043 329,519 294,156 7,329 56,423 309,064 1,029,534Withdrawals (60,774) (381,689) (141,006) (653) (38,161) (346,322) (968,605)income (loss) net of expenses - 13,666 1,142 474 (3,329) 2,668 14,621mudarib’s share - (3,228) (1) (95) (81) (767) (4,172)Foreign exchange translations - - - - (528) (3,060) (3,588)
Balance at 31 December 2011 17,189 105,361 200,702 35,310 126,381 38,185 523,128
Balance at 1 January 2010 48,482 276,277 17,786 27,156 110,624 29,726 510,051deposits 1,350 109,498 95,906 1,197 25,926 217,033 450,910Withdrawals (4,912) (251,787) (67,887) (362) (26,632) (171,160) (522,740)income net of expenses - 15,605 606 326 4,256 2,043 22,836 mudarib’s share - (2,500) - (62) (1,491) (649) (4,702)Foreign exchange translations - - - - (626) (391) (1,017)
Balance at 31 December 2010 44,920 147,093 46,411 28,255 112,057 76,602 455,338
The attached notes 1 to 28 form part of these consolidated financial statements.
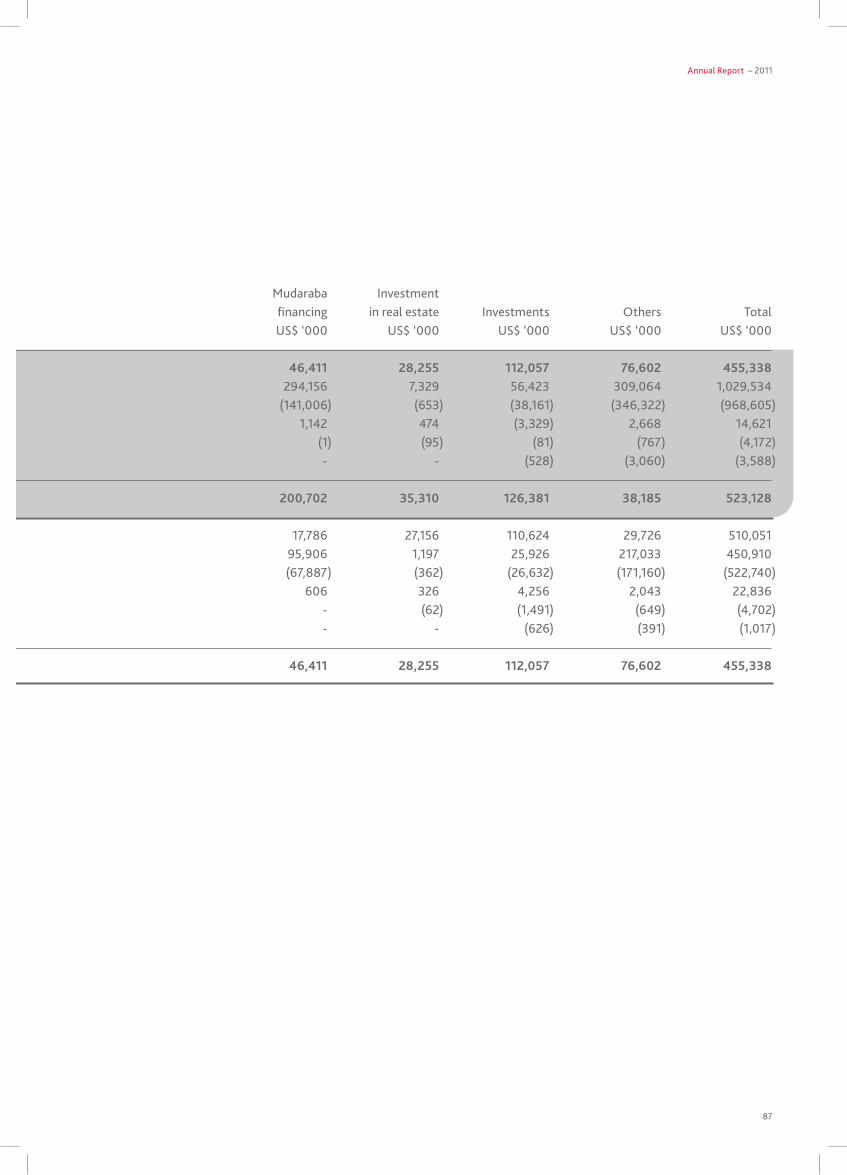
Annual Report – 2011
87
sales mudaraba investment Cash receivables financing in real estate investments others total Us$ ‘000 Us$ ‘000 Us$ ‘000 Us$ ‘000 Us$ ‘000 Us$ ‘000 Us$ ‘000
Balance at 1 January 2011 44,920 147,093 46,411 28,255 112,057 76,602 455,338deposits 33,043 329,519 294,156 7,329 56,423 309,064 1,029,534Withdrawals (60,774) (381,689) (141,006) (653) (38,161) (346,322) (968,605)income (loss) net of expenses - 13,666 1,142 474 (3,329) 2,668 14,621mudarib’s share - (3,228) (1) (95) (81) (767) (4,172)Foreign exchange translations - - - - (528) (3,060) (3,588)
Balance at 31 December 2011 17,189 105,361 200,702 35,310 126,381 38,185 523,128
Balance at 1 January 2010 48,482 276,277 17,786 27,156 110,624 29,726 510,051deposits 1,350 109,498 95,906 1,197 25,926 217,033 450,910Withdrawals (4,912) (251,787) (67,887) (362) (26,632) (171,160) (522,740)income net of expenses - 15,605 606 326 4,256 2,043 22,836 mudarib’s share - (2,500) - (62) (1,491) (649) (4,702)Foreign exchange translations - - - - (626) (391) (1,017)
Balance at 31 December 2010 44,920 147,093 46,411 28,255 112,057 76,602 455,338
88
1 ACTIVITIESAl Baraka Banking Group B.S.C. (‘the Bank’) is a joint stock company incorporated in the Kingdom of Bahrain on 27 June 2002, under Commercial Registration (CR) number 48915. The Bank is engaged in banking activities in the Middle East, Europe, North African and South African region. The address of the Bank’s registered office is P.O. Box 1882, Diplomatic Area, Manama, Kingdom of Bahrain. The Bank is listed on Bahrain Bourse and NASDAQ Dubai.
The Bank operates under an Islamic wholesale banking license issued by the Central Bank of Bahrain (‘the CBB’).
The principal activities of the Bank and its subsidiaries (‘the Group’) comprise of international and commercial banking, financing, treasury and investment activities. The Bank is supervised and regulated by the CBB.
The consolidated financial statements were approved by the Board of Directors on 23 February 2012.
2 SIGNIFICANT ACCOUNTING POLICIES
The significant accounting policies adopted in the preparation of the consolidated financial statements are set out below:
a. Basis of preparationThe consolidated financial statements have been prepared on a historical cost basis, except for investment in real estate, equity-type instruments through statement of income and equity-type instruments through equity that have been measured at fair value. The consolidated financial statements are presented in United States Dollars being the reporting currency of the Group. All values are rounded to the nearest US Dollar thousands unless otherwise indicated.
b. Statement of ComplianceThe consolidated financial statements are prepared in accordance with the Financial Accounting Standards issued by the Accounting and Auditing Organisation for Islamic Financial Institutions (‘AAOIFI’), the Shari’a Rules and Principles as determined by the Shari’a Supervisory Board of the Group, the Bahrain Commercial Companies law, the Central Bank of Bahrain and Financial Institutions law and the CBB Rule Book (volume 2 and applicable provisions of volume 6) and CBB directives, regulations and associated resolutions, rules and procedures of the Bahrain Bourse or the terms of the Bank’s memorandum and articles of association. In accordance with the requirements of AAOIFI, for matters for which no AAOIFI standard exists, the Group uses the relevant International Financial Reporting Standards (‘the IFRS’) issued by International Accounting Standards Board.
c. Basis of consolidationThe consolidated financial statements comprise the financial statements of the Bank and its subsidiaries as at and for the year ended 31 December each year. The financial statements of the subsidiaries are prepared for the same reporting year as the Bank, using consistent accounting policies.
All intra-group balances, transactions, income and expenses and profits and losses resulting from intra-group transactions are eliminated in full.
Subsidiaries are fully consolidated from the date of acquisition, being the date on which the Group obtains control, and continue to be consolidated until the date that control ceases. Control is achieved where the Group has the power to govern the financial and operating policies of an entity so as to obtain benefits from its activities.
Non-controlling interest in a subsidiary’s net assets is reported as a separate item in the Group’s owners’ equity. In the consolidated statement of income, non-controlling interest is included in net profit, and shown separately from that of the shareholders.
Non-controlling interests consist of the amount of those interests at the date of the original business combination and the non-controlling interests’ share of changes in owners’ equity since the date of combination. losses applicable to the non-controlling interest in excess of the non-controlling interest in a subsidiary’s owners’ equity are allocated against the interests of the Group except to the extent that the non-controlling interest has a binding obligation and is able to make an additional investment to cover the losses. Changes in the ownership interest in a subsidiary that do not result in a loss of control are accounted for as an owners’ equity transaction.
notes to tHe ConsolidAted FinAnCiAl stAtements (31 deCemBeR 2011)
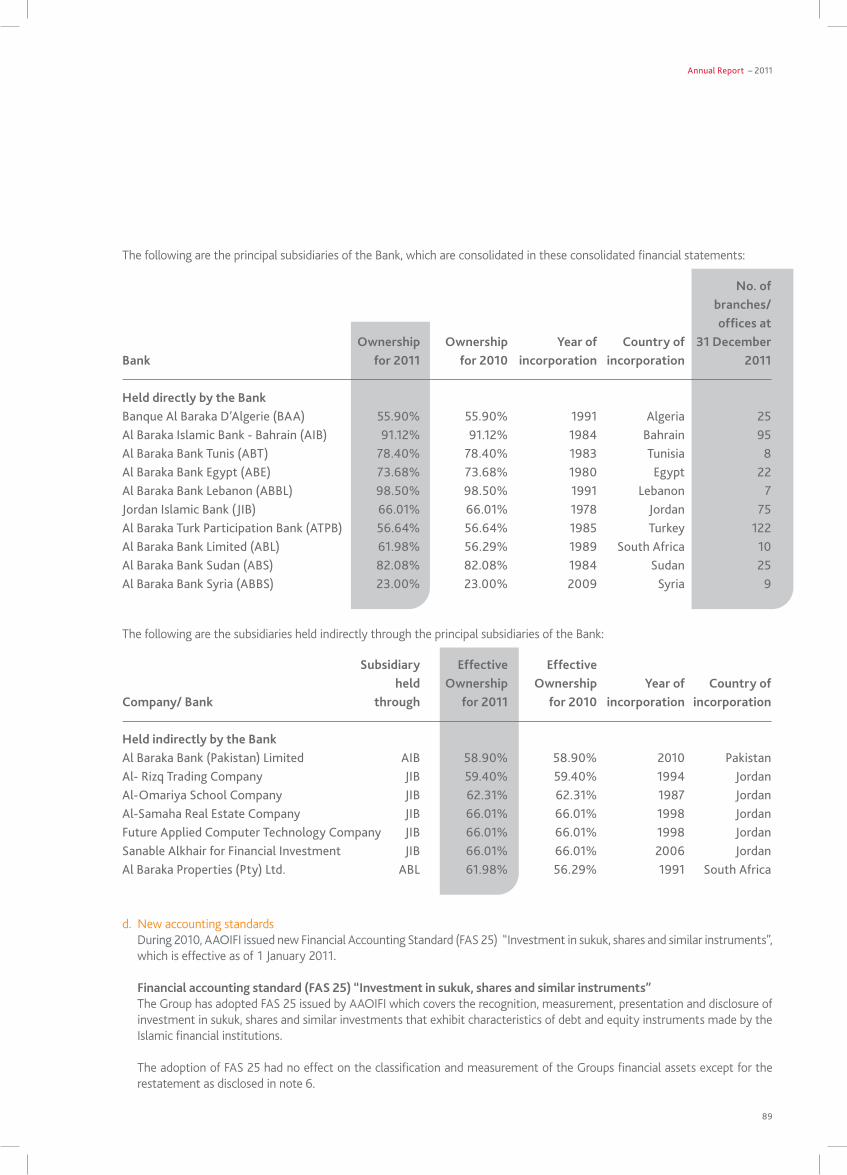
Annual Report – 2011
89
The following are the principal subsidiaries of the Bank, which are consolidated in these consolidated financial statements:
No. of branches/ offices at Ownership Ownership Year of Country of 31 DecemberBank for 2011 for 2010 incorporation incorporation 2011
Held directly by the Bank Banque Al Baraka d’Algerie (BAA) 55.90% 55.90% 1991 Algeria 25Al Baraka islamic Bank - Bahrain (AiB) 91.12% 91.12% 1984 Bahrain 95Al Baraka Bank tunis (ABt) 78.40% 78.40% 1983 tunisia 8Al Baraka Bank egypt (ABe) 73.68% 73.68% 1980 egypt 22Al Baraka Bank lebanon (ABBl) 98.50% 98.50% 1991 lebanon 7Jordan islamic Bank (JiB) 66.01% 66.01% 1978 Jordan 75Al Baraka turk participation Bank (AtpB) 56.64% 56.64% 1985 turkey 122Al Baraka Bank limited (ABl) 61.98% 56.29% 1989 south Africa 10Al Baraka Bank sudan (ABs) 82.08% 82.08% 1984 sudan 25Al Baraka Bank syria (ABBs) 23.00% 23.00% 2009 syria 9
Subsidiary Effective Effective held Ownership Ownership Year of Country ofCompany/ Bank through for 2011 for 2010 incorporation incorporation
Held indirectly by the Bank Al Baraka Bank (pakistan) limited AiB 58.90% 58.90% 2010 pakistanAl- Rizq trading Company JiB 59.40% 59.40% 1994 JordanAl-omariya school Company JiB 62.31% 62.31% 1987 JordanAl-samaha Real estate Company JiB 66.01% 66.01% 1998 JordanFuture Applied Computer technology Company JiB 66.01% 66.01% 1998 Jordansanable Alkhair for Financial investment JiB 66.01% 66.01% 2006 JordanAl Baraka properties (pty) ltd. ABl 61.98% 56.29% 1991 south Africa
The following are the subsidiaries held indirectly through the principal subsidiaries of the Bank:
d. New accounting standardsDuring 2010, AAOIFI issued new Financial Accounting Standard (FAS 25) “Investment in sukuk, shares and similar instruments”, which is effective as of 1 January 2011.
Financial accounting standard (FAS 25) “Investment in sukuk, shares and similar instruments”The Group has adopted FAS 25 issued by AAOIFI which covers the recognition, measurement, presentation and disclosure of investment in sukuk, shares and similar investments that exhibit characteristics of debt and equity instruments made by the Islamic financial institutions.
The adoption of FAS 25 had no effect on the classification and measurement of the Groups financial assets except for the restatement as disclosed in note 6.
90
e. Cash and cash equivalentsCash and cash equivalents as referred to in the consolidated statement of cash flows comprise cash and cash in transit, balances with central banks excluding mandatory reserves and balances with other banks with an original maturity of three months or less.
f. ReceivablesReceivables comprise Sales (Murabaha) receivables, Ijarah receivables, Salam receivables and Istisna’a receivables.
Sales (Murabaha) receivablesSales (Murabaha) receivables consist mainly of Murabaha and international commodities stated net of deferred profits and provision for doubtful amount.
Ijarah receivables Ijarah receivables is the outstanding rental at the end of the year less any provision for doubtful amount.
Salam receivablesSalam receivables is the outstanding amount at the end of the year less any provision for doubtful amount.
Istisna’a receivablesIstisna’a receivables is the outstanding amount at the end of the year less any provision for doubtful amount.
g. Mudaraba and Musharaka financingMudaraba and Musharaka financing are partnerships in which the Bank contributes capital. These are stated at the fair value of consideration given less impairment.
h. InvestmentsInvestments comprise equity-type instruments at fair value through statement of income, equity-type instruments at fair value through equity, debt-type instruments at amortised cost, investment in real estate and investment in associates.
Investment in real estateReal estate held for rental or for capital appreciation purposes, or both, are classified as investment in real estate. These are initially recognised at cost including transaction cost and subsequently re-measured at fair value with the resulting unrealised gains/losses being recognised in the consolidated statement of changes in owners’ equity under cumulative changes in fair values to the extent of the portion of the fair value relating to owners’ equity and under equity of investment account-holders in the consolidated statement of financial position to the extent of the portion of the fair value relating to equity of investment account-holders until the investment is derecognised or determined to be impaired at which time the cumulative gain or loss previously recorded in owners’ equity or in equity of investment account-holders is recognised in the consolidated statement of income.
Investment in associatesThe Group’s investment in its associates is accounted for under the equity method of accounting. An associate is an entity in which the Group has significant influence and which is neither a subsidiary nor a joint venture. Under the equity method, the investment in the associate is carried in the consolidated statement of financial position at cost plus post-acquisition changes in the Group’s share of net assets of the associate. Goodwill relating to an associate is included in the carrying amount of the investment and is not amortised. The consolidated statement of income reflects the Group’s share of the results of operations of the associate. where there has been a change recognised directly in the equity of the associate, the Group recognises its share of any changes and discloses this, when applicable, in the consolidated statement of changes in owners’ equity. Profits and losses resulting from transactions between the Group and the associate are eliminated to the extent of the interest in the associate.
The reporting dates of the associates and the Group are identical and the associates accounting policies conform to those used by the Group for like transactions and events in similar circumstances.
notes to tHe ConsolidAted FinAnCiAl stAtements (31 deCemBeR 2011)
2 SIGNIFICANT ACCOUNTING POLICIES (CONTINuED)
Annual Report – 2011
91
Equity-type instruments at fair value through statement of incomeThis includes instruments held for trading purposes to gain profits from market fluctuations in the short term. These are initially recognised at cost, being the fair value of the consideration given excluding acquisition costs. These are subsequently re-measured at fair value. All related realised and unrealised gains or losses are included in the consolidated statement of income.
All other investments are initially recognised at cost, being the fair value of the consideration given including acquisition costs.
Equity-type instruments at fair value through equityThis includes all instruments that are not covered above. Subsequent to acquisition, investments designated at fair value through equity are re-measured at fair value with unrealised gains or losses recognised proportionately in owners’ equity and equity of investment account-holders until the investment is derecognised or determined to be impaired at which time the cumulative gain or loss previously recorded in owners’ equity or equity of investment account-holders is recognised in consolidated statement of income.
Debt-type instruments at amortised costDebt-type instruments which are managed on a contractual yield basis and are not held for trading and has not been designated at fair value through statement of income are classified as debt-type instruments at amortised cost. Such investments are carried at amortised cost, less provision for impairment in value. Amortised cost is calculated by taking into account any premium or discount on acquisition. Any gain or loss on such investment is recognised in the consolidated statement of income, when the investment is de-recognised or impaired.
i. Ijarah Muntahia BittamleekAssets acquired for leasing (Ijarah) are stated at cost, less accumulated depreciation. Depreciation is provided on the straight line method over the useful life of the asset or the period of the lease, whichever is lower.
j. Property and equipmentProperty and equipment are initially recognised at cost. The cost of additions and major improvements are capitalised; maintenance and repairs are charged to the consolidated statement of income as incurred. Gains or losses on disposal are reflected in other operating income. Depreciation is provided on the straight-line basis over the estimated useful lives of the assets other than freehold land, which is deemed to have an indefinite life.
The calculation of depreciation is on the following basis: Buildings 30 years Office furniture and equipment 4 - 10 years vehicles 3 years Others 4 - 5 years
k. Fair valuesFor investments actively traded in organised financial markets, fair value is determined by reference to quoted market bid prices.
For investment where there is no quoted market price, a reasonable estimate of the fair value is determined by reference to the current market value of another instrument, which is substantially the same or is based on the assessment of future cash flows. The cash equivalent values are determined by the Group at current profit rates for contracts with similar term and risk characteristics.
For Sales (Murabaha) receivables the fair value is determined at Bank or subsidiary level at the end of the financial period at their cash equivalent value.
92
l. GoodwillGoodwill acquired in a business combination is initially measured at cost being the excess of the cost of the business combination over the Group’s interest in the net fair value of the identifiable assets, liabilities and contingent liabilities. Following initial recognition, goodwill is measured at cost less any accumulated impairment losses. Goodwill is reviewed for impairment, annually or more frequently if events or changes in circumstances indicate that the carrying value may be impaired.
For the purpose of impairment testing, goodwill acquired in a business combination is, from the acquisition date, allocated to the cash-generating units, or groups of cash-generating units, that are expected to benefit from the synergies of the combination, irrespective of whether other assets or liabilities of the acquiree are assigned to those units or groups of units.
Impairment is determined by assessing the recoverable amount of the cash-generating unit, to which the goodwill relates. where the recoverable amount of the cash-generating unit is less than the carrying amount, an impairment loss is recognised.
m. Intangible assetsIntangible assets comprise principally the value of computer software. Intangible assets acquired are measured on initial recognition at cost. Following initial recognition, intangible assets are carried at cost less any accumulated amortisation and any accumulated impairment losses.
n. Collateral pending saleCollateral acquired in settlement of certain financing facilities is stated at the lower of the net realisable value of the related financing facilities and the current fair value of such assets. Gains or losses on disposal, and revaluation losses, are recognised in the consolidated statement of income.
o. Employees’ end of service benefitsThe Group provides for end of service benefits to its employees. Entitlement to these benefits is based upon the employees’ length of service and the completion of a minimum service period. The expected costs of these benefits are accrued for over the period of employment.
p. ProvisionsProvisions are recognised when there is a present obligation (legal or constructive) arising from a past event and the costs to settle the obligation are both probable and able to be reliably measured.
q. DividendsDividends to shareholders are recognised as liabilities in the year in which they are declared.
r. Equity of investment account-holdersAll equity of investment account-holders are carried at cost plus accrued profit and related reserves. Investment risk reserves and profit equalisation reserves are made at the Bank or subsidiary level.
s. Investment risk reserveInvestment risk reserves are amounts appropriated out of the income of equity of investment account-holders, after allocating the mudarib share, in order to cater against future losses for equity of investment account-holders.
t. Profit equalisation reserveProfit equalisation reserves are amounts appropriated out of the Mudaraba income, before allocating the mudarib share, in order to maintain a certain level of return on investments for equity of investment account-holders.
2 SIGNIFICANT ACCOUNTING POLICIES (CONTINuED)
notes to tHe ConsolidAted FinAnCiAl stAtements (31 deCemBeR 2011)
Annual Report – 2011
93
u. Off-balance sheet equity of investment account-holdersOff-balance sheet equity of investment account-holders represent funds received by the Group from third parties for investment in specified products as directed by the investment account-holders. These assets are managed in a fiduciary capacity and the Group has no entitlement to these assets. Clients bear all of the risks and earn all of the rewards on these investments. Off-balance sheet equity of investment account-holders are not included in the consolidated statement of financial position since the Group does not have the right to use or dispose these investments except within the conditions of the contract between the Group and off-balance sheet equity of investment account-holders.
v. Treasury sharesOwn equity instruments which are reacquired (treasury shares) are deducted from equity of the parent and accounted for at weighted average cost. Consideration paid or received on the purchase, sale, issue or cancellation of the Group’s own equity instruments is recognised directly in equity of the parent. No gain or loss is recognised in consolidated statement of income on the purchase, sale, issue or cancellation of own equity instruments.
w. Revenue recognitionSales (Murabaha) receivablesProfit from Sales (Murabaha) receivables is recognised when the income is both contractually determinable and quantifiable at the commencement of the transaction. Such income is recognised on time-apportioned basis over the period of the transaction. where the income from a contract is not contractually determinable or quantifiable, it is recognised when the realisation is reasonably certain or when actually realised. Income related to accounts that are 90 days overdue is excluded from the consolidated statement of income.
Salam and Istisna’a receivablesIncome on Salam and Istisna’a is recognised on time-apportioned basis when the income from a contract is contractually determinable or quantifiable.
Mudaraba and Musharaka financingIncome on Mudaraba and Musharaka financing is recognised when the right to receive payment is established or on distribution by the Mudarib. Income related to accounts that are 90 days overdue is excluded from the consolidated statement of income.
Ijarah Muntahia BittamleekIncome net of depreciation is recognised on a time-apportioned basis over the lease term.
Fee and commission incomeFee and commission income is recognised when earned.
Other incomeOther income on investments is recognised when the right to receive payment is established.
Group’s share as a MudaribThe Group’s share of profit as a Mudarib for managing equity of investment account-holders is based on the terms and conditions of the related mudarib agreements.
Mudarib’s share of off-balance sheet equity of investment account-holdersThe Group shares profit for managing off-balance sheet equity of investment account-holders based on the terms and conditions of related contracts
94
2 SIGNIFICANT ACCOUNTING POLICIES (CONTINuED)
x. Return on equity of investment account-holdersEquity of investment account-holders’ share of income is calculated based on the applicable local laws and based on the underlining individual Mudaraba contract. It represents the income generated from joint investment accounts and after deducting other expenses. Other expenses include all expenses incurred by the Group including specific provisions. The Group’s share is deducted before distributing such income.
y. Joint and self financedInvestments, financing and receivables that are jointly owned by the Group and the equity of investment account-holders are classified under the caption “jointly financed” in the consolidated financial statements. Investments, financing and receivables that are financed solely by the Group are classified under “self financed”.
z. TaxationThere is no tax on corporate income in the Kingdom of Bahrain. Taxation on foreign operations is provided in accordance with the fiscal regulations of the respective countries in which the subsidiaries operate. The Group accounts for its share of associates profit after accounting for corporate taxation. Deferred income tax is provided using the liability method on temporary differences at the financial position date between the tax bases of assets and liabilities and their carrying amounts for financial reporting purposes.
aa. Shari’a supervisory boardThe Group’s business activities are subject to the supervision of a Shari’a supervisory board consisting of five members appointed by the general assembly.
bb. ZakahThe responsibility of payment of Zakah is on individual shareholders of the Group, its equity of investment account-holders and other account-holders except for few subsidiaries where the responsibility of payment of Zakah is on the individual subsidiary as a single entity. The calculation of Zakah per share is presented as an attachment to the Shari’a Supervisory Board Report.
cc. Earnings prohibited by Shari’a The Group is committed to avoid recognising any income generated from non-Islamic source. Accordingly, all non-Islamic income is credited to a charity account where the Group uses these funds for various social welfare activities.
dd. Impairment of financial assetsAn assessment is made at each financial position date to determine whether there is objective evidence that a specific financial asset or a group of financial assets may be impaired. If such evidence exists, the estimated recoverable amount of that asset is determined and any impairment loss, based on the assessment by the Group of the estimated cash equivalent value, is recognised in the consolidated statement of income. Specific provisions are created to reduce all impaired financial contracts to their realisable cash equivalent value. Financial assets are written off only in circumstances where effectively all possible means of recovery have been exhausted.
If, in a subsequent period, the amount of the impairment loss decreases and the decrease can be related objectively to an event occurring after the impairment value was recognised, the previously recognised impairment loss is reversed. Any subsequent reversal of an impairment loss is recognised in the consolidated statement of income.
In addition, the Group maintains a provision to reflect a potential loss that may occur as a result of currently unidentifiable risks in relation to receivables, financings or investment assets. The amount reflects estimated losses affecting these assets attributable to events that have already occurred at the date of the financial statements, and not estimated losses attributable to future events.
notes to tHe ConsolidAted FinAnCiAl stAtements (31 deCemBeR 2011)
Annual Report – 2011
95
ee. OffsettingFinancial assets and financial liabilities are only offset and the net amount reported in the consolidated statement of financial position when there is a religious or legal right to offset the recognised amounts and there is actual expectation of the Group to settle on a net basis.
ff. Foreign currenciesForeign currency transactions at the subsidiary levelTransactions in foreign currencies are recorded at the rate of exchange ruling at the date of the transaction. The monetary assets and liabilities denominated in foreign currencies are retranslated at the rate of exchange ruling at the financial position date. All differences are taken to income statement at the entity level.
Foreign currency translationsAs at the reporting date, the assets and liabilities in foreign currencies are translated into the presentation currency of the Group (United States Dollars) at the rate of exchange ruling at the financial position date and their income statements are translated at the average exchange rates for the year. The exchange differences arising on the translation are taken directly to a separate component of owners’ equity.
On disposal of a foreign entity, the deferred cumulative amount recognised in owners’ equity relating to that particular foreign entity is recognised in the consolidated statement of income.
gg. JudgmentsIn the process of applying the Group’s accounting policies, management has made the following judgments, apart from those involving estimations, which effects the amounts recognised in the consolidated financial statements:
Classification of investmentsManagement decides on acquisition of an investment whether it should be classified as equity-type instrument at fair value through statement of income, equity-type instrument at fair value through equity or debt-type instrument at amortised cost.
hh. Use of estimates in preparation of the consolidated financial statementsThe preparation of the consolidated financial statements requires management to make estimates and assumptions that affect the reported amounts of financial assets and liabilities at the date of the consolidated financial statements. The use of estimates is used primarily to the determination of provisions for sales (Murabaha) receivable, Mudaraba financing, Musharaka financing, equity-type instrument at fair value through equity, debt-type instrument at amortised cost, ijarah receivable and other assets
ii. DerecognitionA financial asset (or, where applicable a part of a financial asset or part of a Group of similar financial assets) is derecognised when:
i. the right to receive cash flows from the asset have expired;ii. the Group retains the right to receive cash flows from the asset, but has assumed an obligation to pay them in full without
material delay to a third party under a ‘pass through’ arrangement; oriii. the Group has transferred its rights to receive cash flows from the asset and either (a) has transferred substantially all the
risks and rewards of the asset, or (b) has neither transferred nor retained substantially all the risks and rewards of the asset, but has transferred control of the asset.
A financial liability is derecognised when the obligation specified in the contract is discharged, cancelled or expired.
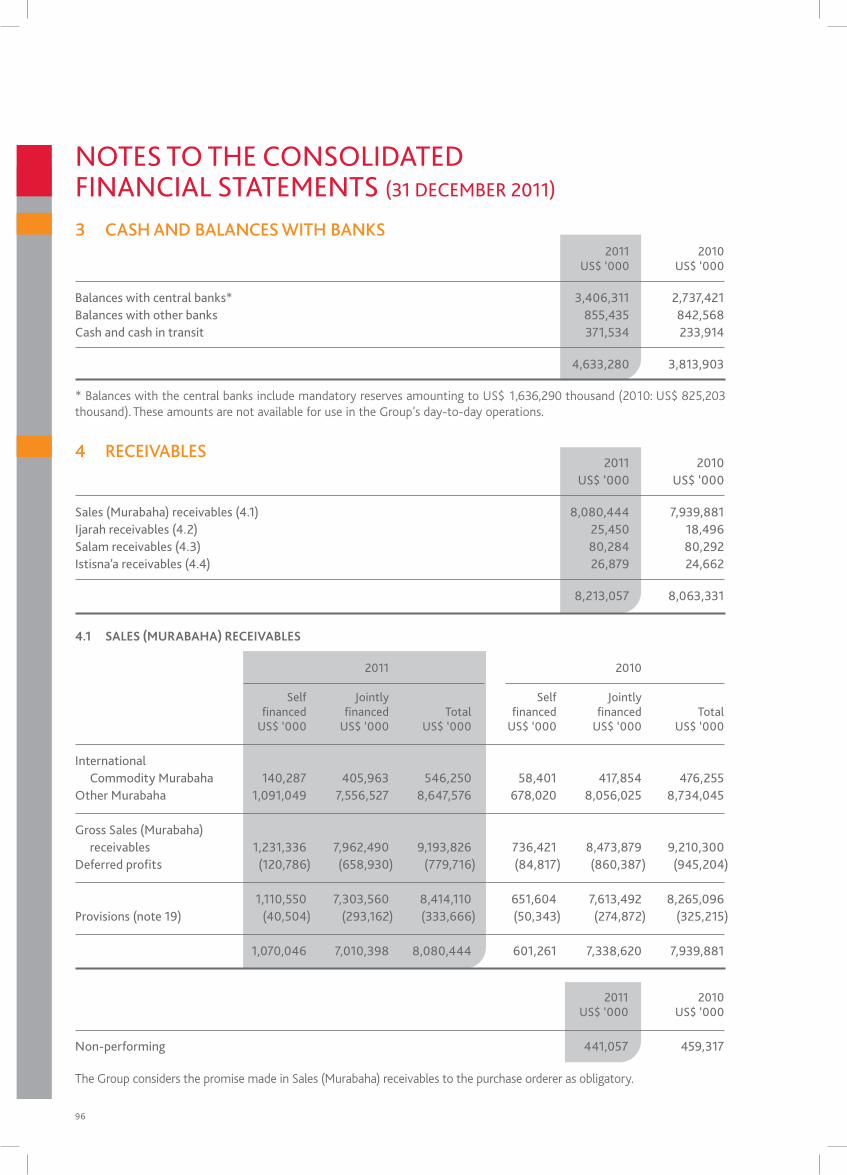
96
3 CASH ANd BALANCES witH BANKS
4 RECEIVABLES
2011 2010 Us$ ‘000 Us$ ‘000 Balances with central banks* 3,406,311 2,737,421 Balances with other banks 855,435 842,568 Cash and cash in transit 371,534 233,914 4,633,280 3,813,903
2011 2010 Us$ ‘000 Us$ ‘000 sales (murabaha) receivables (4.1) 8,080,444 7,939,881 ijarah receivables (4.2) 25,450 18,496 salam receivables (4.3) 80,284 80,292 istisna’a receivables (4.4) 26,879 24,662 8,213,057 8,063,331
2011 2010 Us$ ‘000 Us$ ‘000 non-performing 441,057 459,317
* Balances with the central banks include mandatory reserves amounting to US$ 1,636,290 thousand (2010: US$ 825,203 thousand). These amounts are not available for use in the Group’s day-to-day operations.
4.1 SALES (MuRABAHA) RECEIVABLES
The Group considers the promise made in Sales (Murabaha) receivables to the purchase orderer as obligatory.
notes to tHe ConsolidAted FinAnCiAl stAtements (31 deCemBeR 2011)
2011 2010
self Jointly self Jointly financed financed total financed financed total Us$ ‘000 Us$ ‘000 Us$ ‘000 Us$ ‘000 Us$ ‘000 Us$ ‘000 international Commodity murabaha 140,287 405,963 546,250 58,401 417,854 476,255 other murabaha 1,091,049 7,556,527 8,647,576 678,020 8,056,025 8,734,045
gross sales (murabaha) receivables 1,231,336 7,962,490 9,193,826 736,421 8,473,879 9,210,300 deferred profits (120,786) (658,930) (779,716) (84,817) (860,387) (945,204)
1,110,550 7,303,560 8,414,110 651,604 7,613,492 8,265,096 provisions (note 19) (40,504) (293,162) (333,666) (50,343) (274,872) (325,215)
1,070,046 7,010,398 8,080,444 601,261 7,338,620 7,939,881
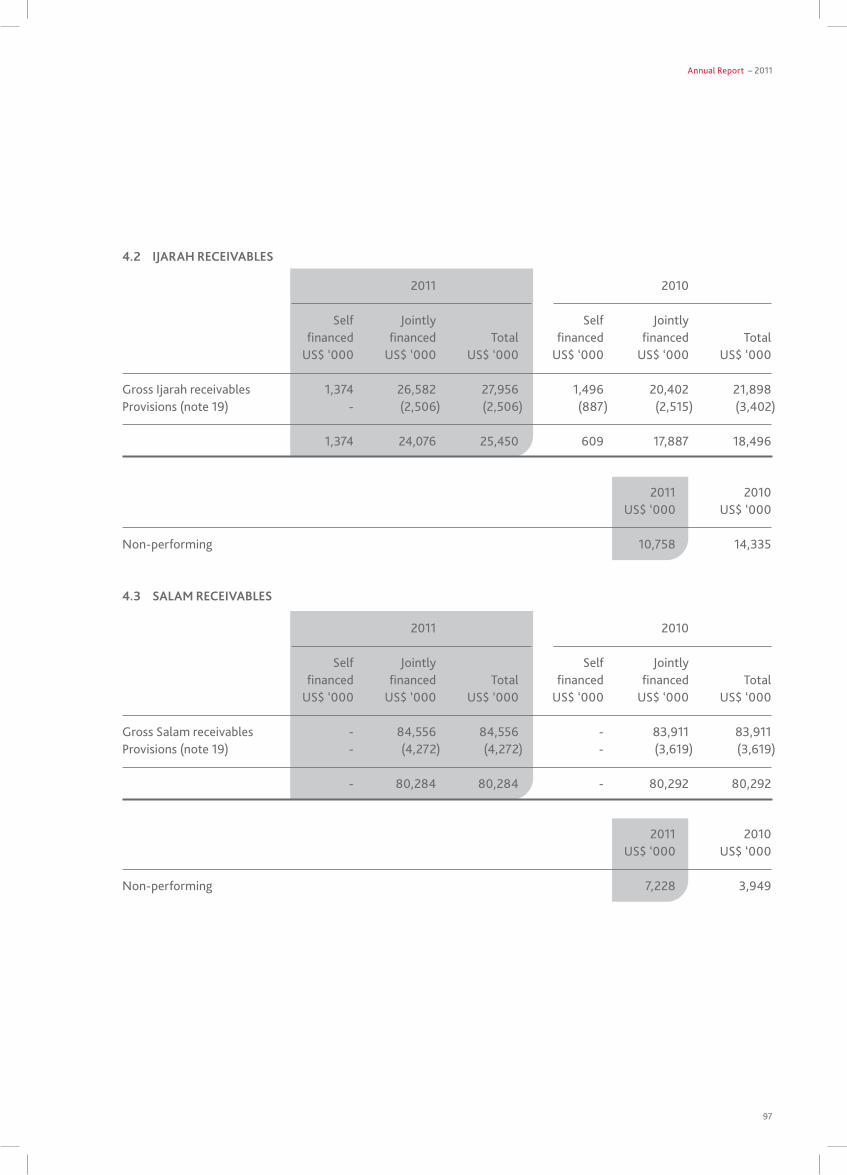
Annual Report – 2011
97
2011 2010 Us$ ‘000 Us$ ‘000 non-performing 10,758 14,335
2011 2010 Us$ ‘000 Us$ ‘000 non-performing 7,228 3,949
4.2 IJARAH RECEIVABLES
4.3 SALAM RECEIVABLES
2011 2010
self Jointly self Jointly financed financed total financed financed total Us$ ‘000 Us$ ‘000 Us$ ‘000 Us$ ‘000 Us$ ‘000 Us$ ‘000 gross ijarah receivables 1,374 26,582 27,956 1,496 20,402 21,898provisions (note 19) - (2,506) (2,506) (887) (2,515) (3,402)
1,374 24,076 25,450 609 17,887 18,496
2011 2010
self Jointly self Jointly financed financed total financed financed total Us$ ‘000 Us$ ‘000 Us$ ‘000 Us$ ‘000 Us$ ‘000 Us$ ‘000 gross salam receivables - 84,556 84,556 - 83,911 83,911provisions (note 19) - (4,272) (4,272) - (3,619) (3,619)
- 80,284 80,284 - 80,292 80,292
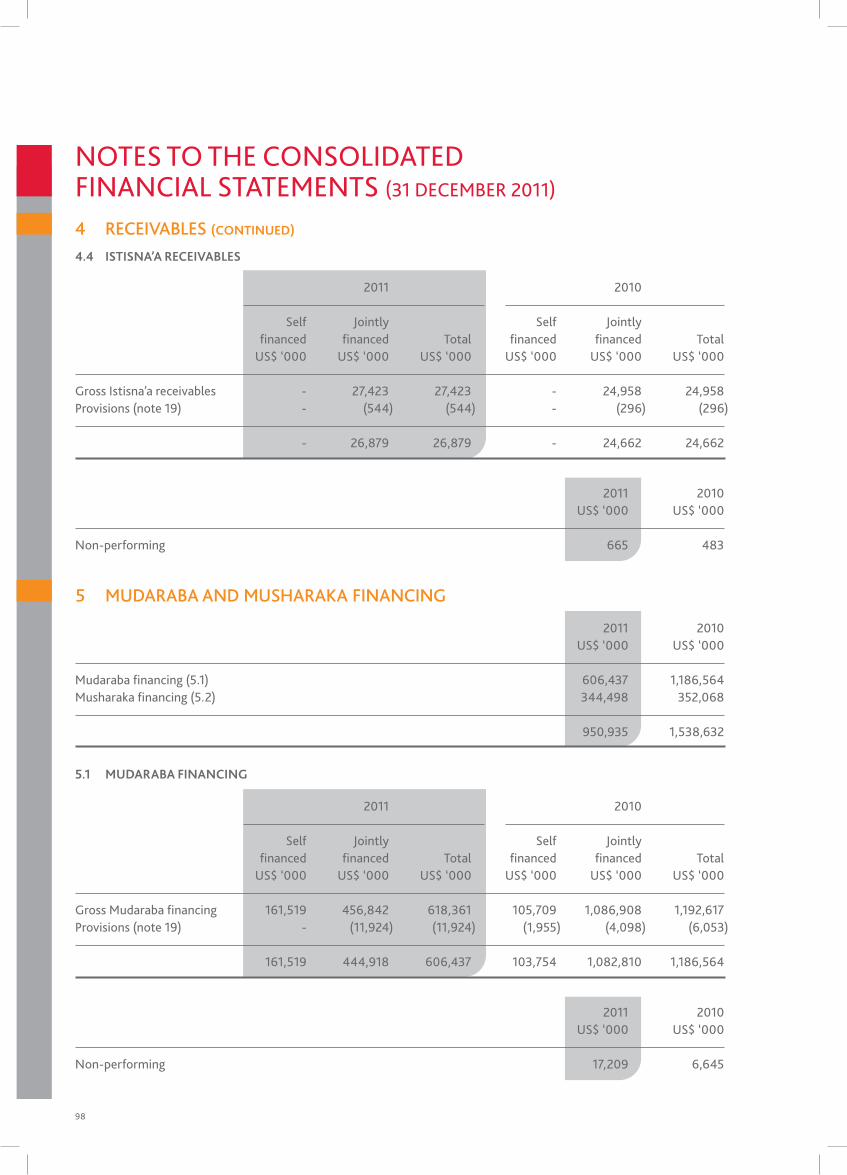
98
5 MUdARABA ANd MUSHARAKA FiNANCiNG
2011 2010 Us$ ‘000 Us$ ‘000 mudaraba financing (5.1) 606,437 1,186,564 musharaka financing (5.2) 344,498 352,068 950,935 1,538,632
5.1 MuDARABA FINANCING
notes to tHe ConsolidAted FinAnCiAl stAtements (31 deCemBeR 2011)
4.4 ISTISNA’A RECEIVABLES
4 RECEIVABLES (CONTINuED)
2011 2010 Us$ ‘000 Us$ ‘000 non-performing 665 483
2011 2010 Us$ ‘000 Us$ ‘000 non-performing 17,209 6,645
2011 2010
self Jointly self Jointly financed financed total financed financed total Us$ ‘000 Us$ ‘000 Us$ ‘000 Us$ ‘000 Us$ ‘000 Us$ ‘000 gross istisna’a receivables - 27,423 27,423 - 24,958 24,958provisions (note 19) - (544) (544) - (296) (296)
- 26,879 26,879 - 24,662 24,662
2011 2010
self Jointly self Jointly financed financed total financed financed total Us$ ‘000 Us$ ‘000 Us$ ‘000 Us$ ‘000 Us$ ‘000 Us$ ‘000 gross mudaraba financing 161,519 456,842 618,361 105,709 1,086,908 1,192,617 provisions (note 19) - (11,924) (11,924) (1,955) (4,098) (6,053)
161,519 444,918 606,437 103,754 1,082,810 1,186,564
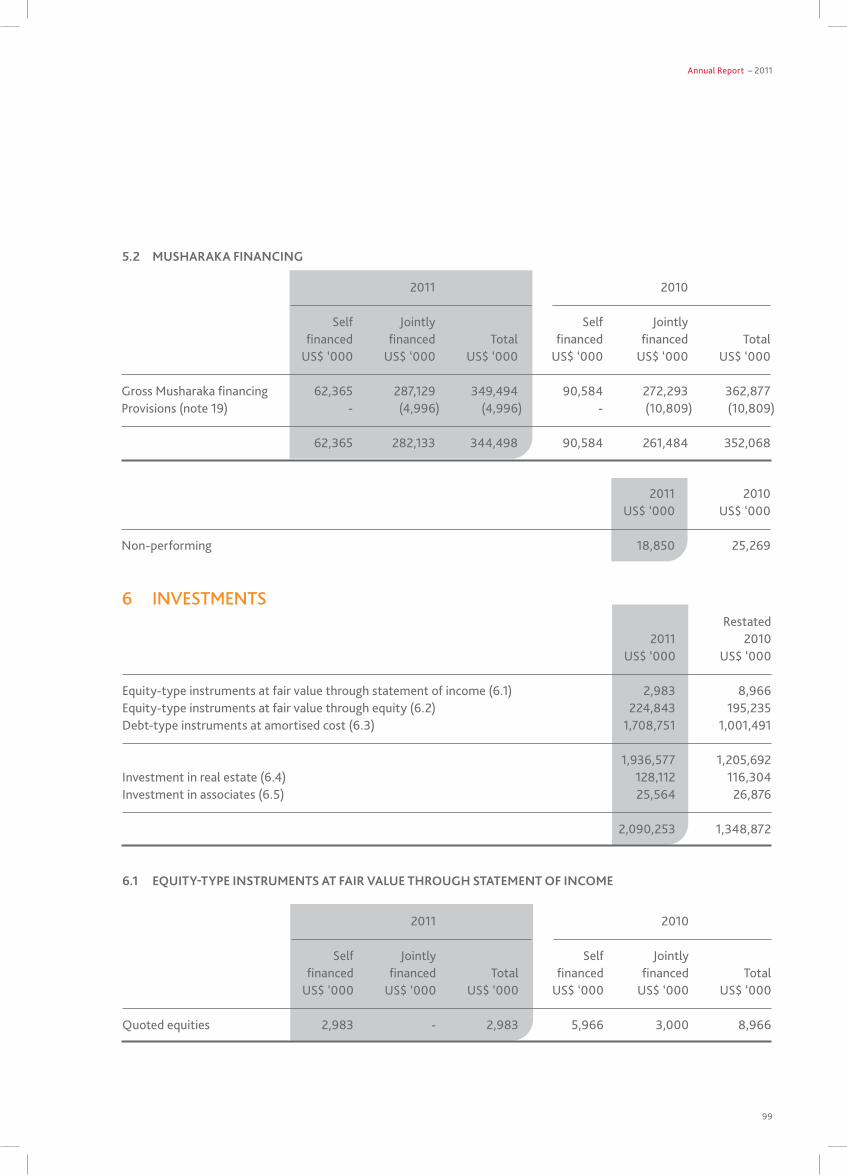
Annual Report – 2011
99
6 INVESTMENTS Restated 2011 2010 Us$ ‘000 Us$ ‘000 equity-type instruments at fair value through statement of income (6.1) 2,983 8,966equity-type instruments at fair value through equity (6.2) 224,843 195,235debt-type instruments at amortised cost (6.3) 1,708,751 1,001,491 1,936,577 1,205,692investment in real estate (6.4) 128,112 116,304investment in associates (6.5) 25,564 26,876 2,090,253 1,348,872
5.2 MuSHARAKA FINANCING
2011 2010 Us$ ‘000 Us$ ‘000 non-performing 18,850 25,269
2011 2010
self Jointly self Jointly financed financed total financed financed total Us$ ‘000 Us$ ‘000 Us$ ‘000 Us$ ‘000 Us$ ‘000 Us$ ‘000 gross musharaka financing 62,365 287,129 349,494 90,584 272,293 362,877provisions (note 19) - (4,996) (4,996) - (10,809) (10,809)
62,365 282,133 344,498 90,584 261,484 352,068
6.1 EQuITY-TYPE INSTRuMENTS AT FAIR VALuE THROuGH STATEMENT OF INCOME
2011 2010
self Jointly self Jointly financed financed total financed financed total Us$ ‘000 Us$ ‘000 Us$ ‘000 Us$ ‘000 Us$ ‘000 Us$ ‘000 Quoted equities 2,983 - 2,983 5,966 3,000 8,966
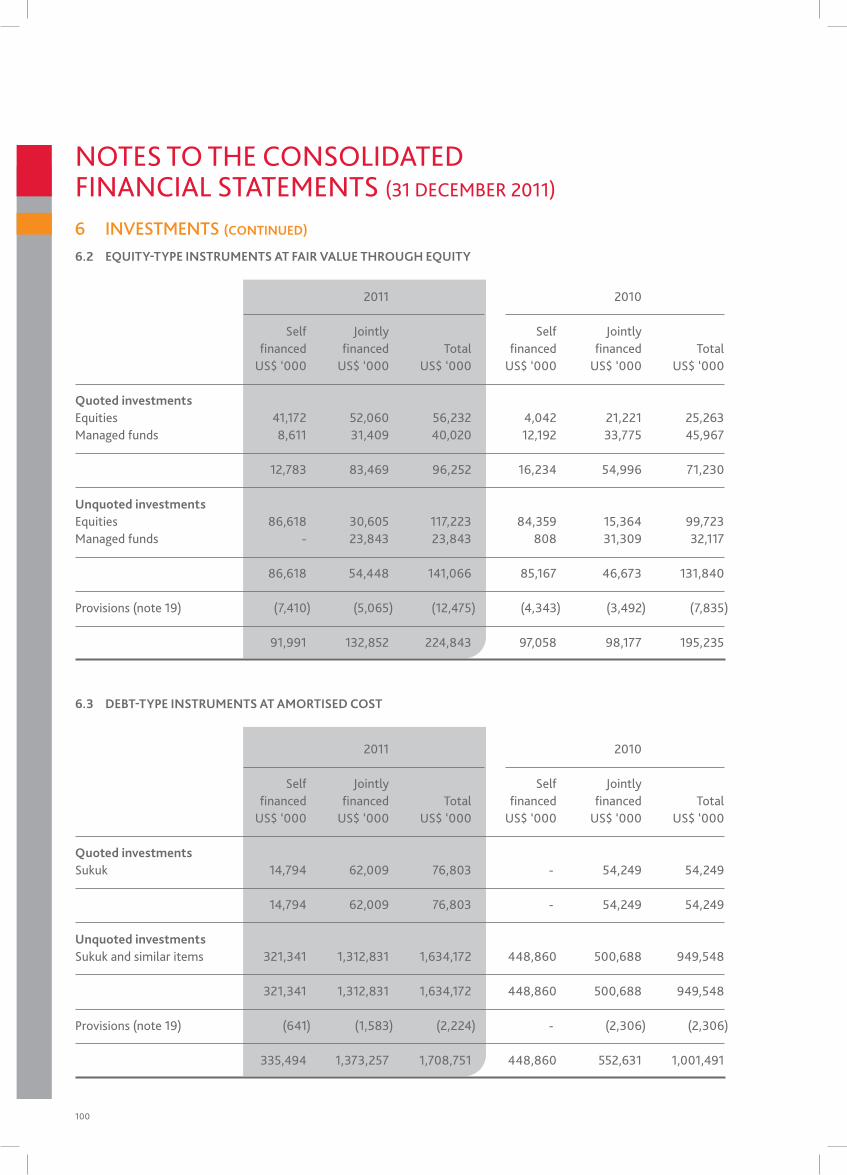
100
6.3 DEBT-TYPE INSTRuMENTS AT AMORTISED COST
6.2 EQuITY-TYPE INSTRuMENTS AT FAIR VALuE THROuGH EQuITY
6 INVESTMENTS (CONTINuED)
2011 2010
self Jointly self Jointly financed financed total financed financed total Us$ ‘000 Us$ ‘000 Us$ ‘000 Us$ ‘000 Us$ ‘000 Us$ ‘000 Quoted investments sukuk 14,794 62,009 76,803 - 54,249 54,249 14,794 62,009 76,803 - 54,249 54,249 unquoted investments sukuk and similar items 321,341 1,312,831 1,634,172 448,860 500,688 949,548
321,341 1,312,831 1,634,172 448,860 500,688 949,548 provisions (note 19) (641) (1,583) (2,224) - (2,306) (2,306) 335,494 1,373,257 1,708,751 448,860 552,631 1,001,491
2011 2010
self Jointly self Jointly financed financed total financed financed total Us$ ‘000 Us$ ‘000 Us$ ‘000 Us$ ‘000 Us$ ‘000 Us$ ‘000
Quoted investments equities 41,172 52,060 56,232 4,042 21,221 25,263managed funds 8,611 31,409 40,020 12,192 33,775 45,967
12,783 83,469 96,252 16,234 54,996 71,230
unquoted investments equities 86,618 30,605 117,223 84,359 15,364 99,723managed funds - 23,843 23,843 808 31,309 32,117
86,618 54,448 141,066 85,167 46,673 131,840
provisions (note 19) (7,410) (5,065) (12,475) (4,343) (3,492) (7,835)
91,991 132,852 224,843 97,058 98,177 195,235
notes to tHe ConsolidAted FinAnCiAl stAtements (31 deCemBeR 2011)
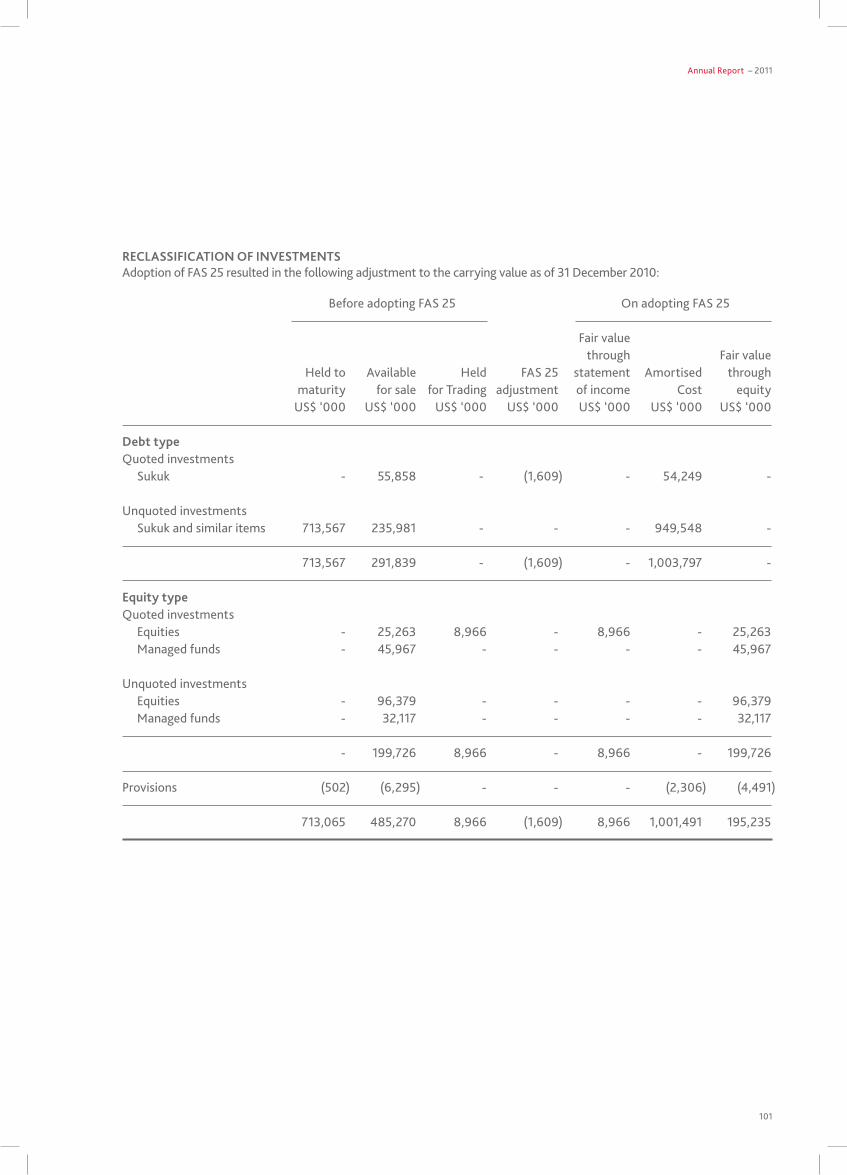
Annual Report – 2011
101
RECLASSIFICATION OF INVESTMENTSAdoption of FAs 25 resulted in the following adjustment to the carrying value as of 31 december 2010:
Before adopting FAs 25 on adopting FAs 25
Fair value through Fair value Held to Available Held FAs 25 statement Amortised through maturity for sale for trading adjustment of income Cost equity Us$ ‘000 Us$ ‘000 Us$ ‘000 Us$ ‘000 Us$ ‘000 Us$ ‘000 Us$ ‘000
Debt type Quoted investments sukuk - 55,858 - (1,609) - 54,249 -
Unquoted investments sukuk and similar items 713,567 235,981 - - - 949,548 -
713,567 291,839 - (1,609) - 1,003,797 -
Equity type Quoted investments equities - 25,263 8,966 - 8,966 - 25,263 managed funds - 45,967 - - - - 45,967 Unquoted investments equities - 96,379 - - - - 96,379 managed funds - 32,117 - - - - 32,117
- 199,726 8,966 - 8,966 - 199,726
provisions (502) (6,295) - - - (2,306) (4,491)
713,065 485,270 8,966 (1,609) 8,966 1,001,491 195,235
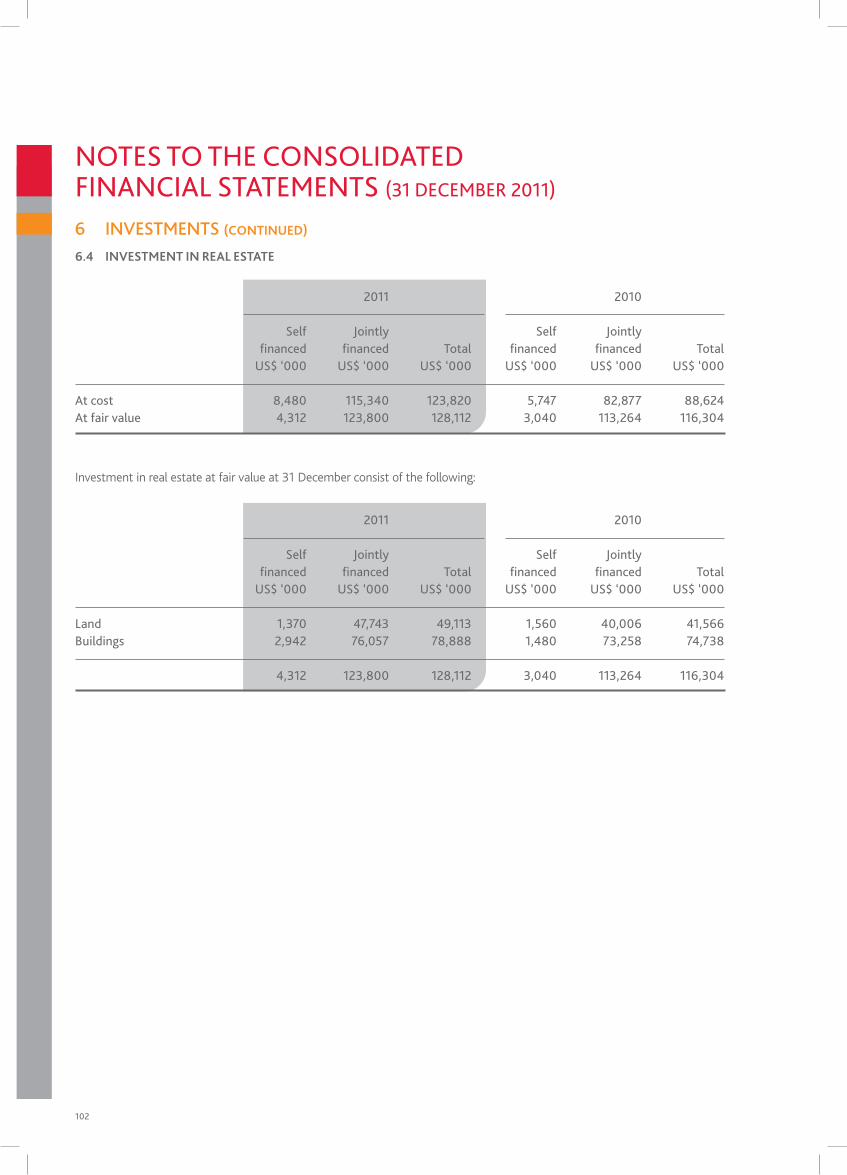
102
6.4 INVESTMENT IN REAL ESTATE
Investment in real estate at fair value at 31 December consist of the following:
2011 2010
self Jointly self Jointly financed financed total financed financed total Us$ ‘000 Us$ ‘000 Us$ ‘000 Us$ ‘000 Us$ ‘000 Us$ ‘000 At cost 8,480 115,340 123,820 5,747 82,877 88,624At fair value 4,312 123,800 128,112 3,040 113,264 116,304
2011 2010
self Jointly self Jointly financed financed total financed financed total Us$ ‘000 Us$ ‘000 Us$ ‘000 Us$ ‘000 Us$ ‘000 Us$ ‘000 land 1,370 47,743 49,113 1,560 40,006 41,566Buildings 2,942 76,057 78,888 1,480 73,258 74,738 4,312 123,800 128,112 3,040 113,264 116,304
6 INVESTMENTS (CONTINuED)
notes to tHe ConsolidAted FinAnCiAl stAtements (31 deCemBeR 2011)
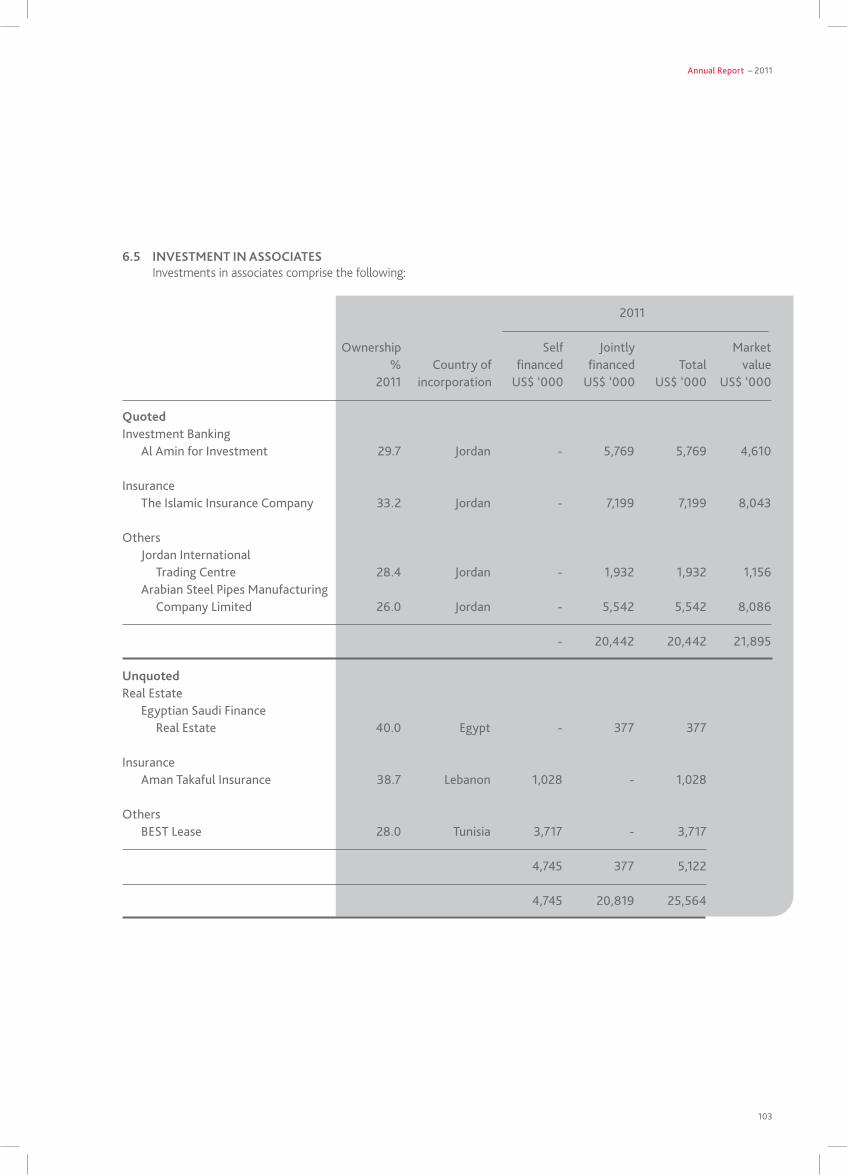
Annual Report – 2011
103
6.5 INVESTMENT IN ASSOCIATES Investments in associates comprise the following:
2011
ownership self Jointly market % Country of financed financed total value 2011 incorporation Us$ ‘000 Us$ ‘000 Us$ ‘000 Us$ ‘000
Quoted investment Banking Al Amin for investment 29.7 Jordan - 5,769 5,769 4,610
insurance the islamic insurance Company 33.2 Jordan - 7,199 7,199 8,043
others Jordan international trading Centre 28.4 Jordan - 1,932 1,932 1,156 Arabian steel pipes manufacturing Company limited 26.0 Jordan - 5,542 5,542 8,086
- 20,442 20,442 21,895
unquotedReal estate egyptian saudi Finance Real estate 40.0 egypt - 377 377
insurance Aman takaful insurance 38.7 lebanon 1,028 - 1,028
others Best lease 28.0 tunisia 3,717 - 3,717
4,745 377 5,122
4,745 20,819 25,564
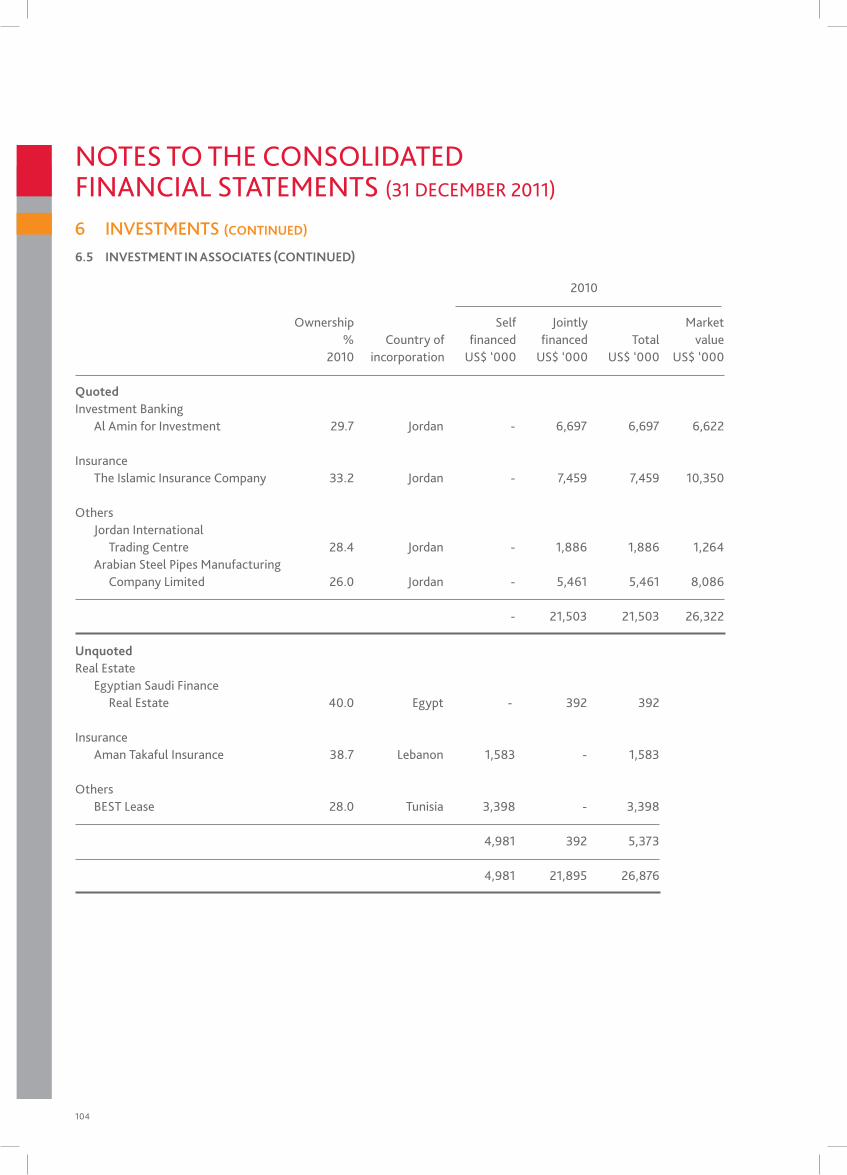
104
2010
ownership self Jointly market % Country of financed financed total value 2010 incorporation Us$ ‘000 Us$ ‘000 Us$ ‘000 Us$ ‘000
Quoted investment Banking Al Amin for investment 29.7 Jordan - 6,697 6,697 6,622 insurance the islamic insurance Company 33.2 Jordan - 7,459 7,459 10,350 others Jordan international trading Centre 28.4 Jordan - 1,886 1,886 1,264 Arabian steel pipes manufacturing Company limited 26.0 Jordan - 5,461 5,461 8,086 - 21,503 21,503 26,322
unquotedReal estate egyptian saudi Finance Real estate 40.0 egypt - 392 392
insurance Aman takaful insurance 38.7 lebanon 1,583 - 1,583 others Best lease 28.0 tunisia 3,398 - 3,398
4,981 392 5,373
4,981 21,895 26,876
6 INVESTMENTS (CONTINuED)
6.5 INVESTMENT IN ASSOCIATES (CONTINuED)
notes to tHe ConsolidAted FinAnCiAl stAtements (31 deCemBeR 2011)
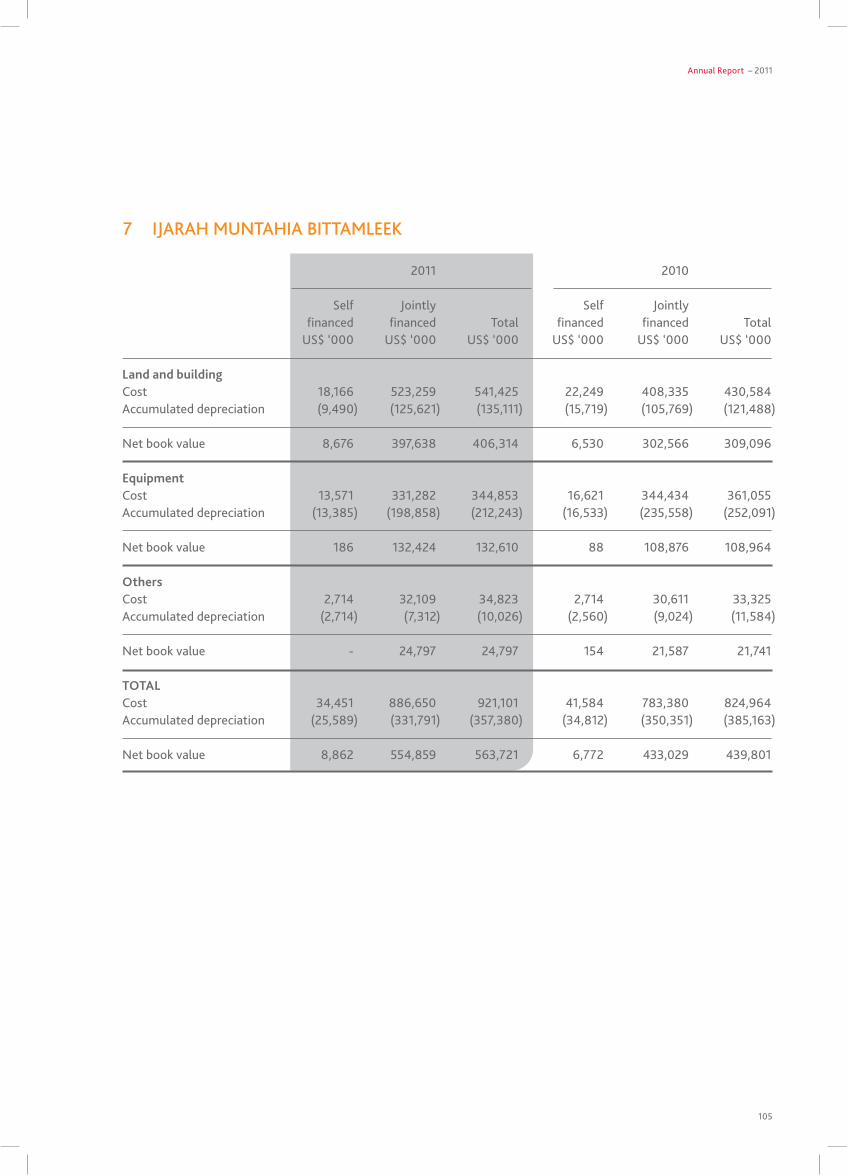
Annual Report – 2011
105
7 iJARAH MUNtAHiA BittAMLEEK
2011 2010
self Jointly self Jointly financed financed total financed financed total Us$ ‘000 Us$ ‘000 Us$ ‘000 Us$ ‘000 Us$ ‘000 Us$ ‘000 Land and building Cost 18,166 523,259 541,425 22,249 408,335 430,584Accumulated depreciation (9,490) (125,621) (135,111) (15,719) (105,769) (121,488) net book value 8,676 397,638 406,314 6,530 302,566 309,096
Equipment Cost 13,571 331,282 344,853 16,621 344,434 361,055Accumulated depreciation (13,385) (198,858) (212,243) (16,533) (235,558) (252,091) net book value 186 132,424 132,610 88 108,876 108,964
OthersCost 2,714 32,109 34,823 2,714 30,611 33,325Accumulated depreciation (2,714) (7,312) (10,026) (2,560) (9,024) (11,584) net book value - 24,797 24,797 154 21,587 21,741
TOTAL Cost 34,451 886,650 921,101 41,584 783,380 824,964Accumulated depreciation (25,589) (331,791) (357,380) (34,812) (350,351) (385,163) net book value 8,862 554,859 563,721 6,772 433,029 439,801
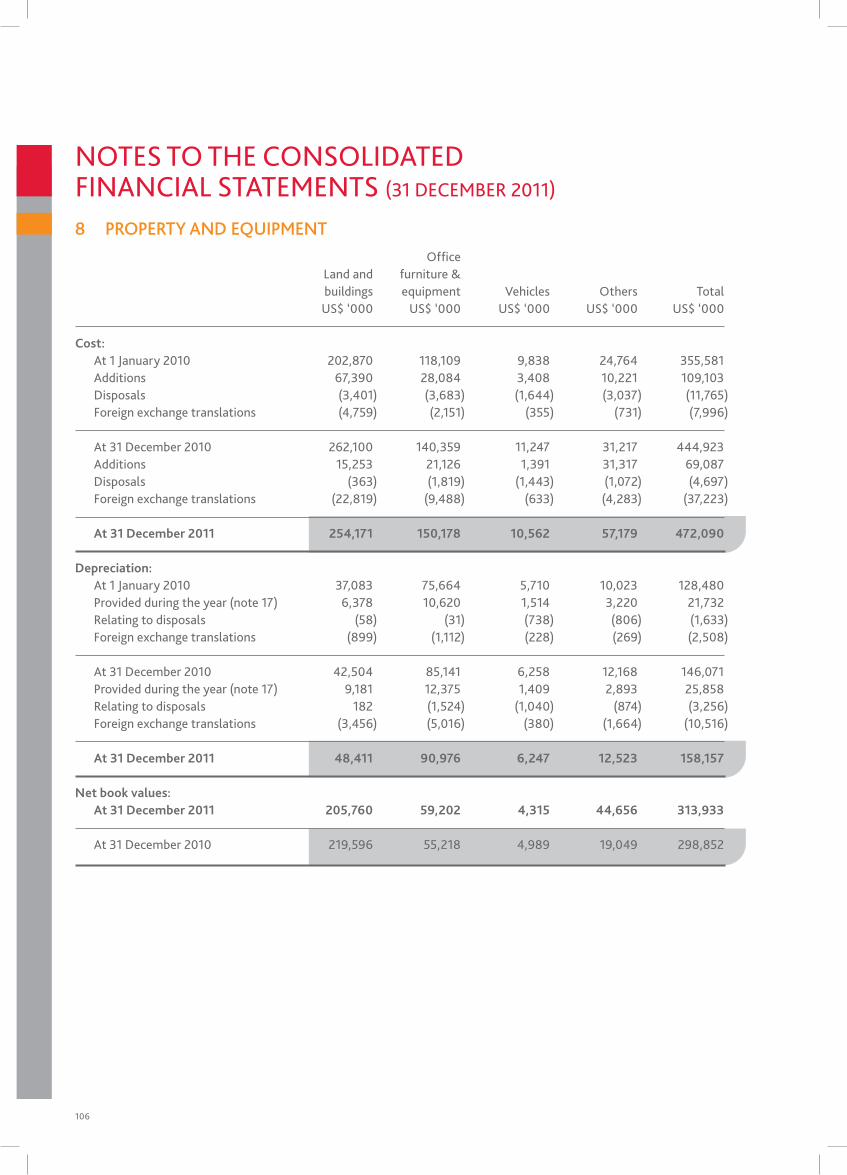
106
8 PROPERTY AND EQUIPMENT
office land and furniture & buildings equipment Vehicles others total Us$ ‘000 Us$ ‘000 Us$ ‘000 Us$ ‘000 Us$ ‘000
Cost: At 1 January 2010 202,870 118,109 9,838 24,764 355,581 Additions 67,390 28,084 3,408 10,221 109,103 disposals (3,401) (3,683) (1,644) (3,037) (11,765) Foreign exchange translations (4,759) (2,151) (355) (731) (7,996)
At 31 december 2010 262,100 140,359 11,247 31,217 444,923 Additions 15,253 21,126 1,391 31,317 69,087 disposals (363) (1,819) (1,443) (1,072) (4,697) Foreign exchange translations (22,819) (9,488) (633) (4,283) (37,223)
At 31 December 2011 254,171 150,178 10,562 57,179 472,090
Depreciation: At 1 January 2010 37,083 75,664 5,710 10,023 128,480 provided during the year (note 17) 6,378 10,620 1,514 3,220 21,732 Relating to disposals (58) (31) (738) (806) (1,633) Foreign exchange translations (899) (1,112) (228) (269) (2,508)
At 31 december 2010 42,504 85,141 6,258 12,168 146,071 provided during the year (note 17) 9,181 12,375 1,409 2,893 25,858 Relating to disposals 182 (1,524) (1,040) (874) (3,256) Foreign exchange translations (3,456) (5,016) (380) (1,664) (10,516) At 31 December 2011 48,411 90,976 6,247 12,523 158,157
Net book values: At 31 December 2011 205,760 59,202 4,315 44,656 313,933 At 31 december 2010 219,596 55,218 4,989 19,049 298,852
notes to tHe ConsolidAted FinAnCiAl stAtements (31 deCemBeR 2011)
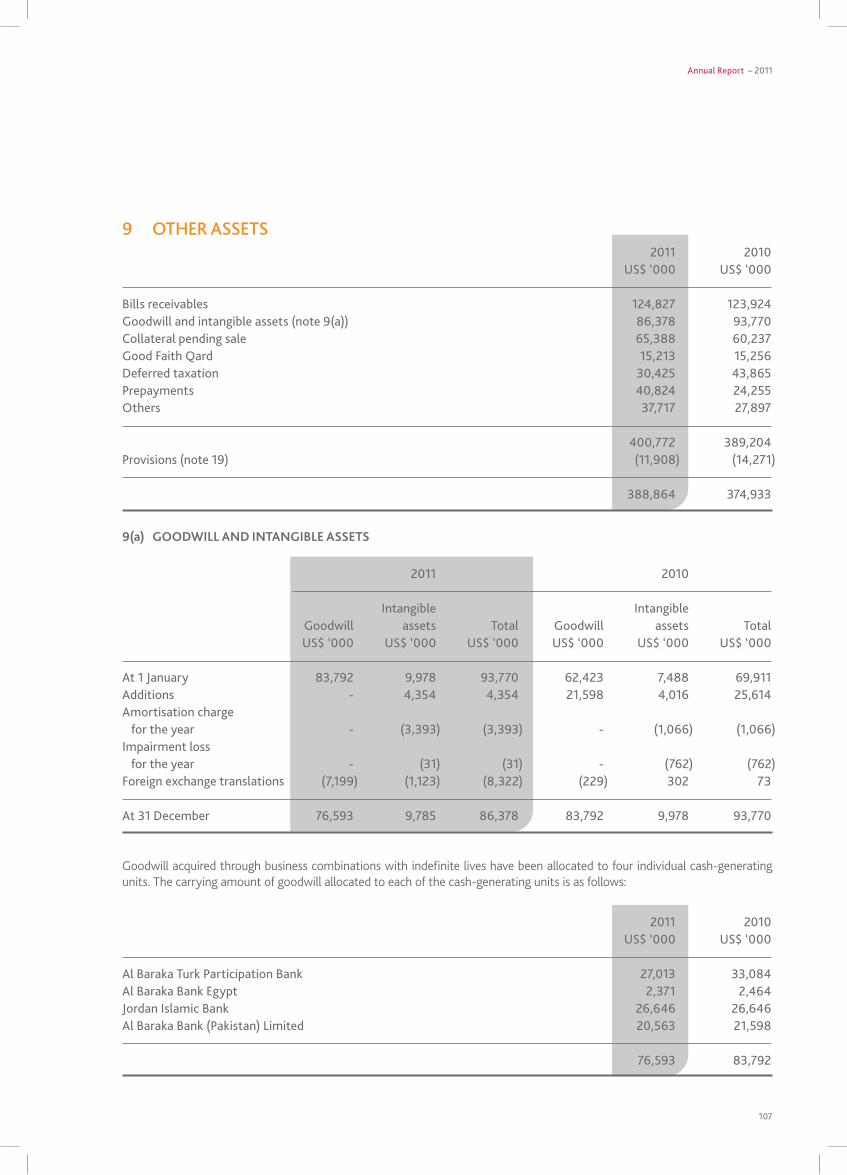
Annual Report – 2011
107
9 OTHER ASSETS 2011 2010 Us$ ‘000 Us$ ‘000
Bills receivables 124,827 123,924goodwill and intangible assets (note 9(a)) 86,378 93,770Collateral pending sale 65,388 60,237good Faith Qard 15,213 15,256deferred taxation 30,425 43,865prepayments 40,824 24,255others 37,717 27,897
400,772 389,204provisions (note 19) (11,908) (14,271)
388,864 374,933
2011 2010
intangible intangible goodwill assets total goodwill assets total Us$ ‘000 Us$ ‘000 Us$ ‘000 Us$ ‘000 Us$ ‘000 Us$ ‘000
At 1 January 83,792 9,978 93,770 62,423 7,488 69,911Additions - 4,354 4,354 21,598 4,016 25,614Amortisation charge for the year - (3,393) (3,393) - (1,066) (1,066)impairment loss for the year - (31) (31) - (762) (762)Foreign exchange translations (7,199) (1,123) (8,322) (229) 302 73
At 31 december 76,593 9,785 86,378 83,792 9,978 93,770
9(a) GOODWILL AND INTANGIBLE ASSETS
2011 2010 Us$ ‘000 Us$ ‘000 Al Baraka turk participation Bank 27,013 33,084Al Baraka Bank egypt 2,371 2,464Jordan islamic Bank 26,646 26,646Al Baraka Bank (pakistan) limited 20,563 21,598 76,593 83,792
Goodwill acquired through business combinations with indefinite lives have been allocated to four individual cash-generating units. The carrying amount of goodwill allocated to each of the cash-generating units is as follows:
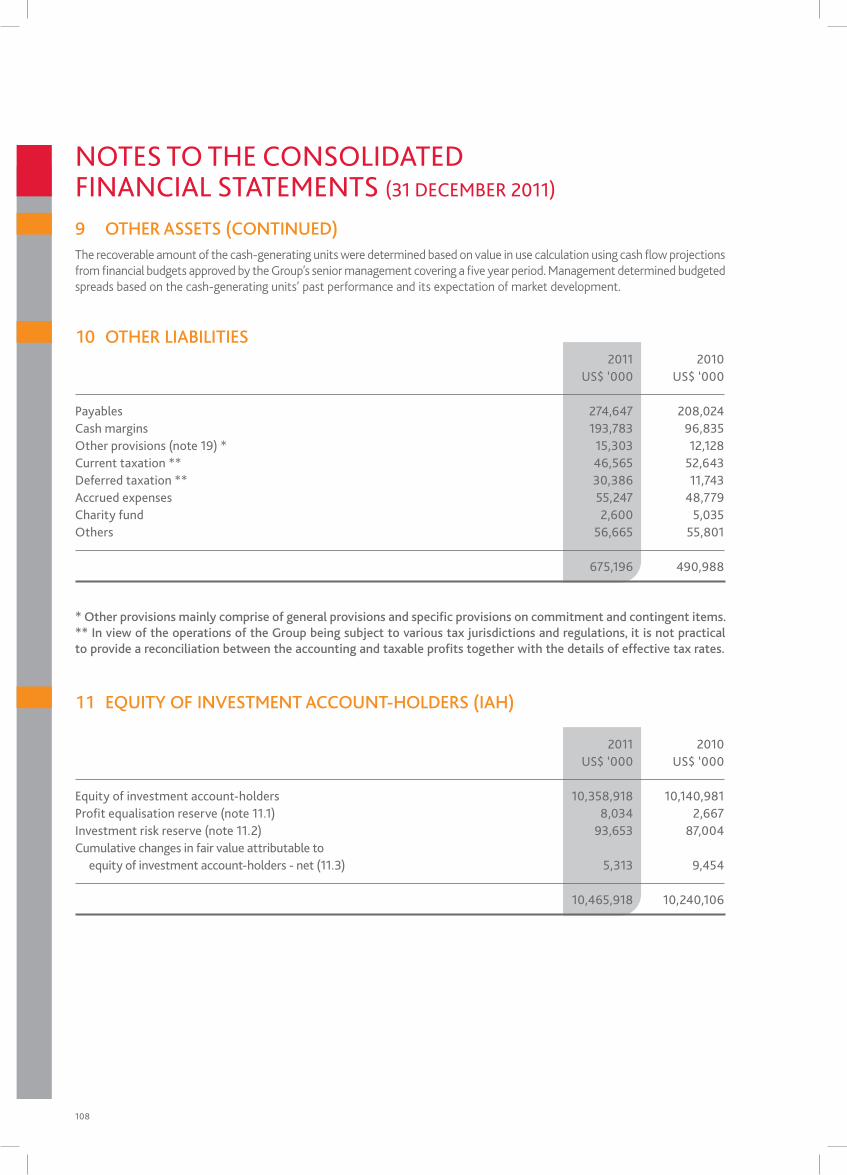
108
10 OTHER LIABILITIES 2011 2010 Us$ ‘000 Us$ ‘000 payables 274,647 208,024Cash margins 193,783 96,835other provisions (note 19) * 15,303 12,128Current taxation ** 46,565 52,643deferred taxation ** 30,386 11,743Accrued expenses 55,247 48,779Charity fund 2,600 5,035others 56,665 55,801
675,196 490,988
* Other provisions mainly comprise of general provisions and specific provisions on commitment and contingent items.** In view of the operations of the Group being subject to various tax jurisdictions and regulations, it is not practical to provide a reconciliation between the accounting and taxable profits together with the details of effective tax rates.
11 EQUITY OF INVESTMENT ACCOUNT-HOLDERS (IAH)
2011 2010 Us$ ‘000 Us$ ‘000 equity of investment account-holders 10,358,918 10,140,981profit equalisation reserve (note 11.1) 8,034 2,667investment risk reserve (note 11.2) 93,653 87,004Cumulative changes in fair value attributable to equity of investment account-holders - net (11.3) 5,313 9,454
10,465,918 10,240,106
notes to tHe ConsolidAted FinAnCiAl stAtements (31 deCemBeR 2011)
The recoverable amount of the cash-generating units were determined based on value in use calculation using cash flow projections from financial budgets approved by the Group’s senior management covering a five year period. Management determined budgeted spreads based on the cash-generating units’ past performance and its expectation of market development.
9 OTHER ASSETS (CONTINUED)
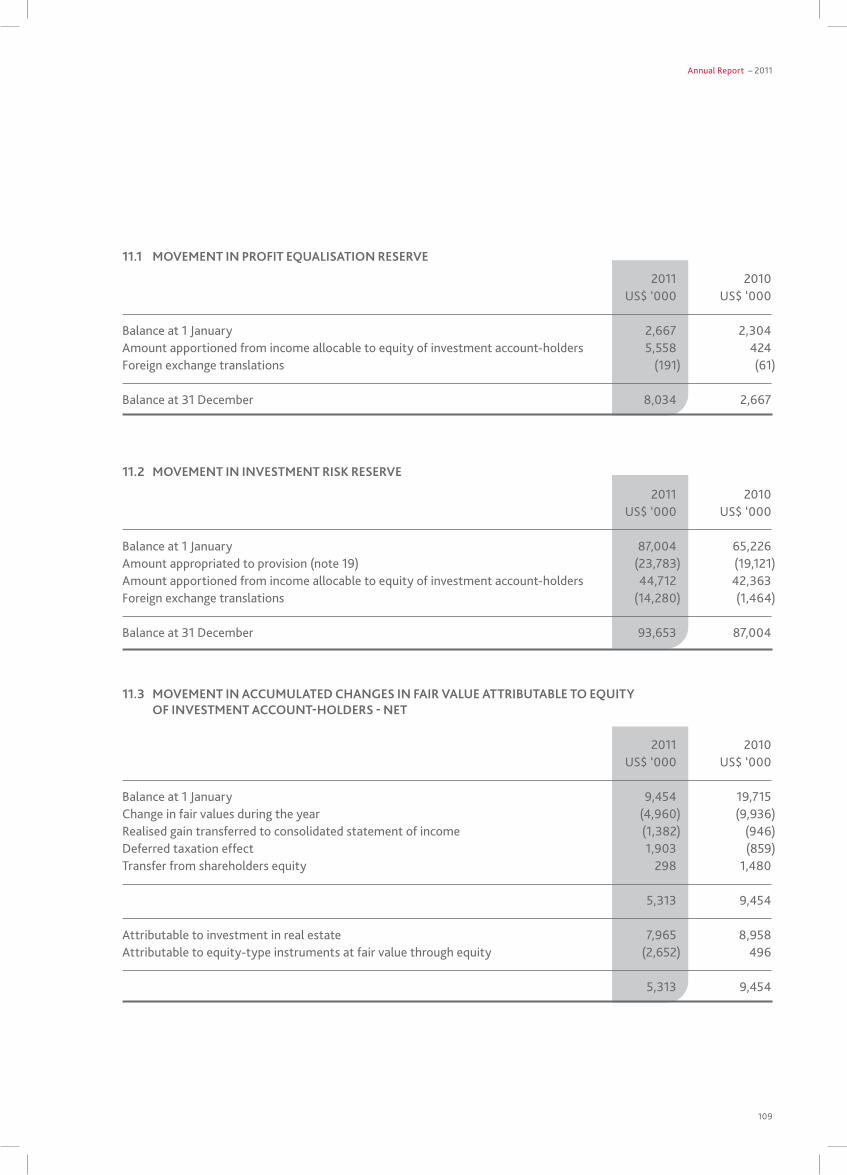
Annual Report – 2011
109
2011 2010 Us$ ‘000 Us$ ‘000 Balance at 1 January 2,667 2,304Amount apportioned from income allocable to equity of investment account-holders 5,558 424Foreign exchange translations (191) (61) Balance at 31 december 8,034 2,667
2011 2010 Us$ ‘000 Us$ ‘000
Balance at 1 January 87,004 65,226Amount appropriated to provision (note 19) (23,783) (19,121)Amount apportioned from income allocable to equity of investment account-holders 44,712 42,363Foreign exchange translations (14,280) (1,464)
Balance at 31 december 93,653 87,004
11.1 MOVEMENT IN PROFIT EQuALISATION RESERVE
11.2 MOVEMENT IN INVESTMENT RISK RESERVE
2011 2010 Us$ ‘000 Us$ ‘000
Balance at 1 January 9,454 19,715Change in fair values during the year (4,960) (9,936)Realised gain transferred to consolidated statement of income (1,382) (946)deferred taxation effect 1,903 (859)transfer from shareholders equity 298 1,480
5,313 9,454
Attributable to investment in real estate 7,965 8,958Attributable to equity-type instruments at fair value through equity (2,652) 496
5,313 9,454
11.3 MOVEMENT IN ACCuMuLATED CHANGES IN FAIR VALuE ATTRIBuTABLE TO EQuITY OF INVESTMENT ACCOuNT-HOLDERS - NET
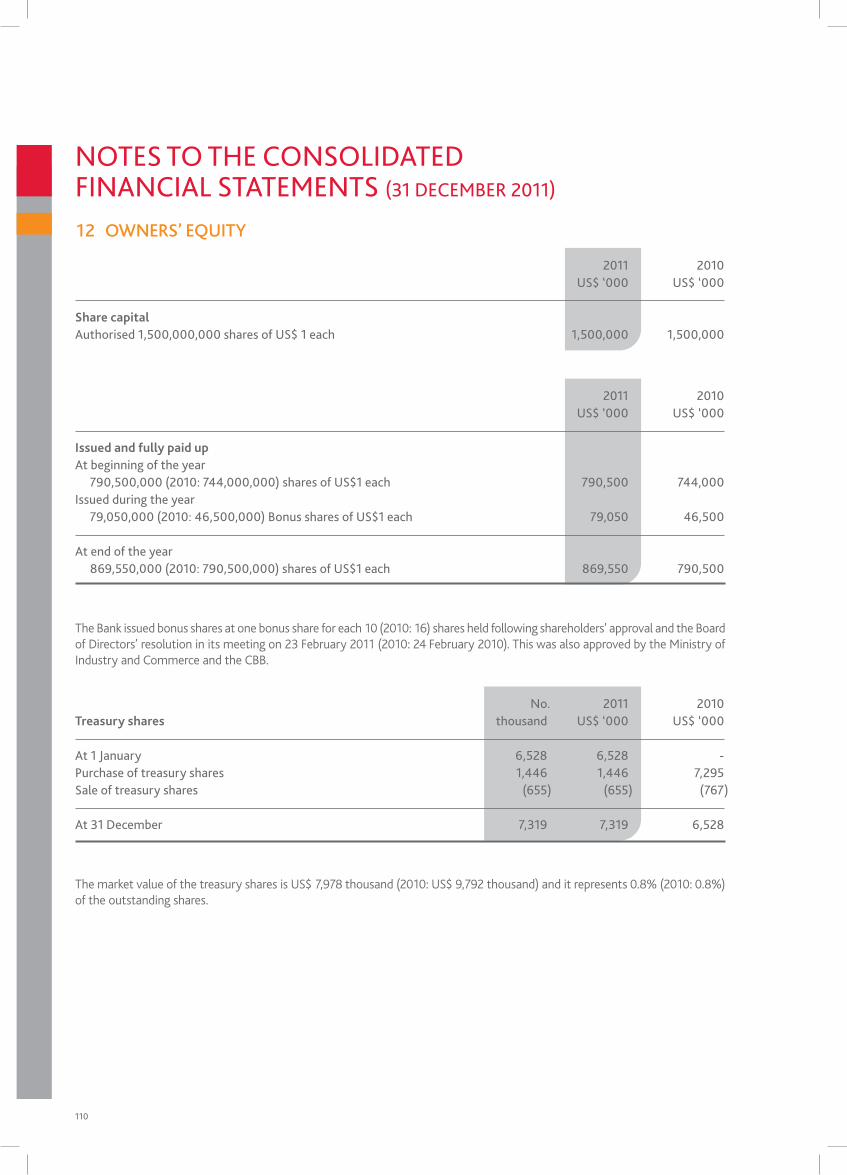
110
2011 2010 Us$ ‘000 Us$ ‘000
Issued and fully paid up At beginning of the year 790,500,000 (2010: 744,000,000) shares of Us$1 each 790,500 744,000issued during the year 79,050,000 (2010: 46,500,000) Bonus shares of Us$1 each 79,050 46,500
At end of the year 869,550,000 (2010: 790,500,000) shares of Us$1 each 869,550 790,500
no. 2011 2010Treasury shares thousand Us$ ‘000 Us$ ‘000
At 1 January 6,528 6,528 -purchase of treasury shares 1,446 1,446 7,295sale of treasury shares (655) (655) (767)
At 31 december 7,319 7,319 6,528
The Bank issued bonus shares at one bonus share for each 10 (2010: 16) shares held following shareholders’ approval and the Board of Directors’ resolution in its meeting on 23 February 2011 (2010: 24 February 2010). This was also approved by the Ministry of Industry and Commerce and the CBB.
The market value of the treasury shares is US$ 7,978 thousand (2010: US$ 9,792 thousand) and it represents 0.8% (2010: 0.8%) of the outstanding shares.
12 OwNERS’ EQUITY
2011 2010 Us$ ‘000 Us$ ‘000
Share capital Authorised 1,500,000,000 shares of Us$ 1 each 1,500,000 1,500,000
notes to tHe ConsolidAted FinAnCiAl stAtements (31 deCemBeR 2011)
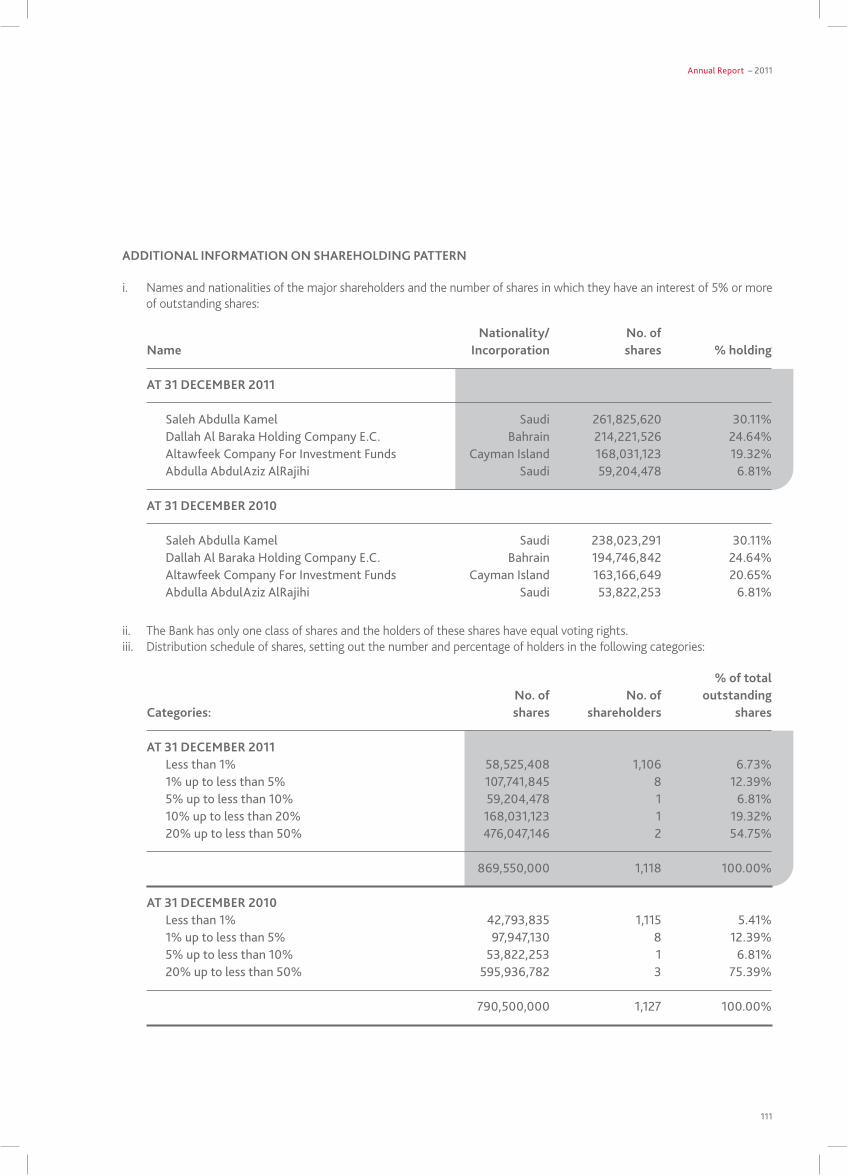
Annual Report – 2011
111
Nationality/ No. of Name Incorporation shares % holding
AT 31 DECEMBER 2011
saleh Abdulla kamel saudi 261,825,620 30.11%dallah Al Baraka Holding Company e.C. Bahrain 214,221,526 24.64%Altawfeek Company For investment Funds Cayman island 168,031,123 19.32%Abdulla AbdulAziz AlRajihi saudi 59,204,478 6.81%
AT 31 DECEMBER 2010
saleh Abdulla kamel saudi 238,023,291 30.11%dallah Al Baraka Holding Company e.C. Bahrain 194,746,842 24.64%Altawfeek Company For investment Funds Cayman island 163,166,649 20.65%Abdulla AbdulAziz AlRajihi saudi 53,822,253 6.81%
ADDITIONAL INFORMATION ON SHAREHOLDING PATTERN
i. Names and nationalities of the major shareholders and the number of shares in which they have an interest of 5% or more of outstanding shares:
ii. The Bank has only one class of shares and the holders of these shares have equal voting rights.iii. Distribution schedule of shares, setting out the number and percentage of holders in the following categories:
% of total No. of No. of outstandingCategories: shares shareholders shares
AT 31 DECEMBER 2011less than 1% 58,525,408 1,106 6.73%1% up to less than 5% 107,741,845 8 12.39%5% up to less than 10% 59,204,478 1 6.81%10% up to less than 20% 168,031,123 1 19.32%20% up to less than 50% 476,047,146 2 54.75%
869,550,000 1,118 100.00%
AT 31 DECEMBER 2010less than 1% 42,793,835 1,115 5.41%1% up to less than 5% 97,947,130 8 12.39%5% up to less than 10% 53,822,253 1 6.81%20% up to less than 50% 595,936,782 3 75.39%
790,500,000 1,127 100.00%
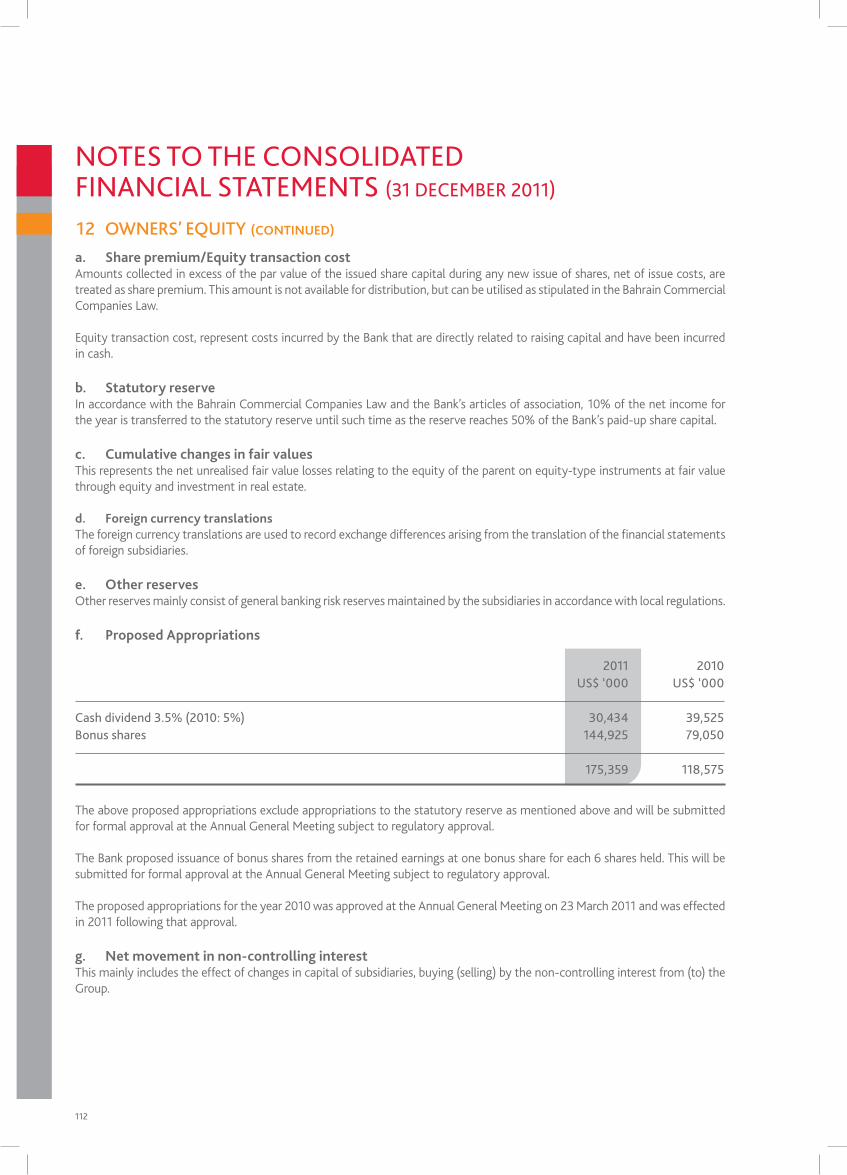
112
a. Share premium/Equity transaction costAmounts collected in excess of the par value of the issued share capital during any new issue of shares, net of issue costs, are treated as share premium. This amount is not available for distribution, but can be utilised as stipulated in the Bahrain Commercial Companies law.
Equity transaction cost, represent costs incurred by the Bank that are directly related to raising capital and have been incurred in cash.
b. Statutory reserveIn accordance with the Bahrain Commercial Companies law and the Bank’s articles of association, 10% of the net income for the year is transferred to the statutory reserve until such time as the reserve reaches 50% of the Bank’s paid-up share capital.
c. Cumulative changes in fair values This represents the net unrealised fair value losses relating to the equity of the parent on equity-type instruments at fair value through equity and investment in real estate.
d. Foreign currency translationsThe foreign currency translations are used to record exchange differences arising from the translation of the financial statements of foreign subsidiaries.
e. Other reservesOther reserves mainly consist of general banking risk reserves maintained by the subsidiaries in accordance with local regulations.
f. Proposed Appropriations
2011 2010 Us$ ‘000 Us$ ‘000
Cash dividend 3.5% (2010: 5%) 30,434 39,525Bonus shares 144,925 79,050
175,359 118,575
The above proposed appropriations exclude appropriations to the statutory reserve as mentioned above and will be submitted for formal approval at the Annual General Meeting subject to regulatory approval.
The Bank proposed issuance of bonus shares from the retained earnings at one bonus share for each 6 shares held. This will be submitted for formal approval at the Annual General Meeting subject to regulatory approval.
The proposed appropriations for the year 2010 was approved at the Annual General Meeting on 23 March 2011 and was effected in 2011 following that approval.
g. Net movement in non-controlling interestThis mainly includes the effect of changes in capital of subsidiaries, buying (selling) by the non-controlling interest from (to) the Group.
12 OwNERS’ EQUITY (CONTINuED)
notes to tHe ConsolidAted FinAnCiAl stAtements (31 deCemBeR 2011)
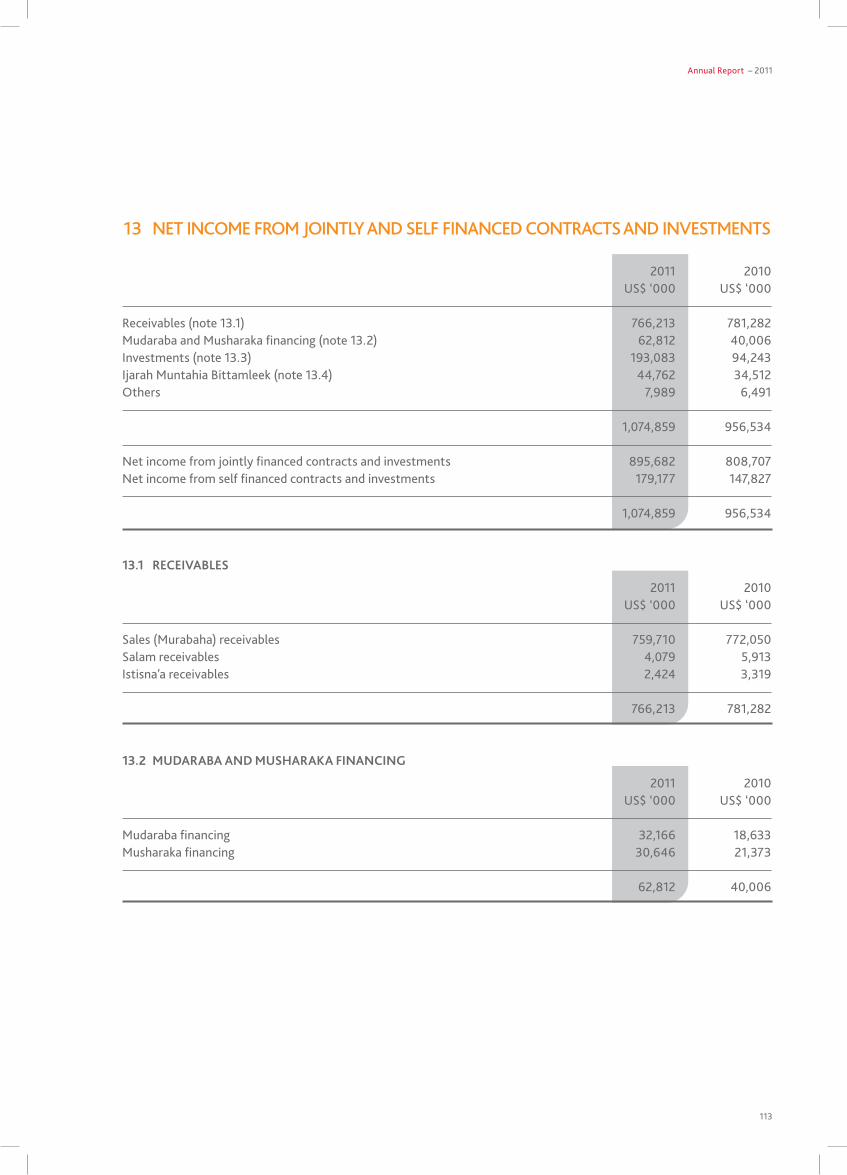
Annual Report – 2011
113
13 NET INCOME FROM JOINTLY AND SELF FINANCED CONTRACTS AND INVESTMENTS
2011 2010 Us$ ‘000 Us$ ‘000
Receivables (note 13.1) 766,213 781,282mudaraba and musharaka financing (note 13.2) 62,812 40,006investments (note 13.3) 193,083 94,243ijarah muntahia Bittamleek (note 13.4) 44,762 34,512others 7,989 6,491
1,074,859 956,534
net income from jointly financed contracts and investments 895,682 808,707net income from self financed contracts and investments 179,177 147,827
1,074,859 956,534
2011 2010 Us$ ‘000 Us$ ‘000
sales (murabaha) receivables 759,710 772,050salam receivables 4,079 5,913istisna’a receivables 2,424 3,319
766,213 781,282
13.1 RECEIVABLES
2011 2010 Us$ ‘000 Us$ ‘000
mudaraba financing 32,166 18,633musharaka financing 30,646 21,373
62,812 40,006
13.2 MuDARABA AND MuSHARAKA FINANCING
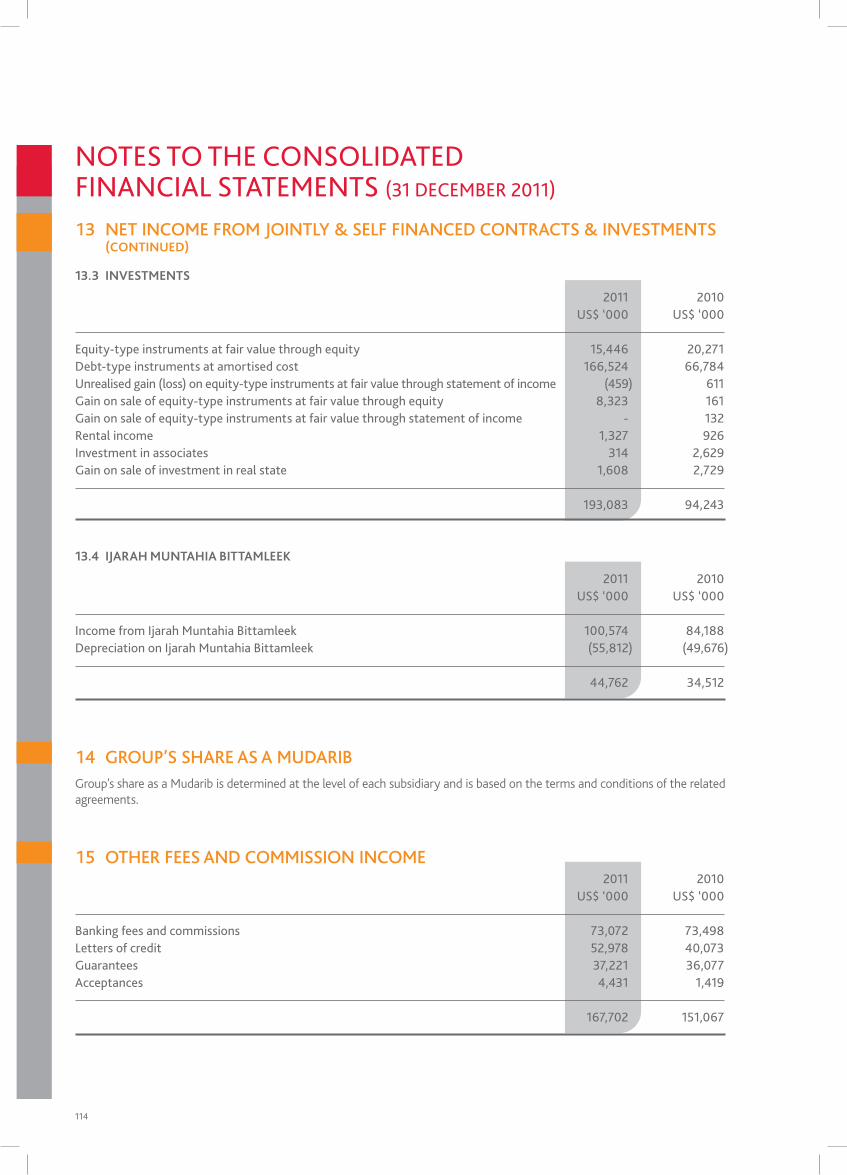
114
2011 2010 Us$ ‘000 Us$ ‘000
equity-type instruments at fair value through equity 15,446 20,271debt-type instruments at amortised cost 166,524 66,784Unrealised gain (loss) on equity-type instruments at fair value through statement of income (459) 611gain on sale of equity-type instruments at fair value through equity 8,323 161gain on sale of equity-type instruments at fair value through statement of income - 132Rental income 1,327 926investment in associates 314 2,629gain on sale of investment in real state 1,608 2,729
193,083 94,243
13.3 INVESTMENTS
2011 2010 Us$ ‘000 Us$ ‘000
income from ijarah muntahia Bittamleek 100,574 84,188depreciation on ijarah muntahia Bittamleek (55,812) (49,676)
44,762 34,512
13.4 IJARAH MuNTAHIA BITTAMLEEK
13 NET INCOME FROM JOINTLY & SELF FINANCED CONTRACTS & INVESTMENTS (CONTINuED)
14 GROUP’S SHARE AS A MUDARIB
15 OTHER FEES AND COMMISSION INCOME 2011 2010 Us$ ‘000 Us$ ‘000
Banking fees and commissions 73,072 73,498letters of credit 52,978 40,073guarantees 37,221 36,077Acceptances 4,431 1,419
167,702 151,067
Group’s share as a Mudarib is determined at the level of each subsidiary and is based on the terms and conditions of the related agreements.
notes to tHe ConsolidAted FinAnCiAl stAtements (31 deCemBeR 2011)
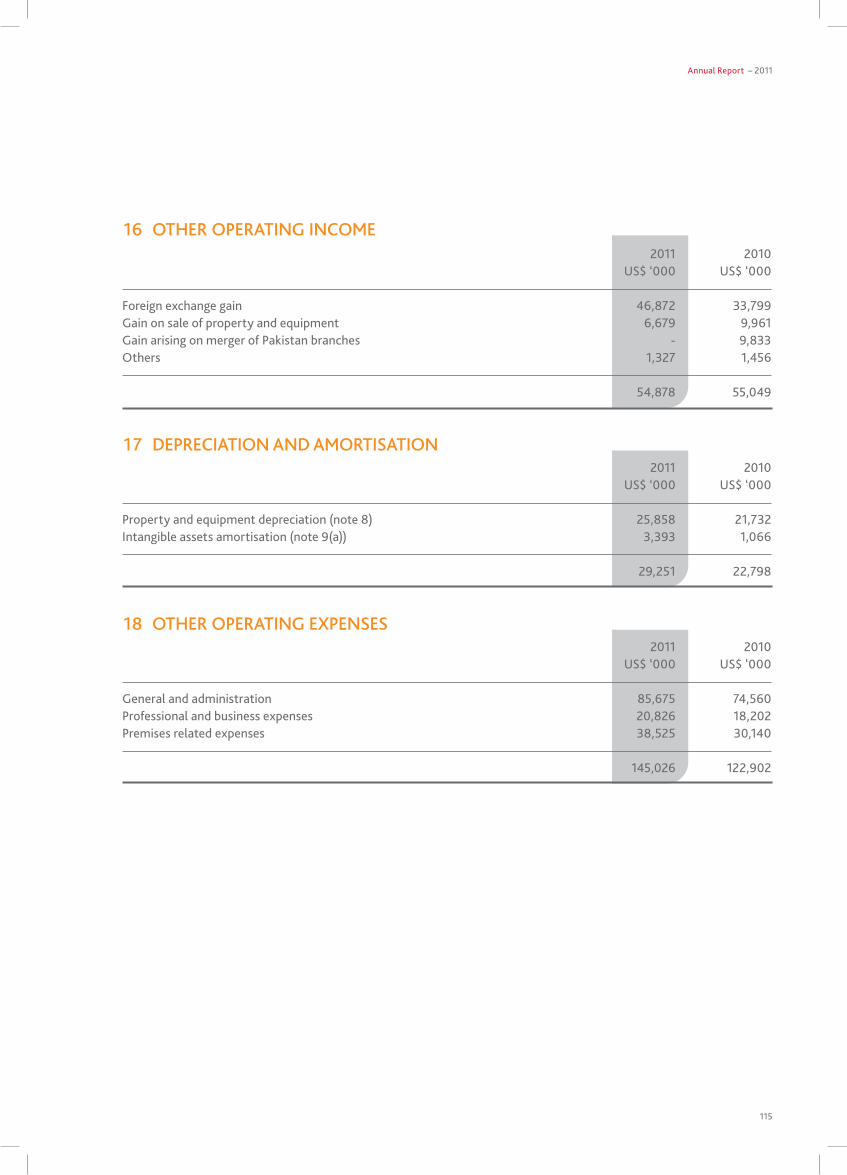
Annual Report – 2011
115
16 OTHER OPERATING INCOME
17 DEPRECIATION AND AMORTISATION
2011 2010 Us$ ‘000 Us$ ‘000
Foreign exchange gain 46,872 33,799gain on sale of property and equipment 6,679 9,961gain arising on merger of pakistan branches - 9,833others 1,327 1,456
54,878 55,049
2011 2010 Us$ ‘000 Us$ ‘000
property and equipment depreciation (note 8) 25,858 21,732intangible assets amortisation (note 9(a)) 3,393 1,066
29,251 22,798
18 OTHER OPERATING ExPENSES 2011 2010 Us$ ‘000 Us$ ‘000
general and administration 85,675 74,560professional and business expenses 20,826 18,202premises related expenses 38,525 30,140
145,026 122,902
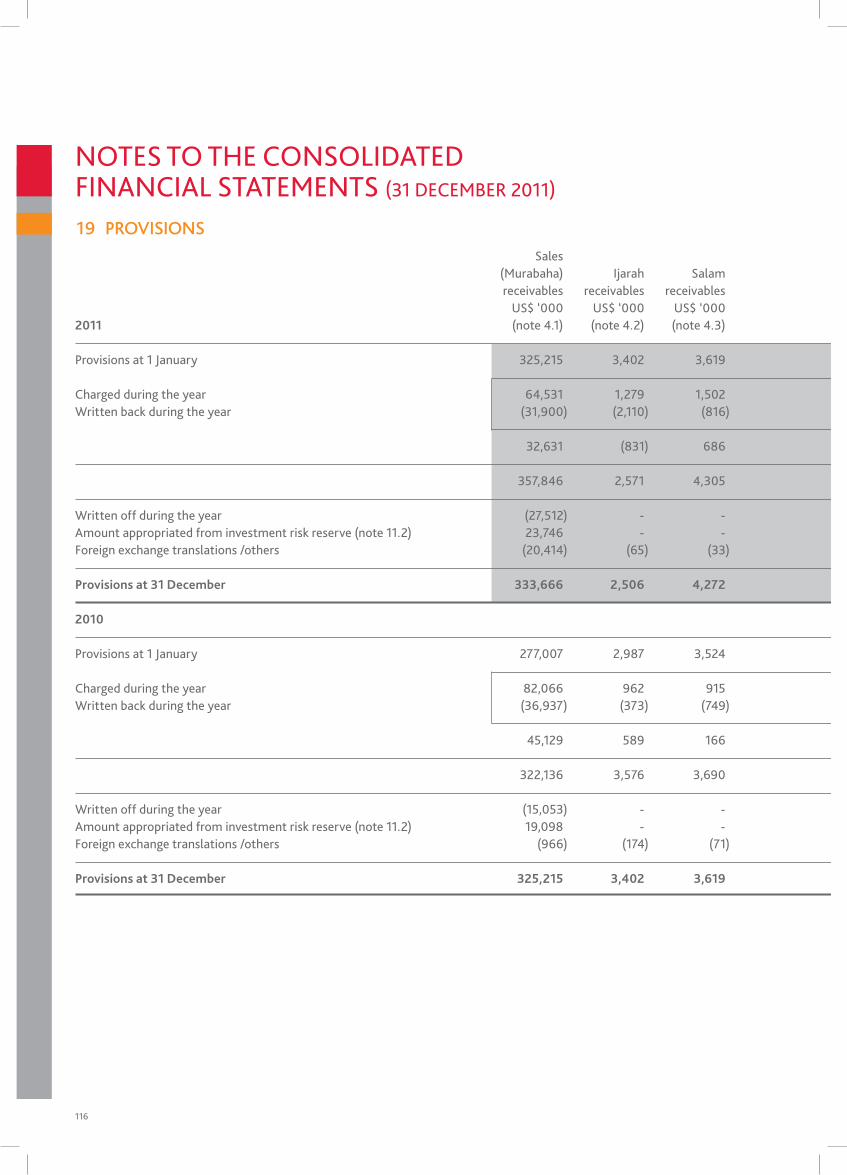
116
19 PROVISIONS
sales (murabaha) ijarah salam istisna’a mudaraba musharaka other other receivables receivables receivables receivables financing financing investments assets liabilities total Us$ ‘000 Us$ ‘000 Us$ ‘000 Us$ ‘000 Us$ ‘000 Us$ ‘000 Us$ ‘000 Us$ ‘000 Us$ ‘000 Us$ ‘0002011 (note 4.1) (note 4.2) (note 4.3) (note 4.4) (note 5.1) (note 5.2) (note 6.2 & 6.3) (note 9) (note 10)
provisions at 1 January 325,215 3,402 3,619 296 6,053 10,809 10,141 14,271 12,128 385,934
Charged during the year 64,531 1,279 1,502 296 6,242 465 4,783 2,126 11,526 92,750Written back during the year (31,900) (2,110) (816) (33) (89) (5,673) - (1,018) (299) (41,938)
32,631 (831) 686 263 6,153 (5,208) 4,783 1,108 11,227 50,812
357,846 2,571 4,305 559 12,206 5,601 14,924 15,379 23,355 436,746
Written off during the year (27,512) - - - - - (134) - (12) (27,658)Amount appropriated from investment risk reserve (note 11.2) 23,746 - - - - 37 - - - 23,783Foreign exchange translations /others (20,414) (65) (33) (15) (282) (642) (91) (3,471) (8,040) (33,053)
Provisions at 31 December 333,666 2,506 4,272 544 11,924 4,996 14,699 11,908 15,303 399,818
2010
provisions at 1 January 277,007 2,987 3,524 151 618 1,858 6,314 16,330 6,180 314,969
Charged during the year 82,066 962 915 169 5,635 1,740 4,614 1,117 8,295 105,513Written back during the year (36,937) (373) (749) (1) (49) (1,675) (558) (1,498) (4,092) (45,932)
45,129 589 166 168 5,586 65 4,056 (381) 4,203 59,581
322,136 3,576 3,690 319 6,204 1,923 10,370 15,949 10,383 374,550
Written off during the year (15,053) - - (3) - (289) (87) (2) (128) (15,562)Amount appropriated from investment risk reserve (note 11.2) 19,098 - - - - 23 - - - 19,121Foreign exchange translations /others (966) (174) (71) (20) (151) 9,152 (142) (1,676) 1,873 7,825
Provisions at 31 December 325,215 3,402 3,619 296 6,053 10,809 10,141 14,271 12,128 385,934
notes to tHe ConsolidAted FinAnCiAl stAtements (31 deCemBeR 2011)
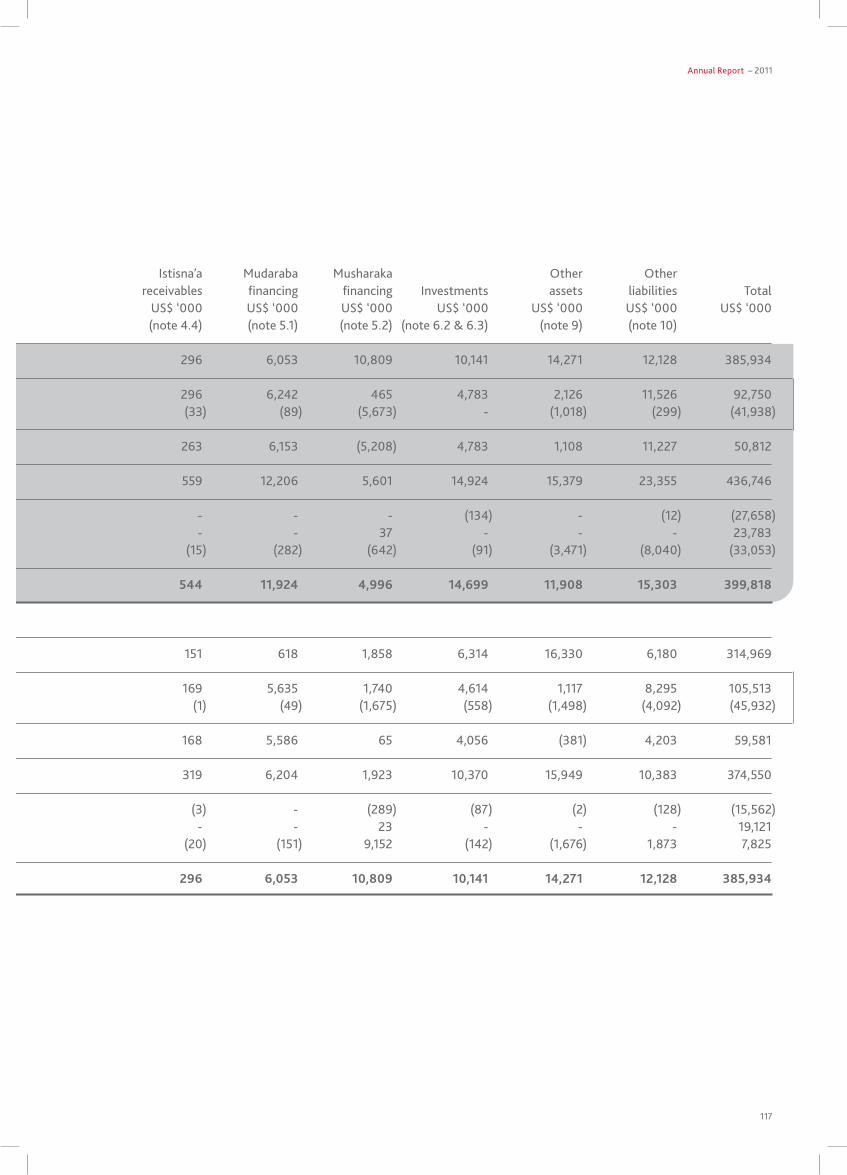
Annual Report – 2011
117
sales (murabaha) ijarah salam istisna’a mudaraba musharaka other other receivables receivables receivables receivables financing financing investments assets liabilities total Us$ ‘000 Us$ ‘000 Us$ ‘000 Us$ ‘000 Us$ ‘000 Us$ ‘000 Us$ ‘000 Us$ ‘000 Us$ ‘000 Us$ ‘0002011 (note 4.1) (note 4.2) (note 4.3) (note 4.4) (note 5.1) (note 5.2) (note 6.2 & 6.3) (note 9) (note 10)
provisions at 1 January 325,215 3,402 3,619 296 6,053 10,809 10,141 14,271 12,128 385,934
Charged during the year 64,531 1,279 1,502 296 6,242 465 4,783 2,126 11,526 92,750Written back during the year (31,900) (2,110) (816) (33) (89) (5,673) - (1,018) (299) (41,938)
32,631 (831) 686 263 6,153 (5,208) 4,783 1,108 11,227 50,812
357,846 2,571 4,305 559 12,206 5,601 14,924 15,379 23,355 436,746
Written off during the year (27,512) - - - - - (134) - (12) (27,658)Amount appropriated from investment risk reserve (note 11.2) 23,746 - - - - 37 - - - 23,783Foreign exchange translations /others (20,414) (65) (33) (15) (282) (642) (91) (3,471) (8,040) (33,053)
Provisions at 31 December 333,666 2,506 4,272 544 11,924 4,996 14,699 11,908 15,303 399,818
2010
provisions at 1 January 277,007 2,987 3,524 151 618 1,858 6,314 16,330 6,180 314,969
Charged during the year 82,066 962 915 169 5,635 1,740 4,614 1,117 8,295 105,513Written back during the year (36,937) (373) (749) (1) (49) (1,675) (558) (1,498) (4,092) (45,932)
45,129 589 166 168 5,586 65 4,056 (381) 4,203 59,581
322,136 3,576 3,690 319 6,204 1,923 10,370 15,949 10,383 374,550
Written off during the year (15,053) - - (3) - (289) (87) (2) (128) (15,562)Amount appropriated from investment risk reserve (note 11.2) 19,098 - - - - 23 - - - 19,121Foreign exchange translations /others (966) (174) (71) (20) (151) 9,152 (142) (1,676) 1,873 7,825
Provisions at 31 December 325,215 3,402 3,619 296 6,053 10,809 10,141 14,271 12,128 385,934
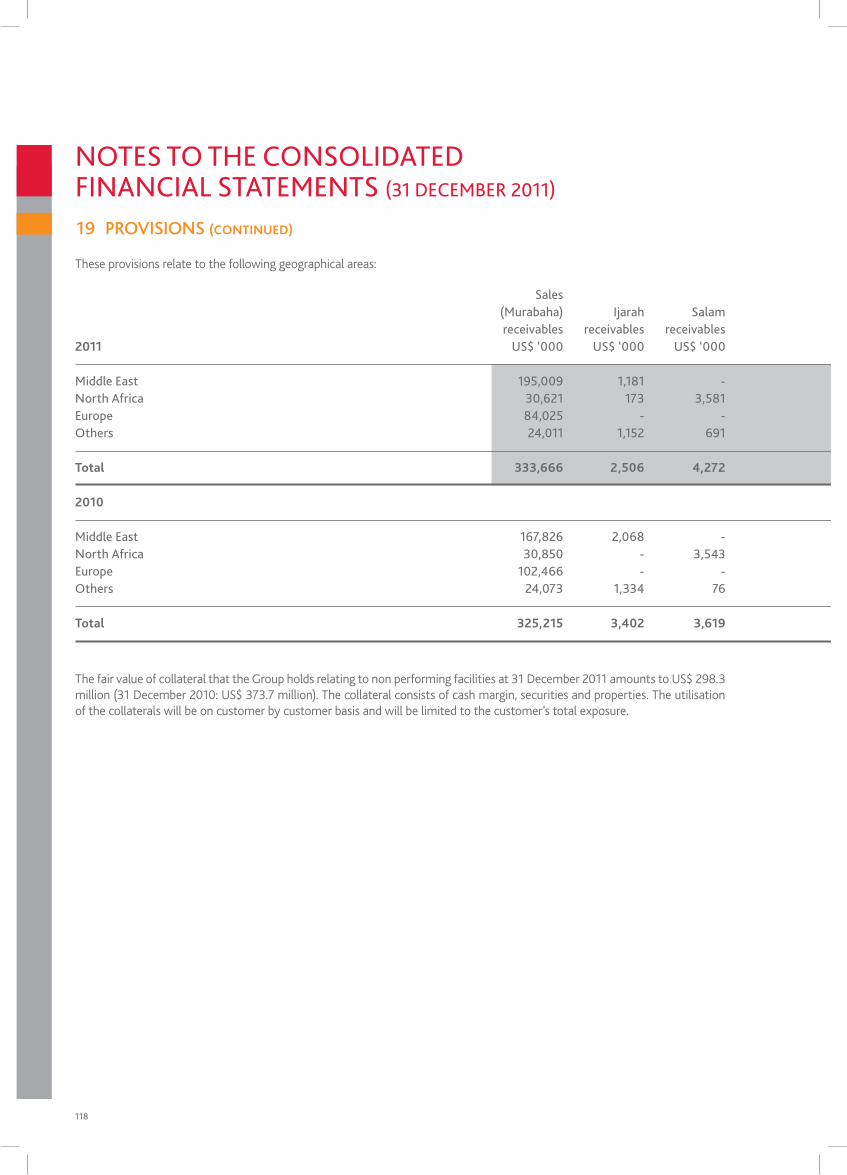
118
19 PROVISIONS (CONTINuED)
sales (murabaha) ijarah salam istisna’a mudaraba musharaka other other receivables receivables receivables receivables financing financing investments assets liabilities total2011 Us$ ‘000 Us$ ‘000 Us$ ‘000 Us$ ‘000 Us$ ‘000 Us$ ‘000 Us$ ‘000 Us$ ‘000 Us$ ‘000 Us$ ‘000
middle east 195,009 1,181 - - 11,249 323 11,501 5,693 14,513 239,469north Africa 30,621 173 3,581 100 675 53 2,557 195 322 38,277europe 84,025 - - - - - 363 535 602 85,525others 24,011 1,152 691 444 - 4,620 278 5,485 (134) 36,547
Total 333,666 2,506 4,272 544 11,924 4,996 14,699 11,908 15,303 399,818
2010
middle east 167,826 2,068 - - 5,411 286 7,085 4,922 11,598 199,196 north Africa 30,850 - 3,543 112 642 54 2,570 3,167 513 41,451 europe 102,466 - - - - - 143 610 18 103,237 others 24,073 1,334 76 184 - 10,469 343 5,572 (1) 42,050
Total 325,215 3,402 3,619 296 6,053 10,809 10,141 14,271 12,128 385,934
notes to tHe ConsolidAted FinAnCiAl stAtements (31 deCemBeR 2011)
The fair value of collateral that the Group holds relating to non performing facilities at 31 December 2011 amounts to US$ 298.3 million (31 December 2010: US$ 373.7 million). The collateral consists of cash margin, securities and properties. The utilisation of the collaterals will be on customer by customer basis and will be limited to the customer’s total exposure.
These provisions relate to the following geographical areas:
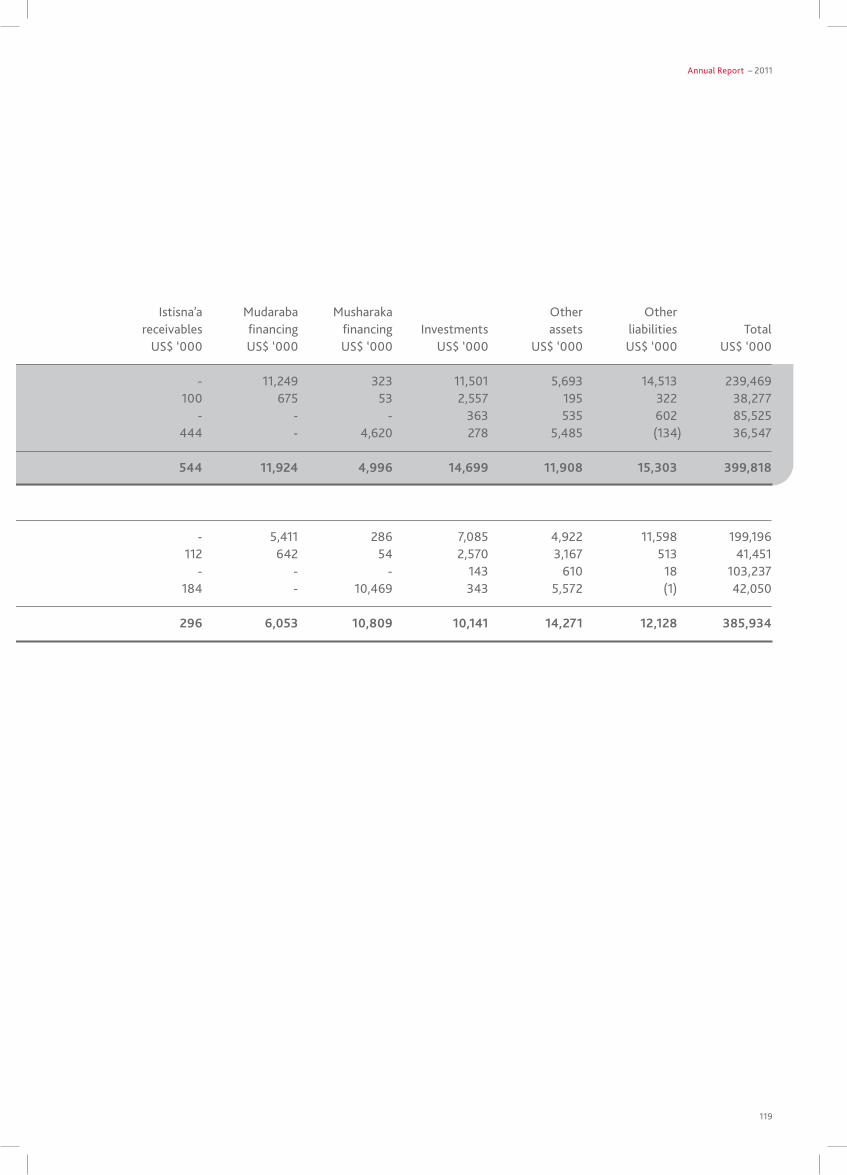
Annual Report – 2011
119
sales (murabaha) ijarah salam istisna’a mudaraba musharaka other other receivables receivables receivables receivables financing financing investments assets liabilities total2011 Us$ ‘000 Us$ ‘000 Us$ ‘000 Us$ ‘000 Us$ ‘000 Us$ ‘000 Us$ ‘000 Us$ ‘000 Us$ ‘000 Us$ ‘000
middle east 195,009 1,181 - - 11,249 323 11,501 5,693 14,513 239,469north Africa 30,621 173 3,581 100 675 53 2,557 195 322 38,277europe 84,025 - - - - - 363 535 602 85,525others 24,011 1,152 691 444 - 4,620 278 5,485 (134) 36,547
Total 333,666 2,506 4,272 544 11,924 4,996 14,699 11,908 15,303 399,818
2010
middle east 167,826 2,068 - - 5,411 286 7,085 4,922 11,598 199,196 north Africa 30,850 - 3,543 112 642 54 2,570 3,167 513 41,451 europe 102,466 - - - - - 143 610 18 103,237 others 24,073 1,334 76 184 - 10,469 343 5,572 (1) 42,050
Total 325,215 3,402 3,619 296 6,053 10,809 10,141 14,271 12,128 385,934
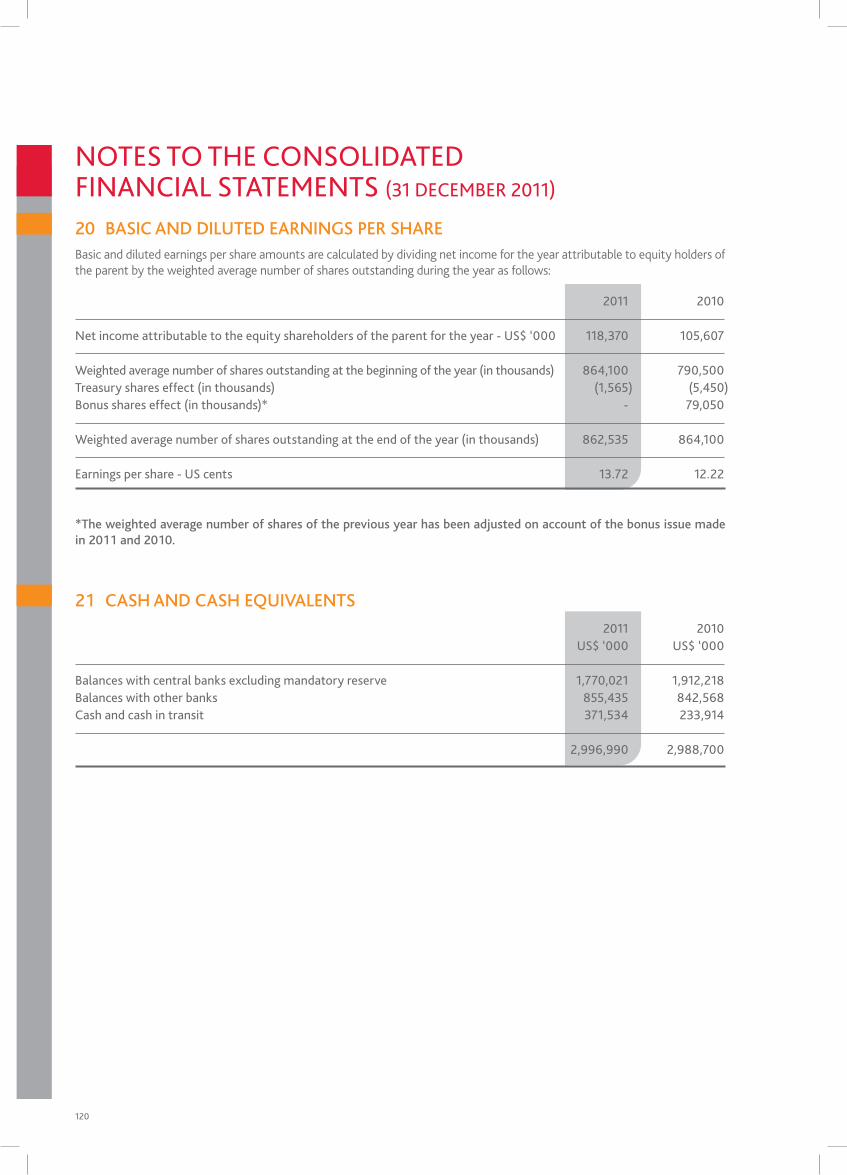
120
20 BASIC AND DILUTED EARNINGS PER SHARE
21 CASH AND CASH EQUIVALENTS
2011 2010
net income attributable to the equity shareholders of the parent for the year - Us$ ‘000 118,370 105,607
Weighted average number of shares outstanding at the beginning of the year (in thousands) 864,100 790,500treasury shares effect (in thousands) (1,565) (5,450)Bonus shares effect (in thousands)* - 79,050
Weighted average number of shares outstanding at the end of the year (in thousands) 862,535 864,100
earnings per share - Us cents 13.72 12.22
2011 2010 Us$ ‘000 Us$ ‘000
Balances with central banks excluding mandatory reserve 1,770,021 1,912,218Balances with other banks 855,435 842,568Cash and cash in transit 371,534 233,914
2,996,990 2,988,700
Basic and diluted earnings per share amounts are calculated by dividing net income for the year attributable to equity holders of the parent by the weighted average number of shares outstanding during the year as follows:
*The weighted average number of shares of the previous year has been adjusted on account of the bonus issue made in 2011 and 2010.
notes to tHe ConsolidAted FinAnCiAl stAtements (31 deCemBeR 2011)
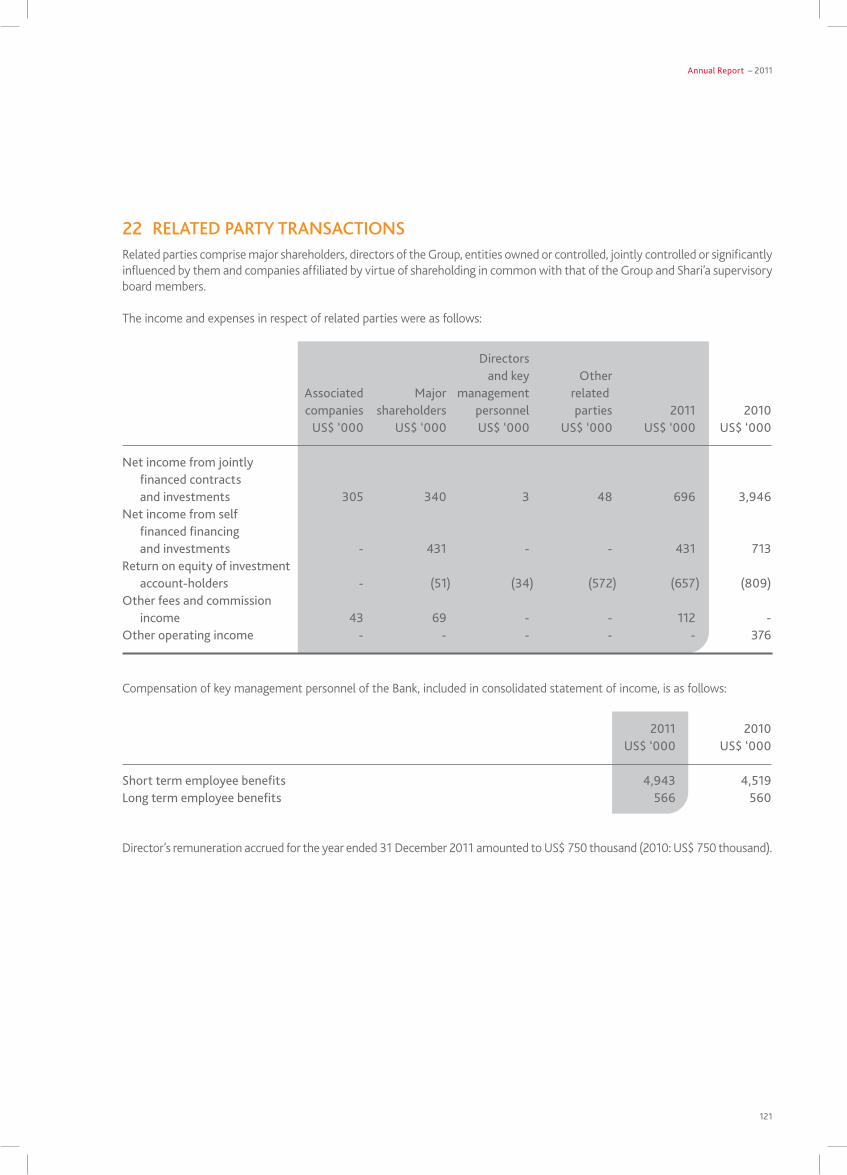
Annual Report – 2011
121
22 RELATED PARTY TRANSACTIONS
directors and key other Associated major management related companies shareholders personnel parties 2011 2010 Us$ ‘000 Us$ ‘000 Us$ ‘000 Us$ ‘000 Us$ ‘000 Us$ ‘000
net income from jointly financed contracts and investments 305 340 3 48 696 3,946net income from self financed financing and investments - 431 - - 431 713Return on equity of investment account-holders - (51) (34) (572) (657) (809)other fees and commission income 43 69 - - 112 -other operating income - - - - - 376
2011 2010 Us$ ‘000 Us$ ‘000
short term employee benefits 4,943 4,519long term employee benefits 566 560
Related parties comprise major shareholders, directors of the Group, entities owned or controlled, jointly controlled or significantly influenced by them and companies affiliated by virtue of shareholding in common with that of the Group and Shari’a supervisory board members.
The income and expenses in respect of related parties were as follows:
Compensation of key management personnel of the Bank, included in consolidated statement of income, is as follows:
Director’s remuneration accrued for the year ended 31 December 2011 amounted to US$ 750 thousand (2010: US$ 750 thousand).
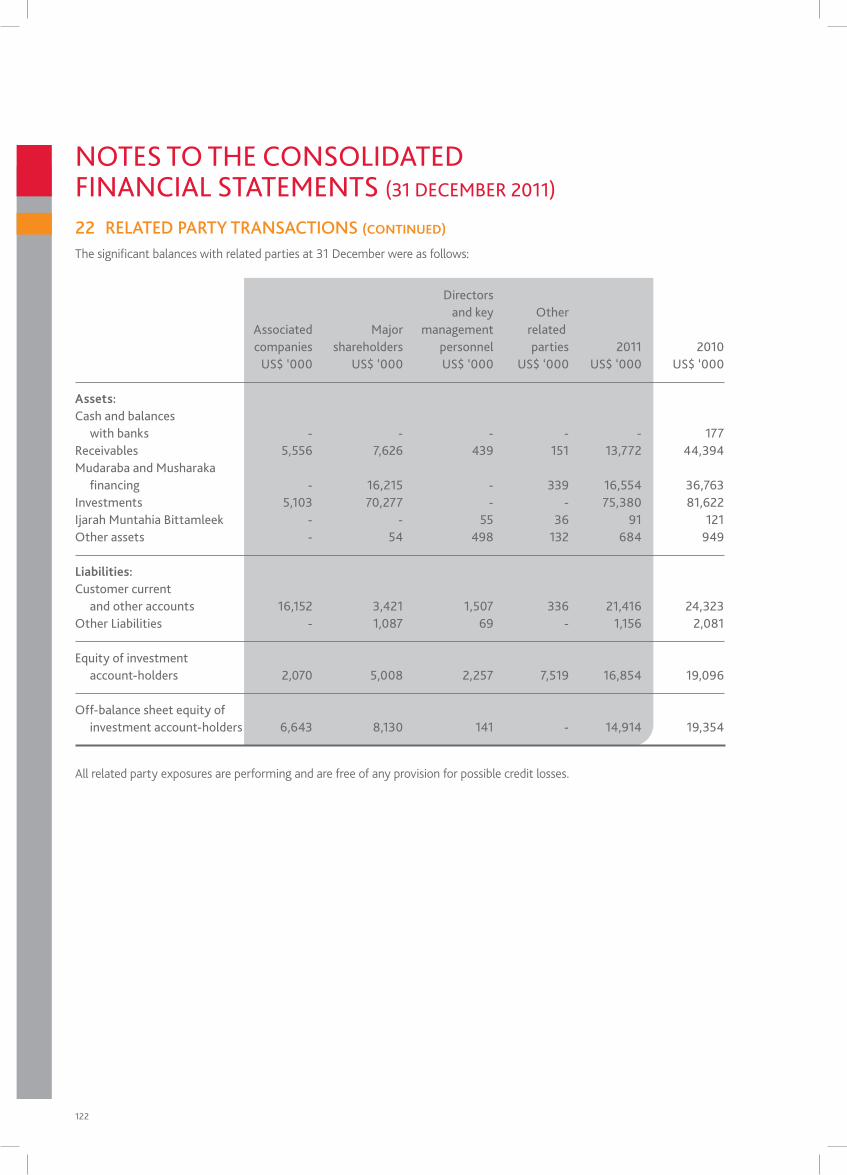
122
22 RELATED PARTY TRANSACTIONS (CONTINuED)
directors and key other Associated major management related companies shareholders personnel parties 2011 2010 Us$ ‘000 Us$ ‘000 Us$ ‘000 Us$ ‘000 Us$ ‘000 Us$ ‘000
Assets:Cash and balances with banks - - - - - 177Receivables 5,556 7,626 439 151 13,772 44,394mudaraba and musharaka financing - 16,215 - 339 16,554 36,763investments 5,103 70,277 - - 75,380 81,622ijarah muntahia Bittamleek - - 55 36 91 121other assets - 54 498 132 684 949
Liabilities: Customer current and other accounts 16,152 3,421 1,507 336 21,416 24,323other liabilities - 1,087 69 - 1,156 2,081
equity of investment account-holders 2,070 5,008 2,257 7,519 16,854 19,096
off-balance sheet equity of investment account-holders 6,643 8,130 141 - 14,914 19,354
The significant balances with related parties at 31 December were as follows:
All related party exposures are performing and are free of any provision for possible credit losses.
notes to tHe ConsolidAted FinAnCiAl stAtements (31 deCemBeR 2011)
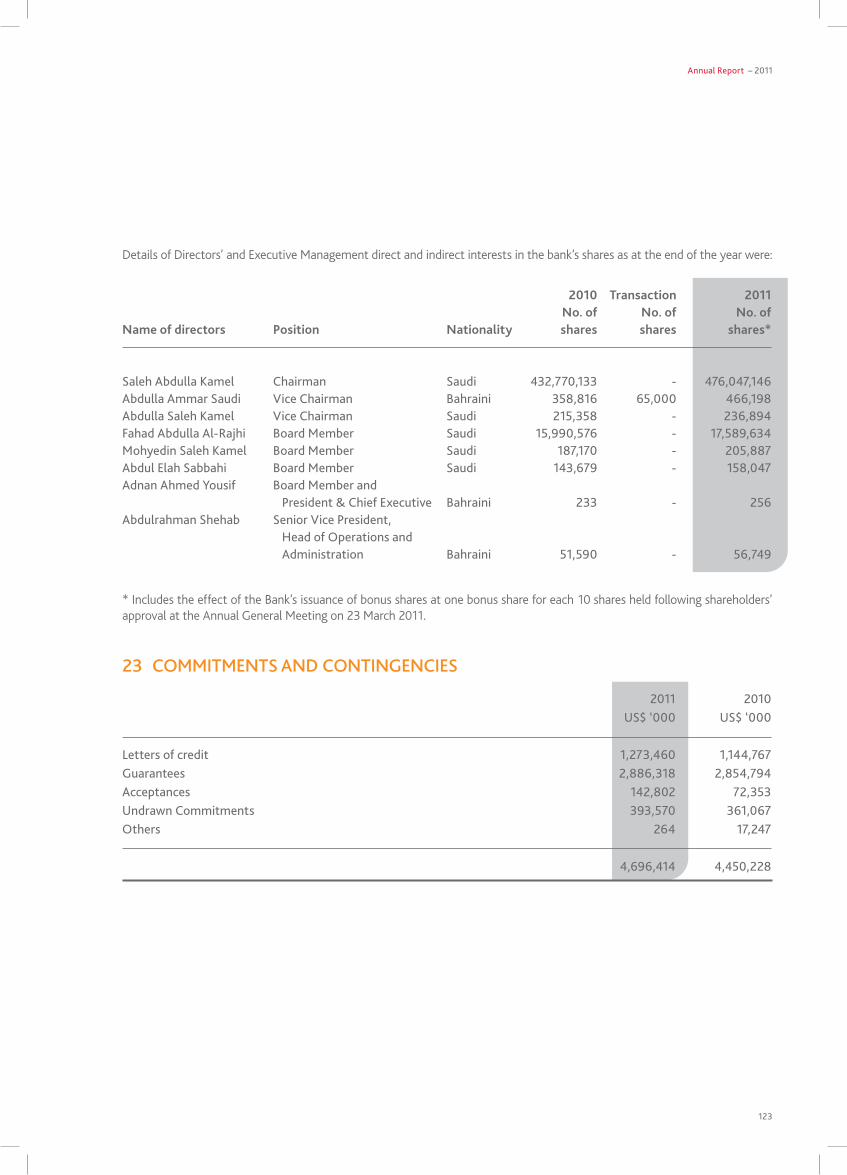
Annual Report – 2011
123
Details of Directors’ and Executive Management direct and indirect interests in the bank’s shares as at the end of the year were:
* Includes the effect of the Bank’s issuance of bonus shares at one bonus share for each 10 shares held following shareholders’ approval at the Annual General Meeting on 23 March 2011.
2010 Transaction 2011 No. of No. of No. ofName of directors Position Nationality shares shares shares*
saleh Abdulla kamel Chairman saudi 432,770,133 - 476,047,146Abdulla Ammar saudi Vice Chairman Bahraini 358,816 65,000 466,198Abdulla saleh kamel Vice Chairman saudi 215,358 - 236,894Fahad Abdulla Al-Rajhi Board member saudi 15,990,576 - 17,589,634mohyedin saleh kamel Board member saudi 187,170 - 205,887Abdul elah sabbahi Board member saudi 143,679 - 158,047Adnan Ahmed yousif Board member and president & Chief executive Bahraini 233 - 256Abdulrahman shehab senior Vice president, Head of operations and Administration Bahraini 51,590 - 56,749
23 COMMITMENTS AND CONTINGENCIES
2011 2010 Us$ ‘000 Us$ ‘000
letters of credit 1,273,460 1,144,767guarantees 2,886,318 2,854,794Acceptances 142,802 72,353Undrawn Commitments 393,570 361,067others 264 17,247
4,696,414 4,450,228
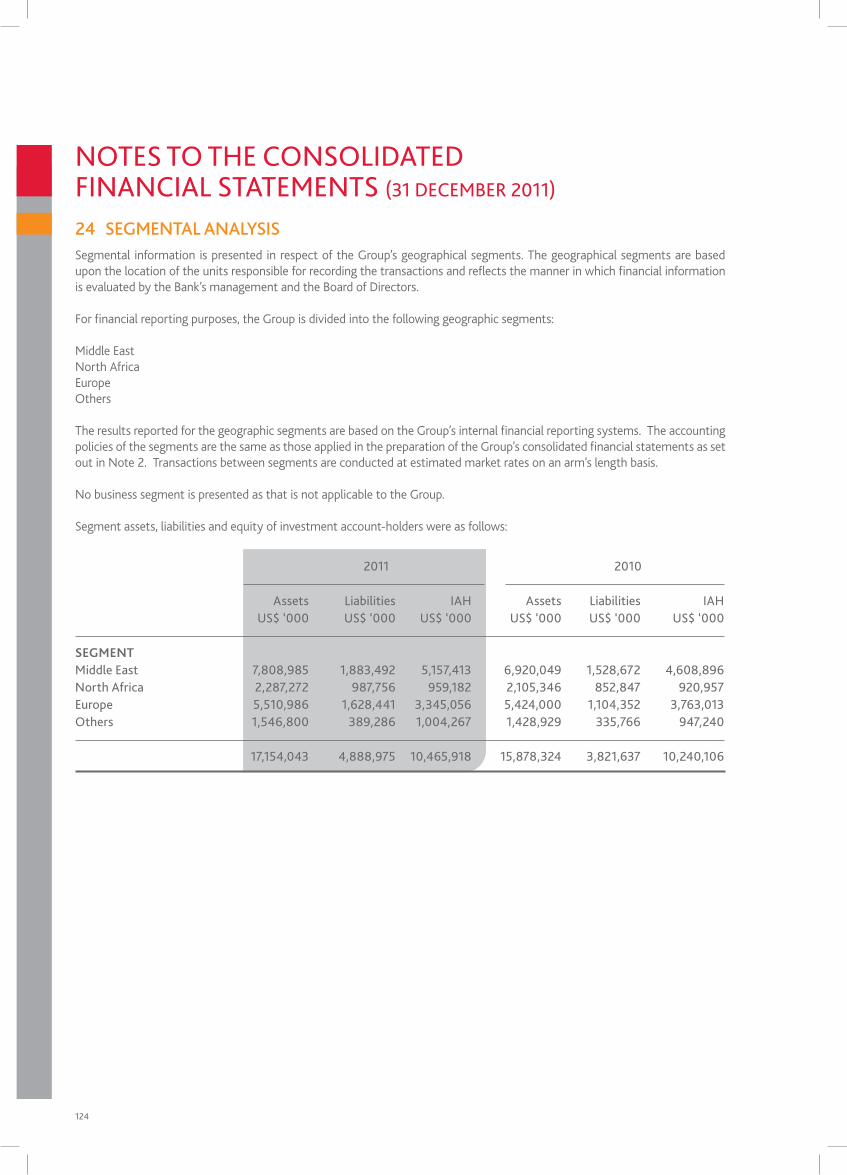
124
24 SEGMENTAL ANALYSISSegmental information is presented in respect of the Group’s geographical segments. The geographical segments are based upon the location of the units responsible for recording the transactions and reflects the manner in which financial information is evaluated by the Bank’s management and the Board of Directors.
For financial reporting purposes, the Group is divided into the following geographic segments:
Middle EastNorth AfricaEuropeOthers
The results reported for the geographic segments are based on the Group’s internal financial reporting systems. The accounting policies of the segments are the same as those applied in the preparation of the Group’s consolidated financial statements as set out in Note 2. Transactions between segments are conducted at estimated market rates on an arm’s length basis.
No business segment is presented as that is not applicable to the Group.
Segment assets, liabilities and equity of investment account-holders were as follows:
2011 2010
Assets liabilities iAH Assets liabilities iAH Us$ ‘000 Us$ ‘000 Us$ ‘000 Us$ ‘000 Us$ ‘000 Us$ ‘000
SEGMENT middle east 7,808,985 1,883,492 5,157,413 6,920,049 1,528,672 4,608,896north Africa 2,287,272 987,756 959,182 2,105,346 852,847 920,957europe 5,510,986 1,628,441 3,345,056 5,424,000 1,104,352 3,763,013others 1,546,800 389,286 1,004,267 1,428,929 335,766 947,240
17,154,043 4,888,975 10,465,918 15,878,324 3,821,637 10,240,106
notes to tHe ConsolidAted FinAnCiAl stAtements (31 deCemBeR 2011)
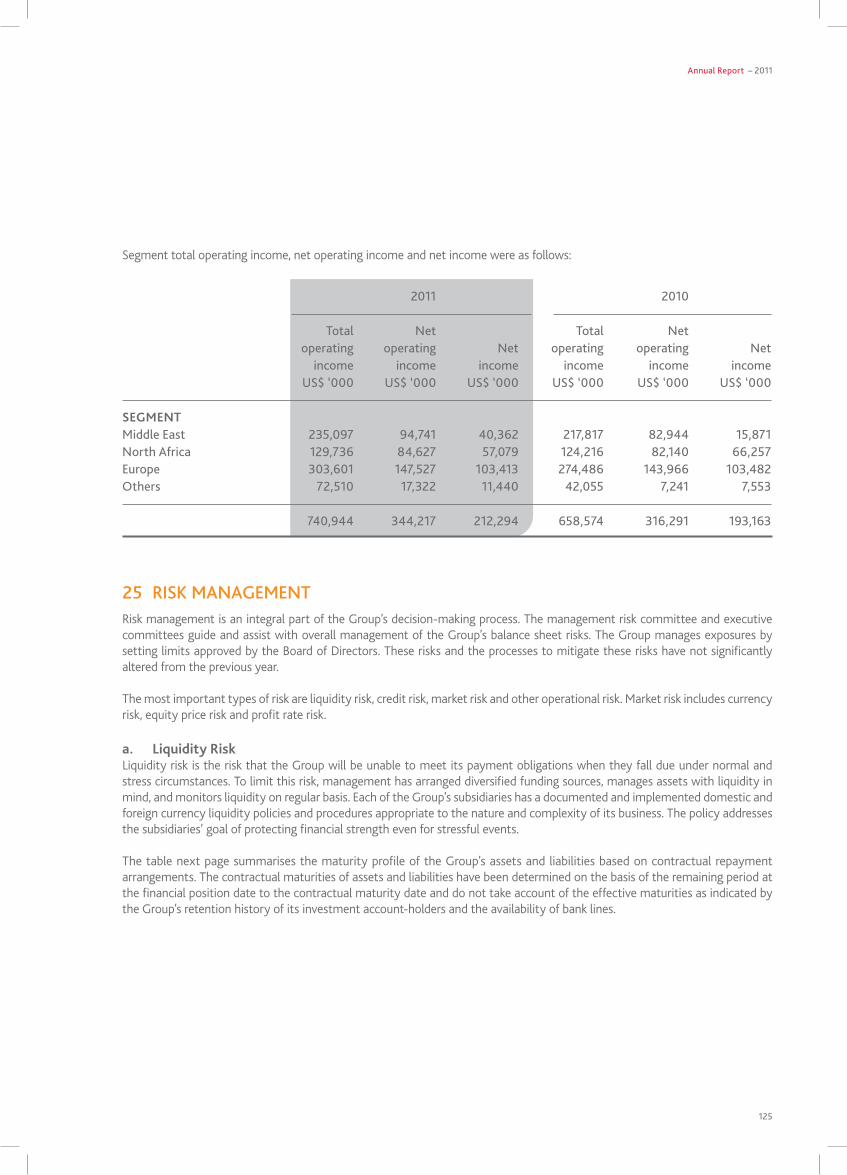
Annual Report – 2011
125
Segment total operating income, net operating income and net income were as follows:
2011 2010
total net total net operating operating net operating operating net income income income income income income Us$ ‘000 Us$ ‘000 Us$ ‘000 Us$ ‘000 Us$ ‘000 Us$ ‘000
SEGMENT middle east 235,097 94,741 40,362 217,817 82,944 15,871north Africa 129,736 84,627 57,079 124,216 82,140 66,257europe 303,601 147,527 103,413 274,486 143,966 103,482others 72,510 17,322 11,440 42,055 7,241 7,553
740,944 344,217 212,294 658,574 316,291 193,163
25 RiSK MANAGEMENtRisk management is an integral part of the Group’s decision-making process. The management risk committee and executive committees guide and assist with overall management of the Group’s balance sheet risks. The Group manages exposures by setting limits approved by the Board of Directors. These risks and the processes to mitigate these risks have not significantly altered from the previous year.
The most important types of risk are liquidity risk, credit risk, market risk and other operational risk. Market risk includes currency risk, equity price risk and profit rate risk.
a. Liquidity Riskliquidity risk is the risk that the Group will be unable to meet its payment obligations when they fall due under normal and stress circumstances. To limit this risk, management has arranged diversified funding sources, manages assets with liquidity in mind, and monitors liquidity on regular basis. Each of the Group’s subsidiaries has a documented and implemented domestic and foreign currency liquidity policies and procedures appropriate to the nature and complexity of its business. The policy addresses the subsidiaries’ goal of protecting financial strength even for stressful events.
The table next page summarises the maturity profile of the Group’s assets and liabilities based on contractual repayment arrangements. The contractual maturities of assets and liabilities have been determined on the basis of the remaining period at the financial position date to the contractual maturity date and do not take account of the effective maturities as indicated by the Group’s retention history of its investment account-holders and the availability of bank lines.
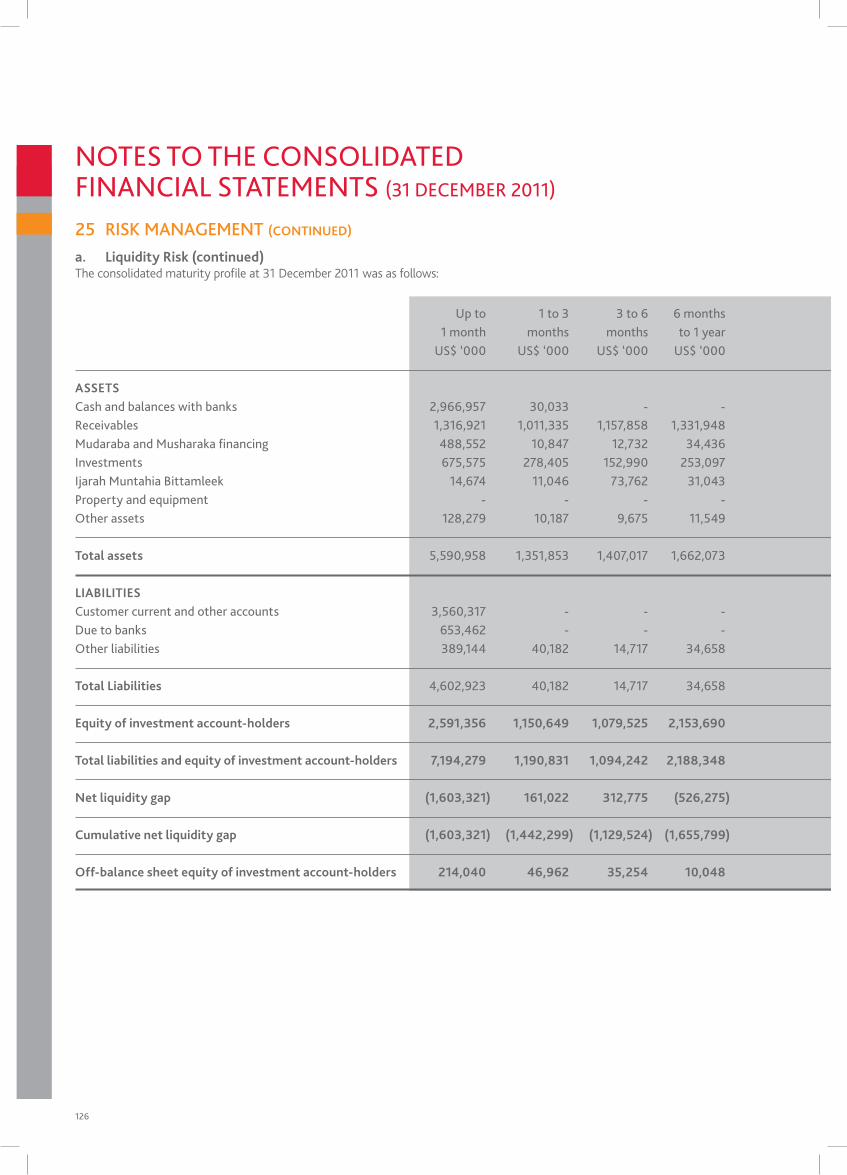
126
Up to 1 to 3 3 to 6 6 months 1 to 3 3 to 5 5 to 10 10 to 20 20 years 1 month months months to 1 year years years years years and above Undated total Us$ ‘000 Us$ ‘000 Us$ ‘000 Us$ ‘000 Us$ ‘000 Us$ ‘000 Us$ ‘000 Us$ ‘000 Us$ ‘000 Us$ ‘000 Us$ ‘000
ASSETS Cash and balances with banks 2,966,957 30,033 - - - - - - - 1,636,290 4,633,280Receivables 1,316,921 1,011,335 1,157,858 1,331,948 2,100,450 1,090,273 198,890 5,149 233 - 8,213,057mudaraba and musharaka financing 488,552 10,847 12,732 34,436 159,301 144,464 91,950 8,653 - - 950,935investments 675,575 278,405 152,990 253,097 507,330 108,863 5,613 10,946 - 97,434 2,090,253ijarah muntahia Bittamleek 14,674 11,046 73,762 31,043 57,695 100,431 130,113 143,263 1,694 - 563,721property and equipment - - - - - - - - - 313,933 313,933other assets 128,279 10,187 9,675 11,549 69,405 14,446 2,513 - - 142,810 388,864
Total assets 5,590,958 1,351,853 1,407,017 1,662,073 2,894,181 1,458,477 429,079 168,011 1,927 2,190,467 17,154,043
LIABILITIESCustomer current and other accounts 3,560,317 - - - - - - - - - 3,560,317due to banks 653,462 - - - - - - - - - 653,462other liabilities 389,144 40,182 14,717 34,658 83,633 18,103 1,720 - 93,039 - 675,196
Total Liabilities 4,602,923 40,182 14,717 34,658 83,633 18,103 1,720 - 93,039 - 4,888,975
Equity of investment account-holders 2,591,356 1,150,649 1,079,525 2,153,690 2,632,959 789,994 67,745 - - - 10,465,918
Total liabilities and equity of investment account-holders 7,194,279 1,190,831 1,094,242 2,188,348 2,716,592 808,097 69,465 - 93,039 - 15,354,893
Net liquidity gap (1,603,321) 161,022 312,775 (526,275) 177,589 650,380 359,614 168,011 (91,112) 2,190,467 1,799,150
Cumulative net liquidity gap (1,603,321) (1,442,299) (1,129,524) (1,655,799) (1,478,210) (827,830) (468,216) (300,205) (390,317) 1,799,150
Off-balance sheet equity of investment account-holders 214,040 46,962 35,254 10,048 120,876 - - - - 95,948 523,128
a. Liquidity Risk (continued)The consolidated maturity profile at 31 December 2011 was as follows:
25 RiSK MANAGEMENt (CONTINuED)
notes to tHe ConsolidAted FinAnCiAl stAtements (31 deCemBeR 2011)
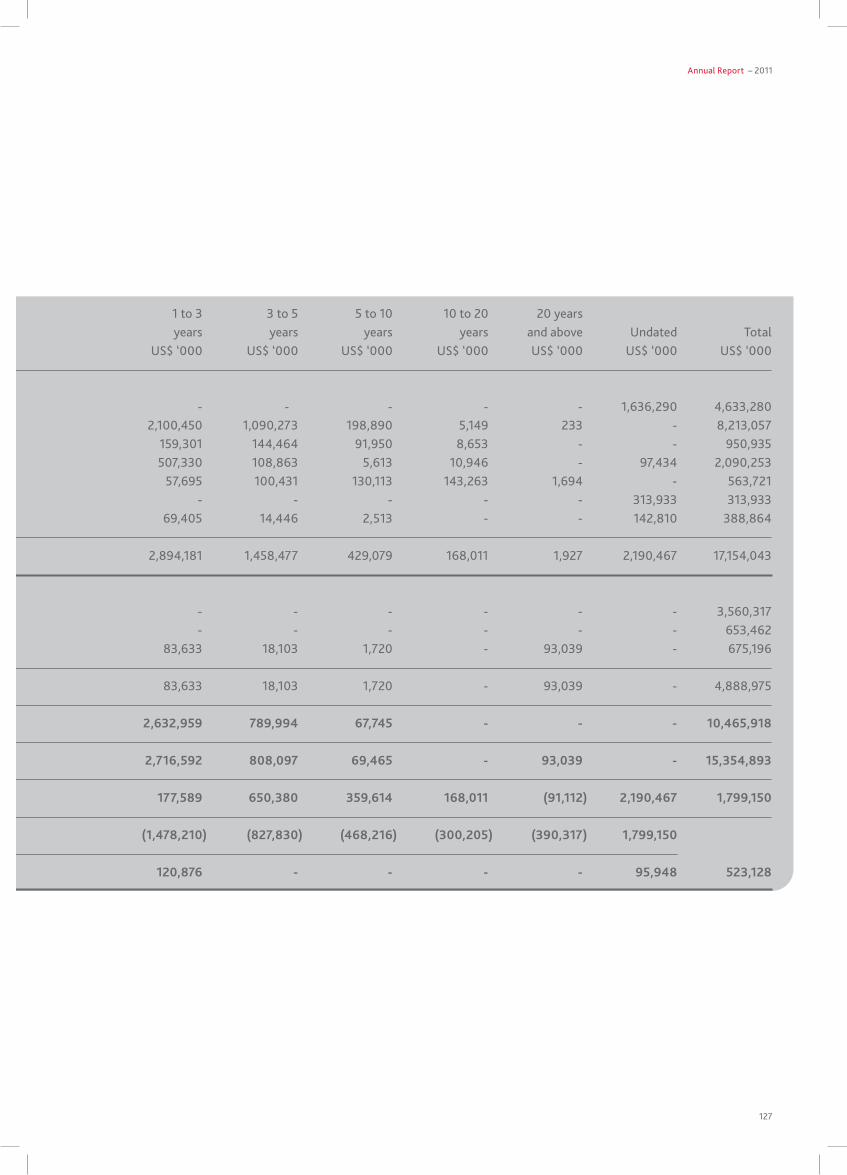
Annual Report – 2011
127
Up to 1 to 3 3 to 6 6 months 1 to 3 3 to 5 5 to 10 10 to 20 20 years 1 month months months to 1 year years years years years and above Undated total Us$ ‘000 Us$ ‘000 Us$ ‘000 Us$ ‘000 Us$ ‘000 Us$ ‘000 Us$ ‘000 Us$ ‘000 Us$ ‘000 Us$ ‘000 Us$ ‘000
ASSETS Cash and balances with banks 2,966,957 30,033 - - - - - - - 1,636,290 4,633,280Receivables 1,316,921 1,011,335 1,157,858 1,331,948 2,100,450 1,090,273 198,890 5,149 233 - 8,213,057mudaraba and musharaka financing 488,552 10,847 12,732 34,436 159,301 144,464 91,950 8,653 - - 950,935investments 675,575 278,405 152,990 253,097 507,330 108,863 5,613 10,946 - 97,434 2,090,253ijarah muntahia Bittamleek 14,674 11,046 73,762 31,043 57,695 100,431 130,113 143,263 1,694 - 563,721property and equipment - - - - - - - - - 313,933 313,933other assets 128,279 10,187 9,675 11,549 69,405 14,446 2,513 - - 142,810 388,864
Total assets 5,590,958 1,351,853 1,407,017 1,662,073 2,894,181 1,458,477 429,079 168,011 1,927 2,190,467 17,154,043
LIABILITIESCustomer current and other accounts 3,560,317 - - - - - - - - - 3,560,317due to banks 653,462 - - - - - - - - - 653,462other liabilities 389,144 40,182 14,717 34,658 83,633 18,103 1,720 - 93,039 - 675,196
Total Liabilities 4,602,923 40,182 14,717 34,658 83,633 18,103 1,720 - 93,039 - 4,888,975
Equity of investment account-holders 2,591,356 1,150,649 1,079,525 2,153,690 2,632,959 789,994 67,745 - - - 10,465,918
Total liabilities and equity of investment account-holders 7,194,279 1,190,831 1,094,242 2,188,348 2,716,592 808,097 69,465 - 93,039 - 15,354,893
Net liquidity gap (1,603,321) 161,022 312,775 (526,275) 177,589 650,380 359,614 168,011 (91,112) 2,190,467 1,799,150
Cumulative net liquidity gap (1,603,321) (1,442,299) (1,129,524) (1,655,799) (1,478,210) (827,830) (468,216) (300,205) (390,317) 1,799,150
Off-balance sheet equity of investment account-holders 214,040 46,962 35,254 10,048 120,876 - - - - 95,948 523,128
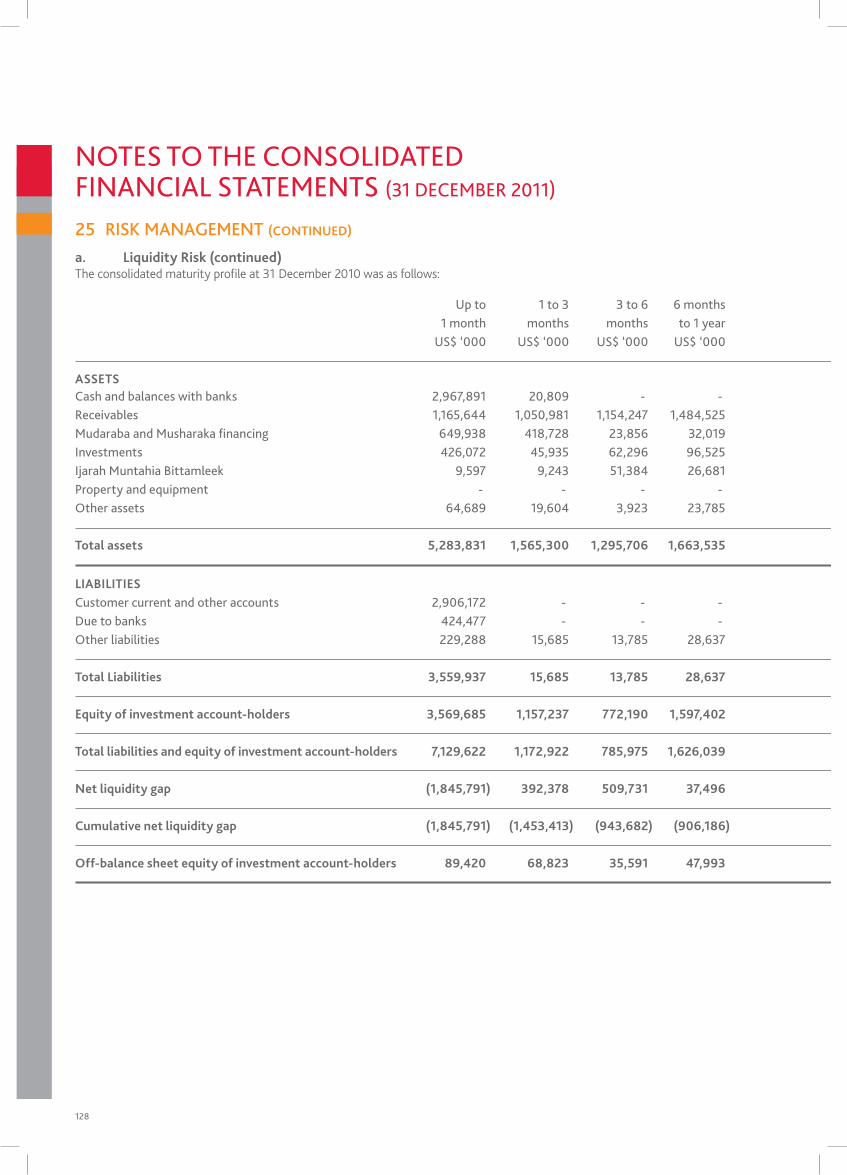
128
Up to 1 to 3 3 to 6 6 months 1 to 3 3 to 5 5 to 10 10 to 20 20 years Restated 1 month months months to 1 year years years years years and above Undated total Us$ ‘000 Us$ ‘000 Us$ ‘000 Us$ ‘000 Us$ ‘000 Us$ ‘000 Us$ ‘000 Us$ ‘000 Us$ ‘000 Us$ ‘000 Us$ ‘000
ASSETS Cash and balances with banks 2,967,891 20,809 - - - - - - - 825,203 3,813,903 Receivables 1,165,644 1,050,981 1,154,247 1,484,525 2,034,115 990,869 177,865 3,787 1,298 - 8,063,331 mudaraba and musharaka financing 649,938 418,728 23,856 32,019 182,736 136,647 88,954 5,754 - - 1,538,632 investments 426,072 45,935 62,296 96,525 252,904 120,366 - 8,551 255,359 80,864 1,348,872ijarah muntahia Bittamleek 9,597 9,243 51,384 26,681 60,663 77,139 107,407 97,687 - - 439,801 property and equipment - - - - - - - - - 298,852 298,852 other assets 64,689 19,604 3,923 23,785 84,938 16,624 2,231 - 36,523 122,616 374,933
Total assets 5,283,831 1,565,300 1,295,706 1,663,535 2,615,356 1,341,645 376,457 115,779 293,180 1,327,535 15,878,324
LIABILITIESCustomer current and other accounts 2,906,172 - - - - - - - - - 2,906,172 due to banks 424,477 - - - - - - - - - 424,477 other liabilities 229,288 15,685 13,785 28,637 66,693 30,045 701 - 106,154 - 490,988
Total Liabilities 3,559,937 15,685 13,785 28,637 66,693 30,045 701 - 106,154 - 3,821,637
Equity of investment account-holders 3,569,685 1,157,237 772,190 1,597,402 2,225,289 870,070 48,233 - - - 10,240,106
Total liabilities and equity of investment account-holders 7,129,622 1,172,922 785,975 1,626,039 2,291,982 900,115 48,934 - 106,154 - 14,061,743
Net liquidity gap (1,845,791) 392,378 509,731 37,496 323,374 441,530 327,523 115,779 187,026 1,327,535 1,816,581
Cumulative net liquidity gap (1,845,791) (1,453,413) (943,682) (906,186) (582,812) (141,282) 186,241 302,020 489,046 1,816,581
Off-balance sheet equity of investment account-holders 89,420 68,823 35,591 47,993 11,903 106,061 - - - 95,547 455,338
a. Liquidity Risk (continued)The consolidated maturity profile at 31 December 2010 was as follows:
25 RiSK MANAGEMENt (CONTINuED)
notes to tHe ConsolidAted FinAnCiAl stAtements (31 deCemBeR 2011)
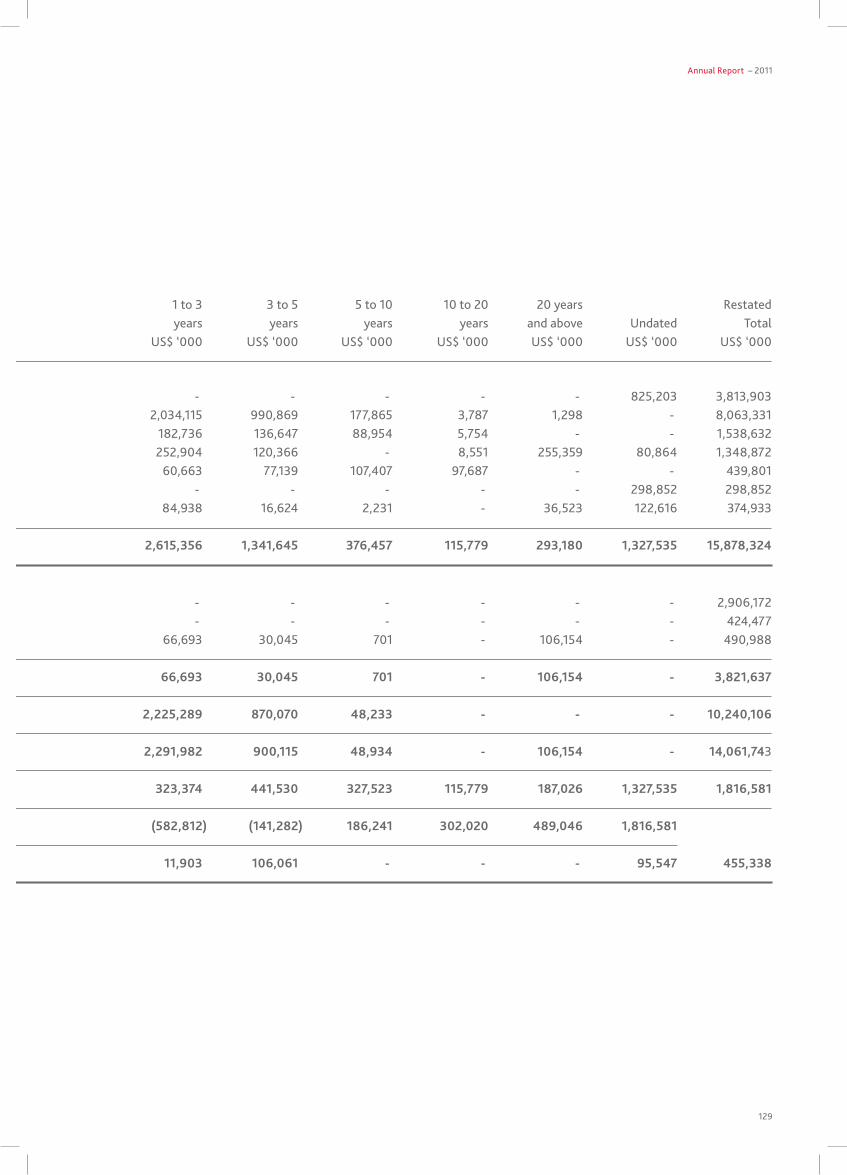
Annual Report – 2011
129
Up to 1 to 3 3 to 6 6 months 1 to 3 3 to 5 5 to 10 10 to 20 20 years Restated 1 month months months to 1 year years years years years and above Undated total Us$ ‘000 Us$ ‘000 Us$ ‘000 Us$ ‘000 Us$ ‘000 Us$ ‘000 Us$ ‘000 Us$ ‘000 Us$ ‘000 Us$ ‘000 Us$ ‘000
ASSETS Cash and balances with banks 2,967,891 20,809 - - - - - - - 825,203 3,813,903 Receivables 1,165,644 1,050,981 1,154,247 1,484,525 2,034,115 990,869 177,865 3,787 1,298 - 8,063,331 mudaraba and musharaka financing 649,938 418,728 23,856 32,019 182,736 136,647 88,954 5,754 - - 1,538,632 investments 426,072 45,935 62,296 96,525 252,904 120,366 - 8,551 255,359 80,864 1,348,872ijarah muntahia Bittamleek 9,597 9,243 51,384 26,681 60,663 77,139 107,407 97,687 - - 439,801 property and equipment - - - - - - - - - 298,852 298,852 other assets 64,689 19,604 3,923 23,785 84,938 16,624 2,231 - 36,523 122,616 374,933
Total assets 5,283,831 1,565,300 1,295,706 1,663,535 2,615,356 1,341,645 376,457 115,779 293,180 1,327,535 15,878,324
LIABILITIESCustomer current and other accounts 2,906,172 - - - - - - - - - 2,906,172 due to banks 424,477 - - - - - - - - - 424,477 other liabilities 229,288 15,685 13,785 28,637 66,693 30,045 701 - 106,154 - 490,988
Total Liabilities 3,559,937 15,685 13,785 28,637 66,693 30,045 701 - 106,154 - 3,821,637
Equity of investment account-holders 3,569,685 1,157,237 772,190 1,597,402 2,225,289 870,070 48,233 - - - 10,240,106
Total liabilities and equity of investment account-holders 7,129,622 1,172,922 785,975 1,626,039 2,291,982 900,115 48,934 - 106,154 - 14,061,743
Net liquidity gap (1,845,791) 392,378 509,731 37,496 323,374 441,530 327,523 115,779 187,026 1,327,535 1,816,581
Cumulative net liquidity gap (1,845,791) (1,453,413) (943,682) (906,186) (582,812) (141,282) 186,241 302,020 489,046 1,816,581
Off-balance sheet equity of investment account-holders 89,420 68,823 35,591 47,993 11,903 106,061 - - - 95,547 455,338
130
b. Credit RiskCredit risk is the risk that one party to a financial contract will fail to discharge an obligation and cause the other party to incur a financial loss. The Group controls credit risk by monitoring credit exposures, and continually assessing the creditworthiness of counterparties. Financing contracts are mostly secured by the personal guarantees of individuals who own the counterparty, by collateral in form of mortgage of the objects financed or other types of tangible security.
Type of credit riskFinancing contracts mainly comprise Sales (Murabaha) receivables, Salam receivables, Istisna’a receivables, Mudaraba financing, Musharaka financing and Ijarah Muntahia Bittamleek.
Sales (Murabaha) receivablesThe Group finances these transactions through buying a commodity which represents the object of the Murabaha and then resells this commodity to the Murabeh (beneficiary) at a profit. The sale price (cost plus the profit margin) is repaid in instalments by the Murabeh over the agreed period. The transactions are secured at times by the object of the Murabaha (in case of real estate finance) and other times by a total collateral package securing all the facilities given to the client.
Salam receivablesSalam is a contract whereby the Group makes an immediate payment to a seller for the future delivery of a commodity. To protect itself from risk associated with the commodity the Group simultaneously enters into Parallel Salam contract whereby it sells the commodity for deferred delivery for immediate payment.
Istisna’a receivablesIstisna’a is a sale agreement between the Group as the seller and the customer as the ultimate purchaser whereby the Group undertakes to have manufactured (or acquire) goods and sell it to the customer for an agreed upon price on completion at future date.
Mudaraba financingThe Group enters into Mudaraba contracts by investing in funds managed primarily by other banks and financial institutions for a definite period of time.
Musharaka financingAn agreement between the Group and a customer to contribute to a certain investment enterprise, whether existing or new, or the ownership of a certain property either permanently or according to a diminishing arrangement ending up with the acquisition by the customer of the full ownership. The profit is shared as per the agreement set between both parties while the loss is shared in proportion to their shares of capital or the enterprise.
Ijarah Muntahia BittamleekThis is a lease whereby the legal title of the leased asset passes to the lessee at the end of the Ijarah (lease) term, provided that all Ijarah instalments are settled.
25 RiSK MANAGEMENt (CONTINuED)
notes to tHe ConsolidAted FinAnCiAl stAtements (31 deCemBeR 2011)
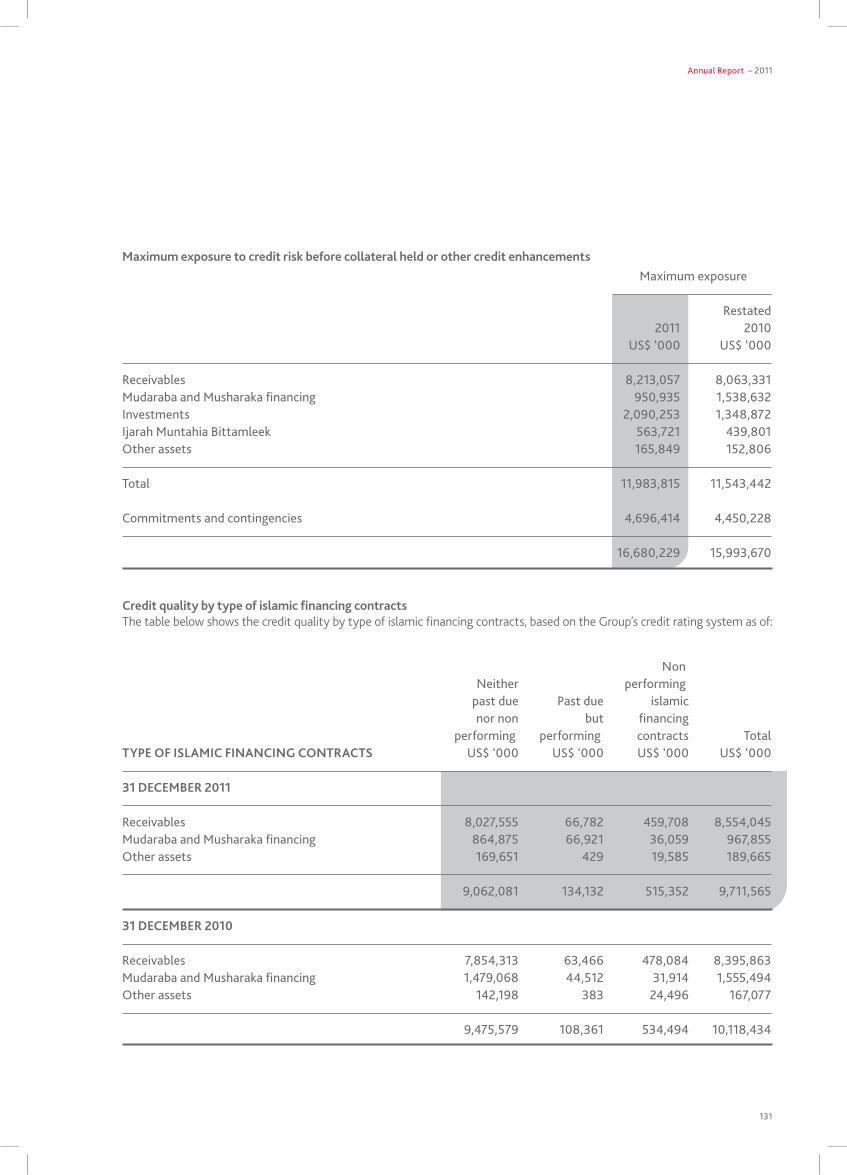
Annual Report – 2011
131
maximum exposure
Restated 2011 2010 Us$ ‘000 Us$ ‘000
Receivables 8,213,057 8,063,331mudaraba and musharaka financing 950,935 1,538,632investments 2,090,253 1,348,872ijarah muntahia Bittamleek 563,721 439,801other assets 165,849 152,806
total 11,983,815 11,543,442
Commitments and contingencies 4,696,414 4,450,228
16,680,229 15,993,670
Credit quality by type of islamic financing contracts The table below shows the credit quality by type of islamic financing contracts, based on the Group’s credit rating system as of:
non neither performing past due past due islamic nor non but financing performing performing contracts totalTYPE OF ISLAMIC FINANCING CONTRACTS Us$ ‘000 Us$ ‘000 Us$ ‘000 Us$ ‘000
31 DECEMBER 2011
Receivables 8,027,555 66,782 459,708 8,554,045mudaraba and musharaka financing 864,875 66,921 36,059 967,855other assets 169,651 429 19,585 189,665
9,062,081 134,132 515,352 9,711,565
31 DECEMBER 2010
Receivables 7,854,313 63,466 478,084 8,395,863mudaraba and musharaka financing 1,479,068 44,512 31,914 1,555,494other assets 142,198 383 24,496 167,077
9,475,579 108,361 534,494 10,118,434
Maximum exposure to credit risk before collateral held or other credit enhancements
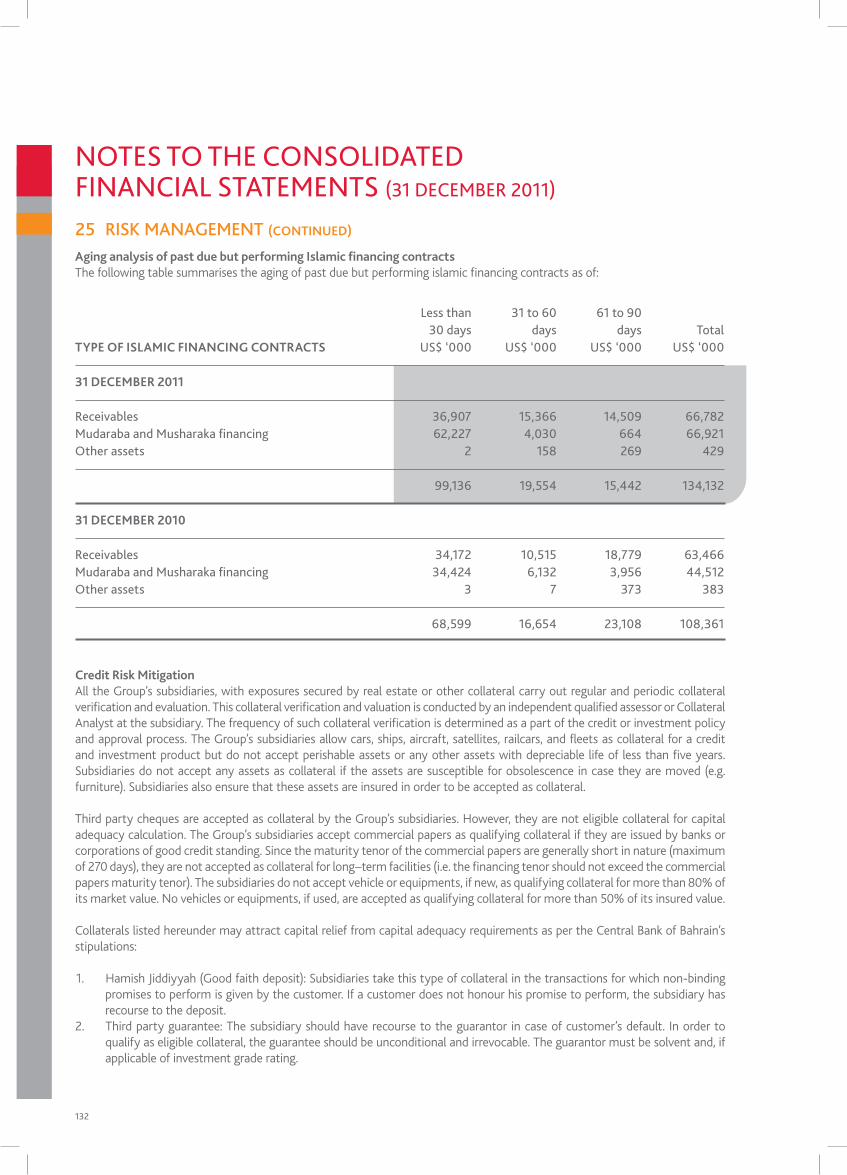
132
Aging analysis of past due but performing Islamic financing contractsThe following table summarises the aging of past due but performing islamic financing contracts as of:
less than 31 to 60 61 to 90 30 days days days totalTYPE OF ISLAMIC FINANCING CONTRACTS Us$ ‘000 Us$ ‘000 Us$ ‘000 Us$ ‘000
31 DECEMBER 2011
Receivables 36,907 15,366 14,509 66,782mudaraba and musharaka financing 62,227 4,030 664 66,921other assets 2 158 269 429
99,136 19,554 15,442 134,132
31 DECEMBER 2010
Receivables 34,172 10,515 18,779 63,466mudaraba and musharaka financing 34,424 6,132 3,956 44,512other assets 3 7 373 383
68,599 16,654 23,108 108,361
25 RiSK MANAGEMENt (CONTINuED)
Credit Risk MitigationAll the Group’s subsidiaries, with exposures secured by real estate or other collateral carry out regular and periodic collateral verification and evaluation. This collateral verification and valuation is conducted by an independent qualified assessor or Collateral Analyst at the subsidiary. The frequency of such collateral verification is determined as a part of the credit or investment policy and approval process. The Group’s subsidiaries allow cars, ships, aircraft, satellites, railcars, and fleets as collateral for a credit and investment product but do not accept perishable assets or any other assets with depreciable life of less than five years. Subsidiaries do not accept any assets as collateral if the assets are susceptible for obsolescence in case they are moved (e.g. furniture). Subsidiaries also ensure that these assets are insured in order to be accepted as collateral.
Third party cheques are accepted as collateral by the Group’s subsidiaries. However, they are not eligible collateral for capital adequacy calculation. The Group’s subsidiaries accept commercial papers as qualifying collateral if they are issued by banks or corporations of good credit standing. Since the maturity tenor of the commercial papers are generally short in nature (maximum of 270 days), they are not accepted as collateral for long–term facilities (i.e. the financing tenor should not exceed the commercial papers maturity tenor). The subsidiaries do not accept vehicle or equipments, if new, as qualifying collateral for more than 80% of its market value. No vehicles or equipments, if used, are accepted as qualifying collateral for more than 50% of its insured value.
Collaterals listed hereunder may attract capital relief from capital adequacy requirements as per the Central Bank of Bahrain’s stipulations:
1. Hamish Jiddiyyah (Good faith deposit): Subsidiaries take this type of collateral in the transactions for which non-binding promises to perform is given by the customer. If a customer does not honour his promise to perform, the subsidiary has recourse to the deposit.
2. Third party guarantee: The subsidiary should have recourse to the guarantor in case of customer’s default. In order to qualify as eligible collateral, the guarantee should be unconditional and irrevocable. The guarantor must be solvent and, if applicable of investment grade rating.
notes to tHe ConsolidAted FinAnCiAl stAtements (31 deCemBeR 2011)
Annual Report – 2011
133
3. Urbon: This is the amount that should be taken from a purchaser or lessee when a contract is established and it is the first line of defence for the subsidiary if the purchaser or lessee breaches the contract.
4. Underlying assets of the lease contract: The underlying asset must be of monetary value and the subsidiary must have legal access to it, own it and sell it to cover the open exposure with the customers in question. The assets have also to be free of any kind of encumbrance.Any excess amount resulting from the closure of the pledge by the subsidiary should be returned to the customer (pledgor). The subsidiary should conduct at least annual evaluation of the pledged assets and keep adequate documentation of this evaluation.
5. Cash deposit free from any legal encumbrance with the subsidiary either in the form of equity of investment account-holders or off-balance sheet equity of investment account-holders.
6. Rated and unrated senior Sukuk issued by first class financial institutions or by GCC sovereigns.
Credit QualityCredit Risk Management at the Group will be based upon the creation and maintenance of a Credit Rating System (CRS) for the non-retail business. All the Group’s units are to incorporate into their respective credit policies the CRS as the framework for credit management taking into consideration the methodology requirements of their local central banks, in this respect. The methodology for obligor (issuer) rating will reflect the specifics of the Group’s main business and the geographical diversity of its operations. Ratings of countries, governments and financial institutions are carried out in centralised fashion at the Bank in Bahrain whereas rating of corporates is done at the subsidiaries level, unless the exposure to the corporate involves cross-border risk, in which case, that rating will also be at the Bank as part of the credit limit approval.
The CRS at the Bank has also been designed to be comparable to the rating system of major international rating agencies (Moody’s, Standard & Poor’s, Fitch) in respect of their foreign currency rating of countries, governments and financial institutions.
Accordingly, countries, governments and financial Institutions will be rated on the basis of their unsecured medium term foreign currency obligations. This means that for governments and financial institutions the cross-border risk will also be part of the rating and the country’s rating will be, in most cases, the ceiling on the financial institution’s rating. Corporates will be rated on their senior unsecured medium term local currency obligations, unless the credit granted is across border or in foreign currency. In the latter case, the obligor’s country’s rating will be the ceiling on corporates’ rating. where all credit to a government is in local currency, the rating for that government is the best i.e. 1 on the rating scale, however, if the exposure to the government includes foreign currency, the rating for that government will be the same as the country’s rating. A rating is a forward looking indication of creditworthiness. It is based on an evaluation of past performance, present conditions and outlook for the future.
The basic approach of the major credit rating agencies to rating is the same as what the Group credit policies requirei.e. a comprehensive fundamental analysis of all relevant quantitative and non quantitative factors aimed at identifying actual and potential vulnerability. Credit rating will be applied to countries and single obligors. Single obligors, in turn are categorised as financial institutions, corporates, governments and retail. CRS therefore rates obligors (issuers) and not facilities. The obligor rating of countries and single obligors will identify the relative probability of default but will not take into account the impact of collateral security and other mitigants in the event of default. Facility ratings by contrast, combine both the probability of default and loss severity in case of defaults. However, initially the Group wide policy will be to set up obligor ratings only (which does not prevent individual subsidiaries internally to also rate facilities if they so wish).
c. Concentration RiskConcentrations arise when a number of counter parties are engaged in similar business activities, or activities in the same geographic region, or have similar economic features that would cause their ability to meet contractual obligations to be similarly affected by changes in economic, political or other conditions. Concentrations indicate the relative sensitivity of the Group’s performance to developments affecting a particular industry or geographical location.
In order to avoid excessive concentrations of risk, the Group policies and procedures include specific guidelines to focus on country and counter party limits and maintaining a diversified portfolio. Identified concentrations of credit risks are controlled and managed accordingly.
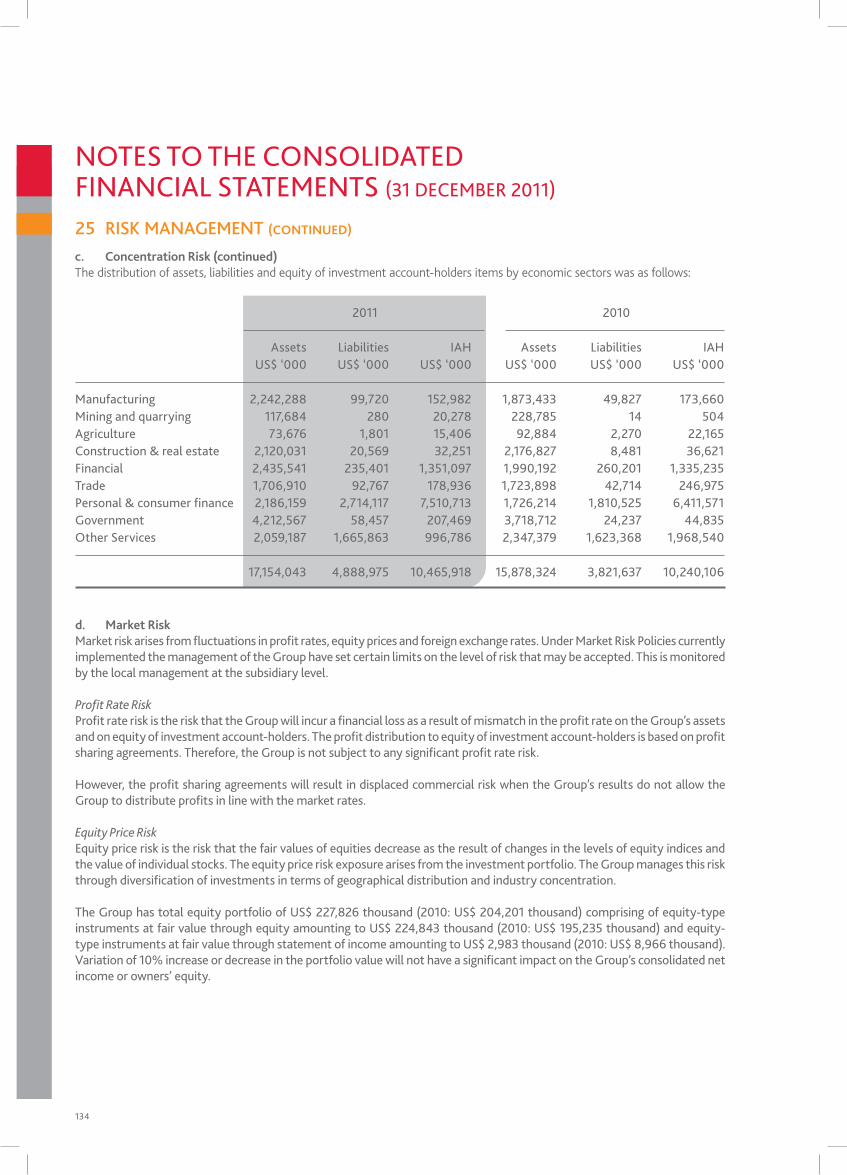
134
25 RiSK MANAGEMENt (CONTINuED)
2011 2010
Assets liabilities iAH Assets liabilities iAH Us$ ‘000 Us$ ‘000 Us$ ‘000 Us$ ‘000 Us$ ‘000 Us$ ‘000
manufacturing 2,242,288 99,720 152,982 1,873,433 49,827 173,660 mining and quarrying 117,684 280 20,278 228,785 14 504 Agriculture 73,676 1,801 15,406 92,884 2,270 22,165 Construction & real estate 2,120,031 20,569 32,251 2,176,827 8,481 36,621 Financial 2,435,541 235,401 1,351,097 1,990,192 260,201 1,335,235 trade 1,706,910 92,767 178,936 1,723,898 42,714 246,975 personal & consumer finance 2,186,159 2,714,117 7,510,713 1,726,214 1,810,525 6,411,571 government 4,212,567 58,457 207,469 3,718,712 24,237 44,835 other services 2,059,187 1,665,863 996,786 2,347,379 1,623,368 1,968,540
17,154,043 4,888,975 10,465,918 15,878,324 3,821,637 10,240,106
d. Market Riskmarket risk arises from fluctuations in profit rates, equity prices and foreign exchange rates. Under market Risk policies currently implemented the management of the group have set certain limits on the level of risk that may be accepted. this is monitored by the local management at the subsidiary level.
Profit Rate Riskprofit rate risk is the risk that the group will incur a financial loss as a result of mismatch in the profit rate on the group’s assets and on equity of investment account-holders. the profit distribution to equity of investment account-holders is based on profit sharing agreements. therefore, the group is not subject to any significant profit rate risk.
However, the profit sharing agreements will result in displaced commercial risk when the group’s results do not allow the group to distribute profits in line with the market rates.
Equity Price Riskequity price risk is the risk that the fair values of equities decrease as the result of changes in the levels of equity indices and the value of individual stocks. the equity price risk exposure arises from the investment portfolio. the group manages this risk through diversification of investments in terms of geographical distribution and industry concentration.
the group has total equity portfolio of Us$ 227,826 thousand (2010: Us$ 204,201 thousand) comprising of equity-type instruments at fair value through equity amounting to Us$ 224,843 thousand (2010: Us$ 195,235 thousand) and equity-type instruments at fair value through statement of income amounting to Us$ 2,983 thousand (2010: Us$ 8,966 thousand). Variation of 10% increase or decrease in the portfolio value will not have a significant impact on the group’s consolidated net income or owners’ equity.
notes to tHe ConsolidAted FinAnCiAl stAtements (31 deCemBeR 2011)
c. Concentration Risk (continued)The distribution of assets, liabilities and equity of investment account-holders items by economic sectors was as follows:
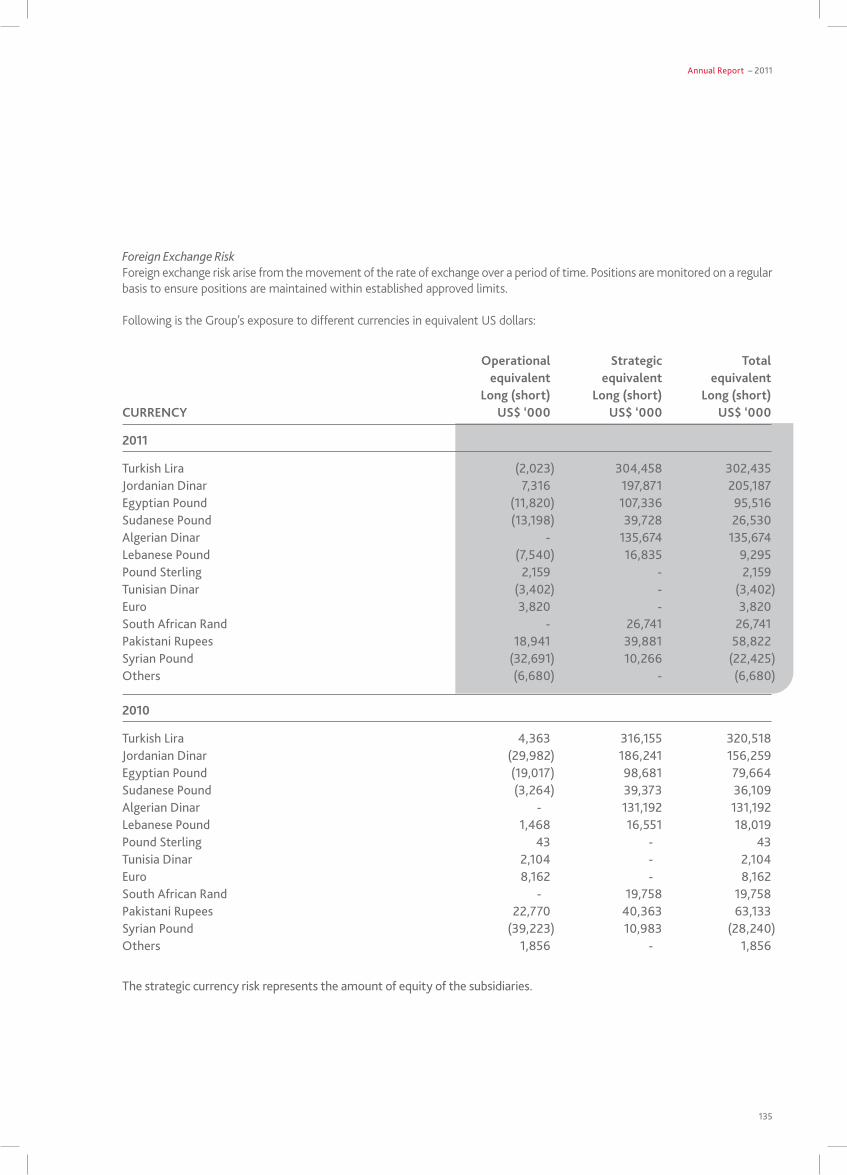
Annual Report – 2011
135
Operational Strategic Total equivalent equivalent equivalent Long (short) Long (short) Long (short)CuRRENCY uS$ ‘000 uS$ ‘000 uS$ ‘000
2011
turkish lira (2,023) 304,458 302,435 Jordanian dinar 7,316 197,871 205,187egyptian pound (11,820) 107,336 95,516sudanese pound (13,198) 39,728 26,530Algerian dinar - 135,674 135,674lebanese pound (7,540) 16,835 9,295 pound sterling 2,159 - 2,159 tunisian dinar (3,402) - (3,402)euro 3,820 - 3,820 south African Rand - 26,741 26,741 pakistani Rupees 18,941 39,881 58,822 syrian pound (32,691) 10,266 (22,425)others (6,680) - (6,680)
2010
turkish lira 4,363 316,155 320,518 Jordanian dinar (29,982) 186,241 156,259 egyptian pound (19,017) 98,681 79,664 sudanese pound (3,264) 39,373 36,109 Algerian dinar - 131,192 131,192 lebanese pound 1,468 16,551 18,019 pound sterling 43 - 43 tunisia dinar 2,104 - 2,104 euro 8,162 - 8,162 south African Rand - 19,758 19,758 pakistani Rupees 22,770 40,363 63,133 syrian pound (39,223) 10,983 (28,240)others 1,856 - 1,856
Foreign Exchange RiskForeign exchange risk arise from the movement of the rate of exchange over a period of time. Positions are monitored on a regular basis to ensure positions are maintained within established approved limits.
Following is the Group’s exposure to different currencies in equivalent US dollars:
the strategic currency risk represents the amount of equity of the subsidiaries.
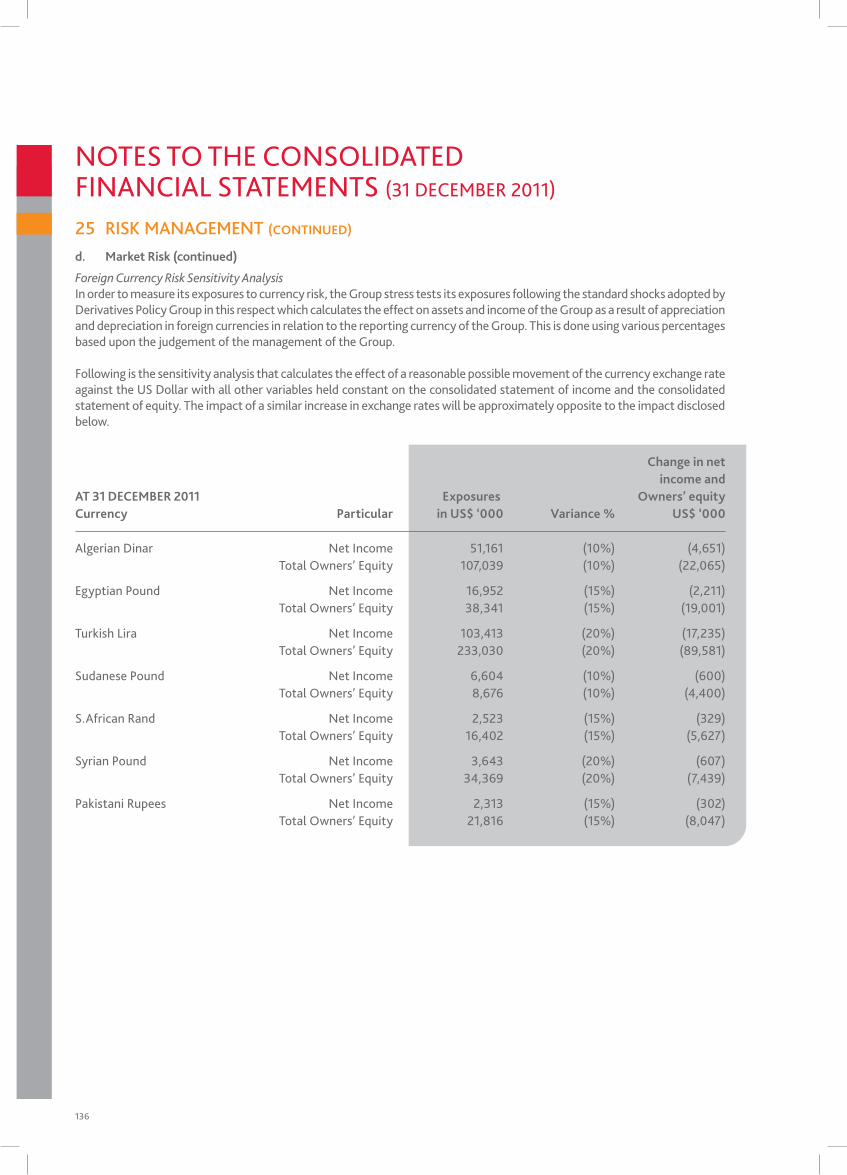
136
d. Market Risk (continued)
Change in net income andAT 31 DECEMBER 2011 Exposures Owners’ equityCurrency Particular in uS$ ‘000 Variance % uS$ ‘000
Algerian dinar net income 51,161 (10%) (4,651) total owners’ equity 107,039 (10%) (22,065)
egyptian pound net income 16,952 (15%) (2,211) total owners’ equity 38,341 (15%) (19,001)
turkish lira net income 103,413 (20%) (17,235) total owners’ equity 233,030 (20%) (89,581)
sudanese pound net income 6,604 (10%) (600) total owners’ equity 8,676 (10%) (4,400)
s.African Rand net income 2,523 (15%) (329) total owners’ equity 16,402 (15%) (5,627)
syrian pound net income 3,643 (20%) (607) total owners’ equity 34,369 (20%) (7,439)
pakistani Rupees net income 2,313 (15%) (302) total owners’ equity 21,816 (15%) (8,047)
Foreign Currency Risk Sensitivity Analysisin order to measure its exposures to currency risk, the group stress tests its exposures following the standard shocks adopted by derivatives policy group in this respect which calculates the effect on assets and income of the group as a result of appreciation and depreciation in foreign currencies in relation to the reporting currency of the group. this is done using various percentages based upon the judgement of the management of the group.
Following is the sensitivity analysis that calculates the effect of a reasonable possible movement of the currency exchange rate against the Us dollar with all other variables held constant on the consolidated statement of income and the consolidated statement of equity. the impact of a similar increase in exchange rates will be approximately opposite to the impact disclosed below.
25 RiSK MANAGEMENt (CONTINuED)
notes to tHe ConsolidAted FinAnCiAl stAtements (31 deCemBeR 2011)
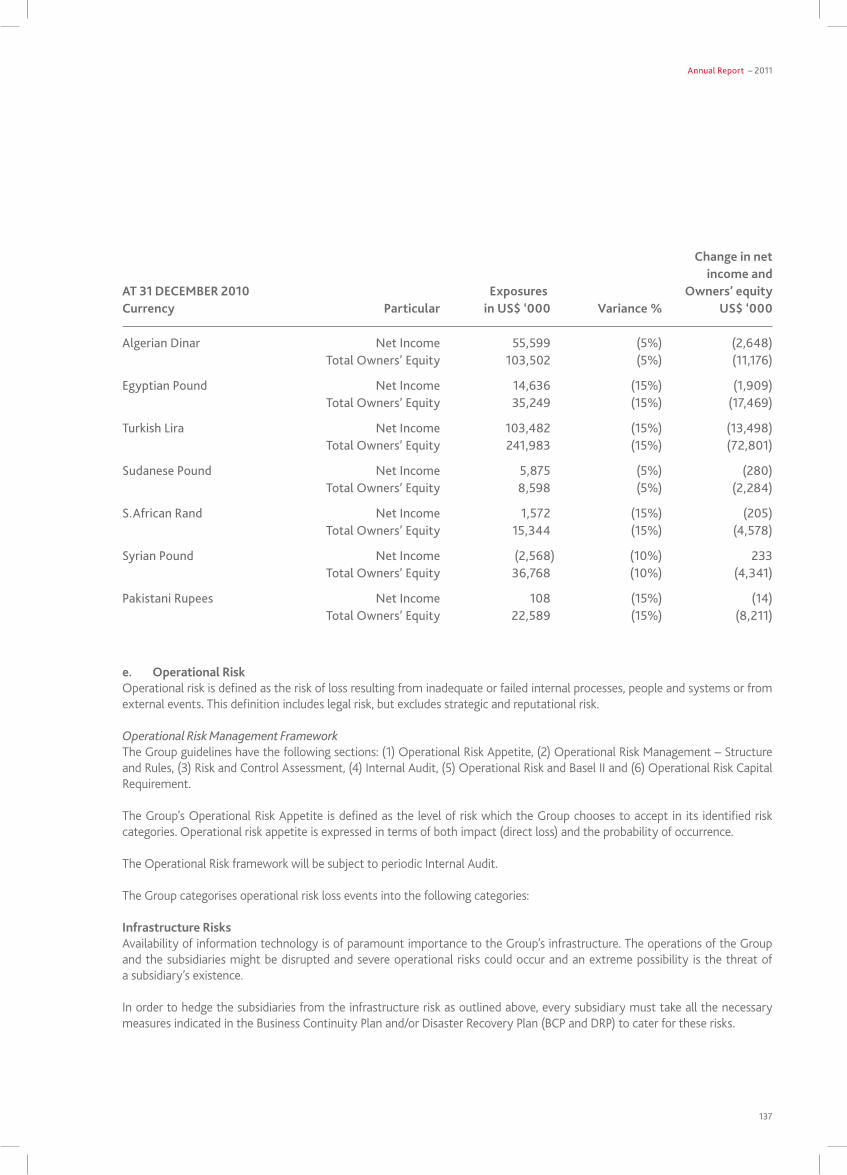
Annual Report – 2011
137
Change in net income andAT 31 DECEMBER 2010 Exposures Owners’ equityCurrency Particular in uS$ ‘000 Variance % uS$ ‘000
Algerian dinar net income 55,599 (5%) (2,648) total owners’ equity 103,502 (5%) (11,176)
egyptian pound net income 14,636 (15%) (1,909) total owners’ equity 35,249 (15%) (17,469)
turkish lira net income 103,482 (15%) (13,498) total owners’ equity 241,983 (15%) (72,801)
sudanese pound net income 5,875 (5%) (280) total owners’ equity 8,598 (5%) (2,284)
s.African Rand net income 1,572 (15%) (205) total owners’ equity 15,344 (15%) (4,578)
syrian pound net income (2,568) (10%) 233 total owners’ equity 36,768 (10%) (4,341)
pakistani Rupees net income 108 (15%) (14) total owners’ equity 22,589 (15%) (8,211)
e. Operational RiskOperational risk is defined as the risk of loss resulting from inadequate or failed internal processes, people and systems or from external events. This definition includes legal risk, but excludes strategic and reputational risk.
Operational Risk Management Framework The Group guidelines have the following sections: (1) Operational Risk Appetite, (2) Operational Risk Management – Structure and Rules, (3) Risk and Control Assessment, (4) Internal Audit, (5) Operational Risk and Basel II and (6) Operational Risk Capital Requirement.
The Group’s Operational Risk Appetite is defined as the level of risk which the Group chooses to accept in its identified risk categories. Operational risk appetite is expressed in terms of both impact (direct loss) and the probability of occurrence.
The Operational Risk framework will be subject to periodic Internal Audit.
The Group categorises operational risk loss events into the following categories:
Infrastructure RisksAvailability of information technology is of paramount importance to the Group’s infrastructure. The operations of the Group and the subsidiaries might be disrupted and severe operational risks could occur and an extreme possibility is the threat of a subsidiary’s existence.
In order to hedge the subsidiaries from the infrastructure risk as outlined above, every subsidiary must take all the necessary measures indicated in the Business Continuity Plan and/or Disaster Recovery Plan (BCP and DRP) to cater for these risks.
138
e. Operational Risk (continued)Information Technology RisksThe main risks that the Group is exposed to in this context is from inadequate software and hardware quality, unauthorised access by third parties or employees, etc.
Staff riskThe main risks that arises from staff risks are risks due to larceny, fraud, corruption, crime, etc. In order to prevent these risks from occurring, the Group has established Group Human Resources Policies and Code of Conduct which entails constructive ways in dealing with mistakes and frauds. The Group has also established approval control steps in business processes as well as creating separate internal control processes. Further, the Group has established measures of organisational structure in terms of segregation of duties as well as diverse training measures to reduce human errors and frauds, etc.
Business riskThis risk may take on the following forms:1. Processes without clear definitions, for example, when insufficient time was spent on documenting or updating the already
documented processes.2. Outdated process descriptions in cases where “reality” already strongly differs from the guidelines laid down in the past.3. The extreme case of a completely missing documentation. To hedge this risk, the Group adopts sound documentation policies
of business processes as it is a basic requirement for a well functioning process organisation. The process description are up to date and clear; furthermore, it is accessible to all employees.
f. Corporate GovernanceBoard of DirectorsThe Board of Directors is responsible for approving the Group’s overall business strategy, monitoring its operations and taking critical business decisions. In line with international leading practices, the Board has instituted corporate governance measures to ensure that the interests of the shareholders are protected, including the appointment to the Board of four independent nonexecutive directors as defined in the Rule Book of the CBB.
The Bank is administered by a Board of Directors consisting of not less than five and not more than fifteen members. However, subject to the provisions of the law, the shareholders at an Ordinary General Meeting may determine that the number of directors shall exceed fifteen in certain circumstances. Members of the Board of Directors hold office for a three-year renewable term, although the term of office may be extended at the request of the Board for a period not exceeding six months by resolution of the Bahrain Minister of Industry and Commerce.
There are currently thirteen Directors on the Board, who have varied backgrounds and experience and who individually and collectively exercise independent and objective judgment. Other than the President and Chief Executive, all Directors are non-executive. The posts of Chairman and President and Chief Executive are held by different Directors and each has separate, clearly defined responsibilities.
25 RiSK MANAGEMENt (CONTINuED)
notes to tHe ConsolidAted FinAnCiAl stAtements (31 deCemBeR 2011)

Annual Report – 2011
139
The Board of Directors meets regularly (usually four times a year) and has a formal schedule of matters reserved to it, considering key aspects of the Group’s affairs referred to it for decision. The Board reviews the Group’s strategy and financial plans, all proposed material changes to the Group’s policies, structure and organisation, reports provided to it on the operations of the Group (with emphasis on organisational development, risk management and information technology development) and the performance of executive management. The Board and its committees are supplied with full and timely information to enable them to discharge their responsibilities. All Directors have access to the advice and services of the secretary, who is responsible for ensuring that the Board procedures and applicable rules and regulations are observed.
The Board of Directors has overall responsibility for the Group’s system of internal control and its effectiveness. There are established and ongoing procedures in place for identifying, evaluating and managing significant risks faced by the Group, which are regularly reviewed by the Board. The Group’s system of internal control provides for a documented and auditable trail of accountability and applies across its operations, is designed to ensure effective and efficient operation and compliance with all applicable laws and regulations, and seeks to manage risk with a view to avoiding material errors, losses and fraud.
Fair value is the amount for which an asset could be exchanged or a liability settled between knowledgeable, willing parties in an arm’s length transaction. Consequently, differences can arise between carrying values and fair value estimates.
Included under investments are unquoted equity-type instruments at fair value through equity amounting to US$ 141,066 million (2010: US$ 131,840 million) which are carried at cost due to lack of other reliable methods for arriving at a reliable fair value for these investments.
The fair values of other on-balance sheet financial instruments are not significantly different from the carrying values included in the financial statement.
Earnings realised during the year from transactions that were not permitted by Shari’a amounted to US$ 4.1 million (2010: US$ 6.8 million). This amount has been taken to charity.
Certain of the prior year’s figures have been reclassified to conform to the presentation adopted in the current year. Such reclassification did not affect previously reported consolidated income or consolidated owners’ equity.
26 FAIR VALUE OF FINANCIAL INSTRUMENTS
27 EARNINGS PROHIBITED BY SHARI’A
28 COMPARATIVE FIGURES

140
By BANKING wITH US OUR CUSTOMERS MAKE A POSITIvE CONTRIBUTION TO A BETTER SOCIETy; THEIR GROwTH AND OUR GROwTH wIll BENEFIT THE wORlD AROUND US.
SOCIAL CONTRIBUTION

141141
Annual Report – 2011
142
AdditionAl pUBliC disClosURes31 deCemBeR 2011 (UnAUdited) 1 CAPITAL STRUCTURE AND CAPITAL ADEQUACYThe primary objectives of the Group’s capital management are to ensure that the Group complies with externally imposed capital requirements and that the Group maintains strong credit ratings and healthy capital ratios in order to support its business and to maximise shareholders’ value.
The Group manages its capital structure and makes adjustments to it in the light of changes in economic conditions and the risk characteristics of its activities. In order to maintain or adjust the capital structure, the Group may adjust the amount of dividend payment to shareholders, return capital to shareholders or issue capital securities. No changes were made in the objectives, policies and processes from the previous year.
The Group’s capital structure is primarily made of its paid-up capital, including the share premium and reserves, and profit equalization reserve and investment risk reserve. From regulation’s perspective, the significant amount of the Group’s capital are in Tier I as defined by the CBB, i.e., most of the consolidated capital are of permanent nature.
To assess its capital adequacy requirements in accordance with the CBB requirements, the Group adopts the standardised approach for its Credit Risk, Basic Indicator Approach for its Operational Risk and Standardised Measurement Approach for its Market Risk. To calculate its capital adequacy, the Group follows the accepted approaches approved by the CBB Rulebook. The Group consolidates all subsidiaries for Capital Adequacy Ratio (CAR) calculation. The Group strives to sustain reasonably higher capital cushion that strikes the balance between its business conduct and the regulatory requirements stipulated in the CBB capital adequacy requirements as a minimum accepted level of capital adequacy.
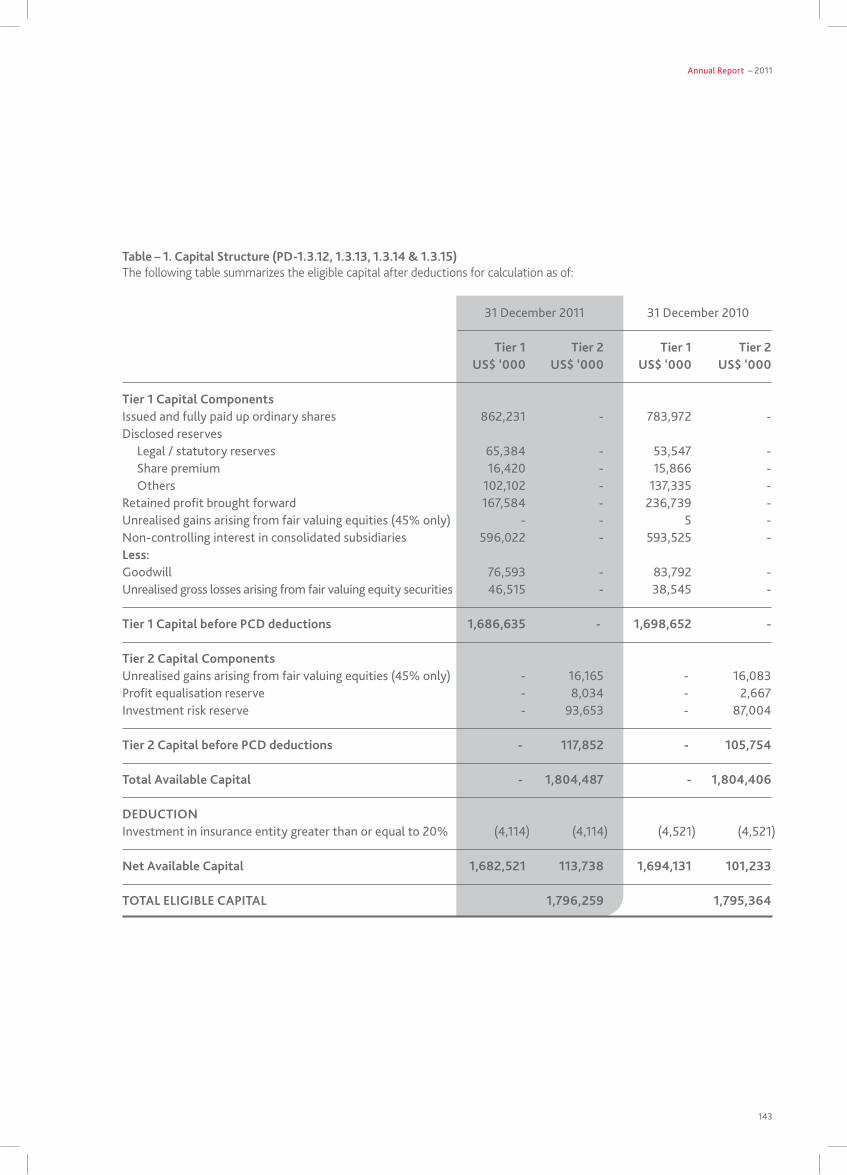
Annual Report – 2011
143
Table – 1. Capital Structure (PD-1.3.12, 1.3.13, 1.3.14 & 1.3.15)The following table summarizes the eligible capital after deductions for calculation as of:
31 december 2011 31 december 2010 Tier 1 Tier 2 Tier 1 Tier 2 uS$ ‘000 uS$ ‘000 uS$ ‘000 uS$ ‘000
Tier 1 Capital Components issued and fully paid up ordinary shares 862,231 - 783,972 -disclosed reserves legal / statutory reserves 65,384 - 53,547 - share premium 16,420 - 15,866 - others 102,102 - 137,335 -Retained profit brought forward 167,584 - 236,739 -Unrealised gains arising from fair valuing equities (45% only) - - 5 -non-controlling interest in consolidated subsidiaries 596,022 - 593,525 -Less: goodwill 76,593 - 83,792 -Unrealised gross losses arising from fair valuing equity securities 46,515 - 38,545 -
Tier 1 Capital before PCD deductions 1,686,635 - 1,698,652 -
Tier 2 Capital Components Unrealised gains arising from fair valuing equities (45% only) - 16,165 - 16,083profit equalisation reserve - 8,034 - 2,667investment risk reserve - 93,653 - 87,004
Tier 2 Capital before PCD deductions - 117,852 - 105,754
Total Available Capital - 1,804,487 - 1,804,406
DEDuCTION investment in insurance entity greater than or equal to 20% (4,114) (4,114) (4,521) (4,521)
Net Available Capital 1,682,521 113,738 1,694,131 101,233
TOTAL ELIGIBLE CAPITAL 1,796,259 1,795,364
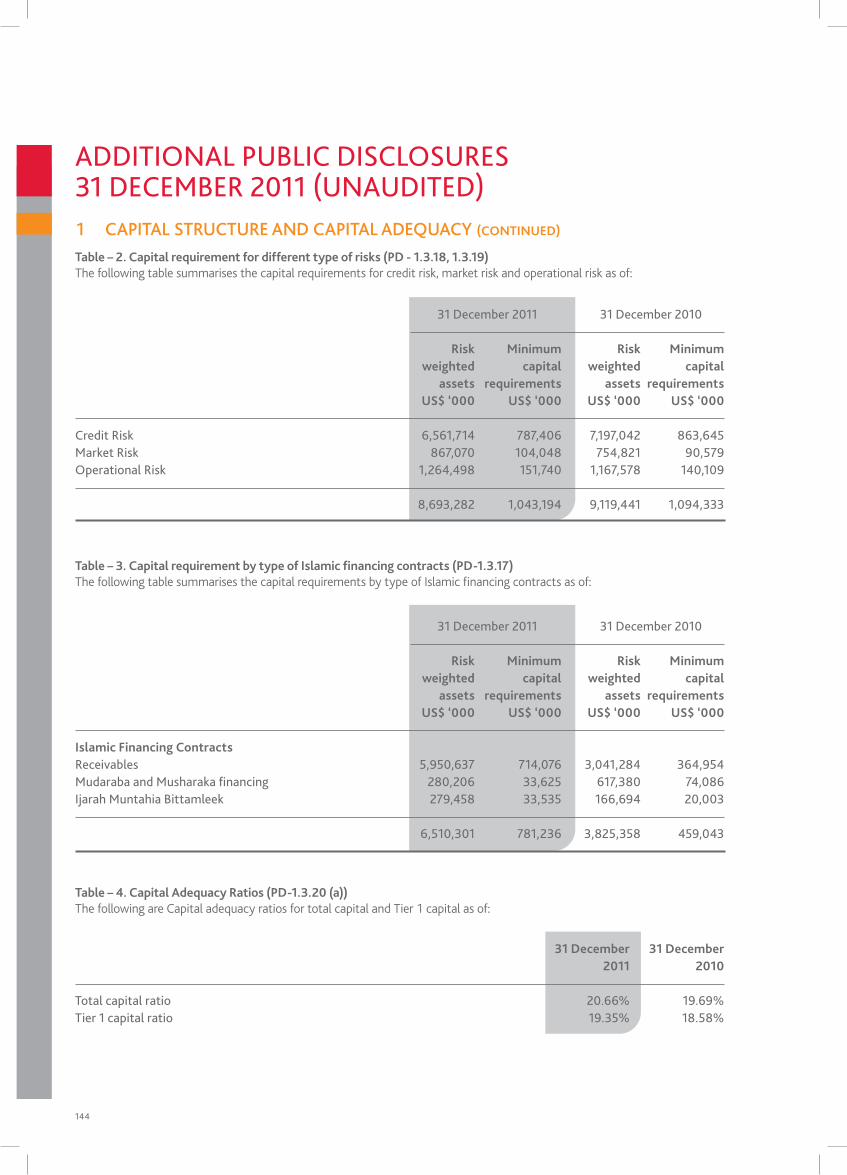
144
Table – 2. Capital requirement for different type of risks (PD - 1.3.18, 1.3.19)The following table summarises the capital requirements for credit risk, market risk and operational risk as of:
Table – 4. Capital Adequacy Ratios (PD-1.3.20 (a))The following are Capital adequacy ratios for total capital and Tier 1 capital as of:
Table – 3. Capital requirement by type of Islamic financing contracts (PD-1.3.17)The following table summarises the capital requirements by type of Islamic financing contracts as of:
31 december 2011 31 december 2010 Risk Minimum Risk Minimum weighted capital weighted capital assets requirements assets requirements uS$ ‘000 uS$ ‘000 uS$ ‘000 uS$ ‘000
Credit Risk 6,561,714 787,406 7,197,042 863,645 market Risk 867,070 104,048 754,821 90,579 operational Risk 1,264,498 151,740 1,167,578 140,109
8,693,282 1,043,194 9,119,441 1,094,333
31 December 31 December 2011 2010
total capital ratio 20.66% 19.69%tier 1 capital ratio 19.35% 18.58%
31 december 2011 31 december 2010
Risk Minimum Risk Minimum weighted capital weighted capital assets requirements assets requirements uS$ ‘000 uS$ ‘000 uS$ ‘000 uS$ ‘000
Islamic Financing ContractsReceivables 5,950,637 714,076 3,041,284 364,954 mudaraba and musharaka financing 280,206 33,625 617,380 74,086 ijarah muntahia Bittamleek 279,458 33,535 166,694 20,003
6,510,301 781,236 3,825,358 459,043
1 CAPITAL STRUCTURE AND CAPITAL ADEQUACY (CONTINuED)
AdditionAl pUBliC disClosURes31 deCemBeR 2011 (UnAUdited)
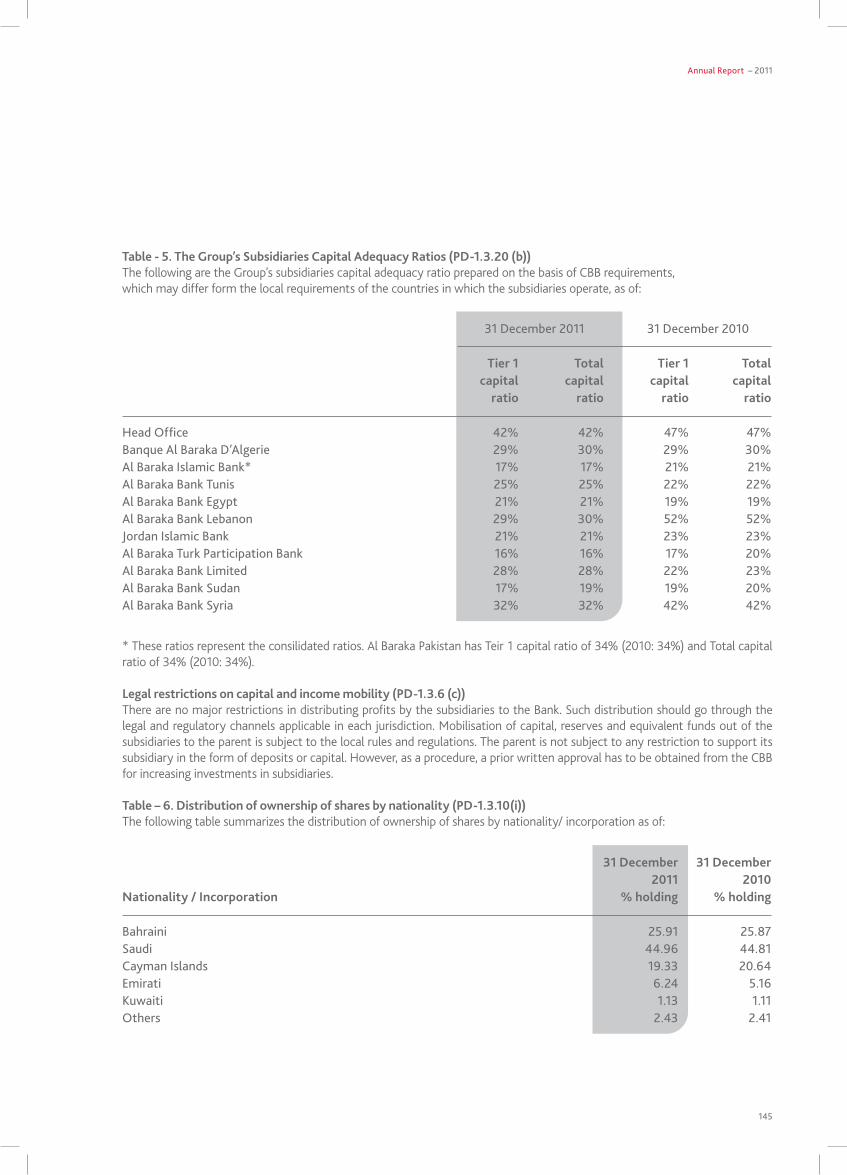
Annual Report – 2011
145
Table - 5. The Group’s Subsidiaries Capital Adequacy Ratios (PD-1.3.20 (b))The following are the Group’s subsidiaries capital adequacy ratio prepared on the basis of CBB requirements, which may differ form the local requirements of the countries in which the subsidiaries operate, as of:
31 december 2011 31 december 2010 Tier 1 Total Tier 1 Total capital capital capital capital ratio ratio ratio ratio
Head office 42% 42% 47% 47%Banque Al Baraka d’Algerie 29% 30% 29% 30%Al Baraka islamic Bank* 17% 17% 21% 21%Al Baraka Bank tunis 25% 25% 22% 22%Al Baraka Bank egypt 21% 21% 19% 19%Al Baraka Bank lebanon 29% 30% 52% 52%Jordan islamic Bank 21% 21% 23% 23%Al Baraka turk participation Bank 16% 16% 17% 20%Al Baraka Bank limited 28% 28% 22% 23%Al Baraka Bank sudan 17% 19% 19% 20%Al Baraka Bank syria 32% 32% 42% 42%
Table – 6. Distribution of ownership of shares by nationality (PD-1.3.10(i))The following table summarizes the distribution of ownership of shares by nationality/ incorporation as of:
* These ratios represent the consilidated ratios. Al Baraka Pakistan has Teir 1 capital ratio of 34% (2010: 34%) and Total capital ratio of 34% (2010: 34%). Legal restrictions on capital and income mobility (PD-1.3.6 (c))There are no major restrictions in distributing profits by the subsidiaries to the Bank. Such distribution should go through the legal and regulatory channels applicable in each jurisdiction. Mobilisation of capital, reserves and equivalent funds out of the subsidiaries to the parent is subject to the local rules and regulations. The parent is not subject to any restriction to support its subsidiary in the form of deposits or capital. However, as a procedure, a prior written approval has to be obtained from the CBB for increasing investments in subsidiaries.
31 December 31 December 2011 2010Nationality / Incorporation % holding % holding
Bahraini 25.91 25.87saudi 44.96 44.81Cayman islands 19.33 20.64emirati 6.24 5.16kuwaiti 1.13 1.11others 2.43 2.41
146
2 RiSK MANAGEMENtThe Group’s risk management strategies have been effectively implemented and the objectives outlined at the beginning of year 2011 across subsidiaries were successfully achieved. The Group is striving to bolster and instil the best practices of risk management in subsidiaries’ risk management functions for the next reporting period by ensuring prudent implementation of risk management policies which entails risk identification, limit controls, monitoring and reporting.
a) Liquidity risk The liquidity management policy at a minimum includes the following:
a. Provide clear guidance on the composition and role of the asset/liability committee or such other committee or department responsible for managing liquidity.
b. Establish approval processes to ensure adherence to liquidity risk management processes. c. Require periodic calculations to determine the extent to which the subsidiary is funding long-term assets with short-term
liabilities.d. Establish liquidity ratio benchmarks, e.g. parameters for the funding of long-term assets with short-term liabilities to guide
liquidity management and the method for computing liquidity indicators.e. Establish limits on the degree of concentrations that are deemed acceptable. This should:
i. Ensure diversification of funding by origin and term structure by, for example, guarding against concentration by individuals or groups of depositors, types of deposit instruments, market sources of deposit, geographical sources, term to maturity, and deposit currencies. where concentrations occur, the Group’s subsidiaries manage their assets and liquidity profile to mitigate the risk; and
ii. Set procedures for the orderly restoration of the liquidity position in the event of loss of funding where such concentrations are unavoidable. In addition, the Group’s subsidiaries conduct an impact analysis on its dependency on any such concentrations.
f. Periodic review of the deposit structure. The review should include the volume and trend of various types of deposits offered, maturity distributions of time deposits, profit rate paid on each type of deposit, prevailing market profit rate, limits on large time deposits, public funds, and non-resident deposits.
g. Review of alternate funding sources including stand-by facilities and lines of credit.h. Establish a framework for the composition of assets.I. Assess the acceptable mismatch in combination with currency commitments. The Group’s subsidiaries undertake separate
analysis of their strategy for each currency individually. They set and regularly review limits on the size of cash flow mismatches over particular time horizons for foreign currencies in aggregate, and for each significant currency.
AdditionAl pUBliC disClosURes31 deCemBeR 2011 (UnAUdited)
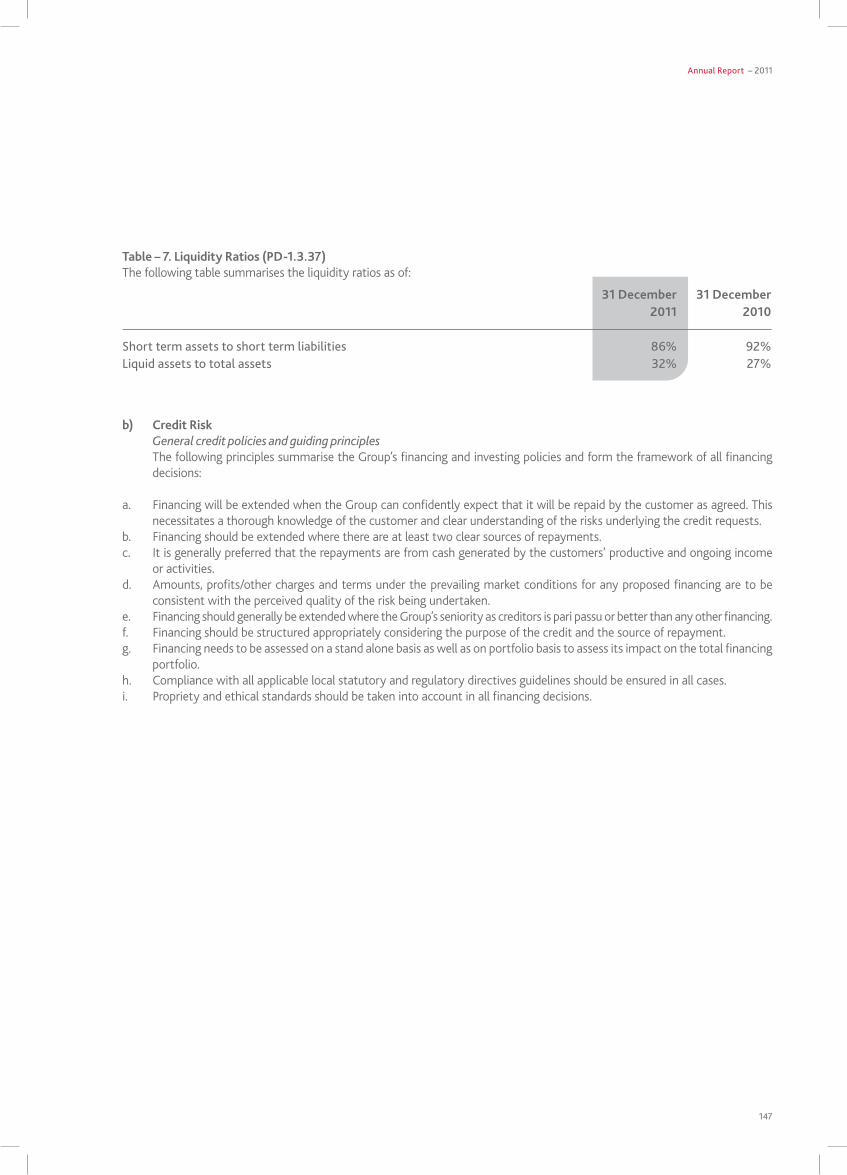
Annual Report – 2011
147
Table – 7. Liquidity Ratios (PD-1.3.37)The following table summarises the liquidity ratios as of:
31 December 31 December 2011 2010
short term assets to short term liabilities 86% 92%liquid assets to total assets 32% 27%
b) Credit Risk General credit policies and guiding principles
The following principles summarise the Group’s financing and investing policies and form the framework of all financing decisions:
a. Financing will be extended when the Group can confidently expect that it will be repaid by the customer as agreed. This necessitates a thorough knowledge of the customer and clear understanding of the risks underlying the credit requests.
b. Financing should be extended where there are at least two clear sources of repayments. c. It is generally preferred that the repayments are from cash generated by the customers’ productive and ongoing income
or activities.d. Amounts, profits/other charges and terms under the prevailing market conditions for any proposed financing are to be
consistent with the perceived quality of the risk being undertaken.e. Financing should generally be extended where the Group’s seniority as creditors is pari passu or better than any other financing.f. Financing should be structured appropriately considering the purpose of the credit and the source of repayment.g. Financing needs to be assessed on a stand alone basis as well as on portfolio basis to assess its impact on the total financing
portfolio.h. Compliance with all applicable local statutory and regulatory directives guidelines should be ensured in all cases. i. Propriety and ethical standards should be taken into account in all financing decisions.
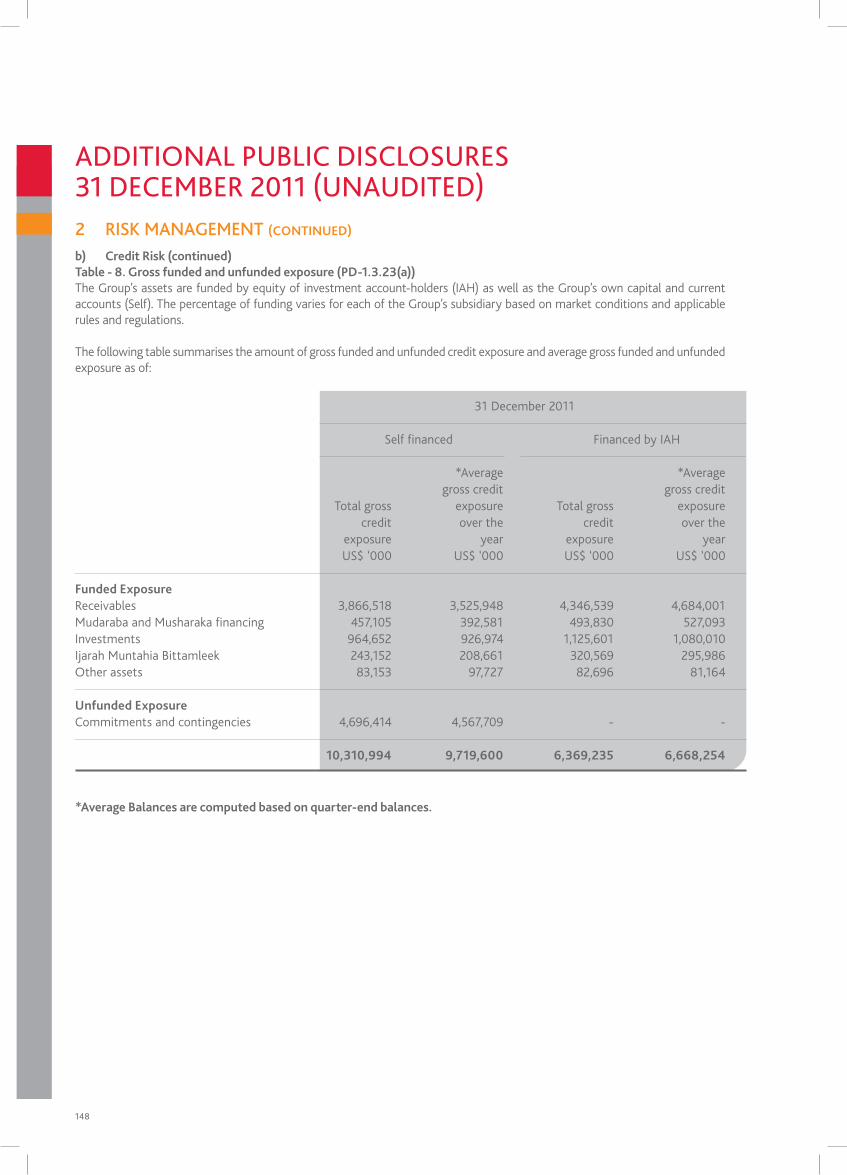
148
b) Credit Risk (continued)Table - 8. Gross funded and unfunded exposure (PD-1.3.23(a))The Group’s assets are funded by equity of investment account-holders (IAH) as well as the Group’s own capital and current accounts (Self). The percentage of funding varies for each of the Group’s subsidiary based on market conditions and applicable rules and regulations.
The following table summarises the amount of gross funded and unfunded credit exposure and average gross funded and unfunded exposure as of:
2 RiSK MANAGEMENt (CONTINuED)
31 December 2011 31 December 2010
Self financed Financed by IAH Self financed Financed by IAH
*Average *Average *Average *Average gross credit gross credit gross credit gross credit Total gross exposure Total gross exposure Total gross exposure Total gross exposure credit over the credit over the credit over the credit over the exposure year exposure year exposure year exposure year US$ ‘000 US$ ‘000 US$ ‘000 US$ ‘000 US$ ‘000 US$ ‘000 US$ ‘000 US$ ‘000
Funded ExposureReceivables 3,866,518 3,525,948 4,346,539 4,684,001 3,184,754 2,712,278 4,878,577 4,779,995 Mudaraba and Musharaka financing 457,105 392,581 493,830 527,093 526,778 404,504 1,011,854 767,929 Investments 964,652 926,974 1,125,601 1,080,010 820,213 722,124 528,659 493,798 Ijarah Muntahia Bittamleek 243,152 208,661 320,569 295,986 180,818 161,218 258,983 238,074 Other assets 83,153 97,727 82,696 81,164 75,262 58,357 77,544 101,587
unfunded ExposureCommitments and contingencies 4,696,414 4,567,709 - - 4,391,687 4,510,846 58,541 43,387
10,310,994 9,719,600 6,369,235 6,668,254 9,179,512 8,569,327 6,814,158 6,424,770
*Average Balances are computed based on quarter-end balances.
AdditionAl pUBliC disClosURes31 deCemBeR 2011 (UnAUdited)
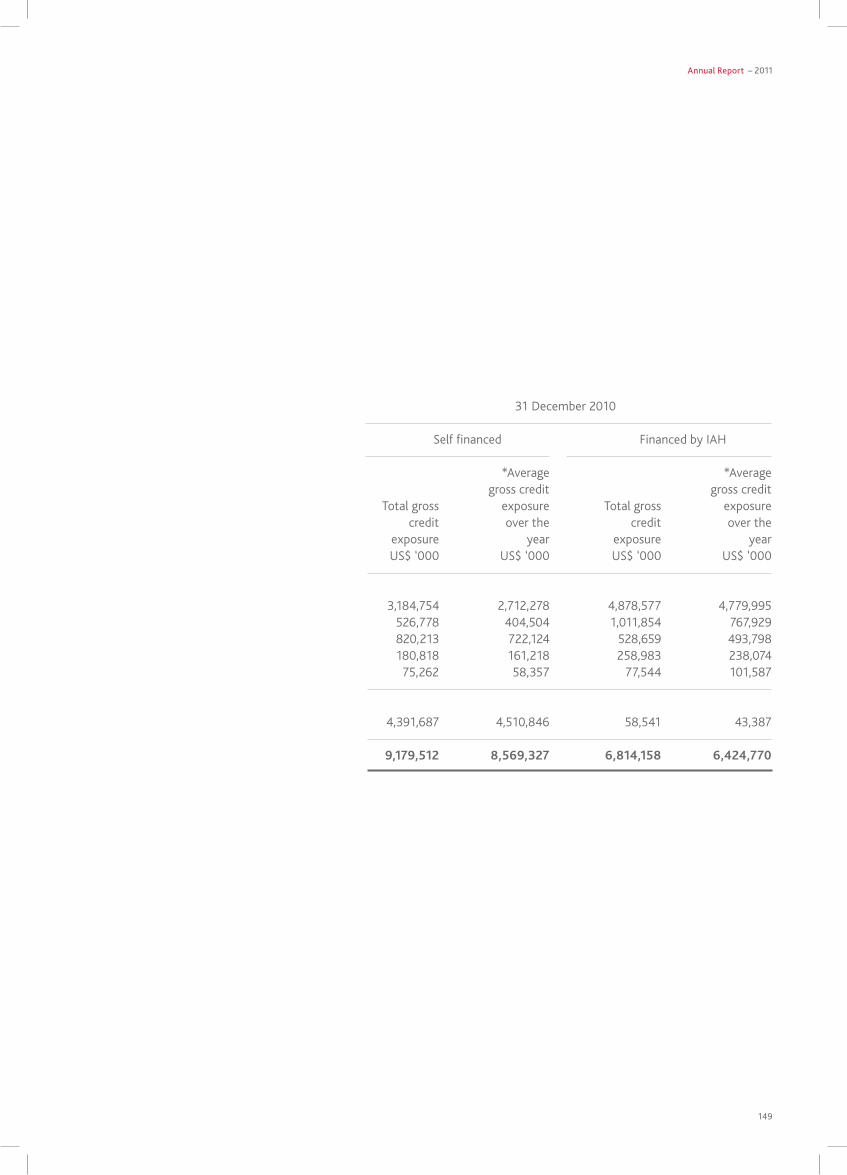
Annual Report – 2011
149
31 December 2011 31 December 2010
Self financed Financed by IAH Self financed Financed by IAH
*Average *Average *Average *Average gross credit gross credit gross credit gross credit Total gross exposure Total gross exposure Total gross exposure Total gross exposure credit over the credit over the credit over the credit over the exposure year exposure year exposure year exposure year US$ ‘000 US$ ‘000 US$ ‘000 US$ ‘000 US$ ‘000 US$ ‘000 US$ ‘000 US$ ‘000
Funded ExposureReceivables 3,866,518 3,525,948 4,346,539 4,684,001 3,184,754 2,712,278 4,878,577 4,779,995 Mudaraba and Musharaka financing 457,105 392,581 493,830 527,093 526,778 404,504 1,011,854 767,929 Investments 964,652 926,974 1,125,601 1,080,010 820,213 722,124 528,659 493,798 Ijarah Muntahia Bittamleek 243,152 208,661 320,569 295,986 180,818 161,218 258,983 238,074 Other assets 83,153 97,727 82,696 81,164 75,262 58,357 77,544 101,587
unfunded ExposureCommitments and contingencies 4,696,414 4,567,709 - - 4,391,687 4,510,846 58,541 43,387
10,310,994 9,719,600 6,369,235 6,668,254 9,179,512 8,569,327 6,814,158 6,424,770
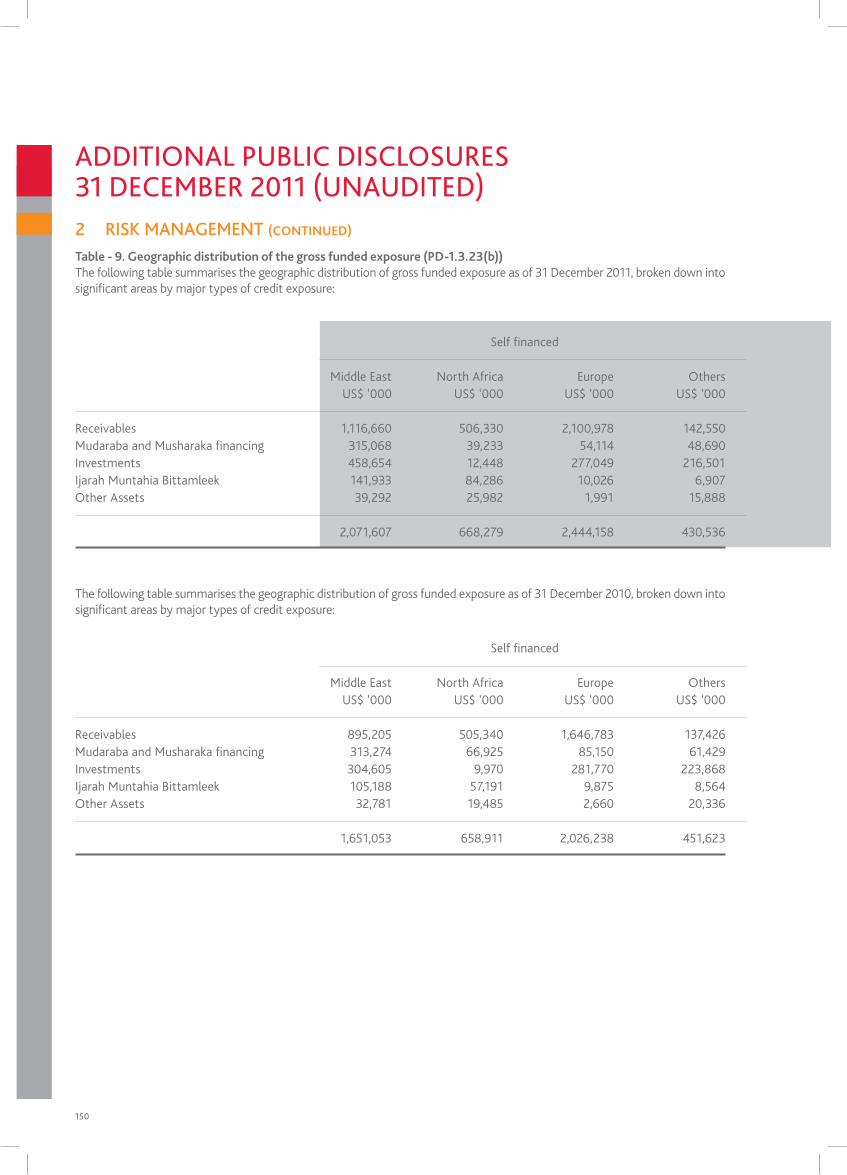
150
Self financed Financed by IAH
Middle East North Africa Europe Others Middle East North Africa Europe Others US$ ‘000 US$ ‘000 US$ ‘000 US$ ‘000 US$ ‘000 US$ ‘000 US$ ‘000 US$ ‘000
Receivables 895,205 505,340 1,646,783 137,426 1,839,866 370,892 2,329,793 338,026 Mudaraba and Musharaka financing 313,274 66,925 85,150 61,429 731,457 77,099 - 203,298 Investments 304,605 9,970 281,770 223,868 476,086 - - 52,573 Ijarah Muntahia Bittamleek 105,188 57,191 9,875 8,564 190,974 34,906 6,913 26,190 Other Assets 32,781 19,485 2,660 20,336 31,433 12,759 5,643 27,709
1,651,053 658,911 2,026,238 451,623 3,269,816 495,656 2,342,349 647,796
2 RiSK MANAGEMENt (CONTINuED)
AdditionAl pUBliC disClosURes31 deCemBeR 2011 (UnAUdited)
Table - 9. Geographic distribution of the gross funded exposure (PD-1.3.23(b))The following table summarises the geographic distribution of gross funded exposure as of 31 December 2011, broken down into significant areas by major types of credit exposure:
The following table summarises the geographic distribution of gross funded exposure as of 31 December 2010, broken down into significant areas by major types of credit exposure:
Self financed Financed by IAH
Middle East North Africa Europe Others Middle East North Africa Europe Others US$ ‘000 US$ ‘000 US$ ‘000 US$ ‘000 US$ ‘000 US$ ‘000 US$ ‘000 US$ ‘000
Receivables 1,116,660 506,330 2,100,978 142,550 1,968,093 368,664 1,686,894 322,888Mudaraba and Musharaka financing 315,068 39,233 54,114 48,690 257,138 34,008 - 202,684Investments 458,654 12,448 277,049 216,501 909,558 - - 216,043Ijarah Muntahia Bittamleek 141,933 84,286 10,026 6,907 239,587 56,751 1,688 22,543Other Assets 39,292 25,982 1,991 15,888 37,991 17,841 2,885 23,979
2,071,607 668,279 2,444,158 430,536 3,412,367 477,264 1,691,467 788,137
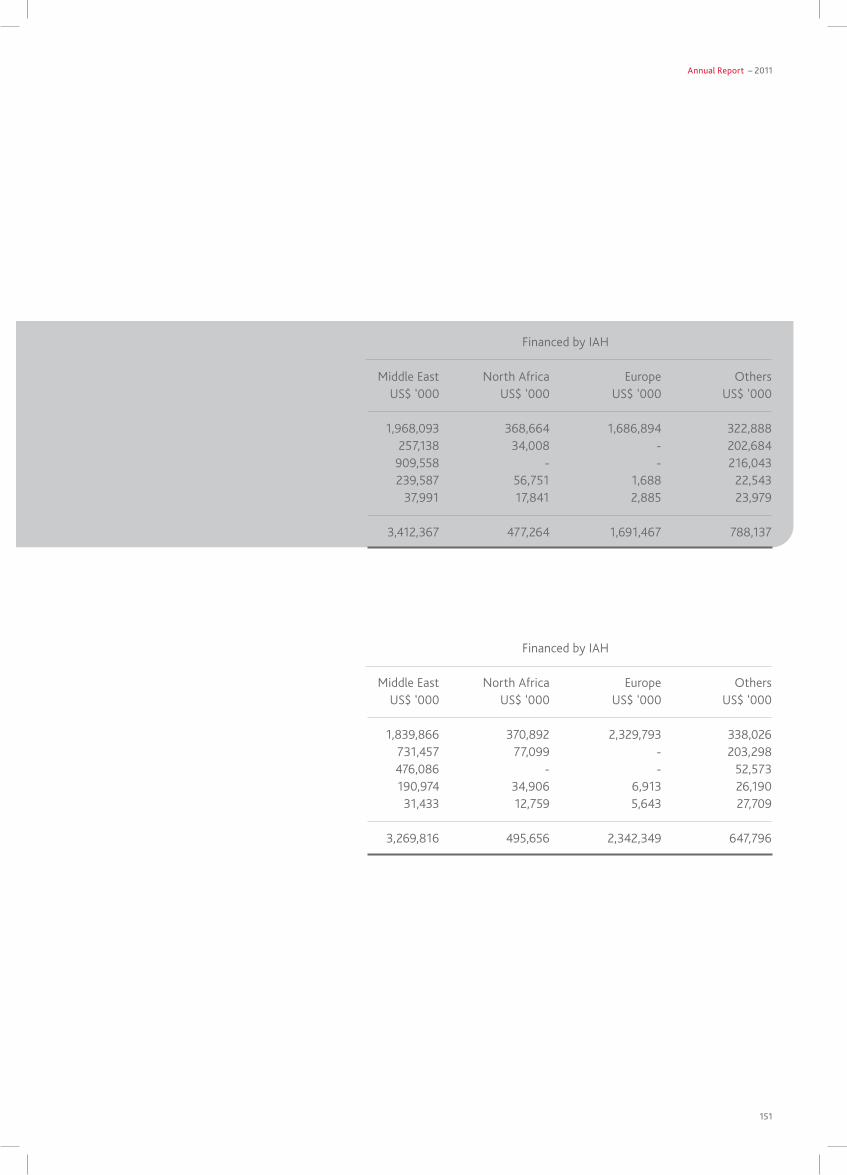
Annual Report – 2011
151
Self financed Financed by IAH
Middle East North Africa Europe Others Middle East North Africa Europe Others US$ ‘000 US$ ‘000 US$ ‘000 US$ ‘000 US$ ‘000 US$ ‘000 US$ ‘000 US$ ‘000
Receivables 895,205 505,340 1,646,783 137,426 1,839,866 370,892 2,329,793 338,026 Mudaraba and Musharaka financing 313,274 66,925 85,150 61,429 731,457 77,099 - 203,298 Investments 304,605 9,970 281,770 223,868 476,086 - - 52,573 Ijarah Muntahia Bittamleek 105,188 57,191 9,875 8,564 190,974 34,906 6,913 26,190 Other Assets 32,781 19,485 2,660 20,336 31,433 12,759 5,643 27,709
1,651,053 658,911 2,026,238 451,623 3,269,816 495,656 2,342,349 647,796
Self financed Financed by IAH
Middle East North Africa Europe Others Middle East North Africa Europe Others US$ ‘000 US$ ‘000 US$ ‘000 US$ ‘000 US$ ‘000 US$ ‘000 US$ ‘000 US$ ‘000
Receivables 1,116,660 506,330 2,100,978 142,550 1,968,093 368,664 1,686,894 322,888Mudaraba and Musharaka financing 315,068 39,233 54,114 48,690 257,138 34,008 - 202,684Investments 458,654 12,448 277,049 216,501 909,558 - - 216,043Ijarah Muntahia Bittamleek 141,933 84,286 10,026 6,907 239,587 56,751 1,688 22,543Other Assets 39,292 25,982 1,991 15,888 37,991 17,841 2,885 23,979
2,071,607 668,279 2,444,158 430,536 3,412,367 477,264 1,691,467 788,137
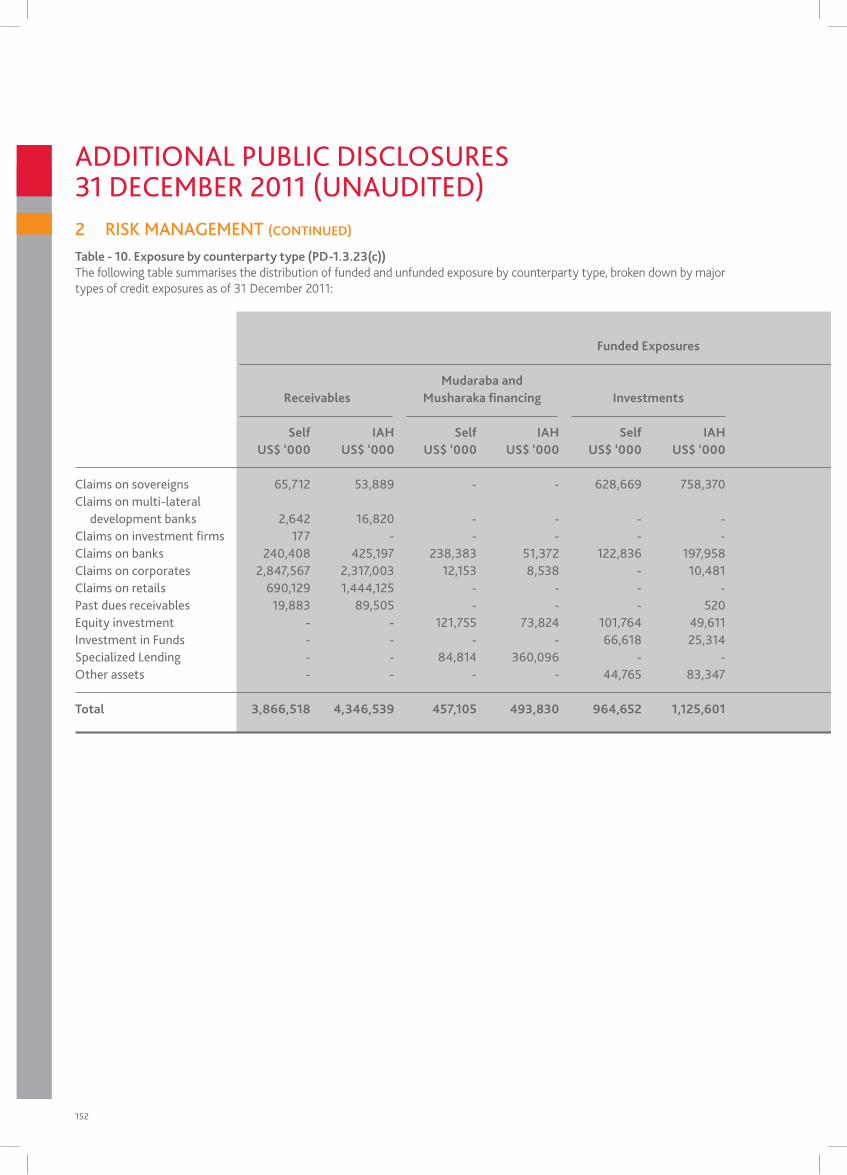
152
Funded and Funded Exposures unfunded Exposures unfunded Exposures
Mudaraba and Ijarah Muntahia Commitments Receivables Musharaka financing Investments Bittamleek Other Assets and contingencies Total
Self IAH Self IAH Self IAH Self IAH Self IAH Self IAH Self IAH uS$ ‘000 uS$ ‘000 uS$ ‘000 uS$ ‘000 uS$ ‘000 uS$ ‘000 uS$ ‘000 uS$ ‘000 uS$ ‘000 uS$ ‘000 uS$ ‘000 uS$ ‘000 uS$ ‘000 uS$ ‘000
Claims on sovereigns 65,712 53,889 - - 628,669 758,370 - 18,971 - - 58,743 - 753,124 831,230 Claims on multi-lateral development banks 2,642 16,820 - - - - - - - - - - 2,642 16,820 Claims on investment firms 177 - - - - - - - - - - - 177 - Claims on banks 240,408 425,197 238,383 51,372 122,836 197,958 - 35,437 - - 196,871 - 798,498 709,964 Claims on corporates 2,847,567 2,317,003 12,153 8,538 - 10,481 60,095 84,076 - - 4,164,099 - 7,083,914 2,420,098 Claims on retails 690,129 1,444,125 - - - - 182,897 181,816 - - 276,701 - 1,149,727 1,625,941 past dues receivables 19,883 89,505 - - - 520 160 269 - - - - 20,043 90,294 equity investment - - 121,755 73,824 101,764 49,611 - - - - - - 223,519 123,435 investment in Funds - - - - 66,618 25,314 - - - - - - 66,618 25,314 specialized lending - - 84,814 360,096 - - - - - - - - 84,814 360,096 other assets - - - - 44,765 83,347 - - 83,153 82,696 - - 127,918 166,043
Total 3,866,518 4,346,539 457,105 493,830 964,652 1,125,601 243,152 320,569 83,153 82,696 4,696,414 - 10,310,994 6,369,235
Table - 10. Exposure by counterparty type (PD-1.3.23(c))The following table summarises the distribution of funded and unfunded exposure by counterparty type, broken down by major types of credit exposures as of 31 December 2011:
2 RiSK MANAGEMENt (CONTINuED)
AdditionAl pUBliC disClosURes31 deCemBeR 2011 (UnAUdited)
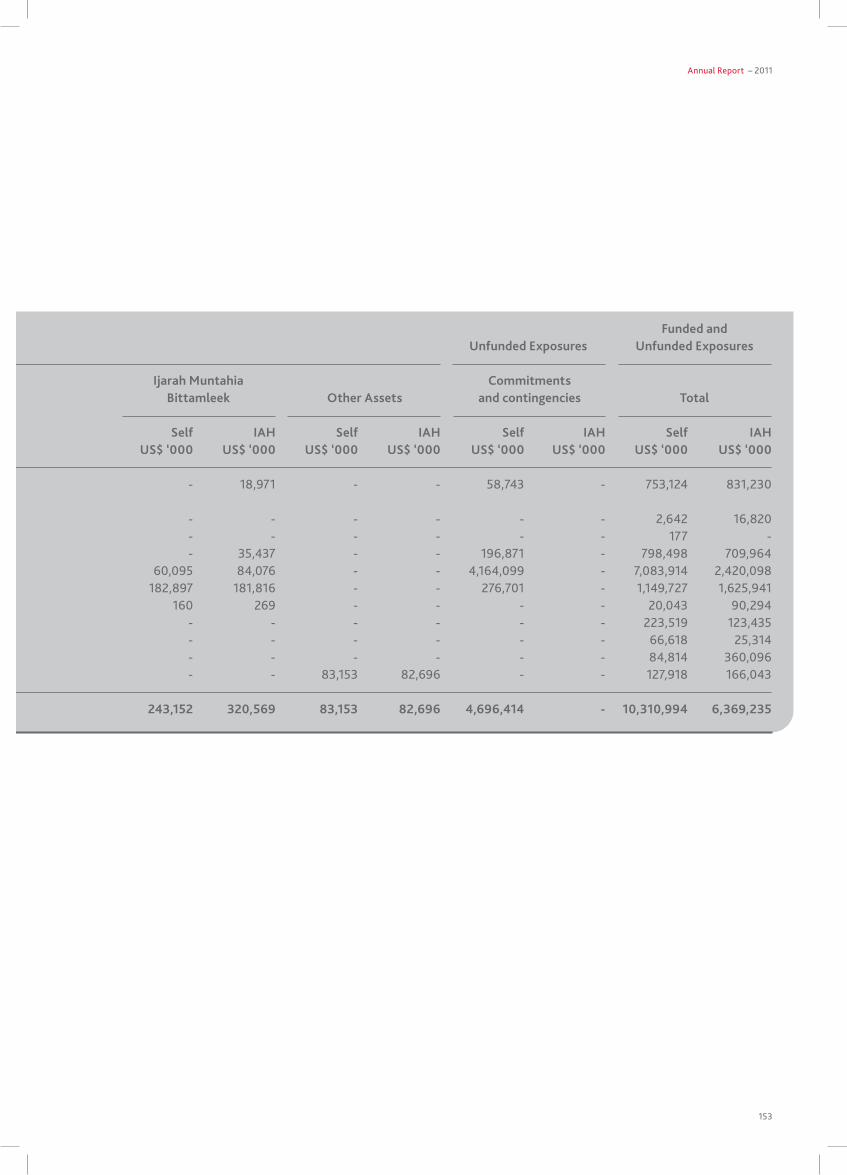
Annual Report – 2011
153
Funded and Funded Exposures unfunded Exposures unfunded Exposures
Mudaraba and Ijarah Muntahia Commitments Receivables Musharaka financing Investments Bittamleek Other Assets and contingencies Total
Self IAH Self IAH Self IAH Self IAH Self IAH Self IAH Self IAH uS$ ‘000 uS$ ‘000 uS$ ‘000 uS$ ‘000 uS$ ‘000 uS$ ‘000 uS$ ‘000 uS$ ‘000 uS$ ‘000 uS$ ‘000 uS$ ‘000 uS$ ‘000 uS$ ‘000 uS$ ‘000
Claims on sovereigns 65,712 53,889 - - 628,669 758,370 - 18,971 - - 58,743 - 753,124 831,230 Claims on multi-lateral development banks 2,642 16,820 - - - - - - - - - - 2,642 16,820 Claims on investment firms 177 - - - - - - - - - - - 177 - Claims on banks 240,408 425,197 238,383 51,372 122,836 197,958 - 35,437 - - 196,871 - 798,498 709,964 Claims on corporates 2,847,567 2,317,003 12,153 8,538 - 10,481 60,095 84,076 - - 4,164,099 - 7,083,914 2,420,098 Claims on retails 690,129 1,444,125 - - - - 182,897 181,816 - - 276,701 - 1,149,727 1,625,941 past dues receivables 19,883 89,505 - - - 520 160 269 - - - - 20,043 90,294 equity investment - - 121,755 73,824 101,764 49,611 - - - - - - 223,519 123,435 investment in Funds - - - - 66,618 25,314 - - - - - - 66,618 25,314 specialized lending - - 84,814 360,096 - - - - - - - - 84,814 360,096 other assets - - - - 44,765 83,347 - - 83,153 82,696 - - 127,918 166,043
Total 3,866,518 4,346,539 457,105 493,830 964,652 1,125,601 243,152 320,569 83,153 82,696 4,696,414 - 10,310,994 6,369,235
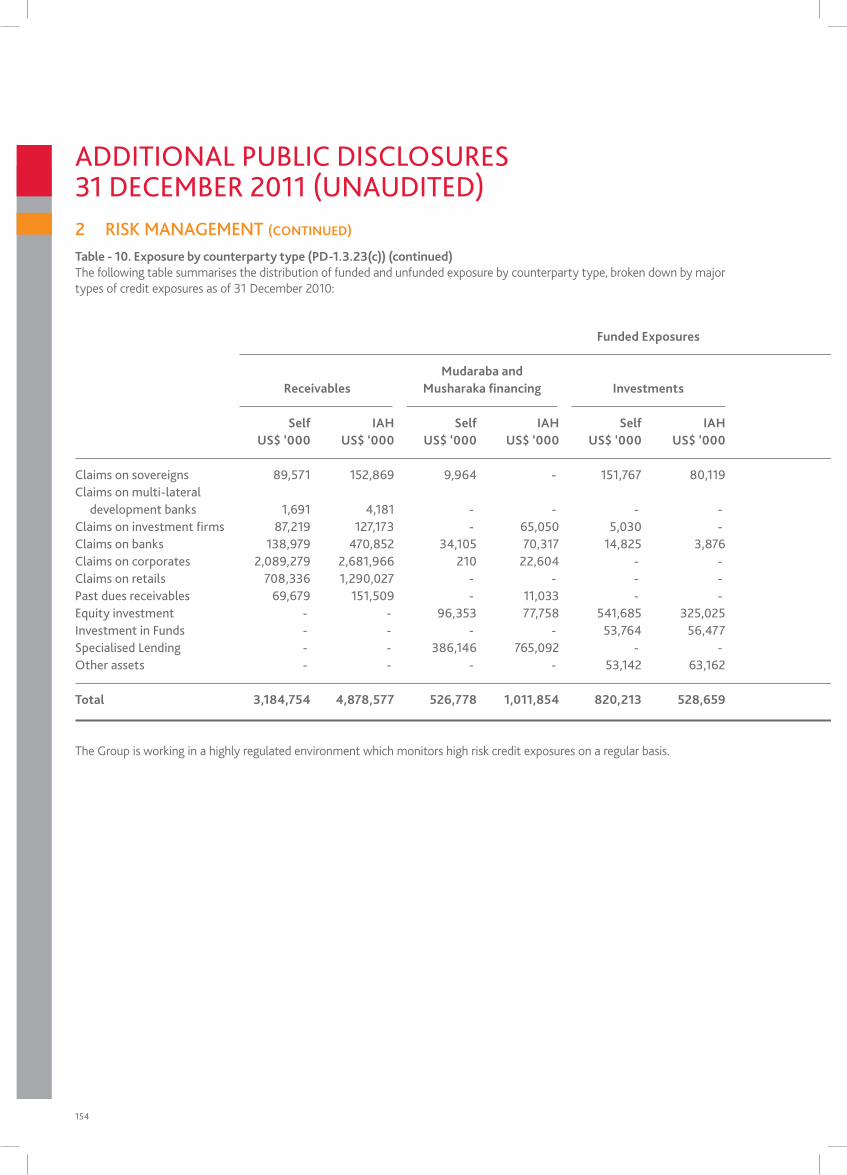
154
Funded and Funded Exposures unfunded Exposures unfunded Exposures
Mudaraba and Ijarah Muntahia Commitments Receivables Musharaka financing Investments Bittamleek Other Assets and contingencies Total
Self IAH Self IAH Self IAH Self IAH Self IAH Self IAH Self IAH uS$ ‘000 uS$ ‘000 uS$ ‘000 uS$ ‘000 uS$ ‘000 uS$ ‘000 uS$ ‘000 uS$ ‘000 uS$ ‘000 uS$ ‘000 uS$ ‘000 uS$ ‘000 uS$ ‘000 uS$ ‘000
Claims on sovereigns 89,571 152,869 9,964 - 151,767 80,119 - - - - 88,701 - 340,003 232,988 Claims on multi-lateral development banks 1,691 4,181 - - - - - - - - - - 1,691 4,181 Claims on investment firms 87,219 127,173 - 65,050 5,030 - - - - - 6 - 92,255 192,223 Claims on banks 138,979 470,852 34,105 70,317 14,825 3,876 2,194 87,475 - - 65,212 - 255,315 632,520 Claims on corporates 2,089,279 2,681,966 210 22,604 - - 51,197 40,912 - - 4,033,497 28,033 6,174,183 2,773,515 Claims on retails 708,336 1,290,027 - - - - 125,795 129,599 - - 204,271 30,508 1,038,402 1,450,134 past dues receivables 69,679 151,509 - 11,033 - - 1,632 997 - - - - 71,311 163,539 equity investment - - 96,353 77,758 541,685 325,025 - - - - - - 638,038 402,783 investment in Funds - - - - 53,764 56,477 - - - - - - 53,764 56,477 specialised lending - - 386,146 765,092 - - - - - - - - 386,146 765,092 other assets - - - - 53,142 63,162 - - 75,262 77,544 - - 128,404 140,706
Total 3,184,754 4,878,577 526,778 1,011,854 820,213 528,659 180,818 258,983 75,262 77,544 4,391,687 58,541 9,179,512 6,814,158
Table - 10. Exposure by counterparty type (PD-1.3.23(c)) (continued)The following table summarises the distribution of funded and unfunded exposure by counterparty type, broken down by major types of credit exposures as of 31 December 2010:
2 RiSK MANAGEMENt (CONTINuED)
AdditionAl pUBliC disClosURes31 deCemBeR 2011 (UnAUdited)
The Group is working in a highly regulated environment which monitors high risk credit exposures on a regular basis.
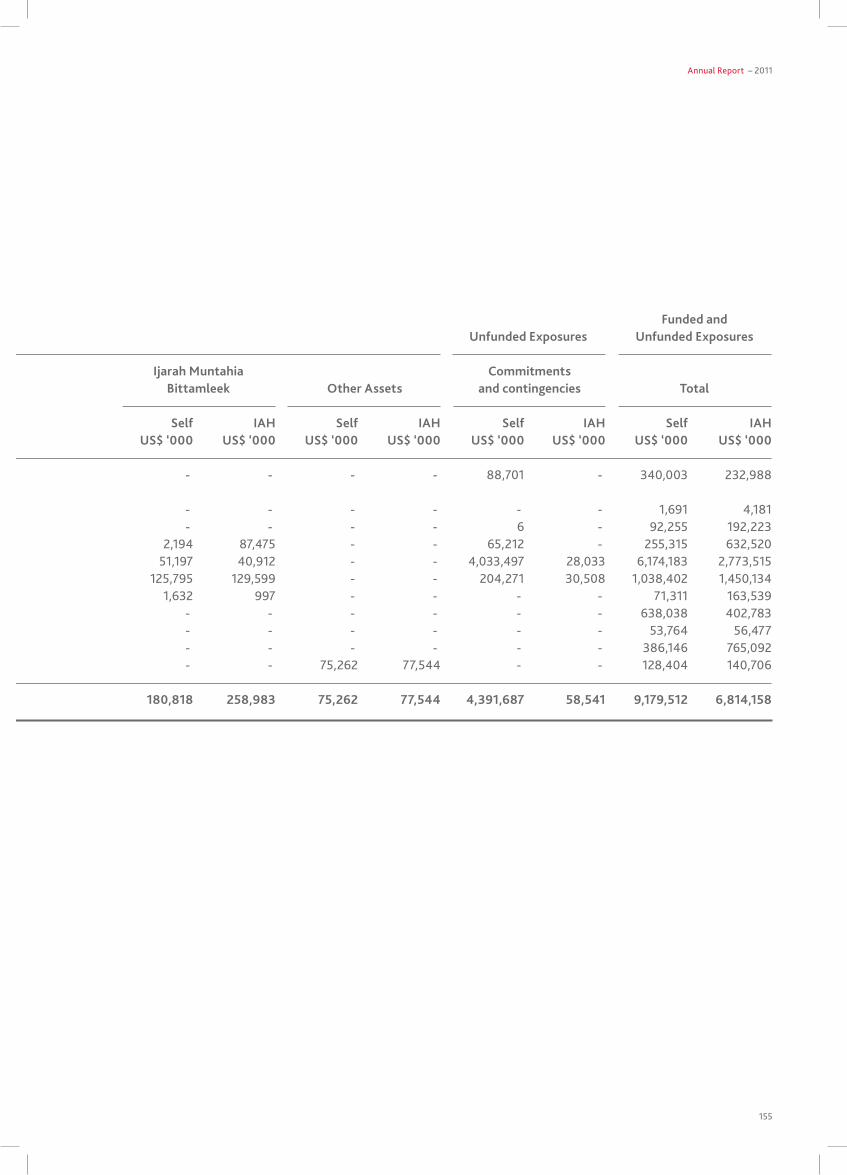
Annual Report – 2011
155
Funded and Funded Exposures unfunded Exposures unfunded Exposures
Mudaraba and Ijarah Muntahia Commitments Receivables Musharaka financing Investments Bittamleek Other Assets and contingencies Total
Self IAH Self IAH Self IAH Self IAH Self IAH Self IAH Self IAH uS$ ‘000 uS$ ‘000 uS$ ‘000 uS$ ‘000 uS$ ‘000 uS$ ‘000 uS$ ‘000 uS$ ‘000 uS$ ‘000 uS$ ‘000 uS$ ‘000 uS$ ‘000 uS$ ‘000 uS$ ‘000
Claims on sovereigns 89,571 152,869 9,964 - 151,767 80,119 - - - - 88,701 - 340,003 232,988 Claims on multi-lateral development banks 1,691 4,181 - - - - - - - - - - 1,691 4,181 Claims on investment firms 87,219 127,173 - 65,050 5,030 - - - - - 6 - 92,255 192,223 Claims on banks 138,979 470,852 34,105 70,317 14,825 3,876 2,194 87,475 - - 65,212 - 255,315 632,520 Claims on corporates 2,089,279 2,681,966 210 22,604 - - 51,197 40,912 - - 4,033,497 28,033 6,174,183 2,773,515 Claims on retails 708,336 1,290,027 - - - - 125,795 129,599 - - 204,271 30,508 1,038,402 1,450,134 past dues receivables 69,679 151,509 - 11,033 - - 1,632 997 - - - - 71,311 163,539 equity investment - - 96,353 77,758 541,685 325,025 - - - - - - 638,038 402,783 investment in Funds - - - - 53,764 56,477 - - - - - - 53,764 56,477 specialised lending - - 386,146 765,092 - - - - - - - - 386,146 765,092 other assets - - - - 53,142 63,162 - - 75,262 77,544 - - 128,404 140,706
Total 3,184,754 4,878,577 526,778 1,011,854 820,213 528,659 180,818 258,983 75,262 77,544 4,391,687 58,541 9,179,512 6,814,158
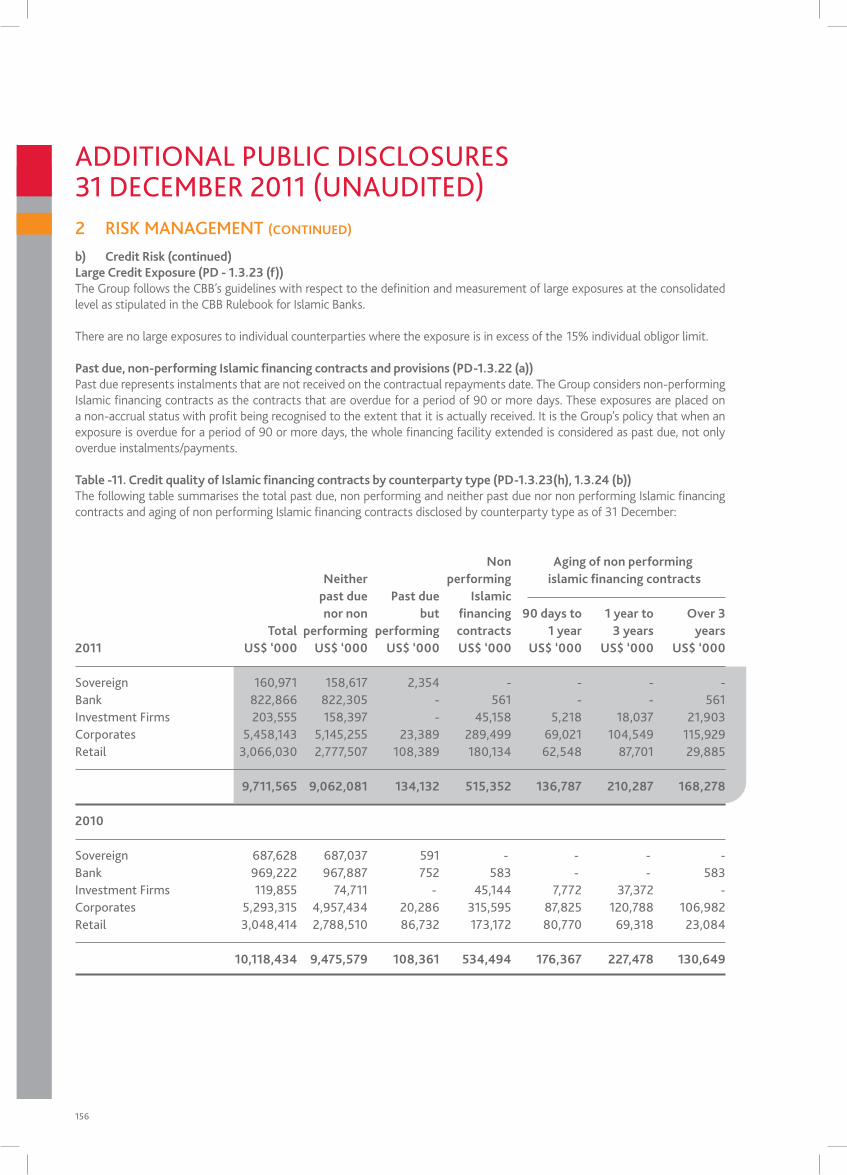
156
Non Aging of non performing Neither performing islamic financing contracts past due Past due Islamic
nor non but financing 90 days to 1 year to Over 3 Total performing performing contracts 1 year 3 years years2011 uS$ ‘000 uS$ ‘000 uS$ ‘000 uS$ ‘000 uS$ ‘000 uS$ ‘000 uS$ ‘000
sovereign 160,971 158,617 2,354 - - - -Bank 822,866 822,305 - 561 - - 561investment Firms 203,555 158,397 - 45,158 5,218 18,037 21,903Corporates 5,458,143 5,145,255 23,389 289,499 69,021 104,549 115,929Retail 3,066,030 2,777,507 108,389 180,134 62,548 87,701 29,885
9,711,565 9,062,081 134,132 515,352 136,787 210,287 168,278
2010
sovereign 687,628 687,037 591 - - - - Bank 969,222 967,887 752 583 - - 583 investment Firms 119,855 74,711 - 45,144 7,772 37,372 - Corporates 5,293,315 4,957,434 20,286 315,595 87,825 120,788 106,982 Retail 3,048,414 2,788,510 86,732 173,172 80,770 69,318 23,084
10,118,434 9,475,579 108,361 534,494 176,367 227,478 130,649
b) Credit Risk (continued)Large Credit Exposure (PD - 1.3.23 (f)) The Group follows the CBB’s guidelines with respect to the definition and measurement of large exposures at the consolidated level as stipulated in the CBB Rulebook for Islamic Banks.
There are no large exposures to individual counterparties where the exposure is in excess of the 15% individual obligor limit.
Past due, non-performing Islamic financing contracts and provisions (PD-1.3.22 (a))Past due represents instalments that are not received on the contractual repayments date. The Group considers non-performing Islamic financing contracts as the contracts that are overdue for a period of 90 or more days. These exposures are placed on a non-accrual status with profit being recognised to the extent that it is actually received. It is the Group’s policy that when an exposure is overdue for a period of 90 or more days, the whole financing facility extended is considered as past due, not only overdue instalments/payments.
Table -11. Credit quality of Islamic financing contracts by counterparty type (PD-1.3.23(h), 1.3.24 (b))The following table summarises the total past due, non performing and neither past due nor non performing Islamic financing contracts and aging of non performing Islamic financing contracts disclosed by counterparty type as of 31 December:
AdditionAl pUBliC disClosURes31 deCemBeR 2011 (UnAUdited) 2 RiSK MANAGEMENt (CONTINuED)
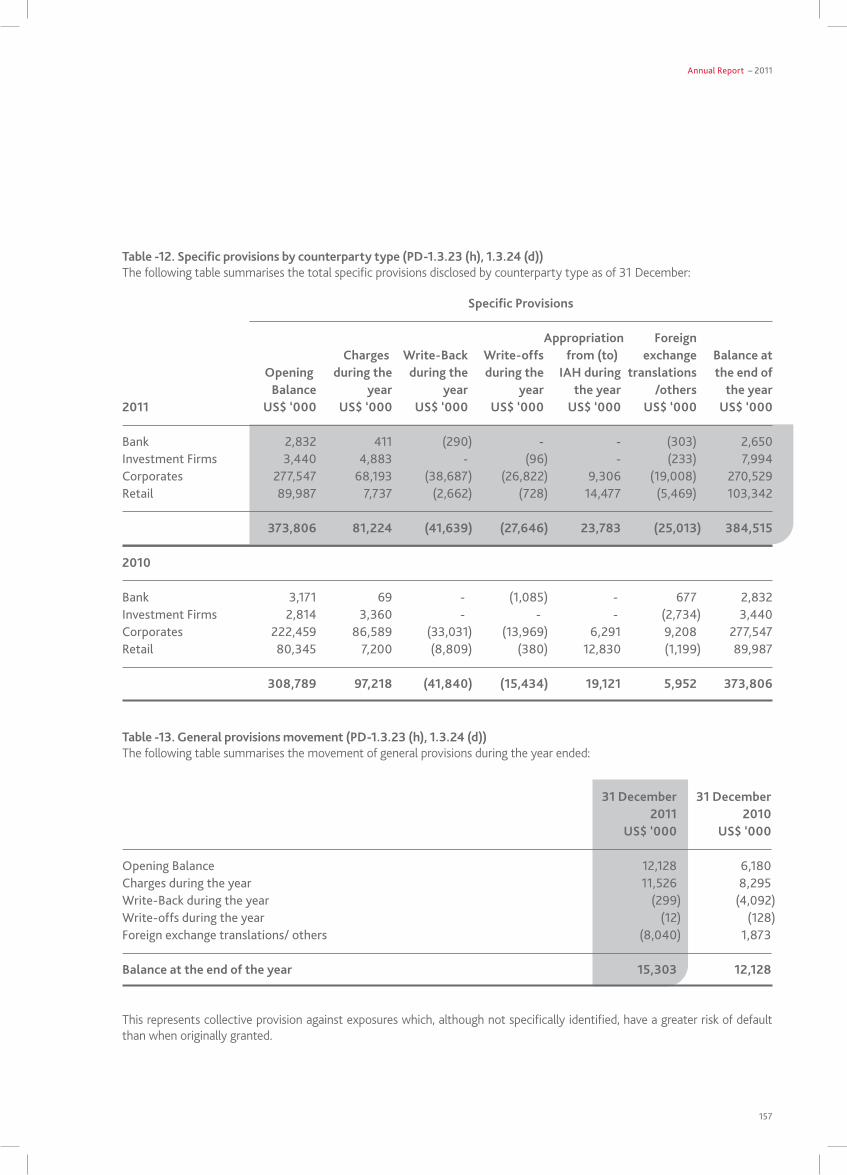
Annual Report – 2011
157
This represents collective provision against exposures which, although not specifically identified, have a greater risk of default than when originally granted.
Specific Provisions
Appropriation Foreign Charges Write-Back Write-offs from (to) exchange Balance at Opening during the during the during the IAH during translations the end of Balance year year year the year /others the year 2011 uS$ ‘000 uS$ ‘000 uS$ ‘000 uS$ ‘000 uS$ ‘000 uS$ ‘000 uS$ ‘000
Bank 2,832 411 (290) - - (303) 2,650investment Firms 3,440 4,883 - (96) - (233) 7,994Corporates 277,547 68,193 (38,687) (26,822) 9,306 (19,008) 270,529Retail 89,987 7,737 (2,662) (728) 14,477 (5,469) 103,342
373,806 81,224 (41,639) (27,646) 23,783 (25,013) 384,515
2010
Bank 3,171 69 - (1,085) - 677 2,832 investment Firms 2,814 3,360 - - - (2,734) 3,440 Corporates 222,459 86,589 (33,031) (13,969) 6,291 9,208 277,547 Retail 80,345 7,200 (8,809) (380) 12,830 (1,199) 89,987
308,789 97,218 (41,840) (15,434) 19,121 5,952 373,806
Table -12. Specific provisions by counterparty type (PD-1.3.23 (h), 1.3.24 (d))The following table summarises the total specific provisions disclosed by counterparty type as of 31 December:
Table -13. General provisions movement (PD-1.3.23 (h), 1.3.24 (d))The following table summarises the movement of general provisions during the year ended:
31 December 31 December 2011 2010 uS$ ‘000 uS$ ‘000
opening Balance 12,128 6,180 Charges during the year 11,526 8,295 Write-Back during the year (299) (4,092)Write-offs during the year (12) (128)Foreign exchange translations/ others (8,040) 1,873
Balance at the end of the year 15,303 12,128
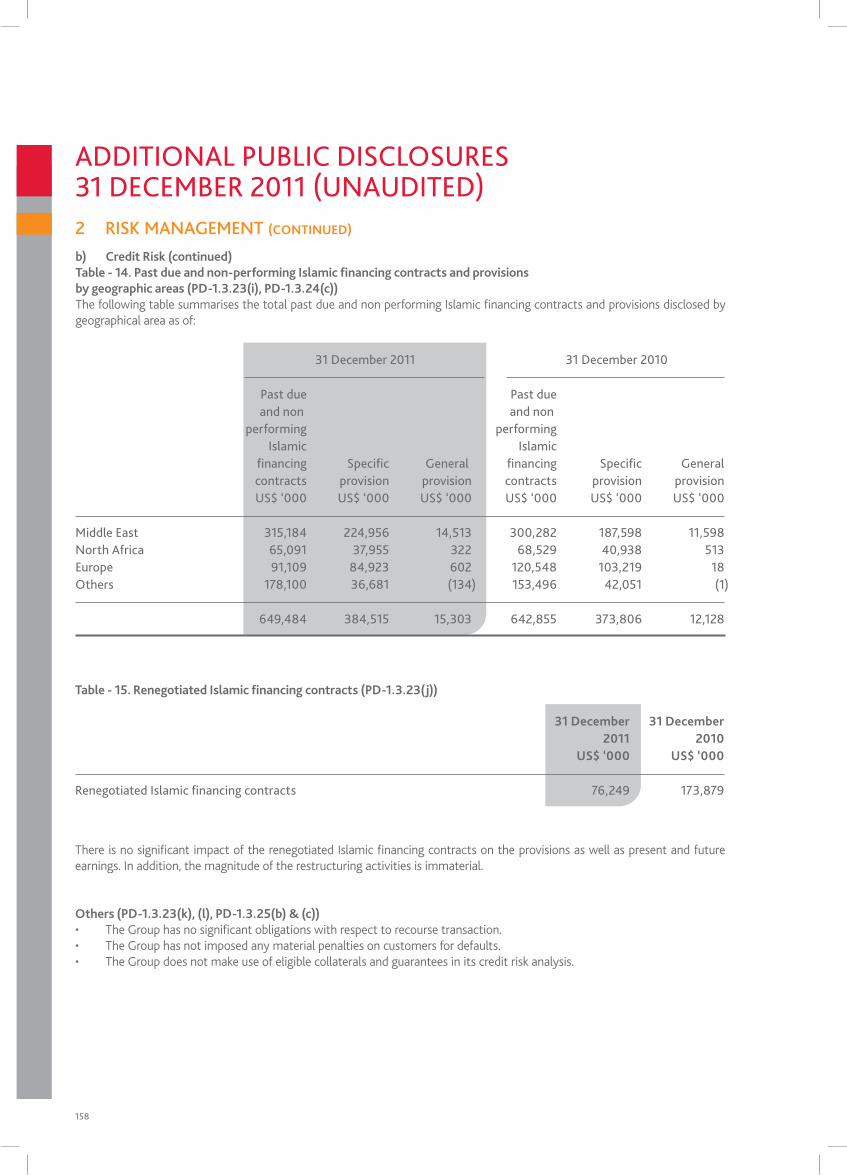
158
b) Credit Risk (continued)Table - 14. Past due and non-performing Islamic financing contracts and provisions by geographic areas (PD-1.3.23(i), PD-1.3.24(c)) The following table summarises the total past due and non performing Islamic financing contracts and provisions disclosed by geographical area as of:
31 december 2011 31 december 2010
past due past due and non and non performing performing islamic islamic financing specific general financing specific general contracts provision provision contracts provision provision Us$ ‘000 Us$ ‘000 Us$ ‘000 Us$ ‘000 Us$ ‘000 Us$ ‘000
middle east 315,184 224,956 14,513 300,282 187,598 11,598 north Africa 65,091 37,955 322 68,529 40,938 513 europe 91,109 84,923 602 120,548 103,219 18 others 178,100 36,681 (134) 153,496 42,051 (1)
649,484 384,515 15,303 642,855 373,806 12,128
AdditionAl pUBliC disClosURes31 deCemBeR 2011 (UnAUdited) 2 RiSK MANAGEMENt (CONTINuED)
Table - 15. Renegotiated Islamic financing contracts (PD-1.3.23(j))
There is no significant impact of the renegotiated Islamic financing contracts on the provisions as well as present and future earnings. In addition, the magnitude of the restructuring activities is immaterial.
Others (PD-1.3.23(k), (l), PD-1.3.25(b) & (c))• The Group has no significant obligations with respect to recourse transaction.• The Group has not imposed any material penalties on customers for defaults. • The Group does not make use of eligible collaterals and guarantees in its credit risk analysis.
31 December 31 December 2011 2010 uS$ ‘000 uS$ ‘000
Renegotiated islamic financing contracts 76,249 173,879
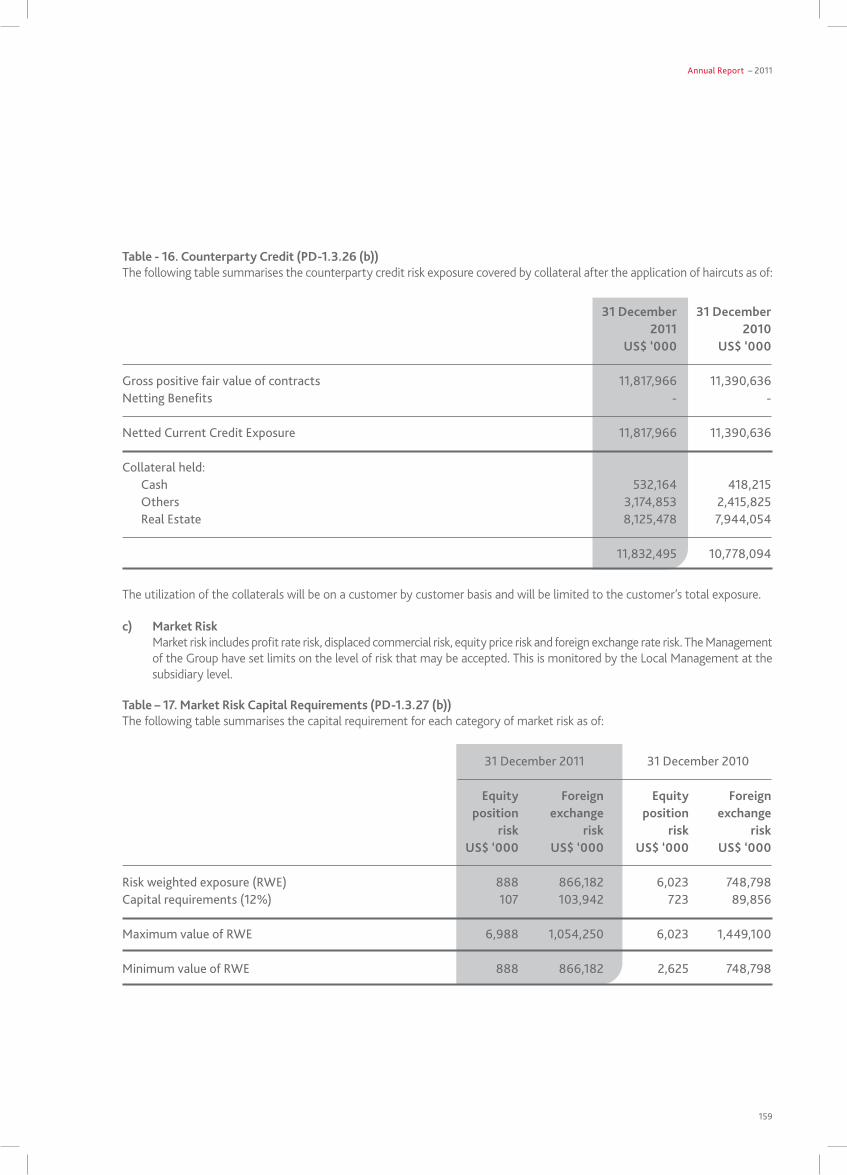
Annual Report – 2011
159
31 December 31 December 2011 2010 uS$ ‘000 uS$ ‘000
gross positive fair value of contracts 11,817,966 11,390,636 netting Benefits - -
netted Current Credit exposure 11,817,966 11,390,636
Collateral held:Cash 532,164 418,215others 3,174,853 2,415,825Real estate 8,125,478 7,944,054
11,832,495 10,778,094
Table - 16. Counterparty Credit (PD-1.3.26 (b))The following table summarises the counterparty credit risk exposure covered by collateral after the application of haircuts as of:
Table – 17. Market Risk Capital Requirements (PD-1.3.27 (b))The following table summarises the capital requirement for each category of market risk as of:
The utilization of the collaterals will be on a customer by customer basis and will be limited to the customer’s total exposure.
c) Market RiskMarket risk includes profit rate risk, displaced commercial risk, equity price risk and foreign exchange rate risk. The Management of the Group have set limits on the level of risk that may be accepted. This is monitored by the local Management at the subsidiary level.
31 december 2011 31 december 2010 Equity Foreign Equity Foreign position exchange position exchange risk risk risk risk uS$ ‘000 uS$ ‘000 uS$ ‘000 uS$ ‘000
Risk weighted exposure (RWe) 888 866,182 6,023 748,798 Capital requirements (12%) 107 103,942 723 89,856
maximum value of RWe 6,988 1,054,250 6,023 1,449,100
minimum value of RWe 888 866,182 2,625 748,798
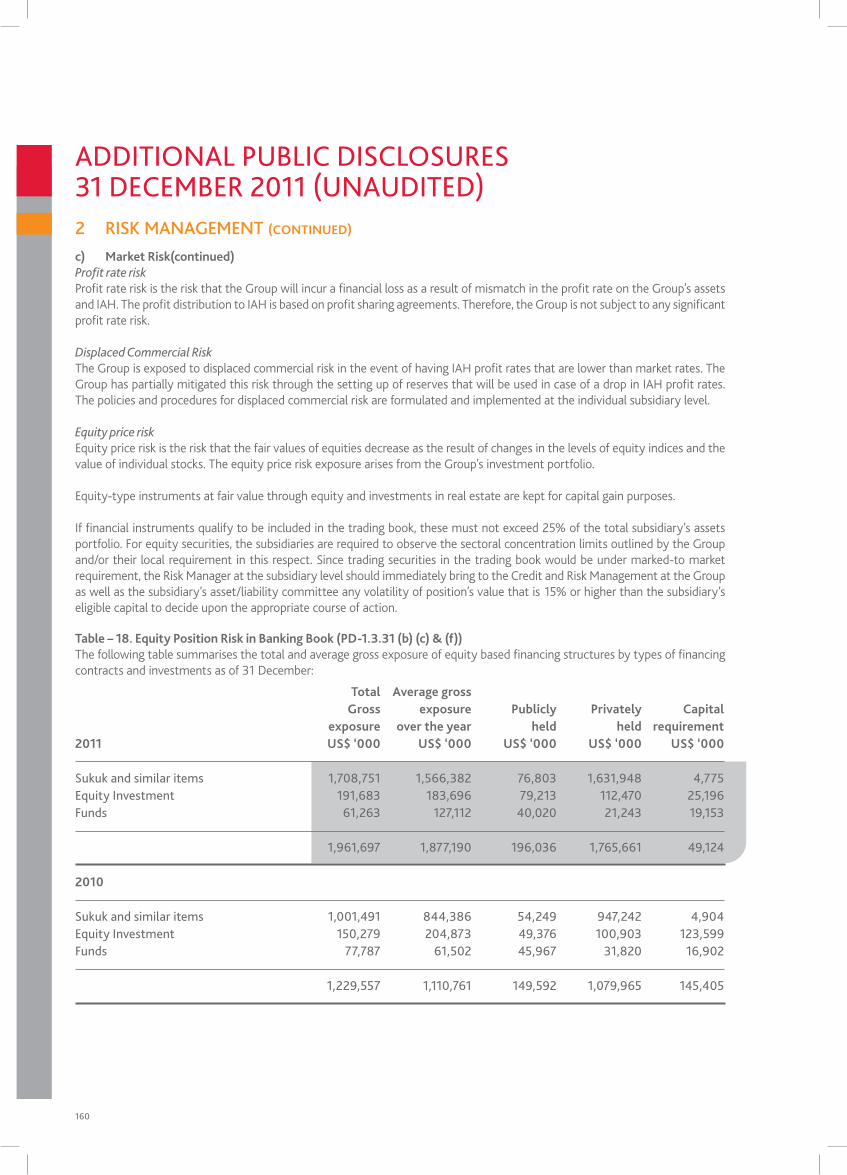
160
c) Market Risk(continued)Profit rate riskProfit rate risk is the risk that the Group will incur a financial loss as a result of mismatch in the profit rate on the Group’s assets and IAH. The profit distribution to IAH is based on profit sharing agreements. Therefore, the Group is not subject to any significant profit rate risk.
Displaced Commercial RiskThe Group is exposed to displaced commercial risk in the event of having IAH profit rates that are lower than market rates. The Group has partially mitigated this risk through the setting up of reserves that will be used in case of a drop in IAH profit rates. The policies and procedures for displaced commercial risk are formulated and implemented at the individual subsidiary level.
Equity price risk Equity price risk is the risk that the fair values of equities decrease as the result of changes in the levels of equity indices and the value of individual stocks. The equity price risk exposure arises from the Group’s investment portfolio.
Equity-type instruments at fair value through equity and investments in real estate are kept for capital gain purposes.
If financial instruments qualify to be included in the trading book, these must not exceed 25% of the total subsidiary’s assets portfolio. For equity securities, the subsidiaries are required to observe the sectoral concentration limits outlined by the Group and/or their local requirement in this respect. Since trading securities in the trading book would be under marked-to market requirement, the Risk Manager at the subsidiary level should immediately bring to the Credit and Risk Management at the Group as well as the subsidiary’s asset/liability committee any volatility of position’s value that is 15% or higher than the subsidiary’s eligible capital to decide upon the appropriate course of action.
AdditionAl pUBliC disClosURes31 deCemBeR 2011 (UnAUdited) 2 RiSK MANAGEMENt (CONTINuED)
Total Average gross Gross exposure Publicly Privately Capital exposure over the year held held requirement2011 uS$ ‘000 uS$ ‘000 uS$ ‘000 uS$ ‘000 uS$ ‘000
sukuk and similar items 1,708,751 1,566,382 76,803 1,631,948 4,775equity investment 191,683 183,696 79,213 112,470 25,196Funds 61,263 127,112 40,020 21,243 19,153
1,961,697 1,877,190 196,036 1,765,661 49,124
2010
sukuk and similar items 1,001,491 844,386 54,249 947,242 4,904 equity investment 150,279 204,873 49,376 100,903 123,599 Funds 77,787 61,502 45,967 31,820 16,902
1,229,557 1,110,761 149,592 1,079,965 145,405
Table – 18. Equity Position Risk in Banking Book (PD-1.3.31 (b) (c) & (f))The following table summarises the total and average gross exposure of equity based financing structures by types of financing contracts and investments as of 31 December:
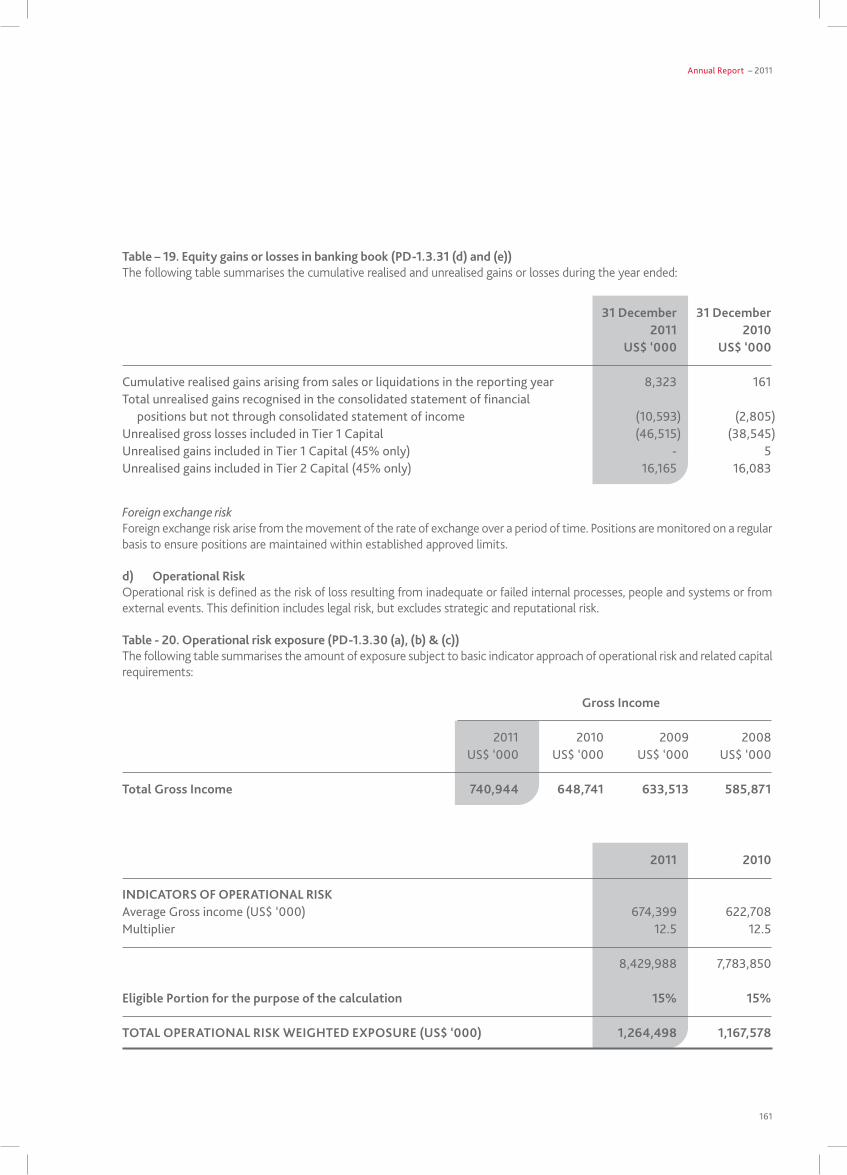
Annual Report – 2011
161
Foreign exchange risk Foreign exchange risk arise from the movement of the rate of exchange over a period of time. Positions are monitored on a regular basis to ensure positions are maintained within established approved limits.
d) Operational Risk Operational risk is defined as the risk of loss resulting from inadequate or failed internal processes, people and systems or from external events. This definition includes legal risk, but excludes strategic and reputational risk.
Table - 20. Operational risk exposure (PD-1.3.30 (a), (b) & (c))The following table summarises the amount of exposure subject to basic indicator approach of operational risk and related capital requirements:
Table – 19. Equity gains or losses in banking book (PD-1.3.31 (d) and (e))The following table summarises the cumulative realised and unrealised gains or losses during the year ended:
31 December 31 December 2011 2010 uS$ ‘000 uS$ ‘000
Cumulative realised gains arising from sales or liquidations in the reporting year 8,323 161 total unrealised gains recognised in the consolidated statement of financial positions but not through consolidated statement of income (10,593) (2,805)Unrealised gross losses included in tier 1 Capital (46,515) (38,545) Unrealised gains included in tier 1 Capital (45% only) - 5Unrealised gains included in tier 2 Capital (45% only) 16,165 16,083
Gross Income 2011 2010 2009 2008 Us$ ‘000 Us$ ‘000 Us$ ‘000 Us$ ‘000
Total Gross Income 740,944 648,741 633,513 585,871
2011 2010
INDICATORS OF OPERATIONAL RISK Average gross income (Us$ ‘000) 674,399 622,708 multiplier 12.5 12.5
8,429,988 7,783,850
Eligible Portion for the purpose of the calculation 15% 15%
TOTAL OPERATIONAL RISK WEIGHTED EXPOSuRE (uS$ ‘000) 1,264,498 1,167,578
162
d) Operational Risk (continued)The Group has no material legal contingencies including pending legal action.
The Group guidelines have the following sections: (1) Operational Risk Appetite, (2) Operational Risk Management – Structure and Rules (3) Risk and Control Assessment (4) Internal Audit (5) Operational Risk and Basel II and (6) Operational Risk Capital Requirement.
The Group’s Operational Risk Appetite is defined as the level of risk which the Group chooses to accept in its identified risk categories. Operational risk appetite is expressed in terms of both impact (direct loss) and the probability of occurrence.
The Group’s policy also lays out the Operational Risk Management structure and the roles of all staff associated with operational risk. The major functional roles are defined for:• Risk Management Committee• Head of Credit and Risk Management• Head of Operational, liquidity and Market Risk• various departments
The Risk Control Self Assessment exercise is viewed as an important part of the Group’s Operational Risk Framework. It is proposed to be conducted every year by the Risk Management Department in coordination with the Internal Audit Department. In addition, the assessment shall also be based on the severity of the residual risks identified through Internal Audit reviews.
The Key processes identified in a Risk Control Self Assessment are:• Risk and Control Identification Process• Measurement of Operational Risk Exposures• Identifying Unacceptable Risk Exposures• Risk Action Plans.
The Operational Risk framework will be subject to periodic internal audit.
3 CORPORATE GOVERNANCE
Board of DirectorsCode of business conduct and ethics for members of the board of directors:
PurposeThe primary objectives of the following Code of Business Conduct and Ethics (the “Code”) is to enable each Director to focus on areas of ethical risks, to help him/her to recognise and deal with ethical issues, to provide mechanisms for reporting unethical conduct, and to foster a culture of honesty and accountability within the Group.
Conflict of interestEach Director must avoid any situation which may give rise to a conflict between their interests and those of the Group. Any situation which either will or may involve, a conflict of interest should be disclosed promptly to the Board of Directors in writing in advance of the meeting or verbally in the meeting itself. The concerned Director shall abstain from any discussion or decision on the matter of question. A conflict of interest can occur when a Director’s personal interest is adverse to, or appears to be adverse to the interests of the Group. Conflicts of interest also arise when a Director, or a member of their immediate family, receives an improper personal benefit as a result of their position as a Director of the Group. Common conflicts which Directors must endeavour to avoid include, but are not limited to, the following:
1. Engagement in any conduct or activity which may conflict with the best interests of the Group, or which may disrupt or impair Group’s standing with any person or entity with whom or which the Group has to proposes to enter into a business or contractual relationship.
AdditionAl pUBliC disClosURes31 deCemBeR 2011 (UnAUdited) 2 RiSK MANAGEMENt (CONTINuED)
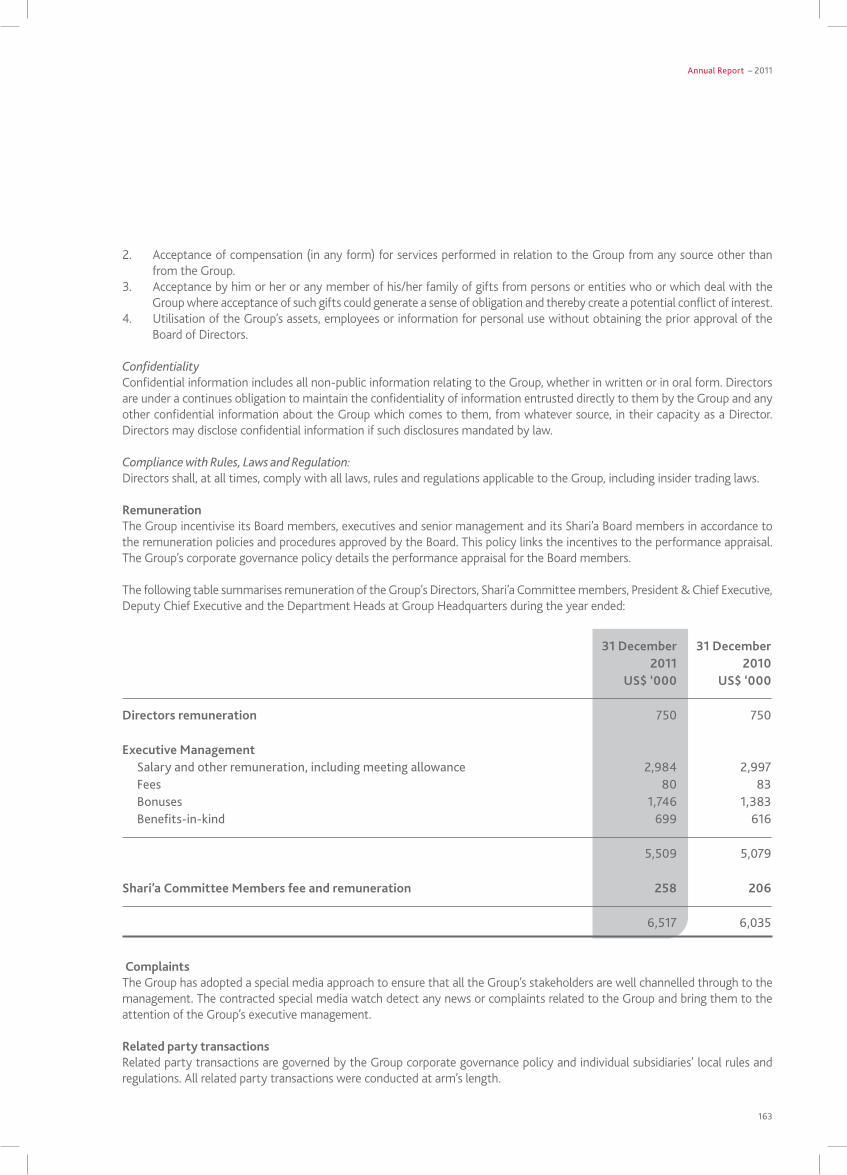
Annual Report – 2011
163
2. Acceptance of compensation (in any form) for services performed in relation to the Group from any source other than from the Group.
3. Acceptance by him or her or any member of his/her family of gifts from persons or entities who or which deal with the Group where acceptance of such gifts could generate a sense of obligation and thereby create a potential conflict of interest.
4. Utilisation of the Group’s assets, employees or information for personal use without obtaining the prior approval of the Board of Directors.
ConfidentialityConfidential information includes all non-public information relating to the Group, whether in written or in oral form. Directors are under a continues obligation to maintain the confidentiality of information entrusted directly to them by the Group and any other confidential information about the Group which comes to them, from whatever source, in their capacity as a Director. Directors may disclose confidential information if such disclosures mandated by law.
Compliance with Rules, Laws and Regulation: Directors shall, at all times, comply with all laws, rules and regulations applicable to the Group, including insider trading laws.
Remuneration The Group incentivise its Board members, executives and senior management and its Shari’a Board members in accordance to the remuneration policies and procedures approved by the Board. This policy links the incentives to the performance appraisal. The Group’s corporate governance policy details the performance appraisal for the Board members.
The following table summarises remuneration of the Group’s Directors, Shari’a Committee members, President & Chief Executive, Deputy Chief Executive and the Department Heads at Group Headquarters during the year ended:
31 December 31 December 2011 2010 uS$ ‘000 uS$ ‘000
Directors remuneration 750 750
Executive Management salary and other remuneration, including meeting allowance 2,984 2,997 Fees 80 83 Bonuses 1,746 1,383 Benefits-in-kind 699 616
5,509 5,079
Shari’a Committee Members fee and remuneration 258 206
6,517 6,035
ComplaintsThe Group has adopted a special media approach to ensure that all the Group’s stakeholders are well channelled through to the management. The contracted special media watch detect any news or complaints related to the Group and bring them to the attention of the Group’s executive management.
Related party transactionsRelated party transactions are governed by the Group corporate governance policy and individual subsidiaries’ local rules and regulations. All related party transactions were conducted at arm’s length.
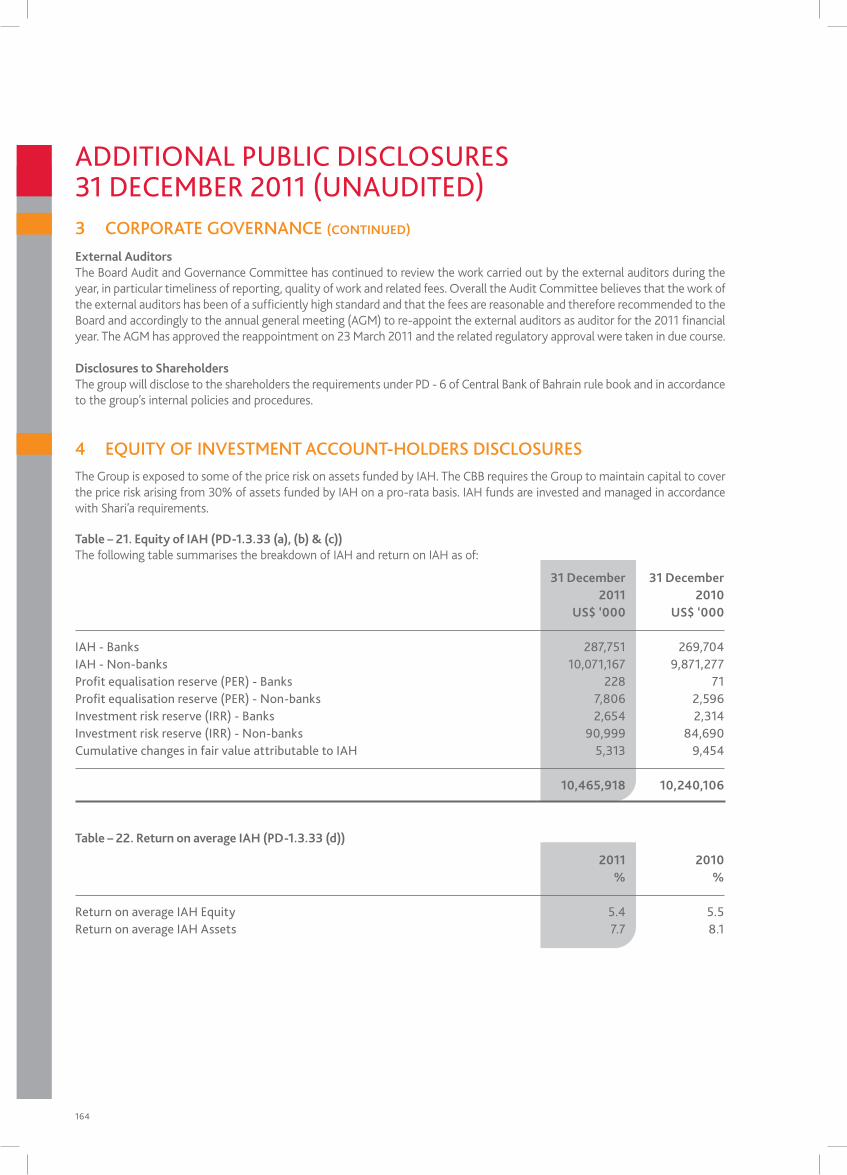
164
External Auditors The Board Audit and Governance Committee has continued to review the work carried out by the external auditors during the year, in particular timeliness of reporting, quality of work and related fees. Overall the Audit Committee believes that the work of the external auditors has been of a sufficiently high standard and that the fees are reasonable and therefore recommended to the Board and accordingly to the annual general meeting (AGM) to re-appoint the external auditors as auditor for the 2011 financial year. The AGM has approved the reappointment on 23 March 2011 and the related regulatory approval were taken in due course.
Disclosures to ShareholdersThe group will disclose to the shareholders the requirements under PD - 6 of Central Bank of Bahrain rule book and in accordance to the group’s internal policies and procedures.
3 CORPORATE GOVERNANCE (CONTINuED)
AdditionAl pUBliC disClosURes31 deCemBeR 2011 (UnAUdited)
31 December 31 December 2011 2010 uS$ ‘000 uS$ ‘000
iAH - Banks 287,751 269,704 iAH - non-banks 10,071,167 9,871,277 profit equalisation reserve (peR) - Banks 228 71 profit equalisation reserve (peR) - non-banks 7,806 2,596 investment risk reserve (iRR) - Banks 2,654 2,314 investment risk reserve (iRR) - non-banks 90,999 84,690 Cumulative changes in fair value attributable to iAH 5,313 9,454
10,465,918 10,240,106
Table – 21. Equity of IAH (PD-1.3.33 (a), (b) & (c))The following table summarises the breakdown of IAH and return on IAH as of:
The Group is exposed to some of the price risk on assets funded by IAH. The CBB requires the Group to maintain capital to cover the price risk arising from 30% of assets funded by IAH on a pro-rata basis. IAH funds are invested and managed in accordance with Shari’a requirements.
4 EQUITY OF INVESTMENT ACCOUNT-HOLDERS DISCLOSURES
2011 2010 % %
Return on average iAH equity 5.4 5.5Return on average iAH Assets 7.7 8.1
Table – 22. Return on average IAH (PD-1.3.33 (d))
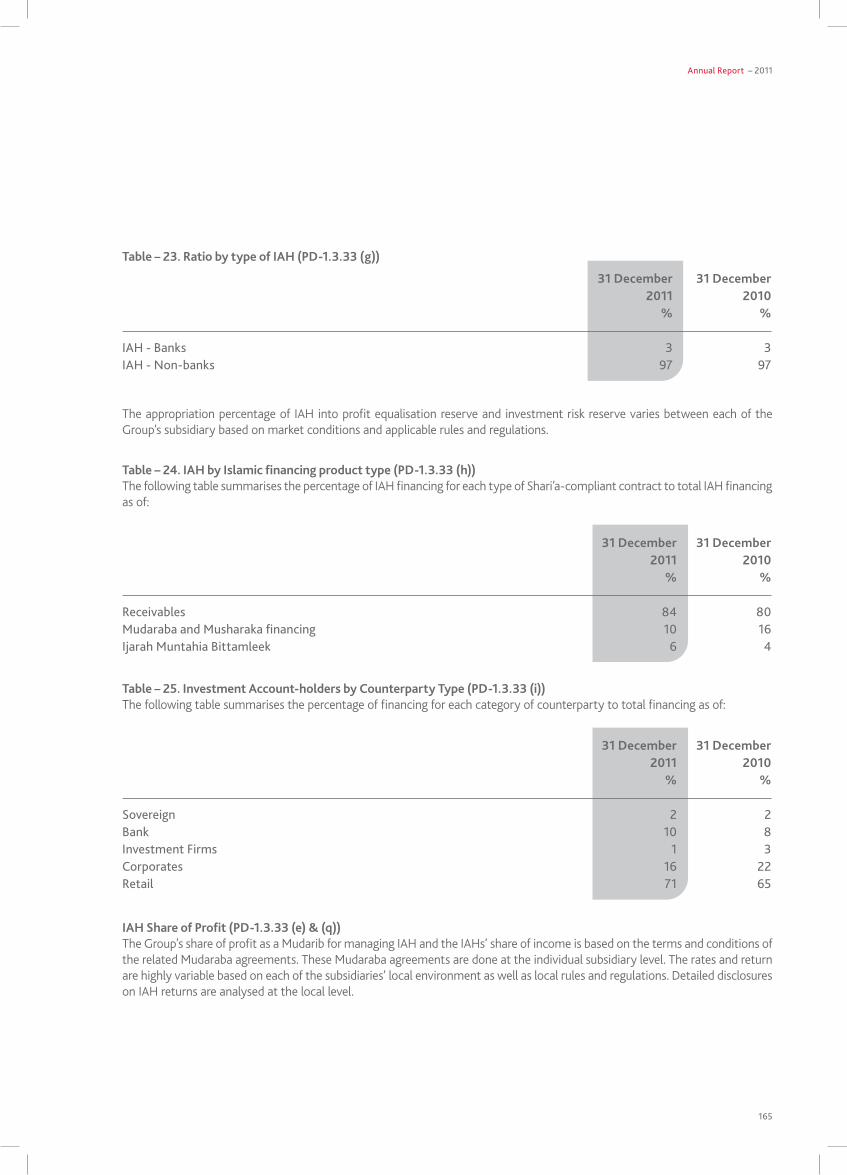
Annual Report – 2011
165
The appropriation percentage of IAH into profit equalisation reserve and investment risk reserve varies between each of the Group’s subsidiary based on market conditions and applicable rules and regulations.
31 December 31 December 2011 2010 % %
iAH - Banks 3 3 iAH - non-banks 97 97
Table – 23. Ratio by type of IAH (PD-1.3.33 (g))
31 December 31 December 2011 2010 % %
Receivables 84 80 mudaraba and musharaka financing 10 16 ijarah muntahia Bittamleek 6 4
Table – 24. IAH by Islamic financing product type (PD-1.3.33 (h))The following table summarises the percentage of IAH financing for each type of Shari’a-compliant contract to total IAH financing as of:
31 December 31 December 2011 2010 % %
sovereign 2 2 Bank 10 8 investment Firms 1 3 Corporates 16 22 Retail 71 65
Table – 25. Investment Account-holders by Counterparty Type (PD-1.3.33 (i))The following table summarises the percentage of financing for each category of counterparty to total financing as of:
IAH Share of Profit (PD-1.3.33 (e) & (q))The Group’s share of profit as a Mudarib for managing IAH and the IAHs’ share of income is based on the terms and conditions of the related Mudaraba agreements. These Mudaraba agreements are done at the individual subsidiary level. The rates and return are highly variable based on each of the subsidiaries’ local environment as well as local rules and regulations. Detailed disclosures on IAH returns are analysed at the local level.
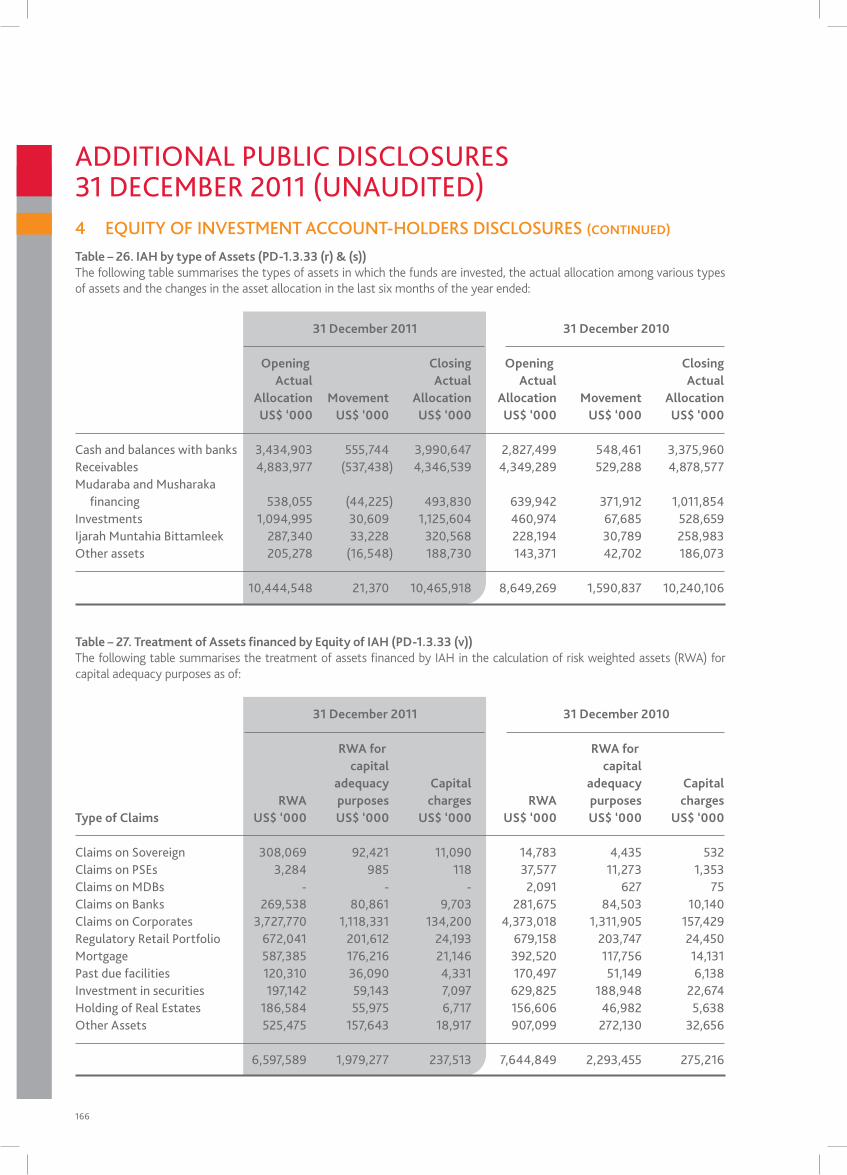
166
AdditionAl pUBliC disClosURes31 deCemBeR 2011 (UnAUdited) 4 EQUITY OF INVESTMENT ACCOUNT-HOLDERS DISCLOSURES (CONTINuED)
31 December 2011 31 December 2010
Opening Closing Opening Closing Actual Actual Actual Actual Allocation Movement Allocation Allocation Movement Allocation uS$ ‘000 uS$ ‘000 uS$ ‘000 uS$ ‘000 uS$ ‘000 uS$ ‘000
Cash and balances with banks 3,434,903 555,744 3,990,647 2,827,499 548,461 3,375,960 Receivables 4,883,977 (537,438) 4,346,539 4,349,289 529,288 4,878,577 mudaraba and musharaka financing 538,055 (44,225) 493,830 639,942 371,912 1,011,854 investments 1,094,995 30,609 1,125,604 460,974 67,685 528,659 ijarah muntahia Bittamleek 287,340 33,228 320,568 228,194 30,789 258,983 other assets 205,278 (16,548) 188,730 143,371 42,702 186,073
10,444,548 21,370 10,465,918 8,649,269 1,590,837 10,240,106
Table – 27. Treatment of Assets financed by Equity of IAH (PD-1.3.33 (v))The following table summarises the treatment of assets financed by IAH in the calculation of risk weighted assets (RwA) for capital adequacy purposes as of:
31 December 2011 31 December 2010
RWA for RWA for capital capital adequacy Capital adequacy Capital RWA purposes charges RWA purposes chargesType of Claims uS$ ‘000 uS$ ‘000 uS$ ‘000 uS$ ‘000 uS$ ‘000 uS$ ‘000 Claims on sovereign 308,069 92,421 11,090 14,783 4,435 532 Claims on pses 3,284 985 118 37,577 11,273 1,353 Claims on mdBs - - - 2,091 627 75 Claims on Banks 269,538 80,861 9,703 281,675 84,503 10,140 Claims on Corporates 3,727,770 1,118,331 134,200 4,373,018 1,311,905 157,429 Regulatory Retail portfolio 672,041 201,612 24,193 679,158 203,747 24,450 mortgage 587,385 176,216 21,146 392,520 117,756 14,131 past due facilities 120,310 36,090 4,331 170,497 51,149 6,138 investment in securities 197,142 59,143 7,097 629,825 188,948 22,674 Holding of Real estates 186,584 55,975 6,717 156,606 46,982 5,638 other Assets 525,475 157,643 18,917 907,099 272,130 32,656 6,597,589 1,979,277 237,513 7,644,849 2,293,455 275,216
Table – 26. IAH by type of Assets (PD-1.3.33 (r) & (s))The following table summarises the types of assets in which the funds are invested, the actual allocation among various types of assets and the changes in the asset allocation in the last six months of the year ended:
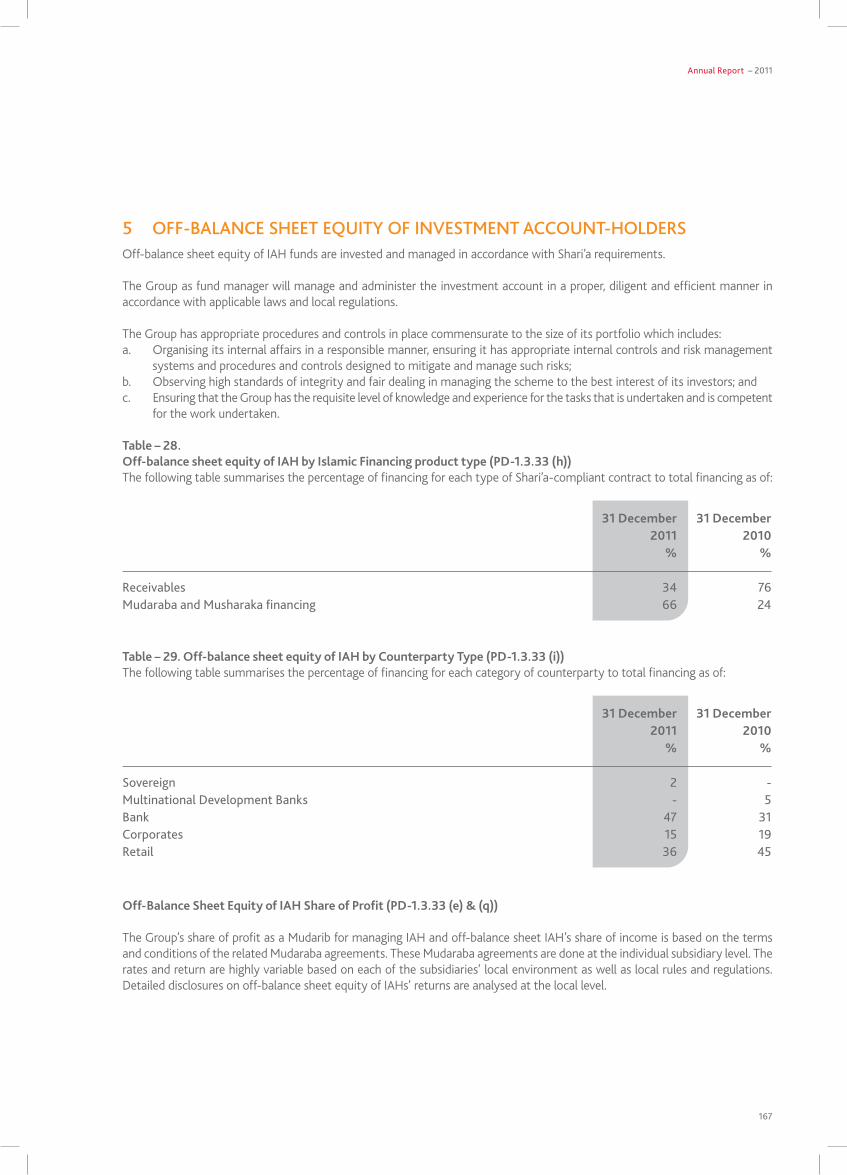
Annual Report – 2011
167
31 December 31 December 2011 2010 % %
Receivables 34 76 mudaraba and musharaka financing 66 24
31 December 31 December 2011 2010 % %
sovereign 2 -multinational development Banks - 5 Bank 47 31 Corporates 15 19 Retail 36 45
Table – 29. Off-balance sheet equity of IAH by Counterparty Type (PD-1.3.33 (i))The following table summarises the percentage of financing for each category of counterparty to total financing as of:
Off-Balance Sheet Equity of IAH Share of Profit (PD-1.3.33 (e) & (q))
The Group’s share of profit as a Mudarib for managing IAH and off-balance sheet IAH’s share of income is based on the terms and conditions of the related Mudaraba agreements. These Mudaraba agreements are done at the individual subsidiary level. The rates and return are highly variable based on each of the subsidiaries’ local environment as well as local rules and regulations. Detailed disclosures on off-balance sheet equity of IAHs’ returns are analysed at the local level.
5 OFF-BALANCE SHEET EQUITY OF INVESTMENT ACCOUNT-HOLDERSOff-balance sheet equity of IAH funds are invested and managed in accordance with Shari’a requirements.
The Group as fund manager will manage and administer the investment account in a proper, diligent and efficient manner in accordance with applicable laws and local regulations.
The Group has appropriate procedures and controls in place commensurate to the size of its portfolio which includes:a. Organising its internal affairs in a responsible manner, ensuring it has appropriate internal controls and risk management
systems and procedures and controls designed to mitigate and manage such risks;b. Observing high standards of integrity and fair dealing in managing the scheme to the best interest of its investors; andc. Ensuring that the Group has the requisite level of knowledge and experience for the tasks that is undertaken and is competent
for the work undertaken.
Table – 28. Off-balance sheet equity of IAH by Islamic Financing product type (PD-1.3.33 (h))The following table summarises the percentage of financing for each type of Shari’a-compliant contract to total financing as of:
NEw HEAD QUARTERS
169
Annual Report – 2011
170
Al Baraka Türk Participation Bank
ADDRESS: Saray Mahallesi , Dr. Adnan Büyükdeniz Caddesi, No: 6, Ümraniye, Istanbul, Turkey
TEl: +90 216 666 01 01FAx: +90 216 666 16 00 albarakaturk.com.tr
Jordan Islamic Bank
ADDRESS: P.O. Box 926225, Amman 11190, Jordan
TEl: + 9626 567 7377FAx: + 9626 566 6326 jordanislamicbank.com
Al Baraka Bank Egypt
ADDRESS: 60, Mohie Elddin Abu Elezz Street, P.O. Box 455, Dokki, Giza, Egypt
TEl: +2023 748 1222FAx: +2023 761 1436/7 albaraka-bank.com.eg
Banque Al Baraka D’Algerie S.P.A.
ADDRESS: Hai Bouteldja Houidef, Villa No.1, Rocade Sud, Ben Aknoun, Algiers, Algeria
TEl: +213 21 91 64 50 to 55FAx: +213 21 91 64 58 albaraka-bank.com
Al Baraka Islamic Bank B.S.C. - Bahrain
ADDRESS: Al Baraka Tower, P.O. Box 1882, Manama, Kingdom of Bahrain
TEl: +973 17 535 300FAx: +973 17 533 993 barakaonline.com
Al BARAkA gloBAl netWoRk
Annual Report – 2011
171
Al Baraka Bank (Pakistan) Limited
ADDRESS: 162, Bangalore Town, Main Shahrah-e-Faisal, Karachi, Pakistan
TEl: +92 21 34315851FAx: +92 21 34546465 albaraka.com.pk
Al Baraka Bank Tunisia
ADDRESS: 88, Avenue Hedi Chaker 1002, Tunis, Tunisia
TEl: +21671 790000FAx: +21671 780235 albarakabank.com.tn
Al Baraka Bank Sudan
ADDRESS: AL Baraka Tower, P.O. Box 3583, Qasr ST, Khartoum, Sudan
TEl: +249183 780 688FAx: +249183 788 585 albaraka.com.sd
Al Baraka Bank Limited - South Africa
ADDRESS: 2 Kingsmead Boulevard, Kingsmead Office Park, Stalwart Simelane Street, Durban 4001, South Africa
TEl: +2731 364 9000FAx: +2731 364 9001 albaraka.co.za
Al Baraka Bank Lebanon S.A.L
ADDRESS: 2nd Floor, Center Verdan 2000, Rashid Karameh Street, Verdan, Beirut, Lebanon
TEl: +9611 808008FAx: +9611 806499 al-baraka.com
172
Al Baraka Banking Group, Representative Office, Libya (Under formation)
ADDRESS: Office No. 144, 14th Floor, Tower 1, Tripoli Tower, P.O. Box 93271, Tripoli, Libya
TEl: +218 (21) 336 2310 +218 (21) 336 2311FAx: +218 (21) 336 2312 albarakalibya.com.ly
Al Baraka Banking Group, Representative Office, Indonesia
ADDRESS: Ravindo Building, 10th Floor, Jalan Kebon Sirih, No. 75, Jakarta Pusat 10340, Indonesia
TEl: +62 21 316 1345FAx: +62 21 316 1074 albaraka.com
Al Baraka Bank Syria s.a.
ADDRESS: Alshahbander Street, P.O. Box 100, Damascus, Syria
TEl: +963 11 443 78 20FAx: +963 11 443 78 10 albarakasyria.com
Al BARAkA gloBAl netWoRk (ContinUed)

Annual Report – 2011
173
Al Baraka Banking Group (B.S.C.)Baraka Tower, Building No. 238Road No. 1704, Block No. 317, Diplomatic AreaP.O. Box 1882, ManamaKingdom of BahrainTel: +973 17541122Fax: +973 17536533C.R.: 48915
albaraka.com(licensed as an Islamic wholesale Bank by CBB)
Bahrain Shares Registering Company W.L.L.Hedaya House 2, Government AvenuePO Box 514, ManamaKingdom of BahrainTel: +973-17215080 Fax: +973-17212055
Email: [email protected]
Investors’ Relations:Mr. Ahmed AbdulGhaffarvice President - Investors RelationsAl Baraka Banking GroupKingdom of BahrainTel: +973 17520701 / 17541122Fax: +973 17910911 / 17531074
Email: [email protected]

albaraka.com


![Baraka [amigos]](https://img.pdfslide.net/doc/110x75/568c503b1a28ab4916ae7c14/baraka-amigos.jpg)