Embed Size (px)
Citation preview

ANNUAL REPORT 2011
WO R KI N G TOG E TH ER FO R LO N G ER , H E ALTH I ER , HAPPI ER L IVE S

201 1 H I G H LIG HTS
Group underlyinG surplus before tax (up 20%)
£559.0m5 year record
net assets (up 1%)
£4.4bn5 year record
Throughout the Annual Report and Accounts: underlying surplus before taxation expense excludes non-recurring items (mainly adjustments relating to amortisation of other intangible assets arising on business combinations, impairment of goodwill and other intangible assets, profit / (loss) on sale of businesses and assets, the impact of property revaluations, realised and unrealised foreign exchange gains and losses, and the absolute return on return seeking assets).
cONTE NTS
Group revenues (up 6%)
£8.0bn5 year record
business review02 Bupa around the world 03 Chairman’s statement 04 Chief Executive’s review
06 Corporate strategy 08 Working together
case studies
16 Divisional review24 Group Finance
Director’s report
28 Sustainability 32 Our people34 Risks and uncertainties
Governance38 Directors40 Report of the
Board of Directors
41 Corporate governance statement
45 Remuneration report 48 Statement of Directors’ responsibilities
financial statements50 Independent Auditors’
report51 Financial statements 111 Five year financial
summary112 International Financial
Reporting Standards relevant to Bupa
surplus by seGment*
£283.4m International Markets
£141.7m Europe and North America
£146.7m care Services
Group revenues by seGment
£3,874.3m International Markets
£2,933.7m Europe and North America
£1,203.7m care Services
37%
48% 49%15% 26%
* Surplus by segment refers to surplus for reportable segment.
Group carbon footprintTonnes of Carbon Dioxide equivalent (tCO2e)
care services
total Group, including care services
07 £3,363.9m07 £374.2m07 £4,545.4m
08 £3,624.5m08 £413.4m08 £5,923.9m
09 £3,985.9m09 £428.2m09 £6,941.4m
10 £4,396.1m10 £464.9m10 £7,576.0m
11 £4,443.9m11 £559.0m11 £8,018.1m
07 £3,363.9m07 £374.2m07 £4,545.4m
08 £3,624.5m08 £413.4m08 £5,923.9m
09 £3,985.9m09 £428.2m09 £6,941.4m
10 £4,396.1m10 £464.9m10 £7,576.0m
11 £4,443.9m11 £559.0m11 £8,018.1m
07 £3,363.9m07 £374.2m07 £4,545.4m
08 £3,624.5m08 £413.4m08 £5,923.9m
09 £3,985.9m09 £428.2m09 £6,941.4m
10 £4,396.1m10 £464.9m10 £7,576.0m
11 £4,443.9m11 £559.0m11 £8,018.1m
197,324
142,739
200
9
192,819
140,751
2010
188,144
129,69620
11
25%

As a leading international healthcare group, Bupa offers personal and company-financed health insurance, runs hospitals, and provides workplace healthcare, health assessments and chronic disease management services. We are also a major international provider of nursing and residential care for the elderly.
With no shareholders, we reinvest our surplus to provide more and better healthcare. We are committed to making quality, patient-centred, affordable healthcare more accessible in the areas of funding, wellness, chronic disease management and ageing.
Bupa employs over 52,000 people in operations around the world, principally in the UK, Australia, Spain, New Zealand and the USA, as well as Saudi Arabia, Hong Kong, India, Thailand, china and across Latin America.
B U PA IS d Ed Ic ATEd TO WO R KI N GWITH I N d IV I d UAL S , B US I N E S S E S , PU B LI c H E ALTH SySTEM S AN d H E ALTH c AR E PRO FE S S IO NAL S TO H ELP PEO PLE L IVE LO N G ER , H E ALTH I ER , HAPP I ER L IVE S .
Bupa Annual Report 2011 01
FIN
AN
CIA
L S
TA
TE
ME
NT
SG
OV
ER
NA
NC
EB
US
INE
SS
RE
VIE
W
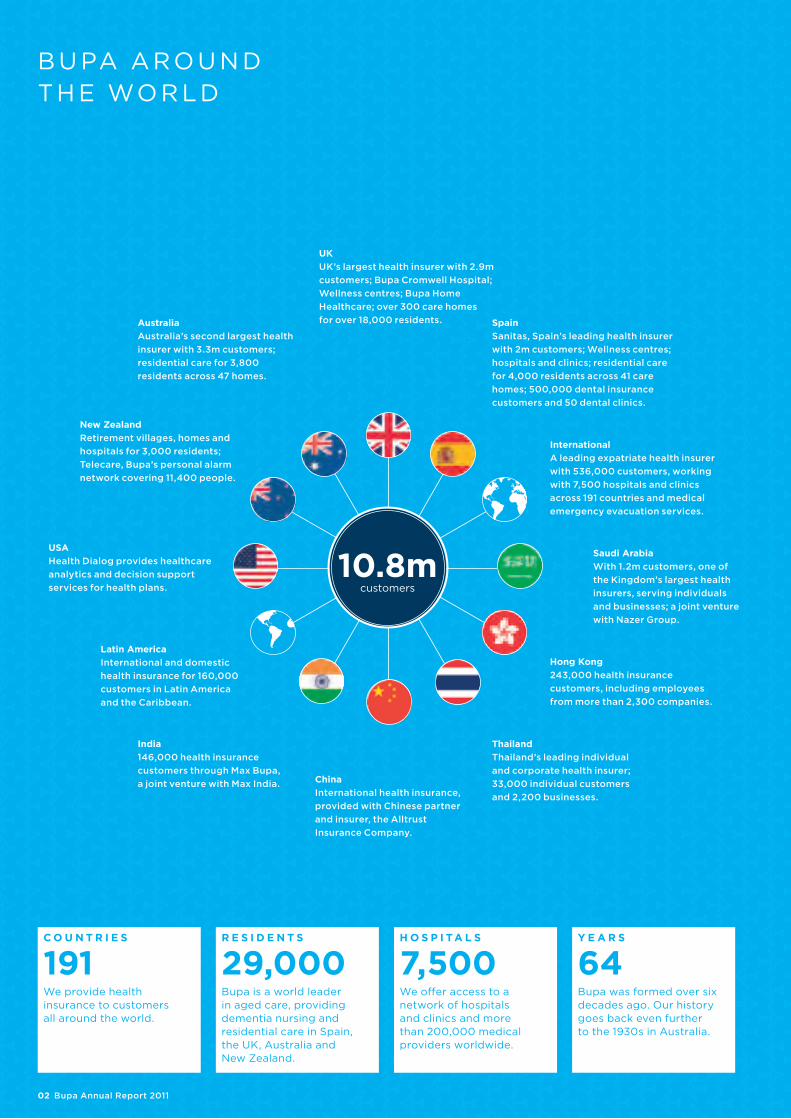
10.8m customers
B U PA ARO U N d TH E WO R Ld
c o u n t r i e s
191We provide health insurance to customers all around the world.
r e s i d e n t s
29,000 Bupa is a world leader in aged care, providing dementia nursing and residential care in Spain, the UK, Australia and New Zealand.
h o s p i ta l s
7,500We offer access to a network of hospitals and clinics and more than 200,000 medical providers worldwide.
y e a r s
64 Bupa was formed over six decades ago. Our history goes back even further to the 1930s in Australia.
hong Kong243,000 health insurance customers, including employees from more than 2,300 companies.
saudi arabia With 1.2m customers, one of the Kingdom’s largest health insurers, serving individuals and businesses; a joint venture with Nazer Group.
spainSanitas, Spain’s leading health insurer with 2m customers; Wellness centres; hospitals and clinics; residential care for 4,000 residents across 41 care homes; 500,000 dental insurance customers and 50 dental clinics.
new ZealandRetirement villages, homes and hospitals for 3,000 residents; Telecare, Bupa’s personal alarm network covering 11,400 people.
australiaAustralia’s second largest health insurer with 3.3m customers; residential care for 3,800 residents across 47 homes.
international A leading expatriate health insurer with 536,000 customers, working with 7,500 hospitals and clinics across 191 countries and medical emergency evacuation services.
usaHealth Dialog provides healthcare analytics and decision support services for health plans.
latin americaInternational and domestic health insurance for 160,000 customers in Latin America and the Caribbean.
uK UK’s largest health insurer with 2.9m customers; Bupa Cromwell Hospital; Wellness centres; Bupa Home Healthcare; over 300 care homes for over 18,000 residents.
india146,000 health insurance customers through Max Bupa, a joint venture with Max India. china
International health insurance, provided with Chinese partner and insurer, the Alltrust Insurance Company.
thailandThailand’s leading individual and corporate health insurer; 33,000 individual customers and 2,200 businesses.
02 Bupa Annual Report 2011
2011 saw a continuing divergence in the world economy. sovereign debt crises and slow growth continued to stifle markets in europe and north america. by contrast, asia, australasia and key latin american economies maintained steady growth.
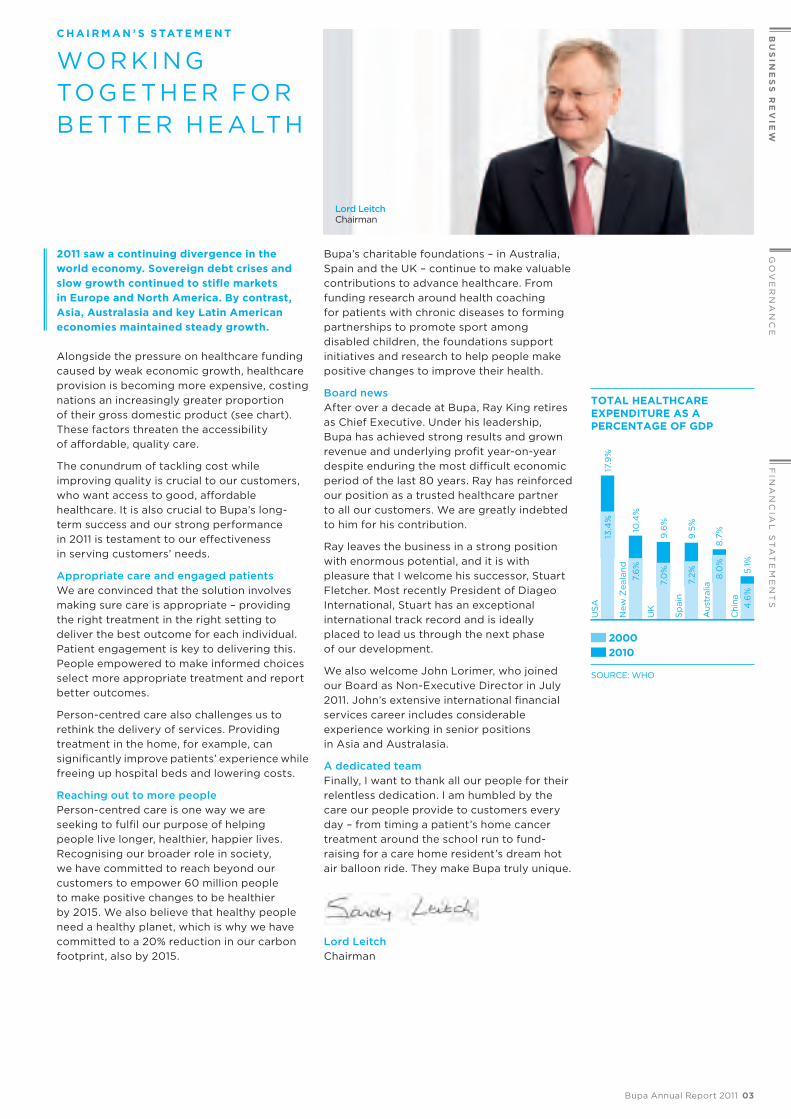
Alongside the pressure on healthcare funding caused by weak economic growth, healthcare provision is becoming more expensive, costing nations an increasingly greater proportion of their gross domestic product (see chart). These factors threaten the accessibility of affordable, quality care.
The conundrum of tackling cost while improving quality is crucial to our customers, who want access to good, affordable healthcare. It is also crucial to Bupa’s long-term success and our strong performance in 2011 is testament to our effectiveness in serving customers’ needs.
Appropriate care and engaged patients We are convinced that the solution involves making sure care is appropriate – providing the right treatment in the right setting to deliver the best outcome for each individual. Patient engagement is key to delivering this. People empowered to make informed choices select more appropriate treatment and report better outcomes.
Person-centred care also challenges us to rethink the delivery of services. Providing treatment in the home, for example, can significantly improve patients’ experience while freeing up hospital beds and lowering costs.
Reaching out to more peoplePerson-centred care is one way we are seeking to fulfil our purpose of helping people live longer, healthier, happier lives. Recognising our broader role in society, we have committed to reach beyond our customers to empower 60 million people to make positive changes to be healthier by 2015. We also believe that healthy people need a healthy planet, which is why we have committed to a 20% reduction in our carbon footprint, also by 2015.
Bupa’s charitable foundations – in Australia, Spain and the UK – continue to make valuable contributions to advance healthcare. From funding research around health coaching for patients with chronic diseases to forming partnerships to promote sport among disabled children, the foundations support initiatives and research to help people make positive changes to improve their health.
Board news After over a decade at Bupa, Ray King retires as chief Executive. Under his leadership, Bupa has achieved strong results and grown revenue and underlying profit year-on-year despite enduring the most difficult economic period of the last 80 years. Ray has reinforced our position as a trusted healthcare partner to all our customers. We are greatly indebted to him for his contribution.
Ray leaves the business in a strong position with enormous potential, and it is with pleasure that I welcome his successor, Stuart Fletcher. Most recently President of diageo International, Stuart has an exceptional international track record and is ideally placed to lead us through the next phase of our development.
We also welcome John Lorimer, who joined our Board as Non-Executive director in July 2011. John’s extensive international financial services career includes considerable experience working in senior positions in Asia and Australasia.
A dedicated team Finally, I want to thank all our people for their relentless dedication. I am humbled by the care our people provide to customers every day – from timing a patient’s home cancer treatment around the school run to fund-raising for a care home resident’s dream hot air balloon ride. They make Bupa truly unique.
Lord Leitchchairman
c h a i r m a n ’ s s tat e m e n t
WO R KI N G TOG E TH ER FO R B E T TER H E ALTH
Lord Leitch chairman
17.9
%U
SA13
.4%
10.4
%N
ew Z
eala
nd7.
6%
9.6
%U
K7.
0%
9.5
%S
pai
n7.
2%
8.7
%A
ustr
alia
8.0
%
5.1%
Chi
na 4.6
%
TOTAL HEALTHCAREEXPENDITURE AS A PERCENTAGE OF GDP
2000 2010
SOURCE: WHO
Bupa Annual Report 2011 03
FIN
AN
CIA
L S
TA
TE
ME
NT
SG
OV
ER
NA
NC
EB
US
INE
SS
RE
VIE
W

c h i e f e x e c u t i v e ’ s r e v i e W
G ROWI N G O U R B US I N E S S TH RO U G H M O R E AN d B E T TER H E ALTH c AR E
revenues
£8.0bnBupa’s revenue in 2011, up from £2.4bn in 2001.
international
63%Group revenues derived from outside the UK in 2011, compared with 17% in 2001.
“bupa’s strong Group performance validates our strategy. our ambition is to be seen by our customers as their healthcare partner. bupa’s trusted brands and extensive healthcare expertise set us apart and we are capitalising on this advantage across our established and developing markets.”
Q: How was 2011 for Bupa? A: 2011 was another good year in which we maintained our unbroken record of growth in revenue over the last decade. This performance reflects the strength of our businesses in key markets which have delivered continuing growth despite the tough economic climate. The management teams have continued to perform well and our results demonstrate that we deliver well for our customers.
Q: What was the picture at divisional level? A: Our International Markets division maintained excellent momentum in 2011. Our Australian and Asian health insurance businesses and our expatriate health insurance business continued to perform very well.
Europe and North America performed well, despite challenging economic conditions. In Europe, we grew the surplus in our health insurance businesses in the UK and Spain. In the US, where the market for outsourced chronic disease management services has changed significantly, our performance was disappointing. Our focus was on managing operating costs and retaining clients.
In care Services, Australia and New Zealand continued to grow and maintained excellent occupancy levels. In the UK, we controlled costs carefully to mitigate the impact of worryingly inadequate state funding of aged care, while ensuring high standards of care were maintained. Sanitas Residencial also continued to deliver growth.
Q: What was your focus in 2011?A: In the European and US markets, where economic conditions have been challenging, our focus was on customer retention, strengthening and broadening our offer, and on managing costs.
In other markets, where the economic conditions have been more positive, we are investing to grow.
Across the Group, we have invested strongly in our brands and to enhance our presence on the web.
Q: What were the highlights in Bupa’s established markets? A: In Australia, we migrated our three historic retail brands – HBA, Mutual community and MBF – to Bupa. We used the brand launch to communicate our unique offer and international healthcare credentials. In 2011, Bupa Australia achieved the largest growth in customer numbers ever.
In the UK, we ran the “Helping you find Healthy” brand advertising campaign, followed by the launch of a new health insurance plan, Bupa By you, which allows individuals to customise the cover to suit their priorities and budget. This level of flexibility is unique in the market and so far we’ve found that customers have purchased cover to a higher value against our initial projections.
In Spain, we acquired the 48-bed centro Internacional de Medicina Avanzada (cIMA) hospital in Barcelona – a valuable strategic move which gives us a presence in the city and strengthens our integrated insurance and provision offer. We also approved an investment plan to expand our branded dental provision and insurance offering across the country.
Q: And in Bupa’s developing markets? A: We made considerable advances in the developing markets.
Our Latin American business performed satisfactorily and we invested in Mexico, opening new sales offices and recruiting new employees, allowing us to get closer to our customers and to agents.
customer numbers grew strongly in Saudi Arabia, and we ended the year with almost 1.2m customers.
Our joint venture in India, Max Bupa, performed strongly, with customer numbers growing from 27,000 at the start of the year to 146,000 by december.
In china, we signed a major distribution deal with the Alltrust Insurance company, so we’ve begun selling expatriate insurance there.
Ray King chief Executive
04 Bupa Annual Report 2011

asia
18%Growth in Bupa’s domestic customers in Asia in 2011.
Q: And across Care Services?A: We continued to build on our strong market position – we shared expertise across the globe and we focused on our capability in dementia care, investing more behind it.
We added 449 beds across our markets in 2011 and approved plans to expand in the UK, Australia and New Zealand.
Funding in aged care remains a serious issue, particularly in the UK but also Spain. The chronic underfunding in the UK needs to be addressed urgently otherwise hundreds of thousands of older people will be isolated in their own homes or an intolerable burden will be placed on an already over-stretched NHS.
Q: Technology is playing an increasing role for Bupa. What happened in 2011?A: We see the web as a key channel for reaching customers. We have been investing in online products, services and resources, not least our health information which is viewed by millions, and other tools, which form part of our outreach to help people be healthier.
We continue to invest in our IT capability so that we have the systems to allow us to provide high quality customer service in a fast-paced environment. These investments delivered returns in improved customer service and satisfaction.
Q: What’s next for Bupa? A: We will continue to invest to grow our position in developing markets. In established markets we will focus on growth by strengthening and broadening our offer to be relevant to customers across life stages.
We anticipate further strong momentum in Asia Pacific and Latin America. Australia, in particular, is ideally positioned to develop an increasingly differentiated proposition for customers.
Market conditions are likely to remain challenging for some time in Europe and the US, but we will remain focused on customer retention, operational efficiency and on developing compelling new products and services that allow customers to exercise choice and control in their healthcare.
Q: Tell us about Bupa’s commitments to society?A: We have made a commitment to help 60m people around the world make positive changes to their health. We’ve also committed to reduce our carbon footprint by 20% by 2015 against our 2009 levels.
We regard these commitments as integral to our purpose and we are reaching out beyond our customers to apply our skills for the benefit of society.
They are stretching but they reflect the scale of the challenge and the contribution we think we can make.
Q: This is your last Annual Report as Chief Executive. How would you summarise Bupa’s journey in the last decade? A: Bupa has grown considerably in the ten years since I joined the Group. Mainly a UK business in 2001, today we are leaders in multiple markets and derive 63% of our turnover from outside the UK. Our turnover during that period has gone from £2.4bn to £8.0bn and our customer numbers have more than doubled.
Amid this growth, our purpose has remained constant – to help people live longer, healthier, happier lives.
We’re closer to our customers today than ever before and they are at the heart of everything we do – as we share expertise across the globe, as we invest in the development of new treatments and care and as we communicate Bupa’s brand promise in new markets.
I would like to thank the tremendously talented people I have worked with during my time with Bupa. I am confident that Bupa will continue to go from strength to strength under Stuart Fletcher’s leadership.
Bupa Annual Report 2011 05
FIN
AN
CIA
L S
TA
TE
ME
NT
SG
OV
ER
NA
NC
EB
US
INE
SS
RE
VIE
W

co r p o r at e s t r at e G y
O U R AM B IT IO N
B U PA’ S PU R P OS E IS TO H ELP PEO PLE L IVE LO N G ER , H E ALTH I ER , HAPP I ER L IVE S . TH IS U N d ER PI N S E VERy TH I N G WE dO
our ambition is to be seen by our customers as their healthcare partner. We are convinced that this is the most effective way of delivering our purpose. it is also the route to differentiation and competitive advantage.
We are well positioned in the healthcare market:
° With no shareholders, we reinvest the money we make into more and better healthcare. Our focus for this reinvestment is on products and services which help us get closer to our customers.
° Bupa’s extensive healthcare expertise in funding and provision, together with our international footprint, sets us apart in the marketplace. To capitalise on this, we are seeking to increase our exposure to higher growth markets.
° We are using our healthcare expertise to improve patient outcomes while managing costs to make access to quality healthcare sustainable over the long term.
our purpose TO HELP PEOPLE LIvE LONGER, HEALTHIER, HAPPIER LIvES
our role YOUR HEALTHCARE PARTNER, PROvIDING ExPERTISE FOR LIFE
strateGic priorities
DEvELOP DIFFERENTIATED PRODUCTS AND SERvICES
° High quality, good value healthcare
° Helping customers exercise choice and control in their healthcare
° Meeting the needs of diverse customers across life stages
° Grounded in customer insight
BUILD HEALTHCARE LEADERSHIP
° Enabling customers to make more informed healthcare decisions
° driving high standards in clinical governance and quality
° demonstrating improved health outcomes
° Being a leading voice in our priority healthcare areas
° Helping individuals, companies, providers and governments manage the rising cost of healthcare
BE ONE BUPA
° Taking advantage of being global to deliver better for customers locally
° Living one brand promise everywhere
° Sharing talent and expertise across markets and businesses
° Ensuring that everything we do is good for society, better for the environment and contributes to our commercial success
06 Bupa Annual Report 2011

our priorities in 2011 reflected the global economic context and our positions in key markets. in our established markets, our focus was on strengthening our position and differentiating our offer to customers. in developing markets, we invested in growing our market position.
Building strength in our established markets
° In Australia, we migrated our health insurance brands to the Bupa brand, successfully communicating Bupa’s brand promise.
° In the UK, we launched Bupa By you, an adaptable health insurance product designed to meet different customer priorities and budgets. We also invested behind the brand.
° In Spain, we acquired cIMA hospital. This acquisition, Sanitas’ first hospital in Barcelona, enhanced our healthcare provision capability in catalonia.
° In Spain, we approved an investment plan to expand our branded dental provision network, helping us grow our role in customers’ lives.
° In Australia, New Zealand and the UK, we approved plans to increase the number of care home beds through new building developments, leveraging our dementia care expertise.
Developing our market position in high growth markets
° In Latin America, Bupa expanded in Mexico to build closer relationships with customers and healthcare providers, provide products tailored to the country, and drive growth.
° In Saudi Arabia, we maintained strong growth in our customer numbers throughout 2011, reaching 1.2 million by the end of the year.
° In India, our joint venture, Max Bupa, reached 146,000 customers since launch in 2010 and, with a strong product, we are well poised to capture growth in this rapidly developing market.
° In Hong Kong and Thailand, we invested in sales and marketing to take advantage of good market growth.
° In china, we signed a distribution deal with chinese insurer, the Alltrust Insurance company, and together introduced a range of health insurance products for expatriates working in china and chinese citizens working abroad.
O U R AM B IT IO N IS THAT cUSTO M ERS S EE B U PA AS TH EI R H E ALTH c AR E PARTN ER
co r p o r at e s t r at e G y
d ELIVER I N G I N 201 1
Bupa Annual Report 2011 07
FIN
AN
CIA
L S
TA
TE
ME
NT
SG
OV
ER
NA
NC
EB
US
INE
SS
RE
VIE
W

Wo r K i n G t o G e t h e r W i t h i n d i v i d ua l s
I WANT HEALTHcARE THAT REFLEcTS My NEEdS
08 Bupa Annual Report 2011

We provide people with innovative healthcare products and services that reflect individuals’ needs, priorities and budgets.
Bupa By You, our new UK health insurance plan allows people to customise their health insurance. After choosing from three core options, customers can pick additional cover, such as for cancer, fitness injuries, dental and optical, to reflect what is important to them and their budget.
Bupa By You also gives peace of mind as there are no financial limits, meaning customers will not run out of funding for eligible treatment.
Customers can get a quote for, and then purchase, their Bupa By You plan online. Each customer then has access to a personal My Bupa web page, making managing their plan easy and convenient.
As well as offering the widest range of health insurance options in the market, Bupa By You customers have access to Bupa’s network of support, including our Treatment Options Service, where Bupa nurses provide information and answers to customers’ questions, helping them choose the most appropriate treatment.
WE AR E d EdIc ATEd TO G IV I N G PEO PLE H IG H q UALIT y, AFFO R dAB LE H E ALTH c AR E
C E N T R E S O F E xC E L L E N C E I N C A N C E R C A R E I N S PA I N
Sanitas has created new Oncology Advice and care Units (UccO) in selected hospitals to provide holistic cancer care.
The units provide not only the most advanced treatment, but also emotional support for the patient and their family and consider patients’ other needs, such as nutrition and psychological support.
F L E x I B L E FA M I LY H E A LT H I N S U R A N C E I N I N D I A
Our family insurance, Heartbeat Family First, is unique in the Indian market. designed around the extended family, the plan can cover up to 13 relatives.
Each family member has an individual sum of cover and, should this be exhausted, access to an additional “floating” sum that is shared by the family, making the cover flexible and affordable.
“ B E I N G T R E AT E D AT H O M E H E L P E D M E F E E L L I K E A P E R S O N N OT A PAT I E N T ”
donna was diagnosed with breast cancer in June 2010 and received treatment – chemotherapy and a mastectomy – on the NHS.
donna found the treatment tough: “After my chemotherapy finished, I didn’t want to be sick anymore and just wanted to get on with my life.” With small children, she didn’t want them to see her unwell.
To complete her treatment, donna needed an IV infusion of Herceptin every three weeks for a year. “I honestly didn’t think I was up to that. Luckily, my hospital offered
me NHS treatment at home via Bupa Home Healthcare.”
donna’s treatment was provided by the same nurse, Emma, who came while the children were at school. “The children have no idea how ill I’ve been and, because Emma was so knowledgeable about cancer, I could ask her anything that was worrying me.”
“The care I’ve received has made having cancer bearable. Bupa provided a wonderful service.”
BU
SIN
ES
S R
EV
IEW
Bupa Annual Report 2011 09
FIN
AN
CIA
L S
TA
TE
ME
NT
SG
Ov
ER
NA
NC
E

Wo r K i n G t o G e t h e r W i t h e m p l oy e r s
I WANT A HEALTHy, HAPPy ANd PROdUcTIVE WORKFORcE
10 Bupa Annual Report 2011

bupa has been pioneering employee health since the 1950s when we created the world’s first corporate health insurance. today, our corporate wellness programmes focus on keeping employees well and recognise the importance of addressing lifestyle at work to improve health.
In Spain, Bupa’s workplace health programme helps to promote a healthy lifestyle among employees. To measure the benefits of the programme, Sanitas has developed the “Cátedra Sanitas Wellbeing” research, in collaboration with the European University of Madrid.
Initial findings of the research, which remains ongoing, show that employees using the programme improved their health against key indicators, including physical activity levels, cardiovascular risk factors and changes in body composition.
WE WO R K WITH EM PLOy ERS TO H ELP TH EM I M PROVE TH EI R EM PLOy EE S ’ H E ALTH
11%Of employees surveyed, 11% cited work commitments as a barrier to making healthier lifestyle choices.
Source: Bupa Health Pulse 2011, international healthcare survey.
75%Bupa provides healthcare products and services to around three quarters of FTSE 100 companies.
H E L P I N G E M P LOY E E S I N AU S T R A L I A
We work on behalf of the Victorian State Government on WorkHealth, a programme to reduce the risk and incidence of chronic disease across the state’s working population.
After a health check, people are advised on ways to reduce health risks and offered health coaching.
To date, Bupa has conducted around 19,000 WorkHealth checks as part of the programme.
W E L L B E I N G AT CO C A - CO L A I N S PA I N
Sanitas is working with coca-cola to improve the wellbeing of employees at their Spanish headquarters.
Part of Sanitas Wellbeing corporate, they are encouraging physical activity in the onsite gym and a range of activities, such as customised workouts. The employees have also taken part in the study by Sanitas and the European University of Madrid to demonstrate how workplace exercise training improves productivity.
C A N C E R S C R E E N I N G I N S AU D I A R A B I A
Bupa is targeting the two most common cancers in Saudi Arabia – colon and breast cancer – in a new screening programme aimed at treating the cancers early.
As part of Bupa’s work with corporate customers, we identify patient segments where the cancers are most prevalent. Individuals are then invited for screening. The service has proved very popular among customers.
BU
SIN
ES
S R
EV
IEW
Bupa Annual Report 2011 11
FIN
AN
CIA
L S
TA
TE
ME
NT
SG
Ov
ER
NA
NC
E

Wo r K i n G t o G e t h e r f o r q ua l i t y h e a lt h c a r e
I WANT TO KNOW THAT cARE IS THERE WHEN I NEEd IT
12 Bupa Annual Report 2011

access to quality healthcare is critical, whether you are living in your home country or abroad. for customers living abroad, we offer access to more than 200,000 medical providers worldwide and a network of over 7,500 hospitals and clinics.
Our hospital quality assurance scheme ensures that all the hospitals in our provider network meet our high standards of treatment and care.
Bupa International also provides assistance and medical evacuation cover for people living abroad. Should they require emergency medical treatment, customers can opt to be transported to their home country or the nearest suitable hospital if local medical facilities are unable to provide high quality treatment.
Bupa also owns and operates hospitals and clinics and provides specialist medical services such as health coaching. We are committed to investing in these services and facilities to provide leading edge treatment and care.
WE EN SU R E q UALIT y H E ALTH c AR E IS Acc E S S I B LE , WH ER E VER yO U AR E
H E L P I N G AU S T R A L I A N v E T E R A N S S TAY F I G H T I N G F I T
Bupa is providing a co-ordinated Veterans’ care Programme for the Australian Government’s department of Veterans’ Affairs.
The groundbreaking programme will help thousands of chronically ill forces veterans and war widows by identifying those most at risk of hospitalisation. As part of the programme, these veterans and widows will then be offered an enhanced level of healthcare management.
Bupa will provide a range of support including health coaching to reduce medical risk factors and help individuals improve their health.
The programme aims to tackle a range of chronic conditions, such as congestive heart failure, pneumonia, chronic obstructive pulmonary disease and diabetes.
Around 17,000 veterans and widows will benefit from the programme by 2014, which goes to the heart of Bupa’s purpose of helping people live longer, healthier, happier lives.
M A K I N G S U R G E RY L E S S I N vA S I v E I N S PA I N
In Spain, we have invested over €1.5 million in a state- of-the-art da Vinci Robot.
The robot combines a high level of precision with very small incisions, making surgery less invasive.
Using the robot reduces patients’ blood loss, risk of infection and stay in hospital. It also means fewer transfusions, smaller scars, less pain and quicker recovery periods.
C U T T I N G - E D G E C T S C A N N E R AT T H E B U PA C R O M W E L L H O S P I TA L , U K
The Bupa cromwell Hospital has the most advanced high definition cT scanner in London, producing highly detailed images with a significantly lower dose of radiation than a conventional cT scanner.
The scanner also provides high resolution cardiac imaging, complementing the hospital’s comprehensive cardiac services.
BU
SIN
ES
S R
EV
IEW
Bupa Annual Report 2011 13
FIN
AN
CIA
L S
TA
TE
ME
NT
SG
Ov
ER
NA
NC
E

Wo r K i n G t o G e t h e r i n aG e d c a r e
I WANT TO HEAR HOW IT WAS WHEN GRANdAd WAS A BOy
14 Bupa Annual Report 2011

d e m e ntiaThe long-term condition people are most worried about getting across the world, after cancer.
Source: Bupa Health Pulse 2011, international healthcare survey.
74%Percentage of our UK care home residents who receive state funding in some form.
bupa is a leader in the development of specialist dementia care. We have pioneered training and development in dementia care, focusing on placing the individual at the centre of care, not their condition.
In 2011, Bupa’s campaign “Your Memories Matter” highlighted the importance of person-centred care for those living with dementia and the role that individuals’ memories can play.
Bupa also offers employees specialist training in dementia care. Called ‘Person First… dementia second’, the training teaches best practice and shows how an understanding of an individual helps the carer provide them with a better quality of life.
In Spain, we pioneered “Partners in care”, an initiative to help us enhance and personalise care for residents with dementia by strengthening relationships between families and care home employees. The approach helps us address families’ concerns and helps relatives know how they can continue to be involved in the care of their loved one.
U N LOc KI N G O U R R E S I d ENTS ’ M EM O RI E S MAK E S TH EM TH E FOcUS O F c AR E , N OT TH EI R d EM ENTIA
L E A D I N G T H E D E B AT E O N AG E D C A R E F U N D I N G R E F O R M
Bupa has been working with policy-makers in the UK and Australia on their aged care reform agendas. Sharing our international insights and expertise, we created a report with the London School of Economics on lessons learned from recent reforms made by other countries, including Germany, France and Japan.
S U P P O R T I N G C A R E R S
To increase the level of specialist care for those with dementia, Bupa has formed partnerships with carers’ organisations around the world. The initiative involves creating practical resources and support for carers of those with dementia, including running dementia day Stay Programmes at our homes in Australia and funding specialist community dementia nurses in the UK.
S H A L L W E DA N C E
In 2011, Bupa held dancing events in our care homes across Australia, New Zealand, Spain and the UK.
The initiative followed a report from Bupa – ‘Keep dancing’ – which emphasised the many ways dance can contribute to the wellbeing of people over 65, including those battling diabetes, Parkinson’s disease and dementia.
BU
SIN
ES
S R
EV
IEW
Bupa Annual Report 2011 15
FIN
AN
CIA
L S
TA
TE
ME
NT
SG
Ov
ER
NA
NC
E

bupa has evolved a strong, international footprint over the past decade, which has significantly benefited our business.
We are well-positioned to take advantage of the long-term drivers of growth in the healthcare market, given our trusted brands, excellent market positions and strong balance sheet.
We will continue to invest strongly in the business to grow our footprint and our role in customers’ lives. This will include remaining focused on retaining customers through the quality of our service, on managing costs to deliver value for money, and on developing new products and services to meet evolving healthcare needs.
WE’ R E d E VELO PI N G O U R STR EN GTH AN d R ELE VAN c E I N O U R E STAB LIS H Ed MAR K E TS AN d I NVE STI N G TO G ROW O U R PR E S EN c E I N AS IA AN d L ATI N AM ER Ic Ar ay K i n GC H I E F E x E C U T I v E
TH E B US I N E S S IS O RGAN IS Ed I NTO TH R EE d IV IS I O N S
PERCENTAGE OF GROUP REVENUESCONTRIBUTED PER DIVISION
PERCENTAGE OF SURPLUSCONTRIBUTED PER DIVISION
37% Europe and North America 48% International Markets
15% Care Services
25% Europe and North America
49% International Markets
26% Care Services
d i v i s i o n a l r e v i e W
dIV IS IO NALOVERVI E W
16 Bupa Annual Report 2011

E U R O P E A N d N O RT H A M E R I c A
£2,933.7mREVENUE (2010: £2,999.5m)
£141.7mSURPLUS (2010: £116.4m)
bupa health and Wellbeing Surplus up, driven by a continued focus on healthcare cost management and customer retention in a soft UK health insurance market.
sanitas Solid performance despite weak economic conditions in Spain. We acquired a 48-bed hospital in Barcelona, and are expanding our dental offer and Milenium centres.
health dialog Surplus was down in a tough market for outsourced disease management services in the US resulting in goodwill and acquired intangible assets impairments.
bupa cromwell hospital Revenues increased, driven by a rise in the number of Embassy customers and marketing activity.
I N T E R N AT I O N A L M A R K E TS
£3,874.3mREVENUE (2010: £3,394.0m)
£283.4mSURPLUS (2010: £208.5m)
australia Strong growth in customer numbers, revenues and surplus and a very successful transition to the Bupa brand.
bupa international Growth in customer numbers, revenues and surplus, with a focus on developing Asian markets, including launching a new partnership to offer international private health insurance in china.
hong Kong and thailand Revenue, customer numbers and surplus increased through investment in sales and marketing, and good economic conditions.
latin america Good growth in revenue and investment in our presence in Mexico.
india Significant growth in Max Bupa’s customer numbers and revenue.
saudi arabia customer numbers grew following investment in new retail channels.
c A R E S E RV I c E S
£1,203.7mREVENUE (2010: £1,182.9m)
£146.7mSURPLUS (2010: £139.7m)
care services australia Revenues and surplus increased and occupancy levels remained high. Good growth was accompanied by strong customer satisfaction.
care services new Zealand Strong growth in surplus and revenue and excellent occupancy levels. Strong customer satisfaction.
sanitas residencial Robust results in challenging economic conditions.
care services uK Revenues were maintained, with surplus marginally down due to lower occupancy rates and increased employee costs.
bupa home healthcare Surplus increased with careful management of costs beginning to show reward.
d i v i s i o n a l r e v i e W
dIV IS IO NAL H IG H LI G HTS
FIN
AN
CIA
L S
TA
TE
ME
NT
SG
OV
ER
NA
NC
EB
US
INE
SS
RE
VIE
W
Bupa Annual Report 2011 17

EUROPE
INTERNATIONAL
CARE SERVICES
REVENUES SURPLUS
£2,999.5m £2,933.7m
Decrease 2%
REVENUES
£3,394.0m £3,874.3m
Increase 14%
REVENUES
£1,182.9m £1,203.7m
Increase 2%
£116.4m £141.7m
Increase 22%
SURPLUS
£208.5m £283.4m
Increase 36%
SURPLUS
£139.7m £146.7m
Increase 5%
2010
2011
2010
2011
2010
2011
2010
2011
2010
2011
2010
2011
revenues increased by 1% on an organic basis, which excludes the impact of the bupa health assurance (bha) disposal and other non-recurring items. surplus increased by £25.3m, up 22%, due to increased profitability in bupa health and Wellbeing (bhW) and sanitas, and a well executed exit from the domestic health insurance business in scandinavia. excluding the impact of foreign exchange movements, surplus increased by 21%.
challenging market conditions across the division impacted customer numbers, which decreased by 0.4% to 4.99m, excluding the impact of business disposals.
Bupa Health and Wellbeing UK (BHW)The business grew underlying revenues and delivered increased surplus in an environment of continuing economic uncertainty, high unemployment and weak consumer confidence, which have contributed to a contraction of the UK health insurance market since 2008.
Health insurance customer numbers declined marginally over the period to 2.87m due to challenging market conditions, however, retention among corporate customers was strong. customer satisfaction was high with 87% of customers rating the overall quality of service as excellent or good.
BHW launched Bupa by you, an adaptable consumer health insurance product which broadens the appeal of health insurance and enables BHW to engage customers more fully about their individual healthcare needs and tailor cover accordingly. Bupa by you can be purchased online and was launched with a multi-channel advertising campaign. This campaign built on the ‘Helping you find Healthy’ campaign, which reinforced Bupa’s position as a healthcare partner to customers.
BHW continues to develop closer relationships with customers. Specialist support teams for cancer, heart conditions, mental health issues and back and knee problems help customers manage the medical and practical aspects of living with these illnesses. The business continues to offer specialist centres for the treatment of musculoskeletal conditions, breast cancer, bowel cancer and gynaecological conditions.
BHW launched a number of initiatives to enhance the patient journey and deliver improved quality, better value healthcare for customers. The business introduced a new clinical review process to ensure clinical best practice in the treatment of conditions such as knee arthroscopy, where it has identified unwarranted variation in the treatment offered to BHW’s customers. In partnership with corporate customers, BHW developed an ‘open referrals’ service to guide patients to a selection of high quality consultants and hospitals offering more certainty over the cost of treatment. The open referral service has been well received, with customers who have experienced it 54% more satisfied than those who have not, and 38% more likely to recommend Bupa to others.
d i v i s i o n a l r e v i e W
EU RO PE AN d N O RTH AM ERIc A
employees
9,000Across the division, from hospital doctors to customer services employees.
customers
4.9mHealth insurance customers covered by Bupa.
cromWell hospital
10,000Patients treated at The Bupa cromwell Hospital in 2011.
“I FELT REASSURED AND CHERISHED AT BUPA’S CROMWELL HOSPITAL”
carolyn was admitted to the Bupa cromwell Hospital’s Intensive Therapy Unit (ITU) with heart failure. “I was very frightened but the warm welcome I received was a huge relief.” carolyn was diagnosed with a rare heart condition – Takotsubo cardiomyopathy – a sudden, temporary weakening of the heart muscle. The condition is usually associated with stress, making it essential for carolyn to feel reassured.
“The care was faultless – tests and treatments were done promptly and the nursing staff were very attentive. Every single member of staff made time for me and took me seriously and I felt cherished.”
18 Bupa Annual Report 2011
BHW has long been concerned about escalating private hospital prices and believes private hospitals and insurers need to work in partnership to drive improved quality and value for customers. In 2011, the business initiated a more robust approach to negotiation with private hospital groups to help drive better value care for customers.
BHW supports the Office of Fair Trading’s (OFT) provisional decision (december 2011) to refer the market for the provision of private healthcare to the competition commission for investigation. Bupa has been saying for some time that more competition and efficiency among private hospitals and consultants is needed and the business engaged with the OFT to inform the study on behalf of its customers.
BHW won a series of awards over the period, including Best Healthcare Provider at both the Money Marketing and corporate Adviser Awards, both for the fourth year in succession, and Best Healthcare Insurance Provider at the Financial Adviser Awards for the fifth year in succession.
SanitasSanitas continued to benefit from its integrated business model, which combines insurance and provision assets and offers differentiation in a highly competitive market. This model helps the business to manage the patient journey to deliver high quality care and manage costs. The business delivered a steady performance in 2011 despite challenging economic conditions in Spain.
Underlying revenue and surplus increased, supported by a focus on medical cost control in the private medical insurance (PMI) business and the strong performance of the dental insurance product. Health insurance customer numbers increased to 2.03m as the business focused on customer loyalty.
Sanitas introduced a number of new products, including an entry level product to facilitate access to PMI for a wider audience. The business launched the first integrated, multi-channel marketing campaign covering all the Sanitas businesses. The business also acquired cIMA, a 48-bed hospital in Barcelona, to provide better healthcare to customers in the region, and put in place plans to expand its dental provision in 2012.
Sanitas Hospitales delivered strong occupancy at its existing two private hospitals and 16 ‘Milenium centres’ (multi-disciplinary primary care clinics) and is investing to support the growth of the network. Two new Milenium centres opened in 2011. Sanitas Hospitales invested in the refurbishment of patient areas in each of its hospitals and the business was the only healthcare organisation to gain the European Foundation for quality Management 500+ European quality stamp.
Sanitas now provides a complete health service to nearly 200,000 people in Manises, as a part of a partnership with the Valencian regional government. The Manises hospital continues to operate very successfully.
Health DialogThe market for healthcare services is undergoing significant change in the US because of uncertainties regarding health reforms. The changing economic climate has led a number of health plans to reassess their priorities and there is a growing trend to in-source disease management services. This trend has affected the revenues of all players in the sector.
As a result, in 2011, Health dialog experienced a lapse in a small number of clients which negatively impacted revenue and surplus. The business responded swiftly to control costs, including the closure of three coaching centres. Health dialog also developed a new line of business which focuses on helping healthcare providers better manage their interaction with patients and is launching a number of pilots to deploy dedicated health coaches to medical practices.
The Bupa Cromwell HospitalRevenues increased in 2011, driven by a rise in the number of Embassy customers and the business was successful in attracting a number of leading doctors and consultants to operate at the hospital. The hospital is undergoing a significant redevelopment programme to improve the facilities, which will gather pace through 2012. In 2011, the hospital won the Independent Healthcare Award for the Best Use of Technology at the Laing & Buisson Awards.
Strategic overview and outlookIn Europe, high unemployment levels and weak consumer confidence are likely to continue; in the USA, the economic outlook is improving. We expect economic conditions to remain difficult in the near term.
Bupa Health and Wellbeing – We anticipate an increase in profitability driven by strong customer retention and a focus on improving the patient journey to deliver higher quality care and better value. Performance will be underpinned by tight controls over the cost base and continued investment in sales and operations.
Sanitas – Sanitas has a strong business model and we anticipate that performance will be steady. We will invest to strengthen our position, namely in our dental expansion plan and in the cIMA hospital, and leverage our integrated provision to deliver value for the Group.
Health dialog – Uncertainty around healthcare reforms and economic pressures are expected to continue to impact the business, which is maintaining its focus on cost control and operational efficiency. We are also redeveloping our offer to be closer to providers.
Bupa cromwell Hospital – The hospital will undergo a major redevelopment in 2012, which will deliver significant patient benefits long term. The works will, however, adversely affect the hospital’s capacity in the short term, which may be partly off-set by an anticipated increase in complex care activity.
Bupa Annual Report 2011 19
FIN
AN
CIA
L S
TA
TE
ME
NT
SG
OV
ER
NA
NC
EB
US
INE
SS
RE
VIE
W

EUROPE
INTERNATIONAL
CARE SERVICES
REVENUES SURPLUS
£2,999.5m £2,933.7m
Decrease 2%
REVENUES
£3,394.0m £3,874.3m
Increase 14%
REVENUES
£1,182.9m £1,203.7m
Increase 2%
£116.4m £141.7m
Increase 22%
SURPLUS
£208.5m £283.4m
Increase 36%
SURPLUS
£139.7m £146.7m
Increase 5%
2010
2011
2010
2011
2010
2011
2010
2011
2010
2011
2010
2011
the division delivered an excellent performance with revenues increasing by 14% and surplus up 36%. excluding the impact of foreign exchange movements, surplus was up 30%. this performance was driven by strong growth in all businesses.
customer numbers across the division grew by 7% to 5.79m, with the most notable increases in Bupa Australia and our associated companies in India and Saudi Arabia.
Bupa AustraliaThe business undertook the highly successful transition of its MBF, HBA and Mutual community brands, and now serves all customers in Australia under the Bupa brand. The transition was supported by a very well received multi-channel marketing campaign showing how Bupa can help ‘find a healthier you’. Prompted awareness of the Bupa brand among Australians more than doubled following the campaign and spontaneous awareness more than trebled.
Bupa Australia delivered a strong financial performance. Overall, revenue and surplus increased as health insurance customer numbers grew by 3% to 3.33m, equivalent to nearly 15% of the Australian population. during 2011, the business improved its loss ratio and achieved increased efficiency in speed of claims processing, which has also increased the speed of the business’s receipts from the industry risk equalisation pool which underpins the community rating system in the Australian PMI market.
customer focus remained central. Bupa Australia maintained its high customer satisfaction rating, with 93% of customers rating the service positively. The business is increasingly working with customers to help them develop healthier lifestyles and to offer them high quality, evidence-based information on treatments. Peak Health, acquired in 2010, is now fully integrated and provides onsite health and wellbeing services, such as vaccinations and health assessments. Bupa Australia continued its expansion into Western Australia, opening six branches in the state in 2011.
d i v i s i o n a l r e v i e W
I NTER NATIO NAL MAR K E TS
employees
4,100Across the division, from doctors on call to health coaches.
customers
5.8mHealth insurance customers covered by Bupa.
emerGency evacuations
1,006Medical emergency evacuations for Bupa customers in 2011, including 41 by helicopter.
B U PA H O N G KO N G ’ S A M B A S S A D O R P R O G R A M M E
As part of our commitment to be our customers’ healthcare partner, Bupa Hong Kong has created an Ambassador Service.
The service helps to take the stress out of the medical and claims processes and allows customers to focus on their recovery. The Ambassador performs a range of services, from providing support and guidance over the phone,
to following up with doctors, hospitals and clinics, to visiting customers in hospital or at home. The Ambassador can also answer customers’ questions and deliver, collect and help to complete claims forms.
M E D I C A L E M E R G E N C Y I N CO N G O
One Bupa International customer had a potentially fatal and urgent bowel condition. The Bupa team confirmed quickly that she required acute medical attention at a level of care unavailable in the democratic Republic of congo where she was living. Within two hours, Bupa commenced emergency medical evacuation arrangements. despite
complex logistics, the customer was transported safely to Johannesburg by air ambulance, where she was treated for an intestinal obstruction. “It was potentially very frightening, but Bupa got me treated very quickly.”
20 Bupa Annual Report 2011

Bupa InternationalBupa International has seen continued momentum in the demand for international private medical insurance services that began in late 2010, particularly in Asia, where the economic outlook remained buoyant. There was also growth among corporate customers, with growth in the oil and gas industry driving demand for international health insurance. The business delivered an increase in revenues and surplus and grew customer numbers by 4% to 536,000 with 82% of customers rating the overall quality of service they received as excellent or good.
The business continued to support customers in Libya and Egypt, amid unrest in the Middle East. It also pursued opportunities for growth in Asia, with a number of new initiatives launched including a partnership with the Alltrust Insurance company to sell international private health insurance in china. The business launched its expatriate health insurance offer in Australia and introduced a new product, Vital Africa, an emergency only offering aimed at middle management in small to medium sized enterprises in Africa.
Bupa Latin AmericaThe business increased its revenues, and customer numbers were up by 5% to 160,000. customer satisfaction also increased, with 83% of customers rating the service as excellent or good. Surplus, however, was down, primarily due to foreign exchange rate volatility and increased investment in growth initiatives including those in Mexico, where the business opened four regional offices and launched Total care, a new product tailored to the needs of the Mexican market, which has been well received by customers.
Bupa Hong KongBupa Hong Kong’s health insurance business performed very well, delivering increases in surplus and revenue. The business delivered record customer numbers, up 11% to 243,000. customer satisfaction remained high with 79% of customers rating the service provided as excellent or good and the business launched an award-winning new TV advertising campaign in the first part of the year.
Bupa ThailandAgainst a backdrop of political instability and widespread flooding, Bupa Thailand delivered good growth and recorded an increase in revenues and underlying surplus. customer numbers in Bupa Thailand grew by 13% to 202,000 and the number of customers who rated the service provided as excellent or good improved to 66%. This increase was driven by strong new business, the introduction of a new group renewal team and improved relationships with brokers.
Max Bupa, IndiaMax Bupa, our health insurance joint venture launched in India in April 2010, increased customer numbers to 146,000 (2010: 27,000), while trading at a small loss in line with our expectations for this start-up business.
Bupa ArabiaBupa Arabia, an associate of the Bupa Group, increased its customer numbers by 10% to 1.2m following investment in a number of new retail distribution channels. Growth continued despite robust competition among health insurers.
Strategic overview and outlookWe anticipate continued growth in the main economies in Asia Pacific and Latin America; we expect further progress from our businesses in these markets. In Australia, we expect customers to remain cautious and price sensitive.
Bupa International – We anticipate sustained growth alongside strong customer retention and new business activity. We will continue to invest to enhance customer service, including upgrading our information technology platforms. We also remain focused on providing tailored products to customers.
Australia – With our business now operating under a single brand, we are well placed to develop an increasingly differentiated proposition for customers. We anticipate that growth levels will be maintained. Proposed healthcare reforms, principally to the Government’s PHI rebate scheme, may impact a proportion of Bupa customers. We will monitor developments and implement mitigation measures, as required.
Hong Kong – We anticipate sustained growth in 2012 and will invest in brand awareness activity and service improvement.
Arabia – Pressure on pricing and regulatory changes make Saudi Arabia a challenging market in 2012.
India – We anticipate sustained growth in customer numbers in this developing market.
china – Significant growth is expected during the first year of operations.
Latin America – We anticipate sustained growth across our markets in the region, including Mexico, and will continue to invest in the region to get closer to customers.
I M P R Ov I N G S E R v I C E TO C U S TO M E R S I N L AT I N A M E R I C A
Bupa Latin America enhanced customer services through a new organisational model. The model enables better communication and accountability, improved case management and increases the quality of response to customer queries. Turnaround time for claims and enquiries reduced by 50% and customer satisfaction rose to 76%.
Bupa Annual Report 2011 21
FIN
AN
CIA
L S
TA
TE
ME
NT
SG
OV
ER
NA
NC
EB
US
INE
SS
RE
VIE
W

EUROPE
INTERNATIONAL
CARE SERVICES
REVENUES SURPLUS
£2,999.5m £2,933.7m
Decrease 2%
REVENUES
£3,394.0m £3,874.3m
Increase 14%
REVENUES
£1,182.9m £1,203.7m
Increase 2%
£116.4m £141.7m
Increase 22%
SURPLUS
£208.5m £283.4m
Increase 36%
SURPLUS
£139.7m £146.7m
Increase 5%
2010
2011
2010
2011
2010
2011
2010
2011
2010
2011
2010
2011
EUROPE
INTERNATIONAL
CARE SERVICES
REVENUES SURPLUS
£2,999.5m £2,933.7m
Decrease 2%
REVENUES
£3,394.0m £3,874.3m
Increase 14%
REVENUES
£1,182.9m £1,203.7m
Increase 2%
£116.4m £141.7m
Increase 22%
SURPLUS
£208.5m £283.4m
Increase 36%
SURPLUS
£139.7m £146.7m
Increase 5%
2010
2011
2010
2011
2010
2011
2010
2011
2010
2011
2010
2011
care services continued to perform well in mixed conditions. revenues for the division increased slightly, driven by a strong performance in australia and new Zealand. surplus was ahead of the previous year, but occupancy was marginally down at 87.8% (2010: 88.2%). excluding the impact of foreign exchange movements, surplus was up 2%.
This performance is against a backdrop of increasing pressure on public sector budgets, notably in the UK, where average local authority fee increases across England remained near flat, and in Spain.
As part of a continued programme of development, Bupa invested over £94m in building, extending or refurbishing homes, adding a total of 449 new beds across the division. The development pipeline remains strong for 2012 and beyond.
Bupa Care Homes UKRevenues were maintained and surplus was marginally lower as a result of lower occupancy rates (overall occupancy was 87.3% in 2011, compared to 88.0% in 2010), increases in employee costs and investment in training.
current pressure on public funding means that older people are being looked after in their own homes for longer, resulting in fewer local authority referrals to care homes. It is also impacting local authority fee rates, which are near flat compared to previous years.
The business is concerned that if local authorities do not pay fairer fees, there will be a lack of investment in the sector which will ultimately jeopardise the quality of care and lead to a contraction in the overall care homes market and a potential bed-blocking crisis for the NHS.
To help address the longer term challenges of funding aged care, Bupa care Homes UK is actively contributing to the UK government’s working groups which have been set up to respond to the Report of the commission on Funding of care and Support in England, led by economist Andrew dilnot. dilnot’s recommendations are likely to help people with assets better prepare for care in old age. However, the majority of people in care homes today are funded by the state. This means there also needs to be significant investment from the government to pay for the care of those with no means to pay for themselves.
The business continues to roll out its ‘Person First... dementia second’ training for care home managers across the division. In addition, the business developed new design standards for its dementia homes, drawing on the latest thinking on dementia friendly environments. The first new home to adopt these design standards was opened in Ashford, Kent in the period and the design standards will be rolled out across a further 20 dementia units in 2012.
d i v i s i o n a l r e v i e W
c AR ES ERVI c E S
employees
38,200Across the division, from specialist dementia care nurses to building maintenance employees.
care home residents
29,000 Across the UK, Spain, Australia and New Zealand.
occupancy
87.8% Occupancy levels remained high in 2011.
B U PA M A P O F L I F E
Every resident who moves into a Bupa care home for a long-term stay completes a ‘Map of Life’ with their family and friends.
This captures key milestones, significant events and allows our carers to know the hobbies and interests of each resident.
This is just one of the ways we ensure that our residents
are the focus of care – and not just their care needs or dementia.
It is also how we discovered Ethel’s love of a good murder mystery novel.
22 Bupa Annual Report 2011

The quality of Bupa’s care was recognised by its highest ever resident satisfaction levels, with 95% rating the quality of service as excellent or good. Bupa care Homes UK also won a number of awards in 2011, including ‘dementia care Manager of the year’ at the National care Awards and ‘Nurse of the year’ at the Scottish care Awards.
Bupa Care Services AustraliaRevenues and surplus increased, supported by higher than expected government fee increases that reflect the value of the service and good control over costs. Occupancy levels remained high at 93.3% (2010: 93.9%) notwithstanding the addition of new capacity.
The business remains engaged in the debate about the delivery of healthcare in Australia, contributing to the inquiry on caring for Older Australians by the Productivity commission. The business will be working with the government and other industry organisations to ensure that funding and the availability of high quality nursing care are at the forefront of the aged care agenda in Australia.
A new home in Wodonga was opened, replacing an existing home, increasing the number of beds from 60 to 114 and offering improved specialist dementia care facilities. Investment in care home development is set to continue in 2012, with over 160 new beds due to be added. In addition, the business is currently constructing three new build projects, which will add over 430 beds by 2014.
customer satisfaction levels were very good, with 84% of residents rating the service as very good or good.
Bupa Care Services New ZealandThe February 2011 christchurch earthquake affected several Bupa homes in the area and, very sadly, three employees, all of whom were visiting central christchurch at the time, lost their lives.
The business delivered strong growth in surplus and revenue, although fee increases for aged care remained under pressure. Excellent occupancy levels of 94.6% (2010: 93.5%) were maintained.
A new 88 bed home was opened in Auckland in July 2011 and extensions to three other care homes were completed, adding 57 beds. In addition, three care village extensions were completed in 2011, adding 50 assisted living units.
The development pipeline is strong, with a new care home and three care home extensions planned for 2012, adding 120 beds, together with five care village extensions, adding over 90 assisted living units.
customer satisfaction levels were excellent with 97% of residents rating the quality of service as excellent or good.
Sanitas ResidencialSanitas Residencial delivered robust results, as a result of improving occupancy in newer homes in the portfolio and a strong focus on operational efficiencies and costs. Occupancy levels remained stable at 81.4% and surplus increased.
The business opened a new home in Tarragona during the period, adding 167 beds.
The economic crisis has continued to affect the aged care sector in Spain as a result of the reduction in public expenditure as well as intense competition in the private market.
Bupa Home Healthcare (BHH)Surplus increased in BHH, with careful management of operating costs beginning to show reward. Revenues declined slightly as a result of exiting some unprofitable lines of business. New business opportunities continued to be affected by the uncertainty surrounding UK health reforms and their impact on the NHS. BHH continues actively to engage in the debate about the role of out of hospital care, publishing ‘Taking the Pressure Off’, a report showing that treating more patients in the home could save the NHS £1.7bn.
Strategic overview and outlookWhile the market conditions in Australia and New Zealand are broadly positive, in the UK and Spain we expect pressure on public spending on aged care to continue to constrain financial performance in the short term.
UK – Focus will remain on managing occupancy levels and costs and we will continue to expand through developing new care homes and redeveloping existing facilities. We will also make representations to the UK government on care homes funding and proposed legislative changes that will impact the sector from 2015.
Sanitas – There remains good potential for an increase in profitability and occupancy, supported by favourable long-term demographics.
Australia – We have a strong new build pipeline and we are focused on offering a differentiated dementia service in 2012.
New Zealand – We will expand our residential care and retirement villages through new developments, which will start construction in 2012. Pressure on government budgets is likely to increase pressure to deliver value for money for medical alarms services.
Bupa Home Healthcare (UK) – As the shake up from the Health and Social care Bill continues throughout 2012, we will adapt our strategy as the future direction of the NHS becomes clearer. The business will seek growth in key product areas, predicated on reform of the NHS and a shift of care provision from an acute hospital setting into the community.
Bupa Annual Report 2011 23
FIN
AN
CIA
L S
TA
TE
ME
NT
SG
OV
ER
NA
NC
EB
US
INE
SS
RE
VIE
W

revenues increased by 6% to £8.0bn, 4% of which was driven by organic growth with the remainder resulting from foreign exchange movements. the Group’s reported surplus before taxation was up 86% to £220.0m, with underlying surplus before taxation increasing 20% to £559.0m.
The strong cash flows delivered in 2011 enabled the repayment of all outstanding bank borrowings and contributed to the continued reduction in leverage which stood at 20% at the end of the year. Net asset value at 31 december was £4.4bn. The combination of strong profitability and cash flows and a resilient balance sheet on the back of a strong underlying financial performance enables our continued focus on investing in order to develop and sustain the Group’s existing established markets, while selectively developing new market opportunities.
Surplus and underlying surplusUnderlying surplus before taxation was £559.0m, an increase of 20% compared to 2010. The Group delivered another year of good underlying growth, despite mixed economic conditions in some of our markets. In the International Markets division, Australia, Asia and the Middle East performed well with good growth in customer numbers. Operational efficiency was enhanced in our Europe and North America division where market conditions were more challenging and Bupa continued to be a healthcare leader in these markets.
Within the care Services division the focus was on providing excellent resident care and managing costs, despite downward pressure on public sector fees in Europe. Good growth was also delivered in care Services Australia and New Zealand, which operated with high levels of occupancy.
Surplus before taxation was up 86% to £220.0m from 2010. The main reason for the difference between surplus before taxation and underlying surplus before taxation is the impairment of goodwill and intangible assets arising on business combinations related to Health dialog and the MBF Brand.
Sustained weak economic conditions and uncertainty over government reforms in the US, combined with the overall decline in the market for outsourced disease management services, have resulted in the impairment of the goodwill and acquisition related intangible assets associated with the Health dialog business of £241.1m (2010: £158.8m). These assets are now fully impaired. In the Australian businesses the successful transition of the HBA, MBF and Mutual community brands to Bupa resulted in a full impairment of the MBF brand intangible asset and a net impairment charge of £57.3m.
Presented below is a reconciliation of the Group’s underlying surplus before taxation to the reported surplus before taxation.
G RO U P F I NAN c E d I R Ec TO R ’ S R EP O RT
WE’ VE G ROWN O U R U N d ER Ly I N G SU R PLUS By 20% TO £ 559 .0 m , AN d FU RTH ER STR EN GTH EN Ed TH E G RO U P ’ S FU N dI N G P OS IT IO Nn e i l tay l o rAc T I N G G R O U P F I N A N c E d I R E c TO R
2010
2011
200
7
200
8
200
9
2010
2011
2010
2011
£374.2m£413.4m£428.2m£464.9m£559.0m
UNDERLYING SURPLUS
24 Bupa Annual Report 2011

Items excluded from underlying surplusThe impairment of goodwill and intangible assets arising on acquisition are referred to above. Other items excluded from underlying surplus are as follows:
Amortisation of intangible assets arising on business combinationsThese numbers are excluded from underlying surplus as they are reflective of past acquisitions.
Property revaluations and impairmentsThe Group has a significant base of care homes within the portfolio and these properties are shown at fair value based on periodic revaluations. On a triennial basis Bupa obtains an external market valuation of its property portfolio and in the intervening years a directors’ impairment review is performed. The valuations increase/decrease depending on the property market and these short-term distortions do not reflect underlying performance. A net impairment charge of £17.5m was made in 2011 (2010: £35.1m), arising from the revaluation of a small number of properties.
Profit/(loss) on sale of businessProfits/losses resulting from a strategic decision to sell a business are not reflective of underlying trading performance and hence are excluded from underlying surplus.
As reported in 2010, an agreement was reached to sell Bupa Health Assurance, in order for the UK business to focus on its core healthcare products and services. In 2010, a £6.5m loss was recorded based on disposal costs incurred to date. The sale was finalised in January 2011 and the completion of the sale process resulted in a profit on sale of business of £0.3m. The profit is reported within other charges in the financial statements.
Gains on return seeking assetsA portion of the Group’s available cash is placed in a return seeking asset portfolio, which is invested primarily in funds holding investment grade bonds and loans. Income from the return seeking asset portfolio is excluded from the underlying results as the volatility in market values and investment performance distorts comparability between years.
Gains from the return seeking asset portfolio amounted to £6.6m (2010: £13.2m). At 31 december 2011, the return seeking asset portfolio represented 6% (2010: 6%) of total cash and financial investments.
Financial income and expensesNet financial income increased to £20.5m (2010: £19.1m). This was primarily due to higher yields generated on cash held in Australia, the impact of increasing cash balances around the Group and lower foreign exchange hedging costs. These were partly offset by lower gains on the return seeking asset portfolio.
TaxationThe taxation expense of £84.1m (2010: £131.4m) represents an effective rate of 38% (2010: 111%). The headline effective tax rate has benefited from the tax savings recognised in the year, but this has been negated by the adverse impact from the impairment of goodwill (£165.8m) and intangible assets and other items which do not qualify for taxation relief. The effective rate based on the underlying surplus of £559.0m is 23% (2010: 33%) and is lower than the Group’s blended rate of 28% mainly due to tax savings recognised in the year.
Balance sheet, funding and solvencyGroup financial strength and solvencyThe Group maintains a strong balance sheet through rigorous financial planning and a conservative approach to leverage. It is designed to facilitate growth within the Group’s risk appetite and this approach is designed to ensure continued compliance with borrowing covenants and with solvency requirements in regulated businesses. The solvency positions of the regulated companies and of the Group as a whole are routinely monitored against the requirements of local regulators and of the UK’s Financial Services Authority (FSA). during 2011, leverage (debt to debt plus equity) decreased from 23% to 20% as the Group repaid all remaining bank debt using cash generated in the period.
2011 £m
2010 £m
Growth£m %
Underlying Surplus before taxation 559.0 464.9 94.1 20%
Less:
Impairment of goodwill and intangible assets arising on acquisition of Health dialog (241.1) (158.8)
Impairment of MBF Brand (57.3) 0.0
Other goodwill impairment 0.0 (90.4)
Other intangible assets impairment (1.1) (17.7)
Amortisation of intangible assets arising on business combinations (34.9) (34.7)
Impairment arising on revaluation of property (17.5) (35.1)
Profit/(Loss) on sale of businesses 0.3 (18.1)
Gain on return seeking assets 6.6 13.2
Other items 6.0 (5.3)
Surplus before taxation 220.0 118.0 102.0 86%
Bupa Annual Report 2011 25
FIN
AN
CIA
L S
TA
TE
ME
NT
SG
OV
ER
NA
NC
EB
US
INE
SS
RE
VIE
W

Balance sheet managementFinancial risk management is undertaken by the Group Treasury department, which is responsible for cash and debt management as well as all hedging activities. Our goals are to ensure that there is adequate funding to allow the Group to meet its obligations, that we effectively manage interest rate and foreign exchange risk and that we protect our financial assets.
credit ratingsThe Group’s goal is to operate within a targeted range for leverage and interest cover ratios which are designed to support an investment grade rating. These ratios are monitored and reported to the Board on a regular basis, with sensitivity analysis carried out to provide early warning of any potential issues.
The Bupa Group is not rated by any rating agency, although individual debt issues and various regulated insurance companies within the Group do have a public rating.
The principal debt ratings relate to the senior, unsecured bonds, secured loans in the care homes business and the callable subordinated perpetual guaranteed bonds.
during the year, Fitch and Moody’s both re-affirmed their ratings in relation to Bupa Finance plc’s senior, unsecured bonds (A- with a stable outlook and Baa2 with a stable outlook respectively). All other key ratings remained constant during the year.
cash flow and financingIn 2011, Bupa generated £515.5m in operating cash flows. This is the third consecutive year in which we have delivered in excess of £500m of operating cash flows allowing us to reduce leverage, invest in our care home estate and other healthcare provision assets, and maintain strong funding headroom.
The Group invested £211.1m in capital expenditure, paid down £205.4m of interest bearing liabilities and invested the balance in cash and financial investments.
The Group’s main source of additional funding comes from a £900m committed bank facility, negotiated in June 2010, which matures in September 2013. The facility has not been used since April 2011.
cash and other financial assetsThe Group holds cash and other financial assets principally to meet the liabilities and solvency requirements of the regulated insurance subsidiaries. cash and other financial investments totalled £3,111.5m (2010: £2,851.3m) at 31 december 2011. The Group has no direct exposure to peripheral Eurozone sovereign debt and our exposure to Eurozone bank deposits has been reduced over the course of 2011 as part of ongoing risk management. The retention of any exposures below the Group’s minimum AA-/Aa3 credit rating policy have been explicitly approved by the Group’s Investment committee.
G RO U P F I NAN c E d I R Ec TO R ’ S R EP O RTco n t i n u e d
80020082007
£m
2009 2010 2011
1,300
1,800
2,300
2,800
3,300
0%
5%
10%
15%
20%
35%
30%
25%
40%
DEBT VS EQUITY
DebtCashLeverage %
26 Bupa Annual Report 2011

Relative to other insurance segments, the Group believes health insurance has a lower level of risk and currently expects to report a strong capital position under the new rules. In addition, we continue to engage with European policymakers and regulators to support the development of regulations which fairly reflect, and are proportionate for, a mixed health insurance and healthcare provider such as Bupa.
conclusionOur international scale, trusted brands, and strong balance sheet create a solid platform for the Bupa Group as it enters 2012. Overall the Group’s existing businesses are in good shape, and we will continue to seek growth from these as well as consider new market and service opportunities.
Neil TaylorActing Group Finance director12 March 2012
Interest bearing liabilitiesAt 31 december 2011 the Group had total interest bearing liabilities of £1,128.5m (2010: £1,294.4m), which consisted primarily of secured loans and bonds.
Foreign exchangeApproximately 66% (2010: 70%) of net assets are denominated in foreign currencies, primarily Australian dollars, Euros and US dollars. Excluding goodwill and intangible assets, the proportion of our net assets denominated in foreign currencies reduces to approximately 27% (2010: 24%). In 2011, approximately 36% of the Group’s net assets exposure, excluding goodwill and intangible assets, was hedged using foreign currency borrowings and currency forward contracts.
The Group’s key exposure results from the Australian dollar with assets in this currency representing approximately 12% of the Group’s net assets after hedging excluding goodwill and intangible assets. This exposure is reviewed on a regular basis.
The Group’s exposure to the Euro is less than 4% of Group net assets after hedging activities. during the year, additional hedging was undertaken to minimise the potential balance sheet impact of a weakening of the Euro. This position remains under review.
The net increase in the foreign exchange translation reserve was £6.6m and represents the increase in the value of the underlying net assets of the Group’s overseas subsidiaries, net of hedging. Much of the increase in reserves reflects the appreciation in 2011 of the Australian dollar against Sterling.
Solvency IIBupa Group, as well as our regulated insurance subsidiaries in the UK and Spain, will be subject to the requirements of the Solvency II directive. The regulation, which is structured around three mutually reinforcing ‘pillars’, imposes new requirements in respect of: how much solvency capital an insurer should hold (Pillar 1); the governance and risk management of insurers, as well as for the effective supervision of insurers (Pillar 2); and supervisory reporting and public disclosure (Pillar 3).
Solvency capital requirements will be linked more closely to the risks that the business faces and increased public disclosure will enhance transparency to stakeholders.
The Group has established a programme, structured around the three pillar approach, to assist all businesses with the implementation of Solvency II. Although implementation of the legislation has been delayed by a year to 1 January 2014 we have decided to maintain the current momentum and continue to introduce appropriate changes given the value they bring to the business.
Bupa Annual Report 2011 27
FIN
AN
CIA
L S
TA
TE
ME
NT
SG
OV
ER
NA
NC
EB
US
INE
SS
RE
VIE
W

our everyday lifestyle – the exercise we do, how we get about and what we eat – not only impacts our health but also our environment. in turn, the environment impacts our health.
We want to use our unique position as a healthcare group to help people make positive changes to their health and protect our environment. This is integral to how we fulfil our purpose of helping people lead longer, healthier, happier lives, and why we have developed our Bupa Well World commitments:
° We will help 60 million people to make positive changes to be healthier and happier by 2015.
° We will reduce our carbon footprint by 20% by 2015 based on our 2009 footprint.
Our goals are ambitious, requiring new approaches and partnerships, and will stretch us to deliver a positive impact beyond the customers we serve today.
developing and delivering bupa Well WorldTo develop our commitments we sought advice from leading international experts.
In early 2011 we convened the first in a series of workshops where we asked external stakeholders, including those from the Climate and Health Council, Oxford University and Forum for the Future, to challenge and inform our Bupa Well World plan.
Their insight and experience will be vital as we strive towards meeting our commitments.
Our Bupa Well World commitments are being embedded into the heart of our business through our annual plans and business metrics.
The Group Sustainability Committee meets quarterly to support and influence progress. A network of Sustainability Champions is responsible for implementing the commitments in each business unit.
TH E B U PA WELL WO R Ld cO M M ITM ENTS FU LLy AL IG N WITH O U R PU R P OS E AN d STR ATEGyr ay K i n GC H I E F E x E C U T I v E
s u s ta i n a b i l i t y
B U PA WELL WO R Ld
18.5mViews of Bupa’s online health information in 2011 globally.
4.7%Reduction of Bupa’s total carbon footprint, against our 2009 baseline.
BUPA VOLUNTEER NUMBERS
8,336
25,968 12,708
200
9
2010
2011
28 Bupa Annual Report 2011

s u s ta i n a b i l i t y
K EEP I N G PEO PLE WELL
£6.8mdonations made to the Bupa foundations in Australia, Spain and the UK in 2011.
50,000Personal health pledges made through Max Bupa’s Health Promises campaign in India.
bupa is committed to helping 60 million people make positive changes to be healthier and happier by 2015. our customers told us that as well as expecting a healthcare partner to look after them when they are ill, they want us to find new ways to help people be healthier, even people who are not our customers.
The scale of the challengeHealthcare systems are facing enormous challenges. Globally there are more than 36 million preventable deaths every year from long-term health problems, such as diabetes and heart disease. Not only do these preventable deaths have a devastating social impact, they also create a huge financial burden. The projected cost of these long-term health conditions threatens access to quality healthcare, particularly in low and middle income countries. More needs to be done to keep people well.
Finding solutionsUsing our health and wellness expertise, Bupa is working with partners to trial a range of innovative projects around the world aimed at keeping people well. Bupa will then look for opportunities to scale up the most successful projects.
Our plans focus on broad engagement – using online health information and other digital tools – combined with initiatives to facilitate deep engagement. Overall, our goal is to help people make and sustain positive changes to their lifestyle to be healthier and happier.
OVER T I M E , WE WI LL d EEPEN O U R EN GAG EM ENT WITH PEO PLE TO SU PP O RT TH EM I N AdO PTI N G H E ALTH I ER B EHAVIO U RS
S TA R T TO M Ov E : D E v E LO P I N G “ P H YS I C A L L I T E R AC Y ” I N T H E U K
Start to Move, a Bupa partnership with youth Sport Trust, will transform the way physical education is taught in UK schools to 4-7 year olds. By equipping teachers to teach skills fundamental to physical activity, children will learn the ABcs of movement – stability, locomotion and object control. In the 2011/2012 academic year, 180,000 children will take part.
H E A LT H I E R L I F E S T Y L E P H O N E A P P S I N AU S T R A L I A
Bupa has designed a range of free, online tools to help people adopt a healthier lifestyle. BrainyApp, a world first and developed by Bupa Health Foundation and Alzheimer’s Australia, helps users improve their lifestyle to reduce their risk of dementia. With over 41,000 downloads in its first 48 hours, it rated number one in the Australian app store. BrainyApp has since been launched internationally.
B U PA G LO B A L C H A L L E N G E 2 0 1 1
In June, Bupa Global challenge engaged 60,000 people to get moving.
Employees and local communities took part in 444 events in 15 countries. From dancing in New Zealand care homes and a walking challenge in Hong Kong to a cycling fund-raiser in Bolivia, participants discovered the health benefits of physical activity while having fun.
Bupa Annual Report 2011 29
FIN
AN
CIA
L S
TA
TE
ME
NT
SG
OV
ER
NA
NC
EB
US
INE
SS
RE
VIE
W

s u s ta i n a b i l i t y
SU PP O RTI N G A H E ALTH y PL AN E T
as part of our commitment to supporting a healthy planet, we have pledged to reduce our carbon footprint by 20% by 2015, based on our 2009 footprint. so far, we have achieved a 4.7% reduction and are committed to accelerating our progress.
We have made substantial infrastructure investments to reduce our energy consumption and improve energy efficiency. Our care Services division, by nature of its business, is most energy intensive and accounts for 69% of our global carbon footprint. care Services invested over £3m in 2011, including the installation of Building Energy Management Systems as well as new boilers, insulation and lighting. In addition, new energy efficient products will continue to be reviewed and installed, including LEd lighting and occupancy sensors.
In total, these and other investments have helped Bupa care Services to reduce its carbon emissions by 7.7% in 2011 (based on 2009 baseline). Across the rest of the Group, some business units have reduced their overall emissions while in others, levels have increased. This has been due to a range of reasons, including business expansion.
We are committed to reducing the carbon footprint of our offices around the world. Sanitas, as an example, has installed carbon emissions monitors to help the business manage and reduce energy consumption across the property portfolio, which includes our Spanish offices and hospitals.
We have been engaging employees through a number of campaigns that focus on behaviour change in our offices, care homes and other facilities. We will also continue to share best practice, trialling innovative technologies and approaches, and supporting these to scale across Bupa.
10,800 tonnes of carbon offset by Bupa International through the climatecare partnership.
30UK care homes participated in a pilot to encourage environmentally-friendly behaviour among employees.
A F O C U S O N C A R E H O M E S I N T H E U K
As part of a multi-million pound carbon reduction investment programme, our UK care homes will be fitted with energy efficient systems.
A trial at colton Lodges achieved a 9% carbon saving following the installation of renewable technologies, including solar panels and air source heat pumps.
I N v E S T M E N T S I N S PA I N
In Spain, Sanitas has a range of initiatives to move its operations to 100% renewable energy. Sanitas has launched a national system to monitor and manage energy consumption and the Sanitas hospitals and medical centres have developed and implemented an environmental management system certified under ISO 14001.
C A R B O N O F F S E T PA R T N E R S H I P
Bupa International is offsetting its carbon footprint and tackling water-borne disease in Kenya. Through an innovative partnership with climatecare, Bupa has so far funded 1,521 water purification tools, or LifeStraws. The LifeStraw removes the need to burn wood to boil water for purification, saving 10,800 tonnes of carbon.
CARBON FOOTPRINT COMPOSITION: DIVISIONS
69% Care Services
16% Europe and North America 13% International Markets 2% Group
30 Bupa Annual Report 2011

s u s ta i n a b i l i t y
FUTU R E FOcUS
the bupa Well World commitments are a core part of our ambition to be a healthcare partner. our commitments establish an ambitious agenda for achievement by 2015. as we make progress towards them, longer term sustainability goals will be developed, commensurate with the global healthcare and environmental challenges that lie ahead and the contribution we believe we can make.
To support our journey to 2015 and beyond, Bupa has established a number of approaches to embed our Bupa Well World goals.
Carbon reporting and managementBupa will improve carbon reporting and management systems across the organisation. In disclosing future global carbon footprint data, we will work towards independent assurance.
We will create a full sustainability reporting framework that drives insight and action at Bupa. This will include investments in our monitoring and reporting processes and systems, and the exploration of external reporting frameworks.
GovernanceThe Group Sustainability committee and network of Sustainability champions will be critical in fulfilling the Bupa Well World commitments. Recognising the commercial importance of sustainability, our senior leaders have incorporated the commitments into their performance objectives.
Sustainability at the heart of the businessOur business strategy incorporates our Bupa Well World commitments and each business unit’s plans include activities to help us achieve them. Improved reporting will better allow us to determine opportunities for quick wins, ongoing improvements and major investments.
Partnering for successIn addressing the pressing global health and environmental challenges, no single entity has all the answers. We also need to address the causes, not just the effects, of the challenges we face. We are committed to working with other organisations and partners to find opportunities to make a positive impact.
H E L P I N G O U R E M P LOY E E S A D O P T H E A LT H I E R L I F E S T Y L E S
Not only a healthcare partner to our customers, we want to be a healthcare partner to our people.
We have invested in the health and wellbeing of our people through a large number of workplace health initiatives across our markets.
2011 saw the launch of Healthy Life Plans at our offices in the UK, where we combined our corporate healthcare expertise with insights into behaviour change.
Healthy Life Plans help employees understand their personal health, set health goals, and form peer to peer coaching networks between colleagues and friends.
We’re committed to using the best of our healthcare expertise to develop tools and resources that can be used across the business to support our people in leading longer, healthier and happier lives.
Bupa Annual Report 2011 31
FIN
AN
CIA
L S
TA
TE
ME
NT
SG
OV
ER
NA
NC
EB
US
INE
SS
RE
VIE
W

o u r p e o p l e
WO R KI N G TOG E TH ER AT B U PA
We are proactive at engaging with our employees across the business so that everyone understands the needs of our customers, who are central to everything we do. We believe that this also provides a more meaningful working experience.
commitment to developing leadership and talentThe quality of our people is at the heart of our ability to deliver our business ambition. We have introduced more rigour to talent attraction, assessment and selection using best practice tools and approaches to support Talent Boards, succession planning, career reviews and to identify potential. Our top 120 global leaders participated in a three-day thought-leadership forum co-created with Harvard Business School focused on ways to add value to customers’ lives.
We invest in building capability at every level and look to harness our people’s healthcare expertise across markets for the benefit of customers throughout the world. Our experts share knowledge, building employees’ capability as a healthcare partner. We move people from all disciplines and levels around the Bupa Group on short and long-term international secondments and stretch assignments.
employee engagement Engaged employees go the extra mile for our customers and our business. We communicate regularly to help our people understand Bupa’s strategy and priorities, unifying them behind our purpose. We encourage employees to get involved in finding ways to improve service quality and our annual survey, ‘Surveying Our People’, invites colleagues to express their views on a wide variety of topics. The results are discussed by every team who decide together how to implement changes.
Key to our success is the value we place on sharing and applying best practice across the Group. To encourage Group-wide collaboration we continue to invest in Bupa Live, our internal social media platform. With over 4,000 online groups generated by our 13,500 users, our progress has been recognised by a number of industry awards. Bupa Live users score up to 11% higher across a number of employee engagement survey questions and daily we see new examples of efficiencies and innovation enabled by the platform.
managing and recognising performance To ensure everyone has challenging goals, we introduced a two-factor performance management scheme. Factor A objectives help individuals focus on operational excellence related to annual business plans. Factor B objectives focus on activity that delivers longer-term improvements to Bupa.
The Bupa One Life scheme recognises innovation, excellence and long service at all levels, with over 2,000 employees throughout the Group receiving an award.
EN GAG I N G O U R PEO PLE I N B U PA’ S B US I N E S S LE AdS TO B E T TER c AR E FO R O U R c USTO M ERS
32 Bupa Annual Report 2011

WE AR E EN HAN cI N G PEO PLE ’ S q UALIT y O F L I FE . TH ER E AR EN ’ T MAN y J O B S WH ER E yO U c AN dO THATa n n e f oxH E A LT H c OAc HB U PA H E A LT H A N d W E L L B E I N G
Health and SafetyBupa operates a safe environment for employees. Over the past 12 months we have maintained a low and improving level of employee-related accidents. We have also undertaken a review of health and safety policies and practices with a view to further developing and strengthening health and safety arrangements.
Diversitydiversity and inclusion is essential to our ability to be a creative, dynamic organisation. While our overarching principles are consistent, our priorities are tailored to meet the local needs of the countries in which we operate.
Employing people with disabilities forms part of our diversity commitment. We recruit, train, develop and promote all our people, including those with disabilities, based on their aptitude and ability. Should an employee become disabled during employment, we make every effort to continue their employment and provide them with appropriate training, as necessary.
Looking forwardBupa is about to enter an exciting new phase in its development through a growth agenda that will take us further forward in our healthcare partner ambitions. We will continue to ensure Bupa has the people, processes and organisational capabilities to deliver the strategy.
G LO B A L M O B I L I T Y I N C A R E S E R v I C E S
To extend best practice and share expertise across markets, we created a programme of short-term international secondments.
The scheme has benefited individual employees, the business and, most importantly, our residents, as employees have learned new approaches and skills from colleagues in other markets. Secondees have welcomed the opportunity to develop a more global perspective and share insights.
B U I L D I N G A B E T T E R S A N I TA S
Sanitas’ senior leaders decided to review their roles to ensure that customers are at the heart of all they do. All 43 members spent time on the frontline, listening to customers and developing ideas to better meet and exceed their expectations.
In two months, the scheme generated 77 proposals to help Sanitas be a better healthcare partner. The programme is continuing and has been extended to further increase engagement.
E N G AG I N G E M P LOY E E S I N “ T H E B U PA WAY ”
In Australia, we implemented the Bupa Way, a programme to help employees understand what it means to be a healthcare partner and how everyone can contribute.
The interactive Bupa Way sessions help employees understand how to build an emotional connection with customers. All Australian employees completed the programme in 2011 and we are now looking at ways to share the learning across the Bupa Group.
Bupa Annual Report 2011 33
FIN
AN
CIA
L S
TA
TE
ME
NT
SG
OV
ER
NA
NC
EB
US
INE
SS
RE
VIE
W

r i s K m a n aG e m e n t
RIS KS AN d U N c ERTAI NTI E S
balancing risk and reward is an integral part of running a successful business. as a large, complex company, we have identified and manage a range of business risks so that we can achieve our objectives.
risk management frameworkThe Bupa Risk Management Framework outlines Bupa’s approach to risk management across the Group. At the heart of the framework is the requirement for the various business units to identify periodically and quantify the key risks that they face and to assess the effectiveness of control strategies to mitigate the risks to an acceptable level.
The Bupa Risk Management Framework assesses risks under five broad headings:
strategic – specifically focused on the economic environment, the products offered, Bupa’s channel/markets and brand.
insurance – those risks associated with providing insurance products including underwriting, pricing and claims, reserving and reinsurance.
financial – associated with the financial operation of the Group including capital management, investments, liquidity and credit.
clinical – those risks associated with the provision of healthcare services to Bupa’s customers.
operational – those risks associated with internal systems and processes or external events.
MANAG I N G O U R R IS KS S EcU R E S VALU E FO R O U R cUSTO M ERS AN d PROTEc TS O U R B US I N E S S
OU R R ISK MANAGEMENT PROcESS
1 . m o n i t o r i n G a n d m a n aG e m e n t
2 . a s s e s s m e n t 3 . e va l uat i o n 4 . ac t i o n p l a n s
Bupa’s risk appetite statements are set by the Board and provide a benchmark against which to identify risks that are outside Bupa’s tolerance. Risk monitoring is further aided by a suite of key risk indicators that provide an early indicator of an adverse shift in risk exposure. Risks are assessed both quantitatively and qualitatively on a quarterly basis in line with good practice and are reviewed and challenged by the Group Risk team.
Each quarterly Risk Assessment (qRA) seeks to identify the key risks faced by the business, the residual likelihood and impact of the risk based on the existing controls, and an evaluation of the level of risk against management’s risk appetite. Stress tests, including reverse stress tests, are performed to assess certain risk scenarios and their potential impact on the Group, as well as identifying scenarios which could lead to insolvency.
The output of the qRA forms the basis for the chief Risk Officer’s report which is presented to the Group Audit, Risk & compliance committee quarterly. The report presents a view of the key risks faced by the Group, trends that present themselves across the business and a view on the action plans that are in place to mitigate identified risks. The Group Board is regularly apprised of key risks identified in the qRA process.
Actions required to bring risks within tolerance levels are assigned to specific owners, with the nominated risk owner responsible for ensuring they progress appropriately. Progress on actions is monitored as part of the qRA process, with performance against plan reported to local management on a regular basis and by local management to the Group Board.
34 Bupa Annual Report 2011

We have identified the principal risks to the achievement of the Group’s goals within the categories of the risk management framework.
S T R AT EG I cBusiness Environment, Government Policy and Development of the Healthcare SystemImpactMany governments are reviewing their approaches to healthcare provision funding and the involvement of the private sector. Such changes to government policy may have an impact on Bupa’s businesses in a number of geographies and market sectors.
MitigationBupa actively monitors the changing political environment across all areas of operation and, where possible, seeks to engage with relevant government officials. The care Services division actively monitors demand and fee levels for residential care and responds appropriately where levels are consistently low. In the face of these pressures, opportunities for efficiency improvements are identified.
The diversified geographic spread of Bupa’s operations reduces the organisation’s exposure to significant changes in government healthcare policy within any one country.
Economic Market ConditionsImpactThe current challenging economic conditions, particularly in Europe, increase the level of risk faced by Bupa’s operations around the world. Rising inflation, prolonged periods of low interest rates, credit rating reductions for investment counterparties and reduced GdP will each impact Bupa’s businesses and investment strategies in a variety of manners.
MitigationBupa seeks to minimise the impact of external economic events through the diversified nature of its operations. Bupa’s governance structures and policies seek to protect the business from excessive exposure to specific external risks while seeking to achieve growth targets. Where considered appropriate, specific actions are implemented to minimise exposures to external market risks including hedging arrangements and the purchase of specific financial instruments. Management teams are responsible for considering the potential impact of macroeconomic events in terms of impacts on their business plans including the use of stress testing to consider potential consequences of specific events.
CompetitionImpactPrivate medical insurance markets are increasingly competitive as companies diversify in search of profits. A number of new entrants have entered the market in recent years, with many seeking to compete on price and often offering products with more limited benefits. Bupa continues to invest in new products and brand development activities to ensure the Group maintains its leading position in the market.
MitigationBupa keeps its competitive position in each of its markets under continuous scrutiny, regularly reviewing competitor activity, and strategic and tactical objectives. The Board and senior management monitor performance via key indicators such as trend data, customer satisfaction results and monthly financial results.
I N S U R A N c EUnderwriting, pricing and claimsImpactBupa’s insurance businesses face the risk that unexpected variations in the frequency, size or timing of claims will lead to variations in financial returns. By virtue of being in the healthcare insurance business, Bupa is exposed to a number of factors affecting its insurance risk. These include macroeconomic trends, medical inflation, shifts in demographics, changes in population health, developments in healthcare technology, natural catastrophes and statistical fluctuation.
MitigationBupa manages its insurance risks by the use of advanced analytic models of products and prices, controls on underwriting and claims settlement, clarity over policy contract definitions, and internal and external actuarial reviews. customers purchase our products primarily to cover the costs of unexpected acute illness. The majority of Bupa’s insurance business covers costs for conditions in a prospective twelve month period which enables regular pricing review in the event of changes in claims trends.
F I N A N c I A LCapital and SolvencyImpactSolvency II will require all insurance businesses to reconsider their approaches to capital management and their overarching governance regimes. This will have particular relevance to Bupa due to the unique nature of its mixed activity operations.
MitigationBupa has established a dedicated Solvency II programme team with workstreams created to ensure that robust and proportionate solutions are embedded throughout the organisation in line with regulatory requirements. Bupa has a strong capital position and it has every expectation that this will continue to be reflected under Solvency II regulation. Bupa is actively engaging with the relevant regulators to ensure that Solvency II requirements appropriately take into account mixed activity insurance firms such as Bupa.
r i s K m a n aG e m e n t
RIS K AN d M IT I GATIO N
Bupa Annual Report 2011 35
FIN
AN
CIA
L S
TA
TE
ME
NT
SG
OV
ER
NA
NC
EB
US
INE
SS
RE
VIE
W
InvestmentImpactBupa had financial assets, cash and cash equivalents totalling £3.1bn at year end. Failure to manage these assets effectively may result in financial loss and a reduction in Group solvency. A small percentage of the Group’s portfolio is invested in return-seeking assets, which may vary in value during periods of market stress or dislocation.
MitigationThe majority of the investments are managed by the Group’s Treasury department under the supervision of the Treasury and Investment committee. Most of the investments are held in cash; exposure to individual counterparties is restricted and generally deposits are not held with institutions without two credit ratings of AA-/Aa3 or better by the major credit rating agencies. The return seeking asset portfolio is managed within a risk budget framework using Value at Risk methodology.
FundingImpactBupa supports its current operations and future growth from a combination of internally generated profits and externally raised debt. The Group needs to maintain good access to a variety of funding sources to ensure that short-term and long-term liquidity is maintained.
MitigationBupa maintains adequate levels of funding headroom through a £900m committed bank facility which expires in September 2013. In addition, Bupa has access to a variety of debt capital markets including the senior and hybrid bond markets. Bupa is committed to maintaining an investment grade credit rating and monitors key financial ratios, such as leverage and interest cover.
c L I N I c A LClinical GovernanceImpactBupa is dedicated to ensuring its customers are treated and cared for according to evidence based best practice, high patient safety and clinical standards. Failure to fulfil these obligations could lead to significant financial, regulatory and reputational impact.
MitigationTo support divisional and Business Managing directors, all major business units have a Medical director responsible for ensuring clinical quality and governance standards. They are professionally accountable to the Group Medical director (GMd) for clinical governance. The GMd has been nominated as the senior manager, independent from the businesses, who takes overall responsibility on behalf of Group for the oversight of systems and controls relating to clinical governance. The Board has a Medical Advisory Panel (MAP) chaired by Professor Sir John Tooke, which advises it on medical issues and considers external perspectives from a number of leading clinicians and health professionals to help inform and develop Bupa’s approach.
The GMd provides a quarterly Report on clinical governance to the MAP with an Annual Report also going to the Board; this annual report makes commendations and recommendations for improvements. The MAP receives summary information regarding clinical incidents and the results of clinical audits undertaken across the Bupa Group. The Group clinical Governance committee, which includes all Medical directors, and reports to the MAP, meets quarterly and monitors business units across the Group to ensure they have effective governance systems and processes in place, including the review of serious clinical incidents. The clinical Governance quality Assurance Programme includes an assessment of the clinical risk arrangements in business units.
O P E R AT I O N A LProvider CostsImpactBupa’s insurance customers benefit from high quality services procured from a wide range of providers including hospitals and consultants. In the face of inflationary pressures, there is a risk that increasing provider charges will lead to substantial increases in premium rates and customer dissatisfaction.
MitigationBupa’s policy is to work with its providers to maintain and improve quality while containing the cost of procuring medical services. This includes, where possible, the use of contracts, preferred supplier arrangements and case management techniques.
RegulatoryImpactBupa serves customers in more than 190 countries and could, therefore, be affected by changes in financial, clinical and health and safety regulations in a number of countries. This could affect the way it carries out business and, in certain cases, might increase costs or reduce revenues.
r i s K m a n aG e m e n t
R IS K AN d M IT I GATIO Nco n t i n u e d
36 Bupa Annual Report 2011

MitigationBupa seeks to operate to high regulatory standards and to maintain an awareness of and, where possible, anticipate regulatory change. Bupa’s principal financial regulator is the UK’s Financial Services Authority, with whom Bupa senior managers maintain a close working relationship.
PeopleImpactAs Bupa changes and grows, it needs to make sure it has the right people to move the Group forward. The Board views the development and training of Bupa’s people, and the recruitment of experienced individuals from outside the Group, as central to the organisation’s future success.
MitigationBupa has sound selection, evaluation and reward processes to recruit, develop, recognise and motivate strong performance and has a structured succession planning process.
Change ManagementImpactLike all major organisations, Bupa has an ongoing programme of change and development to drive continued improvement in the products and services it provides. Should these changes be managed ineffectively, the risk of failure to deliver the intended benefits may be increased.
MitigationBupa mitigates the risk inherent in change by having stringent change management procedures. Major project expenditure on new developments is approved by the Board following a rigorous assessment of plans. Professional programme management resources are used and the Internal Audit team reviews the impact of major changes on Bupa’s operational controls. Progress on key projects is reviewed by the Audit, Risk & compliance committee or the Board.
Information TechnologyImpactThe services provided by each of Bupa’s businesses are underpinned by information technology systems and infrastructure that enable the delivery of core processes and products. Failure of these systems may reduce the ability of Bupa to deliver products and services to its customer base or increase the risk of information security breaches.
MitigationBupa has a global IT team, supported by specific local teams, who are responsible for the development, maintenance and monitoring of IT services. A programme of work is in place to ensure the continued development and enhancement of all IT services to provide the levels of services required by the business and adequately protect sensitive customer and business data. Bupa has a dedicated information technology risk management team which monitors and manages specific risks across the information technology estate, reporting to both senior management and Group Risk on a routine basis.
Bupa also has clear policies and standards for information governance across the Group. These are reviewed regularly at an executive level and reported on to the Audit, Risk & compliance committee annually.
Business ContinuityImpactThe geographic diversification of Bupa’s operations significantly increases its exposure to business disruption. In 2011, Bupa businesses were impacted by civil unrest in Egypt and Libya, flooding in Australia and Thailand and earthquakes in New Zealand.
MitigationEach business unit has detailed Business continuity Plans overseen by the Group Business continuity Management (BcM) committee. Business continuity issues are reported to the Audit, Risk & compliance committee.
As a result of the governance structures and controls in place, Bupa was not significantly impacted by any business disruption event during 2011.
WE ’ R E d EdIc ATEd TO EN SU RI N G ALL O U R cUSTO M ERS R Ec EIVE H IG H q UALIT y c L I N Ic AL c AR E
Bupa Annual Report 2011 37
FIN
AN
CIA
L S
TA
TE
ME
NT
SG
OV
ER
NA
NC
EB
US
INE
SS
RE
VIE
W

G ov e r n a n c e
dI R Ec TO RS
c H A I R M A Nlord leitch2,3
Age 64Joined the Board in May 2005 and was appointed chairman in November 2006. Member of the House of Lords, chairman of Intrinsic Financial Services and chancellor of carnegie college. Formerly deputy chairman of Lloyds Banking Group, chairman and chief Executive of Zurich Financial Services UK, Ireland, South Africa and Asia Pacific, chairman of the Life Insurance council, chairman of Scottish Widows and the Association of British Insurers. Lord Leitch chairs Bupa’s Nomination & Governance committee.
S E N I O R I N d E P E N d E N T d I R Ec TO Rpeter cawdron1,2,3
Age 68Joined the Board as a Non-Executive director in May 2007. chartered Accountant. Formerly Strategy director at Grand Metropolitan, chairman of Punch Taverns and capital Radio, Non-Executive director of compass Group, capita Group and ARM (Holdings). Peter cawdron is Bupa’s Senior Independent director and chairman of Bupa’s Remuneration committee.
P R E S I d E N Tsir bryan nicholson Gbe Appointed as Bupa’s Honorary Life President in 2005. Previously served as chairman of Bupa between 1992 and 2001.
I N d E P E N d E N T N O N - E X Ec U T I V E d I R Ec TO R Slawrence churchill, cbe1
Age 65Joined the Board as a Non-Executive director in July 2009. chairman of the NEST corporation, Senior Independent director of the Good Energy Group and a member of the board for Actuarial Standards. Formerly chairman of the Pension Protection Fund, chief Executive of Zurich Financial Services UK and International Life, chairman and Managing director of UNUM and chief Executive of NatWest Life and Investments.
professor sir John tookeAge 63Joined the Board as a Non-Executive director in July 2009. President, Academy of Medical Sciences. Vice Provost (Health), University college London and Head of UcL’s School of Life and Medical Sciences and Medical School, Non-Executive director of UcL Hospitals NHS Foundation Trust and UcL Business. Professor Sir John Tooke chairs Bupa’s Medical Advisory Panel.
the rt hon baroness bottomley of nettlestone, dl3
Age 64Joined the Board as a Non-Executive director in May 2007. Member of the House of Lords, chancellor of the University of Hull, chair of Board Practice at Odgers Berndtson, a Supervisory Board Member at AkzoNobel NV, and a Trustee of The Economist newspaper. Baroness Bottomley was a member of the House of commons from 1984 to 2005 serving as Secretary of State for Health and then National Heritage (now culture, Media and Sport).
George mitchell, cbe1,2,3
Age 61Joined the Board as a Non-Executive director in May 2007. chairman of the Malcolm Group Limited and Non-Executive director of Intrinsic Financial Services. Formerly an Executive director of HBOS plc and a former Governor of Bank of Scotland plc. George Mitchell chairs the Bupa Audit, Risk & compliance committee and Bupa’s UK Regulated Entities Board.
38 Bupa Annual Report 2011

E X Ec U T I V E d I R Ec TO R Sray King3
Age 58Appointed Group chief Executive of Bupa in May 2008, following six years as Group Finance director. chartered Accountant. Former director of Group Finance and control at diageo, Group Finance director of Southern Water and served as a Non-Executive director of Friends Provident between 2004 and 2009. Board Member of ABI. On 7 July 2011, he announced his plans to retire in 2012.
neil taylorAge 52Joined Bupa in 1999 and appointed Acting Group Finance director in September 2011. Formerly Finance & Business development director of Bupa care Services, Finance director at Scottish Power retail division, Group Financial controller at Kwik Fit Tyres & Exhausts plc, other senior finance management roles at East Midlands Electricity plc, Rodime plc and deloitte.
I N d E P E N d E N T N O N - E X Ec U T I V E d I R Ec TO R S rita clifton2
Age 54Joined the Board as a Non-Executive director in June 2010. chairman and former chief Executive of Interbrand, chairman of Populus and Non-Executive director of dixons Retail plc, President of the Market Research Society, Trustee of WWF (Worldwide Fund for Nature), visiting Professor at Henley Business School and chairman of the BTcV, the social enterprises group.
John lorimerAge 59Joined the Board as a Non-Executive director in July 2011. Trustee of charities Aid Foundation (cAF), chairman of cAF Bank Ltd, Non-Executive director of International Personal Finance plc and Aberdeen New dawn Investment Trust plc and Member of the Board of the Welsh National Opera. Formerly Senior Executive with Standard chartered and citigroup.
S Ec R E TA Rynicholas beazleyAge 52Joined Bupa in 1993, appointed Group Strategy director in June 2000 and became Bupa’s company Secretary in June 2005. Formerly a management consultant at coopers & Lybrand and trained as a solicitor at Freshfields.
Member of: 1. the Audit, Risk & compliance committee 2. the Remuneration committee 3. the Nomination & Governance committee
Bupa Annual Report 2011 39
FIN
AN
CIA
L S
TA
TE
ME
NT
SG
OV
ER
NA
NC
EB
US
INE
SS
RE
VIE
W

the directors of the british united provident association limited (‘bupa’) present their report and the financial statements for the year ended 31 december 2011.
IntroductionBupa is managed in line with the corporate governance safeguards and commercial principles that would be expected to be found in a listed company. Bupa is committed to maintaining high standards of corporate governance in all its businesses.
The business review on pages 1 to 37, the corporate governance statement on pages 41 to 44 and the remuneration report on pages 45 to 47 all form part of this report. The audited financial statements are presented on pages 51 to 110.
Principal activitiesThe principal activities of the Group are the provision of health insurance and healthcare facilities and services. The latter includes ownership and management of care homes, hospitals and clinics, health screening, provision of disease management services and occupational and community health services.
Financial resultsThe results of the Group for 2011 are reported on pages 51 to 58. The surplus for the financial year of £135.9m has been transferred to equity.
Acquisitions and disposalsdetails of the acquisitions and disposals made during the year are shown in notes 34 and 20 respectively.
Charitable and political contributionsduring 2011, Bupa made charitable donations totalling £7.3m (2010: £5.5m). This included payments to The Bupa Foundation of £2.6m (2010: £2.6m), the Sanitas Foundation of £0.8m (2010: £0.4m), the Bupa Health Foundation in Australia of £3.4m (2010: £1.8m) and UK registered charities of £0.5m (2010: £0.6m). No political donations were made.
Employment policies details of Bupa’s employment policies, including policies on equal opportunities for disabled employees, are included in the statement on pages 32 to 33.
Principal risks and uncertaintiesThe Group’s principal risks and uncertainties are set out on pages 34 to 37 together with a description of how the Group manages these.
Board of DirectorsThe Board is responsible for the good standing of the company, the management of its assets, including the management of risk, and the strategy for its future development. There are nine Board meetings each year and other meetings are convened as needed.
G ov e r n a n c e
R EP O RT O F TH E BOAR d O F d I R Ec TO RS
Biographical details of Mr Ray King and eight Non-Executive directors who currently hold office together with the details of the Acting Group Finance director, Mr Neil Taylor, are set out on pages 38 and 39.
during the year, Mr King announced his intention to retire in 2012 and Mr Stuart Fletcher has been appointed as his successor. Mr Fletcher will be appointed to the Board on Mr King’s retirement. Mr Tom Singer resigned as Group Finance director with effect from 16 September 2011.
As at the date of this report, indemnities are in force under which the company has agreed to indemnify the directors and certain senior managers, to the extent permitted by law and the company’s articles of association, in respect of all losses arising out of, or in connection with, the execution of their powers, duties and responsibilities, as directors of the company or any of its subsidiaries.
Going concernThe directors confirm that they are satisfied that the company and the Group has adequate resources to continue in operation for the foreseeable future. Accordingly, they continue to adopt the going concern basis in preparing the financial statements.
Policy for paying creditorsIt is Bupa’s policy to pay its providers and other creditors in accordance with agreed terms and conditions. As a holding company, the company itself has no trade creditors.
Disclosure of information to auditors The directors who held office at the date of approval of this directors’ report confirm that, so far as they are each aware, there is no relevant audit information of which the company’s auditors are unaware; and each director has taken all the steps that they ought to have taken as a director to make themselves aware of any relevant audit information and to establish that the company’s auditors are aware of that information.
AuditorsIn accordance with Section 485 of the companies Act 2006, KPMG Audit Plc offers itself for re-appointment at the Annual General Meeting as auditors of the company.
By order of the Board
N T Beazley company Secretary 12 March 2012
40 Bupa Annual Report 2011

G ov e r n a n c e
cO R P O R ATE GOVER NAN c E STATEM ENT
bupa is a private company limited by guarantee without share capital. as such it has no shareholders and all of its surpluses are available to be reinvested back into the business. bupa exists for the benefit of its present and future customers.
Overview of Bupa’s Corporate GovernanceThe oversight normally provided by shareholders is exercised by a body of around 100 distinguished Association Members drawn mainly from business, public life, the medical professions, the charitable sector and academia, all of whom exercise the usual rights of shareholders. Nonetheless, as Bupa is a company limited by guarantee, the Association Members do not have any claim on the assets of the company and are not entitled to receive a share of profits or dividends.
Bupa is managed in line with the corporate governance safeguards and commercial principles that would be expected to be found in a listed company as explained below. Bupa’s Board of directors includes a majority of independent Non-Executive directors who currently outnumber Executive directors by a ratio of four to one. The Non-Executive directors are eminent people in their own right and normally serve for two three-year terms.
The Board has a number of committees, all of which comply with corporate governance principles, including Audit, Risk & compliance, Nomination & Governance and Remuneration committees, together with a Medical Advisory Panel, which includes leading independent medical professionals. There is also an Executive Sustainability committee, established in 2007, which reports to the Board on an annual basis. The Sustainability Report can be found on pages 28 to 31.
In addition to the internal systems and controls that apply across the Bupa Group, most of Bupa’s principal trading companies are monitored and supervised by external regulators, including in the UK the Financial Services Authority (FSA) and the care quality commission. Separate regulatory requirements apply to each market in which Bupa operates.
Bupa believes that its corporate status is relevant and particularly important to healthcare and a significant advantage to the company and its customers. It represents a considerable strength and means that Bupa is operated with customers, both present and future, as its absolute priority.
B U PA E XISTS FO R TH E B EN EFIT O F ITS cUSTO M ERS – PR E S ENT AN d FUTU R E
Compliance with the UK Corporate Governance CodeThe Board continues to support the principles of corporate governance set out in the UK corporate Governance code published by the Financial Reporting council in June 2010 and available on the FRc’s website www.frc.org.uk. While not itself a listed company, Bupa has complied with the provisions set out in the code, in so far as it is applicable to a company without shareholders, throughout the year ended 31 december 2011. code Section E relating to dialogue with shareholders is not applicable to a company with no share capital.
The Nomination & Governance committee reviews compliance with the code on an annual basis and recommends and monitors actions to ensure compliance, where appropriate. This review considers each code Provision and seeks evidence as to how the company complies.
Bupa Annual Report 2011 41
FIN
AN
CIA
L S
TA
TE
ME
NT
SG
OV
ER
NA
NC
EB
US
INE
SS
RE
VIE
W

Board of Directorsdetails of the directors are set out on pages 38 and 39.
The Board of directors normally meets nine times a year and ad hoc as required. It has adopted a schedule of matters, such as strategy and policy, approval of business plans and significant capital expenditure, acquisitions and disposals, which are required to be brought to it, or its duly authorised committees, for decision or review. Relevant and high quality papers are provided to members of the Board in good time, so that they may consider such information and any issues arising.
The Board currently comprises one Executive director, the independent Non-Executive chairman, and seven further independent Non-Executive directors. Mr N R Taylor is currently acting as Group Finance director, pending the appointment of a permanent Group Finance director. All directors are now subject to annual re-election. All the Non-Executive directors are considered by the Board to be independent of management and free from any business or other relationship which could materially interfere with the exercise of their independent judgement. The terms and conditions of appointment of Non-Executive directors are available from the company Secretary and are on Bupa’s website. Bupa places great emphasis on the principle of diversity, including gender diversity, and has a policy to ensure that there is broad experience and diversity on the Board.
The Executive directors are allowed to take up one Non-Executive directorship of a significant company where this would bring additional value and external perspectives and experiences to Bupa and to retain any remuneration from such an appointment. during 2011, no Executive director held such a position.
The chairman stood down as deputy chairman of Lloyds Banking Group on 1 March 2012.
In 2010, the annual Board evaluation process was externally facilitated by Boardroom Review. This included one-to-one interviews with each member of the Board and divisional managing directors. Boardroom Review’s Report and recommendations were discussed by the Board in december 2010 and again in december 2011 when the Board reviewed both the progress against these recommendations and the results of the 2011 Board Evaluation Survey. In addition, each Board committee has considered and reviewed the findings of its own committee review. The results of these exercises continued to show that the Board, its members and the committees were found to be working well and effectively. A small number of areas were identified for improvement.
Board CommitteesMembers of the following committees are disclosed in directors on pages 38 and 39. The terms of reference of Board committees are available on Bupa’s website.
Audit, Risk & Compliance CommitteeThe Audit, Risk & compliance committee met six times in 2011. The committee is responsible for:
° The overall monitoring of the Group’s systems of internal controls, risk management and compliance. The committee reviews the Annual Risk Assessment carried out across the Group, including action plans to address any significant risks. quarterly, the committee considers a risk update and details of progress against risk action plans, in addition to reports from the Internal Audit and compliance teams. The committee is responsible for the Group’s annual statement on its systems of internal control;
° The integrity of the company’s financial statements, including its annual and interim reports and reviewing significant financial reporting issues;
° The approval of the Group’s annual Internal Audit Plan; and
° The selection of the Group’s external auditors and review of the findings of the external auditor’s work including the audit of the annual report and accounts. The Audit, Risk & compliance committee has discussions with the auditors without management being present.
The committee comprises three Non-Executive directors who have broad experience and knowledge of the issues and items covered by the Audit, Risk & compliance committee. It is chaired by George Mitchell, who has extensive current financial experience. The chief Executive, Group Finance director, Group chief Risk Officer, chief Internal Auditor and external auditors also attend meetings by invitation.
There are plans in place to divide the Audit, Risk & compliance committee into two separate committees in 2012, one focusing on Audit and the other focusing on Risk & compliance.
Remuneration CommitteeThe Remuneration committee met three times during 2011. It determines the detailed terms of service of the Executive directors and the divisional Managing directors, including salary, incentives and benefits. The committee comprises the chairman and three Non-Executive directors. It is chaired by Peter cawdron. The chief Executive attends meetings by invitation. No director attends any meeting relating to his or her remuneration. The Remuneration Report can be found on pages 45 to 47.
Nomination & Governance CommitteeThe Nomination & Governance committee met five times during 2011. It is responsible for the selection and proposal to the Board of suitable candidates for appointment as Executive and Non-Executive directors. during 2011, the committee recommended the appointment of John Lorimer to the Board as a Non-Executive director and managed the recruitment process for a new chief Executive which led to the announcement of the appointment of Stuart Fletcher in december 2011.
G ov e r n a n c e
cO R P O R ATE GOVER NAN c E STATEM ENTco n t i n u e d
42 Bupa Annual Report 2011

The committee is also responsible for making recommendations to the Board for the re-appointment of Non-Executive directors for a further term, membership of committees and new Association Members. The committee’s remit includes responsibility for reviewing the company’s governance and making recommendations to the Board, when appropriate, to ensure that the company’s arrangements remain consistent with best practice governance standards.
A significant exercise has been undertaken during 2011 to review the governance of Bupa’s major overseas subsidiaries and to ensure that these comply with the Group’s governance guidelines issued during 2011.
The committee comprises the chairman, three other Non-Executive directors and the chief Executive; the chairman chairs the meetings.
Attendance at Board, Committee and Panel MeetingsBoard ARC RC NGC MAP
Number of meetings held 12 6 3 5 3
Attendance:
Baroness Bottomley 11 – – 5 3
Peter cawdron 11 5 3 5 –
Lawrence churchill 11 5 – – –
Rita clifton 1 10 – 1 – 1
Ray King 11 – – 3 3
Lord Leitch 12 – 3 5 –
John Lorimer 2 6 – – – –
George Mitchell 10 6 3 4 –
Tom Singer 3 9 – – – –
Prof Sir John Tooke 11 – – – 3
Key:ARc Audit, Risk & compliance committeeRc Remuneration committeeNGc Nomination & Governance committeeMAP Medical Advisory Panel– indicates not a member of that committee1 Rita clifton joined the Rc and the MAP on 1 June 20112 John Lorimer joined the Board on 1 July 20113 Tom Singer resigned from the Board on 15 September 2011
Medical Advisory PanelThe principal role of the Medical Advisory Panel is to advise the Board on medical issues affecting any part of the Group and to oversee Bupa’s clinical governance arrangements. It meets three times a year and monitors Bupa’s clinical and related activities.
Members of the Panel include three Non-Executive directors, Ray King, the chief Executive, and dr Andrew Vallance-Owen, Bupa’s Group Medical director. Professor Sir John Tooke is the chairman. The independent members of the Panel are also Association Members of Bupa. Membership of the Panel is as follows:
° Prof Sir John Tooke MA, MSc, BM, Bch, dM, dSc (Oxon), FRcP, FRcPI, FRcGP (Hon), FAcadMed (Hon), FMedSci (chairman)
° Ray King BSc, FcA, McT (chief Executive)
° The Rt Hon Baroness Bottomley dL, BA, MSc
° Rita clifton MA (Hons)
° Prof Tar-ching Aw MBBS, Phd, FFOM, FRcP, FFPHM
° Tony clayson MB, chB, FRcS, FRcSOrth
° Prof Martin McKee cBE, MSc, Md, FRcP, FRcPI, FFPHM
° Prof Mike Pringle cBE, Md, FRcGP, FRcP
° Prof Mary Watkins Phd, MN, RN, RMN
° dr Andrew Vallance-Owen MBA, FRcS Ed (Group Medical director).
Policy FrameworkThe Group maintains a set of formal policies which ensure a consistent approach to the management of all areas of the business. The Group’s policy set was further enhanced in 2011 and has been rolled out across the Group.
Internal Control StatementThe Board of directors is responsible for the Group’s system of internal control and for reviewing its effectiveness. Such a system is designed to manage rather than eliminate the risk of failure to achieve business objectives and can only provide reasonable, not absolute, assurance against material misstatement or loss.
The Board has established an ongoing process, which is documented in Bupa’s Risk Management Policy, for identifying, evaluating and managing the significant risks faced by the Group. It accords with the guidance set out in Internal control: Revised Guidance for directors (the “Turnbull Guidance”). Further details of Bupa’s risk management process appear on page 34. This process is regularly reviewed by the Group Audit, Risk & compliance committee on behalf of the Board and has been in place for the year ended 31 december 2011 and up to the date of approval of the annual report and accounts. The processes used to review the effectiveness of the system of internal control include the following:
° Bupa has established a ‘three lines of defence’ model. Internal Audit acts as a third line of defence in Bupa’s control framework. It provides independent and objective assurance to the Group Audit, Risk & compliance committee over the adequacy of systems of internal control, risk and governance established by management (first line of defence) and monitored by the Group control functions and divisions (second line of defence). Bupa’s Internal Audit team acts in accordance with the Global Institute of Internal Auditors’ professional standards and has unrestricted access to the chairman of the Group Audit, Risk & compliance committee. Where specific skills are not available in-house, the chief Internal Auditor and chairman of the Group Audit, Risk & compliance committee have the ability to procure the services of expert external advisors.
Bupa Annual Report 2011 43
FIN
AN
CIA
L S
TA
TE
ME
NT
SG
OV
ER
NA
NC
EB
US
INE
SS
RE
VIE
W
° The work of the Internal Audit team is focused on areas of highest operational risk. As in any large and diverse organisation, failings or weaknesses in internal control are identified from time to time. In all such instances, action plans are agreed with management to remedy weaknesses identified and the progress made in implementing these are reported to the Group Audit, Risk & compliance committee.
° In addition to receiving Internal Audit reports, assurance on the key strategic risks facing the Group is provided to the Board or Audit, Risk & compliance committee as appropriate via reports and presentations from either the Group control teams (second line of defence) or from Business Unit Managing directors (first line of defence).
° during 2011 a network of risk professionals employed by Business Units around the Group has been developed to continue the embedding of risk management into local operations, to drive standardisation of processes, and to share good practices.
° Other committees, subsidiary boards and advisors to the Board monitor the Group’s significant risks on an ongoing basis and report to the Board as appropriate. These include the boards of key operating subsidiaries, the Treasury and Investment committee, the Medical Advisory Panel and sub-committees established to manage specific projects such as Solvency II.
° In compliance with Financial Services Authority (FSA) regulations Bupa has established a UK insurance Regulated Entities Board (REB) and a Regulated Entities Audit, Risk & compliance committee. Management regularly updates these committees on issues concerning the UK-based insurance companies. Bupa also maintains a regular dialogue with FSA officials during the course of the year.
° The external auditors are engaged to express an opinion on Bupa’s financial statements, which are prepared from the Group’s accounting records and comply with applicable law and International Financial Reporting Standards as adopted by the EU. They review and test the systems of internal financial control and the data contained in the financial statements to the extent necessary to express their opinion.
Independence of the external auditorsThe Audit, Risk & compliance committee and the external auditors have policies in place to avoid the possibility that the auditors’ objectivity and independence could be compromised. As part of the Board and committee’s evaluation of the external auditors, the directors confirmed that they were satisfied that the external auditors had maintained their independence.
In 2011 an updated policy on the use of external auditors for non-audit services was approved by the Audit, Risk & compliance committee. The policy is primarily intended to ensure that Bupa does not engage the audit firm in situations where there could be a conflict of interest. This policy is kept under review.
On the basis of its meetings and other information available, the Audit, Risk & compliance committee assesses the ongoing effectiveness of the external audit and recommends to the Board the re-election of the external auditors.
G ov e r n a n c e
cO R P O R ATE GOVER NAN c E STATEM ENTco n t i n u e d
44 Bupa Annual Report 2011

IntroductionThe Board is committed to achieving best practice in the determination and implementation of Bupa’s remuneration policy. The purpose of this report is to provide information on the policy and practices followed by the Board and Remuneration committee. This report describes the remuneration and benefit policies of Bupa as they relate to the directors of the Group. It has been prepared in the format of Schedule 8 to the Accounting Regulations 2008.
Members of the Remuneration CommitteeThe Remuneration committee is comprised entirely of Non-Executive directors. The chairman of the Remuneration committee is Peter cawdron and the other members are Lord Leitch, George Mitchell and Rita clifton. They have all served on the committee for the full year with the exception of Rita clifton who was appointed on 1 June 2011.
Operation of the Remuneration CommitteeThe Remuneration committee decides remuneration policy and practice relating to Executive directors and divisional Managing directors. The Remuneration committee meets at least three times a year.
The remit of the Remuneration committee covers all aspects of service contracts including salary, bonus, and the long-term incentive plan (LTIP) as well as pension and benefits.
The remuneration of Non-Executive directors is determined by the Bupa Board as a whole.
It should be noted that during the year, Ray King announced his decision to retire in 2012. Stuart Fletcher has been appointed to succeed Ray King as chief Executive and joined Bupa on 1 March 2012. The Group Finance director resigned and thereafter left Bupa on 16 September 2011. An internal appointment has been made to the role of Acting Group Finance director whilst a formal selection process continues.
Remuneration policyThe aim of the Group’s remuneration policy is to provide total remuneration at a level sufficient to attract and retain key executives and to motivate them to provide strong business performance and excellent customer service.
The policy is intended to deliver a competitive level and mix of remuneration compared with companies of a similar scale and complexity to Bupa, taking into account the significant international element of Bupa’s operations.
In 2011 Bupa continued to benchmark its total remuneration with organisations in the private sector using a comparator group of 22 companies. This group was selected with the assistance of Mercer Ltd (Mercer), who provide advice to the committee.
The policy is to target base salary at the median of the comparator group with the potential to achieve total remuneration at or towards the upper quartile for the delivery of outstanding performance in the long-term. This is in line with Bupa’s objectives of achieving stretching performance targets over the medium and long term.
G ov e r n a n c e
R EM U N ER ATIO N R EP O RT
element purpose aim
Base salary To attract and retain, reflecting role and contribution
Targeting market median, having regard to individual performance and responsibilities
Annual bonus plan To recognise and reward the achievement of annual objectives
Market median to upper quartile according to performance in the achievement of annual profit plan and key objectives
Long-term incentive plan To attract and retain, while ensuring sound long-term strategy implementation and achievement of long-term objectives
Market median to upper quartile according to performance in the achievement of growth in reserves
Pension and benefits, eg medical benefits, life insurance, car allowance and income protection
To attract and retain by providing security and family protection benefits at a competitive market level
Benefits in alignment with current market practice, value generally linked to service and/or salary
In summary, elements of executive remuneration are:
Bupa Annual Report 2011 45
FIN
AN
CIA
L S
TA
TE
ME
NT
SG
OV
ER
NA
NC
EB
US
INE
SS
RE
VIE
W
Base salaryBase salaries are established by taking account of the market median for comparable roles and aim to reflect the market value for the executive’s core responsibilities. An annual review is conducted and any changes are implemented in April. This is to ensure that salary reflects current market conditions, as well as any changes in the level of accountability and individual performance. The typical salary increases for the rest of the company are taken into consideration when determining directors’ remuneration.
Annual bonusThe current chief Executive has a bonus target of 90% of base salary and the former Group Finance director had a bonus target of 75% of base salary. A review of the Management Bonus Scheme was conducted in 2011 and as a result, 70% of the bonus potential is linked to the achievement of the Group’s annual profit plan (previously 85%) and the remaining 30% (previously 15%) to the delivery of key personal objectives. These targets are set at the start of the performance year. For a strong or outstanding performance, there is an opportunity to achieve up to 150% of target bonus.
Long-term incentive plan (LTIP)The LTIP is designed to reward directors and other senior Bupa Executives for the part they play in achieving the Group’s long-term growth objectives over a number of years. As Bupa cannot provide long-term remuneration based on equity plans, it provides a deferred cash incentive in the form of an LTIP that is broadly reflective of equity-based plans in comparable organisations in the private sector.
The LTIP is designed to provide a cash payment subject to the Group achieving pre-determined targets over a three year period. The LTIP targets are currently based on growth in Group reserves as set out in the three year business plan which is considered to be the most appropriate measure of Bupa’s financial performance. The targets used are reviewed and approved by the Remuneration committee.
The LTIP has a three year rolling performance period to reflect the three year business plan and market practice. A new three year performance period starts each year and any awards are paid annually on 1 April in the year after each plan has ended. The most recent performance period began on 1 January 2011 and will end on 31 december 2013 with any payments due in April 2014.
The incentive is calculated on the basis of a notional amount being allocated to the participant’s account on the day each new plan commences. This amount is expressed as a percentage of base salary. The current chief Executive has an annual notional allocation to the LTIP of 130% of base salary and the former Group Finance director had an annual notional allocation of 100% of base salary.
The amount of the LTIP payable is defined by a scale. The threshold performance level will be 67% of the targeted growth in reserves, and this will provide 30% of the target award with 100% being paid for the complete target being achieved. In the event of over-achievement, up to 120% of the award may be earned.
Payments are calculated at the end of the three year period and are normally only made to executives still in the employment of the Group on the date of payment. However, in the event that an executive leaves the Group, there are some circumstances, such as agreed retirement, where a prorated payment may be made.
The LTIP performance targets are currently being reviewed and additional measures may be introduced for 2012.
PensionsThe chief Executive is a member of The Bupa Pension Scheme and is entitled to a defined benefit pension calculated by reference to final pensionable salary and length of service with 1/30th accrual per annum. The defined benefit pension is funded up to the Lifetime Allowance (or Personal Lifetime Allowance) through The Bupa Pension Scheme, using a capped salary. The balance of the pension promise is provided through a non-registered arrangement, set out in an individual deed of agreement, which mirrors the terms of The Bupa Pension Scheme. This non-registered scheme is unfunded but the benefits are secured by a charge, in the name of the independent Trustees, over specific Group assets.
The former Group Finance director was entitled to a defined contribution pension in The Bupa Retirement Savings Plan; employer contributions were 30% of pensionable salary. The former Group Finance director retained the option to take this as a cash allowance instead of pension.
In both cases, pensionable salary refers to the Executive director’s basic salary only.
Other benefitsOther benefits for the Executive directors include car allowance, fuel benefit, use of a car and driver (for the chief Executive), private medical benefits for themselves and any partner or dependent children, annual health assessment for them and their partner, life assurance, income protection and 30 days’ annual holiday.
G ov e r n a n c e
R EM U N ER ATIO N R EP O RTco n t i n u e d
46 Bupa Annual Report 2011

Contracts and notice periodsExecutive directors have a twelve month rolling employment contract. The notice requirements are six months from the Executive director and twelve months from the company which may be payable in lieu. The Group recognises that its Executive directors are likely to be invited to become Non-Executive directors of other companies. Participation in these duties will be to the benefit of Bupa as they can bring value, by way of external perspectives and new experience, to the business. This is on the basis that any appointment is not with a competing organisation and does not give rise to a conflict of interest. Executive directors are usually permitted, subject to approval, to have one Non-Executive director role and to accept and retain the fee for this Non-Executive director appointment.
In 2011, neither the chief Executive nor the Group Finance director earned fees as Non-Executive directors of other companies.
Non-Executive DirectorsThe company’s policy is for Non-Executive directors to be appointed for an initial term of three years, with the possibility of a period of extension for one term. See pages 38 to 39 of this report for appointment dates. Non-Executive directors are paid a fee for their services to the Group. during their time in office, they are also entitled to private medical benefits for themselves and any partner or dependent children and an annual health assessment for themselves and their partner. The chairman is also entitled to the use of a car and driver. There are no continuing benefits on termination except that of an annual health assessment for those who continue as an Association Member.
Non-Executive directors are not entitled to participate in any bonus, long-term incentive plan or pension arrangement funded by the company.
Non-Executive directors’ fees are reviewed periodically by the Board.
AdvisorsThe committee currently takes advice on remuneration issues from Mercer, which provides market data on levels of executive remuneration and benefits. Mercer and related companies also provide Bupa with employee benefit consulting and pensions actuarial support. In addition, as an independent insurance intermediary, it advises some of its other clients about Bupa’s services.
Mercer reports to the chairman of the Remuneration committee and works with the Group Human Resources director in preparing necessary advice to the Remuneration committee on matters of remuneration policy and interpretation of market data.
As Bupa is a company limited by guarantee with no share capital, it is not possible to illustrate company performance in terms of shareholder return.
Disclosure tables (audited)Further details of each director’s remuneration and numerical information, which have been audited, is disclosed in note 5 to the financial statements.
Peter Cawdronchairman of the Remuneration committee
Bupa Annual Report 2011 47
FIN
AN
CIA
L S
TA
TE
ME
NT
SG
OV
ER
NA
NC
EB
US
INE
SS
RE
VIE
W

G ov e r n a n c e
STATEM ENT O F d I R Ec TO RS ’ R E S P O N S I B I L IT I E S
In respect of the annual report and the financial statementsThe directors are responsible for preparing the Annual Report and the Group and Parent company financial statements in accordance with applicable law and regulations.
company law requires the directors to prepare group and parent company financial statements for each financial year. Under that law, they have elected to prepare the Group and the Parent company financial statements in accordance with IFRS as adopted by the EU and applicable law.
Under company law, the directors must not approve the financial statements unless they are satisfied that they give a true and fair view of the state of affairs of the Group and Parent company and of their surplus or deficit for that period. In preparing each of the Group and Parent company financial statements, the directors are required to:
° select suitable accounting policies and then apply them consistently;
° make judgments and estimates that are reasonable and prudent;
° state whether they have been prepared in accordance with IFRS as adopted by the EU; and
° prepare the financial statements on the going concern basis unless it is inappropriate to presume that the Group and the Parent company will continue in business.
The directors are responsible for keeping adequate accounting records that are sufficient to show and explain the Parent company’s transactions and disclose with reasonable accuracy at any time the financial position of the Parent company and enable them to ensure that its financial statements comply with the companies Act 2006. They have general responsibility for taking such steps as are reasonably open to them to safeguard the assets of the Group and to prevent and detect fraud and other irregularities.
The directors have decided to prepare voluntarily a directors’ remuneration report in accordance with Schedule 8 to the companies Act 2006 The Large and Medium-sized companies and Groups (Accounts and Reports) Regulations 2008, as if those requirements were to apply to the company. The directors have also decided to prepare voluntarily a corporate governance statement as if the company were required to comply with the Listing Rules and the disclosure Rules and Transparency Rules of the Financial Services Authority in relation to those matters.
The directors are responsible for the maintenance and integrity of the corporate and financial information included on the company’s website. Legislation in the UK governing the preparation and dissemination of financial statements may differ from legislation in other jurisdictions.
48 Bupa Annual Report 2011

fin
an
cia
l s
ta
te
me
nt
sG
Ov
ER
NA
NC
EB
US
INE
SS
RE
vIE
W
50 Independent auditors’ report51 Consolidated income statement52 Consolidated statement of
comprehensive income53 Consolidated balance sheet54 Consolidated statement of cash flows55 Consolidated statement of changes in equity56 Company balance sheet57 Company statement of cash flows58 Company statement of changes in equity59 Accounting policies68 Notes to the financial statements111 Five year financial summary112 International Financial Reporting
Standards relevant to Bupa
FI NAN cIALSTATEM ENTS
Bupa Annual Report 2011 49

50 Bupa Annual Report 2011
We have audited the financial statements of the British United Provident Association limited for the year ended 31 December 2011 set out on pages 51 to 110. the financial reporting framework that has been applied in their preparation is applicable law and international Financial Reporting standards (iFRss) as adopted by the eU and, as regards the Parent company financial statements, as applied in accordance with the provisions of the companies Act 2006.
in addition to our audit of the financial statements, the Directors have engaged us to audit the information in the Directors’ Remuneration Report that is described as having been audited, which the Directors have decided to prepare (in addition to that required to be prepared) as if the company were required to comply with the requirements of schedule 8 to the large and medium-sized companies and Groups (Accounts and Reports) Regulations 2008 (si 2008 no. 410) made under the companies Act 2006.
this report is made solely to the company’s members, as a body, in accordance with chapter 3 of Part 16 of the companies Act 2006 and, in respect of the separate opinion in relation to the Directors’ Remuneration Report and reporting on corporate governance, on terms that have been agreed. Our audit work has been undertaken so that we might state to the company’s members those matters we are required to state to them in an auditors’ report and, in respect of the separate opinion in relation to the Directors’ Remuneration Report and reporting on corporate governance, those matters that we have agreed to state to them in our report, and for no other purpose. to the fullest extent permitted by law, we do not accept or assume responsibility to anyone other than the company and the company’s members, as a body, for our audit work, for this report, or for the opinions we have formed.
Respective responsibilities of Directors and auditorAs explained more fully in the statement of Directors’ Responsibilities set out on page 48, the Directors are responsible for the preparation of the financial statements and for being satisfied that they give a true and fair view. Our responsibility is to audit, and express an opinion on, the financial statements in accordance with applicable law and international standards on Auditing (UK and ireland). those standards require us to comply with the Auditing Practices Board’s (APB’s) ethical standards for Auditors.
Scope of the audit of the financial statementsA description of the scope of an audit of financial statements is provided on the APB’s website at www.frc.org.uk/apb/scope/private.cfm.
Opinion on financial statementsin our opinion:
° the financial statements give a true and fair view of the state of the Group’s and of the Parent company’s affairs as at 31 December 2011 and of the Group’s surplus for the year then ended;
° the Group financial statements have been properly prepared in accordance with iFRss as adopted by the eU;
° the Parent company financial statements have been properly prepared in accordance with iFRss as adopted by the eU and as applied in accordance with the provisions of the companies Act 2006; and
° the financial statements have been prepared in accordance with the requirements of the companies Act 2006.
Opinion on other matters prescribed by the Companies Act 2006 and under the terms of our engagementin our opinion:
° the part of the Directors’ Remuneration Report which we were engaged to audit has been properly prepared in accordance with schedule 8 to the companies Act 2006 the large and medium-sized companies and Groups (Accounts and Reports) Regulations 2008, as if those requirements were to apply to the company; and
° the information given in the Report of the Board of Directors for the financial year for which the financial statements are prepared is consistent with the financial statements.
Matters on which we are required to report by exceptionWe have nothing to report in respect of the following:
Under the companies Act 2006 and under the terms of our engagement we are required to report to you if, in our opinion:
° adequate accounting records have not been kept by the Parent company, or returns adequate for our audit have not been received from branches not visited by us; or
° the Parent company financial statements and the part of the Directors’ Remuneration Report which we were engaged to audit are not in agreement with the accounting records and returns; or
° certain disclosures of Directors’ remuneration specified by law are not made; or
° we have not received all the information and explanations we require for our audit.
in addition to our audit of the financial statements, the Directors have engaged us to review their corporate Governance statement as if the company were required to comply with the listing Rules and the Disclosure Rules and transparency Rules of the Financial services Authority in relation to those matters. Under the terms of our engagement we are required to review:
° the Directors’ statement, set out on page 40, in relation to going concern; and
° the part of the corporate Governance statement on pages 41 to 44 relating to the company’s compliance with the nine provisions of the UK corporate Governance code specified for our review.
Mary Trussell (Senior Statutory Auditor) for and on behalf of KPMG Audit Plc, Statutory Auditorchartered Accountants15 canada squarelondon e14 5Gl12 march 2012
I N d E p E N d E N T AU d ITO R S ’ R E p O R Tto the members of the British United Provident Association limited

Bupa Annual Report 2011 51
FIN
AN
CIA
L S
TA
TE
ME
NT
SG
OV
eR
nA
nc
eB
Us
ine
ss
Re
Vie
W
note2011 £m
2010£m
RevenuesGross insurance premiums 2 6,379.9 6,011.8
Premiums ceded to reinsurers 2 (34.4) (90.8)
net insurance premiums earned 6,345.5 5,921.0
Revenues from life investment contracts – 7.9
Revenues from service contracts 11.9 3.5
care, health and other revenues 1,660.7 1,643.6
Total revenues 1,2 8,018.1 7,576.0
Claims and expensesinsurance claims incurred 3 (4,948.5) (4,648.7)
Reinsurers’ share of claims incurred 3 29.0 75.3
net insurance claims incurred (4,919.5) (4,573.4)
Decrease in fair value of life investment contract liabilities – 9.9
Return on financial investments backing life investment contract liabilities – (10.1)
share of post-taxation results of equity accounted investments (2.4) (0.7)
Other operating expenses 4 (2,574.3) (2,581.9)
impairment of goodwill 11 (165.8) (249.2)
impairment of other intangible assets arising on business combinations 11 (133.7) (17.7)
Other charges 6 (22.9) (54.0)
Total claims and expenses (7,818.6) (7,477.1)
Surplus before financial income and expenses 199.5 98.9
Financial income and expensesFinancial income 7 95.0 98.3
Financial expenses 8 (74.5) (79.2)
20.5 19.1
Surplus before taxation expense 1 220.0 118.0
Taxation expense 9 (84.1) (131.4)
Surplus / (deficit) for the financial year 135.9 (13.4)
Attributable to:Bupa 131.1 (19.2)
non-controlling interests 4.8 5.8
135.9 (13.4)
CO N S O L I dAT E d I N CO M E S TAT E M E N Tfor the year ended 31 December 2011
the notes on pages 59 to 110 form part of these financial statements.

52 Bupa Annual Report 2011
note2011 £m
2010£m
surplus / (deficit) for the financial year 135.9 (13.4)
Other comprehensive (expense) / incomeUnrealised (loss) / gain on revaluation of property (31.1) 82.2
Actuarial (loss) / gain on pension schemes 26 (93.0) 67.5
Realisation of foreign exchange on disposal of overseas subsidiary companies – 1.6
Foreign exchange translation differences on goodwill 3.4 212.6
Other foreign exchange translation differences (5.8) 150.4
net gain / (loss) on hedge of net investment in overseas subsidiary companies 7.8 (43.2)
Realisation of cash flow hedge (1.3) 1.9
change in fair value of underlying derivative of cash flow hedge (1.0) (0.4)
Disposal of subsidiary companies – 0.1
Other movements in non-controlling interests – (6.8)
taxation credit / (charge) on income and expense recognised directly in other comprehensive income 9 33.2 (35.7)
Other comprehensive (expense) / income for the year, net of taxation (87.8) 430.2
Total comprehensive income for the year 48.1 416.8
Attributable to:Bupa 43.9 417.3
non-controlling interests 4.2 (0.5)
Total comprehensive income for the year 48.1 416.8
CO N S O L I dAT E d S TAT E M E N T O F CO M p R E h E N S I V E I N CO M Efor the year ended 31 December 2011
the notes on pages 59 to 110 form part of these financial statements.

Bupa Annual Report 2011 53
FIN
AN
CIA
L S
TA
TE
ME
NT
SG
OV
ER
NA
NC
EB
US
INE
SS
RE
VIE
W
note
2011
£m
2010
(restated)* £m
Non-current assetsintangible assets 11 2,208.8 2,517.2
Property, plant and equipment 12 2,272.5 2,294.7
investment property 13 132.5 120.3
equity accounted investments 14 43.3 42.2
Financial investments 16 661.5 1,031.8
Assets arising from insurance business 17 4.9 4.4
Other receivables 18 132.4 77.7
Post employment benefit net assets 26 68.1 121.3
5,524.0 6,209.6
Current assetsFinancial investments 16 1,221.6 1,127.0
inventories 19 16.5 19.7
Assets arising from insurance business 17 828.8 785.0
trade and other receivables 18 308.8 367.1
Assets held for sale 20 – 351.5
cash and cash equivalents 21 1,228.4 692.5
3,604.1 3,342.8
Total assets 9,128.1 9,552.4
Non-current liabilities
subordinated liabilities 22 (428.9) (374.7)
Other interest bearing liabilities 23 (669.4) (886.6)
Provisions under insurance contracts issued 24 (25.7) (24.1)
Post employment benefit net liabilities 26 (65.1) (56.7)
Provisions for liabilities and charges 27 (26.6) (33.8)
Deferred taxation liabilities 28 (174.7) (219.8)
trade and other payables 29 (17.3) (13.7)
(1,407.7) (1,609.4)
Current liabilitiessubordinated liabilities 22 (5.9) (5.9)
Other interest bearing liabilities 23 (24.3) (27.2)
Provisions under insurance contracts issued 24 (2,136.5) (2,134.5)
Other liabilities under insurance contracts issued 25 (13.7) (18.9)
Provisions for liabilities and charges 27 (55.9) (64.5)
current taxation liabilities (135.8) (158.2)
trade and other payables 29 (904.4) (956.3)
liabilities associated with assets held for sale 20 – (181.4)
(3,276.5) (3,546.9)
Total liabilities (4,684.2) (5,156.3)
Net assets 4,443.9 4,396.1
EquityProperty revaluation reserve 642.7 660.5
income and expenditure reserve 3,075.9 3,019.1
cash flow hedge reserve 29.0 30.7
Foreign exchange translation reserve 662.7 656.1
Equity attributable to Bupa 4,410.3 4,366.4
Equity attributable to non-controlling interests 33.6 29.7
Total equity 4,443.9 4,396.1
* the 2010 balance sheet has been restated in accordance with iFRs 3 on the finalisation of the accounting for acquisitions made during 2010, refer to note 34.
Approved by the Board of Directors and signed on its behalf on 12 march 2012 by
Lord Leitch Ray Kingchairman chief executive
CO N S O L I dAT E d BA L A N C E S h E E Tas at 31 December 2011
the notes on pages 59 to 110 form part of these financial statements.

54 Bupa Annual Report 2011
CO N S O L I dAT E d S TAT E M E N T O F C A S h F LOWSfor the year ended 31 December 2011
note
2011
£m
2010(restated)
£m
Operating activitiessurplus before taxation expense 220.0 118.0
Adjustments for:net financial income and expenses (20.5) (19.1)
Depreciation, amortisation and impairment 493.5 449.4
Other non-cash items 23.9 54.5
changes in working capital and provisions:
increase in provisions and other liabilities under insurance contracts issued 4.6 80.1
increase in assets under insurance contracts issued (47.2) (19.5)
change in net pension asset / liability (31.4) (33.0)
Decrease in trade and other receivables, and other assets 45.3 36.4
(Decrease) / increase in trade and other payables, and other liabilities (53.1) 65.7
Cash generated from operations 635.1 732.5
income taxation paid (109.7) (105.1)
increase in cash held in restricted access deposits 21 (9.9) (4.2)
Net cash generated from operating activities 515.5 623.2
Cash flow from investing activitiesAcquisition of subsidiary companies, net of cash acquired 34 (11.7) (3.1)
Acquisition of equity accounted investments (5.6) (3.5)
Dividends received from associates 1.5 –
Disposal of subsidiary companies, net of cash disposed of 20 171.7 115.1
Purchase of intangible assets 11 (63.9) (35.7)
Purchase of property, plant and equipment (147.2) (135.5)
Proceeds from sale of property, plant and equipment 1.5 1.6
Purchase of investment property (7.4) (5.1)
Proceeds from sale of investment property – 0.2
Purchase of financial investments, excluding deposits with credit institutions (258.6) (261.5)
Proceeds from sale of financial investments, excluding deposits with credit institutions 321.4 375.2
net withdrawal from / (investment into) deposits with credit institutions 224.7 (778.7)
interest received 61.5 76.4
Net cash generated from / (used in) investing activities 287.9 (654.6)
Cash flow from financing activitiesRepayment of interest bearing liabilities (205.4) (223.9)
interest paid (63.1) (80.1)
Payments for hedging instruments (6.3) (2.7)
Payment of capital redemption to non-controlling interests – (6.8)
Dividends paid to non-controlling interests (0.3) (6.6)
Net cash used in financing activities (275.1) (320.1)
Net increase / (decrease) in cash and cash equivalents 528.3 (351.5)cash and cash equivalents at beginning of year 654.8 1,026.4
effect of exchange rate changes (0.1) 65.3
cash and cash equivalents reclassified to assets held for sale – (85.4)
Cash and cash equivalents at end of year 21 1,183.0 654.8
the notes on pages 59 to 110 form part of these financial statements.

Bupa Annual Report 2011 55
FIN
AN
CIA
L S
TA
TE
ME
NT
SG
OV
ER
NA
NC
EB
US
INE
SS
RE
VIE
W
CO N S O L I dAT E d S TAT E M E N T O F C h A N G E S I N E q U IT yfor the year ended 31 December 2011
note
Property revaluation
reserve £m
income and expenditure
reserve £m
cash flow hedge
reserve £m
Foreign exchange
translation reserve
£m
total attributable
to Bupa £m
non-controlling
interests £m
total equity
£m
2011At beginning of year 660.5 3,019.1 30.7 656.1 4,366.4 29.7 4,396.1
Retained surplus for the financial year – 131.1 – – 131.1 4.8 135.9
Other comprehensive (expense) / incomeUnrealised loss on revaluation of property (31.1) – – – (31.1) – (31.1)
Actuarial loss on pension schemes 26 – (93.0) – – (93.0) – (93.0)
Foreign exchange translation differences on goodwill – – – 3.4 3.4 – 3.4
Other foreign exchange translation differences (0.4) – – (5.1) (5.5) (0.3) (5.8)
net gain on hedge of net investment in overseas subsidiary companies – – – 7.8 7.8 – 7.8
Realisation of cash flow hedge on impairment of intangibles arising on acquisition – – (1.3) – (1.3) – (1.3)
change in fair value of underlying derivative of cash flow hedge – – (0.6) – (0.6) (0.4) (1.0)
taxation credit on income and expense recognised directly in other comprehensive income 9 13.7 18.7 0.2 0.5 33.1 0.1 33.2
Other comprehensive (expense) / income for the year, net of taxation (17.8) (74.3) (1.7) 6.6 (87.2) (0.6) (87.8)
Total comprehensive (expense) / income for the year (17.8) 56.8 (1.7) 6.6 43.9 4.2 48.1
Contributions to non-controlling interestsDividends paid to non-controlling interests (0.3) (0.3)
Total contributions to non-controlling interests for the year (0.3) (0.3)
At end of year 642.7 3,075.9 29.0 662.7 4,410.3 33.6 4,443.9
2010At beginning of year 596.7 2,989.1 29.7 333.6 3,949.1 36.8 3,985.9
Retained (deficit) / surplus for the financial year – (19.2) – – (19.2) 5.8 (13.4)
Other comprehensive income / (expense)Unrealised gain on revaluation of property 82.2 – – – 82.2 – 82.2
Actuarial gain on pension schemes 26 – 67.5 – – 67.5 – 67.5
Realisation of foreign exchange on disposal of overseas subsidiary companies – – – 1.6 1.6 – 1.6
Foreign exchange translation differences on goodwill – – – 212.6 212.6 – 212.6
Other foreign exchange translation differences (1.1) – – 150.9 149.8 0.6 150.4
net loss on hedge of net investment in overseas subsidiary companies – – – (43.2) (43.2) – (43.2)
Realisation of cash flow hedge on disposal of overseas subsidiary companies – – (0.9) – (0.9) – (0.9)
Realisation of cash flow hedge on impairment of overseas subsidiary companies – – 2.8 – 2.8 – 2.8
change in fair value of underlying derivative of cash flow hedge – – (0.2) – (0.2) (0.2) (0.4)
Disposal of subsidiary companies – – – – – 0.1 0.1
Other movements in non-controlling interests – – – – – (6.8) (6.8)
taxation (charge) / credit on income and expense recognised directly in other comprehensive income 9 (17.3) (18.3) (0.7) 0.6 (35.7) – (35.7)
Other comprehensive income / (expense) for the year, net of taxation 63.8 49.2 1.0 322.5 436.5 (6.3) 430.2
Total comprehensive income / (expense) for the year 63.8 30.0 1.0 322.5 417.3 (0.5) 416.8
Contributions to non-controlling interestsDividends paid to non-controlling interests – – – – – (6.6) (6.6)
Total contributions to non-controlling interests for the year – – – – – (6.6) (6.6)
At end of year 660.5 3,019.1 30.7 656.1 4,366.4 29.7 4,396.1
the notes on pages 59 to 110 form part of these financial statements.

56 Bupa Annual Report 2011
CO M pA N y BA L A N C E S h E E Tas at 31 December 2011
note2011 £m
2010 £m
Non-current assetsintangible assets 11 21.9 16.9
Property, plant and equipment 12 29.2 22.0
investment in subsidiary companies 15 200.1 200.1
Other receivables 18 0.2 50.9
Post employment benefit net assets 26 67.8 120.6
Deferred taxation assets 28 1.8 –
321.0 410.5
Current assetstrade and other receivables 18 102.8 433.7
cash and cash equivalents 21 1.0 3.2
103.8 436.9
Total assets 424.8 847.4
Non-current liabilitiesPost employment benefit net liabilities 26 (54.1) (52.8)
Provisions for liabilities and charges 27 (13.3) (15.7)
Deferred taxation liabilities 28 – (8.0)
Other payables 29 (219.6) (240.7)
(287.0) (317.2)
Current liabilitiesProvisions for liabilities and charges 27 (4.2) (4.2)
current taxation liabilities (1.0) (1.2)
trade and other payables 29 (115.7) (582.7)
(120.9) (588.1)
Total liabilities (407.9) (905.3)
Net assets / (liabilities) 16.9 (57.9)
EquityProperty revaluation reserve 0.1 0.1
income and expenditure reserve 16.4 (58.4)
Foreign exchange translation reserve 0.4 0.4
Total equity 16.9 (57.9)
Approved by the Board of Directors and signed on its behalf on 12 march 2012 by
Lord Leitch Ray Kingchairman chief executive
the notes on pages 59 to 110 form part of these financial statements.

Bupa Annual Report 2011 57
FIN
AN
CIA
L S
TA
TE
ME
NT
SG
OV
ER
NA
NC
EB
US
INE
SS
RE
VIE
W
CO M pA N y S TAT E M E N T O F C A S h F LOWSfor the year ended 31 December 2011
note2011 £m
2010 £m
Operating activitiessurplus / (deficit) before taxation expense 130.1 (50.0)
Adjustments for:net financial income and expenses 5.2 2.6
Depreciation, amortisation and impairment 11.8 9.5
Other non-cash items (5.8) –
changes in working capital and provisions:changes in net pension asset / liability (29.8) (30.1)
(Decrease) / increase in provisions for liabilities and charges (2.4) 1.3
Decrease in trade and other receivables, and other assets 381.6 128.8
Decrease in trade and other payables, and other liabilities (459.4) (23.9)
Cash generated from operations 31.3 38.2
Cash flow from investing activitiesPurchase of intangible assets (37.9) (16.9)
Proceeds from sale of intangible assets 26.3 8.6
Purchase of property, plant and equipment (18.5) (13.6)
Proceeds from sale of property, plant and equipment 1.9 0.7
interest received 1.5 4.0
Net cash used in investing activities (26.7) (17.2)
Cash flow from financing activitiesinterest paid (6.8) (6.7)
Net cash used in financing activities (6.8) (6.7)
Net (decrease) / increase in cash and cash equivalents (2.2) 14.3cash and cash equivalents at beginning of year 3.2 (11.1)
Cash and cash equivalents at end of year 21 1.0 3.2
the notes on pages 59 to 110 form part of these financial statements.

58 Bupa Annual Report 2011
CO M pA N y S TAT E M E N T O F C h A N G E S I N E q U IT yfor the year ended 31 December 2011
note
Property revaluation
reserve £m
income and expenditure
reserve £m
Foreign exchange
translation reserve
£m
total equity
£m
2011At beginning of year 0.1 (58.4) 0.4 (57.9)
surplus for the financial year – 142.2 – 142.2
Other comprehensive (expense) / income Actuarial loss on pension schemes 26 – (83.9) – (83.9)
taxation credit on income and expenses recognised directly in other comprehensive income 28 – 16.5 – 16.5
Other comprehensive (expense) / income for the year, net of taxation – (67.4) – (67.4)
Total comprehensive income for the year – 74.8 – 74.8At end of year 0.1 16.4 0.4 16.9
2010At beginning of year 0.1 (59.7) 0.5 (59.1)
Deficit for the financial year – (44.4) – (44.4)
Other comprehensive income / (expense)Actuarial gain on pension schemes 26 – 62.7 – 62.7
Foreign exchange translation differences – – (0.1) (0.1)
taxation charge on income and expenses recognised directly in other comprehensive income 28 – (17.0) – (17.0)
Other comprehensive income / (expense) for the year, net of taxation – 45.7 (0.1) 45.6
Total comprehensive income / (expense) for the year – 1.3 (0.1) 1.2
At end of year 0.1 (58.4) 0.4 (57.9)
the notes on pages 59 to 110 form part of these financial statements.
Bupa Annual Report 2011 59
FIN
AN
CIA
L S
TA
TE
ME
NT
SG
OV
ER
NA
NC
EB
US
INE
SS
RE
VIE
W
ACCO U N TI N G p O L I C I E S
Basis of consolidationthe British United Provident Association limited (‘Bupa’ or the ‘company’), the ultimate parent entity of the Group, is a company incorporated in england and Wales. the company is limited by guarantee. the consolidated financial statements for the year ended 31 December 2011 comprise those of the company and its subsidiary companies (together referred to as the ‘Group’).
the Group’s consolidated financial statements are prepared under international Financial Reporting standards (iFRss) as adopted by the eU. the appropriate provisions of the companies Act have also been complied with.
A summary of iFRss that are relevant for the Group are included on page 112.
the financial statements were approved by the Board of Directors on 12 march 2012. the Directors have reviewed and approved the Group’s accounting policies, which are set out below and which have been applied consistently to all the years presented, unless otherwise stated. For the purposes of consolidation, the accounting policies of subsidiary companies have been aligned with those of the parent company.
Statement of complianceBoth the company financial statements and the Group financial statements have been prepared in accordance with iFRss and approved by the Directors. the company is taking advantage of the exemption in section 408 of the companies Act 2006 not to present its individual income statement and related notes that form a part of these approved financial statements.
Basis of preparationthe financial statements are prepared on a going concern basis, and under the historical cost convention, as modified by the revaluation of property, investment property, financial investments at fair value through profit or loss, available for sale financial investments and derivative instruments.
Finalisation of accounting for business combinationsin accordance with iFRs 3, the acquisition accounting for the acquisition of Health eyewear, made in 2010, was finalised during the financial year. As a result, the 31 December 2010 balance sheet has been restated to reflect the final fair value adjustments (see note 34).
Going concernDetails of the Group’s business activities, together with the factors likely to affect its future development, performance and position are set out in the Business Review on pages 2 to 37. the financial position of the Group, its cash flows, liquidity position and borrowing facilities are described in the Finance Director’s report on pages 24 to 27, together with further information disclosed in notes 21 to 23 and 31. in addition, notes 30, 32 and 33 summarise the Group’s objectives, policies and processes for managing its capital; its financial risk management objectives; details of its financial instruments and hedging activities; and its exposure to credit risk and liquidity risk.
iAs 1 requires the Group to make an assessment of its ability to continue as a going concern when preparing its financial statements. in making this assessment, management have considered the discussions with the relationship banks as well as forecasts based on the Group’s three year plan for the period 2012 to 2014, which take account of reasonably possible changes in trading performance.
After making enquiries, the Directors have a reasonable expectation that the company and the Group have adequate resources to continue in operational existence for the foreseeable future. Accordingly, they continue to adopt the going concern basis in preparing these financial statements.
the Group maintains significant cash balances to meet its day to day working capital requirements (see note 21). the Group’s £900.0m committed bank facility, which matures on 30 september 2013, was undrawn at 31 December 2011 with the exception of £6.4m of outstanding letters of credit for general business purposes.
New financial reporting requirementsAll newly effective financial reporting standards applicable to the Group for the first time for the year ended 31 December 2011 have been reviewed and it has been concluded that they have no material impact on the financial statements of the Group.
Financial reporting standards applicable to the Group for future financial periodsthe following financial reporting standards have been issued but not yet endorsed by the eU and are not effective for the year ended 31 December 2011, and have not been early adopted by the Group. the Group has reviewed the effect of all other amendments to iFRss and interpretations effective for accounting periods beginning on or after 1 January 2012 and does not expect them to have a significant impact on the financial statements of the Group.
iAs 19 employee Benefits (Amendment)the amendment does not change the total return on defined benefit plan assets, but it does change the split between what is recognised in the income statement and what is recognised in other comprehensive income by changing the way the interest expense is calculated in the income statement. A number of new disclosures are also required. the amendment becomes effective for annual periods beginning on or after 1 January 2013. if the amendment had been adopted for the year ended 31 December 2011 the surplus would be reduced by £4.2m.
iFRs 9 Financial instruments: classification and measurementiFRs 9 as issued reflects the first phase of the iAsB’s work on the replacement of iAs 39 and applies to classification and measurement of financial assets and financial liabilities as defined in iAs 39. the standard is effective for annual periods beginning on or after 1 January 2015. in subsequent phases, the iAsB will address hedge accounting and impairment of financial assets. the completion of this project is expected in the second half of 2012. the Group will quantify the effect of iFRs 9 in conjunction with the other phases of the iAsB’s financial instruments project, when issued, in order to present a comprehensive picture.

60 Bupa Annual Report 2011
Business combinationsBusiness combinations are accounted for using the acquisition method as at the acquisition date, which is the date on which control is transferred to the Group. identifiable assets acquired and liabilities and contingent liabilities assumed in a business combination are measured initially at their fair values at the acquisition date, irrespective of the extent of any non-controlling interest.
the excess of the cost of acquisition over the fair value of the Group’s share of the identifiable assets acquired is recorded as goodwill. if the cost of acquisition is less than the fair value of the Group’s share of the net assets of the subsidiary acquired, the difference is recognised directly in the income statement.
costs related to the acquisition, other than those associated with the issue of debt or equity securities, that the Group incurs in connection with a business combination, are expensed as incurred.
Subsidiary companiessubsidiaries are entities controlled by the Group. the financial statements of subsidiaries are included in the consolidated financial statements from the date that control commences to the date that control ceases.
investments in subsidiary companies are carried at cost less impairment in the company’s accounts. Dividends received from subsidiaries are recognised in the income statement when the right to receive the dividend is established.
transactions between Group companies are on commercial terms. intra Group balances and any gains, losses, income and expenses arising from intra Group transactions are eliminated in preparing the consolidated financial statements.
non-controlling interests in the net assets of subsidiaries are identified separately from the Group’s equity. non-controlling interests consist of the amount of those interests at the date of the original acquisition and the non-controlling shareholder’s share of changes in equity since this date.
Equity accounted investments equity accounted investments comprise associated companies and joint ventures. Associated companies include those entities in which the Group has significant influence, but no control, over the financial and operating policies of the entity. Joint ventures include those entities over the activities of which the Group has joint control, established by contractual agreement and requiring unanimous consent for strategic financial and operating decisions. Associated companies and joint ventures are accounted for using the equity method and are initially recognised at cost. the cost of the investment includes transaction costs.
the consolidated financial statements include the Group’s share of the income and expenses, and other comprehensive income, after adjustments to align the accounting policies with those of the Group where materially different, from the date that significant influence or control commences until the date that significant influence or control ceases.
When the Group’s share of losses exceeds its interest in an equity accounted investment, the carrying amount of that interest (including any long-term interests that, in substance, form part of the Group’s net investment), is reduced to nil. in addition, the recognition of further losses is discontinued except to the extent that the Group has an obligation or made payments on behalf of the equity accounted investment.
Foreign currencythe consolidated financial statements are presented in sterling, which is the functional and presentational currency of the company.
Foreign currency transactionsin the Group’s subsidiary companies, transactions in foreign currencies are translated into the functional currency at the exchange rate ruling at the date of the transaction.
monetary assets and liabilities denominated in foreign currencies are translated into the functional currency at the exchange rate ruling at the balance sheet date; the resulting foreign exchange gain or loss is recognised in the income statement. non-monetary assets and liabilities denominated in a foreign currency at historical cost are translated using the exchange rate at the date of the transaction; no exchange differences therefore arise. non-monetary assets and liabilities denominated in a foreign currency at fair value are translated using the exchange rate ruling at the date that the fair value was determined. Foreign exchange differences that arise on retranslation are recognised in the income statement.
in the consolidated financial statements, where a loan between Group entities results in the recognition of a foreign exchange gain or loss, the exchange difference is recognised in the statement of comprehensive income to the extent that it relates to the Group’s net investment in overseas operations.
Foreign operationsthe assets and liabilities of foreign operations, including associated goodwill, held in functional currencies other than sterling are translated from their functional currency into sterling at the exchange rate at the balance sheet date. income and expenses are translated at average rates for the period, provided the average approximates the rates ruling at the date of the transactions. Foreign exchange differences arising on translation are recognised initially in the statement of comprehensive income, and only in the income statement in the period in which the entity is eventually disposed of.
RevenuesRevenues arise from insurance contracts entered into with customers, care and health provision services rendered and contracts relating to the administration of claims funds on behalf of corporate customers. the accounting policies relevant to these revenues are described within insurance activities, revenues from service contracts and care, health and other revenues.
Insurance activitiescontracts entered into by the Group’s insurance entities are classified into those that result in the transfer of significant insurance risk to the Group and those that do not. contracts that result in the transfer of significant insurance risk are accounted for as either general insurance or long-term insurance contracts under iFRs 4. Revenues from contracts that do not result in the transfer of significant insurance risk are included within service contract revenues.
Under current iFRs requirements, insurance contract liabilities are measured using local Generally Accepted Accounting Principles (GAAP), as permitted by iFRs 4.
ACCO U N TI N G p O L I C I E S co n t i n u e d

Bupa Annual Report 2011 61
FIN
AN
CIA
L S
TA
TE
ME
NT
SG
OV
ER
NA
NC
EB
US
INE
SS
RE
VIE
W
Basis of accounting for general insurance activitiesGross insurance premiumsGross insurance premiums represent the premiums earned relating to risk exposure for the reported financial year. they comprise gross premiums written, adjusted for the change in the gross provision for unearned premiums during the financial year. the unearned premium provision represents the proportion of premiums written in the year relating to periods of risk in subsequent financial years. it is calculated on a straight line basis, which is not materially different from a calculation based on the pattern of incidence of risk.
Premiums are shown gross of commissions payable and net of insurance premium taxes that may apply in certain jurisdictions.
Premiums ceded to reinsurersPremiums ceded to reinsurers represent reinsurance premiums payable for contracts entered into that relate to risk mitigation for the reported financial year. these comprise written premiums ceded to reinsurers, adjusted for the reinsurers’ share of the movement in the gross provision for unearned premiums.
Premiums, losses and other amounts relating to reinsurance treaties are recognised over the period from inception of a treaty to expiration of the related business.
insurance claims incurredinsurance claims incurred comprise insurance claims paid during the year together with related handling costs, the movement in the gross provision for claims in the period and the Risk equalisation trust Fund levy for Australian health insurance businesses.
in Australia, the Risk equalisation trust Fund charges a levy to all registered private health insurers and then allocates a proportion of the cost of eligible claims between all fund participants.
the gross provision for claims represents the estimated liability arising from claims episodes in current and preceding financial years which have not yet given rise to claims paid. the provision includes an allowance for claims management and handling expenses.
the gross provision for claims is estimated based on current information and the ultimate liability may vary as a result of subsequent information and events. Adjustments to the amount of claims provision for prior years are included in the income statement in the financial year in which the change is made. in setting the provisions for claims outstanding, a best estimate is determined on an undiscounted basis and then a margin of prudence is added such that there is confidence that future claims will be met from the provisions. the level of prudence set is either one required by regulation or one that provides a high degree of confidence.
Provision is made for unexpired risks where the claims and administrative expenses likely to arise after the end of the financial year, in respect of contracts commencing before that date, are expected to exceed the related unearned premiums, less related deferred acquisition costs.
the methods used and estimates made for claims provisions are reviewed regularly.
Reinsurers’ share of claims incurredReinsurers’ share of claims incurred represents recoveries from reinsurers on claims paid, adjusted for the reinsurers’ share of the change in the gross provision for claims. the recoverables
due from reinsurers are shown within assets arising from insurance business and are assessed for impairment at each balance sheet date. impairments are accounted for within the income statement on an incurred loss basis.
Acquisition costsAcquisition costs, included within other operating expenses, represent commissions payable and other expenses related to the acquisition of insurance contract revenues written during the financial year. Acquisition costs that have been paid but not yet been incurred are deferred to the subsequent period at the point at which they are paid, and recognised in the income statement in the relevant period.
medicare rebatein Australia, the government provides a rebate to health insurers in respect of the premiums paid for private health insurance. Rebates due from the government but not received at the balance sheet date are recognised in assets arising from insurance business.
Revenues from service contractsA number of contracts written by the Group’s general insurance entities do not result in the transfer of significant insurance risk to the Group. the contracts mainly relate to the administration of claims funds on behalf of corporate customers. some of these contracts contain financial liabilities representing deposits repayable to the customer. these are measured at amortised cost. Revenues from service contracts represent the surplus receivable on such contracts and are recognised as the services are provided.
the claims fund deposit held on behalf of customers is reported within other payables, accruals and deferred income.
Care, health and other revenuescare, health and other revenues represent revenues receivable from care and health provision services rendered.
Revenues are stated net of value added taxation and other sales taxes, rebates and discounts. Revenues are recognised in the accounting period in which the Group obtains the right to consideration in exchange for its performance.
Revenues associated with service concession receivables include revenues from the construction of the infrastructure and operation revenues. construction revenues are recognised based on the stage of completion of the work performed. Operation revenues are recognised in the accounting period in which the services are provided.
Financial income and expensesFinancial income comprises interest receivable, realised gains and losses on investments, dividend income on equity investments, changes in the fair value of items recognised at fair value through profit or loss, change in the fair value of derivatives, changes in the fair value of investment property and foreign exchange gains and losses.
interest income, except in relation to assets classified at fair value through profit or loss, is recognised in the income statement as it accrues, using the effective interest method.
changes in the value of financial assets designated as at fair value through profit or loss are recognised within financial income as an unrealised gain or loss while the asset is held. Upon realisation of these assets, the change in fair value since the last valuation is recognised within financial income as a realised gain or loss.

62 Bupa Annual Report 2011
ACCO U N TI N G p O L I C I E S co n t i n u e d
Financial expenses includes interest payable on borrowings, calculated using the effective interest method, impairment losses on financial investments not measured at fair value through profit or loss and other financial expenses.
Taxationincome taxation on the surplus or deficit for the year comprises current and deferred taxation. income taxation is recognised in the income statement except to the extent that it relates to items recognised directly in other comprehensive income, in which case it is recognised directly in other comprehensive income.
current taxation is the expected taxation payable on the taxable surplus for the year, using taxation rates enacted or substantively enacted at the balance sheet date, and any adjustments to taxation payable in respect of previous years.
Deferred taxation is recognised in full using the balance sheet liability method, providing for temporary differences between the carrying amounts of assets and liabilities for financial reporting purposes and the amounts used for taxation purposes. the following temporary differences are not recognised: goodwill not deductible for taxation purposes and the initial recognition of an asset or liability in a transaction that is not a business combination and which, at the time of the transaction, affects neither the accounting profit nor taxable profit or loss.
the amount of deferred taxation recognised is based on the expected manner of realisation or settlement of the carrying amount of assets and liabilities, using taxation rates enacted or substantively enacted at the balance sheet date.
Deferred taxation is recognised on temporary differences arising on investments in subsidiary companies, except where the timing of the reversal of the temporary difference is controlled by the Group and it is probable that the temporary difference will not reverse in the foreseeable future.
A deferred taxation asset is recognised only to the extent that it is probable that future taxable profits will be available against which the asset can be utilised.
Deferred taxation assets and liabilities are offset when they relate to income taxes levied by the same taxation authority and when the Group can settle its current taxation assets and liabilities on a net basis.
Segmental reporting
segment results that are reported to the chief executive (the Group’s chief operating decision maker) include items directly attributable to a segment as well as those that can be allocated on a reasonable basis. Unallocated results comprise mainly head office costs and related recharges, income and expenses which cannot be specifically allocated to the reportable segments.
A reportable segment is a component of the Group that engages in business activities from which it may earn revenues and incur expenses, including inter segment transactions. the reportable segments reflect the Group’s main operating divisions. the divisional structure is defined by the different products and services provided by each division and the geographic areas in which they operate.
these reportable segments reflect the management structure used by management to monitor the results of the business to assess performance and make decisions about the allocation of resources. segmental performance is assessed based on surplus (including share of post taxation results of equity accounted investments) before amortisation of intangible assets arising on business combinations, other charges and income, financial income and expenses, taxation expense and non-controlling equity interests. Financial income and expenses and taxation expense are reported and monitored on a Group basis and are not attributed to individual segments.
Intangible assetsGoodwillGoodwill represents the excess of the cost of a business combination over the fair value of the Group’s share of identifiable assets, liabilities and contingent liabilities of the acquired subsidiary company or associated company at the date of business combination. Where goodwill can only be determined on a provisional basis for a financial year, adjustments may be made to this balance for up to twelve months from the date of business combination.
Goodwill arising on business combinations is capitalised and presented as part of intangible assets in the consolidated balance sheet. Goodwill is stated at cost less accumulated impairment losses. impairment reviews are performed annually, or more frequently if there is an indication that the carrying value may be impaired. impairment reviews are performed at the level of the relevant cash generating unit.
Goodwill is allocated to those cash generating units that are expected to benefit from synergies of the related business combination and represent the lowest level within the Group at which management monitors goodwill.
Any excess of the Group’s interest in the net fair value of the acquired identifiable assets, liabilities and contingent liabilities over cost that arises on an acquisition is recognised immediately in the income statement.
Other intangible assetsintangible assets, other than goodwill, that are acquired separately are stated at cost less accumulated amortisation and impairment. Amortisation is charged to the income statement on a straight line basis as follows:
° computer software 2 to 10 years
intangible assets, other than goodwill, acquired as part of a business combination are capitalised at fair value. Amortisation is charged to the income statement on a straight line basis as follows:
° Brand and trademarks 10 years
° technology and databases 10 years
° Distribution networks 10 to 11 years
° customer relationships 10 to 21 years
° Present value of acquired in-force business 13 to 20 years
° licences to operate care homes term of licence
° non-compete agreements term of agreement
° leases term of lease

Bupa Annual Report 2011 63
FIN
AN
CIA
L S
TA
TE
ME
NT
SG
OV
ER
NA
NC
EB
US
INE
SS
RE
VIE
W
Assets that are subject to amortisation are reviewed for impairment whenever events or changes in circumstances indicate that the carrying amount may not be recoverable. An impairment loss is recognised in the income statement to reduce the carrying amount to the recoverable amount. intangible assets acquired as part of a business combination deemed to have an indefinite life are subject to annual impairment reviews and are substantiated as follows:
° Bed licences: attributed an indefinite useful life due to the fact that these licences, which are issued by the Australian government, have no expiry date. it is common practice in Australia to attribute an indefinite life to bed licences.
° mBF brand: determined upon acquisition by an external valuation expert, based upon the existing awareness, age and market share of the mBF brand in Australia and the retention rates of brand names in acquisitions in the same business sector.
Property, plant and equipmentFreehold and leasehold properties comprise care homes, hospitals and offices. these properties are shown at fair value based on periodic, but at least triennial, valuations performed by external independent valuers, less subsequent depreciation and impairment losses. the valuations are performed with sufficient regularity to ensure that the carrying value does not differ significantly from fair value at the balance sheet date. Directors’ valuations are performed in interim years where impairment indicators exist. Fair value for care homes and hospitals is considered to be existing use value. Valuations of office buildings are on a market value basis. Borrowing costs relating to the acquisition or construction of qualifying assets are capitalised as part of the cost of that asset.
equipment (including leasehold improvements) is stated at historical cost less subsequent depreciation and impairment losses.
Gains and losses on revaluation are recognised in the revaluation reserve, except where an asset is revalued below historical cost, in which case the deficit is recognised in the income statement. Where a revaluation reverses deficits taken to the income statement in prior years, then it is credited to the income statement.
DepreciationFreehold land and assets under construction, included within freehold or leasehold properties as appropriate, are not depreciated. Depreciation on other items of property, plant and equipment is calculated using the straight line method to allocate cost or revalued amount less residual value over estimated useful lives, as follows:
° Freehold buildings 50 years
° leasehold buildings shorter of useful life and lease term
° equipment (leasehold shorter of useful life improvements) and lease term
° equipment 3 to 10 years
the assets’ residual values and useful lives are reviewed, where significant, at each balance sheet date and adjusted if appropriate.
impairment reviews are undertaken where there are indications that carrying value may not be recoverable. An impairment loss on assets carried at cost is recognised in the income statement to reduce the carrying value to the recoverable amount. An impairment loss on assets carried at revalued amount is recognised in the revaluation reserve, except where an asset is revalued below historical cost, in which case the deficit is recognised in the income statement.
Leased assetsleases are classified as finance leases when the terms of the lease transfer substantially all the risks and rewards of ownership to the lessee. All other leases are classified as operating leases.
Assets obtained under finance leases are capitalised within property, plant and equipment at fair value at acquisition or, if lower, at the present value of the minimum lease payments and depreciated over the shorter of their useful economic life and the lease term.
Obligations relating to finance leases, net of finance charges in respect of future periods, are included within other interest bearing liabilities. the interest element of the obligation is allocated over the lease term to reflect a constant rate of interest on the outstanding obligation.
leasehold land, where no option to obtain title exists, is treated as an operating lease.
Payments made under operating leases are recognised as prepayments within trade and other receivables and are recognised in the income statement on a straight line basis over the term of the lease.
On initial recognition, the leased asset is measured at the amount equal to the lower of its fair value and the present value of the minimum lease payments. subsequent to initial recognition, the asset is accounted for in accordance with the accounting policy applicable to that asset.
Other leases are operating leases and are not recognised in the Group’s balance sheet.
Investment propertiesProperty leased to third parties or held for capital appreciation is classified within investment properties. investment properties are stated at fair value.
Fair values are determined individually, on a basis appropriate to the purpose for which the property is intended and with regard to recent market transactions for similar properties in the same location.
in an active market, an independent valuer, holding a recognised and relevant professional qualification and with recent experience in the location and category of investment property being valued, values the portfolio annually.
in the absence of current prices in an active market, the properties are valued using discounted cash flow projections based on reliable estimates of future cash flows. Discount rates are used to reflect current market assessments of the uncertainty in the amount or timing of the cash flows.
Any gain or loss arising from a change in the fair value is recognised in the income statement.
64 Bupa Annual Report 2011
ACCO U N TI N G p O L I C I E S co n t i n u e d
Financial investmentsthe Group has classified its financial investments into the following categories: at fair value through profit or loss, available for sale, held to maturity, and loans and receivables. management determines the classification at initial recognition.
All financial investments are initially recognised at fair value, which includes transaction costs for financial investments not classified as at fair value through profit or loss. Financial investments are derecognised when the rights to receive cash flows from the financial investments have expired or where the Group has transferred substantially all risks and rewards of ownership.
Financial investments at fair value through profit or lossAn instrument is classified at fair value through profit or loss if it is held for trading or is designated as such upon initial recognition. Financial instruments are designated at fair value through profit or loss if the Group manages such investments and makes purchase and sale decisions based on their fair value, in accordance with the Group’s documented risk management or investment strategy.
the investments are carried at fair value, with gains and losses arising from changes in this value recognised in the income statement in the period in which they arise. the fair values of quoted investments in active markets are based on current bid prices. the fair values of unlisted securities, and quoted investments for which there is no active market, are established using valuation techniques corroborated by independent third parties. these may include reference to the current fair value of other instruments that are substantially the same and discounted cash flow analysis.
Derivatives are held at fair value through profit or loss unless they are designated as hedges. the accounting policy for hedging instruments is described on page 66.
Available for saleAvailable for sale financial investments are those intended to be held for an undisclosed period of time, which may be sold in response to liquidity needs or changes in interest rates, exchange rates or equity prices.
Available for sale financial investments are carried at fair value, with the exception of investments in equity instruments where fair value cannot be reliably determined, which are carried at cost. Fair values are determined in the same manner as for investments at fair value through profit or loss. changes in fair value are recognised in other comprehensive income whilst an investment is held, and are subsequently transferred to the income statement upon sale or derecognition of the investment.
Held to maturity investmentsHeld to maturity investments are non-derivative financial assets with fixed or determinable payments and a fixed maturity. investments are designated as held to maturity where the Group has a positive intention and ability to hold investments to maturity. Held to maturity investments are measured at amortised cost using the effective interest method, less any impairment losses.
Any discount or premium on purchase is amortised over the life of the investment through the income statement. the intent and ability to hold the asset to maturity is assessed at each reporting date.
loans and receivablesloans and receivables are non-derivative financial investments with fixed or determinable payments that are not quoted in an active market. they arise when the Group provides money, goods or services directly to a borrower or customer with no intention of trading the receivable. loans are recognised when cash is advanced to the borrowers.
loans and receivables are carried at amortised cost calculated using the effective interest method, less impairment losses.
sale and repurchase agreementssecurities purchased under commitments to resell (‘reverse repos’) are not recognised on the balance sheet; however, the consideration paid is recognised in loans and receivables within financial investments. the difference between sale and repurchase price is treated as interest and accrued over the life of the agreements using the effective interest method.
Trade and other receivablestrade and other receivables, excluding derivative assets, are carried at amortised cost less impairment losses. Derivative assets are carried at fair value as detailed in the derivative financial instruments note.
Service concession receivablesthe Group has recognised a service concession receivable in respect of the public-private-partnership arrangement with the Valencian government (the grantor). Under this arrangement the sanitas business was contracted to build and operate the manises hospital for the grantor for 15 years. A financial asset has been recognised to the extent that the Group has an unconditional contractual right to receive cash from or at the direction of the grantor for the services provided. At the end of the contract ownership of the hospital reverts to the grantor. the service concession receivable is carried at amortised cost less impairment losses.
Impairment of financial assetsFinancial assets comprise investment properties, financial investments, and trade and other receivables. if they are not already held at fair value, financial assets are assessed at each reporting date to determine whether there is any objective evidence that they are impaired. A financial asset is considered impaired if objective evidence indicates that one or more events that have occurred since the initial recognition of the asset have had a negative impact on the estimated future cash flows of that asset.
An impairment loss in respect of a financial investment measured at amortised cost is calculated as the difference between its carrying amount and the present value of the estimated future cash flows discounted at the effective interest rate at the date the investment was made.
significant financial assets are tested for impairment on an individual basis. the remaining financial assets are assessed collectively in groups that share similar credit risk characteristics. All impairment losses are recognised in the income statement.
Non-current assets classified as held for sale and discontinued operationsnon-current assets or disposal groups are classified as held for sale where their carrying amount will be recovered principally through a sale transaction rather than continuing use, where sale is highly probable and where the asset or disposal group is available for immediate sale in its present condition.
non-current assets and disposal groups held for sale are recognised at the lower of carrying amount and fair value less costs to sell. impairment losses are recognised in the income statement.
Bupa Annual Report 2011 65
FIN
AN
CIA
L S
TA
TE
ME
NT
SG
OV
ER
NA
NC
EB
US
INE
SS
RE
VIE
W
A discontinued operation is a component of the Group’s business that represents a separate major line of business or geographical area of operations or is a subsidiary company acquired exclusively with a view to resale. classification as a discontinued operation occurs upon disposal, abandonment or when the operation meets the criteria to be classified as held for sale, if earlier.
Cash and cash equivalentscash and cash equivalents comprise cash balances, call deposits and other short-term highly liquid investments (including money market funds) with original maturities of three months or less which are subject to an insignificant risk of change in value. Bank overdrafts that are repayable on demand and form an integral part of the Group’s cash management are included as a component of cash and cash equivalents for the purpose of the statement of cash flows.
Callable subordinated perpetual guaranteed bondsthe Group has issued callable subordinated perpetual guaranteed bonds. the terms of the bonds are such that Bupa cannot defer payments of interest in certain limited circumstances. the bonds are therefore classified as financial liabilities. the liability is stated at amortised cost using the effective interest method. the carrying value is adjusted for the gain or loss on hedged risk; changes in the fair value of derivatives that mitigate interest rate risk resulting from the fixed interest rate of the bonds are recognised in the income statement as an effective fair value hedge of this exposure. the coupon payable on the bonds is recognised as a financial expense.
the bonds have no set maturity date but are subject to an increase in the interest payments from 2020 and the Group is therefore likely to refinance the bonds as a result of economic compulsion.
Other subordinated liabilities and other interest bearing liabilitiesAll interest bearing liabilities are recognised initially as proceeds receivable less attributable transaction costs. subsequent to initial recognition, they are stated at amortised cost with any difference between cost and redemption value being recognised in the income statement over the period of the borrowings on an effective interest basis. the amortised cost of borrowings with a corresponding fair value hedge is adjusted for the fair value of the risk being hedged.
Offsetting financial instrumentsFinancial investments and financial liabilities are offset and the net amount reported in the balance sheet when there is a legally enforceable right to offset the recognised amounts and there is an intention to settle on a net basis, or realise the asset and settle the liability simultaneously.
Provisions for liabilities and chargesA provision is recognised in the balance sheet when the Group has a present legal or constructive obligation as a result of a past event, and it is probable that an outflow of economic benefits will be required to settle the obligation that can be reliably estimated. if the effect is material, provisions are determined by discounting the expected future cash flows at a pre-taxation rate that reflects current market assessments of the time value of money and, where appropriate, the risks specific to the liability.
Trade and other payablestrade and other payables, excluding derivative liabilities, are carried at amortised cost. Derivative liabilities are stated at fair value, as detailed in the derivative financial instruments note.
Accommodation bond liabilities Accommodation bonds are non-interest bearing deposits paid by the resident of the care home as payment for a place in the care home facility. these deposits are liabilities which fall due and are payable when the resident leaves the facility. the bonds are recorded at an amount equal to the proceeds received, net of retention and any other amounts deducted from the bond at the election of the bondholder.
Employee post employment benefitsthe Group operates defined contribution and defined benefit pension schemes, as well as a post retirement medical benefit scheme. the Group maintains funded and unfunded schemes.
Defined contribution pension schemesObligations for contributions to defined contribution pension schemes are recognised as an expense in the income statement as incurred.
Defined benefit post employment schemesthe Group’s net obligation in respect of defined benefit pension and post retirement medical schemes is calculated separately for each scheme and represents the present value of the defined benefit obligation less, for funded schemes, the fair value of scheme assets. the discount rate used is the yield at the balance sheet date on high quality corporate bonds denominated in the currency in which the benefits will be paid. When the calculation results in a benefit to the Group, the recognised asset is limited to the present value of any future refunds from the scheme or reductions in future contributions to the scheme, plus the total of any unrecognised past service costs.
the charge to the income statement for defined benefit schemes represents the following: current service cost calculated on the projected unit credit method; the expected return on scheme assets, less the interest cost on scheme liabilities; and gains and losses on curtailments.
All actuarial gains and losses are recognised in full in the statement of comprehensive income in the period in which they occur.
Derivative financial instrumentsthe Group uses derivative financial instruments to hedge its exposure to foreign exchange and interest rate risk. Derivatives that have been purchased or issued as part of a hedge that subsequently does not qualify for hedge accounting are accounted for as if they were trading instruments.
Derivative financial instruments are recognised initially at fair value. subsequent to initial recognition, they are remeasured at fair value within trade and other receivables, or within trade and other payables.
Fair values are obtained from exchange quoted prices and, where specific exchange prices are not available, from market observable pricing information including interest rate yield curves. the fair values of futures and options are obtained from the quoted prices on the relevant exchange, including liFFe. the value of foreign exchange forward contracts is established using listed market prices.

66 Bupa Annual Report 2011
ACCO U N TI N G p O L I C I E S co n t i n u e d
Hedge accountingthe Group applies fair value, net investment and cash flow hedge accounting. the Group formally documents the hedging relationship between a hedging instrument and a hedged item. Documentation includes the risk management objectives and the strategy in undertaking the hedge transaction.
Fair value hedgesWhere a derivative financial instrument hedges the change in fair value of a recognised asset or liability or an unrecognised firm commitment, any gain or loss on remeasurement of the hedging instrument at fair value is recognised in the income statement. the hedged item is fair valued for the hedged risk with any adjustment being recognised in the income statement.
cash flow hedgesGains and losses on derivative financial instruments designated as a hedge to the exposure in the variability in cash flows that are attributed to a recognised asset or liability, a firm commitment or a highly probable forecast transaction are accounted for as cash flow hedges.
the effectiveness of a cash flow hedge is the degree to which the cash flows attributable to a hedged risk are offset by changes in the cash flows of the hedging instrument. the effective portion of any gain or loss on the hedging instrument is recognised directly in other comprehensive income until the forecast transaction occurs and results in the recognition of a financial asset or liability which impacts the income statement. the ineffective portion of the gain or loss is recognised in the income statement.
if the hedged cash flow is no longer expected to take place, all deferred gains and losses are released to the income statement immediately. if the hedging instrument or hedge relationship is terminated but the hedged transaction is still expected to occur, the cumulative gain or loss at that point remains in other comprehensive income and is recognised in accordance with the above policy when the transaction occurs.
Foreign currency hedging of net investmentthe Group applies hedge accounting to its foreign currency exposure on a net investment basis. the Group uses foreign currency denominated borrowings and foreign currency forward contracts and foreign currency zero cost collars to hedge net investment risk.
A zero cost collar option is an instrument that combines the purchase of a cap and the sale of a floor to specify a range in which a foreign currency rate will fluctuate. the instrument insulates the buyer against the risk of a significant weakening of a foreign currency rate, but limits the benefit of a strengthening of that foreign currency rate. Zero cost collar options are only exercised, at specified intervals, if the benchmark rate is exceeded. settlement amounts are calculated by reference to the agreed notional amounts.
if an external foreign currency denominated loan is used as a hedge, the portion of the exchange gains or losses arising from the retranslation, that is found to be an effective hedge, is recognised in other comprehensive income. the same treatment is applied to both the realised and unrealised exchange gains and losses arising from foreign currency forward contracts and foreign currency zero cost collars. Any ineffective portion is recognised directly in the income statement. if an entity is subsequently sold or liquidated, any gains or losses that have been previously recognised in other comprehensive income are recognised in the income statement.
Accounting estimates and judgementsthe preparation of financial statements in conformity with iFRss requires the use of certain accounting estimates. it also requires management to exercise its judgement in applying the Group’s accounting policies. the estimates and assumptions are based on historical experience and other related variables, updated to reflect current trading performance. the estimates and assumptions are reviewed on an ongoing basis and are considered to be prudent and appropriate but actual results may differ from these estimates. Judgements made by management in applying the Group’s accounting policies that have a significant effect on the financial statements, and estimates with a significant risk of material adjustment in subsequent periods, are described below:
insurance accounting: the estimates, uncertainties and judgements arising as a result of the Group’s insurance operations are detailed in note 33.
Deferred revenue: in respect of the Group’s revenue and deferred revenue for performance based health service contracts, estimates are made by the Group based on the most recent performance evaluation data available at the year end and these estimates are utilised if they are determined to be reliable. Reliable estimates can only be made on an individual contract basis once the results of an initial performance evaluation is available, and revenue is deferred until the first reliable evaluation is available. Where the results of final performance assessment differ from the estimation or if an updated reliable estimate is available, the difference is recognised in the period in which such determination is made. Where reliable estimates are not available, the Group recognises revenue only to the extent of the contract costs recognised that the Group believes are recoverable.
Financial instruments: the Group is exposed to uncertainty as a result of exposure to currency, credit, liquidity and interest rate risks. these risks, together with the Group’s procedures to mitigate resulting uncertainty, are discussed in note 33.
Pension assumptions: note 26 details the estimation techniques involved in calculating the Group’s net pension assets or liabilities.
intangible assets arising on business combinations: All identifiable assets arising as part of a business combination must be recognised at fair value. the calculation of fair value requires the use of estimates and judgements, including modelling techniques. these assets are described in note 11.
Goodwill impairment: note 11 contains information about the assumptions and estimates used to calculate the impairment of goodwill.
Property valuations: the Group’s care home and hospital properties are valued with regard to their trading potential. Valuations are performed by independent, external valuers who incorporate assumptions. the principal assumptions relate to: quantifying a fair, maintainable level of trade and profitability; levels of competition; and assumed ability to renew existing licences, consents, certificates or permits. the property valuations are discussed in note 12.
income taxes: the Group is subject to income taxes in numerous jurisdictions. there are many transactions and calculations for which the ultimate taxation determination is uncertain during the ordinary course of business. Where the final taxation outcome is different from the amount that was initially recorded, the difference is recognised in the period in which such determination is made. note 9 contains information about the taxation expense.

Bupa Annual Report 2011 67
FIN
AN
CIA
L S
TA
TE
ME
NT
SG
OV
ER
NA
NC
EB
US
INE
SS
RE
VIE
W
the areas of judgement made in the process of applying the Group’s accounting policies to categorise how transactions are displayed and that have the most significant effect on the amounts recognised in the financial statements are:
° establishing whether special purpose entities are controlled by the Group;
° determining the nature of intangible assets arising on business combinations;
° determining the presence or absence of insurance risk in contracts entered into by the Group’s insurance entities;
° determining whether a substantial transfer of risks and rewards has occurred in relation to leased assets; and
° determining the necessary taxation provision where the effect of taxation laws and regulations is unclear.
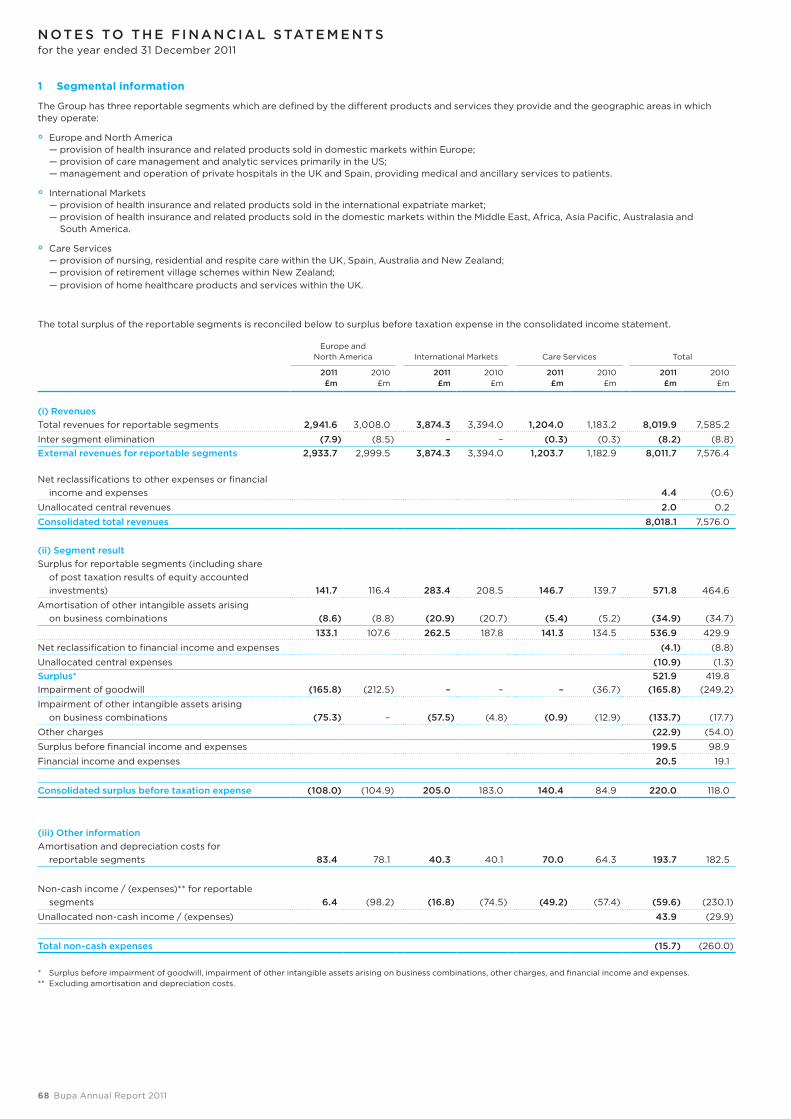
68 Bupa Annual Report 2011
N OT E S TO T h E F I N A N C I A L S TAT E M E N T Sfor the year ended 31 December 2011
1 Segmental information
the Group has three reportable segments which are defined by the different products and services they provide and the geographic areas in which they operate:
° europe and north America — provision of health insurance and related products sold in domestic markets within europe; — provision of care management and analytic services primarily in the Us; — management and operation of private hospitals in the UK and spain, providing medical and ancillary services to patients.
° international markets — provision of health insurance and related products sold in the international expatriate market; — provision of health insurance and related products sold in the domestic markets within the middle east, Africa, Asia Pacific, Australasia and
south America.
° care services — provision of nursing, residential and respite care within the UK, spain, Australia and new Zealand; — provision of retirement village schemes within new Zealand; — provision of home healthcare products and services within the UK.
the total surplus of the reportable segments is reconciled below to surplus before taxation expense in the consolidated income statement.
europe and north America international markets care services total
2011 £m
2010 £m
2011 £m
2010 £m
2011 £m
2010 £m
2011 £m
2010 £m
(i) Revenuestotal revenues for reportable segments 2,941.6 3,008.0 3,874.3 3,394.0 1,204.0 1,183.2 8,019.9 7,585.2
inter segment elimination (7.9) (8.5) – – (0.3) (0.3) (8.2) (8.8)External revenues for reportable segments 2,933.7 2,999.5 3,874.3 3,394.0 1,203.7 1,182.9 8,011.7 7,576.4
net reclassifications to other expenses or financial income and expenses 4.4 (0.6)
Unallocated central revenues 2.0 0.2
Consolidated total revenues 8,018.1 7,576.0
(ii) Segment resultsurplus for reportable segments (including share
of post taxation results of equity accounted investments) 141.7 116.4 283.4 208.5 146.7 139.7 571.8 464.6
Amortisation of other intangible assets arising on business combinations (8.6) (8.8) (20.9) (20.7) (5.4) (5.2) (34.9) (34.7)
133.1 107.6 262.5 187.8 141.3 134.5 536.9 429.9
net reclassification to financial income and expenses (4.1) (8.8)
Unallocated central expenses (10.9) (1.3)Surplus* 521.9 419.8impairment of goodwill (165.8) (212.5) – – – (36.7) (165.8) (249.2)
impairment of other intangible assets arising on business combinations (75.3) – (57.5) (4.8) (0.9) (12.9) (133.7) (17.7)
Other charges (22.9) (54.0)
surplus before financial income and expenses 199.5 98.9
Financial income and expenses 20.5 19.1
Consolidated surplus before taxation expense (108.0) (104.9) 205.0 183.0 140.4 84.9 220.0 118.0
(iii) Other informationAmortisation and depreciation costs for
reportable segments 83.4 78.1 40.3 40.1 70.0 64.3 193.7 182.5
non-cash income / (expenses)** for reportable segments 6.4 (98.2) (16.8) (74.5) (49.2) (57.4) (59.6) (230.1)
Unallocated non-cash income / (expenses) 43.9 (29.9)
Total non-cash expenses (15.7) (260.0)
* surplus before impairment of goodwill, impairment of other intangible assets arising on business combinations, other charges, and financial income and expenses.** excluding amortisation and depreciation costs.
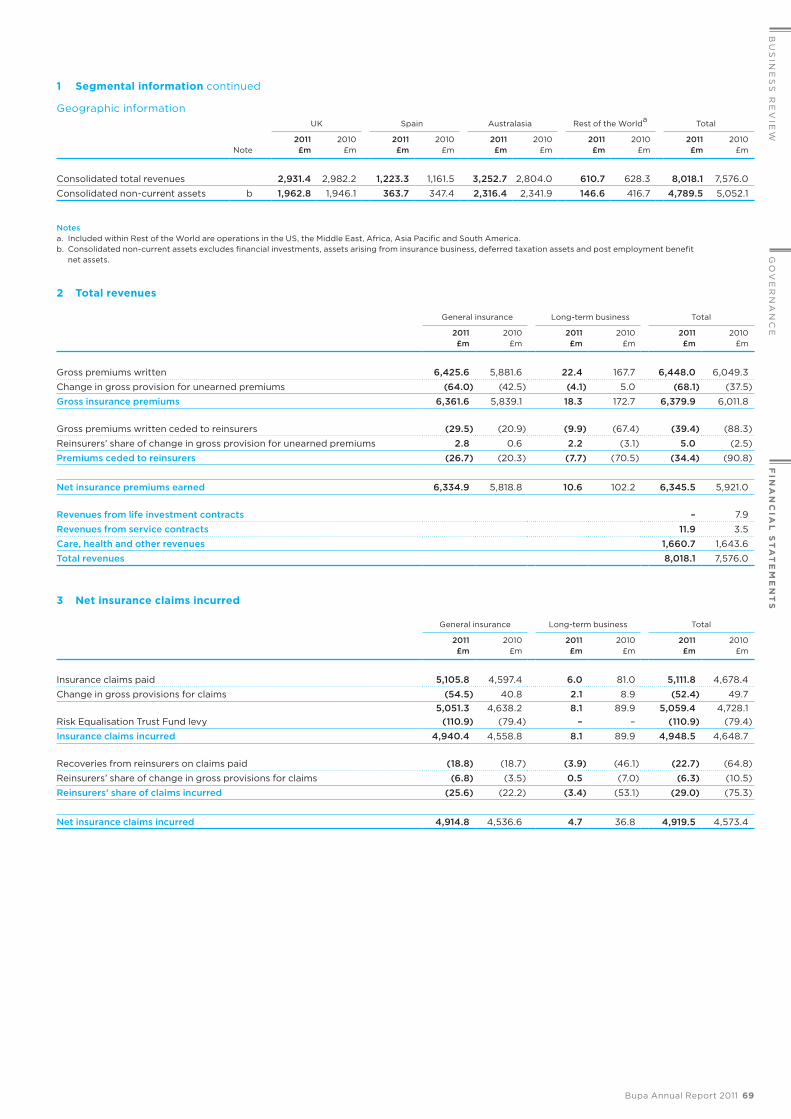
Bupa Annual Report 2011 69
FIN
AN
CIA
L S
TA
TE
ME
NT
SG
OV
ER
NA
NC
EB
US
INE
SS
RE
VIE
W
1 Segmental information continued
Geographic informationUK spain Australasia Rest of the Worlda total
note2011 £m
2010£m
2011 £m
2010 £m
2011 £m
2010 £m
2011 £m
2010 £m
2011 £m
2010 £m
consolidated total revenues 2,931.4 2,982.2 1,223.3 1,161.5 3,252.7 2,804.0 610.7 628.3 8,018.1 7,576.0
consolidated non-current assets b 1,962.8 1,946.1 363.7 347.4 2,316.4 2,341.9 146.6 416.7 4,789.5 5,052.1
Notesa. included within Rest of the World are operations in the Us, the middle east, Africa, Asia Pacific and south America. b. consolidated non-current assets excludes financial investments, assets arising from insurance business, deferred taxation assets and post employment benefit
net assets.
2 Total revenues
General insurance long-term business total
2011 £m
2010 £m
2011 £m
2010 £m
2011 £m
2010 £m
Gross premiums written 6,425.6 5,881.6 22.4 167.7 6,448.0 6,049.3
change in gross provision for unearned premiums (64.0) (42.5) (4.1) 5.0 (68.1) (37.5)
Gross insurance premiums 6,361.6 5,839.1 18.3 172.7 6,379.9 6,011.8
Gross premiums written ceded to reinsurers (29.5) (20.9) (9.9) (67.4) (39.4) (88.3)
Reinsurers’ share of change in gross provision for unearned premiums 2.8 0.6 2.2 (3.1) 5.0 (2.5)
premiums ceded to reinsurers (26.7) (20.3) (7.7) (70.5) (34.4) (90.8)
Net insurance premiums earned 6,334.9 5,818.8 10.6 102.2 6,345.5 5,921.0
Revenues from life investment contracts – 7.9
Revenues from service contracts 11.9 3.5
Care, health and other revenues 1,660.7 1,643.6
Total revenues 8,018.1 7,576.0
3 Net insurance claims incurred
General insurance long-term business total
2011 £m
2010 £m
2011 £m
2010 £m
2011 £m
2010 £m
insurance claims paid 5,105.8 4,597.4 6.0 81.0 5,111.8 4,678.4
change in gross provisions for claims (54.5) 40.8 2.1 8.9 (52.4) 49.75,051.3 4,638.2 8.1 89.9 5,059.4 4,728.1
Risk equalisation trust Fund levy (110.9) (79.4) – – (110.9) (79.4)
Insurance claims incurred 4,940.4 4,558.8 8.1 89.9 4,948.5 4,648.7
Recoveries from reinsurers on claims paid (18.8) (18.7) (3.9) (46.1) (22.7) (64.8)
Reinsurers’ share of change in gross provisions for claims (6.8) (3.5) 0.5 (7.0) (6.3) (10.5)
Reinsurers’ share of claims incurred (25.6) (22.2) (3.4) (53.1) (29.0) (75.3)
Net insurance claims incurred 4,914.8 4,536.6 4.7 36.8 4,919.5 4,573.4

70 Bupa Annual Report 2011
N ot e s to t h e f i N a N c i a l s tat e m e N t s co n t i n u e dfor the year ended 31 December 2011
4 Other operating expenses
2011 £m
2010 £m
staff costs Wages and salaries 1,091.5 1,078.7
social security costs 93.0 91.4
contributions to defined contribution scheme 23.8 22.3
Other pension costs 7.9 9.2
total staff costs 1,216.2 1,201.6
Acquisition costs commission for direct insurance 175.2 208.2
Other acquisition costs paid 15.8 12.0
changes in deferred acquisition costs (1.8) 0.1
total acquisition costs 189.2 220.3
cost of sales 156.0 168.1
Property costs 170.8 165.6
marketing costs 125.8 109.3
medical supplies and fees 165.3 156.7
Operating lease rentals 51.1 41.8
net (gain) / loss on foreign exchange transactions (0.2) 0.3
Amortisation of intangible assets arising on business combinations and computer software 87.7 82.4
Depreciation expense 106.0 100.1
Other operating expenses (including auditors’ remuneration) 306.4 335.7
Total other operating expenses 2,574.3 2,581.9
Auditors’ remuneration
statutory audit of the company’s consolidated annual accounts 0.7 0.7
statutory audit of the company’s subsidiaries and pension scheme audits pursuant to legislation 3.4 3.5
total audit fees payable to the company’s auditors, KPmG Audit Plc and its associates 4.1 4.2Fees payable to other auditors:Audit of overseas subsidiary companies 0.2 0.1
total audit fees 4.3 4.3
Other services relating to taxation 0.5 0.4
services relating to corporate finance transactions 0.2 0.7
All other services 1.1 2.2
total auditors’ remuneration 6.1 7.6
Employee numbers
the average number of full time equivalent employees, including executive Directors, employed by the Group during the year was:
2011 2010
Health insurance 10,415 10,279
care and health provision 32,073 32,268
42,488 42,547
Company
the average number of full time equivalent employees, including executive Directors, employed by the company during the year was:
Health insurance 724 675

Bupa Annual Report 2011 71
FIN
AN
CIA
L S
TA
TE
ME
NT
SG
OV
ER
NA
NC
EB
US
INE
SS
RE
VIE
W
5 Directors’ emoluments
(i) directors’ remunerationDirectors’ remuneration for the year ended 31 December 2011 was as follows:
note
Salary / fees 2011
£
Benefits2011
£
Annual bonus
2011 £
total
2011 £
2010 £
Executive directorRay King a 777,034 61,981 706,120 1,545,135 1,469,340
777,034 61,981 706,120 1,545,135 1,469,340
Non-Executive directorslord leitch (chairman) 303,250 48,750 – 352,000 336,468
Baroness Bottomley 56,000 542 – 56,542 55,502
Peter cawdron b 78,500 1,083 – 79,583 73,004
lawrence churchill c 92,000 1,355 – 93,355 92,256
John lorimer d 28,000 548 – 28,548 –
George mitchell e 151,000 1,083 – 152,083 150,004
Prof sir John tooke f 74,333 1,083 – 75,416 64,504
Rita clifton g 56,000 – – 56,000 28,000
839,083 54,444 – 893,527 799,738
Former directortom singer h,i 303,620 83,209 – 386,829 789,712
303,620 83,209 – 386,829 789,712
1,919,737 199,634 706,120 2,825,491 3,058,790
Notesa. the highest paid Director was Ray King.b. the fees receivable by Peter cawdron include an amount of £13,500 (2010: £10,000) as chairman of the Remuneration committee. Peter cawdron is senior independent
Director and his fees include an amount of £9,000 (2010: £7,000) in respect of this position.c. the fees receivable by lawrence churchill include an amount of £36,000 (2010: £36,000) as a non-executive Director of Bupa insurance limited.d. John lorimer was appointed as a non-executive Director with effect from 1 July 2011.e. the fees receivable by George mitchell include an amount of £75,000 (2010: £75,000) as chairman of Bupa insurance limited and £20,000 (2010: £19,000) as chairman
of the Audit Risk and compliance committee.f. the fees receivable by Prof sir John tooke include an amount of £10,000 (2010: £8,500) as chairman of the medical Advisory Panel. With effect from 1 march 2011, he was
appointed as a member of the cromwell Hospital steering committee, for which he received a fee of £8,333.g. Rita clifton was appointed as a non-executive Director with effect from 1 July 2010.h. tom singer resigned from the company with effect from 16 september 2011. neil taylor, Divisional Finance and Development Director for care services Division, has taken
up the role of Acting Group Finance Director whilst a permanent appointment is made. Remuneration paid to neil taylor from his effective date of Acting Group Finance Director is included in note 36.
i. the benefits received by tom singer include a pension cash allowance paid in lieu of contributions to the defined contribution pension scheme.

72 Bupa Annual Report 2011
N ot e s to t h e f i N a N c i a l s tat e m e N t s co n t i n u e dfor the year ended 31 December 2011
5 Directors’ emoluments continued
(ii) Long-term incentive plan (LTIp) awards
note
At 31 December
2010 £
Paid in year
£
target award
£
Adjustment to
accrued balance
£
Awards becoming
payable £
At 31 December
2011 £
Payable April 2012
£
payable awardsExecutive directorRay King2009 / 2010 plan a 1,009,320 (1,009,320) – – – – –
2009 / 2011 plan – – – – 841,100 841,100 841,100
Former directortom singer2009 / 2010 plan a,b 492,000 (492,000) – – – – –
potential awards
Executive director
Ray King2009 / 2011 plan c 841,100 – – – (841,100) – –
2010 / 2012 plan d 891,566 – – (148,594) – 742,972 –
2011 / 2013 plan d – – 980,723 (490,361) – 490,362 –
Notesa. the maximum potential award was 120% of the target award, and was payable if stretch targets set by the Remuneration committee were achieved. the 2009 / 2010 plan
period ended on 31 December 2010 and the award paid out at 120% of the target value. the payment was made in April 2011.b. tom singer resigned from the company with effect from 16 september 2011. no further payments are due.c. the maximum potential award is 120% of the target award, and is payable if stretch targets set by the Remuneration committee are achieved. the 2009 / 2011 plan period
ended on 31 December 2011 and the award will pay out at 100% of target. d. the 2010 / 2012 plan period ends on 31 December 2012 and the 2011 / 2013 plan period ends on 31 December 2013. the maximum potential award is 120% of the target award
and, subject to the performance criteria being satisfied, the awards will become eligible for payment in April 2013 and April 2014 respectively. As Ray King will be retiring from the company in 2012, his potential awards for 2010 /2012 and 2011 / 2013 have been pro-rated in accordance with the plan rules.
(iii) directors’ pensionsRay King, who joined the Bupa Pension scheme prior to October 2002, participates in defined benefit pension arrangements sponsored by the company. these schemes provide benefits based on earnings at or near retirement and are part funded and part unfunded. the unfunded element is provided for by the Group. the following table shows details of his accrued pension benefits at the end of the year:
note
total accrued pension at
31 December 2011
£
total accrued pension at
31 December 2010
£
transfer value at
31 December 2011
£
transfer value at
31 December 2010
£
increase in transfer value less Director’s contributions
£
Ray King a, b 272,421 236,797 6,159,762 5,219,021 921,751
Notesa. the accrued pension entitlement shown is that which would be paid annually on retirement based on service to the end of the year. the increase in accrued annual pension
during the year for Ray King, excluding any increase for inflation, was £28,284. the transfer value of this increase, less Director’s contributions, was £620,539.b. the transfer values have been calculated by an independent actuary in accordance with Guidance note 11 issued by the institute and Faculty of Actuaries.
During the year, the company paid contributions of £39,408 (2010: £153,689) to the Bupa Retirement savings Plan, a defined contribution scheme, in respect of tom singer. the 2011 figure is lower than the 2010 comparison due to tom singer resigning part way through the year, as well as the company paying a part of the pension benefit as a cash allowance. the effect of this pension cash allowance has increased the 2011 benefits figure shown in note 5 (i) above.
6 Other charges
2011 £m
2010 £m
net gain / (loss) on sale of business 0.3 (11.6)
net charge on disposal group held for sale – (6.5)
net loss on sale of equity accounted investment (0.4) –
Deficit on revaluation of property (0.4) (35.2)
impairment of property (20.9) –
net loss on disposal of property, plant and equipment (1.5) (0.7)
Total other charges (22.9) (54.0)

Bupa Annual Report 2011 73
FIN
AN
CIA
L S
TA
TE
ME
NT
SG
OV
ER
NA
NC
EB
US
INE
SS
RE
VIE
W
7 Financial income
2011 £m
2010 £m
interest income loans and receivables 81.3 67.5
investments held to maturity 5.7 10.0
investments designated at fair value through profit or loss 0.5 5.1
net realised gains on financial investments designated at fair value through profit or loss 0.7 0.5net increase in fair value investments designated at fair value through profit or loss 4.0 15.5
Derivatives – 0.3
investment property 3.8 0.1
net foreign exchange loss (1.0) (0.7)
Total financial income 95.0 98.3
no financial investments designated at fair value through profit or loss are held for trading.
the net amount of foreign exchange differences recognised in financial income for the year, excluding those arising on financial assets and financial liabilities measured at fair value through profit or loss was £nil (2010: gain of £0.5m).
included within financial income of £95.0m (2010: £98.3m) is a net gain, after hedging, on the Group’s return seeking asset portfolio of £6.6m (2010: net gain of £13.2m).
8 Financial expenses
2011 £m
2010 £m
interest expense on financial liabilities at amortised cost 72.8 77.9
Finance charges in respect of finance leases 0.1 0.2
Other financial expenses 1.6 1.1
Total financial expenses 74.5 79.2
9 Taxation expense
(i) Recognised in the income statement2011 £m
2010 £m
current taxation expenseUK taxation on income for the year 63.4 60.2
Adjustments in respect of prior periods (38.7) (11.1)
24.7 49.1Double taxation relief (2.2) (2.0)
Foreign taxation on income for the year 80.8 59.1
Adjustments in respect of prior periods (8.4) (0.5)
72.4 58.6
total current taxation 94.9 105.7
Deferred taxation (income) / expense Origination and reversal of temporary differences (19.6) 20.4
Adjustments in respect of prior periods 8.2 5.8
changes in taxation rates 0.6 (0.5)
total deferred taxation (10.8) 25.7
Taxation expense 84.1 131.4

74 Bupa Annual Report 2011
N ot e s to t h e f i N a N c i a l s tat e m e N t s co n t i n u e dfor the year ended 31 December 2011
9 Taxation expense continued
(ii) Reconciliation of effective taxation rate2011 £m
2010 £m
surplus before taxation expense 220.0 118.0taxation at the domestic UK corporation taxation rate of 26.5% (2010: 28.0%) 58.3 33.0
effect of:Different taxation rates in foreign jurisdictions (4.6) (0.1)
non-deductible expenses 59.1 110.0
current income taxation adjustments in respect of prior periods (47.1) (11.6)
Deferred taxation adjustments in respect of prior periods 8.2 5.8
changes in taxation rate 0.6 (0.5)
movement on deferred taxation asset not recognised 9.6 (5.2)
taxation expense at the effective taxation rate of 38.2% (2010: 111.4%) 84.1 131.4
(iii) Current and deferred taxation recognised directly in other comprehensive income
2011 2010
Before taxation
£m
Taxation benefit /
(expense) £m
Net of taxation
£m
Before taxation
£m
taxation (expense) /
benefit £m
net of taxation
£m
Current taxation credit / (charge) in respect of:Actuarial loss on pension schemes – 6.5 6.5 – – –
Realisation of foreign exchange on disposal of overseas subsidiary companies – – – 1.6 – 1.6
Foreign exchange translation differences on goodwill 3.4 – 3.4 212.6 – 212.6
Other foreign exchange translation differences (5.8) 0.5 (5.3) 150.4 (1.1) 149.3
net gain / (loss) on hedge of net investment in overseas subsidiary companies 7.8 – 7.8 (43.2) 1.7 (41.5)
Realisation of cash flow hedge (1.3) – (1.3) 1.9 (0.8) 1.1
Disposal of subsidiary companies – – – 0.1 – 0.1
Other movements in non-controlling interests – 0.1 0.1 (6.8) – (6.8)deferred taxation (charge) / credit in respect of:Unrealised (deficit) / surplus on revaluation of property (31.1) 13.7 (17.4) 82.2 (17.3) 64.9
Actuarial (loss) / gain on pension schemes (93.0) 12.2 (80.8) 67.5 (18.3) 49.2
change in fair value of underlying derivative of cash flow hedge (1.0) 0.2 (0.8) (0.4) 0.1 (0.3)
Taxation credit / (charge) on (expense) / income recognised directly in other comprehensive income (121.0) 33.2 (87.8) 465.9 (35.7) 430.2
10 Surplus / (deficit) for the financial year attributable to the Company
the surplus for the financial year dealt with in the accounts of the company, the British United Provident Association limited (Bupa), is £142.2m (2010: deficit £44.4m). in accordance with the exemption granted under section 408 of the companies Act 2006, a separate income statement and statement of comprehensive income for the company have not been presented.

Bupa Annual Report 2011 75
FIN
AN
CIA
L S
TA
TE
ME
NT
SG
OV
ER
NA
NC
EB
US
INE
SS
RE
VIE
W
11 Intangible assetsGroup company
Goodwill £m
computer software
£m
customer relation-
ships £m
Other £m
total £m
computer software
£m
2011CostAt beginning of year (restated) 2,238.3 451.8 329.2 333.1 3,352.4 61.9
Assets arising on business combinations 5.8 – 0.3 0.7 6.8 –
Additions – 63.9 – – 63.9 37.9
Disposals – (2.9) – – (2.9) (27.5)
Other – 9.1 – – 9.1 (0.5)
Foreign exchange 9.3 (0.6) 1.8 0.1 10.6 –
At end of year 2,253.4 521.3 331.3 333.9 3,439.9 71.8
Amortisation and impairment lossAt beginning of year 440.2 242.5 69.0 83.5 835.2 45.0
Amortisation for year – 57.8 22.3 7.6 87.7 6.3
impairment loss 165.8 31.0 37.0 67.3 301.1 0.2
Disposals – (2.8) – – (2.8) (1.2)
Other – (0.3) – – (0.3) (0.4)
Foreign exchange 5.8 1.0 2.0 1.4 10.2 –
At end of year 611.8 329.2 130.3 159.8 1,231.1 49.9
Net book value at end of year 1,641.6 192.1 201.0 174.1 2,208.8 21.9net book value at beginning of year (restated) 1,798.1 209.3 260.2 249.6 2,517.2 16.9
2010CostAt beginning of year 2,023.7 438.8 291.4 325.2 3,079.1 56.6
Assets arising on business combinations 9.9 – – – 9.9 –
Additions – 35.7 – – 35.7 16.9
transfer to assets held for sale – (12.3) – – (12.3) –
Disposal of subsidiary companies (22.2) – – (23.4) (45.6) –
Disposals – (13.8) – – (13.8) (10.9)
Other – (0.7) – – (0.7) (0.7)
Foreign exchange 226.9 4.1 37.8 31.3 300.1 –
At end of year (restated) 2,238.3 451.8 329.2 333.1 3,352.4 61.9
Amortisation and impairment lossAt beginning of year 180.5 207.3 42.1 58.8 488.7 41.8
Amortisation for year – 53.0 21.1 8.3 82.4 5.5
impairment loss 246.4 – – 17.7 264.1 –
transfer to assets held for sale – (6.4) – – (6.4) –
Disposal of subsidiary companies (0.3) – – (3.6) (3.9) –
Disposals – (13.7) – – (13.7) (2.3)
Foreign exchange 13.6 2.3 5.8 2.3 24.0 –
At end of year 440.2 242.5 69.0 83.5 835.2 45.0
Net book value at end of year (restated) 1,798.1 209.3 260.2 249.6 2,517.2 16.9net book value at beginning of year 1,843.2 231.5 249.3 266.4 2,590.4 14.8
intangible assets of £2,208.8m (2010: £2,517.2m) includes £375.1m (2010: £546.7m) which is attributable to other intangible assets arising on business combinations (included within computer software, customer relationships and Other) as follows:
2011 £m
2010 £m
customer relationships 201.0 260.2
Bed licences (within Bupa care services Australia) 100.5 99.8
licences to operate care homes 50.0 54.9
leases 12.9 13.4
Distribution networks 8.7 11.4
Present valuation of acquired in-force business 1.4 1.5
Brand and trademarks 0.6 68.6
technology and databases – 36.9
375.1 546.7

76 Bupa Annual Report 2011
N ot e s to t h e f i N a N c i a l s tat e m e N t s co n t i n u e dfor the year ended 31 December 2011
11 Intangible assets continued
Impairment of other intangible assets arising on business combinationsDuring the year, impairment of other intangible assets arising on business combinations totalled £135.0m.
in addition, £1.3m of the cash flow hedge reserve gain of £36.4m on the forward foreign exchange contracts entered into in 2008 to hedge the cash outflow in respect of the acquisition of Bupa Australia has been recycled to the income statement. this brings the total impairment charge recognised in the income statement to £133.7m (2010: £17.7m).
mBF brandAn impairment charge of £58.6m has been recognised in respect of the write down of the mBF brand due to the launch of the Bupa brand in Australia. At the end of October the Bupa retail brand was launched in the Australia market as part of the move to a single retail brand. Given the timing, breadth and scope of the re-branding strategy in Australia the value of the mBF brand has been impaired resulting in a charge of £58.6m. in addition, £1.3m of the cash flow hedge associated with the acquisition of mBF has been released to the income statement as a result of the impairment resulting in a net charge of £57.3m (2010: £nil).
Health Dialogin 2011, an impairment charge of £37.0m (2010: £nil) has been recognised against the Health Dialog customer relationship asset that arose on acquisition of the business in 2008. the asset was fully written down as a result of reduced forecast revenue and expected margins from the customers associated with the asset at acquisition.
in addition, the Health Dialog brand and the technology and databases assets that arose on acquisition have both been fully impaired, resulting in an impairment charge of £7.5m and £30.8m respectively (2010: £nil). Both assets were impaired as a result of the annual impairment testing of the Health Dialog cash generating unit, further details of which are documented below.
Impairment testingGoodwill and intangible assets with indefinite useful lives are tested at least annually for impairment by comparing the net carrying value with the recoverable amount using value in use calculations. in arriving at the value in use for each cash generating unit (cGU), key assumptions have been made regarding future projected cash flows, discount rates and terminal growth rates. the main assumptions upon which the cash flow projections are based include premiums and claims costs for our Pmi businesses, fee rate and occupancy for our care services businesses and revenue growth and gross margins for our Health Dialog, Bupa Home Healthcare and Bupa cromwell Hospital businesses.
except for Bupa care services Australia and the Bupa cromwell Hospital, cash flow projections have been based on management operating profit projections for a three year period which have been approved by the Board. cash flow projections for Bupa care services Australia and the Bupa cromwell Hospital have been based on a period of five and seven years respectively. A longer period was justified for these cGUs as management believes that this is an appropriate timescale over which to look at the annual cash flow projections before applying the terminal growth rate to the final year. taxation has been applied to the pre-taxation management operating profits based on the statutory taxation rates in the country of operation.
Future post-taxation cash flows have been discounted at post-taxation discount rates. the discount rates used for the value in use calculations for each of the Group’s cGUs are an estimate of a market assessment of the time value of money and the risks inherent in the relevant country where the cash flows are generated and within the Group’s business plans.
the following table summarises the pre-taxation discount rates used for impairment testing:
2011 %
2010 %
Health Dialog 14.0 12.6
Bupa Australia 12.9 12.8
Bupa care services Australia 8.9 9.3
Bupa care services UK 9.0 9.0
Bupa international 12.3 10.4
Bupa care services new Zealand 9.6 10.0
Bupa Home Healthcare 12.2 11.9
the Bupa cromwell Hospital 14.0 13.0
Other – range of discount rates 15.0–15.3 12.7–14.3
cash flow projections beyond the three year period have been extrapolated by applying a terminal growth rate between 1.0% and 3.0% (2010: 1.5% and 3.0%) for all cGUs. the terminal growth rates represent management’s estimate of the long-term growth rate for each of the cGUs, taking into account the future and past growth rates and external sources of data. they are conservative estimates which do not exceed the long-term average growth rate for the respective industries, countries or markets in which the cGUs operate.
the values assigned to the key assumptions are based on management’s past experience and assessment of future trends in the relevant industry.
Impairment of goodwill and other intangible assets with indefinite useful livesAt 31 December 2011, the carrying value of the Health Dialog cGU was determined to be higher than its recoverable amount, resulting in an impairment to goodwill arising on business combinations totalling £165.8m. in 2010, an impairment charge of £249.2m was recognised against the Health Dialog, Bupa Home Healthcare and the Bupa cromwell Hospital cGUs.
Health Dialog the goodwill relating to Health Dialog (acquired in 2008) has been fully impaired in 2011, resulting in an impairment charge of £165.8m (2010: £156.0m). Health Dialog is a Us based provider of health analytics and care management services that helps health plans, public insurers and employers manage the cost and quality of healthcare. Due to the continuing weak economic conditions in the Us, the ongoing uncertainty in the Us healthcare market arising from healthcare reform and an increasing trend in the market towards in-sourcing of chronic disease management, the outlook for the business has become more challenging. the main assumptions on which the cash flow projections were based include revenue growth and gross margin. the key valuation assumptions used to test the carrying value of goodwill included a pre-taxation discount rate of 14.0% (2010: 12.6%) and a terminal growth rate of 2.0% (2010: 3.0%).

Bupa Annual Report 2011 77
FIN
AN
CIA
L S
TA
TE
ME
NT
SG
OV
ER
NA
NC
EB
US
INE
SS
RE
VIE
W
11 Intangible assets continued
the Bupa cromwell Hospital in 2011, the recoverable amount of the Bupa cromwell Hospital cGU is greater than its carrying value and therefore no impairment is required.
in 2010, an impairment was made to the goodwill arising on acquisition relating to the Bupa cromwell Hospital (acquired in 2008) of £53.7m.
Bupa Home Healthcare in 2011, the recoverable amount of the Bupa Home Healthcare cGU is greater than its carrying value and therefore no impairment is required.
in 2010, an impairment was made to the goodwill relating to Bupa Home Healthcare (acquired in 2006) of £36.7m.
Impairment of intangible assets with indefinite useful lives Other than the £58.6m impairment to the mBF brand held by Bupa Australia, described above, there have been no further impairments during the year to intangible assets with indefinite useful lives (2010: £16.4m).
the following table summarises goodwill by cGU as at 31 December:
2011
£m
2010(restated)
£m
Bupa Australia 978.7 972.1
Bupa care services Australia 316.5 314.3
Bupa care services UK 178.2 178.2
Bupa international 59.3 59.3
Bupa care services new Zealand 31.5 31.2
sanitas Pmi 24.8 19.8
Bupa Home Healthcare 20.5 20.5
the Bupa cromwell Hospital 16.2 16.2
Bupa latin America 8.5 8.5
Health Dialog – 170.4
Other 7.4 7.6
1,641.6 1,798.1
Sensitivity to changes in key assumptionsA sensitivity analysis has been performed on the key assumptions used to determine the value in use for each cGU as at 31 December 2011.
Other than as disclosed below, management believes that no reasonably possible change in any of the above key assumptions would cause the carrying value of any goodwill or intangible asset with an indefinite useful life to exceed its recoverable amount.
Following the goodwill impairment in 2011 the recoverable amount of Health Dialog equalled the carrying value at 31 December 2011. Any adverse change in the assumptions would not cause a further impairment loss to be recognised as the recoverable amount of the remaining assets of the cGU is greater than or equal to their carrying value.
Bupa care services Australia and Bupa care services new Zealand were impaired to recoverable amounts in 2008. the Bupa cromwell Hospital and Bupa Home Healthcare were impaired to recoverable amounts in 2010. since then these cGUs have built up additional headroom in the recoverable amount of the cGU value relative to the carrying value, however they remain sensitive to changes in assumptions. the table below shows the change required in the terminal growth rate and discount rate for the recoverable amount of the goodwill to equal carrying amount.
Headroom £m
terminal growth
rate %
Decrease in terminal
growth rate %
increase in discount
rate %
the Bupa cromwell Hospital 5.8 2.0 0.7 0.4
Bupa Home Healthcare 7.3 2.0 1.2 1.1
Bupa care services new Zealand 34.4 2.8 1.0 0.9
Bupa care services UK 287.9 2.0 1.3 1.2
Bupa care services Australia 160.4 3.0 1.6 1.4

78 Bupa Annual Report 2011
N ot e s to t h e f i N a N c i a l s tat e m e N t s co n t i n u e dfor the year ended 31 December 2011
12 Property, plant and equipmentGroup company
Freehold property
£m
leasehold property
£mequipment
£mtotal
£m
leasehold property
£mequipment
£mtotal
£m
2011Cost or valuationAt beginning of year (restated) 1,897.3 159.9 705.9 2,763.1 8.9 41.0 49.9
Additions through business combinations – – 3.6 3.6 – – –
Additions 40.3 11.4 96.0 147.7 11.0 7.5 18.5
Disposals (3.9) (6.6) (81.7) (92.2) (1.4) (13.7) (15.1)
Revaluations (12.6) 0.1 – (12.5) – – –
Other (0.5) 0.2 (8.7) (9.0) – 0.5 0.5
Foreign exchange (0.1) – (4.0) (4.1) – – –
At end of year 1,920.5 165.0 711.1 2,796.6 18.5 35.3 53.8
depreciation and impairment lossAt beginning of year 21.5 37.4 409.5 468.4 1.5 26.4 27.9
Depreciation charge for year 30.1 9.1 66.8 106.0 1.1 4.1 5.2
Disposals (2.8) (6.3) (80.1) (89.2) (1.4) (11.8) (13.2)
Revaluations (20.0) – – (20.0) – – –
impairments 59.2 – 0.7 59.9 – 0.1 0.1
Other 0.3 0.1 (0.1) 0.3 4.2 0.4 4.6
Foreign exchange 0.1 0.2 (1.6) (1.3) – – –
At end of year 88.4 40.5 395.2 524.1 5.4 19.2 24.6
Net book value at end of year 1,832.1 124.5 315.9 2,272.5 13.1 16.1 29.2net book value at beginning of year (restated) 1,875.8 122.5 296.4 2,294.7 7.4 14.6 22.0
2010Cost or valuationAt beginning of year 1,865.9 148.5 624.3 2,638.7 4.7 35.1 39.8
Additions through business combinations – 0.6 1.5 2.1 – – –
Additions 35.9 15.6 90.3 141.8 4.2 9.4 13.6
transfer to assets held for sale – – (2.2) (2.2) – – –
Disposal of subsidiary companies – (0.8) (1.8) (2.6) – – –
Disposals (0.3) (2.5) (18.9) (21.7) – (4.2) (4.2)
Revaluations (59.4) (4.7) – (64.1) – – –
Other (2.3) (1.3) 4.6 1.0 – 0.7 0.7
Foreign exchange 57.5 4.5 8.1 70.1 – – –
At end of year (restated) 1,897.3 159.9 705.9 2,763.1 8.9 41.0 49.9
depreciation and impairment lossAt beginning of year 98.4 32.6 360.9 491.9 1.0 26.5 27.5
Depreciation charge for year 25.4 9.2 65.5 100.1 0.5 3.5 4.0
transfer to assets held for sale – – (1.9) (1.9) – – –
Disposal of subsidiary companies – (0.7) (1.1) (1.8) – – –
Disposals – (1.3) (18.1) (19.4) – (3.6) (3.6)
Revaluations (105.8) (4.4) – (110.2) – – –
Foreign exchange 3.5 2.0 4.2 9.7 – – –
At end of year 21.5 37.4 409.5 468.4 1.5 26.4 27.9
Net book value at end of year (restated) 1,875.8 122.5 296.4 2,294.7 7.4 14.6 22.0net book value at beginning of year 1,767.5 115.9 263.4 2,146.8 3.7 8.6 12.3
the impairment on freehold property and equipment of £59.9m (2010: £nil) arose in connection with the Directors’ impairment review of the care home portfolio as at 31 December 2011. An impairment of £0.8m (2010: £nil) also arose from this review in relation to the land, bringing the total impairment to £60.7m. impairments have been recognised against care homes where the decline in future profitability since the last valuation is considered to be of a long-term nature.
certain property, plant and equipment is held as securitised assets under borrowing arrangements described in note 23.

Bupa Annual Report 2011 79
FIN
AN
CIA
L S
TA
TE
ME
NT
SG
OV
ER
NA
NC
EB
US
INE
SS
RE
VIE
W
12 Property, plant and equipment continued
Analysis of cost or valuation of the Group’s freehold and leasehold properties
the table below shows the date at which properties were last subject to external valuation.
Freeholdproperty
£m
leaseholdproperty
£m
Valuation – December 2011 69.2 0.9
Valuation – December 2010 1,746.4 71.2
Valuation – December 2009 49.5 1.4
Assets held at cost 55.4 91.5
1,920.5 165.0
the revaluation of properties was carried out independently by Knight Frank and Darroch, chartered surveyors. the revaluations were effective as of 31 December in the year in which they were undertaken. the fair value of corporate use properties was determined mainly by reference to active market prices. care homes and hospitals are valued based on value in use techniques, the principal assumptions of which are described on page 67.
historical cost of the Group’s revalued assetsA net £8.7m revaluation gain (2010: £82.2m) and £39.8m impairment loss (2010: £nil) have been recognised in the property revaluation reserve. in 2011, a net deficit of £0.4m (2010: £35.2m) and impairments of £20.9m (2010: £nil) were charged to the income statement (see note 6). the entire net £8.3m revaluation surplus (2010: £47.0m) was valued by external valuers. the total £60.7m property impairment arose from internal assessments (2010: £nil).
2011
£m
2010(restated)
£m
Historical cost of revalued assets 1,492.3 1,491.9
Accumulated depreciation based on historical cost (205.4) (175.6)
historical cost net book value 1,286.9 1,316.3
depreciationDepreciation charge for the year on historical cost 29.8 29.8
the historical cost of all property, plant and equipment is £2,244.1m (2010: £2,197.8m).
Amounts included in property, plant and equipment in respect of assets held under finance leases
leasehold property
£mequipment
£mtotal
£m
Net book valueAt end of year 1.0 1.5 2.5
At beginning of year 1.0 2.5 3.5
depreciationcharge for year – 0.9 0.9
Companythe net book value of finance leased property held by the company at 31 December 2011 is £1.0m (2010: £1.0m). the depreciation charge for the year ended 31 December 2011 is £nil (2010: £0.1m).
property, plant and equipment in the course of construction Recognised in the carrying amount of freehold property is £0.6m (2010: £32.8m) in relation to freehold property in the course of construction.

80 Bupa Annual Report 2011
N ot e s to t h e f i N a N c i a l s tat e m e N t s co n t i n u e dfor the year ended 31 December 2011
13 Investment property
Group2011 £m
2010 £m
At beginning of year 120.3 104.7
Additions 7.4 5.1
Disposals – (0.2)
increase in fair value 4.1 0.1
Other – (0.3)
Foreign exchange 0.7 10.9
At end of year 132.5 120.3
the historical cost of investment property is £114.2m (2010: £106.2m).
the carrying value of investment properties is the fair value of the properties.
Of the £132.5m (2010: £120.3m) of investment properties in the balance sheet as at 31 December 2011, £9.1m (2010: £9.8m) was valued by an external valuer, Knight Frank, chartered surveyors.
the remaining carrying value of investment properties of £123.4m (2010: £110.5m) was valued by management using internally prepared discounted cash flow projections, supported by the terms of any existing lease and other contracts, and when possible, by external evidence such as current market rents for similar properties in the same location and condition. Discount rates are used to reflect current market assessments of the uncertainty in the amount or timing of the cash flows. the discounted cash flow projections are reviewed by an independent valuer, Deloitte.
investment properties include commercial properties which are leased to third parties. the leases contain an initial non-cancellable period of between one and four years. subsequent renewals are negotiated with the lessee.
14 Equity accounted investments
Group2011 £m
2010 £m
Carrying amount of equity accounted investments 43.3 42.2
the Group’s principal equity accounted investments are:
Business activity
share of issued share
capitalPrincipally
operates incountry of
incorporation
Accounting period
end date
Bupa Arabia For cooperative insurance company Associate insurance 26.25% saudi Arabia saudi Arabia 31 December
Forsikringsselskaber nes Data centre A / s Associate insurance 33.33% Denmark Denmark 31 December
mutual community General insurance Pty limited Associate insurance 49.00% Australia Australia 31 December
iBc Asia Healthcare limited Associate Healthcare 26.04% Us cayman islands 31 December
mAX Bupa Health insurance company limited Joint Venture insurance 26.00% india india 31 December
All equity accounted investments are included on a coterminous basis.
the Group has not recognised losses relating to Bupa Healthcare Asia in the year of £0.1m (2010: £nil) and cumulatively £0.5m (2010: £0.4m), as this investment has been fully impaired and the share of losses exceeds the interest in the associate.
During 2011, a capital injection of £5.1m (2010: £3.2m) was made in mAX Bupa Health insurance company limited to maintain the shareholding of 26.0%.

Bupa Annual Report 2011 81
FIN
AN
CIA
L S
TA
TE
ME
NT
SG
OV
ER
NA
NC
EB
US
INE
SS
RE
VIE
W
14 Equity accounted investments continued
the Group’s share of the assets, liabilities, revenue and surplus as reported in the most recent accounts of the individual equity accounted associates, is as follows:
2011 £m
2010 £m
Assets 108.5 100.9
liabilities (76.6) (68.3)
31.9 32.6
Revenues 115.4 102.5
surplus before taxation expense 0.7 2.8
the Group’s share of the assets, liabilities, revenue and expenses as reported in the most recent accounts of the individual joint ventures, is as follows:
2011 £m
2010 £m
non-current assets 6.2 5.0
current assets 0.6 0.6
non-current liabilities – –
current liabilities (3.4) (1.7)
3.4 3.9
Revenues 1.2 0.4
expenses (5.9) (4.1)
15 Investment in subsidiary companies
Company£m
At beginning and end of year 200.1
the principal subsidiary companies of the company as at 31 December 2011 are listed below and, except where stated, are incorporated in england and Wales. subsidiary companies are 100% owned unless otherwise stated. Full details of all Group undertakings will be annexed to the company’s next annual return in compliance with the companies Act 2006.
health insurance – general business Care and health provisionBupa insurance limited Bupa care Homes (cFG) plcsanitas, sA de seguros (99% holding) spain Bupa care Homes Group limitedBupa Australia Pty limited Australia Bupa care Homes (BnH) limitedBupa Asia Pacific Pty limited Australia Bupa care services limitedBupa (Asia) limited Hong Kong Bupa care Homes (cFcHomes) limitedBupa insurance company Us Bupa care Homes (cFHcare) limited
Bupa care Homes (Gl) limitedInvestment and financing activities Bupa care Homes (Partnerships) limitedBupa Finance plc* Bupa Home Healthcare limitedBupa investments limited Bupa Occupational Health limitedBupa investments Overseas limited Bupa Aged care Australasia Pty limited AustraliaBupa treasury limited Bupa Healthcare new Zealand limited new ZealandGrupo Bupa sanitas sl spain euroresidencias sotogrande sl spainUK care no 1 limited Guernsey sanitas Residencial sl spain
sanitas, sA de Hospitales spainHealth Dialog services corporation Usmedical services international limited
* Directly owned by the company
Although the Group holds none of the voting power of UK care no 1 limited, it has the right to obtain benefits or is exposed to risks relating to the activities of this company. consequently, the Group has included the results of this entity in its consolidated income statement.

82 Bupa Annual Report 2011
N ot e s to t h e f i N a N c i a l s tat e m e N t s co n t i n u e dfor the year ended 31 December 2011
16 Financial investments
Group
Carrying value 2011 £m
Cost 2011 £m
carrying value 2010
£m
cost 2010
£m
Non-currentDesignated at fair value through profit or loss Debt securities – government gilts 7.1 7.9 39.3 39.1
Debt securities – corporate bonds 56.5 75.0 54.8 69.4
shares and other variable yield securities 139.3 124.2 132.6 124.3
Held to maturity medium-term notes 200.9 200.0 150.8 150.0
loans and receivables Debt securities – corporate bonds 72.2 39.9 69.0 40.2
Deposits with credit institutions 185.5 184.9 585.3 585.3
total non-current financial investments 661.5 631.9 1,031.8 1,008.3
CurrentDesignated at fair value through profit or loss Debt securities – government gilts 8.4 8.3 6.2 6.0
Debt securities – corporate bonds 26.5 26.4 – –
shares and other variable yield securities – – 10.1 19.0
Held to maturity medium-term notes 180.5 179.2 75.5 74.5
Debt securities – government gilts 0.5 0.5 0.3 0.3
loans and receivables Reverse repo securities – – 202.2 202.2
Deposits with credit institutions 1,005.7 979.4 832.7 832.7
total current financial investments 1,221.6 1,193.8 1,127.0 1,134.7
Total financial investments 1,883.1 1,825.7 2,158.8 2,143.0
Financial investments comprise:
Fair value
2011 £m
Cost 2011 £m
Fair value 2010
£m
cost 2010
£m
listed investments 201.5 187.3 110.7 133.8
Unlisted investments 490.4 474.1 630.1 591.2
Deposits with credit institutions 1,191.2 1,164.3 1,418.0 1,418.0
1,883.1 1,825.7 2,158.8 2,143.0
the movement in fair value attributable to credit risk on loans and receivables if designated at fair value is immaterial.

Bupa Annual Report 2011 83
FIN
AN
CIA
L S
TA
TE
ME
NT
SG
OV
ER
NA
NC
EB
US
INE
SS
RE
VIE
W
17 Assets arising from insurance business
Group2011 £m
2010 £m
Non-currentReinsurers’ share of insurance provisions 3.1 1.3
Deferred acquisition costs 1.8 3.1
4.9 4.4
Currentinsurance debtors 656.5 607.1
Reinsurers’ share of insurance provisions 16.3 8.5
Deferred acquisition costs 62.0 60.6
medicare rebate 70.9 80.2
Risk equalisation trust Fund recoveries 23.1 28.6
828.8 785.0
Total assets arising from insurance business 833.7 789.4
Reinsurers’ share of insurance provisions are further analysed in note 24.
impairment losses in respect of insurance debtors amounting to £13.5m (2010: £8.4m) have been charged to other operating expenses in the income statement.
deferred acquisition costsAs part of the Group’s insurance business, direct costs in relation to the acquisition of insurance contract revenues are deferred. the movement in these deferred costs is set out below:
2011 £m
2010 £m
At beginning of year 63.7 139.3
Acquisition costs deferred 273.8 300.7
Acquisition costs released to income statement (271.7) (300.8)
transferred to assets held for sale – (76.4)
Foreign exchange (2.0) 0.9
At end of year 63.8 63.7
18 Trade and other receivables
Group company
2011
£m
2010(restated)
£m
2011
£m
2010
£m
Non-currentinvestment receivables and accrued investment income 2.1 2.1 – –
Amounts owed by subsidiary companies – – – 50.4
Other receivables 4.8 1.8 – –
service concession receivables 33.7 22.0 – –
Fair value of derivative assets 76.7 40.8 – –
Prepayments 12.0 8.1 0.2 0.5
Accrued income 3.1 2.9 – –
total non-current trade and other receivables 132.4 77.7 0.2 50.9
Currenttrade receivables – net of impairment losses 122.8 123.3 – –
investment receivables and accrued investment income 0.7 0.8 – –
Amounts owed by subsidiary companies – – 90.2 415.8
Other receivables 35.6 55.2 2.1 1.2
service concession receivables 103.8 130.2 – –
Fair value of derivative assets 5.0 3.0 – –
Prepayments 36.5 39.5 10.5 16.7
Accrued income 4.4 15.1 – –
total current trade and other receivables 308.8 367.1 102.8 433.7
Total trade and other receivables 441.2 444.8 103.0 484.6
impairment losses on trade receivables amounting to £1.7m (2010: £7.4m) and on investment receivables amounting to £0.1m (2010: £1.6m) have been charged to other operating expenses in the income statement.

84 Bupa Annual Report 2011
N ot e s to t h e f i N a N c i a l s tat e m e N t s co n t i n u e dfor the year ended 31 December 2011
19 Inventories
Group2011
£m
2010(restated)
£m
Drugs, prostheses and consumables 16.5 19.7
inventories are stated at the lower of cost and net realisable value. cost is determined using the first-in-first-out method, or methods that approximate this, and includes costs incurred in acquiring the inventories and in bringing them to their current location and condition.
inventory write downs of £nil (2010: £0.2m) were made during the year.
the Group consumed £176.8m (2010: £201.8m) of inventories, which is recognised within other operating expenses in the income statement. certain inventories are subject to a floating charge in respect of certain interest bearing liabilities (see note 23).
20 Disposals and assets and associated liabilities classified as held for sale
(i) disposals2011 disposalsOn 31 January 2011, the Group sold its 100% shareholding in Bupa Health Assurance limited, which was included in the europe and north America segment, for cash proceeds of £168.2m. this business had been held for sale at 31 December 2010.
2010 disposalsOn 9 June 2010, the Group sold its 100% shareholding in mBF management Pty limited and its subsidiary companies. these subsidiary companies held the trade of the life insurance business (mBF life) and wealth management business (clearView) in Australia, and were included within the international markets segment. the mBF life and clearView businesses were sold for cash proceeds of £121.4m (AU$204.3m).
On 24 september 2010, the Group completed the sale of its 100% shareholding in Guardian Homecare UK limited, the domiciliary care business of Bupa Home Healthcare included within the care services segment, for cash proceeds of £6.9m, of which £0.2m is deferred.
On 21 June 2010, the Group sold its 88% shareholding in Byrne and Hickman limited, which was included in the international markets segment, for cash proceeds of £0.4m (HK$4.8m).
total disposals are analysed below:At 31
december 2011 £m
At 31 December
2010 £m
intangible assets 4.6 41.7
Property, plant and equipment 0.2 0.8
Financial investments 179.1 148.3
Assets backing life investment contract liabilities – 852.4
Assets arising from insurance business 177.0 0.4
trade and other receivables 0.7 9.1
cash and cash equivalents – 5.0
Other interest bearing liabilities (4.5) –
Provisions under insurance contracts issued (157.1) 37.1
Other liabilities under insurance contracts issued (12.1) –
Provisions for liabilities and charges – (0.4)
life investment contract liabilities – (852.8)
Deferred taxation liabilities (18.3) (5.5)
trade and other payables (2.7) (99.2)
net assets divested 166.9 136.9
Foreign exchange – 1.6
cash flow hedge – (0.9)
Directly related costs of disposal
– cash 1.0 2.7
net gain / (loss) on sale of business 0.3 (11.6)
Sale proceeds 168.2 128.7
the net gain on sale of business is included within other charges in the consolidated income statement (see note 6).
the 2011 sale proceeds from the disposal of the subsidiary company was satisfied by cash of £168.2m. the cash proceeds received, net of disposal costs paid to 31 December 2011 and bank overdraft disposed of, resulted in cash inflow of £171.7m.

Bupa Annual Report 2011 85
FIN
AN
CIA
L S
TA
TE
ME
NT
SG
OV
ER
NA
NC
EB
US
INE
SS
RE
VIE
W
20 Disposals and assets and associated liabilities classified as held for sale continued
(ii) Assets and associated liabilities classified as held for salethere were no assets or liabilities classified as held for sale at 31 December 2011.
the assets and liabilities of the Group’s subsidiary Bupa Health Assurance limited, part of the europe and north America segment, were presented as held for sale at 31 December 2010 following the decision to sell the business after a review of strategy for the life market. the completion date of the transaction was 31 January 2011.
Group
2011 £m
2010 £m
Assets held for saleintangible assets – 4.6
Property, plant and equipment – 0.2
Financial investments – 88.2
Assets arising from insurance business – 170.8
trade and other receivables – 2.3
cash and cash equivalents – 85.4
total assets classified as held for sale – 351.5
Liabilities associated with assets held for saleProvisions under insurance contracts issued – (151.9)
Other liabilities under insurance contracts issued – (8.9)
net deferred tax liability – (18.0)
trade and other payables – (2.6)
total liabilities classified as held for sale – (181.4)
Net assets classified as held for sale – 170.1
21 Cash and cash equivalentsGroup company
2011
£m
2010(restated)
£m
2011
£m
2010
£m
cash at bank and in hand 446.0 484.1 1.0 3.2
short-term bank deposits 782.4 208.4 – –
Cash and cash equivalents 1,228.4 692.5 1.0 3.2
Bank overdrafts (0.1) (2.3) – –
Restricted access deposits (45.3) (35.4) – –
cash and cash equivalents in the statement of cash flows 1,183.0 654.8 1.0 3.2
cash and cash equivalents include £45.3m (2010: £35.4m) over which the Group has restricted access. these amounts are held in respect of specific obligations and potential liabilities and may be used only to discharge those obligations and potential liabilities if and when they crystallise. included in short-term deposits is £39.4m (2010: £29.5m) to secure a liability for unapproved pension arrangements.
22 Subordinated liabilities
Group2011 £m
2010 £m
Non-currentcallable subordinated perpetual guaranteed bonds 330.0 330.0
Fair value adjustment in respect of hedged interest rate risk 76.7 40.8
callable subordinated perpetual guaranteed bonds at carrying value 406.7 370.8
Other subordinated debt due 2024 18.3 –
10.5% subordinated guaranteed bonds due 2018 3.9 3.9
428.9 374.7
Currentcallable subordinated perpetual guaranteed bonds 5.9 5.9
Total subordinated liabilities 434.8 380.6

86 Bupa Annual Report 2011
N ot e s to t h e f i N a N c i a l s tat e m e N t s co n t i n u e dfor the year ended 31 December 2011
22 Subordinated liabilities continued
Callable subordinated perpetual guaranteed bondsin December 2004, Bupa Finance plc issued £330.0m of callable subordinated perpetual guaranteed bonds, which are guaranteed by Bupa insurance limited. interest is payable on the bonds at 6.125% per annum. the bonds have no fixed maturity date but a call option is exercisable by Bupa Finance plc to redeem the bonds on 16 september 2020. in the event of the winding up of Bupa Finance plc or Bupa insurance limited, the claims of the bondholders are subordinated to the claims of other creditors of these companies.
the total fair value of the callable subordinated perpetual guaranteed bonds, net of accrued interest, is £412.6m (2010: £376.7m). the valuation adjustment is the change in value arising from interest rate risk, which is matched by the fair value of swap contracts in place to hedge this risk.
Other subordinated debtDebt issued by especializada y Primaria l’Horta-manises sA (a public-private-partnership in spain) matures on 7 may 2024. interest accrues on the debt at eURiBOR +2.5%. in the event of a winding up of especializada y Primaria l’Horta-manises sA, the claims of the holder of the debt are subordinated to the claims of all other creditors of that company. in 2010 this was included in other interest bearing liabilities.
10.5% subordinated guaranteed bondsthe 10.5% subordinated guaranteed bonds, which are repayable on 3 December 2018, were issued by Bupa Finance plc and are guaranteed by the company. A call option is exercisable by Bupa Finance plc to redeem the bonds on 3 December 2013. in the event of the winding up of Bupa Finance plc or the company, the claims of the bondholders are subordinated in right of payment to the claims of other creditors of Bupa Finance plc and the company. interest is payable at 10.5% per annum.
the Group has not had any defaults of principal, interest or other breaches with respect to its subordinated liabilities during 2011 or 2010.
23 Other interest bearing liabilities
Groupthis note provides information about the contractual terms of the Group’s interest bearing liabilities. Further information about the Group’s exposure to interest rate and foreign currency risk is included in note 33.
note
non-current
£mcurrent
£mtotal
£m
2011secured loans (i) 233.9 4.1 238.0Debenture stock (ii) 53.2 1.9 55.1senior unsecured bonds (iii) 348.2 12.3 360.5Bank loans (iv) 31.1 5.5 36.6Bank overdrafts (iv) – 0.1 0.1Finance lease liabilities (v) 3.0 0.4 3.4Total interest bearing liabilities 669.4 24.3 693.7
2010 (restated)secured loans (i) 234.0 4.1 238.1
Debenture stock (ii) 55.1 1.8 56.9
senior unsecured bonds (iii) 347.7 12.3 360.0
Bank loans (iv) 246.5 5.9 252.4
Bank overdrafts (iv) – 2.3 2.3
Finance lease liabilities (v) 3.3 0.8 4.1
Total interest bearing liabilities 886.6 27.2 913.8
(i) Secured loansthe secured loans balance of £238.0m (2010: £238.1m) relates to a loan issue by UK care no 1 limited. On 17 February 2000, UK care no 1 limited issued two classes of secured notes. A £175.0m class A1 note is due to mature in 2029 and a £60.0m class A2 note is due to mature in 2031. the £238.0m balance is shown net of initial issue costs and discount on issue not yet fully amortised of £4.8m. the A1 and A2 loan notes bear a fixed interest rate of 6.3% and 7.5% respectively. the loan notes are secured by fixed and floating charges over the assets and undertakings of UK care no 1 limited. the security includes UK care no 1 limited’s overriding lease interest, and the rental income receivable thereunder, held in a number of the Group’s care homes which eliminates on consolidation. the carrying value of the property, plant and equipment of these homes is £543.8m (2010: £571.2m).
(ii) debenture stockthe 11.8% debenture stock of £55.1m (2010: £56.9m) is repayable at par in 2014. the stock is secured by a fixed charge over certain of the Group’s assets and a first floating charge over the businesses attached thereto and a general floating charge over certain assets. the assets pledged as security include £80.3m (2010: £86.8m) of property, plant and equipment and £0.4m (2010: £0.5m) of inventories.
(iii) Senior unsecured bondsOn 2 July 2009, Bupa Finance plc issued £350.0m of 7.5% senior unsecured bonds. the bonds are repayable in July 2016. they are guaranteed by the company and other Group subsidiary companies. the £360.5m balance (2010: £360.0m) is net of initial issue costs, discount on issue and accrued interest.
(iv) Bank loans and bank overdraftsBank loans of £36.6m (2010: £252.4m) do not include any amounts (2010: £196.9m) that are guaranteed by the company and other Group subsidiary companies. the overdraft facilities are subject to cross guarantees within the Group. the bank loans and overdrafts bear interest at commercial rates linked to liBOR, eURiBOR, or at commercial fixed rates.

Bupa Annual Report 2011 87
FIN
AN
CIA
L S
TA
TE
ME
NT
SG
OV
ER
NA
NC
EB
US
INE
SS
RE
VIE
W
23 Other interest bearing liabilities continued
(v) Obligations under finance leasesFuture minimum payments under finance leases are as follows:
Future minimum
lease payments
2011 £m
present value of
minimum lease
payments 2011 £m
Future minimum
lease payments
2010 £m
Present value of
minimum lease
payments 2010
£m
Payable within one year 0.4 0.3 1.0 0.9
Payable after one year but within five years 1.5 1.1 1.4 1.0
Payable after five years 2.8 2.0 3.1 2.2
total gross payments 4.7 5.5
less: finance charges included above (1.3) (1.4)
total payments net of finance charges 3.4 3.4 4.1 4.1
the balance of £3.4m (2010: £4.1m) due under finance leases relates to leases of equipment.
24 Provisions under insurance contracts issued
Group2011 2010
noteGross
£m
Re- insurance
£mNet £m
Gross £m
Re- insurance
£mnet £m
General insurance businessProvisions for unearned premiums (i) 1,353.7 (7.6) 1,346.1 1,292.1 (4.6) 1,287.5
Provisions for claims (ii) 785.0 (11.0) 774.0 843.2 (3.9) 839.3
Long-term businessProvisions for life insurance benefits (iii) 23.5 (0.8) 22.7 23.3 (1.3) 22.0
Total insurance provisions 2,162.2 (19.4) 2,142.8 2,158.6 (9.8) 2,148.8
non-current 25.7 (3.1) 22.6 24.1 (1.3) 22.8
current 2,136.5 (16.3) 2,120.2 2,134.5 (8.5) 2,126.0
2,162.2 (19.4) 2,142.8 2,158.6 (9.8) 2,148.8
General insurance(i) Analysis of movements in provisions for unearned premiums
At beginning of year 1,292.1 (4.6) 1,287.5 1,202.2 (2.8) 1,199.4
Premiums deferred 6,425.6 (94.1) 6,331.5 5,881.8 (20.9) 5,860.9
Deferred premiums released to income (6,361.6) 91.3 (6,270.3) (5,839.3) 20.3 (5,819.0)
Foreign exchange (2.4) (0.2) (2.6) 47.4 (1.2) 46.2
At end of year 1,353.7 (7.6) 1,346.1 1,292.1 (4.6) 1,287.5
(ii) Analysis of movements in provisions for claims
At beginning of year 843.2 (3.9) 839.3 755.4 (0.5) 754.9
cash paid to settle claims (4,994.9) 18.8 (4,976.1) (4,518.0) 18.7 (4,499.3)
Decrease for prior years’ claims (62.9) 2.0 (60.9) (86.9) – (86.9)
increase for current year claims 5,114.2 (27.6) 5,086.6 4,725.1 (22.2) 4,702.9
increase in Risk equalisation trust Fund levy (110.9) – (110.9) (79.4) – (79.4)
Disposal of subsidiary companies – – – (5.7) – (5.7)
Foreign exchange (3.7) (0.3) (4.0) 52.7 0.1 52.8
At end of year 785.0 (11.0) 774.0 843.2 (3.9) 839.3
Long-term business(iii) Analysis of movements in provisions for life insurance benefits
At beginning of year 23.3 (1.3) 22.0 132.5 (78.4) 54.1
movement in opening value of in force business 0.2 0.5 0.7 (29.7) 12.9 (16.8)
new business written – – – 30.1 (14.9) 15.2
Assumption changes – – – 3.5 (1.9) 1.6
net movement in deferred acquisition costs in Bupa Australia – – – (2.2) – (2.2)
transfer to assets held for sale – – – (151.9) 81.3 (70.6)
Disposal of subsidiary companies – – – 42.8 – 42.8
Foreign exchange – – – (1.8) (0.3) (2.1)
At end of year 23.5 (0.8) 22.7 23.3 (1.3) 22.0

88 Bupa Annual Report 2011
N ot e s to t h e f i N a N c i a l s tat e m e N t s co n t i n u e dfor the year ended 31 December 2011
24 Provisions under insurance contracts issued continued
in compliance with iFRs 4, local GAAP applies for insurance accounting. Under Australian iFRs, acquisition costs incurred in Australia in relation to life insurance contracts are capitalised within the valuation of the policy liabilities. the Group’s Australian life business was disposed of in 2010. the Group’s other deferred acquisition costs are included within assets arising from insurance business (see note 17).
the movement in the long-term business provision includes £0.8m (2010: £2.2m) in respect of the movements in policyholder deposits relating to certain policies that include savings features. the receipts associated with these deposits are accounted for directly in provisions under insurance contracts.
At 31 December 2011, there was no change in the long-term business provision in respect of net assumption changes (2010: increase of £1.6m) relating to model changes, demographic and economic changes.
Assumptions for general insurance businessthe process of recognising liabilities arising from general insurance contracts requires the exercise of judgement in relation to estimating future claims payments, claims handling expenses and unexpired risk provisions. the principal assumption affecting the measurement of liabilities is that the nature of recent claims development profile of the Group’s insurance entities and that current claims experience will be consistent with recent trends. Other assumptions are also applied in measuring the Group’s insurance liabilities but have a less material effect. the aim of these assumptions is to arrive at the best estimate of future obligations and cash outflows of the Group. A margin for adverse deviation is reflected within the estimates.
claims development patterns are analysed in each of the Group’s general insurance entities and, in some cases, are further sub-analysed where an entity has distinct portfolios of general insurance with distinct characteristics. the characteristics may differ by product line, risk profile, geographic sector or market sector. the analysis is used to determine a claims settlement pattern using recent experience, adjusted where appropriate by observed trends over time. claims are assessed on a case by case basis. extrapolation methods based on the claims settlement pattern are used: these are recognised methods described in the institute and Faculty of Actuaries claims Reserving manual (1997). large homogeneous sections of insurance business (eg corporate business in a specific region) are often analysed by more than one method, such as the chain ladder, Bornheutter-Ferguson and paid claim loss ratio methods.
While there is some diversity in the claims development profile across the Group, the Group’s general insurance contracts principally relate to healthcare benefits that occur with stable frequencies and exhibit very short development patterns that can be characterised in months rather than years. less automated medical insurance portfolios may have development patterns extending out to 12 to 18 months, whereas pre-authorisation electronic claims settlement and network provider arrangements may produce development patterns of four to six months.
insurance provisions are estimates. Actual experience may vary, primarily as a result of claims or administrative expenses being greater than expected. the following table shows the sensitivities to such variation from expectations.
2011 2010
Change in variable
%
Reduction in surplus net of reinsurance
before taxation £m
change in variable
%
Reduction in surplus net of reinsurance
before taxation £m
Base runincrease in claims 5.0 52.2 5.0 50.2
increase in expenses 10.0 18.0 10.0 19.8
these variances would lower the amount of surplus that would otherwise be expected to emerge in subsequent periods. since premium provisions include profit margins and claim provisions include margins of prudence, variance from expectations by the amounts shown will be absorbed by these margins for the current book of business.
Assumptions for long-term insurance businessthe Group owns a small life insurance company domiciled in Bermuda that was acquired in 2005, but which is now in run-off and hence does not assume insurance risk. this portfolio is largely reinsured. the long-term insurance liabilities of £23.5m (2010: £23.3m) as shown on the Group’s balance sheet relates entirely to this subsidiary.
25 Other liabilities under insurance contracts issued
Group2011 £m
2010 £m
CurrentReinsurers’ deposits 4.3 1.8
Reinsurance payables 0.3 –
commission payable 6.0 10.5
Other insurance payables 3.1 6.6
Total other liabilities under insurance contracts issued 13.7 18.9

Bupa Annual Report 2011 89
FIN
AN
CIA
L S
TA
TE
ME
NT
SG
OV
ER
NA
NC
EB
US
INE
SS
RE
VIE
W
26 Post employment benefits
the assets and liabilities in respect of defined benefit funded pension schemes, unfunded pension and post retirement medical benefit schemes are as follows:
Group
Pension schemesPost retirement medical
benefit schemes total
note2011 £m
2010 £m
2011 £m
2010 £m
2011 £m
2010 £m
Present value of funded obligations (ii) (1,091.9) (921.9) – – (1,091.9) (921.9)
Fair value of scheme assets (iii) 1,149.0 1,039.3 – – 1,149.0 1,039.3
net assets of funded schemes 57.1 117.4 – – 57.1 117.4
Present value of unfunded obligations (ii) (36.1) (32.0) (18.0) (20.8) (54.1) (52.8)
Net recognised assets / (liabilities) 21.0 85.4 (18.0) (20.8) 3.0 64.6
individual pension schemes showing a net deficit are classified on the balance sheet within post employment benefit liabilities and those schemes showing a net surplus are classified within post employment benefit assets as follows:
net assets 68.1 121.3
net liabilities (65.1) (56.7)
Net recognised assets 3.0 64.6
Company
Pension schemesPost retirement medical
benefit schemes total
note2011 £m
2010 £m
2011 £m
2010 £m
2011 £m
2010 £m
Present value of funded obligations (ii) (1,009.0) (847.3) – – (1,009.0) (847.3)
Fair value of scheme assets (iii) 1,076.8 967.9 – – 1,076.8 967.9
net assets of funded schemes 67.8 120.6 – – 67.8 120.6
Present value of unfunded obligations (ii) (36.1) (32.0) (18.0) (20.8) (54.1) (52.8)
Net recognised assets / (liabilities) 31.7 88.6 (18.0) (20.8) 13.7 67.8
Represented on the balance sheet as:net assets 67.8 120.6
net liabilities (54.1) (52.8)
Net recognised assets 13.7 67.8
pensions – funded schemesthe Group operates several funded defined benefit and defined contribution pension schemes for the benefit of employees and Directors. the defined benefit schemes provide benefits based on final pensionable salary. contributions by Group companies to such schemes are made in accordance with the recommendations of independent scheme actuaries of the individual schemes. complete disclosure of each separate pension scheme’s details is not practicable within this report. the key factors relating to the Group’s funded pension arrangements are discussed below.
the principal defined benefit scheme in the UK is the Bupa Pension scheme. contributions by employees and by Bupa Group companies are administered by the trustees in funds independent of the Group. the scheme was closed to new entrants from 1 October 2002, but its existing members continue to accrue entitlements in respect of current service.
An independent actuary performs detailed triennial valuations together with periodic interim reviews. Both triennial and interim valuations use the attained age method, recognising the closure of the scheme to new entrants. the trustees and the Group are currently in discussions regarding the results of the 1 July 2011 actuarial valuation. Under legislation, the valuation must be finalised by 30 september 2012.
As recommended by the scheme’s independent actuary, employer contributions were paid at the rate of 24.9% of pensionable salaries. included in the employer contributions is 7.0% which represents the employer pension contributions paid as part of the Group’s salary sacrifice arrangement, Peoplechoice Pensions. there is a corresponding reduction in wages and salaries as a result. the expected contributions payable in 2012, with regards to the accumulation of future benefits, are £9.7m in respect of the Bupa Pension scheme and £2.6m in respect of Peoplechoice Pensions.
Following the disposal of the Group’s UK hospitals business in 2007, Bupa agreed to pay, or procure the payment of, a number of further contributions to the trustees of the scheme. During 2011 the total of the additional payments made was £24.5m (2010: £24.5m). A further payment is payable on or before 31 December 2012. this payment is intended to equate to the investment return that the scheme would have achieved had £98.0m been paid into the scheme at the time of the sale of the UK hospitals business, assuming that the scheme would have achieved investment returns of 7.0% per annum compound during that period. the payments may be reduced if, in the view of the scheme’s independent actuary, the liability to take the entire scheme to a closed scheme funding level is secured by a lesser payment.
in addition, Bupa Finance plc (which is not an employer in respect of the scheme) entered into a legally binding and irrevocable guarantee for the benefit of the trustees in respect of the payments due from Bupa as set out above.
the principal defined contribution pension plan in the UK is the Bupa Retirement savings Plan, which is a discrete tier of the Bupa Pension scheme. it provides benefits based on the accumulated contributions made by employee and employer. this scheme was opened with effect from 1 October 2002. the charge to the consolidated income statement in respect of this plan, and all other defined contribution schemes, is the amount of employer contributions payable to the scheme in respect of the accounting period.

90 Bupa Annual Report 2011
N ot e s to t h e f i N a N c i a l s tat e m e N t s co n t i n u e dfor the year ended 31 December 2011
26 Post employment benefits continued
there are several other minor schemes operated by UK and overseas subsidiaries. Of these, the defined benefit schemes are assessed by independent actuaries in accordance with UK or local practice and under iAs 19 as at 31 December 2011 for the purposes of inclusion in the Group’s consolidated financial statements.
pensions – unfunded schemesUnfunded defined benefit pension arrangements exist for certain employees and former employees in excess of the funded pension arrangements provided by the Group. there are no separate funds or assets in the balance sheet to support the unfunded schemes; however, provisions are included in the balance sheet in respect of these liabilities. the latest valuation of these arrangements was performed as at 31 December 2011 under iAs 19 by the Group’s independent actuary. the charge to the consolidated income statement in respect of these arrangements and the assessment of the related pension liability as at 31 December 2011 have been made in accordance with this latest valuation, which used the same principal assumptions as adopted at 31 December 2011 under iAs 19 for the Bupa Pension scheme.
post retirement medical benefit schemesthe Group also provides unfunded post retirement medical benefits for certain former employees. these benefits were granted under an agreement which closed to new entrants in 1992. the latest valuation of this scheme was carried out as at 31 December 2011 by an actuary employed by the Group using the same key assumptions as adopted at 31 December 2011 under iAs 19 for the Bupa Pension scheme.
Companythe company is the sponsoring employer for the Bupa Pension scheme, the unfunded pension scheme and post retirement medical benefit scheme described above.
(i) Actuarial assumptionsthe responsibility for setting the assumptions underlying the iAs 19 valuations rests with the Directors, having first taken advice from the Group’s independent actuary. the key weighted average financial assumptions used when valuing the obligations of the post employment benefit schemes under iAs 19 are as follows:
Group company
Funded schemes Unfunded schemes Funded schemes Unfunded schemes
2011 %
2010 %
2011 %
2010 %
2011 %
2010 %
2011 %
2010 %
inflation rate 3.1 3.5 3.1 3.5 3.1 3.5 3.1 3.5
Rate of increase in salaries 4.6 5.4 4.6 5.5 4.6 5.5 4.6 5.5
Rate of increase to pensions in payment 3.0 3.4 3.1 3.5 3.1 3.5 3.1 3.5
Rate of increase to pensions in deferment 2.4 2.9 2.4 3.0 2.4 3.0 2.4 3.0
Discount rate for scheme obligations 4.7 5.4 4.6 5.4 4.7 5.4 4.6 5.4
Overall expected return on scheme assets 4.6 5.9 – – 4.6 5.8 – –
medical cost trend rate – – 3.9 4.4 – – 3.9 4.4
Asset performance for the disclosures for the year ended 31 December 2011 has been measured against the expected return on assets disclosed as at 31 December 2010.
Actuarial assumptions underlying the valuation of obligationsthe inflation assumption is set by reference to the difference between the yield on long-term fixed interest gilts and the real yield on index-linked gilts, with a deduction of 0.2% to reflect an inflation risk premium. the rate of increase of pensions in payment is the same as the inflation rate, with the exception of benefits which receive fixed increases in payment as defined under the respective scheme rules.
the rate of increase in salaries is equal to the long-term expected annual average salary pay increase for the employees who are members of the scheme. this assumption is set relative to the inflation rate assumption.
the discount rate used to value scheme liabilities is the yield at the balance sheet date on high quality corporate bonds of appropriate term.
Expected rate of return on assetsthe overall expected return on scheme assets has been derived by calculating the weighted average expected return applied to each of the major asset classes, equities, bonds and ‘other’.
the expected return on equities and other return seeking assets has been taken as the yield on fixed interest gilts at the balance sheet date plus a margin of 3.5%, representing the additional return on top of the risk free return available on the asset class. the expected return on bonds has been taken as an average of the yield available on fixed interest gilts and high quality corporate bonds at the balance sheet date. the expected return on ‘other’ has been taken as 3.0% pa, representing the long-term expected return on cash and short dated securities.
Medical cost trend ratethe medical cost trend rate is the assumed additional escalation of medical costs over and above the assumed inflation rate. it is assumed that such an effect will continue during the remaining run-off of the liability. Assumed medical cost trend rates have a significant effect on the amounts recognised in the consolidated income statement. A one percentage point change in assumed medical cost trend rates would result in the following increase and decrease in the post retirement medical benefit obligation:
Group and CompanyOne %point
increase2011£m
One %point
decrease2011£m
One %point
increase2010
£m
One %point
decrease2010
£m
effect on post retirement medical benefit obligation 2.5 (2.1) 3.1 (2.5)
effect on the aggregate of current service cost and interest cost 0.1 (0.1) 0.2 (0.1)

Bupa Annual Report 2011 91
FIN
AN
CIA
L S
TA
TE
ME
NT
SG
OV
ER
NA
NC
EB
US
INE
SS
RE
VIE
W
26 Post employment benefits continued
Mortality assumptionsthe trustees of the Bupa Pension scheme have undertaken a scheme specific mortality investigation as part of the 1 July 2011 triennial valuation. the trustees shared the conclusion drawn from this analysis with the Directors, who have adopted assumptions in line with this analysis for the purposes of the iAs 19 valuation as at 31 December 2011. the mortality tables adopted at 31 December 2011 are the s1 sAPs year of birth mortality tables using the cmi projection model, with a long-term rate of improvement of 1.25% pa and an age rating of minus one year. the life expectancies at age 60 based on these tables for a male currently aged 60 (45) is 27.7 years (29.2 years) and for a female currently aged 60 (45) is 30.2 years (31.8 years).
(ii) present value of the scheme obligationsthe movement in the present value of the schemes’ obligations is:
Group
Pension schemesPost retirement medical
benefit schemes Total
2011 £m
2010 £m
2011 £m
2010 £m
2011 £m
2010 £m
At beginning of year 953.9 930.3 20.8 21.7 974.7 952.0
current service cost 20.0 22.1 – – 20.0 22.1
interest on obligations 50.3 52.0 1.1 1.2 51.4 53.2
contributions by employees 0.9 0.8 – – 0.9 0.8
Actuarial losses / (gains) 131.3 (21.7) (3.3) (1.4) 128.0 (23.1)
Benefits paid (25.8) (25.6) (0.6) (0.7) (26.4) (26.3)
Gains on curtailment (2.8) (5.2) – – (2.8) (5.2)
Past service cost – (2.2) – – – (2.2)
Foreign exchange 0.2 3.4 – – 0.2 3.4
At end of year 1,128.0 953.9 18.0 20.8 1,146.0 974.7
Company
At beginning of year 879.3 859.0 20.8 21.7 900.1 880.7
current service cost 17.6 19.3 – – 17.6 19.3
interest on obligations 46.9 48.4 1.1 1.2 48.0 49.6
contributions by employees 0.1 0.1 – – 0.1 0.1
Actuarial losses / (gains) 125.2 (20.1) (3.3) (1.4) 121.9 (21.5)
Benefits paid (21.2) (22.2) (0.6) (0.7) (21.8) (22.9)
Gains on curtailment (2.8) (5.2) – – (2.8) (5.2)
At end of year 1,045.1 879.3 18.0 20.8 1,063.1 900.1
(iii) Fair value of funded schemes’ assetsthe movement in the fair value of the funded schemes’ assets is:
Group company
2011 £m
2010 £m
2011 £m
2010 £m
At beginning of year 1,039.3 916.2 967.9 855.7
expected return on scheme assets 60.7 58.7 55.9 54.5
Actuarial gains 31.3 41.2 36.6 40.1
contributions by employer 41.3 43.7 36.6 38.9
contributions by employees 0.9 0.8 0.1 0.1
Benefits paid (24.6) (24.6) (20.3) (21.4)
Foreign exchange 0.1 3.3 – –
At end of year 1,149.0 1,039.3 1,076.8 967.9
the market value of the assets of the funded schemes is as follows:
equities 405.2 450.1 363.9 404.1
Bonds 703.8 523.4 686.0 506.2
Other assets 40.0 65.8 26.9 57.6
1,149.0 1,039.3 1,076.8 967.9
the funded schemes’ assets does not include any of the Group’s own financial instruments, or any property occupied by the Group.

92 Bupa Annual Report 2011
N ot e s to t h e f i N a N c i a l s tat e m e N t s co n t i n u e dfor the year ended 31 December 2011
26 Post employment benefits continued
(iv) Amounts recognised in the consolidated income statementthe amounts charged / (credited) to other operating expenses for the year are:
Group company
2011 £m
2010 £m
2011 £m
2010 £m
current service cost 20.0 22.1 17.6 19.3
interest on obligations 51.4 53.2 48.0 49.6
expected return on scheme assets (60.7) (58.7) (55.9) (54.5)
Gains on curtailments (2.8) (5.2) (2.8) (5.2)
Past service cost – (2.2) – –
Total amount charged to income statement 7.9 9.2 6.9 9.2
Actual return on scheme assets (92.0) (99.9) (92.5) (94.6)
the charge to other operating expenses in respect of cash contributions to defined contribution schemes is £23.8m (2010: £22.3m).
(v) Amounts recognised directly in other comprehensive incomethe amounts charged / (credited) directly to other comprehensive income are:
Group company
2011 £m
2010 £m
2011 £m
2010 £m
Actual return less expected return on assets (31.3) (41.2) (36.6) (40.1)
experience losses / (gains) arising on obligations 58.7 (36.7) 58.9 (33.2)
changes in assumptions 65.6 10.4 61.6 10.6
Total actuarial losses / (gains) charged / (credited) directly to other comprehensive income 93.0 (67.5) 83.9 (62.7)
Groupthe cumulative amount of actuarial losses recognised directly in other comprehensive income is £205.4m (2010: £112.4m).
Companythe cumulative amount of actuarial losses recognised directly in other comprehensive income is £188.3m (2010: £104.4m).
(vi) history of experience gains and lossesGroup
2011 £m
2010 £m
2009 £m
2008 £m
2007 £m
pension schemesPresent value of scheme obligations (1,128.0) (953.9) (930.3) (718.6) (772.6)
Fair value of scheme assets 1,149.0 1,039.3 916.2 799.7 813.4
Net surplus / (deficit) 21.0 85.4 (14.1) 81.1 40.8
experience charge / (credit) arising on:scheme obligations 62.7 (33.2) (9.6) (25.7) (3.3)
scheme assets (31.3) (41.2) (45.1) 115.5 6.7
post retirement medical benefit schemesPresent value of scheme obligations (18.0) (20.8) (21.7) (17.0) (16.8)
experience credit arising on:scheme obligations (0.3) (0.3) (0.2) – (0.2)
Company
pension schemesPresent value of scheme obligations (1,045.1) (879.3) (859.0) (663.0) (740.0)
Fair value of scheme assets 1,076.8 967.9 855.7 753.2 778.3
Net surplus / (deficit) 31.7 88.6 (3.3) 90.2 38.3
experience charge / (credit) arising on:scheme obligations 60.6 (31.8) (9.8) (27.3) 1.8
scheme assets (36.5) (40.1) (39.6) 102.9 3.9
post retirement medical benefit schemesPresent value of defined benefit obligations (18.0) (20.8) (21.7) (17.0) (16.8)experience credit arising on:scheme obligations (0.3) (0.3) (0.2) – (0.2)

Bupa Annual Report 2011 93
FIN
AN
CIA
L S
TA
TE
ME
NT
SG
OV
ER
NA
NC
EB
US
INE
SS
RE
VIE
W
27 Provisions for liabilities and charges
Group
insurance £m
long service
and annual leave
£m
Regulatory provisions
£m
Unoccupied property
£mOther
£mtotal
£m
At beginning of year (restated) 17.8 35.8 5.4 9.2 30.1 98.3
charge for year 7.2 26.1 3.8 2.2 7.1 46.4
Released in year – (1.1) (3.2) (0.7) (13.6) (18.6)
Utilised in year – cash (5.3) (22.0) (2.2) (2.3) (6.5) (38.3)
Utilised in year – non cash (4.2) – – – (1.1) (5.3)
Foreign exchange – 0.3 – – (0.3) –
At end of year 15.5 39.1 3.8 8.4 15.7 82.5
non-current 11.5 8.2 – 6.2 0.7 26.6
current 4.0 30.9 3.8 2.2 15.0 55.9
total provisions for liabilities and charges 15.5 39.1 3.8 8.4 15.7 82.5
Insurancethe insurance provision is in respect of the Group’s self insurance and covers the excess that arises on claims made in relation to losses arising from damage to property, business interruption and medical, employee or public liability. Any outflows relating to this provision are dependent on the frequency and value of claims submitted as well as the excess amount specified within individual policies with insurers. the fund is actuarially assessed twice a year to ensure that the provision is adequate.
Long service and annual leavethe long service leave provision relates to territories where employees are legally entitled to substantial paid leave after completing a certain length of qualifying service. Uncertainty around both the amount and timing of future outflows arises as a result of variations in employee retention rates, which may vary based on historical experience. the annual leave provision relates to territories where the annual entitlement of leave is not required to be taken within a pre-determined time nor does it expire. therefore uncertainty exists around the timing of future outflows as well as around the amount of future outflows due to wage inflation.
Regulatory provisionsRegulatory provisions relate to levies payable to customer protection bodies by the Group’s various regulated entities. such levies are generally determined on a capped percentage of revenues basis. Payments are normally made annually, although the frequency may be increased or decreased at the discretion of the customer protection bodies.
Unoccupied propertyin prior years, the Group entered into non-cancellable leases for property which it no longer fully occupies. the Group has provided for lease obligations, net of sub-lease receivables. the lease obligations are payable monthly, quarterly or annually, within a range of one to 13 years, the average being five years. the future net outflows are uncertain and are affected by the Group’s ability to sub-let unoccupied property.
OtherOther provisions include amounts relating to restructuring provisions, legal claims, payments under legislation and deferred consideration.
Company
insurance £m
Unoccupied property
£mOther
£mtotal
£m
At beginning of year 17.8 1.4 0.7 19.9
charge for year 7.2 0.1 – 7.3
Released in year – – (0.2) (0.2)
Utilised in year – cash (5.3) – – (5.3)
Utilised in year – non cash (4.2) – – (4.2)
At end of year 15.5 1.5 0.5 17.5
non–current 11.5 1.4 0.4 13.3
current 4.0 0.1 0.1 4.2
total provisions for liabilities and charges 15.5 1.5 0.5 17.5

94 Bupa Annual Report 2011
N ot e s to t h e f i N a N c i a l s tat e m e N t s co n t i n u e dfor the year ended 31 December 2011
28 Deferred taxation assets and liabilities
Group
Recognised deferred taxation assets and liabilitiesDeferred taxation assets and liabilities are attributable to the following:
Assets liabilities net
2011
£m
2010(restated)
£m
2011
£m
2010 (restated)
£m
2011
£m
2010(restated)
£m
Accelerated capital allowances – – (36.5) (38.4) (36.5) (38.4)
Post employment benefit asset / liability – – (4.5) (17.4) (4.5) (17.4)
Revaluation of properties to fair value – – (117.5) (133.2) (117.5) (133.2)
employee benefits (other than post employment) 24.6 6.2 – – 24.6 6.2
Provisions 3.8 9.1 – – 3.8 9.1
taxation value of losses carried forward 13.3 14.0 – – 13.3 14.0
Goodwill and intangible assets – – (77.3) (98.3) (77.3) (98.3)
Other 23.7 71.4 (4.3) (33.2) 19.4 38.2
Deferred taxation assets / (liabilities) 65.4 100.7 (240.1) (320.5) (174.7) (219.8)
Allowable netting of deferred taxation assets and liabilities (65.4) (100.7) 65.4 100.7 – –
Net deferred taxation asset / (liability) – – (174.7) (219.8) (174.7) (219.8)
Deferred taxation assets relating to the carry forward of employee benefits, other provisions, unused taxation losses and other deferred taxation assets are recognised to the extent that it is probable that future taxable profits will be available against which the deferred taxation assets can be utilised.
Unrecognised deferred taxation assetsAs at 31 December 2011, the Group had deductible temporary differences relating to intangible assets of £8.4m (2010: £19.8m), trading losses of £8.5m (2010: £nil) and capital losses of £31.7m (2010: £23.2m) for which no deferred taxation asset was recognised due to uncertainty of utilisation of those temporary differences.
Movement in net deferred taxation (liabilities) / asset
At beginning of year
£m
Recognised in income statement
£m
Recognised in other
compre- hensive income
£m
Acquisitions through
business combinations
£m
Disposal of subsidiary
companies £m
transferred to assets held
for sale £m
Foreign exchange
£m
At end of year
£m
2011Accelerated capital allowances (38.4) 3.2 – – – – (1.3) (36.5)
Post employment benefit asset / liability (17.4) 0.7 12.2 – – – – (4.5)
Revaluation of properties to fair value (133.2) 1.7 13.7 – – – 0.3 (117.5)
employee benefits (other than post employment) 6.2 18.0 – – – – 0.4 24.6
Provisions 9.1 (5.2) – – – – (0.1) 3.8
taxation value of losses carried forward 14.0 (7.7) 0.2 6.7 – – 0.1 13.3
Goodwill and intangible assets (98.3) 19.5 – – – – 1.5 (77.3)
Other 38.2 (19.4) – – 0.3 – 0.3 19.4
(219.8) 10.8 26.1 6.7 0.3 – 1.2 (174.7)
2010 (restated)Accelerated capital allowances (14.8) (19.1) – – – – (4.5) (38.4)
Post employment benefit asset / liability 8.7 (8.2) (18.3) – – – 0.4 (17.4)
Revaluation of properties to fair value (109.2) (7.5) (17.3) – – – 0.8 (133.2)
employee benefits (other than post employment) 5.0 1.1 – – – – 0.1 6.2
Provisions 5.8 3.1 – – – (0.1) 0.3 9.1
taxation value of losses carried forward 21.1 (7.1) – – – – – 14.0
Goodwill and intangible assets (108.0) 8.7 – – 5.9 – (4.9) (98.3)
Other 17.4 3.3 0.1 0.2 (0.4) 18.1 (0.5) 38.2
(174.0) (25.7) (35.5) 0.2 5.5 18.0 (8.3) (219.8)

Bupa Annual Report 2011 95
FIN
AN
CIA
L S
TA
TE
ME
NT
SG
OV
ER
NA
NC
EB
US
INE
SS
RE
VIE
W
28 Deferred taxation assets and liabilities continued
Company
Recognised deferred taxation assets and liabilitiesDeferred taxation assets and liabilities are attributable to the following:
Assets liabilities net
2011 £m
2010 £m
2011 £m
2010 £m
2011 £m
2010 £m
Accelerated capital allowances 0.8 1.2 – – 0.8 1.2
Post employment benefit asset / liability – – (7.9) (18.4) (7.9) (18.4)
employee benefits (other than post employment) 3.7 3.1 – – 3.7 3.1
Provisions 4.8 5.9 – – 4.8 5.9
Other 0.4 0.2 – – 0.4 0.2
Net deferred taxation asset / (liability) 9.7 10.4 (7.9) (18.4) 1.8 (8.0)
Deferred taxation assets relating to the carry forward of post employment assets, employee benefits, other provisions and other deferred taxation assets are recognised to the extent that it is probable that future taxable profits will be available against which the deferred taxation assets can be utilised.
Movement in net deferred taxation assets / (liabilities)
At beginning
of year £m
Recognised in income statement
£m
Recognised in other
compre- hensive income
£m
At end of year
£m
2011Accelerated capital allowances 1.2 (0.4) – 0.8
Post employment benefit asset / liability (18.4) (6.0) 16.5 (7.9)
employee benefits (other than post employment) 3.1 0.6 – 3.7
Provisions 5.9 (1.1) – 4.8
Other 0.2 0.2 – 0.4
(8.0) (6.7) 16.5 1.8
2010Accelerated capital allowances 1.4 (0.2) – 1.2
Post employment benefit asset / liability 6.7 (8.1) (17.0) (18.4)
employee benefits (other than post employment) 4.4 (1.3) – 3.1
Provisions 5.2 0.7 – 5.9
Other 1.0 (0.8) – 0.2
18.7 (9.7) (17.0) (8.0)
29 Trade and other payablesGroup company
2011
£m
2010(restated)
£m
2011
£m
2010
£m
Non-currentAmounts owed to subsidiary companies – – 210.6 232.6
Deferred income 1.5 1.6 – –
Other payables 1.7 0.5 – –
Accruals 9.1 8.5 9.0 8.1
Fair value of derivative liabilities 5.0 3.1 – –
total non-current trade and other payables 17.3 13.7 219.6 240.7
Currenttrade payables 114.2 123.5 – –
Amounts owed to subsidiary companies – – 49.5 520.7
social security and other taxes 27.8 26.7 – –
Deferred income 71.5 65.4 – –
Other payables 384.4 392.3 6.9 8.5
Accruals 302.7 334.7 59.3 53.5
Fair value of derivative liabilities 3.8 13.7 – –
total current trade and other payables 904.4 956.3 115.7 582.7
Total trade and other payables 921.7 970.0 335.3 823.4
current other payables of £384.4m (2010: £392.3m) includes £230.1m (2010: £219.5m) relating to accommodation bonds in Bupa care services Australia.

96 Bupa Annual Report 2011
N ot e s to t h e f i N a N c i a l s tat e m e N t s co n t i n u e dfor the year ended 31 December 2011
30 Equity
Capital management the Group manages as capital the cumulative individual amount of the equity of all Group subsidiaries, exclusive of any non-controlling interests, and other inadmissible assets as discussed below. the Group has a £330.0m perpetual bond accounted for as debt in these financial statements. However, this is managed as though it were capital for regulatory purposes, as discussed below.
As a company limited by guarantee, Bupa has no shareholders or owners. All profits are therefore used to develop the Group’s businesses for the benefit of customers. except for equity attributable to non-controlling interests, any equity in the Group is considered ‘equity attributable to Bupa’.
the Group’s capital management objective is to maintain sufficient capital to protect the interests of all of its customers, investors, regulators and trading partners while also efficiently deploying capital and managing risk to sustain ongoing business development.
the Group aims to operate within a targeted range for solvency, leverage and interest cover ratios designed to support an investment grade rating. the Bupa Group as a whole is not rated by any rating agency, although individual debt issues and various subsidiaries within the Group do have public ratings.
the UK’s Financial services Authority (FsA) classifies the whole of the Group as an insurance group. As such, the Group must maintain regulatory capital resources in excess of a collective capital requirement, imposed by the FsA through its Prudential sourcebook (PsB), for Bupa to comply with the eU insurance Groups Directive (iGD). When assessing the Group’s compliance with its capital requirement, the PsB requires that the Group values and credits towards its net asset position only those assets that meet certain criteria on admissibility, concentration limits and counterparty exposure limits. Group companies that are regulated are subject to similar regulatory restrictions within the jurisdictions in which they operate. the Group and its regulated subsidiaries complied with all externally imposed capital requirements during the current and prior year. Although they are not insurance businesses, the Group can and does recognise the book value of its care provision businesses as capital resources.
it is the Board’s policy that the Group maintains capital resources significantly in excess of its capital requirements and furthermore, that all regulated entities within the Group’s corporate structure meet any local minimum capital requirement imposed by local regulators at all times.
the Group has a number of internal processes to ensure compliance with the Group’s capital requirements. these include requiring that significant future capital expenditure and growth initiatives be approved by the Board, either as stand alone projects or as part of the budgeting and forecasting exercises. the Group’s treasury and investment committee must approve any change to financial investment strategy. strategic developments and acquisitions affecting the Group’s capital require Board authorisation.
the Group Finance Department routinely reports to the Board the Group’s capital position, leverage and interest cover ratios as well as any constraints, risks or uncertainties about this position. the Group reports on any regulatory capital resources to local regulators and the FsA each year end.
in addition, the Group’s management reporting process to the Board includes the regular calculation of the return on capital employed.
the Group has in place internal debt and investment management arrangements that allow the assets supporting technical liabilities or any solvency capital to be efficiently managed in a centralised manner. the Group’s treasury Department also maintains large external credit lines with several leading banks to ensure the liquidity of the Group as needed.
there have been no changes to the Group’s capital management objectives, policies or procedures during the year.

Bupa Annual Report 2011 97
FIN
AN
CIA
L S
TA
TE
ME
NT
SG
OV
ER
NA
NC
EB
US
INE
SS
RE
VIE
W
31 Movement in net funds
the movement in the Group’s net funds during the year is explained as follows:At 1
January 2011
(restated) £m
cash flow £m
Acquisitions (excluding cash and overdrafts)
£m
changes to market
value and currencies
£m
Other non-cash changes
£m
At 31 December
2011 £m
Cash and cash equivalentscash at bank and in hand 484.1 (37.4) – (0.7) – 446.0
Overdrafts (2.3) 2.2 – – – (0.1)
short-term bank deposits 173.0 563.5 – 0.6 – 737.1528.3
Financial investments – non-currentDebt securities – government gilts 39.3 8.0 – (2.1) (38.1) 7.1
Debt securities – corporate bonds 123.8 (3.8) – (0.1) 8.8 128.7
shares and other variable yield securities 132.6 (0.2) – 6.8 0.1 139.3
medium-term notes 150.8 100.0 – – (49.9) 200.9
Deposits with credit institutions 585.3 (195.7) – (3.5) (200.6) 185.5(91.7)
Financial investments – currentDebt securities – government gilts 6.5 (2.7) – 0.1 5.0 8.9
Debt securities – corporate bonds – 1.4 – 0.8 24.3 26.5
shares and other variable yield securities 10.1 (11.2) – 1.1 – –
medium-term notes 75.5 50.1 – 2.0 52.9 180.5
Reverse repo securities 202.2 (204.4) – 2.2 – –
Deposits with credit institutions 832.7 (29.0) – 1.4 200.6 1,005.7(195.8)
Investment properties 120.3 7.4 – 4.8 – 132.57.4
Other interest bearing liabilities – non-currentsecured loans (234.0) – – – 0.1 (233.9)
Debenture stock (55.1) – – – 1.9 (53.2)
senior unsecured bonds (347.7) – – – (0.5) (348.2)
Bank loans (246.5) 202.1 (5.2) 1.6 16.9 (31.1)
Finance lease liabilities (3.3) – (0.1) 0.1 0.3 (3.0)202.1
Other interest bearing liabilities – currentsecured loans (4.1) – – – – (4.1)
Debenture stock (1.8) – – – (0.1) (1.9)
senior unsecured bonds (12.3) – – – – (12.3)
Bank loans (5.9) 2.5 (1.0) – (1.1) (5.5)
Finance lease liabilities (0.8) 0.8 (0.1) – (0.3) (0.4)3.3
Subordinated liabilities – non-currentcallable subordinated perpetual guaranteed bonds (370.8) – – (35.9) – (406.7)
Other subordinated debt due 2024 – – – 0.7 (19.0) (18.3)
10.5% subordinated guaranteed bonds due 2018 (3.9) – – – – (3.9)–
Subordinated liabilities – currentcallable subordinated perpetual guaranteed bonds (5.9) – – – – (5.9)
–
Net funds per balance sheet 1,641.8 453.6 (6.4) (20.1) 1.3 2,070.2

98 Bupa Annual Report 2011
N ot e s to t h e f i N a N c i a l s tat e m e N t s co n t i n u e dfor the year ended 31 December 2011
32 Financial instruments
Fair value of financial instrumentsthe fair value of a financial instrument is defined as the amount at which a financial instrument could be exchanged in an arm’s length transaction between informed and willing parties. Fair values have been calculated as follows:
° debt securities, shares and other variable yield securities – quoted price if available or discounted expected future principal and interest cash flows;° listed securities – quoted price;° interest bearing loans and borrowings – quoted price if available or discounted expected future principal and interest cash flows;° other receivables and other payables (current) – amortised cost;° other receivables and other payables (non-current) – discounted cash flows;° derivatives (currency forward contracts) – quoted prices at balance sheet date;° derivatives (interest rate swaps) – bank and broker quotes; and° derivatives (currency swaps) – quoted prices at balance sheet date.
the carrying values of short-term receivables and payables are a reasonable approximation of the fair value.
Financial instruments carried at fair value are measured by different valuation methods defined by a three level hierarchy. the different levels have been defined as follows:
° level 1: quoted prices (unadjusted) in active markets for identical assets or liabilities;° level 2: inputs other than quoted prices included within level 1 that are observable for the asset or liability, either directly (ie as prices) or indirectly
(ie derived from prices); and° level 3: inputs for the asset or liability that are not based on observable market data (unobservable inputs).
An analysis is as follows:level 1
£mlevel 2
£mlevel 3
£mtotal
£m
2011Financial investments Debt securities – government gilts 15.4 0.1 – 15.5
Debt securities – corporate bonds 46.4 36.6 – 83.0
shares and other variable yield securities 139.1 0.2 – 139.3
trade and other receivables
Derivative assets – 81.7 – 81.7
trade and other payables
Derivative liabilities – (8.8) – (8.8)
2010Financial investments Debt securities – government gilts 45.3 0.2 – 45.5
Debt securities – corporate bonds 14.4 40.4 – 54.8
shares and other variable yield securities 142.6 0.1 – 142.7
trade and other receivables
Derivative assets – 43.8 – 43.8
trade and other payables
Derivative liabilities – (16.8) – (16.8)
the Group uses the zero coupon curve as at the balance sheet date to discount financial instruments where the fair value cannot otherwise be found from quoted market values. the range of interest rates used is as follows:
2011 %
2010 %
sterling assets and liabilities 1.3 – 3.1 1.5 – 4.2
Australian Dollar assets and liabilities 3.2 – 4.2 5.0 – 5.7
euro assets and liabilities 0.2 – 2.6 0.7 – 3.6
Us Dollar assets and liabilities 0.1 – 3.3 0.3 – 5.0

Bupa Annual Report 2011 99
FIN
AN
CIA
L S
TA
TE
ME
NT
SG
OV
ER
NA
NC
EB
US
INE
SS
RE
VIE
W
32 Financial instruments continued
the fair values of financial instruments are as follows:2011 2010 (restated)
Carrying value
£m
Fair value
£m
carrying value
£m
Fair value
£m
AssetsFinancial investments Debt securities – government gilts 16.0 16.0 45.8 45.8
Debt securities – corporate bonds 155.2 155.2 123.8 123.8
shares and other variable yield securities 139.3 139.3 142.7 142.7
medium-term notes 381.4 381.4 226.3 225.0
Reverse repo securities – – 202.2 202.2
Deposits with credit institutions 1,191.2 1,191.2 1,418.0 1,418.0
trade and other receivables
investment receivables and accrued investment income 2.8 2.5 2.9 2.5
Other receivables 40.4 40.3 57.0 56.9
service concession receivables 137.5 137.5 152.2 152.2
Derivative assets 81.7 81.7 43.8 43.8
Accrued income 7.5 7.5 18.0 17.9
cash and cash equivalents 1,228.4 1,228.4 692.5 692.5
Liabilitiessubordinated liabilities (434.8) (276.3) (380.6) (296.1)
Other interest bearing liabilities (693.7) (789.8) (913.8) (977.2)
trade and other payables
Other payables (386.1) (386.1) (392.8) (392.8)
Accruals (311.8) (311.8) (343.2) (342.9)
Derivative liabilities (8.8) (8.8) (16.8) (16.8)
33 Risk management
Risk management policythe Board is responsible for ensuring that there is a continuous process for identifying, evaluating and managing any material risks faced by the Group and for ensuring that it is effective. As such, the Board is responsible for the nature and extent of the risks facing the Group. this includes:
° the extent and categories of risk the Board regards as acceptable for the Group to bear;° the likelihood of these risks materialising;° the Group’s ability to reduce the incidence or impact on the business of any risks that do crystallise; and° the costs of operating particular controls relative to the benefit from managing the related risks.
Bupa operates the three lines of defence model. Business management provide the first line of defence and is responsible for the identification and assessment of risks and controls. the second line is provided by the risk functions together with risk policy owners who provide support and challenge the completeness and accuracy of risk assessments and the adequacy of mitigation plans. internal audit constitutes the third line by providing independent and objective assurance on the robustness of the risk management framework, and the appropriateness and effectiveness of internal controls.
the principal significant risks of the Group and how they are mitigated are described on pages 34 to 37.
the Group has adopted a risk management strategy that endeavours to mitigate these risks, which is approved by the Board. in managing these exposures, the treasury and investment committee reviews and monitors any significant investment and market risks.
the Group has exposure to a number of risks from its use of financial instruments and risks associated with its insurance business. these have been categorised into the following types of risk, and details of the nature, extent and how the Group has managed these risks is described below:
1. insurance risk and future cash flows from short-term health insurance contracts2. market risk3. credit risk4. liquidity risk
1. Insurance risk and future cash flows from short-term health insurance contracts
(a) Underwriting, pricing and claims riskUnderwriting risk affects future cash flows of the general insurance entities in the Group. it can be subdivided into claims risk and pricing risk which represent the risk of adverse variances in claims outflows and premium inflows respectively; these are described in more detail on page 35, Risk and mitigation. Pricing risk arises from routine revisions to premium tariffs and from the processes, in certain businesses, to set bespoke premiums for large corporate health insurance customers. the adequacy of pricing rests on thorough actuarial analyses of past and most recent claims levels, combined with forward projections of the most recent observed trends. Pricing risk affects only future cash flows since new tariffs impact on levels of premium earned when health insurance contracts renew.

100 Bupa Annual Report 2011
N ot e s to t h e f i N a N c i a l s tat e m e N t s co n t i n u e dfor the year ended 31 December 2011
33 Risk management continued
in every general insurer in the Group, the dominant product style is of an annually renewable health insurance contract. this permits tariff revisions to respond reasonably quickly to changes in claim experience. this is a significant mitigant to pricing risk. the Group underwrites no material general insurance business that commits it to cover risks at premiums fixed beyond a twelve month period from inception or renewal.
claims risk is controlled by means of pre-authorisation of claims, outpatient benefit limits, the use of consultant networks and agreed networks of hospitals and charges. specific processes vary across the Group depending on local conditions and practice.
Future adverse claims experience, for example, caused by external factors such as medical inflation, will affect cash flows after the date of the financial statements. Recent adverse claims risks are reflected in these financial statements in claims paid and in the movement in provisions.
Generally, the Group’s health insurance contracts contain terms and conditions that provide for the reimbursement of incurred medical expenses for treatment related to acute medical conditions. the contracts do not provide for capital sums or indemnified amounts. therefore claims experience is necessarily underpinned by prevailing rates of illness. Additionally, claims risk is generally mitigated by the insurers running control processes to ensure that both the treatments and the consequent reimbursements are appropriate.
(b) Reserving riskReserving risk is the risk of technical provisions for claims incurred proving inadequate in light of later events or information. Reserving risk is not significant to the Group as a result of the shortness of claims development patterns, coupled with the efficacy of the processes used to derive the assumptions used in setting provisions.
the short-tail nature of the Group’s general insurance contracts means that movements in claims development assumptions are generally not significant. the development patterns are kept under constant review to maintain the validity of the assumptions and hence, the validity of the estimation of recognised general insurance liabilities.
the amount of claims provision at any given time that relates to potential claims payments that have not been resolved within one year is not material. Also, of the small provisions that do relate to longer than one year, it is possible to predict with reasonable confidence the outstanding amounts. comparisons of actual claims against previous estimates are therefore not provided.
(c) Other risks related to underwriting health insurance businessclaims provisions are not discounted and their short-term nature means that changes in interest rates have no impact on reserving risk. in addition, the future premium income and claims outflows of health insurance premium liabilities are unaffected by changes in interest rates.
none of the Group’s general insurance contracts contain embedded derivatives so the contracts do not in that respect give rise to interest rate risk.
the Group is exposed to foreign currency risk through some of the insurance liabilities which are settled in a local currency. Where possible these liabilities are matched to assets in the relevant currency to hedge this exposure.
All of the Group’s general insurance activities are single line health portfolios. even though only one line of business is involved, the Group does not have significant concentrations of insurance risk for the following reasons:
° broad geographical diversity across several markets – UK, spain, Australia, latin America, the middle east, and Hong Kong;° product diversity between domestic and expatriate, and individual and corporate health insurance; and° a variety of claims type exposures across diverse medical providers – consultants, nursing staff, clinics, individual hospitals and hospital groups.
the Group as a whole and its principal general insurance entities are very well diversified. Only in select circumstances does the Group use reinsurance. the reinsurance that is used does not give rise to a material credit risk exposure to the Group.
Companythe company is not exposed to insurance risk.
2. Market riskmarket risk is the risk of adverse financial impact due to changes in fair values or future cash flows of financial instruments from fluctuations in interest rates, foreign exchange rates, commodity prices, credit spreads and equity prices. the focus of the Group’s long-term financial strategy is to facilitate growth without undue balance sheet risk. the treasury and investment committee is responsible for the management of the Group’s cash and short-term borrowings.
Under the guidance of the committee, the role of the Group treasury Department is to manage the Group’s liquidity position and short-term borrowings, together with the risks arising on interest rates and foreign currencies and to protect the security of the Group’s financial assets.
in order to reduce the risk of assets being insufficient to meet future policyholder obligations, the Group matches investments to liabilities. in addition, the Group actively manages assets using an approach that balances quality, diversification, liquidity and investment return.
the Group manages price risk by ensuring that the majority of its cash and investments are held with highly rated credit institutions.
Where the Group has moved away from straight money market investments and invested in a limited portfolio of absolute return assets (principally corporate bonds), the Group uses a value at risk analysis (VaR95) to quantify risk, taking account of asset volatility and correlation between asset classes. this portfolio was £179.2m at 31 December 2011 (2010: £184.5m) and the 1 year VaR95 figure attributable to the portfolio is £19.2m at 31 December 2011 (2010: £13.3m).

Bupa Annual Report 2011 101
FIN
AN
CIA
L S
TA
TE
ME
NT
SG
OV
ER
NA
NC
EB
US
INE
SS
RE
VIE
W
33 Risk management continued
(a) Foreign exchange riskthe Group is exposed to foreign exchange risks arising from commercial transactions and from recognising assets, liabilities and investments in overseas operations.
the Group is exposed to both transaction and translation risk. the former is the risk that a company’s cash flows and realised profits may be impacted by movements in foreign exchange rates. the latter arises from translating the financial statements of a foreign operation into the Group’s functional currency.
Bupa has exposure to foreign exchange risk arising from its overseas operations. Key exposures are to the Australian Dollar, Us Dollar, euro, new Zealand Dollar, Bahraini Dinar, Danish Krone, Hong Kong Dollar, thai Baht, swiss Franc, mexican Peso and Brazilian Real.
Where appropriate, the Group uses foreign currency forward contracts and foreign currency borrowings to hedge balance sheet translation exposure.
the carrying value of total assets and total liabilities categorised by currency is as follows:
net currency exposure
£m
currency forward
contracts £m
Borrowing trans-
actions £m
netcurrencyexposureincluding
hedges£m
2011Australian Dollar 2,165.3 (66.0) – 2,099.3
Us Dollar 111.6 (198.7) – (87.1)
euro 362.0 (186.2) – 175.8
new Zealand Dollar 209.5 – – 209.5
Bahraini Dinar 23.7 – – 23.7
Danish Krone (2.3) – – (2.3)
Hong Kong Dollar 19.0 – – 19.0
thai Baht 9.7 – – 9.7
swiss Franc 2.4 (8.2) – (5.8)
mexican Peso 4.3 16.3 – 20.6
Brazilian Real – 14.4 – 14.4
Other 8.3 – – 8.3
total foreign currency denominated net assets 2,913.5 (428.4) – 2,485.1
Percentage of Group net assets 65.6% 55.9%
2010Australian Dollar 2,134.6 (261.2) – 1,873.4
Us Dollar 352.7 (322.8) – 29.9
euro 337.0 (44.3) (94.8) 197.9
new Zealand Dollar 197.1 – – 197.1
Bahraini Dinar 25.0 – – 25.0
Danish Krone (3.8) – – (3.8)
Hong Kong Dollar 9.5 – – 9.5
thai Baht 9.6 – – 9.6
swiss Franc 4.9 (8.2) – (3.3)
Other 7.6 – – 7.6
total foreign currency denominated net assets 3,074.2 (636.5) (94.8) 2,342.9
Percentage of Group net assets 69.9% 53.3%
the following significant exchange rates applied during the year:
Average rate closing rate
2011 2010 2011 2010
Australian Dollar 1.5545 1.6832 1.5157 1.5259
Us Dollar 1.6040 1.5456 1.5539 1.5610
euro 1.1526 1.1664 1.1972 1.1650

102 Bupa Annual Report 2011
N ot e s to t h e f i N a N c i a l s tat e m e N t s co n t i n u e dfor the year ended 31 December 2011
33 Risk management continued
the impact of strengthening / (weakening) of sterling against the currencies below, with all other variables constant, would have increased / (decreased) equity and surplus by the amounts shown below:
Strengthening 10% Weakening 10%
Gains / (losses)
included in income
statement £m
Gains / (losses)
included in equity
£m
Gains / (losses)
included in income
statement £m
Gains / (losses)
included in equity
£m
2011Australian Dollar (22.1) (190.8) 27.0 233.3
Us Dollar 20.4 7.9 (24.9) (9.7)
euro (13.6) (16.0) 16.6 19.5
Other (2.0) (27.1) 2.4 33.0
total sensitivity (17.3) (226.0) 21.1 276.1
2010Australian Dollar (17.0) (170.3) 20.7 208.2
Us Dollar 12.4 (2.7) (15.2) 3.3
euro (7.9) (18.0) 9.6 22.0
Other 2.0 (22.3) (2.4) 27.2
total sensitivity (10.5) (213.3) 12.7 260.7
Foreign exchange hedging activitiesthe Group applies net investment hedges, fair value hedges and cash flow hedge accounting in order to hedge its exposure to foreign exchange.
(i) Net investment hedgesnet investment foreign exchange risk is managed using both foreign currency forward contracts, foreign currency zero cost collar options and foreign currency borrowings. these hedging relationships are documented and tested as required by iAs 39 as net investment hedges. All foreign currency forward contracts are accounted for on a fair value basis.
the Group’s Australian Dollar translation exposure of £2,165.3m (AU$3,281.9m) (2010: £2,134.6m (AU$3,257.2m)) arises from the net assets of Bupa Australia, Bupa Australia Pty limited, Bupa care services Australia and their subsidiary companies. Foreign exchange gains and losses on the Australian Dollar inter company loans that are permitted to be taken to other comprehensive income on consolidation under iAs 21 total a gain of £15.8m (2010: loss of £78.2m). At 31 December 2011, the Group held both forward foreign exchange contracts totalling £66.0m (AU$100.0m) (2010: £261.2m (AU$398.5m)) and collar options totalling £132.0m (AU$200.0m) (2010: £nil (AU$nil)) to hedge a portion of net assets, which have been designated as hedges under iAs 39. the forward contracts mature within six months from balance sheet date. the collar options mature within one year (AU$100.0m) and two years (AU$100.0m) from balance sheet date.
euro translation exposure of £362.0m (€433.4m) (2010: £337.0m (€392.6m)) arises from the net assets of Grupo Bupa sanitas sl and its subsidiary companies. Foreign exchange gains and losses on the euro inter company loans that are permitted to be taken to other comprehensive income on consolidation, under iAs 21, total a gain of £10.2m (2010: gain of £19.9m). At 31 December, the Group held euro borrowings of £nil (€nil) (2010: £94.8m (€110.5m)) and forward foreign exchange contracts totalling £140.8m (€168.6m) (2010: £nil (€nil)) to hedge a portion of these net assets, all of which have been designated as hedges under iAs 39. the forward contracts mature within two months from balance sheet date and are rolled on an ongoing basis.
Us Dollar translation exposure of £130.6m (Us$173.4m, HK$229.3m) (2010: £362.2m (Us$550.6m, HK$115.3m)) arises from the net assets of Health Dialog, Bupa international miami and their subsidiary companies, and from exposure through the Hong Kong Dollar (which is pegged to the Us Dollar), which arises from the net assets of Bupa international (Hong Kong), Bupa Asia limited and Bupa limited (HK). Foreign exchange gains and losses on the Us Dollar inter company loans that are permitted to be taken to other comprehensive income on consolidation under iAs 21 total a gain of £1.2m (2010: gain of £9.3m). At 31 December 2011, the Group held forward foreign exchange contracts totalling £nil (Us$nil) (2010: £182.6m (Us$285.0m)) to hedge a portion of net assets, which have been designated as hedges under iAs 39. Responding to the decrease in the Us dollar translation exposure, on 15 December 2011, the Group discontinued to hedge a portion of the net assets.
(ii) Fair value hedgesAs at 31 December, the following derivative contracts were in place to hedge the Group’s currency exposure:
maturity, expiry or execution date
initial value of contacts
sold £m
notional value of
liabilities £m
carrying value
£m
2011currency forward contracts held in the following currencies:euro (€36.2m) 16 January 2012 (30.4) (30.2) 0.2Us Dollar (Us$79.0m) 17 January 2012 (51.1) (50.8) 0.3
2010currency forward contracts held in the following currencies:euro (€30.3m) 20 January 2011 (25.7) (26.0) (0.3)Us Dollar (Us$84.0m) 20 January 2011 (54.3) (53.8) 0.5
the currency forward contracts hedge the Group’s currency exposure, which arises from holding Us Dollar and euro denominated financial investments classed as shares and other variable yield securities and corporate bonds. these hedged items have resulted in an income statement gain of £0.1m (2010: loss of £0.5m).

Bupa Annual Report 2011 103
FIN
AN
CIA
L S
TA
TE
ME
NT
SG
OV
ER
NA
NC
EB
US
INE
SS
RE
VIE
W
33 Risk management continued
(iii) Cash flow hedgesin 2008, forward foreign exchange contracts were entered into to hedge cash outflows for the acquisition of mBF amounting to AU$2,001.1m (£915.2m), which led to a cash flow hedge reserve gain of £36.4m, and the acquisition of Health Dialog amounting to Us$653.2m (£343.0m) resulting in a cash flow hedge reserve loss of £2.8m. in 2010, part of the mBF business was disposed of and as a result £0.9m of the related cash flow hedge gain was recognised in the income statement. in 2011, an additional £1.3m was recognised in the income statement due to the impairment of the mBF brand. the impairment of Health Dialog goodwill in 2010 resulted in the cash flow hedge loss of £2.8m being recognised in the income statement.
effect of foreign exchange hedging transactionsthe impact of all external foreign currency hedging activity is set out below. the ineffective portion of all hedges recognised in the income statement was a gain of £nil (2010: £0.5m).
Gains / (losses) included in the income statement are:
currency forward
contracts £m
external borrowing
£mtotal
£m
2011euro 0.9 – 0.9
Us Dollar (0.3) – (0.3)
Danish Krone – – –
0.6 – 0.6
2010euro 0.5 – 0.5
Us Dollar (1.7) – (1.7)
Danish Krone – 0.5 0.5
(1.2) 0.5 (0.7)
Gains / (losses) included in other comprehensive income are:
2011Australian Dollar 4.0 – 4.0
euro 2.0 2.0 4.0
Us Dollar (0.2) – (0.2)
Danish Krone – – –
5.8 2.0 7.8
2010Australian Dollar (40.2) – (40.2)
euro – 3.2 3.2
Us Dollar (6.3) – (6.3)
Danish Krone – 0.1 0.1
(46.5) 3.3 (43.2)
At 31 December 2011 and 2010, there were no material exposures to foreign currency transaction risk.
Companythe company is not materially exposed to foreign exchange risk.
(b) Interest rate riskinterest rate risk is the risk that the fair value or future cash flows of a financial instrument will fluctuate because of changes in market interest rates.
the Group is exposed to interest rate risk arising from fluctuations in market rates. this affects both the return on floating rate assets, the cost of floating rate liabilities and the balance sheet value of its investment in fixed rate bonds. Floating rate assets represent a natural hedge for floating rate liabilities. the net balance on which the Group is exposed as at 31 December 2011 was £1,584.6m (2010: £1,259.8m). the rate at which maturing deposits are reinvested represents a significant potential risk to the Group, in currencies such as sterling and Australian Dollar where the Group has a significant net floating cash position.
the Group has also used interest rate swaps to manage interest rate exposure whereby the requirement to settle interest at fixed rates has been swapped for floating rates. this increases the ability to match floating rate assets with floating rate liabilities.
Variable loans are re-priced at intervals of between one and six months. interest is settled on all loans in line with agreements and is settled at least annually.
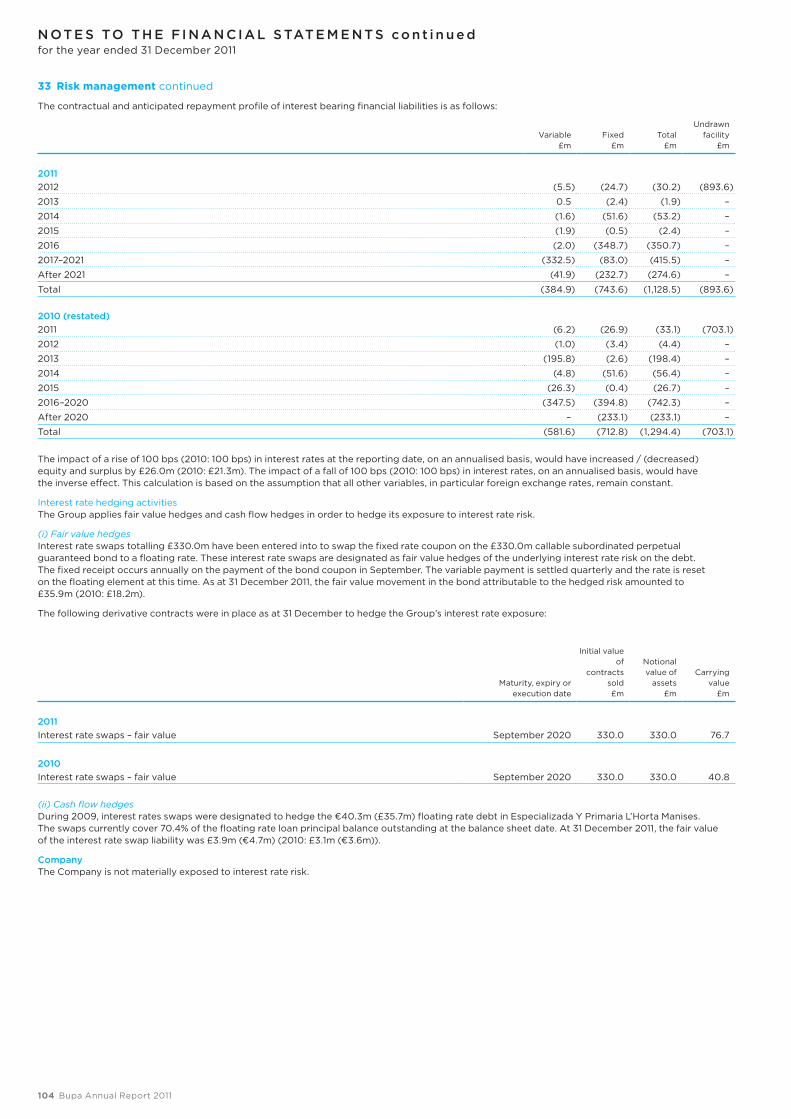
104 Bupa Annual Report 2011
N ot e s to t h e f i N a N c i a l s tat e m e N t s co n t i n u e dfor the year ended 31 December 2011
33 Risk management continued
the contractual and anticipated repayment profile of interest bearing financial liabilities is as follows:
Variable £m
Fixed £m
total £m
Undrawn facility
£m
20112012 (5.5) (24.7) (30.2) (893.6)
2013 0.5 (2.4) (1.9) –
2014 (1.6) (51.6) (53.2) –
2015 (1.9) (0.5) (2.4) –
2016 (2.0) (348.7) (350.7) –
2017–2021 (332.5) (83.0) (415.5) –
After 2021 (41.9) (232.7) (274.6) –
total (384.9) (743.6) (1,128.5) (893.6)
2010 (restated)2011 (6.2) (26.9) (33.1) (703.1)
2012 (1.0) (3.4) (4.4) –
2013 (195.8) (2.6) (198.4) –
2014 (4.8) (51.6) (56.4) –
2015 (26.3) (0.4) (26.7) –
2016–2020 (347.5) (394.8) (742.3) –
After 2020 – (233.1) (233.1) –
total (581.6) (712.8) (1,294.4) (703.1)
the impact of a rise of 100 bps (2010: 100 bps) in interest rates at the reporting date, on an annualised basis, would have increased / (decreased) equity and surplus by £26.0m (2010: £21.3m). the impact of a fall of 100 bps (2010: 100 bps) in interest rates, on an annualised basis, would have the inverse effect. this calculation is based on the assumption that all other variables, in particular foreign exchange rates, remain constant.
interest rate hedging activitiesthe Group applies fair value hedges and cash flow hedges in order to hedge its exposure to interest rate risk.
(i) Fair value hedgesinterest rate swaps totalling £330.0m have been entered into to swap the fixed rate coupon on the £330.0m callable subordinated perpetual guaranteed bond to a floating rate. these interest rate swaps are designated as fair value hedges of the underlying interest rate risk on the debt. the fixed receipt occurs annually on the payment of the bond coupon in september. the variable payment is settled quarterly and the rate is reset on the floating element at this time. As at 31 December 2011, the fair value movement in the bond attributable to the hedged risk amounted to £35.9m (2010: £18.2m).
the following derivative contracts were in place as at 31 December to hedge the Group’s interest rate exposure:
maturity, expiry or execution date
initial value of
contracts sold £m
notional value of
assets £m
carrying value
£m
2011interest rate swaps – fair value september 2020 330.0 330.0 76.7
2010interest rate swaps – fair value september 2020 330.0 330.0 40.8
(ii) Cash flow hedgesDuring 2009, interest rates swaps were designated to hedge the €40.3m (£35.7m) floating rate debt in especializada Y Primaria l’Horta manises. the swaps currently cover 70.4% of the floating rate loan principal balance outstanding at the balance sheet date. At 31 December 2011, the fair value of the interest rate swap liability was £3.9m (€4.7m) (2010: £3.1m (€3.6m)).
Companythe company is not materially exposed to interest rate risk.
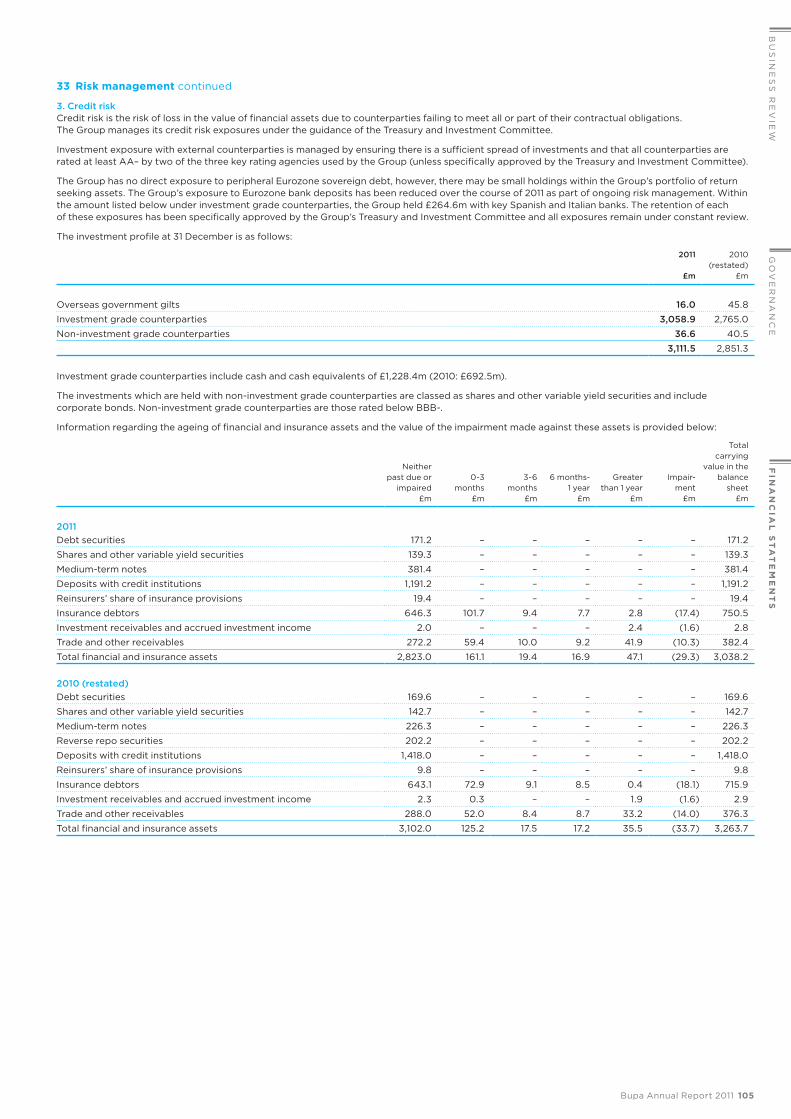
Bupa Annual Report 2011 105
FIN
AN
CIA
L S
TA
TE
ME
NT
SG
OV
ER
NA
NC
EB
US
INE
SS
RE
VIE
W
33 Risk management continued
3. Credit riskcredit risk is the risk of loss in the value of financial assets due to counterparties failing to meet all or part of their contractual obligations. the Group manages its credit risk exposures under the guidance of the treasury and investment committee.
investment exposure with external counterparties is managed by ensuring there is a sufficient spread of investments and that all counterparties are rated at least AA– by two of the three key rating agencies used by the Group (unless specifically approved by the treasury and investment committee).
the Group has no direct exposure to peripheral eurozone sovereign debt, however, there may be small holdings within the Group’s portfolio of return seeking assets. the Group’s exposure to eurozone bank deposits has been reduced over the course of 2011 as part of ongoing risk management. Within the amount listed below under investment grade counterparties, the Group held £264.6m with key spanish and italian banks. the retention of each of these exposures has been specifically approved by the Group’s treasury and investment committee and all exposures remain under constant review.
the investment profile at 31 December is as follows:
2011
£m
2010 (restated)
£m
Overseas government gilts 16.0 45.8
investment grade counterparties 3,058.9 2,765.0
non-investment grade counterparties 36.6 40.5
3,111.5 2,851.3
investment grade counterparties include cash and cash equivalents of £1,228.4m (2010: £692.5m).
the investments which are held with non-investment grade counterparties are classed as shares and other variable yield securities and include corporate bonds. non-investment grade counterparties are those rated below BBB-.
information regarding the ageing of financial and insurance assets and the value of the impairment made against these assets is provided below:
neither past due or
impaired £m
0-3 months
£m
3-6 months
£m
6 months- 1 year
£m
Greater than 1 year
£m
impair- ment
£m
total carrying
value in the balance
sheet£m
2011Debt securities 171.2 – – – – – 171.2
shares and other variable yield securities 139.3 – – – – – 139.3
medium-term notes 381.4 – – – – – 381.4
Deposits with credit institutions 1,191.2 – – – – – 1,191.2
Reinsurers’ share of insurance provisions 19.4 – – – – – 19.4
insurance debtors 646.3 101.7 9.4 7.7 2.8 (17.4) 750.5
investment receivables and accrued investment income 2.0 – – – 2.4 (1.6) 2.8
trade and other receivables 272.2 59.4 10.0 9.2 41.9 (10.3) 382.4
total financial and insurance assets 2,823.0 161.1 19.4 16.9 47.1 (29.3) 3,038.2
2010 (restated)Debt securities 169.6 – – – – – 169.6
shares and other variable yield securities 142.7 – – – – – 142.7
medium-term notes 226.3 – – – – – 226.3
Reverse repo securities 202.2 – – – – – 202.2
Deposits with credit institutions 1,418.0 – – – – – 1,418.0
Reinsurers’ share of insurance provisions 9.8 – – – – – 9.8
insurance debtors 643.1 72.9 9.1 8.5 0.4 (18.1) 715.9
investment receivables and accrued investment income 2.3 0.3 – – 1.9 (1.6) 2.9
trade and other receivables 288.0 52.0 8.4 8.7 33.2 (14.0) 376.3
total financial and insurance assets 3,102.0 125.2 17.5 17.2 35.5 (33.7) 3,263.7

106 Bupa Annual Report 2011
N ot e s to t h e f i N a N c i a l s tat e m e N t s co n t i n u e dfor the year ended 31 December 2011
33 Risk management continued
the carrying amount of financial and insurance assets of £3,038.2m (2010: £3,263.7m) included on the Group balance sheet represents the maximum credit exposure. in aggregate across the Group, reinsurance credit risk is not material.
the movement in the allowance for impairment in respect of financial and insurance assets during the year was as follows:
2011 £m
2010 £m
At beginning of year 33.7 31.3
impairment loss recognised 15.1 17.4
Additions through business combinations 0.1 –
Disposal of subsidiary companies – (0.3)
Bad debt provision released in year (19.5) (14.2)
transferred to assets held for sale – (0.4)
Foreign exchange (0.3) (0.1)
At end of year 29.1 33.7
the Group believes no impairment allowance is necessary in respect of financial assets not past due date.
the Group considers notified disputes, significant changes in the counterparty’s financial position and collection experience in determining which assets should be impaired. the credit quality of receivables is managed at a local business unit level with uncollectable amounts being impaired when necessary.
Assets pledged as security include £45.3m (2010: £35.4m) of cash held in restricted access deposits (see note 21), £80.3m (2010: £86.8m) of property, plant and equipment and £0.4m (2010: £0.5m) of inventories. the property, plant and equipment is subject to a first legal mortgage and inventories are subject to a first floating charge as security for debenture stock issued by the Group, repayable in 2014.
Companythe maximum credit risk exposure of the company is £2.1m (2010: £1.2m). the company believes amounts owed to it by subsidiary companies carry no credit risk.
4. Liquidity riskliquidity risk is the risk that the Group will not have available funds to meet its liabilities when they fall due.
the Group’s main source of funding is via a £900.0m committed bank facility, which matures on 30 september 2013, and was fully undrawn at 31 December 2011 with the exception of £6.4m of outstanding letters of credit required for general business purposes. the Group repaid £196.8m of bank borrowings under this facility during 2011 primarily from operating cash flows and proceeds from the disposal of businesses.
the Group treasury department monitors funding risk as well as compliance with existing financial covenants within the banking arrangements. there were no concerns regarding bank covenant coverage in 2011 and that position is not expected to change in the foreseeable future.
the Group enjoys a strong liquidity position and adheres to strict liquidity management policies as set by the treasury and investment committee as well as adhering to certain liquidity parameters, as defined by the FsA for the Group’s regulated entities in the UK and local equivalent authorities for the Group’s foreign operations.
liquidity is managed by currency, and by considering the segregation of accounts required for regulatory purposes, short-term operational working capital requirements are met by cash in hand and committed bank facilities.
the contractual maturities of financial liabilities and the expected maturities of insurance liabilities including estimated interest payments of the Group as at 31 December are as follows:
sub- ordinated liabilities
£m
Other interest bearing
liabilities £m
Provisions under
insurance contracts
issued £m
Other liabilities
under insurance contracts
issued £m
trade and other payables
£m total
£m
20112012 (20.6) (72.1) (2,136.5) (13.7) (805.1) (3,048.0)
2013 (20.6) (49.7) (2.2) – (9.4) (81.9)
2014 (20.6) (98.1) – – (4.1) (122.8)
2015 (20.6) (44.4) – – (0.7) (65.7)
2016–2021 (431.1) (462.7) – – (1.6) (895.4)
After 2021 (31.5) (403.8) (23.5) – – (458.8)
total (545.0) (1,130.8) (2,162.2) (13.7) (820.9) (4,672.6)
carrying value in the balance sheet (434.8) (693.7) (2,162.2) (13.7) (820.9) (4,125.3)
2010 (restated)2011 (20.6) (75.0) (2,134.5) (18.9) (864.3) (3,113.2)
2012 (20.6) (52.3) (0.8) – (6.5) (80.2)
2013 (20.6) (246.2) – – (3.8) (270.6)
2014 (20.6) (101.3) – – (0.7) (122.6)
2015–2020 (451.7) (527.9) – – (1.0) (980.6)
After 2020 – (377.7) (23.3) – – (401.0)
total (534.1) (1,380.4) (2,158.6) (18.9) (876.3) (4,968.3)
carrying value in the balance sheet (380.6) (913.8) (2,158.6) (18.9) (876.3) (4,348.2)
the total liability is split by remaining duration in proportion to the cash flows expected to arise during that period. interest payments are included in the cash flows for subordinated liabilities and other interest bearing liabilities.

Bupa Annual Report 2011 107
FIN
AN
CIA
L S
TA
TE
ME
NT
SG
OV
ER
NA
NC
EB
US
INE
SS
RE
VIE
W
33 Risk management continued
the maturity profile of financial assets as at 31 December 2011 and 2010, which are available to fund the repayment of liabilities as they crystallise, is as follows:
cash andcash
equivalents£m
Depositswith creditinstitutions
£m
Reverserepo
securities£m
Overseasgovern-
mentgilts£m
UKcorporate
bonds£m
Overseascorporate
bonds£m
mediumterm
notes£m
sharesand other
variableyield
securities£m
total£m
20112012 1,228.4 1,005.8 – 0.5 – – 180.5 – 2,415.2
2013 – 185.4 – 8.7 3.4 29.2 – 139.0 365.7
2014 – – – – 1.9 36.6 150.7 – 189.2
2015 – – – – 0.3 – 50.2 – 50.5
2016 – – – 0.1 1.6 – – – 1.7
2017–2021 – – – 6.7 9.8 – – 0.3 16.8
After 2021 – – – – 72.2 0.2 – – 72.4
total 1,228.4 1,191.2 – 16.0 89.2 66.0 381.4 139.3 3,111.5
2010 (restated)2011 692.5 832.7 202.2 6.5 – – 75.5 10.1 1,819.5
2012 – 585.3 – 39.1 – 14.7 50.1 132.3 821.5
2013 – – – 0.1 – – – – 0.1
2014 – – – – – – 50.0 – 50.0
2015 – – – – – – 50.7 – 50.7
2016–2020 – – – 0.1 – 40.4 – 0.2 40.7
After 2020 – – – – 68.7 – – 0.1 68.8
total 692.5 1,418.0 202.2 45.8 68.7 55.1 226.3 142.7 2,851.3
information regarding the ageing of financial and insurance assets, including those above, and the value of any impairment made against these assets is included on page 105.
Companythe contractual maturity of financial liabilities fall due within one year.
34 Acquisitions
2011 acquisitions On 1 June 2011, the Group acquired 100% of the share capital of centro internacional de medicina Avazada (cimA) for cash consideration of £11.8m (€13.7m). this resulted in goodwill of £5.8m being recognised. the goodwill attributed to the acquisition of cimA represents a premium paid to reflect that the acquisition materially increases sanitas’s provision footprint in catalonia, which is the second largest regional market for the business in spain, and will drive synergies through improved integrated healthcare and by offering higher levels of quality, greater control over healthcare costs and improved product differentiation for opportunities in the local market. the acquisition related costs included in operating expenses within the income statement for the year ended 31 December 2011 are £0.5m (€0.5m). Had cimA been consolidated from 1 January 2011, the consolidated revenue would be £8,024.6m and consolidated surplus for the period would be £135.7m.
carrying value at
acquisition £m
Fair value adjust- ments
£mFair value
£m
intangible assets 0.5 0.4 0.9
Property, plant and equipment 3.6 – 3.6
Deferred taxation asset 6.8 – 6.8
inventories 0.3 – 0.3
trade and other receivables 3.5 – 3.5
cash and cash equivalents 0.1 – 0.1
Other interest bearing liabilities (6.4) – (6.4)
trade and other payables (2.7) – (2.7)
Deferred taxation liabilities – (0.1) (0.1)
5.7 0.3
net assets acquired 6.0
Goodwill 5.8
consideration 11.8
consideration satisfied by:cash 11.8
Purchase consideration settled in cash 11.8
cash acquired on acquisition 0.1
net cash outflow on acquisition 11.7

108 Bupa Annual Report 2011
N ot e s to t h e f i N a N c i a l s tat e m e N t s co n t i n u e dfor the year ended 31 December 2011
34 Acquisitions continued
2010 acquisitions On 25th August 2010, the Group acquired the assets of Peak Fitness management for cash consideration of £2.3m (AU$4.1m), this resulted in goodwill of £3.0m being recognised. the primary reason for this acquisition was to complement the existing offerings to customers.
On 20 september 2010, the Group acquired the remaining 50% shareholding in the Health eyewear business from Blink Optical Pty for cash consideration of £1.1m (AU$1.7m). the net assets recognised at 31 December 2010 were based on provisional amounts. the fair value accounting was finalised during the year ended 31 December 2011 and the provisional amounts recognised at the acquisition date have been retrospectively adjusted. this resulted in goodwill of £6.9m being recognised in the year. the reported Group balance sheet as at 31 December 2010 has been restated as shown below.
As provisionally stated at
31 December 2010
£m
Adjustments to provisional
amounts £m
Restated as at 31 December
2010 £m
intangible assets – 7.6 7.6
Property, plant and equipment 1.1 1.1 2.2
inventories 0.7 (0.2) 0.5
trade and other receivables 0.2 (0.1) 0.1
cash and cash equivalents – 0.3 0.3
Provisions for liabilities and charges 0.1 (0.2) (0.1)
Deferred taxation asset – 0.3 0.3
Other interest bearing liabilities – (5.6) (5.6)
current taxation liabilities – (0.1) (0.1)
trade and other payables (0.2) (3.1) (3.3)
the fair value of the assets and liabilities of Health eyewear and Peak Fitness management as at the date of acquisition are as follows:
carrying value at acquistion
£m
Fair value adjustments
£mFair value
£m
Property, plant and equipment 1.1 1.0 2.1
inventories 0.6 (0.2) 0.4
trade and other receivables 0.2 0.1 0.3
cash and cash equivalents – 0.3 0.3
Provisions for liabilities and charges (0.3) (0.2) (0.5)
Deferred taxation asset – 0.2 0.2
Other interest bearing liabilities – (5.1) (5.1)
current taxation liabilities – (0.1) (0.1)
trade and other payables (0.3) (2.7) (3.0)
1.3 (6.7)
net assets acquired (5.4)
Goodwill 9.9
consideration 4.5
consideration satisfied by:
cash 3.4
Fair value of existing holding 1.1
4.5
Purchase consideration settled in cash 3.4
cash acquired on acquistion 0.3
net cash outflow on acquisition 3.1

Bupa Annual Report 2011 109
FIN
AN
CIA
L S
TA
TE
ME
NT
SG
OV
ER
NA
NC
EB
US
INE
SS
RE
VIE
W
35 Commitments and contingencies
(i) Capital commitments
Groupcapital expenditure for the Group contracted as at 31 December 2011 amounted to £28.1m (2010: £10.0m), of which £17.6m (2010: £7.8m) related to property, plant and equipment and £10.5m (2010: £2.2m) related to investment property.
Companycapital expenditure for the company contracted as at 31 December 2011 but for which no provision has been made in the financial statements amounted to £0.3m (2010: £0.2m), all of which related to property, plant and equipment.
(ii) Operating leases
Groupthe total value of future non-cancellable operating lease rentals is payable as follows:
2011 £m
2010 £m
less than one year 45.1 42.3
Between one and five years 173.1 152.9
more than five years 516.5 362.2
734.7 557.4
the Group leases a number of properties under operating leases. the leases typically run for a period of 25 years, with an option to renew the lease after that date. lease payments are reviewed regularly in accordance with the terms and conditions of the individual lease agreements. none of these leases include contingent rentals.
some of the leased properties have been sub-let by the Group. Both the leased properties and the sub-leases expire between 2012 and 2024. sub-lease receipts of £1.3m (2010: £1.4m) are expected to be received during the next financial year. the Group has an unoccupied property provision of £8.4m (2010: £9.2m) in respect of these leases (see note 27).
Leases as lessorthe Group leases out its investment properties under operating leases (see note 13). the future lease receipts under non-cancellable leases are as follows:
2011 £m
2010 £m
less than one year 1.2 1.1
Between one and five years 2.3 3.5
more than five years – –
3.5 4.6
During the year ended 31 December 2011, £1.1m (2010: £1.1m) was recognised as rental income in the income statement.
(iii) pension contributions
Companythe company has an obligation to make a series of special contributions to the Bupa Pension scheme between 31 December 2011 and 31 December 2012, details of which are set out in note 26. in addition, Bupa Finance plc has entered into a legally binding and irrevocable guarantee for the benefit of the trustees of the Bupa Pension scheme in respect of these payments.
(iv) Contingent assets and liabilities
Groupthe Group has contingent liabilities arising in the ordinary course of business, including losses which might arise from litigation, from which it is anticipated that the likelihood of any material unprovided liabilities arising is remote.
CompanyGroup bank loans do not include any amounts (2010: £196.9m) that are guaranteed by the company.
the company has given a guarantee in respect of a £350.0m bond issued by Bupa Finance plc.
the company is party to a £900.0m revolving credit facility, together with various other companies within the Group. the revolving credit facility was fully undrawn at 31 December 2011 with the exception of £6.4m of outstanding letters of credit required for general business purposes. the company has joint and several liability for all obligations under the agreement.

110 Bupa Annual Report 2011
N ot e s to t h e f i N a N c i a l s tat e m e N t s co n t i n u e dfor the year ended 31 December 2011
36 Related party transactions
Where the company enters into financial guarantee contracts to guarantee the indebtedness of other companies within the Group, the company considers these to be insurance arrangements, and accounts for them as such. in this respect, provision for expected claims is made on an incurred basis.
Groupthe ultimate parent company of the Group is the British United Provident Association limited.
intra Group related party transactions and outstanding balances are eliminated in the preparation of the consolidated financial statements of the Group.
Transactions with key management personnelthe key management personnel are the Group’s executive and non-executive Directors and includes the managing Directors of the Group’s businesssegments, the Acting Group Finance Director and the managing Director of Group Development. the remuneration of the Group’s executive andnon-executive Directors is disclosed in note 5. the total remuneration of the remaining key management personnel is as follows:
2011 £m
2010 £m
short-term employee benefits 3.6 4.3
long-term incentive plan 1.3 1.5
Post employment benefits 1.7 2.5
6.6 8.3
the total remuneration of key management personnel is included in staff costs (see note 4).
no Director had any material interest in any contracts with Group companies at 31 December 2011 (2010: £nil) or at any time during the year.
Transactions in relation to the non-registered (previously referred to as the “unapproved”) pension arrangementsthe company has made pension promises to certain current and former executive Directors and key management personnel through a non-registered pension arrangement which mirrors the terms of the Bupa Pension scheme (see note 26). these unfunded benefits are secured by a charge, governed by the law Debenture Pension trust corporation plc who are the trustees of the non-registered pension arrangement, over £39.4m (2010: £29.5m) of cash deposits (see note 21). the increase in the charge of £9.9m during 2011 reflects the increase in the value of the liabilities resulting from additional accrual of benefits during the year, changes in the underlying actuarial assumptions and changes in market conditions.
there were no material transactions during the year with any other related parties, as defined by iAs 24.
Companythe company has a related party relationship with its key management personnel and with its subsidiary companies (see note 15).
Transactions with key management personnelthe key management personnel are the Group’s executive and non-executive Directors, the managing Directors of the Group’s business segments and the Acting Group Finance Director. the remuneration of the Group’s executive and non-executive Directors is disclosed in note 5. the total remuneration of the business segment managing Directors is as disclosed above.
the total remuneration of key management personnel is included in staff costs (see note 4).
Transactions in relation to the non-registered (previously referred to as the “unapproved”) pension arrangementsthese transactions are as disclosed above.
Transactions and balances with subsidiary companiestransactions
during the yearBalance at
31 December
2011 £m
2010 £m
2011 £m
2010 £m
Income statementmanagement charges received 137.3 132.2
interest income 1.5 4.0
interest expense (6.8) (6.7)
income received (including rental income of £nil (2010: £0.1m)) 2.7 2.3
expenses paid (including rental expense of £5.8m (2010: £6.3m)) (6.6) (6.9)
Dividends received 200.0 –
Balance sheetAmounts owed by subsidiary companies (325.6) 67.1 90.2 415.8
Amounts owed to subsidiary companies 471.2 89.1 (49.5) (520.7)
loans to subsidiary companies (50.4) (194.3) – 50.4
loans from subsidiary companies 22.0 (33.7) (210.6) (232.6)
the above outstanding balances arose during the ordinary course of business and are on substantially the same terms, including interest rates, as for comparable transactions with third parties.

Bupa Annual Report 2011 111
FIN
AN
CIA
L S
TA
TE
ME
NT
SG
OV
ER
NA
NC
EB
US
INE
SS
RE
VIE
W
2011
£m
2010
£m
2009 (restated)
£m
2008 (restated)
£m
2007 (restated)
£m
Revenues – segmental analysiseurope and north America 2,933.7 2,999.5 2,975.2 2,741.2 2,360.8
international markets 3,874.3 3,394.0 2,831.4 2,103.3 1,072.9
care services 1,203.7 1,182.9 1,134.3 1,079.6 815.3
net reclassifications to other expenses or financial income and expenses 4.4 (0.6) (0.1) (3.1) (2.8)
Unallocated central revenues 2.0 0.2 0.6 2.9 3.9
Revenue from continuing operations 8,018.1 7,576.0 6,941.4 5,923.9 4,250.1
Revenue from discontinued operations – – – – 295.3
Consolidated total revenues 8,018.1 7,576.0 6,941.4 5,923.9 4,545.4
Continuing operationsOperating expenses (including claims) (7,496.2) (7,156.2) (6,564.3) (5,567.5) (3,909.2)
impairment of goodwill (165.8) (249.2) – (116.5) –
impairment of other intangible assets arising on business combinations (133.7) (17.7) (11.7) (4.0) (5.7)
Other (charges) / income (22.9) (54.0) 2.4 (3.4) 20.1
claims and expenses from continuing operations (7,818.6) (7,477.1) (6,573.6) (5,691.4) (3,894.8)
claims and expenses from discontinued operations – – – – (242.8)
Total claims and expenses (7,818.6) (7,477.1) (6,573.6) (5,691.4) (4,137.6)
Surplus before financial income and expenses from continuing operations 199.5 98.9 367.8 232.5 355.3
Financial income and expenses 20.5 19.1 48.7 (40.6) 44.1
Surplus before taxation expense 220.0 118.0 416.5 191.9 399.4
taxation expense (84.1) (131.4) (115.7) (79.5) (104.5)
Surplus / (deficit) for the financial year from continuing operations 135.9 (13.4) 300.8 112.4 294.9
discontinued operationssurplus from operating activities before financial income and expenses – – – – 52.5
Financial income and expenses – – – – (9.8)
Surplus from operating activities before taxation expense – – – – 42.7
taxation expense – – – – (12.3)
Surplus from operating activities for the financial year – – – – 30.4–
Profit on sale of business – – – 815.6
taxation on profit on sale of business – – – – (6.3)
– – – – 809.3
Surplus for the financial year from discontinued operations – – – – 839.7
Surplus / (deficit) for the financial year 135.9 (13.4) 300.8 112.4 1,134.6
Attributable to:Bupa 131.1 (19.2) 288.9 106.9 1,132.0non-controlling interestsOther 4.8 5.8 11.9 5.5 2.6
135.9 (13.4) 300.8 112.4 1,134.6
ReservesProperty revaluation reserve 642.7 660.5 596.7 636.5 647.5
income and expense reserve 3,075.9 3,019.1 2,989.1 2,795.2 2,684.2
cash flow hedge reserve 29.0 30.7 29.7 30.9 (1.4)
Foreign exchange translation reserve 662.7 656.1 333.6 124.9 17.1
Equity attributable to Bupa 4,410.3 4,366.4 3,949.1 3,587.5 3,347.4
Equity attributable to non-controlling interests 33.6 29.7 36.8 37.0 16.5
Total equity 4,443.9 4,396.1 3,985.9 3,624.5 3,363.9
FIVE yEAR FINANCIAL SUMMARy

112 Bupa Annual Report 2011
I N T E R N ATI O N A L F I N A N C I A L R E p O R TI N G S TA N dA R d S R E L E VA N T TO B U pA
International Financial Reporting Standards (IFRSs) iFRs 3 Business combinations iFRs 4 insurance contracts iFRs 5 non-current assets held for sale and discontinued operations iFRs 7 Financial instruments: DisclosuresiFRs 8 Operating segments
International Accounting Standards (IAS)iAs 1 Presentation of financial statements iAs 2 inventories iAs 7 cash flow statements iAs 8 Accounting policies, changes in accounting estimates and errors iAs 10 events after the balance sheet date iAs 12 income taxes iAs 16 Property, plant and equipment iAs 17 leases iAs 18 Revenue iAs 19 employee benefits iAs 21 the effects of changes in foreign exchange rates iAs 23 Borrowing costsiAs 24 Related party disclosuresiAs 27 consolidated and separate financial statements iAs 28 investments in associates iAs 31 interests in joint venturesiAs 32 Financial instruments: Presentation iAs 36 impairment of assets iAs 37 Provisions, contingent liabilities and contingent assets iAs 38 intangible assets iAs 39 Financial instruments: Recognition and measurement iAs 40 investment property
InterpretationsiFRic 4 Determining whether an arrangement contains a leaseiFRic 9 Reassessment of embedded derivativesiFRic 12 service concession arrangementsiFRic 13 customer loyalty programmesiFRic 14 the limit on a defined benefit asset, minimum funding requirements and their interactioniFRic 16 Hedges of a net investment in a foreign operationiFRic 17 Distributions of non-cash assets to ownersiFRic 18 transfer of assets from customerssic 12 consolidation: special purpose entitiessic 15 Operating leases – incentivessic 27 evaluating the substance of transactions involving the legal form of a leasesic 32 intangible assets – website costs

This report has been printed on UPM Fine – an FSC® certified paper containing 100% ECF pulp and manufactured at a mill accredited with the ISO 14001 and EMAS environmental standards.
This report is printed by an FSC and ISO 14001 certified printer using vegetable oil-based inks and an alcohol free (0% IPA) process. The carbon footprint of this publication was calculated and carbon credits bought to offset and make this publication completely CarbonNeutral®. These carbon credits are invested in projects around the world that save equivalent amounts of CO2.
Designed and produced by Salterbaxter.
Printed by Pureprint. Pureprint are ISO 14001:2004, FSC certified and CarbonNeutral®.

Registered officeBupa House15–19 Bloomsbury WayLondon WC1A 2BA
For further copies of this document+44 (0)20 7656 2300
Press office+44 (0)20 7656 2454
www.bupa.com
The British United Provident Association Limited is a company limited by guarantee.
Registered in England No. 432511.
‘Bupa’ and the Heartbeat logo are registered service marks.
RA / 2011