Embed Size (px)
Citation preview

WELLNESSWELLNESSWELLNESSWELLNESSWELLNESS
PREVENTIONPREVENTIONPREVENTIONPREVENTIONPREVENTIONMANAGEMENTMANAGEMENTMANAGEMENTMANAGEMENTMANAGEMENT
&MANAGEMENT
&MANAGEMENT
&&&&TREATMENT
&TREATMENT
&TREATMENT CURECURECURECURECURE
A N N U A L R E P O R T 2 0 1 3


Being almost spherical in shape, the apple signifies totality and
unity. The variety of colored apples are symbolic of the colors
of life. They also symbolize the spectrum of healthcare needs
addressed by Sanofi, ranging from wellness to prevention to
management, treatment and cure.
WELLNESS, PREVENTION,MANAGEMENT & TREATMENT, CURE

CONTENTS
Vision 05
Mission 05
Group Profile 07
Group History 08
Our Culture 10
Our Values 12
Strategic Objectives 18
Corporate Profile 20
Company Information 21
Directors’ Profile 22
Corporate Structure 24
Organization Chart 24
Management Committee 25
Corporate Governance 26
Therapeutic Areas & Products 28
Social Media 64
Business Development 65
Medical 66
Transparency Initiative 68
Quality Matters 69
Industrial Affairs 70
Human Resources 74
Corporate Social Responsibility 76
Ethics & Compliance 82
Calendar of Major Events 84
Review Report to the Members 85
Statement of Compliance 86
Directors’ Report 88
Auditors’ Report to the Members 105
Balance Sheet 106
Profit and Loss Account 107
Statement of Comprehensive Income 108
Cash Flow Statement 109
Statement of Changes in Equity 110
Notes to the Financial Statements 111
Pattern of Shareholding 150
Analytical Review 152
Statement of Value Added 154
Operating & Financial Highlights 155
Horizontal Analysis 160
Vertical Analysis 161
Notice of Meeting 162
Glossary 163
Proxy Form

04 ANNUAL REPORT 2013
To enhance the quality of life of the greatest number through providing a continuum of care by
answering unmet medical needs of the community and promoting access to quality healthcare.
OUR MISSION
To be a diversified healthcare leader, focused on patients’ needs.
OUR VISION
05

06 ANNUAL REPORT 2013
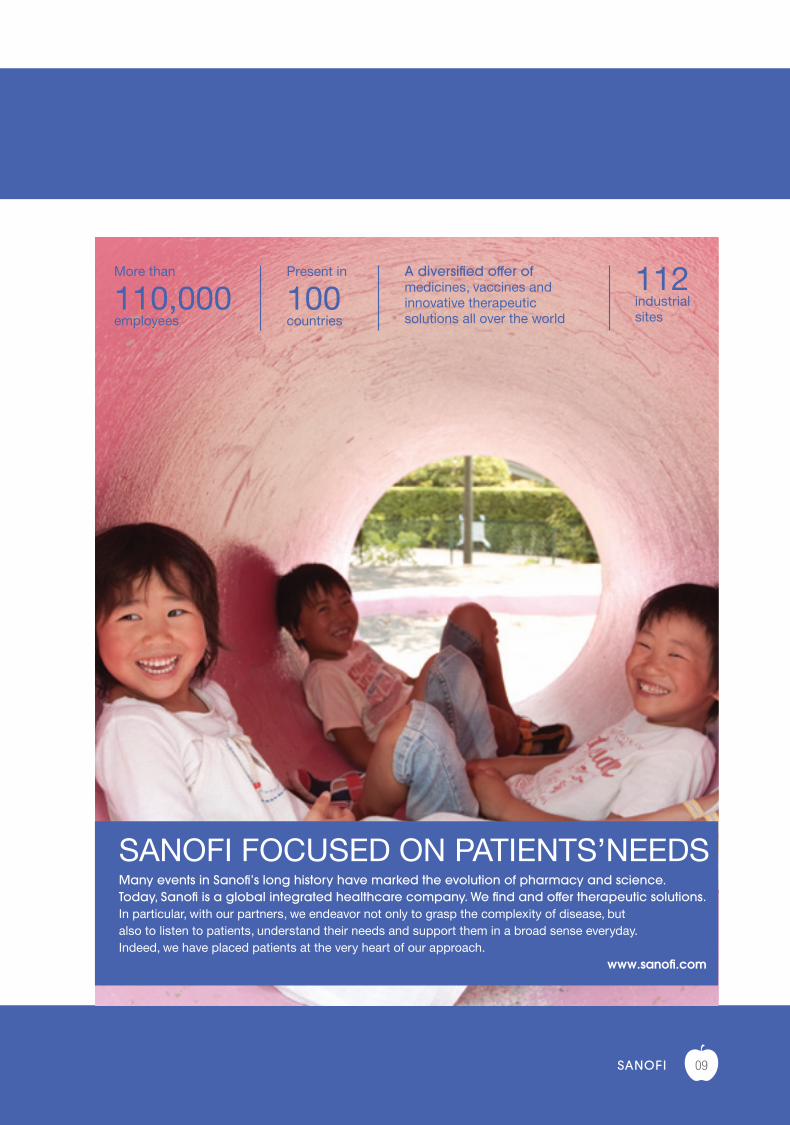
Sanofi, a global integrated healthcare leader, focused on patients’ needs.
Sanofi has core strengths in healthcare, with 7 growth platforms: diabetes solutions, human
vaccines, innovative drugs, consumer healthcare, emerging markets, animal health and Genzyme.
Through the acquisition of Genzyme, Sanofi has strongly reinforced its footprint in rare diseases.
2013 net sales: € 32.9 billion.
GROUP PROFILE
07
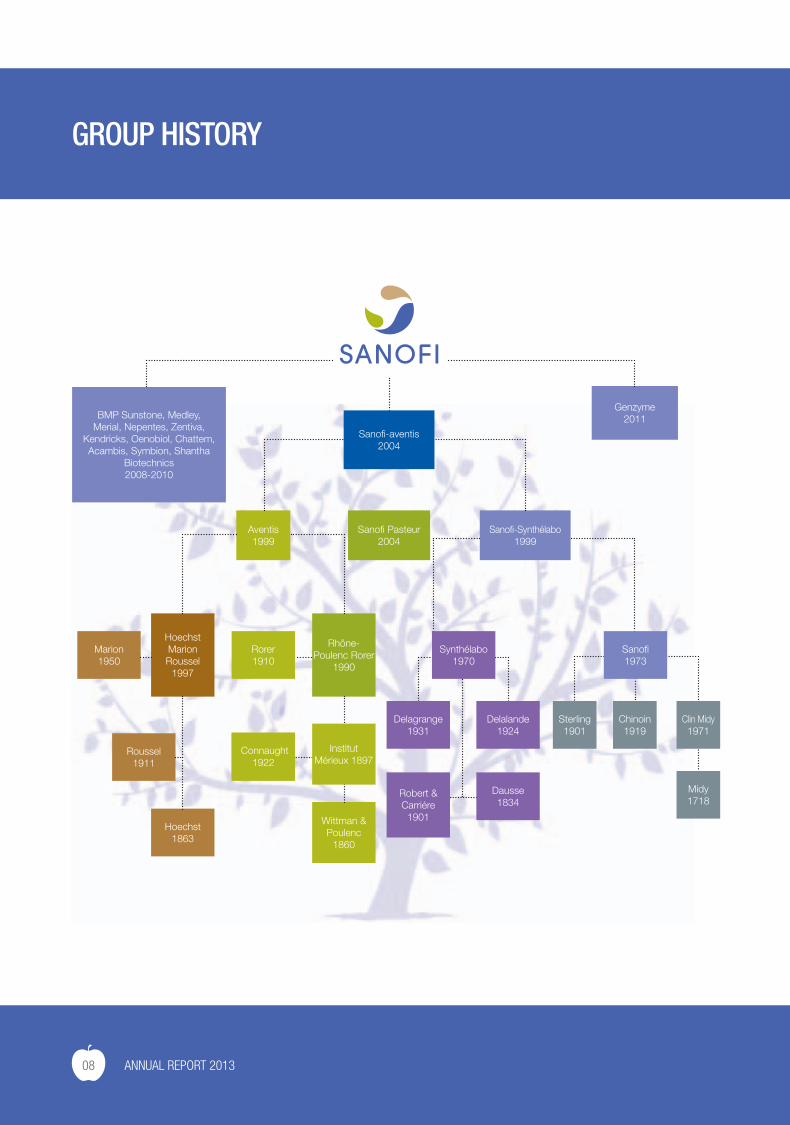
BMP Sunstone, Medley,Merial, Nepentes, Zentiva,
Kendricks, Oenobiol, Chattem, Acambis, Symbion, Shantha
Biotechnics2008-2010
Genzyme2011
Sanofi Pasteur 2004
Aventis1999
Marion1950
Roussel1911
Hoechst1863
Wittman & Poulenc
1860
HoechstMarion Roussel
1997
Rhône-Poulenc Rorer
1990
Sanofi-Synthélabo1999
Rorer1910
Rorer1910
Connaught1922
Institut Mérieux 1897
Chinoin1919
Sterling1901
Clin Midy1971
Sanofi1973
Midy1718
Sanofi-aventis2004
Delagrange1931
Delalande1924
Synthélabo1970
Robert & Carriére
1901
Dausse1834
GROUP HISTORY
08 ANNUAL REPORT 2013
09
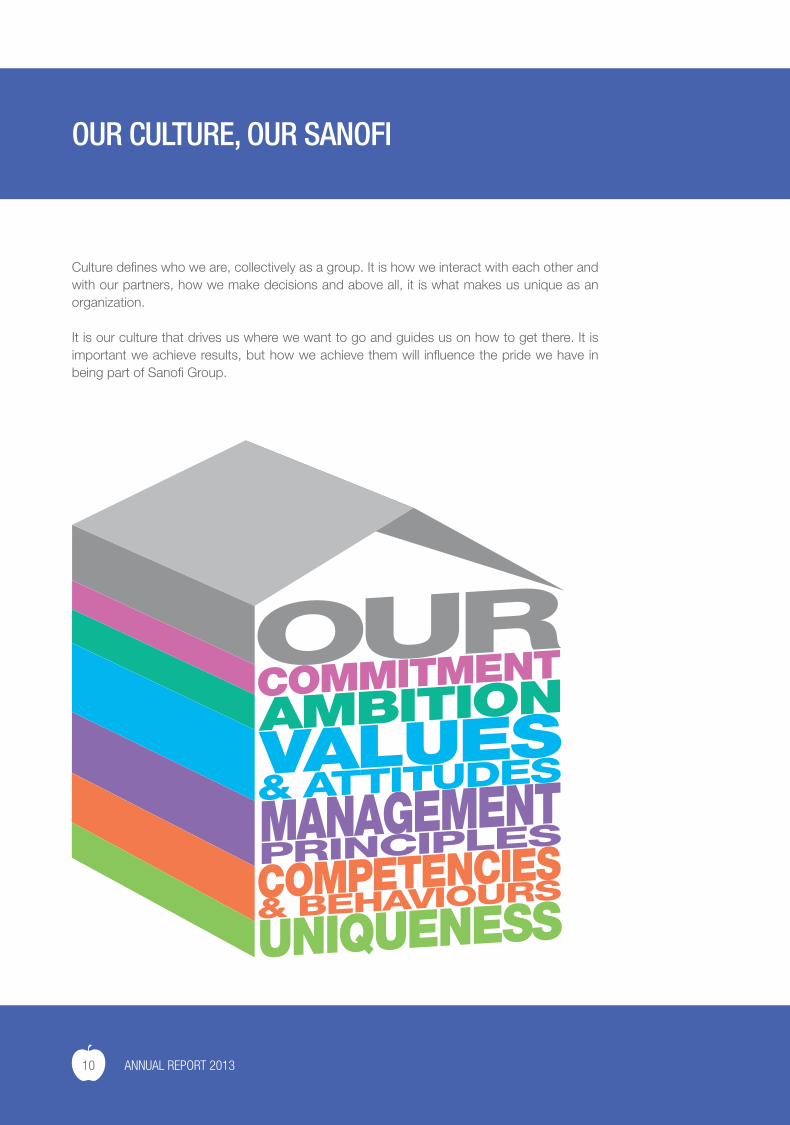
OUR CULTURE, OUR SANOFI
Culture defines who we are, collectively as a group. It is how we interact with each other and with our partners, how we make decisions and above all, it is what makes us unique as an organization.
It is our culture that drives us where we want to go and guides us on how to get there. It is important we achieve results, but how we achieve them will influence the pride we have in being part of Sanofi Group.
10 ANNUAL REPORT 2013
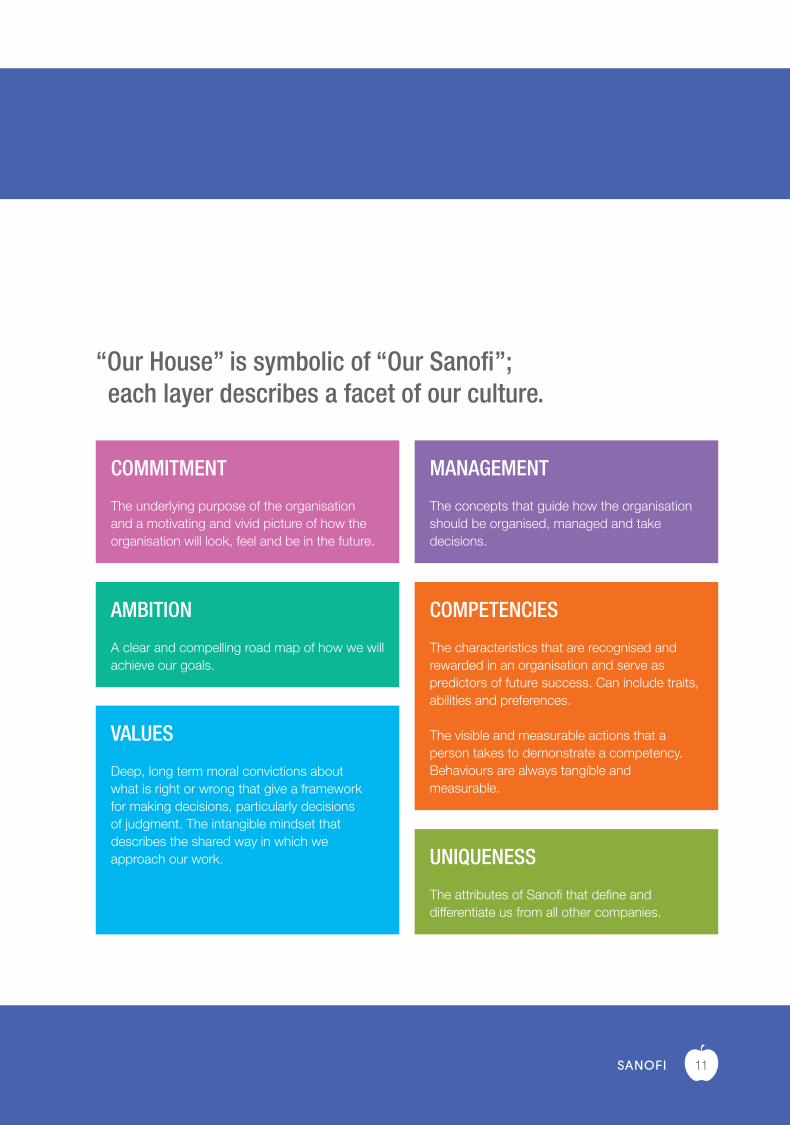
COMMITMENT
The underlying purpose of the organisation and a motivating and vivid picture of how the organisation will look, feel and be in the future.
AMBITION
A clear and compelling road map of how we will achieve our goals.
VALUES
Deep, long term moral convictions about what is right or wrong that give a framework for making decisions, particularly decisions of judgment. The intangible mindset that describes the shared way in which we approach our work.
MANAGEMENT
The concepts that guide how the organisation should be organised, managed and take decisions.
UNIQUENESS
The attributes of Sanofi that define and differentiate us from all other companies.
COMPETENCIES
The characteristics that are recognised and rewarded in an organisation and serve as predictors of future success. Can include traits, abilities and preferences.
The visible and measurable actions that a person takes to demonstrate a competency. Behaviours are always tangible and measurable.
“Our House” is symbolic of “Our Sanofi”; each layer describes a facet of our culture.
11
CONFIDENCE
We are confident; standing up for what we believe in and pursuing our goals passionately. Always resilient, we dare to challenge the norm.
OUR VALUES
12 ANNUAL REPORT 2013
INTEGRITY
We commit to maintain the highest ethical and quality standards without compromise.
13
INNOVATION
We encourage our people and partners to embrace creative solutions and excel through entrepreneurship.
OUR VALUES
14 ANNUAL REPORT 2013
RESPECT
We recognise and respect the diversity and needs of our people, patients and partners, ensuring transparent and constructive interactions through mutual trust.
15
OUR VALUES
16 ANNUAL REPORT 2013
SOLIDARITY
We are united in shared responsibility for our actions, our people, the well being of our patients and in achieving a sustainable impact on the environment.
17
STRATEGIC OBJECTIVES
At the heart of everything we do are people. Through our vaccines and medicines, we help prevent and where needed, treat those in need. As economies and societies evolve, we need healthy populations to meet future challenges. Healthcare needs have changed and will continue to do so and as an industry we have to adapt to meet these needs.
To have a real impact, we have to build a sustainable business to invest in delivering innovative solutions. At the same time we need to improve access to medicines and improved healthcare. In order to move along in this ambition, we continue to push forward with our key strategic priorities:
1. Be a global healthcare leader with synergistic platforms
We have significantly transformed the Group to be focused on the seven strategic growth platforms of diabetes, vaccines, consumer healthcare, rare diseases & multiple sclerosis, other innovative
products, animal health and emerging markets. Not only will these enable us to improve access to quality healthcare and meet unmet needs, but they will also deliver the sustainable growth required to allow us to continue to invest in innovative research & development.
Our ambition is to offer an integrated set of businesses within the healthcare space with opportunities to create synergies across activities, both upstream and at an R&D level and downstream in the market place.
2. Bring innovative products to the market
R&D has always been and will continue to be the cornerstone of our company. The advancements in science mean that more targeted, more effective treatments are within reach and we are ready to take on this challenge. We have built a revitalized R&D organization centered on patients’ needs and delivering truly innovative solutions.
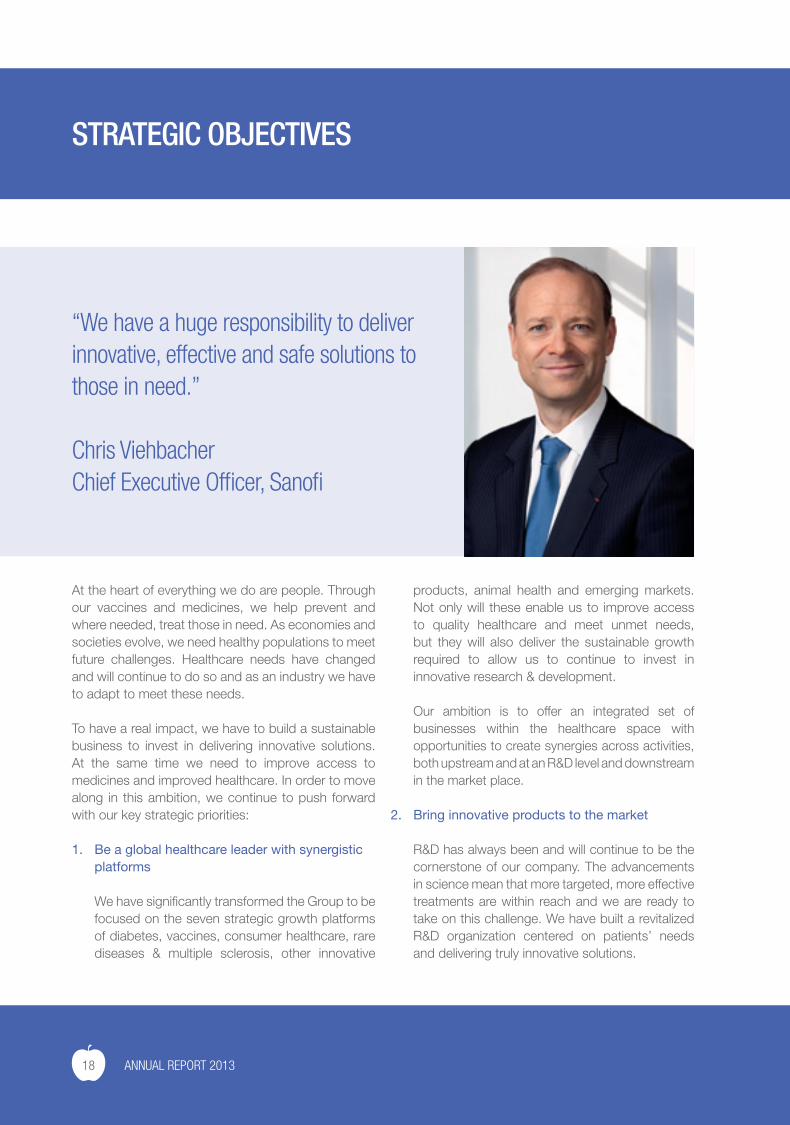
“We have a huge responsibility to deliver innovative, effective and safe solutions to those in need.”
Chris ViehbacherChief Executive Officer, Sanofi
18 ANNUAL REPORT 2013
3. Seizing value-enhancing growth opportunities
The changing face of the industry, healthcare needs and scientific discovery led us to the realization that we need to diversify to grow the business. We need to look outside at partnerships and acquisitions to succeed in delivering future innovative solutions. We have been successful in searching out the best science and the best companies to acquire and partner with. We have strongly reinforced our business in particular areas such as diabetes, oncology, rare diseases and consumer healthcare. We will continue to look for opportunities and partner with the best, whomever and wherever they may be.
4. Adapt structure for future challenges and opportunities
The successful companies of tomorrow are those that go beyond delivering products to delivering real solutions and services. We have identified and delivered on our growth platforms and we have undergone a deep organizational transformation. We have evolved our R&D model and have expanded our footprint in biotechnology through the acquisition of Genzyme and refocused regional and global operations to be ready to meet the next challenge and opportunity around the corner.
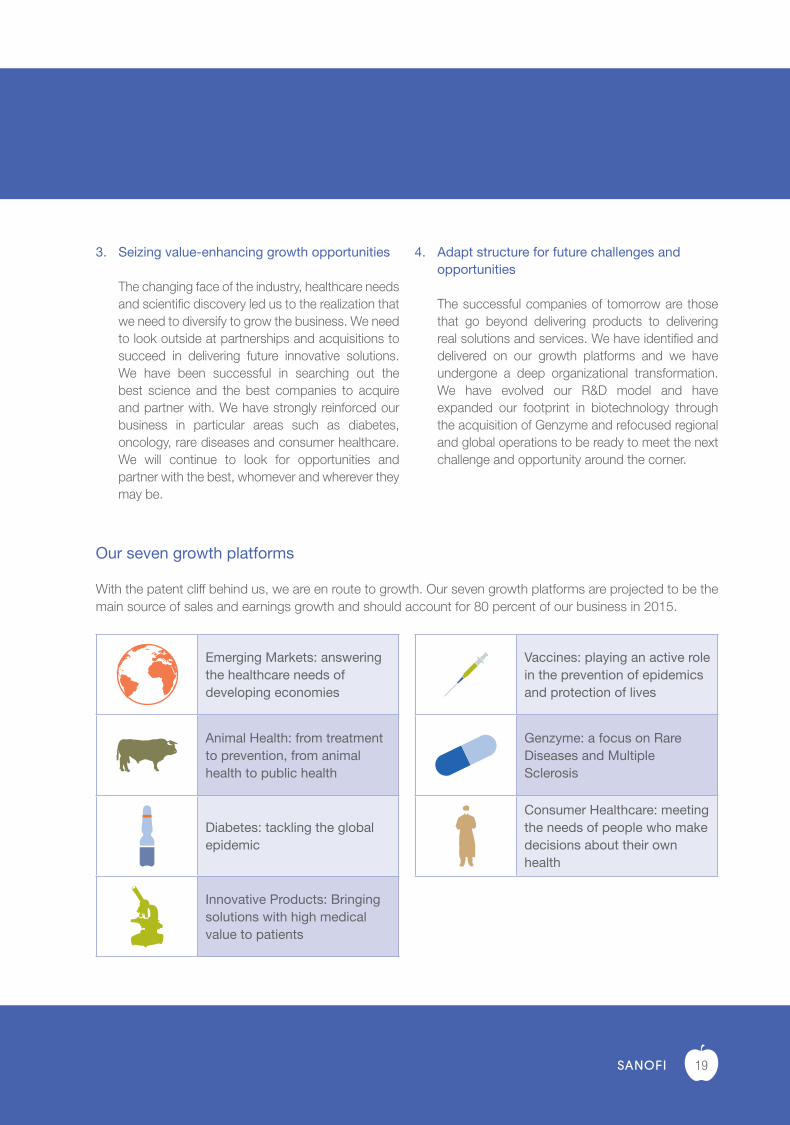
Our seven growth platforms
With the patent cliff behind us, we are en route to growth. Our seven growth platforms are projected to be the main source of sales and earnings growth and should account for 80 percent of our business in 2015.
Emerging Markets: answering the healthcare needs of developing economies
Animal Health: from treatment to prevention, from animal health to public health
Diabetes: tackling the global epidemic
Innovative Products: Bringing solutions with high medical value to patients
Vaccines: playing an active role in the prevention of epidemics and protection of lives
Genzyme: a focus on Rare Diseases and Multiple Sclerosis
Consumer Healthcare: meeting the needs of people who make decisions about their own health
19
May & Bakers Pakistan (Private) Ltd.1968
Rhone-Poulenc Rorer Pakistan (Pvt) Ltd.1999
Aventis Pharma (Pakistan) Limited2000
Hoechst Marion Roussel (Pakistan) Limited1996
Hoechst Pakistan Limited1967
Aventis limited2003
sanofi-aventis Pakistan limited2005
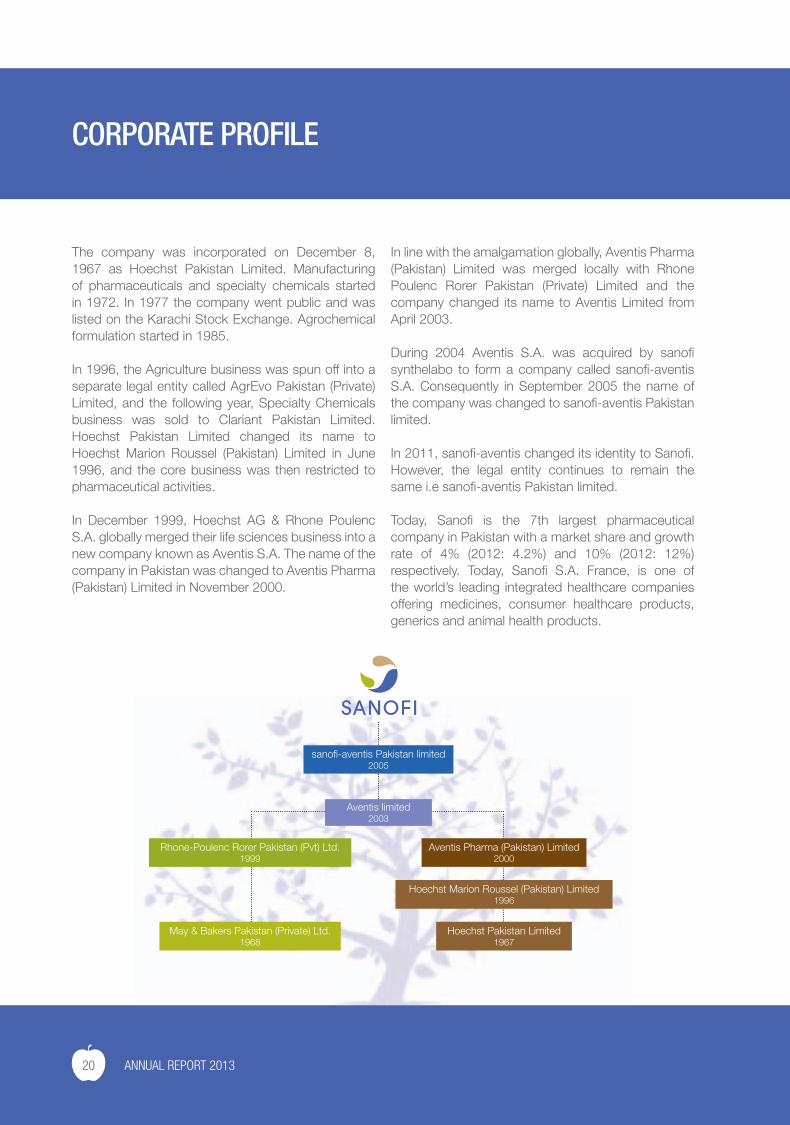
CORPORATE PROFILE
The company was incorporated on December 8, 1967 as Hoechst Pakistan Limited. Manufacturing of pharmaceuticals and specialty chemicals started in 1972. In 1977 the company went public and was listed on the Karachi Stock Exchange. Agrochemical formulation started in 1985.
In 1996, the Agriculture business was spun off into a separate legal entity called AgrEvo Pakistan (Private) Limited, and the following year, Specialty Chemicals business was sold to Clariant Pakistan Limited. Hoechst Pakistan Limited changed its name to Hoechst Marion Roussel (Pakistan) Limited in June 1996, and the core business was then restricted to pharmaceutical activities.
In December 1999, Hoechst AG & Rhone Poulenc S.A. globally merged their life sciences business into a new company known as Aventis S.A. The name of the company in Pakistan was changed to Aventis Pharma (Pakistan) Limited in November 2000.
In line with the amalgamation globally, Aventis Pharma (Pakistan) Limited was merged locally with Rhone Poulenc Rorer Pakistan (Private) Limited and the company changed its name to Aventis Limited from April 2003.
During 2004 Aventis S.A. was acquired by sanofi synthelabo to form a company called sanofi-aventis S.A. Consequently in September 2005 the name of the company was changed to sanofi-aventis Pakistan limited.
In 2011, sanofi-aventis changed its identity to Sanofi. However, the legal entity continues to remain the same i.e sanofi-aventis Pakistan limited.
Today, Sanofi is the 7th largest pharmaceutical company in Pakistan with a market share and growth rate of 4% (2012: 4.2%) and 10% (2012: 12%) respectively. Today, Sanofi S.A. France, is one of the world’s leading integrated healthcare companies offering medicines, consumer healthcare products, generics and animal health products.
20 ANNUAL REPORT 2013
COMPANY INFORMATION
Board of Directors
Syed Babar Ali Chairman
Tariq Wajid Chief Executive
Arshad Ali Gohar
Syed Hyder Ali
Dr. Pius Hornstein (Alternate Laila Khan)
Francois Jean Louis Briens (Alternate Shakeel Mapara)
Jean-Marc Georges (Alternate Syed Muhammad Ali Hasani)
Mohammad Ibadullah
Dr. Amanullah Khan
Company Secretary
Saad Usman
Auditors
Ernst & Young Ford Rhodes Sidat Hyder
Chartered Accountants
Legal Advisors
Bilal Law Associates
Ghani Law Associates
Haidermota & Co.
Saadat Yar Khan & Co.
Registered Office
Plot 23, Sector 22, Korangi Industrial Area,
Karachi - 74900
Postal Address
P.O. Box No. 4962, Karachi - 74000
Contact
Tel : +92 21 3506 0221-35
URL
www.sanofi.com.pk
www.sanofidiabetes.com.pk
Registrars & Share Transfer Office
FAMCO Associates (Pvt.) Ltd.
8-F, Next to Hotel Faran, Nursery,
Block-6, P.E.C.H.S., Shahra-e-Faisal,
Karachi
Tel : +92 21 34380101-5
Fax : +92 21 34380106
URL : www.famco.com.pk
Bankers
Bank of Tokyo-Mitsubishi UFJ, Limited
Barclays Bank PLC
Citibank, N.A.
Deutsche Bank AG
Habib Bank Limited
HSBC Bank Middle East Limited
MCB Bank Limited.
National Bank of Pakistan
Standard Chartered Bank
21
DIRECTORS’ PROFILE
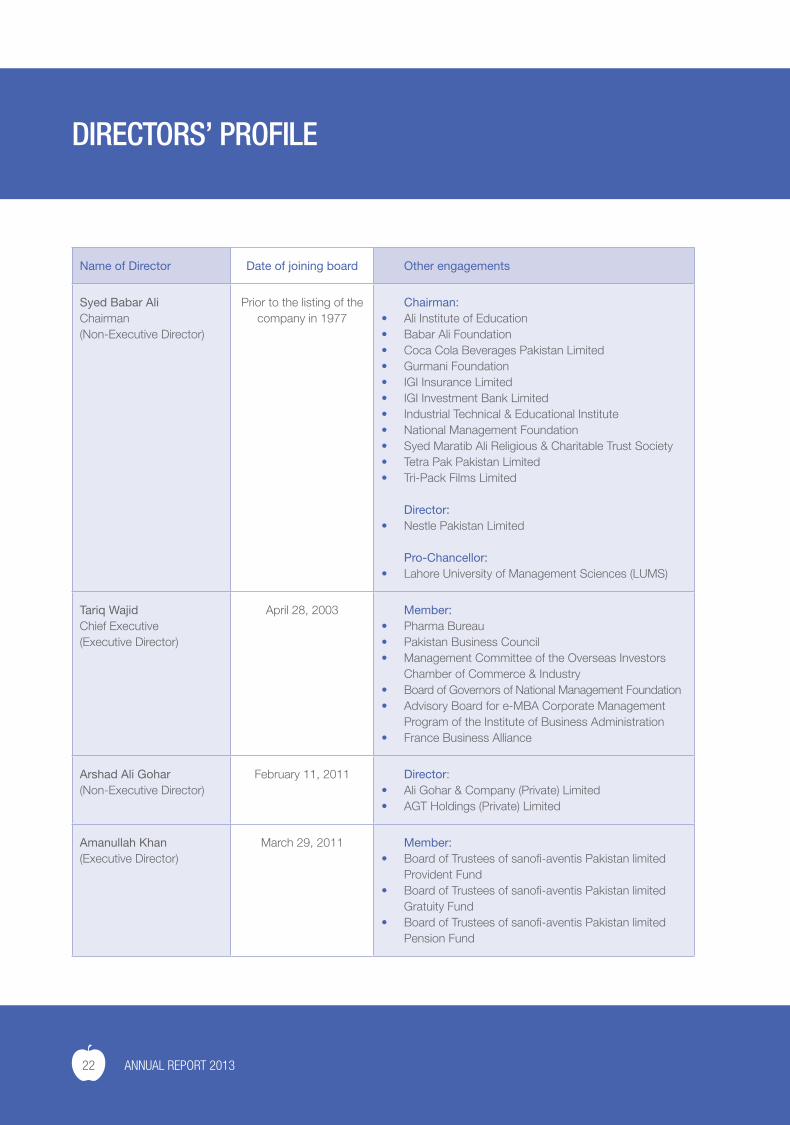
Name of Director Date of joining board Other engagements
Syed Babar AliChairman(Non-Executive Director)
Prior to the listing of the company in 1977
Chairman:• Ali Institute of Education• Babar Ali Foundation• Coca Cola Beverages Pakistan Limited• Gurmani Foundation• IGI Insurance Limited• IGI Investment Bank Limited• Industrial Technical & Educational Institute• National Management Foundation• Syed Maratib Ali Religious & Charitable Trust Society• Tetra Pak Pakistan Limited• Tri-Pack Films Limited
Director:• Nestle Pakistan Limited
Pro-Chancellor:• Lahore University of Management Sciences (LUMS)
Tariq WajidChief Executive(Executive Director)
April 28, 2003 Member:• Pharma Bureau• Pakistan Business Council• Management Committee of the Overseas Investors
Chamber of Commerce & Industry• Board of Governors of National Management Foundation• Advisory Board for e-MBA Corporate Management
Program of the Institute of Business Administration• France Business Alliance
Arshad Ali Gohar(Non-Executive Director)
February 11, 2011 Director:• Ali Gohar & Company (Private) Limited• AGT Holdings (Private) Limited
Amanullah Khan(Executive Director)
March 29, 2011 Member:• Board of Trustees of sanofi-aventis Pakistan limited
Provident Fund • Board of Trustees of sanofi-aventis Pakistan limited
Gratuity Fund• Board of Trustees of sanofi-aventis Pakistan limited
Pension Fund
22 ANNUAL REPORT 2013
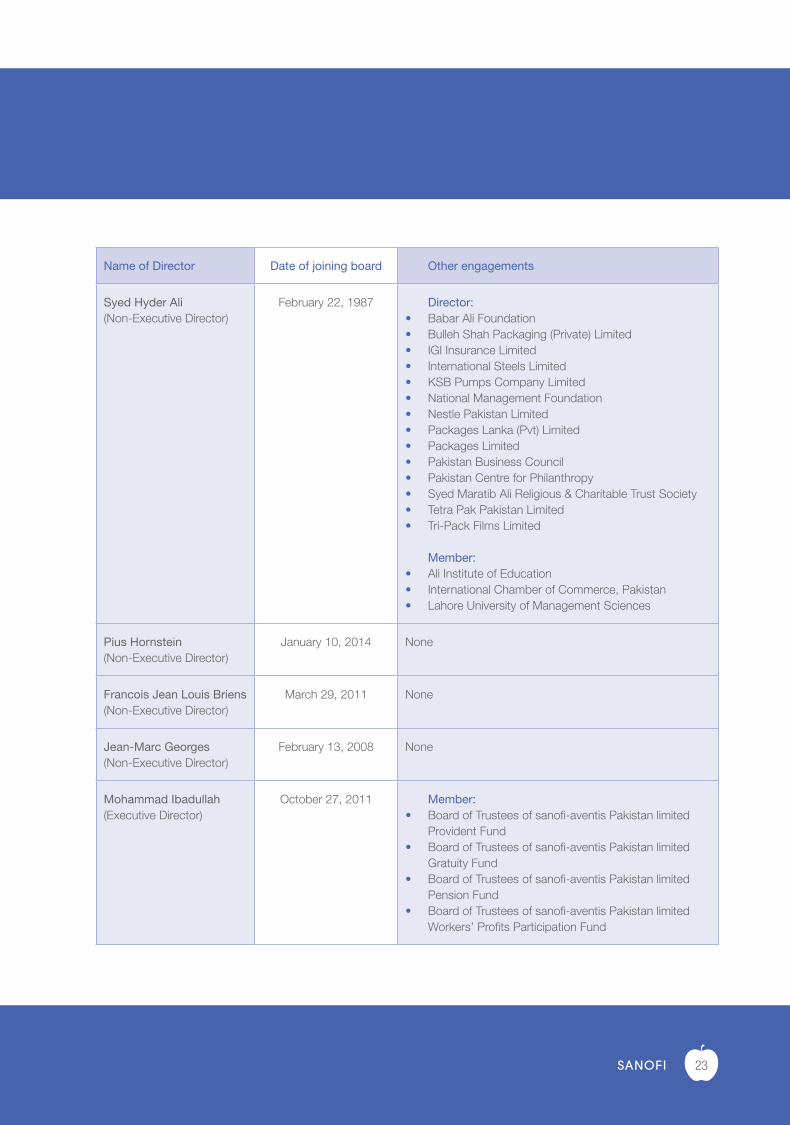
Name of Director Date of joining board Other engagements
Syed Hyder Ali(Non-Executive Director)
February 22, 1987 Director:• Babar Ali Foundation• Bulleh Shah Packaging (Private) Limited• IGI Insurance Limited • International Steels Limited• KSB Pumps Company Limited• National Management Foundation• Nestle Pakistan Limited• Packages Lanka (Pvt) Limited• Packages Limited• Pakistan Business Council• Pakistan Centre for Philanthropy • Syed Maratib Ali Religious & Charitable Trust Society• Tetra Pak Pakistan Limited• Tri-Pack Films Limited
Member:• Ali Institute of Education• International Chamber of Commerce, Pakistan• Lahore University of Management Sciences
Pius Hornstein(Non-Executive Director)
January 10, 2014 None
Francois Jean Louis Briens(Non-Executive Director)
March 29, 2011 None
Jean-Marc Georges(Non-Executive Director)
February 13, 2008 None
Mohammad Ibadullah(Executive Director)
October 27, 2011 Member:• Board of Trustees of sanofi-aventis Pakistan limited
Provident Fund• Board of Trustees of sanofi-aventis Pakistan limited
Gratuity Fund• Board of Trustees of sanofi-aventis Pakistan limited
Pension Fund• Board of Trustees of sanofi-aventis Pakistan limited
Workers’ Profits Participation Fund
23
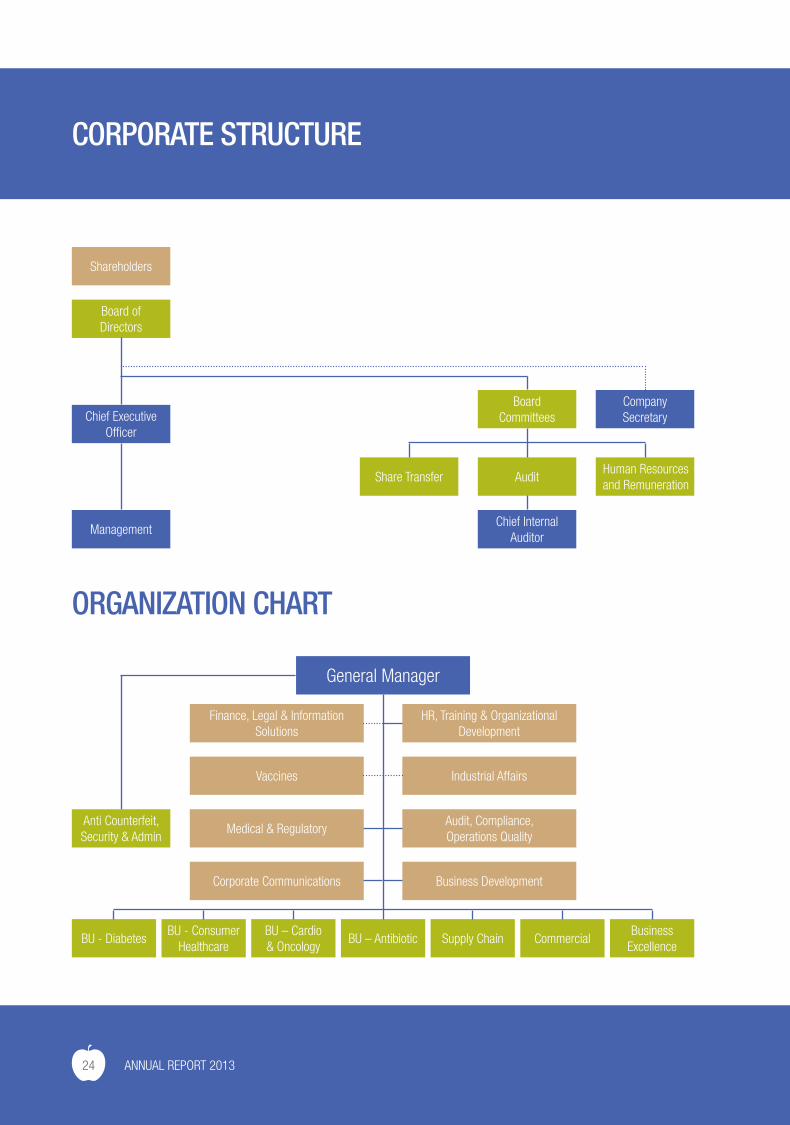
CORPORATE STRUCTURE
ORGANIZATION CHART
Chief Executive Officer
Shareholders
Board ofDirectors
Management
BoardCommittees
Chief InternalAuditor
AuditHuman Resourcesand Remuneration
Share Transfer
CompanySecretary
Anti Counterfeit, Security & Admin
Business Development
Audit, Compliance,Operations Quality
Industrial Affairs
Medical & Regulatory
Vaccines
Finance, Legal & Information Solutions
HR, Training & Organizational Development
General Manager
BU - Diabetes
Corporate Communications
BU - Consumer Healthcare
BU – Cardio& Oncology
BU – Antibiotic Supply Chain CommercialBusiness
Excellence
24 ANNUAL REPORT 2013
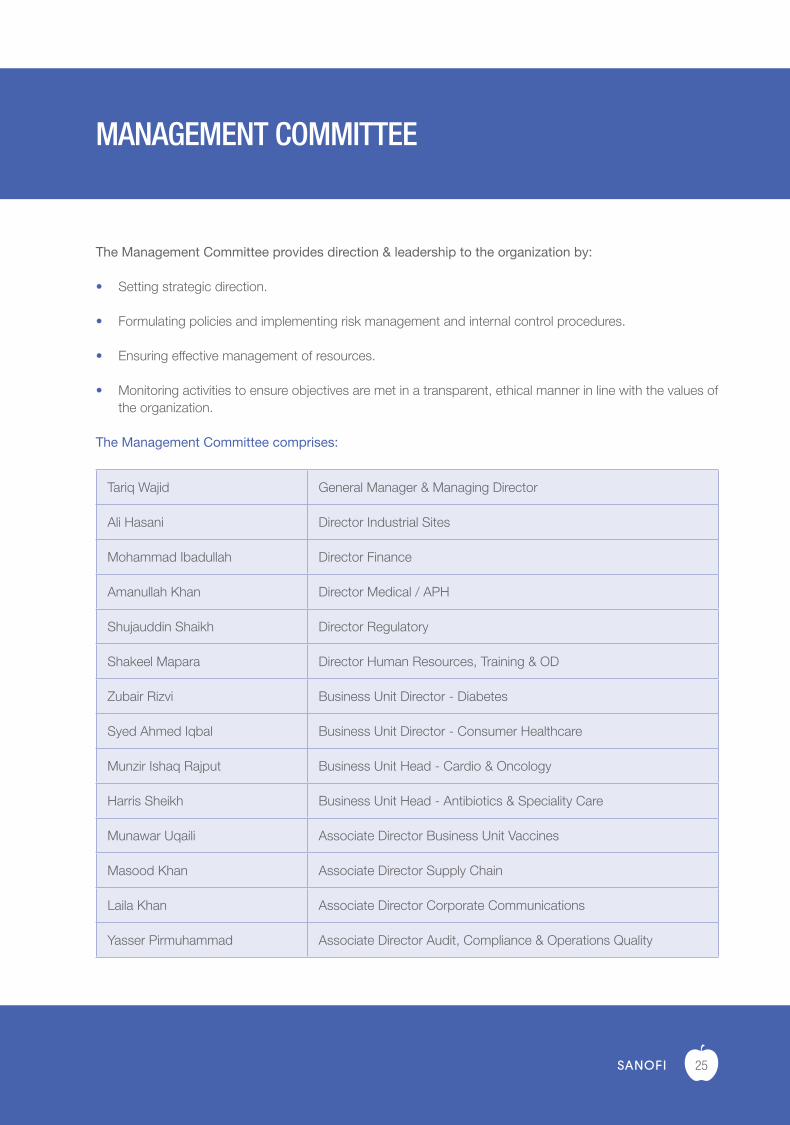
MANAGEMENT COMMITTEE
The Management Committee provides direction & leadership to the organization by:
• Setting strategic direction.
• Formulating policies and implementing risk management and internal control procedures.
• Ensuring effective management of resources.
• Monitoring activities to ensure objectives are met in a transparent, ethical manner in line with the values of the organization.
The Management Committee comprises:
Tariq Wajid General Manager & Managing Director
Ali Hasani Director Industrial Sites
Mohammad Ibadullah Director Finance
Amanullah Khan Director Medical / APH
Shujauddin Shaikh Director Regulatory
Shakeel Mapara Director Human Resources, Training & OD
Zubair Rizvi Business Unit Director - Diabetes
Syed Ahmed Iqbal Business Unit Director - Consumer Healthcare
Munzir Ishaq Rajput Business Unit Head - Cardio & Oncology
Harris Sheikh Business Unit Head - Antibiotics & Speciality Care
Munawar Uqaili Associate Director Business Unit Vaccines
Masood Khan Associate Director Supply Chain
Laila Khan Associate Director Corporate Communications
Yasser Pirmuhammad Associate Director Audit, Compliance & Operations Quality
25
CORPORATE GOVERNANCE
Corporate governance is a system of structures and processes for the direction and control of organizations. It is a process through which balance of duties and responsibilities between shareholders, management and the board are defined, enabling an organization to maintain the right balance of power and accountability while striving to achieve its objective of enhancing shareholder value. Sanofi-aventis Pakistan limited fully implements the principles of Corporate Governance in general and the Code of Corporate Governance in specific.
Orientation on Corporate Governance
The company ensures that the directors are well versed with the principles of corporate governance and are fully aware of the changes in the laws related to the governance of the organization. Consequent to the issuance of the new code of Corporate Governance in April 2012, the company arranged a detailed orientation on the new Code of Corporate Governance, specially focusing on the changes in requirement and the impact of the changes required to be implemented at sanofi.
Composition of Board and Directors’ Independence
The board comprises of 9 directors out of which 6 are non-executive directors, including 3 representing minority interests. The Chairman of the board is a non-executive director representing minority interest. The roles of Chairman and the CEO have been segregated and responsibilities have been clearly defined. The CEO is responsible for operations of the company whereas the board, under the Chairman, performs oversight responsibilities.
Performance Evaluation of the Board
The board, being the trustee of the shareholders, has
set the following broad criteria for evaluation of its performance:
• Ensuring maximum attendance at board meetings to enhance the quality of decision making as well as effective discharge of its roles & responsibilities
• Review and approval of strategic plans and significant policies
• Monitor company’s performance against planned objectives and advise the management on strategic initiatives
• Review of business risks and compliance with the applicable laws & regulations
• Establishing adequate internal control system in the company and its regular assessment through internal audit activities
• Ensuring orientation of the board of directors including new appointments so that each member is fully aware of his/ her roles & responsibilities
Performance Evaluation of the Chief Executive
The performance of the Chief Executive (CEO) is based on the criteria defined by the sanofi group, which takes into account both qualitative as well as quantitative parameters. The Board is fully aware of the criteria and is involved in the assessment of the performance of the CEO
Board Committees
In order to discharge is responsibilities and in line with the stipulations of the Code of Corporate Governance, the Board has formed the following committees
26 ANNUAL REPORT 2013
Audit Committee
The Board Audit Committee assists the Board in fulfilling its responsibilities related to the financial reporting process, the system of internal control over financial reporting, risk management and internal controls assessment and the company’s process for monitoring compliance with laws and regulations.
The Audit Committee comprises three directors, two of which are non-executive. The Chairman of the committee is a non-executive director. The committee is structured as follows:
Syed Hyder Ali ChairmanNon-executive Director
Francois-Jean Louis BriensNon-executive Director
Amanullah KhanExecutive Director
Yasser PirmuhammadSecretaryAssociate Director Audit,Compliance & Operations Quality
During the year 2013, the Audit Committee met 4 times, including one meeting which was attended by the representative of the external auditor.
Human Resource and Remuneration Committee
This Committee assists the Board of Directors in fulfilling its responsibilities in the formulation and implementation of Human Resource Policies and in the appointment, remuneration and succession
of CEO, COO, CFO, Company Secretary, Head of Internal Audit and other senior positions.
The Committee comprises of two non-executive and one executive director. The Chairman of the Committee is a non-executive director. The committee is structured as follows:
Arshad Ali GoharChairmanNon-executive Director
Syed Hyder AliNon-executive Director
Tariq WajidExecutive Director (CEO)
Shakeel MaparaSecretaryDirector Human Resource
Board Share Transfer Committee
The Board Share Transfer Committee has been authorized by the Board to approve transfer of shares. All share transfer resolutions are ratified by the board of directors in subsequent meetings. The committee is structured as follows:
Tariq WajidChief Executive and Managing Director
Mohammad IbadullahChief Financial Officer
27

Therapeutic

Areas and Products
Sanofi in its various incarnations has led the field in insulin manufacturing as well as in diabetes research and development for almost a century: from the first manufacture of insulin through to the development of Lantus® – launched a little over a decade ago and up
to the present day, where we are now investigating the possibility of regenerating the insulin-producing cells in the body. In collaboration with healthcare charities and research organisations, we are actively working to improve the lives of people with diabetes. By understanding and listening to people with diabetes, solving problems through innovation, and making innovation a reality, we strive to increase our reach and add value to the lives of even more people with diabetes worldwide.
As well as our insulin products, we have a range of award-winning delivery devices, oral therapies, and innovative blood glucose monitoring system, so that, together with our personalised services, we can offer a patient-centric partnership to people with diabetes.
DIABETES
1. International Diabetes Federation, Diabetes Atlas, 5th edition.
Worldwide, 366 million people are currently living with diabetes, and this population will grow to 552 million before 2030(1).
Building upon its century long history in this field, Sanofi is committed to improving diabetes management and has the ambition to become the leader in the fight against diabetes worldwide.
30 ANNUAL REPORT 2013
SANOFI’S RICH HERITAGE OF DEVELOPING EFFECTIVE SOLUTIONS FOR DIABETES PATIENTS
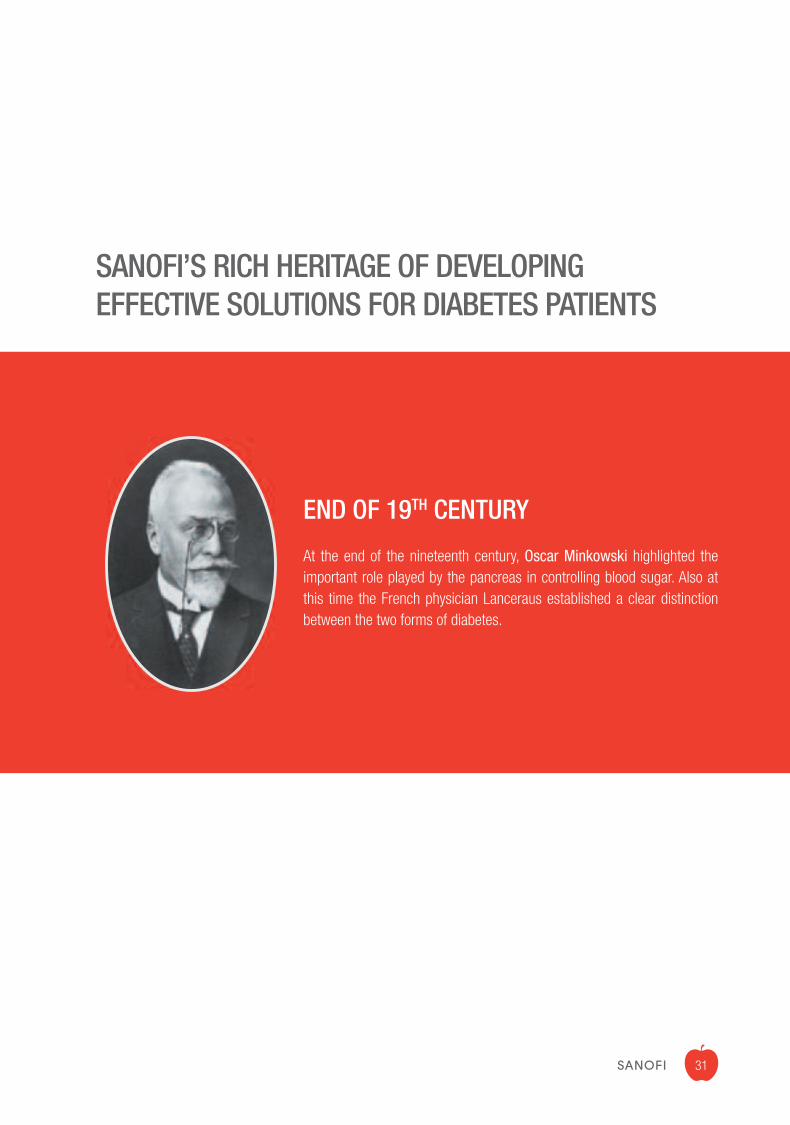
END OF 19TH CENTURY
At the end of the nineteenth century, Oscar Minkowski highlighted the important role played by the pancreas in controlling blood sugar. Also at this time the French physician Lanceraus established a clear distinction between the two forms of diabetes.
31
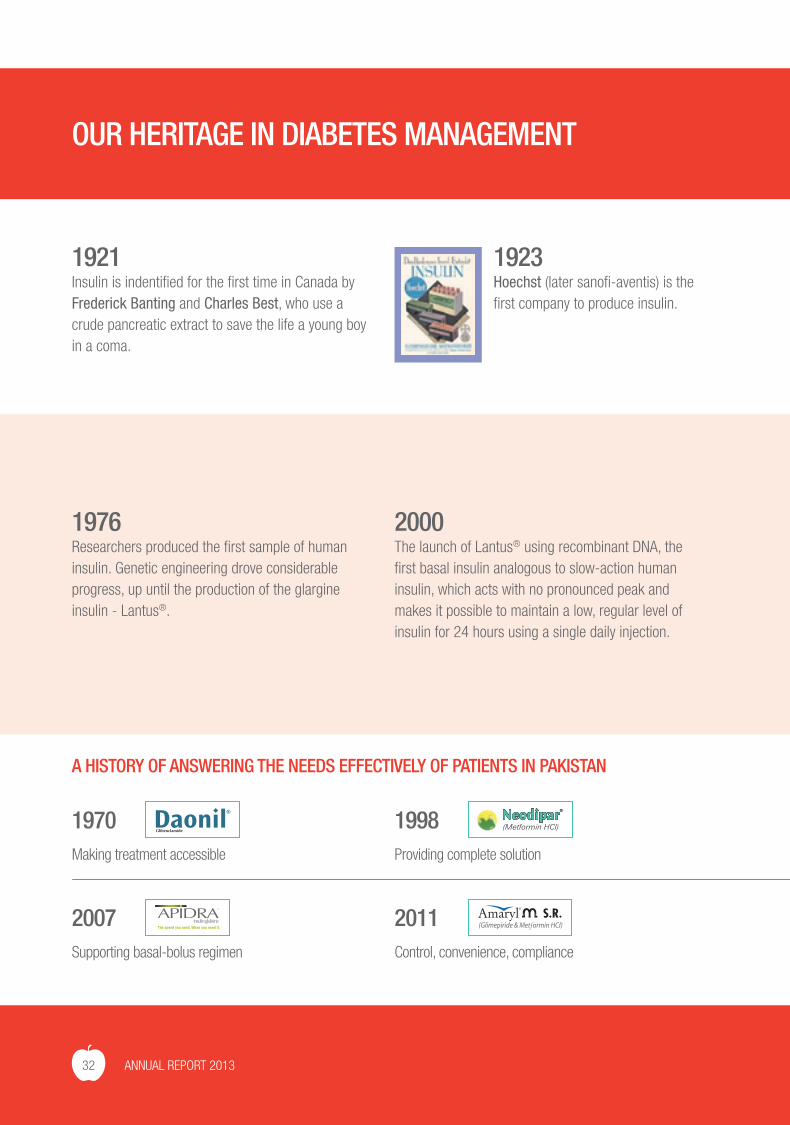
A HISTORY OF ANSWERING THE NEEDS EFFECTIVELY OF PATIENTS IN PAKISTAN
OUR HERITAGE IN DIABETES MANAGEMENT
1921Insulin is indentified for the first time in Canada by Frederick Banting and Charles Best, who use a crude pancreatic extract to save the life a young boy in a coma.
1923Hoechst (later sanofi-aventis) is the first company to produce insulin.
1976Researchers produced the first sample of human insulin. Genetic engineering drove considerable progress, up until the production of the glargine insulin - Lantus®.
2000The launch of Lantus® using recombinant DNA, the first basal insulin analogous to slow-action human insulin, which acts with no pronounced peak and makes it possible to maintain a low, regular level of insulin for 24 hours using a single daily injection.
1970Making treatment accessible
1998Providing complete solution
2007Supporting basal-bolus regimen
2011Control, convenience, compliance
32 ANNUAL REPORT 2013
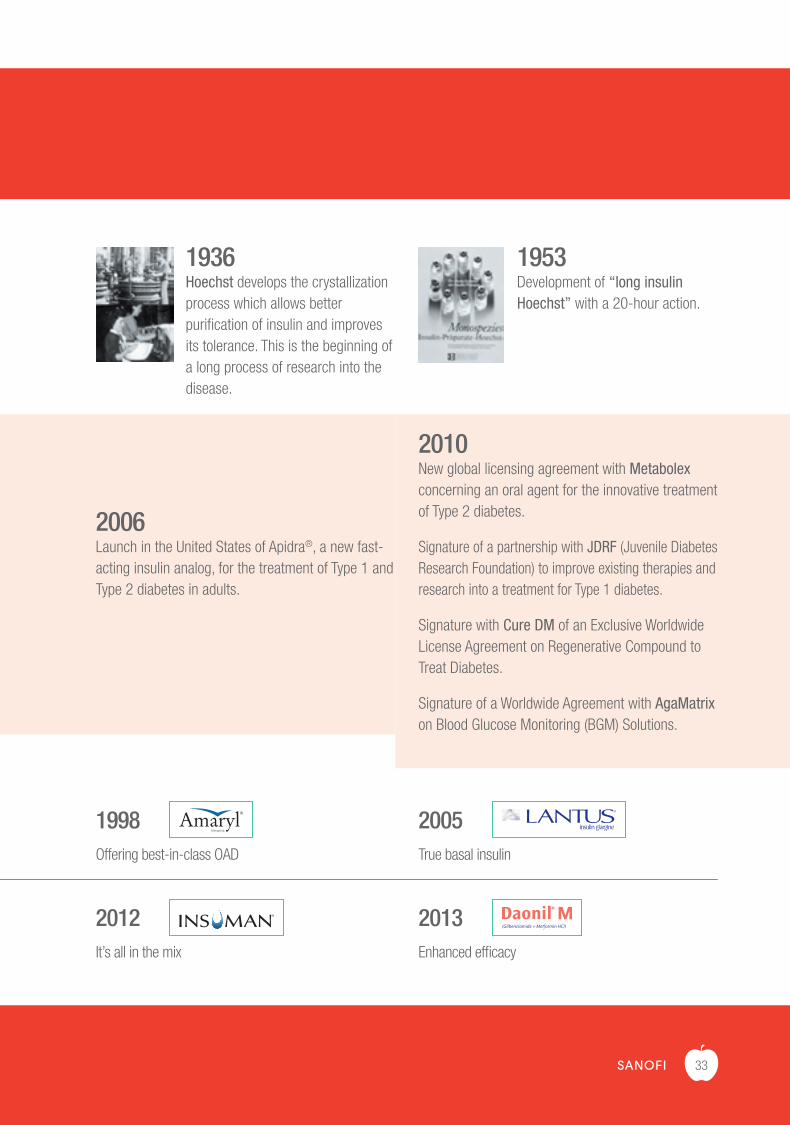
1936Hoechst develops the crystallization process which allows better purification of insulin and improves its tolerance. This is the beginning of a long process of research into the disease.
1953Development of “long insulin Hoechst” with a 20-hour action.
2006Launch in the United States of Apidra®, a new fast-acting insulin analog, for the treatment of Type 1 and Type 2 diabetes in adults.
2010New global licensing agreement with Metabolex concerning an oral agent for the innovative treatment of Type 2 diabetes.
Signature of a partnership with JDRF (Juvenile Diabetes Research Foundation) to improve existing therapies and research into a treatment for Type 1 diabetes.
Signature with Cure DM of an Exclusive Worldwide License Agreement on Regenerative Compound to Treat Diabetes.
Signature of a Worldwide Agreement with AgaMatrix on Blood Glucose Monitoring (BGM) Solutions.
1998Offering best-in-class OAD
2005True basal insulin
2012It’s all in the mix
2013Enhanced efficacy
33
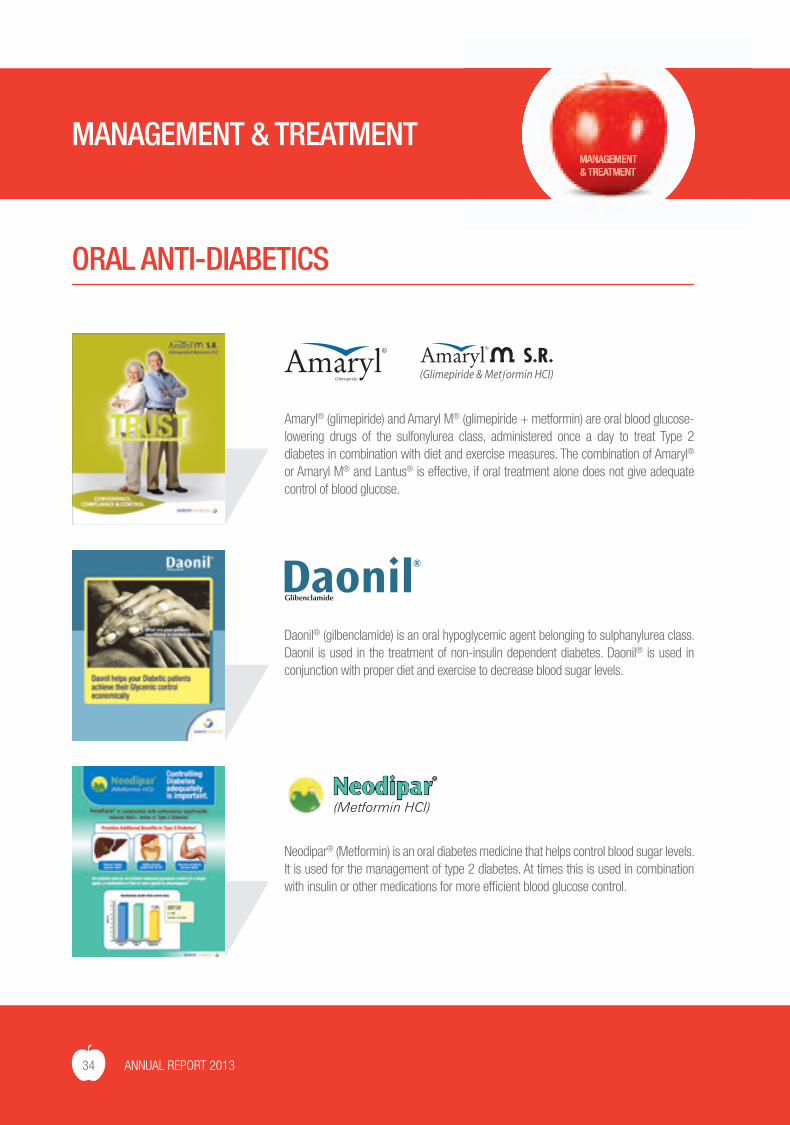
Neodipar® (Metformin) is an oral diabetes medicine that helps control blood sugar levels. It is used for the management of type 2 diabetes. At times this is used in combination with insulin or other medications for more efficient blood glucose control.
ORAL ANTI-DIABETICS
MANAGEMENT & TREATMENT
Daonil® (gilbenclamide) is an oral hypoglycemic agent belonging to sulphanylurea class. Daonil is used in the treatment of non-insulin dependent diabetes. Daonil® is used in conjunction with proper diet and exercise to decrease blood sugar levels.
Amaryl® (glimepiride) and Amaryl M® (glimepiride + metformin) are oral blood glucose-lowering drugs of the sulfonylurea class, administered once a day to treat Type 2 diabetes in combination with diet and exercise measures. The combination of Amaryl®
or Amaryl M® and Lantus® is effective, if oral treatment alone does not give adequate control of blood glucose.
MANAGEMENT& TREATMENT
34 ANNUAL REPORT 2013
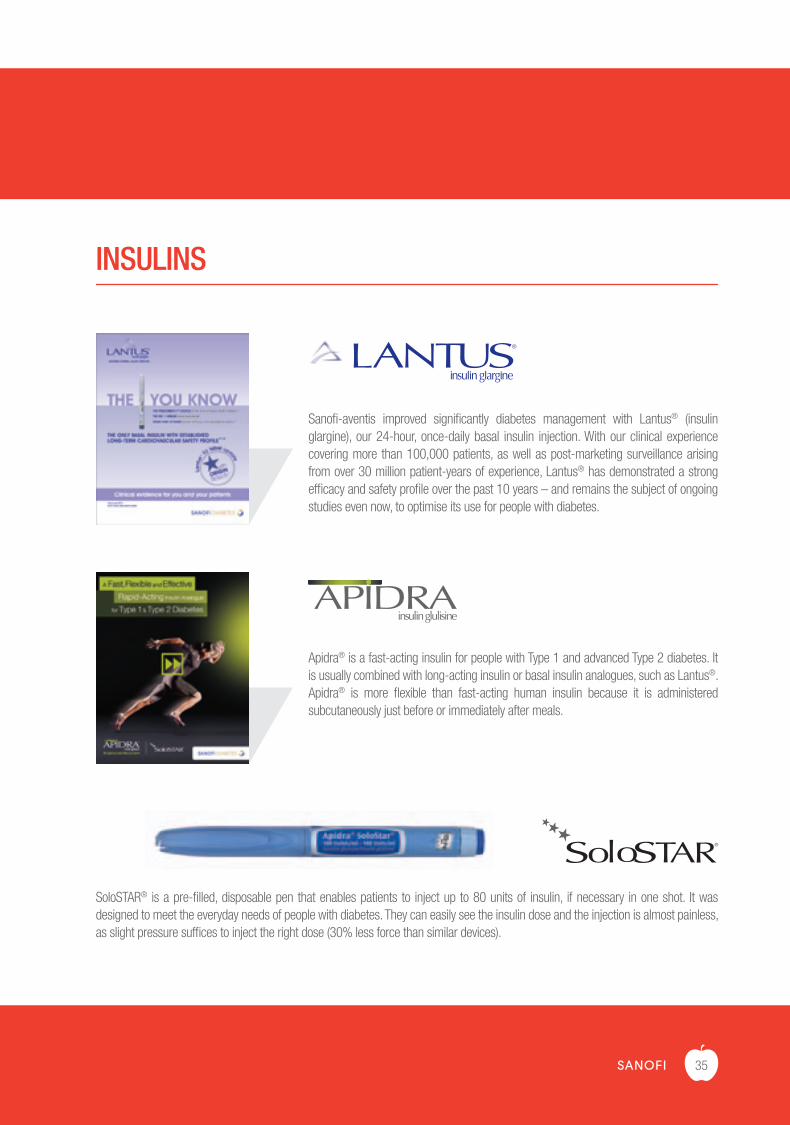
Sanofi-aventis improved significantly diabetes management with Lantus® (insulin glargine), our 24-hour, once-daily basal insulin injection. With our clinical experience covering more than 100,000 patients, as well as post-marketing surveillance arising from over 30 million patient-years of experience, Lantus® has demonstrated a strong efficacy and safety profile over the past 10 years – and remains the subject of ongoing studies even now, to optimise its use for people with diabetes.
Apidra® is a fast-acting insulin for people with Type 1 and advanced Type 2 diabetes. It is usually combined with long-acting insulin or basal insulin analogues, such as Lantus®. Apidra® is more flexible than fast-acting human insulin because it is administered subcutaneously just before or immediately after meals.
SoloSTAR® is a pre-filled, disposable pen that enables patients to inject up to 80 units of insulin, if necessary in one shot. It was designed to meet the everyday needs of people with diabetes. They can easily see the insulin dose and the injection is almost painless, as slight pressure suffices to inject the right dose (30% less force than similar devices).
INSULINS
35
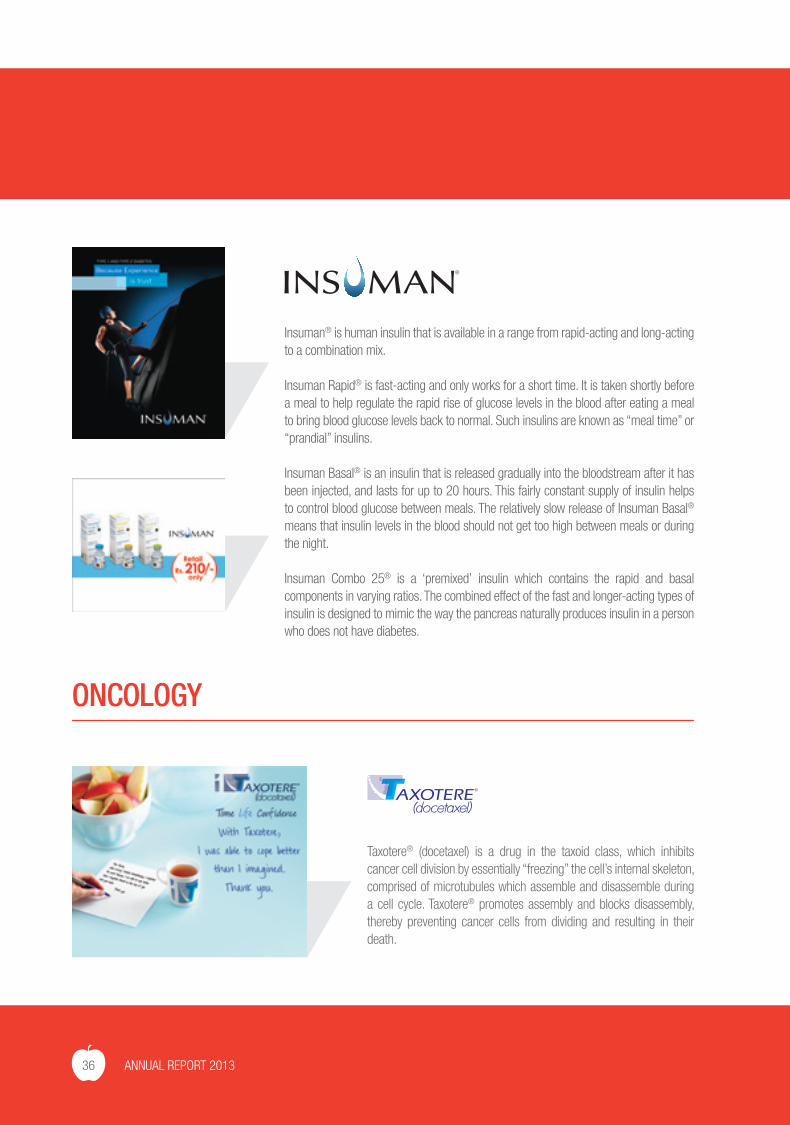
Insuman® is human insulin that is available in a range from rapid-acting and long-acting to a combination mix.
Insuman Rapid® is fast-acting and only works for a short time. It is taken shortly before a meal to help regulate the rapid rise of glucose levels in the blood after eating a meal to bring blood glucose levels back to normal. Such insulins are known as “meal time” or “prandial” insulins.
Insuman Basal® is an insulin that is released gradually into the bloodstream after it has been injected, and lasts for up to 20 hours. This fairly constant supply of insulin helps to control blood glucose between meals. The relatively slow release of Insuman Basal® means that insulin levels in the blood should not get too high between meals or during the night.
Insuman Combo 25® is a ‘premixed’ insulin which contains the rapid and basal components in varying ratios. The combined effect of the fast and longer-acting types of insulin is designed to mimic the way the pancreas naturally produces insulin in a person who does not have diabetes.
ONCOLOGY
Taxotere® (docetaxel) is a drug in the taxoid class, which inhibits cancer cell division by essentially “freezing” the cell’s internal skeleton, comprised of microtubules which assemble and disassemble during a cell cycle. Taxotere® promotes assembly and blocks disassembly, thereby preventing cancer cells from dividing and resulting in their death.
36 ANNUAL REPORT 2013
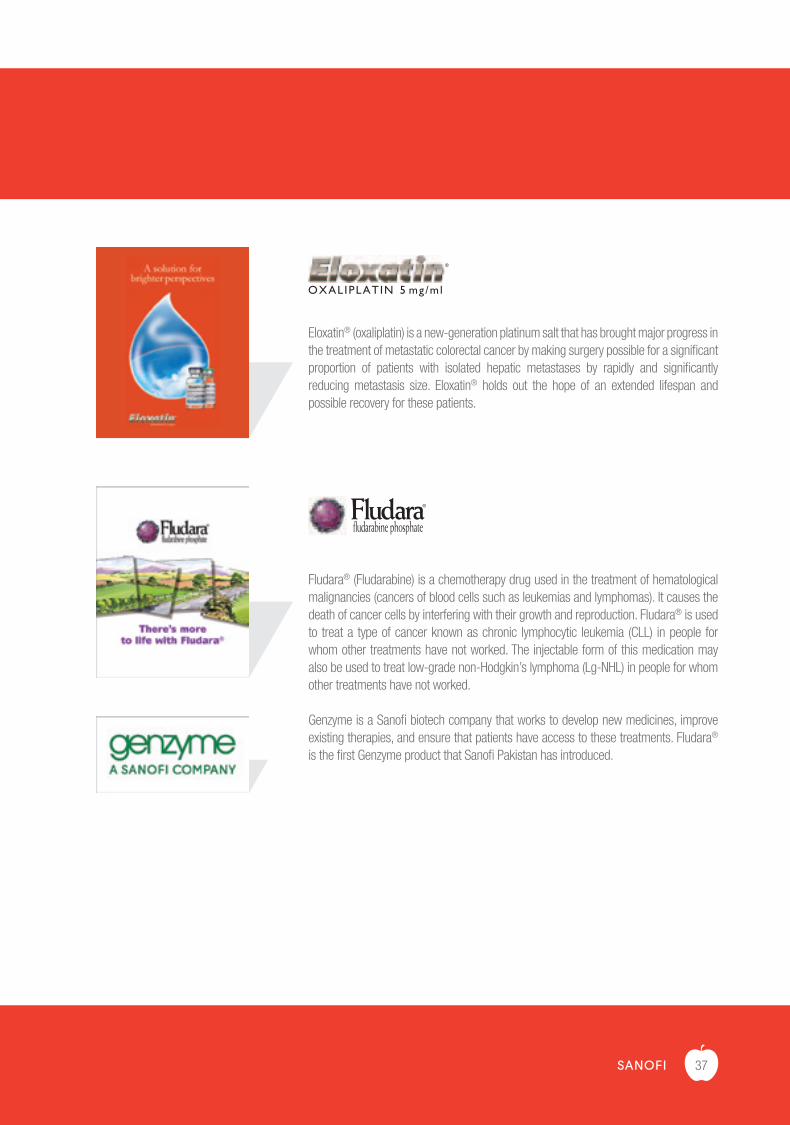
Eloxatin® (oxaliplatin) is a new-generation platinum salt that has brought major progress in the treatment of metastatic colorectal cancer by making surgery possible for a significant proportion of patients with isolated hepatic metastases by rapidly and significantly reducing metastasis size. Eloxatin® holds out the hope of an extended lifespan and possible recovery for these patients.
Fludara® (Fludarabine) is a chemotherapy drug used in the treatment of hematological malignancies (cancers of blood cells such as leukemias and lymphomas). It causes the death of cancer cells by interfering with their growth and reproduction. Fludara® is used to treat a type of cancer known as chronic lymphocytic leukemia (CLL) in people for whom other treatments have not worked. The injectable form of this medication may also be used to treat low-grade non-Hodgkin’s lymphoma (Lg-NHL) in people for whom other treatments have not worked.
Genzyme is a Sanofi biotech company that works to develop new medicines, improve existing therapies, and ensure that patients have access to these treatments. Fludara® is the first Genzyme product that Sanofi Pakistan has introduced.
37
PAIN MANAGEMENT
This is used as an antispasmodic in the management of biliary-tract, urinary-tract, and gastrointestinal spasm. This drug is indicated in the management of irritable bowel syndrome, renal colic, biliary colic, and the management of severe pain during menstruation.
Gardan® (mefanamic acid) is used to relieve mild to moderate pain including soft tissue injuries, other painful musculoskeletal conditions, headache, dental pain, post-operative pain & dysmenorrhea.
Muscoril (thiocholchicoride) is a muscle relaxant drug bundled with anti-inflammatory and analgesic properties. It is used for treating muscular spasms, and rheumatologic, orthopedic, and traumatologic disorders.
38 ANNUAL REPORT 2013

An anti-inflammatory analgesic and antipyretic. Profenid® (ketoprufen) is used in the treatment of rheumatoid arthritis, osteoarthritis and to alleviate moderate pain.
This is a narcotic medication used to manage moderate to severe pain.
ALLERGY MANAGEMENT
Telfast® is an effective and potent antihistaminic agent, devoid of sedative effects and with a prolonged duration of action allowing administration once every 12 or 24 hours. It is indicated for the treatment of hay fever and chronic idiopathic urticaria. The Telfast-D®
formulation combines this antihistaminic with a prolonged-release decongestion agent.
39
One of the oldest and most trusted antihistamine with relatively strong sedative effects, Avil® is used to treat allergic conditions such as hay fever or urticaria.
Nasacort® Allergy Nasal Spray is a once-a-day treatment for hay fever. Nasacort® prevents the body from releasing the chemicals that cause the symptoms of hay fever (sneezing, itching and a runny or blocked nose) and controls symptoms.
Phenergan® (promethazine) is one of the most established antihistamines in the local market. It is useful in perennial and seasonal allergic rhinitis, allergic conjunctivitis, urticaria and pruritis. Phenergan also prevents motion sickness, and treats nausea and vomiting after surgery and is effective in the relief of apprehension and inducing light sleep from which a patient can easily be aroused.
40 ANNUAL REPORT 2013
Rhinathiol® (carbocisteine) is a mucolytic agent for the adjunctive therapy of respiratory tract disorders characterized by excessive, viscous mucus, including otitis media with effusion (glue ear) and chronic obstructive airway disease.
Tixylix® syrup contains glycerol as the active ingredient. It is used to relieve a dry, tickly cough.
COUGH & COLD
Stilnox® is the leading hypnotic worldwide and is indicated in the short-term treatment of insomnia. It rapidly induces sleep that is qualitatively close to natural sleep and devoid of certain side effects that are characteristic of the benzodiazepine class as a whole. Its action lasts for a minimum of six hours, and it is generally well tolerated, allowing the patient to awake with a reduced risk of impaired attention, decreased alertness or memory lapses throughout the day.
SLEEP DISORDERS
41
EPILEPSY
Epilim belongs to a group of medicines called anticonvulsants and is used for the treatment of epilepsy in children and adults.
Haemaccel® (Polygeline) is a plasma substitute for volume replacement used to correct or avert circulatory insufficiency due to plasma / blood volume deficiency, resulting from bleeding or from a shift in plasma volume between the circulatory compartments. It is a ready-for-use solution for intravenous infusion and can also be used as a carrier solution for various medicines.
EMERGENCY CARE
42 ANNUAL REPORT 2013
CARDIOLOGY
Millions of patients all over the world are being treated with Plavix® for the prevention of ischemic events caused by atherothrombosis, confirming the favourable benefit-to-risk ratio of long-term management of atherothrombosis. In Pakistan, Plavix® is rapidly consolidating its position as the foremost platelet antiaggregate agent for the secondary prevention of stroke.
Aprovel® is indicated for the treatment of hypertension and diabetic nephropathy in patients with Type 2 diabetes. It acts by blocking the effect of angiotensin, the hormone responsible for the contraction of blood vessels, thereby permitting the normalization of arterial blood pressure.
A new form of CoAprovel® (irbesartan and hydrochlorothiazide) helps more at-risk hypertensive patients to reach their blood pressure goals. It is also indicated in cases of severe and moderate hypertension, the first fixed dose combination of a sartan and hydrochlorothiazide indicated as treatment for initial use in hypertensive patients who are likely to need multiple drugs to achieve their blood pressure goals.
43
Clexane® is the most widely studied and used low molecular weight heparin (LMWH) in the world & is approved for more clinical indications than any other LMWH. Clexane®
is an anti-coagulant used to inhibit the formation of clots in veins and arteries, thereby preventing possible acute or chronic complications associated with deep vein or arterial thrombosis.
Tritace® contains the active ingredient ramipril, which is a type of medicine called an ACE inhibitor. It is used to lower blood pressure and control hypertension (high blood pressure). It may also be used as treatment following a heart attack (myocardial infarction) complicated with heart failure or to reduce the risk of heart attack, stroke, kidney problems and heart failure.
Co Tritace® is a combination product with two active ingredients: ramipril and hydrochlorothiazide. Ramipril relaxes blood vessels and makes the heart pump more efficiently. Hydrochlorothiazide belongs to the class of medications known as diuretics and helps control blood pressure by eliminating excess salt and water from the body.
44 ANNUAL REPORT 2013
Winstor® (Atorvastatin) is a member of the drug class known as statins, used for lowering blood cholesterol. It also stabilizes plaque and prevents strokes through anti-inflammatory and other mechanisms. This drug is indicated to prevent heart attacks, strokes, to lower cholesterol and other harmful types of cholesterol in the body and to slow the progress of heart disease.
45
Tarivid® (Ofloxacin) is a fluroquinolone antibiotic with a broad anti-bacterial spectrum. Tarivid® is prescribed for acute, chronic or recurrent lower respiratory tract infections, skin and soft tissue infections, bone and joint infections, urinary tract infections and infections of the genital organs.
Claforan® is a third-generation Cephalosporin injectible antibiotic for the treatment of a wide range of infections including those of the respiratory tract, skin and soft tissues, urinary tract, and meningitis due to susceptible pathogens in both adults and children. It is also indicated for surgical prophylaxis (i.e. prevention of surgical infections). Claforan®
is manufactured in a state of the art facility located in Karachi.
Aventriax® (Ceftriaxone) is a third-generation cephalosporin antibiotic. Like other third-generation cephalosporins, it has broad spectrum activity against Gram-positive and Gram-negative bacteria. This drug is indicated for the treatment of lower respiratory tract infections, acute bacterial otitis media, skin infections, bone and joint infections, intra-abdominal and urinary tract infections, pelvic inflammatory disease (PID), uncomplicated gonorrhea, bacterial septicemia, and meningitis. Ceftriaxone injection is also given before certain types of surgery to prevent infections that may develop after the operation.
ANTIBIOTICSCURE
46 ANNUAL REPORT 2013
This antibiotic target a wide range of bacterial infections and is commonly used to treat respiratory tract conditions such as acute bronchitis, tonsillitis and pneumonia. Rulid also combats bacterial infections in the body’s genitals, gastrointestinal tract and soft tissues.
Tavanic® (levofloxacin) is used to treat bacterial infections. Levofloxacin works by killing the bacteria that are causing an infection. As Levofloxacin is effective against a large number of bacteria, it is used to treat a range of infections, including infections of the chest, urinary tract and skin.
Targocid® injection is an antibiotic. It is used to kill bacteria responsible for infections which can occur in your blood, bones or joints. This antibiotic is generally used when the bacteria causing the infection are not satisfactorily eliminated by other antibiotics or when patients may be allergic to other antibiotics.
47
DIARRHEA
Today a household name and among the top-selling drugs in the country, Flagyl® is effective for the treatment of parasitic infections caused by Trichomonas vaginalis or Entamoeba histolytica known to cause diarrhoeal disease.
Flagyl Plus combines Metronidazole (Flagyl®) and Diloxanide Furoate. This combination provides broad spectrum amoebicidal activity through the coverage of both tropozoites & cysts forms, providing not only cure in symptomatic Amoebiasis but also actively preventing the spread of the disease.
Secnidal® is an antibiotic that fights bacteria in the body. It is used to treat certain infections caused by bacteria, such as infection of the intestines or vagina. It is also used to treat certain sexually transmitted infections.
48 ANNUAL REPORT 2013
Enterogermina® is an oral suspension probiotic offered in single doses. It restores the intestinal bacteria balance in case of an intestinal disorder. Enterogermina® can be used for preventive or curative treatment.
A low-osmolarity ORS, Gastrolyte® contains a balanced solution of glucose and electrolytes for the prevention of dehydration that usually occurs with severe diarrhea. Gastrolyte Rice is used for the treatment of fluid and electrolyte loss associated with acute diarrhea. One glass per sachet of rice-based Gastrolye® not only replenishes lost fluids but also provides additional nutrients of rice.
49
GASTRIC DISEASE
Proton pump inhibitors (PPI) block the production of acid by the stomach. Xerosec® is used in the treatment of dyspepsia, peptic ulcer disease (PUD), gastroesophageal reflux disease (GORD/GERD) and Zollinger-Ellison syndrome, all caused by stomach acid. Omeprazole blocks the enzyme in the wall of the stomach that produces acid.
Meldere® (esomeprazole) also belongs to the PPI class and is used to treat the symptoms of gastroesophageal reflux disease (GERD), a condition in which backward flow of acid from the stomach causes heartburn and possible injury of the esophagus. It belongs to a class of medications called proton pump inhibitors and works by decreasing the amount of acid made in the stomach.
It may also be used to decrease the chance of development of ulcers in patients taking non-steroidal anti-inflammatory drugs (NSAIDs). It is also used with other medications to treat and prevent the return of stomach ulcers caused by a certain type of bacteria (H. pylori).
More with
50 ANNUAL REPORT 2013
Nivaquine syrup contains the active ingredient chloroquine sulphate, which is an antimalarial medicine. Chloroquine works by attacking the parasites once they have entered the red blood cells. It kills the parasites and prevents them from multiplying further.
ANTI-MALARIAPREVENTION
51
OVER A CENTURY OFSPECIALIZING IN VACCINES
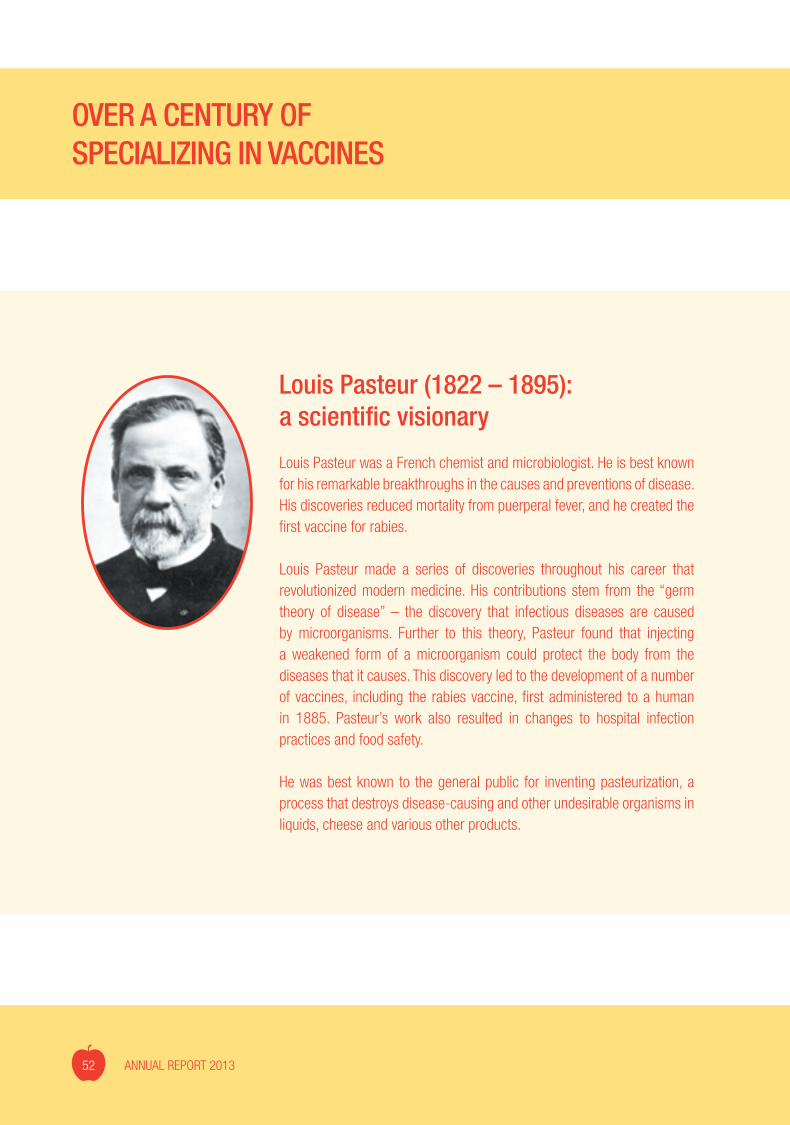
Louis Pasteur (1822 – 1895):a scientific visionary
Louis Pasteur was a French chemist and microbiologist. He is best known for his remarkable breakthroughs in the causes and preventions of disease. His discoveries reduced mortality from puerperal fever, and he created the first vaccine for rabies.
Louis Pasteur made a series of discoveries throughout his career that revolutionized modern medicine. His contributions stem from the “germ theory of disease” – the discovery that infectious diseases are caused by microorganisms. Further to this theory, Pasteur found that injecting a weakened form of a microorganism could protect the body from the diseases that it causes. This discovery led to the development of a number of vaccines, including the rabies vaccine, first administered to a human in 1885. Pasteur’s work also resulted in changes to hospital infection practices and food safety.
He was best known to the general public for inventing pasteurization, a process that destroys disease-causing and other undesirable organisms in liquids, cheese and various other products.
52 ANNUAL REPORT 2013
THE WORLD LEADER IN VACCINES
Our Vision
Immunization saves more than 3 million lives every year in all age groups from diphtheria, tetanus, pertussis and measles – but more than 3 million people still die due to lack of access to vaccines.
Our vision is a world in which no one suffers or dies from a vaccine-preventable disease.
Sanofi Pasteur has the broadest available range of vaccines, protecting against 20 infectious diseases:
• World’s largest producer of seasonal influenza vaccines: more than 200 million doses provided in 2012
• World’s leading provider of inactivated poliomyelitis vaccine
• Broadest range of modern pediatric combination vaccines for children throughout the world
• World’s main provider of meningococcal vaccines with an unfaltering commitment to provide meningococcal vaccine for outbreaks control in West Africa
• Largest portfolio of vaccines for travelers and people living in tropical areas: typhoid, rabies, yellow fever, Japanese encephalitis, meningococcal meningitis, cholera, hepatitis A, hepatitis B
53

BACTERIAL DISEASES
CHOLERA
Cholera is caused by a bacterium, vibrio cholerae, which produces a toxin that affects the intestines. This bacterium has been at the origin of devastating epidemics worldwide throughout history.
DIPTHERIA
Diphtheria is a bacterial infection caused by Corynebacterium diphtheriae. Before the introduction of routine vaccination, the disease ranked among the leading causes of infant mortality.
HAEMOPHILUS INFLUENZAE TYPE B (HIB) INFECTIONS
Haemophilus influenzae type b infections are widespread throughout the world. Hib infections may develop under various forms but meningitis is the most frequent one. Hib infections occur in children under the age of five years, and mostly during the first year of life.
MENINGOCOCCAL INFECTIONS
Meningococci are a major cause of bacterial meningitis and septicemia. There are several meningococcal serogroups, but serogroups A, B, C, Y, and W135 account for 99% of cases of invasive infection.
54 ANNUAL REPORT 2013

PERTUSSIS
Pertussis is a highly contagious infection of the lower respiratory tract caused by the bacterium Bordetella pertussis. Pertussis is a slowly progressing disease (several weeks) that is particularly severe among young infants.
PNEUMOCOCCAL INFECTIONS
Pneumococcal bacteria can cause various invasive (meningitis, bacteremic pneumonia and bacteremia) and non-invasive (pneumonia, otitis, sinusitis, and bronchitis) infections caused by any serotype of the bacteriumStreptococcus pneumoniae.
TETANUS
Tetanus is an often fatal infectious disease caused by the toxigenic strains of the tetanus bacillus. Tetanus is a devastating disease in developing countries and has not yet entirely disappeared from industrialized countries.
TUBERCULOSIS
Tuberculosis is a contagious bacterial disease caused by the bacillus Mycobacterium tuberculosis. With 8 million new cases each year, tuberculosis is the second leading cause of death from infectious diseases throughout the world, after acquired immune deficiency syndrome (AIDS).
55

TYPHOID FEVER
Typhoid fever is a bacterial infection that has become rare in industrialized countries, but that is still common in countries with poor hygiene where it is responsible for 600,000 cases each year. (28)
VIRAL DISEASES
HEPATITIS A
Hepatitis A is a virus that causes an acute inflammation of the liver and is the most common form of all viral hepatitis. Hepatitis A is encountered frequently in the most disadvantaged geographical regions. Improvements in hygiene and sanitation have led to a reduction in the circulation of the virus, but not to its complete disappearance.
HEPATITIS B
Hepatitis B is a virus (HBV) that causes an inflammation of the liver. Severe outcomes may be observed following acute hepatitis, but they mainly result from the complications of chronic HBV infection (e.g., liver cirrhosis and cancer).
56 ANNUAL REPORT 2013

INFLUENZA
Influenza, commonly known as flu, is a highly contagious, acute, viral respiratory infection. Influenza viruses exhibit a high degree of variability. Depending on the extent of the genetic mutations from one year to another, the degree of protection in the population varies and influenza epidemics of variable intensity will occur. An influenza pandemic can occur when a totally new influenza virus against which the human population has no immunity emerges, usually from animals.
JAPANESE ENCEPHALITIS
Japanese encephalitis is a viral infection that was first observed in Japan in 1870. Japanese encephalitis is a vector-borne disease caused by an arbovirus transmitted by a mosquito. With approximately 50,000 cases and 10,000 deaths reported each year, Japanese encephalitis is the most frequent and most severe viral encephalitis, and the leading cause of viral neurological infection among children in Asia.
MEASLES
Measles is an acute, viral, eruptive, and extremely contagious disease which affected practically all children prior to the introduction of vaccination. Today, measles is well controlled and has even been eliminated in many industrialized countries, but remains endemic in many other countries.
MUMPS
Mumps is caused by a virus exhibiting glandular and nervous tissue tropism. Although mumps is considered a rather benign childhood disease, in some instances it can result in severe complications.
57

POLIOMYELITIS
Poliomyelitis is a contagious disease caused by three different serotypes of poliovirus (types 1, 2, and 3). It is responsible for incapacitating paralysis and death.
RABIES
Rabies is a disease of viral origin that affects both wild and domestic animals. In developing countries, where it is transmitted mainly by rabid stray dogs, rabies is still considered a major public health concern and continues to cause 55,000 human deaths each year.
RUBELLA
Rubella is an acute viral eruptive disease. It is not always symptomatic and goes unnoticed in about half of the cases. Rubella is particularly serious for a fetus when transmission of the virus by the mother occurs during the early stages of pregnancy, a condition known as congenital rubella syndrome or CRS.
YELLOW FEVER
Yellow fever is a viral hemorrhagic fever that is transmitted by mosquitoes. Each year, 200,000 cases of yellow fever occur of which 30,000 are fatal. The disease is a threat for over three million travelers visiting endemic regions each year.
58 ANNUAL REPORT 2013
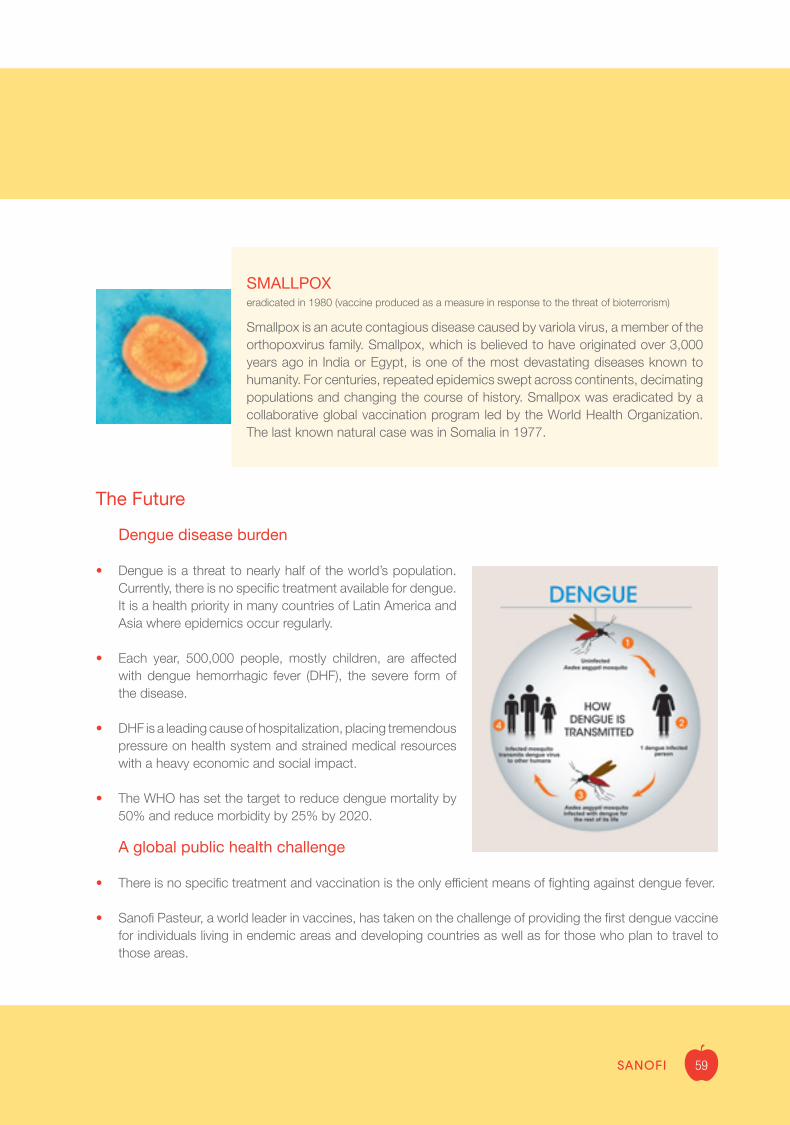
SMALLPOX eradicated in 1980 (vaccine produced as a measure in response to the threat of bioterrorism)
Smallpox is an acute contagious disease caused by variola virus, a member of the orthopoxvirus family. Smallpox, which is believed to have originated over 3,000 years ago in India or Egypt, is one of the most devastating diseases known to humanity. For centuries, repeated epidemics swept across continents, decimating populations and changing the course of history. Smallpox was eradicated by a collaborative global vaccination program led by the World Health Organization. The last known natural case was in Somalia in 1977.
The Future
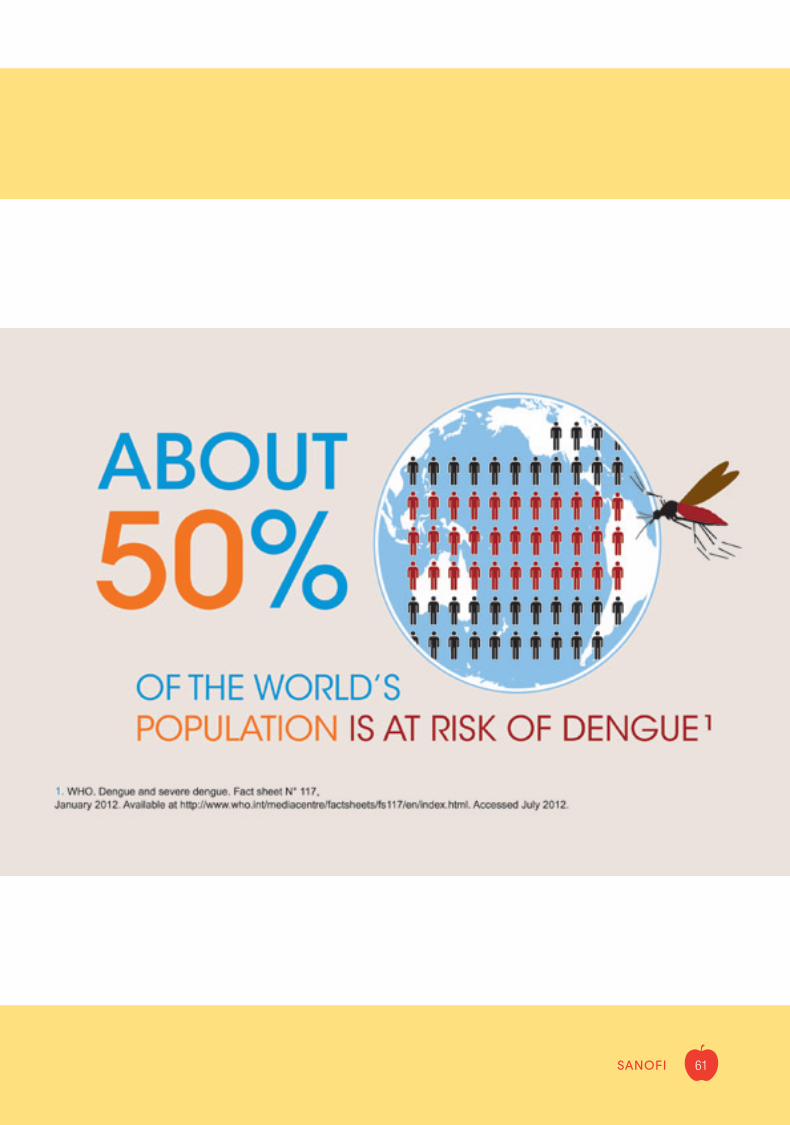
Dengue disease burden
• Dengue is a threat to nearly half of the world’s population. Currently, there is no specific treatment available for dengue. It is a health priority in many countries of Latin America and Asia where epidemics occur regularly.
• Each year, 500,000 people, mostly children, are affected with dengue hemorrhagic fever (DHF), the severe form of the disease.
• DHF is a leading cause of hospitalization, placing tremendous pressure on health system and strained medical resources with a heavy economic and social impact.
• The WHO has set the target to reduce dengue mortality by 50% and reduce morbidity by 25% by 2020.
A global public health challenge
• There is no specific treatment and vaccination is the only efficient means of fighting against dengue fever.
• Sanofi Pasteur, a world leader in vaccines, has taken on the challenge of providing the first dengue vaccine for individuals living in endemic areas and developing countries as well as for those who plan to travel to those areas.
59
Dengue vaccine (in development)
CLINICAL STUDIES
• First vaccine to reach phase III clinical study, the ultimate steps in the clinical development of a vaccine before its introduction.
• 15 endemic and non-endemic countries included in the Sanofi Pasteur global clinical study program (completed, ongoing and planned studies).
• Globally, nearly 40,000 volunteers are participating in the Sanofi Pasteur clinical study program.
• Sanofi Pasteur dengue vaccine has been evaluated in clinical studies (Phase I, II) in adults and children in the United States, Asia and Latin America.
A global public health challenge
• There is no specific treatment and vaccination is the only efficient means of fighting against dengue fever.
• Sanofi Pasteur, a world leader in vaccines, has taken on the challenge of providing the first dengue vaccine for individuals living in endemic areas and developing countries as well as for those who plan to travel to those areas.
“Today, we are very excited to be in the last stage of clinical development. We are confident that we will be the first with a dengue vaccine within a few years. A dengue vaccine will fulfill an unmet medical need and change the lives of millions of people across the world.” Olivier Charmeil, President and CEO, Sanofi Pasteur.
“Because mosquito control has failed to control this disease, an effective vaccine will be a critical tool that can change the life of millions living in endemic countries. I see this success as the beginning of a new era of effective control.” Professor Duane Gubler, Program on Emerging Infectious Diseases, Duke-NSU Graduate Medical School, Singapore.
60 ANNUAL REPORT 2013
61
CONSUMER HEALTHCARE
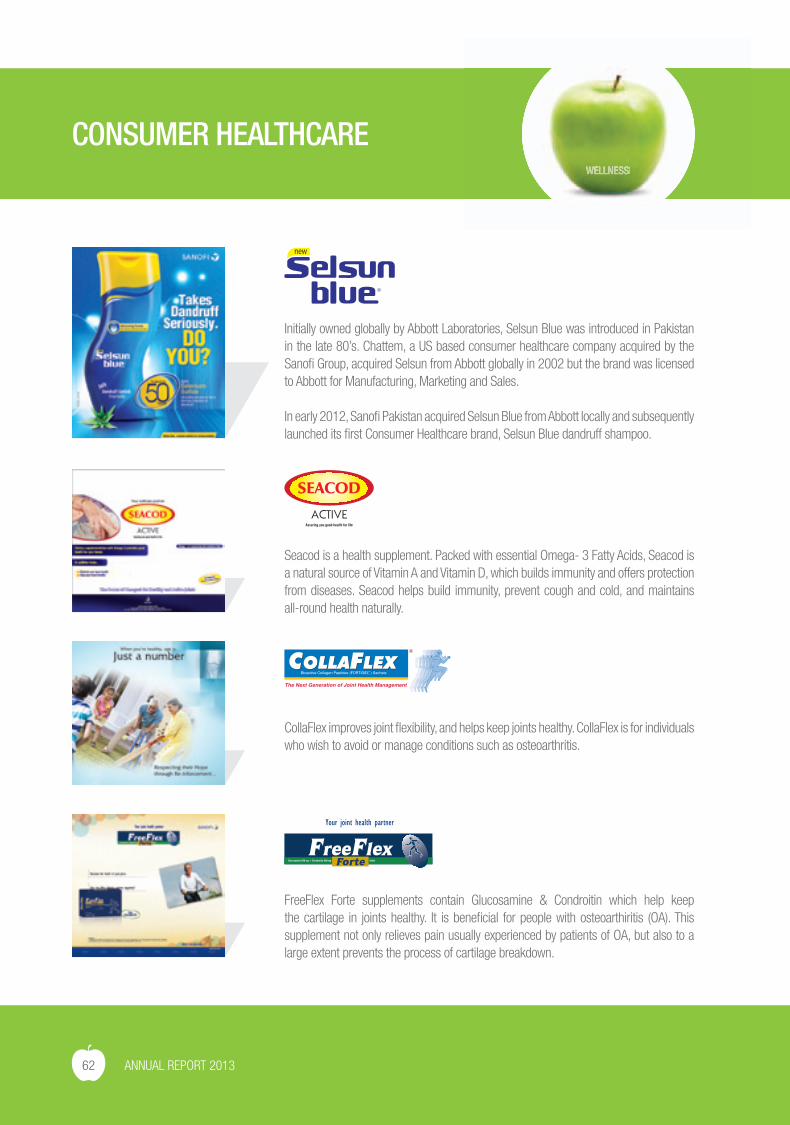
Initially owned globally by Abbott Laboratories, Selsun Blue was introduced in Pakistan in the late 80’s. Chattem, a US based consumer healthcare company acquired by the Sanofi Group, acquired Selsun from Abbott globally in 2002 but the brand was licensed to Abbott for Manufacturing, Marketing and Sales.
In early 2012, Sanofi Pakistan acquired Selsun Blue from Abbott locally and subsequently launched its first Consumer Healthcare brand, Selsun Blue dandruff shampoo.
Seacod is a health supplement. Packed with essential Omega- 3 Fatty Acids, Seacod is a natural source of Vitamin A and Vitamin D, which builds immunity and offers protection from diseases. Seacod helps build immunity, prevent cough and cold, and maintains all-round health naturally.
CollaFlex improves joint flexibility, and helps keep joints healthy. CollaFlex is for individuals who wish to avoid or manage conditions such as osteoarthritis.
FreeFlex Forte supplements contain Glucosamine & Condroitin which help keep the cartilage in joints healthy. It is beneficial for people with osteoarthiritis (OA). This supplement not only relieves pain usually experienced by patients of OA, but also to a large extent prevents the process of cartilage breakdown.
WELLNESS
62 ANNUAL REPORT 2013
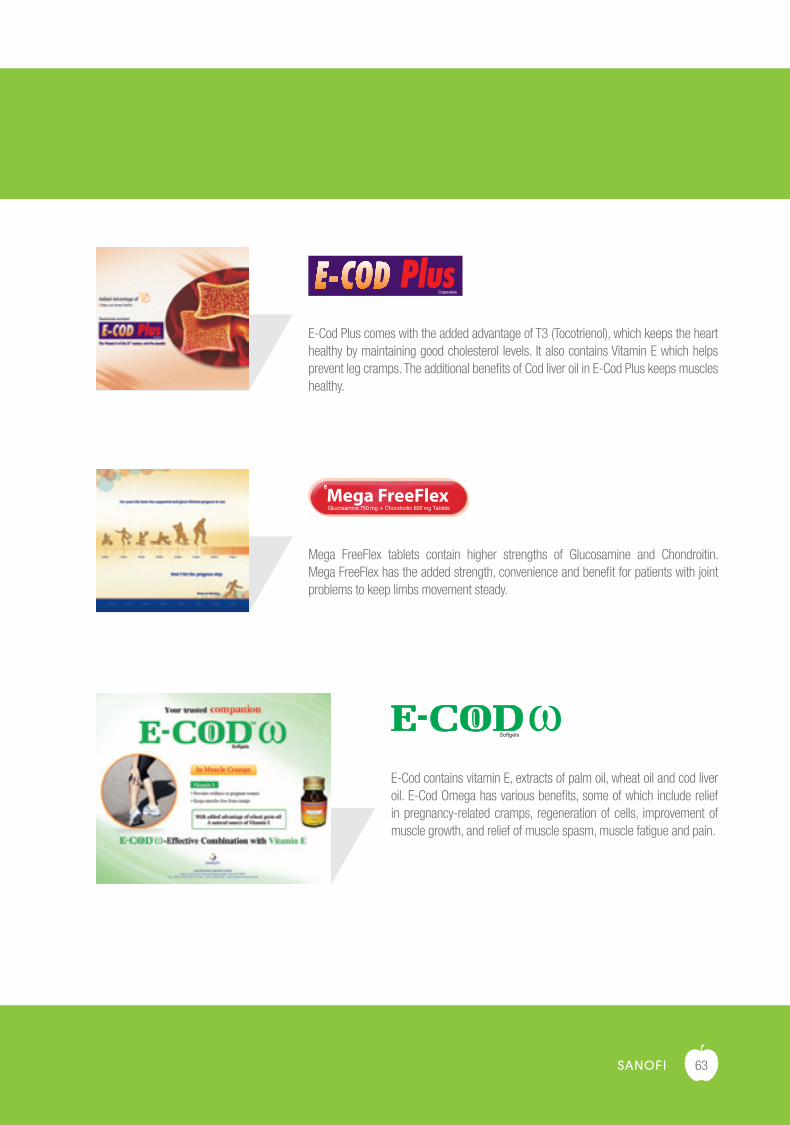
E-Cod Plus comes with the added advantage of T3 (Tocotrienol), which keeps the heart healthy by maintaining good cholesterol levels. It also contains Vitamin E which helps prevent leg cramps. The additional benefits of Cod liver oil in E-Cod Plus keeps muscles healthy.
Mega FreeFlex tablets contain higher strengths of Glucosamine and Chondroitin. Mega FreeFlex has the added strength, convenience and benefit for patients with joint problems to keep limbs movement steady.
E-Cod contains vitamin E, extracts of palm oil, wheat oil and cod liver oil. E-Cod Omega has various benefits, some of which include relief in pregnancy-related cramps, regeneration of cells, improvement of muscle growth, and relief of muscle spasm, muscle fatigue and pain.
63
SOCIAL MEDIA
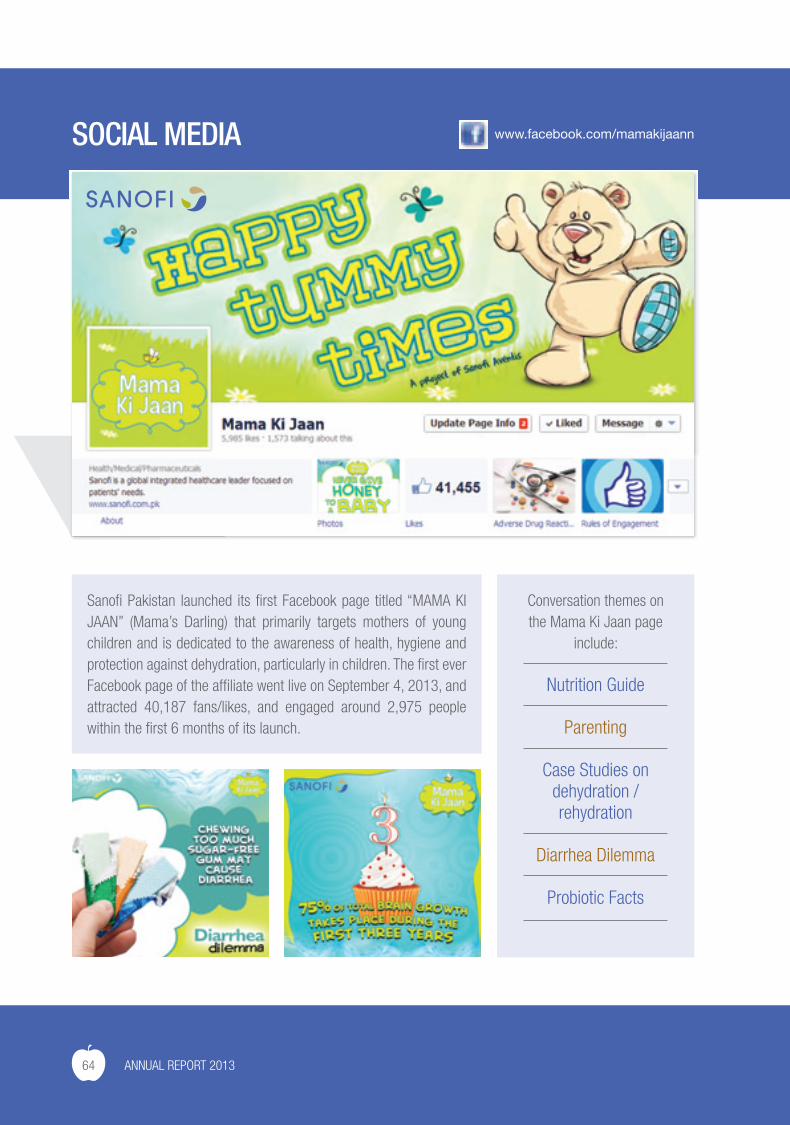
Sanofi Pakistan launched its first Facebook page titled “MAMA KI JAAN” (Mama’s Darling) that primarily targets mothers of young children and is dedicated to the awareness of health, hygiene and protection against dehydration, particularly in children. The first ever Facebook page of the affiliate went live on September 4, 2013, and attracted 40,187 fans/likes, and engaged around 2,975 people within the first 6 months of its launch.
www.facebook.com/mamakijaann
Conversation themes on the Mama Ki Jaan page
include:
Nutrition Guide
Parenting
Case Studies on dehydration / rehydration
Diarrhea Dilemma
Probiotic Facts
64 ANNUAL REPORT 2013
BUSINESS DEVELOPMENT
Business Development, at Sanofi Pakistan, identifies and implements growth opportunities for the affiliate. The mission of Business Development is to:
• articulate the affiliate’s strategic priorities
• seek and execute internal and external growth initiatives to address those priorities
• manage alliances and partnerships
There is focus on exploring inorganic growth opportunities including new potential segments, collaborations, innovations and life-cycle management of our product portfolio.
New Launches of 2013
Pharmaceuticals
1. Gardan 50mg/5mL Suspension 60mL 2. Flagyl 200mg/5mL Suspension 90mL 3. Amisped 4mg Tablets 14’s 4. Amisped 5mg Tablets 14’s 5. Amisped 10mg Tablets 14’s 6. Gastrolyte Rice Powder Sachets 10’s 7. Seprafilm 8. Stilnox 12.5mg CR Tablets 14’s 9. Thymoglobulin Inj.
Consumer Healthcare
1. Seacod Capsule 100’s 2. Seacod Active Capsule 30’s 3. E-Cod Plus Capsules 30’s 4. E-Cod Omega Capsules 20’s 5. FreeFlex Forte Tablet 30’s 6. Mega FreeFlex Tablet 10’s 7. CollaFlex Sachet 10’s
Future Outlook
Genzyme Business – Strengthening our position in the specialty
segment by building the rare diseases / specialized products portfolio of Genzyme.
Branded Generics – Fulfilling the needs of customers by providing
access to high quality economical products. This is being planned and executed through an innovative alliance with local partners to cope with the challenges of capacity constraints, and to manage timing issues associated with registration and products development.
CHC Business – Aligning with Group organization, Sanofi Pakistan
took over the Chattem product, Selsun Blue shampoo, in 2012. In the future, we will focus on expanding the Chattem’s range and other CHC products of the Group.
Continuing the strategy of diversification – Sanofi Pakistan aspires to enter the Animal Health
market in the future through the introduction of Merial products, capitalizing upon the global acquisition of Merial by the Sanofi Group. Products in the areas of poultry, livestock and pets are part of the Merial portfolio, currently being managed by a third party in Pakistan.
65
The Medical team at Sanofi Pakistan has a dynamic vision to be a population centered department that sets standards for clinical, scientific and operational excellence and is a leader in compliance.
Engaging Key Opinion Leaders (KOL’s) of the country in clinical research to improve patient care has been, and will continue to be, the hallmark of the Medical team. KOLs from Pakistan also participated in two regional Advisory Boards on Diabetes and
Enterogermina® respectively. These meetings aimed to engage key physicians who will then update and train local physicians on concepts of bio-similarity and the use of probiotics. Sanofi Pakistan is held in high esteem by the local medical academia. In 2012 – 2013, as many as 16 clinical studies were conducted involving 646 investigators, targeting a patient pool of over 13,000. These studies are aligned with our strategic focus on Diabetes, Anti-infectives, Oncology, and Cardiology.
MEDICAL
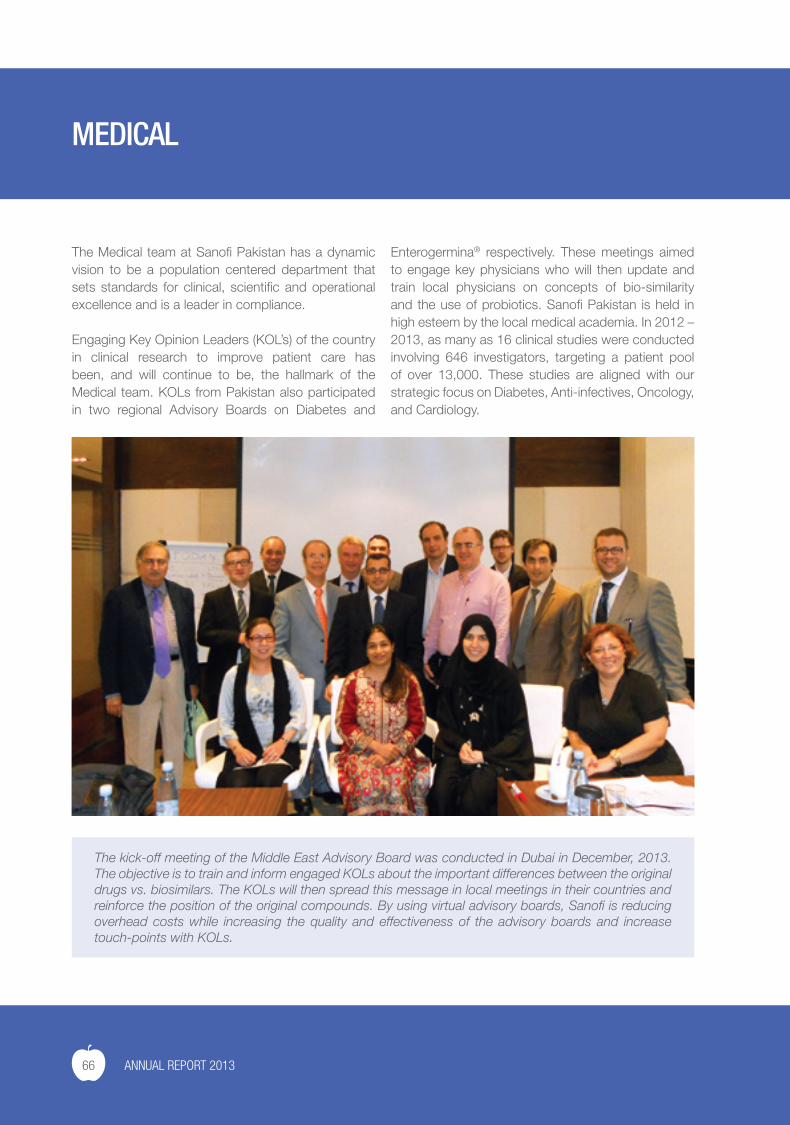
The kick-off meeting of the Middle East Advisory Board was conducted in Dubai in December, 2013. The objective is to train and inform engaged KOLs about the important differences between the original drugs vs. biosimilars. The KOLs will then spread this message in local meetings in their countries and reinforce the position of the original compounds. By using virtual advisory boards, Sanofi is reducing overhead costs while increasing the quality and effectiveness of the advisory boards and increase touch-points with KOLs.
66 ANNUAL REPORT 2013
With a focus on Diabetes, a local study named STEP (Screening of Twin Epidemic in Pakistan) was initiated in November, 2013 which aims to gather information on co-existence of diabetes and hypertension in Pakistan. This project will engage 100 Family Physicians, Diabetologists and Internists who will screen 1,000 individuals for T2DM and HTN across the country. Sanofi Pakistan also participated in a global study on international diabetes management practices called IDMPS wave 6. In this study, 285 T2DM and T1DM patients were enrolled from 20 centers.
For the cardiovascular portfolio, a study called REVEAL, scheduled to enroll almost 3,000 patients was initiated in 2012. It aims to assess the prevalence of HTN in Pakistan in outpatient setting and to also measure the 10 year CV risk score (in %) of patients ≥ 30 years of age based on Framingham risk score laboratory and non-laboratory parameters. The study will finish recruitment in July, 2014.
Rather than allowing data to gather dust on the shelves, Sanofi believes in sharing this information with its investigators and also publishes in accordance with international guidelines. Abstracts of two local registries viz. DIABETIC FOOT (on foot complications related to T2DM) and ACTION (prevalence of HTN in general practice setting) were accepted for presentation at the World Diabetes Congress (WDC) and World Cardiology Congress (WCC) respectively. The WDC took place in December, 2013 while the WCC is scheduled for May, 2014.
In support of the Antibiotic portfolio, dissemination sessions of the RAPID study were conducted across Pakistan. This study has gathered data on Pelvic Inflammatory Disease in women, which is an important public health problem with serious repercussions on women’s health and well-being. Results of this study will be shared in the Royal College of Obstetrics and
Gynecology congress scheduled for March, 2014 in India.
Another major health problem in Pakistan is typhoid fever in children. Results of the TIP (Typhoid in Pediatrics) study which was conducted by Sanofi were shared with an international audience at the Commonwealth Association of Pediatric Gastroenterology and Nutrition Congress (CAPGAN) in December 2013, at Colombo, Sri Lanka.
Our Medical Information Service (MIS) for doctors is highly appreciated and valued by the physicians of the country. Medical queries to address research needs or to improve quality of care of patients are forwarded to MIS and a response is usually provided within 48 hours.
One of key principles at SANOFI is to ensure the safety and quality of our products. Medical at Sanofi Pakistan has a robust Pharmacovigilance system in place. All the employees across organization receive training on regular basis in order to be cognizant with the importance of timely ADR reporting (24hrs).
The Medical Department is cognizant of future challenges and is prepared for transitioning smoothly into the new diversified initiatives.
67
As a diversified healthcare company, our priority is to always apply the highest standards of ethics and integrity to our activities. Corporate Transparency Initiative (TI) was launched in 2012. Transparency means public disclosure of our financial and non financial, direct and indirect relationships with our health stakeholders. Sanofi’s TI addresses three main issues:
• Our interactions with healthcare providers (HCPs), healthcare organizations (HCOs) and medical and scientific associations (MSAs)
• Our interactions with patient associations
• Clinical trials and publications
Medical Department in Pakistan launched this initiative to all affiliate stakeholders in March, 2012. The aim was to ensure that members of the Pakistan affiliate are cognizant and compliant with the global requirements of TI Policy.
Since beginning Pakistan Medical team played a pivotal role in disseminating the TI policy within internal stakeholders, coordinated with Finance Team for transaction details and liaised with legal team for development of External Expert (EEs) Agreement templates. With the help of cross functional teams a Fair Market Value Fee Grid was established for harmonization of EEs Compensation. Also EEs levels were classified and categorized according to global guidelines. In 2013, a centralized validated EEs list was developed, which is updated & shared with all stakeholders every month.
Pakistan Medical team demonstrated the value of courage and solidarity to put the TI into practice. Quarterly transaction reports from 2012-13 were submitted to the ITC Finance & Compliance Team.
Pakistan was the first in South Asia zone to develop and start implementing the fee grid in accordance withTI Policy.
TRANSPARENCY INITIATIVE
Paul ChewChief Medical Officer
Antonio TataranniHead of Global Medical Operations
On behalf of Transparency Initiative task force
“Today, we feel that it is vital that all Sanofi employees be informed and aware of their responsibilities for the publication of financial information related to their working relationships with these stakeholders.”
68 ANNUAL REPORT 2013
At Sanofi, we are committed to our responsibility towards patients and the community. Our products carry a promise of Quality and we take issues related to the quality of our products very seriously. Local manufacturing is in compliance to Sanofi’s stringent global quality standards which are followed and maintained meticulously at every stage of the manufacturing process.
However, despite every possible check and balance, we recognize that issues may still arise, particularly of a purely technical nature, i.e. pertaining to packaging or physical appearance.
Some examples of this could be:
• Discoloration
• Broken or missing tablet
• Melted capsule
• Suspended particles in the solution
• Mislabeling (misprinted text, batch No. &/or missing expiry date)
• Cracked vial/ bottle or ampoule
If you come across any such issue or any other concern with a Sanofi product, please communicate the same on the quality page on www.sanofi.com.pk or email at [email protected] with the following details:
• Your name and contact details
• Sanofi product name and dosage
• Batch number of the product
• Quality issue or complaint
QUALITY MATTERS
69
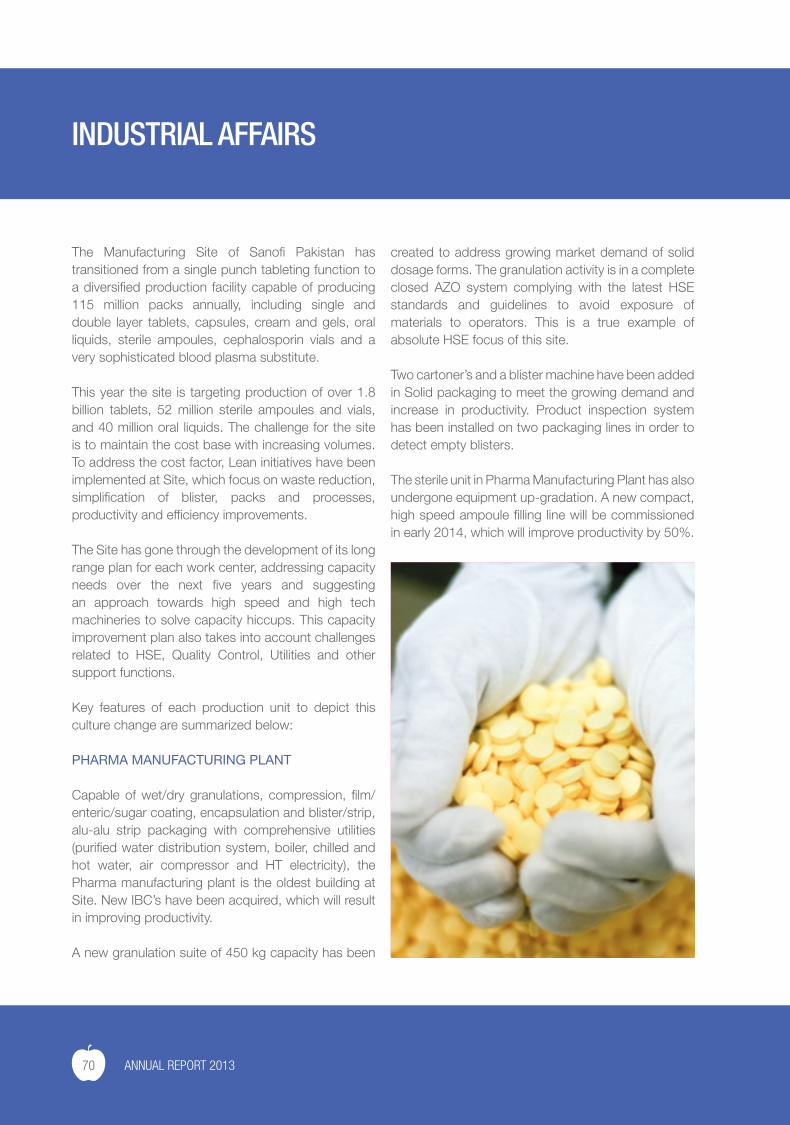
The Manufacturing Site of Sanofi Pakistan has transitioned from a single punch tableting function to a diversified production facility capable of producing 115 million packs annually, including single and double layer tablets, capsules, cream and gels, oral liquids, sterile ampoules, cephalosporin vials and a very sophisticated blood plasma substitute.
This year the site is targeting production of over 1.8 billion tablets, 52 million sterile ampoules and vials, and 40 million oral liquids. The challenge for the site is to maintain the cost base with increasing volumes. To address the cost factor, Lean initiatives have been implemented at Site, which focus on waste reduction, simplification of blister, packs and processes, productivity and efficiency improvements.
The Site has gone through the development of its long range plan for each work center, addressing capacity needs over the next five years and suggesting an approach towards high speed and high tech machineries to solve capacity hiccups. This capacity improvement plan also takes into account challenges related to HSE, Quality Control, Utilities and other support functions.
Key features of each production unit to depict this culture change are summarized below:
PHARMA MANUFACTURING PLANT
Capable of wet/dry granulations, compression, film/enteric/sugar coating, encapsulation and blister/strip, alu-alu strip packaging with comprehensive utilities (purified water distribution system, boiler, chilled and hot water, air compressor and HT electricity), the Pharma manufacturing plant is the oldest building at Site. New IBC’s have been acquired, which will result in improving productivity.
A new granulation suite of 450 kg capacity has been
created to address growing market demand of solid dosage forms. The granulation activity is in a complete closed AZO system complying with the latest HSE standards and guidelines to avoid exposure of materials to operators. This is a true example of absolute HSE focus of this site.
Two cartoner’s and a blister machine have been added in Solid packaging to meet the growing demand and increase in productivity. Product inspection system has been installed on two packaging lines in order to detect empty blisters.
The sterile unit in Pharma Manufacturing Plant has also undergone equipment up-gradation. A new compact, high speed ampoule filling line will be commissioned in early 2014, which will improve productivity by 50%.
INDUSTRIAL AFFAIRS
70 ANNUAL REPORT 2013
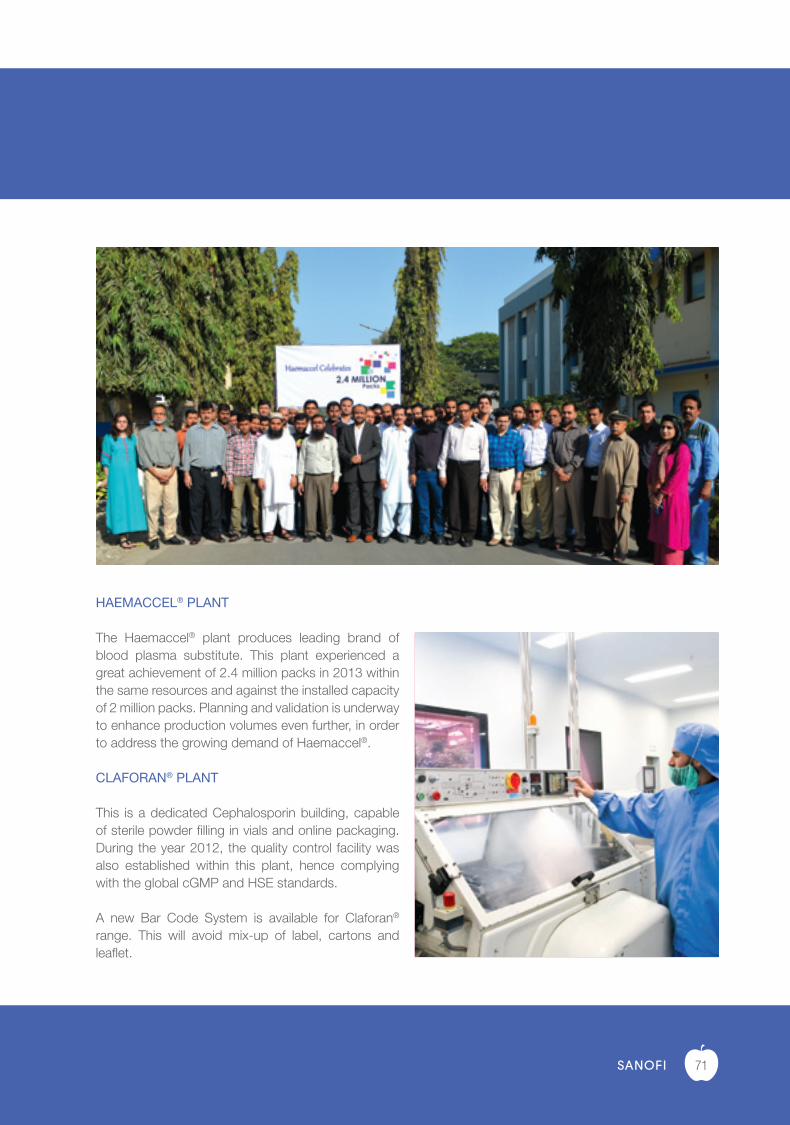
HAEMACCEL® PLANT
The Haemaccel® plant produces leading brand of blood plasma substitute. This plant experienced a great achievement of 2.4 million packs in 2013 within the same resources and against the installed capacity of 2 million packs. Planning and validation is underway to enhance production volumes even further, in order to address the growing demand of Haemaccel®.
CLAFORAN® PLANT
This is a dedicated Cephalosporin building, capable of sterile powder filling in vials and online packaging. During the year 2012, the quality control facility was also established within this plant, hence complying with the global cGMP and HSE standards.
A new Bar Code System is available for Claforan® range. This will avoid mix-up of label, cartons and leaflet.
71
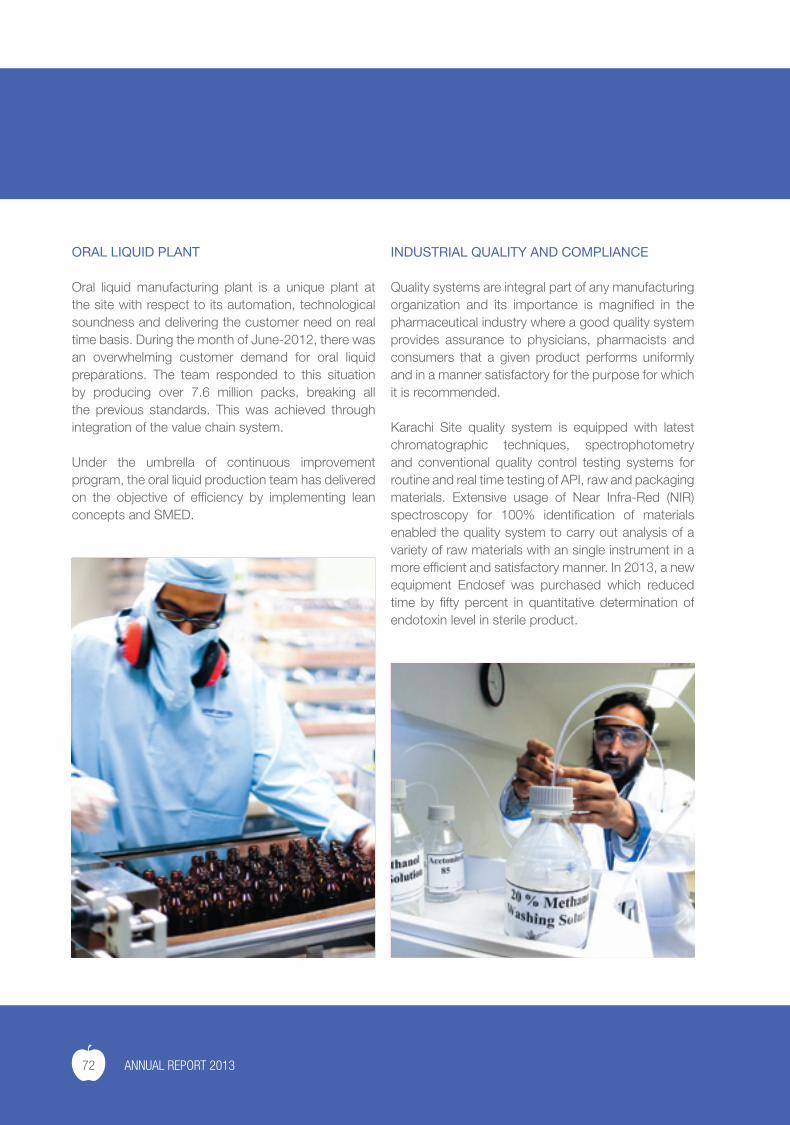
ORAL LIQUID PLANT
Oral liquid manufacturing plant is a unique plant at the site with respect to its automation, technological soundness and delivering the customer need on real time basis. During the month of June-2012, there was an overwhelming customer demand for oral liquid preparations. The team responded to this situation by producing over 7.6 million packs, breaking all the previous standards. This was achieved through integration of the value chain system.
Under the umbrella of continuous improvement program, the oral liquid production team has delivered on the objective of efficiency by implementing lean concepts and SMED.
INDUSTRIAL QUALITY AND COMPLIANCE
Quality systems are integral part of any manufacturing organization and its importance is magnified in the pharmaceutical industry where a good quality system provides assurance to physicians, pharmacists and consumers that a given product performs uniformly and in a manner satisfactory for the purpose for which it is recommended.
Karachi Site quality system is equipped with latest chromatographic techniques, spectrophotometry and conventional quality control testing systems for routine and real time testing of API, raw and packaging materials. Extensive usage of Near Infra-Red (NIR) spectroscopy for 100% identification of materials enabled the quality system to carry out analysis of a variety of raw materials with an single instrument in a more efficient and satisfactory manner. In 2013, a new equipment Endosef was purchased which reduced time by fifty percent in quantitative determination of endotoxin level in sterile product.
72 ANNUAL REPORT 2013
LEAN
The LEAN program is a comprehensive approach for improving our manufacturing efficiency. This long-term project is built by and for Sanofi Industrial Affairs, and is intended to establish performance standards that are adapted to the diversity of our businesses, markets and industrial challenges for 2020.
Main Principles of Lean Industrial Program
• A program focusing on developing people and organizations and on improving our industrial processes.
• Strong personal involvement of employees and greater autonomy through teamwork in multi-site workshops that share and build together a new set of industrial performance standards for Sanofi.
• A very ambitious improvement of our industrial processes using systematic methods and tools that translate into meaningful results.
• Efforts focused primarily on operations with high added value and on eliminating waste (mudas).
73
HUMAN RESOURCESRISING TO THE CHALLENGES OF GROWTH
A company’s true source of competitive advantage and sustainable growth lies in the quality of its people. At Sanofi we take pride in the excellence of our human asset and our team’s continued commitment to organizational success. Our human resource policies, development programs and promotion / incentive activities are designed to create an exemplary team.
Talent Acquisition
A critical aspect of our corporate strategy is to identify, induct and engage diverse talent from across Pakistan. We not only recruit experienced talent but also provide opportunities to potential young university graduates eager to make their mark. The Company boasts of a robust Internship Program which helps students to familiarize themselves with the healthcare industry and corporate environment. Furthermore, our Internship Program also enables students to attain a stronger understanding of their specific area of interest.
We have been actively engaged in conducting Career Counseling workshops and participating at job fairs in the country’s leading educational institutes, reflecting our determination and enthusiasm to build a dynamic and highly competent team.
Our Internal Job Posting process provides existing employees the opportunity to apply for vacant positions across functions throughout the company, aiding their professional growth and enabling them to meet personal career aspirations. Our case-studies, role plays and behavior-based interview guides are developed considering real life situations. This gives us a clear idea about the candidates’ thought process and ability, thereby allowing us to recruit the best.
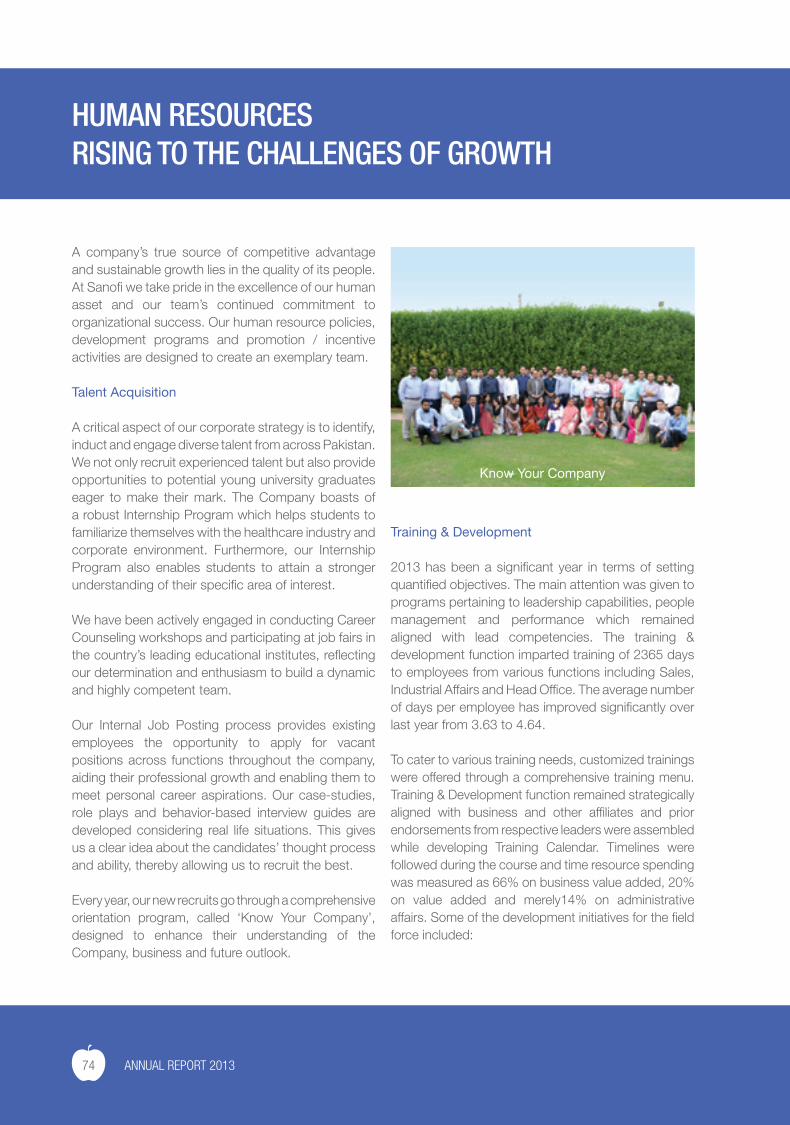
Every year, our new recruits go through a comprehensive orientation program, called ‘Know Your Company’, designed to enhance their understanding of the Company, business and future outlook.
Training & Development
2013 has been a significant year in terms of setting quantified objectives. The main attention was given to programs pertaining to leadership capabilities, people management and performance which remained aligned with lead competencies. The training & development function imparted training of 2365 days to employees from various functions including Sales, Industrial Affairs and Head Office. The average number of days per employee has improved significantly over last year from 3.63 to 4.64.
To cater to various training needs, customized trainings were offered through a comprehensive training menu. Training & Development function remained strategically aligned with business and other affiliates and prior endorsements from respective leaders were assembled while developing Training Calendar. Timelines were followed during the course and time resource spending was measured as 66% on business value added, 20% on value added and merely14% on administrative affairs. Some of the development initiatives for the field force included:
74 ANNUAL REPORT 2013
• Key focus on technical aspects along with soft skills measured through pre-assigned KPIs throughout 2013. Total number of training days improved from 4.02 to 5.48 per sales colleague over last year.
• Functional competencies were ascertained through training and coaching events. Around 3992 training days were observed in addition to 788 days on coaching.
• 113 new colleagues were exposed to Induction Training on priority.
• 287 sales colleagues were trained for new product launched while 540 colleagues got their cross product trainings on schedule.
• 60 Wellness associates of Consumer Healthcare received a series of comprehensive trainings that focused on disease areas.
• A unique hi-tech tool OSEQ (Online Self Evaluation Quiz) was launched enhancing knowledge of disease and product areas for entire field force. The tool is interactive and user-friendly in terms of contents and portal.
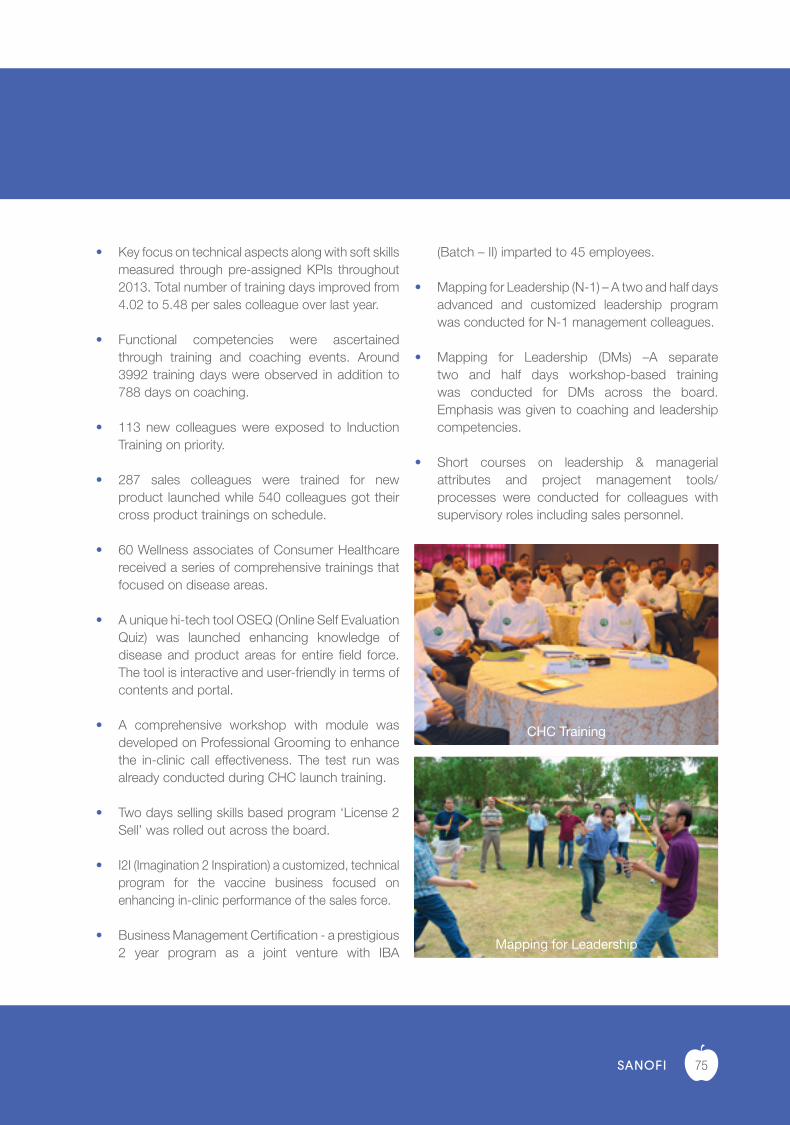
• A comprehensive workshop with module was developed on Professional Grooming to enhance the in-clinic call effectiveness. The test run was already conducted during CHC launch training.
• Two days selling skills based program ‘License 2 Sell’ was rolled out across the board.
• I2I (Imagination 2 Inspiration) a customized, technical program for the vaccine business focused on enhancing in-clinic performance of the sales force.
• Business Management Certification - a prestigious 2 year program as a joint venture with IBA
(Batch – II) imparted to 45 employees.
• Mapping for Leadership (N-1) – A two and half days advanced and customized leadership program was conducted for N-1 management colleagues.
• Mapping for Leadership (DMs) –A separate two and half days workshop-based training was conducted for DMs across the board. Emphasis was given to coaching and leadership competencies.
• Short courses on leadership & managerial attributes and project management tools/ processes were conducted for colleagues with supervisory roles including sales personnel.
CHC Training
Mapping for Leadership
75
CORPORATE SOCIAL RESPONSIBILITY
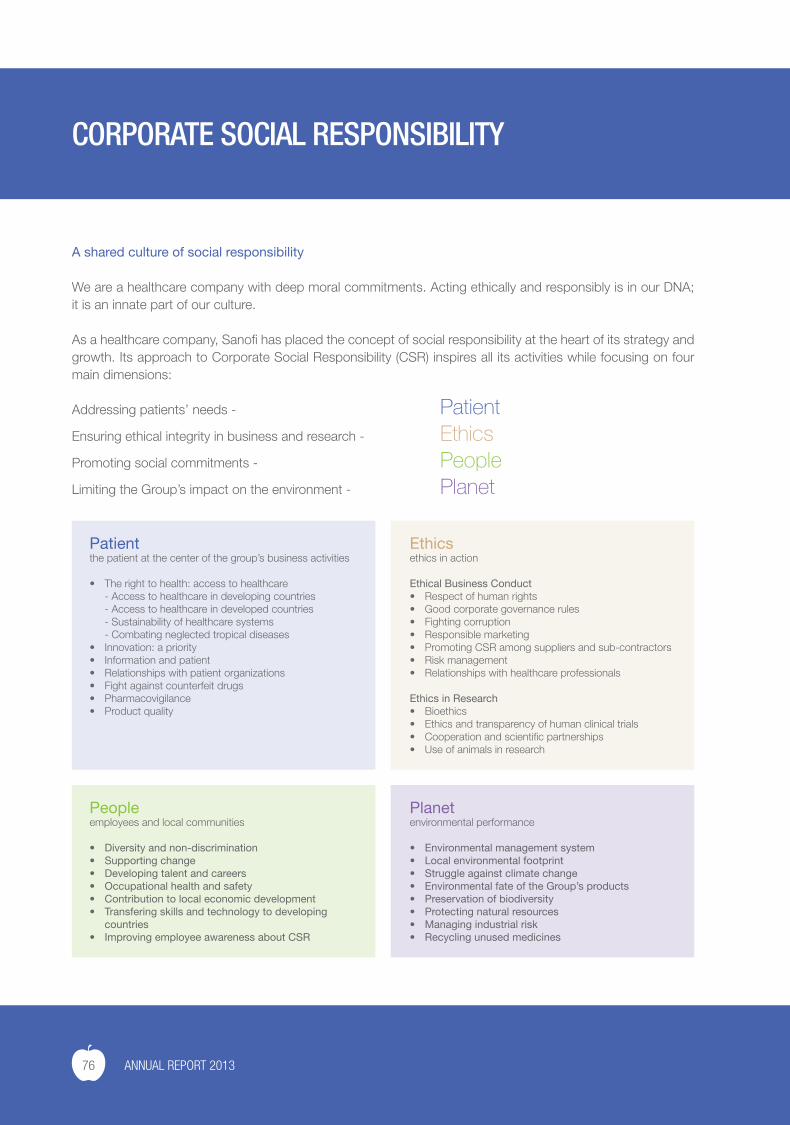
A shared culture of social responsibility
We are a healthcare company with deep moral commitments. Acting ethically and responsibly is in our DNA; it is an innate part of our culture.
As a healthcare company, Sanofi has placed the concept of social responsibility at the heart of its strategy and growth. Its approach to Corporate Social Responsibility (CSR) inspires all its activities while focusing on four main dimensions:
Addressing patients’ needs - PatientEnsuring ethical integrity in business and research - EthicsPromoting social commitments - PeopleLimiting the Group’s impact on the environment - Planet
Patientthe patient at the center of the group’s business activities
• Therighttohealth:accesstohealthcare- Access to healthcare in developing countries- Access to healthcare in developed countries- Sustainability of healthcare systems- Combating neglected tropical diseases
• Innovation:apriority• Informationandpatient• Relationshipswithpatientorganizations• Fightagainstcounterfeitdrugs• Pharmacovigilance• Productquality
Ethicsethics in action
Ethical Business Conduct• Respectofhumanrights• Goodcorporategovernancerules• Fightingcorruption• Responsiblemarketing• PromotingCSRamongsuppliersandsub-contractors• Riskmanagement• Relationshipswithhealthcareprofessionals
Ethics in Research• Bioethics• Ethicsandtransparencyofhumanclinicaltrials• Cooperationandscientificpartnerships• Useofanimalsinresearch
Planetenvironmental performance
• Environmentalmanagementsystem• Localenvironmentalfootprint• Struggleagainstclimatechange• EnvironmentalfateoftheGroup’sproducts• Preservationofbiodiversity• Protectingnaturalresources• Managingindustrialrisk• Recyclingunusedmedicines
Peopleemployees and local communities
• Diversityandnon-discrimination• Supportingchange• Developingtalentandcareers• Occupationalhealthandsafety• Contributiontolocaleconomicdevelopment• Transferingskillsandtechnologytodeveloping
countries• ImprovingemployeeawarenessaboutCSR
76 ANNUAL REPORT 2013
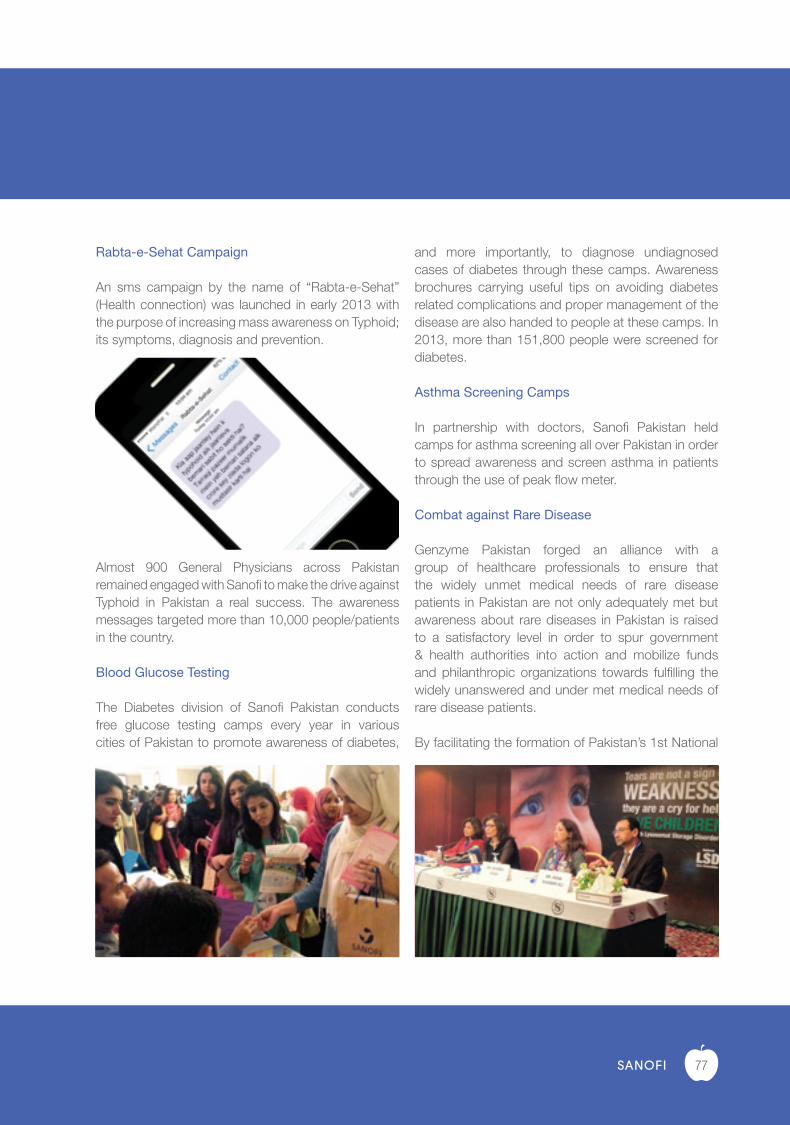
Rabta-e-Sehat Campaign
An sms campaign by the name of “Rabta-e-Sehat” (Health connection) was launched in early 2013 with the purpose of increasing mass awareness on Typhoid; its symptoms, diagnosis and prevention.
Almost 900 General Physicians across Pakistan remained engaged with Sanofi to make the drive against Typhoid in Pakistan a real success. The awareness messages targeted more than 10,000 people/patients in the country.
Blood Glucose Testing
The Diabetes division of Sanofi Pakistan conducts free glucose testing camps every year in various cities of Pakistan to promote awareness of diabetes,
and more importantly, to diagnose undiagnosed cases of diabetes through these camps. Awareness brochures carrying useful tips on avoiding diabetes related complications and proper management of the disease are also handed to people at these camps. In 2013, more than 151,800 people were screened for diabetes.
Asthma Screening Camps
In partnership with doctors, Sanofi Pakistan held camps for asthma screening all over Pakistan in order to spread awareness and screen asthma in patients through the use of peak flow meter.
Combat against Rare Disease
Genzyme Pakistan forged an alliance with a group of healthcare professionals to ensure that the widely unmet medical needs of rare disease patients in Pakistan are not only adequately met but awareness about rare diseases in Pakistan is raised to a satisfactory level in order to spur government & health authorities into action and mobilize funds and philanthropic organizations towards fulfilling the widely unanswered and under met medical needs of rare disease patients.
By facilitating the formation of Pakistan’s 1st National
77
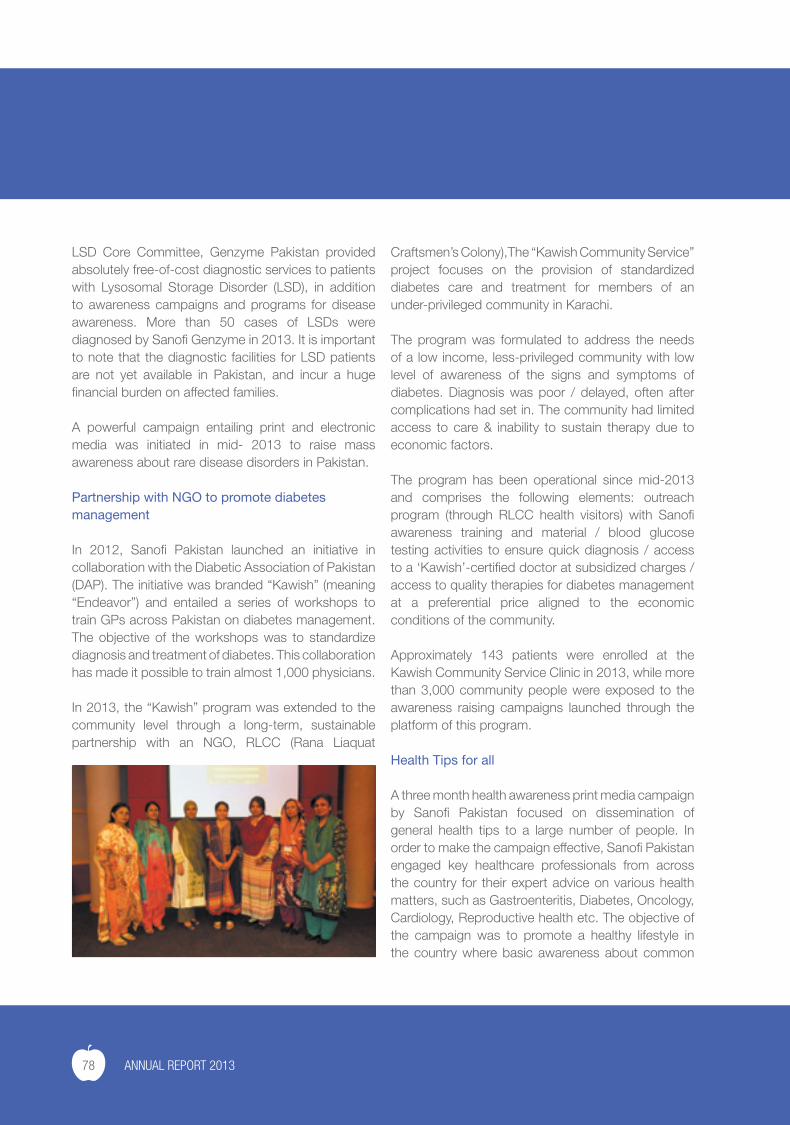
LSD Core Committee, Genzyme Pakistan provided absolutely free-of-cost diagnostic services to patients with Lysosomal Storage Disorder (LSD), in addition to awareness campaigns and programs for disease awareness. More than 50 cases of LSDs were diagnosed by Sanofi Genzyme in 2013. It is important to note that the diagnostic facilities for LSD patients are not yet available in Pakistan, and incur a huge financial burden on affected families.
A powerful campaign entailing print and electronic media was initiated in mid- 2013 to raise mass awareness about rare disease disorders in Pakistan.
Partnership with NGO to promote diabetes management
In 2012, Sanofi Pakistan launched an initiative in collaboration with the Diabetic Association of Pakistan (DAP). The initiative was branded “Kawish” (meaning “Endeavor”) and entailed a series of workshops to train GPs across Pakistan on diabetes management. The objective of the workshops was to standardize diagnosis and treatment of diabetes. This collaboration has made it possible to train almost 1,000 physicians.
In 2013, the “Kawish” program was extended to the community level through a long-term, sustainable partnership with an NGO, RLCC (Rana Liaquat
Craftsmen’s Colony),The “Kawish Community Service” project focuses on the provision of standardized diabetes care and treatment for members of an under-privileged community in Karachi.
The program was formulated to address the needs of a low income, less-privileged community with low level of awareness of the signs and symptoms of diabetes. Diagnosis was poor / delayed, often after complications had set in. The community had limited access to care & inability to sustain therapy due to economic factors.
The program has been operational since mid-2013 and comprises the following elements: outreach program (through RLCC health visitors) with Sanofi awareness training and material / blood glucose testing activities to ensure quick diagnosis / access to a ‘Kawish’-certified doctor at subsidized charges / access to quality therapies for diabetes management at a preferential price aligned to the economic conditions of the community.
Approximately 143 patients were enrolled at the Kawish Community Service Clinic in 2013, while more than 3,000 community people were exposed to the awareness raising campaigns launched through the platform of this program.
Health Tips for all
A three month health awareness print media campaign by Sanofi Pakistan focused on dissemination of general health tips to a large number of people. In order to make the campaign effective, Sanofi Pakistan engaged key healthcare professionals from across the country for their expert advice on various health matters, such as Gastroenteritis, Diabetes, Oncology, Cardiology, Reproductive health etc. The objective of the campaign was to promote a healthy lifestyle in the country where basic awareness about common
78 ANNUAL REPORT 2013
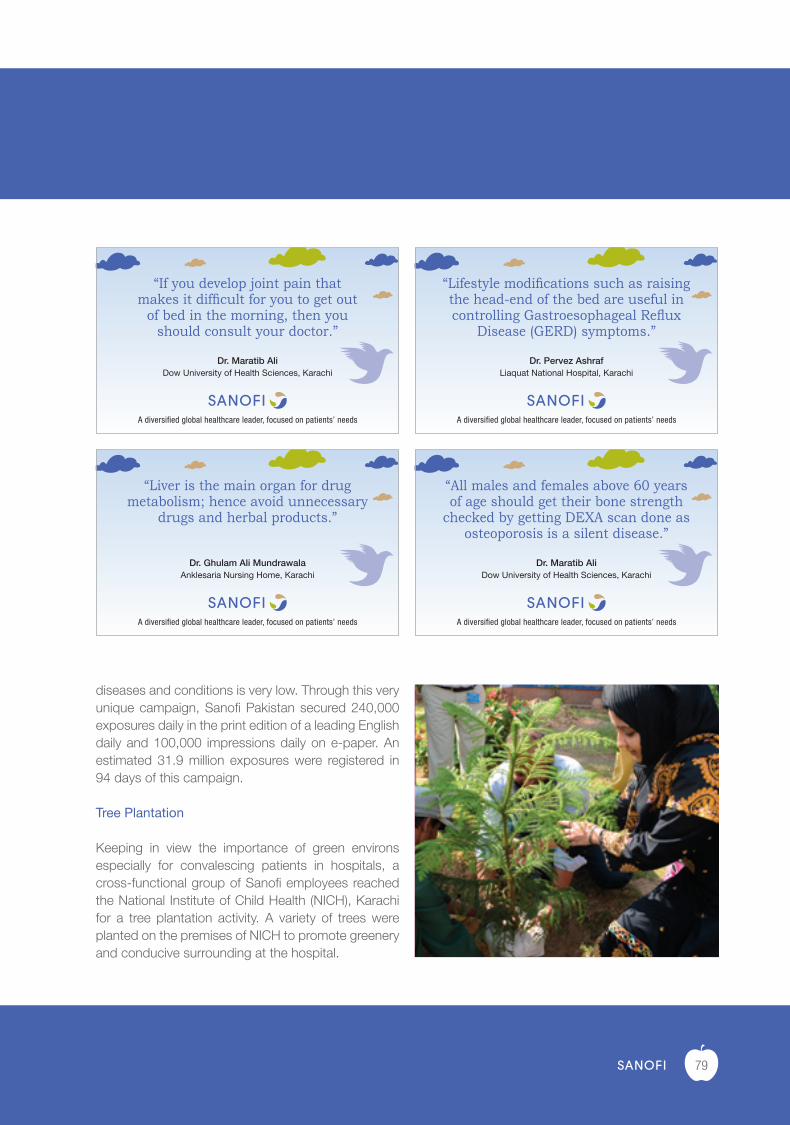
diseases and conditions is very low. Through this very unique campaign, Sanofi Pakistan secured 240,000 exposures daily in the print edition of a leading English daily and 100,000 impressions daily on e-paper. An estimated 31.9 million exposures were registered in 94 days of this campaign.
Tree Plantation
Keeping in view the importance of green environs especially for convalescing patients in hospitals, a cross-functional group of Sanofi employees reached the National Institute of Child Health (NICH), Karachi for a tree plantation activity. A variety of trees were planted on the premises of NICH to promote greenery and conducive surrounding at the hospital.
Dr. Pervez AshrafLiaquat National Hospital, Karachi
“Lifestyle modifications such as raisingthe head-end of the bed are useful in controlling Gastroesophageal Reflux
Disease (GERD) symptoms.”
Dr. Maratib AliDow University of Health Sciences, Karachi
“If you develop joint pain thatmakes it difficult for you to get out
of bed in the morning, then youshould consult your doctor.”
Dr. Ghulam Ali MundrawalaAnklesaria Nursing Home, Karachi
“Liver is the main organ for drugmetabolism; hence avoid unnecessary
drugs and herbal products.”
Dr. Maratib AliDow University of Health Sciences, Karachi
“All males and females above 60 yearsof age should get their bone strength
checked by getting DEXA scan done as osteoporosis is a silent disease.”
79
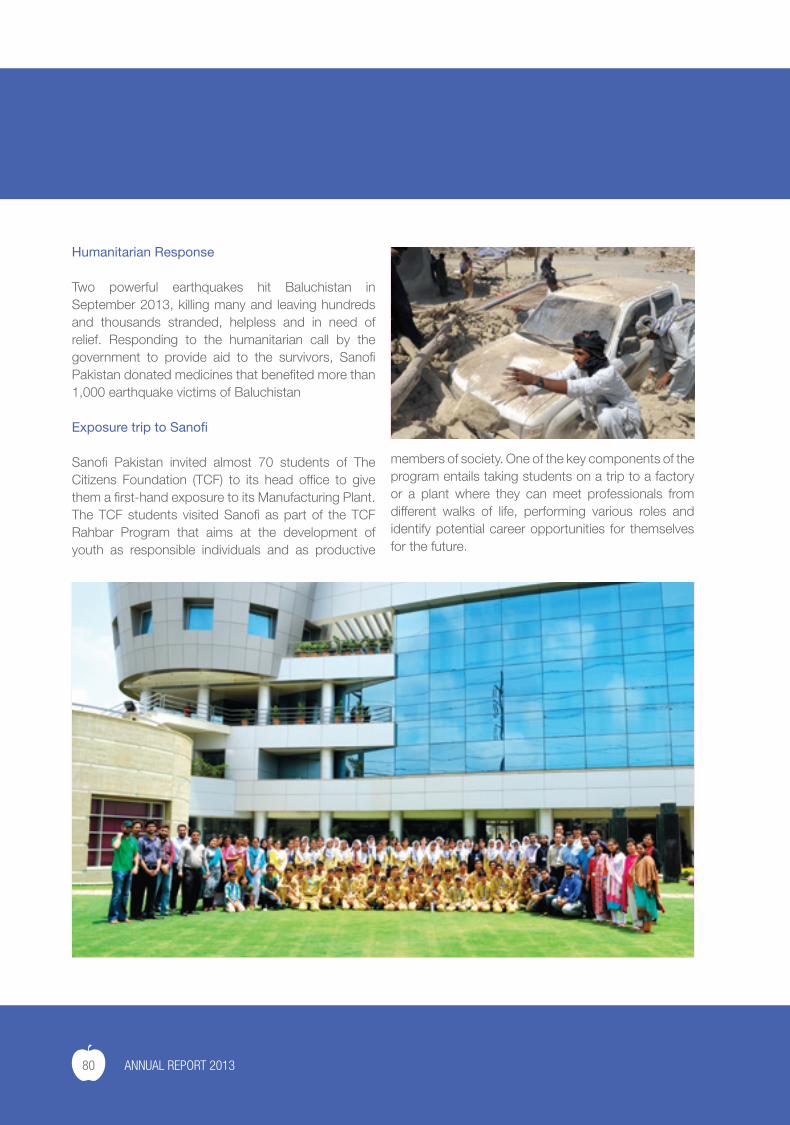
Humanitarian Response
Two powerful earthquakes hit Baluchistan in September 2013, killing many and leaving hundreds and thousands stranded, helpless and in need of relief. Responding to the humanitarian call by the government to provide aid to the survivors, Sanofi Pakistan donated medicines that benefited more than 1,000 earthquake victims of Baluchistan
Exposure trip to Sanofi
Sanofi Pakistan invited almost 70 students of The Citizens Foundation (TCF) to its head office to give them a first-hand exposure to its Manufacturing Plant. The TCF students visited Sanofi as part of the TCF Rahbar Program that aims at the development of youth as responsible individuals and as productive
members of society. One of the key components of the program entails taking students on a trip to a factory or a plant where they can meet professionals from different walks of life, performing various roles and identify potential career opportunities for themselves for the future.
80 ANNUAL REPORT 2013
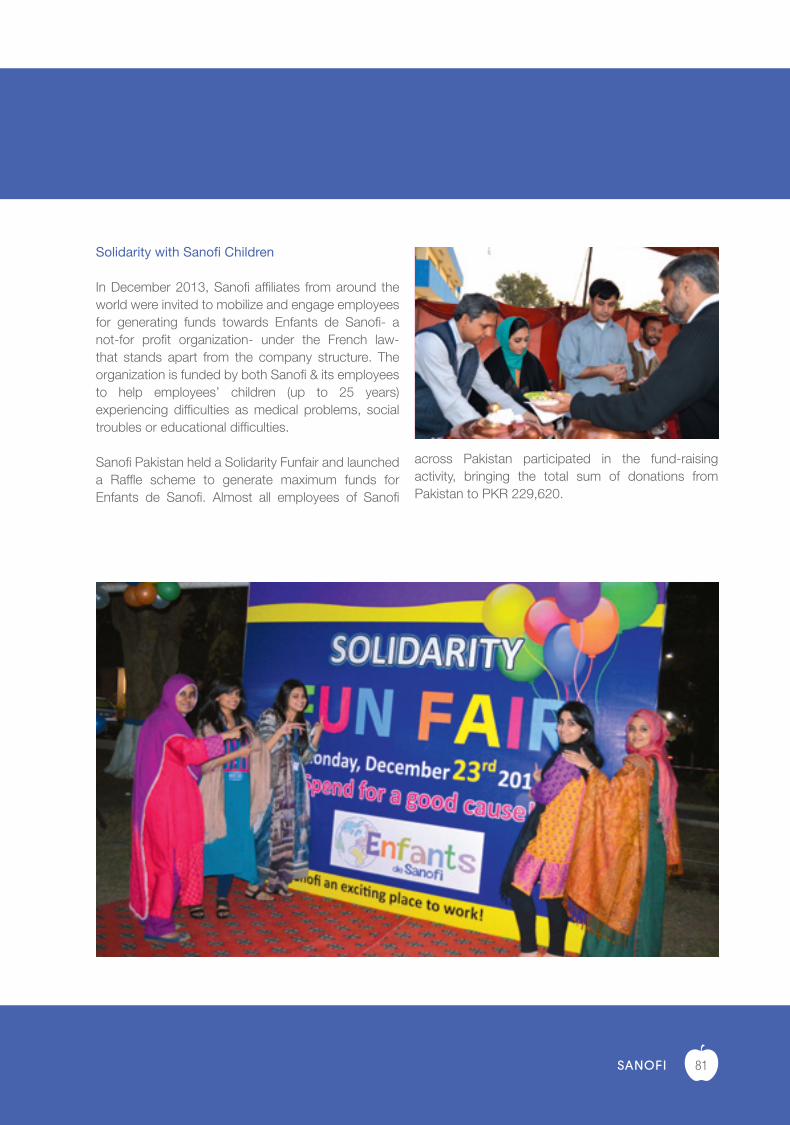
Solidarity with Sanofi Children
In December 2013, Sanofi affiliates from around the world were invited to mobilize and engage employees for generating funds towards Enfants de Sanofi- a not-for profit organization- under the French law-that stands apart from the company structure. The organization is funded by both Sanofi & its employees to help employees’ children (up to 25 years) experiencing difficulties as medical problems, social troubles or educational difficulties.
Sanofi Pakistan held a Solidarity Funfair and launched a Raffle scheme to generate maximum funds for Enfants de Sanofi. Almost all employees of Sanofi
across Pakistan participated in the fund-raising activity, bringing the total sum of donations from Pakistan to PKR 229,620.
81
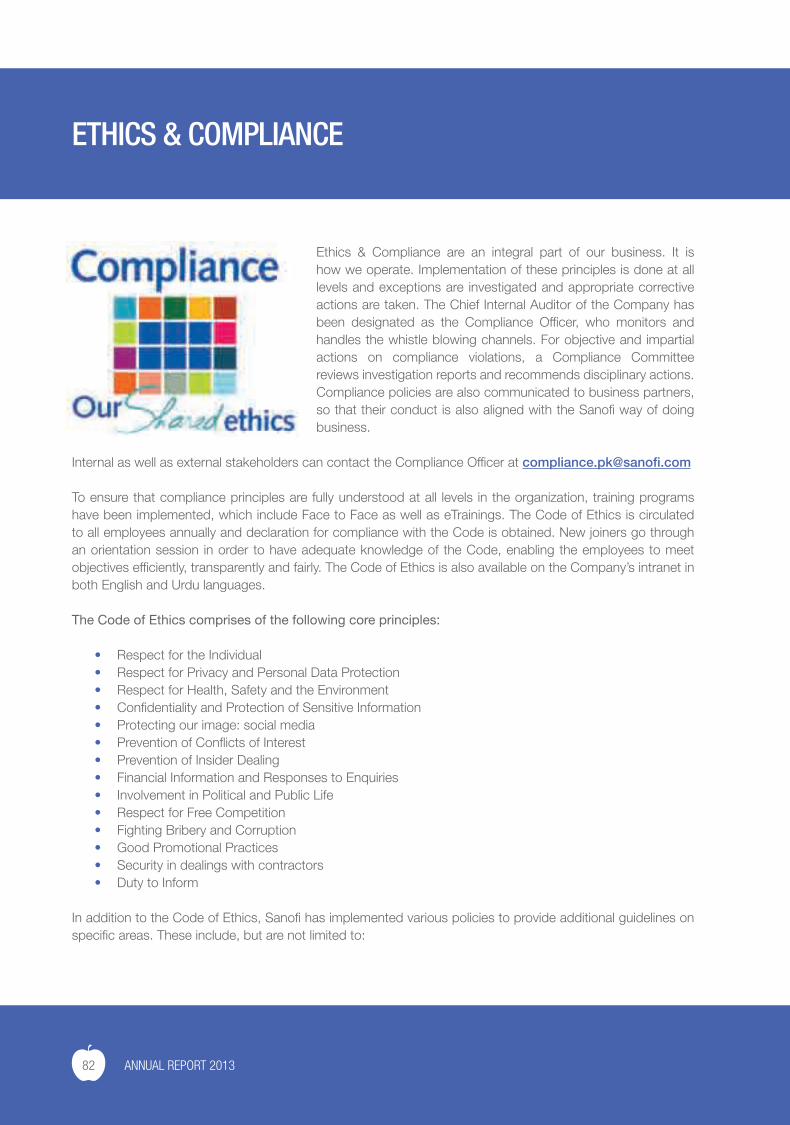
ETHICS & COMPLIANCE
Ethics & Compliance are an integral part of our business. It is how we operate. Implementation of these principles is done at all levels and exceptions are investigated and appropriate corrective actions are taken. The Chief Internal Auditor of the Company has been designated as the Compliance Officer, who monitors and handles the whistle blowing channels. For objective and impartial actions on compliance violations, a Compliance Committee reviews investigation reports and recommends disciplinary actions. Compliance policies are also communicated to business partners, so that their conduct is also aligned with the Sanofi way of doing business.
Internal as well as external stakeholders can contact the Compliance Officer at [email protected]
To ensure that compliance principles are fully understood at all levels in the organization, training programs have been implemented, which include Face to Face as well as eTrainings. The Code of Ethics is circulated to all employees annually and declaration for compliance with the Code is obtained. New joiners go through an orientation session in order to have adequate knowledge of the Code, enabling the employees to meet objectives efficiently, transparently and fairly. The Code of Ethics is also available on the Company’s intranet in both English and Urdu languages.
The Code of Ethics comprises of the following core principles:
• Respect for the Individual• Respect for Privacy and Personal Data Protection• Respect for Health, Safety and the Environment• Confidentiality and Protection of Sensitive Information• Protecting our image: social media• Prevention of Conflicts of Interest• Prevention of Insider Dealing• Financial Information and Responses to Enquiries• Involvement in Political and Public Life• Respect for Free Competition• Fighting Bribery and Corruption• Good Promotional Practices• Security in dealings with contractors• Duty to Inform
In addition to the Code of Ethics, Sanofi has implemented various policies to provide additional guidelines on specific areas. These include, but are not limited to:
82 ANNUAL REPORT 2013
Financial code of ethicsThis code defines the acts and omissions to be followed by senior executives, especially those responsible for public disclosure and financial information.
Complaints management policy (whistle blowing procedure)The company has an elaborate whistle blowing policy, relative to financial, accounting, internal control and anticorruption matters. Global as well as local channels are defined for employees to communicate their concerns.
Principles of good promotional practicesDefines the fundamental promotional rules recommended by the World Health Organization and the International Federation of Pharmaceuticals Manufacturers Association.
Personal data protection charterThis charter outlines Sanofi corporate rules for the collection, processing, use, dissemination, transfer, and storage of personal data, in order to secure an adequate level of protection within the group.
Code for prevention of insider tradingDefines rules for prevention of insider trading within the Sanofi group.
Ethical charter for buyersThis document defines the rules applicable to and the behavior required from all Sanofi employees who are involved in the buying process.
Anti-bribery policyThis policy provides additional guidance and procedures for employees of Sanofi to comply with applicable anti-corruption and anti-bribery laws and regulations.
Policy on interactions with Health Care Providers (HCP)In order to avoid the negative perceptions about influencing and conflict of interest in our interaction with HCP’s, Sanofi has implemented processes to ensure transparency and objectivity in our interaction with HCP’s.
Information protection charterThis policy defines the code of conduct for employees for using the information technology assets of Sanofi. In addition to usage, the charter also provides guidance on protecting information assets of Sanofi.
Conflict of InterestThis policy defines process for identification, reporting and resolution of actual or potential Conflict of Interest situations involving Sanofi employees.
83
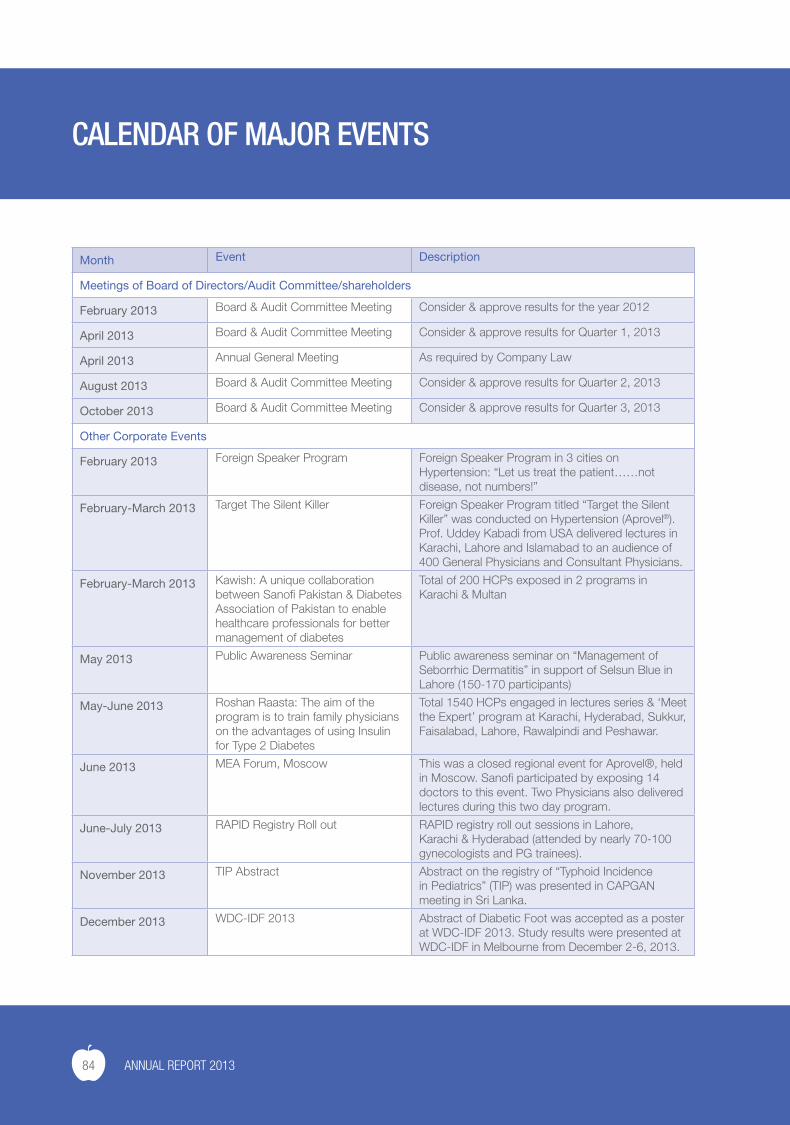
CALENDAR OF MAJOR EVENTS
Month Event Description
Meetings of Board of Directors/Audit Committee/shareholders
February 2013 Board & Audit Committee Meeting Consider & approve results for the year 2012
April 2013 Board & Audit Committee Meeting Consider & approve results for Quarter 1, 2013
April 2013 Annual General Meeting As required by Company Law
August 2013 Board & Audit Committee Meeting Consider & approve results for Quarter 2, 2013
October 2013 Board & Audit Committee Meeting Consider & approve results for Quarter 3, 2013
Other Corporate Events
February 2013 Foreign Speaker Program Foreign Speaker Program in 3 cities on Hypertension: “Let us treat the patient……not disease, not numbers!”
February-March 2013 Target The Silent Killer Foreign Speaker Program titled “Target the Silent Killer” was conducted on Hypertension (Aprovel®). Prof. Uddey Kabadi from USA delivered lectures in Karachi, Lahore and Islamabad to an audience of 400 General Physicians and Consultant Physicians.
February-March 2013 Kawish: A unique collaboration between Sanofi Pakistan & Diabetes Association of Pakistan to enable healthcare professionals for better management of diabetes
Total of 200 HCPs exposed in 2 programs in Karachi & Multan
May 2013 Public Awareness Seminar Public awareness seminar on “Management of Seborrhic Dermatitis” in support of Selsun Blue in Lahore (150-170 participants)
May-June 2013 Roshan Raasta: The aim of the program is to train family physicians on the advantages of using Insulin for Type 2 Diabetes
Total 1540 HCPs engaged in lectures series & ‘Meet the Expert’ program at Karachi, Hyderabad, Sukkur, Faisalabad, Lahore, Rawalpindi and Peshawar.
June 2013 MEA Forum, Moscow This was a closed regional event for Aprovel®, held in Moscow. Sanofi participated by exposing 14 doctors to this event. Two Physicians also delivered lectures during this two day program.
June-July 2013 RAPID Registry Roll out RAPID registry roll out sessions in Lahore, Karachi & Hyderabad (attended by nearly 70-100 gynecologists and PG trainees).
November 2013 TIP Abstract Abstract on the registry of “Typhoid Incidence in Pediatrics” (TIP) was presented in CAPGAN meeting in Sri Lanka.
December 2013 WDC-IDF 2013 Abstract of Diabetic Foot was accepted as a poster at WDC-IDF 2013. Study results were presented at WDC-IDF in Melbourne from December 2-6, 2013.
84 ANNUAL REPORT 2013
REVIEW REPORT TO THE MEMBERSon Statement of Compliance with the Best Practices of Code of the Corporate Governance
Ernst & Young Ford Rhodes Sidat HyderChartered AccountantsProgressive Plaza, Beaumont RoadP.O.Box 15541, Karachi 75530, Pakistan
Tel: +9221 3565 0007Fax: +9221 3568 1965www.ey.com
We have reviewed the enclosed Statement of Compliance with the best practices contained in the Code of Corporate Governance (the Code) prepared by the Board of Directors of sanofi-aventis Pakistan Limited (the Company) for the year ended 31 December 2013 to comply with the requirements of Listing Regulation No. 35 (Chapter XI) of Karachi Stock Exchange Limited, Lahore Stock Exchange Limited and Islamabad Stock Exchange Limited, where the Company is listed.
The responsibility for compliance with the Code is that of the Board of Directors of the Company. Our responsibility is to review, to the extent where such compliance can be objectively verified, whether the Statement of Compliance reflects the status of the Company’s compliance with the provisions of the Code and report if it does not and to highlight any non-compliance with the requirements of the Code. A review is limited primarily to inquiries of the Company’s personnel and review of various documents prepared by the Company to comply with the Code.
As a part of our audit of the financial statements we are required to obtain an understanding of the accounting and internal control systems sufficient to plan the audit and develop an effective audit approach. We are not required to consider whether the Board of Directors’ statement on internal control covers all risks and controls or to form an opinion on the effectiveness of such internal controls, the Company’s corporate governance procedures and risks.
The Code requires the Company to place before the Audit Committee, and upon recommendation of the Audit Committee, place before the Board of Directors for their review and approval its related party transactions distinguishing between transactions carried out on terms equivalent to those that prevail in arm’s length transactions and transactions which are not executed at arm’s length price and recording proper justification for using such alternate pricing mechanism. We are only required and have ensured compliance of this requirement to the extent of the approval of the related party transactions by the Board of Directors upon recommendation of the Audit Committee. We have not carried out any procedures to determine whether the related party transactions were undertaken at arm’s length price or not.
Based on our review, nothing has come to our attention which causes us to believe that the Statement of Compliance does not appropriately reflect the Company’s compliance, in all material respects, with the best practices contained in the Code as applicable to the Company for the year ended 31 December 2013.
Further, we draw your attention to clause 26 of the Statement of Compliance which explains the status of the Directors’ training program. Our conclusion is not qualified in respect of this matter.
Chartered AccountantsAudit Engagement Partner: Riaz A. Rehman ChamdiaDate: 26th February, 2014Place: Karachi
85
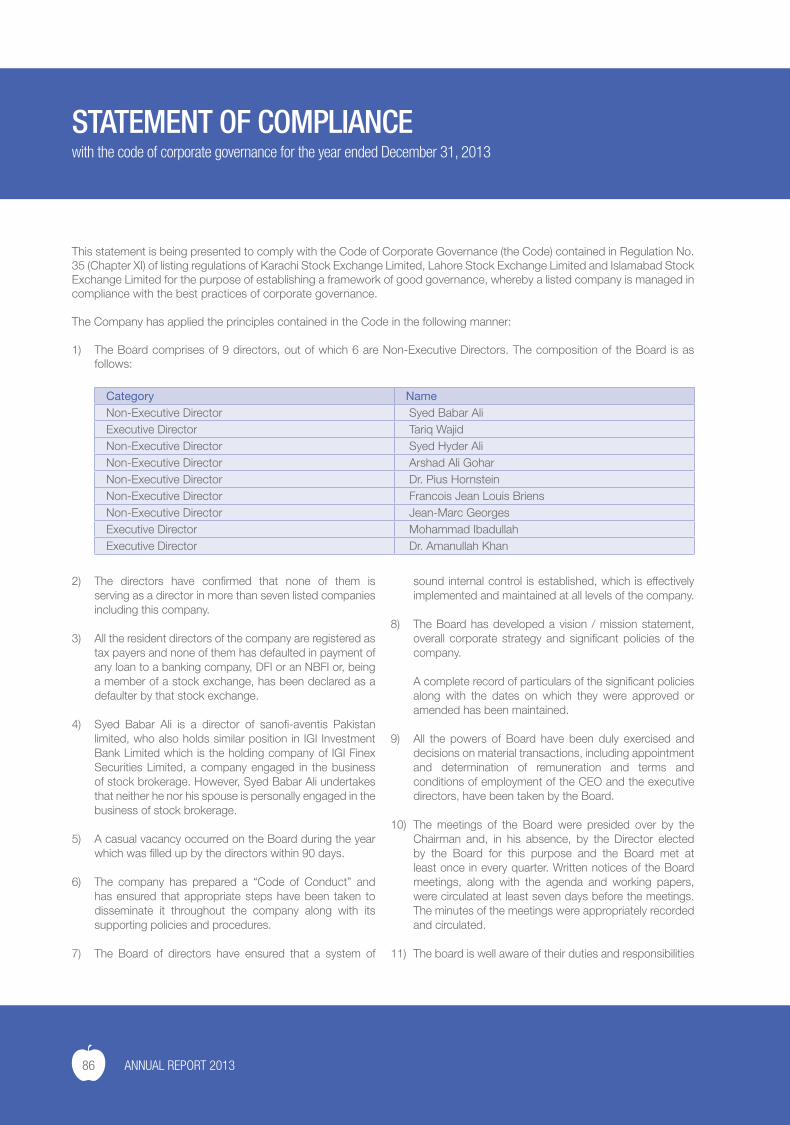
STATEMENT OF COMPLIANCEwith the code of corporate governance for the year ended December 31, 2013
2) The directors have confirmed that none of them is serving as a director in more than seven listed companies including this company.
3) All the resident directors of the company are registered as tax payers and none of them has defaulted in payment of any loan to a banking company, DFI or an NBFI or, being a member of a stock exchange, has been declared as a defaulter by that stock exchange.
4) Syed Babar Ali is a director of sanofi-aventis Pakistan limited, who also holds similar position in IGI Investment Bank Limited which is the holding company of IGI Finex Securities Limited, a company engaged in the business of stock brokerage. However, Syed Babar Ali undertakes that neither he nor his spouse is personally engaged in the business of stock brokerage.
5) A casual vacancy occurred on the Board during the year which was filled up by the directors within 90 days.
6) The company has prepared a “Code of Conduct” and has ensured that appropriate steps have been taken to disseminate it throughout the company along with its supporting policies and procedures.
7) The Board of directors have ensured that a system of
sound internal control is established, which is effectively implemented and maintained at all levels of the company.
8) The Board has developed a vision / mission statement, overall corporate strategy and significant policies of the company.
A complete record of particulars of the significant policies along with the dates on which they were approved or amended has been maintained.
9) All the powers of Board have been duly exercised and decisions on material transactions, including appointment and determination of remuneration and terms and conditions of employment of the CEO and the executive directors, have been taken by the Board.
10) The meetings of the Board were presided over by the Chairman and, in his absence, by the Director elected by the Board for this purpose and the Board met at least once in every quarter. Written notices of the Board meetings, along with the agenda and working papers, were circulated at least seven days before the meetings. The minutes of the meetings were appropriately recorded and circulated.
11) The board is well aware of their duties and responsibilities
This statement is being presented to comply with the Code of Corporate Governance (the Code) contained in Regulation No. 35 (Chapter XI) of listing regulations of Karachi Stock Exchange Limited, Lahore Stock Exchange Limited and Islamabad Stock Exchange Limited for the purpose of establishing a framework of good governance, whereby a listed company is managed in compliance with the best practices of corporate governance.
The Company has applied the principles contained in the Code in the following manner:
1) The Board comprises of 9 directors, out of which 6 are Non-Executive Directors. The composition of the Board is as follows:
Category NameNon-Executive Director Syed Babar AliExecutive Director Tariq WajidNon-Executive Director Syed Hyder AliNon-Executive Director Arshad Ali GoharNon-Executive Director Dr. Pius HornsteinNon-Executive Director Francois Jean Louis BriensNon-Executive Director Jean-Marc GeorgesExecutive Director Mohammad IbadullahExecutive Director Dr. Amanullah Khan
86 ANNUAL REPORT 2013
under the Code. Two of the Non-Executive Directors of the company meet the criteria of exemption under clause (xi) of the Code, and accordingly are exempted from attending the director’s training program. In future, arrangements will be made for other directors for acquiring certification under the directors training program.
12) The Board approves the appointment, remuneration and terms and conditions of employment of Chief Financial Officer, Company Secretary and the Head of Internal Audit. During 2012, the Board appointed the CFO as the interim Company Secretary after the resignation of the previous Company Secretary. However, a new Company Secretary was subsequently appointed by the Board during 2013.
13) The directors’ report for the year ended December 31, 2013 has been prepared in compliance with the requirements of the Code and fully describes the salient matters required to be disclosed.
14) The financial statements of the company were duly endorsed by CEO and CFO before approval of the Board.
15) The directors, CEO and executives do not hold any interest in the shares of the company other than that disclosed in the pattern of shareholding.
16) The company has complied with all the corporate and financial reporting requirements of the Code.
17) The Board has formed an audit committee. It comprises of three members, two of whom are non-executive directors including the Chairman of the committee.
18) The meetings of the audit committee were held at least once every quarter prior to approval of interim and final results of the company and as required by the Code. The terms of reference of the committee have been formed and advised to the committee for compliance.
19) The Board has formed an HR and Remuneration Committee. It comprises of three members, two of whom are nonexecutive directors including the chairman of the committee.
20) The Board has set-up an effective internal audit function manned by suitably qualified and experienced personnel who are conversant with the policies and procedures of the company and are involved in the internal audit function on a full time basis.
21) The statutory auditors of the company have confirmed that they have been given a satisfactory rating under the quality control review program of the Institute of Chartered Accountants of Pakistan, that they or any of the partners of the firm, their spouses and minor children do not hold shares of the company and that the firm and all its partners are in compliance with International Federation of Accountants (IFAC) guidelines on code of ethics as adopted by Institute of Chartered Accountants of Pakistan.
22) The statutory auditors or the persons associated with them have not been appointed to provide other services except in accordance with the listing regulations and the auditors have confirmed that they have observed IFAC guidelines in this regard.
23) The ‘closed period’ prior to the announcement of interim/final results, and business decisions, which may materially affect the market price of company’s securities, was determined and intimated to directors, employees and stock exchanges.
24) Material/price sensitive information has been disseminated among all market participants at once through stock exchanges.
25) All related party transactions have been placed before the audit committee and approved by the Board of Directors along with pricing methods for transactions carried out on terms equivalent to those that prevailed in the arm’s length transactions.
26) We confirm that all other material principles contained in the Code have been complied with except for the matter stated in point 11 above towards which reasonable progress will be made by the Company to seek compliance by the end of the next accounting year.
By order of the Board
Dated: February 26, 2014
Syed Babar AliChairman
Tariq WajidChief Executive
87
Gross Margin(Percentage)
D&M / Net Sales Ratio(Percentage)
Administrative Expenses(Rs. in million)
30.5
30.5
2013 2012
16.6
18.2
2013 2012
237
221
2013 2012
Net Sales - Company(Rs. in million)
8,79
2
8,62
8
2013 2012
Net Sales - Pharmaceuticals including CHC(Rs. in million)
8,26
7
8,37
7
2013 2012
Net Sales - Vaccines(Rs. in million)
525
251
2013 2012
DIRECTORS’ REPORT
We are pleased to present the Annual Report and the Company’s audited financial statements for the year ended December 31, 2013. These financial statements have been prepared in accordance with the approved accounting standards as applicable in Pakistan and the requirements of the Companies Ordinance, 1984. The directors’ report is prepared under section 236 of the Companies Ordinance, 1984 and clause xvi of the Code of Corporate Governance, 2012.
OverviewWe are pleased to inform that net sales for the year ended December 31, 2013 at Rs.8,792 (2012:Rs.8,628) million registered an overall growth of 1.89% over the last year, comprising of Rs.8,152 (2012: Rs.8,329) million, Rs.525 (2012: Rs.251) million and Rs. 115 (2012: Rs. 48) million attributable to pharmaceutical, vaccine and Consumer Healthcare products, respectively. Thus our pharmaceutical products recorded a decline of 2.14% (2012:
88 ANNUAL REPORT 2013
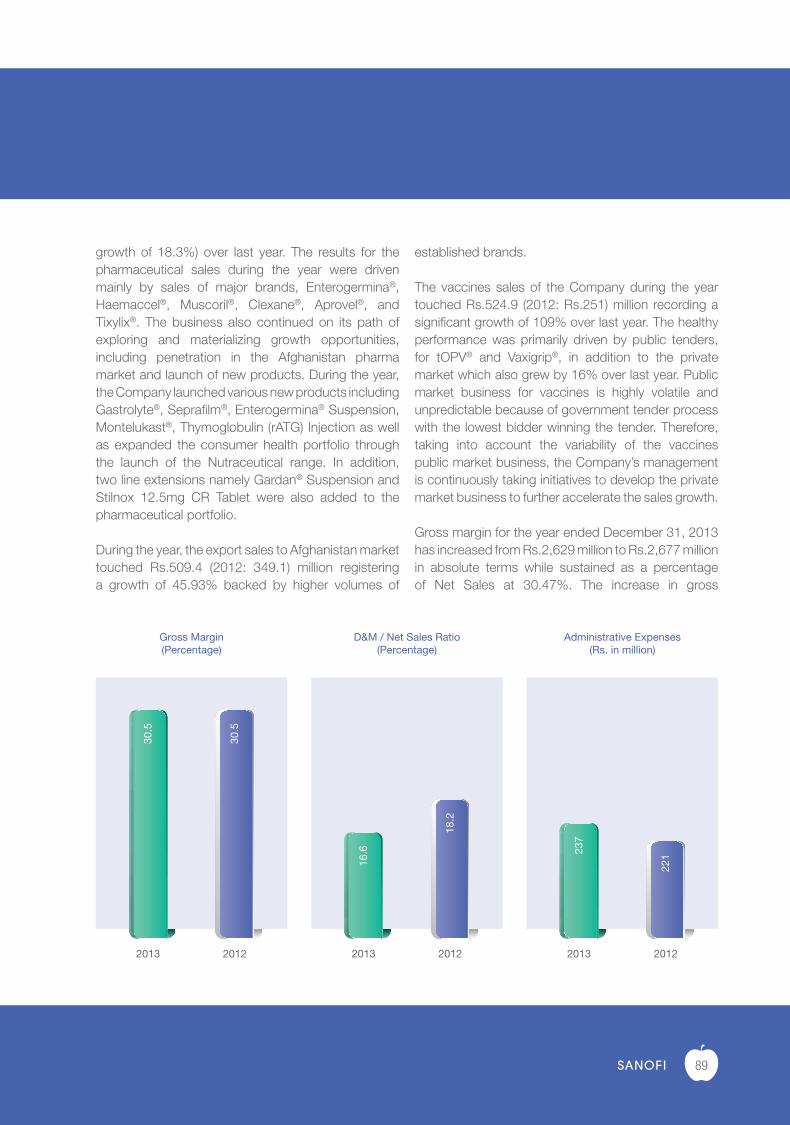
Gross Margin(Percentage)
D&M / Net Sales Ratio(Percentage)
Administrative Expenses(Rs. in million)
30.5
30.5
2013 2012
16.6
18.2
2013 2012
237
221
2013 2012
Net Sales - Company(Rs. in million)
8,79
2
8,62
8
2013 2012
Net Sales - Pharmaceuticals including CHC(Rs. in million)
8,26
7
8,37
7
2013 2012
Net Sales - Vaccines(Rs. in million)
525
251
2013 2012
growth of 18.3%) over last year. The results for the pharmaceutical sales during the year were driven mainly by sales of major brands, Enterogermina®, Haemaccel®, Muscoril®, Clexane®, Aprovel®, and Tixylix®. The business also continued on its path of exploring and materializing growth opportunities, including penetration in the Afghanistan pharma market and launch of new products. During the year, the Company launched various new products including Gastrolyte®, Seprafilm®, Enterogermina® Suspension, Montelukast®, Thymoglobulin (rATG) Injection as well as expanded the consumer health portfolio through the launch of the Nutraceutical range. In addition, two line extensions namely Gardan® Suspension and Stilnox 12.5mg CR Tablet were also added to the pharmaceutical portfolio.
During the year, the export sales to Afghanistan market touched Rs.509.4 (2012: 349.1) million registering a growth of 45.93% backed by higher volumes of
established brands.
The vaccines sales of the Company during the year touched Rs.524.9 (2012: Rs.251) million recording a significant growth of 109% over last year. The healthy performance was primarily driven by public tenders, for tOPV® and Vaxigrip®, in addition to the private market which also grew by 16% over last year. Public market business for vaccines is highly volatile and unpredictable because of government tender process with the lowest bidder winning the tender. Therefore, taking into account the variability of the vaccines public market business, the Company’s management is continuously taking initiatives to develop the private market business to further accelerate the sales growth.
Gross margin for the year ended December 31, 2013 has increased from Rs.2,629 million to Rs.2,677 million in absolute terms while sustained as a percentage of Net Sales at 30.47%. The increase in gross
89
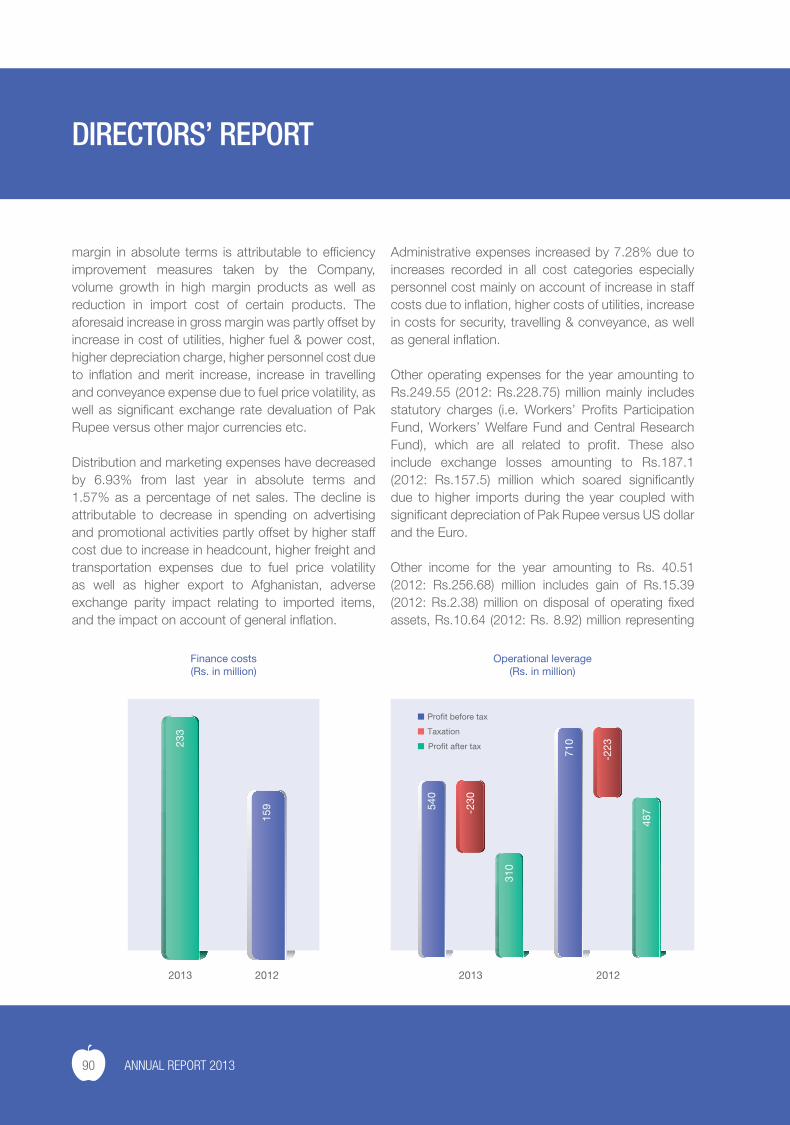
Finance costs(Rs. in million)
233
159
2013 2012
Operational leverage(Rs. in million)
-230540
710
2013 2012
Pro�t before tax
Taxation
Pro�t after tax
310
487
-223
margin in absolute terms is attributable to efficiency improvement measures taken by the Company, volume growth in high margin products as well as reduction in import cost of certain products. The aforesaid increase in gross margin was partly offset by increase in cost of utilities, higher fuel & power cost, higher depreciation charge, higher personnel cost due to inflation and merit increase, increase in travelling and conveyance expense due to fuel price volatility, as well as significant exchange rate devaluation of Pak Rupee versus other major currencies etc.
Distribution and marketing expenses have decreased by 6.93% from last year in absolute terms and 1.57% as a percentage of net sales. The decline is attributable to decrease in spending on advertising and promotional activities partly offset by higher staff cost due to increase in headcount, higher freight and transportation expenses due to fuel price volatility as well as higher export to Afghanistan, adverse exchange parity impact relating to imported items, and the impact on account of general inflation.
Administrative expenses increased by 7.28% due to increases recorded in all cost categories especially personnel cost mainly on account of increase in staff costs due to inflation, higher costs of utilities, increase in costs for security, travelling & conveyance, as well as general inflation.
Other operating expenses for the year amounting to Rs.249.55 (2012: Rs.228.75) million mainly includes statutory charges (i.e. Workers’ Profits Participation Fund, Workers’ Welfare Fund and Central Research Fund), which are all related to profit. These also include exchange losses amounting to Rs.187.1 (2012: Rs.157.5) million which soared significantly due to higher imports during the year coupled with significant depreciation of Pak Rupee versus US dollar and the Euro.
Other income for the year amounting to Rs. 40.51 (2012: Rs.256.68) million includes gain of Rs.15.39 (2012: Rs.2.38) million on disposal of operating fixed assets, Rs.10.64 (2012: Rs. 8.92) million representing
DIRECTORS’ REPORT
90 ANNUAL REPORT 2013
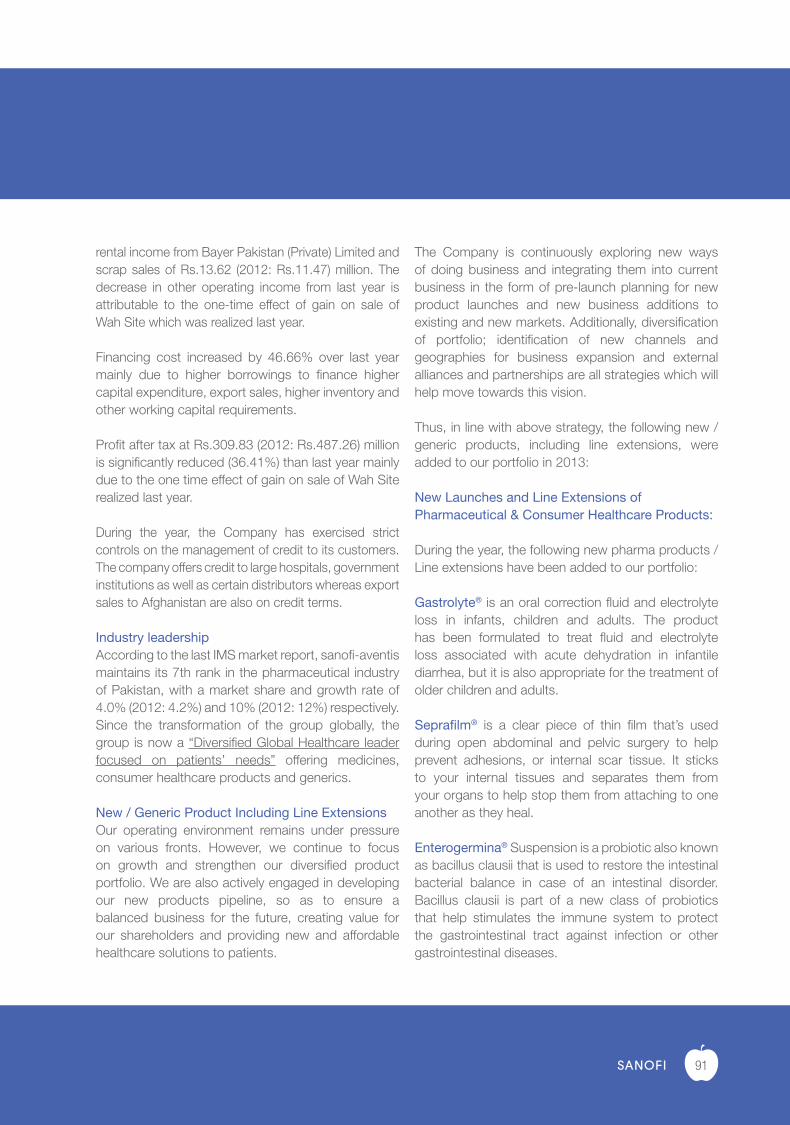
Finance costs(Rs. in million)
233
159
2013 2012
Operational leverage(Rs. in million)
-230540
710
2013 2012
Pro�t before tax
Taxation
Pro�t after tax
310
487
-223
rental income from Bayer Pakistan (Private) Limited and scrap sales of Rs.13.62 (2012: Rs.11.47) million. The decrease in other operating income from last year is attributable to the one-time effect of gain on sale of Wah Site which was realized last year.
Financing cost increased by 46.66% over last year mainly due to higher borrowings to finance higher capital expenditure, export sales, higher inventory and other working capital requirements.
Profit after tax at Rs.309.83 (2012: Rs.487.26) million is significantly reduced (36.41%) than last year mainly due to the one time effect of gain on sale of Wah Site realized last year.
During the year, the Company has exercised strict controls on the management of credit to its customers. The company offers credit to large hospitals, government institutions as well as certain distributors whereas export sales to Afghanistan are also on credit terms.
Industry leadershipAccording to the last IMS market report, sanofi-aventis maintains its 7th rank in the pharmaceutical industry of Pakistan, with a market share and growth rate of 4.0% (2012: 4.2%) and 10% (2012: 12%) respectively. Since the transformation of the group globally, the group is now a “Diversified Global Healthcare leader focused on patients’ needs” offering medicines, consumer healthcare products and generics.
New / Generic Product Including Line ExtensionsOur operating environment remains under pressure on various fronts. However, we continue to focus on growth and strengthen our diversified product portfolio. We are also actively engaged in developing our new products pipeline, so as to ensure a balanced business for the future, creating value for our shareholders and providing new and affordable healthcare solutions to patients.
The Company is continuously exploring new ways of doing business and integrating them into current business in the form of pre-launch planning for new product launches and new business additions to existing and new markets. Additionally, diversification of portfolio; identification of new channels and geographies for business expansion and external alliances and partnerships are all strategies which will help move towards this vision.
Thus, in line with above strategy, the following new /generic products, including line extensions, were added to our portfolio in 2013:
New Launches and Line Extensions of Pharmaceutical & Consumer Healthcare Products:
During the year, the following new pharma products /Line extensions have been added to our portfolio:
Gastrolyte® is an oral correction fluid and electrolyte loss in infants, children and adults. The product has been formulated to treat fluid and electrolyte loss associated with acute dehydration in infantile diarrhea, but it is also appropriate for the treatment of older children and adults.
Seprafilm® is a clear piece of thin film that’s used during open abdominal and pelvic surgery to help prevent adhesions, or internal scar tissue. It sticks to your internal tissues and separates them from your organs to help stop them from attaching to one another as they heal.
Enterogermina® Suspension is a probiotic also known as bacillus clausii that is used to restore the intestinal bacterial balance in case of an intestinal disorder. Bacillus clausii is part of a new class of probiotics that help stimulates the immune system to protect the gastrointestinal tract against infection or other gastrointestinal diseases.
91
Montelukast® is a selective leukotriene receptor antagonist that inhibits the cysteinyl leukotriene type-1 (CysLT1) receptor. It is indicated in adult and pediatric patients 2 years of age and older for the prophylaxis and chronic treatment of asthma, seasonal and perennial allergic rhinitis.
Gardan® Suspension contains the active ingredient mefenamic acid and belongs to a group of medicines called Non-Steroidal Anti-Inflammatory Drugs (or NSAIDs). It has antipyretic with analgesic properties and is available in strawberry flavor.
Stilnox® (zolpidem tartrate) 12.5mg CR Tablets is an extension of existing brand Stilnox that has been available as 10mg tablets since 1998 and 6.25mg extended-release tablets launched in 2012. Stilnox is used to initiate and maintain sleep in patients with sleeping difficulties (also called insomnia). Stilnox has a different chemical structure to other sleeping tablets and works by binding to special sites in the brain which produce sleep.
Thymoglobulin® (rATG) Inj. is a new product of Genzyme; an infusion of which is used in the prevention and treatment of acute rejection in organ transplantation particularly the treatment of renal allograft rejection and therapy of aplastic anemia.
Innovation is the key for growing the business. We will continue to expand into new categories and explore innovative areas to strengthen consumer loyalty and recruit new users. We will further develop those brand platforms through organic growth, such as line extensions.
Consumer Healthcare Business:Consumer Healthcare is a powerful diversification tool, complementary to our prescription-medicines business in the country. We have grown the business through partnerships and targeted acquisitions, building scale
at a regional level and will continue to do so in the context of the newly formed global CHC Division. We have launched 7 Nutraceutical products in Pakistan covering various medical conditions:
• Seacod Capsules for all ages and gender. In children; helps build immunity, physical & mental well-being, reduces chances of getting cough & cold. In women; proper development of growing fetus during pregnancy, promote brain development & vision of the breast-feeding child during lactation and in adults; helps maintain all-around health, lower triglyceride and cholesterol level.
• Seacod Active Capsules helps reduce; triglyceride levels, inflammatory process, vasoconstriction & platelet aggregation, Coronary Heart Disease (CHD) & Myocardial Infarction (MI) and risk of cardiac arrest.
• E-Cod Plus Capsules is a combination of novel form of vitamin E with vitamin B12, folic acid, vitamin B6 and cod liver oil; helps in leg cramps, improve vasodilation, improve ventricular function, reduce cardiac stiffness & hypertension, inhibits cholesterol synthesis, improve metabolic parameters.
• E-Cod Omega Capsules is effective in reducing duration & severity of dysmenorrhea and reducing frequency and intensity of muscle cramps in pregnant women.
• FreeFlex Forte Tablets acts synergistically in reversing cartilage damage & promote cartilage repair, provides symptomatic benefits in patients with knee osteoarthritis and recommended for knee osteoarthritis intervention.
• Mega FreeFlex Tablets acts synergistically in reversing cartilage damage & promote cartilage
DIRECTORS’ REPORT
92 ANNUAL REPORT 2013
repair, provides symptomatic benefits in patients with knee osteoarthritis and recommended for knee osteoarthritis intervention.
• CollaFlex Sachets is a novel bioactive collagen peptide that helps reduce joint pain & improve mobility in patients with osteoarthritis.
Selsun Blue®, being the company’s first brand to advertise in the mass market, has registered a growth of 98% in 2013 through improved distribution and more consumer centric advertising.
Capital expenditureWe continued to invest significantly in expansion of production facilities and modernization of plant and machinery. Capital investments were made in various areas of our manufacturing facilities for balancing, modernization and upgrading infrastructure.
During the year under report an amount of Rs. 464.6 (2012: Rs.318.60) million was incurred on various capital expenditure projects. These mainly included investments on Ampoule Compact Line (Rs.46 million),
Cartoning Machine (Rs.30 million), Haemaccel®
Productivity Improvement (Rs.29.9 million), Blister Packing Machine (Rs.29.7 million) etc. An amount of Rs. 156.5 (2012: Rs.186.48) million was capitalized and transferred to fixed assets.
In addition to the manufacturing facilities, capital expenditure for an amount of Rs.25.6 million and Rs.83.7 million was incurred for the purchase of office equipment and staff vehicles respectively.
Profit, finance & taxationThe Company’s total turnover has increased marginally over the last year due to a number of challenges being faced by the Company coupled with a combination of strategies adopted to ensure the overall sustainability as well as appropriate return for the shareholders. During the year the profit before and after tax also declined over last year primarily due to impact of one time gain on sale of Wah Site as reported in the last year’s financial statements.
The profit, taxation and proposed appropriations are stated below:
(Rs. in ‘000)
Profit for the year before taxation 540,208
Taxation:Current - for the year (228,925)Prior (20,156)Deferred 18,698Total (230,383)
Profit after taxation 309,825
Unappropriated profit brought forward 133,568
Actuarial gain recognized directly in equity– net of deferred taxation (2,104)Profit available for appropriations 441,289
Appropriations:Proposed final dividend @100% out of profits for the
year ended December 31, 2013 (96,448)
Transfer to reserve (200,000)(296,448)
Unappropriated profit carried forward 144,841
93
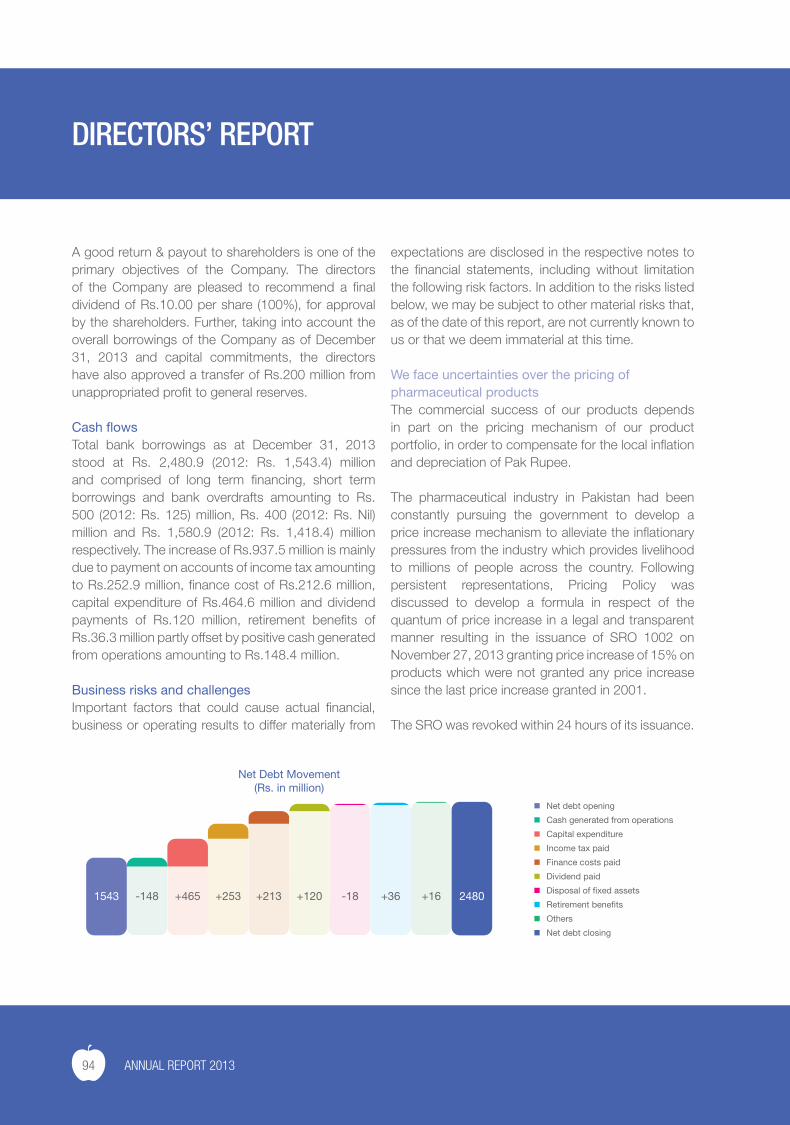
A good return & payout to shareholders is one of the primary objectives of the Company. The directors of the Company are pleased to recommend a final dividend of Rs.10.00 per share (100%), for approval by the shareholders. Further, taking into account the overall borrowings of the Company as of December 31, 2013 and capital commitments, the directors have also approved a transfer of Rs.200 million from unappropriated profit to general reserves.
Cash flowsTotal bank borrowings as at December 31, 2013 stood at Rs. 2,480.9 (2012: Rs. 1,543.4) million and comprised of long term financing, short term borrowings and bank overdrafts amounting to Rs. 500 (2012: Rs. 125) million, Rs. 400 (2012: Rs. Nil) million and Rs. 1,580.9 (2012: Rs. 1,418.4) million respectively. The increase of Rs.937.5 million is mainly due to payment on accounts of income tax amounting to Rs.252.9 million, finance cost of Rs.212.6 million, capital expenditure of Rs.464.6 million and dividend payments of Rs.120 million, retirement benefits of Rs.36.3 million partly offset by positive cash generated from operations amounting to Rs.148.4 million.
Business risks and challengesImportant factors that could cause actual financial, business or operating results to differ materially from
expectations are disclosed in the respective notes to the financial statements, including without limitation the following risk factors. In addition to the risks listed below, we may be subject to other material risks that, as of the date of this report, are not currently known to us or that we deem immaterial at this time.
We face uncertainties over the pricing of pharmaceutical productsThe commercial success of our products depends in part on the pricing mechanism of our product portfolio, in order to compensate for the local inflation and depreciation of Pak Rupee.
The pharmaceutical industry in Pakistan had been constantly pursuing the government to develop a price increase mechanism to alleviate the inflationary pressures from the industry which provides livelihood to millions of people across the country. Following persistent representations, Pricing Policy was discussed to develop a formula in respect of the quantum of price increase in a legal and transparent manner resulting in the issuance of SRO 1002 on November 27, 2013 granting price increase of 15% on products which were not granted any price increase since the last price increase granted in 2001.
The SRO was revoked within 24 hours of its issuance.
DIRECTORS’ REPORT
Net Debt Movement(Rs. in million)
Net debt opening
Cash generated from operations
Capital expenditure
Income tax paid
Finance costs paid
Dividend paid
Disposal of �xed assets
Retirement bene�ts
Others
Net debt closing
1543 -148 +465 +253 +213 +120 -18 +36 +16 2480
94 ANNUAL REPORT 2013
The Pakistan Pharmaceutical Manufacturers’ Association (PPMA) filed a Constitutional Petition with the High Court of Sindh which issued an interim order setting aside the original order revoking the price increase. Based on the High Court order, the Company has increased prices on its pharmaceutical products subsequent to the year end. On the other hand the Drug Regulatory Authority has appealed against the High Court order. The company is closely monitoring the legal and business implications of the case and will take all necessary measures to ensure that the appropriate representations are made to the Government in support of the long awaited price increase.
We face uncertainties over the quota allocation of various controlled raw materialsSome of our products require raw materials, the import of which is regulated and controlled by the Government (Narcotics Division). There have been instances in the past when the Government banned the import of such materials for some months at a stretch, resulting in shortage of products which require these raw materials. The shortages of these products may adversely affect our business, if the healthcare professionals switch to alternative drugs.
A slowdown of economic growth could have negative consequences for our businessThe future growth of the pharmaceutical market also depends on the growth of national economy, any decline in which could negatively affect the pharmaceutical market and, as a result, adversely affect our business.
We rely on third parties for the manufacture and supply of a substantial portion of our raw materials, active ingredients and medical devicesThird parties supply us with a substantial portion of our raw materials, active ingredients and medical devices, which exposes us to the risk of a supply interruption
in the event that our suppliers experience financial difficulties or are unable to provide a sufficient supply of our products meeting requisite quality standards. It also increases the risk of quality issues, even at the most scrupulously selected suppliers. Even though we aim to have backup sources of supply whenever possible, however, we cannot be certain that they will be sufficient if our principal sources become unavailable.
Counterfeit products could harm our businessThe prescription drug supply has been increasingly challenged by vulnerability of distribution channels to illegal counterfeiting and the presence of counterfeit products in the market. Reports of adverse reactions to counterfeit drugs or increased levels of counterfeiting could materially affect patient confidence in the authentic product, and could harm the business of companies such as sanofi-aventis.
The Company together with other pharmaceutical Companies in the country is devising a strategy to minimize the exposure consequent to the above risk facing the pharmaceutical industry as a whole.
The Company has established an anti-counterfeit function with an aim to trace/identify fake drug manufacturing units across the country adversely affecting the sales of the Company as well as causing reputational loss. With the help of law enforcing agencies, a number of these units were identified and dismantled.
Changes in mark-up rates could affect our profits before taxSince the Company’s cash flow management is dependent on the committed financing facilities, accordingly, changes in mark-up rates could also significantly impact Company’s operating results. The Company’s management is taking initiatives as described in detail below (see “Future Outlook – Cash Flow Management”) to ensure effective management of this risk.
95
We are subject to the risk of non-payment by our customersWe run the risk of non-payment by our customers, which consist principally of distributors, hospitals and government institutions. In order to minimize the credit risk exposure we sell our products either on cash basis or on credit to those customers with good credit standing. We also seek to manage our credit risk exposure as described in note 33.2 to the financial statements.
We rely on our patents and proprietary rights to provide exclusive rights to market certain of our products, and if such patents and other rights were limited or circumvented, our financial results could be materially and adversely affectedThrough patent and other proprietary rights we hold exclusivity rights for a number of our products. Patent rights are limited in time and do not always provide effective protection for our products: competitors may successfully avoid patents through design innovation, we may not hold sufficient evidence of infringement to bring suit, manufacturers of generic products are also increasingly seeking to challenge patents before they expire, and our infringement claim may not result in a decision that our rights are valid, enforceable or infringed.
Product liability claims could adversely affect our business, results of operations and financial conditionProduct liability is a significant business risk for any pharmaceutical company. Substantial damage awards and/or settlements have been handed down in some countries against pharmaceutical companies based on claims for injuries allegedly caused by the use of their products. Often the side effect profile of pharmaceutical drugs cannot be fully established based on preapproval clinical studies involving only several hundred to several thousand patients. Routine review and analysis of the continually growing body
of post-marketing safety surveillance and clinical trials provide additional information and may cause product labeling to evolve, including restrictions of therapeutic indications, new contraindications, warnings or precautions, and occasionally even the suspension or withdrawal of a product marketing authorization.
Product liability claims, regardless of their merits or the ultimate success of our defense, are costly, divert management attention, may harm our reputation and can impact the demand for our products.
Claims and investigations relating to competition law, marketing practices, pricing, compliance issues, as well as other legal matters, could adversely affect our business, results of operations and financial conditionThe marketing of our products is heavily regulated. Our business covers an extremely wide range of activities and involves numerous partners. Governments and regulatory authorities have been strengthening enforcement activities in recent years.
Any failure to comply directly or indirectly (including as a result of a business partners’ breach) with law could lead to substantial liabilities. The Company is taking all necessary measures to ensure that the Company as well its business partners conduct their affairs in a compliant manner, including but not limited to insisting the counter parties to adhere to the group’s code of ethics.
We may lose market share to competing remedies or generic brands if they are perceived to be equivalent or superior productsWe are faced with intense competition from generic products and brand-name drugs. Doctors or patients may choose these products over ours if they perceive them to be safer, more reliable, more effective, easier to administer or less expensive, which could cause our revenues to decline and affect our results of operations.
DIRECTORS’ REPORT
96 ANNUAL REPORT 2013
Our pension and gratuity liabilities are affected by factors such as the performance of plan assets, interest rates, actuarial data and experience and changes in laws and regulationsOur future funding obligations for our defined-benefit pension and gratuity plan depend on changes in the future performance of assets held in trust for these plans, the interest rates used to determine funding levels (or company liabilities), actuarial data and experience, inflation trends, the level of benefits provided for by the plans, as well as changes in laws and regulations. Adverse changes in those factors could increase our unfunded obligations under such plans, which would require more funds to be contributed and hence negatively affect our cash flows and results.
Risks relating to Financial Markets
Exchange rate fluctuations could affect our operating profitsSince significant parts of the Company’s operations are based on imported raw material and active ingredients, exchange rate fluctuations can significantly impact the Company’s operations as well as cash flow management. We are particularly sensitive to movements in exchange rates for the Euro and the U.S. dollar. The management policy to manage the currency risk has been described in note 33.1.1 to the financial statements.
Related party transactionsAll related party transactions, during the year 2013, were placed before the Audit Committee and the Board for their review and approval. These transactions were duly approved by the Audit Committee and the Board in their respective meetings. All these transactions were in line with the transfer pricing methods and the policy with related parties approved by the Board previously. The Company also maintains a full record of all such transactions, along with the terms and
conditions. For further details please refer note 31 to the financial statements.
Financial statementsThe financial statements of the Company have been audited and approved without qualification by the auditors, M/s Ernst & Young Ford Rhodes Sidat Hyder, Chartered Accountants.
Contribution to the national exchequerDuring the year the Company paid around Rs. 766.3 (2012: Rs.823.6) million to the government and its various agencies on account of various government levies including custom duty, income tax and Workers Welfare Fund.
Contribution to the country’s economyAt Sanofi, our aim has always been to make noteworthy contributions to the economy we operate in. One of the primary areas of focus has been the creation of employment opportunities. Supporting a large industrial and sales workforce, we have also been a prominent employment provider through third party contractors.
Our contribution to the corporate social responsibility program has been a cornerstone in the quest towards the improvement of the society at large and specifically to the improvement of healthcare standards, details of which are given below. We also prefer buying goods / material from local vendors over imports provided these meet the requisite quality standards in order to support local industry and economy.
Corporate social responsibilityThe Company operates in a socially responsible manner and is committed to the highest standards of corporate behavior. Accordingly, the Company’s CSR program has a very wide scope encompassing initiatives in the areas of healthcare, education, environment protection, water and sanitation, child
97
welfare, infrastructure development and other social welfare activities.
Following is a snapshot of the Company’s CSR initiatives during the year, brief detail of which are given on page 76 to page 81 to the Annual Report:
• Sanofi Pakistan signed an MoU with a Karachi-based NGO “Raana Liaquat Craftsmen’s Colony” (RLCC) to support diabetes management in an under-privileged area of Karachi. Through this partnership, a diabetes clinic was set up in Shah Faisal Colony to provide access of the community to medicines and consultation at subsidized rates. Moreover, free blood glucose testing & awareness camps were held in the community at regular intervals.
• An SMS campaign - “Rabta-e-Sehat” was launched with the objective to reduce prevalence of the
disease in the country by increasing Typhoid awareness through WHO typhoid prevention guidelines.
• Sanofi Pakistan extended the benefit of Diarrhea Control Centers that were established in 2010, to a larger number of people in 2013. Sanofi took an additional 300 institutes on board for the initiative whereby the institutes were equipped with exclusive hygienic environment: hygiene kits containing antibacterial soaps, paper towels, drinking water dispensers, disposable gloves, alcohol swabs, syringe cutters and air purifier. Also each DCC received regular supply of clean drinking water to promote the benefits of safe water along with patient education material like diarrhea awareness posters and booklets.
• Free HbA1c testing and blood glucose testing camps were conducted throughout the country to increase awareness amongst people about
the importance of timely diagnosis. More than 151,800 people were screened at the camps.
• Asthma screening camps were arranged across the country to provide free of cost diagnosis to over 3000 people.
• Sanofi Genzyme in partnership with doctors provided diagnostic services for LSD (Lysosomal Storage Disorder) patients, in addition to arranging awareness campaigns and programs for rare disease awareness. More than 50 cases of LSDs were diagnosed in 2013 through this initiative.
• Cholesterol screening camps were set up throughout Pakistan to screen patients with high lipid levels which can lead to cardiovascular complications.
Information technologyIn line with our continuous endeavors to regularly upgrade information systems we continued with our policy to increasingly invest in information technology (IT) and to upgrade related infrastructure, thereby continuously improving and enhancing both qualitative and quantitative aspects of management reporting including decision making processes. IT spending during the year amounted to Rs.26.5 (2012: Rs.18.2) million.
Following are some of the highlights relating to IT activities during the year:
Infrastructure• Deployed Managed Printing Solution (MPS) at
Head Office- Secure and accountable multi-purpose centralized
printing solution- Savings on repair and consumables cost
DIRECTORS’ REPORT
98 ANNUAL REPORT 2013
• Deployed Radio Frequency (RF) Guns based regional Warehouse Management System (WMS)
- Smooth on-time project deployment- Automates the picking and dispatching process
at the warehouses
• Improving IT Operations based on Information Technology Infrastructure Library (ITIL) Framework for Service Management and IT Industry’s best practices leading to:
- Streamlining of IT processes- Introducing relevant checklists & Standard Operating
Procedures (SOPs)- Hiring of skilled resources- Technical training of IT staff- Taking measures to improve IT governance
• Upgrading of secondary backup internet link to provide for a robust backup
Alternate internet connectivity with higher bandwidth to maintain acceptable level of access for all users in case of primary link failure.
• Implementation in progress of Server Virtualiza-tion technology
All physical servers are planned to be shifted to virtual servers thereby reducing number of servers in Data Center leading to lower power and cooling requirements. New hardware will provide latest and advanced features for business applications.
Business Solutions• Managers’ Tour Planning module: This has been
integrated with CRM which has enhanced the system capability and is helping managers to plan & share the monthly sales activities and schedules.
• Pharmacy Visit Reporting: As per the new business development, reps need to visit Pharmacies located in the vicinity of the visiting doctors, this will become the integral part of the online daily call report.
• CRM Database upgrading planned for better and optimized performance and advanced features.
IT TrainingsWorkshop on “Project Management Concepts &MS Project” was conducted for Project Coordinators.MS Office training was also provided to key users.
Product QualityAt Sanofi, we are committed to our responsibility towards patients and the community. Our products carry a promise of Quality and we take issues related to the quality of our products very seriously. In order to handle concerns on product quality, a “Quality” page is available on the Sanofi corporate website. Users can use the form on the website or simply email their concerns to the attention of our Affiliate Quality Head at [email protected]
WebsiteAll our stakeholders and general public can visit the sanofi-aventis Pakistan limited website, www.sanofi.com.pk, which has a dedicated section for investors containing information related to annual and quarterly financial statements.
In addition, information pertaining to Company products, social responsibility initiatives, product quality as well as general health related issues can be found. Sanofi also maintains a dedicated website on diabetes (www.sanofidiabetes.com.pk) which contains information for public awareness related to diabetes.
Health, Safety & EnvironmentThe Company is committed to maintain the standards of health, safety and environment (HSE) at the highest level. The Company has a dedicated HSE department to oversee the implementation of HSE objectives and reports to the Executive Management.
99
DIRECTORS’ REPORT
Some of the key HSE highlights of the year 2013 were as follows:
• Corporate Safety Culture Training Program.
• CountryFocusHSEReviewbyGlobalVPHSE.
• In-house medical center with ambulance round the clock.
• Annual medical check-ups for employees working in sterile areas and directly exposed to the non-sterile products.
• Specific test for employees performing specific jobs includes - eye testing, audiometry, pulmonary function test and sensitivity test.
Our commitment to Health, Safety & Environment is manifested in all our activities as no major accident was reported during the year.
EnvironmentSite has a dedicated waste water treatment plant to treat effluent. Site also has solid waste management program in place to handle hazardous and non-hazardous solid waste.
DirectorsDuring the year, Dr. Shailesh Ayyangar resigned from the Board of Directors of the Company with effect from November 30, 2013. The Board would like to express its appreciation for the support received from Dr. Shailesh Ayyangar during the tenure of his office and would like to wish him the best for his future endeavors. Subsequent to year-end, the Board has appointed Dr. Pius Hornstein in place of Dr. Shailesh Ayyangar in order to fill the casual vacancy. The Board welcomes Dr. Pius Hornstein on the Board of Directors of the Company and hopes to benefit from the rich experience of Dr. Honstein.
Compliance with the Code of Corporate GovernanceThe Stock Exchanges have included in their Listing Rules, the Code of Corporate Governance (Code) issued by the Securities & Exchange Commission of Pakistan. The Company has adopted the Code and is implementing the same in letter and spirit.
Code of ConductEthics is an integral part of the culture at Sanofi and guides the behavior and conduct of all employees. The “Sanofi Code of Conduct”, which has been approved and adopted by the Board, is circulated to all employees annually and declarations for compliance with this Code are obtained from existing employees annually and from new employees at the time of joining. This Code is also available on the Company’s Intranet in both English and Urdu languages. An eLearning module on the Code of Ethics has also been launched which ensures standardized training for employees across geographical boundaries.
Anti-Corruption MeasuresIn order to prevent corruption in business dealings by Sanofi employees, an anti-bribery and corruption policy has been implemented. This policy supplements the Sanofi Code of Conduct and applies to all employees and to third parties engaged in business with Sanofi, such as suppliers, distributors, consultants etc.
Audit committeeThe Board Audit Committee comprises of following members:
• Syed Hyder Ali - Chairman (Non-Executive Director)
• Mr. Francois Jean Louis Briens - Member (Non-Executive Director)
• Dr. Amanullah Khan - Member (Executive Director)
• Mr. Yasser Pirmuhammad - Secretary
100 ANNUAL REPORT 2013
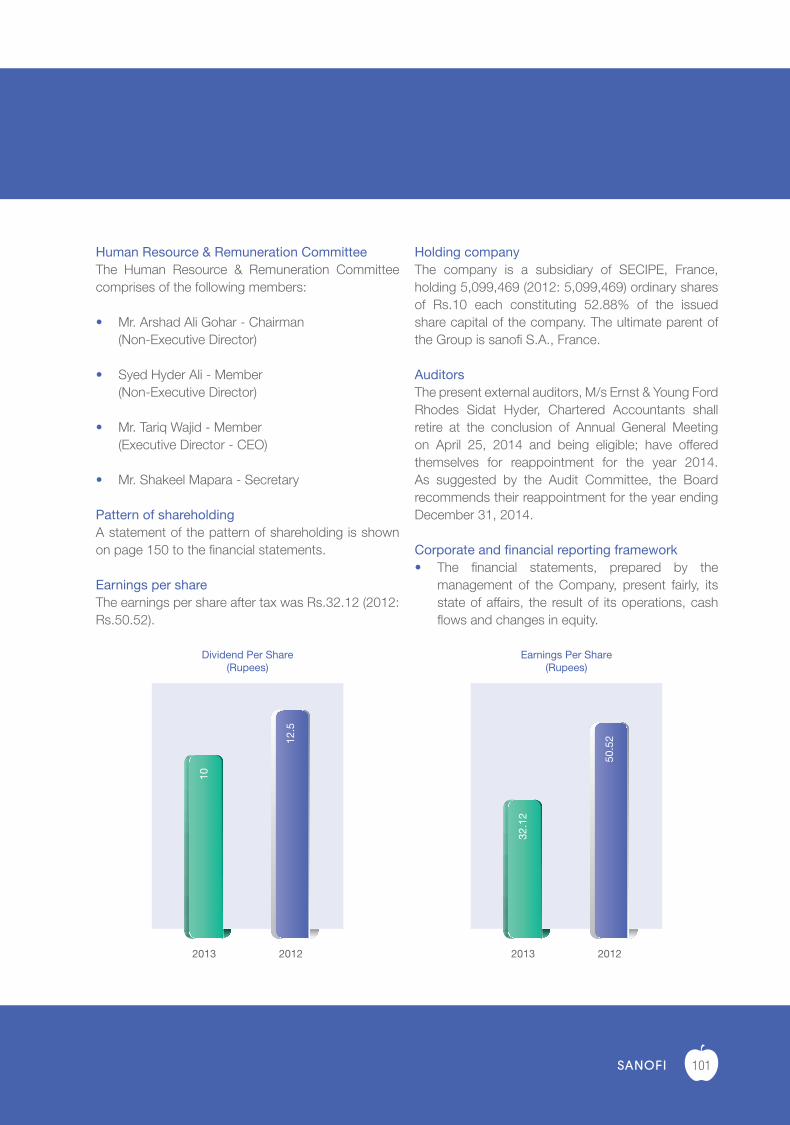
Human Resource & Remuneration CommitteeThe Human Resource & Remuneration Committee comprises of the following members:
• Mr. Arshad Ali Gohar - Chairman(Non-Executive Director)
• Syed Hyder Ali - Member(Non-Executive Director)
• Mr. Tariq Wajid - Member(Executive Director - CEO)
• Mr. Shakeel Mapara - Secretary
Pattern of shareholdingA statement of the pattern of shareholding is shown on page 150 to the financial statements.
Earnings per shareThe earnings per share after tax was Rs.32.12 (2012: Rs.50.52).
Holding companyThe company is a subsidiary of SECIPE, France, holding 5,099,469 (2012: 5,099,469) ordinary shares of Rs.10 each constituting 52.88% of the issued share capital of the company. The ultimate parent of the Group is sanofi S.A., France.
AuditorsThe present external auditors, M/s Ernst & Young Ford Rhodes Sidat Hyder, Chartered Accountants shall retire at the conclusion of Annual General Meeting on April 25, 2014 and being eligible; have offered themselves for reappointment for the year 2014. As suggested by the Audit Committee, the Board recommends their reappointment for the year ending December 31, 2014.
Corporate and financial reporting framework• The financial statements, prepared by the
management of the Company, present fairly, its state of affairs, the result of its operations, cash flows and changes in equity.
Dividend Per Share(Rupees)
10
12.5
2013 2012
Earnings Per Share(Rupees)
32.1
2
50.5
2
2013 2012
101
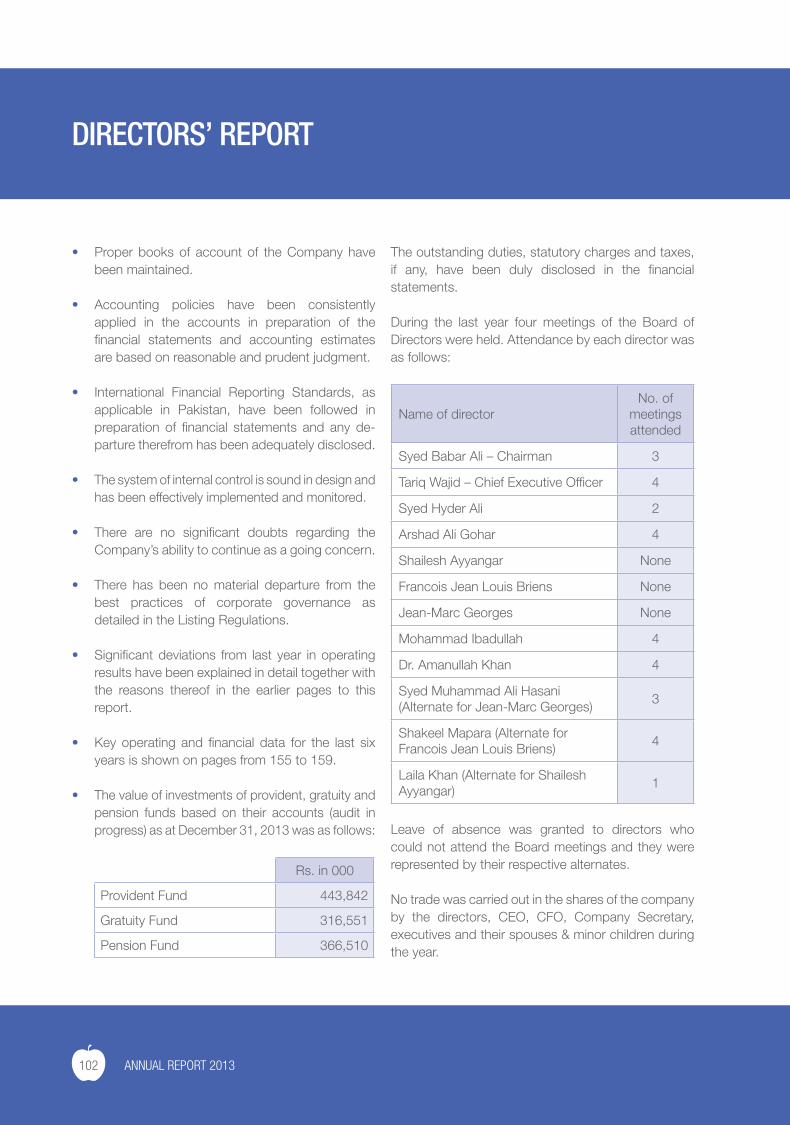
• Proper books of account of the Company have been maintained.
• Accounting policies have been consistently applied in the accounts in preparation of the financial statements and accounting estimates are based on reasonable and prudent judgment.
• International Financial Reporting Standards, as applicable in Pakistan, have been followed in preparation of financial statements and any de-parture therefrom has been adequately disclosed.
• The system of internal control is sound in design and has been effectively implemented and monitored.
• There are no significant doubts regarding the Company’s ability to continue as a going concern.
• There has been no material departure from the best practices of corporate governance as detailed in the Listing Regulations.
• Significant deviations from last year in operating results have been explained in detail together with the reasons thereof in the earlier pages to this report.
• Key operating and financial data for the last six years is shown on pages from 155 to 159.
• The value of investments of provident, gratuity and pension funds based on their accounts (audit in progress) as at December 31, 2013 was as follows:
Rs. in 000
Provident Fund 443,842
Gratuity Fund 316,551
Pension Fund 366,510
The outstanding duties, statutory charges and taxes, if any, have been duly disclosed in the financial statements.
During the last year four meetings of the Board of Directors were held. Attendance by each director was as follows:
Name of directorNo. of
meetings attended
Syed Babar Ali – Chairman 3
Tariq Wajid – Chief Executive Officer 4
Syed Hyder Ali 2
Arshad Ali Gohar 4
Shailesh Ayyangar None
Francois Jean Louis Briens None
Jean-Marc Georges None
Mohammad Ibadullah 4
Dr. Amanullah Khan 4
Syed Muhammad Ali Hasani (Alternate for Jean-Marc Georges)
3
Shakeel Mapara (Alternate for Francois Jean Louis Briens)
4
Laila Khan (Alternate for Shailesh Ayyangar)
1
Leave of absence was granted to directors who could not attend the Board meetings and they were represented by their respective alternates.
No trade was carried out in the shares of the company by the directors, CEO, CFO, Company Secretary, executives and their spouses & minor children during the year.
DIRECTORS’ REPORT
102 ANNUAL REPORT 2013
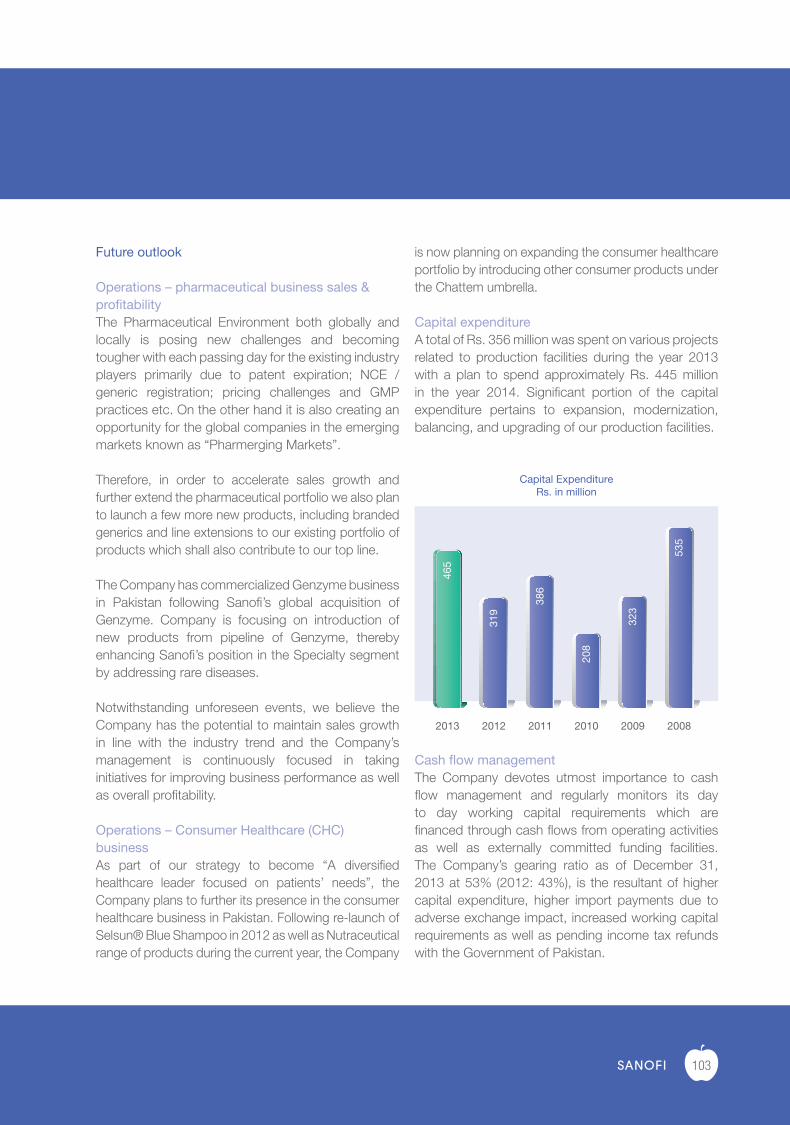
Future outlook
Operations – pharmaceutical business sales & profitabilityThe Pharmaceutical Environment both globally and locally is posing new challenges and becoming tougher with each passing day for the existing industry players primarily due to patent expiration; NCE / generic registration; pricing challenges and GMP practices etc. On the other hand it is also creating an opportunity for the global companies in the emerging markets known as “Pharmerging Markets”.
Therefore, in order to accelerate sales growth and further extend the pharmaceutical portfolio we also plan to launch a few more new products, including branded generics and line extensions to our existing portfolio of products which shall also contribute to our top line.
The Company has commercialized Genzyme business in Pakistan following Sanofi’s global acquisition of Genzyme. Company is focusing on introduction of new products from pipeline of Genzyme, thereby enhancing Sanofi’s position in the Specialty segment by addressing rare diseases.
Notwithstanding unforeseen events, we believe the Company has the potential to maintain sales growth in line with the industry trend and the Company’s management is continuously focused in taking initiatives for improving business performance as well as overall profitability.
Operations – Consumer Healthcare (CHC) businessAs part of our strategy to become “A diversified healthcare leader focused on patients’ needs”, the Company plans to further its presence in the consumer healthcare business in Pakistan. Following re-launch of Selsun® Blue Shampoo in 2012 as well as Nutraceutical range of products during the current year, the Company
is now planning on expanding the consumer healthcare portfolio by introducing other consumer products under the Chattem umbrella.
Capital expenditureA total of Rs. 356 million was spent on various projects related to production facilities during the year 2013 with a plan to spend approximately Rs. 445 million in the year 2014. Significant portion of the capital expenditure pertains to expansion, modernization, balancing, and upgrading of our production facilities.
Cash flow managementThe Company devotes utmost importance to cash flow management and regularly monitors its day to day working capital requirements which are financed through cash flows from operating activities as well as externally committed funding facilities. The Company’s gearing ratio as of December 31, 2013 at 53% (2012: 43%), is the resultant of higher capital expenditure, higher import payments due to adverse exchange impact, increased working capital requirements as well as pending income tax refunds with the Government of Pakistan.
Capital ExpenditureRs. in million
465
319
386
208
323
535
2013 2012 2011 2010 2009 2008
103
DIRECTORS’ REPORT
GeneralThe Board looks forward to the forthcoming Annual General Meeting of the shareholders to discuss Company’s performance during the year 2013, and is thankful for the trust and confidence reposed in the Board by the shareholders.
We are exceedingly grateful to our employees as good results are first and foremost due to people, and thank them for their efforts which played a major role in the results achieved in 2013.
By order of the Board
Karachi: 26th February, 2014
Syed Babar AliChairman
Tariq WajidChief Executive Officer
104 ANNUAL REPORT 2013
Ernst & Young Ford Rhodes Sidat HyderChartered AccountantsProgressive Plaza, Beaumont RoadP.O.Box 15541, Karachi 75530, Pakistan
Tel: +9221 3565 0007Fax: +9221 3568 1965www.ey.com
We have audited the annexed balance sheet of sanofi-aventis Pakistan limited as at 31 December 2013 and the related profit and loss account, statement of comprehensive income, cash flow statement and statement of changes in equity together with the notes forming part thereof, for the year then ended and we state that we have obtained all the information and explanations which, to the best of our knowledge and belief, were necessary for the purposes of our audit.
It is the responsibility of the Company’s management to establish and maintain a system of internal control, and prepare and present the above said statements in conformity with the approved accounting standards and the requirements of the Companies Ordinance, 1984. Our responsibility is to express an opinion on these statements based on our audit.
We conducted our audit in accordance with the auditing standards as applicable in Pakistan. These standards require that we plan and perform the audit to obtain reasonable assurance about whether the above said statements are free of any material misstatement. An audit includes examining on a test basis, evidence supporting the amounts and disclosures in the above said statements. An audit also includes assessing the accounting policies and significant estimates made by management, as well as, evaluating the overall presentation of the above said statements. We believe that our audit provides a reasonable basis for our opinion and, after due verification, we report that:
a) in our opinion, proper books of account have been kept by the Company as required by the Companies Ordinance, 1984;
b) in our opinion:
i) the balance sheet and profit and loss account, together with the notes thereon, have been drawn up in conformity with the Companies Ordinance, 1984, and are in agreement with the books of account and are further in accordance with accounting policies consistently applied except for changes as stated in note 2.3 and note 2.10 to the accompanying financial statements with which we concur;
ii) the expenditure incurred during the year was for the purpose of the Company’s business; and
iii) the business conducted, investments made and the expenditure incurred during the year were in accordance with the objects of the Company;
c) in our opinion and to the best of our information and according to the explanations given to us, the balance sheet, profit and loss account, statement of comprehensive income, cash flow statement and statement of changes in equity together with the notes forming part thereof conform with approved accounting standards as applicable in Pakistan, and, give the information required by the Companies Ordinance, 1984, in the manner so required and respectively give a true and fair view of the state of the Company’s affairs as at 31 December 2013 and of the profit, the comprehensive income, its cash flows and changes in equity for the year then ended; and
d) in our opinion, Zakat deductible at source under the Zakat and Ushr Ordinance, 1980 (XVIII of 1980), was deducted by the Company and deposited in the Central Zakat Fund established under Section 7 of that Ordinance.
Chartered AccountantsAudit Engagement Partner: Riaz A. Rehman ChamdiaDate: 26th February, 2014Place: Karachi
AUDITORS’ REPORT TO THE MEMBERS
105
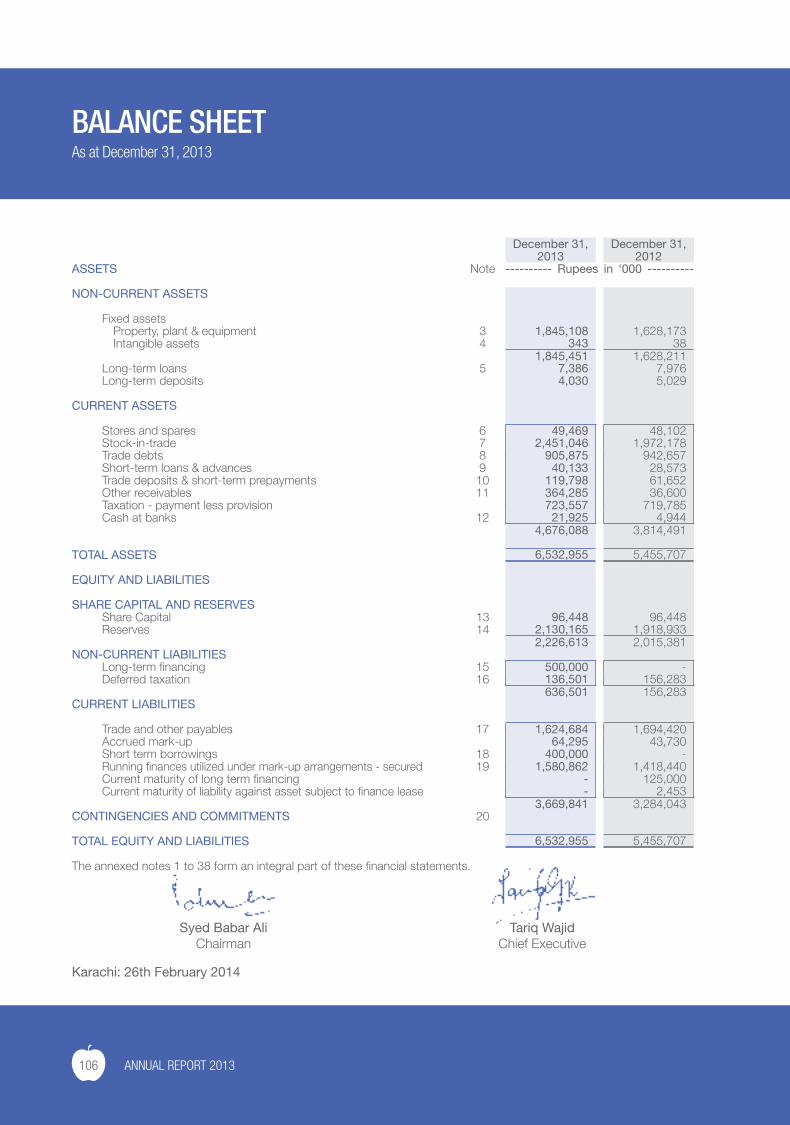
106 ANNUAL REPORT 2013
BALANCE SHEETAs at December 31, 2013
December 31, December 31,2013 2012
ASSETS Note ---------- Rupees in ‘000 ----------
NON-CURRENT ASSETS
Fixed assetsProperty, plant & equipment 3 1,845,108 1,628,173 Intangible assets 4 343 38
1,845,451 1,628,211 Long-term loans 5 7,386 7,976 Long-term deposits 4,030 5,029
CURRENT ASSETS
Stores and spares 6 49,469 48,102 Stock-in-trade 7 2,451,046 1,972,178 Trade debts 8 905,875 942,657 Short-term loans & advances 9 40,133 28,573 Trade deposits & short-term prepayments 10 119,798 61,652 Other receivables 11 364,285 36,600 Taxation - payment less provision 723,557 719,785 Cash at banks 12 21,925 4,944
4,676,088 3,814,491
TOTAL ASSETS 6,532,955 5,455,707
EQUITY AND LIABILITIES
SHARE CAPITAL AND RESERVESShare Capital 13 96,448 96,448 Reserves 14 2,130,165 1,918,933
2,226,613 2,015,381 NON-CURRENT LIABILITIES
Long-term financing 15 500,000 - Deferred taxation 16 136,501 156,283
636,501 156,283 CURRENT LIABILITIES
Trade and other payables 17 1,624,684 1,694,420 Accrued mark-up 64,295 43,730 Short term borrowings 18 400,000 - Running finances utilized under mark-up arrangements - secured 19 1,580,862 1,418,440 Current maturity of long term financing - 125,000 Current maturity of liability against asset subject to finance lease - 2,453
3,669,841 3,284,043 CONTINGENCIES AND COMMITMENTS 20
TOTAL EQUITY AND LIABILITIES 6,532,955 5,455,707
The annexed notes 1 to 38 form an integral part of these financial statements.
Syed Babar AliChairman
Tariq WajidChief Executive
Karachi: 26th February 2014
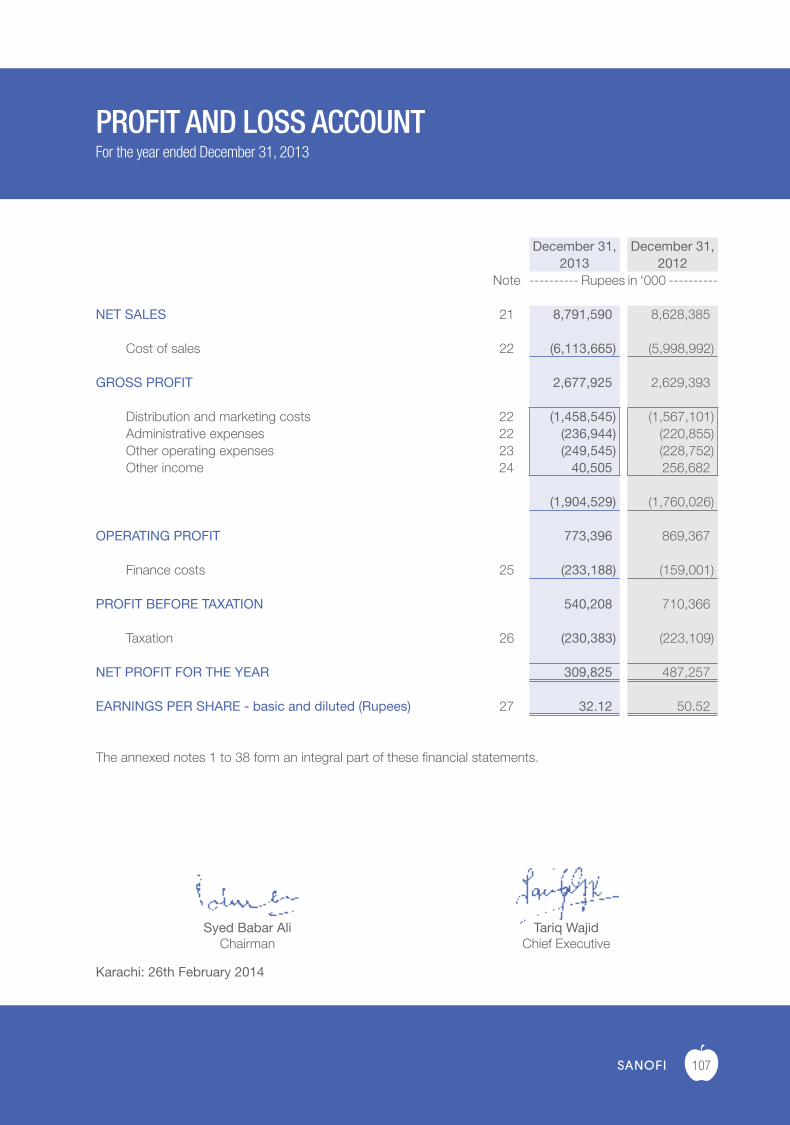
107
PROFIT AND LOSS ACCOUNTFor the year ended December 31, 2013
Syed Babar AliChairman
Tariq WajidChief Executive
Karachi: 26th February 2014
December 31, December 31,2013 2012
Note ---------- Rupees in ‘000 ----------
NET SALES 21 8,791,590 8,628,385
Cost of sales 22 (6,113,665) (5,998,992)
GROSS PROFIT 2,677,925 2,629,393
Distribution and marketing costs 22 (1,458,545) (1,567,101)Administrative expenses 22 (236,944) (220,855)Other operating expenses 23 (249,545) (228,752)Other income 24 40,505 256,682
(1,904,529) (1,760,026)
OPERATING PROFIT 773,396 869,367
Finance costs 25 (233,188) (159,001)
PROFIT BEFORE TAXATION 540,208 710,366
Taxation 26 (230,383) (223,109)
NET PROFIT FOR THE YEAR 309,825 487,257
EARNINGS PER SHARE - basic and diluted (Rupees) 27 32.12 50.52
The annexed notes 1 to 38 form an integral part of these financial statements.
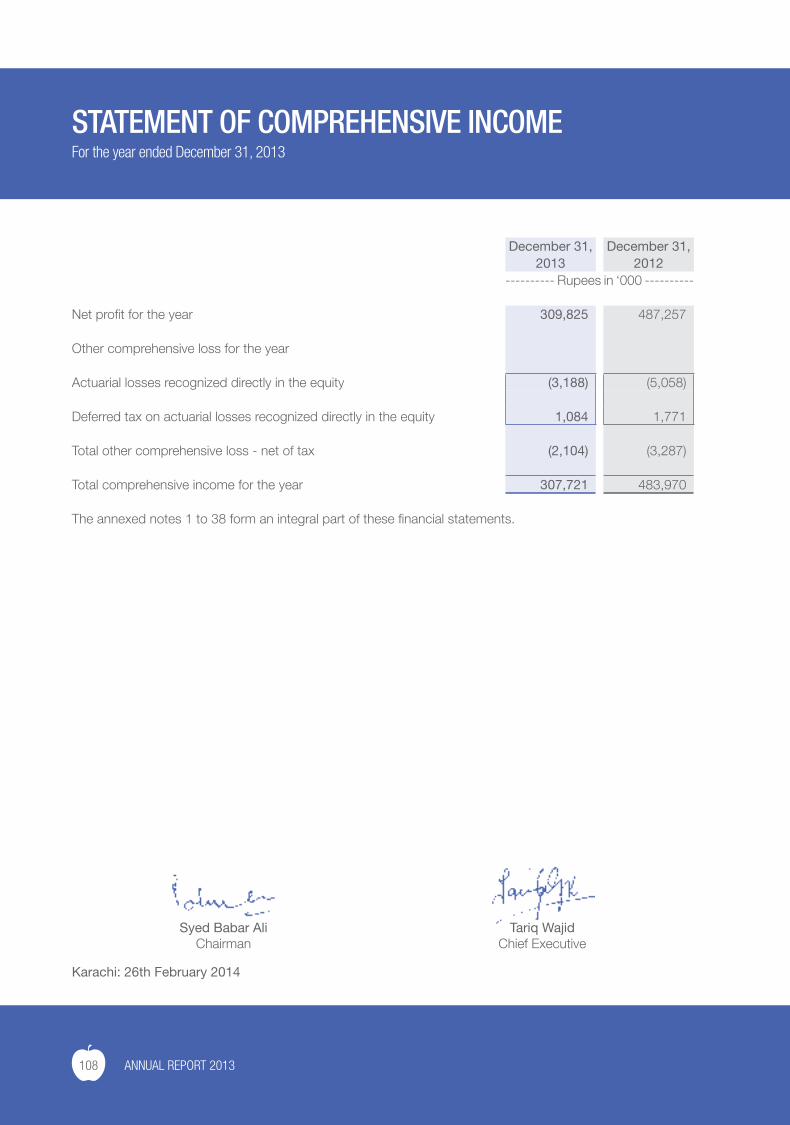
108 ANNUAL REPORT 2013
STATEMENT OF COMPREHENSIVE INCOMEFor the year ended December 31, 2013
December 31, December 31,2013 2012
---------- Rupees in ‘000 ----------
Net profit for the year 309,825 487,257
Other comprehensive loss for the year
Actuarial losses recognized directly in the equity (3,188) (5,058)
Deferred tax on actuarial losses recognized directly in the equity 1,084 1,771
Total other comprehensive loss - net of tax (2,104) (3,287)
Total comprehensive income for the year 307,721 483,970
The annexed notes 1 to 38 form an integral part of these financial statements.
Syed Babar AliChairman
Tariq WajidChief Executive
Karachi: 26th February 2014
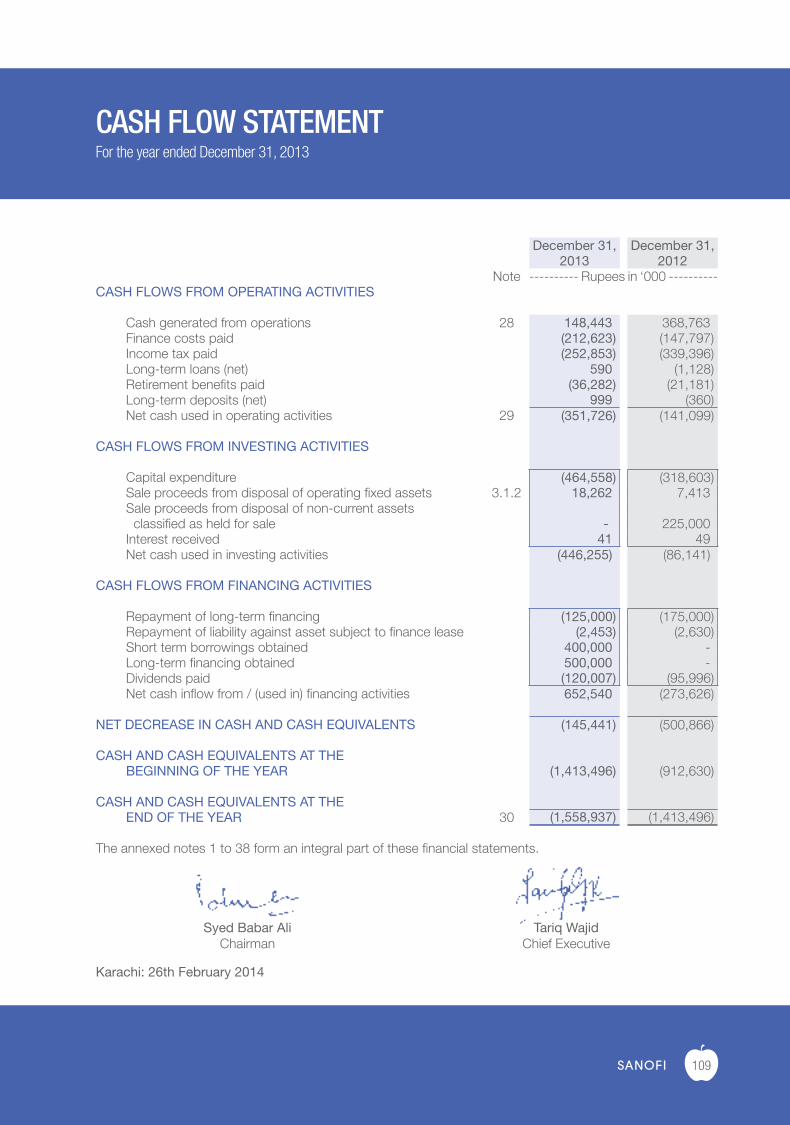
109
CASH FLOW STATEMENTFor the year ended December 31, 2013
December 31, December 31,2013 2012
Note ---------- Rupees in ‘000 ----------CASH FLOWS FROM OPERATING ACTIVITIES
Cash generated from operations 28 148,443 368,763 Finance costs paid (212,623) (147,797)Income tax paid (252,853) (339,396)Long-term loans (net) 590 (1,128)Retirement benefits paid (36,282) (21,181)Long-term deposits (net) 999 (360)Net cash used in operating activities 29 (351,726) (141,099)
CASH FLOWS FROM INVESTING ACTIVITIES
Capital expenditure (464,558) (318,603)Sale proceeds from disposal of operating fixed assets 3.1.2 18,262 7,413 Sale proceeds from disposal of non-current assets
classified as held for sale - 225,000 Interest received 41 49 Net cash used in investing activities (446,255) (86,141)
CASH FLOWS FROM FINANCING ACTIVITIES
Repayment of long-term financing (125,000) (175,000)Repayment of liability against asset subject to finance lease (2,453) (2,630)Short term borrowings obtained 400,000 - Long-term financing obtained 500,000 - Dividends paid (120,007) (95,996)Net cash inflow from / (used in) financing activities 652,540 (273,626)
NET DECREASE IN CASH AND CASH EQUIVALENTS (145,441) (500,866)
CASH AND CASH EQUIVALENTS AT THEBEGINNING OF THE YEAR (1,413,496) (912,630)
CASH AND CASH EQUIVALENTS AT THEEND OF THE YEAR 30 (1,558,937) (1,413,496)
The annexed notes 1 to 38 form an integral part of these financial statements.
Syed Babar AliChairman
Tariq WajidChief Executive
Karachi: 26th February 2014
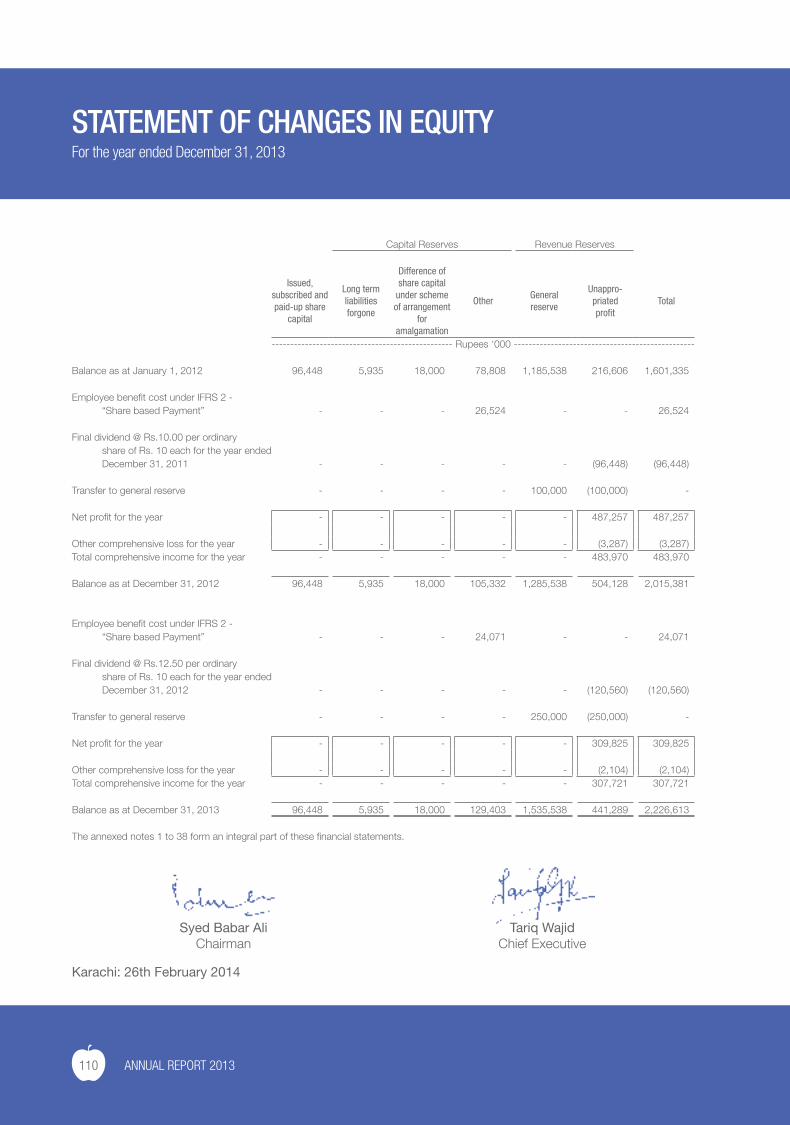
110 ANNUAL REPORT 2013
STATEMENT OF CHANGES IN EQUITYFor the year ended December 31, 2013
Capital Reserves Revenue Reserves
Issued, subscribed and paid-up share
capital
Long term liabilities forgone
Difference of share capital
under scheme of arrangement
for amalgamation
OtherGeneral reserve
Unappro-priatedprofit
Total
------------------------------------------------- Rupees ‘000 -------------------------------------------------
Balance as at January 1, 2012 96,448 5,935 18,000 78,808 1,185,538 216,606 1,601,335
Employee benefit cost under IFRS 2 -“Share based Payment” - - - 26,524 - - 26,524
Final dividend @ Rs.10.00 per ordinary share of Rs. 10 each for the year endedDecember 31, 2011 - - - - - (96,448) (96,448)
Transfer to general reserve - - - - 100,000 (100,000) -
Net profit for the year - - - - - 487,257 487,257
Other comprehensive loss for the year - - - - - (3,287) (3,287)Total comprehensive income for the year - - - - - 483,970 483,970
Balance as at December 31, 2012 96,448 5,935 18,000 105,332 1,285,538 504,128 2,015,381
Employee benefit cost under IFRS 2 -“Share based Payment” - - - 24,071 - - 24,071
Final dividend @ Rs.12.50 per ordinary share of Rs. 10 each for the year endedDecember 31, 2012 - - - - - (120,560) (120,560)
Transfer to general reserve - - - - 250,000 (250,000) -
Net profit for the year - - - - - 309,825 309,825
Other comprehensive loss for the year - - - - - (2,104) (2,104)Total comprehensive income for the year - - - - - 307,721 307,721
Balance as at December 31, 2013 96,448 5,935 18,000 129,403 1,535,538 441,289 2,226,613
The annexed notes 1 to 38 form an integral part of these financial statements.
Syed Babar AliChairman
Tariq WajidChief Executive
Karachi: 26th February 2014
111
1. THE COMPANY AND ITS OPERATIONS
The Company was incorporated in Pakistan in 1967 under the Companies Act, VII of 1913 (now the Companies Ordinance, 1984), as a Public Limited Company. The shares of the Company are listed on Karachi, Lahore and Islamabad Stock Exchanges. It is engaged in the manufacturing and selling of pharmaceutical and consumer products.
The registered office of the Company is located at Plot 23, Sector 22, Korangi Industrial Area, Karachi.
2. SUMMARY OF SIGNIFICANT ACCOUNTING POLICIES
2.1 Statement of Compliance
These financial statements have been prepared in accordance with approved accounting standards as applicable in Pakistan. Approved accounting standards comprise of such International Financial Reporting Standards (IFRS) issued by the International Accounting Standards Board as are notified under the Companies Ordinance, 1984, provisions of and directives issued under the Companies Ordinance, 1984. In case requirements differ, the provisions or directives of the Companies Ordinance, 1984 shall prevail.
2.2 Basis of preparation
These financial statements have been prepared under the historical cost convention except as disclosed in the accounting policies herein below.
2.3 New and amended standards and interpretations
(i) The accounting policies adopted in the preparation of these financial statements are consistent with those of the previous financial year except as described below:
(ii) The Company has adopted the following revised standard, amendments and interpretation of IFRSs which became effective for the current year:
IAS 1 – Presentation of Financial Statements - Presentation of items of other comprehensive income (Amendment)
IAS 19 – Employee Benefits - ( Revised )
IFRS 7 – Financial Instruments : Disclosures - (Amendments) Amendments enhancing disclosures about offsetting of financial assets and financial liabilities
IFRIC 20 – Stripping Costs in the Production Phase of a Surface Mine Improvements to Accounting Standards issued by the IASB
IAS 1 – Presentation of Financial Statements - Clarification of the requirements for comparative information
NOTES TO THE FINANCIAL STATEMENTSFor the year ended December 31, 2013
112 ANNUAL REPORT 2013
NOTES TO THE FINANCIAL STATEMENTSFor the year ended December 31, 2013
IAS 16 – Property, Plant and Equipment - Clarification of Servicing Equipment
IAS 32 – Financial Instruments: Presentation - Tax Effects of Distribution to Holders of Equity Instruments
IAS 34 – Interim Financial Reporting - Interim Financial Reporting and Segment Information for Total Assets and Liabilities
The adoption of the above revision and amendments of the standards did not have any material effect on the financial statements.
2.4 Property, plant and equipment
(i) Operating fixed assets
These are stated at cost less accumulated depreciation, except for freehold land and capital work-in-progress, which are stated at cost.
Cost of leasehold land is amortised over the period of the lease. Depreciation on all other assets is charged to profit and loss account applying the straight-line method whereby the cost of an asset less residual value, if not insignificant, is written off over its estimated useful life. The rates used are stated in note 3.1 to the financial statements.
In respect of additions, depreciation is charged from the month in which asset is put to use and on disposal up to the month the asset is in use. Additional depreciation at the rate of fifty percent of the normal rate is charged on such machinery which is operated on double shift during the year.
The assets’ residual values, useful lives and methods are reviewed, and adjusted if appropriate, at each financial year end. The effect of any adjustment to residual values, useful lives and methods is recognised prospectively as a change of accounting estimate.
The carrying values of property, plant and equipment are reviewed for impairment when events or changes in circumstances indicate that the carrying value may not be recoverable. The Company accounts for impairment by reducing its carrying value to the recoverable amount.
An item of property, plant and equipment is derecognised upon disposal or when no future economic benefits are expected from its use or disposal. Any gain or loss arising on derecognition of the asset is included in the profit and loss account in the year the asset is derecognised.
Subsequent costs are not recognised as assets unless it is probable that future economic benefits associated with these costs will flow to the Company and the cost can be measured reliably.
Maintenance and normal repairs are charged to profit and loss account as and when incurred.
113
NOTES TO THE FINANCIAL STATEMENTSFor the year ended December 31, 2013
(ii) Capital work-in-progress
Capital work-in-progress is stated at cost less impairment in value, if any. It consists of expenditure incurred and advances made in respect of tangible fixed assets in the course of their construction and installation.
2.5 Intangible asset – computer software and product license
Computer software licenses acquired by the Company are stated at cost less accumulated amortization. Cost represents the cost incurred to acquire the software licenses and bring them to use. The cost of computer software is amortised over the estimated useful life as disclosed in note 4 to the financial statements.
Cost associated with maintaining computer software’s are charged to profit and loss account.
Separately acquired product licenses are shown at historical cost. These have a finite useful life and are carried at cost less accumulated amortisation. Amortisation is calculated using the straight-line method to allocate the cost of product licenses over their estimated useful lives as disclosed in note 4 to the financial statements.
The useful lives of intangible assets are reviewed at each reporting date. The effect of any adjustment to useful lives is recognised prospectively as a change of accounting estimate.
2.6 Long term loans and deposits
Long term loans and deposits are stated at cost less an allowance for uncollectible amounts, if any.
2.7 Stores and spares
These are valued at cost less provision for slow moving and obsolete stores and spares. Cost is determined on moving average basis except for the stores and spares in transit, which are stated at invoice price plus other charges incurred thereon up to the balance sheet date. Value of items are reviewed at each balance sheet date to record provision for any slow moving items, where necessary.
2.8 Stock-in-trade
These are valued at lower of cost and net realisable value. Goods in transit are valued at cost, comprising invoice values plus other charges incurred thereon up to the balance sheet date. Cost signifies standard costs adjusted by variances.
Cost in relation to work-in-process and finished goods represent direct cost of materials, direct wages and appropriate manufacturing overheads.
Net realisable value signifies the estimated selling price in the ordinary course of business less estimated costs necessarily to be incurred to make the sale. Provision is made for slow moving and expired stock where necessary.
114 ANNUAL REPORT 2013
2.9 Trade debts and other receivables
These are recognised and carried at original invoice amount, being the fair value, less an allowance for any uncollectible amounts, if any. An estimate for doubtful debts is made when collection is no longer probable. Bad debts are written-off when identified.
2.10 Employees benefits
Defined benefit plans
The Company operates an approved funded gratuity scheme and an approved funded non-contributory pension scheme in respect of all permanent employees and senior management staff respectively excluding expatriates. The schemes define the amounts of benefit that an employee will receive on or after retirement subject to a minimum qualifying period of service under the schemes.
The amounts of retirement benefits are usually dependent on one or more factors such as age, years of service and salary.
The liabilities recognized in respect of gratuity and pension schemes are the present values of the defined benefit obligations under each scheme at the balance sheet date less the fair value of respective plan assets.
The gratuity and pension obligations are calculated annually by independent actuaries using the Projected Unit Credit Method. The most recent valuation in this regard was carried out as at December 31, 2013. The present values of the obligations are determined by discounting the estimated future cash outflows using interest rates of high quality government securities that have terms to maturity approximating to the terms of the related obligations.
Actuarial gains and losses arising from experience adjustments and changes in actuarial assumptions are recognized directly in equity in the statement of comprehensive income in the period in which they arise. All past sercvice costs are recognised at the earlier of when the amendments or curtailment occurs and when the Company has recognised related retirement or termination benifits.
Change in accounting policy
During the year, the Company has changed its accounting policy in respect of recognition of past service cost, whereby with effect from the current year the Company has recognised all past service costs at the earlier of when the amendment or curtailment occurs and when the Company has recognised related restructuring or terminations benefits, instead of past policy, where the past service costs were recognised as an expense on a straight line basis over the average period until the benefits became vested, and if the benefits were already vested, following the introduction of or changes to a scheme, past service costs were recognised immediately in profit and loss account.
The aforesaid change in accounting policy due to the adoption of amendments in IAS – 19 will result in increase in staff cost in respect of unrecognized past service cost of prior years amounting to
Rs. 1.224 million net of deferred tax amounting to Rs. 0.661 million, which the management believes
NOTES TO THE FINANCIAL STATEMENTSFor the year ended December 31, 2013
115
is immaterial. As a result, such prior year effect has not been accounted for retrospectively and the aforesaid impact has been taken in the financial statements for the current year.
Defined contribution plan
The Company also operates a recognized provident fund scheme for all permanent employees excluding expatriates. Equal monthly contributions are made, both by the Company and the employees, to the fund at the rate of 10 percent of basic salary.
2.11 Taxation
Current
Provision for current taxation is based on taxable income at the current rates of taxation after taking into account tax credits and tax rebates available, if any and under the Final Tax Regime (FTR). The tax charge as calculated above is compared with turnover tax under Section 113 of the Income Tax Ordinance, 2001, and whichever is higher is provided in the financial statements.
Deferred
Deferred tax is recognized using the liability method, on all major temporary differences at the balance sheet date between the tax base of assets and liabilities and their carrying amounts for financial reporting purposes.
Deferred income tax assets are recognized for all deductible temporary differences and carry-forward of unused tax losses, to the extent that it is probable that taxable profit will be available against which the deductible temporary differences and / or carry-forward of unused tax losses can be utilized.
The carrying amount of all deferred tax assets is reviewed at each balance sheet date and reduced to the extent that it is no longer probable that sufficient taxable profits will be available to allow all or part of the deferred tax assets to be utilized.
Deferred income tax assets and liabilities are measured at the tax rates that are expected to apply to the period when the asset is realized or the liability is settled, based on tax rates (and tax laws) that have been enacted or substantively enacted at the balance sheet date.
Deferred tax is charged or credited in the profit and loss account except for deferred tax arising on recognition of actuarial loss or gain which is charged or directly credited to equity in the statement of comprehensive income.
2.12 Cash and cash equivalents
Cash and cash equivalents are carried in the balance sheet at cost. For the purpose of cash flow statement, cash and cash equivalents represent balances with banks net of outstanding balance of running finance facilities availed by the Company.
NOTES TO THE FINANCIAL STATEMENTSFor the year ended December 31, 2013
116 ANNUAL REPORT 2013
2.13 Impairment
(i) Financial assets
A financial asset is assessed at each reporting date to determine whether there is any objective evidence that it is impaired. A financial asset is considered to be impaired if objective evidence indicates that one or more events have had a negative effect of the estimated future cash flows of that asset.
(ii) Non-Financial assets
Carrying value of non-financial assets other than inventories and deferred tax assets are assessed at each reporting date to determine whether there is any indication of impairment. If any such indications exist, then the recoverable amount is estimated. An impairment loss is recognized, as an expense in the profit and loss account, for the amount by which an asset’s carrying amount exceeds its recoverable amount. The recoverable amount is the higher of an asset’s fair value less cost to sell and value in use. Value in use is determined through discounting of the estimated future cash flows using a discount rate that reflects current market assessments of the time value of money and risks specific to the assets. For the purpose of assessing impairment, assets are grouped at the lowest levels for which there are separately identifiable cash flows (cash generating units).
2.14 Non-current assets classified as held for sale
Non-current assets are classified as held for sale if their carrying amount is to be recovered principally through a sale transaction rather than through continuing use. These assets are available for sale in their present condition subject only to terms that are usual and customary for sales of such assets and their sale is highly probable.
The Company measures its non-current assets classified as held for sale at the lower of carrying amount and fair value less cost to sell. Costs to sell signify the incremental costs directly attributable to the disposal of an asset, excluding finance costs and income tax expense.
2.15 Leases
(i) Finance leases
Leases that transfer substantially all the risks and rewards incidental to ownership of an asset are classified as finance leases. Assets on finance lease are capitalized at the commencement of the lease term at the lower of fair value of leased assets and the presently value of minimum lease payment, each determined at the inception of the lease. Each lease payment is allocated between the liability and finance cost so as to achieve a constant rate on the finance balance outstanding. The finance cost is charged to profit and loss account and is included under finance costs. The assets acquired under finance lease are depreciated over the shorter of the useful life of the asset or the lease term.
NOTES TO THE FINANCIAL STATEMENTSFor the year ended December 31, 2013
117
(ii) Operating leases
Leases in which a significant portion of the risks and rewards of ownership are retained by the lessor are classified as operating leases. Payments made under operating leases are charged to profit and loss on a straight line basis over the period of the lease.
2.16 Trade and other payables
Liabilities for trade and other amounts payable are carried at cost which is the fair value of the consideration to be paid in the future for goods and services received, whether or not billed to the Company.
2.17 Compensated absences
The Company provides for compensated absences of its employees on unavailed leave balances in the period in which the leave is earned on the basis of accumulated leaves and the last drawn pay.
2.18 Provisions
Provisions are recognised when the Company has a present legal or constructive obligation as a result of a past event and it is probable that an outflow of resources embodying economic benefits will be required to settle the obligation and a reliable estimate can be made of the amount of obligation.
2.19 Foreign currency translation
The financial statements are presented in Pak Rupee, which is the Company’s functional and presentation currency. Foreign currency transactions during the year are recorded at the exchange rates approximating those ruling on the date of the transaction. Monetary assets and liabilities in foreign currencies are translated at the rates of exchange which approximate those prevailing on the balance sheet date. Gains and losses on translation are taken to income currently. Non-monetary items that are measured in terms of historical cost in a foreign currency are translated using the exchange rates as at the dates of the initial transactions. Non-monetary items measured at fair value in a foreign currency are translated using the exchange rates at the date when the fair value was determined.
2.20 Borrowings
Borrowings are recognized initially at fair value, net of transaction costs incurred and are subsequently measured at amortized cost using the effective interest method.
Borrowings are classified as current liabilities unless the Company has an unconditional / contractual right to defer settlement of the liability for atleast twelve months after the balance sheet date.
NOTES TO THE FINANCIAL STATEMENTSFor the year ended December 31, 2013
118 ANNUAL REPORT 2013
2.21 Revenue recognition
— Sales and toll manufacturing income are recorded on despatch of goods;— Return on deposits is recognised on accrual basis; and— License fee is recognised on accrual basis.
2.22 Borrowing Costs
Borrowing costs that are directly attributable to the acquisition, construction or production of an asset that necessarily takes a substantial period of time to get ready for its intended use or sale are capitalized as part of the cost of the respective assets. All other borrowing costs are expensed out in the period they occur. Borrowing costs consist of interest and other cost that an entity incurs in connection with the borrowing of funds.
2.23 Financial Instruments
All the financial assets and financial liabilities are recognised at the time when the Company becomes a party to the contractual provisions of the instrument. Financial assets are derecognised at the time when the Company loses control of the contractual rights that comprise the financial assets. All financial liabilities are derecognised at the time when they are extinguished that is, when the obligation specified in the contract is discharged, cancelled, or expires. Any gains or losses on derecognition of financial assets and financial liabilities are taken to profit and loss account currently.
2.24 Derivative financial instruments and hedging activities
Derivatives are initially recognised at fair value on the date a derivative contract is entered into and are subsequently re-measured at their fair value at each reporting date. The Company enters into derivative transactions mainly to hedge foreign currency liabilities or firm commitments and these are designated as fair value hedge.
Changes in the fair value of derivatives that are designated and qualify as fair value hedges are recorded in the profit and loss account, together with any changes in fair value of the hedged liability that are attributable to the hedged risk.
2.25 Off-setting of financial instruments
A financial asset and a financial liability is offset and the net amount is reported in the balance sheet if the Company has a legally enforceable right to set-off the recognised amounts and intends either to settle on a net basis or to realise the asset and settle the liability simultaneously.
2.26 Dividends and appropriation to general reserve
Dividend distribution to the Company’s shareholders and appropriation to general reserve are recognized in the financial statements in the period in which these are approved by the Company’s shareholders.
NOTES TO THE FINANCIAL STATEMENTSFor the year ended December 31, 2013
119
2.27 Share based compensation
The economic cost of awarding shares of Group Companies to employees is reflected by recording a charge in the profit and loss account, equivalent to the fair value of shares on the grant date over the vesting period, with a corresponding reserve created to reflect the equity component.
2.28 Significant accounting judgments and estimates
The preparation of the Company’s financial statements requires management to make judgments, estimates and assumptions that affect the reported amounts of revenues, expenses, assets and liabilities, and the disclosure of contingent liabilities, at the end of the reporting period. However, uncertainty about these assumptions and estimates could result in outcomes that require a material adjustment to the carrying amount of the asset or liability affected in future periods.
In the process of applying the accounting policies, management has made the following judgments, estimates and assumption which are significant to the financial statements:
(i) Property, plant and equipment
The Company reviews appropriateness of the rate of depreciation, useful life and residual value used in the calculation of depreciation. Further, where applicable, an estimate of the recoverable amount of assets is made for possible impairment on an annual basis. In making these estimates, Company uses the technical resources available with the Company. Any change in the estimates in the future might affect the carrying amount of respective item of property, plant and equipment, with corresponding effects on the depreciation charge and impairment.
(ii) Stock-in-trade and stores and spare parts
The Company reviews the net realizable value of stock-in-trade and stores and spare parts to assess any diminution in the respective carrying values and also review the inventories for obsolescence.
(iii) Provision for doubtful debts and stocks
The Company has used judgements, based on the history of the transactions, for making provisions for the doubtful debts whereas provision for stocks is based on the current market conditions. Management believes that the changes in the outcome of estimates will not have significant effect on the financial statements.
(iv) Post retirement benefits
The Company has post retirement benefit obligations, which are determined through actuarial valuations using various assumptions as disclosed in note 11.4. Management believes that the changes in assumptions will not have significant effect on the financial statements.
NOTES TO THE FINANCIAL STATEMENTSFor the year ended December 31, 2013
120 ANNUAL REPORT 2013
(v) Share based compensation plans
The Company has share-based transactions involving group companies shares accounted for using various assumptions as disclosed in note 14.1 below. Management believes that the changes in assumptions will not have significant effect on the financial statements.
(vi) Taxation
The Company takes into account the current income tax laws and decisions taken by appellate authorities while recognizing provision for income tax. The amounts have not been provided for matters, disclosed in note 20.1(b), where the Company’s view differs from the view taken by the income tax department at the assessment stage and where the Company considers that the matters in appeals will be decided in favour of the Company. Management believes that if the final outcome of the cases differs from the management’s assessment, such differences will impact the income tax provision in the period in which such determination is made.
Estimates and judgments are continually evaluated and are based on historical experience and other factors, including expectations of future event that are believed to be reasonable under the circumstances. Revisions to accounting estimates are recognized in the period in which the estimate is revised and in any future periods affected.
There have been no critical judgements made by the Company’s management in applying the accounting policies that would have a significant effect on the amounts recognised in the financial statements.
2.29 Standards, interpretations and amendments to approved accounting standards that are not yet effective
The following amendments and interpretations with respect to the approved accounting standards as applicable in Pakistan would be effective from the dates mentioned below against the respective standard or interpretation:
Effective date(accounting periods
beginning on or after)Standard or Interpretation
IAS 32 - Offsetting Financial Assets and Financial liabilities – (Amendment) January 1, 2014IAS 36 - Recoverable Amount for Non-Financial Assets – (Amendment) January 1, 2014IAS 39 - Novation of Derivatives and Continuation of Hedge Accounting –
(Amendment)January 1, 2014
IFRIC 21 - Levies January 1, 2014IFAS 3 - Profit and Loss Sharing on Deposits June 12, 2013
NOTES TO THE FINANCIAL STATEMENTSFor the year ended December 31, 2013
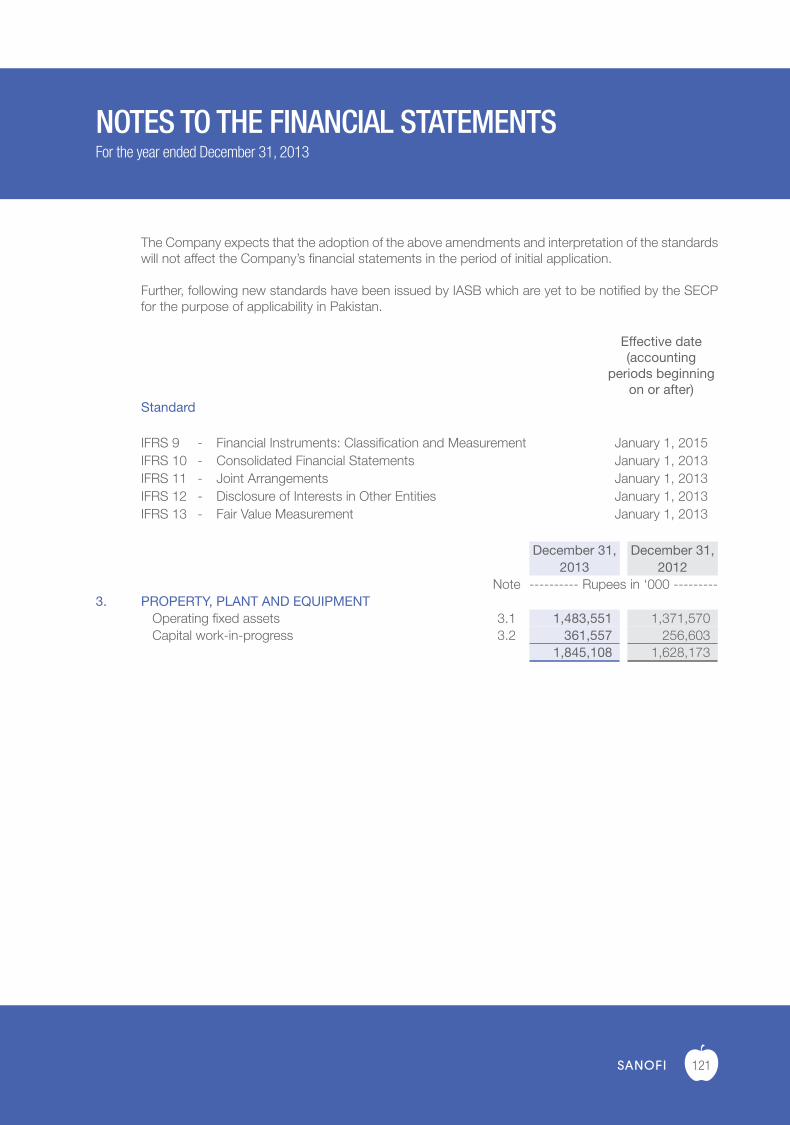
121
The Company expects that the adoption of the above amendments and interpretation of the standards will not affect the Company’s financial statements in the period of initial application.
Further, following new standards have been issued by IASB which are yet to be notified by the SECP for the purpose of applicability in Pakistan.
Effective date(accounting
periods beginningon or after)
Standard
IFRS 9 - Financial Instruments: Classification and Measurement January 1, 2015IFRS 10 - Consolidated Financial Statements January 1, 2013IFRS 11 - Joint Arrangements January 1, 2013IFRS 12 - Disclosure of Interests in Other Entities January 1, 2013IFRS 13 - Fair Value Measurement January 1, 2013
December 31, December 31,2013 2012
Note ---------- Rupees in ‘000 ---------3. PROPERTY, PLANT AND EQUIPMENT
Operating fixed assets 3.1 1,483,551 1,371,570 Capital work-in-progress 3.2 361,557 256,603
1,845,108 1,628,173
NOTES TO THE FINANCIAL STATEMENTSFor the year ended December 31, 2013
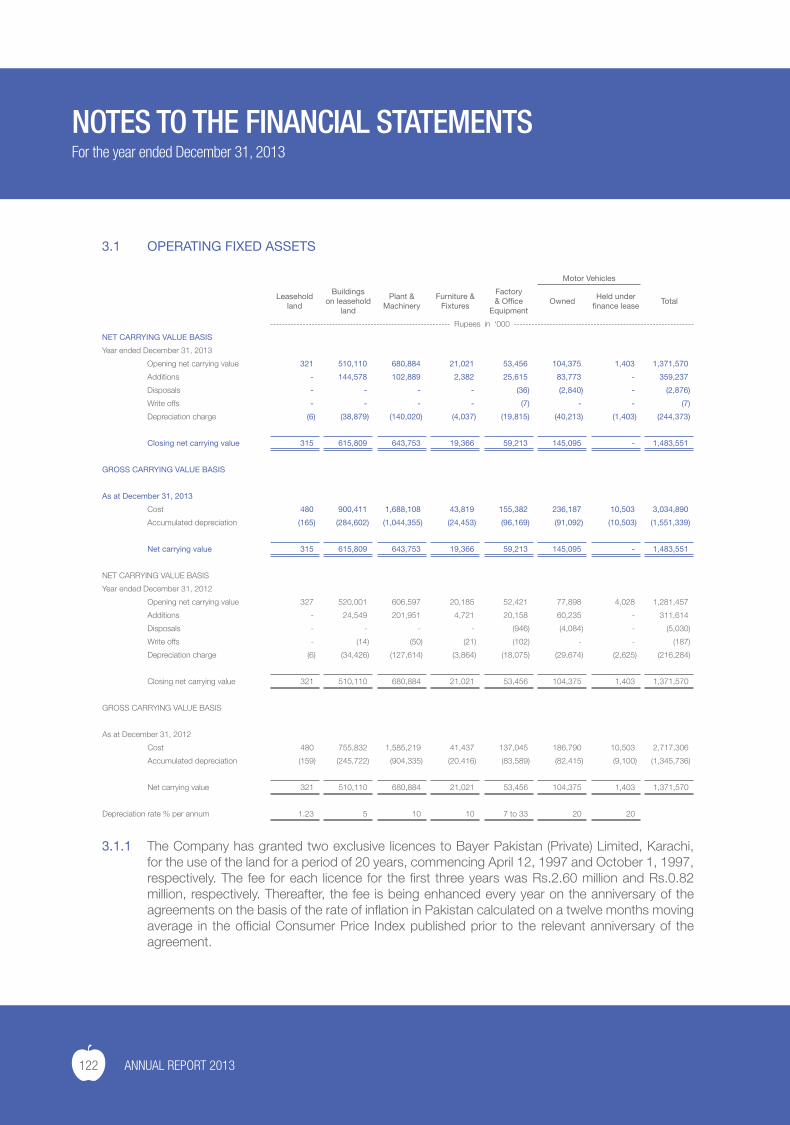
122 ANNUAL REPORT 2013
3.1 OPERATING FIXED ASSETS
Motor Vehicles
Leasehold land
Buildings on leasehold
land
Plant & Machinery
Furniture & Fixtures
Factory & Office
EquipmentOwned
Held under finance lease
Total
------------------------------------------------------------- Rupees in ‘000 -------------------------------------------------------------
NET CARRYING VALUE BASIS
Year ended December 31, 2013
Opening net carrying value 321 510,110 680,884 21,021 53,456 104,375 1,403 1,371,570
Additions - 144,578 102,889 2,382 25,615 83,773 - 359,237
Disposals - - - - (36) (2,840) - (2,876)
Write offs - - - - (7) - - (7)
Depreciation charge (6) (38,879) (140,020) (4,037) (19,815) (40,213) (1,403) (244,373)
Closing net carrying value 315 615,809 643,753 19,366 59,213 145,095 - 1,483,551
GROSS CARRYING VALUE BASIS
As at December 31, 2013
Cost 480 900,411 1,688,108 43,819 155,382 236,187 10,503 3,034,890
Accumulated depreciation (165) (284,602) (1,044,355) (24,453) (96,169) (91,092) (10,503) (1,551,339)
Net carrying value 315 615,809 643,753 19,366 59,213 145,095 - 1,483,551
NET CARRYING VALUE BASIS
Year ended December 31, 2012
Opening net carrying value 327 520,001 606,597 20,185 52,421 77,898 4,028 1,281,457
Additions - 24,549 201,951 4,721 20,158 60,235 - 311,614
Disposals - - - - (946) (4,084) - (5,030)
Write offs - (14) (50) (21) (102) - - (187)
Depreciation charge (6) (34,426) (127,614) (3,864) (18,075) (29,674) (2,625) (216,284)
Closing net carrying value 321 510,110 680,884 21,021 53,456 104,375 1,403 1,371,570
GROSS CARRYING VALUE BASIS
As at December 31, 2012
Cost 480 755,832 1,585,219 41,437 137,045 186,790 10,503 2,717,306
Accumulated depreciation (159) (245,722) (904,335) (20,416) (83,589) (82,415) (9,100) (1,345,736)
Net carrying value 321 510,110 680,884 21,021 53,456 104,375 1,403 1,371,570
Depreciation rate % per annum 1.23 5 10 10 7 to 33 20 20
3.1.1 The Company has granted two exclusive licences to Bayer Pakistan (Private) Limited, Karachi, for the use of the land for a period of 20 years, commencing April 12, 1997 and October 1, 1997, respectively. The fee for each licence for the first three years was Rs.2.60 million and Rs.0.82 million, respectively. Thereafter, the fee is being enhanced every year on the anniversary of the agreements on the basis of the rate of inflation in Pakistan calculated on a twelve months moving average in the official Consumer Price Index published prior to the relevant anniversary of the agreement.
NOTES TO THE FINANCIAL STATEMENTSFor the year ended December 31, 2013
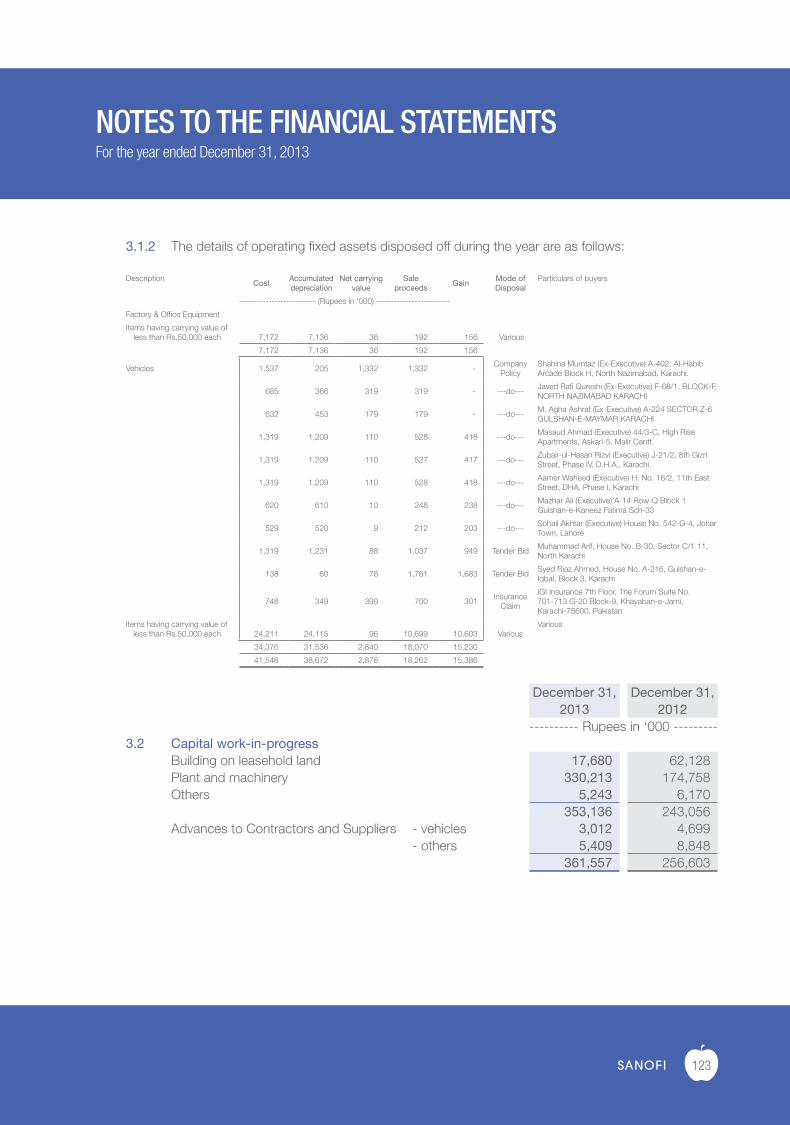
123
3.1.2 The details of operating fixed assets disposed off during the year are as follows:
DescriptionCost
Accumulated depreciation
Net carrying value
Sale proceeds
GainMode of Disposal
Particulars of buyers
-------------------------- (Rupees in ‘000) -------------------------
Factory & Office Equipment
Items having carrying value ofless than Rs.50,000 each 7,172 7,136 36 192 156 Various
7,172 7,136 36 192 156
Vehicles 1,537 205 1,332 1,332 - Company
PolicyShahina Mumtaz (Ex-Executive) A-402, Al-Habib Arcade Block H, North Nazimabad, Karachi.
685 366 319 319 - ---do---Javed Rafi Qureshi (Ex-Executive) F-68/1, BLOCK-F, NORTH NAZIMABAD KARACHI
632 453 179 179 - ---do---M. Agha Ashraf (Ex-Executive) A-224 SECTOR Z-6 GULSHAN-E-MAYMAR KARACHI
1,319 1,209 110 528 418 ---do---Masaud Ahmad (Executive) 44/3-C, High Rise Apartments, Askari-5, Malir Cantt.
1,319 1,209 110 527 417 ---do---Zubair-ul-Hasan Rizvi (Executive) J-21/2, 8th Gizri Street, Phase IV, D.H.A., Karachi.
1,319 1,209 110 528 418 ---do---Aamer Waheed (Executive) H. No. 16/2, 11th East Street, DHA, Phase I, Karachi
620 610 10 248 238 ---do---Mazhar Ali (Executive)’A-14 Row-Q Block 1 Gulshan-e-Kaneez Fatima Sch-33
529 520 9 212 203 ---do---Sohail Akhtar (Executive) House No. 542-G-4, Johar Town, Lahore
1,319 1,231 88 1,037 949 Tender BidMuhammad Arif, House No. B-30, Sector C/1 11, North Karachi
138 60 78 1,761 1,683 Tender BidSyed Riaz Ahmed, House No. A-216, Gulshan-e-Iqbal, Block 3, Karachi
748 349 399 700 301 Insurance
Claim
IGI Insurance 7th Floor, The Forum Suite No. 701-713 G-20 Block-9, Khayaban-e-Jami, Karachi-75600, Pakistan
Items having carrying value ofless than Rs.50,000 each 24,211 24,115 96 10,699 10,603 Various
Various
34,376 31,536 2,840 18,070 15,230
41,548 38,672 2,876 18,262 15,386
December 31, December 31,2013 2012
---------- Rupees in ‘000 ---------3.2 Capital work-in-progress
Building on leasehold land 17,680 62,128 Plant and machinery 330,213 174,758 Others 5,243 6,170
353,136 243,056 Advances to Contractors and Suppliers - vehicles 3,012 4,699 - others 5,409 8,848
361,557 256,603
NOTES TO THE FINANCIAL STATEMENTSFor the year ended December 31, 2013
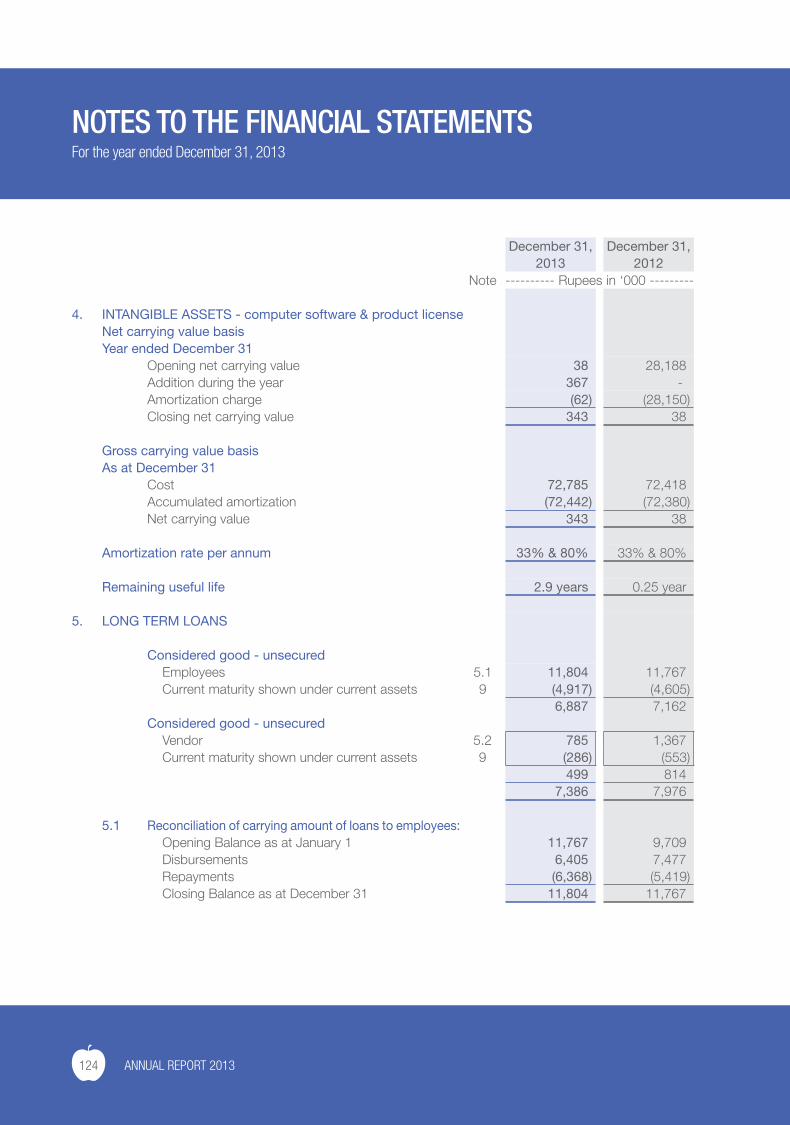
124 ANNUAL REPORT 2013
December 31, December 31,2013 2012
Note ---------- Rupees in ‘000 ---------
4. INTANGIBLE ASSETS - computer software & product licenseNet carrying value basisYear ended December 31
Opening net carrying value 38 28,188 Addition during the year 367 - Amortization charge (62) (28,150)Closing net carrying value 343 38
Gross carrying value basisAs at December 31
Cost 72,785 72,418 Accumulated amortization (72,442) (72,380)Net carrying value 343 38
Amortization rate per annum 33% & 80% 33% & 80%
Remaining useful life 2.9 years 0.25 year
5. LONG TERM LOANS
Considered good - unsecuredEmployees 5.1 11,804 11,767 Current maturity shown under current assets 9 (4,917) (4,605)
6,887 7,162 Considered good - unsecured
Vendor 5.2 785 1,367 Current maturity shown under current assets 9 (286) (553)
499 814 7,386 7,976
5.1 Reconciliation of carrying amount of loans to employees:Opening Balance as at January 1 11,767 9,709 Disbursements 6,405 7,477 Repayments (6,368) (5,419)Closing Balance as at December 31 11,804 11,767
NOTES TO THE FINANCIAL STATEMENTSFor the year ended December 31, 2013
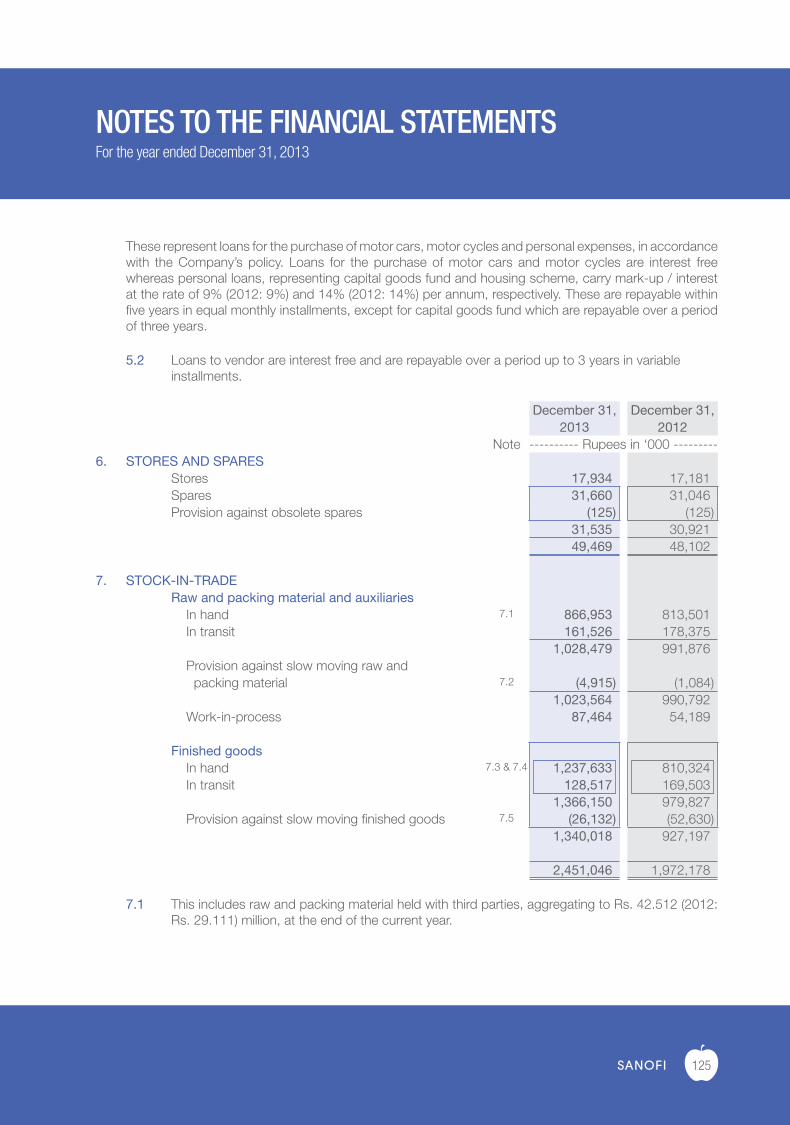
125
These represent loans for the purchase of motor cars, motor cycles and personal expenses, in accordance with the Company’s policy. Loans for the purchase of motor cars and motor cycles are interest free whereas personal loans, representing capital goods fund and housing scheme, carry mark-up / interest at the rate of 9% (2012: 9%) and 14% (2012: 14%) per annum, respectively. These are repayable within five years in equal monthly installments, except for capital goods fund which are repayable over a period of three years.
5.2 Loans to vendor are interest free and are repayable over a period up to 3 years in variable installments.
December 31, December 31,2013 2012
Note ---------- Rupees in ‘000 ---------6. STORES AND SPARES
Stores 17,934 17,181 Spares 31,660 31,046 Provision against obsolete spares (125) (125)
31,535 30,921 49,469 48,102
7. STOCK-IN-TRADE Raw and packing material and auxiliaries
In hand 7.1 866,953 813,501 In transit 161,526 178,375
1,028,479 991,876 Provision against slow moving raw and
packing material 7.2 (4,915) (1,084) 1,023,564 990,792
Work-in-process 87,464 54,189
Finished goodsIn hand 7.3 & 7.4 1,237,633 810,324 In transit 128,517 169,503
1,366,150 979,827 Provision against slow moving finished goods 7.5 (26,132) (52,630)
1,340,018 927,197
2,451,046 1,972,178
7.1 This includes raw and packing material held with third parties, aggregating to Rs. 42.512 (2012: Rs. 29.111) million, at the end of the current year.
NOTES TO THE FINANCIAL STATEMENTSFor the year ended December 31, 2013
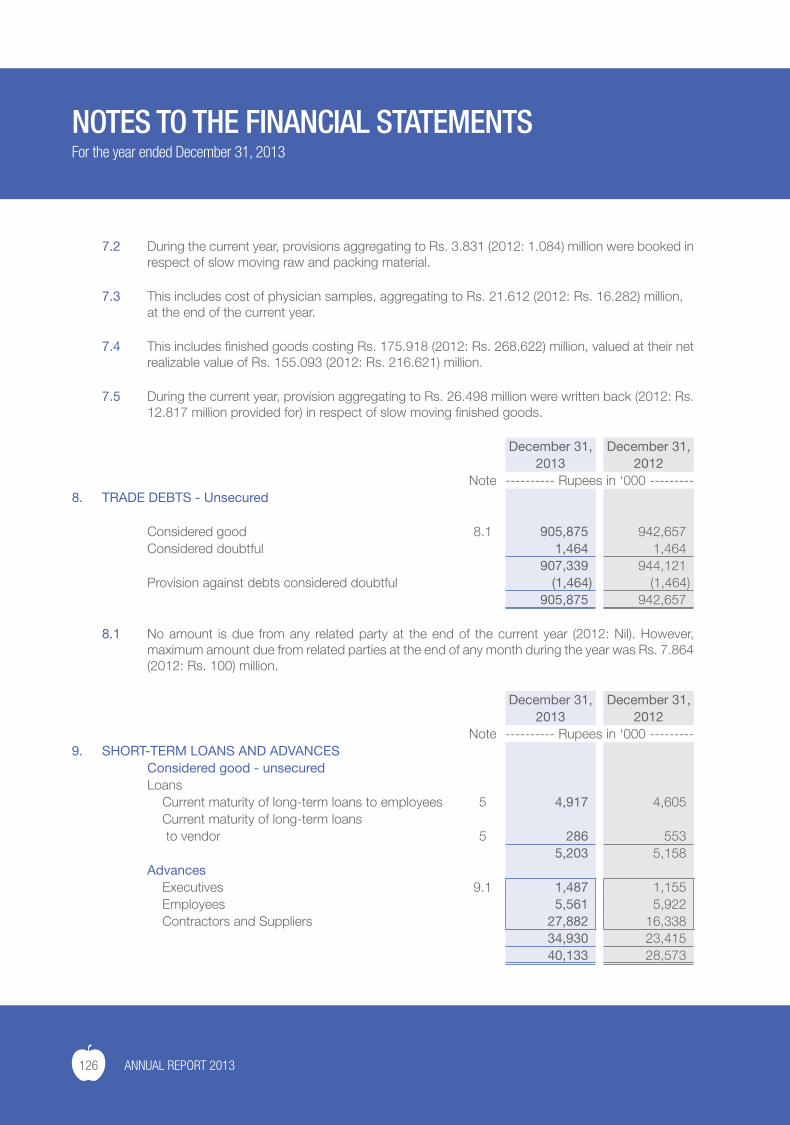
126 ANNUAL REPORT 2013
7.2 During the current year, provisions aggregating to Rs. 3.831 (2012: 1.084) million were booked in respect of slow moving raw and packing material.
7.3 This includes cost of physician samples, aggregating to Rs. 21.612 (2012: Rs. 16.282) million, at the end of the current year.
7.4 This includes finished goods costing Rs. 175.918 (2012: Rs. 268.622) million, valued at their net realizable value of Rs. 155.093 (2012: Rs. 216.621) million.
7.5 During the current year, provision aggregating to Rs. 26.498 million were written back (2012: Rs. 12.817 million provided for) in respect of slow moving finished goods.
December 31, December 31,2013 2012
Note ---------- Rupees in ‘000 ---------8. TRADE DEBTS - Unsecured
Considered good 8.1 905,875 942,657 Considered doubtful 1,464 1,464
907,339 944,121 Provision against debts considered doubtful (1,464) (1,464)
905,875 942,657
8.1 No amount is due from any related party at the end of the current year (2012: Nil). However, maximum amount due from related parties at the end of any month during the year was Rs. 7.864 (2012: Rs. 100) million.
December 31, December 31,2013 2012
Note ---------- Rupees in ‘000 ---------9. SHORT-TERM LOANS AND ADVANCES
Considered good - unsecuredLoans
Current maturity of long-term loans to employees 5 4,917 4,605 Current maturity of long-term loans to vendor 5 286 553
5,203 5,158 Advances
Executives 9.1 1,487 1,155 Employees 5,561 5,922 Contractors and Suppliers 27,882 16,338
34,930 23,415 40,133 28,573
NOTES TO THE FINANCIAL STATEMENTSFor the year ended December 31, 2013
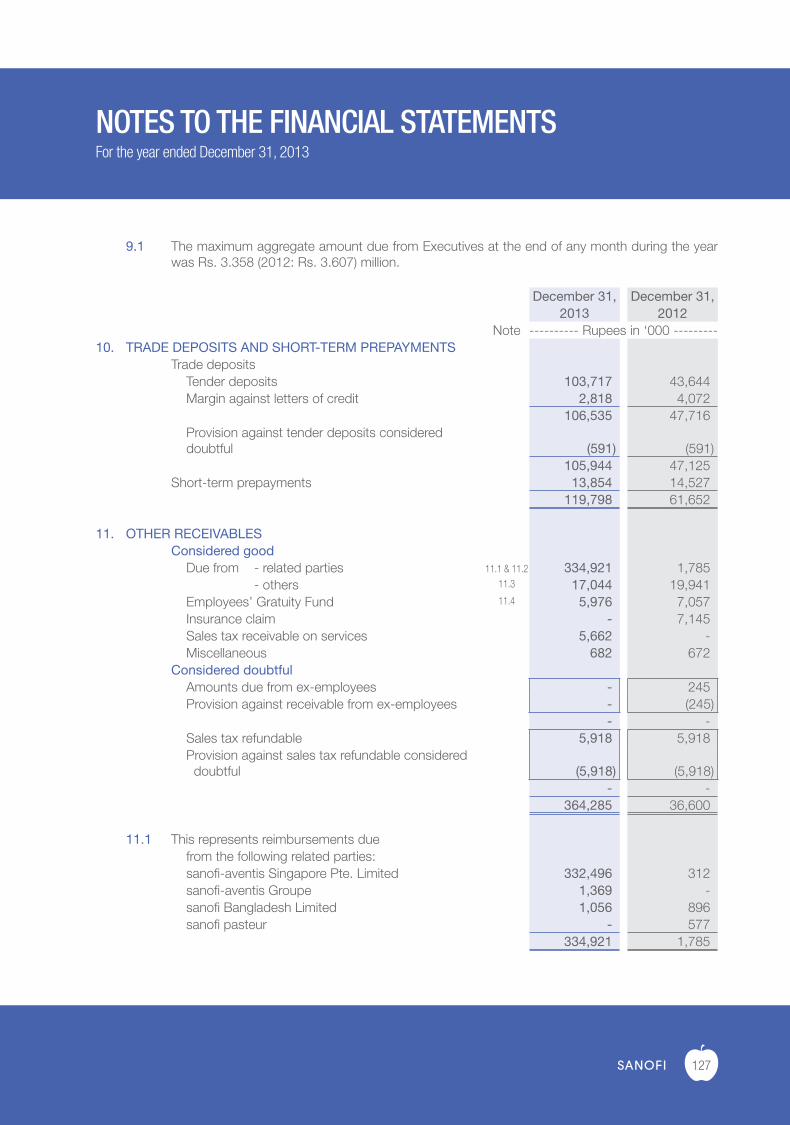
127
9.1 The maximum aggregate amount due from Executives at the end of any month during the year was Rs. 3.358 (2012: Rs. 3.607) million.
December 31, December 31,2013 2012
Note ---------- Rupees in ‘000 ---------10. TRADE DEPOSITS AND SHORT-TERM PREPAYMENTS
Trade depositsTender deposits 103,717 43,644 Margin against letters of credit 2,818 4,072
106,535 47,716 Provision against tender deposits considered doubtful (591) (591)
105,944 47,125 Short-term prepayments 13,854 14,527
119,798 61,652
11. OTHER RECEIVABLESConsidered good
Due from - related parties 11.1 & 11.2 334,921 1,785 - others 11.3 17,044 19,941 Employees’ Gratuity Fund 11.4 5,976 7,057 Insurance claim - 7,145 Sales tax receivable on services 5,662 - Miscellaneous 682 672
Considered doubtfulAmounts due from ex-employees - 245 Provision against receivable from ex-employees - (245)
- - Sales tax refundable 5,918 5,918 Provision against sales tax refundable considered
doubtful (5,918) (5,918) - -
364,285 36,600
11.1 This represents reimbursements due from the following related parties:sanofi-aventis Singapore Pte. Limited 332,496 312 sanofi-aventis Groupe 1,369 - sanofi Bangladesh Limited 1,056 896 sanofi pasteur - 577
334,921 1,785
NOTES TO THE FINANCIAL STATEMENTSFor the year ended December 31, 2013
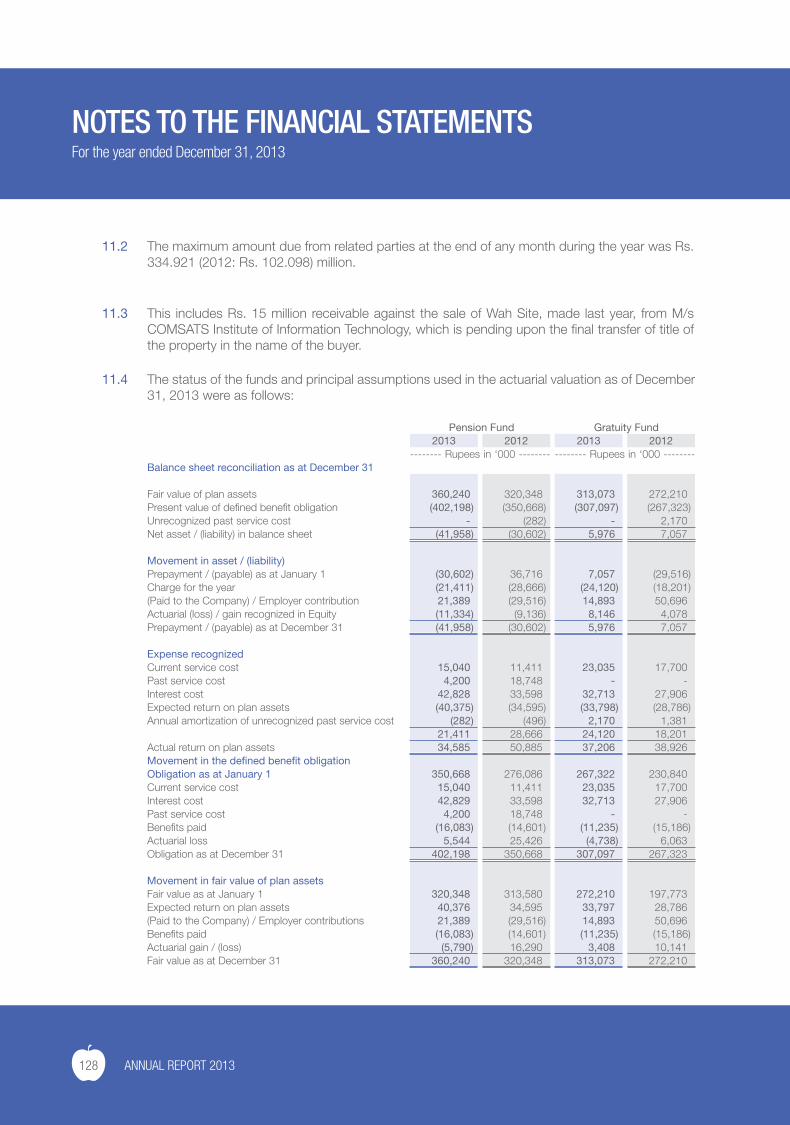
128 ANNUAL REPORT 2013
11.2 The maximum amount due from related parties at the end of any month during the year was Rs. 334.921 (2012: Rs. 102.098) million.
11.3 This includes Rs. 15 million receivable against the sale of Wah Site, made last year, from M/s COMSATS Institute of Information Technology, which is pending upon the final transfer of title of the property in the name of the buyer.
11.4 The status of the funds and principal assumptions used in the actuarial valuation as of December 31, 2013 were as follows:
Pension Fund Gratuity Fund 2013 2012 2013 2012
-------- Rupees in ‘000 -------- -------- Rupees in ‘000 --------Balance sheet reconciliation as at December 31
Fair value of plan assets 360,240 320,348 313,073 272,210 Present value of defined benefit obligation (402,198) (350,668) (307,097) (267,323)Unrecognized past service cost - (282) - 2,170 Net asset / (liability) in balance sheet (41,958) (30,602) 5,976 7,057
Movement in asset / (liability)Prepayment / (payable) as at January 1 (30,602) 36,716 7,057 (29,516)Charge for the year (21,411) (28,666) (24,120) (18,201)(Paid to the Company) / Employer contribution 21,389 (29,516) 14,893 50,696 Actuarial (loss) / gain recognized in Equity (11,334) (9,136) 8,146 4,078 Prepayment / (payable) as at December 31 (41,958) (30,602) 5,976 7,057
Expense recognizedCurrent service cost 15,040 11,411 23,035 17,700 Past service cost 4,200 18,748 - - Interest cost 42,828 33,598 32,713 27,906 Expected return on plan assets (40,375) (34,595) (33,798) (28,786)Annual amortization of unrecognized past service cost (282) (496) 2,170 1,381
21,411 28,666 24,120 18,201 Actual return on plan assets 34,585 50,885 37,206 38,926 Movement in the defined benefit obligationObligation as at January 1 350,668 276,086 267,322 230,840 Current service cost 15,040 11,411 23,035 17,700 Interest cost 42,829 33,598 32,713 27,906 Past service cost 4,200 18,748 - - Benefits paid (16,083) (14,601) (11,235) (15,186)Actuarial loss 5,544 25,426 (4,738) 6,063 Obligation as at December 31 402,198 350,668 307,097 267,323
Movement in fair value of plan assetsFair value as at January 1 320,348 313,580 272,210 197,773 Expected return on plan assets 40,376 34,595 33,797 28,786 (Paid to the Company) / Employer contributions 21,389 (29,516) 14,893 50,696 Benefits paid (16,083) (14,601) (11,235) (15,186)Actuarial gain / (loss) (5,790) 16,290 3,408 10,141 Fair value as at December 31 360,240 320,348 313,073 272,210
NOTES TO THE FINANCIAL STATEMENTSFor the year ended December 31, 2013
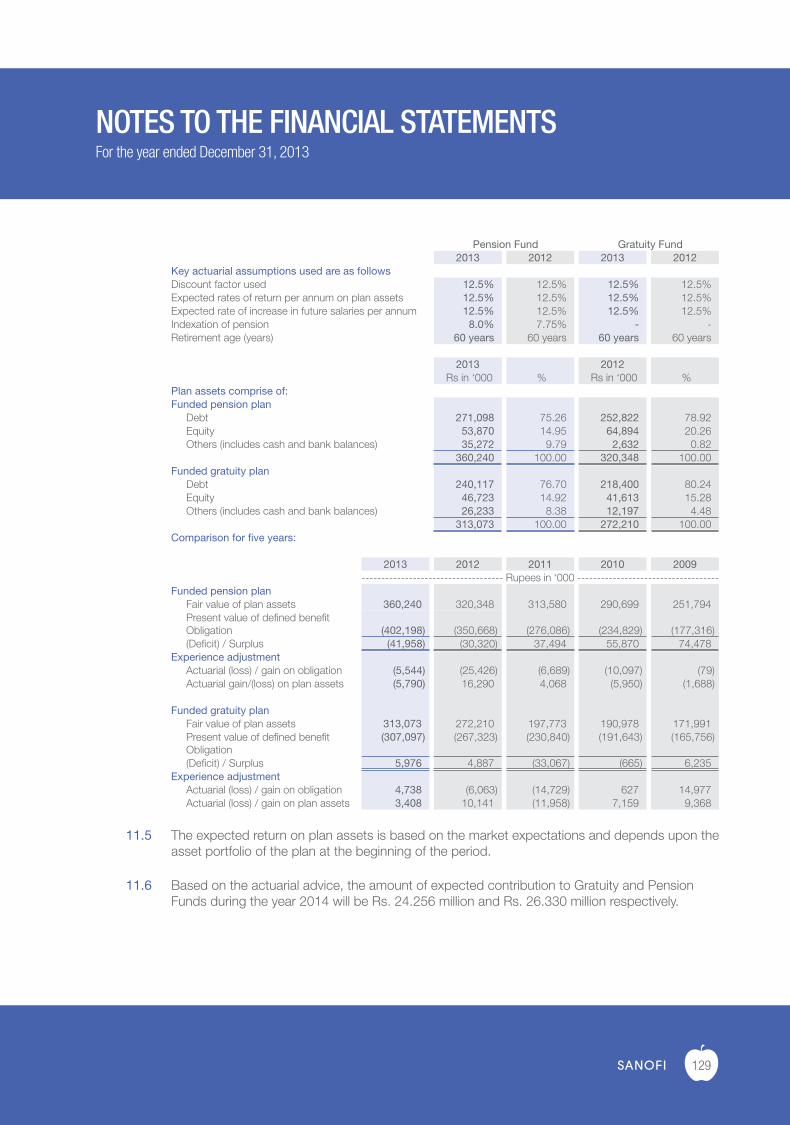
129
Pension Fund Gratuity Fund 2013 2012 2013 2012
Key actuarial assumptions used are as followsDiscount factor used 12.5% 12.5% 12.5% 12.5%Expected rates of return per annum on plan assets 12.5% 12.5% 12.5% 12.5%Expected rate of increase in future salaries per annum 12.5% 12.5% 12.5% 12.5%Indexation of pension 8.0% 7.75% - -Retirement age (years) 60 years 60 years 60 years 60 years
2013 2012 Rs in ‘000 % Rs in ‘000 %
Plan assets comprise of:Funded pension plan
Debt 271,098 75.26 252,822 78.92 Equity 53,870 14.95 64,894 20.26 Others (includes cash and bank balances) 35,272 9.79 2,632 0.82
360,240 100.00 320,348 100.00 Funded gratuity plan
Debt 240,117 76.70 218,400 80.24 Equity 46,723 14.92 41,613 15.28 Others (includes cash and bank balances) 26,233 8.38 12,197 4.48
313,073 100.00 272,210 100.00 Comparison for five years:
2013 2012 2011 2010 2009------------------------------------ Rupees in ‘000 ------------------------------------
Funded pension planFair value of plan assets 360,240 320,348 313,580 290,699 251,794 Present value of defined benefit Obligation (402,198) (350,668) (276,086) (234,829) (177,316)(Deficit) / Surplus (41,958) (30,320) 37,494 55,870 74,478
Experience adjustmentActuarial (loss) / gain on obligation (5,544) (25,426) (6,689) (10,097) (79)Actuarial gain/(loss) on plan assets (5,790) 16,290 4,068 (5,950) (1,688)
Funded gratuity planFair value of plan assets 313,073 272,210 197,773 190,978 171,991 Present value of defined benefit Obligation
(307,097) (267,323) (230,840) (191,643) (165,756)
(Deficit) / Surplus 5,976 4,887 (33,067) (665) 6,235 Experience adjustment
Actuarial (loss) / gain on obligation 4,738 (6,063) (14,729) 627 14,977 Actuarial (loss) / gain on plan assets 3,408 10,141 (11,958) 7,159 9,368
11.5 The expected return on plan assets is based on the market expectations and depends upon the asset portfolio of the plan at the beginning of the period.
11.6 Based on the actuarial advice, the amount of expected contribution to Gratuity and Pension Funds during the year 2014 will be Rs. 24.256 million and Rs. 26.330 million respectively.
NOTES TO THE FINANCIAL STATEMENTSFor the year ended December 31, 2013
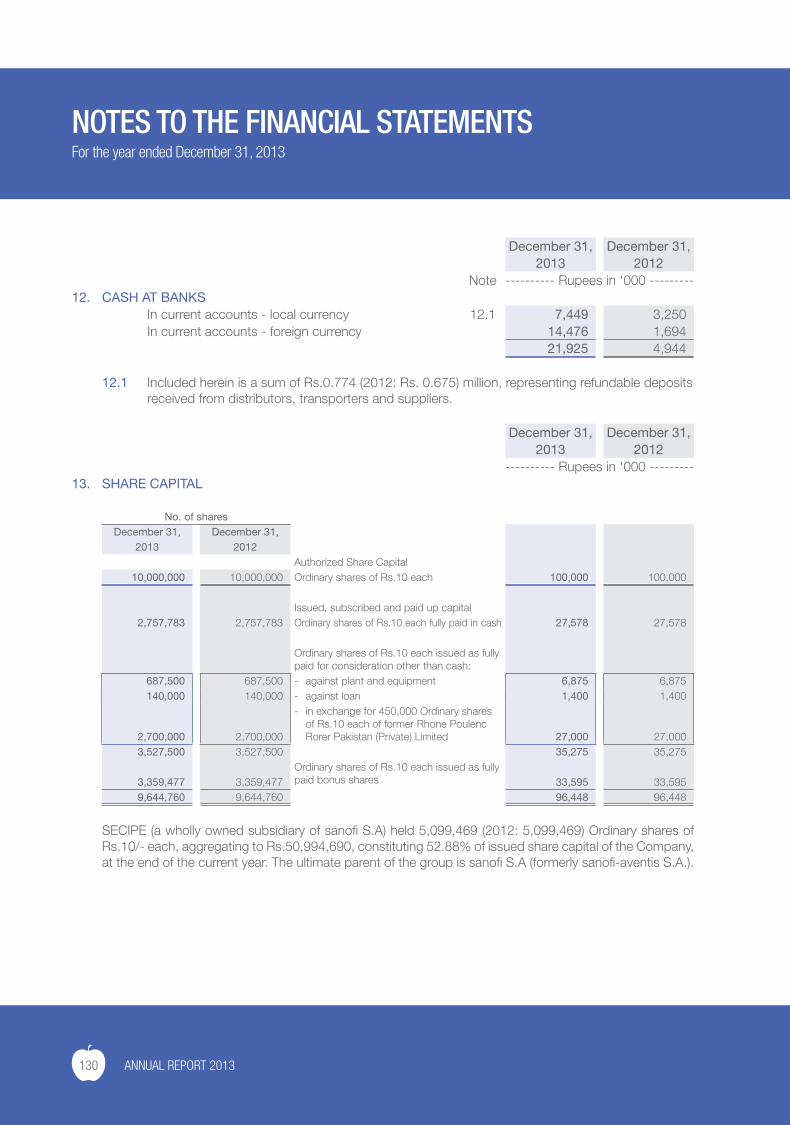
130 ANNUAL REPORT 2013
December 31, December 31,2013 2012
Note ---------- Rupees in ‘000 ---------12. CASH AT BANKS
In current accounts - local currency 12.1 7,449 3,250 In current accounts - foreign currency 14,476 1,694
21,925 4,944
12.1 Included herein is a sum of Rs.0.774 (2012: Rs. 0.675) million, representing refundable deposits received from distributors, transporters and suppliers.
December 31, December 31,2013 2012
---------- Rupees in ‘000 ---------13. SHARE CAPITAL
No. of sharesDecember 31, December 31,
2013 2012Authorized Share Capital
10,000,000 10,000,000 Ordinary shares of Rs.10 each 100,000 100,000
Issued, subscribed and paid up capital2,757,783 2,757,783 Ordinary shares of Rs.10 each fully paid in cash 27,578 27,578
Ordinary shares of Rs.10 each issued as fully paid for consideration other than cash:
687,500 687,500 - against plant and equipment 6,875 6,875 140,000 140,000 - against loan 1,400 1,400
2,700,000 2,700,000
- in exchange for 450,000 Ordinary shares of Rs.10 each of former Rhone Poulenc Rorer Pakistan (Private) Limited 27,000 27,000
3,527,500 3,527,500 35,275 35,275 Ordinary shares of Rs.10 each issued as fully paid bonus shares 3,359,477 3,359,477 33,595 33,595
9,644,760 9,644,760 96,448 96,448
SECIPE (a wholly owned subsidiary of sanofi S.A) held 5,099,469 (2012: 5,099,469) Ordinary shares of Rs.10/- each, aggregating to Rs.50,994,690, constituting 52.88% of issued share capital of the Company, at the end of the current year. The ultimate parent of the group is sanofi S.A (formerly sanofi-aventis S.A.).
NOTES TO THE FINANCIAL STATEMENTSFor the year ended December 31, 2013
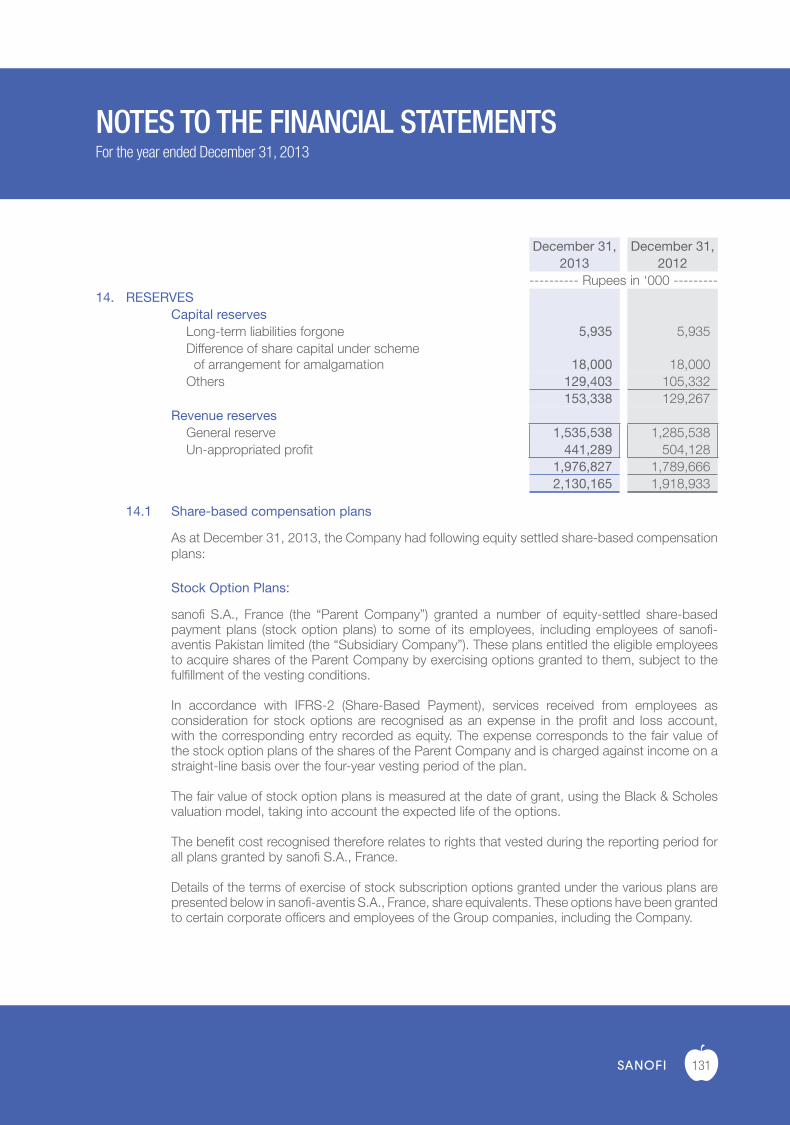
131
December 31, December 31,2013 2012
---------- Rupees in ‘000 ---------14. RESERVES
Capital reservesLong-term liabilities forgone 5,935 5,935 Difference of share capital under scheme
of arrangement for amalgamation 18,000 18,000 Others 129,403 105,332
153,338 129,267 Revenue reserves
General reserve 1,535,538 1,285,538 Un-appropriated profit 441,289 504,128
1,976,827 1,789,666 2,130,165 1,918,933
14.1 Share-based compensation plans
As at December 31, 2013, the Company had following equity settled share-based compensation plans:
Stock Option Plans:
sanofi S.A., France (the “Parent Company”) granted a number of equity-settled share-based payment plans (stock option plans) to some of its employees, including employees of sanofi-aventis Pakistan limited (the “Subsidiary Company”). These plans entitled the eligible employees to acquire shares of the Parent Company by exercising options granted to them, subject to the fulfillment of the vesting conditions.
In accordance with IFRS-2 (Share-Based Payment), services received from employees as consideration for stock options are recognised as an expense in the profit and loss account, with the corresponding entry recorded as equity. The expense corresponds to the fair value of the stock option plans of the shares of the Parent Company and is charged against income on a straight-line basis over the four-year vesting period of the plan.
The fair value of stock option plans is measured at the date of grant, using the Black & Scholes valuation model, taking into account the expected life of the options.
The benefit cost recognised therefore relates to rights that vested during the reporting period for all plans granted by sanofi S.A., France.
Details of the terms of exercise of stock subscription options granted under the various plans are presented below in sanofi-aventis S.A., France, share equivalents. These options have been granted to certain corporate officers and employees of the Group companies, including the Company.
NOTES TO THE FINANCIAL STATEMENTSFor the year ended December 31, 2013
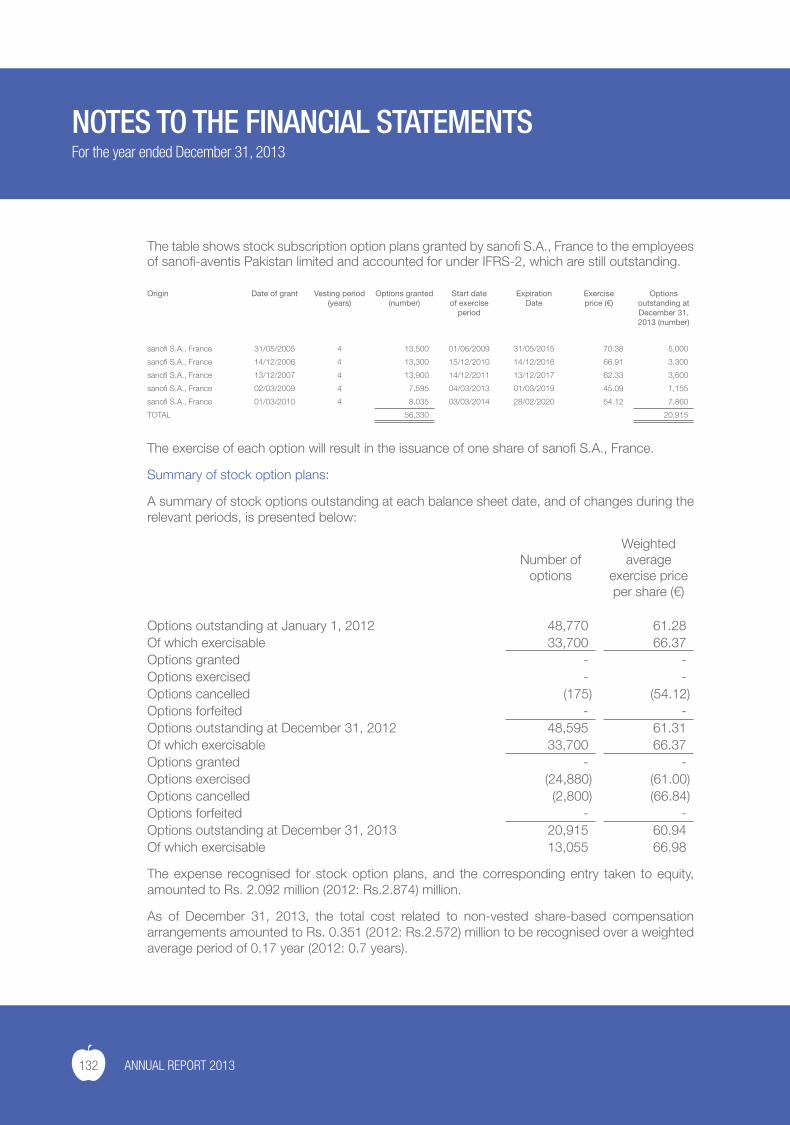
132 ANNUAL REPORT 2013
The table shows stock subscription option plans granted by sanofi S.A., France to the employees of sanofi-aventis Pakistan limited and accounted for under IFRS-2, which are still outstanding.
Origin Date of grant Vesting period (years)
Options granted (number)
Start dateof exercise
period
ExpirationDate
Exerciseprice (€)
Options outstanding at December 31,2013 (number)
sanofi S.A., France 31/05/2005 4 13,500 01/06/2009 31/05/2015 70.38 5,000
sanofi S.A., France 14/12/2006 4 13,300 15/12/2010 14/12/2016 66.91 3,300
sanofi S.A., France 13/12/2007 4 13,900 14/12/2011 13/12/2017 62.33 3,600
sanofi S.A., France 02/03/2009 4 7,595 04/03/2013 01/03/2019 45.09 1,155
sanofi S.A., France 01/03/2010 4 8,035 03/03/2014 28/02/2020 54.12 7,860
TOTAL 56,330 20,915
The exercise of each option will result in the issuance of one share of sanofi S.A., France.
Summary of stock option plans:
A summary of stock options outstanding at each balance sheet date, and of changes during the relevant periods, is presented below:
Number of options
Weighted average
exercise price per share (€)
Options outstanding at January 1, 2012 48,770 61.28 Of which exercisable 33,700 66.37 Options granted - - Options exercised - - Options cancelled (175) (54.12)Options forfeited - - Options outstanding at December 31, 2012 48,595 61.31 Of which exercisable 33,700 66.37 Options granted - - Options exercised (24,880) (61.00)Options cancelled (2,800) (66.84)Options forfeited - - Options outstanding at December 31, 2013 20,915 60.94 Of which exercisable 13,055 66.98
The expense recognised for stock option plans, and the corresponding entry taken to equity, amounted to Rs. 2.092 million (2012: Rs.2.874) million.
As of December 31, 2013, the total cost related to non-vested share-based compensation arrangements amounted to Rs. 0.351 (2012: Rs.2.572) million to be recognised over a weighted average period of 0.17 year (2012: 0.7 years).
NOTES TO THE FINANCIAL STATEMENTSFor the year ended December 31, 2013
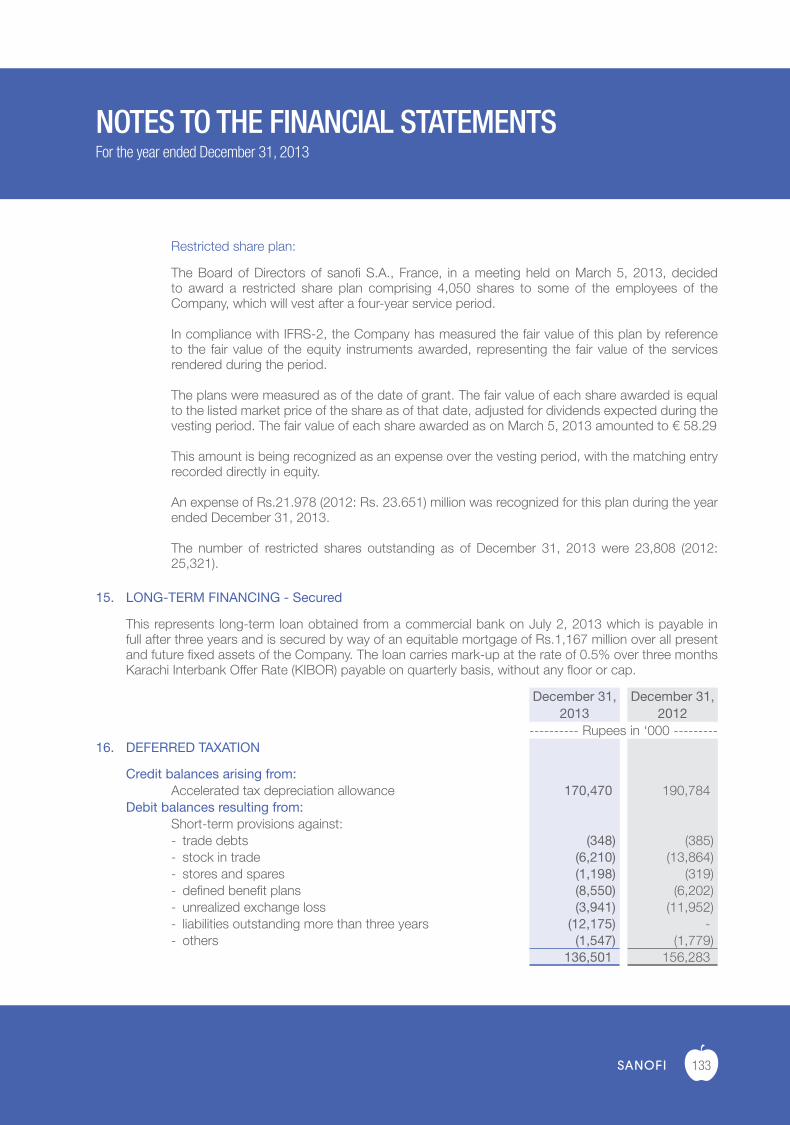
133
Restricted share plan:
The Board of Directors of sanofi S.A., France, in a meeting held on March 5, 2013, decided to award a restricted share plan comprising 4,050 shares to some of the employees of the Company, which will vest after a four-year service period.
In compliance with IFRS-2, the Company has measured the fair value of this plan by reference to the fair value of the equity instruments awarded, representing the fair value of the services rendered during the period.
The plans were measured as of the date of grant. The fair value of each share awarded is equal to the listed market price of the share as of that date, adjusted for dividends expected during the vesting period. The fair value of each share awarded as on March 5, 2013 amounted to € 58.29
This amount is being recognized as an expense over the vesting period, with the matching entry recorded directly in equity.
An expense of Rs.21.978 (2012: Rs. 23.651) million was recognized for this plan during the year ended December 31, 2013.
The number of restricted shares outstanding as of December 31, 2013 were 23,808 (2012: 25,321).
15. LONG-TERM FINANCING - Secured
This represents long-term loan obtained from a commercial bank on July 2, 2013 which is payable in full after three years and is secured by way of an equitable mortgage of Rs.1,167 million over all present and future fixed assets of the Company. The loan carries mark-up at the rate of 0.5% over three months Karachi Interbank Offer Rate (KIBOR) payable on quarterly basis, without any floor or cap.
December 31, December 31,2013 2012
---------- Rupees in ‘000 ---------16. DEFERRED TAXATION
Credit balances arising from:Accelerated tax depreciation allowance 170,470 190,784
Debit balances resulting from:Short-term provisions against:- trade debts (348) (385)- stock in trade (6,210) (13,864)- stores and spares (1,198) (319)- defined benefit plans (8,550) (6,202)- unrealized exchange loss (3,941) (11,952)- liabilities outstanding more than three years (12,175) - - others (1,547) (1,779)
136,501 156,283
NOTES TO THE FINANCIAL STATEMENTSFor the year ended December 31, 2013
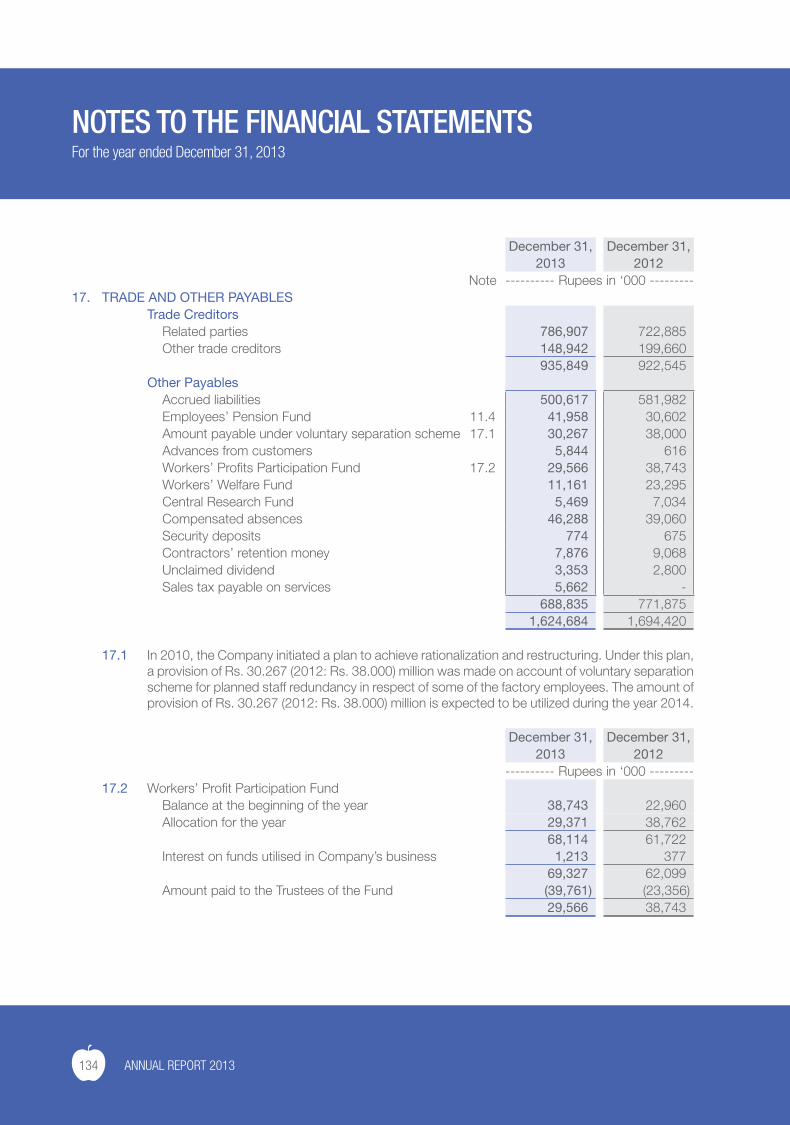
134 ANNUAL REPORT 2013
December 31, December 31,2013 2012
Note ---------- Rupees in ‘000 ---------17. TRADE AND OTHER PAYABLES
Trade CreditorsRelated parties 786,907 722,885 Other trade creditors 148,942 199,660
935,849 922,545 Other Payables
Accrued liabilities 500,617 581,982 Employees’ Pension Fund 11.4 41,958 30,602 Amount payable under voluntary separation scheme 17.1 30,267 38,000 Advances from customers 5,844 616 Workers’ Profits Participation Fund 17.2 29,566 38,743 Workers’ Welfare Fund 11,161 23,295 Central Research Fund 5,469 7,034 Compensated absences 46,288 39,060 Security deposits 774 675 Contractors’ retention money 7,876 9,068 Unclaimed dividend 3,353 2,800 Sales tax payable on services 5,662 -
688,835 771,875 1,624,684 1,694,420
17.1 In 2010, the Company initiated a plan to achieve rationalization and restructuring. Under this plan, a provision of Rs. 30.267 (2012: Rs. 38.000) million was made on account of voluntary separation scheme for planned staff redundancy in respect of some of the factory employees. The amount of provision of Rs. 30.267 (2012: Rs. 38.000) million is expected to be utilized during the year 2014.
December 31, December 31,2013 2012
---------- Rupees in ‘000 ---------17.2 Workers’ Profit Participation Fund
Balance at the beginning of the year 38,743 22,960 Allocation for the year 29,371 38,762
68,114 61,722 Interest on funds utilised in Company’s business 1,213 377
69,327 62,099 Amount paid to the Trustees of the Fund (39,761) (23,356)
29,566 38,743
NOTES TO THE FINANCIAL STATEMENTSFor the year ended December 31, 2013
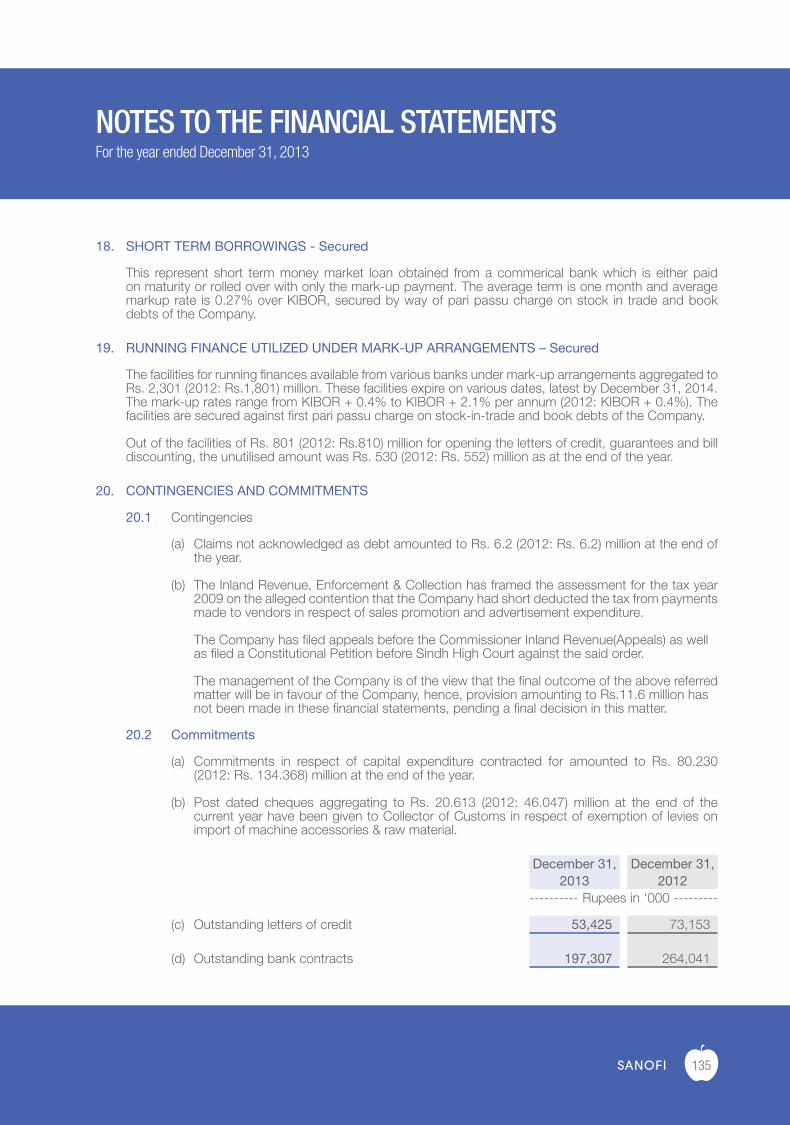
135
18. SHORT TERM BORROWINGS - Secured
This represent short term money market loan obtained from a commerical bank which is either paid on maturity or rolled over with only the mark-up payment. The average term is one month and average markup rate is 0.27% over KIBOR, secured by way of pari passu charge on stock in trade and book debts of the Company.
19. RUNNING FINANCE UTILIZED UNDER MARK-UP ARRANGEMENTS – Secured
The facilities for running finances available from various banks under mark-up arrangements aggregated to Rs. 2,301 (2012: Rs.1,801) million. These facilities expire on various dates, latest by December 31, 2014. The mark-up rates range from KIBOR + 0.4% to KIBOR + 2.1% per annum (2012: KIBOR + 0.4%). The facilities are secured against first pari passu charge on stock-in-trade and book debts of the Company.
Out of the facilities of Rs. 801 (2012: Rs.810) million for opening the letters of credit, guarantees and bill discounting, the unutilised amount was Rs. 530 (2012: Rs. 552) million as at the end of the year.
20. CONTINGENCIES AND COMMITMENTS
20.1 Contingencies
(a) Claims not acknowledged as debt amounted to Rs. 6.2 (2012: Rs. 6.2) million at the end of the year.
(b) The Inland Revenue, Enforcement & Collection has framed the assessment for the tax year 2009 on the alleged contention that the Company had short deducted the tax from payments made to vendors in respect of sales promotion and advertisement expenditure.
The Company has filed appeals before the Commissioner Inland Revenue(Appeals) as well as filed a Constitutional Petition before Sindh High Court against the said order.
The management of the Company is of the view that the final outcome of the above referred matter will be in favour of the Company, hence, provision amounting to Rs.11.6 million has not been made in these financial statements, pending a final decision in this matter.
20.2 Commitments
(a) Commitments in respect of capital expenditure contracted for amounted to Rs. 80.230 (2012: Rs. 134.368) million at the end of the year.
(b) Post dated cheques aggregating to Rs. 20.613 (2012: 46.047) million at the end of the current year have been given to Collector of Customs in respect of exemption of levies on import of machine accessories & raw material.
December 31, December 31,2013 2012
---------- Rupees in ‘000 ---------
(c) Outstanding letters of credit 53,425 73,153
(d) Outstanding bank contracts 197,307 264,041
NOTES TO THE FINANCIAL STATEMENTSFor the year ended December 31, 2013
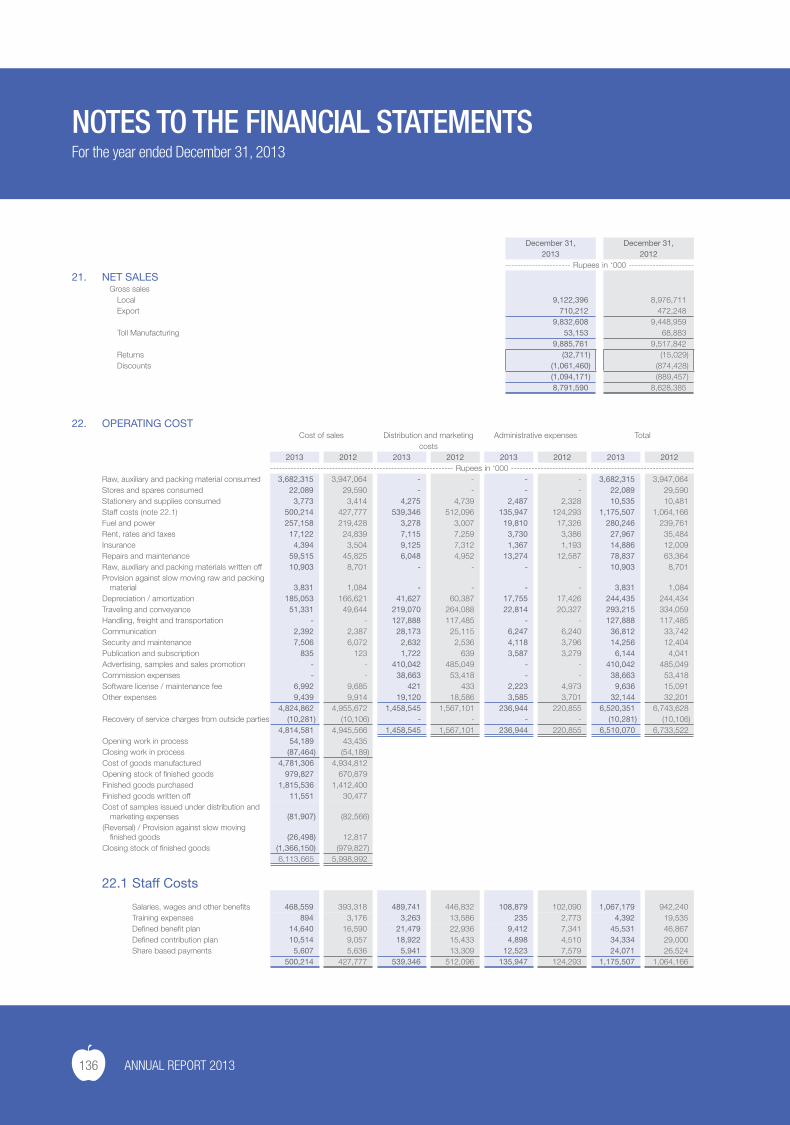
136 ANNUAL REPORT 2013
December 31, December 31,2013 2012
---------------------- Rupees in ‘000 ----------------------
21. NET SALESGross sales
Local 9,122,396 8,976,711 Export 710,212 472,248
9,832,608 9,448,959 Toll Manufacturing 53,153 68,883
9,885,761 9,517,842 Returns (32,711) (15,029)Discounts (1,061,460) (874,428)
(1,094,171) (889,457) 8,791,590 8,628,385
22. OPERATING COSTCost of sales Distribution and marketing Administrative expenses Total
costs2013 2012 2013 2012 2013 2012 2013 2012
-------------------------------------------------------------- Rupees in ‘000 --------------------------------------------------------------Raw, auxiliary and packing material consumed 3,682,315 3,947,064 - - - - 3,682,315 3,947,064 Stores and spares consumed 22,089 29,590 - - - - 22,089 29,590 Stationery and supplies consumed 3,773 3,414 4,275 4,739 2,487 2,328 10,535 10,481 Staff costs (note 22.1) 500,214 427,777 539,346 512,096 135,947 124,293 1,175,507 1,064,166 Fuel and power 257,158 219,428 3,278 3,007 19,810 17,326 280,246 239,761 Rent, rates and taxes 17,122 24,839 7,115 7,259 3,730 3,386 27,967 35,484 Insurance 4,394 3,504 9,125 7,312 1,367 1,193 14,886 12,009 Repairs and maintenance 59,515 45,825 6,048 4,952 13,274 12,587 78,837 63,364 Raw, auxiliary and packing materials written off 10,903 8,701 - - - - 10,903 8,701 Provision against slow moving raw and packing
material 3,831 1,084 - - - - 3,831 1,084 Depreciation / amortization 185,053 166,621 41,627 60,387 17,755 17,426 244,435 244,434 Traveling and conveyance 51,331 49,644 219,070 264,088 22,814 20,327 293,215 334,059 Handling, freight and transportation - - 127,888 117,485 - - 127,888 117,485 Communication 2,392 2,387 28,173 25,115 6,247 6,240 36,812 33,742 Security and maintenance 7,506 6,072 2,632 2,536 4,118 3,796 14,256 12,404 Publication and subscription 835 123 1,722 639 3,587 3,279 6,144 4,041 Advertising, samples and sales promotion - - 410,042 485,049 - - 410,042 485,049 Commission expenses - - 38,663 53,418 - - 38,663 53,418 Software license / maintenance fee 6,992 9,685 421 433 2,223 4,973 9,636 15,091 Other expenses 9,439 9,914 19,120 18,586 3,585 3,701 32,144 32,201
4,824,862 4,955,672 1,458,545 1,567,101 236,944 220,855 6,520,351 6,743,628 Recovery of service charges from outside parties (10,281) (10,106) - - - - (10,281) (10,106)
4,814,581 4,945,566 1,458,545 1,567,101 236,944 220,855 6,510,070 6,733,522 Opening work in process 54,189 43,435 Closing work in process (87,464) (54,189)Cost of goods manufactured 4,781,306 4,934,812 Opening stock of finished goods 979,827 670,879 Finished goods purchased 1,815,536 1,412,400 Finished goods written off 11,551 30,477 Cost of samples issued under distribution and
marketing expenses (81,907) (82,566)(Reversal) / Provision against slow moving
finished goods (26,498) 12,817 Closing stock of finished goods (1,366,150) (979,827)
6,113,665 5,998,992
22.1 Staff Costs
Salaries, wages and other benefits 468,559 393,318 489,741 446,832 108,879 102,090 1,067,179 942,240 Training expenses 894 3,176 3,263 13,586 235 2,773 4,392 19,535 Defined benefit plan 14,640 16,590 21,479 22,936 9,412 7,341 45,531 46,867 Defined contribution plan 10,514 9,057 18,922 15,433 4,898 4,510 34,334 29,000 Share based payments 5,607 5,636 5,941 13,309 12,523 7,579 24,071 26,524
500,214 427,777 539,346 512,096 135,947 124,293 1,175,507 1,064,166
NOTES TO THE FINANCIAL STATEMENTSFor the year ended December 31, 2013
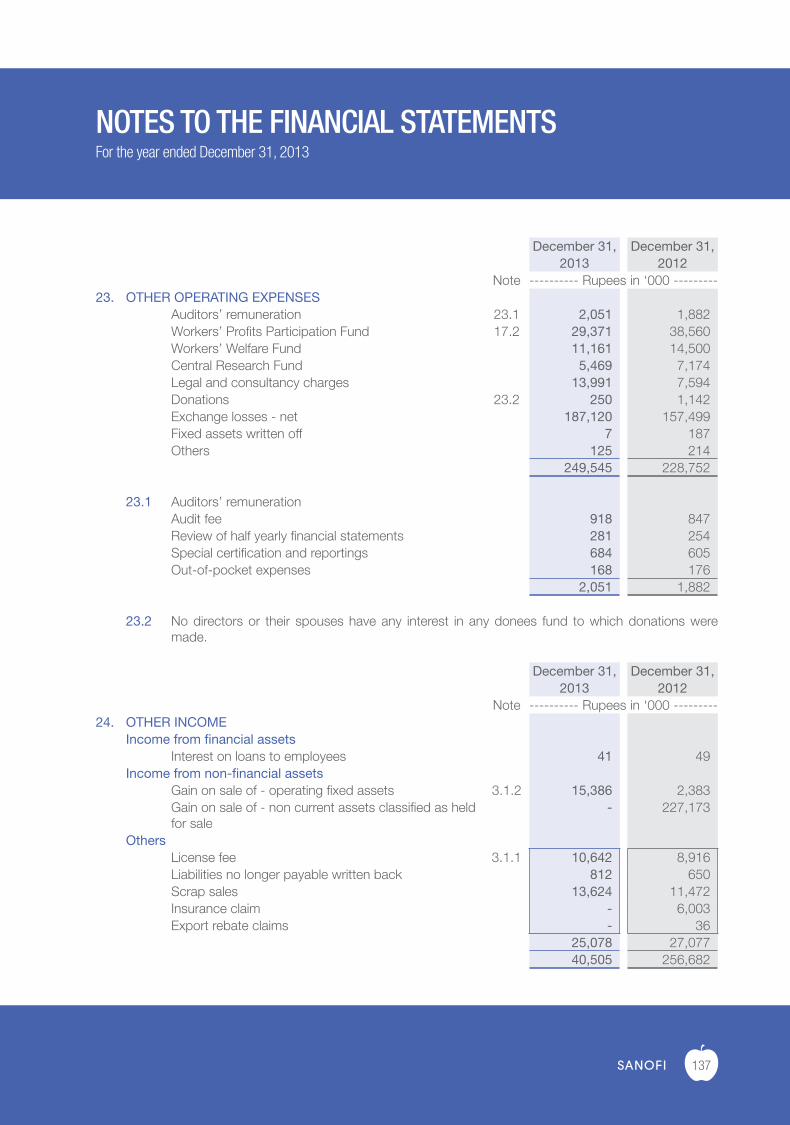
137
December 31, December 31,2013 2012
Note ---------- Rupees in ‘000 ---------23. OTHER OPERATING EXPENSES
Auditors’ remuneration 23.1 2,051 1,882 Workers’ Profits Participation Fund 17.2 29,371 38,560 Workers’ Welfare Fund 11,161 14,500 Central Research Fund 5,469 7,174 Legal and consultancy charges 13,991 7,594 Donations 23.2 250 1,142 Exchange losses - net 187,120 157,499 Fixed assets written off 7 187 Others 125 214
249,545 228,752
23.1 Auditors’ remunerationAudit fee 918 847 Review of half yearly financial statements 281 254 Special certification and reportings 684 605 Out-of-pocket expenses 168 176
2,051 1,882
23.2 No directors or their spouses have any interest in any donees fund to which donations were made.
December 31, December 31,2013 2012
Note ---------- Rupees in ‘000 ---------24. OTHER INCOME
Income from financial assetsInterest on loans to employees 41 49
Income from non-financial assetsGain on sale of - operating fixed assets 3.1.2 15,386 2,383 Gain on sale of - non current assets classified as held for sale
- 227,173
OthersLicense fee 3.1.1 10,642 8,916 Liabilities no longer payable written back 812 650 Scrap sales 13,624 11,472 Insurance claim - 6,003 Export rebate claims - 36
25,078 27,077 40,505 256,682
NOTES TO THE FINANCIAL STATEMENTSFor the year ended December 31, 2013
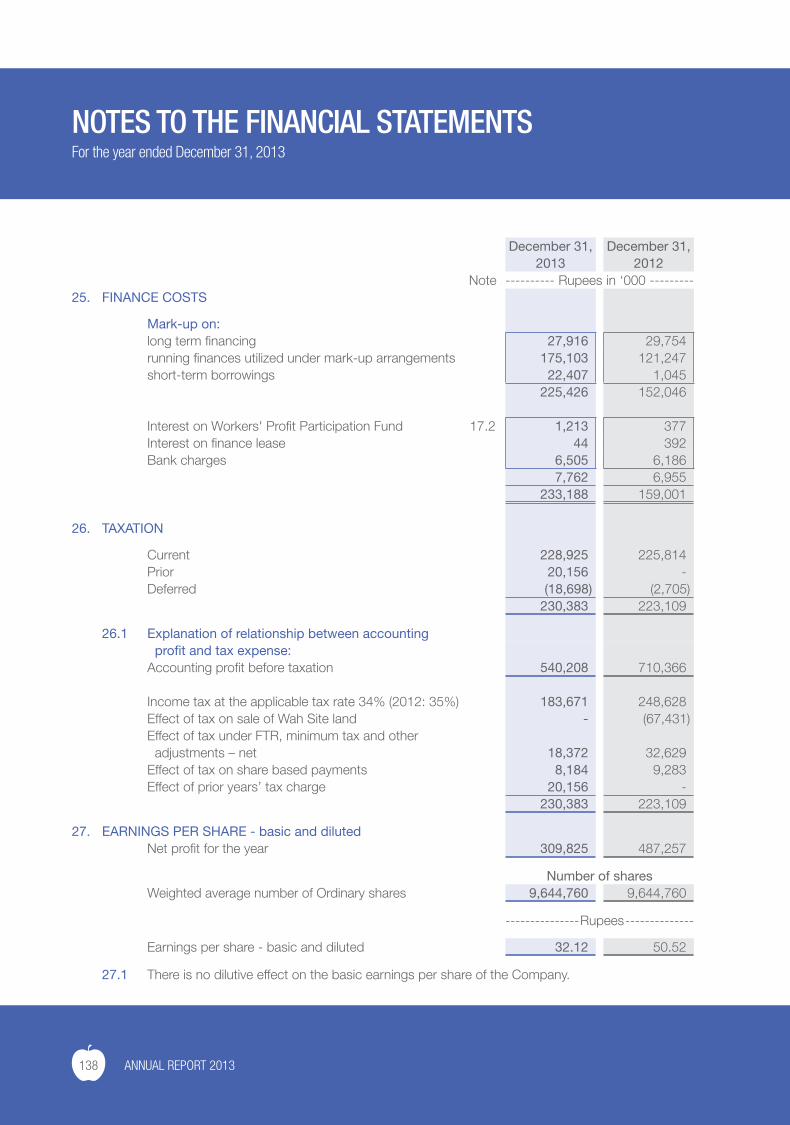
138 ANNUAL REPORT 2013
December 31, December 31,2013 2012
Note ---------- Rupees in ‘000 ---------25. FINANCE COSTS
Mark-up on:long term financing 27,916 29,754 running finances utilized under mark-up arrangements 175,103 121,247 short-term borrowings 22,407 1,045
225,426 152,046
Interest on Workers' Profit Participation Fund 17.2 1,213 377 Interest on finance lease 44 392 Bank charges 6,505 6,186
7,762 6,955 233,188 159,001
26. TAXATION
Current 228,925 225,814 Prior 20,156 - Deferred (18,698) (2,705)
230,383 223,109
26.1 Explanation of relationship between accountingprofit and tax expense:
Accounting profit before taxation 540,208 710,366
Income tax at the applicable tax rate 34% (2012: 35%) 183,671 248,628 Effect of tax on sale of Wah Site land - (67,431)Effect of tax under FTR, minimum tax and other
adjustments – net 18,372 32,629 Effect of tax on share based payments 8,184 9,283 Effect of prior years’ tax charge 20,156 -
230,383 223,109
27. EARNINGS PER SHARE - basic and dilutedNet profit for the year 309,825 487,257
Number of sharesWeighted average number of Ordinary shares 9,644,760 9,644,760
--------------- Rupees --------------
Earnings per share - basic and diluted 32.12 50.52
27.1 There is no dilutive effect on the basic earnings per share of the Company.
NOTES TO THE FINANCIAL STATEMENTSFor the year ended December 31, 2013
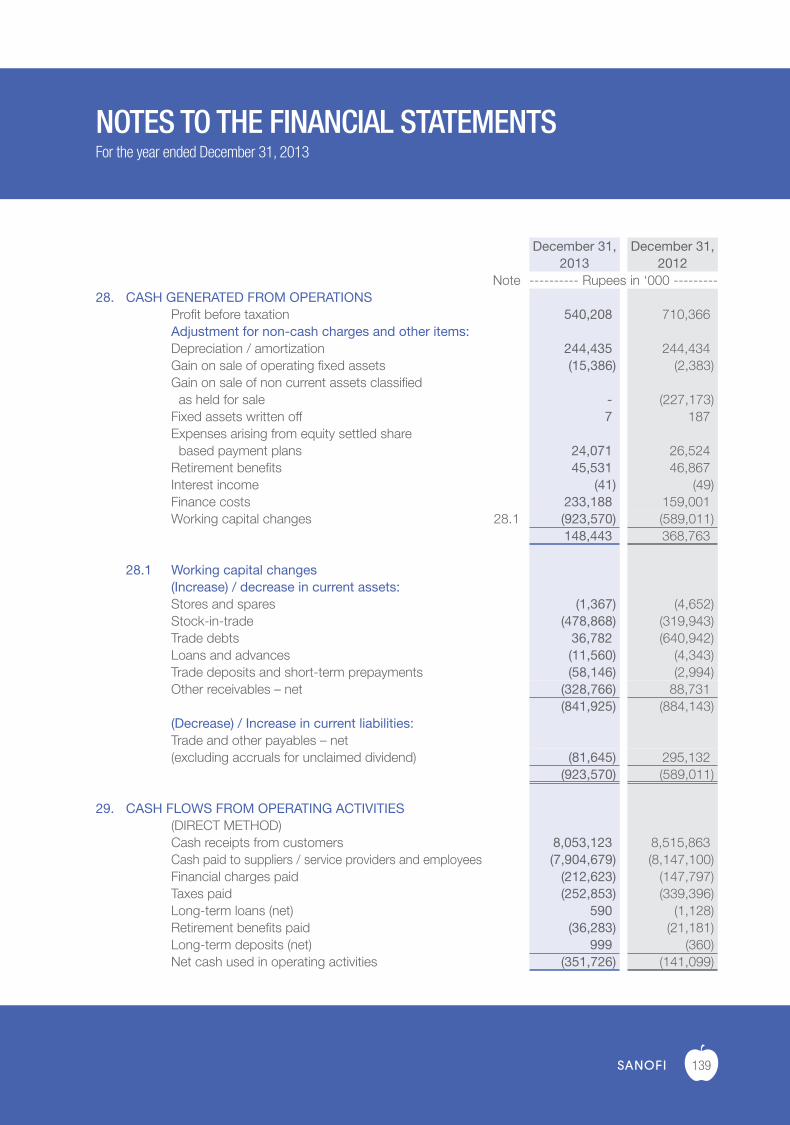
139
December 31, December 31,2013 2012
Note ---------- Rupees in ‘000 ---------28. CASH GENERATED FROM OPERATIONS
Profit before taxation 540,208 710,366 Adjustment for non-cash charges and other items:Depreciation / amortization 244,435 244,434 Gain on sale of operating fixed assets (15,386) (2,383)Gain on sale of non current assets classified
as held for sale - (227,173)Fixed assets written off 7 187 Expenses arising from equity settled share
based payment plans 24,071 26,524 Retirement benefits 45,531 46,867 Interest income (41) (49)Finance costs 233,188 159,001 Working capital changes 28.1 (923,570) (589,011)
148,443 368,763
28.1 Working capital changes(Increase) / decrease in current assets:Stores and spares (1,367) (4,652)Stock-in-trade (478,868) (319,943)Trade debts 36,782 (640,942)Loans and advances (11,560) (4,343)Trade deposits and short-term prepayments (58,146) (2,994)Other receivables – net (328,766) 88,731
(841,925) (884,143)(Decrease) / Increase in current liabilities:Trade and other payables – net(excluding accruals for unclaimed dividend) (81,645) 295,132
(923,570) (589,011)
29. CASH FLOWS FROM OPERATING ACTIVITIES(DIRECT METHOD)Cash receipts from customers 8,053,123 8,515,863 Cash paid to suppliers / service providers and employees (7,904,679) (8,147,100)Financial charges paid (212,623) (147,797)Taxes paid (252,853) (339,396)Long-term loans (net) 590 (1,128)Retirement benefits paid (36,283) (21,181)Long-term deposits (net) 999 (360)Net cash used in operating activities (351,726) (141,099)
NOTES TO THE FINANCIAL STATEMENTSFor the year ended December 31, 2013
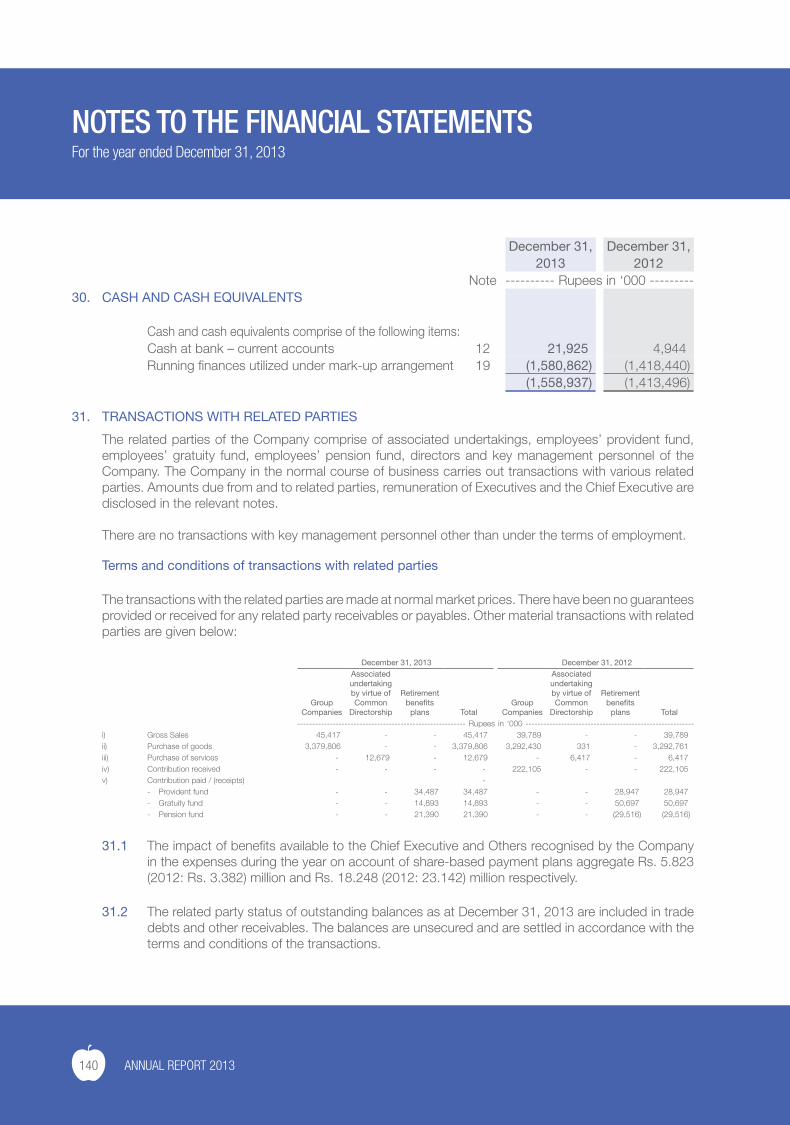
140 ANNUAL REPORT 2013
December 31, December 31,2013 2012
Note ---------- Rupees in ‘000 ---------30. CASH AND CASH EQUIVALENTS
Cash and cash equivalents comprise of the following items:Cash at bank – current accounts 12 21,925 4,944 Running finances utilized under mark-up arrangement 19 (1,580,862) (1,418,440)
(1,558,937) (1,413,496)
31. TRANSACTIONS WITH RELATED PARTIES
The related parties of the Company comprise of associated undertakings, employees’ provident fund, employees’ gratuity fund, employees’ pension fund, directors and key management personnel of the Company. The Company in the normal course of business carries out transactions with various related parties. Amounts due from and to related parties, remuneration of Executives and the Chief Executive are disclosed in the relevant notes.
There are no transactions with key management personnel other than under the terms of employment.
Terms and conditions of transactions with related parties
The transactions with the related parties are made at normal market prices. There have been no guarantees provided or received for any related party receivables or payables. Other material transactions with related parties are given below:
December 31, 2013 December 31, 2012
Group Companies
Associatedundertaking by virtue of Common
Directorship
Retirement benefits
plans TotalGroup
Companies
Associatedundertaking by virtue of Common
Directorship
Retirement benefits
plans Total--------------------------------------------------------- Rupees in ‘000 ---------------------------------------------------------
i) Gross Sales 45,417 - - 45,417 39,789 - - 39,789 ii) Purchase of goods 3,379,806 - - 3,379,806 3,292,430 331 - 3,292,761 iii) Purchase of services - 12,679 - 12,679 - 6,417 - 6,417 iv) Contribution received - - - - 222,105 - - 222,105 v) Contribution paid / (receipts) -
- Provident fund - - 34,487 34,487 - - 28,947 28,947 - Gratuity fund - - 14,893 14,893 - - 50,697 50,697 - Pension fund - - 21,390 21,390 - - (29,516) (29,516)
31.1 The impact of benefits available to the Chief Executive and Others recognised by the Company in the expenses during the year on account of share-based payment plans aggregate Rs. 5.823 (2012: Rs. 3.382) million and Rs. 18.248 (2012: 23.142) million respectively.
31.2 The related party status of outstanding balances as at December 31, 2013 are included in trade debts and other receivables. The balances are unsecured and are settled in accordance with the terms and conditions of the transactions.
NOTES TO THE FINANCIAL STATEMENTSFor the year ended December 31, 2013
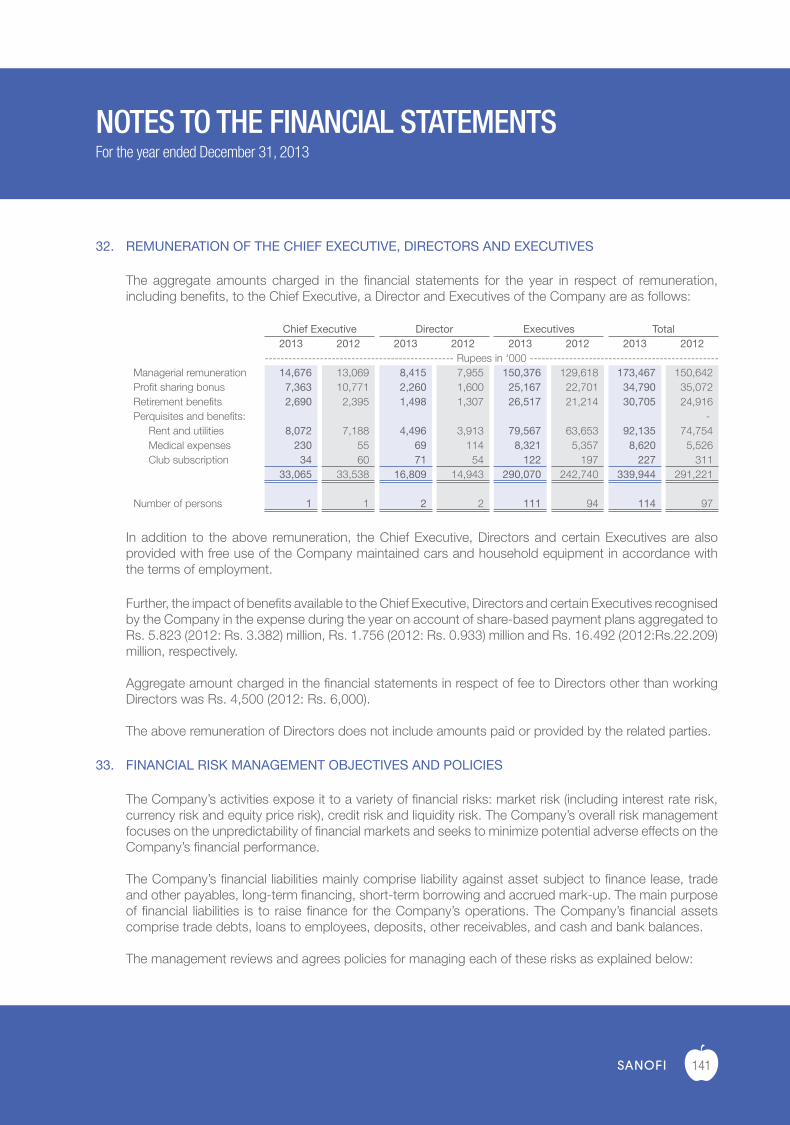
141
32. REMUNERATION OF THE CHIEF EXECUTIVE, DIRECTORS AND EXECUTIVES
The aggregate amounts charged in the financial statements for the year in respect of remuneration, including benefits, to the Chief Executive, a Director and Executives of the Company are as follows:
Chief Executive Director Executives Total2013 2012 2013 2012 2013 2012 2013 2012
------------------------------------------------ Rupees in ‘000 ------------------------------------------------Managerial remuneration 14,676 13,069 8,415 7,955 150,376 129,618 173,467 150,642 Profit sharing bonus 7,363 10,771 2,260 1,600 25,167 22,701 34,790 35,072 Retirement benefits 2,690 2,395 1,498 1,307 26,517 21,214 30,705 24,916 Perquisites and benefits: -
Rent and utilities 8,072 7,188 4,496 3,913 79,567 63,653 92,135 74,754 Medical expenses 230 55 69 114 8,321 5,357 8,620 5,526 Club subscription 34 60 71 54 122 197 227 311
33,065 33,538 16,809 14,943 290,070 242,740 339,944 291,221
Number of persons 1 1 2 2 111 94 114 97
In addition to the above remuneration, the Chief Executive, Directors and certain Executives are also provided with free use of the Company maintained cars and household equipment in accordance with the terms of employment.
Further, the impact of benefits available to the Chief Executive, Directors and certain Executives recognised by the Company in the expense during the year on account of share-based payment plans aggregated to Rs. 5.823 (2012: Rs. 3.382) million, Rs. 1.756 (2012: Rs. 0.933) million and Rs. 16.492 (2012:Rs.22.209) million, respectively.
Aggregate amount charged in the financial statements in respect of fee to Directors other than working Directors was Rs. 4,500 (2012: Rs. 6,000).
The above remuneration of Directors does not include amounts paid or provided by the related parties.
33. FINANCIAL RISK MANAGEMENT OBJECTIVES AND POLICIES
The Company’s activities expose it to a variety of financial risks: market risk (including interest rate risk, currency risk and equity price risk), credit risk and liquidity risk. The Company’s overall risk management focuses on the unpredictability of financial markets and seeks to minimize potential adverse effects on the Company’s financial performance.
The Company’s financial liabilities mainly comprise liability against asset subject to finance lease, trade and other payables, long-term financing, short-term borrowing and accrued mark-up. The main purpose of financial liabilities is to raise finance for the Company’s operations. The Company’s financial assets comprise trade debts, loans to employees, deposits, other receivables, and cash and bank balances.
The management reviews and agrees policies for managing each of these risks as explained below:
NOTES TO THE FINANCIAL STATEMENTSFor the year ended December 31, 2013
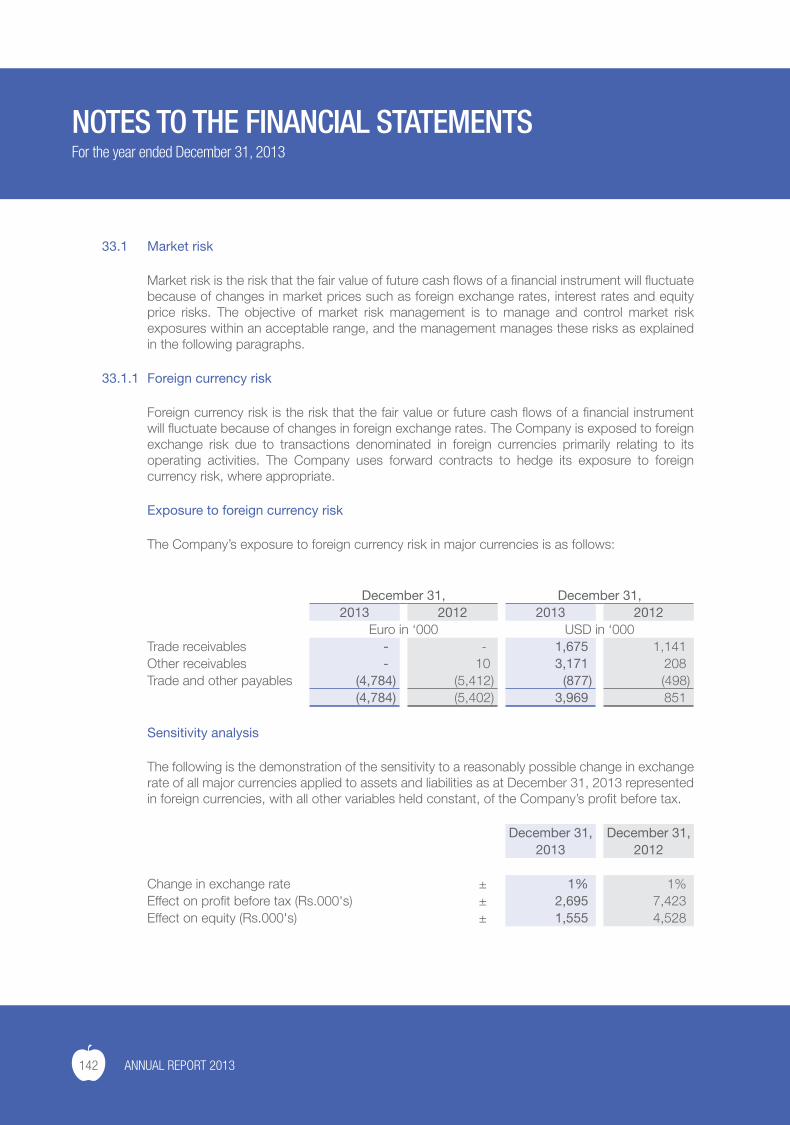
142 ANNUAL REPORT 2013
33.1 Market risk
Market risk is the risk that the fair value of future cash flows of a financial instrument will fluctuate because of changes in market prices such as foreign exchange rates, interest rates and equity price risks. The objective of market risk management is to manage and control market risk exposures within an acceptable range, and the management manages these risks as explained in the following paragraphs.
33.1.1 Foreign currency risk
Foreign currency risk is the risk that the fair value or future cash flows of a financial instrument will fluctuate because of changes in foreign exchange rates. The Company is exposed to foreign exchange risk due to transactions denominated in foreign currencies primarily relating to its operating activities. The Company uses forward contracts to hedge its exposure to foreign currency risk, where appropriate.
Exposure to foreign currency risk
The Company’s exposure to foreign currency risk in major currencies is as follows:
December 31, December 31,2013 2012 2013 2012
Euro in ‘000 USD in ‘000Trade receivables - - 1,675 1,141 Other receivables - 10 3,171 208 Trade and other payables (4,784) (5,412) (877) (498)
(4,784) (5,402) 3,969 851
Sensitivity analysis
The following is the demonstration of the sensitivity to a reasonably possible change in exchange rate of all major currencies applied to assets and liabilities as at December 31, 2013 represented in foreign currencies, with all other variables held constant, of the Company’s profit before tax.
December 31, December 31,2013 2012
Change in exchange rate ± 1% 1%Effect on profit before tax (Rs.000's) ± 2,695 7,423 Effect on equity (Rs.000's) ± 1,555 4,528
NOTES TO THE FINANCIAL STATEMENTSFor the year ended December 31, 2013
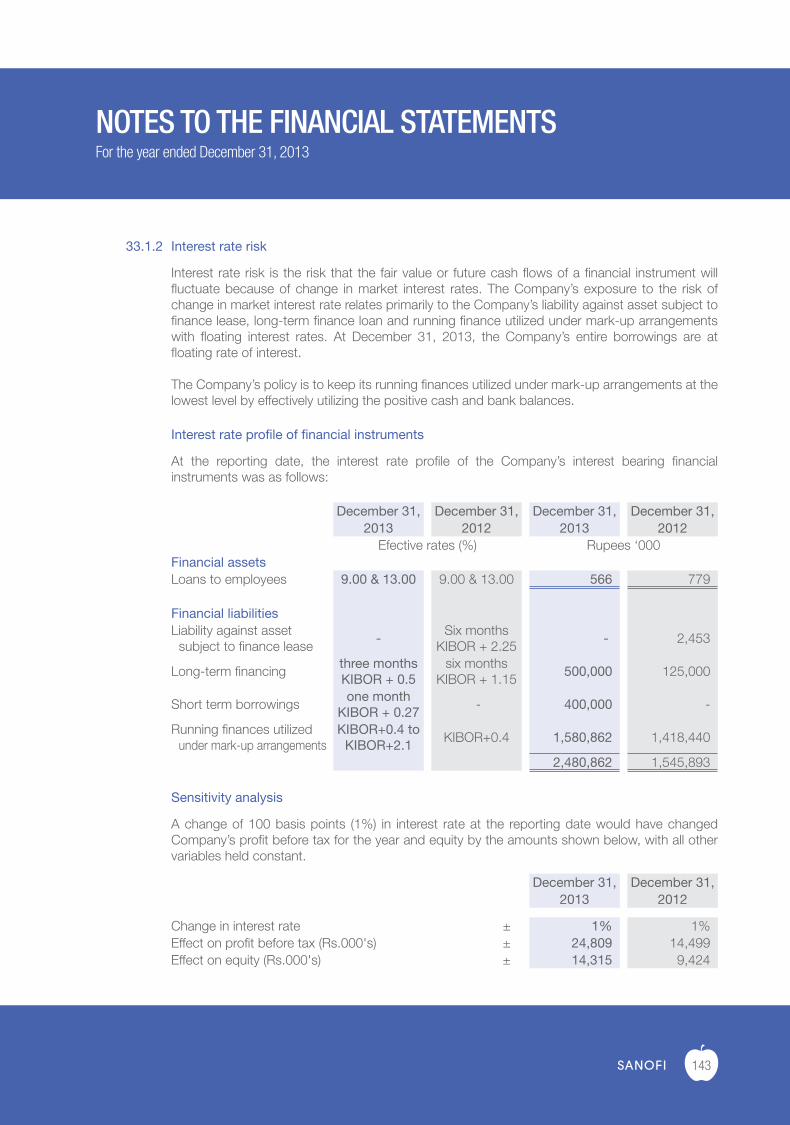
143
33.1.2 Interest rate risk
Interest rate risk is the risk that the fair value or future cash flows of a financial instrument will fluctuate because of change in market interest rates. The Company’s exposure to the risk of change in market interest rate relates primarily to the Company’s liability against asset subject to finance lease, long-term finance loan and running finance utilized under mark-up arrangements with floating interest rates. At December 31, 2013, the Company’s entire borrowings are at floating rate of interest.
The Company’s policy is to keep its running finances utilized under mark-up arrangements at the lowest level by effectively utilizing the positive cash and bank balances.
Interest rate profile of financial instruments
At the reporting date, the interest rate profile of the Company’s interest bearing financial instruments was as follows:
December 31, December 31, December 31, December 31,2013 2012 2013 2012
Efective rates (%) Rupees ‘000Financial assetsLoans to employees 9.00 & 13.00 9.00 & 13.00 566 779
Financial liabilitiesLiability against asset
subject to finance lease-
Six months KIBOR + 2.25
- 2,453
Long-term financingthree months KIBOR + 0.5
six months KIBOR + 1.15
500,000 125,000
Short term borrowingsone month
KIBOR + 0.27 - 400,000 -
Running finances utilizedunder mark-up arrangements
KIBOR+0.4 to KIBOR+2.1
KIBOR+0.4 1,580,862 1,418,440
2,480,862 1,545,893
Sensitivity analysis
A change of 100 basis points (1%) in interest rate at the reporting date would have changed Company’s profit before tax for the year and equity by the amounts shown below, with all other variables held constant.
December 31, December 31,2013 2012
Change in interest rate ± 1% 1%Effect on profit before tax (Rs.000's) ± 24,809 14,499 Effect on equity (Rs.000's) ± 14,315 9,424
NOTES TO THE FINANCIAL STATEMENTSFor the year ended December 31, 2013
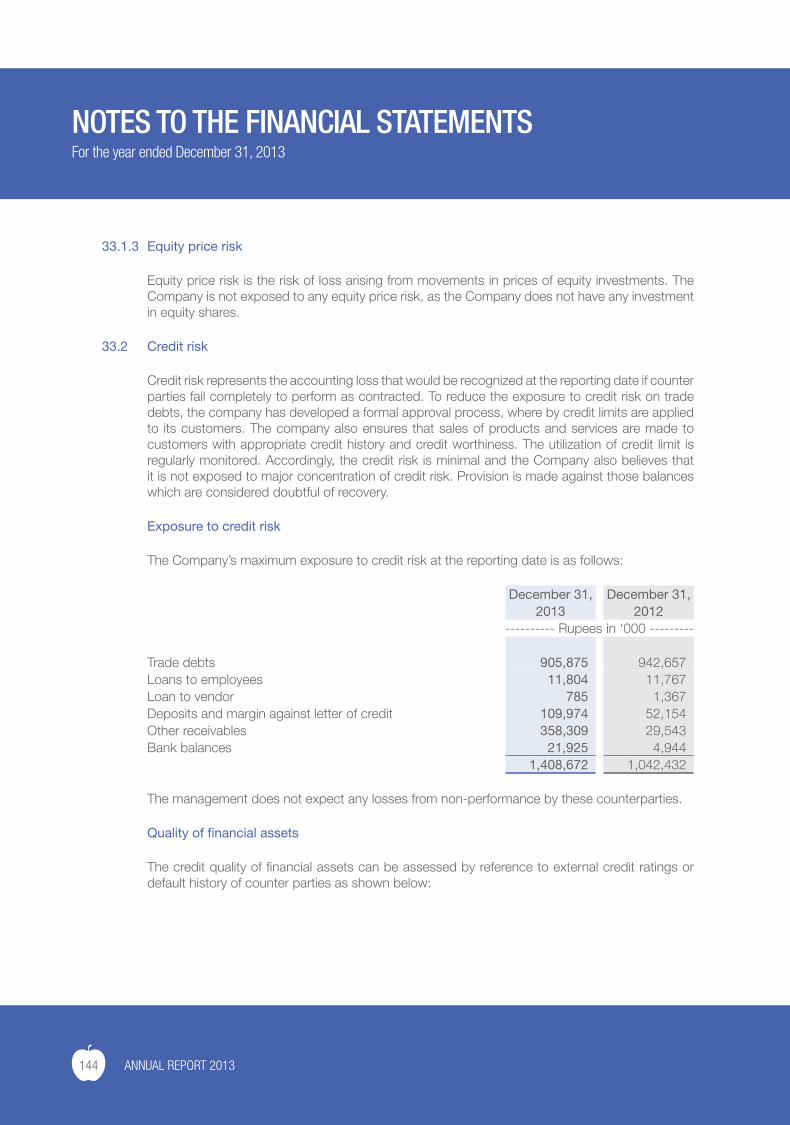
144 ANNUAL REPORT 2013
33.1.3 Equity price risk
Equity price risk is the risk of loss arising from movements in prices of equity investments. The Company is not exposed to any equity price risk, as the Company does not have any investment in equity shares.
33.2 Credit risk
Credit risk represents the accounting loss that would be recognized at the reporting date if counter parties fail completely to perform as contracted. To reduce the exposure to credit risk on trade debts, the company has developed a formal approval process, where by credit limits are applied to its customers. The company also ensures that sales of products and services are made to customers with appropriate credit history and credit worthiness. The utilization of credit limit is regularly monitored. Accordingly, the credit risk is minimal and the Company also believes that it is not exposed to major concentration of credit risk. Provision is made against those balances which are considered doubtful of recovery.
Exposure to credit risk
The Company’s maximum exposure to credit risk at the reporting date is as follows:
December 31, December 31,2013 2012
---------- Rupees in ‘000 ---------
Trade debts 905,875 942,657 Loans to employees 11,804 11,767 Loan to vendor 785 1,367 Deposits and margin against letter of credit 109,974 52,154 Other receivables 358,309 29,543 Bank balances 21,925 4,944
1,408,672 1,042,432
The management does not expect any losses from non-performance by these counterparties.
Quality of financial assets
The credit quality of financial assets can be assessed by reference to external credit ratings or default history of counter parties as shown below:
NOTES TO THE FINANCIAL STATEMENTSFor the year ended December 31, 2013
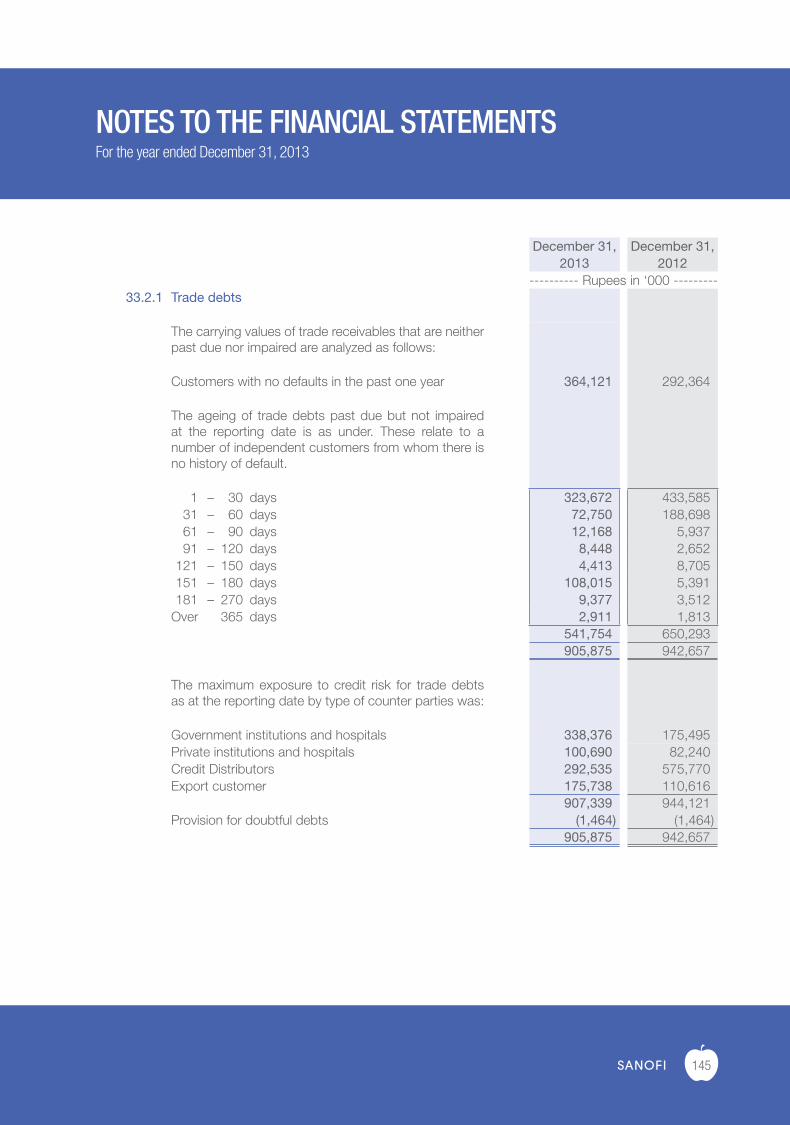
145
December 31, December 31,2013 2012
---------- Rupees in ‘000 ---------33.2.1 Trade debts
The carrying values of trade receivables that are neitherpast due nor impaired are analyzed as follows:
Customers with no defaults in the past one year 364,121 292,364
The ageing of trade debts past due but not impaired at the reporting date is as under. These relate to a number of independent customers from whom there is no history of default.
1 – 30 days 323,672 433,585 31 – 60 days 72,750 188,698 61 – 90 days 12,168 5,937 91 – 120 days 8,448 2,652 121 – 150 days 4,413 8,705 151 – 180 days 108,015 5,391 181 – 270 days 9,377 3,512 Over 365 days 2,911 1,813
541,754 650,293 905,875 942,657
The maximum exposure to credit risk for trade debts as at the reporting date by type of counter parties was:
Government institutions and hospitals 338,376 175,495 Private institutions and hospitals 100,690 82,240 Credit Distributors 292,535 575,770 Export customer 175,738 110,616
907,339 944,121 Provision for doubtful debts (1,464) (1,464)
905,875 942,657
NOTES TO THE FINANCIAL STATEMENTSFor the year ended December 31, 2013
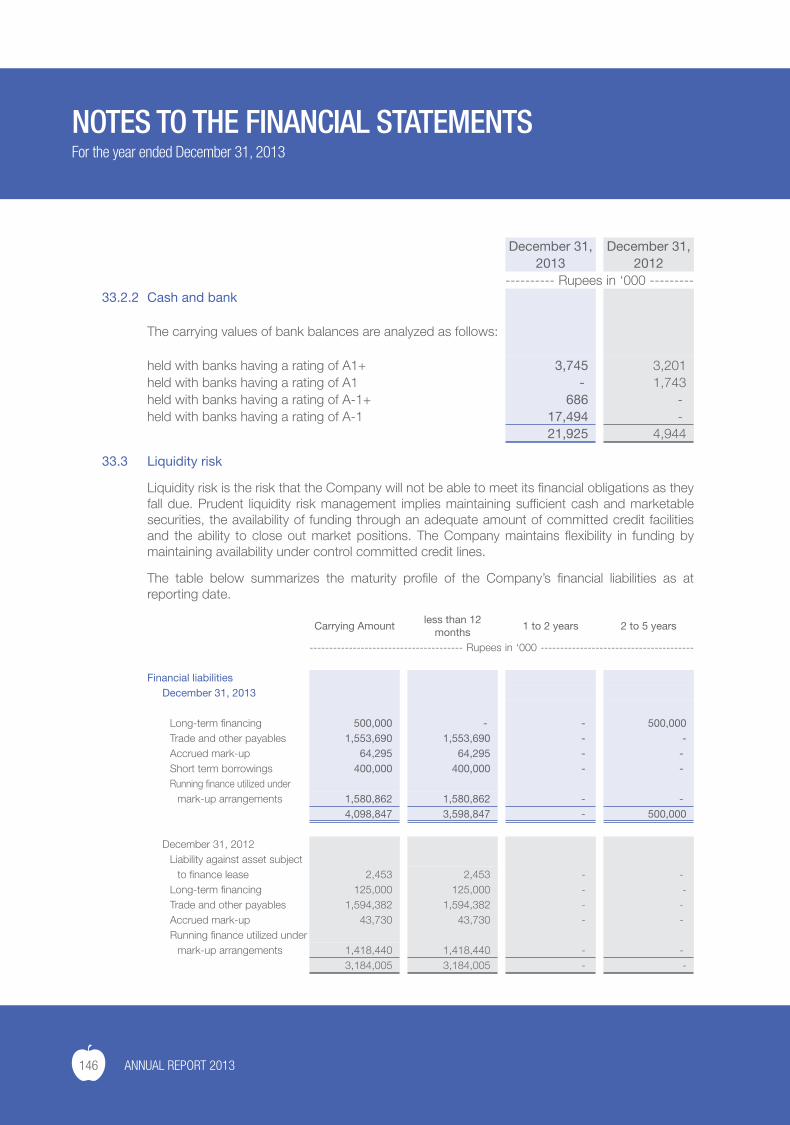
146 ANNUAL REPORT 2013
December 31, December 31,2013 2012
---------- Rupees in ‘000 ---------33.2.2 Cash and bank
The carrying values of bank balances are analyzed as follows:
held with banks having a rating of A1+ 3,745 3,201 held with banks having a rating of A1 - 1,743 held with banks having a rating of A-1+ 686 - held with banks having a rating of A-1 17,494 -
21,925 4,944
33.3 Liquidity risk
Liquidity risk is the risk that the Company will not be able to meet its financial obligations as they fall due. Prudent liquidity risk management implies maintaining sufficient cash and marketable securities, the availability of funding through an adequate amount of committed credit facilities and the ability to close out market positions. The Company maintains flexibility in funding by maintaining availability under control committed credit lines.
The table below summarizes the maturity profile of the Company’s financial liabilities as at reporting date.
Carrying Amountless than 12
months1 to 2 years 2 to 5 years
--------------------------------------- Rupees in ‘000 ---------------------------------------
Financial liabilitiesDecember 31, 2013
Long-term financing 500,000 - - 500,000 Trade and other payables 1,553,690 1,553,690 - - Accrued mark-up 64,295 64,295 - - Short term borrowings 400,000 400,000 - - Running finance utilized under
mark-up arrangements 1,580,862 1,580,862 - - 4,098,847 3,598,847 - 500,000
December 31, 2012Liability against asset subject
to finance lease 2,453 2,453 - - Long-term financing 125,000 125,000 - - Trade and other payables 1,594,382 1,594,382 - - Accrued mark-up 43,730 43,730 - - Running finance utilized under
mark-up arrangements 1,418,440 1,418,440 - - 3,184,005 3,184,005 - -
NOTES TO THE FINANCIAL STATEMENTSFor the year ended December 31, 2013
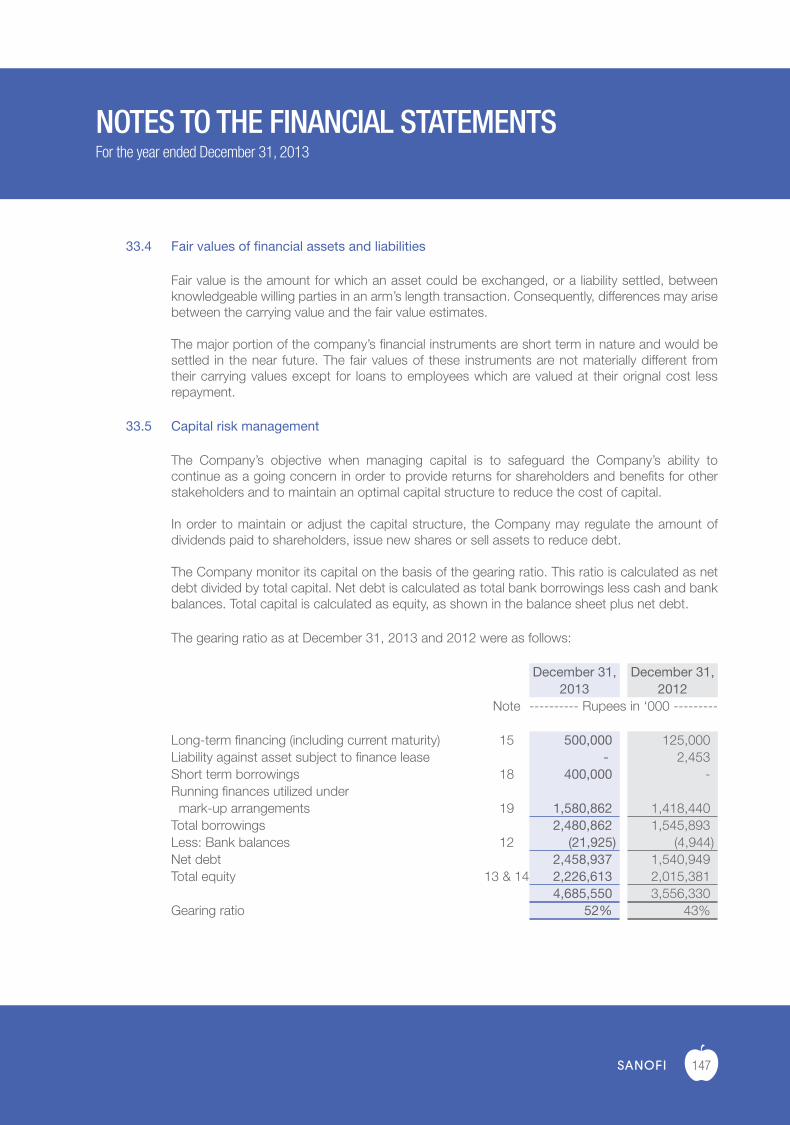
147
33.4 Fair values of financial assets and liabilities
Fair value is the amount for which an asset could be exchanged, or a liability settled, between knowledgeable willing parties in an arm’s length transaction. Consequently, differences may arise between the carrying value and the fair value estimates.
The major portion of the company’s financial instruments are short term in nature and would be settled in the near future. The fair values of these instruments are not materially different from their carrying values except for loans to employees which are valued at their orignal cost less repayment.
33.5 Capital risk management
The Company’s objective when managing capital is to safeguard the Company’s ability to continue as a going concern in order to provide returns for shareholders and benefits for other stakeholders and to maintain an optimal capital structure to reduce the cost of capital.
In order to maintain or adjust the capital structure, the Company may regulate the amount of dividends paid to shareholders, issue new shares or sell assets to reduce debt.
The Company monitor its capital on the basis of the gearing ratio. This ratio is calculated as net debt divided by total capital. Net debt is calculated as total bank borrowings less cash and bank balances. Total capital is calculated as equity, as shown in the balance sheet plus net debt.
The gearing ratio as at December 31, 2013 and 2012 were as follows:
December 31, December 31,2013 2012
Note ---------- Rupees in ‘000 ---------
Long-term financing (including current maturity) 15 500,000 125,000 Liability against asset subject to finance lease - 2,453 Short term borrowings 18 400,000 - Running finances utilized under
mark-up arrangements 19 1,580,862 1,418,440 Total borrowings 2,480,862 1,545,893 Less: Bank balances 12 (21,925) (4,944)Net debt 2,458,937 1,540,949 Total equity 13 & 14 2,226,613 2,015,381
4,685,550 3,556,330 Gearing ratio 52% 43%
NOTES TO THE FINANCIAL STATEMENTSFor the year ended December 31, 2013
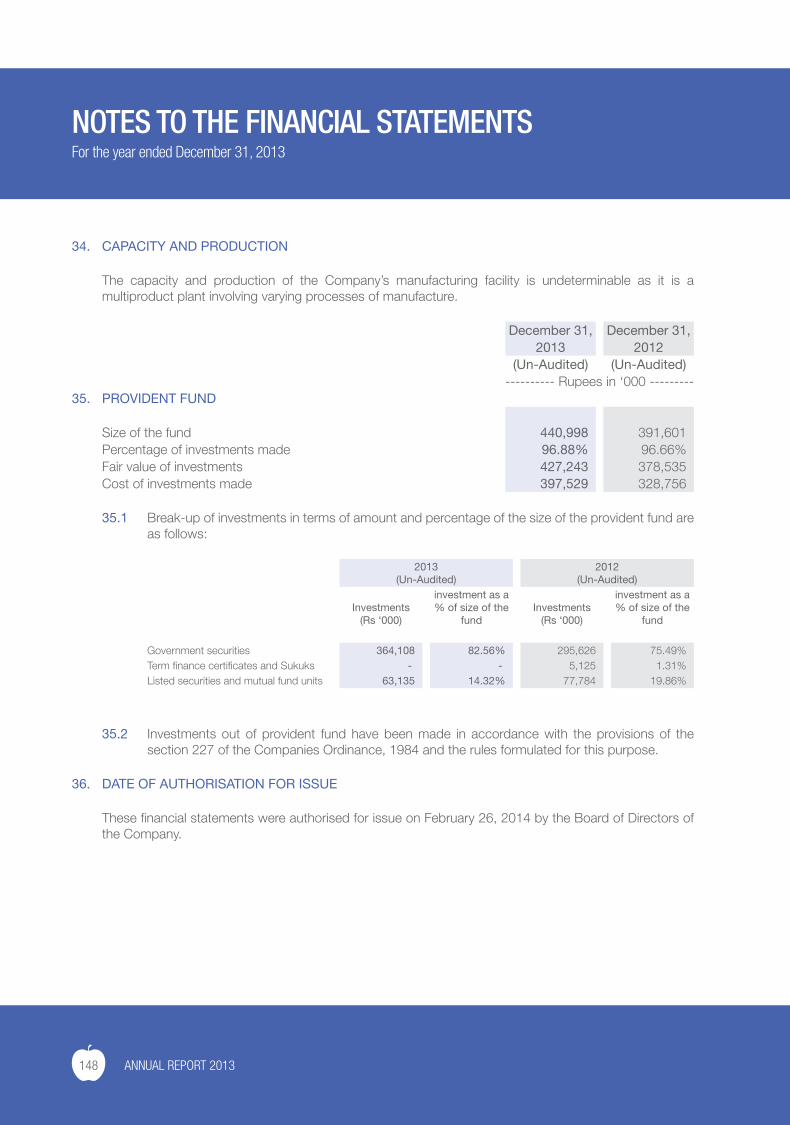
148 ANNUAL REPORT 2013
34. CAPACITY AND PRODUCTION
The capacity and production of the Company’s manufacturing facility is undeterminable as it is a multiproduct plant involving varying processes of manufacture.
December 31, December 31,2013 2012
(Un-Audited) (Un-Audited)---------- Rupees in ‘000 ---------
35. PROVIDENT FUND
Size of the fund 440,998 391,601 Percentage of investments made 96.88% 96.66%Fair value of investments 427,243 378,535 Cost of investments made 397,529 328,756
35.1 Break-up of investments in terms of amount and percentage of the size of the provident fund are as follows:
2013(Un-Audited)
2012(Un-Audited)
Investments(Rs ‘000)
investment as a % of size of the
fundInvestments
(Rs ‘000)
investment as a % of size of the
fund
Government securities 364,108 82.56% 295,626 75.49%Term finance certificates and Sukuks - - 5,125 1.31%Listed securities and mutual fund units 63,135 14.32% 77,784 19.86%
35.2 Investments out of provident fund have been made in accordance with the provisions of the section 227 of the Companies Ordinance, 1984 and the rules formulated for this purpose.
36. DATE OF AUTHORISATION FOR ISSUE
These financial statements were authorised for issue on February 26, 2014 by the Board of Directors of the Company.
NOTES TO THE FINANCIAL STATEMENTSFor the year ended December 31, 2013
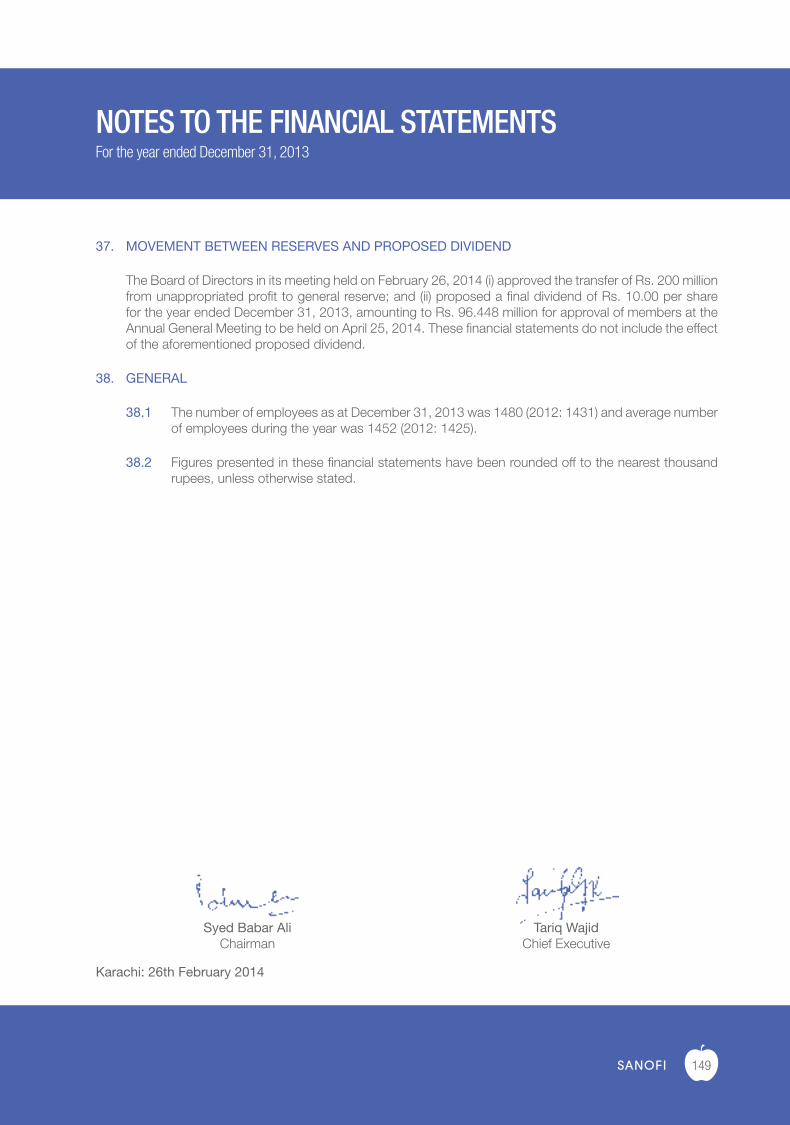
149
37. MOVEMENT BETWEEN RESERVES AND PROPOSED DIVIDEND
The Board of Directors in its meeting held on February 26, 2014 (i) approved the transfer of Rs. 200 million from unappropriated profit to general reserve; and (ii) proposed a final dividend of Rs. 10.00 per share for the year ended December 31, 2013, amounting to Rs. 96.448 million for approval of members at the Annual General Meeting to be held on April 25, 2014. These financial statements do not include the effect of the aforementioned proposed dividend.
38. GENERAL
38.1 The number of employees as at December 31, 2013 was 1480 (2012: 1431) and average number of employees during the year was 1452 (2012: 1425).
38.2 Figures presented in these financial statements have been rounded off to the nearest thousand rupees, unless otherwise stated.
NOTES TO THE FINANCIAL STATEMENTSFor the year ended December 31, 2013
Syed Babar AliChairman
Tariq WajidChief Executive
Karachi: 26th February 2014
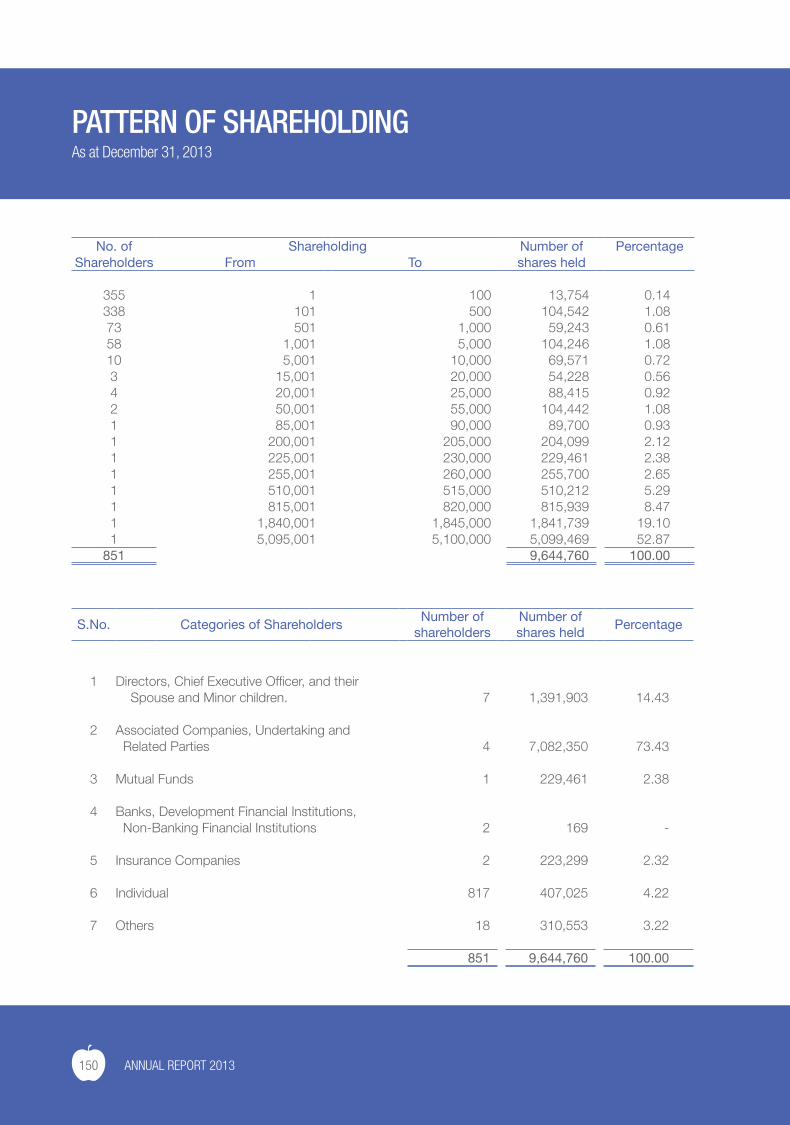
150 ANNUAL REPORT 2013
PATTERN OF SHAREHOLDINGAs at December 31, 2013
No. of Shareholding Number of PercentageShareholders From To shares held
355 1 100 13,754 0.14338 101 500 104,542 1.0873 501 1,000 59,243 0.6158 1,001 5,000 104,246 1.0810 5,001 10,000 69,571 0.723 15,001 20,000 54,228 0.564 20,001 25,000 88,415 0.922 50,001 55,000 104,442 1.081 85,001 90,000 89,700 0.931 200,001 205,000 204,099 2.121 225,001 230,000 229,461 2.381 255,001 260,000 255,700 2.651 510,001 515,000 510,212 5.291 815,001 820,000 815,939 8.471 1,840,001 1,845,000 1,841,739 19.101 5,095,001 5,100,000 5,099,469 52.87
851 9,644,760 100.00
S.No. Categories of ShareholdersNumber of
shareholdersNumber ofshares held
Percentage
1 Directors, Chief Executive Officer, and their Spouse and Minor children. 7 1,391,903 14.43
2 Associated Companies, Undertaking and Related Parties 4 7,082,350 73.43
3 Mutual Funds 1 229,461 2.38
4 Banks, Development Financial Institutions, Non-Banking Financial Institutions 2 169 -
5 Insurance Companies 2 223,299 2.32
6 Individual 817 407,025 4.22
7 Others 18 310,553 3.22
851 9,644,760 100.00
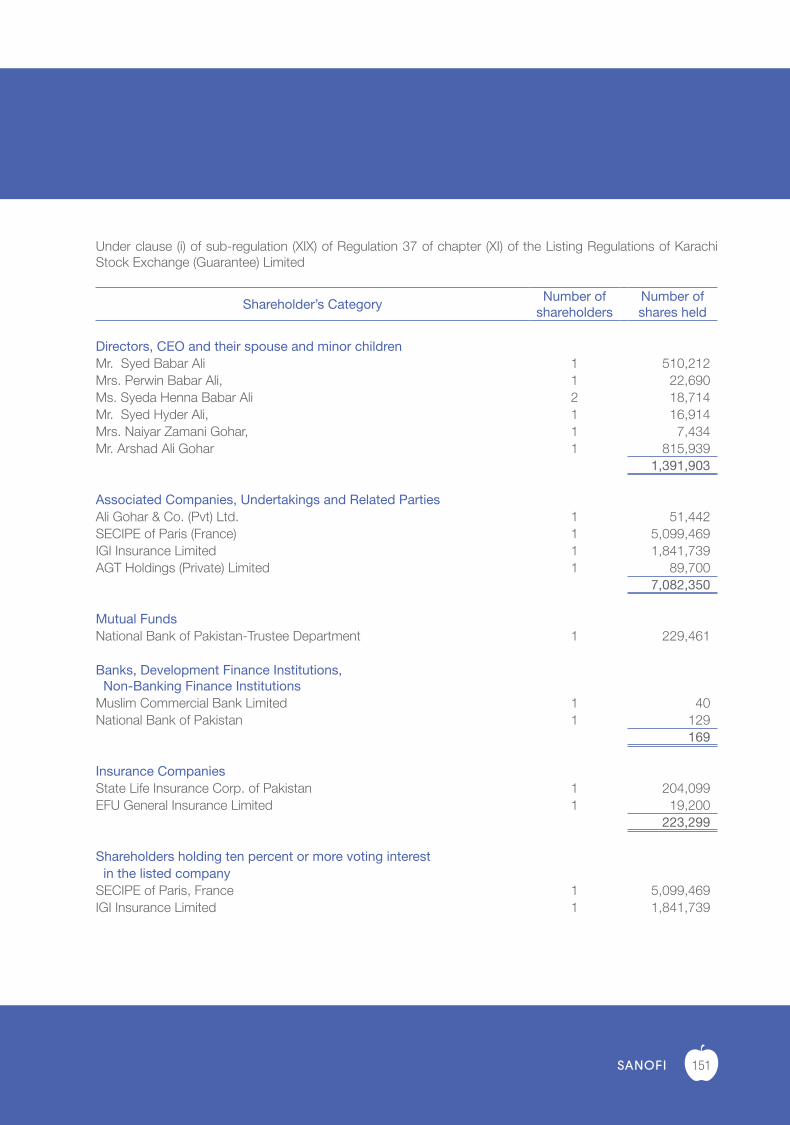
151
Under clause (i) of sub-regulation (XIX) of Regulation 37 of chapter (XI) of the Listing Regulations of Karachi Stock Exchange (Guarantee) Limited
Shareholder’s CategoryNumber of
shareholdersNumber ofshares held
Directors, CEO and their spouse and minor childrenMr. Syed Babar Ali 1 510,212 Mrs. Perwin Babar Ali, 1 22,690 Ms. Syeda Henna Babar Ali 2 18,714 Mr. Syed Hyder Ali, 1 16,914 Mrs. Naiyar Zamani Gohar, 1 7,434 Mr. Arshad Ali Gohar 1 815,939
1,391,903
Associated Companies, Undertakings and Related PartiesAli Gohar & Co. (Pvt) Ltd. 1 51,442 SECIPE of Paris (France) 1 5,099,469 IGI Insurance Limited 1 1,841,739 AGT Holdings (Private) Limited 1 89,700
7,082,350
Mutual FundsNational Bank of Pakistan-Trustee Department 1 229,461
Banks, Development Finance Institutions,Non-Banking Finance Institutions
Muslim Commercial Bank Limited 1 40National Bank of Pakistan 1 129
169
Insurance CompaniesState Life Insurance Corp. of Pakistan 1 204,099EFU General Insurance Limited 1 19,200
223,299
Shareholders holding ten percent or more voting interestin the listed company
SECIPE of Paris, France 1 5,099,469 IGI Insurance Limited 1 1,841,739
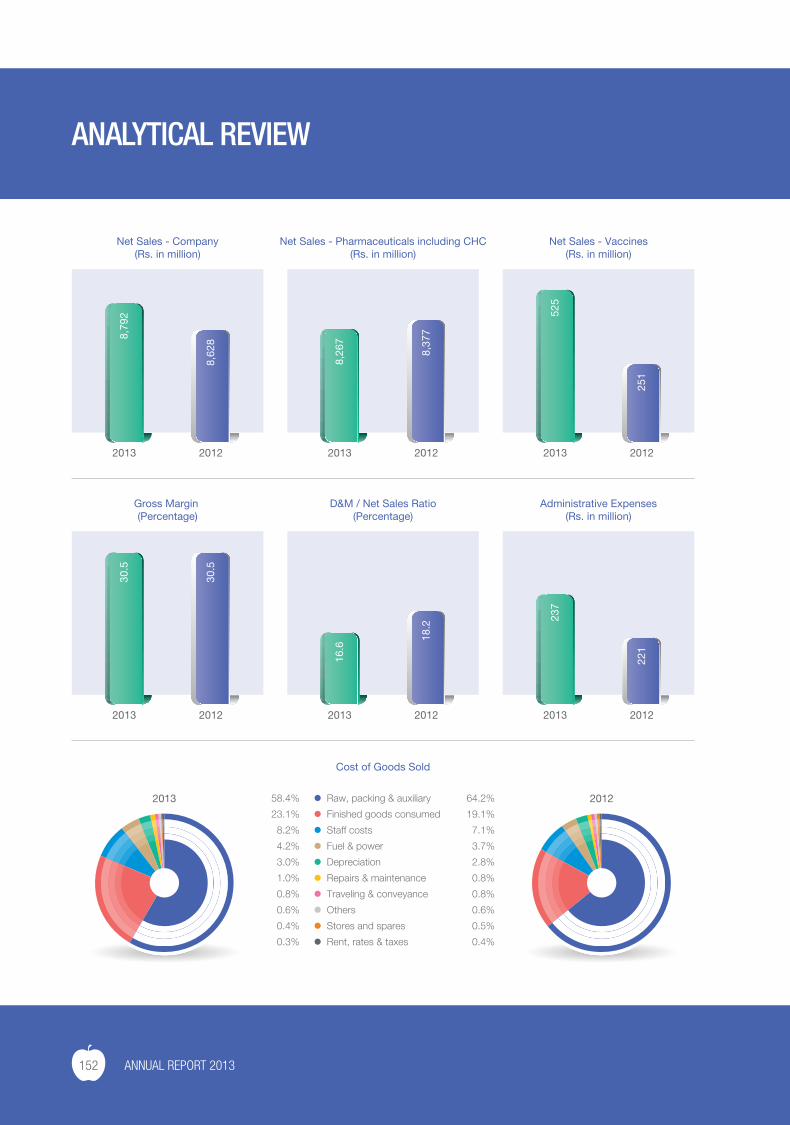
152 ANNUAL REPORT 2013
Raw, packing & auxiliary
Finished goods consumed
Staff costs
Fuel & power
Depreciation
Repairs & maintenance
Traveling & conveyance
Others
Stores and spares
Rent, rates & taxes
58.4%
23.1%
8.2%
4.2%
3.0%
1.0%
0.8%
0.6%
0.4%
0.3%
64.2%
19.1%
7.1%
3.7%
2.8%
0.8%
0.8%
0.6%
0.5%
0.4%
Staff costs
Advertising & sales promotion
Traveling & conveyance
Handling, freight & transportation
Others
Cost of samples issued
Depreciation
Commission expense
36.9%
22.5%
15.0%
8.8%
5.6%
5.6%
2.9%
2.7%
32.5%
25.7%
16.9%
7.5%
4.8%
5.3%
3.9%
3.4%
Cost of Goods Sold
2013
2013 2012
2012
Net Sales - Company(Rs. in million)
8,79
2
8,62
8
2013 2012
Net Sales - Pharmaceuticals including CHC(Rs. in million)
8,26
7
8,37
7
2013 2012
Net Sales - Vaccines(Rs. in million)
525
251
2013 2012
Gross Margin (Percentage)
30.5
30.5
2013 2012
D&M / Net Sales Ratio(Percentage)
16.6
18.2
2013 2012
Administrative Expenses(Rs. in million)
237
221
2013 2012
30.5
30.5
2013 2012
Gross Pro�t Net Pro�t
Gross Pro�t vs. Net Pro�t(Percentage)
Distribution & Marketing Expenses
Staff costs
Traveling & conveyance
Others
Fuel & power
Depreciation
Repairs & maintenance
Communication
57.4%
9.6%
8.9%
8.4%
7.5%
5.6%
2.6%
56.3%
9.2%
10.3%
7.8%
7.9%
5.7%
2.8%
2013 2012
9.5
13.9
2013 2012
Receivables Turnover Inventory Turnover
Receivables Turnover & Inventory Turnover(Times)
Administrative Expenses
5.6
3.5
2.7 3.
2
ANALYTICAL REVIEW
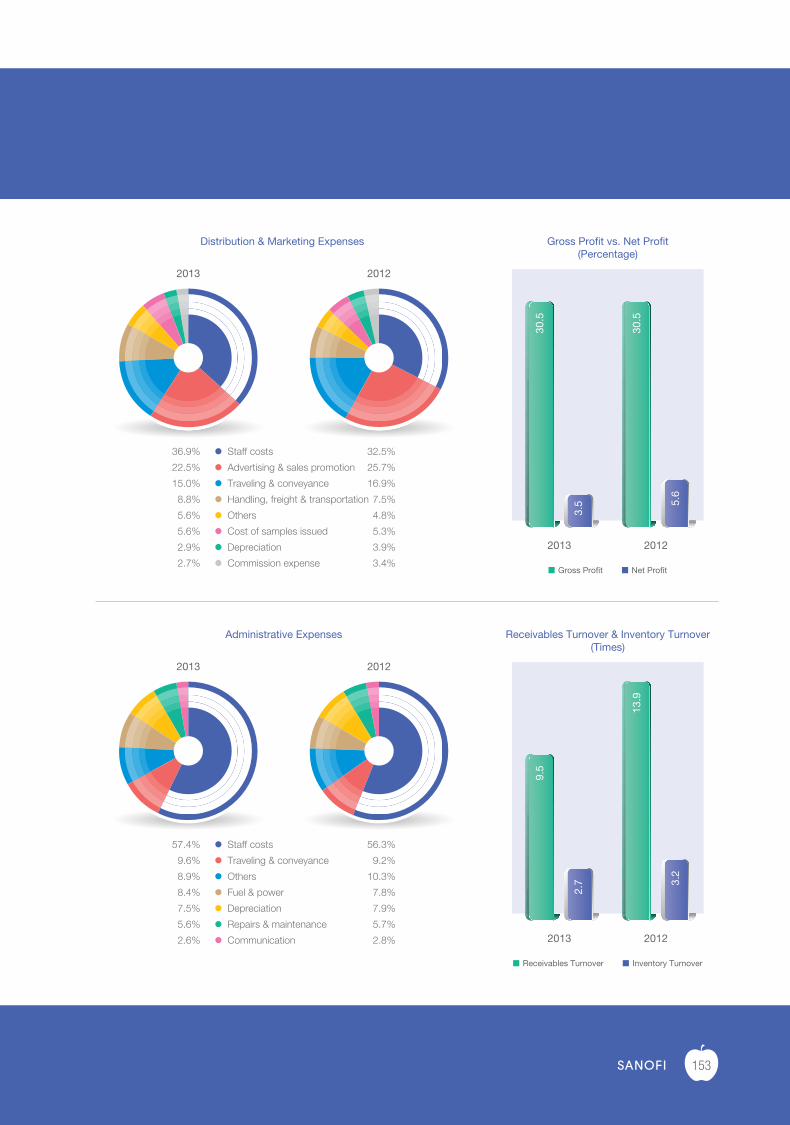
153
Raw, packing & auxiliary
Finished goods consumed
Staff costs
Fuel & power
Depreciation
Repairs & maintenance
Traveling & conveyance
Others
Stores and spares
Rent, rates & taxes
58.4%
23.1%
8.2%
4.2%
3.0%
1.0%
0.8%
0.6%
0.4%
0.3%
64.2%
19.1%
7.1%
3.7%
2.8%
0.8%
0.8%
0.6%
0.5%
0.4%
Staff costs
Advertising & sales promotion
Traveling & conveyance
Handling, freight & transportation
Others
Cost of samples issued
Depreciation
Commission expense
36.9%
22.5%
15.0%
8.8%
5.6%
5.6%
2.9%
2.7%
32.5%
25.7%
16.9%
7.5%
4.8%
5.3%
3.9%
3.4%
Cost of Goods Sold
2013
2013 2012
2012
Net Sales - Company(Rs. in million)
8,79
2
8,62
8
2013 2012
Net Sales - Pharmaceuticals including CHC(Rs. in million)
8,26
7
8,37
7
2013 2012
Net Sales - Vaccines(Rs. in million)
525
251
2013 2012
Gross Margin (Percentage)
30.5
30.5
2013 2012
D&M / Net Sales Ratio(Percentage)
16.6
18.2
2013 2012
Administrative Expenses(Rs. in million)
237
221
2013 2012
30.5
30.5
2013 2012
Gross Pro�t Net Pro�t
Gross Pro�t vs. Net Pro�t(Percentage)
Distribution & Marketing Expenses
Staff costs
Traveling & conveyance
Others
Fuel & power
Depreciation
Repairs & maintenance
Communication
57.4%
9.6%
8.9%
8.4%
7.5%
5.6%
2.6%
56.3%
9.2%
10.3%
7.8%
7.9%
5.7%
2.8%
2013 2012
9.5
13.9
2013 2012
Receivables Turnover Inventory Turnover
Receivables Turnover & Inventory Turnover(Times)
Administrative Expenses
5.6
3.5
2.7 3.
2
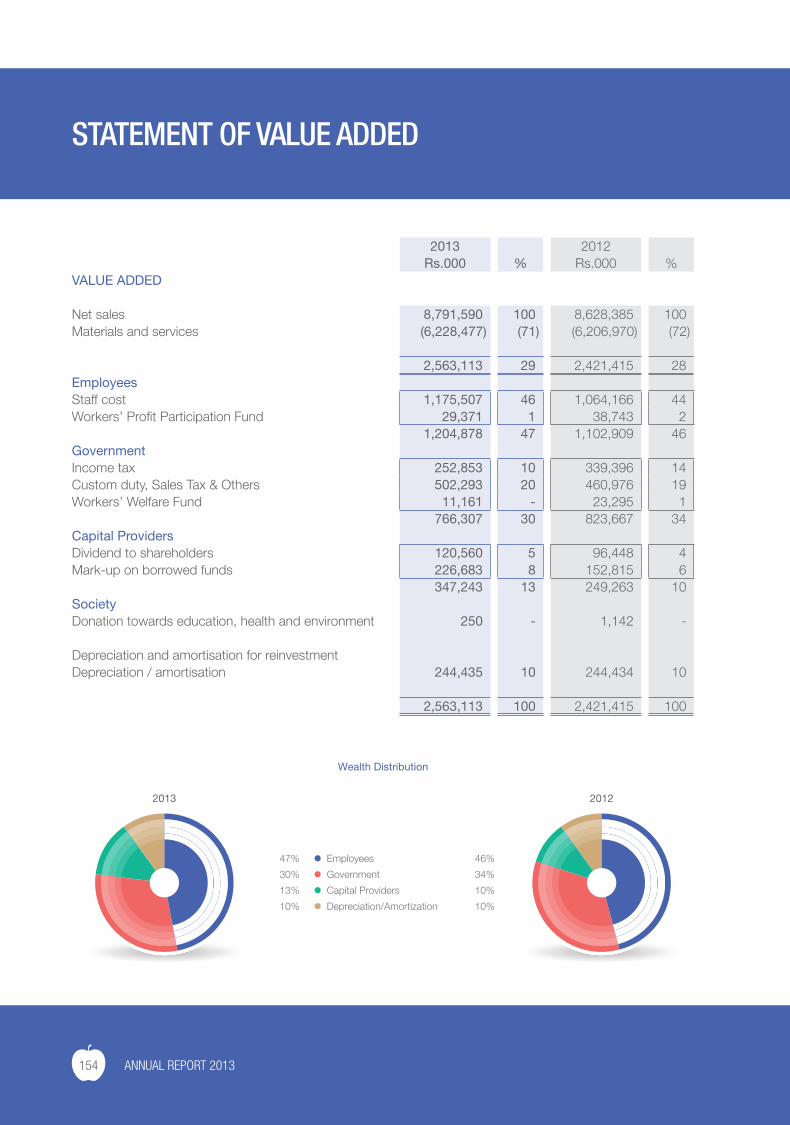
154 ANNUAL REPORT 2013
STATEMENT OF VALUE ADDED
2013 2012Rs.000 % Rs.000 %
VALUE ADDED
Net sales 8,791,590 100 8,628,385 100 Materials and services (6,228,477) (71) (6,206,970) (72)
2,563,113 29 2,421,415 28 EmployeesStaff cost 1,175,507 46 1,064,166 44 Workers’ Profit Participation Fund 29,371 1 38,743 2
1,204,878 47 1,102,909 46 GovernmentIncome tax 252,853 10 339,396 14 Custom duty, Sales Tax & Others 502,293 20 460,976 19 Workers’ Welfare Fund 11,161 - 23,295 1
766,307 30 823,667 34 Capital ProvidersDividend to shareholders 120,560 5 96,448 4 Mark-up on borrowed funds 226,683 8 152,815 6
347,243 13 249,263 10 SocietyDonation towards education, health and environment 250 - 1,142 -
Depreciation and amortisation for reinvestmentDepreciation / amortisation 244,435 10 244,434 10
2,563,113 100 2,421,415 100
Employees
Government
Capital Providers
Depreciation/Amortization
47%
30%
13%
10%
46%
34%
10%
10%
Wealth Distribution
2013 2012
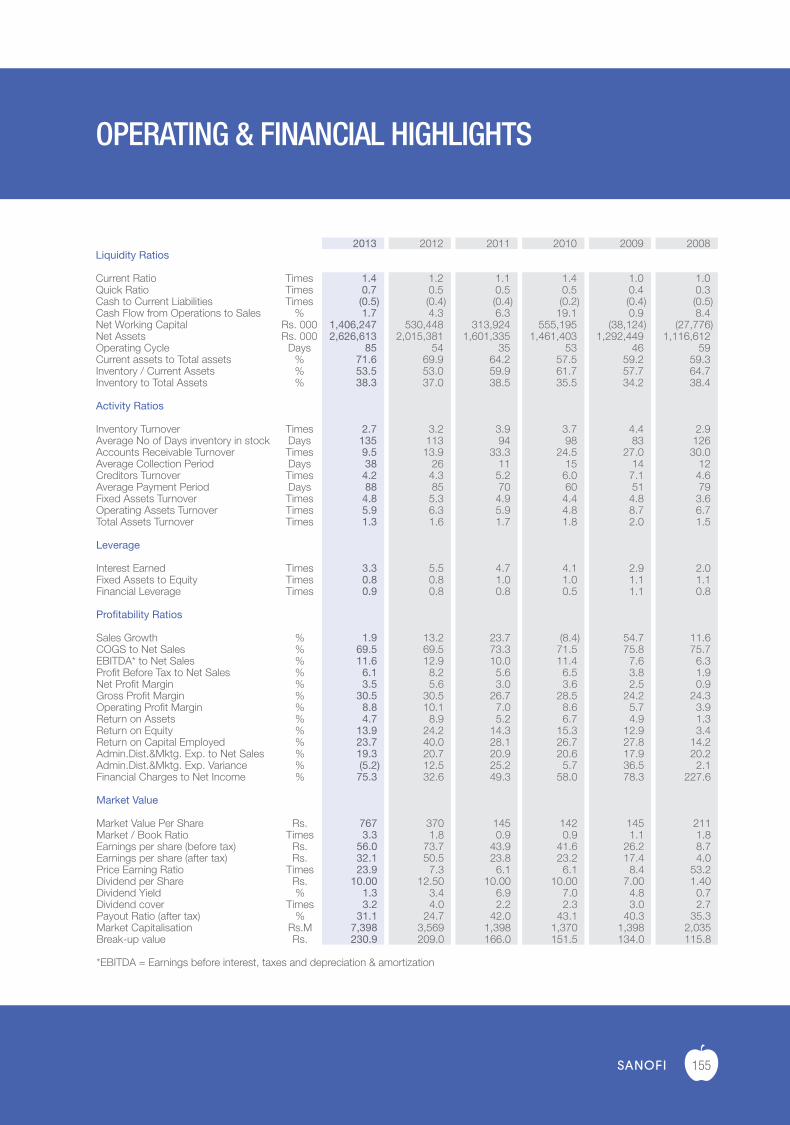
155
OPERATING & FINANCIAL HIGHLIGHTS
2013 2012 2011 2010 2009 2008Liquidity Ratios
Current Ratio Times 1.4 1.2 1.1 1.4 1.0 1.0Quick Ratio Times 0.7 0.5 0.5 0.5 0.4 0.3Cash to Current Liabilities Times (0.5) (0.4) (0.4) (0.2) (0.4) (0.5)Cash Flow from Operations to Sales % 1.7 4.3 6.3 19.1 0.9 8.4Net Working Capital Rs. 000 1,406,247 530,448 313,924 555,195 (38,124) (27,776)Net Assets Rs. 000 2,626,613 2,015,381 1,601,335 1,461,403 1,292,449 1,116,612 Operating Cycle Days 85 54 35 53 46 59Current assets to Total assets % 71.6 69.9 64.2 57.5 59.2 59.3Inventory / Current Assets % 53.5 53.0 59.9 61.7 57.7 64.7Inventory to Total Assets % 38.3 37.0 38.5 35.5 34.2 38.4
Activity Ratios
Inventory Turnover Times 2.7 3.2 3.9 3.7 4.4 2.9Average No of Days inventory in stock Days 135 113 94 98 83 126Accounts Receivable Turnover Times 9.5 13.9 33.3 24.5 27.0 30.0Average Collection Period Days 38 26 11 15 14 12Creditors Turnover Times 4.2 4.3 5.2 6.0 7.1 4.6Average Payment Period Days 88 85 70 60 51 79Fixed Assets Turnover Times 4.8 5.3 4.9 4.4 4.8 3.6Operating Assets Turnover Times 5.9 6.3 5.9 4.8 8.7 6.7Total Assets Turnover Times 1.3 1.6 1.7 1.8 2.0 1.5
Leverage
Interest Earned Times 3.3 5.5 4.7 4.1 2.9 2.0Fixed Assets to Equity Times 0.8 0.8 1.0 1.0 1.1 1.1Financial Leverage Times 0.9 0.8 0.8 0.5 1.1 0.8
Profitability Ratios
Sales Growth % 1.9 13.2 23.7 (8.4) 54.7 11.6COGS to Net Sales % 69.5 69.5 73.3 71.5 75.8 75.7EBITDA* to Net Sales % 11.6 12.9 10.0 11.4 7.6 6.3Profit Before Tax to Net Sales % 6.1 8.2 5.6 6.5 3.8 1.9Net Profit Margin % 3.5 5.6 3.0 3.6 2.5 0.9Gross Profit Margin % 30.5 30.5 26.7 28.5 24.2 24.3Operating Profit Margin % 8.8 10.1 7.0 8.6 5.7 3.9Return on Assets % 4.7 8.9 5.2 6.7 4.9 1.3Return on Equity % 13.9 24.2 14.3 15.3 12.9 3.4Return on Capital Employed % 23.7 40.0 28.1 26.7 27.8 14.2Admin.Dist.&Mktg. Exp. to Net Sales % 19.3 20.7 20.9 20.6 17.9 20.2Admin.Dist.&Mktg. Exp. Variance % (5.2) 12.5 25.2 5.7 36.5 2.1Financial Charges to Net Income % 75.3 32.6 49.3 58.0 78.3 227.6
Market Value
Market Value Per Share Rs. 767 370 145 142 145 211Market / Book Ratio Times 3.3 1.8 0.9 0.9 1.1 1.8Earnings per share (before tax) Rs. 56.0 73.7 43.9 41.6 26.2 8.7Earnings per share (after tax) Rs. 32.1 50.5 23.8 23.2 17.4 4.0Price Earning Ratio Times 23.9 7.3 6.1 6.1 8.4 53.2Dividend per Share Rs. 10.00 12.50 10.00 10.00 7.00 1.40Dividend Yield % 1.3 3.4 6.9 7.0 4.8 0.7Dividend cover Times 3.2 4.0 2.2 2.3 3.0 2.7Payout Ratio (after tax) % 31.1 24.7 42.0 43.1 40.3 35.3Market Capitalisation Rs.M 7,398 3,569 1,398 1,370 1,398 2,035 Break-up value Rs. 230.9 209.0 166.0 151.5 134.0 115.8
*EBITDA = Earnings before interest, taxes and depreciation & amortization
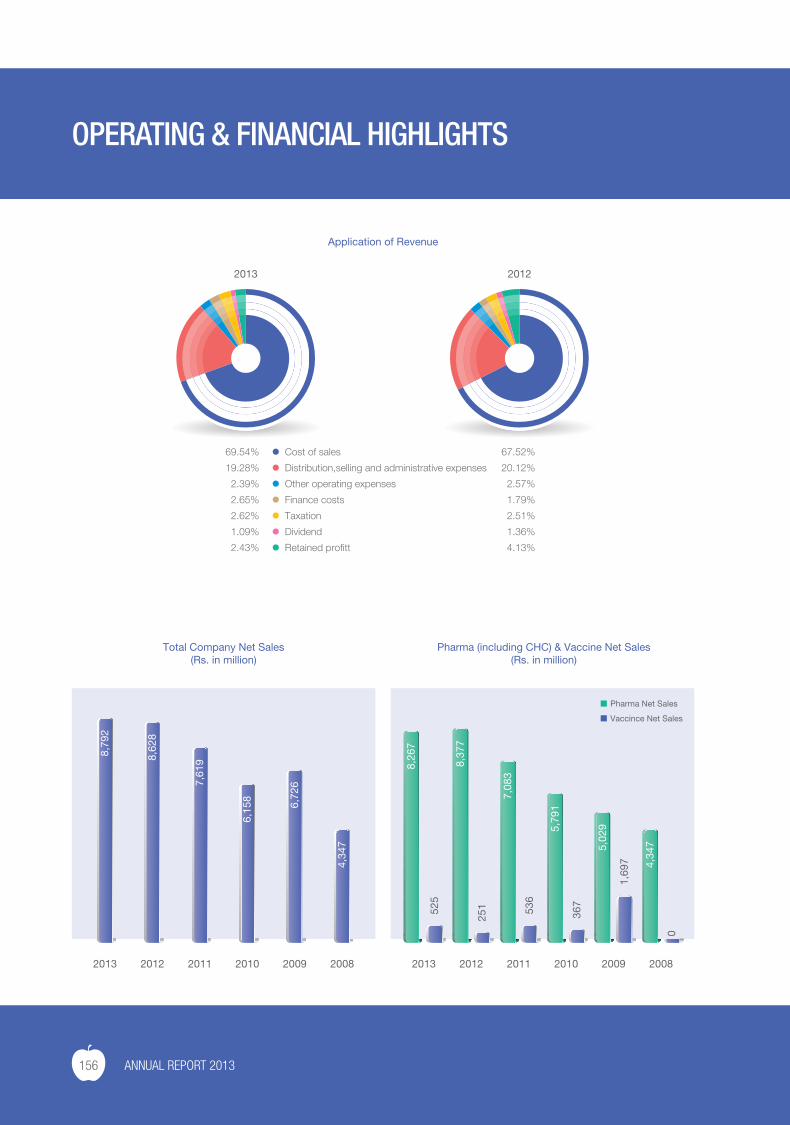
156 ANNUAL REPORT 2013
OPERATING & FINANCIAL HIGHLIGHTS
2013 2012 2011 2010 2009 2008
8,26
7
525
8,37
7
251
7,08
3
536
5,79
1
367
5,02
9
1,69
7
0
4,34
7
2013 2012 2011 2010 2009 2008
187
157
20 7
107
39
2012
Application of Revenue
Cost of sales
Distribution,selling and administrative expenses
Other operating expenses
Finance costs
Taxation
Dividend
Retained profitt
69.54%
19.28%
2.39%
2.65%
2.62%
1.09%
2.43%
67.52%
20.12%
2.57%
1.79%
2.51%
1.36%
4.13%
Pharma (including CHC) & Vaccine Net Sales(Rs. in million)
Pharma Net Sales
Vaccince Net Sales
Total Company Net Sales(Rs. in million)
2013 2012 2011 2010 2009 2008
8,79
2
8,62
8
7,61
9
6,15
8
6,72
6
4,34
7
Bank Borrowing(Rs. in million)
2013 2012 2011 2010 2009 2008
2,48
0
1,54
3
1,21
6
739
1,36
6
873
Gross Pro�t(Rs. in million)
2013 2012 2011 2010 2009 2008
2,67
8
2,62
9
2,03
4
1,75
4
1,62
7
1,05
6
Pro�t before tax & Pro�t after tax(Rs. in million)
2013 2012 2011 2010 2009 2008
Pro�t before tax
Pro�t after tax
Finance Cost
Exchange Loss
310
540
487
710
230
424
224
402
167
253
38
84
Finance Cost & Exchange Loss(Rs. in million)
2013
233
159
113 13
0
131
87
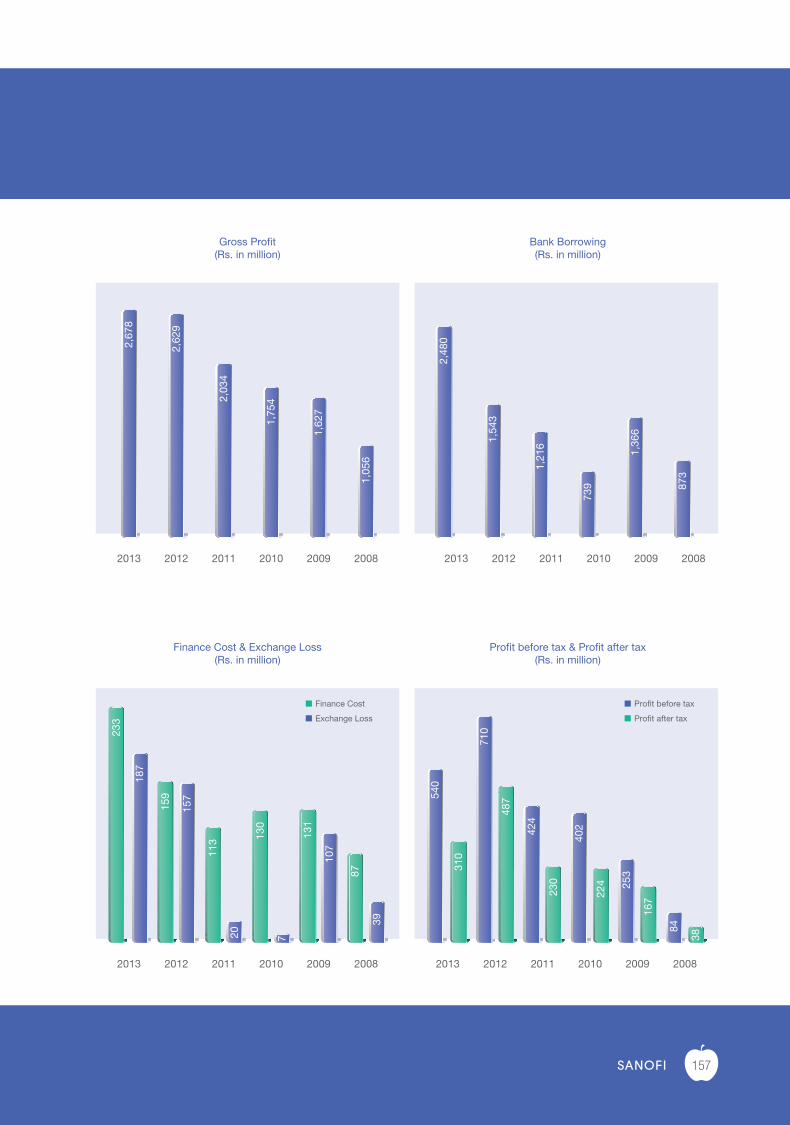
157
2013 2012 2011 2010 2009 2008
8,26
7
525
8,37
7
251
7,08
3
536
5,79
1
367
5,02
9
1,69
7
0
4,34
7
2013 2012 2011 2010 2009 2008
187
157
20 7
107
39
2012
Application of Revenue
Cost of sales
Distribution,selling and administrative expenses
Other operating expenses
Finance costs
Taxation
Dividend
Retained profitt
69.54%
19.28%
2.39%
2.65%
2.62%
1.09%
2.43%
67.52%
20.12%
2.57%
1.79%
2.51%
1.36%
4.13%
Pharma (including CHC) & Vaccine Net Sales(Rs. in million)
Pharma Net Sales
Vaccince Net Sales
Total Company Net Sales(Rs. in million)
2013 2012 2011 2010 2009 2008
8,79
2
8,62
8
7,61
9
6,15
8
6,72
6
4,34
7
Bank Borrowing(Rs. in million)
2013 2012 2011 2010 2009 2008
2,48
0
1,54
3
1,21
6
739
1,36
6
873
Gross Pro�t(Rs. in million)
2013 2012 2011 2010 2009 2008
2,67
8
2,62
9
2,03
4
1,75
4
1,62
7
1,05
6
Pro�t before tax & Pro�t after tax(Rs. in million)
2013 2012 2011 2010 2009 2008
Pro�t before tax
Pro�t after tax
Finance Cost
Exchange Loss
310
540
487
710
230
424
224
402
167
253
38
84
Finance Cost & Exchange Loss(Rs. in million)
2013
233
159
113 13
0
131
87
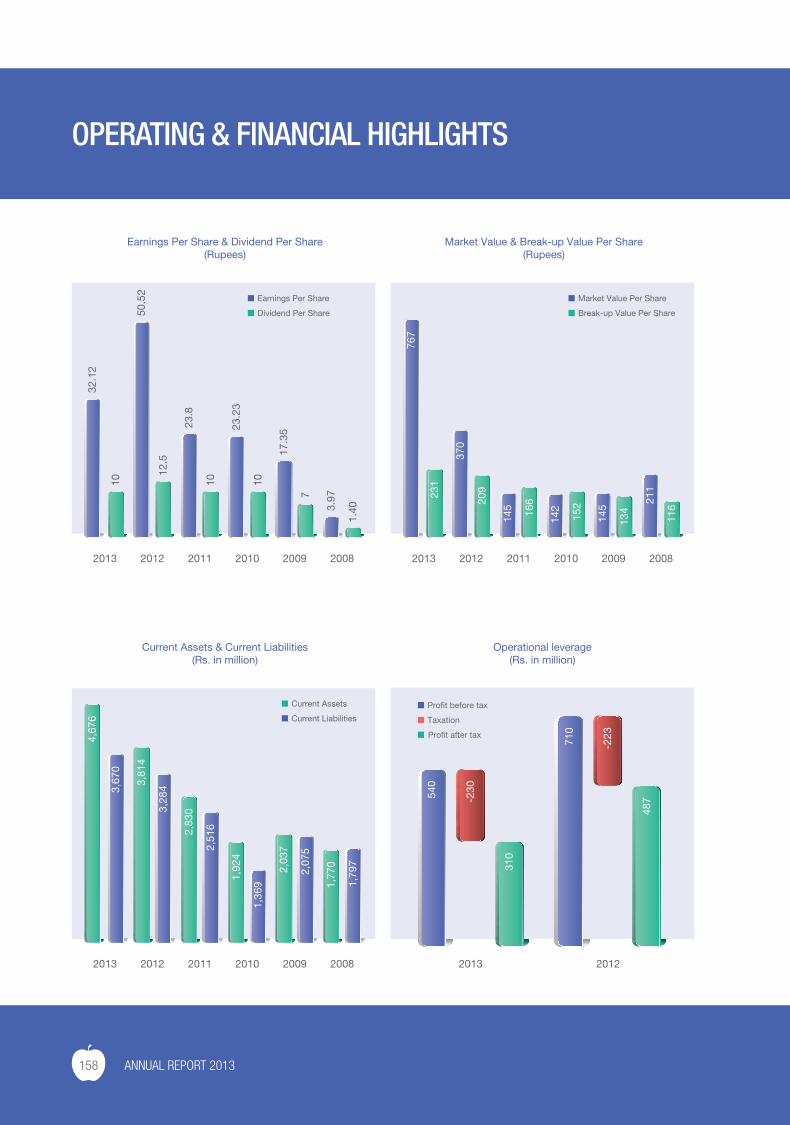
158 ANNUAL REPORT 2013
OPERATING & FINANCIAL HIGHLIGHTS
2013 2012 2011 2010 2009 2008
4,67
6
3,67
0
3,81
4
3,28
4
2,83
0
2,51
6
1,92
4
1,36
9
2,03
7
2,07
5
1,77
0
1,79
7
Current Assets & Current Liabilities(Rs. in million)
Current Assets
Current Liabilities
Earnings Per Share & Dividend Per Share(Rupees)
2013 2012 2011 2010 2009 2008
Earnings Per Share
Dividend Per Share
32.1
2
50.5
2
23.8
23.2
3
17.3
5
10
12.5
10 10
7
1.403.
97
Market Value & Break-up Value Per Share(Rupees)
2013 2012 2011 2010 2009 2008
Market Value Per Share
Break-up Value Per Share
231
767
209
370
166
145
152
142
134
145
116
211
Current Ratio(Times)
2013 2012 2011 2010 2009 2008
1.4
1.2
1.1
1.4
1.0
1.0
Operating Cycle(Days)
2013 2012 2011 2010 2009 2008
85
54
52
53
46
59
EBITDA to Net Sales(%)
2013 2012 2011 2010 2009 2008
11.6
12.9
10.0
7.6
6.3
Dividend Yield Ratio(%)
2013 2012 2011 2010 2009 2008
1.3
3.4
4.8
0.7
11.4
6.9 7.0
Operational leverage(Rs. in million)
-230540
710
2013 2012
Pro�t before tax
Taxation
Pro�t after tax
310
487
-223
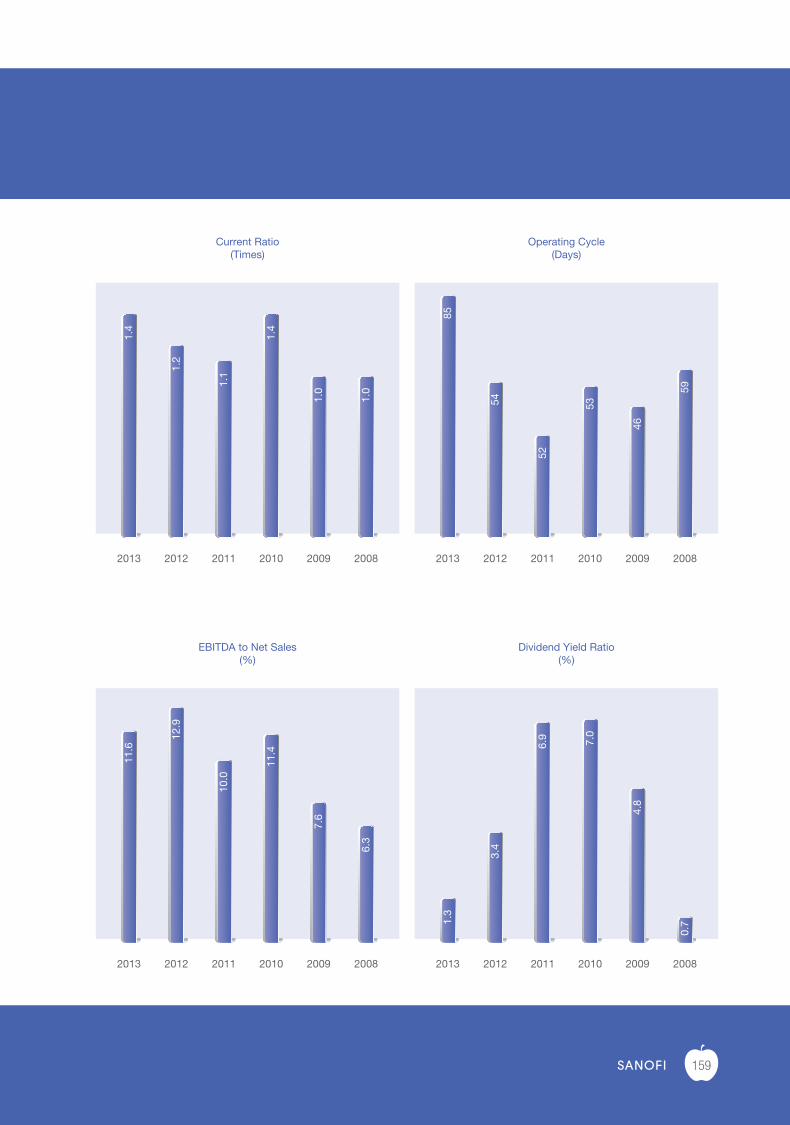
159
2013 2012 2011 2010 2009 2008
4,67
6
3,67
0
3,81
4
3,28
4
2,83
0
2,51
6
1,92
4
1,36
9
2,03
7
2,07
5
1,77
0
1,79
7
Current Assets & Current Liabilities(Rs. in million)
Current Assets
Current Liabilities
Earnings Per Share & Dividend Per Share(Rupees)
2013 2012 2011 2010 2009 2008
Earnings Per Share
Dividend Per Share
32.1
2
50.5
2
23.8
23.2
3
17.3
5
10
12.5
10 10
7
1.403.
97
Market Value & Break-up Value Per Share(Rupees)
2013 2012 2011 2010 2009 2008
Market Value Per Share
Break-up Value Per Share
231
767
209
370
166
145
152
142
134
145
116
211
Current Ratio(Times)
2013 2012 2011 2010 2009 2008
1.4
1.2
1.1
1.4
1.0
1.0
Operating Cycle(Days)
2013 2012 2011 2010 2009 2008
85
54
52
53
46
59
EBITDA to Net Sales(%)
2013 2012 2011 2010 2009 2008
11.6
12.9
10.0
7.6
6.3
Dividend Yield Ratio(%)
2013 2012 2011 2010 2009 2008
1.3
3.4
4.8
0.7
11.4
6.9 7.0
Operational leverage(Rs. in million)
-230540
710
2013 2012
Pro�t before tax
Taxation
Pro�t after tax
310
487
-223
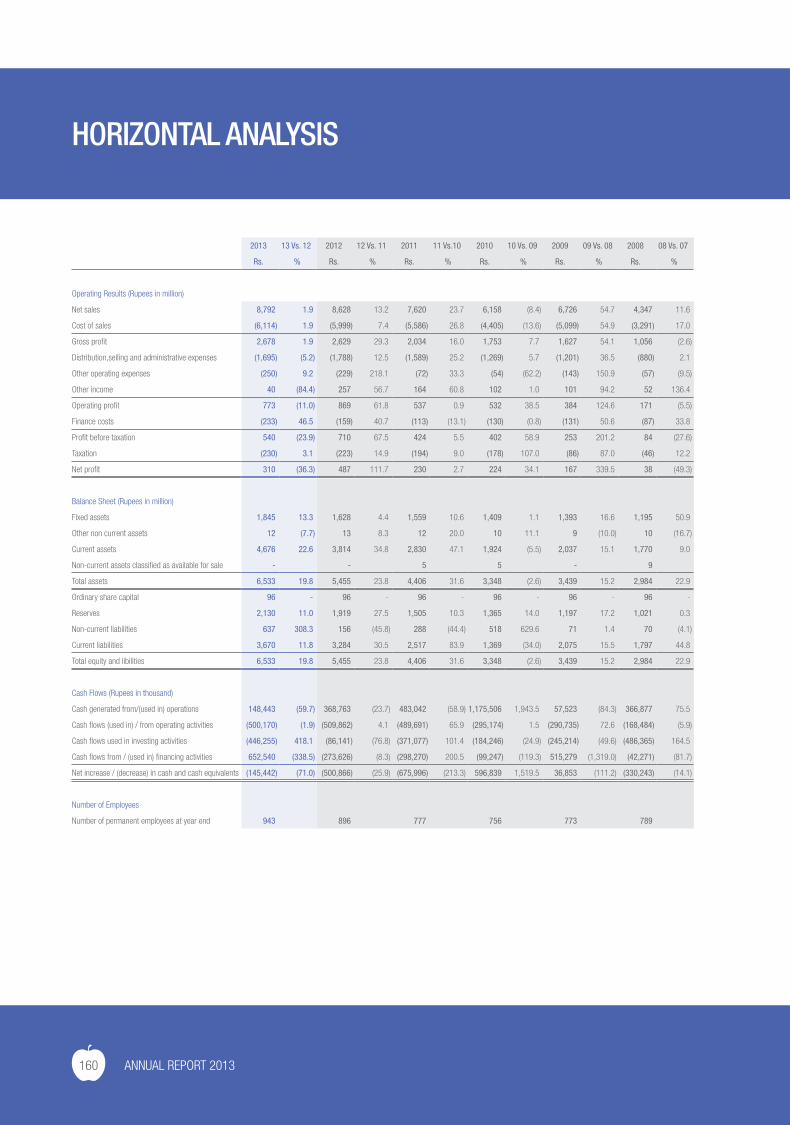
160 ANNUAL REPORT 2013
HORIZONTAL ANALYSIS
2013 13 Vs. 12 2012 12 Vs. 11 2011 11 Vs.10 2010 10 Vs. 09 2009 09 Vs. 08 2008 08 Vs. 07
Rs. % Rs. % Rs. % Rs. % Rs. % Rs. %
Operating Results (Rupees in million)
Net sales 8,792 1.9 8,628 13.2 7,620 23.7 6,158 (8.4) 6,726 54.7 4,347 11.6
Cost of sales (6,114) 1.9 (5,999) 7.4 (5,586) 26.8 (4,405) (13.6) (5,099) 54.9 (3,291) 17.0
Gross profit 2,678 1.9 2,629 29.3 2,034 16.0 1,753 7.7 1,627 54.1 1,056 (2.6)
Distribution,selling and administrative expenses (1,695) (5.2) (1,788) 12.5 (1,589) 25.2 (1,269) 5.7 (1,201) 36.5 (880) 2.1
Other operating expenses (250) 9.2 (229) 218.1 (72) 33.3 (54) (62.2) (143) 150.9 (57) (9.5)
Other income 40 (84.4) 257 56.7 164 60.8 102 1.0 101 94.2 52 136.4
Operating profit 773 (11.0) 869 61.8 537 0.9 532 38.5 384 124.6 171 (5.5)
Finance costs (233) 46.5 (159) 40.7 (113) (13.1) (130) (0.8) (131) 50.6 (87) 33.8
Profit before taxation 540 (23.9) 710 67.5 424 5.5 402 58.9 253 201.2 84 (27.6)
Taxation (230) 3.1 (223) 14.9 (194) 9.0 (178) 107.0 (86) 87.0 (46) 12.2
Net profit 310 (36.3) 487 111.7 230 2.7 224 34.1 167 339.5 38 (49.3)
Balance Sheet (Rupees in million)
Fixed assets 1,845 13.3 1,628 4.4 1,559 10.6 1,409 1.1 1,393 16.6 1,195 50.9
Other non current assets 12 (7.7) 13 8.3 12 20.0 10 11.1 9 (10.0) 10 (16.7)
Current assets 4,676 22.6 3,814 34.8 2,830 47.1 1,924 (5.5) 2,037 15.1 1,770 9.0
Non-current assets classified as available for sale - - 5 5 - 9
Total assets 6,533 19.8 5,455 23.8 4,406 31.6 3,348 (2.6) 3,439 15.2 2,984 22.9
Ordinary share capital 96 - 96 - 96 - 96 - 96 - 96 -
Reserves 2,130 11.0 1,919 27.5 1,505 10.3 1,365 14.0 1,197 17.2 1,021 0.3
Non-current liabilities 637 308.3 156 (45.8) 288 (44.4) 518 629.6 71 1.4 70 (4.1)
Current liabilities 3,670 11.8 3,284 30.5 2,517 83.9 1,369 (34.0) 2,075 15.5 1,797 44.8
Total equity and libilities 6,533 19.8 5,455 23.8 4,406 31.6 3,348 (2.6) 3,439 15.2 2,984 22.9
Cash Flows (Rupees in thousand)
Cash generated from/(used in) operations 148,443 (59.7) 368,763 (23.7) 483,042 (58.9) 1,175,506 1,943.5 57,523 (84.3) 366,877 75.5
Cash flows (used in) / from operating activities (500,170) (1.9) (509,862) 4.1 (489,691) 65.9 (295,174) 1.5 (290,735) 72.6 (168,484) (5.9)
Cash flows used in investing activities (446,255) 418.1 (86,141) (76.8) (371,077) 101.4 (184,246) (24.9) (245,214) (49.6) (486,365) 164.5
Cash flows from / (used in) financing activities 652,540 (338.5) (273,626) (8.3) (298,270) 200.5 (99,247) (119.3) 515,279 (1,319.0) (42,271) (81.7)
Net increase / (decrease) in cash and cash equivalents (145,442) (71.0) (500,866) (25.9) (675,996) (213.3) 596,839 1,519.5 36,853 (111.2) (330,243) (14.1)
Number of Employees
Number of permanent employees at year end 943 896 777 756 773 789
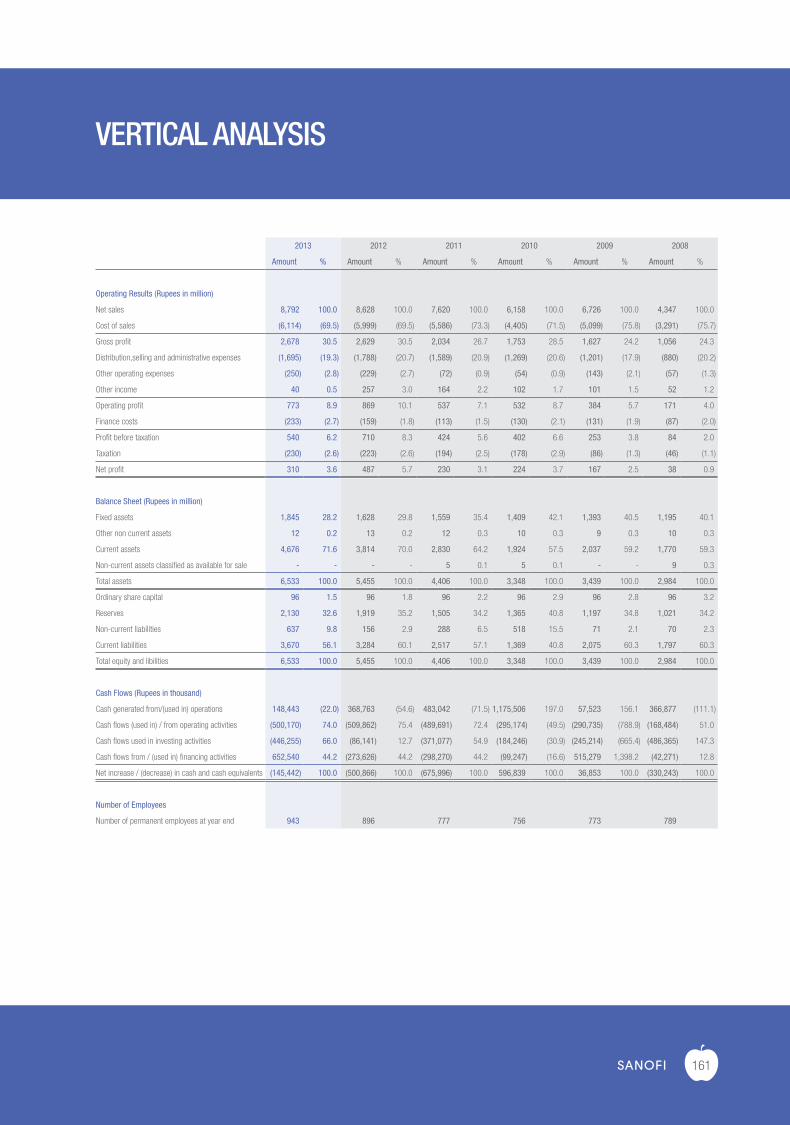
161
VERTICAL ANALYSIS
2013 2012 2011 2010 2009 2008
Amount % Amount % Amount % Amount % Amount % Amount %
Operating Results (Rupees in million)
Net sales 8,792 100.0 8,628 100.0 7,620 100.0 6,158 100.0 6,726 100.0 4,347 100.0
Cost of sales (6,114) (69.5) (5,999) (69.5) (5,586) (73.3) (4,405) (71.5) (5,099) (75.8) (3,291) (75.7)
Gross profit 2,678 30.5 2,629 30.5 2,034 26.7 1,753 28.5 1,627 24.2 1,056 24.3
Distribution,selling and administrative expenses (1,695) (19.3) (1,788) (20.7) (1,589) (20.9) (1,269) (20.6) (1,201) (17.9) (880) (20.2)
Other operating expenses (250) (2.8) (229) (2.7) (72) (0.9) (54) (0.9) (143) (2.1) (57) (1.3)
Other income 40 0.5 257 3.0 164 2.2 102 1.7 101 1.5 52 1.2
Operating profit 773 8.9 869 10.1 537 7.1 532 8.7 384 5.7 171 4.0
Finance costs (233) (2.7) (159) (1.8) (113) (1.5) (130) (2.1) (131) (1.9) (87) (2.0)
Profit before taxation 540 6.2 710 8.3 424 5.6 402 6.6 253 3.8 84 2.0
Taxation (230) (2.6) (223) (2.6) (194) (2.5) (178) (2.9) (86) (1.3) (46) (1.1)
Net profit 310 3.6 487 5.7 230 3.1 224 3.7 167 2.5 38 0.9
Balance Sheet (Rupees in million)
Fixed assets 1,845 28.2 1,628 29.8 1,559 35.4 1,409 42.1 1,393 40.5 1,195 40.1
Other non current assets 12 0.2 13 0.2 12 0.3 10 0.3 9 0.3 10 0.3
Current assets 4,676 71.6 3,814 70.0 2,830 64.2 1,924 57.5 2,037 59.2 1,770 59.3
Non-current assets classified as available for sale - - - - 5 0.1 5 0.1 - - 9 0.3
Total assets 6,533 100.0 5,455 100.0 4,406 100.0 3,348 100.0 3,439 100.0 2,984 100.0
Ordinary share capital 96 1.5 96 1.8 96 2.2 96 2.9 96 2.8 96 3.2
Reserves 2,130 32.6 1,919 35.2 1,505 34.2 1,365 40.8 1,197 34.8 1,021 34.2
Non-current liabilities 637 9.8 156 2.9 288 6.5 518 15.5 71 2.1 70 2.3
Current liabilities 3,670 56.1 3,284 60.1 2,517 57.1 1,369 40.8 2,075 60.3 1,797 60.3
Total equity and libilities 6,533 100.0 5,455 100.0 4,406 100.0 3,348 100.0 3,439 100.0 2,984 100.0
Cash Flows (Rupees in thousand)
Cash generated from/(used in) operations 148,443 (22.0) 368,763 (54.6) 483,042 (71.5) 1,175,506 197.0 57,523 156.1 366,877 (111.1)
Cash flows (used in) / from operating activities (500,170) 74.0 (509,862) 75.4 (489,691) 72.4 (295,174) (49.5) (290,735) (788.9) (168,484) 51.0
Cash flows used in investing activities (446,255) 66.0 (86,141) 12.7 (371,077) 54.9 (184,246) (30.9) (245,214) (665.4) (486,365) 147.3
Cash flows from / (used in) financing activities 652,540 44.2 (273,626) 44.2 (298,270) 44.2 (99,247) (16.6) 515,279 1,398.2 (42,271) 12.8
Net increase / (decrease) in cash and cash equivalents (145,442) 100.0 (500,866) 100.0 (675,996) 100.0 596,839 100.0 36,853 100.0 (330,243) 100.0
Number of Employees
Number of permanent employees at year end 943 896 777 756 773 789
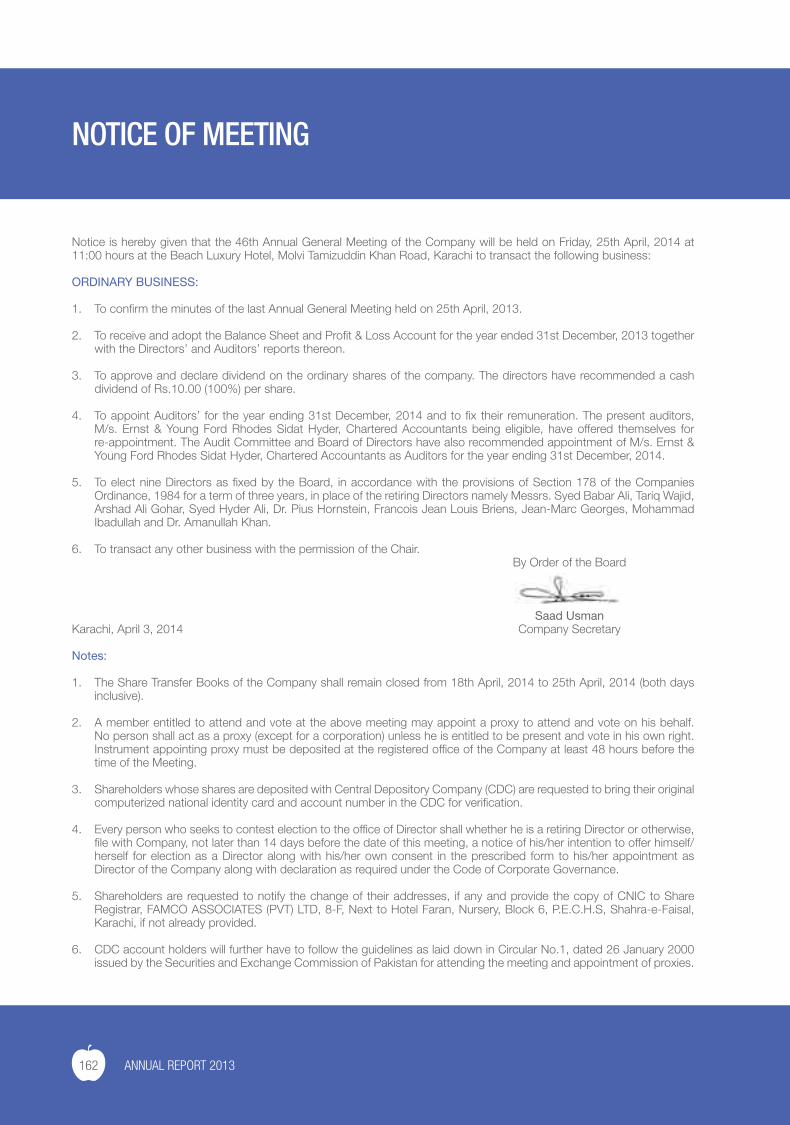
162 ANNUAL REPORT 2013
NOTICE OF MEETING
Notice is hereby given that the 46th Annual General Meeting of the Company will be held on Friday, 25th April, 2014 at 11:00 hours at the Beach Luxury Hotel, Molvi Tamizuddin Khan Road, Karachi to transact the following business:
ORDINARY BUSINESS:
1. To confirm the minutes of the last Annual General Meeting held on 25th April, 2013.
2. To receive and adopt the Balance Sheet and Profit & Loss Account for the year ended 31st December, 2013 together with the Directors’ and Auditors’ reports thereon.
3. To approve and declare dividend on the ordinary shares of the company. The directors have recommended a cash dividend of Rs.10.00 (100%) per share.
4. To appoint Auditors’ for the year ending 31st December, 2014 and to fix their remuneration. The present auditors, M/s. Ernst & Young Ford Rhodes Sidat Hyder, Chartered Accountants being eligible, have offered themselves for re-appointment. The Audit Committee and Board of Directors have also recommended appointment of M/s. Ernst & Young Ford Rhodes Sidat Hyder, Chartered Accountants as Auditors for the year ending 31st December, 2014.
5. To elect nine Directors as fixed by the Board, in accordance with the provisions of Section 178 of the Companies Ordinance, 1984 for a term of three years, in place of the retiring Directors namely Messrs. Syed Babar Ali, Tariq Wajid, Arshad Ali Gohar, Syed Hyder Ali, Dr. Pius Hornstein, Francois Jean Louis Briens, Jean-Marc Georges, Mohammad Ibadullah and Dr. Amanullah Khan.
6. To transact any other business with the permission of the Chair. By Order of the Board
Saad UsmanKarachi, April 3, 2014 Company Secretary
Notes:
1. The Share Transfer Books of the Company shall remain closed from 18th April, 2014 to 25th April, 2014 (both days inclusive).
2. A member entitled to attend and vote at the above meeting may appoint a proxy to attend and vote on his behalf. No person shall act as a proxy (except for a corporation) unless he is entitled to be present and vote in his own right. Instrument appointing proxy must be deposited at the registered office of the Company at least 48 hours before the time of the Meeting.
3. Shareholders whose shares are deposited with Central Depository Company (CDC) are requested to bring their original computerized national identity card and account number in the CDC for verification.
4. Every person who seeks to contest election to the office of Director shall whether he is a retiring Director or otherwise, file with Company, not later than 14 days before the date of this meeting, a notice of his/her intention to offer himself/herself for election as a Director along with his/her own consent in the prescribed form to his/her appointment as Director of the Company along with declaration as required under the Code of Corporate Governance.
5. Shareholders are requested to notify the change of their addresses, if any and provide the copy of CNIC to Share Registrar, FAMCO ASSOCIATES (PVT) LTD, 8-F, Next to Hotel Faran, Nursery, Block 6, P.E.C.H.S, Shahra-e-Faisal, Karachi, if not already provided.
6. CDC account holders will further have to follow the guidelines as laid down in Circular No.1, dated 26 January 2000
issued by the Securities and Exchange Commission of Pakistan for attending the meeting and appointment of proxies.
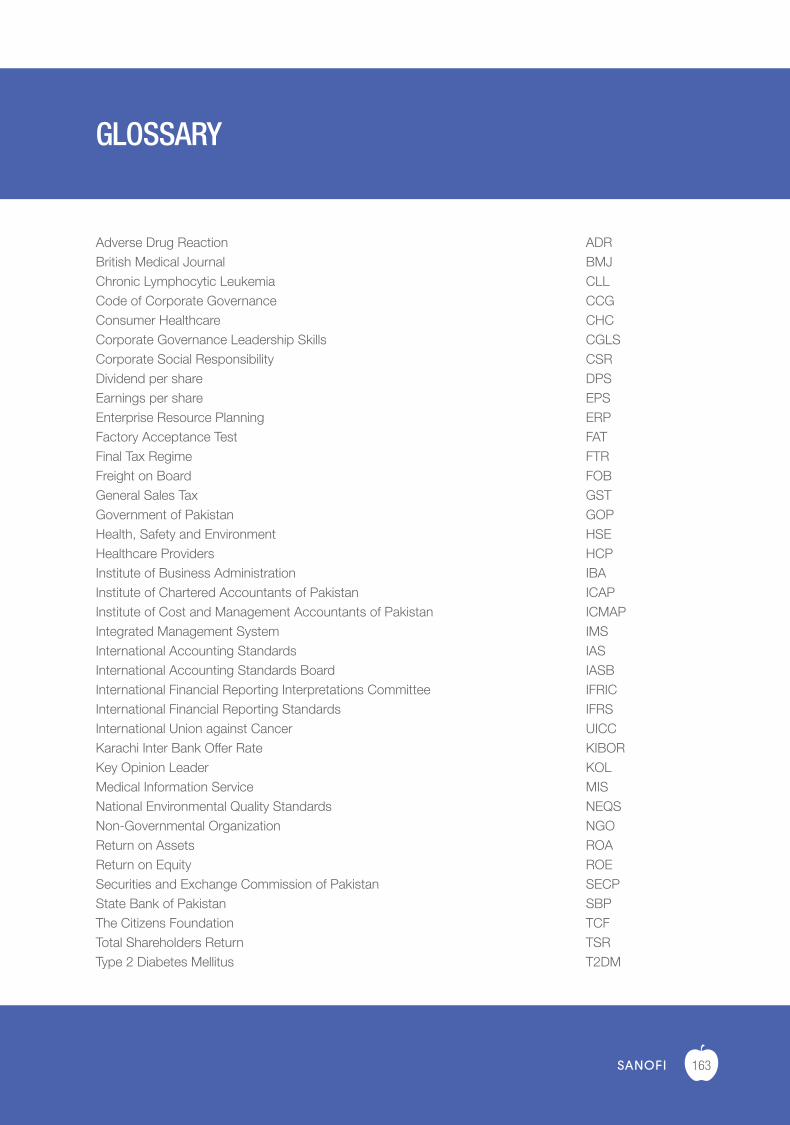
163
GLOSSARY
Adverse Drug Reaction ADRBritish Medical Journal BMJChronic Lymphocytic Leukemia CLLCode of Corporate Governance CCGConsumer Healthcare CHCCorporate Governance Leadership Skills CGLSCorporate Social Responsibility CSRDividend per share DPSEarnings per share EPSEnterprise Resource Planning ERPFactory Acceptance Test FATFinal Tax Regime FTRFreight on Board FOBGeneral Sales Tax GSTGovernment of Pakistan GOPHealth, Safety and Environment HSEHealthcare Providers HCPInstitute of Business Administration IBAInstitute of Chartered Accountants of Pakistan ICAPInstitute of Cost and Management Accountants of Pakistan ICMAPIntegrated Management System IMSInternational Accounting Standards IASInternational Accounting Standards Board IASBInternational Financial Reporting Interpretations Committee IFRICInternational Financial Reporting Standards IFRSInternational Union against Cancer UICCKarachi Inter Bank Offer Rate KIBORKey Opinion Leader KOLMedical Information Service MISNational Environmental Quality Standards NEQSNon-Governmental Organization NGOReturn on Assets ROAReturn on Equity ROESecurities and Exchange Commission of Pakistan SECPState Bank of Pakistan SBPThe Citizens Foundation TCFTotal Shareholders Return TSRType 2 Diabetes Mellitus T2DM
Proxy FormI/We __________________________________________ of __________________________________________________________________________ (full address) being a member of sanofi-aventis Pakistan limited hereby appoint _______________________________________of ____________________________________________________________________________ (full address) or failing him ________________________________________________________of ____________________________________________________________________________(full address) as my / our proxy to attend and vote for me / us and on my / our behalf at the 46th Annual General Meeting of the company to be held on Friday, April 25, 2014 and at any adjournment thereof.
As witness my / our hand this __________ day of __________ 2014.
Witness No.1
Name __________________________________Address ________________________________C.N.I.C. No. _____________________________
___________________ Signature of Member(s)
Witness No.2 ___________________ (Name in Block Letters)Name __________________________________Address ________________________________C.N.I.C. No. _____________________________
Folio No. _________________________ Participant ID No. _________________ Account No. in CDS _______________Important
1. CDC Account Holders are requested to strictly follow the guidelines mentioned in Circular No.1 of 2000 of SECP.
2. A member entitled to attend a General Meeting is entitled to appoint a proxy to attend and vote instead of him/her, no person shall act as a proxy, who is not a member of the Company except that a Corporation may appoint a person who is not a member.
3. The instrument appointing a proxy, together with the Board of Directors’ resolution/Power of Attorney (if any) under which it is signed or a notarially certified copy thereof, should be deposited at the Registered Office not less than 48 hours before the time for holding the meeting.
4. The instrument appointing a proxy should be signed by the member or by his attorney duly authorized in writing. If the member is corporation it’s common seal should be affixed to the instrument
Rs. 5/=Revenue Stamp

The Company Secretary
sanofi-aventis Pakistan limitedPlot 23, Sector 22, Korangi Industrial Area,Karachi - 74900 Pakistan
AFFIXCORRECTPOSTAGE