Embed Size (px)
Citation preview
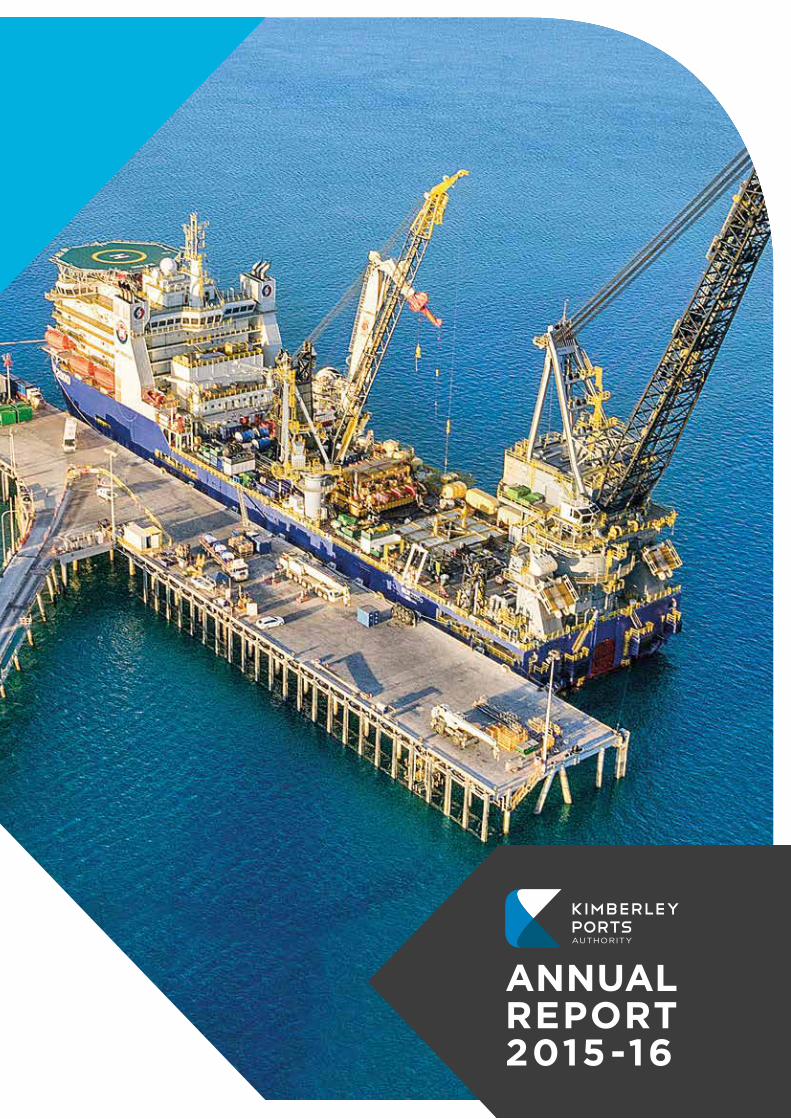
ANNUAL REPORT 2015-16

Contents
From the Chairman and Chief Executive Officer .........................................4
Agency Overview ..................................................7
2.1 Agency Performance ....................................8
2.2 Ministerial Directions .....................................8
2.3 Governance .................................................8
2.4 Environmental Management .......................12
2.5 Organisational Structure .............................13
Operational Performance ...................................15
3.1 Operational Performance ............................16
3.2 Trade Statistics ..........................................17
3.3 Infrastructure Improvement and Maintenance ........................................19
3.4 Occupational Health and Safety ..................20
Directors report ...................................................23
4.1 Role of the Board ........................................24
4.2 Directors’ Rights .........................................24
4.3 Directors’ Details .........................................24
4.4 Directors Meetings ......................................25
4.5 Planned Achievements ...............................26
4.6 Operating Results .......................................28
4.7 Dividends ....................................................28
4.8 Significant Changes in the State of Affairs ..28
4.9 Events Subsequent to Reporting ...............28
4.10 Likely Developments .................................28
4.11 Remuneration Report ...............................29
4.12 Rounding Off ............................................30
Financial Statements ..........................................31
Statement of Comprehensive Income ..............32
Statement of Financial Position .......................33
Statement of Cash Flows ................................34
Statement of Changes in Equity .....................35
Notes to the Financial Statements ....................36
3Kimberley Ports Authority | Annual Report 2015/16
Once again it is a pleasure to report a successful year for the Kimberley Ports Authority (KPA) with satisfactory trade and financial outcomes achieved, while maintaining high safety and environmental standards; for which our Management team, employees, Port users and stakeholders should be congratulated.
The oil and gas sector continued high usage of the port, despite predictions, and the demobilisation of major oil and gas logistics operations resulted in rig tenders spending greater time alongside the wharf to complete this major phase of their campaigns. The prediction of a possible loss making year in 2015-16 for the Port of Broome was turned around through consistent trade in cattle exports, fuel receivals, cruise shipping and general cargo handling. While there was a substantial increase in revenue KPA also achieved under budget expenditure for the year, leading to a profit, before tax and dividend, of $5.6M.
In relation to trade through the Port of Broome, we handled 53 large and small cruise vessels, and 29 ships loading 122,856 head of cattle (an increase of 29,229 head from the previous financial year’s export numbers). The oil and gas industry activity in the Browse Basin generated a significantly greater number of vessel visits to the port than expected.
KPA’s current future trade forecast has identified the potential for a significant downturn in oil and gas vessels utilising the Port of Broome. KPA needs to adapt to the challenges presented by fluctuations in revenue and operational requirements whilst remaining a 24/7 service port.
The safety of our people continues to be our highest priority, closely followed by protecting the environment and the security of our facilities. To ensure safety remains a top priority for KPA in its planning, decision making and operations, KPA has implemented five health, safety and environmental commitments which reflect our overall dedication. The commitments have been endorsed by the Board and form part KPA’s occupational health and safety management system, which is integral to embedding our safety first culture.
FROM THE CHAIRMAN AND CHIEF EXECUTIVE OFFICER
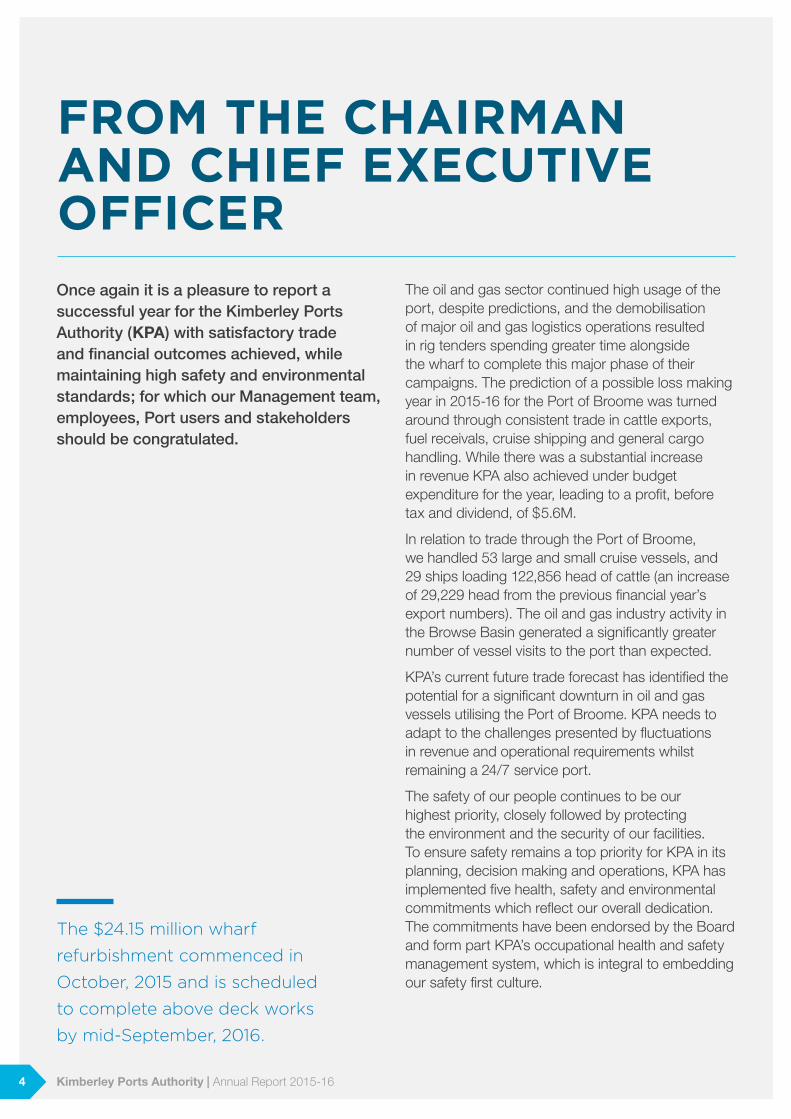
The $24.15 million wharf
refurbishment commenced in
October, 2015 and is scheduled
to complete above deck works
by mid-September, 2016.
4 Kimberley Ports Authority | Annual Report 2015-16
During the period KPA commenced a marine baseline study to gain a better understanding of the physical and biological attributes of the marine environment. In addition KPA has been working closely with the Department of Parks and Wildlife and Nyamba Buru Yawuru to form the basis on which the Roebuck Bay Marine Park may be established. The Marine Park will be adjacent to port waters and subject to Ministerial approval. KPA plans to surrender a portion of port waters to the Marine Park when finalised. The Marine Park, when established, will help to conserve marine biodiversity and provide special places for people to enjoy the park.
In relation to the Ports amalgamation process KPA continues to work very productively with Department of Transport (DoT) and the managers of the Ports of Derby, Wyndham and Yampi Sound to ensure the proposed transfer of responsibilities from DoT is smooth and seamless for port users and all stakeholders. The amalgamation should create new and significant opportunities for all concerned and the Kimberley region into the future.
During this busy operational year we commenced a major refurbishment of the Port of Broome’s 50 year old wharf structure. The $24.15 million, Government funded project commenced in October, 2015 and is scheduled to complete above deck works by mid-September, 2016.
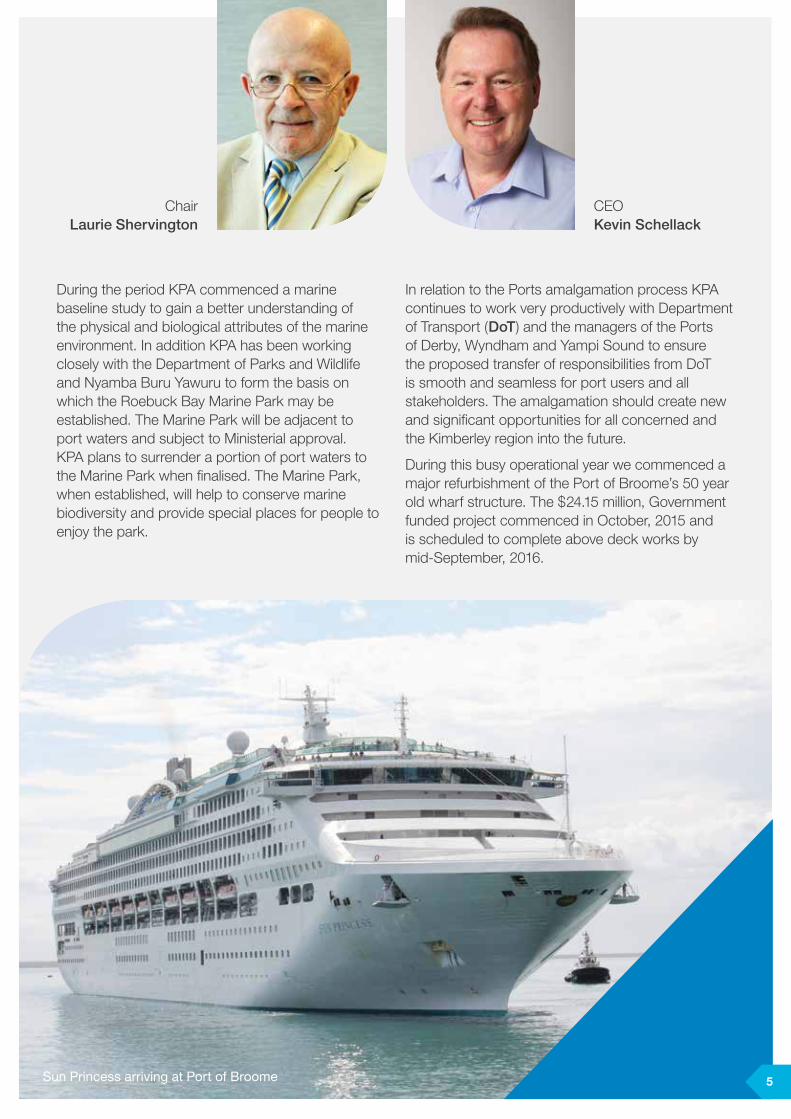
Chair Laurie Shervington
CEO Kevin Schellack
Sun Princess arriving at Port of Broome 5
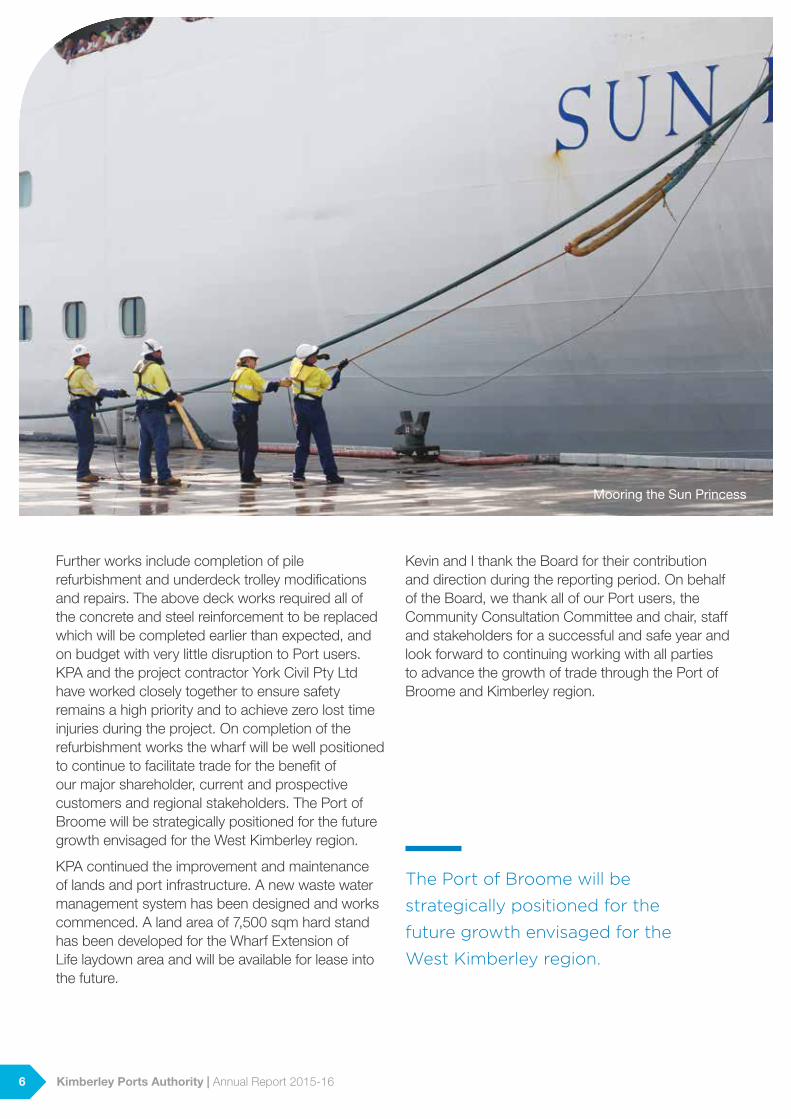
Further works include completion of pile refurbishment and underdeck trolley modifications and repairs. The above deck works required all of the concrete and steel reinforcement to be replaced which will be completed earlier than expected, and on budget with very little disruption to Port users. KPA and the project contractor York Civil Pty Ltd have worked closely together to ensure safety remains a high priority and to achieve zero lost time injuries during the project. On completion of the refurbishment works the wharf will be well positioned to continue to facilitate trade for the benefit of our major shareholder, current and prospective customers and regional stakeholders. The Port of Broome will be strategically positioned for the future growth envisaged for the West Kimberley region.
KPA continued the improvement and maintenance of lands and port infrastructure. A new waste water management system has been designed and works commenced. A land area of 7,500 sqm hard stand has been developed for the Wharf Extension of Life laydown area and will be available for lease into the future.
Kevin and I thank the Board for their contribution and direction during the reporting period. On behalf of the Board, we thank all of our Port users, the Community Consultation Committee and chair, staff and stakeholders for a successful and safe year and look forward to continuing working with all parties to advance the growth of trade through the Port of Broome and Kimberley region.
Mooring the Sun Princess
The Port of Broome will be
strategically positioned for the
future growth envisaged for the
West Kimberley region.
6 Kimberley Ports Authority | Annual Report 2015-16
2.AGENCY OVERVIEW
7
2.1 Agency PerformanceThe following information provides a measurement of agency performance against the Port Authority’s 2015-16 Statement of Corporate Intent.
Financial TargetsTarget Actual Variation
Financial Targets 2015-16 $000’s / % $000’s / % $000’s / %
Gross revenue 18,892 24,552 5660
Total services costs 19,189 18,921 (268)
Net Tax Equivalent paid to Treasury 0 1,691 1,691
Profit/Loss after tax (297) 3,940 4,237
Expected Dividend to be paid to Treasury 0 2,561 2,561
Net increase/(decrease) in cash (from Statement of Cash Flows) (1,642) 3,200 4,842
Rate of Return 0.9% 7.8% 6.9%
Capital Expenditure 11,934 11,315 (619)
Total Assets 64,204 71,385 7,181
Full time equivalent (FTE) staff numbers (last year/this year) 70 66 4
Table 1 – Financial Targets Targets
Variations in financial outcomes from those targeted prior to FY2015-16 were in the main due to significant additional stevedoring labour required for the demobilisation of a number of campaigns, and an increased export of bulk product being sent to rigs. Delays in the demobilisation of two campaigns led to higher than forecast oil and gas vessel visits between February and June. The 2016 live cattle export season started with a flourish with double the number of head being exported for the period. Cattle prices were high and pastoralists quickly took advantage of the situation, particularly given the low rainfall during the wet season. Even with the unforeseen revenue increase KPA maintained expenses below the Mid-Year-Review budget target and as a result the Port Authority returned a positive variance in EBITDA of $7.933M and Profit after Tax of $3.939M.
Customer Satisfaction KPA uses a range of methods to monitor customer satisfaction including regular face to face meetings, and hosting the KPA Logistics Working Group forum where various manager’s provide presentations and respond to customer questions.
A customer survey was finalised in June 2016 with 43 customers being invited to complete an on-line survey, and 22 customers’ participating in telephone interviews. The survey included a range of questions
regarding why the Port of Broome was selected, quality of service, equipment and facilities required, the town of Broome services utilised, pilotage and towage providers service quality, cost of services and quality of communications from KPA.
Key findings were that 71% of customers considered Port of Broome provided their required services and were reliable, 62% rated the quality of service as good or excellent. However, 71% of customers thought the port could improve services, and management is reviewing the survey findings to respond to specific issues highlighted.
2.2 Ministerial DirectionsNo Ministerial directions were received during the period.
2.3 Governance 2.3.1 Equal Opportunity KPA has an Equal Employment Opportunity Policy and employees are provided training in aspects of this policy and bullying and harassment every two years. KPA’s Equal Employment Opportunity Management Plan was recently updated and lodged with the Office of Equal Employment Opportunity.
8 Kimberley Ports Authority | Annual Report 2015-16
2.3.2 Human Resources KPA has a workforce of 83 including full-time, part-time and casual employees. Two replacement staff members were employed during the reporting period: one employee on a 12 month contract and another filling a temporary parental leave position. A consultant was also seconded to cover parental leave in a management position.
KPA continues to ensure that it is a workplace that fosters fairness, equity and diversity by providing equal opportunity employment based on merit, regardless of: sex, age, race, pregnancy, marital status, sexual orientation, family responsibility, religious or political conviction or impairment.
KPA has an Education Assistance Policy which provides financial support and study leave to encourage employees to gain higher skills and qualifications. Currently one employee is studying to attain a CPA accreditation, two employees are enrolled in Certificate IV in Business Management and Certificate IV in Frontline Management, while another is seeking a Masters qualification in Engineering Practice. During 2015-16, four stevedores enrolled in Certificate III level training in Transport and Logistics (Stevedoring).
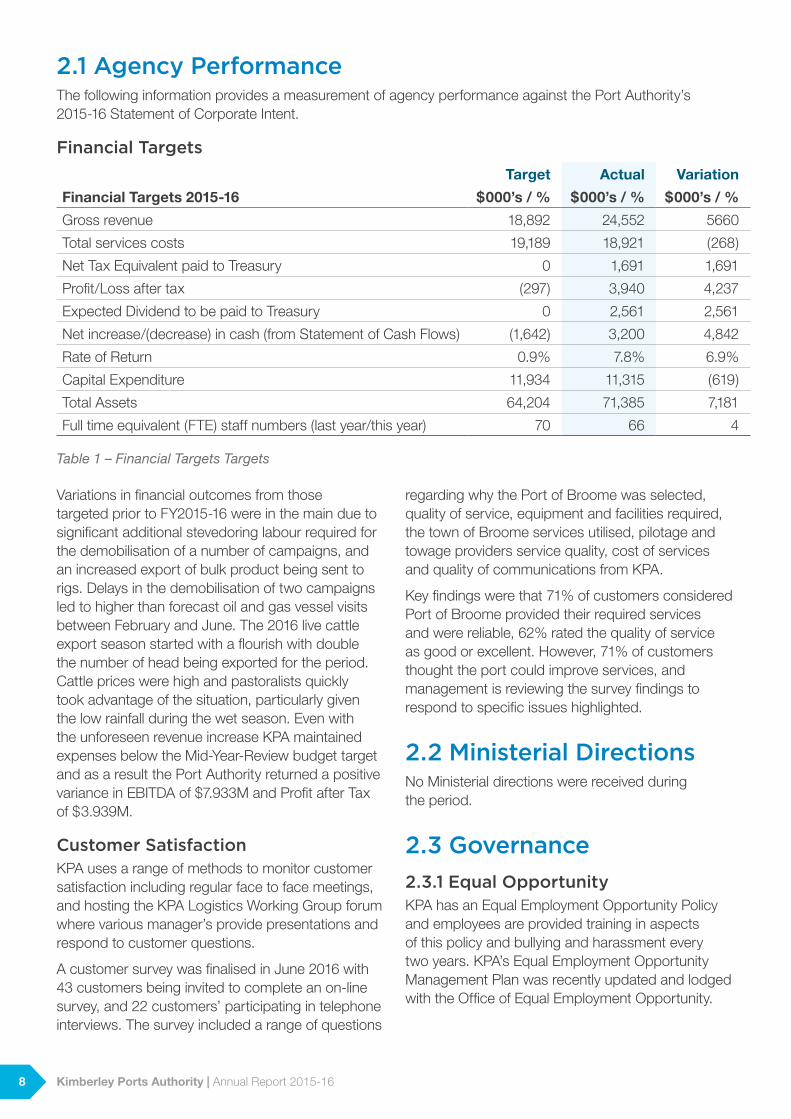
KPA staff at a Speed Careering Day
2.3.3 The State Records Act 2000 KPA has a registered Recordkeeping Plan – RKP 2014035, revised and updated in late 2014, and uses ELO Digital for electronic recordkeeping which is a fully functional Electronic Document Recording Management System. Record Keeping Awareness training was delivered to two of three new office personnel, with one staff member still to finalise their training.
2.3.4 Freedom of Information The Information Statement was updated in June 2016 to reflect current legislation and communication requirements. The Information Statement explains how to lodge a Freedom of Information request, lists associated charges, and explains how a copy of the relevant document is available either from the Port Authority offices or via the website – www.kimberleyports.wa.gov.au
There have been no FoI applications made under the Freedom of Information Act 1992 during the financial year 2015-16.
9Kimberley Ports Authority | Annual Report 2015-16
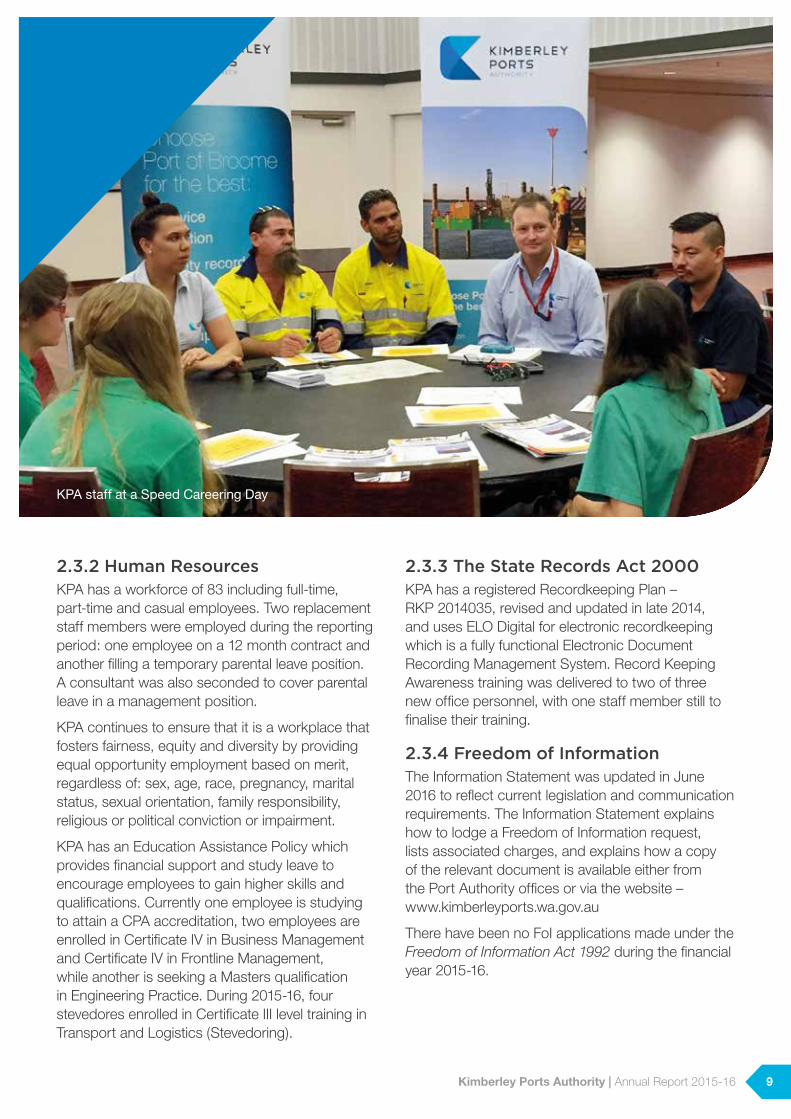
2.3.5 Electoral Act 1907 – Section 175ZEIn accordance with Section 175Ze of the Electoral Act 1907, KPA incurred the following expenses in media advertising and research.
Agency / Organisation Class Value
Aspermont Media Advertising Organisation $2,100
Broome Advertiser Media Advertising Organisation $5,733
GoGo On Hold Pty Ltd Media Advertising Organisation $753
key2creative Media Advertising Organisation $8,320
Mills Wilson Tudorview Media Advertising Organisation $7,065
Purple Communications Media Advertising Organisation $1,210
Redwave Media Pty Ltd Media Advertising Organisation $700
Survey Monkey Market Research Organisations $273
West Australian Newspapers Ltd Media Advertising Organisation $468
Seek Media Advertising Organisation $889
$27,510
Table 2 – Advertising 2016
2.3.6 Risk ManagementRisk management plays an important role within Port decision making functions, from wharf operations through to contractual arrangements and Board decisions. Areas of focus over the last 12 months include:
y Due diligence studies on the ports of Wyndham, Derby and Yampi Sound as part of the ports amalgamation process. In this regard, the Board Chairman heads a port amalgamation risk committee;
y Reviewing KPA risks in keeping with KPA’s updated Risk Reference Tables; and
y Monitoring and ensuring the controls and Treatment Action Plans identified to manage risks associated with the wharf extension of life project are in place and well documented.
The KPA Board has the following sub-Committees: Risk; Governance; and Audit, Human Resources and Remuneration to assess and monitor KPA’s risk profile.
2.3.7 Compliance with LegislationKPA uses professional legal advisers to ensure that KPA documentation and agreements meet best practice and complies with all relevant legislation. Professional staff attend regular training to keep their qualifications up-to-date. KPA also receives newsletters and circulars to stay informed of significant changes to key legislation. A new software system – Integrum is also being adopted. Once the project is complete, the software will record key legislation and establish systems to ensure that the legislation is complied with and monitored on a regular basis.
2.3.8 Insurance of Directors and OfficersKPA’s Directors and Officers are insured against liabilities for costs and expenses incurred by them in defending any civil or criminal proceedings arising out of the lawful performance of their Port Authority duties. Coverage excludes conduct involving a number of matters including a wilful breach of duty in relation to their employment or appointment to the KPA Board.
10 Kimberley Ports Authority | Annual Report 2015-16
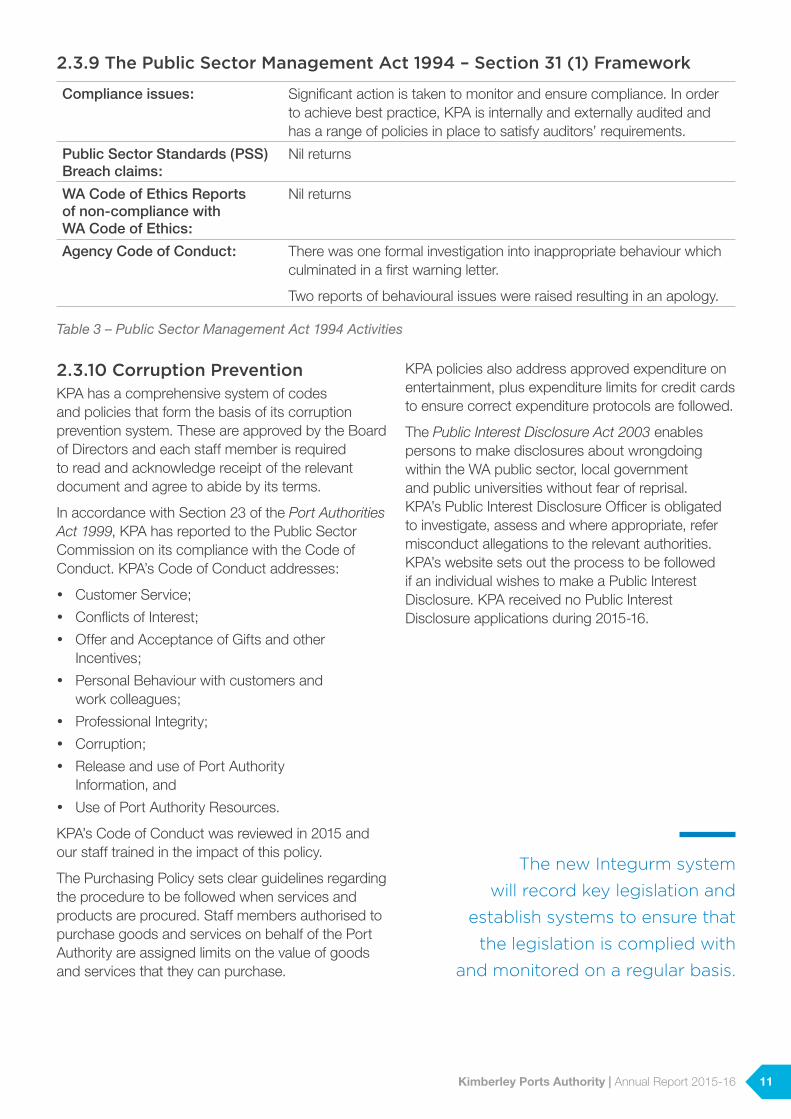
2.3.9 The Public Sector Management Act 1994 – Section 31 (1) Framework
Compliance issues: Significant action is taken to monitor and ensure compliance. In order to achieve best practice, KPA is internally and externally audited and has a range of policies in place to satisfy auditors’ requirements.
Public Sector Standards (PSS) Breach claims:
Nil returns
WA Code of Ethics Reports of non-compliance with WA Code of Ethics:
Nil returns
Agency Code of Conduct: There was one formal investigation into inappropriate behaviour which culminated in a first warning letter.
Two reports of behavioural issues were raised resulting in an apology.
Table 3 – Public Sector Management Act 1994 Activities
2.3.10 Corruption PreventionKPA has a comprehensive system of codes and policies that form the basis of its corruption prevention system. These are approved by the Board of Directors and each staff member is required to read and acknowledge receipt of the relevant document and agree to abide by its terms.
In accordance with Section 23 of the Port Authorities Act 1999, KPA has reported to the Public Sector Commission on its compliance with the Code of Conduct. KPA’s Code of Conduct addresses:
y Customer Service;
y Conflicts of Interest;
y Offer and Acceptance of Gifts and other Incentives;
y Personal Behaviour with customers and work colleagues;
y Professional Integrity;
y Corruption;
y Release and use of Port Authority Information, and
y Use of Port Authority Resources.
KPA’s Code of Conduct was reviewed in 2015 and our staff trained in the impact of this policy.
The Purchasing Policy sets clear guidelines regarding the procedure to be followed when services and products are procured. Staff members authorised to purchase goods and services on behalf of the Port Authority are assigned limits on the value of goods and services that they can purchase.
KPA policies also address approved expenditure on entertainment, plus expenditure limits for credit cards to ensure correct expenditure protocols are followed.
The Public Interest Disclosure Act 2003 enables persons to make disclosures about wrongdoing within the WA public sector, local government and public universities without fear of reprisal. KPA’s Public Interest Disclosure Officer is obligated to investigate, assess and where appropriate, refer misconduct allegations to the relevant authorities. KPA’s website sets out the process to be followed if an individual wishes to make a Public Interest Disclosure. KPA received no Public Interest Disclosure applications during 2015-16.
The new Integurm system
will record key legislation and
establish systems to ensure that
the legislation is complied with
and monitored on a regular basis.
11Kimberley Ports Authority | Annual Report 2015-16
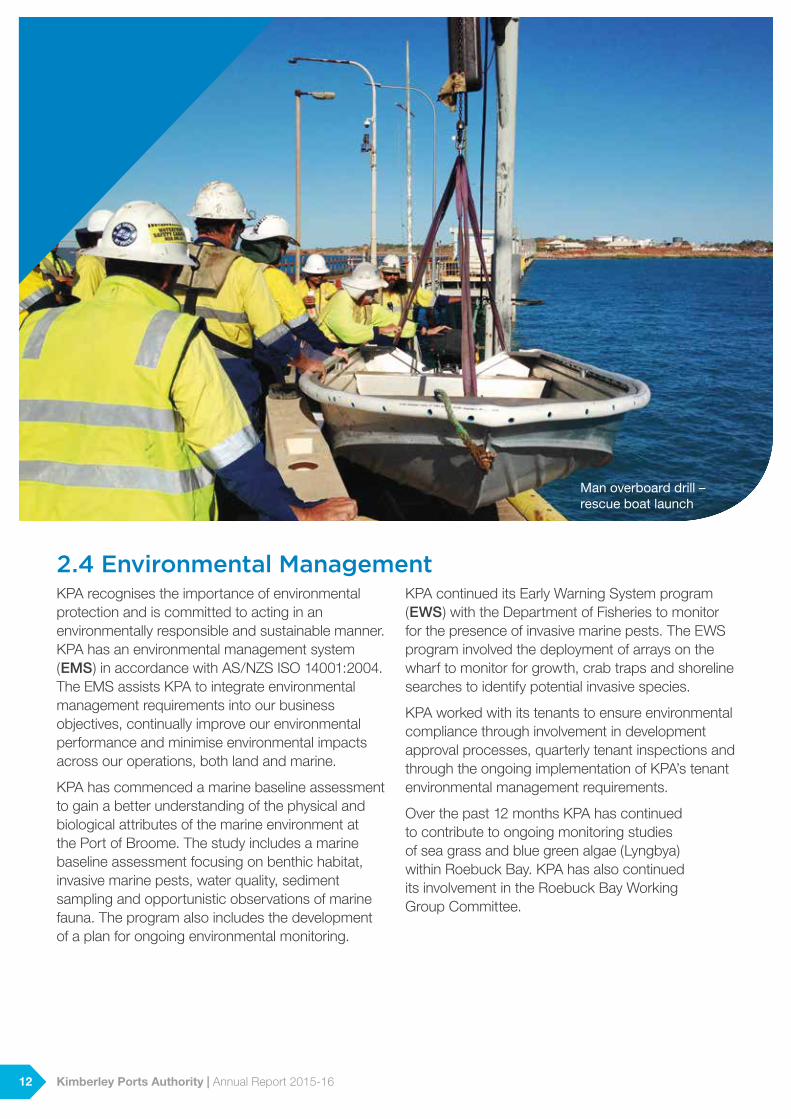
2.4 Environmental ManagementKPA recognises the importance of environmental protection and is committed to acting in an environmentally responsible and sustainable manner. KPA has an environmental management system (EMS) in accordance with AS/NZS ISO 14001:2004. The EMS assists KPA to integrate environmental management requirements into our business objectives, continually improve our environmental performance and minimise environmental impacts across our operations, both land and marine.
KPA has commenced a marine baseline assessment to gain a better understanding of the physical and biological attributes of the marine environment at the Port of Broome. The study includes a marine baseline assessment focusing on benthic habitat, invasive marine pests, water quality, sediment sampling and opportunistic observations of marine fauna. The program also includes the development of a plan for ongoing environmental monitoring.
KPA continued its Early Warning System program (EWS) with the Department of Fisheries to monitor for the presence of invasive marine pests. The EWS program involved the deployment of arrays on the wharf to monitor for growth, crab traps and shoreline searches to identify potential invasive species.
KPA worked with its tenants to ensure environmental compliance through involvement in development approval processes, quarterly tenant inspections and through the ongoing implementation of KPA’s tenant environmental management requirements.
Over the past 12 months KPA has continued to contribute to ongoing monitoring studies of sea grass and blue green algae (Lyngbya) within Roebuck Bay. KPA has also continued its involvement in the Roebuck Bay Working Group Committee.
Man overboard drill – rescue boat launch
12 Kimberley Ports Authority | Annual Report 2015-16
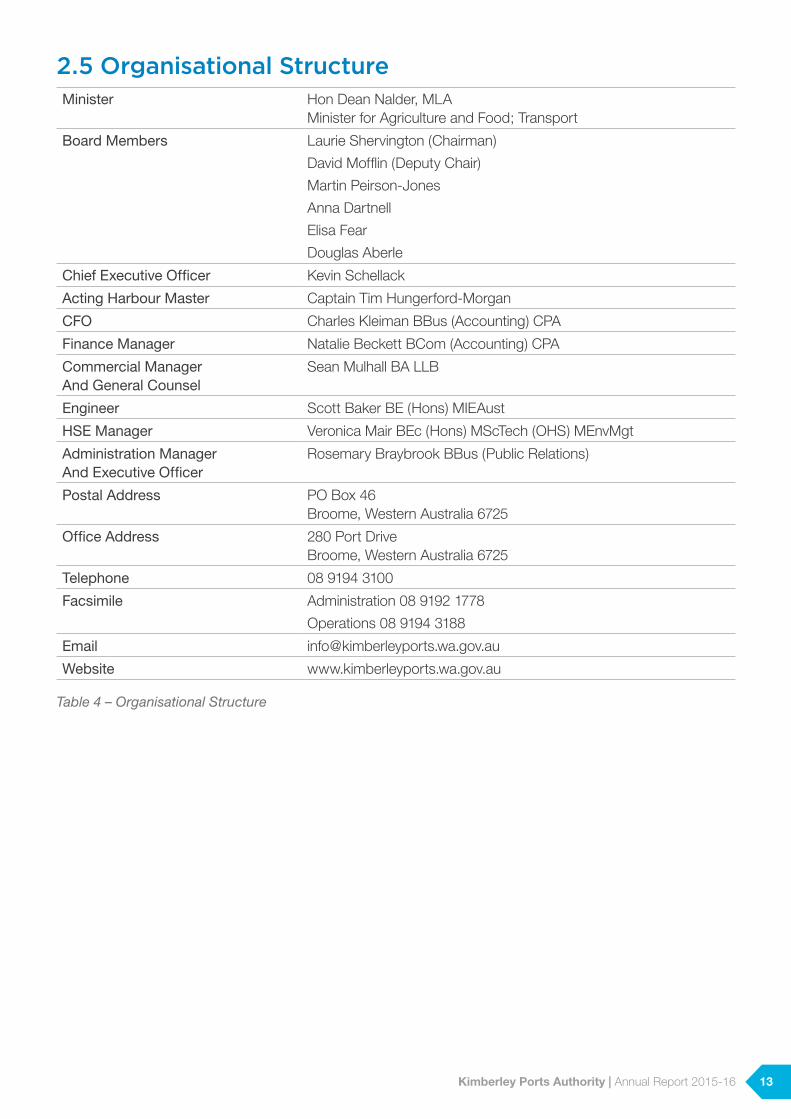
2.5 Organisational StructureMinister Hon Dean Nalder, MLA
Minister for Agriculture and Food; Transport
Board Members Laurie Shervington (Chairman)
David Mofflin (Deputy Chair)
Martin Peirson-Jones
Anna Dartnell
Elisa Fear
Douglas Aberle
Chief Executive Officer Kevin Schellack
Acting Harbour Master Captain Tim Hungerford-Morgan
CFO Charles Kleiman BBus (Accounting) CPA
Finance Manager Natalie Beckett BCom (Accounting) CPA
Commercial Manager And General Counsel
Sean Mulhall BA LLB
Engineer Scott Baker BE (Hons) MIEAust
HSE Manager Veronica Mair BEc (Hons) MScTech (OHS) MEnvMgt
Administration Manager And Executive Officer
Rosemary Braybrook BBus (Public Relations)
Postal Address PO Box 46 Broome, Western Australia 6725
Office Address 280 Port Drive Broome, Western Australia 6725
Telephone 08 9194 3100
Facsimile Administration 08 9192 1778
Operations 08 9194 3188
Email [email protected]
Website www.kimberleyports.wa.gov.au
Table 4 – Organisational Structure
13Kimberley Ports Authority | Annual Report 2015-16
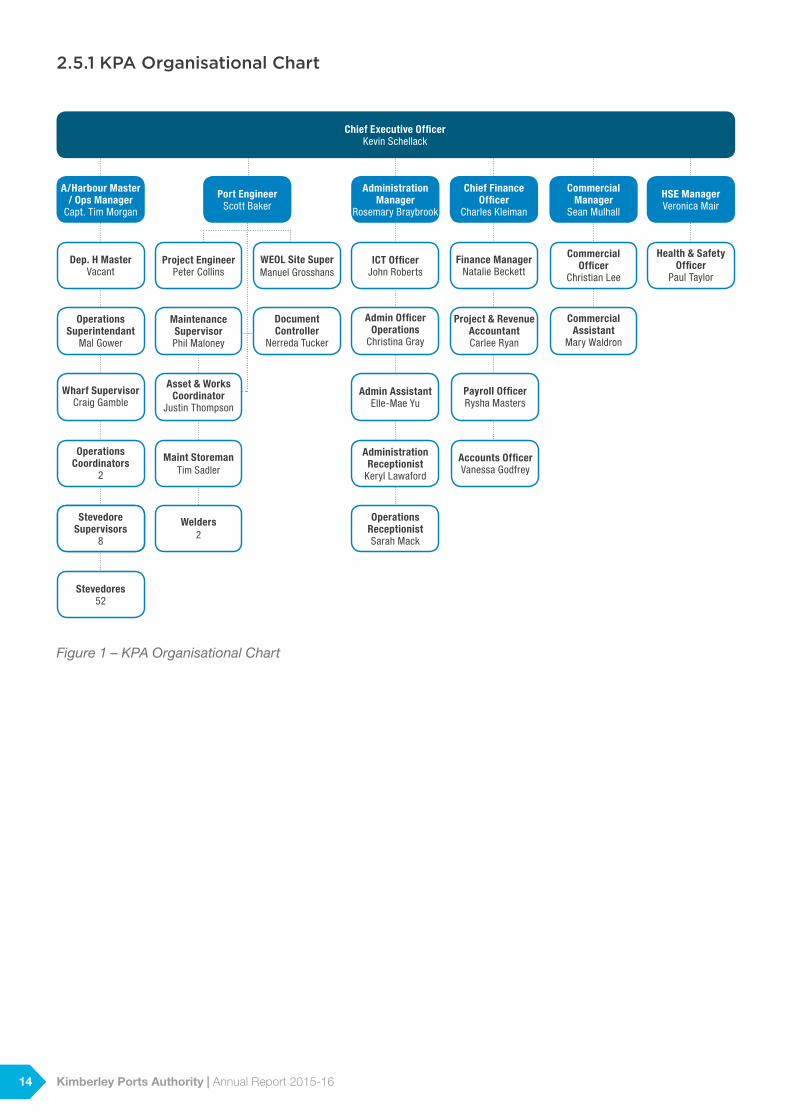
2.5.1 KPA Organisational Chart
A/Harbour Master / Ops Manager
Capt. Tim Morgan
Commercial Manager
Sean Mulhall
Port Engineer Scott Baker
Administration Manager
Rosemary Braybrook
Chief Finance Officer
Charles Kleiman
HSE Manager Veronica Mair
Chief Executive Officer Kevin Schellack
Dep. H Master Vacant
Wharf Supervisor Craig Gamble
Operations Superintendant
Mal Gower
Stevedore Supervisors
8
Stevedores 52
Operations Coordinators
2
Maintenance Supervisor Phil Maloney
Asset & Works Coordinator
Justin Thompson
Project Engineer Peter Collins
Maint Storeman Tim Sadler
Welders 2
WEOL Site Super Manuel Grosshans
Document Controller
Nerreda Tucker
Administration Receptionist
Keryl Lawaford
ICT Officer John Roberts
Admin Assistant Elle-Mae Yu
Admin Officer Operations
Christina Gray
Operations Receptionist Sarah Mack
Finance Manager Natalie Beckett
Project & Revenue Accountant Carlee Ryan
Payroll Officer Rysha Masters
Accounts Officer Vanessa Godfrey
Commercial Officer
Christian Lee
Commercial Assistant
Mary Waldron
Health & Safety Officer
Paul Taylor
Figure 1 – KPA Organisational Chart
14 Kimberley Ports Authority | Annual Report 2015-16
3.OPERATIONAL PERFORMANCE
15
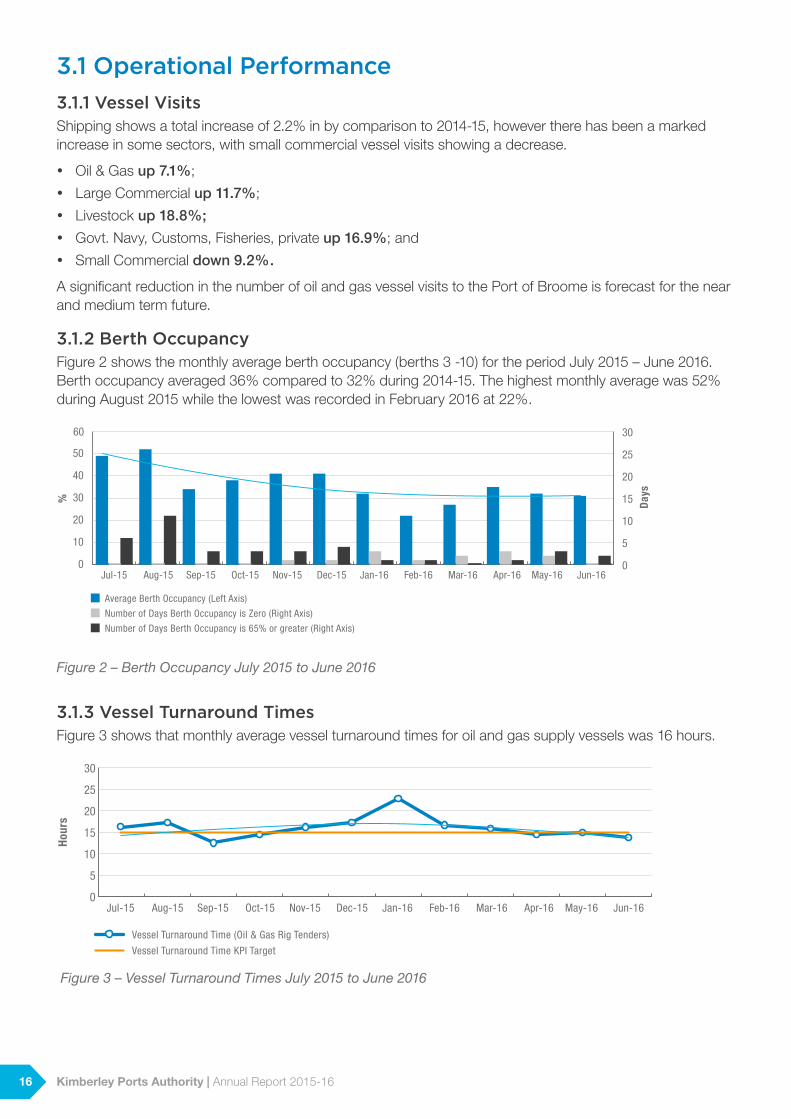
3.1 Operational Performance3.1.1 Vessel VisitsShipping shows a total increase of 2.2% in by comparison to 2014-15, however there has been a marked increase in some sectors, with small commercial vessel visits showing a decrease.
y Oil & Gas up 7.1%;
y Large Commercial up 11.7%;
y Livestock up 18.8%;
y Govt. Navy, Customs, Fisheries, private up 16.9%; and
y Small Commercial down 9.2%.
A significant reduction in the number of oil and gas vessel visits to the Port of Broome is forecast for the near and medium term future.
3.1.2 Berth Occupancy Figure 2 shows the monthly average berth occupancy (berths 3 -10) for the period July 2015 – June 2016. Berth occupancy averaged 36% compared to 32% during 2014-15. The highest monthly average was 52% during August 2015 while the lowest was recorded in February 2016 at 22%.
Average Berth Occupancy (Left Axis)
Number of Days Berth Occupancy is Zero (Right Axis)
Number of Days Berth Occupancy is 65% or greater (Right Axis)
Jul-15 Aug-15 Sep-15 Oct-15 Nov-15 Dec-15 Jan-16 Feb-16 Mar-16 Apr-16 May-16 Jun-160
10
20
30
40
50
60
%
0
5
10
15
20
25
30
Day
s
Figure 2 – Berth Occupancy July 2015 to June 2016
3.1.3 Vessel Turnaround TimesFigure 3 shows that monthly average vessel turnaround times for oil and gas supply vessels was 16 hours.
Vessel Turnaround Time (Oil & Gas Rig Tenders)
Vessel Turnaround Time KPI Target
Jul-15 Aug-15 Sep-15 Oct-15 Nov-15 Dec-15 Jan-16 Feb-16 Mar-16 Apr-16 May-16 Jun-16
Hour
s
0
5
10
15
20
25
30
Figure 3 – Vessel Turnaround Times July 2015 to June 2016
16 Kimberley Ports Authority | Annual Report 2015-16
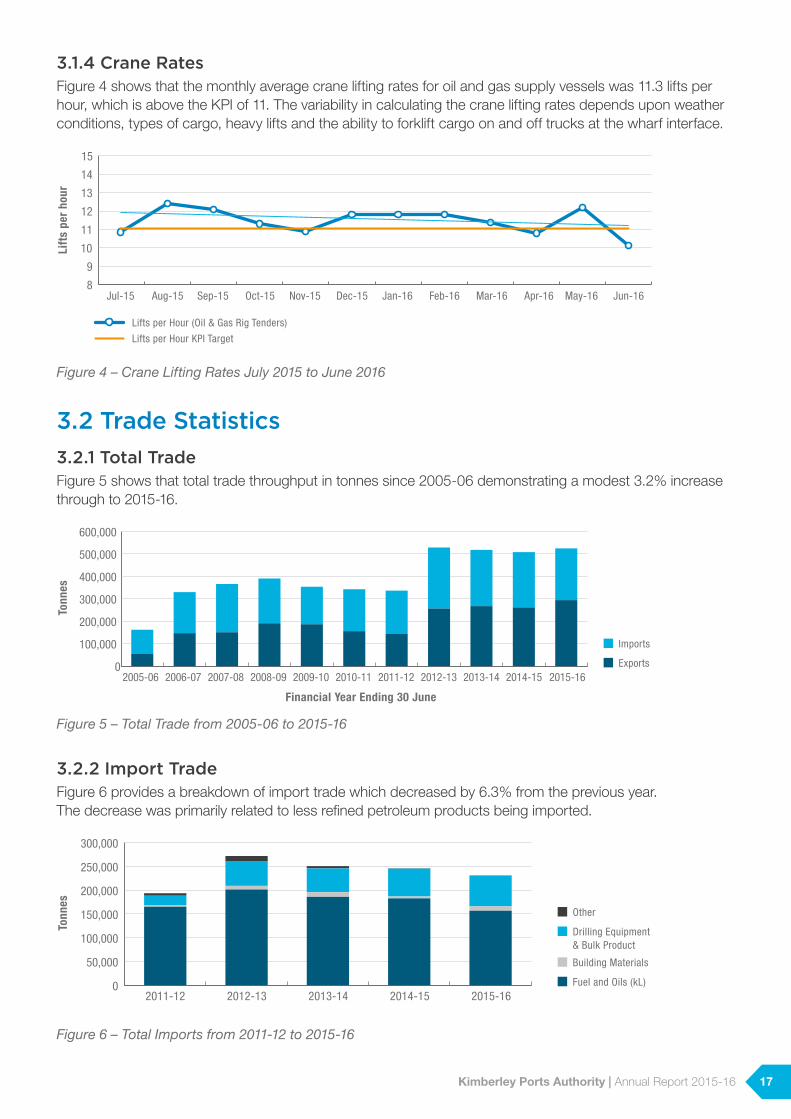
3.1.4 Crane RatesFigure 4 shows that the monthly average crane lifting rates for oil and gas supply vessels was 11.3 lifts per hour, which is above the KPI of 11. The variability in calculating the crane lifting rates depends upon weather conditions, types of cargo, heavy lifts and the ability to forklift cargo on and off trucks at the wharf interface.
Lifts per Hour (Oil & Gas Rig Tenders)
Lifts per Hour KPI Target
Jul-15 Aug-15 Sep-15 Oct-15 Nov-15 Dec-15 Jan-16 Feb-16 Mar-16 Apr-16 May-16 Jun-16
Lift
s pe
r ho
ur
8
9
10
11
12
13
14
15
Figure 4 – Crane Lifting Rates July 2015 to June 2016
3.2 Trade Statistics 3.2.1 Total Trade Figure 5 shows that total trade throughput in tonnes since 2005-06 demonstrating a modest 3.2% increase through to 2015-16.
Imports
Exports2010-112009-10 2011-12 2012-132006-072005-06 2007-08 2008-09 2013-14 2014-15 2015-16
0
100,000
200,000
300,000
400,000
500,000
600,000
Tonn
es
Financial Year Ending 30 June
Figure 5 – Total Trade from 2005-06 to 2015-16
3.2.2 Import Trade Figure 6 provides a breakdown of import trade which decreased by 6.3% from the previous year. The decrease was primarily related to less refined petroleum products being imported.
Other
Drilling Equipment& Bulk Product
Building Materials
Fuel and Oils (kL)2011-12 2012-13 2013-14 2014-15 2015-16
0
50,000
100,000
150,000
200,000
250,000
300,000
Tonn
es
Figure 6 – Total Imports from 2011-12 to 2015-16
17Kimberley Ports Authority | Annual Report 2015-16
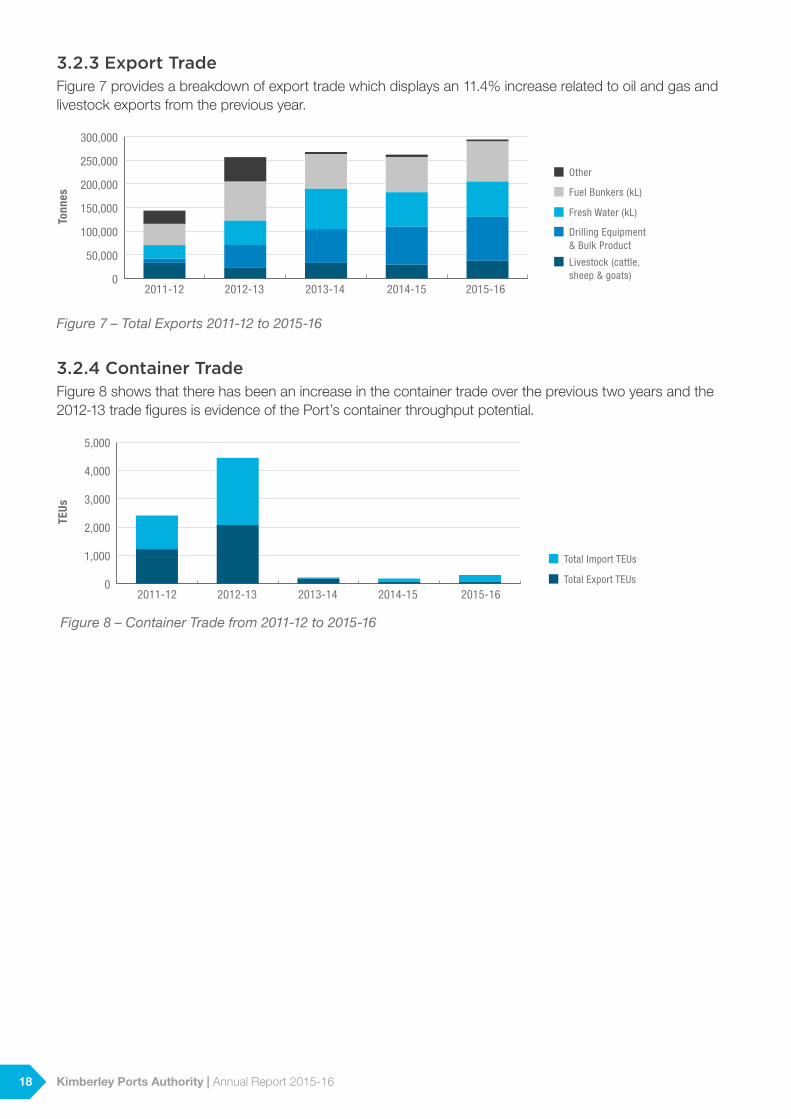
3.2.3 Export TradeFigure 7 provides a breakdown of export trade which displays an 11.4% increase related to oil and gas and livestock exports from the previous year.
Other
Drilling Equipment & Bulk Product
Livestock (cattle,sheep & goats)
Fuel Bunkers (kL)
Fresh Water (kL)
2011-12 2012-13 2013-14 2015-162014-150
50,000
100,000
150,000
200,000
250,000
300,000
Tonn
es
Figure 7 – Total Exports 2011-12 to 2015-16
3.2.4 Container TradeFigure 8 shows that there has been an increase in the container trade over the previous two years and the 2012-13 trade figures is evidence of the Port’s container throughput potential.
Total Import TEUs
Total Export TEUs
2011-12 2012-13 2013-14 2014-15 2015-160
1,000
2,000
3,000
4,000
5,000
TEUs
Figure 8 – Container Trade from 2011-12 to 2015-16
18 Kimberley Ports Authority | Annual Report 2015-16
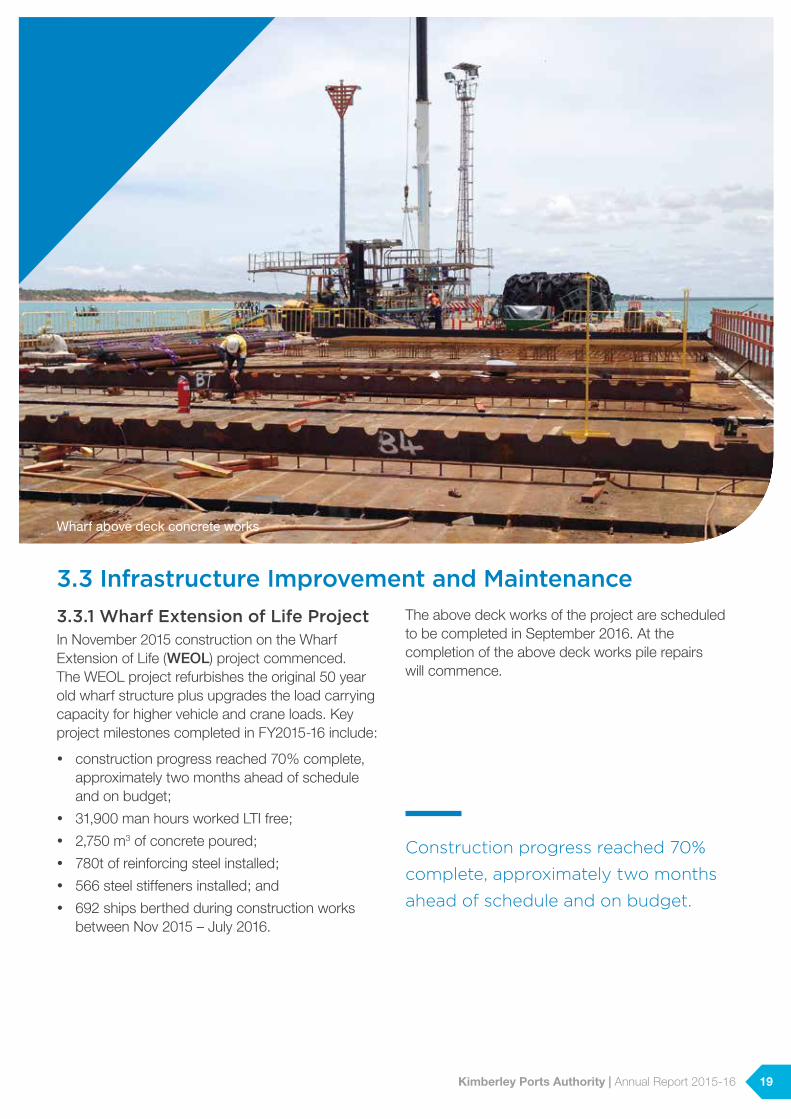
3.3 Infrastructure Improvement and Maintenance
Wharf above deck concrete works
3.3.1 Wharf Extension of Life ProjectIn November 2015 construction on the Wharf Extension of Life (WEOL) project commenced. The WEOL project refurbishes the original 50 year old wharf structure plus upgrades the load carrying capacity for higher vehicle and crane loads. Key project milestones completed in FY2015-16 include:
y construction progress reached 70% complete, approximately two months ahead of schedule and on budget;
y 31,900 man hours worked LTI free;
y 2,750 m3 of concrete poured;
y 780t of reinforcing steel installed;
y 566 steel stiffeners installed; and
y 692 ships berthed during construction works between Nov 2015 – July 2016.
The above deck works of the project are scheduled to be completed in September 2016. At the completion of the above deck works pile repairs will commence.
Construction progress reached 70%
complete, approximately two months
ahead of schedule and on budget.
19Kimberley Ports Authority | Annual Report 2015-16
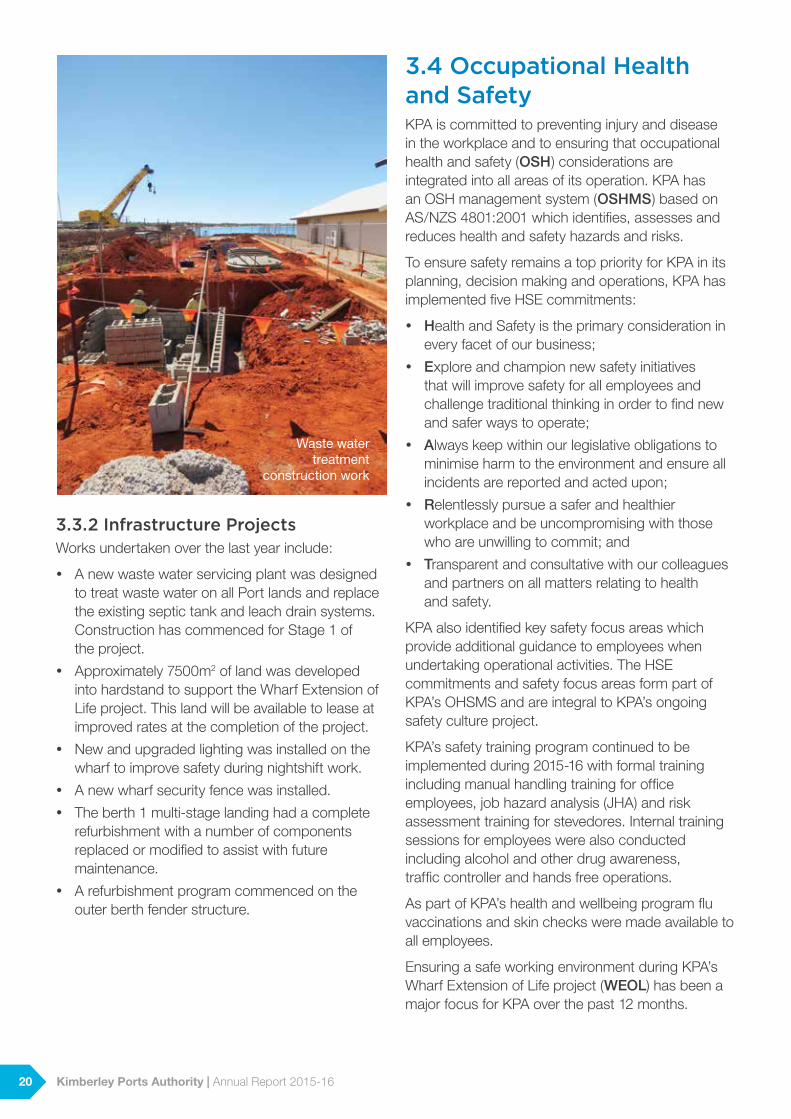
3.3.2 Infrastructure ProjectsWorks undertaken over the last year include:
y A new waste water servicing plant was designed to treat waste water on all Port lands and replace the existing septic tank and leach drain systems. Construction has commenced for Stage 1 of the project.
y Approximately 7500m2 of land was developed into hardstand to support the Wharf Extension of Life project. This land will be available to lease at improved rates at the completion of the project.
y New and upgraded lighting was installed on the wharf to improve safety during nightshift work.
y A new wharf security fence was installed.
y The berth 1 multi-stage landing had a complete refurbishment with a number of components replaced or modified to assist with future maintenance.
y A refurbishment program commenced on the outer berth fender structure.
3.4 Occupational Health and SafetyKPA is committed to preventing injury and disease in the workplace and to ensuring that occupational health and safety (OSH) considerations are integrated into all areas of its operation. KPA has an OSH management system (OSHMS) based on AS/NZS 4801:2001 which identifies, assesses and reduces health and safety hazards and risks.
To ensure safety remains a top priority for KPA in its planning, decision making and operations, KPA has implemented five HSE commitments:
y Health and Safety is the primary consideration in every facet of our business;
y Explore and champion new safety initiatives that will improve safety for all employees and challenge traditional thinking in order to find new and safer ways to operate;
y Always keep within our legislative obligations to minimise harm to the environment and ensure all incidents are reported and acted upon;
y Relentlessly pursue a safer and healthier workplace and be uncompromising with those who are unwilling to commit; and
y Transparent and consultative with our colleagues and partners on all matters relating to health and safety.
KPA also identified key safety focus areas which provide additional guidance to employees when undertaking operational activities. The HSE commitments and safety focus areas form part of KPA’s OHSMS and are integral to KPA’s ongoing safety culture project.
KPA’s safety training program continued to be implemented during 2015-16 with formal training including manual handling training for office employees, job hazard analysis (JHA) and risk assessment training for stevedores. Internal training sessions for employees were also conducted including alcohol and other drug awareness, traffic controller and hands free operations.
As part of KPA’s health and wellbeing program flu vaccinations and skin checks were made available to all employees.
Ensuring a safe working environment during KPA’s Wharf Extension of Life project (WEOL) has been a major focus for KPA over the past 12 months.
Waste water treatment
construction work
20 Kimberley Ports Authority | Annual Report 2015-16

KPA and the project contractor have worked together to ensure safety remains a high priority and to achieve zero lost time injuries during the project. KPA has monitored the safety systems of the contractor through regular workplace inspections, attendance at toolbox talks, review of the project risk assessments and safety documentation, participation in the contractor’s safety workshop and through an HSE audit of the contractor’s systems. To ensure port users were made aware of the changes on the wharf during the WEOL project KPA utilised a variety of communication methods including updates on the websites, memorandums and information sessions for port users.
3.4.1 Commitment to Occupational Safety and HealthSafety is a key focus for KPA and we are committed to providing a safe and healthy work environment for all employees, contractors, port users and visitors. KPA aims for zero harm in the workplace and encourages all employees and contractors to identify and report hazards, incidents and near misses.
KPA’s board and management team take a strong leadership approach in regards to safety. KPA’s management team have safety key performance indicators (KPI’s) which include regular attendance at HSE committee meetings, participation in workplace inspections and regular safety conversations.
3.4.2 Formal Mechanism for Consultation with Employees on OSH MattersKPA recognises that consultation and communication with the workforce is fundamental to an effective OSHMS. KPA has a HSE Committee with seven employee safety representatives and four management representatives. All employee safety representatives undertake formal safety and health representative training. In 2015-16 nine HSE Committee meetings were conducted.
The committee plays an important role in the workplace consultation process and are involved in discussing and reviewing hazards, risks and changes in the workplace. During the reporting period the HSE Committee was integral in raising and resolving a working at heights hazard that was identified when stevedores were undertaking loading and unloading operations on trailer access platforms. A handrail system was developed that addressed the issue of a fall from height while also ensuring a crush hazard was not introduced into the process. KPA’s maintenance team also assisted with the fabrication of the system, making this a team effort to resolve the issue.
OSH information is communicated to employees through team meetings, toolbox talks, after action review meetings and in-house training sessions. Safety notices, updates, posters and monthly hazard reviews are also placed on workplace safety notice boards. The Port Induction provides employees and port users with important safety and environment information.
3.4.3 Injury Management and Workers CompensationKPA is committed to assisting employees who have become injured or ill due to work to return to their pre-existing duties as soon as medically appropriate in accordance with the Workers Compensation and Injury Management Act 1981.
KPA’s Workplace Injury Management Procedure is distributed to all employees and information on injury management is included in new employee inductions. KPA supports the injury management process and understands that success relies on the active participation and cooperation of all parties including the injured worker, treating medical practitioners, insurance provider and KPA. As part of the injury management process KPA develops return to work plans with the injured worker, their supervisor and the return to work coordinator.
3.4.4 Occupational Safety and Health Management SystemsKPA has an effective OSHMS that is internally reviewed on an annual basis. During the reporting period KPA received a Platinum IFAP Safety Achievement Award. As part of the evaluation process for this award IFAP undertook a site audit and desktop review of KPA’s OSHMS.
Ensuring a safe working
environment during KPA’s Wharf
Extension of Life project has been
a major focus for KPA over the
past 12 months.
21Kimberley Ports Authority | Annual Report 2015-16
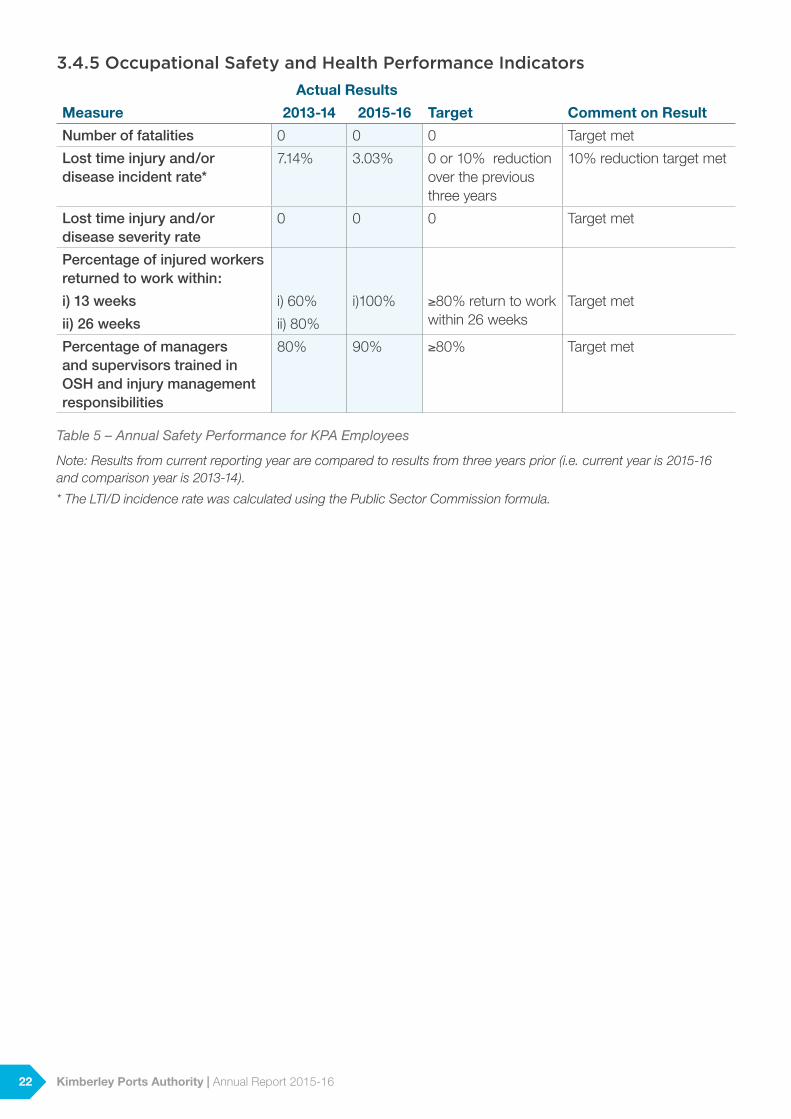
3.4.5 Occupational Safety and Health Performance IndicatorsActual Results
Measure 2013-14 2015-16 Target Comment on Result
Number of fatalities 0 0 0 Target met
Lost time injury and/or disease incident rate*
7.14% 3.03% 0 or 10% reduction over the previous three years
10% reduction target met
Lost time injury and/or disease severity rate
0 0 0 Target met
Percentage of injured workers returned to work within:
i) 13 weeks i) 60% i)100% ≥80% return to work within 26 weeks
Target met
ii) 26 weeks ii) 80%
Percentage of managers and supervisors trained in OSH and injury management responsibilities
80% 90% ≥80% Target met
Table 5 – Annual Safety Performance for KPA Employees
Note: Results from current reporting year are compared to results from three years prior (i.e. current year is 2015-16 and comparison year is 2013-14).
* The LTI/D incidence rate was calculated using the Public Sector Commission formula.
22 Kimberley Ports Authority | Annual Report 2015-16
4.DIRECTORS REPORT
23
4.1 Role of the BoardIn accordance with the Port Authorities Act 1999 (WA) the Board of Kimberley Ports Authority is its governing body, and the Board, in the name of the Port Authority, is to perform the functions, determine the policies and control the affairs of the Port Authority.
4.2 Directors’ RightsIf required, Directors are provided with access to independent legal or financial advice as an approved KPA expense and are entitled to access KPA records for a period of seven years following retirement from the Board.
4.3 Directors’ DetailsThe names and details of the Directors of the Kimberley Ports Authority during the financial year and until 30 June 2016 are:
4.3.1 Mr Laurie Shervington LLB – ChairmanLLB, FAICD, SF FIN, FCL, LLM (Applied Law) (Honorary)
Mr Shervington was appointed on 24 March 2011. He has been a practicing lawyer for 48 years and has listed public company and private company experience as a director. His current term expires 30 June 2017.
4.3.2 Dr David Mofflin – Deputy Chair PhD(Cantab), BE Hons, FIEAust
David has broad experience in the engineering sector, including overall business management, strategic planning, business acquisition, project advisory, project due diligence, technology commercialisation, and project management. In recent times he has been engaged in developing bankable feasibilities and delivery strategies for multi-billion dollar mining projects. David is a civil engineer, and holds a PhD from the University of Cambridge. Until recently he was a non-executive director of Engineering Education Australia, and a past Chair of the WA Centre for Engineering Leadership and Management. For over 20 years he held various roles at WorleyParsons, including Executive Director, Director, and General Manager.
David was appointed to the Board on 21 October 2013 and his current term expires on 31 December 2016.
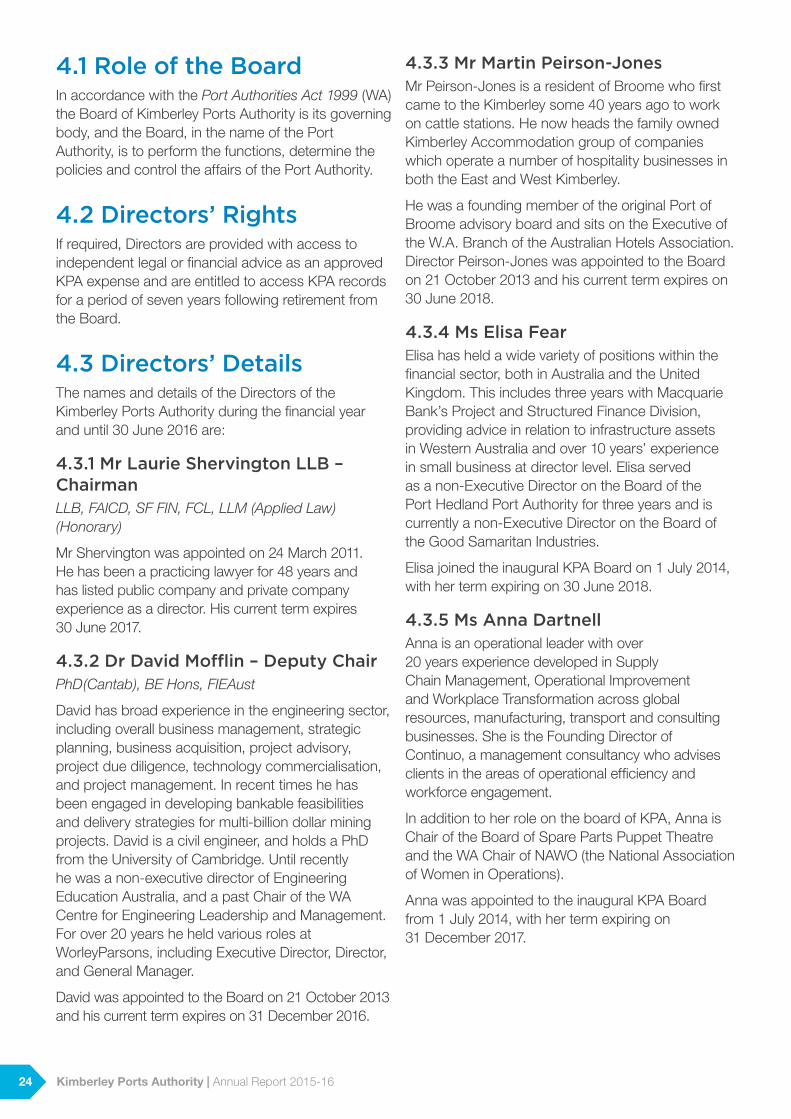
4.3.3 Mr Martin Peirson-JonesMr Peirson-Jones is a resident of Broome who first came to the Kimberley some 40 years ago to work on cattle stations. He now heads the family owned Kimberley Accommodation group of companies which operate a number of hospitality businesses in both the East and West Kimberley.
He was a founding member of the original Port of Broome advisory board and sits on the Executive of the W.A. Branch of the Australian Hotels Association. Director Peirson-Jones was appointed to the Board on 21 October 2013 and his current term expires on 30 June 2018.
4.3.4 Ms Elisa Fear Elisa has held a wide variety of positions within the financial sector, both in Australia and the United Kingdom. This includes three years with Macquarie Bank’s Project and Structured Finance Division, providing advice in relation to infrastructure assets in Western Australia and over 10 years’ experience in small business at director level. Elisa served as a non-Executive Director on the Board of the Port Hedland Port Authority for three years and is currently a non-Executive Director on the Board of the Good Samaritan Industries.
Elisa joined the inaugural KPA Board on 1 July 2014, with her term expiring on 30 June 2018.
4.3.5 Ms Anna Dartnell Anna is an operational leader with over 20 years experience developed in Supply Chain Management, Operational Improvement and Workplace Transformation across global resources, manufacturing, transport and consulting businesses. She is the Founding Director of Continuo, a management consultancy who advises clients in the areas of operational efficiency and workforce engagement.
In addition to her role on the board of KPA, Anna is Chair of the Board of Spare Parts Puppet Theatre and the WA Chair of NAWO (the National Association of Women in Operations).
Anna was appointed to the inaugural KPA Board from 1 July 2014, with her term expiring on 31 December 2017.
24 Kimberley Ports Authority | Annual Report 2015-16
4.3.6 Mr Douglas Aberle MEngSc, BE(Hons), FIEAust, CPEng, FAICD, AARC(Master Clinician), CGANZ, PACFA Reg.20483
Doug is Director of business consultancy Marple Bridge Pty Ltd. He provides support to CEOs and executive teams to improve their capacity to engage and thus lift business performance. He also assists in the development of strategic plans and consults to electricity businesses, having spent almost 40 years in that industry.
Along with his directorship at KPA, Doug is is a board member and immediate past Chairman of CIGRE Australia and Chairman of the Centre for Engineering Leadership and Management in WA and a board member of Edge Employment Solutions.
Doug was appointed to the inaugural KPA Board from 1 July 2014, with his term expiring on 30 June 2017.
4.3.7 Retirements, Appointments and Continuation in Office of DirectorsDirectors Anna Dartnell and Douglas Aberle had their terms extended to 31 December 2017, and 30 June 2017 respectively. Elisa Fear and Martin Peirson-Jones were notified of their terms extending to 30 June 2018. The Chair Laurie Shervington was also notified of his term extending to 30 June 2017.
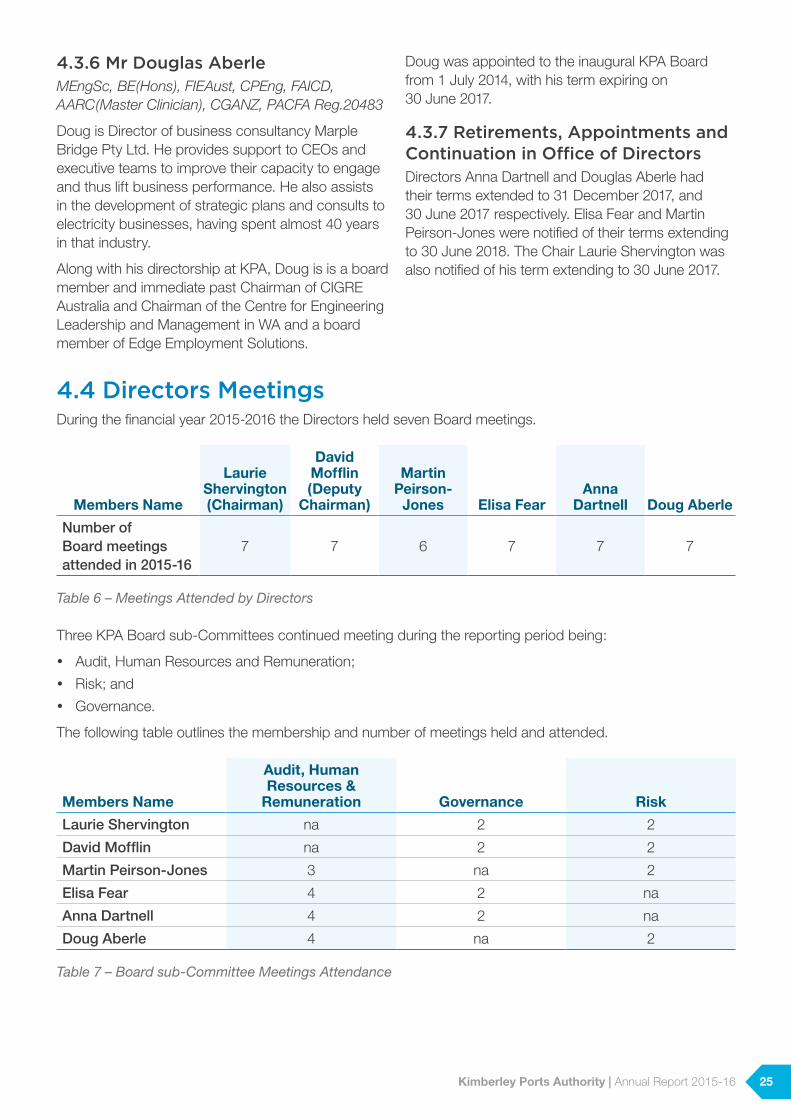
4.4 Directors MeetingsDuring the financial year 2015-2016 the Directors held seven Board meetings.
Members Name
Laurie Shervington (Chairman)
David Mofflin (Deputy
Chairman)
Martin Peirson-
Jones Elisa FearAnna
Dartnell Doug Aberle
Number of Board meetings attended in 2015-16
7 7 6 7 7 7
Table 6 – Meetings Attended by Directors
Three KPA Board sub-Committees continued meeting during the reporting period being:
y Audit, Human Resources and Remuneration;
y Risk; and
y Governance.
The following table outlines the membership and number of meetings held and attended.
Members Name
Audit, Human Resources &
Remuneration Governance Risk
Laurie Shervington na 2 2
David Mofflin na 2 2
Martin Peirson-Jones 3 na 2
Elisa Fear 4 2 na
Anna Dartnell 4 2 na
Doug Aberle 4 na 2
Table 7 – Board sub-Committee Meetings Attendance
25Kimberley Ports Authority | Annual Report 2015-16
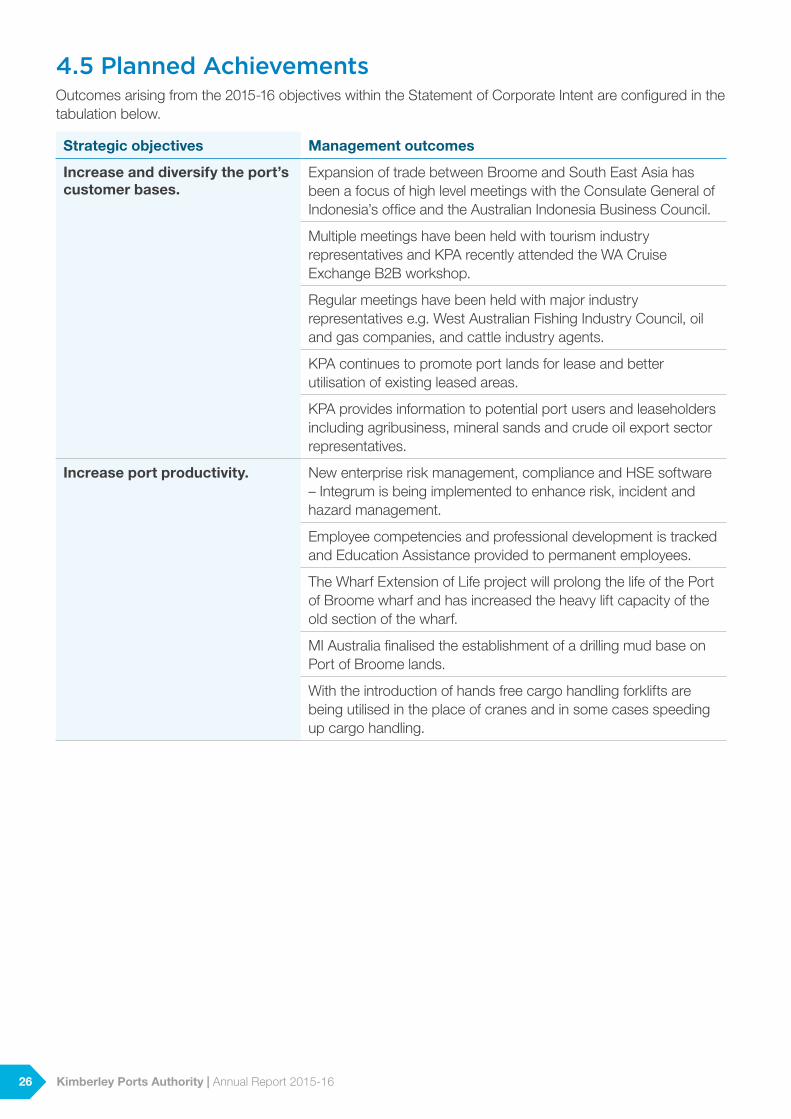
4.5 Planned AchievementsOutcomes arising from the 2015-16 objectives within the Statement of Corporate Intent are configured in the tabulation below.
Strategic objectives Management outcomes
Increase and diversify the port’s customer bases.
Expansion of trade between Broome and South East Asia has been a focus of high level meetings with the Consulate General of Indonesia’s office and the Australian Indonesia Business Council.
Multiple meetings have been held with tourism industry representatives and KPA recently attended the WA Cruise Exchange B2B workshop.
Regular meetings have been held with major industry representatives e.g. West Australian Fishing Industry Council, oil and gas companies, and cattle industry agents.
KPA continues to promote port lands for lease and better utilisation of existing leased areas.
KPA provides information to potential port users and leaseholders including agribusiness, mineral sands and crude oil export sector representatives.
Increase port productivity. New enterprise risk management, compliance and HSE software – Integrum is being implemented to enhance risk, incident and hazard management.
Employee competencies and professional development is tracked and Education Assistance provided to permanent employees.
The Wharf Extension of Life project will prolong the life of the Port of Broome wharf and has increased the heavy lift capacity of the old section of the wharf.
MI Australia finalised the establishment of a drilling mud base on Port of Broome lands.
With the introduction of hands free cargo handling forklifts are being utilised in the place of cranes and in some cases speeding up cargo handling.
26 Kimberley Ports Authority | Annual Report 2015-16
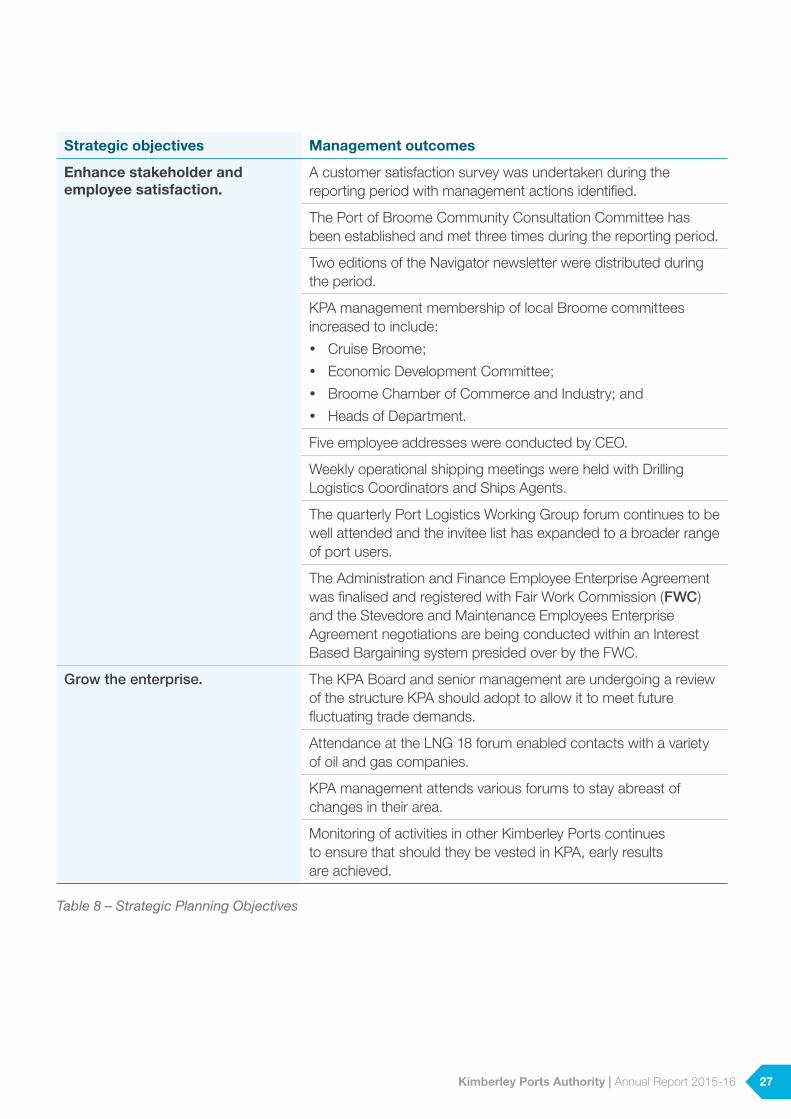
Strategic objectives Management outcomes
Enhance stakeholder and employee satisfaction.
A customer satisfaction survey was undertaken during the reporting period with management actions identified.
The Port of Broome Community Consultation Committee has been established and met three times during the reporting period.
Two editions of the Navigator newsletter were distributed during the period.
KPA management membership of local Broome committees increased to include:
y Cruise Broome;
y Economic Development Committee;
y Broome Chamber of Commerce and Industry; and
y Heads of Department.
Five employee addresses were conducted by CEO.
Weekly operational shipping meetings were held with Drilling Logistics Coordinators and Ships Agents.
The quarterly Port Logistics Working Group forum continues to be well attended and the invitee list has expanded to a broader range of port users.
The Administration and Finance Employee Enterprise Agreement was finalised and registered with Fair Work Commission (FWC) and the Stevedore and Maintenance Employees Enterprise Agreement negotiations are being conducted within an Interest Based Bargaining system presided over by the FWC.
Grow the enterprise. The KPA Board and senior management are undergoing a review of the structure KPA should adopt to allow it to meet future fluctuating trade demands.
Attendance at the LNG 18 forum enabled contacts with a variety of oil and gas companies.
KPA management attends various forums to stay abreast of changes in their area.
Monitoring of activities in other Kimberley Ports continues to ensure that should they be vested in KPA, early results are achieved.
Table 8 – Strategic Planning Objectives
27Kimberley Ports Authority | Annual Report 2015-16
4.6 Operating ResultsKPA’s economic objectives were to employ sound financial management and to enhance trade. In achieving these goals, KPA aimed to achieve its set rate of return on assets, while providing the most cost-effective service to port users. The final result was a pre-tax profit of $5.6M, against a budgeted loss of $0.3M.
KPA’s rate of return for the period was 7.8%. This rate of return is calculated on profit before borrowing and taxation costs, divided by the written down deprival cost of total assets less gifted assets.
KPA met its efficiency dividend requirements as set by government.
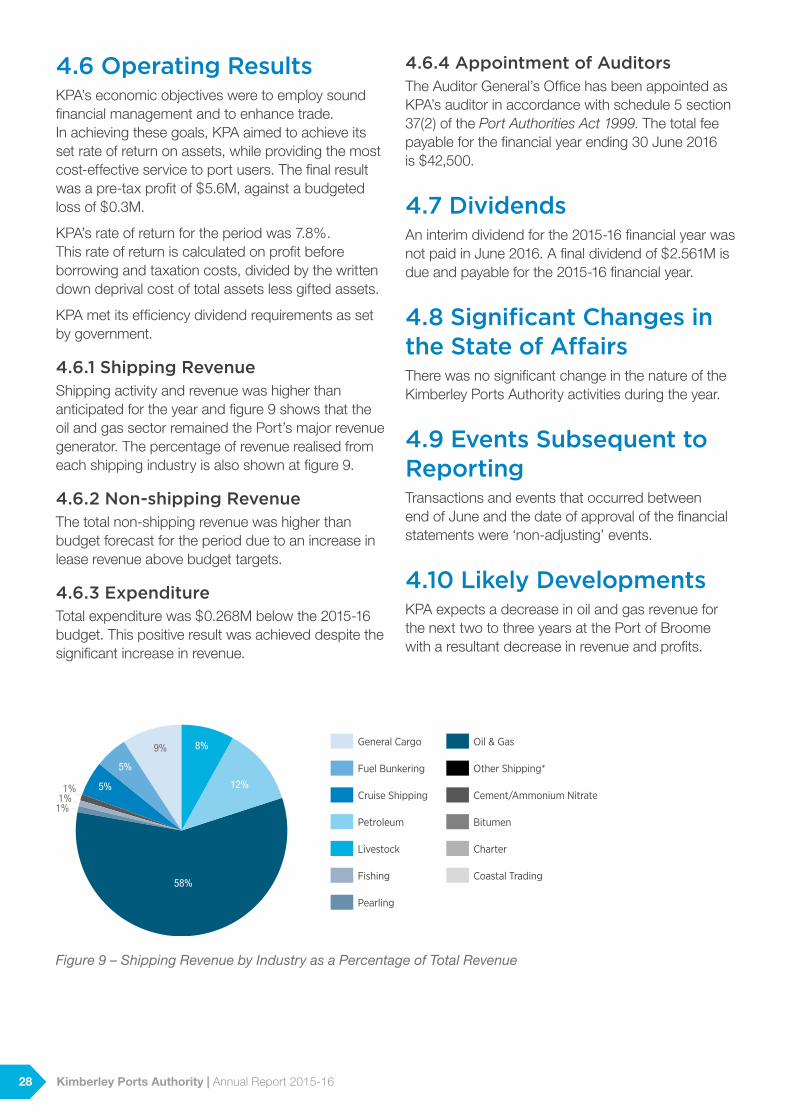
4.6.1 Shipping RevenueShipping activity and revenue was higher than anticipated for the year and figure 9 shows that the oil and gas sector remained the Port’s major revenue generator. The percentage of revenue realised from each shipping industry is also shown at figure 9.
4.6.2 Non-shipping RevenueThe total non-shipping revenue was higher than budget forecast for the period due to an increase in lease revenue above budget targets.
4.6.3 Expenditure Total expenditure was $0.268M below the 2015-16 budget. This positive result was achieved despite the significant increase in revenue.
4.6.4 Appointment of AuditorsThe Auditor General’s Office has been appointed as KPA’s auditor in accordance with schedule 5 section 37(2) of the Port Authorities Act 1999. The total fee payable for the financial year ending 30 June 2016 is $42,500.
4.7 DividendsAn interim dividend for the 2015-16 financial year was not paid in June 2016. A final dividend of $2.561M is due and payable for the 2015-16 financial year.
4.8 Significant Changes in the State of Affairs There was no significant change in the nature of the Kimberley Ports Authority activities during the year.
4.9 Events Subsequent to Reporting Transactions and events that occurred between end of June and the date of approval of the financial statements were ‘non-adjusting’ events.
4.10 Likely Developments KPA expects a decrease in oil and gas revenue for the next two to three years at the Port of Broome with a resultant decrease in revenue and profits.
58%
12%
8%9%
5%
5%1%1%
1%
General Cargo Oil & Gas
Fuel Bunkering Other Shipping*
Cruise Shipping Cement/Ammonium Nitrate
Petroleum Bitumen
Livestock Charter
Fishing Coastal Trading
Pearling
Figure 9 – Shipping Revenue by Industry as a Percentage of Total Revenue
28 Kimberley Ports Authority | Annual Report 2015-16
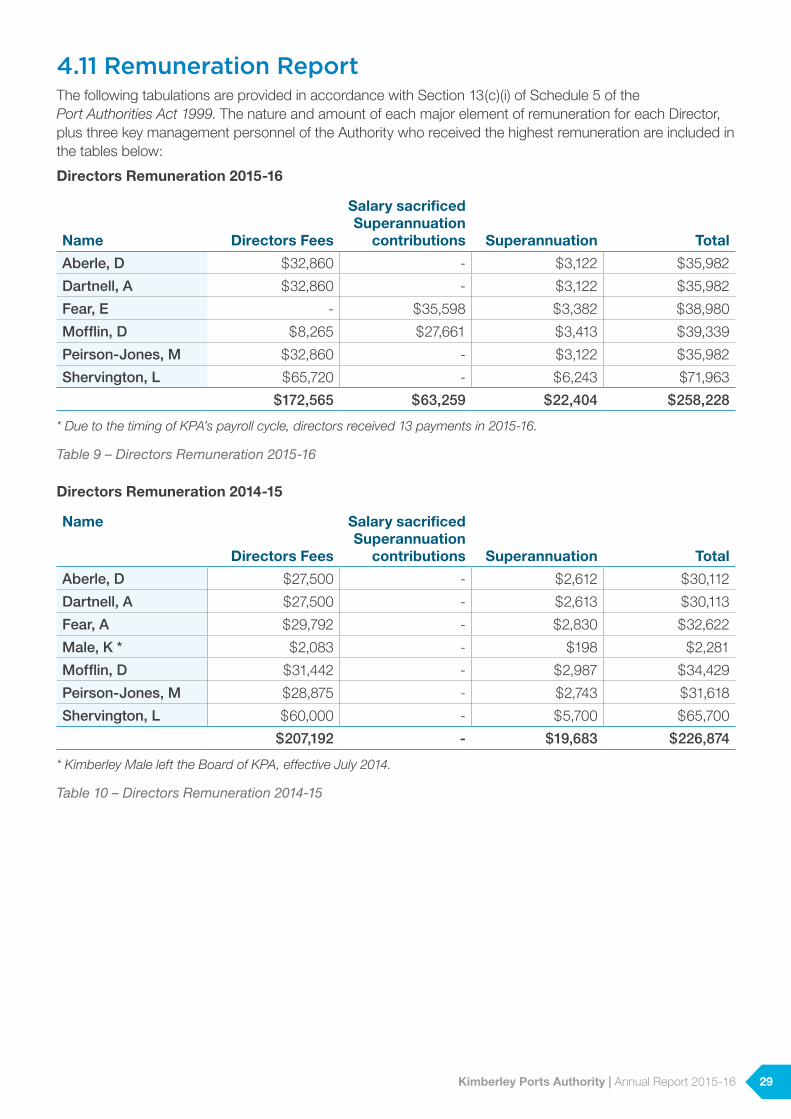
4.11 Remuneration Report The following tabulations are provided in accordance with Section 13(c)(i) of Schedule 5 of the Port Authorities Act 1999. The nature and amount of each major element of remuneration for each Director, plus three key management personnel of the Authority who received the highest remuneration are included in the tables below:
Directors Remuneration 2015-16
Name Directors Fees
Salary sacrificed Superannuation
contributions Superannuation Total
Aberle, D $32,860 - $3,122 $35,982
Dartnell, A $32,860 - $3,122 $35,982
Fear, E - $35,598 $3,382 $38,980
Mofflin, D $8,265 $27,661 $3,413 $39,339
Peirson-Jones, M $32,860 - $3,122 $35,982
Shervington, L $65,720 - $6,243 $71,963
$172,565 $63,259 $22,404 $258,228
* Due to the timing of KPA’s payroll cycle, directors received 13 payments in 2015-16.
Table 9 – Directors Remuneration 2015-16
Directors Remuneration 2014-15
Name
Directors Fees
Salary sacrificed Superannuation
contributions Superannuation Total
Aberle, D $27,500 - $2,612 $30,112
Dartnell, A $27,500 - $2,613 $30,113
Fear, A $29,792 - $2,830 $32,622
Male, K * $2,083 - $198 $2,281
Mofflin, D $31,442 - $2,987 $34,429
Peirson-Jones, M $28,875 - $2,743 $31,618
Shervington, L $60,000 - $5,700 $65,700
$207,192 - $19,683 $226,874
* Kimberley Male left the Board of KPA, effective July 2014.
Table 10 – Directors Remuneration 2014-15
29Kimberley Ports Authority | Annual Report 2015-16
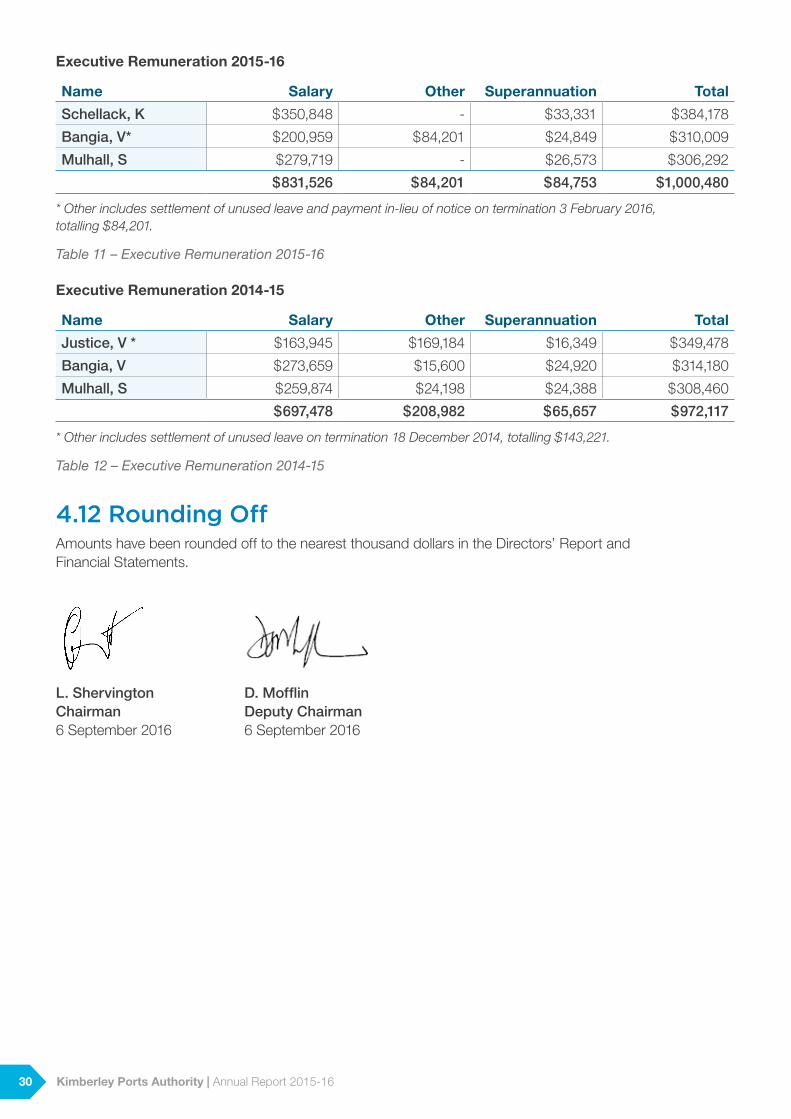
Executive Remuneration 2015-16
Name Salary Other Superannuation Total
Schellack, K $350,848 - $33,331 $384,178
Bangia, V* $200,959 $84,201 $24,849 $310,009
Mulhall, S $279,719 - $26,573 $306,292
$831,526 $84,201 $84,753 $1,000,480
* Other includes settlement of unused leave and payment in-lieu of notice on termination 3 February 2016, totalling $84,201.
Table 11 – Executive Remuneration 2015-16
Executive Remuneration 2014-15
Name Salary Other Superannuation Total
Justice, V * $163,945 $169,184 $16,349 $349,478
Bangia, V $273,659 $15,600 $24,920 $314,180
Mulhall, S $259,874 $24,198 $24,388 $308,460
$697,478 $208,982 $65,657 $972,117
* Other includes settlement of unused leave on termination 18 December 2014, totalling $143,221.
Table 12 – Executive Remuneration 2014-15
4.12 Rounding Off Amounts have been rounded off to the nearest thousand dollars in the Directors’ Report and Financial Statements.
L. Shervington D. Mofflin Chairman Deputy Chairman 6 September 2016 6 September 2016
30 Kimberley Ports Authority | Annual Report 2015-16
FINANCIAL STATEMENTS
31
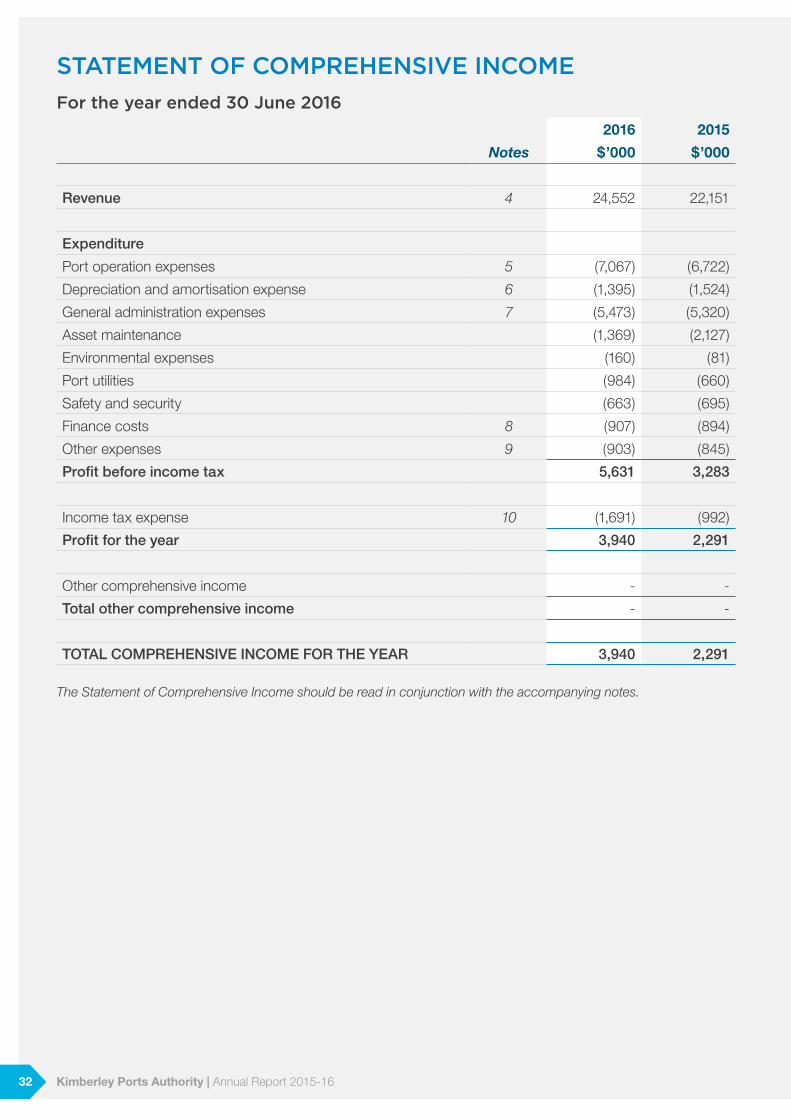
STATEMENT OF COMPREHENSIVE INCOME For the year ended 30 June 2016
2016 2015
Notes $’000 $’000
Revenue 4 24,552 22,151
Expenditure
Port operation expenses 5 (7,067) (6,722)
Depreciation and amortisation expense 6 (1,395) (1,524)
General administration expenses 7 (5,473) (5,320)
Asset maintenance (1,369) (2,127)
Environmental expenses (160) (81)
Port utilities (984) (660)
Safety and security (663) (695)
Finance costs 8 (907) (894)
Other expenses 9 (903) (845)
Profit before income tax 5,631 3,283
Income tax expense 10 (1,691) (992)
Profit for the year 3,940 2,291
Other comprehensive income - -
Total other comprehensive income - -
TOTAL COMPREHENSIVE INCOME FOR THE YEAR 3,940 2,291
The Statement of Comprehensive Income should be read in conjunction with the accompanying notes.
32 Kimberley Ports Authority | Annual Report 2015-16
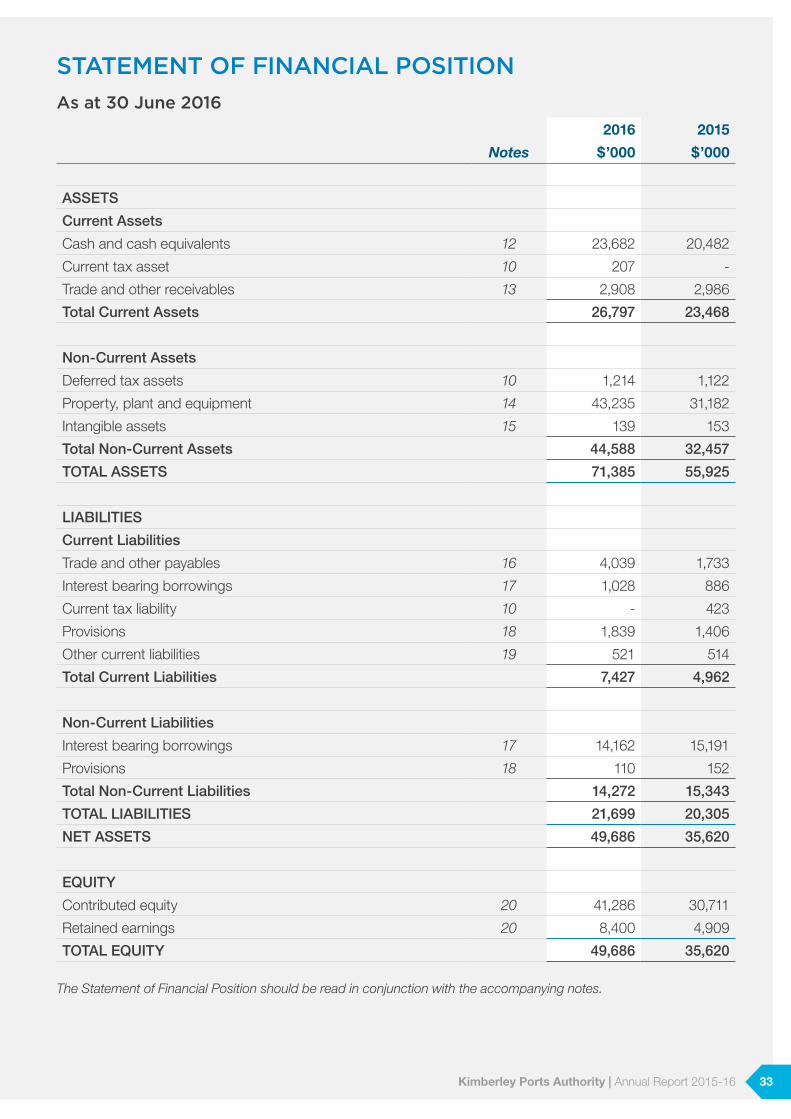
STATEMENT OF FINANCIAL POSITION As at 30 June 2016
2016 2015
Notes $’000 $’000
ASSETS
Current Assets
Cash and cash equivalents 12 23,682 20,482
Current tax asset 10 207 -
Trade and other receivables 13 2,908 2,986
Total Current Assets 26,797 23,468
Non-Current Assets
Deferred tax assets 10 1,214 1,122
Property, plant and equipment 14 43,235 31,182
Intangible assets 15 139 153
Total Non-Current Assets 44,588 32,457
TOTAL ASSETS 71,385 55,925
LIABILITIES
Current Liabilities
Trade and other payables 16 4,039 1,733
Interest bearing borrowings 17 1,028 886
Current tax liability 10 - 423
Provisions 18 1,839 1,406
Other current liabilities 19 521 514
Total Current Liabilities 7,427 4,962
Non-Current Liabilities
Interest bearing borrowings 17 14,162 15,191
Provisions 18 110 152
Total Non-Current Liabilities 14,272 15,343
TOTAL LIABILITIES 21,699 20,305
NET ASSETS 49,686 35,620
EQUITY
Contributed equity 20 41,286 30,711
Retained earnings 20 8,400 4,909
TOTAL EQUITY 49,686 35,620
The Statement of Financial Position should be read in conjunction with the accompanying notes.
33Kimberley Ports Authority | Annual Report 2015-16
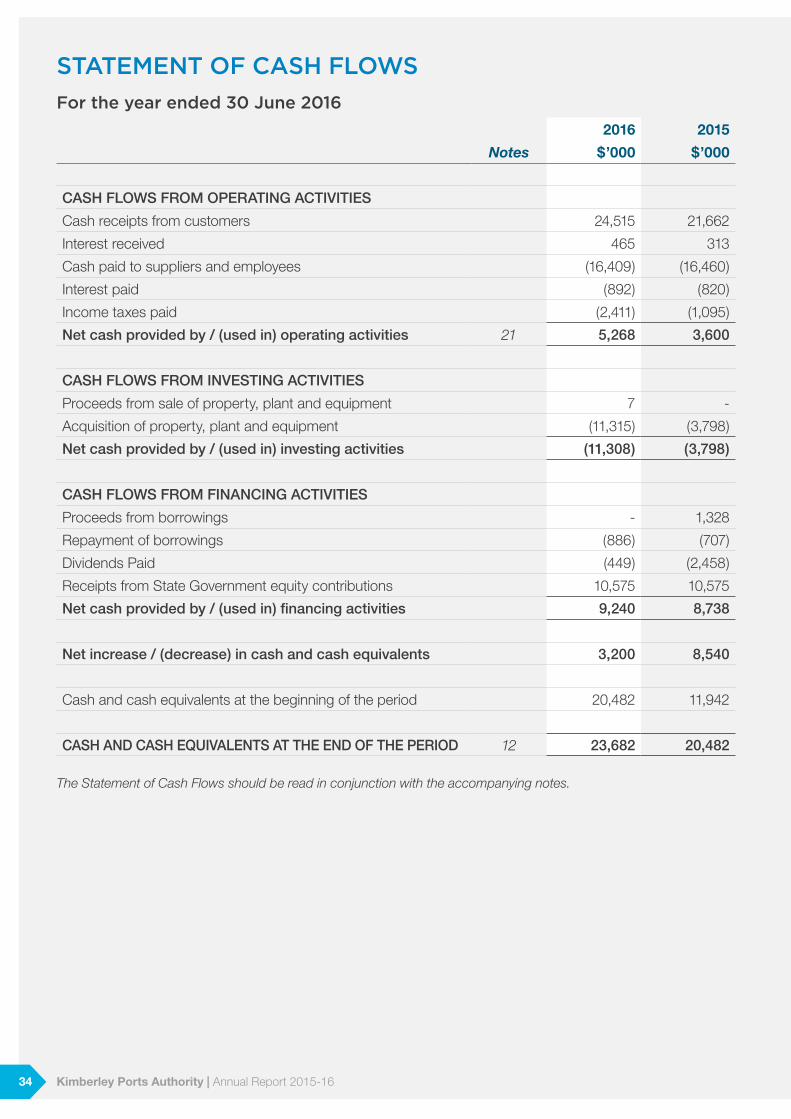
STATEMENT OF CASH FLOWS For the year ended 30 June 2016
2016 2015
Notes $’000 $’000
CASH FLOWS FROM OPERATING ACTIVITIES
Cash receipts from customers 24,515 21,662
Interest received 465 313
Cash paid to suppliers and employees (16,409) (16,460)
Interest paid (892) (820)
Income taxes paid (2,411) (1,095)
Net cash provided by / (used in) operating activities 21 5,268 3,600
CASH FLOWS FROM INVESTING ACTIVITIES
Proceeds from sale of property, plant and equipment 7 -
Acquisition of property, plant and equipment (11,315) (3,798)
Net cash provided by / (used in) investing activities (11,308) (3,798)
CASH FLOWS FROM FINANCING ACTIVITIES
Proceeds from borrowings - 1,328
Repayment of borrowings (886) (707)
Dividends Paid (449) (2,458)
Receipts from State Government equity contributions 10,575 10,575
Net cash provided by / (used in) financing activities 9,240 8,738
Net increase / (decrease) in cash and cash equivalents 3,200 8,540
Cash and cash equivalents at the beginning of the period 20,482 11,942
CASH AND CASH EQUIVALENTS AT THE END OF THE PERIOD 12 23,682 20,482
The Statement of Cash Flows should be read in conjunction with the accompanying notes.
34 Kimberley Ports Authority | Annual Report 2015-16
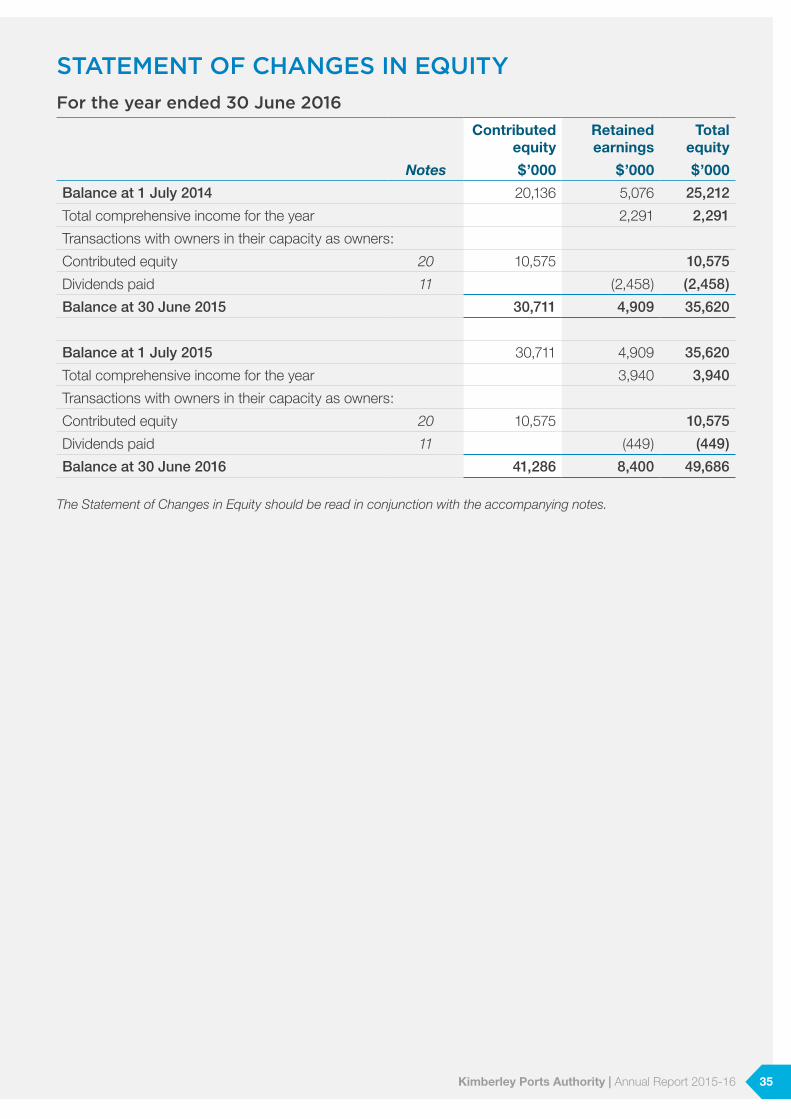
STATEMENT OF CHANGES IN EQUITY For the year ended 30 June 2016
Contributed equity
Retained earnings
Total equity
Notes $’000 $’000 $’000
Balance at 1 July 2014 20,136 5,076 25,212
Total comprehensive income for the year 2,291 2,291
Transactions with owners in their capacity as owners:
Contributed equity 20 10,575 10,575
Dividends paid 11 (2,458) (2,458)
Balance at 30 June 2015 30,711 4,909 35,620
Balance at 1 July 2015 30,711 4,909 35,620
Total comprehensive income for the year 3,940 3,940
Transactions with owners in their capacity as owners:
Contributed equity 20 10,575 10,575
Dividends paid 11 (449) (449)
Balance at 30 June 2016 41,286 8,400 49,686
The Statement of Changes in Equity should be read in conjunction with the accompanying notes.
35Kimberley Ports Authority | Annual Report 2015-16
NOTES TO THE FINANCIAL STATEMENTSContentsNote 1 Basis of preparation ...............................37
Note 2 Summary of significant accounting policies.................................38
Note 3 Expenses by nature ................................45
Note 4 Revenue .................................................45
Note 5 Port operation expenses ........................45
Note 6 Depreciation and amortsation expense .................................................46
Note 7 General administration expense .............46
Note 8 Finance costs .........................................46
Note 9 Other expenses ......................................46
Note 10 Income tax .............................................47
Note 11 Dividends ...............................................48
Note 12 Cash and cash equivalents ....................49
Note 13 Trade and other receivables ...................49
Note 14 Property, plant and equipment ...............50
Note 15 Intangible assets ....................................55
Note 16 Trade and other payables .......................55
Note 17 Interest bearing borrowings ....................56
Note 18 Provisions ...............................................57
Note 19 Other liabilities ........................................59
Note 20 Equity .....................................................59
Note 21 Reconciliation of cash flows from operating activities..................................60
Note 22 Financial instruments ..............................60
Note 23 Commitments ........................................64
Note 24 Remuneration of Auditor .........................65
Note 25 Related parties .......................................65
Note 26 Contingent liabilities and assets ..............65
Note 27 Subsequent events ................................65
36 Kimberley Ports Authority | Annual Report 2015-16
Note 1 – Basis Of Preparation a) Statement of Compliance
Kimberley Ports Authority (“the Authority”) is a not-for-profit reporting entity that prepares general purpose financial statements in accordance with Australian Accounting Standards (AASBs) (including Australian Interpretations) adopted by the Australian Accounting Standards Board (AASB) and the financial reporting provisions of the Port Authorities Act 1999.
The financial statements were authorised for issue on 6 September 2016 by the Board of Directors of the Authority.
b) Presentation of the Statement of Comprehensive Income
Statement of Comprehensive Income classification of expenses by nature is considered to provide more relevant and reliable information than classification by function due to the nature of the Authority’s operations.
According to AASB 101 Presentation of Financial Statements, expenses classified by nature are not reallocated among various functions within the entity. However, the Authority has allocated employee benefits expenses to various line items on the Statement of Comprehensive Income including marine expenses, port operations expenses, general administration, and asset maintenance. This allocation reflects the internal reporting structure of the Authority which allocates labour expenses to significant expense items in the Statement of Comprehensive Income based on the nature of the expenses incurred. The Authority believes that the allocation is more relevant to the understanding of the financial performance of the Authority and does not result in a function of expense presentation.
c) Basis of measurement
The financial statements have been prepared on the accrual basis of accounting using the historical cost convention.
d) Functional and presentation currency
These financial statements are presented in Australian dollars which is the Authority’s functional currency. All financial information presented in Australian dollars has been rounded to the nearest thousand dollars ($’000) unless otherwise stated.
e) Use of estimates and judgements
The preparation of financial statements requires management to make judgments’, estimates and assumptions that affect the application of accounting policies and the reported amounts of assets, liabilities, income and expenses. Actual results may differ from these estimates.
Estimates and underlying assumptions are reviewed on an ongoing basis. Revisions to accounting estimates are recognised in the period in which the estimates are revised and in any future periods affected.
Information about significant areas of estimation and uncertainty and critical judgments’ in applying accounting policies that have the most significant effect on the amounts recognised in the financial statements are:
(i) discount rates used in estimating provisions;
(ii) estimating useful life and residual values of key assets;
(iii) long service leave – retention rates and discount rates.
37Kimberley Ports Authority | Annual Report 2015-16
Note 2 – Summary of Significant Accounting PoliciesThe accounting policies set out below have been applied consistently to all periods presented in these financial statements unless otherwise stated.
Certain comparative amounts have been reclassified to conform with the current year’s presentation [see note 1(b)].
a) Revenue recognition
Revenue is measured at the fair value of consideration received or receivable. Revenue is recognised for the major business activities as follows:
(i) Rendering of services
Revenue from services rendered is recognised to the extent that the service is provided at the reporting date. Where the contract outcome cannot be measured reliably, revenue is recognised only to the extent of the expenses recognised that are recoverable.
(ii) Interest
Interest revenue is recognised as it accrues using the effective interest method [see note 2(b)].
(iii) Rental income
Rental income is recognised in profit or loss on a straight-line basis over the term of the lease. Lease incentives granted are recognised as an integral part of the total rental income, over the term of the lease.
(iv) Deferred income
Deferred income represents income received in advance and is released to the Statement of Comprehensive Income over that period to which the income relates.
(v) Contributed assets
Contributed assets or services received by the Authority is recognised as income at the fair value of the assets or services where they can be reliably measured.
b) Finance income and expenses
Finance income comprises interest income on funds invested and interest receivable from debtors. Interest income is recognised as it accrues in profit or loss using the effective interest method.
Finance costs comprise interest expense on borrowing and finance charges payable under finance leases. All borrowing costs are recognised in profit or loss using the effective interest method. The interest expense component of finance lease payments is also recognised in the Statement of Comprehensive Income using the effective interest method.
Borrowing costs are recognised as expenses in the period in which they are incurred except where they are directly attributable to the acquisition, construction or production of a qualifying asset in which case they are capitalised as part of the cost of the asset, in accordance with AASB 123 Borrowing Costs.
In determining the amount of borrowing costs to be capitalised during the financial year, investment revenue earned directly relating to borrowings, is deducted from the borrowing costs incurred.
c) Income tax
The Authority operates within the National Tax Equivalent Regime (“NTER”) whereby an equivalent amount in respect of income tax is payable to the State Government. The calculation of the liability in respect of income tax is governed by NTER guidelines and directions approved by Government.
As a consequence of participation in the NTER, the Authority is required to comply with AASB 112 Income Taxes.
Income tax expense comprises current and deferred tax. Income tax expense is recognised in profit or loss except to the extent that it relates to items recognised directly in equity or in other comprehensive income.
Current tax is the expected tax payable or receivable on the taxable income or loss for the year, using tax rates enacted or substantially enacted at the reporting date and any adjustment to tax payable in respect of previous years.
Deferred tax is recognised using the balance sheet method, providing for temporary differences between the carrying amounts of assets and liabilities for financial reporting purposes and the amounts used for taxation purposes. Deferred tax is not recognised on the initial recognition of assets or liabilities in a transaction that is not a business combination and that affects neither accounting nor taxable profit/loss.
38 Kimberley Ports Authority | Annual Report 2015-16
Deferred tax is recognised in respect of temporary differences between the carrying amounts of assets and liabilities for financial reporting purposes and the amounts used for taxation purposes. Deferred tax is not recognised for temporary differences on the initial recognition of assets or liabilities in a transaction that is not a business combination and that affects neither accounting nor taxable profit or loss. Deferred tax is measured at the tax rates that are expected to be applied to temporary differences when they reverse, using tax rates enacted or substantively enacted at the reporting date.
A deferred tax asset is recognised for unused tax losses, tax credits and deductible temporary differences to the extent that it is probable that future taxable profits will be available against which they can be utilised. Deferred tax assets are reviewed at each reporting date and are reduced to the extent that it is no longer probable that the related tax benefit will be realised.
d) Receivables
(i) Trade Receivables
Trade receivables are recognised and carried at the original invoice amounts less an allowance for any uncollectable amounts. Receivables are generally settled within 14 days except for property rentals, which are governed by individual lease agreements.
The collectability of receivables is reviewed on an ongoing basis and any receivables identified as uncollectable are written-off against the allowance account. The allowance for uncollectable amounts (doubtful debts) is raised when there is objective evidence that the Authority will not be able to collect a debt.
(ii) Lease receivables
A lease receivable is recognised for leases of property which effectively transfers to the lessee substantially all of the risks and benefits incidental to legal ownership of the leased asset. The lease receivable is initially recognised as the amount of the present value of the minimum lease payments receivable at the reporting date plus the present value of any unguaranteed residual value expected to accrue at the end of the lease term.
Finance lease payments are allocated between interest revenue and reduction of the lease receivable over the term of the lease in order to reflect a constant periodic rate of return on the net investment outstanding in respect of the lease with interest revenue calculated using the interest rate implicit in the lease recognised directly in the Statement of Comprehensive Income.
e) Property, plant and equipment
(i) Capitalisation / expensing of assets
Items of property, plant and equipment purchased or constructed costing more than $1,000 are recorded at the cost of acquisition less accumulated depreciation and impairment losses. Cost includes expenditure that is directly attributable to the acquisition of the asset. The cost of self-constructed assets includes the cost of materials and direct labour, and any other costs directly attributable to bringing the asset to a working condition for its intended use.
When parts of an item of property, plant and equipment have different useful lives, they are accounted for as separate items (major components) of property, plant and equipment.
Any gain or loss on disposal of an item of property, plant and equipment is calculated as the difference between the net proceeds from disposal and the carrying amount of the item and is recognised in profit or loss.
(ii) Initial recognition and measurement
Property, plant and equipment are initially recognised at cost.
For items of property, plant and equipment acquired at no cost or for nominal cost, the cost is the fair value at the date of acquisition.
(iii) Subsequent costs
Any subsequent cost of replacing/upgrading an item of property, plant and equipment is recognised in the carrying amount of the item if it is probable that the future economic benefits embodied within the part will flow to the Authority and its cost can be measured reliably.
39Kimberley Ports Authority | Annual Report 2015-16
(iv) Derecognition
An item of property, plant and equipment is derecognised upon disposal or when no future economic benefits are expected from its use or disposal.
(v) Depreciation
Items of property, plant and equipment are depreciated on either a straight-line or diminishing basis in profit or loss over the estimated useful lives of each component. Leased assets are depreciated over the shorter of the lease term and their useful lives unless it is reasonably certain that the Authority will obtain ownership by the end of the lease term. Land is not depreciated.
Property, plant and equipment, excluding freehold land, are depreciated at rates based on the expected useful lives using the straight line method. Depreciation on assets under construction commences when the assets are ready for use. Depreciation is charged to the Statement of Comprehensive Income.
The depreciation rates for the various classes of non-current assets are as follows:
Access Channel 5 to 20 yearsBuildings 3.75 to 50 yearsElectronic 2.5 to 20 yearsFurniture & fittings 3 to 17 yearsHarbour facilities 10 to 40 yearsImprovements 2.5 to 20 yearsInfrastructure 15 to 40 yearsLow Value Pool 3 yearsPlant & equipment 3 to 50 yearsMotor vehicles 3 to 8 years
Depreciation methods, useful lives and residual values are reviewed at each reporting date and adjusted if appropriate.
f) Intangible assets
(i) Capitalisation / expensing of assets
Acquisitions of intangible assets and internally generated intangible assets are capitalised. The cost of using the asset is expensed (amortised) over their useful life. Intangible assets are initially recognised at cost. For assets acquired at no cost or for nominal cost, the cost is their fair value at the date of acquisition.
(ii) Subsequent expenditure
Subsequent expenditure is capitalised only when it increases the future economic benefits embodied in the specific asset to which it relates.
(iii) Computer software
Software that is an integral part of the related hardware is treated as property, plant and equipment. Software that is not an integral part of the related hardware is treated as an intangible asset.
(iv) Amortisation
Intangible assets are amortised on a straight-line basis in profit or loss over their estimated useful lives, from the date that they are available for use. The estimated useful lives for the current and comparative years are as follows:
Computer software 2 to 20 years
Amortisation methods, useful lives and residual values are reviewed at each reporting date and adjusted if appropriate.
g) Impairment
Property, plant and equipment and intangible assets are tested for any indication of impairment at each balance sheet date. Where there is any indication of impairment, the recoverable amount is estimated. Where the recoverable amount is less than the carrying amount, the asset is considered impaired and is written down to the recoverable amount and an impairment loss is recognised. As the Authority is a not for profit entity, unless an asset has been identified as a surplus asset, the carrying amounts of assets are reviewed at each reporting date to determine whether there is any indication of impairment.
If any such indication exists, then the asset’s recoverable amount is estimated. An impairment loss is recognised if the carrying amount of an asset exceeds its recoverable amount. The recoverable amount is the greater of an asset’s fair value less costs to sell and depreciated replacement cost.
The risk of impairment is generally limited to circumstances where an asset’s depreciation is materially understated, where the replacement cost is falling or where there is a significant change in useful life. Each relevant class
40 Kimberley Ports Authority | Annual Report 2015-16
of assets is reviewed annually to verify that the accumulated depreciation/amortisation reflects the level of consumption or expiration of the asset’s future economic benefits and to evaluate any impairment risk from falling replacement costs.
Intangible assets with an indefinite useful life and intangible assets not yet available for use are tested for impairment at each reporting date irrespective of whether there is any indication of impairment.
The recoverable amount of assets identified as surplus assets is the higher of fair value less costs to sell and the present value of future cash flows expected to be derived from the asset. Surplus assets carried at fair value have no risk of material impairment where fair value is determined by reference to market-based evidence. Where fair value is determined by reference to depreciated replacement cost, surplus assets are at risk of impairment and the recoverable amount is measured. Surplus assets at cost are tested for indications of impairment at the end of each reporting period.
Impairment losses are recognised in profit or loss.
An impairment loss is reversed only to the extent that the asset’s carrying amount does not exceed the carrying amount that would have been determined, net of depreciation or amortisation, if no impairment loss had been recognised.
h) Leases
Leases are classified as either finance leases or operating leases based on the economic substance of the lease agreements.
Leases in terms of which the Authority assumes substantially all the risks and rewards of ownership are classified as finance leases. On initial recognition the leased asset is measured at an amount equal to the lower of its fair value and the present value of the minimum lease payments. A finance lease liability of equal value is also recognised. Subsequent to initial recognition, the asset is accounted for in accordance with the accounting policy applicable to that asset.
Other leases are operating leases and the leased assets are not recognised on the Authority’s Statement of Financial Position.
Payments made under operating leases are recognised in profit or loss on a straight line basis over the term of the lease. Lease incentives received are recognised as an integral part of the total lease expense, over the term of the lease.
Minimum lease payments made under finance leases are apportioned between the finance expense and the reduction of the outstanding liability. The finance expense is allocated to each period during the lease term so as to produce a constant periodic rate of interest on the remaining balance of the liability.
i) Financial instruments
In addition to cash and cash equivalents, the Authority has three categories of financial instruments:
1. Loans and receivables;
2. Held to maturity investments; and
3. Financial liabilities measured at amortised cost.
Financial instruments have been disaggregated into the following classes:
(i) Financial Assets
Cash and cash equivalents
Trade and other receivables
(ii) Financial Liabilities
Trade payables and accruals
Borrowings
Finance lease liabilities
Refer to Note 22 for further information on the classification of financial instruments.
Initial recognition and measurement is at fair value plus directly attributable transaction costs for assets not carried at fair value through profit or loss. Subsequent measurement is at amortised cost using the effective interest method.
The fair value of short-term receivables and payables approximates their carrying amount because there is no interest rate applicable and subsequent measurement is not required as the effect of discounting is not material. Gains or losses are recognised when the financial assets are derecognised or impaired.
41Kimberley Ports Authority | Annual Report 2015-16
j) Payables
Payables, including trade payables, amounts payable and accrued expenses, are recognised for amounts to be paid in the future for goods and services received prior to the reporting date. The carrying amount is equivalent to fair value, as they are generally settled within 30 days.
k) Borrowings
All borrowings are initially recognised at the fair value of the consideration received less directly attributable transaction costs. Subsequent measurement is at amortised cost using the effective interest rate method.
Gains and losses are recognised in the Statement of Comprehensive Income when the liabilities are derecognised, as well as through the amortisation process.
Borrowing costs are expensed as incurred unless they relate to qualifying assets.
l) Employee benefits
The liability for annual and long service leave expected to be settled within 12 months after the reporting date is recognised and measured at the undiscounted amounts expected to be paid when the liabilities are settled using the remuneration rates expected to apply at the time of settlement.
Annual and long service leave expected to be settled more than 12 months after the reporting date is measured at the present value of amounts expected to be paid when the liabilities are settled. Leave liabilities are in respect of services provided by employees up to the reporting date.
When assessing expected future payments consideration is given to expected future wage and salary levels including non-salary components such as employer superannuation contributions, as well as the experience of employee departures and periods of service. The expected future payments are discounted to present value using market yields at the reporting date on national government bonds with terms to maturity that match, as closely as possible, the estimated future cash outflows.
All annual leave and unconditional long service leave provisions are classified as current liabilities as the Authority does not have an unconditional right to defer settlement of the liability for at least 12 months after the reporting date.
Associated payroll on-costs are included in the determination of other provisions.
m) Employee superannuation
The Gold State Superannuation Scheme (GSS), a defined benefit lump sum scheme, and the Superannuation and Family Benefits Act Scheme, a defined benefit pension scheme, are now closed to new members. The Authority is liable for superannuation benefits for past years’ service of members of the Superannuation and Family Benefits Act Scheme who elected to transfer to the GSS Scheme. The Authority also accrues for superannuation benefits to the pension scheme for those members who elected not to transfer from that scheme.
The superannuation liability for existing employees with the pre-transfer service incurred under the Superannuation and Family Benefits Act Scheme who transferred to the GSS Scheme is provided for at reporting date.
Employees who are not members of either the Pension or the GSS Schemes became non-contributory members of the West State Superannuation Scheme (WSS), an accumulation fund until 15 April 2007. From 16 April 2007, employees who are not members of the Pension, GSS or WSS Schemes become non-contributory members of the GESB Superannuation Scheme (GESB Super), a taxed accumulation fund.
The Authority makes concurrent contributions to the Government Employee Superannuation Board (GESB) on behalf of employees in compliance with the Commonwealth Government’s Superannuation Guarantee (Administration) Act 1992. These contributions extinguish the liability for superannuation charges in respect of the WSS and GESB Super Schemes.
Defined benefit plan
The Authority’s net obligation in respect of defined benefit pension plan is calculated separately by estimating the amount of future benefit that employees have earned in return for their service in the current and prior periods; that benefit is discounted to determine its present value, and the fair value of any plan assets is deducted. These benefits are unfunded.
42 Kimberley Ports Authority | Annual Report 2015-16
The discount rate used is the market yield rate at the reporting date on national government bonds that have maturity dates approximating to the terms of the entity’s obligations. The calculation is performed by a qualified actuary using the projected unit credit method.
The superannuation expense of the defined benefit plan is made up of the following elements:
(i) Current service cost;
(ii) Interest cost (unwinding of the discount);
(iii) Actuarial gains and losses; and
(iv) Past service cost.
Actuarial gains and losses of the defined benefit plan are recognised immediately in profit or loss.
The superannuation expense of the defined contribution plan is recognised as and when the contributions fall due.
n) Dividends
Dividends are declared and recognised as a liability in the period in which the Minister’s approval and the Treasurer’s concurrence is received.
o) Provisions
A provision is recognised if, as a result of a past event, the Authority has a present legal or constructive obligation that can be estimated reliably and it is probable that an outflow of economic benefits will be required to settle the obligation. Provisions are determined by discounting the expected future cash flows at a pre tax rate that reflects current market assessments of the time value of money and the risks specific to the liability.
The unwinding of the discount is recognised as a finance cost.
p) Cash and cash equivalents
Cash and cash equivalents in the Statement of Financial Position comprise cash on hand, cash at bank, at call deposit and term deposits with original maturities of no greater than 90 days.
For the purpose of the Statement of Cash Flows, cash equivalents consist of cash and cash equivalents as defined above.
q) Goods and Services Tax
Revenue, expenses and assets are recognised net of the amount of Goods and Services Tax (GST), except where the amount of GST incurred is not recoverable from the taxation authority. In these circumstances, the GST is recognised as part of the cost of acquisition of the asset or as part of the expense item as applicable.
Receivables and payables are stated inclusive of GST. The net amount of GST recoverable from, or payable to, the ATO is included as a current asset or liability in the Statement of Financial Position.
Cash flows are included in the Statement of Cash Flows on a gross basis. The GST components of cash flows arising from investing and financing activities which are recoverable from, or payable to, the ATO are classified as operating cash flows.
r) Contributed equity
The Authority receives support from the WA Government (see note 20). The amount received is recognised directly as a credit to contributed equity.
s) Current and non-current classification
Assets and liabilities are presented in the statement of financial position based on current and non-current classification.
An asset is classified as current when it is either expected to be realised or intended to be sold or consumed in normal operating cycle; it is held primarily for the purpose of trading; it is expected to be realised within 12 months after the reporting period; or the asset is cash or cash equivalent unless restricted from being exchanged or used to settle a liability for at least 12 months after the reporting period. All other assets are classified as non-current.
A liability is classified as current when it is either expected to be settled in normal operating cycle; it is held primarily for the purpose of trading; it is due to be settled within 12 months after the reporting period; or there is no unconditional right to defer the settlement of the liability for at least 12 months after the reporting period. All other liabilities are classified as non-current.
Deferred tax assets and liabilities are classified as non-current.
43Kimberley Ports Authority | Annual Report 2015-16
t) Changes in accounting policies, new and amended standards and interpretations
In the current year, the Authority has adopted all of the new and revised Standards and Interpretations issued by the Australian Accounting Standards Board (the AASB) that are relevant to its operations and effective for the current annual reporting period. The adoption of these new and revised Standards and Interpretations has not resulted in a significant or material change to the Authority’s accounting policies.
u) Comparative figures
Comparative figures are, where appropriate, reclassified to be comparable with figures presented in the current financial year.
v) New Accounting Standards and Interpretations not yet mandatory or adopted
The following most relevant new and amended Australian Accounting Standards and Interpretations were available for early adoption but have not been assessed for application by the Authority in these financial statements:
AASB 9 Financial Instruments
This standard is applicable to annual reporting periods beginning on or after 1 January 2018. This Standard supersedes AASB 139 Financial Instruments: Recognition and Measurement, introducing a number of changes to accounting treatments. The mandatory application date of this Standard is currently 1 January 2018 after being amended by AASB 2012 6, AASB 2013-9, and AASB 2014 1 Amendments to Australian Accounting Standards. The Authority has not yet determined the application or the potential impact of the Standard.
AASB 15 Revenue from Contracts with Customers
This standard is applicable to annual reporting periods beginning on or after 1 January 2018. This Standard establishes the principles that the Authority shall apply to report useful information to users of financial statements about the nature, amount, timing and uncertainty of revenue and cash flows arising from a contract with a customer. The Authority has not yet determined the application or the potential impact of the Standard.
AASB 16 Leases
This standard is applicable to annual reporting periods beginning on or after 1 January 2019. This Standard introduces a single lessee accounting model and requires a lessee to recognise assets and liabilities for all leases with a term of more than 12 months, unless the underlying asset is of low value. The Authority has not yet determined the application or the potential impact of the Standard.
44 Kimberley Ports Authority | Annual Report 2015-16
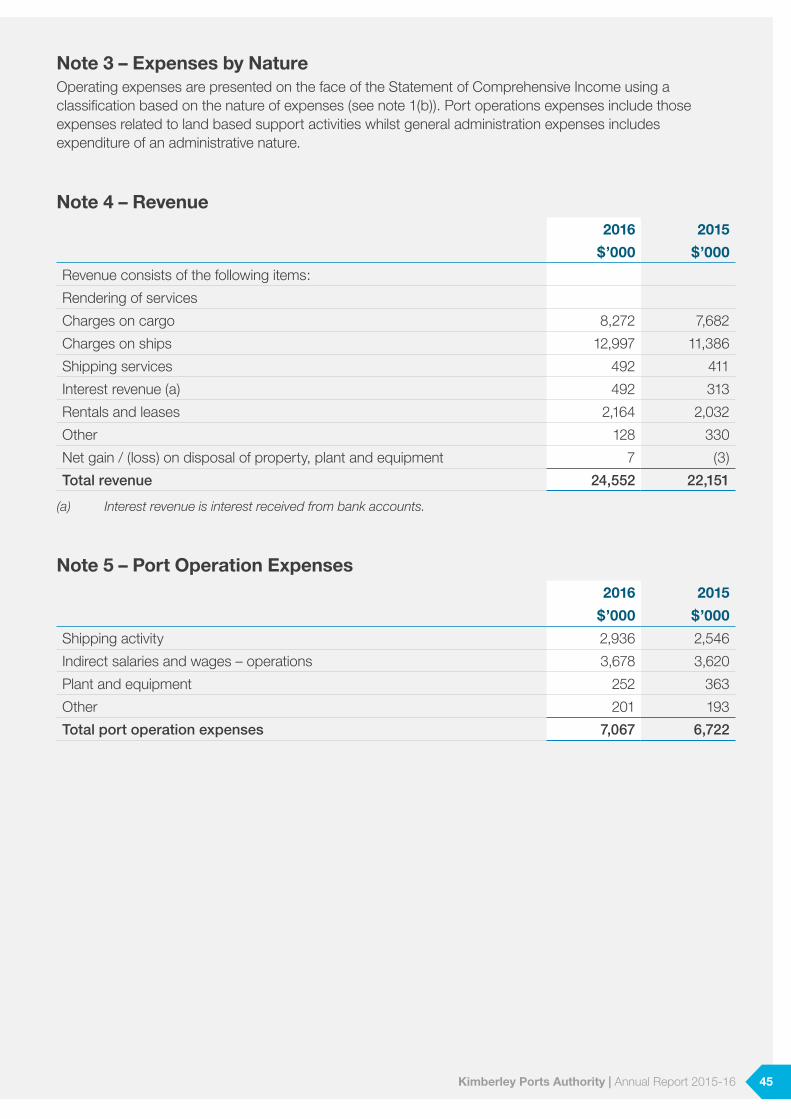
Note 3 – Expenses by NatureOperating expenses are presented on the face of the Statement of Comprehensive Income using a classification based on the nature of expenses (see note 1(b)). Port operations expenses include those expenses related to land based support activities whilst general administration expenses includes expenditure of an administrative nature.
Note 4 – Revenue 2016 2015
$’000 $’000
Revenue consists of the following items:
Rendering of services
Charges on cargo 8,272 7,682
Charges on ships 12,997 11,386
Shipping services 492 411
Interest revenue (a) 492 313
Rentals and leases 2,164 2,032
Other 128 330
Net gain / (loss) on disposal of property, plant and equipment 7 (3)
Total revenue 24,552 22,151
(a) Interest revenue is interest received from bank accounts.
Note 5 – Port Operation Expenses2016 2015
$’000 $’000
Shipping activity 2,936 2,546
Indirect salaries and wages – operations 3,678 3,620
Plant and equipment 252 363
Other 201 193
Total port operation expenses 7,067 6,722
45Kimberley Ports Authority | Annual Report 2015-16
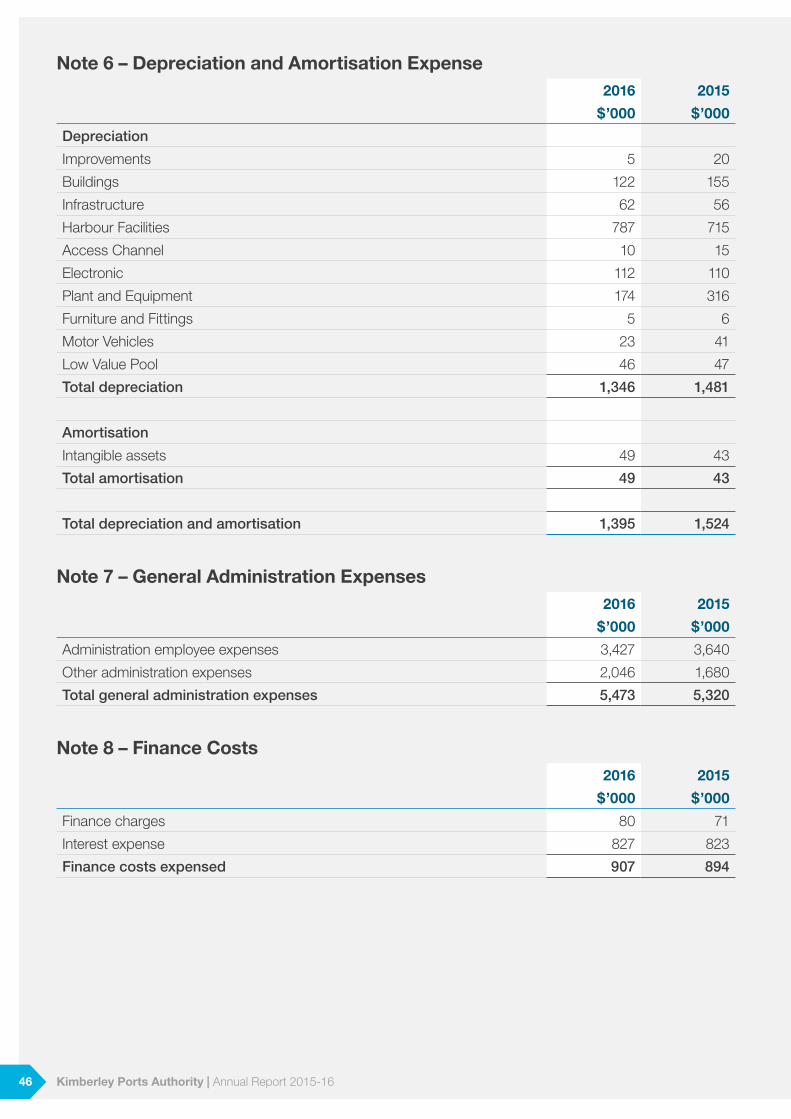
Note 6 – Depreciation and Amortisation Expense2016 2015
$’000 $’000
Depreciation
Improvements 5 20
Buildings 122 155
Infrastructure 62 56
Harbour Facilities 787 715
Access Channel 10 15
Electronic 112 110
Plant and Equipment 174 316
Furniture and Fittings 5 6
Motor Vehicles 23 41
Low Value Pool 46 47
Total depreciation 1,346 1,481
Amortisation
Intangible assets 49 43
Total amortisation 49 43
Total depreciation and amortisation 1,395 1,524
Note 7 – General Administration Expenses 2016 2015
$’000 $’000
Administration employee expenses 3,427 3,640
Other administration expenses 2,046 1,680
Total general administration expenses 5,473 5,320
Note 8 – Finance Costs 2016 2015
$’000 $’000
Finance charges 80 71
Interest expense 827 823
Finance costs expensed 907 894
46 Kimberley Ports Authority | Annual Report 2015-16
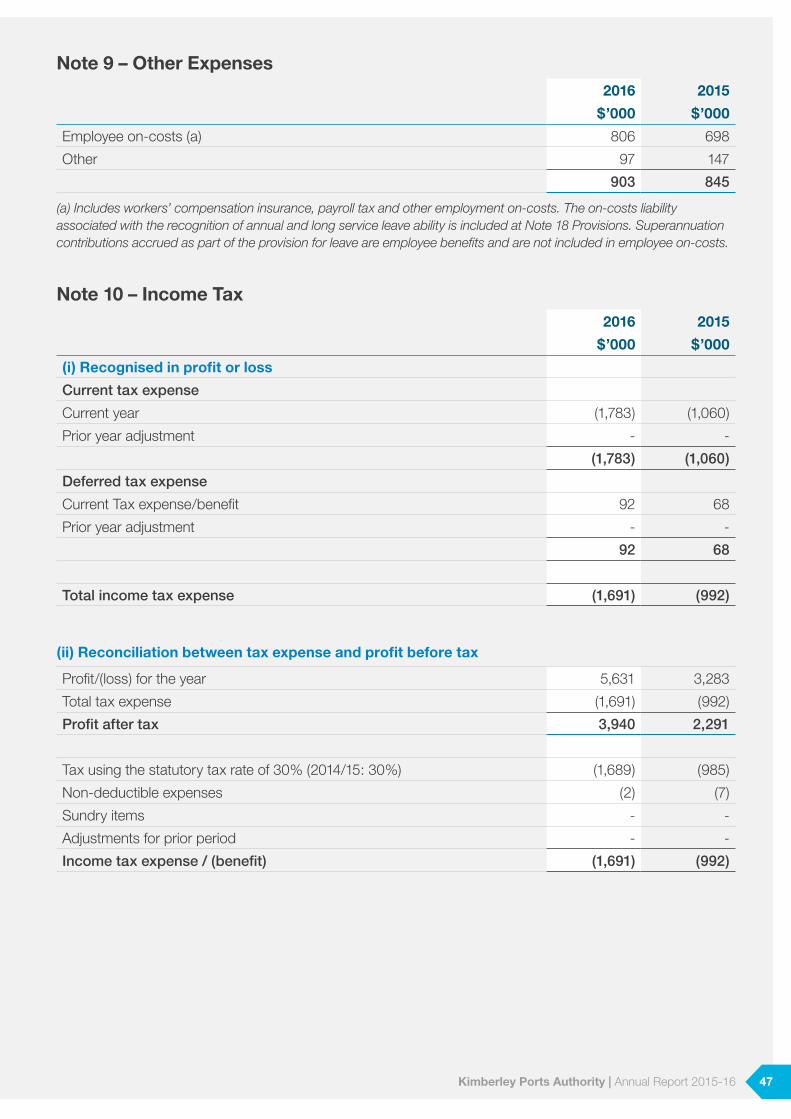
Note 9 – Other Expenses 2016 2015
$’000 $’000
Employee on-costs (a) 806 698
Other 97 147
903 845
(a) Includes workers’ compensation insurance, payroll tax and other employment on-costs. The on-costs liability associated with the recognition of annual and long service leave ability is included at Note 18 Provisions. Superannuation contributions accrued as part of the provision for leave are employee benefits and are not included in employee on-costs.
Note 10 – Income Tax2016 2015
$’000 $’000
(i) Recognised in profit or loss
Current tax expense
Current year (1,783) (1,060)
Prior year adjustment - -
(1,783) (1,060)
Deferred tax expense
Current Tax expense/benefit 92 68
Prior year adjustment - -
92 68
Total income tax expense (1,691) (992)
(ii) Reconciliation between tax expense and profit before tax
Profit/(loss) for the year 5,631 3,283
Total tax expense (1,691) (992)
Profit after tax 3,940 2,291
Tax using the statutory tax rate of 30% (2014/15: 30%) (1,689) (985)
Non-deductible expenses (2) (7)
Sundry items - -
Adjustments for prior period - -
Income tax expense / (benefit) (1,691) (992)
47Kimberley Ports Authority | Annual Report 2015-16
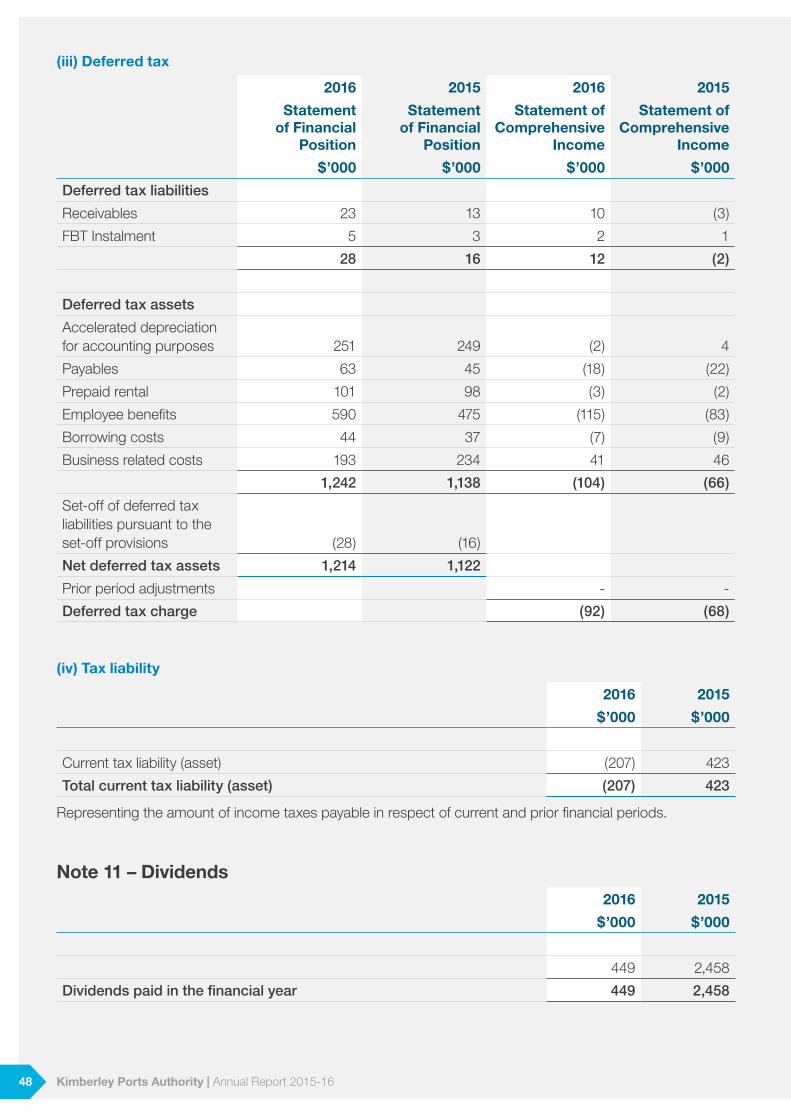
(iii) Deferred tax
2016 2015 2016 2015
Statement of Financial
Position
Statement of Financial
Position
Statement of Comprehensive
Income
Statement of Comprehensive
Income
$’000 $’000 $’000 $’000
Deferred tax liabilities
Receivables 23 13 10 (3)
FBT Instalment 5 3 2 1
28 16 12 (2)
Deferred tax assets
Accelerated depreciation for accounting purposes 251 249 (2) 4
Payables 63 45 (18) (22)
Prepaid rental 101 98 (3) (2)
Employee benefits 590 475 (115) (83)
Borrowing costs 44 37 (7) (9)
Business related costs 193 234 41 46
1,242 1,138 (104) (66)
Set-off of deferred tax liabilities pursuant to the set-off provisions (28) (16)
Net deferred tax assets 1,214 1,122
Prior period adjustments - -
Deferred tax charge (92) (68)
(iv) Tax liability
2016 2015
$’000 $’000
Current tax liability (asset) (207) 423
Total current tax liability (asset) (207) 423
Representing the amount of income taxes payable in respect of current and prior financial periods.
Note 11 – Dividends2016 2015
$’000 $’000
449 2,458
Dividends paid in the financial year 449 2,458
48 Kimberley Ports Authority | Annual Report 2015-16
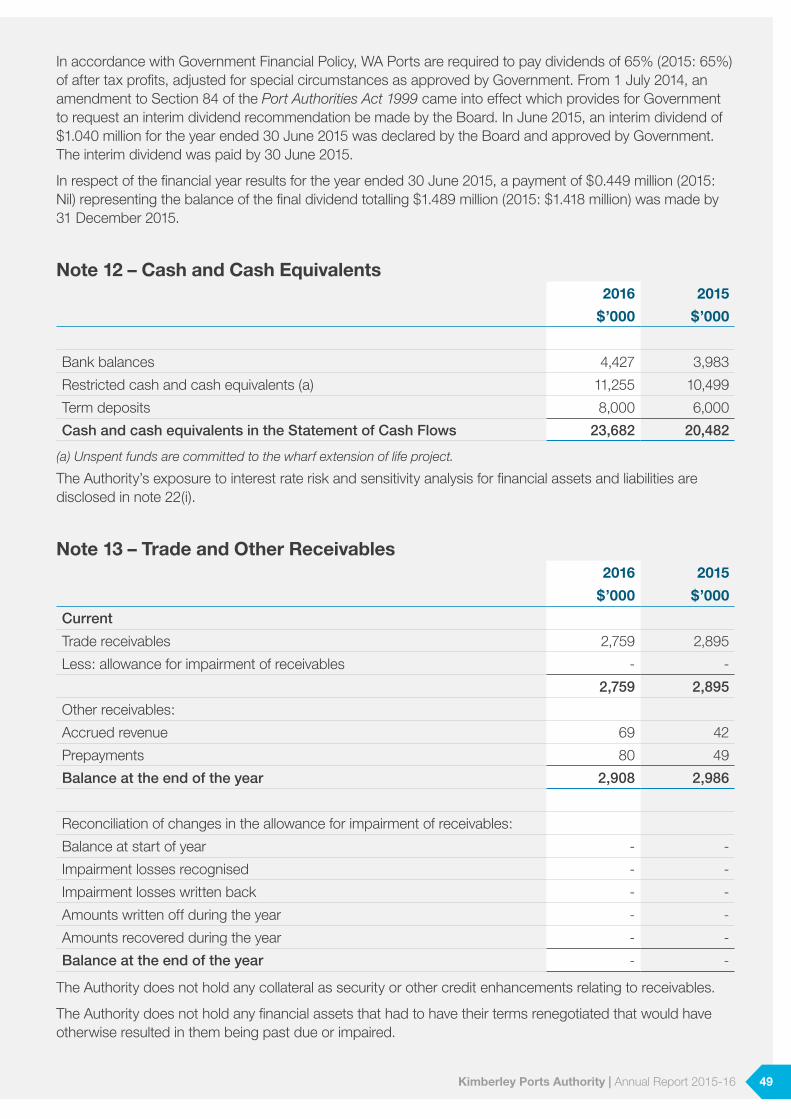
In accordance with Government Financial Policy, WA Ports are required to pay dividends of 65% (2015: 65%) of after tax profits, adjusted for special circumstances as approved by Government. From 1 July 2014, an amendment to Section 84 of the Port Authorities Act 1999 came into effect which provides for Government to request an interim dividend recommendation be made by the Board. In June 2015, an interim dividend of $1.040 million for the year ended 30 June 2015 was declared by the Board and approved by Government. The interim dividend was paid by 30 June 2015.
In respect of the financial year results for the year ended 30 June 2015, a payment of $0.449 million (2015: Nil) representing the balance of the final dividend totalling $1.489 million (2015: $1.418 million) was made by 31 December 2015.
Note 12 – Cash and Cash Equivalents2016 2015
$’000 $’000
Bank balances 4,427 3,983
Restricted cash and cash equivalents (a) 11,255 10,499
Term deposits 8,000 6,000
Cash and cash equivalents in the Statement of Cash Flows 23,682 20,482
(a) Unspent funds are committed to the wharf extension of life project.
The Authority’s exposure to interest rate risk and sensitivity analysis for financial assets and liabilities are disclosed in note 22(i).
Note 13 – Trade and Other Receivables2016 2015
$’000 $’000
Current
Trade receivables 2,759 2,895
Less: allowance for impairment of receivables - -
2,759 2,895
Other receivables:
Accrued revenue 69 42
Prepayments 80 49
Balance at the end of the year 2,908 2,986
Reconciliation of changes in the allowance for impairment of receivables:
Balance at start of year - -
Impairment losses recognised - -
Impairment losses written back - -
Amounts written off during the year - -
Amounts recovered during the year - -
Balance at the end of the year - -
The Authority does not hold any collateral as security or other credit enhancements relating to receivables.
The Authority does not hold any financial assets that had to have their terms renegotiated that would have otherwise resulted in them being past due or impaired.
49Kimberley Ports Authority | Annual Report 2015-16
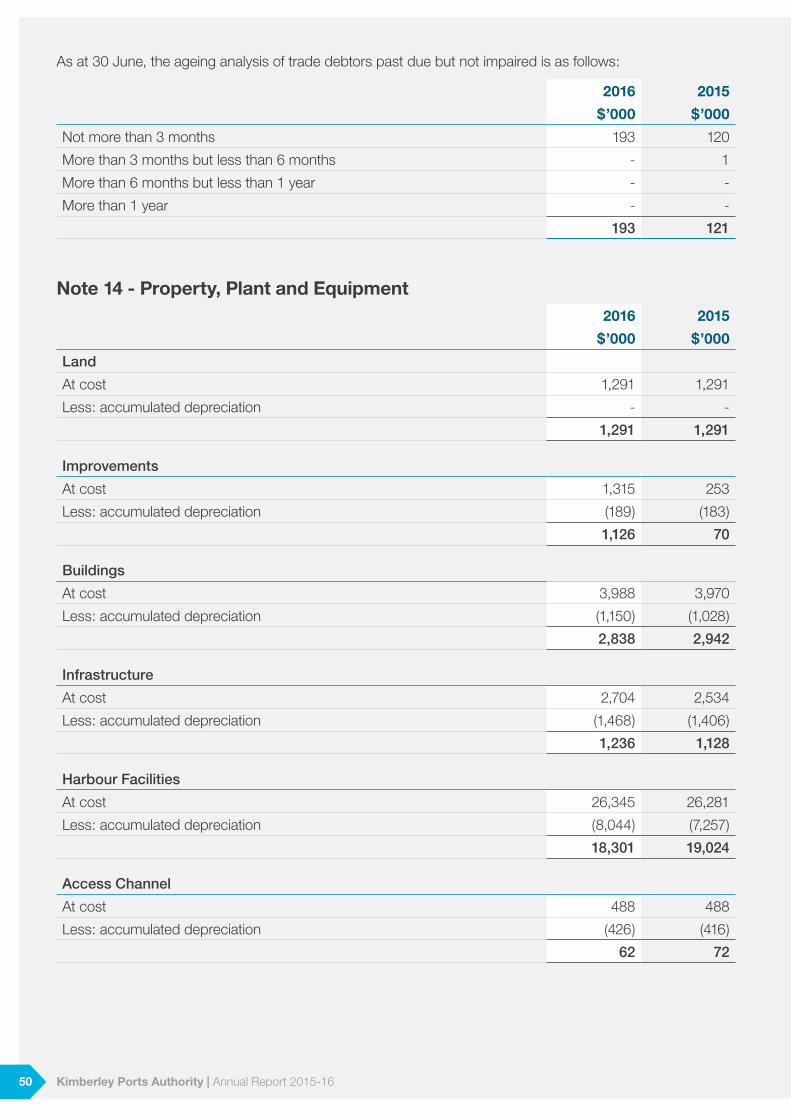
As at 30 June, the ageing analysis of trade debtors past due but not impaired is as follows:
2016 2015
$’000 $’000
Not more than 3 months 193 120
More than 3 months but less than 6 months - 1
More than 6 months but less than 1 year - -
More than 1 year - -
193 121
Note 14 - Property, Plant and Equipment2016 2015
$’000 $’000
Land
At cost 1,291 1,291
Less: accumulated depreciation - -
1,291 1,291
Improvements
At cost 1,315 253
Less: accumulated depreciation (189) (183)
1,126 70
Buildings
At cost 3,988 3,970
Less: accumulated depreciation (1,150) (1,028)
2,838 2,942
Infrastructure
At cost 2,704 2,534
Less: accumulated depreciation (1,468) (1,406)
1,236 1,128
Harbour Facilities
At cost 26,345 26,281
Less: accumulated depreciation (8,044) (7,257)
18,301 19,024
Access Channel
At cost 488 488
Less: accumulated depreciation (426) (416)
62 72
50 Kimberley Ports Authority | Annual Report 2015-16
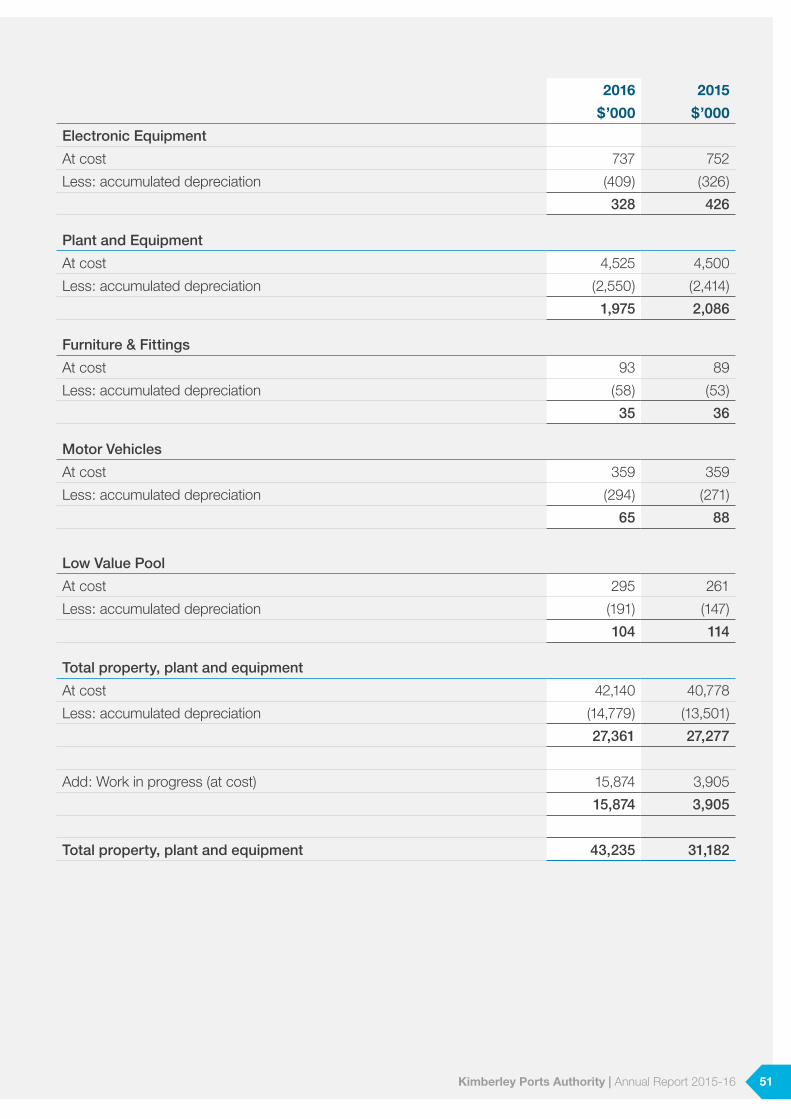
2016 2015
$’000 $’000
Electronic Equipment
At cost 737 752
Less: accumulated depreciation (409) (326)
328 426
Plant and Equipment
At cost 4,525 4,500
Less: accumulated depreciation (2,550) (2,414)
1,975 2,086
Furniture & Fittings
At cost 93 89
Less: accumulated depreciation (58) (53)
35 36
Motor Vehicles
At cost 359 359
Less: accumulated depreciation (294) (271)
65 88
Low Value Pool
At cost 295 261
Less: accumulated depreciation (191) (147)
104 114
Total property, plant and equipment
At cost 42,140 40,778
Less: accumulated depreciation (14,779) (13,501)
27,361 27,277
Add: Work in progress (at cost) 15,874 3,905
15,874 3,905
Total property, plant and equipment 43,235 31,182
51Kimberley Ports Authority | Annual Report 2015-16
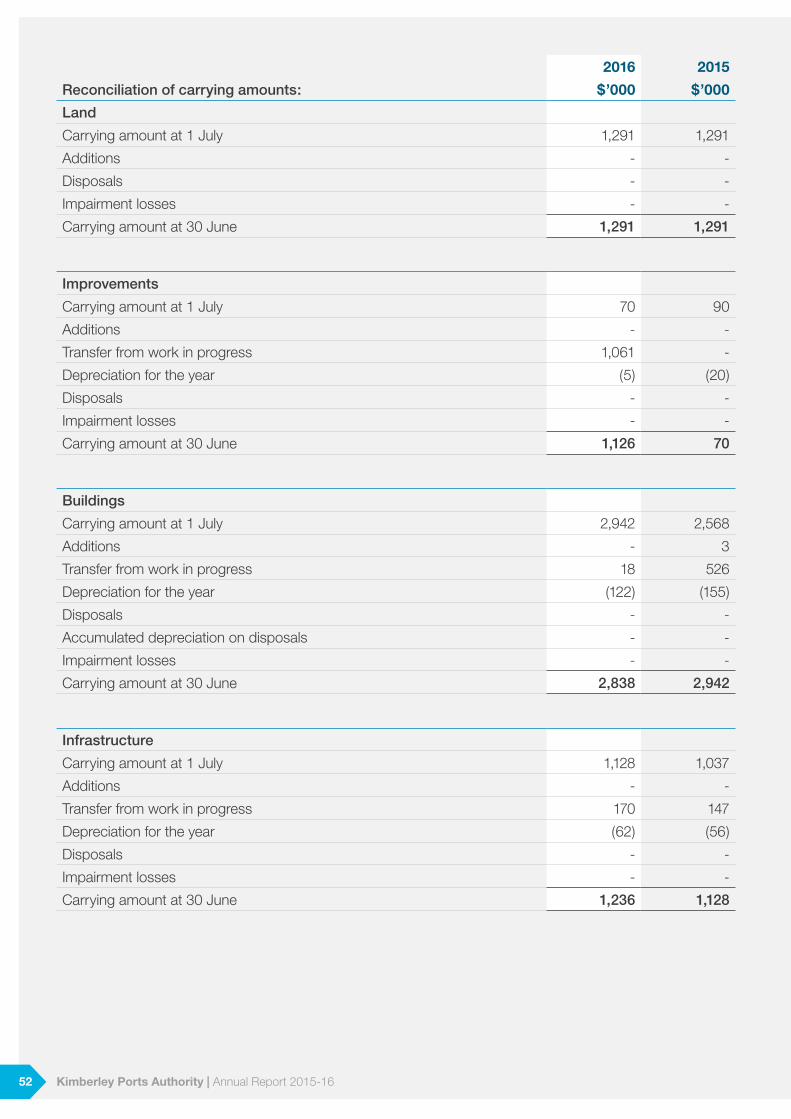
2016 2015
Reconciliation of carrying amounts: $’000 $’000
Land
Carrying amount at 1 July 1,291 1,291
Additions - -
Disposals - -
Impairment losses - -
Carrying amount at 30 June 1,291 1,291
Improvements
Carrying amount at 1 July 70 90
Additions - -
Transfer from work in progress 1,061 -
Depreciation for the year (5) (20)
Disposals - -
Impairment losses - -
Carrying amount at 30 June 1,126 70
Buildings
Carrying amount at 1 July 2,942 2,568
Additions - 3
Transfer from work in progress 18 526
Depreciation for the year (122) (155)
Disposals - -
Accumulated depreciation on disposals - -
Impairment losses - -
Carrying amount at 30 June 2,838 2,942
Infrastructure
Carrying amount at 1 July 1,128 1,037
Additions - -
Transfer from work in progress 170 147
Depreciation for the year (62) (56)
Disposals - -
Impairment losses - -
Carrying amount at 30 June 1,236 1,128
52 Kimberley Ports Authority | Annual Report 2015-16
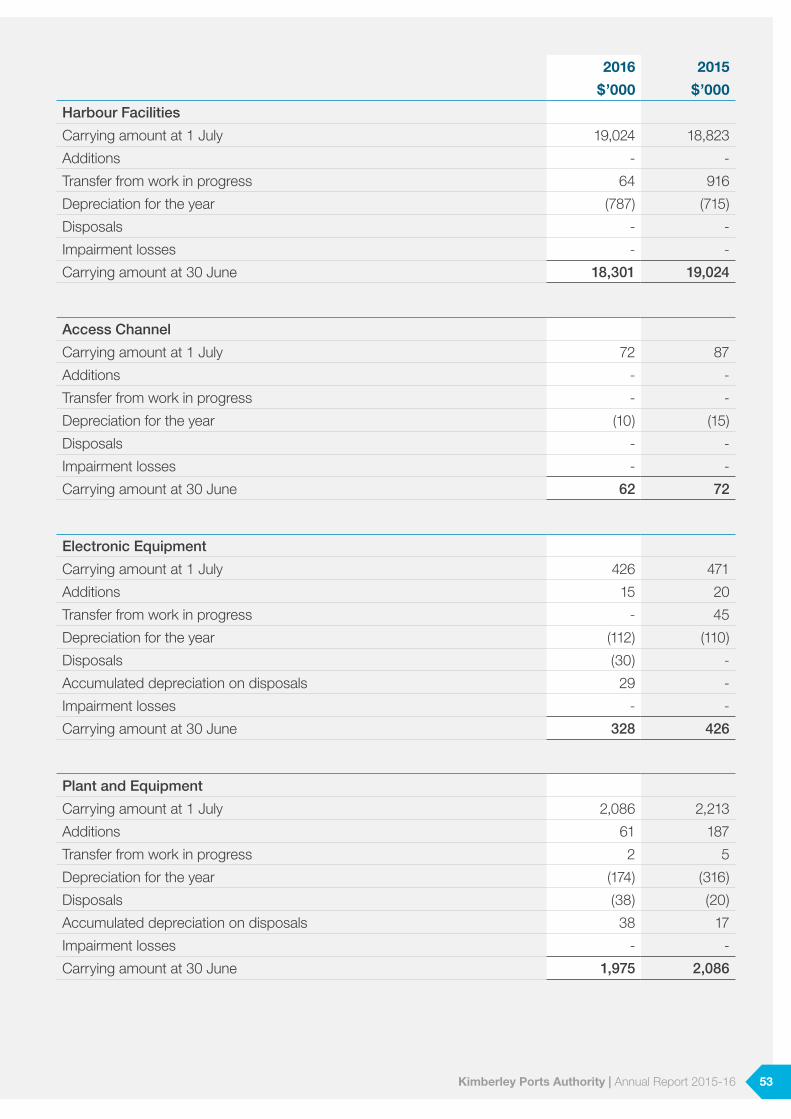
2016 2015
$’000 $’000
Harbour Facilities
Carrying amount at 1 July 19,024 18,823
Additions - -
Transfer from work in progress 64 916
Depreciation for the year (787) (715)
Disposals - -
Impairment losses - -
Carrying amount at 30 June 18,301 19,024
Access Channel
Carrying amount at 1 July 72 87
Additions - -
Transfer from work in progress - -
Depreciation for the year (10) (15)
Disposals - -
Impairment losses - -
Carrying amount at 30 June 62 72
Electronic Equipment
Carrying amount at 1 July 426 471
Additions 15 20
Transfer from work in progress - 45
Depreciation for the year (112) (110)
Disposals (30) -
Accumulated depreciation on disposals 29 -
Impairment losses - -
Carrying amount at 30 June 328 426
Plant and Equipment
Carrying amount at 1 July 2,086 2,213
Additions 61 187
Transfer from work in progress 2 5
Depreciation for the year (174) (316)
Disposals (38) (20)
Accumulated depreciation on disposals 38 17
Impairment losses - -
Carrying amount at 30 June 1,975 2,086
53Kimberley Ports Authority | Annual Report 2015-16
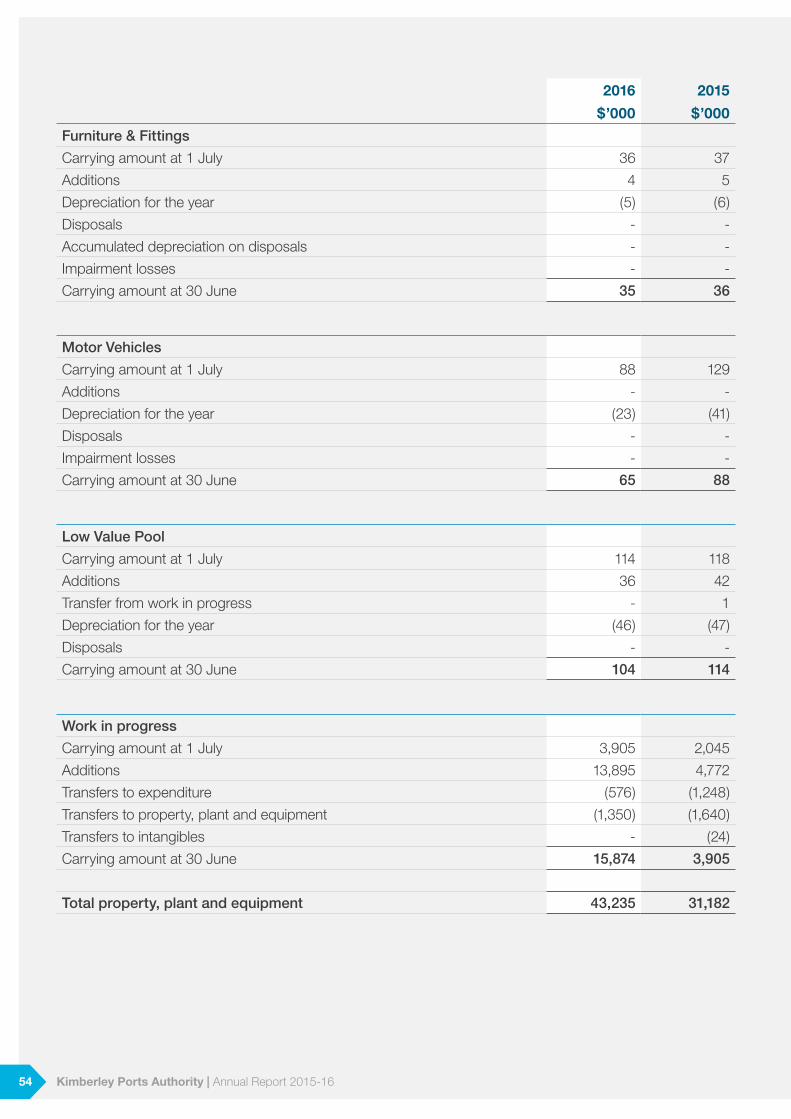
2016 2015
$’000 $’000
Furniture & Fittings
Carrying amount at 1 July 36 37
Additions 4 5
Depreciation for the year (5) (6)
Disposals - -
Accumulated depreciation on disposals - -
Impairment losses - -
Carrying amount at 30 June 35 36
Motor Vehicles
Carrying amount at 1 July 88 129
Additions - -
Depreciation for the year (23) (41)
Disposals - -
Impairment losses - -
Carrying amount at 30 June 65 88
Low Value Pool
Carrying amount at 1 July 114 118
Additions 36 42
Transfer from work in progress - 1
Depreciation for the year (46) (47)
Disposals - -
Carrying amount at 30 June 104 114
Work in progress
Carrying amount at 1 July 3,905 2,045
Additions 13,895 4,772
Transfers to expenditure (576) (1,248)
Transfers to property, plant and equipment (1,350) (1,640)
Transfers to intangibles - (24)
Carrying amount at 30 June 15,874 3,905
Total property, plant and equipment 43,235 31,182
54 Kimberley Ports Authority | Annual Report 2015-16
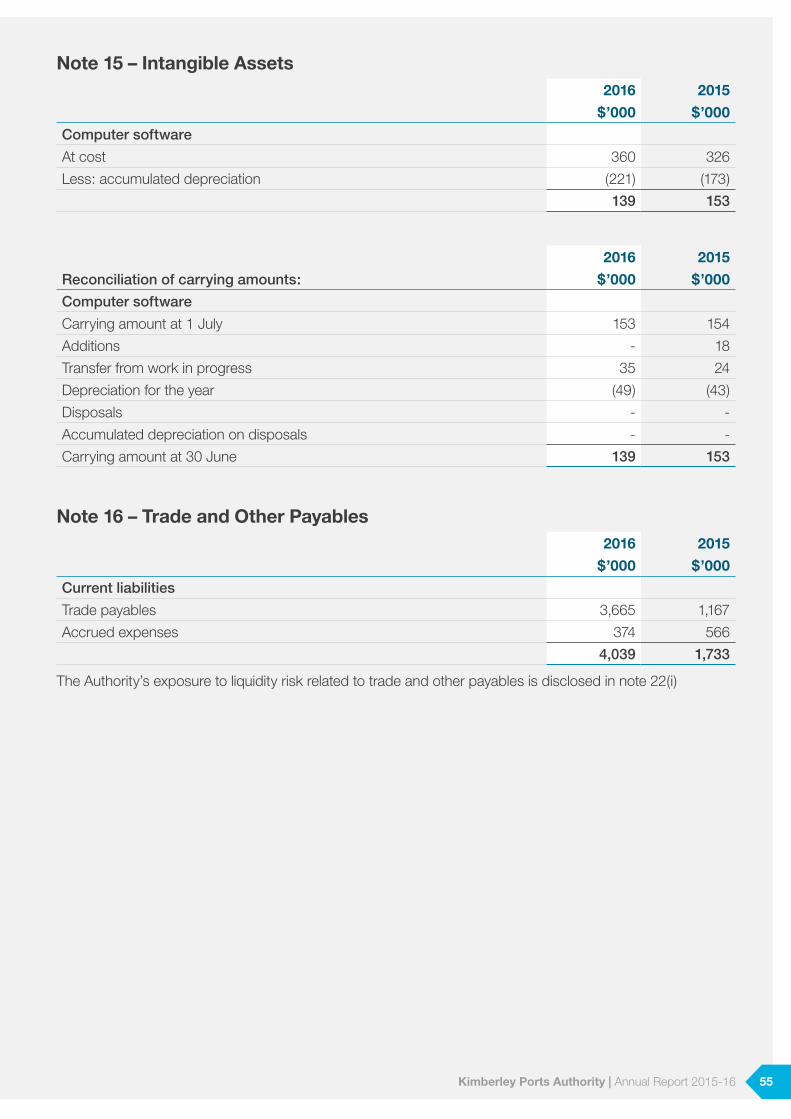
Note 15 – Intangible Assets2016 2015
$’000 $’000
Computer software
At cost 360 326
Less: accumulated depreciation (221) (173)
139 153
2016 2015
Reconciliation of carrying amounts: $’000 $’000
Computer software
Carrying amount at 1 July 153 154
Additions - 18
Transfer from work in progress 35 24
Depreciation for the year (49) (43)
Disposals - -
Accumulated depreciation on disposals - -
Carrying amount at 30 June 139 153
Note 16 – Trade and Other Payables2016 2015
$’000 $’000
Current liabilities
Trade payables 3,665 1,167
Accrued expenses 374 566
4,039 1,733
The Authority’s exposure to liquidity risk related to trade and other payables is disclosed in note 22(i)
55Kimberley Ports Authority | Annual Report 2015-16
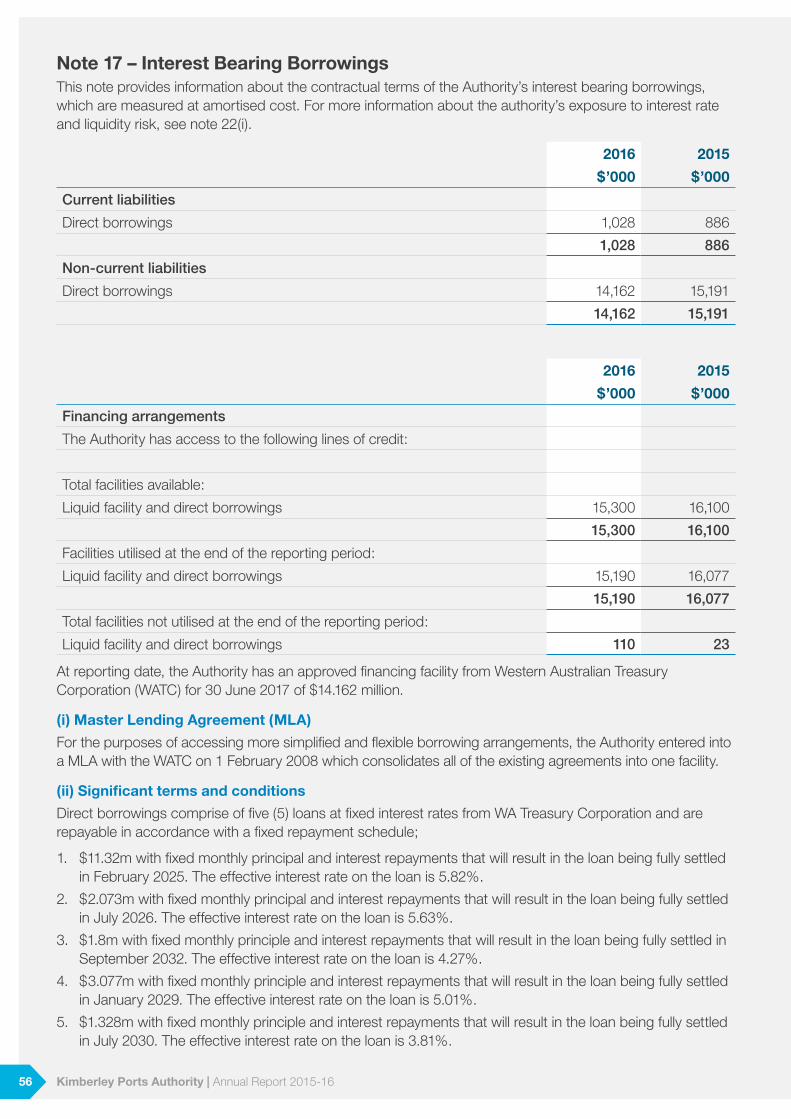
Note 17 – Interest Bearing BorrowingsThis note provides information about the contractual terms of the Authority’s interest bearing borrowings, which are measured at amortised cost. For more information about the authority’s exposure to interest rate and liquidity risk, see note 22(i).
2016 2015
$’000 $’000
Current liabilities
Direct borrowings 1,028 886
1,028 886
Non-current liabilities
Direct borrowings 14,162 15,191
14,162 15,191
2016 2015
$’000 $’000
Financing arrangements
The Authority has access to the following lines of credit:
Total facilities available:
Liquid facility and direct borrowings 15,300 16,100
15,300 16,100
Facilities utilised at the end of the reporting period:
Liquid facility and direct borrowings 15,190 16,077
15,190 16,077
Total facilities not utilised at the end of the reporting period:
Liquid facility and direct borrowings 110 23
At reporting date, the Authority has an approved financing facility from Western Australian Treasury Corporation (WATC) for 30 June 2017 of $14.162 million.
(i) Master Lending Agreement (MLA)
For the purposes of accessing more simplified and flexible borrowing arrangements, the Authority entered into a MLA with the WATC on 1 February 2008 which consolidates all of the existing agreements into one facility.
(ii) Significant terms and conditions
Direct borrowings comprise of five (5) loans at fixed interest rates from WA Treasury Corporation and are repayable in accordance with a fixed repayment schedule;
1. $11.32m with fixed monthly principal and interest repayments that will result in the loan being fully settled in February 2025. The effective interest rate on the loan is 5.82%.
2. $2.073m with fixed monthly principal and interest repayments that will result in the loan being fully settled in July 2026. The effective interest rate on the loan is 5.63%.
3. $1.8m with fixed monthly principle and interest repayments that will result in the loan being fully settled in September 2032. The effective interest rate on the loan is 4.27%.
4. $3.077m with fixed monthly principle and interest repayments that will result in the loan being fully settled in January 2029. The effective interest rate on the loan is 5.01%.
5. $1.328m with fixed monthly principle and interest repayments that will result in the loan being fully settled in July 2030. The effective interest rate on the loan is 3.81%.
56 Kimberley Ports Authority | Annual Report 2015-16
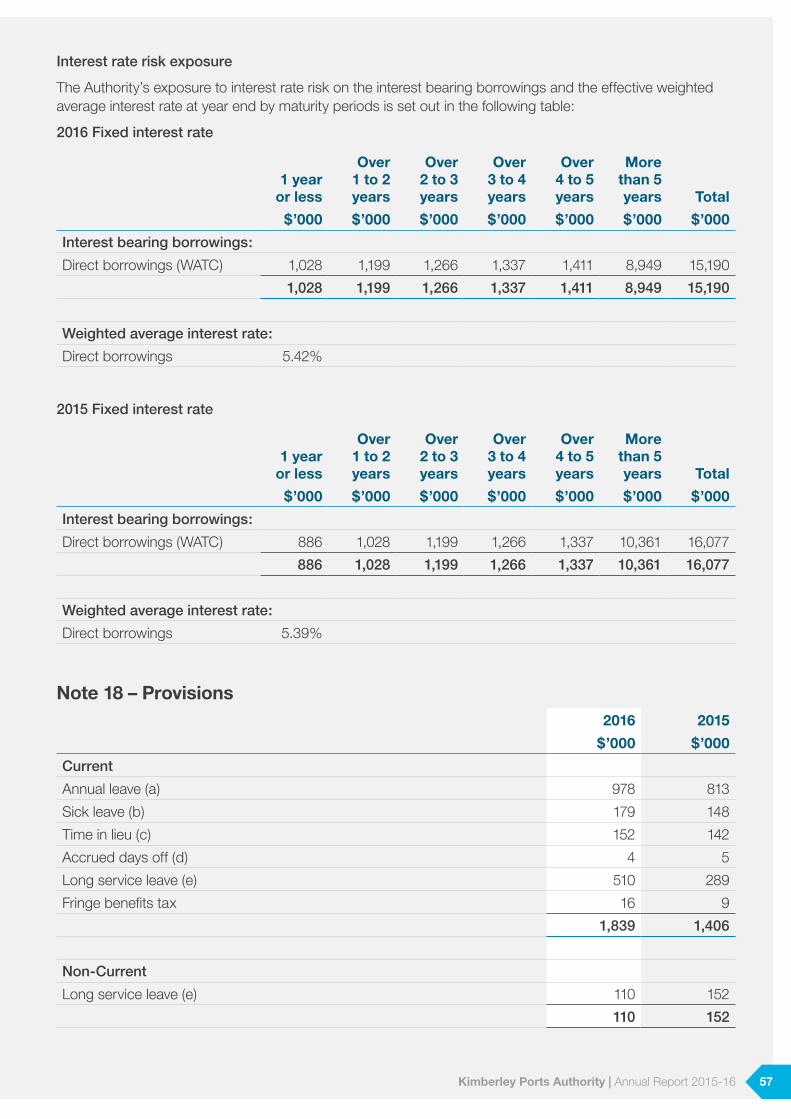
Interest rate risk exposure
The Authority’s exposure to interest rate risk on the interest bearing borrowings and the effective weighted average interest rate at year end by maturity periods is set out in the following table:
2016 Fixed interest rate
1 year or less
Over 1 to 2 years
Over 2 to 3 years
Over 3 to 4 years
Over 4 to 5 years
More than 5 years Total
$’000 $’000 $’000 $’000 $’000 $’000 $’000
Interest bearing borrowings:
Direct borrowings (WATC) 1,028 1,199 1,266 1,337 1,411 8,949 15,190
1,028 1,199 1,266 1,337 1,411 8,949 15,190
Weighted average interest rate:
Direct borrowings 5.42%
2015 Fixed interest rate
1 year or less
Over 1 to 2 years
Over 2 to 3 years
Over 3 to 4 years
Over 4 to 5 years
More than 5 years Total
$’000 $’000 $’000 $’000 $’000 $’000 $’000
Interest bearing borrowings:
Direct borrowings (WATC) 886 1,028 1,199 1,266 1,337 10,361 16,077
886 1,028 1,199 1,266 1,337 10,361 16,077
Weighted average interest rate:
Direct borrowings 5.39%
Note 18 – Provisions2016 2015
$’000 $’000
Current
Annual leave (a) 978 813
Sick leave (b) 179 148
Time in lieu (c) 152 142
Accrued days off (d) 4 5
Long service leave (e) 510 289
Fringe benefits tax 16 9
1,839 1,406
Non-Current
Long service leave (e) 110 152
110 152
57Kimberley Ports Authority | Annual Report 2015-16
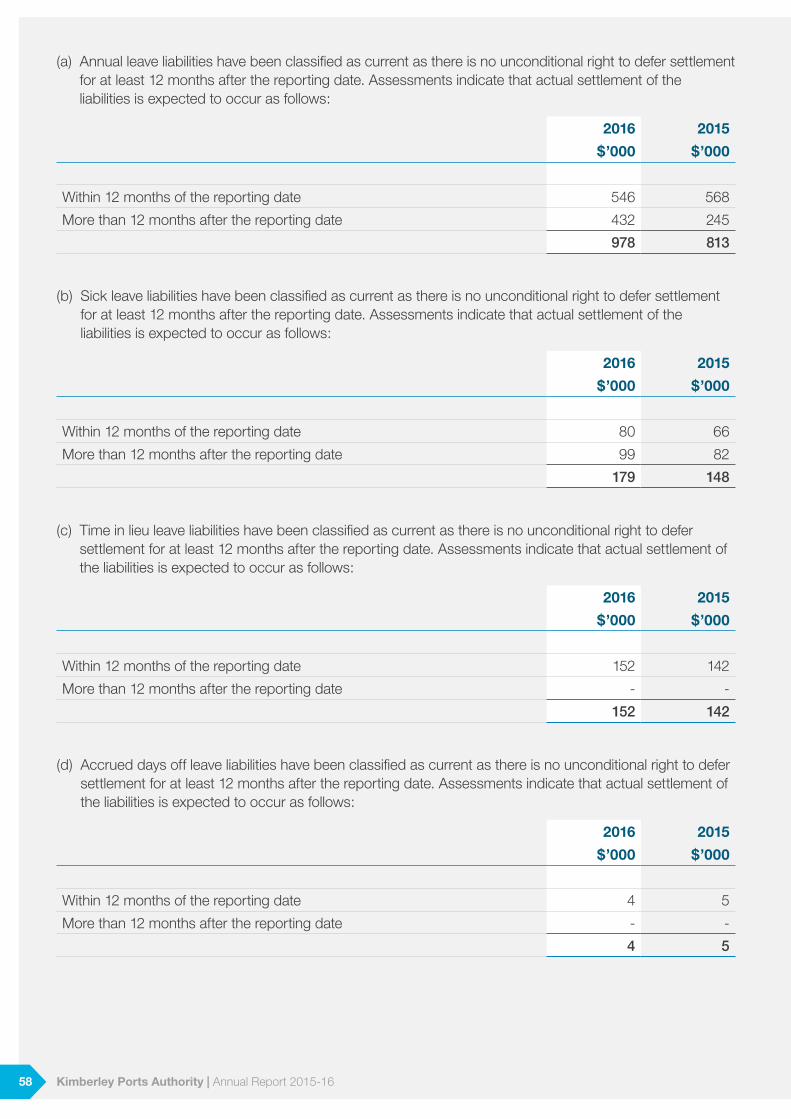
(a) Annual leave liabilities have been classified as current as there is no unconditional right to defer settlement for at least 12 months after the reporting date. Assessments indicate that actual settlement of the liabilities is expected to occur as follows:
2016 2015
$’000 $’000
Within 12 months of the reporting date 546 568
More than 12 months after the reporting date 432 245
978 813
(b) Sick leave liabilities have been classified as current as there is no unconditional right to defer settlement for at least 12 months after the reporting date. Assessments indicate that actual settlement of the liabilities is expected to occur as follows:
2016 2015
$’000 $’000
Within 12 months of the reporting date 80 66
More than 12 months after the reporting date 99 82
179 148
(c) Time in lieu leave liabilities have been classified as current as there is no unconditional right to defer settlement for at least 12 months after the reporting date. Assessments indicate that actual settlement of the liabilities is expected to occur as follows:
2016 2015
$’000 $’000
Within 12 months of the reporting date 152 142
More than 12 months after the reporting date - -
152 142
(d) Accrued days off leave liabilities have been classified as current as there is no unconditional right to defer settlement for at least 12 months after the reporting date. Assessments indicate that actual settlement of the liabilities is expected to occur as follows:
2016 2015
$’000 $’000
Within 12 months of the reporting date 4 5
More than 12 months after the reporting date - -
4 5
58 Kimberley Ports Authority | Annual Report 2015-16
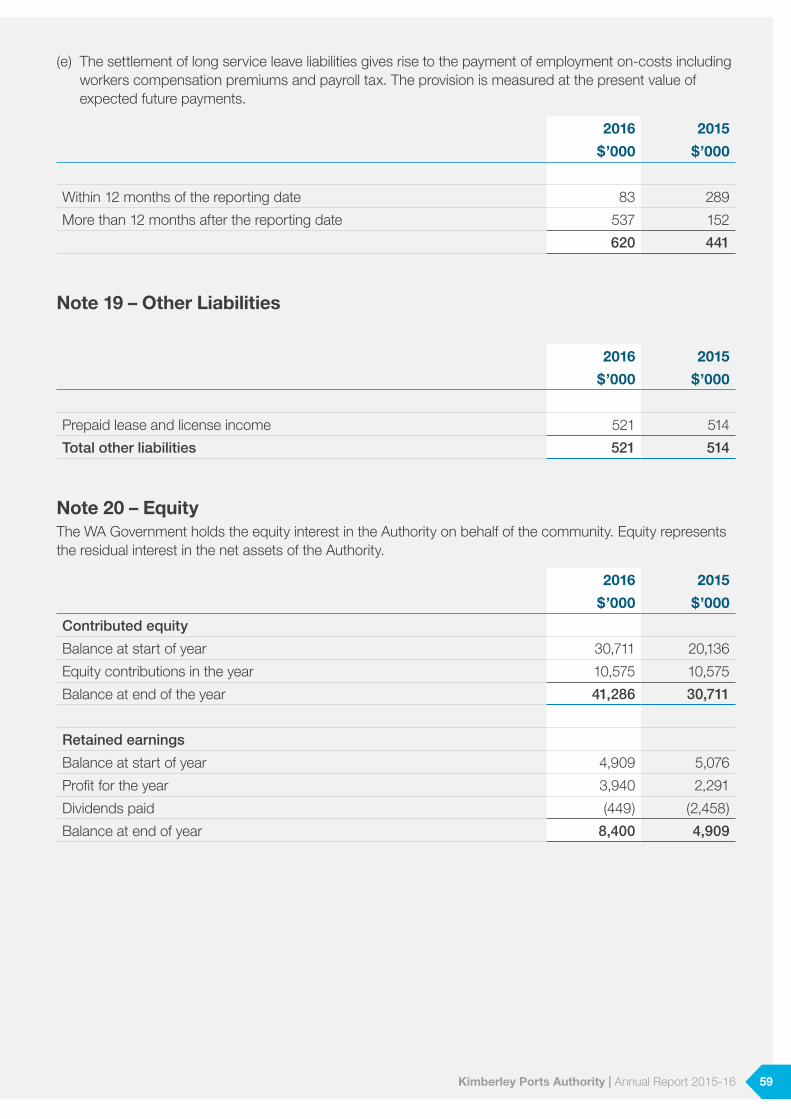
(e) The settlement of long service leave liabilities gives rise to the payment of employment on-costs including workers compensation premiums and payroll tax. The provision is measured at the present value of expected future payments.
2016 2015
$’000 $’000
Within 12 months of the reporting date 83 289
More than 12 months after the reporting date 537 152
620 441
Note 19 – Other Liabilities
2016 2015
$’000 $’000
Prepaid lease and license income 521 514
Total other liabilities 521 514
Note 20 – EquityThe WA Government holds the equity interest in the Authority on behalf of the community. Equity represents the residual interest in the net assets of the Authority.
2016 2015
$’000 $’000
Contributed equity
Balance at start of year 30,711 20,136
Equity contributions in the year 10,575 10,575
Balance at end of the year 41,286 30,711
Retained earnings
Balance at start of year 4,909 5,076
Profit for the year 3,940 2,291
Dividends paid (449) (2,458)
Balance at end of year 8,400 4,909
59Kimberley Ports Authority | Annual Report 2015-16
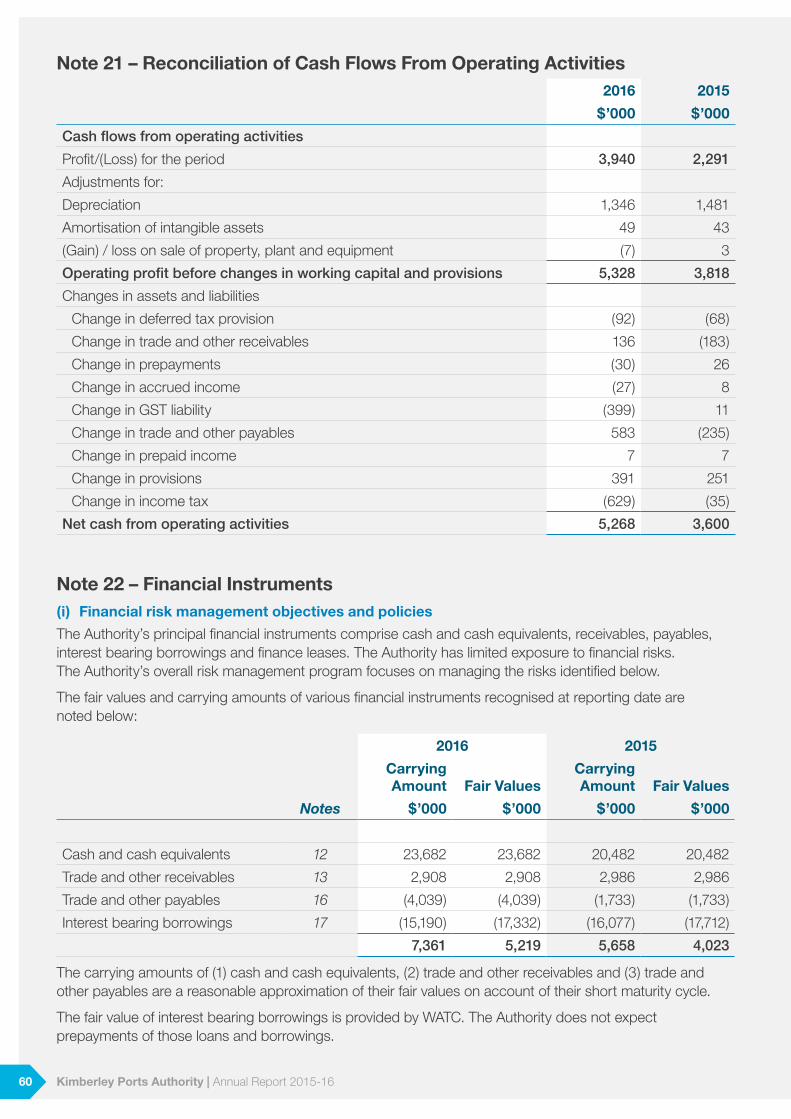
Note 21 – Reconciliation of Cash Flows From Operating Activities2016 2015
$’000 $’000
Cash flows from operating activities
Profit/(Loss) for the period 3,940 2,291
Adjustments for:
Depreciation 1,346 1,481
Amortisation of intangible assets 49 43
(Gain) / loss on sale of property, plant and equipment (7) 3
Operating profit before changes in working capital and provisions 5,328 3,818
Changes in assets and liabilities
Change in deferred tax provision (92) (68)
Change in trade and other receivables 136 (183)
Change in prepayments (30) 26
Change in accrued income (27) 8
Change in GST liability (399) 11
Change in trade and other payables 583 (235)
Change in prepaid income 7 7
Change in provisions 391 251
Change in income tax (629) (35)
Net cash from operating activities 5,268 3,600
Note 22 – Financial Instruments(i) Financial risk management objectives and policies
The Authority’s principal financial instruments comprise cash and cash equivalents, receivables, payables, interest bearing borrowings and finance leases. The Authority has limited exposure to financial risks. The Authority’s overall risk management program focuses on managing the risks identified below.
The fair values and carrying amounts of various financial instruments recognised at reporting date are noted below:
2016 2015
Carrying Amount Fair Values
Carrying Amount Fair Values
Notes $’000 $’000 $’000 $’000
Cash and cash equivalents 12 23,682 23,682 20,482 20,482
Trade and other receivables 13 2,908 2,908 2,986 2,986
Trade and other payables 16 (4,039) (4,039) (1,733) (1,733)
Interest bearing borrowings 17 (15,190) (17,332) (16,077) (17,712)
7,361 5,219 5,658 4,023
The carrying amounts of (1) cash and cash equivalents, (2) trade and other receivables and (3) trade and other payables are a reasonable approximation of their fair values on account of their short maturity cycle.
The fair value of interest bearing borrowings is provided by WATC. The Authority does not expect prepayments of those loans and borrowings.
60 Kimberley Ports Authority | Annual Report 2015-16
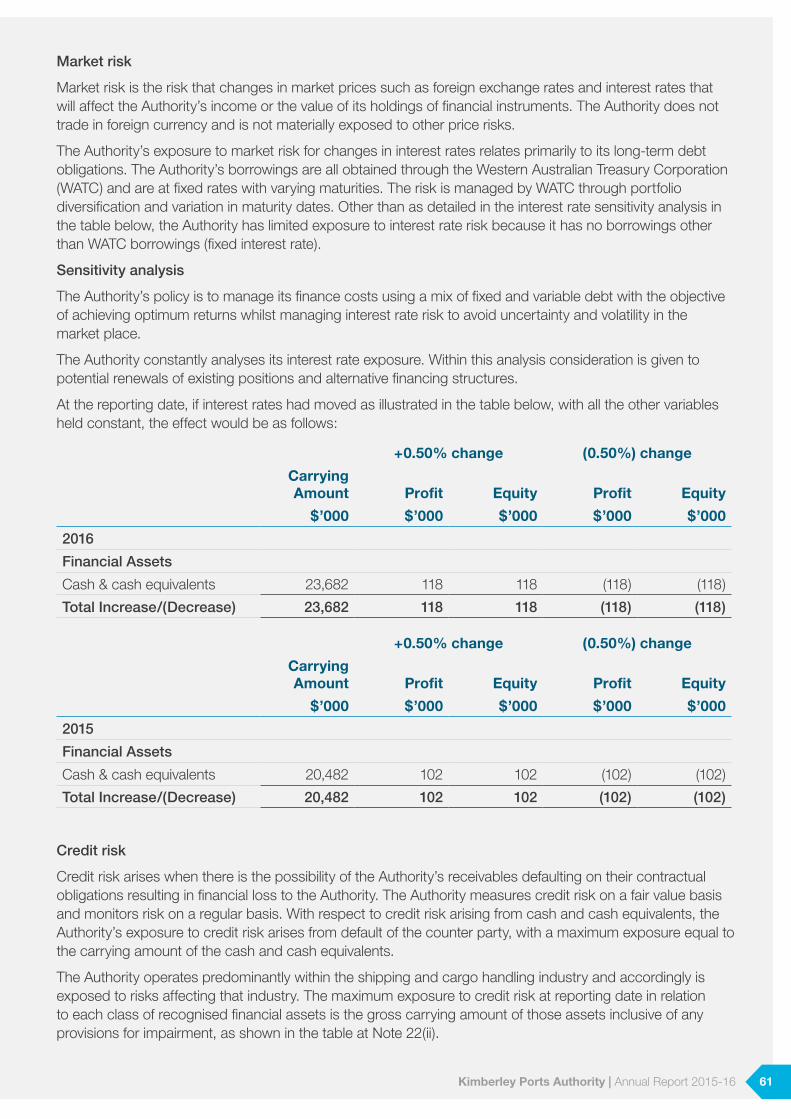
Market risk
Market risk is the risk that changes in market prices such as foreign exchange rates and interest rates that will affect the Authority’s income or the value of its holdings of financial instruments. The Authority does not trade in foreign currency and is not materially exposed to other price risks.
The Authority’s exposure to market risk for changes in interest rates relates primarily to its long-term debt obligations. The Authority’s borrowings are all obtained through the Western Australian Treasury Corporation (WATC) and are at fixed rates with varying maturities. The risk is managed by WATC through portfolio diversification and variation in maturity dates. Other than as detailed in the interest rate sensitivity analysis in the table below, the Authority has limited exposure to interest rate risk because it has no borrowings other than WATC borrowings (fixed interest rate).
Sensitivity analysis
The Authority’s policy is to manage its finance costs using a mix of fixed and variable debt with the objective of achieving optimum returns whilst managing interest rate risk to avoid uncertainty and volatility in the market place.
The Authority constantly analyses its interest rate exposure. Within this analysis consideration is given to potential renewals of existing positions and alternative financing structures.
At the reporting date, if interest rates had moved as illustrated in the table below, with all the other variables held constant, the effect would be as follows:
+0.50% change (0.50%) change
Carrying Amount Profit Equity Profit Equity
$’000 $’000 $’000 $’000 $’000
2016
Financial Assets
Cash & cash equivalents 23,682 118 118 (118) (118)
Total Increase/(Decrease) 23,682 118 118 (118) (118)
+0.50% change (0.50%) change
Carrying Amount Profit Equity Profit Equity
$’000 $’000 $’000 $’000 $’000
2015
Financial Assets
Cash & cash equivalents 20,482 102 102 (102) (102)
Total Increase/(Decrease) 20,482 102 102 (102) (102)
Credit risk
Credit risk arises when there is the possibility of the Authority’s receivables defaulting on their contractual obligations resulting in financial loss to the Authority. The Authority measures credit risk on a fair value basis and monitors risk on a regular basis. With respect to credit risk arising from cash and cash equivalents, the Authority’s exposure to credit risk arises from default of the counter party, with a maximum exposure equal to the carrying amount of the cash and cash equivalents.
The Authority operates predominantly within the shipping and cargo handling industry and accordingly is exposed to risks affecting that industry. The maximum exposure to credit risk at reporting date in relation to each class of recognised financial assets is the gross carrying amount of those assets inclusive of any provisions for impairment, as shown in the table at Note 22(ii).
61Kimberley Ports Authority | Annual Report 2015-16
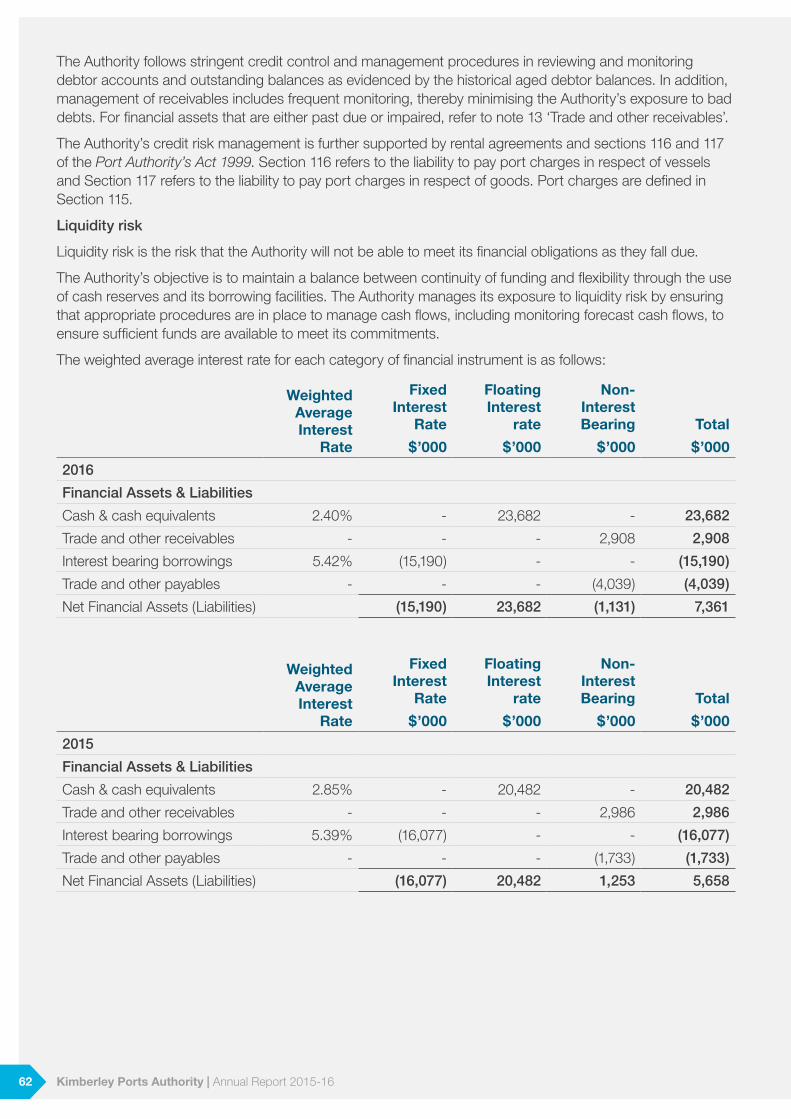
The Authority follows stringent credit control and management procedures in reviewing and monitoring debtor accounts and outstanding balances as evidenced by the historical aged debtor balances. In addition, management of receivables includes frequent monitoring, thereby minimising the Authority’s exposure to bad debts. For financial assets that are either past due or impaired, refer to note 13 ‘Trade and other receivables’.
The Authority’s credit risk management is further supported by rental agreements and sections 116 and 117 of the Port Authority’s Act 1999. Section 116 refers to the liability to pay port charges in respect of vessels and Section 117 refers to the liability to pay port charges in respect of goods. Port charges are defined in Section 115.
Liquidity risk
Liquidity risk is the risk that the Authority will not be able to meet its financial obligations as they fall due.
The Authority’s objective is to maintain a balance between continuity of funding and flexibility through the use of cash reserves and its borrowing facilities. The Authority manages its exposure to liquidity risk by ensuring that appropriate procedures are in place to manage cash flows, including monitoring forecast cash flows, to ensure sufficient funds are available to meet its commitments.
The weighted average interest rate for each category of financial instrument is as follows:
Weighted Average Interest
Rate
Fixed Interest
Rate
Floating Interest
rate
Non-Interest Bearing Total
$’000 $’000 $’000 $’000
2016
Financial Assets & Liabilities
Cash & cash equivalents 2.40% - 23,682 - 23,682
Trade and other receivables - - - 2,908 2,908
Interest bearing borrowings 5.42% (15,190) - - (15,190)
Trade and other payables - - - (4,039) (4,039)
Net Financial Assets (Liabilities) (15,190) 23,682 (1,131) 7,361
Weighted Average Interest
Rate
Fixed Interest
Rate
Floating Interest
rate
Non-Interest Bearing Total
$’000 $’000 $’000 $’000
2015
Financial Assets & Liabilities
Cash & cash equivalents 2.85% - 20,482 - 20,482
Trade and other receivables - - - 2,986 2,986
Interest bearing borrowings 5.39% (16,077) - - (16,077)
Trade and other payables - - - (1,733) (1,733)
Net Financial Assets (Liabilities) (16,077) 20,482 1,253 5,658
62 Kimberley Ports Authority | Annual Report 2015-16
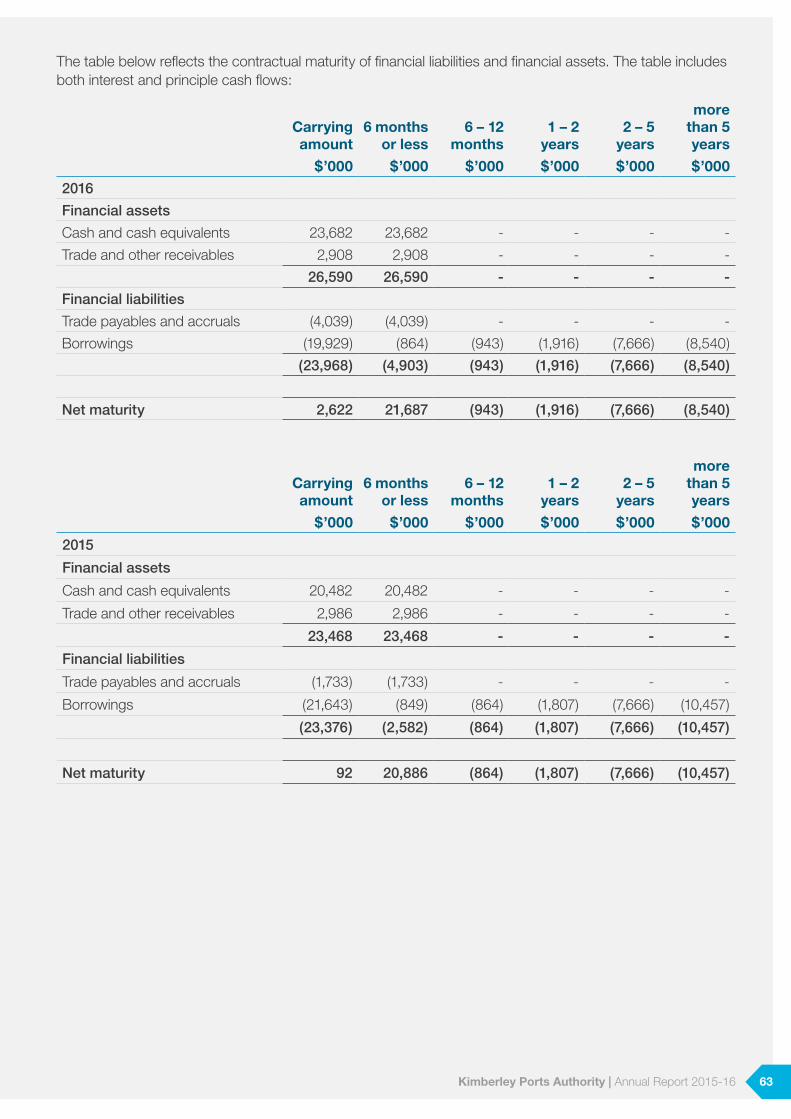
The table below reflects the contractual maturity of financial liabilities and financial assets. The table includes both interest and principle cash flows:
Carrying amount
6 months or less
6 – 12 months
1 – 2 years
2 – 5 years
more than 5 years
$’000 $’000 $’000 $’000 $’000 $’000
2016
Financial assets
Cash and cash equivalents 23,682 23,682 - - - -
Trade and other receivables 2,908 2,908 - - - -
26,590 26,590 - - - -
Financial liabilities
Trade payables and accruals (4,039) (4,039) - - - -
Borrowings (19,929) (864) (943) (1,916) (7,666) (8,540)
(23,968) (4,903) (943) (1,916) (7,666) (8,540)
Net maturity 2,622 21,687 (943) (1,916) (7,666) (8,540)
Carrying amount
6 months or less
6 – 12 months
1 – 2 years
2 – 5 years
more than 5 years
$’000 $’000 $’000 $’000 $’000 $’000
2015
Financial assets
Cash and cash equivalents 20,482 20,482 - - - -
Trade and other receivables 2,986 2,986 - - - -
23,468 23,468 - - - -
Financial liabilities
Trade payables and accruals (1,733) (1,733) - - - -
Borrowings (21,643) (849) (864) (1,807) (7,666) (10,457)
(23,376) (2,582) (864) (1,807) (7,666) (10,457)
Net maturity 92 20,886 (864) (1,807) (7,666) (10,457)
63Kimberley Ports Authority | Annual Report 2015-16
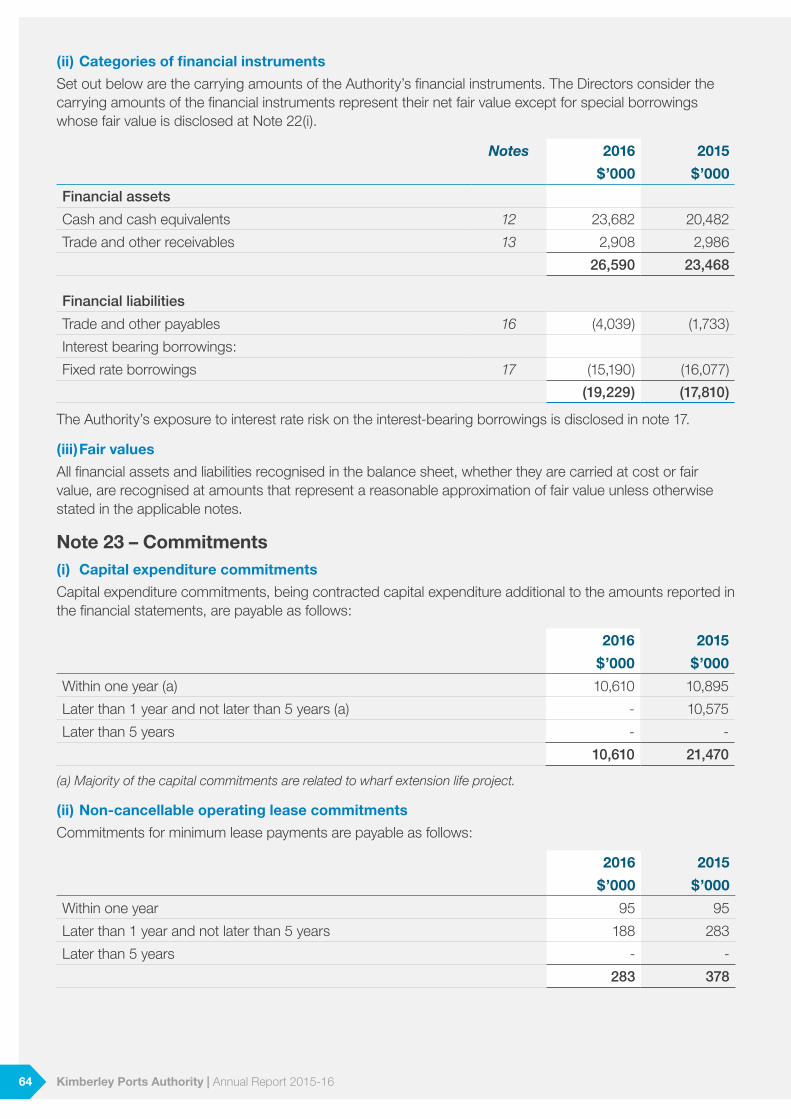
(ii) Categories of financial instruments
Set out below are the carrying amounts of the Authority’s financial instruments. The Directors consider the carrying amounts of the financial instruments represent their net fair value except for special borrowings whose fair value is disclosed at Note 22(i).
Notes 2016 2015
$’000 $’000
Financial assets
Cash and cash equivalents 12 23,682 20,482
Trade and other receivables 13 2,908 2,986
26,590 23,468
Financial liabilities
Trade and other payables 16 (4,039) (1,733)
Interest bearing borrowings:
Fixed rate borrowings 17 (15,190) (16,077)
(19,229) (17,810)
The Authority’s exposure to interest rate risk on the interest-bearing borrowings is disclosed in note 17.
(iii) Fair values
All financial assets and liabilities recognised in the balance sheet, whether they are carried at cost or fair value, are recognised at amounts that represent a reasonable approximation of fair value unless otherwise stated in the applicable notes.
Note 23 – Commitments(i) Capital expenditure commitments
Capital expenditure commitments, being contracted capital expenditure additional to the amounts reported in the financial statements, are payable as follows:
2016 2015
$’000 $’000
Within one year (a) 10,610 10,895
Later than 1 year and not later than 5 years (a) - 10,575
Later than 5 years - -
10,610 21,470
(a) Majority of the capital commitments are related to wharf extension life project.
(ii) Non-cancellable operating lease commitments
Commitments for minimum lease payments are payable as follows:
2016 2015
$’000 $’000
Within one year 95 95
Later than 1 year and not later than 5 years 188 283
Later than 5 years - -
283 378
64 Kimberley Ports Authority | Annual Report 2015-16
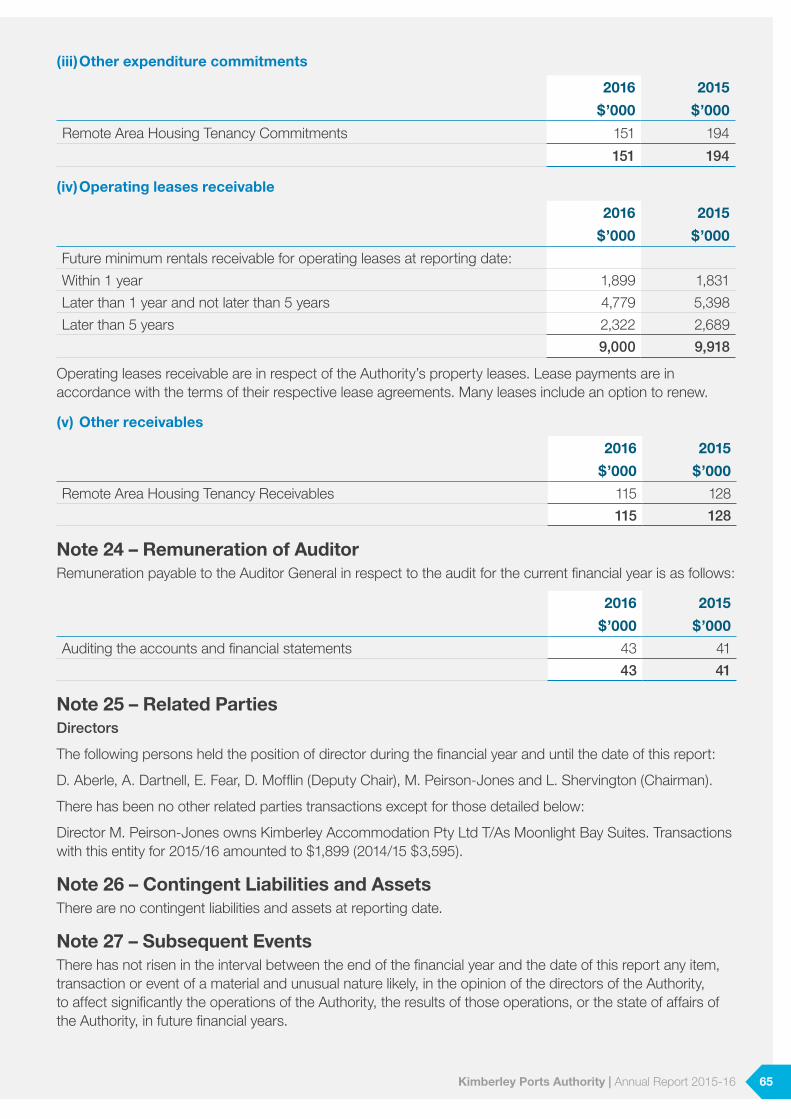
(iii) Other expenditure commitments
2016 2015
$’000 $’000
Remote Area Housing Tenancy Commitments 151 194
151 194
(iv) Operating leases receivable
2016 2015
$’000 $’000
Future minimum rentals receivable for operating leases at reporting date:
Within 1 year 1,899 1,831
Later than 1 year and not later than 5 years 4,779 5,398
Later than 5 years 2,322 2,689
9,000 9,918
Operating leases receivable are in respect of the Authority’s property leases. Lease payments are in accordance with the terms of their respective lease agreements. Many leases include an option to renew.
(v) Other receivables
2016 2015
$’000 $’000
Remote Area Housing Tenancy Receivables 115 128
115 128
Note 24 – Remuneration of AuditorRemuneration payable to the Auditor General in respect to the audit for the current financial year is as follows:
2016 2015
$’000 $’000
Auditing the accounts and financial statements 43 41
43 41
Note 25 – Related PartiesDirectors
The following persons held the position of director during the financial year and until the date of this report:
D. Aberle, A. Dartnell, E. Fear, D. Mofflin (Deputy Chair), M. Peirson-Jones and L. Shervington (Chairman).
There has been no other related parties transactions except for those detailed below:
Director M. Peirson-Jones owns Kimberley Accommodation Pty Ltd T/As Moonlight Bay Suites. Transactions with this entity for 2015/16 amounted to $1,899 (2014/15 $3,595).
Note 26 – Contingent Liabilities and AssetsThere are no contingent liabilities and assets at reporting date.
Note 27 – Subsequent EventsThere has not risen in the interval between the end of the financial year and the date of this report any item, transaction or event of a material and unusual nature likely, in the opinion of the directors of the Authority, to affect significantly the operations of the Authority, the results of those operations, or the state of affairs of the Authority, in future financial years.
65Kimberley Ports Authority | Annual Report 2015-16
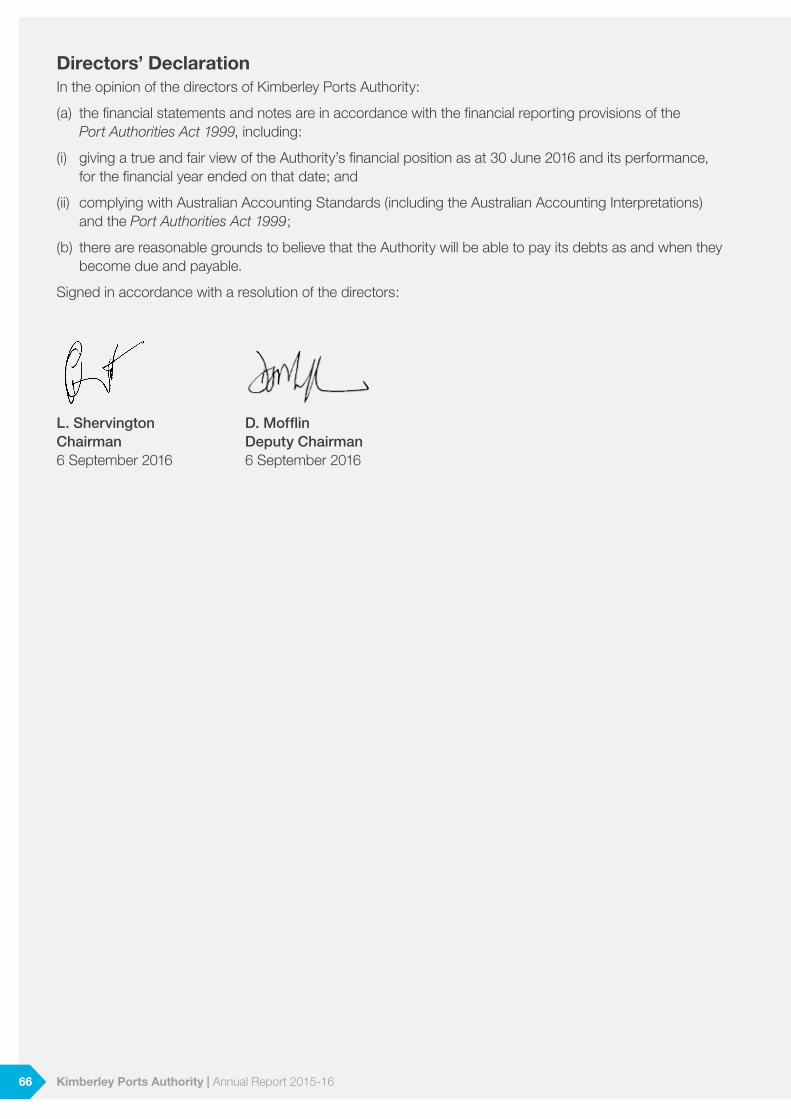
Directors’ Declaration In the opinion of the directors of Kimberley Ports Authority:
(a) the financial statements and notes are in accordance with the financial reporting provisions of the Port Authorities Act 1999, including:
(i) giving a true and fair view of the Authority’s financial position as at 30 June 2016 and its performance, for the financial year ended on that date; and
(ii) complying with Australian Accounting Standards (including the Australian Accounting Interpretations) and the Port Authorities Act 1999;
(b) there are reasonable grounds to believe that the Authority will be able to pay its debts as and when they become due and payable.
Signed in accordance with a resolution of the directors:
L. Shervington D. Mofflin Chairman Deputy Chairman 6 September 2016 6 September 2016
66 Kimberley Ports Authority | Annual Report 2015-16
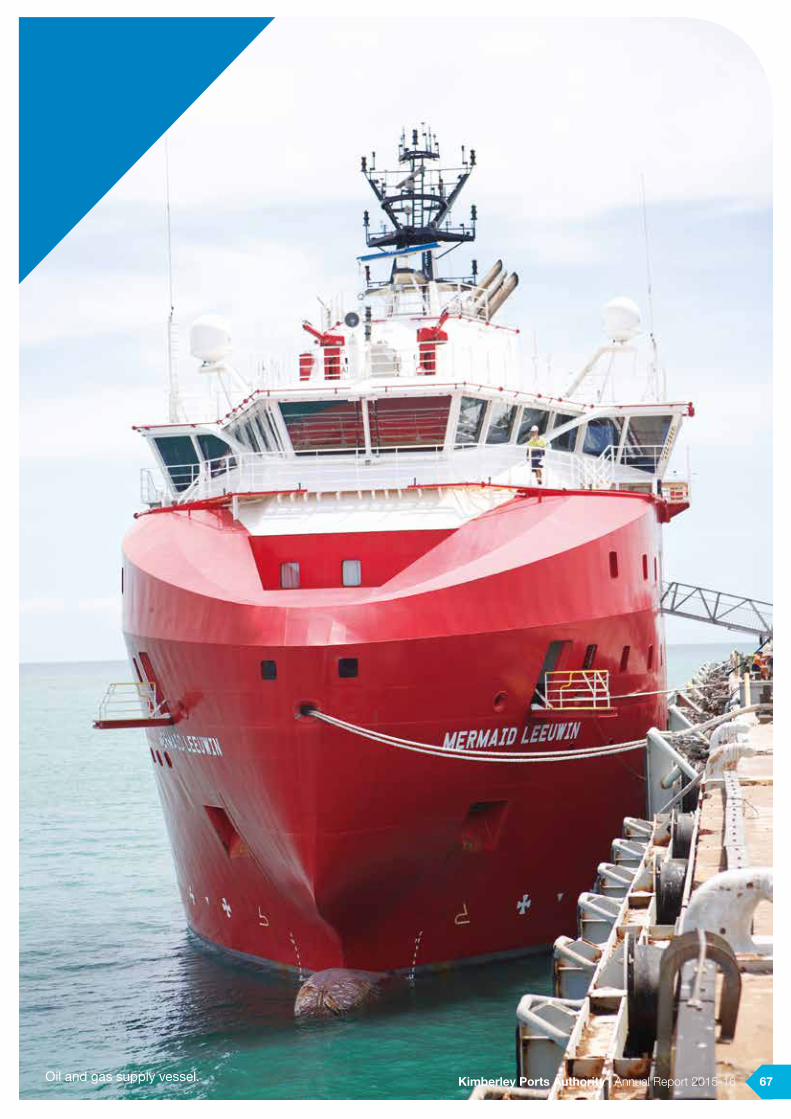
Oil and gas supply vessel. 67Kimberley Ports Authority | Annual Report 2015-16
68 Kimberley Ports Authority | Annual Report 2015-16
69Kimberley Ports Authority | Annual Report 2015-16
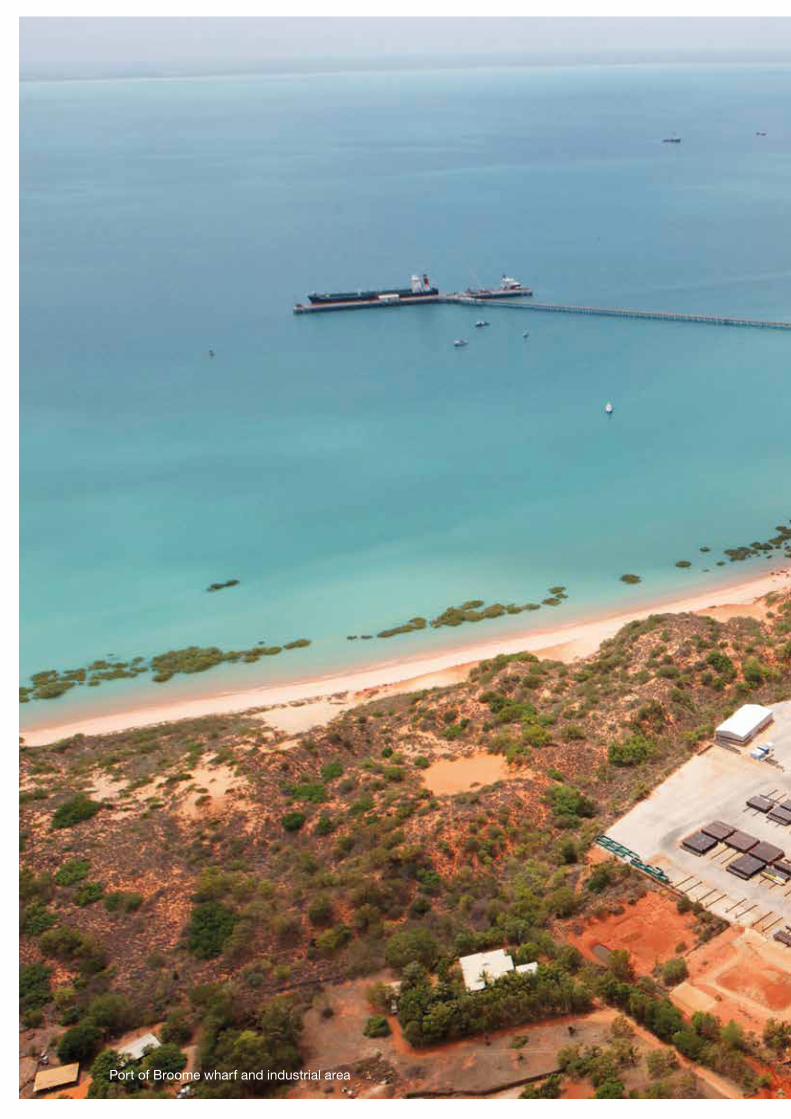
Port of Broome wharf and industrial area
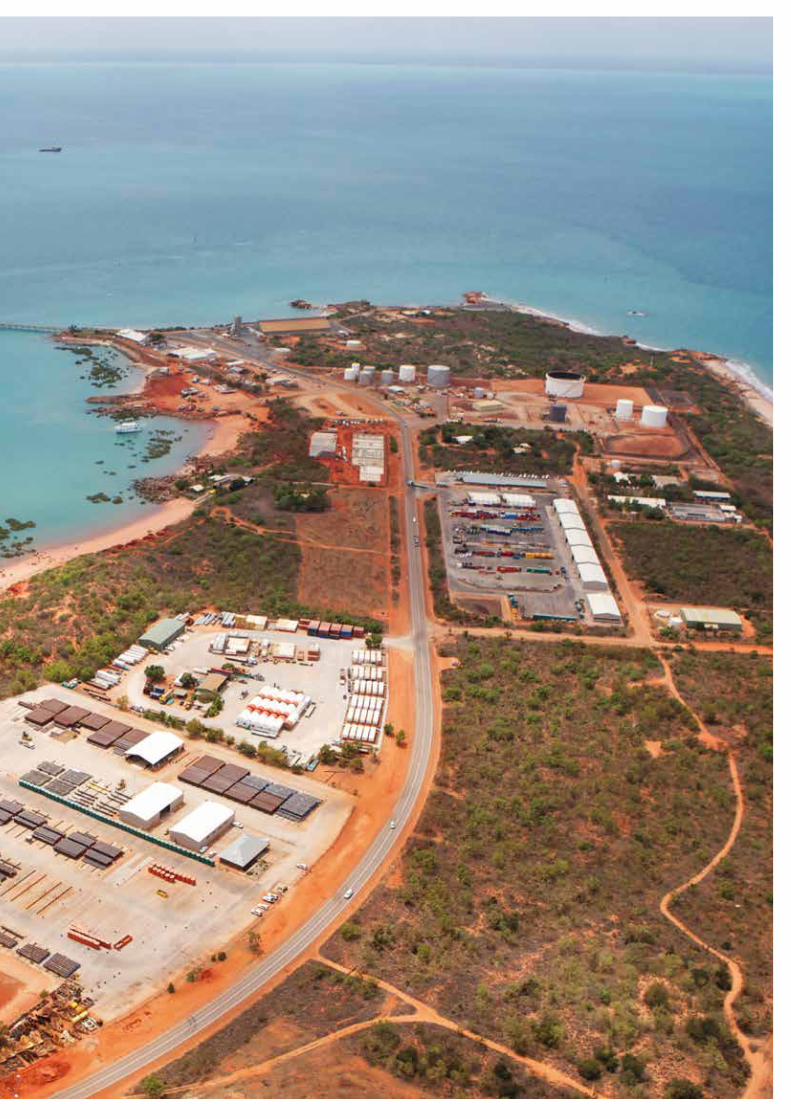
key2creative_37678_0916
280 Port Drive / PO Box 46, Broome, Western Australia 6725
Telephone: +61 (08) 9194 3100
Operations facsimile: +61 (08) 9194 3188Administration facsimile: +61 (08) 9192 1778
www.kimberleyports.wa.gov.au