Embed Size (px)
Citation preview

SA
BM
iller plc A
nnual Rep
ort 2010
Annual ReportSABMiller plc Annual Report 2010
Annual Report 2010This report is also available on our website,go to www.sabmiller.com/annualreport
Sustainable Development Report 2010This report is available on our website, go to www.sabmiller.com/sdreporting
www.sabmiller.comFor more information on the group andlatest news, go to www.sabmiller.com
About SABMiller plc
Overview
1 Our performance2 The group at a glance
Business review
6 Chairman’s statement9 Global beer market trends
10 Chief Executive’s review14 Strategic priorities
14 Creating a balanced and attractive global spread of businesses
16 Developing strong, relevant brand portfolios that win in the local market
18 Constantly raising the profitability of local businesses, sustainably
20 Leveraging our skills and global scale22 Key performance indicators24 Principal risks26 Operations review
26 Latin America27 Europe29 North America30 Africa31 Asia32 South Africa
34 Chief Financial Officer’s review40 Sustainable development
Governance
44 Board of directors46 Executive committee47 Directors’ report51 Corporate governance59 Remuneration report
Financial statements
68 Statement of directors’ responsibilitiesin respect of the consolidated financialstatements
69 Independent auditors’ report to themembers of SABMiller plc on theconsolidated financial statements
70 Consolidated income statement71 Consolidated statement of
comprehensive income72 Consolidated balance sheet73 Consolidated cash flow statement74 Consolidated statement of changes in equity75 Notes to the consolidated financial statements
143 Statement of directors’ responsibilities inrespect of the company financial statements
144 Independent auditors’ report to the members of SABMiller plc on the company financial statements
145 Balance sheet of SABMiller plc146 Notes to the company financial statements156 Five-year financial review158 Definitions
Shareholder information
161 Ordinary shareholding analyses162 Shareholders’ diary163 Administration164 Cautionary statement
Front cover and aboveFirst brewed in 1895 to quench the thirsts of hard-working gold prospectors inJohannesburg, Castle Lager has become South Africa’s iconic beer and a symbolof the country’s passion for sport.
SABMiller plc is one of the world’s largest brewers with brewing interests and distribution agreements across six continents.
The group’s wide portfolio of brandsincludes premium international beers suchas Pilsner Urquell, Peroni Nastro Azzurro,Miller Genuine Draft and Grolsch, as well as leading local brands such as Aguila,Castle, Miller Lite, Snow and Tyskie. Weare also one of the world’s largest bottlersof Coca-Cola products.
This report covers the financial year ended 31 March 2010. For more detailedinformation, please refer to our website at www.sabmiller.com.
This report is also available on our website as a downloadable pdf.
www.sabmiller.com/annualreport
SABMiller plc Annual Report 2010 Our performance 1
Our performance
Group revenue3
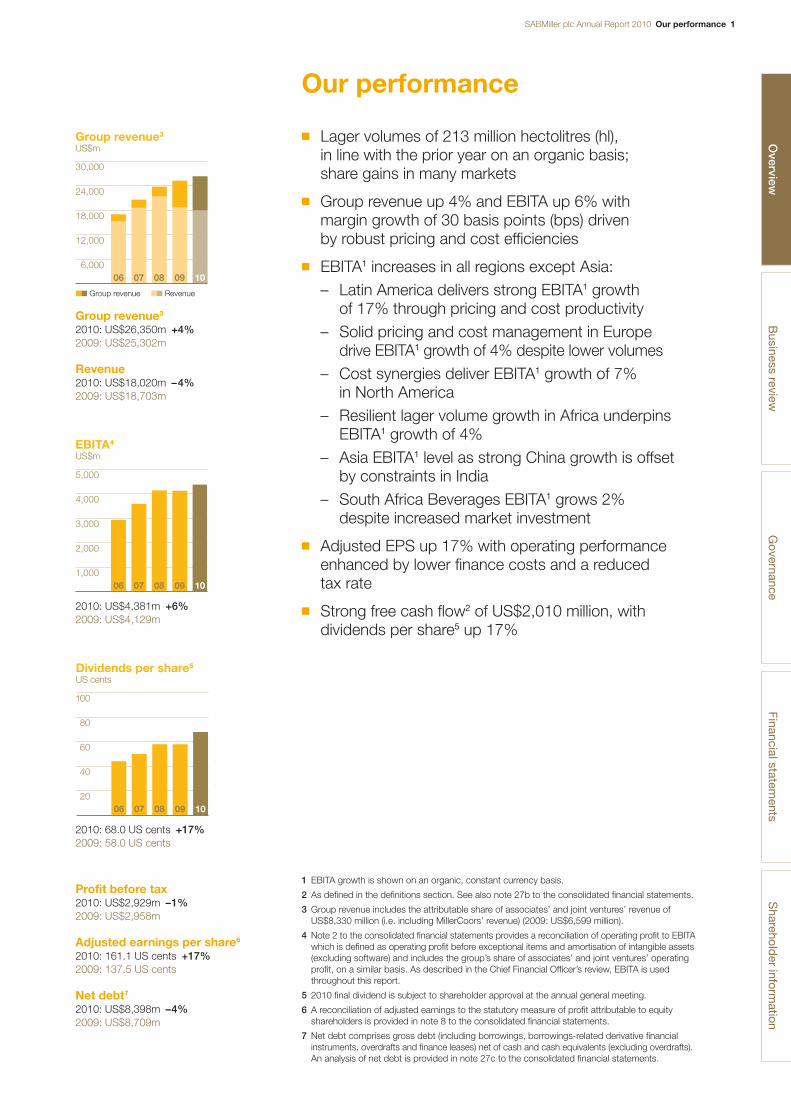
2010: US$26,350m +4%2009: US$25,302m
Revenue2010: US$18,020m –4%2009: US$18,703m
2010: US$4,381m +6%2009: US$4,129m
2010: 68.0 US cents +17%2009: 58.0 US cents
Profit before tax2010: US$2,929m –1%2009: US$2,958m
Adjusted earnings per share6
2010: 161.1 US cents +17%2009: 137.5 US cents
Net debt7
2010: US$8,398m –4%2009: US$8,709m
Group revenue3
US$m
30,000
24,000
18,000
12,000
6,000
■■ Group revenue ■■ Revenue
06 08 0907 10
Dividends per share5
US cents
100
80
60
40
2006 08 0907 1010
EBITA4
US$m
5,000
4,000
3,000
2,000
1,00006 08 0907 10
■ Lager volumes of 213 million hectolitres (hl), in line with the prior year on an organic basis; share gains in many markets
■ Group revenue up 4% and EBITA up 6% withmargin growth of 30 basis points (bps) driven by robust pricing and cost efficiencies
■ EBITA1 increases in all regions except Asia:– Latin America delivers strong EBITA1 growth
of 17% through pricing and cost productivity– Solid pricing and cost management in Europe
drive EBITA1 growth of 4% despite lower volumes– Cost synergies deliver EBITA1 growth of 7%
in North America– Resilient lager volume growth in Africa underpins
EBITA1 growth of 4%– Asia EBITA1 level as strong China growth is offset
by constraints in India– South Africa Beverages EBITA1 grows 2%
despite increased market investment
■ Adjusted EPS up 17% with operating performanceenhanced by lower finance costs and a reduced tax rate
■ Strong free cash flow2 of US$2,010 million, withdividends per share5 up 17%
Business review
Governance
Financial statements
Sharehold
er information
1 EBITA growth is shown on an organic, constant currency basis.
2 As defined in the definitions section. See also note 27b to the consolidated financial statements.
3 Group revenue includes the attributable share of associates’ and joint ventures’ revenue ofUS$8,330 million (i.e. including MillerCoors’ revenue) (2009: US$6,599 million).
4 Note 2 to the consolidated financial statements provides a reconciliation of operating profit to EBITAwhich is defined as operating profit before exceptional items and amortisation of intangible assets(excluding software) and includes the group’s share of associates’ and joint ventures’ operatingprofit, on a similar basis. As described in the Chief Financial Officer’s review, EBITA is usedthroughout this report.
5 2010 final dividend is subject to shareholder approval at the annual general meeting.
6 A reconciliation of adjusted earnings to the statutory measure of profit attributable to equityshareholders is provided in note 8 to the consolidated financial statements.
7 Net debt comprises gross debt (including borrowings, borrowings-related derivative financialinstruments, overdrafts and finance leases) net of cash and cash equivalents (excluding overdrafts).An analysis of net debt is provided in note 27c to the consolidated financial statements.
Overview
2 The group at a glance SABMiller plc Annual Report 2010
The group at a glance
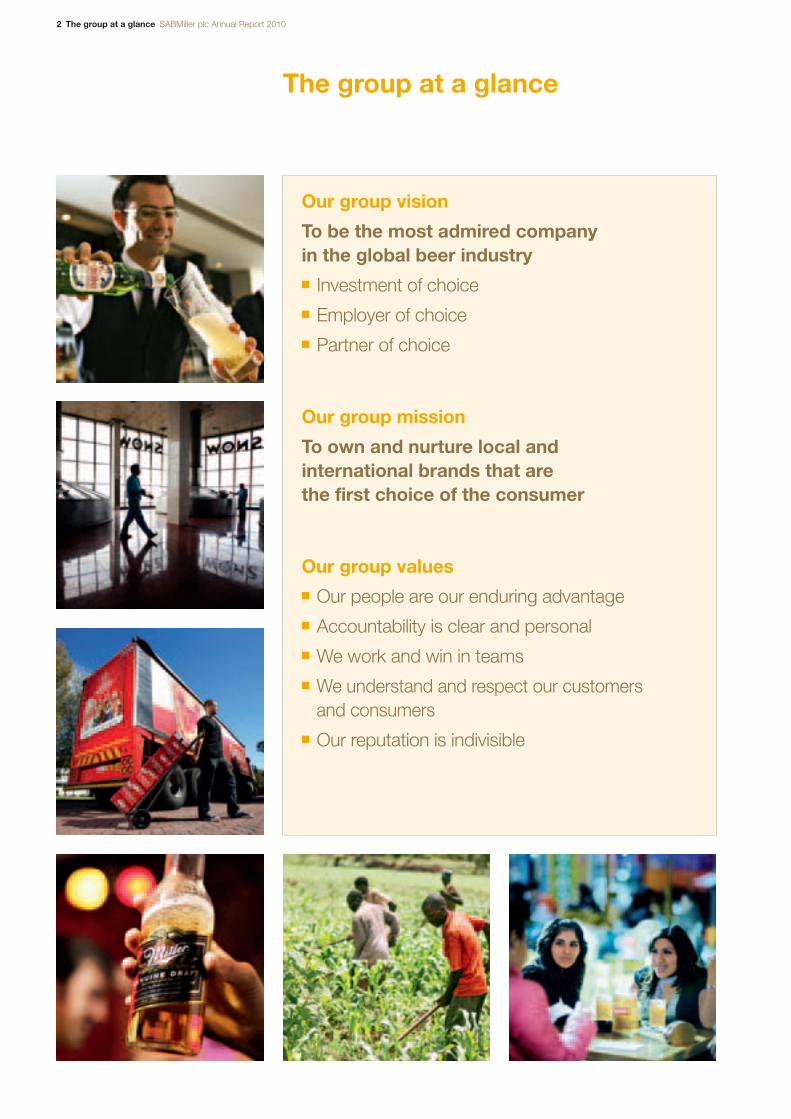
Our group vision
To be the most admired company in the global beer industry■ Investment of choice■ Employer of choice■ Partner of choice
Our group mission
To own and nurture local and international brands that are the first choice of the consumer
Our group values■ Our people are our enduring advantage■ Accountability is clear and personal■ We work and win in teams■ We understand and respect our customers
and consumers■ Our reputation is indivisible
SABMiller plc Annual Report 2010 The group at a glance 3B
usiness reviewG
overnanceFinancial statem
entsS
hareholder inform
ation
Our strategic prioritiesSABMiller has four clear strategic priorities:
Creating a balanced and attractive global spread of businessesThe wide geographic spread of our operations allows us to benefit from growth in volumes and value in beer markets around the world. We continue to look for opportunities to strengthen our geographic footprint in both developed and developing markets through greenfield entries,alliances, mergers and acquisitions.
For more information see page 14
Developing strong, relevant brand portfolios that win in the local marketWe seek to develop attractive brand portfolios that meet consumers’ needs in each of our markets.This includes expanding our offerings, to address new consumer segments and drinking occasions,strengthening our mainstream brands, building a differentiated portfolio of international and localpremium brands and channelling the right brands to the right outlets at the right time and price.
For more information see page 16
Constantly raising the profitability of local businesses, sustainablyOur aim is to keep enhancing our operational performance through top-line growth and continuousimprovement in costs and productivity. It’s also important that we maintain and advance ourreputation, protect our licence to trade and develop our businesses sustainably for the benefit of our stakeholders.
For more information see page 18
Leveraging our skills and global scaleOur global spread presents increasing opportunities to gain value from the scale and skills of the group, not least by standardising our back-office functions around the world and regionallyintegrating our front-office systems. We are also benefiting from ongoing collaboration and thesharing of skills between our businesses.
For more information see page 20
Overview

4 The group at a glance SABMiller plc Annual Report 2010
The group at a glance continued
North America
Overview■ MillerCoors is a joint venture with
Molson Coors Brewing Company,formed in 2008 by bringingtogether the US and Puerto Ricooperations of both companies.
■ It is the second-largest brewer in the USA with nearly 30% of the beer market.
■ MillerCoors is headquartered inChicago, USA.
■ Our wholly owned Miller BrewingInternational business is based inMilwaukee, USA and exports ourbrands to Canada and Mexico.
Key local brands
Blue Moon, Coors Banquet,Coors Light, Foster’s, HenryWeinhard’s, Icehouse, KeystoneLight, Killian’s, Leinenkugel’s,MGD 64, Mickey’s, Miller Chill,Miller Genuine Draft, Miller HighLife, Miller Lite, Milwaukee’s Best,Molson Canadian, Olde English,Sparks and Steel Reserve.
Further facts
MillerCoors operates eight majorbreweries, and as at 31 March2010 had 8,500 employees.
Latin America
Overview■ Our primary brewing and
beverage operations cover sixcountries across South andCentral America. These areColombia, Ecuador, El Salvador,Honduras, Panama and Peru.
■ In each of these countries we are the number one brewer bymarket share.
■ We bottle soft drinks for The Coca-Cola Company in El Salvador and Honduras, and for Pepsico International in Panama.
■ Our regional office is located in Bogotá, Colombia.
Key local brands
Aguila, Atlas, Balboa, Barena,Club, Club Colombia, Costeña,Cristal, Cusqueña, Golden Light,Imperial, Pilsen, Pilsener, PilsenCallao, Pilsen Trujillo, Poker, PonyMalta, Port Royal and Salva Vida.
Further facts
Total number of breweries2 17
Total number of bottling plants2 16
Total average number of employees3 24,979
Europe
Overview■ Our primary brewing operations
cover 10 countries. These are the Czech Republic, Hungary,Italy, Poland, Romania, Russia,Slovakia, Spain (Canary Islands),The Netherlands and Ukraine.
■ In the majority of these countrieswe are the number one or twobrewer by market share.
■ We also export significantvolumes to a further eightEuropean markets of which thelargest are the UK and Germany.
■ Our regional office is located inZug, Switzerland.
Key local brands
Arany Ászok, Dorada, Dreher,Gambrinus, Grolsch, Kozel, Lech,Peroni, Peroni Nastro Azzurro,Pilsner Urquell, Radegast Birell,Šariš, Timisoreana, Topvar,Tropical, Tyskie, Ursus, ZolotayaBochka and Zubr.
Further facts
Total number of breweries2 22
Total average number of employees3 15,201
SABMiller is a global operation covering 75 countries on six continents andemploying over 70,000 people.
Our portfolio of businesses is divided into six regions and is well balancedbetween developed and emergingmarkets. Between them, our businessesproduce over 200 different brands and sell 213 million hectolitres of lager a year.
For further information see ourOperations review: page 29
For further information see ourOperations review: page 26
For further information see ourOperations review: page 27
■ Latin America
■ Europe
■ North America
■ Africa
■ Asia
■ South Africa
31%
19%
14%
12%
2%
22%
Contribution to group EBITA1 2010
%
SABMiller plc Annual Report 2010 The group at a glance 5B
usiness reviewG
overnanceFinancial statem
entsS
hareholder inform
ation
Africa
Overview■ In Africa, our brewing and
beverage operations cover 15 countries with a further 18 covered through a strategicalliance with the Castel group.We also have associatedundertakings in Kenya and Zimbabwe.
■ In most of these countries we are the number one brewer bymarket share.
■ We bottle soft drinks for TheCoca-Cola Company in 20 of ourAfrican markets, 13 of which arethrough our alliance with Castel.
■ Our regional office is located inJohannesburg, South Africa.
Key local brands
2M, Ambo, Castle Lager, Castle Milk Stout, Chibuku, Club,Eagle, Kilimanjaro, Laurentina,Lion Lager, Maluti, Mosi, Ndovu,N’gola, Nile Special, Rwenzori,Safari, Sebebe, Source, Stone, St Louis, Voltic and White Bull.
Further facts
Total number of breweries2 30
Total number of bottling plants2 21
Total average number of employees3 12,182
South Africa
Overview■ The South African Breweries
Limited is our original brewingcompany and South Africa’sleading producer and distributorof alcoholic and non-alcoholicbeverages.
■ We also export our brands fordistribution across Namibia.
■ Our soft drinks division is SouthAfrica’s leading producer ofproducts for The Coca-ColaCompany.
■ We also have hotel and gaminginterests through Tsogo Sun, thelargest hotel and gaming group in South Africa.
■ Our regional office is located in Johannesburg, South Africa.
Key local brands
Appletiser, Brutal Fruit, CarlingBlack Label, Castle Lager, CastleLite, Castle Milk Stout, HansaMarzen Gold, Hansa Pilsener,Redd’s, Sarita and Skelter’s Straight.
Further facts
Total number of breweries2 7
Total number of bottling plants2 6
Total average number of employees3 12,885
Asia
Overview■ CR Snow, our partnership with
China Resources Enterprise,Limited, is the largest brewer in China.
■ We are the second-largestbrewer in India.
■ We have an operation in Vietnam,a joint venture in Australia andexport significant volumes toSouth Korea and Taiwan.
■ Our regional office is located in Hong Kong.
Key local brands
Bluetongue, Foster’s, Haywards,Indus Pride, Knock Out, RoyalChallenge, Snow and Zorok.
Further facts
Total number of breweries2 12
Total average number of employees3 4,494
1 Excluding corporatecosts.
2 The number of breweries and bottling plants relates tosubsidiaries only(except MillerCoors).
3 See note 6 tothe consolidatedfinancial statementson page 91. Theaverage number ofemployees relates to subsidiaries only(except MillerCoors).
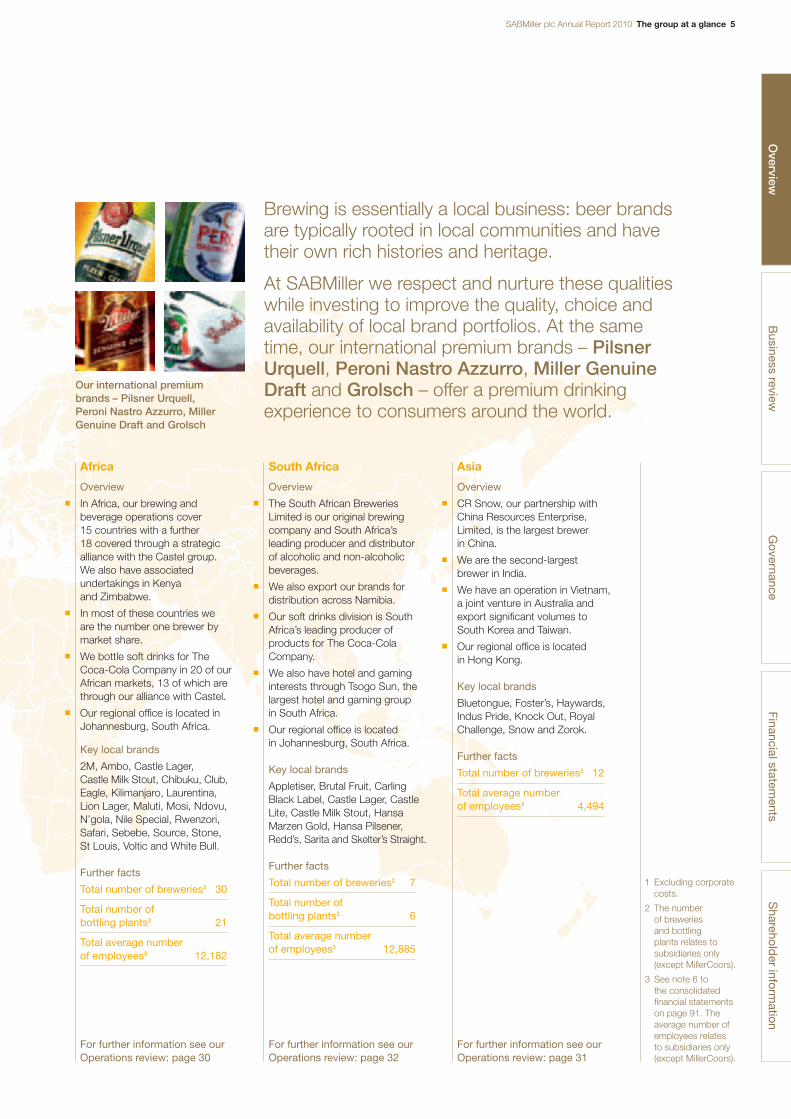
Brewing is essentially a local business: beer brandsare typically rooted in local communities and havetheir own rich histories and heritage.
At SABMiller we respect and nurture these qualitieswhile investing to improve the quality, choice andavailability of local brand portfolios. At the sametime, our international premium brands – PilsnerUrquell, Peroni Nastro Azzurro, Miller GenuineDraft and Grolsch – offer a premium drinkingexperience to consumers around the world.
Our international premiumbrands – Pilsner Urquell,Peroni Nastro Azzurro, MillerGenuine Draft and Grolsch
Overview
For further information see ourOperations review: page 30
For further information see ourOperations review: page 32
For further information see ourOperations review: page 31
6 Chairman’s statement SABMiller plc Annual Report 2010
In difficult conditions, we have drawn on our many advantages – notleast our leading market positions, the strength of our local brandsand the quality of our management – to produce very good results.
Chairman’s statement
Dear Shareholder,I am pleased to report a very good set of results, achievedin difficult conditions as the global economy struggledand consumer demand remained weak, particularly in our more developed markets.
As I said last year, beer is a fairly resilient product and ourbroad geographic footprint proved to be an advantage inthat different countries were affected by the global economiccrisis at different rates and to differing degrees. This year,in addition, we have benefited from management’s abilityto reduce costs and selectively increase prices in order to maximise revenues – capitalising here on our strongmarket positions and leading local brands.
Results and dividendTotal beverage volumes of 261 million hectolitres were in line with the prior year on an organic basis and lagervolumes were level at 213 million hectolitres. We madeshare gains in many of our markets. Group revenue grew by 4%, driven by price increases in the prior andcurrent years.
Earnings before interest, tax and amortisation (EBITA)grew 6% on both an organic, constant currency and areported basis. EBITA margin on an organic, constantcurrency basis increased by 30 basis points (bps) to 16.7%.Cost efficiencies were offset by increases in depreciation,higher pay costs and, in some markets, increasedinvestment in brand and customer management.Exceptional charges, primarily relating to our businesscapability programme, resulted in a fall of 1% in profitbefore tax to US$2,929 million.
Adjusted earnings were 22% ahead of the prior year. The increase reflects higher EBITA, lower finance costs, a lower effective tax rate and a fall in the minority share ofprofit, mainly due to the purchase of the 28.1% minorityinterest in our Polish subsidiary, Kompania Piwowarska, inMay 2009 in exchange for the issue of 60 million ordinaryshares. Adjusted earnings per share of 161.1 US centswere up 17% in the year.
The group generated free cash flow of US$2,010 million,an improvement of US$1,913 million compared withthe prior year. This includes significant improvements inthe management of working capital with a considerablecontribution from the business capability initiativesmentioned below.
Capital expenditure for the period, including the purchase of intangible assets, was US$1,528 million – downUS$619 million on the prior year after the completion of several major projects. Normalised EBITDA margin,including both dividends and revenue from MillerCoors,decreased by 40 bps to 20.2%.
Net debt decreased by US$311 million to US$8,398 million,reflecting the strong cash flow partly offset by adversecurrency translation. The group’s balance sheet wasfurther strengthened with the gearing ratio fallingsignificantly to 41%.
The board has recommended a final dividend of 51 UScents per share to be paid to shareholders on 13 August2010. This brings the total dividend for the year to 68 UScents, an increase of 10 cents (17%) over the prior year.
Our assetsThe strength of our balance sheet gives us a majoradvantage in relation to our competitors. That said, itdoes not reflect all the assets of the business. One mightalso mention the strength of our local brands, the qualityof our management, our skills at managing businesspartnerships and a key asset that is often undervalued –our reputation.
It’s the group’s reputation – the sum of all our strengths –that ensures the trust of our stakeholders and gives usour licence to trade. For this reason, it’s fundamental toour group vision ‘to be the most admired company in the global beer industry’. We saw solid progress in thisrespect when Fortune Magazine published its 2010 list of the world’s most admired companies in March thisyear. From seventh position in 2009, the Fortune surveynow ranks us third in the worldwide beverage sector.While we’re obviously pleased with this result, we remaindetermined to maintain this high ranking.
Meyer KahnChairman
SABMiller plc Annual Report 2010 Chairman’s statement 7
InvestmentThe economic pressures of the past year have notdeflected us from our strategy. Rather, they have underlinedits value as we seek to gain maximum returns from ourglobal business portfolio.
Although our capital investment was lower this year than last, we’ve continued selectively to add new brewingcapacity as emerging economies resume their growth,lifting demand for our products, and as more consumersmove from informal home brews to commercial brands. It has therefore been a busy year for brewery acquisitionsand new construction. In China, for example, CR Snowhas bought three more breweries and built a further four. In Africa in the past year, we invested in four newbreweries and one soft drinks plant while two existingbreweries were expanded and upgraded. Where we seeopportunities on the African continent, we continue toenter new markets and to acquire businesses producingnon-alcoholic beverages where these fit well with ourexisting business.
As we invest to meet future demand, it’s pleasing to see past investments producing good returns. OurChinese joint venture, CR Snow, has started to reap thecost synergies of earlier acquisitions in China and is nowgaining economies of scale in procurement, operationsand routes to market. Almost five years on from ourmerger with Bavaria, the businesses in Colombia, Peru, Ecuador and Panama have generated an attractivereturn on the group’s initial investment of US$7.8 billionannounced in 2005. EBITA from our Latin Americanbusiness has grown at a compound annual rate of 16% over this period with margins rising by 320 bps.Since the MillerCoors joint venture began operations in North America on 1 July 2008, it has delivered totalsynergies of US$326 million with a further US$83 millionin cost savings in areas such as production, procurement,marketing and administration. MillerCoors remains ontrack to achieve US$750 million in total synergies andother cost savings by the end of the 2012 calendar year.
The group has embarked on a major business capabilityprogramme to simplify processes and reduce costs, sogiving local management more time to focus on market-facing initiatives. Back-office activities including finance,human resources and procurement will be streamlinedthrough global information processes and applicationswhile front-office processes such as sales, distributionand supply chain management will benefit from commonregional platforms. The programme is on track to becompleted by 2014, by which time we expect ongoingcost benefits of US$300 million a year. In the currentfinancial year, we have recognised US$342 million ofexceptional costs relating to the programme.
Operational highlightsLager volumes in Latin America increased by 3% as economic conditions showed signs of easing and we gained or held share in the majority of our markets.EBITA grew very strongly at 18% on a reported basis and17% on an organic, constant currency basis as a result ofpricing benefits, positive sales mix and cost productivityimprovements.
In Europe, lager volumes declined by 5% on an organicbasis as beer markets contracted in difficult economicconditions and governments in a number of key marketsimposed heavy increases in excise. Nonetheless, throughcost efficiencies and robust pricing, EBITA grew by 4% on an organic, constant currency basis. Reported EBITAdeclined by 8% as central European currencies weakened.
Reported within the North America segment, MillerCoorsdelivered pro forma1 EBITA growth of 13% despite asluggish US beer market impacted by continued adverseeconomic conditions. MillerCoors’ domestic sales towholesalers and retailers on a pro forma basis, were both down 2%, but revenue per hectolitre grew by 3%.
Most of our markets in Africa continued to grow, albeitmore slowly than in recent years. Lager volumes grew6%, helped by strong performances in Mozambique,Zambia and Uganda, and soft drinks volumes by 4% on an organic basis. While EBITA grew by 4% on anorganic, constant currency basis, reported EBITA washeld back by currency weaknesses and increased by 1%.
In Asia, lager volumes increased organically by 7%across the region and by 10% in China. India saw a 14% fall in volumes due to regulatory issues and highertaxes. EBITA on an organic, constant currency basis waslevel, while reported EBITA, which includes initial losses in recent Chinese acquisitions, fell 12%.
In South Africa, where the market grew marginally, lager volumes were 1% below the prior year. Soft drinksvolumes also declined by 1% as a result of the weakeconomic environment and unfavourable weather in thepeak summer trading period. Constant currency EBITAgrew 2%, although margin declined slightly as pricingbenefits and fixed cost productivity were eroded by risinginput costs and higher expenditure on marketing. Thanksto the strength of the rand against the US dollar, reportedEBITA grew by 16%.
Overview
Governance
Financial statements
Sharehold
er information
Business review
1 MillerCoors’ pro formais defined on page 29note 3.
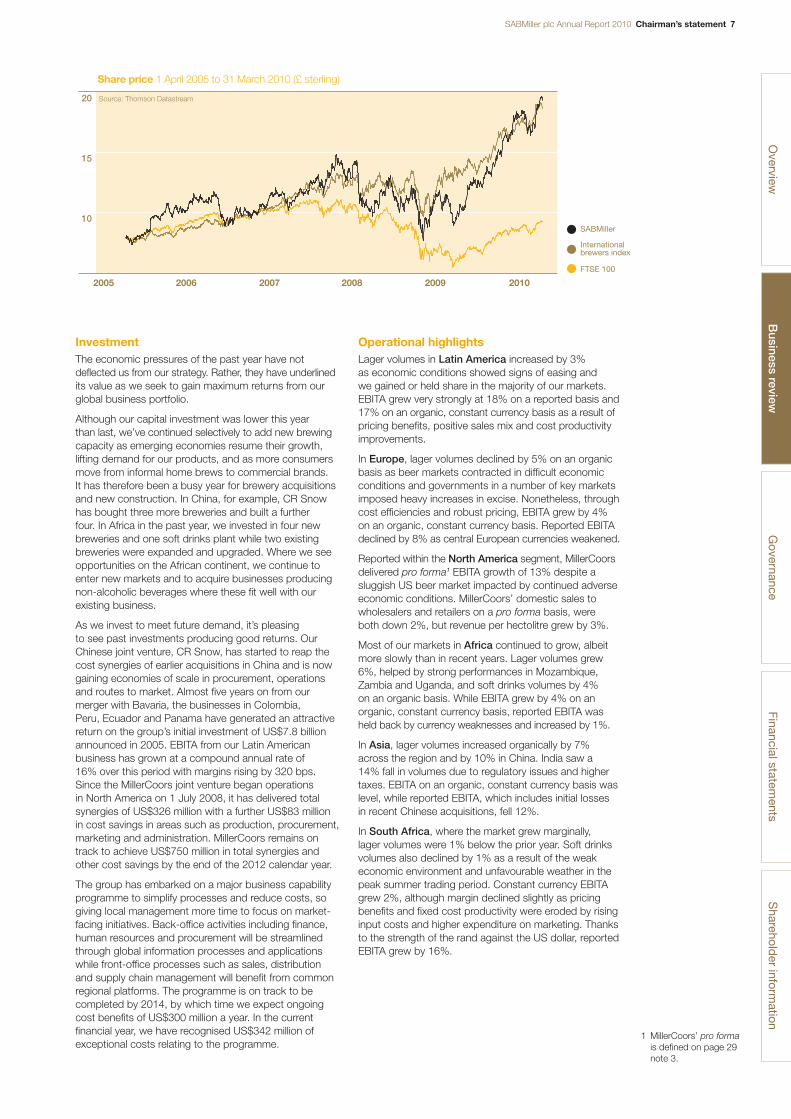
Share price 1 April 2005 to 31 March 2010 (£ sterling)
20
10
15
SABMiller
International brewers index
FTSE 100
Source: Thomson Datastream
2005 2006 2007 2008 2009 2010

8 Chairman’s statement SABMiller plc Annual Report 2010
Chairman’s statement continued
Rewarding our stakeholdersOur strong performance, along with some recovery inglobal stock markets, has supported another rise in ourshare price. Over the 12 months to 31 March 2010, ourmarket capitalisation has grown from US$22,415 millionto US$46,381 million, a rise of 107% compared with a44% rise for the FTSE 100.
Our growth around the world rewards not only theshareholders of SABMiller plc but also those of oursubsidiaries which are listed on local stock exchanges.Shares in our Zambian Breweries plc subsidiary, for example,have produced a compound annual growth rate of 21%in constant currency since they were listed on the nationalstock exchange in September 1998, and have grown40% in the last 12 months. Subsidiaries in countries suchas Tanzania have also grown substantially, to the benefitof local investors.
In another move to reward smaller stakeholders, we announced in December 2009 that 8.45% of theshares in our South African subsidiary, The South AfricanBreweries Ltd (SAB), would be placed under blackownership as part of our commitment to Broad-BasedBlack Economic Empowerment in South Africa. The so-called Zenzele transaction will create some 40,000new shareholders among SAB employees and qualifyingretailers – two groups that play a central role in the country’slong-term success. The deal has also created a charitablefoundation which will hold 18% of the shares to be issuedunder the transaction and will use the dividend income for the benefit of the wider South African community.
We have always argued that the best contribution we can make to the societies in which we operate is to runsuccessful businesses. Last year, an independent studyinto SABMiller’s operations in Uganda and Hondurasrevealed that for every person we employ directly in Uganda,a further 100 farmers and other workers depend on us for at least part of their livelihood. In the more developedHonduran economy, the figure is 33. Where appropriate,we also contribute by sourcing raw materials from small-scale, local suppliers and working with them to developthe quality and type of materials we need. Some 28,500smallholders are currently involved in programmes of thiskind in Africa, India and Latin America. In these and otherways, we seek to encourage enterprise development inour value chains and to stimulate the local economy.
As a responsible beer company, we have always beenpassionate about discouraging irresponsible drinking. To embed this ethos even more firmly into the businessand to make it a bigger part of everything we do, we’recurrently training all our employees to promote responsibleconsumption in the workplace, at home and in thecommunity. So far, more than 75% of our employeeshave undergone this training.
Corporate governanceWe believe that effective corporate governance dependson the quality of the board and on members’ understandingof their role and responsibilities. We are fortunate atSABMiller in having board directors of the highest calibre,four of whom have served for all or most of the periodsince the company’s London listing in 1999.
One principle of the Combined Code governing UK-listedcompanies is that the board should include an appropriatebalance of independent non-executive directors. The Code
identifies directors’ length of tenure as one factor a boardshould consider when deciding whether directors shouldbe deemed independent. We strongly believe the Code’snine-year cut-off point is arbitrary and does not placesufficient weight on experience gained by a director whileon the board. It is our firm view that a rigid application ofthis criterion, as advocated by some commentators, wouldnot be in the interests of SABMiller or its shareholders.
One board member who will be stepping down at this year’s annual general meeting is Lord Fellowes, our SeniorIndependent Director and Chairman of our CorporateAccountability and Risk Assurance Committee (CARAC).Robert Fellowes has been a diligent and committeddirector for the past 11 years. We will miss his enormouscontribution and we wish him well in his retirement. Hisrole as Senior Independent Director will be taken by JohnManser, while Dr Dambisa Moyo will take his place asChair of CARAC.
During the year we were pleased to welcome HowardWillard to the board as a non-executive director under the terms of our agreement with our largest shareholder,Altria Group, Inc.
On 1 May 2010 we welcomed Mark Armour as anindependent non-executive director and a member of the audit and remuneration committees. Previously a partner at Price Waterhouse, Mark has been ChiefFinancial Officer of Reed Elsevier Group plc since 1996and brings a wealth of experience in financial and accountingmatters. His appointment is another step in the continuingrenewal of the SABMiller board.
With members representing five continents, the SABMillerboard has been recognised as one of the most internationallydiverse in the FTSE 100. Its quality is matched by that ofour executive team, exemplified when our Chief Executive,Graham Mackay, was named Business Leader of theYear by an independent group of CEOs at the CNBCEuropean Business Leaders Awards 2010. The awardcites his ‘outstanding leadership and performance’ andwe congratulate him on this well-deserved recognition.
I would also like to pay tribute to our executives, managersand staff whose skills and commitment have brought usthrough a difficult year and helped to secure such impressiveresults. We are also grateful to our business partners andto you, our shareholders, for your continuing support.
OutlookAlthough the economic environment began to improve for some of our emerging market businesses in the latterpart of the financial year under review, a broader recoveryin consumer spending is not expected before the secondhalf of the current financial year. Price increases will betaken selectively, predominantly in the second half, andwe expect raw material input costs for the year to be level with, or marginally down on, the prior year. We willcontinue to implement our cost productivity initiativeswhile increasing investment in our brands.
The group’s brand equities and its financial positionremain strong and we are well positioned to takeadvantage of any improvement in trading conditions.
Meyer KahnChairman
SABMiller plc Annual Report 2010 Global beer market trends 9
Global beer market trends
The global beer market1
At the turn of the century, the top 10 brewersaccounted for just over one-third of global beersales volumes. The past decade has seen arapid consolidation, resulting in the top fourbrewers – Anheuser-Busch InBev, SABMiller,Heineken and Carlsberg – accounting foralmost 50% of beer sales volumes and up to75% of the global profit pool2. Consolidationhas continued in the past 12 months withfurther transactions in Mexico and China. Asthe pace of consolidation slows in the future,organic volume growth is expected to comefrom developing markets along with valuecreation opportunities in developed markets.
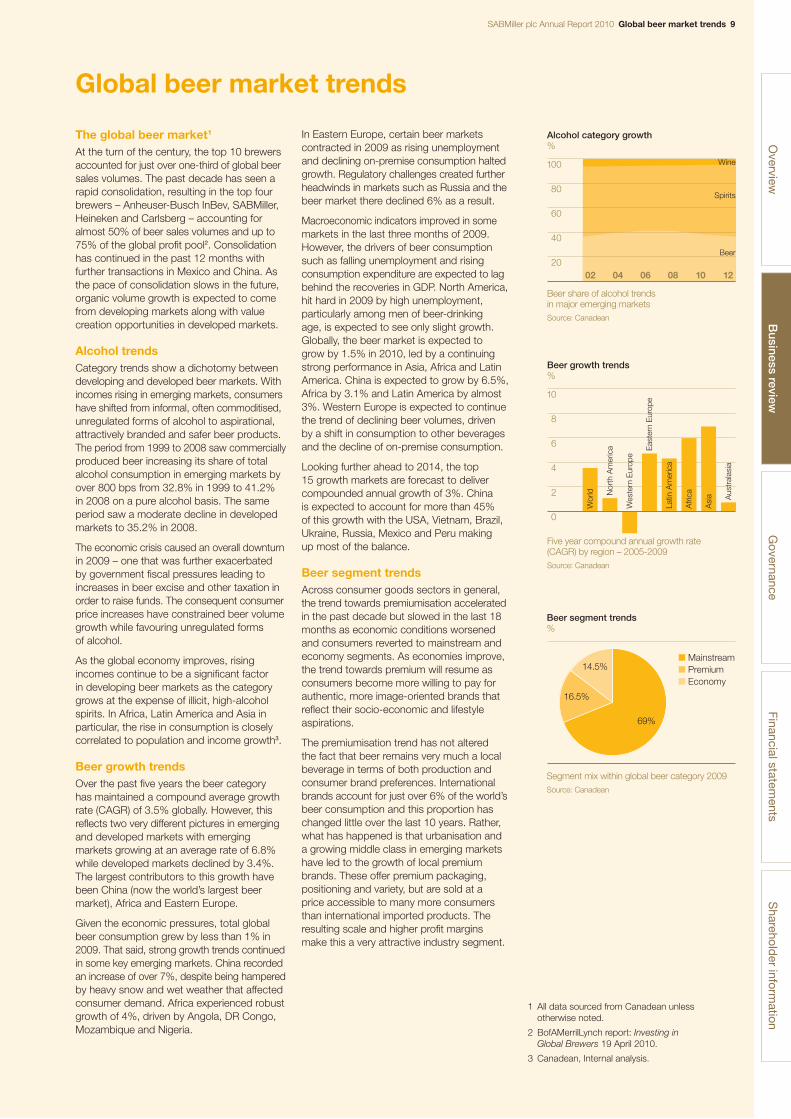
Alcohol trendsCategory trends show a dichotomy betweendeveloping and developed beer markets. Withincomes rising in emerging markets, consumershave shifted from informal, often commoditised,unregulated forms of alcohol to aspirational,attractively branded and safer beer products.The period from 1999 to 2008 saw commerciallyproduced beer increasing its share of totalalcohol consumption in emerging markets byover 800 bps from 32.8% in 1999 to 41.2% in 2008 on a pure alcohol basis. The sameperiod saw a moderate decline in developedmarkets to 35.2% in 2008.
The economic crisis caused an overall downturnin 2009 – one that was further exacerbated by government fiscal pressures leading toincreases in beer excise and other taxation inorder to raise funds. The consequent consumerprice increases have constrained beer volumegrowth while favouring unregulated forms of alcohol.
As the global economy improves, risingincomes continue to be a significant factor in developing beer markets as the categorygrows at the expense of illicit, high-alcoholspirits. In Africa, Latin America and Asia inparticular, the rise in consumption is closelycorrelated to population and income growth3.
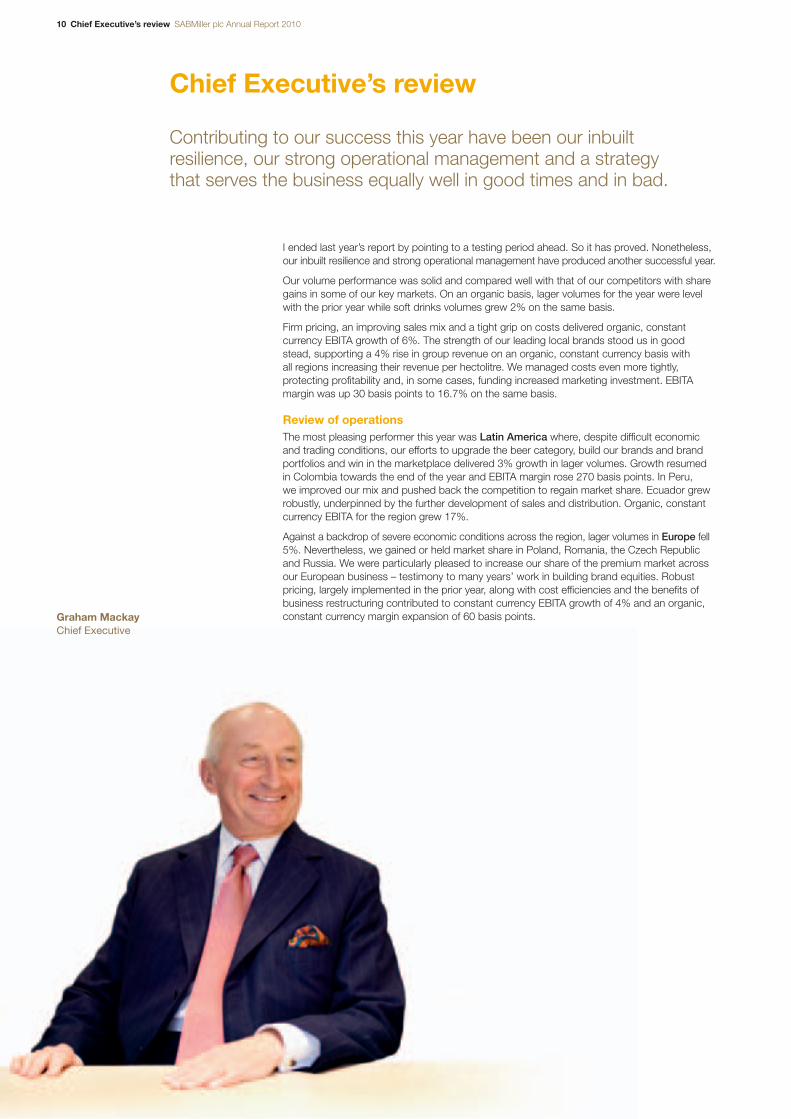
Beer growth trendsOver the past five years the beer categoryhas maintained a compound average growthrate (CAGR) of 3.5% globally. However, thisreflects two very different pictures in emergingand developed markets with emergingmarkets growing at an average rate of 6.8%while developed markets declined by 3.4%.The largest contributors to this growth havebeen China (now the world’s largest beermarket), Africa and Eastern Europe.
Given the economic pressures, total globalbeer consumption grew by less than 1% in2009. That said, strong growth trends continuedin some key emerging markets. China recordedan increase of over 7%, despite being hamperedby heavy snow and wet weather that affectedconsumer demand. Africa experienced robustgrowth of 4%, driven by Angola, DR Congo,Mozambique and Nigeria.
In Eastern Europe, certain beer marketscontracted in 2009 as rising unemploymentand declining on-premise consumption haltedgrowth. Regulatory challenges created furtherheadwinds in markets such as Russia and thebeer market there declined 6% as a result.
Macroeconomic indicators improved in somemarkets in the last three months of 2009.However, the drivers of beer consumptionsuch as falling unemployment and risingconsumption expenditure are expected to lagbehind the recoveries in GDP. North America,hit hard in 2009 by high unemployment,particularly among men of beer-drinking age, is expected to see only slight growth.Globally, the beer market is expected to grow by 1.5% in 2010, led by a continuingstrong performance in Asia, Africa and LatinAmerica. China is expected to grow by 6.5%,Africa by 3.1% and Latin America by almost3%. Western Europe is expected to continuethe trend of declining beer volumes, drivenby a shift in consumption to other beveragesand the decline of on-premise consumption.
Looking further ahead to 2014, the top 15 growth markets are forecast to delivercompounded annual growth of 3%. China is expected to account for more than 45% of this growth with the USA, Vietnam, Brazil,Ukraine, Russia, Mexico and Peru making up most of the balance.
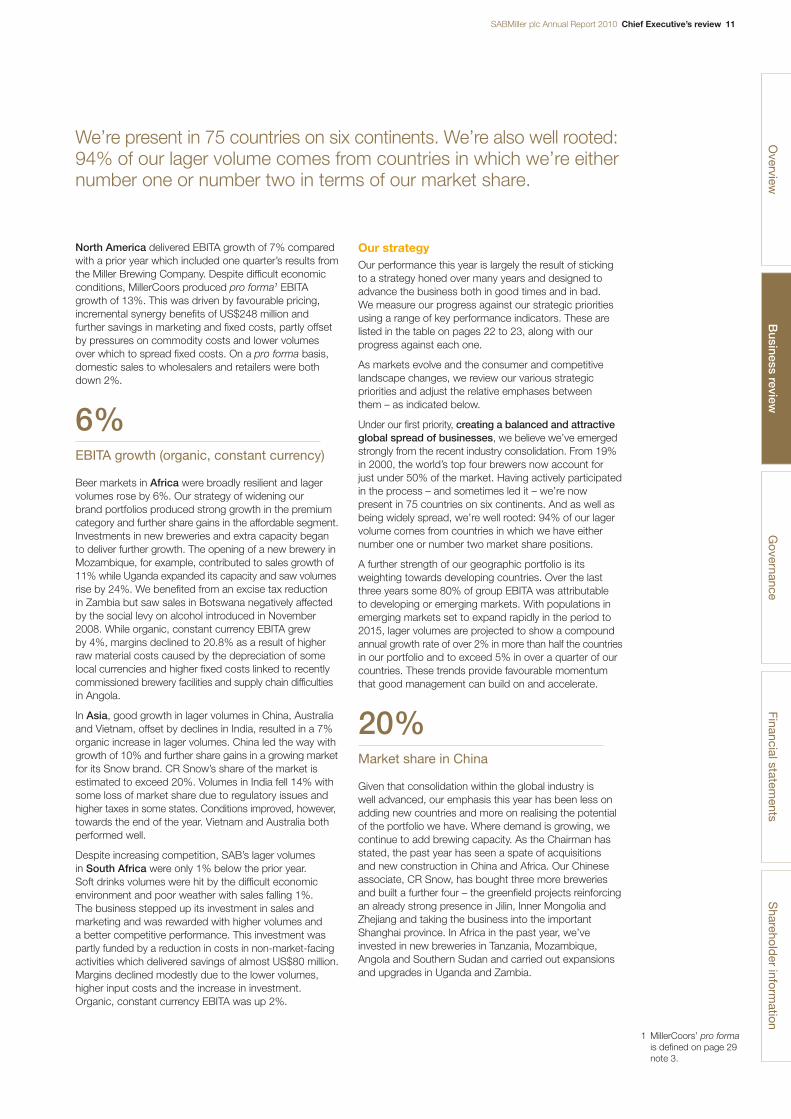
Beer segment trendsAcross consumer goods sectors in general,the trend towards premiumisation acceleratedin the past decade but slowed in the last 18months as economic conditions worsenedand consumers reverted to mainstream andeconomy segments. As economies improve,the trend towards premium will resume asconsumers become more willing to pay forauthentic, more image-oriented brands thatreflect their socio-economic and lifestyleaspirations.
The premiumisation trend has not altered the fact that beer remains very much a localbeverage in terms of both production andconsumer brand preferences. Internationalbrands account for just over 6% of the world’sbeer consumption and this proportion haschanged little over the last 10 years. Rather,what has happened is that urbanisation anda growing middle class in emerging marketshave led to the growth of local premiumbrands. These offer premium packaging,positioning and variety, but are sold at a price accessible to many more consumersthan international imported products. Theresulting scale and higher profit marginsmake this a very attractive industry segment.
Overview
Governance
Financial statements
Sharehold
er information
Business review
Alcohol category growth%
100
80
60
40
2002 06 0804 10 12
Beer share of alcohol trends in major emerging marketsSource: Canadean
Spirits
Wine
Beer
Beer growth trends%
Five year compound annual growth rate (CAGR) by region – 2005-2009Source: Canadean
10
8
6
4
2
0
Wor
ld
Aus
tral
asia
Asi
a
Afri
ca
Latin
Am
eric
a
Eas
tern
Eur
ope
Wes
tern
Eur
ope
Nor
th A
mer
ica
■ Mainstream■ Premium■ Economy
Beer segment trends%
14.5%
69%
16.5%
Segment mix within global beer category 2009Source: Canadean
1 All data sourced from Canadean unlessotherwise noted.
2 BofAMerrilLynch report: Investing in Global Brewers 19 April 2010.
3 Canadean, Internal analysis.
Graham MackayChief Executive
10 Chief Executive’s review SABMiller plc Annual Report 2010
Contributing to our success this year have been our inbuiltresilience, our strong operational management and a strategy that serves the business equally well in good times and in bad.
Chief Executive’s review
I ended last year’s report by pointing to a testing period ahead. So it has proved. Nonetheless,our inbuilt resilience and strong operational management have produced another successful year.
Our volume performance was solid and compared well with that of our competitors with sharegains in some of our key markets. On an organic basis, lager volumes for the year were levelwith the prior year while soft drinks volumes grew 2% on the same basis.
Firm pricing, an improving sales mix and a tight grip on costs delivered organic, constantcurrency EBITA growth of 6%. The strength of our leading local brands stood us in good stead, supporting a 4% rise in group revenue on an organic, constant currency basis with all regions increasing their revenue per hectolitre. We managed costs even more tightly,protecting profitability and, in some cases, funding increased marketing investment. EBITAmargin was up 30 basis points to 16.7% on the same basis.
Review of operationsThe most pleasing performer this year was Latin America where, despite difficult economicand trading conditions, our efforts to upgrade the beer category, build our brands and brandportfolios and win in the marketplace delivered 3% growth in lager volumes. Growth resumedin Colombia towards the end of the year and EBITA margin rose 270 basis points. In Peru, we improved our mix and pushed back the competition to regain market share. Ecuador grewrobustly, underpinned by the further development of sales and distribution. Organic, constantcurrency EBITA for the region grew 17%.
Against a backdrop of severe economic conditions across the region, lager volumes in Europe fell5%. Nevertheless, we gained or held market share in Poland, Romania, the Czech Republicand Russia. We were particularly pleased to increase our share of the premium market acrossour European business – testimony to many years’ work in building brand equities. Robustpricing, largely implemented in the prior year, along with cost efficiencies and the benefits ofbusiness restructuring contributed to constant currency EBITA growth of 4% and an organic,constant currency margin expansion of 60 basis points.
SABMiller plc Annual Report 2010 Chief Executive’s review 11
North America delivered EBITA growth of 7% comparedwith a prior year which included one quarter’s results fromthe Miller Brewing Company. Despite difficult economicconditions, MillerCoors produced pro forma1 EBITAgrowth of 13%. This was driven by favourable pricing,incremental synergy benefits of US$248 million andfurther savings in marketing and fixed costs, partly offsetby pressures on commodity costs and lower volumesover which to spread fixed costs. On a pro forma basis,domestic sales to wholesalers and retailers were bothdown 2%.
6%EBITA growth (organic, constant currency)
Beer markets in Africa were broadly resilient and lagervolumes rose by 6%. Our strategy of widening our brand portfolios produced strong growth in the premiumcategory and further share gains in the affordable segment.Investments in new breweries and extra capacity beganto deliver further growth. The opening of a new brewery inMozambique, for example, contributed to sales growth of11% while Uganda expanded its capacity and saw volumesrise by 24%. We benefited from an excise tax reduction in Zambia but saw sales in Botswana negatively affectedby the social levy on alcohol introduced in November2008. While organic, constant currency EBITA grew by 4%, margins declined to 20.8% as a result of higherraw material costs caused by the depreciation of somelocal currencies and higher fixed costs linked to recentlycommissioned brewery facilities and supply chain difficultiesin Angola.
In Asia, good growth in lager volumes in China, Australiaand Vietnam, offset by declines in India, resulted in a 7%organic increase in lager volumes. China led the way withgrowth of 10% and further share gains in a growing marketfor its Snow brand. CR Snow’s share of the market isestimated to exceed 20%. Volumes in India fell 14% withsome loss of market share due to regulatory issues andhigher taxes in some states. Conditions improved, however,towards the end of the year. Vietnam and Australia bothperformed well.
Despite increasing competition, SAB’s lager volumes in South Africa were only 1% below the prior year. Soft drinks volumes were hit by the difficult economicenvironment and poor weather with sales falling 1%. The business stepped up its investment in sales andmarketing and was rewarded with higher volumes and a better competitive performance. This investment waspartly funded by a reduction in costs in non-market-facingactivities which delivered savings of almost US$80 million.Margins declined modestly due to the lower volumes,higher input costs and the increase in investment.Organic, constant currency EBITA was up 2%.
Our strategyOur performance this year is largely the result of stickingto a strategy honed over many years and designed toadvance the business both in good times and in bad. We measure our progress against our strategic prioritiesusing a range of key performance indicators. These arelisted in the table on pages 22 to 23, along with ourprogress against each one.
As markets evolve and the consumer and competitivelandscape changes, we review our various strategicpriorities and adjust the relative emphases between them – as indicated below.
Under our first priority, creating a balanced and attractiveglobal spread of businesses, we believe we’ve emergedstrongly from the recent industry consolidation. From 19%in 2000, the world’s top four brewers now account forjust under 50% of the market. Having actively participatedin the process – and sometimes led it – we’re nowpresent in 75 countries on six continents. And as well asbeing widely spread, we’re well rooted: 94% of our lagervolume comes from countries in which we have eithernumber one or number two market share positions.
A further strength of our geographic portfolio is itsweighting towards developing countries. Over the lastthree years some 80% of group EBITA was attributable to developing or emerging markets. With populations inemerging markets set to expand rapidly in the period to2015, lager volumes are projected to show a compoundannual growth rate of over 2% in more than half the countriesin our portfolio and to exceed 5% in over a quarter of ourcountries. These trends provide favourable momentumthat good management can build on and accelerate.
20%Market share in China
Given that consolidation within the global industry is well advanced, our emphasis this year has been less onadding new countries and more on realising the potentialof the portfolio we have. Where demand is growing, wecontinue to add brewing capacity. As the Chairman hasstated, the past year has seen a spate of acquisitions and new construction in China and Africa. Our Chineseassociate, CR Snow, has bought three more breweriesand built a further four – the greenfield projects reinforcingan already strong presence in Jilin, Inner Mongolia andZhejiang and taking the business into the importantShanghai province. In Africa in the past year, we’veinvested in new breweries in Tanzania, Mozambique,Angola and Southern Sudan and carried out expansionsand upgrades in Uganda and Zambia.
Overview
Governance
Financial statements
Sharehold
er information
We’re present in 75 countries on six continents. We’re also well rooted:94% of our lager volume comes from countries in which we’re eithernumber one or number two in terms of our market share.
Business review
1 MillerCoors’ pro formais defined on page 29note 3.
12 Chief Executive’s review SABMiller plc Annual Report 2010
As industry consolidation slows, competitive advantage dependsincreasingly on realising the potential of our business portfolio. Hence our emphasis on organic growth through understanding the consumer and constantly enhancing our brand portfolios.
Chief Executive’s review continued
On the African continent we’re also looking at productsother than beer where it makes sense to do so. As one of the world’s largest bottlers of Coca-Cola, we have long experience of managing both beer and soft drinks in markets where the cost and operational benefits make it advantageous. This year we’ve pushed the strategyfurther by acquiring a Zambian maheu business (a non-alcoholic traditional beverage) and two water companiescovering Uganda and Ethiopia. We’ve also added softdrinks capacity in Ghana, Angola and Southern Sudan.
In developing our business portfolio, we benefit fromvaluable partnerships with China Resources Enterprise,Castel in Africa and Molson Coors in North America. Thisyear we’ve further strengthened our relationship with ourpartners in China with managers from CR Snow making a number of visits to other parts of the SABMiller group to share learning and best practice.
As the pace of consolidation in the global brewing industryslows, competitive advantage depends increasingly ongenerating organic growth. For SABMiller, this means asharper focus on the commercial imperatives of understandingthe consumer, enhancing our brand portfolios and gettingour products into the market efficiently and effectively.
Against this background, our strategic priority ofdeveloping strong, relevant brand portfolios that win in the local market comes more to the fore. Theconviction that we stand or fall by the success of ourbrands finds expression in our group mission ‘to own and nurture local and international brands that are thefirst choice of the consumer’.
Our performance owes much to SABMiller’s powerfulportfolio of over 200 local brands whose consumer appealand brand equity have made it possible in many marketsto gain share and assume price leadership at the sametime. This year group revenues rose 4% on an organic,constant currency basis with all regions increasing theirrevenue per hectolitre.
4%Group revenue growth (organic, constant currency)
In developing our brand portfolios, we’re able to draw on our deep understanding of local consumers, our ability to match specific needs and occasions with differentiatedbrands and the excitement that comes from constantlyupgrading and enhancing the portfolio.
The Latin American businesses have achieved particularsuccess by revitalising existing brands and introducingnew ones, making bottles and labels more attractive and overhauling the route to market so as to enhance our ability to deliver the right brands to the right outlets at the right time. Recent innovations include Aguila Light(suitable for drinking at home with meals), flavoured beeralternatives (Redd’s in Colombia, for example) and thedevelopment of non-alcoholic soft drinks, all helping to address new and different drinking occasions.
Around the group, we’re also benefiting from brandportfolios that offer affordable options to price-consciousconsumers. Our Colombian business, for example, hasmade it cheaper to buy a beer by offering its Aguila brandin smaller bottles. Our operations in Africa continue todevelop new, low-cost products based on indigenous cropssuch as sorghum and cassava that can then be marketedas affordable alternatives to traditional home brews.
270 bpsEBITA margin increase in Colombia
Nor are we forgetting consumers who aspire to a luxury brand on special occasions but find internationalpremium beers too expensive. To meet this need, we’vechampioned the concept of the local premium brand tooffer the cachet of a premium beer at a more affordableprice. Selling at attractive margins, these have provedvery successful in Latin America, Africa, Europe and eventhe USA in the form of craft beers such as Blue Moon.
Development of our four international premium brands is continuing, but this is a longer-term process requiringthe seeding of the brands into the marketplace overseveral years.
Developing successful brand portfolios requires the rightinterplay of global and local skills. Through The MarketingWay, a group-wide initiative to codify and disseminate bestpractice, we’re building our marketing and sales expertisearound the world. Now, through our 5 to Drive initiative, wehave an improved global system for monitoring progressand highlighting the potential for further organic growth in our existing operations. In implementing these globalinitiatives, however, we remain aware that beer isessentially a local product, embedded in communitiesand cultures. It’s one of our competitive strengths that weunderstand the local dimension and that group businessesare able to address local needs within the global framework.
SABMiller plc Annual Report 2010 Chief Executive’s review 13
Beer is essentially a local product, embedded in communities and cultures. It’s one of our strengths that we understand the localdimension and that group businesses can address local needs in a sustainable way within the global framework.
To free up local management for the task of winning intheir own markets, we’re running a number of projects to simplify and streamline the organisation, reducecomplexity and capitalise on the spread and expertise ofthe worldwide group – which brings us to another of ourstrategic priorities, namely leveraging our skills andglobal scale.
Following a period of rapid growth in which many newoperations have joined the group, we believe the time is right for a step-change in our global processes andsystems. A major business capability programme, nowunder way, will standardise information and processesbased on a single, integrated IT system across finance,procurement and human resources. Sales, distributionand supply chain management processes will also bestreamlined and moved onto common, regional systemsplatforms. A new global procurement organisation basedin Switzerland will capitalise on SABMiller’s worldwidepurchasing power by centralising the group’s procurementwhere it’s in our interests to do so.
These various initiatives are based on proven technologiesand systems and will take four years to complete. As wellas creating a more connected global organisation, they’reexpected to produce ongoing cost benefits of US$300million a year by 2014. This year, we have realised totalfinancial benefits of US$350 million, US$333 million of which were from improved working capital, whilerecognising exceptional costs of US$342 million relatingto the programme.
US$2,010mFree cash flow
Our businesses around the world continue to demonstratetight operational management and cost control, in linewith our next strategic priority of constantly raising the profitability of local businesses, sustainably. Theacquisitions of the last few years in China are starting to generate the expected synergies and economies of scale. In the USA, MillerCoors is making excellentprogress in its three-year cost-management programme.In South Africa, SAB is extracting further efficiencies from its production, supply chain and administration andreinvesting the savings in growth generating activitiessuch as marketing, distribution and developing its brandportfolio. In response to severe economic conditions inEurope, we’ve restructured some of our businesses andannounced the closure of a number of breweries anddistribution centres.
This year we tightened our management of cash and re-examined all our capital expenditure, applying stringentcriteria based on the risks and opportunities in each country.As a result, capital expenditure, including the purchase ofintangible assets, at US$1,528 million, was US$619 millionlower than in the prior year and the group generated freecash flow of US$2,010 million.
In difficult times, it’s easy to take actions that protectshort-term profitability at the expense of long-termsustainability. We do not believe that this is the best wayto generate value for our stakeholders. For this reason,we’ve reworded this particular strategic priority to includethe word ‘sustainably’.
In line with this imperative, we continue to work on the 10 sustainable development priorities detailed on pages42 to 43. Our breweries are making good progresstowards our targets to reduce water use and fossil fuelemissions per hectolitre of beer produced. Water usedper hectolitre of beer produced fell 0.2hl to 4.3hl andfossil fuel emissions per hectolitre were 0.6 kg CO2edown at 13.3 kg CO2e. As repeated studies have shown,we continue to make a valuable social and economiccontribution to the communities in which we operate.We’ve also been addressing public concerns about the harmful consumption of alcohol, both in the way we conduct our own business and in projects jointlyundertaken with other stakeholders. Further details of what we are doing in this area are contained in thesustainable development report on pages 40 to 41.
Addressing risksLike any organisation, we face a variety of risks. Recognisingthat risk is a fact of business, presenting opportunity aswell as threat, we aim to manage it in a way that generatesthe best return for our shareholders. The well-developedrisk management process described on pages 57 and 58helps us to identify and monitor the principal risks to thebusiness and deal with them appropriately. The principalrisks we face are set out on pages 24 and 25.
Looking aheadWe expect the coming year to be another testing onewith consumers in developed markets, in particular, stillfeeling the effects of the global recession. Against thisbackground, the actions we’ve taken to position ourbusiness around the world, to invest in our brands and to develop our operational capabilities will continue tounderpin our medium-term growth.
Graham MackayChief Executive
Overview
Governance
Financial statements
Sharehold
er information
Business review
14 Strategic priorities SABMiller plc Annual Report 2010
Strategic priorities
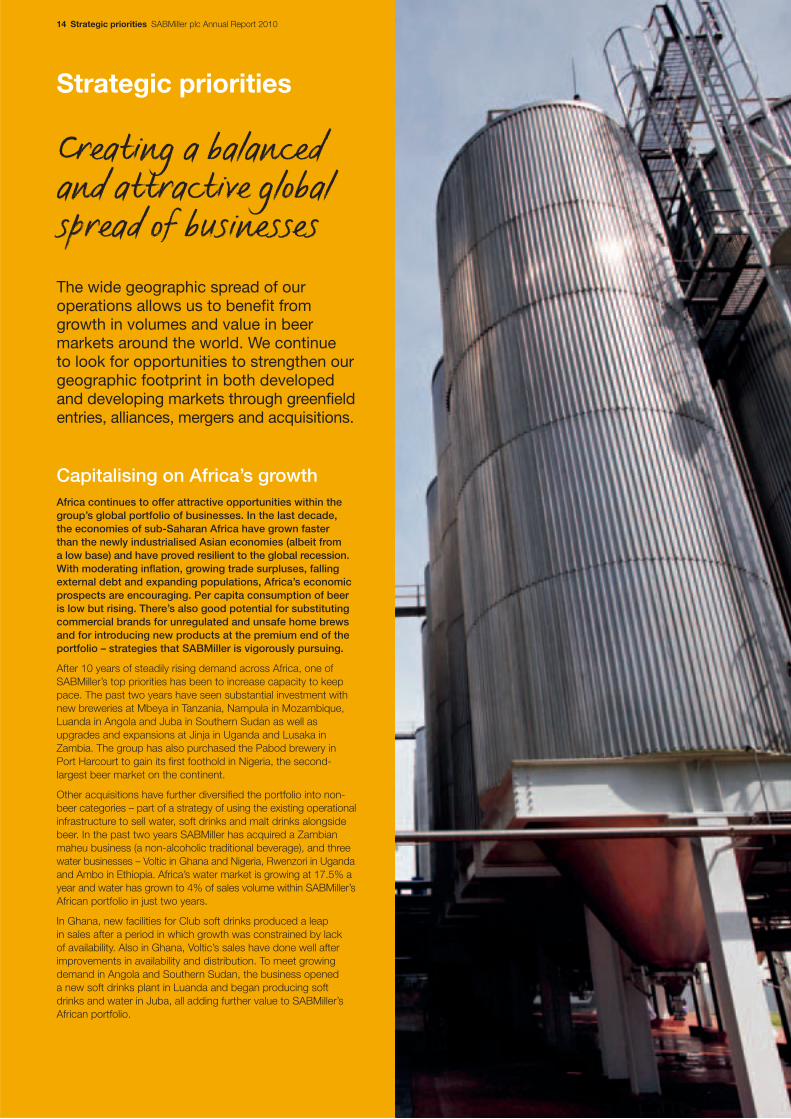
Creating a balancedand attractive globalspread of businessesThe wide geographic spread of ouroperations allows us to benefit fromgrowth in volumes and value in beermarkets around the world. We continueto look for opportunities to strengthen ourgeographic footprint in both developedand developing markets through greenfieldentries, alliances, mergers and acquisitions.
Capitalising on Africa’s growthAfrica continues to offer attractive opportunities within thegroup’s global portfolio of businesses. In the last decade, the economies of sub-Saharan Africa have grown faster than the newly industrialised Asian economies (albeit from a low base) and have proved resilient to the global recession.With moderating inflation, growing trade surpluses, fallingexternal debt and expanding populations, Africa’s economicprospects are encouraging. Per capita consumption of beeris low but rising. There’s also good potential for substitutingcommercial brands for unregulated and unsafe home brewsand for introducing new products at the premium end of theportfolio – strategies that SABMiller is vigorously pursuing.
After 10 years of steadily rising demand across Africa, one ofSABMiller’s top priorities has been to increase capacity to keeppace. The past two years have seen substantial investment withnew breweries at Mbeya in Tanzania, Nampula in Mozambique,Luanda in Angola and Juba in Southern Sudan as well asupgrades and expansions at Jinja in Uganda and Lusaka inZambia. The group has also purchased the Pabod brewery inPort Harcourt to gain its first foothold in Nigeria, the second-largest beer market on the continent.
Other acquisitions have further diversified the portfolio into non-beer categories – part of a strategy of using the existing operationalinfrastructure to sell water, soft drinks and malt drinks alongsidebeer. In the past two years SABMiller has acquired a Zambianmaheu business (a non-alcoholic traditional beverage), and threewater businesses – Voltic in Ghana and Nigeria, Rwenzori in Ugandaand Ambo in Ethiopia. Africa’s water market is growing at 17.5% ayear and water has grown to 4% of sales volume within SABMiller’sAfrican portfolio in just two years.
In Ghana, new facilities for Club soft drinks produced a leap in sales after a period in which growth was constrained by lack of availability. Also in Ghana, Voltic’s sales have done well afterimprovements in availability and distribution. To meet growingdemand in Angola and Southern Sudan, the business opened a new soft drinks plant in Luanda and began producing softdrinks and water in Juba, all adding further value to SABMiller’sAfrican portfolio.
SABMiller plc Annual Report 2010 Strategic priorities 15
Latin American business builds a solid foundation for growthWhen SABMiller merged with Bavaria’s businesses in Colombia, Peru, Ecuador and Panamain 2005, it set out to achieve annual savings of US$120 million from operating improvementsand cost synergies by March 2010. By transferring skills and knowledge from around theSABMiller group to these businesses, it has more than met this savings target.
One of its first priorities was to transform the image of beer, presenting it as a high-quality,aspirational product to increase its share of the total alcohol market. The task included segmentingthe market and creating a full portfolio of rejuvenated and differentiated brands and packs tomatch specific consumer needs and beer-drinking occasions, all backed by extensive marketinginvestment. Unattractive bottles were replaced with more modern shapes and graphics. A thoroughoverhaul of the route to market made it possible to deliver the right products to each outletwith far greater efficiency and better customer service.
The result for SABMiller is a successful portfolio of businesses that have generated an attractivereturn on the group’s initial investment of US$7.8 billion announced in 2005. EBITA from theLatin American businesses has grown at a compound annual growth rate of 16% over thisperiod with margins rising by 320 bps. The lessons learned from this valuable addition to theglobal portfolio are now being shared with other group businesses.
The Latin American business sees further opportunities for organic growth as economies grow,consumers switch to commercially produced beer from other forms of alcohol (particularlyinformal spirits) and consumption per capita rises to the level of other countries in the region.
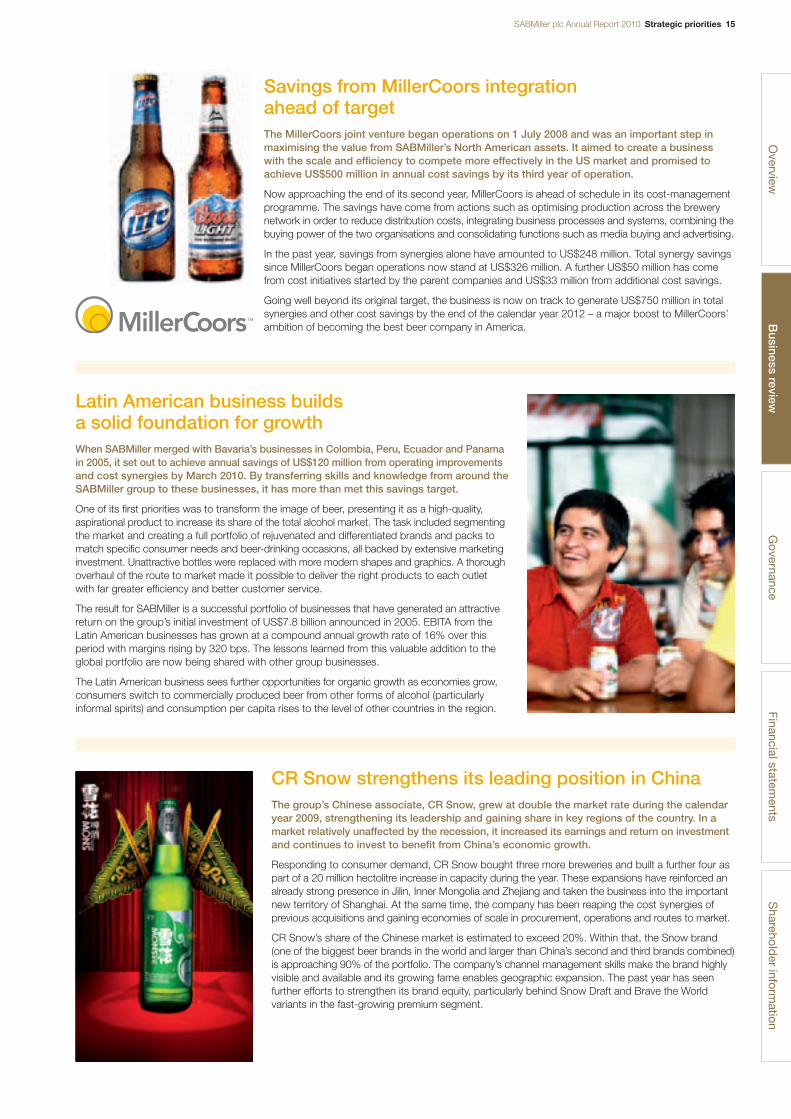
Savings from MillerCoors integration ahead of targetThe MillerCoors joint venture began operations on 1 July 2008 and was an important step inmaximising the value from SABMiller’s North American assets. It aimed to create a businesswith the scale and efficiency to compete more effectively in the US market and promised toachieve US$500 million in annual cost savings by its third year of operation.
Now approaching the end of its second year, MillerCoors is ahead of schedule in its cost-managementprogramme. The savings have come from actions such as optimising production across the brewerynetwork in order to reduce distribution costs, integrating business processes and systems, combining thebuying power of the two organisations and consolidating functions such as media buying and advertising.
In the past year, savings from synergies alone have amounted to US$248 million. Total synergy savingssince MillerCoors began operations now stand at US$326 million. A further US$50 million has comefrom cost initiatives started by the parent companies and US$33 million from additional cost savings.
Going well beyond its original target, the business is now on track to generate US$750 million in totalsynergies and other cost savings by the end of the calendar year 2012 – a major boost to MillerCoors’ambition of becoming the best beer company in America.
Overview
Business review
Governance
Financial statements
Sharehold
er information
CR Snow strengthens its leading position in ChinaThe group’s Chinese associate, CR Snow, grew at double the market rate during the calendaryear 2009, strengthening its leadership and gaining share in key regions of the country. In amarket relatively unaffected by the recession, it increased its earnings and return on investmentand continues to invest to benefit from China’s economic growth.
Responding to consumer demand, CR Snow bought three more breweries and built a further four aspart of a 20 million hectolitre increase in capacity during the year. These expansions have reinforced analready strong presence in Jilin, Inner Mongolia and Zhejiang and taken the business into the importantnew territory of Shanghai. At the same time, the company has been reaping the cost synergies ofprevious acquisitions and gaining economies of scale in procurement, operations and routes to market.
CR Snow’s share of the Chinese market is estimated to exceed 20%. Within that, the Snow brand(one of the biggest beer brands in the world and larger than China’s second and third brands combined)is approaching 90% of the portfolio. The company’s channel management skills make the brand highlyvisible and available and its growing fame enables geographic expansion. The past year has seenfurther efforts to strengthen its brand equity, particularly behind Snow Draft and Brave the Worldvariants in the fast-growing premium segment.
16 Strategic priorities SABMiller plc Annual Report 2010
Strategic priorities continued
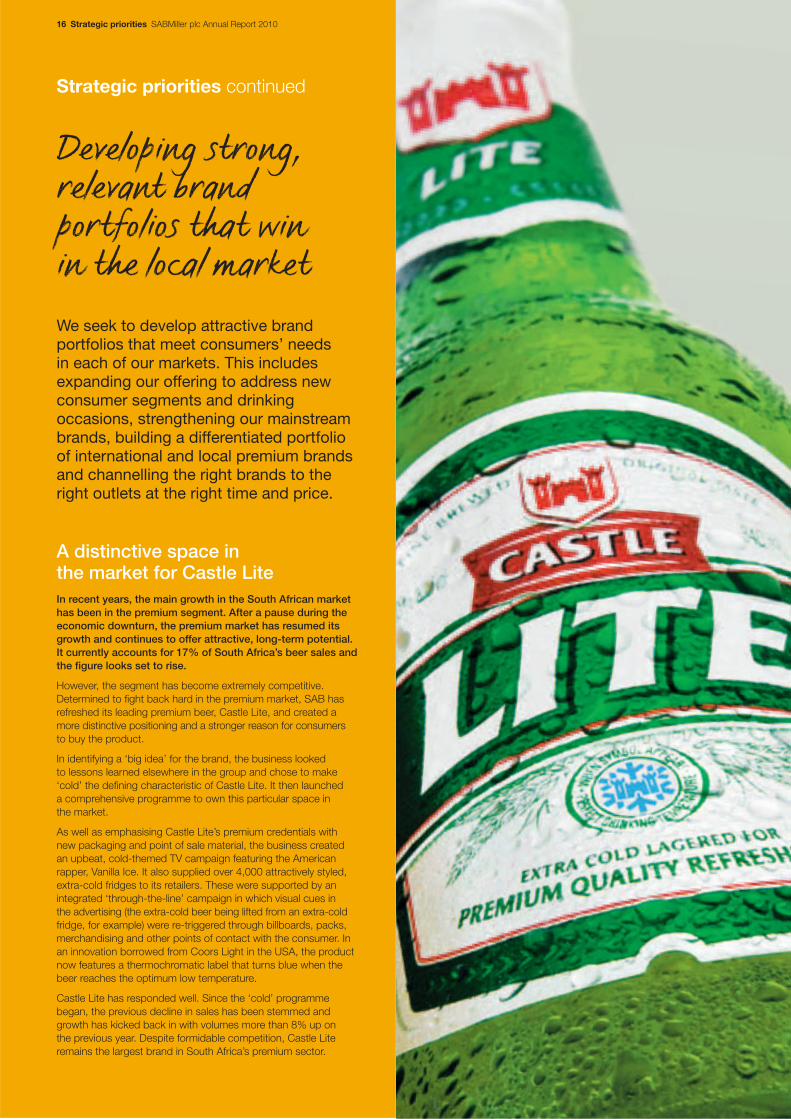
Developing strong,relevant brandportfolios that win in the local marketWe seek to develop attractive brandportfolios that meet consumers’ needs in each of our markets. This includesexpanding our offering to address newconsumer segments and drinkingoccasions, strengthening our mainstreambrands, building a differentiated portfolioof international and local premium brandsand channelling the right brands to theright outlets at the right time and price.
A distinctive space in the market for Castle LiteIn recent years, the main growth in the South African markethas been in the premium segment. After a pause during theeconomic downturn, the premium market has resumed itsgrowth and continues to offer attractive, long-term potential.It currently accounts for 17% of South Africa’s beer sales andthe figure looks set to rise.
However, the segment has become extremely competitive.Determined to fight back hard in the premium market, SAB hasrefreshed its leading premium beer, Castle Lite, and created amore distinctive positioning and a stronger reason for consumers to buy the product.
In identifying a ‘big idea’ for the brand, the business looked to lessons learned elsewhere in the group and chose to make‘cold’ the defining characteristic of Castle Lite. It then launched a comprehensive programme to own this particular space in the market.
As well as emphasising Castle Lite’s premium credentials withnew packaging and point of sale material, the business createdan upbeat, cold-themed TV campaign featuring the Americanrapper, Vanilla Ice. It also supplied over 4,000 attractively styled,extra-cold fridges to its retailers. These were supported by anintegrated ‘through-the-line’ campaign in which visual cues in the advertising (the extra-cold beer being lifted from an extra-coldfridge, for example) were re-triggered through billboards, packs,merchandising and other points of contact with the consumer. Inan innovation borrowed from Coors Light in the USA, the productnow features a thermochromatic label that turns blue when thebeer reaches the optimum low temperature.
Castle Lite has responded well. Since the ‘cold’ programmebegan, the previous decline in sales has been stemmed andgrowth has kicked back in with volumes more than 8% up on the previous year. Despite formidable competition, Castle Literemains the largest brand in South Africa’s premium sector.
SABMiller plc Annual Report 2010 Strategic priorities 17
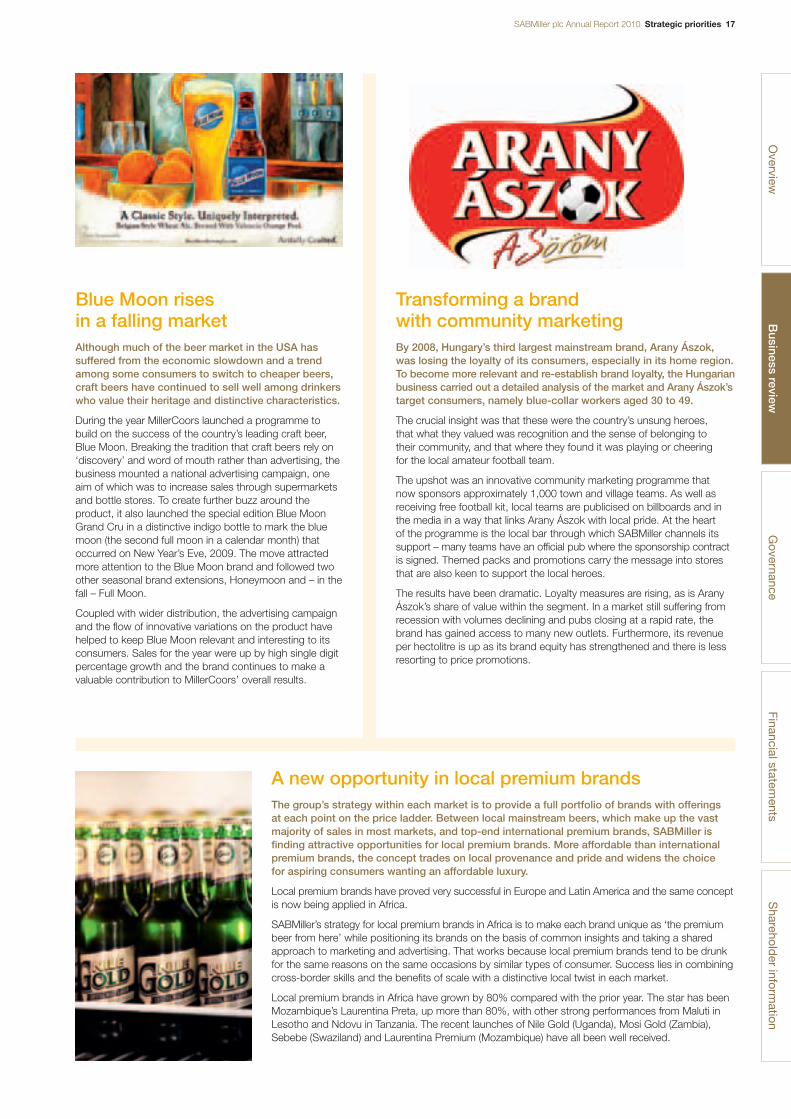
Blue Moon rises in a falling marketAlthough much of the beer market in the USA hassuffered from the economic slowdown and a trendamong some consumers to switch to cheaper beers,craft beers have continued to sell well among drinkerswho value their heritage and distinctive characteristics.
During the year MillerCoors launched a programme tobuild on the success of the country’s leading craft beer,Blue Moon. Breaking the tradition that craft beers rely on‘discovery’ and word of mouth rather than advertising, thebusiness mounted a national advertising campaign, oneaim of which was to increase sales through supermarketsand bottle stores. To create further buzz around theproduct, it also launched the special edition Blue MoonGrand Cru in a distinctive indigo bottle to mark the bluemoon (the second full moon in a calendar month) thatoccurred on New Year’s Eve, 2009. The move attractedmore attention to the Blue Moon brand and followed twoother seasonal brand extensions, Honeymoon and – in thefall – Full Moon.
Coupled with wider distribution, the advertising campaignand the flow of innovative variations on the product havehelped to keep Blue Moon relevant and interesting to itsconsumers. Sales for the year were up by high single digitpercentage growth and the brand continues to make avaluable contribution to MillerCoors’ overall results.
Transforming a brand with community marketingBy 2008, Hungary’s third largest mainstream brand, Arany Ászok,was losing the loyalty of its consumers, especially in its home region.To become more relevant and re-establish brand loyalty, the Hungarianbusiness carried out a detailed analysis of the market and Arany Ászok’starget consumers, namely blue-collar workers aged 30 to 49.
The crucial insight was that these were the country’s unsung heroes, that what they valued was recognition and the sense of belonging to their community, and that where they found it was playing or cheering for the local amateur football team.
The upshot was an innovative community marketing programme that now sponsors approximately 1,000 town and village teams. As well asreceiving free football kit, local teams are publicised on billboards and inthe media in a way that links Arany Ászok with local pride. At the heart of the programme is the local bar through which SABMiller channels itssupport – many teams have an official pub where the sponsorship contractis signed. Themed packs and promotions carry the message into storesthat are also keen to support the local heroes.
The results have been dramatic. Loyalty measures are rising, as is AranyÁszok’s share of value within the segment. In a market still suffering fromrecession with volumes declining and pubs closing at a rapid rate, thebrand has gained access to many new outlets. Furthermore, its revenueper hectolitre is up as its brand equity has strengthened and there is lessresorting to price promotions.
Overview
Business review
Governance
Financial statements
Sharehold
er information
A new opportunity in local premium brandsThe group’s strategy within each market is to provide a full portfolio of brands with offerings at each point on the price ladder. Between local mainstream beers, which make up the vastmajority of sales in most markets, and top-end international premium brands, SABMiller isfinding attractive opportunities for local premium brands. More affordable than internationalpremium brands, the concept trades on local provenance and pride and widens the choice for aspiring consumers wanting an affordable luxury.
Local premium brands have proved very successful in Europe and Latin America and the same conceptis now being applied in Africa.
SABMiller’s strategy for local premium brands in Africa is to make each brand unique as ‘the premiumbeer from here’ while positioning its brands on the basis of common insights and taking a sharedapproach to marketing and advertising. That works because local premium brands tend to be drunkfor the same reasons on the same occasions by similar types of consumer. Success lies in combiningcross-border skills and the benefits of scale with a distinctive local twist in each market.
Local premium brands in Africa have grown by 80% compared with the prior year. The star has beenMozambique’s Laurentina Preta, up more than 80%, with other strong performances from Maluti inLesotho and Ndovu in Tanzania. The recent launches of Nile Gold (Uganda), Mosi Gold (Zambia),Sebebe (Swaziland) and Laurentina Premium (Mozambique) have all been well received.
18 Strategic priorities SABMiller plc Annual Report 2010
Strategic priorities continued
Constantly raising theprofitability of localbusinesses, sustainablyOur aim is to keep enhancing ouroperational performance through top-linegrowth and continuous improvement incosts and productivity. It’s also importantthat we maintain and advance ourreputation, protect our licence to tradeand develop our businesses sustainablyfor the benefit of our stakeholders.
Colombia’s profitability continues to improve despiteeconomic slowdownAs one of SABMiller’s largest businesses, Bavaria in Colombiahas been at the forefront of the group’s rapid progress in theregion. Against the backdrop of SABMiller’s work to transformthe image of the beer market, its operational improvementshave steadily lifted its performance to new levels.
Having carefully segmented the market and created a full portfolioof renovated and differentiated brands, the business was able tofocus on the quality of its service and developing its relationshipwith customers. It has expanded its pre-selling operation and nowprovides a single point of service to each retailer, agreeing in eachcase which brands, presentations and point-of-sale material willbest meet the consumer needs and beer-drinking occasionsserved by the outlet in question.
Another important step was to increase control over the distributionnetwork and the number of direct deliveries, and optimise the networkfor maximum efficiency. This included rationalising distribution centres,consolidating a fragmented distributor network and introducingand standardising performance incentives for distributors. Thebusiness has also increased its vehicle utilisation by replacing theageing, overloaded, fuel-inefficient trucks of the past with new,palletised vehicles using modern loading techniques and workingto planned routes and schedules. All these initiatives have reduceddistribution costs and made delivery more effective and reliablewith a consequent leap in customer satisfaction.
Colombia felt the effects of the global downturn relatively early.Bavaria responded swiftly to worsening conditions, carrying out adetailed review of its costs and organisation. This, along with thework on its brands, sales and distribution operations, has enabledthe business to deliver an impressive year-on-year rise of 270basis points in EBITA margin. The double digit compound annualgrowth in EBITA since 2007 underlines the resilience and flexibilityof the business and its strong position as the economy recovers.

SABMiller plc Annual Report 2010 Strategic priorities 19
Investing in local suppliersIn procuring its raw materials, SABMiller combines thescale benefits of global sourcing with the advantagesof sourcing locally where this makes sense.
Local sourcing means zero import duties and shorter, moresecure supply chains while encouraging enterprise andstimulating the local economy on which every SABMillerbusiness depends. In Africa, in particular, it supports thegroup’s strategy of developing new, low-cost productsbased on indigenous crops such as sorghum and cassavathat can be marketed as affordable alternatives to traditionalhome brews.
SABMiller is working hard to source more of its raw materials(both conventional and new) from local suppliers. In Africa,it’s scaling up commercial barley production in countriessuch as Zambia and Tanzania and recently won donorfunding to help establish a cassava supply chain usingsmall-scale farmers in Southern Sudan. In Peru andEcuador, it’s developing high-quality, local supplies ofmaize and rice to replace imported crops. In India, thebusiness is working with small-scale barley farmers toimprove their yields and quality, enabling them to meetmore of SABMiller’s requirements while also boosting theirincomes. There are currently some 9,000 farmers involvedin this project.
A market-focused strategy for growthThe South African competitive scene is unique in that the mainchallenge comes not from new players launching new brands, butfrom a former partner offering well-established premium brands thatSAB itself helped to build over the decades.
SAB’s response is to concentrate on building the equity of selectedbrands and getting its products efficiently to market. While its relativelynew international premium brands attack the top end of the market, SABis packing most of its resource behind four ‘power brands’ – Castle Lite inthe local premium segment and Hansa Pilsener, Castle Lager and CarlingBlack Label in the large, cash-generating mainstream segment. In parallel,it’s seeking to offer superior value and service to retailers (including tens of thousands of previously unlicensed ‘shebeens’ that have now enteredthe formal sector as licensed taverns) and to make the most meaningfulcontribution to society.
The strategy calls for greater investment in market-facing, brand-relatedactivities – everything that touches consumers, retailers, government and the community. To this end, SAB is squeezing all possible efficienciesfrom non-market-facing operations such as production, supply chain andadministration and channelling the savings into its brands, marketing anddistribution. The aim is to achieve a virtuous circle whereby greater scalein the marketplace presents opportunities for higher efficiency whichcreates more funding for marketing and sales, which drives demand,which generates further scale efficiencies.
Overview
Business review
Governance
Financial statements
Sharehold
er information
WWF partnership seeks to safeguard water suppliesA crucial factor in securing the sustainable profitability of local businesses is to ensure goodsupplies of high-quality water for SABMiller’s breweries. Concern is growing worldwide aboutwater scarcity and the group is taking steps to understand and manage any potential risks to its business.
In 2008 SABMiller set itself the target of using 25% less water per hectolitre of beer produced by2015. A range of programmes are now in place to achieve this reduction, but the issue also affectsSABMiller’s suppliers and demands wider action.
In partnership with the World Wide Fund for Nature (WWF), SABMiller is pioneering the technique of water footprinting to understand how much water is used, and where, within its value chain. Thework breaks new ground in Non-Governmental Organisation (NGO)-corporate partnerships by aligningenvironmental interests with the need to protect SABMiller’s operations. Joint projects with WWF in anumber of water-scarce markets are helping to identify where communities, the local environment andSABMiller businesses face possible shortages and to decide what can be done to safeguard supplies.
One example of working in partnership to improve the management of water is a project with WWF,local farmers and the authorities in Honduras that seeks to reduce soil erosion and the use of pesticidesby farmers. As well as helping the environment and improving water quality in the watershed from whichSABMiller’s operation draws its supplies, the project benefits farmers by reducing their input costs.
20 Strategic priorities SABMiller plc Annual Report 2010
Strategic priorities continued
Leveraging our skills and global scaleOur global spread presents increasingopportunities to gain value from the scale and skills of the group, not least bystandardising our back-office functionsaround the world and regionally integratingour front-office systems. We are alsobenefiting from ongoing collaboration andthe sharing of skills between our businesses.
Exploiting scale to develop global purchasingSABMiller spends over US$5,000 million a year on materials – mainly malt, barley, hops, glass and cans, but also otheressentials such as marketing items and freight. Havingpreviously made these purchases mainly on a regional basis, the group is now exploiting its worldwide scale andcreating a centralised procurement organisation to managethis expenditure globally while also retaining the flexibility to buy locally where this is advantageous.
Among its many benefits, global procurement offers greaternegotiating power and the opportunity to build strong, collaborativerelationships with key suppliers. It also allows the group to optimiseand harmonise its specifications to obtain the best quality andvalue. Procurement processes can be streamlined, expendituremade more transparent and new ideas and developmentsdisseminated more quickly around the group.
The formation of the global procurement organisation is welladvanced with a head office now established in Switzerland – aknown centre of procurement expertise and within a convenienttime zone in relation to the group’s global footprint. The organisationrecently carried out pilot programmes in some of its smallerpurchasing categories. These included trade fridges and glasswarein Europe and Latin America and other marketing items such as umbrellas, furniture and signage. Despite rising raw materialprices, these two programmes produced significant savings onprevious expenditure.
As systems are tested and lessons incorporated, global procurementwill be rolled out to other, larger categories in 2010 and beyond.
SABMiller plc Annual Report 2010 Strategic priorities 21O
verviewB
usiness reviewG
overnanceFinancial statem
entsS
hareholder inform
ation
Global scale, global processesIn a project due to go live from June 2010, SABMiller will capitalise on its scale by creatingconsistent information and processes and a single, integrated IT system across finance,procurement and human resources. By standardising essential processes around the globe,the project will, among other benefits, save costs, enable faster sharing of better qualityinformation, accelerate the integration of new acquisitions, free up local management to focus on their own commercial priorities and create a more connected global organisation.
Standardised processes, especially in finance and administration, will also make it possible toestablish outsourced shared service centres, presenting further opportunities to optimise efficiencyand reduce costs.
SAB in South Africa has for some time run back-office financial activities for its beer and soft drinksbusinesses through an in-house shared service centre enabled by a local Enterprise Resource Planningsystem. The SAB model was chosen as the basis for the global template with development expertisecoming from around the group. In a step towards some of the advantages that the project will deliver,SAB recently outsourced its shared service centre to a business process provider. It’s already seeingthe benefits through more efficient processes at lower cost.
Cross-regional IT solutionsAs part of the process of transforming their operations, SABMiller’s Latin Americanbusinesses have developed a common system for optimising the planning and supplychain operations in each market. Another collaborative project, first implemented inPeru and now also live in Colombia, is a front-office tool for improving control of salesand distribution and becoming more effective at the point of sale. Benefits from thetwo projects have included more accurate budgeting and forecasting, improvedproduction scheduling, reduced working capital and better customer service.
The next step is to combine these locally developed solutions with SABMiller’s standardisedand integrated back-office system (see case study above) as it starts being rolled out in LatinAmerica. Ecuador will shortly become the first country to adopt all three systems – supplychain planning, front-office sales and distribution and the integrated back-office – on a singleIT platform.
Having drawn on developments in South Africa, Latin America is now collaborating withSABMiller’s European businesses to adapt the platform to their markets – ensuring, for example,that a system designed to include ‘mom and pop’ stores in Peru can be adapted to Europeansupermarkets. As learning is shared in this way, each region is able to innovate more quicklythan it could have done on its own.
Exchanging knowledge to achieve marketing excellenceCrucial to the group’s success is learning what works in one market andapplying it in others to generate growth. To this end, the system of SABMiller‘Ways’ has codified best practice in key areas of the business to allow learningand innovation to spread rapidly and efficiently across the group.
Building on The Marketing Way, SABMiller’s marketing team has developed progressivebut formal methods of disseminating knowledge, to improve on the ad hoc methodspreviously used. One result was the creation of BigM, the global marketing intranet forthe sharing of best practice. BigM was the first component of WEBrew, the group-wideintranet launched in 2008.
WEBrew also hosts the Mercatus awards programme and the innovative Quencher,SABMiller’s first global marketing e-zine. The former recognises marketing excellenceacross the business and encourages the adoption of award-winning examples. The e-zine has proved to be a valuable source of news for the marketing community. Newto the mix is the Knowledge Library, currently being piloted in response to demand forgreater exchange of knowledge.
Through these innovations, the global marketing function has created a sophisticatedplatform for new learning to travel quickly and efficiently to all parts of the group. Thiswill prove essential in the rolling out of new initiatives such as 5 to Drive.
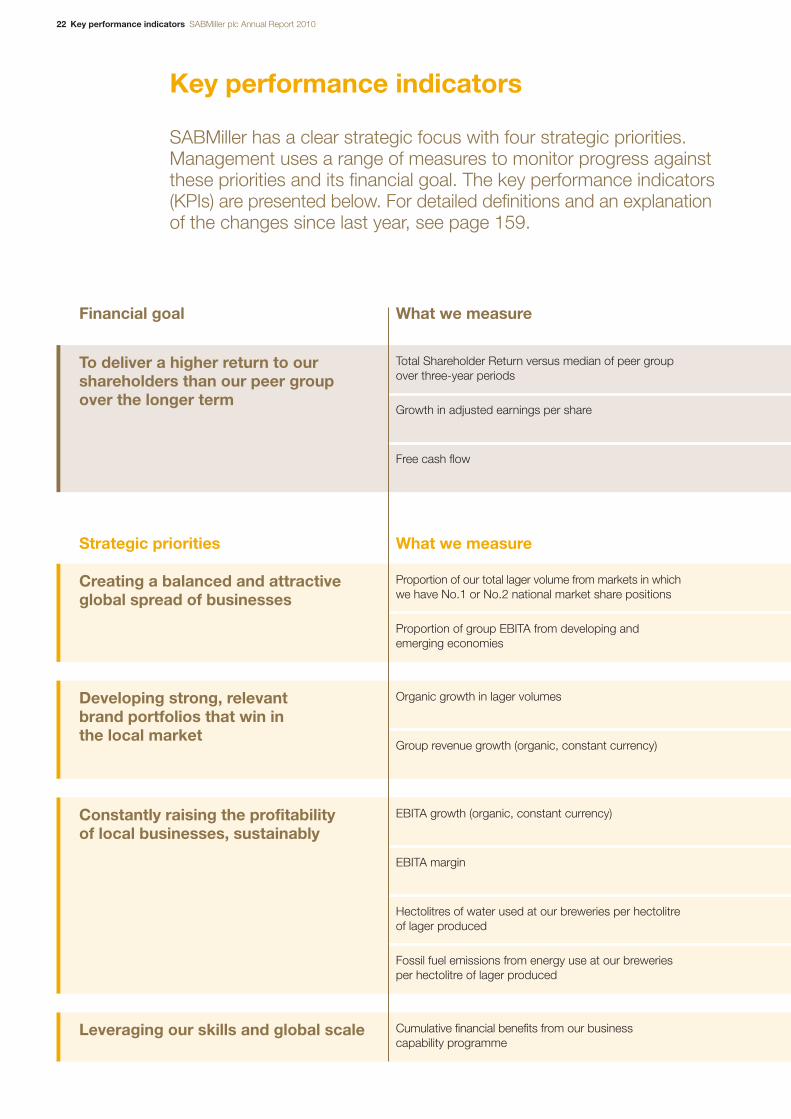
22 Key performance indicators SABMiller plc Annual Report 2010
SABMiller has a clear strategic focus with four strategic priorities.Management uses a range of measures to monitor progress againstthese priorities and its financial goal. The key performance indicators(KPIs) are presented below. For detailed definitions and an explanationof the changes since last year, see page 159.
Key performance indicators
Total Shareholder Return versus median of peer group over three-year periods
To deliver a higher return to ourshareholders than our peer group over the longer term
Creating a balanced and attractive global spread of businesses
Developing strong, relevant brand portfolios that win in the local market
Constantly raising the profitability of local businesses, sustainably
Leveraging our skills and global scale
Growth in adjusted earnings per share
Free cash flow
Proportion of our total lager volume from markets in which we have No.1 or No.2 national market share positions
Proportion of group EBITA from developing and emerging economies
Organic growth in lager volumes
Group revenue growth (organic, constant currency)
EBITA growth (organic, constant currency)
EBITA margin
Hectolitres of water used at our breweries per hectolitre of lager produced
Fossil fuel emissions from energy use at our breweries per hectolitre of lager produced
Cumulative financial benefits from our business capability programme
What we measureFinancial goal
What we measureStrategic priorities
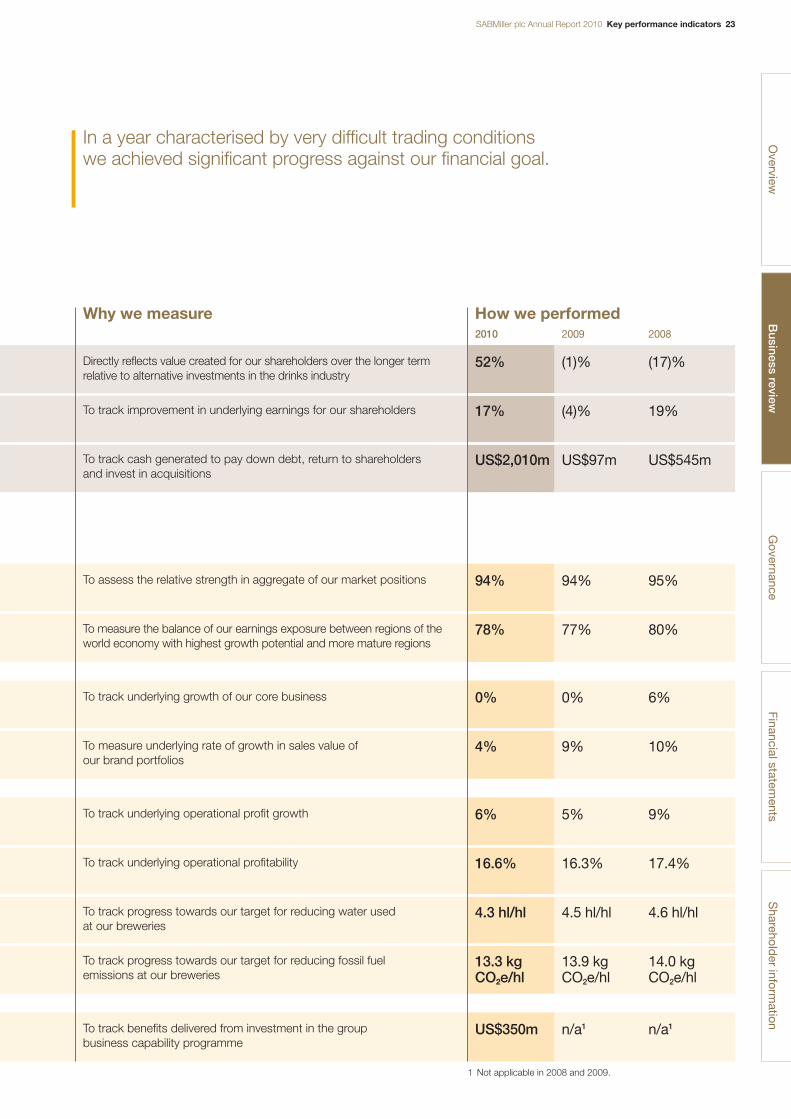
SABMiller plc Annual Report 2010 Key performance indicators 23
In a year characterised by very difficult trading conditions we achieved significant progress against our financial goal.
Overview
Governance
Financial statements
Sharehold
er information
Directly reflects value created for our shareholders over the longer termrelative to alternative investments in the drinks industry
To track improvement in underlying earnings for our shareholders
To track cash generated to pay down debt, return to shareholders and invest in acquisitions
To assess the relative strength in aggregate of our market positions
To measure the balance of our earnings exposure between regions of theworld economy with highest growth potential and more mature regions
To track underlying growth of our core business
To measure underlying rate of growth in sales value of our brand portfolios
To track underlying operational profit growth
To track underlying operational profitability
To track progress towards our target for reducing water used at our breweries
To track progress towards our target for reducing fossil fuel emissions at our breweries
To track benefits delivered from investment in the group business capability programme
52% (1)% (17)%
2010 2009 2008
17% (4)% 19%
US$2,010m US$97m US$545m
94% 94% 95%
78% 77% 80%
0% 0% 6%
4% 9% 10%
6% 5% 9%
16.6% 16.3% 17.4%
4.3 hl/hl 4.5 hl/hl 4.6 hl/hl
13.3 kg 13.9 kg 14.0 kgCO2e/hl CO2e/hl CO2e/hl
US$350m n/a1 n/a1
Why we measure How we performed Business review
1 Not applicable in 2008 and 2009.
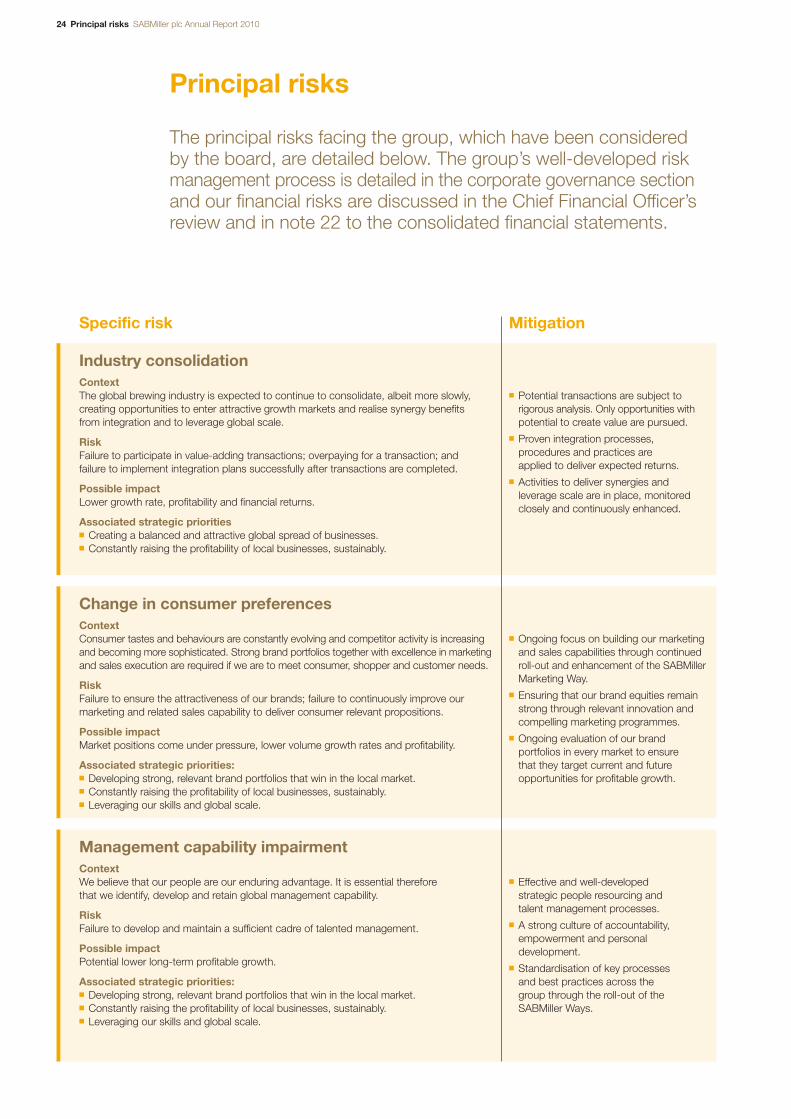
24 Principal risks SABMiller plc Annual Report 2010
The principal risks facing the group, which have been considered by the board, are detailed below. The group’s well-developed riskmanagement process is detailed in the corporate governance sectionand our financial risks are discussed in the Chief Financial Officer’sreview and in note 22 to the consolidated financial statements.
Principal risks
Industry consolidationContextThe global brewing industry is expected to continue to consolidate, albeit more slowly,creating opportunities to enter attractive growth markets and realise synergy benefits from integration and to leverage global scale.
RiskFailure to participate in value-adding transactions; overpaying for a transaction; andfailure to implement integration plans successfully after transactions are completed.
Possible impactLower growth rate, profitability and financial returns.
Associated strategic priorities■ Creating a balanced and attractive global spread of businesses.■ Constantly raising the profitability of local businesses, sustainably.
■ Potential transactions are subject torigorous analysis. Only opportunities withpotential to create value are pursued.
■ Proven integration processes,procedures and practices are applied to deliver expected returns.
■ Activities to deliver synergies andleverage scale are in place, monitoredclosely and continuously enhanced.
Change in consumer preferencesContextConsumer tastes and behaviours are constantly evolving and competitor activity is increasingand becoming more sophisticated. Strong brand portfolios together with excellence in marketingand sales execution are required if we are to meet consumer, shopper and customer needs.
RiskFailure to ensure the attractiveness of our brands; failure to continuously improve ourmarketing and related sales capability to deliver consumer relevant propositions.
Possible impactMarket positions come under pressure, lower volume growth rates and profitability.
Associated strategic priorities:■ Developing strong, relevant brand portfolios that win in the local market.■ Constantly raising the profitability of local businesses, sustainably.■ Leveraging our skills and global scale.
■ Ongoing focus on building our marketingand sales capabilities through continuedroll-out and enhancement of the SABMillerMarketing Way.
■ Ensuring that our brand equities remainstrong through relevant innovation andcompelling marketing programmes.
■ Ongoing evaluation of our brand portfolios in every market to ensure that they target current and futureopportunities for profitable growth.
Management capability impairmentContextWe believe that our people are our enduring advantage. It is essential therefore that we identify, develop and retain global management capability.
RiskFailure to develop and maintain a sufficient cadre of talented management.
Possible impactPotential lower long-term profitable growth.
Associated strategic priorities:■ Developing strong, relevant brand portfolios that win in the local market.■ Constantly raising the profitability of local businesses, sustainably.■ Leveraging our skills and global scale.
■ Effective and well-developed strategic people resourcing and talent management processes.
■ A strong culture of accountability,empowerment and personaldevelopment.
■ Standardisation of key processes and best practices across the group through the roll-out of theSABMiller Ways.
MitigationSpecific risk
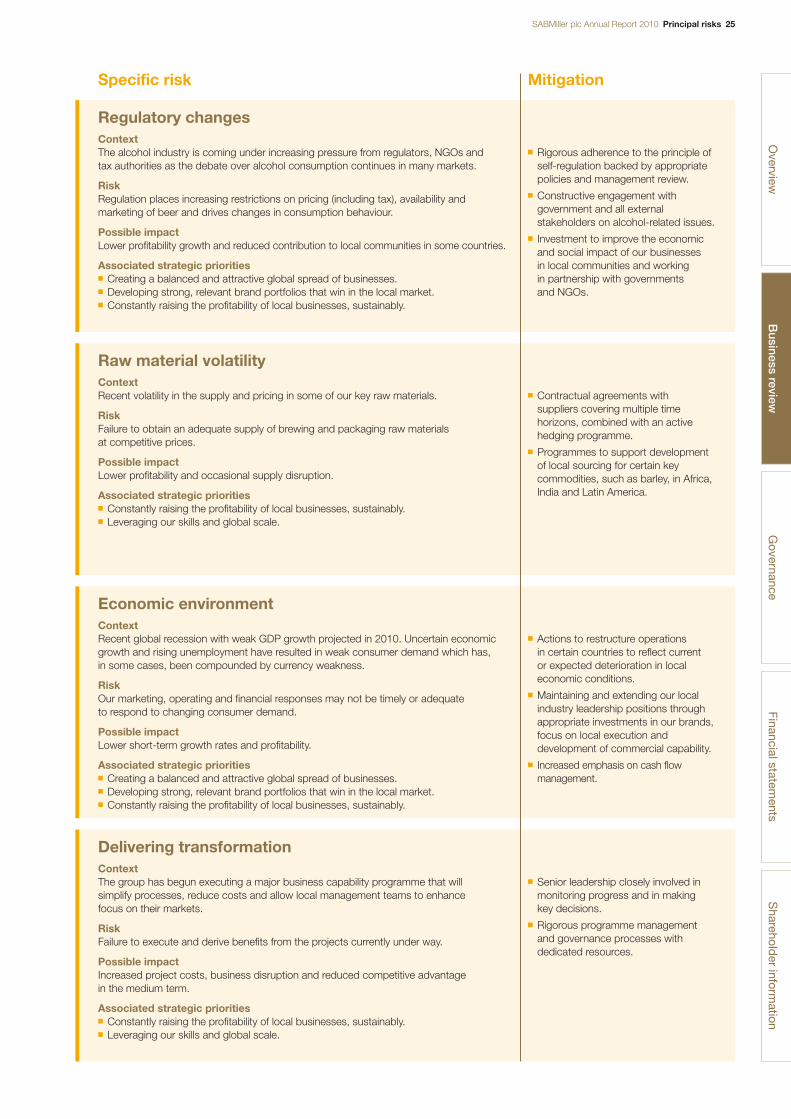
SABMiller plc Annual Report 2010 Principal risks 25O
verviewG
overnanceFinancial statem
entsS
hareholder inform
ation
Regulatory changesContextThe alcohol industry is coming under increasing pressure from regulators, NGOs and tax authorities as the debate over alcohol consumption continues in many markets.
RiskRegulation places increasing restrictions on pricing (including tax), availability andmarketing of beer and drives changes in consumption behaviour.
Possible impactLower profitability growth and reduced contribution to local communities in some countries.
Associated strategic priorities■ Creating a balanced and attractive global spread of businesses.■ Developing strong, relevant brand portfolios that win in the local market.■ Constantly raising the profitability of local businesses, sustainably.
■ Rigorous adherence to the principle ofself-regulation backed by appropriatepolicies and management review.
■ Constructive engagement withgovernment and all externalstakeholders on alcohol-related issues.
■ Investment to improve the economicand social impact of our businesses in local communities and working in partnership with governments and NGOs.
Raw material volatilityContextRecent volatility in the supply and pricing in some of our key raw materials.
RiskFailure to obtain an adequate supply of brewing and packaging raw materials at competitive prices.
Possible impactLower profitability and occasional supply disruption.
Associated strategic priorities■ Constantly raising the profitability of local businesses, sustainably.■ Leveraging our skills and global scale.
■ Contractual agreements with suppliers covering multiple timehorizons, combined with an activehedging programme.
■ Programmes to support developmentof local sourcing for certain keycommodities, such as barley, in Africa,India and Latin America.
Economic environmentContextRecent global recession with weak GDP growth projected in 2010. Uncertain economicgrowth and rising unemployment have resulted in weak consumer demand which has, in some cases, been compounded by currency weakness.
RiskOur marketing, operating and financial responses may not be timely or adequate to respond to changing consumer demand.
Possible impactLower short-term growth rates and profitability.
Associated strategic priorities■ Creating a balanced and attractive global spread of businesses.■ Developing strong, relevant brand portfolios that win in the local market.■ Constantly raising the profitability of local businesses, sustainably.
■ Actions to restructure operations in certain countries to reflect current or expected deterioration in localeconomic conditions.
■ Maintaining and extending our localindustry leadership positions throughappropriate investments in our brands,focus on local execution anddevelopment of commercial capability.
■ Increased emphasis on cash flowmanagement.
Delivering transformationContextThe group has begun executing a major business capability programme that will simplify processes, reduce costs and allow local management teams to enhance focus on their markets.
RiskFailure to execute and derive benefits from the projects currently under way.
Possible impactIncreased project costs, business disruption and reduced competitive advantage in the medium term.
Associated strategic priorities■ Constantly raising the profitability of local businesses, sustainably.■ Leveraging our skills and global scale.
■ Senior leadership closely involved inmonitoring progress and in making key decisions.
■ Rigorous programme managementand governance processes withdedicated resources.
MitigationSpecific risk
Business review
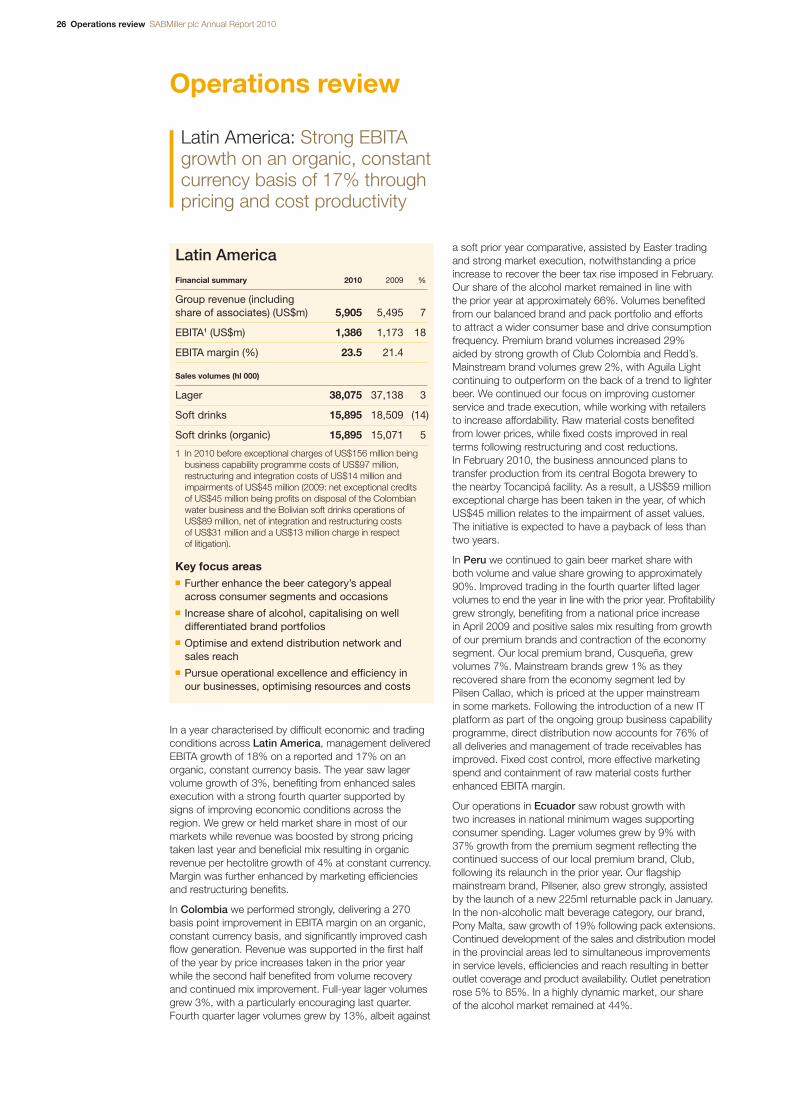
26 Operations review SABMiller plc Annual Report 2010
Latin America: Strong EBITAgrowth on an organic, constantcurrency basis of 17% throughpricing and cost productivity
Operations review
In a year characterised by difficult economic and tradingconditions across Latin America, management deliveredEBITA growth of 18% on a reported and 17% on anorganic, constant currency basis. The year saw lagervolume growth of 3%, benefiting from enhanced salesexecution with a strong fourth quarter supported by signs of improving economic conditions across theregion. We grew or held market share in most of ourmarkets while revenue was boosted by strong pricingtaken last year and beneficial mix resulting in organicrevenue per hectolitre growth of 4% at constant currency.Margin was further enhanced by marketing efficienciesand restructuring benefits.
In Colombia we performed strongly, delivering a 270basis point improvement in EBITA margin on an organic,constant currency basis, and significantly improved cashflow generation. Revenue was supported in the first halfof the year by price increases taken in the prior year while the second half benefited from volume recovery and continued mix improvement. Full-year lager volumesgrew 3%, with a particularly encouraging last quarter.Fourth quarter lager volumes grew by 13%, albeit against
a soft prior year comparative, assisted by Easter tradingand strong market execution, notwithstanding a priceincrease to recover the beer tax rise imposed in February.Our share of the alcohol market remained in line with the prior year at approximately 66%. Volumes benefitedfrom our balanced brand and pack portfolio and efforts to attract a wider consumer base and drive consumptionfrequency. Premium brand volumes increased 29% aided by strong growth of Club Colombia and Redd’s.Mainstream brand volumes grew 2%, with Aguila Lightcontinuing to outperform on the back of a trend to lighterbeer. We continued our focus on improving customerservice and trade execution, while working with retailersto increase affordability. Raw material costs benefitedfrom lower prices, while fixed costs improved in real terms following restructuring and cost reductions. In February 2010, the business announced plans totransfer production from its central Bogota brewery to the nearby Tocancipá facility. As a result, a US$59 millionexceptional charge has been taken in the year, of whichUS$45 million relates to the impairment of asset values.The initiative is expected to have a payback of less thantwo years.
In Peru we continued to gain beer market share withboth volume and value share growing to approximately90%. Improved trading in the fourth quarter lifted lagervolumes to end the year in line with the prior year. Profitabilitygrew strongly, benefiting from a national price increase in April 2009 and positive sales mix resulting from growthof our premium brands and contraction of the economysegment. Our local premium brand, Cusqueña, grewvolumes 7%. Mainstream brands grew 1% as theyrecovered share from the economy segment led by Pilsen Callao, which is priced at the upper mainstream in some markets. Following the introduction of a new ITplatform as part of the ongoing group business capabilityprogramme, direct distribution now accounts for 76% ofall deliveries and management of trade receivables hasimproved. Fixed cost control, more effective marketingspend and containment of raw material costs furtherenhanced EBITA margin.
Our operations in Ecuador saw robust growth with two increases in national minimum wages supportingconsumer spending. Lager volumes grew by 9% with37% growth from the premium segment reflecting thecontinued success of our local premium brand, Club,following its relaunch in the prior year. Our flagshipmainstream brand, Pilsener, also grew strongly, assistedby the launch of a new 225ml returnable pack in January.In the non-alcoholic malt beverage category, our brand,Pony Malta, saw growth of 19% following pack extensions.Continued development of the sales and distribution modelin the provincial areas led to simultaneous improvementsin service levels, efficiencies and reach resulting in betteroutlet coverage and product availability. Outlet penetrationrose 5% to 85%. In a highly dynamic market, our share of the alcohol market remained at 44%.
Latin AmericaFinancial summary 2010 2009 %
Group revenue (including share of associates) (US$m) 5,905 5,495 7
EBITA1 (US$m) 1,386 1,173 18
EBITA margin (%) 23.5 21.4
Sales volumes (hl 000)
Lager 38,075 37,138 3
Soft drinks 15,895 18,509 (14)
Soft drinks (organic) 15,895 15,071 5
1 In 2010 before exceptional charges of US$156 million beingbusiness capability programme costs of US$97 million,restructuring and integration costs of US$14 million andimpairments of US$45 million (2009: net exceptional credits of US$45 million being profits on disposal of the Colombianwater business and the Bolivian soft drinks operations ofUS$89 million, net of integration and restructuring costs of US$31 million and a US$13 million charge in respect of litigation).
Key focus areas■ Further enhance the beer category’s appeal
across consumer segments and occasions■ Increase share of alcohol, capitalising on well
differentiated brand portfolios■ Optimise and extend distribution network and
sales reach■ Pursue operational excellence and efficiency in
our businesses, optimising resources and costs
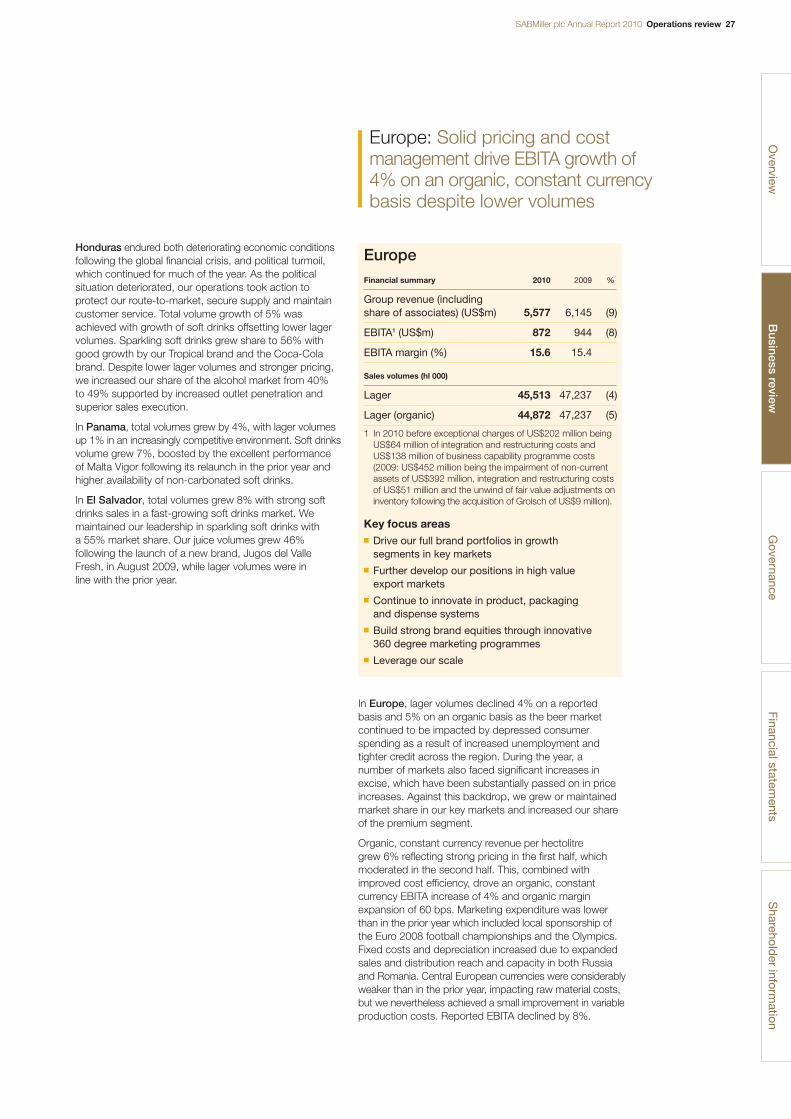
SABMiller plc Annual Report 2010 Operations review 27
Europe: Solid pricing and costmanagement drive EBITA growth of 4% on an organic, constant currencybasis despite lower volumes
Honduras endured both deteriorating economic conditionsfollowing the global financial crisis, and political turmoil,which continued for much of the year. As the politicalsituation deteriorated, our operations took action toprotect our route-to-market, secure supply and maintaincustomer service. Total volume growth of 5% wasachieved with growth of soft drinks offsetting lower lagervolumes. Sparkling soft drinks grew share to 56% withgood growth by our Tropical brand and the Coca-Colabrand. Despite lower lager volumes and stronger pricing,we increased our share of the alcohol market from 40%to 49% supported by increased outlet penetration andsuperior sales execution.
In Panama, total volumes grew by 4%, with lager volumesup 1% in an increasingly competitive environment. Soft drinksvolume grew 7%, boosted by the excellent performance of Malta Vigor following its relaunch in the prior year andhigher availability of non-carbonated soft drinks.
In El Salvador, total volumes grew 8% with strong softdrinks sales in a fast-growing soft drinks market. Wemaintained our leadership in sparkling soft drinks with a 55% market share. Our juice volumes grew 46%following the launch of a new brand, Jugos del ValleFresh, in August 2009, while lager volumes were in line with the prior year.
In Europe, lager volumes declined 4% on a reportedbasis and 5% on an organic basis as the beer marketcontinued to be impacted by depressed consumerspending as a result of increased unemployment andtighter credit across the region. During the year, a number of markets also faced significant increases inexcise, which have been substantially passed on in priceincreases. Against this backdrop, we grew or maintainedmarket share in our key markets and increased our shareof the premium segment.
Organic, constant currency revenue per hectolitre grew 6% reflecting strong pricing in the first half, whichmoderated in the second half. This, combined withimproved cost efficiency, drove an organic, constantcurrency EBITA increase of 4% and organic marginexpansion of 60 bps. Marketing expenditure was lowerthan in the prior year which included local sponsorship ofthe Euro 2008 football championships and the Olympics.Fixed costs and depreciation increased due to expandedsales and distribution reach and capacity in both Russiaand Romania. Central European currencies were considerablyweaker than in the prior year, impacting raw material costs,but we nevertheless achieved a small improvement in variableproduction costs. Reported EBITA declined by 8%.
Overview
Governance
Financial statements
Sharehold
er information
EuropeFinancial summary 2010 2009 %
Group revenue (including share of associates) (US$m) 5,577 6,145 (9)
EBITA1 (US$m) 872 944 (8)
EBITA margin (%) 15.6 15.4
Sales volumes (hl 000)
Lager 45,513 47,237 (4)
Lager (organic) 44,872 47,237 (5)
1 In 2010 before exceptional charges of US$202 million beingUS$64 million of integration and restructuring costs andUS$138 million of business capability programme costs(2009: US$452 million being the impairment of non-currentassets of US$392 million, integration and restructuring costsof US$51 million and the unwind of fair value adjustments oninventory following the acquisition of Grolsch of US$9 million).
Key focus areas■ Drive our full brand portfolios in growth
segments in key markets■ Further develop our positions in high value
export markets■ Continue to innovate in product, packaging
and dispense systems■ Build strong brand equities through innovative
360 degree marketing programmes■ Leverage our scale
Business review
28 Operations review SABMiller plc Annual Report 2010
Europe: continued
Operations review continued
In Poland, lager volumes were down 3% although we grew market share, reflecting a sustained focus onsales execution and trade programmes. Brand activitiescentred on Tyskie, Poland’s leading brand, as sponsor ofthe International Year of Beer, driving an increase in brandmarket share for the third consecutive year. Zubr alsocaptured significant market share, growing volumes by3%. In the premium segment, we increased our valueshare, and Grolsch was successfully launched in thesuper-premium segment. Revenue per hectolitre grew4% in constant currency terms. In September 2009 weannounced the closure of the Kielce brewery and threedistribution centres.
In the Czech Republic, the market was impacted byhigher unemployment and significant increases in VATand excise in January 2010. Our domestic lager volumesdeclined 5%, reflecting a 7% fall in the on-premise channelwhich has been severely affected by economic pressuresand lower tourism. Despite this, we maintained marketshare with our brands now occupying the number one,two and three market positions. Our combined super-premium and premium portfolio grew over 6% with all key brands growing market share. The performance ofPilsner Urquell, underpinned by strong and improvingbrand health, was particularly noteworthy given its price premium. The market-leading brand, Gambrinus,continued to be negatively affected by its significantexposure to the on-premise channel; however, the higherpriced variant, Gambrinus 11, performed well, maintainingits leadership of the semi-premium segment. In themainstream segment, Kozel enjoyed another exceptionalyear, growing 5% and consolidating its position as Czech’snumber two brand. Improved overhead productivity led to an EBITA margin expansion of over 100 bps.
Romania suffered a severe recession during the year and our lager volumes fell 13% on an organic basis in a market that declined 24%. We took market leadershipwith share improving by 400 bps to reach 32% over theyear. The mainstream segment continued to grow at theexpense of premium and economy sectors as consumerssought brands with strong value propositions. Our largestbrand, Timisoreana, continued its strong performancewith volume growth of 2%. We increased our share in the off-premise channel with intensive 360 degree brandactivation and strong display support and took marketleadership of the growing key accounts sub-channel. We maintained our leadership of the declining on-premisechannel. Revenue per hectolitre grew 9% at constantcurrency, although EBITA declined due to reduced volumesand increased depreciation following investment in theprior year. During the year we strengthened our economysegment with the acquisition of the Azuga operations and we closed the acquired brewery, as planned.
In Russia, a significant increase in excise in January 2010and a sharp decline in consumer disposable income led to a drop in industry beer production and sales. Ourlager volumes were down 5% but our market share wasmaintained. Repositioning, renovation and line extensionson Zolotaya Bochka lifted the brand to number two in thepremium segment, while the Kozel brand delivered 13%volume growth to become the number one licensed brandin Moscow. In September 2009, we launched Grolsch withbrand equity indicators showing good growth potential. In May 2009, we opened the new brewery in Ulyanovsk,in line with our geographic expansion strategy; andlaunched the Tri Bogatyrya economy brand in a new PET format leading to a doubling of the brand’s volume.Brand mix partially diluted the strong pricing taken in the prior year but we still achieved revenue per hectolitregrowth of 7% at constant currency. In the Ukraine, theSarmat brand was relaunched but volume performancewas severely impacted by a 94% increase in excise inJuly 2009. Volume growth on licensed brands Kozel andZolotaya Bochka was very strong, benefiting mix anddriving revenue per hectolitre growth.
In Italy, economic conditions remained negative,although the second half saw some signs of stabilisation.Birra Peroni volumes declined 7% during the year as wereduced promoted volume and stock in trade levels. Ourmarket share of STRs was marginally below the prior yearwhile constant currency revenue per hectolitre grew 4%reflecting strong pricing and improved channel mix. This,combined with refocused marketing investment behindcore brands, production efficiencies and fixed costproductivity, drove an improvement in EBITA.
Domestic lager volumes in The Netherlands declined 2%,in line with the branded market; a solid result given heavycompetitor discounting and off-premise consolidation inthe year. Restructuring initiatives taken in the prior yearbegan to deliver benefits with fixed costs down 5%.
In the United Kingdom, lager volumes grew 14% on a comparable basis, with Peroni Nastro Azzurro sales up 29% following strong growth in on-premise channelsand in key national retailers. During the year, exports ofMiller Genuine Draft to Ireland were taken over by our UK business following the termination of the previouslicensing arrangement.
In Hungary, Slovakia and the Canaries, economicconditions remain difficult and beer markets depressed.We grew market share in Hungary and maintained sharein Slovakia and the Canaries, despite the decline in theon-premise channel. In November 2009 we announcedthe closure of the Topolcany brewery in Slovakia.
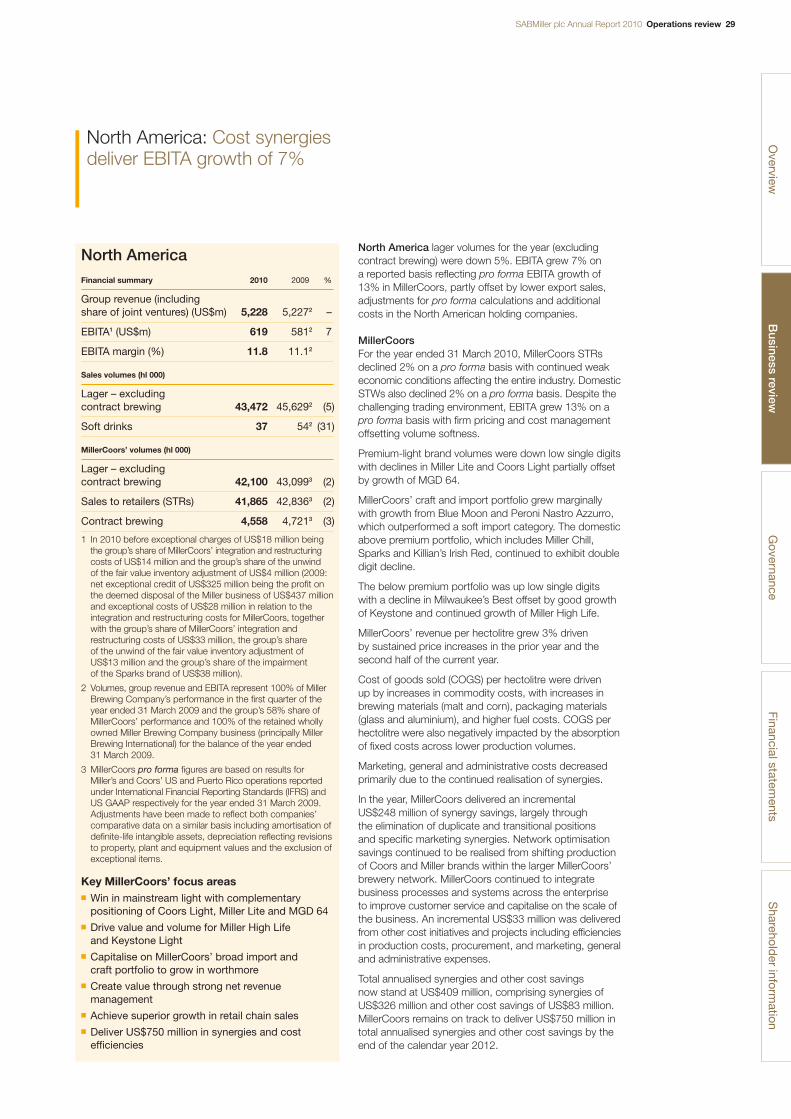
SABMiller plc Annual Report 2010 Operations review 29
North America: Cost synergiesdeliver EBITA growth of 7%
North America lager volumes for the year (excludingcontract brewing) were down 5%. EBITA grew 7% on a reported basis reflecting pro forma EBITA growth of13% in MillerCoors, partly offset by lower export sales,adjustments for pro forma calculations and additionalcosts in the North American holding companies.
MillerCoorsFor the year ended 31 March 2010, MillerCoors STRsdeclined 2% on a pro forma basis with continued weakeconomic conditions affecting the entire industry. DomesticSTWs also declined 2% on a pro forma basis. Despite thechallenging trading environment, EBITA grew 13% on apro forma basis with firm pricing and cost managementoffsetting volume softness.
Premium-light brand volumes were down low single digitswith declines in Miller Lite and Coors Light partially offsetby growth of MGD 64.
MillerCoors’ craft and import portfolio grew marginallywith growth from Blue Moon and Peroni Nastro Azzurro,which outperformed a soft import category. The domesticabove premium portfolio, which includes Miller Chill,Sparks and Killian’s Irish Red, continued to exhibit doubledigit decline.
The below premium portfolio was up low single digits with a decline in Milwaukee’s Best offset by good growthof Keystone and continued growth of Miller High Life.
MillerCoors’ revenue per hectolitre grew 3% driven by sustained price increases in the prior year and thesecond half of the current year.
Cost of goods sold (COGS) per hectolitre were driven up by increases in commodity costs, with increases inbrewing materials (malt and corn), packaging materials(glass and aluminium), and higher fuel costs. COGS perhectolitre were also negatively impacted by the absorptionof fixed costs across lower production volumes.
Marketing, general and administrative costs decreasedprimarily due to the continued realisation of synergies.
In the year, MillerCoors delivered an incremental US$248 million of synergy savings, largely through the elimination of duplicate and transitional positions and specific marketing synergies. Network optimisationsavings continued to be realised from shifting productionof Coors and Miller brands within the larger MillerCoors’brewery network. MillerCoors continued to integratebusiness processes and systems across the enterprise to improve customer service and capitalise on the scale ofthe business. An incremental US$33 million was deliveredfrom other cost initiatives and projects including efficienciesin production costs, procurement, and marketing, generaland administrative expenses.
Total annualised synergies and other cost savings now stand at US$409 million, comprising synergies ofUS$326 million and other cost savings of US$83 million.MillerCoors remains on track to deliver US$750 million intotal annualised synergies and other cost savings by theend of the calendar year 2012.
Overview
Governance
Financial statements
Sharehold
er information
North AmericaFinancial summary 2010 2009 %
Group revenue (including share of joint ventures) (US$m) 5,228 5,2272 –
EBITA1 (US$m) 619 5812 7
EBITA margin (%) 11.8 11.12
Sales volumes (hl 000)
Lager – excluding contract brewing 43,472 45,6292 (5)
Soft drinks 37 542 (31)
MillerCoors’ volumes (hl 000)
Lager – excluding contract brewing 42,100 43,0993 (2)
Sales to retailers (STRs) 41,865 42,8363 (2)
Contract brewing 4,558 4,7213 (3)
1 In 2010 before exceptional charges of US$18 million beingthe group’s share of MillerCoors’ integration and restructuringcosts of US$14 million and the group’s share of the unwindof the fair value inventory adjustment of US$4 million (2009:net exceptional credit of US$325 million being the profit onthe deemed disposal of the Miller business of US$437 millionand exceptional costs of US$28 million in relation to theintegration and restructuring costs for MillerCoors, togetherwith the group’s share of MillerCoors’ integration andrestructuring costs of US$33 million, the group’s share of the unwind of the fair value inventory adjustment ofUS$13 million and the group’s share of the impairment of the Sparks brand of US$38 million).
2 Volumes, group revenue and EBITA represent 100% of MillerBrewing Company’s performance in the first quarter of theyear ended 31 March 2009 and the group’s 58% share ofMillerCoors’ performance and 100% of the retained whollyowned Miller Brewing Company business (principally MillerBrewing International) for the balance of the year ended 31 March 2009.
3 MillerCoors pro forma figures are based on results for Miller’s and Coors’ US and Puerto Rico operations reportedunder International Financial Reporting Standards (IFRS) andUS GAAP respectively for the year ended 31 March 2009.Adjustments have been made to reflect both companies’comparative data on a similar basis including amortisation ofdefinite-life intangible assets, depreciation reflecting revisionsto property, plant and equipment values and the exclusion ofexceptional items.
Key MillerCoors’ focus areas■ Win in mainstream light with complementary
positioning of Coors Light, Miller Lite and MGD 64■ Drive value and volume for Miller High Life
and Keystone Light■ Capitalise on MillerCoors’ broad import and
craft portfolio to grow in worthmore■ Create value through strong net revenue
management■ Achieve superior growth in retail chain sales■ Deliver US$750 million in synergies and cost
efficiencies
Business review
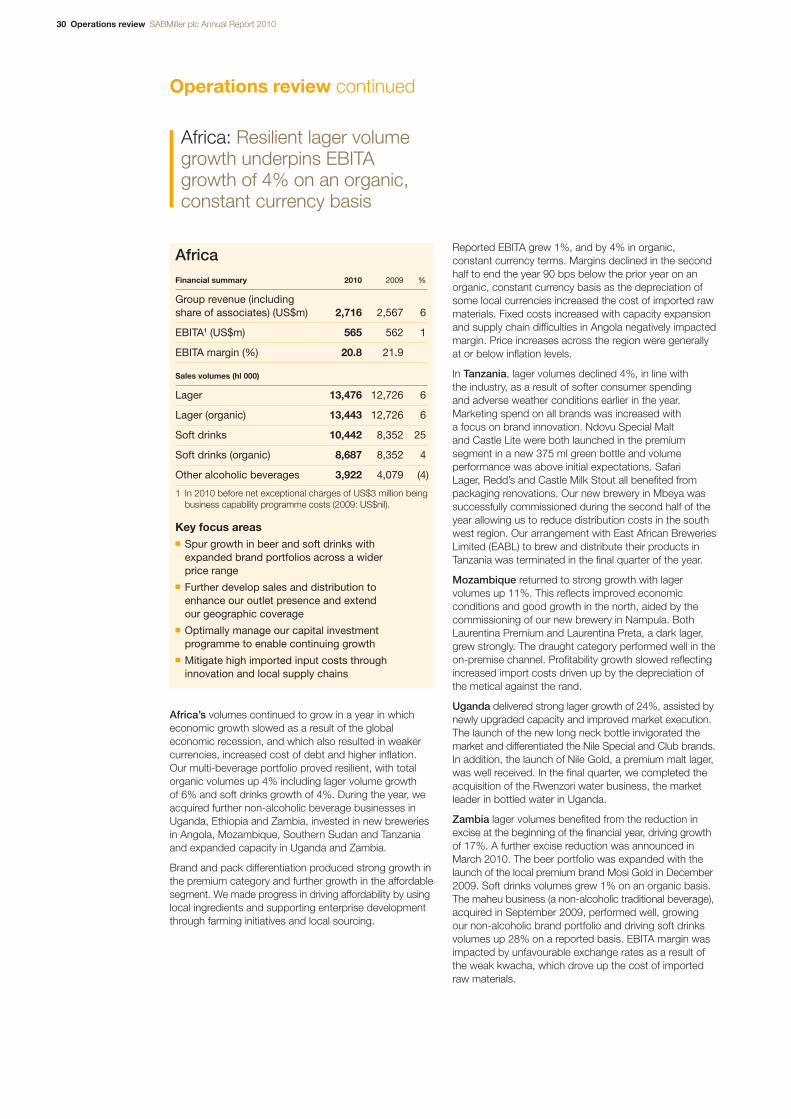
30 Operations review SABMiller plc Annual Report 2010
Africa: Resilient lager volumegrowth underpins EBITAgrowth of 4% on an organic,constant currency basis
Operations review continued
Africa’s volumes continued to grow in a year in whicheconomic growth slowed as a result of the globaleconomic recession, and which also resulted in weakercurrencies, increased cost of debt and higher inflation.Our multi-beverage portfolio proved resilient, with totalorganic volumes up 4% including lager volume growth of 6% and soft drinks growth of 4%. During the year, weacquired further non-alcoholic beverage businesses inUganda, Ethiopia and Zambia, invested in new breweriesin Angola, Mozambique, Southern Sudan and Tanzaniaand expanded capacity in Uganda and Zambia.
Brand and pack differentiation produced strong growth inthe premium category and further growth in the affordablesegment. We made progress in driving affordability by usinglocal ingredients and supporting enterprise developmentthrough farming initiatives and local sourcing.
Reported EBITA grew 1%, and by 4% in organic,constant currency terms. Margins declined in the secondhalf to end the year 90 bps below the prior year on anorganic, constant currency basis as the depreciation ofsome local currencies increased the cost of imported rawmaterials. Fixed costs increased with capacity expansionand supply chain difficulties in Angola negatively impactedmargin. Price increases across the region were generallyat or below inflation levels.
In Tanzania, lager volumes declined 4%, in line with the industry, as a result of softer consumer spending and adverse weather conditions earlier in the year.Marketing spend on all brands was increased with a focus on brand innovation. Ndovu Special Malt and Castle Lite were both launched in the premiumsegment in a new 375 ml green bottle and volumeperformance was above initial expectations. Safari Lager, Redd’s and Castle Milk Stout all benefited frompackaging renovations. Our new brewery in Mbeya wassuccessfully commissioned during the second half of theyear allowing us to reduce distribution costs in the southwest region. Our arrangement with East African BreweriesLimited (EABL) to brew and distribute their products inTanzania was terminated in the final quarter of the year.
Mozambique returned to strong growth with lagervolumes up 11%. This reflects improved economicconditions and good growth in the north, aided by thecommissioning of our new brewery in Nampula. BothLaurentina Premium and Laurentina Preta, a dark lager,grew strongly. The draught category performed well in theon-premise channel. Profitability growth slowed reflectingincreased import costs driven up by the depreciation ofthe metical against the rand.
Uganda delivered strong lager growth of 24%, assisted bynewly upgraded capacity and improved market execution.The launch of the new long neck bottle invigorated themarket and differentiated the Nile Special and Club brands.In addition, the launch of Nile Gold, a premium malt lager,was well received. In the final quarter, we completed theacquisition of the Rwenzori water business, the marketleader in bottled water in Uganda.
Zambia lager volumes benefited from the reduction inexcise at the beginning of the financial year, driving growthof 17%. A further excise reduction was announced inMarch 2010. The beer portfolio was expanded with thelaunch of the local premium brand Mosi Gold in December2009. Soft drinks volumes grew 1% on an organic basis.The maheu business (a non-alcoholic traditional beverage),acquired in September 2009, performed well, growingour non-alcoholic brand portfolio and driving soft drinksvolumes up 28% on a reported basis. EBITA margin wasimpacted by unfavourable exchange rates as a result ofthe weak kwacha, which drove up the cost of importedraw materials.
AfricaFinancial summary 2010 2009 %
Group revenue (including share of associates) (US$m) 2,716 2,567 6
EBITA1 (US$m) 565 562 1
EBITA margin (%) 20.8 21.9
Sales volumes (hl 000)
Lager 13,476 12,726 6
Lager (organic) 13,443 12,726 6
Soft drinks 10,442 8,352 25
Soft drinks (organic) 8,687 8,352 4
Other alcoholic beverages 3,922 4,079 (4)
1 In 2010 before net exceptional charges of US$3 million beingbusiness capability programme costs (2009: US$nil).
Key focus areas■ Spur growth in beer and soft drinks with
expanded brand portfolios across a wider price range
■ Further develop sales and distribution to enhance our outlet presence and extend our geographic coverage
■ Optimally manage our capital investmentprogramme to enable continuing growth
■ Mitigate high imported input costs throughinnovation and local supply chains
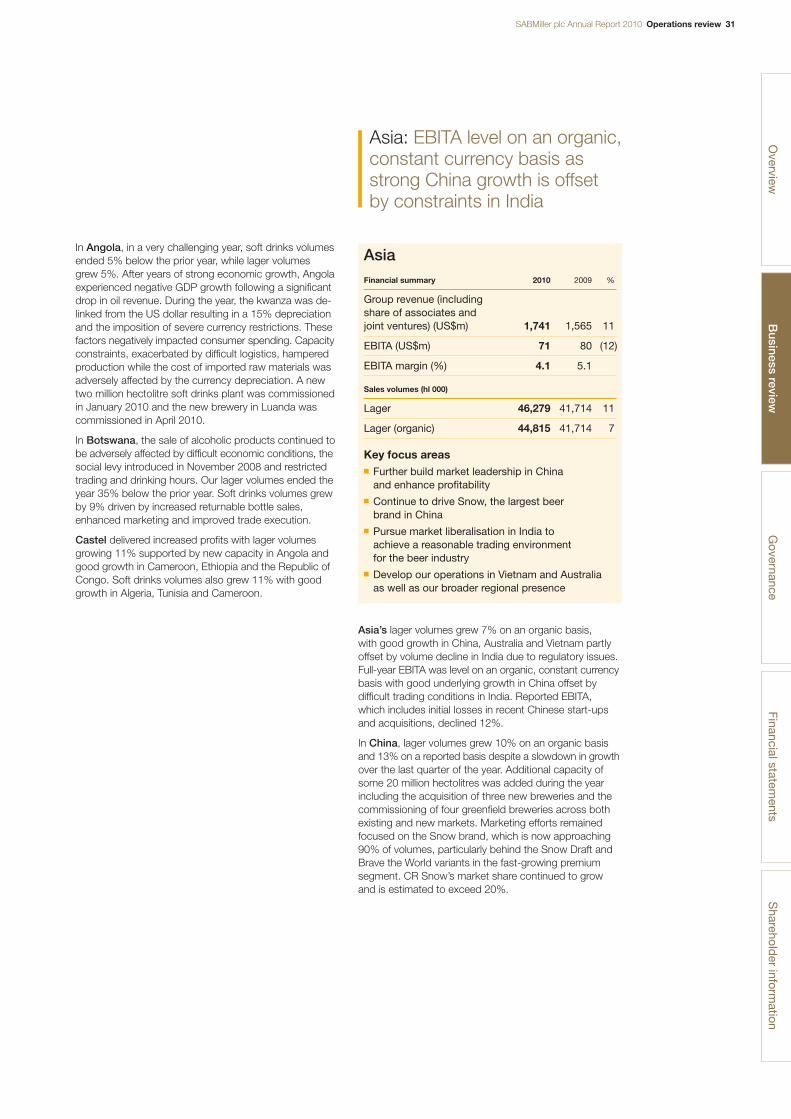
SABMiller plc Annual Report 2010 Operations review 31
Asia: EBITA level on an organic,constant currency basis asstrong China growth is offsetby constraints in India
In Angola, in a very challenging year, soft drinks volumesended 5% below the prior year, while lager volumes grew 5%. After years of strong economic growth, Angolaexperienced negative GDP growth following a significantdrop in oil revenue. During the year, the kwanza was de-linked from the US dollar resulting in a 15% depreciationand the imposition of severe currency restrictions. Thesefactors negatively impacted consumer spending. Capacityconstraints, exacerbated by difficult logistics, hamperedproduction while the cost of imported raw materials wasadversely affected by the currency depreciation. A newtwo million hectolitre soft drinks plant was commissionedin January 2010 and the new brewery in Luanda wascommissioned in April 2010.
In Botswana, the sale of alcoholic products continued tobe adversely affected by difficult economic conditions, thesocial levy introduced in November 2008 and restrictedtrading and drinking hours. Our lager volumes ended theyear 35% below the prior year. Soft drinks volumes grewby 9% driven by increased returnable bottle sales,enhanced marketing and improved trade execution.
Castel delivered increased profits with lager volumesgrowing 11% supported by new capacity in Angola andgood growth in Cameroon, Ethiopia and the Republic ofCongo. Soft drinks volumes also grew 11% with goodgrowth in Algeria, Tunisia and Cameroon.
Asia’s lager volumes grew 7% on an organic basis, with good growth in China, Australia and Vietnam partlyoffset by volume decline in India due to regulatory issues.Full-year EBITA was level on an organic, constant currencybasis with good underlying growth in China offset bydifficult trading conditions in India. Reported EBITA, which includes initial losses in recent Chinese start-upsand acquisitions, declined 12%.
In China, lager volumes grew 10% on an organic basisand 13% on a reported basis despite a slowdown in growthover the last quarter of the year. Additional capacity ofsome 20 million hectolitres was added during the yearincluding the acquisition of three new breweries and thecommissioning of four greenfield breweries across bothexisting and new markets. Marketing efforts remainedfocused on the Snow brand, which is now approaching90% of volumes, particularly behind the Snow Draft andBrave the World variants in the fast-growing premiumsegment. CR Snow’s market share continued to growand is estimated to exceed 20%.
Overview
Governance
Financial statements
Sharehold
er information
AsiaFinancial summary 2010 2009 %
Group revenue (including share of associates and joint ventures) (US$m) 1,741 1,565 11
EBITA (US$m) 71 80 (12)
EBITA margin (%) 4.1 5.1
Sales volumes (hl 000)
Lager 46,279 41,714 11
Lager (organic) 44,815 41,714 7
Key focus areas■ Further build market leadership in China
and enhance profitability■ Continue to drive Snow, the largest beer
brand in China■ Pursue market liberalisation in India to
achieve a reasonable trading environment for the beer industry
■ Develop our operations in Vietnam and Australia as well as our broader regional presence
Business review
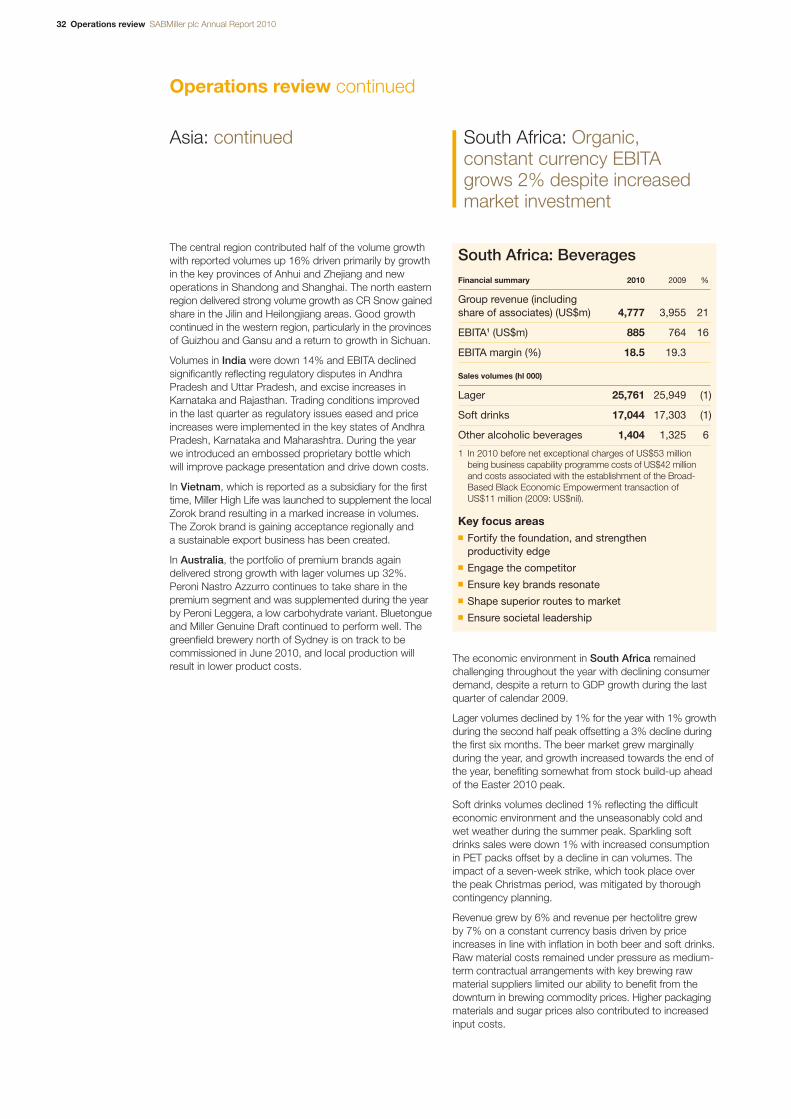
32 Operations review SABMiller plc Annual Report 2010
South Africa: Organic, constant currency EBITA grows 2% despite increasedmarket investment
Operations review continued
The central region contributed half of the volume growthwith reported volumes up 16% driven primarily by growthin the key provinces of Anhui and Zhejiang and newoperations in Shandong and Shanghai. The north easternregion delivered strong volume growth as CR Snow gainedshare in the Jilin and Heilongjiang areas. Good growthcontinued in the western region, particularly in the provincesof Guizhou and Gansu and a return to growth in Sichuan.
Volumes in India were down 14% and EBITA declinedsignificantly reflecting regulatory disputes in AndhraPradesh and Uttar Pradesh, and excise increases inKarnataka and Rajasthan. Trading conditions improved in the last quarter as regulatory issues eased and priceincreases were implemented in the key states of AndhraPradesh, Karnataka and Maharashtra. During the year we introduced an embossed proprietary bottle which will improve package presentation and drive down costs.
In Vietnam, which is reported as a subsidiary for the firsttime, Miller High Life was launched to supplement the localZorok brand resulting in a marked increase in volumes.The Zorok brand is gaining acceptance regionally and a sustainable export business has been created.
In Australia, the portfolio of premium brands againdelivered strong growth with lager volumes up 32%.Peroni Nastro Azzurro continues to take share in thepremium segment and was supplemented during the yearby Peroni Leggera, a low carbohydrate variant. Bluetongueand Miller Genuine Draft continued to perform well. Thegreenfield brewery north of Sydney is on track to becommissioned in June 2010, and local production willresult in lower product costs.
The economic environment in South Africa remainedchallenging throughout the year with declining consumerdemand, despite a return to GDP growth during the lastquarter of calendar 2009.
Lager volumes declined by 1% for the year with 1% growthduring the second half peak offsetting a 3% decline duringthe first six months. The beer market grew marginallyduring the year, and growth increased towards the end ofthe year, benefiting somewhat from stock build-up aheadof the Easter 2010 peak.
Soft drinks volumes declined 1% reflecting the difficulteconomic environment and the unseasonably cold andwet weather during the summer peak. Sparkling softdrinks sales were down 1% with increased consumptionin PET packs offset by a decline in can volumes. Theimpact of a seven-week strike, which took place over the peak Christmas period, was mitigated by thoroughcontingency planning.
Revenue grew by 6% and revenue per hectolitre grew by 7% on a constant currency basis driven by priceincreases in line with inflation in both beer and soft drinks.Raw material costs remained under pressure as medium-term contractual arrangements with key brewing rawmaterial suppliers limited our ability to benefit from thedownturn in brewing commodity prices. Higher packagingmaterials and sugar prices also contributed to increasedinput costs.
South Africa: BeveragesFinancial summary 2010 2009 %
Group revenue (including share of associates) (US$m) 4,777 3,955 21
EBITA1 (US$m) 885 764 16
EBITA margin (%) 18.5 19.3
Sales volumes (hl 000)
Lager 25,761 25,949 (1)
Soft drinks 17,044 17,303 (1)
Other alcoholic beverages 1,404 1,325 6
1 In 2010 before net exceptional charges of US$53 millionbeing business capability programme costs of US$42 millionand costs associated with the establishment of the Broad-Based Black Economic Empowerment transaction of US$11 million (2009: US$nil).
Key focus areas■ Fortify the foundation, and strengthen
productivity edge■ Engage the competitor■ Ensure key brands resonate■ Shape superior routes to market■ Ensure societal leadership
Asia: continued
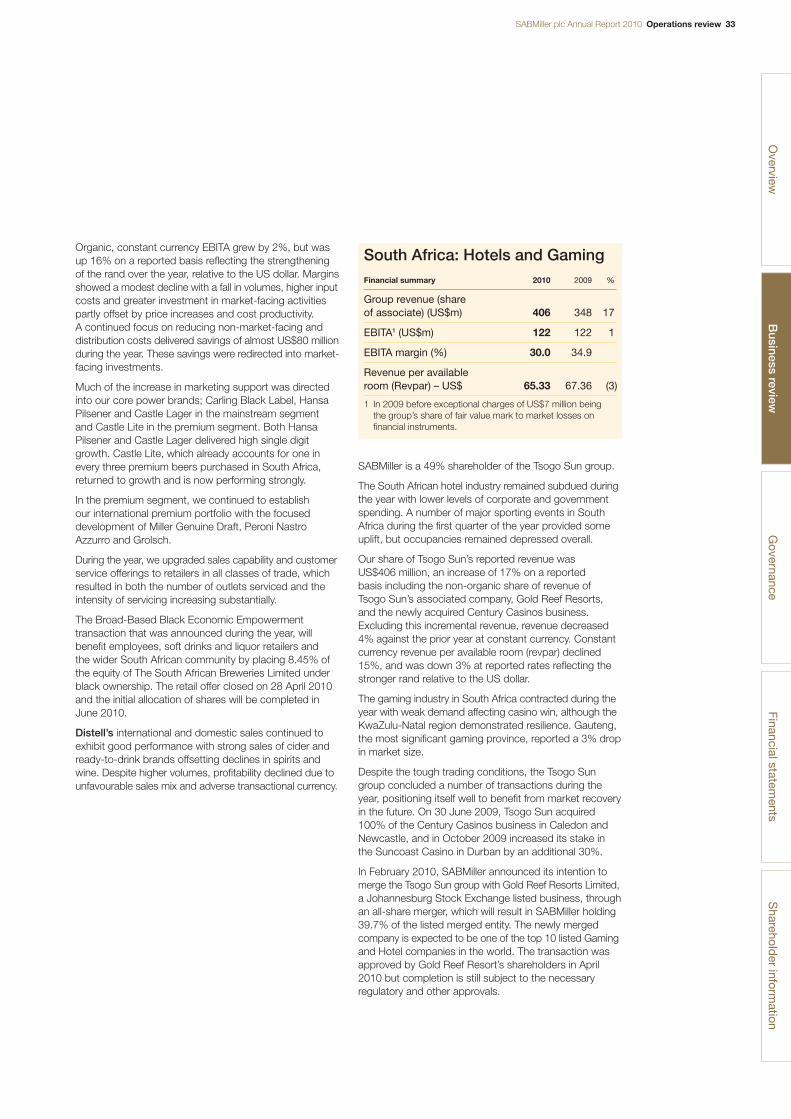
SABMiller plc Annual Report 2010 Operations review 33
Organic, constant currency EBITA grew by 2%, but wasup 16% on a reported basis reflecting the strengtheningof the rand over the year, relative to the US dollar. Marginsshowed a modest decline with a fall in volumes, higher inputcosts and greater investment in market-facing activitiespartly offset by price increases and cost productivity. A continued focus on reducing non-market-facing anddistribution costs delivered savings of almost US$80 millionduring the year. These savings were redirected into market-facing investments.
Much of the increase in marketing support was directedinto our core power brands; Carling Black Label, HansaPilsener and Castle Lager in the mainstream segmentand Castle Lite in the premium segment. Both HansaPilsener and Castle Lager delivered high single digitgrowth. Castle Lite, which already accounts for one inevery three premium beers purchased in South Africa,returned to growth and is now performing strongly.
In the premium segment, we continued to establish our international premium portfolio with the focuseddevelopment of Miller Genuine Draft, Peroni NastroAzzurro and Grolsch.
During the year, we upgraded sales capability and customerservice offerings to retailers in all classes of trade, whichresulted in both the number of outlets serviced and theintensity of servicing increasing substantially.
The Broad-Based Black Economic Empowermenttransaction that was announced during the year, willbenefit employees, soft drinks and liquor retailers and the wider South African community by placing 8.45% ofthe equity of The South African Breweries Limited underblack ownership. The retail offer closed on 28 April 2010and the initial allocation of shares will be completed inJune 2010.
Distell’s international and domestic sales continued toexhibit good performance with strong sales of cider andready-to-drink brands offsetting declines in spirits andwine. Despite higher volumes, profitability declined due tounfavourable sales mix and adverse transactional currency.
SABMiller is a 49% shareholder of the Tsogo Sun group.
The South African hotel industry remained subdued duringthe year with lower levels of corporate and governmentspending. A number of major sporting events in SouthAfrica during the first quarter of the year provided someuplift, but occupancies remained depressed overall.
Our share of Tsogo Sun’s reported revenue was US$406 million, an increase of 17% on a reported basis including the non-organic share of revenue of Tsogo Sun’s associated company, Gold Reef Resorts,and the newly acquired Century Casinos business.Excluding this incremental revenue, revenue decreased4% against the prior year at constant currency. Constantcurrency revenue per available room (revpar) declined15%, and was down 3% at reported rates reflecting thestronger rand relative to the US dollar.
The gaming industry in South Africa contracted during theyear with weak demand affecting casino win, although theKwaZulu-Natal region demonstrated resilience. Gauteng,the most significant gaming province, reported a 3% dropin market size.
Despite the tough trading conditions, the Tsogo Sungroup concluded a number of transactions during theyear, positioning itself well to benefit from market recoveryin the future. On 30 June 2009, Tsogo Sun acquired100% of the Century Casinos business in Caledon andNewcastle, and in October 2009 increased its stake inthe Suncoast Casino in Durban by an additional 30%.
In February 2010, SABMiller announced its intention tomerge the Tsogo Sun group with Gold Reef Resorts Limited,a Johannesburg Stock Exchange listed business, throughan all-share merger, which will result in SABMiller holding39.7% of the listed merged entity. The newly mergedcompany is expected to be one of the top 10 listed Gamingand Hotel companies in the world. The transaction wasapproved by Gold Reef Resort’s shareholders in April2010 but completion is still subject to the necessaryregulatory and other approvals.
Overview
Governance
Financial statements
Sharehold
er information
South Africa: Hotels and GamingFinancial summary 2010 2009 %
Group revenue (share of associate) (US$m) 406 348 17
EBITA1 (US$m) 122 122 1
EBITA margin (%) 30.0 34.9
Revenue per available room (Revpar) – US$ 65.33 67.36 (3)
1 In 2009 before exceptional charges of US$7 million beingthe group’s share of fair value mark to market losses onfinancial instruments.
Business review
Malcolm WymanChief Financial Officer
34 Chief Financial Officer’s review SABMiller plc Annual Report 2010
Group revenue growth showed the group’s success in raising pricesin difficult trading conditions and, in the absence of volume growth,demonstrated the strength of the group’s brand equities.
Chief Financial Officer’s review
Key performance indicators (KPIs)SABMiller has a clear strategic focus with four strategic priorities, andmanagement uses a range of KPIs to monitor progress against thesepriorities and our financial goal, as noted on pages 22 and 23. CertainKPIs and other performance indicators are discussed in further detailwithin the review of the current year’s financial performance below.
VolumesThis year’s volumes reflect the difficult economic conditions, increasedexcise taxes and reduced consumer demand, particularly in Europe. Totalvolumes, including soft drinks and other alcoholic beverages volumes, werein line with the prior year on both an organic basis and a reported basis.Total volumes amounted to 261 million hectolitres on a reported basis. Lagervolumes at 213 million hectolitres were up 1% on a reported basis andwere level with the prior year on an organic basis. Aggregated beveragevolumes as defined in the definitions section on page 158, including softdrinks and other alcoholic beverages, grew 5% to 373 million hectolitresand aggregated lager volumes increased 6% to 308 million hectolitres,reflecting strong growth in our associates CR Snow and Castel.
The adjacent chart shows the group’s organic growth in lager volumes for each of the last five years.
RevenueGroup revenue was US$26,350 million (including the group’s share of jointventures’ and associates’ revenue of US$8,330 million). This represented anincrease of 4% on an organic, constant currency basis and related solelyto price/mix gains, given organic volumes were in line with the prior year,with South Africa Beverages and Africa the most significant contributors.
Group revenue growth showed the group’s success in raising prices indifficult trading conditions and, in the absence of volume growth, demonstratedthe strength of the group’s brand equities. The adjacent chart illustratesthe organic growth in group revenue for each of the last five years withperformance shown in constant currency.
Currency movements during the year reduced reported group revenuegrowth marginally. Business combinations completed in the financial yearin Romania, Ethiopia, Uganda, Zambia, China and South Africa Hotels andGaming, together with those completed in the prior year in Russia, Ukraine,Ghana, Nigeria, Vietnam and China, partially offset by the disposal of softdrinks businesses in Colombia and Bolivia in the prior year, marginallyincreased reported group revenue, offsetting the currency impact.
Lager: organic volume growth%
10
8
6
4
2
006 08 0907 10
Group revenue growth %Organic, constant currency basis
15
12
9
6
306 08 0907 10
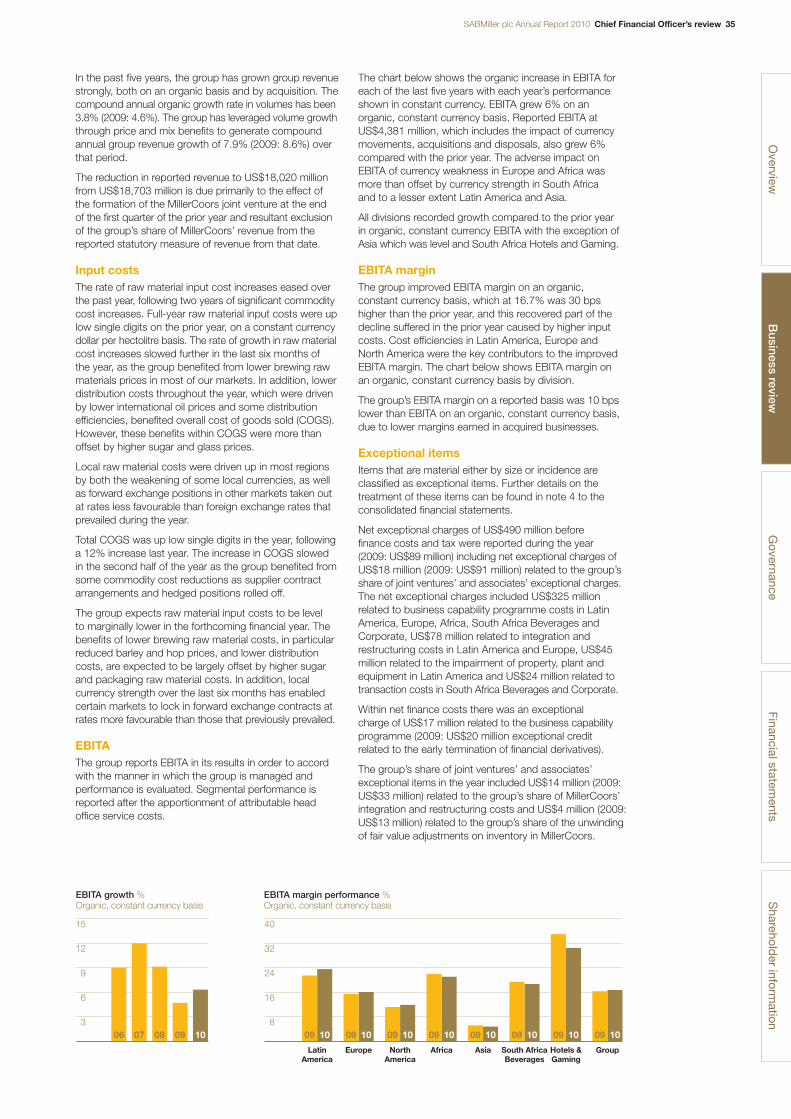
SABMiller plc Annual Report 2010 Chief Financial Officer’s review 35
In the past five years, the group has grown group revenuestrongly, both on an organic basis and by acquisition. Thecompound annual organic growth rate in volumes has been3.8% (2009: 4.6%). The group has leveraged volume growththrough price and mix benefits to generate compoundannual group revenue growth of 7.9% (2009: 8.6%) overthat period.
The reduction in reported revenue to US$18,020 millionfrom US$18,703 million is due primarily to the effect ofthe formation of the MillerCoors joint venture at the end of the first quarter of the prior year and resultant exclusionof the group’s share of MillerCoors’ revenue from thereported statutory measure of revenue from that date.
Input costsThe rate of raw material input cost increases eased overthe past year, following two years of significant commoditycost increases. Full-year raw material input costs were uplow single digits on the prior year, on a constant currencydollar per hectolitre basis. The rate of growth in raw materialcost increases slowed further in the last six months of the year, as the group benefited from lower brewing rawmaterials prices in most of our markets. In addition, lowerdistribution costs throughout the year, which were drivenby lower international oil prices and some distributionefficiencies, benefited overall cost of goods sold (COGS).However, these benefits within COGS were more thanoffset by higher sugar and glass prices.
Local raw material costs were driven up in most regionsby both the weakening of some local currencies, as wellas forward exchange positions in other markets taken outat rates less favourable than foreign exchange rates thatprevailed during the year.
Total COGS was up low single digits in the year, followinga 12% increase last year. The increase in COGS slowedin the second half of the year as the group benefited fromsome commodity cost reductions as supplier contractarrangements and hedged positions rolled off.
The group expects raw material input costs to be level to marginally lower in the forthcoming financial year. Thebenefits of lower brewing raw material costs, in particularreduced barley and hop prices, and lower distributioncosts, are expected to be largely offset by higher sugarand packaging raw material costs. In addition, localcurrency strength over the last six months has enabledcertain markets to lock in forward exchange contracts atrates more favourable than those that previously prevailed.
EBITAThe group reports EBITA in its results in order to accordwith the manner in which the group is managed andperformance is evaluated. Segmental performance isreported after the apportionment of attributable headoffice service costs.
The chart below shows the organic increase in EBITA foreach of the last five years with each year’s performanceshown in constant currency. EBITA grew 6% on anorganic, constant currency basis. Reported EBITA atUS$4,381 million, which includes the impact of currencymovements, acquisitions and disposals, also grew 6%compared with the prior year. The adverse impact onEBITA of currency weakness in Europe and Africa wasmore than offset by currency strength in South Africa and to a lesser extent Latin America and Asia.
All divisions recorded growth compared to the prior yearin organic, constant currency EBITA with the exception ofAsia which was level and South Africa Hotels and Gaming.
EBITA marginThe group improved EBITA margin on an organic,constant currency basis, which at 16.7% was 30 bpshigher than the prior year, and this recovered part of thedecline suffered in the prior year caused by higher inputcosts. Cost efficiencies in Latin America, Europe andNorth America were the key contributors to the improvedEBITA margin. The chart below shows EBITA margin onan organic, constant currency basis by division.
The group’s EBITA margin on a reported basis was 10 bpslower than EBITA on an organic, constant currency basis,due to lower margins earned in acquired businesses.
Exceptional itemsItems that are material either by size or incidence areclassified as exceptional items. Further details on thetreatment of these items can be found in note 4 to theconsolidated financial statements.
Net exceptional charges of US$490 million before finance costs and tax were reported during the year(2009: US$89 million) including net exceptional charges ofUS$18 million (2009: US$91 million) related to the group’sshare of joint ventures’ and associates’ exceptional charges.The net exceptional charges included US$325 millionrelated to business capability programme costs in LatinAmerica, Europe, Africa, South Africa Beverages andCorporate, US$78 million related to integration andrestructuring costs in Latin America and Europe, US$45million related to the impairment of property, plant andequipment in Latin America and US$24 million related totransaction costs in South Africa Beverages and Corporate.
Within net finance costs there was an exceptional charge of US$17 million related to the business capabilityprogramme (2009: US$20 million exceptional creditrelated to the early termination of financial derivatives).
The group’s share of joint ventures’ and associates’exceptional items in the year included US$14 million (2009:US$33 million) related to the group’s share of MillerCoors’integration and restructuring costs and US$4 million (2009:US$13 million) related to the group’s share of the unwindingof fair value adjustments on inventory in MillerCoors.
Overview
Governance
Financial statements
Sharehold
er information
EBITA growth %Organic, constant currency basis
15
12
9
6
306 08 0907 10
EBITA margin performance %Organic, constant currency basis
40
32
24
16
809 10 09 10 09 10 09 10 09 10 09 10 09 10 09 10
LatinAmerica
Europe NorthAmerica
Africa Asia South AfricaBeverages
Hotels &Gaming
Group
Business review
36 Chief Financial Officer’s review SABMiller plc Annual Report 2010
Free cash flow improved to US$2,010 million benefiting from significantly improved working capital and lower capital expenditure.
Chief Financial Officer’s review continued
In 2009 net exceptional charges of US$89 million before finance costs and tax were reported, including net exceptional charges of US$91 million related to the group’s share of joint ventures’ and associates’exceptional charges. The net exceptional chargesincluded US$110 million related to integration andrestructuring costs in Latin America, Europe and North America, US$392 million related to impairments in Europe, US$9 million related to the unwinding of fairvalue adjustments on inventory related to the acquisitionof Grolsch, and US$13 million in relation to litigation inLatin America, partially offset by a US$437 million profiton the deemed disposal of 42% of the US and PuertoRico operations of Miller and a US$89 million profit on the disposal of soft drinks businesses in Colombia andBolivia. The group’s share of joint ventures’ and associates’exceptional items included, in addition to the amountsnoted above, charges of US$38 million related to thegroup’s share of the impairment of the Sparks brand inMillerCoors and US$7 million related to the group’s shareof fair value mark to market losses on financial instrumentsin Tsogo Sun.
In addition to the exceptional costs charged to the incomestatement in the year as noted above, US$95 million of intangible assets and property, plant and equipmenthas been capitalised to date in relation to the businesscapability programme. While the programme is still in itsinitial phase, it has already led to an improvement in workingcapital of US$333 million, together with US$17 million ofother savings.
Finance costs and taxNet finance costs were US$563 million, a 20% decreaseon the prior year’s US$706 million, reflecting lower interestrates. Finance costs in the current year included a netloss of US$8 million (2009: US$27 million) from the mark tomarket adjustments of various derivatives on capital itemsfor which hedge accounting cannot be applied. Financecosts in the year also included a charge of US$17 millionin relation to the business capability programme (2009:gain of US$20 million on the early termination of financialderivatives). The mark to market loss and the businesscapability programme charge have been excluded fromthe determination of adjusted finance costs and adjustedearnings per share. Adjusted net finance costs wereUS$538 million, down 23%. Interest cover, as defined on page 158 in the definitions section, has increased to 8.7 times from 6.6 times in the prior year.
The effective rate of tax for the year before amortisation of intangible assets (other than software) and exceptionalitems was 28.5% compared to a rate of 30.2% in the prioryear. This reduction in the rate results from a combinationof factors, including the following:■ more favourable geographic mix of profits between
different territories;■ ongoing tax efficiency measures; and■ releases of some tax provisions in Latin America and
Russia following the satisfactory resolution of certaintax matters.
The UK Government has introduced senior accountingofficer (SAO) legislation. The SAO will be personallyresponsible for certifying that the underlying systems areadequate for the purpose of calculating the tax liability.We have reviewed our tax processes and believe that ourexisting systems and controls are sufficient for this purpose.
Profit and earningsAdjusted profit before tax of US$3,803 million increasedby 12% over the prior year primarily as a result of strongerpricing, cost efficiencies and lower finance costs. On astatutory basis, profit before tax of US$2,929 million was1% lower, reflecting the impact of exceptional items andthe adjustments to net finance costs as noted above.
The group presents the measure of adjusted basic earningsper share, which excludes the impact of amortisation ofintangible assets (other than software), certain non-recurringitems and post-tax exceptional items, in order to presentan additional measure of underlying performance for theyears shown in the consolidated financial statements.Adjusted earnings increased by 22% to US$2,509 millionand the weighted average number of basic shares inissue for the year was 1,558 million, up from last year’s1,502 million. The increase in the weighted number ofbasic shares in issue resulted from the issue of 60 millionshares in May 2009 for the acquisition of the minorityinterests in our Polish business, together with the exerciseof share options during the year.
Adjusted earnings per share were 17% higher at 161.1 UScents. Adjusted earnings per share also showed increaseswhen measured in rand and sterling. A reconciliation of the statutory measure of profit attributable to equityshareholders to adjusted earnings is shown in note 8 to the consolidated financial statements. On a statutorybasis, basic earnings per share were 2% lower primarilyas a result of higher exceptional charges in the year.
DividendsThe board has proposed a final dividend of 51 US centsto make a total of 68 US cents per share for the year – an increase of 17% from the prior year. This represents adividend cover of 2.4 times based on adjusted earningsper share, as described above (2009: 2.4 times). Thegroup’s guideline is to achieve dividend cover of between2.0 and 2.5 times adjusted earnings. The relationshipbetween the growth in dividends and adjusted earnings pershare is demonstrated in the chart on page 37. Details ofpayment dates and related matters are disclosed in thedirectors’ report.
Business combinations and acquisitionsOn 10 April 2009 the group assumed control of a 70.56%interest in Bere Azuga SA in Romania following receipt of clearance from the competition authorities and hasconsolidated Bere Azuga from this date. Subsequently,further share purchases were made for cash, togetherwith a mandatory public offer for the remainder of sharesin Bere Azuga. As at 31 March 2010, Bere Azuga waswholly owned. The brewing operations of Bere Azugahave been transferred into the group’s other Romanianoperation, Ursus Breweries SA.
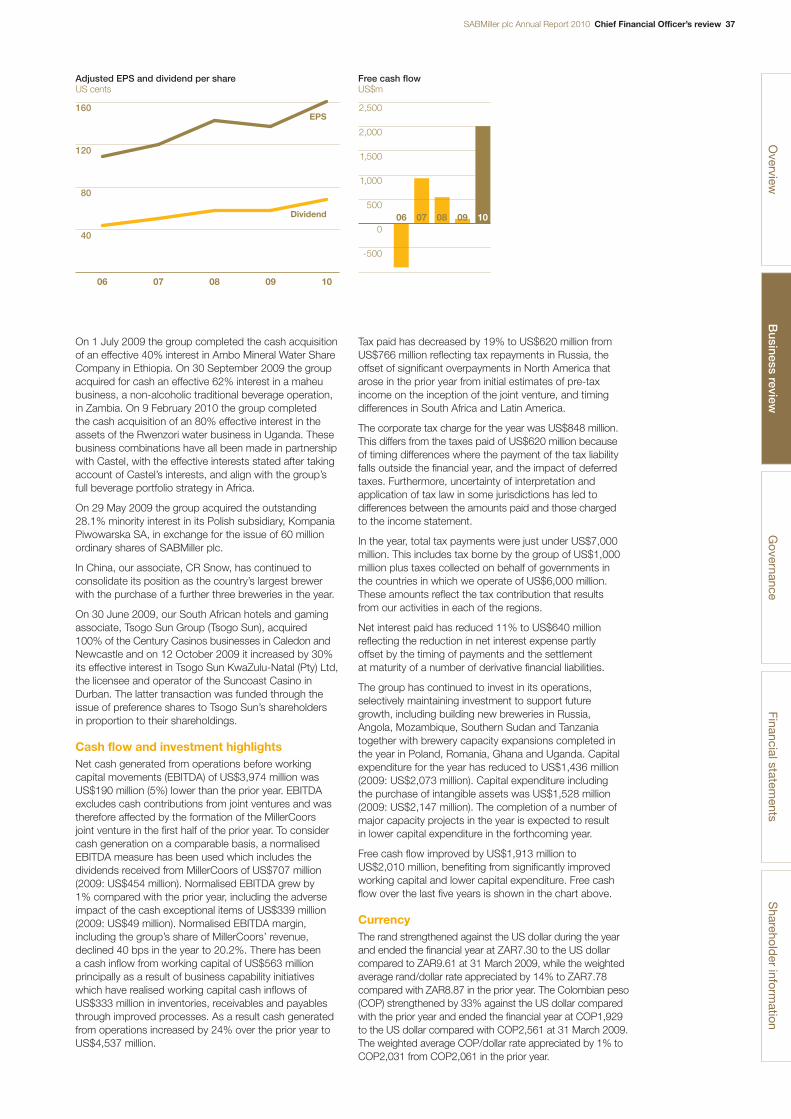
SABMiller plc Annual Report 2010 Chief Financial Officer’s review 37
On 1 July 2009 the group completed the cash acquisitionof an effective 40% interest in Ambo Mineral Water ShareCompany in Ethiopia. On 30 September 2009 the groupacquired for cash an effective 62% interest in a maheubusiness, a non-alcoholic traditional beverage operation,in Zambia. On 9 February 2010 the group completed the cash acquisition of an 80% effective interest in theassets of the Rwenzori water business in Uganda. Thesebusiness combinations have all been made in partnershipwith Castel, with the effective interests stated after takingaccount of Castel’s interests, and align with the group’sfull beverage portfolio strategy in Africa.
On 29 May 2009 the group acquired the outstanding28.1% minority interest in its Polish subsidiary, KompaniaPiwowarska SA, in exchange for the issue of 60 millionordinary shares of SABMiller plc.
In China, our associate, CR Snow, has continued toconsolidate its position as the country’s largest brewerwith the purchase of a further three breweries in the year.
On 30 June 2009, our South African hotels and gamingassociate, Tsogo Sun Group (Tsogo Sun), acquired 100% of the Century Casinos businesses in Caledon andNewcastle and on 12 October 2009 it increased by 30%its effective interest in Tsogo Sun KwaZulu-Natal (Pty) Ltd,the licensee and operator of the Suncoast Casino inDurban. The latter transaction was funded through theissue of preference shares to Tsogo Sun’s shareholders in proportion to their shareholdings.
Cash flow and investment highlightsNet cash generated from operations before workingcapital movements (EBITDA) of US$3,974 million wasUS$190 million (5%) lower than the prior year. EBITDAexcludes cash contributions from joint ventures and wastherefore affected by the formation of the MillerCoors joint venture in the first half of the prior year. To considercash generation on a comparable basis, a normalisedEBITDA measure has been used which includes thedividends received from MillerCoors of US$707 million(2009: US$454 million). Normalised EBITDA grew by 1% compared with the prior year, including the adverseimpact of the cash exceptional items of US$339 million(2009: US$49 million). Normalised EBITDA margin,including the group’s share of MillerCoors’ revenue,declined 40 bps in the year to 20.2%. There has been a cash inflow from working capital of US$563 millionprincipally as a result of business capability initiativeswhich have realised working capital cash inflows ofUS$333 million in inventories, receivables and payablesthrough improved processes. As a result cash generatedfrom operations increased by 24% over the prior year toUS$4,537 million.
Tax paid has decreased by 19% to US$620 million fromUS$766 million reflecting tax repayments in Russia, theoffset of significant overpayments in North America thatarose in the prior year from initial estimates of pre-taxincome on the inception of the joint venture, and timingdifferences in South Africa and Latin America.
The corporate tax charge for the year was US$848 million.This differs from the taxes paid of US$620 million becauseof timing differences where the payment of the tax liabilityfalls outside the financial year, and the impact of deferredtaxes. Furthermore, uncertainty of interpretation andapplication of tax law in some jurisdictions has led todifferences between the amounts paid and those chargedto the income statement.
In the year, total tax payments were just under US$7,000million. This includes tax borne by the group of US$1,000million plus taxes collected on behalf of governments inthe countries in which we operate of US$6,000 million.These amounts reflect the tax contribution that resultsfrom our activities in each of the regions.
Net interest paid has reduced 11% to US$640 millionreflecting the reduction in net interest expense partlyoffset by the timing of payments and the settlement at maturity of a number of derivative financial liabilities.
The group has continued to invest in its operations,selectively maintaining investment to support futuregrowth, including building new breweries in Russia,Angola, Mozambique, Southern Sudan and Tanzaniatogether with brewery capacity expansions completed inthe year in Poland, Romania, Ghana and Uganda. Capitalexpenditure for the year has reduced to US$1,436 million(2009: US$2,073 million). Capital expenditure includingthe purchase of intangible assets was US$1,528 million(2009: US$2,147 million). The completion of a number ofmajor capacity projects in the year is expected to result in lower capital expenditure in the forthcoming year.
Free cash flow improved by US$1,913 million toUS$2,010 million, benefiting from significantly improvedworking capital and lower capital expenditure. Free cashflow over the last five years is shown in the chart above.
CurrencyThe rand strengthened against the US dollar during the yearand ended the financial year at ZAR7.30 to the US dollarcompared to ZAR9.61 at 31 March 2009, while the weightedaverage rand/dollar rate appreciated by 14% to ZAR7.78compared with ZAR8.87 in the prior year. The Colombian peso(COP) strengthened by 33% against the US dollar comparedwith the prior year and ended the financial year at COP1,929to the US dollar compared with COP2,561 at 31 March 2009.The weighted average COP/dollar rate appreciated by 1% toCOP2,031 from COP2,061 in the prior year.
Overview
Governance
Financial statements
Sharehold
er information
Adjusted EPS and dividend per share US cents
160
120
80
40
EPS
Dividend
06 07 08 09 10
Free cash flowUS$m
2,500
2,000
1,500
1,000
500
0
-500
06 08 0907 10
Business review
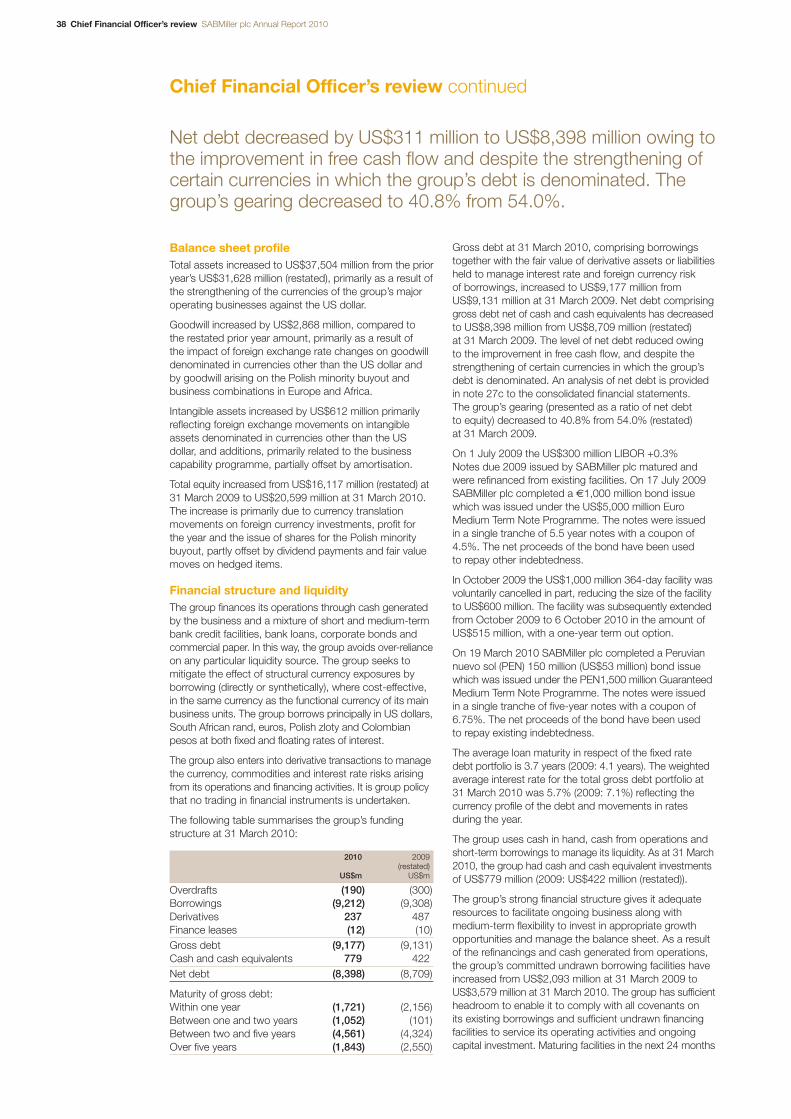
38 Chief Financial Officer’s review SABMiller plc Annual Report 2010
Net debt decreased by US$311 million to US$8,398 million owing tothe improvement in free cash flow and despite the strengthening ofcertain currencies in which the group’s debt is denominated. Thegroup’s gearing decreased to 40.8% from 54.0%.
Chief Financial Officer’s review continued
Balance sheet profileTotal assets increased to US$37,504 million from the prioryear’s US$31,628 million (restated), primarily as a result ofthe strengthening of the currencies of the group’s majoroperating businesses against the US dollar.
Goodwill increased by US$2,868 million, compared to the restated prior year amount, primarily as a result of the impact of foreign exchange rate changes on goodwilldenominated in currencies other than the US dollar andby goodwill arising on the Polish minority buyout andbusiness combinations in Europe and Africa.
Intangible assets increased by US$612 million primarilyreflecting foreign exchange movements on intangibleassets denominated in currencies other than the USdollar, and additions, primarily related to the businesscapability programme, partially offset by amortisation.
Total equity increased from US$16,117 million (restated) at31 March 2009 to US$20,599 million at 31 March 2010.The increase is primarily due to currency translationmovements on foreign currency investments, profit for the year and the issue of shares for the Polish minoritybuyout, partly offset by dividend payments and fair valuemoves on hedged items.
Financial structure and liquidityThe group finances its operations through cash generatedby the business and a mixture of short and medium-termbank credit facilities, bank loans, corporate bonds andcommercial paper. In this way, the group avoids over-relianceon any particular liquidity source. The group seeks tomitigate the effect of structural currency exposures byborrowing (directly or synthetically), where cost-effective, in the same currency as the functional currency of its mainbusiness units. The group borrows principally in US dollars,South African rand, euros, Polish zloty and Colombianpesos at both fixed and floating rates of interest.
The group also enters into derivative transactions to managethe currency, commodities and interest rate risks arisingfrom its operations and financing activities. It is group policythat no trading in financial instruments is undertaken.
The following table summarises the group’s fundingstructure at 31 March 2010:
2010 2009(restated)
US$m US$m
Overdrafts (190) (300)Borrowings (9,212) (9,308)Derivatives 237 487Finance leases (12) (10)Gross debt (9,177) (9,131)Cash and cash equivalents 779 422Net debt (8,398) (8,709)
Maturity of gross debt:Within one year (1,721) (2,156)Between one and two years (1,052) (101)Between two and five years (4,561) (4,324)Over five years (1,843) (2,550)
Gross debt at 31 March 2010, comprising borrowingstogether with the fair value of derivative assets or liabilitiesheld to manage interest rate and foreign currency risk of borrowings, increased to US$9,177 million fromUS$9,131 million at 31 March 2009. Net debt comprisinggross debt net of cash and cash equivalents has decreasedto US$8,398 million from US$8,709 million (restated) at 31 March 2009. The level of net debt reduced owing to the improvement in free cash flow, and despite thestrengthening of certain currencies in which the group’sdebt is denominated. An analysis of net debt is providedin note 27c to the consolidated financial statements. The group’s gearing (presented as a ratio of net debt to equity) decreased to 40.8% from 54.0% (restated) at 31 March 2009.
On 1 July 2009 the US$300 million LIBOR +0.3% Notes due 2009 issued by SABMiller plc matured andwere refinanced from existing facilities. On 17 July 2009SABMiller plc completed a €1,000 million bond issuewhich was issued under the US$5,000 million EuroMedium Term Note Programme. The notes were issued in a single tranche of 5.5 year notes with a coupon of4.5%. The net proceeds of the bond have been used to repay other indebtedness.
In October 2009 the US$1,000 million 364-day facility wasvoluntarily cancelled in part, reducing the size of the facilityto US$600 million. The facility was subsequently extendedfrom October 2009 to 6 October 2010 in the amount ofUS$515 million, with a one-year term out option.
On 19 March 2010 SABMiller plc completed a Peruviannuevo sol (PEN) 150 million (US$53 million) bond issuewhich was issued under the PEN1,500 million GuaranteedMedium Term Note Programme. The notes were issued in a single tranche of five-year notes with a coupon of6.75%. The net proceeds of the bond have been used to repay existing indebtedness.
The average loan maturity in respect of the fixed rate debt portfolio is 3.7 years (2009: 4.1 years). The weightedaverage interest rate for the total gross debt portfolio at31 March 2010 was 5.7% (2009: 7.1%) reflecting thecurrency profile of the debt and movements in ratesduring the year.
The group uses cash in hand, cash from operations andshort-term borrowings to manage its liquidity. As at 31 March2010, the group had cash and cash equivalent investmentsof US$779 million (2009: US$422 million (restated)).
The group’s strong financial structure gives it adequateresources to facilitate ongoing business along withmedium-term flexibility to invest in appropriate growthopportunities and manage the balance sheet. As a resultof the refinancings and cash generated from operations,the group’s committed undrawn borrowing facilities haveincreased from US$2,093 million at 31 March 2009 toUS$3,579 million at 31 March 2010. The group has sufficientheadroom to enable it to comply with all covenants on its existing borrowings and sufficient undrawn financingfacilities to service its operating activities and ongoingcapital investment. Maturing facilities in the next 24 months
SABMiller plc Annual Report 2010 Chief Financial Officer’s review 39
include the US$515 million 364-day facility maturing inOctober 2010 (currently undrawn and with a one-yearterm out option), a US$600 million facility maturing in May 2011, a US$600 million bond maturing in July 2011and a number of local bank facilities. Current committedheadroom is sufficient to cover all maturing facilities overthe next 23 months. The group has continued to be ableto access sufficient and significant funding from a numberof sources and expects to renew maturing facilities asthey fall due.
Interest rate, foreign exchange and credit risk managementThe group’s policy is to borrow (directly or synthetically) in floating rates, reflecting the fact that floating rates aregenerally lower than fixed rates in the medium term.However, in order to mitigate against the impact of anupward change in interest rates, the extent to which groupdebt may be in floating rates is restricted to the lower of(a) 75% of consolidated net debt and (b) that amount ofnet borrowings in floating rates that would, with a 1%increase in interest rates, increase finance costs by anamount equal to (but not more than) 1.2% of normalisedEBITDA adjusted to exclude cash exceptional items. Thispolicy excludes borrowings arising from recent acquisitionactivity and inflation-linked debt. Based on this policy asat 31 March 2010, 47% of net borrowings were at fixedrates taking into account financial derivatives, comparedwith 35% at 31 March 2009.
Exposure to movements in interest rates on group borrowingsis managed through interest rate swaps and forward rateagreements. A 1% move in interest rates would result in a 0.78% (2009: 1.08%) impact on normalised EBITDAadjusted to exclude cash exceptional items.
Most of the group’s net assets are denominated incurrencies other than the US dollar with the result that the group’s US dollar balance sheet can be significantlyaffected by currency movements. The group seeks tomitigate this impact, where cost-effective, by borrowing(directly or synthetically) in the same currencies as thefunctional currencies of its main operating units. Other thanthis, the group does not hedge translation exposures.
The group is also exposed to transactional currency risk on sales and purchases. Committed transactionalexposures are fully hedged and a proportion of othertransactional exposures for a period of up to 18 monthsare also hedged; this is principally achieved using forwardexchange contracts.
The group’s counterparty credit risks arise mainly fromexposure to customers and financial institutions. The grouplimits the exposure to financial institutions arising fromcash, deposits of surplus funds and derivative financialinstruments by setting credit limits based on the institutions’credit ratings and generally only with counterparties witha minimum credit rating of BBB- and Baa3 from Standard& Poors and Moody’s respectively. There is no significantconcentration of credit risk with respect to trade receivablesas the group has a large number of internationallydispersed customers.
Shareholder valueThe value that a company returns to its owners is bestmeasured by total shareholder return (TSR) – a combinationof share price appreciation and dividends returned overthe medium to long term. Recent measures of shareholderreturn have been affected by the volatility of equity indices.Nevertheless, since SABMiller moved its primary listing to the London Stock Exchange in March 1999, the FTSE100 has produced a TSR of 32% to 31 March 2010 (to31 March 2009: –12%) while the group has delivered aTSR of 481% (to 31 March 2009: 204%) in sterling termsover the same period. Over the last five years the grouphas delivered a TSR of 163% (five years to 31 March2009: 87%) whereas the FTSE 100 has only produced a TSR of 39% (to 31 March 2009: 7%) in sterling termsover the same period.
Executive remuneration includes Performance Share AwardPlans, a portion of which are subject to TSR performanceconditions which compare the group’s TSR performanceagainst the performance of a comparator group ofinternational alcoholic beverage companies over a three-year period. Over the three years to 18 May 2010, thegroup achieved a TSR of 80.6% compared to the medianof the comparator group of 28.4%.
Accounting policies and definitionsThe principal accounting policies used by the group areshown in note 1 to the consolidated financial statements.Note 1 also includes recent accounting developments,none of which is expected to have a material impact onthe group.
In addition, note 1 details the areas where a high degreeof judgement has been applied in the selection of a policy,an assumption or estimates used. These relate to theassumptions used in impairment tests of carrying valuesfor goodwill and intangible assets; judgements in relationto provision for taxes where the tax treatment cannot befully determined until a formal resolution has been reachedwith the relevant tax authority; assumptions required for the calculation of post-retirement benefit obligations;estimates of useful economic lives and residual values for intangible assets, property, plant and equipment;judgements in relation to the fair values of assets andliabilities on acquisition; and judgements as to thedetermination of exceptional items.
The group’s operating results on a segmental basis areset out in the segmental analysis of operations, and thedisclosures are in accordance with the basis on which thebusinesses are managed and how performance is evaluated.
Translation differences on non-dollar assets and liabilitiesare recognised in the consolidated statement of othercomprehensive income. It is not the group’s policy tohedge foreign currency earnings and their translation ismade at weighted (by monthly revenue) average rates.
Malcolm WymanChief Financial Officer
Overview
Governance
Financial statements
Sharehold
er information
Business review
40 Sustainable development SABMiller plc Annual Report 2010
Sustainable development is fundamental to our business success. We have a clear and well-embedded approach that is delivering tangible benefits for our business and the communities in which we work.
Sustainable development
A positive role in societyWe believe that the most effective way forSABMiller to meet its sustainable developmentobjectives is by maximising the success ofthe business.
We are clear that our business is not somethingseparate from society. It is, at one and the sametime, an employer, a customer, a supplier anda taxpayer. The interests of SABMiller and thewider community are therefore inextricably linked.
Our activities provide high-quality productsthat society wants and enjoys. As long as markets are free and competitive, ourbusiness will succeed if we manage ourrelationships well, use resources efficientlyand meet the needs of our consumers andthe communities in which we operate.
A robust approach to sustainable developmentunderpins our ability to grow and our licenceto operate. A well-managed and growingbusiness is good for wider economicdevelopment, leading to greater employment,more taxes paid and greater investment in localeconomies and communities. An analysis ofour economic contribution has been publishedin our sustainable development report.
In 2009, we announced a major transactionin South Africa to support our long-termcommitment to Broad-Based BlackEconomic Empowerment which will createapproximately 40,000 shareholders, includingemployees and local retailers. We have alsocreated a charitable foundation to benefit the wider community. More information onthis can be found on page 8.
Making partnership a central part of our approachWe recognise that by building strong andequitable partnerships we can create morevalue for our business and make a greaterdifference in our markets than if we worked in isolation. Moreover, as one of manyplayers that have a role to play in building a successful community, we endeavour tobuild strong relationships with local partnersto address the issues that we face together.
We encourage our businesses to directlydevelop specific partnership projects withNGOs, governments and communities whichwill protect or enhance their ability to operateor create new value. Working with thesegroups often provides us with additionalinsight and local knowledge that enable us to be more effective. By working with us, ourpartners are able to harness the scale of ourbusiness and access accumulated expertiseto help implement meaningful programmes intheir local communities.
Integrating sustainabledevelopment into business strategyFor SABMiller to achieve competitiveadvantage – and ultimately better profitability– sustainable development needs to be part of what we do every day. It needs to be integrated into our decision-making andthe way we run our business.
To better reflect our long-standing commitmentto sustainable development we have revisedone of our four strategic priorities that guidethe management of our business. One ofthese priorities is now ‘to constantly raisethe profitability of local businesses,sustainably’. Further details on this and the other strategic priorities can be found on page 3.
Management within our local operatingbusinesses, regional hubs and at a group levelare responsible for ensuring that sustainabledevelopment is taken into account as part of their business planning and management.Progress is overseen by regional and groupCorporate Accountability and Risk AssuranceCommittees (CARACs).
This strategic focus is underpinned by our 10 sustainable development priorities. Thesedefine the key issues for our business andhave been developed through extensiveconsultation internally, and also with externalstakeholders. The priorities also support ourcommitment to the 10 principles of the UNGlobal Compact and contribute to the UN’sMillennium Development Goals.
Locally and globally we focus our resourceson the priorities which we believe are themost material for our business. As a resultwe have established three global focusareas, namely alcohol responsibility, waterand enterprise development. We believe thatthese are the issues which have the potentialto impact all parts of the business and whichare best tackled through harnessing thescale and expertise across SABMiller.
Discouraging irresponsible drinkingThroughout our business we promoteresponsible consumption as part of our day-to-day activities, whether designingmarketing campaigns, developing newproducts or out in the market selling ourbeers. We strive to ensure our employeesunderstand the risks that arise fromirresponsible drinking and we expect highstandards from them – over 75% of ouremployees are now trained in the six coreprinciples of our Alcohol Framework.
In 2009 we were proud to sign up to GlobalActions on Harmful Drinking – a plan of actionsigned by the CEOs of 10 global beer, wineand spirit producers – to help combat theharmful use of alcohol in developing markets.
We believe that consumers should receiveaccurate and balanced information aboutirresponsible alcohol consumption and wehave launched a number of targeted informationcampaigns across the world. We havecontinued to promote TalkingAlcohol.com andadded a new module called ‘Open the Facts’to assist parents in discussing alcohol withtheir children.
Water FuturesWater scarcity represents a significant long-term risk to parts of our business, as well as tosome of the communities in which we operate.It is a complex issue, with many differentfactors at play that cannot be addressed only within the boundaries of our breweriesor bottling plants. Consequently, we haveadopted a flexible and multifaceted approach.
In 2009, SABMiller joined a consortium of business partners, including McKinsey & Company and the International FinanceCorporation, to examine the challenges of water scarcity around the world. Thesubsequent report – Charting our WaterFuture – launched in November, shows howgrowing water scarcity can be mitigatedaffordably and sustainably.
In partnership with WWF, we have pioneeredthe technique of water footprinting within ourvalue chain, which we use to identify andfocus our actions on the specific issuesrelevant for breweries most at risk. Buildingon this work, we launched our first globalpartnership, Water Futures, with WWF.Further information on this partnership canbe found on page 19.
Investing in local suppliersEnterprise development supports the long-termgrowth and stability of both our business andthe economies in which we operate. In procuringits raw materials, SABMiller combines thescale advantages of global sourcing with therecognition that using local suppliers can alsobenefit the business commercially.
Local sourcing is often far more cost-effectivethan importing raw materials, and encouragingenterprise in our supply chains contributes to the local economies in which we work.During the year we bought crops from28,590 local smallholder farmers, an increaseof 34% compared with last year. Furtherinformation on this can be found on page 19.
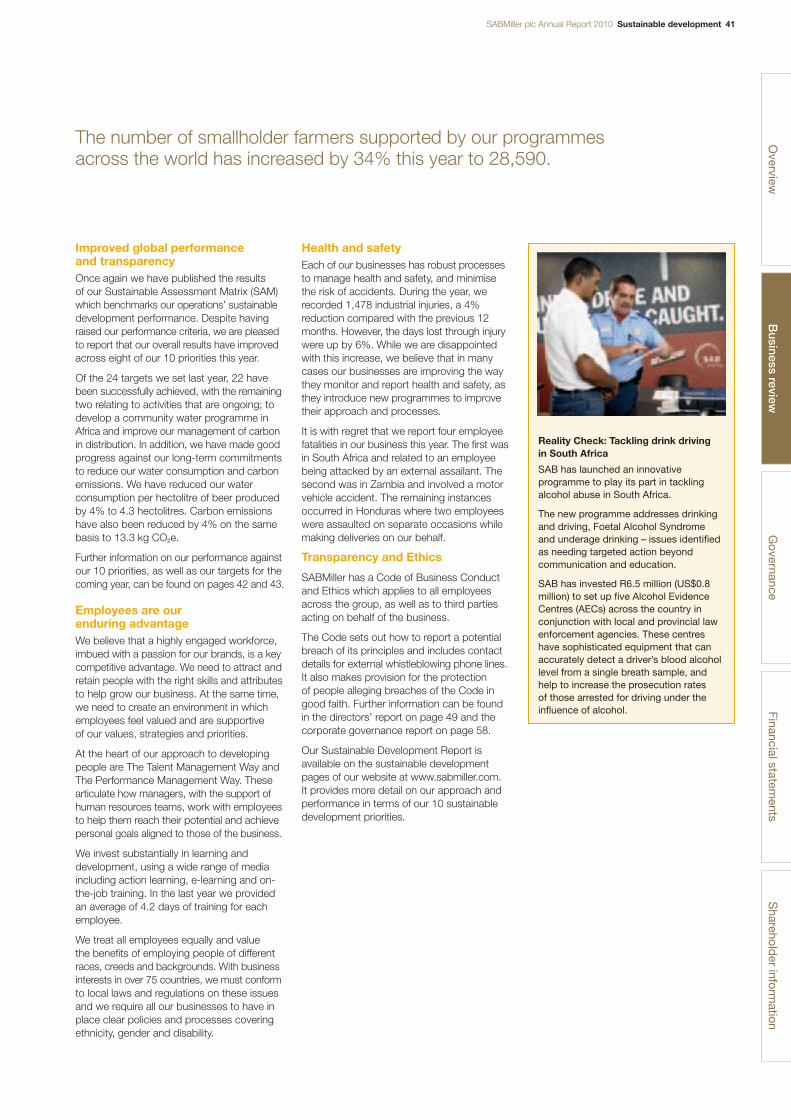
Reality Check: Tackling drink driving in South Africa
SAB has launched an innovativeprogramme to play its part in tacklingalcohol abuse in South Africa.
The new programme addresses drinkingand driving, Foetal Alcohol Syndrome and underage drinking – issues identifiedas needing targeted action beyondcommunication and education.
SAB has invested R6.5 million (US$0.8million) to set up five Alcohol EvidenceCentres (AECs) across the country inconjunction with local and provincial lawenforcement agencies. These centreshave sophisticated equipment that canaccurately detect a driver’s blood alcohollevel from a single breath sample, andhelp to increase the prosecution rates of those arrested for driving under theinfluence of alcohol.
SABMiller plc Annual Report 2010 Sustainable development 41
The number of smallholder farmers supported by our programmes across the world has increased by 34% this year to 28,590.
Improved global performance and transparencyOnce again we have published the results of our Sustainable Assessment Matrix (SAM)which benchmarks our operations’ sustainabledevelopment performance. Despite havingraised our performance criteria, we are pleasedto report that our overall results have improvedacross eight of our 10 priorities this year.
Of the 24 targets we set last year, 22 havebeen successfully achieved, with the remainingtwo relating to activities that are ongoing; todevelop a community water programme inAfrica and improve our management of carbonin distribution. In addition, we have made goodprogress against our long-term commitmentsto reduce our water consumption and carbonemissions. We have reduced our waterconsumption per hectolitre of beer producedby 4% to 4.3 hectolitres. Carbon emissionshave also been reduced by 4% on the samebasis to 13.3 kg CO2e.
Further information on our performance againstour 10 priorities, as well as our targets for thecoming year, can be found on pages 42 and 43.
Employees are our enduring advantageWe believe that a highly engaged workforce,imbued with a passion for our brands, is a keycompetitive advantage. We need to attract andretain people with the right skills and attributesto help grow our business. At the same time,we need to create an environment in whichemployees feel valued and are supportive of our values, strategies and priorities.
At the heart of our approach to developingpeople are The Talent Management Way andThe Performance Management Way. Thesearticulate how managers, with the support ofhuman resources teams, work with employeesto help them reach their potential and achievepersonal goals aligned to those of the business.
We invest substantially in learning anddevelopment, using a wide range of mediaincluding action learning, e-learning and on-the-job training. In the last year we providedan average of 4.2 days of training for eachemployee.
We treat all employees equally and value the benefits of employing people of differentraces, creeds and backgrounds. With businessinterests in over 75 countries, we must conformto local laws and regulations on these issuesand we require all our businesses to have inplace clear policies and processes coveringethnicity, gender and disability.
Health and safetyEach of our businesses has robust processesto manage health and safety, and minimisethe risk of accidents. During the year, werecorded 1,478 industrial injuries, a 4%reduction compared with the previous 12months. However, the days lost through injurywere up by 6%. While we are disappointedwith this increase, we believe that in manycases our businesses are improving the waythey monitor and report health and safety, asthey introduce new programmes to improvetheir approach and processes.
It is with regret that we report four employeefatalities in our business this year. The first wasin South Africa and related to an employeebeing attacked by an external assailant. Thesecond was in Zambia and involved a motorvehicle accident. The remaining instancesoccurred in Honduras where two employeeswere assaulted on separate occasions whilemaking deliveries on our behalf.
Transparency and Ethics
SABMiller has a Code of Business Conductand Ethics which applies to all employeesacross the group, as well as to third partiesacting on behalf of the business.
The Code sets out how to report a potentialbreach of its principles and includes contactdetails for external whistleblowing phone lines.It also makes provision for the protection of people alleging breaches of the Code ingood faith. Further information can be foundin the directors’ report on page 49 and thecorporate governance report on page 58.
Our Sustainable Development Report isavailable on the sustainable developmentpages of our website at www.sabmiller.com.It provides more detail on our approach andperformance in terms of our 10 sustainabledevelopment priorities.
Overview
Governance
Financial statements
Sharehold
er information
Business review
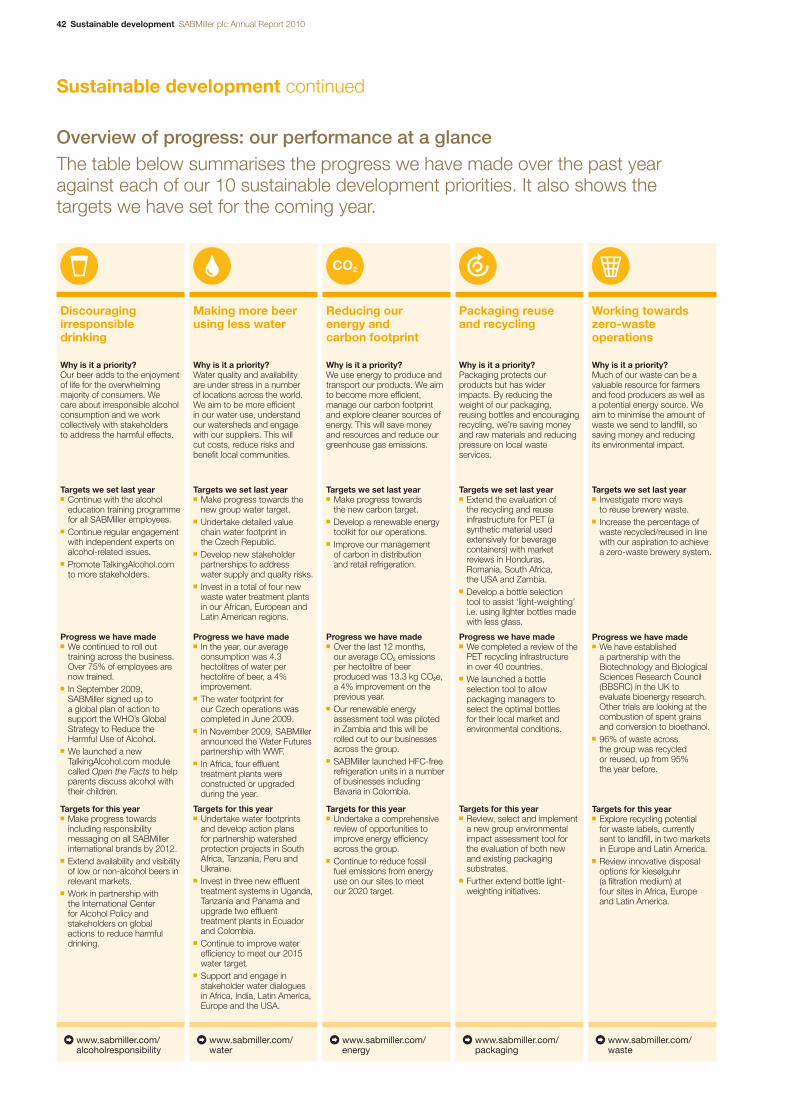
42 Sustainable development SABMiller plc Annual Report 2010
Overview of progress: our performance at a glanceThe table below summarises the progress we have made over the past yearagainst each of our 10 sustainable development priorities. It also shows thetargets we have set for the coming year.
Sustainable development continued
Discouragingirresponsibledrinking
Why is it a priority?Our beer adds to the enjoymentof life for the overwhelmingmajority of consumers. We care about irresponsible alcoholconsumption and we workcollectively with stakeholders to address the harmful effects.
Targets we set last year■ Continue with the alcohol
education training programmefor all SABMiller employees.
■ Continue regular engagementwith independent experts onalcohol-related issues.
■ Promote TalkingAlcohol.comto more stakeholders.
Progress we have made■ We continued to roll out
training across the business.Over 75% of employees arenow trained.
■ In September 2009,SABMiller signed up to a global plan of action tosupport the WHO’s GlobalStrategy to Reduce theHarmful Use of Alcohol.
■ We launched a newTalkingAlcohol.com modulecalled Open the Facts to helpparents discuss alcohol withtheir children.
Targets for this year■ Make progress towards
including responsibilitymessaging on all SABMillerinternational brands by 2012.
■ Extend availability and visibilityof low or non-alcohol beers inrelevant markets.
■ Work in partnership with the International Center for Alcohol Policy andstakeholders on globalactions to reduce harmfuldrinking.
www.sabmiller.com/alcoholresponsibility
Making more beerusing less water
Why is it a priority?Water quality and availability are under stress in a number of locations across the world.We aim to be more efficient in our water use, understandour watersheds and engagewith our suppliers. This will cut costs, reduce risks andbenefit local communities.
Targets we set last year■ Make progress towards the
new group water target.■ Undertake detailed value
chain water footprint in the Czech Republic.
■ Develop new stakeholderpartnerships to address water supply and quality risks.
■ Invest in a total of four newwaste water treatment plantsin our African, European andLatin American regions.
Progress we have made■ In the year, our average
consumption was 4.3hectolitres of water perhectolitre of beer, a 4%improvement.
■ The water footprint for our Czech operations wascompleted in June 2009.
■ In November 2009, SABMillerannounced the Water Futurespartnership with WWF.
■ In Africa, four effluenttreatment plants wereconstructed or upgradedduring the year.
Targets for this year■ Undertake water footprints
and develop action plans for partnership watershedprotection projects in SouthAfrica, Tanzania, Peru andUkraine.
■ Invest in three new effluenttreatment systems in Uganda,Tanzania and Panama andupgrade two effluenttreatment plants in Ecuadorand Colombia.
■ Continue to improve waterefficiency to meet our 2015water target.
■ Support and engage instakeholder water dialoguesin Africa, India, Latin America,Europe and the USA.
www.sabmiller.com/water
Reducing our energy and carbon footprint
Why is it a priority?We use energy to produce andtransport our products. We aimto become more efficient,manage our carbon footprintand explore cleaner sources ofenergy. This will save moneyand resources and reduce ourgreenhouse gas emissions.
Targets we set last year■ Make progress towards
the new carbon target.■ Develop a renewable energy
toolkit for our operations.■ Improve our management
of carbon in distribution and retail refrigeration.
Progress we have made■ Over the last 12 months,
our average CO2 emissionsper hectolitre of beerproduced was 13.3 kg CO2e,a 4% improvement on theprevious year.
■ Our renewable energyassessment tool was pilotedin Zambia and this will berolled out to our businessesacross the group.
■ SABMiller launched HFC-freerefrigeration units in a numberof businesses includingBavaria in Colombia.
Targets for this year■ Undertake a comprehensive
review of opportunities toimprove energy efficiencyacross the group.
■ Continue to reduce fossil fuel emissions from energyuse on our sites to meet our 2020 target.
www.sabmiller.com/energy
Packaging reuse and recycling
Why is it a priority?Packaging protects ourproducts but has widerimpacts. By reducing the weight of our packaging,reusing bottles and encouragingrecycling, we’re saving moneyand raw materials and reducingpressure on local wasteservices.
Targets we set last year■ Extend the evaluation of
the recycling and reuseinfrastructure for PET (asynthetic material usedextensively for beveragecontainers) with marketreviews in Honduras,Romania, South Africa, the USA and Zambia.
■ Develop a bottle selection tool to assist ‘light-weighting’i.e. using lighter bottles madewith less glass.
Progress we have made■ We completed a review of the
PET recycling infrastructure in over 40 countries.
■ We launched a bottleselection tool to allowpackaging managers to select the optimal bottles for their local market andenvironmental conditions.
Targets for this year■ Review, select and implement
a new group environmentalimpact assessment tool forthe evaluation of both newand existing packagingsubstrates.
■ Further extend bottle light-weighting initiatives.
www.sabmiller.com/packaging
Working towardszero-wasteoperations
Why is it a priority?Much of our waste can be avaluable resource for farmersand food producers as well as a potential energy source. Weaim to minimise the amount ofwaste we send to landfill, sosaving money and reducing its environmental impact.
Targets we set last year■ Investigate more ways
to reuse brewery waste.■ Increase the percentage of
waste recycled/reused in linewith our aspiration to achievea zero-waste brewery system.
Progress we have made■ We have established
a partnership with theBiotechnology and BiologicalSciences Research Council(BBSRC) in the UK toevaluate bioenergy research.Other trials are looking at thecombustion of spent grainsand conversion to bioethanol.
■ 96% of waste across the group was recycled or reused, up from 95% the year before.
Targets for this year■ Explore recycling potential
for waste labels, currentlysent to landfill, in two marketsin Europe and Latin America.
■ Review innovative disposaloptions for kieselguhr(a filtration medium) at four sites in Africa, Europeand Latin America.
www.sabmiller.com/waste
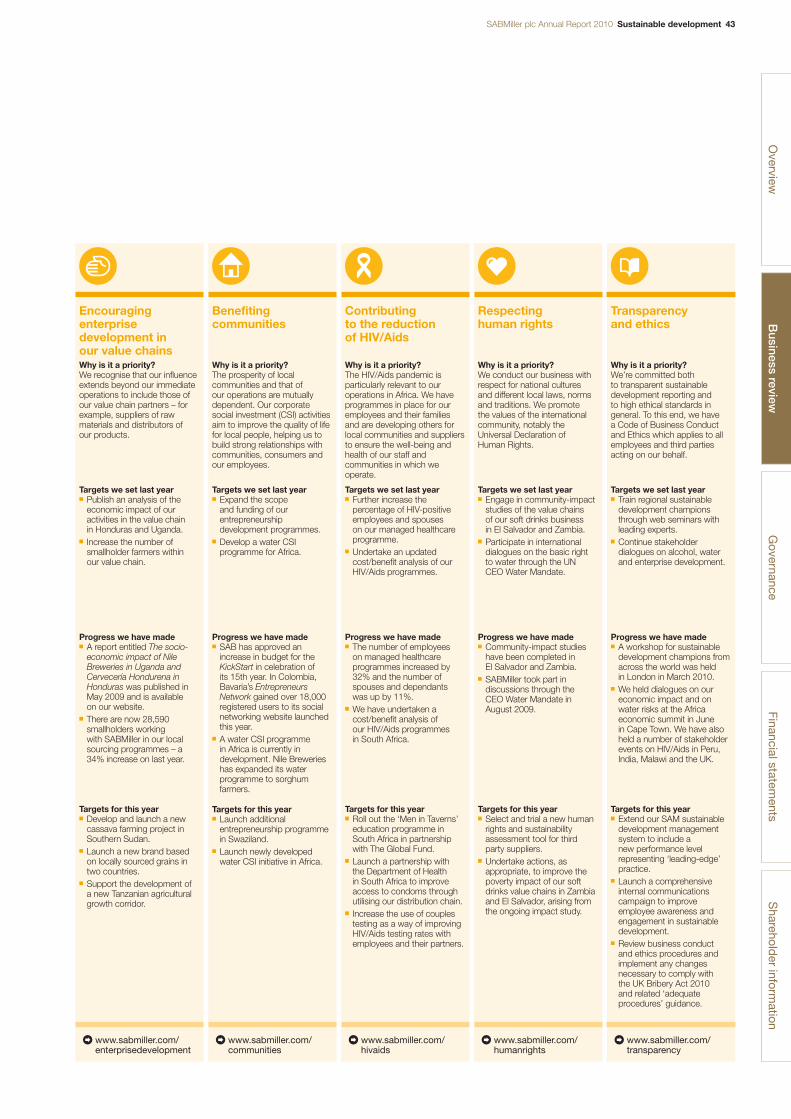
SABMiller plc Annual Report 2010 Sustainable development 43O
verviewG
overnanceFinancial statem
entsS
hareholder inform
ationB
usiness review
Encouragingenterprisedevelopment in our value chainsWhy is it a priority?We recognise that our influenceextends beyond our immediateoperations to include those ofour value chain partners – forexample, suppliers of rawmaterials and distributors of our products.
Targets we set last year■ Publish an analysis of the
economic impact of ouractivities in the value chain in Honduras and Uganda.
■ Increase the number ofsmallholder farmers within our value chain.
Progress we have made■ A report entitled The socio-
economic impact of NileBreweries in Uganda andCervecería Hondurena inHonduras was published inMay 2009 and is available on our website.
■ There are now 28,590smallholders working with SABMiller in our localsourcing programmes – a34% increase on last year.
Targets for this year■ Develop and launch a new
cassava farming project inSouthern Sudan.
■ Launch a new brand basedon locally sourced grains intwo countries.
■ Support the development of a new Tanzanian agriculturalgrowth corridor.
www.sabmiller.com/enterprisedevelopment
Benefitingcommunities
Why is it a priority?The prosperity of localcommunities and that of our operations are mutuallydependent. Our corporatesocial investment (CSI) activitiesaim to improve the quality of lifefor local people, helping us tobuild strong relationships withcommunities, consumers andour employees.
Targets we set last year■ Expand the scope
and funding of ourentrepreneurshipdevelopment programmes.
■ Develop a water CSIprogramme for Africa.
Progress we have made■ SAB has approved an
increase in budget for theKickStart in celebration of its 15th year. In Colombia,Bavaria’s EntrepreneursNetwork gained over 18,000registered users to its socialnetworking website launchedthis year.
■ A water CSI programme in Africa is currently indevelopment. Nile Brewerieshas expanded its waterprogramme to sorghumfarmers.
Targets for this year■ Launch additional
entrepreneurship programmein Swaziland.
■ Launch newly developedwater CSI initiative in Africa.
www.sabmiller.com/communities
Contributing to the reduction of HIV/Aids
Why is it a priority?The HIV/Aids pandemic isparticularly relevant to ouroperations in Africa. We haveprogrammes in place for ouremployees and their familiesand are developing others forlocal communities and suppliersto ensure the well-being andhealth of our staff andcommunities in which weoperate.
Targets we set last year■ Further increase the
percentage of HIV-positiveemployees and spouses on our managed healthcareprogramme.
■ Undertake an updatedcost/benefit analysis of ourHIV/Aids programmes.
Progress we have made■ The number of employees
on managed healthcareprogrammes increased by32% and the number ofspouses and dependants was up by 11%.
■ We have undertaken acost/benefit analysis of our HIV/Aids programmes in South Africa.
Targets for this year■ Roll out the ‘Men in Taverns’
education programme inSouth Africa in partnershipwith The Global Fund.
■ Launch a partnership with the Department of Health in South Africa to improveaccess to condoms throughutilising our distribution chain.
■ Increase the use of couplestesting as a way of improvingHIV/Aids testing rates withemployees and their partners.
www.sabmiller.com/hivaids
Respecting human rights
Why is it a priority?We conduct our business withrespect for national cultures and different local laws, normsand traditions. We promote the values of the internationalcommunity, notably theUniversal Declaration of Human Rights.
Targets we set last year■ Engage in community-impact
studies of the value chains of our soft drinks business in El Salvador and Zambia.
■ Participate in internationaldialogues on the basic right to water through the UN CEO Water Mandate.
Progress we have made■ Community-impact studies
have been completed in El Salvador and Zambia.
■ SABMiller took part indiscussions through the CEO Water Mandate inAugust 2009.
Targets for this year■ Select and trial a new human
rights and sustainabilityassessment tool for thirdparty suppliers.
■ Undertake actions, asappropriate, to improve thepoverty impact of our softdrinks value chains in Zambiaand El Salvador, arising fromthe ongoing impact study.
www.sabmiller.com/humanrights
Transparency and ethics
Why is it a priority?We’re committed both to transparent sustainabledevelopment reporting and to high ethical standards ingeneral. To this end, we have a Code of Business Conductand Ethics which applies to allemployees and third partiesacting on our behalf.
Targets we set last year■ Train regional sustainable
development championsthrough web seminars withleading experts.
■ Continue stakeholderdialogues on alcohol, waterand enterprise development.
Progress we have made■ A workshop for sustainable
development champions fromacross the world was held in London in March 2010.
■ We held dialogues on oureconomic impact and onwater risks at the Africaeconomic summit in June in Cape Town. We have alsoheld a number of stakeholderevents on HIV/Aids in Peru,India, Malawi and the UK.
Targets for this year■ Extend our SAM sustainable
development managementsystem to include a new performance levelrepresenting ‘leading-edge’practice.
■ Launch a comprehensiveinternal communicationscampaign to improveemployee awareness andengagement in sustainabledevelopment.
■ Review business conduct and ethics procedures andimplement any changesnecessary to comply with the UK Bribery Act 2010 and related ‘adequateprocedures’ guidance.
www.sabmiller.com/transparency

44 Board of directors SABMiller plc Annual Report 2010
Board of directors
Graham Mackay (60) ● ▲
BSc (Eng), BComChief Executive
Graham Mackay joined The South African BreweriesLimited (SAB Ltd) in 1978 andhas held a number of seniorpositions in the group, includingExecutive Chairman of the beerbusiness in South Africa.
He was appointed GroupManaging Director in 1997 and Chief Executive of SouthAfrican Breweries plc upon its listing on the London StockExchange in 1999.
He is the Senior IndependentNon-Executive Director ofReckitt Benckiser Group plcand a Director of Philip MorrisInternational Inc.
John Manzoni (50) ● ■ ◆BEng, MEng, MBA
John Manzoni joined the boardin 2004. He is President andChief Executive Officer ofTalisman Energy Inc. Prior tojoining Talisman in September2007 he was Chief Executive of Refining and Marketing of BP plc. He joined BP in 1983and was appointed to the BPplc board in January 2003. Heis a member of the AccentureEnergy Advisory Board.
Malcolm Wyman (63) ● ▲
CA (SA)Chief Financial Officer
Malcolm Wyman joined SABLtd in 1986, and joined theboard as Group CorporateFinance Director in 1990. Hewas appointed to the board ofSouth African Breweries plcupon its listing on the LondonStock Exchange in 1999.
He became Chief FinancialOfficer in 2001, with responsibilityfor the group’s financeoperations, corporate financeand development, and groupstrategy.
He is a Non-Executive Directorof Nedbank Group Limited andNedbank Limited.
Miles Morland (66) ■ ◆ ▼
Miles Morland joined the boardin 1999. He is founder andChairman of two companiesinvesting in Africa, BlakeneyManagement and DevelopmentPartners International. He isalso a director of variouscompanies investing in theemerging world.
Meyer Kahn (70) ● ■
BA (Law), MBA, DCom (hc), SOEChairman
Meyer Kahn joined the group in1966 and occupied executivepositions in a number of thegroup’s former retail interestsbefore being appointed to theboard of SAB Ltd in 1981. He was appointed GroupManaging Director in 1983 andExecutive Chairman in 1990. In 1997 he was seconded full-time to the South African PoliceService as its Chief Executive,serving for two and a half years.He was appointed Chairman of South African Breweries plcupon its listing on the LondonStock Exchange in 1999.
Among other awards, he holds an honorary doctorate incommerce from the Universityof Pretoria and was awardedThe South African Police Starfor Outstanding Service (SOE)in 2000.
Dambisa Moyo (41) ●BSc, Ph.D, MPA, MBA
Dambisa Moyo joined theboard in June 2009. She is an international economist and commentator on the global economy and worked at Goldman Sachs for eightyears. A Non-Executive Directorof Barclays PLC, Dambisapreviously worked at the WorldBank in Washington D.C.
Dambisa is a Patron forAbsolute Return for Kids (ARK), a hedge fund supportedchildren’s charity, and serves on the board of the Lundin forAfrica Foundation. She alsoserves on the board of Room to Read, an education charity.
Mark Armour (55) ◆ ▼
MA, ACA
Mark Armour joined the boardin May 2010. He has been the Chief Financial Officer ofReed Elsevier Group PLC since1996, and of its two parentcompanies, Reed Elsevier PLCand Reed Elsevier NV, havingpreviously been a partner in the London office of PriceWaterhouse.
From 2002 until 2004 he was Chairman of The HundredGroup of Finance Directors. He was a member of theFinance and Reporting WorkingGroup of the UK Government’sCompany Law Review SteeringGroup, which reported in 2001,and a member of the groupappointed by the FinancialReporting Council whichproduced the Smith Report on Audit Committees in 2003.
Carlos Alejandro PérezDávila (47)BA, MPhil
Carlos Pérez joined the boardin 2005, following completion of the Bavaria transaction. He is a Managing Director atQuadrant Capital Advisors, Inc.,and serves on the board andexecutive committee of ValoremS.A. He is also a director ofCaracol Television S.A.,Comunican S.A., CineColombia S.A. and the QueenSofia Spanish Institute. He was previously an investmentbanker at Goldman Sachs &Co., S.G. Warburg & Co. andVioly, Byorum & Partners.
Geoffrey Bible (72) ■FCA (Aust), ACMA
Geoffrey Bible joined the boardin 2002 following completion of the Miller Brewing Companytransaction. He served as Chief Executive Officer of AltriaGroup, Inc. from 1994 untilApril 2002 and as Chairman ofthe Altria board from January1995 until August 2002, whenhe retired. He also served as Chairman of the board ofKraft Foods Inc. from March2001 until his retirement inAugust 2002.
Rob Pieterse (67) ●
Rob Pieterse joined the boardin 2008. He is chairman of the supervisory boards ofMercurius Groep B.V., andRoyal Grolsch N.V. and is amember of the supervisoryboard of CSM N.V. He serveson the boards of VEUO, theassociation of Dutch listedcompanies, and ofEuropeanIssuers.
He spent 25 years at themultinational informationservices company, WoltersKluwer N.V., where he wasChairman from 2000 until 2003.He was a Non-ExecutiveDirector of Mecom Group plcbetween 2007 and 2009, andhas previously been a memberof the supervisory boards ofConnexxion Holding N.V.,Essent N.V. and KoninklijkeWegener N.V.

SABMiller plc Annual Report 2010 Board of directors 45
● Corporate accountability and risk assurance committee (CARAC)▲ Executive committee■ Nomination committee◆ Remuneration committee▼ Audit committee
Overview
Business review
Financial statements
Sharehold
er information
Dinyar Devitre (63) ▼
BA (hons), MBA
Dinyar Devitre joined the boardin 2007 as a nominee of AltriaGroup, Inc. He is a member ofthe board of Altria. BetweenApril 2002 and March 2008 hewas Senior Vice President andChief Financial Officer of Altriaand prior to his appointment to this position had held anumber of senior managementpositions within the Altriagroup. He is a director ofWestern Union Company,Emdeon Inc. and a specialadviser to General Atlantic LLC.He was a director of KraftFoods Inc. from 2002 untilMarch 2007. He serves as a trustee of the Asia Societyand the Brooklyn Academy of Music and is a director of the Lincoln Center for thePerforming Arts, Inc.
Cyril Ramaphosa (57) ● ■
Bproc LLD (hc)
Cyril Ramaphosa joined theboard of SAB Ltd in 1997 andwas appointed to the board of South African Breweries plcupon its listing on the LondonStock Exchange in 1999. He is the founder and chairman of Shanduka Group and JointNon-Executive Chairman of Mondi Group. He holdsdirectorships in Macsteel Global B.V., MTN Group Ltd,The Bidvest Group, StandardBank and Alexander Forbesand serves on the board of the Commonwealth Business Council.
He is a former SecretaryGeneral of the African NationalCongress (ANC) and wasChairman of the ConstitutionalAssembly, which negotiatedSouth Africa’s first democraticconstitution.
Liz Doherty (52) ▼
BSc (hons), FCMA
Liz Doherty joined the board in 2006. Between December2007 and November 2009 she was Chief Financial Officerof Brambles Limited. Prior tojoining Brambles she wasGroup International FinanceDirector of Tesco PLC. Beforejoining Tesco in 2001, she helda number of commercial andstrategic positions in UnileverPLC, including Senior VicePresident Finance – Central & Eastern Europe, FinancialDirector – Unilever ThaiHoldings and Financial Director,Frigo, España.
Alejandro SantoDomingo Dávila (33) ■BA
Alejandro Santo Domingojoined the board in 2005,following completion of theBavaria transaction. He is aManaging Director at QuadrantCapital Advisors, Inc., andserves on the boards ofValorem S.A., Comunican S.A.and Caracol Television S.A. Heis the treasurer of Aid for AIDSCharity, a member of the boardof trustees of The MetropolitanMuseum of Art and is also amember of the board of theUS-based DKMS AmericasFoundation.
Robert Fellowes (68) ● ■ ◆ ▼
Lord Fellowes joined the boardin 1999. He was Chairman ofBarclays Private Bank (BarclaysWealth) until 31 December2009 and was Private Secretaryto the Queen from 1990 until1999, having joined the RoyalHousehold in 1977 from acareer in the London MoneyMarket. He is a trustee of the Rhodes Trust and theMandela-Rhodes Foundation.He is also on the board of theBritish Library.
Howard Willard (46) ●BA (hons), MBA
Howard Willard joined theboard in August 2009 as anominee of Altria Group, Inc.He is Executive Vice President,Strategy and BusinessDevelopment for Altria withoversight responsibility forChateau Ste. Michelle WineEstates, Philip Morris Duty Free Inc., and the Strategy &Business Development groupat Altria Client Services Inc. He has held various leadershippositions at Philip Morris USA Inc. in Finance, Sales,Information Services andCorporate Responsibility.Before joining the Altria family of companies in 1992 heworked at Bain & Companyand Salomon Brothers Inc. He currently serves on theboard of the YMCA of GreaterRichmond.
John Manser (70) ● ■ ◆ ▼
CBE, DL, FCA
John Manser joined the boardin 2001. He is Chairman ofIntermediate Capital Group plcand Shaftesbury PLC andDeputy Chairman of ColliersCRE plc. He was previouslyChairman of Hiscox InvestmentManagement Ltd, London AsiaChinese Private Equity FundLimited and Robert FlemingHoldings Limited, a formermember of the President’sCommittee of the BritishBanking Association, adirector of the Securities and Investments Boardbetween 1986 and 1993 and is a past Chairman of the London Investment Banking Association.
Go
vernance
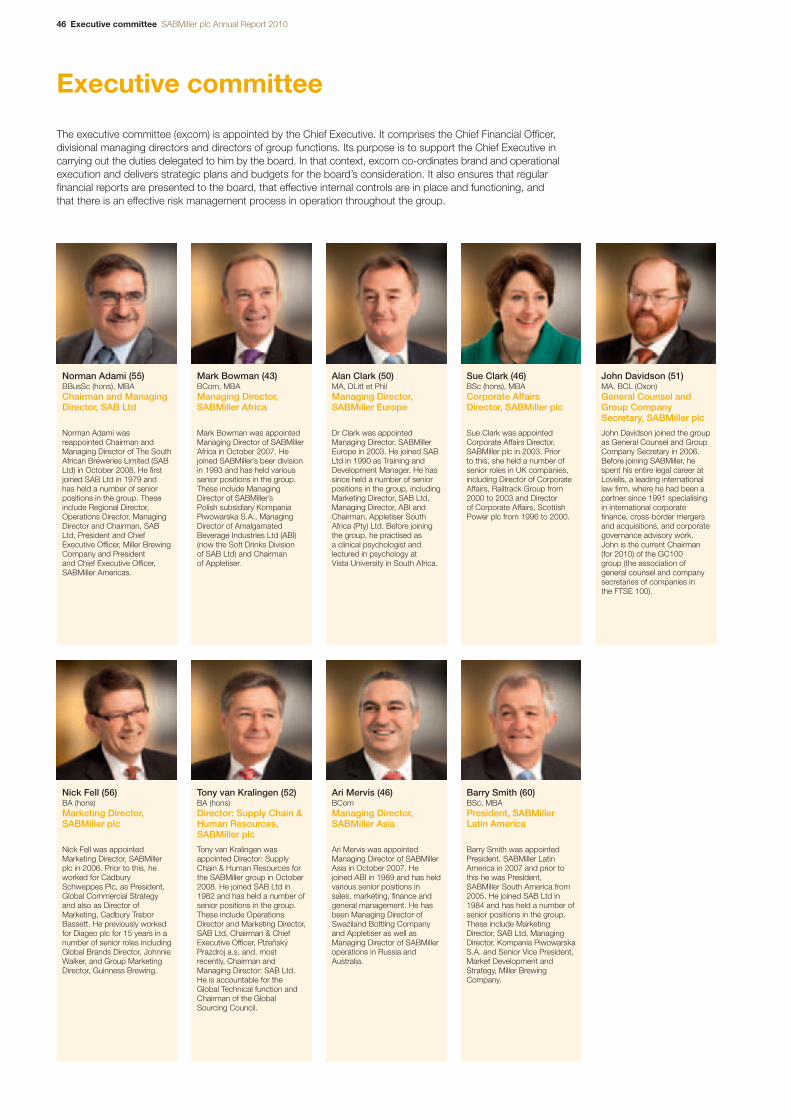
46 Executive committee SABMiller plc Annual Report 2010
Executive committee
Norman Adami (55)BBusSc (hons), MBAChairman and ManagingDirector, SAB Ltd
Norman Adami wasreappointed Chairman andManaging Director of The SouthAfrican Breweries Limited (SABLtd) in October 2008. He firstjoined SAB Ltd in 1979 and has held a number of seniorpositions in the group. Theseinclude Regional Director,Operations Director, ManagingDirector and Chairman, SABLtd, President and ChiefExecutive Officer, Miller BrewingCompany and President and Chief Executive Officer,SABMiller Americas.
Nick Fell (56)BA (hons)Marketing Director,SABMiller plc
Nick Fell was appointedMarketing Director, SABMillerplc in 2006. Prior to this, heworked for CadburySchweppes Plc, as President,Global Commercial Strategyand also as Director ofMarketing, Cadbury TreborBassett. He previously workedfor Diageo plc for 15 years in anumber of senior roles includingGlobal Brands Director, JohnnieWalker, and Group MarketingDirector, Guinness Brewing.
Mark Bowman (43)BCom, MBAManaging Director,SABMiller Africa
Mark Bowman was appointedManaging Director of SABMillerAfrica in October 2007. Hejoined SABMiller’s beer divisionin 1993 and has held varioussenior positions in the group.These include ManagingDirector of SABMiller’s Polish subsidiary KompaniaPiwowarska S.A., ManagingDirector of AmalgamatedBeverage Industries Ltd (ABI)(now the Soft Drinks Division of SAB Ltd) and Chairman of Appletiser.
Tony van Kralingen (52)BA (hons)Director: Supply Chain &Human Resources,SABMiller plc
Tony van Kralingen wasappointed Director: SupplyChain & Human Resources forthe SABMiller group in October2008. He joined SAB Ltd in1982 and has held a number ofsenior positions in the group.These include OperationsDirector and Marketing Director,SAB Ltd, Chairman & ChiefExecutive Officer, PlzeňskýPrazdroj a.s. and, mostrecently, Chairman andManaging Director: SAB Ltd.He is accountable for theGlobal Technical function andChairman of the GlobalSourcing Council.
Alan Clark (50)MA, DLitt et PhilManaging Director,SABMiller Europe
Dr Clark was appointedManaging Director, SABMillerEurope in 2003. He joined SABLtd in 1990 as Training andDevelopment Manager. He hassince held a number of seniorpositions in the group, includingMarketing Director, SAB Ltd,Managing Director, ABI andChairman, Appletiser SouthAfrica (Pty) Ltd. Before joiningthe group, he practised as a clinical psychologist andlectured in psychology at Vista University in South Africa.
Ari Mervis (46)BComManaging Director,SABMiller Asia
Ari Mervis was appointedManaging Director of SABMillerAsia in October 2007. Hejoined ABI in 1989 and has heldvarious senior positions insales, marketing, finance andgeneral management. He hasbeen Managing Director ofSwaziland Bottling Companyand Appletiser as well asManaging Director of SABMilleroperations in Russia andAustralia.
Sue Clark (46)BSc (hons), MBACorporate AffairsDirector, SABMiller plc
Sue Clark was appointedCorporate Affairs Director,SABMiller plc in 2003. Prior to this, she held a number ofsenior roles in UK companies,including Director of CorporateAffairs, Railtrack Group from2000 to 2003 and Director of Corporate Affairs, ScottishPower plc from 1996 to 2000.
Barry Smith (60)BSc, MBAPresident, SABMillerLatin America
Barry Smith was appointedPresident, SABMiller LatinAmerica in 2007 and prior tothis he was President,SABMiller South America from2005. He joined SAB Ltd in1984 and has held a number ofsenior positions in the group.These include MarketingDirector, SAB Ltd, ManagingDirector, Kompania PiwowarskaS.A. and Senior Vice President,Market Development andStrategy, Miller BrewingCompany.
John Davidson (51)MA, BCL (Oxon)General Counsel andGroup CompanySecretary, SABMiller plc
John Davidson joined the groupas General Counsel and GroupCompany Secretary in 2006.Before joining SABMiller, hespent his entire legal career atLovells, a leading internationallaw firm, where he had been apartner since 1991 specialisingin international corporatefinance, cross-border mergersand acquisitions, and corporategovernance advisory work.John is the current Chairman(for 2010) of the GC100 group (the association ofgeneral counsel and companysecretaries of companies in the FTSE 100).
The executive committee (excom) is appointed by the Chief Executive. It comprises the Chief Financial Officer,divisional managing directors and directors of group functions. Its purpose is to support the Chief Executive incarrying out the duties delegated to him by the board. In that context, excom co-ordinates brand and operationalexecution and delivers strategic plans and budgets for the board’s consideration. It also ensures that regularfinancial reports are presented to the board, that effective internal controls are in place and functioning, andthat there is an effective risk management process in operation throughout the group.
SABMiller plc Annual Report 2010 Directors’ report 47
Directors’ report
The directors have pleasure in submitting their report to shareholders,together with the audited annual financial statements for the year ended31 March 2010.
Principal activities and business reviewSABMiller plc is a holding company which has brewing and beverageinterests across six continents. The principal subsidiaries, associatesand joint ventures of the company are listed in note 33 to the consolidatedfinancial statements. The principal activities of the group are themanufacture, distribution and sale of beverages.
The company is required by the Companies Act 2006 to produce afair review of the business of the group including a description of theprincipal risks and uncertainties it faces, its development and performanceduring the year and the position of the group at the end of the year.The business review, including a review of the development andperformance of the group during the financial year, its position at theend of the year, likely future developments in the business of the group,key performance indicators and a description of the principal risks anduncertainties facing the group, is set out on pages 6 to 39 of this annualreport. Other key performance indicators and information relating toenvironmental matters, employee matters and social and communityissues required by the business review are set out in the sustainabledevelopment review on pages 40 to 43 of this annual report.
Significant acquisitions, disposals, financing transactions,investments and material developments during the yearIn April 2009 the company’s Romanian subsidiary Ursus Breweries SAassumed control over 71% of the issued share capital of Bere AzugaSA in Romania. Subsequently, further share purchases were madeand at the year end Bere Azuga was wholly owned by Ursus.
In May 2009 the company acquired the outstanding 28.1% minorityinterest in its Polish subsidiary, Kompania Piwowarska SA, from KulczykHolding SA in exchange for the issue of 60 million new ordinary shares.
In July 2009 the company announced that it proposed to enter into a Broad-Based Black Economic Empowerment transaction in SouthAfrica. The transaction will result in 8.45% of its South African subsidiary,The South African Breweries Limited (SAB), being held by a broad baseof black participants, which include SAB’s employees, black-ownedlicensed liquor retailers and liquor licence applicants, as well as registeredblack-owned customers of ABI (the soft drinks division of SAB), andthe broader South African community through an SAB foundation. Atthe end of the 10-year transaction period, participants will exchangetheir shareholdings in SAB for shares in SABMiller plc. At a generalmeeting of the company held in January 2010 the transaction wasapproved by shareholders, with over 99.99% of the votes cast beingin favour of the adoption of a scheme of arrangement to give effect to the transaction. The scheme of arrangement was subsequentlysanctioned by the High Court of Justice in England and Wales inFebruary 2010. The economic cost of the transaction as at 27 November2009 was calculated at approximately US$279 million, equating to approximately 0.6% of SABMiller plc’s market capitalisation on 27 November 2009, and the initial allocation of shares in SAB isexpected to be completed in June 2010.
In July 2009 the company completed a €1,000 million bond issueunder its US$5,000 million Euro Medium Term Note Programme. The 5.5 year notes were issued with a coupon of 4.50%. The netproceeds of the issue were used to repay certain indebtedness andfor general corporate purposes.
In July 2009 the company announced plans to open a new breweryand sparkling soft drinks plant in Angola. The new soft drinks plant wascommissioned in January 2010 and the new brewery in April 2010.
In July 2009 the company’s Mauritian subsidiary Ambo InternationalHoldings Limited completed an investment resulting in the companyholding an effective 40% interest in Ambo Mineral Water Share Companyin Ethiopia.
In September 2009 the company’s Zambian subsidiary, Heinrich’sSyndicate Limited, acquired a maheu business, a non-alcoholictraditional beverage.
In September 2009 the company’s Namibian subsidiary, SABMiller(Namibia) (Proprietary) Limited (SABMiller Namibia), was granted alicence to brew and bottle beer in Namibia. Following the year end, it was announced that SABMiller Namibia, which will be 60% ownedby SABMiller and 40% owned by local Namibian partners in a Broad-Based Black Economic Empowerment initiative, will build a brewery at a cost of US$34 million. Construction of the new brewery on 7.3hectares of land outside Okahandja is expected to start in the secondhalf of 2010 and will also include a returnable bottle packaging lineand warehousing facilities.
In December 2009 SABMiller’s Ugandan subsidiary, Nile BreweriesLtd, announced that following the success of its initiative to convertlocally grown barley into brewing malt it would build a malting plant at a cost of US$16 million. Construction began in January 2010 onNile Breweries’ existing site in Jinja and is expected to be completedin the first quarter of 2011.
In February 2010 the company announced that it had agreed to mergeTsogo Sun, its South African hotels and gaming associate, with GoldReef Resorts Limited (Gold Reef), a Johannesburg Stock Exchange(JSE) listed business, through an all-share merger. The transaction willbe effected through the acquisition by Gold Reef of the entire issuedshare capital of Tsogo Sun Holdings (Proprietary) Limited (Tsogo Sun)in exchange for the issue of new shares in Gold Reef. SABMiller’s whollyowned subsidiary SABSA Holdings (Pty) Limited (SABSA), will exchangeits 49% interest in Tsogo Sun for a 39.7% interest in the enlarged GoldReef/Tsogo Sun business, which will continue to be listed on the JSEwith an expected market capitalisation of approximately ZAR21 billion(US$2,700 million) as at 29 January 2010. The merger was approvedby Gold Reef shareholders in April 2010, and completion remains subjectto requisite regulatory approvals.
In February 2010 the company’s subsidiary Rwenzori Bottling CompanyLimited acquired the assets of the Rwenzori water business in Uganda.
In March 2010 the company completed an issue of Peruvian nuevosol (PEN) 150 million (approximately US$53 million) 6.75% notes due2015, under the PEN1,500 million Guaranteed Medium Term NoteProgramme which had been established by the company and itswholly owned subsidiary Racetrack Perú S.R.L. in January 2009. Thenet proceeds of the issue were used for the repayment of loans incurredto fund the acquisition of shares in Unión de Cervecerías PeruanasBackus y Johnston S.A.A. and for general corporate purposes.
Overview
Business review
Go
vernanceFinancial statem
entsS
hareholder inform
ation
48 Directors’ report SABMiller plc Annual Report 2010
Directors’ report continued
DividendsAn interim dividend of 17 US cents per share was paid to shareholderson 11 December 2009, in respect of the year ended 31 March 2010.Details of the final dividend proposed by the board for the year ended31 March 2010 are set out below:
Amount of final dividend proposed by the board: 51 US cents per share
Total proposed dividend for the year ended 31 March 2010: 68 US cents per share
If approved, the final dividend will be payable to shareholders on either section of the register at 6 August 2010 in the following way:
Dividend payable on: 13 August 2010
Currency of payment: South African rands – toshareholders on the RSA section of the register,
US dollars – to shareholders shownas having an address in the USAand recorded on the UK section of the register (unless mandatedotherwise),
Pounds sterling – to all othershareholders on the UK section of the register.
Ex-dividend dates: 2 August 2010 for shares traded on the JSE Limited, South Africa.
4 August 2010 for shares traded onthe London Stock Exchange (LSE).
The rate of exchange for conversion from US dollars will be calculatedon 21 July 2010 and published on the RNS of the LSE and the SENSof the JSE Limited on 22 July 2010.
Note 9 to the consolidated financial statements discloses dividendswaived.
DirectorsThe names and biographical details of the current directors are set outon pages 44 and 45. Apart from Dr Moyo (who was appointed to theboard on 1 June 2009), Mr Willard (who was appointed to the board on1 August 2009) and Mr Armour (who was appointed to the board on1 May 2010) all directors served throughout the period. Lord Felloweswill retire from the board at the conclusion of the 2010 annual generalmeeting. Details of the interests in shares and/or options of the directorswho held office during the period and any persons connected to themare set out in the remuneration report on pages 59 to 67.
Corporate governanceThe directors remain committed to maintaining high standards ofcorporate governance, which they see as fundamental to dischargingtheir stewardship responsibilities. The board strives to provide the rightleadership, strategic oversight and control environment to produce andsustain the delivery of value to all of the company’s shareholders. Theboard applies integrity, principles of good governance and accountabilitythroughout its activities and each director brings independence ofcharacter and judgement to the role. All of the members of the boardare individually and collectively aware of their responsibilities to thecompany’s stakeholders and the board keeps its performance andcore governance principles under regular review. Statements of ourapplication of the Combined Code on Corporate Governance are set out in the corporate governance report, which forms part of thisdirectors’ report, on pages 51 to 58 and the remuneration report onpages 59 to 67.
Share capitalDuring the year, the issued ordinary share capital of the companyincreased from 1,585,366,969 shares of 10 US cents each to1,654,749,852 shares of 10 US cents each. Of the 69,382,883 new ordinary shares issued during the year, 60,000,000 ordinaryshares were issued in respect of the Kompania Piwowarska transactionnoted earlier in this report and 9,382,883 ordinary shares were issuedto satisfy the exercise of options granted under the company’s shareincentive plans, details of which are shown in note 25 to the consolidatedfinancial statements.
During the year the company transferred 5,300,000 ordinary sharesfrom treasury to the SABMiller plc Employees’ Benefit Trust for noconsideration, to be used to satisfy awards outstanding under thecompany’s share incentive plans. At year end the company held atotal of 72,068,338 shares in treasury.
In addition, the company has 50,000 deferred shares of £1 each in issue, none of which were issued during the year.
Purchase of own sharesAt the last annual general meeting, shareholder authority was obtainedfor the company to purchase its own shares up to a maximum of 10%of the number of ordinary shares in issue on 29 May 2009. This authorityis due to expire at the earlier of the next annual general meeting or 31 October 2010, and remains exercisable provided that certainconditions relating to the purchase are met. The notice of annual generalmeeting proposes that shareholders approve a resolution updating andrenewing the authority allowing the company to purchase its own shares.
Shares in the company were purchased during the year by the trusteeof the employees’ benefit trust, details of which are provided in theremuneration report.
The company did not repurchase any shares during the year for thepurpose of cancellation, holding in treasury or for any other purpose.
Annual general meetingThe company’s annual general meeting for 2010 will be held at theInterContinental London Park Lane, One Hamilton Place, LondonW1V 7QY, UK at 11.00am on Thursday 22 July 2010. Notice of this meeting may be obtained from the company’s website.
DonationsDuring the year the group invested US$43.7 million in corporate social investment programmes, of which US$6,122,486 representedcharitable donations. Of this amount US$224,764 were charitabledonations made by the company and Miller Brands (UK) Limited forthe benefit of various causes, both in the UK and overseas, comprisingdonations in respect of community development, health and education,the environment and other causes.
It remains the group’s policy that political donations are only made byexception, and where permitted by local laws, and must be consistentwith building multi-party democracy.
To support democracy in Colombia, the group’s subsidiary Bavaria SAmade donations totalling US$2,394,845 to a number of political partiesand movements participating in the congressional elections.
To support the democratic process in Botswana, group companies inBotswana made donations totalling US$218,451 to registered politicalparties participating in the general elections.
In Honduras the group’s subsidiary donated soft drinks to the value of US$5,061 for the benefit of volunteers assisting during the generalelections.
The board has reaffirmed the group’s policy not to make donations to political organisations in the European Union.
SABMiller plc Annual Report 2010 Directors’ report 49
Employment, environmental and social policiesThe aim of the group is to be the employer of choice in each countryin which it operates. In order to achieve this, each operating companydesigns employment policies which attract, retain and motivate thehighest quality of staff. The group is committed to an active equalopportunities policy from recruitment and selection, through trainingand development, appraisal and promotion to retirement. Within theconstraints of local law, it is our policy to ensure that everyone istreated equally, regardless of gender, colour, nationality, ethnic origin,race, disability, marital status, sexual orientation, religion or tradeunion affiliation. We value the benefits of employing people of differentraces, creeds and backgrounds. In the event of employees becomingdisabled, efforts are made to allow them to continue in their role, or a suitable alternative role, through making reasonable adjustments.
All employees of all SABMiller group companies must adhere to a code of business conduct and ethics. This sets out our core principlesof business conduct and ethics, including being fair and ethical in allour dealings and treating people with dignity and respect. The group is committed to the 10 principles of the United Nations Global Compact.This framework sets out universally accepted principles in the areas ofhuman rights, labour, the environment and anti-corruption. The company’swebsite sets out these principles and the group’s progress towards them.
The directors believe that the group’s policies and procedures forcombating bribery and corruption are robust, but in light of the newUK Bribery Act 2010, expected to come into force in October 2010with its accompanying ‘adequate procedures’ guidance, the group willbe conducting a thorough review of the application of its groupwidecode of business conduct and ethics to ensure that any changesnecessary to comply with the new legislation and the guidance areidentified and implemented in good time.
The group is committed to regular communication and consultation withemployees and encourages employee involvement in the performanceof the company. The group has implemented the distribution of real timenews on a global basis via our global intranet. The news is available to all of the group’s businesses to help inform employees about whatis happening in our global operations. Further information is providedto employees at a regional/country level by way of newsletters andelectronic communication. Certain employees throughout the groupare eligible to participate in the group’s share incentive plans.
The sustainable development review on pages 40 to 43 gives anoverview of the progress against the group’s 10 sustainable developmentpriorities and of the impact of the group’s business on the environment.More detailed information is provided in the company’s sustainabledevelopment report 2010, available on the company’s website.
Research and developmentTo ensure improved overall operational effectiveness, the group places considerable emphasis on research and development in itsglobal technical activities. This enables us to develop new products,packaging, processes and manufacturing technologies. Continuedprogress was made in the group’s ongoing research in the key areasof raw materials, brewing, flavour stability, packaging materials andenergy and water saving. In July 2009 the company announced plansto build a £2 million global brewing research facility in the UK, to bebuilt within Nottingham University’s School of Biosciences. Our totalinvestment in research and development in the year under review was US$4 million (2009: US$7 million).
Payment of suppliersThe group’s policy is to pay invoices in accordance with the terms ofpayment agreed in advance. At the year end, the amount owed by thegroup to trade creditors was equivalent to 48.2 days (2009: 36.3 days)of purchases from suppliers.
Overseas branchesThe company does not have any branches registered overseas.
Going concern and auditPage 68 details the directors’ responsibilities for preparing theconsolidated financial statements. As set out in that statement,the directors are satisfied that SABMiller plc is a going concern.
PricewaterhouseCoopers LLP have expressed their willingness to continue in office as auditors and resolutions proposing their re-appointment and authorising the board to set their remuneration will be submitted to the forthcoming annual general meeting.
Directors’ indemnitiesThe company has granted rolling indemnities to the directors, uncappedin amount, in relation to certain losses and liabilities which they mayincur in the course of acting as directors of the company or of one ormore of its subsidiaries. The Company Secretary and Deputy CompanySecretary have also been granted indemnities, on similar terms, coveringtheir roles as Company Secretary and Deputy Company Secretaryrespectively of the company and as directors or as company secretaryof one or more of the company’s subsidiaries. The board believes that it is in the best interests of the group to attract and retain theservices of the most able and experienced directors and officers byoffering competitive terms of engagement, including the granting ofsuch indemnities.
The indemnities were granted at different times according to the law in force at the time and where relevant are categorised as qualifyingthird-party indemnity provisions as defined by Section 309B of theCompanies Act 1985 and Section 234 of the Companies Act 2006.They will continue in force for the benefit of directors and officers foras long as they remain in their positions.
Substantial shareholdingsDetails of notifications received by the company in accordance with theDisclosure and Transparency Rules as at 2 June 2010 and of personswith significant direct or indirect holdings known to the company atyear end are set out in the ordinary shareholding analyses on page161 of this annual report.
Financial instrumentsInformation on the financial risk management objectives and policiesof the group and details of the group’s exposure to price risk, creditrisk, liquidity risk and cash flow risk are contained in note 22 to theconsolidated financial statements.
Other disclosures required by the Companies Act and the Disclosure and Transparency RulesThe company does not have any contractual or other arrangementsthat individually are essential to the business of the company.
The structure of the company’s share capital, including the rights andobligations attaching to each class of share and the percentage of theshare capital that each class of share comprises, is set out in note 25to the consolidated financial statements. There are no securities of the company that grant the holder special control rights.
At year end the company’s employees’ benefit trust held 8,675,839ordinary shares in the company. By agreement with the company, thetrustees do not exercise the voting rights attached to these shares.
The directors are responsible for the management of the business ofthe company and may exercise all the powers of the company subjectto the company’s articles of association and relevant statutes. Powersof the directors relating to the issuing and buying back of shares areset out in the articles of association. These powers are subject torenewal by the shareholders of the company each year at the annualgeneral meeting.
Overview
Business review
Go
vernanceFinancial statem
entsS
hareholder inform
ation

50 Directors’ report SABMiller plc Annual Report 2010
Directors’ report continued
The company’s articles of association give the board of directors powerto appoint directors. The articles of association may be amended byspecial resolution of the shareholders. Directors appointed by the boardare required to submit themselves for election by the shareholders at the next annual general meeting of the company. Additionally, asdisclosed in the corporate governance report on pages 51 to 58,Altria Group, Inc. (Altria) and BevCo Ltd (BevCo) have power undertheir respective relationship agreements with the company to nominatedirectors for appointment to the board and certain committees. Theserelationship agreements also regulate processes applicable in relationto the acquisition or disposal of shares by Altria and BevCo.
The company’s articles of association allow directors, in their absolutediscretion, to refuse to register the transfer of a share in certificatedform which is not fully paid or the transfer of a share in certificated formon which the company has a lien. If that share has been admitted tothe Official List, the board may not refuse to register the transfer if thiswould prevent dealings in the company’s shares from taking place onan open and proper basis. They may also refuse to register a transferof a share in certificated form unless the instrument of transfer is lodged,duly stamped (if stampable), at the address at which the register of thecompany is held or at such other place as the directors may appoint,and (except in the case of a transfer by a financial institution where acertificate has not been issued in respect of the share) is accompaniedby the certificate for the share to which it relates and such otherevidence as the directors may reasonably require to show the right of the transferor to make the transfer, is in respect of only one class of share and is in favour of not more than four transferees jointly.
Transfers of shares in uncertificated form must be made in accordancewith, and subject to, the Uncertificated Securities Regulations (theRegulations), the facilities and requirements of the relevant CRESTsystem and such arrangements as the board may determine in relationto the transfer of certificated shares (subject to the Regulations).
Transfers of shares listed on the JSE in uncertificated form must be made in accordance with, and subject to, the Securities ServicesAct 2004, the Rules and Directives of the JSE and STRATE Ltd.Certificated shares may be transferred prior to dematerialisation, but share certificates must be dematerialised prior to trading in theSTRATE environment.
Pursuant to the company’s code for securities transactions, directorsand persons discharging managerial responsibilities require, andemployees may in certain circumstances require, approval to deal in the company’s shares.
No shareholder shall, unless the directors otherwise determine, beentitled in respect of any share held by them to vote either personallyor by proxy at a shareholders’ meeting or to exercise any other rightconferred by membership in relation to shareholders’ meetings if anycall or other sum presently payable by them to the company in respectof that share remains unpaid. In addition, no shareholder shall be entitledto vote if they have been served with a notice after failing to providethe company with information concerning interests in those sharesrequired to be provided under Section 793 of the Companies Act2006. Restrictions on the rights of the holders of convertible sharesand deferred shares are set out in note 25 to the consolidatedfinancial statements.
Votes may be exercised in person, by proxy, or in relation to corporatemembers, by a corporate representative. The deadline for deliveringproxy forms is 48 hours before the time for holding the meeting.
The company has a number of facility agreements with banks whichcontain provisions giving rights to the banks upon a change of controlof the company. A change of control of the company would also giveThe Coca-Cola Company certain rights under its bottling agreementswith various subsidiaries of the company, and in certain limitedcircumstances may give China Resources Enterprise, Limited theability to exercise certain rights under a shareholders agreement inrelation to the company’s associate CR Snow. A change of controlmay also give the Molson Coors Brewing Company the ability toexercise certain rights under the MillerCoors operating agreement.
The company does not have any agreements with any director orofficer that would provide compensation for loss of office or employmentresulting from a takeover.
John DavidsonGeneral Counsel and Group Company SecretaryFor and on behalf of the board of SABMiller plc
3 June 2010
SABMiller plc Annual Report 2010 Corporate governance 51
Corporate governance
1. The directors’ report on corporate governanceThe global financial crisis brought an increased focus on directors’governance responsibilities, leading the UK Government to commissiona review of governance in financial institutions and caused the FinancialReporting Council (FRC) to bring forward a review of the CombinedCode of Corporate Governance (the Combined Code), which containsthe principal governance rules applying to UK companies listed on theLondon Stock Exchange.
SABMiller participated in both those reviews and in submissions madeto the FRC expressed the directors’ belief that the Combined Codereflected good and responsible governance and was working well.However, the board reiterated the fundamental and underlying pointthat there seems to be an unrealistic expectation that more ‘governance’will guarantee success or, perhaps more pertinently, guarantee nofailure. The global financial crisis has presented an important opportunityto review how robust corporate governance processes are, and tolearn what might have been done differently. However, every businesshas to manage risk, and judgements about risk must be taken byexecutives as part of the management by them of the business. Ifthere were governance weaknesses that contributed to the currentcrisis, the board believes it was in the application of the Code, ratherthan a lack of prescription within the Code itself. Adding extra governancerequirements is likely to lead to more box ticking and hamper effectivescrutiny by non-executive directors by occupying time with formrather than looking at substance. Key to the effectiveness of corporategovernance is the calibre of the individuals involved, and their clearunderstanding of their roles and responsibilities and the tools necessaryto discharge their responsibilities effectively.
SABMiller’s specific submissions to the FRC were directed at reinforcingwhat the directors believe is, and should be, the philosophy behindthe FRC’s approach to the Code, which is that prescription should beavoided, and that companies should have the flexibility to design theirown governance processes in the light of their own circumstancesand their view of the interests of their shareholders as a whole, andnot to satisfy governance scorecards.
The directors remain committed to maintaining high standards ofcorporate governance, which they see as fundamental to dischargingtheir stewardship responsibilities. The board strives to provide the rightleadership, strategic oversight and control environment to produce andsustain the delivery of value to all of the company’s shareholders. Theboard applies integrity, principles of good governance and accountabilitythroughout its activities and each director brings independence ofcharacter and judgement to the role. All of the members of the boardare individually and collectively aware of their responsibilities to thecompany’s stakeholders and the board keeps its performance andcore governance principles under regular review.
This report describes the board’s approach to corporate governanceand explains how it applies the principles of the Combined Code onCorporate Governance adopted by the FRC in June 2008.
2. Application of the Combined CodeThe board applied all of the principles and provisions of the CombinedCode throughout the year ended 31 March 2010, except for one, whichis that the audit committee did not consist solely of independentdirectors. The committee included Mr Devitre, an Altria Group, Inc.(Altria) nominee, who is not independent for the purposes of theCombined Code. This is because the composition of the auditcommittee is governed by our relationship agreement with Altria,which was originally approved by shareholders in 2002 as part of theMiller transaction, and was amended in 2005, again with shareholderapproval, at the time of the Bavaria transaction, and under whichAltria has the right to nominate a director to the audit committee.
The board considers that the composition of the audit committeeremains appropriate, given Altria’s interest as the company’s largestshareholder, and is satisfied that, having regard to the terms of therelationship agreement between the company and Altria, and theexperience and background in financial matters of Mr Devitre, theindependence and effectiveness of the audit committee in dischargingits functions in terms of the Combined Code continue to be considerablyenhanced and not compromised.
3. Board of directors: composition,independence and renewal
3.1 CompositionThe board currently consists of the Chairman (Mr Kahn); nineindependent non-executive directors (including Lord Fellowes, theSenior Independent Director, and Mr Manser, who will take on the role of Senior Independent Director following the 2010 annual generalmeeting at which Lord Fellowes will retire); five non-executive directorswho are not considered to be independent, and two executive directors(Mr Mackay, the Chief Executive, and Mr Wyman, the Chief FinancialOfficer). Biographical information concerning each of the directors isset out on pages 44 and 45.
The size and certain aspects of the composition of the board and ofthe audit, nomination and corporate accountability and risk assurancecommittees are determined primarily by the terms of our relationshipagreements with Altria and with BevCo Ltd (BevCo), a holding companyof the Santo Domingo Group, both of which have been approved bythe shareholders of SABMiller.
The agreement with Altria limits the size of the board to a maximum of15 directors, of whom no more than two are to be executive directors,up to three are to be non-executive directors nominated by Altria, upto two are to be non-executive directors nominated by BevCo, and up to eight are to be non-executive directors appointed by the board.Since 2004, in order to assist the company to apply the provision of the Combined Code that at least half the directors (excluding theChairman) should be independent non-executive directors, Altria has only nominated two directors for appointment to the board and, more recently, has permitted the maximum number of directorsallowed under the relationship agreement to be exceeded. As neitherof the Altria nominees at the start of the year (Mr Bible and Mr Devitre)were members of Altria’s executive management, and noting that theappointment of a third Altria nominee would not impact upon SABMiller’sability to apply that provision of the Combined Code, Altria, during theyear, nominated a third director, Mr Howard Willard, for appointment tothe board. Mr Willard is an executive officer of Altria and was appointedto the board with effect from 1 August 2009. The agreement withBevCo remains unchanged: it allows BevCo to nominate up to two non-executive directors for appointment to the board.
The board is grateful to Altria for its continued indulgence in permittingfor the time being the maximum number of directors allowed under therelationship agreement to be exceeded. Altria and BevCo have eachexercised their right under their respective agreements to nominateone director for appointment to the nomination committee. Both Altriaand BevCo have the right to nominate directors for appointment tothe corporate accountability and risk assurance committee (CARAC)(Altria has exercised this right, BevCo has not), and, as noted above,Altria has the right to nominate one director for appointment to theaudit committee (which it has exercised).
3.2 Independence and attendance at meetingsThe board considers nine directors – Mr Armour, Ms Doherty, LordFellowes, Mr Manser, Mr Manzoni, Mr Morland, Dr Moyo, Mr Pieterseand Mr Ramaphosa – to be independent for the purposes of theCombined Code. The board considers five non-executive directorsnot to be independent for the purposes of the Combined Code: MrBible, Mr Devitre and Mr Willard, as they are nominees of Altria, thecompany’s largest shareholder; and Mr Santo Domingo and Mr Pérez,as they are nominees of the Santo Domingo Group, the company’ssecond largest shareholder. The Combined Code states that the test ofindependence is not appropriate in relation to the Chairman, Mr Kahn,who is a former chief executive of the company.
For ease of reference, directors’ independence status for CombinedCode purposes is indicated in the table on page 52.
Overview
Business review
Go
vernanceFinancial statem
entsS
hareholder inform
ation

52 Corporate governance SABMiller plc Annual Report 2010
Corporate governance continued
3.3 Progressive renewal of the boardThe board continues to believe that its overall composition remainsappropriate, having regard in particular to the independence of characterand integrity of all of its directors, and the experience and skills whichthey bring to their duties.
It is now 11 years since the company listed on the London StockExchange. SABMiller has been fortunate to retain the services ofseveral distinguished non-executive directors – the Chairman, LordFellowes, Mr Manser, Mr Morland and Mr Ramaphosa – for all or mostof that period. They have provided considerable stability to the boardand the board has benefited greatly from the presence of individualswho have over time gained valuable insight into the group, its marketsand the industry. It is with great sadness that we have announced thatLord Fellowes, who has diligently served the board since the companylisted in London in 1999, will be retiring from the board in July 2010after 11 years of distinguished service.
The provisions of the Combined Code require the board to consider,where a director has served for a period of nine years or more, whetherthat director continues to be independent. In respect of each of thethree independent directors who have served the board for more thannine years and are offering themselves for re-election (Mr Manser, Mr Morland and Mr Ramaphosa), the board has considered specificallywhether their length of service has compromised their independence.In each case the board has determined that the director concernedremains independent of character and judgement and that there areno relationships or circumstances which are likely to affect, or couldappear to affect, the director’s judgement, and that the independenceof character and judgement of each of the directors concerned is notin any way affected or impaired by length of service. The board hasalso conducted a rigorous review of the performance of the Chairman,Mr Manser, Mr Morland and Mr Ramaphosa and considers that eachof these directors brings invaluable integrity, wisdom and experienceto the board and that they continue to contribute positively to board
and committee deliberations. Therefore, the board is entirely satisfiedas to the performance and continued independence of judgement ofeach of these directors.
Under the Combined Code, it is recommended that directors who haveserved for more than nine years should stand for annual re-election andaccordingly the Chairman, Mr Manser, Mr Morland and Mr Ramaphosawill offer themselves for re-election for a term of one year.
The board does not consider it to be in the interests of the company orshareholders to require all directors who have served for nine years orlonger to retire at the same time and, as reported in our last corporategovernance report, strongly favours ensuring continuity and stabilitythrough orderly succession.
While recognising the benefits of the experience and stability broughtby its long-standing directors, the board remains committed to theprogressive renewal of board membership, having acted during theyear under review to bring about the appointment of Dr Moyo and,since the year end, the appointment of Mr Armour.
The board considers there is an appropriate balance of skills, collectiveexperience, independence and knowledge among the non-executivedirectors.
4. How the board operates
4.1 Board meetings and attendanceDuring the year there were six board meetings. Individual directors’attendance at board and committee meetings and at the annual generalmeeting is set out in the table below. In the few instances where adirector has not been able to attend a board or committee meeting,any comments which they have had arising out of the papers to beconsidered at that meeting have been relayed in advance to therelevant chairman.
Directors’ attendance (1 April 2009 to 31 March 2010) and committee memberships
Board Audit Remuneration Nomination CARAC
Independent* Attended Possible Attended Possible Attended Possible Attended Possible Attended Possible AGM
J M Kahn N/A 5 6 2 2 2 2 ✓
E A G Mackay N/A 6 6 2 2 ✓
M I Wyman N/A 6 6 2 2 ✓
G C Bible ✕ 6 6 2 2 ✓
D S Devitre ✕ 6 6 4 4 ✓
M E Doherty ✓ 6 6 4 4 ✓
Lord Fellowes ✓ 6 6 4 4 4 5 2 2 2 2 ✓
P J Manser ✓ 5 6 4 4 5 5 2 2 2 2 ✓
J A Manzoni ✓ 5 6 4 5 1 2 ✓
M Q Morland ✓ 6 6 4 4 5 5 2 2 ✓
D F Moyo ✓ 4 4 1 1 ✓
C A Pérez Dávila ✕ 6 6 ✓
R Pieterse ✓ 6 6 2 2 ✓
M C Ramaphosa ✓ 6 6 2 2 1 2 ✓
A Santo Domingo Dávila ✕ 6 6 2 2 ✓
H A Willard ✕ 3 3 1 1 n/a
*Considered to be independent for Combined Code purposes.
Mr Kahn was unable to travel from South Africa to the UK for the board meeting held in April 2009 as he was recuperating following a minor operation.
Mr Manser was unable to attend the board meeting held in April 2009 because of a long-standing prior commitment.
In March 2010 the company held meetings of the board and key committees in South Africa, which had originally been scheduled for February 2010. As a result ofthe rescheduling:
– Mr Manzoni was unable to attend the board, remuneration committee and CARAC meetings as they clashed with a Talisman Energy board meeting in Canada;and
– Mr Ramaphosa was unable to attend the CARAC meeting as a result of a clash with a long-standing prior engagement.
In consequence of the triennial review of the structure of the group’s remuneration policies, an additional meeting of the remuneration committee was called in March2010. Lord Fellowes was unable to attend this meeting due to a prior commitment.
Mr Armour is not included in the table as he joined the board with effect from 1 May 2010.
SABMiller plc Annual Report 2010 Corporate governance 53
4.2 Operation of the boardThe board sets the strategic objectives of the group, determinesinvestment policies, agrees on performance criteria and delegates to management the detailed planning and implementation of thoseobjectives and policies in accordance with appropriate risk parameters.The board monitors compliance with policies and achievement againstobjectives by holding management accountable for its activities throughmonthly and quarterly performance reporting and budget updates. Inaddition, the board receives regular presentations, on a rotational basis,from the divisional managing directors as well as from directors of key group functions (marketing; corporate affairs; supply chain andhuman resources; and legal) enabling it to explore specific issues anddevelopments in greater detail.
Board and committee meetings are held in an atmosphere of intellectualhonesty of purpose, integrity and mutual respect, requiring reporting ofthe highest standard by management and direct, robust and constructivechallenge and debate among board and committee members.
4.3 Matters reserved for the boardThere is a schedule of matters which are dealt with exclusively by theboard. These include approval of financial statements; the group’sbusiness strategy; the annual capital expenditure plan; major capitalprojects; major changes to the group’s management and control structure;material investments or disposals; risk management strategy; socialand environmental policy; and treasury policies.
The board governs through clearly mandated board committees,accompanied by monitoring and reporting systems. Each standingboard committee has specific written terms of reference issued by theboard and adopted in committee. The terms of reference of the audit,remuneration and nomination committees are available on the company’swebsite or, on request, from the Company Secretary. All committeechairmen report orally on the proceedings of their committees at thenext meeting of the board, and the minutes of the meetings of all boardcommittees are included in the papers distributed to board membersin advance of the next board meeting.
4.4 Conflicts of interestThe directors are required to avoid a situation where they have, or can have, a direct or indirect interest that conflicts, or possibly mayconflict, with the company’s interests. As permitted by the CompaniesAct 2006, the articles of association of the company allow the boardto authorise potential conflicts of interest that may arise and to imposesuch limits or conditions as it thinks fit. Procedures are in place for thedisclosure by directors of any such conflicts and for the appropriateauthorisation to be sought if a conflict arises. These procedures havebeen operating effectively.
4.5 The roles of executive and non-executive directorsThe executive directors are responsible for proposing strategy and formaking and implementing operational decisions. Non-executive directorscomplement the skills and experience of the executive directors, bringindependent judgement and contribute to the formulation of strategy,policy and decision-making through their knowledge and experienceof other businesses and sectors.
4.6 Information and trainingThe board and its committees are supplied with full and timely information,including detailed financial information, to enable directors to dischargetheir responsibilities. All directors have access to the advice of theCompany Secretary. Independent professional advice is also availableto directors in appropriate circumstances, at the company’s expense,and the committees have been provided with sufficient resources toundertake their duties. None of the directors has sought independentexternal advice through the company. The Company Secretary isresponsible for advising the board, through the Chairman, on mattersof corporate governance.
Following the appointment of new directors to the board, directors arebriefed on the duties they owe as directors to the company and tailoredinduction programmes are arranged which involve industry-specifictraining and include visits to the group’s businesses and meetings withsenior management, as appropriate. New directors are briefed on internalcontrols at business unit level and are advised of the legal and otherduties they have as directors of a listed company as well as on relevantcompany policies and governance-related matters. The companyarranges for major shareholders to have the opportunity to meet newappointees. The company is also committed to the continuing developmentof directors in order that they may build on their expertise and developan ever more detailed understanding of the business and the marketsin which group companies operate. Members of board committees are encouraged to attend internal and external briefings and courseson aspects of their respective committee specialities and regular updateson relevant legal, regulatory, corporate governance and technicaldevelopments are presented to committee members and, as appropriate,to the board.
4.7 Outside appointmentsNon-executive directors may serve on a number of outside boardsprovided that they continue to demonstrate the requisite commitmentto discharge effectively their duties to SABMiller. The nominationcommittee keeps the extent of directors’ other interests under reviewto ensure that the effectiveness of the board is not compromised. Theboard is satisfied that the Chairman and each of the non-executivedirectors commit sufficient time to the fulfilment of their duties asChairman and directors of the company, respectively.
The board believes, in principle, in the benefit of executive directorsand members of the executive committee accepting non-executivedirectorships of other companies in order to widen their experienceand knowledge for the benefit of the company. Accordingly, executivedirectors and members of the executive committee are permitted toaccept external non-executive board appointments, subject to theagreement of the board, and are allowed to retain any fees receivedfrom such appointments.
Mr Mackay is a non-executive director of Reckitt Benckiser Group plcand is the Senior Independent Director and a member of the remunerationcommittee of that company. He is also a member of the board ofPhilip Morris International Inc. and serves on three of its committees:compensation and leadership development, finance, and productinnovation and regulatory affairs. The board remains entirely satisfiedthat these duties do not impinge on Mr Mackay’s commitment andability to discharge fully his duties to the company, and that his serviceon the boards of two global consumer product companies, whichoperate in many of the developed and emerging markets in which thecompany also has businesses, continues to give Mr Mackay valuableadditional insights and knowledge which enhance his ability to fulfil hisduties as Chief Executive of the company.
During the year, after consultation with the Chairman and the ChiefExecutive and with the agreement of the board, Mr Wyman acceptedappointment as a non-executive director of Nedbank Group Limited, acompany whose shares are listed on the Johannesburg Stock Exchange,and of its subsidiary Nedbank Limited. He is a member of the auditand remuneration committees of Nedbank Group Limited. The board issatisfied that Mr Wyman’s position with Nedbank, a major South Africanfinancial institution, is complementary to his role as Chief Financial Officerand widens his experience and knowledge to the benefit of the company.
Fees earned by Mr Mackay and Mr Wyman from their appointmentsare set out in the remuneration report on page 64.
4.8 Chairman, Chief Executive and Senior Independent DirectorThe roles of Chairman and Chief Executive are separate with responsibilitiesdivided between them. This separation of responsibilities is formalisedin their respective letters of appointment, approved by the board. Therewere no significant changes to the Chairman’s external commitmentsduring the year.
Overview
Business review
Go
vernanceFinancial statem
entsS
hareholder inform
ation
54 Corporate governance SABMiller plc Annual Report 2010
Corporate governance continued
The Chairman is available to consult with shareholders throughout the year and, in the month prior to the annual general meeting, healso invites major shareholders to meet with him to deal with anyissues. The board is kept informed of the views of shareholdersthrough regular updates from the Chairman, the Company Secretaryand the executive directors, as well as through the inclusion in theboard papers of reports on commentaries of, and exchanges with,shareholders and investor bodies.
The Senior Independent Director is currently Lord Fellowes, who willretire from the board in July 2010 and will be succeeded by Mr Manser.Both Lord Fellowes and Mr Manser chair or serve on all four maincommittees of the board, and are therefore well placed to influencethe governance of the company and to meet their responsibilities asSenior Independent Director. The Senior Independent Director servesas an additional contact point for shareholders should they feel thattheir concerns are not being addressed through the normal channels,and is also available to fellow non-executive directors, either individuallyor collectively, to discuss any matters of concern in a forum that doesnot include executive directors or the management of the company.
In the year under review, the Chairman hosted a meeting of the non-executive directors without the executive directors present. The SeniorIndependent Director also held a meeting of non-executive directorswithout the presence of the Chairman at which, among other things,the performance of the Chairman was discussed.
4.9 Board, committee and director performance evaluationA formal evaluation of the performance and effectiveness of the boardand of the audit, remuneration, nomination and corporate accountabilityand risk assurance committees is carried out each year, led by theChairman, with input from the Senior Independent Director and inconsultation with other directors and the Company Secretary. Theprocess was once again facilitated by completion by each director ofa questionnaire, and supplemented by individual meetings betweenthe Chairman and other directors where necessary. The questionnaireis refined each year as appropriate to focus on the progress made inaddressing the key issues raised in the previous performance andeffectiveness evaluation conducted for the previous year. Mr Armourwas not included in this process, which had been completed beforehe joined the board.
The performance of the Chief Executive is reviewed by the remunerationcommittee and this review is shared with and considered by the board.The performance of the Chief Financial Officer is reviewed by the ChiefExecutive and the remuneration committee, and reported on to theboard by the remuneration committee. Each non-executive director’sperformance is evaluated by the Chairman, in consultation with theSenior Independent Director, who in turn consults with the executivedirectors and the Company Secretary. The Chairman’s performance isevaluated against the same criteria by the Senior Independent Director,the non-executive directors and the Company Secretary, taking intoaccount the views of the executive directors.
In considering the contribution of individual directors for the year underreview, performance was assessed against the company’s selectedcriteria of strategy, expertise in their field, ethics and governance factors,commitment, profile, knowledge of the industry and team contribution,culminating in an overall contribution rating. The Chairman was satisfiedthat the performance assessment process and criteria adequatelycovered all of the appraisal factors suggested by the Higgs Report. A rating scale of ‘Poor’, ‘Below Average’, ‘Average’, ‘Above Average’and ‘Fully Satisfactory’ was used in assessing directors’ performanceagainst the criteria. The performance and contribution of each directorwas assessed as either ‘Above Average’ or ‘Fully Satisfactory’, whilerecognising the importance of the different roles played by individualdirectors in bringing a balanced overall view to the board. In reviewingthe performance of the board and its committees, the Chairman andthe Senior Independent Director were aligned in their conclusion that,
measured against the principal duties expected of it, the board (includingby extension its standing and ad hoc sub-committees) continued to operate effectively and to meet in full its obligations to supportmanagement, to monitor performance across a wide area, and tomaintain its strategic oversight.
In a meeting of the Chairman, the Senior Independent Director, thecommittee chairmen and the Company Secretary, the results of theperformance and effectiveness evaluations conducted in respect ofthe board, each of the directors, the Chairman, the Senior IndependentDirector and each of the board’s four standing committees werereviewed. Regarding the board committees, each of the committeechairmen expressed their views regarding the operation of his committeeagainst its terms of reference and the performance and effectivenessof that committee. These views were discussed in an open andconstructive manner with recommendations arising from the discussionsbeing brought forward to the board and the respective committees.The conclusion of this meeting was that the board was balanced andoperated effectively and that the board committees discharged theirduties under which their respective terms of reference operated effectively.Each of the directors and the Chairman had been assessed to beperforming at least satisfactorily and continued to demonstratecommitment to their respective roles and to devote sufficient time to the fulfilment of their duties.
The results of the performance and effectiveness assessment processas outlined above were reviewed in full and approved by the board.The board is satisfied with the developments made in addressing thematters identified in the 2009 evaluation as requiring further consideration,and will address the minor areas identified in the most recent evaluationprocess during the forthcoming period.
At the forthcoming annual general meeting two directors, Mr Devitreand Mr Wyman are required to seek re-election in accordance withthe company’s articles of association, having served for three yearssince their last election. As noted in section 3.3 of this report, theChairman, Mr Manser, Mr Morland and Mr Ramaphosa have eachserved continuously on the board for more than nine years and,accordingly, offer themselves for re-election annually.
The Chairman confirms that each of the directors offering themselvesfor re-election continues to perform effectively and to demonstratecommitment to his role. In addition, the Chairman confirms that, inrelation to each of the directors who will have served for over nine years,the board is satisfied with his performance and has determined thatthe length of their service does not compromise their independence.Lord Fellowes, as Senior Independent Director, confirms that theChairman continues to perform effectively and to demonstratecommitment to his role.
Biographical details of Mr Armour and Mr Willard, who are standingfor election, and of the directors who are standing for re-election, are included on pages 44 and 45 of this report.
4.10 Retirement of directorsNew directors are subject to election at the first annual generalmeeting following their appointment, and directors are subject toretirement and re-election by shareholders every three years. Thereappointment of non-executive directors is not automatic. The boardhas determined that non-executive directors who have served for nineyears will be asked to stand for re-election annually, provided that theboard remains satisfied both with the director’s performance and thatnine years’ continuous service does not compromise the director’scontinuing independence.
4.11 The Company SecretaryThe Company Secretary acts as secretary to the board and its committeesand he attended all meetings during the year under review.
SABMiller plc Annual Report 2010 Corporate governance 55
5. The board’s committees and the executive committee5.1 The executive committeeThe board delegates responsibility for determining and implementing the group’s strategy and for managing the group to the Chief Executive,Mr Mackay, who is supported by the executive committee (excom),which he chairs. Excom members are appointed by Mr Mackay. Theother members of excom are the Chief Financial Officer, Mr Wyman; the divisional managing directors responsible for managing the group’sregional hubs (Africa, Asia, Europe and Latin America); the ManagingDirector of The South African Breweries Limited; the directors of keygroup functions (corporate affairs; marketing; and supply chain andhuman resources); and the General Counsel and Group CompanySecretary. Excom’s purpose is to support the Chief Executive in carryingout the duties delegated to him by the board and, in that context, excomco-ordinates brand and operational execution, delivers strategic plans,budgets and financial reports for the board’s consideration and, throughthe Chief Executive, reports on these matters to the board.
Excom also ensures that effective internal controls are in place andfunctioning, and that there is an effective risk management process in operation throughout the group.
5.2 The disclosure committeeThe disclosure committee consists of the Chairman, the ChiefExecutive, the Chief Financial Officer, the Senior Independent Directorand the Company Secretary or the Deputy Company Secretary. Thefunction of the disclosure committee, in accordance with the group’sinside information policy, is to assure compliance with the Disclosureand Transparency Rules and the Listing Rules, and to ensure that theroutes of communication between excom members, the disclosurecommittee, the General Counsel’s office, the company secretarial officeand investor relations are clear, and provide for rapid escalation to thedisclosure committee and key advisers of any decision regarding potentialinside information, so that the company is able to comply fully with itscontinuing obligations under the Disclosure and Transparency Rulesand the Listing Rules.
5.3 The audit committeeDuring the year under review, the audit committee was chaired by Mr Manser, who has been chairman of the committee since May 2002.Mr Manser qualified as a chartered accountant in 1964 and was madea Fellow of the Institute of Chartered Accountants in 1976. Furtherbiographical information concerning Mr Manser is set out on page 45.
Lord Fellowes (who will step down from the committee upon hisretirement in July 2010), Mr Morland, Mr Devitre and Ms Doherty servedon the committee throughout the year. Mr Morland has been a memberof the committee from its first meeting on 13 April 1999. Lord Felloweswas appointed to the committee on 1 June 2001, Ms Doherty on 1 April 2006 and Mr Devitre on 16 May 2007. The Chairman hasrecent and relevant financial experience, as does Ms Doherty, whowas Chief Financial Officer of Brambles Limited until November 2009and was previously Group International Finance Director of TescoPLC, and Mr Devitre, having until 31 March 2008 held the position ofChief Financial Officer of Altria. Mr Armour, who was appointed to theaudit committee on 1 May 2010, also has recent and relevant financialexperience, being the Chief Financial Officer of Reed Elsevier Groupplc, a position he has held since 1996, and of its parent companies,Reed Elsevier PLC and Reed Elsevier NV. The committee met fourtimes during the year. The external auditors, the Chief Executive, theChief Financial Officer and the Chief Internal Auditor attended eachmeeting by invitation. Other members of the management teamattended as required.
The work of the committee during the year included consideration of the following matters:■ in respect of the year ended 31 March 2009: the annual financial
statements and the preliminary announcement before their submissionto the board for approval, including consideration of the group on agoing concern basis, with particular reference to balance sheet andtreasury considerations;
■ the interim financial statements and interim announcement;■ the accounting treatment of the major business capability programme
being undertaken throughout the group and of the Broad-BasedBlack Economic Empowerment transaction in South Africa;
■ reports from the external auditors on the annual and interim financialstatements; approval of the audit plan and fee proposal for the 2010year end audit;
■ developments in accounting standards and the group’s responses;■ the progress of the year’s internal audit programme and matters arising;■ the effectiveness of the internal audit function and the appointment
of the new Chief Internal Auditor;■ the group’s state of readiness for compliance with section 404 of the
US Sarbanes-Oxley Act (although the company is not an SEC registrantand is not required to comply with Sarbanes-Oxley standards);
■ the results of the group’s bi-annual letters of representation andmanagement’s investigation and follow-up of any instances of non-compliance;
■ the internal control environment and risk management systems andthe group’s statement on internal control systems, prior to endorsementby the board;
■ material legal developments;■ the effectiveness of the external auditors and the recommendation
to the board of the reappointment of PricewaterhouseCoopers LLPas the external auditors;
■ the length of tenure of the audit engagement partner and whether toseek an extension of that tenure from PricewaterhouseCoopers LLP(as detailed in section 6 of this report);
■ the policy on auditor independence and non-audit services; and■ its terms of reference and effectiveness.
The audit committee reports its activities and makes recommendationsto the board. During the year, the audit committee discharged itsresponsibilities as they are defined in the committee’s terms of reference,and has been engaged in ensuring that appropriate standards ofgovernance, reporting and compliance are being met. The committeehas advised the board on issues relating to the application of accountingstandards as they relate to published financial information.
The Chief Internal Auditor has direct access to the committee, primarilythrough its chairman. The committee has access to subsidiary companyinternal audit leadership. The reports of the divisional audit committeesare also available to the audit committee.
During the year, the committee met with the external auditors and with the Chief Internal Auditor without management being present.
In addition to the review of the committee’s performance, terms ofreference and effectiveness led by the Chairman of the board, thecommittee critically reviewed its own performance during the year by means of a questionnaire which each member of the committeecompleted independently. The committee chairman then reviewed theresponses and conducted one-to-one discussions with members ofthe committee where he felt it was necessary. The results of the self-assessment and any action plans arising were then reported to the board.
5.4 The nomination committeeDuring the year, the nomination committee was chaired by Mr Kahn.Lord Fellowes, Mr Bible, Mr Manser, Mr Morland, Mr Ramaphosa andMr Santo Domingo were members of this committee throughout theyear. Mr Manzoni, an independent non-executive director, was appointedto the committee with effect from 19 May 2010. Lord Fellowes willstep down from the committee upon his retirement in July 2010. Thecommittee is empowered to consider the composition of the boardand its committees. It is asked to consider the retirement, appointmentand replacement of directors, and is required to make appropriaterecommendations to the board.
The nomination committee has continued to evaluate the balance ofskills, knowledge and experience of the board and is committed to theprogressive renewal of the board through orderly succession. Appropriatesuccession plans for the non-executive directors, for the executivedirectors and for senior management were also kept under review.
Overview
Business review
Go
vernanceFinancial statem
entsS
hareholder inform
ation
56 Corporate governance SABMiller plc Annual Report 2010
Corporate governance continued
Where non-executive vacancies arise, the committee may use theservices of external consultants in order to identify suitable candidatesfor the board to consider. Candidates are shortlisted for considerationby the nomination committee on the basis of their relevant corporateor professional skills and experience. Strong shortlists for the positionsfilled recently by Dr Moyo and Mr Armour, both of whom the committeeregarded as outstanding candidates, were derived after extensiveconsultation. An external search firm was not involved in theseappointments, the committee’s recent engagement of a leading searchfirm for a similar position not having yielded any suitable candidates. In accordance with the terms of the relationship agreement with Altria,the only executive directors appointed to the board are the ChiefExecutive and the Chief Financial Officer.
5.5 The remuneration committeeDuring the year, the remuneration committee consisted entirely ofindependent directors: Mr Morland (Chairman), Lord Fellowes, MrManzoni and Mr Manser. Mr Armour, an independent non-executivedirector was appointed to the committee with effect from 19 May2010. Lord Fellowes will step down from the committee upon hisretirement in July 2010.
The committee is empowered by the board to set short-term andlong-term remuneration for the executive directors and members ofthe executive committee. More generally, the committee is responsiblefor the assessment and approval of a broad remuneration strategy for the group and for the operation of the company’s share-basedincentive plans. This includes determination of short-term and long-term incentives for executives across the group.
The remuneration committee has implemented its strategy of ensuringthat employees and executives are rewarded for their contribution tothe group’s operating and financial performance at levels which takeaccount of industry, market and country benchmarks. To ensure thatthe executives’ goals are aligned to those of the company, shareincentives are considered to be critical elements of executive incentivepay. During the year, the committee engaged the services of consultants,Kepler Associates. These consultants have no other connection withthe company. At levels below the company’s executive committee, thecompany’s management consults, among others, Hay Consulting andTowers Watson, on a project basis.
Specifically, during the year the work of the remuneration committeeincluded:■ reviewing trends in global executive remuneration and governance;■ conducting the triennial review of the structure of the group’s
remuneration policies, and consulting with the group’s majorshareholders and institutional investor representative bodies on the changes identified by the committee as desirable;
■ reviewing the key elements and design of the group’s long-termincentive schemes (including peer comparator group composition);
■ reviewing global benchmarking methodologies and outcomes;■ reviewing and approving performance hurdles for short and
long-term incentive awards;■ reviewing and approving long-term incentive awards for executive
committee members;■ reviewing and approving total remuneration for the executive
directors and executive committee members; and■ reviewing and approving the draft remuneration report.
More details of the company’s remuneration policy can be found in the remuneration report on pages 59 to 67.
5.6 The corporate accountability and risk assurancecommittee (CARAC)Lord Fellowes chaired the committee throughout the year. Mr Kahn,Mr Mackay, Mr Manser, Mr Manzoni, Mr Pieterse, Mr Ramaphosa and Mr Wyman served as members for the entire period. Dr Moyo and Mr Willard joined the committee on 10 September 2009, and Dr Moyo willsucceed Lord Fellowes as Chair of the committee upon his retirement
in July 2010. Additionally, the Director of Corporate Affairs, Ms Clark,met regularly with the chairman of CARAC to discuss implementationand planning issues, and attended all meetings of the committee.
The objective of CARAC is to assist the board in the discharge of its responsibilities in relation to corporate accountability, includingsustainable development, corporate social responsibility, corporatesocial investment and ethical commercial behaviour. More details ofthe committee’s activities can be found in the sustainable developmentreview section of this report and in the company’s separate SustainableDevelopment Report which is available on the company’s website and,upon request, in hard copy.
During the year, the CARAC focused on company-specific and industryissues which are critical to protecting the company’s licence to operate.
6. Relationship with auditorsPricewaterhouseCoopers were appointed as auditors of the company on8 February 1999, subsequently becoming PricewaterhouseCoopersLLP (PwC) in 2003.
The company has in place a formal policy on auditor independenceand non-audit services, with which the external auditors are required tocomply, to ensure that the independence of the auditors is not impairedby the nature of non-audit work. The policy stipulates work which ispermitted or not permitted to be performed by the auditors, and providesfor appropriate approval and oversight processes. As a further safeguard,PwC confirm in a formal report to the audit committee that processesto ensure compliance with this policy are in place and that theseprocesses are monitored regularly. This report includes a statementthat, in their opinion, PwC believe that the nature of its non-auditservices has not impaired the audit of the company. Note 3 to theconsolidated financial statements has a breakdown of non-audit servicesprovided to the group by the auditors for the year under review.
The audit committee is satisfied that, for the period under review, theindependence of the auditors has not been affected by the provisionof non-audit services. Fees in respect of non-audit services providedby PwC were primarily related to services relating to taxation, ourmajor business capability programme and to transaction services.
The committee has also implemented a formal system for the reviewof the effectiveness of the external auditors. This process involves the external auditors presenting to the committee their proposed audit strategy followed by the output of their initial discussions withmanagement. At the audit committee meeting in May, the externalauditors present the output of their detailed year-end work. In makingits assessment of external auditor effectiveness, the committee reviewsthe audit engagement letters before signature by management, reviewsthe external auditors’ summary of group and subsidiary issues andmanagement’s response to the summary, and conducts an overallreview of the effectiveness of the external audit process and the externalauditors. This review is facilitated by the use of templates that rateeffectiveness across 18 key criteria. Following the review, the committeemakes a recommendation to the Board on the reappointment of theexternal auditors by the shareholders. The committee has not adopteda policy on tendering frequency since it prefers to conduct an annualassessment of the auditors’ effectiveness; there are no contractualobligations restricting the company’s choice of external auditor.
With the signing of the audit opinion in this Annual Report, the audit engagement partner has completed five years in this role. Thecommittee has requested PwC (pursuant to the Auditing PracticesBoard’s revised ethical standard ES 3 – Long association with theaudit engagement) to agree to an extension of the audit engagementpartner’s tenure by one year. This was sought in order to safeguardthe quality of the audit, primarily due to the significant changes to keybusiness processes arising from implementation of the major businesscapability programme being undertaken throughout the group, andthe consequent shift in the profile of operational, tax, compliance andreporting risks. PwC has acceded to this request.
SABMiller plc Annual Report 2010 Corporate governance 57
7. Relations with shareholdersDuring the year, the company has continued to promote dialogue with its major institutional shareholders. All shareholders were againencouraged to attend the annual general meeting held in July 2009,which provides shareholders with the opportunity to ask questions of the board and chairmen of all the board committees. Similarly, all shareholders were encouraged to attend the General and CourtMeetings held in January 2010 at which they were asked to considerour Broad-Based Black Economic Empowerment transaction. At the meetings, all resolutions were put to a poll, with the results beingpublished on the Regulatory News Service and on the company’swebsite. A transcript of the General and Court Meetings was alsomade available on the company’s website.
Alongside the facilities offered by the Company Secretary’s department,the company maintains a dedicated investor relations function whichreports to the Director of Corporate Affairs. The investor relations teambuilds and maintains long-term relationships with institutional investorsand analysts and, in partnership with our corporate and divisionalmanagement teams and within the scope of regulatory constraints,gives presentations on regional business outlooks and strives to ensurethat these are understood across the global equity markets in subsequentone-to-one meetings with investors. Occasional business site visits arealso arranged. Dialogue on socially responsible investment is handledby the Head of Sustainable Development in the corporate affairsdepartment, who undertakes focused briefings with interested investorsand stakeholders.
In addition to scheduled management-led programmes in whichexecutives interact with investors and analysts, the Chairman has,independently, initiated formal contact with all shareholders (or theirrepresentatives) holding more than 1% of the issued share capital ofthe company. The purpose of this contact is to enable the Chairmanto address any queries shareholders may have regarding the governanceof the company or non-operational aspects of company strategy. It isalso, more broadly, designed to give the board a greater awareness ofshareholder concerns. During the year, this invitation was taken up bytwo shareholders and, following the year end, the Chairman and theSenior Independent Director, accompanied by Mr Manser and theCompany Secretary, met with representatives from the investmentcommittee of the Association of British Insurers. Alongside the Chairman,the Senior Independent Director is also available to discuss issueswith shareholders and views expressed will be communicated by theChairman to the board. During the year, one shareholder requested ameeting with the Senior Independent Director. As part of this initiative,and recognising that given the geographic spread of our shareholdersit is not possible for all shareholders to attend our general meetings,the Chairman offers to meet with significant shareholders in the monthbefore the annual general meeting specifically to deal with issues arisingfrom the annual report and notice of the annual general meeting. Noshareholders took up this invitation in 2009. All non-executive directorsof the company are invited to participate in this process. Institutionaland shareholder comment on the Annual Report is conveyed to theboard through the audit and remuneration committees and theCompany Secretary.
In addition, the remuneration committee this year conducted an extensiveconsultation process with major shareholders and institutional investorrepresentative bodies to discuss the outcome of the committee’striennial review of the structure of the group’s remuneration policies,as more fully described in the remuneration report.
8. Risk managementThe group’s risk management system is subject to regular review toensure compliance with the requirements of the Combined Code andthe Turnbull Guidance (2005) on internal control and risk management.
8.1 Risk and the board of directorsThe directors are ultimately responsible for the group’s risk managementsystem and for reviewing its effectiveness. The risk managementsystem is designed to manage, rather than eliminate, the risk of failure
to achieve business objectives and there is an ongoing process in placefor identifying, assessing, managing, monitoring and reporting on thesignificant risks faced by individual group companies and by the groupas a whole. This process has been in place for the year under review upto the approval of the Annual Report and Accounts. The principal risksand uncertainties facing the group are set out on pages 24 and 25.
8.2 Executive committeeExcom has specific responsibility as the risk management committeefor the group’s system of risk management. Excom reviews the group’ssignificant risks and subsequently reports to the board on materialchanges and the associated mitigating actions.
In accordance with the Turnbull Guidance (2005), reviews on theeffectiveness of the risk management system were carried out by the risk management committee in April and September 2009 and in April 2010.
8.3 Enterprise-wide risk managementExcom views the careful and appropriate management of risk as a keymanagement role. Managing business risk to deliver opportunities is a key element of all our business activities. This is undertaken using a practical and flexible framework which provides a consistent andsustained approach to risk evaluation. The business risks, which maybe strategic, operational, financial, environmental or concerning thegroup’s reputation, are understood and visible. The business contextdetermines in each situation the level of acceptable risk and controls.We continue to seek improvement in the management of risk bysharing best practice throughout the organisation.
Key features of the group’s system of risk management are:■ group statements on strategic direction, ethics and values;■ clear business objectives and business principles;■ an established risk policy;■ a continuing process for identification and evaluation of significant
risks to the achievement of business objectives;■ management processes in place to mitigate significant risks to
an acceptable level;■ ongoing monitoring of significant risks and internal and external
environmental factors that may change the group’s risk profile; and■ a regular review by the group of both the type and amount of external
insurance that it buys, bearing in mind the availability of such cover,its cost and the likelihood and magnitude of the risks involved.
In addition to excom’s bi-annual reports to the board on key risks,there is a process of regular reporting to the board through the auditcommittee on the status of the risk management process. Ourapproach has been strengthened during 2010 by further integratingstrategic planning, internal audit and other risk control specialists intoline management’s risk processes and simplifying risk reporting.
Key reports include those that identify, assess and monitor strategicand operational risks in each division and on a group basis.
9. Internal controlThe Turnbull Guidance sets out best practice on internal control forUK listed companies to assist them in assessing the application of the Combined Code’s principles and compliance with the CombinedCode’s provisions with regard to internal control.
The group’s systems of internal control are designed and operated tosupport the identification, evaluation and management of risks affectingthe group, including in relation to the financial reporting process andthe preparation of consolidated accounts, and the business environmentin which it operates. As such, they are subject to continuous review as circumstances change and new risks emerge. The company hasmaintained a state of readiness for compliance with s404 of theSarbanes-Oxley Act through the Internal Financial Control (IFC) programme.This is a voluntary initiative, and has led to a further strengthening ofinternal control systems and processes within the group.
Overview
Business review
Go
vernanceFinancial statem
entsS
hareholder inform
ation
58 Corporate governance SABMiller plc Annual Report 2010
Corporate governance continued
Key features of the systems of internal control are:■ the risk management system described in the preceding section;■ written policies and procedures within our businesses, which are
detailed in policy manuals;■ clearly defined lines of accountability and delegation of authority;■ identification and regular testing of key financial controls through
the IFC programme;■ key policies employed in managing operating risk involve
segregation of duties, transaction authorisation, monitoring, financial and managerial and comprehensive reporting and analysis against approved standards and budgets;
■ group treasury operations which manage exposure to interest rate, counterparty, liquidity and currency transaction risks and co-ordinate the activities of group companies in this area. Treasurypolicies, risk limits and monitoring procedures are reviewed regularly by the audit committee on behalf of the board;
■ a group tax risk and tax operating framework which forms the basis of tax governance across the group and is managed by a group tax function which monitors tax risk and implementsstrategies and procedures to control it;
■ minimisation of operating risk by using appropriate infrastructure,controls, systems and people throughout the businesses; and
■ business continuity planning, including preventative and contingencymeasures, back-up capabilities and the purchase of insurance.
Assurance on compliance with systems of internal control and on their effectiveness is obtained through regular management reviews,review of key financial controls, internal audit reviews and qualityassurance described in section 10 below, testing of certain aspects of the internal financial control systems by the external auditors duringthe course of their statutory examinations and regular reports to the audit committee by the external auditors. The group’s divisionalFinance, Control and Assurance committees consider the results ofthese reviews to confirm that controls are functioning and to ensurethat any material breakdowns and remedial actions have beenreported to the appropriate boards of directors. This does not apply in respect of the group’s associated undertakings or joint ventures.
At the half year and at the year end the divisional managing directorsand finance directors of all the group’s operations, and each of thegroup’s functional directors, are required to submit formal letters ofrepresentation on controls, compliance and notification of continuingor potential material financial and legal exposures.
These letters form the subject of reports to the audit committee. They cover all subsidiary companies but do not cover joint ventures or associates (except for MillerCoors and Tsogo Sun, which submittailored letters of representation). Where material, group executives sit on the boards of associated companies. Directors and members of the executive committee also make annual written declarations of interests and are obliged to report without delay any potential or actual conflicts of interest which may arise.
The directors are responsible for the group’s systems of internal control and for reviewing their effectiveness annually. The board has conducted a review of the effectiveness of the group’s internalcontrols covering material financial, operational and compliancecontrols and risk management systems for the year under review.Necessary actions have been, or are being, taken to remedy anysignificant weaknesses identified from the board’s review of theinternal control system. The systems of internal control are designed to manage, rather than eliminate, the risk of failure to achieve businessobjectives and can provide reasonable, but not absolute, assuranceagainst material misstatement or loss. In reviewing these, the boardhas taken into account the results of all the work carried out byinternal and external auditors.
The board, with advice from the audit committee, has completed its annual review of the effectiveness of the system of internal controlfor the period since 1 April 2009 in accordance with the TurnbullGuidance, and is satisfied that this system is in accordance with thatGuidance and that it has been in place throughout the year underreview and up to the date of this report.
10. Internal auditThe global internal audit function consists of local and regional internal audit functions operating in each of the group’s principalbusiness units, centrally co-ordinated by the group internal audit team and led by the Chief Internal Auditor. In keeping with the group’sdecentralised collaborative management structure, the local internalaudit functions report to local senior finance management but havedirect access to local audit committees, group internal audit and the Chief Internal Auditor. The local and regional audit functions havecontinuous, unfettered interface with the group internal audit function,which reports directly to the Chief Financial Officer and has directaccess to the audit committee through the Chief Internal Auditor.Internal audit activities are performed either by teams of appropriate,qualified and experienced employees, or through the engagement ofexternal practitioners upon specified and agreed terms with equivalentaccess. The Chief Internal Auditor prepares formal reports for eachaudit committee meeting as to the consolidated activities and keyfindings of the global internal audit function.
The global internal audit function utilises a standardised group-wideinternal audit methodology and has implemented a formal globalquality assurance and effectiveness programme. Accordingly, detailedquality review assessments are performed with regard to the local and regional internal audit teams, to ensure compliance with definedquality and performance measures. This process provides a basis for the annual review of the effectiveness of the global internal auditfunction and results in a formal report (prepared by the Chief InternalAuditor) to the audit committee to support the committee’s formalannual assessment of the effectiveness of internal audit. In addition,periodic reviews by independent external consultants are undertakenwhen deemed necessary by the audit committee.
The audit committee has therefore satisfied itself that adequate,objective internal audit assurance standards and procedures existwithin the group, and that continuous improvement in the quality and objectivity of the global internal audit function remains a primaryobjective of the department.
11. Whistleblowing measuresAll employees in subsidiaries within the group have the opportunity to make confidential disclosures about suspected impropriety andwrongdoing. The Company Secretary or the Deputy Company Secretary,in consultation with the Chief Internal Auditor where appropriate,decide on the appropriate method and level of investigation. The auditcommittee is notified of all material disclosures made and receivesreports on the results of investigations and actions taken. The auditcommittee has the power to request further information, conduct itsown inquiries or order additional action as it sees fit.
John DavidsonGeneral Counsel and Group Company Secretary For and on behalf of the board of SABMiller plc
3 June 2010
SABMiller plc Annual Report 2010 Remuneration report 59
Remuneration report
IntroductionThis report and the recommendations of the remuneration committeehave been approved by the board and will be submitted to shareholdersfor approval at the 2010 annual general meeting. This report complieswith the requirements of the Large and Medium-sized Companies and Groups (Accounts and Reports) Regulations 2008. Throughout the year ended 31 March 2010 the company applied the provisions of the Combined Code relating to remuneration.
Information not subject to audit
Composition and terms of reference of theremuneration committeeDuring the year ended 31 March 2010, the members of the committeewere Mr Morland (Chairman), Lord Fellowes, Mr Manser and Mr Manzoni.Mr Bible, Mr Willard, Mr Santo Domingo and Mr Kahn joined meetingsas observers. Also present were the Chief Executive, Mr Mackay, theGeneral Counsel and Company Secretary, Mr Davidson, the DeputyCompany Secretary, Mr Shapiro, and the Group Head of Compensationand Benefits, Mr Scoones, except when their own remuneration wasdiscussed. Mr Armour joined the committee on 19 May 2010.
The committee deals with the remuneration of the executive directorsand other members of the executive committee, as well as approvingall grants under the company’s share incentive plans, in accordancewith terms of reference approved by the board. Consideration is alsogiven to the company’s group-wide compensation and incentivepolicies to ensure alignment. When setting the remuneration ofexecutive directors, the committee has the discretion to considercorporate performance on environmental, social and governanceissues, and has oversight to ensure that the incentive structure forsenior management does not raise environmental, social or governanceissues by inadvertently motivating irresponsible or short-term behaviour.
AdvisersIn the course of its deliberations, the committee considered the views of the Chief Executive on the remuneration and performance of the members of the executive committee. The Company Secretaryand the Group Head of Compensation and Benefits also providedinformation to the committee on the co-ordination of global paypolicies, expatriate and local pay for international deployments, equity usage through share incentive plans and on legal, regulatoryand governance issues.
Kepler Associates has been appointed by the committee to provideadvice on long-term incentive design, information on current marketpractices, and metrics on performance conditions, specifically relativeTSR and other remuneration matters. Kepler Associates does notprovide any other advice or services to the group.
Review of the group’s remuneration policiesThe committee last reviewed the overall structure of the group’sremuneration policies in 2006, when it adopted policies which weredesigned to target executive directors’ total compensation at or nearthe comparative upper quartile if the group achieved upper quartileperformance. In accordance with its expressed intention to review the structure of the group’s remuneration policies at approximatelythree-yearly intervals, the committee conducted a detailed reviewduring the second half of the year ended 31 March 2010 to ensurethat remuneration structures remained appropriate and continued to focus on alignment with shareholders’ interests and linkage toSABMiller’s long-term strategic goals. The committee was guided bythe philosophy that shareholder interest and shareholder alignmentshould be placed at the forefront, alongside the need to reaffirm thatsenior executives, within the bounds of appropriate governancelimitations, would have confidence that the incentive plans woulddeliver superior reward for superior performance, and little or noincentive reward for average or under-performance.
On balance, the committee concluded that its policy of agreeing atotal remuneration package for each executive director comprising an annual base salary, a short-term incentive in the form of an annualcash bonus, long-term incentives through participation in share incentiveplans, pension contributions, other usual security and health benefits,and benefits in kind, continued to be appropriate. The committeeconcluded that there was no requirement to change its approach tothe setting of base salaries, pensions and other benefits, which wereintended to establish a level of fixed pay which is competitive withappropriate global comparators. The committee also concluded thatthe variable pay elements provided by short-term and long-termincentives (LTI) should continue to form a significant proportion of executivedirectors’ pay, and that most aspects of the current incentive designworked well together to align the interests of the executive directorsand executive committee members with the interests of shareholders.
However, the committee determined that it could further strengthenalignment of senior executives with shareholder interests by modifyingthe TSR-based performance share component of the overall package.The committee proposed that the relative TSR performance conditionshould be replaced with a new TSR-based performance condition, to be communicated to shareholders and senior executives as a‘Value Sharing’ performance condition, under which executives will be given the right to receive a pre-defined number of shares for each£10 million of additional shareholder value delivered over the life of an award. Additional shareholder value is defined as growth in marketcapitalisation of SABMiller (plus net equity cash flows) in excess of theperformance of the weighted median of a group of peer companies.To the extent that surplus value above the median is created, executiveswill be able to exercise these awards at quarterly intervals betweenyears three and five of the performance period. However, unlike theexisting TSR-based performance condition, under which 25% of theawards vest on reaching the median performance of the relevantcomparator group and 100% vest on reaching upper quartileperformance, no awards will vest at median performance under thenew performance condition. On the other hand, executives will be ableto continue earning additional shares to the extent that performanceexceeds the upper quartile (with an overall cap at the point at whichthe out-performance above the median equals the company’s initialmarket capitalisation). In effect, the committee decided that executiveswould receive no value for performance that is at median, and lessvalue for performance that is just above median, but would have theopportunity to earn more for performance which exceeds the upperquartile or upper decile.
The principles underlying the proposed new Value Sharing conditionwere reviewed with the company’s two largest shareholders, holdingbetween them approximately 43% of the company’s shares, whoexpressed their support for the proposed change. The committeethen commenced a process of consultation and discussion by writing to the company’s next 10 largest shareholders and to selectedinstitutional investor representative bodies to set out the details of theproposed change, to provide them with the opportunity to commenton the proposal, and to offer to discuss any concerns or questionswhich shareholders might have. Three shareholders accepted theinvitation to engage in discussions, and each expressed themselvesto be broadly supportive of the proposed change in principle, whileoffering differing and sometimes conflicting views on a number ofaspects either of the proposed change or other aspects of the group’swider remuneration structure. In addition, one shareholder submittedwritten comments, and the Association of British Insurers submittedwritten comments on behalf of a number of its members collectively.All of the points raised in discussions and in writing were consideredin detail by the committee, and the committee is grateful to thoseshareholders for taking the time to engage with the committee and for providing their input.
Overview
Business review
Go
vernanceFinancial statem
entsS
hareholder inform
ation
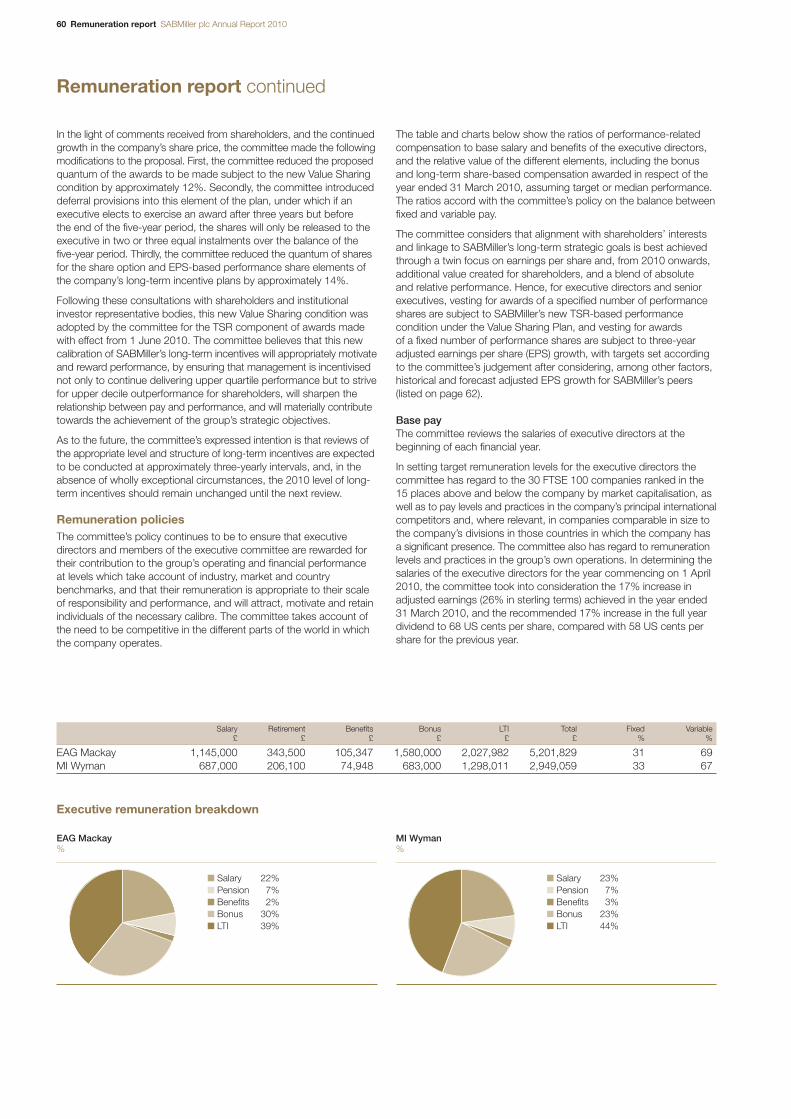
60 Remuneration report SABMiller plc Annual Report 2010
Remuneration report continued
In the light of comments received from shareholders, and the continuedgrowth in the company’s share price, the committee made the followingmodifications to the proposal. First, the committee reduced the proposedquantum of the awards to be made subject to the new Value Sharingcondition by approximately 12%. Secondly, the committee introduceddeferral provisions into this element of the plan, under which if anexecutive elects to exercise an award after three years but before the end of the five-year period, the shares will only be released to theexecutive in two or three equal instalments over the balance of thefive-year period. Thirdly, the committee reduced the quantum of sharesfor the share option and EPS-based performance share elements ofthe company’s long-term incentive plans by approximately 14%.
Following these consultations with shareholders and institutionalinvestor representative bodies, this new Value Sharing condition wasadopted by the committee for the TSR component of awards madewith effect from 1 June 2010. The committee believes that this newcalibration of SABMiller’s long-term incentives will appropriately motivateand reward performance, by ensuring that management is incentivisednot only to continue delivering upper quartile performance but to strivefor upper decile outperformance for shareholders, will sharpen therelationship between pay and performance, and will materially contributetowards the achievement of the group’s strategic objectives.
As to the future, the committee’s expressed intention is that reviews ofthe appropriate level and structure of long-term incentives are expectedto be conducted at approximately three-yearly intervals, and, in theabsence of wholly exceptional circumstances, the 2010 level of long-term incentives should remain unchanged until the next review.
Remuneration policiesThe committee’s policy continues to be to ensure that executivedirectors and members of the executive committee are rewarded fortheir contribution to the group’s operating and financial performanceat levels which take account of industry, market and countrybenchmarks, and that their remuneration is appropriate to their scaleof responsibility and performance, and will attract, motivate and retainindividuals of the necessary calibre. The committee takes account ofthe need to be competitive in the different parts of the world in whichthe company operates.
The table and charts below show the ratios of performance-relatedcompensation to base salary and benefits of the executive directors,and the relative value of the different elements, including the bonusand long-term share-based compensation awarded in respect of theyear ended 31 March 2010, assuming target or median performance.The ratios accord with the committee’s policy on the balance betweenfixed and variable pay.
The committee considers that alignment with shareholders’ interestsand linkage to SABMiller’s long-term strategic goals is best achievedthrough a twin focus on earnings per share and, from 2010 onwards,additional value created for shareholders, and a blend of absolute and relative performance. Hence, for executive directors and seniorexecutives, vesting for awards of a specified number of performanceshares are subject to SABMiller’s new TSR-based performancecondition under the Value Sharing Plan, and vesting for awards of a fixed number of performance shares are subject to three-yearadjusted earnings per share (EPS) growth, with targets set accordingto the committee’s judgement after considering, among other factors,historical and forecast adjusted EPS growth for SABMiller’s peers(listed on page 62).
Base payThe committee reviews the salaries of executive directors at thebeginning of each financial year.
In setting target remuneration levels for the executive directors thecommittee has regard to the 30 FTSE 100 companies ranked in the15 places above and below the company by market capitalisation, aswell as to pay levels and practices in the company’s principal internationalcompetitors and, where relevant, in companies comparable in size tothe company’s divisions in those countries in which the company hasa significant presence. The committee also has regard to remunerationlevels and practices in the group’s own operations. In determining thesalaries of the executive directors for the year commencing on 1 April2010, the committee took into consideration the 17% increase inadjusted earnings (26% in sterling terms) achieved in the year ended31 March 2010, and the recommended 17% increase in the full yeardividend to 68 US cents per share, compared with 58 US cents pershare for the previous year.
Salary Retirement Benefits Bonus LTI Total Fixed Variable£ £ £ £ £ £ % %
EAG Mackay 1,145,000 343,500 105,347 1,580,000 2,027,982 5,201,829 31 69MI Wyman 687,000 206,100 74,948 683,000 1,298,011 2,949,059 33 67
Executive remuneration breakdown
■ Salary 22%■ Pension 7%■ Benefits 2%■ Bonus 30%■ LTI 39%
EAG Mackay%
■ Salary 23%■ Pension 7%■ Benefits 3%■ Bonus 23%■ LTI 44%
MI Wyman%
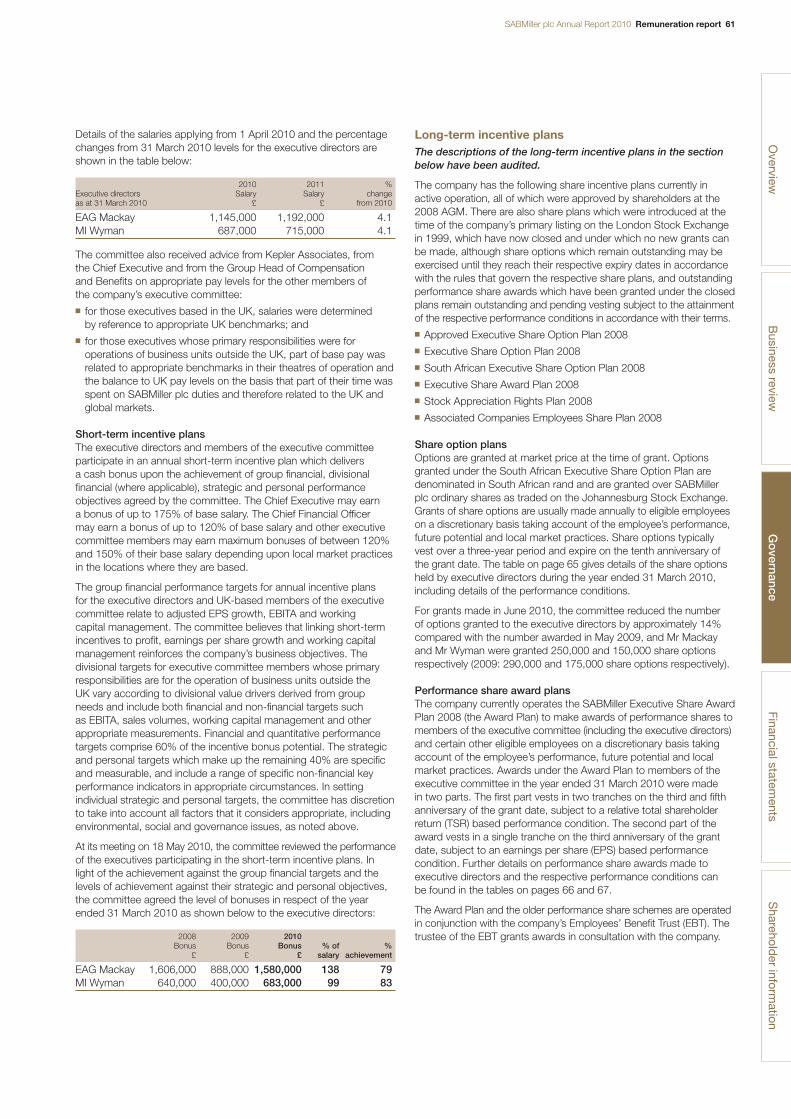
SABMiller plc Annual Report 2010 Remuneration report 61
Details of the salaries applying from 1 April 2010 and the percentagechanges from 31 March 2010 levels for the executive directors areshown in the table below:
2010 2011 %Executive directors Salary Salary changeas at 31 March 2010 £ £ from 2010
EAG Mackay 1,145,000 1,192,000 4.1MI Wyman 687,000 715,000 4.1
The committee also received advice from Kepler Associates, from the Chief Executive and from the Group Head of Compensation and Benefits on appropriate pay levels for the other members of the company’s executive committee:■ for those executives based in the UK, salaries were determined
by reference to appropriate UK benchmarks; and■ for those executives whose primary responsibilities were for
operations of business units outside the UK, part of base pay wasrelated to appropriate benchmarks in their theatres of operation andthe balance to UK pay levels on the basis that part of their time wasspent on SABMiller plc duties and therefore related to the UK andglobal markets.
Short-term incentive plansThe executive directors and members of the executive committeeparticipate in an annual short-term incentive plan which delivers a cash bonus upon the achievement of group financial, divisionalfinancial (where applicable), strategic and personal performanceobjectives agreed by the committee. The Chief Executive may earn a bonus of up to 175% of base salary. The Chief Financial Officer may earn a bonus of up to 120% of base salary and other executivecommittee members may earn maximum bonuses of between 120%and 150% of their base salary depending upon local market practicesin the locations where they are based.
The group financial performance targets for annual incentive plans for the executive directors and UK-based members of the executivecommittee relate to adjusted EPS growth, EBITA and working capital management. The committee believes that linking short-termincentives to profit, earnings per share growth and working capitalmanagement reinforces the company’s business objectives. Thedivisional targets for executive committee members whose primaryresponsibilities are for the operation of business units outside the UK vary according to divisional value drivers derived from groupneeds and include both financial and non-financial targets such as EBITA, sales volumes, working capital management and otherappropriate measurements. Financial and quantitative performancetargets comprise 60% of the incentive bonus potential. The strategicand personal targets which make up the remaining 40% are specificand measurable, and include a range of specific non-financial keyperformance indicators in appropriate circumstances. In settingindividual strategic and personal targets, the committee has discretionto take into account all factors that it considers appropriate, includingenvironmental, social and governance issues, as noted above.
At its meeting on 18 May 2010, the committee reviewed the performanceof the executives participating in the short-term incentive plans. Inlight of the achievement against the group financial targets and thelevels of achievement against their strategic and personal objectives,the committee agreed the level of bonuses in respect of the yearended 31 March 2010 as shown below to the executive directors:
2008 2009 2010Bonus Bonus Bonus % of %
£ £ £ salary achievement
EAG Mackay 1,606,000 888,000 1,580,000 138 79MI Wyman 640,000 400,000 683,000 99 83
Long-term incentive plansThe descriptions of the long-term incentive plans in the sectionbelow have been audited.
The company has the following share incentive plans currently inactive operation, all of which were approved by shareholders at the2008 AGM. There are also share plans which were introduced at thetime of the company’s primary listing on the London Stock Exchangein 1999, which have now closed and under which no new grants canbe made, although share options which remain outstanding may beexercised until they reach their respective expiry dates in accordancewith the rules that govern the respective share plans, and outstandingperformance share awards which have been granted under the closedplans remain outstanding and pending vesting subject to the attainmentof the respective performance conditions in accordance with their terms.■ Approved Executive Share Option Plan 2008■ Executive Share Option Plan 2008■ South African Executive Share Option Plan 2008■ Executive Share Award Plan 2008■ Stock Appreciation Rights Plan 2008■ Associated Companies Employees Share Plan 2008
Share option plansOptions are granted at market price at the time of grant. Optionsgranted under the South African Executive Share Option Plan aredenominated in South African rand and are granted over SABMillerplc ordinary shares as traded on the Johannesburg Stock Exchange.Grants of share options are usually made annually to eligible employeeson a discretionary basis taking account of the employee’s performance,future potential and local market practices. Share options typicallyvest over a three-year period and expire on the tenth anniversary ofthe grant date. The table on page 65 gives details of the share optionsheld by executive directors during the year ended 31 March 2010,including details of the performance conditions.
For grants made in June 2010, the committee reduced the number of options granted to the executive directors by approximately 14%compared with the number awarded in May 2009, and Mr Mackayand Mr Wyman were granted 250,000 and 150,000 share optionsrespectively (2009: 290,000 and 175,000 share options respectively).
Performance share award plansThe company currently operates the SABMiller Executive Share AwardPlan 2008 (the Award Plan) to make awards of performance shares tomembers of the executive committee (including the executive directors)and certain other eligible employees on a discretionary basis takingaccount of the employee’s performance, future potential and localmarket practices. Awards under the Award Plan to members of theexecutive committee in the year ended 31 March 2010 were made in two parts. The first part vests in two tranches on the third and fifthanniversary of the grant date, subject to a relative total shareholderreturn (TSR) based performance condition. The second part of theaward vests in a single tranche on the third anniversary of the grantdate, subject to an earnings per share (EPS) based performancecondition. Further details on performance share awards made toexecutive directors and the respective performance conditions can be found in the tables on pages 66 and 67.
The Award Plan and the older performance share schemes are operatedin conjunction with the company’s Employees’ Benefit Trust (EBT). Thetrustee of the EBT grants awards in consultation with the company.
Overview
Business review
Go
vernanceFinancial statem
entsS
hareholder inform
ation
62 Remuneration report SABMiller plc Annual Report 2010
Remuneration report continued
For the purpose of calculating TSR the share prices and dividends ofthe comparator companies are converted, as necessary, into sterlingat the exchange rates prevailing at the relevant times. The conversioninto sterling is intended to remove distortions arising from differingrates of inflation in the countries in which the comparator companiesare listed. TSR and the relevant statistical quartiles are determined inaccordance with current market practice. The companies comprisingthe TSR comparator group for all the performance share awards whichhad not yet vested or lapsed as at 31 March 2010 are listed below:
Anheuser-Busch InBev (formerly InBev) Kirin HoldingsAnheuser-Busch* (acquired by InBev) Lion Nathan*Asahi Breweries (acquired by Kirin Carlsberg A Holdings)Constellation Brands Molson CoorsDiageo Pernod RicardFemsa UBD* (acquired by Heineken) Sapporo BreweriesFosters Group Scottish & Newcastle* Grolsch* (acquired by SABMiller) (acquired by Heineken Heineken and Carlsberg)
*Denotes company has been removed from the comparator group.
Kepler Associates undertakes each year the assessment of thecompany’s TSR performance relative to the comparator group, and the methodology used and the final results for each award are subject to review by the company’s auditors.
For awards made to executive directors in June 2010, the committeereduced the number of shares subject to an EPS-based performancecondition by approximately 14% compared with the number awardedin May 2009. Also in June 2010, the first awards of performance sharessubject to the new Value Sharing TSR-based performance conditiondescribed above (see pages 59 to 60) were made to the executivedirectors. Under these awards, Mr Mackay and Mr Wyman receivedawards of 220 and 130 shares respectively for each £10 million ofadditional shareholder value created, being the amount by which thegrowth in SABMiller’s market capitalisation plus net equity cash flowsexceeds the median growth of a weighted peer group index over thethree to five-year performance period.
DilutionTaking account of all shares newly issued as a consequence of exercisesof share options over the 10-year period ended 31 March 2010 plusoutstanding share options under all the company’s share option plans,where new issue shares may be used to satisfy their exercise, potentialdilution amounts to 3.41% of the issued ordinary shares of the company(excluding shares held in treasury) on 31 March 2010. Obligationsunder the company’s other long-term incentive plans are typicallysettled by the EBT from shares transferred from treasury or purchasedin the market. The dilution calculation also excludes shares arisingfrom any options granted before 8 March 1999, as disclosed in theoriginal listing particulars relating to the company’s listing in London.
The SABMiller plc Employees’ Benefit Trust (EBT)At 31 March 2010 the number of shares held in the EBT was 8.7 million,representing 0.55% of the issued ordinary shares of the company.
During the year, 5.3 million ordinary shares which were formerly heldby the company as treasury shares were acquired by the trustee onbehalf of the EBT to ensure that the EBT continued to hold sufficientordinary shares to meet potential future obligations in respect ofperformance share awards and share-settled share appreciationrights. During the year, the EBT repurchased 0.4 million shares fromparticipants upon the vesting of their awards at an average price of £12.55 per share which amounted to 0.02% of the issued sharecapital of the company. The trustee of the EBT has waived its right to receive dividends on shares held in the EBT, and will only voteshares or claim dividends on shares which are beneficially owned by an employee of the group, and only then in accordance with theinstructions of the underlying employee shareholder. As at 31 March2010, there were 0.3 million beneficially held shares in the EBT.
PensionsIt is the company’s policy to provide money purchase occupationalretirement funding schemes wherever possible so as to minimise the company’s funding risk. Where feasible, the company applies this policy to its new acquisitions.
The rate of contribution from the company as a percentage of base salaries paid in sterling is set at 30% for the executive directors.During the year the company made contributions for the executivedirectors to the SABMiller plc Staff Pension Scheme, an ApprovedOccupational Pension Scheme in the United Kingdom. Contributionswere paid in respect of each executive director to the extent allowedin light of the changes to pension allowances that took effect in 2006,with any excess credited in an unfunded corporate plan. Furtherdetails on executive directors’ pension contributions during thefinancial year are on page 64.
Service contractsMr Mackay and Mr Wyman have service contracts with the companywhich are terminable on not less than 12 months’ notice to be givenby the company or by the executive. A payment in lieu of notice maybe made on termination of employment, calculated by reference tothe executive’s base salary plus company pension contributions forthe relevant period, less any deduction considered by the company to be appropriate and reasonable to take account of acceleratedreceipt and the executive’s duty to mitigate his loss.
Execution Date first Date last Date nextdate of appointed re-elected due for
service contract to the board as a director re-election
EAG Mackay 27/02/1999 08/02/1999 31/07/2008 July 2011MI Wyman 26/02/1999 08/02/1999 31/07/2007 July 2010
Other benefitsThe executive directors are provided with medical insurance, permanenthealth insurance, company car allowance, accompanied travel, legaland professional fees, club subscriptions, death in service benefit andoccasional London accommodation. The estimated values of theseprovisions are included in the summary of emoluments paid table onpage 64.
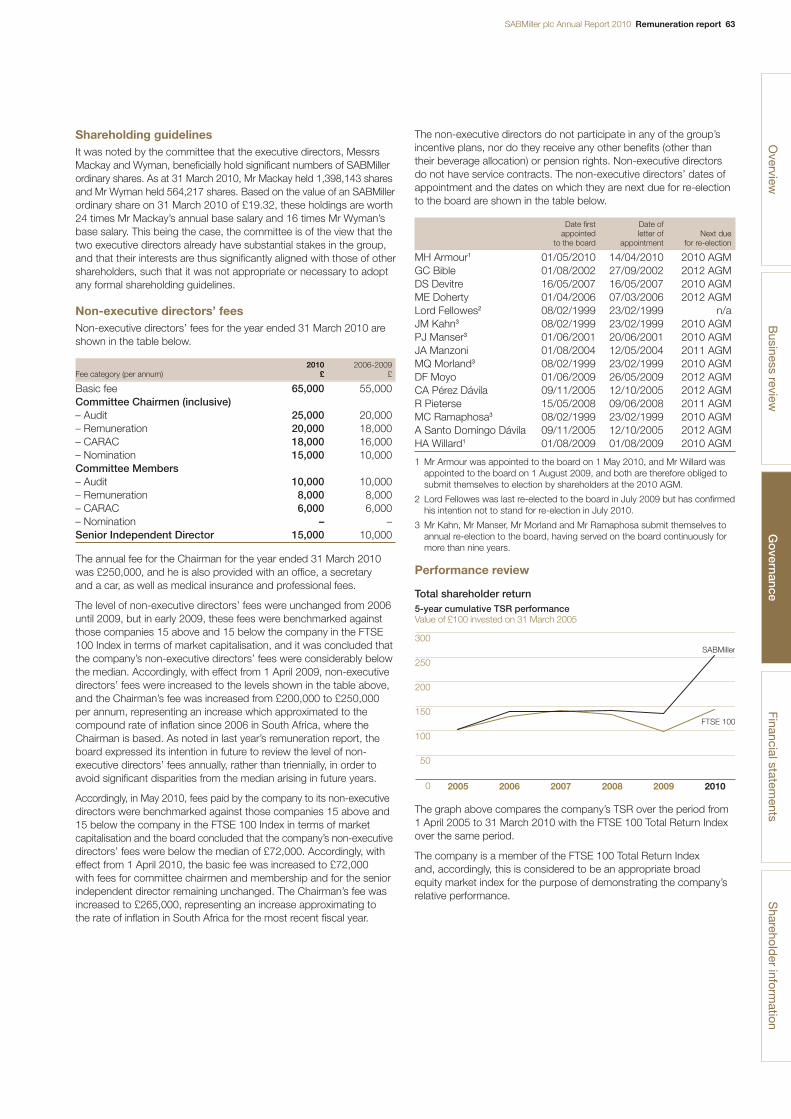
SABMiller plc Annual Report 2010 Remuneration report 63
Shareholding guidelinesIt was noted by the committee that the executive directors, MessrsMackay and Wyman, beneficially hold significant numbers of SABMillerordinary shares. As at 31 March 2010, Mr Mackay held 1,398,143 sharesand Mr Wyman held 564,217 shares. Based on the value of an SABMillerordinary share on 31 March 2010 of £19.32, these holdings are worth24 times Mr Mackay’s annual base salary and 16 times Mr Wyman’sbase salary. This being the case, the committee is of the view that thetwo executive directors already have substantial stakes in the group,and that their interests are thus significantly aligned with those of othershareholders, such that it was not appropriate or necessary to adoptany formal shareholding guidelines.
Non-executive directors’ feesNon-executive directors’ fees for the year ended 31 March 2010 areshown in the table below.
2010 2006-2009Fee category (per annum) £ £
Basic fee 65,000 55,000Committee Chairmen (inclusive)– Audit 25,000 20,000– Remuneration 20,000 18,000– CARAC 18,000 16,000– Nomination 15,000 10,000Committee Members– Audit 10,000 10,000– Remuneration 8,000 8,000– CARAC 6,000 6,000– Nomination – –Senior Independent Director 15,000 10,000
The annual fee for the Chairman for the year ended 31 March 2010was £250,000, and he is also provided with an office, a secretary and a car, as well as medical insurance and professional fees.
The level of non-executive directors’ fees were unchanged from 2006until 2009, but in early 2009, these fees were benchmarked againstthose companies 15 above and 15 below the company in the FTSE100 Index in terms of market capitalisation, and it was concluded thatthe company’s non-executive directors’ fees were considerably belowthe median. Accordingly, with effect from 1 April 2009, non-executivedirectors’ fees were increased to the levels shown in the table above,and the Chairman’s fee was increased from £200,000 to £250,000per annum, representing an increase which approximated to thecompound rate of inflation since 2006 in South Africa, where theChairman is based. As noted in last year’s remuneration report, theboard expressed its intention in future to review the level of non-executive directors’ fees annually, rather than triennially, in order toavoid significant disparities from the median arising in future years.
Accordingly, in May 2010, fees paid by the company to its non-executivedirectors were benchmarked against those companies 15 above and15 below the company in the FTSE 100 Index in terms of marketcapitalisation and the board concluded that the company’s non-executivedirectors’ fees were below the median of £72,000. Accordingly, witheffect from 1 April 2010, the basic fee was increased to £72,000 with fees for committee chairmen and membership and for the seniorindependent director remaining unchanged. The Chairman’s fee wasincreased to £265,000, representing an increase approximating to the rate of inflation in South Africa for the most recent fiscal year.
The non-executive directors do not participate in any of the group’sincentive plans, nor do they receive any other benefits (other than their beverage allocation) or pension rights. Non-executive directorsdo not have service contracts. The non-executive directors’ dates ofappointment and the dates on which they are next due for re-electionto the board are shown in the table below.
Date first Date ofappointed letter of Next due
to the board appointment for re-election
MH Armour1 01/05/2010 14/04/2010 2010 AGMGC Bible 01/08/2002 27/09/2002 2012 AGMDS Devitre 16/05/2007 16/05/2007 2010 AGMME Doherty 01/04/2006 07/03/2006 2012 AGMLord Fellowes2 08/02/1999 23/02/1999 n/aJM Kahn3 08/02/1999 23/02/1999 2010 AGMPJ Manser3 01/06/2001 20/06/2001 2010 AGMJA Manzoni 01/08/2004 12/05/2004 2011 AGMMQ Morland3 08/02/1999 23/02/1999 2010 AGMDF Moyo 01/06/2009 26/05/2009 2012 AGMCA Pérez Dávila 09/11/2005 12/10/2005 2012 AGMR Pieterse 15/05/2008 09/06/2008 2011 AGMMC Ramaphosa3 08/02/1999 23/02/1999 2010 AGMA Santo Domingo Dávila 09/11/2005 12/10/2005 2012 AGMHA Willard1 01/08/2009 01/08/2009 2010 AGM
1 Mr Armour was appointed to the board on 1 May 2010, and Mr Willard wasappointed to the board on 1 August 2009, and both are therefore obliged tosubmit themselves to election by shareholders at the 2010 AGM.
2 Lord Fellowes was last re-elected to the board in July 2009 but has confirmedhis intention not to stand for re-election in July 2010.
3 Mr Kahn, Mr Manser, Mr Morland and Mr Ramaphosa submit themselves toannual re-election to the board, having served on the board continuously formore than nine years.
Performance review
Total shareholder return
The graph above compares the company’s TSR over the period from1 April 2005 to 31 March 2010 with the FTSE 100 Total Return Indexover the same period.
The company is a member of the FTSE 100 Total Return Index and, accordingly, this is considered to be an appropriate broad equity market index for the purpose of demonstrating the company’srelative performance.
5-year cumulative TSR performanceValue of £100 invested on 31 March 2005
300
250
200
150
100
50
0 2005 2007 20082006 2009 2010
SABMiller
FTSE 100
Overview
Business review
Go
vernanceFinancial statem
entsS
hareholder inform
ation
64 Remuneration report SABMiller plc Annual Report 2010
Remuneration report continued
Information subject to audit
Directors’ interests in shares of the companyNon-beneficial Beneficial
Beneficial holding as at Beneficial shares shares disposed Beneficialholding as at 31 March 2009 acquired during of during holding as at
31 March 2009 and 2010 the period the period 31 March 20103
JM Kahn 1,670,578 – – – 1,670,578EAG Mackay 798,936 – 1,551,3441 952,1371 1,398,143MI Wyman 471,413 – 538,1182 445,3142 564,217MH Armour 4 – – – – –GC Bible – – – – –DS Devitre – – – – –ME Doherty – – – – –Lord Fellowes 1,000 – – – 1,000PJ Manser – – – – –JA Manzoni – – – – –MQ Morland 40,000 – – – 40,000DF Moyo – – – – –CA Pérez Dávila – – – – –R Pieterse – – – – –MC Ramaphosa – 4,000 – – –A Santo Domingo Dávila – – – – –HA Willard – – – – –
1 Awards vested in respect of 266,883 shares and subsequent sale of shares to settle tax liabilities on the gross awards vested, with the balance of the shares beingretained by Mr Mackay beneficially, and exercise of options over 1,284,361 shares under the SABMiller Executive Share Option (No.2) Scheme, of which Mr Mackaysold sufficient shares to cover exercise costs and tax and retained the balance of the shares beneficially.
2 Awards vested in respect of 157,298 shares and subsequent sale of shares to settle tax liabilities on the gross awards vested, with the balance of the shares beingretained by Mr Wyman beneficially, and exercise of options over 380,820 shares under the SABMiller Executive Share Option (No.2) Scheme, all of which were soldby Mr Wyman.
3 On 18 May 2010, Messrs Mackay and Wyman’s beneficial holdings increased by 4,784 and 2,912 shares, respectively following the vesting of awards over 9,764and 5,943 shares respectively, and the subsequent sales of shares to settle tax liabilities on the gross awards vested, with the balance of the shares being retained.There have been no other changes in the beneficial interests in directors as at 18 May 2010.
4 Mr Armour was appointed to the board on 1 May 2010 and accordingly did not have a disclosable interest in the company’s securities during the financial yearended 31 March 2010. As at his appointment date, Mr Armour did not have an interest in the company’s securities.
Directors’ emolumentsThe directors’ emoluments in respect of the year ended 31 March 2010 in total have been audited and are set out in the table below:
Emoluments paid for the period 1 April 2009 to 31 March 2010
2010 2010 Total2010 2009 Expense 2010 (excluding 2010 2010 2009
Salary/fees Salary/fees allowances Benefits bonus) Bonus Total1 Total1
£ £ £ £ £ £ £ £
Executive directorsEAG Mackay2 1,145,000 1,100,000 – 105,3473 1,250,347 1,580,000 2,830,347 2,117,615MI Wyman4 687,000 660,000 – 74,948 761,948 683,000 1,444,948 1,146,254Total (A) 4,275,295 3,263,869Non-executive directorsMH Armour5 – – – – – – – –GC Bible 65,000 55,000 – – – – 65,000 55,000DS Devitre 75,000 65,000 – 117 – – 75,117 65,055ME Doherty 75,000 65,000 – 223 – – 75,223 65,216Lord Fellowes 116,000 99,000 – 62 – – 116,062 99,056JM Kahn 271,000 216,000 – 965 – – 271,965 216,968PJ Manser 104,000 89,000 – 361 – – 104,361 89,331JA Manzoni 79,000 69,000 – 440 – – 79,440 69,167MQ Morland 95,000 83,000 – 369 – – 95,369 83,323DF Moyo 57,667 – – 285 – – 57,952 –CA Pérez Dávila 65,000 55,000 – 189 – – 65,189 55,175R Pieterse 71,000 52,125 – – – – 71,000 52,125MC Ramaphosa 71,000 61,000 – 163 – – 71,163 61,122A Santo Domingo Dávila 65,000 55,000 – 258 – – 65,258 55,238HA Willard6 – – – 145 – – 145 –Total (B) 1,213,244 966,776Grand total (A+B) 5,488,539 4,230,645
1 The total emoluments reported for 2009 and 2010 exclude retirement contributions made by the company to the pension schemes as detailed above. Retirementcontributions were paid on behalf of Mr Mackay and Mr Wyman in the amounts of £245,000 and £206,100 respectively being within the annual allowance (2009:£235,000 and £198,000), and contributions of £98,500 in excess of the annual allowance were paid on behalf of Mr Mackay (2009: £95,000).
2 Mr Mackay receives annual fees for his service as a non-executive director from Reckitt Benckiser Group plc and from Philip Morris International Inc of £92,000 andUS$126,250, respectively, which he is permitted to retain. £13,500 of the fee from Reckitt Benckiser Group plc is applied to the purchase of Reckitt BenckiserGroup plc ordinary shares. In addition, Mr Mackay receives from Philip Morris International Inc. an annual award of shares of common stock in Philip MorrisInternational Inc. pursuant to that company’s Stock Compensation Plan for Non-Employee Directors, which for the year ended 31 December 2009 had a fairmarket value of US$140,000 on the date of grant, being 5 May 2009.
3 During the year, the group’s apartment in London was made available to Mr Mackay to occupy intermittently, subject to tax on this use for his own account.4 Mr Wyman receives annual fees for his service as a non-executive director from Nedbank Group Limited and Nedbank Limited of ZAR442,800 in total, which he is
permitted to retain.5 Mr Armour was appointed to the board on 1 May 2010 and accordingly did not receive any emoluments from the company in the year ended 31 March 2010.6 Mr Willard is an executive officer of Altria Group, Inc (Altria) who is nominated by Altria for appointment as a director, and, in terms of the company’s agreement
with Altria, does not receive any emoluments from the company for serving as a director.

SABMiller plc Annual Report 2010 Remuneration report 65
Share incentive plansThe interests of the executive directors in shares of the company provided in the form of options and awards are shown in the tables below,and have been audited. During the year ended 31 March 2010 the highest and lowest market prices for the company’s shares were £10.45(on 20 April 2009) and £19.59 (on 29 March 2010) respectively and the market price on 31 March 2010 was £19.32.
Share optionsShare options Sale price/
Subscription Share options Share options Share options Share options vested and market priceExercisable for price outstanding as at granted during exercised outstanding as at exercisable as at (if applicable)
3-10 years from £ 31 March 2009 the year during the year 31 March 2010 31 March 2010 £
EAG Mackay 02/06/20001 4.11 159,416 – 159,416 – 12.5601/06/20011 5.16 161,589 – 161,589 – – 12.5631/05/20022 5.705 201,578 – 201,578 – – 12.5623/05/20032 4.1575 327,721 – 327,721 – – 12.5621/05/20042 6.605 222,704 – 222,704 – – 12.6320/05/20052 8.28 211,353 – 211,3534 – 18.0219/05/20063 10.61 230,000 – – 230,000 154,1005 n/a18/05/20073 11.67 230,000 – – 230,0006 – n/a16/05/20083 12.50 230,000 – – 230,000 – n/a14/11/20083 9.295 60,000 – – 60,000 – n/a15/05/20093 12.31 – 290,000 – 290,000 – n/a
2,034,361 290,000 1,284,361 1,040,0007 154,100
MI Wyman 31/05/20021 5.705 93,339 – 93,339 – – 12.5521/05/20042 6.605 102,195 – 102,195 – – 16.8520/05/20052 8.28 95,109 – 91,4864 3,623 3,6234 17.0719/05/20063 10.61 140,000 – 93,8005 46,200 – 18.8918/05/20073 11.67 140,000 – – 140,0006 – n/a16/05/20083 12.50 140,000 – – 140,000 – n/a01/08/20083 10.49 35,000 – – 35,000 – n/a15/05/20093 12.31 – 175,000 – 175,000 – n/a
745,643 175,000 380,820 539,8237 3,623
1 The performance condition for options granted prior to 2002 required growth in adjusted EPS (expressed in sterling) of 3% per annum compound in excess of thechange in the Retail Price Index (RPI) over any three-year period within the 10-year option life. This performance condition was satisfied in respect of all optionsgranted to executive directors in 2000 and 2001.
2 The performance condition for options granted in 2002 and until 2005 required compound annualised adjusted EPS growth (expressed in sterling) of RPI + 3%subject to testing at three, four and five-year intervals from a fixed base for vesting of the base annual award. Half of any additional annual amount vested at compoundannualised adjusted EPS growth of RPI + 4%; and the other half of any additional annual amount vested at compound annualised adjusted EPS growth of RPI + 5%.After the five-year test any unvested portion of the option lapsed.
3 The performance condition for options granted in 2006 and onwards requires compound annualised adjusted EPS growth of RPI + 3% from a fixed base forvesting of the base annual award. Half of any additional annual amount vests at compound annualised adjusted EPS growth of RPI + 4%; and the other half of any additional annual amount vests at compound annualised adjusted EPS growth of RPI + 5%. The performance tests are applied to two-thirds of the award after three years and one-third of the award after five years, with any unvested portion of the options lapsing after three years or five years, as the case may be,and with no provision for retesting any part of the awards.
4 In the year ended 31 March 2009, options granted in 2005 vested in full and became exercisable as the company’s adjusted EPS for the year ended 31 March 2008, at 71.28 pence (converted from US$ at the average exchange rate over the period 1 April 2007 to 31 March 2008) was more than 27.1% higher (the aggregate of RPI movement and 5% per annum compound growth) than the adjusted EPS of 54.7 pence for the year ended 31 March 2005 (the base year calculation of theperformance condition) converted from US$ at the average exchange rate for the period from 1 April 2004 to 31 March 2005. The mid market close on 20 May 2008was £12.74.
5 Two-thirds of the share options indicated were eligible to be tested against the performance condition described in this report for the three years ended 31 March2009, and on 19 May 2009 vested in full and became exercisable as the company’s adjusted EPS for the year ended 31 March 2009, at 79.7 pence (convertedfrom US$ at the average exchange rate over the period 1 April 2008 to 31 March 2009) was more than 24.2% higher (the aggregate of RPI movement and 5% per annum compound growth) than the adjusted EPS of 61.1 pence for the year ended 31 March 2006 (the base year calculation of the performance condition)converted from US$ at the average exchange rate for the period from 1 April 2005 to 31 March 2006. The mid market close on 19 May 2009 was £12.57. Theone-third which remain unvested will be eligible to be tested against the performance condition described in note 3 above for the five years ending 31 March 2011.
6 Two-thirds of the share options indicated were eligible to be tested against the performance condition described in this report for the three years ended 31 March2010, and on 18 May 2010 vested in full and became exercisable as the company’s adjusted EPS for the year ended 31 March 2010, at 100.7 pence (convertedfrom US$ at the average exchange rate over the period 1 April 2009 to 31 March 2010) was 28.7% higher than the adjusted EPS of 63.4 pence for the year ended31 March 2007 (the base year calculation of the performance condition converted from US$ at the average exchange rate for the period from 1 April 2006 to 31 March 2007) plus the aggregate of RPI movement and 5% per annum compound growth. The mid market close on 18 May 2010 was £20.76. The one-third which remain unvested will be eligible to be tested against the performance condition described in note 3 above for the five years ending 31 March 2012.
7 Messrs Mackay and Wyman were granted 250,000 and 150,000 share options respectively at a subscription price of £19.51 per share on 1 June 2010.
Overview
Business review
Go
vernanceFinancial statem
entsS
hareholder inform
ation
66 Remuneration report SABMiller plc Annual Report 2010
Remuneration report continued
Performance Shares
Performance Performanceshares Performance Performance Performance shares
outstanding as at shares granted shares vested shares lapsed outstanding as atDirector Date of grant 31 March 2009 during the year during the year during the year 31 March 2010 Vesting date
EAG Mackay 19/05/20061 230,000 – 62,1005 129,950 37,950 19/05/201118/05/20072 230,000 – 170,0856 – 59,915 18/05/201216/05/20083 230,000 – – – 230,000 16/05/201114/11/20083 60,000 – – – 60,000 14/11/201115/05/20094 – 290,000 – – 290,000 15/05/2012
750,000 290,000 232,185 129,950 677,865
MI Wyman 19/05/20061 140,000 – 37,8005 79,100 23,100 19/05/201118/05/20072 140,000 – 103,5306 – 36,470 18/05/201216/05/20083 140,000 – – – 140,000 16/05/201101/08/20083 35,000 – – – 35,000 01/08/201115/05/20094 – 175,000 – – 175,000 15/05/2012
455,000 175,000 141,330 79,100 409,5707
1 From 2006 to 2009, 50% of performance share awards were subject to a TSR performance condition and 50% to an adjusted EPS growth performance condition.The TSR test is applied to two-thirds of the relevant part of the award after three years and to one-third after five years. The EPS condition is a three-year adjustedEPS growth target, set by reference to historical and forecast adjusted EPS growth for the six members of the comparator group determined by the committee to be the company’s closest peers in the global brewing industry, namely Anheuser-Busch, Carlsberg, Heineken, InBev, Molson Coors and Scottish & Newcastle(although Scottish & Newcastle has been dropped from this group for the purposes of awards made in 2008, and Anheuser-Busch has been dropped from thisgroup for the purposes of awards made in 2009).
TSR condition EPS condition
2006 2006Performance shares awarded in 2006 vest if three year and five year TSR The EPS growth target for awards made in 2006 is 11% p.a. for full vesting,exceeds the median TSR of a comparator group of companies identified at with threshold vesting of 25% at 6% p.a., and pro rata vesting between these the time of the award, with two-thirds of the award being tested after three levels of achievement.years, and one-third after five years. On reaching the median performanceof the comparator group,25% of the award vests, and on reaching at leastthe upper quartile, 100% of the award vests, with pro rata vesting in between.
2 2007 2007Performance shares awarded in 2007 vest if three year and five year TSR The EPS growth target for awards made in 2007 is 11% p.a. for full vesting, exceeds the median TSR of a comparator group of companies identified at with threshold vesting of 25% at 6% p.a., and pro rata vesting between these the time of the award. 25% of the award vests on reaching the median, and levels of achievement.100% vests if TSR exceeds the median by 25% with respect to the three-year vesting test and by 33% with respect to the five-year vesting test.
3 2008 2008The same TSR performance condition applies to performance shares awarded The EPS growth target for awards made in 2008 is 10% p.a. for full vesting, in 2008 as applied in 2007. with threshold vesting of 25% at 6% p.a., and pro rata vesting between these
levels of achievement.
4 2009 2009The same TSR performance condition applies to performance shares awarded The EPS growth target for awards made in 2009 is 9% p.a. for full vesting, in 2009 as applied in 2008. with threshold vesting of 25% at 5% p.a., and pro rata vesting between these
levels of achievement.
5 In May 2009, the executive directors’ 2006 performance share awards were tested against the applicable TSR and EPS performance conditions. The EPSperformance measurement was achieved as to 54% of maximum which resulted in 62,100 and 37,800 EPS awards vesting on 19 May 2009 and 25,462 and15,499 shares were sold to cover income tax liabilities owing by Mr Mackay and Mr Wyman respectively. The price on the vesting date was £12.57 per share. TSR for the three-year period ended 18 May 2009 was below median and therefore all of the shares comprised in the first two-thirds of the 2006 awards lapsed,with the remaining one-third to be tested against the TSR performance condition for the five-year period ending 18 May 2011.
6 After the year end, the executive directors’ 2007 performance share awards were tested against the applicable TSR and EPS performance conditions. The EPSperformance measurement was achieved as to 89.39% of maximum which resulted in 102,799 and 62,573 EPS awards vesting for Mr Mackay and Mr Wymanrespectively. Of these, the remuneration committee exercised its discretion to recommend to the trustee of the SABMiller Employees’ Benefit Trust that 93,035 and56,630 shares be released to Mr Mackay and Mr Wyman respectively on 23 March 2010 (when the price was £19.42) and the remainder, being 9,764 and 5,943shares respectively, were released on 18 May 2010 (when the price was £20.64). Of these, 38,145 and 23,219 shares were sold on 23 March 2010 and 4,980 and3,031 shares were sold on 18 May 2010 to cover income tax liabilities owing by Mr Mackay and Mr Wyman respectively. TSR for the three-year period ended 18May 2010 was 80.6%, which exceeded the peer group median of 28.4% by more than 50% and therefore all of the shares comprised in the first two-thirds of the2007 awards vested, with the remaining one-third to be tested against the TSR performance condition for the five-year period ending 18 May 2012. This resultedin 77,050 and 46,900 TSR awards vesting. The remuneration committee exercised its discretion to recommend to the trustee of the SABMiller Employees’ BenefitTrust that these shares be released to Mr Mackay and Mr Wyman on 23 March 2010 (when the price was £19.42). Of these, 31,591 and 19,229 shares were soldon 23 March 2010 to cover income tax liabilities owing by Mr Mackay and Mr Wyman respectively.
7 On 1 June 2010 Messrs Mackay and Wyman were awarded 125,000 and 75,000 conditional awards of performance shares respectively, subject to the company’sadjusted EPS growth performance condition, and 220 and 130 TSR-based performance shares respectively for each £10 million of additional shareholder valuecreated, being the amount by which the growth in SABMiller’s market capitalisation plus net equity cash flows exceeds the median growth of a weighted peergroup index over the three to five-year performance period.
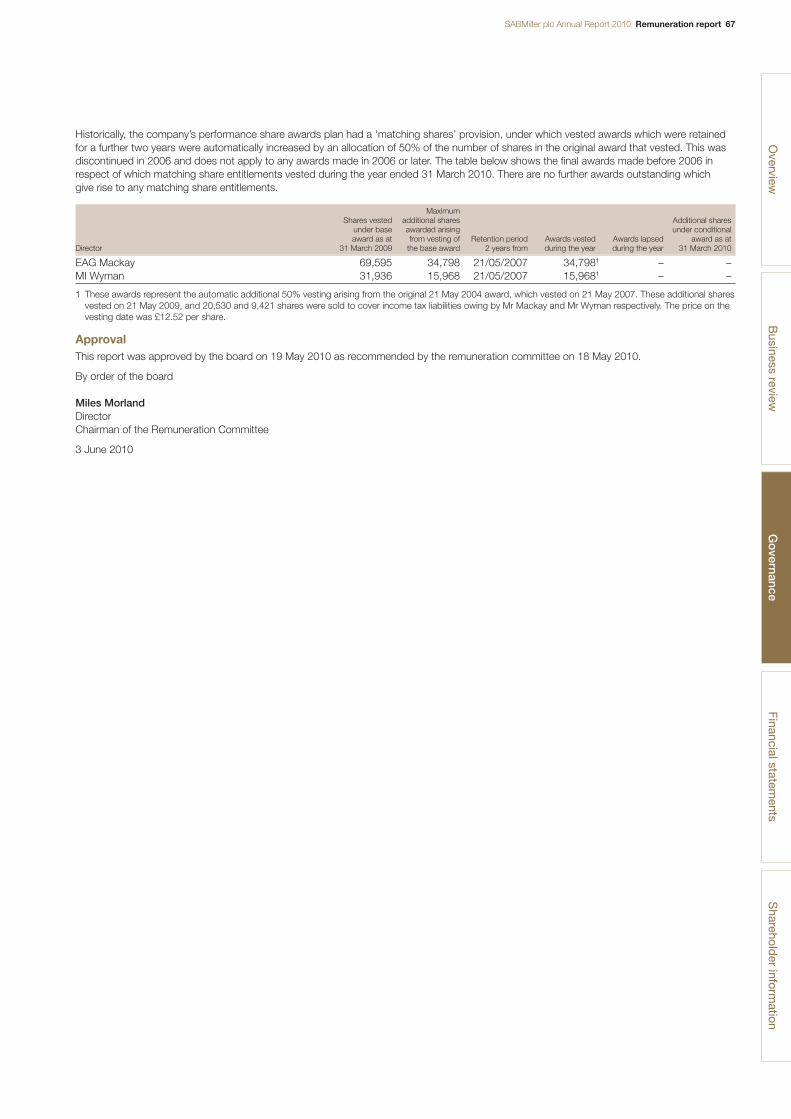
SABMiller plc Annual Report 2010 Remuneration report 67
Historically, the company’s performance share awards plan had a ‘matching shares’ provision, under which vested awards which were retainedfor a further two years were automatically increased by an allocation of 50% of the number of shares in the original award that vested. This wasdiscontinued in 2006 and does not apply to any awards made in 2006 or later. The table below shows the final awards made before 2006 inrespect of which matching share entitlements vested during the year ended 31 March 2010. There are no further awards outstanding which give rise to any matching share entitlements.
MaximumShares vested additional shares Additional shares
under base awarded arising under conditionalaward as at from vesting of Retention period Awards vested Awards lapsed award as at
Director 31 March 2009 the base award 2 years from during the year during the year 31 March 2010
EAG Mackay 69,595 34,798 21/05/2007 34,7981 – –MI Wyman 31,936 15,968 21/05/2007 15,9681 – –
1 These awards represent the automatic additional 50% vesting arising from the original 21 May 2004 award, which vested on 21 May 2007. These additional sharesvested on 21 May 2009, and 20,530 and 9,421 shares were sold to cover income tax liabilities owing by Mr Mackay and Mr Wyman respectively. The price on thevesting date was £12.52 per share.
ApprovalThis report was approved by the board on 19 May 2010 as recommended by the remuneration committee on 18 May 2010.
By order of the board
Miles MorlandDirectorChairman of the Remuneration Committee
3 June 2010
Overview
Business review
Go
vernanceFinancial statem
entsS
hareholder inform
ation
68 Statement of directors’ responsibilities SABMiller plc Annual Report 2010
Statement of directors’ responsibilitiesin respect of the consolidated financial statements
The directors are responsible for preparing the consolidated financialstatements in accordance with applicable law and regulations.
Company law requires the directors to prepare consolidated financialstatements for each financial year. The directors have prepared theconsolidated financial statements in accordance with InternationalFinancial Reporting Standards (IFRSs) as adopted by the EuropeanUnion. The consolidated financial statements are required by law togive a true and fair view of the state of affairs of the group and of theprofit or loss of the group for that year.
In preparing those financial statements, the directors are required to:
■ select suitable accounting policies and then apply them consistently;■ make judgements and estimates that are reasonable and prudent;■ state that the financial statements comply with IFRSs as adopted
by the European Union; and■ prepare the consolidated financial statements on the going concern
basis, unless it is inappropriate to presume that the group will continuein business, in which case there should be supporting assumptionsor qualifications as necessary.
The directors confirm that they have complied with the aboverequirements in preparing the financial statements.
The directors are responsible for keeping adequate accounting recordsthat disclose with reasonable accuracy at any time the financial positionof the group and to enable them to ensure that the consolidatedfinancial statements comply with the Companies Act 2006 and Article4 of the IAS Regulation. They are also responsible for safeguardingthe assets of the group and hence for taking reasonable steps for the prevention and detection of fraud and other irregularities.
Each of the directors, whose names and functions are listed in theGovernance section of the Annual Report, confirms that, to the bestof their knowledge:
■ the consolidated financial statements, which have been prepared in accordance with IFRSs as adopted by the EU, give a true and fair view of the assets, liabilities, financial position and profit of thegroup; and
■ the directors’ report contained in the Governance section of the Annual Report includes a fair review of the development and performance of the business and the position of the group,together with a description of the principal risks and uncertaintiesthat it faces.
In addition, the Companies Act 2006 requires directors to provide thegroup’s auditors with every opportunity to take whatever steps andundertake whatever inspections the auditors consider to be appropriatefor the purpose of enabling them to give their audit report. Each of thedirectors, having made appropriate enquiries, confirms that:
■ so far as the director is aware, there is no relevant audit informationof which the group’s auditors are unaware; and
■ each director has taken all the steps that they ought to have takenas a director in order to make themselves aware of any relevantaudit information and to establish that the group’s auditors areaware of that information.
The directors have reviewed the group’s budget and cash flowforecasts. On the basis of this review, and in the light of the currentfinancial position and existing borrowing facilities, the directors aresatisfied that SABMiller plc is a going concern and have continued toadopt the going concern basis in preparing the financial statements.
A copy of the financial statements of the group is placed on thecompany’s website. The directors are responsible for the maintenanceand integrity of statutory and audited information on the company’swebsite. Information published on the internet is accessible in manycountries with different legal requirements. Legislation in the UnitedKingdom governing the preparation and dissemination of financialstatements may differ from legislation in other jurisdictions.
SABMiller plc Annual Report 2010 Independent auditors’ report 69
Independent auditors’ reportto the members of SABMiller plc
We have audited the consolidated financial statements of SABMiller plcfor the year ended 31 March 2010 which comprise the consolidatedincome statement, the consolidated statement of comprehensiveincome, the consolidated balance sheet, the consolidated cash flowstatement, the consolidated statement of changes in equity and the related notes. The financial reporting framework that has beenapplied in their preparation is applicable law and International FinancialReporting Standards (IFRSs) as adopted by the European Union.
Respective responsibilities of directors and auditorsAs explained more fully in the statement of directors’ responsibilitieson page 68, the directors are responsible for the preparation of theconsolidated financial statements and for being satisfied that they givea true and fair view. Our responsibility is to audit the consolidated financialstatements in accordance with applicable law and International Standardson Auditing (UK and Ireland). Those standards require us to complywith the Auditing Practices Board’s Ethical Standards for Auditors.
This report, including the opinions, has been prepared for and only forthe company’s members as a body in accordance with Chapter 3 ofPart 16 of the Companies Act 2006 and for no other purpose. We donot, in giving these opinions, accept or assume responsibility for anyother purpose or to any other person to whom this report is shown or into whose hands it may come save where expressly agreed by our prior consent in writing.
Scope of the audit of the financial statementsAn audit involves obtaining evidence about the amounts and disclosuresin the financial statements sufficient to give reasonable assurance thatthe financial statements are free from material misstatement, whethercaused by fraud or error. This includes an assessment of: whether the accounting policies are appropriate to the group’s circumstancesand have been consistently applied and adequately disclosed; thereasonableness of significant accounting estimates made by thedirectors; and the overall presentation of the financial statements.
Opinion on financial statementsIn our opinion the consolidated financial statements:
■ give a true and fair view of the state of the group’s affairs as at 31 March 2010 and of its profit and cash flows for the year then ended;
■ have been properly prepared in accordance with IFRSs as adopted by the European Union; and
■ have been prepared in accordance with the requirements of the Companies Act 2006 and Article 4 of the lAS Regulation.
Opinion on other matters prescribed by the CompaniesAct 2006In our opinion the information given in the directors’ report for thefinancial year for which the consolidated financial statements areprepared is consistent with the consolidated financial statements.
Matters on which we are required to report by exceptionWe have nothing to report in respect of the following:
Under the Companies Act 2006 we are required to report to you if, in our opinion:
■ certain disclosures of directors’ remuneration specified by law are not made; or
■ we have not received all the information and explanations werequire for our audit.
Under the Listing Rules we are required to review:
■ the directors’ statement in relation to going concern, as set out on page 68; and
■ the part of the corporate governance report relating to the company’scompliance with the nine provisions of the June 2008 CombinedCode specified for our review.
Other matterWe have reported separately on the company financial statements ofSABMiller plc for the year ended 31 March 2010 and on the informationin the remuneration report that is described as having been audited.
John Baker (Senior Statutory Auditor)for and on behalf of PricewaterhouseCoopers LLPChartered Accountants and Statutory AuditorsLondon
3 June 2010
Overview
Business review
Governance
Financial statem
entsS
hareholder inform
ation
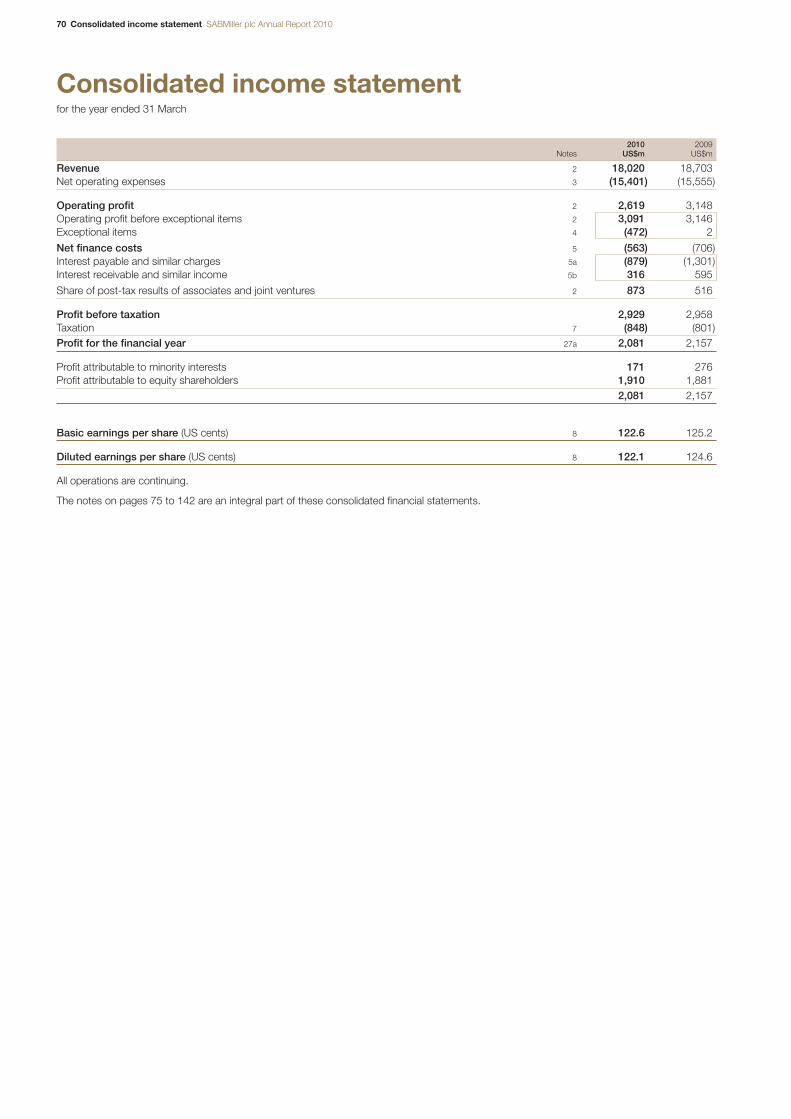
70 Consolidated income statement SABMiller plc Annual Report 2010
Consolidated income statementfor the year ended 31 March
2010 2009Notes US$m US$m
Revenue 2 18,020 18,703Net operating expenses 3 (15,401) (15,555)
Operating profit 2 2,619 3,148Operating profit before exceptional items 2 3,091 3,146Exceptional items 4 (472) 2
Net finance costs 5 (563) (706)Interest payable and similar charges 5a (879) (1,301)Interest receivable and similar income 5b 316 595
Share of post-tax results of associates and joint ventures 2 873 516
Profit before taxation 2,929 2,958Taxation 7 (848) (801)Profit for the financial year 27a 2,081 2,157
Profit attributable to minority interests 171 276Profit attributable to equity shareholders 1,910 1,881
2,081 2,157
Basic earnings per share (US cents) 8 122.6 125.2
Diluted earnings per share (US cents) 8 122.1 124.6
All operations are continuing.
The notes on pages 75 to 142 are an integral part of these consolidated financial statements.
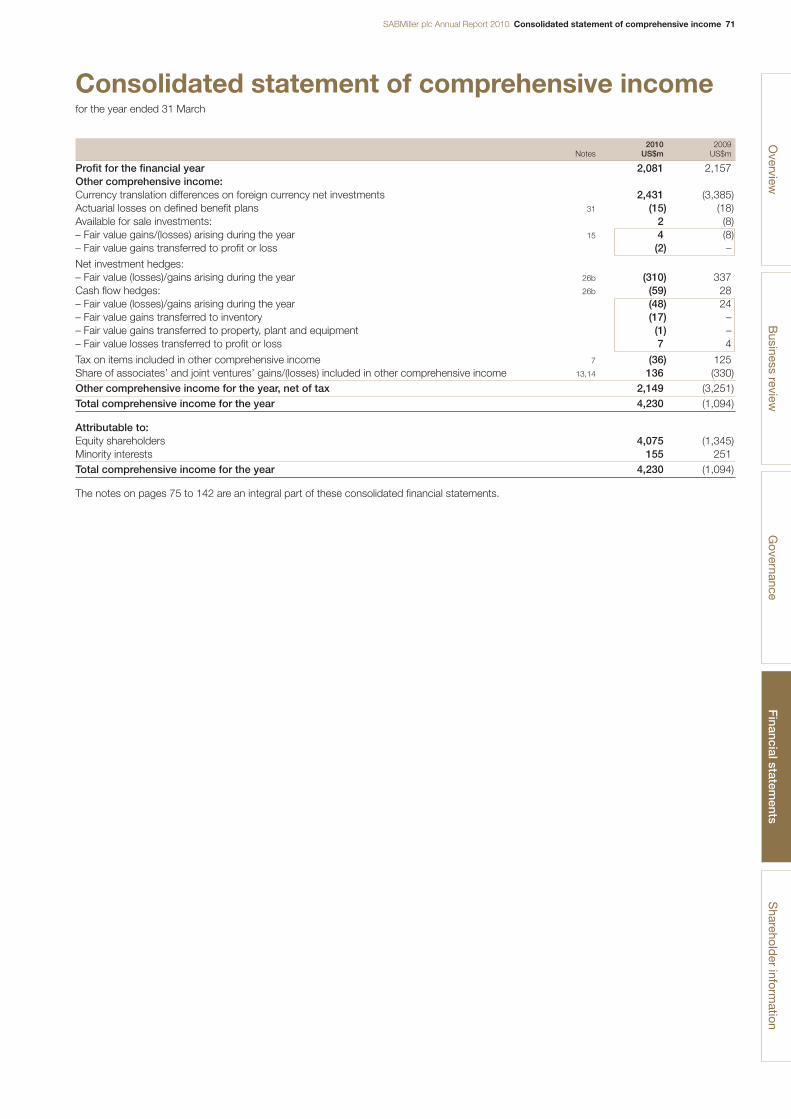
SABMiller plc Annual Report 2010 Consolidated statement of comprehensive income 71
Consolidated statement of comprehensive incomefor the year ended 31 March
2010 2009Notes US$m US$m
Profit for the financial year 2,081 2,157Other comprehensive income:Currency translation differences on foreign currency net investments 2,431 (3,385)Actuarial losses on defined benefit plans 31 (15) (18)Available for sale investments: 2 (8)– Fair value gains/(losses) arising during the year 15 4 (8)– Fair value gains transferred to profit or loss (2) –
Net investment hedges:– Fair value (losses)/gains arising during the year 26b (310) 337Cash flow hedges: 26b (59) 28– Fair value (losses)/gains arising during the year (48) 24– Fair value gains transferred to inventory (17) –– Fair value gains transferred to property, plant and equipment (1) –– Fair value losses transferred to profit or loss 7 4
Tax on items included in other comprehensive income 7 (36) 125Share of associates’ and joint ventures’ gains/(losses) included in other comprehensive income 13,14 136 (330)Other comprehensive income for the year, net of tax 2,149 (3,251)Total comprehensive income for the year 4,230 (1,094)
Attributable to:Equity shareholders 4,075 (1,345)Minority interests 155 251Total comprehensive income for the year 4,230 (1,094)
The notes on pages 75 to 142 are an integral part of these consolidated financial statements.
Overview
Business review
Governance
Financial statem
entsS
hareholder inform
ation

72 Consolidated balance sheet SABMiller plc Annual Report 2010
Consolidated balance sheetat 31 March
2010 20091
Notes US$m US$m
AssetsNon-current assetsGoodwill 10 11,584 8,716Intangible assets 11 4,354 3,742Property, plant and equipment 12 8,915 7,406Investments in joint ventures 13 5,822 5,495Investments in associates 14 2,213 1,787Available for sale investments 15 31 29Derivative financial instruments 23 409 695Trade and other receivables 17 117 125Deferred tax assets 20 164 161
33,609 28,156
Current assetsInventories 16 1,295 1,241Trade and other receivables 17 1,665 1,576Current tax assets 135 168Derivative financial instruments 23 20 54Available for sale investments 15 1 11Cash and cash equivalents 18 779 422
3,895 3,472Total assets 37,504 31,628
LiabilitiesCurrent liabilitiesDerivative financial instruments 23 (174) (35)Borrowings 21 (1,605) (2,148)Trade and other payables 19 (3,227) (2,400)Current tax liabilities (616) (463)Provisions 24 (355) (299)
(5,977) (5,345)
Non-current liabilitiesDerivative financial instruments 23 (147) (107)Borrowings 21 (7,809) (7,470)Trade and other payables 19 (145) (186)Deferred tax liabilities 20 (2,374) (2,030)Provisions 24 (453) (373)
(10,928) (10,166)Total liabilities (16,905) (15,511)Net assets 20,599 16,117
EquityShare capital 25 165 159Share premium 6,312 6,198Merger relief reserve 4,586 3,395Other reserves 26b 1,322 (872)Retained earnings 26a 7,525 6,496Total shareholders’ equity 19,910 15,376Minority interests in equity 689 741Total equity 20,599 16,117
1 As restated (see note 28).
The balance sheet of SABMiller plc is shown on page 145.
The notes on pages 75 to 142 are an integral part of these consolidated financial statements.
The financial statements were authorised for issue by the board of directors on 3 June 2010 and were signed on its behalf by:
Graham Mackay Malcolm WymanChief Executive Chief Financial Officer
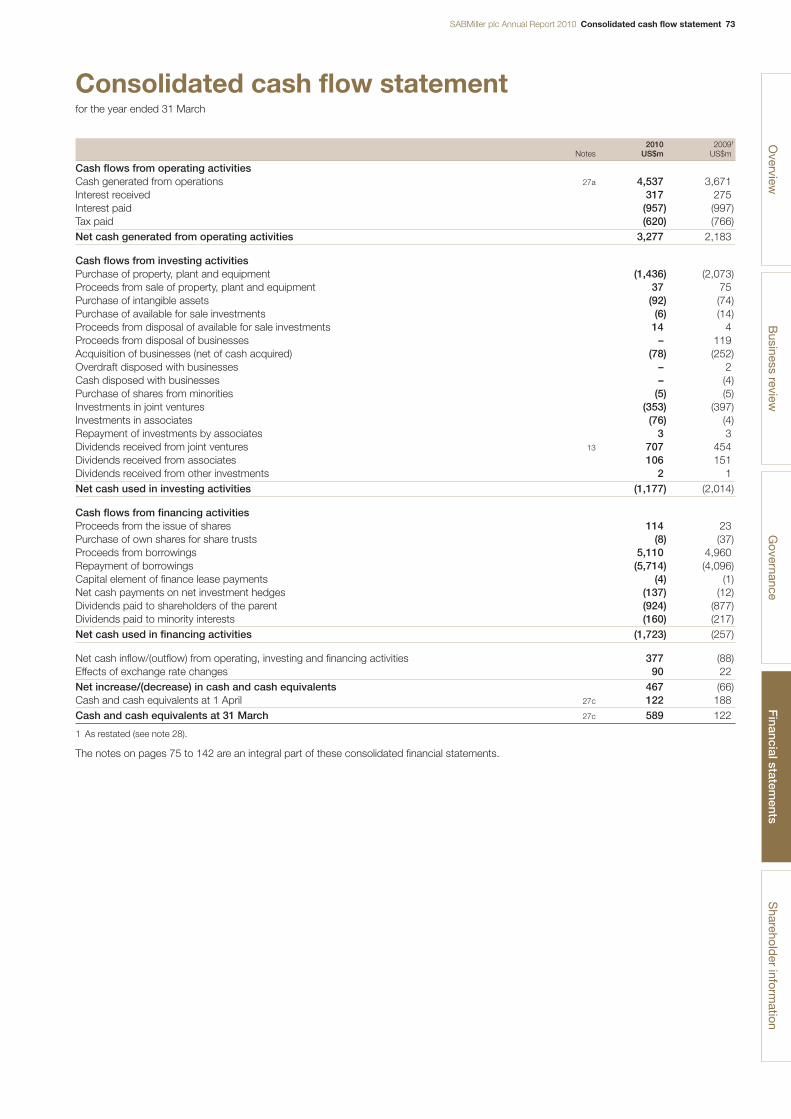
SABMiller plc Annual Report 2010 Consolidated cash flow statement 73
Consolidated cash flow statementfor the year ended 31 March
2010 20091
Notes US$m US$m
Cash flows from operating activitiesCash generated from operations 27a 4,537 3,671Interest received 317 275Interest paid (957) (997)Tax paid (620) (766)Net cash generated from operating activities 3,277 2,183
Cash flows from investing activitiesPurchase of property, plant and equipment (1,436) (2,073)Proceeds from sale of property, plant and equipment 37 75Purchase of intangible assets (92) (74)Purchase of available for sale investments (6) (14)Proceeds from disposal of available for sale investments 14 4Proceeds from disposal of businesses – 119Acquisition of businesses (net of cash acquired) (78) (252)Overdraft disposed with businesses – 2Cash disposed with businesses – (4)Purchase of shares from minorities (5) (5)Investments in joint ventures (353) (397)Investments in associates (76) (4)Repayment of investments by associates 3 3Dividends received from joint ventures 13 707 454Dividends received from associates 106 151Dividends received from other investments 2 1Net cash used in investing activities (1,177) (2,014)
Cash flows from financing activitiesProceeds from the issue of shares 114 23Purchase of own shares for share trusts (8) (37)Proceeds from borrowings 5,110 4,960Repayment of borrowings (5,714) (4,096)Capital element of finance lease payments (4) (1)Net cash payments on net investment hedges (137) (12)Dividends paid to shareholders of the parent (924) (877)Dividends paid to minority interests (160) (217)Net cash used in financing activities (1,723) (257)
Net cash inflow/(outflow) from operating, investing and financing activities 377 (88)Effects of exchange rate changes 90 22Net increase/(decrease) in cash and cash equivalents 467 (66)Cash and cash equivalents at 1 April 27c 122 188Cash and cash equivalents at 31 March 27c 589 122
1 As restated (see note 28).
The notes on pages 75 to 142 are an integral part of these consolidated financial statements.
Overview
Business review
Governance
Financial statem
entsS
hareholder inform
ation
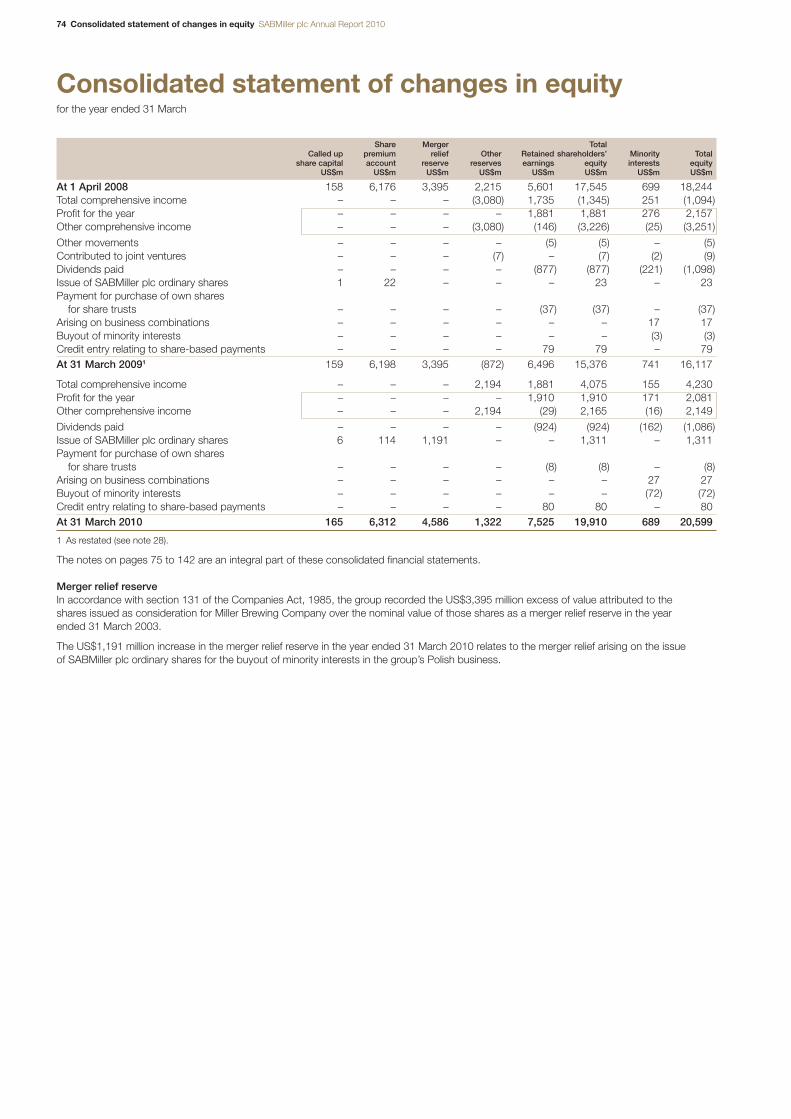
74 Consolidated statement of changes in equity SABMiller plc Annual Report 2010
Consolidated statement of changes in equityfor the year ended 31 March
Share Merger TotalCalled up premium relief Other Retained shareholders’ Minority Total
share capital account reserve reserves earnings equity interests equityUS$m US$m US$m US$m US$m US$m US$m US$m
At 1 April 2008 158 6,176 3,395 2,215 5,601 17,545 699 18,244Total comprehensive income – – – (3,080) 1,735 (1,345) 251 (1,094)Profit for the year – – – – 1,881 1,881 276 2,157Other comprehensive income – – – (3,080) (146) (3,226) (25) (3,251)
Other movements – – – – (5) (5) – (5)Contributed to joint ventures – – – (7) – (7) (2) (9)Dividends paid – – – – (877) (877) (221) (1,098)Issue of SABMiller plc ordinary shares 1 22 – – – 23 – 23Payment for purchase of own shares
for share trusts – – – – (37) (37) – (37)Arising on business combinations – – – – – – 17 17Buyout of minority interests – – – – – – (3) (3)Credit entry relating to share-based payments – – – – 79 79 – 79At 31 March 20091 159 6,198 3,395 (872) 6,496 15,376 741 16,117
Total comprehensive income – – – 2,194 1,881 4,075 155 4,230Profit for the year – – – – 1,910 1,910 171 2,081Other comprehensive income – – – 2,194 (29) 2,165 (16) 2,149
Dividends paid – – – – (924) (924) (162) (1,086)Issue of SABMiller plc ordinary shares 6 114 1,191 – – 1,311 – 1,311Payment for purchase of own shares
for share trusts – – – – (8) (8) – (8)Arising on business combinations – – – – – – 27 27Buyout of minority interests – – – – – – (72) (72)Credit entry relating to share-based payments – – – – 80 80 – 80At 31 March 2010 165 6,312 4,586 1,322 7,525 19,910 689 20,599
1 As restated (see note 28).
The notes on pages 75 to 142 are an integral part of these consolidated financial statements.
Merger relief reserveIn accordance with section 131 of the Companies Act, 1985, the group recorded the US$3,395 million excess of value attributed to the shares issued as consideration for Miller Brewing Company over the nominal value of those shares as a merger relief reserve in the year ended 31 March 2003.
The US$1,191 million increase in the merger relief reserve in the year ended 31 March 2010 relates to the merger relief arising on the issue of SABMiller plc ordinary shares for the buyout of minority interests in the group’s Polish business.
SABMiller plc Annual Report 2010 Notes to the consolidated financial statements 75
Notes to the consolidated financial statements
1. Accounting policiesThe principal accounting policies adopted in the preparation of thegroup’s financial statements are set out below. These policies have beenconsistently applied to all the years presented, unless otherwise stated.
a) Basis of preparationThe consolidated financial statements of SABMiller plc have beenprepared in accordance with International Financial Reporting Standardsas adopted by the European Union (IFRSs as adopted by the EU),IFRIC interpretations and the Companies Act 2006 applicable tocompanies reporting under IFRS.
The financial statements are prepared under the historical cost convention,except for the revaluation to fair value of certain financial assets andliabilities, and post-retirement assets and liabilities as described in theaccounting policies below. The accounts have been prepared on agoing concern basis.
The preparation of financial statements in conformity with IFRS requiresthe use of certain critical accounting estimates. It also requires managementto exercise its judgement in the process of applying the group’saccounting policies. Actual results could differ from those estimates.
b) Recent accounting developments
(i) Standards, amendments and interpretations of existingstandards adopted by the groupThe group has adopted the following as of 1 April 2009:■ IAS 1 (revised), ‘Presentation of financial statements’ requires
the presentation of a statement of changes in equity as a primarystatement, includes non-mandatory changes to the titles of primarystatements and introduces a statement of comprehensive income,but allows the presentation of a two statement approach with aseparate income statement and statement of comprehensiveincome. The group has chosen to maintain existing primarystatement titles and to follow the two statement approach.
■ Amendment to IFRS 7, ‘Financial Instruments: Disclosures’ requires additional disclosures about fair value measurement and liquidity risk.
■ IFRS 8, ‘Operating Segments’ requires separate reporting of segmentalinformation for operating segments. Operating segments reflect themanagement structure of the group and the way performance isevaluated and resources allocated based on group revenue andEBITA by the group’s chief operating decision maker, defined as the executive directors. The group is focused geographically and as a result of the implementation of IFRS 8, Africa and Asia are now presented as separate segments. Comparative information has been restated accordingly. While not meeting the definition ofreportable segments, the group reports separately as segmentsAsia, South Africa Hotels and Gaming and Corporate as thisprovides useful additional information.
On 23 March 2010, the EU endorsed Annual Improvements toIFRSs (2009), which included an amendment to the disclosuresrequired by IFRS 8, ‘Operating Segments’. Although only mandatoryfor periods beginning on or after 1 January 2010, the group haschosen to adopt this amendment early. Following the implementationof IFRS 8 and the early adoption of the subsequent amendment,the group no longer discloses segment assets or liabilities, as theseare not reported to the group’s chief operating decision maker.
The following standards, interpretations and amendments have beenadopted by the group since 1 April 2009 with no significant impact on its consolidated results or financial position:■ Annual improvements to IFRSs (2008).■ Amendment to IAS 23 (revised), ‘Borrowing Costs’.■ Amendment to IFRS 2, ‘Share-based Payments’ – Vesting
Conditions and Cancellations.
■ Amendment to IFRS 1, ‘First-time Adoption of IFRS’ and IAS 27,‘Consolidated and Separate Financial Statements’ on the ‘Cost ofan Investment in a Subsidiary, Jointly Controlled Entity or Associate’.
■ Amendment to IAS 32, ‘Financial Instruments: Presentation’ andIAS 1, ‘Presentation of Financial Statements’ – ‘Puttable FinancialInstruments and Obligations Arising on Liquidation’.
■ IFRIC 12, ‘Service Concession Arrangements’.■ IFRIC 13, ‘Customer Loyalty Programmes’.■ Amendment to IFRIC 9 and IAS 39, ‘Reassessment of Embedded
Derivatives’.
(ii) Standards, amendments and interpretations to existingstandards that are not yet effective and have not been earlyadopted by the group:The following standards, interpretations and amendments to existingstandards have been published and are mandatory for the group’saccounting periods beginning on or after 1 April 2010 or later periods,but which have not been early adopted by the group:■ IFRS 1 (revised), ‘First-time Adoption’, is effective from 1 July 2009.■ IFRS 3 (revised), ‘Business Combinations’, is effective from 1 July 2009.■ IAS 27 (revised), ‘Consolidated and Separate Financial Statements’,
is effective from 1 July 2009.■ Amendment to IAS 39, ‘Financial Instruments: Recognition and
Measurement’ – Eligible Hedged Items, is effective from 1 July 2009.■ IFRIC 16, ‘Hedges of a Net Investment in a Foreign Operation’,
is effective from 1 October 20081.■ IFRIC 17, ‘Distribution of Non-cash Assets to Owners’, is effective
from 1 July 2009.■ IFRIC 18, ‘Transfers of Assets from Customers’, is effective from
31 October 2009.■ Amendment to IFRS 2, ‘Group Cash-settled and Share-based
Payment Transactions’, effective from 1 January 20102.■ Amendment to IAS 32, ‘Financial Instruments: Presentation’ –
Classification of Rights Issues, is effective from 1 February 2010.■ Annual improvements to IFRSs (2009), is effective from 1 January 2010.■ Amendment to IFRS 1 for additional exemptions, is effective from
1 January 20102.■ IFRIC 19, ‘Extinguishing Financial Liabilities with Equity Instruments’,
is effective from 1 July 20102.■ Annual improvements to IFRSs (2010), is effective from 1 January 20112.■ Amendment to IAS 24, ‘Related Party Disclosures’, is effective from
1 January 20112.■ Amendment to IFRIC 14, ‘Pre-payments of a Minimum Funding
Requirement’, is effective January 20112.■ IFRS 9, ‘Financial Instruments’, effective from 1 January 20132.
1 EU endorsed for 1 July 2009.
2 Not yet endorsed by the EU.
The adoption of these standards, interpretations and amendments isnot anticipated to have a material effect on the consolidated results ofoperations or financial position of the group.
c) Significant judgements and estimatesIn determining and applying accounting policies, judgement is oftenrequired where the choice of specific policy, assumption or accountingestimate to be followed could materially affect the reported results ornet position of the group, should it later be determined that a differentchoice be more appropriate.
Overview
Business review
Governance
Financial statem
entsS
hareholder inform
ation
76 Notes to the consolidated financial statements SABMiller plc Annual Report 2010
Notes to the consolidated financial statements continued
1. Accounting policies continuedManagement considers the following to be areas of significantjudgement and estimation for the group due to greater complexityand/or particularly subject to the exercise of judgement:
(i) Impairment reviewsGoodwill arising on business combinations is allocated to the relevantcash generating unit (CGU). Impairment reviews in respect of therelevant CGUs are performed at least annually or more regularly ifevents indicate that this is necessary. Impairment reviews are basedon future cash flows discounted using the weighted average cost ofcapital for the relevant country with terminal values calculated applyingthe long-term growth rate. The future cash flows which are based onbusiness forecasts, the long-term growth rates and the discount ratesused are dependent on management estimates and judgements.Future events could cause the assumptions used in these impairmentreviews to change with a consequent adverse impact on the resultsand net position of the group. Details of the estimates used in theimpairment reviews for the year are set out in note 10.
(ii) TaxationThe group operates in many countries and is subject to taxes in numerousjurisdictions. Significant judgement is required in determining theprovision for taxes as the tax treatment is often by its nature complex,and cannot be finally determined until a formal resolution has beenreached with the relevant tax authority which may take several yearsto conclude. Amounts provided are accrued based on management’sinterpretation of country specific tax laws and the likelihood of settlement.Actual liabilities could differ from the amount provided which couldhave a significant impact on the results and net position of the group.
(iii) Pension and post-retirement benefitsPension accounting requires certain assumptions to be made in orderto value the group’s pension and post-retirement obligations in thebalance sheet and to determine the amounts to be recognised in theincome statement and in other comprehensive income in accordancewith IAS 19. The calculations of these obligations and charges arebased on assumptions determined by management which includediscount rates, salary and pension inflation, healthcare cost inflation,mortality rates and expected long-term rates of return on assets.Details of the assumptions used are set out in note 31. The selectionof different assumptions could affect the net position of the group andfuture results.
(iv) Property, plant and equipmentThe determination of the useful economic life and residual values ofproperty, plant and equipment is subject to management estimation.The group regularly reviews all of its depreciation rates and residualvalues to take account of any changes in circumstances, and anychanges that could affect prospective depreciation charges and asset carrying values.
(v) Business combinationsOn the acquisition of a company or business, a determination of thefair value and the useful life of intangible assets acquired is performed,which requires the application of management judgement. Futureevents could cause the assumptions used by the group to changewhich would have a significant impact on the results and net positionof the group.
(vi) Exceptional itemsExceptional items are expense or income items recorded in a periodwhich have been determined by management as being material bytheir size or incidence and are presented separately within the resultsof the group. The determination of which items are disclosed asexceptional items will affect the presentation of profit measuresincluding EBITA and adjusted earnings per share, and requires adegree of judgement. Details relating to exceptional items reportedduring the year are set out in note 4.
(vii) MillerCoors joint ventureThe determination of the valuation of the Coors business contributedto the MillerCoors joint venture was a specific area of judgement for thegroup during the previous financial year. The valuation was determinedusing recognised valuation techniques based upon specific assumptions.If alternative assumptions had been used then the value of the investmentand gain recognised on disposal would have been different.
d) Segmental reportingOperating segments reflect the management structure of the groupand the way performance is evaluated and resources allocated basedon group revenue and EBITA by the group’s chief operating decisionmaker, defined as the executive directors. The group is focusedgeographically and as a result of the implementation of IFRS 8, Africaand Asia are now presented as separate segments. Comparativeinformation has been restated accordingly. While not meeting thedefinition of reportable segments, the group reports separately assegments Asia, South Africa Hotels and Gaming and Corporate asthis provides useful additional information.
e) Basis of consolidationSABMiller plc (the company) is a public limited company incorporatedin Great Britain and registered in England and Wales. The consolidatedfinancial statements include the financial information of the subsidiary,associate and joint venture entities owned by the company.
(i) SubsidiariesSubsidiaries are entities controlled by the company, where control isthe power directly or indirectly to govern the financial and operatingpolicies of the entity so as to obtain benefit from its activities, regardlessof whether this power is actually exercised. Where the company’sinterest in subsidiaries is less than 100%, the share attributable tooutside shareholders is reflected in minority interests. Subsidiaries areincluded in the financial statements from the date control commencesuntil the date control ceases.
Intra-group balances, and any unrealised gains and losses or incomeand expenses arising from intra-group transactions, are eliminated inpreparing the consolidated financial statements. Unrealised losses areeliminated unless the transaction provides evidence of an impairmentof the asset transferred.
Some of the company’s subsidiaries have a local statutory accountingreference date of 31 December. These are consolidated using managementprepared information on a basis coterminous with the company’saccounting reference date.
(ii) AssociatesAssociates are entities in which the group has a long-term interest andover which the group has directly or indirectly significant influence,where significant influence is the ability to influence the financial andoperating policies of the entity.
The associate, Distell Group Ltd, has a statutory accounting referencedate of 30 June. In respect of each year ending 31 March, this companyis included based on financial statements drawn up to the previous 31 December, but taking into account any changes in the subsequentperiod from 1 January to 31 March that would materially affect theresults. All other associates are included on a coterminous basis.
(iii) Joint venturesJoint ventures are contractual arrangements which the group hasentered into with one or more parties to undertake an economicactivity that is subject to joint control. Joint control is the contractuallyagreed sharing of control over an economic activity, and exists onlywhen the strategic, financial and operating decisions relating to theactivity require the unanimous consent of the parties sharing the control.
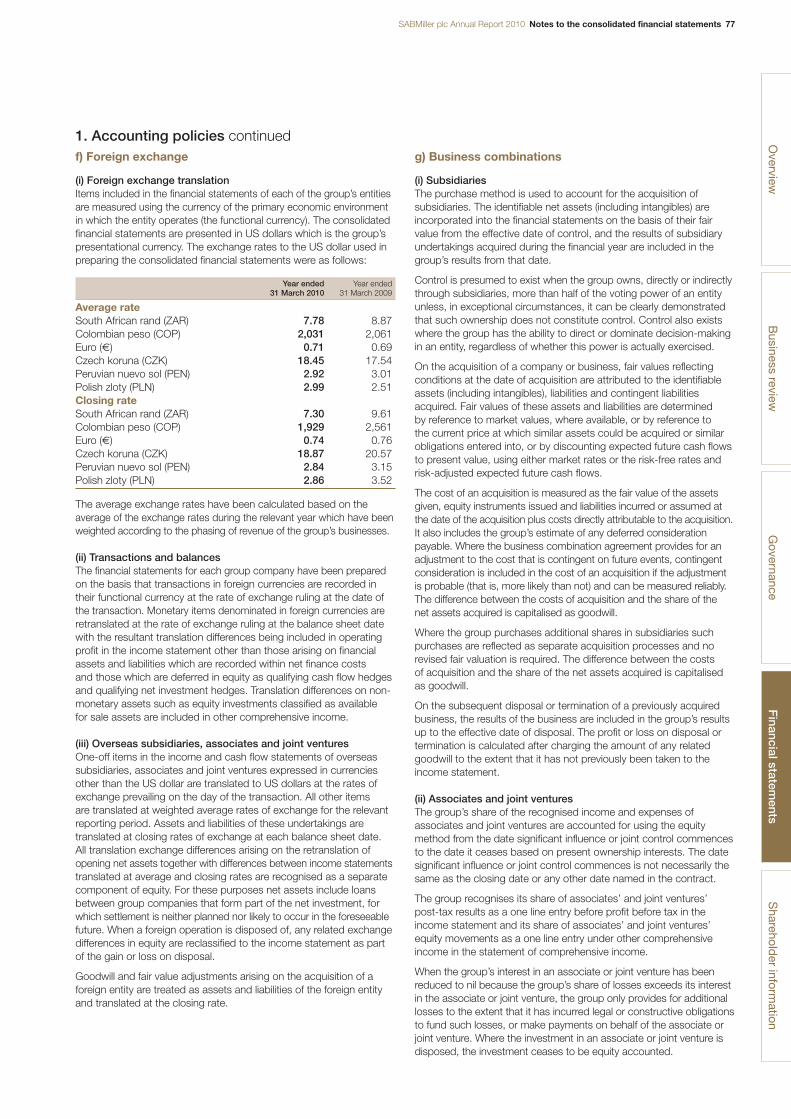
SABMiller plc Annual Report 2010 Notes to the consolidated financial statements 77
1. Accounting policies continuedf) Foreign exchange
(i) Foreign exchange translationItems included in the financial statements of each of the group’s entitiesare measured using the currency of the primary economic environmentin which the entity operates (the functional currency). The consolidatedfinancial statements are presented in US dollars which is the group’spresentational currency. The exchange rates to the US dollar used inpreparing the consolidated financial statements were as follows:
Year ended Year ended 31 March 2010 31 March 2009
Average rateSouth African rand (ZAR) 7.78 8.87Colombian peso (COP) 2,031 2,061Euro (€) 0.71 0.69Czech koruna (CZK) 18.45 17.54Peruvian nuevo sol (PEN) 2.92 3.01Polish zloty (PLN) 2.99 2.51Closing rateSouth African rand (ZAR) 7.30 9.61Colombian peso (COP) 1,929 2,561Euro (€) 0.74 0.76Czech koruna (CZK) 18.87 20.57Peruvian nuevo sol (PEN) 2.84 3.15Polish zloty (PLN) 2.86 3.52
The average exchange rates have been calculated based on theaverage of the exchange rates during the relevant year which have beenweighted according to the phasing of revenue of the group’s businesses.
(ii) Transactions and balancesThe financial statements for each group company have been preparedon the basis that transactions in foreign currencies are recorded intheir functional currency at the rate of exchange ruling at the date ofthe transaction. Monetary items denominated in foreign currencies areretranslated at the rate of exchange ruling at the balance sheet datewith the resultant translation differences being included in operatingprofit in the income statement other than those arising on financialassets and liabilities which are recorded within net finance costs and those which are deferred in equity as qualifying cash flow hedgesand qualifying net investment hedges. Translation differences on non-monetary assets such as equity investments classified as available for sale assets are included in other comprehensive income.
(iii) Overseas subsidiaries, associates and joint venturesOne-off items in the income and cash flow statements of overseassubsidiaries, associates and joint ventures expressed in currenciesother than the US dollar are translated to US dollars at the rates ofexchange prevailing on the day of the transaction. All other items are translated at weighted average rates of exchange for the relevantreporting period. Assets and liabilities of these undertakings aretranslated at closing rates of exchange at each balance sheet date. All translation exchange differences arising on the retranslation ofopening net assets together with differences between income statementstranslated at average and closing rates are recognised as a separatecomponent of equity. For these purposes net assets include loansbetween group companies that form part of the net investment, forwhich settlement is neither planned nor likely to occur in the foreseeablefuture. When a foreign operation is disposed of, any related exchangedifferences in equity are reclassified to the income statement as partof the gain or loss on disposal.
Goodwill and fair value adjustments arising on the acquisition of aforeign entity are treated as assets and liabilities of the foreign entityand translated at the closing rate.
g) Business combinations
(i) SubsidiariesThe purchase method is used to account for the acquisition ofsubsidiaries. The identifiable net assets (including intangibles) areincorporated into the financial statements on the basis of their fairvalue from the effective date of control, and the results of subsidiaryundertakings acquired during the financial year are included in thegroup’s results from that date.
Control is presumed to exist when the group owns, directly or indirectlythrough subsidiaries, more than half of the voting power of an entityunless, in exceptional circumstances, it can be clearly demonstratedthat such ownership does not constitute control. Control also existswhere the group has the ability to direct or dominate decision-makingin an entity, regardless of whether this power is actually exercised.
On the acquisition of a company or business, fair values reflectingconditions at the date of acquisition are attributed to the identifiableassets (including intangibles), liabilities and contingent liabilitiesacquired. Fair values of these assets and liabilities are determined by reference to market values, where available, or by reference to the current price at which similar assets could be acquired or similarobligations entered into, or by discounting expected future cash flowsto present value, using either market rates or the risk-free rates andrisk-adjusted expected future cash flows.
The cost of an acquisition is measured as the fair value of the assetsgiven, equity instruments issued and liabilities incurred or assumed atthe date of the acquisition plus costs directly attributable to the acquisition.It also includes the group’s estimate of any deferred considerationpayable. Where the business combination agreement provides for anadjustment to the cost that is contingent on future events, contingentconsideration is included in the cost of an acquisition if the adjustmentis probable (that is, more likely than not) and can be measured reliably.The difference between the costs of acquisition and the share of the net assets acquired is capitalised as goodwill.
Where the group purchases additional shares in subsidiaries suchpurchases are reflected as separate acquisition processes and norevised fair valuation is required. The difference between the costs of acquisition and the share of the net assets acquired is capitalisedas goodwill.
On the subsequent disposal or termination of a previously acquiredbusiness, the results of the business are included in the group’s resultsup to the effective date of disposal. The profit or loss on disposal ortermination is calculated after charging the amount of any relatedgoodwill to the extent that it has not previously been taken to theincome statement.
(ii) Associates and joint venturesThe group’s share of the recognised income and expenses ofassociates and joint ventures are accounted for using the equitymethod from the date significant influence or joint control commencesto the date it ceases based on present ownership interests. The datesignificant influence or joint control commences is not necessarily thesame as the closing date or any other date named in the contract.
The group recognises its share of associates’ and joint ventures’ post-tax results as a one line entry before profit before tax in theincome statement and its share of associates’ and joint ventures’equity movements as a one line entry under other comprehensiveincome in the statement of comprehensive income.
When the group’s interest in an associate or joint venture has beenreduced to nil because the group’s share of losses exceeds its interestin the associate or joint venture, the group only provides for additionallosses to the extent that it has incurred legal or constructive obligationsto fund such losses, or make payments on behalf of the associate orjoint venture. Where the investment in an associate or joint venture isdisposed, the investment ceases to be equity accounted.
Overview
Business review
Governance
Financial statem
entsS
hareholder inform
ation
78 Notes to the consolidated financial statements SABMiller plc Annual Report 2010
Notes to the consolidated financial statements continued
1. Accounting policies continuediii) GoodwillGoodwill arising on consolidation represents the excess of the costs ofacquisition over the group’s interest in the fair value of the identifiableassets (including intangibles), liabilities and contingent liabilities of theacquired entity at the date of acquisition. Where the fair value of thegroup’s share of identifiable net assets acquired exceeds the fair valueof the consideration, the difference is recorded as negative goodwill.Negative goodwill arising on an acquisition is recognised immediatelyin the income statement.
Goodwill is stated at cost less impairment losses and is reviewed forimpairment on an annual basis. Any impairment identified is recognisedimmediately in the income statement and is not reversed.
The carrying amount of goodwill in respect of associates and jointventures is included in the carrying value of the investment in theassociate or joint venture.
Where a business combination occurs in several stages, the goodwillassociated with each stage is calculated using fair value information at the date of each additional share purchase.
h) Intangible assetsIntangible assets are stated at cost less accumulated amortisation on a straight-line basis (if applicable) and impairment losses. Cost isusually determined as the amount paid by the group, unless the assethas been acquired as part of a business combination. Amortisation is included within net operating expenses in the income statement.Internally generated intangibles are not recognised except for softwareand applied development costs referred to under software and researchand development below.
Intangible assets with finite lives are amortised over their estimateduseful economic lives, and only tested for impairment where there is atriggering event. The group regularly reviews all of its amortisation ratesand residual values to take account of any changes in circumstances.The directors’ assessment of the useful life of intangible assets is basedon the nature of the asset acquired, the durability of the products towhich the asset attaches and the expected future impact of competitionon the business.
Intangible assets acquired as part of a business combination arerecognised separately when they are identifiable, it is probable thateconomic benefits will flow to the group and the fair value can bemeasured reliably.
(i) Brands recognised as part of a business combinationBrands are recognised as an intangible asset where the brand has a long-term value. Acquired brands are only recognised where title is clear or the brand could be sold separately from the rest of thebusiness and the earnings attributable to it are separately identifiable.The group typically arrives at the cost of such brands on a relief fromroyalty basis.
Acquired brands are amortised. In respect of brands currently held the amortisation period is 10 to 40 years, being the period for whichthe group has exclusive rights to those brands.
(ii) Contract brewing and other licences recognised as part of a business combinationContractual arrangements for contract brewing and competitor licensingarrangements are recognised as an intangible asset at a fair valuerepresenting the remaining contractual period with an assumptionabout the expectation that such a contract will be renewed, togetherwith a valuation of this extension. Contractual arrangements andrelationships with customers and distributors are also valued on asimilar basis.
Acquired licences or contracts are amortised. In respect of licences orcontracts currently held, the amortisation period is the period for whichthe group has exclusive rights to these assets or income streams.
(iii) Customer lists and distributor relationships recognised as part of a business combinationThe fair value of businesses acquired may include customer lists and distributor relationships. These are recognised as intangibleassets and are calculated by discounting the future revenue streamattributable to these lists or relationships.
Acquired customer lists or distributor relationships are amortised. In respect of contracts currently held, the amortisation period is the period for which the group has the benefit of these assets.
(iv) SoftwareWhere computer software is not an integral part of a related item of property, plant and equipment, the software is capitalised as anintangible asset.
Acquired computer software licences are capitalised on the basis of the costs incurred to acquire and bring them to use. Direct costsassociated with the production of identifiable and unique internallygenerated software products controlled by the group that will probablygenerate economic benefits exceeding costs beyond one year arecapitalised. Direct costs include software development employmentcosts (including those of contractors used), capitalised interest and an appropriate portion of overheads. Capitalised computer software,licence and development costs are amortised over their useful economiclives of between three and eight years.
Internally generated costs associated with maintaining computersoftware programmes are expensed as incurred.
(v) Research and developmentResearch and general development expenditure is written off in the period in which it is incurred.
Certain applied development costs are only capitalised as internallygenerated intangible assets where there is a clearly defined project,separately identifiable expenditure, an outcome assessed withreasonable certainty (in terms of feasibility and commerciality),expected revenues exceed expected costs and the group has theresources to complete the task. Such assets are amortised on astraight-line basis over their useful lives once the project is complete.
i) Property, plant and equipmentProperty, plant and equipment are stated at cost net of accumulateddepreciation and any impairment losses.
Cost includes expenditure that is directly attributable to the acquisitionof the assets. Subsequent costs are included in the asset’s carryingvalue or recognised as a separate asset as appropriate, only when it is probable that future economic benefits associated with the specificasset will flow to the group and the cost can be measured reliably.Repairs and maintenance costs are charged to the income statementduring the financial period in which they are incurred.
(i) Assets in the course of constructionAssets in the course of construction are carried at cost less anyimpairment loss. Cost includes professional fees and for qualifyingassets certain borrowing costs as determined below. When theseassets are ready for their intended use, they are transferred into theappropriate category. At this point, depreciation commences on thesame basis as on other property, plant and equipment.
SABMiller plc Annual Report 2010 Notes to the consolidated financial statements 79
1. Accounting policies continued(ii) Assets held under finance leasesAssets held under finance leases which result in the group bearingsubstantially all the risks and rewards incidental to ownership arecapitalised as property, plant and equipment. Finance lease assets areinitially recognised at an amount equal to the lower of their fair valueand the present value of the minimum lease payments at inception of the lease, then depreciated over the lower of the lease term or theiruseful lives. The capital element of future obligations under the leasesis included as a liability in the balance sheet classified, as appropriate,as a current or non-current liability. The interest element of the leaseobligations is charged to the income statement over the period of the lease term to reflect a constant rate of interest on the remainingbalance of the obligation for each financial period.
(iii) Returnable containersReturnable containers in circulation are recorded within property, plant and equipment at cost net of accumulated depreciation less any impairment loss.
Depreciation of returnable bottles and containers is recorded to write the containers off over the course of their economic life. This is typically undertaken in a two stage process;
■ The excess over deposit value is written down over a period of 1 to 10 years.
■ Provisions are made against the deposit values for breakages andloss in trade together with a design obsolescence provision held towrite off the deposit value over the expected bottle design period –which is a period of no more than 14 years from the inception of a bottle design. This period is shortened where appropriate byreference to market dynamics and the ability of the entity to usebottles for different brands.
(iv) DepreciationNo depreciation is provided on freehold land or assets in the course of construction. In respect of all other plant, property and equipment,depreciation is provided on a straight-line basis at rates calculated towrite off the cost, less the estimated residual value, of each asset overits expected useful life as follows:
Freehold buildings 20 – 50 yearsLeasehold buildings Shorter of the lease term
or 50 yearsPlant, vehicles and systems 2 – 30 yearsReturnable containers (non-returnable containers are recorded as inventory) 1 – 14 yearsAssets held under finance leases Lower of the lease term
or life of the asset
The group regularly reviews all of its depreciation rates and residualvalues to take account of any changes in circumstances. When settinguseful economic lives, the principal factors the group takes into accountare the expected rate of technological developments, expected marketrequirements for the equipment and the intensity at which the assetsare expected to be used.
The profit or loss on the disposal of an asset is the difference betweenthe disposal proceeds and the net book amount.
(v) Capitalisation of borrowing costsFinancing costs incurred, before tax, on major capital projects duringthe period of development or construction that necessarily take asubstantial period of time to be developed for their intended use, are capitalised up to the time of completion of the project.
j) Advance payments made to customers (principallyhotels, restaurants, bars and clubs)Advance payments made to customers are conditional on theachievement of contracted sales targets or marketing commitments.The group records such payments as prepayments initially at fair valueand are amortised in the income statement over the relevant period towhich the customer commitment is made (typically three to five years).These prepayments are recorded net of any impairment losses.
Where there is a volume target the amortised cost of the advance isincluded in sales discounts as a reduction to revenue and where thereare specific marketing activities/commitments the cost is included as an operating expense. The amounts capitalised are reassessedannually for achievement of targets and are impaired where there isobjective evidence that the targets will not be achieved.
Assets held at customer premises are included within plant, propertyand equipment and are depreciated in line with group policies onsimilar assets.
k) InventoriesInventories are stated at the lower of cost incurred in bringing eachproduct to its present location and condition, and net realisable value,as follows:
■ Raw materials, consumables and goods for resale: Purchase costnet of discounts and rebates on a first-in first-out basis (FIFO).
■ Finished goods and work in progress: Raw material cost plus directcosts and a proportion of manufacturing overhead expenses on aFIFO basis.
Net realisable value is based on estimated selling price less furthercosts expected to be incurred to completion and disposal. Costs ofinventories include the transfer from equity of any gains or losses onmatured qualifying cash flow hedges of purchases of raw materials.
l) Financial assets and financial liabilitiesFinancial assets and financial liabilities are initially recorded at fair value(plus any directly attributable transaction costs, except in the case ofthose classified at fair value through profit or loss). For those financialinstruments that are not subsequently held at fair value, the groupassesses whether there is any objective evidence of impairment ateach balance sheet date.
Financial assets are recognised when the group has rights or otheraccess to economic benefits. Such assets consist of cash, equityinstruments, a contractual right to receive cash or another financialasset, or a contractual right to exchange financial instruments withanother entity on potentially favourable terms. Financial assets arederecognised when the right to receive cash flows from the assethave expired or have been transferred and the group has transferredsubstantially all risks and rewards of ownership.
Financial liabilities are recognised when there is an obligation to transferbenefits and that obligation is a contractual liability to deliver cash or another financial asset or to exchange financial instruments withanother entity on potentially unfavourable terms. Financial liabilities are derecognised when they are extinguished, that is discharged,cancelled or expired.
If a legally enforceable right exists to set off recognised amounts offinancial assets and liabilities, which are in determinable monetaryamounts, and there is the intention to settle net, the relevant financialassets and liabilities are offset.
Interest costs are charged to the income statement in the year inwhich they accrue. Premiums or discounts arising from the differencebetween the net proceeds of financial instruments purchased or issuedand the amounts receivable or repayable at maturity are included inthe effective interest calculation and taken to net finance costs overthe life of the instrument.
Overview
Business review
Governance
Financial statem
entsS
hareholder inform
ation

80 Notes to the consolidated financial statements SABMiller plc Annual Report 2010
Notes to the consolidated financial statements continued
1. Accounting policies continuedThere are four categories of financial assets and financial liabilities.These are described as follows:
(i) Financial assets and financial liabilities at fair value through profit or lossFinancial assets and financial liabilities at fair value through profit orloss include derivative assets and derivative liabilities not designatedas effective hedging instruments.
All gains or losses arising from changes in the fair value of financialassets or financial liabilities within this category are recognised in the income statement.
a. Derivative financial assets and financial liabilitiesDerivative financial assets and financial liabilities are financial instrumentswhose value changes in response to an underlying variable, requirelittle or no initial investment and are settled in the future.
These include derivatives embedded in host contracts. Suchembedded derivatives need not be accounted for separately if the host contract is already fair valued; if it is not considered as a derivative if it was freestanding; or if it can be demonstrated that it is closely related to the host contract. There are certain currencyexemptions which the group has applied to these rules which limit the need to account for certain potential embedded foreign exchangederivatives. These are: if a contract is denominated in the functionalcurrency of either party; where that currency is commonly used ininternational trade of the good traded; or if it is commonly used forlocal transactions in an economic environment.
Derivative financial assets and liabilities are analysed between currentand non-current assets and liabilities on the face of the balance sheet,depending on when they are expected to mature.
For derivatives that have not been designated to a hedgingrelationship, all fair value movements are recognised immediately inthe income statement. (See note x for the group’s accounting policyon hedge accounting).
(ii) Loans and receivablesLoans and receivables are non-derivative financial assets with fixed ordeterminable payments that are not quoted on an active market. Theyarise when the group provides money, goods or services directly to a debtor with no intention of trading the receivable. They are includedin current assets, except for maturities of greater than 12 months afterthe balance sheet date which are classified as non-current assets.Loans and receivables are initially recognised at fair value includingoriginating fees and transaction costs, and subsequently measured at amortised cost using the effective interest method less provision forimpairment. Loans and receivables include trade receivables, amountsowed by associates – trade, amounts owed by joint ventures – trade,accrued income and cash and cash equivalents.
a. Trade receivablesTrade receivables are initially recognised at fair value and subsequentlymeasured at amortised cost less provision for impairment.
A provision for impairment of trade receivables is established whenthere is objective evidence that the group will not be able to collect allamounts due according to the terms of the receivables. The amountof the provision is the difference between the asset’s carrying valueand the present value of the estimated future cash flows discountedat the original effective interest rate. This provision is recognised in the income statement.
b. Cash and cash equivalentsIn the consolidated balance sheet, cash and cash equivalents includescash in hand, bank deposits repayable on demand and other short-term highly liquid investments with original maturities of three monthsor less. In the consolidated cash flow statement, cash and cashequivalents also includes bank overdrafts which are shown withinborrowings in current liabilities on the balance sheet.
(iii) Available for sale investmentsAvailable for sale investments are non-derivative financial assets that are either designated in this category or not classified as financialassets at fair value through profit or loss, or loans and receivables.Investments in this category are included in non-current assets unlessmanagement intends to dispose of the investment within 12 monthsof the balance sheet date. They are initially recognised at fair valueplus transaction costs and are subsequently remeasured at fair valueand tested for impairment. Gains and losses arising from changes in fair value including any related foreign exchange movements arerecognised in other comprehensive income. On disposal or impairmentof available for sale investments, any gains or losses in othercomprehensive income are reclassified to the income statement.
Purchases and sales of investments are recognised on the date onwhich the group commits to purchase or sell the asset. Investmentsare derecognised when the rights to receive cash flows from theinvestments have expired or have been transferred and the group has transferred substantially all risks and rewards of ownership.
(iv) Financial liabilities held at amortised costFinancial liabilities held at amortised cost include trade payables,accruals, amounts owed to associates – trade, amounts owed to joint ventures – trade, other payables and borrowings.
a. Trade payablesTrade payables are initially recognised at fair value and subsequentlymeasured at amortised cost using the effective interest method. Tradepayables are analysed between current and non-current liabilities onthe face of the balance sheet, depending on when the obligation tosettle will be realised.
b. BorrowingsBorrowings are recognised initially at fair value, net of transactioncosts and are subsequently stated at amortised cost and includeaccrued interest and prepaid interest. Borrowings are classified ascurrent liabilities unless the group has an unconditional right to defersettlement of the liability for at least 12 months from the balance sheetdate. Borrowings classified as hedged items are subject to hedgeaccounting requirements (see note x). Bank overdrafts are shownwithin borrowings in current liabilities and are included within cash and cash equivalents on the face of the cash flow statement as they form an integral part of the group’s cash management.
m) ImpairmentThis policy covers all assets except inventories (see note k), financialassets (see note l), non-current assets classified as held for sale (see note n), and deferred tax assets (see note u).
Impairment reviews are performed by comparing the carrying value of the non-current asset to its recoverable amount, being the higher of the fair value less costs to sell and value in use. The fair value lesscosts to sell is considered to be the amount that could be obtained on disposal of the asset. Value in use is determined by discountingthe future post-tax cash flows generated from continuing use of theCGU using a post-tax discount rate, as this closely approximates to applying pre-tax discount rates to pre-tax cash flows. Where apotential impairment is identified using post-tax cash flows and post-tax discount rates, the impairment review is reperformed on a pre-taxbasis in order to determine the impairment loss to be recorded.
Where the asset does not generate cash flows that are independentfrom the cash flows of other assets, the group estimates therecoverable amount of the cash generating unit (CGU) to which theasset belongs. For the purpose of conducting impairment reviews,CGUs are considered to be groups of assets that have separatelyidentifiable cash flows. They also include those assets and liabilitiesdirectly involved in producing the income and a suitable proportion of those used to produce more than one income stream.
SABMiller plc Annual Report 2010 Notes to the consolidated financial statements 81
1. Accounting policies continuedAn impairment loss is held firstly against any specifically impairedassets. Where an impairment is recognised against a CGU, theimpairment is first taken against goodwill balances and if there is aremaining loss it is set against the remaining intangible and tangibleassets on a pro-rata basis.
Should circumstances or events change and give rise to a reversal of a previous impairment loss, the reversal is recognised in the incomestatement in the period in which it occurs and the carrying value of the asset is increased. The increase in the carrying value of the assetis restricted to the amount that it would have been had the originalimpairment not occurred. Impairment losses in respect of goodwill are irreversible.
Goodwill is tested annually for impairment. Assets subject to amortisationare reviewed for impairment if circumstances or events change toindicate that the carrying value may not be fully recoverable.
n) Non-current assets (or disposal groups) held for saleNon-current assets and all assets and liabilities classified as held forsale are measured at the lower of carrying value and fair value lesscosts to sell.
Such assets are classified as held for resale if their carrying amountwill be recovered through a sale transaction rather than throughcontinued use. This condition is regarded as met only when a sale ishighly probable, the asset or disposal group is available for immediatesale in its present condition and when management is committed tothe sale which is expected to qualify for recognition as a completedsale within one year from date of classification.
o) ProvisionsProvisions are recognised when there is a present obligation, whetherlegal or constructive, as a result of a past event for which it is probablethat a transfer of economic benefits will be required to settle theobligation and a reliable estimate can be made of the amount of the obligation. Such provisions are calculated on a discounted basiswhere the effect is material to the original undiscounted provision. Thecarrying amount of the provision increases in each period to reflect thepassage of time and the unwinding of the discount and the movementis recognised in the income statement within net finance costs.
Restructuring provisions comprise lease termination penalties andemployee termination payments. Provisions are not recognised forfuture operating losses, however, provisions are recognised for onerouscontracts where the unavoidable cost exceeds the expected benefit.
p) Share capitalOrdinary shares are classified as equity. Incremental costs directlyattributable to the issue of new shares or options are shown in equityas a deduction, net of tax, from the proceeds.
q) Investments in own shares (treasury and shares held by employee benefit trusts)Shares held by employee share ownership plans, employee benefittrusts and in treasury are treated as a deduction from equity until the shares are cancelled, reissued, or disposed.
Purchases of such shares are classified in the cash flow statement as a purchase of own shares for share trusts or purchase of ownshares for treasury within net cash from financing activities.
Where such shares are subsequently sold or reissued, any considerationreceived, net of any directly attributable incremental costs and relatedtax effects, is included in equity attributable to the company’s equityshareholders.
r) Revenue recognition
(i) Sale of goods and servicesRevenue represents the fair value of consideration received or receivablefor goods and services provided to third parties and is recognisedwhen the risks and rewards of ownership are substantially transferred.
The group presents revenue gross of excise duties because unlikevalue added tax, excise is not directly related to the value of sales. It isnot generally recognised as a separate item on invoices, increases inexcise are not always directly passed on to customers, and the groupcannot reclaim the excise where customers do not pay for productreceived. The group therefore considers excise as a cost to the groupand reflects it as a production cost. Consequently, any excise that isrecovered in the sale price is included in revenue.
Revenue excludes value added tax. It is stated net of price discounts,promotional discounts, settlement discounts and after an appropriateamount has been provided to cover the sales value of credit notes yet to be issued that relate to the current and prior periods.
The same recognition criteria also apply to the sale of by-products andwaste (such as spent grain, malt dust and yeast) with the exceptionthat these are included within other income.
(ii) Interest incomeInterest income is recognised on an accruals basis using the effectiveinterest method.
When a receivable is impaired the group reduces the carrying amountto its recoverable amount by discounting the estimated future cashflows at the original effective interest rate, and continuing to unwindthe discount as interest income.
(iii) Royalty incomeRoyalty income is recognised on an accruals basis in accordance with the relevant agreements and is included in other income.
(iv) Dividend incomeDividend income is recognised when the right to receive payment is established.
s) Operating leasesRentals paid and incentives received on operating leases are chargedor credited to the income statement on a straight-line basis over thelease term.
t) Exceptional itemsWhere certain expense or income items recorded in a period arematerial by their size or incidence, the group reflects such items as exceptional items within a separate line on the income statementexcept for those exceptional items that relate to associates, jointventures, net finance costs and tax. (Associates, joint ventures, netfinance costs and tax exceptional items are only referred to in thenotes to the consolidated financial statements).
Exceptional items are also summarised in the segmental analyses,excluding those that relate to net finance costs and tax.
Where certain income statement items incurred are of a capital nature or are considered non-recurring or are exceptional items, thegroup presents alternative earnings per share calculations both on aheadline (under the South African Circular 8/2007 definition) and onan adjusted basis.
u) TaxationThe tax expense for the period comprises current and deferred tax.Tax is recognised in the income statement, except to the extent that itrelates to items recognised in other comprehensive income or directlyin equity, in which case it is recognised in other comprehensive incomeor directly in equity, respectively.
Overview
Business review
Governance
Financial statem
entsS
hareholder inform
ation
82 Notes to the consolidated financial statements SABMiller plc Annual Report 2010
Notes to the consolidated financial statements continued
1. Accounting policies continuedCurrent tax expense is based on the results for the period as adjustedfor items that are not taxable or not deductible. The group’s liability forcurrent taxation is calculated using tax rates and laws that have beenenacted or substantively enacted by the balance sheet date.
Deferred tax is provided in full using the liability method, in respect ofall temporary differences arising between the tax bases of assets andliabilities and their carrying values in the consolidated financial statements,except where the temporary difference arises from goodwill (in thecase of deferred tax liabilities) or from the initial recognition (other thana business combination) of other assets and liabilities in a transactionthat affects neither accounting nor taxable profit.
Deferred tax liabilities are recognised where the carrying value of an asset is greater than its tax base, or where the carrying value of a liability is less than its tax base. Deferred tax is recognised in full ontemporary differences arising from investment in subsidiaries, associatesand joint ventures, except where the timing of the reversal of thetemporary difference is controlled by the group and it is probable that the temporary difference will not reverse in the foreseeable future.This includes taxation in respect of the retained earnings of overseassubsidiaries only to the extent that, at the balance sheet date, dividendshave been accrued as receivable or a binding agreement to distributepast earnings in future periods has been entered into by the subsidiary.Deferred income tax is also recognised in respect of the unremittedretained earnings of overseas associates and joint ventures as thegroup is not able to determine when such earnings will be remitted andwhen such additional tax such as withholding taxes might be payable.
A net deferred tax asset is regarded as recoverable and thereforerecognised only when, on the basis of all available evidence, it is probablethat future taxable profit will be available against which the temporarydifferences (including carried forward tax losses) can be utilised.
Deferred tax is measured at the tax rates expected to apply in the periodsin which the timing differences are expected to reverse based on taxrates and laws that have been enacted or substantively enacted atbalance sheet date. Deferred tax is measured on a non-discounted basis.
v) Dividend distributionsDividend distributions to equity holders of the parent are recognisedas a liability in the group’s financial statements in the period in whichthe dividends are approved by the company’s shareholders. Interimdividends are recognised when paid. Dividends declared after thebalance sheet date are not recognised, as there is no presentobligation at the balance sheet date.
w) Employee benefits
(i) Wages and salariesWages and salaries for current employees are recognised in the income statement as the employees’ services are rendered.
(ii) Vacation and long-term service awards costsThe group recognises a liability and an expense for accrued vacation paywhen such benefits are earned and not when these benefits are paid.
The group also recognises a liability and an expense for long-termservice awards where cash is paid to the employee at certain milestonedates in a career with the group. Such accruals are appropriatelydiscounted to reflect the future payment dates at discount ratesdetermined by reference to local high-quality corporate bonds.
(iii) Profit-sharing and bonus plansThe group recognises a liability and an expense for bonuses andprofit-sharing, based on a formula that takes into consideration the profit attributable to the company’s shareholders after certainadjustments.
The group recognises a provision where contractually obliged or wherethere is a past practice that has created a constructive obligation. At amid-year point an accrual is maintained for the appropriate proportionof the expected bonuses which would become payable at the year end.
(iv) Share-based compensationThe group operates a variety of equity-settled, share-basedcompensation plans. These comprise share option plans (with and without non-market performance conditions attached) and aperformance share award plan (with market performance conditionsattached). An expense is recognised to spread the fair value of eachaward granted after 7 November 2002 over the vesting period on astraight-line basis, after allowing for an estimate of the share awardsthat will eventually vest. A corresponding adjustment is made to equityover the remaining vesting period. The estimate of the level of vestingis reviewed at least annually, with any impact on the cumulativecharge being recognised immediately. The charge is based on the fair value of the award as at the date of grant, as calculated by various binomial model calculations and Monte Carlo simulations.
The charge is not reversed if the options are not exercised becausethe market value of the shares is lower than the option price at thedate of grant.
The proceeds received net of any directly attributable transactioncosts are credited to share capital (nominal value) and share premiumwhen the options are exercised.
(v) Pension obligationsThe group has both defined benefit and defined contribution plans.
The liability recognised in the balance sheet in respect of defined benefitpension plans is the present value of the defined benefit obligation atthe balance sheet date less the fair value of plan assets, together withadjustments for unrecognised past service costs. The defined benefitobligation is calculated annually by independent actuaries using theprojected unit credit method. The present value of the defined benefitobligation is determined by discounting the estimated future cashoutflows using interest rates of high-quality corporate bonds that aredenominated in the currency in which the benefits will be paid, andthat have terms to maturity approximating to the terms of the relatedpension liability.
Actuarial gains and losses arising from experience adjustments andchanges in actuarial assumptions are recognised in full as they ariseoutside of the income statement and are charged or credited to equityin other comprehensive income in the period in which they arise, withthe exception of gains or losses arising from changes in the benefitsregarding past services, which are recognised in the income statement.
Past service costs are recognised immediately in the incomestatement, unless the changes to the pension plan are conditional onthe employees remaining in service for a specified period of time (thevesting period). In this case, the past service costs are amortised on a straight-line basis over the vesting period.
The contributions to defined contribution plans are recognised as an expense as the costs become payable. The contributions are recognised as employee benefit expense when they are due.Prepaid contributions are recognised as an asset to the extent that a cash refund or a reduction in the future payments is available.
SABMiller plc Annual Report 2010 Notes to the consolidated financial statements 83
1. Accounting policies continued(vi) Other post-employment obligationsSome group companies provide post-retirement healthcare benefits toqualifying employees. The expected costs of these benefits are assessedin accordance with the advice of qualified actuaries and contributionsare made to the relevant funds over the expected service lives of theemployees entitled to those funds. Actuarial gains and losses arisingfrom experience adjustments, and changes in actuarial assumptionsare recognised in full as they arise outside the income statement andare charged or credited to equity in other comprehensive income inthe period in which they arise. These obligations are valued annuallyby independent qualified actuaries.
(vii) Termination benefitsTermination benefits are payable when employment is terminated beforethe normal retirement date, or whenever an employee accepts voluntaryredundancy in exchange for these benefits. The group recognisestermination benefits when it is demonstrably committed to terminatingthe employment of current employees according to a detailed formalplan without possibility of withdrawal, or providing termination benefitsas a result of an offer made to encourage voluntary redundancy.Benefits falling due more than 12 months after balance sheet date are discounted to present value in a similar manner to all long-termemployee benefits.
x) Derivative financial instruments – hedge accountingFinancial assets and financial liabilities at fair value through profit or loss include all derivative financial instruments. The derivativeinstruments used by the group, which are used solely for hedgingpurposes (i.e. to offset foreign exchange and interest rate risks),comprise interest rate swaps, cross currency swaps and forwardforeign exchange contracts. Such derivative instruments are used to alter the risk profile of an existing underlying exposure of the groupin line with the group’s risk management policies. The group also hasderivatives embedded in other contracts primarily cross border foreigncurrency supply contracts for raw materials.
Derivatives are initially recorded at fair value on the date a derivativecontract is entered into and are subsequently remeasured at their fairvalue. The method of recognising the resulting gain or loss dependson whether the derivative is designated as a hedging instrument, andif so, the nature of the hedging relationship.
In order to qualify for hedge accounting, the group is required todocument at inception, the relationship between the hedged item and the hedging instrument as well as its risk management objectivesand strategy for undertaking hedging transactions. The group is alsorequired to document and demonstrate that the relationship betweenthe hedged item and the hedging instrument will be highly effective.This effectiveness test is reperformed at each period end to ensurethat the hedge has remained and will continue to remain highly effective.
The group designates certain derivatives as either: hedges of the fairvalue of recognised assets or liabilities or a firm commitment (fair valuehedge); hedges of highly probable forecast transactions or commitments(cash flow hedge); or hedges of net investments in foreign operations(net investment hedge).
(i) Fair value hedgesFair value hedges comprise derivative financial instruments designatedin a hedging relationship to manage the group’s interest rate risk towhich the fair value of certain assets and liabilities are exposed. Changesin the fair value of the derivative offset the relevant changes in the fairvalue of the underlying hedged item attributable to the hedged risk inthe income statement in the period incurred.
Gains or losses on fair value hedges that are regarded as highlyeffective are recorded in the income statement together with the gain or loss on the hedged item attributable to the hedged risk.
(ii) Cash flow hedgesCash flow hedges comprise derivative financial instruments designatedin a hedging relationship to manage currency and interest rate risk towhich the cash flows of certain liabilities are exposed. The effectiveportion of changes in the fair value of the derivative that is designatedand qualifies for hedge accounting is recognised in other comprehensiveincome. The ineffective portion is recognised immediately in the incomestatement. Amounts accumulated in equity are reclassified to the incomestatement in the period in which the hedged item affects profit or loss.However, where a forecasted transaction results in a non-financialasset or liability, the accumulated fair value movements previouslydeferred in equity are included in the initial cost of the asset or liability.
(iii) Hedges of net investments in foreign operationsHedges of net investments in foreign operations comprise either foreigncurrency borrowings or derivatives (typically forward exchange contractsand cross currency swaps) designated in a hedging relationship.
Gains or losses on hedging instruments that are regarded as highlyeffective are recognised in other comprehensive income. These largelyoffset foreign currency gains or losses arising on the translation of netinvestments that are recorded in equity, in the foreign currency translationreserve. The ineffective portion of gains or losses on hedging instrumentsis recognised immediately in the income statement. Amountsaccumulated in equity are only reclassified to the income statementupon disposal of the net investment.
Where a derivative ceases to meet the criteria of being a hedginginstrument or the underlying exposure which it is hedging is sold,matures or is extinguished, hedge accounting is discontinued andamounts previously recorded in equity are reclassified to the incomestatement. A similar treatment is applied where the hedge is of afuture transaction and that transaction is no longer likely to occur.When the hedge is discontinued due to ineffectiveness, hedgeaccounting is discontinued prospectively.
Certain derivative instruments, while providing effective economichedges under the group’s policies, are not designated as hedges.Changes in the fair value of any derivative instruments that do not qualify or have not been designated as hedges are recognisedimmediately in the income statement. The group does not hold or issue derivative financial instruments for speculative purposes.
y) Deposits by customersReturnable bottles and containers in circulation are recorded withinproperty, plant and equipment and a corresponding liability is recordedin respect of the obligation to repay the customers’ deposits. Depositspaid by customers for branded returnable containers are reflected inthe balance sheet within current liabilities. Any estimated liability thatmay arise in respect of deposits for unbranded containers and bottlesis shown in provisions.
z) Earnings per shareBasic earnings per share represents the profit on ordinary activitiesafter taxation attributable to the equity shareholders of the parent entity,divided by the weighted average number of ordinary shares in issueduring the year, less the weighted average number of ordinary sharesheld in the group’s employee benefit trust and in treasury during the year.
Diluted earnings per share represents the profit on ordinary activitiesafter taxation attributable to the equity shareholders, divided by theweighted average number of ordinary shares in issue during the year, less the weighted average number of ordinary shares held in thegroup’s employee benefit trust and in treasury during the year, plusthe weighted average number of dilutive shares resulting from shareoptions and other potential ordinary shares outstanding during the year.
Overview
Business review
Governance
Financial statem
entsS
hareholder inform
ation
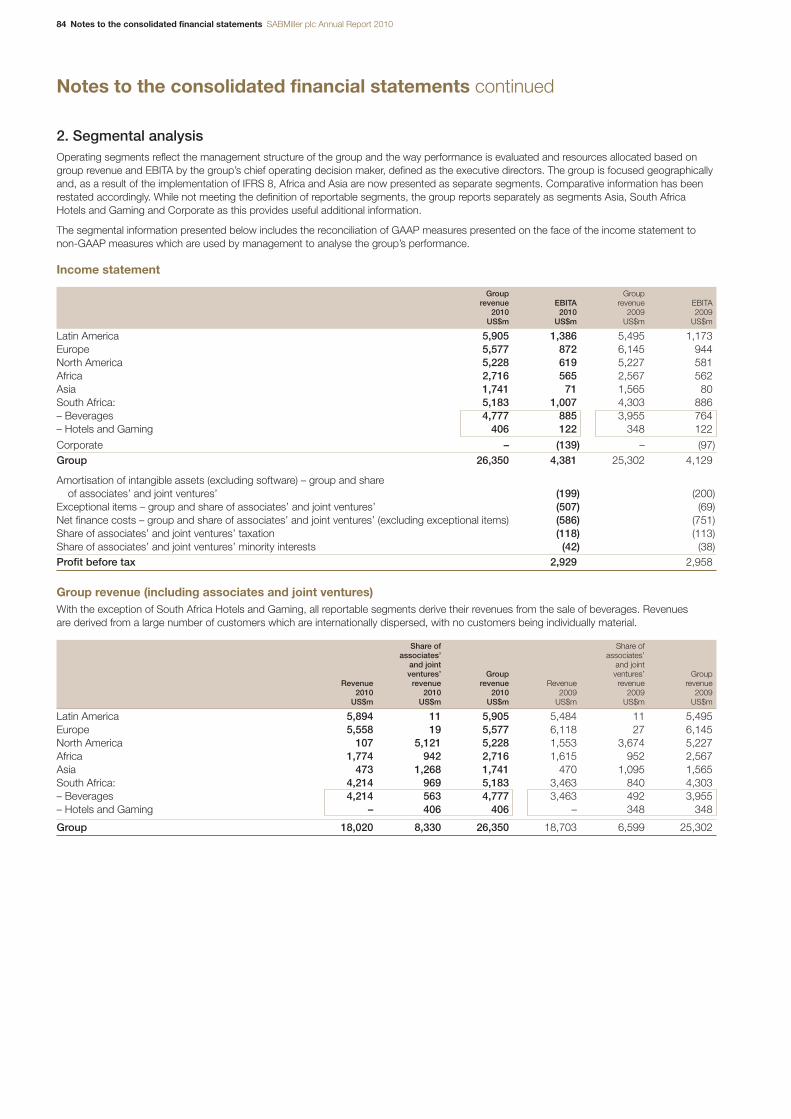
84 Notes to the consolidated financial statements SABMiller plc Annual Report 2010
Notes to the consolidated financial statements continued
2. Segmental analysis Operating segments reflect the management structure of the group and the way performance is evaluated and resources allocated based ongroup revenue and EBITA by the group’s chief operating decision maker, defined as the executive directors. The group is focused geographicallyand, as a result of the implementation of IFRS 8, Africa and Asia are now presented as separate segments. Comparative information has beenrestated accordingly. While not meeting the definition of reportable segments, the group reports separately as segments Asia, South AfricaHotels and Gaming and Corporate as this provides useful additional information.
The segmental information presented below includes the reconciliation of GAAP measures presented on the face of the income statement tonon-GAAP measures which are used by management to analyse the group’s performance.
Income statement
Group Grouprevenue EBITA revenue EBITA
2010 2010 2009 2009US$m US$m US$m US$m
Latin America 5,905 1,386 5,495 1,173Europe 5,577 872 6,145 944North America 5,228 619 5,227 581Africa 2,716 565 2,567 562Asia 1,741 71 1,565 80South Africa: 5,183 1,007 4,303 886– Beverages 4,777 885 3,955 764– Hotels and Gaming 406 122 348 122
Corporate – (139) – (97)Group 26,350 4,381 25,302 4,129
Amortisation of intangible assets (excluding software) – group and share of associates’ and joint ventures’ (199) (200)
Exceptional items – group and share of associates’ and joint ventures’ (507) (69)Net finance costs – group and share of associates’ and joint ventures’ (excluding exceptional items) (586) (751)Share of associates’ and joint ventures’ taxation (118) (113)Share of associates’ and joint ventures’ minority interests (42) (38)Profit before tax 2,929 2,958
Group revenue (including associates and joint ventures)With the exception of South Africa Hotels and Gaming, all reportable segments derive their revenues from the sale of beverages. Revenues are derived from a large number of customers which are internationally dispersed, with no customers being individually material.
Share of Share ofassociates’ associates’
and joint and jointventures’ Group ventures’ Group
Revenue revenue revenue Revenue revenue revenue2010 2010 2010 2009 2009 2009
US$m US$m US$m US$m US$m US$m
Latin America 5,894 11 5,905 5,484 11 5,495Europe 5,558 19 5,577 6,118 27 6,145North America 107 5,121 5,228 1,553 3,674 5,227Africa 1,774 942 2,716 1,615 952 2,567Asia 473 1,268 1,741 470 1,095 1,565South Africa: 4,214 969 5,183 3,463 840 4,303– Beverages 4,214 563 4,777 3,463 492 3,955– Hotels and Gaming – 406 406 – 348 348
Group 18,020 8,330 26,350 18,703 6,599 25,302
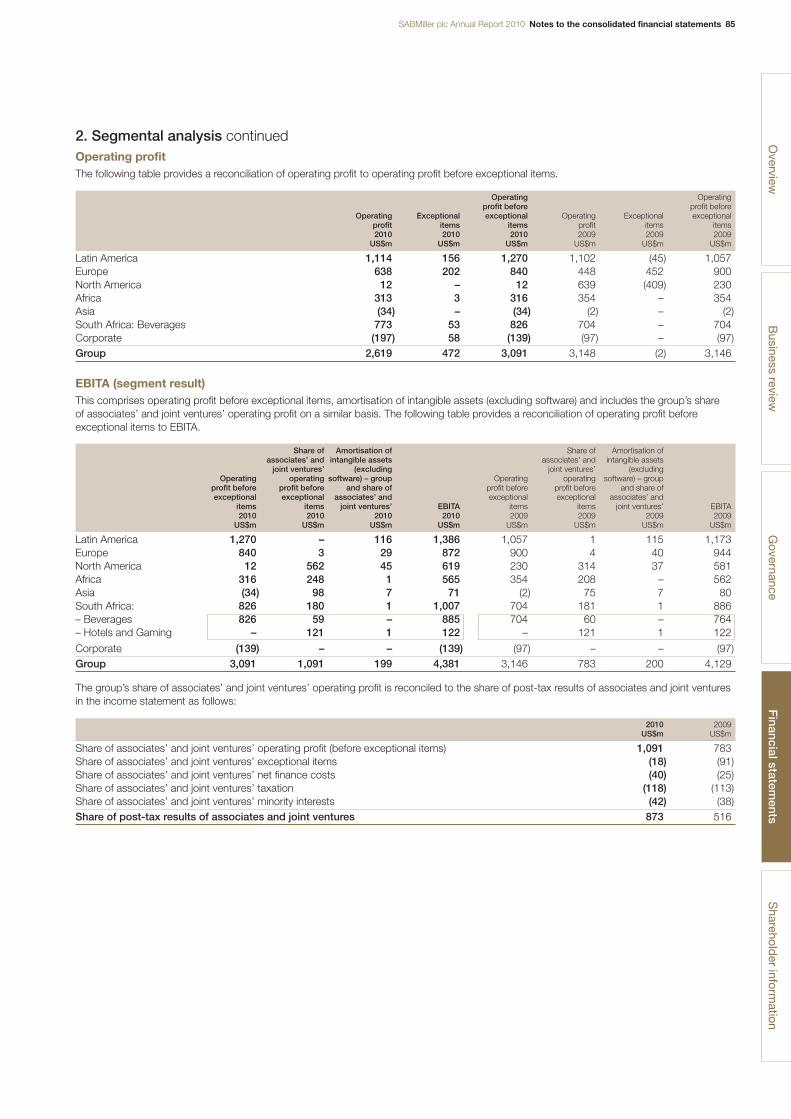
SABMiller plc Annual Report 2010 Notes to the consolidated financial statements 85
2. Segmental analysis continuedOperating profitThe following table provides a reconciliation of operating profit to operating profit before exceptional items.
Operating Operatingprofit before profit before
Operating Exceptional exceptional Operating Exceptional exceptionalprofit items items profit items items2010 2010 2010 2009 2009 2009
US$m US$m US$m US$m US$m US$m
Latin America 1,114 156 1,270 1,102 (45) 1,057Europe 638 202 840 448 452 900North America 12 – 12 639 (409) 230Africa 313 3 316 354 – 354Asia (34) – (34) (2) – (2)South Africa: Beverages 773 53 826 704 – 704Corporate (197) 58 (139) (97) – (97)Group 2,619 472 3,091 3,148 (2) 3,146
EBITA (segment result)This comprises operating profit before exceptional items, amortisation of intangible assets (excluding software) and includes the group’s share of associates’ and joint ventures’ operating profit on a similar basis. The following table provides a reconciliation of operating profit beforeexceptional items to EBITA.
Share of Amortisation of Share of Amortisation ofassociates’ and intangible assets associates’ and intangible assets
joint ventures’ (excluding joint ventures’ (excludingOperating operating software) – group Operating operating software) – group
profit before profit before and share of profit before profit before and share ofexceptional exceptional associates’ and exceptional exceptional associates’ and
items items joint ventures’ EBITA items items joint ventures’ EBITA2010 2010 2010 2010 2009 2009 2009 2009
US$m US$m US$m US$m US$m US$m US$m US$m
Latin America 1,270 – 116 1,386 1,057 1 115 1,173Europe 840 3 29 872 900 4 40 944North America 12 562 45 619 230 314 37 581Africa 316 248 1 565 354 208 – 562Asia (34) 98 7 71 (2) 75 7 80South Africa: 826 180 1 1,007 704 181 1 886– Beverages 826 59 – 885 704 60 – 764– Hotels and Gaming – 121 1 122 – 121 1 122
Corporate (139) – – (139) (97) – – (97)Group 3,091 1,091 199 4,381 3,146 783 200 4,129
The group’s share of associates’ and joint ventures’ operating profit is reconciled to the share of post-tax results of associates and joint venturesin the income statement as follows:
2010 2009US$m US$m
Share of associates’ and joint ventures’ operating profit (before exceptional items) 1,091 783Share of associates’ and joint ventures’ exceptional items (18) (91)Share of associates’ and joint ventures’ net finance costs (40) (25)Share of associates’ and joint ventures’ taxation (118) (113)Share of associates’ and joint ventures’ minority interests (42) (38)Share of post-tax results of associates and joint ventures 873 516
Overview
Business review
Governance
Financial statem
entsS
hareholder inform
ation
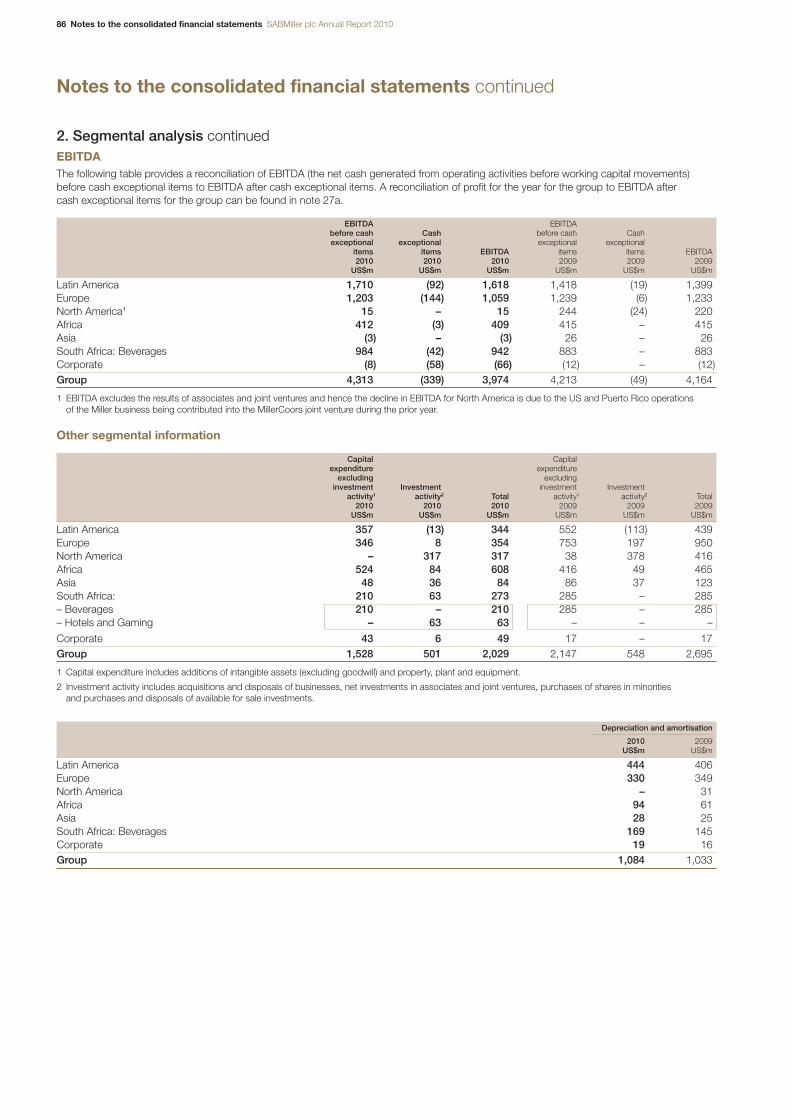
86 Notes to the consolidated financial statements SABMiller plc Annual Report 2010
Notes to the consolidated financial statements continued
2. Segmental analysis continuedEBITDAThe following table provides a reconciliation of EBITDA (the net cash generated from operating activities before working capital movements)before cash exceptional items to EBITDA after cash exceptional items. A reconciliation of profit for the year for the group to EBITDA after cash exceptional items for the group can be found in note 27a.
EBITDA EBITDAbefore cash Cash before cash Cashexceptional exceptional exceptional exceptional
items items EBITDA items items EBITDA2010 2010 2010 2009 2009 2009
US$m US$m US$m US$m US$m US$m
Latin America 1,710 (92) 1,618 1,418 (19) 1,399Europe 1,203 (144) 1,059 1,239 (6) 1,233North America1 15 – 15 244 (24) 220Africa 412 (3) 409 415 – 415Asia (3) – (3) 26 – 26South Africa: Beverages 984 (42) 942 883 – 883Corporate (8) (58) (66) (12) – (12)Group 4,313 (339) 3,974 4,213 (49) 4,164
1 EBITDA excludes the results of associates and joint ventures and hence the decline in EBITDA for North America is due to the US and Puerto Rico operations of the Miller business being contributed into the MillerCoors joint venture during the prior year.
Other segmental information
Capital Capitalexpenditure expenditure
excluding excludinginvestment Investment investment Investment
activity1 activity2 Total activity1 activity2 Total2010 2010 2010 2009 2009 2009
US$m US$m US$m US$m US$m US$m
Latin America 357 (13) 344 552 (113) 439Europe 346 8 354 753 197 950North America – 317 317 38 378 416Africa 524 84 608 416 49 465Asia 48 36 84 86 37 123South Africa: 210 63 273 285 – 285– Beverages 210 – 210 285 – 285– Hotels and Gaming – 63 63 – – –
Corporate 43 6 49 17 – 17Group 1,528 501 2,029 2,147 548 2,695
1 Capital expenditure includes additions of intangible assets (excluding goodwill) and property, plant and equipment.
2 Investment activity includes acquisitions and disposals of businesses, net investments in associates and joint ventures, purchases of shares in minorities and purchases and disposals of available for sale investments.
Depreciation and amortisation
2010 2009US$m US$m
Latin America 444 406Europe 330 349North America – 31Africa 94 61Asia 28 25South Africa: Beverages 169 145Corporate 19 16Group 1,084 1,033
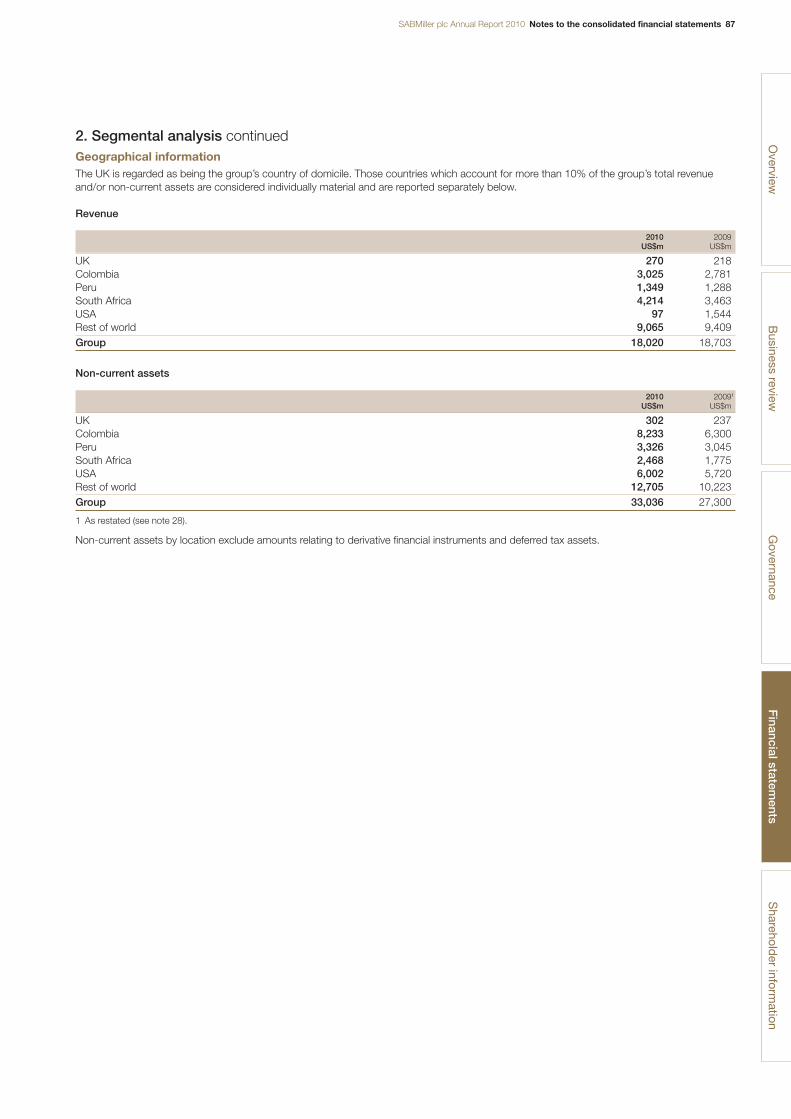
SABMiller plc Annual Report 2010 Notes to the consolidated financial statements 87
2. Segmental analysis continuedGeographical informationThe UK is regarded as being the group’s country of domicile. Those countries which account for more than 10% of the group’s total revenueand/or non-current assets are considered individually material and are reported separately below.
Revenue
2010 2009US$m US$m
UK 270 218Colombia 3,025 2,781Peru 1,349 1,288South Africa 4,214 3,463USA 97 1,544Rest of world 9,065 9,409Group 18,020 18,703
Non-current assets
2010 20091
US$m US$m
UK 302 237Colombia 8,233 6,300Peru 3,326 3,045South Africa 2,468 1,775USA 6,002 5,720Rest of world 12,705 10,223Group 33,036 27,300
1 As restated (see note 28).
Non-current assets by location exclude amounts relating to derivative financial instruments and deferred tax assets.
Overview
Business review
Governance
Financial statem
entsS
hareholder inform
ation

88 Notes to the consolidated financial statements SABMiller plc Annual Report 2010
Notes to the consolidated financial statements continued
3. Net operating expenses
2010 2009US$m US$m
Cost of inventories recognised as an expense 4,565 5,203– Changes in inventories of finished goods and work in progress 34 69– Raw materials and consumables used 4,531 5,134
Excise duties1 3,825 3,820Employee benefits costs (see note 6a) 1,985 1,940Depreciation of property, plant and equipment 881 829– Owned assets 649 621– Under finance lease 6 5– Containers 226 203
Profit on disposal of available for sale investments (2) –Profit on disposal of businesses – (526)Loss on disposal of property, plant and equipment 39 10Amortisation of intangible assets 203 204– Intangible assets excluding software 150 164– Software 53 40
Other expenses 4,184 4,352– Selling, marketing and distribution costs 2,054 2,281– Repairs and maintenance expenditure on property, plant and equipment 295 308– Impairment of goodwill – 364– Impairment of intangible assets – 14– Impairment of property, plant and equipment 45 16– Impairment of trade and other receivables 43 31– Operating lease rentals – land and buildings 57 65– Operating lease rentals – plant, vehicles and systems 89 91– Research and development expenditure 4 7– Other operating expenses 1,597 1,175
Total net operating expenses by nature 15,680 15,832Other income (279) (277)– Revenue received from royalties (35) (36)– Dividends received from investments (2) (1)– Other operating income (242) (240)
Net operating expenses 15,401 15,555
1 Excise duties of US$3,825 million (2009: US$3,820 million) have been incurred during the year as follows: Latin America US$1,517 million (2009: US$1,383 million);Europe US$1,075 million (2009: US$1,118 million); North America US$2 million (2009: US$239 million); Africa US$282 million (2009: US$270 million); Asia US$181 million(2009: US$184 million) and South Africa US$768 million (2009: US$626 million).
Foreign exchange differences recognised in the profit for the year, except for those arising on financial instruments measured at fair value underIAS 39, were a gain of US$27 million (2009: loss of US$34 million).
The following fees were paid to a number of different accounting firms as auditors of various parts of the group:
2010 2009US$m US$m
Group auditorsFees payable to the group’s auditor and its associates for:
Auditing of subsidiaries, pursuant to legislation 8 6Other services supplied pursuant to legislation 1 1Other services relating to taxation 6 4Services relating to corporate finance transactions 3 –Other services1 6 4
Fees payable to the group’s auditor for auditing of the parent company’s annual accounts 2 126 16
1 In 2010, principally relating to the business capability programme.
2010 2009US$m US$m
Other auditorsFees payable to other auditors for other services:
Auditing of subsidiaries, pursuant to legislation 2 1Other services relating to taxation 2 2Internal audit services – 1IT consulting services1 4 –Other services1 15 3
23 7
1 In 2010, principally relating to the business capability programme.
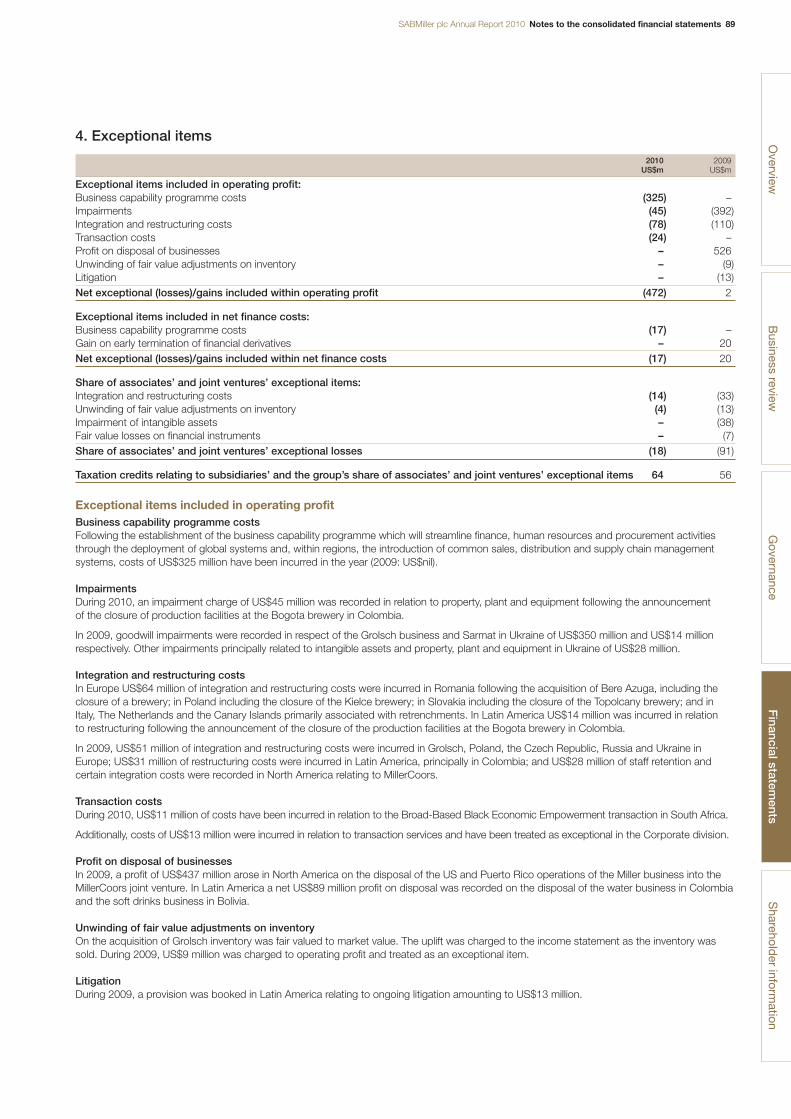
SABMiller plc Annual Report 2010 Notes to the consolidated financial statements 89
4. Exceptional items
2010 2009US$m US$m
Exceptional items included in operating profit:Business capability programme costs (325) –Impairments (45) (392)Integration and restructuring costs (78) (110)Transaction costs (24) –Profit on disposal of businesses – 526Unwinding of fair value adjustments on inventory – (9)Litigation – (13)Net exceptional (losses)/gains included within operating profit (472) 2
Exceptional items included in net finance costs:Business capability programme costs (17) –Gain on early termination of financial derivatives – 20Net exceptional (losses)/gains included within net finance costs (17) 20
Share of associates’ and joint ventures’ exceptional items:Integration and restructuring costs (14) (33)Unwinding of fair value adjustments on inventory (4) (13)Impairment of intangible assets – (38)Fair value losses on financial instruments – (7)Share of associates’ and joint ventures’ exceptional losses (18) (91)
Taxation credits relating to subsidiaries’ and the group’s share of associates’ and joint ventures’ exceptional items 64 56
Exceptional items included in operating profitBusiness capability programme costsFollowing the establishment of the business capability programme which will streamline finance, human resources and procurement activitiesthrough the deployment of global systems and, within regions, the introduction of common sales, distribution and supply chain managementsystems, costs of US$325 million have been incurred in the year (2009: US$nil).
ImpairmentsDuring 2010, an impairment charge of US$45 million was recorded in relation to property, plant and equipment following the announcement of the closure of production facilities at the Bogota brewery in Colombia.
In 2009, goodwill impairments were recorded in respect of the Grolsch business and Sarmat in Ukraine of US$350 million and US$14 millionrespectively. Other impairments principally related to intangible assets and property, plant and equipment in Ukraine of US$28 million.
Integration and restructuring costsIn Europe US$64 million of integration and restructuring costs were incurred in Romania following the acquisition of Bere Azuga, including theclosure of a brewery; in Poland including the closure of the Kielce brewery; in Slovakia including the closure of the Topolcany brewery; and inItaly, The Netherlands and the Canary Islands primarily associated with retrenchments. In Latin America US$14 million was incurred in relation to restructuring following the announcement of the closure of the production facilities at the Bogota brewery in Colombia.
In 2009, US$51 million of integration and restructuring costs were incurred in Grolsch, Poland, the Czech Republic, Russia and Ukraine inEurope; US$31 million of restructuring costs were incurred in Latin America, principally in Colombia; and US$28 million of staff retention andcertain integration costs were recorded in North America relating to MillerCoors.
Transaction costsDuring 2010, US$11 million of costs have been incurred in relation to the Broad-Based Black Economic Empowerment transaction in South Africa.
Additionally, costs of US$13 million were incurred in relation to transaction services and have been treated as exceptional in the Corporate division.
Profit on disposal of businessesIn 2009, a profit of US$437 million arose in North America on the disposal of the US and Puerto Rico operations of the Miller business into theMillerCoors joint venture. In Latin America a net US$89 million profit on disposal was recorded on the disposal of the water business in Colombiaand the soft drinks business in Bolivia.
Unwinding of fair value adjustments on inventoryOn the acquisition of Grolsch inventory was fair valued to market value. The uplift was charged to the income statement as the inventory wassold. During 2009, US$9 million was charged to operating profit and treated as an exceptional item.
LitigationDuring 2009, a provision was booked in Latin America relating to ongoing litigation amounting to US$13 million.
Overview
Business review
Governance
Financial statem
entsS
hareholder inform
ation
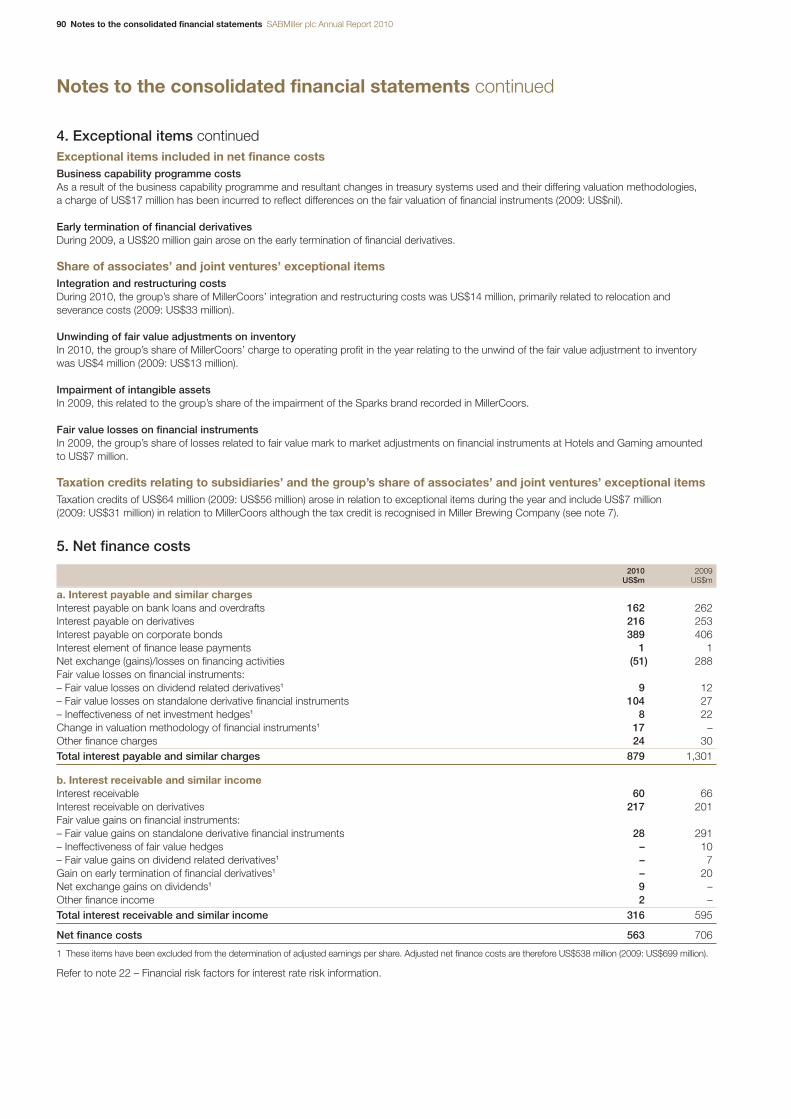
90 Notes to the consolidated financial statements SABMiller plc Annual Report 2010
Notes to the consolidated financial statements continued
4. Exceptional items continuedExceptional items included in net finance costsBusiness capability programme costsAs a result of the business capability programme and resultant changes in treasury systems used and their differing valuation methodologies, a charge of US$17 million has been incurred to reflect differences on the fair valuation of financial instruments (2009: US$nil).
Early termination of financial derivativesDuring 2009, a US$20 million gain arose on the early termination of financial derivatives.
Share of associates’ and joint ventures’ exceptional itemsIntegration and restructuring costsDuring 2010, the group’s share of MillerCoors’ integration and restructuring costs was US$14 million, primarily related to relocation andseverance costs (2009: US$33 million).
Unwinding of fair value adjustments on inventoryIn 2010, the group’s share of MillerCoors’ charge to operating profit in the year relating to the unwind of the fair value adjustment to inventorywas US$4 million (2009: US$13 million).
Impairment of intangible assetsIn 2009, this related to the group’s share of the impairment of the Sparks brand recorded in MillerCoors.
Fair value losses on financial instrumentsIn 2009, the group’s share of losses related to fair value mark to market adjustments on financial instruments at Hotels and Gaming amounted to US$7 million.
Taxation credits relating to subsidiaries’ and the group’s share of associates’ and joint ventures’ exceptional itemsTaxation credits of US$64 million (2009: US$56 million) arose in relation to exceptional items during the year and include US$7 million (2009: US$31 million) in relation to MillerCoors although the tax credit is recognised in Miller Brewing Company (see note 7).
5. Net finance costs
2010 2009US$m US$m
a. Interest payable and similar chargesInterest payable on bank loans and overdrafts 162 262Interest payable on derivatives 216 253Interest payable on corporate bonds 389 406Interest element of finance lease payments 1 1Net exchange (gains)/losses on financing activities (51) 288Fair value losses on financial instruments:– Fair value losses on dividend related derivatives1 9 12– Fair value losses on standalone derivative financial instruments 104 27– Ineffectiveness of net investment hedges1 8 22Change in valuation methodology of financial instruments1 17 –Other finance charges 24 30Total interest payable and similar charges 879 1,301
b. Interest receivable and similar incomeInterest receivable 60 66Interest receivable on derivatives 217 201Fair value gains on financial instruments:– Fair value gains on standalone derivative financial instruments 28 291– Ineffectiveness of fair value hedges – 10– Fair value gains on dividend related derivatives1 – 7Gain on early termination of financial derivatives1 – 20Net exchange gains on dividends1 9 –Other finance income 2 –Total interest receivable and similar income 316 595
Net finance costs 563 706
1 These items have been excluded from the determination of adjusted earnings per share. Adjusted net finance costs are therefore US$538 million (2009: US$699 million).
Refer to note 22 – Financial risk factors for interest rate risk information.
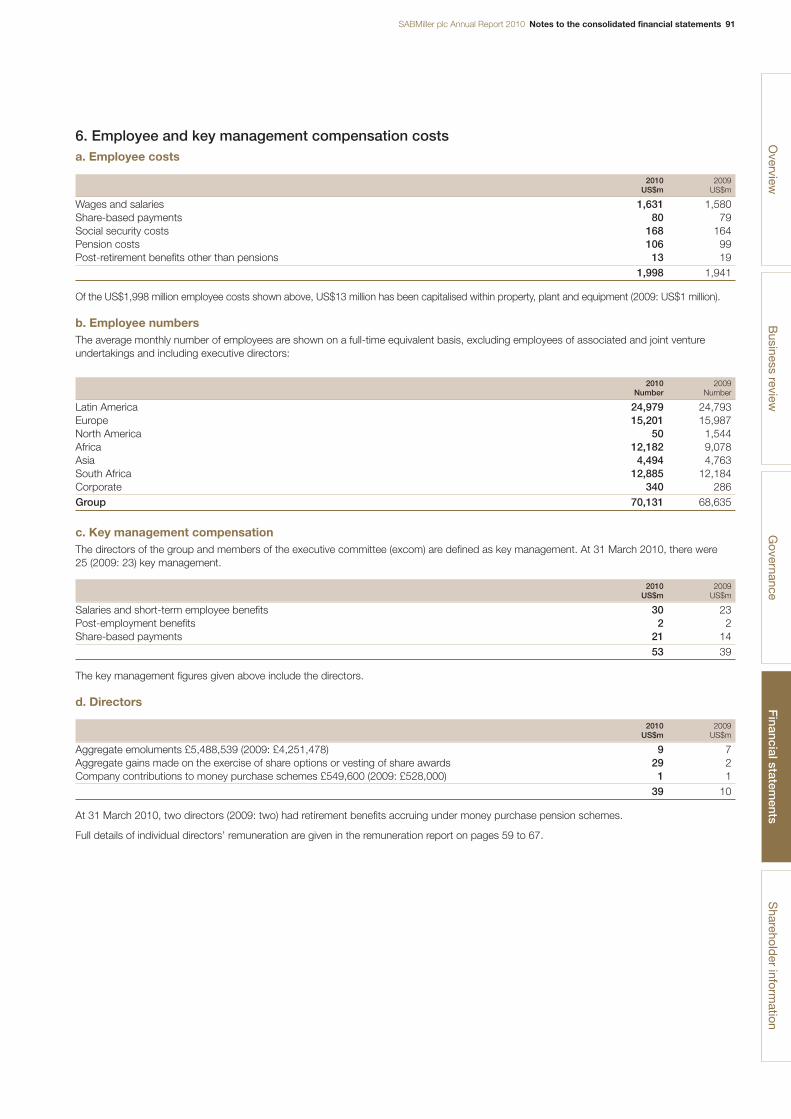
SABMiller plc Annual Report 2010 Notes to the consolidated financial statements 91
6. Employee and key management compensation costsa. Employee costs
2010 2009US$m US$m
Wages and salaries 1,631 1,580Share-based payments 80 79Social security costs 168 164Pension costs 106 99Post-retirement benefits other than pensions 13 19
1,998 1,941
Of the US$1,998 million employee costs shown above, US$13 million has been capitalised within property, plant and equipment (2009: US$1 million).
b. Employee numbersThe average monthly number of employees are shown on a full-time equivalent basis, excluding employees of associated and joint ventureundertakings and including executive directors:
2010 2009Number Number
Latin America 24,979 24,793Europe 15,201 15,987North America 50 1,544Africa 12,182 9,078Asia 4,494 4,763South Africa 12,885 12,184Corporate 340 286Group 70,131 68,635
c. Key management compensationThe directors of the group and members of the executive committee (excom) are defined as key management. At 31 March 2010, there were 25 (2009: 23) key management.
2010 2009US$m US$m
Salaries and short-term employee benefits 30 23Post-employment benefits 2 2Share-based payments 21 14
53 39
The key management figures given above include the directors.
d. Directors
2010 2009US$m US$m
Aggregate emoluments £5,488,539 (2009: £4,251,478) 9 7Aggregate gains made on the exercise of share options or vesting of share awards 29 2Company contributions to money purchase schemes £549,600 (2009: £528,000) 1 1
39 10
At 31 March 2010, two directors (2009: two) had retirement benefits accruing under money purchase pension schemes.
Full details of individual directors’ remuneration are given in the remuneration report on pages 59 to 67.
Overview
Business review
Governance
Financial statem
entsS
hareholder inform
ation
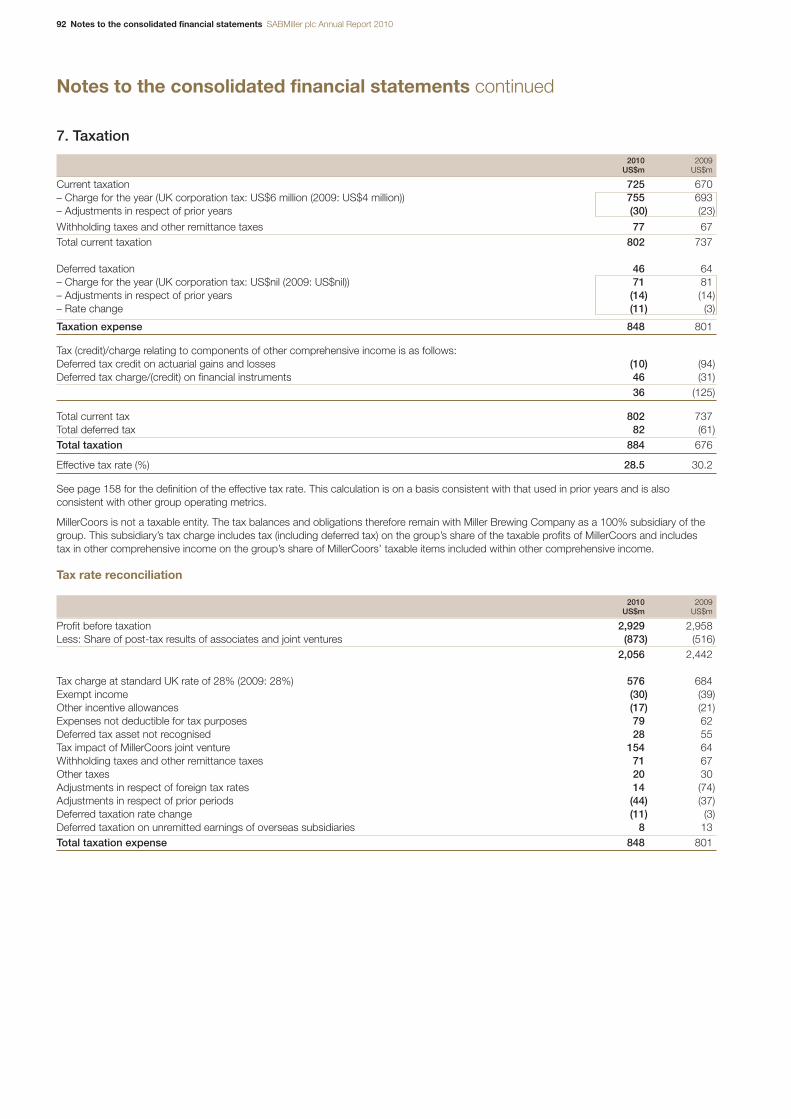
92 Notes to the consolidated financial statements SABMiller plc Annual Report 2010
Notes to the consolidated financial statements continued
7. Taxation
2010 2009US$m US$m
Current taxation 725 670– Charge for the year (UK corporation tax: US$6 million (2009: US$4 million)) 755 693– Adjustments in respect of prior years (30) (23)
Withholding taxes and other remittance taxes 77 67Total current taxation 802 737
Deferred taxation 46 64– Charge for the year (UK corporation tax: US$nil (2009: US$nil)) 71 81– Adjustments in respect of prior years (14) (14)– Rate change (11) (3)
Taxation expense 848 801
Tax (credit)/charge relating to components of other comprehensive income is as follows:Deferred tax credit on actuarial gains and losses (10) (94)Deferred tax charge/(credit) on financial instruments 46 (31)
36 (125)
Total current tax 802 737Total deferred tax 82 (61)Total taxation 884 676
Effective tax rate (%) 28.5 30.2
See page 158 for the definition of the effective tax rate. This calculation is on a basis consistent with that used in prior years and is alsoconsistent with other group operating metrics.
MillerCoors is not a taxable entity. The tax balances and obligations therefore remain with Miller Brewing Company as a 100% subsidiary of thegroup. This subsidiary’s tax charge includes tax (including deferred tax) on the group’s share of the taxable profits of MillerCoors and includes tax in other comprehensive income on the group’s share of MillerCoors’ taxable items included within other comprehensive income.
Tax rate reconciliation
2010 2009US$m US$m
Profit before taxation 2,929 2,958Less: Share of post-tax results of associates and joint ventures (873) (516)
2,056 2,442
Tax charge at standard UK rate of 28% (2009: 28%) 576 684Exempt income (30) (39)Other incentive allowances (17) (21)Expenses not deductible for tax purposes 79 62Deferred tax asset not recognised 28 55Tax impact of MillerCoors joint venture 154 64Withholding taxes and other remittance taxes 71 67Other taxes 20 30Adjustments in respect of foreign tax rates 14 (74)Adjustments in respect of prior periods (44) (37)Deferred taxation rate change (11) (3)Deferred taxation on unremitted earnings of overseas subsidiaries 8 13Total taxation expense 848 801

SABMiller plc Annual Report 2010 Notes to the consolidated financial statements 93
8. Earnings per share
2010 2009US cents US cents
Basic earnings per share 122.6 125.2Diluted earnings per share 122.1 124.6Headline earnings per share 127.3 119.0Adjusted basic earnings per share 161.1 137.5Adjusted diluted earnings per share 160.4 136.8
The weighted average number of shares was:
2010 2009Millions of shares Millions of shares
Ordinary shares 1,641 1,514Treasury shares (see note 25) (77) (7)ESOP trust ordinary shares (6) (5)Basic shares 1,558 1,502Dilutive ordinary shares from share options 6 8Diluted shares 1,564 1,510
The calculation of diluted earnings per share excludes 6,920,802 (2009: 12,793,912) share options that were non-dilutive for the year becausethe exercise price of the option exceeded the fair value of the shares during the year and 10,485,166 (2009: 8,912,780) share awards that werenon-dilutive for the year because the performance conditions attached to the share awards have not been met. These share awards couldpotentially dilute earnings per share in the future.
9,932,750 share awards were granted after 31 March 2010 and before the date of signing of these financial statements.
Adjusted and headline earningsThe group presents an adjusted earnings per share figure which excludes the impact of amortisation of intangible assets (excluding capitalisedsoftware), certain non-recurring items and post-tax exceptional items in order to present an additional measure of performance for the yearsshown in the consolidated financial statements. Adjusted earnings per share has been based on adjusted earnings for each financial year and on the same number of weighted average shares in issue as the basic earnings per share calculation. Headline earnings per share has beencalculated in accordance with the South African Circular 8/2007 entitled ‘Headline Earnings’ which forms part of the listing requirements for theJSE Ltd (JSE). The adjustments made to arrive at headline earnings and adjusted earnings are as follows:
2010 2009US$m US$m
Profit for the financial year attributable to equity holders of the parent 1,910 1,881Headline adjustmentsImpairment of goodwill – 364Impairment of intangible assets – 14Impairment of property, plant and equipment 45 16Loss on disposal of property, plant and equipment 39 10Profit on disposal of businesses – (526)Profit on disposal of available for sale investments (2) –Tax effects of the above items (17) (4)Minority interests’ share of the above items 9 (1)Share of joint ventures’ and associates’ headline adjustments, net of tax and minority interests – 34Headline earnings 1,984 1,788Business capability programme costs 342 –Integration and restructuring costs 41 108Transaction costs 24 –Net loss on fair value movements on capital items1 8 27Unwind of fair value adjustments on inventory – 9Gain on early termination of financial derivatives – (20)Litigation – 13Amortisation of intangible assets (excluding capitalised software) 150 164Tax effects of the above items (101) (110)Minority interests’ share of the above items (6) (4)Share of joint ventures’ and associates’ other adjustments, net of tax and minority interests 67 90Adjusted earnings 2,509 2,065
1 This does not include all fair value movements but includes those in relation to capital items for which hedge accounting cannot be applied.
Overview
Business review
Governance
Financial statem
entsS
hareholder inform
ation
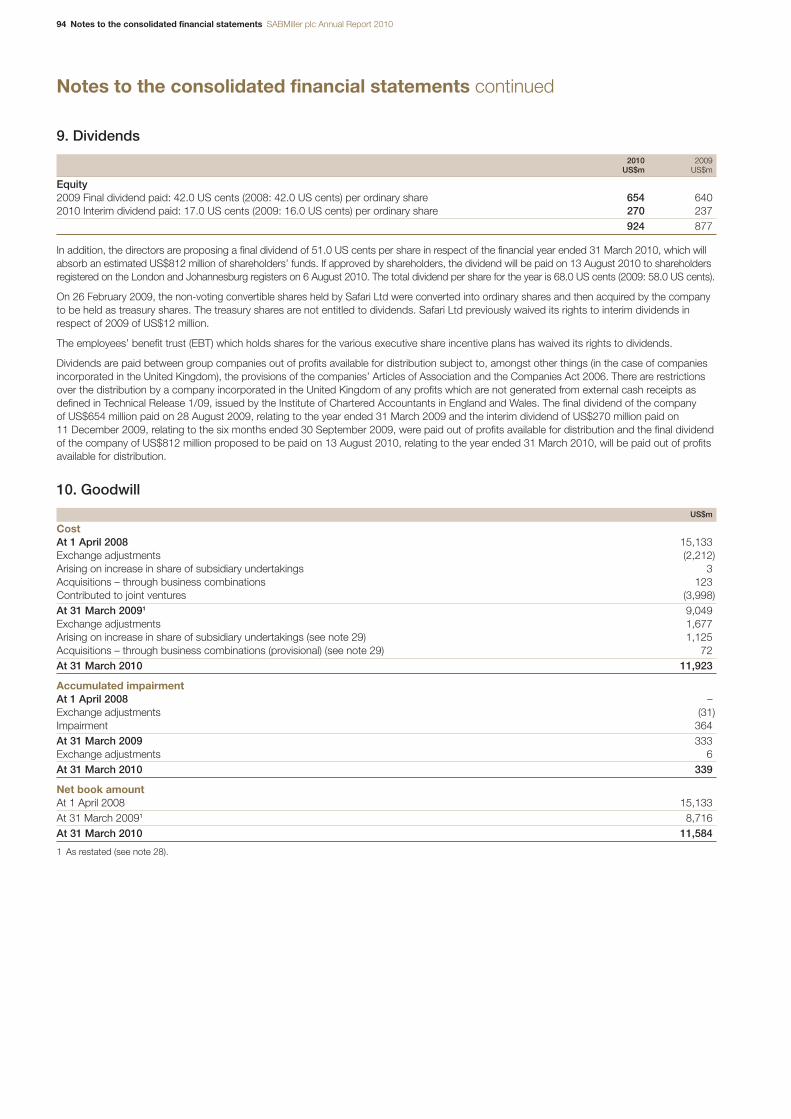
94 Notes to the consolidated financial statements SABMiller plc Annual Report 2010
Notes to the consolidated financial statements continued
9. Dividends
2010 2009US$m US$m
Equity2009 Final dividend paid: 42.0 US cents (2008: 42.0 US cents) per ordinary share 654 6402010 Interim dividend paid: 17.0 US cents (2009: 16.0 US cents) per ordinary share 270 237
924 877
In addition, the directors are proposing a final dividend of 51.0 US cents per share in respect of the financial year ended 31 March 2010, which willabsorb an estimated US$812 million of shareholders’ funds. If approved by shareholders, the dividend will be paid on 13 August 2010 to shareholdersregistered on the London and Johannesburg registers on 6 August 2010. The total dividend per share for the year is 68.0 US cents (2009: 58.0 US cents).
On 26 February 2009, the non-voting convertible shares held by Safari Ltd were converted into ordinary shares and then acquired by the companyto be held as treasury shares. The treasury shares are not entitled to dividends. Safari Ltd previously waived its rights to interim dividends inrespect of 2009 of US$12 million.
The employees’ benefit trust (EBT) which holds shares for the various executive share incentive plans has waived its rights to dividends.
Dividends are paid between group companies out of profits available for distribution subject to, amongst other things (in the case of companiesincorporated in the United Kingdom), the provisions of the companies’ Articles of Association and the Companies Act 2006. There are restrictionsover the distribution by a company incorporated in the United Kingdom of any profits which are not generated from external cash receipts asdefined in Technical Release 1/09, issued by the Institute of Chartered Accountants in England and Wales. The final dividend of the company of US$654 million paid on 28 August 2009, relating to the year ended 31 March 2009 and the interim dividend of US$270 million paid on11 December 2009, relating to the six months ended 30 September 2009, were paid out of profits available for distribution and the final dividend of the company of US$812 million proposed to be paid on 13 August 2010, relating to the year ended 31 March 2010, will be paid out of profitsavailable for distribution.
10. Goodwill
US$m
CostAt 1 April 2008 15,133Exchange adjustments (2,212)Arising on increase in share of subsidiary undertakings 3Acquisitions – through business combinations 123Contributed to joint ventures (3,998)At 31 March 20091 9,049Exchange adjustments 1,677Arising on increase in share of subsidiary undertakings (see note 29) 1,125Acquisitions – through business combinations (provisional) (see note 29) 72At 31 March 2010 11,923
Accumulated impairmentAt 1 April 2008 –Exchange adjustments (31)Impairment 364At 31 March 2009 333Exchange adjustments 6At 31 March 2010 339
Net book amountAt 1 April 2008 15,133At 31 March 20091 8,716At 31 March 2010 11,584
1 As restated (see note 28).

SABMiller plc Annual Report 2010 Notes to the consolidated financial statements 95
10. Goodwill continued2010Provisional goodwill arose on the acquisition through business combinations in the year of Ambo in Ethiopia, Rwenzori in Uganda, a maheubusiness in Zambia and Azuga in Romania, together with goodwill arising on the increase in the group’s share of subsidiary undertakingsprimarily related to the buyout of minority interests in Poland (see note 29). The fair value exercises in respect of these business combinationshave yet to be completed.
2009Additional goodwill arose on the acquisitions of Vladpivo in Russia, Sarmat in Ukraine, Pabod in Nigeria, Voltic in Nigeria and Ghana and SABMillerVietnam JV Company Limited in Vietnam, which occurred in the year. The fair value exercises in respect of these acquisitions are now complete.
Goodwill arising on the formation of the MillerCoors joint venture is recorded within the investment in joint ventures.
Goodwill impairments were recorded in respect of the Grolsch business and Sarmat in Ukraine of US$350 million and US$14 million respectively.
Goodwill is monitored principally on an individual country basis and the net book value is allocated by cash generating unit (CGU) as follows:
2010 20091
US$m US$m
CGUs:Latin America:– Central America 830 830– Colombia 4,474 3,387– Peru 1,645 1,482– Other Latin America 204 201Europe:– Czech 933 873– Netherlands 104 103– Italy 437 428– Poland 1,331 58– Other Europe 122 91North America 256 256Africa 195 148Asia:– India 390 354– Other Asia 13 11South Africa 650 494
11,584 8,716
1 As restated (see note 28).
AssumptionsThe recoverable amount for a CGU is determined based on value in use calculations. Value in use is determined by discounting the future post-taxcash flows generated from continuing use of the CGU using a post-tax discount rate, as this closely approximates to applying pre-tax discountrates to pre-tax cash flows. Where a potential impairment is identified using post-tax cash flows and post-tax discount rates, the impairmentreview is re-performed on a pre-tax basis in order to determine the impairment loss to be recorded. The key assumptions for the value in usecalculations are as follows:
Expected volume growth rate – Cash flows are based on financial forecasts approved by management covering five-year periods and aredependent on the expected volume growth rates.
Discount rate – The discount rate (weighted average cost of capital) is calculated using a methodology which reflects the returns from UnitedStates Treasury notes with a maturity of 20 years, and an equity risk premium adjusted for specific industry and country risks. The group applieslocal post-tax discount rates to local post-tax cash flows.
Long-term growth rate – Cash flows after the first five-year period were extrapolated using a long-term growth rate, in order to calculate theterminal recoverable amount.
The following table presents the key assumptions used in the value in use calculations in each of the group’s operating segments:
Expected volume Post-tax Long-term growth rates 2011–2015 discount rates growth rates
Latin America 3.9%–5.7% 9.0%–13.9% 2.0%–3.0%Europe 0.5%–11.0% 8.1%–10.6% 2.0%–2.5%North America 4.7% 7.8% 2.5%Africa 1.6%–14.9% 8.8%–25.1% 3.0%–7.5%Asia 9.7%–12.7% 8.1%–9.9% 3.0%–7.0%South Africa 4.1% 9.8% 3.0%
Overview
Business review
Governance
Financial statem
entsS
hareholder inform
ation

96 Notes to the consolidated financial statements SABMiller plc Annual Report 2010
Notes to the consolidated financial statements continued
10. Goodwill continuedImpairment reviews resultsAs a result of the annual impairment reviews, no impairment losses have been recognised in the year.
In 2009 total impairment losses recognised in respect of CGUs were as follows:
US$m
Netherlands 350Ukraine 42
392
NetherlandsThe Grolsch business was acquired in February 2008 for total consideration of US$1,201 million. The impairment loss of US$350 million aroseprincipally due to deterioration in forecast trading conditions in both The Netherlands, which was impacted by excise increases and the introductionof a smoking ban, and in export markets. The impairment loss was allocated to goodwill.
UkraineA total impairment loss of US$42 million was recognised in respect of CJSC Sarmat in Ukraine which was acquired in July 2008. Subsequent tothe acquisition, the business did not perform as expected as the Ukrainian economy suffered a significant downturn from which it was expectedto take a significant amount of time to recover. The impairment loss was allocated to goodwill, intangible assets and property, plant and equipment.
Sensitivities to assumptionsThe group’s impairment reviews are sensitive to changes in the key assumptions described above. Based on the group’s sensitivity analysis, a reasonably possible change in a single assumption will not cause an impairment loss in any of the group’s CGUs.
11. Intangible assets
ComputerBrands software Other TotalUS$m US$m US$m US$m
CostAt 1 April 2008 5,148 417 71 5,636Exchange adjustments (1,019) (51) (2) (1,072)Additions – separately acquired 28 44 1 73Acquisitions – through business combinations 41 1 – 42Contributed to joint ventures (215) (149) – (364)Transfers – 7 (7) –Transfers from property, plant and equipment – 13 2 15Transfers to other assets – (13) – (13)Disposals (9) – – (9)At 31 March 20091 3,974 269 65 4,308Exchange adjustments 718 39 2 759Additions – separately acquired – 92 1 93Acquisitions – through business combinations (see note 29) 32 – 1 33Transfers from property, plant and equipment – 30 2 32At 31 March 2010 4,724 430 71 5,225
Aggregate amortisation and impairmentAt 1 April 2008 353 241 6 600Exchange adjustments (92) (25) – (117)Amortisation 148 40 16 204Contributed to joint ventures (27) (105) – (132)Impairment 14 – – 14Disposals (3) – – (3)At 31 March 2009 393 151 22 566Exchange adjustments 80 19 3 102Amortisation 144 53 6 203At 31 March 2010 617 223 31 871
Net book amountAt 1 April 2008 4,795 176 65 5,036At 31 March 20091 3,581 118 43 3,742At 31 March 2010 4,107 207 40 4,354
1 As restated (see note 28).
During 2010, no impairment charge in respect of intangible assets was incurred (2009: impairment charge of US$14 million was incurredin respect of intangible assets in Ukraine).
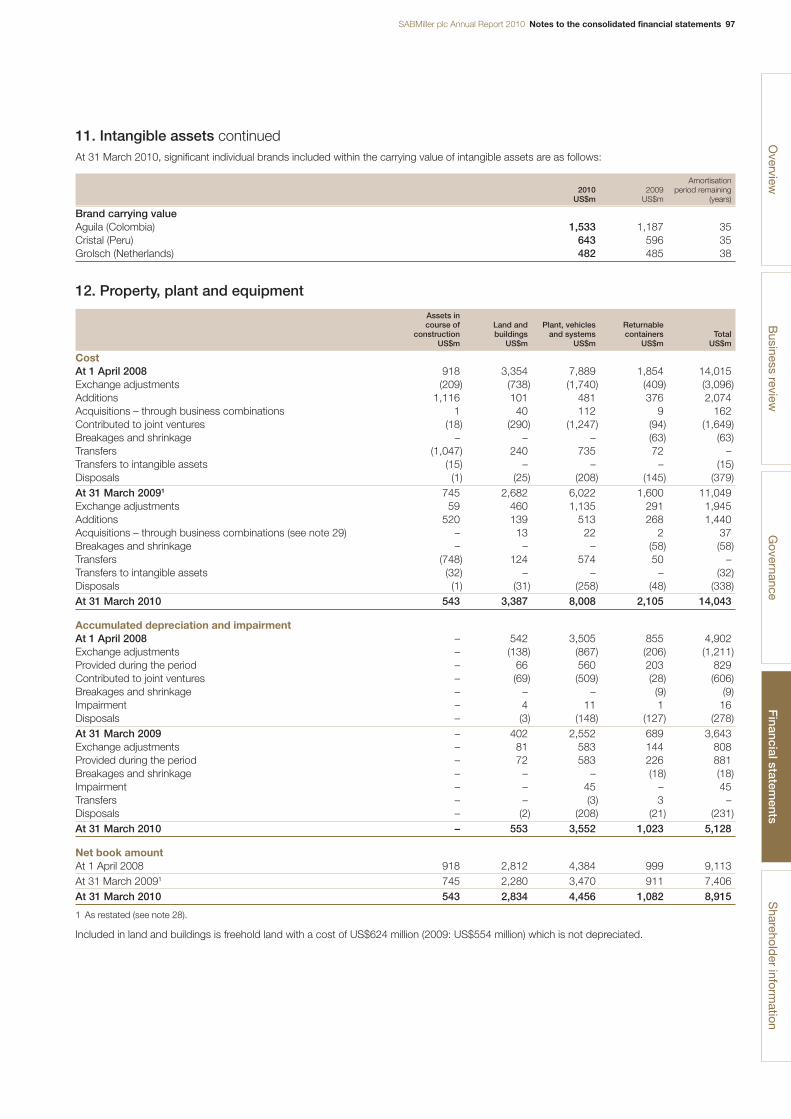
SABMiller plc Annual Report 2010 Notes to the consolidated financial statements 97
11. Intangible assets continuedAt 31 March 2010, significant individual brands included within the carrying value of intangible assets are as follows:
Amortisation2010 2009 period remaining
US$m US$m (years)
Brand carrying valueAguila (Colombia) 1,533 1,187 35Cristal (Peru) 643 596 35Grolsch (Netherlands) 482 485 38
12. Property, plant and equipment
Assets in course of Land and Plant, vehicles Returnable
construction buildings and systems containers TotalUS$m US$m US$m US$m US$m
CostAt 1 April 2008 918 3,354 7,889 1,854 14,015Exchange adjustments (209) (738) (1,740) (409) (3,096)Additions 1,116 101 481 376 2,074Acquisitions – through business combinations 1 40 112 9 162Contributed to joint ventures (18) (290) (1,247) (94) (1,649)Breakages and shrinkage – – – (63) (63)Transfers (1,047) 240 735 72 –Transfers to intangible assets (15) – – – (15)Disposals (1) (25) (208) (145) (379)At 31 March 20091 745 2,682 6,022 1,600 11,049Exchange adjustments 59 460 1,135 291 1,945Additions 520 139 513 268 1,440Acquisitions – through business combinations (see note 29) – 13 22 2 37Breakages and shrinkage – – – (58) (58)Transfers (748) 124 574 50 –Transfers to intangible assets (32) – – – (32)Disposals (1) (31) (258) (48) (338)At 31 March 2010 543 3,387 8,008 2,105 14,043
Accumulated depreciation and impairmentAt 1 April 2008 – 542 3,505 855 4,902Exchange adjustments – (138) (867) (206) (1,211)Provided during the period – 66 560 203 829Contributed to joint ventures – (69) (509) (28) (606)Breakages and shrinkage – – – (9) (9)Impairment – 4 11 1 16Disposals – (3) (148) (127) (278)At 31 March 2009 – 402 2,552 689 3,643Exchange adjustments – 81 583 144 808Provided during the period – 72 583 226 881Breakages and shrinkage – – – (18) (18)Impairment – – 45 – 45Transfers – – (3) 3 –Disposals – (2) (208) (21) (231)At 31 March 2010 – 553 3,552 1,023 5,128
Net book amountAt 1 April 2008 918 2,812 4,384 999 9,113At 31 March 20091 745 2,280 3,470 911 7,406At 31 March 2010 543 2,834 4,456 1,082 8,915
1 As restated (see note 28).
Included in land and buildings is freehold land with a cost of US$624 million (2009: US$554 million) which is not depreciated.
Overview
Business review
Governance
Financial statem
entsS
hareholder inform
ation
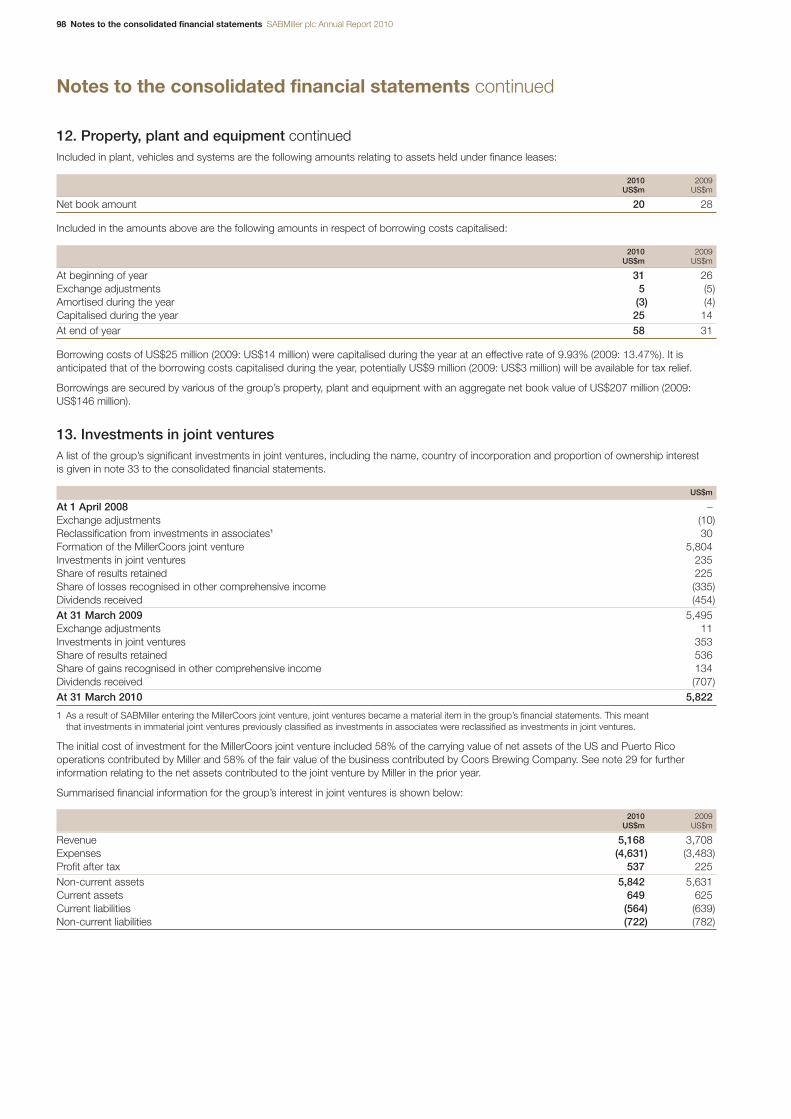
98 Notes to the consolidated financial statements SABMiller plc Annual Report 2010
Notes to the consolidated financial statements continued
12. Property, plant and equipment continuedIncluded in plant, vehicles and systems are the following amounts relating to assets held under finance leases:
2010 2009US$m US$m
Net book amount 20 28
Included in the amounts above are the following amounts in respect of borrowing costs capitalised:
2010 2009US$m US$m
At beginning of year 31 26Exchange adjustments 5 (5)Amortised during the year (3) (4)Capitalised during the year 25 14At end of year 58 31
Borrowing costs of US$25 million (2009: US$14 million) were capitalised during the year at an effective rate of 9.93% (2009: 13.47%). It isanticipated that of the borrowing costs capitalised during the year, potentially US$9 million (2009: US$3 million) will be available for tax relief.
Borrowings are secured by various of the group’s property, plant and equipment with an aggregate net book value of US$207 million (2009:US$146 million).
13. Investments in joint venturesA list of the group’s significant investments in joint ventures, including the name, country of incorporation and proportion of ownership interest is given in note 33 to the consolidated financial statements.
US$m
At 1 April 2008 –Exchange adjustments (10)Reclassification from investments in associates1 30Formation of the MillerCoors joint venture 5,804Investments in joint ventures 235Share of results retained 225Share of losses recognised in other comprehensive income (335)Dividends received (454)At 31 March 2009 5,495Exchange adjustments 11Investments in joint ventures 353Share of results retained 536Share of gains recognised in other comprehensive income 134Dividends received (707)At 31 March 2010 5,822
1 As a result of SABMiller entering the MillerCoors joint venture, joint ventures became a material item in the group’s financial statements. This meant that investments in immaterial joint ventures previously classified as investments in associates were reclassified as investments in joint ventures.
The initial cost of investment for the MillerCoors joint venture included 58% of the carrying value of net assets of the US and Puerto Ricooperations contributed by Miller and 58% of the fair value of the business contributed by Coors Brewing Company. See note 29 for furtherinformation relating to the net assets contributed to the joint venture by Miller in the prior year.
Summarised financial information for the group’s interest in joint ventures is shown below:
2010 2009US$m US$m
Revenue 5,168 3,708Expenses (4,631) (3,483)Profit after tax 537 225Non-current assets 5,842 5,631Current assets 649 625Current liabilities (564) (639)Non-current liabilities (722) (782)
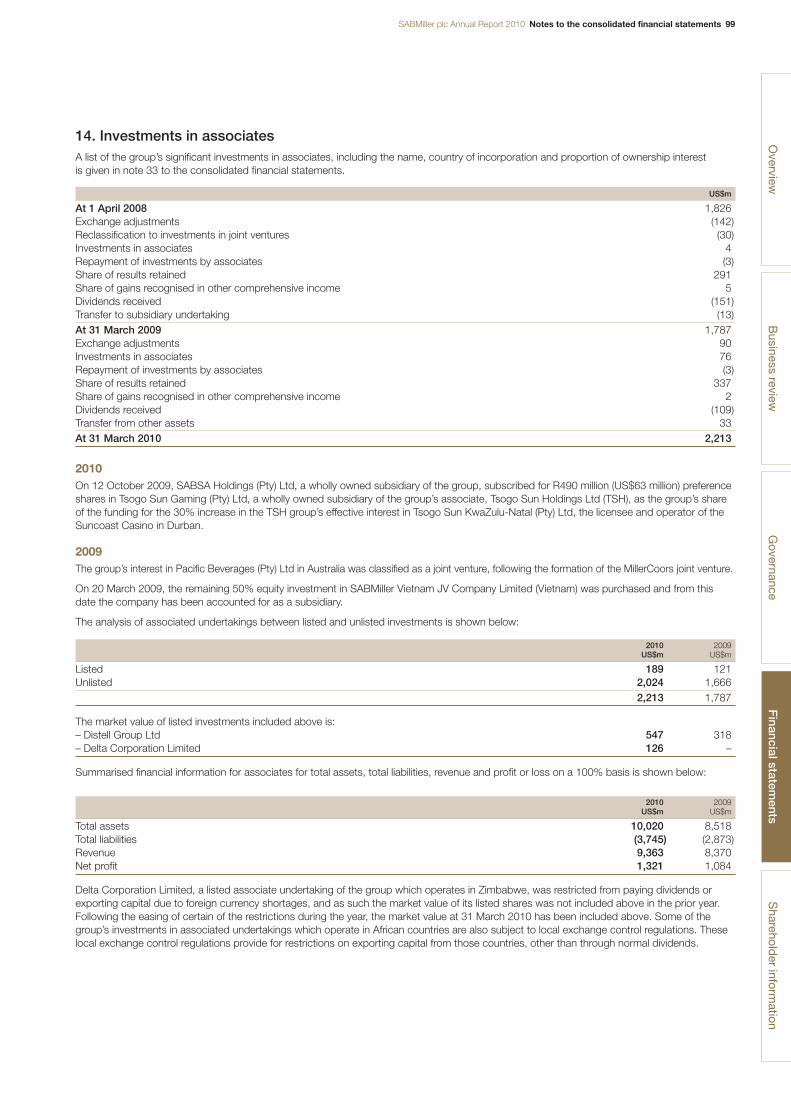
SABMiller plc Annual Report 2010 Notes to the consolidated financial statements 99
14. Investments in associatesA list of the group’s significant investments in associates, including the name, country of incorporation and proportion of ownership interest is given in note 33 to the consolidated financial statements.
US$m
At 1 April 2008 1,826Exchange adjustments (142)Reclassification to investments in joint ventures (30)Investments in associates 4Repayment of investments by associates (3)Share of results retained 291Share of gains recognised in other comprehensive income 5Dividends received (151)Transfer to subsidiary undertaking (13)At 31 March 2009 1,787Exchange adjustments 90Investments in associates 76Repayment of investments by associates (3)Share of results retained 337Share of gains recognised in other comprehensive income 2Dividends received (109)Transfer from other assets 33At 31 March 2010 2,213
2010On 12 October 2009, SABSA Holdings (Pty) Ltd, a wholly owned subsidiary of the group, subscribed for R490 million (US$63 million) preferenceshares in Tsogo Sun Gaming (Pty) Ltd, a wholly owned subsidiary of the group’s associate, Tsogo Sun Holdings Ltd (TSH), as the group’s shareof the funding for the 30% increase in the TSH group’s effective interest in Tsogo Sun KwaZulu-Natal (Pty) Ltd, the licensee and operator of theSuncoast Casino in Durban.
2009The group’s interest in Pacific Beverages (Pty) Ltd in Australia was classified as a joint venture, following the formation of the MillerCoors joint venture.
On 20 March 2009, the remaining 50% equity investment in SABMiller Vietnam JV Company Limited (Vietnam) was purchased and from thisdate the company has been accounted for as a subsidiary.
The analysis of associated undertakings between listed and unlisted investments is shown below:
2010 2009US$m US$m
Listed 189 121Unlisted 2,024 1,666
2,213 1,787
The market value of listed investments included above is:– Distell Group Ltd 547 318– Delta Corporation Limited 126 –
Summarised financial information for associates for total assets, total liabilities, revenue and profit or loss on a 100% basis is shown below:
2010 2009US$m US$m
Total assets 10,020 8,518Total liabilities (3,745) (2,873)Revenue 9,363 8,370Net profit 1,321 1,084
Delta Corporation Limited, a listed associate undertaking of the group which operates in Zimbabwe, was restricted from paying dividends orexporting capital due to foreign currency shortages, and as such the market value of its listed shares was not included above in the prior year.Following the easing of certain of the restrictions during the year, the market value at 31 March 2010 has been included above. Some of thegroup’s investments in associated undertakings which operate in African countries are also subject to local exchange control regulations. Theselocal exchange control regulations provide for restrictions on exporting capital from those countries, other than through normal dividends.
Overview
Business review
Governance
Financial statem
entsS
hareholder inform
ation
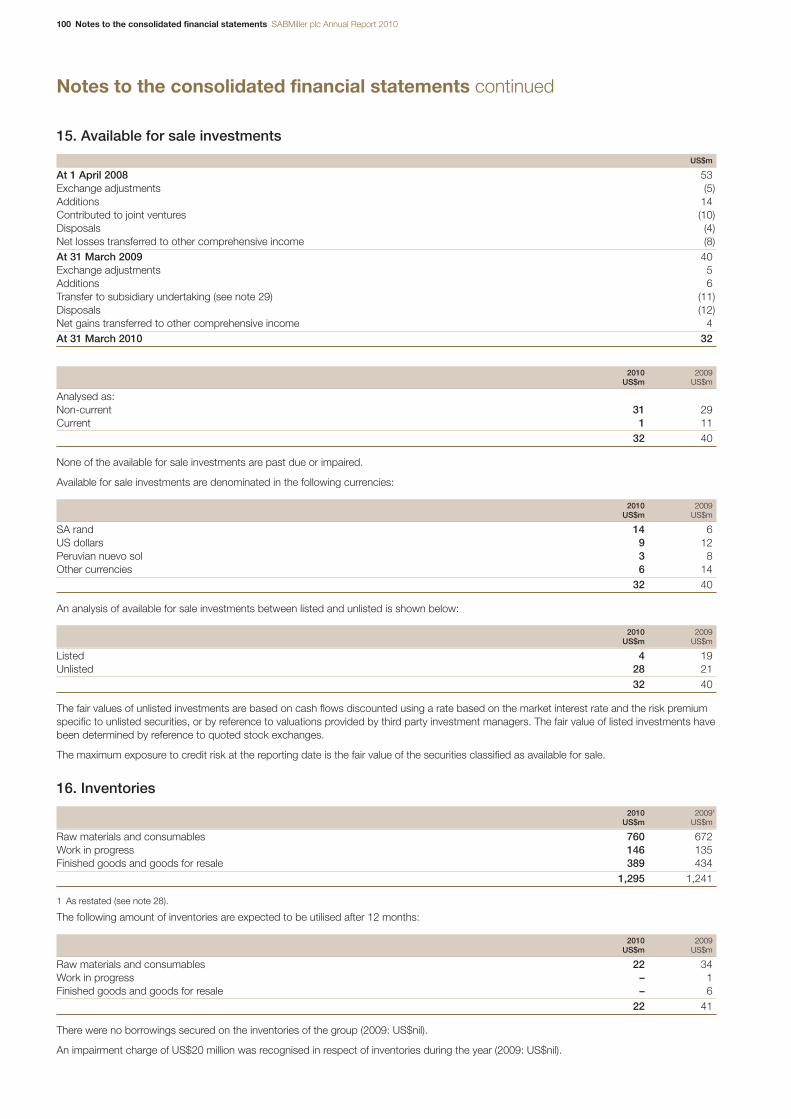
100 Notes to the consolidated financial statements SABMiller plc Annual Report 2010
Notes to the consolidated financial statements continued
15. Available for sale investments
US$m
At 1 April 2008 53Exchange adjustments (5)Additions 14Contributed to joint ventures (10)Disposals (4)Net losses transferred to other comprehensive income (8)At 31 March 2009 40Exchange adjustments 5Additions 6Transfer to subsidiary undertaking (see note 29) (11)Disposals (12)Net gains transferred to other comprehensive income 4At 31 March 2010 32
2010 2009US$m US$m
Analysed as:Non-current 31 29Current 1 11
32 40
None of the available for sale investments are past due or impaired.
Available for sale investments are denominated in the following currencies:
2010 2009US$m US$m
SA rand 14 6US dollars 9 12Peruvian nuevo sol 3 8Other currencies 6 14
32 40
An analysis of available for sale investments between listed and unlisted is shown below:
2010 2009US$m US$m
Listed 4 19Unlisted 28 21
32 40
The fair values of unlisted investments are based on cash flows discounted using a rate based on the market interest rate and the risk premiumspecific to unlisted securities, or by reference to valuations provided by third party investment managers. The fair value of listed investments havebeen determined by reference to quoted stock exchanges.
The maximum exposure to credit risk at the reporting date is the fair value of the securities classified as available for sale.
16. Inventories
2010 20091
US$m US$m
Raw materials and consumables 760 672Work in progress 146 135Finished goods and goods for resale 389 434
1,295 1,241
1 As restated (see note 28).
The following amount of inventories are expected to be utilised after 12 months:
2010 2009US$m US$m
Raw materials and consumables 22 34Work in progress – 1Finished goods and goods for resale – 6
22 41
There were no borrowings secured on the inventories of the group (2009: US$nil).
An impairment charge of US$20 million was recognised in respect of inventories during the year (2009: US$nil).
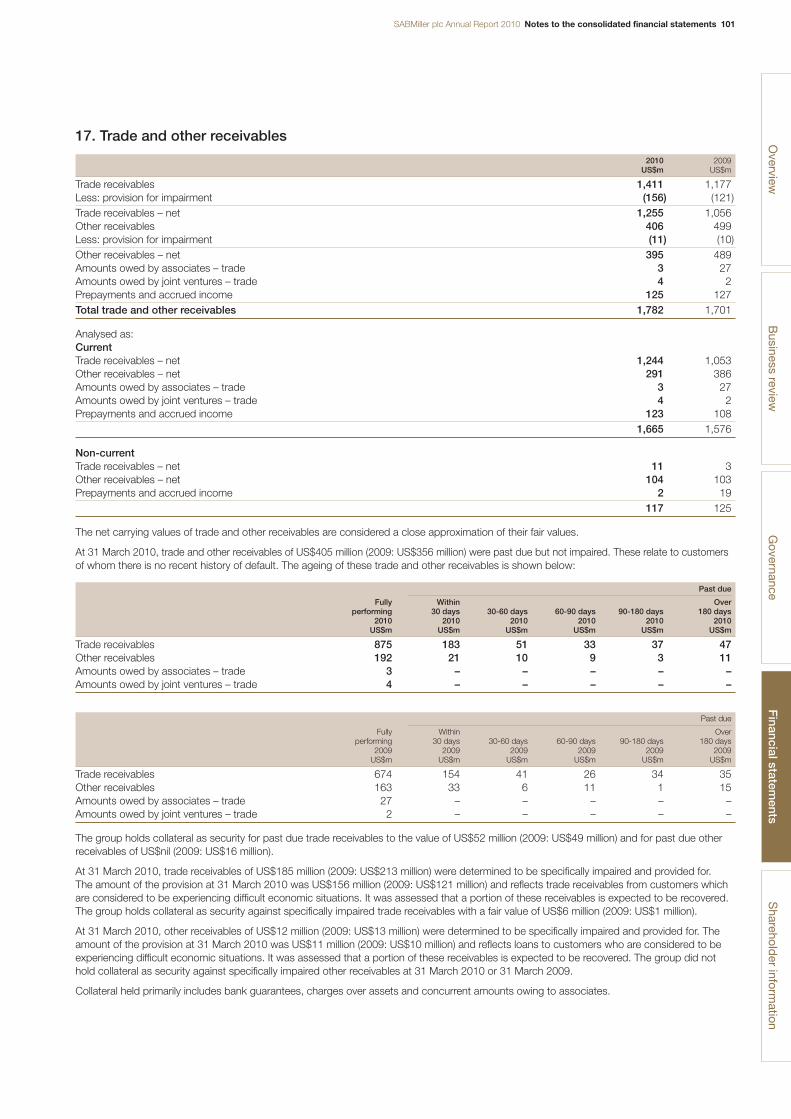
SABMiller plc Annual Report 2010 Notes to the consolidated financial statements 101
17. Trade and other receivables
2010 2009US$m US$m
Trade receivables 1,411 1,177Less: provision for impairment (156) (121)Trade receivables – net 1,255 1,056Other receivables 406 499Less: provision for impairment (11) (10)Other receivables – net 395 489Amounts owed by associates – trade 3 27Amounts owed by joint ventures – trade 4 2Prepayments and accrued income 125 127Total trade and other receivables 1,782 1,701
Analysed as:CurrentTrade receivables – net 1,244 1,053Other receivables – net 291 386Amounts owed by associates – trade 3 27Amounts owed by joint ventures – trade 4 2Prepayments and accrued income 123 108
1,665 1,576
Non-currentTrade receivables – net 11 3Other receivables – net 104 103Prepayments and accrued income 2 19
117 125
The net carrying values of trade and other receivables are considered a close approximation of their fair values.
At 31 March 2010, trade and other receivables of US$405 million (2009: US$356 million) were past due but not impaired. These relate to customersof whom there is no recent history of default. The ageing of these trade and other receivables is shown below:
Past due
Fully Within Overperforming 30 days 30-60 days 60-90 days 90-180 days 180 days
2010 2010 2010 2010 2010 2010US$m US$m US$m US$m US$m US$m
Trade receivables 875 183 51 33 37 47Other receivables 192 21 10 9 3 11Amounts owed by associates – trade 3 – – – – –Amounts owed by joint ventures – trade 4 – – – – –
Past due
Fully Within Overperforming 30 days 30-60 days 60-90 days 90-180 days 180 days
2009 2009 2009 2009 2009 2009US$m US$m US$m US$m US$m US$m
Trade receivables 674 154 41 26 34 35Other receivables 163 33 6 11 1 15Amounts owed by associates – trade 27 – – – – –Amounts owed by joint ventures – trade 2 – – – – –
The group holds collateral as security for past due trade receivables to the value of US$52 million (2009: US$49 million) and for past due otherreceivables of US$nil (2009: US$16 million).
At 31 March 2010, trade receivables of US$185 million (2009: US$213 million) were determined to be specifically impaired and provided for. The amount of the provision at 31 March 2010 was US$156 million (2009: US$121 million) and reflects trade receivables from customers whichare considered to be experiencing difficult economic situations. It was assessed that a portion of these receivables is expected to be recovered.The group holds collateral as security against specifically impaired trade receivables with a fair value of US$6 million (2009: US$1 million).
At 31 March 2010, other receivables of US$12 million (2009: US$13 million) were determined to be specifically impaired and provided for. Theamount of the provision at 31 March 2010 was US$11 million (2009: US$10 million) and reflects loans to customers who are considered to beexperiencing difficult economic situations. It was assessed that a portion of these receivables is expected to be recovered. The group did nothold collateral as security against specifically impaired other receivables at 31 March 2010 or 31 March 2009.
Collateral held primarily includes bank guarantees, charges over assets and concurrent amounts owing to associates.
Overview
Business review
Governance
Financial statem
entsS
hareholder inform
ation
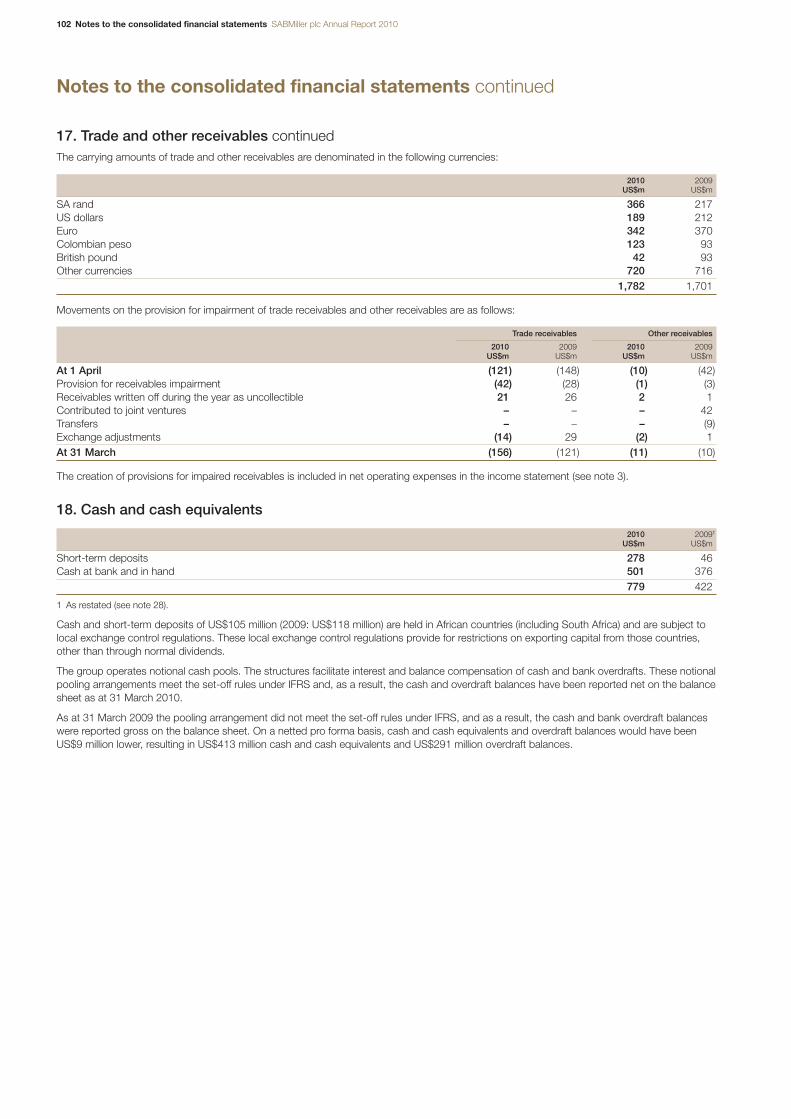
102 Notes to the consolidated financial statements SABMiller plc Annual Report 2010
Notes to the consolidated financial statements continued
17. Trade and other receivables continuedThe carrying amounts of trade and other receivables are denominated in the following currencies:
2010 2009US$m US$m
SA rand 366 217US dollars 189 212Euro 342 370Colombian peso 123 93British pound 42 93Other currencies 720 716
1,782 1,701
Movements on the provision for impairment of trade receivables and other receivables are as follows:
Trade receivables Other receivables
2010 2009 2010 2009US$m US$m US$m US$m
At 1 April (121) (148) (10) (42)Provision for receivables impairment (42) (28) (1) (3)Receivables written off during the year as uncollectible 21 26 2 1Contributed to joint ventures – – – 42Transfers – – – (9)Exchange adjustments (14) 29 (2) 1At 31 March (156) (121) (11) (10)
The creation of provisions for impaired receivables is included in net operating expenses in the income statement (see note 3).
18. Cash and cash equivalents
2010 20091
US$m US$m
Short-term deposits 278 46Cash at bank and in hand 501 376
779 422
1 As restated (see note 28).
Cash and short-term deposits of US$105 million (2009: US$118 million) are held in African countries (including South Africa) and are subject tolocal exchange control regulations. These local exchange control regulations provide for restrictions on exporting capital from those countries,other than through normal dividends.
The group operates notional cash pools. The structures facilitate interest and balance compensation of cash and bank overdrafts. These notionalpooling arrangements meet the set-off rules under IFRS and, as a result, the cash and overdraft balances have been reported net on the balancesheet as at 31 March 2010.
As at 31 March 2009 the pooling arrangement did not meet the set-off rules under IFRS, and as a result, the cash and bank overdraft balanceswere reported gross on the balance sheet. On a netted pro forma basis, cash and cash equivalents and overdraft balances would have beenUS$9 million lower, resulting in US$413 million cash and cash equivalents and US$291 million overdraft balances.
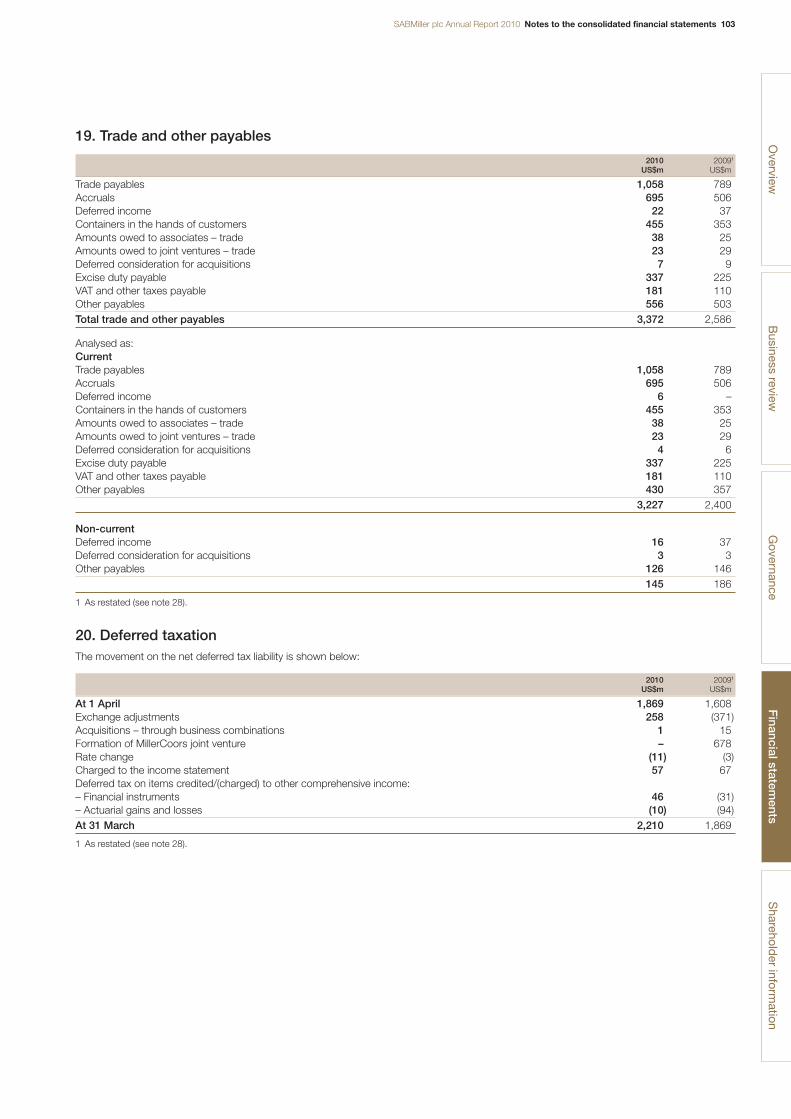
SABMiller plc Annual Report 2010 Notes to the consolidated financial statements 103
19. Trade and other payables
2010 20091
US$m US$m
Trade payables 1,058 789Accruals 695 506Deferred income 22 37Containers in the hands of customers 455 353Amounts owed to associates – trade 38 25Amounts owed to joint ventures – trade 23 29Deferred consideration for acquisitions 7 9Excise duty payable 337 225VAT and other taxes payable 181 110Other payables 556 503Total trade and other payables 3,372 2,586
Analysed as:CurrentTrade payables 1,058 789Accruals 695 506Deferred income 6 –Containers in the hands of customers 455 353Amounts owed to associates – trade 38 25Amounts owed to joint ventures – trade 23 29Deferred consideration for acquisitions 4 6Excise duty payable 337 225VAT and other taxes payable 181 110Other payables 430 357
3,227 2,400
Non-currentDeferred income 16 37Deferred consideration for acquisitions 3 3Other payables 126 146
145 186
1 As restated (see note 28).
20. Deferred taxationThe movement on the net deferred tax liability is shown below:
2010 20091
US$m US$m
At 1 April 1,869 1,608Exchange adjustments 258 (371)Acquisitions – through business combinations 1 15Formation of MillerCoors joint venture – 678Rate change (11) (3)Charged to the income statement 57 67Deferred tax on items credited/(charged) to other comprehensive income:– Financial instruments 46 (31)– Actuarial gains and losses (10) (94)At 31 March 2,210 1,869
1 As restated (see note 28).
Overview
Business review
Governance
Financial statem
entsS
hareholder inform
ation
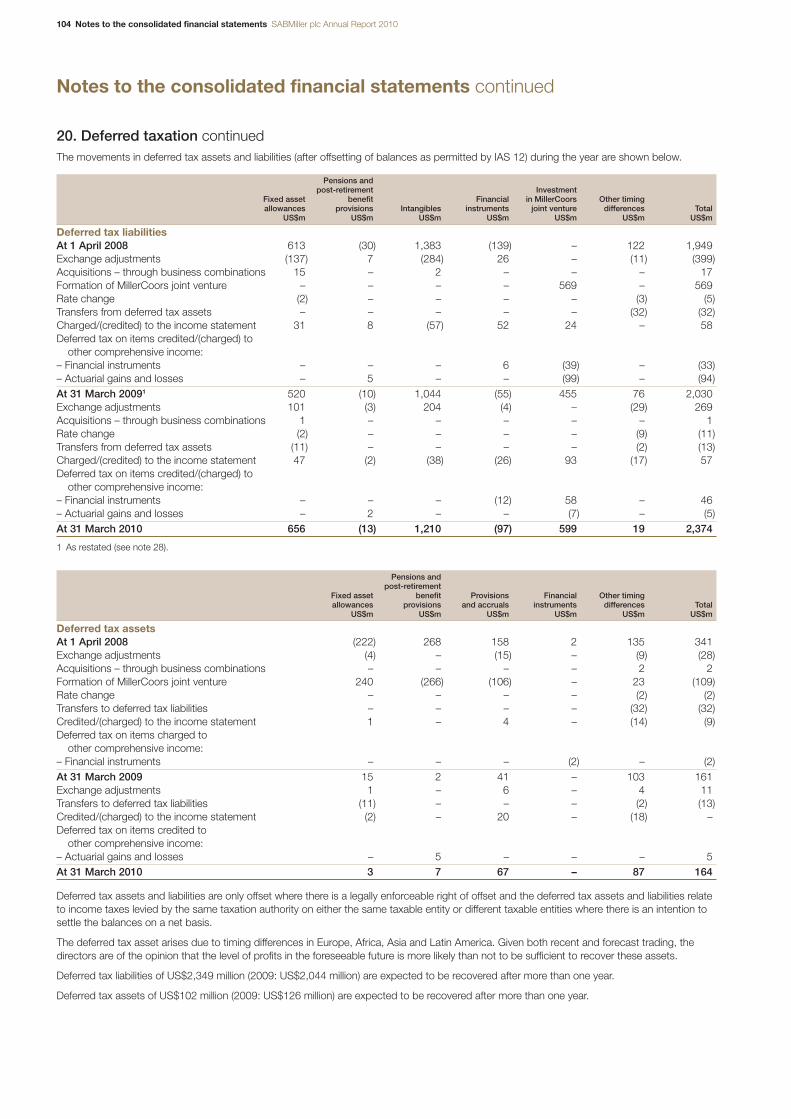
104 Notes to the consolidated financial statements SABMiller plc Annual Report 2010
Notes to the consolidated financial statements continued
20. Deferred taxation continuedThe movements in deferred tax assets and liabilities (after offsetting of balances as permitted by IAS 12) during the year are shown below.
Pensions andpost-retirement Investment
Fixed asset benefit Financial in MillerCoors Other timingallowances provisions Intangibles instruments joint venture differences Total
US$m US$m US$m US$m US$m US$m US$m
Deferred tax liabilitiesAt 1 April 2008 613 (30) 1,383 (139) – 122 1,949Exchange adjustments (137) 7 (284) 26 – (11) (399)Acquisitions – through business combinations 15 – 2 – – – 17Formation of MillerCoors joint venture – – – – 569 – 569Rate change (2) – – – – (3) (5)Transfers from deferred tax assets – – – – – (32) (32)Charged/(credited) to the income statement 31 8 (57) 52 24 – 58Deferred tax on items credited/(charged) to
other comprehensive income:– Financial instruments – – – 6 (39) – (33)– Actuarial gains and losses – 5 – – (99) – (94)At 31 March 20091 520 (10) 1,044 (55) 455 76 2,030Exchange adjustments 101 (3) 204 (4) – (29) 269Acquisitions – through business combinations 1 – – – – – 1Rate change (2) – – – – (9) (11)Transfers from deferred tax assets (11) – – – – (2) (13)Charged/(credited) to the income statement 47 (2) (38) (26) 93 (17) 57Deferred tax on items credited/(charged) to
other comprehensive income:– Financial instruments – – – (12) 58 – 46– Actuarial gains and losses – 2 – – (7) – (5)At 31 March 2010 656 (13) 1,210 (97) 599 19 2,374
1 As restated (see note 28).
Pensions andpost-retirement
Fixed asset benefit Provisions Financial Other timingallowances provisions and accruals instruments differences Total
US$m US$m US$m US$m US$m US$m
Deferred tax assetsAt 1 April 2008 (222) 268 158 2 135 341Exchange adjustments (4) – (15) – (9) (28)Acquisitions – through business combinations – – – – 2 2Formation of MillerCoors joint venture 240 (266) (106) – 23 (109)Rate change – – – – (2) (2)Transfers to deferred tax liabilities – – – – (32) (32)Credited/(charged) to the income statement 1 – 4 – (14) (9)Deferred tax on items charged to
other comprehensive income:– Financial instruments – – – (2) – (2)At 31 March 2009 15 2 41 – 103 161Exchange adjustments 1 – 6 – 4 11Transfers to deferred tax liabilities (11) – – – (2) (13)Credited/(charged) to the income statement (2) – 20 – (18) –Deferred tax on items credited to
other comprehensive income:– Actuarial gains and losses – 5 – – – 5At 31 March 2010 3 7 67 – 87 164
Deferred tax assets and liabilities are only offset where there is a legally enforceable right of offset and the deferred tax assets and liabilities relateto income taxes levied by the same taxation authority on either the same taxable entity or different taxable entities where there is an intention tosettle the balances on a net basis.
The deferred tax asset arises due to timing differences in Europe, Africa, Asia and Latin America. Given both recent and forecast trading, thedirectors are of the opinion that the level of profits in the foreseeable future is more likely than not to be sufficient to recover these assets.
Deferred tax liabilities of US$2,349 million (2009: US$2,044 million) are expected to be recovered after more than one year.
Deferred tax assets of US$102 million (2009: US$126 million) are expected to be recovered after more than one year.
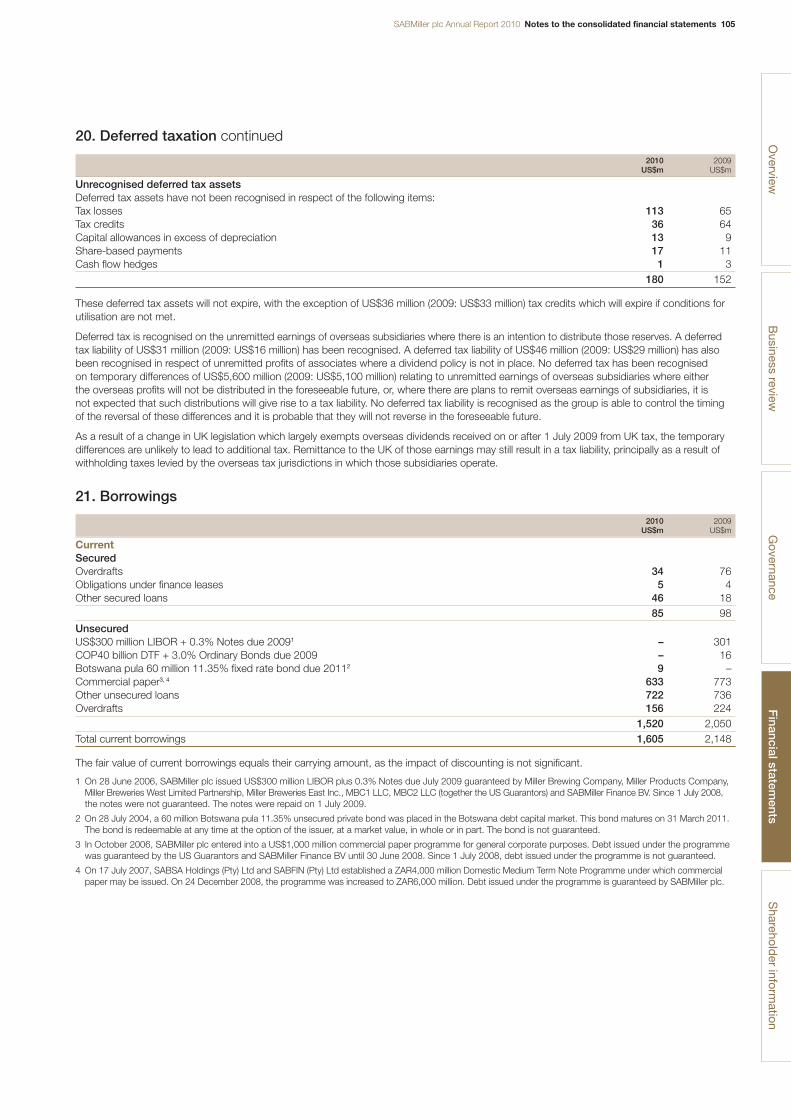
SABMiller plc Annual Report 2010 Notes to the consolidated financial statements 105
20. Deferred taxation continued
2010 2009US$m US$m
Unrecognised deferred tax assetsDeferred tax assets have not been recognised in respect of the following items:Tax losses 113 65Tax credits 36 64Capital allowances in excess of depreciation 13 9Share-based payments 17 11Cash flow hedges 1 3
180 152
These deferred tax assets will not expire, with the exception of US$36 million (2009: US$33 million) tax credits which will expire if conditions forutilisation are not met.
Deferred tax is recognised on the unremitted earnings of overseas subsidiaries where there is an intention to distribute those reserves. A deferredtax liability of US$31 million (2009: US$16 million) has been recognised. A deferred tax liability of US$46 million (2009: US$29 million) has alsobeen recognised in respect of unremitted profits of associates where a dividend policy is not in place. No deferred tax has been recognised on temporary differences of US$5,600 million (2009: US$5,100 million) relating to unremitted earnings of overseas subsidiaries where either the overseas profits will not be distributed in the foreseeable future, or, where there are plans to remit overseas earnings of subsidiaries, it is not expected that such distributions will give rise to a tax liability. No deferred tax liability is recognised as the group is able to control the timingof the reversal of these differences and it is probable that they will not reverse in the foreseeable future.
As a result of a change in UK legislation which largely exempts overseas dividends received on or after 1 July 2009 from UK tax, the temporarydifferences are unlikely to lead to additional tax. Remittance to the UK of those earnings may still result in a tax liability, principally as a result ofwithholding taxes levied by the overseas tax jurisdictions in which those subsidiaries operate.
21. Borrowings
2010 2009US$m US$m
CurrentSecuredOverdrafts 34 76Obligations under finance leases 5 4Other secured loans 46 18
85 98UnsecuredUS$300 million LIBOR + 0.3% Notes due 20091 – 301COP40 billion DTF + 3.0% Ordinary Bonds due 2009 – 16Botswana pula 60 million 11.35% fixed rate bond due 20112 9 –Commercial paper3, 4 633 773Other unsecured loans 722 736Overdrafts 156 224
1,520 2,050Total current borrowings 1,605 2,148
The fair value of current borrowings equals their carrying amount, as the impact of discounting is not significant.
1 On 28 June 2006, SABMiller plc issued US$300 million LIBOR plus 0.3% Notes due July 2009 guaranteed by Miller Brewing Company, Miller Products Company,Miller Breweries West Limited Partnership, Miller Breweries East Inc., MBC1 LLC, MBC2 LLC (together the US Guarantors) and SABMiller Finance BV. Since 1 July 2008,the notes were not guaranteed. The notes were repaid on 1 July 2009.
2 On 28 July 2004, a 60 million Botswana pula 11.35% unsecured private bond was placed in the Botswana debt capital market. This bond matures on 31 March 2011.The bond is redeemable at any time at the option of the issuer, at a market value, in whole or in part. The bond is not guaranteed.
3 In October 2006, SABMiller plc entered into a US$1,000 million commercial paper programme for general corporate purposes. Debt issued under the programmewas guaranteed by the US Guarantors and SABMiller Finance BV until 30 June 2008. Since 1 July 2008, debt issued under the programme is not guaranteed.
4 On 17 July 2007, SABSA Holdings (Pty) Ltd and SABFIN (Pty) Ltd established a ZAR4,000 million Domestic Medium Term Note Programme under which commercialpaper may be issued. On 24 December 2008, the programme was increased to ZAR6,000 million. Debt issued under the programme is guaranteed by SABMiller plc.
Overview
Business review
Governance
Financial statem
entsS
hareholder inform
ation
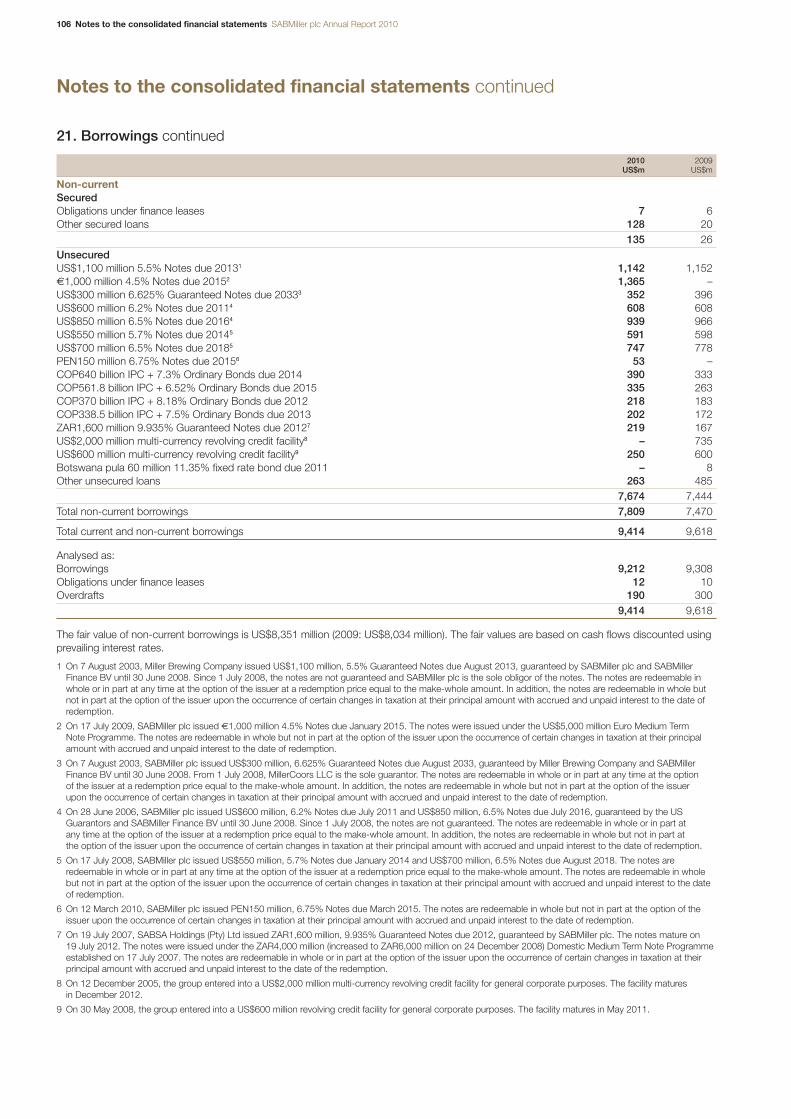
106 Notes to the consolidated financial statements SABMiller plc Annual Report 2010
Notes to the consolidated financial statements continued
21. Borrowings continued
2010 2009US$m US$m
Non-currentSecuredObligations under finance leases 7 6Other secured loans 128 20
135 26UnsecuredUS$1,100 million 5.5% Notes due 20131 1,142 1,152€1,000 million 4.5% Notes due 20152 1,365 –US$300 million 6.625% Guaranteed Notes due 20333 352 396US$600 million 6.2% Notes due 20114 608 608US$850 million 6.5% Notes due 20164 939 966US$550 million 5.7% Notes due 20145 591 598US$700 million 6.5% Notes due 20185 747 778PEN150 million 6.75% Notes due 20156 53 –COP640 billion IPC + 7.3% Ordinary Bonds due 2014 390 333COP561.8 billion IPC + 6.52% Ordinary Bonds due 2015 335 263COP370 billion IPC + 8.18% Ordinary Bonds due 2012 218 183COP338.5 billion IPC + 7.5% Ordinary Bonds due 2013 202 172ZAR1,600 million 9.935% Guaranteed Notes due 20127 219 167US$2,000 million multi-currency revolving credit facility8 – 735US$600 million multi-currency revolving credit facility9 250 600Botswana pula 60 million 11.35% fixed rate bond due 2011 – 8Other unsecured loans 263 485
7,674 7,444Total non-current borrowings 7,809 7,470
Total current and non-current borrowings 9,414 9,618
Analysed as:Borrowings 9,212 9,308Obligations under finance leases 12 10Overdrafts 190 300
9,414 9,618
The fair value of non-current borrowings is US$8,351 million (2009: US$8,034 million). The fair values are based on cash flows discounted usingprevailing interest rates.
1 On 7 August 2003, Miller Brewing Company issued US$1,100 million, 5.5% Guaranteed Notes due August 2013, guaranteed by SABMiller plc and SABMillerFinance BV until 30 June 2008. Since 1 July 2008, the notes are not guaranteed and SABMiller plc is the sole obligor of the notes. The notes are redeemable inwhole or in part at any time at the option of the issuer at a redemption price equal to the make-whole amount. In addition, the notes are redeemable in whole butnot in part at the option of the issuer upon the occurrence of certain changes in taxation at their principal amount with accrued and unpaid interest to the date ofredemption.
2 On 17 July 2009, SABMiller plc issued €1,000 million 4.5% Notes due January 2015. The notes were issued under the US$5,000 million Euro Medium Term Note Programme. The notes are redeemable in whole but not in part at the option of the issuer upon the occurrence of certain changes in taxation at their principalamount with accrued and unpaid interest to the date of redemption.
3 On 7 August 2003, SABMiller plc issued US$300 million, 6.625% Guaranteed Notes due August 2033, guaranteed by Miller Brewing Company and SABMillerFinance BV until 30 June 2008. From 1 July 2008, MillerCoors LLC is the sole guarantor. The notes are redeemable in whole or in part at any time at the option of the issuer at a redemption price equal to the make-whole amount. In addition, the notes are redeemable in whole but not in part at the option of the issuer upon the occurrence of certain changes in taxation at their principal amount with accrued and unpaid interest to the date of redemption.
4 On 28 June 2006, SABMiller plc issued US$600 million, 6.2% Notes due July 2011 and US$850 million, 6.5% Notes due July 2016, guaranteed by the USGuarantors and SABMiller Finance BV until 30 June 2008. Since 1 July 2008, the notes are not guaranteed. The notes are redeemable in whole or in part at any time at the option of the issuer at a redemption price equal to the make-whole amount. In addition, the notes are redeemable in whole but not in part at the option of the issuer upon the occurrence of certain changes in taxation at their principal amount with accrued and unpaid interest to the date of redemption.
5 On 17 July 2008, SABMiller plc issued US$550 million, 5.7% Notes due January 2014 and US$700 million, 6.5% Notes due August 2018. The notes areredeemable in whole or in part at any time at the option of the issuer at a redemption price equal to the make-whole amount. The notes are redeemable in wholebut not in part at the option of the issuer upon the occurrence of certain changes in taxation at their principal amount with accrued and unpaid interest to the dateof redemption.
6 On 12 March 2010, SABMiller plc issued PEN150 million, 6.75% Notes due March 2015. The notes are redeemable in whole but not in part at the option of theissuer upon the occurrence of certain changes in taxation at their principal amount with accrued and unpaid interest to the date of redemption.
7 On 19 July 2007, SABSA Holdings (Pty) Ltd issued ZAR1,600 million, 9.935% Guaranteed Notes due 2012, guaranteed by SABMiller plc. The notes mature on 19 July 2012. The notes were issued under the ZAR4,000 million (increased to ZAR6,000 million on 24 December 2008) Domestic Medium Term Note Programmeestablished on 17 July 2007. The notes are redeemable in whole or in part at the option of the issuer upon the occurrence of certain changes in taxation at theirprincipal amount with accrued and unpaid interest to the date of the redemption.
8 On 12 December 2005, the group entered into a US$2,000 million multi-currency revolving credit facility for general corporate purposes. The facility matures in December 2012.
9 On 30 May 2008, the group entered into a US$600 million revolving credit facility for general corporate purposes. The facility matures in May 2011.
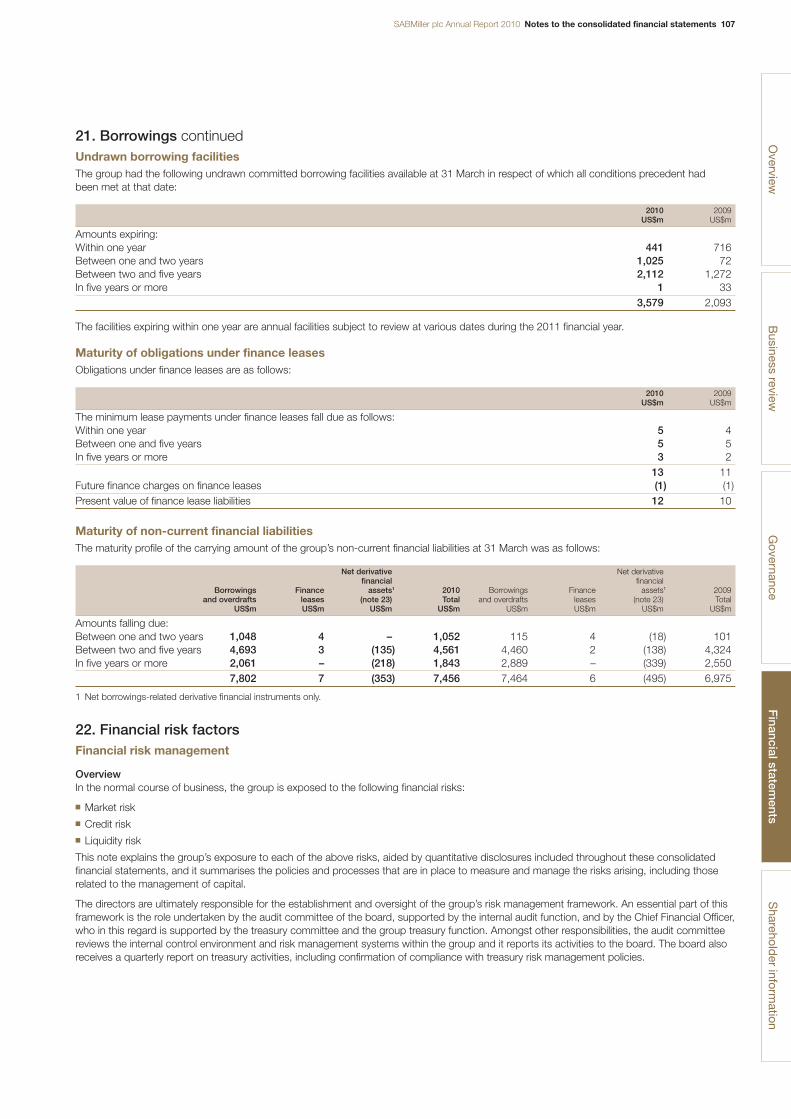
SABMiller plc Annual Report 2010 Notes to the consolidated financial statements 107
21. Borrowings continuedUndrawn borrowing facilitiesThe group had the following undrawn committed borrowing facilities available at 31 March in respect of which all conditions precedent had been met at that date:
2010 2009US$m US$m
Amounts expiring:Within one year 441 716Between one and two years 1,025 72Between two and five years 2,112 1,272In five years or more 1 33
3,579 2,093
The facilities expiring within one year are annual facilities subject to review at various dates during the 2011 financial year.
Maturity of obligations under finance leasesObligations under finance leases are as follows:
2010 2009US$m US$m
The minimum lease payments under finance leases fall due as follows:Within one year 5 4Between one and five years 5 5In five years or more 3 2
13 11Future finance charges on finance leases (1) (1)Present value of finance lease liabilities 12 10
Maturity of non-current financial liabilitiesThe maturity profile of the carrying amount of the group’s non-current financial liabilities at 31 March was as follows:
Net derivative Net derivativefinancial financial
Borrowings Finance assets1 2010 Borrowings Finance assets1 2009and overdrafts leases (note 23) Total and overdrafts leases (note 23) Total
US$m US$m US$m US$m US$m US$m US$m US$m
Amounts falling due:Between one and two years 1,048 4 – 1,052 115 4 (18) 101Between two and five years 4,693 3 (135) 4,561 4,460 2 (138) 4,324In five years or more 2,061 – (218) 1,843 2,889 – (339) 2,550
7,802 7 (353) 7,456 7,464 6 (495) 6,975
1 Net borrowings-related derivative financial instruments only.
22. Financial risk factorsFinancial risk management
OverviewIn the normal course of business, the group is exposed to the following financial risks:
■ Market risk■ Credit risk■ Liquidity risk
This note explains the group’s exposure to each of the above risks, aided by quantitative disclosures included throughout these consolidatedfinancial statements, and it summarises the policies and processes that are in place to measure and manage the risks arising, including thoserelated to the management of capital.
The directors are ultimately responsible for the establishment and oversight of the group’s risk management framework. An essential part of thisframework is the role undertaken by the audit committee of the board, supported by the internal audit function, and by the Chief Financial Officer,who in this regard is supported by the treasury committee and the group treasury function. Amongst other responsibilities, the audit committeereviews the internal control environment and risk management systems within the group and it reports its activities to the board. The board alsoreceives a quarterly report on treasury activities, including confirmation of compliance with treasury risk management policies.
Overview
Business review
Governance
Financial statem
entsS
hareholder inform
ation
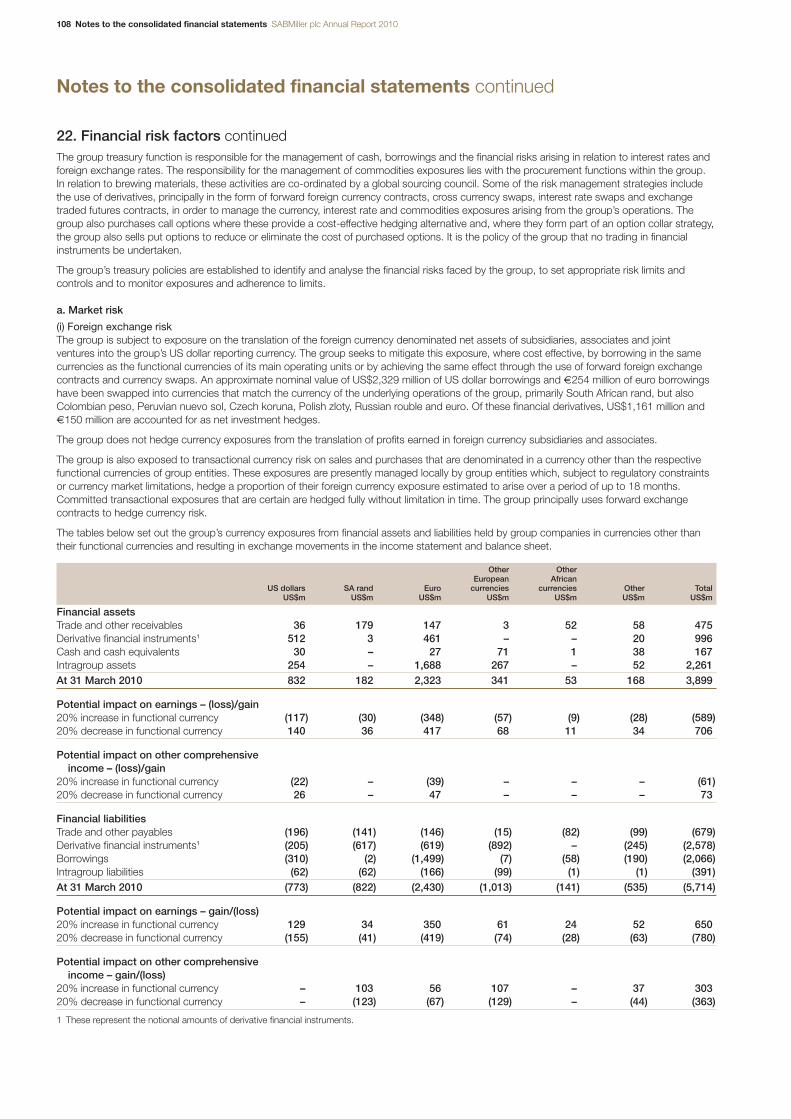
108 Notes to the consolidated financial statements SABMiller plc Annual Report 2010
Notes to the consolidated financial statements continued
22. Financial risk factors continuedThe group treasury function is responsible for the management of cash, borrowings and the financial risks arising in relation to interest rates andforeign exchange rates. The responsibility for the management of commodities exposures lies with the procurement functions within the group.In relation to brewing materials, these activities are co-ordinated by a global sourcing council. Some of the risk management strategies includethe use of derivatives, principally in the form of forward foreign currency contracts, cross currency swaps, interest rate swaps and exchangetraded futures contracts, in order to manage the currency, interest rate and commodities exposures arising from the group’s operations. Thegroup also purchases call options where these provide a cost-effective hedging alternative and, where they form part of an option collar strategy,the group also sells put options to reduce or eliminate the cost of purchased options. It is the policy of the group that no trading in financialinstruments be undertaken.
The group’s treasury policies are established to identify and analyse the financial risks faced by the group, to set appropriate risk limits andcontrols and to monitor exposures and adherence to limits.
a. Market risk
(i) Foreign exchange riskThe group is subject to exposure on the translation of the foreign currency denominated net assets of subsidiaries, associates and joint ventures into the group’s US dollar reporting currency. The group seeks to mitigate this exposure, where cost effective, by borrowing in the samecurrencies as the functional currencies of its main operating units or by achieving the same effect through the use of forward foreign exchangecontracts and currency swaps. An approximate nominal value of US$2,329 million of US dollar borrowings and €254 million of euro borrowingshave been swapped into currencies that match the currency of the underlying operations of the group, primarily South African rand, but alsoColombian peso, Peruvian nuevo sol, Czech koruna, Polish zloty, Russian rouble and euro. Of these financial derivatives, US$1,161 million and€150 million are accounted for as net investment hedges.
The group does not hedge currency exposures from the translation of profits earned in foreign currency subsidiaries and associates.
The group is also exposed to transactional currency risk on sales and purchases that are denominated in a currency other than the respectivefunctional currencies of group entities. These exposures are presently managed locally by group entities which, subject to regulatory constraintsor currency market limitations, hedge a proportion of their foreign currency exposure estimated to arise over a period of up to 18 months.Committed transactional exposures that are certain are hedged fully without limitation in time. The group principally uses forward exchangecontracts to hedge currency risk.
The tables below set out the group’s currency exposures from financial assets and liabilities held by group companies in currencies other thantheir functional currencies and resulting in exchange movements in the income statement and balance sheet.
Other OtherEuropean African
US dollars SA rand Euro currencies currencies Other TotalUS$m US$m US$m US$m US$m US$m US$m
Financial assetsTrade and other receivables 36 179 147 3 52 58 475Derivative financial instruments1 512 3 461 – – 20 996Cash and cash equivalents 30 – 27 71 1 38 167Intragroup assets 254 – 1,688 267 – 52 2,261At 31 March 2010 832 182 2,323 341 53 168 3,899
Potential impact on earnings – (loss)/gain20% increase in functional currency (117) (30) (348) (57) (9) (28) (589)20% decrease in functional currency 140 36 417 68 11 34 706
Potential impact on other comprehensive income – (loss)/gain
20% increase in functional currency (22) – (39) – – – (61)20% decrease in functional currency 26 – 47 – – – 73
Financial liabilitiesTrade and other payables (196) (141) (146) (15) (82) (99) (679)Derivative financial instruments1 (205) (617) (619) (892) – (245) (2,578)Borrowings (310) (2) (1,499) (7) (58) (190) (2,066)Intragroup liabilities (62) (62) (166) (99) (1) (1) (391)At 31 March 2010 (773) (822) (2,430) (1,013) (141) (535) (5,714)
Potential impact on earnings – gain/(loss)20% increase in functional currency 129 34 350 61 24 52 65020% decrease in functional currency (155) (41) (419) (74) (28) (63) (780)
Potential impact on other comprehensive income – gain/(loss)
20% increase in functional currency – 103 56 107 – 37 30320% decrease in functional currency – (123) (67) (129) – (44) (363)
1 These represent the notional amounts of derivative financial instruments.
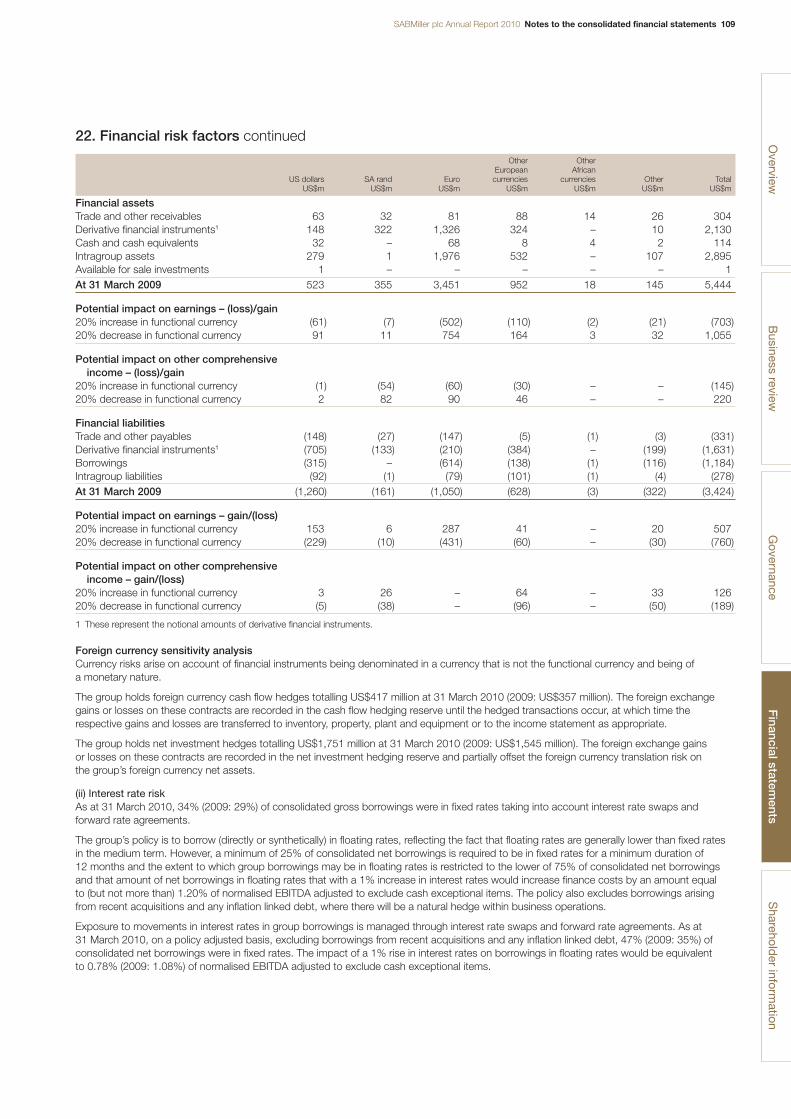
SABMiller plc Annual Report 2010 Notes to the consolidated financial statements 109
22. Financial risk factors continued
Other OtherEuropean African
US dollars SA rand Euro currencies currencies Other TotalUS$m US$m US$m US$m US$m US$m US$m
Financial assetsTrade and other receivables 63 32 81 88 14 26 304Derivative financial instruments1 148 322 1,326 324 – 10 2,130Cash and cash equivalents 32 – 68 8 4 2 114Intragroup assets 279 1 1,976 532 – 107 2,895Available for sale investments 1 – – – – – 1At 31 March 2009 523 355 3,451 952 18 145 5,444
Potential impact on earnings – (loss)/gain20% increase in functional currency (61) (7) (502) (110) (2) (21) (703)20% decrease in functional currency 91 11 754 164 3 32 1,055
Potential impact on other comprehensive income – (loss)/gain
20% increase in functional currency (1) (54) (60) (30) – – (145)20% decrease in functional currency 2 82 90 46 – – 220
Financial liabilitiesTrade and other payables (148) (27) (147) (5) (1) (3) (331)Derivative financial instruments1 (705) (133) (210) (384) – (199) (1,631)Borrowings (315) – (614) (138) (1) (116) (1,184)Intragroup liabilities (92) (1) (79) (101) (1) (4) (278)At 31 March 2009 (1,260) (161) (1,050) (628) (3) (322) (3,424)
Potential impact on earnings – gain/(loss)20% increase in functional currency 153 6 287 41 – 20 50720% decrease in functional currency (229) (10) (431) (60) – (30) (760)
Potential impact on other comprehensive income – gain/(loss)
20% increase in functional currency 3 26 – 64 – 33 12620% decrease in functional currency (5) (38) – (96) – (50) (189)
1 These represent the notional amounts of derivative financial instruments.
Foreign currency sensitivity analysisCurrency risks arise on account of financial instruments being denominated in a currency that is not the functional currency and being of a monetary nature.
The group holds foreign currency cash flow hedges totalling US$417 million at 31 March 2010 (2009: US$357 million). The foreign exchangegains or losses on these contracts are recorded in the cash flow hedging reserve until the hedged transactions occur, at which time therespective gains and losses are transferred to inventory, property, plant and equipment or to the income statement as appropriate.
The group holds net investment hedges totalling US$1,751 million at 31 March 2010 (2009: US$1,545 million). The foreign exchange gains or losses on these contracts are recorded in the net investment hedging reserve and partially offset the foreign currency translation risk on the group’s foreign currency net assets.
(ii) Interest rate riskAs at 31 March 2010, 34% (2009: 29%) of consolidated gross borrowings were in fixed rates taking into account interest rate swaps andforward rate agreements.
The group’s policy is to borrow (directly or synthetically) in floating rates, reflecting the fact that floating rates are generally lower than fixed rates in the medium term. However, a minimum of 25% of consolidated net borrowings is required to be in fixed rates for a minimum duration of 12 months and the extent to which group borrowings may be in floating rates is restricted to the lower of 75% of consolidated net borrowingsand that amount of net borrowings in floating rates that with a 1% increase in interest rates would increase finance costs by an amount equal to (but not more than) 1.20% of normalised EBITDA adjusted to exclude cash exceptional items. The policy also excludes borrowings arising from recent acquisitions and any inflation linked debt, where there will be a natural hedge within business operations.
Exposure to movements in interest rates in group borrowings is managed through interest rate swaps and forward rate agreements. As at 31 March 2010, on a policy adjusted basis, excluding borrowings from recent acquisitions and any inflation linked debt, 47% (2009: 35%) ofconsolidated net borrowings were in fixed rates. The impact of a 1% rise in interest rates on borrowings in floating rates would be equivalent to 0.78% (2009: 1.08%) of normalised EBITDA adjusted to exclude cash exceptional items.
Overview
Business review
Governance
Financial statem
entsS
hareholder inform
ation
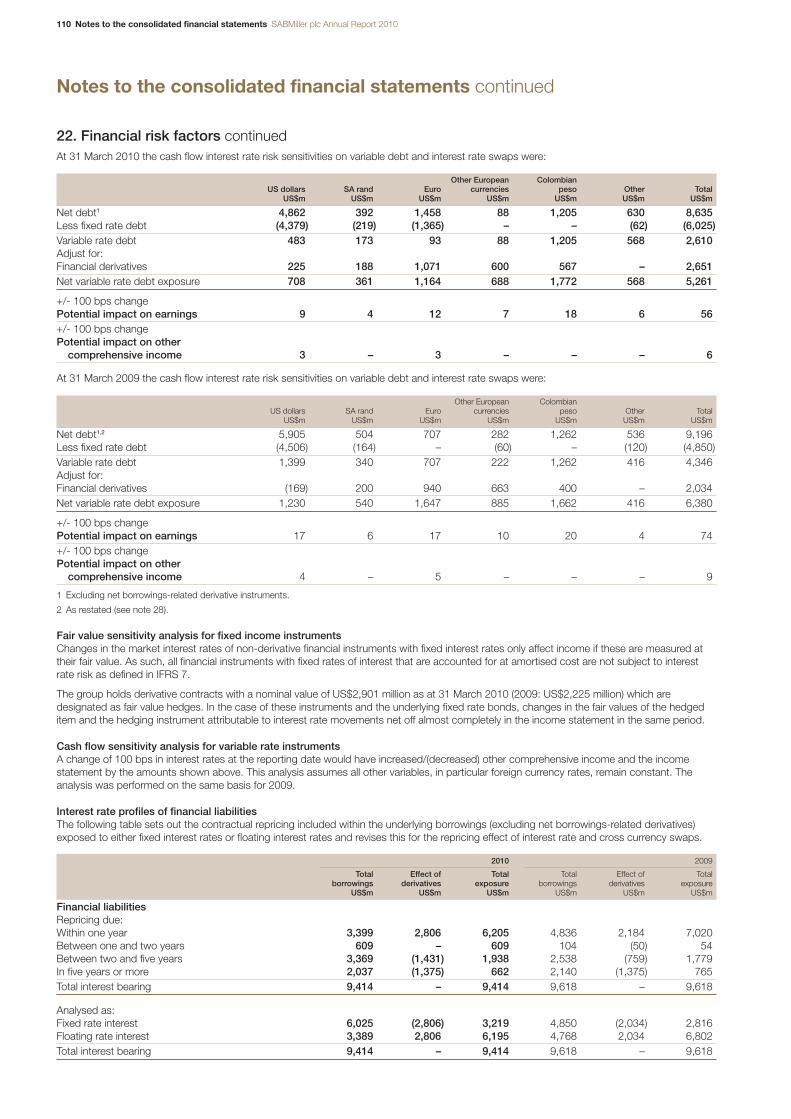
110 Notes to the consolidated financial statements SABMiller plc Annual Report 2010
Notes to the consolidated financial statements continued
22. Financial risk factors continuedAt 31 March 2010 the cash flow interest rate risk sensitivities on variable debt and interest rate swaps were:
Other European Colombian US dollars SA rand Euro currencies peso Other Total
US$m US$m US$m US$m US$m US$m US$m
Net debt1 4,862 392 1,458 88 1,205 630 8,635Less fixed rate debt (4,379) (219) (1,365) – – (62) (6,025)Variable rate debt 483 173 93 88 1,205 568 2,610Adjust for:Financial derivatives 225 188 1,071 600 567 – 2,651Net variable rate debt exposure 708 361 1,164 688 1,772 568 5,261
+/- 100 bps changePotential impact on earnings 9 4 12 7 18 6 56+/- 100 bps changePotential impact on other
comprehensive income 3 – 3 – – – 6
At 31 March 2009 the cash flow interest rate risk sensitivities on variable debt and interest rate swaps were:
Other European Colombian US dollars SA rand Euro currencies peso Other Total
US$m US$m US$m US$m US$m US$m US$m
Net debt1,2 5,905 504 707 282 1,262 536 9,196Less fixed rate debt (4,506) (164) – (60) – (120) (4,850)Variable rate debt 1,399 340 707 222 1,262 416 4,346Adjust for:Financial derivatives (169) 200 940 663 400 – 2,034Net variable rate debt exposure 1,230 540 1,647 885 1,662 416 6,380
+/- 100 bps changePotential impact on earnings 17 6 17 10 20 4 74+/- 100 bps changePotential impact on other
comprehensive income 4 – 5 – – – 9
1 Excluding net borrowings-related derivative instruments.
2 As restated (see note 28).
Fair value sensitivity analysis for fixed income instrumentsChanges in the market interest rates of non-derivative financial instruments with fixed interest rates only affect income if these are measured attheir fair value. As such, all financial instruments with fixed rates of interest that are accounted for at amortised cost are not subject to interestrate risk as defined in IFRS 7.
The group holds derivative contracts with a nominal value of US$2,901 million as at 31 March 2010 (2009: US$2,225 million) which aredesignated as fair value hedges. In the case of these instruments and the underlying fixed rate bonds, changes in the fair values of the hedgeditem and the hedging instrument attributable to interest rate movements net off almost completely in the income statement in the same period.
Cash flow sensitivity analysis for variable rate instrumentsA change of 100 bps in interest rates at the reporting date would have increased/(decreased) other comprehensive income and the incomestatement by the amounts shown above. This analysis assumes all other variables, in particular foreign currency rates, remain constant. Theanalysis was performed on the same basis for 2009.
Interest rate profiles of financial liabilitiesThe following table sets out the contractual repricing included within the underlying borrowings (excluding net borrowings-related derivatives)exposed to either fixed interest rates or floating interest rates and revises this for the repricing effect of interest rate and cross currency swaps.
2010 2009
Total Effect of Total Total Effect of Total borrowings derivatives exposure borrowings derivatives exposure
US$m US$m US$m US$m US$m US$m
Financial liabilitiesRepricing due:Within one year 3,399 2,806 6,205 4,836 2,184 7,020Between one and two years 609 – 609 104 (50) 54Between two and five years 3,369 (1,431) 1,938 2,538 (759) 1,779In five years or more 2,037 (1,375) 662 2,140 (1,375) 765Total interest bearing 9,414 – 9,414 9,618 – 9,618
Analysed as:Fixed rate interest 6,025 (2,806) 3,219 4,850 (2,034) 2,816Floating rate interest 3,389 2,806 6,195 4,768 2,034 6,802Total interest bearing 9,414 – 9,414 9,618 – 9,618
SABMiller plc Annual Report 2010 Notes to the consolidated financial statements 111
22. Financial risk factors continued(iii) Price risk
Commodity price riskThe group is exposed to variability in the price of commodities used in the production or in the packaging of finished products, such as the priceof malt, barley, sugar and aluminium. These price risks are managed principally through multi year fixed price contracts with suppliers internationally.
At 31 March 2010 the notional value of commodity derivatives amounted to US$42 million (2009: US$55 million). No sensitivity analysis has beenprovided on these outstanding contracts as the impact is considered to be immaterial.
Equity securities price riskThe group is exposed to equity securities price risk because of investments held by the group and classified on the balance sheet as available for sale investments. No sensitivity analysis has been provided on these outstanding contracts as the impact is considered to be immaterial.
b. Credit riskCredit risk is the risk of financial loss to the group if a customer or counterparty to a financial instrument fails to meet its contractual obligations.
Financial instrumentsThe group limits its exposure to financial institutions by setting credit limits on a sliding scale based on their credit ratings and generally only withcounterparties with a minimum credit rating of BBB- by Standard & Poors and Baa3 from Moody’s. For banks with a lower credit rating, or with nointernational credit rating, a maximum limit of US$3 million is applied, unless specific approval is obtained from either the Chief Financial Officeror the audit committee of the board. The utilisation of credit limits is regularly monitored. To reduce credit exposures, the group has ISDA MasterAgreements with most of its counterparties for financial derivatives, which permit net settlement of assets and liabilities in certain circumstances.
Trade and other receivablesThere is no significant concentration of credit risk with respect to trade receivables as the group has a large number of customers which areinternationally dispersed. The type of customers range from wholesalers and distributors to smaller retailers. The group has implemented policiesthat require appropriate credit checks on potential customers before sales commence. Credit risk is managed by limiting the aggregate amountof exposure to any one counterparty.
The group considers its maximum credit risk to be US$2,749 million (2009: US$2,528 million (restated)) which is the total of the group’s financial assets.
c. Liquidity riskLiquidity risk is the risk that the group will not be able to meet its financial obligations as they fall due.
The group finances its operations through cash generated by the business and a mixture of short-term and medium-term bank credit facilities,bank loans, corporate bonds and commercial paper with a range of maturity dates. In this way, the group ensures that it is not overly reliant onany particular liquidity source or that maturities of borrowings sourced in this way are not overly concentrated.
Subsidiaries have access to local bank credit facilities, but are principally funded by the group.
The group has the following core lines of credit that are available for general corporate purposes and which are maintained by SABMiller plc:
■ US$2,000 million committed syndicated facility maturing in December 2012.■ US$515 million committed syndicated facility maturing in October 2010, including the right of the company to term out any amounts drawn
for a maximum period of one year from the date of maturity of the facility.■ US$600 million committed syndicated facility maturing in May 2011.
Liquidity risk faced by the group is mitigated by having diverse sources of finance available to it and by maintaining substantial unutilised bankingfacilities and reserve borrowing capacity, as indicated by the level of undrawn facilities.
As at 31 March 2010, borrowing capacity under committed bank facilities amounted to US$3,579 million.
Overview
Business review
Governance
Financial statem
entsS
hareholder inform
ation
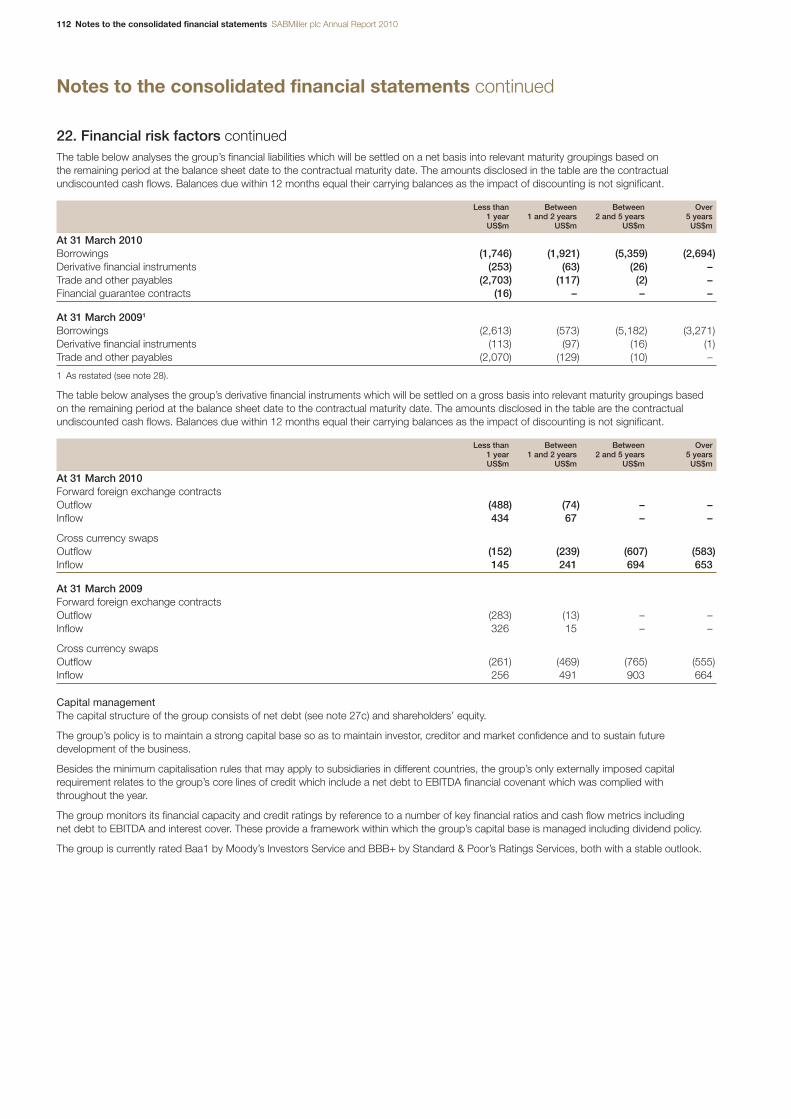
112 Notes to the consolidated financial statements SABMiller plc Annual Report 2010
Notes to the consolidated financial statements continued
22. Financial risk factors continuedThe table below analyses the group’s financial liabilities which will be settled on a net basis into relevant maturity groupings based on the remaining period at the balance sheet date to the contractual maturity date. The amounts disclosed in the table are the contractualundiscounted cash flows. Balances due within 12 months equal their carrying balances as the impact of discounting is not significant.
Less than Between Between Over1 year 1 and 2 years 2 and 5 years 5 yearsUS$m US$m US$m US$m
At 31 March 2010Borrowings (1,746) (1,921) (5,359) (2,694)Derivative financial instruments (253) (63) (26) –Trade and other payables (2,703) (117) (2) –Financial guarantee contracts (16) – – –
At 31 March 20091
Borrowings (2,613) (573) (5,182) (3,271)Derivative financial instruments (113) (97) (16) (1)Trade and other payables (2,070) (129) (10) –
1 As restated (see note 28).
The table below analyses the group’s derivative financial instruments which will be settled on a gross basis into relevant maturity groupings basedon the remaining period at the balance sheet date to the contractual maturity date. The amounts disclosed in the table are the contractualundiscounted cash flows. Balances due within 12 months equal their carrying balances as the impact of discounting is not significant.
Less than Between Between Over1 year 1 and 2 years 2 and 5 years 5 yearsUS$m US$m US$m US$m
At 31 March 2010Forward foreign exchange contractsOutflow (488) (74) – –Inflow 434 67 – –
Cross currency swapsOutflow (152) (239) (607) (583)Inflow 145 241 694 653
At 31 March 2009Forward foreign exchange contractsOutflow (283) (13) – –Inflow 326 15 – –
Cross currency swapsOutflow (261) (469) (765) (555)Inflow 256 491 903 664
Capital managementThe capital structure of the group consists of net debt (see note 27c) and shareholders’ equity.
The group’s policy is to maintain a strong capital base so as to maintain investor, creditor and market confidence and to sustain futuredevelopment of the business.
Besides the minimum capitalisation rules that may apply to subsidiaries in different countries, the group’s only externally imposed capitalrequirement relates to the group’s core lines of credit which include a net debt to EBITDA financial covenant which was complied withthroughout the year.
The group monitors its financial capacity and credit ratings by reference to a number of key financial ratios and cash flow metrics including net debt to EBITDA and interest cover. These provide a framework within which the group’s capital base is managed including dividend policy.
The group is currently rated Baa1 by Moody’s Investors Service and BBB+ by Standard & Poor’s Ratings Services, both with a stable outlook.
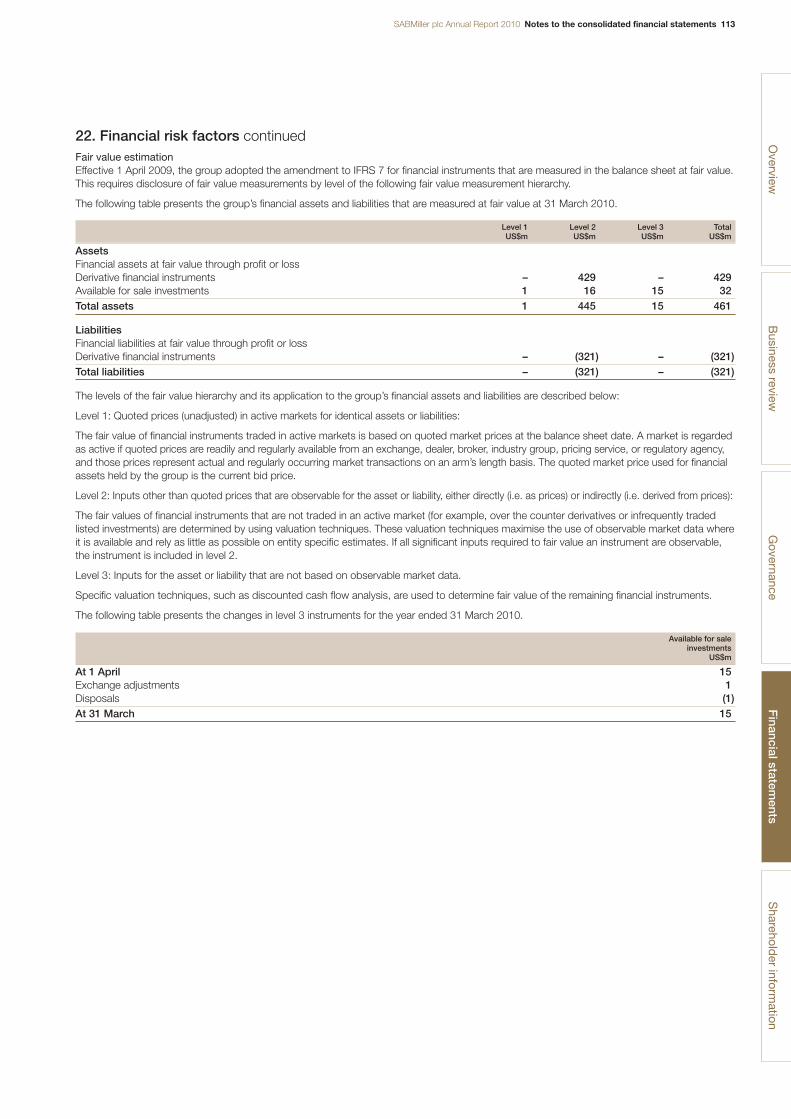
SABMiller plc Annual Report 2010 Notes to the consolidated financial statements 113
22. Financial risk factors continuedFair value estimationEffective 1 April 2009, the group adopted the amendment to IFRS 7 for financial instruments that are measured in the balance sheet at fair value.This requires disclosure of fair value measurements by level of the following fair value measurement hierarchy.
The following table presents the group’s financial assets and liabilities that are measured at fair value at 31 March 2010.
Level 1 Level 2 Level 3 TotalUS$m US$m US$m US$m
AssetsFinancial assets at fair value through profit or lossDerivative financial instruments – 429 – 429Available for sale investments 1 16 15 32Total assets 1 445 15 461
LiabilitiesFinancial liabilities at fair value through profit or lossDerivative financial instruments – (321) – (321)Total liabilities – (321) – (321)
The levels of the fair value hierarchy and its application to the group’s financial assets and liabilities are described below:
Level 1: Quoted prices (unadjusted) in active markets for identical assets or liabilities:
The fair value of financial instruments traded in active markets is based on quoted market prices at the balance sheet date. A market is regardedas active if quoted prices are readily and regularly available from an exchange, dealer, broker, industry group, pricing service, or regulatory agency,and those prices represent actual and regularly occurring market transactions on an arm’s length basis. The quoted market price used for financialassets held by the group is the current bid price.
Level 2: Inputs other than quoted prices that are observable for the asset or liability, either directly (i.e. as prices) or indirectly (i.e. derived from prices):
The fair values of financial instruments that are not traded in an active market (for example, over the counter derivatives or infrequently tradedlisted investments) are determined by using valuation techniques. These valuation techniques maximise the use of observable market data whereit is available and rely as little as possible on entity specific estimates. If all significant inputs required to fair value an instrument are observable,the instrument is included in level 2.
Level 3: Inputs for the asset or liability that are not based on observable market data.
Specific valuation techniques, such as discounted cash flow analysis, are used to determine fair value of the remaining financial instruments.
The following table presents the changes in level 3 instruments for the year ended 31 March 2010.
Available for saleinvestments
US$m
At 1 April 15Exchange adjustments 1Disposals (1)At 31 March 15
Overview
Business review
Governance
Financial statem
entsS
hareholder inform
ation

114 Notes to the consolidated financial statements SABMiller plc Annual Report 2010
Notes to the consolidated financial statements continued
23. Derivative financial instrumentsCurrent derivative financial instruments
2010 2009
Assets Liabilities Assets LiabilitiesUS$m US$m US$m US$m
Embedded derivatives – (4) – (1)Interest rate swaps designated as cash flow hedges1 – (4) – (2)Forward foreign currency contracts – on operating items 5 (12) 10 (2)Forward foreign currency contracts – on borrowings1 – (1) 1 (8)Forward foreign currency contracts designated as net investment hedges – – – (1)Forward foreign currency contracts designated as cash flow hedges – (26) 42 (4)Forward foreign currency contracts designated as fair value hedges – – – (2)Cross currency swaps – on operating items – (1) – –Cross currency swaps – on borrowings1 14 (125) 1 –Commodity contracts designated as cash flow hedges 1 (1) – (15)
20 (174) 54 (35)
1 Borrowings-related derivative financial instruments amounting to a net liability of US$116 million (2009: US$8 million).
Non-current derivative financial instruments
2010 2009
Assets Liabilities Assets LiabilitiesUS$m US$m US$m US$m
Interest rate swaps designated as fair value hedges1 252 – 379 –Interest rate swaps designated as cash flow hedges1 – (9) – (22)Forward foreign currency contracts – on operating items – – – (1)Forward foreign currency contracts – on borrowings1 2 (1) – –Forward foreign currency contracts designated as net investment hedges 2 (17) 5 (5)Forward foreign currency contracts designated as cash flow hedges – (7) 3 –Cross currency swaps – on operating items – – – (1)Cross currency swaps – on borrowings1 123 (14) 162 (24)Cross currency swaps designated as net investment hedges 30 (99) 146 (54)
409 (147) 695 (107)
1 Borrowings-related derivative financial instruments amounting to a net asset of US$353 million (2009: US$495 million).
Derivatives designated as hedging instruments
(i) Fair value hedgesThe group has entered into several interest rate swaps to pay floating and receive fixed interest which have been designated as fair value hedges to hedge exposure to changes in the fair value of its US dollar and euro fixed rate borrowings. Non-current borrowings are designated as the hedged item as part of the fair value hedge. The borrowings and the interest rate swaps have the same critical terms.
As at 31 March 2010, the notional amount of the US dollar interest rate swaps was US$2,225 million (2009: US$2,225 million). The fixed interestrates received vary from 5.5% to 6.625% (2009: 5.5% to 6.625%) and the floating interest rates paid vary from LIBOR plus 71.6 bps to LIBORplus 198.8 bps (2009: LIBOR plus 71.6 bps to LIBOR plus 198.8 bps) on the notional amount.
As at 31 March 2010, the notional amount of the euro interest rate swaps was €500 million (2009: €nil). The fixed interest rates received are 4.5% and floating interest rates paid vary from EURIBOR plus 177 bps to EURIBOR plus 178 bps on the notional amount.
As at 31 March 2010, the carrying value of the hedged borrowings was US$3,152 million (2009: US$2,576 million).
(ii) Cash flow hedgesThe group has entered into interest rate swaps designated as cash flow hedges to manage the interest rate on borrowings. The notional amountof these interest rate swaps was US$345 million equivalent (2009: US$493 million). The fair value of these interest rate swaps was a liability ofUS$13 million (2009: US$24 million). The fixed interest rates paid vary from 3.5% to 4.7% (2009: 3.4% to 5.4%) and the floating rates receivedare LIBOR and EURIBOR plus zero bps (2009: LIBOR and EURIBOR plus zero bps). As at 31 March 2010, the carrying value of the hedgedborrowings was US$345 million (2009: US$493 million).
The group has entered into forward exchange contracts designated as cash flow hedges to manage short-term foreign currency exposures toexpected future trade imports and exports. As at 31 March 2010, the notional amounts of these contracts were €195 million (2009: €149 million)and US$153 million (2009: US$142 million).
The group has entered into commodity contracts designated as cash flow hedges to manage the future price of commodities. As at 31 March2010, the notional amount of forward contracts for the purchase price of corn was US$8 million (2009: US$5 million) and the notional amount of forward contracts for the purchase price of aluminium was US$34 million (2009: US$50 million).
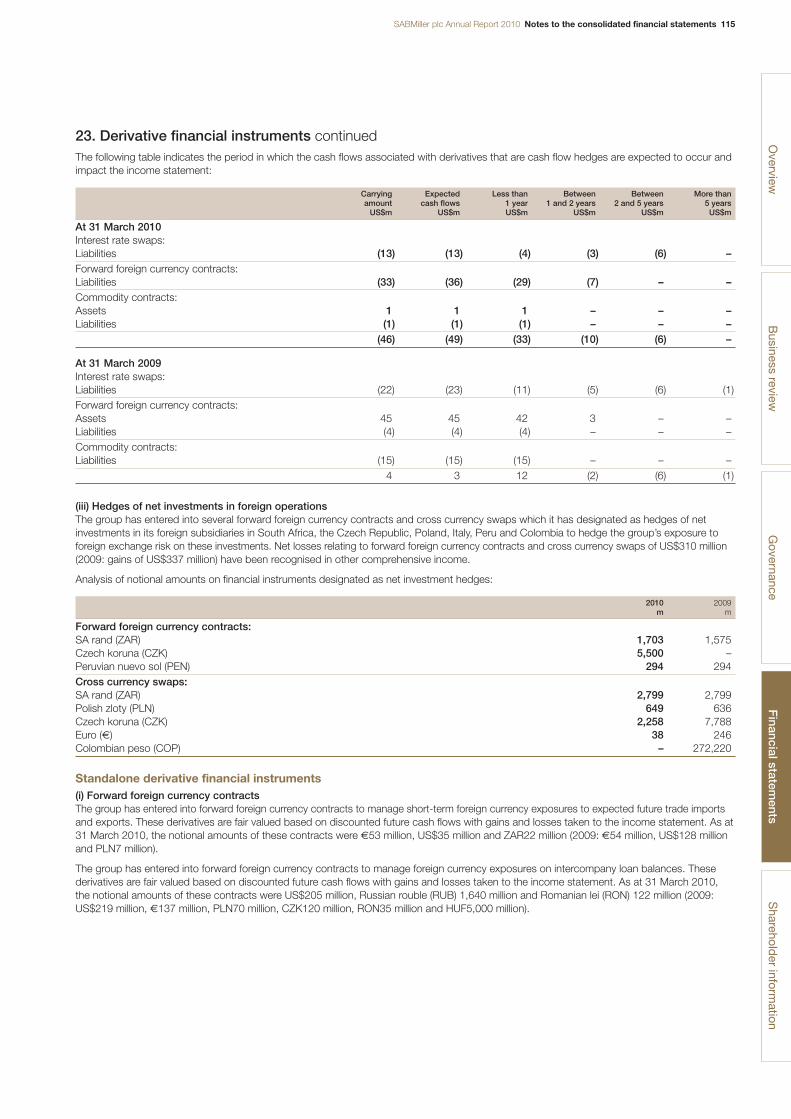
SABMiller plc Annual Report 2010 Notes to the consolidated financial statements 115
23. Derivative financial instruments continuedThe following table indicates the period in which the cash flows associated with derivatives that are cash flow hedges are expected to occur andimpact the income statement:
Carrying Expected Less than Between Between More than amount cash flows 1 year 1 and 2 years 2 and 5 years 5 years
US$m US$m US$m US$m US$m US$m
At 31 March 2010Interest rate swaps:Liabilities (13) (13) (4) (3) (6) –Forward foreign currency contracts:Liabilities (33) (36) (29) (7) – –Commodity contracts:Assets 1 1 1 – – –Liabilities (1) (1) (1) – – –
(46) (49) (33) (10) (6) –
At 31 March 2009Interest rate swaps:Liabilities (22) (23) (11) (5) (6) (1)Forward foreign currency contracts:Assets 45 45 42 3 – –Liabilities (4) (4) (4) – – –Commodity contracts:Liabilities (15) (15) (15) – – –
4 3 12 (2) (6) (1)
(iii) Hedges of net investments in foreign operationsThe group has entered into several forward foreign currency contracts and cross currency swaps which it has designated as hedges of netinvestments in its foreign subsidiaries in South Africa, the Czech Republic, Poland, Italy, Peru and Colombia to hedge the group’s exposure toforeign exchange risk on these investments. Net losses relating to forward foreign currency contracts and cross currency swaps of US$310 million(2009: gains of US$337 million) have been recognised in other comprehensive income.
Analysis of notional amounts on financial instruments designated as net investment hedges:
2010 2009m m
Forward foreign currency contracts:SA rand (ZAR) 1,703 1,575Czech koruna (CZK) 5,500 –Peruvian nuevo sol (PEN) 294 294Cross currency swaps:SA rand (ZAR) 2,799 2,799Polish zloty (PLN) 649 636Czech koruna (CZK) 2,258 7,788Euro (€) 38 246Colombian peso (COP) – 272,220
Standalone derivative financial instruments(i) Forward foreign currency contractsThe group has entered into forward foreign currency contracts to manage short-term foreign currency exposures to expected future trade importsand exports. These derivatives are fair valued based on discounted future cash flows with gains and losses taken to the income statement. As at31 March 2010, the notional amounts of these contracts were €53 million, US$35 million and ZAR22 million (2009: €54 million, US$128 millionand PLN7 million).
The group has entered into forward foreign currency contracts to manage foreign currency exposures on intercompany loan balances. Thesederivatives are fair valued based on discounted future cash flows with gains and losses taken to the income statement. As at 31 March 2010,the notional amounts of these contracts were US$205 million, Russian rouble (RUB) 1,640 million and Romanian lei (RON) 122 million (2009:US$219 million, €137 million, PLN70 million, CZK120 million, RON35 million and HUF5,000 million).
Overview
Business review
Governance
Financial statem
entsS
hareholder inform
ation

116 Notes to the consolidated financial statements SABMiller plc Annual Report 2010
Notes to the consolidated financial statements continued
23. Derivative financial instruments continued(ii) Cross currency swapsThe group has entered into cross currency swaps to manage foreign currency exposures on intercompany loan balances. These derivatives are fair valued based on discounted future cash flows with gains and losses taken to the income statement. As at 31 March 2010, the notionalamounts of these contracts were €571 million, RUB2,900 million and PLN443 million (2009: €571 million and RUB2,900 million).
The group has entered into cross currency swaps to manage the fluctuation of the exchange rates over a portion of its US dollar debt. Thesederivatives are fair valued based on discounted future cash flows with gains and losses taken to the income statement. As at 31 March 2010,the notional amount of these contracts was US$300 million (2009: US$300 million).
The group has entered into a cross currency swap to hedge the exposure to foreign exchange risk on its investment in foreign subsidiaries in Colombia. This derivative is fair valued based on discounted future cash flows with gains and losses taken to the income statement. As at31 March 2010, the notional amount of this contract was COP272,220 million.
Fair value (loss)/gain on financial instruments recognised in the income statement
2010 2009US$m US$m
Derivative financial instruments:Interest rate swaps designated as fair value hedges (116) 246Forward foreign currency contracts (7) 16Forward foreign currency contracts designated as fair value hedges (1) (3)Cross currency swaps (99) 265Cross currency swaps designated as net investment hedges (8) (22)Gain on early termination of financial derivatives – 20Change in valuation methodology of financial instruments (17) –
(248) 522Other financial instruments:Non-current borrowings designated as the hedged item in a fair value hedge 118 (236)Total fair value (loss)/gain on financial instruments recognised in the income statement (130) 286
Fair value gains or losses on borrowings and derivative financial instruments held to hedge interest rate risk on borrowings are recognised as part of net finance costs. Fair value gains or losses on all other derivative financial instruments are recognised in operating profit.
Reconciliation of total financial instrumentsThe table below reconciles the group’s accounting categorisation of financial assets and liabilities (based on initial recognition) to the classes of assets and liabilities as shown on the face of the balance sheet.
Fair value Financial Notthrough liabilities categorisedincome Loans and Available held at as a financial
statement receivables for sale amortised cost instrument Total Non current CurrentUS$m US$m US$m US$m US$m US$m US$m US$m
At 31 March 2010AssetsAvailable for sale investments – – 32 – – 32 31 1Derivative financial instruments 429 – – – – 429 409 20Trade and other receivables – 1,509 – – 273 1,782 117 1,665Cash and cash equivalents – 779 – – – 779 – 779LiabilitiesDerivative financial instruments (321) – – – – (321) (147) (174)Borrowings – – – (9,414) – (9,414) (7,809) (1,605)Trade and other payables – – – (2,831) (541) (3,372) (145) (3,227)
At 31 March 20091
AssetsAvailable for sale investments – – 40 – – 40 29 11Derivative financial instruments 749 – – – – 749 695 54Trade and other receivables – 1,317 – – 384 1,701 125 1,576Cash and cash equivalents – 422 – – – 422 – 422LiabilitiesDerivative financial instruments (142) – – – – (142) (107) (35)Borrowings – – – (9,618) – (9,618) (7,470) (2,148)Trade and other payables – – – (2,214) (372) (2,586) (186) (2,400)
1 As restated (see note 28).
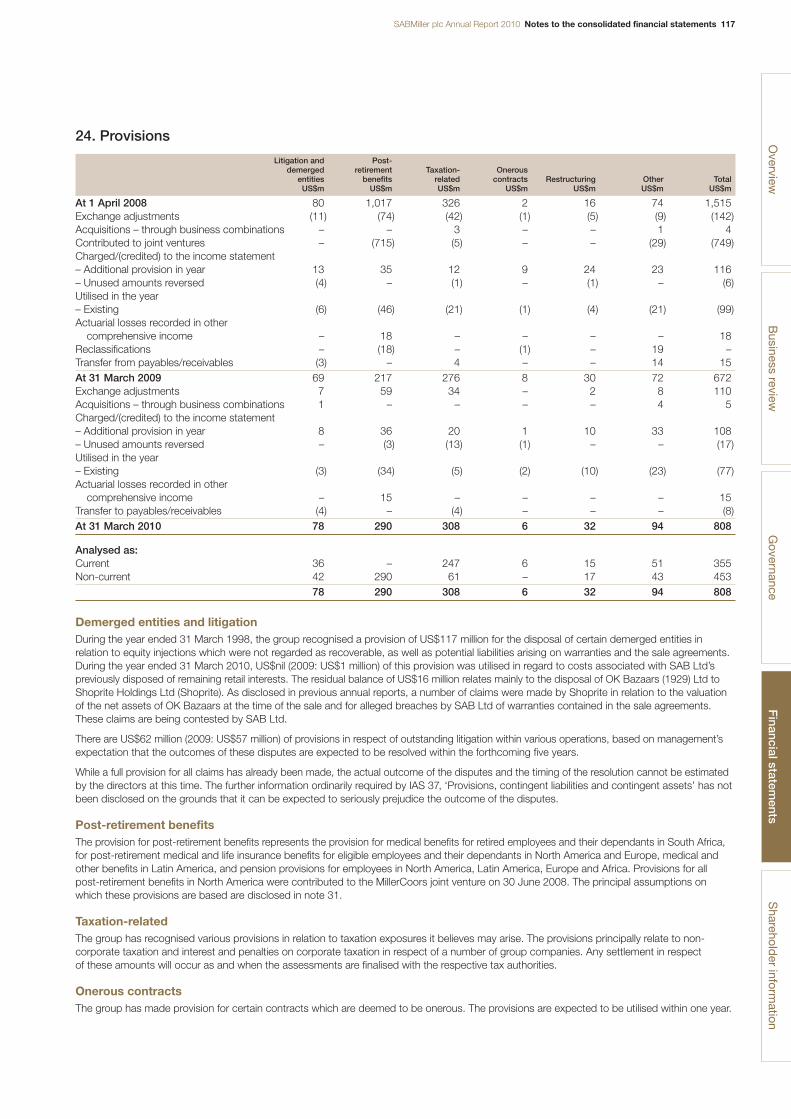
SABMiller plc Annual Report 2010 Notes to the consolidated financial statements 117
24. Provisions
Litigation and Post-demerged retirement Taxation- Onerous
entities benefits related contracts Restructuring Other TotalUS$m US$m US$m US$m US$m US$m US$m
At 1 April 2008 80 1,017 326 2 16 74 1,515Exchange adjustments (11) (74) (42) (1) (5) (9) (142)Acquisitions – through business combinations – – 3 – – 1 4Contributed to joint ventures – (715) (5) – – (29) (749)Charged/(credited) to the income statement– Additional provision in year 13 35 12 9 24 23 116– Unused amounts reversed (4) – (1) – (1) – (6)Utilised in the year– Existing (6) (46) (21) (1) (4) (21) (99)Actuarial losses recorded in other
comprehensive income – 18 – – – – 18Reclassifications – (18) – (1) – 19 –Transfer from payables/receivables (3) – 4 – – 14 15At 31 March 2009 69 217 276 8 30 72 672Exchange adjustments 7 59 34 – 2 8 110Acquisitions – through business combinations 1 – – – – 4 5Charged/(credited) to the income statement– Additional provision in year 8 36 20 1 10 33 108– Unused amounts reversed – (3) (13) (1) – – (17)Utilised in the year– Existing (3) (34) (5) (2) (10) (23) (77)Actuarial losses recorded in other
comprehensive income – 15 – – – – 15Transfer to payables/receivables (4) – (4) – – – (8)At 31 March 2010 78 290 308 6 32 94 808
Analysed as:Current 36 – 247 6 15 51 355Non-current 42 290 61 – 17 43 453
78 290 308 6 32 94 808
Demerged entities and litigationDuring the year ended 31 March 1998, the group recognised a provision of US$117 million for the disposal of certain demerged entities inrelation to equity injections which were not regarded as recoverable, as well as potential liabilities arising on warranties and the sale agreements.During the year ended 31 March 2010, US$nil (2009: US$1 million) of this provision was utilised in regard to costs associated with SAB Ltd’spreviously disposed of remaining retail interests. The residual balance of US$16 million relates mainly to the disposal of OK Bazaars (1929) Ltd toShoprite Holdings Ltd (Shoprite). As disclosed in previous annual reports, a number of claims were made by Shoprite in relation to the valuationof the net assets of OK Bazaars at the time of the sale and for alleged breaches by SAB Ltd of warranties contained in the sale agreements.These claims are being contested by SAB Ltd.
There are US$62 million (2009: US$57 million) of provisions in respect of outstanding litigation within various operations, based on management’sexpectation that the outcomes of these disputes are expected to be resolved within the forthcoming five years.
While a full provision for all claims has already been made, the actual outcome of the disputes and the timing of the resolution cannot be estimatedby the directors at this time. The further information ordinarily required by IAS 37, ‘Provisions, contingent liabilities and contingent assets’ has notbeen disclosed on the grounds that it can be expected to seriously prejudice the outcome of the disputes.
Post-retirement benefitsThe provision for post-retirement benefits represents the provision for medical benefits for retired employees and their dependants in South Africa,for post-retirement medical and life insurance benefits for eligible employees and their dependants in North America and Europe, medical andother benefits in Latin America, and pension provisions for employees in North America, Latin America, Europe and Africa. Provisions for all post-retirement benefits in North America were contributed to the MillerCoors joint venture on 30 June 2008. The principal assumptions onwhich these provisions are based are disclosed in note 31.
Taxation-relatedThe group has recognised various provisions in relation to taxation exposures it believes may arise. The provisions principally relate to non-corporate taxation and interest and penalties on corporate taxation in respect of a number of group companies. Any settlement in respect of these amounts will occur as and when the assessments are finalised with the respective tax authorities.
Onerous contractsThe group has made provision for certain contracts which are deemed to be onerous. The provisions are expected to be utilised within one year.
Overview
Business review
Governance
Financial statem
entsS
hareholder inform
ation
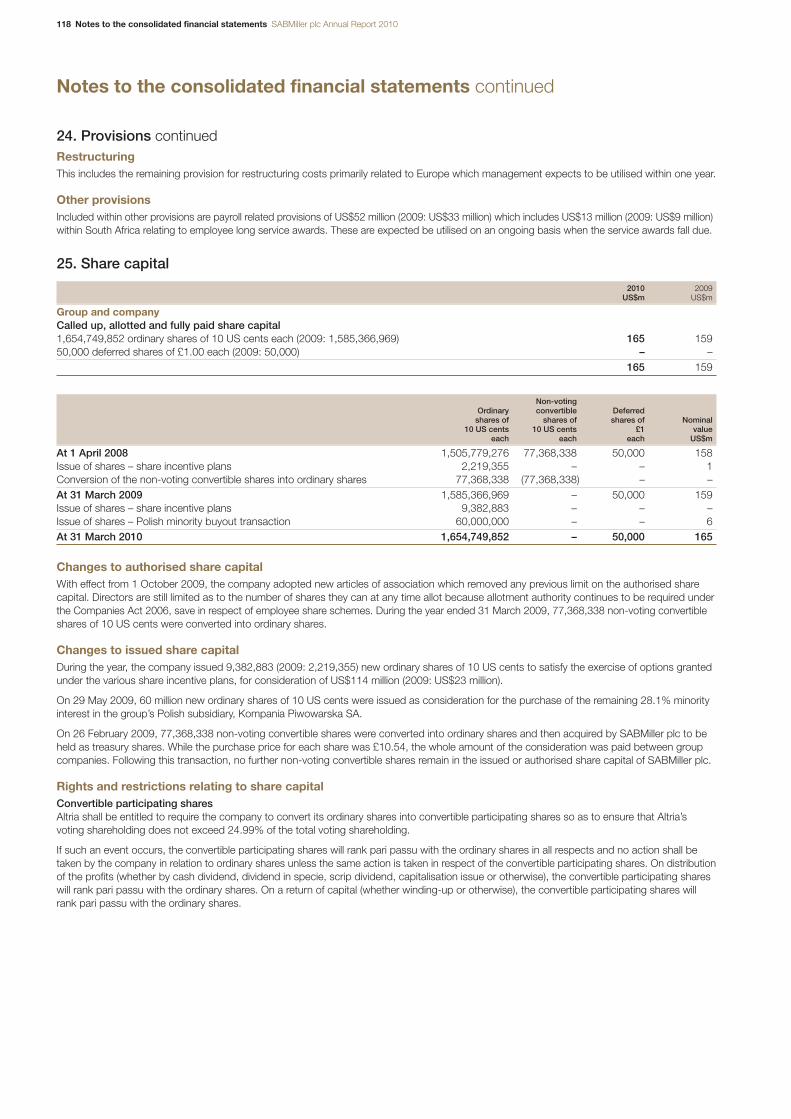
118 Notes to the consolidated financial statements SABMiller plc Annual Report 2010
Notes to the consolidated financial statements continued
24. Provisions continuedRestructuringThis includes the remaining provision for restructuring costs primarily related to Europe which management expects to be utilised within one year.
Other provisionsIncluded within other provisions are payroll related provisions of US$52 million (2009: US$33 million) which includes US$13 million (2009: US$9 million)within South Africa relating to employee long service awards. These are expected be utilised on an ongoing basis when the service awards fall due.
25. Share capital
2010 2009US$m US$m
Group and companyCalled up, allotted and fully paid share capital1,654,749,852 ordinary shares of 10 US cents each (2009: 1,585,366,969) 165 15950,000 deferred shares of £1.00 each (2009: 50,000) – –
165 159
Non-votingOrdinary convertible Deferred
shares of shares of shares of Nominal10 US cents 10 US cents £1 value
each each each US$m
At 1 April 2008 1,505,779,276 77,368,338 50,000 158Issue of shares – share incentive plans 2,219,355 – – 1Conversion of the non-voting convertible shares into ordinary shares 77,368,338 (77,368,338) – –At 31 March 2009 1,585,366,969 – 50,000 159Issue of shares – share incentive plans 9,382,883 – – –Issue of shares – Polish minority buyout transaction 60,000,000 – – 6At 31 March 2010 1,654,749,852 – 50,000 165
Changes to authorised share capitalWith effect from 1 October 2009, the company adopted new articles of association which removed any previous limit on the authorised sharecapital. Directors are still limited as to the number of shares they can at any time allot because allotment authority continues to be required underthe Companies Act 2006, save in respect of employee share schemes. During the year ended 31 March 2009, 77,368,338 non-voting convertibleshares of 10 US cents were converted into ordinary shares.
Changes to issued share capitalDuring the year, the company issued 9,382,883 (2009: 2,219,355) new ordinary shares of 10 US cents to satisfy the exercise of options grantedunder the various share incentive plans, for consideration of US$114 million (2009: US$23 million).
On 29 May 2009, 60 million new ordinary shares of 10 US cents were issued as consideration for the purchase of the remaining 28.1% minorityinterest in the group’s Polish subsidiary, Kompania Piwowarska SA.
On 26 February 2009, 77,368,338 non-voting convertible shares were converted into ordinary shares and then acquired by SABMiller plc to beheld as treasury shares. While the purchase price for each share was £10.54, the whole amount of the consideration was paid between groupcompanies. Following this transaction, no further non-voting convertible shares remain in the issued or authorised share capital of SABMiller plc.
Rights and restrictions relating to share capitalConvertible participating sharesAltria shall be entitled to require the company to convert its ordinary shares into convertible participating shares so as to ensure that Altria’svoting shareholding does not exceed 24.99% of the total voting shareholding.
If such an event occurs, the convertible participating shares will rank pari passu with the ordinary shares in all respects and no action shall betaken by the company in relation to ordinary shares unless the same action is taken in respect of the convertible participating shares. On distributionof the profits (whether by cash dividend, dividend in specie, scrip dividend, capitalisation issue or otherwise), the convertible participating shareswill rank pari passu with the ordinary shares. On a return of capital (whether winding-up or otherwise), the convertible participating shares willrank pari passu with the ordinary shares.
SABMiller plc Annual Report 2010 Notes to the consolidated financial statements 119
25. Share capital continuedAltria shall be entitled to vote its convertible participating shares at general meetings of the company on a poll on the basis of one-tenth of a votefor every convertible participating share on all resolutions other than a resolution:
(i) proposed by any person other than Altria, to wind-up the company;
(ii) proposed by any person other than Altria, to appoint an administrator or to approve any arrangement with the company’s creditors;
(iii) proposed by the board, to sell all or substantially all of the undertaking of the company; or
(iv) proposed by any person other than Altria, to alter any of the class rights attaching to the convertible participating shares or to approve the creation of any new class of shares, in which case Altria shall be entitled on a poll to vote on the resolution on the basis of one vote foreach convertible participating share, but, for the purposes of any resolution other than a resolution mentioned in (iv) above, the convertibleparticipating shares shall be treated as being of the same class as the ordinary shares and no separate meeting or resolution of the holdersof the convertible participating shares shall be required to be convened or passed.
Upon a transfer of convertible participating shares by Altria other than to an affiliate, such convertible participating shares shall convert intoordinary shares.
Altria shall be entitled to require the company to convert its convertible participating shares into ordinary shares if:
(i) a third party has made a takeover offer for the company and (if such offer becomes or is declared unconditional in all respects) it would result in the voting shareholding of the third party being more than 30% of the total voting shareholding; and
(ii) Altria has communicated to the company in writing its intention not itself to make an offer competing with such third party offer, provided that the conversion date shall be no earlier than the date on which the third party’s offer becomes or is declared unconditional in all respects.
Altria shall be entitled to require the company to convert its convertible participating shares into ordinary shares if the voting shareholding of a third party should be more than 24.99%, provided that:
(i) the number of ordinary shares held by Altria following such conversion shall be limited to one ordinary share more than the number ofordinary shares held by the third party; and
(ii) such conversion shall at no time result in Altria’s voting shareholding being equal to or greater than the voting shareholding which wouldrequire Altria to make a mandatory offer in terms of rule 9 of the City Code.
If Altria wishes to acquire additional ordinary shares (other than pursuant to a pre-emptive issue of new ordinary shares or with the prior approvalof the board), Altria shall first convert into ordinary shares the lesser of:
(i) such number of convertible participating shares as would result in Altria’s voting shareholding being such percentage as would, in the eventof Altria subsequently acquiring one additional ordinary share, require Altria to make a mandatory offer in terms of rule 9 of the City Code; and
(ii) all of its remaining convertible participating shares.
The company shall use its best endeavours to procure that the ordinary shares arising on conversion of the convertible participating shares are admitted to the Official List and to trading on the London Stock Exchange’s market for listed securities, admitted to listing and trading on the JSE Securities Exchange South Africa, and admitted to listing and trading on any other stock exchange upon which the ordinary shares are from time to time listed and traded, but no admission to listing or trading shall be sought for the convertible participating shares whilst they remain convertible participating shares.
Non-voting convertible sharesAt 1 April 2008, Safari, a special purpose vehicle established and financed by a wholly owned subsidiary of SABMiller plc, held 77,368,338 non-voting convertible shares of US$0.10 each in the capital of the company. On 26 February 2009, these non-voting convertible shares wereconverted into ordinary shares and then acquired by the company to be held as treasury shares. While the purchase price for each share was£10.54, the whole amount of the consideration was paid between group companies. Following this transaction, no further non-voting convertibleshares remain in the issued share capital of the company.
Deferred sharesThe deferred shares do not carry any voting rights and do not entitle holders thereof to receive any dividends or other distributions. In the eventof a winding up deferred shareholders would receive no more than the nominal value. Deferred shares represent the only non-equity share capitalof the group.
Overview
Business review
Governance
Financial statem
entsS
hareholder inform
ation
120 Notes to the consolidated financial statements SABMiller plc Annual Report 2010
Notes to the consolidated financial statements continued
25. Share capital continuedShare-based paymentsThe group operates various equity-settled share award plans for certain employees. The awards outstanding can be summarised as follows:
Number of Number of Ordinary shares Ordinary shares
Scheme 2010 2009
Mirror Executive Share Purchase Scheme (South Africa) and South African Share Option Plan 2008 (a) 13,447,779 14,336,899Executive Share Option Scheme (Approved Scheme and (No 2) Scheme), Executive Share Option Plan 2008,
Approved Executive Share Option Plan 2008 and SABMiller plc Associated Companies Employee Share Plan 2008 (b) 10,450,149 11,719,449
Performance Share Award Scheme (c) 1,584,181 2,885,680International Performance Share Award Sub-Scheme (d) 2,554,522 3,442,520Executive Share Award Plan 2008 (e) 2,777,152 115,000International Employee Share Scheme (f) 3,065,536 4,297,282International Employee Stock Appreciation Rights Scheme (g) 4,203,749 7,020,930Stock Appreciation Rights Scheme 2008 (h) 93,300 9,100Total awards outstanding 38,176,368 43,826,860
Further details relating to all of the share award schemes can be found in the remuneration report in the section entitled ‘Long-term incentiveplans’ on pages 59 to 67.
(a) Mirror Executive Share Purchase Scheme (South Africa) and South African Executive Share Option Plan 2008As at 31 March 2010 the following options were outstanding under the SABMiller plc Mirror Executive Share Purchase Scheme (South Africa)and the South African Executive Share Option Plan 2008:
Exercise period2010 2009 Exercise price
Date of grant Ordinary shares Ordinary shares ZAR Earliest date Expiry date
27 May 1999 – 5,500 50.90 27.05.2004 27.05.200925 November 1999 – 26,000 56.50 25.11.2004 25.11.20092 June 2000 – 167,500 43.09 02.06.2005 02.06.20101 December 2000 61,000 136,750 45.97 01.12.2005 01.12.20101 June 2001 3,000 69,500 59.15 01.06.2006 01.06.201130 November 2001 165,500 361,700 67.05 30.11.2006 30.11.201131 May 2002 23,000 94,300 80.05 31.05.2007 31.05.201222 November 2002 295,000 666,000 67.17 22.11.2007 22.11.201223 May 2003 268,132 535,432 53.30 23.05.2008 23.05.201321 November 2003 272,700 592,000 62.55 21.11.2008 21.11.201321 May 2004 236,000 688,500 78.30 21.05.2009 21.05.201419 November 2004 401,500 869,000 96.25 19.11.2009 19.11.201420 May 2005 780,157 810,157 96.95 20.05.2010 20.05.20159 September 2005 245,000 245,000 117.07 09.09.2010 09.09.201511 November 2005 850,000 887,000 124.34 11.11.2010 11.11.201519 May 2006 657,740 1,132,360 129.18 19.05.2009 19.05.201610 November 2006 454,700 846,500 149.26 10.11.2009 10.11.201618 May 2007 841,750 872,450 161.85 18.05.2010 18.05.20172 August 2007 37,500 37,500 178.56 02.08.2010 02.08.201716 November 2007 1,591,800 1,688,500 181.88 16.11.2010 16.11.201716 May 2008 1,168,950 1,210,950 185.98 16.05.2011 16.05.20181 August 2008 75,000 75,000 155.91 01.08.2011 01.08.201814 November 20081 2,184,800 2,319,300 141.14 14.11.2011 14.11.201815 May 20091 590,750 – 158.43 15.05.2012 15.05.201920 November 20091 2,243,800 – 215.31 20.11.2012 20.11.2019Total 13,447,779 14,336,899
1 Options issued under the South African Executive Share Option Plan 2008 – all other options issued under the Mirror Executive Share Purchase Scheme (South Africa).
No further options can be granted under the Mirror Executive Share Purchase Scheme (South Africa) after 30 September 2008.
SABMiller plc Annual Report 2010 Notes to the consolidated financial statements 121
25. Share capital continued(b) SABMiller plc Executive Share Option Scheme (Approved Scheme and (No 2) Scheme), Executive Share Option Plan 2008, ApprovedExecutive Share Option Plan 2008 and SABMiller plc Associated Companies Employee Share Plan 2008As at 31 March 2010 the following options were outstanding under the UK SABMiller plc Approved Executive Share Option Scheme, theSABMiller plc Unapproved Executive Share Option (No 2) Scheme, the Executive Share Option Plan 2008, the Approved Executive Share Option Plan 2008 and the SABMiller plc Associated Companies Employee Share Plan 2008:
Exercise period2010 2009 Exercise price
Date of grant Ordinary shares Ordinary shares £ Earliest date Expiry date
27 May 1999 – 9,386 5.170 27.05.2002 27.05.20092 June 2000 19,978 197,237 4.110 02.06.2003 02.06.20101 December 2000 40,284 40,284 4.220 01.12.2003 01.12.20101 December 20001 7,109 7,109 4.220 01.12.2003 01.12.20101 June 2001 21,753 319,069 5.160 01.06.2004 01.06.201130 November 2001 38,136 38,136 4.720 30.11.2004 30.11.201131 May 2002 138,270 534,437 5.705 31.05.2005 31.05.201231 May 20021 5,259 10,518 5.705 31.05.2005 31.05.201222 November 2002 65,000 94,000 4.400 22.11.2005 22.11.201222 November 20021 – 6,818 4.400 22.11.2005 22.11.201223 May 2003 178,650 773,247 4.1575 23.05.2006 23.05.201323 May 20031 – 7,216 4.1575 23.05.2006 23.05.201321 November 2003 72,900 112,900 5.537 21.11.2006 21.11.201321 November 20031 11,273 19,329 5.537 21.11.2006 21.11.201321 May 2004 192,350 916,581 6.605 21.05.2007 21.05.201421 May 20041 4,542 13,210 6.605 21.05.2007 21.05.201419 November 2004 44,450 106,750 8.700 19.11.2007 19.11.201419 November 20041 3,169 3,169 8.700 19.11.2007 19.11.201420 May 2005 324,273 1,220,901 8.280 20.05.2008 20.05.201520 May 20051 25,126 46,215 8.280 20.05.2008 20.05.201511 November 2005 135,685 277,285 10.530 11.11.2008 11.11.201511 November 20051 2,849 9,421 10.530 11.11.2008 11.11.201519 May 2006 806,201 1,807,129 10.610 19.05.2009 19.05.201619 May 20061 6,042 44,952 10.610 19.05.2009 19.05.201610 November 2006 26,200 103,600 10.930 10.11.2009 10.11.201610 November 20061 2,060 2,060 10.930 10.11.2009 10.11.201622 November 2006 11,600 26,600 10.930 22.11.2009 22.11.201618 May 2007 1,787,364 2,010,224 11.670 18.05.2010 18.05.201718 May 20071 81,486 88,026 11.670 18.05.2010 18.05.20172 August 2007 40,561 55,561 12.300 02.08.2010 02.08.20172 August 20071 2,439 2,439 12.300 02.08.2010 02.08.201716 November 2007 23,588 28,836 13.320 16.11.2010 16.11.201716 November 20071 2,252 4,504 13.320 16.11.2010 16.11.201716 May 2008 2,263,226 2,430,844 12.500 16.05.2011 16.05.201816 May 20081 71,724 75,456 12.500 16.05.2011 16.05.20181 August 2008 160,000 160,000 10.490 01.08.2011 01.08.201814 November 20082 116,000 116,000 9.295 14.11.2011 14.11.201815 May 20092 3,606,694 – 12.310 15.05.2012 15.05.201915 May 20093 7,000 – 12.310 15.05.2012 15.05.201915 May 20094 70,456 – 12.310 15.05.2012 15.05.201920 November 20092 32,450 – 17.140 20.11.2012 20.11.201920 November 20094 1,750 – 17.140 20.11.2012 20.11.2019
10,450,149 11,719,449
1 SABMiller plc Approved Executive Share Option Scheme.
2 SABMiller plc Executive Share Option Plan 2008.
3 SABMiller plc Associated Companies Employee Share Plan 2008.
4 SABMiller plc Approved Executive Share Option Plan 2008.
No further options can be granted under the Executive Share Option Schemes (Approved Scheme and (No 2) Scheme) after 30 September 2008.
Overview
Business review
Governance
Financial statem
entsS
hareholder inform
ation
122 Notes to the consolidated financial statements SABMiller plc Annual Report 2010
Notes to the consolidated financial statements continued
25. Share capital continued(c) Performance Share Award SchemeAs at 31 March 2010 the following conditional awards were outstanding under the SABMiller plc Performance Share Award Scheme:
Earliest dateby which
performance2010 2009 Exercise price condition
Date of award Ordinary shares Ordinary shares £ may be met
19 May 2006 136,125 675,000 Nil 19.05.200913 March 2007 10,560 32,000 Nil 13.03.201018 May 2007 342,927 1,041,200 Nil 18.05.20102 August 2007 12,375 37,500 Nil 02.08.201016 November 2007 894 4,680 Nil 16.11.201016 May 2008 921,300 935,300 Nil 16.05.20111 August 2008 160,000 160,000 Nil 01.08.2011
1,584,181 2,885,680
No further awards can be made under this scheme after 30 September 2008.
(d) International Performance Share Award Sub-SchemeAt 31 March 2010 the following conditional awards were outstanding under the SABMiller plc International Performance Share Award Sub-Scheme:
Date by whichperformance
2010 2009 Exercise price conditionGrant dates (period of the performance condition) Ordinary shares Ordinary shares £ must be met
19 May 2006 and 10 November 2006 (1 April 2006 to 31 March 2009) – 726,660 Nil 01.04.200918 May 2007, 2 August 2007, 3 October 2007 and 16 November 2007
(1 April 2007 to 31 March 2010) 1,208,672 1,297,940 Nil 01.04.201016 May 2008 and 1 August 2008 (1 April 2008 to 31 March 2011) 1,345,850 1,417,920 Nil 01.04.2011
2,554,522 3,442,520
No further awards can be made under this scheme after 30 September 2008.
(e) Executive Share Award Plan 2008At 31 March 2010 the following conditional awards were outstanding under the SABMiller plc Executive Share Award Plan 2008:
Earliest dateby which
performance2010 2009 Exercise price condition
Date of award Ordinary shares Ordinary shares £ may be met
14 November 2008 115,000 115,000 Nil 14.11.201115 May 2009 2,584,450 – Nil 15.05.20129 September 2009 30,000 – Nil 09.09.201220 November 2009 47,702 – Nil 20.11.2012
2,777,152 115,000
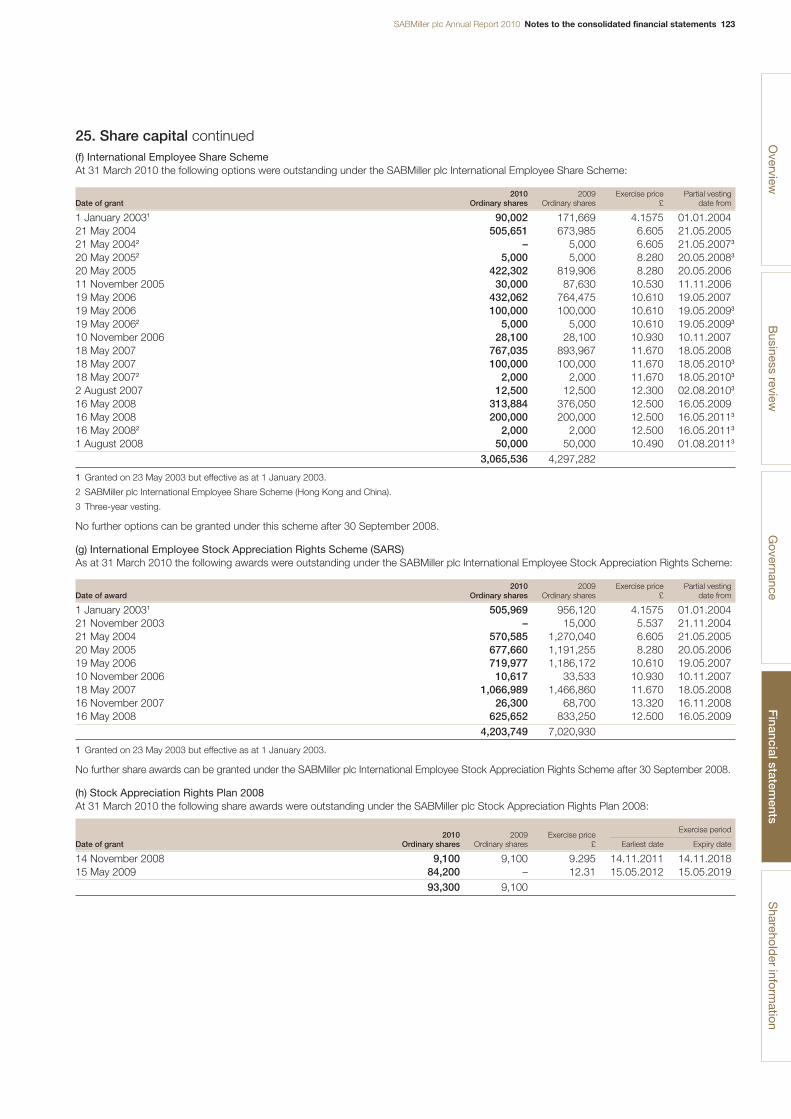
SABMiller plc Annual Report 2010 Notes to the consolidated financial statements 123
25. Share capital continued(f) International Employee Share SchemeAt 31 March 2010 the following options were outstanding under the SABMiller plc International Employee Share Scheme:
2010 2009 Exercise price Partial vestingDate of grant Ordinary shares Ordinary shares £ date from
1 January 20031 90,002 171,669 4.1575 01.01.200421 May 2004 505,651 673,985 6.605 21.05.200521 May 20042 – 5,000 6.605 21.05.20073
20 May 20052 5,000 5,000 8.280 20.05.20083
20 May 2005 422,302 819,906 8.280 20.05.200611 November 2005 30,000 87,630 10.530 11.11.200619 May 2006 432,062 764,475 10.610 19.05.200719 May 2006 100,000 100,000 10.610 19.05.20093
19 May 20062 5,000 5,000 10.610 19.05.20093
10 November 2006 28,100 28,100 10.930 10.11.200718 May 2007 767,035 893,967 11.670 18.05.200818 May 2007 100,000 100,000 11.670 18.05.20103
18 May 20072 2,000 2,000 11.670 18.05.20103
2 August 2007 12,500 12,500 12.300 02.08.20103
16 May 2008 313,884 376,050 12.500 16.05.200916 May 2008 200,000 200,000 12.500 16.05.20113
16 May 20082 2,000 2,000 12.500 16.05.20113
1 August 2008 50,000 50,000 10.490 01.08.20113
3,065,536 4,297,282
1 Granted on 23 May 2003 but effective as at 1 January 2003.
2 SABMiller plc International Employee Share Scheme (Hong Kong and China).
3 Three-year vesting.
No further options can be granted under this scheme after 30 September 2008.
(g) International Employee Stock Appreciation Rights Scheme (SARS)As at 31 March 2010 the following awards were outstanding under the SABMiller plc International Employee Stock Appreciation Rights Scheme:
2010 2009 Exercise price Partial vestingDate of award Ordinary shares Ordinary shares £ date from
1 January 20031 505,969 956,120 4.1575 01.01.200421 November 2003 – 15,000 5.537 21.11.200421 May 2004 570,585 1,270,040 6.605 21.05.200520 May 2005 677,660 1,191,255 8.280 20.05.200619 May 2006 719,977 1,186,172 10.610 19.05.200710 November 2006 10,617 33,533 10.930 10.11.200718 May 2007 1,066,989 1,466,860 11.670 18.05.200816 November 2007 26,300 68,700 13.320 16.11.200816 May 2008 625,652 833,250 12.500 16.05.2009
4,203,749 7,020,930
1 Granted on 23 May 2003 but effective as at 1 January 2003.
No further share awards can be granted under the SABMiller plc International Employee Stock Appreciation Rights Scheme after 30 September 2008.
(h) Stock Appreciation Rights Plan 2008At 31 March 2010 the following share awards were outstanding under the SABMiller plc Stock Appreciation Rights Plan 2008:
Exercise period2010 2009 Exercise price
Date of grant Ordinary shares Ordinary shares £ Earliest date Expiry date
14 November 2008 9,100 9,100 9.295 14.11.2011 14.11.201815 May 2009 84,200 – 12.31 15.05.2012 15.05.2019
93,300 9,100
Overview
Business review
Governance
Financial statem
entsS
hareholder inform
ation
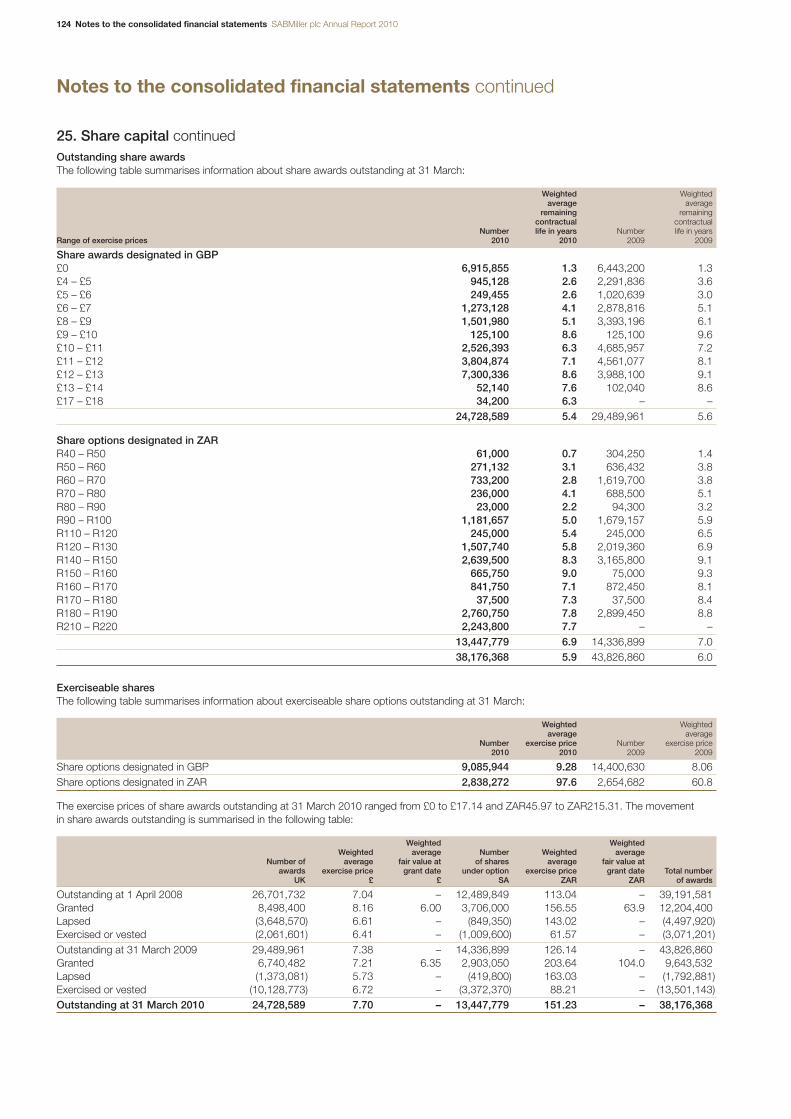
124 Notes to the consolidated financial statements SABMiller plc Annual Report 2010
Notes to the consolidated financial statements continued
25. Share capital continuedOutstanding share awardsThe following table summarises information about share awards outstanding at 31 March:
Weighted Weightedaverage average
remaining remainingcontractual contractual
Number life in years Number life in yearsRange of exercise prices 2010 2010 2009 2009
Share awards designated in GBP£0 6,915,855 1.3 6,443,200 1.3£4 – £5 945,128 2.6 2,291,836 3.6£5 – £6 249,455 2.6 1,020,639 3.0£6 – £7 1,273,128 4.1 2,878,816 5.1£8 – £9 1,501,980 5.1 3,393,196 6.1£9 – £10 125,100 8.6 125,100 9.6£10 – £11 2,526,393 6.3 4,685,957 7.2£11 – £12 3,804,874 7.1 4,561,077 8.1£12 – £13 7,300,336 8.6 3,988,100 9.1£13 – £14 52,140 7.6 102,040 8.6£17 – £18 34,200 6.3 – –
24,728,589 5.4 29,489,961 5.6
Share options designated in ZARR40 – R50 61,000 0.7 304,250 1.4R50 – R60 271,132 3.1 636,432 3.8R60 – R70 733,200 2.8 1,619,700 3.8R70 – R80 236,000 4.1 688,500 5.1R80 – R90 23,000 2.2 94,300 3.2R90 – R100 1,181,657 5.0 1,679,157 5.9R110 – R120 245,000 5.4 245,000 6.5R120 – R130 1,507,740 5.8 2,019,360 6.9R140 – R150 2,639,500 8.3 3,165,800 9.1R150 – R160 665,750 9.0 75,000 9.3R160 – R170 841,750 7.1 872,450 8.1R170 – R180 37,500 7.3 37,500 8.4R180 – R190 2,760,750 7.8 2,899,450 8.8R210 – R220 2,243,800 7.7 – –
13,447,779 6.9 14,336,899 7.038,176,368 5.9 43,826,860 6.0
Exerciseable sharesThe following table summarises information about exerciseable share options outstanding at 31 March:
Weighted Weightedaverage average
Number exercise price Number exercise price2010 2010 2009 2009
Share options designated in GBP 9,085,944 9.28 14,400,630 8.06Share options designated in ZAR 2,838,272 97.6 2,654,682 60.8
The exercise prices of share awards outstanding at 31 March 2010 ranged from £0 to £17.14 and ZAR45.97 to ZAR215.31. The movement in share awards outstanding is summarised in the following table:
Weighted WeightedWeighted average Number Weighted average
Number of average fair value at of shares average fair value atawards exercise price grant date under option exercise price grant date Total number
UK £ £ SA ZAR ZAR of awards
Outstanding at 1 April 2008 26,701,732 7.04 – 12,489,849 113.04 – 39,191,581Granted 8,498,400 8.16 6.00 3,706,000 156.55 63.9 12,204,400Lapsed (3,648,570) 6.61 – (849,350) 143.02 – (4,497,920)Exercised or vested (2,061,601) 6.41 – (1,009,600) 61.57 – (3,071,201)Outstanding at 31 March 2009 29,489,961 7.38 – 14,336,899 126.14 – 43,826,860Granted 6,740,482 7.21 6.35 2,903,050 203.64 104.0 9,643,532Lapsed (1,373,081) 5.73 – (419,800) 163.03 – (1,792,881)Exercised or vested (10,128,773) 6.72 – (3,372,370) 88.21 – (13,501,143)Outstanding at 31 March 2010 24,728,589 7.70 – 13,447,779 151.23 – 38,176,368
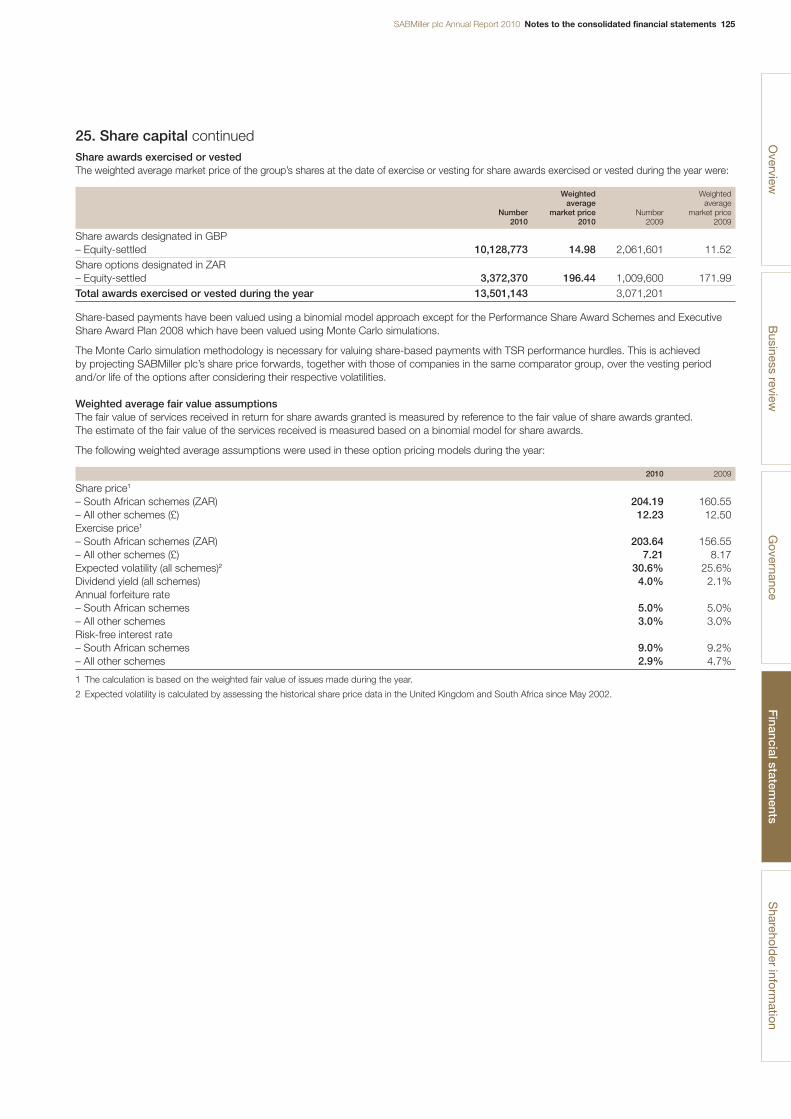
SABMiller plc Annual Report 2010 Notes to the consolidated financial statements 125
25. Share capital continuedShare awards exercised or vestedThe weighted average market price of the group’s shares at the date of exercise or vesting for share awards exercised or vested during the year were:
Weighted Weightedaverage average
Number market price Number market price2010 2010 2009 2009
Share awards designated in GBP– Equity-settled 10,128,773 14.98 2,061,601 11.52Share options designated in ZAR– Equity-settled 3,372,370 196.44 1,009,600 171.99Total awards exercised or vested during the year 13,501,143 3,071,201
Share-based payments have been valued using a binomial model approach except for the Performance Share Award Schemes and ExecutiveShare Award Plan 2008 which have been valued using Monte Carlo simulations.
The Monte Carlo simulation methodology is necessary for valuing share-based payments with TSR performance hurdles. This is achieved by projecting SABMiller plc’s share price forwards, together with those of companies in the same comparator group, over the vesting periodand/or life of the options after considering their respective volatilities.
Weighted average fair value assumptionsThe fair value of services received in return for share awards granted is measured by reference to the fair value of share awards granted. The estimate of the fair value of the services received is measured based on a binomial model for share awards.
The following weighted average assumptions were used in these option pricing models during the year:
2010 2009
Share price1
– South African schemes (ZAR) 204.19 160.55– All other schemes (£) 12.23 12.50Exercise price1
– South African schemes (ZAR) 203.64 156.55– All other schemes (£) 7.21 8.17Expected volatility (all schemes)2 30.6% 25.6%Dividend yield (all schemes) 4.0% 2.1%Annual forfeiture rate– South African schemes 5.0% 5.0%– All other schemes 3.0% 3.0%Risk-free interest rate– South African schemes 9.0% 9.2%– All other schemes 2.9% 4.7%
1 The calculation is based on the weighted fair value of issues made during the year.
2 Expected volatility is calculated by assessing the historical share price data in the United Kingdom and South Africa since May 2002.
Overview
Business review
Governance
Financial statem
entsS
hareholder inform
ation
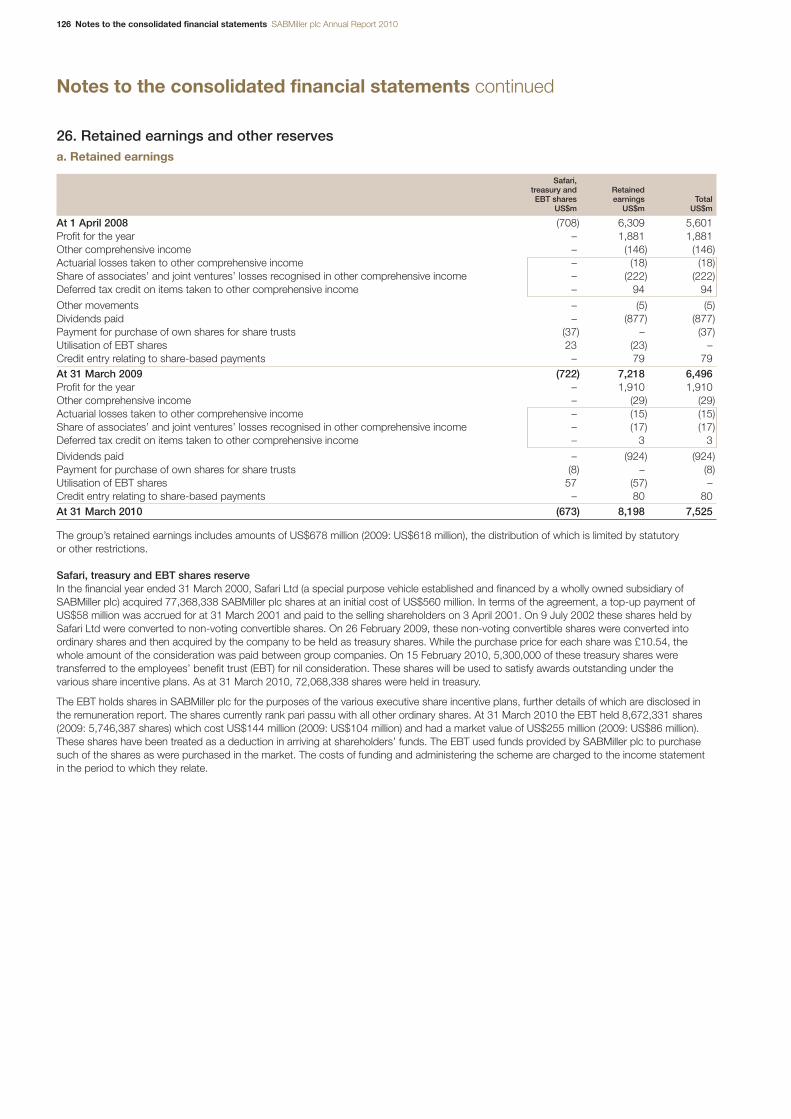
126 Notes to the consolidated financial statements SABMiller plc Annual Report 2010
Notes to the consolidated financial statements continued
26. Retained earnings and other reservesa. Retained earnings
Safari, treasury and RetainedEBT shares earnings Total
US$m US$m US$m
At 1 April 2008 (708) 6,309 5,601Profit for the year – 1,881 1,881Other comprehensive income – (146) (146)Actuarial losses taken to other comprehensive income – (18) (18)Share of associates’ and joint ventures’ losses recognised in other comprehensive income – (222) (222)Deferred tax credit on items taken to other comprehensive income – 94 94
Other movements – (5) (5)Dividends paid – (877) (877)Payment for purchase of own shares for share trusts (37) – (37)Utilisation of EBT shares 23 (23) –Credit entry relating to share-based payments – 79 79At 31 March 2009 (722) 7,218 6,496Profit for the year – 1,910 1,910Other comprehensive income – (29) (29)Actuarial losses taken to other comprehensive income – (15) (15)Share of associates’ and joint ventures’ losses recognised in other comprehensive income – (17) (17)Deferred tax credit on items taken to other comprehensive income – 3 3
Dividends paid – (924) (924)Payment for purchase of own shares for share trusts (8) – (8)Utilisation of EBT shares 57 (57) –Credit entry relating to share-based payments – 80 80At 31 March 2010 (673) 8,198 7,525
The group’s retained earnings includes amounts of US$678 million (2009: US$618 million), the distribution of which is limited by statutory or other restrictions.
Safari, treasury and EBT shares reserveIn the financial year ended 31 March 2000, Safari Ltd (a special purpose vehicle established and financed by a wholly owned subsidiary ofSABMiller plc) acquired 77,368,338 SABMiller plc shares at an initial cost of US$560 million. In terms of the agreement, a top-up payment ofUS$58 million was accrued for at 31 March 2001 and paid to the selling shareholders on 3 April 2001. On 9 July 2002 these shares held bySafari Ltd were converted to non-voting convertible shares. On 26 February 2009, these non-voting convertible shares were converted intoordinary shares and then acquired by the company to be held as treasury shares. While the purchase price for each share was £10.54, thewhole amount of the consideration was paid between group companies. On 15 February 2010, 5,300,000 of these treasury shares weretransferred to the employees’ benefit trust (EBT) for nil consideration. These shares will be used to satisfy awards outstanding under the various share incentive plans. As at 31 March 2010, 72,068,338 shares were held in treasury.
The EBT holds shares in SABMiller plc for the purposes of the various executive share incentive plans, further details of which are disclosed inthe remuneration report. The shares currently rank pari passu with all other ordinary shares. At 31 March 2010 the EBT held 8,672,331 shares(2009: 5,746,387 shares) which cost US$144 million (2009: US$104 million) and had a market value of US$255 million (2009: US$86 million).These shares have been treated as a deduction in arriving at shareholders’ funds. The EBT used funds provided by SABMiller plc to purchasesuch of the shares as were purchased in the market. The costs of funding and administering the scheme are charged to the income statement in the period to which they relate.
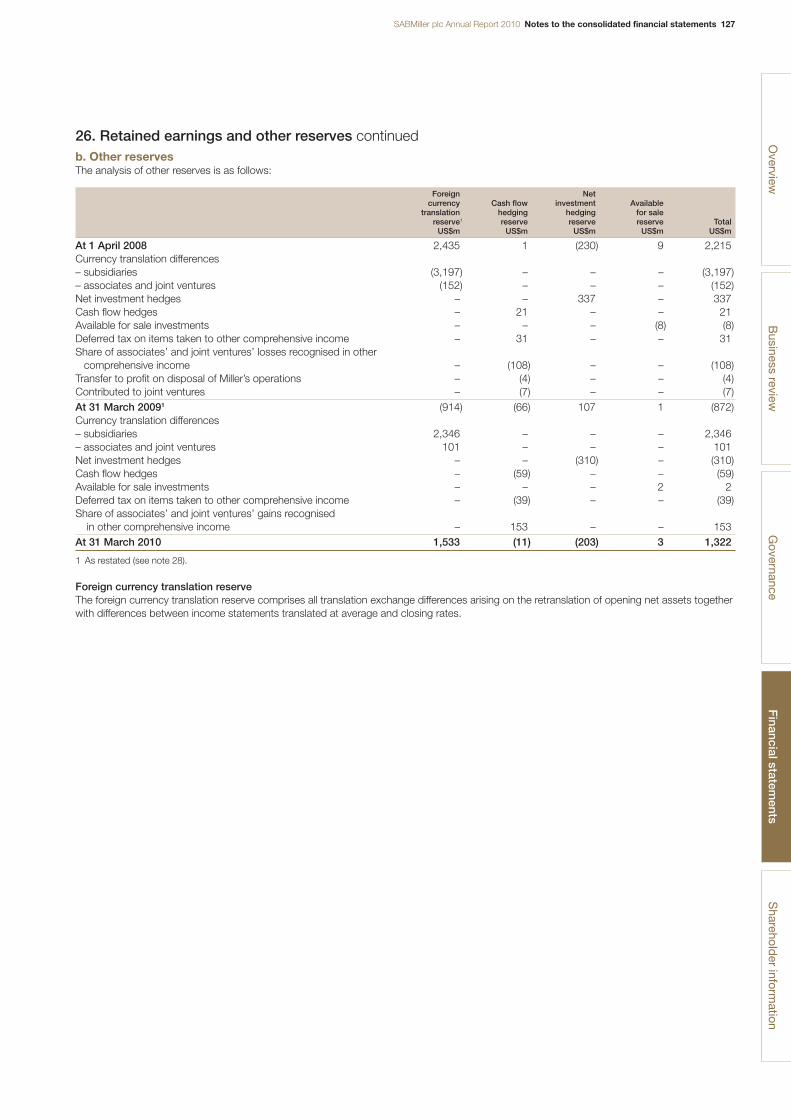
SABMiller plc Annual Report 2010 Notes to the consolidated financial statements 127
26. Retained earnings and other reserves continuedb. Other reservesThe analysis of other reserves is as follows:
Foreign Netcurrency Cash flow investment Available
translation hedging hedging for salereserve1 reserve reserve reserve Total
US$m US$m US$m US$m US$m
At 1 April 2008 2,435 1 (230) 9 2,215Currency translation differences– subsidiaries (3,197) – – – (3,197)– associates and joint ventures (152) – – – (152)Net investment hedges – – 337 – 337Cash flow hedges – 21 – – 21Available for sale investments – – – (8) (8)Deferred tax on items taken to other comprehensive income – 31 – – 31Share of associates’ and joint ventures’ losses recognised in other
comprehensive income – (108) – – (108)Transfer to profit on disposal of Miller’s operations – (4) – – (4)Contributed to joint ventures – (7) – – (7)At 31 March 20091 (914) (66) 107 1 (872)Currency translation differences– subsidiaries 2,346 – – – 2,346– associates and joint ventures 101 – – – 101Net investment hedges – – (310) – (310)Cash flow hedges – (59) – – (59)Available for sale investments – – – 2 2Deferred tax on items taken to other comprehensive income – (39) – – (39)Share of associates’ and joint ventures’ gains recognised
in other comprehensive income – 153 – – 153At 31 March 2010 1,533 (11) (203) 3 1,322
1 As restated (see note 28).
Foreign currency translation reserveThe foreign currency translation reserve comprises all translation exchange differences arising on the retranslation of opening net assets togetherwith differences between income statements translated at average and closing rates.
Overview
Business review
Governance
Financial statem
entsS
hareholder inform
ation
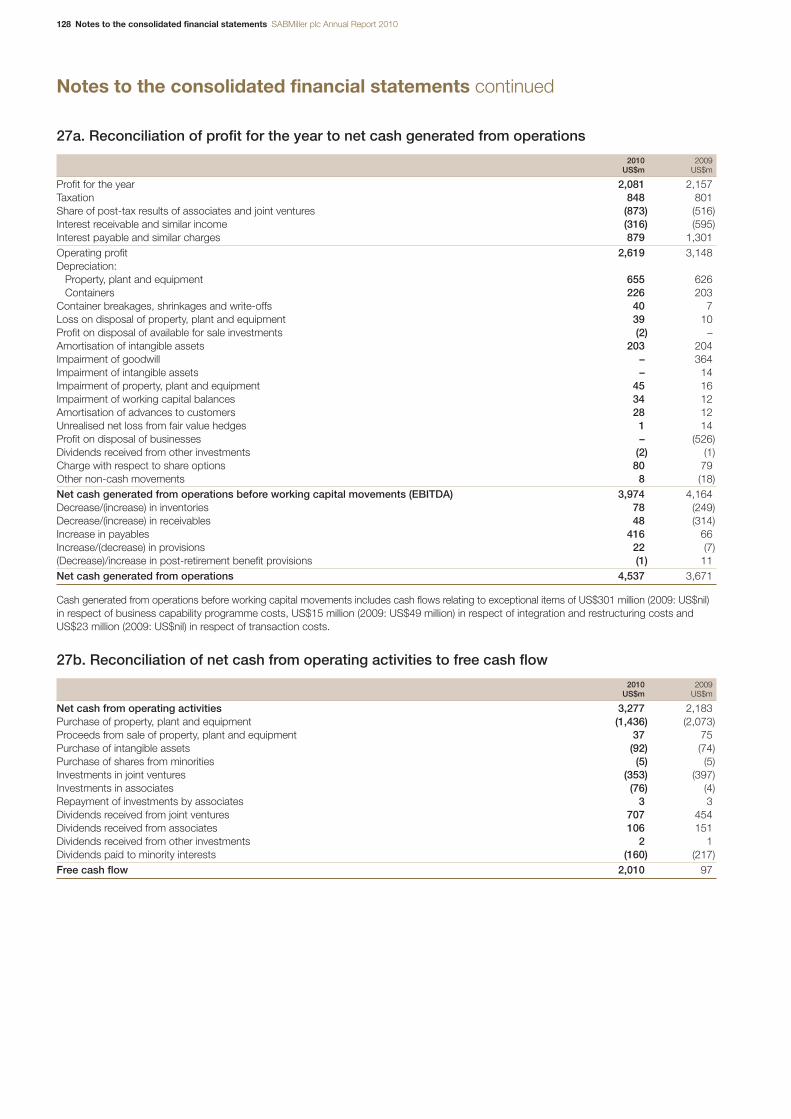
128 Notes to the consolidated financial statements SABMiller plc Annual Report 2010
Notes to the consolidated financial statements continued
27a. Reconciliation of profit for the year to net cash generated from operations
2010 2009US$m US$m
Profit for the year 2,081 2,157Taxation 848 801Share of post-tax results of associates and joint ventures (873) (516)Interest receivable and similar income (316) (595)Interest payable and similar charges 879 1,301Operating profit 2,619 3,148Depreciation:
Property, plant and equipment 655 626Containers 226 203
Container breakages, shrinkages and write-offs 40 7Loss on disposal of property, plant and equipment 39 10Profit on disposal of available for sale investments (2) –Amortisation of intangible assets 203 204Impairment of goodwill – 364Impairment of intangible assets – 14Impairment of property, plant and equipment 45 16Impairment of working capital balances 34 12Amortisation of advances to customers 28 12Unrealised net loss from fair value hedges 1 14Profit on disposal of businesses – (526)Dividends received from other investments (2) (1)Charge with respect to share options 80 79Other non-cash movements 8 (18)Net cash generated from operations before working capital movements (EBITDA) 3,974 4,164Decrease/(increase) in inventories 78 (249)Decrease/(increase) in receivables 48 (314)Increase in payables 416 66Increase/(decrease) in provisions 22 (7)(Decrease)/increase in post-retirement benefit provisions (1) 11Net cash generated from operations 4,537 3,671
Cash generated from operations before working capital movements includes cash flows relating to exceptional items of US$301 million (2009: US$nil)in respect of business capability programme costs, US$15 million (2009: US$49 million) in respect of integration and restructuring costs andUS$23 million (2009: US$nil) in respect of transaction costs.
27b. Reconciliation of net cash from operating activities to free cash flow
2010 2009US$m US$m
Net cash from operating activities 3,277 2,183Purchase of property, plant and equipment (1,436) (2,073)Proceeds from sale of property, plant and equipment 37 75Purchase of intangible assets (92) (74)Purchase of shares from minorities (5) (5)Investments in joint ventures (353) (397)Investments in associates (76) (4)Repayment of investments by associates 3 3Dividends received from joint ventures 707 454Dividends received from associates 106 151Dividends received from other investments 2 1Dividends paid to minority interests (160) (217)Free cash flow 2,010 97
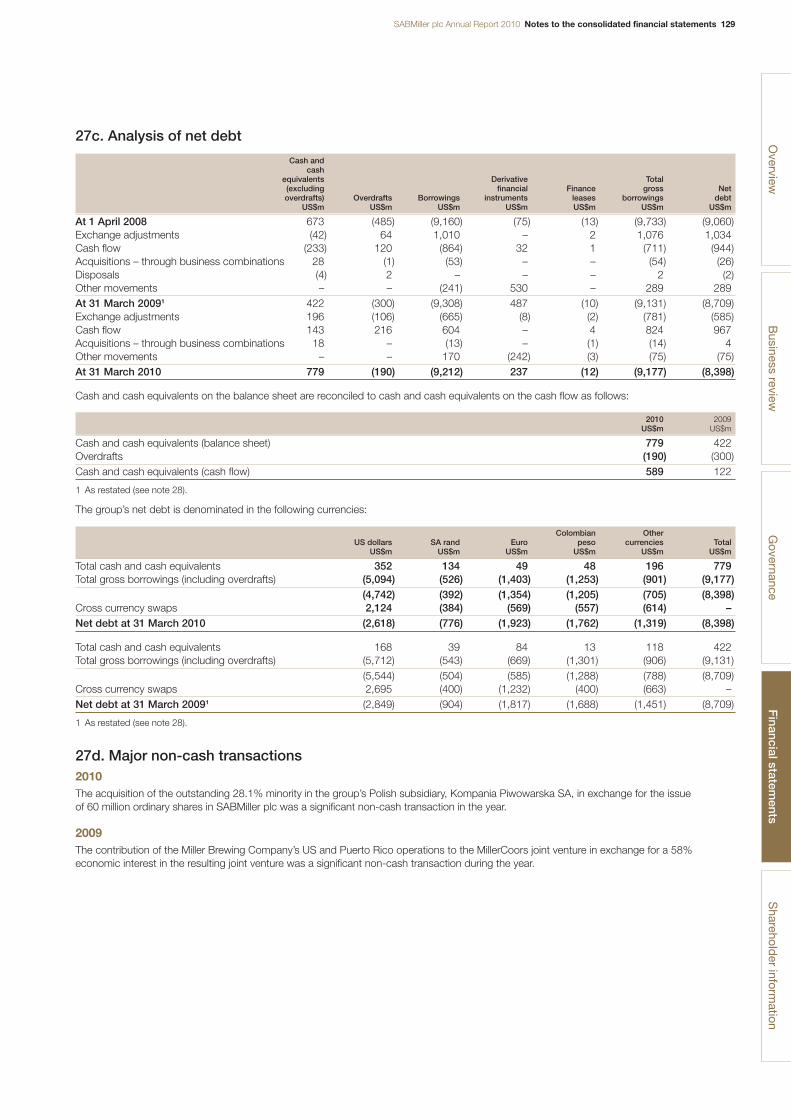
SABMiller plc Annual Report 2010 Notes to the consolidated financial statements 129
27c. Analysis of net debt
Cash andcash
equivalents Derivative Total(excluding financial Finance gross Netoverdrafts) Overdrafts Borrowings instruments leases borrowings debt
US$m US$m US$m US$m US$m US$m US$m
At 1 April 2008 673 (485) (9,160) (75) (13) (9,733) (9,060)Exchange adjustments (42) 64 1,010 – 2 1,076 1,034Cash flow (233) 120 (864) 32 1 (711) (944)Acquisitions – through business combinations 28 (1) (53) – – (54) (26)Disposals (4) 2 – – – 2 (2)Other movements – – (241) 530 – 289 289At 31 March 20091 422 (300) (9,308) 487 (10) (9,131) (8,709)Exchange adjustments 196 (106) (665) (8) (2) (781) (585)Cash flow 143 216 604 – 4 824 967Acquisitions – through business combinations 18 – (13) – (1) (14) 4Other movements – – 170 (242) (3) (75) (75)At 31 March 2010 779 (190) (9,212) 237 (12) (9,177) (8,398)
Cash and cash equivalents on the balance sheet are reconciled to cash and cash equivalents on the cash flow as follows:
2010 2009US$m US$m
Cash and cash equivalents (balance sheet) 779 422Overdrafts (190) (300)Cash and cash equivalents (cash flow) 589 122
1 As restated (see note 28).
The group’s net debt is denominated in the following currencies:
Colombian OtherUS dollars SA rand Euro peso currencies Total
US$m US$m US$m US$m US$m US$m
Total cash and cash equivalents 352 134 49 48 196 779Total gross borrowings (including overdrafts) (5,094) (526) (1,403) (1,253) (901) (9,177)
(4,742) (392) (1,354) (1,205) (705) (8,398)Cross currency swaps 2,124 (384) (569) (557) (614) –Net debt at 31 March 2010 (2,618) (776) (1,923) (1,762) (1,319) (8,398)
Total cash and cash equivalents 168 39 84 13 118 422Total gross borrowings (including overdrafts) (5,712) (543) (669) (1,301) (906) (9,131)
(5,544) (504) (585) (1,288) (788) (8,709)Cross currency swaps 2,695 (400) (1,232) (400) (663) –Net debt at 31 March 20091 (2,849) (904) (1,817) (1,688) (1,451) (8,709)
1 As restated (see note 28).
27d. Major non-cash transactions2010The acquisition of the outstanding 28.1% minority in the group’s Polish subsidiary, Kompania Piwowarska SA, in exchange for the issue of 60 million ordinary shares in SABMiller plc was a significant non-cash transaction in the year.
2009The contribution of the Miller Brewing Company’s US and Puerto Rico operations to the MillerCoors joint venture in exchange for a 58%economic interest in the resulting joint venture was a significant non-cash transaction during the year.
Overview
Business review
Governance
Financial statem
entsS
hareholder inform
ation
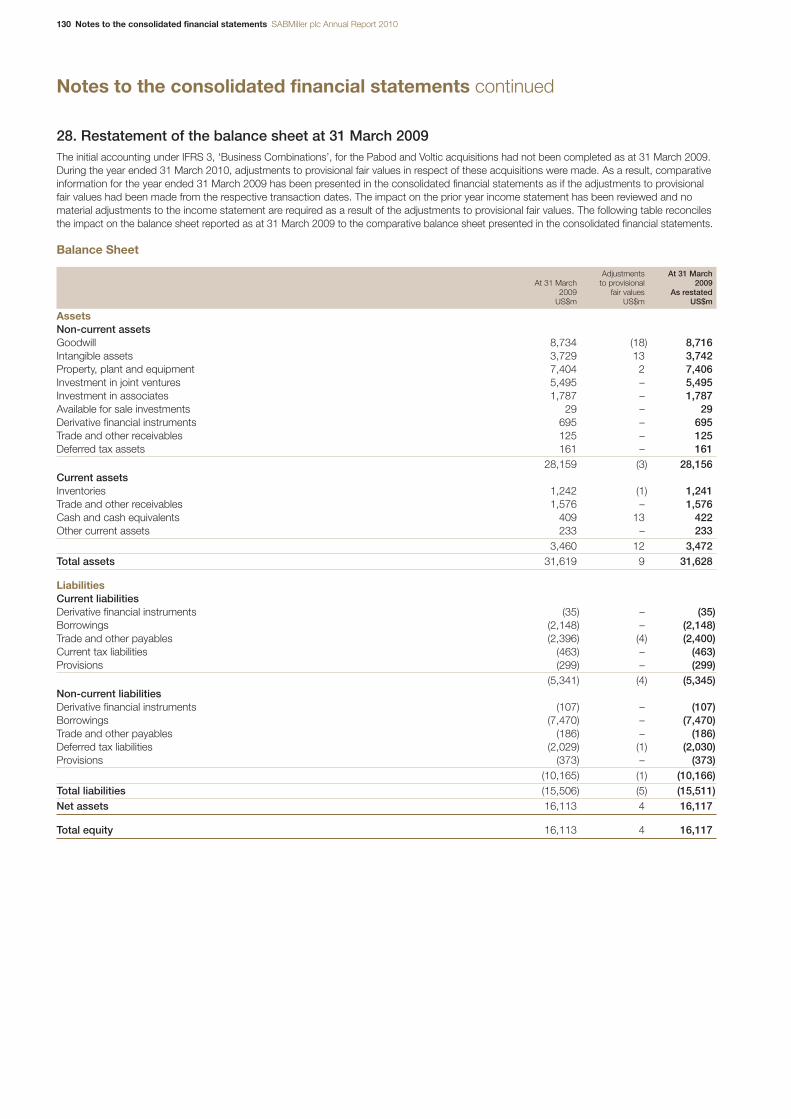
130 Notes to the consolidated financial statements SABMiller plc Annual Report 2010
Notes to the consolidated financial statements continued
28. Restatement of the balance sheet at 31 March 2009The initial accounting under IFRS 3, ‘Business Combinations’, for the Pabod and Voltic acquisitions had not been completed as at 31 March 2009.During the year ended 31 March 2010, adjustments to provisional fair values in respect of these acquisitions were made. As a result, comparativeinformation for the year ended 31 March 2009 has been presented in the consolidated financial statements as if the adjustments to provisionalfair values had been made from the respective transaction dates. The impact on the prior year income statement has been reviewed and nomaterial adjustments to the income statement are required as a result of the adjustments to provisional fair values. The following table reconcilesthe impact on the balance sheet reported as at 31 March 2009 to the comparative balance sheet presented in the consolidated financial statements.
Balance Sheet
Adjustments At 31 MarchAt 31 March to provisional 2009
2009 fair values As restatedUS$m US$m US$m
AssetsNon-current assetsGoodwill 8,734 (18) 8,716Intangible assets 3,729 13 3,742Property, plant and equipment 7,404 2 7,406Investment in joint ventures 5,495 – 5,495Investment in associates 1,787 – 1,787Available for sale investments 29 – 29Derivative financial instruments 695 – 695Trade and other receivables 125 – 125Deferred tax assets 161 – 161
28,159 (3) 28,156Current assetsInventories 1,242 (1) 1,241Trade and other receivables 1,576 – 1,576Cash and cash equivalents 409 13 422Other current assets 233 – 233
3,460 12 3,472Total assets 31,619 9 31,628
LiabilitiesCurrent liabilitiesDerivative financial instruments (35) – (35)Borrowings (2,148) – (2,148)Trade and other payables (2,396) (4) (2,400)Current tax liabilities (463) – (463)Provisions (299) – (299)
(5,341) (4) (5,345)Non-current liabilitiesDerivative financial instruments (107) – (107)Borrowings (7,470) – (7,470)Trade and other payables (186) – (186)Deferred tax liabilities (2,029) (1) (2,030)Provisions (373) – (373)
(10,165) (1) (10,166)Total liabilities (15,506) (5) (15,511)Net assets 16,113 4 16,117
Total equity 16,113 4 16,117
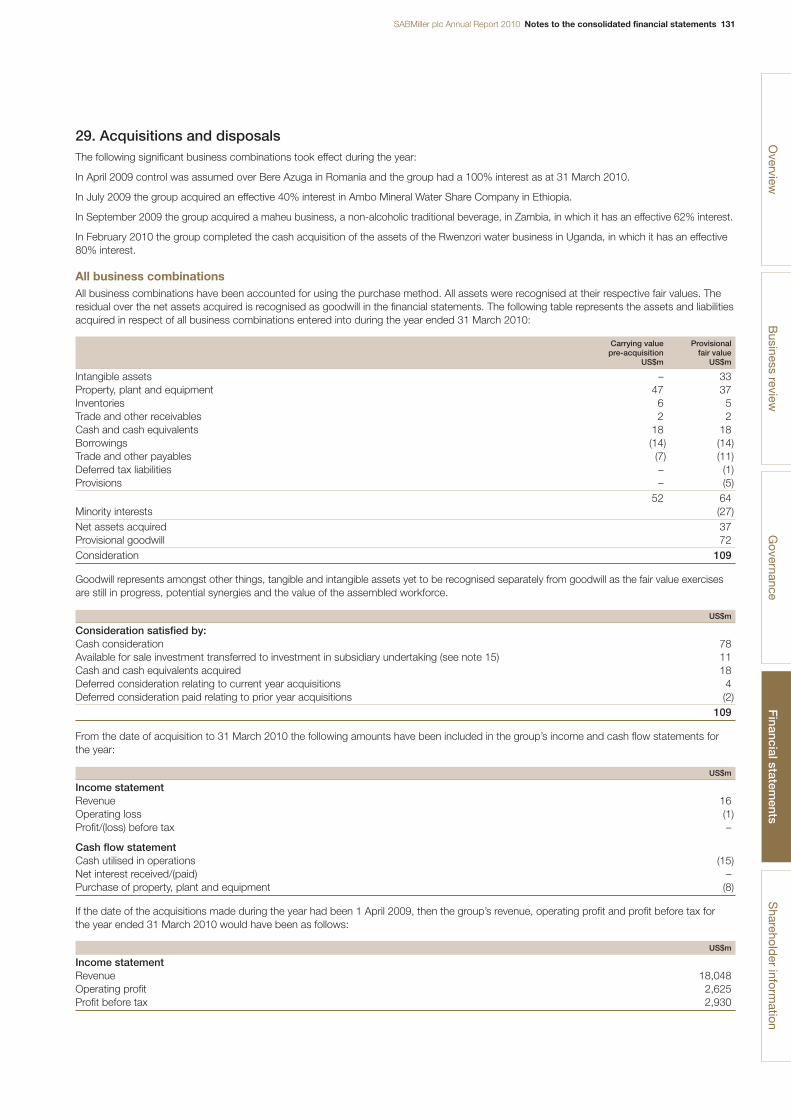
SABMiller plc Annual Report 2010 Notes to the consolidated financial statements 131
29. Acquisitions and disposalsThe following significant business combinations took effect during the year:
In April 2009 control was assumed over Bere Azuga in Romania and the group had a 100% interest as at 31 March 2010.
In July 2009 the group acquired an effective 40% interest in Ambo Mineral Water Share Company in Ethiopia.
In September 2009 the group acquired a maheu business, a non-alcoholic traditional beverage, in Zambia, in which it has an effective 62% interest.
In February 2010 the group completed the cash acquisition of the assets of the Rwenzori water business in Uganda, in which it has an effective80% interest.
All business combinationsAll business combinations have been accounted for using the purchase method. All assets were recognised at their respective fair values. Theresidual over the net assets acquired is recognised as goodwill in the financial statements. The following table represents the assets and liabilitiesacquired in respect of all business combinations entered into during the year ended 31 March 2010:
Carrying value Provisionalpre-acquisition fair value
US$m US$m
Intangible assets – 33Property, plant and equipment 47 37Inventories 6 5Trade and other receivables 2 2Cash and cash equivalents 18 18Borrowings (14) (14)Trade and other payables (7) (11)Deferred tax liabilities – (1)Provisions – (5)
52 64Minority interests (27)Net assets acquired 37Provisional goodwill 72Consideration 109
Goodwill represents amongst other things, tangible and intangible assets yet to be recognised separately from goodwill as the fair value exercisesare still in progress, potential synergies and the value of the assembled workforce.
US$m
Consideration satisfied by:Cash consideration 78Available for sale investment transferred to investment in subsidiary undertaking (see note 15) 11Cash and cash equivalents acquired 18Deferred consideration relating to current year acquisitions 4Deferred consideration paid relating to prior year acquisitions (2)
109
From the date of acquisition to 31 March 2010 the following amounts have been included in the group’s income and cash flow statements forthe year:
US$m
Income statementRevenue 16Operating loss (1)Profit/(loss) before tax –
Cash flow statementCash utilised in operations (15)Net interest received/(paid) –Purchase of property, plant and equipment (8)
If the date of the acquisitions made during the year had been 1 April 2009, then the group’s revenue, operating profit and profit before tax for the year ended 31 March 2010 would have been as follows:
US$m
Income statementRevenue 18,048Operating profit 2,625Profit before tax 2,930
Overview
Business review
Governance
Financial statem
entsS
hareholder inform
ation
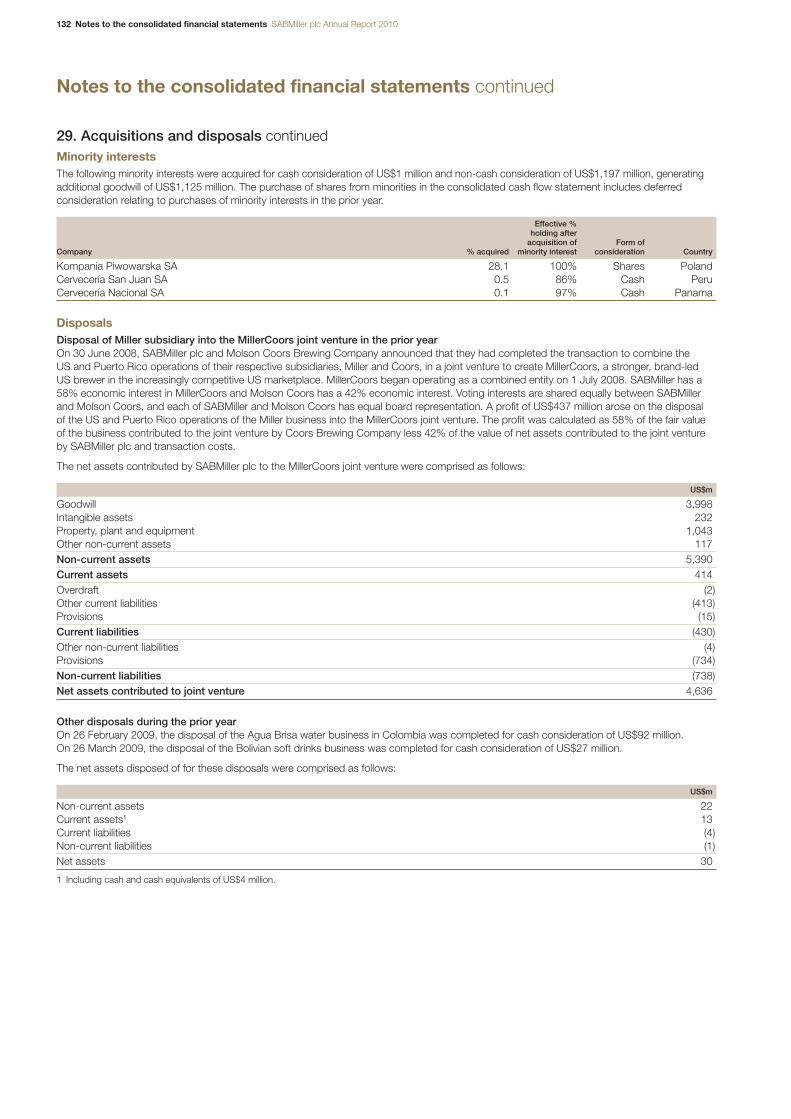
132 Notes to the consolidated financial statements SABMiller plc Annual Report 2010
Notes to the consolidated financial statements continued
29. Acquisitions and disposals continuedMinority interestsThe following minority interests were acquired for cash consideration of US$1 million and non-cash consideration of US$1,197 million, generatingadditional goodwill of US$1,125 million. The purchase of shares from minorities in the consolidated cash flow statement includes deferredconsideration relating to purchases of minority interests in the prior year.
Effective %holding after
acquisition of Form ofCompany % acquired minority interest consideration Country
Kompania Piwowarska SA 28.1 100% Shares PolandCervecería San Juan SA 0.5 86% Cash PeruCervecería Nacional SA 0.1 97% Cash Panama
DisposalsDisposal of Miller subsidiary into the MillerCoors joint venture in the prior yearOn 30 June 2008, SABMiller plc and Molson Coors Brewing Company announced that they had completed the transaction to combine the US and Puerto Rico operations of their respective subsidiaries, Miller and Coors, in a joint venture to create MillerCoors, a stronger, brand-led US brewer in the increasingly competitive US marketplace. MillerCoors began operating as a combined entity on 1 July 2008. SABMiller has a58% economic interest in MillerCoors and Molson Coors has a 42% economic interest. Voting interests are shared equally between SABMillerand Molson Coors, and each of SABMiller and Molson Coors has equal board representation. A profit of US$437 million arose on the disposal of the US and Puerto Rico operations of the Miller business into the MillerCoors joint venture. The profit was calculated as 58% of the fair valueof the business contributed to the joint venture by Coors Brewing Company less 42% of the value of net assets contributed to the joint ventureby SABMiller plc and transaction costs.
The net assets contributed by SABMiller plc to the MillerCoors joint venture were comprised as follows:
US$m
Goodwill 3,998Intangible assets 232Property, plant and equipment 1,043Other non-current assets 117Non-current assets 5,390Current assets 414Overdraft (2)Other current liabilities (413)Provisions (15)Current liabilities (430)Other non-current liabilities (4)Provisions (734)Non-current liabilities (738)Net assets contributed to joint venture 4,636
Other disposals during the prior yearOn 26 February 2009, the disposal of the Agua Brisa water business in Colombia was completed for cash consideration of US$92 million. On 26 March 2009, the disposal of the Bolivian soft drinks business was completed for cash consideration of US$27 million.
The net assets disposed of for these disposals were comprised as follows:
US$m
Non-current assets 22Current assets1 13Current liabilities (4)Non-current liabilities (1)Net assets 30
1 Including cash and cash equivalents of US$4 million.
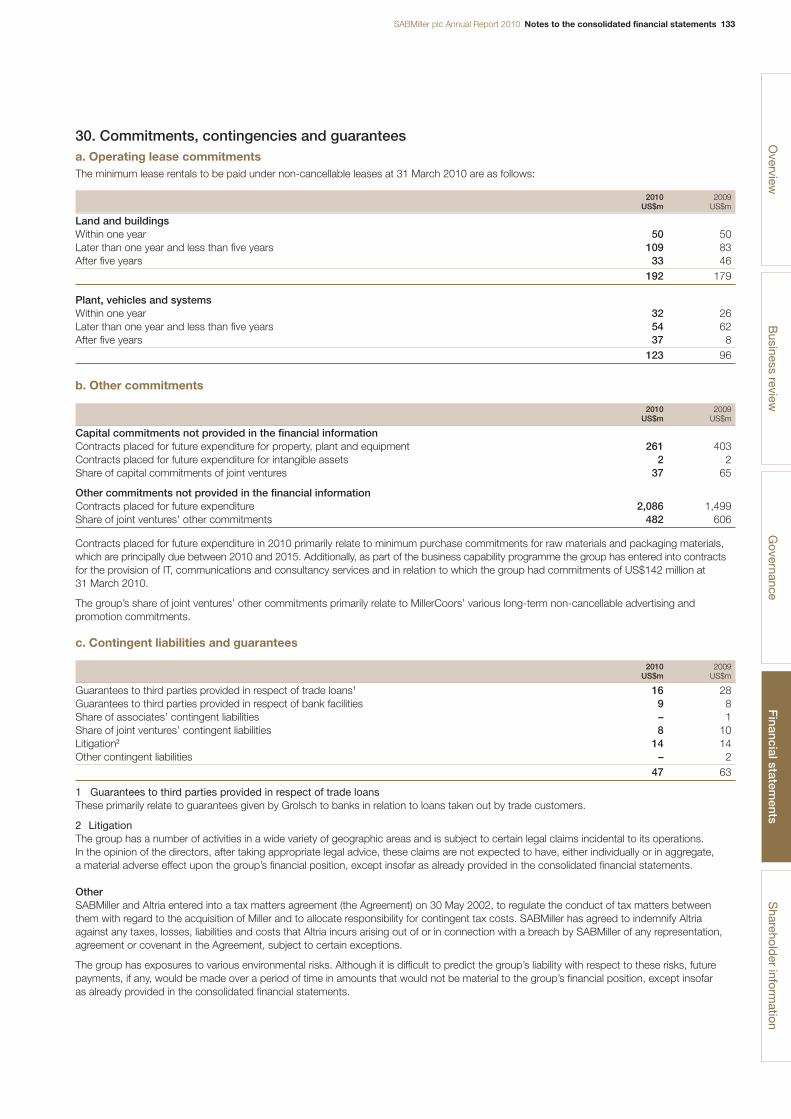
SABMiller plc Annual Report 2010 Notes to the consolidated financial statements 133
30. Commitments, contingencies and guaranteesa. Operating lease commitmentsThe minimum lease rentals to be paid under non-cancellable leases at 31 March 2010 are as follows:
2010 2009US$m US$m
Land and buildingsWithin one year 50 50Later than one year and less than five years 109 83After five years 33 46
192 179
Plant, vehicles and systemsWithin one year 32 26Later than one year and less than five years 54 62After five years 37 8
123 96
b. Other commitments
2010 2009US$m US$m
Capital commitments not provided in the financial informationContracts placed for future expenditure for property, plant and equipment 261 403Contracts placed for future expenditure for intangible assets 2 2Share of capital commitments of joint ventures 37 65
Other commitments not provided in the financial informationContracts placed for future expenditure 2,086 1,499Share of joint ventures’ other commitments 482 606
Contracts placed for future expenditure in 2010 primarily relate to minimum purchase commitments for raw materials and packaging materials,which are principally due between 2010 and 2015. Additionally, as part of the business capability programme the group has entered into contractsfor the provision of IT, communications and consultancy services and in relation to which the group had commitments of US$142 million at31 March 2010.
The group’s share of joint ventures’ other commitments primarily relate to MillerCoors’ various long-term non-cancellable advertising andpromotion commitments.
c. Contingent liabilities and guarantees
2010 2009US$m US$m
Guarantees to third parties provided in respect of trade loans1 16 28Guarantees to third parties provided in respect of bank facilities 9 8Share of associates’ contingent liabilities – 1Share of joint ventures’ contingent liabilities 8 10Litigation2 14 14Other contingent liabilities – 2
47 63
1 Guarantees to third parties provided in respect of trade loansThese primarily relate to guarantees given by Grolsch to banks in relation to loans taken out by trade customers.
2 LitigationThe group has a number of activities in a wide variety of geographic areas and is subject to certain legal claims incidental to its operations. In the opinion of the directors, after taking appropriate legal advice, these claims are not expected to have, either individually or in aggregate, a material adverse effect upon the group’s financial position, except insofar as already provided in the consolidated financial statements.
OtherSABMiller and Altria entered into a tax matters agreement (the Agreement) on 30 May 2002, to regulate the conduct of tax matters betweenthem with regard to the acquisition of Miller and to allocate responsibility for contingent tax costs. SABMiller has agreed to indemnify Altriaagainst any taxes, losses, liabilities and costs that Altria incurs arising out of or in connection with a breach by SABMiller of any representation,agreement or covenant in the Agreement, subject to certain exceptions.
The group has exposures to various environmental risks. Although it is difficult to predict the group’s liability with respect to these risks, futurepayments, if any, would be made over a period of time in amounts that would not be material to the group’s financial position, except insofar as already provided in the consolidated financial statements.
Overview
Business review
Governance
Financial statem
entsS
hareholder inform
ation
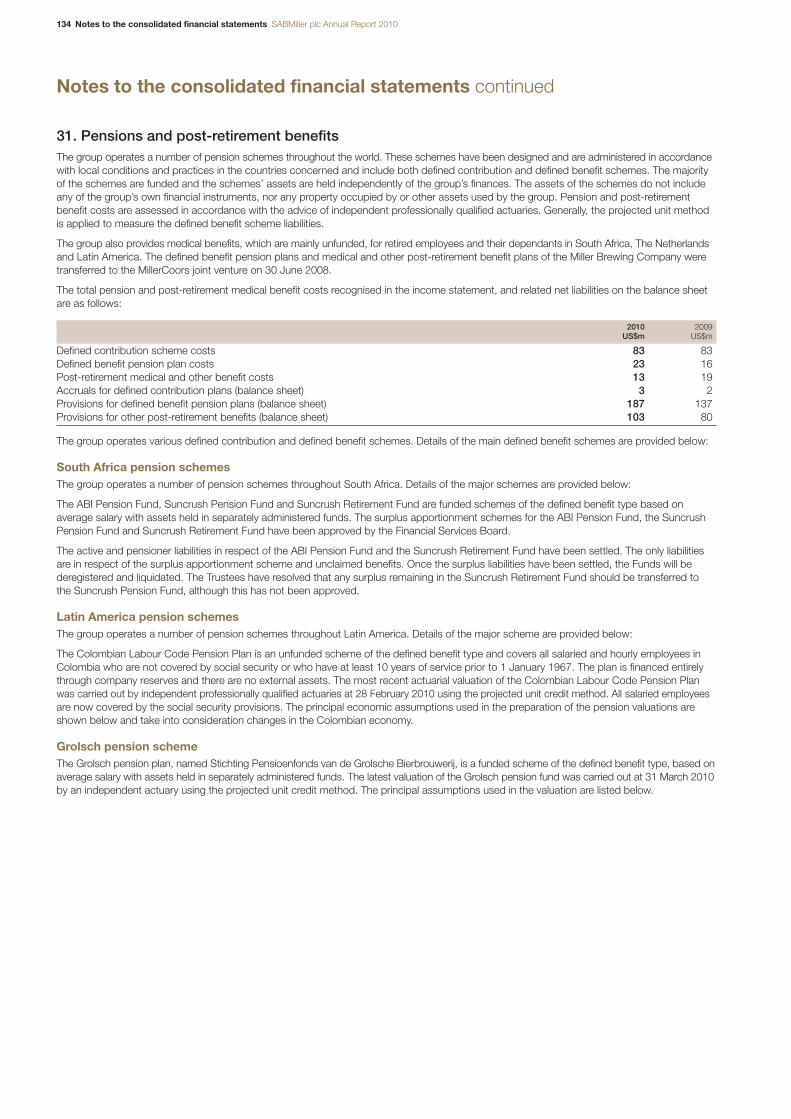
134 Notes to the consolidated financial statements SABMiller plc Annual Report 2010
Notes to the consolidated financial statements continued
31. Pensions and post-retirement benefitsThe group operates a number of pension schemes throughout the world. These schemes have been designed and are administered in accordancewith local conditions and practices in the countries concerned and include both defined contribution and defined benefit schemes. The majorityof the schemes are funded and the schemes’ assets are held independently of the group’s finances. The assets of the schemes do not includeany of the group’s own financial instruments, nor any property occupied by or other assets used by the group. Pension and post-retirementbenefit costs are assessed in accordance with the advice of independent professionally qualified actuaries. Generally, the projected unit methodis applied to measure the defined benefit scheme liabilities.
The group also provides medical benefits, which are mainly unfunded, for retired employees and their dependants in South Africa, The Netherlandsand Latin America. The defined benefit pension plans and medical and other post-retirement benefit plans of the Miller Brewing Company weretransferred to the MillerCoors joint venture on 30 June 2008.
The total pension and post-retirement medical benefit costs recognised in the income statement, and related net liabilities on the balance sheetare as follows:
2010 2009US$m US$m
Defined contribution scheme costs 83 83Defined benefit pension plan costs 23 16Post-retirement medical and other benefit costs 13 19Accruals for defined contribution plans (balance sheet) 3 2Provisions for defined benefit pension plans (balance sheet) 187 137Provisions for other post-retirement benefits (balance sheet) 103 80
The group operates various defined contribution and defined benefit schemes. Details of the main defined benefit schemes are provided below:
South Africa pension schemesThe group operates a number of pension schemes throughout South Africa. Details of the major schemes are provided below:
The ABI Pension Fund, Suncrush Pension Fund and Suncrush Retirement Fund are funded schemes of the defined benefit type based onaverage salary with assets held in separately administered funds. The surplus apportionment schemes for the ABI Pension Fund, the SuncrushPension Fund and Suncrush Retirement Fund have been approved by the Financial Services Board.
The active and pensioner liabilities in respect of the ABI Pension Fund and the Suncrush Retirement Fund have been settled. The only liabilitiesare in respect of the surplus apportionment scheme and unclaimed benefits. Once the surplus liabilities have been settled, the Funds will bederegistered and liquidated. The Trustees have resolved that any surplus remaining in the Suncrush Retirement Fund should be transferred to the Suncrush Pension Fund, although this has not been approved.
Latin America pension schemesThe group operates a number of pension schemes throughout Latin America. Details of the major scheme are provided below:
The Colombian Labour Code Pension Plan is an unfunded scheme of the defined benefit type and covers all salaried and hourly employees inColombia who are not covered by social security or who have at least 10 years of service prior to 1 January 1967. The plan is financed entirelythrough company reserves and there are no external assets. The most recent actuarial valuation of the Colombian Labour Code Pension Planwas carried out by independent professionally qualified actuaries at 28 February 2010 using the projected unit credit method. All salaried employeesare now covered by the social security provisions. The principal economic assumptions used in the preparation of the pension valuations areshown below and take into consideration changes in the Colombian economy.
Grolsch pension schemeThe Grolsch pension plan, named Stichting Pensioenfonds van de Grolsche Bierbrouwerij, is a funded scheme of the defined benefit type, based onaverage salary with assets held in separately administered funds. The latest valuation of the Grolsch pension fund was carried out at 31 March 2010by an independent actuary using the projected unit credit method. The principal assumptions used in the valuation are listed below.
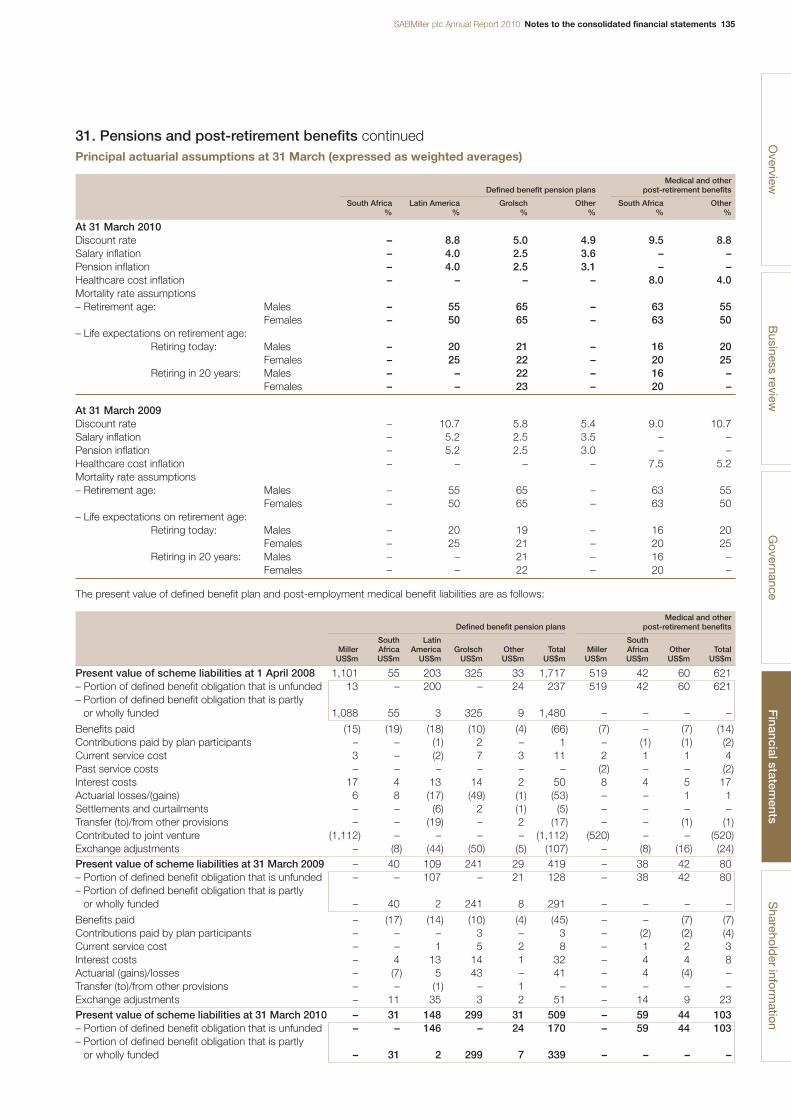
SABMiller plc Annual Report 2010 Notes to the consolidated financial statements 135
31. Pensions and post-retirement benefits continuedPrincipal actuarial assumptions at 31 March (expressed as weighted averages)
Medical and otherDefined benefit pension plans post-retirement benefits
South Africa Latin America Grolsch Other South Africa Other% % % % % %
At 31 March 2010Discount rate – 8.8 5.0 4.9 9.5 8.8Salary inflation – 4.0 2.5 3.6 – –Pension inflation – 4.0 2.5 3.1 – –Healthcare cost inflation – – – – 8.0 4.0Mortality rate assumptions– Retirement age: Males – 55 65 – 63 55
Females – 50 65 – 63 50– Life expectations on retirement age:
Retiring today: Males – 20 21 – 16 20Females – 25 22 – 20 25
Retiring in 20 years: Males – – 22 – 16 –Females – – 23 – 20 –
At 31 March 2009Discount rate – 10.7 5.8 5.4 9.0 10.7Salary inflation – 5.2 2.5 3.5 – –Pension inflation – 5.2 2.5 3.0 – –Healthcare cost inflation – – – – 7.5 5.2Mortality rate assumptions– Retirement age: Males – 55 65 – 63 55
Females – 50 65 – 63 50– Life expectations on retirement age:
Retiring today: Males – 20 19 – 16 20Females – 25 21 – 20 25
Retiring in 20 years: Males – – 21 – 16 –Females – – 22 – 20 –
The present value of defined benefit plan and post-employment medical benefit liabilities are as follows:
Medical and otherDefined benefit pension plans post-retirement benefits
South Latin SouthMiller Africa America Grolsch Other Total Miller Africa Other TotalUS$m US$m US$m US$m US$m US$m US$m US$m US$m US$m
Present value of scheme liabilities at 1 April 2008 1,101 55 203 325 33 1,717 519 42 60 621– Portion of defined benefit obligation that is unfunded 13 – 200 – 24 237 519 42 60 621– Portion of defined benefit obligation that is partly
or wholly funded 1,088 55 3 325 9 1,480 – – – –
Benefits paid (15) (19) (18) (10) (4) (66) (7) – (7) (14)Contributions paid by plan participants – – (1) 2 – 1 – (1) (1) (2)Current service cost 3 – (2) 7 3 11 2 1 1 4Past service costs – – – – – – (2) – – (2)Interest costs 17 4 13 14 2 50 8 4 5 17Actuarial losses/(gains) 6 8 (17) (49) (1) (53) – – 1 1Settlements and curtailments – – (6) 2 (1) (5) – – – –Transfer (to)/from other provisions – – (19) – 2 (17) – – (1) (1)Contributed to joint venture (1,112) – – – – (1,112) (520) – – (520)Exchange adjustments – (8) (44) (50) (5) (107) – (8) (16) (24)Present value of scheme liabilities at 31 March 2009 – 40 109 241 29 419 – 38 42 80– Portion of defined benefit obligation that is unfunded – – 107 – 21 128 – 38 42 80– Portion of defined benefit obligation that is partly
or wholly funded – 40 2 241 8 291 – – – –
Benefits paid – (17) (14) (10) (4) (45) – – (7) (7)Contributions paid by plan participants – – – 3 – 3 – (2) (2) (4)Current service cost – – 1 5 2 8 – 1 2 3Interest costs – 4 13 14 1 32 – 4 4 8Actuarial (gains)/losses – (7) 5 43 – 41 – 4 (4) –Transfer (to)/from other provisions – – (1) – 1 – – – – –Exchange adjustments – 11 35 3 2 51 – 14 9 23Present value of scheme liabilities at 31 March 2010 – 31 148 299 31 509 – 59 44 103– Portion of defined benefit obligation that is unfunded – – 146 – 24 170 – 59 44 103– Portion of defined benefit obligation that is partly
or wholly funded – 31 2 299 7 339 – – – –
Overview
Business review
Governance
Financial statem
entsS
hareholder inform
ation
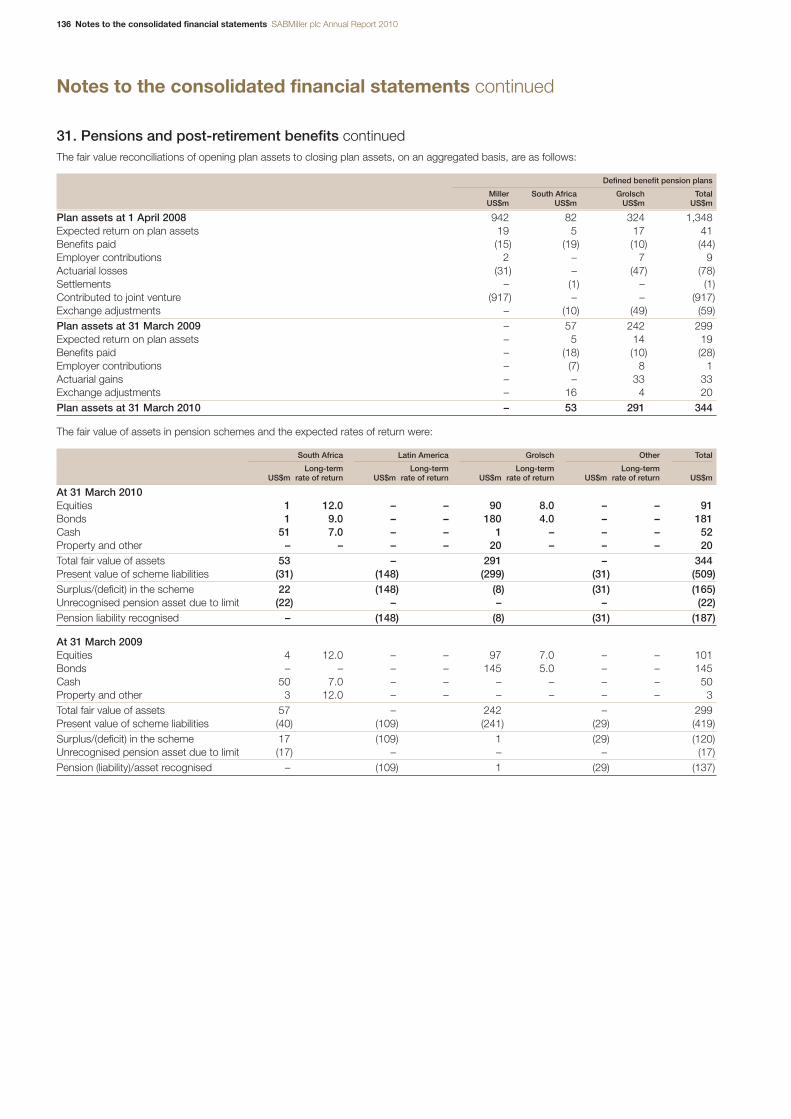
136 Notes to the consolidated financial statements SABMiller plc Annual Report 2010
Notes to the consolidated financial statements continued
31. Pensions and post-retirement benefits continuedThe fair value reconciliations of opening plan assets to closing plan assets, on an aggregated basis, are as follows:
Defined benefit pension plans
Miller South Africa Grolsch TotalUS$m US$m US$m US$m
Plan assets at 1 April 2008 942 82 324 1,348Expected return on plan assets 19 5 17 41Benefits paid (15) (19) (10) (44)Employer contributions 2 – 7 9Actuarial losses (31) – (47) (78)Settlements – (1) – (1)Contributed to joint venture (917) – – (917)Exchange adjustments – (10) (49) (59)Plan assets at 31 March 2009 – 57 242 299Expected return on plan assets – 5 14 19Benefits paid – (18) (10) (28)Employer contributions – (7) 8 1Actuarial gains – – 33 33Exchange adjustments – 16 4 20Plan assets at 31 March 2010 – 53 291 344
The fair value of assets in pension schemes and the expected rates of return were:
South Africa Latin America Grolsch Other Total
Long-term Long-term Long-term Long-term US$m rate of return US$m rate of return US$m rate of return US$m rate of return US$m
At 31 March 2010Equities 1 12.0 – – 90 8.0 – – 91Bonds 1 9.0 – – 180 4.0 – – 181Cash 51 7.0 – – 1 – – – 52Property and other – – – – 20 – – – 20Total fair value of assets 53 – 291 – 344Present value of scheme liabilities (31) (148) (299) (31) (509)Surplus/(deficit) in the scheme 22 (148) (8) (31) (165)Unrecognised pension asset due to limit (22) – – – (22)Pension liability recognised – (148) (8) (31) (187)
At 31 March 2009Equities 4 12.0 – – 97 7.0 – – 101Bonds – – – – 145 5.0 – – 145Cash 50 7.0 – – – – – – 50Property and other 3 12.0 – – – – – – 3Total fair value of assets 57 – 242 – 299Present value of scheme liabilities (40) (109) (241) (29) (419)Surplus/(deficit) in the scheme 17 (109) 1 (29) (120)Unrecognised pension asset due to limit (17) – – – (17)Pension (liability)/asset recognised – (109) 1 (29) (137)
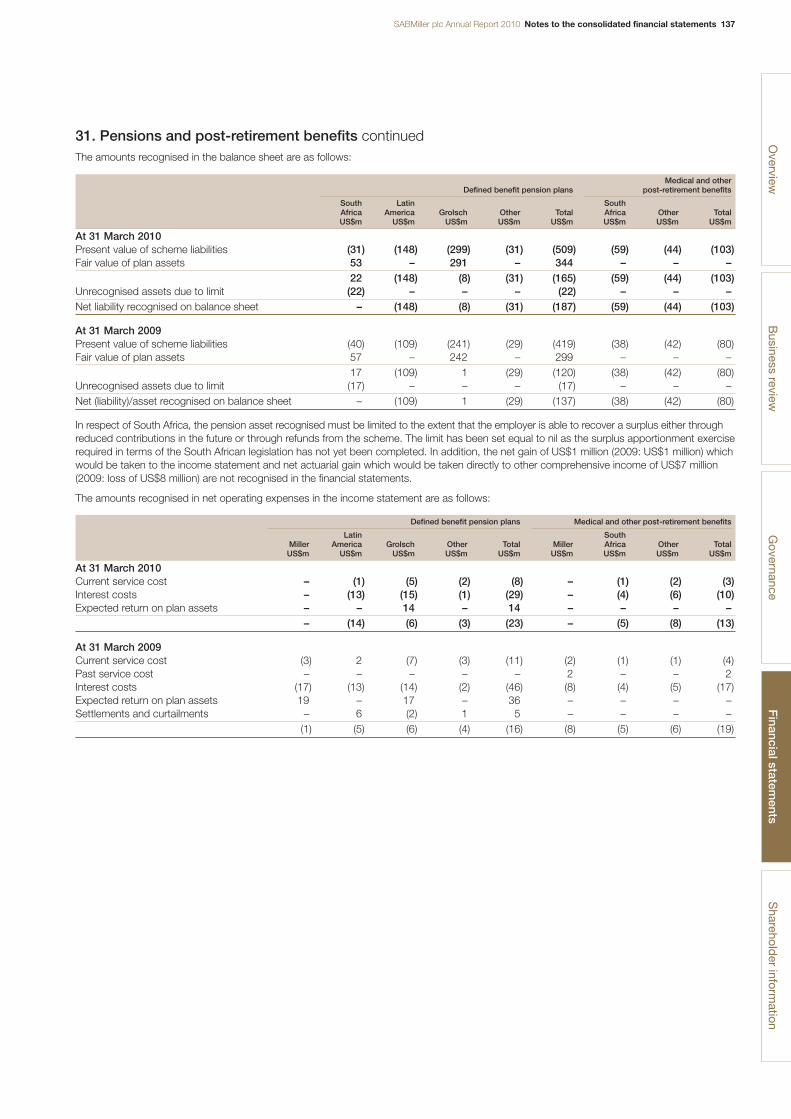
SABMiller plc Annual Report 2010 Notes to the consolidated financial statements 137
31. Pensions and post-retirement benefits continuedThe amounts recognised in the balance sheet are as follows:
Medical and otherDefined benefit pension plans post-retirement benefits
South Latin SouthAfrica America Grolsch Other Total Africa Other TotalUS$m US$m US$m US$m US$m US$m US$m US$m
At 31 March 2010Present value of scheme liabilities (31) (148) (299) (31) (509) (59) (44) (103)Fair value of plan assets 53 – 291 – 344 – – –
22 (148) (8) (31) (165) (59) (44) (103)Unrecognised assets due to limit (22) – – – (22) – – –Net liability recognised on balance sheet – (148) (8) (31) (187) (59) (44) (103)
At 31 March 2009Present value of scheme liabilities (40) (109) (241) (29) (419) (38) (42) (80)Fair value of plan assets 57 – 242 – 299 – – –
17 (109) 1 (29) (120) (38) (42) (80)Unrecognised assets due to limit (17) – – – (17) – – –Net (liability)/asset recognised on balance sheet – (109) 1 (29) (137) (38) (42) (80)
In respect of South Africa, the pension asset recognised must be limited to the extent that the employer is able to recover a surplus either throughreduced contributions in the future or through refunds from the scheme. The limit has been set equal to nil as the surplus apportionment exerciserequired in terms of the South African legislation has not yet been completed. In addition, the net gain of US$1 million (2009: US$1 million) whichwould be taken to the income statement and net actuarial gain which would be taken directly to other comprehensive income of US$7 million(2009: loss of US$8 million) are not recognised in the financial statements.
The amounts recognised in net operating expenses in the income statement are as follows:
Defined benefit pension plans Medical and other post-retirement benefits
Latin SouthMiller America Grolsch Other Total Miller Africa Other TotalUS$m US$m US$m US$m US$m US$m US$m US$m US$m
At 31 March 2010Current service cost – (1) (5) (2) (8) – (1) (2) (3)Interest costs – (13) (15) (1) (29) – (4) (6) (10)Expected return on plan assets – – 14 – 14 – – – –
– (14) (6) (3) (23) – (5) (8) (13)
At 31 March 2009Current service cost (3) 2 (7) (3) (11) (2) (1) (1) (4)Past service cost – – – – – 2 – – 2Interest costs (17) (13) (14) (2) (46) (8) (4) (5) (17)Expected return on plan assets 19 – 17 – 36 – – – –Settlements and curtailments – 6 (2) 1 5 – – – –
(1) (5) (6) (4) (16) (8) (5) (6) (19)
Overview
Business review
Governance
Financial statem
entsS
hareholder inform
ation
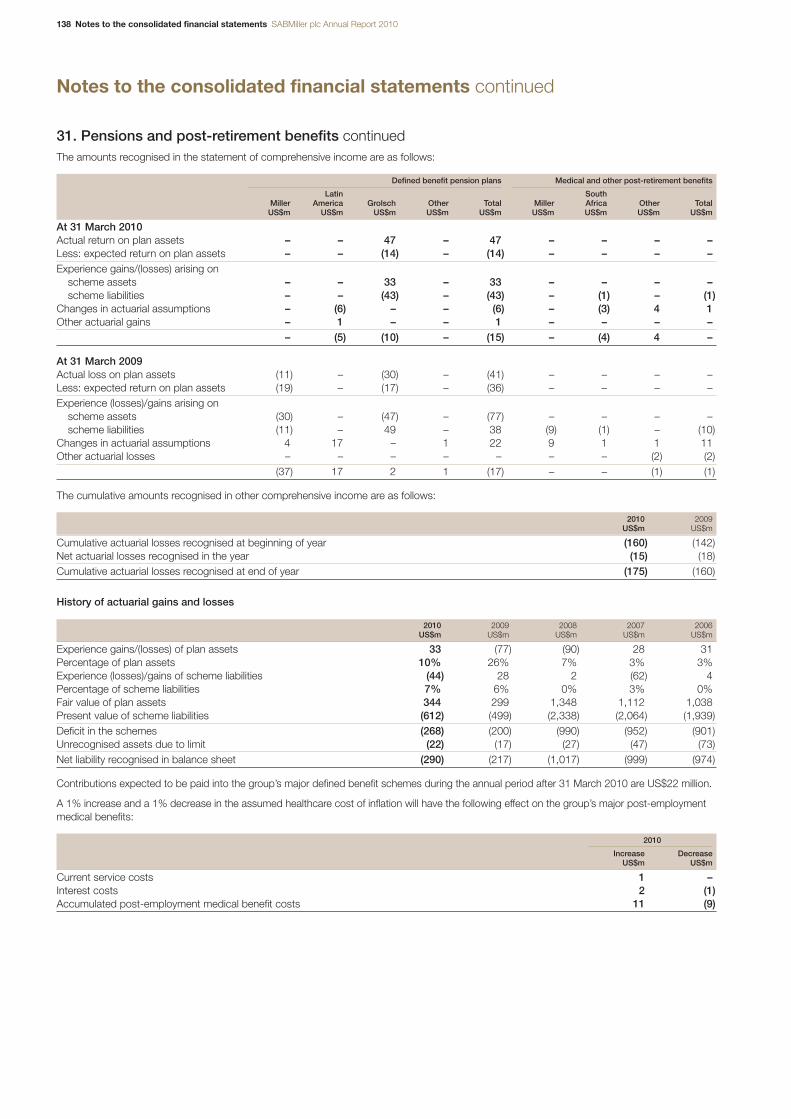
138 Notes to the consolidated financial statements SABMiller plc Annual Report 2010
Notes to the consolidated financial statements continued
31. Pensions and post-retirement benefits continuedThe amounts recognised in the statement of comprehensive income are as follows:
Defined benefit pension plans Medical and other post-retirement benefits
Latin SouthMiller America Grolsch Other Total Miller Africa Other TotalUS$m US$m US$m US$m US$m US$m US$m US$m US$m
At 31 March 2010Actual return on plan assets – – 47 – 47 – – – –Less: expected return on plan assets – – (14) – (14) – – – –Experience gains/(losses) arising on
scheme assets – – 33 – 33 – – – –scheme liabilities – – (43) – (43) – (1) – (1)
Changes in actuarial assumptions – (6) – – (6) – (3) 4 1Other actuarial gains – 1 – – 1 – – – –
– (5) (10) – (15) – (4) 4 –
At 31 March 2009Actual loss on plan assets (11) – (30) – (41) – – – –Less: expected return on plan assets (19) – (17) – (36) – – – –Experience (losses)/gains arising on
scheme assets (30) – (47) – (77) – – – –scheme liabilities (11) – 49 – 38 (9) (1) – (10)
Changes in actuarial assumptions 4 17 – 1 22 9 1 1 11Other actuarial losses – – – – – – – (2) (2)
(37) 17 2 1 (17) – – (1) (1)
The cumulative amounts recognised in other comprehensive income are as follows:
2010 2009US$m US$m
Cumulative actuarial losses recognised at beginning of year (160) (142)Net actuarial losses recognised in the year (15) (18)Cumulative actuarial losses recognised at end of year (175) (160)
History of actuarial gains and losses
2010 2009 2008 2007 2006US$m US$m US$m US$m US$m
Experience gains/(losses) of plan assets 33 (77) (90) 28 31Percentage of plan assets 10% 26% 7% 3% 3%Experience (losses)/gains of scheme liabilities (44) 28 2 (62) 4Percentage of scheme liabilities 7% 6% 0% 3% 0%Fair value of plan assets 344 299 1,348 1,112 1,038Present value of scheme liabilities (612) (499) (2,338) (2,064) (1,939)Deficit in the schemes (268) (200) (990) (952) (901)Unrecognised assets due to limit (22) (17) (27) (47) (73)Net liability recognised in balance sheet (290) (217) (1,017) (999) (974)
Contributions expected to be paid into the group’s major defined benefit schemes during the annual period after 31 March 2010 are US$22 million.
A 1% increase and a 1% decrease in the assumed healthcare cost of inflation will have the following effect on the group’s major post-employmentmedical benefits:
2010
Increase DecreaseUS$m US$m
Current service costs 1 –Interest costs 2 (1)Accumulated post-employment medical benefit costs 11 (9)
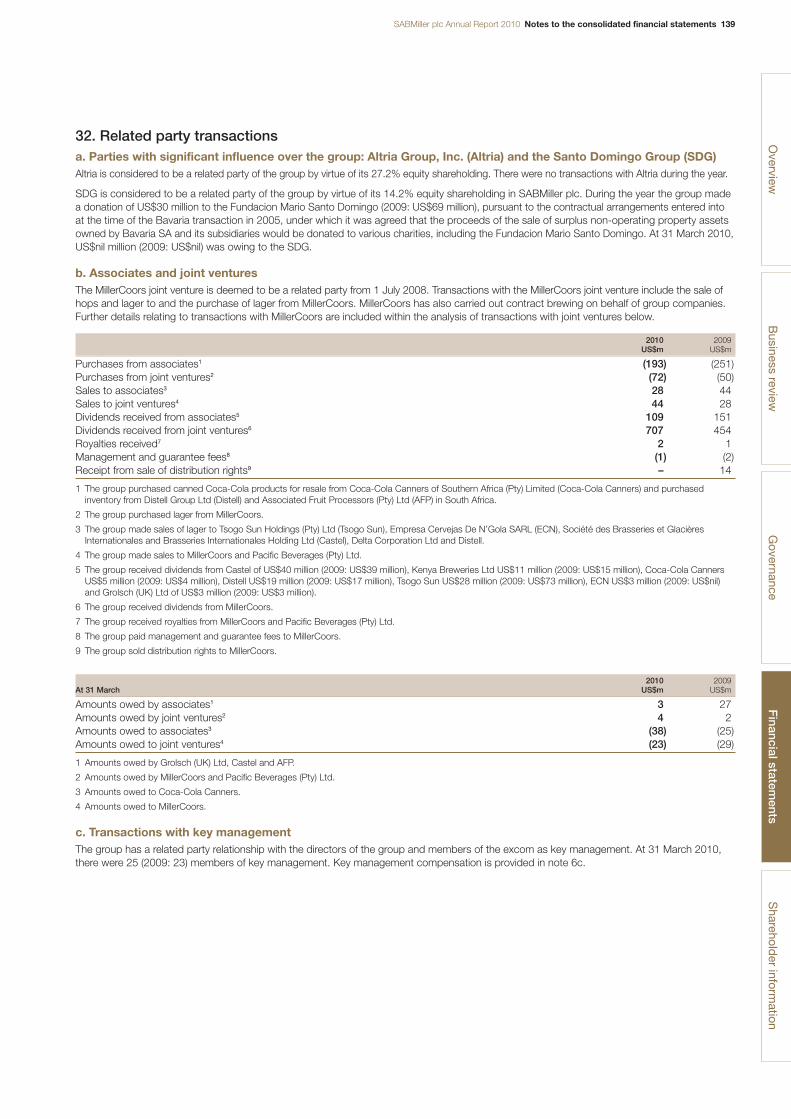
SABMiller plc Annual Report 2010 Notes to the consolidated financial statements 139
32. Related party transactionsa. Parties with significant influence over the group: Altria Group, Inc. (Altria) and the Santo Domingo Group (SDG)Altria is considered to be a related party of the group by virtue of its 27.2% equity shareholding. There were no transactions with Altria during the year.
SDG is considered to be a related party of the group by virtue of its 14.2% equity shareholding in SABMiller plc. During the year the group madea donation of US$30 million to the Fundacion Mario Santo Domingo (2009: US$69 million), pursuant to the contractual arrangements entered intoat the time of the Bavaria transaction in 2005, under which it was agreed that the proceeds of the sale of surplus non-operating property assetsowned by Bavaria SA and its subsidiaries would be donated to various charities, including the Fundacion Mario Santo Domingo. At 31 March 2010,US$nil million (2009: US$nil) was owing to the SDG.
b. Associates and joint venturesThe MillerCoors joint venture is deemed to be a related party from 1 July 2008. Transactions with the MillerCoors joint venture include the sale ofhops and lager to and the purchase of lager from MillerCoors. MillerCoors has also carried out contract brewing on behalf of group companies.Further details relating to transactions with MillerCoors are included within the analysis of transactions with joint ventures below.
2010 2009US$m US$m
Purchases from associates1 (193) (251)Purchases from joint ventures2 (72) (50)Sales to associates3 28 44Sales to joint ventures4 44 28Dividends received from associates5 109 151Dividends received from joint ventures6 707 454Royalties received7 2 1Management and guarantee fees8 (1) (2)Receipt from sale of distribution rights9 – 14
1 The group purchased canned Coca-Cola products for resale from Coca-Cola Canners of Southern Africa (Pty) Limited (Coca-Cola Canners) and purchasedinventory from Distell Group Ltd (Distell) and Associated Fruit Processors (Pty) Ltd (AFP) in South Africa.
2 The group purchased lager from MillerCoors.
3 The group made sales of lager to Tsogo Sun Holdings (Pty) Ltd (Tsogo Sun), Empresa Cervejas De N’Gola SARL (ECN), Société des Brasseries et GlacièresInternationales and Brasseries Internationales Holding Ltd (Castel), Delta Corporation Ltd and Distell.
4 The group made sales to MillerCoors and Pacific Beverages (Pty) Ltd.
5 The group received dividends from Castel of US$40 million (2009: US$39 million), Kenya Breweries Ltd US$11 million (2009: US$15 million), Coca-Cola CannersUS$5 million (2009: US$4 million), Distell US$19 million (2009: US$17 million), Tsogo Sun US$28 million (2009: US$73 million), ECN US$3 million (2009: US$nil)and Grolsch (UK) Ltd of US$3 million (2009: US$3 million).
6 The group received dividends from MillerCoors.
7 The group received royalties from MillerCoors and Pacific Beverages (Pty) Ltd.
8 The group paid management and guarantee fees to MillerCoors.
9 The group sold distribution rights to MillerCoors.
2010 2009At 31 March US$m US$m
Amounts owed by associates1 3 27Amounts owed by joint ventures2 4 2Amounts owed to associates3 (38) (25)Amounts owed to joint ventures4 (23) (29)
1 Amounts owed by Grolsch (UK) Ltd, Castel and AFP.
2 Amounts owed by MillerCoors and Pacific Beverages (Pty) Ltd.
3 Amounts owed to Coca-Cola Canners.
4 Amounts owed to MillerCoors.
c. Transactions with key managementThe group has a related party relationship with the directors of the group and members of the excom as key management. At 31 March 2010,there were 25 (2009: 23) members of key management. Key management compensation is provided in note 6c.
Overview
Business review
Governance
Financial statem
entsS
hareholder inform
ation
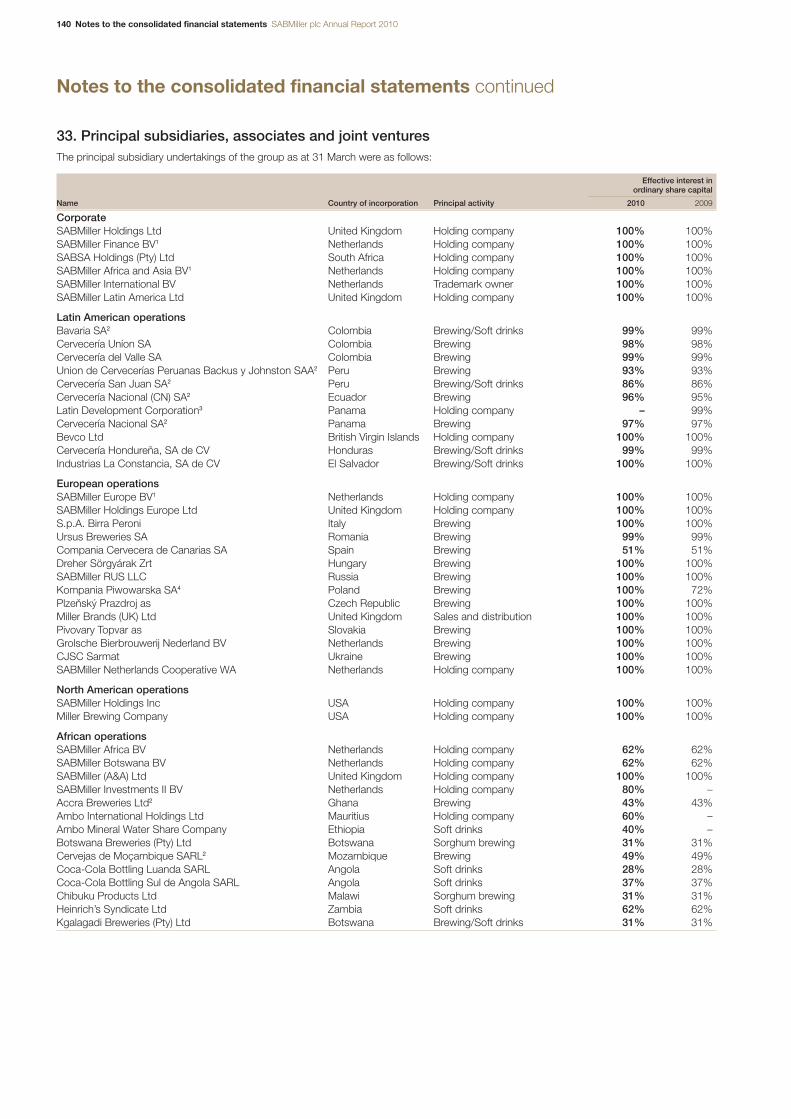
140 Notes to the consolidated financial statements SABMiller plc Annual Report 2010
Notes to the consolidated financial statements continued
33. Principal subsidiaries, associates and joint venturesThe principal subsidiary undertakings of the group as at 31 March were as follows:
Effective interest inordinary share capital
Name Country of incorporation Principal activity 2010 2009
CorporateSABMiller Holdings Ltd United Kingdom Holding company 100% 100%SABMiller Finance BV1 Netherlands Holding company 100% 100%SABSA Holdings (Pty) Ltd South Africa Holding company 100% 100%SABMiller Africa and Asia BV1 Netherlands Holding company 100% 100%SABMiller International BV Netherlands Trademark owner 100% 100%SABMiller Latin America Ltd United Kingdom Holding company 100% 100%
Latin American operationsBavaria SA2 Colombia Brewing/Soft drinks 99% 99%Cervecería Uníon SA Colombia Brewing 98% 98%Cervecería del Valle SA Colombia Brewing 99% 99%Union de Cervecerías Peruanas Backus y Johnston SAA2 Peru Brewing 93% 93%Cervecería San Juan SA2 Peru Brewing/Soft drinks 86% 86%Cervecería Nacional (CN) SA2 Ecuador Brewing 96% 95%Latin Development Corporation3 Panama Holding company – 99%Cervecería Nacional SA2 Panama Brewing 97% 97%Bevco Ltd British Virgin Islands Holding company 100% 100%Cervecería Hondureña, SA de CV Honduras Brewing/Soft drinks 99% 99%Industrias La Constancia, SA de CV El Salvador Brewing/Soft drinks 100% 100%
European operationsSABMiller Europe BV1 Netherlands Holding company 100% 100%SABMiller Holdings Europe Ltd United Kingdom Holding company 100% 100%S.p.A. Birra Peroni Italy Brewing 100% 100%Ursus Breweries SA Romania Brewing 99% 99%Compania Cervecera de Canarias SA Spain Brewing 51% 51%Dreher Sörgyárak Zrt Hungary Brewing 100% 100%SABMiller RUS LLC Russia Brewing 100% 100%Kompania Piwowarska SA4 Poland Brewing 100% 72%Plzeňský Prazdroj as Czech Republic Brewing 100% 100%Miller Brands (UK) Ltd United Kingdom Sales and distribution 100% 100%Pivovary Topvar as Slovakia Brewing 100% 100%Grolsche Bierbrouwerij Nederland BV Netherlands Brewing 100% 100%CJSC Sarmat Ukraine Brewing 100% 100%SABMiller Netherlands Cooperative WA Netherlands Holding company 100% 100%
North American operationsSABMiller Holdings Inc USA Holding company 100% 100%Miller Brewing Company USA Holding company 100% 100%
African operationsSABMiller Africa BV Netherlands Holding company 62% 62%SABMiller Botswana BV Netherlands Holding company 62% 62%SABMiller (A&A) Ltd United Kingdom Holding company 100% 100%SABMiller Investments II BV Netherlands Holding company 80% –Accra Breweries Ltd2 Ghana Brewing 43% 43%Ambo International Holdings Ltd Mauritius Holding company 60% –Ambo Mineral Water Share Company Ethiopia Soft drinks 40% –Botswana Breweries (Pty) Ltd Botswana Sorghum brewing 31% 31%Cervejas de Moçambique SARL2 Mozambique Brewing 49% 49%Coca-Cola Bottling Luanda SARL Angola Soft drinks 28% 28%Coca-Cola Bottling Sul de Angola SARL Angola Soft drinks 37% 37%Chibuku Products Ltd Malawi Sorghum brewing 31% 31%Heinrich’s Syndicate Ltd Zambia Soft drinks 62% 62%Kgalagadi Breweries (Pty) Ltd Botswana Brewing/Soft drinks 31% 31%
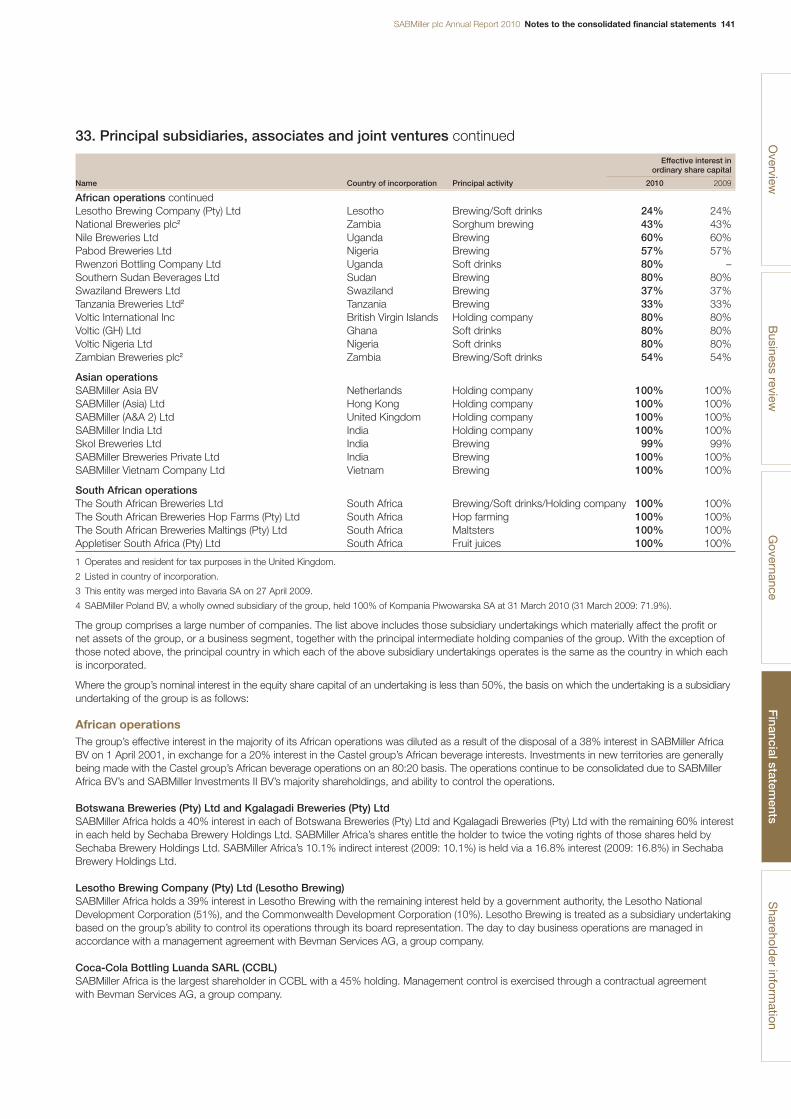
SABMiller plc Annual Report 2010 Notes to the consolidated financial statements 141
33. Principal subsidiaries, associates and joint ventures continued
Effective interest inordinary share capital
Name Country of incorporation Principal activity 2010 2009
African operations continuedLesotho Brewing Company (Pty) Ltd Lesotho Brewing/Soft drinks 24% 24%National Breweries plc2 Zambia Sorghum brewing 43% 43%Nile Breweries Ltd Uganda Brewing 60% 60%Pabod Breweries Ltd Nigeria Brewing 57% 57%Rwenzori Bottling Company Ltd Uganda Soft drinks 80% –Southern Sudan Beverages Ltd Sudan Brewing 80% 80%Swaziland Brewers Ltd Swaziland Brewing 37% 37%Tanzania Breweries Ltd2 Tanzania Brewing 33% 33%Voltic International Inc British Virgin Islands Holding company 80% 80%Voltic (GH) Ltd Ghana Soft drinks 80% 80%Voltic Nigeria Ltd Nigeria Soft drinks 80% 80%Zambian Breweries plc2 Zambia Brewing/Soft drinks 54% 54%
Asian operationsSABMiller Asia BV Netherlands Holding company 100% 100%SABMiller (Asia) Ltd Hong Kong Holding company 100% 100%SABMiller (A&A 2) Ltd United Kingdom Holding company 100% 100%SABMiller India Ltd India Holding company 100% 100%Skol Breweries Ltd India Brewing 99% 99%SABMiller Breweries Private Ltd India Brewing 100% 100%SABMiller Vietnam Company Ltd Vietnam Brewing 100% 100%
South African operationsThe South African Breweries Ltd South Africa Brewing/Soft drinks/Holding company 100% 100%The South African Breweries Hop Farms (Pty) Ltd South Africa Hop farming 100% 100%The South African Breweries Maltings (Pty) Ltd South Africa Maltsters 100% 100%Appletiser South Africa (Pty) Ltd South Africa Fruit juices 100% 100%
1 Operates and resident for tax purposes in the United Kingdom.
2 Listed in country of incorporation.
3 This entity was merged into Bavaria SA on 27 April 2009.
4 SABMiller Poland BV, a wholly owned subsidiary of the group, held 100% of Kompania Piwowarska SA at 31 March 2010 (31 March 2009: 71.9%).
The group comprises a large number of companies. The list above includes those subsidiary undertakings which materially affect the profit or net assets of the group, or a business segment, together with the principal intermediate holding companies of the group. With the exception ofthose noted above, the principal country in which each of the above subsidiary undertakings operates is the same as the country in which eachis incorporated.
Where the group’s nominal interest in the equity share capital of an undertaking is less than 50%, the basis on which the undertaking is a subsidiaryundertaking of the group is as follows:
African operationsThe group’s effective interest in the majority of its African operations was diluted as a result of the disposal of a 38% interest in SABMiller AfricaBV on 1 April 2001, in exchange for a 20% interest in the Castel group’s African beverage interests. Investments in new territories are generallybeing made with the Castel group’s African beverage operations on an 80:20 basis. The operations continue to be consolidated due to SABMillerAfrica BV’s and SABMiller Investments II BV’s majority shareholdings, and ability to control the operations.
Botswana Breweries (Pty) Ltd and Kgalagadi Breweries (Pty) LtdSABMiller Africa holds a 40% interest in each of Botswana Breweries (Pty) Ltd and Kgalagadi Breweries (Pty) Ltd with the remaining 60% interestin each held by Sechaba Brewery Holdings Ltd. SABMiller Africa’s shares entitle the holder to twice the voting rights of those shares held bySechaba Brewery Holdings Ltd. SABMiller Africa’s 10.1% indirect interest (2009: 10.1%) is held via a 16.8% interest (2009: 16.8%) in SechabaBrewery Holdings Ltd.
Lesotho Brewing Company (Pty) Ltd (Lesotho Brewing)SABMiller Africa holds a 39% interest in Lesotho Brewing with the remaining interest held by a government authority, the Lesotho NationalDevelopment Corporation (51%), and the Commonwealth Development Corporation (10%). Lesotho Brewing is treated as a subsidiary undertakingbased on the group’s ability to control its operations through its board representation. The day to day business operations are managed inaccordance with a management agreement with Bevman Services AG, a group company.
Coca-Cola Bottling Luanda SARL (CCBL)SABMiller Africa is the largest shareholder in CCBL with a 45% holding. Management control is exercised through a contractual agreement with Bevman Services AG, a group company.
Overview
Business review
Governance
Financial statem
entsS
hareholder inform
ation
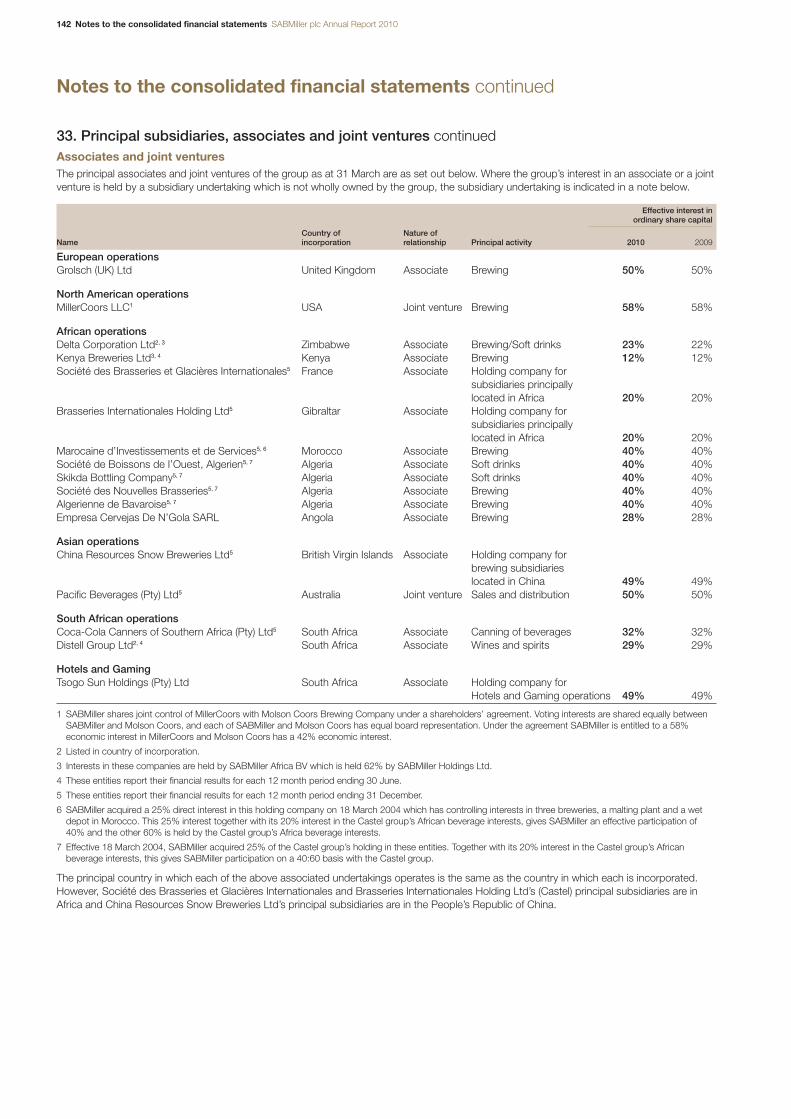
142 Notes to the consolidated financial statements SABMiller plc Annual Report 2010
Notes to the consolidated financial statements continued
33. Principal subsidiaries, associates and joint ventures continuedAssociates and joint venturesThe principal associates and joint ventures of the group as at 31 March are as set out below. Where the group’s interest in an associate or a jointventure is held by a subsidiary undertaking which is not wholly owned by the group, the subsidiary undertaking is indicated in a note below.
Effective interest inordinary share capital
Country of Nature ofName incorporation relationship Principal activity 2010 2009
European operationsGrolsch (UK) Ltd United Kingdom Associate Brewing 50% 50%
North American operationsMillerCoors LLC1 USA Joint venture Brewing 58% 58%
African operationsDelta Corporation Ltd2, 3 Zimbabwe Associate Brewing/Soft drinks 23% 22%Kenya Breweries Ltd3, 4 Kenya Associate Brewing 12% 12%Société des Brasseries et Glacières Internationales5 France Associate Holding company for
subsidiaries principally located in Africa 20% 20%
Brasseries Internationales Holding Ltd5 Gibraltar Associate Holding company for subsidiaries principally located in Africa 20% 20%
Marocaine d’Investissements et de Services5, 6 Morocco Associate Brewing 40% 40%Société de Boissons de I’Ouest, Algerien5, 7 Algeria Associate Soft drinks 40% 40%Skikda Bottling Company5, 7 Algeria Associate Soft drinks 40% 40%Société des Nouvelles Brasseries5, 7 Algeria Associate Brewing 40% 40%Algerienne de Bavaroise5, 7 Algeria Associate Brewing 40% 40%Empresa Cervejas De N’Gola SARL Angola Associate Brewing 28% 28%
Asian operationsChina Resources Snow Breweries Ltd5 British Virgin Islands Associate Holding company for
brewing subsidiaries located in China 49% 49%
Pacific Beverages (Pty) Ltd5 Australia Joint venture Sales and distribution 50% 50%
South African operationsCoca-Cola Canners of Southern Africa (Pty) Ltd5 South Africa Associate Canning of beverages 32% 32%Distell Group Ltd2, 4 South Africa Associate Wines and spirits 29% 29%
Hotels and GamingTsogo Sun Holdings (Pty) Ltd South Africa Associate Holding company for
Hotels and Gaming operations 49% 49%
1 SABMiller shares joint control of MillerCoors with Molson Coors Brewing Company under a shareholders’ agreement. Voting interests are shared equally betweenSABMiller and Molson Coors, and each of SABMiller and Molson Coors has equal board representation. Under the agreement SABMiller is entitled to a 58%economic interest in MillerCoors and Molson Coors has a 42% economic interest.
2 Listed in country of incorporation.
3 Interests in these companies are held by SABMiller Africa BV which is held 62% by SABMiller Holdings Ltd.
4 These entities report their financial results for each 12 month period ending 30 June.
5 These entities report their financial results for each 12 month period ending 31 December.
6 SABMiller acquired a 25% direct interest in this holding company on 18 March 2004 which has controlling interests in three breweries, a malting plant and a wetdepot in Morocco. This 25% interest together with its 20% interest in the Castel group’s African beverage interests, gives SABMiller an effective participation of40% and the other 60% is held by the Castel group’s Africa beverage interests.
7 Effective 18 March 2004, SABMiller acquired 25% of the Castel group’s holding in these entities. Together with its 20% interest in the Castel group’s Africanbeverage interests, this gives SABMiller participation on a 40:60 basis with the Castel group.
The principal country in which each of the above associated undertakings operates is the same as the country in which each is incorporated.However, Société des Brasseries et Glacières Internationales and Brasseries Internationales Holding Ltd’s (Castel) principal subsidiaries are inAfrica and China Resources Snow Breweries Ltd’s principal subsidiaries are in the People’s Republic of China.
SABMiller plc Annual Report 2010 Statement of directors’ responsibilities 143
Statement of directors’ responsibilitiesin respect of the company financial statements
The directors are responsible for preparing the Annual Report, theremuneration report and the company financial statements in accordancewith applicable law and regulations.
Company law requires the directors to prepare financial statements foreach financial year. The directors have elected to prepare the companyfinancial statements in accordance with United Kingdom AccountingStandards (United Kingdom Generally Accepted Accounting Practice)and applicable law. The financial statements are required by law to givea true and fair view of the state of affairs of the company for that year.
In preparing those financial statements, the directors are required to:
■ select suitable accounting policies and then apply them consistently;■ make judgements and estimates that are reasonable and prudent;■ state whether applicable UK Accounting Standards have been followed,
subject to any material departures disclosed and explained in thefinancial statements; and
■ prepare the financial statements on the going concern basis unlessit is inappropriate to presume that the company will continue inbusiness, in which case there should be supporting assumptions or qualifications as necessary.
The directors confirm that they have complied with the aboverequirements in preparing the financial statements.
The directors are responsible for keeping adequate accountingrecords that disclose with reasonable accuracy at any time thefinancial position of the company and enable them to ensure that the financial statements comply with the Companies Act 2006. Theyare also responsible for safeguarding the assets of the company andhence for taking reasonable steps for the prevention and detection of fraud and other irregularities.
In addition, the Companies Act 2006 requires directors to provide thecompany’s auditors with every opportunity to take whatever steps andundertake whatever inspections the auditors consider to be appropriatefor the purpose of enabling them to give their audit report. Each of thedirectors, having made appropriate enquiries, confirms that:
■ so far as the director is aware, there is no relevant audit informationof which the company’s auditors are unaware; and
■ each director has taken all the steps that they ought to have takenas a director in order to make themselves aware of any relevantaudit information and to establish that the company’s auditors areaware of that information.
A copy of the financial statements of the company is placed on thecompany’s website. The directors are responsible for the maintenanceand integrity of statutory and audited information on the company’swebsite. Information published on the internet is accessible in manycountries with different legal requirements. Legislation in the UnitedKingdom governing the preparation and dissemination of financialstatements may differ from legislation in other jurisdictions.
Overview
Business review
Governance
Financial statem
entsS
hareholder inform
ation
144 Independent auditors’ report SABMiller plc Annual Report 2010
Independent auditors’ reportto the members of SABMiller plc
We have audited the company financial statements of SABMiller plcfor the year ended 31 March 2010 which comprise the companybalance sheet and the related notes. The financial reporting frameworkthat has been applied in their preparation is applicable law and UnitedKingdom Accounting Standards (United Kingdom Generally AcceptedAccounting Practice).
Respective responsibilities of directors and auditorsAs explained more fully in the statement of directors’ responsibilities,set out on page 143, the directors are responsible for the preparationof the company financial statements and for being satisfied that theygive a true and fair view. Our responsibility is to audit the companyfinancial statements in accordance with applicable law and InternationalStandards on Auditing (UK and Ireland). Those standards require us tocomply with the Auditing Practices Board’s Ethical Standards for Auditors.
This report, including the opinions, has been prepared for and only forthe company’s members as a body in accordance with Chapter 3 ofPart 16 of the Companies Act 2006 and for no other purpose. We donot, in giving these opinions, accept or assume responsibility for anyother purpose or to any other person to whom this report is shown orinto whose hands it may come save where expressly agreed by ourprior consent in writing.
Scope of the audit of the financial statementsAn audit involves obtaining evidence about the amounts and disclosuresin the financial statements sufficient to give reasonable assurance thatthe financial statements are free from material misstatement, whethercaused by fraud or error. This includes an assessment of: whether theaccounting policies are appropriate to the company’s circumstancesand have been consistently applied and adequately disclosed; thereasonableness of significant accounting estimates made by thedirectors; and the overall presentation of the financial statements.
Opinion on financial statementsIn our opinion the company financial statements:
■ give a true and fair view of the state of the company’s affairs as at 31 March 2010;
■ have been properly prepared in accordance with United KingdomGenerally Accepted Accounting Practice; and
■ have been prepared in accordance with the requirements of theCompanies Act 2006.
Opinion on other matters prescribed by the Companies Act 2006In our opinion:
■ the part of the remuneration report to be audited has been properlyprepared in accordance with the Companies Act 2006; and
■ the information given in the directors’ report for the financial year forwhich the company financial statements are prepared is consistentwith the company financial statements.
Matters on which we are required to report by exceptionWe have nothing to report in respect of the following matters wherethe Companies Act 2006 requires us to report to you if, in our opinion:
■ adequate accounting records have not been kept by the company,or returns adequate for our audit have not been received frombranches not visited by us; or
■ the company financial statements and the part of the remunerationreport to be audited are not in agreement with the accountingrecords and returns; or
■ certain disclosures of directors’ remuneration specified by law arenot made; or
■ we have not received all the information and explanations werequire for our audit.
Other matterWe have reported separately on the consolidated financial statementsof SABMiller plc for the year ended 31 March 2010.
John Baker (Senior Statutory Auditor)for and on behalf of PricewaterhouseCoopers LLPChartered Accountants and Statutory AuditorsLondon
3 June 2010
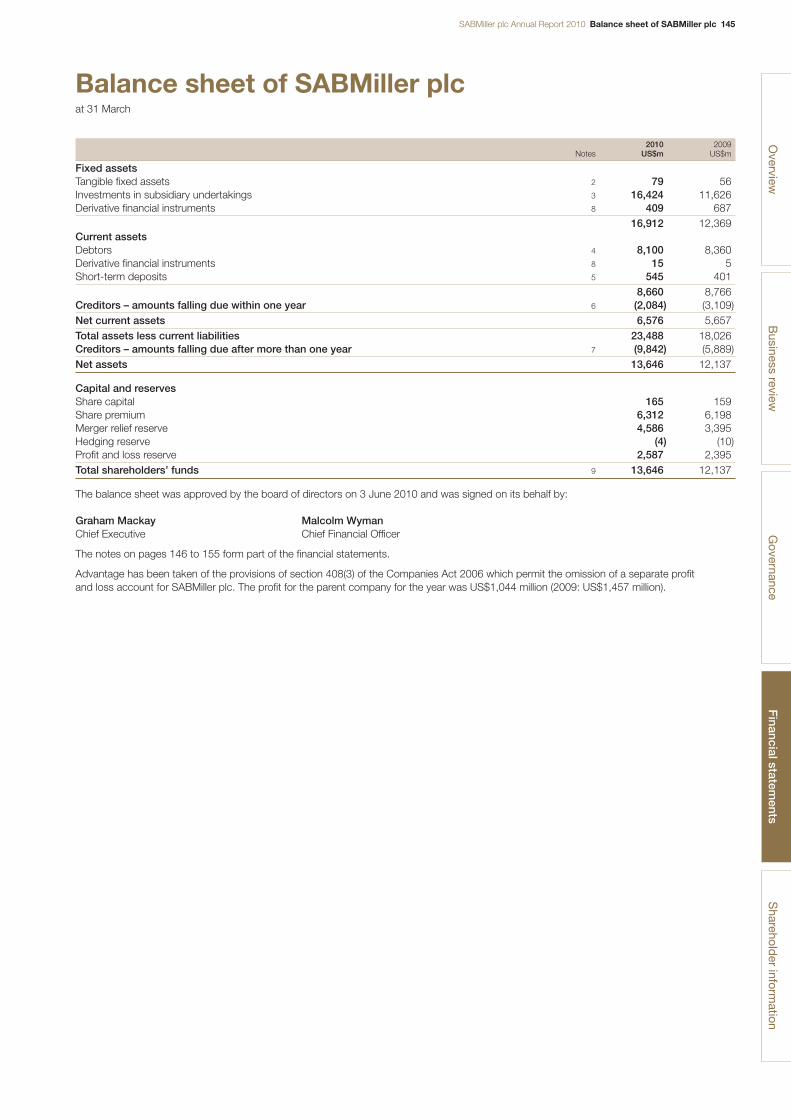
SABMiller plc Annual Report 2010 Balance sheet of SABMiller plc 145
Balance sheet of SABMiller plcat 31 March
2010 2009Notes US$m US$m
Fixed assetsTangible fixed assets 2 79 56Investments in subsidiary undertakings 3 16,424 11,626Derivative financial instruments 8 409 687
16,912 12,369Current assetsDebtors 4 8,100 8,360Derivative financial instruments 8 15 5Short-term deposits 5 545 401
8,660 8,766Creditors – amounts falling due within one year 6 (2,084) (3,109)Net current assets 6,576 5,657Total assets less current liabilities 23,488 18,026Creditors – amounts falling due after more than one year 7 (9,842) (5,889)Net assets 13,646 12,137
Capital and reservesShare capital 165 159Share premium 6,312 6,198Merger relief reserve 4,586 3,395Hedging reserve (4) (10)Profit and loss reserve 2,587 2,395Total shareholders’ funds 9 13,646 12,137
The balance sheet was approved by the board of directors on 3 June 2010 and was signed on its behalf by:
Graham Mackay Malcolm WymanChief Executive Chief Financial Officer
The notes on pages 146 to 155 form part of the financial statements.
Advantage has been taken of the provisions of section 408(3) of the Companies Act 2006 which permit the omission of a separate profit and loss account for SABMiller plc. The profit for the parent company for the year was US$1,044 million (2009: US$1,457 million).
Overview
Business review
Governance
Financial statem
entsS
hareholder inform
ation
146 Notes to the company financial statements SABMiller plc Annual Report 2010
Notes to the company financial statements
1. Accounting policiesa. Statement of complianceSABMiller plc (the company) is a public limited company incorporatedin Great Britain and registered in England and Wales. The companyfinancial statements have been prepared under the historical costconvention, as modified for the revaluation of certain financial instruments,in accordance with the Companies Act 2006 and with accountingstandards applicable in the United Kingdom (UK GAAP). A summaryof the significant company accounting policies is set out below.
The company has not presented a cash flow statement or provideddetails of certain related party transactions as permitted under FRS 1(revised) ‘Cash Flow Statements’ and FRS 8 (Amendment) ‘RelatedParty Disclosures’ respectively. In addition, the company has alsotaken advantage of the exemption from providing financial instrumentsdisclosures as permitted by FRS 29 (Amendment) ‘FinancialInstruments: Disclosure’.
b. Investments in subsidiary undertakingsThese comprise investments in shares and loans that the directorsintend to hold on a continuing basis in the company’s business. Theinvestments are stated at cost less provisions for impairment. A reviewfor the potential impairment of an investment is carried out if events or changes in circumstances indicate that the carrying amount of theinvestment may not be recoverable. Such impairment reviews areperformed in accordance with FRS 11.
c. Foreign currenciesThe financial statements are presented in US dollars which is thecompany’s functional and presentational currency.
The South African rand (ZAR) and British pound (GBP) exchange rates to the US dollar used in preparing the company financialstatements were as follows:
Weighted average rate Closing rate
ZAR GBP ZAR GBP
Year ended 31 March 2010 7.78 1.60 7.30 1.52Year ended 31 March 2009 8.87 1.72 9.61 1.43
Monetary items denominated in foreign currencies are retranslated at the rate of exchange ruling at the balance sheet date with theresultant translation differences being included in operating profit,other than those arising on financial liabilities which are recordedwithin net finance costs.
Non-monetary items that are measured in terms of historical cost in a foreign currency are translated at the rate of exchange ruling at thedate of the transaction. All other non-monetary items denominated ina foreign currency are translated at the rate of exchange ruling at thebalance sheet date.
d. Tangible fixed assets and depreciationTangible fixed assets are stated at cost net of accumulated depreciationand impairment losses.
No depreciation is provided on freehold land or assets in the course ofconstruction. In respect of all other tangible fixed assets, depreciationis provided on a straight-line basis at rates calculated to write off thecost, less the estimated residual value of each asset, evenly over itsexpected useful life as follows:
Office equipment 2–30 yearsLeasehold land and buildings Shorter of the lease term or 50 years
The company regularly reviews its depreciation rates to take accountof any changes in circumstances. When setting useful economic lives,the principal factors the company takes into account are the expectedrate of technological developments, expected market requirements forthe equipment and the intensity at which the assets are expected tobe used. The profit or loss on the disposal of an asset is the differencebetween the disposal proceeds and the net book value of the asset.
e. ImpairmentIn accordance with FRS 11 ‘Impairment of fixed assets and goodwill’,fixed assets are subject to an impairment review if circumstances or events change to indicate that the carrying value may not be fully recoverable. The review is performed by comparing the carryingvalue of the fixed asset to its recoverable amount, being the higher of the net realisable value and value in use. The net realisable value is considered to be the amount that could be obtained on disposal ofthe asset. The value in use of the asset is determined by discounting,at a market based discount rate, the expected future cash flows resultingfrom its continued use, including those arising from its final disposal.When the carrying values of fixed assets are written down by anyimpairment amount, the loss is recognised in the profit and loss accountin the period in which it is incurred. Should circumstances or eventschange and give rise to a reversal of a previous impairment loss, thereversal is recognised in the profit and loss account in the period inwhich it occurs and the carrying value of the asset is increased.
The increase in the carrying value of the asset will only be up to the amount that it would have been had the original impairment notoccurred. For the purpose of conducting impairment reviews, incomegenerating units are considered to be groups of assets and liabilitiesthat generate income, and are largely independent of other incomestreams. They also include those assets and liabilities directly involvedin producing the income and a suitable proportion of those used toproduce more than one income stream.
SABMiller plc Annual Report 2010 Notes to the company financial statements 147
1. Accounting policies continuedf. Financial assets and financial liabilitiesFinancial assets and financial liabilities are initially recorded at fair value(plus any directly attributable transaction costs, except in the case ofthose classified at fair value through profit or loss). For those financialinstruments that are not subsequently held at fair value, the companyassesses whether there is any objective evidence of impairment ateach balance sheet date.
Financial assets are recognised when the company has rights or otheraccess to economic benefits. Such assets consist of cash, equityinstruments, a contractual right to receive cash or another financialasset, or a contractual right to exchange financial instruments withanother entity on potentially favourable terms. Financial assets arederecognised when the rights to receive cash flows from the assethave expired or have been transferred and the company hastransferred substantially all risks and rewards of ownership.
Financial liabilities are recognised when there is an obligation to transferbenefits and that obligation is a contractual liability to deliver cash or another financial asset or to exchange financial instruments withanother entity on potentially unfavourable terms. Financial liabilities are derecognised when they are extinguished, that is discharged,cancelled or expired. If a legally enforceable right exists to set offrecognised amounts of financial assets and liabilities, which are indeterminable monetary amounts, and there is the intention to settlenet, the relevant financial assets and liabilities are offset. Interest costs are charged to the income statement in the year in which theyaccrue. Premiums or discounts arising from the difference betweenthe net proceeds of financial instruments purchased or issued and the amounts receivable or repayable at maturity are included in theeffective interest calculation and taken to net interest payable over the life of the instrument.
(i) Loans and receivablesLoans and receivables are non-derivative financial assets with fixed or determinable payments that are not quoted in an active market.They arise when the company provides money, goods or servicesdirectly to a debtor with no intention of trading the receivable. Loansand receivables are included in debtors in the balance sheet.
(ii) Cash and short-term depositsCash and short-term deposits include cash in hand, bank depositsrepayable on demand, other short-term highly liquid investments withoriginal maturities of three months or less. Bank overdrafts are shownwithin creditors – amounts falling due within one year.
(iii) Derivative financial assets and financial liabilitiesDerivative financial assets and financial liabilities are financial instrumentswhose value changes in response to an underlying variable, requirelittle or no initial investment and are settled in the future.
Derivative financial assets and liabilities are analysed between currentand fixed assets and creditors on the face of the balance sheet,depending on when they are expected to mature. For derivatives that have not been designated to a hedging relationship, all fair valuemovements are recognised immediately in the profit and loss account.See note k for the company’s accounting policy on hedge accounting.
(iv) Trade creditorsTrade creditors are initially recognised at fair value and subsequentlymeasured at amortised cost.
Trade creditors are classified as creditors falling due within one yearunless the company has an unconditional right to defer settlement for at least 12 months from the balance sheet date.
(v) BorrowingsBorrowings are recognised initially at fair value, net of transactioncosts and are subsequently stated at amortised cost and includeaccrued interest and prepaid interest. Borrowings are classified as current liabilities unless the company has an unconditional right to defer settlement of the liability for at least 12 months from thebalance sheet date. Borrowings classified as hedged items aresubject to hedge accounting requirements (see note k).
(vi) Financial guaranteesFRS 26 (Amendment) requires that issued financial guarantees, otherthan those previously asserted by the entity to be insurance contracts,are to be initially recognised at their fair value and subsequentlymeasured at the higher of the amount initially recognised less cumulativeamortisation recognised and the amount determined in accordancewith FRS 12 ‘Provisions, Contingent Liabilities and Contingent Assets’.
Financial guarantee contracts are defined in FRS 26 as contracts that require the issuer to make specified payments to reimburse theholder for a loss it incurs because a specified debtor fails to makepayment when due in accordance with the original or modified termsof a debt instrument.
g. Revenue recognition
(i) Interest incomeInterest income is recognised on an accruals basis using the effectiveinterest method.
(ii) Dividend incomeDividend income is recognised when the right to receive payment is established.
h. Deferred taxationDeferred tax is recognised in respect of all timing differences that have originated but not reversed at the balance sheet date, wheretransactions or events that result in an obligation to pay more tax inthe future or a right to pay less tax in the future have occurred at thebalance sheet date.
A net deferred tax asset is regarded as recoverable and thereforerecognised only when, on the basis of all available evidence, it can beregarded as more likely than not that there will be suitable taxable profitsagainst which to recover carried forward tax losses and from whichthe future reversal of underlying timing differences can be deducted.
Deferred tax is measured at the tax rates that are expected to apply in the periods in which the timing differences are expected to reverse,based on tax rates and laws that have been enacted or substantivelyenacted by the balance sheet date. Deferred tax is measured on anon-discounted basis.
Overview
Business review
Governance
Financial statem
entsS
hareholder inform
ation
148 Notes to the company financial statements SABMiller plc Annual Report 2010
Notes to the company financial statements continued
1. Accounting policies continuedi. Dividend distributionsIn accordance with FRS 21, dividend distributions to equity holdersare recognised as a liability in the financial statements of the companyin the period in which the dividends are approved by the company’sshareholders. Interim dividends are recognised when paid. Dividendsdeclared after the balance sheet date are not recognised, as there isno present obligation at the balance sheet date.
j. Share-based compensationThe company operates several equity-settled share-based compensationschemes. These include option plans (with and without non-marketperformance conditions attached).
In accordance with FRS 20, an expense is recognised to spread thefair value at date of grant of each award granted after 7 November2002 over the vesting period on a straight-line basis, after allowing foran estimate of the share awards that will eventually vest. A correspondingadjustment is made to equity over the remaining vesting period. Theestimate of the level of vesting is reviewed at least annually, with anyimpact on the cumulative charge being recognised immediately. Thecharge is based on the fair value of the award at the date of grant, ascalculated by binomial model calculations and Monte Carlo simulations.
The charge is not reversed if the options have not been exercisedbecause the market value of the shares is lower than the option price atthe date of grant. The proceeds received net of any directly attributabletransaction costs are credited to share capital (nominal value) andshare premium when the options are exercised, unless the options are satisfied by treasury or EBT shares.
The issuance by the company to its subsidiaries of a grant over the company’s options represents additional capital contributions by the company to its subsidiaries, except to the extent the companyis reimbursed. An additional investment in subsidiaries results in acorresponding increase in shareholders’ equity. The additional capitalcontribution is based on the fair value of the grant issued allocatedover the underlying grant’s vesting period.
k. Hedge accountingThe derivative instruments used by the company, which are usedsolely for hedging purposes (i.e. to offset foreign exchange andinterest rate risks), comprise interest rate swaps and forward foreignexchange contracts. Such derivative instruments are used to alter the risk profile of an existing underlying exposure of the company in line with the company’s risk management policies.
Derivatives are initially recorded at fair value on the date a derivativecontract is entered into and are subsequently re-measured at their fairvalue. The method of recognising the resulting gain or loss dependson whether the derivative is designated as a hedging instrument, andif so, the nature of the hedging relationship.
In order to qualify for hedge accounting, the company is required todocument the relationship between the hedged item and the hedginginstrument. The company is also required to document and demonstratethat the relationship between the hedged item and the hedginginstrument will be highly effective. This effectiveness test is re-performedat each period end to ensure that the hedge has remained and willcontinue to remain highly effective.
The company designates certain derivatives as hedges of the fairvalue of recognised assets or liabilities or a firm commitment (fair value hedge) or hedges of highly probable forecast transactions orcommitments (cash flow hedge).
Where a derivative ceases to meet the criteria of being a hedginginstrument or the underlying exposure which it is hedging is sold,matures or is extinguished, hedge accounting is discontinued andamounts previously recorded in equity are recycled to the incomestatement. A similar treatment is applied where the hedge is of afuture transaction and that transaction is no longer likely to occur.When the hedge is discontinued due to ineffectiveness, hedgeaccounting is discontinued prospectively.
Certain derivative instruments, whilst providing effective economichedges under the company’s policies, are not designated as hedges.Changes in the fair value of any derivative instruments that do notqualify or have not been designated as hedges are recognisedimmediately in the profit and loss account. The company does nothold or issue derivative financial instruments for speculative purposes.
(i) Fair value hedgesFair value hedges comprise derivative financial instruments designatedin a hedging relationship to manage the company’s interest rate risk to which the fair value of certain assets and liabilities are exposed.Changes in the fair value of the derivative offset the relevant changesin the fair value of the underlying hedged item attributable to thehedged risk in the profit and loss account in the period incurred.Gains or losses on fair value hedges that are regarded as highlyeffective are recorded in the profit and loss account together with the gain or loss on the hedged item attributable to the hedged risk.
(ii) Cash flow hedgesCash flow hedges comprise derivative financial instruments designatedin a hedging relationship to manage currency and interest rate risk to which the cash flows of certain liabilities are exposed. The effectiveportion of changes in the fair value of the derivative that is designatedand qualifies for hedge accounting is recognised as a separatecomponent of equity. The ineffective portion is recognised immediatelyin the profit and loss account. Amounts accumulated in equity arerecycled to the profit and loss account in the period in which thehedged item affects profit or loss. However, where a forecastedtransaction results in a non-financial asset or liability, the accumulatedfair value movements previously deferred in equity are included in theinitial cost of the asset or liability.
Details of the group’s financial risk management objectives andpolicies are provided on pages 107 to 113.
l. Operating leasesRentals paid on operating leases are charged to the incomestatement on a straight-line basis over the lease term.
m. Pension obligationsThe company operates a defined contribution scheme. Contributionsto this scheme are charged to the income statement as incurred.
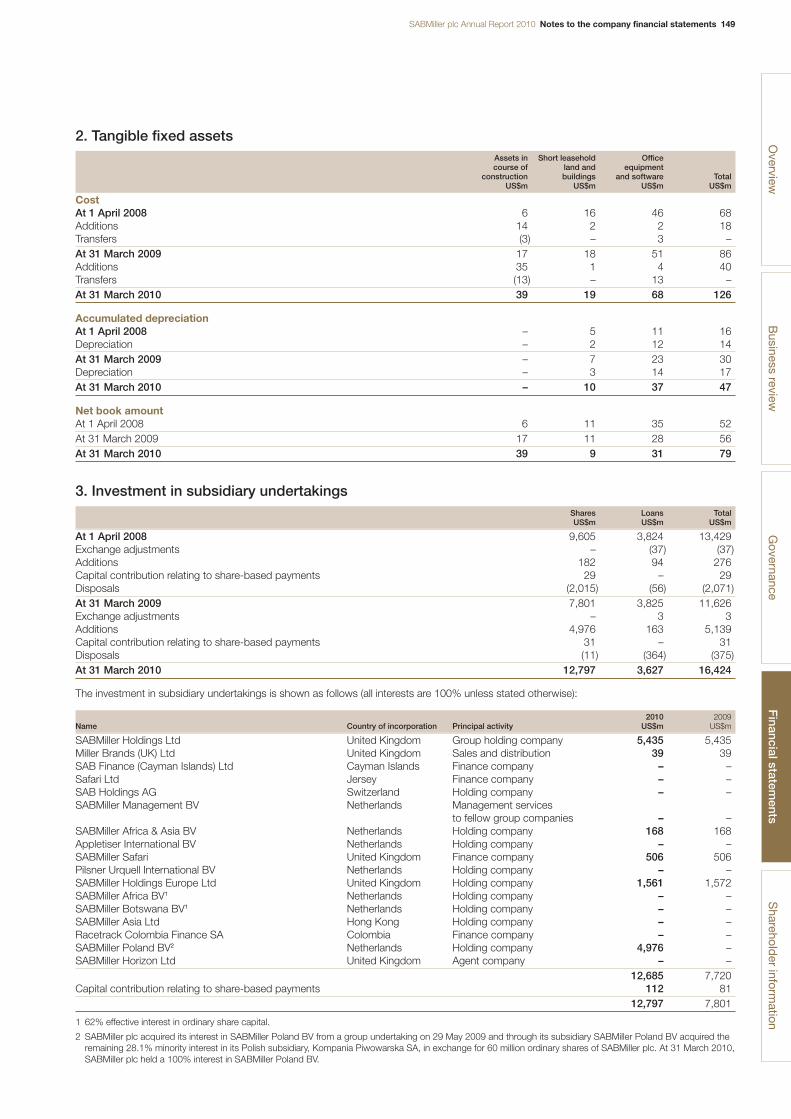
SABMiller plc Annual Report 2010 Notes to the company financial statements 149
2. Tangible fixed assetsAssets in Short leasehold Officecourse of land and equipment
construction buildings and software TotalUS$m US$m US$m US$m
CostAt 1 April 2008 6 16 46 68Additions 14 2 2 18Transfers (3) – 3 –At 31 March 2009 17 18 51 86Additions 35 1 4 40Transfers (13) – 13 –At 31 March 2010 39 19 68 126
Accumulated depreciationAt 1 April 2008 – 5 11 16Depreciation – 2 12 14At 31 March 2009 – 7 23 30Depreciation – 3 14 17At 31 March 2010 – 10 37 47
Net book amountAt 1 April 2008 6 11 35 52At 31 March 2009 17 11 28 56At 31 March 2010 39 9 31 79
3. Investment in subsidiary undertakingsShares Loans TotalUS$m US$m US$m
At 1 April 2008 9,605 3,824 13,429Exchange adjustments – (37) (37)Additions 182 94 276Capital contribution relating to share-based payments 29 – 29Disposals (2,015) (56) (2,071)At 31 March 2009 7,801 3,825 11,626Exchange adjustments – 3 3Additions 4,976 163 5,139Capital contribution relating to share-based payments 31 – 31Disposals (11) (364) (375)At 31 March 2010 12,797 3,627 16,424
The investment in subsidiary undertakings is shown as follows (all interests are 100% unless stated otherwise):
2010 2009Name Country of incorporation Principal activity US$m US$m
SABMiller Holdings Ltd United Kingdom Group holding company 5,435 5,435Miller Brands (UK) Ltd United Kingdom Sales and distribution 39 39SAB Finance (Cayman Islands) Ltd Cayman Islands Finance company – –Safari Ltd Jersey Finance company – –SAB Holdings AG Switzerland Holding company – –SABMiller Management BV Netherlands Management services
to fellow group companies – –SABMiller Africa & Asia BV Netherlands Holding company 168 168Appletiser International BV Netherlands Holding company – –SABMiller Safari United Kingdom Finance company 506 506Pilsner Urquell International BV Netherlands Holding company – –SABMiller Holdings Europe Ltd United Kingdom Holding company 1,561 1,572SABMiller Africa BV1 Netherlands Holding company – –SABMiller Botswana BV1 Netherlands Holding company – –SABMiller Asia Ltd Hong Kong Holding company – –Racetrack Colombia Finance SA Colombia Finance company – –SABMiller Poland BV2 Netherlands Holding company 4,976 –SABMiller Horizon Ltd United Kingdom Agent company – –
12,685 7,720Capital contribution relating to share-based payments 112 81
12,797 7,801
1 62% effective interest in ordinary share capital.
2 SABMiller plc acquired its interest in SABMiller Poland BV from a group undertaking on 29 May 2009 and through its subsidiary SABMiller Poland BV acquired theremaining 28.1% minority interest in its Polish subsidiary, Kompania Piwowarska SA, in exchange for 60 million ordinary shares of SABMiller plc. At 31 March 2010,SABMiller plc held a 100% interest in SABMiller Poland BV.
Overview
Business review
Governance
Financial statem
entsS
hareholder inform
ation

150 Notes to the company financial statements SABMiller plc Annual Report 2010
Notes to the company financial statements continued
4. Debtors
2010 2009US$m US$m
Amounts owed by subsidiary undertakings 7,976 8,277Other debtors 124 83
8,100 8,360
Included in the table above are debtors due after more than one year of US$0.5 million (2009: US$6 million).
5. Short-term deposits
2010 2009US$m US$m
Short-term deposits 545 401
The effective interest rate on short-term deposits is 3.94% (2009: 5.12%).
6. Creditors amounts falling due within one year
2010 2009US$m US$m
Bank overdrafts 191 46Bank loans 53 –Commercial paper1 420 423US$300 million LIBOR + 0.3% Notes due 20092 – 301Amounts owed to subsidiary undertakings 1,264 2,260Taxation and social security 26 5Derivative financial instruments (see note 8) 72 7Other creditors 9 13Payroll-related creditors 8 13Accruals and deferred income 40 40Dividends payable to shareholders 1 1
2,084 3,109
1 In October 2006, SABMiller plc entered into a US$1,000 million commercial paper programme for general corporate purposes. Debt issued under the programmewas guaranteed by the US guarantors and SABMiller Finance BV until 30 June 2008. Since 1 July 2008, debt issued under the programme is not guaranteed.
2 Further information relating to the notes is detailed in note 21 to the consolidated financial statements of the group.
7. Creditors amounts falling due after more than one year
2010 2009US$m US$m
US$1,100 million 5.5% Notes due 20131 1,119 1,129€1,000 million 4.5% Notes due 20152 1,365 –US$300 million 6.625% Guaranteed Notes due 20332 352 396US$600 million 6.2% Notes due 20112 608 608US$850 million 6.5% Notes due 20162 939 966US$550 million 5.7% Notes due 20142 591 598US$700 million 6.5% Notes due 20182 747 778PEN150 million 6.75% Notes due 20152 53 –US$2,000 million multi-currency revolving credit facility (RCF)2 – 735US$600 million multi-currency revolving credit facility (RCF)2 250 600€140 million revolving credit facility (RCF) 132 –Loans from subsidiary undertakings3 3,620 –Derivative financial instruments (see note 8) 62 66Other creditors – –Deferred income 4 13
9,842 5,889
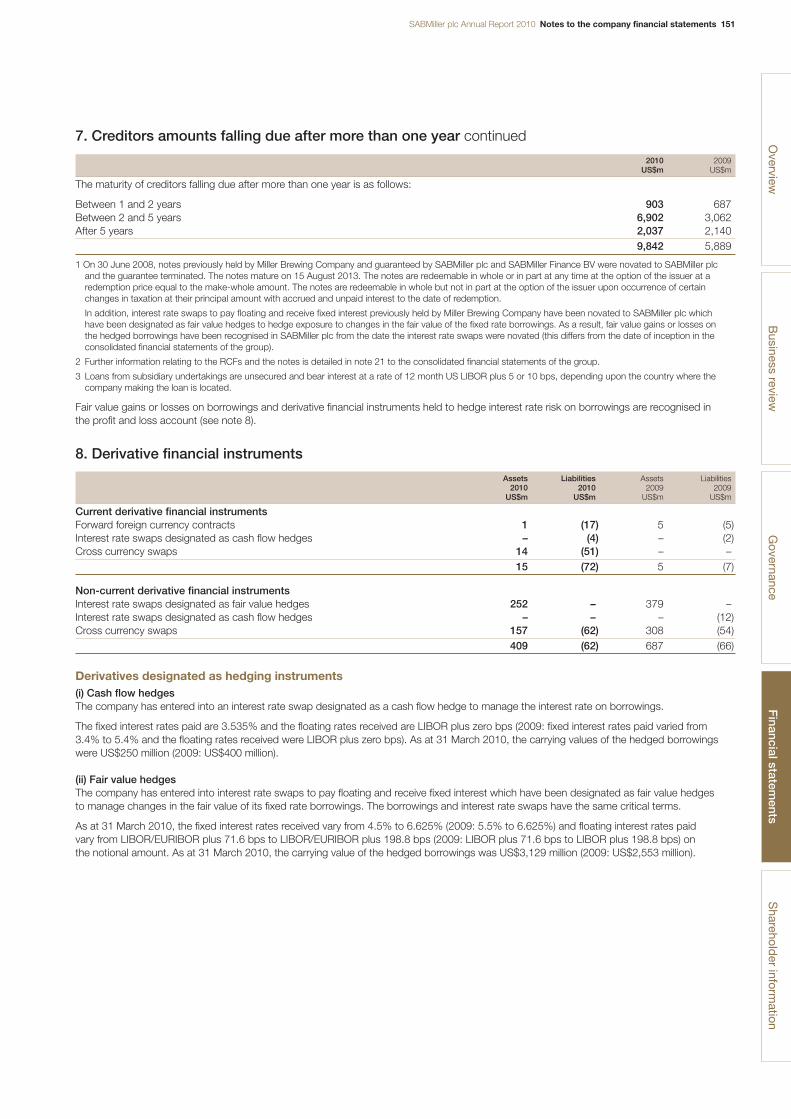
SABMiller plc Annual Report 2010 Notes to the company financial statements 151
7. Creditors amounts falling due after more than one year continued
2010 2009US$m US$m
The maturity of creditors falling due after more than one year is as follows:
Between 1 and 2 years 903 687Between 2 and 5 years 6,902 3,062After 5 years 2,037 2,140
9,842 5,889
1 On 30 June 2008, notes previously held by Miller Brewing Company and guaranteed by SABMiller plc and SABMiller Finance BV were novated to SABMiller plcand the guarantee terminated. The notes mature on 15 August 2013. The notes are redeemable in whole or in part at any time at the option of the issuer at aredemption price equal to the make-whole amount. The notes are redeemable in whole but not in part at the option of the issuer upon occurrence of certainchanges in taxation at their principal amount with accrued and unpaid interest to the date of redemption.
In addition, interest rate swaps to pay floating and receive fixed interest previously held by Miller Brewing Company have been novated to SABMiller plc which have been designated as fair value hedges to hedge exposure to changes in the fair value of the fixed rate borrowings. As a result, fair value gains or losses on the hedged borrowings have been recognised in SABMiller plc from the date the interest rate swaps were novated (this differs from the date of inception in theconsolidated financial statements of the group).
2 Further information relating to the RCFs and the notes is detailed in note 21 to the consolidated financial statements of the group.
3 Loans from subsidiary undertakings are unsecured and bear interest at a rate of 12 month US LIBOR plus 5 or 10 bps, depending upon the country where thecompany making the loan is located.
Fair value gains or losses on borrowings and derivative financial instruments held to hedge interest rate risk on borrowings are recognised in the profit and loss account (see note 8).
8. Derivative financial instruments
Assets Liabilities Assets Liabilities2010 2010 2009 2009
US$m US$m US$m US$m
Current derivative financial instrumentsForward foreign currency contracts 1 (17) 5 (5)Interest rate swaps designated as cash flow hedges – (4) – (2)Cross currency swaps 14 (51) – –
15 (72) 5 (7)
Non-current derivative financial instrumentsInterest rate swaps designated as fair value hedges 252 – 379 –Interest rate swaps designated as cash flow hedges – – – (12)Cross currency swaps 157 (62) 308 (54)
409 (62) 687 (66)
Derivatives designated as hedging instruments(i) Cash flow hedgesThe company has entered into an interest rate swap designated as a cash flow hedge to manage the interest rate on borrowings.
The fixed interest rates paid are 3.535% and the floating rates received are LIBOR plus zero bps (2009: fixed interest rates paid varied from 3.4% to 5.4% and the floating rates received were LIBOR plus zero bps). As at 31 March 2010, the carrying values of the hedged borrowingswere US$250 million (2009: US$400 million).
(ii) Fair value hedgesThe company has entered into interest rate swaps to pay floating and receive fixed interest which have been designated as fair value hedges to manage changes in the fair value of its fixed rate borrowings. The borrowings and interest rate swaps have the same critical terms.
As at 31 March 2010, the fixed interest rates received vary from 4.5% to 6.625% (2009: 5.5% to 6.625%) and floating interest rates paid vary from LIBOR/EURIBOR plus 71.6 bps to LIBOR/EURIBOR plus 198.8 bps (2009: LIBOR plus 71.6 bps to LIBOR plus 198.8 bps) on the notional amount. As at 31 March 2010, the carrying value of the hedged borrowings was US$3,129 million (2009: US$2,553 million).
Overview
Business review
Governance
Financial statem
entsS
hareholder inform
ation
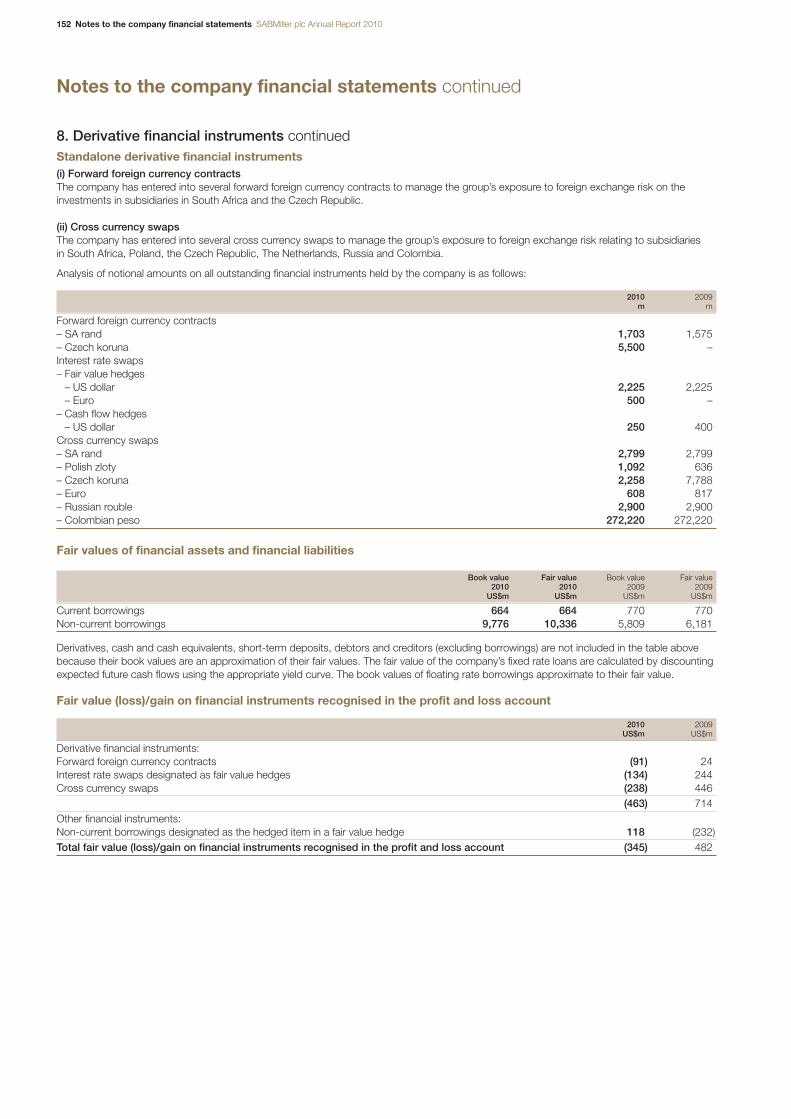
152 Notes to the company financial statements SABMiller plc Annual Report 2010
Notes to the company financial statements continued
8. Derivative financial instruments continuedStandalone derivative financial instruments(i) Forward foreign currency contractsThe company has entered into several forward foreign currency contracts to manage the group’s exposure to foreign exchange risk on theinvestments in subsidiaries in South Africa and the Czech Republic.
(ii) Cross currency swapsThe company has entered into several cross currency swaps to manage the group’s exposure to foreign exchange risk relating to subsidiaries in South Africa, Poland, the Czech Republic, The Netherlands, Russia and Colombia.
Analysis of notional amounts on all outstanding financial instruments held by the company is as follows:
2010 2009m m
Forward foreign currency contracts– SA rand 1,703 1,575– Czech koruna 5,500 –Interest rate swaps– Fair value hedges
– US dollar 2,225 2,225– Euro 500 –
– Cash flow hedges– US dollar 250 400
Cross currency swaps– SA rand 2,799 2,799– Polish zloty 1,092 636– Czech koruna 2,258 7,788– Euro 608 817– Russian rouble 2,900 2,900– Colombian peso 272,220 272,220
Fair values of financial assets and financial liabilities
Book value Fair value Book value Fair value2010 2010 2009 2009
US$m US$m US$m US$m
Current borrowings 664 664 770 770Non-current borrowings 9,776 10,336 5,809 6,181
Derivatives, cash and cash equivalents, short-term deposits, debtors and creditors (excluding borrowings) are not included in the table abovebecause their book values are an approximation of their fair values. The fair value of the company’s fixed rate loans are calculated by discountingexpected future cash flows using the appropriate yield curve. The book values of floating rate borrowings approximate to their fair value.
Fair value (loss)/gain on financial instruments recognised in the profit and loss account
2010 2009US$m US$m
Derivative financial instruments:Forward foreign currency contracts (91) 24Interest rate swaps designated as fair value hedges (134) 244Cross currency swaps (238) 446
(463) 714Other financial instruments:Non-current borrowings designated as the hedged item in a fair value hedge 118 (232)Total fair value (loss)/gain on financial instruments recognised in the profit and loss account (345) 482
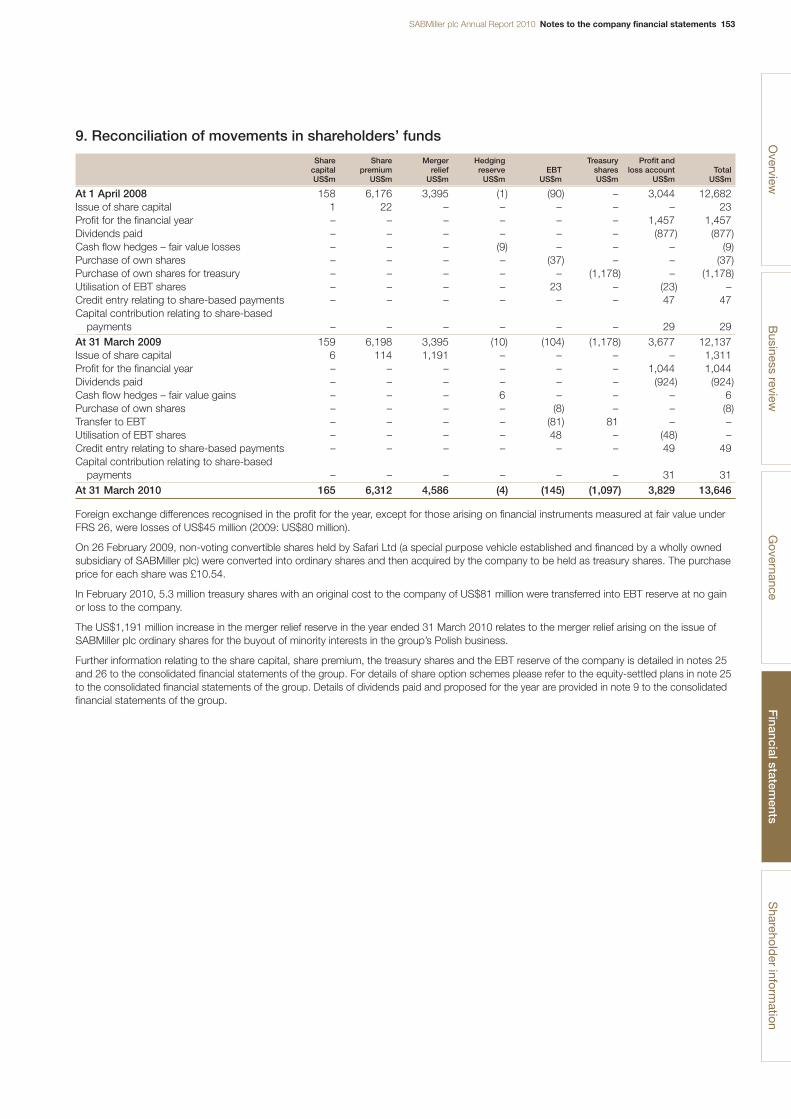
SABMiller plc Annual Report 2010 Notes to the company financial statements 153
9. Reconciliation of movements in shareholders’ funds
Share Share Merger Hedging Treasury Profit andcapital premium relief reserve EBT shares loss account TotalUS$m US$m US$m US$m US$m US$m US$m US$m
At 1 April 2008 158 6,176 3,395 (1) (90) – 3,044 12,682Issue of share capital 1 22 – – – – – 23Profit for the financial year – – – – – – 1,457 1,457Dividends paid – – – – – – (877) (877)Cash flow hedges – fair value losses – – – (9) – – – (9)Purchase of own shares – – – – (37) – – (37)Purchase of own shares for treasury – – – – – (1,178) – (1,178)Utilisation of EBT shares – – – – 23 – (23) –Credit entry relating to share-based payments – – – – – – 47 47Capital contribution relating to share-based
payments – – – – – – 29 29At 31 March 2009 159 6,198 3,395 (10) (104) (1,178) 3,677 12,137Issue of share capital 6 114 1,191 – – – – 1,311Profit for the financial year – – – – – – 1,044 1,044Dividends paid – – – – – – (924) (924)Cash flow hedges – fair value gains – – – 6 – – – 6Purchase of own shares – – – – (8) – – (8)Transfer to EBT – – – – (81) 81 – –Utilisation of EBT shares – – – – 48 – (48) –Credit entry relating to share-based payments – – – – – – 49 49Capital contribution relating to share-based
payments – – – – – – 31 31At 31 March 2010 165 6,312 4,586 (4) (145) (1,097) 3,829 13,646
Foreign exchange differences recognised in the profit for the year, except for those arising on financial instruments measured at fair value under FRS 26, were losses of US$45 million (2009: US$80 million).
On 26 February 2009, non-voting convertible shares held by Safari Ltd (a special purpose vehicle established and financed by a wholly ownedsubsidiary of SABMiller plc) were converted into ordinary shares and then acquired by the company to be held as treasury shares. The purchaseprice for each share was £10.54.
In February 2010, 5.3 million treasury shares with an original cost to the company of US$81 million were transferred into EBT reserve at no gainor loss to the company.
The US$1,191 million increase in the merger relief reserve in the year ended 31 March 2010 relates to the merger relief arising on the issue ofSABMiller plc ordinary shares for the buyout of minority interests in the group’s Polish business.
Further information relating to the share capital, share premium, the treasury shares and the EBT reserve of the company is detailed in notes 25and 26 to the consolidated financial statements of the group. For details of share option schemes please refer to the equity-settled plans in note 25to the consolidated financial statements of the group. Details of dividends paid and proposed for the year are provided in note 9 to the consolidatedfinancial statements of the group.
Overview
Business review
Governance
Financial statem
entsS
hareholder inform
ation
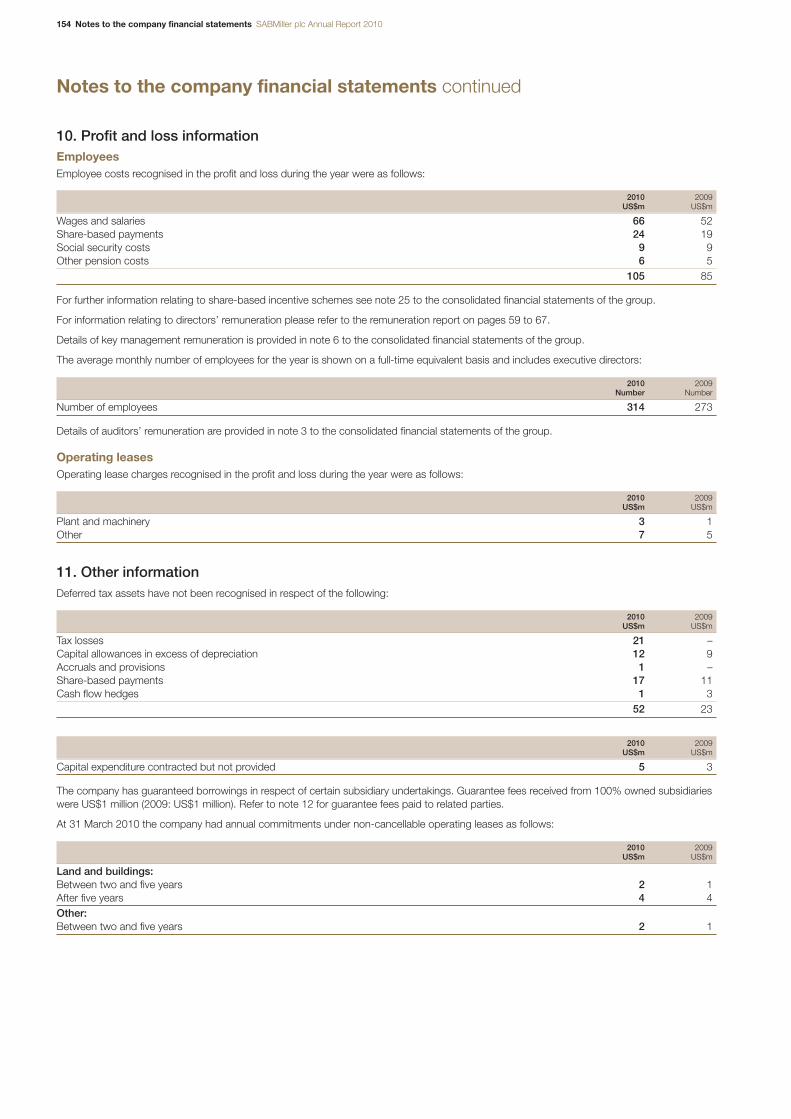
154 Notes to the company financial statements SABMiller plc Annual Report 2010
Notes to the company financial statements continued
10. Profit and loss informationEmployeesEmployee costs recognised in the profit and loss during the year were as follows:
2010 2009US$m US$m
Wages and salaries 66 52Share-based payments 24 19Social security costs 9 9Other pension costs 6 5
105 85
For further information relating to share-based incentive schemes see note 25 to the consolidated financial statements of the group.
For information relating to directors’ remuneration please refer to the remuneration report on pages 59 to 67.
Details of key management remuneration is provided in note 6 to the consolidated financial statements of the group.
The average monthly number of employees for the year is shown on a full-time equivalent basis and includes executive directors:
2010 2009Number Number
Number of employees 314 273
Details of auditors’ remuneration are provided in note 3 to the consolidated financial statements of the group.
Operating leasesOperating lease charges recognised in the profit and loss during the year were as follows:
2010 2009US$m US$m
Plant and machinery 3 1Other 7 5
11. Other informationDeferred tax assets have not been recognised in respect of the following:
2010 2009US$m US$m
Tax losses 21 –Capital allowances in excess of depreciation 12 9Accruals and provisions 1 –Share-based payments 17 11Cash flow hedges 1 3
52 23
2010 2009US$m US$m
Capital expenditure contracted but not provided 5 3
The company has guaranteed borrowings in respect of certain subsidiary undertakings. Guarantee fees received from 100% owned subsidiarieswere US$1 million (2009: US$1 million). Refer to note 12 for guarantee fees paid to related parties.
At 31 March 2010 the company had annual commitments under non-cancellable operating leases as follows:
2010 2009US$m US$m
Land and buildings:Between two and five years 2 1After five years 4 4Other:Between two and five years 2 1
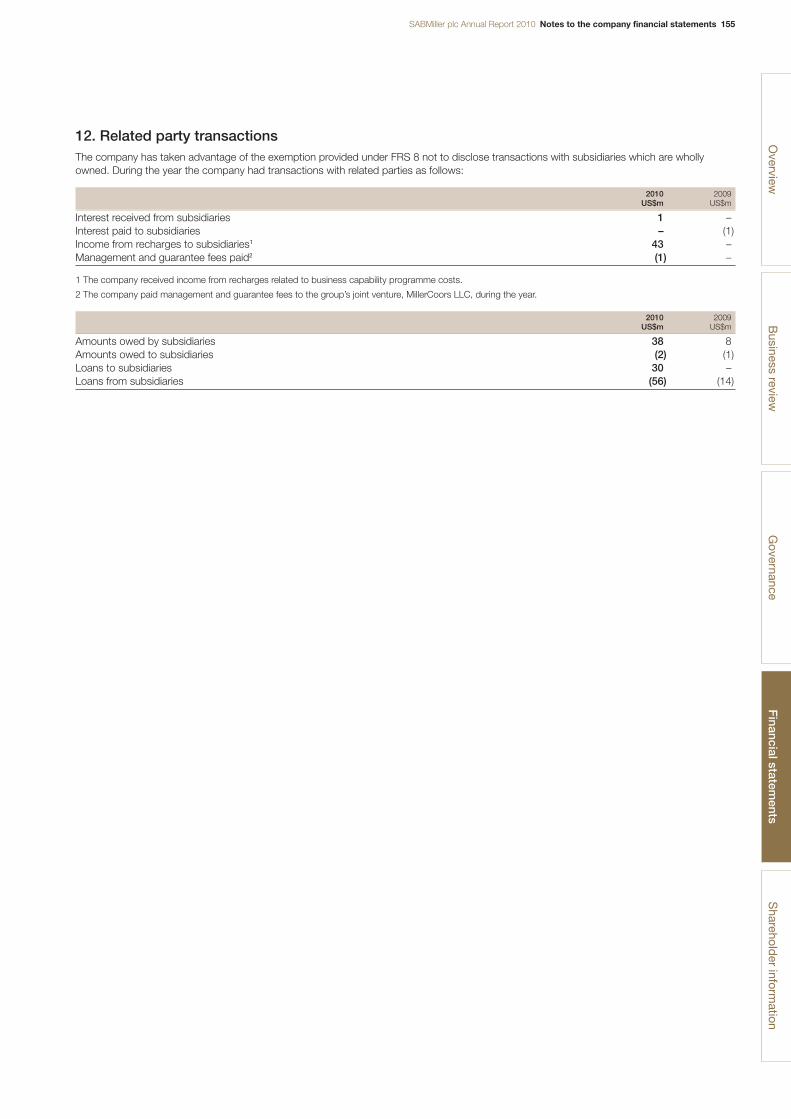
SABMiller plc Annual Report 2010 Notes to the company financial statements 155
12. Related party transactionsThe company has taken advantage of the exemption provided under FRS 8 not to disclose transactions with subsidiaries which are whollyowned. During the year the company had transactions with related parties as follows:
2010 2009US$m US$m
Interest received from subsidiaries 1 –Interest paid to subsidiaries – (1)Income from recharges to subsidiaries1 43 –Management and guarantee fees paid2 (1) –
1 The company received income from recharges related to business capability programme costs.
2 The company paid management and guarantee fees to the group’s joint venture, MillerCoors LLC, during the year.
2010 2009US$m US$m
Amounts owed by subsidiaries 38 8Amounts owed to subsidiaries (2) (1)Loans to subsidiaries 30 –Loans from subsidiaries (56) (14)
Overview
Business review
Governance
Financial statem
entsS
hareholder inform
ation
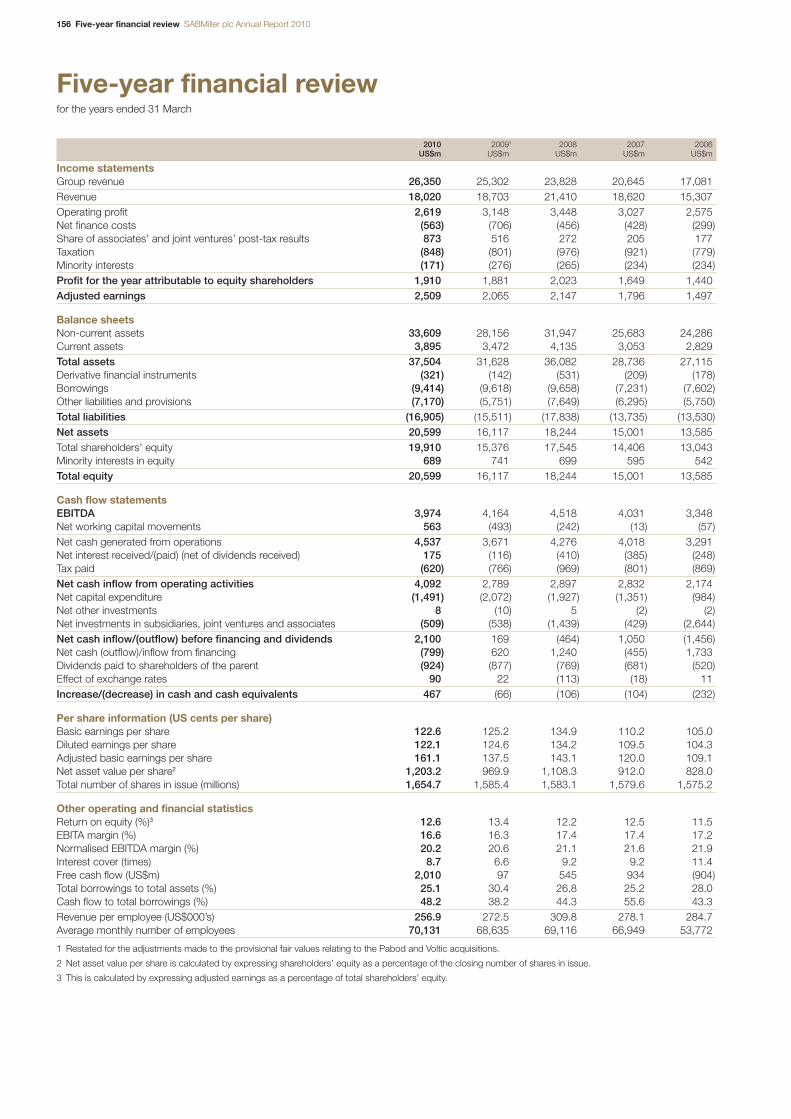
156 Five-year financial review SABMiller plc Annual Report 2010
Five-year financial reviewfor the years ended 31 March
2010 20091 2008 2007 2006US$m US$m US$m US$m US$m
Income statementsGroup revenue 26,350 25,302 23,828 20,645 17,081Revenue 18,020 18,703 21,410 18,620 15,307Operating profit 2,619 3,148 3,448 3,027 2,575Net finance costs (563) (706) (456) (428) (299)Share of associates’ and joint ventures’ post-tax results 873 516 272 205 177Taxation (848) (801) (976) (921) (779)Minority interests (171) (276) (265) (234) (234)Profit for the year attributable to equity shareholders 1,910 1,881 2,023 1,649 1,440Adjusted earnings 2,509 2,065 2,147 1,796 1,497
Balance sheetsNon-current assets 33,609 28,156 31,947 25,683 24,286Current assets 3,895 3,472 4,135 3,053 2,829Total assets 37,504 31,628 36,082 28,736 27,115Derivative financial instruments (321) (142) (531) (209) (178)Borrowings (9,414) (9,618) (9,658) (7,231) (7,602)Other liabilities and provisions (7,170) (5,751) (7,649) (6,295) (5,750)Total liabilities (16,905) (15,511) (17,838) (13,735) (13,530)Net assets 20,599 16,117 18,244 15,001 13,585Total shareholders’ equity 19,910 15,376 17,545 14,406 13,043Minority interests in equity 689 741 699 595 542Total equity 20,599 16,117 18,244 15,001 13,585
Cash flow statementsEBITDA 3,974 4,164 4,518 4,031 3,348Net working capital movements 563 (493) (242) (13) (57)Net cash generated from operations 4,537 3,671 4,276 4,018 3,291Net interest received/(paid) (net of dividends received) 175 (116) (410) (385) (248)Tax paid (620) (766) (969) (801) (869)Net cash inflow from operating activities 4,092 2,789 2,897 2,832 2,174Net capital expenditure (1,491) (2,072) (1,927) (1,351) (984)Net other investments 8 (10) 5 (2) (2)Net investments in subsidiaries, joint ventures and associates (509) (538) (1,439) (429) (2,644)Net cash inflow/(outflow) before financing and dividends 2,100 169 (464) 1,050 (1,456)Net cash (outflow)/inflow from financing (799) 620 1,240 (455) 1,733Dividends paid to shareholders of the parent (924) (877) (769) (681) (520)Effect of exchange rates 90 22 (113) (18) 11Increase/(decrease) in cash and cash equivalents 467 (66) (106) (104) (232)
Per share information (US cents per share)Basic earnings per share 122.6 125.2 134.9 110.2 105.0Diluted earnings per share 122.1 124.6 134.2 109.5 104.3Adjusted basic earnings per share 161.1 137.5 143.1 120.0 109.1Net asset value per share2 1,203.2 969.9 1,108.3 912.0 828.0Total number of shares in issue (millions) 1,654.7 1,585.4 1,583.1 1,579.6 1,575.2
Other operating and financial statisticsReturn on equity (%)3 12.6 13.4 12.2 12.5 11.5EBITA margin (%) 16.6 16.3 17.4 17.4 17.2Normalised EBITDA margin (%) 20.2 20.6 21.1 21.6 21.9Interest cover (times) 8.7 6.6 9.2 9.2 11.4Free cash flow (US$m) 2,010 97 545 934 (904)Total borrowings to total assets (%) 25.1 30.4 26.8 25.2 28.0Cash flow to total borrowings (%) 48.2 38.2 44.3 55.6 43.3Revenue per employee (US$000’s) 256.9 272.5 309.8 278.1 284.7Average monthly number of employees 70,131 68,635 69,116 66,949 53,772
1 Restated for the adjustments made to the provisional fair values relating to the Pabod and Voltic acquisitions.
2 Net asset value per share is calculated by expressing shareholders’ equity as a percentage of the closing number of shares in issue.
3 This is calculated by expressing adjusted earnings as a percentage of total shareholders’ equity.

SABMiller plc Annual Report 2010 Five-year financial review 157
2010 2009 2008 2007 2006US$m US$m US$m US$m US$m
Group revenueSegmental analysisLatin America 5,905 5,495 5,251 4,392 2,165Europe 5,577 6,145 5,248 4,078 3,258North America 5,228 5,227 5,120 4,887 4,912Africa 2,716 2,567 n/a n/a n/aAsia 1,741 1,565 n/a n/a n/a
Africa and Asia 4,457 4,132 3,367 2,674 2,221South Africa:– Beverages 4,777 3,955 4,446 4,274 4,204– Hotels and Gaming 406 348 396 340 321Group 26,350 25,302 23,828 20,645 17,081
Operating profit (excluding share of associates and joint ventures)Segmental analysisLatin America 1,270 1,057 953 810 387Europe 840 900 947 730 567North America 12 230 462 366 454Africa 316 354 n/a n/a n/aAsia (34) (2) n/a n/a n/a
Africa and Asia 282 352 330 272 257South Africa: Beverages 826 704 962 1,043 1,011Corporate (139) (97) (94) (101) (86)Group operating profit – before exceptional items 3,091 3,146 3,560 3,120 2,590
Exceptional (charge)/creditLatin America (156) 45 (61) (64) (11)Europe (202) (452) – (24) –North America – 409 (51) – –Africa (3) – n/a n/a n/aAsia – – n/a n/a n/a
Africa and Asia (3) – – – –South Africa: Beverages (53) – – – –Corporate (58) – – (5) (4)
(472) 2 (112) (93) (15)Group operating profit – after exceptional items 2,619 3,148 3,448 3,027 2,575
EBITASegmental analysisLatin America 1,386 1,173 1,071 915 436Europe 872 944 952 733 569North America 619 581 477 375 454Africa 565 562 n/a n/a n/aAsia 71 80 n/a n/a n/a
Africa and Asia 636 642 568 467 422South Africa:– Beverages 885 764 1,026 1,102 1,062– Hotels and Gaming 122 122 141 100 84Corporate (139) (97) (94) (101) (86)Group 4,381 4,129 4,141 3,591 2,941
Overview
Business review
Governance
Financial statem
entsS
hareholder inform
ation

158 Definitions SABMiller plc Annual Report 2010
Definitions
Financial definitions
Adjusted earningsAdjusted earnings are calculated by adjusting headline earnings (as defined below) for the amortisation of intangible assets (excludingsoftware), integration and restructuring costs, the fair value movementsin relation to capital items for which hedge accounting cannot beapplied and other items which have been treated as exceptional butnot included above or as headline earnings adjustments together withthe group’s share of joint ventures’ and associates’ adjustments forsimilar items. The tax and minority interests in respect of these itemsare also adjusted.
Adjusted net finance costsThis comprises net finance costs excluding fair value movements in relation to capital items for which hedge accounting cannot beapplied and any exceptional finance charges or income.
Adjusted profit before taxThis comprises EBITA less adjusted net finance costs and less thegroup’s share of associates’ and joint ventures’ net finance costs on a similar basis.
Constant currencyConstant currency results have been determined by translating thelocal currency denominated results for the year ended 31 March atthe exchange rates for the prior year.
EBITAThis comprises operating profit before exceptional items, amortisationof intangible assets (excluding software) and includes the group’s shareof associates’ and joint ventures’ operating profit on a similar basis.
EBITA margin (%)This is calculated by expressing EBITA as a percentage of group revenue.
EBITDAThis comprises the net cash generated from operations before workingcapital movements. This includes cash flows relating to exceptionalitems.
EBITDA margin (%)This is calculated by expressing EBITDA as a percentage of revenue.
Effective tax rate (%)The effective tax rate is calculated by expressing tax before tax onexceptional items and on amortisation of intangible assets (excludingsoftware), including the group’s share of associates’ and joint ventures’tax on the same basis, as a percentage of adjusted profit before tax.
Free cash flowThis comprises net cash generated from operating activities less cashpaid for the purchase of property, plant and equipment, intangibleassets and shares from minorities, net investments in associates and joint ventures and dividends paid to minority interests plus cashreceived from the sale of property, plant and equipment and intangibleassets and dividends received.
Group revenueThis comprises revenue together with the group’s share of revenuefrom associates and joint ventures.
Headline earningsHeadline earnings are calculated by adjusting profit for the financialperiod attributable to equity holders of the parent for items inaccordance with the South African Circular 8/2007 entitled ‘HeadlineEarnings’. Such items include impairments of non-current assets andprofits or losses on disposals of non-current assets and their relatedtax and minority interests. This also includes the group’s share ofassociates’ and joint ventures’ adjustments on the same basis.
Interest coverThis is the ratio of normalised EBITDA to adjusted net finance costs.
Net debtThis comprises gross debt (including borrowings, borrowings-relatedderivative financial instruments, overdrafts and finance leases) net ofcash and cash equivalents (excluding overdrafts).
Normalised EBITDAThis comprises EBITDA together with dividends received fromMillerCoors.
Normalised EBITDA marginThis is calculated by expressing normalised EBITDA as a percentageof revenue plus the group’s share of MillerCoors’ revenue.
Organic informationOrganic results and volumes exclude the first 12 months’ results andvolumes relating to acquisitions and the last 12 months’ results andvolumes relating to disposals.
Total Shareholder Return (TSR)TSR is the measure of the returns that a company has provided for its shareholders, reflecting share price movements and assumingreinvestment of dividends.
Sales volumesIn the determination and disclosure of sales volumes, the groupaggregates 100% of the volumes of all consolidated subsidiaries and its equity accounted percentage of all associates’ and jointventures’ volumes. Contract brewing volumes are excluded fromvolumes although revenue from contract brewing is included withingroup revenue. Volumes exclude intra-group sales volumes. Thismeasure of volumes is used for lager volumes, soft drinks volumes,other alcoholic beverage volumes and beverage volumes and is used in the segmental analyses as it more closely aligns with theconsolidated group revenue and EBITA disclosures.
In the determination and disclosure of aggregated sales volumes, thegroup aggregates 100% of the volumes of all consolidated subsidiaries,associated companies and joint ventures. Contract brewing volumesare excluded from aggregated volumes although revenue from contractbrewing is included within group revenue. Aggregated volumes excludeintra-group sales volumes. This measure is used for aggregatedbeverage volumes and for aggregated lager volumes.
SABMiller plc Annual Report 2010 Definitions 159
KPI definitions – How we measure
Total Shareholder Return (TSR) versus median of peer group over three-year periodsTSR performance is measured by taking the percentage growth in our TSR over the three-year period to the date aligned with therelated vesting date of performance share awards for the excom, and deducting the percentage growth in the TSR of the median of our peer group over the same period.
Growth in adjusted earnings per share (EPS) Growth in adjusted EPS is measured by comparing the adjusted EPS for the current year with that of the prior year. Adjusted EPS ismeasured using adjusted earnings divided by the basic number ofshares in issue. Adjusted earnings are measured using the definitionon page 158.
Free cash flow Free cash flow is measured using the definition on page 158.
Proportion of our total lager volume from markets in which wehave No.1 or No.2 national market share positionsLager volumes generated in markets where we have a number one or number two national beer market share position divided by totallager volumes. Lager volumes are measured as defined on page 158.
Proportion of group EBITA from developing and emergingeconomiesEBITA generated in developing and emerging economies divided bygroup EBITA before corporate costs. EBITA is defined on page 158.Developing and emerging economies are as defined by the InternationalMonetary Fund (IMF).
Organic growth in lager volumesOrganic growth in lager volumes is measured by comparing lagervolumes in the year with those in the prior year excluding the effects of acquisitions and disposals (organic information is defined on page158). Lager volumes are measured as defined on page 158.
Group revenue growth (organic, constant currency)Growth in group revenue compared to the prior year is measured on a constant currency basis (as defined on page 158) and excluding theeffects of acquisitions and disposals (organic information is defined onpage 158). Group revenue is defined on page 158.
EBITA growth (organic, constant currency)EBITA growth compared to the prior year is measured on a constantcurrency basis (as defined on page 158) and excluding the effects ofacquisitions and disposals (organic information is defined on page158). EBITA is defined on page 158.
EBITA marginEBITA margin is defined on page 158.
Hectolitres of water used at our breweries per hectolitre of lager producedWater used at our breweries divided by the volume of lager produced.All consolidated subsidiaries are included on a 100% basis together withthe equity accounted percentage share of the MillerCoors joint venture.
Fossil fuel emissions from energy used at our breweries per hectolitre of lager producedFossil fuel emissions are measured by the total amount of carbondioxide (CO2) in kilogrammes generated by our breweries divided by the volume of lager produced. The total amount of CO2 is the sum of direct emissions produced by the combustion of fuel (e.g.coal, oil, gas) and indirect emissions from the use of electricity andsteam. Emissions are calculated using the internationally recognisedWRI/WBCSD Greenhouse Gas Protocol. All consolidated subsidiariesare included on a 100% basis together with the equity accountedpercentage share of the MillerCoors joint venture.
Cumulative financial benefits from our business capability programmeIncremental cash flows generated as a result of the adoption of newprocesses and systems including incremental revenues, reduced costof goods sold and overheads, reduced investment in working capitaland lower cost of capital investments.
KPI explanation of changes The group has reviewed its key performance indicators during the year. As a consequence, a number of new KPIs have beenintroduced and are presented in this Annual Report. The changesreflect an increased focus on cash generation and total shareholderreturn; the implementation of the business capability programme; and the group’s new target for reduction in fossil fuel emissions. They also recognise the importance attached to the group’s positionin developing and emerging markets and to leading market sharepositions in individual country markets. As the reporting of premiumand international premium brand performance is currently underreview, no group KPI has been presented in this Annual Report.
Overview
Business review
Governance
Financial statem
entsS
hareholder inform
ation
160 Definitions SABMiller plc Annual Report 2010
Definitions continued
Non-financial definitions
Combined CodeThe Combined Code on Corporate Governance, published by the UKFinancial Reporting Council.
Economy segmentTaking the leading brand in the most popular pack type as thestandard (=100), brands with a weighted average market price whichfall below an index of 90 form the economy segment. Normally, allbrands in this segment will be local brands.
International brewers indexThe index of International brewers charts the share price progressionof an index of the company’s closest peers in the global brewingindustry – Anheuser-Busch InBev (Anheuser-Busch and InBevincluded separately, until the acquisition of Anheuser-Busch by InBevon 17 November 2008), Carlsberg, Heineken and Molson Coors,relative to 1 April 2005. The index is weighted relative to the marketcapitalisation of the brewers as at 1 April 2005.
Mainstream segmentTaking the leading brand in the most popular pack type as thestandard (=100), the mainstream segment is formed of brands with a weighted average market price which fall into the 90-109 band.Mainstream brands tend to be local.
PETPET is short for polyethylene terephthalate, a form of plastic which is used for bottling alcoholic and non-alcoholic drinks.
Premium segment (worthmore segment in the USA)Taking the leading brand in the most popular pack type as thestandard (=100), brands with a weighted average market price whichhave an index of 110+ form the premium segment. The premiumsegment comprises both local and international brands.
STRATESTRATE stands for Share Transactions Totally Electronic and is an unlisted company owned by JSE Limited and Central SecuritiesDepository Participants (CSDP) and exists to allow share transactionsin South Africa to be settled electronically.
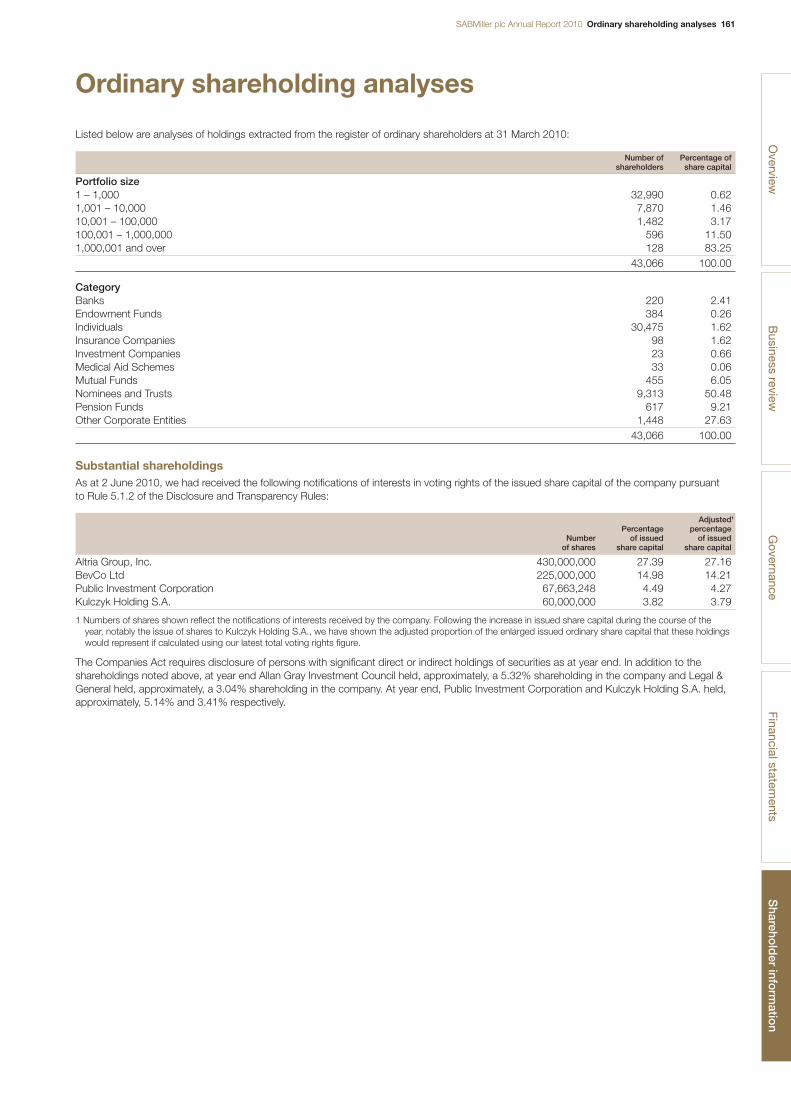
SABMiller plc Annual Report 2010 Ordinary shareholding analyses 161O
verviewB
usiness reviewG
overnanceFinancial statem
entsS
harehold
er inform
ation
Ordinary shareholding analyses
Listed below are analyses of holdings extracted from the register of ordinary shareholders at 31 March 2010:
Number of Percentage ofshareholders share capital
Portfolio size1 – 1,000 32,990 0.621,001 – 10,000 7,870 1.4610,001 – 100,000 1,482 3.17100,001 – 1,000,000 596 11.501,000,001 and over 128 83.25
43,066 100.00
CategoryBanks 220 2.41Endowment Funds 384 0.26Individuals 30,475 1.62Insurance Companies 98 1.62Investment Companies 23 0.66Medical Aid Schemes 33 0.06Mutual Funds 455 6.05Nominees and Trusts 9,313 50.48Pension Funds 617 9.21Other Corporate Entities 1,448 27.63
43,066 100.00
Substantial shareholdingsAs at 2 June 2010, we had received the following notifications of interests in voting rights of the issued share capital of the company pursuant to Rule 5.1.2 of the Disclosure and Transparency Rules:
Adjusted1
Percentage percentageNumber of issued of issued
of shares share capital share capital
Altria Group, Inc. 430,000,000 27.39 27.16BevCo Ltd 225,000,000 14.98 14.21Public Investment Corporation 67,663,248 4.49 4.27Kulczyk Holding S.A. 60,000,000 3.82 3.79
1 Numbers of shares shown reflect the notifications of interests received by the company. Following the increase in issued share capital during the course of the year, notably the issue of shares to Kulczyk Holding S.A., we have shown the adjusted proportion of the enlarged issued ordinary share capital that these holdingswould represent if calculated using our latest total voting rights figure.
The Companies Act requires disclosure of persons with significant direct or indirect holdings of securities as at year end. In addition to theshareholdings noted above, at year end Allan Gray Investment Council held, approximately, a 5.32% shareholding in the company and Legal &General held, approximately, a 3.04% shareholding in the company. At year end, Public Investment Corporation and Kulczyk Holding S.A. held,approximately, 5.14% and 3.41% respectively.
162 Shareholders’ diary SABMiller plc Annual Report 2010
Shareholders’ diary
Financial reporting calendar and annual general meeting
Annual general meeting July
Announcement of interim results, for half-year to September November
Preliminary announcement of annual results May
Annual financial statements published June
Dividends Declared Paid
Ordinary:Interim November DecemberFinal May August
Unsolicited investment advice – warning to shareholdersMany companies have become aware that their shareholders have received unsolicited phone calls or correspondence concerning investmentmatters. These are typically from overseas-based ‘brokers’ who target UK shareholders offering to sell them what often turn out to be worthlessor high risk shares in US or UK investments. They can be very persistent and extremely persuasive. A 2006 survey by the Financial ServicesAuthority (FSA) reported that the average amount lost by investors was around £20,000. It is not just the novice investor that has been duped in this way; many of the victims had been successfully investing for several years. Shareholders are advised to be very wary of any unsolicitedadvice, offers to buy shares at a discount or offers of free reports into the company.
If you receive any unsolicited investment advice:
■ Make sure you get the correct name of the person and organisation.■ Check that they are properly authorised by the FSA before getting involved. You can check at www.fsa.gov.uk/register■ The FSA also maintains on its website a list of unauthorised overseas firms who are targeting, or have targeted, UK investors and any
approach from such organisations should be reported to the FSA so that this list can be kept up to date and any other appropriate action can be considered.
■ Report the matter to the FSA either by calling 0300 500 5000 or by completing an online form at:http://www.moneymadeclear.org.uk/news/scams/share_scams.html
If you deal with an unauthorised firm, you would not be eligible to receive payment under the Financial Services Compensation Scheme.
South African shareholders may report such approaches to the Financial Services Board (FSB) on:
Toll Free: 0800 110443Facsimile: 012 347 0221E-mail: [email protected]
Complete the FSB online complaint form which can be found on their website www.fsb.co.za
SABMiller plc Annual Report 2010 Administration 163O
verviewB
usiness reviewG
overnanceFinancial statem
entsS
harehold
er inform
ation
Administration
SABMiller plc(Registration No. 3528416)
General Counsel and Group Company SecretaryJohn Davidson
Registered officeSABMiller HouseChurch Street WestWokingSurreyGU21 6HSEnglandFacsimile +44 1483 264103Telephone +44 1483 264000
Head officeOne Stanhope GateLondonW1K 1AFEnglandFacsimile +44 20 7659 0111Telephone +44 20 7659 0100
Internet addresswww.sabmiller.com
Investor relationsTelephone +44 20 7659 [email protected]
Sustainable developmentTelephone +44 1483 [email protected]
Independent auditorsPricewaterhouseCoopers LLP1 Embankment PlaceLondonWC2N 6RHEnglandFacsimile +44 20 7822 4652Telephone +44 20 7583 5000
Registrar (United Kingdom)Capita RegistrarsThe Registry34 Beckenham RoadBeckenhamKentBR3 4TUEnglandFacsimile +44 20 8658 2342Telephone +44 20 8639 3399 (outside UK)Telephone 0871 664 0300 (from UK)
(calls cost 10p per minute plusnetwork extras, lines are open 8.30am-5.30pm Mon-Fri)
Registrar (South Africa)Computershare Investor Services (Pty) Ltd70 Marshall StreetJohannesburgPO Box 61051Marshalltown 2107South AfricaFacsimile +27 11 688 5248Telephone +27 11 370 5000
United States ADR depositaryThe Bank of New York MellonShareholder ServicesPO Box 358516Pittsburgh PA 15252-8516USATelephone +1 888 269 2377Telephone +1 888 BNY ADRS (toll freewithin the US)Telephone +1 201 680 6825 (outside US)E-mail: [email protected]
164 Cautionary statement SABMiller plc Annual Report 2010
Cautionary statement
This document does not constitute an offer to sell or issue or the solicitation of an offer to buy or acquire ordinary shares in thecapital of SABMiller plc (the ‘company’) or any other securities of the company in any jurisdiction or an inducement to enter into investment activity.
This document includes ‘forward-looking statements’ with respect to certain of SABMiller plc’s plans, current goals and expectationsrelating to its future financial condition, performance and results.These statements contain the words ‘anticipate’, ‘believe’, ‘intend’,‘estimate’, ‘expect’ and words of similar meaning. All statementsother than statements of historical facts included in this document,including, without limitation, those regarding the company’s financialposition, business strategy, plans and objectives of management for future operations (including development plans and objectivesrelating to the company’s products and services) are forward-lookingstatements. Such forward-looking statements involve known andunknown risks, uncertainties and other important factors that couldcause the actual results, performance or achievements of thecompany to be materially different from future results, performance or achievements expressed or implied by such forward-lookingstatements. Such forward-looking statements are based on numerousassumptions regarding the company’s present and future businessstrategies and the environment in which the company will operate in the future. These forward-looking statements speak only as at the date of this document. The company expressly disclaims anyobligation or undertaking to disseminate any updates or revisions to any forward-looking statements contained herein to reflect anychange in the company’s expectations with regard thereto or anychange in events, conditions or circumstances on which any suchstatement is based. The past business and financial performance of SABMiller plc is not to be relied on as an indication of its futureperformance.

This paper is made from 100% post-consumer recycled fibre. It has been certified according to the rules of the Forest StewardshipCouncil (FSC) and it is produced at a mill that is certified to the ISO 14001 environmental management standards, through a totallychlorine free process (TCF). The inks used are all vegetable oil based.
Printed by The Pureprint Group, ISO 14001, FSC certified andCarbonNeutral®
Designed by Likemind www.likemind.com
Cert no. SGS-COC-0620
SA
BM
iller plc A
nnual Rep
ort 2010
Annual ReportSABMiller plc Annual Report 2010
Annual Report 2010This report is also available on our website,go to www.sabmiller.com/annualreport
Sustainable Development Report 2010This report is available on our website, go to www.sabmiller.com/sdreporting
www.sabmiller.comFor more information on the group andlatest news, go to www.sabmiller.com