Embed Size (px)
Citation preview
Private equity
Gresham Private Equity Co-Investment Fund arsn 109 573 015
Annual Report 2011
2 Gresham Private Equity Co-Investment Fund
Contents
Letter from the Chairman 1Review of Operations 2Noel Leeming Group Limited 4 GEON 5Witchery 6Barminco 7Anthology 8Silk Logistics Group 9Financial Report 11Directory 28

Gresham Private Equity Co-Investment Fund 1
September 2011
Dear Unitholder,
Enclosed is the Annual Report for the Gresham Private Equity Co-investment Fund (“the Fund”) for the financial year ended 30 June 2011.
Since our last report, the Fund has faced significant headwinds associated with the continued volatility in global financial markets. This volatility has frustrated attempts to achieve further realisations from the portfolio and, given its impact on consumer confidence, has negatively impacted the operating performance of some of the investee businesses.
Throughout this difficult trading period, the Fund’s management remained focused on developing and implementing initiatives aimed at protecting the value which has been embedded in the portfolio since acquisition, and positioning each of the investments appropriately for a return to a more stable economic climate.
As for previous reports, Gresham has valued each of the portfolio companies in line with the guidelines developed by the Australian Venture Capital Association Limited (“AVCAL”). These guidelines provide an assessment of the Fair Value of the Fund’s assets primarily by reference to the valuations of comparable listed entities.
Throughout the year these valuations were impacted by persistent volatility in public markets which, along with the declining market and operating environments in some key sectors, were the primary contributors to the decrease in Net Assets Attributable to Unitholders for the full year.
At 30 June 2011, 95 cents per unit had been called, of which 15 cents per unit had been returned through the exit of APPP, resulting in a net cash investment of 80 cents per unit. The Net Assets Attributable to Unitholders, for this amount, based on the Fair Value methodology mentioned above was 71 cents per unit at year end.
The gross Internal Rate of Return (“IRR”) on the Fund’s Investment Portfolio is 5.2% per annum since inception. The net IRR, which takes into consideration the timing of calls and distributions to Unitholders, along with payment of fees associated with managing the Fund and its investments for the same period is, -2.4% per annum.
An overview of the business activities of the portfolio companies is set out in this report, and as in previous years we will hold a series of investor information meetings during October to provide an update on the Fund’s operations.
Details of these meetings, which will again be held in Sydney, Brisbane, Melbourne and Perth are available on the Gresham Private Equity Website, www.gresham.com.au/co-invest-fund-login/
If you would like to attend, or require additional information regarding the meetings, please do not hesitate to contact Kate Ashton, either by email at [email protected] or by phone on (02) 9221 5133.
James P Graham AMChairmanGresham Funds Management Limited
Letter from the Chairman

2 Gresham Private Equity Co-Investment Fund
Fund Overview and Portfolio DevelopmentSince the inception of the Fund, Gresham Private Equity Limited (“the Manager”) has invested $86.46 million of the Fund’s capital into a portfolio of seven companies which provide Unitholders with exposure to a broad range of industries in both Australia and New Zealand.
In building this portfolio the Manager has identified investments which it believes will be responsive to a strategy of active engagement focused on delivering a fundamental transformation in business performance over time.
Following the exit of the Fund’s investment in APPP in 2008 a total of six portfolio companies remain, each of these is exposed to different markets, with generally different market dynamics and each of the portfolio companies is in a different stage of its development.
Over the short to medium term the key focus of the Fund’s Management will be to continue to prepare the Fund’s more mature assets for exit when the market conditions are conducive to realisation of the value which has been generated since the initial investments were made.
Management TeamAs noted above, Gresham is an active manager of the Fund and its portfolio companies, and is extremely focused on identifying talented executives and cohesive, incentivised management teams for each of the investee businesses.
During the year a number of senior executive appointments were made across each of the portfolio companies to both strengthen the performance of existing management, and to provide a platform for future growth.
At the Manager level, a number of changes were made to the investment team during the year. The most significant of which followed a review of the Gresham Private Equity business which resulted in the departure of Roy McKelvie and the appointment of Mark Rimmer and Mark Youens as joint heads of Private Equity.
Outlook and StrategyThe Manager believes that the current turmoil in global financial markets will persist for the short to medium term and that this will continue to result in fluctuations in asset valuations. As noted above, the primary strategy remains to manage each of the portfolio companies to ensure they are best placed to capitalise on a return to more stable market conditions, and to ensure that each of the investee companies is appropriately positioned for exit, with formal processes put in place with respect to Witchery and Mimco.
Mark Rimmer Mark Youens Joint Head Joint Head Gresham Private Gresham Private Equity Limited Equity Limited
Review of Operations
Gresham Private Equity Co-Investment Fund 3
{..Management will continue to prepare the Fund’s more mature assets for exit when the market conditions are conducive to the realisation of the value which has been generated since the initial investments were made.. }
4 Gresham Private Equity Co-Investment Fund
year in review
2011 was another challenging year for the New Zealand economy with a significant slow down in discretionary spend after the GST increase in October and challenging operating conditions in the aftermath of the Christchurch Earthquakes.
Despite the continued difficult trading environment, Noel Leeming continued to profitably grow its revenue and strengthen its position as New Zealand’s market leading appliance retailer, and over the year increased its market share from 23% to 27% with sales increasing by 9.4% year-on-year.
Management’s ongoing program of business improvement initiatives again underpinned the improved result and in particular delivered strong like-for-like sales growth, improved staff training, a 5% increase in customer traffic, improved stockturn, and an 80% growth in the commercial sales division.
Store development also contributed to growth with eight store refurbishments and two new Noel Leeming stores which opened in strategic rural catchments during the year. Rebranding of two Bond+Bond stores to Noel Leeming was also completed in order to optimise the Group’s retail footprint in provincial locations.
In addition the Group continued its cost reduction program with savings coming from store occupancy, marketing production and telephony costs.
Two key longer term initiatives were launched during the year, Tech Solutions and Noel Leeming Lifestyle Appliances. The mobile Tech Solutions team provide a range of in-home installation and technical services which have proved to be very popular for computer and audio visual customers. Lifestyle Appliances is a new trial format that targets the high-end kitchen and laundry market.
ChristChurCh earthquakes
The Noel Leeming Group is fortunate that none of its staff was injured in the Christchurch earthquakes, although many of its staff are living and working in difficult circumstances, and they deserve special recognition for their positive response during such trying times.
The management team is pleased to report that the Group’s Christchurch stores have delivered outstanding results in the months following the quake and continue to do so.
the year ahead
While the NZ economy continues to be fragile there are modest signs of recovery in the appliance market and the Group will continue to build on the gains achieved over the past two years to position for further growth as the economy improves.
Noel Leeming Group’s performance has continued the positive trend from last year with results ahead of budget and market share further strengthening to 28%.
Bank financing was recently successfully renewed until December 2013, providing a solid platform for the improvements planned by the management team.
New initiatives include specific strategies to grow key categories strengthening the Group’s dominant position in smartphones and high end TV’s, evolution of the best practice and high volume store programs, improving margin and inventory management, optimisation of new telephony infrastructure, implementation of an automated advertising production system, along with several supply chain initiatives.
Continuing on from last year’s successes we will be opening three new stores in key rural catchments, expanding the Commercial sales division into government and larger key accounts, increasing the geographic coverage of the Tech Solutions offer and evaluating and fine tuning the Lifestyles Appliances trial.
Many of our initiatives have been designed to improve the customer focus of the company and this will remain a critical focus into the future.
The Rugby World Cup will provide a significant opportunity to grow sales in the Audio Visual category and the Group has observed a significant uplift with the two strongest months yet to come.
Whilst management continues to be cautious about growth in consumer demand and aggressive competitor activity, it believes the investments made in the team, improvements to the in-store experience, and ongoing focus on business optimisation will continue to deliver profitable growth over the coming year.
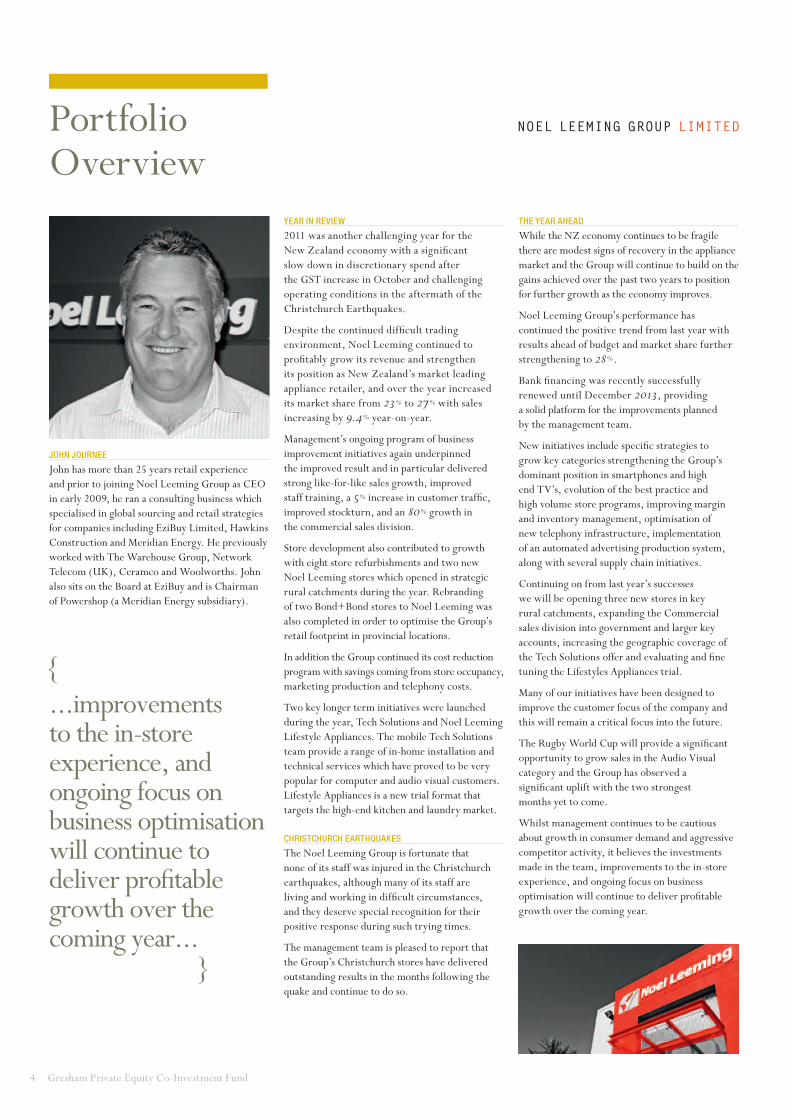
John Journee
John has more than 25 years retail experience and prior to joining Noel Leeming Group as CEO in early 2009, he ran a consulting business which specialised in global sourcing and retail strategies for companies including EziBuy Limited, Hawkins Construction and Meridian Energy. He previously worked with The Warehouse Group, Network Telecom (UK), Ceramco and Woolworths. John also sits on the Board at EziBuy and is Chairman of Powershop (a Meridian Energy subsidiary).
Portfolio Overview
{...improvements to the in-store experience, and ongoing focus on business optimisation will continue to deliver profitable growth over the coming year... }

Gresham Private Equity Co-Investment Fund 5
year in review
The printing industry continued to be challenging during the year with offset volumes contracting and continuing pricing volatility and margin pressure experienced across the industry.
Notwithstanding this, GEON’s revenue continued to diversify during the year with expansion of services into its key growth areas - Mail, Design and Digital print. Expanding this service offering has retained existing and attracted new clients.
GEON has significantly expanded its digital capability and reach with new technology implemented in Sydney, Perth, Auckland, Melbourne and Cairns.
During the year, GEON significantly increased its sales force with product specialisation and geographic expansion the main focus areas. This delivered significant benefits with new product areas posting above plan sales and geographic expansion performing largely to plan.
GEON has successfully secured a significant amount in new business in the past 12 months, gaining market share in the process.
Trading for the first seven months of the year was on plan but fell away during the latter part of the year, partly due to the natural disasters (Queensland floods and cyclone, and Christchurch earthquakes) and the tightening of economic conditions, particularly in New Zealand. Whilst the overall performance was below plan, the business posted growth in both revenue and EBITDA over the prior year.
GEON completed a significant restructure of its debt facilities during the year, with its bankers providing a significant reduction to its debt obligations and an extension of its facilities through to 2015.
outlook
GEON expects the industry outlook to stabilise with a slightly declining offset print market overall and growth in non offset print product segments.
GEON’s focus in the year ahead is a continued drive towards operational excellence with the ongoing development of products and services in non offset print categories and through further investment in technology. In addition, cost reduction initiatives will continue to lower the cost-to-serve structure of the business and improve profitability.
Graham morGan, Chief exeCutive offiCer
Graham joined the GEON Group in October 2006 as the Chief Operating Officer and was promoted to Chief Executive Officer in February 2008.
Graham has over 28 years international general management experience across a number of industries. His roles have included Group Operations Director, Regionals for Trinity Mirror Plc, the largest publisher in the UK and Managing Director for the Huddersfield Examiner, where he successfully led the growth strategy for the region.
Portfolio Overview
{GEON’s focus in the year ahead is a continued drive towards operational excellence through the ongoing development of products and services in non offset print categories and through further investment in technology... }

6 Gresham Private Equity Co-Investment Fund
Witchery’s partnership with David Jones was solidified with the signing of a further five year exclusivity agreement which included the launch of WitcheryMan into eight of David Jones’ top stores.
Store rollout has also continued for both brands with Witchery opening 17 and Mimco opening 11 new stores across Australia and NZ during the year and both brands selectively relocating and upsizing stores.
Over this period Witchery Group has also focused on growing and nurturing its connection to its customer base. The Witchery loyalty program has proven to be a valuable marketing channel as well as a key tool for delivering insight into customer behaviour. The number of Witchery loyalty members has grown from 100,000 to 280,000. Mimco, in parallel, has grown its online subscriber base from 100,000 to 130,000 and is scheduled to launch its own loyalty program in late 2011.
Online and social media continue to be fundamental to the Group’s multi-channel sales and marketing strategy with Group online sales growing by over 30% versus last year and Facebook followers hitting 100,000.
the year ahead
While market conditions are expected to remain subdued, at least for the first half of FY2012, Witchery Group continues to have a number of initiatives underway to deliver business growth.
New store rollout is planned to continue with 13 new Witchery stores planned for the year across Australia and New Zealand.
In addition WitcheryKids will have its first full year of trade and continue its rollout to new locations as they become available. WitcheryMan is also expected to continue its like-for-like growth with material margin improvement coming through as the range improves based on learnings from previous seasons.
Mimco has six new locations planned across Australia and New Zealand. In addition Mimco is preparing for launch in a new category expansion under the banner of MimPrecious. This taps into a new market for precious metal jewellery which Mimco currently does not access.
Overall the Group continues to be in a strong position to manage trading risk and to be able to capitalise on a series of growth opportunities over the next 12 months.
iain nairn
Iain Nairn has more than 33 years experience in the retail industry. His previous positions have given him exposure to almost all operational roles within complex brands and retail business.
Commencing his career in the UK with Next, Iain has held senior management roles with the Burton Group and River Island, directorships at QS plc and as Joint Chief Operating Officer for the Laura Ashley Group globally.
year in review
This last year has proven to be another challenging period for discretionary retail. Weak underlying consumer demand saw the total clothing market shrink year-on-year with continued emphasis on discounting as retailers battled for share in a declining market.
Against this backdrop Witchery Group continued its growth trajectory driven predominantly through two very strong seasons at Mimco and the expansion of the Witchery brand into WitcheryKids.
The Mimco brand capitalised on recent investment in new categories including Footwear and Sunglasses as well as strong styling across its core range to deliver double digit like-for-like growth across its store portfolio.
The Witchery brand launched WitcheryKids in September 2010. Initially as a trial in 23 locations the WitcheryKids offer is now represented in over 100 locations and provided a good stimulus for like-for-like growth across the Witchery store portfolio in the second half of the year.
In addition, Witchery has continued its testing of international markets commencing operations in South Africa in December 2010 through a concession model with Stuttafords (a leading South African department store).
Portfolio Overview
{...Witchery Group continues to have a number of initiatives underway to deliver business growth. }

Gresham Private Equity Co-Investment Fund 7
neil warburton
Neil Warburton has been the CEO of Barminco since the Fund’s investment in August 2007. Prior to taking the CEO role, he was the General Manager of Western Australian operations, which account for the majority of Barminco’s earnings.
Prior to joining Barminco in 2001, Neil was Managing Director of Coolgardie Gold, a publicly listed gold producer, and worked for Western Mining Corporation at Kambalda in the 1980’s. He has been in the mining industry for over 30 years and qualified as a mining engineer at the West Australian School of Mines.
year in review
Barminco (excluding contribution from African Underground Mining Services “AUMS”) demonstrated increased revenue and stable earnings performance during the year.
Increased revenue was driven by ongoing recovery in metal prices driving expansion at existing sites, reopening of mines closed during the Global Financial Crisis and activities at new underground mines commencing.
During the year, Barminco won several new contracts including development only mining contracts at The Mount (Focus Minerals owned gold mine) and Wallaby and Rubicon (Barrick Gold owned/operated gold mine assets), as well as development and production mining contracts won at Mt Gordon (Aditya Birla owned Queensland copper mine) and at Spotted Quoll (Western Areas’ owned nickel mine).
The Yalea development mining contract at the Randgold Resources owned Loulo gold mine in Mali was won through Barminco’s West African 50% joint venture, AUMS.
In 2011, Barminco was awarded the largest contract in its 21 year history with the five year contract renewal (with potential three year extension) of its contract with AngloGold Ashanti Australia to deliver underground mining services at Sunrise Dam, Western Australia. This contract is estimated to be worth $500 million.
Contracts which expired or Barminco failed to renew during the year were the Mt Lyell and Paulsens contracts.
Australian government initiatives such as the Resource Super Profits Tax and the Carbon Tax caused only minor impact on domestic sales.
the year ahead
Subject to satisfactory results from the current strategic review, management expects to see improved profits for 2012 through the full year contribution of new contract wins in 2011 (totalling $800 million) and through improved margins and revenue from AUMS as this business continues to mature and select projects expand from development into the production phase.
Management is seeing a flattening of tendering activity in domestic markets further to the cessation of exploration activity during the Global Financial Crisis and the immediate uplift in activity pursuant to the reopening of mines closed during the Global Financial Crisis.
AUMS has a very healthy pipeline of new projects and expanding current projects in a captive market. The funding and support that Barminco provides AUMS will be commensurate with the opportunities available to it and the relatively higher margins this market offers.
Management is confident that Barminco is well positioned to win its share of new work when projects come online.
Portfolio Overview
{…Management is confident that Barminco is well positioned to win its share of new work when projects come online. }
8 Gresham Private Equity Co-Investment Fund
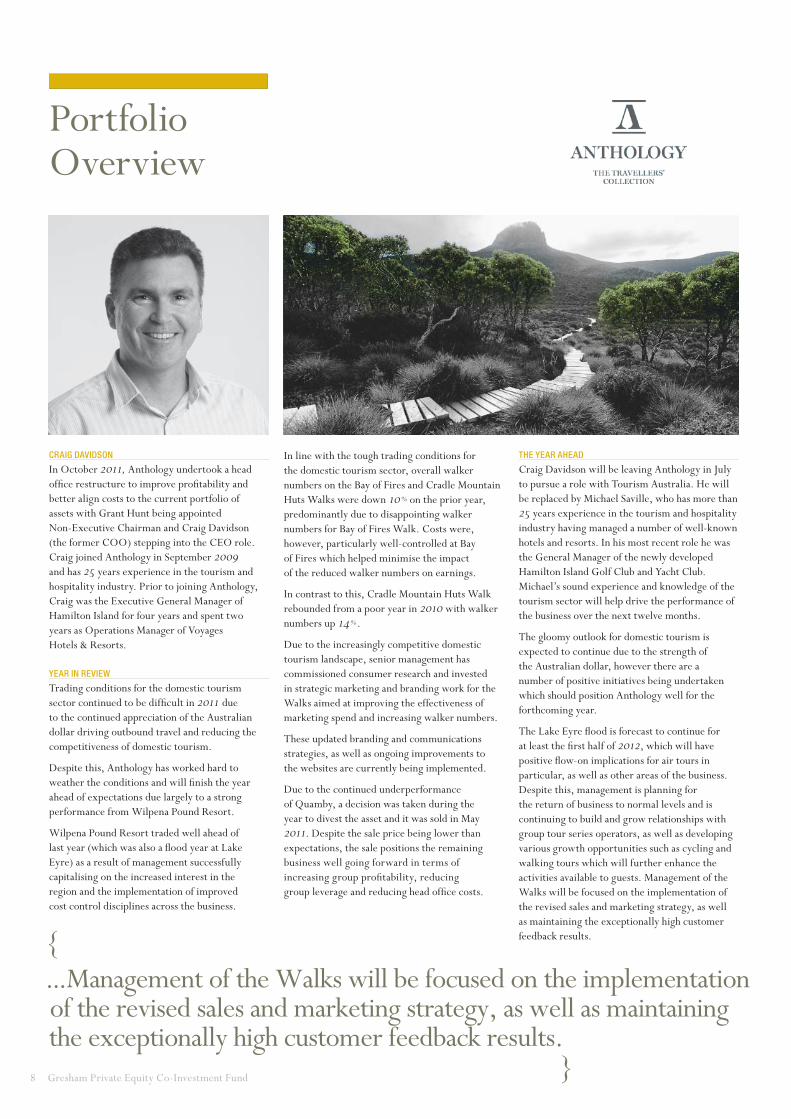
CraiG davidson
In October 2011, Anthology undertook a head office restructure to improve profitability and better align costs to the current portfolio of assets with Grant Hunt being appointed Non-Executive Chairman and Craig Davidson (the former COO) stepping into the CEO role. Craig joined Anthology in September 2009 and has 25 years experience in the tourism and hospitality industry. Prior to joining Anthology, Craig was the Executive General Manager of Hamilton Island for four years and spent two years as Operations Manager of Voyages Hotels & Resorts.
year in review
Trading conditions for the domestic tourism sector continued to be difficult in 2011 due to the continued appreciation of the Australian dollar driving outbound travel and reducing the competitiveness of domestic tourism.
Despite this, Anthology has worked hard to weather the conditions and will finish the year ahead of expectations due largely to a strong performance from Wilpena Pound Resort.
Wilpena Pound Resort traded well ahead of last year (which was also a flood year at Lake Eyre) as a result of management successfully capitalising on the increased interest in the region and the implementation of improved cost control disciplines across the business.
In line with the tough trading conditions for the domestic tourism sector, overall walker numbers on the Bay of Fires and Cradle Mountain Huts Walks were down 10% on the prior year, predominantly due to disappointing walker numbers for Bay of Fires Walk. Costs were, however, particularly well-controlled at Bay of Fires which helped minimise the impact of the reduced walker numbers on earnings.
In contrast to this, Cradle Mountain Huts Walk rebounded from a poor year in 2010 with walker numbers up 14%.
Due to the increasingly competitive domestic tourism landscape, senior management has commissioned consumer research and invested in strategic marketing and branding work for the Walks aimed at improving the effectiveness of marketing spend and increasing walker numbers.
These updated branding and communications strategies, as well as ongoing improvements to the websites are currently being implemented.
Due to the continued underperformance of Quamby, a decision was taken during the year to divest the asset and it was sold in May 2011. Despite the sale price being lower than expectations, the sale positions the remaining business well going forward in terms of increasing group profitability, reducing group leverage and reducing head office costs.
the year ahead
Craig Davidson will be leaving Anthology in July to pursue a role with Tourism Australia. He will be replaced by Michael Saville, who has more than 25 years experience in the tourism and hospitality industry having managed a number of well-known hotels and resorts. In his most recent role he was the General Manager of the newly developed Hamilton Island Golf Club and Yacht Club. Michael’s sound experience and knowledge of the tourism sector will help drive the performance of the business over the next twelve months.
The gloomy outlook for domestic tourism is expected to continue due to the strength of the Australian dollar, however there are a number of positive initiatives being undertaken which should position Anthology well for the forthcoming year.
The Lake Eyre flood is forecast to continue for at least the first half of 2012, which will have positive flow-on implications for air tours in particular, as well as other areas of the business. Despite this, management is planning for the return of business to normal levels and is continuing to build and grow relationships with group tour series operators, as well as developing various growth opportunities such as cycling and walking tours which will further enhance the activities available to guests. Management of the Walks will be focused on the implementation of the revised sales and marketing strategy, as well as maintaining the exceptionally high customer feedback results.
Portfolio Overview
{...Management of the Walks will be focused on the implementation of the revised sales and marketing strategy, as well as maintaining the exceptionally high customer feedback results. }

Gresham Private Equity Co-Investment Fund 9
John dixon
John Dixon was appointed as CEO of Silk Logistics Group in April 2010. John was previously COO/Executive Director of ASX listed Skilled Group Limited, prior to which he spent over 25 years in the logistics sector in senior executive or executive director roles with Patrick Corporation, Linfox and TNT.
year in review
Trading conditions across the transport and logistics sector continued to be difficult in 2011 primarily due to the ongoing weakness in domestic retail and manufacturing sectors, as well as disruption caused by flooding of major highways.
Domestic container port volumes (an indicator of freight volumes) remained subdued, especially during the second half of the year which increased spare capacity in the market and exerted pressure on pricing due to increased competition between second tier operators.
Despite the challenging industry conditions, Silk increased revenue by 9% due to the conversion of its business development pipeline. However, the business has not effectively recovered cost increases in its existing customer base (particularly labour, fleet and subcontractor costs) resulting in a decline in profitability.
The poor trading resulted in the Group breaching its banking covenants in the year. Following an Investigative Accountant’s report on the performance and trading prospects of the business, the Group has secured the continuing support of the banking syndicate with increased performance monitoring requirements.
In response, management has engaged external consultants to help accelerate the implementation of profit improvement initiatives.
the year ahead
Silk’s focus for the year ahead will be to recover costs and margins that have been severely impacted during the economic downturn. The forecast uplift in earnings for the forthcoming year will be driven by the implementation of group-wide profit improvement initiatives and recent rate rises.
The Group’s senior management team will also continue to work on the new business pipeline which has reaped some encouraging results over the last 12 months.
Portfolio Overview
{...the management team will continue to work on the new business pipeline which has reaped some encouraging results over the last 12 months. }
10 Gresham Private Equity Co-Investment Fund Gresham Private Equity Co-Investment Fund 10
{...During the year, the manager has been investigating realisation opportunities for certain of the Fund’s existing businesses, and expects to continue to explore opportunities if deemed in the interests of unitholders... }
Gresham Private Equity Co-Investment Fund 11
direCtors’ rePort
The directors of Gresham Funds Management Limited (the “Company”), the Responsible Entity of the Gresham Private Equity Co-Investment Fund (the “Fund”), submit their report together with the financial report of the Fund for the financial year ended 30 June 2011.
direCtors
The following persons held office as directors of the Company during the financial year and since the end of the financial year and up to the date of this report, unless noted otherwise:
James P Graham AM (Chairman)
Roger S Casey (Deputy Chairman)
Mark J Rimmer (Joint Head of Private Equity, appointed 26 October 2010)
Mark R Youens (Joint Head of Private Equity, appointed 26 October 2010)
Terence J Bowen
Antony G Breuer
Richard J B Goyder
Neil R Sutton (appointed 26 October 2010)
Timothy J Bult (alternate for Terence J Bowen and Richard B Goyder, appointed 21 February 2011)
Roy D McKelvie (ceased 26 October 2010)
Graham J Rich (ceased 31 December 2010)
PrinCiPal aCtivities
The Fund’s objective is to pursue investments in a wide range of companies predominantly in Australia and New Zealand, in conjunction with the institutional Gresham Private Equity Funds No. 2a and No. 2b. The investments have been in unlisted opportunities. The Fund seeks to exit through trade sales, secondary buy-outs or Initial Public Offerings. There have been no significant changes in the nature of the Fund’s activities.
review of oPerations
The Fund has completed its major investment activity other than continue to support Follow-on Investments in existing businesses. During the year, the manager has been investigating realisation opportunities for certain of the Fund’s existing businesses, and expects to continue to explore opportunities if deemed in the interests of Unitholders.
As at 30 June 2011, Unitholders had invested 95 cents per unit in the Fund and received a cash distribution of 15 cents per unit, resulting in a net cash investment in the Fund of 80 cents per unit. As at 30 June 2011, the net assets of the Fund had an assessed carrying value of 71 cents per unit, however the ultimate financial outcome will reflect the underlying business and market conditions at the time of investment realisations.
For the financial year ended 30 June 2011, the net operating loss before financing costs attributable to Unitholders was $23,726,729 (2010: net operating profit $23,799,592), reflecting an overall downwards revaluation of the Fund’s investments and after taking account of management and operating expenses of the Fund. The valuation methodology used by the Manager in determining this result is in accordance with Australian and international standards for Private Equity. This methodology reflects the fact that portfolio companies are long-term, illiquid investments. The Manager’s focus is on delivering ultimate capital returns to Unitholders arising from the progressive sale of the underlying portfolio companies over the Fund’s life.
distributions
No distributions have been paid or are payable for the year ended 30 June 2011 (2010: $nil).
siGnifiCant ChanGes
In the opinion of the directors, there were no significant changes in the state of affairs of the Fund that occurred during the financial year under review not otherwise disclosed in this report and financial statements.
matters subsequent to balanCe date.
Except as disclosed in the financial report, no matters or circumstances have arisen since 30 June 2011 that have significantly affected or may significantly affect:
• the operations of the Fund in future financial years; or
• the results of those operations in future financial years; or
• the state of affairs of the Fund in future financial years.
likely develoPments and exPeCted results
of oPerations
There are no material changes proposed for the operation of the Fund and its investment philosophy.
value of assets
The carrying value of the Fund’s net assets attributable to Unitholders at 30 June 2011 was $72,615,424 (2010: $96,342,153) which is derived using the bases set out in Note 1 to the financial statements.
indemnifiCation and insuranCe of offiCers
and auditor
During the financial year, no insurance premiums were paid out of the Fund in respect of any insurance cover relating to the Responsible Entity or the auditor. So long as the officers of the Responsible Entity act in accordance with the Fund’s Constitution and the law, they will remain fully indemnified out of the assets of the Fund against any losses incurred whilst acting on behalf of the Fund. There is no indemnification of the auditor of the Fund out of the assets of the Fund.
Financial Report
12 Gresham Private Equity Co-Investment Fund
direCtors’ rePort (Continued)
fees Paid to and interests held in the fund by the resPonsible entity or its assoCiates
Note 11 sets out the fees paid to and interests held in the Fund by the Responsible Entity or its associates.
environmental reGulation
The activities of the Fund itself are not subject to any particular or significant environmental regulations under a Commonwealth, State or Territory law.
auditor’s indePendenCe deClaration
A copy of the Auditor’s Independence Declaration as required under Section 307 of the Corporations Act 2001 is set out on page 13.
This report is made out in accordance with a resolution of the directors.
James P Graham AMChairmanSydney, 27 July 2011
{…focus is on delivering capital returns from the progressive sale of the portfolio companies over the Fund’s life… }
Gresham Private Equity Co-Investment Fund 13
auditor’s indePendenCe deClaration
As lead auditor for the audit of Gresham Private Equity Co-Investment Fund for the year ended 30 June 2011, I declare that to the best of my knowledge and belief, there have been:
a) no contraventions of the auditor independence requirements of the Corporations Act 2001 in relation to the audit; and
b) no contraventions of any applicable code of professional conduct in relation to the audit.
This declaration is in respect of Gresham Private Equity Co-Investment Fund during the period.
S J Hadfield Partner PricewaterhouseCoopers Sydney, 27 July 2011
PricewaterhouseCoopers, ABN 52 780 433 757 Darling Park Tower 2, 201 Sussex Street, GPO BOX 2650, SYDNEY NSW 1171 DX 77 Sydney, Australia T +61 2 8266 0000, F +61 2 8266 9999, www.pwc.com.au Liability limited by a scheme approved under Professional Standards Legislation
PricewaterhouseCoopers, ABN 52 780 433 757 Darling Park Tower 2, 201 Sussex Street, GPO BOX 2650, SYDNEY NSW 1171 DX 77 Sydney, Australia T +61 2 8266 0000, F +61 2 8266 9999, www.pwc.com.au Liability limited by a scheme approved under Professional Standards Legislation
Auditor’s Independence Declaration
14 Gresham Private Equity Co-Investment Fund
Note 2011 2010
$ $
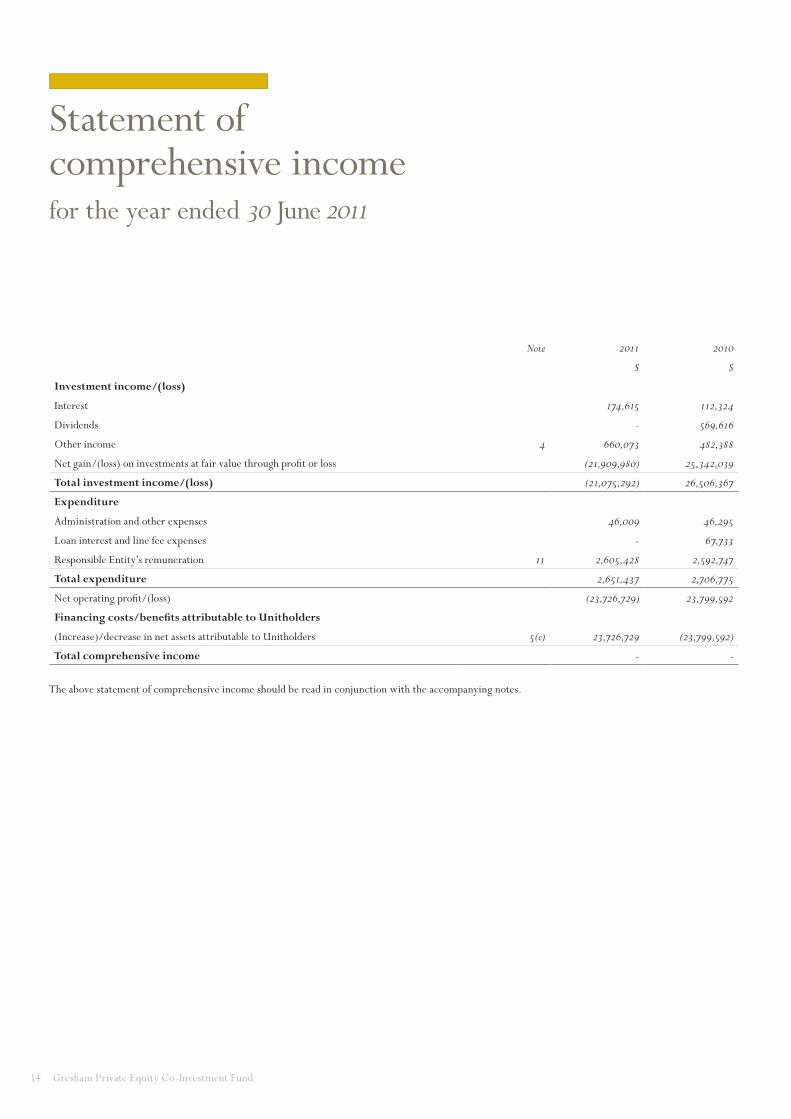
Investment income/(loss)
Interest 174,615 112,324
Dividends - 569,616
Other income 4 660,073 482,388
Net gain/(loss) on investments at fair value through profit or loss (21,909,980) 25,342,039
Total investment income/(loss) (21,075,292) 26,506,367
Expenditure
Administration and other expenses 46,009 46,295
Loan interest and line fee expenses - 67,733
Responsible Entity’s remuneration 11 2,605,428 2,592,747
Total expenditure 2,651,437 2,706,775
Net operating profit/(loss) (23,726,729) 23,799,592
Financing costs/benefits attributable to Unitholders
(Increase)/decrease in net assets attributable to Unitholders 5(c) 23,726,729 (23,799,592)
Total comprehensive income - -
The above statement of comprehensive income should be read in conjunction with the accompanying notes.
Statement of comprehensive incomefor the year ended 30 June 2011
Gresham Private Equity Co-Investment Fund 15
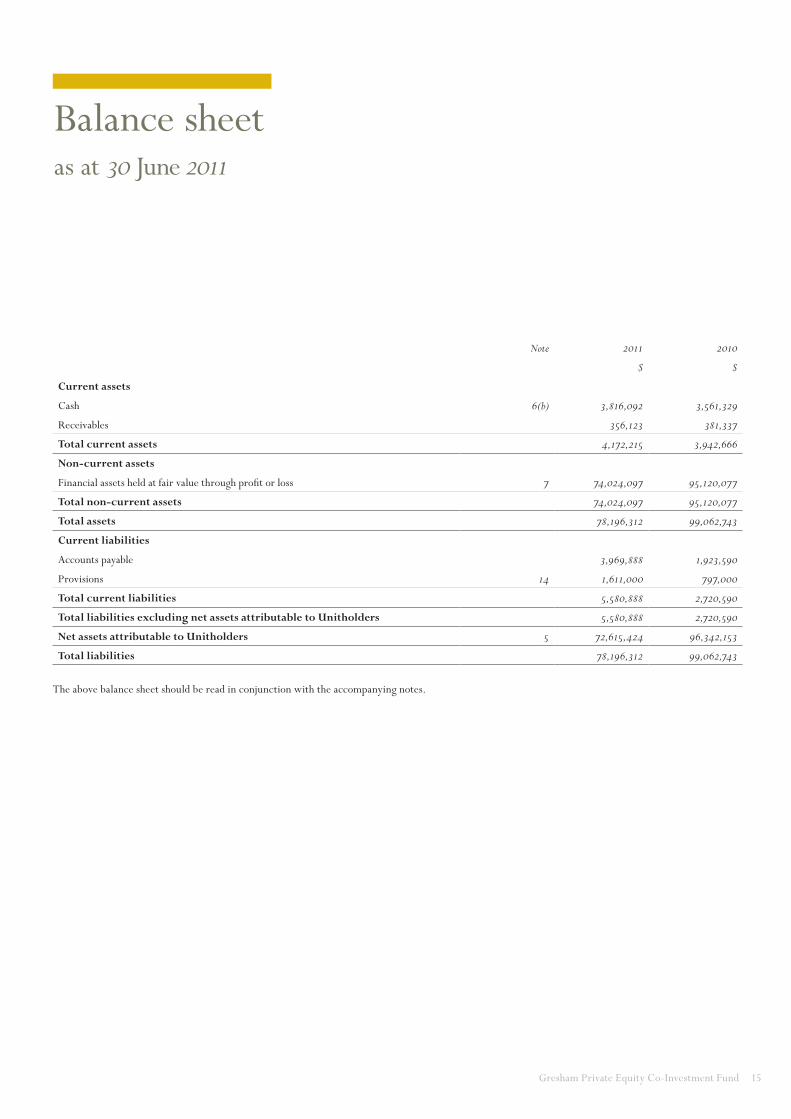
Note 2011 2010
$ $
Current assets
Cash 6(b) 3,816,092 3,561,329
Receivables 356,123 381,337
Total current assets 4,172,215 3,942,666
Non-current assets
Financial assets held at fair value through profit or loss 7 74,024,097 95,120,077
Total non-current assets 74,024,097 95,120,077
Total assets 78,196,312 99,062,743
Current liabilities
Accounts payable 3,969,888 1,923,590
Provisions 14 1,611,000 797,000
Total current liabilities 5,580,888 2,720,590
Total liabilities excluding net assets attributable to Unitholders 5,580,888 2,720,590
Net assets attributable to Unitholders 5 72,615,424 96,342,153
Total liabilities 78,196,312 99,062,743
The above balance sheet should be read in conjunction with the accompanying notes.
Balance sheetas at 30 June 2011
16 Gresham Private Equity Co-Investment Fund
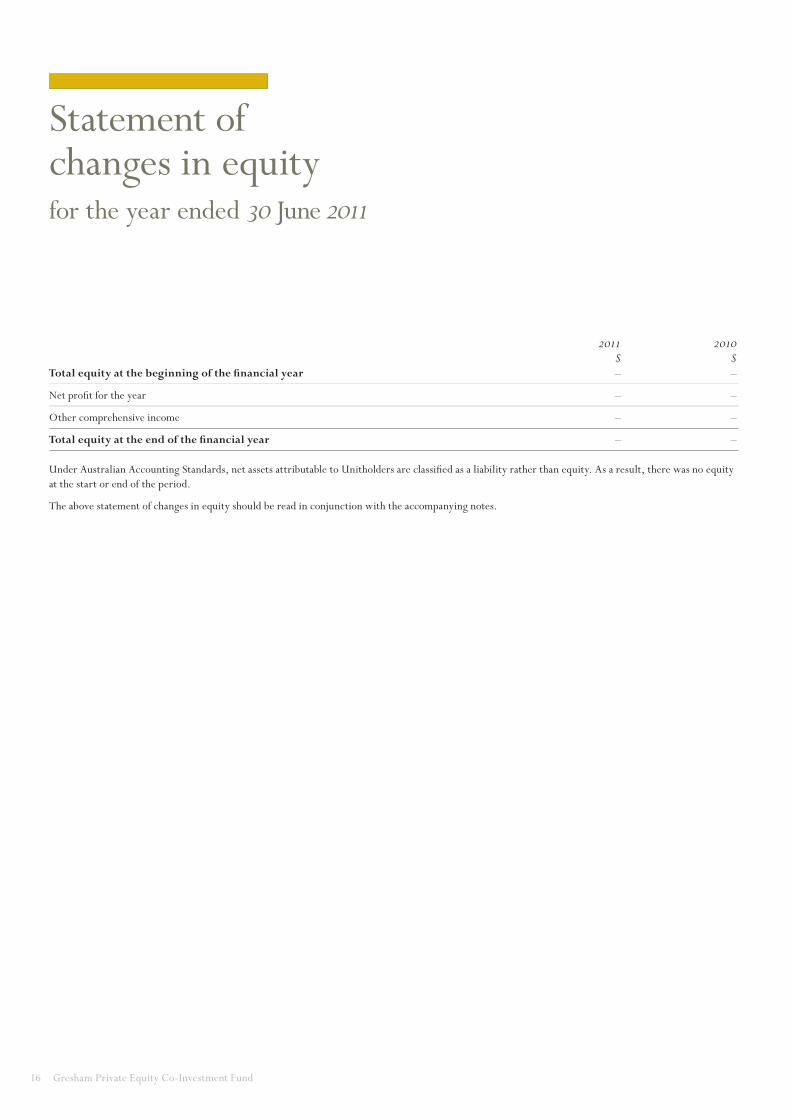
2011 2010 $ $Total equity at the beginning of the financial year – –
Net profit for the year – –
Other comprehensive income – –
Total equity at the end of the financial year – –
Under Australian Accounting Standards, net assets attributable to Unitholders are classified as a liability rather than equity. As a result, there was no equity at the start or end of the period.
The above statement of changes in equity should be read in conjunction with the accompanying notes.
Statement of changes in equityfor the year ended 30 June 2011
Gresham Private Equity Co-Investment Fund 17
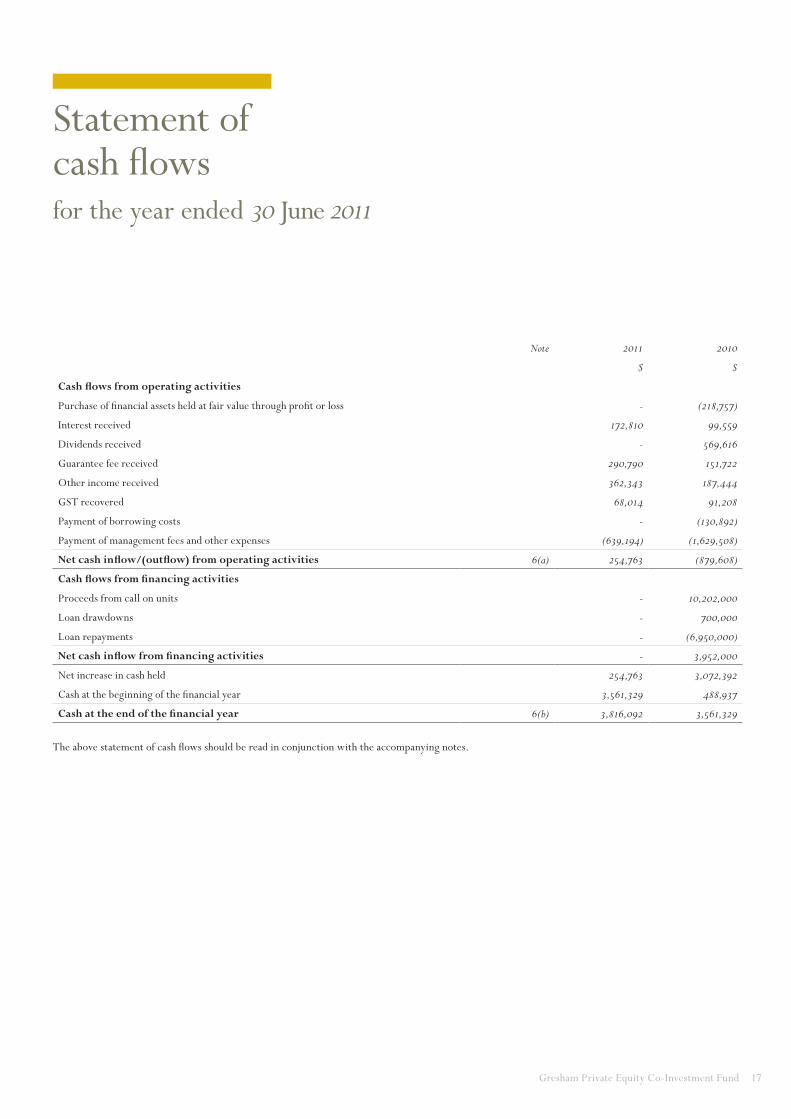
Statement of cash flowsfor the year ended 30 June 2011
Note 2011 2010
$ $
Cash flows from operating activities
Purchase of financial assets held at fair value through profit or loss - (218,757)
Interest received 172,810 99,559
Dividends received - 569,616
Guarantee fee received 290,790 151,722
Other income received 362,343 187,444
GST recovered 68,014 91,208
Payment of borrowing costs - (130,892)
Payment of management fees and other expenses (639,194) (1,629,508)
Net cash inflow/(outflow) from operating activities 6(a) 254,763 (879,608)
Cash flows from financing activities
Proceeds from call on units - 10,202,000
Loan drawdowns - 700,000
Loan repayments - (6,950,000)
Net cash inflow from financing activities - 3,952,000
Net increase in cash held 254,763 3,072,392
Cash at the beginning of the financial year 3,561,329 488,937
Cash at the end of the financial year 6(b) 3,816,092 3,561,329
The above statement of cash flows should be read in conjunction with the accompanying notes.
18 Gresham Private Equity Co-Investment Fund
note 1. summary of siGnifiCant aCCountinG PoliCies
basis of PreParation
This general purpose financial report for the financial year ended 30 June 2011 for the Gresham Private Equity Co-Investment Fund as an individual entity, has been prepared in accordance with the Fund’s Constitution. The Constitution requires the financial report to be prepared in accordance with Australian Accounting Standards, other authoritative pronouncements of the Australian Accounting Standards Board, Urgent Issues Group (UIG) Consensus Views and the Corporations Act 2001. The financial statements of the Fund also comply with International Financial Reporting Standards as issued by the International Accounting Standards Board.
The financial statements have been prepared under the historical cost convention, as modified by the revaluation of investments and derivative financial instruments held at fair value with changes in fair value recognised through the statement of comprehensive income.
The principal accounting policies applied in the preparation of these financial statements are set out below. The accounting policies adopted are consistent with the prior year unless otherwise stated.
valuation of finanCial assets and liabilities held
at fair value
The Fund has designated all of its investments as at fair value through profit or loss (refer below in relation to forward currency contracts). Individual investments may take the form of a combination of equities and loans and are managed as a single investment. These investments are initially recognised on the date the Fund becomes party to the contractual agreement at fair value, typically represented by cost. Investments are valued at their net fair value as at reporting date. Gains and losses arising from changes in the fair value of the financial
assets at fair value through profit or loss category are included in the statement of comprehensive income in the period in which they arise. Investments are valued in line with industry practice using appropriate valuation techniques as reasonably determined by the Responsible Entity and which reflect market conditions as at the reporting date. However, given the continuing financial markets’ volatility and economic conditions, future valuations may be volatile.
forward CurrenCy ContraCts
The Fund’s only derivative financial instruments would relate to forward currency contracts. The Fund may hold these forward currency contracts in order to economically hedge up to 80% of its foreign currency investment exposure. However, for accounting purposes, the Fund does not designate any derivatives as hedges in a hedging relationship, and hence these derivative financial instruments are recognised at fair value on the date on which a contract is entered into and subsequently re-measured at their fair value using the prevailing bid price at the reporting date. The Fund recognises a gain or loss through the statement of comprehensive income equal to the change in fair value at the reporting date.
Cash
Cash includes cash in hand, deposits held at call with banks, and other short-term highly liquid investments with maturities of three months or less, net of bank overdrafts, if any.
Payments and receipts relating to the purchase and sale of investments are classified as cash flows from operating activities, as movements in the fair value of these investments represent the Fund’s main income generating activity.
investment inCome and exPenses
Interest income and expenses are recognised in the statement of comprehensive income for all debt instruments using the effective interest method. Dividends from companies are recorded as income when the Fund’s right to receive payment is established. Other investment income and expenses are brought to account on an accruals basis.
distribution exPense and ChanGes in net asset
value attributable to unitholders
The Fund makes distributions in accordance with the Fund’s Constitution. The taxable and tax free component of distributions is recognised in the statement of comprehensive income as a distribution expense within financing costs. The difference between the distributions made and the taxable and tax free component of these distributions is recognised as a return of capital within net assets attributable to Unitholders. Income and expenses which are respectively not taxable or not deductible and do not form part of the taxable component of distributions are recognised in the statement of comprehensive income as changes in net assets attributable to Unitholders within financing costs.
resPonsible entity’s remuneration
Responsible Entity’s remuneration has been calculated in accordance with the Fund’s Constitution.
foreiGn CurrenCy transaCtions
Items included in the Fund’s financial statements are measured using the currency of the primary economic environment in which it operates (the functional currency). This is the Australian dollar, which is the currency of the economy in which the Fund competes for capital and is regulated. The Australian dollar is also the Fund’s presentation currency.
Notes to and forming part of the financial statementsfor the year ended 30 June 2011
Gresham Private Equity Co-Investment Fund 19
note 1. summary of siGnifiCant aCCountinG
PoliCies (Continued)
Foreign currency transactions are translated into the functional currency using the exchange rates prevailing at the date of the transaction. Foreign exchange gains and losses resulting from the settlement of such transactions and from the translation at period end exchange rates of monetary assets and liabilities denominated in foreign currencies are recognised in the statement of comprehensive income. The Fund does not isolate that portion of gains or losses on securities and derivative financial instruments which is due to changes in foreign exchange rates from that due to changes in the fair value of such securities. Such fluctuations are included with the net gains or losses on financial instruments at fair value through profit or loss.
ComParative Period
Comparative information is reclassified where appropriate to enhance comparability.
reCeivables
Receivables may include amounts for dividends, interest and securities sold where settlement has not yet occurred. Amounts are generally received within 30 days of being recorded as receivables, with the exception of interest on certain non-current investments.
aCCounts Payable
Accounts payable represent liabilities for amounts owing by the Fund which are unpaid at year end.
Goods and serviCes tax (Gst)
The Fund qualifies for Reduced Input Tax Credits at a rate of 75%. Investment management fees and other expenses have been recognised in the statement of comprehensive income inclusive of the amount of GST not recoverable from the Australian Taxation Office (ATO). The net amount of GST recoverable from the ATO is included in receivables in the balance sheet. Accounts payable are inclusive of GST. Cash flows relating to GST are included in the statement of cash flows on a gross basis.
new aCCountinG standards and interPretations
Certain new accounting standards and interpretations have been published that are not mandatory for 30 June 2011 reporting periods. The directors’ assessment of the impact of these new standards (to the extent relevant to the Fund) and interpretations is set below:
AASB 1053 Application of Tiers of Australian Accounting Standards and AASB 2010-2 Amendments to Australian Accounting Standards arising from Reduced Disclosure Requirements are applicable for annual reporting periods commencing 1 July 2013. The AASB has officially introduced a revised differential reporting framework in Australia. Under this framework, a two-tier differential reporting regime applies to all entities that prepare general purpose financial statements. The Fund is a registered management investment scheme and is not eligible to adopt the new Australian Accounting Standards – Reduced Disclosure Requirements. As a consequence, the two standards will have no impact on the financial statements of the Fund.
AASB 2010-4 Further Amendments to Australian Accounting Standards arising from the Annual Improvements Project is applicable for the Fund’s annual reporting period commencing 1 July 2011. The AASB has made a number of amendments to Australian Accounting Standards as a result of the IASB’s annual improvements project. The Fund does not expect that any adjustments will be necessary as the result of applying the revised rules.
issue date
The financial statements were authorised for issue by the directors on 27 July 2011. The directors of the Responsible Entity have the power to amend and reissue the financial statements.
note 2. taxation
Under current legislation, the Fund would not be liable to income tax to the extent that the income of the Fund is distributed in full to Unitholders.
note 3. life of fund
The Fund was registered on 29 June 2004 under a Constitution dated 28 June 2004 and shall terminate on the earliest to occur of:
a) unless previously extended or determined, 30 June 2015; and
b) the date on which the Fund is terminated by law.
Notes to and forming part of the financial statementsfor the year ended 30 June 2011 (continued)
20 Gresham Private Equity Co-Investment Fund
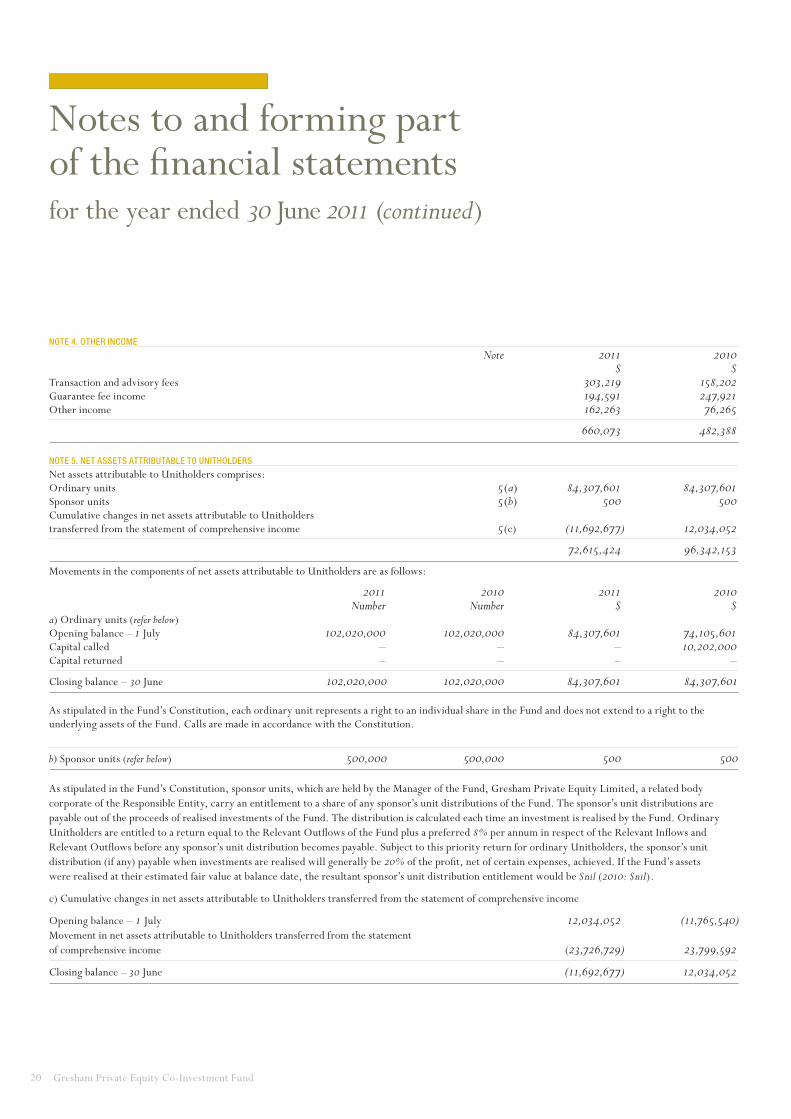
note 4. other inCome
Note 2011 2010 $ $Transaction and advisory fees 303,219 158,202Guarantee fee income 194,591 247,921Other income 162,263 76,265
660,073 482,388
note 5. net assets attributable to unitholders
Net assets attributable to Unitholders comprises:Ordinary units 5(a) 84,307,601 84,307,601Sponsor units 5(b) 500 500Cumulative changes in net assets attributable to Unitholders transferred from the statement of comprehensive income 5(c) (11,692,677) 12,034,052
72,615,424 96,342,153
Movements in the components of net assets attributable to Unitholders are as follows:
2011 2010 2011 2010 Number Number $ $a) Ordinary units (refer below)Opening balance – 1 July 102,020,000 102,020,000 84,307,601 74,105,601Capital called – – – 10,202,000Capital returned – – – –
Closing balance – 30 June 102,020,000 102,020,000 84,307,601 84,307,601
As stipulated in the Fund’s Constitution, each ordinary unit represents a right to an individual share in the Fund and does not extend to a right to the underlying assets of the Fund. Calls are made in accordance with the Constitution.
b) Sponsor units (refer below) 500,000 500,000 500 500
As stipulated in the Fund’s Constitution, sponsor units, which are held by the Manager of the Fund, Gresham Private Equity Limited, a related body corporate of the Responsible Entity, carry an entitlement to a share of any sponsor’s unit distributions of the Fund. The sponsor’s unit distributions are payable out of the proceeds of realised investments of the Fund. The distribution is calculated each time an investment is realised by the Fund. Ordinary Unitholders are entitled to a return equal to the Relevant Outflows of the Fund plus a preferred 8% per annum in respect of the Relevant Inflows and Relevant Outflows before any sponsor’s unit distribution becomes payable. Subject to this priority return for ordinary Unitholders, the sponsor’s unit distribution (if any) payable when investments are realised will generally be 20% of the profit, net of certain expenses, achieved. If the Fund’s assets were realised at their estimated fair value at balance date, the resultant sponsor’s unit distribution entitlement would be $nil (2010: $nil).
c) Cumulative changes in net assets attributable to Unitholders transferred from the statement of comprehensive income
Opening balance – 1 July 12,034,052 (11,765,540)Movement in net assets attributable to Unitholders transferred from the statement of comprehensive income (23,726,729) 23,799,592
Closing balance – 30 June (11,692,677) 12,034,052
Notes to and forming part of the financial statementsfor the year ended 30 June 2011 (continued)

Gresham Private Equity Co-Investment Fund 21
note 6. reConCiliation of net Profit to net Cash inflow/(outflow) from oPeratinG aCtivities
2011 2010 $ $a) Reconciliation of net profit to net cash inflow/(outflow) from operating activities
Net profit for the year – –Net operating profit/(loss) (23,726,729) 23,799,592Change in operating assets and liabilities:(Increase)/decrease in investments 21,095,980 (26,357,796)(Increase)/decrease in receivables 25,214 (215,144)Increase in accounts payable and provisions 2,860,298 1,893,740
Net cash inflow/(outflow) from operating activities 254,763 (879,608)
b) Components of cashCash as at the end of the financial year as shown in the statement of cash flows is reconciled to the balance sheet as follows:
Cash 3,816,092 3,561,329
note 7. finanCial instruments held at fair value throuGh Profit or loss
Investments 74,024,097 95,120,077
An overview of the risk exposures relating to financial instruments at fair value through profit or loss is included in note 10.
note 8. borrowinG/finanCinG faCilities
The Fund did not have during the year and does not have any borrowing or financing facilities in place at the date of this report.
note 9. redemPtion arranGement
The Responsible Entity has no obligation in the Constitution to repurchase units or redeem units issued under the Fund’s Constitution.
note 10. finanCial instruments
The Fund’s activities expose it to a variety of financial risks: market risk (including price risk, foreign exchange risk and interest rate risk), credit risk and liquidity risk.
The Fund’s overall risk management program which is carried out by the Manager, focuses on ensuring compliance with the Constitution and seeks to maximise the returns derived for the level of risk to which the Fund is exposed.
PriCe risk
Investments are valued in line with industry practice using appropriate valuation techniques as reasonably determined by the Manager. These techniques include the application of relevant earnings multiples based on earnings multiples for comparable listed entities with an allowance for a liquidity discount due to the investments being unlisted, applied to forecast applicable earnings. The determination of the values of the relevant inputs to be applied is a matter of professional judgement. The key inputs relate to earnings and earnings multiples, and if either of these were 5% higher or 5% lower, the value of the Fund’s investments would be $7.9 million higher and $8.0 million lower respectively (30 June 2010: $8.8 million higher and $9.5 million lower respectively).
The Manager mitigates price risk by generally limiting the Fund’s exposure to an investment in a single entity to 20% of committed capital, such limit being able to be increased with the approval of the Policy Committee on a case by case basis, and by careful selection of prospective investment opportunities.
Notes to and forming part of the financial statementsfor the year ended 30 June 2011 (continued)
22 Gresham Private Equity Co-Investment Fund
note 10. finanCial instruments (Continued)
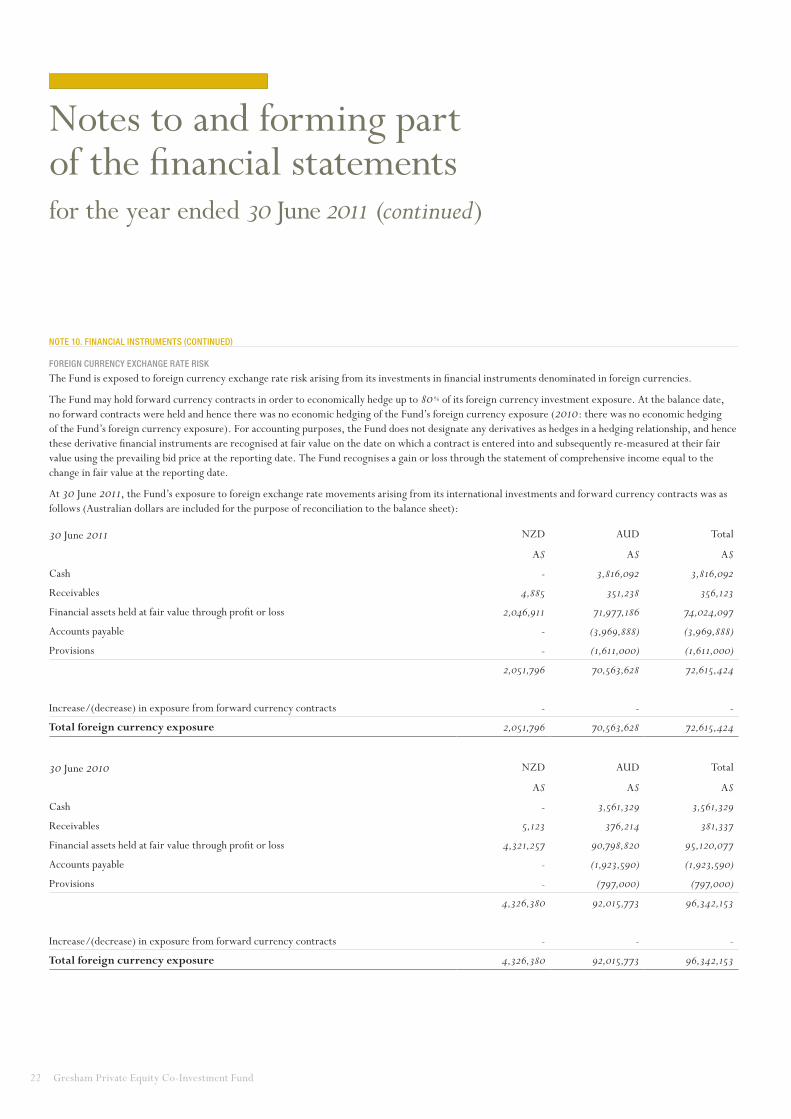
foreiGn CurrenCy exChanGe rate risk
The Fund is exposed to foreign currency exchange rate risk arising from its investments in financial instruments denominated in foreign currencies.
The Fund may hold forward currency contracts in order to economically hedge up to 80% of its foreign currency investment exposure. At the balance date, no forward contracts were held and hence there was no economic hedging of the Fund’s foreign currency exposure (2010: there was no economic hedging of the Fund’s foreign currency exposure). For accounting purposes, the Fund does not designate any derivatives as hedges in a hedging relationship, and hence these derivative financial instruments are recognised at fair value on the date on which a contract is entered into and subsequently re-measured at their fair value using the prevailing bid price at the reporting date. The Fund recognises a gain or loss through the statement of comprehensive income equal to the change in fair value at the reporting date.
At 30 June 2011, the Fund’s exposure to foreign exchange rate movements arising from its international investments and forward currency contracts was as follows (Australian dollars are included for the purpose of reconciliation to the balance sheet):
30 June 2011 NZD AUD Total
A$ A$ A$
Cash - 3,816,092 3,816,092
Receivables 4,885 351,238 356,123
Financial assets held at fair value through profit or loss 2,046,911 71,977,186 74,024,097
Accounts payable - (3,969,888) (3,969,888)
Provisions - (1,611,000) (1,611,000)
2,051,796 70,563,628 72,615,424
Increase/(decrease) in exposure from forward currency contracts - - -
Total foreign currency exposure 2,051,796 70,563,628 72,615,424
30 June 2010 NZD AUD Total
A$ A$ A$
Cash - 3,561,329 3,561,329
Receivables 5,123 376,214 381,337
Financial assets held at fair value through profit or loss 4,321,257 90,798,820 95,120,077
Accounts payable - (1,923,590) (1,923,590)
Provisions - (797,000) (797,000)
4,326,380 92,015,773 96,342,153
Increase/(decrease) in exposure from forward currency contracts - - -
Total foreign currency exposure 4,326,380 92,015,773 96,342,153
Notes to and forming part of the financial statementsfor the year ended 30 June 2011 (continued)
Gresham Private Equity Co-Investment Fund 23
note 10. finanCial instruments (Continued)
interest rate risk
Interest rate risk includes cash flow interest rate risk on financial instruments with variable interest rates as well as interest rate risk on the value of financial instruments with fixed interest rates, which will fluctuate due to changes in market interest rates. The Fund does not have any significant exposure to interest rate risk.
liquidity risk
Liquidity risk is the risk that the Fund may not be able to generate sufficient cash resources to settle its obligations in full as they fall due or can only do so on terms that are materially disadvantageous. In order to mitigate this risk, the Responsible Entity has agreed that payment of its remuneration accruing from 1 July 2009 be deferred and paid from cash received by the Fund from investment income and/or proceeds from realisations of investments.
The Fund manages its net assets attributable to Unitholders as capital, notwithstanding net assets attributable to Unitholders are classified as a liability. Settlement of this liability is dependent on realisation of assets, with the net proceeds from such realisations being distributed to Unitholders as soon as practicable in accordance with the Constitution.
Credit risk
Credit risk is the risk that a counterparty will fail to perform obligations under a contract. The Fund enters into investments which may take the form of a combination of equities and loans which are managed as a single investment. Credit risk arises in relation to the investment in these loans. Investments, including loans, are valued at their net fair value at the reporting date. The maximum exposure to credit risk in these loans at the reporting date is approximately $2.0 million (2010: $4.3 million).
net fair value of finanCial assets and liabilities and fair value hierarChy
The carrying value of the Fund’s financial assets and liabilities included in the balance sheet approximate their fair value.
The Fund classifies fair value measurements using a fair value hierarchy that, in descending order, reflects the subjectivity of the inputs used in making the measurements. The fair value hierarchy has the following levels:
• Quoted prices (unadjusted) in active markets for identical assets or liabilities (level 1).
• Inputs other than quoted prices included within level 1 that are observable for the asset or liability, either directly (that is, as prices) or indirectly (that is, derived from prices) (level 2).
• Inputs for the asset or liability that are not based on observable market data (that is, unobservable inputs) (level 3).
The determination of what constitutes ‘observable’ requires significant judgement by the Responsible Entity. The Responsible Entity considers observable data to be that market data that is readily available, regularly distributed or updated, reliable and verifiable, and provided by independent sources that are actively involved in the relevant market.
The level which is applied in the fair value hierarchy is determined by reference to the lowest level category which describes the basis of valuation for each asset which is being fair valued.
The Responsible Entity has determined that all of the Fund’s financial assets held at fair value through the profit or loss are classified at level 3. They are valued using appropriate valuation techniques including the application of relevant earnings multiples based on earnings multiples for comparable listed entities, with an allowance for a liquidity discount due to the investments being unlisted, applied to forecast applicable earnings.
The effect of changes to key inputs of the valuation is disclosed in the price risk section of this note 10.
Notes to and forming part of the financial statementsfor the year ended 30 June 2011 (continued)

24 Gresham Private Equity Co-Investment Fund
note 10. finanCial instruments (Continued)
net fair value of finanCial assets and liabilities and fair value hierarChy (Continued)
There have been no transfers in or out between levels for the year ended 30 June 2011 and 30 June 2010.
The following table presents the movement in level 3 instruments.
2011 2010 $ $Opening balance – 1 July 95,120,077 68,762,281Additions 814,000 1,015,757Net gains/(losses) recognised in profit or loss (21,909,980) 25,342,039
Closing balance – 30 June 74,024,097 95,120,077
All net gains/(losses) in the table above are included in the statement of comprehensive income for the financial assets and liabilities held at the end of the year.
note 11. related Parties
The Responsible Entity of the Fund is Gresham Funds Management Limited, which is incorporated and domiciled in Australia. The registered office and principal place of business is:
Level 17167 Macquarie StreetSydney NSW 2000
key manaGement Personnel
Key management personnel, who comprise the directors of the Responsible Entity during the financial year, were as follows:
James P Graham AM (Chairman)Roger S Casey (Deputy Chairman) Mark J Rimmer (Joint Head of Private Equity, appointed 26 October 2010)Mark R Youens (Joint Head of Private Equity, appointed 26 October 2010)Terence J BowenAntony G Breuer Richard J B Goyder Neil R Sutton (appointed 26 October 2010)Timothy J Bult (alternate for Terence J Bowen and Richard B Goyder, appointed 21 February 2011)Roy D McKelvie (ceased 26 October 2010)Graham J Rich (ceased 31 December 2010)
Notes to and forming part of the financial statementsfor the year ended 30 June 2011 (continued)
Gresham Private Equity Co-Investment Fund 25
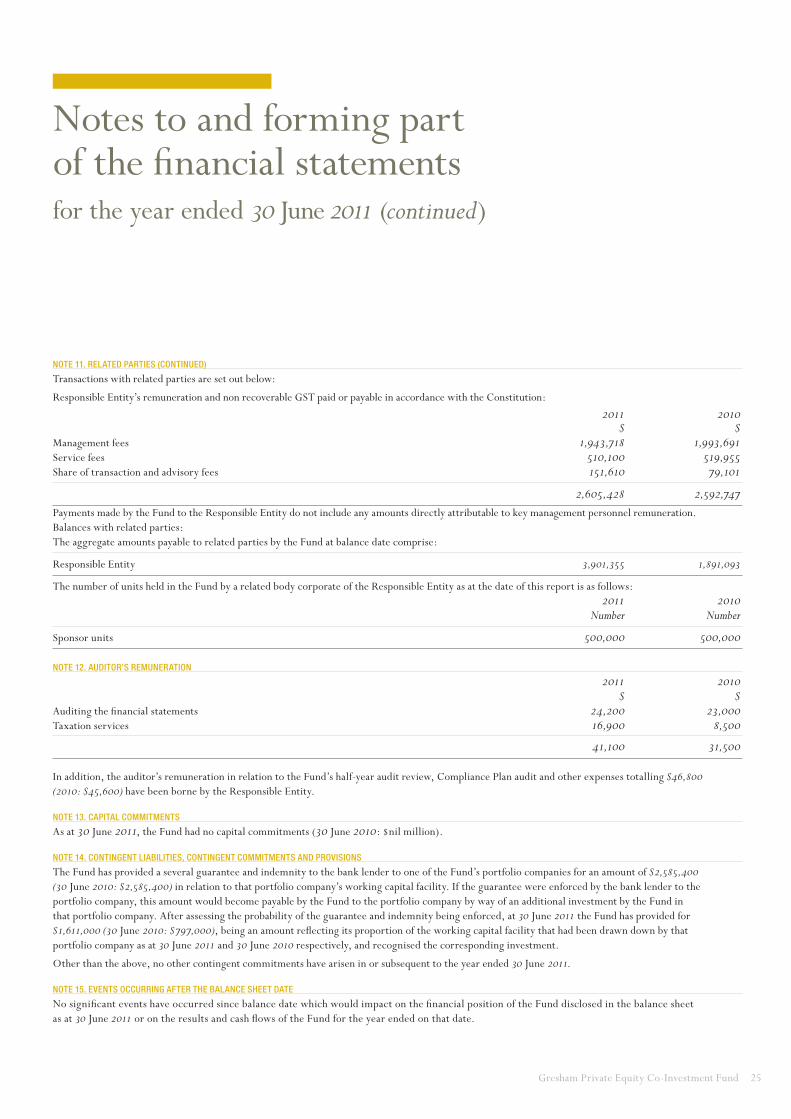
note 11. related Parties (Continued)
Transactions with related parties are set out below:
Responsible Entity’s remuneration and non recoverable GST paid or payable in accordance with the Constitution:
2011 2010 $ $Management fees 1,943,718 1,993,691Service fees 510,100 519,955Share of transaction and advisory fees 151,610 79,101
2,605,428 2,592,747
Payments made by the Fund to the Responsible Entity do not include any amounts directly attributable to key management personnel remuneration.Balances with related parties:The aggregate amounts payable to related parties by the Fund at balance date comprise:
Responsible Entity 3,901,355 1,891,093
The number of units held in the Fund by a related body corporate of the Responsible Entity as at the date of this report is as follows: 2011 2010 Number Number
Sponsor units 500,000 500,000
note 12. auditor’s remuneration
2011 2010 $ $Auditing the financial statements 24,200 23,000Taxation services 16,900 8,500
41,100 31,500
In addition, the auditor’s remuneration in relation to the Fund’s half-year audit review, Compliance Plan audit and other expenses totalling $46,800 (2010: $45,600) have been borne by the Responsible Entity.
note 13. CaPital Commitments
As at 30 June 2011, the Fund had no capital commitments (30 June 2010: $nil million).
note 14. ContinGent liabilities, ContinGent Commitments and Provisions
The Fund has provided a several guarantee and indemnity to the bank lender to one of the Fund’s portfolio companies for an amount of $2,585,400 (30 June 2010: $2,585,400) in relation to that portfolio company’s working capital facility. If the guarantee were enforced by the bank lender to the portfolio company, this amount would become payable by the Fund to the portfolio company by way of an additional investment by the Fund in that portfolio company. After assessing the probability of the guarantee and indemnity being enforced, at 30 June 2011 the Fund has provided for $1,611,000 (30 June 2010: $797,000), being an amount reflecting its proportion of the working capital facility that had been drawn down by that portfolio company as at 30 June 2011 and 30 June 2010 respectively, and recognised the corresponding investment.
Other than the above, no other contingent commitments have arisen in or subsequent to the year ended 30 June 2011.
note 15. events oCCurrinG after the balanCe sheet date
No significant events have occurred since balance date which would impact on the financial position of the Fund disclosed in the balance sheet as at 30 June 2011 or on the results and cash flows of the Fund for the year ended on that date.
Notes to and forming part of the financial statementsfor the year ended 30 June 2011 (continued)

26 Gresham Private Equity Co-Investment Fund
In the Directors’ opinion:
a) the financial statements and notes set out on pages 14 to 25 are in accordance with the Corporations Act 2001, including:
i) complying with Australian Accounting Standards, the Corporations Regulations 2001 and other mandatory professional reporting requirements; and
ii) giving a true and fair view of the Fund’s financial position as at 30 June 2011 and of its performance for the financial year ended on that date; and
b) there are reasonable grounds to believe that the Fund will be able to pay its debts as and when they become due and payable.
The summary of significant accounting policies confirms that the financial statements also comply with International Financial Reporting Standards as issued by the International Accounting Standards Board.
This declaration is made in accordance with a resolution of the directors.
James P Graham AMDirectorSydney, 27 July 2011
Directors’ declaration
Gresham Private Equity Co-Investment Fund 27
This audit report relates to the financial report of the Gresham Private Equity Co-Investment Fund for the financial year ended 30 June 2006 included on the Gresham Private Equity Co-Investment Fund web site. The directors of the fund are responsible for the integrity of the Gresham Private Equity Co-Investment Fund web site. We have not been engaged to report on the integrity of this web site. The audit report refers only to the financial report identified below. It does not provide an opinion on any other information which may have been hyperlinked to/from the financial report. If users of this report are concerned with the inherent risks arising from electronic data communications they are advised to refer to the hard copy of the audited financial report to confirm the information included in the audited financial report presented on this web site.
Report on the financial reportWe have audited the accompanying financial report of Gresham Private Equity Co-investment Fund (the ‘Fund’), which comprises the balance sheet as at 30 June 2011, and the statement of comprehensive income, statement of changes in equity and statement of cash flows for the year ended on that date, a summary of significant accounting policies, other explanatory notes and directors’ declaration.
Directors’ responsibility for the financial reportThe directors of Gresham Funds Management Limited (the ‘Responsibility Entity’) are responsible for the preparation of the financial report that gives a true and fair view in accordance with Australian Accounting Standards and the Corporations Act 2001 and for such internal control as the directors determine is necessary to enable the preparation of the financial report that is free from material misstatement, whether due to fraud or error. In Note 1, the directors also state. In accordance with the Accounting Standard AASB 101 Presentation of Financial Statements, that the financial statements comply with International Financial Reporting Standards.
Auditor’s responsibility Our responsibility is to express and opinion on the financial report based on audit. We conducted our audit in accordance with Australian Auditing Standards. These Auditing Standards require that we comply with relevant ethical requirements relating to audit engagements and plan and perform the audit to obtain reasonable assurance whether the financial report is free from material misstatement.
An audit involves performing procedures to obtain audit evidence about the amounts and disclosures in the financial report. The procedures selected depend on the auditor’s judgement, including the assessment of the risks of material misstatement of the financial report, whether due to fraud or error. In making
those risk assessments, the auditor considers internal control relevant to the entity’s preparation and fair presentation of the financial report in order to design audit procedures that are appropriate in the circumstances, but not for the purpose of expressing an opinion on the effectiveness of the entity’s internal control. An audit also includes evaluating the appropriateness of accounting policies used and the reasonableness of accounting estimates made by the directors, as well as evaluating the overall presentation of the financial report.
Our procedures include reading the other information in the Annual Report to determine whether it contains any material inconsistencies with the financial report.
We believe that the audit evidence we have obtained is sufficient and appropriate to provide a basis for our audit opinions.
IndependenceIn conducting our audit, we have complied with the independence requirements of the Corporations Act 2001.
Auditor’s opinion In our opinion:
a) the financial report of the Gresham Private Equity Co-Investment Fund is in accordance with the Corporations Act 2001, including:
i) giving a true and fair view of the Fund’s financial position as at 30 June 2011 and of its performance for the year ended on that date; and
ii) complying with Australian Accounting Standards (including the Australian Accounting Interpretations) and the Corporations Regulations 2001; and
b) the Fund’s financial report also complies with International Financial Reporting Standards as disclosed in Note 1.
PricewaterhouseCoopers
S J Hadfield Partner Sydney, 27 July 2011
indePendent audit rePort to the members of the Gresham Private
equity Co-investment fund
Matters relating to the electronic presentation of the audited financial report
PricewaterhouseCoopers, ABN 52 780 433 757 Darling Park Tower 2, 201 Sussex Street, GPO BOX 2650, SYDNEY NSW 1171 DX 77 Sydney, Australia T +61 2 8266 0000, F +61 2 8266 9999, www.pwc.com.au Liability limited by a scheme approved under Professional Standards Legislation
PricewaterhouseCoopers, ABN 52 780 433 757 Darling Park Tower 2, 201 Sussex Street, GPO BOX 2650, SYDNEY NSW 1171 DX 77 Sydney, Australia T +61 2 8266 0000, F +61 2 8266 9999, www.pwc.com.au Liability limited by a scheme approved under Professional Standards Legislation
Independent auditor’s report
28 Gresham Private Equity Co-Investment Fund
resPonsible entity
Gresham funds manaGement limited
ABN 32 109 020 153AFSL 276368
Registered Office: Level 17, 167 Macquarie StreetSydney NSW 2000 AustraliaTelephone: 61 2 9221 5133Facsimile: 61 2 9223 9072
manaGer
Gresham Private equity limited
ABN 86 084 509 946AFSL 247102
Registered Office: Level 17, 167 Macquarie StreetSydney NSW 2000 AustraliaTelephone: 61 2 9221 5133Facsimile: 61 2 9223 9072
direCtors of resPonsible entity
James P Graham AM, ChairmanRoger S Casey, Deputy ChairmanMark Rimmer, Joint Head of Private EquityMark Youens, Joint Head of Private EquityTerence J BowenAntony G Breuer Richard J B Goyder Neil R SuttonTimothy J Bult ( alternate for Terence J Bowen and Richard B Goyder)
reGistry
ComPutershare investor serviCes Pty ltd
Level 3, 60 Carrington StreetSydney NSW 2000 AustraliaWithin Australia: 1300 855 080Outside Australia: 61 3 9415 4000Facsimile: 61 2 8235 8150
sPonsorinG brokers
Goldman saChs Jbwere
Level 42, Governor Phillip Tower1 Farrer PlaceSydney NSW 2000 Australia
rbs morGans
Level 29, Riverside Centre123 Eagle StreetBrisbane QLD 4000 Australia
maCquarie equities
Level 7, 1 Shelley StreetSydney NSW 2000 Australia
ord minnett
Level 8, NAB House255 George StreetSydney NSW 2000 Australia
soliCitors
freehills
Level 32, MLC Centre19 Martin PlaceSydney NSW 2000 Australia
tax advisor
PriCewaterhouseCooPers
Darling Park Tower 2201 Sussex StreetSydney NSW 2000 Australia
auditor
PriCewaterhouseCooPers
Darling Park Tower 2201 Sussex StreetSydney NSW 2000 Australia
Custodian
PerPetual CorPorate trust limited
ABN 99 000 341 533
Level 12, 123 Pitt StreetSydney NSW 2000 Australia
Designed and produced by gho www.ghosydney.com
Directory

Gresham Private Equity Co-Investment Fund 29

Responsible EntityGresham Funds Management Limitedabn 32 109 020 153afsl 276368