Embed Size (px)
Citation preview
2016Annual Report
2016 Annual Report
When you have to be right
Wolters Kluwer 2016 Annual Report
102 Note 19 - Financial Assets102 Note 20 - Tax Assets and Liabilities105 Note 21 - Inventories106 Note 22 - Trade and Other Receivables106 Note 23 - Cash and Cash Equivalents106 Note 24 - Other Current Liabilities107 Note 25 - Long-term Debt109 Note 26 - Financial Risk Management117 Note 27 - Employee Benefits126 Note 28 - Provisions for Restructuring Commitments127 Note 29 - Capital and Reserves128 Note 30 - Share-based Payments132 Note 31 - Related Party Transactions133 Note 32 - Audit Fees134 Note 33 - Commitments and Contingent Liabilities135 Note 34 - Remuneration of the Executive Board and Supervisory Board138 Note 35 - Events after Balance Sheet Date
139 Company Financial Statements
142 Notes to the Company Financial Statements142 Note 36 - Significant Accounting Policies142 Note 37 - Financial Assets143 Note 38 - Accounts Receivable143 Note 39 - Cash and Cash Equivalents144 Note 40 - Current Liabilities144 Note 41 - Long-term Debt to Subsidiaries144 Note 42 - Personnel Expenses145 Note 43 - Shareholders’ Equity147 Note 44 - Commitments and Contingent Liabilities147 Note 45 - Details of Participating Interests147 Note 46 - Events after Balance Sheet Date147 Note 47 - Profit Appropriation148 Authorization for Issuance
149 Other Information on the Financial Statements149 Independent Auditor’s Report
156 Other Information156 Report of the Wolters Kluwer Preference Shares Foundation157 Shares and Bonds162 5-Year Key Figures 164 Profiles Supervisory Board165 Glossary 166 Contact information
6 Message from the CEO
8 Company Profile10 Our Customers 12 Management and Organization16 Key Figures
18 Report of the Executive Board18 Operational and Financial Review28 Cross-divisional Organization30 Global Workforce32 Sustainability33 2016-2018 Strategy34 2017 Full-Year Outlook
35 Report of the Supervisory Board35 Supervisory Board Report39 Remuneration Report
43 Corporate Governance and Risk Management43 Corporate Governance49 Risk Management58 Statements by the Executive Board
59 2016 Financial Statements
60 Consolidated Financial Statements
67 Notes to the Consolidated Financial Statements67 Note 1 - General and Basis of Preparation70 Note 2 - Significant Accounting Policies79 Note 3 - Accounting Estimates and Judgments81 Note 4 - Benchmark Figures86 Note 5 - Segment Reporting88 Note 6 - Earnings per Share89 Note 7 - Acquisitions and Divestments92 Note 8 - Sales Costs92 Note 9 - General and Administrative Costs93 Note 10 - Other Operating Income and (Expense)93 Note 11 - Personnel Expenses93 Note 12 - Amortization, Impairments, and Depreciation94 Note 13 - Financing Results95 Note 14 - Income Tax Expense96 Note 15 - Non-controlling Interests97 Note 16 - Goodwill and Intangible Assets100 Note 17 - Property, Plant, and Equipment101 Note 18 - Investments in Equity-accounted Investees
Table of Contents
5

Wolters Kluwer 2016 Annual Report
Our customers – doctors, nurses,
accountants, lawyers, and audit,
compliance, and regulatory
professionals – make critical decisions
every day. We pride ourselves on our
ability to serve them with innovative,
expert solutions to deliver the best
outcomes for their clients.
Our digital & services
revenues representing
85% of total revenues in
2016 is proof of how we
continue to create real
value for our customers
while also serving the
needs of our employees
and our shareholders.
6
Message from the CEO
Message from the CEO Wolters Kluwer 2016 Annual Report
Financial strengthIn 2016, we delivered sustained growth with revenues up 3% organically. Our strategy has supported our organic growth and a significant improvement in margins and cash flow. Digital & services revenues grew 5% organically, representing 85% of total revenues. We delivered adjusted operating profit margin of 22.1%. Our strategy is supported by a strong financial backbone. Our adjusted free cash flow increased 9% in constant currencies and supported a net-debt-to-EBITDA of 1.7x at year-end. This provides Wolters Kluwer with a solid financial position to grow our business.
Deep domain knowledgeWolters Kluwer celebrated 180 years of rich heritage in 2016, providing the foundation for where we are today as a global company. These roots support our combination of innovation and deep knowledge, driving us towards a digital experience that could not have been imagined almost two centuries ago.
Strategic directionWe completed the first year of our strategy for 2016-2018, Growing Our Value. Throughout the year, we consistently kept our focus on the three imperatives supporting this strategy:– Expand market coverage;– Deliver expert solutions; and– Drive efficiencies and engagement.
Expand market coverageWe expanded our coverage in key markets like patient engagement solutions and EHS (environmental, health, and safety) compliance software through the acquisitions of Emmi and Enablon. We will continue to allocate the majority of our capital towards leading growth businesses and digital products. Our aim with each of these initiatives is to immediately further our ability to provide greater value to our customers.
Deliver expert solutionsCustomers are at the center of everything we do. The solutions we build help experts in their respective fields to make the right decisions. The launch of products like the Health Language Enterprise Terminology Management Platform and CCH iQ, our leading-edge predictive intelligence tool for accounting professionals, will provide real growth for our customers’ own businesses. This marks our early foray into the rapidly growing field of artificial intelligence. At the heart of our ability to deliver expert solutions like these is a relentless focus on innovation.
Drive efficiencies and engagementIn 2016, we advanced our technology strategy with a focus on cloud, mobility and SaaS solutions. Across all divisions we launched new products using these technologies while at the same time continuing to optimize our technology infrastructure. Customer response has been favorable, driving the organic growth of our global expert solutions.
Our workforce is one of diversity, high performance, and accountability. This includes having a clearly defined set of values, improving agility so that our people can work smarter every day, and helping them develop their skills and careers every year.
Throughout the year we celebrated our renewed company values: Focus on Customer Success, Make it Better, Aim High and Deliver, and Win as a Team.
Our employees are deeply engaged with our customers on a daily basis, so they are best able to determine how we can offer greater value. Our second global all employee engagement survey was conducted in 2016 and results show our employee engagement is higher than ever.
Ultimately, our improvements in engagement and technology have been made with one goal in mind: serving our customers.
Sustainable value creation The company’s innovation-driven sustainability strategy is a central part of our strategy. By helping customers save lives, improve the way they do business, navigate change and complexity, and build smarter legal systems, the company is shaping a better future. You can read more about our ongoing sustainability efforts in our 2016 Sustainability Report.
We see a world in which all of our customers are empowered with the deep domain knowledge and intelligent technology that will help create a better future for all of us.
On the road to achieving this vision, I’m pleased to be able to say that year one of our three-year plan has been a success, and I am very grateful to our shareholders for their support. This gratitude extends to our other key stakeholders as well – our employees for their hard work and embodiment of our values, our suppliers and partners, and above all our customers for their trust and support.
Nancy McKinstryCEO and Chairman of the Executive Board Wolters Kluwer
7
Wolters Kluwer 2016 Annual Report
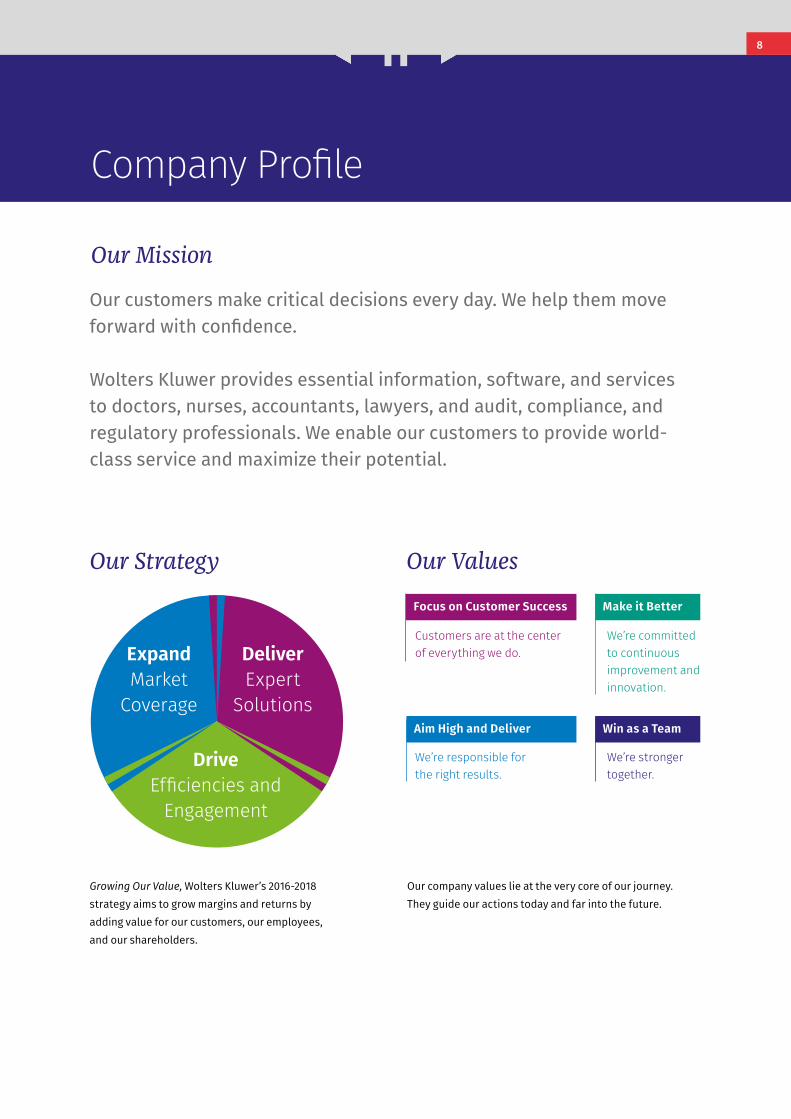
Our customers make critical decisions every day. We help them move forward with confidence.
Wolters Kluwer provides essential information, software, and services to doctors, nurses, accountants, lawyers, and audit, compliance, and regulatory professionals. We enable our customers to provide world-class service and maximize their potential.
Company Profile
Focus on Customer Success
Aim High and Deliver
Make it Better
Win as a Team
Our Values Our Strategy
Our Mission
Drive Efficiencies and
Engagement
Expand Market
Coverage
Deliver Expert
Solutions
Growing Our Value, Wolters Kluwer’s 2016-2018 strategy aims to grow margins and returns by adding value for our customers, our employees, and our shareholders.
Our company values lie at the very core of our journey. They guide our actions today and far into the future.
Customers are at the center of everything we do.
We’re committed to continuous improvement and innovation.
We’re responsible for the right results.
We’re stronger together.
8
Company Profile Wolters Kluwer 2016 Annual Report
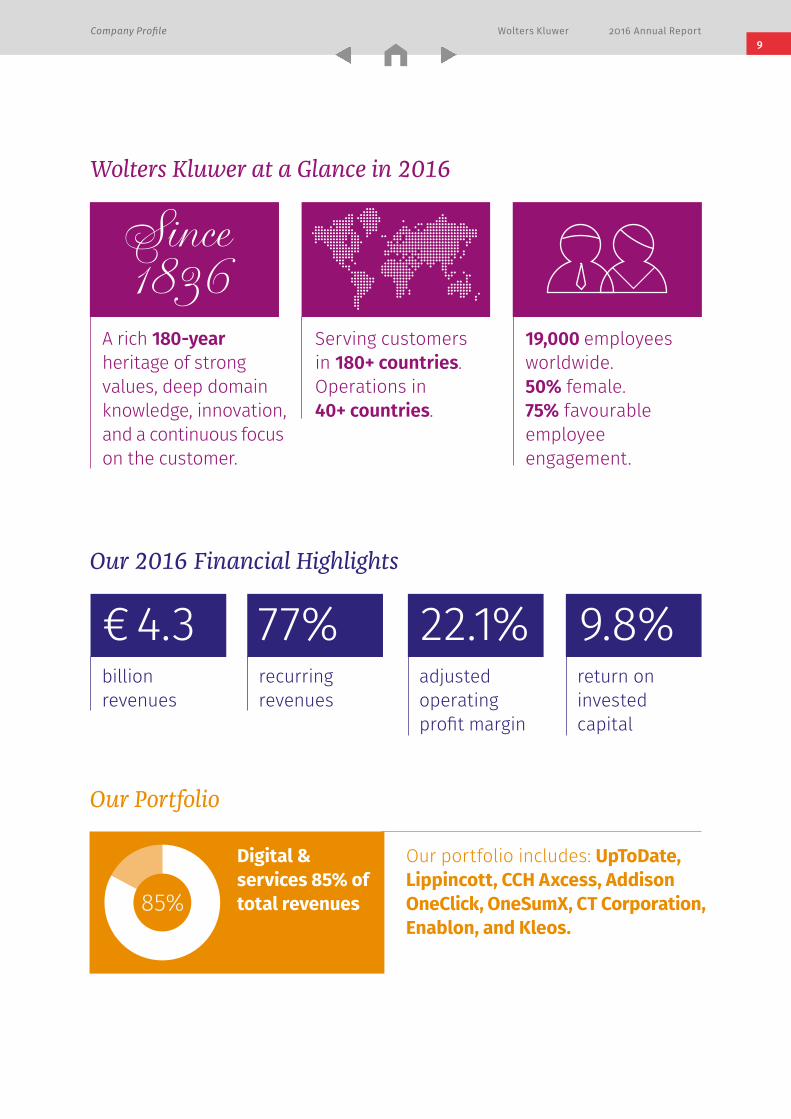
Our Portfolio
Our 2016 Financial Highlights
Wolters Kluwer at a Glance in 2016
A rich 180-year heritage of strong values, deep domain knowledge, innovation, and a continuous focus on the customer.
Serving customers in 180+ countries.Operations in 40+ countries.
19,000 employees worldwide. 50% female. 75% favourable employee engagement.
Since1836
billion revenues
recurring revenues
adjusted operating profit margin
return on invested capital
€ 4.3 77% 22.1% 9.8%
85%
Digital & services 85% of total revenues
Our portfolio includes: UpToDate, Lippincott, CCH Axcess, Addison OneClick, OneSumX, CT Corporation, Enablon, and Kleos.
9
Wolters Kluwer 2016 Annual Report
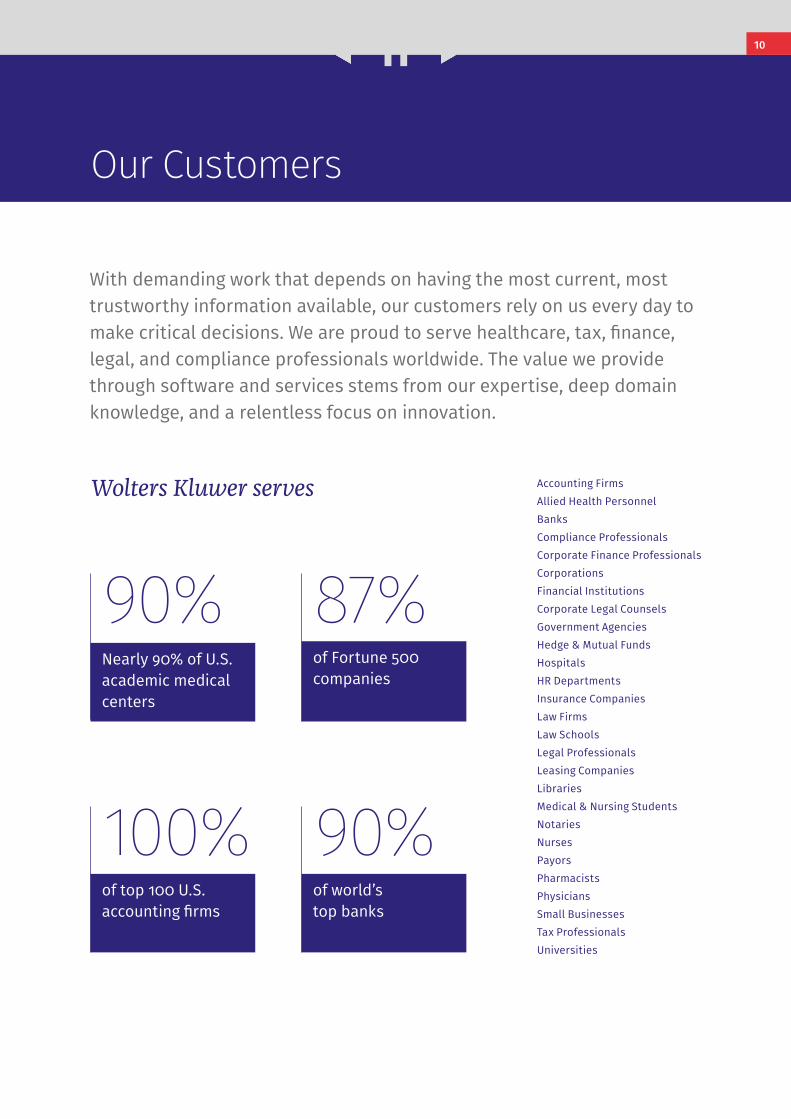
Our Customers
90%Nearly 90% of U.S. academic medical centers
100%of top 100 U.S. accounting firms
87%of Fortune 500 companies
of world’s top banks
90%
Accounting FirmsAllied Health PersonnelBanksCompliance ProfessionalsCorporate Finance ProfessionalsCorporationsFinancial InstitutionsCorporate Legal CounselsGovernment AgenciesHedge & Mutual FundsHospitalsHR DepartmentsInsurance CompaniesLaw FirmsLaw SchoolsLegal ProfessionalsLeasing CompaniesLibrariesMedical & Nursing StudentsNotariesNursesPayorsPharmacistsPhysiciansSmall BusinessesTax ProfessionalsUniversities
With demanding work that depends on having the most current, most trustworthy information available, our customers rely on us every day to make critical decisions. We are proud to serve healthcare, tax, finance, legal, and compliance professionals worldwide. The value we provide through software and services stems from our expertise, deep domain knowledge, and a relentless focus on innovation.
Wolters Kluwer serves
10

Our Customers Wolters Kluwer 2016 Annual Report 11
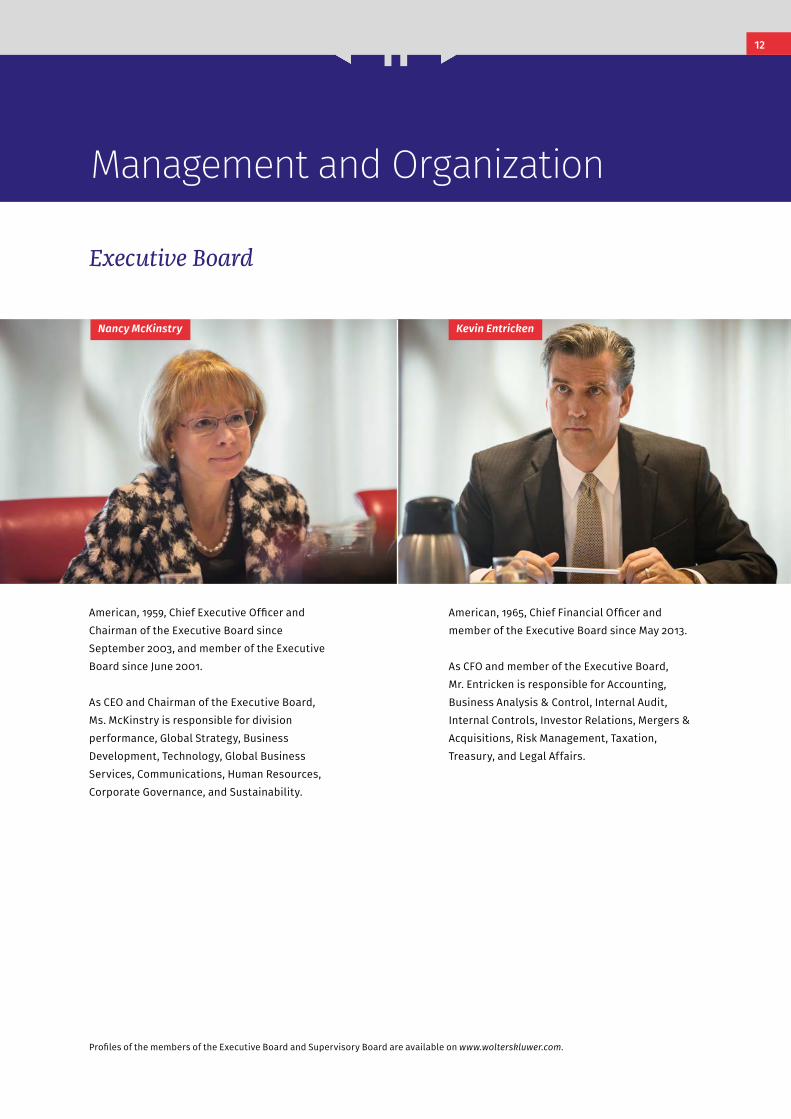
American, 1965, Chief Financial Officer and member of the Executive Board since May 2013.
As CFO and member of the Executive Board, Mr. Entricken is responsible for Accounting,Business Analysis & Control, Internal Audit, Internal Controls, Investor Relations, Mergers &Acquisitions, Risk Management, Taxation, Treasury, and Legal Affairs.
American, 1959, Chief Executive Officer and Chairman of the Executive Board since September 2003, and member of the Executive Board since June 2001.
As CEO and Chairman of the Executive Board, Ms. McKinstry is responsible for division performance, Global Strategy, Business Development, Technology, Global Business Services, Communications, Human Resources, Corporate Governance, and Sustainability.
Wolters Kluwer 2016 Annual Report
Executive Board
Management and Organization
Nancy McKinstry Kevin Entricken
Profiles of the members of the Executive Board and Supervisory Board are available on www.wolterskluwer.com.
12

Management and Organization Wolters Kluwer 2016 Annual Report
Ben Noteboom
Dutch, 1958, member of the Audit Committee, appointed in 2015, current term until 2019.
Supervisory Board
Len Forman Bruno Angelici
Jeannette Horan
American, 1945, Deputy Chairman of the Supervisory Board, Chairman of the Selection and Remuneration Committee, appointed in 2005, current term until 2017.
French, 1947, member of the Audit Committee, appointed in 2007, current term until 2019.
British, 1955, member of the Selection and Remuneration Committee, appointed in 2016, current term until 2020.
Fidelma Russo
Irish and American, 1963, member of the Audit Committee, appointed in 2016, current term until 2020.
René Hooft Graafland
Dutch, 1955, Chairman of the Audit Committee, appointed in 2012, current term until 2020.
Dutch, 1948, Chairman of the Supervisory Board, member of the Selection and Remuneration Committee, appointed in 2005, current term until 2017.
Peter Wakkie
13

Management and Organization Wolters Kluwer 2016 Annual Report 14
Organizational Management
Full list of management is available on www.wolterskluwer.com.
CEO Legal & Regulatory CEO Tax & Accounting
Chief Human Resources Officer
SVP, General Counsel and Company Secretary
SVP, Global Strategy
EVP, Global Platform Organization
CEO Governance, Risk & Compliance
CEO Health
SVP, Accounting & Control/CFO Global Business Services
SVP, Treasury & Risk
CEO Emerging & Developing Markets
CEO Global Business Services
Diana Nole
Sander van Dam George Dessing
Corinne Saunders Andres Sadler Dennis Cahill
Karen Abramson
Maryjo Charbonnier
Maarten Thompson Atul Dubey
Richard Flynn Stacey Caywood
Management and Organization Wolters Kluwer 2016 Annual Report
Tax & Accounting Governance, Risk & Compliance
Legal & RegulatoryHealth
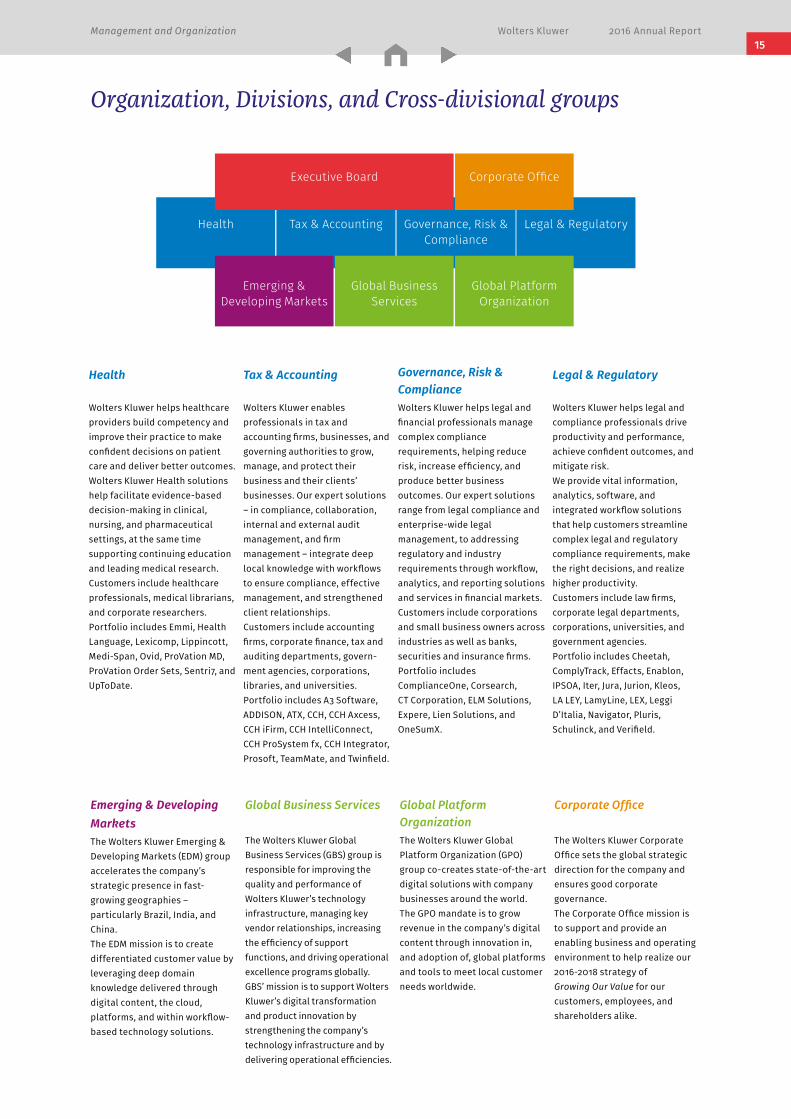
Organization, Divisions, and Cross-divisional groups
Tax & Accounting Governance, Risk & Compliance
Legal & RegulatoryHealth
Emerging & Developing MarketsThe Wolters Kluwer Emerging & Developing Markets (EDM) group accelerates the company’s strategic presence in fast-growing geographies – particularly Brazil, India, and China.The EDM mission is to create differentiated customer value by leveraging deep domain knowledge delivered through digital content, the cloud, platforms, and within workflow-based technology solutions.
Global Business Services
The Wolters Kluwer Global Business Services (GBS) group is responsible for improving the quality and performance of Wolters Kluwer’s technology infrastructure, managing key vendor relationships, increasing the efficiency of support func tions, and driving operational excellence programs globally. GBS’ mission is to support Wolters Kluwer’s digital transformation and product innovation by strength ening the company’s tech nol ogy infrastructure and by delivering operational efficiencies.
Global Platform OrganizationThe Wolters Kluwer Global Platform Organization (GPO) group co-creates state-of-the-art digital solutions with company businesses around the world.The GPO mandate is to grow revenue in the company’s digital content through innovation in, and adoption of, global platforms and tools to meet local customer needs worldwide.
Corporate Office
The Wolters Kluwer Corporate Office sets the global strategic direction for the company and ensures good corporate governance.The Corporate Office mission is to support and provide an enabling business and operating environ ment to help realize our 2016-2018 strategy of Growing Our Value for our customers, employees, and shareholders alike.
Health
Wolters Kluwer helps healthcare providers build competency and improve their practice to make confident decisions on patient care and deliver better outcomes. Wolters Kluwer Health solutions help facilitate evidence-based decision-making in clinical, nursing, and pharmaceutical settings, at the same time supporting continuing education and leading medical research. Customers include healthcare professionals, medical librarians, and corporate researchers.Portfolio includes Emmi, Health Language, Lexicomp, Lippincott, Medi-Span, Ovid, ProVation MD, ProVation Order Sets, Sentri7, and UpToDate.
Tax & Accounting Wolters Kluwer enables professionals in tax and accounting firms, businesses, and governing authorities to grow, manage, and protect their business and their clients’ businesses. Our expert solutions – in compliance, collaboration, internal and external audit management, and firm management – integrate deep local knowledge with workflows to ensure compliance, effective management, and strengthened client relationships. Customers include accounting firms, corporate finance, tax and auditing departments, govern-ment agencies, corporations, libraries, and universities.Portfolio includes A3 Software, ADDISON, ATX, CCH, CCH Axcess, CCH iFirm, CCH IntelliConnect, CCH ProSystem fx, CCH Integrator, Prosoft, TeamMate, and Twinfield.
Governance, Risk & ComplianceWolters Kluwer helps legal and financial professionals manage complex compliance requirements, helping reduce risk, increase efficiency, and produce better business outcomes. Our expert solutions range from legal compliance and enterprise-wide legal management, to addressing regulatory and industry requirements through workflow, analytics, and reporting solutions and services in financial markets. Customers include corporations and small business owners across industries as well as banks, securities and insurance firms.Portfolio includes ComplianceOne, Corsearch, CT Corporation, ELM Solutions, Expere, Lien Solutions, and OneSumX.
Legal & Regulatory
Wolters Kluwer helps legal and compliance professionals drive productivity and performance, achieve confident outcomes, and mitigate risk.We provide vital information, analytics, software, and integrated workflow solutions that help customers streamline complex legal and regulatory compliance requirements, make the right decisions, and realize higher productivity.Customers include law firms, corporate legal departments, corporations, universities, and government agencies.Portfolio includes Cheetah, ComplyTrack, Effacts, Enablon, IPSOA, Iter, Jura, Jurion, Kleos, LA LEY, LamyLine, LEX, Leggi D’Italia, Navigator, Pluris, Schulinck, and Verifield.
Executive Board Corporate Office
Emerging & Developing Markets
Global Platform Organization
Global Business Services
15
Management and Organization Wolters Kluwer 2016 Annual Report 16
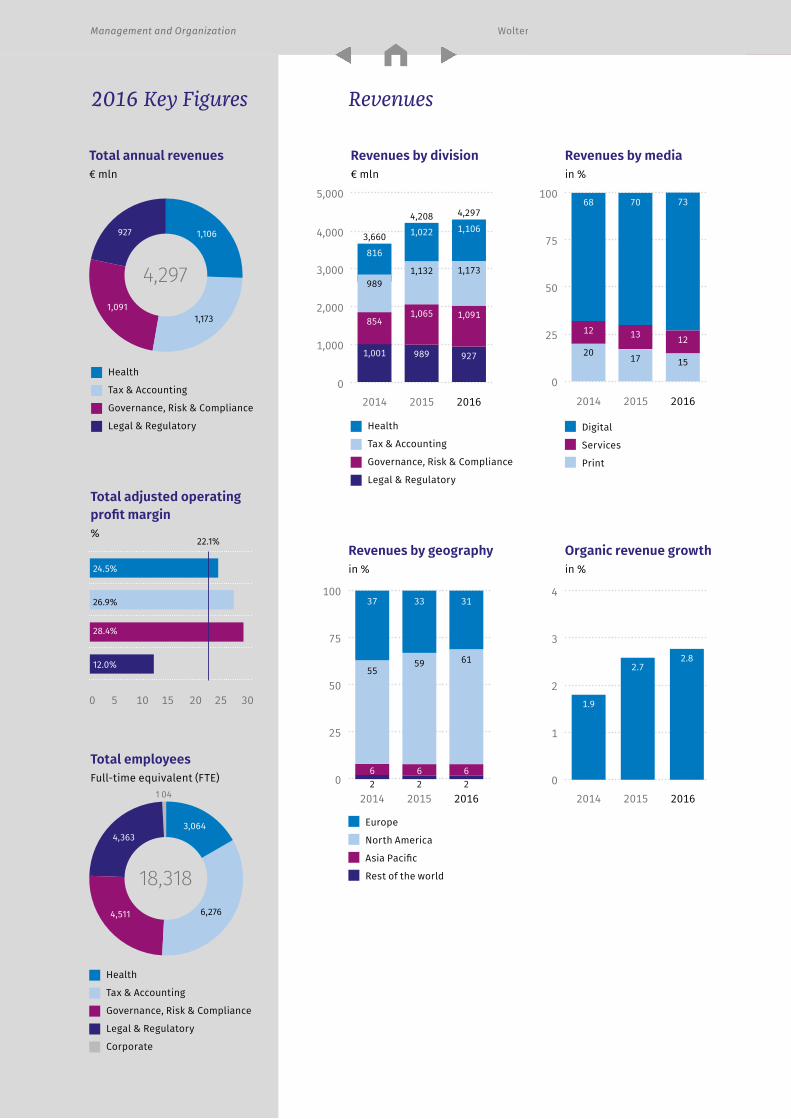
2016 Key Figures Revenues
1,106927
1,0911,173
Total annual revenues€ mln
Health
Tax & Accounting
Governance, Risk & Compliance
Legal & Regulatory
4,297
Total employeesFull-time equivalent (FTE)
Total adjusted operating profit margin%
0 5 10 15 20 25 30
24.5%
22.1%
26.9%
28.4%
12.0%
Revenues by mediain %
Digital
Services
100
75
50
25
0
2014 2015 2016
15
73
17
70
20
68
12 13 12
5,000
4,000
3,000
2,000
1,000
02014 2015 2016
Revenues by division€ mln
Health
Tax & Accounting
Governance, Risk & Compliance
Legal & Regulatory
4,297
927
1,091
1,106
1,173
3,660
1,001
854
816
989
4,208
989
1,065
1,022
1,132
62
100
75
50
25
02014 2015 2016
Revenues by geographyin %
Europe
North America
Asia Pacific
Rest of the world
6
55
37
2
61
31
6
59
33
2
Organic revenue growthin %
4
3
2
1
02014 2015 2016
4,511
4,363
18,318
3,064
1 04
6,276
1.9
2.72.8
Health
Tax & Accounting
Governance, Risk & Compliance
Legal & Regulatory
Corporate
Key Figures
Management and Organization Wolters Kluwer 2016 Annual Report
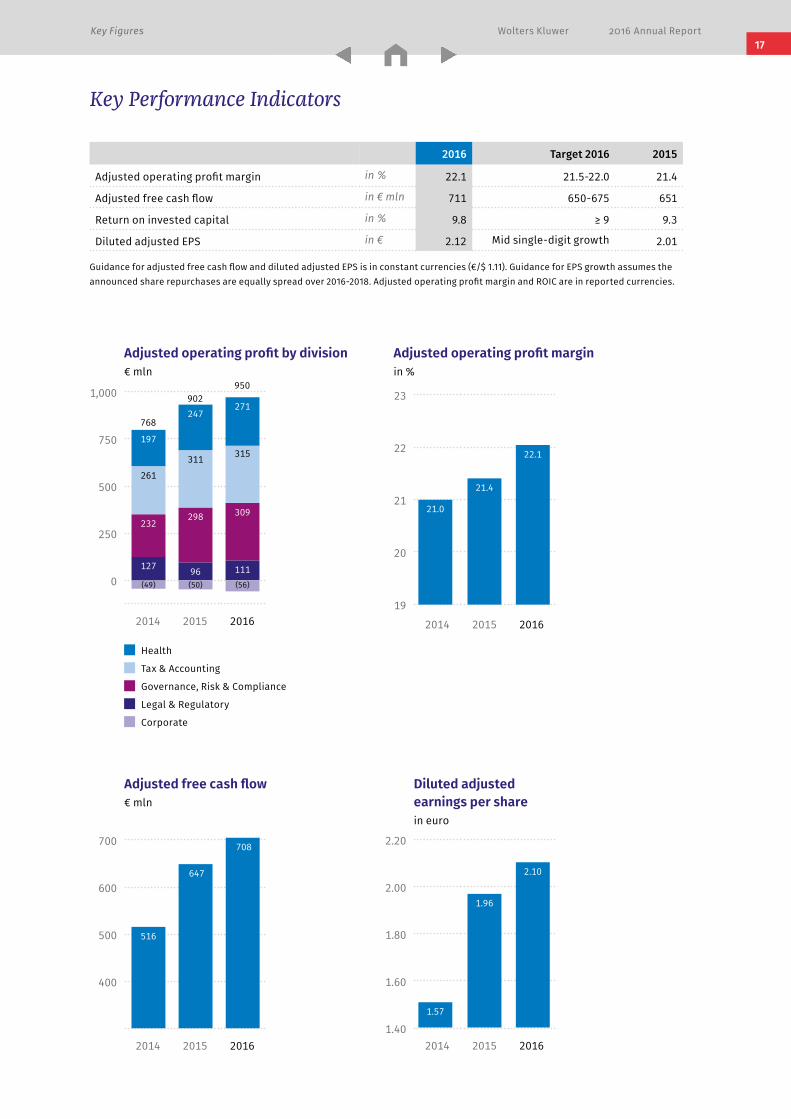
2016 Target 2016 2015
Adjusted operating profit margin in % 22.1 21.5-22.0 21.4
Adjusted free cash flow in € mln 711 650-675 651
Return on invested capital in % 9.8 ≥ 9 9.3
Diluted adjusted EPS in € 2.12 Mid single-digit growth 2.01
Guidance for adjusted free cash flow and diluted adjusted EPS is in constant currencies (€/$ 1.11). Guidance for EPS growth assumes the announced share repurchases are equally spread over 2016-2018. Adjusted operating profit margin and ROIC are in reported currencies.
Key Performance Indicators
Adjusted free cash flow € mln
700
600
500
400
2014 2015 2016
647
708
516
1,000
750
500
250
0
2014 2015 2016
Adjusted operating profit by division€ mln
Health
Tax & Accounting
Governance, Risk & Compliance
Legal & Regulatory
Corporate
(49)
902950
96 111
298 309
311 315
247271
(56)
768
127
232
261
197
(50)
Adjusted operating profit marginin %
23
22
21
20
19
2014 2015 2016
2.20
2.00
1.80
1.60
1.402014 2015 2016
Diluted adjusted earnings per sharein euro
21.0
1.57
21.4
22.1
1.96
2.10
Key Figures17
Wolters Kluwer 2016 Annual Report
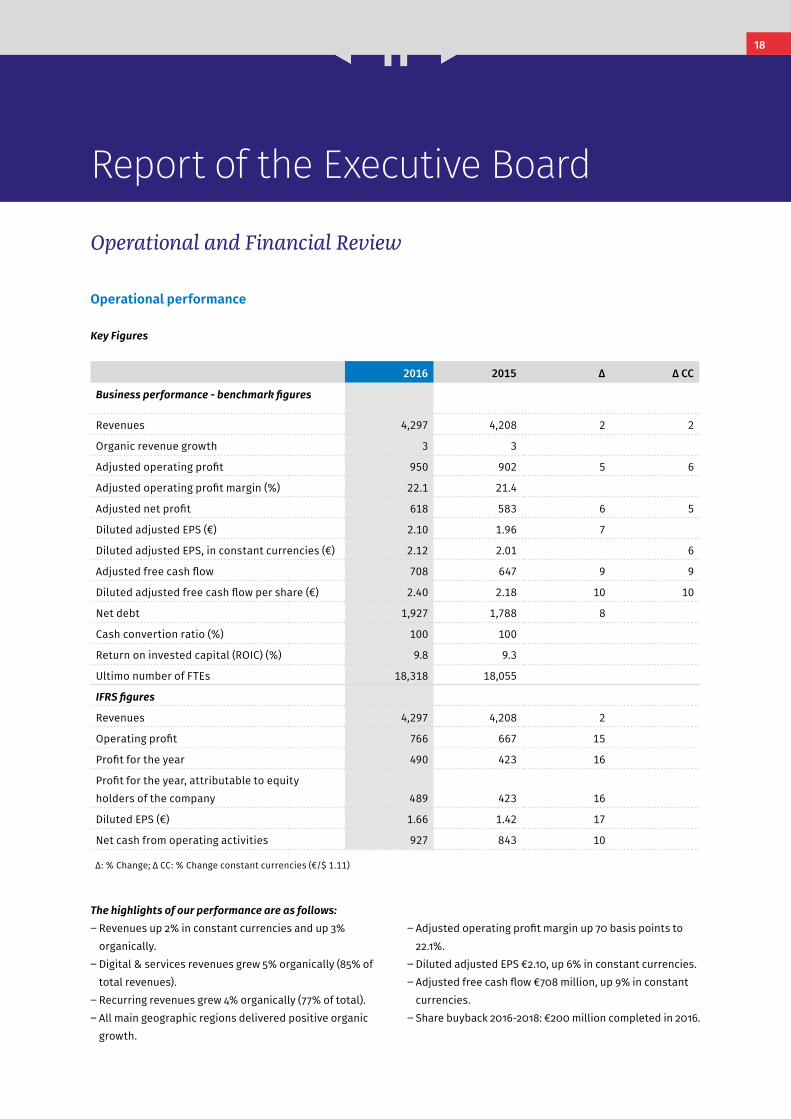
Report of the Executive Board
Operational performance
Key Figures
2016 2015 ∆ ∆ CC
Business performance - benchmark figures
Revenues 4,297 4,208 2 2
Organic revenue growth 3 3
Adjusted operating profit 950 902 5 6
Adjusted operating profit margin (%) 22.1 21.4
Adjusted net profit 618 583 6 5
Diluted adjusted EPS (€) 2.10 1.96 7
Diluted adjusted EPS, in constant currencies (€) 2.12 2.01 6
Adjusted free cash flow 708 647 9 9
Diluted adjusted free cash flow per share (€) 2.40 2.18 10 10
Net debt 1,927 1,788 8
Cash convertion ratio (%) 100 100
Return on invested capital (ROIC) (%) 9.8 9.3
Ultimo number of FTEs 18,318 18,055
IFRS figures
Revenues 4,297 4,208 2
Operating profit 766 667 15
Profit for the year 490 423 16
Profit for the year, attributable to equity holders of the company 489 423 16
Diluted EPS (€) 1.66 1.42 17
Net cash from operating activities 927 843 10
∆: % Change; ∆ CC: % Change constant currencies (€/$ 1.11)
The highlights of our performance are as follows: ‒ Revenues up 2% in constant currencies and up 3% organically. ‒ Digital & services revenues grew 5% organically (85% of total revenues). ‒ Recurring revenues grew 4% organically (77% of total). ‒ All main geographic regions delivered positive organic growth.
‒ Adjusted operating profit margin up 70 basis points to 22.1%. ‒ Diluted adjusted EPS €2.10, up 6% in constant currencies. ‒ Adjusted free cash flow €708 million, up 9% in constant currencies. ‒ Share buyback 2016-2018: €200 million completed in 2016.
18
Operational and Financial Review
Report of the Executive Board Wolters Kluwer 2016 Annual Report
‒ Strong financial position: net-debt-to-EBITDA 1.7x at year-end. ‒ Proposed full-year total dividend of €0.79 per share, up 5%. ‒ Outlook 2017: expect mid-single digit growth in diluted adjusted EPS in constant currencies.
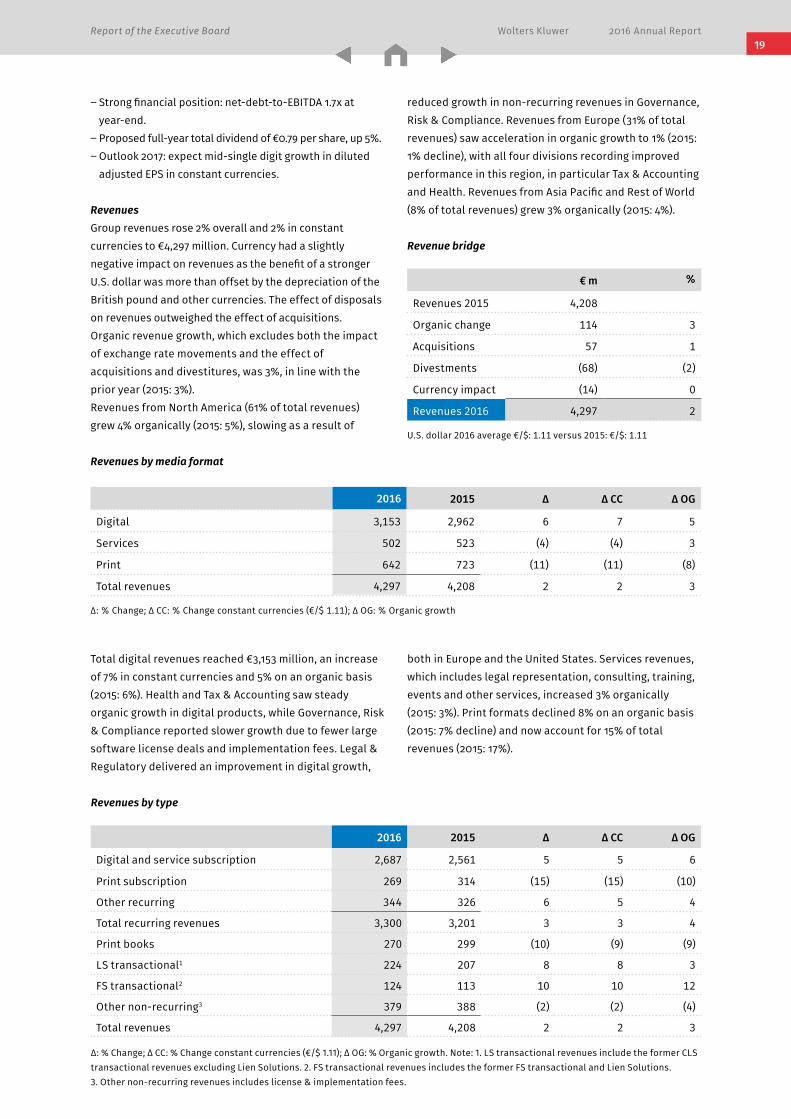
RevenuesGroup revenues rose 2% overall and 2% in constant currencies to €4,297 million. Currency had a slightly negative impact on revenues as the benefit of a stronger U.S. dollar was more than offset by the depreciation of the British pound and other currencies. The effect of disposals on revenues outweighed the effect of acquisitions. Organic revenue growth, which excludes both the impact of exchange rate movements and the effect of acquisitions and divestitures, was 3%, in line with the prior year (2015: 3%). Revenues from North America (61% of total revenues) grew 4% organically (2015: 5%), slowing as a result of
Total digital revenues reached €3,153 million, an increase of 7% in constant currencies and 5% on an organic basis (2015: 6%). Health and Tax & Accounting saw steady organic growth in digital products, while Governance, Risk & Compliance reported slower growth due to fewer large software license deals and implementation fees. Legal & Regulatory delivered an improvement in digital growth,
both in Europe and the United States. Services revenues, which includes legal representation, consulting, training, events and other services, increased 3% organically (2015: 3%). Print formats declined 8% on an organic basis (2015: 7% decline) and now account for 15% of total revenues (2015: 17%).
reduced growth in non-recurring revenues in Governance, Risk & Compliance. Revenues from Europe (31% of total revenues) saw acceleration in organic growth to 1% (2015: 1% decline), with all four divisions recording improved performance in this region, in particular Tax & Accounting and Health. Revenues from Asia Pacific and Rest of World (8% of total revenues) grew 3% organically (2015: 4%).
Revenue bridge
€ m %
Revenues 2015 4,208
Organic change 114 3
Acquisitions 57 1
Divestments (68) (2)
Currency impact (14) 0
Revenues 2016 4,297 2
U.S. dollar 2016 average €/$: 1.11 versus 2015: €/$: 1.11
Revenues by type
2016 2015 ∆ ∆ CC ∆ OG
Digital and service subscription 2,687 2,561 5 5 6
Print subscription 269 314 (15) (15) (10)
Other recurring 344 326 6 5 4
Total recurring revenues 3,300 3,201 3 3 4
Print books 270 299 (10) (9) (9)
LS transactional1 224 207 8 8 3
FS transactional2 124 113 10 10 12
Other non-recurring3 379 388 (2) (2) (4)
Total revenues 4,297 4,208 2 2 3
∆: % Change; ∆ CC: % Change constant currencies (€/$ 1.11); ∆ OG: % Organic growth. Note: 1. LS transactional revenues include the former CLS transactional revenues excluding Lien Solutions. 2. FS transactional revenues includes the former FS transactional and Lien Solutions. 3. Other non-recurring revenues includes license & implementation fees.
Revenues by media format
2016 2015 ∆ ∆ CC ∆ OG
Digital 3,153 2,962 6 7 5
Services 502 523 (4) (4) 3
Print 642 723 (11) (11) (8)
Total revenues 4,297 4,208 2 2 3
∆: % Change; ∆ CC: % Change constant currencies (€/$ 1.11); ∆ OG: % Organic growth
19
Report of the Executive Board Wolters Kluwer 2016 Annual Report 20
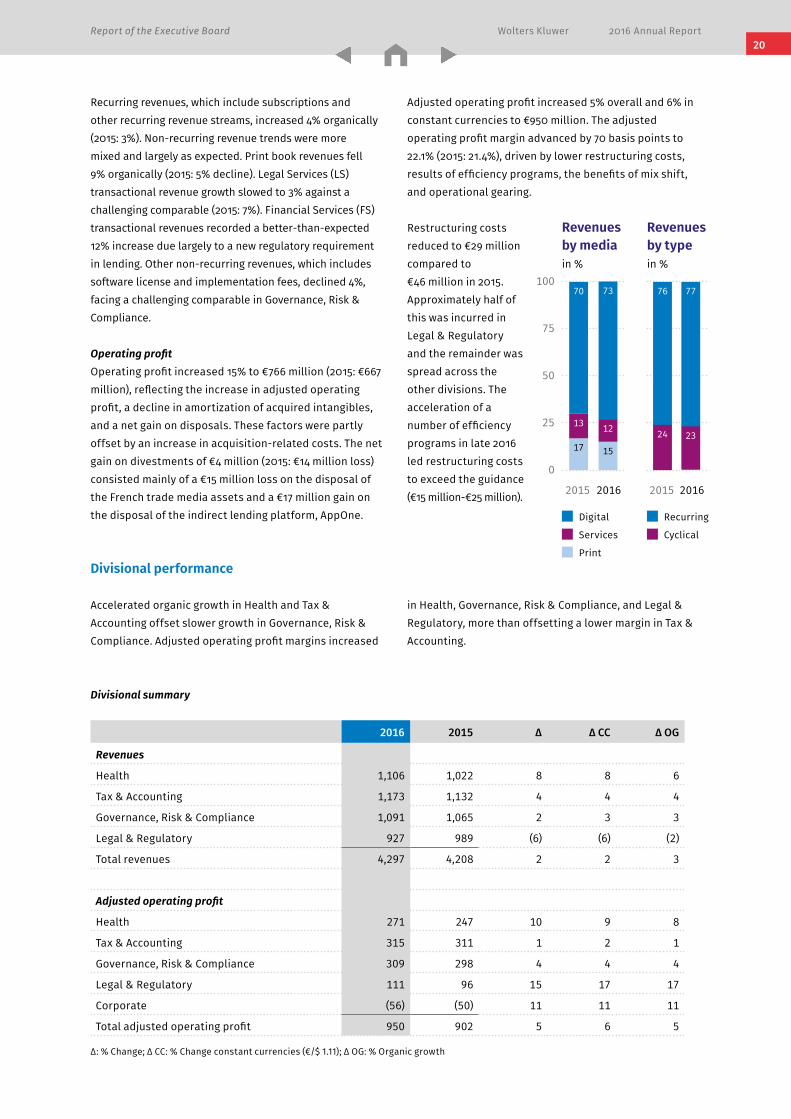
Recurring revenues, which include subscriptions and other recurring revenue streams, increased 4% organically (2015: 3%). Non-recurring revenue trends were more mixed and largely as expected. Print book revenues fell 9% organically (2015: 5% decline). Legal Services (LS) transactional revenue growth slowed to 3% against a challenging comparable (2015: 7%). Financial Services (FS) transactional revenues recorded a better-than-expected 12% increase due largely to a new regulatory requirement in lending. Other non-recurring revenues, which includes software license and implementation fees, declined 4%, facing a challenging comparable in Governance, Risk & Compliance.
Operating profitOperating profit increased 15% to €766 million (2015: €667 million), reflecting the increase in adjusted operating profit, a decline in amortization of acquired intangibles, and a net gain on disposals. These factors were partly offset by an increase in acquisition-related costs. The net gain on divestments of €4 million (2015: €14 million loss) consisted mainly of a €15 million loss on the disposal of the French trade media assets and a €17 million gain on the disposal of the indirect lending platform, AppOne.
Adjusted operating profit increased 5% overall and 6% in constant currencies to €950 million. The adjusted operating profit margin advanced by 70 basis points to 22.1% (2015: 21.4%), driven by lower restructuring costs, results of efficiency programs, the benefits of mix shift, and operational gearing.
Restructuring costs reduced to €29 million compared to €46 million in 2015. Approximately half of this was incurred in Legal & Regulatory and the remainder was spread across the other divisions. The acceleration of a number of efficiency programs in late 2016 led restructuring costs to exceed the guidance (€15 million-€25 million).
Divisional performance
Divisional summary
2016 2015 ∆ ∆ CC ∆ OG
Revenues
Health 1,106 1,022 8 8 6
Tax & Accounting 1,173 1,132 4 4 4
Governance, Risk & Compliance 1,091 1,065 2 3 3
Legal & Regulatory 927 989 (6) (6) (2)
Total revenues 4,297 4,208 2 2 3
Adjusted operating profit
Health 271 247 10 9 8
Tax & Accounting 315 311 1 2 1
Governance, Risk & Compliance 309 298 4 4 4
Legal & Regulatory 111 96 15 17 17
Corporate (56) (50) 11 11 11
Total adjusted operating profit 950 902 5 6 5
∆: % Change; ∆ CC: % Change constant currencies (€/$ 1.11); ∆ OG: % Organic growth
Accelerated organic growth in Health and Tax & Accounting offset slower growth in Governance, Risk & Compliance. Adjusted operating profit margins increased
in Health, Governance, Risk & Compliance, and Legal & Regulatory, more than offsetting a lower margin in Tax & Accounting.
Revenues by mediain %
Digital
Services
Revenues by typein %
Recurring
Cyclical
100
75
50
25
0
2015 2016 2015 2016
15
73
17
70 76 77
1324 23
12
Report of the Executive Board Wolters Kluwer 2016 Annual Report
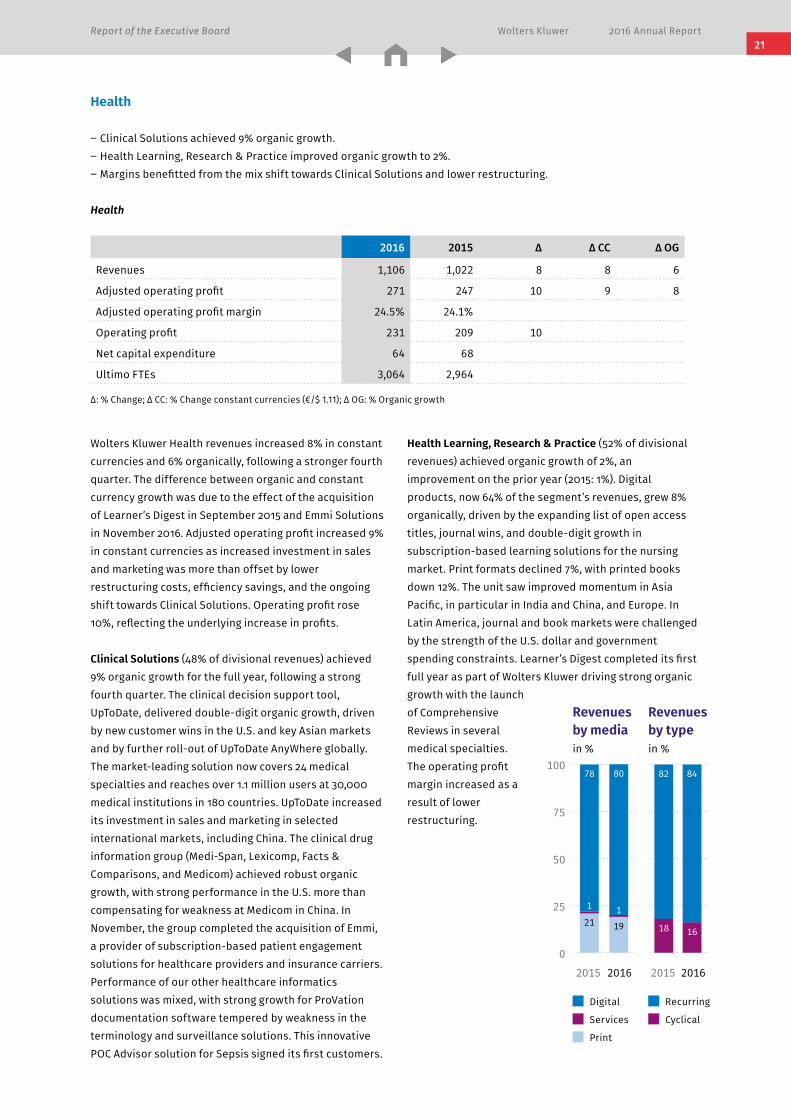
Wolters Kluwer Health revenues increased 8% in constant currencies and 6% organically, following a stronger fourth quarter. The difference between organic and constant currency growth was due to the effect of the acquisition of Learner’s Digest in September 2015 and Emmi Solutions in November 2016. Adjusted operating profit increased 9% in constant currencies as increased investment in sales and marketing was more than offset by lower restructuring costs, efficiency savings, and the ongoing shift towards Clinical Solutions. Operating profit rose 10%, reflecting the underlying increase in profits.
Clinical Solutions (48% of divisional revenues) achieved 9% organic growth for the full year, following a strong fourth quarter. The clinical decision support tool, UpToDate, delivered double-digit organic growth, driven by new customer wins in the U.S. and key Asian markets and by further roll-out of UpToDate AnyWhere globally. The market-leading solution now covers 24 medical specialties and reaches over 1.1 million users at 30,000 medical institutions in 180 countries. UpToDate increased its investment in sales and marketing in selected international markets, including China. The clinical drug information group (Medi-Span, Lexicomp, Facts & Comparisons, and Medicom) achieved robust organic growth, with strong performance in the U.S. more than compensating for weakness at Medicom in China. In November, the group completed the acquisition of Emmi, a provider of subscription-based patient engagement solutions for healthcare providers and insurance carriers. Performance of our other healthcare informatics solutions was mixed, with strong growth for ProVation documentation software tempered by weakness in the terminology and surveillance solutions. This innovative POC Advisor solution for Sepsis signed its first customers.
Health Learning, Research & Practice (52% of divisional revenues) achieved organic growth of 2%, an improvement on the prior year (2015: 1%). Digital products, now 64% of the segment’s revenues, grew 8% organically, driven by the expanding list of open access titles, journal wins, and double-digit growth in subscription-based learning solutions for the nursing market. Print formats declined 7%, with printed books down 12%. The unit saw improved momentum in Asia Pacific, in particular in India and China, and Europe. In Latin America, journal and book markets were challenged by the strength of the U.S. dollar and government spending constraints. Learner’s Digest completed its first full year as part of Wolters Kluwer driving strong organic growth with the launch of Comprehensive Reviews in several medical specialties. The operating profit margin increased as a result of lower restructuring.
Health
2016 2015 ∆ ∆ CC ∆ OG
Revenues 1,106 1,022 8 8 6
Adjusted operating profit 271 247 10 9 8
Adjusted operating profit margin 24.5% 24.1%
Operating profit 231 209 10
Net capital expenditure 64 68
Ultimo FTEs 3,064 2,964
∆: % Change; ∆ CC: % Change constant currencies (€/$ 1.11); ∆ OG: % Organic growth
Revenues by mediain %
Digital
Services
Revenues by typein %
Recurring
Cyclical
100
75
50
25
0
2015 2016 2015 2016
19
80
21
78 82 84
11
18 16
Health
‒ Clinical Solutions achieved 9% organic growth. ‒ Health Learning, Research & Practice improved organic growth to 2%. ‒ Margins benefitted from the mix shift towards Clinical Solutions and lower restructuring.
21
Report of the Executive Board Wolters Kluwer 2016 Annual Report 22
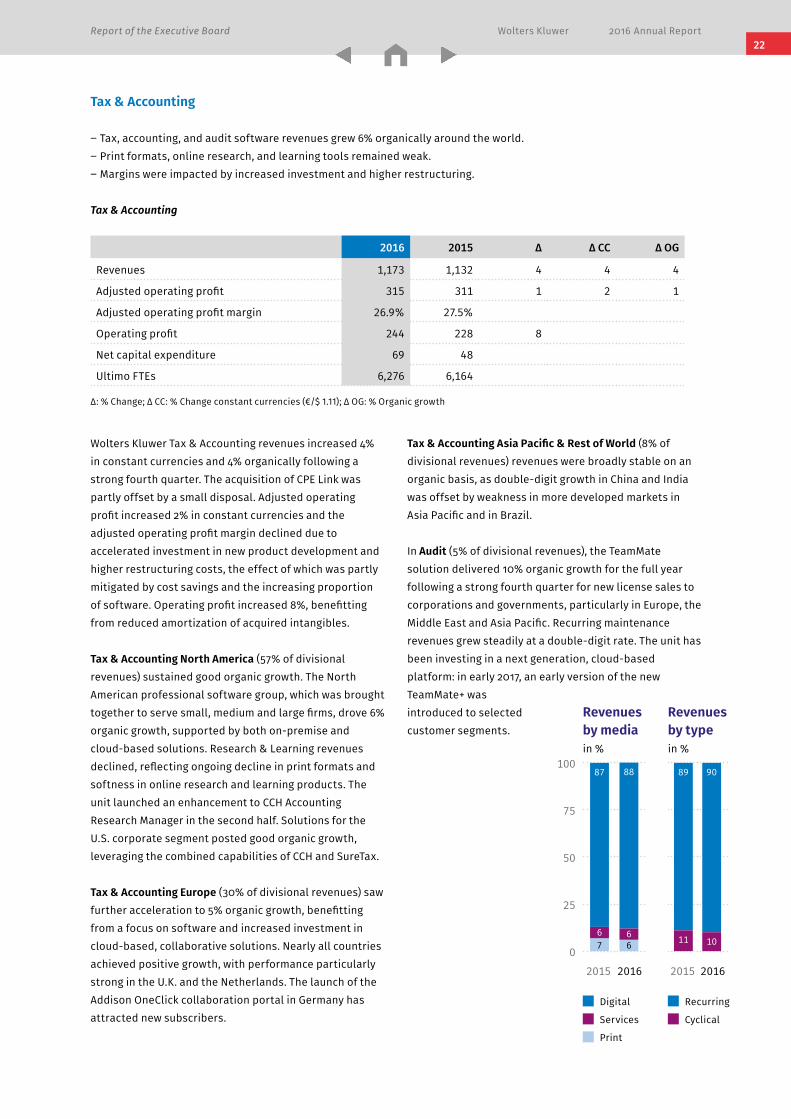
Wolters Kluwer Tax & Accounting revenues increased 4% in constant currencies and 4% organically following a strong fourth quarter. The acquisition of CPE Link was partly offset by a small disposal. Adjusted operating profit increased 2% in constant currencies and the adjusted operating profit margin declined due to accelerated investment in new product development and higher restructuring costs, the effect of which was partly mitigated by cost savings and the increasing proportion of software. Operating profit increased 8%, benefitting from reduced amortization of acquired intangibles.
Tax & Accounting North America (57% of divisional revenues) sustained good organic growth. The North American professional software group, which was brought together to serve small, medium and large firms, drove 6% organic growth, supported by both on-premise and cloud-based solutions. Research & Learning revenues declined, reflecting ongoing decline in print formats and softness in online research and learning products. The unit launched an enhancement to CCH Accounting Research Manager in the second half. Solutions for the U.S. corporate segment posted good organic growth, leveraging the combined capabilities of CCH and SureTax.
Tax & Accounting Europe (30% of divisional revenues) saw further acceleration to 5% organic growth, benefitting from a focus on software and increased investment in cloud-based, collaborative solutions. Nearly all countries achieved positive growth, with performance particularly strong in the U.K. and the Netherlands. The launch of the Addison OneClick collaboration portal in Germany has attracted new subscribers.
Tax & Accounting Asia Pacific & Rest of World (8% of divisional revenues) revenues were broadly stable on an organic basis, as double-digit growth in China and India was offset by weakness in more developed markets in Asia Pacific and in Brazil.
In Audit (5% of divisional revenues), the TeamMate solution delivered 10% organic growth for the full year following a strong fourth quarter for new license sales to corporations and governments, particularly in Europe, the Middle East and Asia Pacific. Recurring maintenance revenues grew steadily at a double-digit rate. The unit has been investing in a next generation, cloud-based platform: in early 2017, an early version of the new TeamMate+ was introduced to selected customer segments.
Tax & Accounting
‒ Tax, accounting, and audit software revenues grew 6% organically around the world. ‒ Print formats, online research, and learning tools remained weak. ‒ Margins were impacted by increased investment and higher restructuring.
Tax & Accounting
2016 2015 ∆ ∆ CC ∆ OG
Revenues 1,173 1,132 4 4 4
Adjusted operating profit 315 311 1 2 1
Adjusted operating profit margin 26.9% 27.5%
Operating profit 244 228 8
Net capital expenditure 69 48
Ultimo FTEs 6,276 6,164
∆: % Change; ∆ CC: % Change constant currencies (€/$ 1.11); ∆ OG: % Organic growth
Revenues by mediain %
Digital
Services
Revenues by typein %
Recurring
Cyclical
100
75
50
25
0
2015 2016 2015 2016
6
88
7
87 89 90
611 10
6
Report of the Executive Board Wolters Kluwer 2016 Annual Report
Governance, Risk & Compliance
2016 2015 ∆ ∆ CC ∆ OG
Revenues 1,091 1,065 2 3 3
Adjusted operating profit 309 298 4 4 4
Adjusted operating profit margin 28.4% 28.0%
Operating profit 276 225 22
Net capital expenditure 50 31
Ultimo FTEs 4,511 4,413
∆: % Change; ∆ CC: % Change constant currencies (€/$ 1.11); ∆ OG: % Organic growth
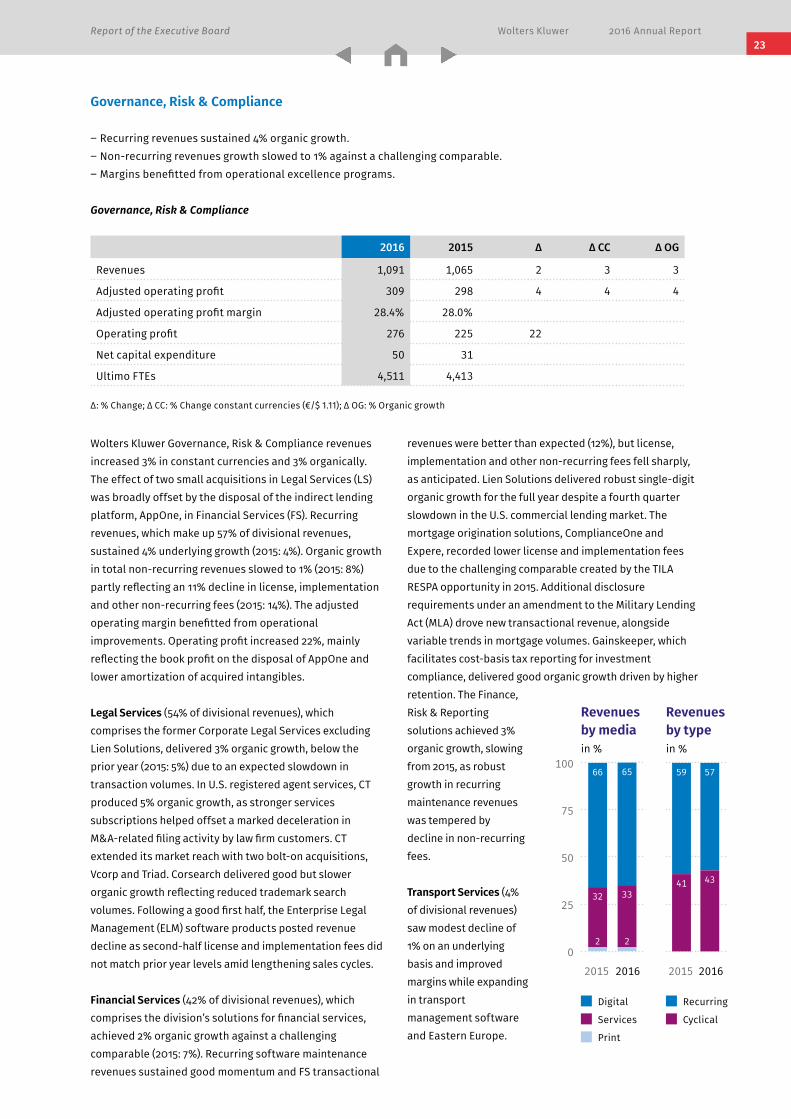
Wolters Kluwer Governance, Risk & Compliance revenues increased 3% in constant currencies and 3% organically. The effect of two small acquisitions in Legal Services (LS) was broadly offset by the disposal of the indirect lending platform, AppOne, in Financial Services (FS). Recurring revenues, which make up 57% of divisional revenues, sustained 4% underlying growth (2015: 4%). Organic growth in total non-recurring revenues slowed to 1% (2015: 8%) partly reflecting an 11% decline in license, implementation and other non-recurring fees (2015: 14%). The adjusted operating margin benefitted from operational improvements. Operating profit increased 22%, mainly reflecting the book profit on the disposal of AppOne and lower amortization of acquired intangibles.
Legal Services (54% of divisional revenues), which comprises the former Corporate Legal Services excluding Lien Solutions, delivered 3% organic growth, below the prior year (2015: 5%) due to an expected slowdown in transaction volumes. In U.S. registered agent services, CT produced 5% organic growth, as stronger services subscriptions helped offset a marked deceleration in M&A-related filing activity by law firm customers. CT extended its market reach with two bolt-on acquisitions, Vcorp and Triad. Corsearch delivered good but slower organic growth reflecting reduced trademark search volumes. Following a good first half, the Enterprise Legal Management (ELM) software products posted revenue decline as second-half license and implementation fees did not match prior year levels amid lengthening sales cycles.
Financial Services (42% of divisional revenues), which comprises the division’s solutions for financial services, achieved 2% organic growth against a challenging comparable (2015: 7%). Recurring software maintenance revenues sustained good momentum and FS transactional
revenues were better than expected (12%), but license, implementation and other non-recurring fees fell sharply, as anticipated. Lien Solutions delivered robust single-digit organic growth for the full year despite a fourth quarter slowdown in the U.S. commercial lending market. The mortgage origination solutions, ComplianceOne and Expere, recorded lower license and implementation fees due to the challenging comparable created by the TILA RESPA opportunity in 2015. Additional disclosure requirements under an amendment to the Military Lending Act (MLA) drove new transactional revenue, alongside variable trends in mortgage volumes. Gainskeeper, which facilitates cost-basis tax reporting for investment compliance, delivered good organic growth driven by higher retention. The Finance, Risk & Reporting solutions achieved 3% organic growth, slowing from 2015, as robust growth in recurring maintenance revenues was tempered by decline in non-recurring fees.
Transport Services (4% of divisional revenues) saw modest decline of 1% on an underlying basis and improved margins while expanding in transport management software and Eastern Europe.
Governance, Risk & Compliance
‒ Recurring revenues sustained 4% organic growth. ‒ Non-recurring revenues growth slowed to 1% against a challenging comparable. ‒ Margins benefitted from operational excellence programs.
Revenues by mediain %
Digital
Services
Revenues by typein %
Recurring
Cyclical
100
75
50
25
0
2015 2016 2015 2016
6566 59 57
3241 43
33
2 2
23
Report of the Executive Board Wolters Kluwer 2016 Annual Report 24
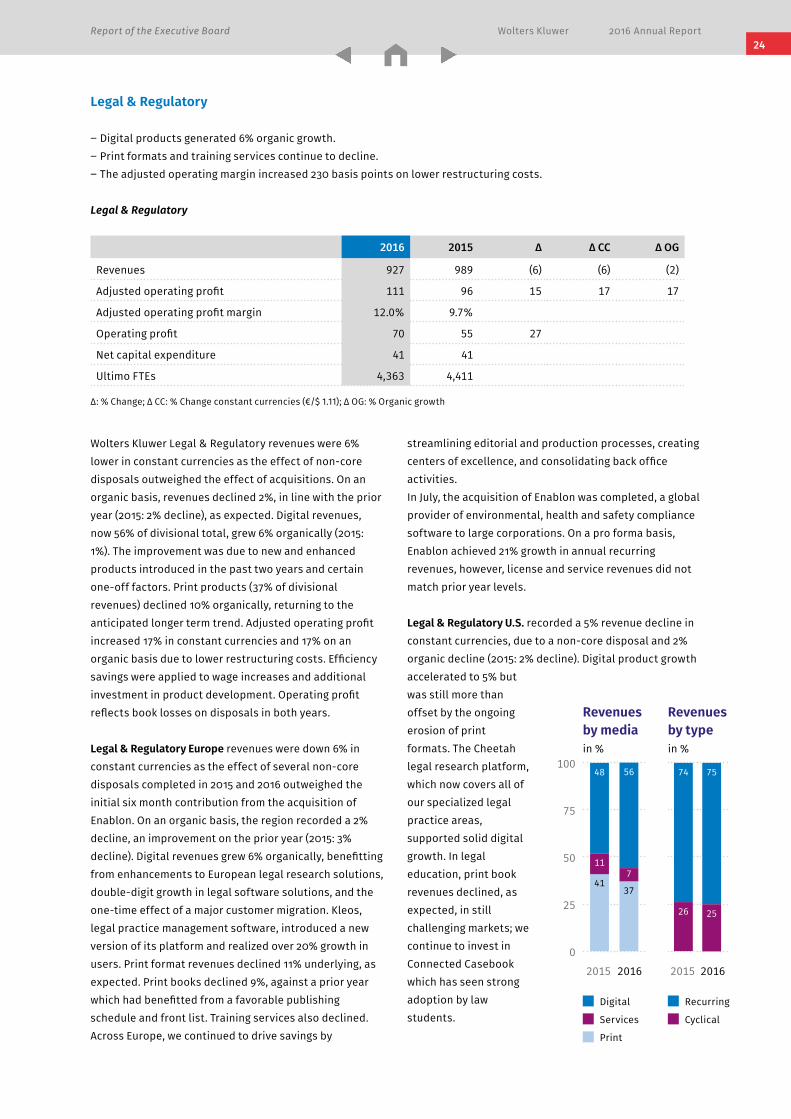
Legal & Regulatory
2016 2015 ∆ ∆ CC ∆ OG
Revenues 927 989 (6) (6) (2)
Adjusted operating profit 111 96 15 17 17
Adjusted operating profit margin 12.0% 9.7%
Operating profit 70 55 27
Net capital expenditure 41 41
Ultimo FTEs 4,363 4,411
∆: % Change; ∆ CC: % Change constant currencies (€/$ 1.11); ∆ OG: % Organic growth
Wolters Kluwer Legal & Regulatory revenues were 6% lower in constant currencies as the effect of non-core disposals outweighed the effect of acquisitions. On an organic basis, revenues declined 2%, in line with the prior year (2015: 2% decline), as expected. Digital revenues, now 56% of divisional total, grew 6% organically (2015: 1%). The improvement was due to new and enhanced products introduced in the past two years and certain one-off factors. Print products (37% of divisional revenues) declined 10% organically, returning to the anticipated longer term trend. Adjusted operating profit increased 17% in constant currencies and 17% on an organic basis due to lower restructuring costs. Efficiency savings were applied to wage increases and additional investment in product development. Operating profit reflects book losses on disposals in both years.
Legal & Regulatory Europe revenues were down 6% in constant currencies as the effect of several non-core disposals completed in 2015 and 2016 outweighed the initial six month contribution from the acquisition of Enablon. On an organic basis, the region recorded a 2% decline, an improvement on the prior year (2015: 3% decline). Digital revenues grew 6% organically, benefitting from enhancements to European legal research solutions, double-digit growth in legal software solutions, and the one-time effect of a major customer migration. Kleos, legal practice management software, introduced a new version of its platform and realized over 20% growth in users. Print format revenues declined 11% underlying, as expected. Print books declined 9%, against a prior year which had benefitted from a favorable publishing schedule and front list. Training services also declined. Across Europe, we continued to drive savings by
streamlining editorial and production processes, creating centers of excellence, and consolidating back office activities. In July, the acquisition of Enablon was completed, a global provider of environmental, health and safety compliance software to large corporations. On a pro forma basis, Enablon achieved 21% growth in annual recurring revenues, however, license and service revenues did not match prior year levels.
Legal & Regulatory U.S. recorded a 5% revenue decline in constant currencies, due to a non-core disposal and 2% organic decline (2015: 2% decline). Digital product growth accelerated to 5% but was still more than offset by the ongoing erosion of print formats. The Cheetah legal research platform, which now covers all of our specialized legal practice areas, supported solid digital growth. In legal education, print book revenues declined, as expected, in still challenging markets; we continue to invest in Connected Casebook which has seen strong adoption by law students.
Legal & Regulatory
‒ Digital products generated 6% organic growth. ‒ Print formats and training services continue to decline. ‒ The adjusted operating margin increased 230 basis points on lower restructuring costs.
Revenues by mediain %
Digital
Services
Revenues by typein %
Recurring
Cyclical
100
75
50
25
0
2015 2016 2015 2016
37
56
41
48 74 75
11
26 25
7
Report of the Executive Board Wolters Kluwer 2016 Annual Report
Corporate
2016 2015 ∆ ∆ CC ∆ OG
Adjusted operating profit (56) (50) 11 11 11
Operating profit (55) (50) 10
Net capital expenditure 0 0
Ultimo FTEs 104 103
∆: % Change; ∆ CC: % Change constant currencies (€/$ 1.11); ∆ OG: % Organic growth
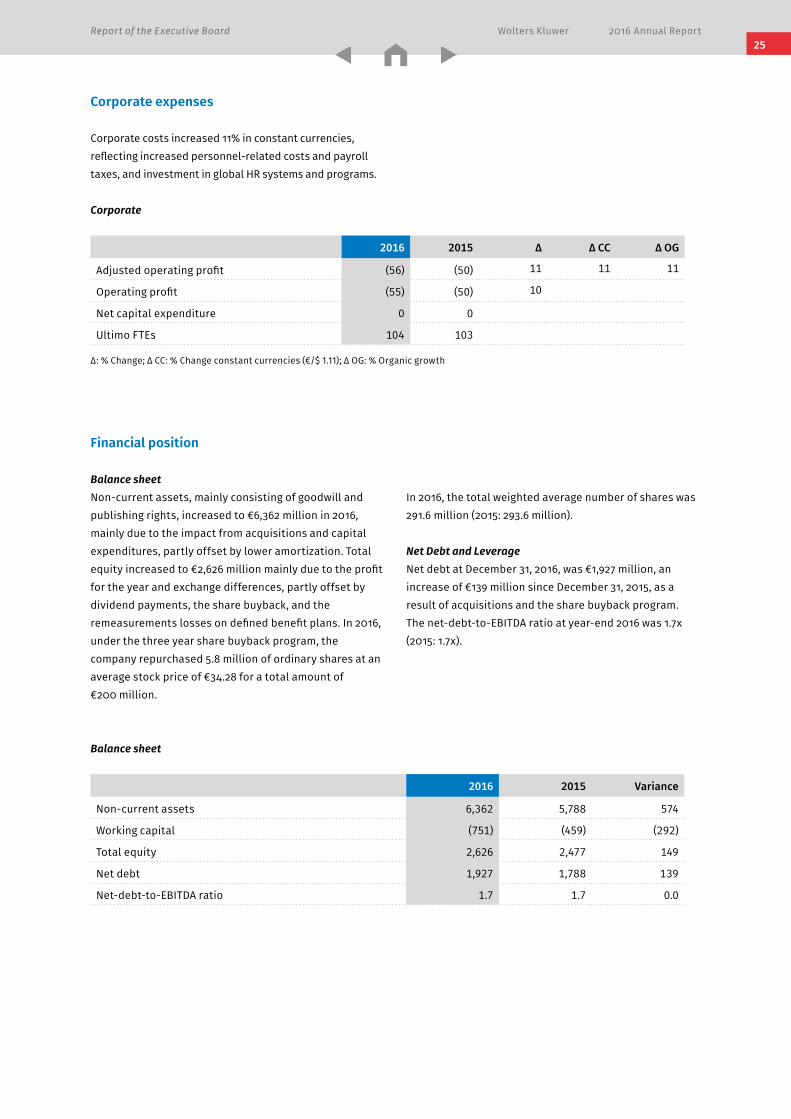
Corporate expenses
Corporate costs increased 11% in constant currencies, reflecting increased personnel-related costs and payroll taxes, and investment in global HR systems and programs.
Financial position
Balance sheetNon-current assets, mainly consisting of goodwill and publishing rights, increased to €6,362 million in 2016, mainly due to the impact from acquisitions and capital expenditures, partly offset by lower amortization. Total equity increased to €2,626 million mainly due to the profit for the year and exchange differences, partly offset by dividend payments, the share buyback, and the remeasurements losses on defined benefit plans. In 2016, under the three year share buyback program, the company repurchased 5.8 million of ordinary shares at an average stock price of €34.28 for a total amount of €200 million.
In 2016, the total weighted average number of shares was 291.6 million (2015: 293.6 million).
Net Debt and LeverageNet debt at December 31, 2016, was €1,927 million, an increase of €139 million since December 31, 2015, as a result of acquisitions and the share buyback program. The net-debt-to-EBITDA ratio at year-end 2016 was 1.7x (2015: 1.7x).
Balance sheet
2016 2015 Variance
Non-current assets 6,362 5,788 574
Working capital (751) (459) (292)
Total equity 2,626 2,477 149
Net debt 1,927 1,788 139
Net-debt-to-EBITDA ratio 1.7 1.7 0.0
25
Report of the Executive Board Wolters Kluwer 2016 Annual Report 26
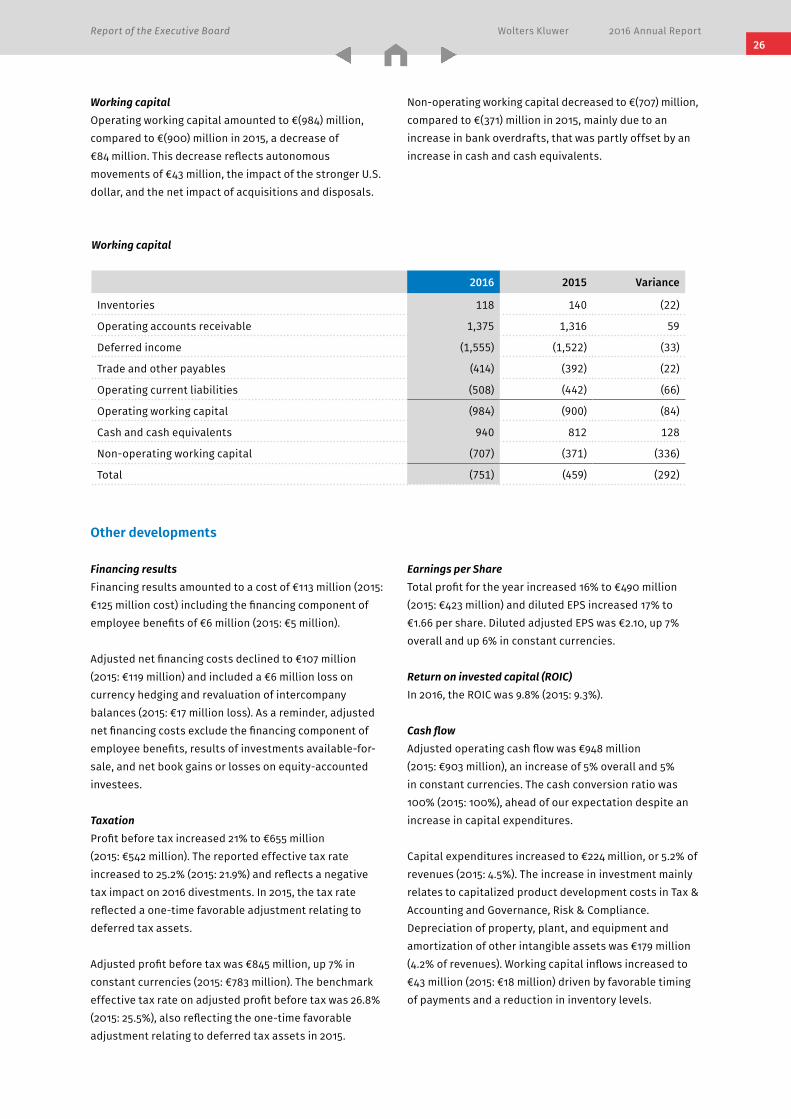
Working capitalOperating working capital amounted to €(984) million, compared to €(900) million in 2015, a decrease of€84 million. This decrease reflects autonomous movements of €43 million, the impact of the stronger U.S. dollar, and the net impact of acquisitions and disposals.
Working capital
2016 2015 Variance
Inventories 118 140 (22)
Operating accounts receivable 1,375 1,316 59
Deferred income (1,555) (1,522) (33)
Trade and other payables (414) (392) (22)
Operating current liabilities (508) (442) (66)
Operating working capital (984) (900) (84)
Cash and cash equivalents 940 812 128
Non-operating working capital (707) (371) (336)
Total (751) (459) (292)
Other developments
Financing resultsFinancing results amounted to a cost of €113 million (2015: €125 million cost) including the financing component of employee benefits of €6 million (2015: €5 million).
Adjusted net financing costs declined to €107 million (2015: €119 million) and included a €6 million loss on currency hedging and revaluation of intercompany balances (2015: €17 million loss). As a reminder, adjusted net financing costs exclude the financing component of employee benefits, results of investments available-for-sale, and net book gains or losses on equity-accounted investees.
TaxationProfit before tax increased 21% to €655 million (2015: €542 million). The reported effective tax rate increased to 25.2% (2015: 21.9%) and reflects a negative tax impact on 2016 divestments. In 2015, the tax rate reflected a one-time favorable adjustment relating to deferred tax assets.
Adjusted profit before tax was €845 million, up 7% in constant currencies (2015: €783 million). The benchmark effective tax rate on adjusted profit before tax was 26.8% (2015: 25.5%), also reflecting the one-time favorable adjustment relating to deferred tax assets in 2015.
Earnings per ShareTotal profit for the year increased 16% to €490 million (2015: €423 million) and diluted EPS increased 17% to €1.66 per share. Diluted adjusted EPS was €2.10, up 7% overall and up 6% in constant currencies.
Return on invested capital (ROIC)In 2016, the ROIC was 9.8% (2015: 9.3%).
Cash flowAdjusted operating cash flow was €948 million (2015: €903 million), an increase of 5% overall and 5% in constant currencies. The cash conversion ratio was 100% (2015: 100%), ahead of our expectation despite an increase in capital expenditures.
Capital expenditures increased to €224 million, or 5.2% of revenues (2015: 4.5%). The increase in investment mainly relates to capitalized product development costs in Tax & Accounting and Governance, Risk & Compliance. Depreciation of property, plant, and equipment and amortization of other intangible assets was €179 million (4.2% of revenues). Working capital inflows increased to €43 million (2015: €18 million) driven by favorable timing of payments and a reduction in inventory levels.
Non-operating working capital decreased to €(707) million, compared to €(371) million in 2015, mainly due to an increase in bank overdrafts, that was partly offset by an increase in cash and cash equivalents.

Report of the Executive Board Wolters Kluwer 2016 Annual Report
Acquisitions and divestmentsAcquisition spending, net of cash acquired and including acquisition-related costs, was €461 million (2015: €183 million). Of this, €5 million related to earn-outs on acquisitions made in prior years. The majority of acquisition spending reflects the purchase of Enablon in Legal & Regulatory (July 2016) and Emmi Solutions in Health (November 2016). Divestiture proceeds, net of cash disposed, were €14 million, representing the net proceeds from the sale of the French trade media assets and the U.S. indirect lending solution, AppOne.
Leverage target and financial policyWolters Kluwer uses its cash flow to invest in the business organically or through acquisitions, to maintain optimal leverage, and provide returns to shareholders. We regularly assess our financial position and evaluate the appropriate level of debt in view of our expectations for cash flow, investment plans, interest rates, and capital market conditions.
While we may temporarily deviate from our leverage target at times, we continue to believe that, in the longer run, a net-debt-to-EBITDA ratio of around 2.5x remains appropriate for our business given the high proportion of recurring revenues and resilient cash flow.
Dividend policy and 2016 dividendsWolters Kluwer has a progressive dividend policy under which the company aims to increase the dividend per share each year. In light of the current below-target leverage and the solid 2016 operating performance, we are proposing a final dividend of €0.60 per share. This will bring the total dividend over the 2016 financial year to €0.79 per share, an increase of 4 euro cents or 5% on the prior year dividend (2015: €0.75). If approved, the 2016 dividend will mark the 11th consecutive year of increase in dividend per share.
Under our progressive dividend policy, we remain committed to increasing the total dividend per share each year, with the annual increase dependent on our financial performance, market conditions, and our need for financial flexibility.
For 2017, we intend to set the interim dividend at 25% of prior year total dividend.
Shareholders can choose to reinvest both interim and final dividends by purchasing additional Wolters Kluwer shares through the Dividend Reinvestment Plan (DRIP) administered by ABN AMRO Bank N.V.
Cash flow
2016 2015 ∆ ∆ CC
Net cash flow from operating activities 927 843 10 10
Adjusted operating cash flow 948 903 5 5
Capital expenditure (224) (188) 19 20
Adjusted free cash flow 708 647 9 9
Diluted adjusted free cash flow per share (€) 2.40 2.18 10 10
Cash conversion ratio (%) 100 100
∆: % Change; ∆ CC: % Change constant currencies (€/$ 1.11)
Adjusted free cash flow was €708 million, up 9% overall and up 9% in constant currencies, reflecting the increase in adjusted operating cash flow and benefitting from a reduction in corporate income taxes paid. Paid financing costs were broadly stable at €100 million (2015: €101 million). The net movement of restructuring provisions of €10 million related to cash spending of €31 million on efficiency programs and net additions of €21 million during 2016. In 2016, a €22 million voluntary injection was paid into our North American pension
scheme. Corporate income taxes paid were €108 million (2015: €141 million), as a result of favorable timing of cash tax payments.
Dividends paid to shareholders during 2016 totaled €223 million, comprising the 2015 final dividend and the 2016 interim dividend. During the year, we completed €200 million of share buybacks, of which €2 million was settled in January 2017.
27
Report of the Executive Board Wolters Kluwer 2016 Annual Report 28
Cross-divisional Organization
Global Business Services
Global Business Services (GBS) plays a critical role in Wolters Kluwer’s strategic priority of driving efficiencies and engagement. GBS focuses on delivering economies of scale and scope, enhancing the performance and quality of non-customer facing operations, and instilling greater agility in the way Wolters Kluwer operates through better tooling and harmonized/streamlined processes. These efficiencies help shift spending to new product development and away from maintenance, thereby helping to fund growth.
In 2016, GBS delivered substantial savings and value to Wolters Kluwer. The group made significant strides in migrating applications to the cloud, reducing data centers and processing centers through consolidation, application portfolio management and resiliency programs, strategic sourcing, and operational excellence.
To deliver on its objectives, GBS focused on: the journey to the cloud, the formation of the North American Accounting Center, and the continued pursuit of strategic sourcing and operational excellence opportunities.
Journey to the cloud: GBS has accelerated its migration of applications to the cloud, leading to greater resiliency, as well as a lower cost structure with greater variability. We have embarked on a “cloud-first” data center consolidation effort, which reduces the number of data centers and managed hosting services providers by migrating to the cloud when possible. By the end of 2016, Wolters Kluwer more than tripled its capacity in the cloud as compared to 2015.
GBS also completed the migration to Office 365, which facilitates collaboration across the company globally, consistent with the One Wolters Kluwer culture.
North American Accounting Center: in 2016, GBS launched the new central North American Accounting Center, which consolidated all resources in North America associated with the Procure-to-Pay, Record-to-Report, and Order-to-Cash processes. As a result, processes are being harmonized across divisions, leading to improved quality, better controls, and great efficiency.
Strategic sourcing and operational excellence: in 2016, GBS focused on increasing the amount of spending that is centrally managed through GBS. This allows Wolters Kluwer to leverage its full scale in vendor negotiations, improve results by shifting the workload to preferred vendors, and manage demand more tightly across divisions while reducing the complexity of operations. In addition, GBS has expanded its pipeline of operational excellence initiatives which continue to deliver higher quality at a lower cost, including efforts to improve the efficiency and effectiveness of technology operations.
All of these initiatives are contributing to our efforts to consolidate disparate processes, simplify and centralize non-customer facing and market-differentiating activities, foster greater agility, improve quality and controls, and support the strategy of operating as One Wolters Kluwer in our ongoing digital transformation.
Anti-dilution policy and share buyback program 2016-2018Wolters Kluwer has a policy to offset the dilution caused by our annual performance share issuance with share repurchases.
On February 24, 2016, the company announced the intention to repurchase up to €600 million in shares over the three-year period 2016-2018. This buyback includes repurchases made under the anti-dilution policy. Assuming global economic conditions do not deteriorate substantially, the company believes this level of cash return will leave ample headroom for investment in the business, including acquisitions.
During 2016, Wolters Kluwer repurchased 5.8 million shares for a total consideration of €200 million under this program. The repurchased shares are added to and held as treasury shares.
In 2017, the company intends to repurchase a similar amount. Up to and including February 21, 2017, it has repurchased a further 1.4 million shares for a total consideration of €50 million in the year to date. Part of the shares held in treasury will be retained and used to meet future obligations under share-based incentive plans. At the 2017 Annual General Meeting of Shareholders, Wolters Kluwer will propose cancelling any or all of the other shares held in treasury or to be acquired under the share buyback program 2016-2018.
Report of the Executive Board Wolters Kluwer 2016 Annual Report
Global Platform Organization
The Global Platform Organization (GPO) is Wolters Kluwer’s central technology organization, delivering operational efficiencies, shared development, and innovation power to Wolters Kluwer globally. GPO accelerates Wolters Kluwer’s portfolio transformation by leveraging global assets that can be customized to local market needs.
At the same time, GPO drives innovation within Wolters Kluwer, acting as a global innovation transfer agent by providing platforms, tools, and expertise in addition to rolling out a Lean Product Development process across the company.
GPO also focuses on co-creating state-of-the-art products and solutions with Wolters Kluwer businesses. Additional areas of work include consolidating technology platforms to leverage technology investments, and on driving innovation by mapping technological advances to our customers’ needs.
Next-generation product developmentGPO delivers the technologies, platforms, and tools that enable businesses to accelerate product development and time to market. In 2016, GPO delivered 70 customer-facing, value-driving solutions across all four divisions, using its Lean Product Development approach.
Examples of next-generation products that were launched in 2016 include: – Verifield Action Manager – a compliance suite for
Belgian health and safety compliance professionals;– Zeteo 3 – research tool for Swedish legal professional;– SmartTasks Manager – step-by-step practical legal
guidance guide;– ComplyTrack – a compliance tool focused on the health
care market;– Kleos 2.0 – a legal practice management tool for legal
professionals in Europe; and– CCH iQ – artificial intelligence technology that provides
actionable insights to accountants in Australia.
Continued consolidation of technology platformsTo reduce costs and drive efficiency, GPO consolidated formerly country-based IT and product development teams into GPO. This resulted in uniting more than 450 internal expert employees, augmented by outsourced development in a flexible staff augmentation model.
GPO also expanded its technology portfolio in 2016 to create scalability, reusability, and global leverage in areas such as contract management, procurement, e-signatures and cloud services to support a range of products including Effacts, SmartReader, E-Sign, and Twinfield.
Technology advances the work of professionalsGPO continues to drive the adoption of advanced technologies, such as artificial intelligence, semantic search, and workflow integration solutions within Wolters Kluwer.These activities are centered around a number of Centers of Excellence (CoEs):– Advanced Technology – accelerating the adoption of
advanced technologies in our platforms and throughout the company;
– Lean Product Development – applying Lean Startup, User-First /Design Thinking and Agile principles in a practical and results-driven manner, supporting Wolters Kluwer businesses to get better products to market faster;
– Content Management – next generation products require richer content delivery, which in turn requires state-of the-art content management systems: cloud-based, multi-tenant, applying best of breed solutions, both home-grown and third-party; and
– Legal Software – centralizing the software resources that develop and operate Wolters Kluwer’s expanding legal product portfolio to ensure product interoperability, and to leverage internal expertise, optimizing our spending in this space.
29
Report of the Executive Board Wolters Kluwer 2016 Annual Report 30
Global Workforce
Wolters Kluwer recognizes its diverse workforce as its most valuable asset. In a rapidly changing market, it is essential to continually drive a culture of high performance and accountability that attracts, develops, and retains the best talent to deliver on our strategy. In over 40 countries, our workforce delivers on its commitment to our customers – to help them work more effectively and make critical decisions every day.
Listening to our employees through our employee engagement survey and taking action on the results is one of the ways we continuously make Wolters Kluwer an even better place to work while also delivering on our strategy. Our employee engagement survey measures alignment, agility, development, and other components that drive engagement.
Pride in building One Wolters KluwerGoal: Connect employees with a shared understanding of our mission, strategy, goals, and values at Wolters Kluwer.
We have completed the rollout of our refreshed company values and, through our 2016 employee engagement survey, we learned that we are living our values and have made One Wolters Kluwer even stronger.
Our high employee engagement also provides a competitive advantage as we evolve as a solutions company and adapt to continuously changing dynamics in the marketplace.
Improving agility Goal: Make it easier to focus on what matters most by improving basic tools and resources in order to get work done.
As Wolters Kluwer grows as a digital enterprise, we continue to leverage technology to improve our efficiency in our daily work. This year, we completed the global rollout of Office 365 and upgraded and improved essential tools for global communication, collaboration, and productivity. We have included even more of our leaders in talent planning and leveraged our global talent system to streamline the process. We are preparing for the global rollout of significant improvements to our performance management process and are introducing many more learning resources and opportunities in the first quarter of 2017. This will all be delivered through the expansion of our globally integrated talent system. As we continue to invest in new digital solutions, we enable our employees to further streamline and improve their work, gain access to information faster, quickly anticipate change, and improve performance and employee development.
Europe
North America
Asia Pacific
Rest of the World
Health
Tax & Accounting
Governance, Risk & Compliance
Legal & Regulatory
Corporate
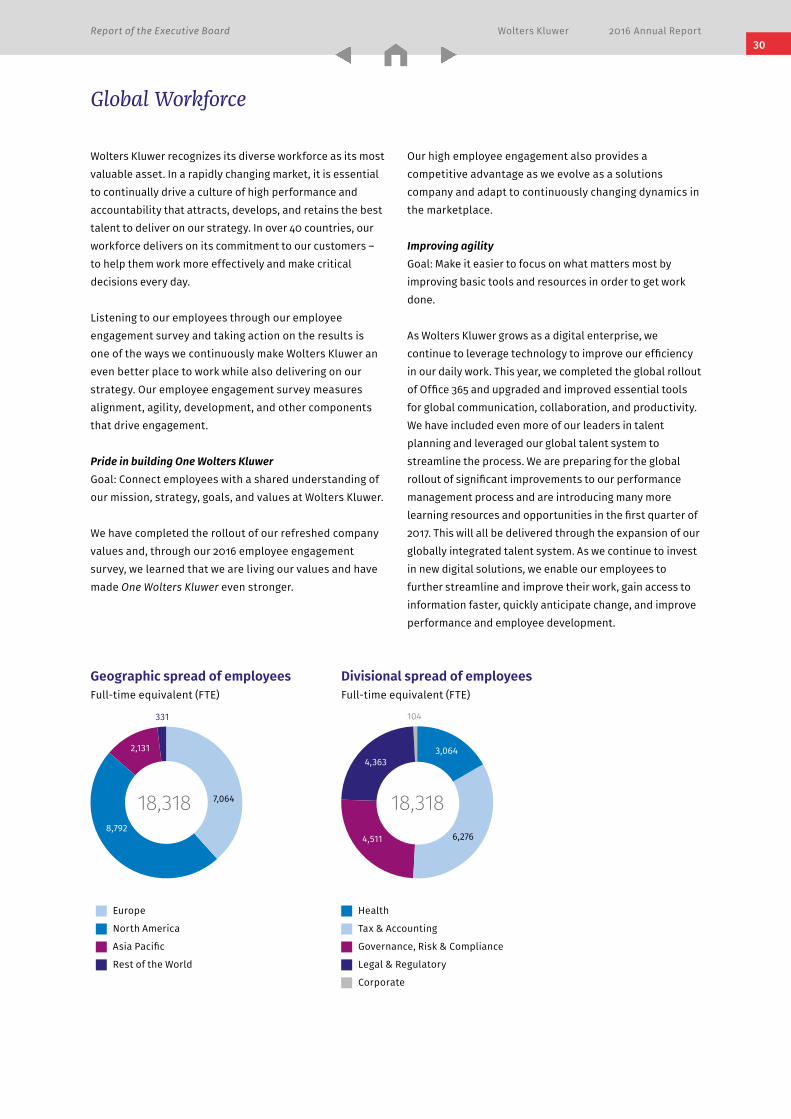
Geographic spread of employeesFull-time equivalent (FTE)
8,792
7,064
2,131
18,055
331
Divisional spread of employeesFull-time equivalent (FTE)
18,3184,511
4,363
18,318
3,064
104
6,276
Report of the Executive Board Wolters Kluwer 2016 Annual Report
Developing skills and careersGoal: Support employees and managers to develop skills, knowledge, and careers.
Wolters Kluwer prides itself on providing development opportunities for our workforce both in the everyday work we do and through informal and formal learning. Development is a shared responsibility between manager, employee and employer. Specifically, our company focused on building skills and developing careers globally by:– Training over 95% of our managers and over 4,800
employees in career development, helping our managers conduct effective development conversations, coaching and development planning, with our employees taking more ownership for their own development.
– Stimulating innovation through our annual contest, the Global Innovation Awards, where employees propose creative new ideas to help solve customer needs and improve our organization.
– Strengthening our leadership pipeline and driving our growth and expansion through our leadership programs including the annual Leadership Summit and Leadership Essentials development program.
– Conducting an annual talent review to better understand the skills, capabilities, and career aspirations of our talent. This ensures we are not only prepared to deliver on today’s work, but also on tomorrow’s strategy.
– Preparing to launch thousands of new learning opportunities that will be available to all employees globally in the first quarter of 2017.
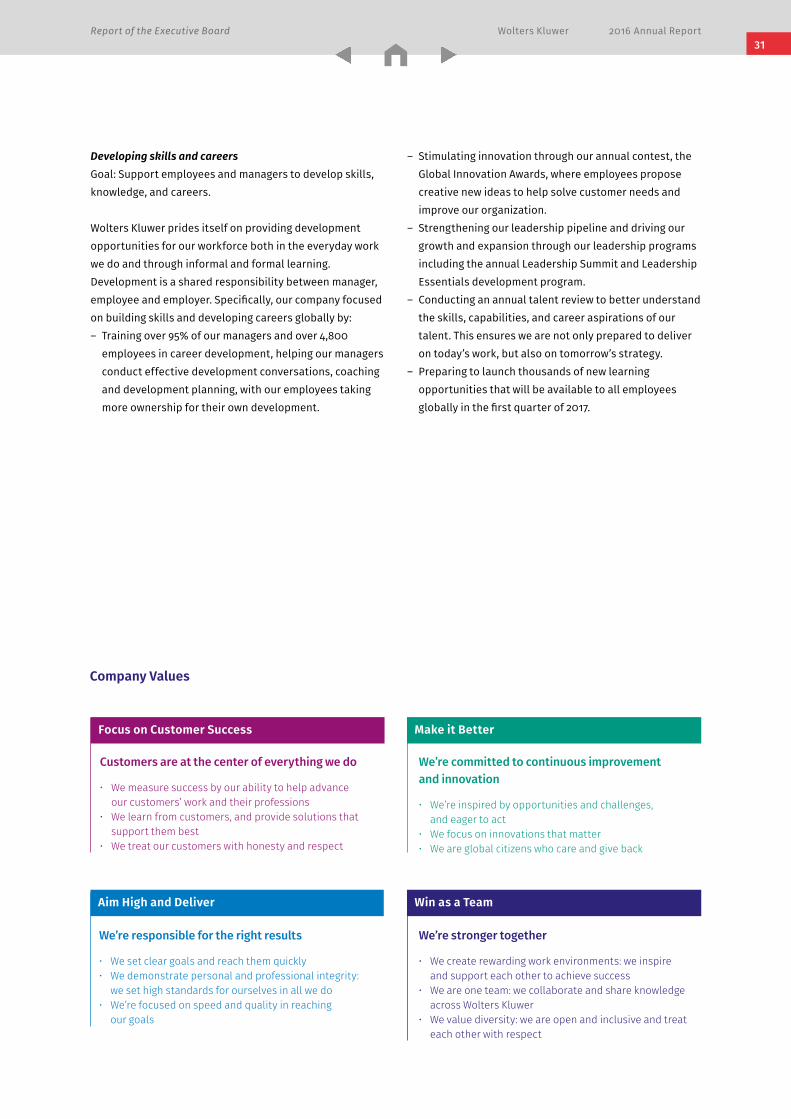
Company Values
Focus on Customer Success
Aim High and Deliver
Make it Better
Win as a Team
Customers are at the center of everything we do
• We measure success by our ability to help advance our customers’ work and their professions
• We learn from customers, and provide solutions that support them best
• We treat our customers with honesty and respect
We’re committed to continuous improvement and innovation
• We’re inspired by opportunities and challenges, and eager to act
• We focus on innovations that matter • We are global citizens who care and give back
We’re responsible for the right results
• We set clear goals and reach them quickly• We demonstrate personal and professional integrity:
we set high standards for ourselves in all we do • We’re focused on speed and quality in reaching
our goals
We’re stronger together
• We create rewarding work environments: we inspire and support each other to achieve success
• We are one team: we collaborate and share knowledge across Wolters Kluwer
• We value diversity: we are open and inclusive and treat each other with respect
31
Report of the Executive Board Wolters Kluwer 2016 Annual Report 32
Sustainability
Around the world, sustainability strategies are becoming increasingly important to tackle current and future challenges. Wolters Kluwer is continuously searching to further improve its impact on its stakeholders while also being aware of the resources it uses.
Our innovation-driven sustainability strategy is a central part of our strategy. By helping customers provide better healthcare, improve the way they do business, navigate change and complexity, and build smarter legal systems, the company is shaping a better future. Sustainability contributes to creating brand recognition, employee engagement, efficient use of resources, and innovative products that matter.
To ensure our sustainability efforts and focus areas are aligned with relevant and critical economic, social, and environmental issues, Wolters Kluwer conducts materiality analyses each year. We classify topics that drive value creation, as well as potential risk areas, as important to our business operations. For more detailed information, see the 2016 Sustainability Report.
Wolters Kluwer has reported on its sustainability performance for 13 years. Over this period, our strategy and markets have changed. Our sustainability framework expresses how we align our various sustainability initiatives:
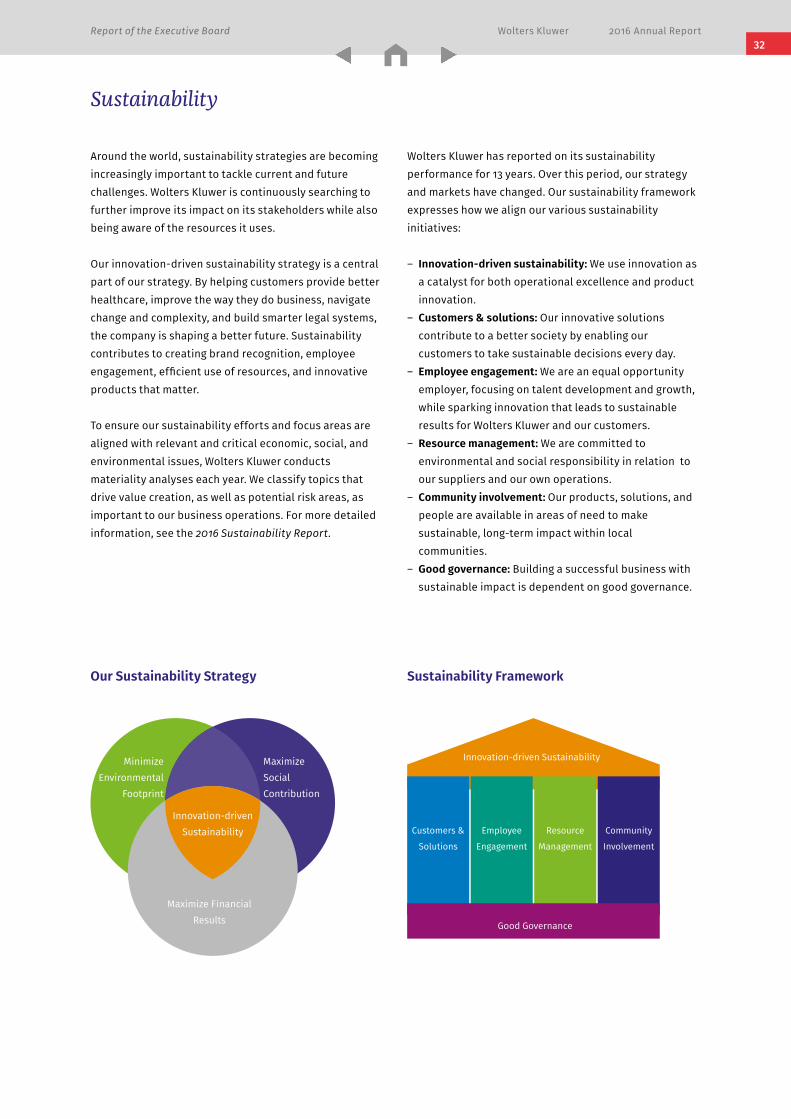
– Innovation-driven sustainability: We use innovation as a catalyst for both operational excellence and product innovation.
– Customers & solutions: Our innovative solutions contribute to a better society by enabling our customers to take sustainable decisions every day.
– Employee engagement: We are an equal opportunity employer, focusing on talent development and growth, while sparking innovation that leads to sustainable results for Wolters Kluwer and our customers.
– Resource management: We are committed to environmental and social responsibility in relation to our suppliers and our own operations.
– Community involvement: Our products, solutions, and people are available in areas of need to make sustainable, long-term impact within local communities.
– Good governance: Building a successful business with sustainable impact is dependent on good governance.
Minimize Environmental
Footprint
Maximize Social Contribution
Maximize Financial Results
Innovation-driven Sustainability Customers &
Solutions
Employee
Engagement
Resource
Management
Community
Involvement
Innovation-driven Sustainability
Good Governance
Our Sustainability Strategy Sustainability Framework
Report of the Executive Board Wolters Kluwer 2016 Annual Report
2016-2018 Strategy: Growing Our Value
Every three years, we review and update our strategic priorities. In 2016, we launched our strategic plan for 2016-2018, Growing Our Value. This plan builds on the strategic direction we have been following since 2013, during which we prioritized capital allocation towards specific leading, high-growth businesses while also delivering solutions that bring insights and productivity benefits to our customers. In addition, we stepped up efforts to drive operating efficiencies. This strategy has delivered accelerated organic growth in 2013-2015 and has improved operating profit margins and return on invested capital. Our 2016-2018 strategic plan aims to sustain and further improve our organic growth rate, and to increase margins and returns as we continue to focus on growing value for customers, employees and shareholders.
Our strategic priorities for 2016-2018 are:
Expand market coverageWe will continue to allocate the majority of our capital towards leading growth businesses and digital products, extending into adjacent markets and new geographies where we see the best potential for growth and competitive advantage. Expanding our market reach will also entail allocating funds to broaden our sales and marketing coverage in certain global markets. We intend to support this organic growth strategy with value- enhancing acquisitions while also continuing our program of small non-core disposals.
Deliver expert solutionsOur plan calls for increased focus on expert solutions that combine deep domain knowledge with specialized technology and services to deliver expert answers, analytics and improved productivity for our customers. To support digital growth across all divisions, we intend to accelerate our ongoing shift to global platforms and to cloud-based, integrated solutions that offer mobile access. Our plan is to also expand our use of new media channels and to create an all-around, rich end-to-end digital experience for our customers. Investment in new and enhanced products will be sustained in the range of 8-10% of total revenues in the coming years.
Drive efficiencies and engagementWe intend to continue driving economies of scale while improving the quality of our offerings and agility of our organization. These operating efficiencies will help fund investment and wage inflation, and support a rising operating margin over the long term. Through increased standardization of processes and technology planning, and by focusing on fewer global platforms and software applications, we expect to free up capital to reinvest in product innovation. In addition, we will maintain our focus on initiatives that reinforce our employee engagement and associated performance.
33
Report of the Executive Board Wolters Kluwer 2016 Annual Report 34
2017 Full-Year Outlook
Our guidance for full year 2017 is provided in the table below. We expect to deliver solid organic growth, to drive further margin improvement, and to grow diluted adjusted EPS at a mid-single-digit rate in constant currencies. The first half year, in particular the first quarter, is expected to see slower organic growth due to phasing and challenging comparables in Health and in Governance, Risk & Compliance.
Our guidance is based on constant exchange rates. In 2016, Wolters Kluwer generated more than 60% of its revenues and adjusted operating profit in North America. As a rule of thumb, based on our 2016 currency profile, each 1 U.S. cent move in the average €/$ exchange rate for the year causes an opposite change of approximately two euro cents in diluted adjusted EPS.
Restructuring costs are included in adjusted operating profit. We expect these costs to return to normal levels of around €15 million-€25 million this year (2016: €29 million). We expect adjusted net financing costs of approximately €110 million, excluding the impact of exchange rate movements on currency hedging and intercompany balances. We expect the benchmark effective tax rate to increase to approximately 27.5%. Capital expenditure is expected to be in the range of 5%-6% of total revenues (2016: 5.2%) with the cash conversion ratio likely to be approximately 95%.
Our guidance assumes no significant change to the scope of operations. We may make further disposals which can be dilutive to margins and earnings in the near term.
2017 Outlook by divisionHealth: we expect good organic growth, comparable to 2016, and improved margins due to the ongoing mix shift towards Clinical Solutions. First-quarter growth will be muted due to phasing and a challenging comparable.
Tax & Accounting: we expect solid organic growth, in line with 2016 and reflecting normal seasonal selling patterns. Margins are expected to increase slightly.
Governance, Risk & Compliance: we expect full-year organic growth to be similar to 2016, with growth to be second-half weighted due to expected timing of larger contracts and a challenging first-half comparable for transactional and other non-recurring revenues. Full-year margins are expected to increase due to operating efficiencies.
Legal & Regulatory: we expect organic revenue decline, in line with 2016 trend, due to more moderate growth in digital products following a large customer migration in 2016. Margins are expected to improve in the second half year.
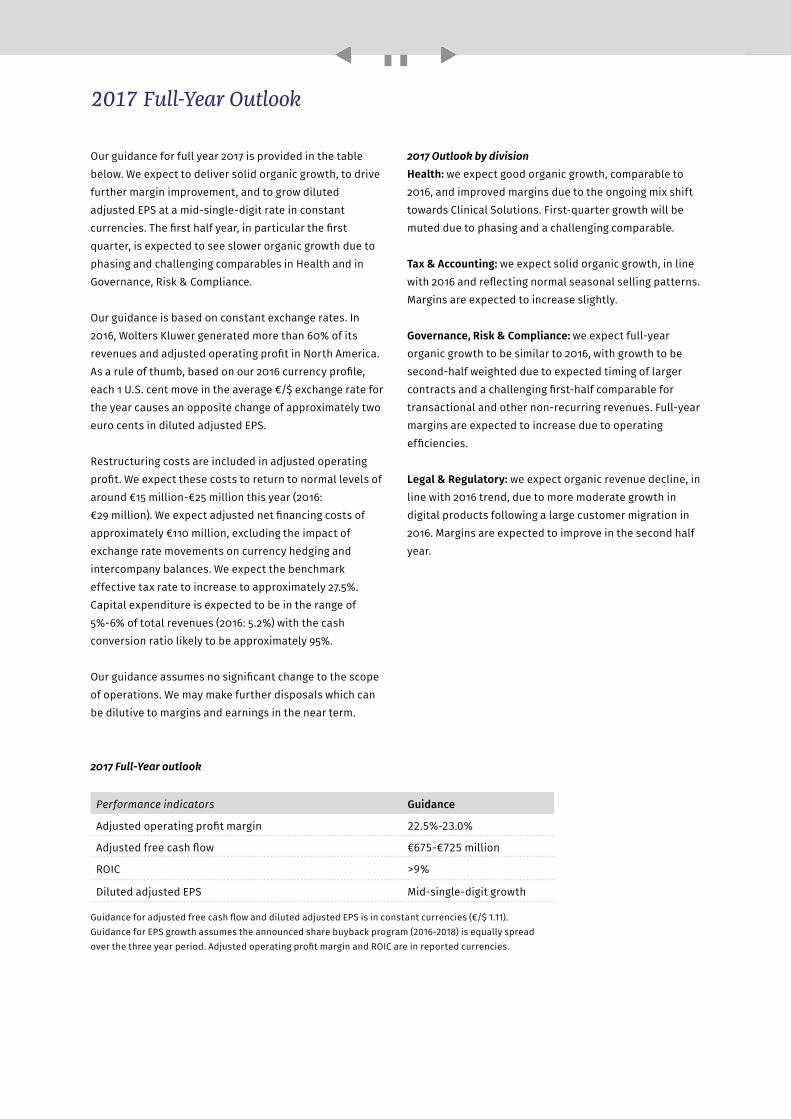
2017 Full-Year outlook
Performance indicators Guidance
Adjusted operating profit margin 22.5%-23.0%
Adjusted free cash flow €675-€725 million
ROIC >9%
Diluted adjusted EPS Mid-single-digit growth
Guidance for adjusted free cash flow and diluted adjusted EPS is in constant currencies (€/$ 1.11). Guidance for EPS growth assumes the announced share buyback program (2016-2018) is equally spread over the three year period. Adjusted operating profit margin and ROIC are in reported currencies.
Wolters Kluwer 2016 Annual Report
MeetingsThe Supervisory Board held seven scheduled meetings in 2016. Three meetings were partly held without the members of the Executive Board being present. Five of the current Supervisory Board members attended all meetings. Two members (Ms. Horan and Ms. Russo) were excused for one meeting due to obligations already existing at the time of their appointment to the Supervisory Board. Ms. Horan participated by phone during part of that meeting. In addition to the scheduled meetings, there were two conference calls with the Supervisory Board to discuss acquisition proposals and one scheduled conference call between the Executive Board and the Chairman of the Audit Committee. The Chairman of the Supervisory Board had regular contact with the Chairman of the Executive Board.
Financial statementsThe Executive Board submitted the 2016 financial statements to the Supervisory Board. The Supervisory Board also took notice of the report and the statement by Deloitte Accountants B.V. (as referred to in Article 27, paragraph 3 of the company’s Articles of Association), which the Supervisory Board discussed with Deloitte. The members of the Supervisory Board signed the 2016 financial statements, pursuant to their statutory obligation under clause 2:101 (2) of the Dutch Civil Code. The Supervisory Board proposes to the shareholders that they adopt these financial statements, at the Annual General Meeting of Shareholders of April 20, 2017, see 2016 Financial Statements.
EvaluationsThe functioning of the Supervisory Board and the Executive Board and the performance of the individual members of both Boards were discussed without members of the Executive Board being present. The composition of the Supervisory Board, the Audit Committee, and the Selection and Remuneration Committee, was also discussed in the absence of the Executive Board. In preparation of these discussions, the members of the Supervisory Board provided feedback about the performance of the Supervisory Board through a written assessment. Overall, the outcome of the evaluation was positive. There were several recommendations to further improve the functioning of the Supervisory Board. These recommendations included suggestions to optimize the information provided to the Supervisory Board. These recommendations were implemented in the course of 2016.
StrategyThe Supervisory Board was closely involved in the development of the strategy for 2016 and beyond, Growing Our Value, which was announced on February 24, 2016. During 2016 the Supervisory Board was kept informed of the execution of the strategy. Ms. McKinstry gave an update of the strategy and the Vision and Strategy Plan 2017-2019. The divisional CEOs were invited to present their Vision and Strategy Plans for 2017-2019 to the Supervisory Board. This enabled the Supervisory Board to get a good view on the opportunities and challenges for each of the divisions, and to support the Executive Board in making the right strategic choices for
Report of the Supervisory Board
Introduction
The Supervisory Board of Wolters Kluwer is responsible for supervising and advising the Executive Board in setting and achieving the company’s strategy, targets, and policies. The Supervisory Board is guided by the interests of the company and takes into account the interests of the company’s stakeholders.
Supervisory Board Report
35
Report of the Supervisory Board Wolters Kluwer 2016 Annual Report 36
each business. The Supervisory Board is supportive of the continuing transformation of the company towards a global organization delivering expert solutions which uniquely combine expertise with technology and tools.
During the working visit in New York, the management team of the Governance, Risk & Compliance division gave presentations to the Supervisory Board. In addition, the CEO of the Health division and one of her management team members, as well as the CEO of Legal & Regulatory U.S. gave presentations in New York.
The Supervisory Board was also informed about the innovation activities within Wolters Kluwer. 2016 was the sixth year in which Wolters Kluwer rewarded promising new internal business initiatives via the Global Innovation Awards. The Supervisory Board fully supports all efforts to drive an increased culture of innovation within Wolters Kluwer, which is an important element of the company’s strategy.
Due to the transformation of Wolters Kluwer, Information Technology is increasingly important for the company. Management of the Global Business Services (GBS) organization and Global Platform Organization (GPO) gave presentations, updating the Supervisory Board on the company’s technology strategy and execution thereof.
In relation to the strategy, the Supervisory Board also considers it important to be aware of the main developments with respect to competition and the markets the company operates in. Towards that end an overview of the most important developments in the market is discussed during each meeting. In addition, an outside expert was invited to speak about developments with respect to digital health solutions.
Acquisitions and divestmentsThe Supervisory Board discussed (potential) acquisitions and divestments with the Executive Board. The Executive Board informed the Supervisory Board about all pending acquisition and divestment activity. In 2016, the Supervisory Board approved the acquisitions of Emmi Solutions (Health division) and Enablon (Legal & Regulatory division). For both of these acquisitions, division management and members of the business development teams gave presentations, which enabled the Supervisory Board to directly question the leaders of the responsible management teams and thoroughly assess the acquisitions. The Supervisory Board also discussed the performance and value creation of previous acquisitions, also in relation to Wolters
Kluwer’s financial criteria for acquisitions and developments in the market. Acquisitions are an important contributor to the execution of the company’s strategy, accelerating the ongoing transformation of the portfolio towards higher-value digital products and geographic expansion.
Corporate governance, sustainability, and risk managementThe Supervisory Board was kept informed about developments with respect to corporate governance and sustainability. An overview of the company’s corporate governance can be found in Corporate Governance. The Supervisory Board has taken notice of the new Dutch Corporate Governance Code which was published in December 2016 and will become applicable as of reporting year 2017. During 2017, the company will work on implementation of the revised Code. Updates were shared on the continuous progress of the sustainability initiatives in 2016. The Supervisory Board supports the sustainability efforts and is pleased with the accomplishments. These include the increase of innovative digital expert solutions, diversity at Board and division level, sustainability goals on the reduction of print, the use of responsible paper, the global compliance training, and the integrated supplier principles. For more detailed information, see the 2016 Sustainability Report.
The Supervisory Board and Audit Committee discussed risk management on various occasions and were also informed about the general and financial risks of the business and the results of an assessment of internal risk management and control systems and the risk profile of the company. The Audit Committee and Supervisory Board discussed the ongoing actions the company takes to further improve the internal risk management and control systems. GBS management gave a presentation about the efforts with respect to IT and cybersecurity. For more information, see Risk Management.
Talent management and organizational developmentsThe Supervisory Board considers talent development and succession planning an important focus area. Each year, the outcome of the annual talent reviews is discussed. The Supervisory Board met with various executives and managers who gave presentations. As a standing topic the Supervisory Board is informed about organizational developments. In addition the Supervisory Board was informed about the company’s engagement survey, allowing each of the employees worldwide to share their views on important topics such
Report of the Supervisory Board Wolters Kluwer 2016 Annual Report
as engagement, alignment, agility, development, and cultural components.
FinanceThe Supervisory Board carefully observes the financing of the company including the balance sheet and available headroom. The Supervisory Board also closely monitors the development of the net-debt-to-EBITDA ratio. The Supervisory Board approved the up to €600 million share buyback over the period 2016-2018 which was announced in February 2016. Other financial subjects discussed were the budget, the financial outlook, the achievement of financial targets, the use of free cash flow including the year-end and interim dividend, the outcome of the annual impairment test, and annual and interim financial results.
Investor RelationsThe Supervisory Board was well informed about Investor Relations, which is a standing item during the Supervisory Board meetings. Updates included share price developments, communication with shareholders, analyst research, reactions on acquisition announcements, and the composition of the shareholder base. Furthermore, an outside speaker who previously worked as a sell-side analyst, attended one of the meetings to share his view on the market. The Supervisory Board also carefully reviewed and approved the Annual Report and press releases regarding the full-year and half-year results, and the three and nine-month trading updates.
Audit CommitteeThe Audit Committee met four times in 2016, during the preparation of the full-year and half-year results, and around the three and nine-month trading updates. In 2016, Mr. Forman resigned as member of the Audit Committee and Ms. Russo was appointed as a new member. The Audit Committee currently consists of Mr. Hooft Graafland (Chairman), Mr. Angelici, Mr. Noteboom, and Ms. Russo. Of the current members, Mr. Hooft Graafland, Mr. Forman, and Mr. Noteboom attended all of the meetings. Ms. Russo was excused for one meeting due to an obligation which already existed at the time of her appointment to the Supervisory Board. Due to the appointment of Ms. Russo as Committee member, the Committee has one member with expertise in the areas of Information and Communication Technology and cybersecurity. The meetings of the Audit Committee were held in the presence of the Executive Board members, the external auditor, the internal auditor, and other corporate staff members. In line with the Dutch Corporate Governance Code, the Audit Committee meets once a year with the external auditors without members of the Executive Board being present. After every meeting, the
Chairman of the Committee reports back to the full Supervisory Board. Among the main items discussed during the Audit Committee meetings were the financial results of the company, status updates on internal audit and internal controls, IFRS, pensions, tax planning, impairment testing, the treasury policy, the financing of the company, risk management, cybersecurity, hedging, claims, incident management, the quarterly reports of the external auditors, and their full-year report on the audit.
The Audit Committee has reviewed the proposed audit scope and approach, the audit fees, the independence of the external auditor, and the non-audit services provided by the external auditor. The Auditor Independence Policy is published on www.wolterskluwer.com.
Selection and Remuneration CommitteeThe Selection and Remuneration Committee met four times in 2016 and had one scheduled conference call. The Committee currently consists of Mr. Forman (Chairman), Ms. Horan, and Mr. Wakkie. Of the current members, Mr. Forman and Mr. Wakkie attended all meetings and the scheduled conference call. Ms. Horan was excused for one meeting, due to an obligation which already existed at the time of her appointment. After every meeting, the Chairman of the Committee reports back to the full Supervisory Board. The resolutions regarding appointments and remuneration were taken by the full Supervisory Board, based on recommendations from the Committee.
The Committee has discussed the remuneration policy for the Executive Board, including the base salary, new conditional awards of performance shares under the Long-Term Incentive Plan, and targets for the Short-Term Incentive Plan. For more information about the remuneration policy of the Executive Board and the execution thereof, see Remuneration Report and Note 34 of the 2016 Financial Statements.
The Supervisory Board, based on a recommendation of the Selection and Remuneration Committee, also reviewed its own remuneration. Taking into consideration the responsibilities of Supervisory Board members and market practice, it was proposed to the Annual General Meeting of Shareholders on April 21, 2016, to increase the Supervisory Board remuneration. This proposal was adopted.
37
Report of the Supervisory Board Wolters Kluwer 2016 Annual Report 38
Supervisory Board compositionIn 2016, the first term of Mr. Hooft Graafland expired. He was reappointed by the Annual General Meeting of Shareholders that was held on April 21, 2016. At the same meeting, Ms. Horan and Ms. Russo were appointed as new Supervisory Board members. Ms. Rima Qureshi resigned from the Supervisory Board after that meeting.
In 2017, the third and final term of both Mr. Wakkie and Mr. Forman will expire. The Supervisory Board is very pleased to propose to the Annual General Meeting of Shareholders the appointment of Mr. Frans Cremers and Ms. Ann Ziegler. Upon his appointment, Mr. Cremers will succeed Mr. Wakkie as Chairman of the Supervisory Board.
The composition of the Supervisory Board is in line with the preferred profile as it relates to expertise, nationality, and age. Five nationalities are represented on the Supervisory Board, with different talents and relevant areas of expertise. After the appointment of both Mr. Cremers and Ms. Ziegler, three out of the seven Supervisory Board members will be female, which means a female representation of 43%, which is in line with Dutch governance standards and the profile of the Supervisory Board.
All Supervisory Board members comply with the Dutch law and best practice provision of the Dutch Corporate Governance Code (2008) regarding the maximum number of supervisory board memberships at Dutch listed companies. Furthermore, all members of the Supervisory Board are independent from the company within the meaning of the Dutch Corporate Governance Code. For more information on each Supervisory Board member in accordance with the Dutch Corporate Governance Code, see Profile Supervisory Board and Corporate Governance.
Finally, the Supervisory Board would like to take this opportunity to thank the Executive Board and all employees worldwide for their highly appreciated efforts in the past year.
Alphen aan den Rijn, February 21, 2017
Supervisory BoardPeter Wakkie, ChairmanLen Forman, Deputy ChairmanBruno AngeliciRené Hooft GraaflandJeanette HoranBen NoteboomFidelma Russo
Report of the Supervisory Board Wolters Kluwer 2016 Annual Report
Introduction
During the Annual General Meeting of Shareholders of April 21, 2004, the remuneration policy for members of the Executive Board was adopted and the Long-Term Incentive Plan approved. Amendments to the remuneration policy and the Long-Term Incentive Plan were approved during the Annual General Meetings of Shareholders in 2007 and 2011. In line with Dutch legislation, the execution of the remuneration policy will be put on the agenda for discussion as a separate agenda item at the Annual General Meeting of Shareholders of April 20, 2017.
Remuneration Report
Remuneration PolicyThe goals of Executive Board remuneration are to align individual and company performance, strengthen long-term commitment to the company, and attract and retain the best executive management talent.
The remuneration of Executive Board members is based on surveys and analyses by an internationally recognized firm specializing in executive compensation. Because Wolters Kluwer is a global organization, remuneration is benchmarked individually against surveys from European and U.S. companies, taking into consideration geographic locations where Executive Board members might be recruited to and where new members might be recruited from in the future.
Composition of remunerationRemuneration for the Executive Board consists of three elements: a base salary, a Short-Term Incentive Plan (STIP) on which a cash bonus can be earned, and a Long-Term Incentive Plan (LTIP) on which performance shares can be earned. The base salary of individual Executive Board members is determined annually by the Supervisory Board, based on recommendations from its Selection and Remuneration Committee. Both the short-term and long-term incentives vary according to performance. Variable elements of the remuneration package make up the largest portion of the Executive Board’s total compensation, reflecting the philosophy that senior executive compensation is linked to shareholder value and performance. Because the LTIP is based on the performance over a three-year period, the remuneration policy contributes to the long-term objectives of the company. The STIP targets are annually determined by the Supervisory Board and largely reflect the key performance indicators that the company reports about in its annual results. These indicators are important measures of the success of the execution of
the company’s strategy. As such, the remuneration is directly linked to performance and the company’s long-term growth and profitability.
Additionally, Ms. McKinstry and Mr. Entricken participate in health and wellness programs as well as the defined contribution retirement savings plan of Wolters Kluwer United States.
Governance and contractsThe Selection and Remuneration Committee engaged an outside compensation advisor to provide recommendations and information on market practices for compensation structure and levels. The Committee had extensive discussions, supported by its external advisor, to review the composition and key drivers of remuneration. In line with the Dutch Corporate Governance Code, the Selection and Remuneration Committee and Supervisory Board made scenario analyses when they determined the level and structure of the Executive Board’s remuneration. The Committee has also taken into consideration to which extent the variable remuneration might expose the company to risks, taking into consideration the overall risk profile and risk appetite of the company, as described in the Risk Management section. The Committee believes that the remuneration policy provides management with good incentives to create long-term value creation, without increasing the overall risk profile of the company.
In line with the Dutch Corporate Governance Code, as a policy, future appointments of Executive Board members will take place for a period of four years. As such, the appointment of Mr. Entricken at the Annual General Meeting of Shareholders in 2013, took place for an initial period of four years. The Supervisory Board will nominate Mr. Entricken for reappointment for a second four-year term at the Annual General Meeting of Shareholders of
39
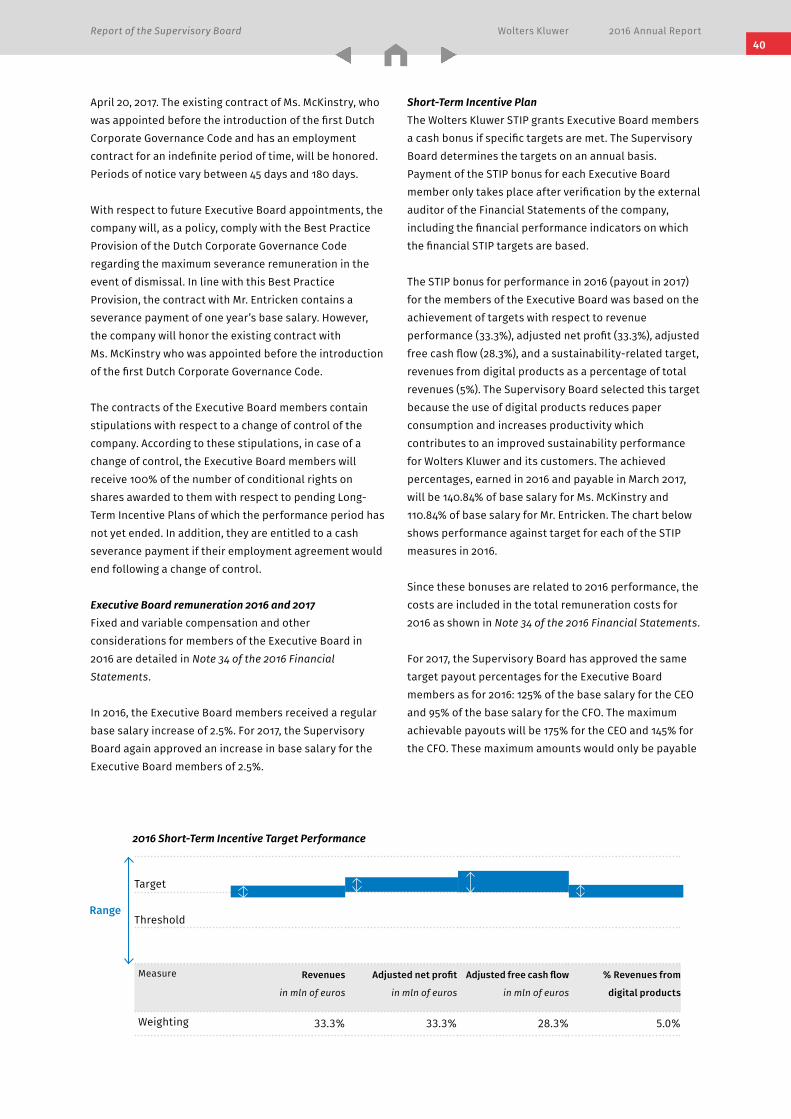
Report of the Supervisory Board Wolters Kluwer 2016 Annual Report 40
April 20, 2017. The existing contract of Ms. McKinstry, who was appointed before the introduction of the first Dutch Corporate Governance Code and has an employment contract for an indefinite period of time, will be honored. Periods of notice vary between 45 days and 180 days.
With respect to future Executive Board appointments, the company will, as a policy, comply with the Best Practice Provision of the Dutch Corporate Governance Code regarding the maximum severance remuneration in the event of dismissal. In line with this Best Practice Provision, the contract with Mr. Entricken contains a severance payment of one year’s base salary. However, the company will honor the existing contract with Ms. McKinstry who was appointed before the introduction of the first Dutch Corporate Governance Code.
The contracts of the Executive Board members contain stipulations with respect to a change of control of the company. According to these stipulations, in case of a change of control, the Executive Board members will receive 100% of the number of conditional rights on shares awarded to them with respect to pending Long- Term Incentive Plans of which the performance period has not yet ended. In addition, they are entitled to a cash severance payment if their employment agreement would end following a change of control.
Executive Board remuneration 2016 and 2017Fixed and variable compensation and other considerations for members of the Executive Board in 2016 are detailed in Note 34 of the 2016 Financial Statements.
In 2016, the Executive Board members received a regular base salary increase of 2.5%. For 2017, the Supervisory Board again approved an increase in base salary for the Executive Board members of 2.5%.
Short-Term Incentive PlanThe Wolters Kluwer STIP grants Executive Board members a cash bonus if specific targets are met. The Supervisory Board determines the targets on an annual basis. Payment of the STIP bonus for each Executive Board member only takes place after verification by the external auditor of the Financial Statements of the company, including the financial performance indicators on which the financial STIP targets are based.
The STIP bonus for performance in 2016 (payout in 2017) for the members of the Executive Board was based on the achievement of targets with respect to revenue performance (33.3%), adjusted net profit (33.3%), adjusted free cash flow (28.3%), and a sustainability-related target, revenues from digital products as a percentage of total revenues (5%). The Supervisory Board selected this target because the use of digital products reduces paper consumption and increases productivity which contributes to an improved sustainability performance for Wolters Kluwer and its customers. The achieved percentages, earned in 2016 and payable in March 2017, will be 140.84% of base salary for Ms. McKinstry and 110.84% of base salary for Mr. Entricken. The chart below shows performance against target for each of the STIP measures in 2016.
Since these bonuses are related to 2016 performance, the costs are included in the total remuneration costs for 2016 as shown in Note 34 of the 2016 Financial Statements.
For 2017, the Supervisory Board has approved the same target payout percentages for the Executive Board members as for 2016: 125% of the base salary for the CEO and 95% of the base salary for the CFO. The maximum achievable payouts will be 175% for the CEO and 145% for the CFO. These maximum amounts would only be payable
Measure Revenues
in mln of euros
Adjusted net profit
in mln of euros
Adjusted free cash flow
in mln of euros
% Revenues from
digital products
Weighting 33.3% 33.3% 28.3% 5.0%
Range
2016 Short-Term Incentive Target Performance
Threshold
Target
Report of the Supervisory Board Wolters Kluwer 2016 Annual Report
if the actual performance for all individual measures exceeds 110% of target. There is no payout for individual measures with results below 90% of target. These payout percentages were determined through market benchmarking and have remained unchanged for the CEO and CFO level since 2007.
For 2017, the Supervisory Board has approved the same measures as for 2016: revenue performance (33.3%), adjusted net profit (33.3%), adjusted free cash flow (28.3%), and revenues from digital products as a percentage of total revenues (5%).
Long-Term Incentive PlanThe Long-Term Incentive Plan (LTIP) aligns the organization and its management with the strategic goals of the company, thus rewarding the creation of shareholder value. The plan uses performance shares and at the beginning of a three-year period a conditional award of shares is established. The total number of shares that the Executive Board members will actually receive at the end of the three-year performance period depends on the achievement of predetermined performance conditions.
As approved by the Annual General Meeting of Shareholders in 2011, for 50% of the value of shares conditionally awarded at the beginning of a three-year period, the payout at the end of the performance period depends on a target based on Wolters Kluwer’s Total Shareholder Return (TSR) in relation to a group of peer companies (TSR Related Shares). For the other 50% of the value of the shares conditionally awarded at the beginning of a three-year performance period, the payout at the end of the performance period will depend on a target based on diluted earnings per share (EPS) performance (EPS Related Shares). Payout of the performance shares at the end of the three-year performance period will only take place after verification by the external auditor of the achievement of the TSR and EPS targets.
TSR peer group and incentive zonesTSR is calculated as the share price appreciation over a three-year period including dividend reinvestment. By using a three-year performance period, there is a clear relation between remuneration and long-term value creation. As a policy, the company uses a 60-day average of the share price at the beginning and end of each three-year performance period to reduce the influence of potential volatility in the stock markets around year-end.
In 2016, the TSR peer group consisted of the following companies: Arnoldo Mondadori, Axel Springer, Daily Mail & General, Dun & Bradstreet, Grupo PRISA, Informa, John Wiley & Sons, Lagardère, McClatchy, Pearson, RELX, S&P Global, Thomson Reuters, Trinity Mirror, and UBM. This peer group is consistent with the peer group at the launch of the plan in 2004, with the exception of companies that have been replaced because their shares are no longer publicly traded. The Supervisory Board has carefully reviewed and established the criteria for selecting companies for the peer group.
The Executive Board can earn 0-150% of the number of conditionally awarded TSR Related Shares at the end of the three-year performance period depending on Wolters Kluwer’s TSR performance compared to the peer group (TSR Ranking). As approved in the 2007 Annual General Meeting of Shareholders, there will be no payout for the Executive Board with respect to TSR Related Shares if Wolters Kluwer ends below the eighth position in the TSR Ranking, 150% for first or second position, 125% for third or fourth position, 100% for fifth or sixth position, and 75% payout for seventh or eighth position. These incentive zones are in line with best practice recommendations for the governance of long-term incentive plans.
TSR performance 2013-15 and 2014-16For the three-year performance period 2013-15, Wolters Kluwer reached the third position in the TSR Ranking. As a result, in 2016, the Executive Board members received 125% of the number of conditional rights on TSR Related Shares that were awarded to them in 2013.
For the three-year performance period 2014-16, Wolters Kluwer reached the first position in the TSR Ranking. As a result, in 2017, the Executive Board Members will receive 150% of the number of conditional rights on TSR Related Shares that were awarded to them in 2014.
EPS Targets and payout schedulesWith respect to the EPS Related Shares the Executive Board members can earn 0-150% of the number of conditionally awarded EPS Related Shares, depending on Wolters Kluwer’s EPS performance over the three-year performance period. For calculation purposes the definition of diluted EPS as disclosed in the Annual Reports of Wolters Kluwer will be used, the definition of which is similar to basic earnings per share (the profit or loss attributable to the ordinary shareholders of the company, divided by the weighted average number of ordinary shares outstanding during the period), except
41
Report of the Supervisory Board Wolters Kluwer 2016 Annual Report 42
that the weighted average number of ordinary shares is adjusted for the effects of all dilutive potential ordinary shares. Using EPS as a performance measure for LTIP leads to a strong alignment between the successful execution of the strategy to generate long-term shareholder value and management compensation.
At the end of the three-year performance period, the Executive Board members will receive 100% of the number of conditionally awarded EPS Related Shares if the performance over the three-year period is on target. There will be no payout if the performance over the three-year period is less than 50% of the target. In case of overachievement of the target, the Executive Board members can earn up to a maximum of 150% of the conditionally awarded shares. The Supervisory Board determines the exact targets for the EPS Related Shares for each three-year performance period. The targets will be based on the EPS performance in constant currencies, to exclude benefits or disadvantages based on currency effects over which the Executive Board has no control.
EPS performance 2013-15 and 2014-16The EPS target that was set for the 2013-15 performance period was based on a Compound Annual Growth Rate (CAGR) for EPS of 6.1%. The company outperformed the target. Due to the outperformance, in 2016, the Executive Board members received 150% of the number of conditional rights on EPS Related Shares that were awarded to them in 2013.
The EPS target that was set for the 2014-16 performance period was based on a Compound Annual Growth Rate (CAGR) for EPS of 6.6%. The company outperformed the target. Due to the outperformance, the Executive Board members will receive 140% of the number of conditional rights on EPS Related Shares that were awarded to them in 2014.
Conditional share awardsThe conditional share awards for the Executive Board members are determined by the comparable market information from European and U.S. companies. The actual number of conditional rights on shares awarded over the performance periods 2015-17 and 2016-18 can be found in Note 34 of the 2016 Financial Statements.
As explained above, shares are conditionally awarded at the beginning of a three-year performance period. The 2007 Annual General Meeting of Shareholders also approved the proposal to determine awards of conditional rights on shares for the Executive Board on a fixed percentage of base salary determined by individual benchmarking. For the 2017-19 performance period, these percentages are determined to be 285% for the CEO, and 175% for the CFO. These percentages are determined through a benchmarking process and have remained unchanged for the CEO and CFO level since 2007.The number of shares conditionally awarded at the start of the performance period is computed by dividing the amount, as calculated above, by the fair value of a conditionally awarded share at the start of the performance period. The actual amount granted can vary from year to year, depending upon benchmark salary reviews. Because the fair value of TSR Related Shares can be different from the fair value of EPS Related Shares, the number of conditionally awarded TSR Related Shares can deviate from the number of conditionally awarded EPS Related Shares.
Senior management remunerationSenior management remuneration consists of a base salary, STIP, and LTIP. The senior management STIP is based on the achievement of specific objective targets that are linked to creating value for shareholders, such as revenue performance and profit. The LTIP targets and payout schedule of senior management are similar to the LTIP targets and payout schedule for the Executive Board.
Alphen aan den Rijn, February 21, 2017
Supervisory Board
Wolters Kluwer 2016 Annual Report
Executive BoardThe Executive Board is entrusted with the management of the company and is responsible for achieving the company’s aims, the strategy and associated risk profile, the development of results, and corporate social responsibility/sustainability. The members of the Executive Board are appointed by the General Meeting of Shareholders. The full procedure for appointment and dismissal of members of the Executive Board is explained in article 15 of the company’s Articles of Association. The Executive Board currently consists of Ms. Nancy McKinstry (CEO and Chairman of the Executive Board) and Mr. Kevin Entricken (CFO and Member of the Executive Board). The remuneration of the members of the Executive Board is determined by the Supervisory Board, based on the advice of the Selection and Remuneration Committee. In 2004, the Annual General Meeting of Shareholders adopted and approved the remuneration policy and the Long-Term Incentive Plan (LTIP) for the Executive Board. Subsequently, in connection with a number of changes to the remuneration policy and to the LTIP, amendments were submitted to and adopted/approved by the Annual General Meeting of Shareholders in 2007. In the General Meeting held in 2011, the shareholders approved the proposal to change the LTIP of
the Executive Board, adding Diluted Earnings per Share as a second performance measure to the Executive Board LTIP 2011–13 and future plans, in addition to Relative Total Shareholder Return. In line with Dutch legislation, the execution of the remuneration policy will be put on the agenda for discussion as a separate agenda item at the Annual General Meeting of Shareholders of April 20, 2017.
Long-Term Incentive PlanUnder the LTIP, Executive Board members can earn ordinary shares after a period of three years from the date of the conditional award of shares. Earning of the ordinary shares is subject to clear and objective three-year performance criteria established in advance. After earning ordinary shares, the Executive Board members are not required to retain them for a period of five years or until the end of their employment, as recommended in Best Practice Provision II.2.5 of the Corporate Governance Code (2008). Wolters Kluwer sees no reason to require the Executive Board members to hold their ordinary shares for five years, because under the LTIP, conditional awards by the Supervisory Board recur on an annual basis and, as such, the Executive Board members will always have a strong incentive to pursue the long-term interests of the company.
Corporate Governance and Risk Management
General
Wolters Kluwer N.V., a publicly listed company organized under Dutch law, is the parent company of the Wolters Kluwer group. The Executive Board and the Supervisory Board are responsible for the corporate governance structure of the company. An outline of the broad corporate governance structure will be provided in this chapter. Wolters Kluwer complies with all Principles and Best Practice Provisions of the Dutch Corporate Governance Code (2008), unless stipulated otherwise in this chapter. Potential future material corporate developments might justify deviations from the Code at the moment of occurrence. The Code is available on www.commissiecorporategovernance.nl. The company has reviewed the new Corporate Governance Code which was published in December 2016, and will become applicable as of reporting year 2017. The company will work on implementation of the revised Corporate Governance Code during 2017 and report on compliance next year.
Corporate Governance
43
Corporate Governance and Risk Management Wolters Kluwer 2016 Annual Report 44
Term of appointmentIn line with Best Practice Provision II.1.1 of the Corporate Governance Code (2008), as a policy, future appointments of Executive Board members will take place for a period of four years. Mr. Entricken was therefore appointed for an initial period of four years during the Annual General Meeting of Shareholders on April 24, 2013, which term will expire in 2017. The Supervisory Board will nominate Mr. Entricken for reappointment for a second four-year term at the Annual General Meeting of Shareholders of April 20, 2017. The existing contract with Ms. McKinstry, who was appointed before the introduction of the first Dutch Corporate Governance Code and has an employment contract for an indefinite period of time, will be honored.
Severance arrangementsWith respect to future Executive Board appointments, the company will, as a policy, comply with Best Practice Provision II.2.8 of the Code regarding the maximum severance remuneration in the event of dismissal. In line with this Best Practice Provision, the contract with Mr. Entricken contains a severance payment of one year’s base salary. However, the company will honor the existing contract with Ms. McKinstry who was appointed before the introduction of the first Dutch Corporate Governance Code.
Insider Dealing PolicyIn 2016, Wolters Kluwer has updated its Insider Dealing Policy in order to align it with the European Market Abuse Regulation ((EU) No 596/2014), which took effect as of July 3, 2016. The Executive Board Members are not allowed to trade in Wolters Kluwer securities during closed periods. These periods begin either on the first business day of the quarter, or 30 calendar days prior to the publication of Wolters Kluwer’s annual results, half-year results or three and nine-month trading updates, whichever is earlier. The day after the announcement of these results or updates, the Executive Board members can trade again, with prior approval of the compliance officer which will be granted if they do not have inside information at that point in time.
Risk managementWolters Kluwer has implemented internal risk management and control systems which are embedded in the operations of the businesses to identify significant risks to which the company is exposed, and to enable the effective management of those risks. Our internal risk management and control systems are in line with the Dutch Corporate Governance Code (2008) and the COSO (Committee of Sponsoring Organizations of the Treadway Commission) framework. The aim of the systems is to
provide a reasonable level of assurance on the reliability of financial reporting. These systems can never provide absolute assurance regarding the achievement of the company’s objectives or the reliability of the financial reporting, or entirely prevent material errors, losses, fraud, and violation of applicable laws and/or regulations.
For a detailed description of the risks and the internal risk management and control systems, reference is made to Risk Management.
SustainabilityThe Executive Board is committed to Wolters Kluwer’s sustainability strategy. Under supervision of the CEO and Chairman of the Executive Board, the Senior Vice President, General Counsel/Company Secretary, is responsible for the sustainability policy and our Corporate Sustainability team. To communicate the goals and progress achieved, a Sustainability Report is published annually. On the company’s website a dedicated section shows the on-going sustainability activities. We recognize the importance of aligning and adjusting the various sustainability efforts every year through the Sustainability Framework:– Good Governance;– Customers & Solutions;– Employee Engagement;– Resource Management; and– Community Involvement.
Good corporate governance is the foundation for building a successful business with sustainable impact. As a provider of governance-related expert solutions, we want to lead by example. Wolters Kluwer has therefore developed several policies and principles. These policies cover a wide range of topics to ensure the continuous compliance with high business standards. In 2016, we updated our Supplier Code of Conduct (previously called Standards of Engagement), as well as our Tax Principles. As a leader in Tax & Accounting products we take our responsibility as a corporate citizen seriously.
To be able to further develop our sustainability strategy and focus on our policies, we conduct materiality analyses. We first developed the list of material issues in 2013 and revised it in subsequent years. These analyses uncover how sustainability topics are relevant to the business success of Wolters Kluwer and are linked to the interests of our stakeholders. The results are portrayed in the 2016 Sustainability Report and show the importance of the sustainability topics to both Wolters Kluwer and its stakeholders.
Corporate Governance and Risk Management Wolters Kluwer 2016 Annual Report
Appointment and compositionThe General Meeting of Shareholders appoints the members of the Supervisory Board. The full procedure of appointment and dismissal of members of the Supervisory Board is explained in article 21 of the company’s Articles of Association. The Supervisory Board currently consists of Mr. Peter Wakkie (Chairman), Mr. Len Forman (Deputy Chairman), Mr. Bruno Angelici, Mr. René Hooft Graafland (reappointed in 2016), Ms. Jeanette Horan (appointed in 2016), Mr. Ben Noteboom, and Ms. Fidelma Russo (appointed in 2016). Ms. Rima Qureshi resigned from the Supervisory Board in 2016. In 2017 the third and final term of both Mr. Wakkie and Mr. Forman will expire. The Supervisory Board is very pleased to propose to the Annual General Meeting of Shareholders the appointment of Mr. Frans Cremers and Ms. Ann Ziegler. Upon his appointment, Mr. Cremers will succeed Mr. Wakkie as Chairman of the Supervisory Board. The composition of the Supervisory Board shall always be such that the members are able to act critically and independently of one another, the Executive Board and any particular interests. In accordance with the Dutch Corporate Governance Code (2008) and the Supervisory Board By-Laws, all Supervisory Board members with the exception of not more than one should be independent from the company. As a policy, the Supervisory Board in principle aims at having all its members independent from the company, which currently is the case. The independence of Supervisory Board members is monitored on an ongoing basis, based on the criteria of independence as set out in Best Practice Provision III.2.2 of the Dutch Corporate Governance Code (2008) and Clause 1.4 of the Supervisory Board By-Laws. The newly nominated Supervisory Board members (Mr. Cremers and Ms. Ziegler) are also independent from the company.
The number of supervisory board memberships of all Supervisory Board members is limited to such extent that the proper performance of their duties is assured. None of the Supervisory Board members is a member of more than five supervisory boards of Dutch listed companies, with any chairmanships counting as two memberships. The Supervisory Board recognizes the importance of diversity. Elements of diversity include nationality, gender, age, and expertise. In its current and proposed composition, the Supervisory Board reflects these various elements. More specifically, the current and proposed composition of the Supervisory Board comprises expertise within the broad information industry as well as specific market segments in which the company operates, and reflects the international nature of the company with Board members representing five nationalities. According to Dutch Corporate Governance
Over the past few years, investors are becoming more aware of responsible investment strategies and are increasingly enthused about the opportunities they offer. They look for sustainable companies to invest in and judge these by their environmental, social and governance (ESG) policies. We see it as a confirmation of our path that we are repeatedly recognized by influential ESG analysts. In 2016, we have been included in the Dow Jones Sustainability Index for the tenth year in a row. We have again been awarded the Bronze Class Sustainability Award from RobecoSAM as a part of The Sustainability Yearbook. In addition we were again included in the STOXX Global ESG Leaders index and the Corporate Knights Global 100 index.
More information can be found in our 2016 Sustainability Report.
Supervisory BoardWolters Kluwer has a two-tier board structure. The Executive Board members are responsible for the day-to-day operations of the company. The role of the Supervisory Board is to supervise the policies of the Executive Board and the general affairs of the company and its enterprise, taking into account the relevant interests of the company’s stakeholders, and to advise the Executive Board. The Supervisory Board also has due regard for corporate social responsibility/sustainability issues which may be relevant to Wolters Kluwer. The By-Laws of the Supervisory Board include a list of Executive Board resolutions that have to be approved by the Supervisory Board. These resolutions include the operational and financial aims of the company, the strategy designed to achieve those aims, resolutions in which there are conflicts of interest with Executive Board members that are of significant interest for the company or the Executive Board member, acquisitions or divestments of which the value is at least equal to one percent of the consolidated revenues of the company, the issuance of new shares or granting of rights to subscribe for shares, the issue of bonds or other external financing of which the value exceeds 2.5% of annual consolidated revenues, and a proposal to amend the Articles of Association. The By-Laws of the Supervisory Board can be found on www.wolterskluwer.com.
45
Corporate Governance and Risk Management Wolters Kluwer 2016 Annual Report 46
Audit Committee consists of at least three people. Currently, the Audit Committee consists of Mr. Hooft Graafland (Chairman), Mr. Angelici, Mr. Noteboom, and Ms. Russo. In line with the Corporate Governance Code (2008), the Terms of Reference of the Audit Committee determine that at least one member of the Audit Committee shall be a financial expert. In the current composition, Mr. Hooft Graafland is a financial expert.
Selection and Remuneration CommitteeThe Supervisory Board has also installed a Selection and Remuneration Committee. Because appointments and remuneration are often closely related, the Supervisory Board sees no advantages in two separate committees. Installing two separate committees consisting of the same members would only increase the administrative burden. The Chairman of the Supervisory Board will not be the Chairman of the combined Selection and Remuneration Committee. The Selection and Remuneration Committee currently consists of Mr. Forman (Chairman), Ms. Horan, and Mr. Wakkie.
The Selection and Remuneration Committee shall in any event be responsible for drafting policies associated with remuneration within the company and for a proposal to the Supervisory Board regarding the specific remuneration of individual Executive Board members. The Selection and Remuneration Committee is also responsible for drawing up selection criteria and appointment procedures for Supervisory Board members and Executive Board members. Furthermore, the Selection and Remuneration Committee monitors the succession planning at the company.
Shareholders and the General Meeting of ShareholdersAt least once a year, a General Meeting of Shareholders will be held. The agenda of the Annual General Meeting of Shareholders shall in each case contain the report of the Executive Board, the execution of the remuneration policy, the adoption of the financial statements, the report of the Supervisory Board, and the proposal to distribute dividends or other distributions. Resolutions to release the members of the Executive Board and Supervisory Board from liability for their respective duties shall be voted on separately. Shareholders who alone or jointly represent at least half a percent (0.5%) of the issued capital of Wolters Kluwer shall have the right to request the Executive Board or Supervisory Board to put items on the agenda of the Annual General Meeting of Shareholders, provided that such requests are made in writing at least 60 days before a General Meeting of Shareholders.
standards, which the company as a policy aims to adhere to, a balanced composition of the Supervisory Board means that at least 30% of the members should be female. After the resignation of Mr. Wakkie and Mr. Forman, and the appointment of both Mr. Cremers and Ms. Ziegler, three out of the seven Supervisory Board members will be female, which means a female representation of 43%, which is in line with Dutch Corporate Governance standards and the profile of the Supervisory Board.
Provision of informationWolters Kluwer considers it important that the Supervisory Board members are well-informed about the business and operations of the company. The Chairman of the Supervisory Board, the CEO, and the Company Secretary monitor, on an ongoing basis, that the Supervisory Board receives adequate information. In addition, the CEO sends written updates to the Supervisory Board about important events. The Chairman of the Supervisory Board and the CEO hold several meetings and calls per year outside of formal meetings, to discuss the course of events at the company.
The Supervisory Board also has direct contact with layers of management below Executive Board level. Towards this end, operating managers, including divisional CEOs, hold presentations to the Supervisory Board with respect to their businesses on a regular basis. These presentations can relate to the operations in general and to business development. In addition, the company facilitates visits to business units and individual meetings with staff and line managers. Furthermore, various staff members attend the Audit Committee meetings.
Remuneration and Insider Dealing Policy The Annual General Meeting of Shareholders shall determine the remuneration of the Supervisory Board members. The remuneration shall not depend on the results of the company. The Supervisory Board members do not receive shares or stock options by way of remuneration, nor shall they be granted loans. The members are bound by the same Insider Dealing Policy as the Executive Board members. The Supervisory Board submitted a proposal to increase its remuneration to the Annual General Meeting of Shareholders which was held on April 21, 2016. This proposal was adopted.
Audit CommitteeAs part of its responsibilities, the Audit Committee focuses on the operation of internal risk management and control systems, and on the role and functioning of the internal audit department and external auditors. The
Corporate Governance and Risk Management Wolters Kluwer 2016 Annual Report
External auditorAt the 2014 Annual General Meeting of Shareholders, Deloitte Accountants B.V. was appointed as the external auditor of the company, in relation to the audit of the financial reporting years 2015 up to and including 2018. The Executive Board and the Audit Committee shall report their dealings with the external auditor to the Supervisory Board on an annual basis. The external auditor may be questioned by the General Meeting of Shareholders in relation to his auditor’s opinion on the financial statements. The external auditor shall attend and be entitled to address the General Meeting of Shareholders for this purpose. The company has a policy on auditor independence in place, which is available on www.wolterskluwer.com.
Internal auditorThe internal auditor operates under the responsibility of the Executive Board. The external auditor and the Audit Committee are involved in drawing up the work schedule of the internal auditor. The work schedule is based on an overall risk assessment within the company. The findings of the internal auditor and follow-up actions will be presented to the external auditor and the Audit Committee.
Preference sharesWolters Kluwer N.V. and the Wolters Kluwer Preference Shares Foundation (the Foundation) have concluded an agreement based on which preference shares can be taken by the Foundation. This option on preference shares is at present a measure that could be considered as a potential protection at Wolters Kluwer against exercising influence by a third party on the policy of the company without the consent of the Executive Board and Supervisory Board, including events that could threaten the strategy, continuity, independence, identity, or coherence between the activities of the company. The Foundation is entitled to exercise the option on preference shares in such a way that the number of preference shares taken will be no more than 100% of the number of issued and outstanding ordinary shares at the time of exercise. Among others by the exercise of the option on the preference shares by the Foundation, the Executive Board and the Supervisory Board will have the possibility to determine their position with respect to, for example, a party making a bid on the shares of Wolters Kluwer and its plans, or with respect to a third party that otherwise wishes to exercise decisive influence, and enables the Boards to examine and implement alternatives. All members of the Board of the Foundation are independent of the company.
Voting at the General Meeting of Shareholders In 2016, Wolters Kluwer again took active steps to try to reach a high percentage of shareholders present or represented at the Annual General Meeting of Shareholders. These steps included making standard proxy forms and voting instruction forms available online, enabling shareholders to give voting instructions electronically prior to the meeting, and actively contacting larger shareholders to inquire if they intended to vote during the Annual General Meeting of Shareholders. As a result, shareholders with voting rights for approximately 71% of the issued capital of the company were present or represented at the Annual General Meeting of Shareholders in 2016.
Amendment Articles of AssociationA resolution to amend the Articles of Association may only be passed by the General Meeting of Shareholders at the proposal of the Executive Board subject to the approval of the Supervisory Board. The most recent amendment of the Articles of Association took place in 2016.
Issuance of sharesThe Articles of Association of the company determine that shares shall be issued at the proposal of the Executive Board and by virtue of a resolution of the General Meeting of Shareholders, subject to designation of the Executive Board by the General Meeting of Shareholders. At the Annual General Meeting of Shareholders of April 21, 2016, the Executive Board was granted the authority for a period of 18 months to issue new shares, with exclusion of pre-emptive rights, subject to approval of the Supervisory Board. The authorization is limited to a maximum of 10% of the issued capital on the date of the meeting.
Acquisition of own sharesAcquisition of own shares may only be effected if the General Meeting of Shareholders has authorized the Executive Board for the purpose, and while respecting the restrictions imposed by the Articles of Associations of the company. At the Annual General Meeting of Shareholders of April 21, 2016, the authorization to acquire own shares was granted to the Executive Board for a period of 18 months. The authorization is limited to a maximum of 10% of the issued capital on the date of the meeting.
Audit functionsThe Executive Board is responsible for the quality and completeness of publicly disclosed financial reports. The Supervisory Board shall see to it that this responsibility is fulfilled.
47
Corporate Governance and Risk Management Wolters Kluwer 2016 Annual Report 48
Information pursuant to Decree Clause 10 Take-over DirectiveThe information specified in both clause 10 of the Takeover Directive and the Decree, which came into force on December 31, 2006 (Decree Clause 10 Take-over Directive), can be found in this chapter and in Shares and Bonds.
Information and statements pursuant to the Decree of December 23, 2004This chapter also contains information and the statements pursuant to the Decree of December 23, 2004, to determine additional regulations regarding the content of the Annual Report, as amended most recently with effect as of January 1, 2010, including the relevant information from the Decree Clause 10 Take-over Directive.
Legal structureThe ultimate parent company of the Wolters Kluwer group is Wolters Kluwer N.V. In 2002, Wolters Kluwer N.V. abolished the voluntary application of the structure regime (structuurregeling). As a consequence, the structure regime became applicable to Wolters Kluwer Holding Nederland B.V., which is the parent company of Dutch operating subsidiaries. Wolters Kluwer International Holding B.V. is the direct or indirect parent company of the operating subsidiaries outside of the Netherlands.
Major shareholdings According to the Dutch Act on financial supervision (Wet op het financieel toezicht), investors who hold shareholding or voting rights exceeding (or falling below) certain thresholds, being 3, 5, 10, 15, 20, 25, 30, 40, 50, 60, 75 and 95 percent, of the issued capital are (inter alia) required to notify their interest with the Dutch Authority for the Financial Markets (AFM). Until December 31, 2016, the following shareholders notified an interest/voting rights of 3% or more in the company: The Bank of New York Mellon Corporation had a 14.91% interest (disclosed on September 14, 2015); Lazard Asset Management Company LLC had a 5.09% interest (disclosed on October 24, 2015); Wolters Kluwer N.V. had a 3.03% interest (disclosed in June 2013, 2016); FMR LLC had a 3% interest (disclosed on September 19, 2016); FIL Limited had a 3.07% interest (disclosed on September 20, 2016); Invesco Limited has a 3.28% interest (disclosed on November 8, 2016); and Blackrock, Inc. had a 3.89% interest (disclosed on November 21, 2016). After December 31, 2016, the following AFM notifications were made: Wolters Kluwer N.V. disclosed an interest of 5% (on February 1, 2017), and Blackrock, Inc. disclosed an interest of 4.08% (on February 21, 2017).
Change of controlThe employment contracts of the Executive Board members and a small group of senior executives contain stipulations with respect to a change of control of the company. According to these stipulations, in case of a change of control, the relevant persons will receive 100% of the number of conditional rights on shares awarded to them with respect to pending Long-Term Incentive Plans of which the performance period has not yet been ended. In addition, they are entitled to a cash severance payment if their employment agreement would end following a change of control.
Corporate Governance and Risk Management Wolters Kluwer 2016 Annual Report
annually participate in a Conduct and Ethics training, based on the company values and business principles, including anti-bribery and anti-corruption, as well as a cyber and IT security training, and are requested to acknowledge compliance.
The company has an Internal Control Framework for financial reporting (ICF), based on the COSO (Committee of Sponsoring Organizations of the Treadway Commission) 2013 framework, which is designed to provide reasonable assurance that the results of business are accurately reflected in its internal and external financial reporting. The ICF is deployed by internal control officers in the corporate office, Global Business Services organization, Global Platform Organization, and the main operating entities. An annual risk assessment program for financial and IT general control risks determines the scope and controls to be tested. As part of that scope, key controls are tested annually. The results of testing are reported to management, the Audit Committee, internal auditors, and external auditors on a quarterly basis. Where needed, remedial action plans are designed and implemented to address significant risks as derived from internal control testing, and internal and external audits.
The global Internal Audit department works according to an audit plan which is approved by the Executive Board and the Audit Committee. The audit plan is based on risk assessments and focuses on strategy execution, financial (reporting) risks, and operational risks including IT-related risks. The aim of the audits is that existing controls provide adequate protection against actual risks, evaluating the effectiveness of established processes and controls, and ensuring compliance with policies and procedures.
The global Risk Management Department facilitates risk prevention, protection, and response programs via procurement of insurance, claims and incident management, business continuity management, loss control programs, and other initiatives to mitigate specific risks. Internal Audit, Internal Controls, Legal, Treasury, Tax, and Risk Management departments report every quarter to the Audit Committee and the Executive Board.
Introduction
The Executive Board is responsible for risk management and internal controls within Wolters Kluwer. The company has implemented internal risk management and control processes, which are largely integrated in the operations of the businesses. The aim is to identify significant risks to which the company is exposed, enable the effective management of those risks and to provide a reasonable level of assurance on the reliability of the financial reporting of the Wolters Kluwer group. Internal risk management and control systems can never provide absolute assurance regarding the achievement of the company’s objectives or the reliability of the financial reporting, or entirely prevent material errors, losses, fraud, and violation of applicable laws and/or regulations.
Managing risks is integrated in the conduct of business of our divisions and operating entities, supported by several staff functions. The Executive Board is informed about risks as part of the regular planning and reporting cycles on divisional and operational entity levels, which includes annual Vision and Strategy Plans (long-term strategic plans), annual budgets, and quarterly and monthly financial and operational reports. During the monthly division meetings, material risks at each of the divisions, including the Global Business Services organization and Global Platform Organization, are part of the discussion between the Executive Board and division management. The Corporate Risk Committee, consisting of various specialized departments, meets periodically and monitors material risks and remediating actions. The Committee also follows up on mitigating certain risks that emerge and require a centralized approach.
The company values and business principles stipulate the core values of our company, as well as group wide rules that each of our employees worldwide is expected to adhere to. In addition, several other global policies provide more detailed rules and guidelines for specific subjects. We have a group-wide management certification process in place, requiring management of each of the divisions and operating entities, to sign a Letter of Representation on a quarterly basis. In these letters, the executives confirm that they comply with all applicable policies, laws, and procedures. In addition, employees
Risk Management
This section provides an overview of Wolters Kluwer’s approach to risk management, the main risks facing the company and the organization, as well as processes and actions to identify, assess, and mitigate these risks.
49
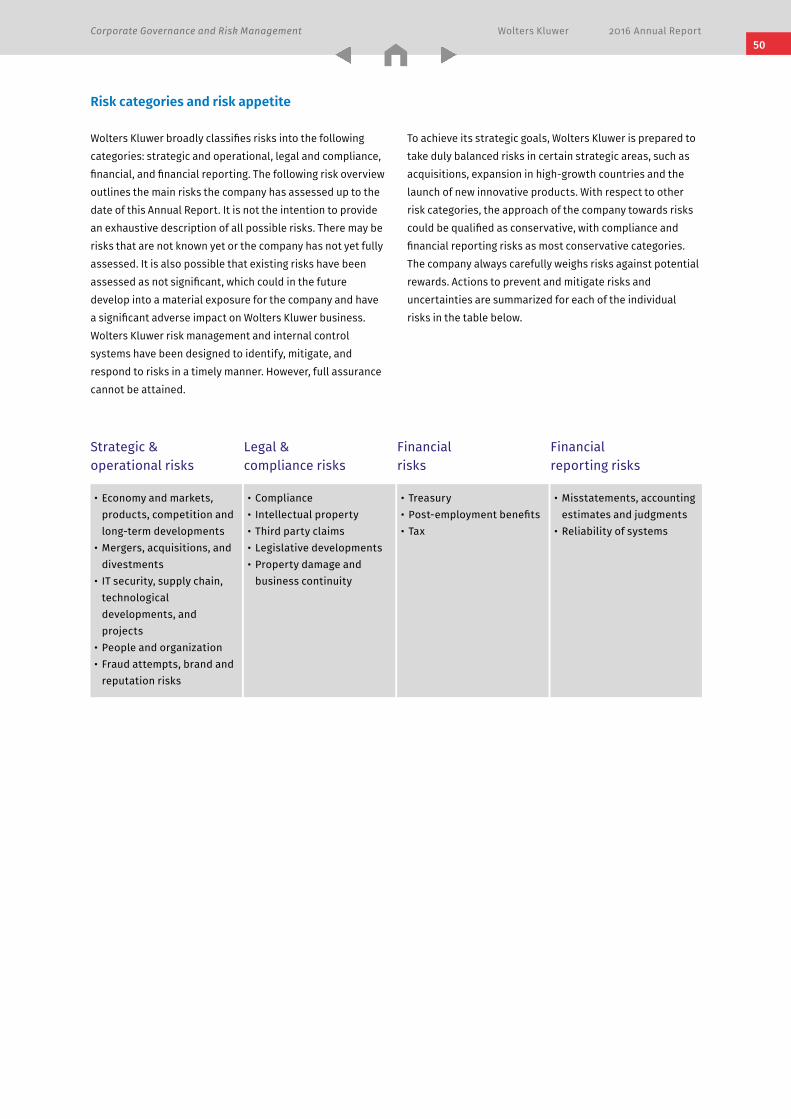
Strategic & operational risks
• Economy and markets, products, competition and long-term developments
• Mergers, acquisitions, and divestments
• IT security, supply chain, technological developments, and projects
• People and organization• Fraud attempts, brand and
reputation risks
Legal & compliance risks
• Compliance• Intellectual property• Third party claims• Legislative developments• Property damage and
business continuity
Financial risks
• Treasury• Post-employment benefits • Tax
Financial reporting risks
• Misstatements, accounting estimates and judgments
• Reliability of systems
Risk categories and risk appetite
Wolters Kluwer broadly classifies risks into the following categories: strategic and operational, legal and compliance, financial, and financial reporting. The following risk overview outlines the main risks the company has assessed up to the date of this Annual Report. It is not the intention to provide an exhaustive description of all possible risks. There may be risks that are not known yet or the company has not yet fully assessed. It is also possible that existing risks have been assessed as not significant, which could in the future develop into a material exposure for the company and have a significant adverse impact on Wolters Kluwer business. Wolters Kluwer risk management and internal control systems have been designed to identify, mitigate, and respond to risks in a timely manner. However, full assurance cannot be attained.
To achieve its strategic goals, Wolters Kluwer is prepared to take duly balanced risks in certain strategic areas, such as acquisitions, expansion in high-growth countries and the launch of new innovative products. With respect to other risk categories, the approach of the company towards risks could be qualified as conservative, with compliance and financial reporting risks as most conservative categories. The company always carefully weighs risks against potential rewards. Actions to prevent and mitigate risks and uncertainties are summarized for each of the individual risks in the table below.
Corporate Governance and Risk Management Wolters Kluwer 2016 Annual Report 50
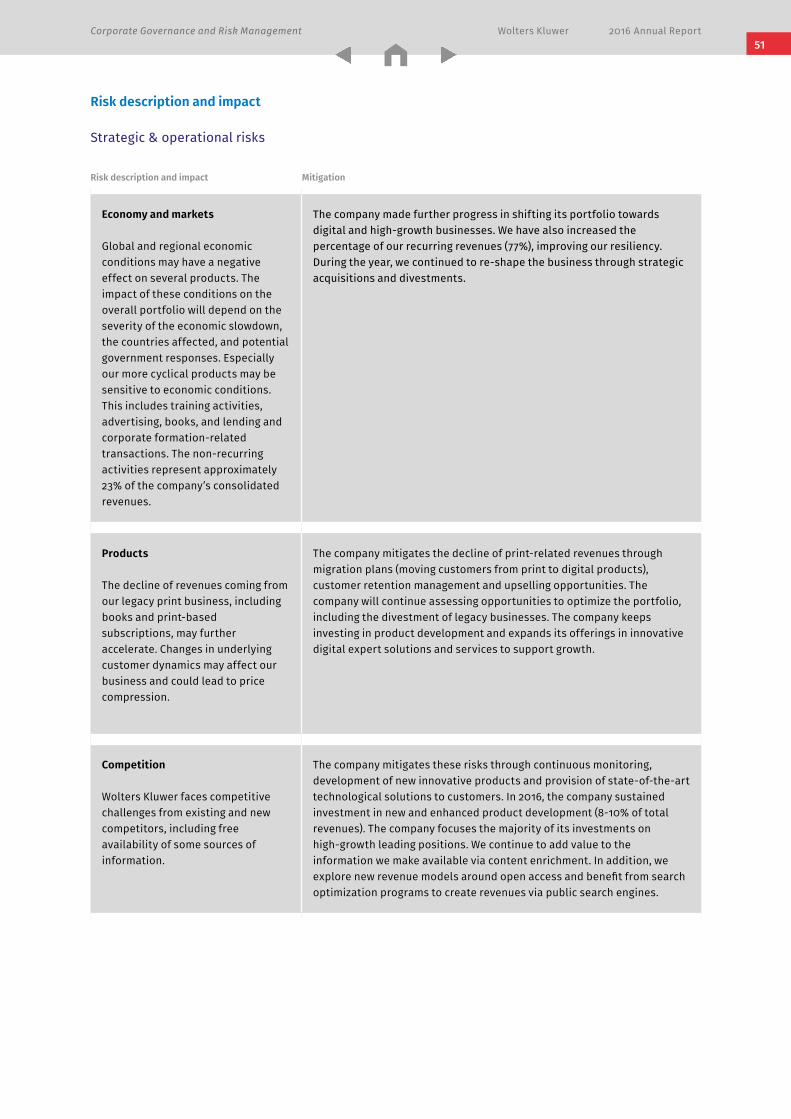
Corporate Governance and Risk Management Wolters Kluwer 2016 Annual Report
Risk description and impact
Strategic & operational risks
Risk description and impact Mitigation
Economy and markets
Global and regional economic conditions may have a negative effect on several products. The impact of these conditions on the overall portfolio will depend on the severity of the economic slowdown, the countries affected, and potential government responses. Especially our more cyclical products may be sensitive to economic conditions. This includes training activities, advertising, books, and lending and corporate formation-related transactions. The non-recurring activities represent approximately 23% of the company’s consolidated revenues.
The company made further progress in shifting its portfolio towards digital and high-growth businesses. We have also increased the percentage of our recurring revenues (77%), improving our resiliency. During the year, we continued to re-shape the business through strategic acquisitions and divestments.
Products
The decline of revenues coming from our legacy print business, including books and print-based subscriptions, may further accelerate. Changes in underlying customer dynamics may affect our business and could lead to price compression.
The company mitigates the decline of print-related revenues through migration plans (moving customers from print to digital products), customer retention management and upselling opportunities. The company will continue assessing opportunities to optimize the portfolio, including the divestment of legacy businesses. The company keeps investing in product development and expands its offerings in innovative digital expert solutions and services to support growth.
Competition
Wolters Kluwer faces competitive challenges from existing and new competitors, including free availability of some sources of information.
The company mitigates these risks through continuous monitoring, development of new innovative products and provision of state-of-the-art technological solutions to customers. In 2016, the company sustained investment in new and enhanced product development (8-10% of total revenues). The company focuses the majority of its investments on high-growth leading positions. We continue to add value to the information we make available via content enrichment. In addition, we explore new revenue models around open access and benefit from search optimization programs to create revenues via public search engines.
51
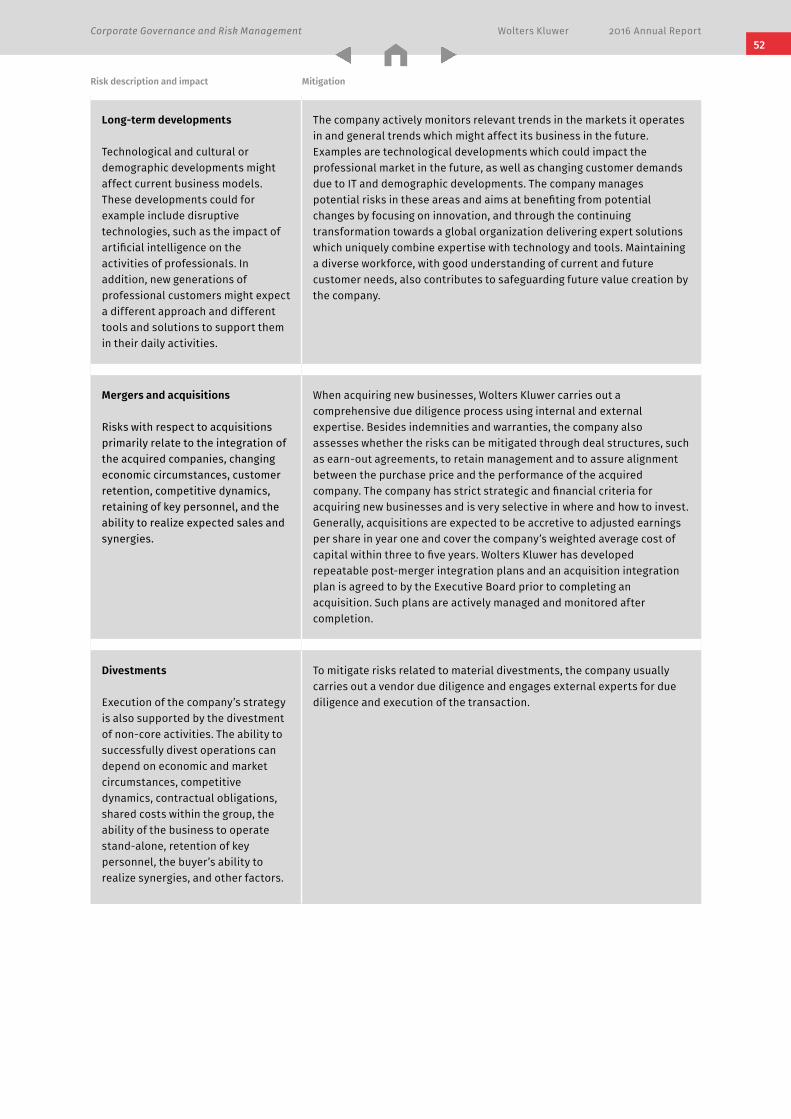
Corporate Governance and Risk Management Wolters Kluwer 2016 Annual Report 52
Long-term developments
Technological and cultural or demographic developments might affect current business models. These developments could for example include disruptive technologies, such as the impact of artificial intelligence on the activities of professionals. In addition, new generations of professional customers might expect a different approach and different tools and solutions to support them in their daily activities.
The company actively monitors relevant trends in the markets it operates in and general trends which might affect its business in the future. Examples are technological developments which could impact the professional market in the future, as well as changing customer demands due to IT and demographic developments. The company manages potential risks in these areas and aims at benefiting from potential changes by focusing on innovation, and through the continuing transformation towards a global organization delivering expert solutions which uniquely combine expertise with technology and tools. Maintaining a diverse workforce, with good understanding of current and future customer needs, also contributes to safeguarding future value creation by the company.
Mergers and acquisitions
Risks with respect to acquisitions primarily relate to the integration of the acquired companies, changing economic circumstances, customer retention, competitive dynamics, retaining of key personnel, and the ability to realize expected sales and synergies.
When acquiring new businesses, Wolters Kluwer carries out a comprehensive due diligence process using internal and external expertise. Besides indemnities and warranties, the company also assesses whether the risks can be mitigated through deal structures, such as earn-out agreements, to retain management and to assure alignment between the purchase price and the performance of the acquired company. The company has strict strategic and financial criteria for acquiring new businesses and is very selective in where and how to invest. Generally, acquisitions are expected to be accretive to adjusted earnings per share in year one and cover the company’s weighted average cost of capital within three to five years. Wolters Kluwer has developed repeatable post-merger integration plans and an acquisition integration plan is agreed to by the Executive Board prior to completing an acquisition. Such plans are actively managed and monitored after completion.
Divestments
Execution of the company’s strategy is also supported by the divestment of non-core activities. The ability to successfully divest operations can depend on economic and market circumstances, competitive dynamics, contractual obligations, shared costs within the group, the ability of the business to operate stand-alone, retention of key personnel, the buyer’s ability to realize synergies, and other factors.
To mitigate risks related to material divestments, the company usually carries out a vendor due diligence and engages external experts for due diligence and execution of the transaction.
Risk description and impact Mitigation
Corporate Governance and Risk Management Wolters Kluwer 2016 Annual Report
IT and cybersecurity
Like all companies, Wolters Kluwer is exposed to IT security/cyber threats which could affect our IT infrastructure and system availability, applications, data, and information. Wolters Kluwer is also faced by changing legislation, including laws and regulations regarding data protection and privacy, which can apply or relate to the company, its customers, and employees.
Wolters Kluwer takes active steps to reduce cyber risks by continuously improving cybersecurity measures. Two external advisory firms were engaged to support in these efforts. Since early 2016, a new governance model has been established to secure execution of the plans and management attention and accountability at various levels of the organization. The efforts are focused on the following categories:– Application security;– Infrastructure security;– Endpoint device security;– Global vulnerability management;– Policy and standard measures; and– Compliance and assurance.
The business units and Global Business Services organization work to continually identify critical applications and providers. We are bolstering business continuity and enterprise incident management plans and work to further strengthen IT disaster recovery and cyber incident response and reporting plans, for the main operations, to mitigate the impact of those risks. A worldwide training program consisting of online modules and in person training was performed in 2016.
IT General Controls (ITGCs) form an integral part of Wolters Kluwer Internal Control Framework and are aligned with the Global IT Security Policy. Controls over data and security programs are tested regularly to ensure that personal data are protected and compliant with relevant legislation and regulatory requirements.
The company will continue to strengthen its security and incident response plans throughout 2017. IT and cybersecurity are standing Risk Committee items.
Supply chain, technological developments and projects
Our businesses could be adversely affected by the dependency on our supply chain, including but not limited to parties delivering outsourced and offshored data center services, software development, and maintenance activities, including back office transactions processing.
Implementing new technology-related initiatives for delivering Wolters Kluwer’s products and services, as well as achieving cost efficiencies through technology/IT sourcing initiatives, is inherently complex and is subjected to many execution risks during the development and implementation phases.
To manage supply chain risks, obligations are expected to be governed by detailed operating and service agreements with outside providers, who are selected after careful assessment. Additionally, oversight boards and program management teams monitor the progress and performance of vendors during the term of these agreements. Loss prevention and assurance programs are also increasingly focused on supply chain risks.
A roadmap for consolidation and simplification of IT infrastructure and for implementing more service capabilities to support customers in the cloud has been set over the past years. This includes vendor rationalization, preferred financial and legal partnerships, and de-risking of the vendor portfolio. In addition, the company has refined the strategy for IT back office operations to ensure more effective management of all back office systems. The company strives to continuously improve and streamline its IT environment and infrastructure.
The Corporate Quality Assurance team aims at improving the success of initiatives by providing assurance that key projects/programs can move to the next stage of development or implementation and by transferring lessons learned from one project/program to another.
Risk description and impact Mitigation
53
Corporate Governance and Risk Management Wolters Kluwer 2016 Annual Report 54
People and organization
The success of the company is highly dependent on its ability to attract and retain the appropriate level of talent.
The company ensures its ability to attract the appropriate level of talent through a combination of competitive rewards, including market-based remuneration, pay for performance with short-term and long-term incentives aligned with individual and company achievements, and benefits benchmarked against local markets. The company mitigates the loss of personnel through formal talent management programs that incorporate succession planning, company-sponsored learning programs, tuition refund at external universities, and consistently applied performance appraisal systems. Retention is also stimulated through offering opportunities for growth within the company through job posting programs and internal slating programs. HR executives also monitor employee turnover across different categories very closely, including performing structured exit interviews and identification of key drivers for leaving. The company periodically performs engagement surveys among its employees, giving the company a better insight in the level of involvement of its employees and enabling it to take steps to improve this.
Fraud
In the conduct of its business, the company may be exposed to internal or external fraudulent actions.
Measures to mitigate the risks related to fraud include the Internal Control Framework, strict policies on segregation of duties, risk-based internal audits, training, and information sharing. In 2016, a task force of the Corporate Risk Committee examined the risk of being exposed to fraudulent actions and is continually implementing measures to further reduce this exposure. Fraud is a standing Risk Committee topic.
Brand and reputation risks
With the increasing prominence of the Wolters Kluwer brand, the company potentially becomes more vulnerable for brand or reputation risks.
The Corporate Brand and Communications team works closely with other corporate functions and the businesses to monitor and control brand and reputational risks. Next to the Incident Management Response plan, we are currently updating the global crisis communications plan with the intention to implement in 2017.
Legal & compliance risks
Regulatory compliance
The company can be exposed to non-compliance with laws, regulations, or internal policies. Non-compliance could potentially lead to fines, restrictions to carry out certain activities, third party claims, and reputational damage.
Compliance is part of the Wolters Kluwer Internal Control Framework, for example through quarterly Letters of Representation, annual internal control testing and internal audits. Furthermore, several training programs are currently in place to create awareness about these subjects among employees. We continuously monitor whether legislative changes require additional compliance efforts.The company has updated its Insider Dealing Policy in 2016, reflecting changes following from the new European Market Abuse Regulation.
Contractual compliance
The company could be exposed to claims by its contractual counterpar-ties based on alleged non-compli-ance of contractual terms, such as the number of users agreed upon (available licenses), price commit-ments, or services to be delivered.
The company manages contractual risks by negotiating contracts with particular attention to risk transfer clauses. For part of the contracts the company uses contract management systems to monitor contractual rights and obligations and software tools to track the use of software for which licenses are required.
Risk description and impact Mitigation
Corporate Governance and Risk Management Wolters Kluwer 2016 Annual Report
Intellectual property protection
Intellectual property rights could be challenged, limited, invalidated, circumvented, or infringed.Technological developments make it increasingly difficult to protect intellectual property rights. Changes in legislation could have an impact on the ability to protect intellectual property rights.
Wolters Kluwer actively protects its intellectual property rights, which is important to safeguard its portfolio of information, software, and services. The company relies on trademark, copyright, patent, and other intellectual property laws to establish and protect its proprietary rights to these products and services. We closely monitor legislative developments with respect to intellectual property rights.
Third party claims
The company may be exposed to claims (including class actions or mass tort) by third parties relating to products, services (including software or SaaS offerings), or informational content provided or published by the company. Such claims may be based on legal theories such as alleged negligence, product liability, breach of contract, or infringement of third party intellectual property rights.
Wolters Kluwer manages and transfers these risks by striving to produce high quality products, services, and content, and by including customary and appropriate disclaimers and limitations of liability in its contracts. Furthermore, the company expects its employees to strictly comply with intellectual property laws and regulations.
The company’s insurance program may cover certain types of claims exposures. The company manages a range of insurable risks by arranging for insurance coverage for first-party and third-party liability exposures.
Property damage and business Interruption
The company could be exposed to damages to its facilities and IT systems, which could cause business interruption.
To mitigate specifically against property damage and business interruption risks, the company has implemented a centralized worldwide risk control and business continuity management program. Accompanied by insurers, company risk managers perform regular loss control visits at key operating company and supplier locations working with our operating companies to cost-effectively implement recommendations for continued improvement. In 2016, a task force of the Corporate Risk Committee drafted an enterprise level incident response plan that is expected to be rolled out during 2017. Incident management is a standing topic of the Risk Committee and incidents are reported quarterly to the Audit Committee.
Legislative developments
As a global information services provider, changes in legislation or (temporary) trade restrictions, could impact the company’s business in certain jurisdictions. Certain countries could impose restrictions on ownership of publishing activities by foreign companies.
The company carefully monitors legislative developments. In emerging countries, the company often partners with local companies.
Risk description and impact Mitigation
55
Corporate Governance and Risk Management Wolters Kluwer 2016 Annual Report 56
Financial risks
Risk description and impact Mitigation
Treasury risks
Fluctuations in exchange and interest rates affect Wolters Kluwer’s results.
It is the company’s goal to mitigate the effects of currency and interest rate movements on net income, equity, and cash flow. Whenever possible, the company tries to do this by creating natural hedges, by matching the currency profile of income and expenses and of assets and liabilities. When natural hedges are not present, Wolters Kluwer strives to realize the same effect with the aid of derivative financial instruments. For this purpose, hedging ranges have been identified and policies and governance are in place, including authorization procedures and limits. The company only purchases or holds derivative financial instruments with the aim of mitigating risks and most of these instruments qualify for hedge accounting as defined in IAS 39. The company does not purchase or hold derivative financial instruments for speculative purposes. In line with IFRS requirements, detailed information on financial risks and policies is provided in Note 26 of the 2016 Financial Statements. Treasury policies on market (currency and interest), liquidity, and credit risk are reviewed by the Audit Committee, with quarterly reporting by the Treasury Committee to the Audit Committee on the status of these financial risks.
Post-employment benefits
The company faces risks relating to additional funding required for its main defined benefit plans, namely the pension and post-retirement medical plans in the United States and the pension plans in the Netherlands, the United Kingdom, Canada, Australia, and Belgium. These plans are affected by the annual developments on the international financial markets and may be further affected by future developments on these markets.
The company has mitigated these risks by closing some of the defined benefit plans to future accruals, such as the pension plans in the United States, Canada and the United Kingdom, or by having an average salary instead of final salary benefit plan, and by having a reduction in plan volatility of the U.S. pension plan by reducing the number of participants from the U.S. plan through lump-sum pension buy-out programs. Furthermore, the company engages independent advisors to perform asset liability management studies regularly and advise on the investment strategies for the various pension funds. The accounting for post-employment benefit plans is based on annual actuarial calculations.
Taxes
Changes in operational taxes and corporate income tax rates, laws and regulations could adversely affect the company’s financial results, tax assets and liabilities.
Most taxes are transactional and employee-related and are levied from the legal entities in the relevant jurisdictions. Wolters Kluwer maintains a liability for certain contingencies in line with IFRS accounting standards. The adequacy of this liability is judged on a regular basis in consultation with external advisors. Reference is made to Note 20 of the 2016 Financial Statements for additional information about corporate income tax and related risks.As leader in Tax & Accounting products, the company takes its responsibility as a corporate citizen seriously. The company has updated its Tax Principles in 2016. These principles are published on the company’s website.
Corporate Governance and Risk Management Wolters Kluwer 2016 Annual Report
Financial reporting risks
Risk description and impact Mitigation
Misstatements, accounting estimates and judgments, and reliability of systems
The processes and systems supporting the financial reporting may be susceptible to unintentional misstatements or manipulation. The preparation of financial statements in conformity with IFRS requires management to make judgments, estimates, and assumptions. The estimates and underlying assumptions are based on historical experience and various other factors that are believed to be reasonable under the circumstances. Actual results may differ from those estimates.
The company mitigates these risks by maintaining an Internal Control Framework for financial reporting as described in the introduction. In addition, senior executives in the divisional and operating companies and senior corporate staff members provide signed Letters of Representation quarterly. Independent internal audits are also carried out to ensure compliance with policies and procedures and ensure that existing controls provide adequate protection against actual risks.
Potential impact Adjusted operating profit
€ millions
Diluted adjusted EPS € cents
1% decline of the U.S. dollar against the euro (8) (2)
1% decrease in discount rate in determining the gross service costs for the post-employment benefit plans
(6) (1)
1% increase in interest rate assuming same mix of variable and fixed n.a. 0
1% increase in the benchmark tax rate on adjusted net profit n.a. (3)
Sensitivity analysisFluctuations in exchange, discount, interest, and tax rates affect Wolters Kluwer’s results. The following information
illustrates the sensitivity to a change in certain assumptions for Wolters Kluwer’s adjusted operating profit and diluted adjusted EPS:
57
Corporate Governance and Risk Management Wolters Kluwer 2016 Annual Report 58
The Executive Board is responsible for the preparation of the financial statements in accordance with International Financial Reporting Standards (IFRS) as adopted by the European Union and with Part 9 of Book 2 of the Dutch Civil Code. The financial statements consist of the consolidated financial statements and the company’s financial statements. The responsibility of the Executive Board includes selecting and applying appropriate accounting policies and making accounting estimates that are reasonable in the circumstances.
The Executive Board is also responsible for the preparation of the Report of the Executive Board that is included in the 2016 Annual Report. The Annual Report is prepared in accordance with Part 9 of Book 2 of the Dutch Civil Code. In the Annual Report, the Executive Board endeavors to present a fair review of the situation of the business at balance sheet date and of the state of affairs in the year under review. Such an overview contains a selection of some of the main developments in the financial year and can never be exhaustive.
The company has identified the main risks it faces, including financial reporting risks. These risks can be found in Risk Management. In line with the Dutch Corporate Governance Code and the Dutch Act on financial supervision (Wet op het financieel toezicht), the company has not provided an exhaustive list of all possible risks. Furthermore, developments that are currently unknown to the Executive Board or considered to be unlikely may change the future risk profile of the company.
As explained in Risk Management, the company must have internal risk management and control systems that are suitable for the company. The design of the company’s internal risk management and control systems has been described in Risk Management. The objective of these systems is to manage, rather than eliminate, the risk of failure to achieve business objectives and the risk of material errors to the financial reporting. Accordingly, these systems can only provide reasonable, but not absolute, assurance against material losses or material errors.
As required by provision II.1.5 of the Dutch Corporate Governance Code (2008) and section 5:25c(2)(c) of the Dutch Act on financial supervision (Wet op het financieel toezicht) and on the basis of the foregoing and the explanations contained in Risk Management, the Executive Board confirms that to its knowledge:– The company’s internal risk management and control
systems as regards financial reporting risks provide a reasonable assurance that the group’s financial reporting over 2016 does not contain any errors of material importance;
– The company’s risk management and control systems as regards financial reporting risks worked properly in 2016;
– The 2016 financial statements give a true and fair view of the assets, liabilities, financial position, and profit or loss of the company and the undertakings included in the consolidation taken as a whole; and
– The 2016 Annual Report includes a fair review of the situation at the balance sheet date, the course of affairs during the financial year of the company, and undertakings included in the consolidation taken as a whole, together with a description of the principal risks that the company faces.
Alphen aan den Rijn, February 21, 2017
Executive BoardNancy McKinstry CEO and Chairman of the Executive BoardKevin EntrickenCFO and member of the Executive Board
Statements by the Executive Board
2016
FinancialStatements
59
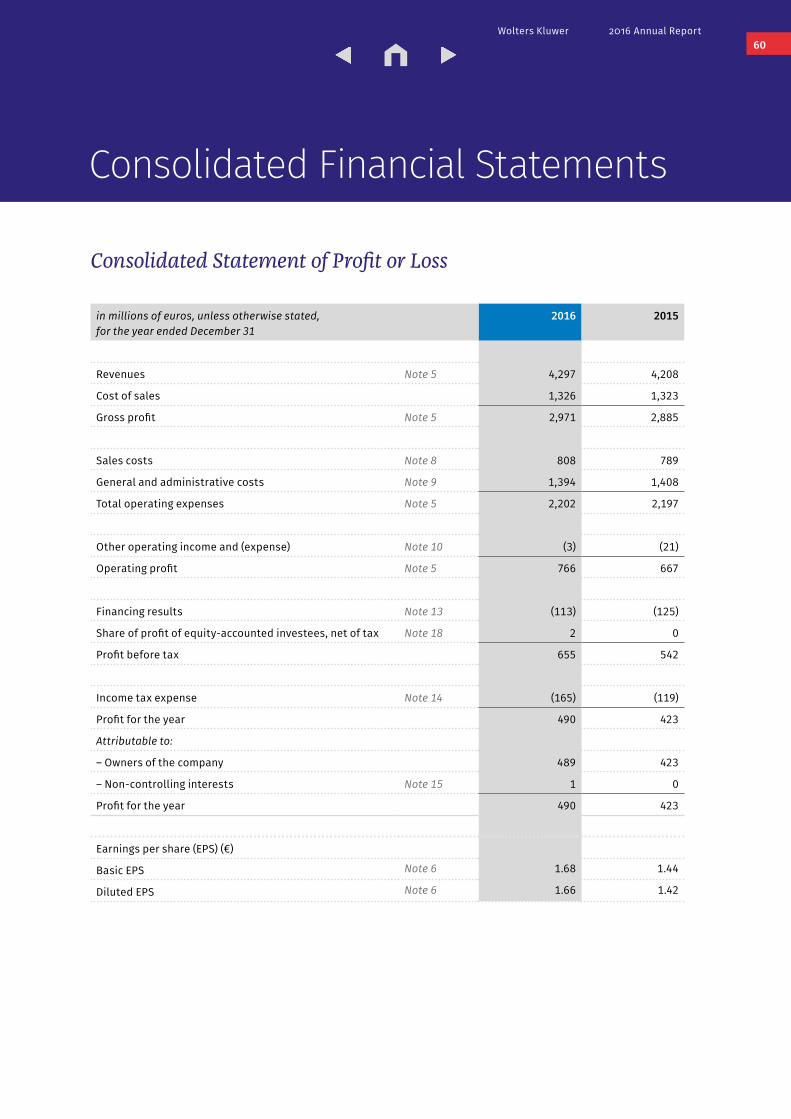
Wolters Kluwer 2016 Annual Report
Consolidated Statement of Profit or Loss
in millions of euros, unless otherwise stated, for the year ended December 31
2016 2015
Revenues Note 5 4,297 4,208
Cost of sales 1,326 1,323
Gross profit Note 5 2,971 2,885
Sales costs Note 8 808 789
General and administrative costs Note 9 1,394 1,408
Total operating expenses Note 5 2,202 2,197
Other operating income and (expense) Note 10 (3) (21)
Operating profit Note 5 766 667
Financing results Note 13 (113) (125)
Share of profit of equity-accounted investees, net of tax Note 18 2 0
Profit before tax 655 542
Income tax expense Note 14 (165) (119)
Profit for the year 490 423
Attributable to:
– Owners of the company 489 423
– Non-controlling interests Note 15 1 0
Profit for the year 490 423
Earnings per share (EPS) (€)
Basic EPS Note 6 1.68 1.44
Diluted EPS Note 6 1.66 1.42
Consolidated Financial Statements
60
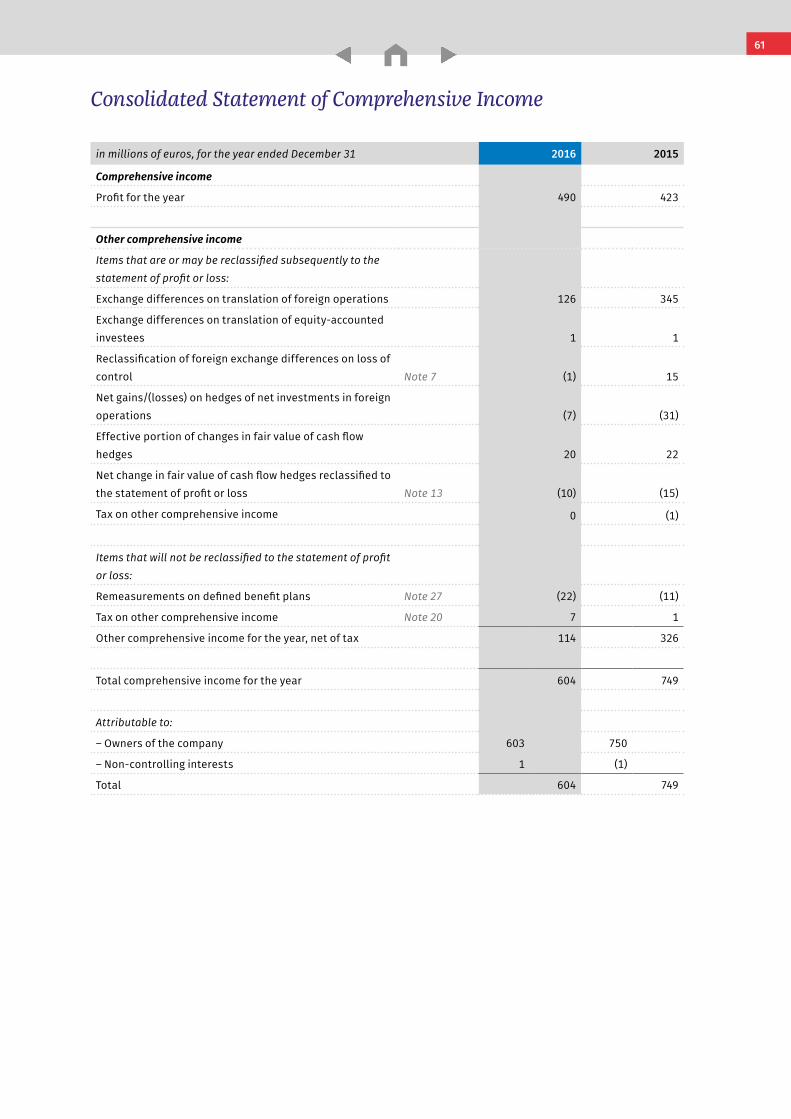
Consolidated Financial Statements Wolters Kluwer 2016 Annual Report
Consolidated Statement of Comprehensive Income
in millions of euros, for the year ended December 31 2016 2015
Comprehensive income
Profit for the year 490 423
Other comprehensive income
Items that are or may be reclassified subsequently to the statement of profit or loss:
Exchange differences on translation of foreign operations 126 345
Exchange differences on translation of equity-accounted investees 1 1
Reclassification of foreign exchange differences on loss of control Note 7 (1) 15
Net gains/(losses) on hedges of net investments in foreign operations (7) (31)
Effective portion of changes in fair value of cash flow hedges 20 22
Net change in fair value of cash flow hedges reclassified to the statement of profit or loss Note 13 (10) (15)
Tax on other comprehensive income 0 (1)
Items that will not be reclassified to the statement of profit or loss:
Remeasurements on defined benefit plans Note 27 (22) (11)
Tax on other comprehensive income Note 20 7 1
Other comprehensive income for the year, net of tax 114 326
Total comprehensive income for the year 604 749
Attributable to:
– Owners of the company 603 750
– Non-controlling interests 1 (1)
Total 604 749
61
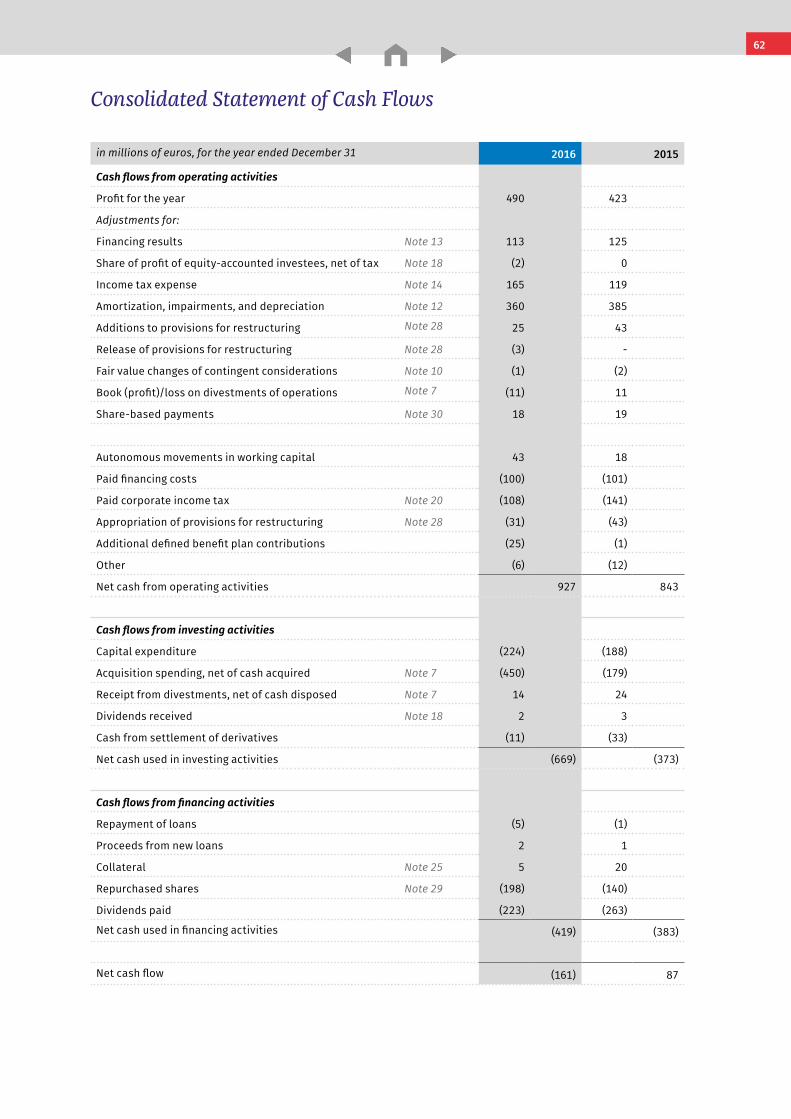
Consolidated Financial Statements Wolters Kluwer 2016 Annual Report
Consolidated Statement of Cash Flows
in millions of euros, for the year ended December 31 2016 2015
Cash flows from operating activities
Profit for the year 490 423
Adjustments for:
Financing results Note 13 113 125
Share of profit of equity-accounted investees, net of tax Note 18 (2) 0
Income tax expense Note 14 165 119
Amortization, impairments, and depreciation Note 12 360 385
Additions to provisions for restructuring Note 28 25 43
Release of provisions for restructuring Note 28 (3) -
Fair value changes of contingent considerations Note 10 (1) (2)
Book (profit)/loss on divestments of operations Note 7 (11) 11
Share-based payments Note 30 18 19
Autonomous movements in working capital 43 18
Paid financing costs (100) (101)
Paid corporate income tax Note 20 (108) (141)
Appropriation of provisions for restructuring Note 28 (31) (43)
Additional defined benefit plan contributions (25) (1)
Other (6) (12)
Net cash from operating activities 927 843
Cash flows from investing activities
Capital expenditure (224) (188)
Acquisition spending, net of cash acquired Note 7 (450) (179)
Receipt from divestments, net of cash disposed Note 7 14 24
Dividends received Note 18 2 3
Cash from settlement of derivatives (11) (33)
Net cash used in investing activities (669) (373)
Cash flows from financing activities
Repayment of loans (5) (1)
Proceeds from new loans 2 1
Collateral Note 25 5 20
Repurchased shares Note 29 (198) (140)
Dividends paid (223) (263)
Net cash used in financing activities (419) (383)
Net cash flow (161) 87
62
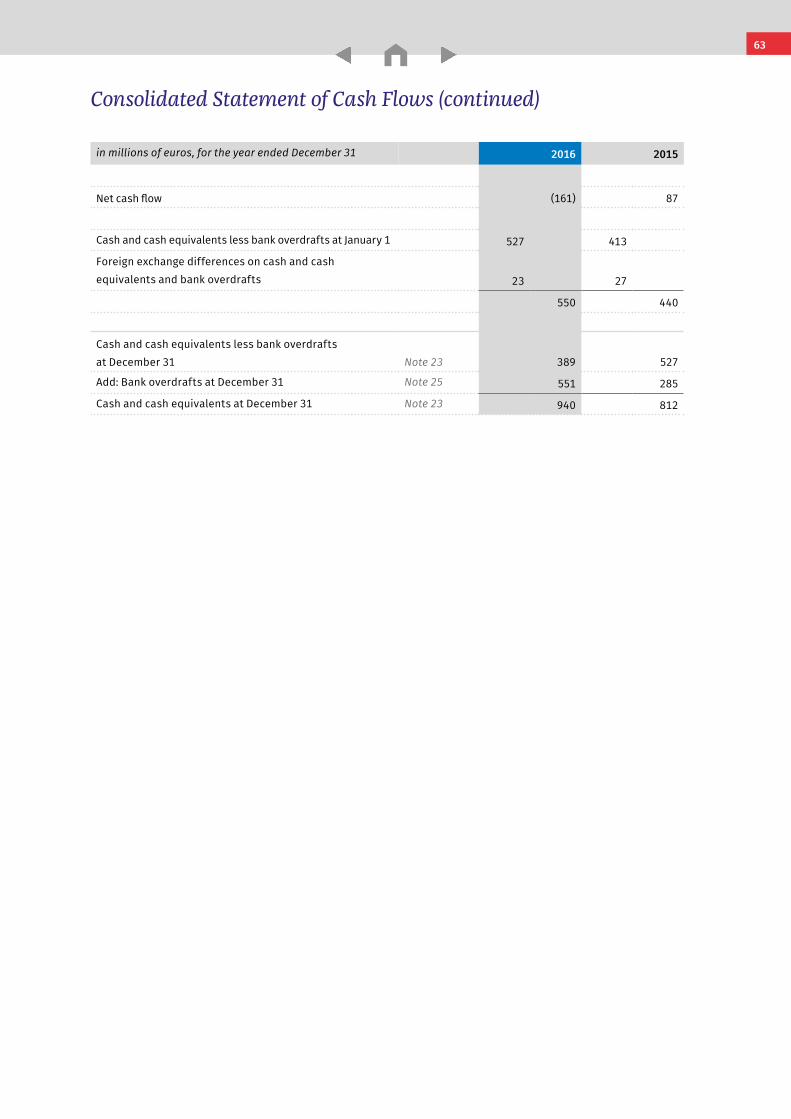
Consolidated Financial Statements Wolters Kluwer 2016 Annual Report
Consolidated Statement of Cash Flows (continued)
in millions of euros, for the year ended December 31 2016 2015
Net cash flow (161) 87
Cash and cash equivalents less bank overdrafts at January 1 527 413
Foreign exchange differences on cash and cash equivalents and bank overdrafts 23 27
550 440
Cash and cash equivalents less bank overdrafts at December 31 Note 23 389 527
Add: Bank overdrafts at December 31 Note 25 551 285
Cash and cash equivalents at December 31 Note 23 940 812
63
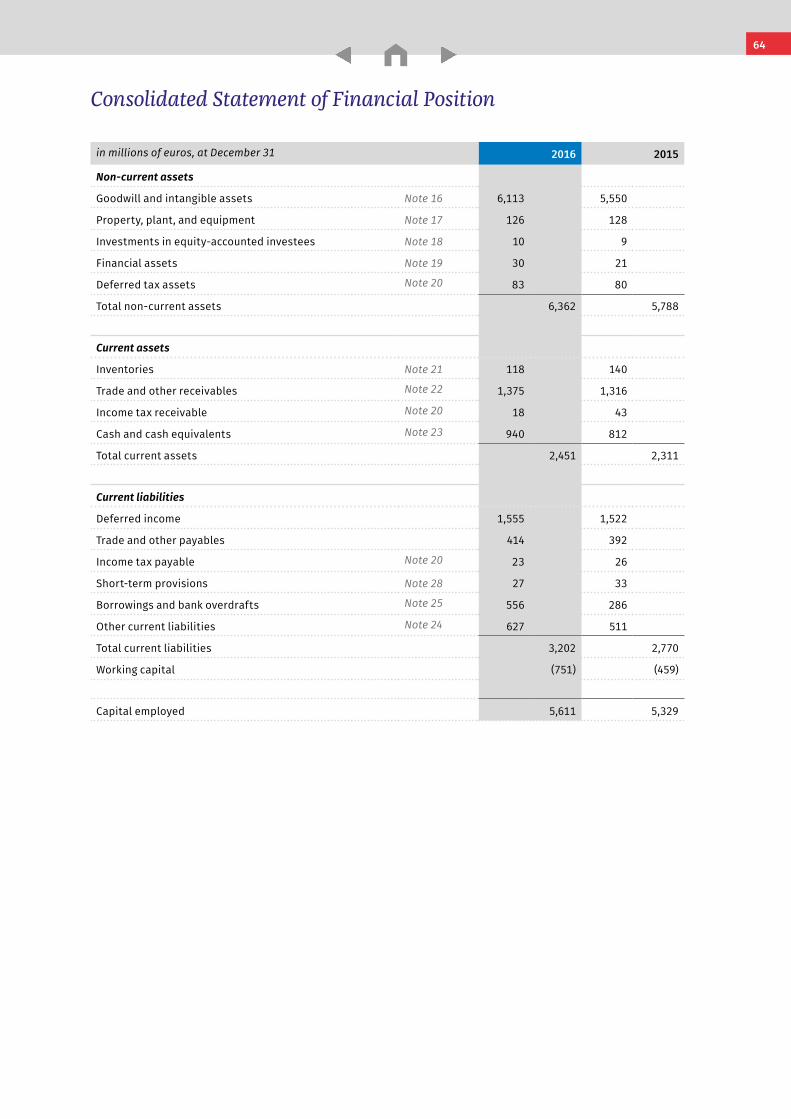
Consolidated Financial Statements Wolters Kluwer 2016 Annual Report
Consolidated Statement of Financial Position
in millions of euros, at December 31 2016 2015
Non-current assets
Goodwill and intangible assets Note 16 6,113 5,550
Property, plant, and equipment Note 17 126 128
Investments in equity-accounted investees Note 18 10 9
Financial assets Note 19 30 21
Deferred tax assets Note 20 83 80
Total non-current assets 6,362 5,788
Current assets
Inventories Note 21 118 140
Trade and other receivables Note 22 1,375 1,316
Income tax receivable Note 20 18 43
Cash and cash equivalents Note 23 940 812
Total current assets 2,451 2,311
Current liabilities
Deferred income 1,555 1,522
Trade and other payables 414 392
Income tax payable Note 20 23 26
Short-term provisions Note 28 27 33
Borrowings and bank overdrafts Note 25 556 286
Other current liabilities Note 24 627 511
Total current liabilities 3,202 2,770
Working capital (751) (459)
Capital employed 5,611 5,329
64
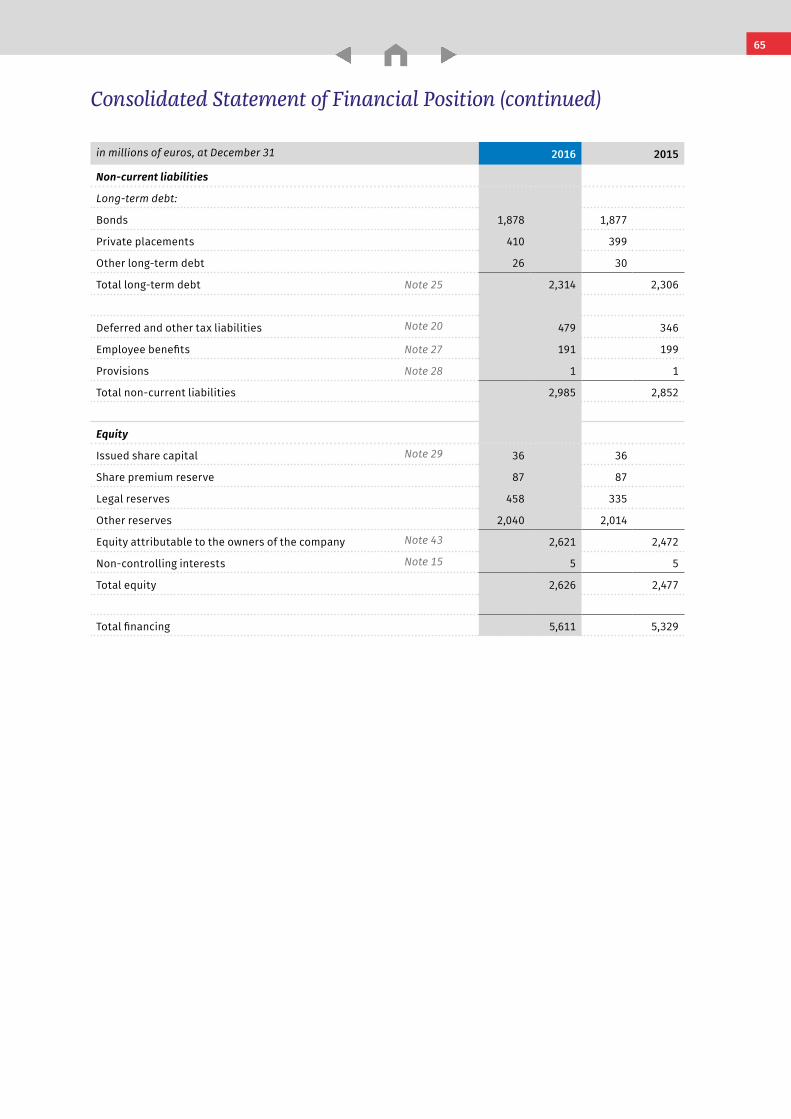
Consolidated Financial Statements Wolters Kluwer 2016 Annual Report
Consolidated Statement of Financial Position (continued)
in millions of euros, at December 31 2016 2015
Non-current liabilities
Long-term debt:
Bonds 1,878 1,877
Private placements 410 399
Other long-term debt 26 30
Total long-term debt Note 25 2,314 2,306
Deferred and other tax liabilities Note 20 479 346
Employee benefits Note 27 191 199
Provisions Note 28 1 1
Total non-current liabilities 2,985 2,852
Equity
Issued share capital Note 29 36 36
Share premium reserve 87 87
Legal reserves 458 335
Other reserves 2,040 2,014
Equity attributable to the owners of the company Note 43 2,621 2,472
Non-controlling interests Note 15 5 5
Total equity 2,626 2,477
Total financing 5,611 5,329
65
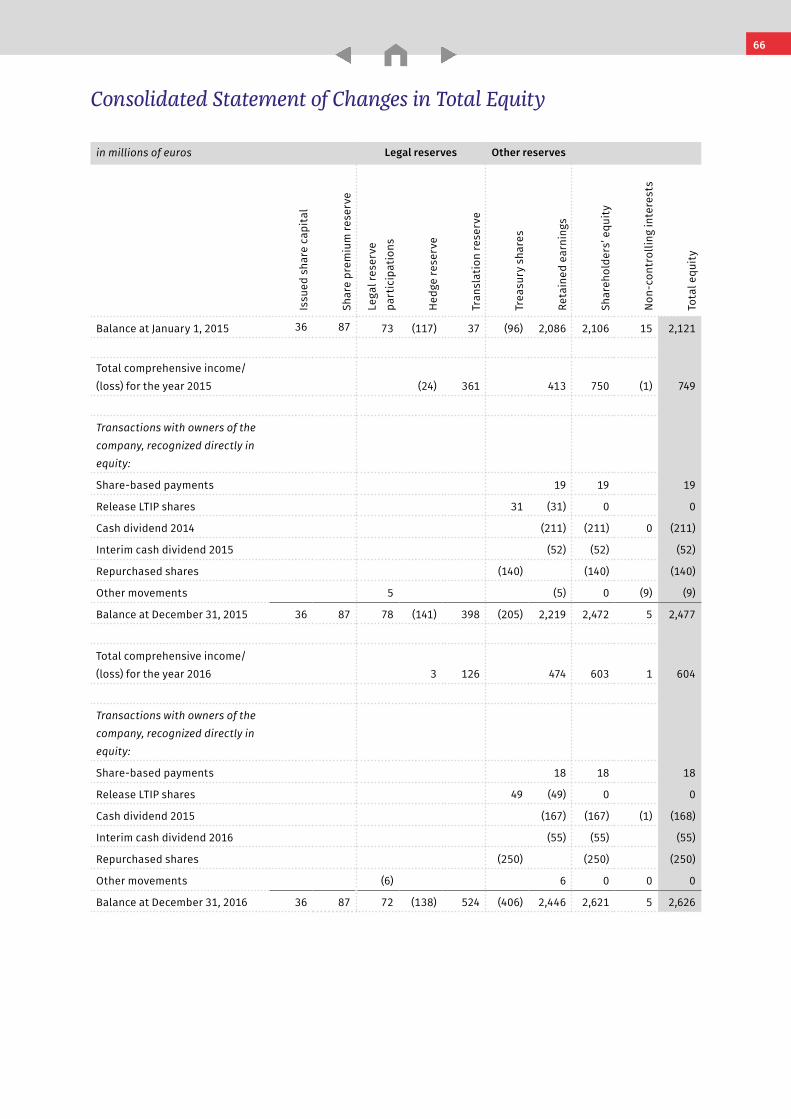
Consolidated Financial Statements Wolters Kluwer 2016 Annual Report
Consolidated Statement of Changes in Total Equity
in millions of euros Legal reserves Other reserves
Issu
ed s
hare
cap
ital
Shar
e pr
emiu
m re
serv
e
Lega
l res
erve
pa
rtic
ipat
ions
Hed
ge re
serv
e
Tran
slat
ion
rese
rve
Trea
sury
sha
res
Reta
ined
ear
ning
s
Shar
ehol
ders
’ equ
ity
Non
-con
trol
ling
inte
rest
s
Tota
l equ
ity
Balance at January 1, 2015 36 87 73 (117) 37 (96) 2,086 2,106 15 2,121
Total comprehensive income/ (loss) for the year 2015 (24) 361 413 750 (1) 749
Transactions with owners of the company, recognized directly in equity:
Share-based payments 19 19 19
Release LTIP shares 31 (31) 0 0
Cash dividend 2014 (211) (211) 0 (211)
Interim cash dividend 2015 (52) (52) (52)
Repurchased shares (140) (140) (140)
Other movements 5 (5) 0 (9) (9)
Balance at December 31, 2015 36 87 78 (141) 398 (205) 2,219 2,472 5 2,477
Total comprehensive income/ (loss) for the year 2016 3 126 474 603 1 604
Transactions with owners of the company, recognized directly in equity:
Share-based payments 18 18 18
Release LTIP shares 49 (49) 0 0
Cash dividend 2015 (167) (167) (1) (168)
Interim cash dividend 2016 (55) (55) (55)
Repurchased shares (250) (250) (250)
Other movements (6) 6 0 0 0
Balance at December 31, 2016 36 87 72 (138) 524 (406) 2,446 2,621 5 2,626
66
Wolters Kluwer 2016 Annual Report
General
Reporting entityWolters Kluwer N.V. (‘the company’) with its subsidiaries (together ‘the group’) is a global leader in information services and solutions for professionals in the health, tax and accounting, risk and compliance, finance, and legal sectors. We help our customers make critical decisions every day by providing expert solutions that combine deep domain knowledge with specialized technology and services.The group maintains operations across North America, Europe, Asia Pacific, and other regions (‘Rest of the World’). The company’s ordinary shares are quoted on Euronext Amsterdam (WKL) and are included in the AEX and Euronext 100 indices.The address of the company’s registered office is Zuidpoolsingel 2, Alphen aan den Rijn, the Netherlands with its statutory seat in Amsterdam and a registration with the Dutch Commercial Register under number 33.202.517.
Statement of complianceThe consolidated financial statements have been prepared in accordance with International Financial Reporting Standards (IFRS) and its interpretations, prevailing as of December 31, 2016, as endorsed for use in the European Union by the European Commission.These financial statements were authorized for issue by the Executive Board and Supervisory Board on February 21, 2017. The adoption of the financial statements and the adoption of the dividend are reserved for the shareholders in the Annual General Meeting of Shareholders (AGM) on April 20, 2017.
Consolidated financial statementsThe consolidated financial statements of the company at and for the year ended December 31, 2016, comprise the company and its subsidiaries (together referred to as the ‘group’ and individually as ‘group entities’) and the
group’s interest in associates and jointly controlled entities. The significant accounting policies applied in the preparation of these consolidated financial statements are set out in Note 2 - Significant Accounting Policies. These policies have been consistently applied by the group entities.
A list of participation has been filed with the Chamber of Commerce in The Hague, the Netherlands and is available from the company upon request.
Basis of preparation
Basis of measurementThe consolidated financial statements have been prepared under historical cost except for the following material items in the statement of financial position:– those financial assets and those financial liabilities (including derivative financial instruments) recognized at their fair value or their amortized costs;– share-based payments; and– net defined employee benefit assets/liabilities.
Functional and presentation currencyThe consolidated financial statements are presented in euros, which is the company’s functional and presentation currency. Unless otherwise indicated the financial information in these financial statements is in euros and has been rounded to the nearest million.
Use of estimates and judgmentsThe preparation of financial statements in conformity with IFRS requires management to make judgments, estimates, and assumptions that affect the application of policies and reported amounts of assets and liabilities, the disclosure of contingent assets and liabilities, and the reported amounts of income and expense. The estimates and underlying assumptions are based on historical experience and various other factors that are believed to
Notes to the Consolidated Financial Statements
Note 1 – General and Basis of Preparation
67
Notes to the Consolidated Financial Statements Wolters Kluwer 2016 Annual Report
be reasonable under the circumstances, the results of which form the basis of making the judgments about carrying values of assets and liabilities that are not readily apparent from other sources.Actual results may differ from those estimates.
The estimates and underlying assumptions are reviewed on an ongoing basis. Revisions to accounting estimates are recognized in the period in which the estimate is revised if the revision affects only that period or the period of the revision and future periods if the revision affects both current and future periods. Judgments made by management in the application of IFRS that have significant effect on the financial statements and estimates with a significant risk of material adjustment in the next year are discussed in Note 3 - Accounting Estimates and Judgments.
Going concernThe Executive Board and Supervisory Board have assessed, during the preparation of the consolidated financial statements of the group, the going concern assumptions. The Executive Board and Supervisory Board believe that no events or conditions give rise to doubt about the ability of the group to continue in operation within the next reporting period. This conclusion is drawn based on knowledge of the group, the estimated economic outlook and related identified risks and uncertainties. Furthermore, the conclusion is based on a review of the strategic plan and budget, including expected development in liquidity and capital, as well as current credit facilities available, including contractual and expected maturities and covenants. Consequently, it has been concluded that it is reasonable to apply the going concern concept as the underlying assumption for the financial statements.
ComparativesWhere necessary, certain reclassifications have been made to the prior-year financial information and the related notes to conform to the current year presentation and to improve insights. These have had no impact on the shareholders’ equity and profit for the year.
Effect of new accounting standardsExcept for the EU endorsed amendments below, the group has consistently applied the accounting policies set out in Note 2 - Significant Accounting Policies, to all periods presented in these consolidated financial statements.The group has adopted the amendments to the following standards:– Annual Improvements Cycle - 2012-2014;– Amendments to IFRS 11: Accounting for acquisitions of
interest in joint operations;– Amendments to IAS 16 and IAS 38: Clarification of
acceptable methods for depreciation and amortization; and
– Disclosure initiative Amendments to IAS 1.
Changes in these standards did not result in a material effect on the 2016 financial statements.
Effect of forthcoming accounting standardsA number of new standards and amendments are not yet effective for the year ended December 31, 2016, and have not been adopted earlier in preparing these consolidated financial statements.
IFRS 9 – Financial InstrumentsIFRS 9 includes revised guidance on the classification and measurement of financial instruments, including a new expected credit loss model for calculating impairment on financial assets, and the new general hedge accounting requirements. IFRS 9 is effective on or after January 1, 2018. The group expects no significant changes as result of this new standard.
IFRS 15 – Revenue from Contracts with CustomersIn May 2014 the IASB issued the new standard IFRS 15 “Revenue from Contracts with Customers”. According to the new standard, revenue is recognized to depict the transfer of promised goods or services to a customer in an amount that reflects the consideration to which the company expects to be entitled in exchange for those goods and services. The underlying principle is a five-step approach to determine performance obligations, the consideration and timing of revenue recognition. IFRS 15 also includes guidance on the presentation of contracts balances, assets and liabilities arising from contracts with customers, which are dependent on the relationship between the entity’s performance and the customer’s payment.
68
Notes to the Consolidated Financial Statements Wolters Kluwer 2016 Annual Report
IFRS 15 will supersede the current revenue recognition guidance, including IAS 18 Revenue, IAS 11 Construction Contracts, and the related interpretations when it becomes effective on or after January 1, 2018. IFRS 15 allows companies to either adopt the standard fully retrospectively, restating comparatives, or applying a modified retrospective approach. The company is still in the process of considering the appropriate method of adoption.
The group is currently assessing the potential impact on its consolidated financial statements resulting from the application of IFRS 15. The group launched a group-wide IFRS 15 implementation project with two phases. During the first phase, the group performed a gap analysis of the impact of the principles of IFRS 15. The subsequent phase will serve particularly to implement the initial adjustments and start reporting under the new standard. The preliminary assessments show that the financial statements will be impacted for the recognition of:– License/maintenance software business models where
certain licenses will no longer be recognized directly in the statement of profit and loss, but are considered to be a right of access under IFRS 15 and will be recognized in the statement of profit and loss over the term of the underlying contract;
– The transaction price, which is required to be allocated to performance obligations based on relative standalone selling prices, and which will result in a different allocation of discounts within multiple element contracts and a different revenue recognition pattern in such arrangements.
– Balance sheet extension, which will result from the capitalization of incremental cost to obtain a contract, especially sales commissions, and which will be capitalized for new contracts and amortized over the contract period. Currently sales commissions are expensed when incurred.
The group expects primarily an impact on the timing of revenue recognition, and the cost associated with the cost to obtain a contract, in its Consolidated Financial Statements.
IFRS 16 – LeasesIFRS 16 is the new standard on lease accounting and will result in recognition of almost all leases in the balance sheet, as there is no longer a distinction between operating and finance lease. Under the new standard, an asset (the right to use the leased item) and a financial liability to pay rentals are recognized. A practical expedient is applicable for short-term and low-value leases.
IFRS 16 is effective on or after January 1, 2019. At this stage, the group does not intend to adopt the standard before its effective date. The group has not yet started with the assessment of this new standard but expects it has no material impact on the statement of profit and loss, but will result in presentation changes in the statement of profit or loss and the statement of financial position. As at the reporting date, the group has non-cancellable operating lease commitments of €198 million (Note 33 – Commitments and Contingent Liabilities). However, the group has not yet determined to what extent these commitments will result in the recognition of an asset and a liability for future payments and how this will affect the group’s profit and classification of cash flows. Some of the commitments may be covered by the exception for short-term and low-value leases and some commitments may relate to arrangements that will not qualify as leases under IFRS 16.
69
Notes to the Consolidated Financial Statements Wolters Kluwer 2016 Annual Report
Except for the changes explained in Note 1 - General and Basis of Presentation, the group has consistently applied the following significant accounting policies to all periods presented in these consolidated financial statements.
Basis of consolidation
SubsidiariesSubsidiaries are all entities controlled by the group. The group controls an entity when it is exposed to, or has rights to, variable returns from its involvement with the entity and has the ability to affect those returns through its power over the entity.
Equity-accounted investeesEquity-accounted investees comprise interests in associates and joint ventures.
Interests in associates and joint ventures are accounted for using the equity method of accounting and are initially recognized at cost, which includes transaction costs. Associates are recognized from the date on which the group has significant influence, and recognition ceases the date the group has no significant influence over an associate. The group’s investment in associates includes goodwill (net of any accumulated impairment loss) identified on acquisition. Joint ventures are recognized from the date that joint control commences, and recognition ceases the date the group no longer has joint control over a joint venture.
When an interest in an associate is increased to a controlling interest, the equity interest previously held (which qualified the organization as an associate) is treated as if it were disposed of and re-acquired at fair value on the acquisition date. Accordingly, it is remeasured to its acquisition date fair value, and any resulting gain or loss compared to its carrying amount is recognized in profit or loss. Any amount that has previously been recognized in other comprehensive income, and that would be reclassified to profit or loss following a disposal, is similarly reclassified to profit or loss. Loss of controlOn loss of control, the group derecognizes the assets and liabilities of the subsidiary, any non-controlling interests and the other components of equity related to the subsidiary. Any surplus or deficit arising on the loss of control is recognized in profit or loss.
If the group retains any equity interest in the previous subsidiary, then such interest is measured at fair value at the date that control is lost. Subsequently the remaining interest is accounted for as an equity-accounted investee or as available-for-sale financial asset depending on the level of influence retained.
Transactions eliminated on consolidationIntragroup balances and transactions, as well as income and expenses and any unrealized gains and losses arising from transactions between group companies are eliminated in preparing the consolidated financial statements. Unrealized losses are also eliminated unless the transaction provides evidence of an impairment of the asset transferred.
Unrealized gains arising from transactions between the group and its equity-accounted investees and joint ventures are eliminated to the extent of the group’s interest in the equity-accounted investees and joint ventures.
Foreign currencyFunctional and presentation currencyItems included in the financial statements of each of the group’s entities are measured using the currency of the primary economic environment in which the group entities operate (the functional currency). The consolidated financial statements are presented in euros, which is the group’s presentation currency.
Foreign currency transactions and balancesForeign currency transactions are translated into the functional currency using the exchange rates prevailing at the dates of the transactions. Foreign exchange gains and losses resulting from the settlement of such transactions and from the translation at year-end exchange rates of monetary assets and liabilities denominated in foreign currencies are recognized in profit or loss.
However, foreign currency differences arising from the following items are recognized in other comprehensive income:– Qualifying cash flow hedges to the extent that the hedge is effective;– Available-for-sale equity investments (except for impairment); and– Qualifying net investment hedges in foreign operations to the extent the hedge is effective.
Note 2 – Significant Accounting Policies
70
Notes to the Consolidated Financial Statements Wolters Kluwer 2016 Annual Report
Non-monetary assets and liabilities in a foreign currency that are measured in terms of historical cost are translated using the exchange rate at the transaction date. Non-monetary assets and liabilities denominated in foreign currencies that are stated at fair value are translated to the functional currency at the foreign exchange rates prevailing on the dates the fair value was determined.
Foreign operationsThe assets and liabilities of group companies are translated to euros at foreign exchange rates prevailing at the end of the reporting period. Income and expenses of group companies are translated to euros at exchange rates on the dates of the transactions. All resulting exchange differences are recognized in the currency translation reserve as a component of other comprehensive income.When a foreign subsidiary is disposed of, exchange differences that were recorded in other comprehensive income prior to the sale are reclassified through profit or loss as part of the gain or loss on disposal.
Net investment in foreign operationsNet investment in foreign operations includes equity financing and long-term intercompany loans for which settlement is neither planned nor likely to occur in the foreseeable future. Exchange differences arising from the translation of the net investment in foreign operations, and of related hedges, are taken to the currency translation reserve in other comprehensive income.
Main currency exchange rates
rates to the euro 2016 2015
U.S. dollar (average) 1.11 1.11
U.S. dollar (at December 31) 1.05 1.09
Business combinationsBusiness combinations are accounted for using the acquisition method as at the acquisition date, which is the date on which control is transferred to the group.
When a business combination is achieved in stages, the group’s previously held equity interest in the acquiree is remeasured to its acquisition date fair value and the resulting gain or loss, if any, is recognized in financing results.
Changes in the group’s interests in a subsidiary that do not result in a loss of control are accounted for as equity transactions.
GoodwillThe group measures goodwill at the acquisition date as the sum of the fair value of the consideration transferred and the recognized amount of any non-controlling interests in the acquiree, less the net recognized amount (generally fair value) of the identifiable assets acquired and liabilities assumed. If the business is acquired in stages, the fair value of the existing equity interest in the acquiree is also included in the determination of goodwill. When the excess is negative, a bargain purchase is recognized immediately in profit or loss.
The consideration transferred does not include amounts related to the settlement of pre-existing relationships. Such amounts are generally recognized in profit or loss.
Costs related to acquisitions, other than those associated with the cost of debt or equity securities, which the group incurs in connection with a business combination, are expensed as incurred. Any contingent consideration payable (such as earn-out arrangements) is recognized at fair value at the acquisition date.
Non-controlling interestsAcquisitions of non-controlling interests are accounted for as transactions with owners in their capacity as owners and therefore no goodwill is recognized as a result of those transactions. The adjustments to non-controlling interests are based on a proportionate amount of the net assets of the subsidiary.
Principles for the determination and presentation of results
RevenuesRevenues represent the revenues billed to third parties net of value-added tax and discounts. Shipping and handling fees billed to customers are included in revenues.
SubscriptionsRevenues related to subscriptions are recognized over the period in which the goods and/or content are dispatched and/or made available online, when the goods and/or content involved are similar in value over time. Subscription income received or receivable in advance of the delivery of goods and/or content are included in deferred income.
71
Notes to the Consolidated Financial Statements Wolters Kluwer 2016 Annual Report
Licenses License fees paid for the use of the group’s software products and/or services are recognized in accordance with the substance of the agreement. Normally licenses representing a right to access are recognized as revenue on a straight-line basis. In case of a transfer of rights, which permits the licensee to exploit those rights freely and the group as a licensor has no remaining obligations to perform subsequent to delivery, revenue is recognized at the time of the sale.
Related implementation fees are normally recognized as revenues by reference to the stage of completion of the implementation.
GoodsRevenue from the sale of goods is recognized upon shipment and transfer of the significant risks and rewards of ownership to the customer, provided that the ultimate collectability and final acceptance by the customer is reasonably assured. Revenue from the sale of goods is recognized net of estimated returns for which the group has recognized a provision based on previous experience and other relevant factors.If returns on a product category exceed a certain threshold, it is assumed that the transfer of the ownership of the product has only occurred upon receipt of payment from the customer.
ServicesRevenue from the sale of services is recognized on a straight-line basis over the agreed or estimated service period, unless there is evidence that some other method is more representative for the stage of completion of the service at the end of the reporting period.
Multiple element contractsIn case a product consists of a combination of multiple goods and/or services (also known as “bundled product”) the group will estimate the fair value of the individual contract obligations and recognize each obligation at the moment of delivery and/or when it is made available.
Agent/principal arrangementsIf the group acts as an agent, whereby the group sells goods or services on behalf of a principal, the group recognizes the amount of the net consideration as revenues.
Cost of salesCost of sales comprises directly attributable costs of goods and services sold.
For digital products and services these costs include data maintenance, hosting, royalties, product support, personnel cost, subcontracted work, training, and other costs incurred to support and maintain the products, applications, and services.For print products these costs may include cost for paper, printing and binding, royalties, personnel cost, subcontracted work, shipping cost, and other incurred costs.
General and administrative costsGeneral and administrative costs include costs that are neither directly attributable to cost of sales nor to sales costs (sales and marketing activities). They include costs such as product development cost, information technology cost, general overhead, and amortization of publishing rights and impairments of goodwill and publishing rights.
Other operating income and expenseOther operating income and expense relate to items which are different in their nature or frequency from operating items. They include results on divestments (including direct attributable divestment costs), additions to provisions for restructuring of stranded costs following divestments, acquisitions costs, additions to acquisition integration provisions, and subsequent fair value changes on contingent considerations.
Financing resultsFinancing results include interest payable/receivable on loans and borrowings for the period, calculated using the effective interest rate method, interest receivable on funds invested, divestment results of equity-accounted investees, dividend income on available-for-sale investments, gain or loss on the sale of financial assets classified as available-for-sale, impairments of financial assets (other than receivables), financing income or costs resulting from defined benefit plans, foreign exchange gains and losses on financial assets and liabilities, and gains and losses on hedging instruments that are recognized in profit or loss.
Share-based paymentsThe group’s Long-Term Incentive Plan (LTIP) qualifies as an equity-settled share-based payments transaction. The fair value of shares awarded is recognized as an expense with a corresponding increase in equity. The fair value is measured at the grant date and spread over the period during which the employees become unconditionally entitled to the shares. The amount recognized as an expense is adjusted for the actual forfeitures due to participants’ resignations before the vesting date.
72
Notes to the Consolidated Financial Statements Wolters Kluwer 2016 Annual Report
Total Shareholder Return (‘TSR’) conditionThe fair value of the shares based on the TSR performance condition, a market condition under IFRS 2, is measured using a Monte Carlo simulation model, taking into account the terms and conditions upon which the shares were awarded.
Earnings Per Share (‘EPS’) conditionThe fair value of the shares based on the non-market performance condition of EPS is equal to the opening share price of the Wolters Kluwer shares in the year at the grant date, adjusted by the present value of the future dividend payments during the three-year performance period.The amount recognized as an expense in a given year is adjusted to reflect the number of share awards for which the related service and non-market performance conditions are expected to be met, such that the amount ultimately recognized as an expense is based on the number of awards that meet the related service and non-market conditions at the vesting date.
Operating segmentsAn operating segment is a component of the group that engages in business activities from which it may earn revenues and incur expenses. All operating segments are regularly reviewed by the group’s chief operating decision-maker to make decisions about resources to be allocated to the segment and assess its performance and for which discrete financial information is available.
Operating segments are reported in a manner consistent with the internal financial reporting provided to the chief operating decision-maker. The chief operating decision-maker, who is responsible for allocating resources and assessing performance of the operating segments, has been identified as the Executive Board.
Segment results reported to the Executive Board include items directly attributable to a segment as well as those that can be allocated on a reasonable basis. Unallocated items are made up of mainly corporate assets and liabilities, corporate office expenses, and income tax assets and liabilities.
Operating segments that do not meet the quantitative thresholds and that have similar economic characteristics have been aggregated into a single reportable segment.
Principles underlying the statement of cash flows
Cash flows from operating activitiesCash flows from operating activities are calculated by the indirect method; by adjusting the consolidated profit for the year for items and expenses that are not cash flows and for autonomous movements in operating working capital (excluding impact from acquisitions and foreign currency differences).
Cash payments to employees and suppliers are recognized as cash flow from operating activities. Cash flows from operating activities also include paid financing costs of operating activities, acquisition and divestment-related costs, spending on restructuring provisions, and corporate income taxes paid on operating activities.
Cash flows from investing activitiesCash flows from investing activities are those arising from net capital expenditure, from the acquisition and sale of subsidiaries and business activities.
Net capital expenditure is the balance of purchases of property, plant, and equipment less the book value of disposals, and expenditures on other intangible assets less the book value of disposals.
Dividends received relate to dividends received from equity-accounted investees and investments available-for-sale.
Cash receipts and payments from derivative financial instruments are classified in the same manner as the cash flows of the hedged items. The group has primarily used derivatives for the purpose of hedging its net investments in the United States. As a result, cash receipts and payments from settlement from derivatives are either classified under cash flows from investing activities or cash flows from operating activities under paid financing costs.
Cash flows from financing activitiesThe cash flows from financing activities comprise the cash receipts and payments from issued and repurchased shares, dividends paid, debt instruments, and short-term financing. Dividends paid relate to dividends paid to the owners of the company and the non-controlling interests.
Bank overdrafts repayable on demand are included as cash and cash equivalents in the statement of cash flows to the extent that they form an integral part of the group’s cash management. However, in the statement of financial position, the bank overdrafts are presented separately as the offsetting criteria are not met.
73
Notes to the Consolidated Financial Statements Wolters Kluwer 2016 Annual Report
Principles of valuation and presentation of assets and liabilities
Goodwill, acquired publishing rights, and other intangible assets
GoodwillGoodwill recognized for acquisitions represents the consideration made by the group in anticipation of the future economic benefits from assets that are not capable of being individually identified and separately recognized. This includes - amongst other factors - expected synergies, skilled workforces, new customers expected to generate revenue streams in the future, revenues generated by new versions of software, and the possibility to have an immediate significant presence in new markets through an existing customer base that can be leveraged by the group for other products and services.
Goodwill on acquisitions of subsidiaries is included in intangible assets. Goodwill on acquisitions of associates is included in investments in associates. Goodwill is carried at cost less any accumulated impairment losses. Gains and losses on the disposal of an entity include the carrying amount of goodwill allocated to the entity that is sold.
Goodwill acquired in a business combination is not amortized. Instead, the goodwill is tested for impairment annually or more frequently if events or changes in circumstances indicate that it might be impaired.Goodwill is allocated to cash-generating units for the purpose of impairment testing. The allocation is made to those cash-generating units that are expected to benefit from the business combination in which the goodwill arose.
Acquired publishing rightsPublishing rights acquired through business combinations consist of:– Customer relationships: subscriber accounts and other customer relationships;– Technology: databases, software, and product technology;– Trademarks and titles: trademarks, imprints, product titles, and copyrights; and– Other: license agreements, non-compete covenants, and favorable purchase agreements.
The fair value of the acquired publishing rights is computed at the time of the acquisition applying one of the following methods:– Relief from royalty approach: this approach assumes
that if the publishing right was not owned, it would be acquired through a royalty agreement. The value of actually owning the asset equals the benefits from not having to pay royalty fees;
– Multi-period excess earnings method: under this approach, cash flows associated with the specific publishing rights are determined. Contributory charges of other assets that are being used to generate the cash flows are deducted from these cash flows. The net cash flows are discounted to arrive at the value of the asset; or
– Cost method: the cost method reflects the accumulated cost that would currently be required to replace the asset.
Publishing rights are stated at cost less accumulated amortization and any impairment losses, and are amortized over their estimated useful economic life by applying the straight-line method. The useful life of the publishing rights is deemed finite, reflecting management’s assessment of the life of the assets, usually supported by outside valuation experts, and taking into account the impact of technological change and changes in the marketplace. If, and to the extent that, publishing rights are considered to be impaired in value, this is immediately charged to profit or loss as impairment.
The estimated useful life for publishing rights is five to thirty years.
Other intangible assetsOther intangible assets mainly relate to purchased and self-constructed information systems and software that are valued at cost less accumulated amortization and any impairment losses. Capitalized software is amortized using the straight-line method over the economic life of the software. If, and to the extent that, the assets are considered to be impaired in value, this is immediately recognized in profit or loss as impairment. The estimated useful life for other intangibles is three to ten year.
ImpairmentThe carrying amounts of the group’s non-current assets other than deferred tax assets are reviewed at the end of each reporting period to determine whether there is any indication of impairment. If such indication exists, the asset’s recoverable amount is estimated.Irrespective of whether there is any indication of
74
Notes to the Consolidated Financial Statements Wolters Kluwer 2016 Annual Report
impairment, the group also: (1) annually tests for impairment any goodwill and publishing rights acquired in a business combination; and (2) annually tests an intangible asset not yet available for use for impairment by comparing its carrying amount with its recoverable amount.
An impairment loss is immediately recognized whenever the carrying amount of an asset or its cash-generating unit exceeds its recoverable amount.
In assessing value in use, the estimated future cash flows are discounted to their present value using a pre-tax discount rate that reflects current market assessments of the time value of money and the risks specific to the asset or Cash Generating Unit (CGU). For the purpose of impairment testing, assets are grouped together into the smallest group of assets that generates cash inflows from continuing use that are largely independent of the cash inflows of other assets or CGUs. Subject to an operating segment ceiling test, CGUs to which goodwill has been allocated are aggregated so that the level at which impairment testing is performed reflects the lowest level at which goodwill is monitored. Goodwill acquired in a business combination is allocated to groups of CGUs that are expected to benefit from the synergies of the combination.
The group assesses at the end of each reporting period whether there is any indication that an impairment loss recognized in prior periods for an asset other than goodwill may no longer exist or may have decreased. If any such indication exists, the group will estimate the recoverable amount of that asset. Financial instrumentsFinancial instruments comprise:– Non-derivative financial assets and liabilities:
investments, other receivables, trade and other receivables, cash and cash equivalents, borrowings and bank overdrafts, other current liabilities (excluding derivative financial instruments), and long-term debt;
– Derivative financial assets and liabilities: single-currency and cross-currency interest rate swaps and forward contracts.
Financial assets and liabilities are offset and presented as net in the statement of financial position when the group has a legal right to offset the amounts and intends either to settle them on a net basis or to realize the asset and settle the liability simultaneously.
The group derecognizes a financial asset when the contractual rights to the cash flows from the asset expire, or it transfers the rights to receive the contractual cash flows in a transaction in which substantially all the risk and rewards of ownership of the financial asset are transferred. Any interest in such transferred financial assets that is created or retained by the group is recognized as a separate asset or liability. The group derecognizes a financial liability when its contractual obligations are discharged, cancelled, or expired.
Non-derivative financial assets and liabilitiesThe group recognizes non-derivative financial assets and liabilities on the trade date.
Non-derivative financial assetsa) Loans and receivables comprise trade and other
receivables, and non-current other receivables, and are measured at amortized cost, less accumulated impairment.All individually significant receivables are assessed for specific impairment. All individually significant loans and receivables found not to be specifically impaired are then collectively assessed for any impairment that has been incurred but not yet identified. Loans and receivables that are not individually significant are collectively assessed for impairment by grouping together loans and receivables with similar risk characteristics.
b) Available-for-sale financial assets (non-current investments) are recognized initially at fair value plus any directly attributable transaction costs. Subsequent to initial recognition, these assets are measured at fair value and changes therein are recognized in other comprehensive income and presented in fair value differences on available-for-sale financial assets.Dividends and other gains related to available-for-sale investments are recognized as financing income in the statement of profit or loss.
Non-derivative financial liabilitiesNon-derivative financial liabilities comprise long-term debt (such as bond loans and other loans from credit institutions), trade and other payables, borrowings and bank overdrafts, and other current liabilities (excluding derivative financial instruments).
75
Notes to the Consolidated Financial Statements Wolters Kluwer 2016 Annual Report
Non-derivative financial liabilities measured at amortized costThe group initially recognizes non-derivative financial liabilities at fair value less any directly attributable transaction costs. Subsequent to initial recognition, these financial liabilities are measured at amortized cost with any difference between cost and redemption value being recognized in profit or loss over the period of the borrowings, using the effective interest method.
Non-derivative financial liabilities designated at fair value through profit or lossNon-derivative financial liabilities designated at fair value through profit or loss comprise contingent considerations and are measured at fair value. Changes therein are recognized in profit or loss.
Derivative financial instruments and hedging activities The group holds derivative financial instruments to hedge risk exposures.
Derivative financial instruments are initially recognized at fair value on the date a derivative contract is entered into and are subsequently remeasured at their fair value. The method of recognizing the resulting gain or loss depends on whether the derivative is designated as a hedging instrument and if so, the nature of the item being hedged. The group designates certain derivatives as either: – hedges of a particular risk associated with a recognized
asset or liability or a highly probable forecast transaction (cash flow hedge); or
– hedges of a net investment in a foreign operation (net investment hedge).
The fair value of derivative financial instruments is classified as a non-current asset or long-term debt if the remaining maturity of the derivative financial instrument is more than twelve months and as a current asset or liability if the remaining maturity of the derivative financial instrument is less than twelve months after the end of the reporting period.
Cash flow hedgeThe effective part of changes in the fair value of derivatives that are designated and qualify as cash flow hedges are recognized in other comprehensive income and accumulated under the heading of effective portion of changes in fair value of cash flow hedges. The gain or loss relating to the ineffective part is recognized in profit or loss within financing income or costs. Amounts accumulated in other comprehensive income are reclassified to profit or loss in the same periods the hedged item affects the statement of profit or loss. The
gain or loss relating to the effective part of derivative financial instruments is recognized in profit or loss within the line where the result from the hedged transaction is recognized.
When a hedging instrument matures or is sold, or when a hedge no longer meets the criteria for hedge accounting, any cumulative gain or loss existing in other comprehensive income at that time remains in other comprehensive income and is recognized when the hedged transaction is ultimately recognized in profit or loss. When a hedged transaction is no longer expected to occur, the cumulative gain or loss that was reported in other comprehensive income is reclassified from other comprehensive income to profit or loss.
Net investment hedgeFair value changes of derivative financial instruments that are used to hedge the net investment in foreign operations, which are determined to be an effective hedge, are recognized directly in other comprehensive income in the translation reserve. The ineffective part is recognized in profit or loss within financing results. Gains and losses accumulated in other comprehensive income are included in profit or loss when the foreign operation is disposed of. If a hedging relationship is terminated and the derivative financial instrument is not sold, future changes in its fair value are recognized in profit or loss.
Derivatives that do not qualify for hedge accountingCertain derivatives do not qualify for hedge accounting. Changes in the fair value of any derivative financial instruments that do not qualify for hedge accounting are recognized in profit or loss within financing results.
Deferred incomeDeferred income represents the part of the amount invoiced to customers that has not yet met the criteria for revenue recognition and thus still has to be earned as revenues by means of the delivery of goods and services in the future. Deferred income is recognized at its nominal value.
TaxationCorporate income tax on the result for the year is made up of current and deferred tax. Corporate income tax is recognized in profit or loss except to the extent that it relates to business combinations and/or items directly recognized in equity or other comprehensive income.
Current tax is the expected tax payable or tax receivable on the taxable income for the year, using the tax rates and tax laws that have been enacted or substantively enacted
76
Notes to the Consolidated Financial Statements Wolters Kluwer 2016 Annual Report
by the end of the reporting period, and any adjustment to tax payable or tax receivable in respect of previous years. The group recognizes deferred tax liabilities for all taxable temporary differences between the carrying amounts of assets or liabilities in the balance sheet for financial reporting purposes and their tax base for taxation purposes.
Deferred tax liabilities are not recognized for temporary differences arising on:– Initial recognition of goodwill;– Investments in subsidiaries and jointly controlled
entities to the extent that the parent is able to control the timing of the reversal of the temporary difference, and it is probable that they will not reverse in the foreseeable future; and
– Initial recognition of an asset or liability in a transaction, which is not a business combination and that, at the time of the transaction, affects neither accounting profit nor taxable profit.
A deferred tax asset is recognized for deductible temporary differences and for the carry forward of unused tax losses and unused tax credits to the extent that it is probable that future taxable profits will be available against which these can be utilized. Deferred tax assets are reviewed at the end of each reporting period and are reduced to the extent that it is no longer probable that the related tax benefit will be realized.
Deferred tax assets and liabilities are measured at the tax rates that are expected to be applied to the temporary differences when they reverse, based on the laws that have been enacted or substantively enacted by the end of the reporting period. The effect of changes in tax rates on the deferred taxation is recognized in profit or loss if, and to the extent that, this provision was originally formed as a charge to profit or loss.
Deferred tax assets and liabilities are offset if there is a legally enforceable right to offset current tax liabilities and assets, and they relate to income taxes levied by the same tax authority on the same taxable entity, or on different tax entities, but they intend to settle current tax liabilities and assets on a net basis or their tax assets and liabilities will be realized simultaneously.
Employee benefitsDefined contribution plansObligations for contributions to defined contribution plans are recognized as an employee benefit expense in profit or loss in the period during which services are rendered by employees. Prepaid contributions are
recognized as an asset to the extent that a cash refund or reduction in future payment is available.
Defined benefit plansThe group’s net obligation in respect of defined benefit plans is calculated separately for each plan by estimating the amount of future benefit that employees have earned in the current and prior periods, discounting that amount, and deducting the fair value of any plan assets.
The calculation of defined benefit obligations is performed annually by a qualified actuary using the projected unit credit method. When the calculation results in a potential asset for the group, the recognized asset is limited to the present value of economic benefits available in the form of any future refunds from the plan or reductions in future contribution to the plan. To calculate the present value of economic benefits, consideration is given to any applicable minimum funding requirements.
Remeasurements of the net defined benefit liability or asset, which are made up of actuarial gains and losses, the return on plan assets (excluding interest), and the effect of the asset ceiling (if any, excluding interest), are recognized immediately in other comprehensive income.
The group determines the net interest expense or income on the net defined benefit liability or asset for the period by applying the discount rate used to measure the defined benefit obligation at the beginning of the annual period to the then-net defined benefit liability or asset, taking into account any changes in the net defined benefit liability or asset during the period resulting from contributions and benefit payments. Net interest expense and other expense related to defined benefit plans, like fund administration costs, are recognized in profit or loss. When the benefits of a plan are changed or when a plan is curtailed, the resulting change in the defined benefits that relates to past service or the gain or loss on curtailment is recognized directly in profit or loss.The group recognizes gains and losses on the settlement of a defined benefit plan when the settlement occurs. A curtailment occurs when an entity significantly reduces the number of employees covered by a plan. A curtailment may arise from an isolated event, such as disposal or restructuring, discontinuance of an operation or termination and suspension of a plan. Amendments to the terms of a defined benefit plan will be considered plan amendments and will be fully accounted for as past service costs.
77
Notes to the Consolidated Financial Statements Wolters Kluwer 2016 Annual Report
Long-term service benefitsThe group’s net obligation in respect of long-term service benefits, such as jubilee benefits, is the amount of future benefits that employees have earned in return for their service in the current and prior periods. The obligation is calculated using the projected unit credit method and is discounted to its present value, and the fair value of any related assets is deducted.
The group recognizes all remeasurement gains and losses arising from defined benefit plans immediately in the period in which they occur in other comprehensive income. All expenses related to defined benefit plans are presented in the statement of profit or loss.
Termination benefitsTermination benefits are recognized as an expense when the group is demonstrably committed - without realistic possibility of withdrawal - to a formal detailed plan to either terminate employment before the normal retirement date, or to provide termination benefits as result of an offer made to encourage voluntary redundancy.
ProvisionsA provision is recognized when: (1) the group has a present legal or constructive obligation as a result of a past event; (2) it is probable that an outflow of resources in the form of economic benefits will be required to settle the obligation; and (3) the amount of the obligation can be reliably estimated.
RestructuringThe provision for restructuring relates to provisions for the integration of activities, including acquisitions, and other substantial changes of the organizational structure and onerous contracts. A provision for restructuring is recognized only when the aforementioned general recognition criteria are met.
Shareholders’ equity
Ordinary sharesOrdinary shares are classified as equity. Incremental costs directly attributable to the issue of ordinary shares are recognized as a deduction from equity, net of any tax effects.
Preference sharesPreference share capital is classified as equity if it is non-redeemable, or redeemable only at the company’s option, and any dividends are discretionary.
Repurchase and reissue of share capital (treasury shares) When share capital recognized as equity is repurchased (treasury shares), the amount of the consideration paid, including directly attributable costs, is recognized as a change in equity.
DividendsDividends are recognized as a liability upon being declared.
Non-controlling interestsNon-controlling interests are the portion of the profit or loss and net assets of a subsidiary attributable to equity interests that are not owned, directly or indirectly through subsidiaries, by the group. Losses applicable to the non-controlling interest in a subsidiary are allocated to the non-controlling interest even if these cause the non-controlling interest to have a debit balance.
Earnings per share
The group presents basic and diluted earnings per share data for its ordinary shares. Basic earnings per share is calculated by dividing the profit and loss attributable to ordinary shareholders of the company by the weighted average number of ordinary shares outstanding during the year, adjusted for own shares held (‘treasury shares’). Diluted earnings per share is determined by adjusting the profit and loss attributable to ordinary shareholders and the weighted average number of ordinary shares outstanding, adjusted for own shares and for the effects of all dilutive potential ordinary shares which consist of LTIP-shares granted.
78
Notes to the Consolidated Financial Statements Wolters Kluwer 2016 Annual Report
Note 3 – Accounting Estimates and Judgments
The preparation of financial statements in conformity with IFRS requires management to make judgments, estimates, and assumptions that affect the application of policies and reported amounts of assets and liabilities, the disclosure of contingent assets and liabilities, and the reported amounts of revenues and expense. Actual results may differ from those estimates, and may result in material adjustments in the next financial year(s).
Policies that are critical for the presentation of the financial position and financial performance of the group and that require estimates and judgments are summarized in this note.
Revenue recognitionRevenue recognition requires estimates and judgments as far as it relates to estimating expected returns from customers and non-renewed orders. The group recognizes a provision for these delivered goods or rendered services based on historical rates. If these rates exceed a certain threshold, revenue is recognized only upon receipt of the payment or the order. Revenue of a combination of goods and services is recognized based on estimates of the fair value of the individual components.
Employee benefitsWolters Kluwer has its main defined benefit pension plans in the Netherlands, U.S., and U.K., and large post- retirement medical plans in the U.S.The net assets and liabilities of these plans are presented in the balance sheet of the group. The costs related to these pension plans and post-retirement medical plans are included in profit or loss.
The plan assets and liabilities as well as the related costs are based upon actuarial and economic assumptions. The main economic assumptions are:– Discount rate;– Indexation;– Inflation; and– Medical trend rate.
For actuarial assumptions the group uses generally accepted mortality rates (longevity risk). The withdrawal rates and retirement rates are based upon statistics provided by the relevant entities based on past experiences.
Capitalized softwareSoftware development costs are capitalized if the group can demonstrate the technical feasibility of completing the software project so that it will be available for use or sale and if it can demonstrate that the project complies with the following requirements: the intention to complete the development project; the ability to sell or use the end-product; demonstration of how the end-product will yield probable future economic benefits; the availability of adequate technical, financial and other resources to complete the project; and the ability to reliably measure the expenditure attributable to the project.
Capitalized software is amortized using the straight-line method over the economic life of the software, between three and ten years. Capitalization of software depends on several assumptions as indicated above. While management has procedures in place to control the software development process, there is uncertainty with regard to the outcome of the development process (timing of technological developments, technological obsolescence, and competitive pressures).
Useful lives of assetsThe useful life has to be determined for assets such as publishing rights, other intangible assets, and property, plant, and equipment. The useful lives are estimated based upon best practice within the group and in line with common market practice. The group reviews the remaining useful lives of its assets annually.
Valuation and impairment testing intangiblesUpon acquisition, the values of intangible assets acquired are estimated, applying the methodologies as set out under the accounting policies. These calculations are usually performed by the management of the acquiring division in close cooperation with an external consulting firm. These calculations require estimates like future cash flows, useful life, churn rate, and rate of return. The estimates are based upon best practice within the group and the methodology applied is in line with normal market practice.
The impairment test requires estimates of a discount rate, future cash flows, and a perpetual growth rate. These estimates are made by management that manages the business with which the goodwill is associated. The future cash flows cover a five-year period and are based on Vision and Strategy Plans (VSP), prepared by management and approved by the Executive Board.
79
Notes to the Consolidated Financial Statements Wolters Kluwer 2016 Annual Report
The fair value of the assets, liabilities, and contingent liabilities of a business combination should be measured within twelve months from the acquisition date. For some acquisitions, provisional fair values have been included in the statement of financial position and final valuation of the identifiable tangible assets is still pending, but will be completed within the twelve-month timeframe. Actual valuation of these assets, liabilities, and contingent liabilities may differ from the provisional valuation.
When a business combination agreement provides for an adjustment to the cost of the combination contingent on future events (such as earn-outs), the group includes an initial fair value of that adjustment in the cost of the combination at the acquisition date if the adjustment is probable and can be measured reliably. The initial and subsequent measurement will usually be based on estimates of future results of the business combination. Subsequent changes to the fair value are recognized in profit or loss.
Accounting for income taxesCorporate income tax in is calculated on the basis of income before taxation, taking into account the local tax rates and regulations. For each operating entity, the current corporate income tax expense is calculated and differences between the accounting and tax base are determined, resulting in deferred tax assets or liabilities. These calculations may deviate from the final tax assessments, which will be received in future periods.
A deferred tax asset is recognized for deductible temporary differences, the carry-forward of unused tax losses and unused tax credits to the extent that it is probable that future taxable profit will be available against which the unused tax losses and unused tax credits can be utilized. Management assesses the probability that taxable profit will be available against which the unused tax losses or unused tax credits can be utilized.
In determining the amount of current and deferred tax, the group takes into account the impact of uncertain tax positions and whether additional taxes and interest may be due. The group believes that its accruals for tax liabilities are adequate for all open tax years based on its assessment of many factors, including interpretations of tax law and prior experience. The assessment relies on estimates and assumptions and may involve a series of judgments about future events. New information may become available that causes the group to change its judgment regarding the adequacy of existing tax liabilities. Such changes to tax liabilities will impact the corporate income tax expenses in the statement of profit or loss in the period that such a determination is made.
Legal and judicial proceedings, claimsFor legal and judicial proceedings and claims against the company and its operating entities, a liability is accrued only if an adverse outcome is probable and the amount of the loss can be reasonably estimated. If one of these conditions is not met, the proceeding or claim is disclosed as contingent liability, if material. The actual outcome of a proceeding or claim may differ from the estimated liability, and consequently may affect the actual result.The prediction of the outcome and the assessment of a possible loss by management are based on management’s judgments and estimates. Management usually consults lawyers and other specialists for support.
80
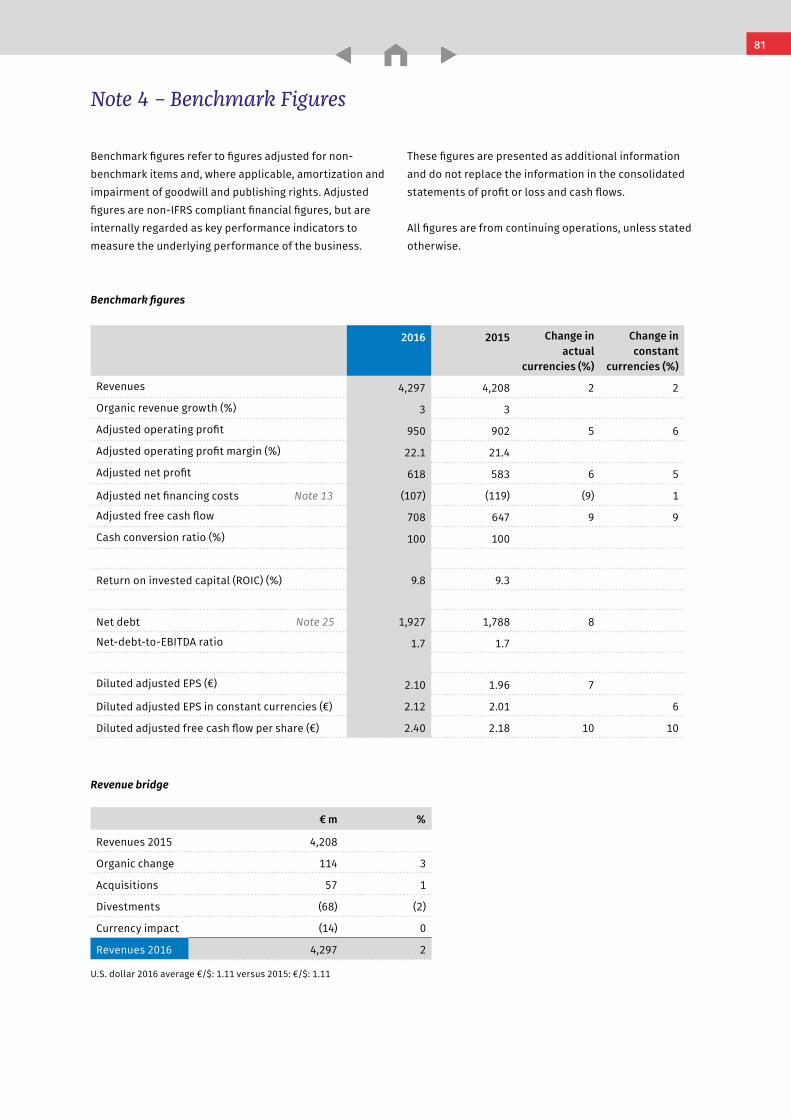
Notes to the Consolidated Financial Statements Wolters Kluwer 2016 Annual Report
Note 4 – Benchmark Figures
Benchmark figures
2016 2015 Change in actual
currencies (%)
Change in constant
currencies (%)
Revenues 4,297 4,208 2 2
Organic revenue growth (%) 3 3
Adjusted operating profit 950 902 5 6
Adjusted operating profit margin (%) 22.1 21.4
Adjusted net profit 618 583 6 5
Adjusted net financing costs Note 13 (107) (119) (9) 1
Adjusted free cash flow 708 647 9 9
Cash conversion ratio (%) 100 100
Return on invested capital (ROIC) (%) 9.8 9.3
Net debt Note 25 1,927 1,788 8
Net-debt-to-EBITDA ratio 1.7 1.7
Diluted adjusted EPS (€) 2.10 1.96 7
Diluted adjusted EPS in constant currencies (€) 2.12 2.01 6
Diluted adjusted free cash flow per share (€) 2.40 2.18 10 10
Revenue bridge
€ m %
Revenues 2015 4,208
Organic change 114 3
Acquisitions 57 1
Divestments (68) (2)
Currency impact (14) 0
Revenues 2016 4,297 2
U.S. dollar 2016 average €/$: 1.11 versus 2015: €/$: 1.11
Benchmark figures refer to figures adjusted for non-benchmark items and, where applicable, amortization and impairment of goodwill and publishing rights. Adjusted figures are non-IFRS compliant financial figures, but are internally regarded as key performance indicators to measure the underlying performance of the business.
These figures are presented as additional information and do not replace the information in the consolidated statements of profit or loss and cash flows.
All figures are from continuing operations, unless stated otherwise.
81
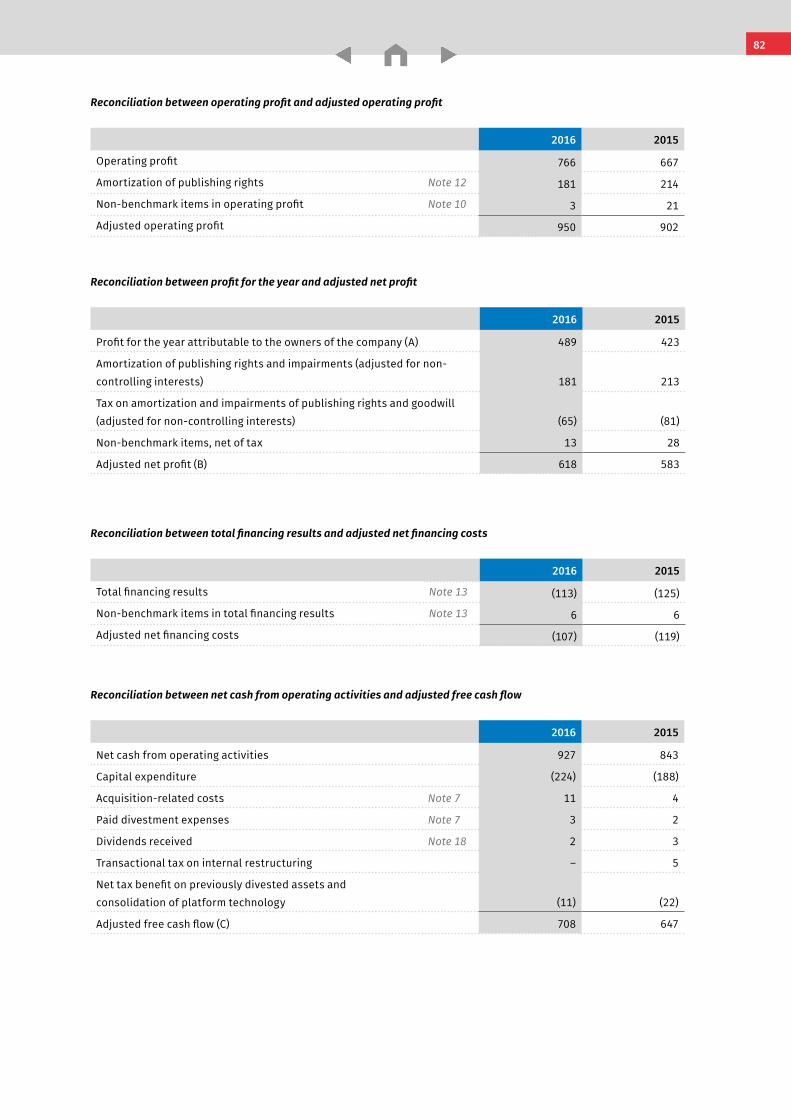
Notes to the Consolidated Financial Statements Wolters Kluwer 2016 Annual Report
Reconciliation between operating profit and adjusted operating profit
2016 2015
Operating profit 766 667
Amortization of publishing rights Note 12 181 214
Non-benchmark items in operating profit Note 10 3 21
Adjusted operating profit 950 902
Reconciliation between profit for the year and adjusted net profit
2016 2015
Profit for the year attributable to the owners of the company (A) 489 423
Amortization of publishing rights and impairments (adjusted for non-controlling interests) 181 213
Tax on amortization and impairments of publishing rights and goodwill (adjusted for non-controlling interests) (65) (81)
Non-benchmark items, net of tax 13 28
Adjusted net profit (B) 618 583
Reconciliation between total financing results and adjusted net financing costs
2016 2015
Total financing results Note 13 (113) (125)
Non-benchmark items in total financing results Note 13 6 6
Adjusted net financing costs (107) (119)
Reconciliation between net cash from operating activities and adjusted free cash flow
2016 2015
Net cash from operating activities 927 843
Capital expenditure (224) (188)
Acquisition-related costs Note 7 11 4
Paid divestment expenses Note 7 3 2
Dividends received Note 18 2 3
Transactional tax on internal restructuring – 5
Net tax benefit on previously divested assets and consolidation of platform technology (11) (22)
Adjusted free cash flow (C) 708 647
82
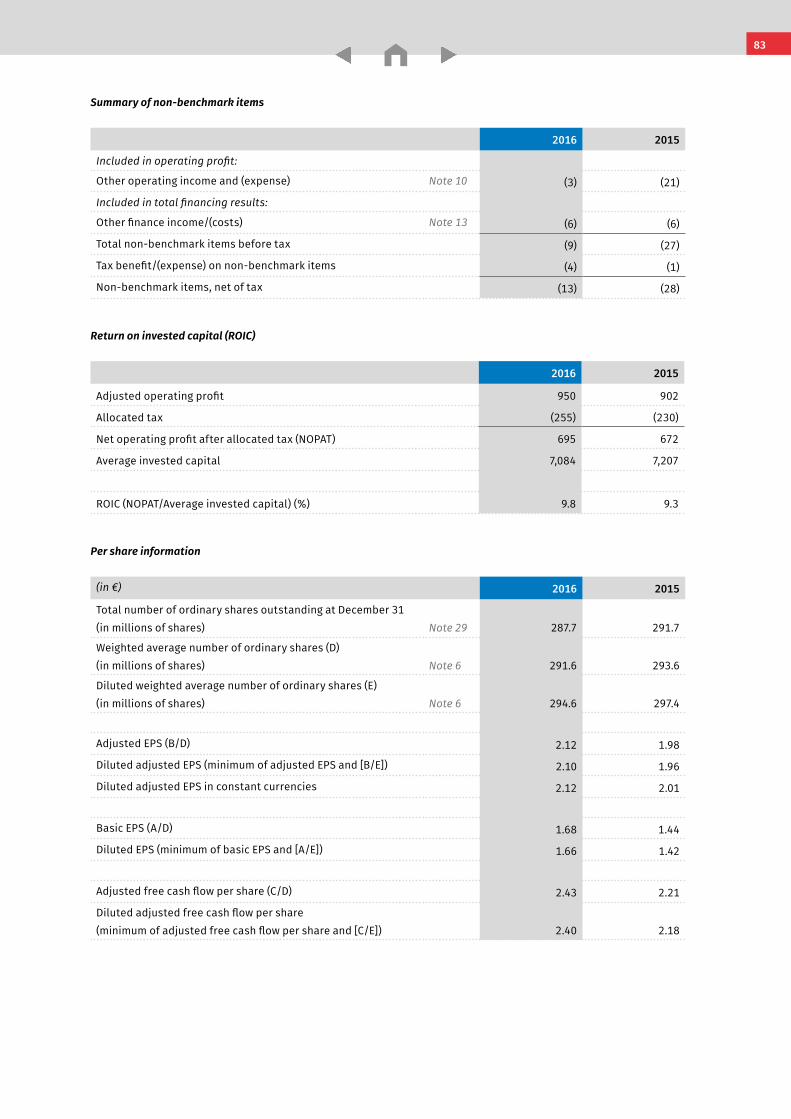
Notes to the Consolidated Financial Statements Wolters Kluwer 2016 Annual Report
Summary of non-benchmark items
2016 2015
Included in operating profit:
Other operating income and (expense) Note 10 (3) (21)
Included in total financing results:
Other finance income/(costs) Note 13 (6) (6)
Total non-benchmark items before tax (9) (27)
Tax benefit/(expense) on non-benchmark items (4) (1)
Non-benchmark items, net of tax (13) (28)
Return on invested capital (ROIC)
2016 2015
Adjusted operating profit 950 902
Allocated tax (255) (230)
Net operating profit after allocated tax (NOPAT) 695 672
Average invested capital 7,084 7,207
ROIC (NOPAT/Average invested capital) (%) 9.8 9.3
Per share information
(in €) 2016 2015
Total number of ordinary shares outstanding at December 31 (in millions of shares) Note 29 287.7 291.7
Weighted average number of ordinary shares (D) (in millions of shares) Note 6 291.6 293.6
Diluted weighted average number of ordinary shares (E) (in millions of shares) Note 6 294.6 297.4
Adjusted EPS (B/D) 2.12 1.98
Diluted adjusted EPS (minimum of adjusted EPS and [B/E]) 2.10 1.96
Diluted adjusted EPS in constant currencies 2.12 2.01
Basic EPS (A/D) 1.68 1.44
Diluted EPS (minimum of basic EPS and [A/E]) 1.66 1.42
Adjusted free cash flow per share (C/D) 2.43 2.21
Diluted adjusted free cash flow per share (minimum of adjusted free cash flow per share and [C/E]) 2.40 2.18
83
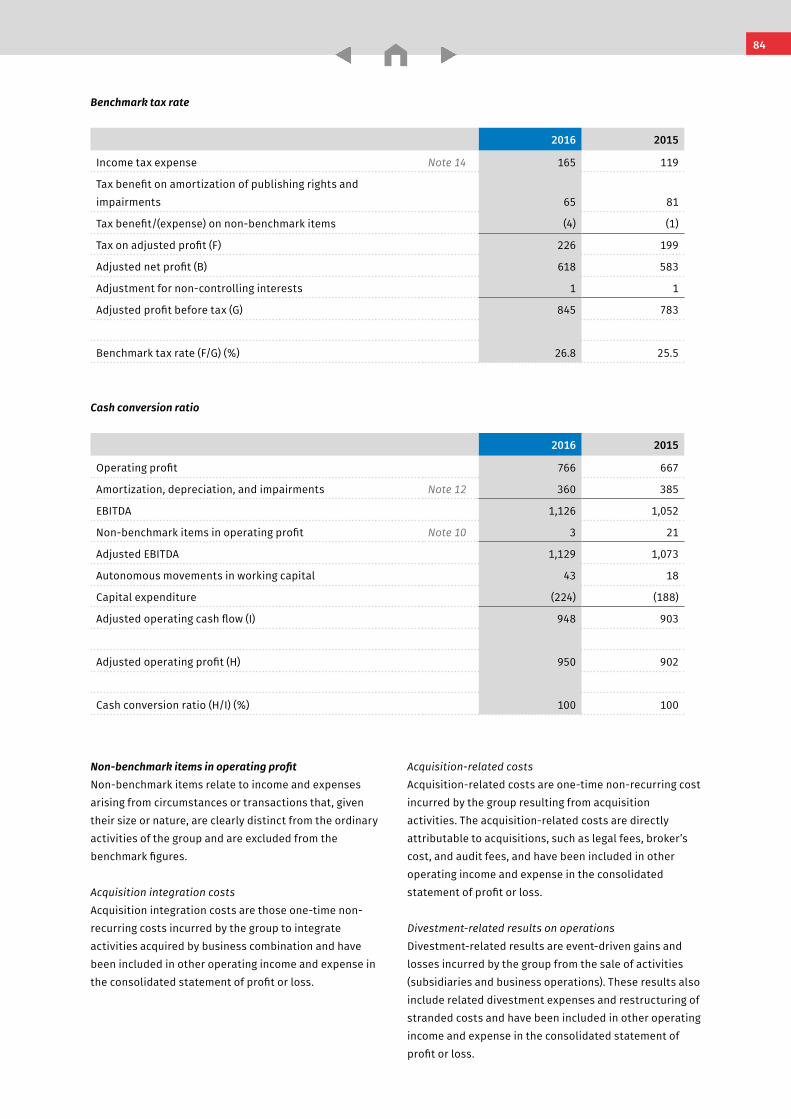
Notes to the Consolidated Financial Statements Wolters Kluwer 2016 Annual Report
Benchmark tax rate
2016 2015
Income tax expense Note 14 165 119
Tax benefit on amortization of publishing rights and impairments 65 81
Tax benefit/(expense) on non-benchmark items (4) (1)
Tax on adjusted profit (F) 226 199
Adjusted net profit (B) 618 583
Adjustment for non-controlling interests 1 1
Adjusted profit before tax (G) 845 783
Benchmark tax rate (F/G) (%) 26.8 25.5
Cash conversion ratio
2016 2015
Operating profit 766 667
Amortization, depreciation, and impairments Note 12 360 385
EBITDA 1,126 1,052
Non-benchmark items in operating profit Note 10 3 21
Adjusted EBITDA 1,129 1,073
Autonomous movements in working capital 43 18
Capital expenditure (224) (188)
Adjusted operating cash flow (I) 948 903
Adjusted operating profit (H) 950 902
Cash conversion ratio (H/I) (%) 100 100
Non-benchmark items in operating profitNon-benchmark items relate to income and expenses arising from circumstances or transactions that, given their size or nature, are clearly distinct from the ordinary activities of the group and are excluded from the benchmark figures.
Acquisition integration costsAcquisition integration costs are those one-time non-recurring costs incurred by the group to integrate activities acquired by business combination and have been included in other operating income and expense in the consolidated statement of profit or loss.
Acquisition-related costsAcquisition-related costs are one-time non-recurring cost incurred by the group resulting from acquisition activities. The acquisition-related costs are directly attributable to acquisitions, such as legal fees, broker’s cost, and audit fees, and have been included in other operating income and expense in the consolidated statement of profit or loss.
Divestment-related results on operationsDivestment-related results are event-driven gains and losses incurred by the group from the sale of activities (subsidiaries and business operations). These results also include related divestment expenses and restructuring of stranded costs and have been included in other operating income and expense in the consolidated statement of profit or loss.
84
Notes to the Consolidated Financial Statements Wolters Kluwer 2016 Annual Report
Fair value changes of contingent considerations Results from changes in the fair value of contingent considerations are not considered to be part of the ordinary activities of the group and have been included in other operating income and expense in the consolidated statement of profit or loss.
Other non-benchmark itemsNon-benchmark items, which cannot be classified in the categories above, relate to income and expenses arising from circumstances or transactions that, given their size or nature, are clearly distinct from the ordinary activities of the group and are excluded from the benchmark figures.
Non-benchmark items in financing results
Financing component employee benefitsFinancing component employee benefits relates to net interest results on the net defined benefit liability or asset of the group’s defined benefit pension plans and other employee benefit plans.
Impairment of investments available-for-saleImpairment loss on available-for-sale investments is based on fair value calculations. An impairment loss is recognized when the change in fair value is considered to be significant and prolonged.
Book results and fair value changes of investments available-for-saleFair value changes of available-for-sale investments, being recognized in other comprehensive income, and any book results are based on fair value calculations.
Divestments-related results on equity-accounted investeesWhen equity accounting for equity-accounted investees ceases, the group calculates the book gain or loss as the difference between the sum of the fair value of proceeds, the fair value of retained investment, and any amount reclassified from other comprehensive income less the carrying amount of the investment at the date on which significant influence or joint control is lost.
Revaluation gain or loss on equity-accounted investee following step acquisitionThis item includes revaluation gains or losses on previously held equity-accounted investees in a step acquisition. When an interest in an associate is increased to a controlling interest, the equity interest previously held which qualified as an associate is treated as if it was disposed of and reacquired at fair value on the acquisition date. Accordingly, it is remeasured to fair value at its acquisition date fair value, and any resulting gain or loss compared to its carrying amount is recognized in profit or loss.
85
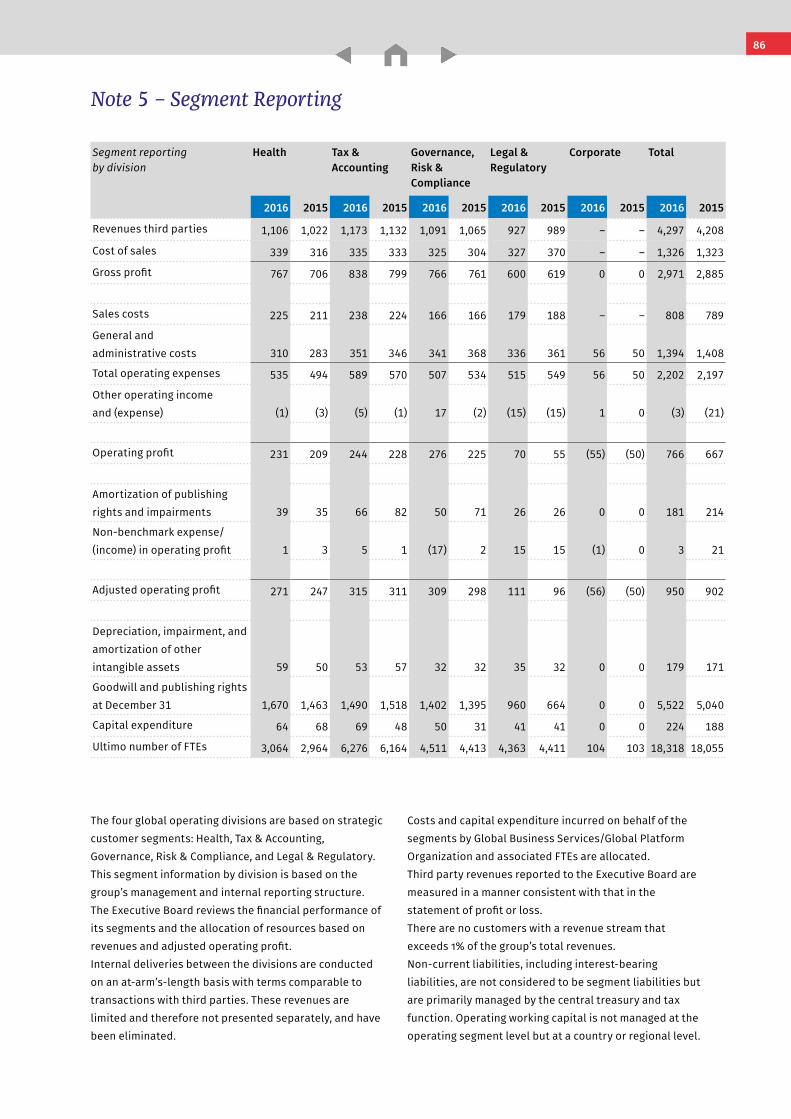
Notes to the Consolidated Financial Statements Wolters Kluwer 2016 Annual Report
Note 5 – Segment Reporting
Segment reporting by division
Health Tax & Accounting
Governance, Risk & Compliance
Legal & Regulatory
Corporate Total
2016 2015 2016 2015 2016 2015 2016 2015 2016 2015 2016 2015
Revenues third parties 1,106 1,022 1,173 1,132 1,091 1,065 927 989 – – 4,297 4,208
Cost of sales 339 316 335 333 325 304 327 370 – – 1,326 1,323
Gross profit 767 706 838 799 766 761 600 619 0 0 2,971 2,885
Sales costs 225 211 238 224 166 166 179 188 – – 808 789
General and administrative costs 310 283 351 346 341 368 336 361 56 50 1,394 1,408
Total operating expenses 535 494 589 570 507 534 515 549 56 50 2,202 2,197
Other operating income and (expense) (1) (3) (5) (1) 17 (2) (15) (15) 1 0 (3) (21)
Operating profit 231 209 244 228 276 225 70 55 (55) (50) 766 667
Amortization of publishing rights and impairments 39 35 66 82 50 71 26 26 0 0 181 214
Non-benchmark expense/ (income) in operating profit 1 3 5 1 (17) 2 15 15 (1) 0 3 21
Adjusted operating profit 271 247 315 311 309 298 111 96 (56) (50) 950 902
Depreciation, impairment, and amortization of other intangible assets 59 50 53 57 32 32 35 32 0 0 179 171
Goodwill and publishing rights at December 31 1,670 1,463 1,490 1,518 1,402 1,395 960 664 0 0 5,522 5,040
Capital expenditure 64 68 69 48 50 31 41 41 0 0 224 188
Ultimo number of FTEs 3,064 2,964 6,276 6,164 4,511 4,413 4,363 4,411 104 103 18,318 18,055
The four global operating divisions are based on strategic customer segments: Health, Tax & Accounting, Governance, Risk & Compliance, and Legal & Regulatory. This segment information by division is based on the group’s management and internal reporting structure. The Executive Board reviews the financial performance of its segments and the allocation of resources based on revenues and adjusted operating profit. Internal deliveries between the divisions are conducted on an at-arm’s-length basis with terms comparable to transactions with third parties. These revenues are limited and therefore not presented separately, and have been eliminated.
Costs and capital expenditure incurred on behalf of the segments by Global Business Services/Global Platform Organization and associated FTEs are allocated. Third party revenues reported to the Executive Board are measured in a manner consistent with that in the statement of profit or loss.There are no customers with a revenue stream that exceeds 1% of the group’s total revenues. Non-current liabilities, including interest-bearing liabilities, are not considered to be segment liabilities but are primarily managed by the central treasury and tax function. Operating working capital is not managed at the operating segment level but at a country or regional level.
86
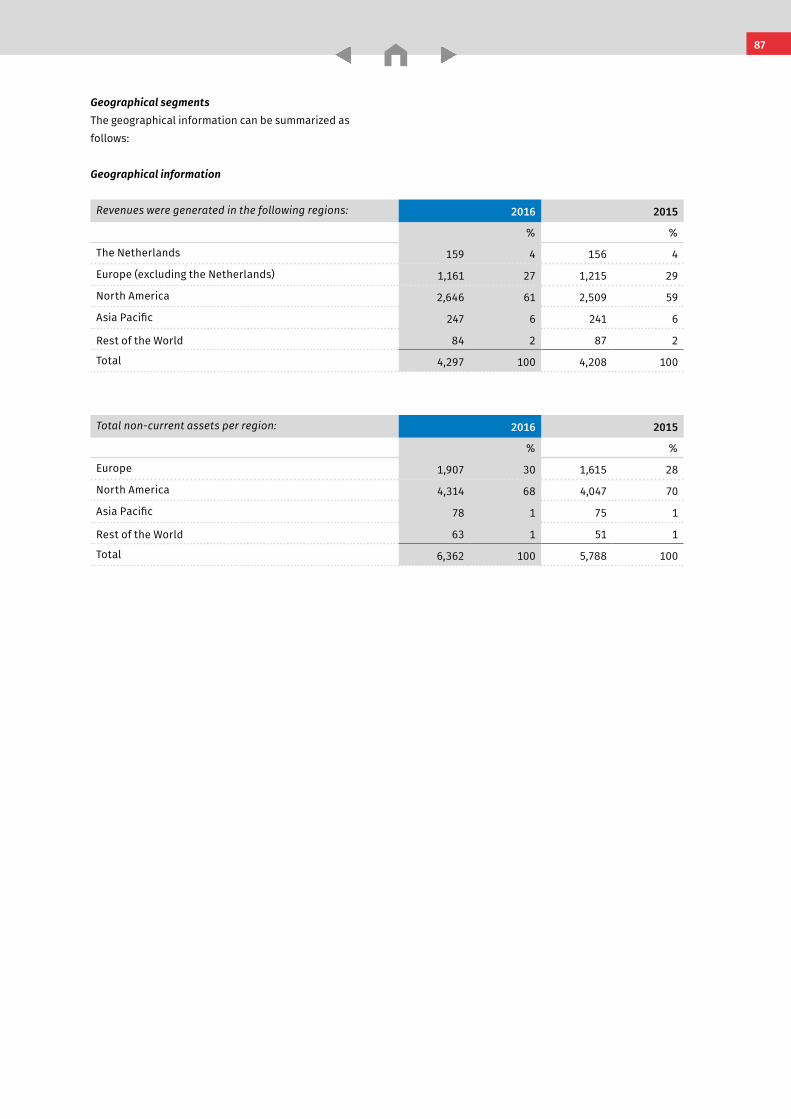
Notes to the Consolidated Financial Statements Wolters Kluwer 2016 Annual Report
Geographical information
Revenues were generated in the following regions: 2016 2015
% %
The Netherlands 159 4 156 4
Europe (excluding the Netherlands) 1,161 27 1,215 29
North America 2,646 61 2,509 59
Asia Pacific 247 6 241 6
Rest of the World 84 2 87 2
Total 4,297 100 4,208 100
Total non-current assets per region: 2016 2015
% %
Europe 1,907 30 1,615 28
North America 4,314 68 4,047 70
Asia Pacific 78 1 75 1
Rest of the World 63 1 51 1
Total 6,362 100 5,788 100
Geographical segmentsThe geographical information can be summarized as follows:
87
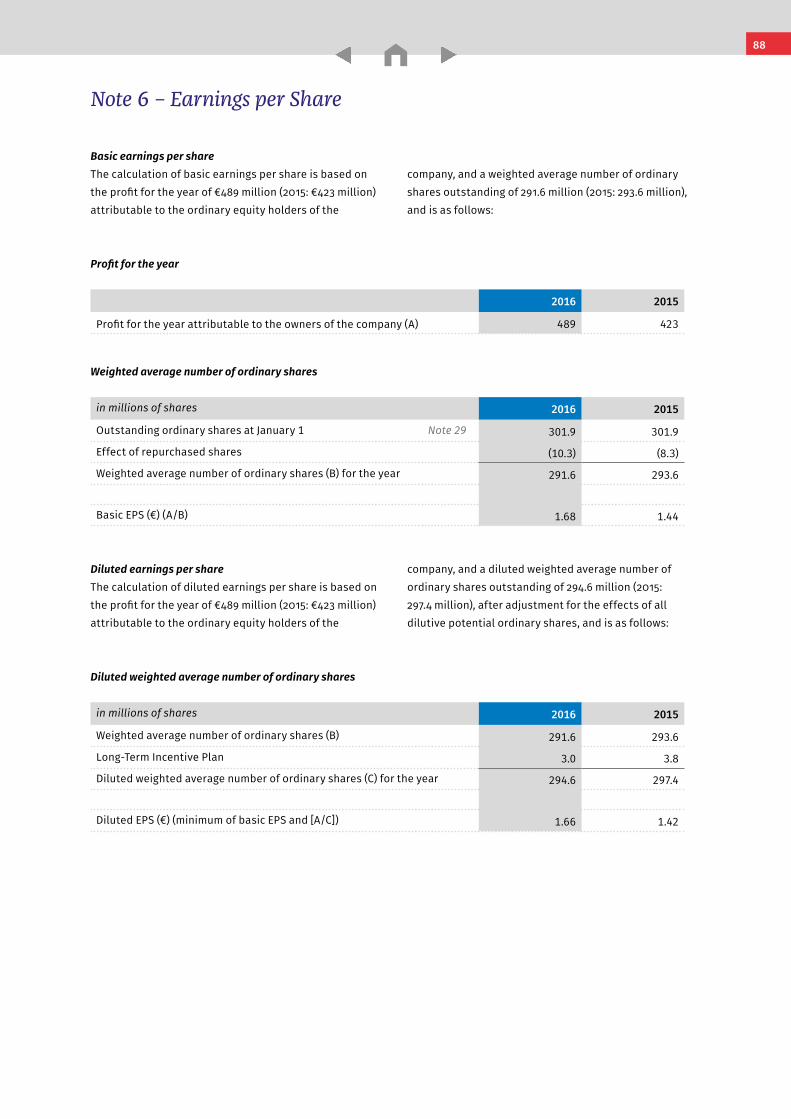
Notes to the Consolidated Financial Statements Wolters Kluwer 2016 Annual Report
Note 6 – Earnings per Share
Basic earnings per shareThe calculation of basic earnings per share is based on the profit for the year of €489 million (2015: €423 million) attributable to the ordinary equity holders of the
Diluted earnings per shareThe calculation of diluted earnings per share is based on the profit for the year of €489 million (2015: €423 million) attributable to the ordinary equity holders of the
company, and a weighted average number of ordinary shares outstanding of 291.6 million (2015: 293.6 million), and is as follows:
company, and a diluted weighted average number ofordinary shares outstanding of 294.6 million (2015:297.4 million), after adjustment for the effects of all dilutive potential ordinary shares, and is as follows:
Profit for the year
2016 2015
Profit for the year attributable to the owners of the company (A) 489 423
Weighted average number of ordinary shares
in millions of shares 2016 2015
Outstanding ordinary shares at January 1 Note 29 301.9 301.9
Effect of repurchased shares (10.3) (8.3)
Weighted average number of ordinary shares (B) for the year 291.6 293.6
Basic EPS (€) (A/B) 1.68 1.44
Diluted weighted average number of ordinary shares
in millions of shares 2016 2015
Weighted average number of ordinary shares (B) 291.6 293.6
Long-Term Incentive Plan 3.0 3.8
Diluted weighted average number of ordinary shares (C) for the year 294.6 297.4
Diluted EPS (€) (minimum of basic EPS and [A/C]) 1.66 1.42
88
Notes to the Consolidated Financial Statements Wolters Kluwer 2016 Annual Report
Note 7 – Acquisitions and Divestments
In 2016, the following main acquisitions were completed:
On July 1, 2016, Wolters Kluwer Legal & Regulatory acquired 100% of the shares of Enablon S.A., a leading global provider of environmental, health and safety compliance software to large corporations. Enablon has annualized revenues of €45 million and has 340 employees. The purchase price consideration, net of cash and debt acquired, was €250 million in cash.
On November 15, 2016, Wolters Kluwer Health acquired 100% of the shares of Emmi Solutions LLC, a provider of subscription-based patient engagement solutions for healthcare providers and insurance carriers. Emmi has annualized revenues of €28 million and 165 employees. The purchase price consideration net of cash acquired was €158 million ($170 million) in cash.
In addition, the following noteworthy smaller acquisitions were completed, with a combined purchase price consideration of €50 million, including deferred payments of €4 million, and combined annualized revenues of €9 million.
On February 2, 2016, Wolters Kluwer Governance, Risk & Compliance completed the acquisition of 100% of the shares of Triad Professional Services LLC, a provider of U.S. legal and compliance products and services. Triad has become part of the CT Corporation suite of products and has 13 employees.
On April 15, 2016, Wolters Kluwer Health acquired the assets of PrepU, an adaptive learning technology that powers a quizzing tool for nursing education. Since 2010, Wolters Kluwer Health has licensed the technology platform from Macmillan Learning and worked together with the Macmillan team to enhance the PrepU solution, which is embedded with Wolters Kluwer’s expert-written Lippincott question content. The company has 3 employees.
On June 1, 2016, Wolters Kluwer Tax & Accounting acquired 100% of the shares of CPE Link, a leading online provider of continuing professional education (CPE) for accountants, tax preparers, and financial advisors. The acquisition will expand and complement Wolters Kluwer’s existing learning portfolio and enable us to reach a broader range of customers. CPE Link has 5 employees.
On October 7, 2016, Wolters Kluwer Governance, Risk & Compliance completed the acquisition of 100% of the shares of Vcorp Services LLC, a provider of registered agent, UCC and other corporate legal services. Vcorp joins GRC, has 22 employees, and will continue to deliver its solutions to customers as part of CT’s suite of products and services.
Acquisition spendingTotal acquisition spending, net of cash acquired, in 2016 was €450 million (2015: €179 million) including deferred and contingent consideration payments of €5 million (2015: €21 million). Acquisition related costs amounted to €11 million in 2016 (2015: €4 million).The goodwill recorded in connection with the 2016 acquisitions represents future economic benefits specific to Wolters Kluwer arising from assets that do not qualify for separate recognition as intangible assets. This includes, amongst others, expected new customers who generate revenue streams in the future, revenues generated as result of the development of future content, and revenues generated as result of new capabilities of the acquired software platforms.
The goodwill recognized in 2016 included an amount of€11 million that is deductible for corporate income tax purposes (2015: €58 million).
The following tables provide information in aggregate for all business combinations in 2016.
89

Notes to the Consolidated Financial Statements Wolters Kluwer 2016 Annual Report
Acquisitions
2016 2015Carrying amount
Fair value adjustments
Recognized values
Recognized values
Consideration payable in cash 463 161
Non-controlling interests 0 –
Deferred and contingent considerations:
Non-current 4 11
Current 2 2
Total consideration 469 174
Intangible assets Note 16 13 332 345 138
Other non-current assets 2 2 2
Current assets 47 47 8
Current liabilities (48) (48) (30)
Long-term debt (10) (10) –
Provisions for restructuring commitments Note 28 (1) (1) –
Deferred tax assets/(liabilities) 12 (106) (94) (7)
Fair value of net identifiable assets/(liabilities) 15 226 241 111
Goodwill on acquisitions Note 16 228 63
Cash effect of acquisitions:
Consideration payable in cash 463 161
Cash acquired (18) (3)
Deferred and contingent considerations paid 5 21
Acquisition spending, net of cash acquired 450 179
Contribution of acquisitions
Revenues Adjusted operating profit
Profit for the year
Totals excluding the impact of 2016 acquisitions 4,264 948 496
Contribution of 2016 acquisitions 33 2 (6)
Totals for the year 2016 4,297 950 490
Pro-forma contribution of 2016 acquisitions for the period January 1, 2016, up to acquisition date 52 1 (8)
Pro-forma totals for the year 2016 4,349 951 482
The above unaudited pro-forma information does not purport to represent what the actual results would have been had the acquisitions actually been concluded on January 1, 2016, nor is the information necessarily indicative for future results of the acquired operations. In determining the contributions by the acquisitions,
management has assumed that the fair value adjustments that arose on the date of the acquisition would have been the same as if the acquisition had occurred on January 1, 2016.
90
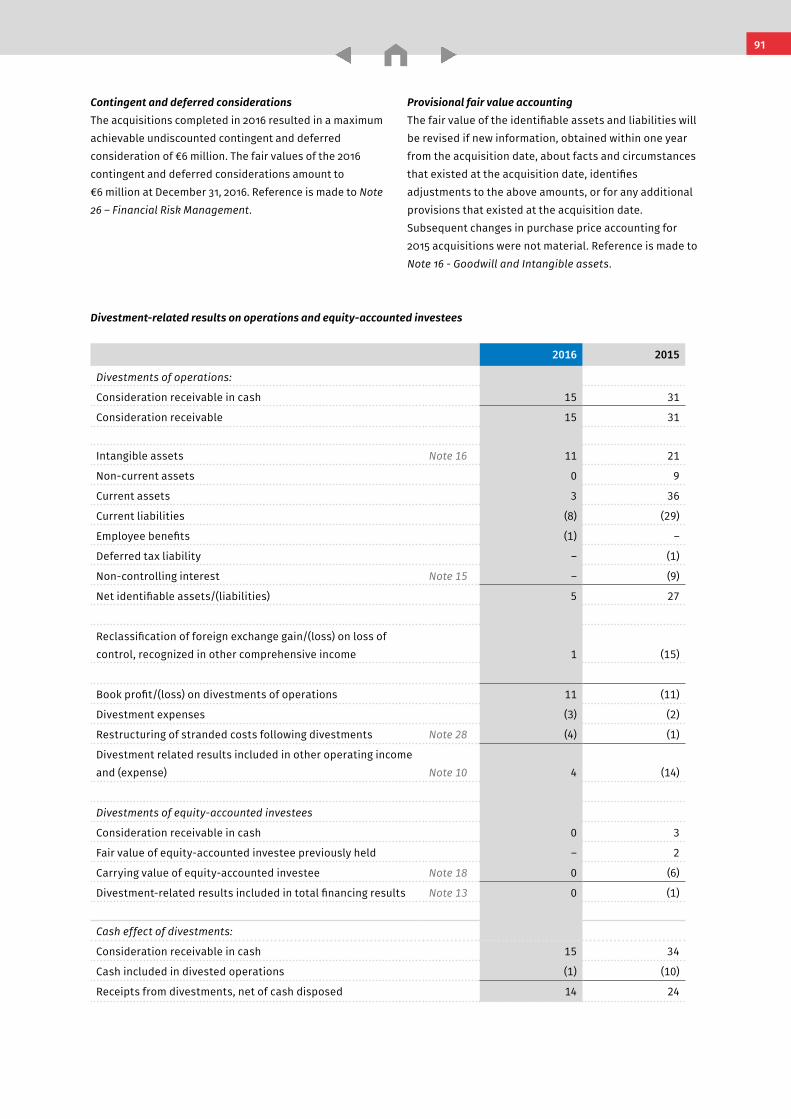
Notes to the Consolidated Financial Statements Wolters Kluwer 2016 Annual Report
Contingent and deferred considerationsThe acquisitions completed in 2016 resulted in a maximum achievable undiscounted contingent and deferred consideration of €6 million. The fair values of the 2016 contingent and deferred considerations amount to €6 million at December 31, 2016. Reference is made to Note 26 – Financial Risk Management.
Provisional fair value accountingThe fair value of the identifiable assets and liabilities will be revised if new information, obtained within one year from the acquisition date, about facts and circumstances that existed at the acquisition date, identifies adjustments to the above amounts, or for any additional provisions that existed at the acquisition date. Subsequent changes in purchase price accounting for 2015 acquisitions were not material. Reference is made to Note 16 - Goodwill and Intangible assets.
Divestment-related results on operations and equity-accounted investees
2016 2015
Divestments of operations:
Consideration receivable in cash 15 31
Consideration receivable 15 31
Intangible assets Note 16 11 21
Non-current assets 0 9
Current assets 3 36
Current liabilities (8) (29)
Employee benefits (1) –
Deferred tax liability – (1)
Non-controlling interest Note 15 – (9)
Net identifiable assets/(liabilities) 5 27
Reclassification of foreign exchange gain/(loss) on loss of control, recognized in other comprehensive income 1 (15)
Book profit/(loss) on divestments of operations 11 (11)
Divestment expenses (3) (2)
Restructuring of stranded costs following divestments Note 28 (4) (1)
Divestment related results included in other operating income and (expense) Note 10 4 (14)
Divestments of equity-accounted investees
Consideration receivable in cash 0 3
Fair value of equity-accounted investee previously held – 2
Carrying value of equity-accounted investee Note 18 0 (6)
Divestment-related results included in total financing results Note 13 0 (1)
Cash effect of divestments:
Consideration receivable in cash 15 34
Cash included in divested operations (1) (10)
Receipts from divestments, net of cash disposed 14 24
91
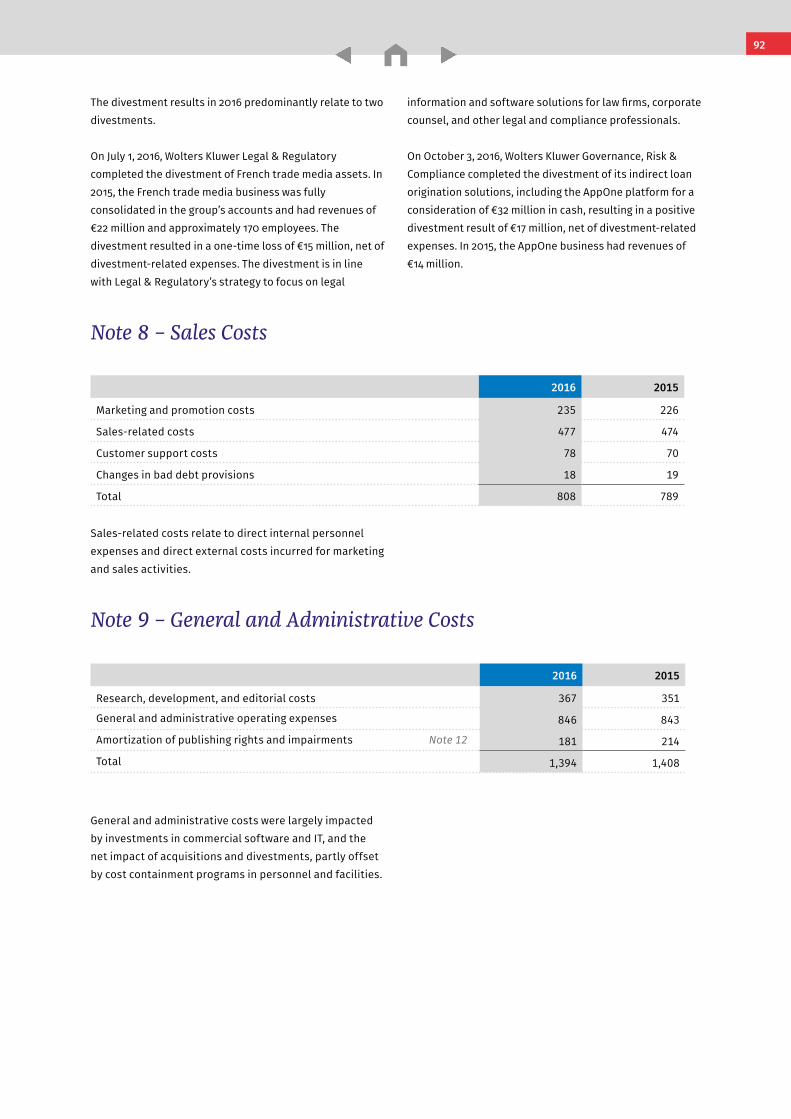
Notes to the Consolidated Financial Statements Wolters Kluwer 2016 Annual Report
The divestment results in 2016 predominantly relate to two divestments.
On July 1, 2016, Wolters Kluwer Legal & Regulatory completed the divestment of French trade media assets. In 2015, the French trade media business was fully consolidated in the group’s accounts and had revenues of €22 million and approximately 170 employees. The divestment resulted in a one-time loss of €15 million, net of divestment-related expenses. The divestment is in line with Legal & Regulatory’s strategy to focus on legal
information and software solutions for law firms, corporate counsel, and other legal and compliance professionals.
On October 3, 2016, Wolters Kluwer Governance, Risk & Compliance completed the divestment of its indirect loan origination solutions, including the AppOne platform for a consideration of €32 million in cash, resulting in a positive divestment result of €17 million, net of divestment-related expenses. In 2015, the AppOne business had revenues of €14 million.
2016 2015
Marketing and promotion costs 235 226
Sales-related costs 477 474
Customer support costs 78 70
Changes in bad debt provisions 18 19
Total 808 789
Note 8 – Sales Costs
Sales-related costs relate to direct internal personnel expenses and direct external costs incurred for marketing and sales activities.
General and administrative costs were largely impacted by investments in commercial software and IT, and the net impact of acquisitions and divestments, partly offset by cost containment programs in personnel and facilities.
2016 2015
Research, development, and editorial costs 367 351
General and administrative operating expenses 846 843
Amortization of publishing rights and impairments Note 12 181 214
Total 1,394 1,408
Note 9 – General and Administrative Costs
92
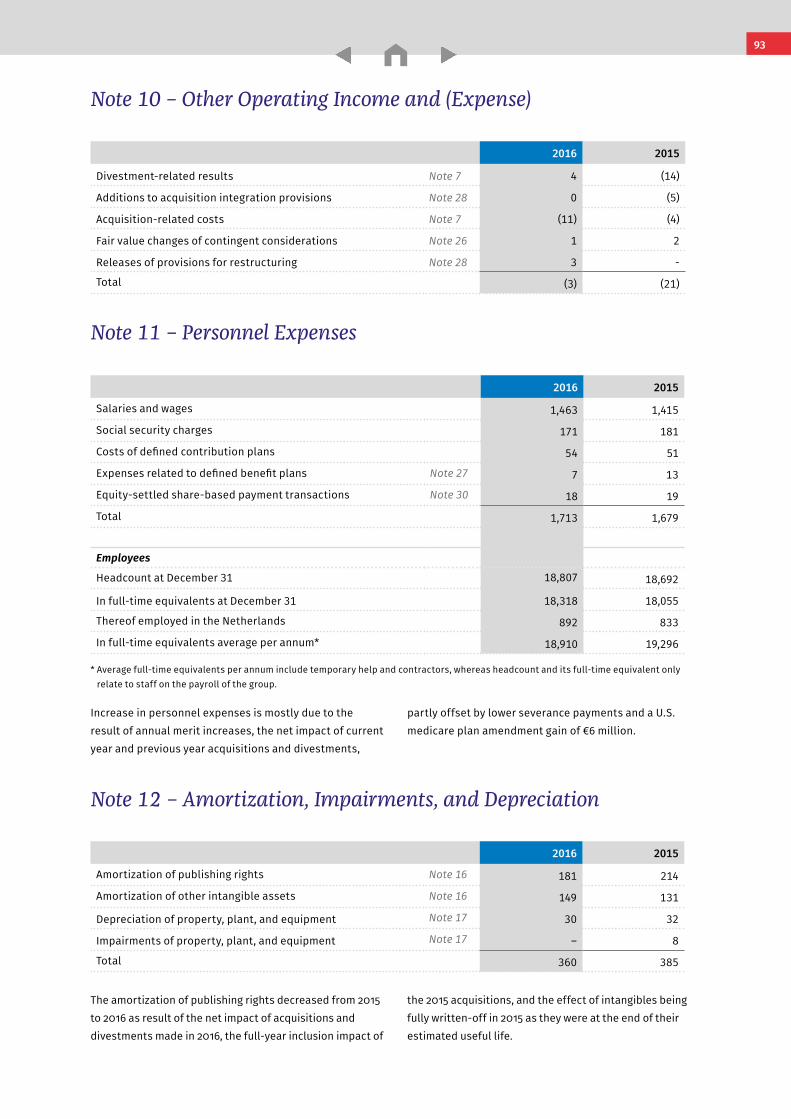
Notes to the Consolidated Financial Statements Wolters Kluwer 2016 Annual Report
2016 2015
Divestment-related results Note 7 4 (14)
Additions to acquisition integration provisions Note 28 0 (5)
Acquisition-related costs Note 7 (11) (4)
Fair value changes of contingent considerations Note 26 1 2
Releases of provisions for restructuring Note 28 3 -
Total (3) (21)
Note 10 – Other Operating Income and (Expense)
2016 2015
Salaries and wages 1,463 1,415
Social security charges 171 181
Costs of defined contribution plans 54 51
Expenses related to defined benefit plans Note 27 7 13
Equity-settled share-based payment transactions Note 30 18 19
Total 1,713 1,679
Employees
Headcount at December 31 18,807 18,692
In full-time equivalents at December 31 18,318 18,055
Thereof employed in the Netherlands 892 833
In full-time equivalents average per annum* 18,910 19,296
* Average full-time equivalents per annum include temporary help and contractors, whereas headcount and its full-time equivalent only relate to staff on the payroll of the group.
Note 11 – Personnel Expenses
Increase in personnel expenses is mostly due to the result of annual merit increases, the net impact of current year and previous year acquisitions and divestments,
partly offset by lower severance payments and a U.S. medicare plan amendment gain of €6 million.
The amortization of publishing rights decreased from 2015 to 2016 as result of the net impact of acquisitions and divestments made in 2016, the full-year inclusion impact of
the 2015 acquisitions, and the effect of intangibles being fully written-off in 2015 as they were at the end of their estimated useful life.
2016 2015
Amortization of publishing rights Note 16 181 214
Amortization of other intangible assets Note 16 149 131
Depreciation of property, plant, and equipment Note 17 30 32
Impairments of property, plant, and equipment Note 17 – 8
Total 360 385
Note 12 – Amortization, Impairments, and Depreciation
93
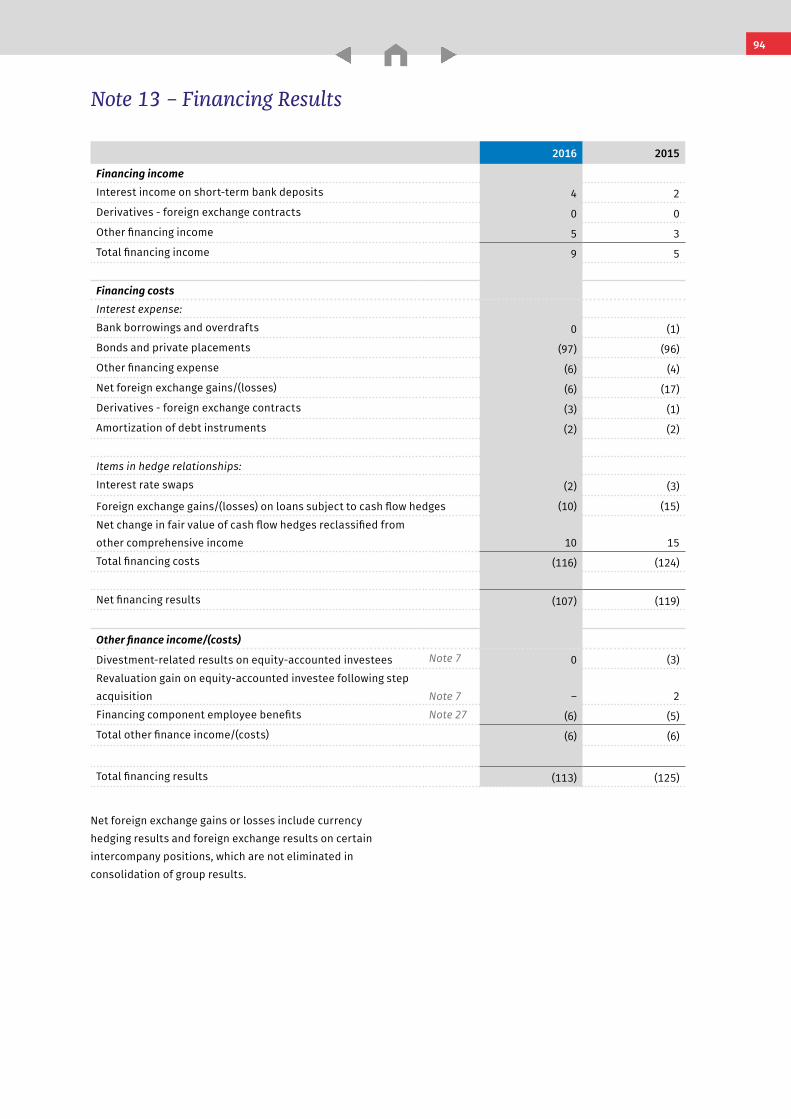
Notes to the Consolidated Financial Statements Wolters Kluwer 2016 Annual Report
Net foreign exchange gains or losses include currency hedging results and foreign exchange results on certain intercompany positions, which are not eliminated in consolidation of group results.
2016 2015
Financing incomeInterest income on short-term bank deposits 4 2Derivatives - foreign exchange contracts 0 0Other financing income 5 3Total financing income 9 5
Financing costsInterest expense:Bank borrowings and overdrafts 0 (1)Bonds and private placements (97) (96)Other financing expense (6) (4)Net foreign exchange gains/(losses) (6) (17)Derivatives - foreign exchange contracts (3) (1)Amortization of debt instruments (2) (2)
Items in hedge relationships:Interest rate swaps (2) (3)
Foreign exchange gains/(losses) on loans subject to cash flow hedges (10) (15)Net change in fair value of cash flow hedges reclassified from other comprehensive income 10 15Total financing costs (116) (124)
Net financing results (107) (119)
Other finance income/(costs)
Divestment-related results on equity-accounted investees Note 7 0 (3)Revaluation gain on equity-accounted investee following step acquisition Note 7 – 2Financing component employee benefits Note 27 (6) (5)Total other finance income/(costs) (6) (6)
Total financing results (113) (125)
Note 13 – Financing Results
94
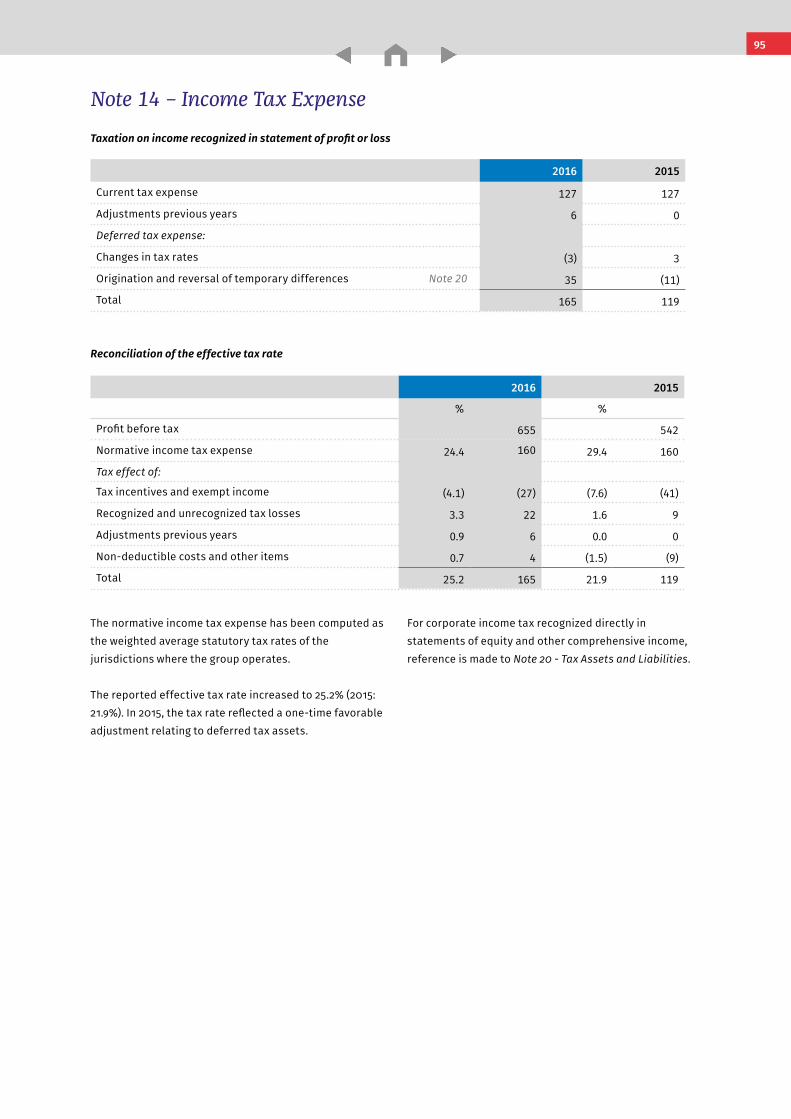
Notes to the Consolidated Financial Statements Wolters Kluwer 2016 Annual Report
2016 2015
Current tax expense 127 127
Adjustments previous years 6 0
Deferred tax expense:
Changes in tax rates (3) 3
Origination and reversal of temporary differences Note 20 35 (11)
Total 165 119
Note 14 – Income Tax Expense
2016 2015
% %
Profit before tax 655 542
Normative income tax expense 24.4 160 29.4 160
Tax effect of:
Tax incentives and exempt income (4.1) (27) (7.6) (41)
Recognized and unrecognized tax losses 3.3 22 1.6 9
Adjustments previous years 0.9 6 0.0 0
Non-deductible costs and other items 0.7 4 (1.5) (9)
Total 25.2 165 21.9 119
The normative income tax expense has been computed as the weighted average statutory tax rates of the jurisdictions where the group operates.
The reported effective tax rate increased to 25.2% (2015: 21.9%). In 2015, the tax rate reflected a one-time favorable adjustment relating to deferred tax assets.
For corporate income tax recognized directly in statements of equity and other comprehensive income, reference is made to Note 20 - Tax Assets and Liabilities.
Taxation on income recognized in statement of profit or loss
Reconciliation of the effective tax rate
95
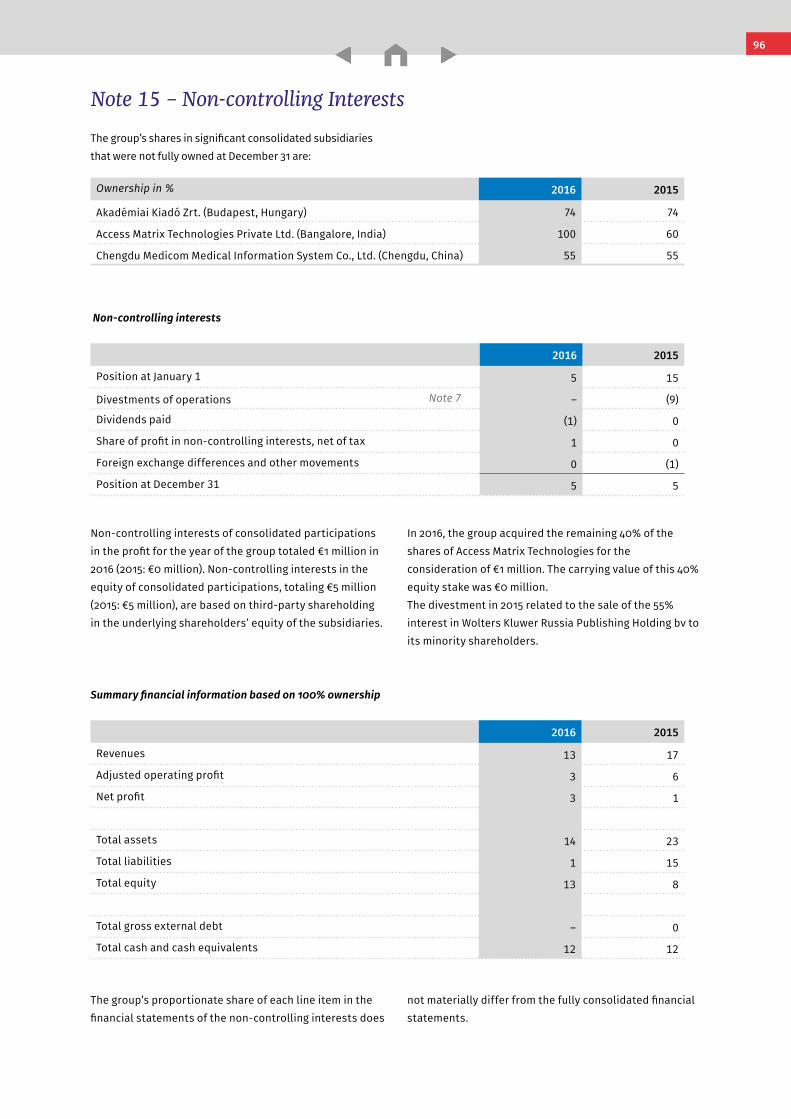
Notes to the Consolidated Financial Statements Wolters Kluwer 2016 Annual Report
Ownership in % 2016 2015
Akadémiai Kiadó Zrt. (Budapest, Hungary) 74 74
Access Matrix Technologies Private Ltd. (Bangalore, India) 100 60
Chengdu Medicom Medical Information System Co., Ltd. (Chengdu, China) 55 55
Non-controlling interests
2016 2015
Position at January 1 5 15
Divestments of operations Note 7 – (9)
Dividends paid (1) 0
Share of profit in non-controlling interests, net of tax 1 0
Foreign exchange differences and other movements 0 (1)
Position at December 31 5 5
Note 15 – Non-controlling Interests
Non-controlling interests of consolidated participations in the profit for the year of the group totaled €1 million in 2016 (2015: €0 million). Non-controlling interests in the equity of consolidated participations, totaling €5 million (2015: €5 million), are based on third-party shareholding in the underlying shareholders’ equity of the subsidiaries.
In 2016, the group acquired the remaining 40% of the shares of Access Matrix Technologies for the consideration of €1 million. The carrying value of this 40% equity stake was €0 million.The divestment in 2015 related to the sale of the 55% interest in Wolters Kluwer Russia Publishing Holding bv to its minority shareholders.
The group’s proportionate share of each line item in the financial statements of the non-controlling interests does
not materially differ from the fully consolidated financial statements.
The group’s shares in significant consolidated subsidiaries that were not fully owned at December 31 are:
Summary financial information based on 100% ownership
2016 2015
Revenues 13 17
Adjusted operating profit 3 6
Net profit 3 1
Total assets 14 23
Total liabilities 1 15
Total equity 13 8
Total gross external debt – 0
Total cash and cash equivalents 12 12
96
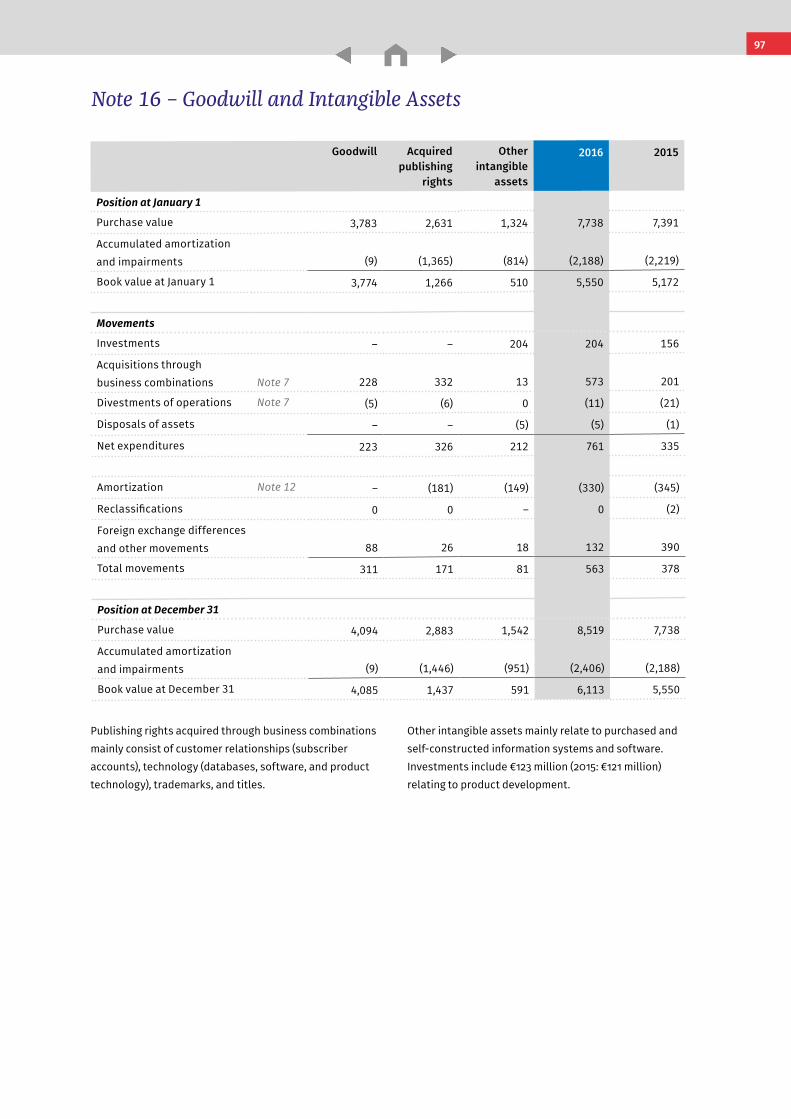
Notes to the Consolidated Financial Statements Wolters Kluwer 2016 Annual Report
Goodwill Acquired publishing
rights
Other intangible
assets
2016 2015
Position at January 1
Purchase value 3,783 2,631 1,324 7,738 7,391
Accumulated amortization and impairments (9) (1,365) (814) (2,188) (2,219)
Book value at January 1 3,774 1,266 510 5,550 5,172
Movements
Investments – – 204 204 156
Acquisitions through business combinations Note 7 228 332 13 573 201
Divestments of operations Note 7 (5) (6) 0 (11) (21)
Disposals of assets – – (5) (5) (1)
Net expenditures 223 326 212 761 335
Amortization Note 12 – (181) (149) (330) (345)
Reclassifications 0 0 – 0 (2)
Foreign exchange differences and other movements 88 26 18 132 390
Total movements 311 171 81 563 378
Position at December 31
Purchase value 4,094 2,883 1,542 8,519 7,738
Accumulated amortization and impairments (9) (1,446) (951) (2,406) (2,188)
Book value at December 31 4,085 1,437 591 6,113 5,550
Publishing rights acquired through business combinations mainly consist of customer relationships (subscriber accounts), technology (databases, software, and product technology), trademarks, and titles.
Other intangible assets mainly relate to purchased and self-constructed information systems and software.Investments include €123 million (2015: €121 million) relating to product development.
Note 16 – Goodwill and Intangible Assets
97
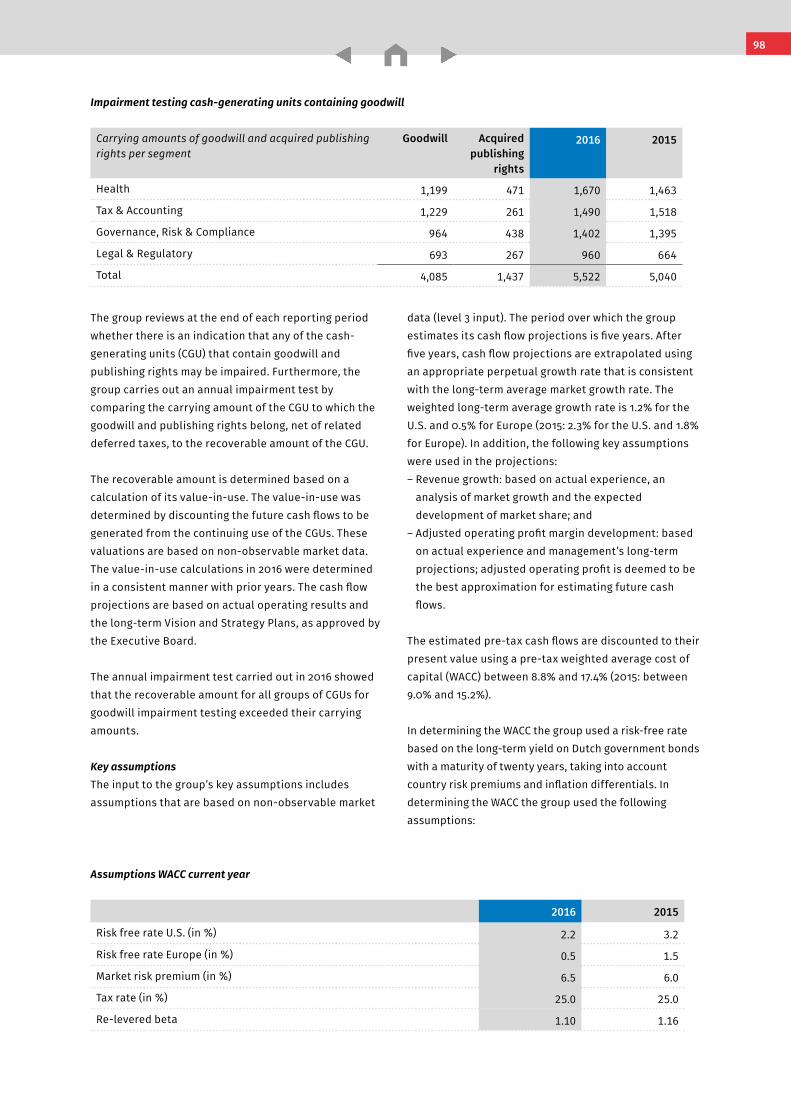
Notes to the Consolidated Financial Statements Wolters Kluwer 2016 Annual Report
Impairment testing cash-generating units containing goodwill
Carrying amounts of goodwill and acquired publishing rights per segment
Goodwill Acquired publishing
rights
2016 2015
Health 1,199 471 1,670 1,463
Tax & Accounting 1,229 261 1,490 1,518
Governance, Risk & Compliance 964 438 1,402 1,395
Legal & Regulatory 693 267 960 664
Total 4,085 1,437 5,522 5,040
The group reviews at the end of each reporting period whether there is an indication that any of the cash- generating units (CGU) that contain goodwill and publishing rights may be impaired. Furthermore, the group carries out an annual impairment test by comparing the carrying amount of the CGU to which the goodwill and publishing rights belong, net of related deferred taxes, to the recoverable amount of the CGU.
The recoverable amount is determined based on a calculation of its value-in-use. The value-in-use was determined by discounting the future cash flows to be generated from the continuing use of the CGUs. These valuations are based on non-observable market data. The value-in-use calculations in 2016 were determined in a consistent manner with prior years. The cash flow projections are based on actual operating results and the long-term Vision and Strategy Plans, as approved by the Executive Board.
The annual impairment test carried out in 2016 showed that the recoverable amount for all groups of CGUs for goodwill impairment testing exceeded their carrying amounts.
Key assumptionsThe input to the group’s key assumptions includes assumptions that are based on non-observable market
data (level 3 input). The period over which the group estimates its cash flow projections is five years. After five years, cash flow projections are extrapolated using an appropriate perpetual growth rate that is consistent with the long-term average market growth rate. The weighted long-term average growth rate is 1.2% for the U.S. and 0.5% for Europe (2015: 2.3% for the U.S. and 1.8% for Europe). In addition, the following key assumptions were used in the projections:– Revenue growth: based on actual experience, an
analysis of market growth and the expected development of market share; and
– Adjusted operating profit margin development: based on actual experience and management’s long-term projections; adjusted operating profit is deemed to be the best approximation for estimating future cash flows.
The estimated pre-tax cash flows are discounted to their present value using a pre-tax weighted average cost of capital (WACC) between 8.8% and 17.4% (2015: between 9.0% and 15.2%).
In determining the WACC the group used a risk-free rate based on the long-term yield on Dutch government bonds with a maturity of twenty years, taking into account country risk premiums and inflation differentials. In determining the WACC the group used the following assumptions:
Assumptions WACC current year
2016 2015
Risk free rate U.S. (in %) 2.2 3.2
Risk free rate Europe (in %) 0.5 1.5
Market risk premium (in %) 6.5 6.0
Tax rate (in %) 25.0 25.0
Re-levered beta 1.10 1.16
98
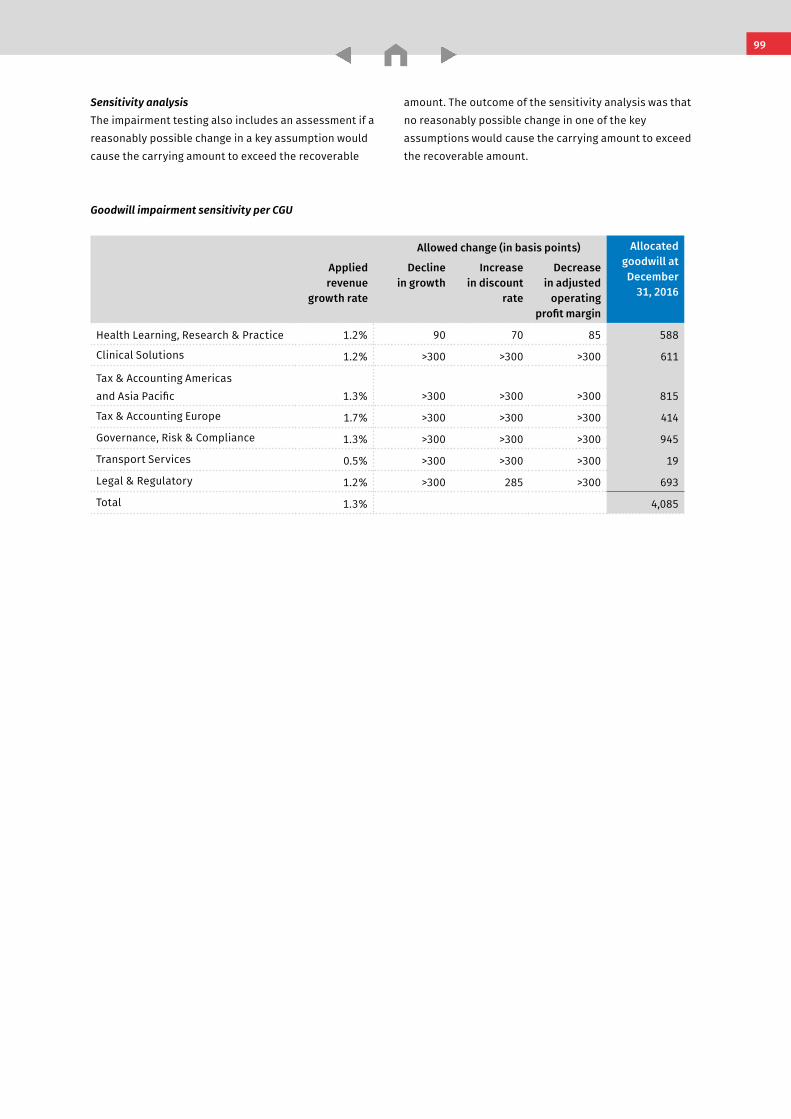
Notes to the Consolidated Financial Statements Wolters Kluwer 2016 Annual Report
Sensitivity analysisThe impairment testing also includes an assessment if a reasonably possible change in a key assumption would cause the carrying amount to exceed the recoverable
amount. The outcome of the sensitivity analysis was that no reasonably possible change in one of the key assumptions would cause the carrying amount to exceed the recoverable amount.
Goodwill impairment sensitivity per CGU
Allowed change (in basis points) Allocated goodwill atDecember
31, 2016
Applied revenue
growth rate
Decline in growth
Increase in discount
rate
Decrease in adjusted
operating profit margin
Health Learning, Research & Practice 1.2% 90 70 85 588
Clinical Solutions 1.2% >300 >300 >300 611
Tax & Accounting Americas and Asia Pacific 1.3% >300 >300 >300 815
Tax & Accounting Europe 1.7% >300 >300 >300 414
Governance, Risk & Compliance 1.3% >300 >300 >300 945
Transport Services 0.5% >300 >300 >300 19
Legal & Regulatory 1.2% >300 285 >300 693
Total 1.3% 4,085
99
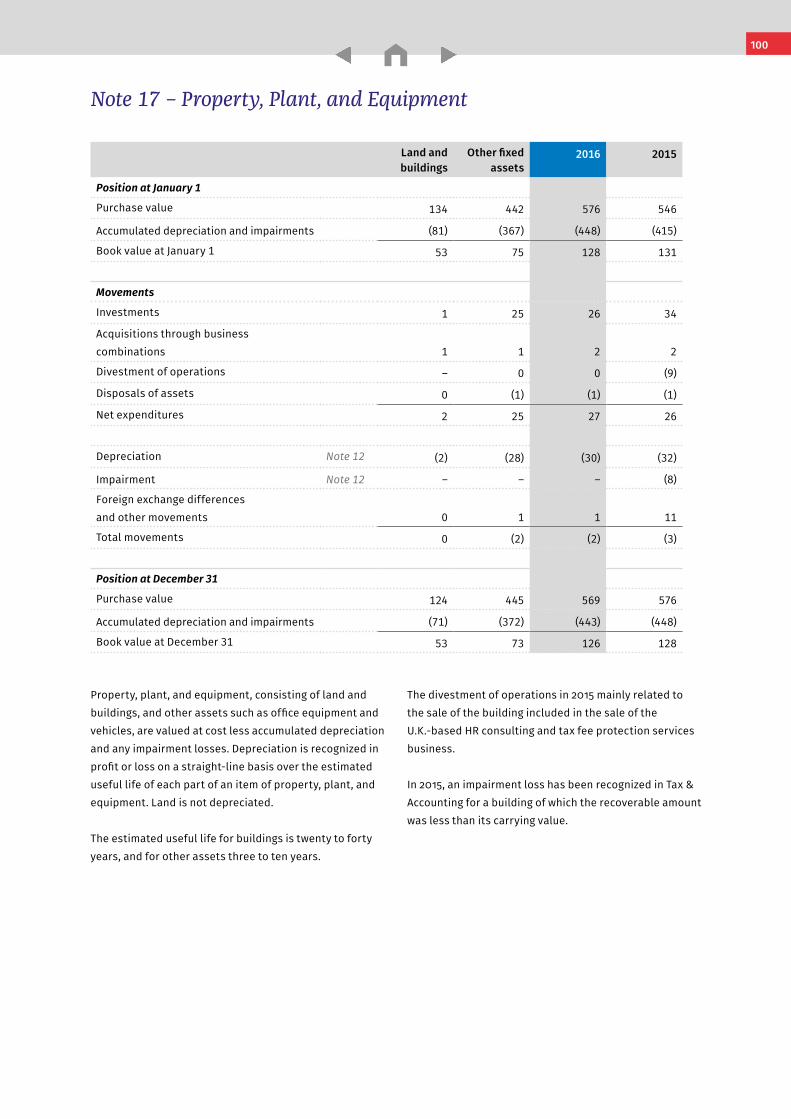
Notes to the Consolidated Financial Statements Wolters Kluwer 2016 Annual Report
Property, plant, and equipment, consisting of land and buildings, and other assets such as office equipment and vehicles, are valued at cost less accumulated depreciation and any impairment losses. Depreciation is recognized in profit or loss on a straight-line basis over the estimated useful life of each part of an item of property, plant, and equipment. Land is not depreciated.
The estimated useful life for buildings is twenty to forty years, and for other assets three to ten years.
Land and buildings
Other fixed assets
2016 2015
Position at January 1
Purchase value 134 442 576 546
Accumulated depreciation and impairments (81) (367) (448) (415)
Book value at January 1 53 75 128 131
Movements
Investments 1 25 26 34
Acquisitions through business combinations 1 1 2 2
Divestment of operations – 0 0 (9)
Disposals of assets 0 (1) (1) (1)
Net expenditures 2 25 27 26
Depreciation Note 12 (2) (28) (30) (32)
Impairment Note 12 – – – (8)
Foreign exchange differences and other movements 0 1 1 11
Total movements 0 (2) (2) (3)
Position at December 31
Purchase value 124 445 569 576
Accumulated depreciation and impairments (71) (372) (443) (448)
Book value at December 31 53 73 126 128
Note 17 – Property, Plant, and Equipment
The divestment of operations in 2015 mainly related to the sale of the building included in the sale of the U.K.-based HR consulting and tax fee protection services business.
In 2015, an impairment loss has been recognized in Tax & Accounting for a building of which the recoverable amount was less than its carrying value.
100
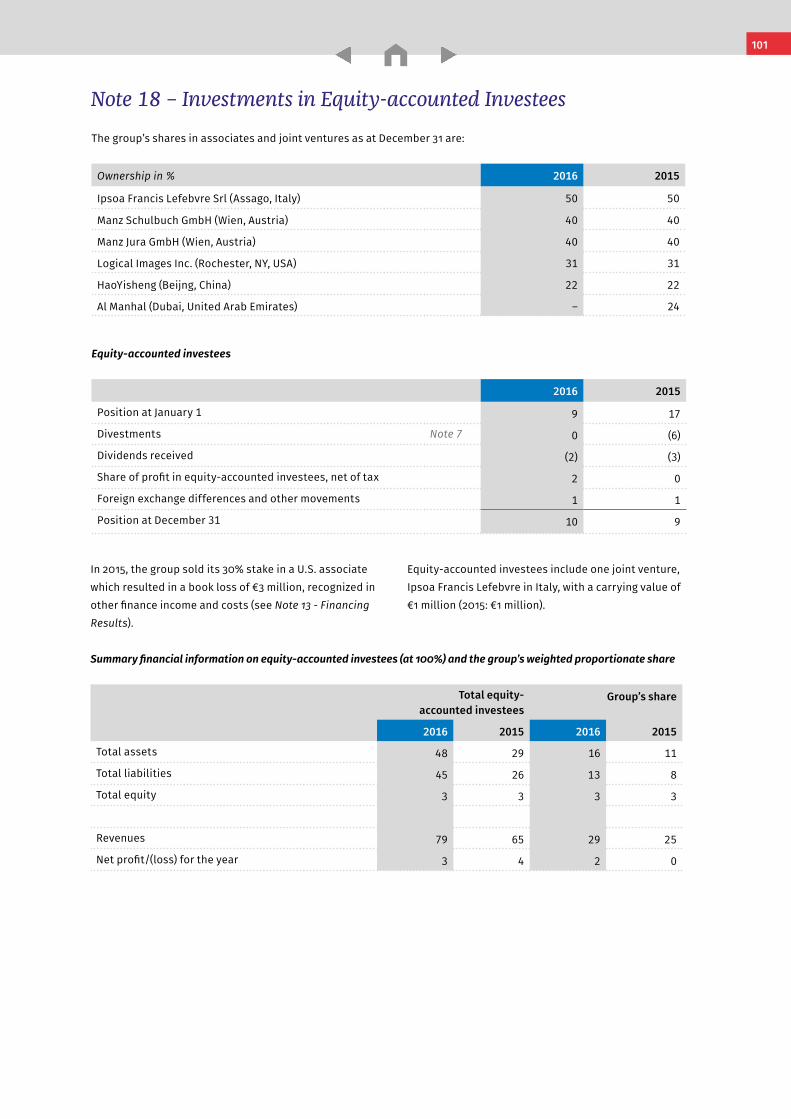
Notes to the Consolidated Financial Statements Wolters Kluwer 2016 Annual Report
Note 18 – Investments in Equity-accounted Investees
Equity-accounted investees
2016 2015
Position at January 1 9 17
Divestments Note 7 0 (6)
Dividends received (2) (3)
Share of profit in equity-accounted investees, net of tax 2 0
Foreign exchange differences and other movements 1 1
Position at December 31 10 9
In 2015, the group sold its 30% stake in a U.S. associate which resulted in a book loss of €3 million, recognized in other finance income and costs (see Note 13 - Financing Results).
Summary financial information on equity-accounted investees (at 100%) and the group’s weighted proportionate share
Total equity-accounted investees
Group’s share
2016 2015 2016 2015
Total assets 48 29 16 11
Total liabilities 45 26 13 8
Total equity 3 3 3 3
Revenues 79 65 29 25
Net profit/(loss) for the year 3 4 2 0
Equity-accounted investees include one joint venture, Ipsoa Francis Lefebvre in Italy, with a carrying value of€1 million (2015: €1 million).
The group’s shares in associates and joint ventures as at December 31 are:
Ownership in % 2016 2015
Ipsoa Francis Lefebvre Srl (Assago, Italy) 50 50
Manz Schulbuch GmbH (Wien, Austria) 40 40
Manz Jura GmbH (Wien, Austria) 40 40
Logical Images Inc. (Rochester, NY, USA) 31 31
HaoYisheng (Beijng, China) 22 22
Al Manhal (Dubai, United Arab Emirates) – 24
101
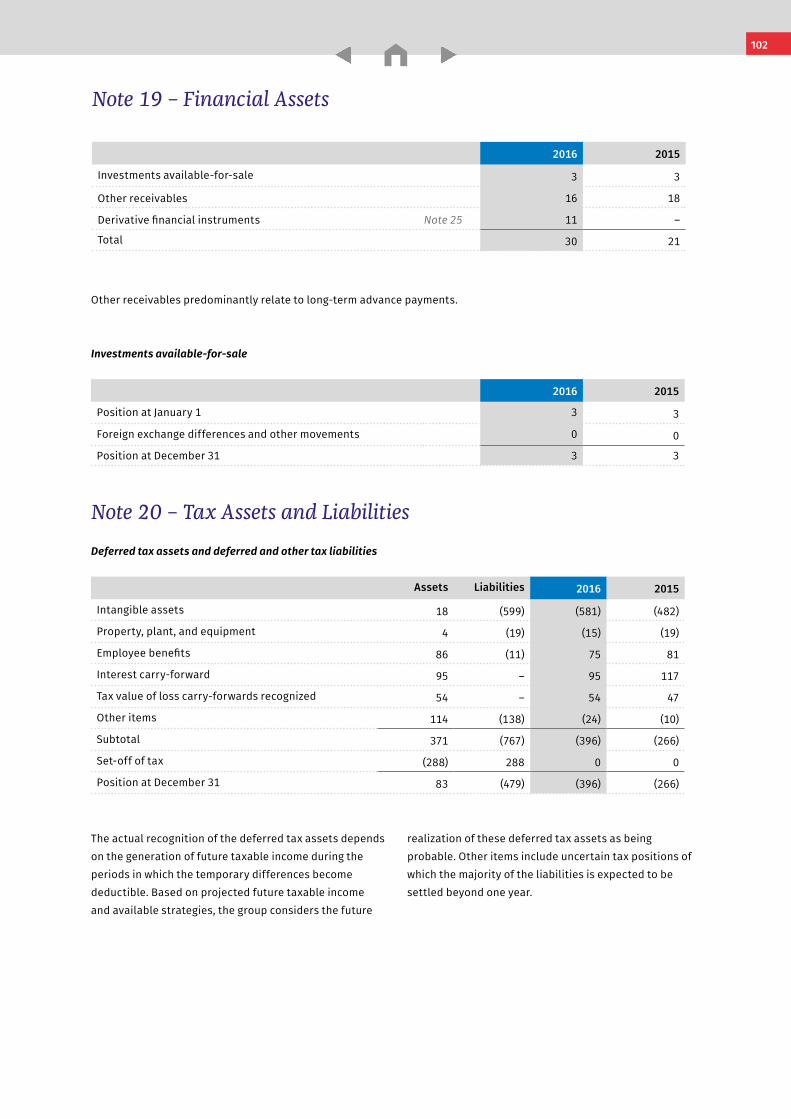
Notes to the Consolidated Financial Statements Wolters Kluwer 2016 Annual Report
Deferred tax assets and deferred and other tax liabilities
Assets Liabilities 2016 2015
Intangible assets 18 (599) (581) (482)
Property, plant, and equipment 4 (19) (15) (19)
Employee benefits 86 (11) 75 81
Interest carry-forward 95 – 95 117
Tax value of loss carry-forwards recognized 54 – 54 47
Other items 114 (138) (24) (10)
Subtotal 371 (767) (396) (266)
Set-off of tax (288) 288 0 0
Position at December 31 83 (479) (396) (266)
Note 19 – Financial Assets
2016 2015
Investments available-for-sale 3 3
Other receivables 16 18
Derivative financial instruments Note 25 11 –
Total 30 21
Note 20 – Tax Assets and Liabilities
Other receivables predominantly relate to long-term advance payments.
Investments available-for-sale
2016 2015
Position at January 1 3 3
Foreign exchange differences and other movements 0 0
Position at December 31 3 3
The actual recognition of the deferred tax assets depends on the generation of future taxable income during the periods in which the temporary differences become deductible. Based on projected future taxable income and available strategies, the group considers the future
realization of these deferred tax assets as being probable. Other items include uncertain tax positions of which the majority of the liabilities is expected to be settled beyond one year.
102
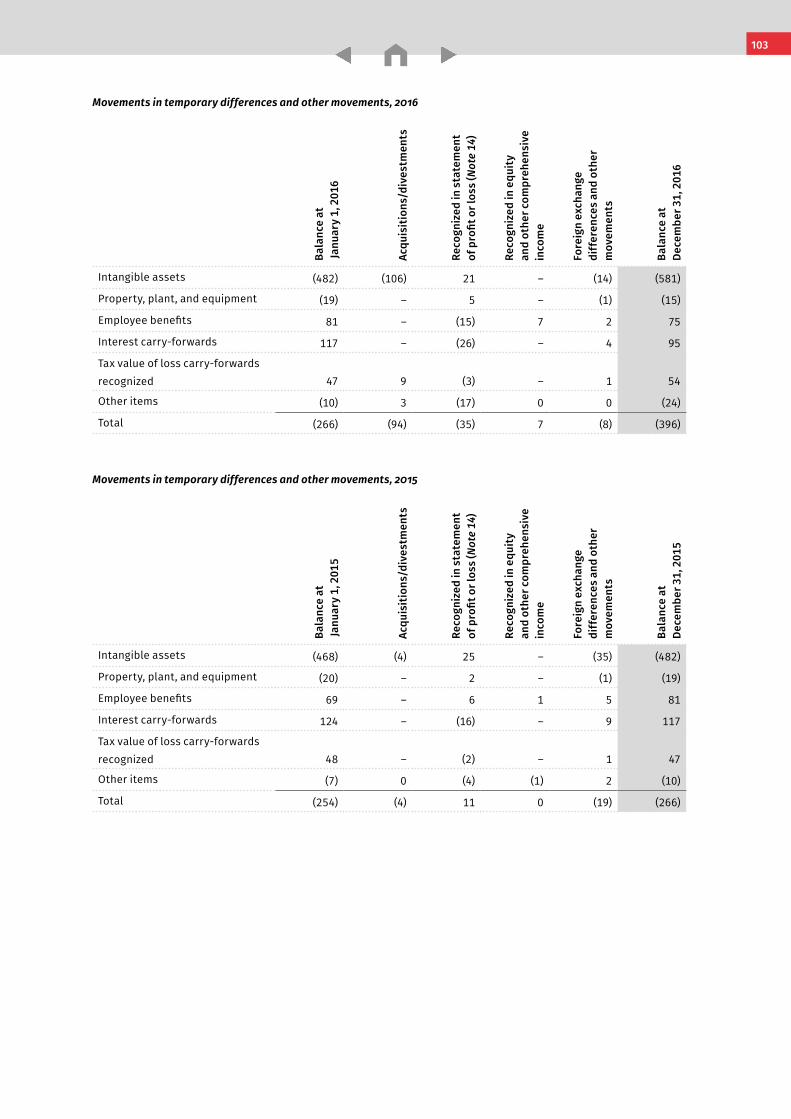
Notes to the Consolidated Financial Statements Wolters Kluwer 2016 Annual Report
Bala
nce
at
Janu
ary
1, 2
015
Acqu
isit
ions
/div
estm
ents
Reco
gniz
ed in
sta
tem
ent
of p
rofit
or l
oss
(Not
e 14
)
Reco
gniz
ed in
equ
ity
an
d ot
her c
ompr
ehen
sive
in
com
e
Fore
ign
exch
ange
di
ffer
ence
s an
d ot
her
mov
emen
ts
Bala
nce
at
Dece
mbe
r 31,
201
5
Intangible assets (468) (4) 25 – (35) (482)
Property, plant, and equipment (20) – 2 – (1) (19)
Employee benefits 69 – 6 1 5 81
Interest carry-forwards 124 – (16) – 9 117
Tax value of loss carry-forwards recognized 48 – (2) – 1 47
Other items (7) 0 (4) (1) 2 (10)
Total (254) (4) 11 0 (19) (266)
Movements in temporary differences and other movements, 2015
Bala
nce
at
Janu
ary
1, 2
016
Acqu
isit
ions
/div
estm
ents
Reco
gniz
ed in
sta
tem
ent
of p
rofit
or l
oss
(Not
e 14
)
Reco
gniz
ed in
equ
ity
an
d ot
her c
ompr
ehen
sive
in
com
e
Fore
ign
exch
ange
di
ffer
ence
s an
d ot
her
mov
emen
ts
Bala
nce
at
Dece
mbe
r 31,
201
6
Intangible assets (482) (106) 21 – (14) (581)
Property, plant, and equipment (19) – 5 – (1) (15)
Employee benefits 81 – (15) 7 2 75
Interest carry-forwards 117 – (26) – 4 95
Tax value of loss carry-forwards recognized 47 9 (3) – 1 54
Other items (10) 3 (17) 0 0 (24)
Total (266) (94) (35) 7 (8) (396)
Movements in temporary differences and other movements, 2016
103
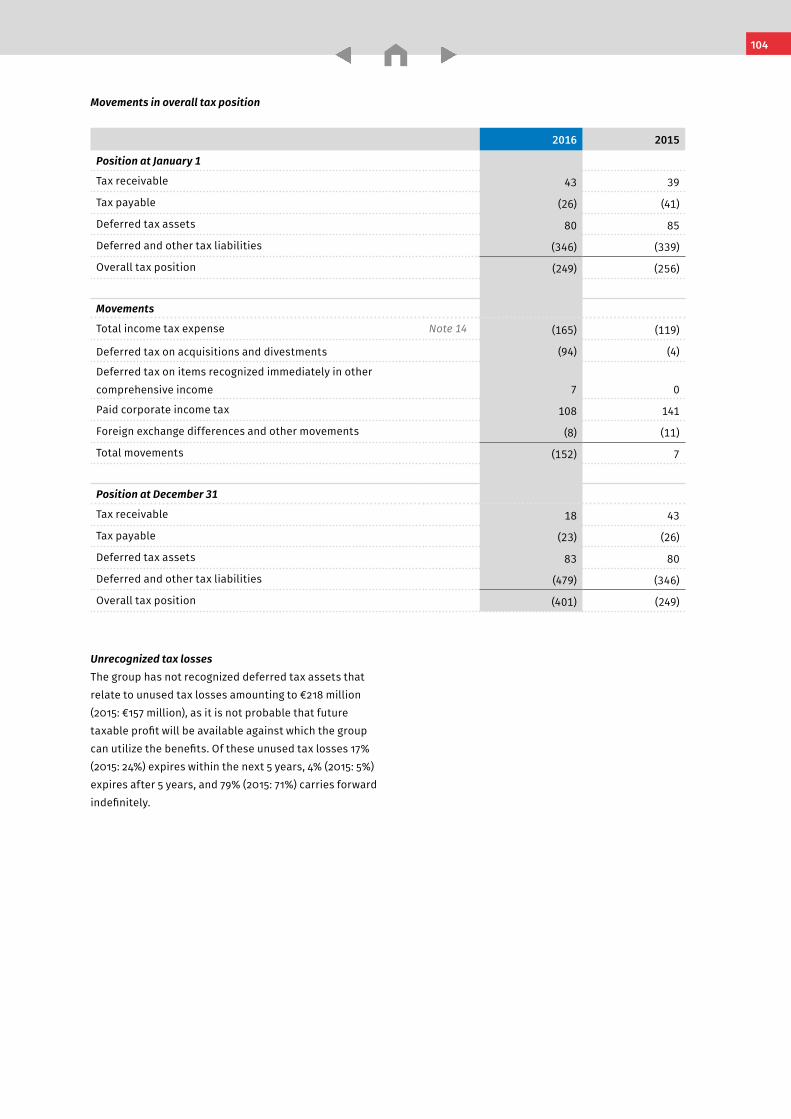
Notes to the Consolidated Financial Statements Wolters Kluwer 2016 Annual Report
Unrecognized tax lossesThe group has not recognized deferred tax assets that relate to unused tax losses amounting to €218 million (2015: €157 million), as it is not probable that future taxable profit will be available against which the group can utilize the benefits. Of these unused tax losses 17% (2015: 24%) expires within the next 5 years, 4% (2015: 5%) expires after 5 years, and 79% (2015: 71%) carries forward indefinitely.
Movements in overall tax position
2016 2015
Position at January 1
Tax receivable 43 39
Tax payable (26) (41)
Deferred tax assets 80 85
Deferred and other tax liabilities (346) (339)
Overall tax position (249) (256)
Movements
Total income tax expense Note 14 (165) (119)
Deferred tax on acquisitions and divestments (94) (4)
Deferred tax on items recognized immediately in other comprehensive income 7 0
Paid corporate income tax 108 141
Foreign exchange differences and other movements (8) (11)
Total movements (152) 7
Position at December 31
Tax receivable 18 43
Tax payable (23) (26)
Deferred tax assets 83 80
Deferred and other tax liabilities (479) (346)
Overall tax position (401) (249)
104
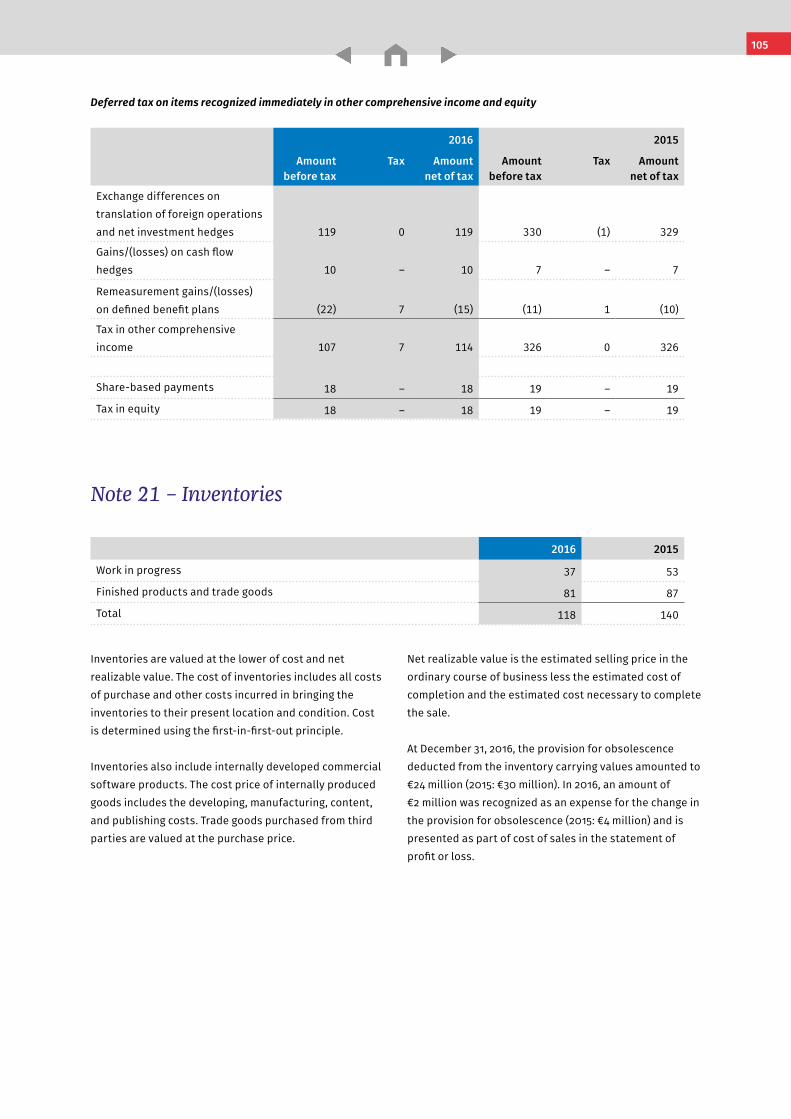
Notes to the Consolidated Financial Statements Wolters Kluwer 2016 Annual Report
Deferred tax on items recognized immediately in other comprehensive income and equity
2016 2015
Amount before tax
Tax Amount net of tax
Amount before tax
Tax Amount net of tax
Exchange differences on translation of foreign operations and net investment hedges 119 0 119 330 (1) 329
Gains/(losses) on cash flow hedges 10 – 10 7 – 7
Remeasurement gains/(losses) on defined benefit plans (22) 7 (15) (11) 1 (10)
Tax in other comprehensive income 107 7 114 326 0 326
Share-based payments 18 – 18 19 – 19
Tax in equity 18 – 18 19 – 19
Note 21 – Inventories
2016 2015
Work in progress 37 53
Finished products and trade goods 81 87
Total 118 140
Inventories are valued at the lower of cost and net realizable value. The cost of inventories includes all costs of purchase and other costs incurred in bringing the inventories to their present location and condition. Cost is determined using the first-in-first-out principle.
Inventories also include internally developed commercial software products. The cost price of internally produced goods includes the developing, manufacturing, content, and publishing costs. Trade goods purchased from third parties are valued at the purchase price.
Net realizable value is the estimated selling price in the ordinary course of business less the estimated cost of completion and the estimated cost necessary to complete the sale.
At December 31, 2016, the provision for obsolescence deducted from the inventory carrying values amounted to €24 million (2015: €30 million). In 2016, an amount of €2 million was recognized as an expense for the change in the provision for obsolescence (2015: €4 million) and is presented as part of cost of sales in the statement of profit or loss.
105
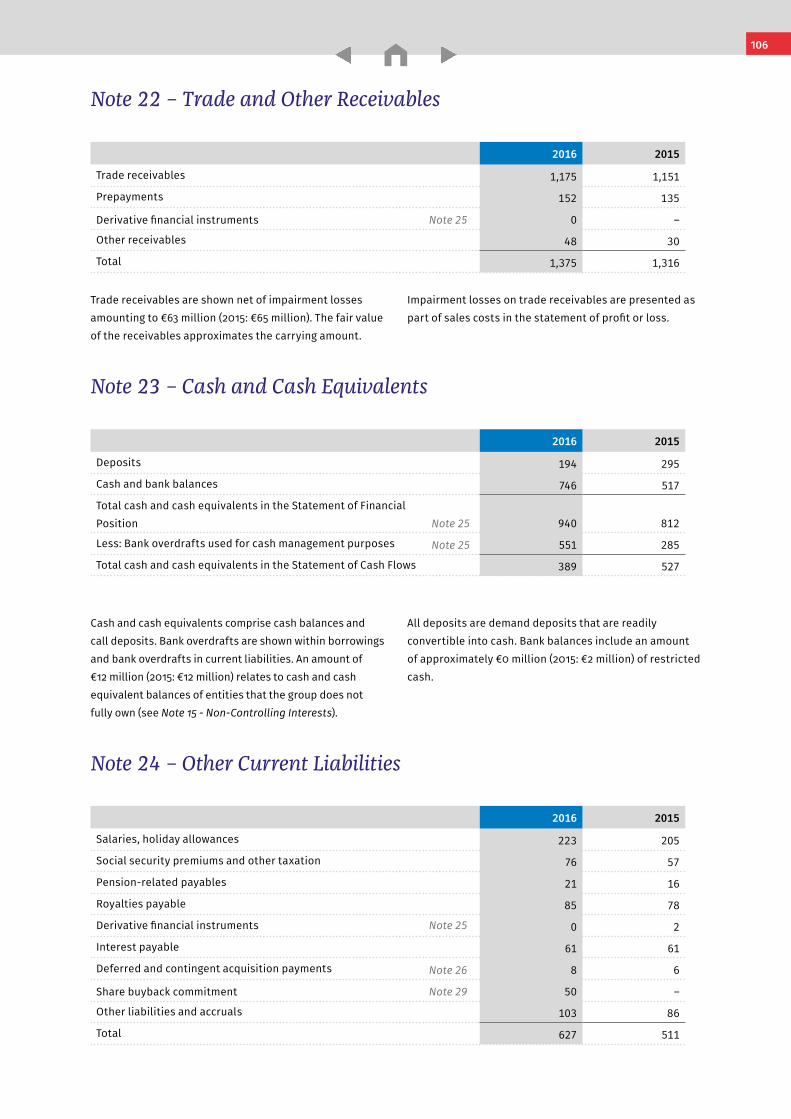
Notes to the Consolidated Financial Statements Wolters Kluwer 2016 Annual Report
Note 22 – Trade and Other Receivables
Note 23 – Cash and Cash Equivalents
Note 24 – Other Current Liabilities
2016 2015
Trade receivables 1,175 1,151
Prepayments 152 135
Derivative financial instruments Note 25 0 –
Other receivables 48 30
Total 1,375 1,316
2016 2015
Deposits 194 295
Cash and bank balances 746 517
Total cash and cash equivalents in the Statement of Financial Position Note 25 940 812
Less: Bank overdrafts used for cash management purposes Note 25 551 285
Total cash and cash equivalents in the Statement of Cash Flows 389 527
2016 2015
Salaries, holiday allowances 223 205
Social security premiums and other taxation 76 57
Pension-related payables 21 16
Royalties payable 85 78
Derivative financial instruments Note 25 0 2
Interest payable 61 61
Deferred and contingent acquisition payments Note 26 8 6
Share buyback commitment Note 29 50 –
Other liabilities and accruals 103 86
Total 627 511
Trade receivables are shown net of impairment losses amounting to €63 million (2015: €65 million). The fair value of the receivables approximates the carrying amount.
Impairment losses on trade receivables are presented as part of sales costs in the statement of profit or loss.
Cash and cash equivalents comprise cash balances and call deposits. Bank overdrafts are shown within borrowings and bank overdrafts in current liabilities. An amount of €12 million (2015: €12 million) relates to cash and cash equivalent balances of entities that the group does not fully own (see Note 15 - Non-Controlling Interests).
All deposits are demand deposits that are readily convertible into cash. Bank balances include an amount of approximately €0 million (2015: €2 million) of restricted cash.
106
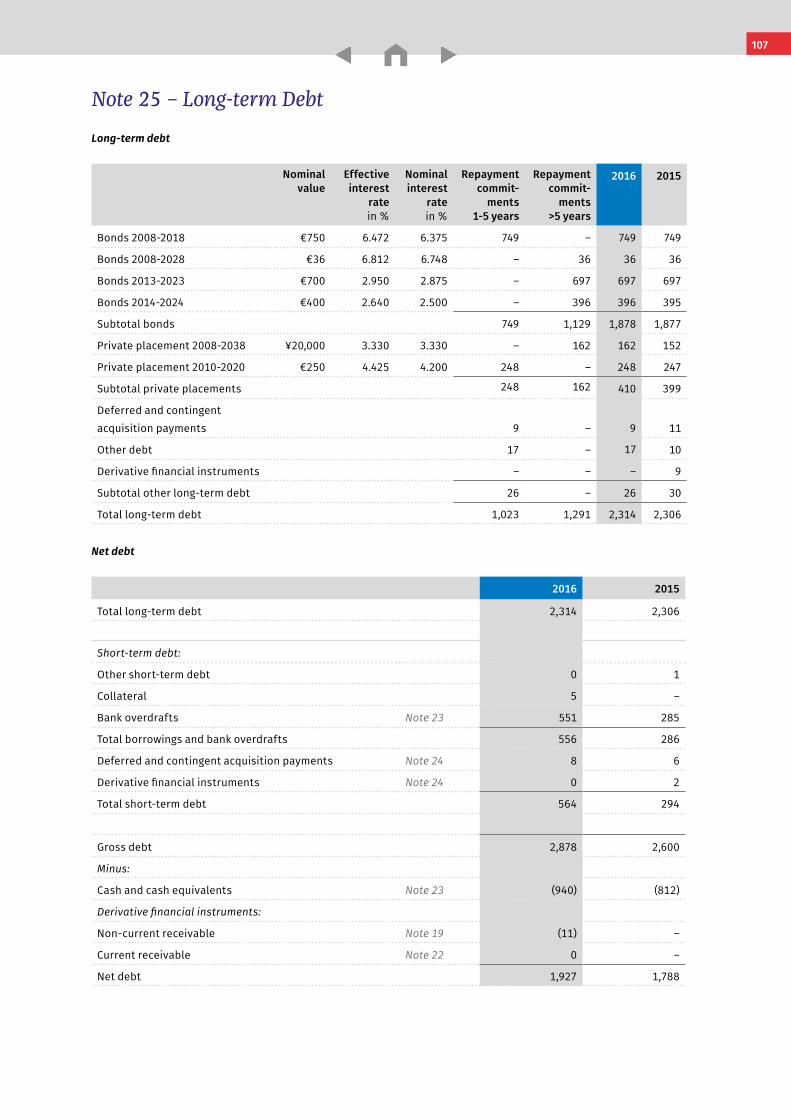
Notes to the Consolidated Financial Statements Wolters Kluwer 2016 Annual Report
Long-term debt
Nominal value
Effective interest
rate in %
Nominal interest
rate in %
Repayment commit-
ments 1-5 years
Repayment commit-
ments >5 years
2016 2015
Bonds 2008-2018 €750 6.472 6.375 749 – 749 749
Bonds 2008-2028 €36 6.812 6.748 – 36 36 36
Bonds 2013-2023 €700 2.950 2.875 – 697 697 697
Bonds 2014-2024 €400 2.640 2.500 – 396 396 395
Subtotal bonds 749 1,129 1,878 1,877
Private placement 2008-2038 ¥20,000 3.330 3.330 – 162 162 152
Private placement 2010-2020 €250 4.425 4.200 248 – 248 247
Subtotal private placements 248 162 410 399
Deferred and contingent acquisition payments 9 – 9 11
Other debt 17 – 17 10
Derivative financial instruments – – – 9
Subtotal other long-term debt 26 – 26 30
Total long-term debt 1,023 1,291 2,314 2,306
Net debt
2016 2015
Total long-term debt 2,314 2,306
Short-term debt:
Other short-term debt 0 1
Collateral 5 –
Bank overdrafts Note 23 551 285
Total borrowings and bank overdrafts 556 286
Deferred and contingent acquisition payments Note 24 8 6
Derivative financial instruments Note 24 0 2
Total short-term debt 564 294
Gross debt 2,878 2,600
Minus:
Cash and cash equivalents Note 23 (940) (812)
Derivative financial instruments:
Non-current receivable Note 19 (11) –
Current receivable Note 22 0 –
Net debt 1,927 1,788
Note 25 – Long-term Debt
107
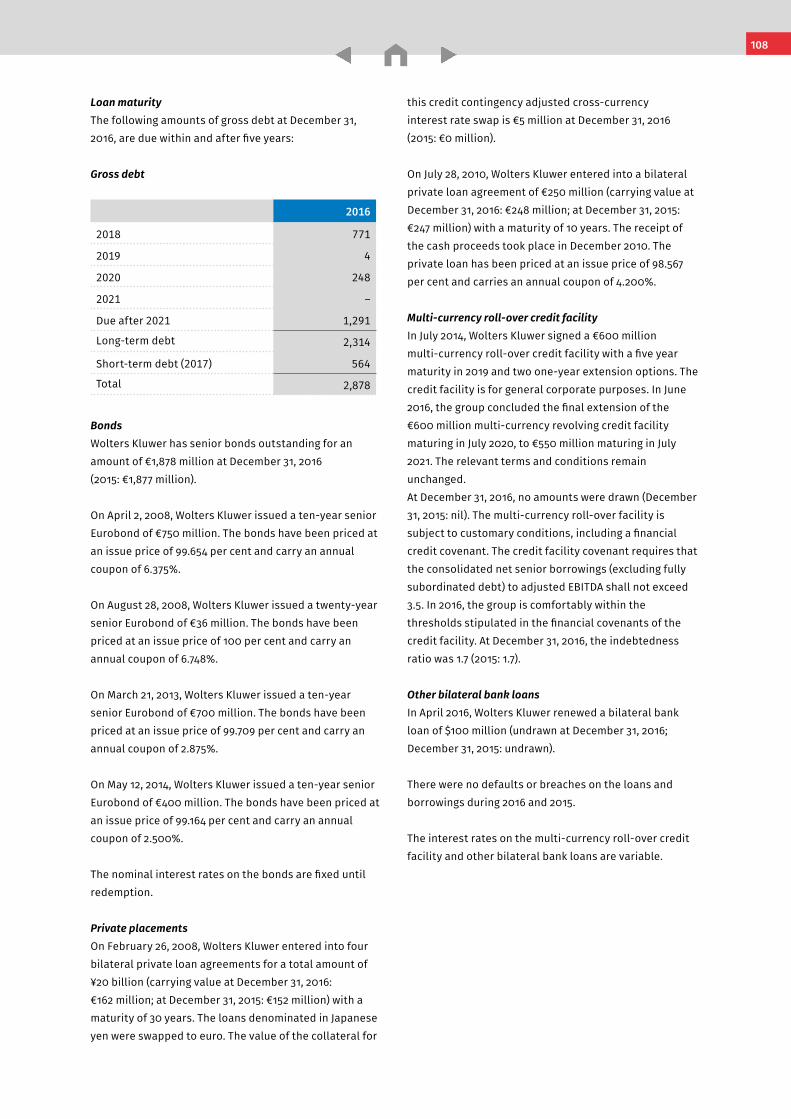
Notes to the Consolidated Financial Statements Wolters Kluwer 2016 Annual Report
Loan maturityThe following amounts of gross debt at December 31, 2016, are due within and after five years:
Gross debt
2016
2018 771
2019 4
2020 248
2021 –
Due after 2021 1,291
Long-term debt 2,314
Short-term debt (2017) 564
Total 2,878
BondsWolters Kluwer has senior bonds outstanding for an amount of €1,878 million at December 31, 2016 (2015: €1,877 million).
On April 2, 2008, Wolters Kluwer issued a ten-year senior Eurobond of €750 million. The bonds have been priced at an issue price of 99.654 per cent and carry an annual coupon of 6.375%.
On August 28, 2008, Wolters Kluwer issued a twenty-year senior Eurobond of €36 million. The bonds have been priced at an issue price of 100 per cent and carry an annual coupon of 6.748%.
On March 21, 2013, Wolters Kluwer issued a ten-year senior Eurobond of €700 million. The bonds have been priced at an issue price of 99.709 per cent and carry an annual coupon of 2.875%.
On May 12, 2014, Wolters Kluwer issued a ten-year senior Eurobond of €400 million. The bonds have been priced at an issue price of 99.164 per cent and carry an annual coupon of 2.500%.
The nominal interest rates on the bonds are fixed until redemption.
Private placementsOn February 26, 2008, Wolters Kluwer entered into four bilateral private loan agreements for a total amount of¥20 billion (carrying value at December 31, 2016:€162 million; at December 31, 2015: €152 million) with a maturity of 30 years. The loans denominated in Japaneseyen were swapped to euro. The value of the collateral for
this credit contingency adjusted cross-currency interest rate swap is €5 million at December 31, 2016 (2015: €0 million).
On July 28, 2010, Wolters Kluwer entered into a bilateral private loan agreement of €250 million (carrying value at December 31, 2016: €248 million; at December 31, 2015: €247 million) with a maturity of 10 years. The receipt of the cash proceeds took place in December 2010. The private loan has been priced at an issue price of 98.567 per cent and carries an annual coupon of 4.200%.
Multi-currency roll-over credit facilityIn July 2014, Wolters Kluwer signed a €600 million multi-currency roll-over credit facility with a five year maturity in 2019 and two one-year extension options. The credit facility is for general corporate purposes. In June 2016, the group concluded the final extension of the €600 million multi-currency revolving credit facility maturing in July 2020, to €550 million maturing in July 2021. The relevant terms and conditions remain unchanged.At December 31, 2016, no amounts were drawn (December 31, 2015: nil). The multi-currency roll-over facility is subject to customary conditions, including a financial credit covenant. The credit facility covenant requires that the consolidated net senior borrowings (excluding fully subordinated debt) to adjusted EBITDA shall not exceed 3.5. In 2016, the group is comfortably within the thresholds stipulated in the financial covenants of the credit facility. At December 31, 2016, the indebtedness ratio was 1.7 (2015: 1.7).
Other bilateral bank loansIn April 2016, Wolters Kluwer renewed a bilateral bank loan of $100 million (undrawn at December 31, 2016; December 31, 2015: undrawn).
There were no defaults or breaches on the loans and borrowings during 2016 and 2015.
The interest rates on the multi-currency roll-over credit facility and other bilateral bank loans are variable.
108
Notes to the Consolidated Financial Statements Wolters Kluwer 2016 Annual Report
Risk management frameworkThe group’s activities are exposed to a variety of financial risks, including market, liquidity, and credit risk. Financial risk identification and management is carried out by the central treasury department (Corporate Treasury), whereby the treasury operations are conducted within a framework of policies and guidelines (Treasury Policy), which have been approved by the Executive Board and Supervisory Board. The Treasury Policy may change on an annual basis in light of market circumstances and market volatility, and is based on a number of assumptions concerning future events, subject to uncertainties and risks that are outside the group’s control. The Treasury Committee, comprising the Vice President group Accounting & Reporting, Controller Corporate Office, Senior Vice President Treasury & Risk, and representatives of the Corporate Treasury and Treasury Back-Office, meets quarterly to review treasury activities and compliance with the Treasury Policy and reports directly to the Executive Board and the Audit Committee. The Treasury Back-Office reports deviations directly to the CFO and the Senior Vice President Treasury & Risk.
The Internal Audit Department reviews the Corporate Treasury Department on financial risk management controls and procedures of Corporate Treasury, both according to a fixed schedule and on an ad-hoc basis. Corporate Treasury reports on a quarterly basis to the Audit Committee about its hedging status.
The group’s funding activities are carried out by Corporate Treasury, using a mixture of long-term capital market instruments and committed credit facilities. A variety of instruments is used to ensure optimal financial flexibility and capital efficiency. The borrowings, together with cash generated from operations, are lent or contributed as equity to the operating companies. The group targets a net-debt-to-EBITDA ratio of approximately 2.5; however, the group could temporarily deviate from this relative indebtedness ratio. At December 31, 2016, the net-debt-to- EBITDA ratio was 1.7 (2015: 1.7).
All treasury activities - in particular the use of derivative financial instruments - are subject to the principle of risk minimization and are transacted by specialist treasury personnel. For this reason, financial transactions and risk positions are managed in a central treasury management and payment system. The group does not purchase or hold derivative financial instruments for speculative purposes. The group’s risk profile is defined and reviewed
regularly. Although the economic environment has become more challenging as a consequence of the volatility on financial markets, the exposure to financial risks for the company has not significantly changed, nor the approach to these risks.
Market riskMarket risk is the risk that changes in market prices such as foreign exchange rates and interest rates will affect the group’s income or the value of its holdings of financial instruments. The objective of market risk management is to manage and control market risk exposures within acceptable parameters, while optimizing the return.
Currency riskThe group has identified transaction and translation risks as the main currency risks. The transaction risk exposure within individual Wolters Kluwer entities is considered to be relatively immaterial. The prices that Wolters Kluwer charges its customers for products and services are mainly denominated in the customers’ local currencies. Given the nature of the business, almost all related costs are also incurred in those local currencies. Derivative financial instruments to hedge transaction risks are therefore not frequently used.
Translation risk is the risk that exchange rate gains or losses arise from translating the statement of profit or loss, balance sheet, and statement of cash flows of foreign subsidiaries to the group’s presentation currency (the euro) for consolidation purposes.
It is the group’s practice that material currency translation exposures are partially hedged by Corporate Treasury. Currency exposures which impact the consolidated statement of financial position and statement of profit or loss by 10% or more are considered material. The translation exposure on the statement of cash flows is partly mitigated by matching cash inflows and outflows in the same currency. The group’s main translation risk is its exposure to the U.S. dollar. The following table details the group’s sensitivity on the group’s financials to a 1% weakening of the U.S. dollar against the euro.
Note 26 – Financial Risk Management
109
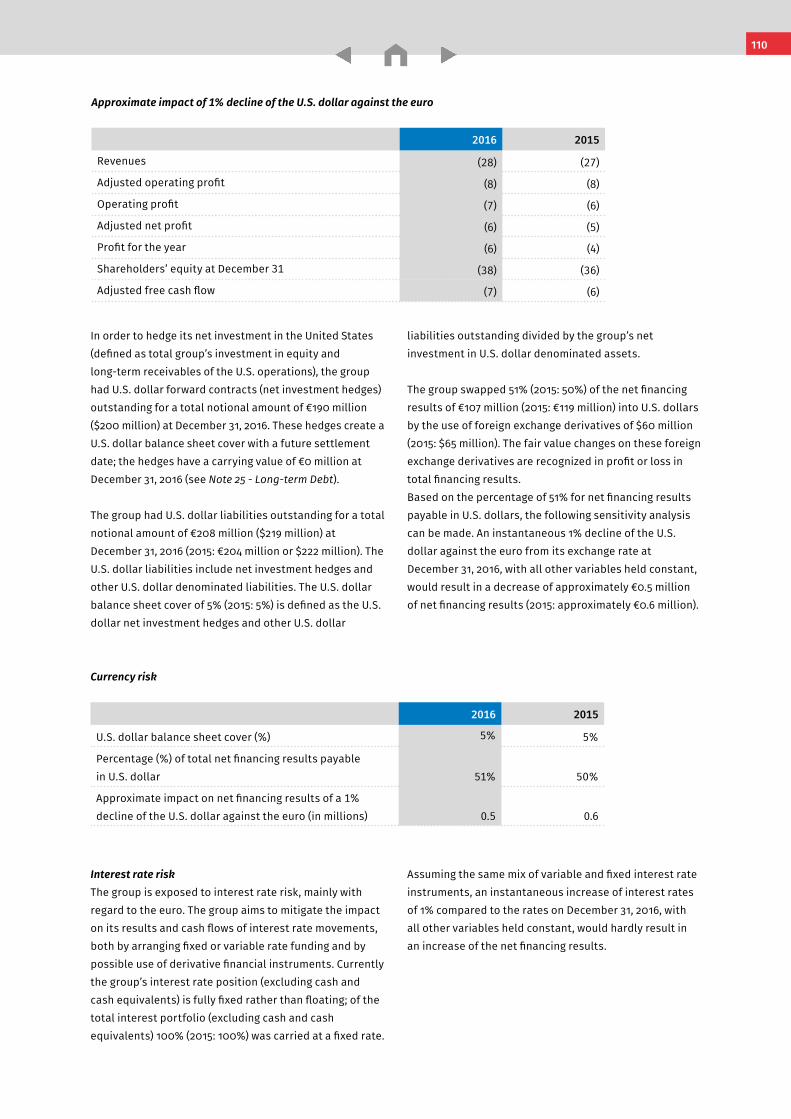
Notes to the Consolidated Financial Statements Wolters Kluwer 2016 Annual Report
Approximate impact of 1% decline of the U.S. dollar against the euro
2016 2015
Revenues (28) (27)
Adjusted operating profit (8) (8)
Operating profit (7) (6)
Adjusted net profit (6) (5)
Profit for the year (6) (4)
Shareholders’ equity at December 31 (38) (36)
Adjusted free cash flow (7) (6)
In order to hedge its net investment in the United States (defined as total group’s investment in equity and long-term receivables of the U.S. operations), the group had U.S. dollar forward contracts (net investment hedges) outstanding for a total notional amount of €190 million ($200 million) at December 31, 2016. These hedges create a U.S. dollar balance sheet cover with a future settlement date; the hedges have a carrying value of €0 million at December 31, 2016 (see Note 25 - Long-term Debt).
The group had U.S. dollar liabilities outstanding for a total notional amount of €208 million ($219 million) at December 31, 2016 (2015: €204 million or $222 million). The U.S. dollar liabilities include net investment hedges and other U.S. dollar denominated liabilities. The U.S. dollar balance sheet cover of 5% (2015: 5%) is defined as the U.S. dollar net investment hedges and other U.S. dollar
liabilities outstanding divided by the group’s net investment in U.S. dollar denominated assets. The group swapped 51% (2015: 50%) of the net financing results of €107 million (2015: €119 million) into U.S. dollars by the use of foreign exchange derivatives of $60 million (2015: $65 million). The fair value changes on these foreign exchange derivatives are recognized in profit or loss in total financing results. Based on the percentage of 51% for net financing results payable in U.S. dollars, the following sensitivity analysis can be made. An instantaneous 1% decline of the U.S. dollar against the euro from its exchange rate at December 31, 2016, with all other variables held constant, would result in a decrease of approximately €0.5 million of net financing results (2015: approximately €0.6 million).
Interest rate riskThe group is exposed to interest rate risk, mainly with regard to the euro. The group aims to mitigate the impact on its results and cash flows of interest rate movements, both by arranging fixed or variable rate funding and by possible use of derivative financial instruments. Currently the group’s interest rate position (excluding cash and cash equivalents) is fully fixed rather than floating; of the total interest portfolio (excluding cash and cash equivalents) 100% (2015: 100%) was carried at a fixed rate.
Assuming the same mix of variable and fixed interest rate instruments, an instantaneous increase of interest rates of 1% compared to the rates on December 31, 2016, with all other variables held constant, would hardly result in an increase of the net financing results.
Currency risk
2016 2015
U.S. dollar balance sheet cover (%) 5% 5%
Percentage (%) of total net financing results payable in U.S. dollar 51% 50%
Approximate impact on net financing results of a 1% decline of the U.S. dollar against the euro (in millions) 0.5 0.6
110
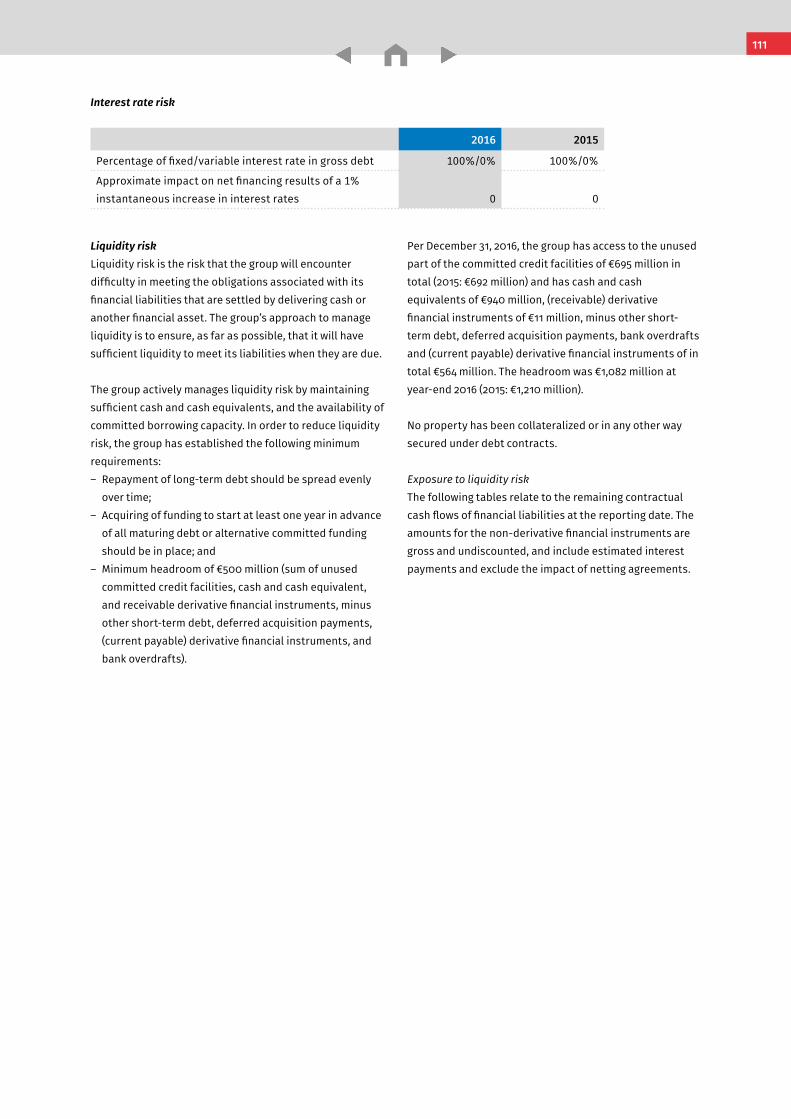
Notes to the Consolidated Financial Statements Wolters Kluwer 2016 Annual Report
Interest rate risk
2016 2015
Percentage of fixed/variable interest rate in gross debt 100%/0% 100%/0%
Approximate impact on net financing results of a 1% instantaneous increase in interest rates
0
0
Liquidity riskLiquidity risk is the risk that the group will encounter difficulty in meeting the obligations associated with its financial liabilities that are settled by delivering cash or another financial asset. The group’s approach to manage liquidity is to ensure, as far as possible, that it will have sufficient liquidity to meet its liabilities when they are due.
The group actively manages liquidity risk by maintaining sufficient cash and cash equivalents, and the availability of committed borrowing capacity. In order to reduce liquidity risk, the group has established the following minimum requirements:– Repayment of long-term debt should be spread evenly
over time;– Acquiring of funding to start at least one year in advance
of all maturing debt or alternative committed funding should be in place; and
– Minimum headroom of €500 million (sum of unused committed credit facilities, cash and cash equivalent, and receivable derivative financial instruments, minus other short-term debt, deferred acquisition payments, (current payable) derivative financial instruments, and bank overdrafts).
Per December 31, 2016, the group has access to the unused part of the committed credit facilities of €695 million in total (2015: €692 million) and has cash and cash equivalents of €940 million, (receivable) derivative financial instruments of €11 million, minus other short- term debt, deferred acquisition payments, bank overdrafts and (current payable) derivative financial instruments of in total €564 million. The headroom was €1,082 million at year-end 2016 (2015: €1,210 million).
No property has been collateralized or in any other way secured under debt contracts.
Exposure to liquidity riskThe following tables relate to the remaining contractual cash flows of financial liabilities at the reporting date. The amounts for the non-derivative financial instruments are gross and undiscounted, and include estimated interest payments and exclude the impact of netting agreements.
111
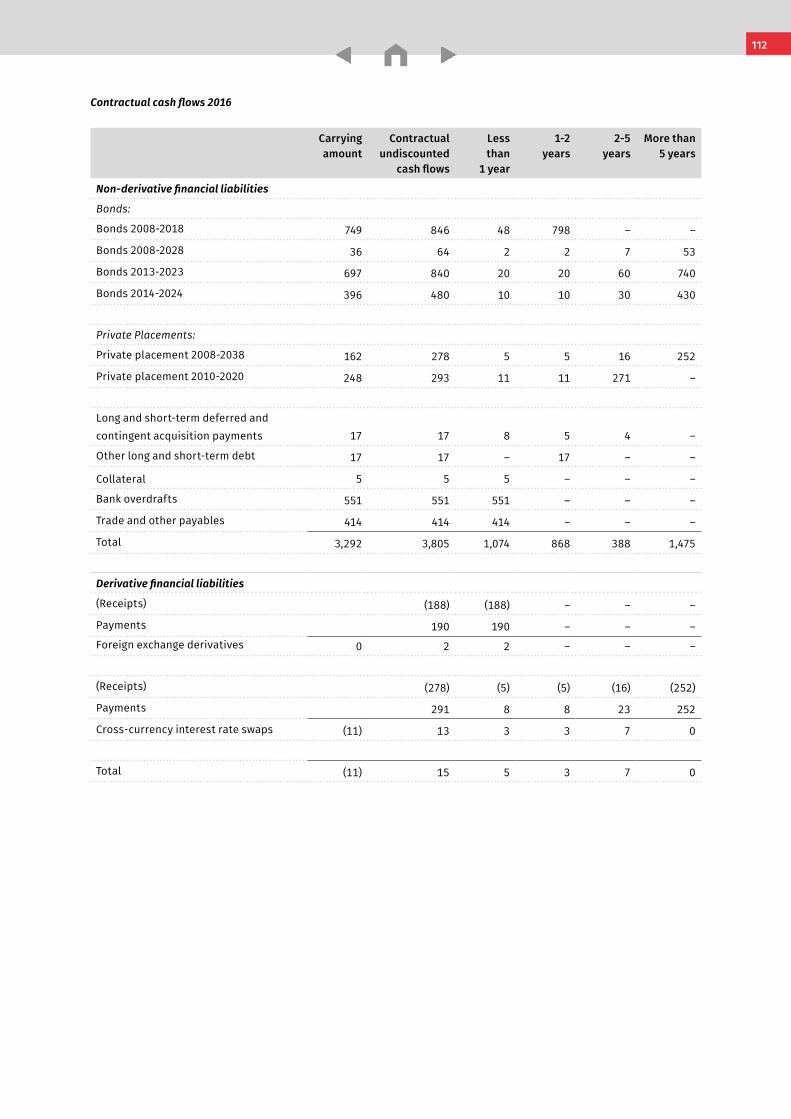
Notes to the Consolidated Financial Statements Wolters Kluwer 2016 Annual Report
Contractual cash flows 2016
Carrying amount
Contractual undiscounted
cash flows
Less than
1 year
1-2 years
2-5 years
More than 5 years
Non-derivative financial liabilities
Bonds:
Bonds 2008-2018 749 846 48 798 – –
Bonds 2008-2028 36 64 2 2 7 53
Bonds 2013-2023 697 840 20 20 60 740
Bonds 2014-2024 396 480 10 10 30 430
Private Placements:
Private placement 2008-2038 162 278 5 5 16 252
Private placement 2010-2020 248 293 11 11 271 –
Long and short-term deferred and contingent acquisition payments 17 17 8 5 4 –
Other long and short-term debt 17 17 – 17 – –
Collateral 5 5 5 – – –
Bank overdrafts 551 551 551 – – –
Trade and other payables 414 414 414 – – –
Total 3,292 3,805 1,074 868 388 1,475
Derivative financial liabilities
(Receipts) (188) (188) – – –
Payments 190 190 – – –Foreign exchange derivatives 0 2 2 – – –
(Receipts) (278) (5) (5) (16) (252)
Payments 291 8 8 23 252
Cross-currency interest rate swaps (11) 13 3 3 7 0
Total (11) 15 5 3 7 0
112
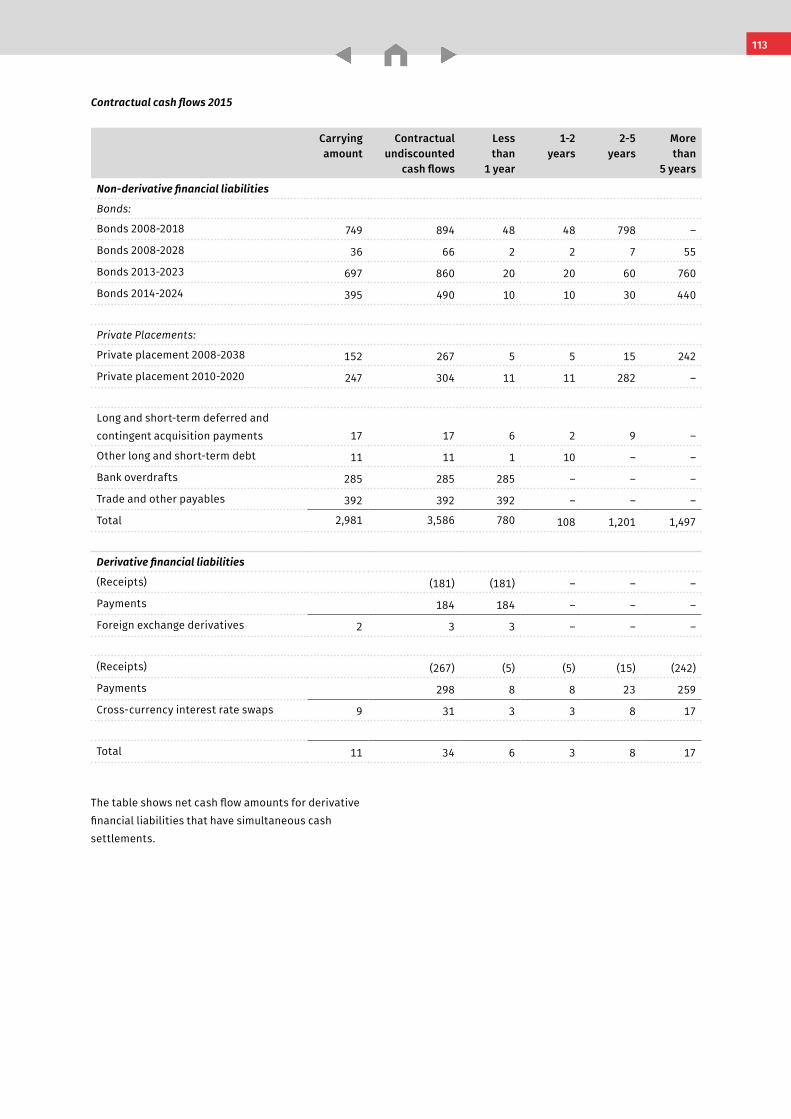
Notes to the Consolidated Financial Statements Wolters Kluwer 2016 Annual Report
Contractual cash flows 2015
Carrying amount
Contractual undiscounted
cash flows
Less than
1 year
1-2 years
2-5 years
More than
5 years
Non-derivative financial liabilities
Bonds:
Bonds 2008-2018 749 894 48 48 798 –
Bonds 2008-2028 36 66 2 2 7 55
Bonds 2013-2023 697 860 20 20 60 760
Bonds 2014-2024 395 490 10 10 30 440
Private Placements:
Private placement 2008-2038 152 267 5 5 15 242
Private placement 2010-2020 247 304 11 11 282 –
Long and short-term deferred and contingent acquisition payments 17 17 6 2 9 –
Other long and short-term debt 11 11 1 10 – –
Bank overdrafts 285 285 285 – – –
Trade and other payables 392 392 392 – – –
Total 2,981 3,586 780 108 1,201 1,497
Derivative financial liabilities
(Receipts) (181) (181) – – –
Payments 184 184 – – –
Foreign exchange derivatives 2 3 3 – – –
(Receipts) (267) (5) (5) (15) (242)
Payments 298 8 8 23 259
Cross-currency interest rate swaps 9 31 3 3 8 17
Total 11 34 6 3 8 17
The table shows net cash flow amounts for derivative financial liabilities that have simultaneous cash settlements.
113
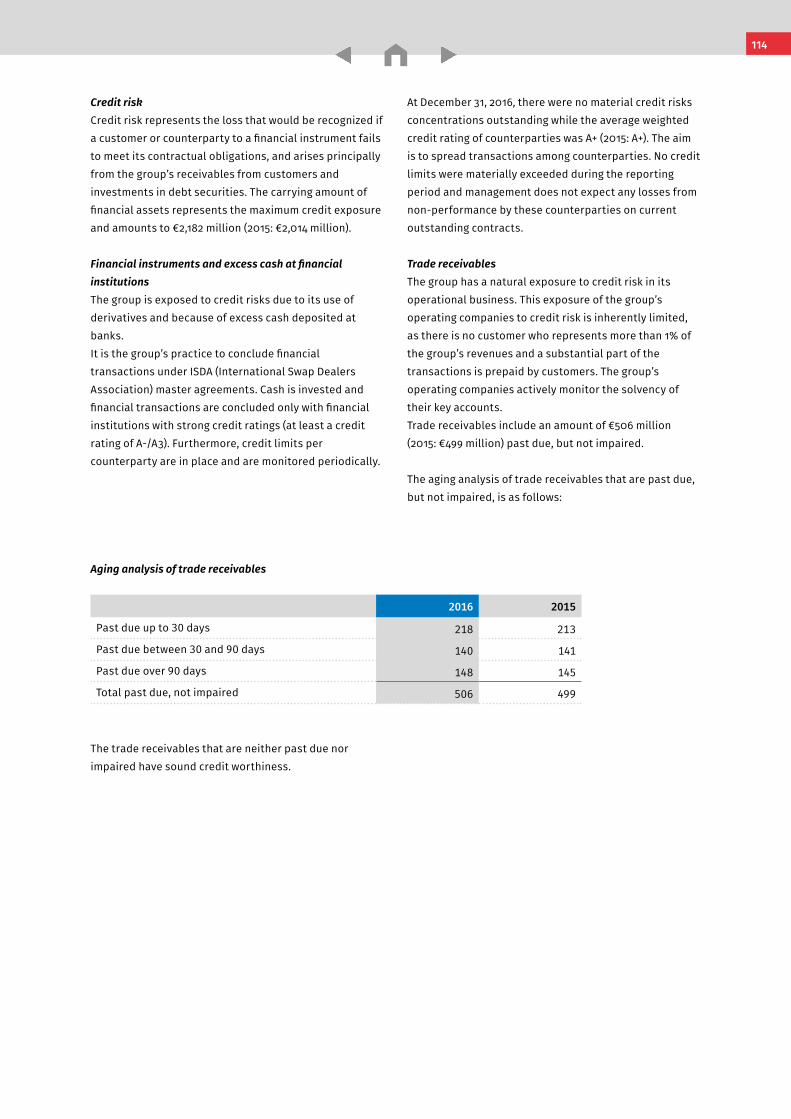
Notes to the Consolidated Financial Statements Wolters Kluwer 2016 Annual Report
Credit riskCredit risk represents the loss that would be recognized if a customer or counterparty to a financial instrument fails to meet its contractual obligations, and arises principally from the group’s receivables from customers and investments in debt securities. The carrying amount of financial assets represents the maximum credit exposure and amounts to €2,182 million (2015: €2,014 million).
Financial instruments and excess cash at financial institutionsThe group is exposed to credit risks due to its use of derivatives and because of excess cash deposited at banks.It is the group’s practice to conclude financial transactions under ISDA (International Swap Dealers Association) master agreements. Cash is invested and financial transactions are concluded only with financial institutions with strong credit ratings (at least a credit rating of A-/A3). Furthermore, credit limits per counterparty are in place and are monitored periodically.
At December 31, 2016, there were no material credit risks concentrations outstanding while the average weighted credit rating of counterparties was A+ (2015: A+). The aim is to spread transactions among counterparties. No credit limits were materially exceeded during the reporting period and management does not expect any losses from non-performance by these counterparties on current outstanding contracts.
Trade receivablesThe group has a natural exposure to credit risk in its operational business. This exposure of the group’s operating companies to credit risk is inherently limited, as there is no customer who represents more than 1% of the group’s revenues and a substantial part of the transactions is prepaid by customers. The group’s operating companies actively monitor the solvency of their key accounts.Trade receivables include an amount of €506 million (2015: €499 million) past due, but not impaired.
The aging analysis of trade receivables that are past due, but not impaired, is as follows:
The trade receivables that are neither past due nor impaired have sound credit worthiness.
Aging analysis of trade receivables
2016 2015
Past due up to 30 days 218 213
Past due between 30 and 90 days 140 141
Past due over 90 days 148 145
Total past due, not impaired 506 499
114
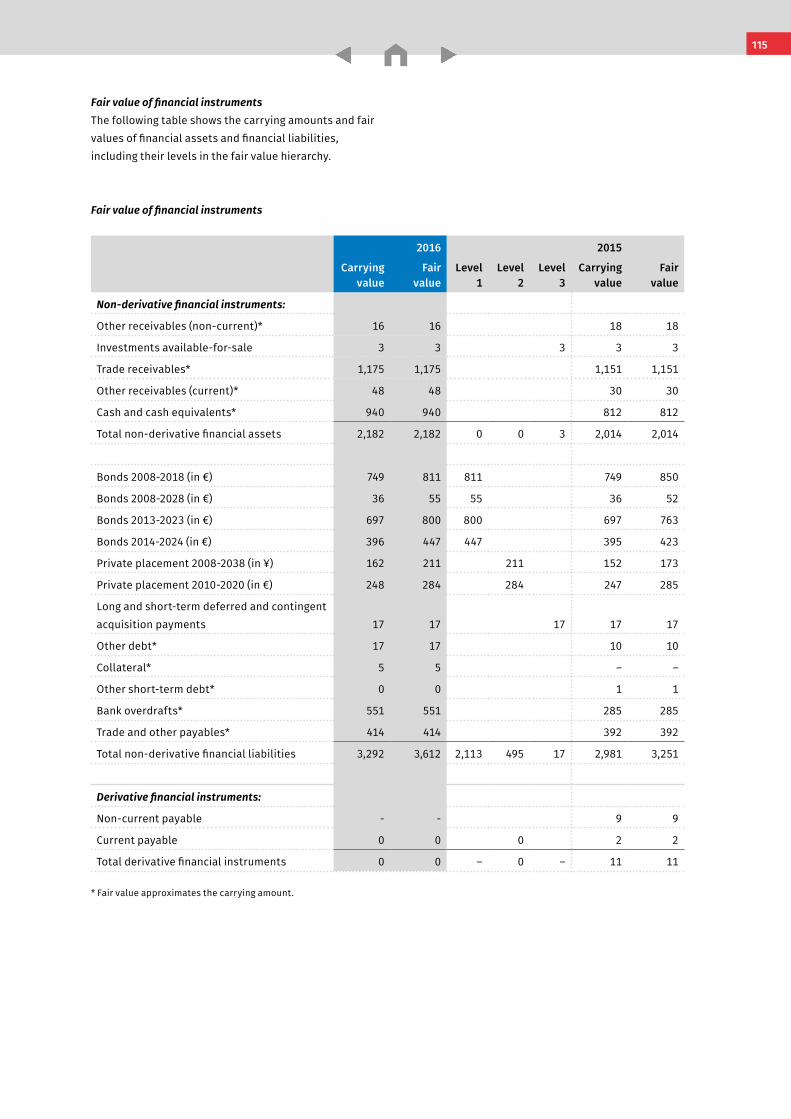
Notes to the Consolidated Financial Statements Wolters Kluwer 2016 Annual Report
Fair value of financial instrumentsThe following table shows the carrying amounts and fair values of financial assets and financial liabilities, including their levels in the fair value hierarchy.
Fair value of financial instruments
2016 2015
Carrying value
Fair value
Level 1
Level 2
Level 3
Carrying value
Fair value
Non-derivative financial instruments:
Other receivables (non-current)* 16 16 18 18
Investments available-for-sale 3 3 3 3 3
Trade receivables* 1,175 1,175 1,151 1,151
Other receivables (current)* 48 48 30 30
Cash and cash equivalents* 940 940 812 812
Total non-derivative financial assets 2,182 2,182 0 0 3 2,014 2,014
Bonds 2008-2018 (in €) 749 811 811 749 850
Bonds 2008-2028 (in €) 36 55 55 36 52
Bonds 2013-2023 (in €) 697 800 800 697 763
Bonds 2014-2024 (in €) 396 447 447 395 423
Private placement 2008-2038 (in ¥) 162 211 211 152 173
Private placement 2010-2020 (in €) 248 284 284 247 285
Long and short-term deferred and contingent acquisition payments 17 17 17 17 17
Other debt* 17 17 10 10
Collateral* 5 5 – –
Other short-term debt* 0 0 1 1
Bank overdrafts* 551 551 285 285
Trade and other payables* 414 414 392 392
Total non-derivative financial liabilities 3,292 3,612 2,113 495 17 2,981 3,251
Derivative financial instruments:
Non-current payable - - 9 9
Current payable 0 0 0 2 2
Total derivative financial instruments 0 0 – 0 – 11 11
* Fair value approximates the carrying amount.
115
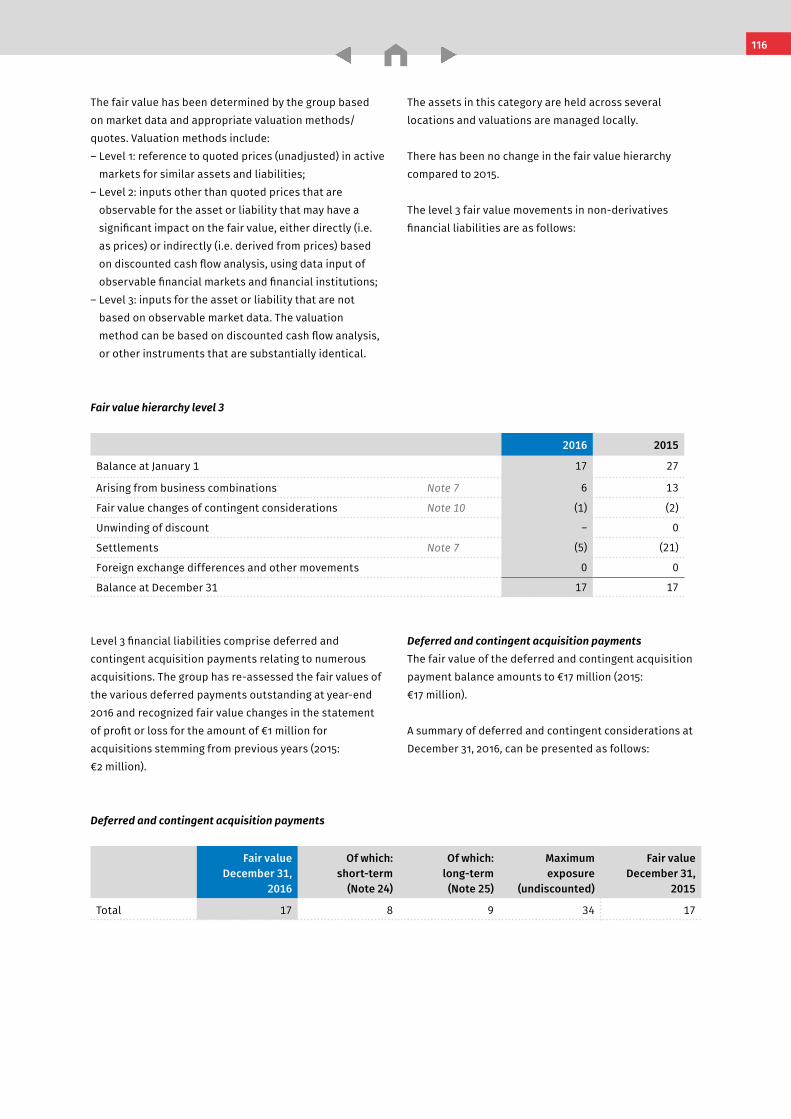
Notes to the Consolidated Financial Statements Wolters Kluwer 2016 Annual Report
Level 3 financial liabilities comprise deferred and contingent acquisition payments relating to numerous acquisitions. The group has re-assessed the fair values of the various deferred payments outstanding at year-end 2016 and recognized fair value changes in the statement of profit or loss for the amount of €1 million for acquisitions stemming from previous years (2015: €2 million).
Deferred and contingent acquisition paymentsThe fair value of the deferred and contingent acquisition payment balance amounts to €17 million (2015: €17 million).
A summary of deferred and contingent considerations at December 31, 2016, can be presented as follows:
Fair value hierarchy level 3
2016 2015
Balance at January 1 17 27
Arising from business combinations Note 7 6 13
Fair value changes of contingent considerations Note 10 (1) (2)
Unwinding of discount – 0
Settlements Note 7 (5) (21)
Foreign exchange differences and other movements 0 0
Balance at December 31 17 17
Deferred and contingent acquisition payments
Fair value December 31,
2016
Of which: short-term
(Note 24)
Of which: long-term (Note 25)
Maximum exposure
(undiscounted)
Fair value December 31,
2015
Total 17 8 9 34 17
The assets in this category are held across several locations and valuations are managed locally.
There has been no change in the fair value hierarchy compared to 2015.
The level 3 fair value movements in non-derivatives financial liabilities are as follows:
The fair value has been determined by the group based on market data and appropriate valuation methods/ quotes. Valuation methods include:– Level 1: reference to quoted prices (unadjusted) in active markets for similar assets and liabilities;– Level 2: inputs other than quoted prices that are
observable for the asset or liability that may have a significant impact on the fair value, either directly (i.e. as prices) or indirectly (i.e. derived from prices) based on discounted cash flow analysis, using data input of observable financial markets and financial institutions;
– Level 3: inputs for the asset or liability that are not based on observable market data. The valuation method can be based on discounted cash flow analysis, or other instruments that are substantially identical.
116
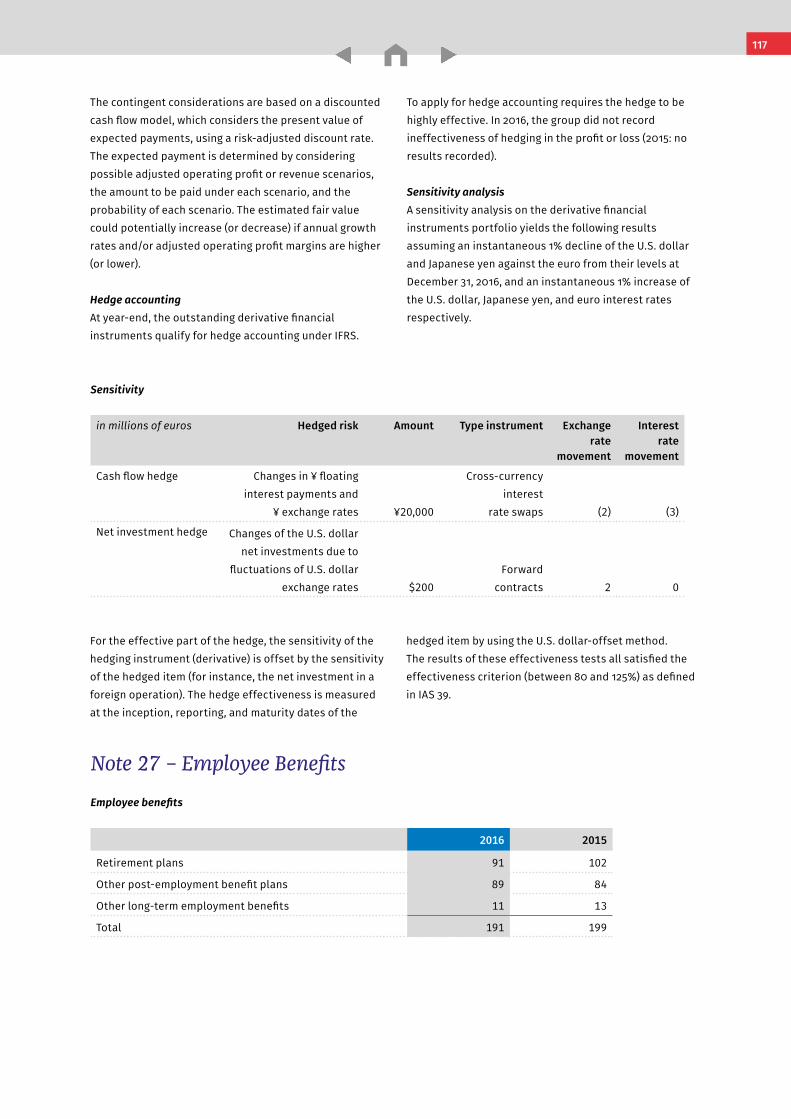
Notes to the Consolidated Financial Statements Wolters Kluwer 2016 Annual Report
Sensitivity
in millions of euros Hedged risk Amount Type instrument Exchange rate
movement
Interest rate
movement
Cash flow hedge Changes in ¥ floating interest payments and
¥ exchange rates
¥20,000
Cross-currency interest
rate swaps
(2)
(3)
Net investment hedge Changes of the U.S. dollar net investments due to
fluctuations of U.S. dollar exchange rates
$200
Forward
contracts
2 0
The contingent considerations are based on a discounted cash flow model, which considers the present value of expected payments, using a risk-adjusted discount rate. The expected payment is determined by considering possible adjusted operating profit or revenue scenarios, the amount to be paid under each scenario, and the probability of each scenario. The estimated fair value could potentially increase (or decrease) if annual growth rates and/or adjusted operating profit margins are higher (or lower).
Hedge accountingAt year-end, the outstanding derivative financial instruments qualify for hedge accounting under IFRS.
To apply for hedge accounting requires the hedge to be highly effective. In 2016, the group did not record ineffectiveness of hedging in the profit or loss (2015: no results recorded).
Sensitivity analysisA sensitivity analysis on the derivative financial instruments portfolio yields the following results assuming an instantaneous 1% decline of the U.S. dollar and Japanese yen against the euro from their levels at December 31, 2016, and an instantaneous 1% increase of the U.S. dollar, Japanese yen, and euro interest rates respectively.
For the effective part of the hedge, the sensitivity of the hedging instrument (derivative) is offset by the sensitivity of the hedged item (for instance, the net investment in a foreign operation). The hedge effectiveness is measured at the inception, reporting, and maturity dates of the
hedged item by using the U.S. dollar-offset method.The results of these effectiveness tests all satisfied the effectiveness criterion (between 80 and 125%) as defined in IAS 39.
Employee benefits
2016 2015
Retirement plans 91 102
Other post-employment benefit plans 89 84
Other long-term employment benefits 11 13
Total 191 199
Note 27 – Employee Benefits
117
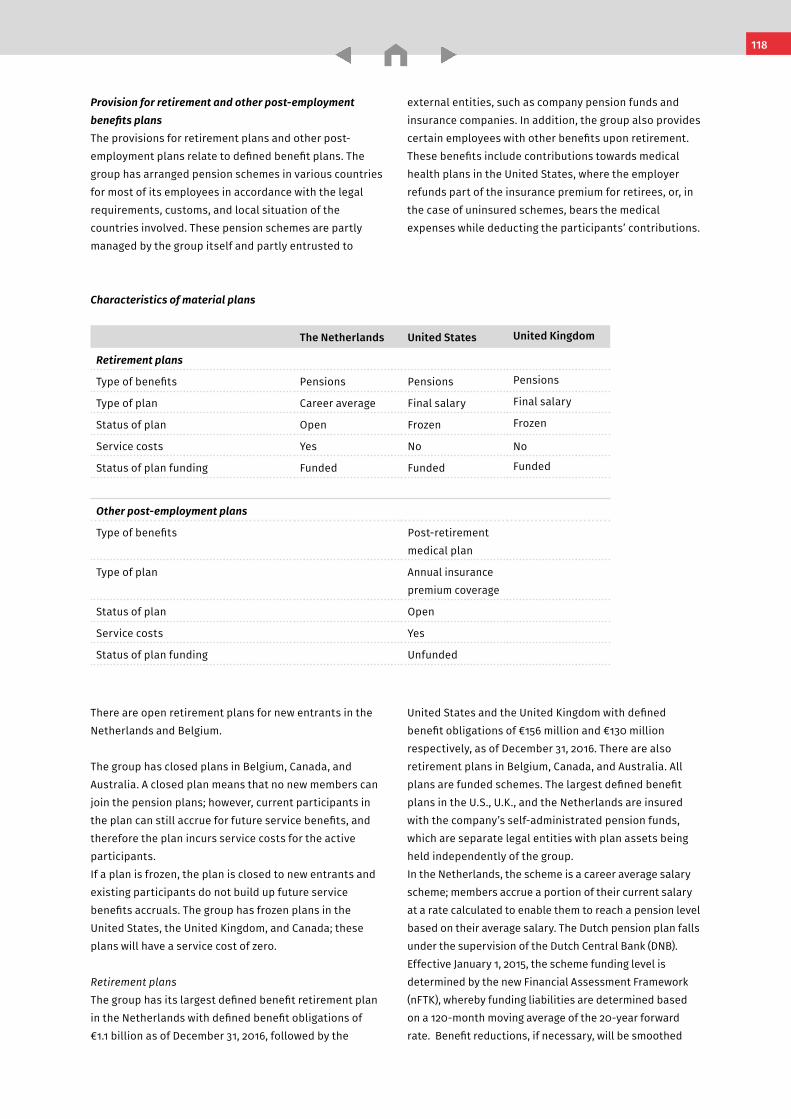
Notes to the Consolidated Financial Statements Wolters Kluwer 2016 Annual Report
Characteristics of material plans
The Netherlands United States United Kingdom
Retirement plans
Type of benefits Pensions Pensions Pensions
Type of plan Career average Final salary Final salary
Status of plan Open Frozen Frozen
Service costs Yes No No
Status of plan funding Funded Funded Funded
Other post-employment plans
Type of benefits Post-retirement medical plan
Type of plan Annual insurance premium coverage
Status of plan Open
Service costs Yes
Status of plan funding Unfunded
Provision for retirement and other post-employment benefits plansThe provisions for retirement plans and other post-employment plans relate to defined benefit plans. The group has arranged pension schemes in various countries for most of its employees in accordance with the legal requirements, customs, and local situation of the countries involved. These pension schemes are partly managed by the group itself and partly entrusted to
external entities, such as company pension funds and insurance companies. In addition, the group also provides certain employees with other benefits upon retirement. These benefits include contributions towards medical health plans in the United States, where the employer refunds part of the insurance premium for retirees, or, in the case of uninsured schemes, bears the medical expenses while deducting the participants’ contributions.
There are open retirement plans for new entrants in the Netherlands and Belgium.
The group has closed plans in Belgium, Canada, and Australia. A closed plan means that no new members can join the pension plans; however, current participants in the plan can still accrue for future service benefits, and therefore the plan incurs service costs for the active participants.If a plan is frozen, the plan is closed to new entrants and existing participants do not build up future service benefits accruals. The group has frozen plans in the United States, the United Kingdom, and Canada; these plans will have a service cost of zero.
Retirement plansThe group has its largest defined benefit retirement plan in the Netherlands with defined benefit obligations of €1.1 billion as of December 31, 2016, followed by the
United States and the United Kingdom with defined benefit obligations of €156 million and €130 million respectively, as of December 31, 2016. There are also retirement plans in Belgium, Canada, and Australia. All plans are funded schemes. The largest defined benefit plans in the U.S., U.K., and the Netherlands are insured with the company’s self-administrated pension funds, which are separate legal entities with plan assets being held independently of the group.In the Netherlands, the scheme is a career average salary scheme; members accrue a portion of their current salary at a rate calculated to enable them to reach a pension level based on their average salary. The Dutch pension plan falls under the supervision of the Dutch Central Bank (DNB). Effective January 1, 2015, the scheme funding level is determined by the new Financial Assessment Framework (nFTK), whereby funding liabilities are determined based on a 120-month moving average of the 20-year forward rate. Benefit reductions, if necessary, will be smoothed
118
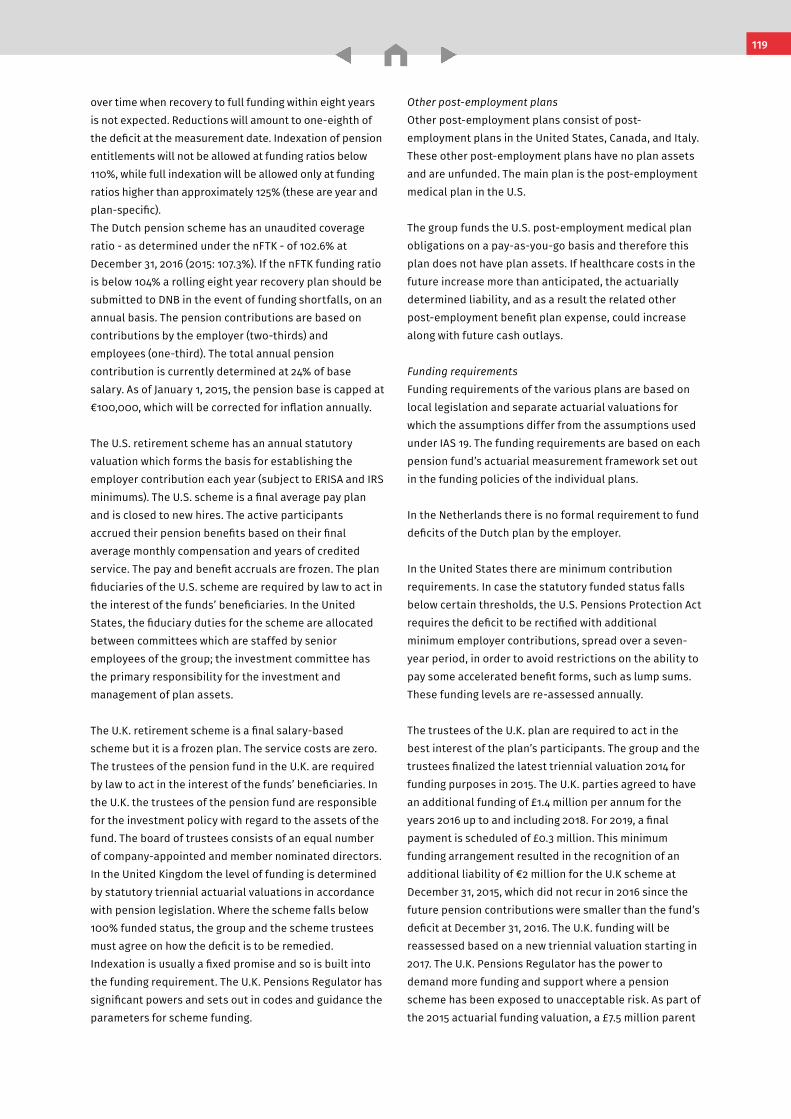
Notes to the Consolidated Financial Statements Wolters Kluwer 2016 Annual Report
over time when recovery to full funding within eight years is not expected. Reductions will amount to one-eighth of the deficit at the measurement date. Indexation of pension entitlements will not be allowed at funding ratios below 110%, while full indexation will be allowed only at funding ratios higher than approximately 125% (these are year and plan-specific).The Dutch pension scheme has an unaudited coverage ratio - as determined under the nFTK - of 102.6% at December 31, 2016 (2015: 107.3%). If the nFTK funding ratio is below 104% a rolling eight year recovery plan should be submitted to DNB in the event of funding shortfalls, on an annual basis. The pension contributions are based on contributions by the employer (two-thirds) and employees (one-third). The total annual pension contribution is currently determined at 24% of base salary. As of January 1, 2015, the pension base is capped at €100,000, which will be corrected for inflation annually.
The U.S. retirement scheme has an annual statutory valuation which forms the basis for establishing the employer contribution each year (subject to ERISA and IRS minimums). The U.S. scheme is a final average pay plan and is closed to new hires. The active participants accrued their pension benefits based on their final average monthly compensation and years of credited service. The pay and benefit accruals are frozen. The plan fiduciaries of the U.S. scheme are required by law to act in the interest of the funds’ beneficiaries. In the United States, the fiduciary duties for the scheme are allocated between committees which are staffed by senior employees of the group; the investment committee has the primary responsibility for the investment and management of plan assets. The U.K. retirement scheme is a final salary-based scheme but it is a frozen plan. The service costs are zero. The trustees of the pension fund in the U.K. are required by law to act in the interest of the funds’ beneficiaries. In the U.K. the trustees of the pension fund are responsible for the investment policy with regard to the assets of the fund. The board of trustees consists of an equal number of company-appointed and member nominated directors. In the United Kingdom the level of funding is determined by statutory triennial actuarial valuations in accordance with pension legislation. Where the scheme falls below 100% funded status, the group and the scheme trustees must agree on how the deficit is to be remedied. Indexation is usually a fixed promise and so is built into the funding requirement. The U.K. Pensions Regulator has significant powers and sets out in codes and guidance the parameters for scheme funding.
Other post-employment plansOther post-employment plans consist of post-employment plans in the United States, Canada, and Italy. These other post-employment plans have no plan assets and are unfunded. The main plan is the post-employment medical plan in the U.S.
The group funds the U.S. post-employment medical plan obligations on a pay-as-you-go basis and therefore this plan does not have plan assets. If healthcare costs in the future increase more than anticipated, the actuarially determined liability, and as a result the related other post-employment benefit plan expense, could increase along with future cash outlays.
Funding requirementsFunding requirements of the various plans are based on local legislation and separate actuarial valuations for which the assumptions differ from the assumptions used under IAS 19. The funding requirements are based on each pension fund’s actuarial measurement framework set out in the funding policies of the individual plans.
In the Netherlands there is no formal requirement to fund deficits of the Dutch plan by the employer.
In the United States there are minimum contribution requirements. In case the statutory funded status falls below certain thresholds, the U.S. Pensions Protection Act requires the deficit to be rectified with additional minimum employer contributions, spread over a seven-year period, in order to avoid restrictions on the ability to pay some accelerated benefit forms, such as lump sums. These funding levels are re-assessed annually.
The trustees of the U.K. plan are required to act in the best interest of the plan’s participants. The group and the trustees finalized the latest triennial valuation 2014 for funding purposes in 2015. The U.K. parties agreed to have an additional funding of £1.4 million per annum for the years 2016 up to and including 2018. For 2019, a final payment is scheduled of £0.3 million. This minimum funding arrangement resulted in the recognition of an additional liability of €2 million for the U.K scheme at December 31, 2015, which did not recur in 2016 since the future pension contributions were smaller than the fund’s deficit at December 31, 2016. The U.K. funding will be reassessed based on a new triennial valuation starting in 2017. The U.K. Pensions Regulator has the power to demand more funding and support where a pension scheme has been exposed to unacceptable risk. As part of the 2015 actuarial funding valuation, a £7.5 million parent
119
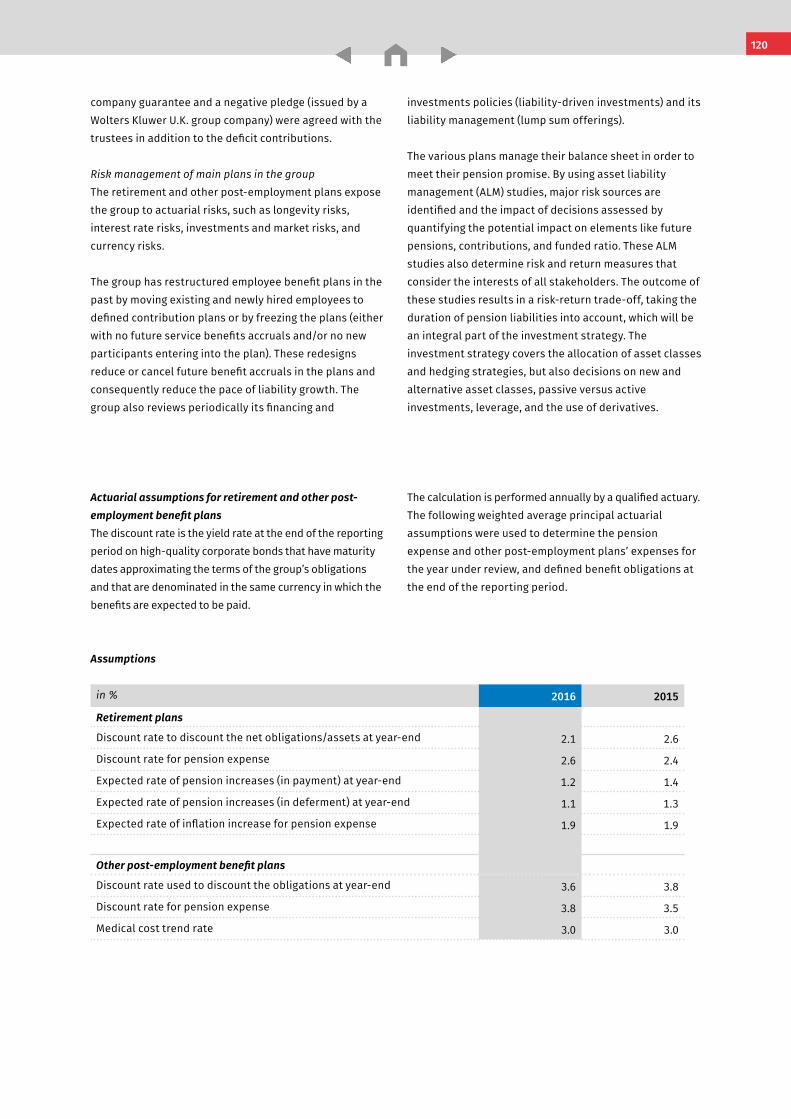
Notes to the Consolidated Financial Statements Wolters Kluwer 2016 Annual Report
company guarantee and a negative pledge (issued by a Wolters Kluwer U.K. group company) were agreed with the trustees in addition to the deficit contributions.
Risk management of main plans in the groupThe retirement and other post-employment plans expose the group to actuarial risks, such as longevity risks, interest rate risks, investments and market risks, and currency risks.
The group has restructured employee benefit plans in the past by moving existing and newly hired employees to defined contribution plans or by freezing the plans (either with no future service benefits accruals and/or no newparticipants entering into the plan). These redesigns reduce or cancel future benefit accruals in the plans and consequently reduce the pace of liability growth. The group also reviews periodically its financing and
investments policies (liability-driven investments) and its liability management (lump sum offerings).
The various plans manage their balance sheet in order to meet their pension promise. By using asset liability management (ALM) studies, major risk sources are identified and the impact of decisions assessed by quantifying the potential impact on elements like future pensions, contributions, and funded ratio. These ALM studies also determine risk and return measures that consider the interests of all stakeholders. The outcome of these studies results in a risk-return trade-off, taking the duration of pension liabilities into account, which will be an integral part of the investment strategy. The investment strategy covers the allocation of asset classes and hedging strategies, but also decisions on new and alternative asset classes, passive versus active investments, leverage, and the use of derivatives.
Assumptions
in % 2016 2015
Retirement plans
Discount rate to discount the net obligations/assets at year-end 2.1 2.6
Discount rate for pension expense 2.6 2.4
Expected rate of pension increases (in payment) at year-end 1.2 1.4
Expected rate of pension increases (in deferment) at year-end 1.1 1.3
Expected rate of inflation increase for pension expense 1.9 1.9
Other post-employment benefit plans
Discount rate used to discount the obligations at year-end 3.6 3.8
Discount rate for pension expense 3.8 3.5
Medical cost trend rate 3.0 3.0
Actuarial assumptions for retirement and other post- employment benefit plansThe discount rate is the yield rate at the end of the reporting period on high-quality corporate bonds that have maturity dates approximating the terms of the group’s obligations and that are denominated in the same currency in which the benefits are expected to be paid.
The calculation is performed annually by a qualified actuary.The following weighted average principal actuarial assumptions were used to determine the pension expense and other post-employment plans’ expenses for the year under review, and defined benefit obligations at the end of the reporting period.
120
Notes to the Consolidated Financial Statements Wolters Kluwer 2016 Annual Report
For the majority of the retirement and other post-employment schemes, the discount rate is determined or validated using the Towers Watson Rate: Link methodology, which uses mid-price AA corporate bond data from Bloomberg with a minimum outstanding amount of €500 million (less than 10 years to maturity) or €50 million (10 or more years to maturity). Bonds are considered AA-graded if they receive an AA (or equivalent) rating from either or both of the two primary rating agencies in a given geography. Bonds with options are excluded, as are bonds whose yields are among the top and bottom 10% within each maturity category (outliers). The 30-year spot rate is assumed constant beyond 30 years. For the U.S. plans the discount rate is based on the yield curve/cash flow matching approach which uses spot yields from the Citigroup Above Median Yield Curve and the timing of the cash flows of the plan.
Mortality assumptions for the most important plans are based on the following retirement mortality tables:– The Netherlands: AG projection table 2016, including
fund specific 2016 experience loading (2015: AG projection table 2014, including fund specific 2014 experience loading);
– U.S.: RP-2006 Mortality Table with MP 2015 projections, being the current standard mortality table (2015: Mortality Table with MP 2015 projections); and
– U.K.: SAPS S2 (Year of Birth) CMI 2013 projections with 1.5% long-term improvement rate (2015: SAPS S2 (Year of Birth) - CMI 2013 projections with 1.5% long-term improvement rate).
Assumptions regarding future mortality experience are set based on actuarial advice and best estimate mortality tables in the applicable countries.
The current life expectancy underlying the value of the defined benefit retirement obligations at December 31, 2016, are as follows:
Life expectancy
in years The Netherlands United States United Kingdom
Life expectancy at age of 65 now - male 21.5 20.8 22.8
Life expectancy at age of 65 now - female 25.5 22.8 24.9
Life expectancy aged 65 in 20 years - male 23.9 22.5 25.1
Life expectancy aged 65 in 20 years - female 27.7 24.4 27.2
In 2016, the life expectancies went up for the pension plans in the Netherlands and the U.K. The life expectancy in the U.S. plan went down due to updated mortality projection scales, which resulted in slightly shorter life expectancies. Given the nature of the defined benefit
obligations in Belgium, Italy, and Australia, with lump-sum benefit payments at retirement date instead of annuity payments, the impact of changing life expectancy after the retirement age on the plan liabilities is limited in these countries.
121
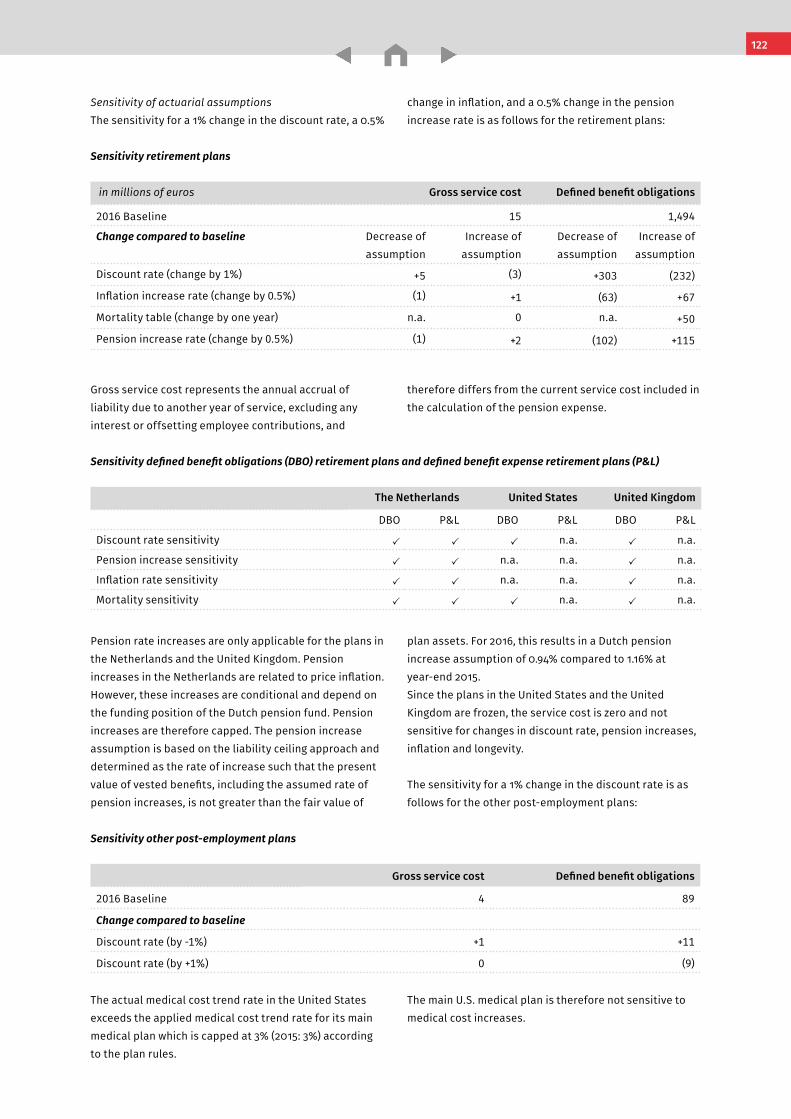
Notes to the Consolidated Financial Statements Wolters Kluwer 2016 Annual Report
Sensitivity of actuarial assumptionsThe sensitivity for a 1% change in the discount rate, a 0.5%
change in inflation, and a 0.5% change in the pension increase rate is as follows for the retirement plans:
Sensitivity retirement plans
in millions of euros Gross service cost Defined benefit obligations
2016 Baseline 15 1,494
Change compared to baseline Decrease of assumption
Increase of assumption
Decrease of assumption
Increase of assumption
Discount rate (change by 1%) +5 (3) +303 (232)
Inflation increase rate (change by 0.5%) (1) +1 (63) +67
Mortality table (change by one year) n.a. 0 n.a. +50
Pension increase rate (change by 0.5%) (1) +2 (102) +115
Gross service cost represents the annual accrual of liability due to another year of service, excluding any interest or offsetting employee contributions, and
therefore differs from the current service cost included in the calculation of the pension expense.
Sensitivity defined benefit obligations (DBO) retirement plans and defined benefit expense retirement plans (P&L)
The Netherlands United States United Kingdom
DBO P&L DBO P&L DBO P&L
Discount rate sensitivity P P P n.a. P n.a.
Pension increase sensitivity P P n.a. n.a. P n.a.
Inflation rate sensitivity P P n.a. n.a. P n.a.
Mortality sensitivity P P P n.a. P n.a.
Sensitivity other post-employment plans
Gross service cost Defined benefit obligations
2016 Baseline 4 89
Change compared to baseline
Discount rate (by -1%) +1 +11
Discount rate (by +1%) 0 (9)
Pension rate increases are only applicable for the plans in the Netherlands and the United Kingdom. Pension increases in the Netherlands are related to price inflation. However, these increases are conditional and depend on the funding position of the Dutch pension fund. Pension increases are therefore capped. The pension increase assumption is based on the liability ceiling approach and determined as the rate of increase such that the present value of vested benefits, including the assumed rate of pension increases, is not greater than the fair value of
plan assets. For 2016, this results in a Dutch pension increase assumption of 0.94% compared to 1.16% at year-end 2015.Since the plans in the United States and the United Kingdom are frozen, the service cost is zero and not sensitive for changes in discount rate, pension increases, inflation and longevity.
The sensitivity for a 1% change in the discount rate is as follows for the other post-employment plans:
The actual medical cost trend rate in the United States exceeds the applied medical cost trend rate for its main medical plan which is capped at 3% (2015: 3%) according to the plan rules.
The main U.S. medical plan is therefore not sensitive to medical cost increases.
122
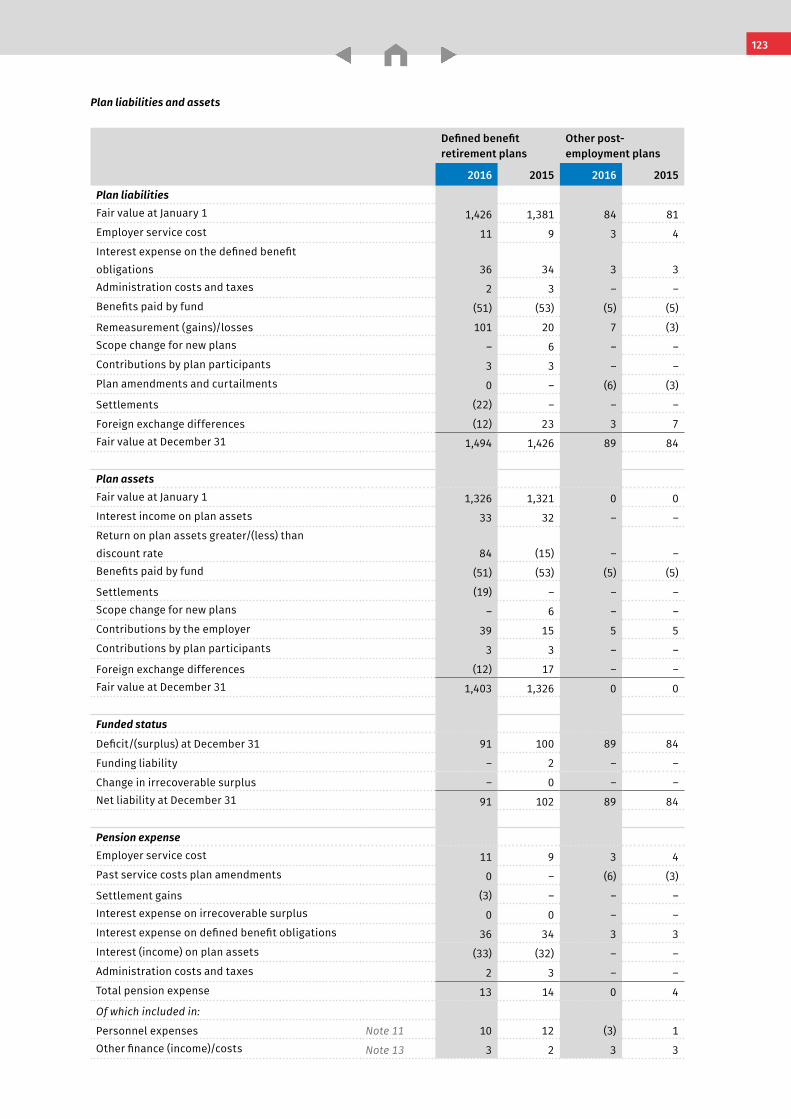
Notes to the Consolidated Financial Statements Wolters Kluwer 2016 Annual Report
Plan liabilities and assets
Defined benefit retirement plans
Other post-employment plans
2016 2015 2016 2015
Plan liabilitiesFair value at January 1 1,426 1,381 84 81Employer service cost 11 9 3 4Interest expense on the defined benefit obligations 36 34 3 3Administration costs and taxes 2 3 – –Benefits paid by fund (51) (53) (5) (5)
Remeasurement (gains)/losses 101 20 7 (3)Scope change for new plans – 6 – –Contributions by plan participants 3 3 – –Plan amendments and curtailments 0 – (6) (3)
Settlements (22) – – –
Foreign exchange differences (12) 23 3 7Fair value at December 31 1,494 1,426 89 84
Plan assetsFair value at January 1 1,326 1,321 0 0Interest income on plan assets 33 32 – –Return on plan assets greater/(less) than discount rate 84 (15) – –Benefits paid by fund (51) (53) (5) (5)
Settlements (19) – – –Scope change for new plans – 6 – –Contributions by the employer 39 15 5 5Contributions by plan participants 3 3 – –
Foreign exchange differences (12) 17 – –Fair value at December 31 1,403 1,326 0 0
Funded status
Deficit/(surplus) at December 31 91 100 89 84
Funding liability – 2 – –
Change in irrecoverable surplus – 0 – –Net liability at December 31 91 102 89 84
Pension expenseEmployer service cost 11 9 3 4Past service costs plan amendments 0 – (6) (3)
Settlement gains (3) – – –Interest expense on irrecoverable surplus 0 0 – –Interest expense on defined benefit obligations 36 34 3 3Interest (income) on plan assets (33) (32) – –Administration costs and taxes 2 3 – –Total pension expense 13 14 0 4
Of which included in:
Personnel expenses Note 11 10 12 (3) 1Other finance (income)/costs Note 13 3 2 3 3
123
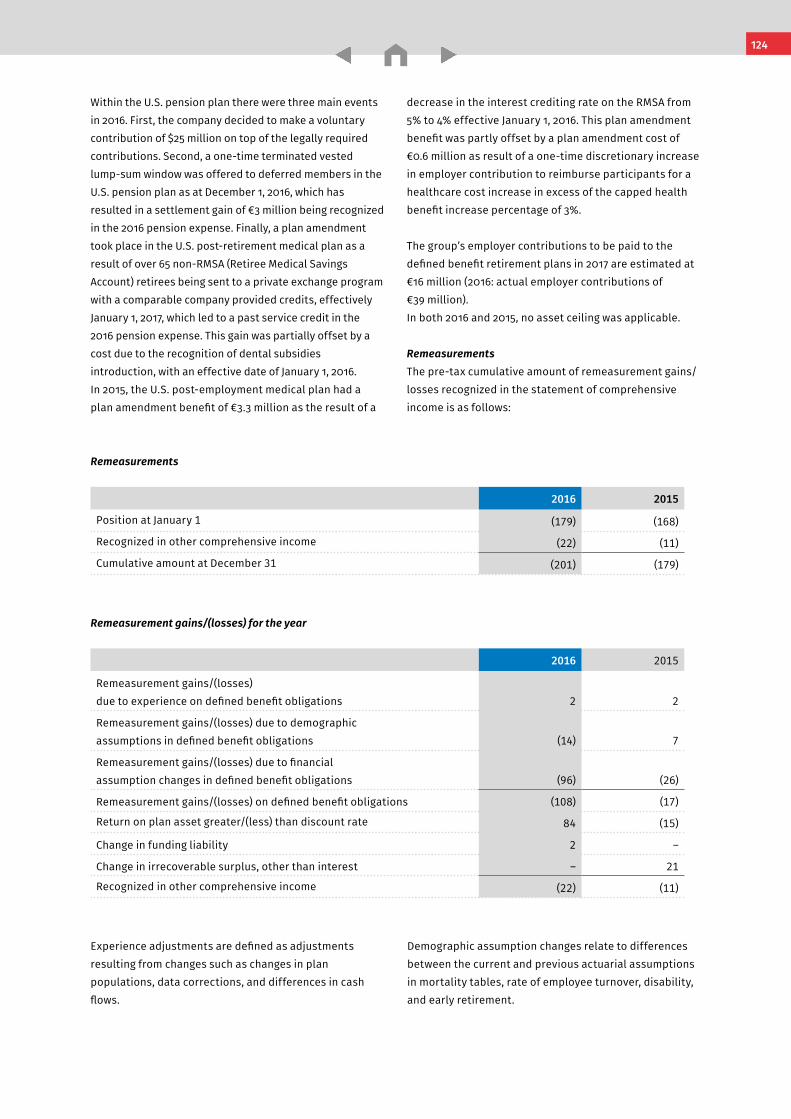
Notes to the Consolidated Financial Statements Wolters Kluwer 2016 Annual Report
Remeasurements
2016 2015
Position at January 1 (179) (168)
Recognized in other comprehensive income (22) (11)
Cumulative amount at December 31 (201) (179)
Remeasurement gains/(losses) for the year
2016 2015
Remeasurement gains/(losses) due to experience on defined benefit obligations 2 2
Remeasurement gains/(losses) due to demographic assumptions in defined benefit obligations (14) 7
Remeasurement gains/(losses) due to financial assumption changes in defined benefit obligations (96) (26)
Remeasurement gains/(losses) on defined benefit obligations (108) (17)
Return on plan asset greater/(less) than discount rate 84 (15)
Change in funding liability 2 –
Change in irrecoverable surplus, other than interest – 21
Recognized in other comprehensive income (22) (11)
Within the U.S. pension plan there were three main events in 2016. First, the company decided to make a voluntary contribution of $25 million on top of the legally required contributions. Second, a one-time terminated vested lump-sum window was offered to deferred members in the U.S. pension plan as at December 1, 2016, which has resulted in a settlement gain of €3 million being recognized in the 2016 pension expense. Finally, a plan amendment took place in the U.S. post-retirement medical plan as a result of over 65 non-RMSA (Retiree Medical Savings Account) retirees being sent to a private exchange program with a comparable company provided credits, effectively January 1, 2017, which led to a past service credit in the 2016 pension expense. This gain was partially offset by a cost due to the recognition of dental subsidies introduction, with an effective date of January 1, 2016.In 2015, the U.S. post-employment medical plan had a plan amendment benefit of €3.3 million as the result of a
decrease in the interest crediting rate on the RMSA from 5% to 4% effective January 1, 2016. This plan amendment benefit was partly offset by a plan amendment cost of €0.6 million as result of a one-time discretionary increase in employer contribution to reimburse participants for a healthcare cost increase in excess of the capped health benefit increase percentage of 3%.
The group’s employer contributions to be paid to the defined benefit retirement plans in 2017 are estimated at €16 million (2016: actual employer contributions of €39 million).In both 2016 and 2015, no asset ceiling was applicable.
RemeasurementsThe pre-tax cumulative amount of remeasurement gains/losses recognized in the statement of comprehensive income is as follows:
Experience adjustments are defined as adjustments resulting from changes such as changes in plan populations, data corrections, and differences in cash flows.
Demographic assumption changes relate to differences between the current and previous actuarial assumptions in mortality tables, rate of employee turnover, disability, and early retirement.
124
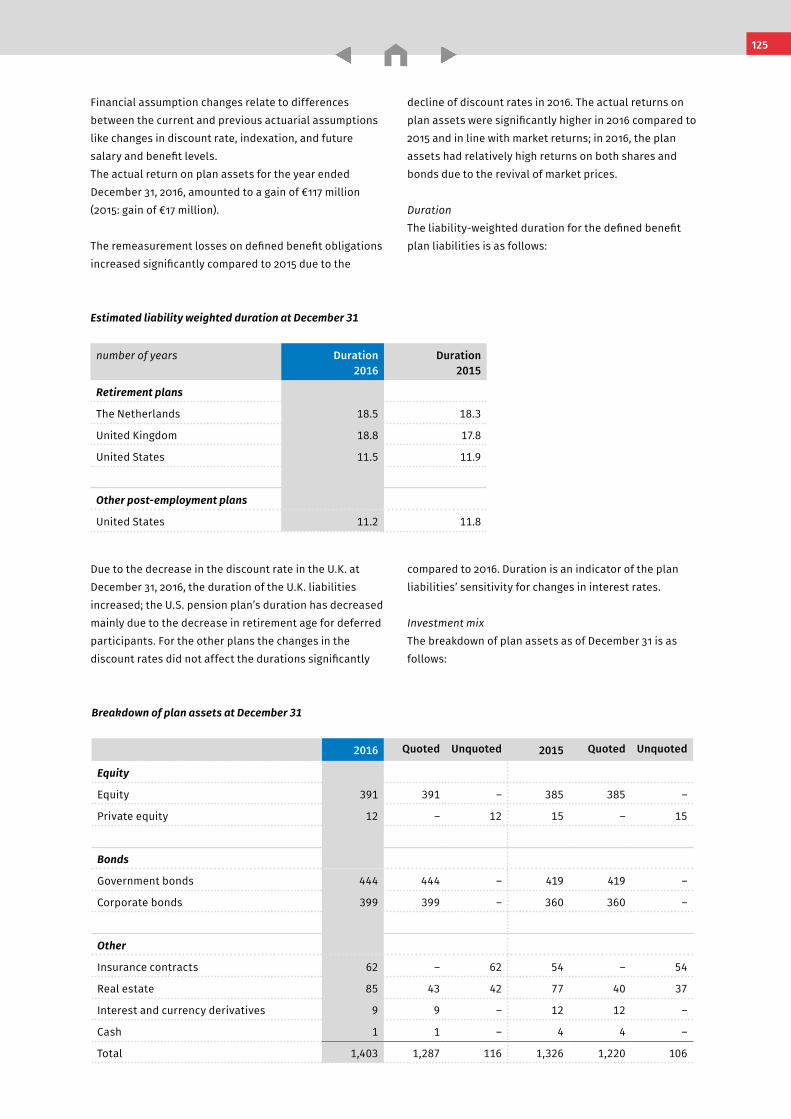
Notes to the Consolidated Financial Statements Wolters Kluwer 2016 Annual Report
Estimated liability weighted duration at December 31
number of years Duration 2016
Duration 2015
Retirement plans
The Netherlands 18.5 18.3
United Kingdom 18.8 17.8
United States 11.5 11.9
Other post-employment plans
United States 11.2 11.8
Financial assumption changes relate to differences between the current and previous actuarial assumptions like changes in discount rate, indexation, and future salary and benefit levels.The actual return on plan assets for the year ended December 31, 2016, amounted to a gain of €117 million (2015: gain of €17 million).
The remeasurement losses on defined benefit obligations increased significantly compared to 2015 due to the
decline of discount rates in 2016. The actual returns on plan assets were significantly higher in 2016 compared to 2015 and in line with market returns; in 2016, the plan assets had relatively high returns on both shares and bonds due to the revival of market prices.
DurationThe liability-weighted duration for the defined benefit plan liabilities is as follows:
Due to the decrease in the discount rate in the U.K. at December 31, 2016, the duration of the U.K. liabilities increased; the U.S. pension plan’s duration has decreased mainly due to the decrease in retirement age for deferred participants. For the other plans the changes in the discount rates did not affect the durations significantly
compared to 2016. Duration is an indicator of the plan liabilities’ sensitivity for changes in interest rates.
Investment mixThe breakdown of plan assets as of December 31 is as follows:
Breakdown of plan assets at December 31
2016 Quoted Unquoted 2015 Quoted Unquoted
Equity
Equity 391 391 – 385 385 –
Private equity 12 – 12 15 – 15
Bonds
Government bonds 444 444 – 419 419 –
Corporate bonds 399 399 – 360 360 –
Other
Insurance contracts 62 – 62 54 – 54
Real estate 85 43 42 77 40 37
Interest and currency derivatives 9 9 – 12 12 –
Cash 1 1 – 4 4 –
Total 1,403 1,287 116 1,326 1,220 106
125
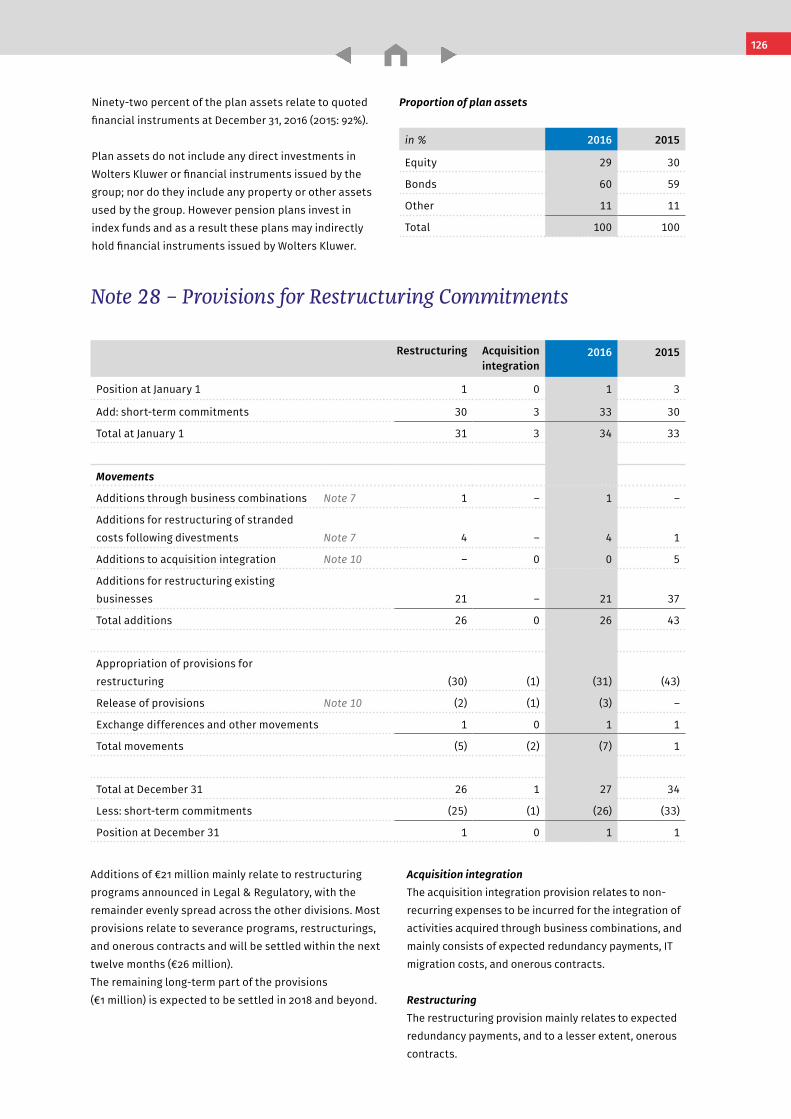
Notes to the Consolidated Financial Statements Wolters Kluwer 2016 Annual Report
Restructuring Acquisition integration
2016 2015
Position at January 1 1 0 1 3
Add: short-term commitments 30 3 33 30
Total at January 1 31 3 34 33
Movements
Additions through business combinations Note 7 1 – 1 –
Additions for restructuring of stranded costs following divestments Note 7 4 – 4 1
Additions to acquisition integration Note 10 – 0 0 5
Additions for restructuring existing businesses 21 – 21 37
Total additions 26 0 26 43
Appropriation of provisions for restructuring (30) (1) (31) (43)
Release of provisions Note 10 (2) (1) (3) –
Exchange differences and other movements 1 0 1 1
Total movements (5) (2) (7) 1
Total at December 31 26 1 27 34
Less: short-term commitments (25) (1) (26) (33)
Position at December 31 1 0 1 1
Additions of €21 million mainly relate to restructuring programs announced in Legal & Regulatory, with the remainder evenly spread across the other divisions. Most provisions relate to severance programs, restructurings, and onerous contracts and will be settled within the next twelve months (€26 million).The remaining long-term part of the provisions (€1 million) is expected to be settled in 2018 and beyond.
Acquisition integrationThe acquisition integration provision relates to non-recurring expenses to be incurred for the integration of activities acquired through business combinations, and mainly consists of expected redundancy payments, IT migration costs, and onerous contracts. RestructuringThe restructuring provision mainly relates to expected redundancy payments, and to a lesser extent, onerous contracts.
Note 28 – Provisions for Restructuring Commitments
Ninety-two percent of the plan assets relate to quoted financial instruments at December 31, 2016 (2015: 92%).
Plan assets do not include any direct investments in Wolters Kluwer or financial instruments issued by the group; nor do they include any property or other assets used by the group. However pension plans invest in index funds and as a result these plans may indirectly hold financial instruments issued by Wolters Kluwer.
Proportion of plan assets
in % 2016 2015
Equity 29 30
Bonds 60 59
Other 11 11
Total 100 100
126
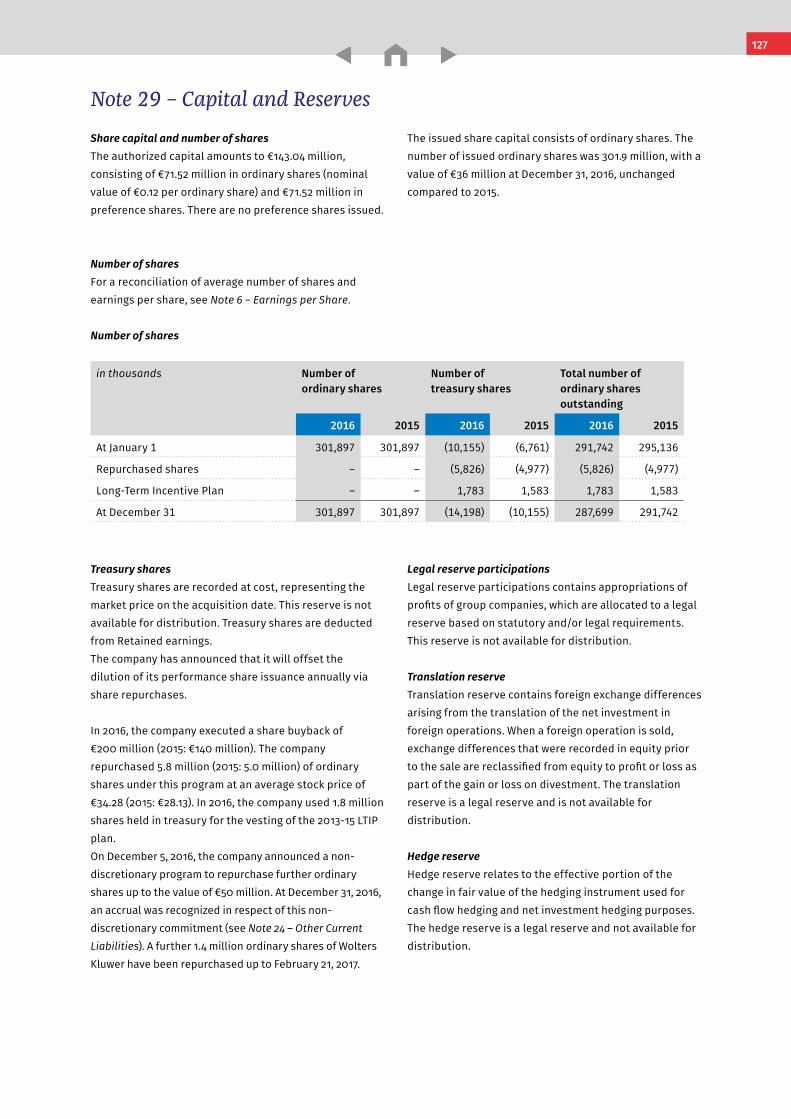
Notes to the Consolidated Financial Statements Wolters Kluwer 2016 Annual Report
Note 29 – Capital and Reserves
Share capital and number of sharesThe authorized capital amounts to €143.04 million, consisting of €71.52 million in ordinary shares (nominal value of €0.12 per ordinary share) and €71.52 million in preference shares. There are no preference shares issued.
The issued share capital consists of ordinary shares. The number of issued ordinary shares was 301.9 million, with a value of €36 million at December 31, 2016, unchanged compared to 2015.
Treasury sharesTreasury shares are recorded at cost, representing the market price on the acquisition date. This reserve is not available for distribution. Treasury shares are deducted from Retained earnings.The company has announced that it will offset the dilution of its performance share issuance annually via share repurchases.
In 2016, the company executed a share buyback of €200 million (2015: €140 million). The company repurchased 5.8 million (2015: 5.0 million) of ordinary shares under this program at an average stock price of €34.28 (2015: €28.13). In 2016, the company used 1.8 million shares held in treasury for the vesting of the 2013-15 LTIP plan.On December 5, 2016, the company announced a non-discretionary program to repurchase further ordinary shares up to the value of €50 million. At December 31, 2016, an accrual was recognized in respect of this non-discretionary commitment (see Note 24 – Other Current Liabilities). A further 1.4 million ordinary shares of Wolters Kluwer have been repurchased up to February 21, 2017.
Legal reserve participationsLegal reserve participations contains appropriations of profits of group companies, which are allocated to a legal reserve based on statutory and/or legal requirements. This reserve is not available for distribution.
Translation reserveTranslation reserve contains foreign exchange differences arising from the translation of the net investment in foreign operations. When a foreign operation is sold, exchange differences that were recorded in equity prior to the sale are reclassified from equity to profit or loss as part of the gain or loss on divestment. The translation reserve is a legal reserve and is not available for distribution.
Hedge reserveHedge reserve relates to the effective portion of the change in fair value of the hedging instrument used for cash flow hedging and net investment hedging purposes. The hedge reserve is a legal reserve and not available for distribution.
Number of shares
in thousands Number of ordinary shares
Number of treasury shares
Total number of ordinary shares outstanding
2016 2015 2016 2015 2016 2015
At January 1 301,897 301,897 (10,155) (6,761) 291,742 295,136
Repurchased shares – – (5,826) (4,977) (5,826) (4,977)
Long-Term Incentive Plan – – 1,783 1,583 1,783 1,583
At December 31 301,897 301,897 (14,198) (10,155) 287,699 291,742
Number of sharesFor a reconciliation of average number of shares and earnings per share, see Note 6 – Earnings per Share.
127
Notes to the Consolidated Financial Statements Wolters Kluwer 2016 Annual Report
DividendsPursuant to Article 29 of the Articles of Association, and with the approval of the Supervisory Board, a proposal will be submitted to the Annual General Meeting of Shareholders to make a total distribution of €0.79 per share (dividend over financial year 2015: €0.75 per share). Wolters Kluwer moved to semi-annual dividend frequency in 2015, starting with an interim dividend for 2015. On February 24, 2016, the Supervisory Board and Executive Board of Wolters Kluwer resolved to distribute an interim dividend of €0.19 per share on September 14, 2016. Subject to the approval of the Annual General meeting of Shareholders a final dividend of €0.60 per ordinary share will be paid in cash on May 16, 2017.
The company has a progressive dividend policy under which the company expects to increase the total dividend per share each year.
Free distributable reservesThe share premium reserve, the retained earnings, and undistributed profit for the year are available for dividend distribution.
Option preference sharesThe company has granted an option to purchase preference shares to the Wolters Kluwer Preference Shares Foundation (Stichting Preferente Aandelen Wolters Kluwer). The dividend on these shares would equal a normal market rate of return, based on a weighted average interest rate applied by the European Central Bank. Therefore, the fair value of the option is deemed to be zero. Shareholder’s equity movement scheduleFor the equity movement schedule reference is made toNote 43 - Shareholders’ Equity in the 2016 Financial Statements.
Note 30 – Share-based Payments
Long-Term Incentive PlanExecutive Board members and senior management are awarded shares under the equity-settled Long-Term Incentive Plan (LTIP); the performance conditions are based on Diluted Earnings per Share (EPS) at constant currencies and Total Shareholder Return (TSR).
For the Executive Board, the LTIP awards depend partially on the TSR performance (50% of the value of the conditionally awarded rights on shares) and partially on the EPS performance (50% of the value of the conditionally awarded rights on shares).
For senior management, the LTIP awards depend partially on the TSR performance (50% of the conditionally awarded rights on shares) and partially on the EPS performance (50% of the conditionally awarded rights on shares). The TSR-related LTIP awards for the Executive Board and senior management are based on the same payout schedules.The performance period of the LTIP is three years, at the beginning of which a base number of shares (normpayout) is conditionally awarded to each beneficiary.
In 2016, €18 million has been recognized within personnel expenses in profit or loss (2015: €19 million) related to the total cost of the LTIP grants for 2014-16, 2015-17, and 2016-18 (Note 11 - Personnel Expenses). The costs related to the share-based payments decreased compared to the prior year mainly due to forfeitures.
Conditionally awarded TSR related LTIP-sharesFor the conditional TSR awards that were awarded up to and including 2016, the payout of shares after three years fully depends on the group’s TSR relative to a pre-defined group of 15 peer companies. Vesting of these conditional grants is subject to the non-market condition that the participant stays with the group until the plan’s maturity. The expense of the TSR-related LTIP is recognized ratably in profit or loss over the performance period.Actual awards at the end of the performance period will range anywhere from 0% to 150% of the norm payout. There will be no payout for the Executive Board and senior management if Wolters Kluwer ends below the eighth position in the TSR ranking, while other payouts will be made as follows: 150% for first or second position, 125% for third or fourth position, 100% for fifth or sixth position, and 75% for seventh or eighth position.
128
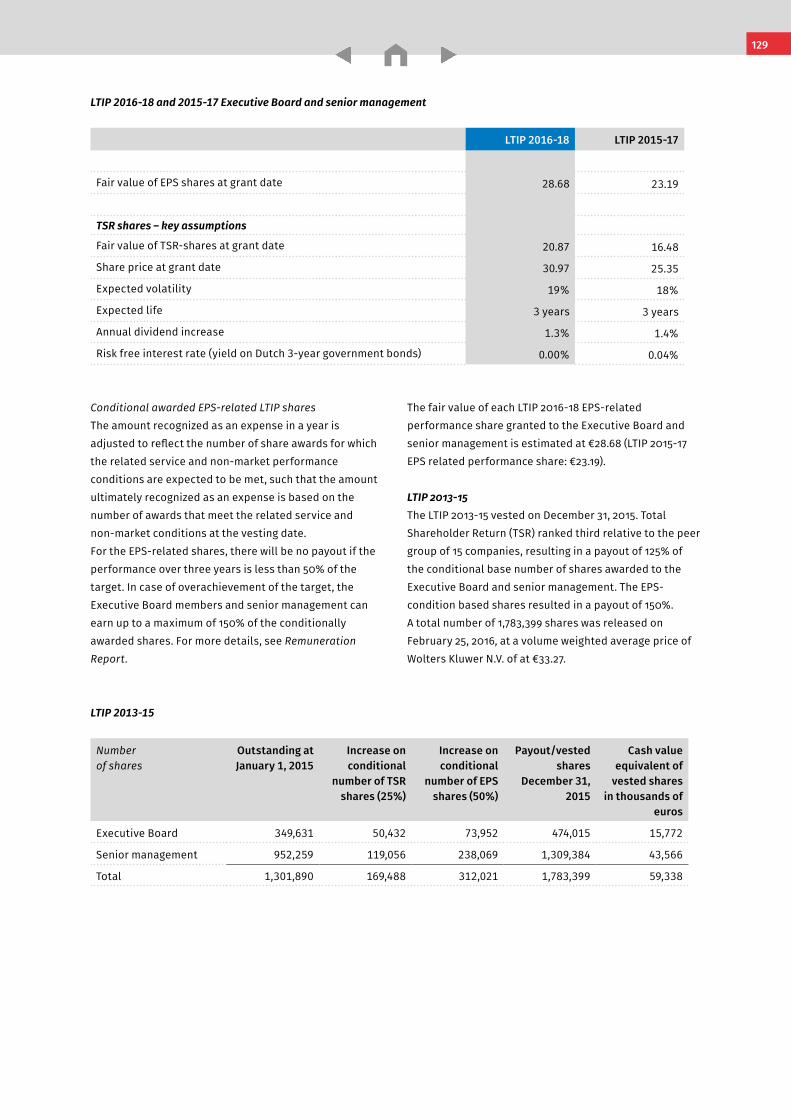
Notes to the Consolidated Financial Statements Wolters Kluwer 2016 Annual Report
LTIP 2016-18 and 2015-17 Executive Board and senior management
LTIP 2016-18 LTIP 2015-17
Fair value of EPS shares at grant date 28.68 23.19
TSR shares – key assumptions
Fair value of TSR-shares at grant date 20.87 16.48
Share price at grant date 30.97 25.35
Expected volatility 19% 18%
Expected life 3 years 3 years
Annual dividend increase 1.3% 1.4%
Risk free interest rate (yield on Dutch 3-year government bonds) 0.00% 0.04%
LTIP 2013-15
Number of shares
Outstanding at January 1, 2015
Increase on conditional
number of TSR shares (25%)
Increase on conditional
number of EPS shares (50%)
Payout/vested shares
December 31, 2015
Cash value equivalent of
vested shares in thousands of
euros
Executive Board 349,631 50,432 73,952 474,015 15,772
Senior management 952,259 119,056 238,069 1,309,384 43,566
Total 1,301,890 169,488 312,021 1,783,399 59,338
Conditional awarded EPS-related LTIP shares The amount recognized as an expense in a year is adjusted to reflect the number of share awards for which the related service and non-market performance conditions are expected to be met, such that the amount ultimately recognized as an expense is based on the number of awards that meet the related service and non-market conditions at the vesting date.For the EPS-related shares, there will be no payout if the performance over three years is less than 50% of the target. In case of overachievement of the target, the Executive Board members and senior management can earn up to a maximum of 150% of the conditionally awarded shares. For more details, see Remuneration Report.
The fair value of each LTIP 2016-18 EPS-related performance share granted to the Executive Board and senior management is estimated at €28.68 (LTIP 2015-17 EPS related performance share: €23.19). LTIP 2013-15The LTIP 2013-15 vested on December 31, 2015. Total Shareholder Return (TSR) ranked third relative to the peer group of 15 companies, resulting in a payout of 125% of the conditional base number of shares awarded to the Executive Board and senior management. The EPS- condition based shares resulted in a payout of 150%.A total number of 1,783,399 shares was released on February 25, 2016, at a volume weighted average price of Wolters Kluwer N.V. of at €33.27.
129
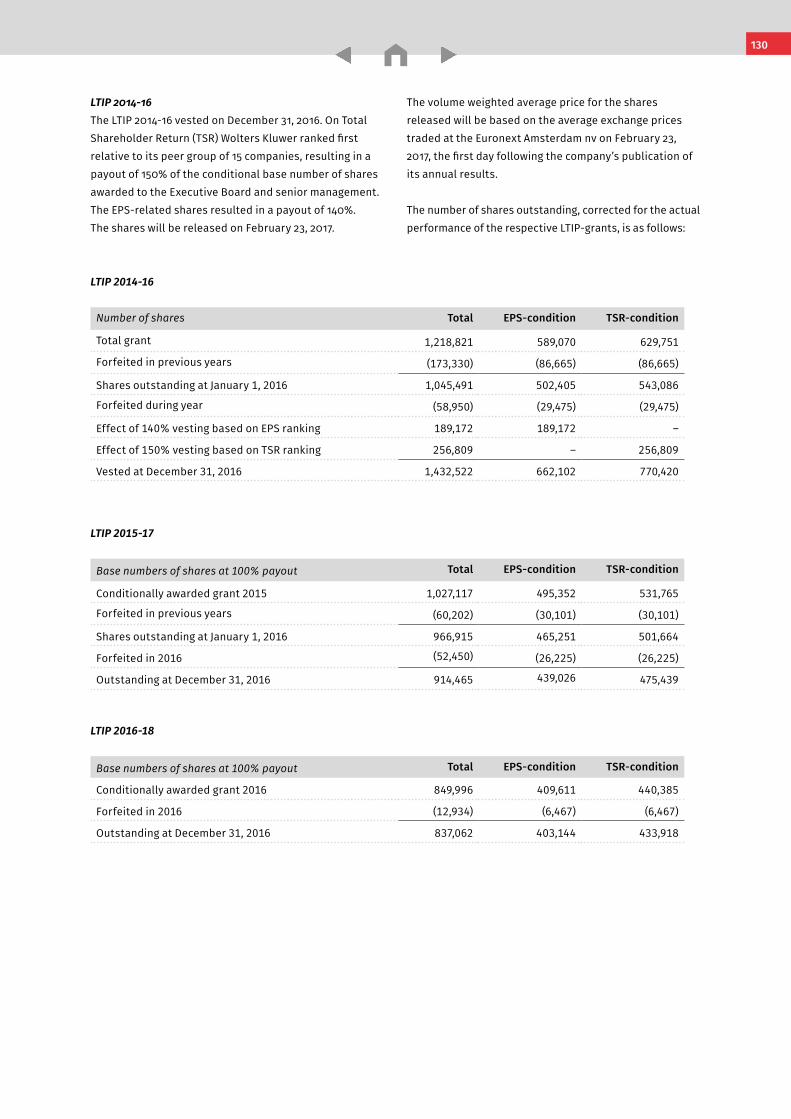
Notes to the Consolidated Financial Statements Wolters Kluwer 2016 Annual Report
LTIP 2014-16The LTIP 2014-16 vested on December 31, 2016. On Total Shareholder Return (TSR) Wolters Kluwer ranked first relative to its peer group of 15 companies, resulting in a payout of 150% of the conditional base number of shares awarded to the Executive Board and senior management. The EPS-related shares resulted in a payout of 140%.The shares will be released on February 23, 2017.
The volume weighted average price for the shares released will be based on the average exchange prices traded at the Euronext Amsterdam nv on February 23, 2017, the first day following the company’s publication of its annual results.
The number of shares outstanding, corrected for the actual performance of the respective LTIP-grants, is as follows:
LTIP 2014-16
Number of shares Total EPS-condition TSR-condition
Total grant 1,218,821 589,070 629,751
Forfeited in previous years (173,330) (86,665) (86,665)
Shares outstanding at January 1, 2016 1,045,491 502,405 543,086
Forfeited during year (58,950) (29,475) (29,475)
Effect of 140% vesting based on EPS ranking 189,172 189,172 –
Effect of 150% vesting based on TSR ranking 256,809 – 256,809
Vested at December 31, 2016 1,432,522 662,102 770,420
LTIP 2015-17
Base numbers of shares at 100% payout Total EPS-condition TSR-condition
Conditionally awarded grant 2015 1,027,117 495,352 531,765
Forfeited in previous years (60,202) (30,101) (30,101)
Shares outstanding at January 1, 2016 966,915 465,251 501,664
Forfeited in 2016 (52,450) (26,225) (26,225)
Outstanding at December 31, 2016 914,465 439,026 475,439
LTIP 2016-18
Base numbers of shares at 100% payout Total EPS-condition TSR-condition
Conditionally awarded grant 2016 849,996 409,611 440,385
Forfeited in 2016 (12,934) (6,467) (6,467)
Outstanding at December 31, 2016 837,062 403,144 433,918
130
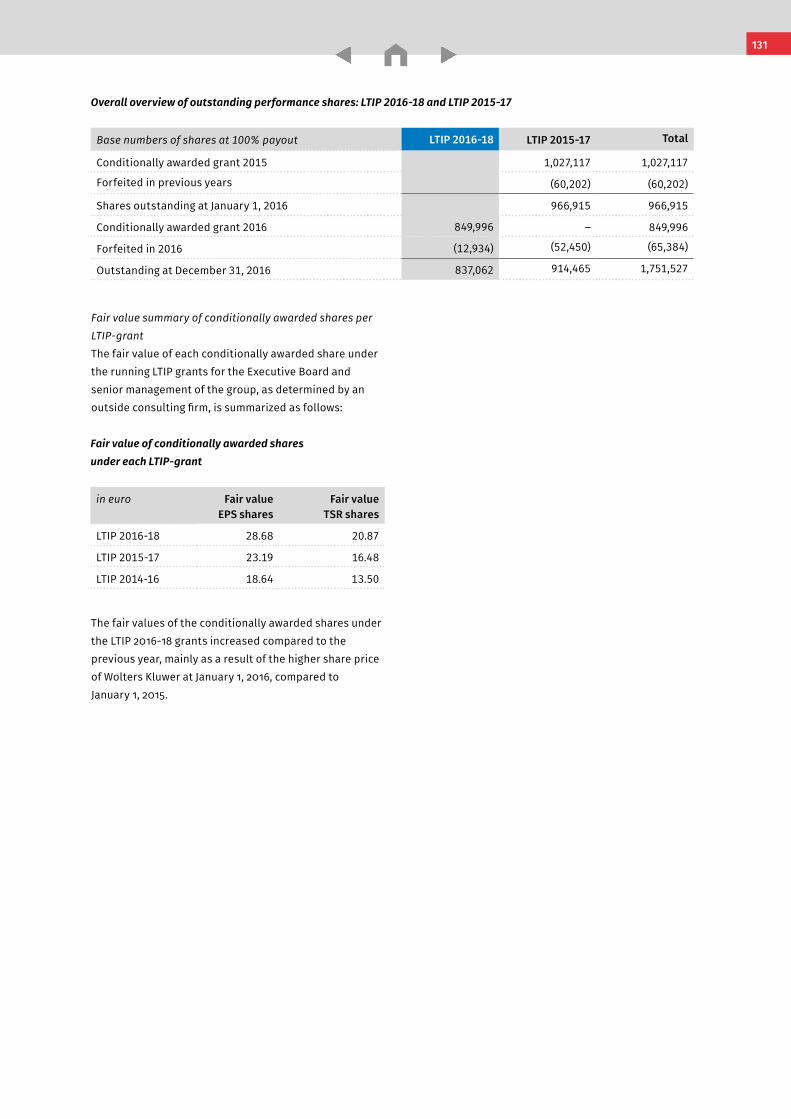
Notes to the Consolidated Financial Statements Wolters Kluwer 2016 Annual Report
Fair value summary of conditionally awarded shares per LTIP-grantThe fair value of each conditionally awarded share under the running LTIP grants for the Executive Board and senior management of the group, as determined by an outside consulting firm, is summarized as follows:
The fair values of the conditionally awarded shares under the LTIP 2016-18 grants increased compared to the previous year, mainly as a result of the higher share price of Wolters Kluwer at January 1, 2016, compared to January 1, 2015.
Overall overview of outstanding performance shares: LTIP 2016-18 and LTIP 2015-17
Base numbers of shares at 100% payout LTIP 2016-18 LTIP 2015-17 Total
Conditionally awarded grant 2015 1,027,117 1,027,117
Forfeited in previous years (60,202) (60,202)
Shares outstanding at January 1, 2016 966,915 966,915
Conditionally awarded grant 2016 849,996 – 849,996
Forfeited in 2016 (12,934) (52,450) (65,384)
Outstanding at December 31, 2016 837,062 914,465 1,751,527
Fair value of conditionally awarded shares under each LTIP-grant
in euro Fair value EPS shares
Fair value TSR shares
LTIP 2016-18 28.68 20.87
LTIP 2015-17 23.19 16.48
LTIP 2014-16 18.64 13.50
131
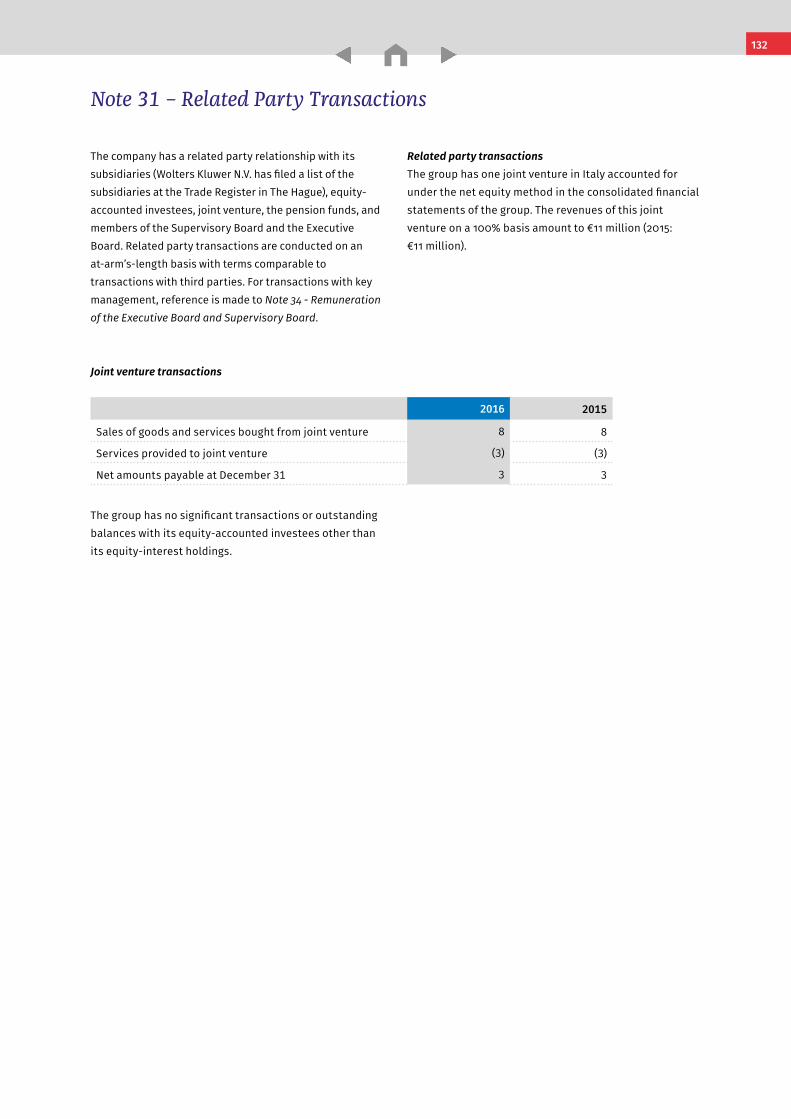
Notes to the Consolidated Financial Statements Wolters Kluwer 2016 Annual Report
The company has a related party relationship with its subsidiaries (Wolters Kluwer N.V. has filed a list of the subsidiaries at the Trade Register in The Hague), equity- accounted investees, joint venture, the pension funds, and members of the Supervisory Board and the Executive Board. Related party transactions are conducted on anat-arm’s-length basis with terms comparable to transactions with third parties. For transactions with key management, reference is made to Note 34 - Remuneration of the Executive Board and Supervisory Board.
Related party transactionsThe group has one joint venture in Italy accounted for under the net equity method in the consolidated financial statements of the group. The revenues of this joint venture on a 100% basis amount to €11 million (2015: €11 million).
Note 31 – Related Party Transactions
Joint venture transactions
2016 2015
Sales of goods and services bought from joint venture 8 8
Services provided to joint venture (3) (3)
Net amounts payable at December 31 3 3
The group has no significant transactions or outstanding balances with its equity-accounted investees other than its equity-interest holdings.
132
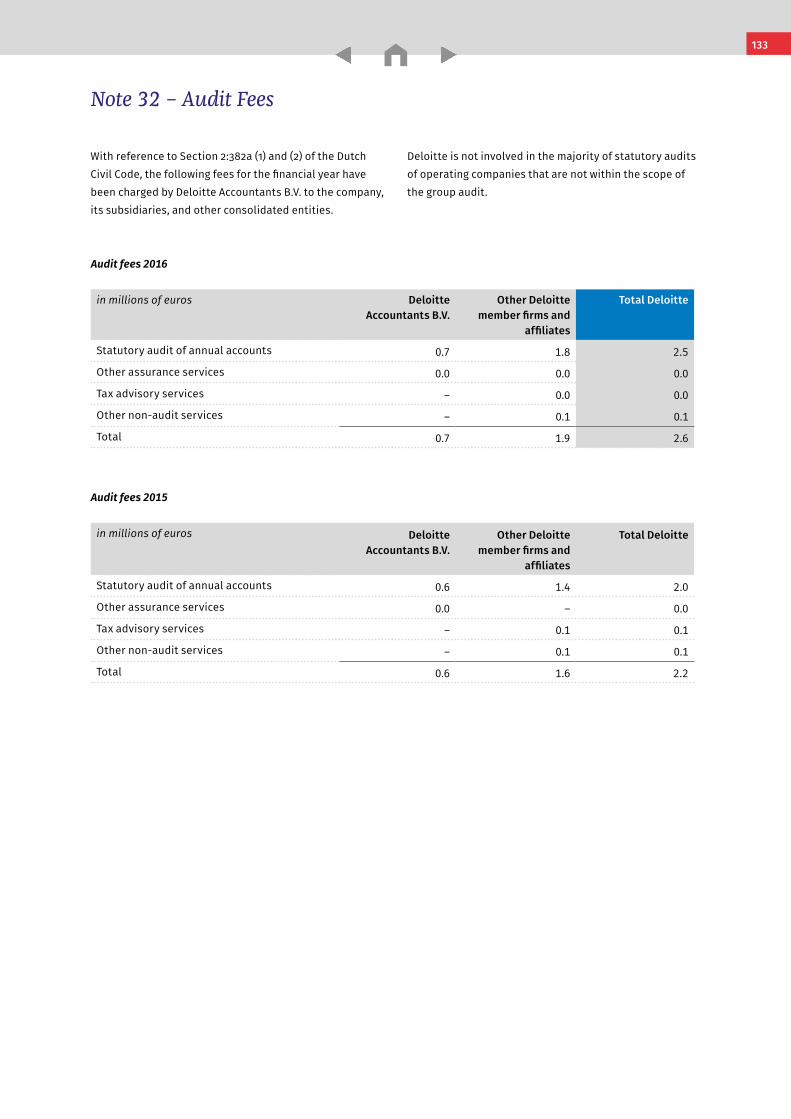
Notes to the Consolidated Financial Statements Wolters Kluwer 2016 Annual Report
Note 32 – Audit Fees
With reference to Section 2:382a (1) and (2) of the Dutch Civil Code, the following fees for the financial year have been charged by Deloitte Accountants B.V. to the company, its subsidiaries, and other consolidated entities.
Deloitte is not involved in the majority of statutory audits of operating companies that are not within the scope of the group audit.
Audit fees 2016
in millions of euros Deloitte Accountants B.V.
Other Deloitte member firms and
affiliates
Total Deloitte
Statutory audit of annual accounts 0.7 1.8 2.5
Other assurance services 0.0 0.0 0.0
Tax advisory services – 0.0 0.0
Other non-audit services – 0.1 0.1
Total 0.7 1.9 2.6
Audit fees 2015
in millions of euros Deloitte Accountants B.V.
Other Deloitte member firms and
affiliates
Total Deloitte
Statutory audit of annual accounts 0.6 1.4 2.0
Other assurance services 0.0 – 0.0
Tax advisory services – 0.1 0.1
Other non-audit services – 0.1 0.1
Total 0.6 1.6 2.2
133
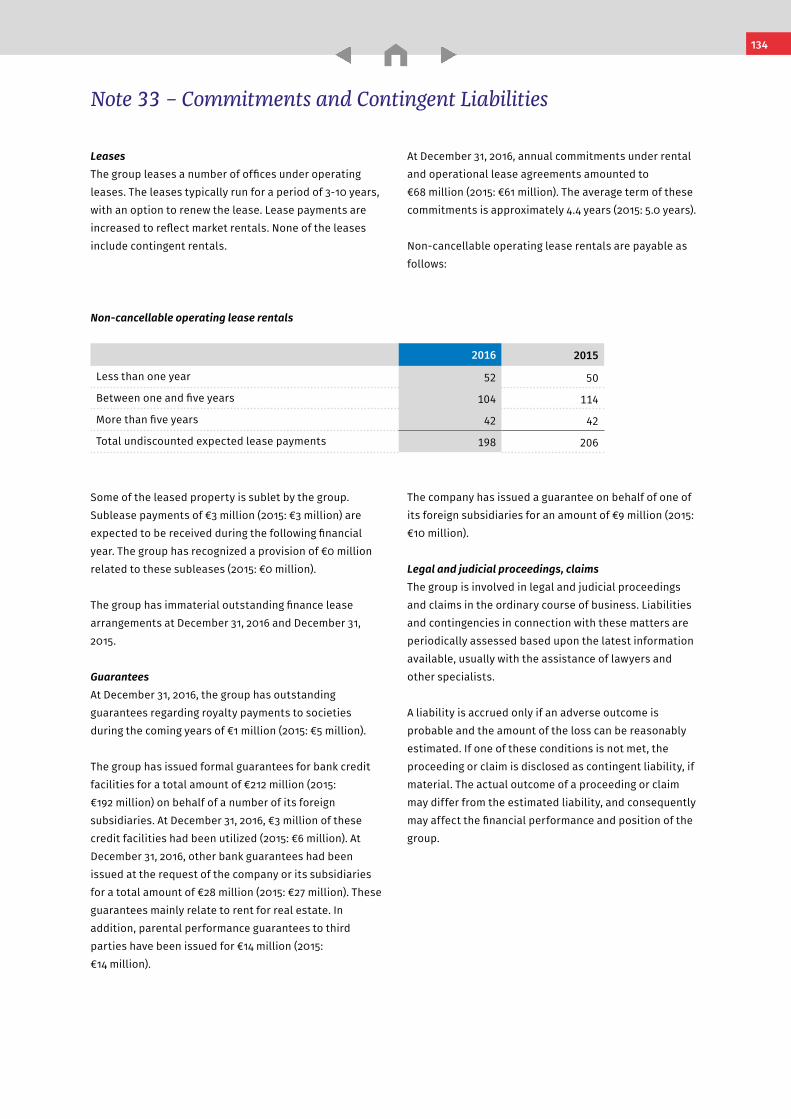
Notes to the Consolidated Financial Statements Wolters Kluwer 2016 Annual Report
Some of the leased property is sublet by the group. Sublease payments of €3 million (2015: €3 million) are expected to be received during the following financial year. The group has recognized a provision of €0 million related to these subleases (2015: €0 million).
The group has immaterial outstanding finance lease arrangements at December 31, 2016 and December 31, 2015.
GuaranteesAt December 31, 2016, the group has outstanding guarantees regarding royalty payments to societies during the coming years of €1 million (2015: €5 million).
The group has issued formal guarantees for bank credit facilities for a total amount of €212 million (2015: €192 million) on behalf of a number of its foreign subsidiaries. At December 31, 2016, €3 million of these credit facilities had been utilized (2015: €6 million). At December 31, 2016, other bank guarantees had been issued at the request of the company or its subsidiaries for a total amount of €28 million (2015: €27 million). These guarantees mainly relate to rent for real estate. In addition, parental performance guarantees to third parties have been issued for €14 million (2015: €14 million).
The company has issued a guarantee on behalf of one of its foreign subsidiaries for an amount of €9 million (2015:€10 million).
Legal and judicial proceedings, claimsThe group is involved in legal and judicial proceedings and claims in the ordinary course of business. Liabilities and contingencies in connection with these matters are periodically assessed based upon the latest information available, usually with the assistance of lawyers and other specialists.
A liability is accrued only if an adverse outcome is probable and the amount of the loss can be reasonably estimated. If one of these conditions is not met, the proceeding or claim is disclosed as contingent liability, if material. The actual outcome of a proceeding or claim may differ from the estimated liability, and consequently may affect the financial performance and position of the group.
Note 33 – Commitments and Contingent Liabilities
LeasesThe group leases a number of offices under operating leases. The leases typically run for a period of 3-10 years, with an option to renew the lease. Lease payments are increased to reflect market rentals. None of the leases include contingent rentals.
At December 31, 2016, annual commitments under rental and operational lease agreements amounted to€68 million (2015: €61 million). The average term of these commitments is approximately 4.4 years (2015: 5.0 years).
Non-cancellable operating lease rentals are payable as follows:
Non-cancellable operating lease rentals
2016 2015
Less than one year 52 50
Between one and five years 104 114
More than five years 42 42
Total undiscounted expected lease payments 198 206
134
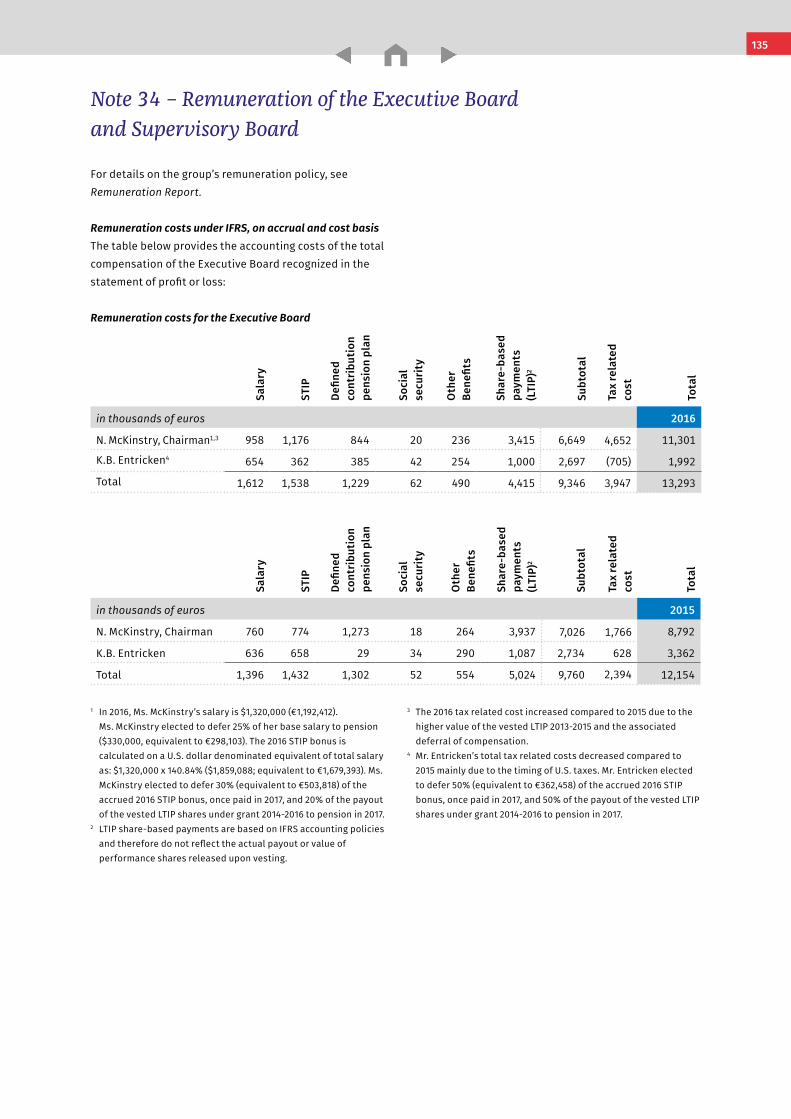
Notes to the Consolidated Financial Statements Wolters Kluwer 2016 Annual Report
Remuneration costs for the Executive Board
Sala
ry
STIP
Defin
ed
cont
ribu
tion
pe
nsio
n pl
an
Soci
al
secu
rity
Oth
er
Bene
fits
Shar
e-ba
sed
paym
ents
(L
TIP)
2
Subt
otal
Tax
rela
ted
cost
Tota
l
in thousands of euros 2016
N. McKinstry, Chairman1,3 958 1,176 844 20 236 3,415 6,649 4,652 11,301
K.B. Entricken4 654 362 385 42 254 1,000 2,697 (705) 1,992
Total 1,612 1,538 1,229 62 490 4,415 9,346 3,947 13,293
Sala
ry
STIP
Defin
ed
cont
ribu
tion
pe
nsio
n pl
an
Soci
al
secu
rity
Oth
er
Bene
fits
Shar
e-ba
sed
paym
ents
(L
TIP)
2
Subt
otal
Tax
rela
ted
cost
Tota
l
in thousands of euros 2015
N. McKinstry, Chairman 760 774 1,273 18 264 3,937 7,026 1,766 8,792
K.B. Entricken 636 658 29 34 290 1,087 2,734 628 3,362
Total 1,396 1,432 1,302 52 554 5,024 9,760 2,394 12,154
Note 34 – Remuneration of the Executive Board and Supervisory Board
For details on the group’s remuneration policy, see Remuneration Report.
Remuneration costs under IFRS, on accrual and cost basis The table below provides the accounting costs of the total compensation of the Executive Board recognized in the statement of profit or loss:
1 In 2016, Ms. McKinstry’s salary is $1,320,000 (€1,192,412).Ms. McKinstry elected to defer 25% of her base salary to pension ($330,000, equivalent to €298,103). The 2016 STIP bonus is calculated on a U.S. dollar denominated equivalent of total salary as: $1,320,000 x 140.84% ($1,859,088; equivalent to €1,679,393). Ms. McKinstry elected to defer 30% (equivalent to €503,818) of the accrued 2016 STIP bonus, once paid in 2017, and 20% of the payout of the vested LTIP shares under grant 2014-2016 to pension in 2017.
2 LTIP share-based payments are based on IFRS accounting policies and therefore do not reflect the actual payout or value of performance shares released upon vesting.
3 The 2016 tax related cost increased compared to 2015 due to the higher value of the vested LTIP 2013-2015 and the associated deferral of compensation.
4 Mr. Entricken’s total tax related costs decreased compared to 2015 mainly due to the timing of U.S. taxes. Mr. Entricken elected to defer 50% (equivalent to €362,458) of the accrued 2016 STIP bonus, once paid in 2017, and 50% of the payout of the vested LTIP shares under grant 2014-2016 to pension in 2017.
135
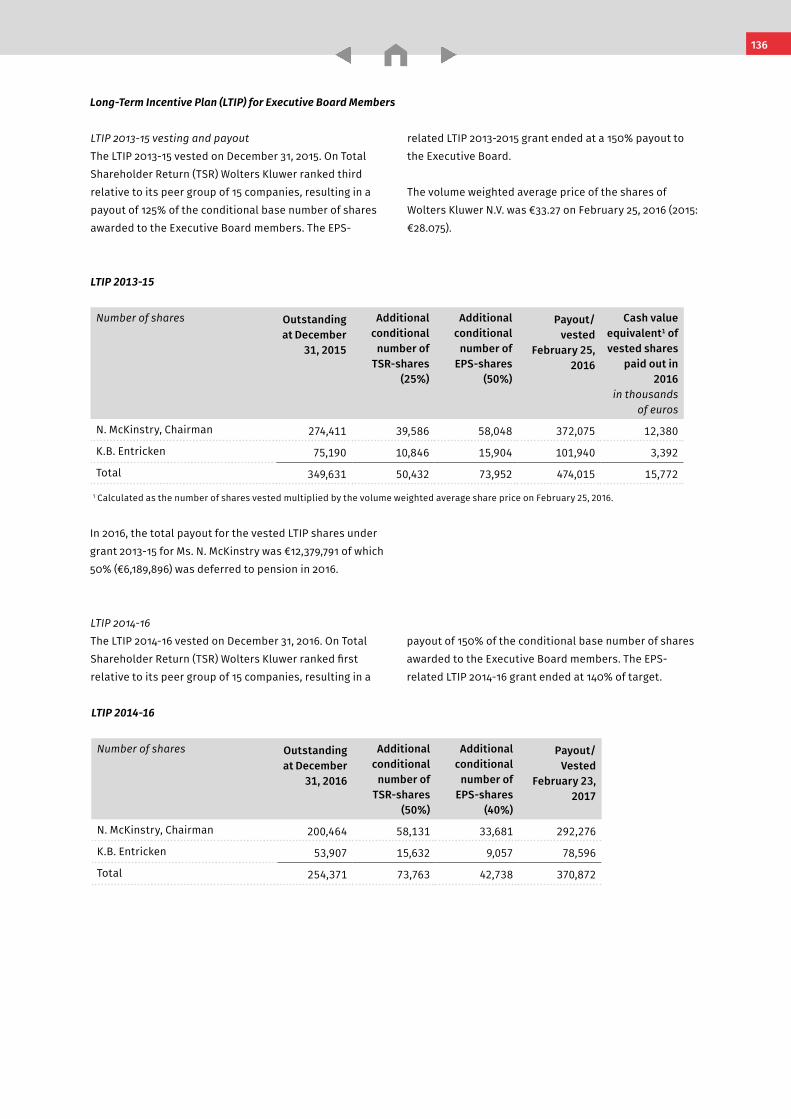
Notes to the Consolidated Financial Statements Wolters Kluwer 2016 Annual Report
LTIP 2013-15
Number of shares Outstanding at December
31, 2015
Additional conditional
number of TSR-shares
(25%)
Additional conditional
number of EPS-shares
(50%)
Payout/ vested
February 25, 2016
Cash value equivalent1 of vested shares
paid out in 2016
in thousands of euros
N. McKinstry, Chairman 274,411 39,586 58,048 372,075 12,380
K.B. Entricken 75,190 10,846 15,904 101,940 3,392
Total 349,631 50,432 73,952 474,015 15,772
1 Calculated as the number of shares vested multiplied by the volume weighted average share price on February 25, 2016.
LTIP 2014-16
Number of shares Outstanding at December
31, 2016
Additional conditional
number of TSR-shares
(50%)
Additional conditional
number of EPS-shares
(40%)
Payout/ Vested
February 23, 2017
N. McKinstry, Chairman 200,464 58,131 33,681 292,276
K.B. Entricken 53,907 15,632 9,057 78,596
Total 254,371 73,763 42,738 370,872
LTIP 2014-16The LTIP 2014-16 vested on December 31, 2016. On Total Shareholder Return (TSR) Wolters Kluwer ranked first relative to its peer group of 15 companies, resulting in a
payout of 150% of the conditional base number of shares awarded to the Executive Board members. The EPS-related LTIP 2014-16 grant ended at 140% of target.
In 2016, the total payout for the vested LTIP shares under grant 2013-15 for Ms. N. McKinstry was €12,379,791 of which 50% (€6,189,896) was deferred to pension in 2016.
LTIP 2013-15 vesting and payoutThe LTIP 2013-15 vested on December 31, 2015. On Total Shareholder Return (TSR) Wolters Kluwer ranked third relative to its peer group of 15 companies, resulting in a payout of 125% of the conditional base number of shares awarded to the Executive Board members. The EPS-
related LTIP 2013-2015 grant ended at a 150% payout to the Executive Board. The volume weighted average price of the shares of Wolters Kluwer N.V. was €33.27 on February 25, 2016 (2015: €28.075).
Long-Term Incentive Plan (LTIP) for Executive Board Members
136
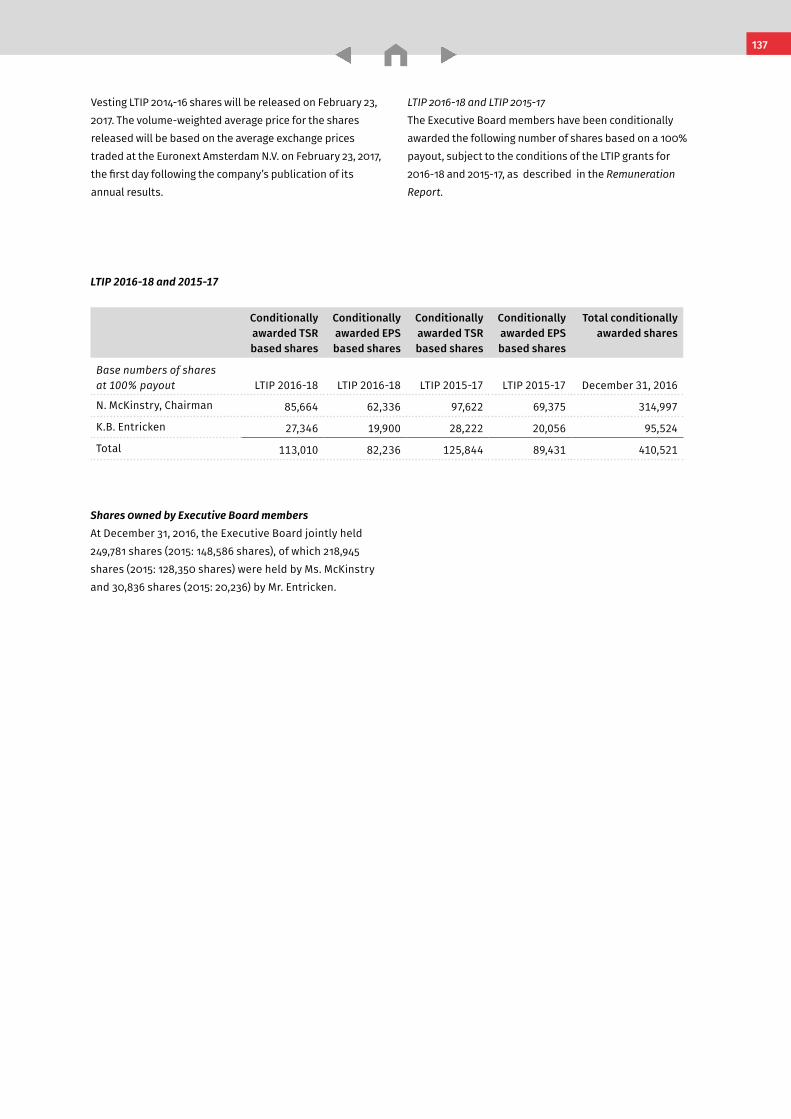
Notes to the Consolidated Financial Statements Wolters Kluwer 2016 Annual Report
Vesting LTIP 2014-16 shares will be released on February 23, 2017. The volume-weighted average price for the shares released will be based on the average exchange prices traded at the Euronext Amsterdam N.V. on February 23, 2017, the first day following the company’s publication of its annual results.
LTIP 2016-18 and LTIP 2015-17The Executive Board members have been conditionally awarded the following number of shares based on a 100% payout, subject to the conditions of the LTIP grants for 2016-18 and 2015-17, as described in the Remuneration Report.
LTIP 2016-18 and 2015-17
Conditionally awarded TSR based shares
Conditionally awarded EPS based shares
Conditionally awarded TSR based shares
Conditionally awarded EPS based shares
Total conditionally awarded shares
Base numbers of shares at 100% payout LTIP 2016-18 LTIP 2016-18 LTIP 2015-17 LTIP 2015-17 December 31, 2016
N. McKinstry, Chairman 85,664 62,336 97,622 69,375 314,997
K.B. Entricken 27,346 19,900 28,222 20,056 95,524
Total 113,010 82,236 125,844 89,431 410,521
Shares 0wned by Executive Board membersAt December 31, 2016, the Executive Board jointly held 249,781 shares (2015: 148,586 shares), of which 218,945 shares (2015: 128,350 shares) were held by Ms. McKinstry and 30,836 shares (2015: 20,236) by Mr. Entricken.
137
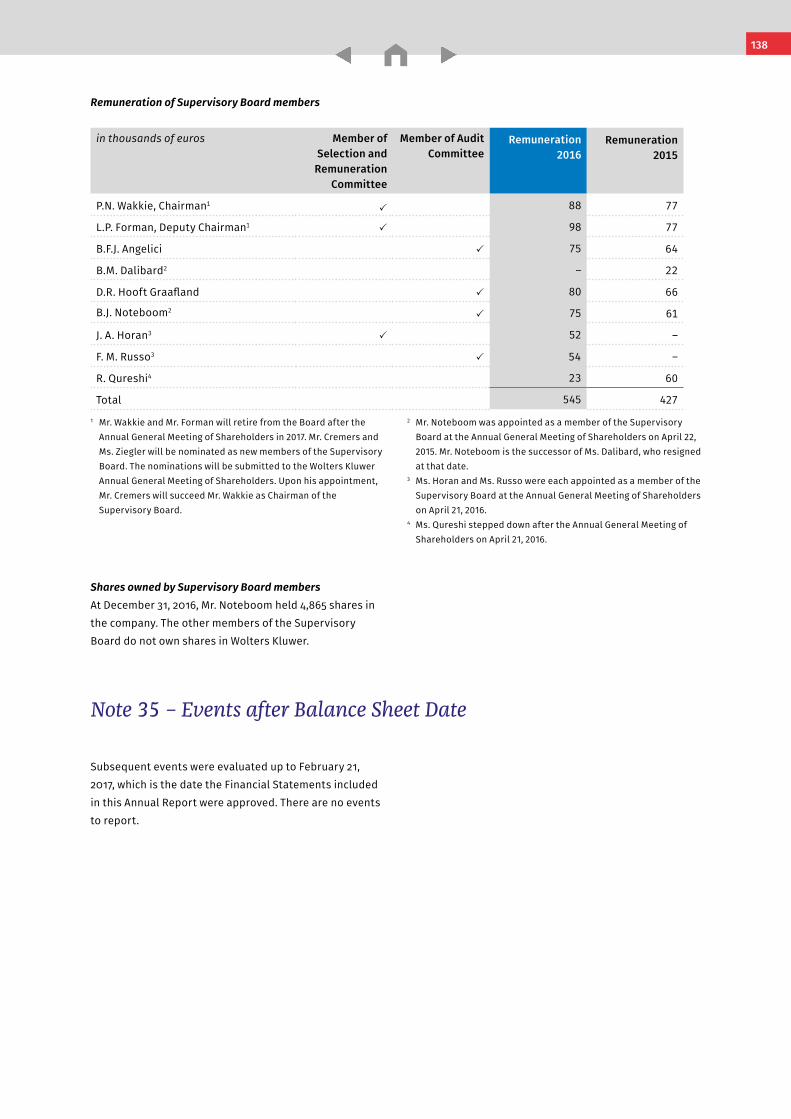
Notes to the Consolidated Financial Statements Wolters Kluwer 2016 Annual Report
Remuneration of Supervisory Board members
in thousands of euros Member of Selection and Remuneration
Committee
Member of Audit Committee
Remuneration 2016
Remuneration 2015
P.N. Wakkie, Chairman1P 88 77
L.P. Forman, Deputy Chairman1 P 98 77
B.F.J. Angelici P 75 64
B.M. Dalibard2 – 22
D.R. Hooft Graafland P 80 66
B.J. Noteboom2 P 75 61
J. A. Horan3 P 52 –
F. M. Russo3 P 54 –
R. Qureshi4 23 60
Total 545 4271 Mr. Wakkie and Mr. Forman will retire from the Board after the
Annual General Meeting of Shareholders in 2017. Mr. Cremers and Ms. Ziegler will be nominated as new members of the Supervisory Board. The nominations will be submitted to the Wolters Kluwer Annual General Meeting of Shareholders. Upon his appointment, Mr. Cremers will succeed Mr. Wakkie as Chairman of the Supervisory Board.
2 Mr. Noteboom was appointed as a member of the Supervisory Board at the Annual General Meeting of Shareholders on April 22, 2015. Mr. Noteboom is the successor of Ms. Dalibard, who resigned at that date.
3 Ms. Horan and Ms. Russo were each appointed as a member of the Supervisory Board at the Annual General Meeting of Shareholders on April 21, 2016.
4 Ms. Qureshi stepped down after the Annual General Meeting of Shareholders on April 21, 2016.
Subsequent events were evaluated up to February 21, 2017, which is the date the Financial Statements included in this Annual Report were approved. There are no events to report.
Note 35 – Events after Balance Sheet Date
Shares owned by Supervisory Board membersAt December 31, 2016, Mr. Noteboom held 4,865 shares in the company. The other members of the Supervisory Board do not own shares in Wolters Kluwer.
138
Company FinancialStatements
139
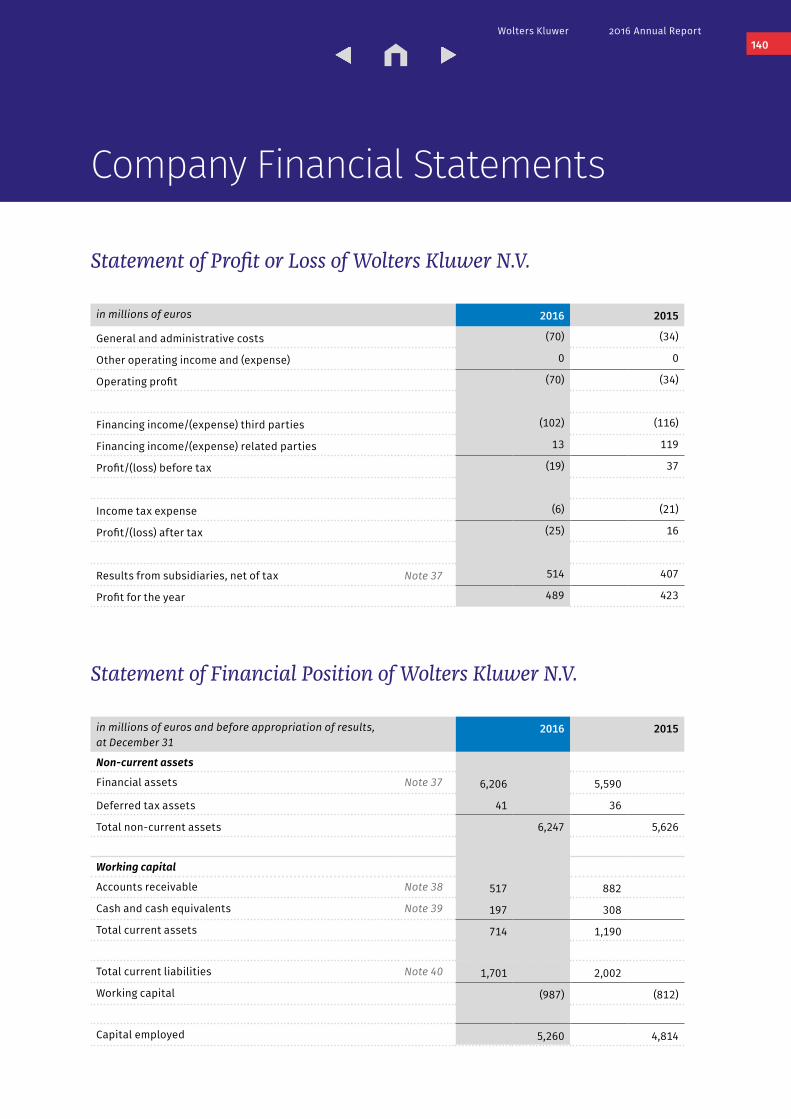
Wolters Kluwer 2016 Annual Report
Company Financial Statements
Statement of Profit or Loss of Wolters Kluwer N.V.
in millions of euros 2016 2015
General and administrative costs (70) (34)
Other operating income and (expense) 0 0
Operating profit (70) (34)
Financing income/(expense) third parties (102) (116)
Financing income/(expense) related parties 13 119
Profit/(loss) before tax (19) 37
Income tax expense (6) (21)
Profit/(loss) after tax (25) 16
Results from subsidiaries, net of tax Note 37 514 407
Profit for the year 489 423
Statement of Financial Position of Wolters Kluwer N.V.
in millions of euros and before appropriation of results, at December 31
2016 2015
Non-current assets
Financial assets Note 37 6,206 5,590
Deferred tax assets 41 36
Total non-current assets 6,247 5,626
Working capital
Accounts receivable Note 38 517 882
Cash and cash equivalents Note 39 197 308
Total current assets 714 1,190
Total current liabilities Note 40 1,701 2,002
Working capital (987) (812)
Capital employed 5,260 4,814
140
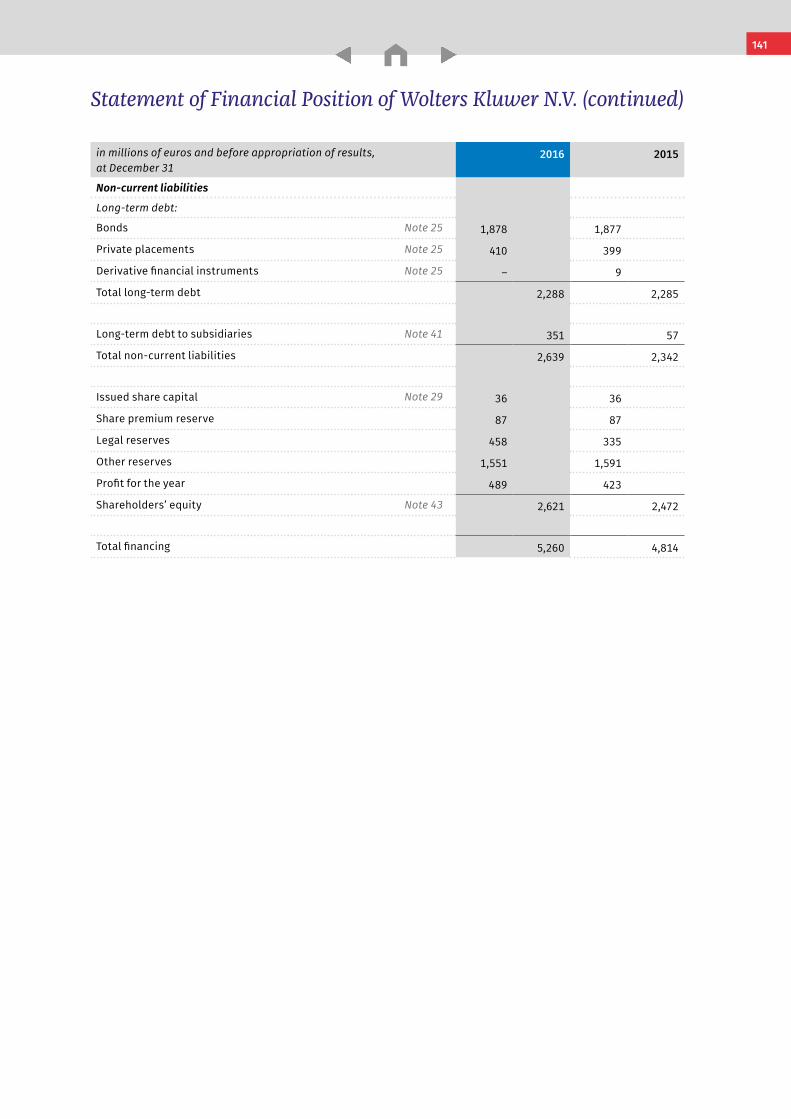
Company Financial Statements Wolters Kluwer 2016 Annual Report
Statement of Financial Position of Wolters Kluwer N.V. (continued)
in millions of euros and before appropriation of results, at December 31
2016 2015
Non-current liabilities
Long-term debt:
Bonds Note 25 1,878 1,877
Private placements Note 25 410 399
Derivative financial instruments Note 25 – 9
Total long-term debt 2,288 2,285
Long-term debt to subsidiaries Note 41 351 57
Total non-current liabilities 2,639 2,342
Issued share capital Note 29 36 36
Share premium reserve 87 87
Legal reserves 458 335
Other reserves 1,551 1,591
Profit for the year 489 423
Shareholders’ equity Note 43 2,621 2,472
Total financing 5,260 4,814
141
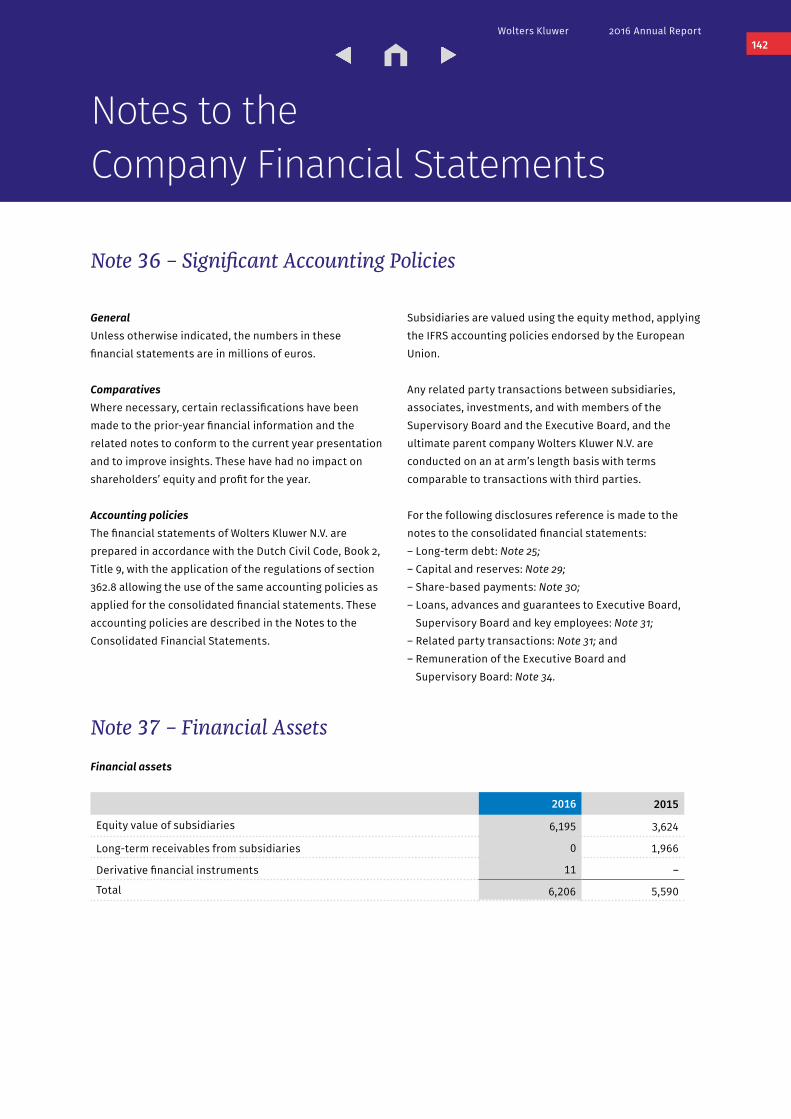
Wolters Kluwer 2016 Annual Report
Note 36 – Significant Accounting Policies
General Unless otherwise indicated, the numbers in these financial statements are in millions of euros.
ComparativesWhere necessary, certain reclassifications have been made to the prior-year financial information and the related notes to conform to the current year presentation and to improve insights. These have had no impact on shareholders’ equity and profit for the year.
Accounting policiesThe financial statements of Wolters Kluwer N.V. are prepared in accordance with the Dutch Civil Code, Book 2, Title 9, with the application of the regulations of section 362.8 allowing the use of the same accounting policies as applied for the consolidated financial statements. These accounting policies are described in the Notes to the Consolidated Financial Statements.
Subsidiaries are valued using the equity method, applying the IFRS accounting policies endorsed by the European Union. Any related party transactions between subsidiaries, associates, investments, and with members of the Supervisory Board and the Executive Board, and the ultimate parent company Wolters Kluwer N.V. are conducted on an at arm’s length basis with terms comparable to transactions with third parties.
For the following disclosures reference is made to the notes to the consolidated financial statements:– Long-term debt: Note 25;– Capital and reserves: Note 29;– Share-based payments: Note 30;– Loans, advances and guarantees to Executive Board, Supervisory Board and key employees: Note 31;– Related party transactions: Note 31; and– Remuneration of the Executive Board and Supervisory Board: Note 34.
Note 37 – Financial Assets
Financial assets
2016 2015
Equity value of subsidiaries 6,195 3,624
Long-term receivables from subsidiaries 0 1,966
Derivative financial instruments 11 –
Total 6,206 5,590
Notes to the Company Financial Statements
142
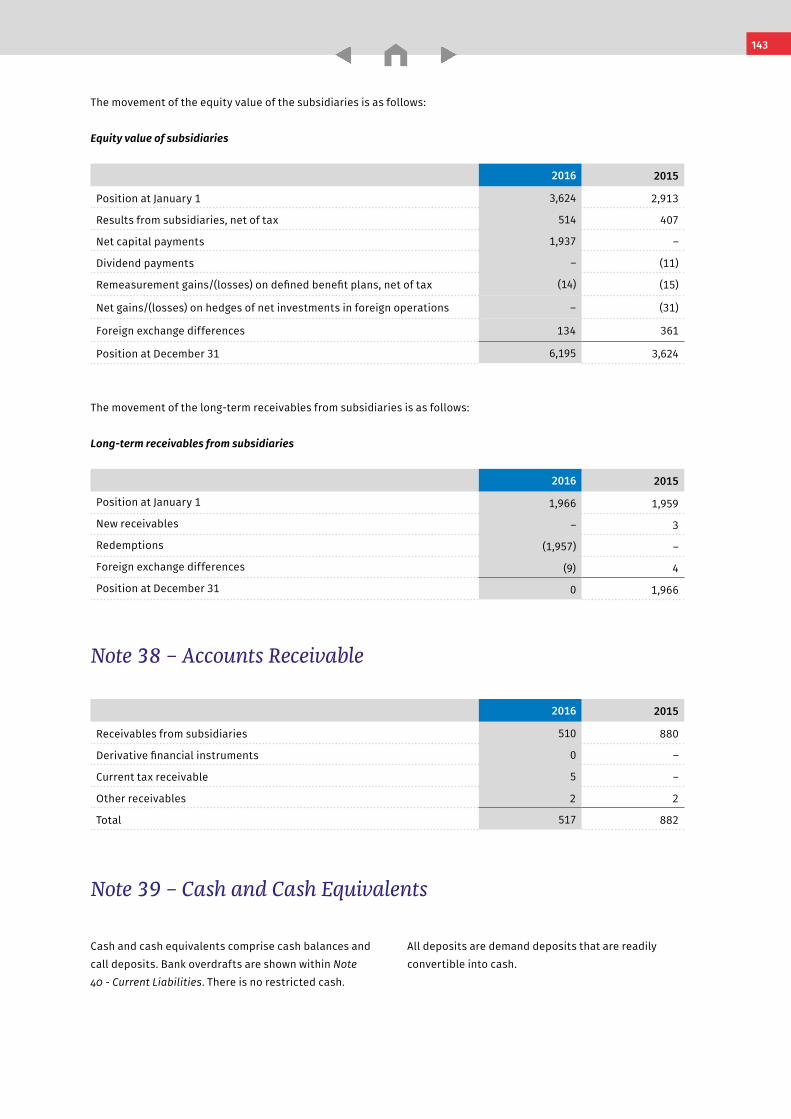
Notes to the Company Financial Statements Wolters Kluwer 2016 Annual Report
The movement of the equity value of the subsidiaries is as follows:
Equity value of subsidiaries
2016 2015
Position at January 1 3,624 2,913
Results from subsidiaries, net of tax 514 407
Net capital payments 1,937 –
Dividend payments – (11)
Remeasurement gains/(losses) on defined benefit plans, net of tax (14) (15)
Net gains/(losses) on hedges of net investments in foreign operations – (31)
Foreign exchange differences 134 361
Position at December 31 6,195 3,624
The movement of the long-term receivables from subsidiaries is as follows:
Long-term receivables from subsidiaries
2016 2015
Position at January 1 1,966 1,959
New receivables – 3
Redemptions (1,957) –
Foreign exchange differences (9) 4
Position at December 31 0 1,966
Note 38 – Accounts Receivable
2016 2015
Receivables from subsidiaries 510 880
Derivative financial instruments 0 –
Current tax receivable 5 –
Other receivables 2 2
Total 517 882
Note 39 – Cash and Cash Equivalents
Cash and cash equivalents comprise cash balances and call deposits. Bank overdrafts are shown within Note 40 - Current Liabilities. There is no restricted cash.
All deposits are demand deposits that are readily convertible into cash.
143
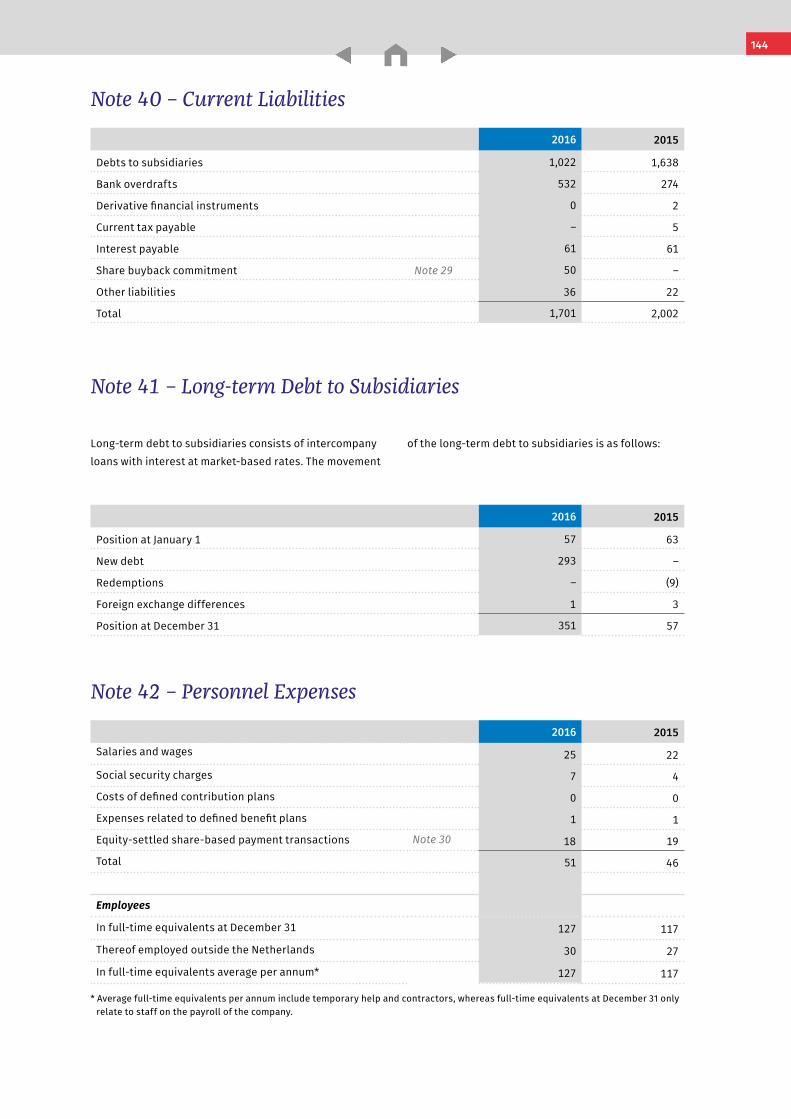
Notes to the Company Financial Statements Wolters Kluwer 2016 Annual Report
Note 40 – Current Liabilities
2016 2015
Debts to subsidiaries 1,022 1,638
Bank overdrafts 532 274
Derivative financial instruments 0 2
Current tax payable – 5
Interest payable 61 61
Share buyback commitment Note 29 50 –
Other liabilities 36 22
Total 1,701 2,002
Note 41 – Long-term Debt to Subsidiaries
2016 2015
Position at January 1 57 63
New debt 293 –
Redemptions – (9)
Foreign exchange differences 1 3
Position at December 31 351 57
Note 42 – Personnel Expenses
2016 2015
Salaries and wages 25 22
Social security charges 7 4
Costs of defined contribution plans 0 0
Expenses related to defined benefit plans 1 1
Equity-settled share-based payment transactions Note 30 18 19
Total 51 46
Employees
In full-time equivalents at December 31 127 117
Thereof employed outside the Netherlands 30 27
In full-time equivalents average per annum* 127 117
* Average full-time equivalents per annum include temporary help and contractors, whereas full-time equivalents at December 31 only relate to staff on the payroll of the company.
Long-term debt to subsidiaries consists of intercompany loans with interest at market-based rates. The movement
of the long-term debt to subsidiaries is as follows:
144
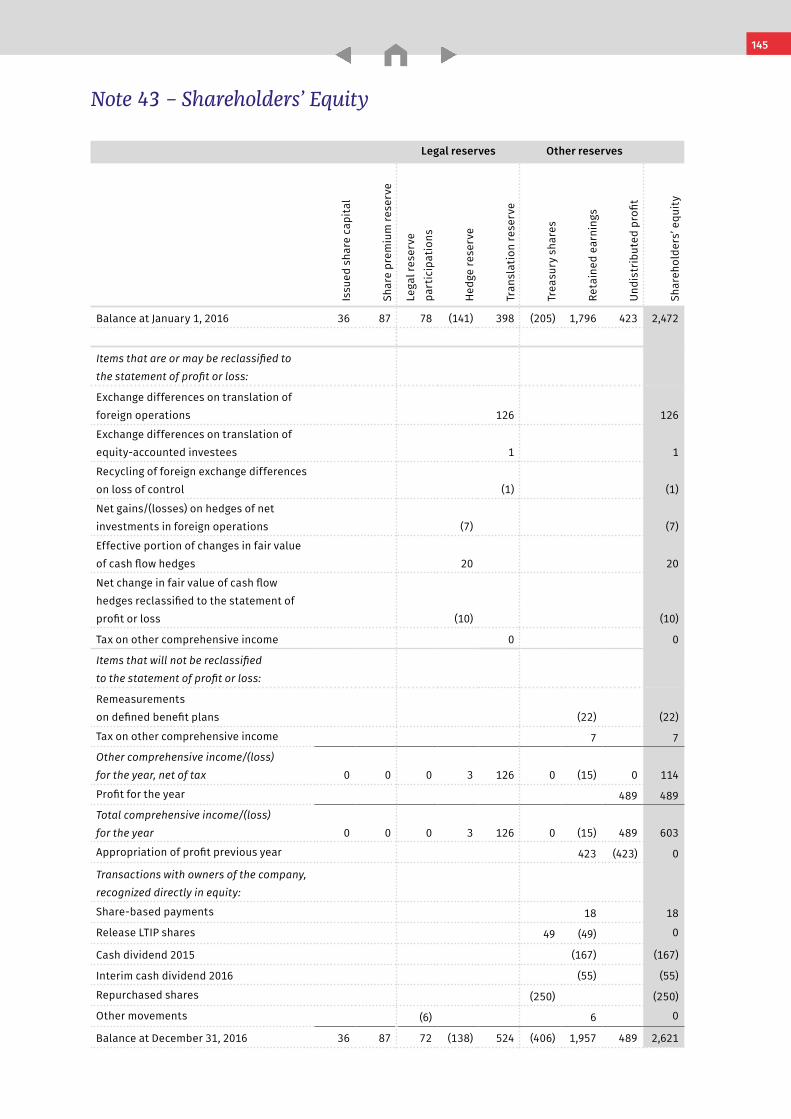
Notes to the Company Financial Statements Wolters Kluwer 2016 Annual Report
Legal reserves Other reserves
Issu
ed s
hare
cap
ital
Shar
e pr
emiu
m re
serv
e
Lega
l res
erve
pa
rtic
ipat
ions
Hed
ge re
serv
e
Tran
slat
ion
rese
rve
Trea
sury
sha
res
Reta
ined
ear
ning
s
Undi
strib
uted
pro
fit
Shar
ehol
ders
’ equ
ity
Balance at January 1, 2016 36 87 78 (141) 398 (205) 1,796 423 2,472
Items that are or may be reclassified to the statement of profit or loss:
Exchange differences on translation of foreign operations 126 126
Exchange differences on translation of equity-accounted investees 1 1
Recycling of foreign exchange differences on loss of control (1) (1)
Net gains/(losses) on hedges of net investments in foreign operations (7) (7)
Effective portion of changes in fair value of cash flow hedges 20 20
Net change in fair value of cash flow hedges reclassified to the statement of profit or loss (10) (10)
Tax on other comprehensive income 0 0
Items that will not be reclassified to the statement of profit or loss:
Remeasurements on defined benefit plans (22) (22)
Tax on other comprehensive income 7 7
Other comprehensive income/(loss) for the year, net of tax 0 0 0 3 126 0 (15) 0 114
Profit for the year 489 489
Total comprehensive income/(loss) for the year 0 0 0 3 126 0 (15) 489 603
Appropriation of profit previous year 423 (423) 0
Transactions with owners of the company, recognized directly in equity:
Share-based payments 18 18
Release LTIP shares 49 (49) 0
Cash dividend 2015 (167) (167)
Interim cash dividend 2016 (55) (55)
Repurchased shares (250) (250)
Other movements (6) 6 0
Balance at December 31, 2016 36 87 72 (138) 524 (406) 1,957 489 2,621
Note 43 – Shareholders’ Equity
145
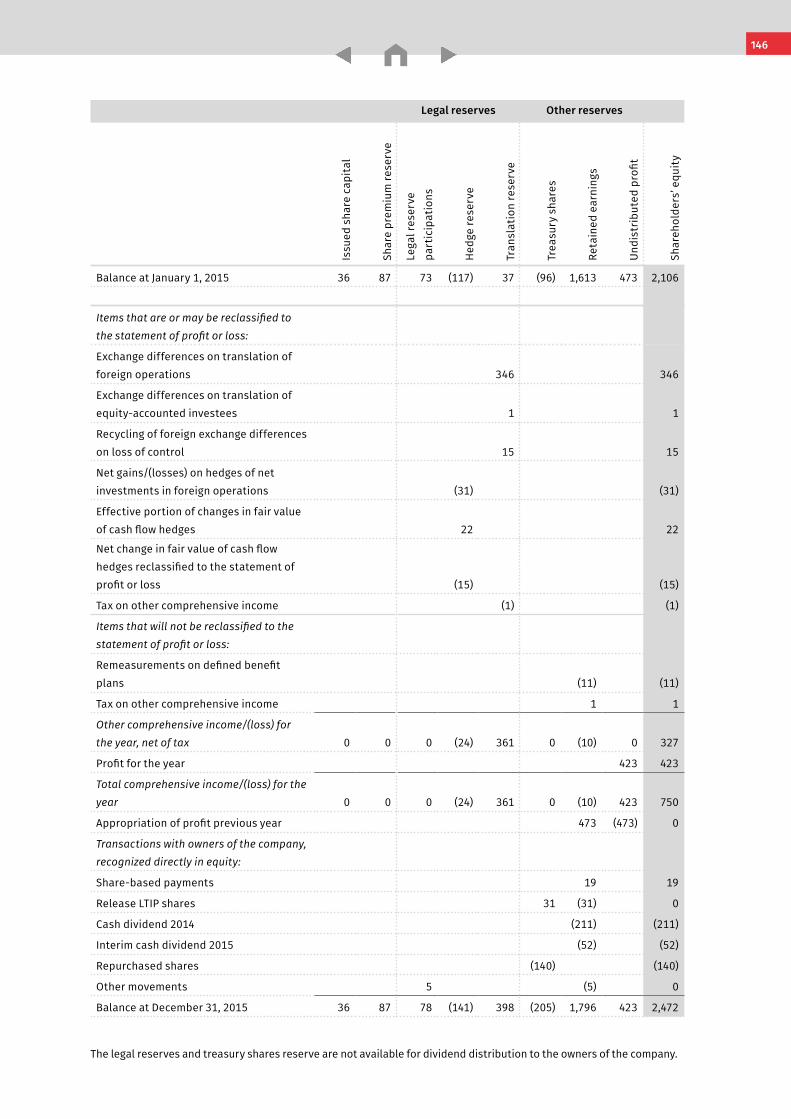
Notes to the Company Financial Statements Wolters Kluwer 2016 Annual Report
Legal reserves Other reserves
Issu
ed s
hare
cap
ital
Shar
e pr
emiu
m re
serv
e
Lega
l res
erve
pa
rtic
ipat
ions
Hed
ge re
serv
e
Tran
slat
ion
rese
rve
Trea
sury
sha
res
Reta
ined
ear
ning
s
Undi
strib
uted
pro
fit
Shar
ehol
ders
’ equ
ity
Balance at January 1, 2015 36 87 73 (117) 37 (96) 1,613 473 2,106
Items that are or may be reclassified to the statement of profit or loss:
Exchange differences on translation of foreign operations 346 346
Exchange differences on translation of equity-accounted investees 1 1
Recycling of foreign exchange differences on loss of control 15 15
Net gains/(losses) on hedges of net investments in foreign operations (31) (31)
Effective portion of changes in fair value of cash flow hedges 22 22
Net change in fair value of cash flow hedges reclassified to the statement of profit or loss (15) (15)
Tax on other comprehensive income (1) (1)
Items that will not be reclassified to the statement of profit or loss:
Remeasurements on defined benefit plans (11) (11)
Tax on other comprehensive income 1 1
Other comprehensive income/(loss) for the year, net of tax 0 0 0 (24) 361 0 (10) 0 327
Profit for the year 423 423
Total comprehensive income/(loss) for the year 0 0 0 (24) 361 0 (10) 423 750
Appropriation of profit previous year 473 (473) 0
Transactions with owners of the company, recognized directly in equity:
Share-based payments 19 19
Release LTIP shares 31 (31) 0
Cash dividend 2014 (211) (211)
Interim cash dividend 2015 (52) (52)
Repurchased shares (140) (140)
Other movements 5 (5) 0
Balance at December 31, 2015 36 87 78 (141) 398 (205) 1,796 423 2,472
The legal reserves and treasury shares reserve are not available for dividend distribution to the owners of the company.
146
Notes to the Company Financial Statements Wolters Kluwer 2016 Annual Report
Note 44 – Commitments and Contingent Liabilities
GuaranteesPursuant to section 403 of the Dutch Civil Code, Book 2, the company has assumed joint and several liabilities for the debts arising out of the legal acts of a number of subsidiaries in the Netherlands. The relevant declarations have been filed with and are open for inspection at the Trade Register for the district in which the legal entity respective to the liability has its registered office.
The company has issued formal guarantees for bank credit facilities for a total amount of €212 million (2015: €192 million) on behalf of a number of its foreign subsidiaries. At December 31, 2016, €3 million of these credit facilities had been utilized (2015: €6 million).
In addition, parental performance guarantees to third parties have been issued for €14 million (2015:€14 million).
The company has issued a guarantee on behalf of one of its foreign subsidiaries for an amount of €9 million (2015: €10 million).
OtherThe company forms part of a Dutch fiscal unity and pursuant to standard conditions has assumed joint and several liabilities for the tax liabilities of the fiscal unity.
Note 45 – Details of Participating Interests
Note 46 – Events after Balance Sheet Date
A list of subsidiaries and affiliated companies, prepared in accordance with the relevant legal requirements (Dutch Civil Code, Book 2, Part 9, Sections 379 and 414) is filed at
the offices of Chamber of Commerce of The Hague, the Netherlands.
Subsequent events were evaluated up to February 21, 2017, which is the date the Financial Statements included
in this Annual Report were approved. There are no events to report.
Note 47 – Profit Appropriation
Article 29 of the Articles of AssociationParagraph 1From the profit as it appears on the annual accounts adopted by the General Meeting, a dividend shall be distributed on the preference shares, whose percentage – calculated on the paid part of the nominal amount – is equal to that of the average of the interest rate on Basis Refinancing Transactions (Refi interest of the European Central Bank). These are weighted according to the number of days over which this rate of interest applies during the financial year over which the dividend was paid, increased by a debit interest rate to be determined by the large Dutch banks and also increased by a margin determined by the Executive Board and approved by the Supervisory Board of one percentage point (1%) minimum and four percentage points (4%) maximum. The dividend on the preference shares shall be calculated on an annual
basis on the paid part of the nominal amount. If in any financial year the distribution referred to in the first full sentence cannot be made or can only be made in part because the profits are not sufficient, the deficiency shall be distributed from the distributable part of the company’s equity. No further dividend shall be distributed on the preference shares.
Paragraph 2Subsequently such allocations to reserves shall be made as the Executive Board shall determine, subject to the approval of the Supervisory Board.
Paragraph 3Any balance remaining after that shall be distributed at the disposal of the General Meeting of Shareholders.
147
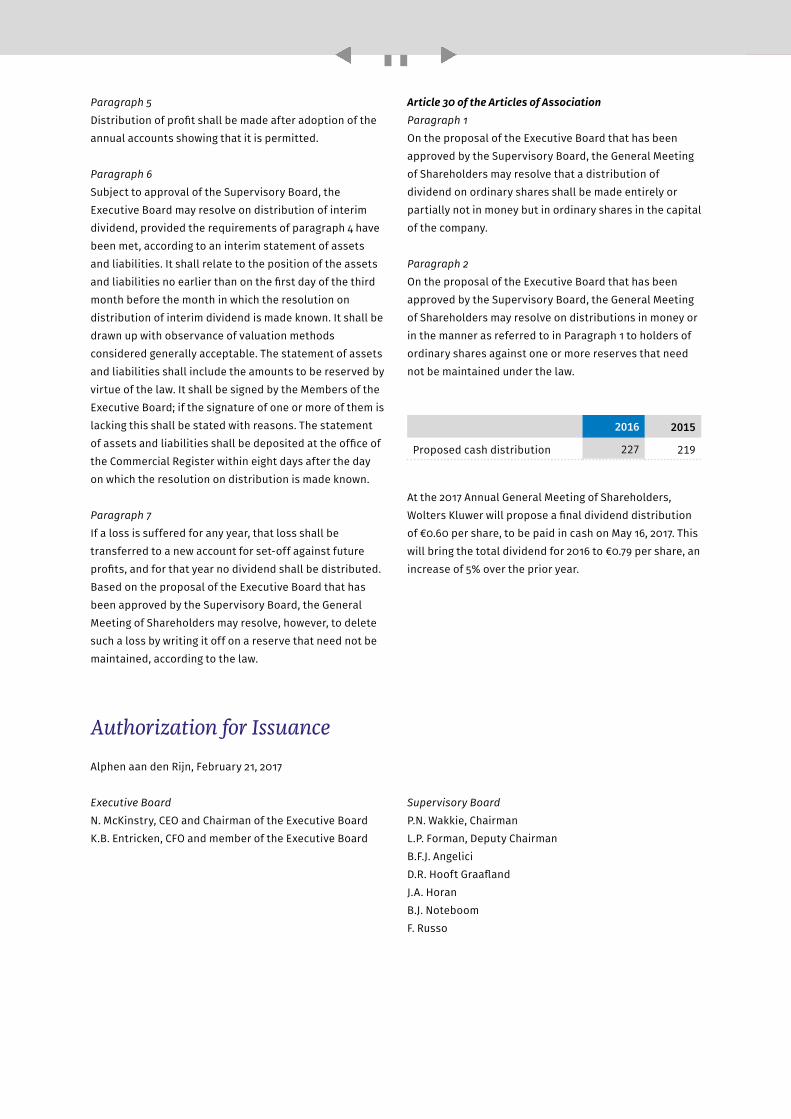
Other Information on the Financial Statements Wolters Kluwer 2016 Annual Report 148
Paragraph 5Distribution of profit shall be made after adoption of the annual accounts showing that it is permitted.
Paragraph 6Subject to approval of the Supervisory Board, the Executive Board may resolve on distribution of interim dividend, provided the requirements of paragraph 4 have been met, according to an interim statement of assets and liabilities. It shall relate to the position of the assets and liabilities no earlier than on the first day of the third month before the month in which the resolution on distribution of interim dividend is made known. It shall be drawn up with observance of valuation methods considered generally acceptable. The statement of assets and liabilities shall include the amounts to be reserved by virtue of the law. It shall be signed by the Members of the Executive Board; if the signature of one or more of them is lacking this shall be stated with reasons. The statement of assets and liabilities shall be deposited at the office of the Commercial Register within eight days after the day on which the resolution on distribution is made known.
Paragraph 7If a loss is suffered for any year, that loss shall be transferred to a new account for set-off against future profits, and for that year no dividend shall be distributed. Based on the proposal of the Executive Board that has been approved by the Supervisory Board, the General Meeting of Shareholders may resolve, however, to delete such a loss by writing it off on a reserve that need not be maintained, according to the law.
Article 30 of the Articles of AssociationParagraph 1On the proposal of the Executive Board that has been approved by the Supervisory Board, the General Meeting of Shareholders may resolve that a distribution of dividend on ordinary shares shall be made entirely or partially not in money but in ordinary shares in the capital of the company.
Paragraph 2On the proposal of the Executive Board that has been approved by the Supervisory Board, the General Meeting of Shareholders may resolve on distributions in money or in the manner as referred to in Paragraph 1 to holders of ordinary shares against one or more reserves that need not be maintained under the law.
2016 2015
Proposed cash distribution 227 219
At the 2017 Annual General Meeting of Shareholders, Wolters Kluwer will propose a final dividend distribution of €0.60 per share, to be paid in cash on May 16, 2017. This will bring the total dividend for 2016 to €0.79 per share, an increase of 5% over the prior year.
Authorization for Issuance
Alphen aan den Rijn, February 21, 2017
Executive BoardN. McKinstry, CEO and Chairman of the Executive BoardK.B. Entricken, CFO and member of the Executive Board
Supervisory BoardP.N. Wakkie, ChairmanL.P. Forman, Deputy ChairmanB.F.J. AngeliciD.R. Hooft GraaflandJ.A. Horan B.J. NoteboomF. Russo
Wolters Kluwer 2016 Annual Report
Other Information on the Financial Statements
Independent Auditor’s Report
To the Shareholders and the Supervisory Board of Wolters Kluwer N.V.
Report on the financial statements for the year ended December 31, 2016 included in the 2016 Annual Report
Our opinion
We have audited the financial statements for the year ended December 31, 2016, of Wolters Kluwer N.V. (“the company”), based in Alphen aan den Rijn. The financial statements include the consolidated financial statements and the company financial statements as set out on pages 59 to 148 of this Annual Report.
In our opinion:– The consolidated financial statements give a true and
fair view of the financial position of Wolters Kluwer N.V. as at December 31, 2016, and of its result and cash flows for the year then ended in accordance with International Financial Reporting Standards as adopted by the European Union (“EU-IFRS”) and with Part 9 of Book 2 of the Dutch Civil Code.
– The company financial statements give a true and fair view of the financial position of Wolters Kluwer N.V. as at December 31, 2016, and of its results for the year then ended in accordance with Part 9 of Book 2 of the Dutch Civil Code.
What have we audited
The consolidated financial statements comprise:1. The following statements for the year ended December 31,
2016: the consolidated statement of profit or loss, the consolidated statement of comprehensive income, consolidated statement of cash flows and consolidated statement of changes in total equity;
2. The consolidated statement of financial position as at December 31, 2016; and3. The notes to the consolidated financial statements
comprising a summary of the significant accounting policies and other explanatory information.
The company financial statements comprise:1. The company statement of profit or loss for the year ended December 31, 2016; 2. The company statement of financial position as at December 31, 2016; and3. The notes to the company financial statements
comprising a summary of the significant accounting policies and other explanatory information.
Basis for our opinion
We conducted our audit in accordance with Dutch law, including the Dutch Standards on Auditing. Our responsibilities under those standards are further described in the “Our responsibilities for the audit of the financial statements” section of our report.
We are independent of Wolters Kluwer N.V. in accordance with the Regulation on Auditor Independence in Assurance Engagements “Verordening inzake de onafhankelijkheid van accountants bij assurance-opdrachten” (ViO) and other relevant independence regulations in The Netherlands.
Furthermore we have complied with the Regulation on Rules of Professional Conduct and Practice of Accountants “Verordening gedrags- en beroepsregels accountants” (VGBA).
We believe the audit evidence we have obtained is sufficient and appropriate to provide a basis for our opinion.
Our audit approach
As part of our audit we have determined materiality and used it to assess the risks of material misstatement. We have specifically assessed accounts in which subjectivity is high because of estimates regarding uncertain future developments. We have likewise specifically focused on the risk related to management override of controls and the risk of material misstatement due to fraud. In addition, our audit included the continuity and reliability of the financial information systems.
149
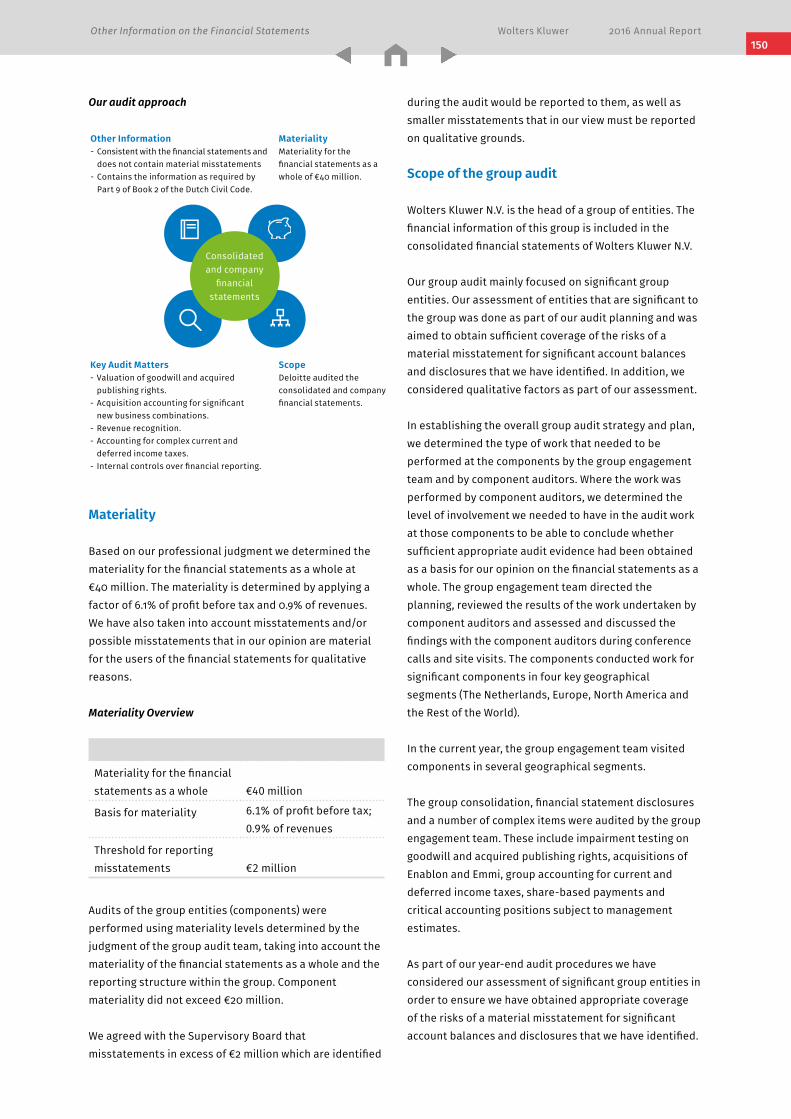
Other Information on the Financial Statements Wolters Kluwer 2016 Annual Report 150
Materiality
Based on our professional judgment we determined the materiality for the financial statements as a whole at €40 million. The materiality is determined by applying a factor of 6.1% of profit before tax and 0.9% of revenues. We have also taken into account misstatements and/or possible misstatements that in our opinion are material for the users of the financial statements for qualitative reasons.
Materiality Overview
Materiality for the financial statements as a whole €40 million
Basis for materiality 6.1% of profit before tax; 0.9% of revenues
Threshold for reporting misstatements €2 million
Audits of the group entities (components) were performed using materiality levels determined by the judgment of the group audit team, taking into account the materiality of the financial statements as a whole and the reporting structure within the group. Component materiality did not exceed €20 million.
We agreed with the Supervisory Board that misstatements in excess of €2 million which are identified
during the audit would be reported to them, as well as smaller misstatements that in our view must be reported on qualitative grounds.
Scope of the group audit
Wolters Kluwer N.V. is the head of a group of entities. The financial information of this group is included in the consolidated financial statements of Wolters Kluwer N.V.
Our group audit mainly focused on significant group entities. Our assessment of entities that are significant to the group was done as part of our audit planning and was aimed to obtain sufficient coverage of the risks of a material misstatement for significant account balances and disclosures that we have identified. In addition, we considered qualitative factors as part of our assessment.
In establishing the overall group audit strategy and plan, we determined the type of work that needed to be performed at the components by the group engagement team and by component auditors. Where the work was performed by component auditors, we determined the level of involvement we needed to have in the audit work at those components to be able to conclude whether sufficient appropriate audit evidence had been obtained as a basis for our opinion on the financial statements as a whole. The group engagement team directed the planning, reviewed the results of the work undertaken by component auditors and assessed and discussed the findings with the component auditors during conference calls and site visits. The components conducted work for significant components in four key geographical segments (The Netherlands, Europe, North America and the Rest of the World).
In the current year, the group engagement team visited components in several geographical segments.
The group consolidation, financial statement disclosures and a number of complex items were audited by the group engagement team. These include impairment testing on goodwill and acquired publishing rights, acquisitions of Enablon and Emmi, group accounting for current and deferred income taxes, share-based payments and critical accounting positions subject to management estimates.
As part of our year-end audit procedures we have considered our assessment of significant group entities in order to ensure we have obtained appropriate coverage of the risks of a material misstatement for significant account balances and disclosures that we have identified.
Consolidated and company
financial statements
Materiality Materiality for the financial statements as a whole of €40 million.
ScopeDeloitte audited the consolidated and company financial statements.
Key Audit Matters- Valuation of goodwill and acquired publishing rights.- Acquisition accounting for significant new business combinations.- Revenue recognition.- Accounting for complex current and deferred income taxes.- Internal controls over financial reporting.
Other Information - Consistent with the financial statements and does not contain material misstatements- Contains the information as required by Part 9 of Book 2 of the Dutch Civil Code.
Our audit approach
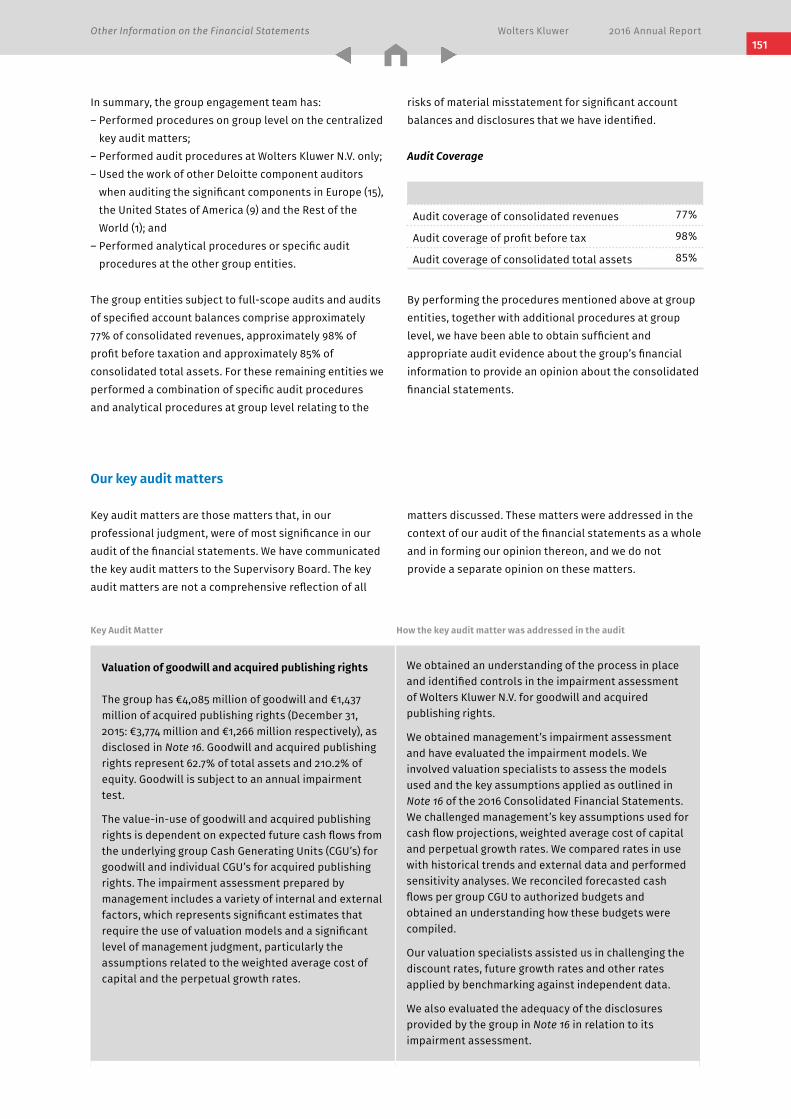
Other Information on the Financial Statements Wolters Kluwer 2016 Annual Report
In summary, the group engagement team has:– Performed procedures on group level on the centralized key audit matters; – Performed audit procedures at Wolters Kluwer N.V. only;– Used the work of other Deloitte component auditors
when auditing the significant components in Europe (15), the United States of America (9) and the Rest of the World (1); and
– Performed analytical procedures or specific audit procedures at the other group entities.
The group entities subject to full-scope audits and audits of specified account balances comprise approximately 77% of consolidated revenues, approximately 98% of profit before taxation and approximately 85% of consolidated total assets. For these remaining entities we performed a combination of specific audit procedures and analytical procedures at group level relating to the
risks of material misstatement for significant account balances and disclosures that we have identified.
Audit Coverage
Audit coverage of consolidated revenues 77%
Audit coverage of profit before tax 98%
Audit coverage of consolidated total assets 85%
By performing the procedures mentioned above at group entities, together with additional procedures at group level, we have been able to obtain sufficient and appropriate audit evidence about the group’s financial information to provide an opinion about the consolidated financial statements.
Our key audit matters
Key audit matters are those matters that, in our professional judgment, were of most significance in our audit of the financial statements. We have communicated the key audit matters to the Supervisory Board. The key audit matters are not a comprehensive reflection of all
matters discussed. These matters were addressed in the context of our audit of the financial statements as a whole and in forming our opinion thereon, and we do not provide a separate opinion on these matters.
Valuation of goodwill and acquired publishing rights
The group has €4,085 million of goodwill and €1,437 million of acquired publishing rights (December 31, 2015: €3,774 million and €1,266 million respectively), as disclosed in Note 16. Goodwill and acquired publishing rights represent 62.7% of total assets and 210.2% of equity. Goodwill is subject to an annual impairment test.
The value-in-use of goodwill and acquired publishing rights is dependent on expected future cash flows from the underlying group Cash Generating Units (CGU’s) for goodwill and individual CGU’s for acquired publishing rights. The impairment assessment prepared by management includes a variety of internal and external factors, which represents significant estimates that require the use of valuation models and a significant level of management judgment, particularly the assumptions related to the weighted average cost of capital and the perpetual growth rates.
We obtained an understanding of the process in place and identified controls in the impairment assessment of Wolters Kluwer N.V. for goodwill and acquired publishing rights.
We obtained management’s impairment assessment and have evaluated the impairment models. We involved valuation specialists to assess the models used and the key assumptions applied as outlined in Note 16 of the 2016 Consolidated Financial Statements.We challenged management’s key assumptions used for cash flow projections, weighted average cost of capital and perpetual growth rates. We compared rates in use with historical trends and external data and performed sensitivity analyses. We reconciled forecasted cash flows per group CGU to authorized budgets and obtained an understanding how these budgets were compiled.
Our valuation specialists assisted us in challenging the discount rates, future growth rates and other rates applied by benchmarking against independent data.
We also evaluated the adequacy of the disclosures provided by the group in Note 16 in relation to its impairment assessment.
Key Audit Matter How the key audit matter was addressed in the audit
151
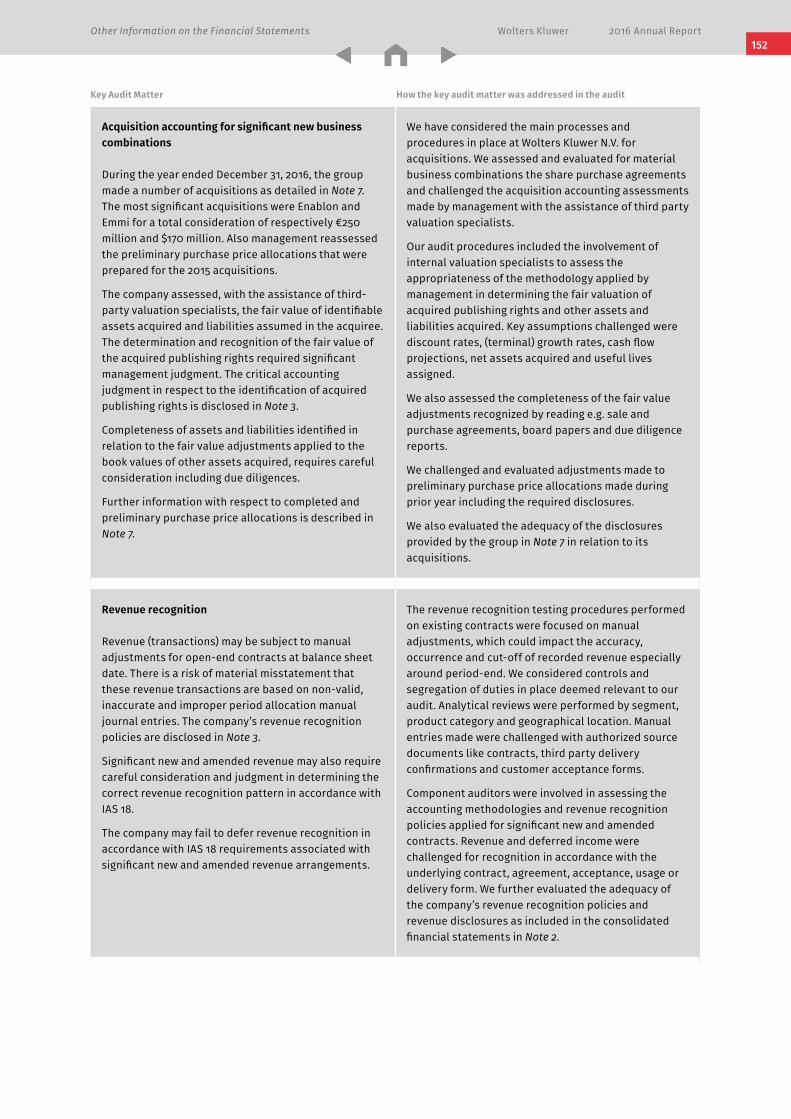
Other Information on the Financial Statements Wolters Kluwer 2016 Annual Report 152
Acquisition accounting for significant new business combinations
During the year ended December 31, 2016, the group made a number of acquisitions as detailed in Note 7. The most significant acquisitions were Enablon and Emmi for a total consideration of respectively €250 million and $170 million. Also management reassessed the preliminary purchase price allocations that were prepared for the 2015 acquisitions.
The company assessed, with the assistance of third-party valuation specialists, the fair value of identifiable assets acquired and liabilities assumed in the acquiree. The determination and recognition of the fair value of the acquired publishing rights required significant management judgment. The critical accounting judgment in respect to the identification of acquired publishing rights is disclosed in Note 3.
Completeness of assets and liabilities identified in relation to the fair value adjustments applied to the book values of other assets acquired, requires careful consideration including due diligences.
Further information with respect to completed and preliminary purchase price allocations is described in Note 7.
We have considered the main processes and procedures in place at Wolters Kluwer N.V. for acquisitions. We assessed and evaluated for material business combinations the share purchase agreements and challenged the acquisition accounting assessments made by management with the assistance of third party valuation specialists.
Our audit procedures included the involvement of internal valuation specialists to assess the appropriateness of the methodology applied by management in determining the fair valuation of acquired publishing rights and other assets and liabilities acquired. Key assumptions challenged were discount rates, (terminal) growth rates, cash flow projections, net assets acquired and useful lives assigned.
We also assessed the completeness of the fair value adjustments recognized by reading e.g. sale and purchase agreements, board papers and due diligence reports.
We challenged and evaluated adjustments made to preliminary purchase price allocations made during prior year including the required disclosures.
We also evaluated the adequacy of the disclosures provided by the group in Note 7 in relation to its acquisitions.
Revenue recognition
Revenue (transactions) may be subject to manual adjustments for open-end contracts at balance sheet date. There is a risk of material misstatement that these revenue transactions are based on non-valid, inaccurate and improper period allocation manual journal entries. The company’s revenue recognition policies are disclosed in Note 3.
Significant new and amended revenue may also require careful consideration and judgment in determining the correct revenue recognition pattern in accordance with IAS 18.
The company may fail to defer revenue recognition in accordance with IAS 18 requirements associated with significant new and amended revenue arrangements.
The revenue recognition testing procedures performed on existing contracts were focused on manual adjustments, which could impact the accuracy, occurrence and cut-off of recorded revenue especially around period-end. We considered controls and segregation of duties in place deemed relevant to our audit. Analytical reviews were performed by segment, product category and geographical location. Manual entries made were challenged with authorized source documents like contracts, third party delivery confirmations and customer acceptance forms.
Component auditors were involved in assessing the accounting methodologies and revenue recognition policies applied for significant new and amended contracts. Revenue and deferred income were challenged for recognition in accordance with the underlying contract, agreement, acceptance, usage or delivery form. We further evaluated the adequacy of the company’s revenue recognition policies and revenue disclosures as included in the consolidated financial statements in Note 2.
Key Audit Matter How the key audit matter was addressed in the audit
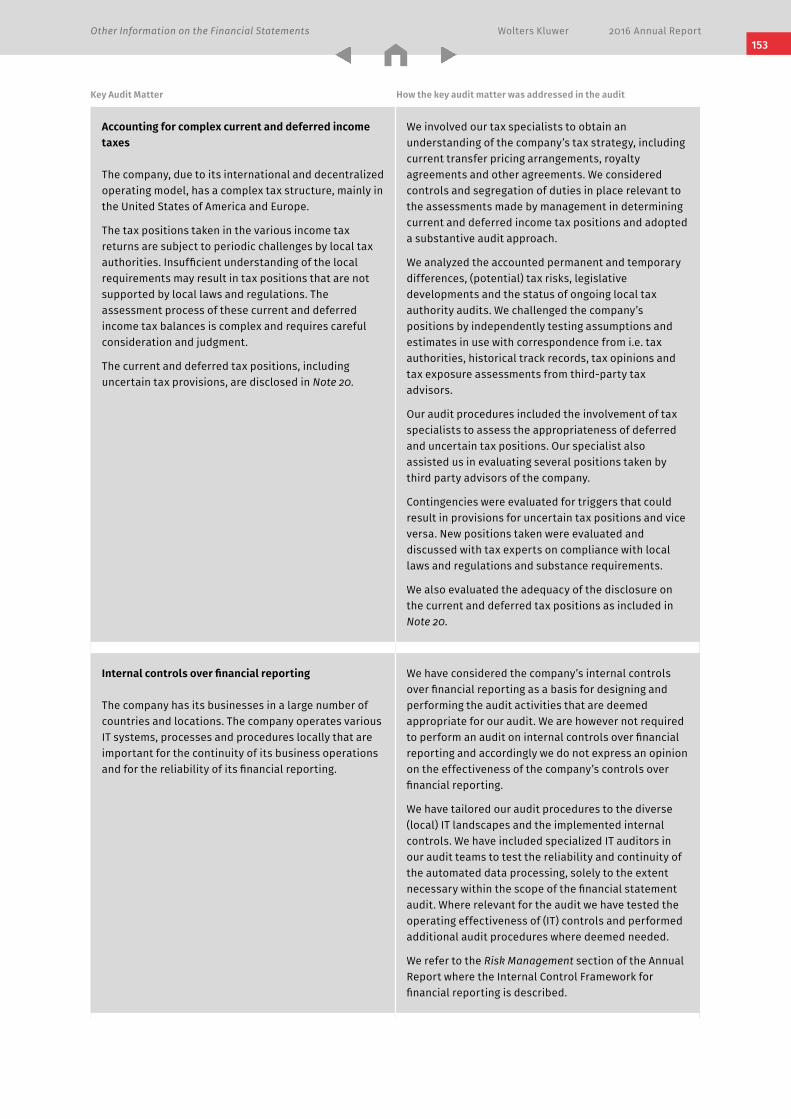
Other Information on the Financial Statements Wolters Kluwer 2016 Annual Report
Accounting for complex current and deferred income taxes
The company, due to its international and decentralized operating model, has a complex tax structure, mainly in the United States of America and Europe.
The tax positions taken in the various income tax returns are subject to periodic challenges by local tax authorities. Insufficient understanding of the local requirements may result in tax positions that are not supported by local laws and regulations. The assessment process of these current and deferred income tax balances is complex and requires careful consideration and judgment.
The current and deferred tax positions, including uncertain tax provisions, are disclosed in Note 20.
We involved our tax specialists to obtain an understanding of the company’s tax strategy, including current transfer pricing arrangements, royalty agreements and other agreements. We considered controls and segregation of duties in place relevant to the assessments made by management in determining current and deferred income tax positions and adopted a substantive audit approach.
We analyzed the accounted permanent and temporary differences, (potential) tax risks, legislative developments and the status of ongoing local tax authority audits. We challenged the company’s positions by independently testing assumptions and estimates in use with correspondence from i.e. tax authorities, historical track records, tax opinions and tax exposure assessments from third-party tax advisors.
Our audit procedures included the involvement of tax specialists to assess the appropriateness of deferred and uncertain tax positions. Our specialist also assisted us in evaluating several positions taken by third party advisors of the company.
Contingencies were evaluated for triggers that could result in provisions for uncertain tax positions and vice versa. New positions taken were evaluated and discussed with tax experts on compliance with local laws and regulations and substance requirements.
We also evaluated the adequacy of the disclosure on the current and deferred tax positions as included in Note 20.
Internal controls over financial reporting
The company has its businesses in a large number of countries and locations. The company operates various IT systems, processes and procedures locally that are important for the continuity of its business operations and for the reliability of its financial reporting.
We have considered the company’s internal controls over financial reporting as a basis for designing and performing the audit activities that are deemed appropriate for our audit. We are however not required to perform an audit on internal controls over financial reporting and accordingly we do not express an opinion on the effectiveness of the company’s controls over financial reporting.
We have tailored our audit procedures to the diverse (local) IT landscapes and the implemented internal controls. We have included specialized IT auditors in our audit teams to test the reliability and continuity of the automated data processing, solely to the extent necessary within the scope of the financial statement audit. Where relevant for the audit we have tested the operating effectiveness of (IT) controls and performed additional audit procedures where deemed needed.
We refer to the Risk Management section of the Annual Report where the Internal Control Framework for financial reporting is described.
Key Audit Matter How the key audit matter was addressed in the audit
153
Other Information on the Financial Statements Wolters Kluwer 2016 Annual Report 154
Report on the other information included in the annual accounts 2016
In addition to the financial statements and our auditor’s report, the annual accounts contain other information that consists of:– Report of the Executive Board;– Report of the Supervisory Board;– Corporate Governance and Risk Management; and– Other Information as required by Part 9 Book 2 of the Dutch Civil Code.
Based on the following procedures performed, we conclude that the other information:– is consistent with the financial statements and does not contain material misstatements; and– contains the information as required by Part 9 of Book 2 of the Dutch Civil Code.
We have read the other information. Based on our knowledge and understanding obtained through our audit of the financial statements or otherwise, we have considered whether the other information contains material misstatements.
By performing these procedures, we comply with the requirements of Part 9 of Book 2 of the Dutch Civil Code and the Dutch Standard 720. The scope of the procedures performed is substantially less than the scope of those performed in our audit of the financial statements.
The Executive Board is responsible for the preparation of other information, including the Report of the Executive Board in accordance with Part 9 of Book 2 of the Dutch Civil Code, and the other information as required by Part 9 of Book 2 of the Dutch Civil Code.
Report on other legal and regulatory requirements
EngagementWe were engaged as auditor by the Shareholders of Wolters Kluwer N.V. on April 23, 2014, as of the audit for the year 2015 and have operated as statutory auditor ever since that date.
Description of responsibilities for the financial statements
Responsibilities of the Executive Board and the Supervisory Board for the financial statements.The Executive Board is responsible for the preparation and fair presentation of the financial statements in accordance with EU-IFRS and Part 9 of Book 2 of the Dutch Civil Code. Furthermore, the Executive Board is responsible for such internal control as the Executive Board determines is necessary to enable the preparation of the financial statements that are free from material misstatement, whether due to fraud or error.
As part of the preparation of the financial statements, the Executive Board is responsible for assessing the company’s ability to continue as a going concern. Based on EU-IFRS, the Executive Board should prepare the financial statements using the going concern basis of accounting unless the Executive Board either intends to liquidate the company or to cease operations, or has no realistic alternative but to do so. The Executive Board should disclose events and circumstances that may cast significant doubt on the company’s ability to continue as a going concern in the financial statements.
The Supervisory Board is responsible for overseeing the company’s financial reporting process.
Our responsibilities for the audit of the financial statements
Our objective is to plan and perform the audit assignment in a manner that allows us to obtain sufficient and appropriate audit evidence for our opinion.
Our audit has been performed with a high, but not absolute, level of assurance, which means we may not have detected all errors and fraud.
Misstatements can arise from fraud or error and are considered material if, individually or in the aggregate, they could reasonably be expected to influence the economic decisions of users taken on the basis of these financial statements. The materiality affects the nature, timing and extent of our audit procedures and the evaluation of the effect of identified misstatements on our opinion.
Other Information on the Financial Statements Wolters Kluwer 2016 Annual Report
We have exercised professional judgment and have maintained professional skepticism throughout the audit, in accordance with Dutch Standards on Auditing, ethical requirements and independence requirements.
Our audit included e.g.:– Identifying and assessing the risks of material
misstatement of the financial statements, whether due to fraud or error, designing and performing audit procedures responsive to those risks, and obtaining audit evidence that is sufficient and appropriate to provide a basis for our opinion. The risk of not detecting a material misstatement resulting from fraud is higher than for one resulting from error, as fraud may involve collusion, forgery, intentional omissions, misrepresentations, or the override of internal control;
– Obtaining an understanding of internal control relevant to the audit in order to design audit procedures that are appropriate in the circumstances, but not for the purpose of expressing an opinion on the effectiveness of the company’s internal control;
– Evaluating the appropriateness of accounting policies used and the reasonableness of accounting estimates and related disclosures made by the Executive Board;
– Concluding on the appropriateness of the Executive Board’s use of the going concern basis of accounting, and based on the audit evidence obtained, whether a material uncertainty exists related to events or conditions that may cast significant doubt on the company’s ability to continue as a going concern. If we conclude that a material uncertainty exists, we are required to draw attention in our auditor’s report to the related disclosures in the financial statements or, if such disclosures are inadequate, to modify our opinion. Our conclusions are based on the audit evidence obtained up to the date of our auditor’s report. However, future events or conditions may cause the company to cease to continue as a going concern;
– Evaluating the overall presentation, structure, and content of the financial statements, including the disclosures; and
– Evaluating whether the financial statements represent the underlying transactions and events in a manner that achieves fair presentation.
Because we are ultimately responsible for the opinion, we are also responsible for directing, supervising and performing the group audit. In this respect we have determined the nature and extent of the audit procedures to be carried out for group entities. Decisive were the size and / or the risk profile of the group entities or operations. On this basis, we selected group entities for which an audit or review had to be carried out on the complete set of financial information or specific items.
We communicate with the Supervisory Board regarding, among other matters, the planned scope and timing of the audit and significant audit findings, including any significant findings in internal control that we identify during our audit.
We provided the Supervisory Board with a statement that we have complied with relevant ethical requirements regarding independence, and to communicate with them all relationships and other matters that may reasonably be thought to bear on our independence, and where applicable, related safeguards.
From the matters communicated with the Supervisory Board, we determine those matters that were of most significance in the audit of the financial statements of the current period and are therefore the key audit matters. We describe these matters in our auditor’s report unless law or regulation precludes public disclosure about the matter or when, in extremely rare circumstances, not communicating the matter is in the public interest.
Amsterdam, February 21, 2017
Deloitte Accountants B.V.
Signed on the original
B.C.J. Dielissen
155
Wolters Kluwer 2016 Annual Report
Other Information
ActivitiesThe Board of the Wolters Kluwer Preference Shares Foundation met twice in 2016. The matters discussed included the full-year 2015 results of Wolters Kluwer, the execution of the strategy, the financing of the company, acquisitions and divestments, developments in the market, and the general course of events at Wolters Kluwer. A representative of the Executive Board of the company and corporate staff attended the meetings in order to give the Board of the Foundation information about the developments within Wolters Kluwer.
The Board of the Foundation also followed developments of the company outside of Board meetings, among others through receipt by the Board members of press releases. As a result, the Board of the Foundation has a good view on the course of events at Wolters Kluwer. The Board of the Foundation also closely monitored the developments with respect to corporate governance and relevant Dutch legislation, and discussed that topic during the meetings. Furthermore, the financing of the Foundation and the composition of the Board of the Foundation were discussed and it was decided to amend the articles of association. The Foundation acquired no preference shares during the year under review.
Exercise of the preference shares optionWolters Kluwer N.V. and the Foundation have concluded an agreement based on which preference shares can be taken by the Foundation. This option on preference shares is at present a measure that could be considered as a potential protection at Wolters Kluwer against exercising influence by a third party on the policy of the company without the consent of the Executive Board and Supervisory Board, including events that could threaten the strategy, continuity, independence, identity, or coherence between the activities of the company. The Foundation is entitled to exercise the option on preference shares in such a way that the number of
preference shares taken will be no more than 100% of the number of issued and outstanding ordinary shares at the time of exercise. Among others by the exercise of the option on the preference shares by the Foundation, the Executive Board and the Supervisory Board will have the possibility to determine their position with respect to, for example, a party making a bid on the shares of Wolters Kluwer and its plans, or with respect to a third party that otherwise wishes to exercise decisive influence, and enables the Boards to examine and implement alternatives.
Composition of the Board of the Wolters Kluwer Preference Shares FoundationIn 2016, Mr. Bouwman resigned from the Board of the Foundation due to the expiration of his final term. The Board decided to not replace him and keep the number of Board members at four. In relation to that resolution, the articles of association of the Foundation were amended, creating more flexibility with respect to the number of Board members. The articles of association now also stipulate that all members of the Board should be independent from the company and are appointed by the Board of the Foundation.
The Foundation is a legal entity that is independent from the company as stipulated in clause 5:71 (1) sub c of the Act on financial supervision (Wet op het financieel toezicht). All members of the Board of the Foundation are independent from the company.
Alphen aan den Rijn, February 21, 2017
Board of Wolters Kluwer Preference Shares FoundationR.P. Voogd, ChairmanP. BouwJ.H.M. LindenberghJ.S.T. Tiemstra
Report of the Wolters Kluwer Preference Shares Foundation
156
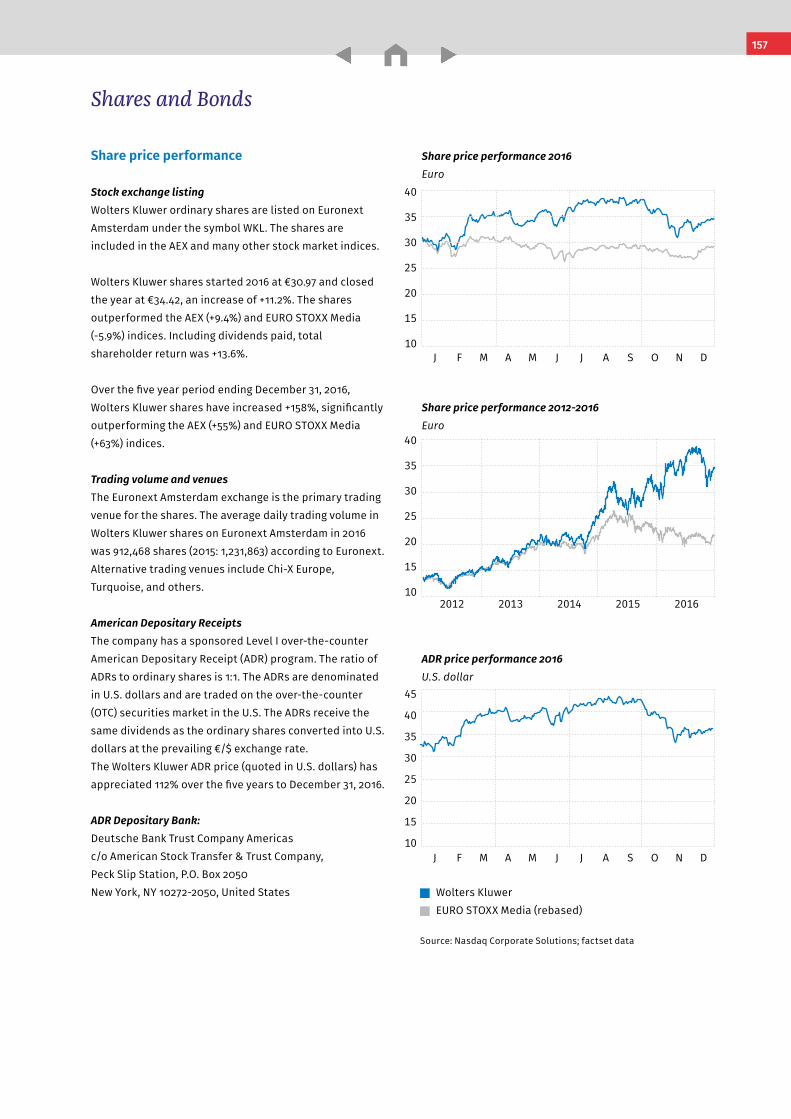
Other Information Wolters Kluwer 2016 Annual Report
Share price performance
Stock exchange listingWolters Kluwer ordinary shares are listed on Euronext Amsterdam under the symbol WKL. The shares are included in the AEX and many other stock market indices.
Wolters Kluwer shares started 2016 at €30.97 and closed the year at €34.42, an increase of +11.2%. The shares outperformed the AEX (+9.4%) and EURO STOXX Media (-5.9%) indices. Including dividends paid, total shareholder return was +13.6%.
Over the five year period ending December 31, 2016, Wolters Kluwer shares have increased +158%, significantly outperforming the AEX (+55%) and EURO STOXX Media (+63%) indices.
Trading volume and venuesThe Euronext Amsterdam exchange is the primary trading venue for the shares. The average daily trading volume in Wolters Kluwer shares on Euronext Amsterdam in 2016 was 912,468 shares (2015: 1,231,863) according to Euronext. Alternative trading venues include Chi-X Europe, Turquoise, and others.
American Depositary ReceiptsThe company has a sponsored Level I over-the-counter American Depositary Receipt (ADR) program. The ratio of ADRs to ordinary shares is 1:1. The ADRs are denominated in U.S. dollars and are traded on the over-the-counter (OTC) securities market in the U.S. The ADRs receive the same dividends as the ordinary shares converted into U.S. dollars at the prevailing €/$ exchange rate. The Wolters Kluwer ADR price (quoted in U.S. dollars) has appreciated 112% over the five years to December 31, 2016.
ADR Depositary Bank:Deutsche Bank Trust Company Americasc/o American Stock Transfer & Trust Company, Peck Slip Station, P.O. Box 2050New York, NY 10272-2050, United States
Shares and Bonds
40
35
30
25
20
15
10J F M A M J J A S O N D
Wolters Kluwer
EURO STOXX Media (rebased)
Source: Nasdaq Corporate Solutions; factset data
Share price performance 2016 Euro
Share price performance 2012-2016 Euro
40
35
30
25
20
15
102012 2013 2014 2015 2016
45
40
35
30
25
20
15
10J F M A M J J A S O N D
ADR price performance 2016 U.S. dollar
157
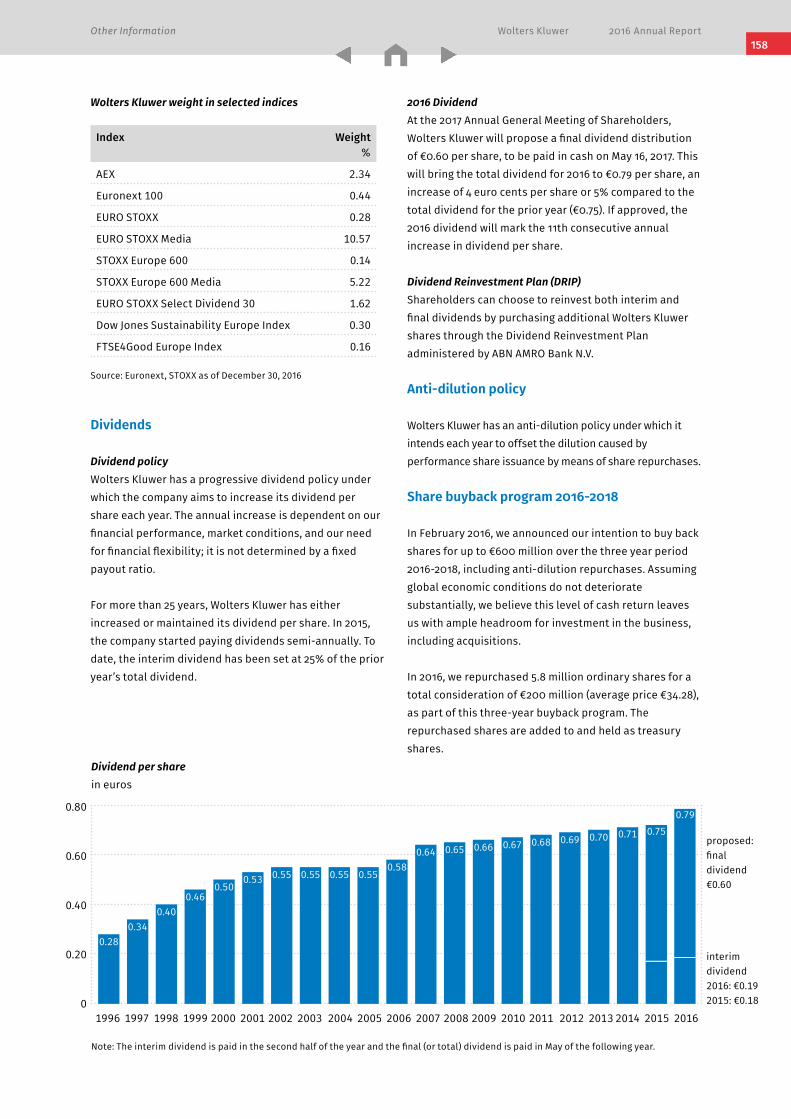
Other Information Wolters Kluwer 2016 Annual Report
Wolters Kluwer weight in selected indices
Index Weight %
AEX 2.34
Euronext 100 0.44
EURO STOXX 0.28
EURO STOXX Media 10.57
STOXX Europe 600 0.14
STOXX Europe 600 Media 5.22
EURO STOXX Select Dividend 30 1.62
Dow Jones Sustainability Europe Index 0.30
FTSE4Good Europe Index 0.16
Source: Euronext, STOXX as of December 30, 2016
Dividends
Dividend policyWolters Kluwer has a progressive dividend policy under which the company aims to increase its dividend per share each year. The annual increase is dependent on our financial performance, market conditions, and our need for financial flexibility; it is not determined by a fixed payout ratio.
For more than 25 years, Wolters Kluwer has either increased or maintained its dividend per share. In 2015, the company started paying dividends semi-annually. To date, the interim dividend has been set at 25% of the prior year’s total dividend.
2016 DividendAt the 2017 Annual General Meeting of Shareholders, Wolters Kluwer will propose a final dividend distribution of €0.60 per share, to be paid in cash on May 16, 2017. This will bring the total dividend for 2016 to €0.79 per share, an increase of 4 euro cents per share or 5% compared to the total dividend for the prior year (€0.75). If approved, the 2016 dividend will mark the 11th consecutive annual increase in dividend per share.
Dividend Reinvestment Plan (DRIP)Shareholders can choose to reinvest both interim and final dividends by purchasing additional Wolters Kluwer shares through the Dividend Reinvestment Plan administered by ABN AMRO Bank N.V.
Anti-dilution policy
Wolters Kluwer has an anti-dilution policy under which it intends each year to offset the dilution caused by performance share issuance by means of share repurchases.
Share buyback program 2016-2018
In February 2016, we announced our intention to buy back shares for up to €600 million over the three year period 2016-2018, including anti-dilution repurchases. Assuming global economic conditions do not deteriorate substantially, we believe this level of cash return leaves us with ample headroom for investment in the business, including acquisitions.
In 2016, we repurchased 5.8 million ordinary shares for a total consideration of €200 million (average price €34.28), as part of this three-year buyback program. The repurchased shares are added to and held as treasury shares.
Dividend per share in euros
1996 1997 1998 1999 2000 2001 2002 2003 2004 2005 2006 2007 2008 2009 2010 2011 2012 2013 2014 2015 2016
0.80
0.60
0.40
0.20
0
Note: The interim dividend is paid in the second half of the year and the final (or total) dividend is paid in May of the following year.
0.280.34
0.400.46
0.500.53 0.55 0.55 0.55 0.55
0.580.64 0.65 0.66 0.67 0.68 0.69 0.70 0.71 proposed:
final dividend €0.60
interim dividend 2016: €0.19 2015: €0.18
0.790.75
158
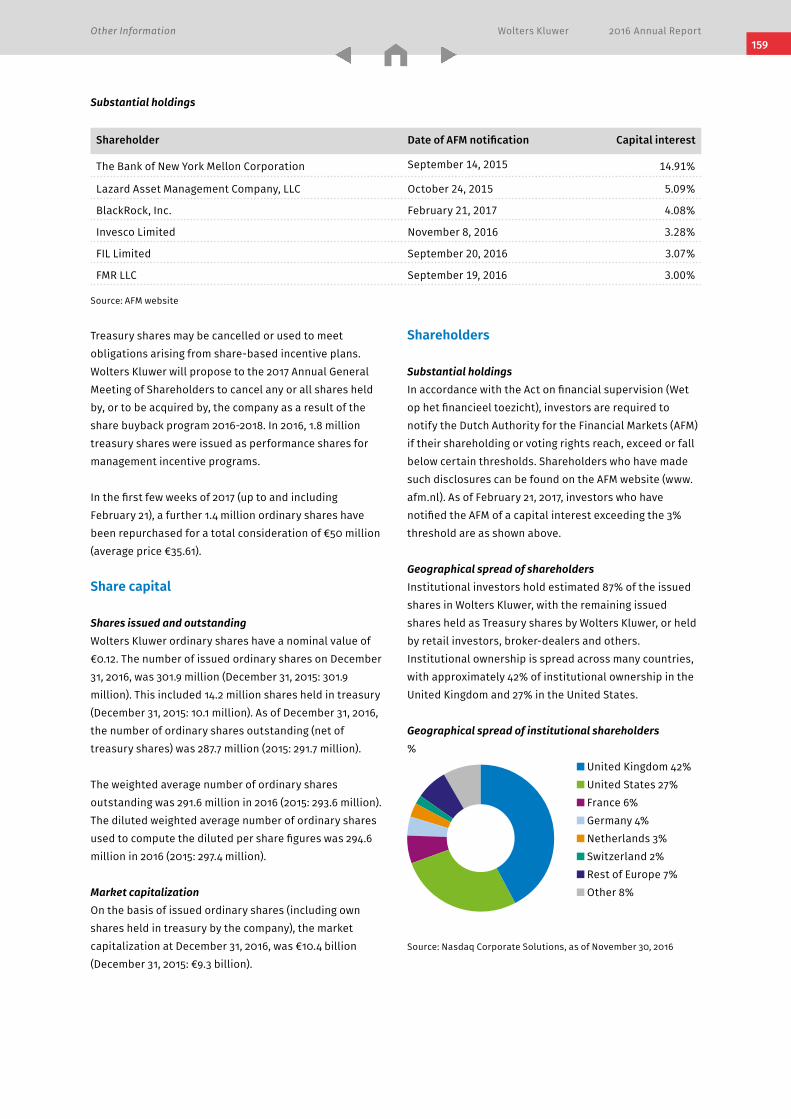
Other Information Wolters Kluwer 2016 Annual Report
Treasury shares may be cancelled or used to meet obligations arising from share-based incentive plans. Wolters Kluwer will propose to the 2017 Annual General Meeting of Shareholders to cancel any or all shares held by, or to be acquired by, the company as a result of the share buyback program 2016-2018. In 2016, 1.8 million treasury shares were issued as performance shares for management incentive programs.
In the first few weeks of 2017 (up to and including February 21), a further 1.4 million ordinary shares have been repurchased for a total consideration of €50 million (average price €35.61).
Share capital
Shares issued and outstandingWolters Kluwer ordinary shares have a nominal value of €0.12. The number of issued ordinary shares on December 31, 2016, was 301.9 million (December 31, 2015: 301.9 million). This included 14.2 million shares held in treasury (December 31, 2015: 10.1 million). As of December 31, 2016, the number of ordinary shares outstanding (net of treasury shares) was 287.7 million (2015: 291.7 million).
The weighted average number of ordinary shares outstanding was 291.6 million in 2016 (2015: 293.6 million). The diluted weighted average number of ordinary shares used to compute the diluted per share figures was 294.6 million in 2016 (2015: 297.4 million).
Market capitalizationOn the basis of issued ordinary shares (including own shares held in treasury by the company), the market capitalization at December 31, 2016, was €10.4 billion (December 31, 2015: €9.3 billion).
Shareholders
Substantial holdingsIn accordance with the Act on financial supervision (Wet op het financieel toezicht), investors are required to notify the Dutch Authority for the Financial Markets (AFM) if their shareholding or voting rights reach, exceed or fall below certain thresholds. Shareholders who have made such disclosures can be found on the AFM website (www.afm.nl). As of February 21, 2017, investors who have notified the AFM of a capital interest exceeding the 3% threshold are as shown above.
Geographical spread of shareholdersInstitutional investors hold estimated 87% of the issued shares in Wolters Kluwer, with the remaining issued shares held as Treasury shares by Wolters Kluwer, or held by retail investors, broker-dealers and others. Institutional ownership is spread across many countries, with approximately 42% of institutional ownership in the United Kingdom and 27% in the United States.
Geographical spread of institutional shareholders%
United Kingdom 42% United States 27% France 6% Germany 4% Netherlands 3% Switzerland 2% Rest of Europe 7% Other 8%
Source: Nasdaq Corporate Solutions, as of November 30, 2016
Substantial holdings
Shareholder Date of AFM notification Capital interest
The Bank of New York Mellon Corporation September 14, 2015 14.91%
Lazard Asset Management Company, LLC October 24, 2015 5.09%
BlackRock, Inc. February 21, 2017 4.08%
Invesco Limited November 8, 2016 3.28%
FIL Limited September 20, 2016 3.07%
FMR LLC September 19, 2016 3.00%
Source: AFM website
159
Other Information Wolters Kluwer 2016 Annual Report 160
Key figures per share
in euro, unless otherwise indicated 2016 2015
Adjusted earnings per share 2.12 1.98
Diluted adjusted earnings per share 2.10 1.96
Diluted earnings per share 1.66 1.42
Total dividend per share (2016 proposed) 0.79 0.75
Weighted average number of shares issued (millions) 291.6 293.6
Diluted weighted average number of shares (millions) 294.6 297.4
Highest quotation 38.69 33.56
Lowest quotation 28.24 24.71
Quotation at December 31 34.42 30.97
Average daily volume on Euronext Amsterdam (thousands of shares) 912 1,232
Wolters Kluwer bonds and private placements outstanding
Issuance Due Amount (million) Listing ISIN
6.375% senior bonds 2018 €750 Luxembourg XS0357251726
4.200% private placement 2020 €250 Frankfurt XS0522820801
2.875% senior bonds 2023 €700 Luxembourg XS0907301260
2.500% senior bonds 2024 €400 Luxembourg XS1067329570
6.748% senior bonds 2028 €36 Luxembourg XS0384322656
Credit ratingsWolters Kluwer is rated by Moody’s Investor Services (Moody’s) and S&P Global Ratings (S&P).
Index Long-term Short-term Outlook
Moody’s (Sept. 12, 2013) Baa1 Stable Stable
S&P (March 7, 2013) BBB+ A-2 Stable
Bonds and credit ratingsAs of December 31, 2016, Wolters Kluwer has the following listed debt securities:
Other Information Wolters Kluwer 2016 Annual Report
Investor Relations
Dialogue with capital marketsWolters Kluwer is committed to a high degree of transparency in its financial reporting and strives to be open with its shareholders and the wider investment community. The company manages a comprehensive communications program for investors, including the Annual General Meeting of Shareholders in April and many other events throughout the year. In 2016, activities for investors and analysts included live webcast presentations by management of half-year and full-year results, participation in a number of broker conferences, and an active schedule of roadshow meetings with investors in Europe and North America.
Further information, including annual reports and investor presentations, can be found on the investors section of our website (www.wolterskluwer.com/investors). Presentations hosted by the company are webcast live on our website.
Investor relations policyWolters Kluwer is strict in its compliance with applicable rules and regulations on fair disclosure to shareholders. Presentations are posted on the company’s website at the same time they are made available to analysts and investors. In adherence with fair disclosure rules, meetings and presentations do not take place during ‘closed periods’ before the publication of annual and quarterly financial information. The company does not assess, comment upon, or correct, other than factually, any analyst report or valuation prior to publication. The company is committed to helping investors and analysts become better acquainted with Wolters Kluwer and its management, as well as to maintaining a long-term relationship of trust with the investment community at large.
Securities codes and ticker symbols
System Code/Ticker
Ordinary shares
ISIN NL0000395903
Security 39590
SEDOL 5671519 NL
Bloomberg WKL:NA
Thomson Reuters WLSNc.AS
ADR
ISIN US9778742059
CUSIP 97787420 5
Bloomberg WTKWY:US
Thomson Reuters WTKWY
Financial calendar
April 20 Annual General Meeting of Shareholders
April 24 Ex-dividend date: 2016 final dividend
April 25 Record date: 2016 final dividend
May 10 2017 First-Quarter Trading Update
May 16 Payment date: 2016 final dividend ordinary shares
May 23 Payment date: 2016 final dividend ADRs
July 28 2017 Half-Year Results
August 28 Ex-dividend date: 2017 interim dividend
August 29 Record date: 2017 interim dividend
September 19 Payment date: 2017 interim dividend ordinary shares
September 26 Payment date: 2017 interim dividend ADRs
November 1 2017 Nine-Month Trading Update
2018 Financial calendar
February 21 2017 Full-Year Results
161
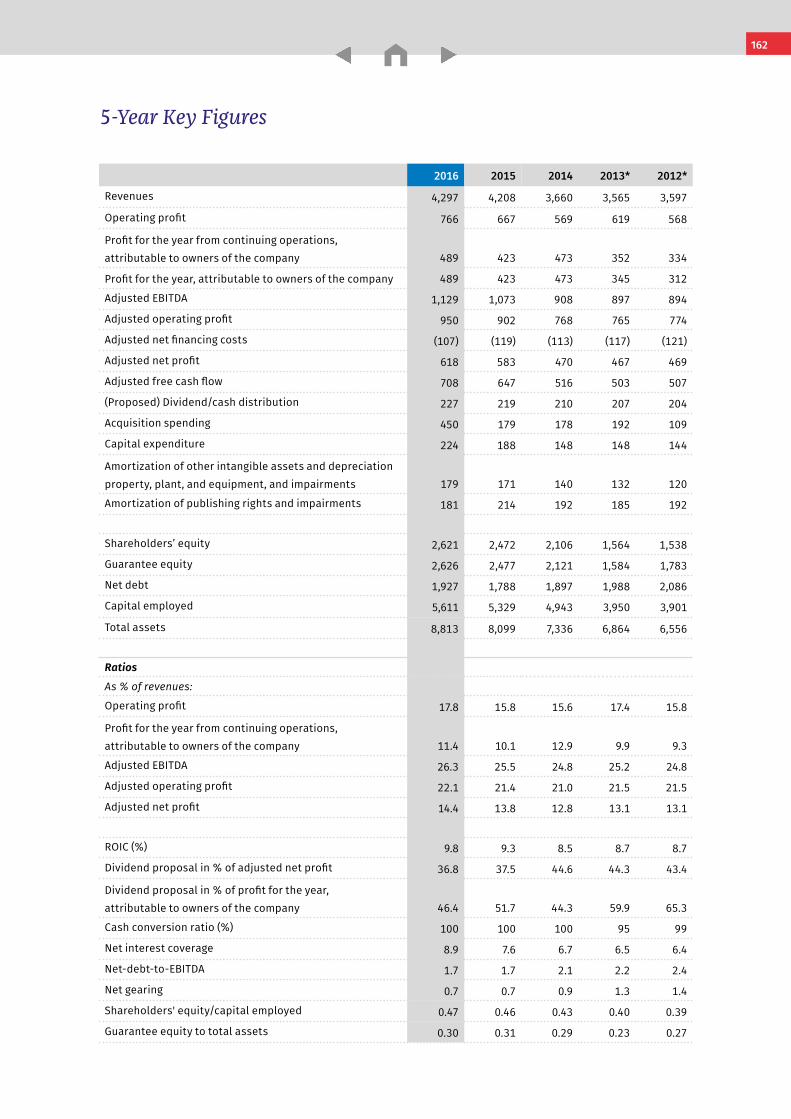
Other Information Wolters Kluwer 2016 Annual Report
5-Year Key Figures
2016 2015 2014 2013* 2012*
Revenues 4,297 4,208 3,660 3,565 3,597
Operating profit 766 667 569 619 568
Profit for the year from continuing operations, attributable to owners of the company 489 423 473 352 334
Profit for the year, attributable to owners of the company 489 423 473 345 312
Adjusted EBITDA 1,129 1,073 908 897 894
Adjusted operating profit 950 902 768 765 774
Adjusted net financing costs (107) (119) (113) (117) (121)
Adjusted net profit 618 583 470 467 469
Adjusted free cash flow 708 647 516 503 507
(Proposed) Dividend/cash distribution 227 219 210 207 204
Acquisition spending 450 179 178 192 109
Capital expenditure 224 188 148 148 144
Amortization of other intangible assets and depreciation property, plant, and equipment, and impairments 179 171 140 132 120
Amortization of publishing rights and impairments 181 214 192 185 192
Shareholders’ equity 2,621 2,472 2,106 1,564 1,538
Guarantee equity 2,626 2,477 2,121 1,584 1,783
Net debt 1,927 1,788 1,897 1,988 2,086
Capital employed 5,611 5,329 4,943 3,950 3,901
Total assets 8,813 8,099 7,336 6,864 6,556
Ratios
As % of revenues:
Operating profit 17.8 15.8 15.6 17.4 15.8
Profit for the year from continuing operations, attributable to owners of the company 11.4 10.1 12.9 9.9 9.3
Adjusted EBITDA 26.3 25.5 24.8 25.2 24.8
Adjusted operating profit 22.1 21.4 21.0 21.5 21.5
Adjusted net profit 14.4 13.8 12.8 13.1 13.1
ROIC (%) 9.8 9.3 8.5 8.7 8.7
Dividend proposal in % of adjusted net profit 36.8 37.5 44.6 44.3 43.4
Dividend proposal in % of profit for the year, attributable to owners of the company 46.4 51.7 44.3 59.9 65.3
Cash conversion ratio (%) 100 100 100 95 99
Net interest coverage 8.9 7.6 6.7 6.5 6.4
Net-debt-to-EBITDA 1.7 1.7 2.1 2.2 2.4
Net gearing 0.7 0.7 0.9 1.3 1.4
Shareholders' equity/capital employed 0.47 0.46 0.43 0.40 0.39
Guarantee equity to total assets 0.30 0.31 0.29 0.23 0.27
162
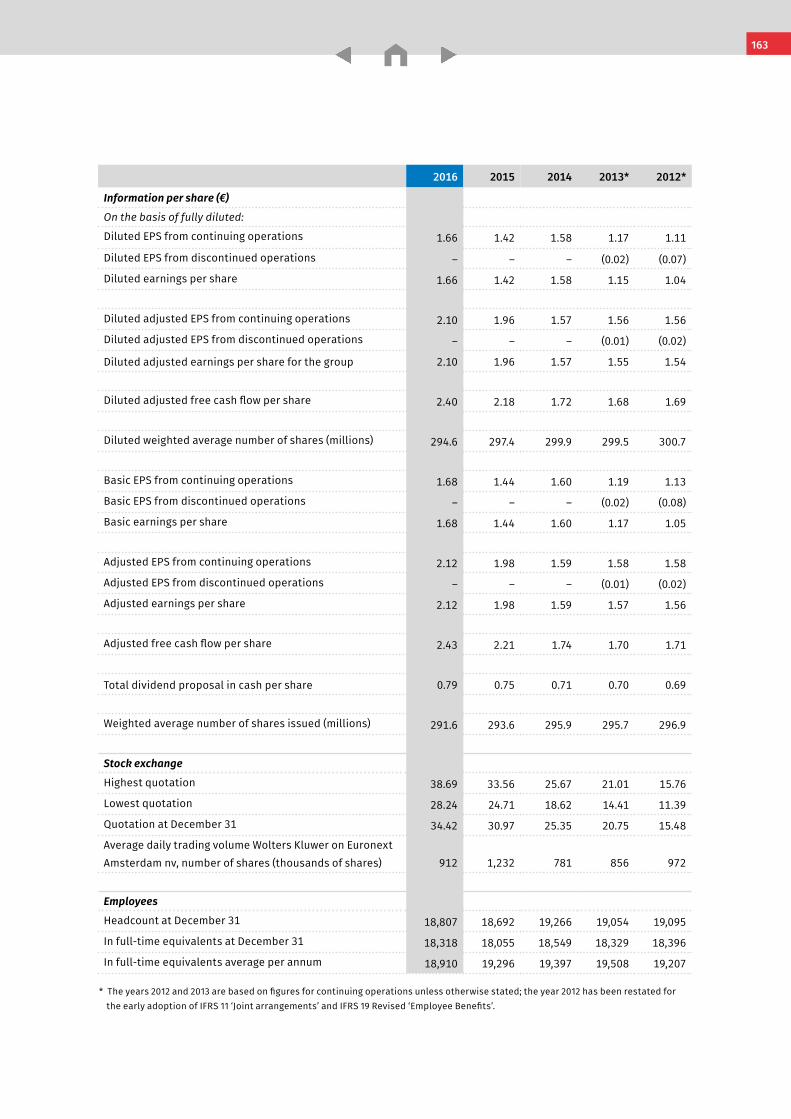
Other Information Wolters Kluwer 2016 Annual Report
2016 2015 2014 2013* 2012*
Information per share (€)
On the basis of fully diluted:
Diluted EPS from continuing operations 1.66 1.42 1.58 1.17 1.11
Diluted EPS from discontinued operations – – – (0.02) (0.07)
Diluted earnings per share 1.66 1.42 1.58 1.15 1.04
Diluted adjusted EPS from continuing operations 2.10 1.96 1.57 1.56 1.56
Diluted adjusted EPS from discontinued operations – – – (0.01) (0.02)
Diluted adjusted earnings per share for the group 2.10 1.96 1.57 1.55 1.54
Diluted adjusted free cash flow per share 2.40 2.18 1.72 1.68 1.69
Diluted weighted average number of shares (millions) 294.6 297.4 299.9 299.5 300.7
Basic EPS from continuing operations 1.68 1.44 1.60 1.19 1.13
Basic EPS from discontinued operations – – – (0.02) (0.08)
Basic earnings per share 1.68 1.44 1.60 1.17 1.05
Adjusted EPS from continuing operations 2.12 1.98 1.59 1.58 1.58
Adjusted EPS from discontinued operations – – – (0.01) (0.02)
Adjusted earnings per share 2.12 1.98 1.59 1.57 1.56
Adjusted free cash flow per share 2.43 2.21 1.74 1.70 1.71
Total dividend proposal in cash per share 0.79 0.75 0.71 0.70 0.69
Weighted average number of shares issued (millions) 291.6 293.6 295.9 295.7 296.9
Stock exchange
Highest quotation 38.69 33.56 25.67 21.01 15.76
Lowest quotation 28.24 24.71 18.62 14.41 11.39
Quotation at December 31 34.42 30.97 25.35 20.75 15.48
Average daily trading volume Wolters Kluwer on Euronext Amsterdam nv, number of shares (thousands of shares) 912 1,232 781 856 972
Employees
Headcount at December 31 18,807 18,692 19,266 19,054 19,095
In full-time equivalents at December 31 18,318 18,055 18,549 18,329 18,396
In full-time equivalents average per annum 18,910 19,296 19,397 19,508 19,207
* The years 2012 and 2013 are based on figures for continuing operations unless otherwise stated; the year 2012 has been restated for the early adoption of IFRS 11 ‘Joint arrangements’ and IFRS 19 Revised ‘Employee Benefits’.
163
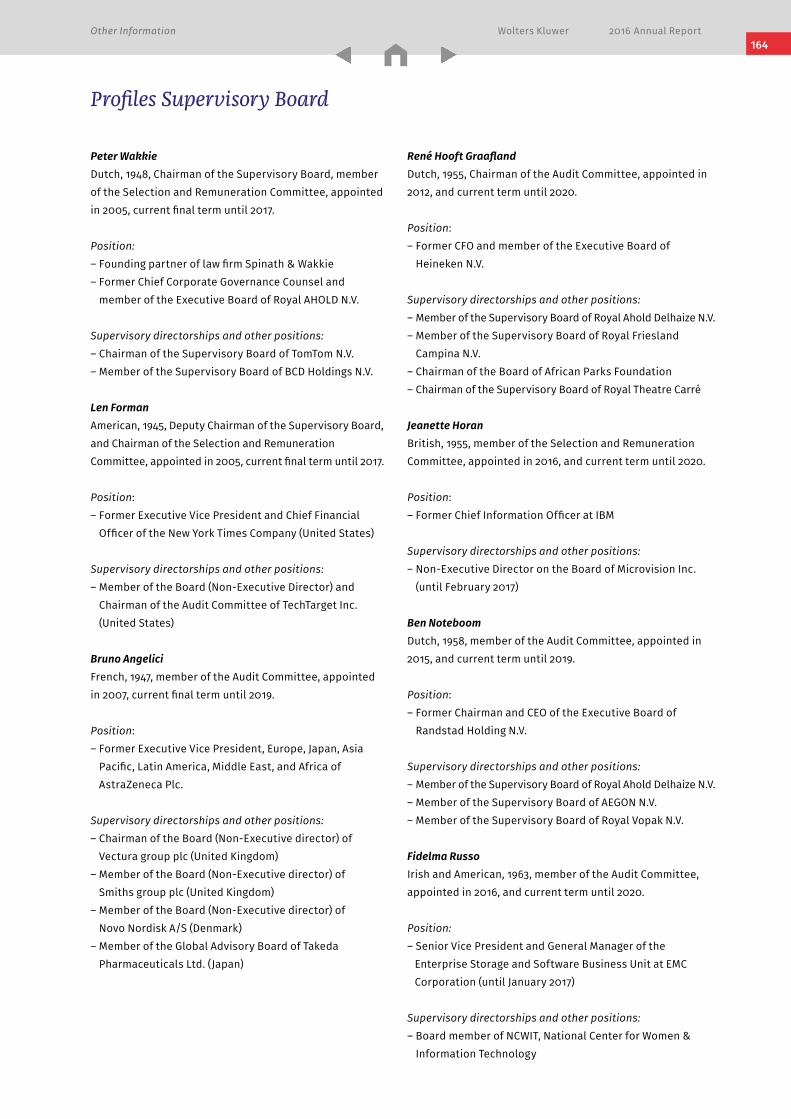
Other Information Wolters Kluwer 2016 Annual Report 164
Peter WakkieDutch, 1948, Chairman of the Supervisory Board, member of the Selection and Remuneration Committee, appointed in 2005, current final term until 2017.
Position:– Founding partner of law firm Spinath & Wakkie– Former Chief Corporate Governance Counsel and member of the Executive Board of Royal AHOLD N.V.
Supervisory directorships and other positions:– Chairman of the Supervisory Board of TomTom N.V.– Member of the Supervisory Board of BCD Holdings N.V.
Len FormanAmerican, 1945, Deputy Chairman of the Supervisory Board, and Chairman of the Selection and Remuneration Committee, appointed in 2005, current final term until 2017.
Position:– Former Executive Vice President and Chief Financial Officer of the New York Times Company (United States)
Supervisory directorships and other positions:– Member of the Board (Non-Executive Director) and Chairman of the Audit Committee of TechTarget Inc. (United States)
Bruno AngeliciFrench, 1947, member of the Audit Committee, appointed in 2007, current final term until 2019.
Position:– Former Executive Vice President, Europe, Japan, Asia Pacific, Latin America, Middle East, and Africa of AstraZeneca Plc.
Supervisory directorships and other positions:– Chairman of the Board (Non-Executive director) of Vectura group plc (United Kingdom)– Member of the Board (Non-Executive director) of Smiths group plc (United Kingdom)– Member of the Board (Non-Executive director) of Novo Nordisk A/S (Denmark)– Member of the Global Advisory Board of Takeda Pharmaceuticals Ltd. (Japan)
René Hooft GraaflandDutch, 1955, Chairman of the Audit Committee, appointed in 2012, and current term until 2020.
Position:– Former CFO and member of the Executive Board of Heineken N.V.
Supervisory directorships and other positions:– Member of the Supervisory Board of Royal Ahold Delhaize N.V.– Member of the Supervisory Board of Royal Friesland Campina N.V.– Chairman of the Board of African Parks Foundation– Chairman of the Supervisory Board of Royal Theatre Carré
Jeanette HoranBritish, 1955, member of the Selection and Remuneration Committee, appointed in 2016, and current term until 2020.
Position:– Former Chief Information Officer at IBM
Supervisory directorships and other positions: – Non-Executive Director on the Board of Microvision Inc. (until February 2017)
Ben NoteboomDutch, 1958, member of the Audit Committee, appointed in 2015, and current term until 2019.
Position:– Former Chairman and CEO of the Executive Board of Randstad Holding N.V.
Supervisory directorships and other positions:– Member of the Supervisory Board of Royal Ahold Delhaize N.V.– Member of the Supervisory Board of AEGON N.V.– Member of the Supervisory Board of Royal Vopak N.V.
Fidelma RussoIrish and American, 1963, member of the Audit Committee, appointed in 2016, and current term until 2020.
Position:– Senior Vice President and General Manager of the
Enterprise Storage and Software Business Unit at EMC Corporation (until January 2017)
Supervisory directorships and other positions:– Board member of NCWIT, National Center for Women & Information Technology
Profiles Supervisory Board
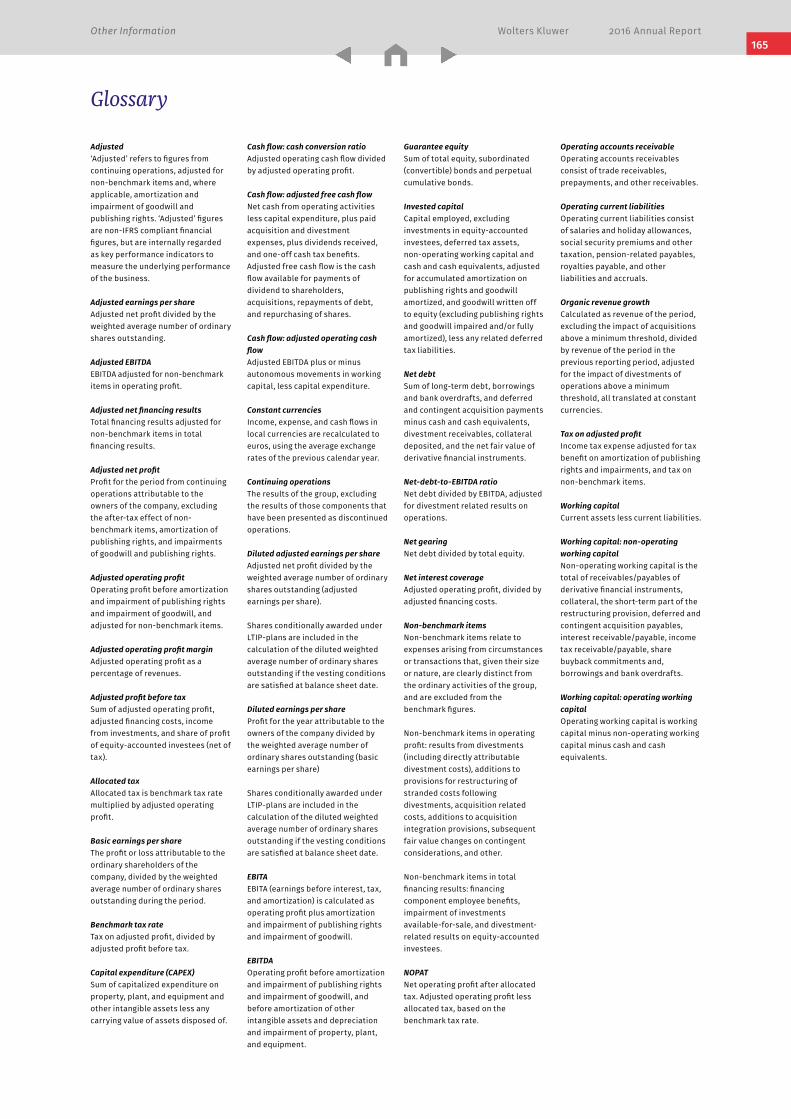
Other Information Wolters Kluwer 2016 Annual Report
Adjusted‘Adjusted’ refers to figures from continuing operations, adjusted for non-benchmark items and, where applicable, amortization and impairment of goodwill and publishing rights. ‘Adjusted’ figures are non-IFRS compliant financial figures, but are internally regarded as key performance indicators to measure the underlying performance of the business.
Adjusted earnings per shareAdjusted net profit divided by the weighted average number of ordinary shares outstanding.
Adjusted EBITDAEBITDA adjusted for non-benchmark items in operating profit.
Adjusted net financing resultsTotal financing results adjusted for non-benchmark items in total financing results.
Adjusted net profitProfit for the period from continuing operations attributable to the owners of the company, excluding the after-tax effect of non-benchmark items, amortization of publishing rights, and impairments of goodwill and publishing rights.
Adjusted operating profitOperating profit before amortization and impairment of publishing rights and impairment of goodwill, and adjusted for non-benchmark items.
Adjusted operating profit marginAdjusted operating profit as a percentage of revenues.
Adjusted profit before taxSum of adjusted operating profit, adjusted financing costs, income from investments, and share of profit of equity-accounted investees (net of tax).
Allocated taxAllocated tax is benchmark tax rate multiplied by adjusted operating profit.
Basic earnings per shareThe profit or loss attributable to the ordinary shareholders of the company, divided by the weighted average number of ordinary shares outstanding during the period.
Benchmark tax rateTax on adjusted profit, divided by adjusted profit before tax. Capital expenditure (CAPEX)Sum of capitalized expenditure on property, plant, and equipment and other intangible assets less any carrying value of assets disposed of.
Cash flow: cash conversion ratioAdjusted operating cash flow divided by adjusted operating profit.
Cash flow: adjusted free cash flowNet cash from operating activities less capital expenditure, plus paid acquisition and divestment expenses, plus dividends received, and one-off cash tax benefits. Adjusted free cash flow is the cash flow available for payments of dividend to shareholders, acquisitions, repayments of debt, and repurchasing of shares.
Cash flow: adjusted operating cash flowAdjusted EBITDA plus or minus autonomous movements in working capital, less capital expenditure.
Constant currenciesIncome, expense, and cash flows in local currencies are recalculated to euros, using the average exchange rates of the previous calendar year.
Continuing operationsThe results of the group, excluding the results of those components that have been presented as discontinued operations.
Diluted adjusted earnings per shareAdjusted net profit divided by the weighted average number of ordinary shares outstanding (adjusted earnings per share).
Shares conditionally awarded under LTIP-plans are included in the calculation of the diluted weighted average number of ordinary shares outstanding if the vesting conditions are satisfied at balance sheet date.
Diluted earnings per shareProfit for the year attributable to the owners of the company divided by the weighted average number of ordinary shares outstanding (basic earnings per share)
Shares conditionally awarded under LTIP-plans are included in the calculation of the diluted weighted average number of ordinary shares outstanding if the vesting conditions are satisfied at balance sheet date.
EBITAEBITA (earnings before interest, tax, and amortization) is calculated as operating profit plus amortization and impairment of publishing rights and impairment of goodwill.
EBITDAOperating profit before amortization and impairment of publishing rights and impairment of goodwill, and before amortization of other intangible assets and depreciation and impairment of property, plant, and equipment.
Guarantee equitySum of total equity, subordinated (convertible) bonds and perpetual cumulative bonds.
Invested capitalCapital employed, excluding investments in equity-accounted investees, deferred tax assets, non-operating working capital and cash and cash equivalents, adjusted for accumulated amortization on publishing rights and goodwill amortized, and goodwill written off to equity (excluding publishing rights and goodwill impaired and/or fully amortized), less any related deferred tax liabilities.
Net debtSum of long-term debt, borrowings and bank overdrafts, and deferred and contingent acquisition payments minus cash and cash equivalents, divestment receivables, collateral deposited, and the net fair value of derivative financial instruments.
Net-debt-to-EBITDA ratioNet debt divided by EBITDA, adjusted for divestment related results on operations.
Net gearingNet debt divided by total equity.
Net interest coverageAdjusted operating profit, divided by adjusted financing costs.
Non-benchmark itemsNon-benchmark items relate to expenses arising from circumstances or transactions that, given their size or nature, are clearly distinct from the ordinary activities of the group, and are excluded from the benchmark figures.
Non-benchmark items in operating profit: results from divestments (including directly attributable divestment costs), additions to provisions for restructuring of stranded costs following divestments, acquisition related costs, additions to acquisition integration provisions, subsequent fair value changes on contingent considerations, and other.
Non-benchmark items in total financing results: financing component employee benefits, impairment of investments available-for-sale, and divestment-related results on equity-accounted investees.
NOPATNet operating profit after allocated tax. Adjusted operating profit less allocated tax, based on the benchmark tax rate.
Operating accounts receivableOperating accounts receivables consist of trade receivables, prepayments, and other receivables.
Operating current liabilitiesOperating current liabilities consist of salaries and holiday allowances, social security premiums and other taxation, pension-related payables, royalties payable, and other liabilities and accruals.
Organic revenue growthCalculated as revenue of the period, excluding the impact of acquisitions above a minimum threshold, divided by revenue of the period in the previous reporting period, adjusted for the impact of divestments of operations above a minimum threshold, all translated at constant currencies.
Tax on adjusted profitIncome tax expense adjusted for tax benefit on amortization of publishing rights and impairments, and tax on non-benchmark items.
Working capitalCurrent assets less current liabilities.
Working capital: non-operating working capitalNon-operating working capital is the total of receivables/payables of derivative financial instruments, collateral, the short-term part of the restructuring provision, deferred and contingent acquisition payables, interest receivable/payable, income tax receivable/payable, share buyback commitments and, borrowings and bank overdrafts.
Working capital: operating working capitalOperating working capital is working capital minus non-operating working capital minus cash and cash equivalents.
Glossary
165
Other Information Wolters Kluwer 2016 Annual Report 166
Contact information
Wolters Kluwer N.V. Zuidpoolsingel 2P.O. Box 10302400 BA Alphen aan den Rijn The Netherlands
[email protected]/company/wolters-kluwerwww.facebook.com/wolterskluwerwww.twitter.com/wolters_kluwer
Chamber of CommerceTrade Registry No. 33.202.517
Forward-looking statements and other important legal information
This report contains forward-looking statements. These statements may be identified by words such as “expect”, “should”, “could”, “shall” and similar expressions. Wolters Kluwer cautions that such forward-looking statements are qualified by certain risks and uncertainties that could cause actual results and events to differ materially from what is contemplated by the forward-looking statements. Factors which could cause actual results to differ from these forward-looking statements may include, without limitation, general economic conditions; conditions in the markets in which Wolters Kluwer is engaged; behavior of customers, suppliers, and competitors; technological developments; the implementation and execution of new ICT systems or outsourcing; and legal, tax, and regulatory rules affecting Wolters Kluwer’s businesses, as well as risks related to mergers, acquisitions, and divestments. In addition, financial risks such as currency movements, interest rate fluctuations, liquidity, and credit risks could influence future results. The foregoing list of factors should not be construed as exhaustive. Wolters Kluwer disclaims any intention or obligation to publicly update or revise any forward-looking statements, whether as a result of new information, future events or otherwise.
About this report
This Annual Report is available as a PDF on our website www.wolterskluwer.com and as a limited editionprint version.
Wolters Kluwer also issued a 2016 Sustainability Report, available as a PDF on our website.
carbon neutralnatureOffice.com | NL-001-419668
print production

When you have to be right