Embed Size (px)
Citation preview
ANNUAL SUSTAINABILITYSUMMARY
JULY 2014-JUNE 2015
Annual Sustainability Summary (July 2014-June 2015) | 2
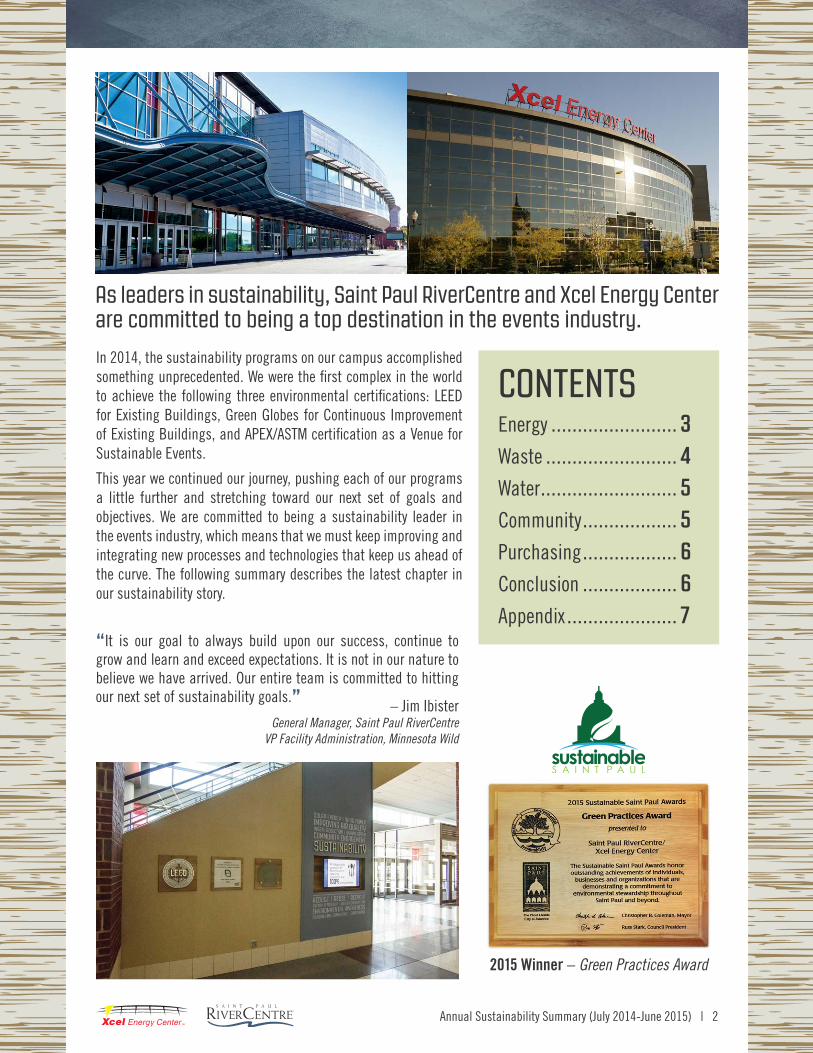
In 2014, the sustainability programs on our campus accomplished something unprecedented. We were the first complex in the world to achieve the following three environmental certifications: LEED for Existing Buildings, Green Globes for Continuous Improvement of Existing Buildings, and APEX/ASTM certification as a Venue for Sustainable Events.
This year we continued our journey, pushing each of our programs a little further and stretching toward our next set of goals and objectives. We are committed to being a sustainability leader in the events industry, which means that we must keep improving and integrating new processes and technologies that keep us ahead of the curve. The following summary describes the latest chapter in our sustainability story.
CONTENTSEnergy ........................ 3Waste ......................... 4Water .......................... 5Community .................. 5Purchasing .................. 6Conclusion .................. 6Appendix ..................... 7
As leaders in sustainability, Saint Paul RiverCentre and Xcel Energy Center are committed to being a top destination in the events industry.
“It is our goal to always build upon our success, continue to grow and learn and exceed expectations. It is not in our nature to believe we have arrived. Our entire team is committed to hitting our next set of sustainability goals.” – Jim Ibister
General Manager, Saint Paul RiverCentre VP Facility Administration, Minnesota Wild
2015 Winner – Green Practices Award
Annual Sustainability Summary (July 2014-June 2015) | 3
ENERGYLED TECHNOLOGYIn January of 2015, 300 metal halide lights in the Roy Wilkins Auditorium exhibition hall were upgraded to LED technology. Not only is the space brighter and emitting better light quality, but the change will save almost $20,000 per year in energy costs and pay itself back in under two years.
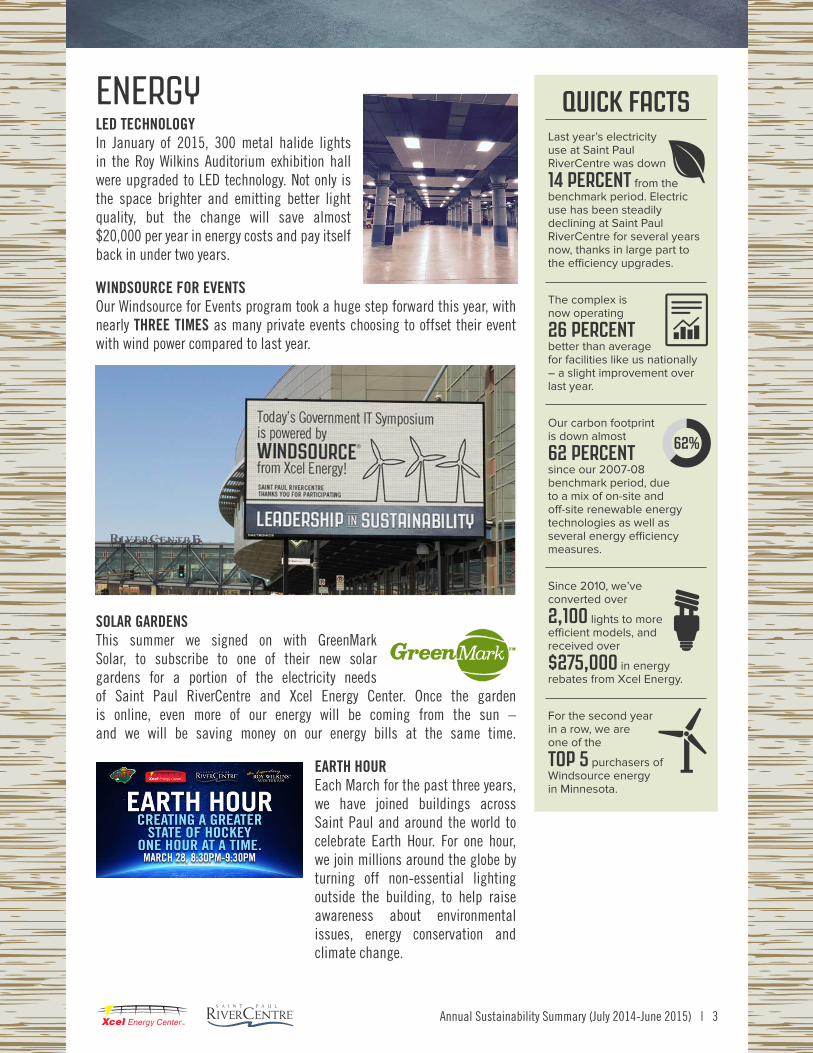
WINDSOURCE FOR EVENTSOur Windsource for Events program took a huge step forward this year, with nearly THREE TIMES as many private events choosing to offset their event with wind power compared to last year.
SOLAR GARDENSThis summer we signed on with GreenMark Solar, to subscribe to one of their new solar gardens for a portion of the electricity needs of Saint Paul RiverCentre and Xcel Energy Center. Once the garden is online, even more of our energy will be coming from the sun – and we will be saving money on our energy bills at the same time.
EARTH HOUREach March for the past three years, we have joined buildings across Saint Paul and around the world to celebrate Earth Hour. For one hour, we join millions around the globe by turning off non-essential lighting outside the building, to help raise awareness about environmental issues, energy conservation and climate change.
Last year’s electricity use at Saint Paul RiverCentre was down
14 PERCENT from the benchmark period. Electric use has been steadily declining at Saint Paul RiverCentre for several years now, thanks in large part to the efficiency upgrades.
The complex is now operating
26 PERCENT better than average for facilities like us nationally – a slight improvement over last year.
Our carbon footprint is down almost
62 PERCENT since our 2007-08 benchmark period, due to a mix of on-site and off-site renewable energy technologies as well as several energy efficiency measures.
Since 2010, we’ve converted over
2,100 lights to more efficient models, and received over
$275,000 in energy rebates from Xcel Energy.
For the second year in a row, we are one of the
TOP 5 purchasers of Windsource energy in Minnesota.
QUICK FACTS
Annual Sustainability Summary (July 2014-June 2015) | 4
WASTERECYCLING BINSIn late 2014, we were awarded nearly $50,000 in grant funds from the Minnesota Pollution Control Agency as part of their Environmental Assistance Grant Program. This funding has allowed us to add over 100 new recycling bins around our campus to better collect compostable material in public areas. It also allowed us to purchase new equipment behind the scenes that makes the program cleaner and more efficient.
DIGITAL BOARDSLast summer our digital scoreboard, arenamation and outdoor marquees at Xcel Energy Center were replaced with a high-tech LED system from Daktronics that is both more efficient and much more visually dynamic. The entire old system was recycled - equating to an additional 37,487 pounds of recycled material.
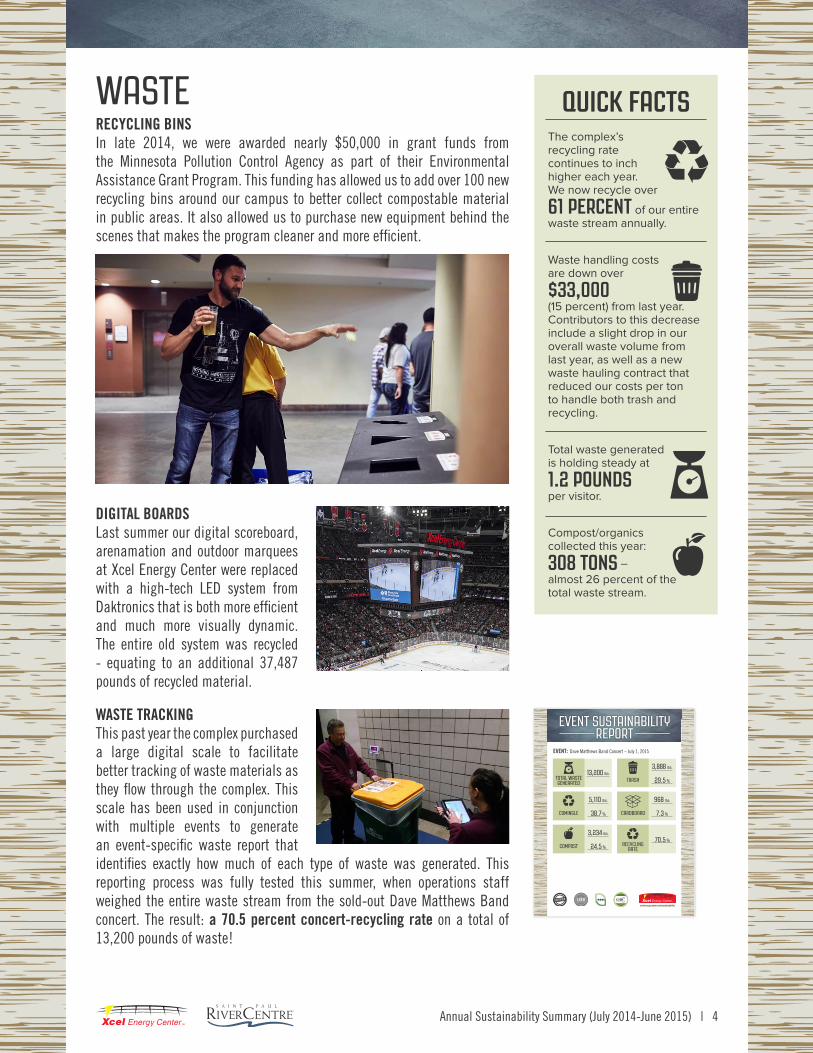
WASTE TRACKINGThis past year the complex purchased a large digital scale to facilitate better tracking of waste materials as they flow through the complex. This scale has been used in conjunction with multiple events to generate an event-specific waste report that identifies exactly how much of each type of waste was generated. This reporting process was fully tested this summer, when operations staff weighed the entire waste stream from the sold-out Dave Matthews Band concert. The result: a 70.5 percent concert-recycling rate on a total of 13,200 pounds of waste!
The complex’s recycling rate continues to inch higher each year. We now recycle over
61 PERCENT of our entire waste stream annually.
Waste handling costs are down over
$33,000 (15 percent) from last year. Contributors to this decrease include a slight drop in our overall waste volume from last year, as well as a new waste hauling contract that reduced our costs per ton to handle both trash and recycling.
Total waste generated is holding steady at
1.2 POUNDS per visitor.
Compost/organics collected this year:
308 TONS – almost 26 percent of the total waste stream.
QUICK FACTS
EVENT: Dave Matthews Band Concert – July 1, 2015
EVENT SUSTAINABILITY –––––––– REPORT ––––––––
13,200 lbs.TOTAL WASTE GENERATED
3,234 lbs.
24.5 %
5,110 lbs.
38.7 %
968 lbs.
7.3 %
70.5 %
3,888 lbs.
29.5 %TRASH
RECYCLING RATE
COMINGLE CARDBOARD
COMPOST
xcelenergycenter.com/sustainabilityVERIFIED
TM2014
CERTIFIED
Annual Sustainability Summary (July 2014-June 2015) | 5
WATERCHANGE THE COURSEAs part of our goal surrounding water conservation, we partnered with the NHL and Bonneville Environmental Foundation this year to “Change the Course.” The program focused on creating water conservation awareness in our community, while at the same time raising funds to restore critically de-watered rivers like the Colorado River in the southwest. In-game announcements, social media contests, concourse signage and intermission activities were implemented to engage fans in the effort.
CORPORATE ACTIVATIONWe partnered with our corporate partner, Coca-ColaTM to generate buzz around the Change the Course program by giving away a free rain barrel, made from a recycled Coca-Cola syrup barrel, to three Wild fans.
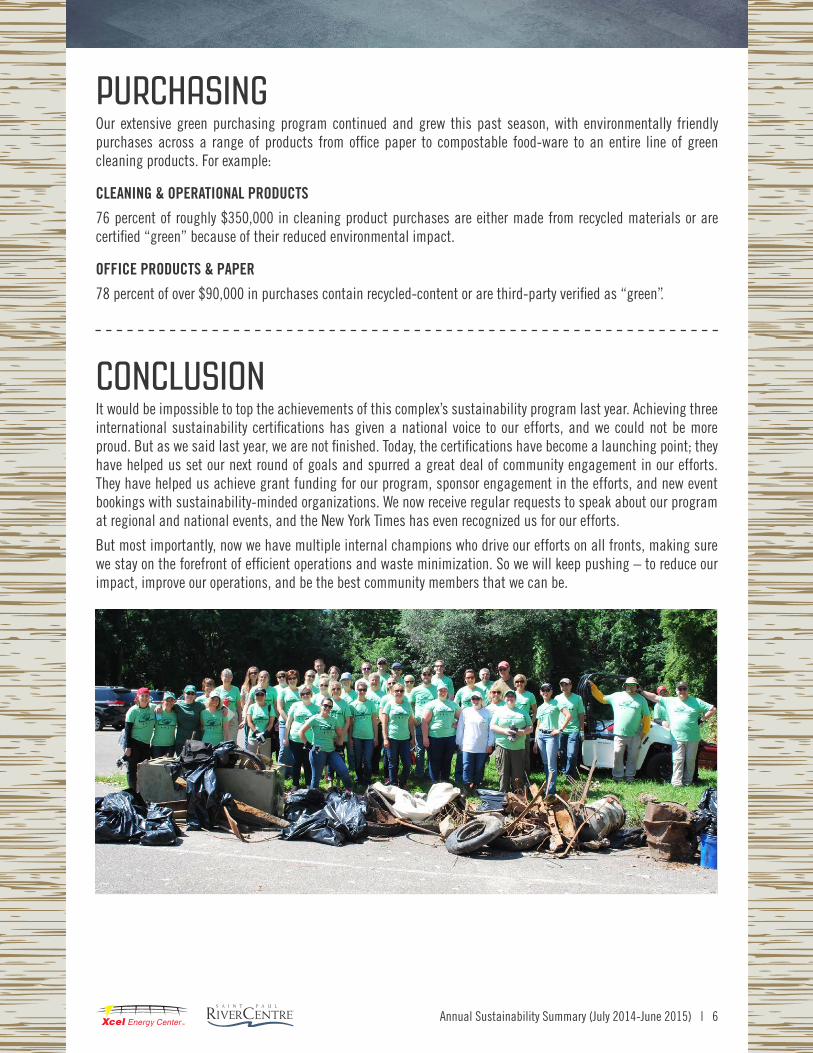
COMMUNITYADOPT-A-RIVERThis year, our organization celebrated Earth Day by committing to Minnesota’s Adopt-a-River program. This Minnesota DNR-based volunteer program collects trash from thousands of miles of lake and river shoreline each year. Over 40 volunteers from our campus spent a half day removing trash and unwanted items from the banks of the Mississippi River in Lilydale.
The result: approximately 2,100 pounds of waste was collected, including old tires, a hot water heater, an old refrigerator and many bags of discarded litter.
SAINT PAUL ECO DISTRICTOur sustainability programs have expanded beyond our own campus. In 2014, Saint Paul RiverCentre and Xcel Energy Center partnered with District Energy St Paul, the Science Museum of Minnesota, the City of Saint Paul and the Saint Paul Public Library to create the Saint Paul EcoDistrict, a self-guided walking tour that showcases sustainable technology in downtown Saint Paul. A mobile website was created to facilitate this tour for educators, visitors and environmental enthusiasts.
HOCKEY NEEDS ICE.…ice needs water.
THE MINNESOTA WILD IS CHARTING A COURSE TO LEARN ABOUT OUR WATER FOOTPRINT AND
WHAT WE CAN DO TO REDUCE USAGE AND KEEP OUR WATER CLEAN.
YOU CAN HELP MAKE A DIFFERENCE. IT’S EASY!
PLEDGE TO CONSERVE WATER BY TEXTING “WILD” TO 77177
AND WE’LL RESTORE 1,000 GALLONS OF WATER TO A CRITICALLY DEWATERED RIVER
Total water use is down almost
7 PERCENT at Xcel Energy Center, and holding within one percent of last year’s usage at Saint Paul RiverCentre.
Water use per visitor in 2014-15:
7.4 GALLONS (up slightly from last year.)
This year, the complex focused on water in a new way:
COMMUNITY OUTREACH and education. We implemented several initiatives around water protection and conservation in our community.
QUICK FACTS
STORM DRAIN GOALIETo further educate the public on water protection, we partnered with Hamline University’s Storm Drain Goalie program this season. This interactive goalie display in the arena concourse engaged Wild fans by having them pose for photos while they “protected” storm drains from common pollutants. This light-hearted activity educated fans about the importance of healthy storm drains to our local watersheds.
Annual Sustainability Summary (July 2014-June 2015) | 6
PURCHASINGOur extensive green purchasing program continued and grew this past season, with environmentally friendly purchases across a range of products from office paper to compostable food-ware to an entire line of green cleaning products. For example:
CLEANING & OPERATIONAL PRODUCTS
76 percent of roughly $350,000 in cleaning product purchases are either made from recycled materials or are certified “green” because of their reduced environmental impact.
OFFICE PRODUCTS & PAPER
78 percent of over $90,000 in purchases contain recycled-content or are third-party verified as “green”.
CONCLUSIONIt would be impossible to top the achievements of this complex’s sustainability program last year. Achieving three international sustainability certifications has given a national voice to our efforts, and we could not be more proud. But as we said last year, we are not finished. Today, the certifications have become a launching point; they have helped us set our next round of goals and spurred a great deal of community engagement in our efforts. They have helped us achieve grant funding for our program, sponsor engagement in the efforts, and new event bookings with sustainability-minded organizations. We now receive regular requests to speak about our program at regional and national events, and the New York Times has even recognized us for our efforts.
But most importantly, now we have multiple internal champions who drive our efforts on all fronts, making sure we stay on the forefront of efficient operations and waste minimization. So we will keep pushing – to reduce our impact, improve our operations, and be the best community members that we can be.
Annual Sustainability Summary (July 2014-June 2015) | 7
APPENDIX
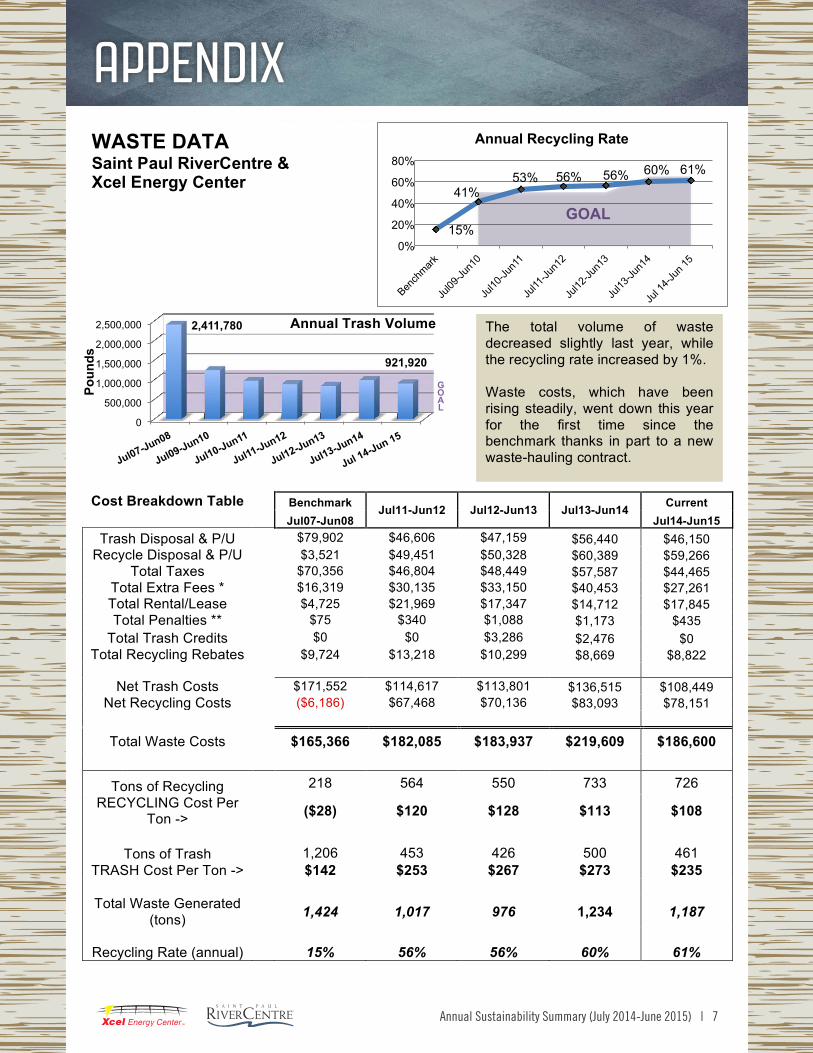
Cost Breakdown Table Benchmark Jul11-Jun12 Jul12-Jun13 Jul13-Jun14 Current
Jul07-Jun08 Jul14-Jun15 Trash Disposal & P/U $79,902 $46,606 $47,159 $56,440 $46,150
Recycle Disposal & P/U $3,521 $49,451 $50,328 $60,389 $59,266 Total Taxes $70,356 $46,804 $48,449 $57,587 $44,465
Total Extra Fees * $16,319 $30,135 $33,150 $40,453 $27,261 Total Rental/Lease $4,725 $21,969 $17,347 $14,712 $17,845 Total Penalties ** $75 $340 $1,088 $1,173 $435
Total Trash Credits $0 $0 $3,286 $2,476 $0 Total Recycling Rebates $9,724 $13,218 $10,299 $8,669 $8,822
Net Trash Costs $171,552 $114,617 $113,801 $136,515 $108,449 Net Recycling Costs ($6,186) $67,468 $70,136 $83,093 $78,151
Total Waste Costs $165,366 $182,085 $183,937 $219,609 $186,600
Tons of Recycling 218 564 550 733 726 RECYCLING Cost Per
Ton -> ($28) $120 $128 $113 $108
Tons of Trash 1,206 453 426 500 461
TRASH Cost Per Ton -> $142 $253 $267 $273 $235 Total Waste Generated
(tons) 1,424 1,017 976 1,234 1,187
Recycling Rate (annual) 15% 56% 56% 60% 61%
0
500,000
1,000,000
1,500,000
2,000,000
2,500,000 2,411,780
921,920
Poun
ds
GOAL
Annual Trash Volume
GOAL 15%
41% 53% 56% 56% 60% 61%
0%
20%
40%
60%
80%
Annual Recycling Rate WASTE DATA Saint Paul RiverCentre & Xcel Energy Center
The total volume of waste decreased slightly last year, while the recycling rate increased by 1%. Waste costs, which have been rising steadily, went down this year for the first time since the benchmark thanks in part to a new waste-hauling contract.
Annual Sustainability Summary (July 2014-June 2015) | 8
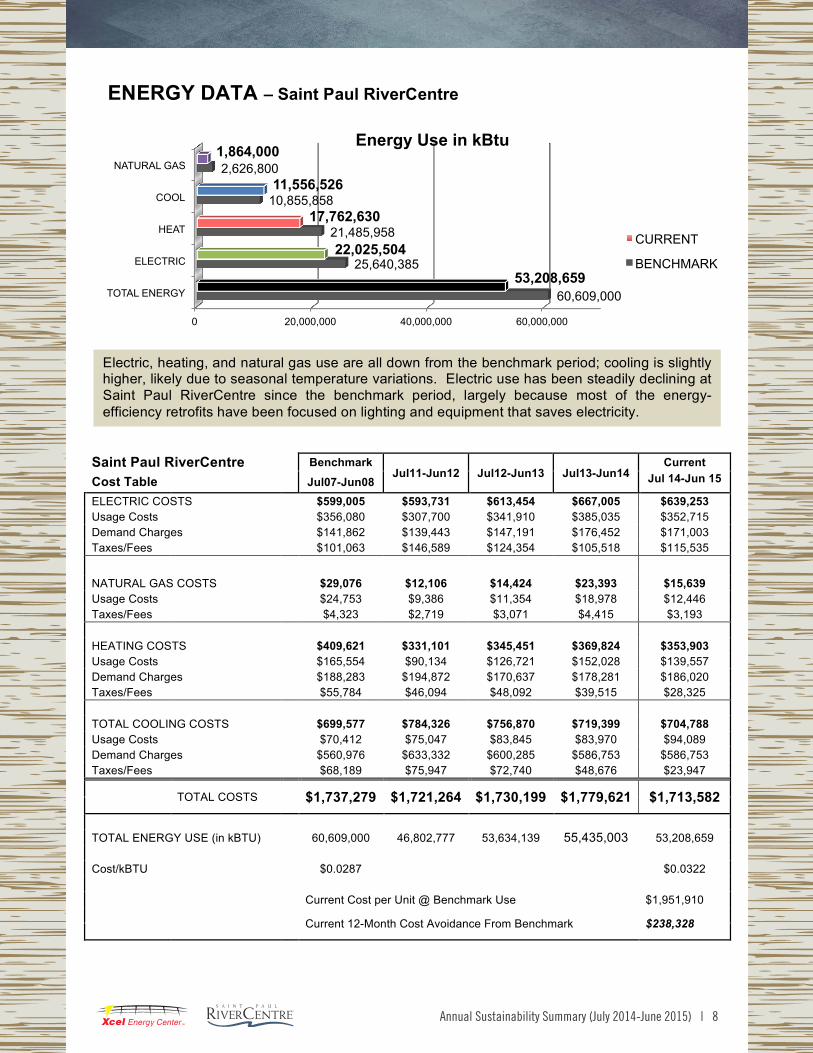
Electric, heating, and natural gas use are all down from the benchmark period; cooling is slightly higher, likely due to seasonal temperature variations. Electric use has been steadily declining at Saint Paul RiverCentre since the benchmark period, largely because most of the energy-efficiency retrofits have been focused on lighting and equipment that saves electricity.
Saint Paul RiverCentre Benchmark Jul11-Jun12 Jul12-Jun13 Jul13-Jun14
Current Cost Table Jul07-Jun08 Jul 14-Jun 15
ELECTRIC COSTS $599,005 $593,731 $613,454 $667,005 $639,253 Usage Costs $356,080 $307,700 $341,910 $385,035 $352,715 Demand Charges $141,862 $139,443 $147,191 $176,452 $171,003 Taxes/Fees $101,063 $146,589 $124,354 $105,518 $115,535 NATURAL GAS COSTS $29,076 $12,106 $14,424 $23,393 $15,639 Usage Costs $24,753 $9,386 $11,354 $18,978 $12,446 Taxes/Fees $4,323 $2,719 $3,071 $4,415 $3,193 HEATING COSTS $409,621 $331,101 $345,451 $369,824 $353,903 Usage Costs $165,554 $90,134 $126,721 $152,028 $139,557 Demand Charges $188,283 $194,872 $170,637 $178,281 $186,020 Taxes/Fees $55,784 $46,094 $48,092 $39,515 $28,325 TOTAL COOLING COSTS $699,577 $784,326 $756,870 $719,399 $704,788 Usage Costs $70,412 $75,047 $83,845 $83,970 $94,089 Demand Charges $560,976 $633,332 $600,285 $586,753 $586,753 Taxes/Fees $68,189 $75,947 $72,740 $48,676 $23,947
TOTAL COSTS $1,737,279 $1,721,264 $1,730,199 $1,779,621 $1,713,582
TOTAL ENERGY USE (in kBTU) 60,609,000 46,802,777 53,634,139 55,435,003 53,208,659 Cost/kBTU $0.0287 $0.0322 Current Cost per Unit @ Benchmark Use $1,951,910
Current 12-Month Cost Avoidance From Benchmark $238,328
0 20,000,000 40,000,000 60,000,000
TOTAL ENERGY
ELECTRIC
HEAT
COOL
NATURAL GAS
60,609,000
25,640,385
21,485,958
10,855,858
2,626,800
53,208,659
22,025,504
17,762,630
11,556,526
1,864,000 Energy Use in kBtu
CURRENT
BENCHMARK
ENERGY DATA – Saint Paul RiverCentre
Annual Sustainability Summary (July 2014-June 2015) | 9
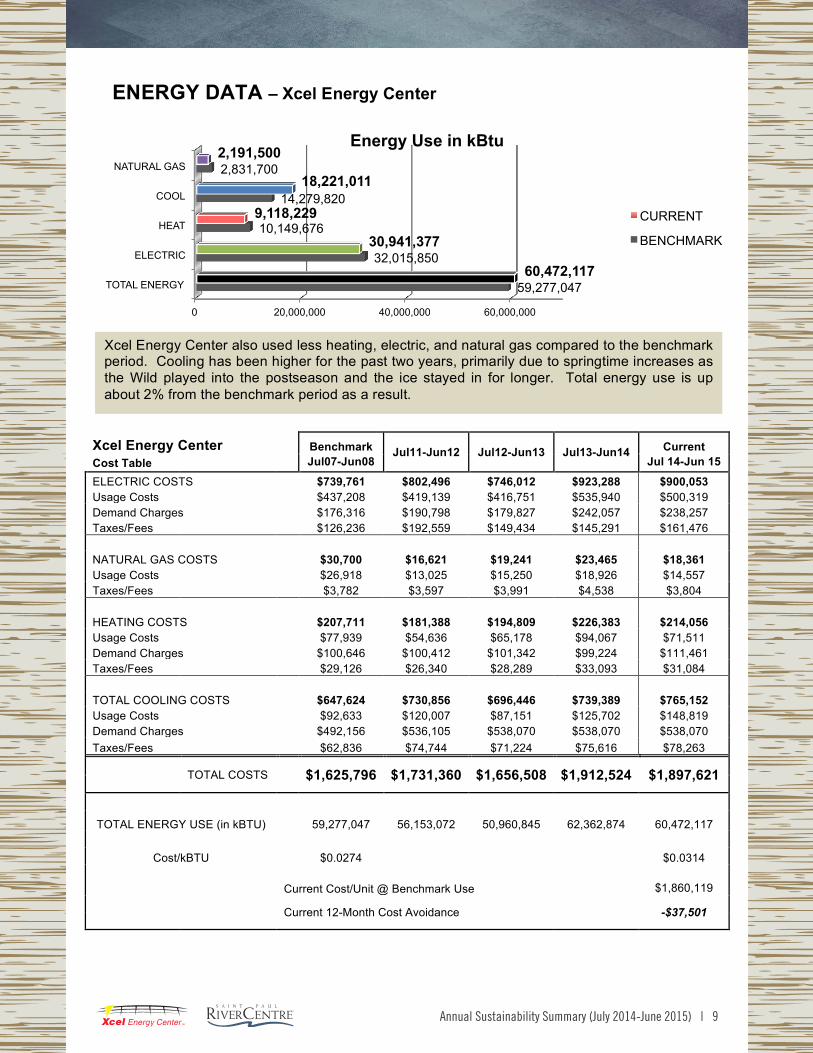
Xcel Energy Center also used less heating, electric, and natural gas compared to the benchmark period. Cooling has been higher for the past two years, primarily due to springtime increases as the Wild played into the postseason and the ice stayed in for longer. Total energy use is up about 2% from the benchmark period as a result.
Xcel Energy Center Benchmark Jul11-Jun12 Jul12-Jun13 Jul13-Jun14 Current Cost Table Jul07-Jun08 Jul 14-Jun 15
ELECTRIC COSTS $739,761 $802,496 $746,012 $923,288 $900,053 Usage Costs $437,208 $419,139 $416,751 $535,940 $500,319 Demand Charges $176,316 $190,798 $179,827 $242,057 $238,257 Taxes/Fees $126,236 $192,559 $149,434 $145,291 $161,476 NATURAL GAS COSTS $30,700 $16,621 $19,241 $23,465 $18,361 Usage Costs $26,918 $13,025 $15,250 $18,926 $14,557 Taxes/Fees $3,782 $3,597 $3,991 $4,538 $3,804 HEATING COSTS $207,711 $181,388 $194,809 $226,383 $214,056 Usage Costs $77,939 $54,636 $65,178 $94,067 $71,511 Demand Charges $100,646 $100,412 $101,342 $99,224 $111,461 Taxes/Fees $29,126 $26,340 $28,289 $33,093 $31,084 TOTAL COOLING COSTS $647,624 $730,856 $696,446 $739,389 $765,152 Usage Costs $92,633 $120,007 $87,151 $125,702 $148,819 Demand Charges $492,156 $536,105 $538,070 $538,070 $538,070 Taxes/Fees $62,836 $74,744 $71,224 $75,616 $78,263
TOTAL COSTS
$1,625,796 $1,731,360 $1,656,508 $1,912,524 $1,897,621 TOTAL ENERGY USE (in kBTU) 59,277,047 56,153,072 50,960,845 62,362,874 60,472,117
Cost/kBTU $0.0274 $0.0314
Current Cost/Unit @ Benchmark Use $1,860,119
Current 12-Month Cost Avoidance
-$37,501
0 20,000,000 40,000,000 60,000,000
TOTAL ENERGY
ELECTRIC
HEAT
COOL
NATURAL GAS
59,277,047
32,015,850
10,149,676
14,279,820
2,831,700
60,472,117
30,941,377
9,118,229
18,221,011
2,191,500 Energy Use in kBtu
CURRENT
BENCHMARK
ENERGY DATA – Xcel Energy Center
Annual Sustainability Summary (July 2014-June 2015) | 10
0 5,000,000 10,000,000 15,000,000 20,000,000
Saint Paul RiverCentre
Xcel Energy Center
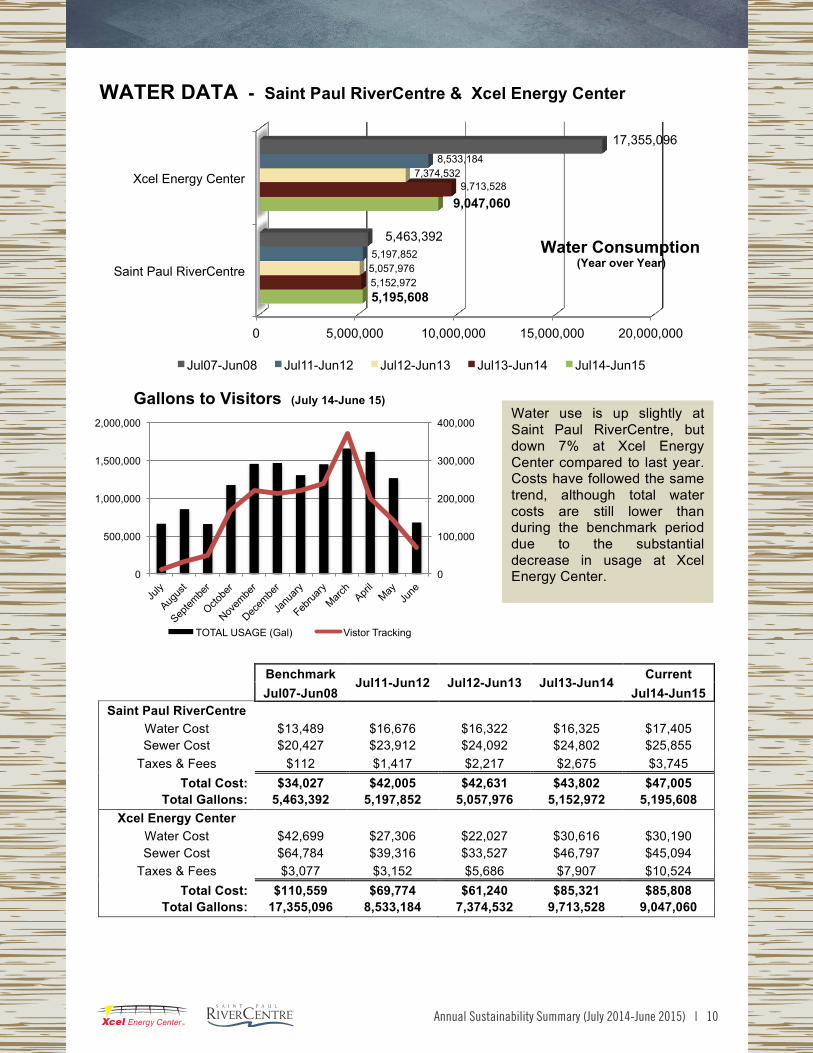
5,195,608
9,047,060
5,152,972
9,713,528
5,057,976
7,374,532
5,197,852
8,533,184
5,463,392
17,355,096
Jul07-Jun08 Jul11-Jun12 Jul12-Jun13 Jul13-Jun14 Jul14-Jun15
Water Consumption (Year over Year)
Gallons to Visitors (July 14-June 15)
Benchmark Jul11-Jun12 Jul12-Jun13 Jul13-Jun14 Current Jul07-Jun08 Jul14-Jun15 Saint Paul RiverCentre
Water Cost $13,489 $16,676 $16,322 $16,325 $17,405 Sewer Cost $20,427 $23,912 $24,092 $24,802 $25,855
Taxes & Fees $112 $1,417 $2,217 $2,675 $3,745 Total Cost: $34,027 $42,005 $42,631 $43,802 $47,005
Total Gallons: 5,463,392 5,197,852 5,057,976 5,152,972 5,195,608 Xcel Energy Center
Water Cost $42,699 $27,306 $22,027 $30,616 $30,190 Sewer Cost $64,784 $39,316 $33,527 $46,797 $45,094
Taxes & Fees $3,077 $3,152 $5,686 $7,907 $10,524 Total Cost: $110,559 $69,774 $61,240 $85,321 $85,808
Total Gallons: 17,355,096 8,533,184 7,374,532 9,713,528 9,047,060
0
100,000
200,000
300,000
400,000
0
500,000
1,000,000
1,500,000
2,000,000
TOTAL USAGE (Gal) Vistor Tracking
0 5,000,000 10,000,000 15,000,000 20,000,000
Saint Paul RiverCentre
Xcel Energy Center
5,195,608
9,047,060
5,152,972
9,713,528
5,057,976
7,374,532
5,197,852
8,533,184
5,463,392
17,355,096
Jul07-Jun08 Jul11-Jun12 Jul12-Jun13 Jul13-Jun14 Jul14-Jun15
Water Consumption (Year over Year)
Water use is up slightly at Saint Paul RiverCentre, but down 7% at Xcel Energy Center compared to last year. Costs have followed the same trend, although total water costs are still lower than during the benchmark period due to the substantial decrease in usage at Xcel Energy Center.
WATER DATA - Saint Paul RiverCentre & Xcel Energy Center