Embed Size (px)
Citation preview
Anomalous Spectral Shift of Near- and Far-Field PlasmonicResonances in NanogapsAnna Lombardi,† Angela Demetriadou,‡,§ Lee Weller,† Patrick Andrae,†,⊥ Felix Benz,†
Rohit Chikkaraddy,† Javier Aizpurua,‡ and Jeremy J. Baumberg*,†
†NanoPhotonics Centre, Cavendish Laboratory, University of Cambridge, Cambridge, CB3 0HE, U.K.‡Centro de Física de Materiales, Centro Mixto CSIC-UPV/EHU, and Donostia International Physics Center (DIPC), Paseo ManuelLardizabal 4, 20018 Donostia-San Sebastian, Spain§Blackett Laboratory, Department of Physics, Imperial College London, London SW7 2AZ, United Kingdom
*S Supporting Information
ABSTRACT: The near-field and far-field spectral response ofplasmonic systems are often assumed to be identical, due tothe lack of methods that can directly compare and correlateboth responses under similar environmental conditions. Wedevelop a widely tunable optical technique to probe the near-field resonances within individual plasmonic nanostructuresthat can be directly compared to the corresponding far-fieldresponse. In tightly coupled nanoparticle-on-mirror constructswith nanometer-sized gaps we find >40 meV blue-shifts of the near-field compared to the dark-field scattering peak, which agreeswith full electromagnetic simulations. Using a transformation optics approach, we show such shifts arise from the differentspectral interference between different gap modes in the near- and far-field. The control and tuning of near-field and far-fieldresponses demonstrated here is of paramount importance in the design of optical nanostructures for field-enhanced spectroscopy,as well as to control near-field activity monitored through the far-field of nano-optical devices.
KEYWORDS: SERS, ultrafast tunable lasers, plasmonics, nanoparticle on mirror, sensing
The interaction of light with noble metal nanostructuresexcites collective electron oscillations in the form of
localized plasmonic resonances. As a result, such plasmonicnanostructures are able to confine light within extremely smallvolumes, millions of times smaller than a wavelength-sized box.Squeezing light into such small regions creates near-thousand-fold field enhancements, which are ideal for intense surface-enhanced Raman scattering (SERS), thus allowing only a fewatoms, molecules, or nano-objects to be directly tracked.1 Sofar, researchers have typically assumed that both the localizednear-field and radiated far-field support their resonant behavior(i.e., strongest field enhancements) at similar spectral wave-lengths. As a result, optimization of SERS has depended onmeasurements of the far-field scattering spectrum.Here we show that when the optical field is tightly confined
by nanoscale gaps, the resulting multiple order plasmonresonances supported at different wavelengths interfere witheach other differently to build up the signal from the near- andfar-fields. As a result, significant spectral shifts are observed. Weexperimentally demonstrate this using a spectral-scanningtechnique that simultaneously records dark-field scatteringspectra and tunable-pump SERS measurements on eachnanostructure individually. We utilize plasmonic constructsfor this that provide extremely robust nanoscale gaps,2 using Aunanoparticles separated from a bulk Au film by an ultrathinmolecular spacer, known as the nanoparticle-on-mirror
(NPoM) geometry.3−5 In contrast to the red-shifts alwaysfound in isolated nanoparticles,6 the near-field NPoMresonance from SERS is found to be always blue-shifted fromthe scattering peak. We explain this through a transformationoptics model that allows the decomposition of the total signalinto individual modes that show different radiative properties.In particular the n = 1 and 2 modes interfere constructively inthe far-field, but destructively in the near-field. From thisunderstanding, our experiments also allow us to show that theSERS background arises from a completely different processfrom the SERS vibrational signal, as it follows instead the far-field spectral enhancement. Our insights provide a solidintuition to predict how near-fields behave within a widevariety of plasmonic nanoconstructs.Direct measurements of the near-field plasmonic enhance-
ment spectra either are probe-based techniques or must exploitnonlinear processes, since only then do the evanescent fieldscontribute most strongly. Probe-based techniques are notsuitable for single NPoM measurements, and second-harmonicgeneration is not very reliable for this task, as it possesses bothbulk and surface contributions and is thus very sensitive tomany additional aspects of nanoscale geometry. Third-harmonic generation techniques7 are also possible but so far
Received: December 10, 2015
Article
pubs.acs.org/journal/apchd5
© XXXX American Chemical Society A DOI: 10.1021/acsphotonics.5b00707ACS Photonics XXXX, XXX, XXX−XXX
are primarily single-wavelength studies.8−12 The other favorableprocess for this task is SERS, but this has also been challengingbecause of the requirement for wide tuning of the Raman pumplaser, while ensuring high-contrast tunable filtering of thescattered light from the background Rayleigh pump scatter. Asa result, most experiments work with arrays of nanoparticles13
or use a limited number of excitation wavelengths on individualnanostructures.14−18 Alternative approaches with fixed excita-tion wavelength that attempt to tune the plasmon resonancesuffer uncontrolled changes in confinement and enhance-ment.8−12 Recent experiments15 have managed to deliverwavelength-scanned Raman and dark-field measurements onlithographically defined plasmonic dimers in order to ascertainhow quantum tunneling affects the SERS amplitude. Lithog-raphy however generates considerable uncertainty in the gapsizes and morphologies. Compared to such nanoparticledimers, the NPoM geometry guarantees much better controlof gap size between gold film and nanoparticle, higherreproducibility, and a much simpler and robust nanoassemblyprocedure and has thus been recently utilized in manyexperimental studies.3−5 The well-defined architecture alsoprecisely defines the orientation of the optical fields and of themolecules that are currently studied in SERS, and thus allowsprecise comparison of the near- and far-field response.Our experimental setup is optimized to realize both dark-field
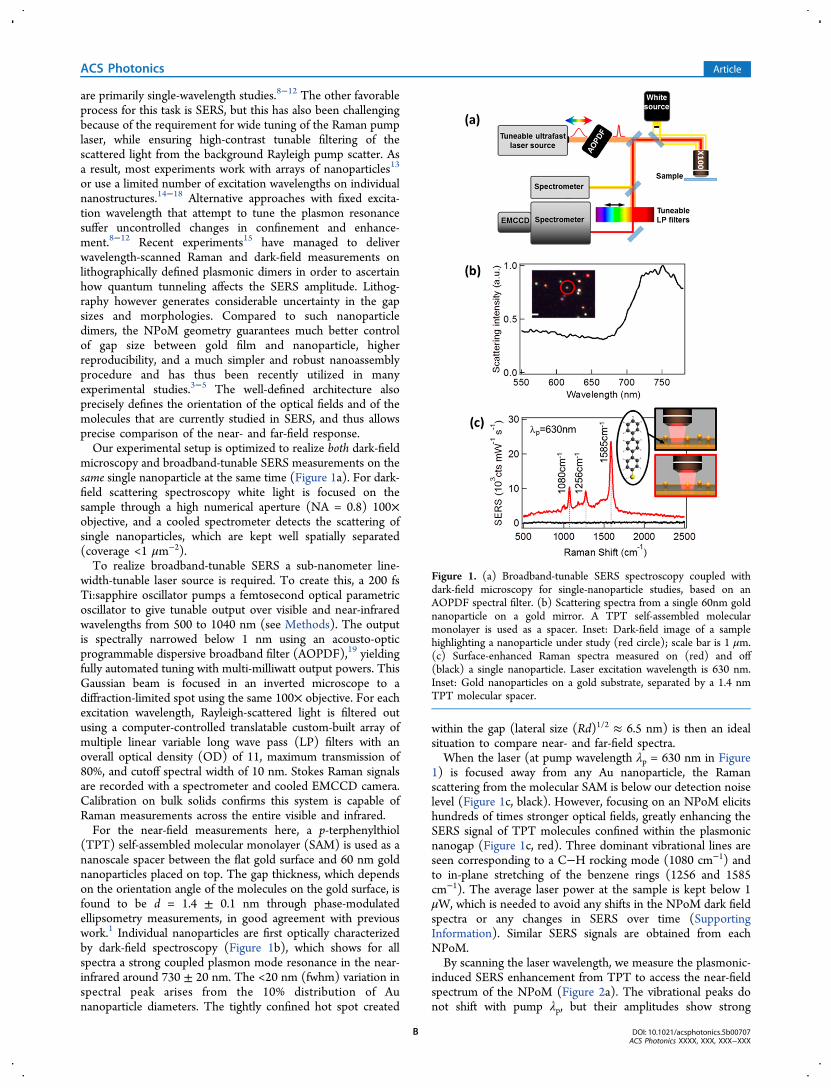
microscopy and broadband-tunable SERS measurements on thesame single nanoparticle at the same time (Figure 1a). For dark-field scattering spectroscopy white light is focused on thesample through a high numerical aperture (NA = 0.8) 100×objective, and a cooled spectrometer detects the scattering ofsingle nanoparticles, which are kept well spatially separated(coverage <1 μm−2).To realize broadband-tunable SERS a sub-nanometer line-
width-tunable laser source is required. To create this, a 200 fsTi:sapphire oscillator pumps a femtosecond optical parametricoscillator to give tunable output over visible and near-infraredwavelengths from 500 to 1040 nm (see Methods). The outputis spectrally narrowed below 1 nm using an acousto-opticprogrammable dispersive broadband filter (AOPDF),19 yieldingfully automated tuning with multi-milliwatt output powers. ThisGaussian beam is focused in an inverted microscope to adiffraction-limited spot using the same 100× objective. For eachexcitation wavelength, Rayleigh-scattered light is filtered outusing a computer-controlled translatable custom-built array ofmultiple linear variable long wave pass (LP) filters with anoverall optical density (OD) of 11, maximum transmission of80%, and cutoff spectral width of 10 nm. Stokes Raman signalsare recorded with a spectrometer and cooled EMCCD camera.Calibration on bulk solids confirms this system is capable ofRaman measurements across the entire visible and infrared.For the near-field measurements here, a p-terphenylthiol
(TPT) self-assembled molecular monolayer (SAM) is used as ananoscale spacer between the flat gold surface and 60 nm goldnanoparticles placed on top. The gap thickness, which dependson the orientation angle of the molecules on the gold surface, isfound to be d = 1.4 ± 0.1 nm through phase-modulatedellipsometry measurements, in good agreement with previouswork.1 Individual nanoparticles are first optically characterizedby dark-field spectroscopy (Figure 1b), which shows for allspectra a strong coupled plasmon mode resonance in the near-infrared around 730 ± 20 nm. The <20 nm (fwhm) variation inspectral peak arises from the 10% distribution of Aunanoparticle diameters. The tightly confined hot spot created
within the gap (lateral size (Rd)1/2 ≈ 6.5 nm) is then an idealsituation to compare near- and far-field spectra.When the laser (at pump wavelength λp = 630 nm in Figure
1) is focused away from any Au nanoparticle, the Ramanscattering from the molecular SAM is below our detection noiselevel (Figure 1c, black). However, focusing on an NPoM elicitshundreds of times stronger optical fields, greatly enhancing theSERS signal of TPT molecules confined within the plasmonicnanogap (Figure 1c, red). Three dominant vibrational lines areseen corresponding to a C−H rocking mode (1080 cm−1) andto in-plane stretching of the benzene rings (1256 and 1585cm−1). The average laser power at the sample is kept below 1μW, which is needed to avoid any shifts in the NPoM dark fieldspectra or any changes in SERS over time (SupportingInformation). Similar SERS signals are obtained from eachNPoM.By scanning the laser wavelength, we measure the plasmonic-
induced SERS enhancement from TPT to access the near-fieldspectrum of the NPoM (Figure 2a). The vibrational peaks donot shift with pump λp, but their amplitudes show strong
Figure 1. (a) Broadband-tunable SERS spectroscopy coupled withdark-field microscopy for single-nanoparticle studies, based on anAOPDF spectral filter. (b) Scattering spectra from a single 60nm goldnanoparticle on a gold mirror. A TPT self-assembled molecularmonolayer is used as a spacer. Inset: Dark-field image of a samplehighlighting a nanoparticle under study (red circle); scale bar is 1 μm.(c) Surface-enhanced Raman spectra measured on (red) and off(black) a single nanoparticle. Laser excitation wavelength is 630 nm.Inset: Gold nanoparticles on a gold substrate, separated by a 1.4 nmTPT molecular spacer.
ACS Photonics Article
DOI: 10.1021/acsphotonics.5b00707ACS Photonics XXXX, XXX, XXX−XXX
B
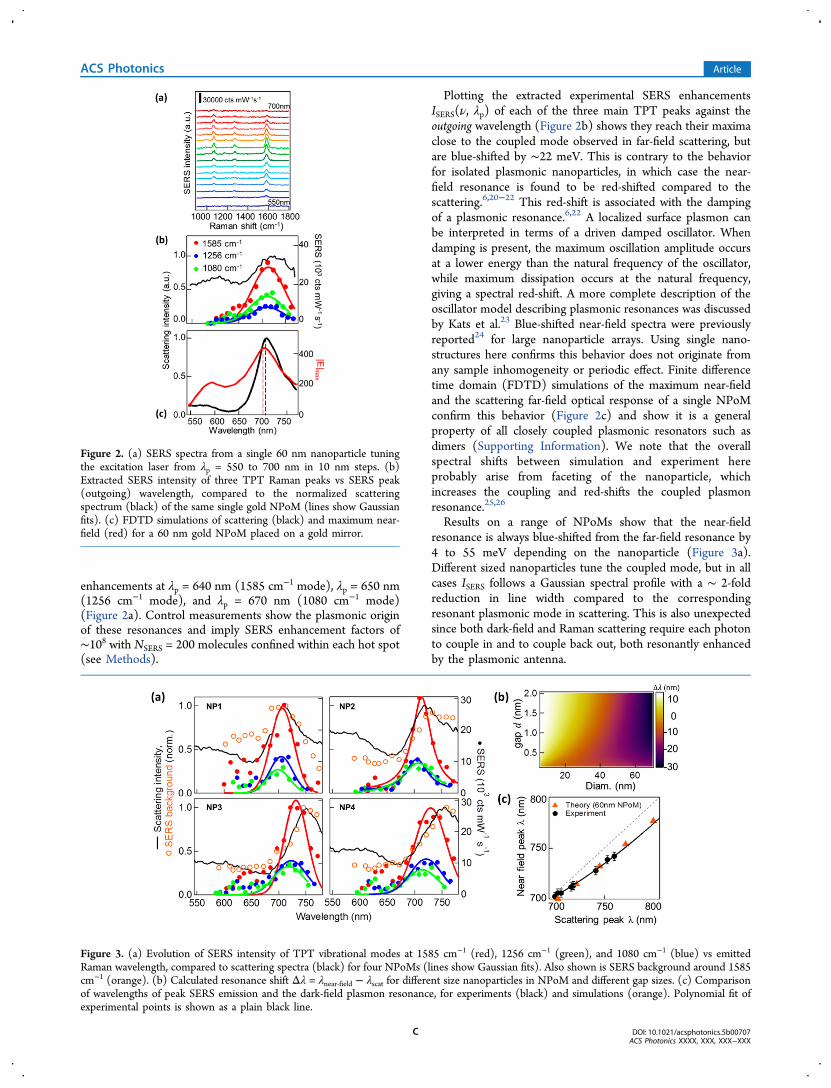
enhancements at λp = 640 nm (1585 cm−1 mode), λp = 650 nm(1256 cm−1 mode), and λp = 670 nm (1080 cm−1 mode)(Figure 2a). Control measurements show the plasmonic originof these resonances and imply SERS enhancement factors of∼108 with NSERS = 200 molecules confined within each hot spot(see Methods).
Plotting the extracted experimental SERS enhancementsISERS(ν, λp) of each of the three main TPT peaks against theoutgoing wavelength (Figure 2b) shows they reach their maximaclose to the coupled mode observed in far-field scattering, butare blue-shifted by ∼22 meV. This is contrary to the behaviorfor isolated plasmonic nanoparticles, in which case the near-field resonance is found to be red-shifted compared to thescattering.6,20−22 This red-shift is associated with the dampingof a plasmonic resonance.6,22 A localized surface plasmon canbe interpreted in terms of a driven damped oscillator. Whendamping is present, the maximum oscillation amplitude occursat a lower energy than the natural frequency of the oscillator,while maximum dissipation occurs at the natural frequency,giving a spectral red-shift. A more complete description of theoscillator model describing plasmonic resonances was discussedby Kats et al.23 Blue-shifted near-field spectra were previouslyreported24 for large nanoparticle arrays. Using single nano-structures here confirms this behavior does not originate fromany sample inhomogeneity or periodic effect. Finite differencetime domain (FDTD) simulations of the maximum near-fieldand the scattering far-field optical response of a single NPoMconfirm this behavior (Figure 2c) and show it is a generalproperty of all closely coupled plasmonic resonators such asdimers (Supporting Information). We note that the overallspectral shifts between simulation and experiment hereprobably arise from faceting of the nanoparticle, whichincreases the coupling and red-shifts the coupled plasmonresonance.25,26
Results on a range of NPoMs show that the near-fieldresonance is always blue-shifted from the far-field resonance by4 to 55 meV depending on the nanoparticle (Figure 3a).Different sized nanoparticles tune the coupled mode, but in allcases ISERS follows a Gaussian spectral profile with a ∼ 2-foldreduction in line width compared to the correspondingresonant plasmonic mode in scattering. This is also unexpectedsince both dark-field and Raman scattering require each photonto couple in and to couple back out, both resonantly enhancedby the plasmonic antenna.
Figure 2. (a) SERS spectra from a single 60 nm nanoparticle tuningthe excitation laser from λp = 550 to 700 nm in 10 nm steps. (b)Extracted SERS intensity of three TPT Raman peaks vs SERS peak(outgoing) wavelength, compared to the normalized scatteringspectrum (black) of the same single gold NPoM (lines show Gaussianfits). (c) FDTD simulations of scattering (black) and maximum near-field (red) for a 60 nm gold NPoM placed on a gold mirror.
Figure 3. (a) Evolution of SERS intensity of TPT vibrational modes at 1585 cm−1 (red), 1256 cm−1 (green), and 1080 cm−1 (blue) vs emittedRaman wavelength, compared to scattering spectra (black) for four NPoMs (lines show Gaussian fits). Also shown is SERS background around 1585cm−1 (orange). (b) Calculated resonance shift Δλ = λnear‑field − λscat for different size nanoparticles in NPoM and different gap sizes. (c) Comparisonof wavelengths of peak SERS emission and the dark-field plasmon resonance, for experiments (black) and simulations (orange). Polynomial fit ofexperimental points is shown as a plain black line.
ACS Photonics Article
DOI: 10.1021/acsphotonics.5b00707ACS Photonics XXXX, XXX, XXX−XXX
C
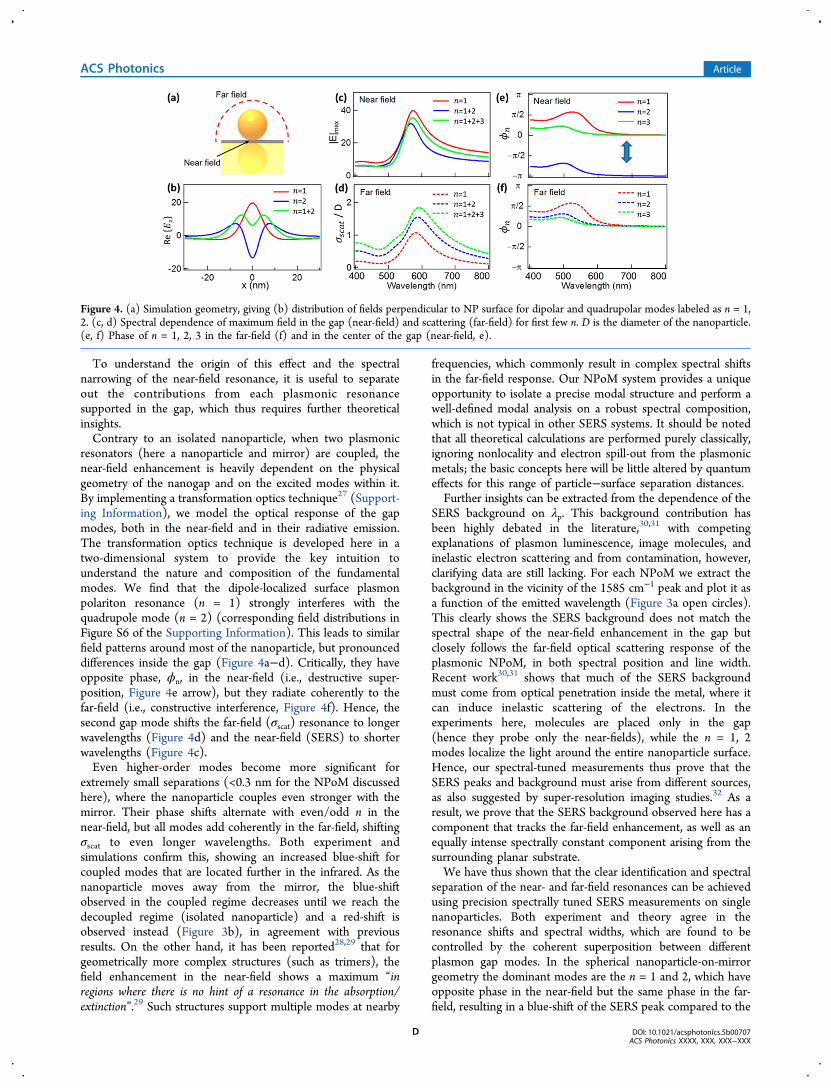
To understand the origin of this effect and the spectralnarrowing of the near-field resonance, it is useful to separateout the contributions from each plasmonic resonancesupported in the gap, which thus requires further theoreticalinsights.Contrary to an isolated nanoparticle, when two plasmonic
resonators (here a nanoparticle and mirror) are coupled, thenear-field enhancement is heavily dependent on the physicalgeometry of the nanogap and on the excited modes within it.By implementing a transformation optics technique27 (Support-ing Information), we model the optical response of the gapmodes, both in the near-field and in their radiative emission.The transformation optics technique is developed here in atwo-dimensional system to provide the key intuition tounderstand the nature and composition of the fundamentalmodes. We find that the dipole-localized surface plasmonpolariton resonance (n = 1) strongly interferes with thequadrupole mode (n = 2) (corresponding field distributions inFigure S6 of the Supporting Information). This leads to similarfield patterns around most of the nanoparticle, but pronounceddifferences inside the gap (Figure 4a−d). Critically, they haveopposite phase, ϕn, in the near-field (i.e., destructive super-position, Figure 4e arrow), but they radiate coherently to thefar-field (i.e., constructive interference, Figure 4f). Hence, thesecond gap mode shifts the far-field (σscat) resonance to longerwavelengths (Figure 4d) and the near-field (SERS) to shorterwavelengths (Figure 4c).Even higher-order modes become more significant for
extremely small separations (<0.3 nm for the NPoM discussedhere), where the nanoparticle couples even stronger with themirror. Their phase shifts alternate with even/odd n in thenear-field, but all modes add coherently in the far-field, shiftingσscat to even longer wavelengths. Both experiment andsimulations confirm this, showing an increased blue-shift forcoupled modes that are located further in the infrared. As thenanoparticle moves away from the mirror, the blue-shiftobserved in the coupled regime decreases until we reach thedecoupled regime (isolated nanoparticle) and a red-shift isobserved instead (Figure 3b), in agreement with previousresults. On the other hand, it has been reported28,29 that forgeometrically more complex structures (such as trimers), thefield enhancement in the near-field shows a maximum “inregions where there is no hint of a resonance in the absorption/extinction”.29 Such structures support multiple modes at nearby
frequencies, which commonly result in complex spectral shiftsin the far-field response. Our NPoM system provides a uniqueopportunity to isolate a precise modal structure and perform awell-defined modal analysis on a robust spectral composition,which is not typical in other SERS systems. It should be notedthat all theoretical calculations are performed purely classically,ignoring nonlocality and electron spill-out from the plasmonicmetals; the basic concepts here will be little altered by quantumeffects for this range of particle−surface separation distances.Further insights can be extracted from the dependence of the
SERS background on λp. This background contribution hasbeen highly debated in the literature,30,31 with competingexplanations of plasmon luminescence, image molecules, andinelastic electron scattering and from contamination, however,clarifying data are still lacking. For each NPoM we extract thebackground in the vicinity of the 1585 cm−1 peak and plot it asa function of the emitted wavelength (Figure 3a open circles).This clearly shows the SERS background does not match thespectral shape of the near-field enhancement in the gap butclosely follows the far-field optical scattering response of theplasmonic NPoM, in both spectral position and line width.Recent work30,31 shows that much of the SERS backgroundmust come from optical penetration inside the metal, where itcan induce inelastic scattering of the electrons. In theexperiments here, molecules are placed only in the gap(hence they probe only the near-fields), while the n = 1, 2modes localize the light around the entire nanoparticle surface.Hence, our spectral-tuned measurements thus prove that theSERS peaks and background must arise from different sources,as also suggested by super-resolution imaging studies.32 As aresult, we prove that the SERS background observed here has acomponent that tracks the far-field enhancement, as well as anequally intense spectrally constant component arising from thesurrounding planar substrate.We have thus shown that the clear identification and spectral
separation of the near- and far-field resonances can be achievedusing precision spectrally tuned SERS measurements on singlenanoparticles. Both experiment and theory agree in theresonance shifts and spectral widths, which are found to becontrolled by the coherent superposition between differentplasmon gap modes. In the spherical nanoparticle-on-mirrorgeometry the dominant modes are the n = 1 and 2, which haveopposite phase in the near-field but the same phase in the far-field, resulting in a blue-shift of the SERS peak compared to the
Figure 4. (a) Simulation geometry, giving (b) distribution of fields perpendicular to NP surface for dipolar and quadrupolar modes labeled as n = 1,2. (c, d) Spectral dependence of maximum field in the gap (near-field) and scattering (far-field) for first few n. D is the diameter of the nanoparticle.(e, f) Phase of n = 1, 2, 3 in the far-field (f) and in the center of the gap (near-field, e).
ACS Photonics Article
DOI: 10.1021/acsphotonics.5b00707ACS Photonics XXXX, XXX, XXX−XXX
D
dark-field scattering and a 2-fold smaller resonance line width.This intuitive understanding of how the resonance positions aredetermined is generally applicable to coupled plasmonicsystems. It also shows that the ever-present SERS backgrounddoes not come from the same spatial locations as the near-field-controlled SERS peaks.
■ METHODSSample Preparation. Gold substrates are prepared by
evaporating 100 nm gold (Kurt J. Lesker Company, PVD 200)on a silicon (100) wafer (Si-Mat, Germany) with a rate of 1 Å/s. To obtain atomically smooth films, a standard templatestripping method is used: silicon substrates are glued onto thefreshly evaporated gold using an epoxy glue (EpoTek 377),33
and the resulting gold/epoxy/silicon sandwich is peeled off thesilicon wafer.Self-assembled monolayers of 1,1′,4′,1″-terphenyl-4-thiol
(Sigma-Aldrich, 97%) are formed by submerging the freshlytemplate-stripped substrates into a 1 mM solution in water-freeethanol (Sigma-Aldrich, reagent grade, anhydrous) for 24 h.The samples are subsequently thoroughly rinsed with ethanoland blown dry. Gold nanoparticles (BBI Solutions, UK) aredeposited by drop casting from the as-received solution. Thedeposition time is adjusted in order to obtain the desirednanoparticle coverage. The samples are rinsed with Milli-Qwater in order to remove any salt residues.Ellipsometry. The thickness of the self-assembled mono-
layers is measured using both ellipsometry (Jobin-YvonUVISEL spectroscopic ellipsometer) and normalizing plasmonresonance spectroscopy.34 For the ellipsometry measurementsan angle of incidence of 70° is used. The data are modeled andfitted using a three-layer model. A thickness of 1.5 nm isdetermined with a refractive index of n = 1.45.Dark-Field Spectroscopy. Optical dark-field images are
recorded on a custom Olympus GX51 inverted microscope.Samples are illuminated with a focused white light source(halogen lamp). The scattered light is collected through a 100×dark-field objective (LMPLFLN-BD, NA = 0.8) and analyzedwith a fiber-coupled (50 μm optical fiber) Ocean OpticsQE65000 cooled spectrometer. We use a standard diffuser as areference to normalize white light scattering. For each sample,we record optical spectra from 20 randomly selected isolatednanoparticles.Tunable SERS. An ultrafast laser system based on a 200 fs
Ti:sapphire oscillator (Spectra Physics MaiTai delivering 200 fspulses, fwhm 10 nm, at 80 MHz repetition rate) pumps afemtosecond optical parametric oscillator (Spectra PhysicsInspire). This light source provides a tunable output over awide range of visible and near-infrared wavelengths from 500 to1040 nm. The monochromaticity of the output beam is reducedbelow 1 nm spectral bandwidth using an acousto-opticprogrammable dispersive broadband filter (AOPDF, Dazzler,Fastlite). Relying on interactions between a polychromaticacoustic wave and a polychromatic optical wave in the bulk of abirefringent crystal, it is fully automated across a widewavelength range (500−900 nm), yielding average outputpowers of several milliwatts.SERS experiments are performed on the same modified
Olympus GX51 inverted microscope used for dark-fieldspectroscopy. A monochromatic wavelength-tunable laserbeam is focused on the sample using a 100× objective (NA= 0.8). Raman scattering is collected through the center of theobjective and analyzed with a Shamrock SR-303i fully
automated spectrometer coupled with an EMCCD camerawater cooled to −85 °C. For the current experiments we use a600l/mm 650 nm blazed grating. Rayleigh scattering is filteredout with a set of three long pass linear variable filters (DELTA);this filtering system allows the detection of a minimum Ramanshift of about 400 cm−1 over the studied spectral range. Thesystem is calibrated using a silicon substrate as a reference.Spectral acquisitions are taken using an integration time of 10 sand an average laser power on the sample below 1 μW.The enhancement factor per molecule (EF) is calculated for
each nanoparticle by integrating the Raman peak areas andtaking the ratio between SERS at 1585 cm−1 (ISERS) and thecorresponding unenhanced signal from the bulk powder (IR):
=I N
I NEF
//
SERS SERS
R R
where NSERS and NR are the estimated number of moleculescontributing to SERS and Raman signals, respectively(Supporting Information). From a spot size of 0.4 μm andassuming that NSERS = 200 molecules are confined in each hotspot, we estimate the measured EF to be ∼108 for thisexcitation wavelength. We compare this to predictions fromnumerical simulations of this geometry, which suggest EF =|Ep|
2|ESERS|2 = 106−107, where |Ep| is the field amplitude
enhancement at the incident laser wavelength, while |ESERS| isthe field amplitude enhancement at the outgoing wavelength(Stokes emission). By fitting Lorentzian lines to eachvibrational peak and subtracting the SERS backgrounds, thespectral evolution ISERS(ν, λp) of the three main TPT peaks isextracted. Normalizing these to the incident laser power (weseparately confirm all signals are linear in pump power), theseare plotted as a function of the excitation wavelength anddirectly compared to the dark-field spectrum of the samenanoparticle (Figure 2b).
FDTD Simulation. The electromagnetic response of thenanoparticle on mirror geometry has been simulated by three-dimensional FDTD calculations using Lumerical FDTDSolutions v8.9. The structure has been modeled as a goldsphere of 60 nm diameter on top of a 200 nm thick gold layer,with a 1 nm thick dielectric sheet in between. For the gold, wereferred to the dielectric constants reported in Johnson andChristy.35 The gold nanoparticle was illuminated with p-polarized plane waves from an angle of incidence of θi = 55°.The scattered light was then collected within a cone of half-angle θc = 53°, based on the numerical aperture of theobjective.
■ ASSOCIATED CONTENT*S Supporting InformationThe Supporting Information is available free of charge on theACS Publications website at DOI: 10.1021/acsphoto-nics.5b00707.
Laser power effects on the optical response of singlenanoparticles, terphenylthiol powder absorption meas-urements, biphenyl-4-thiol-tunable SERS measurementson different size nanoparticles, FDTD simulations for adimer geometry, transformation optics technique,scanning electron microscopy correlation (PDF)
■ AUTHOR INFORMATIONCorresponding Author*E-mail: [email protected].
ACS Photonics Article
DOI: 10.1021/acsphotonics.5b00707ACS Photonics XXXX, XXX, XXX−XXX
E

Present Address⊥Nanooptical Concepts for PV, Helmholtz-Zentrum Berlin,Hahn-Meitner-Platz 1, 14109 Berlin, Germany.
NotesThe authors declare no competing financial interest.
■ ACKNOWLEDGMENTSWe acknowledge financial support from EPSRC grants EP/G060649/1, EP/L027151/1, EP/G037221/1, EPSRCNanoDTC, and ERC grant LINASS 320503. J.A. acknowledgessupport from project FIS2013-41184-P from Spanish MINE-CO and project NANOGUNE’14 from the Department ofIndustry of the Basque Country. F.B. acknowledges supportfrom the Winton Programme for the Physics of Sustainability.R.C. acknowledges financial support from St. John’s College,Cambridge, for a Dr. Manmohan Singh Scholarship. P.A.acknowledges funding from the Helmholtz Association for theYoung Investigator group VH-NG-928 within the Initiative andNetworking Fund. We thank Laurynas Pukenas and SteveEvans (University of Leeds, UK) for support with theellipsometry measurements.
■ REFERENCES(1) Kneipp, K.; Wang, Y.; Kneipp, H.; Perelman, L. T.; Itzkan, I.;Dasari, R. R.; Feld, M. S. Single Molecule Detection Using Surface-Enhanced Raman Scattering (SERS). Phys. Rev. Lett. 1997, 78, 1667−1670.(2) Benz, F.; Tserkezis, C.; Herrmann, L. O.; De Nijs, B.; Sanders, A.;Sigle, D. O.; Pukenas, L.; Evans, S. D.; Aizpurua, J.; Baumberg, J. J.Nanooptics of Molecular-Shunted Plasmonic Nanojunction. Nano Lett.2015, 15, 669−674.(3) Mubeen, S.; Zhang, S.; Kim, N.; Lee, S.; Kramer, S.; Xu, H.;Moskovits, M. Plasmonic Properties of Gold Nanoparticles Separatedfrom a Gold Mirror by an Ultrathin Oxide. Nano Lett. 2012, 12, 2088−2094.(4) Daniels, J. K.; Chumanov, G. Nanoparticle-Mirror SandwichSubstrates for Surface-Enhanced Raman Scattering. J. Phys. Chem. B2005, 109, 17936−17942.(5) Mertens, J.; Eiden, A. L.; Sigle, D. O.; Huang, F.; Lombardo, A.;Sun, Z.; Sundaram, R. S.; Colli, A.; Tserkezis, C.; Aizpurua, J.; Milana,S.; Ferrari, A. C.; Baumberg, J. J. Controlling Subnanometer Gaps inPlasmonic Dimers Using Graphene. Nano Lett. 2013, 13, 5033−5038.(6) Zuloaga, J.; Nordlander, P. On the Energy Shift between Near-Field and Far-Field Peak Intensities in Localized Plasmon Systems.Nano Lett. 2011, 11, 1280−1283.(7) Hajisalem, G.; Nezami, M. S.; Gordon, R. Probing the QuantumTunneling Limit of Plasmonic Enhancement by Third HarmonicGeneration. Nano Lett. 2014, 14, 6651−6654.(8) Driskell, J. D.; Larrick, C. G.; Trunell, C. Effect of Hydration onPlasmonic Coupling of Bioconjugated Gold Nanoparticles Immobi-lized on a Gold Film Probed by Surface-Enhanced Raman Spectros-copy. Langmuir 2014, 30, 6309−6313.(9) Liusman, C.; Li, H.; Lu, G.; Wu, J.; Boey, F.; Li, S.; Zhang, H.Surface-Enhanced Raman Scattering of Ag-Au Nanodisk Hetero-dimers. J. Phys. Chem. C 2012, 116, 10390−10395.(10) Kang, M.; Kim, J.-J.; Oh, Y.-J. A Deformable NanoplasmonicMembrane Reveals Universal Correlations Between Plasmon Reso-nance and Surface Enhanced Raman Scattering. Adv. Mater. 2014, 26,4510−4514.(11) Blaber, M. G.; Schatz, G. C. Extending SERS into the Infraredwith Gold Nanosphere Dimers. Chem. Commun. 2011, 47, 3769−3771.(12) Lamberti, A.; Virga, A.; Angelini, A.; Ricci, A.; Descrovi, E.;Cocuzza, M.; Giorgis, F. Metal-elastomer Nanostructures for TunableSERS and Easy Microfluidic Integration. RSC Adv. 2015, 5, 4404−4410.
(13) McFarland, A.; Young, M. A.; Dieringer, J. A.; Van Duyne, R. P.Wavelength-Scanned Surface-Enhanced Raman Excitation Spectrosco-py. J. Phys. Chem. B 2005, 109, 11279−11285.(14) Li, L.; Hutter, T.; Steiner, U.; Mahajan, S. Single Molecule SERSand Detection of Biomolecules with a Single Gold Nanoparticle on aMirror Junction. Analyst 2013, 138, 4574−4578.(15) Zhu, W.; Crozier, K. B. Quantum Mechanical Limit toPlasmonic Enhancement as Observed by Surface-Enhanced RamanScattering. Nat. Commun. 2014, 5, 5228.(16) Ye, J.; Hutchinson, J. A.; Uji-i, H.; Hofkens, J.; Lagae, L.; Maes,G.; Borghs, G.; Van Dorpe, P. Excitation Wavelength DependentSurface Enhanced Raman Scattering of 4-aminothiophenol on GoldNanorings. Nanoscale 2012, 4, 1606−1611.(17) Wang, P.; Zhang, D.; Zhang, L.; Fang, Y. The SERS Study ofGraphene Deposited by Gold Nanoparticles with 785nm Excitation.Chem. Phys. Lett. 2013, 556, 146−150.(18) Wei, A.; Kim, B.; Sadtler, B.; Tripp, S. L. Tunable Surface-Enhanced Raman Scattering from Large Gold Nanoparticle Arrays.ChemPhysChem 2001, 12, 743−745.(19) Verluise, F.; Laude, V.; Cheng, Z.; Spielmann, C.; Tournois, P.Amplitude and Phase Control of Ultrashort Pulses by Use of anAcousto-Optic Programmable Dispersive Filter: Pulse Compressionand Shaping. Opt. Lett. 2000, 25, 575−577.(20) Chen, J.; Albella, P.; Pirzadeh, Z.; Alonso-Gonzalez, P.; Huth, F.;Bonetti, S.; Bonanni, V.; Akerman, J.; Nogues, J.; Vavassori, P.Plasmonic Nickel Nanoantennas. Small 2011, 7, 2341−2347.(21) Alonso-Gonzalez, P.; Albella, P.; Neubrech, F.; Huck, C.; Chen,J.; Golmar, F.; Casanova, F.; Hueso, L. E.; Pucci, A.; Aizpurua, J.Experimental Verification of the Spectral Shift Between Near- and Far-Field Peak Intensities of Plasmonic Infrared Nanoantennas. Phys. Rev.Lett. 2013, 110, 203902.(22) Moreno, F.; Albella, P.; Nieto-Vesperinas, M. Analysis of theSpectral Behavior of Localized Plasmon Resonances in the Near- andFar-Field Regimes. Langmuir 2013, 29, 6715−6721.(23) Kats, M. A.; Yu, N.; Genevet, P.; Gaburro, Z.; Capasso, F. Effectof radiation damping on the spectral response of plasmoniccomponents. Opt. Express 2011, 19, 21748.(24) Dieringer, J. A.; McFarland, A.; Shah, N.; Stuart, D.; Whitney, A.Surface Enhanced Raman Spectroscopy: New Materials, Concepts,Characterization Tools, and Applications. Faraday Discuss. 2006, 132,9−26.(25) Sigle, D. O.; Mertens, J.; Herrmann, L. O.; Bowman, R. W.;Ithurria, S.; Dubertret, B.; Shi, Y.; Ying Yang, H.; Tserkezis, C.;Aizpurua, J.; Baumberg, J. J. Monitoring Morphological Changes in 2DMonolayer Semiconductors Using Atom-Thick Plasmonic Nano-cavities. ACS Nano 2015, 9, 825−830.(26) Tserkezis, C.; Esteban, R.; Sigle, D. O.; Mertens, J.; Herrmann,L. O.; Baumberg, J. J.; Aizpurua, J. Hybridization of PlasmonicAntenna and Cavity Modes: Extreme Optics of Nanoparticle-On-Mirror Nanogaps. Phys. Rev. A: At., Mol., Opt. Phys. 2015, 92, 053811.(27) Aubry, A.; Lei, D. Y.; Maier, S. A.; Pendry, J. B. PlasmonicHybridization between Nanowires and a Metallic Surface: a Trans-formation Optics Approach. ACS Nano 2011, 5, 3293−3308.(28) Wustholz, K. L.; Herny, A.-I.; McMahon, J. M.; Freeman, R. G.;Valley, N.; Piotti, M. E.; Natan, M. J.; Schatz, G. C.; Van Duyne, R. P.Structure-Activity Relationships in Gold Nanoparticle Dimers andTrimers for Surface-Enhanced Raman Spectroscopy. J. Am. Chem. Soc.2010, 132, 10903−10910.(29) Le Ru, E. C.; Galloway, C.; Etchegoin, P. G. On the connectionbetween optical absorption/extinction and SERS enhancements. Phys.Chem. Chem. Phys. 2006, 8, 3083−3087.(30) Barnett, S. M.; Harris, N.; Baumberg, J. J. Molecules in theMirror: how SERS Background Arise From the Quantum Method ofImages. Phys. Chem. Chem. Phys. 2014, 16, 6544−6549.(31) Hugall, J. T.; Baumberg, J. J. Demonstrating Photoluminescencefrom Au is Electronic Inelastic Light Scattering of a Plasmonic Metal:The Origin of SERS Background. Nano Lett. 2015, 15, 2600−2604.(32) Willets, K. A.; Stranahan, S. M.; Weber, M. L. Shedding Light onSurface-Enhanced Raman Scattering Hot Spots through Single-
ACS Photonics Article
DOI: 10.1021/acsphotonics.5b00707ACS Photonics XXXX, XXX, XXX−XXX
F

Molecule Super-Resolution Imaging. J. Phys. Chem. Lett. 2012, 3,1286−1294.(33) Hegner, M.; Wagner, P.; Semenza, G. Ultrafast Atomically FlatTemplate-Stripped Au Surfaces for Scanning Probe Microscopy. Surf.Sci. 1993, 291, 39−46.(34) De Nijs, B.; Bowman, R. W.; Herrmann, L. O.; Benz, F.; Barrow,S. J.; Mertens, J.; Sigle, D. O.; Chikkaraddy, R.; Eiden, A.; Ferrari, A.;Scherman, O. A.; Baumberg, J. J. Unfolding the Contents of sub-nmPlasmonic Gaps using Normalising Plasmon Resonance Spectroscopy.Faraday Discuss. 2015, 178, 185−193.(35) Johnson, P. B.; Christy, R. W. Optical Constants of the NobleMetals. Phys. Rev. B: Solid State 1972, 6, 4370−4379.
ACS Photonics Article
DOI: 10.1021/acsphotonics.5b00707ACS Photonics XXXX, XXX, XXX−XXX
G


![Enhancing the Angular Sensitivity of Plasmonic Sensors ...biotheory.phys.cwru.edu/PDF/AOM.pdf · ultrasensitive plasmonic biosensors.[29,30] A plasmonic nanorod metamaterial (Type](https://img.pdfslide.net/doc/110x75/5fcdd2c6db367d06a677e7be/enhancing-the-angular-sensitivity-of-plasmonic-sensors-ultrasensitive-plasmonic.jpg)