Embed Size (px)
Citation preview
H. Sakurai, S. Takeuchi, N. Aoi, H. Baba, S. Bishop, M. Ishihara, T. Kubo, T. Motobayashi, Y. YanagisawaN. Imai D. Suzuki, T. Nakao, H. Iwasaki, T. K. Onishi, M. K. Suzuki, Y. IchikawaS. OtaY. Togano, K. KuritaY. Kondo, T. Nakamura, T. Okumura
RIKENKEKTokyo U.CNS, Tokyo U.Rikkyo U.Titech
In collaboration with
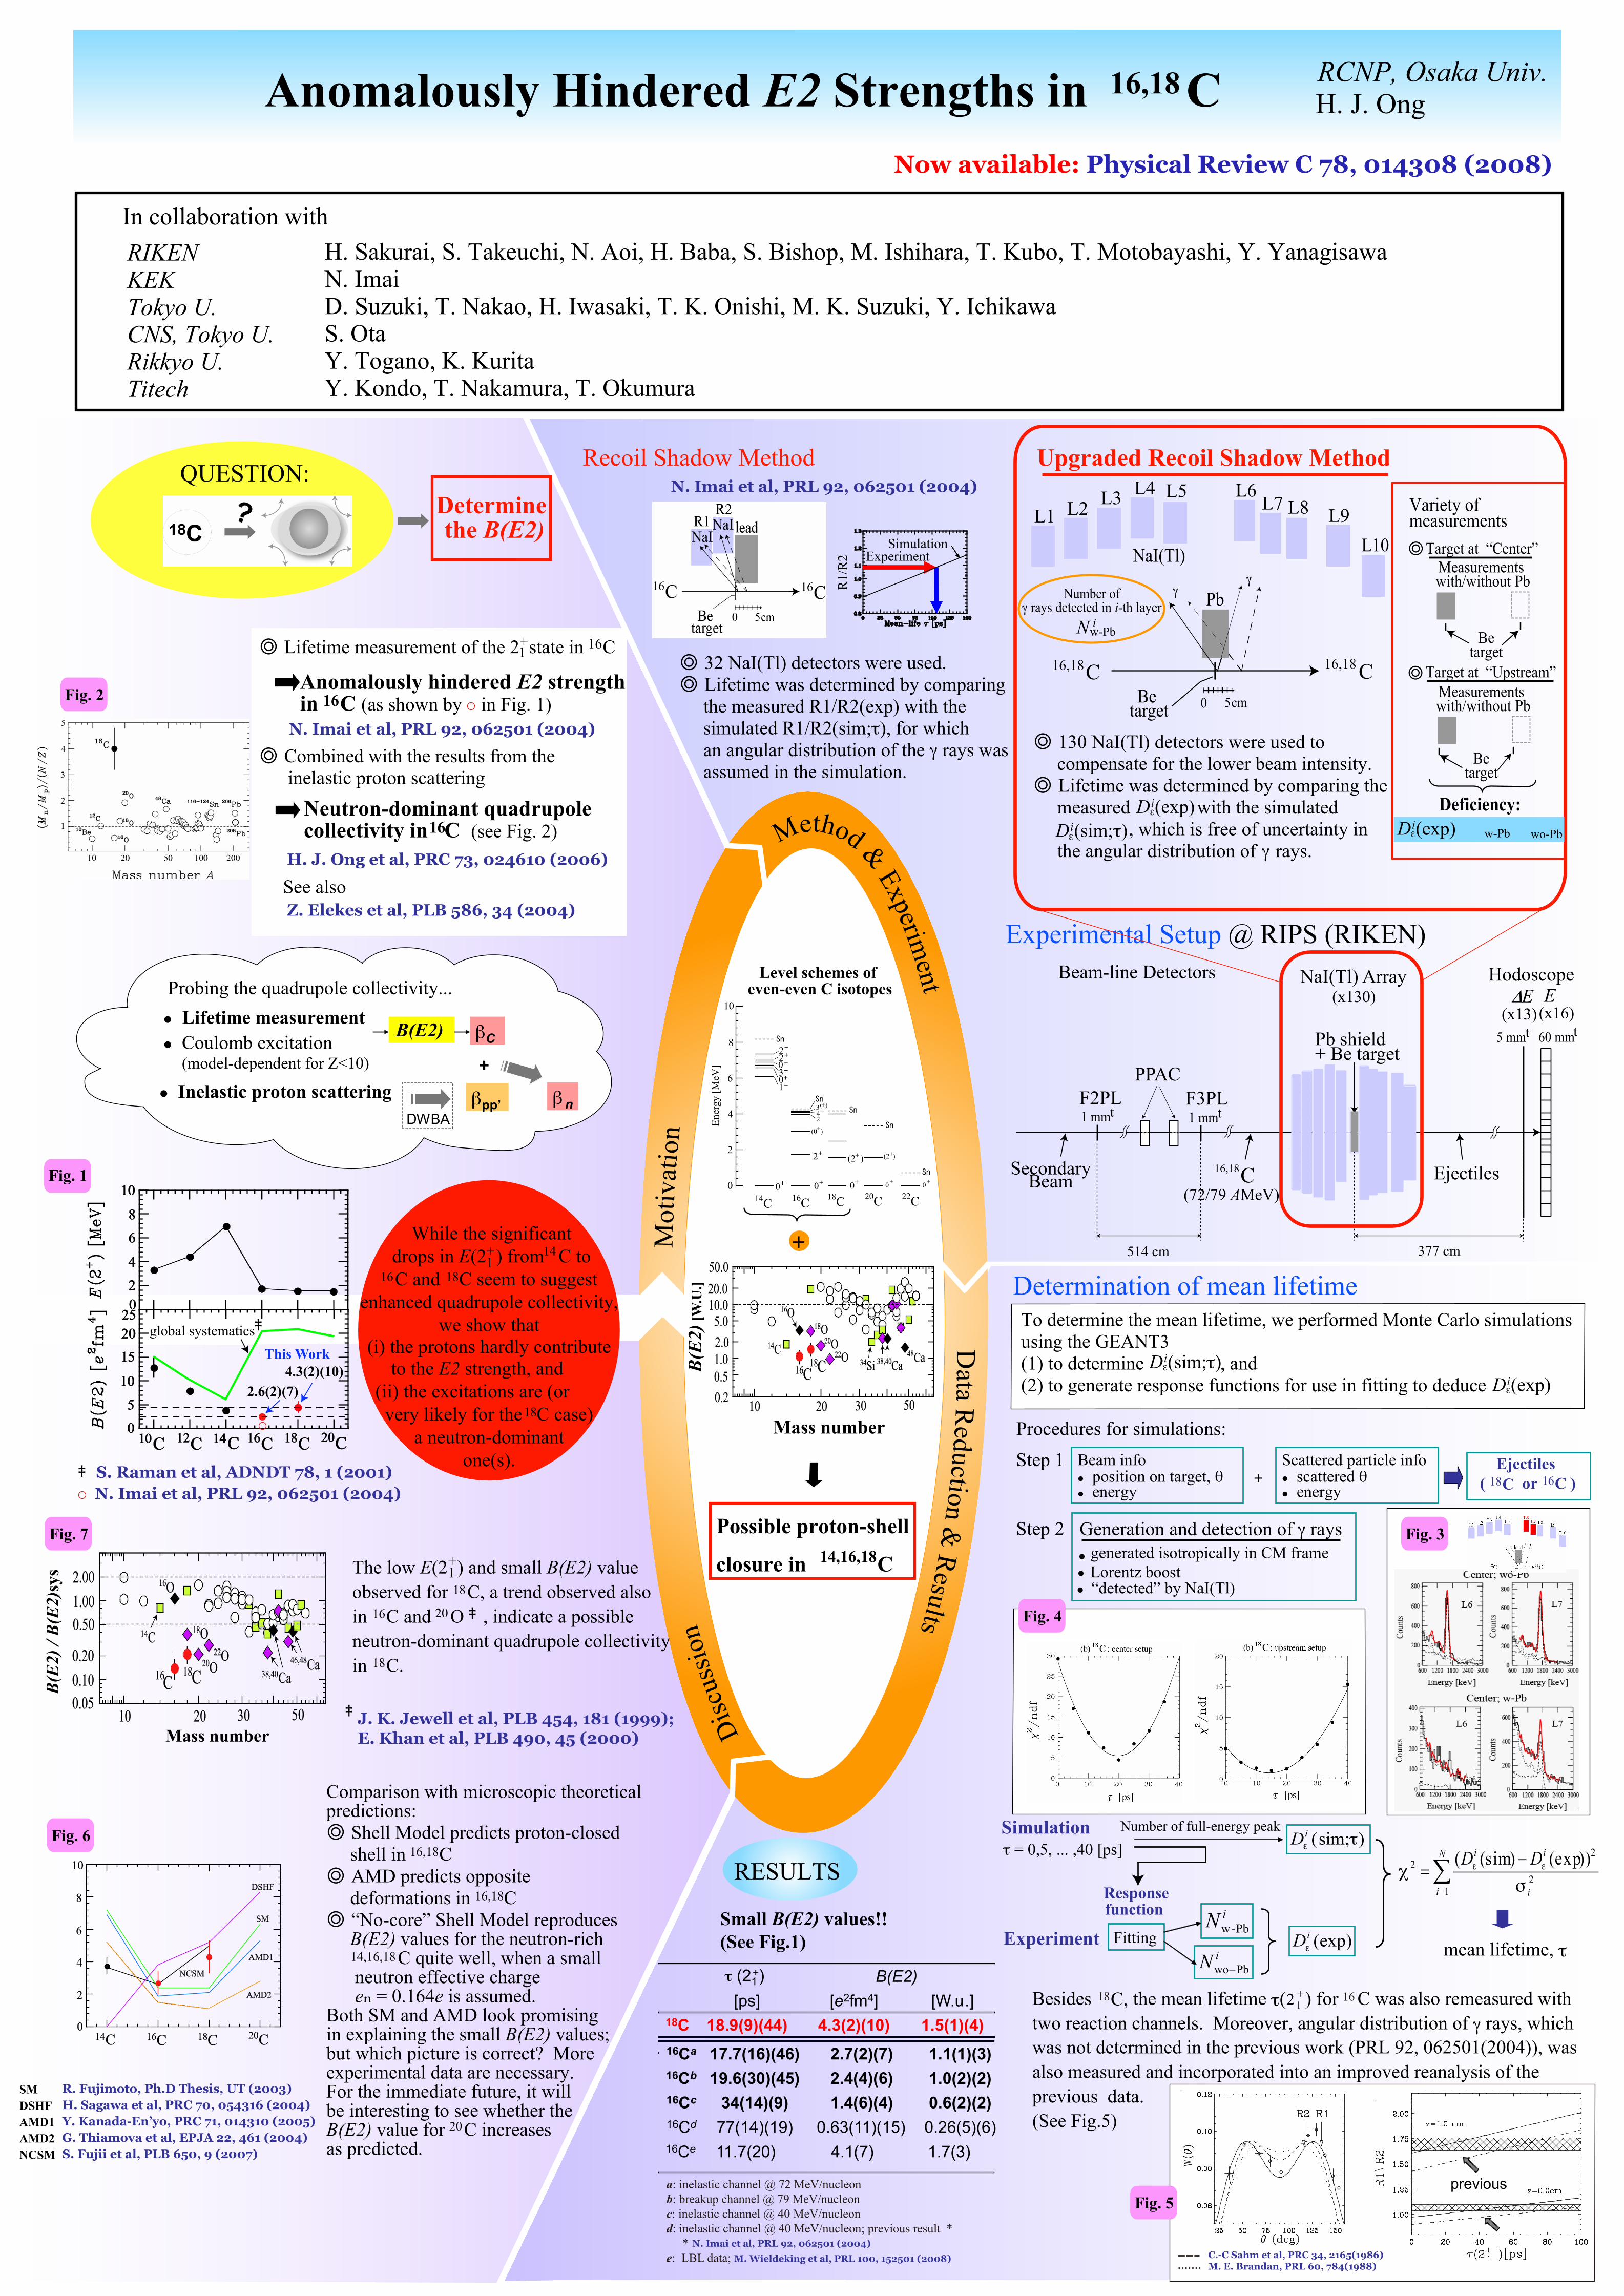
Anomalously Hindered E2 Strengths in C16,18H. J. Ong
Upgraded Recoil Shadow Method
377 cm514 cm
HodoscopeNaI(Tl) ArrayBeam-line DetectorsEΔ E
F3PLF2PLPPAC
SecondaryBeam
Pb shield + Be target
16,18C Ejectiles
(x13)(x16)(x130)
5 mmt 60 mmt
1 mmt1 mmt
Experimental Setup @ RIPS (RIKEN)
L1 L2 L3 L4 L5 L6L7 L8 L9
L10
Pb
Be target
16,18C
NaI(Tl)
0 5cm
16,18 CBe
target
Measurements with/without Pb
Betarget
Measurements with/without Pb
Target at “Center”
Target at “Upstream”
◎
◎
Variety of measurements
◎ 130 NaI(Tl) detectors were used to compensate for the lower beam intensity.◎ Lifetime was determined by comparing the measured with the simulated , which is free of uncertainty in the angular distribution of γ rays.
iN Pbwo−
)exp(iDε
∑=
−=
N
i i
ii DD1
2
22 ))exp()sim((
σχ εε
FittingiN Pb-w
sim;τ( )iDε
Experiment
Simulation
Generation and detection of γ rays generated isotropically in CM frame Lorentz boost “detected” by NaI(Tl)
Number of full-energy peak
Beam info position on target, θ energy
Scattered particle info scattered θ energy
Responsefunction
+Ejectiles
( or )18CStep 1
Step 2
(72/79 AMeV)
ii NN /≡
Nw-Pb
Number of γ rays detected in i-th layer
i
γ γ
Deficiency:D (exp)iε
D (sim;τ)iε
Determination of mean lifetime
0
2
4
6
8
10
Ener
gy [M
eV]
14C 16C 18C 20C
(2 )+
0+ 0+ 0+ 0 +
(0 )+
2+ (2 )+
2+
3(+)4+2
1−0+3−
2−
0−
Sn
Sn
Sn
Sn
22C0 +Sn
Level schemes of even-even C isotopes
N. Imai et al, PRL 92, 062501 (2004)Recoil Shadow Method
SimulationExperiment
Data R
eduction & Results
Disc
ussio
n
R1/
R2
◎ 32 NaI(Tl) detectors were used.◎ Lifetime was determined by comparing the measured R1/R2(exp) with the simulated R1/R2(sim;τ), for which an angular distribution of the γ rays was assumed in the simulation.
D (exp)iε w-Pb wo-Pb
Mot
ivat
ion
Method & Experiment
Possible proton-shell
closure in C 14,16,18
B(E
2) [W
.U.]
Mass number
B(E
2) /
B(E
2)sy
s
Mass number
◎ Lifetime measurement of the 2 state in C
◎ Combined with the results from the inelastic proton scattering
See also
161+
Anomalously hindered E2 strength in C (as shown by in Fig. 1) 16
N. Imai et al, PRL 92, 062501 (2004)
Probing the quadrupole collectivity... Lifetime measurement Coulomb excitation
(model-dependent for Z<10)
Inelastic proton scattering
B(E2)
βpp’
βC
β n
+
DWBA
Fig. 2
H. J. Ong et al, PRC 73, 024610 (2006)
Neutron-dominant quadrupole collectivity in C (see Fig. 2) 16
Z. Elekes et al, PLB 586, 34 (2004)
S. Raman et al, ADNDT 78, 1 (2001)‡
While the significantdrops in E(2 ) from C to
C and C seem to suggest enhanced quadrupole collectivity,
we show that (i) the protons hardly contribute
to the E2 strength, and (ii) the excitations are (or very likely for the C case)
a neutron-dominant one(s).
QUESTION:
1+ 14
16 18
18
+
To determine the mean lifetime, we performed Monte Carlo simulationsusing the GEANT3(1) to determine , and(2) to generate response functions for use in fitting to deduce
D (exp)iε
D (sim;τ)iε
τ = 0,5, ... ,40 [ps]
Procedures for simulations:
Fig. 3
Fig. 4
RESULTS
Comparison with microscopic theoretical predictions:◎ Shell Model predicts proton-closed shell in C◎ AMD predicts opposite deformations in C◎ “No-core” Shell Model reproduces B(E2) values for the neutron-rich C quite well, when a small neutron effective charge en = 0.164e is assumed.Both SM and AMD look promisingin explaining the small B(E2) values;but which picture is correct? Moreexperimental data are necessary.For the immediate future, it will be interesting to see whether theB(E2) value for C increasesas predicted.
R. Fujimoto, Ph.D Thesis, UT (2003)H. Sagawa et al, PRC 70, 054316 (2004)Y. Kanada-En’yo, PRC 71, 014310 (2005)G. Thiamova et al, EPJA 22, 461 (2004)S. Fujii et al, PLB 650, 9 (2007)
J. K. Jewell et al, PLB 454, 181 (1999);E. Khan et al, PLB 490, 45 (2000)
16,18
16,18
14,16,18
The low E(2 ) and small B(E2) valueobserved for C, a trend observed alsoin C and O , indicate a possible neutron-dominant quadrupole collectivityin C.
18
18
16 20 ‡
‡
Determine the B(E2)
1+
RCNP, Osaka Univ.
16C
[W.u.][e2fm4][ps]1.5(1)(4)4.3(2)(10)18.9(9)(44)18C
B(E2)τ (21+)
0.26(5)(6)0.63(11)(15)77(14)(19)16Cd
0.6(2)(2)1.4(6)(4)34(14)(9)16Cc
1.0(2)(2)2.4(4)(6)19.6(30)(45)16Cb
1.1(1)(3)2.7(2)(7)17.7(16)(46)16Ca
Besides C, the mean lifetime τ( ) for C was also remeasured withtwo reaction channels. Moreover, angular distribution of γ rays, which was not determined in the previous work (PRL 92, 062501(2004)), was also measured and incorporated into an improved reanalysis of the previous data.(See Fig.5)
N. Imai et al, PRL 92, 062501 (2004)*
18 21+ 16
previous
C.-C Sahm et al, PRC 34, 2165(1986)M. E. Brandan, PRL 60, 784(1988)
Fig. 5a: inelastic channel @ 72 MeV/nucleonb: breakup channel @ 79 MeV/nucleonc: inelastic channel @ 40 MeV/nucleond: inelastic channel @ 40 MeV/nucleon; previous result *
e: LBL data; M. Wieldeking et al, PRL 100, 152501 (2008)
‡global systematics
4.3(2)(10) This Work
2.6(2)(7)
Fig. 7
Fig. 6
20
Small B(E2) values!!(See Fig.1)
SMDSHFAMD1AMD2NCSM 1.7(3)4.1(7)11.7(20)16Ce
Now available: Physical Review C 78, 014308 (2008)
mean lifetime, τ
Fig. 1
N. Imai et al, PRL 92, 062501 (2004)
![Anomalously Steep ReddeningLaw in Quasars ...1307.3305v1 [astro-ph.CO] 12 Jul 2013 Anomalously Steep ReddeningLaw in Quasars: AnExceptional Example Observed in IRAS14026+4341 Peng](https://img.pdfslide.net/doc/110x75/5abf8f7d7f8b9ac0598e86db/anomalously-steep-reddeninglaw-in-quasars-13073305v1-astro-phco-12-jul-2013.jpg)