Embed Size (px)
Citation preview
© 2014 Jones & Bartlett Learning
Answers to Selected Study Questions and Calculat ion Problems
Chapter 1
Study Questions1. Epidemiology2. Framingham Heart Study3. John Snow’s4. Determinants5. population6. morbidity; mortality7. Quantification8. Qualitative9. epidemic
10. Love Canal11. pandemic12. endemic13. surveillance14. plague15. Edward Jenner
49
Appendix
A
9781449651589_AppA_FINAL.indd 49 10/06/13 12:15 PM
© 2014 Jones & Bartlett Learning
Chapter 2
Study Questions1. Primary; prepathogenesis2. secondary prevention3. pathogenesis4. Tertiary5. demographic transition6. epidemiologic transition
Chapter 3
Study Questions1. count2. ratio3. proportion4. rate5. incidence rate6. attack rate7. proportional mortality ratio
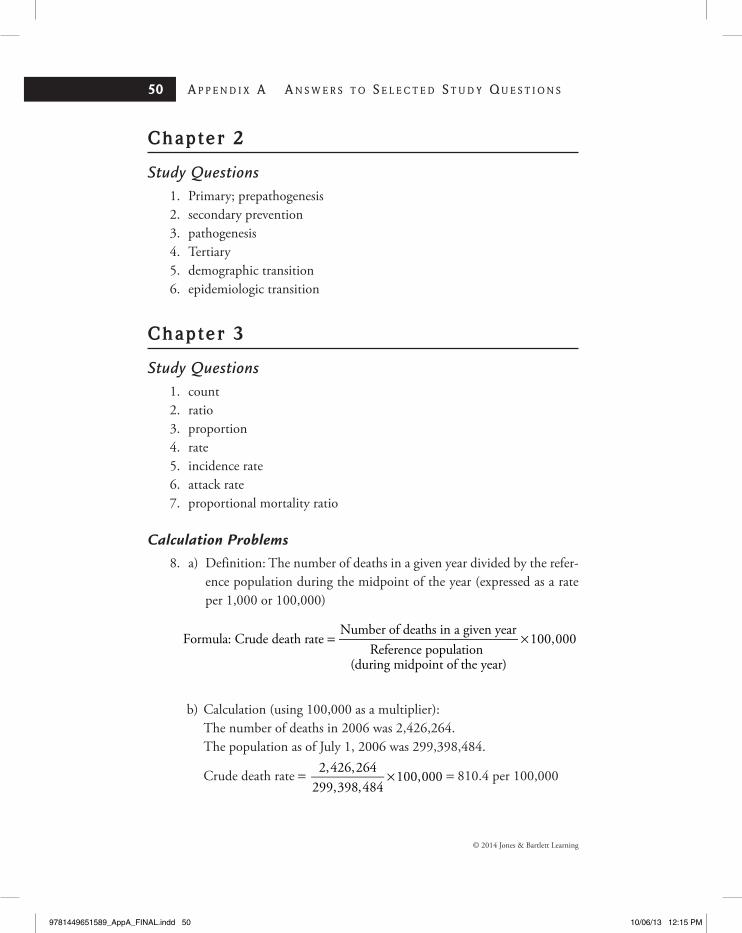
Calculation Problems8. a) Definition: The number of deaths in a given year divided by the refer-
ence population during the midpoint of the year (expressed as a rate per 1,000 or 100,000)
Formula: Crude death rateNumber of deaths in a given year
Reference population(during midpoint of the year)
100,000= ×
b) Calculation (using 100,000 as a multiplier):The number of deaths in 2006 was 2,426,264.The population as of July 1, 2006 was 299,398,484.
Crude death rate = 2,426,264299,398,484
100,000× = 810.4 per 100,000
50 A p p e n d i x A A n s w e r s t o s e l e c t e d s t u d y Q u e s t i o n s
9781449651589_AppA_FINAL.indd 50 10/06/13 12:15 PM
© 2014 Jones & Bartlett Learning
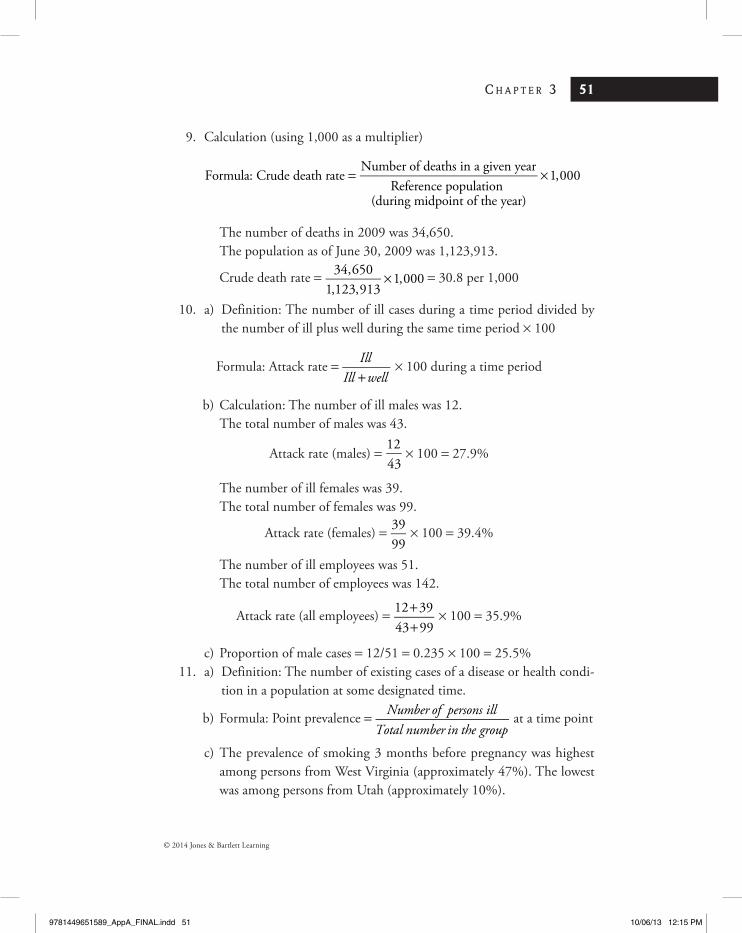
9. Calculation (using 1,000 as a multiplier)
Formula: Crude death rateNumber of deaths in a given year
Reference population(during midpoint of the year)
1,000= ×
The number of deaths in 2009 was 34,650.The population as of June 30, 2009 was 1,123,913.
Crude death rate = 34,6501,123,913
1,000× = 30.8 per 1,000
10. a) Definition: The number of ill cases during a time period divided by the number of ill plus well during the same time period × 100
Formula: Attack rate = IllIll well+
× 100 during a time period
b) Calculation: The number of ill males was 12.The total number of males was 43.
Attack rate (males) = 1243
× 100 = 27.9%
The number of ill females was 39.The total number of females was 99.
Attack rate (females) = 3999
× 100 = 39.4%
The number of ill employees was 51.The total number of employees was 142.
Attack rate (all employees) = 12 3943 99
++
× 100 = 35.9%
c) Proportion of male cases = 12/51 = 0.235 × 100 = 25.5%11. a) Definition: The number of existing cases of a disease or health condi-
tion in a population at some designated time.
b) Formula: Point prevalence = Number of persons illTotal number in the group
at a time point
c) The prevalence of smoking 3 months before pregnancy was highest among persons from West Virginia (approximately 47%). The lowest was among persons from Utah (approximately 10%).
c h A p t e r 3 51
9781449651589_AppA_FINAL.indd 51 10/06/13 12:15 PM
© 2014 Jones & Bartlett Learning
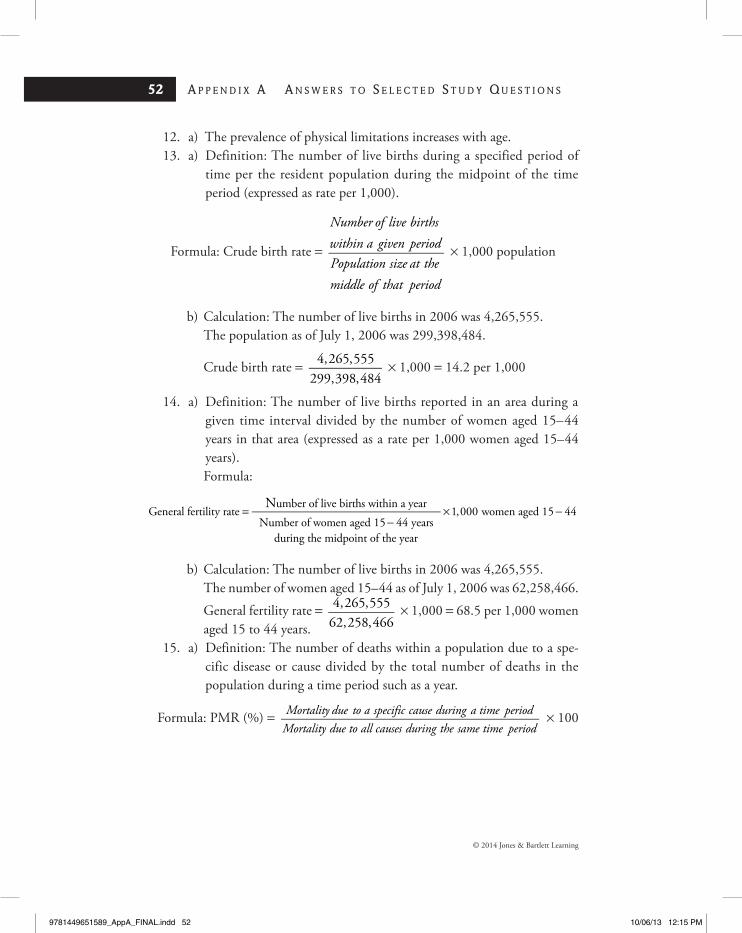
12. a) The prevalence of physical limitations increases with age.13. a) Definition: The number of live births during a specified period of
time per the resident population during the midpoint of the time period (expressed as rate per 1,000).
Formula: Crude birth rate =
Number of live birthswithin a given periodPopulation size at themiddle of that period
× 1,000 population
b) Calculation: The number of live births in 2006 was 4,265,555.The population as of July 1, 2006 was 299,398,484.
Crude birth rate = 4,265,555299,398,484
× 1,000 = 14.2 per 1,000
14. a) Definition: The number of live births reported in an area during a given time interval divided by the number of women aged 15– 44 years in that area (expressed as a rate per 1,000 women aged 15– 44 years).Formula:
=−
× −N
General fertility rateumber of live births within a year
Number of women aged 15 44 yearsduring the midpoint of the year
1,000 women aged 15 44
b) Calculation: The number of live births in 2006 was 4,265,555.The number of women aged 15– 44 as of July 1, 2006 was 62,258,466.
General fertility rate = 4,265,55562,258,466
× 1,000 = 68.5 per 1,000 women aged 15 to 44 years.
15. a) Definition: The number of deaths within a population due to a spe-cific disease or cause divided by the total number of deaths in the population during a time period such as a year.
Formula: PMR (%) = Mortality due to a specific cause during a time periodMortality due to all causes during the same time period
× 100
52 A p p e n d i x A A n s w e r s t o s e l e c t e d s t u d y Q u e s t i o n s
9781449651589_AppA_FINAL.indd 52 10/06/13 12:15 PM
© 2014 Jones & Bartlett Learning
b) Calculation: Mortality due to diseases of the heart in 2006 was 631,636.Mortality due to all causes in 2006 was 2,426,264.PMR (Diseases of the heart) = 631,636
2,426,264 × 100 = 26.0%
PMR (Malignant neoplasms) = 23.1%PMR (Cerebrovascular diseases) = 5.7%PMR (Chronic lower respiratory diseases) = 5.1%PMR (Accidents/unintentional injuries) = 5.0%
c) Definition: The number of deaths (mortality) assigned to a specific cause during a year divided by the estimated population size during the midpoint of that same year (expressed as the rate per 100,000 pop-ulation). Table 3.3 shows 631,636 deaths for diseases of the heart. The estimated population was 299,398,484.Formula: Cause-specific mortality rate
= ×Mortality from a given disease
Population size at midpo of time periodint100,000
d) Calculation: Cause-specific mortality rate for diseases of the heart = 631,636
299,398,484 × 100,000 = 210.97
16. a) Definition: The number of infant deaths among infants aged 0 to 365 days during a year divided by the number of live births during the same year (expressed as the rate per 1,000 live births). Formula:
=
−
×Infant mortality rate
Number of infant deathsamong infants aged 0 365 days
during a year
Number of live birthsduring the year
1,000
b) Calculation: The number of infant deaths during 2006 was 28,527.The number of live births during 2006 was 4,265,555.
Infant mortality rate = 28,5274,265,555
1,000× = 6.69 per 1,000 live births.
c h A p t e r 3 53
9781449651589_AppA_FINAL.indd 53 10/06/13 12:15 PM
© 2014 Jones & Bartlett Learning
Chapter 4
Study Questions1. Descriptive2. Analytic3. Descriptive; analytic4. case reports (counts), case series, and cross-sectional studies5. Cyclic fluctuations6. Secular trends7. Case clustering8. spatial clustering9. temporal clustering
10. acculturation
Chapter 5
Study Questions1. Multiphasic screening2. nature of the data3. availability of the data4. thoroughness5. record linkage6. California Health Interview Survey (CHIS)7. life insurance8. registry9. reportable and notifiable diseases
10. HIPAA
Chapter 6
Study Questions1. Manipulation2. Randomization3. experimental
54 A p p e n d i x A A n s w e r s t o s e l e c t e d s t u d y Q u e s t i o n s
9781449651589_AppA_FINAL.indd 54 10/06/13 12:15 PM
© 2014 Jones & Bartlett Learning
4. clinical trial5. Community interventions6. Quasi-experimental7. observational8. descriptive studies; analytic studies9. 2 by 2
10. ecologic11. ecologic fallacy12. case-control13. case-control studies14. odds ratio15. a) Definition: Measure of association between frequency of exposure
and frequency of outcome used in case-control studies. Formula: (AD)/(BC), where A is the number of subjects who have the disease and have been exposed, B is the number who do not have the disease and have been exposed, C is the number who have the disease and have not been exposed, and D is the number who do not have the disease and have not been exposed.
b) Calculation: (64 × 117)/(56 × 27) = 4.95
Chapter 7
Study Questions1. temporality2. cohort3. period life4. life expectancy5. population-based cohort6. prospective cohort7. retrospective cohort8. relative risk9. nested case-control
10. a) Definition: Ratio of the risk of disease or death among the exposed to the risk among the unexposed.Formula: (Refer to Chapter 7.) Relative risk =
++
[A/(A B)][C/(C D)]
b) RR = =[23/70][121/822]
2.23
c h A p t e r 7 55
9781449651589_AppA_FINAL.indd 55 10/06/13 12:15 PM
© 2014 Jones & Bartlett Learning
Chapter 8
Study Questions1. prophylactic2. therapeutic3. formative evaluation, process evaluation, impact evaluation, outcome
evaluation4. Impact5. Formative6. crossover7. clinical trial8. double-blind9. blinding (masking)
Chapter 9
Study Questions1. Population risk difference2. P value3. risk difference4. etiologic fraction5. population etiologic fraction6. confidence interval
Chapter 10
Study Questions1. validity2. internal3. External4. Sampling error5. bias6. Selection7. Recall8. Prevarication (lying)9. Confounding
10. prevention; analysis
56 A p p e n d i x A A n s w e r s t o s e l e c t e d s t u d y Q u e s t i o n s
9781449651589_AppA_FINAL.indd 56 10/06/13 12:15 PM
© 2014 Jones & Bartlett Learning
Chapter 11
Study Questions1. Screening2. Mass3. Selective4. simple; rapid; inexpensive; safe; acceptable5. Reliability6. validity7. Construct8. Predictive value (+)9. Specificity
10. Accuracy
Chapter 12
Study Questions
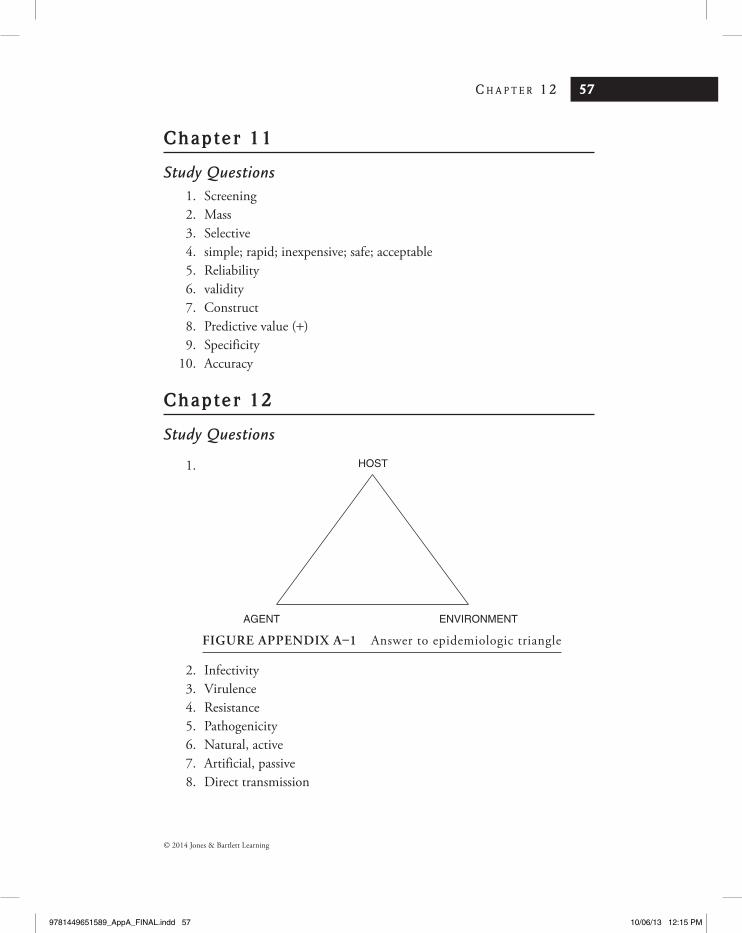
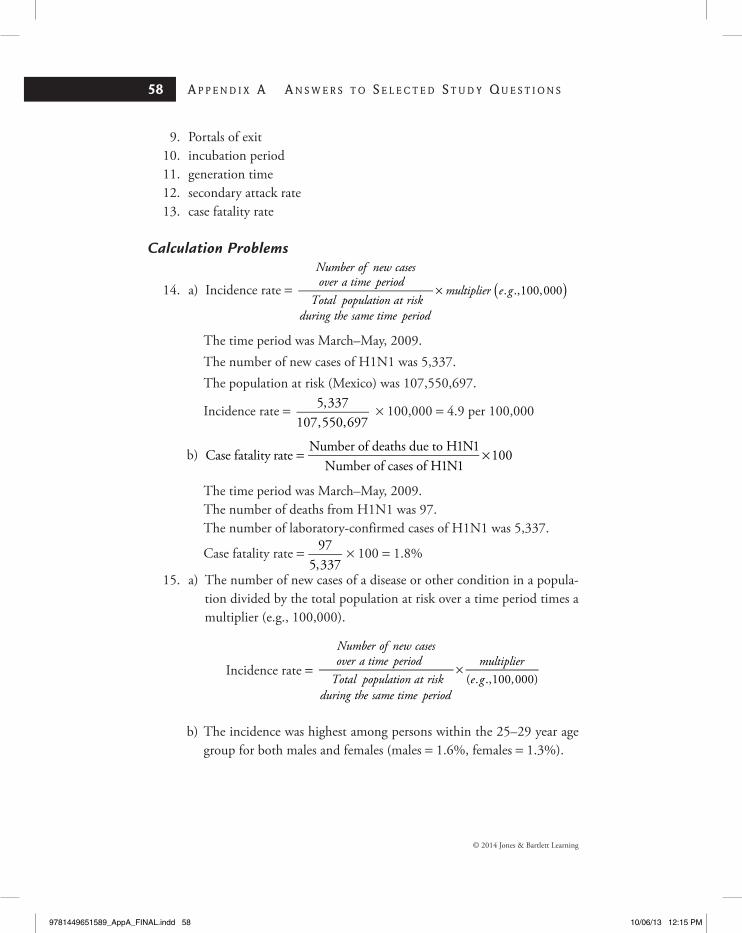
1.
2. Infectivity3. Virulence4. Resistance5. Pathogenicity6. Natural, active7. Artificial, passive8. Direct transmission
figure Appendix A–1 Answer to epidemiologic triangle
c h A p t e r 1 2 57
HOST
AGENT ENVIRONMENT
9781449651589_AppA_FINAL.indd 57 10/06/13 12:15 PM
© 2014 Jones & Bartlett Learning
9. Portals of exit10. incubation period11. generation time12. secondary attack rate13. case fatality rate
Calculation Problems
14. a) Incidence rate = ( )×
Number of new casesover a time period
Total population at riskduring the same time period
multiplier e g. .,100,000
The time period was March–May, 2009. The number of new cases of H1N1 was 5,337.The population at risk (Mexico) was 107,550,697.
Incidence rate = 5,337107,550,697
× 100,000 = 4.9 per 100,000
b) Case fatality rateNumber of deaths due to H1N1
Number of cases of H1N1100= ×
The time period was March–May, 2009. The number of deaths from H1N1 was 97.The number of laboratory-confirmed cases of H1N1 was 5,337.
Case fatality rate = 975,337
× 100 = 1.8%
15. a) The number of new cases of a disease or other condition in a popula-tion divided by the total population at risk over a time period times a multiplier (e.g., 100,000).
Incidence rate = ×
Number of new casesover a time periodTotal population at risk
during the same time period
multipliere g( . .,100,000)
b) The incidence was highest among persons within the 25–29 year age group for both males and females (males = 1.6%, females = 1.3%).
58 A p p e n d i x A A n s w e r s t o s e l e c t e d s t u d y Q u e s t i o n s
9781449651589_AppA_FINAL.indd 58 10/06/13 12:15 PM

© 2014 Jones & Bartlett Learning
Chapter 13
Study Questions1. healthy worker effect2. threshold3. Latency4. Synergism5. dose–response relationship6. sick building syndrome7. passive smoking
Chapter 14
Study Questions1. genetic epidemiology2. Segregation analysis3. autosomal dominant4. Autosomal recessive5. Molecular6. proband7. men; women8. recombination
Chapter 15
Study Questions1. operationalization2. social support; social network ties3. Social networks4. person-environment fit5. type A behavior pattern
Chapter 16
Study Questions1. Reproductive epidemiology2. Nutrition epidemiology3. Pharmacoepidemiology
c h A p t e r 1 6 59
9781449651589_AppA_FINAL.indd 59 10/06/13 12:15 PM

9781449651589_AppA_FINAL.indd 60 10/06/13 12:15 PM