Embed Size (px)
Citation preview
NTIA TM-13-489
Antenna Models For Electromagnetic Compatibility
Analyses
technical memorandum
U.S. DEPARTMENT OF COMMERCE National Telecommunications and Information Administration
i
NTIA TM-13-489
Antenna Models
For Electromagnetic Compatibility
Analyses
C.W. Wang, Ph.D.
T. Keech, Ph.D.
U.S. Department of Commerce
Rebecca Blank, Acting Secretary Lawrence E. Strickling, Assistant Secretary
for Communications and Information
October 2012
ii
EXECUTIVE SUMMARY
The National Telecommunications and Information Administration (NTIA) is the
Executive Branch agency principally responsible for advising the President on
telecommunications and information policy issues. NTIA’s responsibilities include developing
and articulating domestic and international telecommunications and information policies
concerning spectrum allocation and utilization, presenting executive branch views on
telecommunications and information matters to Congress, the Federal Communications
Commission (FCC), and the public, and providing guidance to federal agencies to ensure their
telecommunication activities are consistent with these policies.
To fulfill these responsibilities, NTIA has undertaken numerous spectrum-related studies
to assess spectrum utilization and recommend changes to promote efficient and effective
spectrum utilization, examine the feasibility of reallocating spectrum used by the federal
government to the private sector, recommend changes to improve federal spectrum management
procedures, and identify existing or potential electromagnetic compatibility (EMC) problems
between radio systems and provide recommendations to resolve EMC conflicts.
NTIA and the federal agencies have long relied on engineering analyses and technical
studies to assess compatibility between federal and non-federal radio systems and to evaluate
emerging radio technologies. Unfortunately, regulators and the spectrum management
community have yet to recognize a common set of approaches for conducting these analyses and
studies. Moreover, in light of the increasing spectrum demands, federal regulators and spectrum
managers must use analysis methods that accurately represent interference between radio
systems to ensure efficient and effective spectrum utilization.
To make the analyses and studies more effective and accurate, NTIA, in coordination
with the federal agencies and the FCC, is developing a Best Practices Handbook of engineering
analytical tools and procedures with the aim of optimizing spectrum utilization. The handbook
will include appropriate transmitter and receiver technical standards, radio service-specific
interference protection criteria, limits of unwanted emission, frequency dependent environmental
characteristics, engineering models of antennas and radiowave propagation, and a description of
radio service-specific analysis models that address single and aggregate interference.
To support the development of the handbook, NTIA’s Office of Spectrum Management,
Spectrum Engineering and Analysis Division developed this technical memorandum to address
the antenna characteristics for EMC analyses. The memorandum covers the antenna gain
requirements, radiation patterns, sidelobe requirements, and other technical data. The results of
this memorandum will be incorporated into the Best Practices Handbook.
This memorandum contains two compilations of antenna parameters. The first one is the
collection of rules, regulations, and recommendations regarding antennas that are published by
authoritative institutions and are relevant to EMC analyses. Various authoritative institutions
have published rules, regulations, and recommendations regarding antennas for regulating, as
well as improving, EMC, with the aim of optimizing spectrum efficiency. NTIA technical staff
conducted an extensive search for the rules, regulations, and recommendations published by
iii
itself, the FCC, International Telecommunication Union, RTCA, Inc. (formerly Radio Technical
Commission for Aeronautics), etc., and compiled the findings in this memorandum. The
information includes the antenna gain values, reference radiation patterns, sidelobe requirements,
and other technical data. Thus, this memorandum is a library of the rules, regulations, and
recommendations regarding antennas that are relevant to EMC analyses. This will enable
regulators and spectrum managers to easily identify the appropriate antenna parameters for their
EMC analyses.
The second compilation is the recommendations of antenna parameters for NTIA and the
federal agencies to conduct their EMC analysis tasks. NTIA conducts the following EMC
analysis tasks for the federal agencies: system review for equipment approval, frequency
assignment, and spectrum sharing studies. The official source of antenna parameters for these
tasks is the NTIA’s Manual of Regulations and Procedures for Federal Radio Frequency
Management. However, the Manual only provides antenna parameters for some radio services.
NTIA technical staff evaluated the characteristics of the radio services, the federal usage of the
radio spectrum, and the technical merit and practicality of the antenna parameters in the rules,
regulations, and recommendations, and then developed recommendations of antenna parameters
for all of the radio services. These recommendations are compiled in this memorandum. Thus,
this memorandum is also a library of the antenna parameters for NTIA and the federal agencies
to conduct their EMC analysis tasks.
This technical memorandum is a living document. The content will be periodically
reviewed for new and revised technical parameters from the authoritative institutions, and the
memorandum will be revised accordingly.
iv
TABLE OF CONTENTS
EXECUTIVE SUMMARY ............................................................................................................ ii
TABLE OF CONTENTS ............................................................................................................... iv
LIST OF TABLES ....................................................................................................................... xiv
LIST OF FIGURES ................................................................................................................... xxvi
ACRONYMS ABBREVIATIONS AND SYMBOLS ................................................................xxx
SECTION 1. INTRODUCTION ............................................................................................... 1-1
1.1 Background .......................................................................................................... 1-1
1.2 Objective .............................................................................................................. 1-1
1.3 Approach .............................................................................................................. 1-2
1.4 Scope .................................................................................................................... 1-3
SECTION 2. ANTENNA FUNDAMENTALS......................................................................... 2-1
2.1 Introduction .......................................................................................................... 2-1
2.2 Near-Field and Far-Field Regions ....................................................................... 2-2
2.3 Power and Gain .................................................................................................... 2-3
2.3.1 Radiated Power ........................................................................................ 2-3
2.3.2 Directive Gain and Power Gain ............................................................... 2-4
2.4 Radiation Pattern .................................................................................................. 2-4
2.4.1 Characteristics .......................................................................................... 2-4
2.4.2 Types of Patterns...................................................................................... 2-5
2.4.3 Reference Radiation Pattern .................................................................... 2-7
2.4.4 Reciprocity ............................................................................................... 2-8
2.5 Efficiency ............................................................................................................. 2-8
2.6 Beamwidth ........................................................................................................... 2-9
2.7 Polarization .......................................................................................................... 2-9
2.7.1 Characteristics .......................................................................................... 2-9
2.7.2 Co-Polarization and Cross-Polarization ................................................. 2-10
2.7.3 System Degradation due to Cross-Polarization ..................................... 2-11
2.7.4 Orthogonal Polarization Frequency Reuse ............................................ 2-12
2.8 Antenna Noise and System Noise ...................................................................... 2-12
2.9 Bandwidth .......................................................................................................... 2-13
SECTION 3. COMMON ANTENNA TYPES ......................................................................... 3-1
3.1 Introduction .......................................................................................................... 3-1
3.2 Wire Antenna ....................................................................................................... 3-1
v
3.2.1 Dipole Antenna ........................................................................................ 3-1
3.2.2 Variations of Dipole Antenna .................................................................. 3-1
3.2.3 Loop Antenna........................................................................................... 3-5
3.2.4 Helical Antenna ....................................................................................... 3-6
3.2.5 Yagi-Uda Antenna ................................................................................... 3-8
3.2.6 Rhombic Antenna .................................................................................... 3-9
3.3 Aperture Antenna ............................................................................................... 3-10
3.4 Fractal Antenna .................................................................................................. 3-11
3.5 Microstrip Antenna ............................................................................................ 3-12
3.6 Lens Antenna ..................................................................................................... 3-12
3.7 Reflector Antenna .............................................................................................. 3-13
3.8 Array Antenna .................................................................................................... 3-17
3.7 Billboard Reflector............................................................................................. 3-21
3.8 Gains of Typical HF-Band Linear Antennas and Arrays ................................... 3-22
SECTION 4. ANTENNA ESTIMATION AND MODELING TECHNIQUES ....................... 4-1
4.1 Introduction .......................................................................................................... 4-1
4.2 Directional Antenna Directivity Calculation ....................................................... 4-1
4.3 Circular Reflector Antenna Gain and Beamwidth Calculation ............................ 4-1
4.4 Formulas for Modeling ........................................................................................ 4-2
4.4.1 Wolfgain Formula for Low-Gain Antenna .............................................. 4-2
4.4.2 Statgain Formula for High-Gain Antenna................................................ 4-3
4.4.3 ECAC Masks for Developing Reference Radiation Pattern .................... 4-4
4.5 Numerical Methods for Computational Modeling ............................................... 4-6
4.5.1 Method of Moments ................................................................................. 4-6
4.5.2 Uniform Theory of Diffraction ................................................................ 4-7
SECTION 5. ANTENNA REFERENCE RADIATION PATTERNS AND
CHARACTERISTICS ......................................................................................... 5-1
5.1 Introduction .......................................................................................................... 5-1
5.2 Fixed Service ....................................................................................................... 5-2
5.2.1 Point-to-Point System .............................................................................. 5-2
5.2.2 Point-to-Multipoint System ................................................................... 5-11
5.2.3 System with High Altitude Platform Station ......................................... 5-16
5.3 Fixed-Satellite Service ....................................................................................... 5-17
5.3.1 Earth Station Antenna ............................................................................ 5-17
5.3.2 Satellite Antenna .................................................................................... 5-25
5.4 Broadcasting Service ......................................................................................... 5-30
5.4.1 AM Audio .............................................................................................. 5-30
5.4.1.1 Transmitting Antenna .......................................................... 5-30
5.4.1.2 Receiving Antenna ............................................................... 5-36
5.4.2 FM Audio ............................................................................................... 5-37
5.4.3 TV .......................................................................................................... 5-39
5.5 Broadcasting-Satellite Service ........................................................................... 5-41
5.5.1 Earth Station Antenna ............................................................................ 5-41
5.5.1.1 Feeder Link Transmitting Antenna ...................................... 5-42
5.5.1.2 Downlink Receive-Only Antenna ........................................ 5-43
vi
5.5.2 Satellite Antenna .................................................................................... 5-46
5.5.2.1 Downlink Transmitting Antenna ......................................... 5-47
5.5.2.2 Feeder Link Receiving Antenna .......................................... 5-47
5.6 Mobile Service ................................................................................................... 5-48
5.6.1 Land Mobile Service .............................................................................. 5-48
5.6.2 Maritime Mobile Service ....................................................................... 5-51
5.6.3 Aeronautical Mobile Service ................................................................. 5-52
5.7 Mobile Satellite Service ..................................................................................... 5-54
5.7.1 Land Mobile Satellite Service ................................................................ 5-54
5.7.1.1 Earth Station Antenna .......................................................... 5-54
5.7.1.2 Satellite Antenna .................................................................. 5-55
5.7.2 Maritime Mobile Satellite Service ......................................................... 5-55
5.7.2.1 Earth Station Antenna .......................................................... 5-55
5.7.2.2 Satellite Antenna .................................................................. 5-56
5.7.3 Aeronautical Mobile Satellite Service ................................................... 5-56
5.7.3.1 Earth Station Antenna .......................................................... 5-57
5.7.3.2 Satellite Antenna .................................................................. 5-58
5.8 Radiodetermination Service ............................................................................... 5-58
5.8.1 General Radiodetermination Service ..................................................... 5-58
5.8.2 Radiolocation Service ............................................................................ 5-64
5.8.3 Radionavigation Service ........................................................................ 5-70
5.8.3.1 Maritime Radionavigation Service ...................................... 5-71
5.8.3.2 Aeronautical Radionavigation Service ................................ 5-71
5.9 Radiodetermination-Satellite Service ................................................................ 5-76
5.9.1 Radiolocation-Satellite Service .............................................................. 5-76
5.9.2 Radionavigation-Satellite Service .......................................................... 5-85
5.10 Radio Astronomy Service .................................................................................. 5-88
5.11 Remote Sensing Service .................................................................................... 5-91
5.11.1 Meteorological Aids Service.................................................................. 5-91
5.11.1.1 Meteorological Radar........................................................... 5-91
5.11.1.2 Meteorological Remote Sensing Devices ............................ 5-95
5.11.1.3 Meteorological Optical Sensor ............................................ 5-98
5.11.2 Meteorological Satellite Services and Earth Exploration-Satellite ...... 5-103
5.11.3 Space Research Service ....................................................................... 5-104
5.12 Space Applications Service.............................................................................. 5-109
5.12.1 Space Operation Service ...................................................................... 5-109
5.12.2 Data Relay Service ............................................................................... 5-110
5.13 Summary .......................................................................................................... 5-111
SECTION 6. RECOMMENDATIONS ..................................................................................... 6-1
6.1 Introduction .......................................................................................................... 6-1
6.1.1 Objective .................................................................................................. 6-1
6.1.2 Methodology ............................................................................................ 6-1
6.2 Fixed Service ....................................................................................................... 6-2
6.2.1 System Review......................................................................................... 6-3
6.2.1.1 Standard Antenna ................................................................... 6-3
6.2.1.1.1 Masks ................................................................ 6-3
vii
6.2.1.1.2 Evaluation ......................................................... 6-4
6.2.1.1.3 Recommendation .............................................. 6-9
6.2.1.2 High Performance Antenna .................................................. 6-10
6.2.2 Frequency Assignment........................................................................... 6-12
6.2.2.1 Actual Radiation Pattern ...................................................... 6-12
6.2.2.2 Reference Radiation Pattern ................................................ 6-13
6.2.3 Spectrum Sharing Analyses ................................................................... 6-18
6.2.3.1 406.1−420 MHz ................................................................... 6-19
6.2.3.2 932.5−935 and 941.5−944 MHz .......................................... 6-20
6.2.3.3 1.71−1.85 GHz ..................................................................... 6-21
6.2.3.4 2.2−2.4 GHz ......................................................................... 6-22
6.2.3.5 4.4−4.99 GHz ....................................................................... 6-24
6.2.3.6 7.125−8.5 GHz ..................................................................... 6-25
6.2.3.7 14.4−15.35 GHz ................................................................... 6-26
6.2.3.8 21.2−23.6 GHz ..................................................................... 6-28
6.2.3.9 25.25−27.5 GHz ................................................................... 6-29
6.3 Fixed-Satellite Service ....................................................................................... 6-30
6.3.1 System Review....................................................................................... 6-30
6.3.1.1 GSO System Earth Station Antenna Co-Polarization
Radiation Performance Standard ......................................... 6-31
6.3.1.2 GSO System Earth Station Antenna Cross-
Polarization Radiation Performance Standard ..................... 6-34
6.3.1.3 NGSO System Earth Station Antenna Co-Polarization
Radiation Performance Standard ......................................... 6-36
6.3.2 Frequency Assignment........................................................................... 6-37
6.3.3 Spectrum Sharing Analyses ................................................................... 6-38
6.3.3.1 3.6−4.2 GHz Downlink ........................................................ 6-39
6.3.3.2 5.85−6.425 GHz Uplink ....................................................... 6-40
6.3.3.3 7.25−7.75 GHz Downlink .................................................... 6-41
6.3.3.4 7.9−8.4 GHz Uplink ............................................................. 6-42
6.3.3.5 10.7−12.2 GHz Downlink .................................................... 6-44
6.3.3.6 14−14.5 GHz Uplink ............................................................ 6-45
6.3.3.7 20.2−21.2 GHz Downlink .................................................... 6-46
6.3.3.8 30−31 GHz Uplink ............................................................... 6-47
6.3.3.9 43−45 GHz Uplink ............................................................... 6-48
6.3.3.10 1.35−1.39 GHz Downlink for NGSO System ..................... 6-49
6.4 Broadcasting Service ......................................................................................... 6-50
6.5 Broadcasting-Satellite Service ........................................................................... 6-50
6.6 Mobile Service ................................................................................................... 6-50
6.6.1 Land Mobile Service .............................................................................. 6-50
6.6.1.1 System Review..................................................................... 6-50
6.6.1.2 Frequency Assignment......................................................... 6-52
6.6.1.3 Spectrum Sharing Analyses ................................................. 6-53
6.6.1.3.1 496–535 kHz ................................................... 6-54
6.6.1.3.2 1.605–1.8 MHz ............................................... 6-55
6.6.1.3.3 2–3.4 MHz ...................................................... 6-55
viii
6.6.1.3.4 4.438–8.1 MHz ............................................... 6-57
6.6.1.3.5 23.35–24.89 MHz ........................................... 6-58
6.6.1.3.6 25.33–26.95 MHz ........................................... 6-59
6.6.1.3.7 27.54–28 MHz ................................................ 6-59
6.6.1.3.8 29.89–75.4 MHz ............................................. 6-60
6.6.1.3.9 138–150.08 MHz ............................................ 6-61
6.6.1.3.10 162–174 MHz ................................................. 6-63
6.6.1.3.11 220–420 MHz ................................................. 6-64
6.6.1.3.12 1.755–1.85 GHz .............................................. 6-66
6.6.1.3.13 2.2–2.395 GHz ................................................ 6-66
6.6.1.3.14 21.2–23.6 GHz ................................................ 6-67
6.6.2 Maritime Mobile Service ....................................................................... 6-68
6.6.2.1 System Review..................................................................... 6-68
6.6.2.2 Frequency Assignment......................................................... 6-70
6.6.2.3 Spectrum Sharing Analyses ................................................. 6-70
6.6.2.3.1 20–190 kHz ..................................................... 6-72
6.6.2.3.2 415–535 kHz ................................................... 6-72
6.6.2.3.3 2.065–2.194 MHz ........................................... 6-73
6.6.2.3.4 2–3.4 MHz ...................................................... 6-74
6.6.2.3.5 4–5.9 MHz ...................................................... 6-75
6.6.2.3.6 6.765–8.815 MHz ........................................... 6-76
6.6.2.3.7 12.23–19.8 MHz ............................................. 6-77
6.6.2.3.8 23.35–28 MHz ................................................ 6-78
6.6.2.3.9 138–174 MHz ................................................. 6-79
6.6.3 Aeronautical Mobile Service ................................................................. 6-80
6.6.3.1 System Review..................................................................... 6-80
6.6.3.2 Frequency Assignment......................................................... 6-82
6.6.3.3 Spectrum Sharing Analyses ................................................. 6-83
6.6.3.3.1 2−3.5 MHz ...................................................... 6-85
6.6.3.3.2 4.438−5.73 MHz ............................................. 6-86
6.6.3.3.3 5.73−8.1MHz .................................................. 6-86
6.6.3.3.4 8.815−18.03 MHz ........................................... 6-87
6.6.3.3.5 21.924−23.35 MHz ......................................... 6-88
6.6.3.3.6 23.35−30.56 MHz ........................................... 6-89
6.6.3.3.7 32−50 MHz ..................................................... 6-90
6.6.3.3.8 117.975−137 MHz .......................................... 6-91
6.6.3.3.9 138−150.8 MHz .............................................. 6-91
6.6.3.3.10 162.0125−174 MHz ........................................ 6-92
6.6.3.3.11 225−420 MHz Range ...................................... 6-93
6.6.3.3.12 1.35−1.525 GHz .............................................. 6-94
6.6.3.3.13 1.755−1.85 GHz .............................................. 6-94
6.6.3.3.14 4.4−4.94 GHz .................................................. 6-96
6.7 Mobile-Satellite Service..................................................................................... 6-97
6.7.1 Land Mobile-Satellite Service ............................................................... 6-98
6.7.1.1 System Review..................................................................... 6-98
6.7.1.2 Frequency Assignment....................................................... 6-101
ix
6.7.1.3 Spectrum Sharing Analyses ............................................... 6-101
6.7.1.3.1 240−270 MHz Downlink .............................. 6-101
6.7.1.3.2 290−320 MHz Uplink ................................... 6-102
6.7.1.3.3 1.525−1.559 GHz Downlink and
1.61−1.6605 GHz Uplink .............................. 6-103
6.7.1.3.4 7.25−7.3 GHz Downlink and 7.9−8.025
GHz Uplink ................................................... 6-103
6.7.1.3.5 39.5−40.5 GHz Downlink and 43.5−47
GHz Uplink ................................................... 6-104
6.7.2 Maritime Mobile-Satellite Service ....................................................... 6-104
6.7.2.1 System Review................................................................... 6-104
6.7.2.2 Frequency Assignment....................................................... 6-106
6.7.2.3 Spectrum Sharing Analyses ............................................... 6-106
6.7.2.3.1 240−270 MHz Downlink .............................. 6-107
6.7.2.3.2 290−320 MHz Uplink ................................... 6-107
6.7.2.3.3 1.525−1.559 GHz Downlink and
1.61−1.6605 GHz Uplink .............................. 6-108
6.7.2.3.4 20.2−21.2 GHz Downlink ............................. 6-109
6.7.2.3.5 30−31 GHz Uplink ........................................ 6-109
6.7.2.3.6 39.5−40.5 GHz Downlink and 43.5−47
GHz Uplink ................................................... 6-110
6.7.3 Aeronautical Mobile-Satellite Service ................................................. 6-111
6.7.3.1 System Review................................................................... 6-111
6.7.3.2 Frequency Assignment....................................................... 6-113
6.7.3.3 Spectrum Sharing Analyses ............................................... 6-113
6.7.3.3.1 240−270 MHz Downlink .............................. 6-114
6.7.3.3.2 290−320 MHz Uplink ................................... 6-114
6.7.3.3.3 20.2−21.2 GHz Downlink ............................. 6-115
6.7.3.3.4 30−31 GHz Uplink ........................................ 6-115
6.7.3.3.5 39.5−40.5 GHz Downlink and 43.5−47
GHz Uplink ................................................... 6-116
6.8 Radiodetermination Service ............................................................................. 6-116
6.8.1 Radiolocation Service .......................................................................... 6-117
6.8.1.1 System Review................................................................... 6-117
6.8.1.2 Frequency Assignment....................................................... 6-118
6.8.1.3 Spectrum Sharing Analyses ............................................... 6-120
6.8.1.3.1 1.705–1.8 MHz ............................................. 6-121
6.8.1.3.2 216–217 MHz ............................................... 6-121
6.8.1.3.3 420–450 MHz ............................................... 6-122
6.8.1.3.4 902–928 MHz ............................................... 6-124
6.8.1.3.5 1.215–1.3 GHz .............................................. 6-126
6.8.1.3.6 1.35–1.39 GHz .............................................. 6-128
6.8.1.3.7 2.9–3.65 GHz ................................................ 6-129
6.8.1.3.8 5.25–5.6 GHz ................................................ 6-131
6.8.1.3.9 5.65–5.925 GHz ............................................ 6-134
6.8.1.3.10 8.5–9 GHz ..................................................... 6-136
x
6.8.1.3.11 9.5–10.55 GHz .............................................. 6-137
6.8.1.3.12 13.4–14 GHz ................................................. 6-140
6.8.1.3.13 15.7–17.3 GHz .............................................. 6-141
6.8.1.3.14 24.05–24.25 GHz .......................................... 6-143
6.8.1.3.15 33.4–36 GHz ................................................. 6-144
6.8.2 Maritime Radionavigation Service ...................................................... 6-146
6.8.2.1 System Review................................................................... 6-146
6.8.2.2 Frequency Assignment....................................................... 6-146
6.8.2.3 Spectrum Sharing Analyses ............................................... 6-148
6.8.2.3.1 2.9–3.1 GHz .................................................. 6-148
6.8.2.3.2 9.2–9.3 GHz .................................................. 6-149
6.8.2.3.3 9.3–9.5 GHz .................................................. 6-149
6.8.3 Aeronautical Radionavigation Service ................................................ 6-150
6.8.3.1 System Review................................................................... 6-150
6.8.3.2 Frequency Assignment....................................................... 6-152
6.8.3.3 Spectrum Sharing Analyses ............................................... 6-154
6.8.3.3.1 190–435 kHz ................................................. 6-155
6.8.3.3.2 510–535 kHz and 1.705–1.75 MHz .............. 6-156
6.8.3.3.3 74.8–75.2 MHz ............................................. 6-157
6.8.3.3.4 108–117.975 MHz ........................................ 6-158
6.8.3.3.5 328.6–335.4 MHz ......................................... 6-160
6.8.3.3.6 960–1215 MHz ............................................. 6-161
6.8.3.3.7 1.24–2.9 GHz ................................................ 6-164
6.8.3.3.8 4.2–4.4 GHz .................................................. 6-165
6.8.3.3.9 5–5.25 GHz ................................................... 6-166
6.8.3.3.10 9–9.2 GHz ..................................................... 6-167
6.8.3.3.11 9.3–9.5 GHz .................................................. 6-169
6.8.3.3.12 13.25–13.4 GHz ............................................ 6-170
6.8.3.3.13 15.4–15.7 GHz .............................................. 6-171
6.9 Radiodetermination-Satellite Service .............................................................. 6-172
6.9.1 Radiolocation-Satellite Service ............................................................ 6-172
6.9.1.1 System Review................................................................... 6-172
6.9.1.2 Frequency Assignment....................................................... 6-172
6.9.1.3 Spectrum Sharing Analyses ............................................... 6-172
6.9.2 Radionavigation-Satellite Service ........................................................ 6-173
6.9.2.1 System Review................................................................... 6-173
6.9.2.2 Frequency Assignment....................................................... 6-174
6.9.2.3 Spectrum Sharing Analyses ............................................... 6-174
6.9.2.3.1 149.9−150.05 MHz ....................................... 6-175
6.9.2.3.2 1.164−1.24 GHz ............................................ 6-176
6.9.2.3.3 1.559−1.61 GHz ............................................ 6-176
6.10 Radio Astronomy Service ................................................................................ 6-177
6.10.1 System Review..................................................................................... 6-177
6.10.2 Frequency Assignment......................................................................... 6-177
6.10.3 Spectrum Sharing Analyses ................................................................. 6-178
6.11 Remote Sensing Service .................................................................................. 6-179
xi
6.11.1 Meteorological Aids Service................................................................ 6-179
6.11.1.1 System Review................................................................... 6-179
6.11.1.2 Frequency Assignment....................................................... 6-182
6.11.1.3 Spectrum Sharing Analyses ............................................... 6-182
6.11.1.3.1 400.15−406 MHz for Radiosonde System
and Precipitation Gauge ................................ 6-183
6.11.1.3.2 1.675−1.7 GHz for Radiosonde System ...... 6-184
6.11.1.3.3 2.7−2.9 GHz for Meteorological Radar ........ 6-185
6.11.1.3.4 5.6−5.65 GHz for Meteorological Radar ..... 6-186
6.11.2 Meteorological Satellite Services ........................................................ 6-186
6.11.2.1 System Review................................................................... 6-186
6.11.2.2 Frequency Assignment....................................................... 6-189
6.11.2.3 Spectrum Sharing Analyses ............................................... 6-189
6.11.2.3.1 137−138 MHz Downlink .............................. 6-190
6.11.2.3.2 401−403 MHz Uplink ................................... 6-191
6.11.2.3.3 460−470 MHz Downlink .............................. 6-192
6.11.2.3.4 1.675−1.71 GHz Downlink ........................... 6-193
6.11.3 Earth Exploration-Satellite Service...................................................... 6-194
6.11.3.1 System Review................................................................... 6-194
6.11.3.2 Frequency Assignment....................................................... 6-196
6.11.3.3 Spectrum Sharing Analyses ............................................... 6-196
6.11.3.3.1 401−403 MHz Uplink ................................... 6-196
6.11.3.3.2 2.025−2.11 GHz ............................................ 6-197
6.11.3.3.3 2.2−2.29 GHz Downlink ............................... 6-200
6.11.3.3.4 8.025−8.4 GHz Downlink ............................. 6-201
6.11.3.3.5 25.5−27 GHz Downlink ................................ 6-201
6.11.4 Space Research Service ....................................................................... 6-202
6.11.4.1 System Review................................................................... 6-202
6.11.4.2 Frequency Assignment....................................................... 6-203
6.11.4.3 Spectrum Sharing Analyses ............................................... 6-204
6.11.4.3.1 2.025−2.11 GHz ............................................ 6-205
6.11.4.3.2 2.2−2.3 GHz .................................................. 6-207
6.11.4.3.3 7.145−7.235 GHz .......................................... 6-209
6.11.4.3.4 8.4−8.5 GHz .................................................. 6-210
6.11.4.3.5 13.25−13.75 GHz .......................................... 6-211
6.11.4.3.6 14.8−15.4 GHz .............................................. 6-212
6.11.4.3.7 25.5−27 GHz ................................................. 6-213
6.11.4.3.8 31.3−32.3 GHz .............................................. 6-213
6.11.4.3.9 34.2−34.7 GHz .............................................. 6-214
6.12 Space Application Service ............................................................................... 6-215
6.12.1 Space Operation Service ...................................................................... 6-215
6.12.1.1 System Review................................................................... 6-215
6.12.1.2 Frequency Assignment....................................................... 6-217
6.12.1.3 Spectrum Sharing Analyses ............................................... 6-217
6.12.1.3.1 148−149.9 MHz ............................................ 6-217
6.12.1.3.2 401−402 MHz ............................................... 6-218
xii
6.12.1.3.3 2.025−2.11 GHz ............................................ 6-218
6.12.1.3.4 2.2−2.29 GHz ................................................ 6-220
6.12.2 Data Relay Service ............................................................................... 6-222
SECTION 7. SUMMARY OF RECOMMENDATIONS ......................................................... 7-1
7.1 Introduction .......................................................................................................... 7-1
7.2 Fixed Service (FS) ............................................................................................... 7-1
7.2.1 System Review......................................................................................... 7-1
7.2.2 Frequency Assignment............................................................................. 7-1
7.2.3 Spectrum Sharing Analyses ..................................................................... 7-4
7.3 Fixed-Satellite Service (FSS) ............................................................................... 7-5
7.3.1 System Review......................................................................................... 7-5
7.3.2 Frequency Assignment............................................................................. 7-7
7.3.3 Spectrum Sharing Analyses ..................................................................... 7-8
7.4 Broadcasting Service (BS) ................................................................................. 7-10
7.5 Broadcasting-Satellite Service (BSS) ................................................................ 7-11
7.6 Mobile Service (MS).......................................................................................... 7-11
7.6.1 Land Mobile Service (LMS) .................................................................. 7-11
7.6.1.1 System Review..................................................................... 7-11
7.6.1.2 Frequency Assignment......................................................... 7-12
7.6.1.3 Spectrum Sharing Analyses ................................................. 7-12
7.6.2 Maritime Mobile Service (MMS) .......................................................... 7-15
7.6.2.1 System Review..................................................................... 7-15
7.6.2.2 Frequency Assignment......................................................... 7-17
7.6.2.3 Spectrum Sharing Analyses ................................................. 7-17
7.6.3 Aeronautical Mobile Service (AMS) ..................................................... 7-18
7.6.3.1 System Review..................................................................... 7-18
7.6.3.2 Frequency Assignment......................................................... 7-20
7.6.3.3 Spectrum Sharing Analyses ................................................. 7-20
7.7 Mobile-Satellite Service (MSS) ......................................................................... 7-22
7.7.1 Land Mobile-Satellite Service (LMSS) ................................................. 7-22
7.7.1.1 System Review..................................................................... 7-22
7.7.1.2 Frequency Assignment......................................................... 7-24
7.7.1.3 Spectrum Sharing Analyses ................................................. 7-24
7.7.2 Maritime Mobile-Satellite Service (MMSS) ......................................... 7-25
7.7.2.1 System Review..................................................................... 7-25
7.7.2.2 Frequency Assignment......................................................... 7-26
7.7.2.3 Spectrum Sharing Analyses ................................................. 7-27
7.7.3 Aeronautical Mobile-Satellite Service (AMSS) .................................... 7-28
7.7.3.1 System Review..................................................................... 7-28
7.7.3.2 Frequency Assignment......................................................... 7-30
7.7.3.3 Spectrum Sharing Analyses ................................................. 7-30
7.8 Radiodetermination Service (RDS) ................................................................... 7-31
7.8.1 Radiolocation Service (RLS) ................................................................. 7-31
7.8.1.1 System Review..................................................................... 7-31
7.8.1.2 Frequency Assignment......................................................... 7-32
7.8.1.3 Spectrum Sharing Analyses ................................................. 7-34
xiii
7.8.2 Maritime Radionavigation Service (MRNS) ......................................... 7-37
7.8.2.1 System Review..................................................................... 7-37
7.8.2.2 Frequency Assignment......................................................... 7-38
7.8.2.3 Spectrum Sharing Analyses ................................................. 7-40
7.8.3 Aeronautical Radionavigation Service (ARNS) .................................... 7-41
7.8.3.1 System Review..................................................................... 7-41
7.8.3.2 Frequency Assignment......................................................... 7-43
7.8.3.3 Spectrum Sharing Analyses ................................................. 7-45
7.9 Radiodetermination-Satellite Service (RDSS) ................................................... 7-47
7.9.1 Radiolocation-Satellite Service (RLSS) ................................................ 7-47
7.9.1.1 System Review..................................................................... 7-47
7.9.1.2 Frequency Assignment......................................................... 7-47
7.9.1.3 Spectrum Sharing Analyses ................................................. 7-47
7.9.2 Radionavigation-Satellite Service (RNSS) ............................................ 7-47
7.9.2.1 System Review..................................................................... 7-47
7.9.2.2 Frequency Assignment......................................................... 7-48
7.9.2.3 Spectrum Sharing Analyses ................................................. 7-49
7.10 Radio Astronomy (RAS).................................................................................... 7-50
7.10.1 System Review....................................................................................... 7-50
7.10.2 Frequency Assignment........................................................................... 7-50
7.10.3 Spectrum Sharing Analyses ................................................................... 7-51
7.11 Remote Sensing Service (RSS) .......................................................................... 7-51
7.11.1 Meteorological Aids Service (MetAids) ................................................ 7-51
7.11.1.1 System Review..................................................................... 7-51
7.11.1.2 Frequency Assignment......................................................... 7-54
7.11.1.3 Spectrum Sharing Analyses ................................................. 7-55
7.11.2 Meteorological Satellite Service (MetSat) ............................................. 7-56
7.11.2.1 System Review..................................................................... 7-56
7.11.2.2 Frequency Assignment......................................................... 7-59
7.11.2.3 Spectrum Sharing Analyses ................................................. 7-59
7.11.3 Earth Exploration-Satellite Service (EESS)........................................... 7-60
7.11.3.1 System Review..................................................................... 7-60
7.11.3.2 Frequency Assignment......................................................... 7-62
7.11.3.3 Spectrum Sharing Analyses ................................................. 7-62
7.11.4 Space Research Service (SRS) ............................................................... 7-63
7.11.4.1 System Review..................................................................... 7-63
7.11.4.2 Frequency Assignment......................................................... 7-64
7.11.4.3 Spectrum Sharing Analyses ................................................. 7-65
7.12 Space Application Service (SAS) ...................................................................... 7-67
7.12.1 Space Operation Service (SOS) ............................................................. 7-67
7.12.1.1 System Review..................................................................... 7-67
7.12.1.2 Frequency Assignment......................................................... 7-69
7.12.1.3 Spectrum Sharing Analyses ................................................. 7-69
7.12.2 Data Relay Service (DRS) ..................................................................... 7-71
xiv
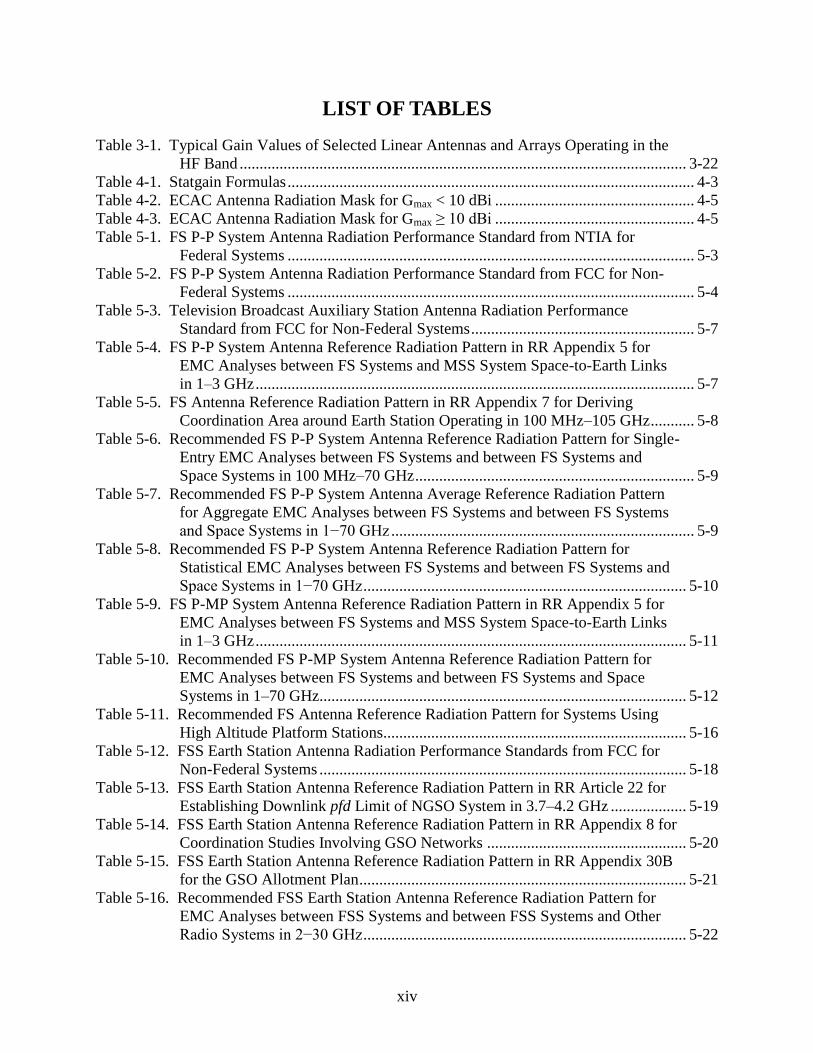
LIST OF TABLES
Table 3-1. Typical Gain Values of Selected Linear Antennas and Arrays Operating in the
HF Band ................................................................................................................ 3-22
Table 4-1. Statgain Formulas ...................................................................................................... 4-3 Table 4-2. ECAC Antenna Radiation Mask for Gmax < 10 dBi .................................................. 4-5 Table 4-3. ECAC Antenna Radiation Mask for Gmax ≥ 10 dBi .................................................. 4-5 Table 5-1. FS P-P System Antenna Radiation Performance Standard from NTIA for
Federal Systems ...................................................................................................... 5-3
Table 5-2. FS P-P System Antenna Radiation Performance Standard from FCC for Non-
Federal Systems ...................................................................................................... 5-4 Table 5-3. Television Broadcast Auxiliary Station Antenna Radiation Performance
Standard from FCC for Non-Federal Systems ........................................................ 5-7
Table 5-4. FS P-P System Antenna Reference Radiation Pattern in RR Appendix 5 for
EMC Analyses between FS Systems and MSS System Space-to-Earth Links
in 1–3 GHz .............................................................................................................. 5-7
Table 5-5. FS Antenna Reference Radiation Pattern in RR Appendix 7 for Deriving
Coordination Area around Earth Station Operating in 100 MHz–105 GHz ........... 5-8
Table 5-6. Recommended FS P-P System Antenna Reference Radiation Pattern for Single-
Entry EMC Analyses between FS Systems and between FS Systems and
Space Systems in 100 MHz–70 GHz ...................................................................... 5-9
Table 5-7. Recommended FS P-P System Antenna Average Reference Radiation Pattern
for Aggregate EMC Analyses between FS Systems and between FS Systems
and Space Systems in 1−70 GHz ............................................................................ 5-9 Table 5-8. Recommended FS P-P System Antenna Reference Radiation Pattern for
Statistical EMC Analyses between FS Systems and between FS Systems and
Space Systems in 1−70 GHz ................................................................................. 5-10
Table 5-9. FS P-MP System Antenna Reference Radiation Pattern in RR Appendix 5 for
EMC Analyses between FS Systems and MSS System Space-to-Earth Links
in 1–3 GHz ............................................................................................................ 5-11
Table 5-10. Recommended FS P-MP System Antenna Reference Radiation Pattern for
EMC Analyses between FS Systems and between FS Systems and Space
Systems in 1–70 GHz............................................................................................ 5-12
Table 5-11. Recommended FS Antenna Reference Radiation Pattern for Systems Using
High Altitude Platform Stations............................................................................ 5-16 Table 5-12. FSS Earth Station Antenna Radiation Performance Standards from FCC for
Non-Federal Systems ............................................................................................ 5-18 Table 5-13. FSS Earth Station Antenna Reference Radiation Pattern in RR Article 22 for
Establishing Downlink pfd Limit of NGSO System in 3.7–4.2 GHz ................... 5-19 Table 5-14. FSS Earth Station Antenna Reference Radiation Pattern in RR Appendix 8 for
Coordination Studies Involving GSO Networks .................................................. 5-20 Table 5-15. FSS Earth Station Antenna Reference Radiation Pattern in RR Appendix 30B
for the GSO Allotment Plan .................................................................................. 5-21 Table 5-16. Recommended FSS Earth Station Antenna Reference Radiation Pattern for
EMC Analyses between FSS Systems and between FSS Systems and Other
Radio Systems in 2−30 GHz ................................................................................. 5-22
xv
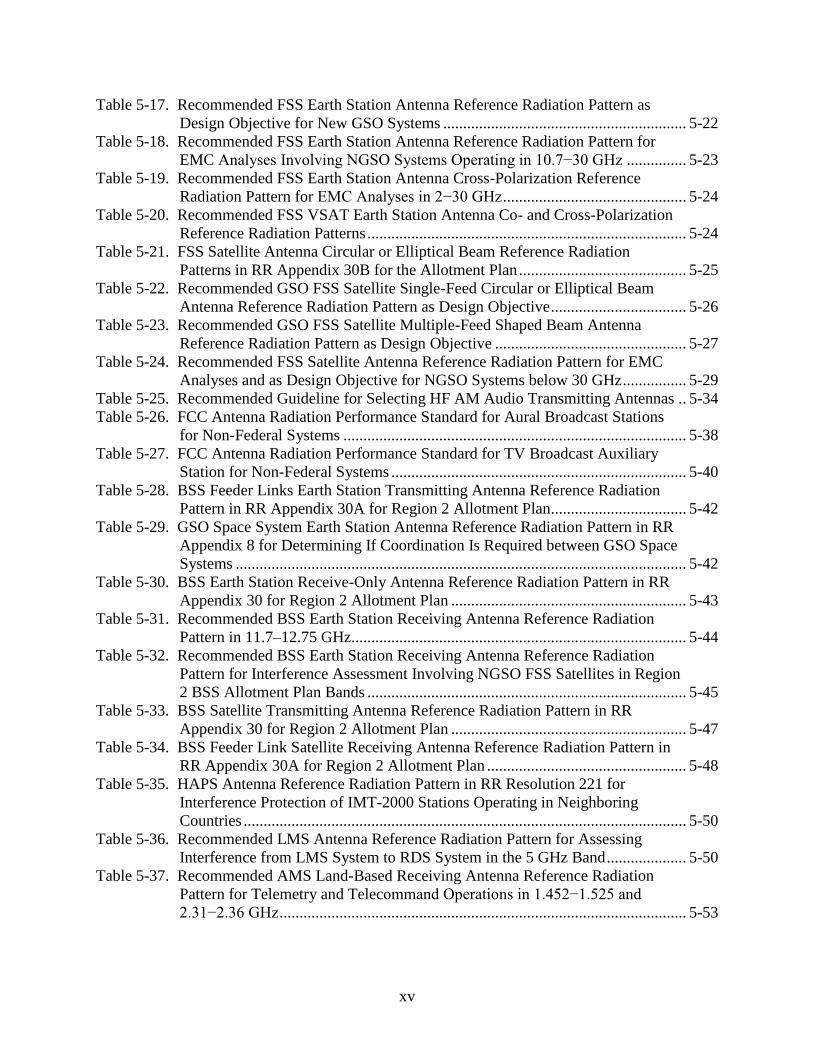
Table 5-17. Recommended FSS Earth Station Antenna Reference Radiation Pattern as
Design Objective for New GSO Systems ............................................................. 5-22 Table 5-18. Recommended FSS Earth Station Antenna Reference Radiation Pattern for
EMC Analyses Involving NGSO Systems Operating in 10.7−30 GHz ............... 5-23
Table 5-19. Recommended FSS Earth Station Antenna Cross-Polarization Reference
Radiation Pattern for EMC Analyses in 2−30 GHz .............................................. 5-24 Table 5-20. Recommended FSS VSAT Earth Station Antenna Co- and Cross-Polarization
Reference Radiation Patterns ................................................................................ 5-24 Table 5-21. FSS Satellite Antenna Circular or Elliptical Beam Reference Radiation
Patterns in RR Appendix 30B for the Allotment Plan .......................................... 5-25 Table 5-22. Recommended GSO FSS Satellite Single-Feed Circular or Elliptical Beam
Antenna Reference Radiation Pattern as Design Objective .................................. 5-26 Table 5-23. Recommended GSO FSS Satellite Multiple-Feed Shaped Beam Antenna
Reference Radiation Pattern as Design Objective ................................................ 5-27 Table 5-24. Recommended FSS Satellite Antenna Reference Radiation Pattern for EMC
Analyses and as Design Objective for NGSO Systems below 30 GHz ................ 5-29 Table 5-25. Recommended Guideline for Selecting HF AM Audio Transmitting Antennas .. 5-34
Table 5-26. FCC Antenna Radiation Performance Standard for Aural Broadcast Stations
for Non-Federal Systems ...................................................................................... 5-38 Table 5-27. FCC Antenna Radiation Performance Standard for TV Broadcast Auxiliary
Station for Non-Federal Systems .......................................................................... 5-40 Table 5-28. BSS Feeder Links Earth Station Transmitting Antenna Reference Radiation
Pattern in RR Appendix 30A for Region 2 Allotment Plan.................................. 5-42 Table 5-29. GSO Space System Earth Station Antenna Reference Radiation Pattern in RR
Appendix 8 for Determining If Coordination Is Required between GSO Space
Systems ................................................................................................................. 5-42
Table 5-30. BSS Earth Station Receive-Only Antenna Reference Radiation Pattern in RR
Appendix 30 for Region 2 Allotment Plan ........................................................... 5-43 Table 5-31. Recommended BSS Earth Station Receiving Antenna Reference Radiation
Pattern in 11.7–12.75 GHz.................................................................................... 5-44 Table 5-32. Recommended BSS Earth Station Receiving Antenna Reference Radiation
Pattern for Interference Assessment Involving NGSO FSS Satellites in Region
2 BSS Allotment Plan Bands ................................................................................ 5-45
Table 5-33. BSS Satellite Transmitting Antenna Reference Radiation Pattern in RR
Appendix 30 for Region 2 Allotment Plan ........................................................... 5-47 Table 5-34. BSS Feeder Link Satellite Receiving Antenna Reference Radiation Pattern in
RR Appendix 30A for Region 2 Allotment Plan .................................................. 5-48 Table 5-35. HAPS Antenna Reference Radiation Pattern in RR Resolution 221 for
Interference Protection of IMT-2000 Stations Operating in Neighboring
Countries ............................................................................................................... 5-50
Table 5-36. Recommended LMS Antenna Reference Radiation Pattern for Assessing
Interference from LMS System to RDS System in the 5 GHz Band .................... 5-50 Table 5-37. Recommended AMS Land-Based Receiving Antenna Reference Radiation
Pattern for Telemetry and Telecommand Operations in 1.452−1.525 and
2.31−2.36 GHz ...................................................................................................... 5-53
xvi
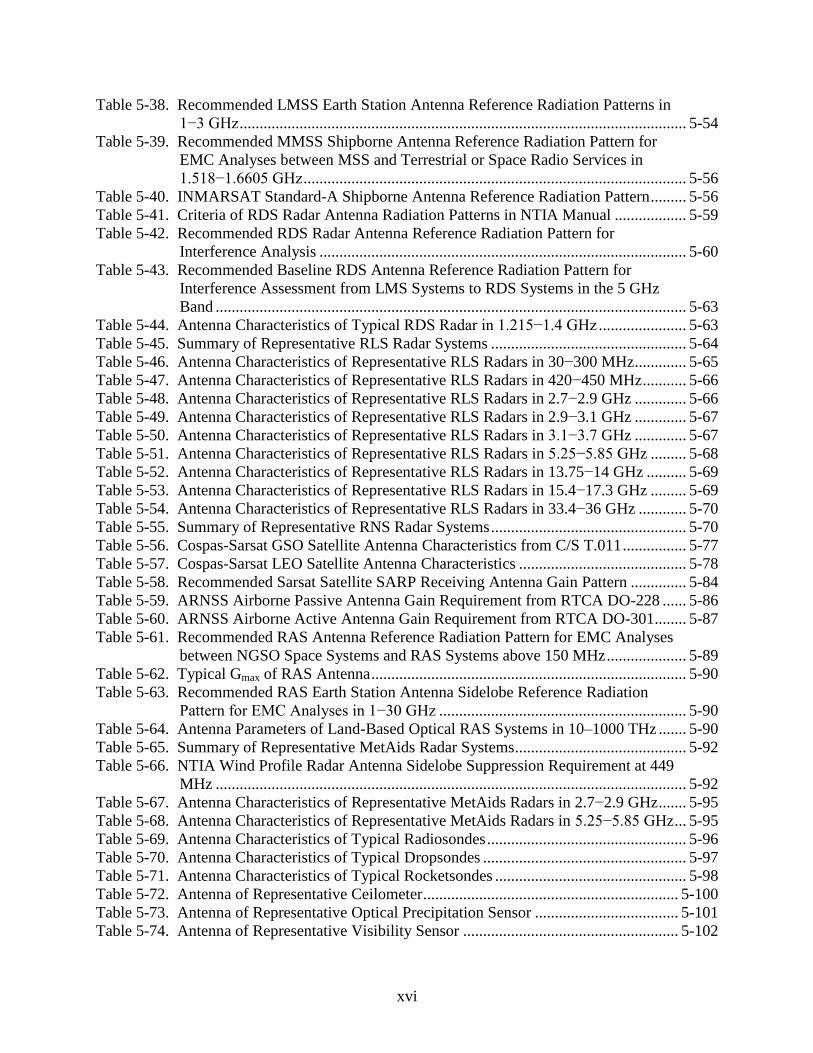
Table 5-38. Recommended LMSS Earth Station Antenna Reference Radiation Patterns in
1−3 GHz ................................................................................................................ 5-54 Table 5-39. Recommended MMSS Shipborne Antenna Reference Radiation Pattern for
EMC Analyses between MSS and Terrestrial or Space Radio Services in
1.518−1.6605 GHz ................................................................................................ 5-56 Table 5-40. INMARSAT Standard-A Shipborne Antenna Reference Radiation Pattern ......... 5-56 Table 5-41. Criteria of RDS Radar Antenna Radiation Patterns in NTIA Manual .................. 5-59 Table 5-42. Recommended RDS Radar Antenna Reference Radiation Pattern for
Interference Analysis ............................................................................................ 5-60
Table 5-43. Recommended Baseline RDS Antenna Reference Radiation Pattern for
Interference Assessment from LMS Systems to RDS Systems in the 5 GHz
Band ...................................................................................................................... 5-63 Table 5-44. Antenna Characteristics of Typical RDS Radar in 1.215−1.4 GHz ...................... 5-63
Table 5-45. Summary of Representative RLS Radar Systems ................................................. 5-64 Table 5-46. Antenna Characteristics of Representative RLS Radars in 30−300 MHz ............. 5-65
Table 5-47. Antenna Characteristics of Representative RLS Radars in 420−450 MHz ........... 5-66 Table 5-48. Antenna Characteristics of Representative RLS Radars in 2.7−2.9 GHz ............. 5-66
Table 5-49. Antenna Characteristics of Representative RLS Radars in 2.9−3.1 GHz ............. 5-67 Table 5-50. Antenna Characteristics of Representative RLS Radars in 3.1−3.7 GHz ............. 5-67 Table 5-51. Antenna Characteristics of Representative RLS Radars in 5.25−5.85 GHz ......... 5-68
Table 5-52. Antenna Characteristics of Representative RLS Radars in 13.75−14 GHz .......... 5-69 Table 5-53. Antenna Characteristics of Representative RLS Radars in 15.4−17.3 GHz ......... 5-69
Table 5-54. Antenna Characteristics of Representative RLS Radars in 33.4−36 GHz ............ 5-70 Table 5-55. Summary of Representative RNS Radar Systems ................................................. 5-70 Table 5-56. Cospas-Sarsat GSO Satellite Antenna Characteristics from C/S T.011 ................ 5-77
Table 5-57. Cospas-Sarsat LEO Satellite Antenna Characteristics .......................................... 5-78
Table 5-58. Recommended Sarsat Satellite SARP Receiving Antenna Gain Pattern .............. 5-84 Table 5-59. ARNSS Airborne Passive Antenna Gain Requirement from RTCA DO-228 ...... 5-86 Table 5-60. ARNSS Airborne Active Antenna Gain Requirement from RTCA DO-301........ 5-87
Table 5-61. Recommended RAS Antenna Reference Radiation Pattern for EMC Analyses
between NGSO Space Systems and RAS Systems above 150 MHz .................... 5-89
Table 5-62. Typical Gmax of RAS Antenna ............................................................................... 5-90 Table 5-63. Recommended RAS Earth Station Antenna Sidelobe Reference Radiation
Pattern for EMC Analyses in 1−30 GHz .............................................................. 5-90 Table 5-64. Antenna Parameters of Land-Based Optical RAS Systems in 10–1000 THz ....... 5-90 Table 5-65. Summary of Representative MetAids Radar Systems ........................................... 5-92 Table 5-66. NTIA Wind Profile Radar Antenna Sidelobe Suppression Requirement at 449
MHz ...................................................................................................................... 5-92
Table 5-67. Antenna Characteristics of Representative MetAids Radars in 2.7−2.9 GHz ....... 5-95 Table 5-68. Antenna Characteristics of Representative MetAids Radars in 5.25−5.85 GHz ... 5-95
Table 5-69. Antenna Characteristics of Typical Radiosondes .................................................. 5-96 Table 5-70. Antenna Characteristics of Typical Dropsondes ................................................... 5-97 Table 5-71. Antenna Characteristics of Typical Rocketsondes ................................................ 5-98 Table 5-72. Antenna of Representative Ceilometer ................................................................ 5-100 Table 5-73. Antenna of Representative Optical Precipitation Sensor .................................... 5-101 Table 5-74. Antenna of Representative Visibility Sensor ...................................................... 5-102
xvii
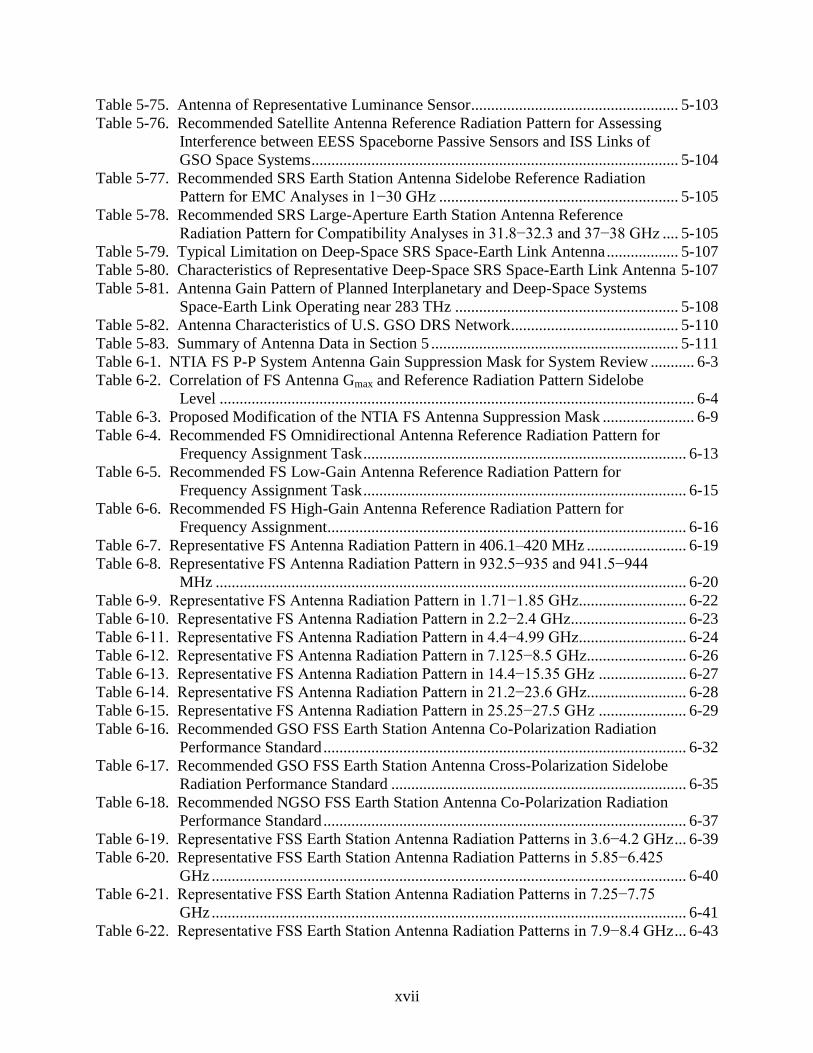
Table 5-75. Antenna of Representative Luminance Sensor .................................................... 5-103
Table 5-76. Recommended Satellite Antenna Reference Radiation Pattern for Assessing
Interference between EESS Spaceborne Passive Sensors and ISS Links of
GSO Space Systems ............................................................................................ 5-104
Table 5-77. Recommended SRS Earth Station Antenna Sidelobe Reference Radiation
Pattern for EMC Analyses in 1−30 GHz ............................................................ 5-105 Table 5-78. Recommended SRS Large-Aperture Earth Station Antenna Reference
Radiation Pattern for Compatibility Analyses in 31.8−32.3 and 37−38 GHz .... 5-105 Table 5-79. Typical Limitation on Deep-Space SRS Space-Earth Link Antenna .................. 5-107
Table 5-80. Characteristics of Representative Deep-Space SRS Space-Earth Link Antenna 5-107 Table 5-81. Antenna Gain Pattern of Planned Interplanetary and Deep-Space Systems
Space-Earth Link Operating near 283 THz ........................................................ 5-108 Table 5-82. Antenna Characteristics of U.S. GSO DRS Network .......................................... 5-110
Table 5-83. Summary of Antenna Data in Section 5 .............................................................. 5-111 Table 6-1. NTIA FS P-P System Antenna Gain Suppression Mask for System Review ........... 6-3
Table 6-2. Correlation of FS Antenna Gmax and Reference Radiation Pattern Sidelobe
Level ....................................................................................................................... 6-4
Table 6-3. Proposed Modification of the NTIA FS Antenna Suppression Mask ....................... 6-9 Table 6-4. Recommended FS Omnidirectional Antenna Reference Radiation Pattern for
Frequency Assignment Task ................................................................................. 6-13
Table 6-5. Recommended FS Low-Gain Antenna Reference Radiation Pattern for
Frequency Assignment Task ................................................................................. 6-15
Table 6-6. Recommended FS High-Gain Antenna Reference Radiation Pattern for
Frequency Assignment.......................................................................................... 6-16 Table 6-7. Representative FS Antenna Radiation Pattern in 406.1–420 MHz ......................... 6-19
Table 6-8. Representative FS Antenna Radiation Pattern in 932.5−935 and 941.5−944
MHz ...................................................................................................................... 6-20 Table 6-9. Representative FS Antenna Radiation Pattern in 1.71−1.85 GHz........................... 6-22 Table 6-10. Representative FS Antenna Radiation Pattern in 2.2−2.4 GHz............................. 6-23
Table 6-11. Representative FS Antenna Radiation Pattern in 4.4−4.99 GHz........................... 6-24 Table 6-12. Representative FS Antenna Radiation Pattern in 7.125−8.5 GHz......................... 6-26
Table 6-13. Representative FS Antenna Radiation Pattern in 14.4−15.35 GHz ...................... 6-27 Table 6-14. Representative FS Antenna Radiation Pattern in 21.2−23.6 GHz......................... 6-28
Table 6-15. Representative FS Antenna Radiation Pattern in 25.25−27.5 GHz ...................... 6-29 Table 6-16. Recommended GSO FSS Earth Station Antenna Co-Polarization Radiation
Performance Standard ........................................................................................... 6-32 Table 6-17. Recommended GSO FSS Earth Station Antenna Cross-Polarization Sidelobe
Radiation Performance Standard .......................................................................... 6-35
Table 6-18. Recommended NGSO FSS Earth Station Antenna Co-Polarization Radiation
Performance Standard ........................................................................................... 6-37
Table 6-19. Representative FSS Earth Station Antenna Radiation Patterns in 3.6−4.2 GHz ... 6-39 Table 6-20. Representative FSS Earth Station Antenna Radiation Patterns in 5.85−6.425
GHz ....................................................................................................................... 6-40 Table 6-21. Representative FSS Earth Station Antenna Radiation Patterns in 7.25−7.75
GHz ....................................................................................................................... 6-41 Table 6-22. Representative FSS Earth Station Antenna Radiation Patterns in 7.9−8.4 GHz ... 6-43
xviii
Table 6-23. Representative FSS Earth Station Antenna Radiation Patterns in 10.7−12.2
GHz ....................................................................................................................... 6-44 Table 6-24. Representative FSS Earth Station Antenna Radiation Patterns in 14−14.5 GHz .. 6-45 Table 6-25. Representative FSS Earth Station Antenna Radiation Patterns in 20.2−21.2
GHz ....................................................................................................................... 6-47 Table 6-26. Representative FSS Earth Station Antenna Radiation Patterns in 30−31 GHz ..... 6-48 Table 6-27. Representative FSS Earth Station Antenna Radiation Patterns in 43−45 GHz ..... 6-49 Table 6-28. Representative NGSO FSS Earth Station Antenna Sidelobe Radiation Pattern
in 1.35−1.39 GHz .................................................................................................. 6-50
Table 6-29. LMS Directional Antenna Radiation Performance Standards ............................... 6-51 Table 6-30. Representative LMS Mobile Station Directional Antenna Radiation Pattern in
2.2−2.395 GHz ...................................................................................................... 6-67 Table 6-31. Representative LMS Mobile Station Directional Antenna Radiation Pattern in
21.2−23.6 GHz ...................................................................................................... 6-68 Table 6-32. MMS Coast Station Directional Antenna Radiation Performance Standards ....... 6-69
Table 6-33. AMS Land-Based Directional Antenna Radiation Performance Standards .......... 6-81 Table 6-34. Representative AMS Land-Based Antenna Radiation Pattern in 4.4−4.94 GHz .. 6-96
Table 6-35. LMSS Earth Station Omnidirectional Antenna Radiation Performance
Standards ............................................................................................................... 6-98 Table 6-36. LMSS Earth Station Low- and Medium-Gain Antenna Radiation Performance
Standards ............................................................................................................... 6-99 Table 6-37. LMSS Earth Station High-Gain Antenna Radiation Performance Standards ..... 6-100
Table 6-38. Representative LMSS Earth Station Antenna Radiation Pattern in 240−270
MHz .................................................................................................................... 6-102 Table 6-39. Representative LMSS Earth Station Antenna Radiation Pattern in 290−320
MHz .................................................................................................................... 6-102
Table 6-40. Representative LMSS Earth Station Antenna Radiation Pattern in 1.525−1.559
and 1.61−1.6605 GHz ......................................................................................... 6-103 Table 6-41. Representative LMSS Earth Station Antenna Radiation Pattern in 7.25−7.3
and 7.9−8.025 GHz ............................................................................................. 6-103 Table 6-42. Representative LMSS Earth Station Antenna Radiation Pattern in 39.5−40.5
and 43.5−47 GHz ................................................................................................ 6-104 Table 6-43. MMSS Shipborne Directional Antenna Radiation Performance Standard ......... 6-104
Table 6-44. GSO MMSS Coast Earth Station Antenna Radiation Performance Standards ... 6-105 Table 6-45. Representative MMSS Earth Station Antenna Radiation Pattern in 240−270
MHz .................................................................................................................... 6-107 Table 6-46. Representative MMSS Earth Station Antenna Radiation Pattern in 290−320
MHz .................................................................................................................... 6-108
Table 6-47. Representative MMSS Earth Station Antenna Radiation Pattern in
1.525−1.559 and 1.61−1.6605 GHz .................................................................... 6-109
Table 6-48. Representative MMSS Earth Station Antenna Radiation Pattern in 20.2−21.2
GHz ..................................................................................................................... 6-109 Table 6-49. Representative MMSS Earth Station Antenna Radiation Pattern in 30−31 GHz 6-110 Table 6-50. Representative MMSS Earth Station Antenna Radiation Pattern in 39.5−40.5
and 43.5−47 GHz ................................................................................................ 6-110 Table 6-51. AMSS Land-Based Antenna Radiation Performance Standards ......................... 6-112
xix
Table 6-52. Representative AMSS Earth Station Antenna Radiation Pattern in 20.2−21.2
GHz ..................................................................................................................... 6-115 Table 6-53. Representative AMSS Earth Station Antenna Radiation Pattern in 30−31 GHz 6-115 Table 6-54. Representative AMSS Earth Station Antenna Radiation Pattern in 39.5−40.5
GHz and 43.5−47 GHz ....................................................................................... 6-116 Table 6-55. NTIA RDS Radars Antenna Radiation Performance Standards ......................... 6-117 Table 6-56. RLS Directional Antenna Reference Radiation Pattern for Frequency
Assignment ......................................................................................................... 6-118 Table 6-57. Representative RLS Directional Transmitting Antenna Radiation Pattern in
216–217 MHz ..................................................................................................... 6-122 Table 6-58. Representative RLS Directional Receiving Antenna Radiation Pattern in 216–
217 MHz ............................................................................................................. 6-122 Table 6-59. Representative RLS Directional Transmitting Antenna Radiation Pattern in
420−450 MHz ..................................................................................................... 6-123 Table 6-60. Representative RLS Directional Receiving Antenna Radiation Pattern in 420–
450 MHz ............................................................................................................. 6-124 Table 6-61. Representative RLS Directional Transmitting Antenna Radiation Pattern in
902–928 MHz ..................................................................................................... 6-125 Table 6-62. Representative RLS Directional Receiving Antenna Radiation Pattern in 902–
928 MHz ............................................................................................................. 6-126
Table 6-63. Representative RLS Directional Transmitting Antenna Radiation Pattern in
1.215−1.3 GHz .................................................................................................... 6-127
Table 6-64. Representative RLS Directional Receiving Antenna Radiation Pattern in
1.215−1.3 GHz .................................................................................................... 6-128 Table 6-65. Representative RLS Directional Transmitting Antenna Radiation Pattern in
1.35–1.39 GHz .................................................................................................... 6-128
Table 6-66. Representative RLS Directional Receiving Antenna Radiation Pattern in 1.35–
1.39 GHz ............................................................................................................. 6-129 Table 6-67. Representative RLS Directional Transmitting Antenna Radiation Pattern in
2.9−3.65 GHz ...................................................................................................... 6-130 Table 6-68. Representative RLS Directional Receiving Antenna Radiation Pattern in
2.9−3.65 GHz ...................................................................................................... 6-131 Table 6-69. Representative RLS Directional Transmitting Antenna Radiation Pattern in
5.25−5.6 GHz ...................................................................................................... 6-132 Table 6-70. Representative RLS Directional Receiving Antenna Radiation Pattern in
5.25−5.6 GHz ...................................................................................................... 6-133 Table 6-71. Representative RLS Directional Transmitting Antenna Radiation Pattern in
5.65−5.925 GHz .................................................................................................. 6-135
Table 6-72. Representative RLS Directional Receiving Antenna Radiation Pattern in
5.65−5.925 GHz .................................................................................................. 6-136
Table 6-73. Representative RLS Directional Transmitting Antenna Radiation Pattern in e
8.5−9 GHz ........................................................................................................... 6-137 Table 6-74. Representative RLS Directional Receiving Antenna Radiation Pattern in 8.5−9
GHz ..................................................................................................................... 6-137 Table 6-75. Representative RLS Directional Transmitting Antenna Radiation Pattern in
9.5–10.55 GHz .................................................................................................... 6-138
xx
Table 6-76. Representative RLS Directional Receiving Antenna Radiation Pattern in 9.5–
10.55 GHz ........................................................................................................... 6-139 Table 6-77. Representative RLS Directional Receiving Antenna Radiation Pattern in 13.4–
14 GHz ................................................................................................................ 6-140
Table 6-78. Representative RLS Directional Receiving Antenna Radiation Pattern in 13.4–
14 GHz ................................................................................................................ 6-140 Table 6-79. Representative RLS Directional Transmitting Antenna Radiation Pattern in
15.7–17.3 GHz .................................................................................................... 6-142 Table 6-80. Representative RLS Directional Receiving Antenna Radiation Pattern in 15.7–
17.3 GHz ............................................................................................................. 6-142 Table 6-81. Representative RLS Directional Transmitting Antenna Radiation Pattern in
24.05–24.25 GHz ................................................................................................ 6-143 Table 6-82. Representative RLS Directional Receiving Antenna Radiation Pattern in
24.05–24.25 GHz ................................................................................................ 6-144 Table 6-83. Representative RLS Directional Transmitting Antenna Radiation Pattern in
33.4–36 GHz ....................................................................................................... 6-145 Table 6-84. Representative RLS Directional Receiving Antenna Radiation Pattern in 33.4–
36 GHz ................................................................................................................ 6-146 Table 6-85. MRNS Directional Antenna Reference Radiation Patterns ................................. 6-147 Table 6-86. Representative MRNS Antenna Radiation Pattern in 9.2−9.3 GHz .................... 6-149
Table 6-87. Representative MRNS Directional Beacon Antenna Radiation Pattern in
9.3−9.5 GHz ........................................................................................................ 6-150
Table 6-88. ARNS Directional Antenna Reference Radiation Patterns ................................. 6-153 Table 6-89. Representative ARNS Directional Antenna Radiation Pattern in 74.8−75.2
MHz .................................................................................................................... 6-157
Table 6-90. Representative ARNS Directional Transmitting Antenna Radiation Pattern in
108−117.975 MHz .............................................................................................. 6-159 Table 6-91. Representative ARNS Directional Transmitting Antenna Radiation Pattern in
108−117.975 MHz .............................................................................................. 6-160
Table 6-92. Representative ARNS Directional Transmitting Antenna Radiation Pattern in
328.6–335.4 MHz ............................................................................................... 6-161
Table 6-93. Representative ARNS Directional Transmitting Antenna Radiation Pattern in
960−1215 MHz ................................................................................................... 6-162
Table 6-94. Representative ARNS Directional Receiving Antenna Radiation Pattern in
960−1215 MHz ................................................................................................... 6-164 Table 6-95. Representative ARNS Directional Transmitting Antenna Radiation Pattern in
1.24–2.9 GHz ...................................................................................................... 6-164 Table 6-96. Representative ARNS Directional Receiving Antenna Radiation Pattern in
1.24–2.9 GHz ...................................................................................................... 6-165 Table 6-97. Representative ARNS Directional Transmitting Antenna Radiation Pattern in
4.2–4.4 GHz ........................................................................................................ 6-165 Table 6-98. Representative ARNS Directional Receiving Antenna Radiation Pattern in
4.2–4.4 GHz ........................................................................................................ 6-166 Table 6-99. Representative ARNS Directional Transmitting Antenna Radiation Pattern in
5–5.25 GHz ......................................................................................................... 6-166
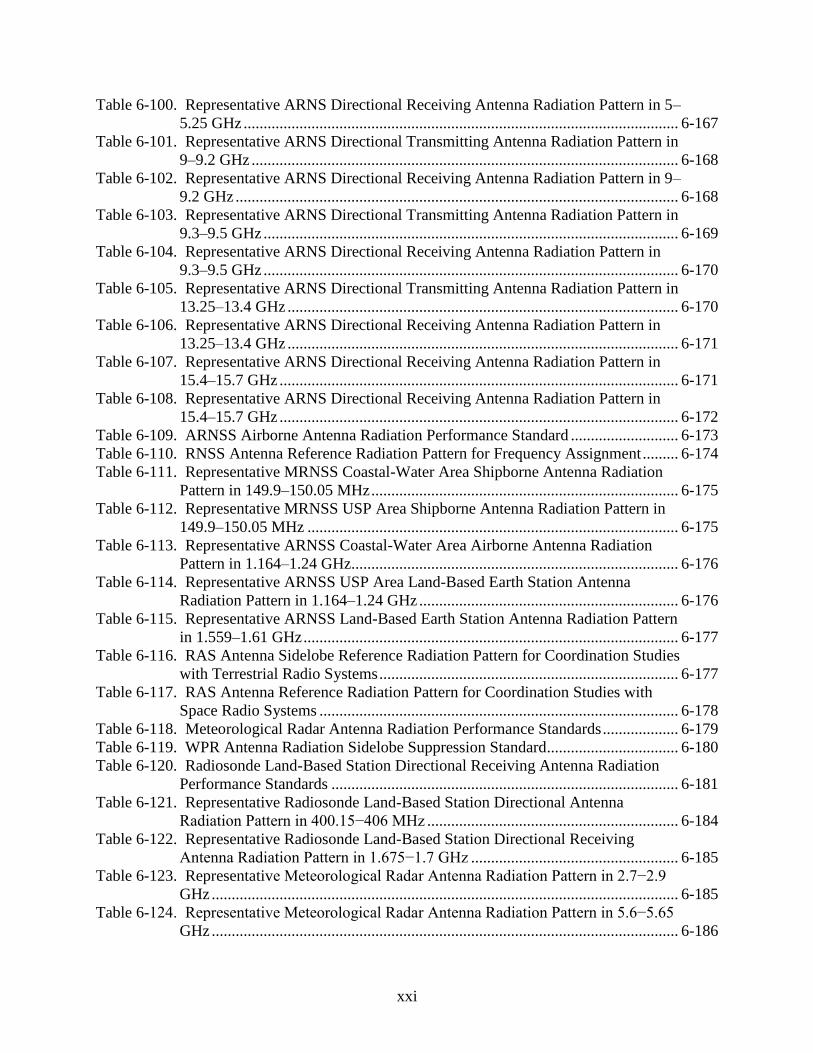
xxi
Table 6-100. Representative ARNS Directional Receiving Antenna Radiation Pattern in 5–
5.25 GHz ............................................................................................................. 6-167 Table 6-101. Representative ARNS Directional Transmitting Antenna Radiation Pattern in
9–9.2 GHz ........................................................................................................... 6-168
Table 6-102. Representative ARNS Directional Receiving Antenna Radiation Pattern in 9–
9.2 GHz ............................................................................................................... 6-168 Table 6-103. Representative ARNS Directional Transmitting Antenna Radiation Pattern in
9.3–9.5 GHz ........................................................................................................ 6-169 Table 6-104. Representative ARNS Directional Receiving Antenna Radiation Pattern in
9.3–9.5 GHz ........................................................................................................ 6-170 Table 6-105. Representative ARNS Directional Transmitting Antenna Radiation Pattern in
13.25–13.4 GHz .................................................................................................. 6-170 Table 6-106. Representative ARNS Directional Receiving Antenna Radiation Pattern in
13.25–13.4 GHz .................................................................................................. 6-171 Table 6-107. Representative ARNS Directional Receiving Antenna Radiation Pattern in
15.4–15.7 GHz .................................................................................................... 6-171 Table 6-108. Representative ARNS Directional Receiving Antenna Radiation Pattern in
15.4–15.7 GHz .................................................................................................... 6-172 Table 6-109. ARNSS Airborne Antenna Radiation Performance Standard ........................... 6-173 Table 6-110. RNSS Antenna Reference Radiation Pattern for Frequency Assignment ......... 6-174
Table 6-111. Representative MRNSS Coastal-Water Area Shipborne Antenna Radiation
Pattern in 149.9–150.05 MHz ............................................................................. 6-175
Table 6-112. Representative MRNSS USP Area Shipborne Antenna Radiation Pattern in
149.9–150.05 MHz ............................................................................................. 6-175 Table 6-113. Representative ARNSS Coastal-Water Area Airborne Antenna Radiation
Pattern in 1.164–1.24 GHz.................................................................................. 6-176
Table 6-114. Representative ARNSS USP Area Land-Based Earth Station Antenna
Radiation Pattern in 1.164–1.24 GHz ................................................................. 6-176 Table 6-115. Representative ARNSS Land-Based Earth Station Antenna Radiation Pattern
in 1.559–1.61 GHz .............................................................................................. 6-177 Table 6-116. RAS Antenna Sidelobe Reference Radiation Pattern for Coordination Studies
with Terrestrial Radio Systems ........................................................................... 6-177 Table 6-117. RAS Antenna Reference Radiation Pattern for Coordination Studies with
Space Radio Systems .......................................................................................... 6-178 Table 6-118. Meteorological Radar Antenna Radiation Performance Standards ................... 6-179 Table 6-119. WPR Antenna Radiation Sidelobe Suppression Standard................................. 6-180 Table 6-120. Radiosonde Land-Based Station Directional Receiving Antenna Radiation
Performance Standards ....................................................................................... 6-181
Table 6-121. Representative Radiosonde Land-Based Station Directional Antenna
Radiation Pattern in 400.15−406 MHz ............................................................... 6-184
Table 6-122. Representative Radiosonde Land-Based Station Directional Receiving
Antenna Radiation Pattern in 1.675−1.7 GHz .................................................... 6-185 Table 6-123. Representative Meteorological Radar Antenna Radiation Pattern in 2.7−2.9
GHz ..................................................................................................................... 6-185 Table 6-124. Representative Meteorological Radar Antenna Radiation Pattern in 5.6−5.65
GHz ..................................................................................................................... 6-186
xxii
Table 6-125. MetSat Earth Station Omnidirectional, Low- and Medium-Gain Antenna
Vertical Radiation Performance Standards ......................................................... 6-187 Table 6-126. MetSat Earth Station Low- and Medium-Gain Antenna Radiation
Performance Standards ....................................................................................... 6-187
Table 6-127. MetSat Earth Station High-Gain Antenna Radiation Performance Standards .. 6-188 Table 6-128. Representative MetSat Earth Station Omnidirectional Antenna Vertical
Radiation Pattern in 137−138 MHz .................................................................... 6-190 Table 6-129. Representative MetSat NGSO System Earth Station Directional Antenna
Radiation Pattern in 137−138 MHz .................................................................... 6-190
Table 6-130. Representative MetSat Earth Station Omnidirectional Antenna Vertical
Radiation Pattern in 401−403 MHz .................................................................... 6-191 Table 6-131. Representative MetSat Earth Station Directional Antenna Radiation Pattern
in 401−403 MHz ................................................................................................. 6-191
Table 6-132. Representative MetSat Earth Station Omnidirectional Antenna Vertical
Radiation Pattern in 460−470 MHz .................................................................... 6-192
Table 6-133. Representative MetSat Earth Station Directional Antenna Radiation Pattern
in 460−470 MHz ................................................................................................. 6-192
Table 6-134. Representative MetSat Earth Station Omnidirectional Antenna Vertical
Radiation Pattern in 1.675−1.71 GHz ................................................................. 6-193 Table 6-135. Representative MetSat Earth Station Directional Antenna Radiation Pattern
in 1.675−1.71 GHz .............................................................................................. 6-193 Table 6-136. EESS Earth Station Antenna Radiation Performance Standards ...................... 6-194
Table 6-137. Representative EESS GSO System Earth Station Antenna Radiation Pattern
in 401−403 MHz ................................................................................................. 6-197 Table 6-138. Representative EESS NGSO System Earth Station Antenna Radiation Pattern
in 401−403 MHz ................................................................................................. 6-197
Table 6-139. Representative EESS GSO System Uplink Earth Station Antenna Radiation
Pattern in 2.025−2.11 GHz ................................................................................. 6-198 Table 6-140. Representative EESS GSO System Downlink Earth Station Antenna
Radiation Pattern in 2.025−2.11 GHz ................................................................. 6-198 Table 6-141. Representative EESS NGSO System Uplink Earth Station Low-Gain
Antenna Radiation Pattern in 2.025−2.11 GHz .................................................. 6-199 Table 6-142. Representative EESS NGSO System Uplink Earth Station High-Gain
Antenna Radiation Pattern in 2.025−2.11 GHz .................................................. 6-200 Table 6-143. Representative EESS Earth Station Antenna Radiation Pattern in 2.2−2.29
GHz ..................................................................................................................... 6-200 Table 6-144. Representative EESS Earth Station Antenna Radiation Pattern in 8.025−8.4
GHz ..................................................................................................................... 6-201
Table 6-145. Representative EESS Earth Station Antenna Radiation Pattern in 25.5−27
GHz ..................................................................................................................... 6-201
Table 6-146. SRS Earth Station Large-Aperture Antenna Radiation Standards .................... 6-202 Table 6-147. SRS Earth Station Large-Aperture Antenna Reference Radiation Pattern
against Large Number of Distributed Interfering Sources above 30 GHz .......... 6-204 Table 6-148. Representative SRS Deep-Space System Uplink Earth Station Antenna
Radiation Pattern in 2.025−2.11 GHz ................................................................. 6-205
xxiii
Table 6-149. Representative SRS GSO System Uplink Earth Station Antenna Radiation
Pattern in 2.025−2.11 GHz ................................................................................. 6-206 Table 6-150. Representative SRS GSO System Downlink Earth Station Antenna Radiation
Pattern in 2.025−2.11 GHz ................................................................................. 6-206
Table 6-151. Representative SRS NGSO System Uplink Earth Station Antenna Radiation
Pattern in 2.025−2.11 GHz ................................................................................. 6-207 Table 6-152. Representative SRS Deep-Space System Downlink Earth Station Antenna
Radiation Pattern in 2.2−2.3 GHz ....................................................................... 6-208 Table 6-153. Representative SRS GSO System Uplink Earth Station Antenna Radiation
Pattern in 2.2−2.3 GHz ....................................................................................... 6-208 Table 6-154. Representative SRS NGSO System Downlink Earth Station Antenna
Radiation Pattern in 2.2−2.3 GHz ....................................................................... 6-209 Table 6-155. Representative SRS Deep-Space System Uplink Earth Station Antenna
Radiation Pattern in 7.145−7.235 GHz ............................................................... 6-210 Table 6-156. Representative SRS NGSO System Uplink Earth Station Antenna Radiation
Pattern in 7.145−7.235 GHz ............................................................................... 6-210 Table 6-157. Representative SRS Deep-Space System Downlink Earth Station Antenna
Radiation Pattern in 8.4−8.5 GHz ....................................................................... 6-211 Table 6-158. Representative SRS NGSO System Downlink Earth Station Antenna
Radiation Pattern in 8.4−8.5 GHz ....................................................................... 6-211
Table 6-159. Representative SRS GSO System Downlink Earth Station Antenna Radiation
Pattern in 13.25−13.75 GHz ............................................................................... 6-212
Table 6-160. Representative SRS GSO System Uplink Earth Station Antenna Radiation
Pattern in 14.8−15.4 GHz ................................................................................... 6-212 Table 6-161. Representative SRS NGSO System Uplink Earth Station Antenna Radiation
Pattern in 14.8−15.4 GHz ................................................................................... 6-212
Table 6-162. Representative SRS Moon-Orbiting System Downlink Earth Station Antenna
Radiation Pattern in 25.5−27 GHz ...................................................................... 6-213 Table 6-163. Representative SRS NGSO System Downlink Earth Station Antenna
Radiation Pattern in 25.5−27 GHz ...................................................................... 6-213 Table 6-164. Representative SRS Deep-Space System Downlink Earth Station Antenna
Radiation Pattern in 31.3−32.3 GHz ................................................................... 6-214 Table 6-165. Representative SRS NGSO System Downlink Earth Station Antenna
Radiation Pattern in 31.3−32.3 GHz ................................................................... 6-214 Table 6-166. Representative SRS Deep-Space System Uplink Earth Station Antenna
Radiation Pattern in 34.2−34.7 GHz ................................................................... 6-215 Table 6-167. SOS Earth Station Antenna Radiation Performance Standards ........................ 6-215 Table 6-168. Representative SOS GSO System Uplink Earth Station Antenna Radiation
Pattern in 148−149.9 MHz .................................................................................. 6-218 Table 6-169. Representative SOS NGSO System Downlink Earth Station Antenna
Radiation Pattern in 401−402 MHz .................................................................... 6-218 Table 6-170. Representative SOS Deep-Space System Uplink Earth Station Antenna
Radiation Pattern in 2.025−2.11 GHz ................................................................. 6-218 Table 6-171. Representative SOS GSO System Uplink Earth Station Antenna Radiation
Pattern in 2.025−2.11 GHz ................................................................................. 6-219
xxiv
Table 6-172. Representative SOS GSO System Downlink Earth Station Antenna Radiation
Pattern in 2.025−2.11 GHz ................................................................................. 6-219 Table 6-173. Representative SOS NGSO System Uplink Earth Station Antenna Radiation
Pattern in 2.025−2.11 GHz ................................................................................. 6-220
Table 6-174. Representative SOS Deep-Space System Downlink Earth Station Antenna
Radiation Pattern in 2.2−2.29 GHz ..................................................................... 6-220 Table 6-175. Representative SOS GSO System Uplink Earth Station Antenna Radiation
Pattern in 2.2−2.29 GHz ..................................................................................... 6-221 Table 6-176. Representative SOS GSO System Downlink Earth Station Antenna Radiation
Pattern in 2.2−2.29 GHz ..................................................................................... 6-222 Table 6-177. Representative SOS NGSO System Downlink Earth Station Antenna
Radiation Pattern in 2.2−2.29 GHz ..................................................................... 6-222 Table 7-1. FS Antenna Suppression Masks for System Review ................................................ 7-1
Table 7-2. FS Antenna Reference Radiation Patterns for Frequency Assignment ..................... 7-2 Table 7-3. Representative FS Antenna Radiation Patterns for Spectrum Sharing Analyses ...... 7-4
Table 7-4. FSS Earth Station Antenna Radiation Performance Standards ................................. 7-5 Table 7-5. Representative FSS Earth Station Antenna Reference Radiation Patterns for
Spectrum Sharing Analyses .................................................................................... 7-8 Table 7-6. LMS Directional Antenna Radiation Performance Standards ................................. 7-11 Table 7-7. Representative LMS Antenna Reference Radiation Patterns for Spectrum
Sharing Analyses .................................................................................................. 7-13 Table 7-8. MMS Coast Station Directional Antenna Radiation Performance Standards ......... 7-15
Table 7-9. Representative MMS Antenna Reference Radiation Patterns for Spectrum
Sharing Analyses .................................................................................................. 7-17 Table 7-10. AMS Land-Based Directional Antenna Radiation Performance Standards .......... 7-19
Table 7-11. Representative AMS Antenna Reference Radiation Patterns for Spectrum
Sharing Analyses .................................................................................................. 7-20 Table 7-12. LMSS Earth Station Omnidirectional Antenna Radiation Performance
Standards ............................................................................................................... 7-22
Table 7-13. LMSS Earth Station Low- and Medium-Gain Antenna Radiation Performance
Standards ............................................................................................................... 7-22
Table 7-14. LMSS Earth Station High-Gain Antenna Radiation Performance Standards ....... 7-23 Table 7-15. Representative LMSS Earth Station Antenna Reference Radiation Patterns for
Spectrum Sharing Analyses .................................................................................. 7-24 Table 7-16. MMSS Shipborne Directional Antenna Radiation Performance Standard ........... 7-25 Table 7-17. MMSS Coast Station Earth Station Antenna Radiation Performance Standards .. 7-25 Table 7-18. Representative MMSS Earth Station Antenna Reference Radiation Patterns for
Spectrum Sharing Analyses .................................................................................. 7-27
Table 7-19. AMSS Land-Based Earth Station Antenna Radiation Performance Standards..... 7-29 Table 7-20. Representative AMSS Earth Station Antenna Reference Radiation Patterns for
Spectrum Sharing Analyses .................................................................................. 7-30 Table 7-21. RLS Antenna Radiation Performance Standards .................................................. 7-31 Table 7-22. RLS Directional Antenna Reference Radiation Patterns for Frequency
Assignment ........................................................................................................... 7-33 Table 7-23. Representative RLS Antenna Reference Radiation Patterns for Spectrum
Sharing Analyses .................................................................................................. 7-34
xxv
Table 7-24. MRNS Antenna Radiation Performance Standards .............................................. 7-37
Table 7-25. MRNS Directional Antenna Reference Radiation Patterns for Frequency
Assignment ........................................................................................................... 7-39 Table 7-26. Representative MRNS Antenna Reference Radiation Patterns for Spectrum
Sharing Analyses .................................................................................................. 7-40 Table 7-27. ARNS Directional Antenna Reference Radiation Patterns for Frequency
Assignment ........................................................................................................... 7-44 Table 7-28. Representative ARNS Antenna Reference Radiation Patterns for Spectrum
Sharing Analyses .................................................................................................. 7-45
Table 7-29. ARNSS Airborne Antenna Radiation Performance Standard ............................... 7-48 Table 7-30. RNSS Earth Station Antenna Reference Radiation Pattern for Frequency
Assignment ........................................................................................................... 7-49 Table 7-31. Representative RNSS Antenna Reference Radiation Patterns for Spectrum
Sharing Analyses .................................................................................................. 7-49 Table 7-32. RAS Antenna Reference Radiation Patterns for Frequency Assignment ............. 7-50
Table 7-33. Meteorological Radar Antenna Radiation Performance Standards ....................... 7-51 Table 7-34. WPR Antenna Radiation Sidelobe Suppression Standard..................................... 7-53
Table 7-35. Radiosonde Land-Based Directional Receiving Antenna Radiation
Performance Standards ......................................................................................... 7-53 Table 7-36. Representative MetAids Antenna Reference Radiation Pattern for Spectrum
Sharing Analyses .................................................................................................. 7-55 Table 7-37. MetSat Earth Station Omnidirectional, Low- and Medium-Gain Antenna
Vertical Radiation Performance Standards ........................................................... 7-56 Table 7-38. MetSat Earth Station Low- and Medium-Gain Antenna Radiation Performance
Standards ............................................................................................................... 7-57
Table 7-39. MetSat Earth Station High-Gain Antenna Radiation Performance Standards ...... 7-57
Table 7-40. Representative MetSat Antenna Reference Radiation Patterns for Spectrum
Sharing Analyses .................................................................................................. 7-59 Table 7-41. EESS Earth Station Antenna Radiation Performance Standards .......................... 7-60
Table 7-42. Representative EESS Earth Station Antenna Reference Radiation Patterns for
Spectrum Sharing Analyses .................................................................................. 7-62
Table 7-43. SRS Earth Station Large-Aperture Antenna Radiation Standards ........................ 7-63 Table 7-44. SRS Earth Station Large-Aperture Antenna Reference Radiation Pattern
against Large Number of Distributed Interfering Sources above 30 GHz ............ 7-65 Table 7-45. Representative SRS Earth Station Antenna Reference Radiation Patterns for
Spectrum Sharing Analyses .................................................................................. 7-65 Table 7-46. SOS Earth Station Antenna Radiation Performance Standards ............................ 7-68 Table 7-47. Representative SOS Antenna Reference Radiation Patterns for Spectrum
Sharing Analyses .................................................................................................. 7-70
xxvi
LIST OF FIGURES
Figure 2-1. Spherical Coordinate System ................................................................................... 2-1 Figure 2-2. Radiation Pattern of an Omnidirectional Antenna ................................................... 2-6
Figure 2-3. Directional Antenna Radiation Pattern .................................................................... 2-7 Figure 2-4. Comparison of Measured and Reference Radiation Patterns ................................... 2-8 Figure 2-5. Antenna Beam and HPBW....................................................................................... 2-9 Figure 2-6. Comparison of Co- and Cross-Polarization Radiation Patterns ............................. 2-11 Figure 2-7. Antenna Noise and System Noise .......................................................................... 2-12
Figure 3-1. Dipole Antenna ........................................................................................................ 3-1 Figure 3-2. Monopole Antenna Radiation Pattern ..................................................................... 3-2 Figure 3-3. Folded Dipole Antenna ............................................................................................ 3-3 Figure 3-4. Vehicle-Mounted Whip Antenna ............................................................................. 3-3
Figure 3-5. T-antenna.................................................................................................................. 3-4 Figure 3-6. Biconical and Discone Antennas ............................................................................. 3-4 Figure 3-7. V Antenna ................................................................................................................ 3-5
Figure 3-8. Circular Loop Antenna Radiation Pattern ................................................................ 3-6 Figure 3-9. Small Loop Antenna ................................................................................................ 3-6
Figure 3-10. Helical Antenna ...................................................................................................... 3-7 Figure 3-11. Applications of Helical Antennas .......................................................................... 3-8 Figure 3-12. Yagi-Uda Antenna ................................................................................................. 3-9
Figure 3-13. Rhombic Antenna................................................................................................. 3-10 Figure 3-14. Horn Antenna ....................................................................................................... 3-11
Figure 3-15. Fractal Antenna .................................................................................................... 3-12 Figure 3-16. Microstrip Antenna .............................................................................................. 3-12 Figure 3-17. Lens Antenna ....................................................................................................... 3-13
Figure 3-18. Corner Reflector Antenna .................................................................................... 3-13
Figure 3-19. Diagram of Parabolic Antenna ............................................................................. 3-14 Figure 3-20. Paraboloidal Antenna ........................................................................................... 3-14 Figure 3-21. Offset-Fed Antenna .............................................................................................. 3-15
Figure 3-22. Diagrams of Cassegrain and Gregory Antennas .................................................. 3-16 Figure 3-23. Cosecant-Square Antenna .................................................................................... 3-17 Figure 3-24. Log-Periodic Antenna .......................................................................................... 3-19
Figure 3-25. Phased Arrays....................................................................................................... 3-19 Figure 3-26. Collinear Array Antenna ...................................................................................... 3-20 Figure 3-27. Slotted Array ........................................................................................................ 3-21 Figure 3-28. Billboard Reflector ............................................................................................... 3-21 Figure 4-1. Wolfgain Pattern ...................................................................................................... 4-3
Figure 4-2. Statgain Pattern ........................................................................................................ 4-4 Figure 4-3. Modeling Antenna with Wires ................................................................................. 4-7
Figure 5-1. Satellite Coverage Contour Map ............................................................................ 5-26 Figure 5-2. AM Audio Broadcasting Antenna .......................................................................... 5-31 Figure 5-3. Recommended Reference Receiving Radiation Pattern for AM HF
Broadcasting for Performance Evaluation and System Planning ........................... 5-37 Figure 5-4. Recommended Directivity of VHF Audio Broadcasting Receiving Antenna for
System Planning ..................................................................................................... 5-39
xxvii
Figure 5-5. Recommended Directivity for TV Receiving Antenna for System Planning ........ 5-40
Figure 5-6. AMS Airborne Antennas........................................................................................ 5-52 Figure 5-7. Air Traffic Control Radar Beacon Antenna ........................................................... 5-71 Figure 5-8. Sarsat INSAT Satellite Transmitting Antenna Coverage ....................................... 5-78
Figure 5-9. Cospas-Sarsat LEO Satellite Antenna Gain Pattern............................................... 5-83 Figure 5-10. Cospas-Sarsat Beacons......................................................................................... 5-84 Figure 5-11. NAVSTAR GPS Satellite .................................................................................... 5-85 Figure 5-12. GPS Receiver ....................................................................................................... 5-85 Figure 5-13. Sample of GPS Antenna Radiation Pattern .......................................................... 5-86
Figure 5-14. 46.5 MHz Wind Profile Radar in UK .................................................................. 5-93 Figure 5-15. 915 MHz Wind Profile Radar for U.S. Atmospheric Radiation Measurement ... 5-94 Figure 5-16. Radiosonde ........................................................................................................... 5-96 Figure 5-17. Rocketsonde ......................................................................................................... 5-98
Figure 5-18. Laser Ceilometer .................................................................................................. 5-99 Figure 5-19. Optical Precipitation/Visibility Sensor .............................................................. 5-101
Figure 5-20. Sunshine Sensor ................................................................................................. 5-102 Figure 6-1. NTIA FS Antenna Gain Suppression Mask ............................................................. 6-5
Figure 6-2. FS Antenna Measured Patterns versus NTIA Mask in 1.71-1.85 GHz ................... 6-6 Figure 6-3. FS Antenna Measured Patterns versus NTIA Mask in 2.2-2.4 GHz ....................... 6-8 Figure 6-4. FS Antenna Measured Patterns versus NTIA Mask in 4.4-4.99 GHz ..................... 6-8
Figure 6-5. Graphic Representation of the Proposed Modification of the NTIA Suppression
Masks ...................................................................................................................... 6-10
Figure 6-6. Comparison of NTIA FS Antenna Suppression Mask and Measured Standard
and High Performance Antenna Performance Data ............................................... 6-12 Figure 6-7. NTIA FS Antenna Radiation Mask versus Wolfgain Model and Rec. ITU-R
F.699-7 Reference Radiation Pattern in the 400 MHz Band .................................. 6-15
Figure 6-8. Statgain Model versus Reference Radiation Pattern in Rec. ITU-R F.699-7 ........ 6-18 Figure 6-9. Population Profile of FS Receiving Antenna Gmax Data in 406.1–420 MHz ........ 6-19 Figure 6-10. Population Profile of FS Receiving Antenna Gmax Data in 932.5−935 and
941.5−944 MHz...................................................................................................... 6-20 Figure 6-11. Comparison of Representative FS Antenna Radiation Pattern and
Measurement Data in 932.5−935 and 941.5−944 MHz ......................................... 6-21 Figure 6-12. Population Profile of FS Receiving Antenna Gmax Data in 1.71−1.85 GHz ........ 6-21
Figure 6-13. Comparison of Representative FS Antenna Radiation Pattern and
Measurement Data in 1.71−1.85 GHz .................................................................... 6-22 Figure 6-14. Population Profile of FS Receiving Antenna Gmax Data in 2.2−2.4 GHz ............ 6-23 Figure 6-15. Comparison of Representative FS Antenna Radiation Pattern and
Measurement Data in 2.2−2.4 GHz ........................................................................ 6-23
Figure 6-16. Population Profile of FS Receiving Antenna Gmax Data in 4.4−4.99 GHz .......... 6-24 Figure 6-17. Comparison of Representative FS Antenna Radiation Pattern and
Measurement Data in 4.4−4.99 GHz ...................................................................... 6-25 Figure 6-18. Population Profile of FS Receiving Antenna Gmax Data in 7.125−8.5 GHz ........ 6-25 Figure 6-19. Comparison of Representative FS Antenna Radiation Pattern and
Measurement Data in 7.125−8.5 GHz .................................................................... 6-26 Figure 6-20. Population Profile of FS Receiving Antenna Gmax Data in 14.4−15.35 GHz ...... 6-27
xxviii
Figure 6-21. Comparison of Representative FS Antenna Radiation Pattern and
Measurement Data in 14.4−15.35 GHz .................................................................. 6-27 Figure 6-22. Population Profile of FS Receiving Antenna Gmax Data in 21.2−23.6 GHz ........ 6-28 Figure 6-23. Comparison of Representative FS Antenna Radiation Pattern and
Measurement Data in 21.2−23.6 GHz .................................................................... 6-29 Figure 6-24. Comparison of Representative FS Antenna Radiation Pattern and
Measurement Data in 25.25−27.5 GHz .................................................................. 6-30 Figure 6-25. Comparison of GSO FSS Earth Station Antenna Co-Polarization Radiation
Patterns ................................................................................................................... 6-32
Figure 6-26. Comparison of FSS Earth Station Antenna Cross-Polarization Radiation
Patterns ................................................................................................................... 6-35 Figure 6-27. Comparison of NGSO FSS Earth Station Antenna Co-Polarization Radiation
Patterns ................................................................................................................... 6-36
Figure 6-28. Population Profile of FSS Earth Station Receiving Antenna Gmax Data in
7.25−7.75 GHz ....................................................................................................... 6-41
Figure 6-29. Population Profile of FSS Earth Station Transmitting Antenna Gmax Data in
7.9−8.4 GHz ........................................................................................................... 6-43
Figure 6-30. Population Profile of FSS Earth Station Transmitting Antenna Gmax Data in
14−14.5 GHz .......................................................................................................... 6-45 Figure 6-31. Population Profile of LMS Mobile Station Transmitting Antenna Gmax Data
in 4.438−8.1 MHz .................................................................................................. 6-58 Figure 6-32. Population Profile of LMS Base Station Transmitting Antenna Gmax Data in
138–150.08 MHz .................................................................................................... 6-62 Figure 6-33. Population Profile of LMS Mobile Station Transmitting Antenna Gmax Data
in 138–150.08 MHz ................................................................................................ 6-62
Figure 6-34. Population Profile of LMS Base Station Transmitting Antenna Gmax Data in
162–174 MHz ......................................................................................................... 6-63 Figure 6-35. Population Profile of LMS Mobile Station Transmitting Antenna Gmax Data
in 162–174 MHz ..................................................................................................... 6-64
Figure 6-36. Population Profile of LMS Base Station Transmitting Antenna Gmax Data in
220–420 MHz ......................................................................................................... 6-65
Figure 6-37. Population Profile of LMS Mobile Station Transmitting Antenna Gmax Data
in 220–420 MHz ..................................................................................................... 6-65
Figure 6-38. Measured Airborne Antenna Radiation Patterns.................................................. 6-83 Figure 6-39. Population Profile of AMS Land-Based Transmitting Antenna Gmax Data in
1.755−1.85 GHz ..................................................................................................... 6-95 Figure 6-40. Population Profile of AMS Airborne Transmitting Omnidirectional Antenna
Gmax Data in 1.755−1.85 GHz ................................................................................ 6-95
Figure 6-41. Population Profile of AMS Airborne Transmitting Directional Antenna Gmax
Data in 1.755−1.85 GHz......................................................................................... 6-96
Figure 6-42. Population Profile of RLS Directional transmitting Antenna Gmax Data in
902−928 MHz....................................................................................................... 6-125 Figure 6-43. Population Profile of RLS Directional Transmitting Antenna Gmax Data in
1.215−1.3 GHz ..................................................................................................... 6-127 Figure 6-44. Population Profile of RLS Directional Transmitting Antenna Gmax Data in
2.9−3.65 GHz ....................................................................................................... 6-130
xxix
Figure 6-45. Population Profile of RLS Directional Receiving Antenna Gmax Data in
2.9−3.65 GHz ....................................................................................................... 6-131 Figure 6-46. Population Profile of RLS Directional Transmitting Antenna Gmax Data in
5.25−5.6 GHz ....................................................................................................... 6-132
Figure 6-47. Population Profile of RLS Directional Receiving Antenna Gmax Data in
5.25−5.6 GHz ....................................................................................................... 6-133 Figure 6-48. Population Profile of RLS Directional Transmitting Antenna Gmax Data in
5.65−5.925 GHz ................................................................................................... 6-135 Figure 6-49. Population Profile of RLS Directional Receiving Antenna Gmax Data in
5.65−5.925 GHz ................................................................................................... 6-136 Figure 6-50. Population Profile of RLS Directional Transmitting Antenna Gmax Data in
9.5–10.55 GHz ..................................................................................................... 6-138 Figure 6-51. Population Profile of RLS Directional Receiving Antenna Gmax Data in 9.5–
10.55 GHz ............................................................................................................ 6-139 Figure 6-52. Population Profile of RLS Directional Transmitting Antenna Gmax Data in
15.7–17.3 GHz ..................................................................................................... 6-141 Figure 6-53. Population Profile of ARNS Omnidirectional Transmitting Antenna Gmax
Data in 108−117.975 MHz ................................................................................... 6-158 Figure 6-54. Population Profile of ARNS Directional Transmitting Antenna Gmax Data in
108−117.975 MHz................................................................................................ 6-159
Figure 6-55. Population Profile of ARNS Omnidirectional Transmitting Antenna Gmax
Data in 960−1215 MHz ........................................................................................ 6-162
Figure 6-56. Population Profile of ARNS Directional Receiving Antenna Gmax Data in
960−1215 MHz..................................................................................................... 6-163 Figure 6-57. Population Profile of ARNS Directional Transmitting Antenna Gmax Data in
9–9.2 GHz ............................................................................................................ 6-167
Figure 6-58. Population Profile of ARNS Directional Receiving Antenna Gmax Data in 9–
9.2 GHz ................................................................................................................ 6-168 Figure 6-59. Population Profile of ARNS Directional Transmitting Antenna Gmax Data in
9.3–9.5 GHz ......................................................................................................... 6-169 Figure 6-60. Population Profile of EESS NGSO System Uplink Earth Station High-Gain
Antenna Gmax Data in 2.025−2.11 GHz ............................................................... 6-199 Figure 6-61. Population Profile of EESS Earth Station Antenna Gmax Data in 2.2−2.29
GHz ...................................................................................................................... 6-200 Figure 6-62. Population Profile of SRS NGSO System Uplink Earth Station Antenna Gmax
Data in 2.025−2.11 GHz....................................................................................... 6-207 Figure 6-63. Population Profile of SRS NGSO System Downlink Earth Station Antenna
Gmax Data in 2.2−2.3 GHz .................................................................................... 6-209
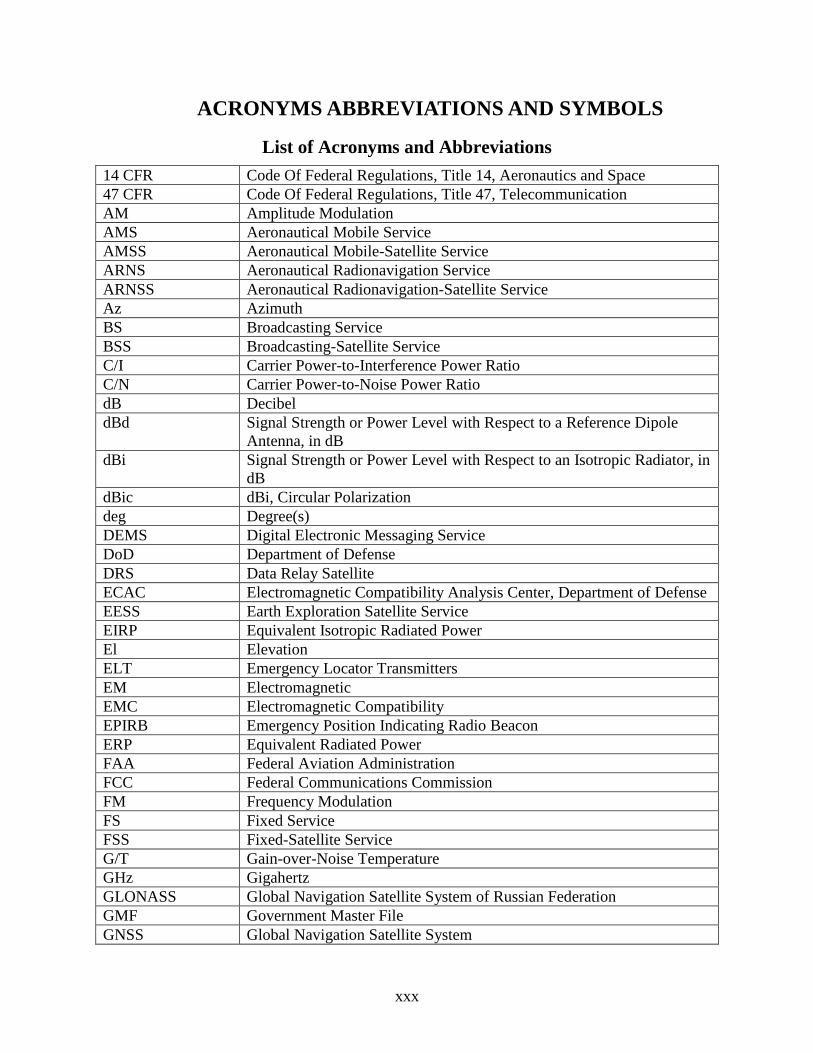
xxx
ACRONYMS ABBREVIATIONS AND SYMBOLS
List of Acronyms and Abbreviations
14 CFR Code Of Federal Regulations, Title 14, Aeronautics and Space
47 CFR Code Of Federal Regulations, Title 47, Telecommunication
AM Amplitude Modulation
AMS Aeronautical Mobile Service
AMSS Aeronautical Mobile-Satellite Service
ARNS Aeronautical Radionavigation Service
ARNSS Aeronautical Radionavigation-Satellite Service
Az Azimuth
BS Broadcasting Service
BSS Broadcasting-Satellite Service
C/I Carrier Power-to-Interference Power Ratio
C/N Carrier Power-to-Noise Power Ratio
dB Decibel
dBd Signal Strength or Power Level with Respect to a Reference Dipole
Antenna, in dB
dBi Signal Strength or Power Level with Respect to an Isotropic Radiator, in
dB
dBic dBi, Circular Polarization
deg Degree(s)
DEMS Digital Electronic Messaging Service
DoD Department of Defense
DRS Data Relay Satellite
ECAC Electromagnetic Compatibility Analysis Center, Department of Defense
EESS Earth Exploration Satellite Service
EIRP Equivalent Isotropic Radiated Power
El Elevation
ELT Emergency Locator Transmitters
EM Electromagnetic
EMC Electromagnetic Compatibility
EPIRB Emergency Position Indicating Radio Beacon
ERP Equivalent Radiated Power
FAA Federal Aviation Administration
FCC Federal Communications Commission
FM Frequency Modulation
FS Fixed Service
FSS Fixed-Satellite Service
G/T Gain-over-Noise Temperature
GHz Gigahertz
GLONASS Global Navigation Satellite System of Russian Federation
GMF Government Master File
GNSS Global Navigation Satellite System
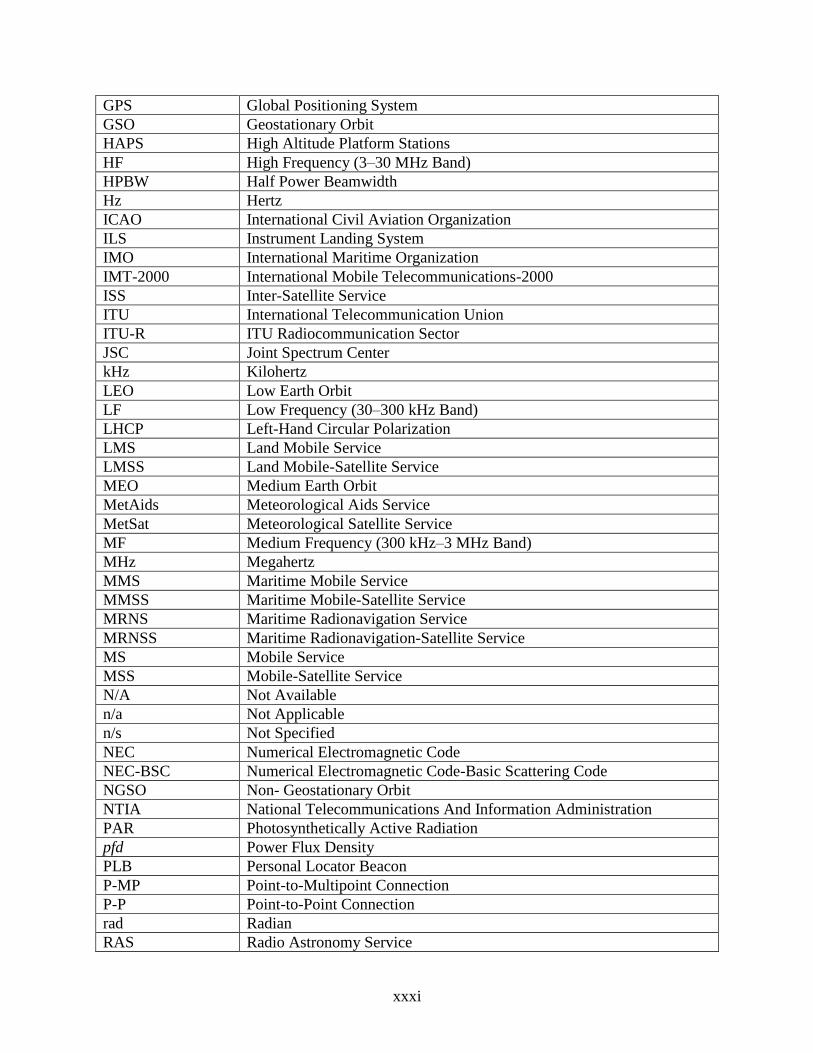
xxxi
GPS Global Positioning System
GSO Geostationary Orbit
HAPS High Altitude Platform Stations
HF High Frequency (3–30 MHz Band)
HPBW Half Power Beamwidth
Hz Hertz
ICAO International Civil Aviation Organization
ILS Instrument Landing System
IMO International Maritime Organization
IMT-2000 International Mobile Telecommunications-2000
ISS Inter-Satellite Service
ITU International Telecommunication Union
ITU-R ITU Radiocommunication Sector
JSC Joint Spectrum Center
kHz Kilohertz
LEO Low Earth Orbit
LF Low Frequency (30–300 kHz Band)
LHCP Left-Hand Circular Polarization
LMS Land Mobile Service
LMSS Land Mobile-Satellite Service
MEO Medium Earth Orbit
MetAids Meteorological Aids Service
MetSat Meteorological Satellite Service
MF Medium Frequency (300 kHz–3 MHz Band)
MHz Megahertz
MMS Maritime Mobile Service
MMSS Maritime Mobile-Satellite Service
MRNS Maritime Radionavigation Service
MRNSS Maritime Radionavigation-Satellite Service
MS Mobile Service
MSS Mobile-Satellite Service
N/A Not Available
n/a Not Applicable
n/s Not Specified
NEC Numerical Electromagnetic Code
NEC-BSC Numerical Electromagnetic Code-Basic Scattering Code
NGSO Non- Geostationary Orbit
NTIA National Telecommunications And Information Administration
PAR Photosynthetically Active Radiation
pfd Power Flux Density
PLB Personal Locator Beacon
P-MP Point-to-Multipoint Connection
P-P Point-to-Point Connection
rad Radian
RAS Radio Astronomy Service
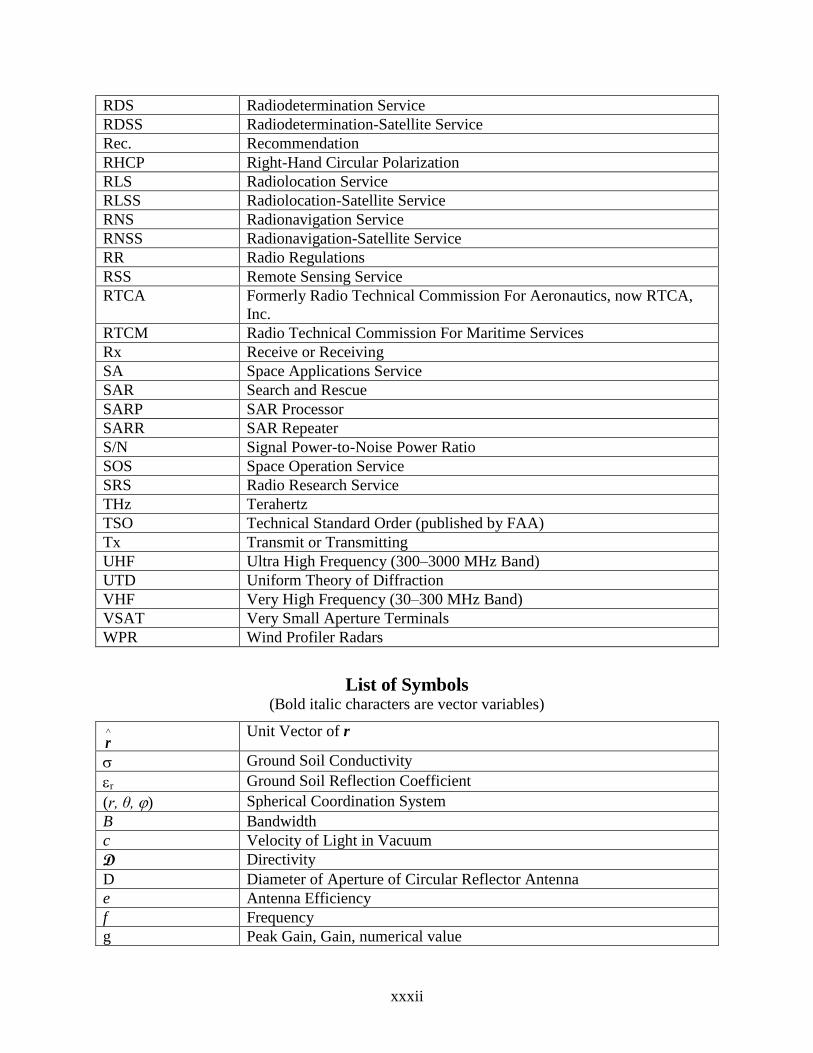
xxxii
RDS Radiodetermination Service
RDSS Radiodetermination-Satellite Service
Rec. Recommendation
RHCP Right-Hand Circular Polarization
RLS Radiolocation Service
RLSS Radiolocation-Satellite Service
RNS Radionavigation Service
RNSS Radionavigation-Satellite Service
RR Radio Regulations
RSS Remote Sensing Service
RTCA Formerly Radio Technical Commission For Aeronautics, now RTCA,
Inc.
RTCM Radio Technical Commission For Maritime Services
Rx Receive or Receiving
SA Space Applications Service
SAR Search and Rescue
SARP SAR Processor
SARR SAR Repeater
S/N Signal Power-to-Noise Power Ratio
SOS Space Operation Service
SRS Radio Research Service
THz Terahertz
TSO Technical Standard Order (published by FAA)
Tx Transmit or Transmitting
UHF Ultra High Frequency (300–3000 MHz Band)
UTD Uniform Theory of Diffraction
VHF Very High Frequency (30–300 MHz Band)
VSAT Very Small Aperture Terminals
WPR Wind Profiler Radars
List of Symbols (Bold italic characters are vector variables)
r Unit Vector of r
Ground Soil Conductivity
r Ground Soil Reflection Coefficient
(r, θ, ) Spherical Coordination System
B Bandwidth
c Velocity of Light in Vacuum
D Directivity
D Diameter of Aperture of Circular Reflector Antenna
e Antenna Efficiency
f Frequency
g Peak Gain, Gain, numerical value
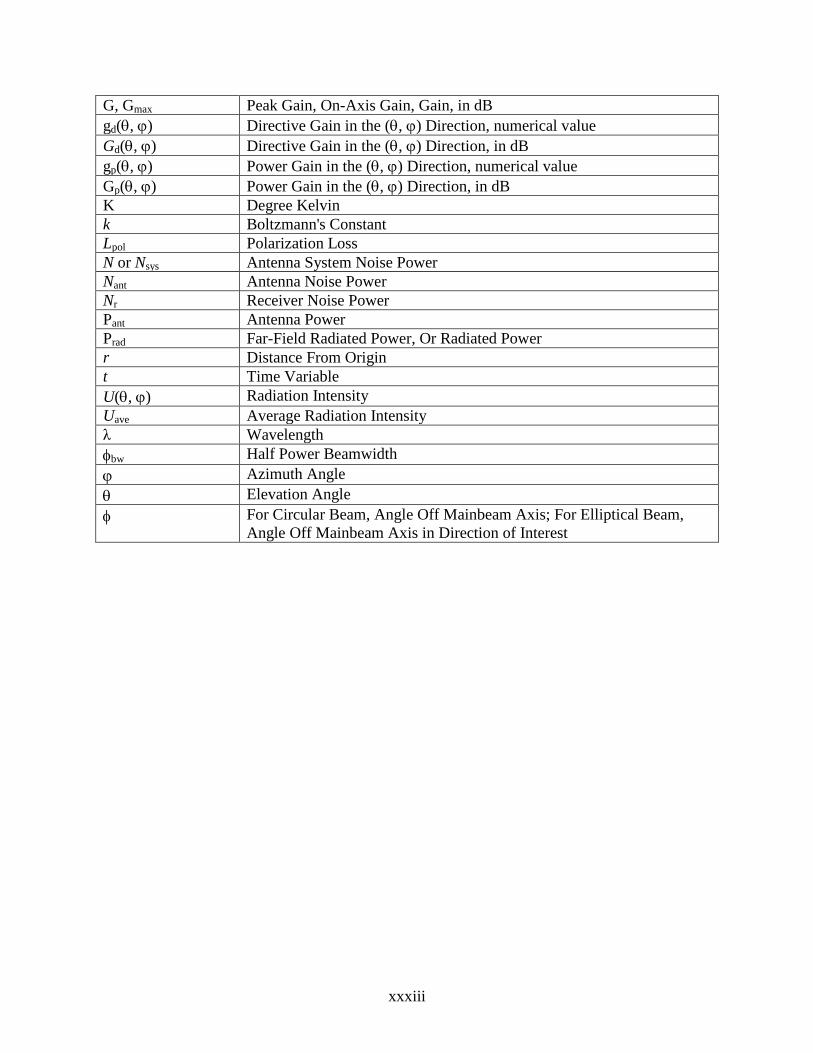
xxxiii
G, Gmax Peak Gain, On-Axis Gain, Gain, in dB
gd(, ) Directive Gain in the (, ) Direction, numerical value
Gd(, ) Directive Gain in the (, ) Direction, in dB
gp(, ) Power Gain in the (, ) Direction, numerical value
Gp(, ) Power Gain in the (, ) Direction, in dB
K Degree Kelvin
k Boltzmann's Constant
Lpol Polarization Loss
N or Nsys Antenna System Noise Power
Nant Antenna Noise Power
Nr Receiver Noise Power
Pant Antenna Power
Prad Far-Field Radiated Power, Or Radiated Power
r Distance From Origin
t Time Variable
U(, ) Radiation Intensity
Uave Average Radiation Intensity
λ Wavelength
bw Half Power Beamwidth
Azimuth Angle
Elevation Angle
For Circular Beam, Angle Off Mainbeam Axis; For Elliptical Beam,
Angle Off Mainbeam Axis in Direction of Interest
1-1
SECTION 1. INTRODUCTION
1.1 Background
The National Telecommunications and Information Administration (NTIA) is the
Executive Branch agency principally responsible for advising the President on
telecommunications and information policy issues. NTIA’s responsibilities include developing
and articulating domestic and international telecommunications and information policies
concerning spectrum allocation and utilization, presenting executive branch views on
telecommunications and information matters to Congress, the Federal Communications
Commission (FCC), and the public, and providing guidance to federal agencies to ensure their
telecommunication activities are consistent with these policies.
To fulfill these responsibilities, NTIA has undertaken numerous spectrum-related studies
to assess spectrum utilization and recommend changes to promote efficient and effective
spectrum utilization, examine the feasibility of reallocating spectrum used by the federal
government to the private sector, recommend changes to improve federal spectrum management
procedures, and identify existing or potential electromagnetic compatibility (EMC) problems
between radio systems and provide recommendations for resolving EMC conflicts.
NTIA and the federal agencies have long relied on engineering analyses and technical
studies to assess compatibility between federal and non-federal radio systems and to evaluate
emerging radio technologies. Unfortunately, regulators and the spectrum management
community have yet to recognize a common set of approaches for conducting these analyses and
studies. Moreover, in light of the increasing spectrum demands, federal regulators and spectrum
managers must use analysis methods that accurately represent interference between radio
systems to ensure efficient and effective spectrum utilization.
To make the analyses and studies more effective and accurate, NTIA, in coordination
with the federal agencies and the FCC, is developing a Best Practices Handbook of engineering
analytical tools and procedures with the aim of optimizing spectrum utilization. The handbook
will include appropriate transmitter and receiver technical standards, radio service-specific
interference protection criteria, limits of unwanted emission, frequency dependent environmental
characteristics, engineering models of antennas and radiowave propagation, and a description of
radio service-specific analysis models that address single and aggregate interference.
To support the development of the handbook, NTIA’s Office of Spectrum Management,
Spectrum Engineering and Analysis Division developed this technical memorandum to address
the antenna characteristics for EMC analyses. The memorandum covers the antenna gain
requirements, radiation patterns, sidelobe requirements, and other technical data. The results of
this technical memorandum will be incorporated into the Best Practices Handbook.
1.2 Objective
This technical memorandum serves two purposes. The first one is to serve as a library of
rules, regulations, and recommendations regarding antennas that are published by authoritative
institutions and are relevant to EMC analyses. Federal agencies and international institutions
have published many rules, regulations, and recommendations regarding antennas for regulating,
1-2
as well as improving, EMC, with the aim of optimizing spectrum utilization. However, the
diverse sources of these rules, regulations, and recommendations make it difficult for regulators
and spectrum managers to find the correct information for their EMC analyses. NTIA technical
staff collected these rules, regulations, and recommendations, and compiled them in this
technical memorandum. This will make the necessary information regarding antennas more
easily accessible to regulators and spectrum managers.
The second purpose is to serve as a library of the antenna parameters for NTIA and the
federal agencies to conduct their EMC analysis tasks. NTIA conducts the following EMC
analysis tasks for the federal agencies: system review for equipment approval, frequency
assignment, and spectrum sharing studies. The official source of antenna parameters for these
tasks is the NTIA’s Manual of Regulations and Procedures for Federal Radio Frequency
Management.1 However, the Manual only provides antenna parameters for some radio services.
In order to provide the complete information, NTIA technical staff developed recommendations
of antenna parameters for all of the radio services, and compiled them in this memorandum. This
will provide regulators and spectrum managers with all of the necessary antenna parameters for
their EMC analysis tasks.
1.3 Approach
To develop the library of rules, regulations, and recommendations regarding antennas
that are relevant to EMC analyses, NTIA technical staff searched for documentations from the
authoritative institutions whose information has regulatory status for the spectrum management
tasks. These institutions include NTIA, FCC, International Telecommunication Union (ITU),
RTCA, Inc. (formerly Radio Technical Commission for Aeronautics), etc. Technical journals
with the most up-to-date information on antenna technologies, e.g., publications from the
Institute of Electrical and Electronics Engineers (IEEE), were not searched. Almost all of the
information is publically available either from the Internet or published documents.
To develop the library of antenna parameters for NTIA and the federal agencies to
conduct their EMC analysis tasks, NTIA evaluated the characteristics of the radio services, the
federal usage of the radio spectrum, and the technical merit and practicality of the antenna
parameters from the authoritative institutions, and then developed the recommendations. The
recommendations only cover the radio services for which NTIA conducts the EMC analysis
tasks; therefore, recommendations for the Broadcasting Service and Broadcasting-Satellite
Service were not developed. A summary of these recommendations will be included in the Best
Practices Handbook.
This technical memorandum is a living document. The content will be periodically
reviewed for new or revised technical parameters from authoritative institutions, and the
memorandum will be revised accordingly.
1 National Telecommunications and Information Administration, U.S. Department of Commerce, Manual of
Regulations and Procedures for Federal Radio Frequency Management (2008).
1-3
1.4 Scope
This technical memorandum contains three parts. The first part, in Sections 2 to 4,
provides a brief introduction of the antenna fundamentals, antenna types, and common
techniques associated with antenna modeling.
Section 2 presents the basics of antenna characteristics most often encountered by the
spectrum managers, e.g., gain, radiated power, reference radiation pattern, efficiency,
beamwidth, polarization, noise, bandwidth, and near-field and far-field regions.
Section 3 presents the fundamental types of antennas applicable to all the radio services,
e.g., linear antennas, aperture antennas, fractal antennas, microstrip antennas, and array antennas.
It also presents photographs, diagrams, and radiation patterns of antennas. Since many spectrum
managers work with only one or a few radio services that employ only a few types of antennas,
the information in Section 3 may broaden a spectrum manager’s knowledge of antenna types
beyond her/his regular work requirement.
Section 4 provides the following information for modeling antenna performance:
equations to calculate gain and beamwidth, reference radiation patterns currently used by the
federal government for system planning purposes, and algorithms commonly used to develop
antenna models.
The second part, in Section 5, is the compilation of rules, regulations, and
recommendations published by authoritative institutions such as NTIA, FCC, ITU, and RTCA.
The content is organized by the categories of radio services classified in the ITU
Radiocommunication Sector (ITU-R). Typical technical parameters are provided when the rules,
regulations, and recommendations are not available. A summary list of these rules, regulations,
recommendations, data, and specifications are provided in Table 5-83 at the end of Section 5 for
easy reference.
The third part, in Sections 6 and 7, provides the antenna parameters for NTIA and the
federal agencies to conduct their EMC analysis tasks. The recommendations cover the antenna
radiation performance standards for system review, the antenna radiation patterns for frequency
assignment, and the representative antenna radiation patterns for spectrum sharing analyses.
Section 6 provides the complete processes for developing the recommendations, and Section 7 is
the summary of recommendations in Section 6. The content is also organized by the categories of
radio services classified in ITU-R.
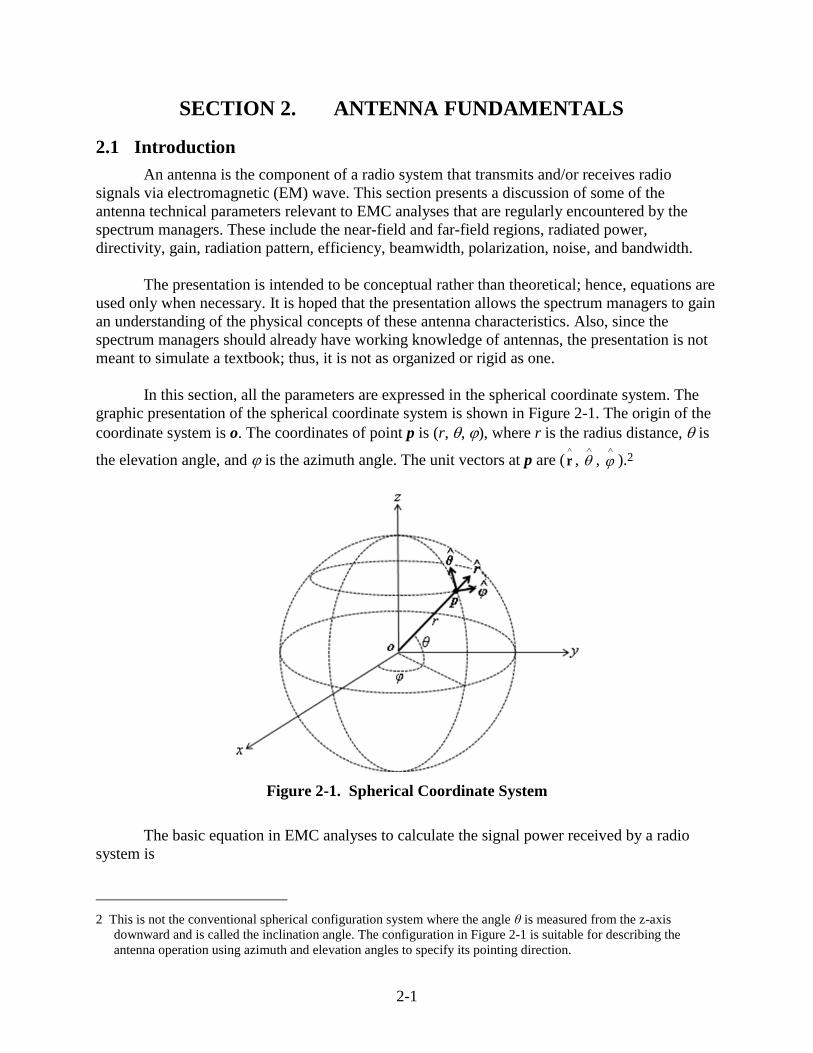
2-1
SECTION 2. ANTENNA FUNDAMENTALS
2.1 Introduction
An antenna is the component of a radio system that transmits and/or receives radio
signals via electromagnetic (EM) wave. This section presents a discussion of some of the
antenna technical parameters relevant to EMC analyses that are regularly encountered by the
spectrum managers. These include the near-field and far-field regions, radiated power,
directivity, gain, radiation pattern, efficiency, beamwidth, polarization, noise, and bandwidth.
The presentation is intended to be conceptual rather than theoretical; hence, equations are
used only when necessary. It is hoped that the presentation allows the spectrum managers to gain
an understanding of the physical concepts of these antenna characteristics. Also, since the
spectrum managers should already have working knowledge of antennas, the presentation is not
meant to simulate a textbook; thus, it is not as organized or rigid as one.
In this section, all the parameters are expressed in the spherical coordinate system. The
graphic presentation of the spherical coordinate system is shown in Figure 2-1. The origin of the
coordinate system is o. The coordinates of point p is (r, , ), where r is the radius distance, is
the elevation angle, and is the azimuth angle. The unit vectors at p are (
r ,
,
).2
Figure 2-1. Spherical Coordinate System
The basic equation in EMC analyses to calculate the signal power received by a radio
system is
2 This is not the conventional spherical configuration system where the angle θ is measured from the z-axis
downward and is called the inclination angle. The configuration in Figure 2-1 is suitable for describing the
antenna operation using azimuth and elevation angles to specify its pointing direction.
2-2
Pr = Pt + Gt(t) + Gr(r) - F(ft, Bt, Mt, fr, Br, Mr) - Lp (2-1)
where
Pr: received power, dBW;
Pt: transmitter power, dBW;
Gt: transmitting antenna power gain, dBi;
t: angle off transmitting antenna mainbeam axis;
Gr: receiving antenna power gain, dBi;
r: angle off receiving antenna mainbeam axis;
F(ft, Bt, Mt, fr, Br, Mr): frequency dependent rejection factor, dB;
ft: transmitting signal carrier frequency;
Bt: transmitting signal bandwidth;
Mt: transmitting signal modulation;
fr: receiver filter center frequency;
Br: receiver filter bandwidth;
Mr: receiver filter modulation; and
Lp: propagation loss, dB.
This equation is used for both the intended signals and the unintended interfering signals.
The transmitting and receiving antenna gain characteristics, Gt(t) and Gr(r), play an important
role in interference management. These two parameters, or specifically t and r, are controlled
in the system planning process to manage the interfering signals. Better spectrum management
and frequency utilization may be achieved by effectively controlling these parameters to
minimize the impact of interference.
2.2 Near-Field and Far-Field Regions
The EM field generated by an antenna has three components that differ in their distance-
dependencies. The first one is the inductive near-field, the second one is the radiated near-field,
and the third one is the radiated far-field. The inductive field stores energy near the antenna, and
the radiated fields dissipate energy into space. The near-fields are large compared with the far-
field in the vicinity of the antenna, but their strengths decrease more rapidly than the far-field as
the distance of propagation increases. Beyond a certain distance, the far-field becomes the
dominant component. The area where the far-field dominates is called the far-field region, where
the far-field can be approximated as a plane wave. The area between the far-field region and the
antenna is called the near-field region.
It has been generally accepted that the plane-wave approximation is valid when at least
one of the following conditions is met:
r > 2L2/λ (2-2a)
r >> L (2-2b)
r >> λ (2-2c)
where
2-3
r: distance from the antenna,
L: maximum linear dimension of the antenna radiation portion or surface,
λ: wavelength, and
>>: much larger.
Eq. (2-2a) alone is sufficient for antennas operating in the Very High Frequency (VHF, 30–300
MHz range) and higher frequency bands, and Eqs. (2-2a–c) should all be satisfied for antennas
operating below the VHF band.
EMC analyses almost always consider only the far-field radiation characteristics.
However, in some special cases, the dominant interfering signals are the near-field. For instance,
broadband power-line communications utilize the electric power lines as the telecommunication
media to transmit the signals, and other radio systems near the power lines may be interfered
with by the near-field. This case is documented in two NTIA reports.3 4 Another example is the
co-site issue when two antennas with overlapping frequency bands are installed nearby, e.g., in
the same hosting tower. This is a system design issue, not a spectrum management issue. Co-site
analysis tools are available commercially.
2.3 Power and Gain
2.3.1 Radiated Power
The antenna power, Pant, is the total power input to the antenna system. It generates the
radiating EM wave that dissipates power into the far field, the non-radiating EM field that stores
energy in the near field, and joule heat.
The far-field radiated power, commonly referred to as the radiated power, Prad, is the
total radiated power carried by the far-field EM wave. Prad is independent of the propagation
distance r and is a constant.
The power flux density (pfd) is a measure of the radiated power density at a particular
location in space. In designing a radio system, one of the specifications is the lower limit pfd at
the front end of a receiving antenna to guarantee required signal qualities. When regulating radio
interference between radio systems, one of the specifications could be the maximum allowable
pfd, either for a single-entry interfering signal or aggregated interfering signals, at the front end
of a receiving antenna to limit radio interference from other radio systems.
The radiation intensity, U(, ), from an antenna in a given direction (, ) is the far-
field radiated power per unit solid angle in the direction (, ).5 U(, ) is independent of the
propagation distance r.
3 NTIA, U.S. Department of Commerce, NTIA 04-413, Broadband-Over-Powerline Report (2004).
4 NTIA, U.S. Department of Commerce, NTIA 08-450, Potential Interference From Broadband Over Power Line
(BPL] Systems To Federal Government Radiocommunication Systems at 1.7 - 80 MHz Phase 2 Study (2007).
5 Solid angle is the angle of an object seen from the center of a sphere. The unit of solid angle is the steradian (or
square radian). The total solid angle is the solid angle over a sphere and is equal to 4π steradian.
2-4
2.3.2 Directive Gain and Power Gain
The directive gain, gd(, ), of an antenna in a given direction (, ) is the ratio of the
radiation intensity U(, ) in a given direction (, ) to the average radiation intensity, i.e.,
rad
dP
),(U4),(g
(2-3)
where (Prad/4π) is the average radiation intensity over the complete spherical steradian angle of
4π. The gd(, ) value of Eq. (2-3) is numerical. Usually, it is more practical for antenna
engineers and spectrum managers to express the gain value in decibels. Denoting the directive
gain in decibel as Gd(, ), then
,glog10,G dd (dB) (2-4)
The directivity, D, of an antenna is the peak directive gain at the mainbeam axis.
The power gain, gp(, ), of an antenna in a given direction (, ) is the ratio of the
radiation intensity U(, ) to the average radiation intensity if the antenna power were
completely radiated, i.e.,
ant
pP
),(U4),(g
(2-5)
The gp(,) value of Eq. (2-5) is numerical. Often, its value is expressed in decibel; denoting the
power gain in decibel as Gp(, ), then
,glog10,G pp (dB) (2-6)
The peak gain, g, or on-axis gain, or simply Gain, is the peak power gain at the
mainbeam axis. The peak gain in decibels is usually denoted G.
2.4 Radiation Pattern
2.4.1 Characteristics
The antenna radiation pattern is a graphical representation of the geometrical distribution
of the radiated power over all space. It is typically expressed in the spherical coordinates as a
function of space coordinates and is independent of distance.
A radiation pattern usually consists of a mainbeam, one or a few near sidelobes adjacent
to the mainbeam and many far sidelobes further away from the mainbeam. The mainbeam can be
of various shapes, e.g., toroidal beam, pencil beam, or elliptical beam. The near sidelobes usually
have predictable power levels and directions. The far sidelobes are very random in their power
levels and directions, but generally the power levels decrease rapidly and level off at a threshold
2-5
value. The randomness of the far sidelobes depends on the detailed structure of the antenna, e.g.,
the accuracy of the surface, the shape of the edge, and the antenna supporting elements.
Radiation patterns can be seriously affected by the environment. For instance, the
radiation pattern of an antenna operating in the Low Frequency (LF, 30–300 kHz range) or
Medium Frequency (MF, 300–3000 kHz range) band and installed above the ground is
profoundly influenced by the lossy earth. Or, the radiation pattern of an antenna installed
onboard a ship or an airplane is distorted by the metallic structure in its surrounding.
2.4.2 Types of Patterns
Antennas generate three types of radiation patterns: isotropic, omnidirectional, and
directional. These types of radiation patterns are discussed here.
(a) Isotropic Radiation Pattern
An isotropic radiator is a theoretical antenna that radiates power uniformly in all
directions. Therefore, it is sometimes called a non-directional radiator. Such three-dimensionally
uniform radiation capability is possible only with a point radiator.
Although purely theoretical, it is best known for its usage as a reference. An isotropic
radiator is used as a reference antenna to specify the directional gain of an antenna. As a
common practice, an antenna gain value is expressed as "x dB above an isotropic radiator" and
labeled as “x dBi”.
(b) Omnidirectional Radiation Pattern
An omnidirectional antenna is an antenna that can provide uniform radiation in a
reference plane; this reference plane is referred to as the peak gain plane where G = Gmax in all
radiant directions. The radiation pattern of an omnidirectional antenna is shown in Figure 2-2.6
The pattern is a toroid (i.e., doughnut) or a figure-eight, with the axis of the toroid aligned with
the axis of the antenna. In most of the radio systems using omnidirectional antennas, the peak
gain plane is the horizontal plane parallel to the local Earth surface; this is the case shown in
Figure 2-2.
6 http://www.tpub.com/content/neets/14182/css/14182_186.htm, accessed Nov. 9, 2011.
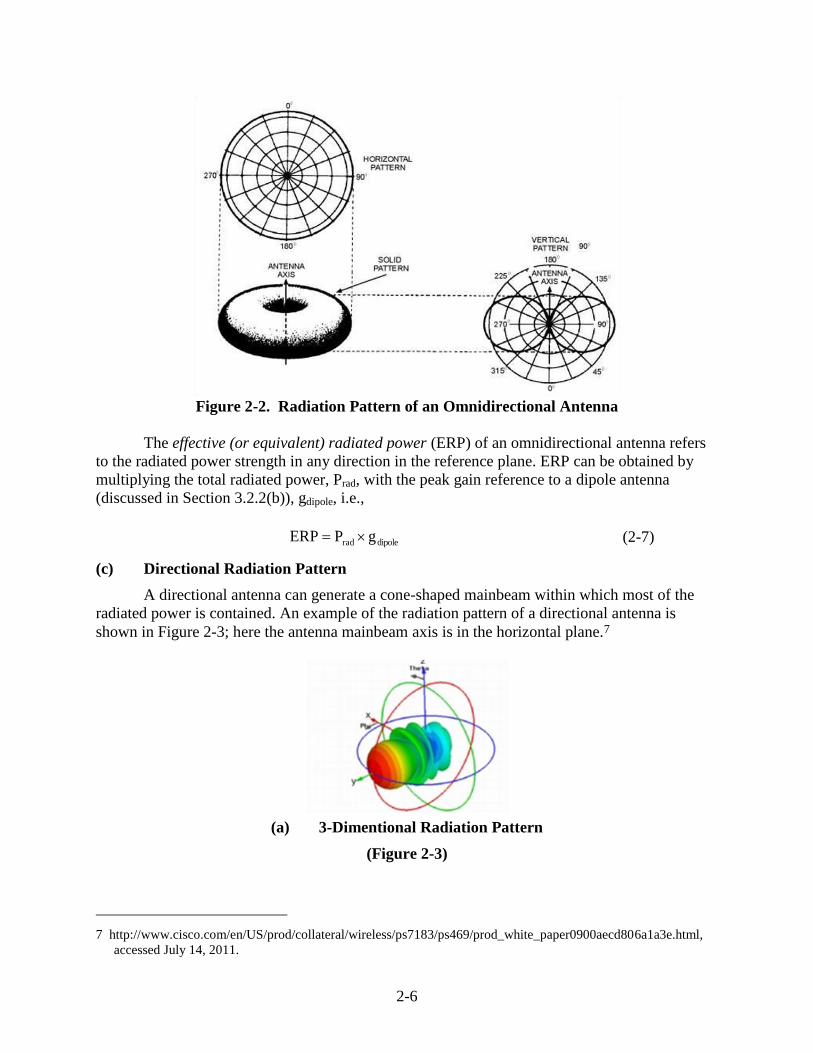
2-6
Figure 2-2. Radiation Pattern of an Omnidirectional Antenna
The effective (or equivalent) radiated power (ERP) of an omnidirectional antenna refers
to the radiated power strength in any direction in the reference plane. ERP can be obtained by
multiplying the total radiated power, Prad, with the peak gain reference to a dipole antenna
(discussed in Section 3.2.2(b)), gdipole, i.e.,
dipolerad gPERP (2-7)
(c) Directional Radiation Pattern
A directional antenna can generate a cone-shaped mainbeam within which most of the
radiated power is contained. An example of the radiation pattern of a directional antenna is
shown in Figure 2-3; here the antenna mainbeam axis is in the horizontal plane.7
(a) 3-Dimentional Radiation Pattern
(Figure 2-3)
7 http://www.cisco.com/en/US/prod/collateral/wireless/ps7183/ps469/prod_white_paper0900aecd806a1a3e.html,
accessed July 14, 2011.
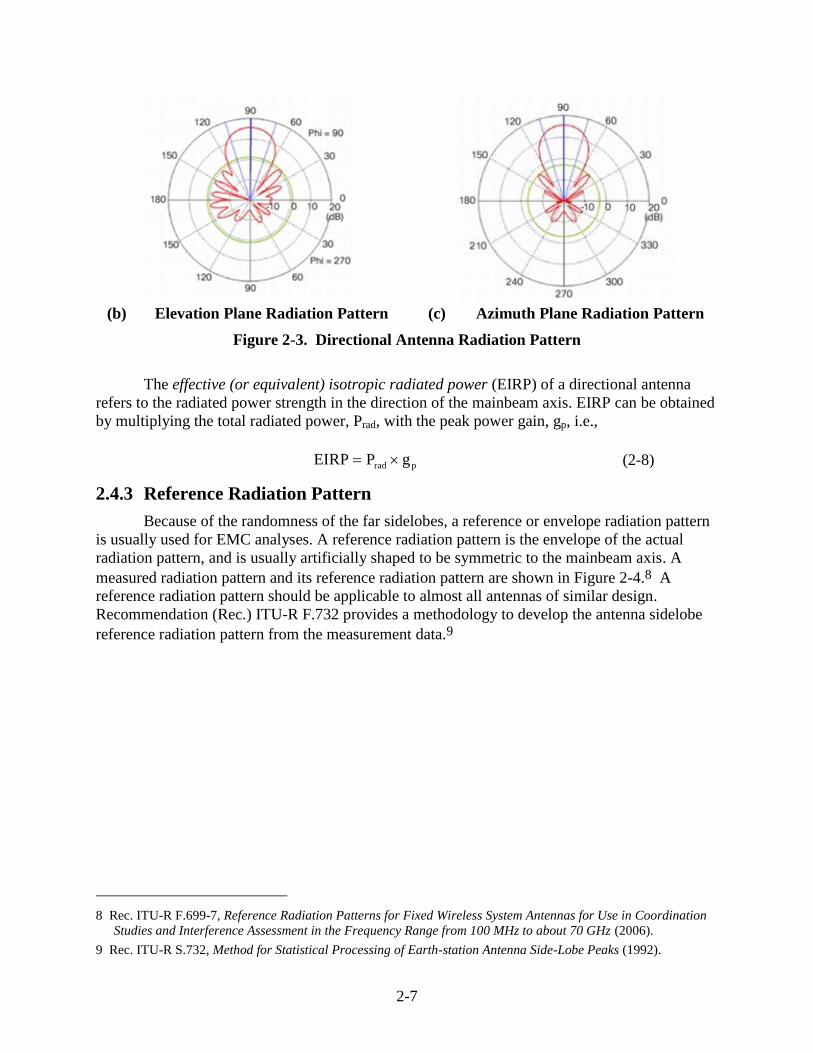
2-7
(b) Elevation Plane Radiation Pattern (c) Azimuth Plane Radiation Pattern
Figure 2-3. Directional Antenna Radiation Pattern
The effective (or equivalent) isotropic radiated power (EIRP) of a directional antenna
refers to the radiated power strength in the direction of the mainbeam axis. EIRP can be obtained
by multiplying the total radiated power, Prad, with the peak power gain, gp, i.e.,
prad gPEIRP (2-8)
2.4.3 Reference Radiation Pattern
Because of the randomness of the far sidelobes, a reference or envelope radiation pattern
is usually used for EMC analyses. A reference radiation pattern is the envelope of the actual
radiation pattern, and is usually artificially shaped to be symmetric to the mainbeam axis. A
measured radiation pattern and its reference radiation pattern are shown in Figure 2-4.8 A
reference radiation pattern should be applicable to almost all antennas of similar design.
Recommendation (Rec.) ITU-R F.732 provides a methodology to develop the antenna sidelobe
reference radiation pattern from the measurement data.9
8 Rec. ITU-R F.699-7, Reference Radiation Patterns for Fixed Wireless System Antennas for Use in Coordination
Studies and Interference Assessment in the Frequency Range from 100 MHz to about 70 GHz (2006).
9 Rec. ITU-R S.732, Method for Statistical Processing of Earth-station Antenna Side-Lobe Peaks (1992).
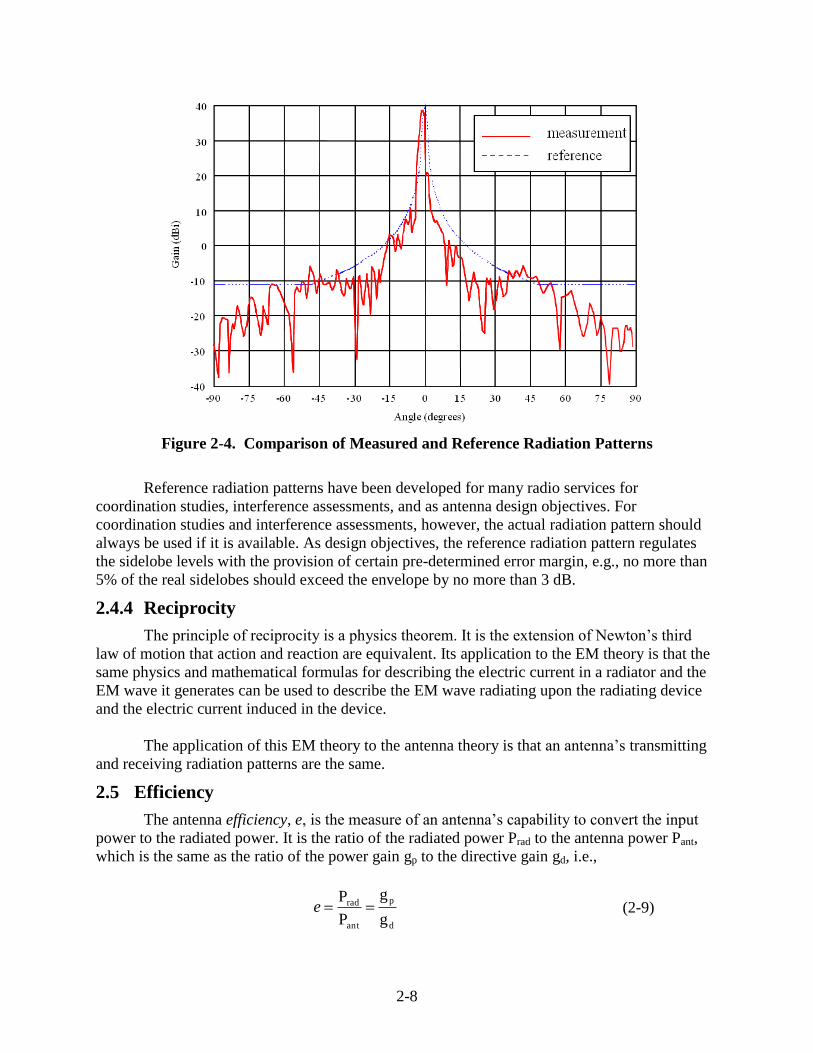
2-8
Figure 2-4. Comparison of Measured and Reference Radiation Patterns
Reference radiation patterns have been developed for many radio services for
coordination studies, interference assessments, and as antenna design objectives. For
coordination studies and interference assessments, however, the actual radiation pattern should
always be used if it is available. As design objectives, the reference radiation pattern regulates
the sidelobe levels with the provision of certain pre-determined error margin, e.g., no more than
5% of the real sidelobes should exceed the envelope by no more than 3 dB.
2.4.4 Reciprocity
The principle of reciprocity is a physics theorem. It is the extension of Newton’s third
law of motion that action and reaction are equivalent. Its application to the EM theory is that the
same physics and mathematical formulas for describing the electric current in a radiator and the
EM wave it generates can be used to describe the EM wave radiating upon the radiating device
and the electric current induced in the device.
The application of this EM theory to the antenna theory is that an antenna’s transmitting
and receiving radiation patterns are the same.
2.5 Efficiency
The antenna efficiency, e, is the measure of an antenna’s capability to convert the input
power to the radiated power. It is the ratio of the radiated power Prad to the antenna power Pant,
which is the same as the ratio of the power gain gp to the directive gain gd, i.e.,
d
p
ant
rad
g
g
P
Pe (2-9)
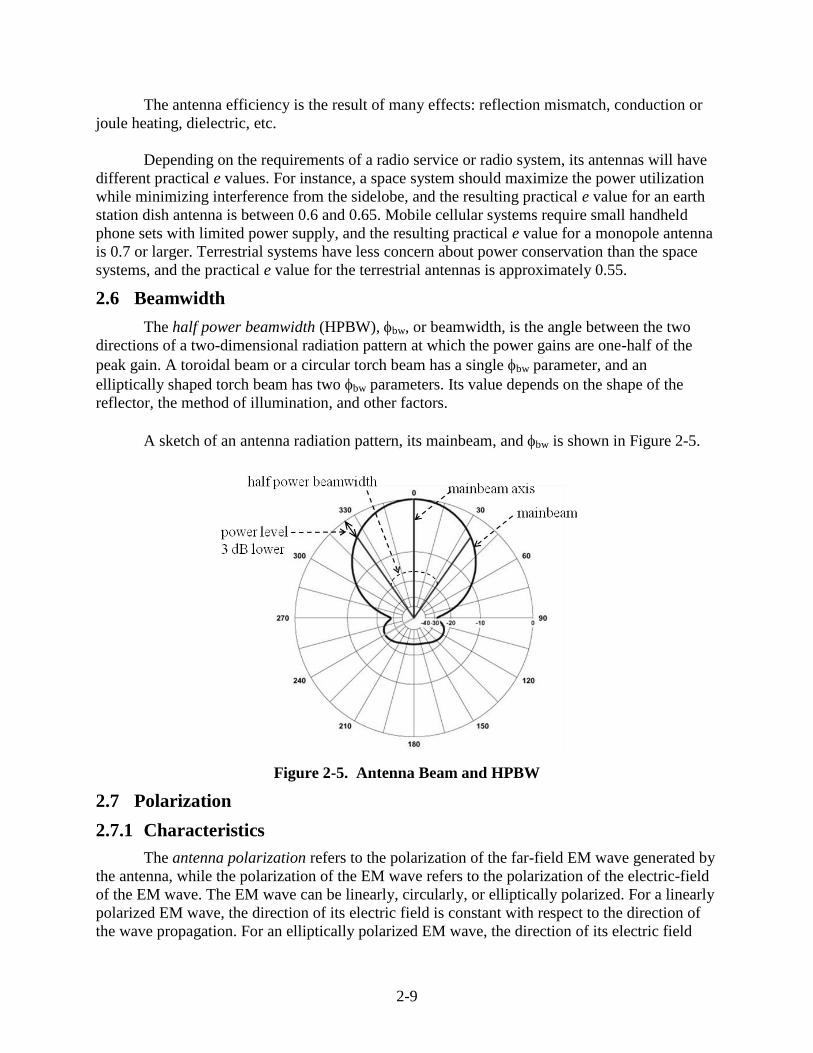
2-9
The antenna efficiency is the result of many effects: reflection mismatch, conduction or
joule heating, dielectric, etc.
Depending on the requirements of a radio service or radio system, its antennas will have
different practical e values. For instance, a space system should maximize the power utilization
while minimizing interference from the sidelobe, and the resulting practical e value for an earth
station dish antenna is between 0.6 and 0.65. Mobile cellular systems require small handheld
phone sets with limited power supply, and the resulting practical e value for a monopole antenna
is 0.7 or larger. Terrestrial systems have less concern about power conservation than the space
systems, and the practical e value for the terrestrial antennas is approximately 0.55.
2.6 Beamwidth
The half power beamwidth (HPBW), bw, or beamwidth, is the angle between the two
directions of a two-dimensional radiation pattern at which the power gains are one-half of the
peak gain. A toroidal beam or a circular torch beam has a single bw parameter, and an
elliptically shaped torch beam has two bw parameters. Its value depends on the shape of the
reflector, the method of illumination, and other factors.
A sketch of an antenna radiation pattern, its mainbeam, and bw is shown in Figure 2-5.
Figure 2-5. Antenna Beam and HPBW
2.7 Polarization
2.7.1 Characteristics
The antenna polarization refers to the polarization of the far-field EM wave generated by
the antenna, while the polarization of the EM wave refers to the polarization of the electric-field
of the EM wave. The EM wave can be linearly, circularly, or elliptically polarized. For a linearly
polarized EM wave, the direction of its electric field is constant with respect to the direction of
the wave propagation. For an elliptically polarized EM wave, the direction of its electric field
2-10
rotates with respect to the direction of the wave propagation, and it can be either right-hand
circular polarization (RHCP) or left-hand circular polarization (LHCP). Circular polarization is a
special case of elliptical polarization where the major and minor axes of the rotation are the
same.
In radio communications, linear polarization is designated according to the relationship of
the polarization to the Earth, and is usually horizontal or vertical. For the terrestrial radio
services, a radio signal is horizontally polarized when its electric-field is parallel to the
horizontal plane (or ground), and it is vertically polarized when its electric-field is perpendicular
to the horizontal plane. For the space radio services, a radio signal is horizontally polarized when
its electric-field is parallel to the equatorial plane (or the east-west direction), and it is vertically
polarized when its electric-field is perpendicular to the equatorial plane (or the north-south
direction).
Characteristics of a radio system’s propagation environment and operation may dictate
the selection of polarization. For instance, in the case of propagation environment, vertical
polarization is the preferred choice for a terrestrial radio relay system or broadcasting system due
to the lossy characteristics of the ground. Or, circular polarization is the preferred choice for a
space system operating in frequency bands subject to Faraday rotation in the ionosphere.10 In the
case of operation, circular polarization is the preferred choice for the mobile satellite systems
because it is difficult to align the linear polarization of the mobile earth station terminals.
2.7.2 Co-Polarization and Cross-Polarization
When a radio signal has the same polarization as the antenna’s designated polarization,
the signal and the antenna are mutually “co-polarized.” When the radio signal has orthogonal
polarization to the antenna’s designated polarization, i.e., horizontal vs. vertical or RHCP vs.
LHCP, the signal and the antenna are mutually “cross-polarized.”
While an antenna is designed with a specific polarization, the unavoidable imperfection
of the antenna geometry and its mounting structures can cause the antenna to have cross-
polarization characteristics in its operations. Therefore, an antenna is always associated with a
co-polarization radiation pattern and a cross-polarization radiation pattern, and it always
transmits and receives cross-polarized radio signals. A graph of an antenna co- and cross-
polarization radiation patterns are shown in Figure 2-6.11
10 The Faraday effect describes the reaction of an EM wave when it passes through a magnetic field. When an EM
wave passes through a medium possessing magnetic field, e.g., ionosphere, the Faraday effect causes the
polarization of the wave to rotate gradually. Therefore, this effect is also called Faraday rotation. The magnitude
of the rotation is proportional to the square of the wavelength and the strength of the magnetic field in the
direction of propagation. It causes polarization tiltation of a linearly polarized EM wave and phase shift of a
circularly polarized EM wave.
11 http://www.nearfield.com/amta/Images/AMTA00_TS_Thm_05.jpg, accessed Nov. 9, 2011.
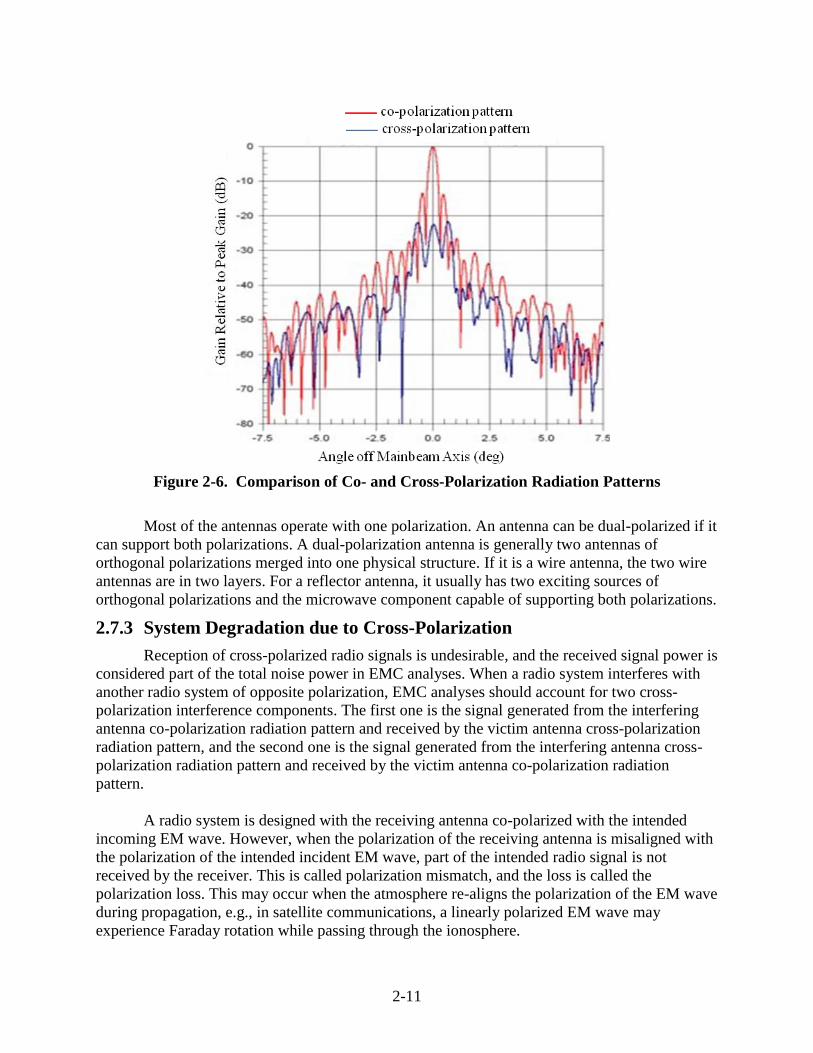
2-11
Figure 2-6. Comparison of Co- and Cross-Polarization Radiation Patterns
Most of the antennas operate with one polarization. An antenna can be dual-polarized if it
can support both polarizations. A dual-polarization antenna is generally two antennas of
orthogonal polarizations merged into one physical structure. If it is a wire antenna, the two wire
antennas are in two layers. For a reflector antenna, it usually has two exciting sources of
orthogonal polarizations and the microwave component capable of supporting both polarizations.
2.7.3 System Degradation due to Cross-Polarization
Reception of cross-polarized radio signals is undesirable, and the received signal power is
considered part of the total noise power in EMC analyses. When a radio system interferes with
another radio system of opposite polarization, EMC analyses should account for two cross-
polarization interference components. The first one is the signal generated from the interfering
antenna co-polarization radiation pattern and received by the victim antenna cross-polarization
radiation pattern, and the second one is the signal generated from the interfering antenna cross-
polarization radiation pattern and received by the victim antenna co-polarization radiation
pattern.
A radio system is designed with the receiving antenna co-polarized with the intended
incoming EM wave. However, when the polarization of the receiving antenna is misaligned with
the polarization of the intended incident EM wave, part of the intended radio signal is not
received by the receiver. This is called polarization mismatch, and the loss is called the
polarization loss. This may occur when the atmosphere re-aligns the polarization of the EM wave
during propagation, e.g., in satellite communications, a linearly polarized EM wave may
experience Faraday rotation while passing through the ionosphere.
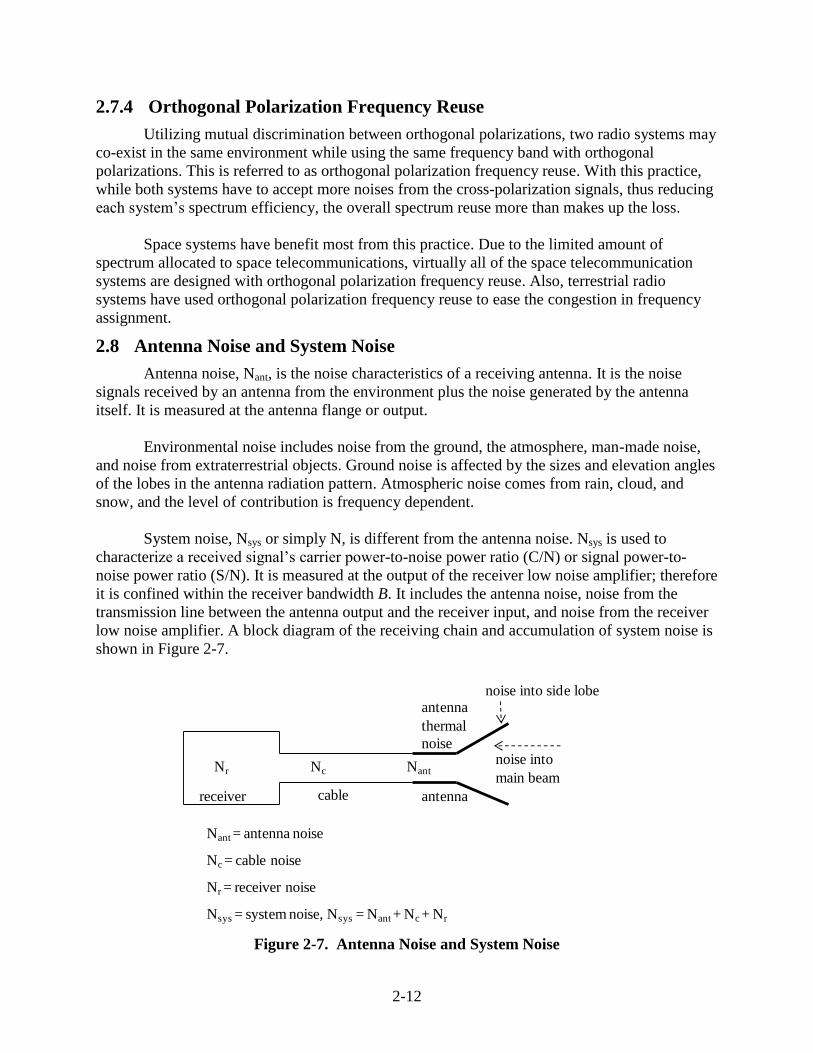
2-12
2.7.4 Orthogonal Polarization Frequency Reuse
Utilizing mutual discrimination between orthogonal polarizations, two radio systems may
co-exist in the same environment while using the same frequency band with orthogonal
polarizations. This is referred to as orthogonal polarization frequency reuse. With this practice,
while both systems have to accept more noises from the cross-polarization signals, thus reducing
each system’s spectrum efficiency, the overall spectrum reuse more than makes up the loss.
Space systems have benefit most from this practice. Due to the limited amount of
spectrum allocated to space telecommunications, virtually all of the space telecommunication
systems are designed with orthogonal polarization frequency reuse. Also, terrestrial radio
systems have used orthogonal polarization frequency reuse to ease the congestion in frequency
assignment.
2.8 Antenna Noise and System Noise
Antenna noise, Nant, is the noise characteristics of a receiving antenna. It is the noise
signals received by an antenna from the environment plus the noise generated by the antenna
itself. It is measured at the antenna flange or output.
Environmental noise includes noise from the ground, the atmosphere, man-made noise,
and noise from extraterrestrial objects. Ground noise is affected by the sizes and elevation angles
of the lobes in the antenna radiation pattern. Atmospheric noise comes from rain, cloud, and
snow, and the level of contribution is frequency dependent.
System noise, Nsys or simply N, is different from the antenna noise. Nsys is used to
characterize a received signal’s carrier power-to-noise power ratio (C/N) or signal power-to-
noise power ratio (S/N). It is measured at the output of the receiver low noise amplifier; therefore
it is confined within the receiver bandwidth B. It includes the antenna noise, noise from the
transmission line between the antenna output and the receiver input, and noise from the receiver
low noise amplifier. A block diagram of the receiving chain and accumulation of system noise is
shown in Figure 2-7.
Figure 2-7. Antenna Noise and System Noise
receiver cable
Nr Nc Nant
antenna
Nant = antenna noise
Nc = cable noise
Nr = receiver noise
Nsys = system noise, Nsys = Nant + Nc + Nr
noise into
main beam
noise into side lobeantenna
thermal
noise
2-13
2.9 Bandwidth
Antennas are usually designed with a specific frequency, and their performance
characteristics, e.g., gain and radiation pattern, are generally specified with that specific
frequency. These characteristics change, generally deteriorate, as the operating frequency
deviates from the specified frequency. The frequency range within which the performance
characteristics maintain certain level with respect to the specified performance characteristics,
e.g., 90%, is referred to as the antenna bandwidth.
Different types of antennas, e.g., wire or aperture antenna to be discussed in Section 3,
have different bandwidth characteristics. In general, wire antennas have narrower bandwidths
than aperture antennas. For instance, the bandwidth of a simple linear wire antenna is about 8–
16% of its designed frequency. Therefore, much effort had been spent to develop broadband wire
antennas by changing the physical shapes of the antennas.
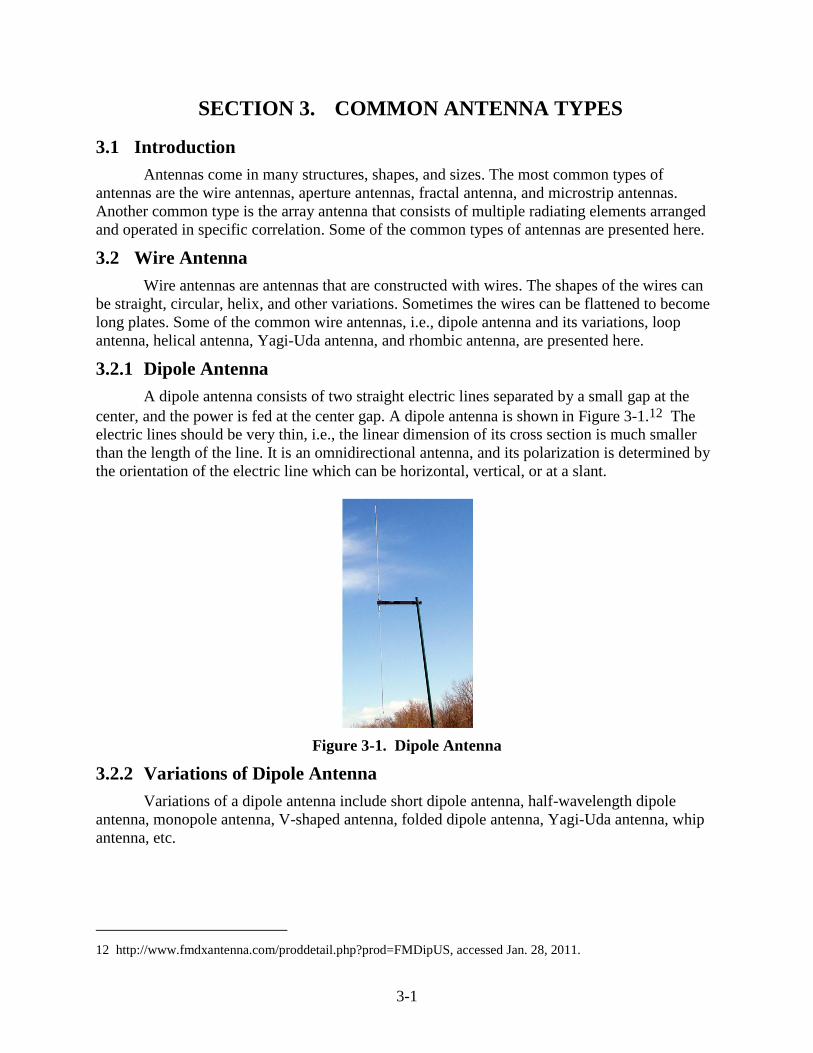
3-1
SECTION 3. COMMON ANTENNA TYPES
3.1 Introduction
Antennas come in many structures, shapes, and sizes. The most common types of
antennas are the wire antennas, aperture antennas, fractal antenna, and microstrip antennas.
Another common type is the array antenna that consists of multiple radiating elements arranged
and operated in specific correlation. Some of the common types of antennas are presented here.
3.2 Wire Antenna
Wire antennas are antennas that are constructed with wires. The shapes of the wires can
be straight, circular, helix, and other variations. Sometimes the wires can be flattened to become
long plates. Some of the common wire antennas, i.e., dipole antenna and its variations, loop
antenna, helical antenna, Yagi-Uda antenna, and rhombic antenna, are presented here.
3.2.1 Dipole Antenna
A dipole antenna consists of two straight electric lines separated by a small gap at the
center, and the power is fed at the center gap. A dipole antenna is shown in Figure 3-1.12 The
electric lines should be very thin, i.e., the linear dimension of its cross section is much smaller
than the length of the line. It is an omnidirectional antenna, and its polarization is determined by
the orientation of the electric line which can be horizontal, vertical, or at a slant.
Figure 3-1. Dipole Antenna
3.2.2 Variations of Dipole Antenna
Variations of a dipole antenna include short dipole antenna, half-wavelength dipole
antenna, monopole antenna, V-shaped antenna, folded dipole antenna, Yagi-Uda antenna, whip
antenna, etc.
12 http://www.fmdxantenna.com/proddetail.php?prod=FMDipUS, accessed Jan. 28, 2011.
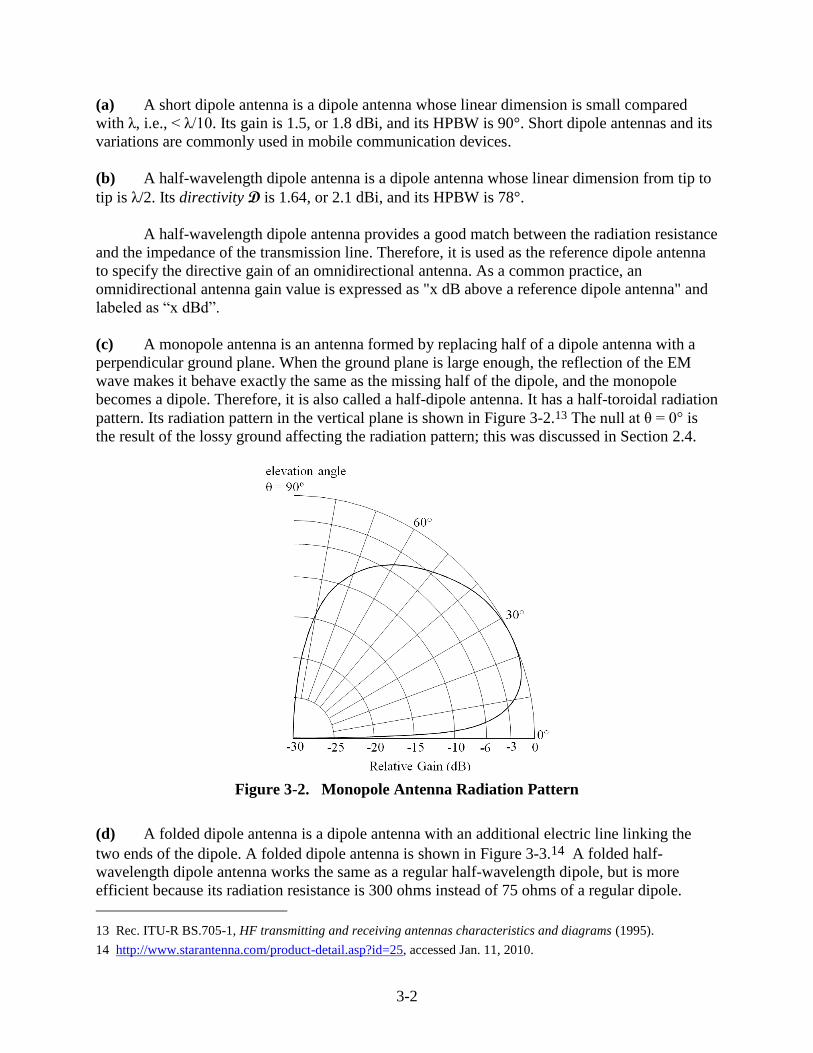
3-2
(a) A short dipole antenna is a dipole antenna whose linear dimension is small compared
with λ, i.e., < λ/10. Its gain is 1.5, or 1.8 dBi, and its HPBW is 90°. Short dipole antennas and its
variations are commonly used in mobile communication devices.
(b) A half-wavelength dipole antenna is a dipole antenna whose linear dimension from tip to
tip is λ/2. Its directivity D is 1.64, or 2.1 dBi, and its HPBW is 78°.
A half-wavelength dipole antenna provides a good match between the radiation resistance
and the impedance of the transmission line. Therefore, it is used as the reference dipole antenna
to specify the directive gain of an omnidirectional antenna. As a common practice, an
omnidirectional antenna gain value is expressed as "x dB above a reference dipole antenna" and
labeled as “x dBd”.
(c) A monopole antenna is an antenna formed by replacing half of a dipole antenna with a
perpendicular ground plane. When the ground plane is large enough, the reflection of the EM
wave makes it behave exactly the same as the missing half of the dipole, and the monopole
becomes a dipole. Therefore, it is also called a half-dipole antenna. It has a half-toroidal radiation
pattern. Its radiation pattern in the vertical plane is shown in Figure 3-2.13 The null at θ = 0° is
the result of the lossy ground affecting the radiation pattern; this was discussed in Section 2.4.
Figure 3-2. Monopole Antenna Radiation Pattern
(d) A folded dipole antenna is a dipole antenna with an additional electric line linking the
two ends of the dipole. A folded dipole antenna is shown in Figure 3-3.14 A folded half-
wavelength dipole antenna works the same as a regular half-wavelength dipole, but is more
efficient because its radiation resistance is 300 ohms instead of 75 ohms of a regular dipole.
13 Rec. ITU-R BS.705-1, HF transmitting and receiving antennas characteristics and diagrams (1995).
14 http://www.starantenna.com/product-detail.asp?id=25, accessed Jan. 11, 2010.
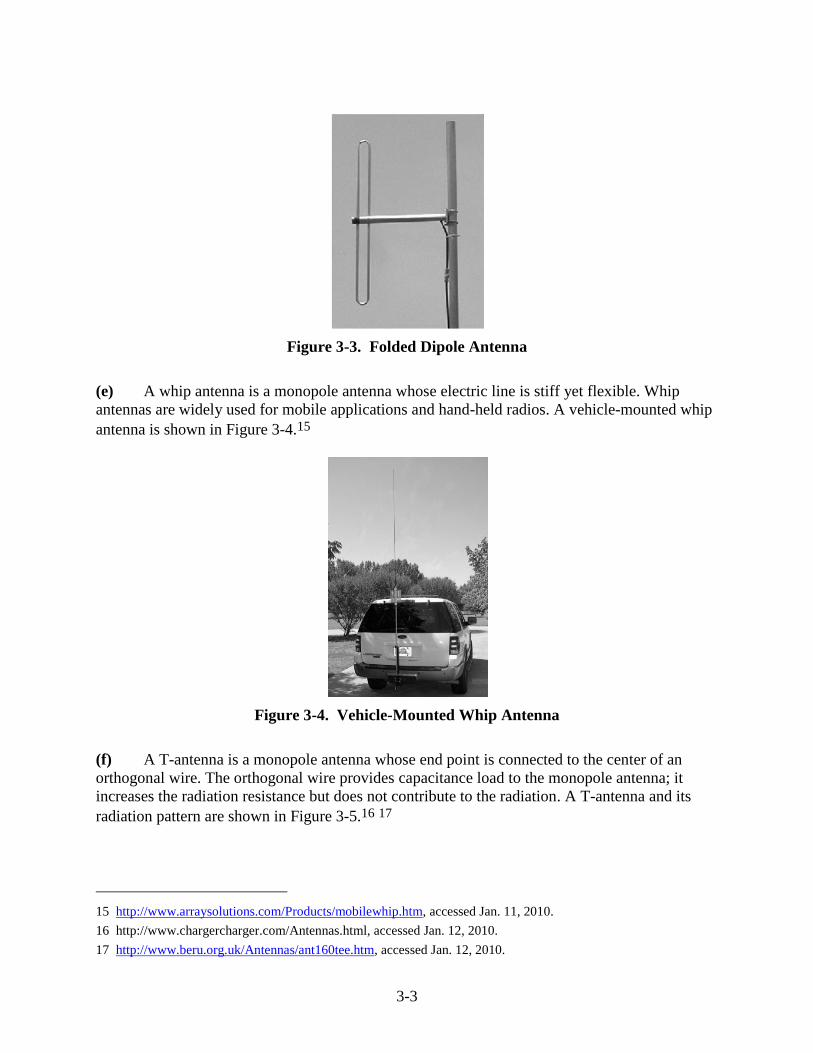
3-3
Figure 3-3. Folded Dipole Antenna
(e) A whip antenna is a monopole antenna whose electric line is stiff yet flexible. Whip
antennas are widely used for mobile applications and hand-held radios. A vehicle-mounted whip
antenna is shown in Figure 3-4.15
Figure 3-4. Vehicle-Mounted Whip Antenna
(f) A T-antenna is a monopole antenna whose end point is connected to the center of an
orthogonal wire. The orthogonal wire provides capacitance load to the monopole antenna; it
increases the radiation resistance but does not contribute to the radiation. A T-antenna and its
radiation pattern are shown in Figure 3-5.16 17
15 http://www.arraysolutions.com/Products/mobilewhip.htm, accessed Jan. 11, 2010.
16 http://www.chargercharger.com/Antennas.html, accessed Jan. 12, 2010.
17 http://www.beru.org.uk/Antennas/ant160tee.htm, accessed Jan. 12, 2010.
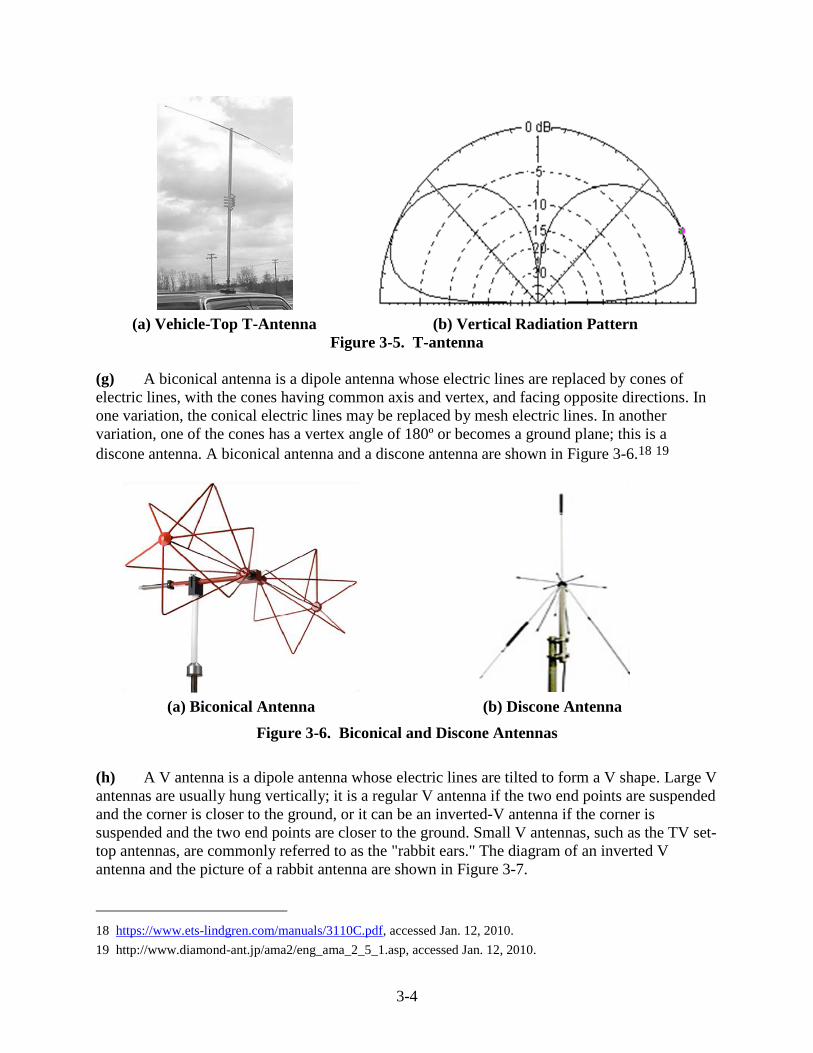
3-4
(a) Vehicle-Top T-Antenna (b) Vertical Radiation Pattern
Figure 3-5. T-antenna
(g) A biconical antenna is a dipole antenna whose electric lines are replaced by cones of
electric lines, with the cones having common axis and vertex, and facing opposite directions. In
one variation, the conical electric lines may be replaced by mesh electric lines. In another
variation, one of the cones has a vertex angle of 180º or becomes a ground plane; this is a
discone antenna. A biconical antenna and a discone antenna are shown in Figure 3-6.18 19
(a) Biconical Antenna (b) Discone Antenna
Figure 3-6. Biconical and Discone Antennas
(h) A V antenna is a dipole antenna whose electric lines are tilted to form a V shape. Large V
antennas are usually hung vertically; it is a regular V antenna if the two end points are suspended
and the corner is closer to the ground, or it can be an inverted-V antenna if the corner is
suspended and the two end points are closer to the ground. Small V antennas, such as the TV set-
top antennas, are commonly referred to as the "rabbit ears." The diagram of an inverted V
antenna and the picture of a rabbit antenna are shown in Figure 3-7.
18 https://www.ets-lindgren.com/manuals/3110C.pdf, accessed Jan. 12, 2010.
19 http://www.diamond-ant.jp/ama2/eng_ama_2_5_1.asp, accessed Jan. 12, 2010.
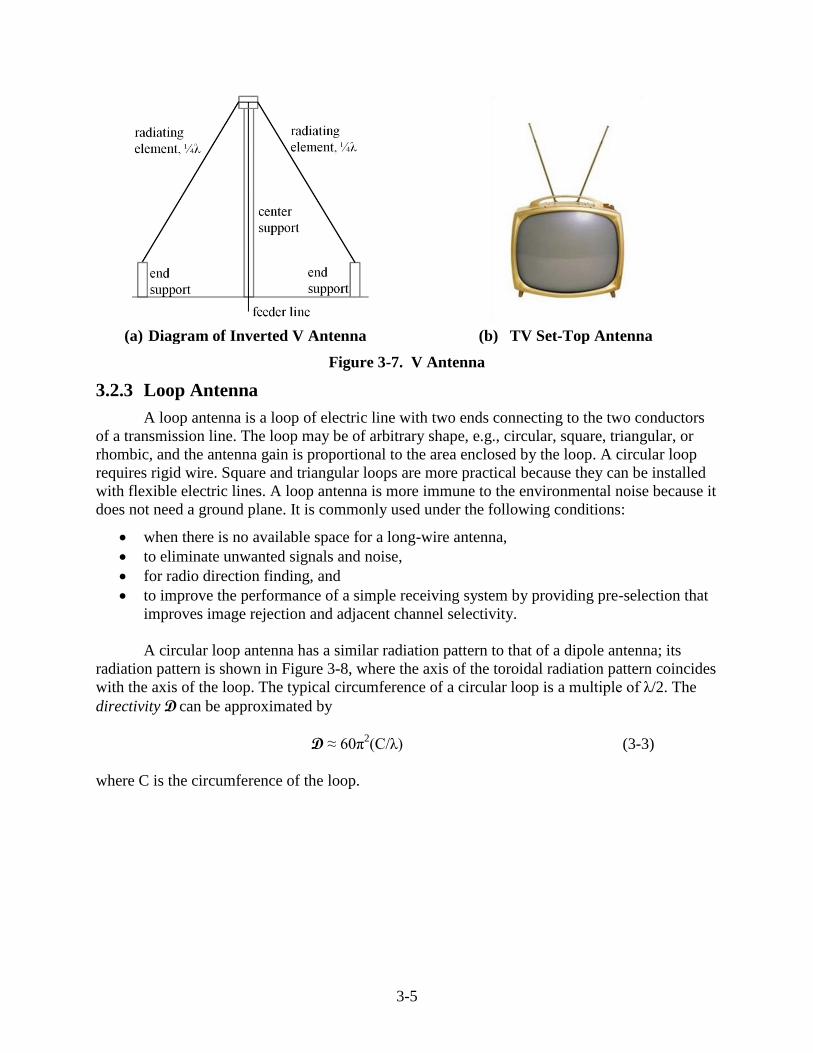
3-5
(a) Diagram of Inverted V Antenna (b) TV Set-Top Antenna
Figure 3-7. V Antenna
3.2.3 Loop Antenna
A loop antenna is a loop of electric line with two ends connecting to the two conductors
of a transmission line. The loop may be of arbitrary shape, e.g., circular, square, triangular, or
rhombic, and the antenna gain is proportional to the area enclosed by the loop. A circular loop
requires rigid wire. Square and triangular loops are more practical because they can be installed
with flexible electric lines. A loop antenna is more immune to the environmental noise because it
does not need a ground plane. It is commonly used under the following conditions:
when there is no available space for a long-wire antenna,
to eliminate unwanted signals and noise,
for radio direction finding, and
to improve the performance of a simple receiving system by providing pre-selection that
improves image rejection and adjacent channel selectivity.
A circular loop antenna has a similar radiation pattern to that of a dipole antenna; its
radiation pattern is shown in Figure 3-8, where the axis of the toroidal radiation pattern coincides
with the axis of the loop. The typical circumference of a circular loop is a multiple of λ/2. The
directivity D can be approximated by
D ≈ 60π2(C/λ) (3-3)
where C is the circumference of the loop.
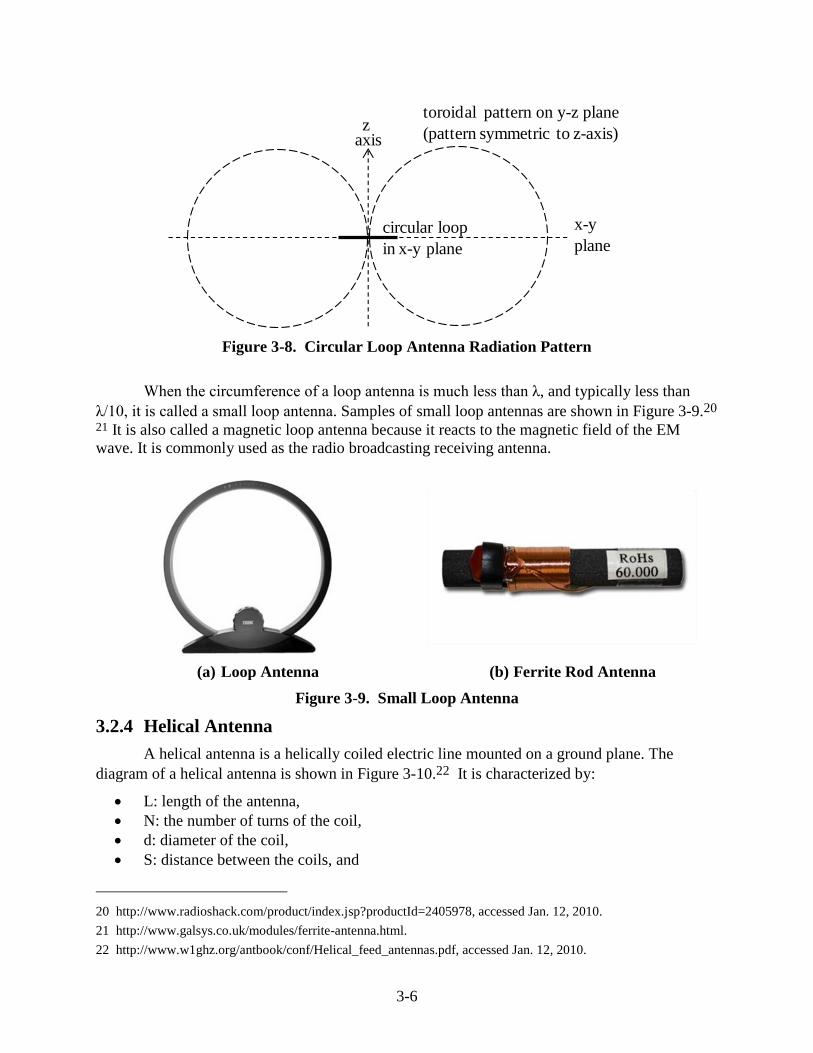
3-6
Figure 3-8. Circular Loop Antenna Radiation Pattern
When the circumference of a loop antenna is much less than λ, and typically less than
λ/10, it is called a small loop antenna. Samples of small loop antennas are shown in Figure 3-9.20 21 It is also called a magnetic loop antenna because it reacts to the magnetic field of the EM
wave. It is commonly used as the radio broadcasting receiving antenna.
(a) Loop Antenna (b) Ferrite Rod Antenna
Figure 3-9. Small Loop Antenna
3.2.4 Helical Antenna
A helical antenna is a helically coiled electric line mounted on a ground plane. The
diagram of a helical antenna is shown in Figure 3-10.22 It is characterized by:
L: length of the antenna,
N: the number of turns of the coil,
d: diameter of the coil,
S: distance between the coils, and
20 http://www.radioshack.com/product/index.jsp?productId=2405978, accessed Jan. 12, 2010.
21 http://www.galsys.co.uk/modules/ferrite-antenna.html.
22 http://www.w1ghz.org/antbook/conf/Helical_feed_antennas.pdf, accessed Jan. 12, 2010.
z
x-y
plane
toroidal pattern on y-z plane
(pattern symmetric to z-axis)
circular loop
in x-y plane
axis
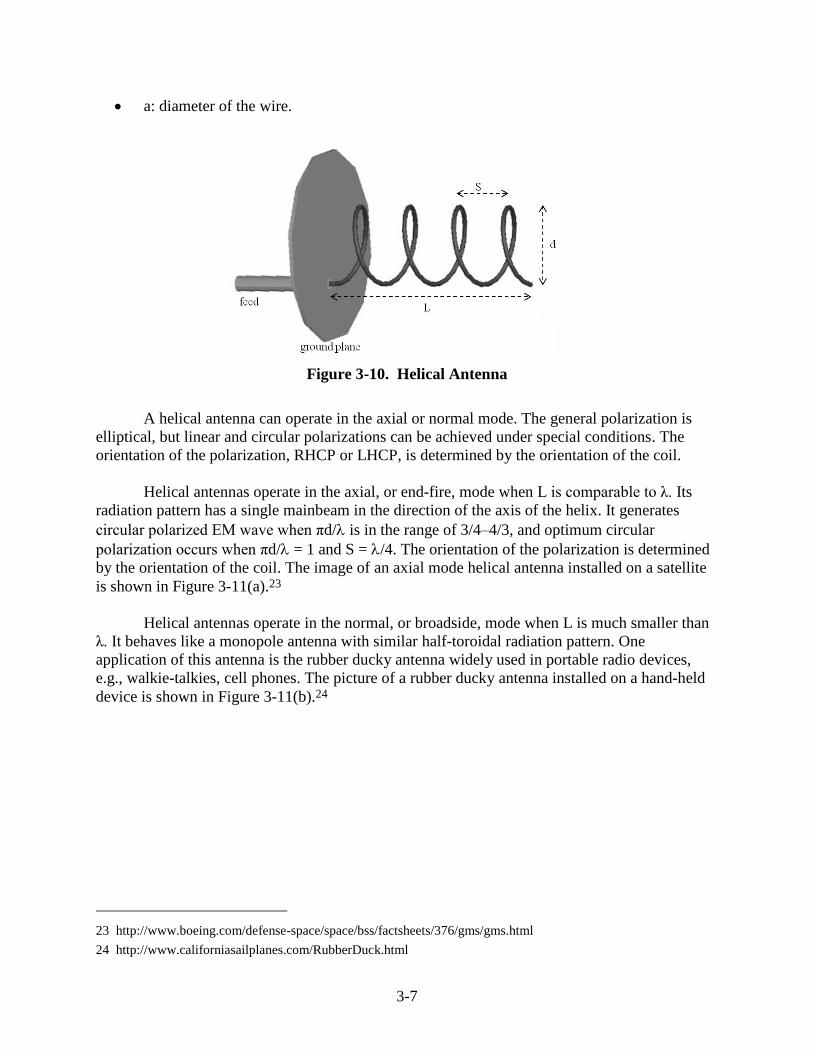
3-7
a: diameter of the wire.
Figure 3-10. Helical Antenna
A helical antenna can operate in the axial or normal mode. The general polarization is
elliptical, but linear and circular polarizations can be achieved under special conditions. The
orientation of the polarization, RHCP or LHCP, is determined by the orientation of the coil.
Helical antennas operate in the axial, or end-fire, mode when L is comparable to λ. Its
radiation pattern has a single mainbeam in the direction of the axis of the helix. It generates
circular polarized EM wave when πd/ is in the range of 3/4–4/3, and optimum circular
polarization occurs when πd/= 1 and S = /4. The orientation of the polarization is determined
by the orientation of the coil. The image of an axial mode helical antenna installed on a satellite
is shown in Figure 3-11(a).23
Helical antennas operate in the normal, or broadside, mode when L is much smaller than
λ. It behaves like a monopole antenna with similar half-toroidal radiation pattern. One
application of this antenna is the rubber ducky antenna widely used in portable radio devices,
e.g., walkie-talkies, cell phones. The picture of a rubber ducky antenna installed on a hand-held
device is shown in Figure 3-11(b).24
23 http://www.boeing.com/defense-space/space/bss/factsheets/376/gms/gms.html
24 http://www.californiasailplanes.com/RubberDuck.html
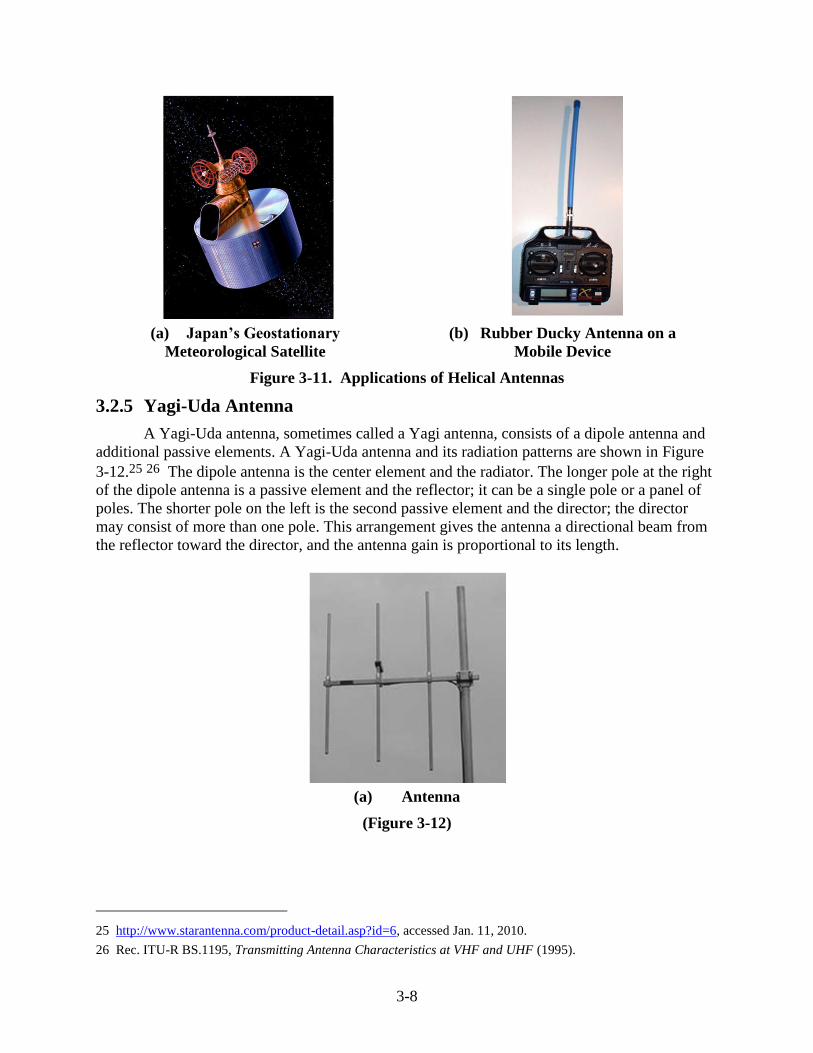
3-8
(a) Japan’s Geostationary
Meteorological Satellite
(b) Rubber Ducky Antenna on a
Mobile Device
Figure 3-11. Applications of Helical Antennas
3.2.5 Yagi-Uda Antenna
A Yagi-Uda antenna, sometimes called a Yagi antenna, consists of a dipole antenna and
additional passive elements. A Yagi-Uda antenna and its radiation patterns are shown in Figure
3-12.25 26 The dipole antenna is the center element and the radiator. The longer pole at the right
of the dipole antenna is a passive element and the reflector; it can be a single pole or a panel of
poles. The shorter pole on the left is the second passive element and the director; the director
may consist of more than one pole. This arrangement gives the antenna a directional beam from
the reflector toward the director, and the antenna gain is proportional to its length.
(a) Antenna
(Figure 3-12)
25 http://www.starantenna.com/product-detail.asp?id=6, accessed Jan. 11, 2010.
26 Rec. ITU-R BS.1195, Transmitting Antenna Characteristics at VHF and UHF (1995).
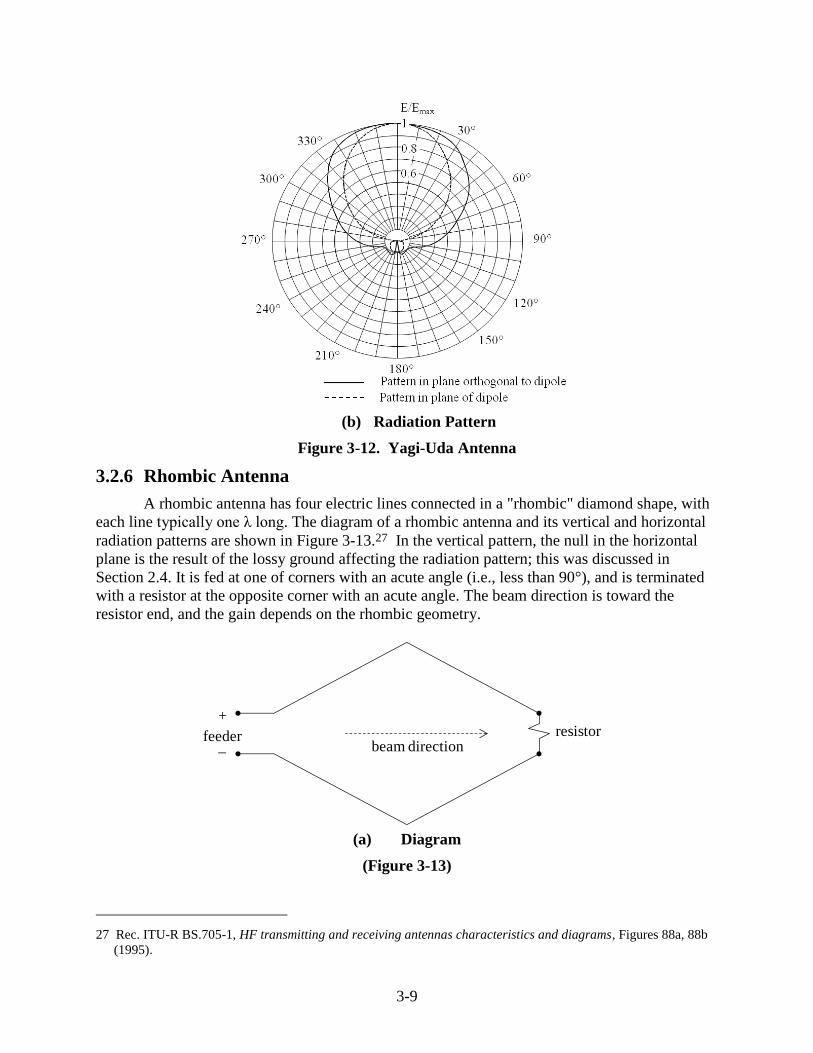
3-9
(b) Radiation Pattern
Figure 3-12. Yagi-Uda Antenna
3.2.6 Rhombic Antenna
A rhombic antenna has four electric lines connected in a "rhombic" diamond shape, with
each line typically one λ long. The diagram of a rhombic antenna and its vertical and horizontal
radiation patterns are shown in Figure 3-13.27 In the vertical pattern, the null in the horizontal
plane is the result of the lossy ground affecting the radiation pattern; this was discussed in
Section 2.4. It is fed at one of corners with an acute angle (i.e., less than 90°), and is terminated
with a resistor at the opposite corner with an acute angle. The beam direction is toward the
resistor end, and the gain depends on the rhombic geometry.
(a) Diagram
(Figure 3-13)
27 Rec. ITU-R BS.705-1, HF transmitting and receiving antennas characteristics and diagrams, Figures 88a, 88b
(1995).
resistorbeam direction
feeder
+
_
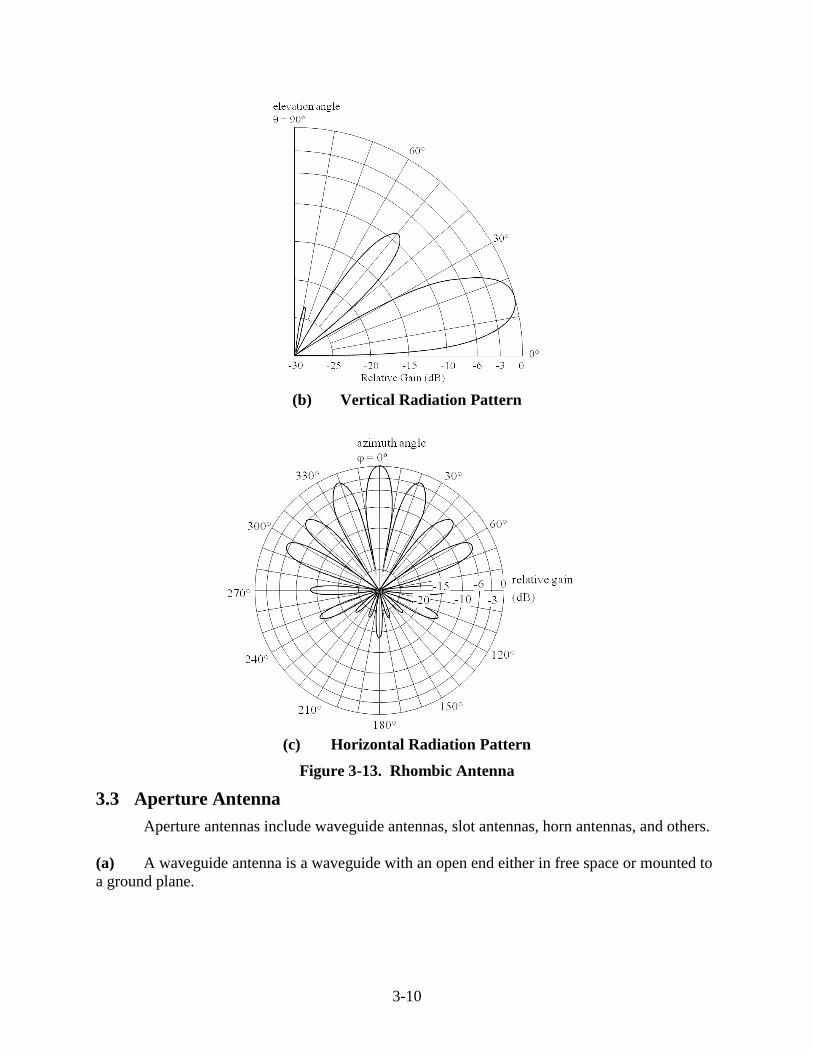
3-10
(b) Vertical Radiation Pattern
(c) Horizontal Radiation Pattern
Figure 3-13. Rhombic Antenna
3.3 Aperture Antenna
Aperture antennas include waveguide antennas, slot antennas, horn antennas, and others.
(a) A waveguide antenna is a waveguide with an open end either in free space or mounted to
a ground plane.
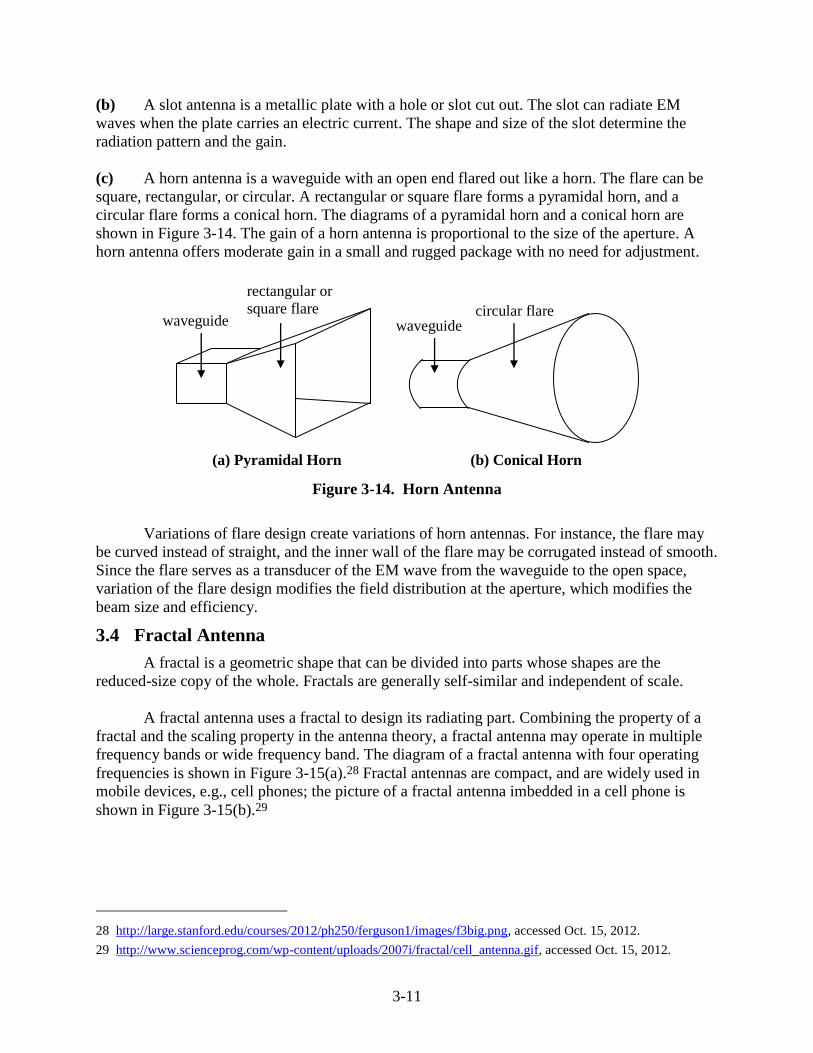
3-11
(b) A slot antenna is a metallic plate with a hole or slot cut out. The slot can radiate EM
waves when the plate carries an electric current. The shape and size of the slot determine the
radiation pattern and the gain.
(c) A horn antenna is a waveguide with an open end flared out like a horn. The flare can be
square, rectangular, or circular. A rectangular or square flare forms a pyramidal horn, and a
circular flare forms a conical horn. The diagrams of a pyramidal horn and a conical horn are
shown in Figure 3-14. The gain of a horn antenna is proportional to the size of the aperture. A
horn antenna offers moderate gain in a small and rugged package with no need for adjustment.
Figure 3-14. Horn Antenna
Variations of flare design create variations of horn antennas. For instance, the flare may
be curved instead of straight, and the inner wall of the flare may be corrugated instead of smooth.
Since the flare serves as a transducer of the EM wave from the waveguide to the open space,
variation of the flare design modifies the field distribution at the aperture, which modifies the
beam size and efficiency.
3.4 Fractal Antenna
A fractal is a geometric shape that can be divided into parts whose shapes are the
reduced-size copy of the whole. Fractals are generally self-similar and independent of scale.
A fractal antenna uses a fractal to design its radiating part. Combining the property of a
fractal and the scaling property in the antenna theory, a fractal antenna may operate in multiple
frequency bands or wide frequency band. The diagram of a fractal antenna with four operating
frequencies is shown in Figure 3-15(a).28 Fractal antennas are compact, and are widely used in
mobile devices, e.g., cell phones; the picture of a fractal antenna imbedded in a cell phone is
shown in Figure 3-15(b).29
28 http://large.stanford.edu/courses/2012/ph250/ferguson1/images/f3big.png, accessed Oct. 15, 2012.
29 http://www.scienceprog.com/wp-content/uploads/2007i/fractal/cell_antenna.gif, accessed Oct. 15, 2012.
(a) Pyramidal Horn (b) Conical Horn
waveguide waveguide
rectangular or
square flare circular flare
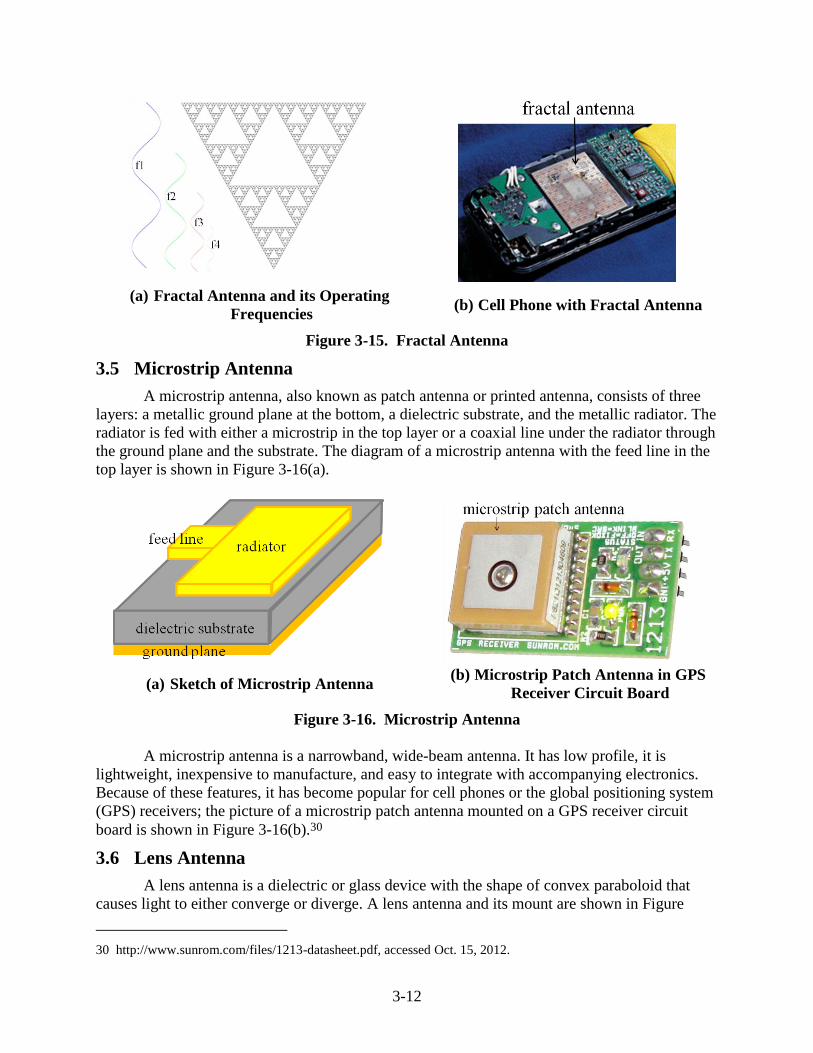
3-12
(a) Fractal Antenna and its Operating
Frequencies (b) Cell Phone with Fractal Antenna
Figure 3-15. Fractal Antenna
3.5 Microstrip Antenna
A microstrip antenna, also known as patch antenna or printed antenna, consists of three
layers: a metallic ground plane at the bottom, a dielectric substrate, and the metallic radiator. The
radiator is fed with either a microstrip in the top layer or a coaxial line under the radiator through
the ground plane and the substrate. The diagram of a microstrip antenna with the feed line in the
top layer is shown in Figure 3-16(a).
(a) Sketch of Microstrip Antenna (b) Microstrip Patch Antenna in GPS
Receiver Circuit Board
Figure 3-16. Microstrip Antenna
A microstrip antenna is a narrowband, wide-beam antenna. It has low profile, it is
lightweight, inexpensive to manufacture, and easy to integrate with accompanying electronics.
Because of these features, it has become popular for cell phones or the global positioning system
(GPS) receivers; the picture of a microstrip patch antenna mounted on a GPS receiver circuit
board is shown in Figure 3-16(b).30
3.6 Lens Antenna
A lens antenna is a dielectric or glass device with the shape of convex paraboloid that
causes light to either converge or diverge. A lens antenna and its mount are shown in Figure
30 http://www.sunrom.com/files/1213-datasheet.pdf, accessed Oct. 15, 2012.
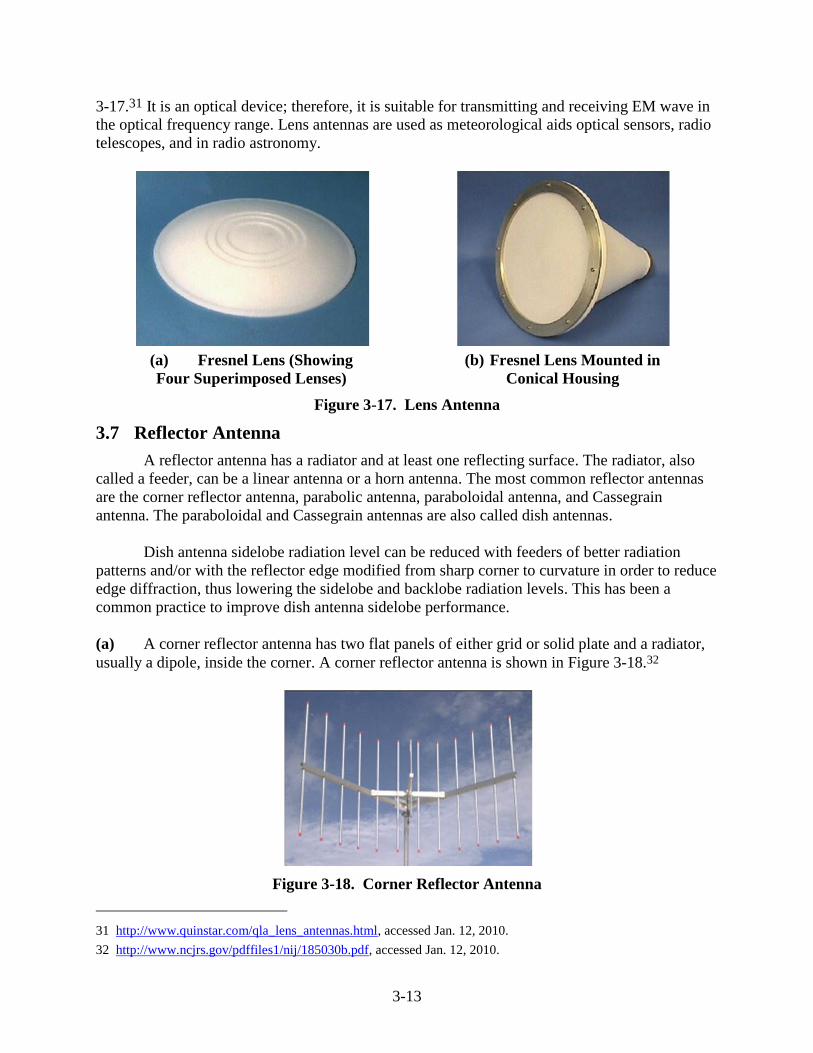
3-13
3-17.31 It is an optical device; therefore, it is suitable for transmitting and receiving EM wave in
the optical frequency range. Lens antennas are used as meteorological aids optical sensors, radio
telescopes, and in radio astronomy.
(a) Fresnel Lens (Showing
Four Superimposed Lenses)
(b) Fresnel Lens Mounted in
Conical Housing
Figure 3-17. Lens Antenna
3.7 Reflector Antenna
A reflector antenna has a radiator and at least one reflecting surface. The radiator, also
called a feeder, can be a linear antenna or a horn antenna. The most common reflector antennas
are the corner reflector antenna, parabolic antenna, paraboloidal antenna, and Cassegrain
antenna. The paraboloidal and Cassegrain antennas are also called dish antennas.
Dish antenna sidelobe radiation level can be reduced with feeders of better radiation
patterns and/or with the reflector edge modified from sharp corner to curvature in order to reduce
edge diffraction, thus lowering the sidelobe and backlobe radiation levels. This has been a
common practice to improve dish antenna sidelobe performance.
(a) A corner reflector antenna has two flat panels of either grid or solid plate and a radiator,
usually a dipole, inside the corner. A corner reflector antenna is shown in Figure 3-18.32
Figure 3-18. Corner Reflector Antenna
31 http://www.quinstar.com/qla_lens_antennas.html, accessed Jan. 12, 2010.
32 http://www.ncjrs.gov/pdffiles1/nij/185030b.pdf, accessed Jan. 12, 2010.
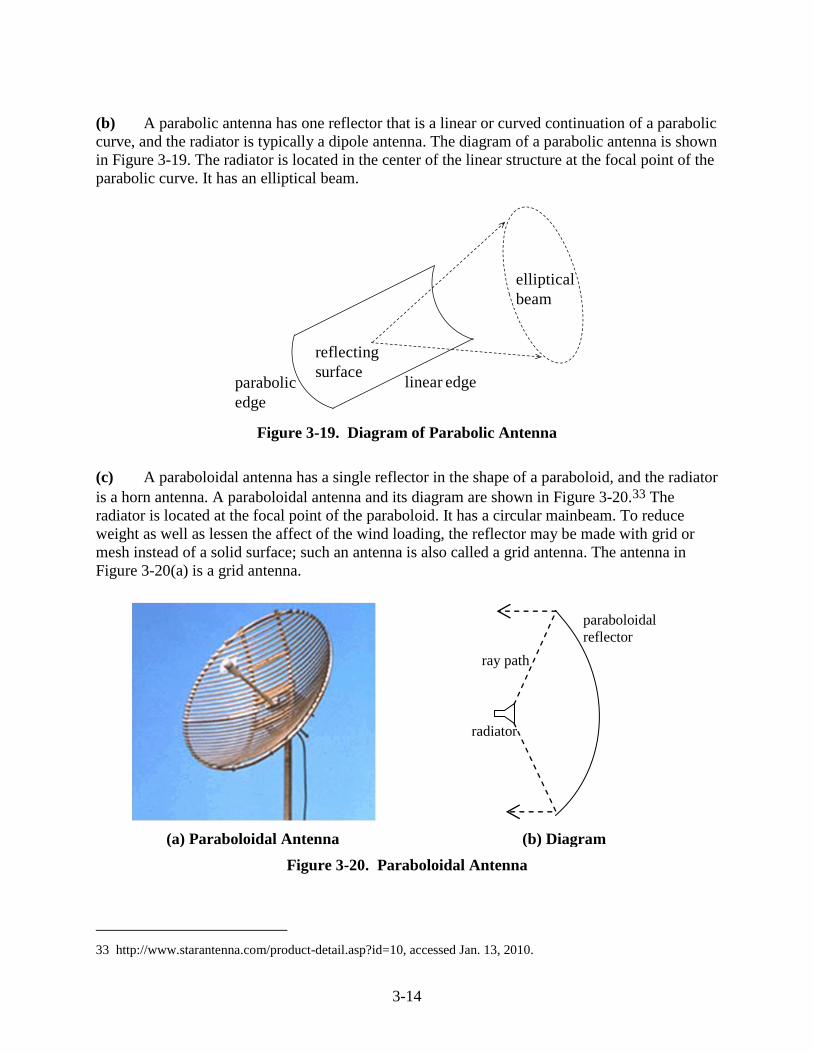
3-14
(b) A parabolic antenna has one reflector that is a linear or curved continuation of a parabolic
curve, and the radiator is typically a dipole antenna. The diagram of a parabolic antenna is shown
in Figure 3-19. The radiator is located in the center of the linear structure at the focal point of the
parabolic curve. It has an elliptical beam.
Figure 3-19. Diagram of Parabolic Antenna
(c) A paraboloidal antenna has a single reflector in the shape of a paraboloid, and the radiator
is a horn antenna. A paraboloidal antenna and its diagram are shown in Figure 3-20.33 The
radiator is located at the focal point of the paraboloid. It has a circular mainbeam. To reduce
weight as well as lessen the affect of the wind loading, the reflector may be made with grid or
mesh instead of a solid surface; such an antenna is also called a grid antenna. The antenna in
Figure 3-20(a) is a grid antenna.
(a) Paraboloidal Antenna (b) Diagram
Figure 3-20. Paraboloidal Antenna
33 http://www.starantenna.com/product-detail.asp?id=10, accessed Jan. 13, 2010.
elliptical
beam
linear edgeparabolic
edge
reflecting
surface
radiator
paraboloidal
reflector
ray path
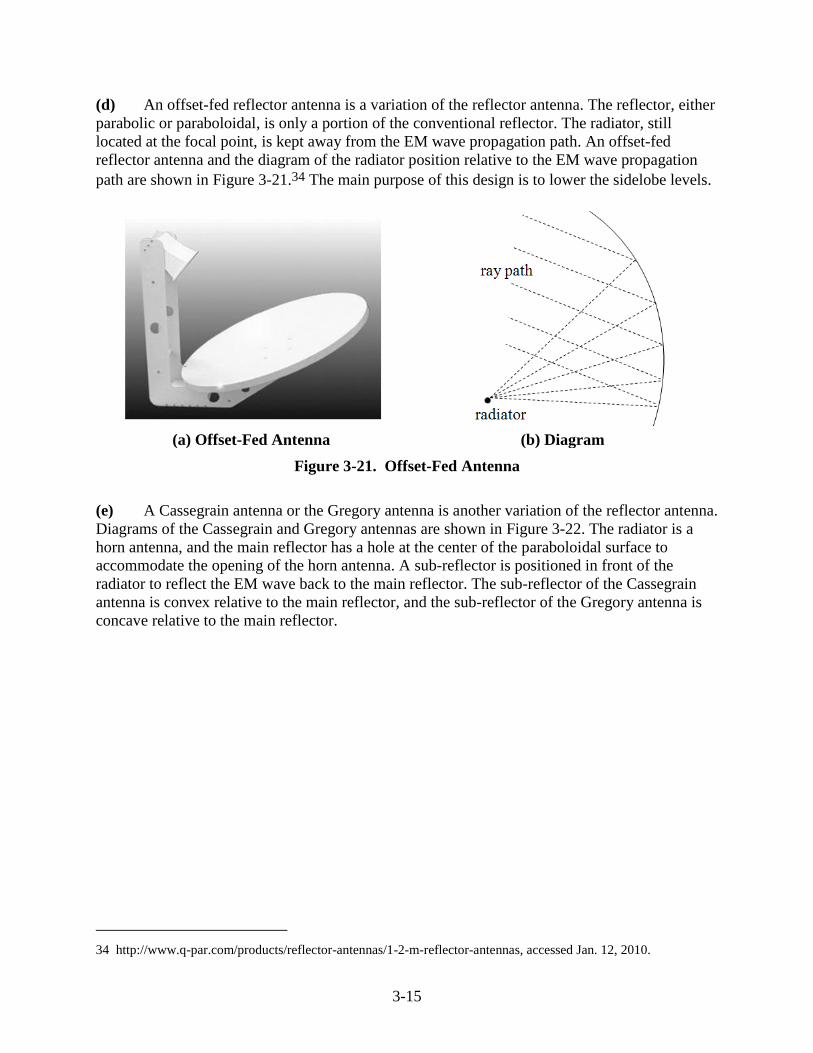
3-15
(d) An offset-fed reflector antenna is a variation of the reflector antenna. The reflector, either
parabolic or paraboloidal, is only a portion of the conventional reflector. The radiator, still
located at the focal point, is kept away from the EM wave propagation path. An offset-fed
reflector antenna and the diagram of the radiator position relative to the EM wave propagation
path are shown in Figure 3-21.34 The main purpose of this design is to lower the sidelobe levels.
(a) Offset-Fed Antenna (b) Diagram
Figure 3-21. Offset-Fed Antenna
(e) A Cassegrain antenna or the Gregory antenna is another variation of the reflector antenna.
Diagrams of the Cassegrain and Gregory antennas are shown in Figure 3-22. The radiator is a
horn antenna, and the main reflector has a hole at the center of the paraboloidal surface to
accommodate the opening of the horn antenna. A sub-reflector is positioned in front of the
radiator to reflect the EM wave back to the main reflector. The sub-reflector of the Cassegrain
antenna is convex relative to the main reflector, and the sub-reflector of the Gregory antenna is
concave relative to the main reflector.
34 http://www.q-par.com/products/reflector-antennas/1-2-m-reflector-antennas, accessed Jan. 12, 2010.
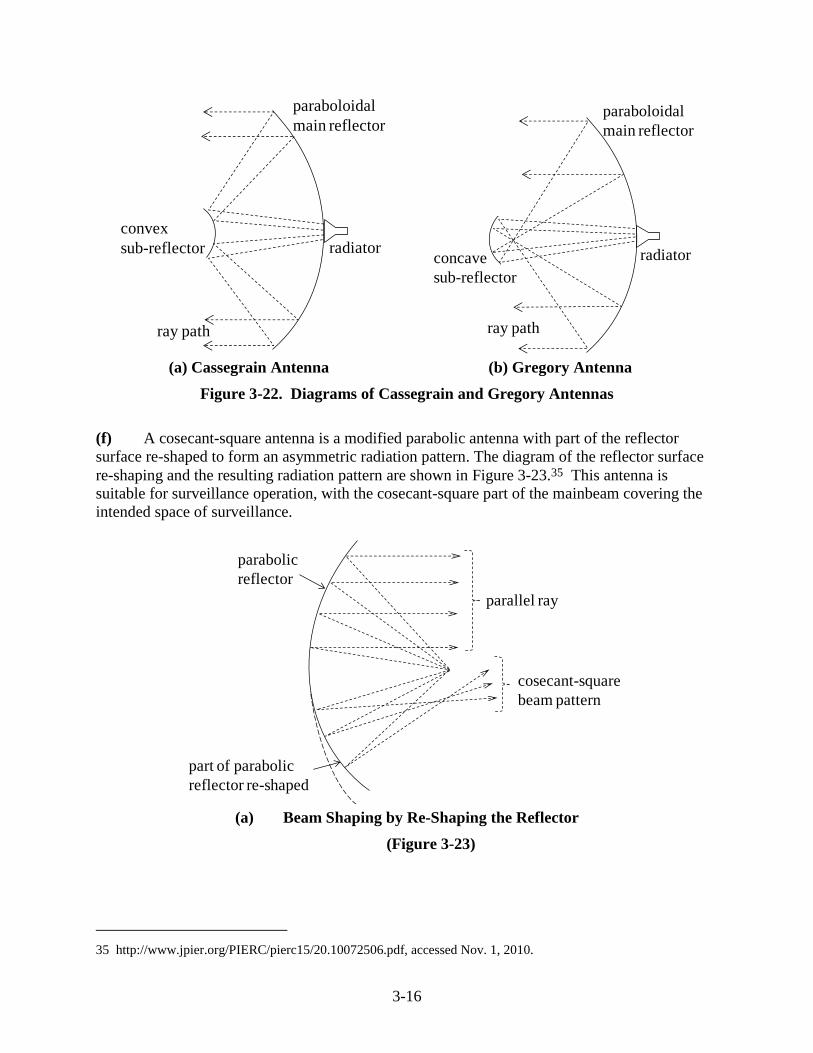
3-16
(a) Cassegrain Antenna (b) Gregory Antenna
Figure 3-22. Diagrams of Cassegrain and Gregory Antennas
(f) A cosecant-square antenna is a modified parabolic antenna with part of the reflector
surface re-shaped to form an asymmetric radiation pattern. The diagram of the reflector surface
re-shaping and the resulting radiation pattern are shown in Figure 3-23.35 This antenna is
suitable for surveillance operation, with the cosecant-square part of the mainbeam covering the
intended space of surveillance.
(a) Beam Shaping by Re-Shaping the Reflector
(Figure 3-23)
35 http://www.jpier.org/PIERC/pierc15/20.10072506.pdf, accessed Nov. 1, 2010.
paraboloidal
main reflector
ray path
convex
sub-reflector radiatorconcave
sub-reflector
paraboloidal
main reflector
ray path
radiator
parabolic
reflector
parallel ray
part of parabolic
reflector re-shaped
cosecant-square
beam pattern
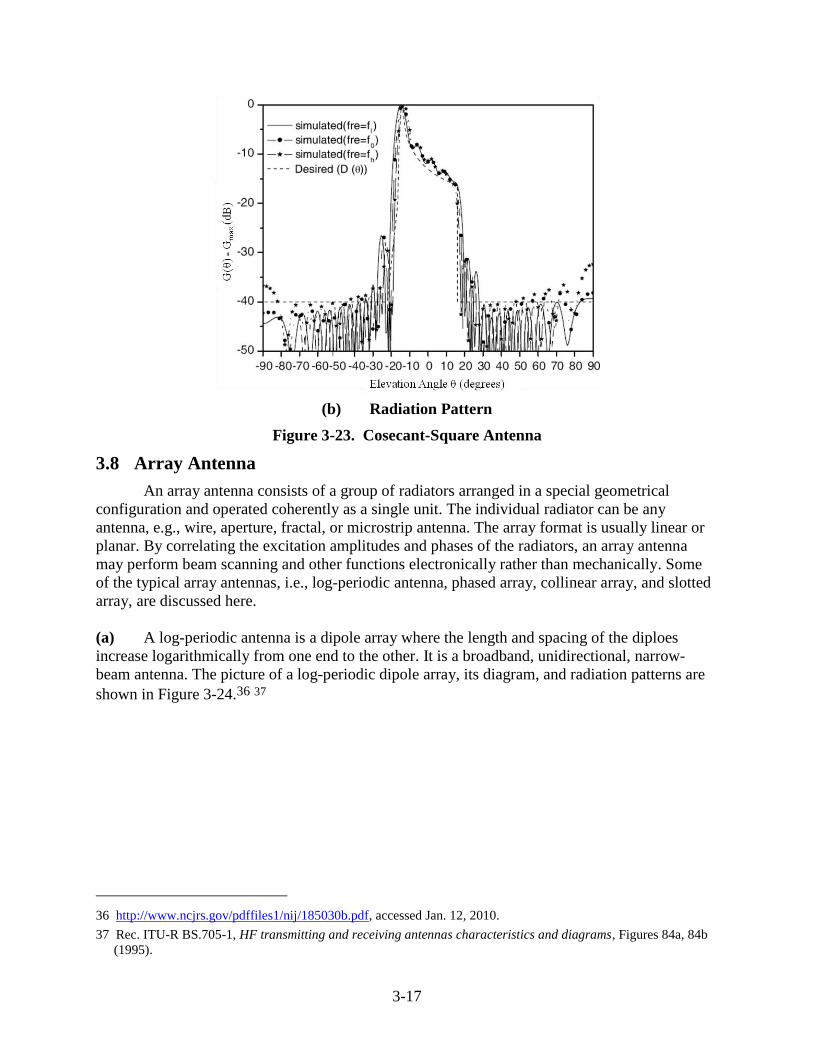
3-17
(b) Radiation Pattern
Figure 3-23. Cosecant-Square Antenna
3.8 Array Antenna
An array antenna consists of a group of radiators arranged in a special geometrical
configuration and operated coherently as a single unit. The individual radiator can be any
antenna, e.g., wire, aperture, fractal, or microstrip antenna. The array format is usually linear or
planar. By correlating the excitation amplitudes and phases of the radiators, an array antenna
may perform beam scanning and other functions electronically rather than mechanically. Some
of the typical array antennas, i.e., log-periodic antenna, phased array, collinear array, and slotted
array, are discussed here.
(a) A log-periodic antenna is a dipole array where the length and spacing of the diploes
increase logarithmically from one end to the other. It is a broadband, unidirectional, narrow-
beam antenna. The picture of a log-periodic dipole array, its diagram, and radiation patterns are
shown in Figure 3-24.36 37
36 http://www.ncjrs.gov/pdffiles1/nij/185030b.pdf, accessed Jan. 12, 2010.
37 Rec. ITU-R BS.705-1, HF transmitting and receiving antennas characteristics and diagrams, Figures 84a, 84b
(1995).
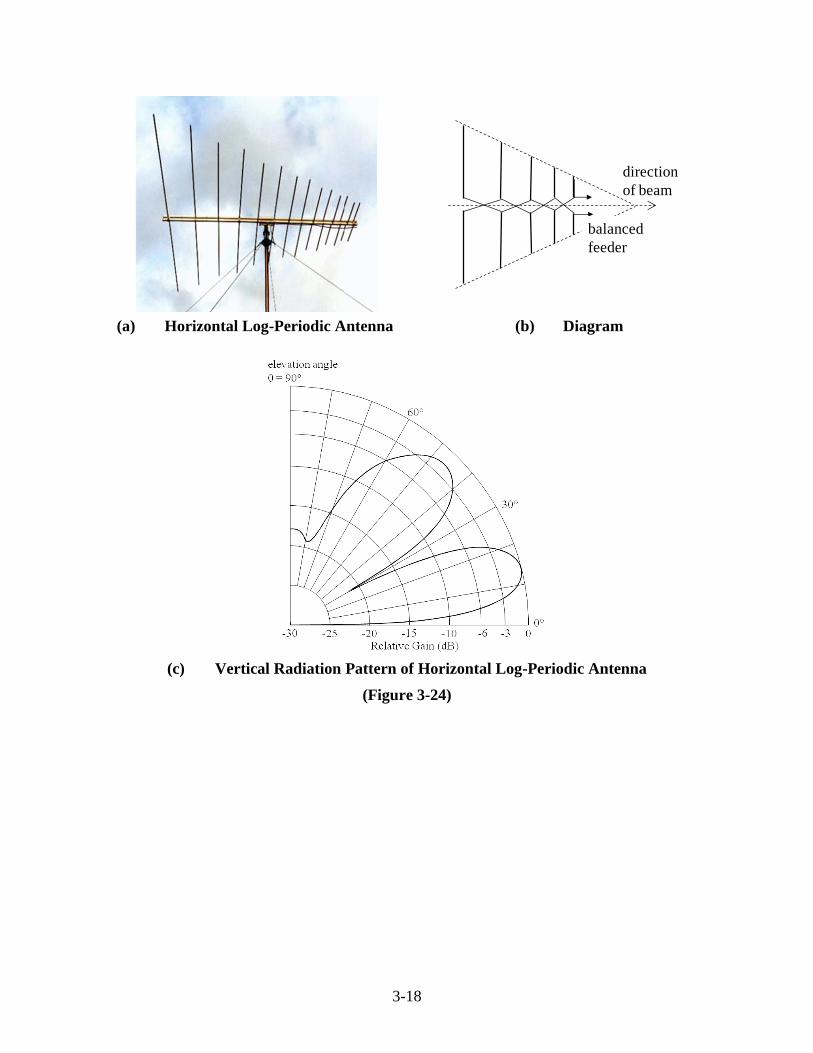
3-18
(a) Horizontal Log-Periodic Antenna (b) Diagram
(c) Vertical Radiation Pattern of Horizontal Log-Periodic Antenna
(Figure 3-24)
balanced
feeder
direction
of beam
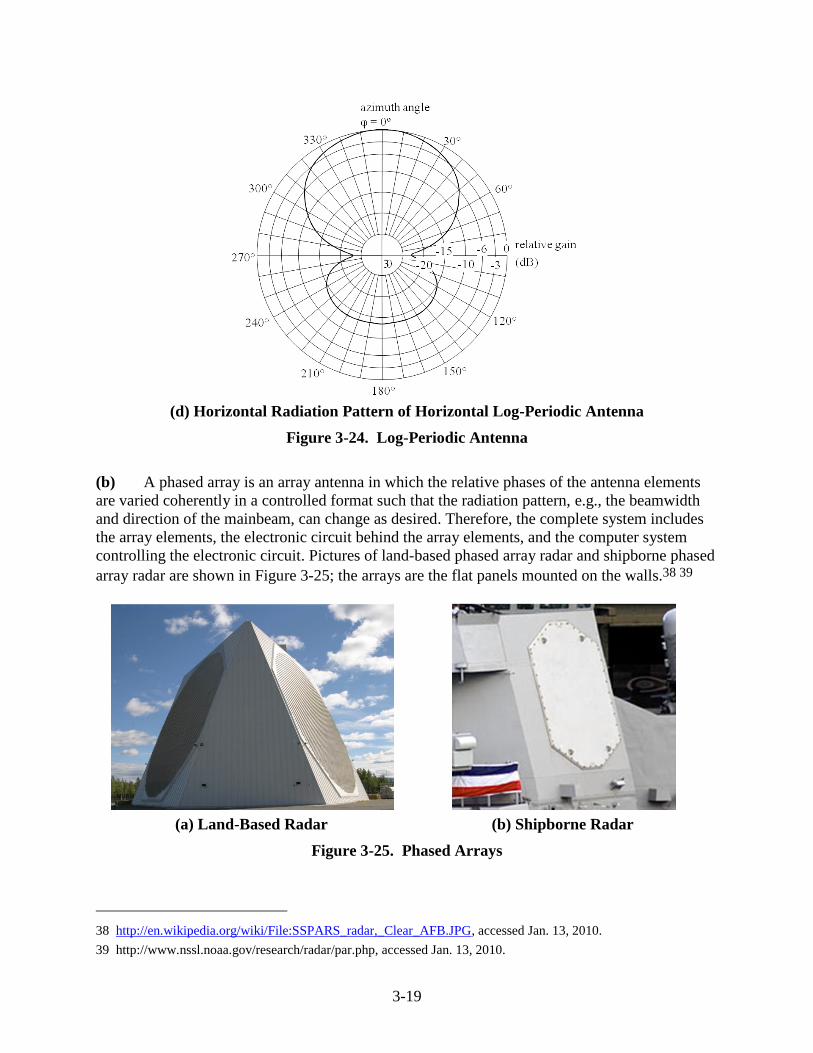
3-19
(d) Horizontal Radiation Pattern of Horizontal Log-Periodic Antenna
Figure 3-24. Log-Periodic Antenna
(b) A phased array is an array antenna in which the relative phases of the antenna elements
are varied coherently in a controlled format such that the radiation pattern, e.g., the beamwidth
and direction of the mainbeam, can change as desired. Therefore, the complete system includes
the array elements, the electronic circuit behind the array elements, and the computer system
controlling the electronic circuit. Pictures of land-based phased array radar and shipborne phased
array radar are shown in Figure 3-25; the arrays are the flat panels mounted on the walls.38 39
(a) Land-Based Radar (b) Shipborne Radar
Figure 3-25. Phased Arrays
38 http://en.wikipedia.org/wiki/File:SSPARS_radar,_Clear_AFB.JPG, accessed Jan. 13, 2010.
39 http://www.nssl.noaa.gov/research/radar/par.php, accessed Jan. 13, 2010.
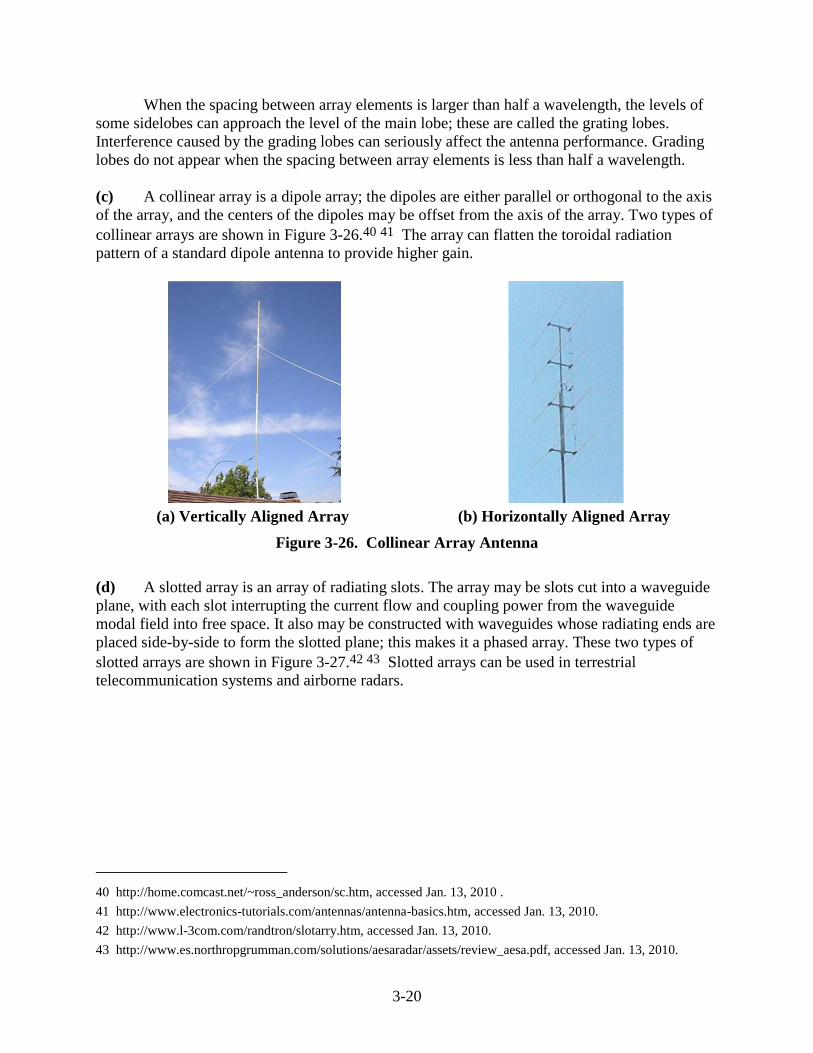
3-20
When the spacing between array elements is larger than half a wavelength, the levels of
some sidelobes can approach the level of the main lobe; these are called the grating lobes.
Interference caused by the grading lobes can seriously affect the antenna performance. Grading
lobes do not appear when the spacing between array elements is less than half a wavelength.
(c) A collinear array is a dipole array; the dipoles are either parallel or orthogonal to the axis
of the array, and the centers of the dipoles may be offset from the axis of the array. Two types of
collinear arrays are shown in Figure 3-26.40 41 The array can flatten the toroidal radiation
pattern of a standard dipole antenna to provide higher gain.
(a) Vertically Aligned Array (b) Horizontally Aligned Array
Figure 3-26. Collinear Array Antenna
(d) A slotted array is an array of radiating slots. The array may be slots cut into a waveguide
plane, with each slot interrupting the current flow and coupling power from the waveguide
modal field into free space. It also may be constructed with waveguides whose radiating ends are
placed side-by-side to form the slotted plane; this makes it a phased array. These two types of
slotted arrays are shown in Figure 3-27.42 43 Slotted arrays can be used in terrestrial
telecommunication systems and airborne radars.
40 http://home.comcast.net/~ross_anderson/sc.htm, accessed Jan. 13, 2010 .
41 http://www.electronics-tutorials.com/antennas/antenna-basics.htm, accessed Jan. 13, 2010.
42 http://www.l-3com.com/randtron/slotarry.htm, accessed Jan. 13, 2010.
43 http://www.es.northropgrumman.com/solutions/aesaradar/assets/review_aesa.pdf, accessed Jan. 13, 2010.
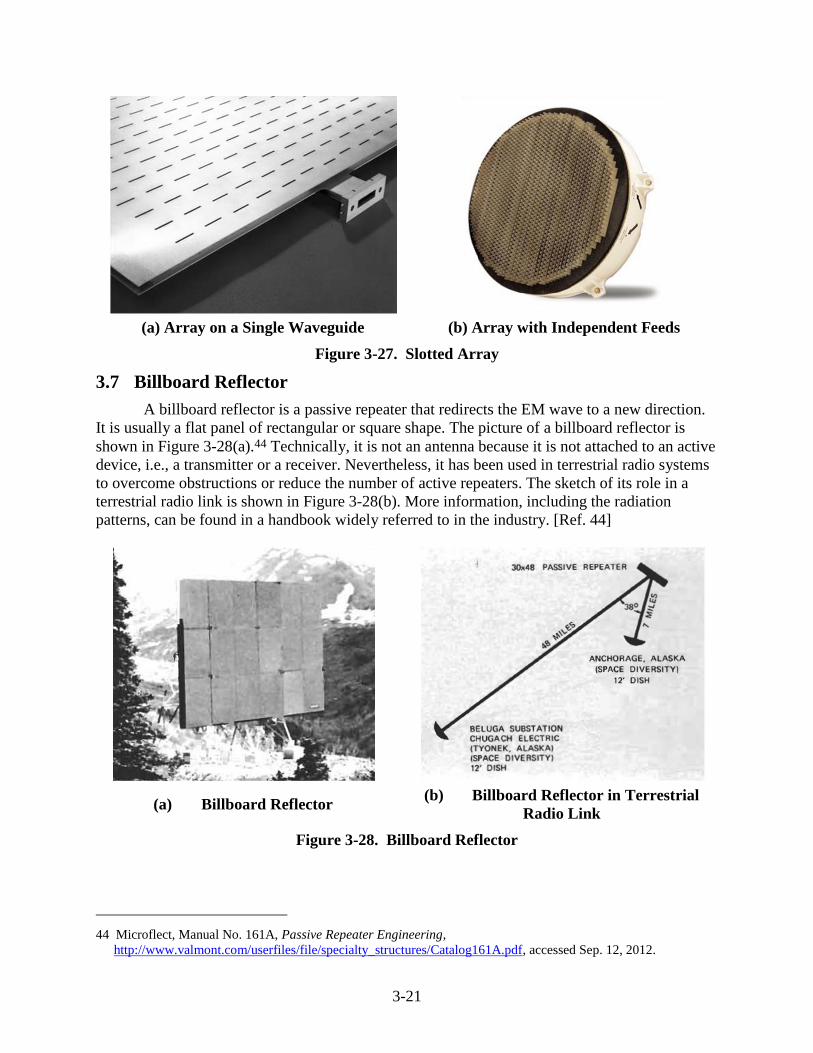
3-21
(a) Array on a Single Waveguide (b) Array with Independent Feeds
Figure 3-27. Slotted Array
3.7 Billboard Reflector
A billboard reflector is a passive repeater that redirects the EM wave to a new direction.
It is usually a flat panel of rectangular or square shape. The picture of a billboard reflector is
shown in Figure 3-28(a).44 Technically, it is not an antenna because it is not attached to an active
device, i.e., a transmitter or a receiver. Nevertheless, it has been used in terrestrial radio systems
to overcome obstructions or reduce the number of active repeaters. The sketch of its role in a
terrestrial radio link is shown in Figure 3-28(b). More information, including the radiation
patterns, can be found in a handbook widely referred to in the industry. [Ref. 44]
(a) Billboard Reflector (b) Billboard Reflector in Terrestrial
Radio Link
Figure 3-28. Billboard Reflector
44 Microflect, Manual No. 161A, Passive Repeater Engineering,
http://www.valmont.com/userfiles/file/specialty_structures/Catalog161A.pdf, accessed Sep. 12, 2012.
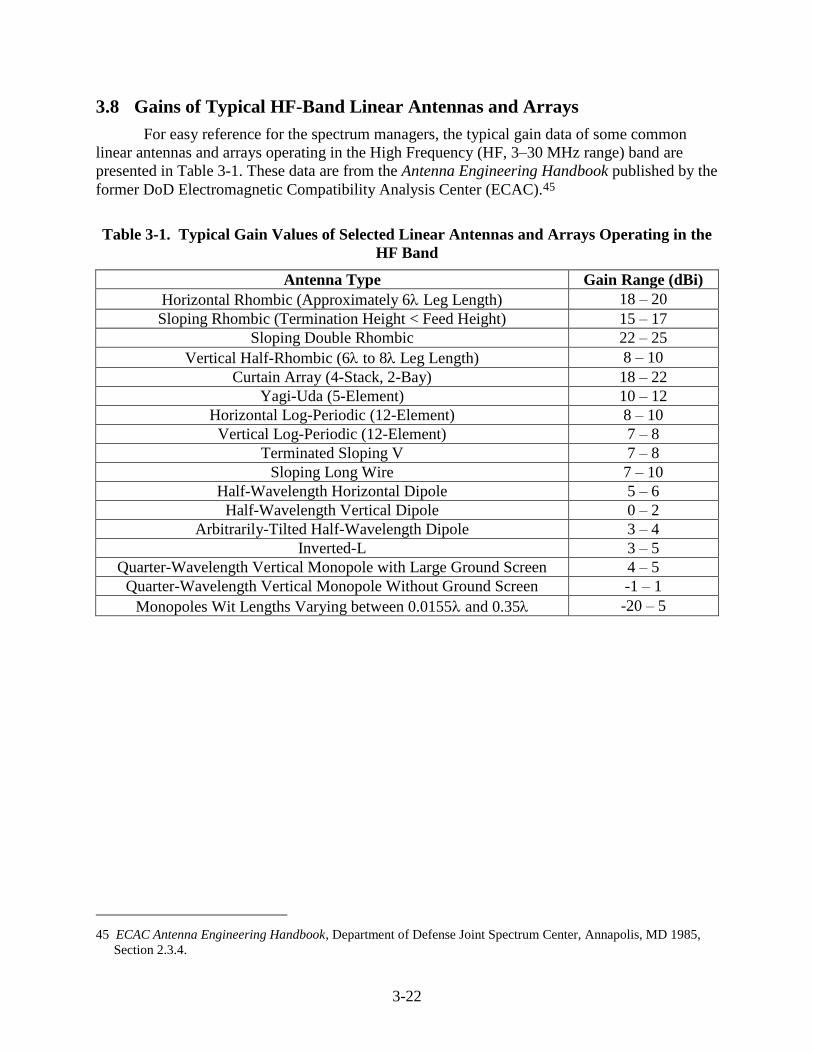
3-22
3.8 Gains of Typical HF-Band Linear Antennas and Arrays
For easy reference for the spectrum managers, the typical gain data of some common
linear antennas and arrays operating in the High Frequency (HF, 3–30 MHz range) band are
presented in Table 3-1. These data are from the Antenna Engineering Handbook published by the
former DoD Electromagnetic Compatibility Analysis Center (ECAC).45
Table 3-1. Typical Gain Values of Selected Linear Antennas and Arrays Operating in the
HF Band
Antenna Type Gain Range (dBi)
Horizontal Rhombic (Approximately 6 Leg Length) 18 – 20
Sloping Rhombic (Termination Height < Feed Height) 15 – 17
Sloping Double Rhombic 22 – 25
Vertical Half-Rhombic (6 to 8 Leg Length) 8 – 10
Curtain Array (4-Stack, 2-Bay) 18 – 22
Yagi-Uda (5-Element) 10 – 12
Horizontal Log-Periodic (12-Element) 8 – 10
Vertical Log-Periodic (12-Element) 7 – 8
Terminated Sloping V 7 – 8
Sloping Long Wire 7 – 10
Half-Wavelength Horizontal Dipole 5 – 6
Half-Wavelength Vertical Dipole 0 – 2
Arbitrarily-Tilted Half-Wavelength Dipole 3 – 4
Inverted-L 3 – 5
Quarter-Wavelength Vertical Monopole with Large Ground Screen 4 – 5
Quarter-Wavelength Vertical Monopole Without Ground Screen -1 – 1
Monopoles Wit Lengths Varying between 0.0155 and 0.35 -20 – 5
45 ECAC Antenna Engineering Handbook, Department of Defense Joint Spectrum Center, Annapolis, MD 1985,
Section 2.3.4.
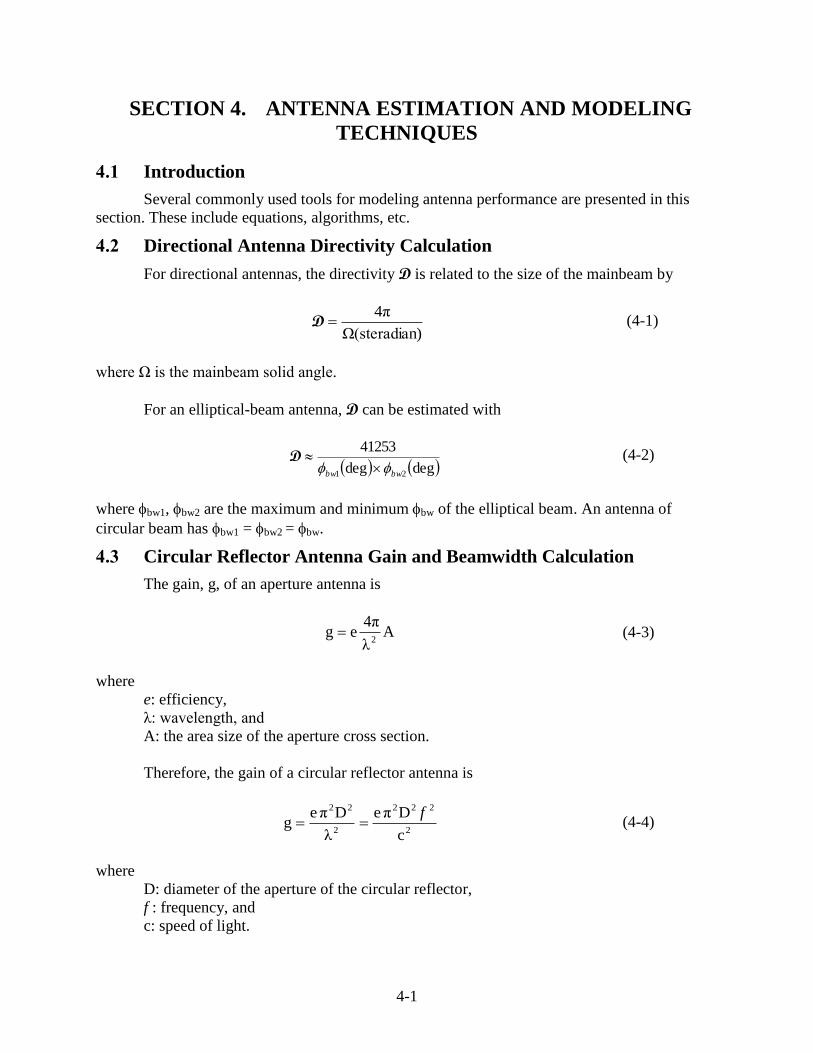
4-1
SECTION 4. ANTENNA ESTIMATION AND MODELING
TECHNIQUES
4.1 Introduction
Several commonly used tools for modeling antenna performance are presented in this
section. These include equations, algorithms, etc.
4.2 Directional Antenna Directivity Calculation
For directional antennas, the directivity D is related to the size of the mainbeam by
n)Ω(steradia
4πD (4-1)
where Ω is the mainbeam solid angle.
For an elliptical-beam antenna, D can be estimated with
degdeg
41253
21 bwbw D (4-2)
where bw1, bw2 are the maximum and minimum bw of the elliptical beam. An antenna of
circular beam has bw1 = bw2 = bw.
4.3 Circular Reflector Antenna Gain and Beamwidth Calculation
The gain, g, of an aperture antenna is
Aλ
4πeg
2 (4-3)
where
e: efficiency,
λ: wavelength, and
A: the area size of the aperture cross section.
Therefore, the gain of a circular reflector antenna is
2
222
2
22
c
Dπe
λ
Dπeg
f (4-4)
where
D: diameter of the aperture of the circular reflector,
f : frequency, and
c: speed of light.
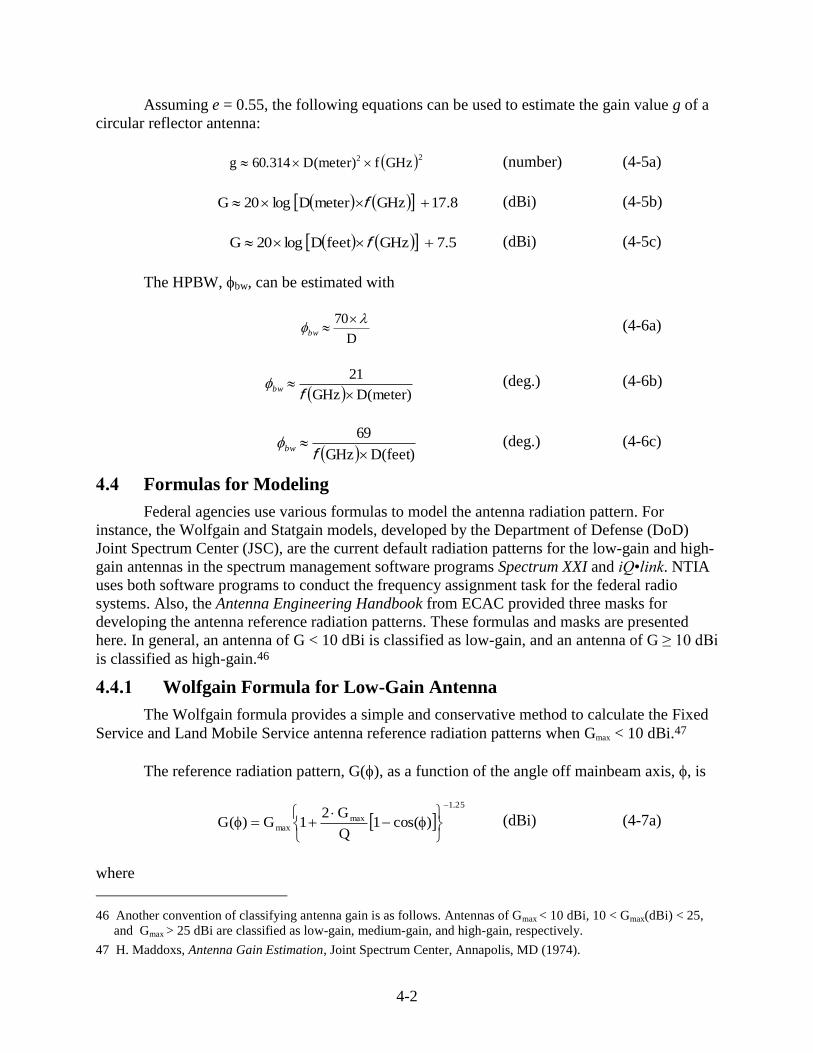
4-2
Assuming e = 0.55, the following equations can be used to estimate the gain value g of a
circular reflector antenna:
22 GHzfD(meter)60.314g (number) (4-5a)
8.17GHzmeterDlog20G f (dBi) (4-5b)
5.7GHzfeetDlog20G f (dBi) (4-5c)
The HPBW, bw, can be estimated with
D
70
bw
(4-6a)
)meter(DGHz
21
f
bw (deg.) (4-6b)
)feet(DGHz
69
f
bw (deg.) (4-6c)
4.4 Formulas for Modeling
Federal agencies use various formulas to model the antenna radiation pattern. For
instance, the Wolfgain and Statgain models, developed by the Department of Defense (DoD)
Joint Spectrum Center (JSC), are the current default radiation patterns for the low-gain and high-
gain antennas in the spectrum management software programs Spectrum XXI and iQ•link. NTIA
uses both software programs to conduct the frequency assignment task for the federal radio
systems. Also, the Antenna Engineering Handbook from ECAC provided three masks for
developing the antenna reference radiation patterns. These formulas and masks are presented
here. In general, an antenna of G < 10 dBi is classified as low-gain, and an antenna of G ≥ 10 dBi
is classified as high-gain.46
4.4.1 Wolfgain Formula for Low-Gain Antenna
The Wolfgain formula provides a simple and conservative method to calculate the Fixed
Service and Land Mobile Service antenna reference radiation patterns when Gmax < 10 dBi.47
The reference radiation pattern, G(), as a function of the angle off mainbeam axis, , is
25.1
maxmax )cos(1
Q
G21G)(G
(dBi) (4-7a)
where
46 Another convention of classifying antenna gain is as follows. Antennas of Gmax < 10 dBi, 10 < Gmax(dBi) < 25,
and Gmax > 25 dBi are classified as low-gain, medium-gain, and high-gain, respectively.
47 H. Maddoxs, Antenna Gain Estimation, Joint Spectrum Center, Annapolis, MD (1974).
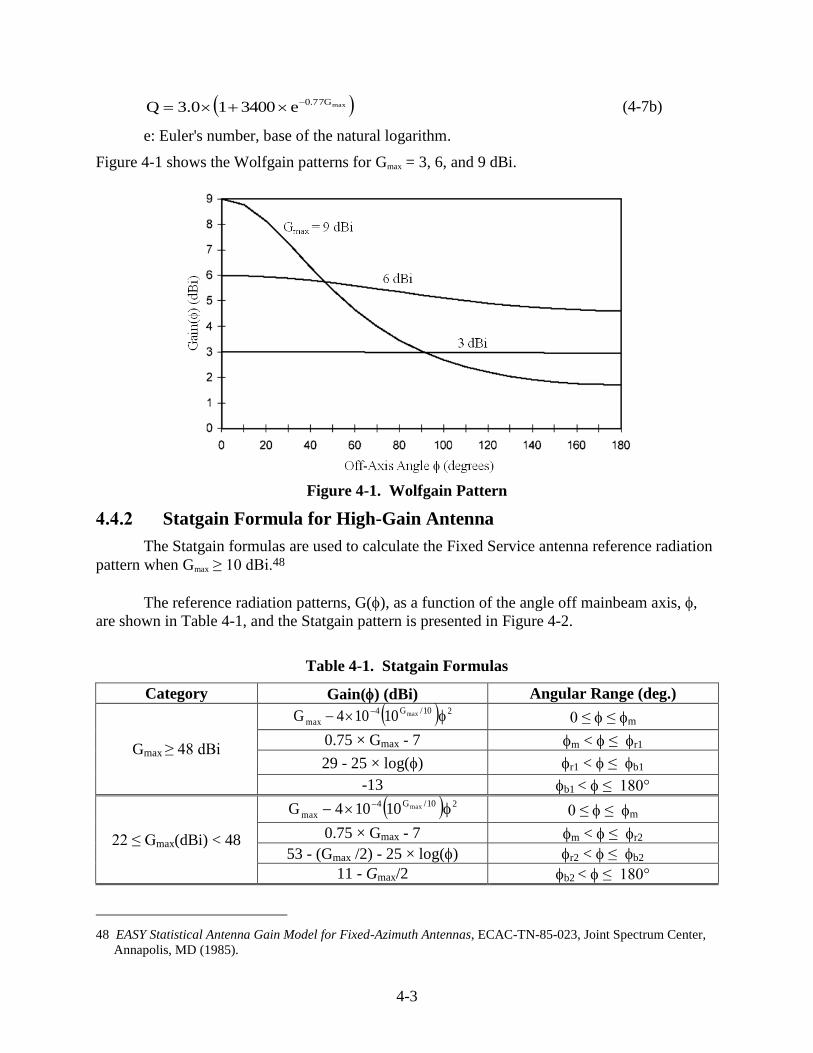
4-3
maxG77.0e340010.3Q
(4-7b)
e: Euler's number, base of the natural logarithm.
Figure 4-1 shows the Wolfgain patterns for Gmax = 3, 6, and 9 dBi.
Figure 4-1. Wolfgain Pattern
4.4.2 Statgain Formula for High-Gain Antenna
The Statgain formulas are used to calculate the Fixed Service antenna reference radiation
pattern when Gmax ≥ 10 dBi.48
The reference radiation patterns, G(), as a function of the angle off mainbeam axis, ,
are shown in Table 4-1, and the Statgain pattern is presented in Figure 4-2.
Table 4-1. Statgain Formulas
Category Gain() (dBi) Angular Range (deg.)
Gmax ≥ 48 dBi
210/G4
maxmax10104G
0 ≤ ≤ m
0.75 × Gmax - 7 m < ≤ r1
29 - 25 × log() r1 < ≤ b1
-13 b1 < ≤ 180°
22 ≤ Gmax(dBi) < 48
210/G4
maxmax10104G
0 ≤ ≤ m
0.75 × Gmax - 7 m < ≤ r2
53 - (Gmax /2) - 25 × log() r2 < ≤ b2
11 - Gmax/2 b2 < ≤ 180°
48 EASY Statistical Antenna Gain Model for Fixed-Azimuth Antennas, ECAC-TN-85-023, Joint Spectrum Center,
Annapolis, MD (1985).
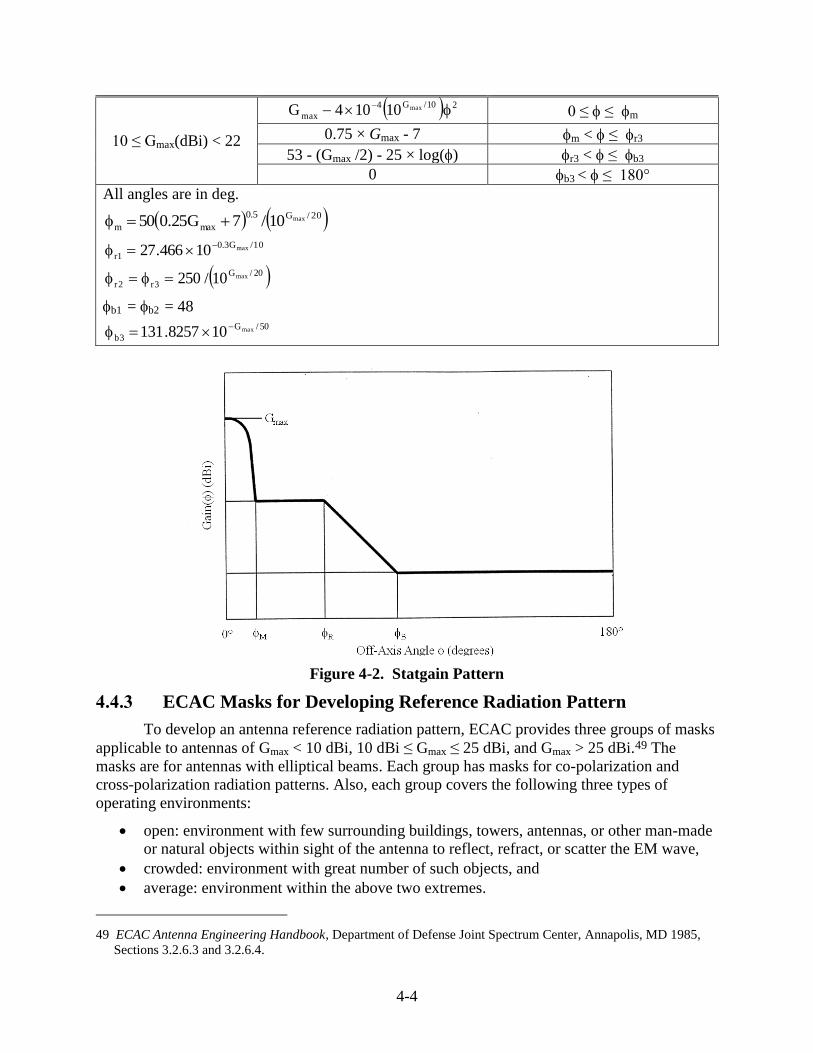
4-4
10 ≤ Gmax(dBi) < 22
210/G4
maxmax10104G
0 ≤ ≤ m
0.75 × Gmax - 7 m < ≤ r3
53 - (Gmax /2) - 25 × log() r3 < ≤ b3
0 b3 < ≤ 180°
All angles are in deg.
20/G5.0
maxmmax10/7G25.050
10/G3.0
1rmax10466.27
20/G
3r2rmax10/250
b1 = b2 = 48 50/G
3bmax108257.131
Figure 4-2. Statgain Pattern
4.4.3 ECAC Masks for Developing Reference Radiation Pattern
To develop an antenna reference radiation pattern, ECAC provides three groups of masks
applicable to antennas of Gmax < 10 dBi, 10 dBi ≤ Gmax ≤ 25 dBi, and Gmax > 25 dBi.49 The
masks are for antennas with elliptical beams. Each group has masks for co-polarization and
cross-polarization radiation patterns. Also, each group covers the following three types of
operating environments:
open: environment with few surrounding buildings, towers, antennas, or other man-made
or natural objects within sight of the antenna to reflect, refract, or scatter the EM wave,
crowded: environment with great number of such objects, and
average: environment within the above two extremes.
49 ECAC Antenna Engineering Handbook, Department of Defense Joint Spectrum Center, Annapolis, MD 1985,
Sections 3.2.6.3 and 3.2.6.4.
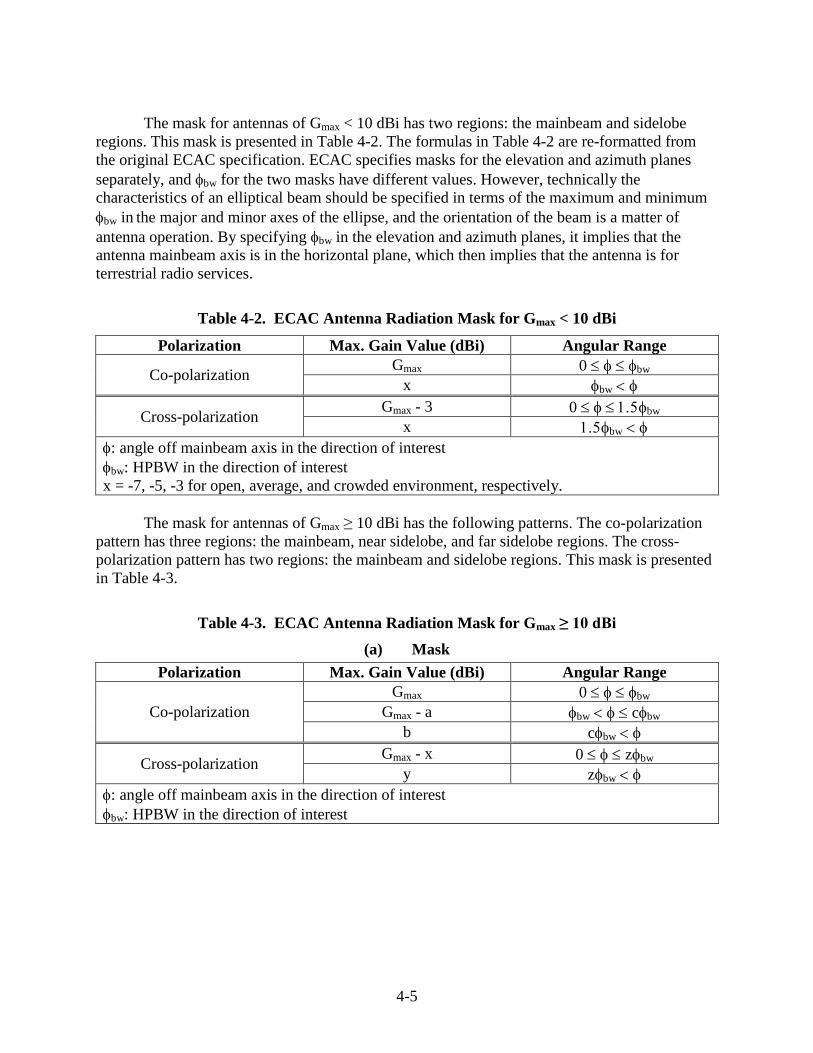
4-5
The mask for antennas of Gmax < 10 dBi has two regions: the mainbeam and sidelobe
regions. This mask is presented in Table 4-2. The formulas in Table 4-2 are re-formatted from
the original ECAC specification. ECAC specifies masks for the elevation and azimuth planes
separately, and bw for the two masks have different values. However, technically the
characteristics of an elliptical beam should be specified in terms of the maximum and minimum
bw in the major and minor axes of the ellipse, and the orientation of the beam is a matter of
antenna operation. By specifying bw in the elevation and azimuth planes, it implies that the
antenna mainbeam axis is in the horizontal plane, which then implies that the antenna is for
terrestrial radio services.
Table 4-2. ECAC Antenna Radiation Mask for Gmax < 10 dBi
Polarization Max. Gain Value (dBi) Angular Range
Co-polarization Gmax 0 bw
x bw
Cross-polarization Gmax - 3 0 bw
x bw
: angle off mainbeam axis in the direction of interest
bw: HPBW in the direction of interest
x = -7, -5, -3 for open, average, and crowded environment, respectively.
The mask for antennas of Gmax ≥ 10 dBi has the following patterns. The co-polarization
pattern has three regions: the mainbeam, near sidelobe, and far sidelobe regions. The cross-
polarization pattern has two regions: the mainbeam and sidelobe regions. This mask is presented
in Table 4-3.
Table 4-3. ECAC Antenna Radiation Mask for Gmax ≥ 10 dBi
(a) Mask
Polarization Max. Gain Value (dBi) Angular Range
Co-polarization
Gmax 0 bw
Gmax - a bw cbw
b cbw
Cross-polarization Gmax - x 0 zbw
y zbw
: angle off mainbeam axis in the direction of interest
bw: HPBW in the direction of interest
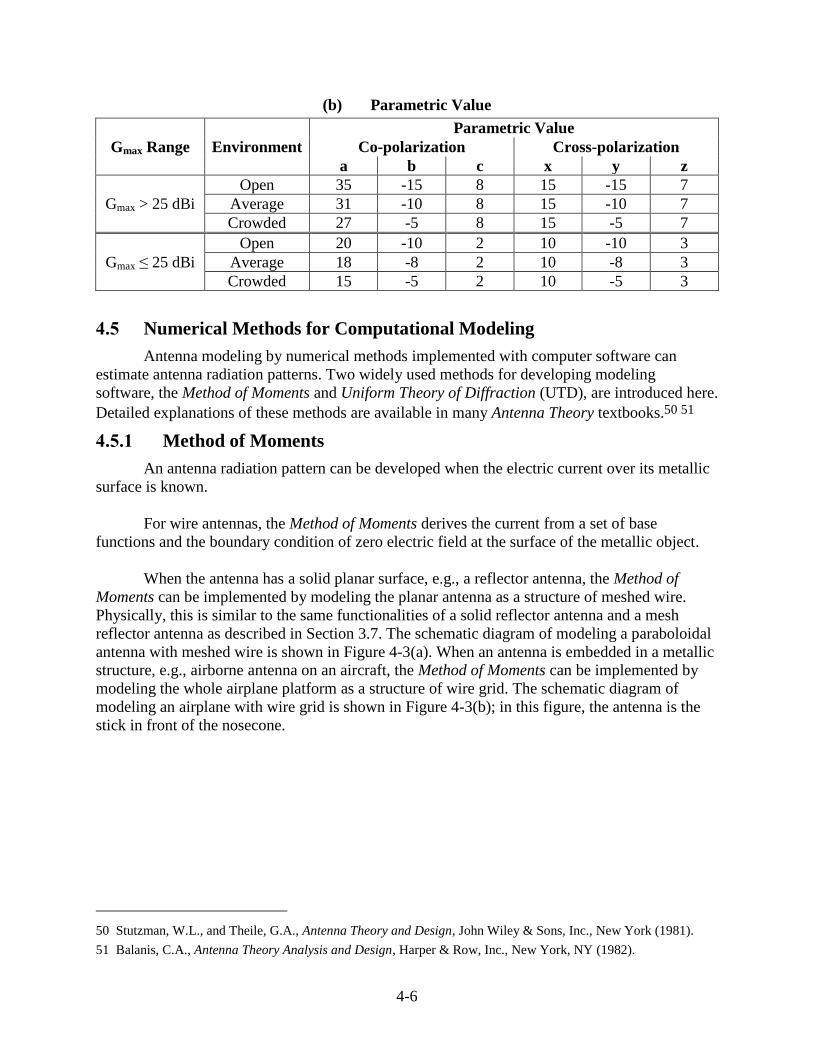
4-6
(b) Parametric Value
Gmax Range Environment
Parametric Value
Co-polarization Cross-polarization
a b c x y z
Gmax > 25 dBi
Open 35 -15 8 15 -15 7
Average 31 -10 8 15 -10 7
Crowded 27 -5 8 15 -5 7
Gmax ≤ 25 dBi
Open 20 -10 2 10 -10 3
Average 18 -8 2 10 -8 3
Crowded 15 -5 2 10 -5 3
4.5 Numerical Methods for Computational Modeling
Antenna modeling by numerical methods implemented with computer software can
estimate antenna radiation patterns. Two widely used methods for developing modeling
software, the Method of Moments and Uniform Theory of Diffraction (UTD), are introduced here.
Detailed explanations of these methods are available in many Antenna Theory textbooks.50 51
4.5.1 Method of Moments
An antenna radiation pattern can be developed when the electric current over its metallic
surface is known.
For wire antennas, the Method of Moments derives the current from a set of base
functions and the boundary condition of zero electric field at the surface of the metallic object.
When the antenna has a solid planar surface, e.g., a reflector antenna, the Method of
Moments can be implemented by modeling the planar antenna as a structure of meshed wire.
Physically, this is similar to the same functionalities of a solid reflector antenna and a mesh
reflector antenna as described in Section 3.7. The schematic diagram of modeling a paraboloidal
antenna with meshed wire is shown in Figure 4-3(a). When an antenna is embedded in a metallic
structure, e.g., airborne antenna on an aircraft, the Method of Moments can be implemented by
modeling the whole airplane platform as a structure of wire grid. The schematic diagram of
modeling an airplane with wire grid is shown in Figure 4-3(b); in this figure, the antenna is the
stick in front of the nosecone.
50 Stutzman, W.L., and Theile, G.A., Antenna Theory and Design, John Wiley & Sons, Inc., New York (1981).
51 Balanis, C.A., Antenna Theory Analysis and Design, Harper & Row, Inc., New York, NY (1982).
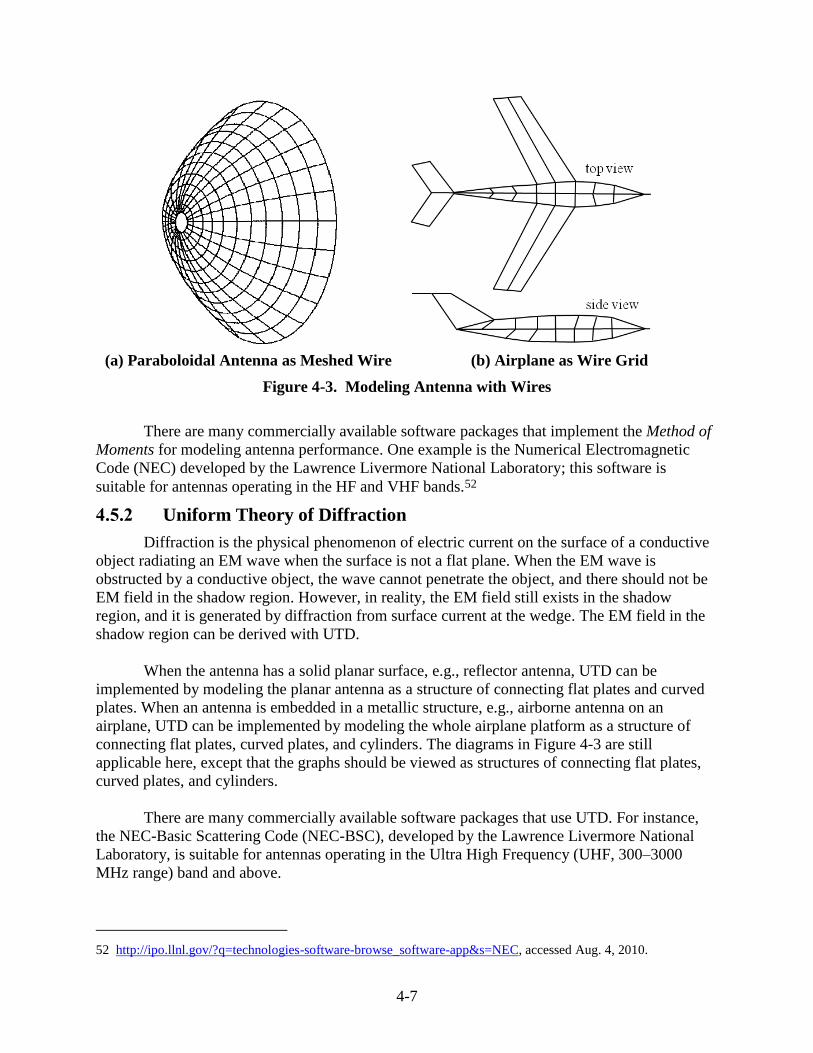
4-7
(a) Paraboloidal Antenna as Meshed Wire (b) Airplane as Wire Grid
Figure 4-3. Modeling Antenna with Wires
There are many commercially available software packages that implement the Method of
Moments for modeling antenna performance. One example is the Numerical Electromagnetic
Code (NEC) developed by the Lawrence Livermore National Laboratory; this software is
suitable for antennas operating in the HF and VHF bands.52
4.5.2 Uniform Theory of Diffraction
Diffraction is the physical phenomenon of electric current on the surface of a conductive
object radiating an EM wave when the surface is not a flat plane. When the EM wave is
obstructed by a conductive object, the wave cannot penetrate the object, and there should not be
EM field in the shadow region. However, in reality, the EM field still exists in the shadow
region, and it is generated by diffraction from surface current at the wedge. The EM field in the
shadow region can be derived with UTD.
When the antenna has a solid planar surface, e.g., reflector antenna, UTD can be
implemented by modeling the planar antenna as a structure of connecting flat plates and curved
plates. When an antenna is embedded in a metallic structure, e.g., airborne antenna on an
airplane, UTD can be implemented by modeling the whole airplane platform as a structure of
connecting flat plates, curved plates, and cylinders. The diagrams in Figure 4-3 are still
applicable here, except that the graphs should be viewed as structures of connecting flat plates,
curved plates, and cylinders.
There are many commercially available software packages that use UTD. For instance,
the NEC-Basic Scattering Code (NEC-BSC), developed by the Lawrence Livermore National
Laboratory, is suitable for antennas operating in the Ultra High Frequency (UHF, 300–3000
MHz range) band and above.
52 http://ipo.llnl.gov/?q=technologies-software-browse_software-app&s=NEC, accessed Aug. 4, 2010.
5-1
SECTION 5. ANTENNA REFERENCE RADIATION
PATTERNS AND CHARACTERISTICS
5.1 Introduction
This section contains the rules, regulations, and recommendations about antennas that are
relevant to EMC analyses. Most of the information here is the antenna radiation performance
standards, antenna reference radiation patterns, and antenna operational requirements. The
sources of these rules, regulations, and recommendations are the NTIA Manual, Title 47 of the
Code of Federal Regulations (47 CFR) for FCC, the ITU-R Radio Regulations (RR), the ITU-R
Recommendations, and publications from RTCA and other institutions.53 54 55 56
Antenna radiation performance standards and reference radiation patterns are developed
from measured radiation patterns, and then established as reference with consensus from radio
spectrum regulators and antenna engineers. Regulators use them as reference in EMC analyses,
and engineers use them as compliance guidelines in antenna design and production. While
measured radiation patterns should always be used in interference analyses, the reference
radiation patterns are the best alternatives when the measured radiation patterns are not available.
The information in this section is organized by the class of radio services categorized by
ITU-R. Antenna data for the Fixed Service (FS), Fixed-Satellite Service (FSS), Broadcasting
Service (BS), Broadcasting-Satellite Service (BSS), Mobile Service (MS), Mobile-Satellite
Service (MSS), Radiodetermination Service (RDS), Radiodetermination-Satellite Service
(RDSS), Radio Astronomy Service (RAS), Remote Sensing Service (RSS), and Space
Application Service (SA) are presented in Sections 5.2 through 5.12. Some radio services are
partitioned into subsets of services, and these subsets are discussed separately. A summary list is
provided in Section 5.13 for easy reference.
Within a radio service or subset service, the antenna data are presented in the order of
authority, i.e., NTIA, FCC, ITU-R RR, authoritative institutions, and the ITU-R
Recommendations. A note is given if NTIA does not provide the specifications. The antenna data
are presented in the order of frequency bands when there are numerous entries from one source.
Unless specifically stated, the reference radiation patterns are the co-polarization patterns,
the gain and directivity values are in dB or dBi, and the angles are in degrees. For easy reference,
some of the symbols and acronyms that are extensively used in this section are listed here:
D: diameter of a circular object or circular aperture;
dBic: dBi and circular polarization;
53 Code of Federal Regulations, Title 47, Telecommunication, (“47 CFR”), U.S., FCC,
http://www.access.gpo.gov/cgi-bin/cfrassemble.cgi?title=201147, accessed Feb. 9, 2012.
54 Manual of Regulations and Procedures for Federal Radio Frequency Management, U.S. Department of
Commerce, NTIA, (“NTIA Manual”).
55 Radio Regulations, ITU-R (“RR”) (2008).
56 RTCA, http://www.rtca.org/doclist.asp (2011).
5-2
f: frequency;
Gmax: peak power gain;
G1: level of the first sidelobe of an actual radiation pattern, or the first plateau of a
reference radiation pattern representing the first sidelobe of the actual radiation pattern;
G(): power gain in the direction, where is the solid angle in the spherical
coordinate;
N/A: not available;
n/a: not applicable;
n/s: not specified;
: wavelength;
: azimuth angle;
elevation angle; and
: angle off mainbeam axis for a circular beam, or angle off mainbeam axis in the
direction of interest for an elliptical beam.
5.2 Fixed Service
The FS line-of-sight radio relay operation may be either a land-based system of point-to-
point (P-P) or point-to-multipoint (P-MP) connections, or a system using high altitude platform
station (HAPS). The P-P systems use mostly paraboloidal antennas. The P-MP systems use
mostly omnidirectional or sectoral antennas at the central stations and paraboloidal antennas at
the outer stations. Antenna data of these systems are presented here. When not specified, the
antenna radiation patterns apply to both the vertical and horizontal polarizations.
5.2.1 Point-to-Point System
This sub-section contains the following FS P-P system antenna radiation performance
standards:
from NTIA Manual Chapter 5, for federal systems with fixed stations;57
from 47 CFR Part 101, for non-federal systems operating at or above 932.5 MHz;58 59
from 47 CFR Part 78, for non-federal systems of cable TV relay service;60
from RR Appendix 5, for EMC analyses between FS systems and MSS system space-to-
Earth links operating in 1–3 GHz;61 and
from RR Appendix 7, for deriving the coordination area around a space system earth
station operating in 100 MHz–105 GHz.62
It also contains the following recommended reference radiation patterns from ITU-R:
57 NTIA Manual, Chapter 5, Spectrum Standards, §5.3.
58 47 CFR, Part 101, Fixed Microwave Services, §101.115.
59 47 CFR, Part 101, Fixed Microwave Services, §101.117.
60 47 CFR, Part 78, Cable Television Relay Service, §78.105.
61 RR, Appendix 5, Identification of Administrations with Which Coordination is to Be Effected or Agreement
Sought Under the Provisions of Article 9, Annex 1.
62 RR, Appendix 7, Methods for the Determination of the Coordination Area Around an Earth Station in
Frequency Bands between 100 MHz and 105 GHz, Annex 6.
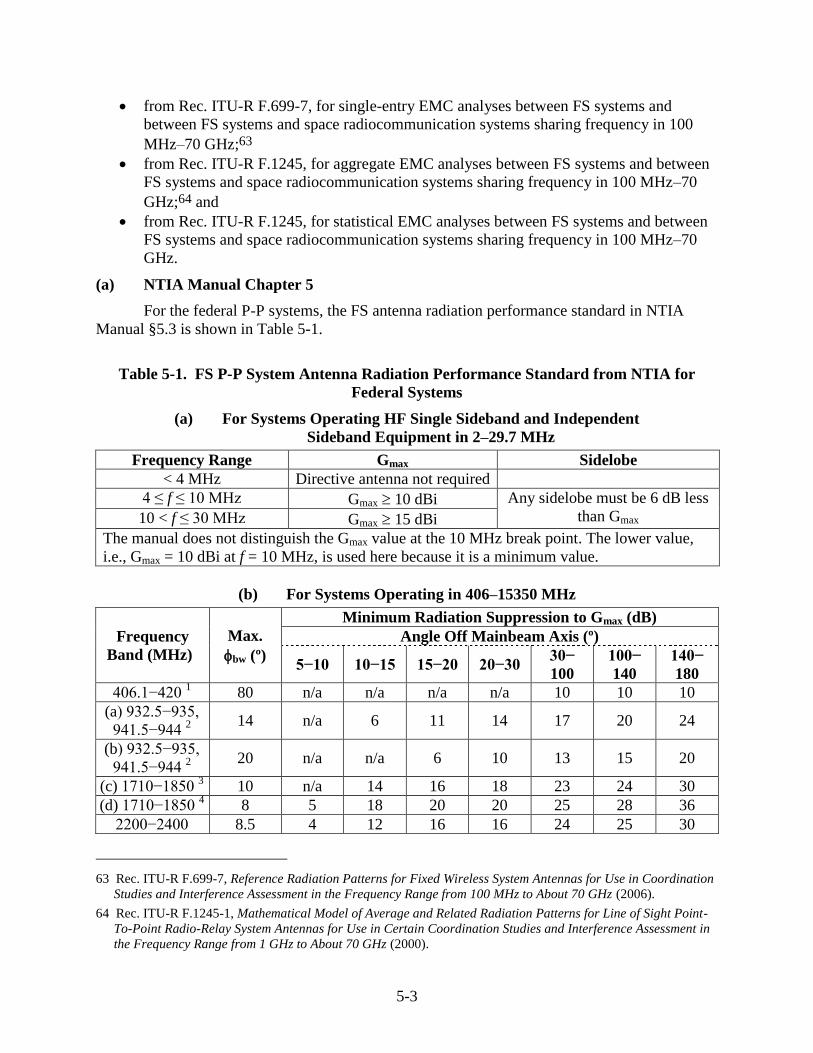
5-3
from Rec. ITU-R F.699-7, for single-entry EMC analyses between FS systems and
between FS systems and space radiocommunication systems sharing frequency in 100
MHz–70 GHz;63
from Rec. ITU-R F.1245, for aggregate EMC analyses between FS systems and between
FS systems and space radiocommunication systems sharing frequency in 100 MHz–70
GHz;64 and
from Rec. ITU-R F.1245, for statistical EMC analyses between FS systems and between
FS systems and space radiocommunication systems sharing frequency in 100 MHz–70
GHz.
(a) NTIA Manual Chapter 5
For the federal P-P systems, the FS antenna radiation performance standard in NTIA
Manual §5.3 is shown in Table 5-1.
Table 5-1. FS P-P System Antenna Radiation Performance Standard from NTIA for
Federal Systems
(a) For Systems Operating HF Single Sideband and Independent
Sideband Equipment in 2–29.7 MHz
Frequency Range Gmax Sidelobe
< 4 MHz Directive antenna not required
4 ≤ f ≤ 10 MHz Gmax 10 dBi Any sidelobe must be 6 dB less
than Gmax 10 < f ≤ 30 MHz Gmax 15 dBi
The manual does not distinguish the Gmax value at the 10 MHz break point. The lower value,
i.e., Gmax = 10 dBi at f = 10 MHz, is used here because it is a minimum value.
(b) For Systems Operating in 406–15350 MHz
Frequency
Band (MHz)
Max.
bw (º)
Minimum Radiation Suppression to Gmax (dB)
Angle Off Mainbeam Axis (º)
5−10 10−15 15−20 20−30 30−
100
100−
140
140−
180
406.1−420 1 80 n/a n/a n/a n/a 10 10 10
(a) 932.5−935,
941.5−944 2
14 n/a 6 11 14 17 20 24
(b) 932.5−935,
941.5−944 2
20 n/a n/a 6 10 13 15 20
(c) 1710−1850 3 10 n/a 14 16 18 23 24 30
(d) 1710−1850 4 8 5 18 20 20 25 28 36
2200−2400 8.5 4 12 16 16 24 25 30
63 Rec. ITU-R F.699-7, Reference Radiation Patterns for Fixed Wireless System Antennas for Use in Coordination
Studies and Interference Assessment in the Frequency Range from 100 MHz to About 70 GHz (2006).
64 Rec. ITU-R F.1245-1, Mathematical Model of Average and Related Radiation Patterns for Line of Sight Point-
To-Point Radio-Relay System Antennas for Use in Certain Coordination Studies and Interference Assessment in
the Frequency Range from 1 GHz to About 70 GHz (2000).
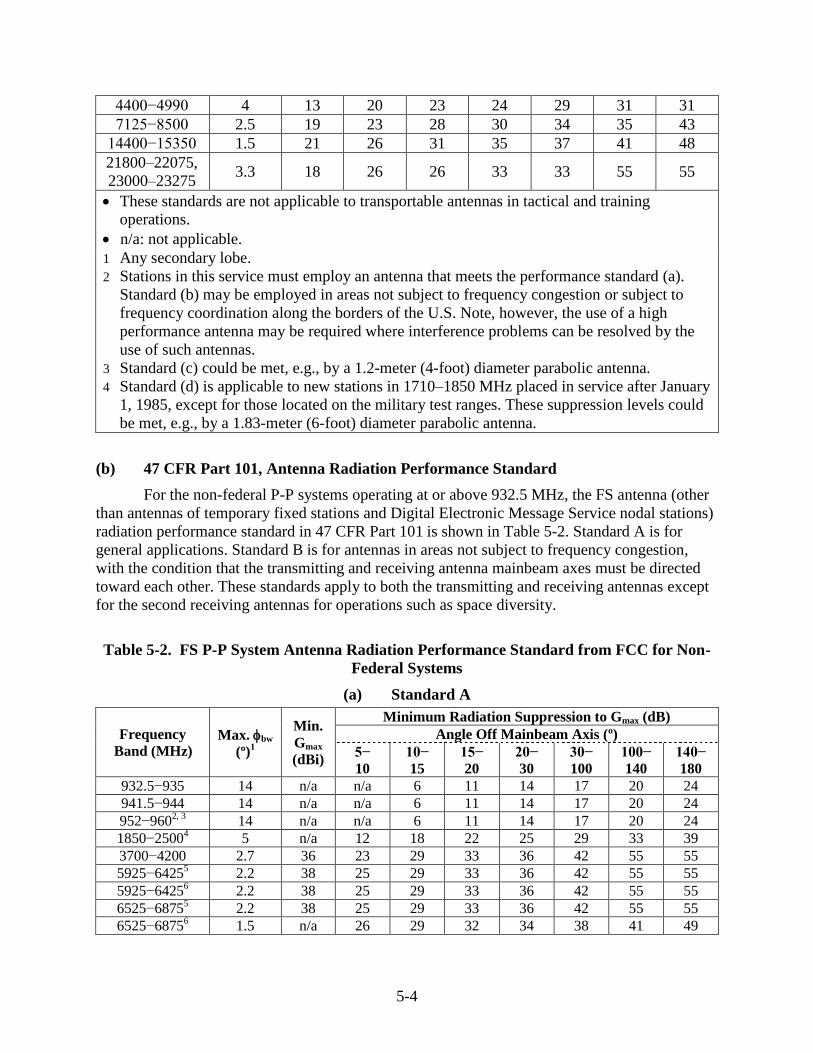
5-4
4400−4990 4 13 20 23 24 29 31 31
7125−8500 2.5 19 23 28 30 34 35 43
14400−15350 1.5 21 26 31 35 37 41 48
21800–22075,
23000–23275 3.3 18 26 26 33 33 55 55
These standards are not applicable to transportable antennas in tactical and training
operations.
n/a: not applicable.
1 Any secondary lobe.
2 Stations in this service must employ an antenna that meets the performance standard (a).
Standard (b) may be employed in areas not subject to frequency congestion or subject to
frequency coordination along the borders of the U.S. Note, however, the use of a high
performance antenna may be required where interference problems can be resolved by the
use of such antennas.
3 Standard (c) could be met, e.g., by a 1.2-meter (4-foot) diameter parabolic antenna.
4 Standard (d) is applicable to new stations in 1710–1850 MHz placed in service after January
1, 1985, except for those located on the military test ranges. These suppression levels could
be met, e.g., by a 1.83-meter (6-foot) diameter parabolic antenna.
(b) 47 CFR Part 101, Antenna Radiation Performance Standard
For the non-federal P-P systems operating at or above 932.5 MHz, the FS antenna (other
than antennas of temporary fixed stations and Digital Electronic Message Service nodal stations)
radiation performance standard in 47 CFR Part 101 is shown in Table 5-2. Standard A is for
general applications. Standard B is for antennas in areas not subject to frequency congestion,
with the condition that the transmitting and receiving antenna mainbeam axes must be directed
toward each other. These standards apply to both the transmitting and receiving antennas except
for the second receiving antennas for operations such as space diversity.
Table 5-2. FS P-P System Antenna Radiation Performance Standard from FCC for Non-
Federal Systems
(a) Standard A
Frequency
Band (MHz) Max. bw
(º)1
Min.
Gmax
(dBi)
Minimum Radiation Suppression to Gmax (dB)
Angle Off Mainbeam Axis (º)
5−
10
10−
15
15−
20
20−
30
30−
100
100−
140
140−
180
932.5−935 14 n/a n/a 6 11 14 17 20 24
941.5−944 14 n/a n/a 6 11 14 17 20 24
952−9602, 3
14 n/a n/a 6 11 14 17 20 24
1850−25004 5 n/a 12 18 22 25 29 33 39
3700−4200 2.7 36 23 29 33 36 42 55 55
5925−64255 2.2 38 25 29 33 36 42 55 55
5925−64256 2.2 38 25 29 33 36 42 55 55
6525−68755 2.2 38 25 29 33 36 42 55 55
6525−68756 1.5 n/a 26 29 32 34 38 41 49
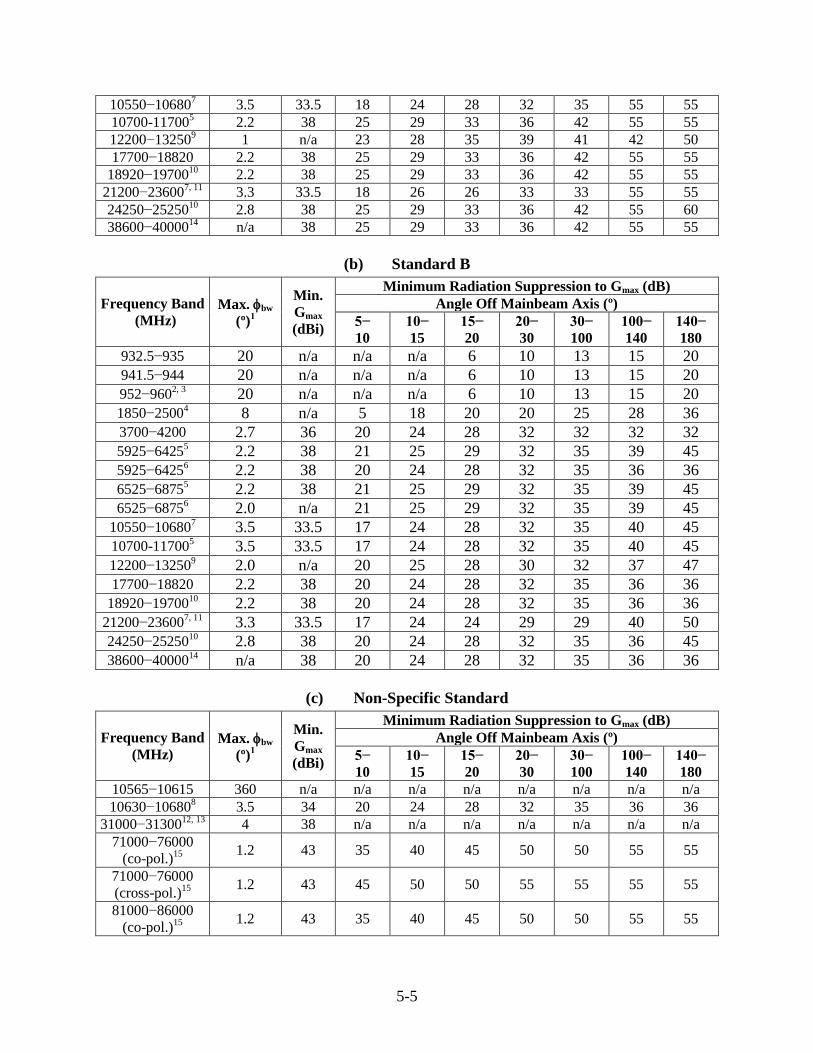
5-5
10550−106807 3.5 33.5 18 24 28 32 35 55 55
10700-117005 2.2 38 25 29 33 36 42 55 55
12200−132509 1 n/a 23 28 35 39 41 42 50
17700−18820 2.2 38 25 29 33 36 42 55 55
18920−1970010
2.2 38 25 29 33 36 42 55 55
21200−236007, 11
3.3 33.5 18 26 26 33 33 55 55
24250−2525010
2.8 38 25 29 33 36 42 55 60
38600−4000014
n/a 38 25 29 33 36 42 55 55
(b) Standard B
Frequency Band
(MHz) Max. bw
(º)1
Min.
Gmax
(dBi)
Minimum Radiation Suppression to Gmax (dB)
Angle Off Mainbeam Axis (º)
5−
10
10−
15
15−
20
20−
30
30−
100
100−
140
140−
180
932.5−935 20 n/a n/a n/a 6 10 13 15 20
941.5−944 20 n/a n/a n/a 6 10 13 15 20
952−9602, 3
20 n/a n/a n/a 6 10 13 15 20
1850−25004 8 n/a 5 18 20 20 25 28 36
3700−4200 2.7 36 20 24 28 32 32 32 32
5925−64255 2.2 38 21 25 29 32 35 39 45
5925−64256 2.2 38 20 24 28 32 35 36 36
6525−68755 2.2 38 21 25 29 32 35 39 45
6525−68756 2.0 n/a 21 25 29 32 35 39 45
10550−106807 3.5 33.5 17 24 28 32 35 40 45
10700-117005 3.5 33.5 17 24 28 32 35 40 45
12200−132509 2.0 n/a 20 25 28 30 32 37 47
17700−18820 2.2 38 20 24 28 32 35 36 36
18920−1970010
2.2 38 20 24 28 32 35 36 36
21200−236007, 11
3.3 33.5 17 24 24 29 29 40 50
24250−2525010
2.8 38 20 24 28 32 35 36 45
38600−4000014
n/a 38 20 24 28 32 35 36 36
(c) Non-Specific Standard
Frequency Band
(MHz) Max. bw
(º)1
Min.
Gmax
(dBi)
Minimum Radiation Suppression to Gmax (dB)
Angle Off Mainbeam Axis (º)
5−
10
10−
15
15−
20
20−
30
30−
100
100−
140
140−
180
10565−10615 360 n/a n/a n/a n/a n/a n/a n/a n/a
10630−106808 3.5 34 20 24 28 32 35 36 36
31000−3130012, 13
4 38 n/a n/a n/a n/a n/a n/a n/a
71000−76000
(co-pol.)15
1.2 43 35 40 45 50 50 55 55
71000−76000
(cross-pol.)15
1.2 43 45 50 50 55 55 55 55
81000−86000
(co-pol.)15
1.2 43 35 40 45 50 50 55 55
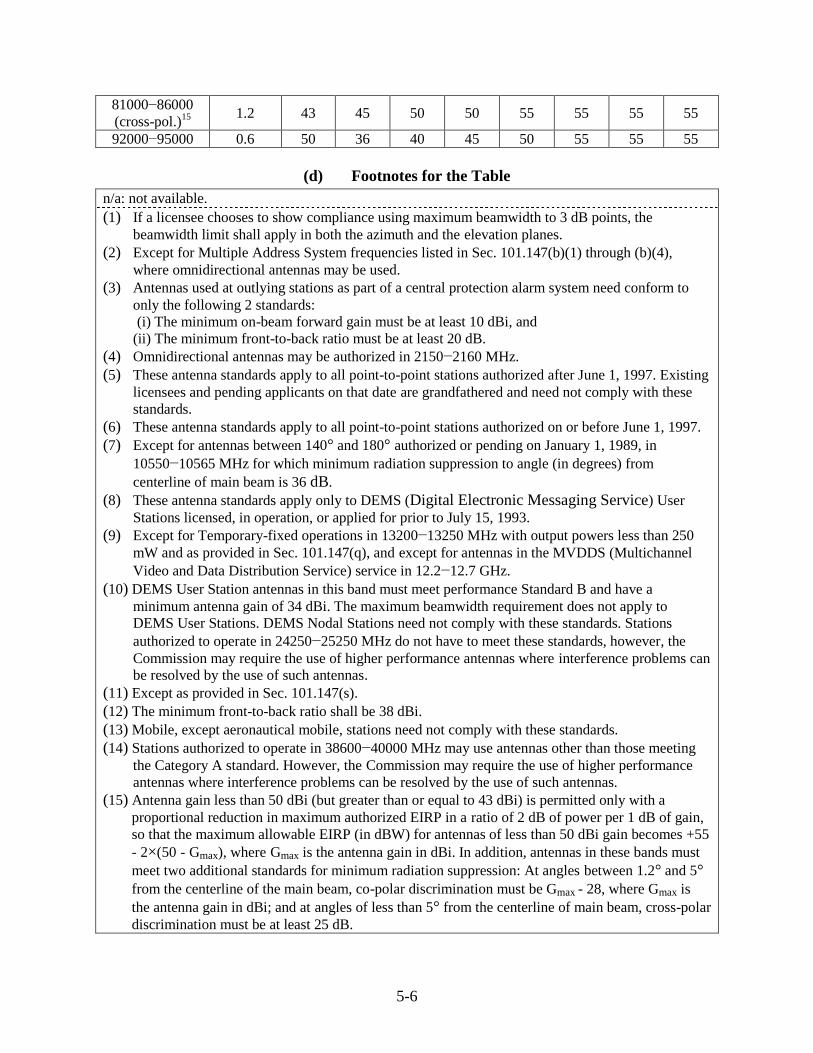
5-6
81000−86000
(cross-pol.)15
1.2 43 45 50 50 55 55 55 55
92000−95000 0.6 50 36 40 45 50 55 55 55
(d) Footnotes for the Table
n/a: not available.
(1) If a licensee chooses to show compliance using maximum beamwidth to 3 dB points, the
beamwidth limit shall apply in both the azimuth and the elevation planes.
(2) Except for Multiple Address System frequencies listed in Sec. 101.147(b)(1) through (b)(4),
where omnidirectional antennas may be used.
(3) Antennas used at outlying stations as part of a central protection alarm system need conform to
only the following 2 standards:
(i) The minimum on-beam forward gain must be at least 10 dBi, and
(ii) The minimum front-to-back ratio must be at least 20 dB.
(4) Omnidirectional antennas may be authorized in 2150−2160 MHz.
(5) These antenna standards apply to all point-to-point stations authorized after June 1, 1997. Existing
licensees and pending applicants on that date are grandfathered and need not comply with these
standards.
(6) These antenna standards apply to all point-to-point stations authorized on or before June 1, 1997.
(7) Except for antennas between 140° and 180° authorized or pending on January 1, 1989, in
10550−10565 MHz for which minimum radiation suppression to angle (in degrees) from
centerline of main beam is 36 dB.
(8) These antenna standards apply only to DEMS (Digital Electronic Messaging Service) User
Stations licensed, in operation, or applied for prior to July 15, 1993.
(9) Except for Temporary-fixed operations in 13200−13250 MHz with output powers less than 250
mW and as provided in Sec. 101.147(q), and except for antennas in the MVDDS (Multichannel
Video and Data Distribution Service) service in 12.2−12.7 GHz.
(10) DEMS User Station antennas in this band must meet performance Standard B and have a
minimum antenna gain of 34 dBi. The maximum beamwidth requirement does not apply to
DEMS User Stations. DEMS Nodal Stations need not comply with these standards. Stations
authorized to operate in 24250−25250 MHz do not have to meet these standards, however, the
Commission may require the use of higher performance antennas where interference problems can
be resolved by the use of such antennas.
(11) Except as provided in Sec. 101.147(s).
(12) The minimum front-to-back ratio shall be 38 dBi.
(13) Mobile, except aeronautical mobile, stations need not comply with these standards.
(14) Stations authorized to operate in 38600−40000 MHz may use antennas other than those meeting
the Category A standard. However, the Commission may require the use of higher performance
antennas where interference problems can be resolved by the use of such antennas.
(15) Antenna gain less than 50 dBi (but greater than or equal to 43 dBi) is permitted only with a
proportional reduction in maximum authorized EIRP in a ratio of 2 dB of power per 1 dB of gain,
so that the maximum allowable EIRP (in dBW) for antennas of less than 50 dBi gain becomes +55 - 2×(50 - Gmax), where Gmax is the antenna gain in dBi. In addition, antennas in these bands must
meet two additional standards for minimum radiation suppression: At angles between 1.2° and 5°
from the centerline of the main beam, co-polar discrimination must be Gmax - 28, where Gmax is
the antenna gain in dBi; and at angles of less than 5° from the centerline of main beam, cross-polar
discrimination must be at least 25 dB.
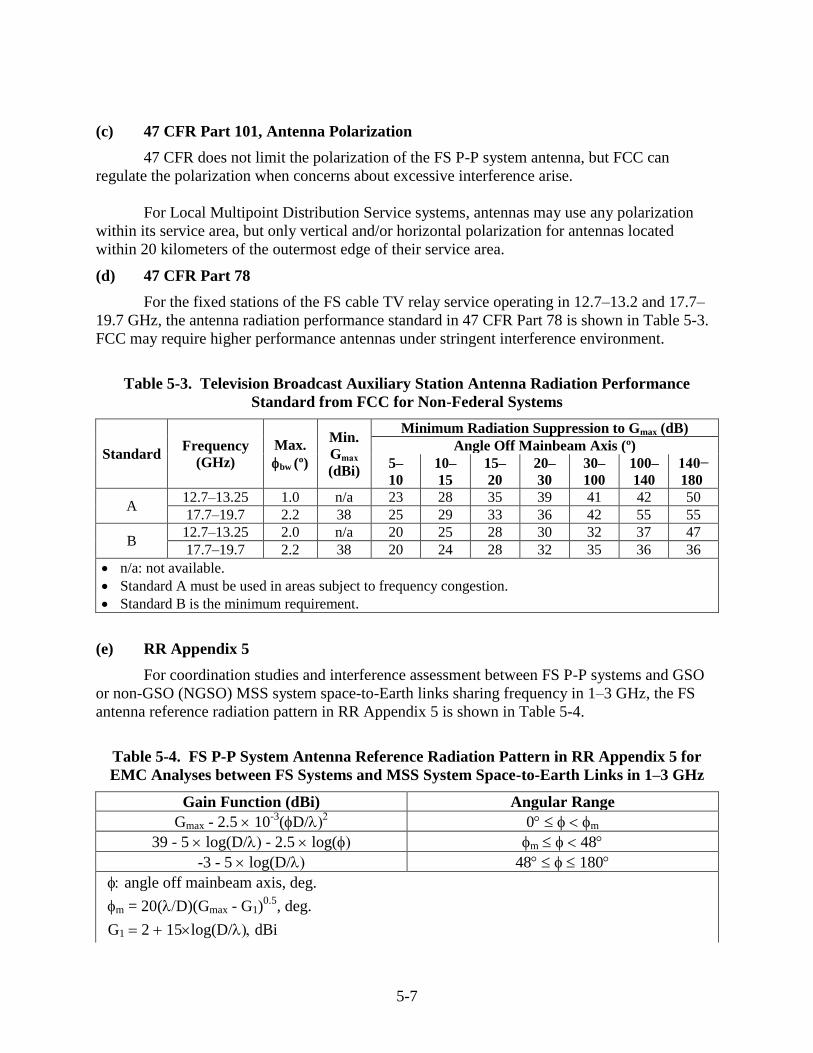
5-7
(c) 47 CFR Part 101, Antenna Polarization
47 CFR does not limit the polarization of the FS P-P system antenna, but FCC can
regulate the polarization when concerns about excessive interference arise.
For Local Multipoint Distribution Service systems, antennas may use any polarization
within its service area, but only vertical and/or horizontal polarization for antennas located
within 20 kilometers of the outermost edge of their service area.
(d) 47 CFR Part 78
For the fixed stations of the FS cable TV relay service operating in 12.7–13.2 and 17.7–
19.7 GHz, the antenna radiation performance standard in 47 CFR Part 78 is shown in Table 5-3.
FCC may require higher performance antennas under stringent interference environment.
Table 5-3. Television Broadcast Auxiliary Station Antenna Radiation Performance
Standard from FCC for Non-Federal Systems
Standard Frequency
(GHz)
Max.
bw (º)
Min.
Gmax
(dBi)
Minimum Radiation Suppression to Gmax (dB)
Angle Off Mainbeam Axis (º)
5–
10
10–
15
15–
20
20–
30
30–
100
100–
140
140−
180
A 12.7–13.25 1.0 n/a 23 28 35 39 41 42 50
17.7–19.7 2.2 38 25 29 33 36 42 55 55
B 12.7–13.25 2.0 n/a 20 25 28 30 32 37 47
17.7–19.7 2.2 38 20 24 28 32 35 36 36
n/a: not available.
Standard A must be used in areas subject to frequency congestion.
Standard B is the minimum requirement.
(e) RR Appendix 5
For coordination studies and interference assessment between FS P-P systems and GSO
or non-GSO (NGSO) MSS system space-to-Earth links sharing frequency in 1–3 GHz, the FS
antenna reference radiation pattern in RR Appendix 5 is shown in Table 5-4.
Table 5-4. FS P-P System Antenna Reference Radiation Pattern in RR Appendix 5 for
EMC Analyses between FS Systems and MSS System Space-to-Earth Links in 1–3 GHz
Gain Function (dBi) Angular Range
Gmax - 2.5 10-3
(D/ 0 m
39 - 5 log(D/ - 2.5 log( m 48
-3 - 5 log(D/ 48 180
angle off mainbeam axis, deg.
m = 20(D)(Gmax - G1)0.5
, deg.
G1 2 15log(D/ dBi
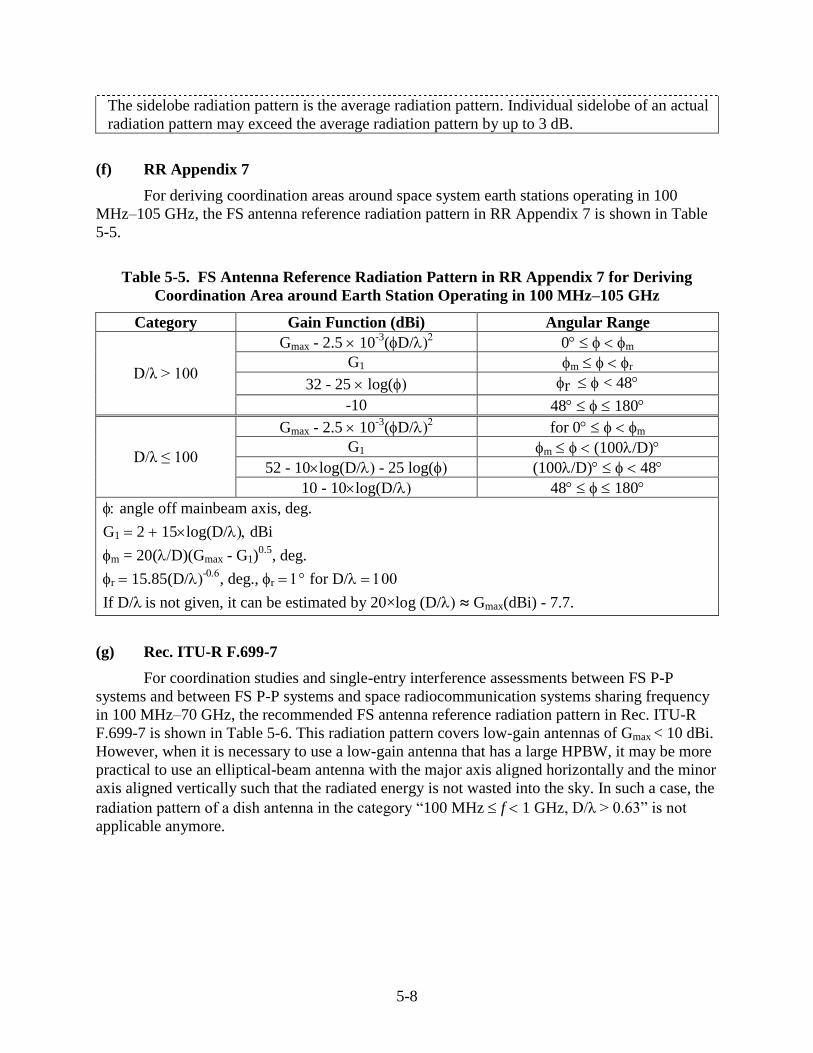
5-8
The sidelobe radiation pattern is the average radiation pattern. Individual sidelobe of an actual
radiation pattern may exceed the average radiation pattern by up to 3 dB.
(f) RR Appendix 7
For deriving coordination areas around space system earth stations operating in 100
MHz–105 GHz, the FS antenna reference radiation pattern in RR Appendix 7 is shown in Table
5-5.
Table 5-5. FS Antenna Reference Radiation Pattern in RR Appendix 7 for Deriving
Coordination Area around Earth Station Operating in 100 MHz–105 GHz
Category Gain Function (dBi) Angular Range
D/λ > 100
Gmax - 2.5 10-3
(D/ 0 m
G1 m r
32 - 25 log( r < 48
-10 48 180
D/λ ≤ 100
Gmax - 2.5 10-3
(D/ for 0 m
G1 m (100/D)
52 - 10log(D/ - 25 log( (100/D) 48
10 - 10log(D/ 48 180
angle off mainbeam axis, deg.
G1 2 15log(D/dBi
m = 20(D)(Gmax - G1)0.5
, deg.
r 15.85(D/-
, deg.,r for D/
If D/ is not given, it can be estimated by 20×log (D/≈Gmax(dBi) - 7.7.
(g) Rec. ITU-R F.699-7
For coordination studies and single-entry interference assessments between FS P-P
systems and between FS P-P systems and space radiocommunication systems sharing frequency
in 100 MHz–70 GHz, the recommended FS antenna reference radiation pattern in Rec. ITU-R
F.699-7 is shown in Table 5-6. This radiation pattern covers low-gain antennas of Gmax < 10 dBi.
However, when it is necessary to use a low-gain antenna that has a large HPBW, it may be more
practical to use an elliptical-beam antenna with the major axis aligned horizontally and the minor
axis aligned vertically such that the radiated energy is not wasted into the sky. In such a case, the
radiation pattern of a dish antenna in the category “100 MHz f1 GHz, D/λ > 0.63” is not
applicable anymore.
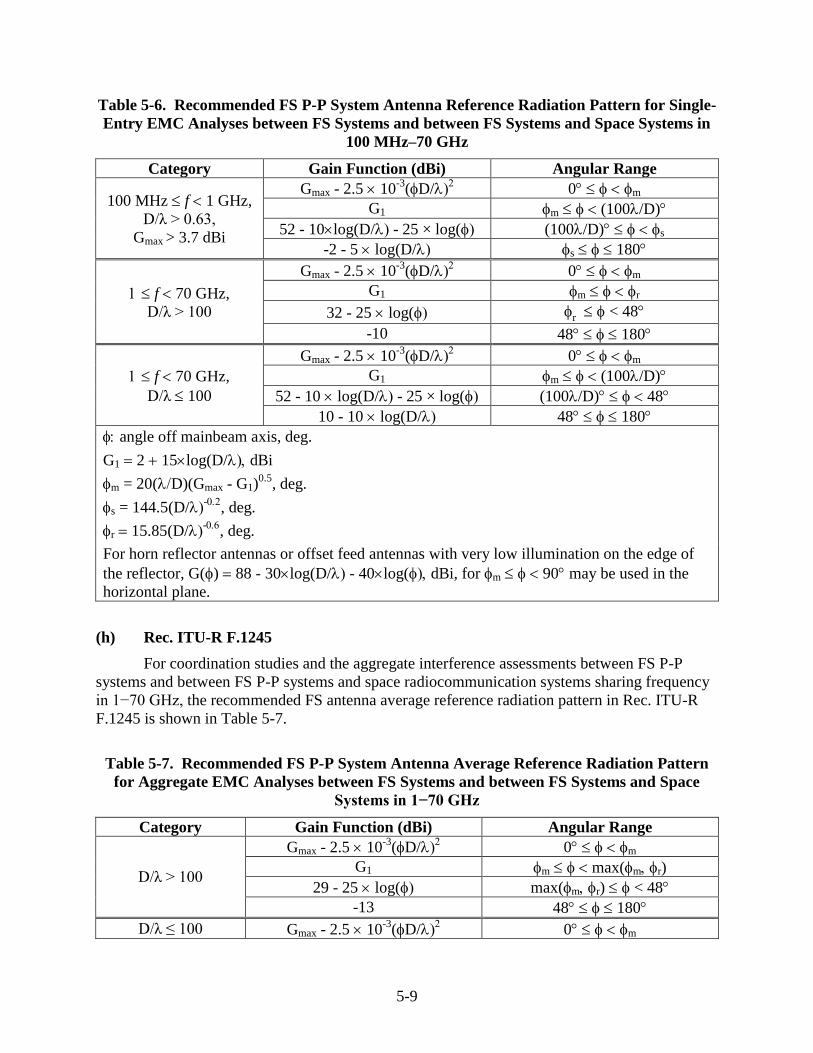
5-9
Table 5-6. Recommended FS P-P System Antenna Reference Radiation Pattern for Single-
Entry EMC Analyses between FS Systems and between FS Systems and Space Systems in
100 MHz–70 GHz
Category Gain Function (dBi) Angular Range
100 MHz f1 GHz,
D/λ > 0.63,
Gmax > 3.7 dBi
Gmax - 2.5 10-3
(D/ 0 m
G1 m (100/D)
52 - 10log(D/ - 25 × log( (100/D) s
-2 - 5 log(D/ s 180
f70 GHz,
D/λ > 100
Gmax - 2.5 10-3
(D/ 0 m
G1 m r
32 - 25 log( r < 48
-10 48 180
f70 GHz,
D/λ 100
Gmax - 2.5 10-3
(D/ 0 m
G1 m (100/D)
52 - 10 log(D/ - 25 × log( (100/D) 48
10 - 10 log(D/ 48 180
angle off mainbeam axis, deg.
G1 2 15log(D/dBi
m = 20(D)(Gmax - G1)0.5
, deg.
s = 144.5(D/-
, deg.
r 15.85(D/-
, deg.
For horn reflector antennas or offset feed antennas with very low illumination on the edge of
the reflector, G() 88 - 30log(D/ - 40log( dBi, for m 90may be used in the
horizontal plane.
(h) Rec. ITU-R F.1245
For coordination studies and the aggregate interference assessments between FS P-P
systems and between FS P-P systems and space radiocommunication systems sharing frequency
in 1−70 GHz, the recommended FS antenna average reference radiation pattern in Rec. ITU-R
F.1245 is shown in Table 5-7.
Table 5-7. Recommended FS P-P System Antenna Average Reference Radiation Pattern
for Aggregate EMC Analyses between FS Systems and between FS Systems and Space
Systems in 1−70 GHz
Category Gain Function (dBi) Angular Range
D/λ > 100
Gmax - 2.5 10-3
(D/ 0 m
G1 m max(mr)
29 - 25 log( max(mr) < 48
-13 48 180
D/λ ≤ 100 Gmax - 2.5 10-3
(D/ 0 m
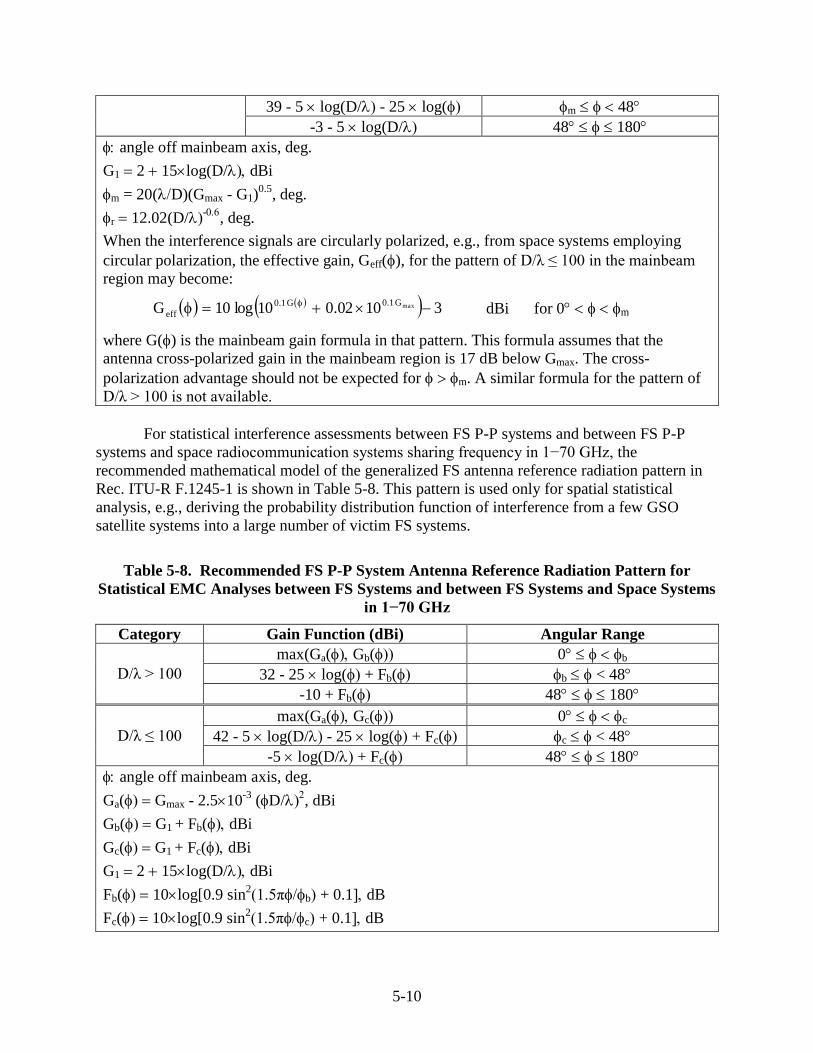
5-10
39 - 5 log(D/ - 25 log( m 48
-3 - 5 log(D/ 48 180
angle off mainbeam axis, deg.
G1 2 15log(D/dBi
m = 20(D)(Gmax - G1)0.5
, deg.
r 12.02(D/-
, deg.
When the interference signals are circularly polarized, e.g., from space systems employing
circular polarization, the effective gain, Geff(), for the pattern of D/λ ≤ 100 in the mainbeam
region may become:
31002.010log10G maxG1.0G1.0
eff dBi for 0 m
where G() is the mainbeam gain formula in that pattern. This formula assumes that the
antenna cross-polarized gain in the mainbeam region is 17 dB below Gmax. The cross-
polarization advantage should not be expected for m. A similar formula for the pattern of
D/λ > 100 is not available.
For statistical interference assessments between FS P-P systems and between FS P-P
systems and space radiocommunication systems sharing frequency in 1−70 GHz, the
recommended mathematical model of the generalized FS antenna reference radiation pattern in
Rec. ITU-R F.1245-1 is shown in Table 5-8. This pattern is used only for spatial statistical
analysis, e.g., deriving the probability distribution function of interference from a few GSO
satellite systems into a large number of victim FS systems.
Table 5-8. Recommended FS P-P System Antenna Reference Radiation Pattern for
Statistical EMC Analyses between FS Systems and between FS Systems and Space Systems
in 1−70 GHz
Category Gain Function (dBi) Angular Range
D/λ > 100
max(Ga(Gb( 0 b
32 - 25 log(+ Fb( b < 48
-10 + Fb( 48 180
D/λ ≤ 100
max(Ga(Gc( 0 c
42 - 5 log(D/ - 25 log(+ Fc( c < 48
-5 log(D/ + Fc( 48 180
angle off mainbeam axis, deg.
Ga( Gmax - 2.510-3
(D/, dBi
Gb(G1 + Fb(dBi
Gc(G1 + Fc(dBi
G1 2 15log(D/dBi
Fb(10log[0.9 sin2(1.5πb+ 0.1dB
Fc(10log[0.9 sin2(1.5πc+ 0.1dB
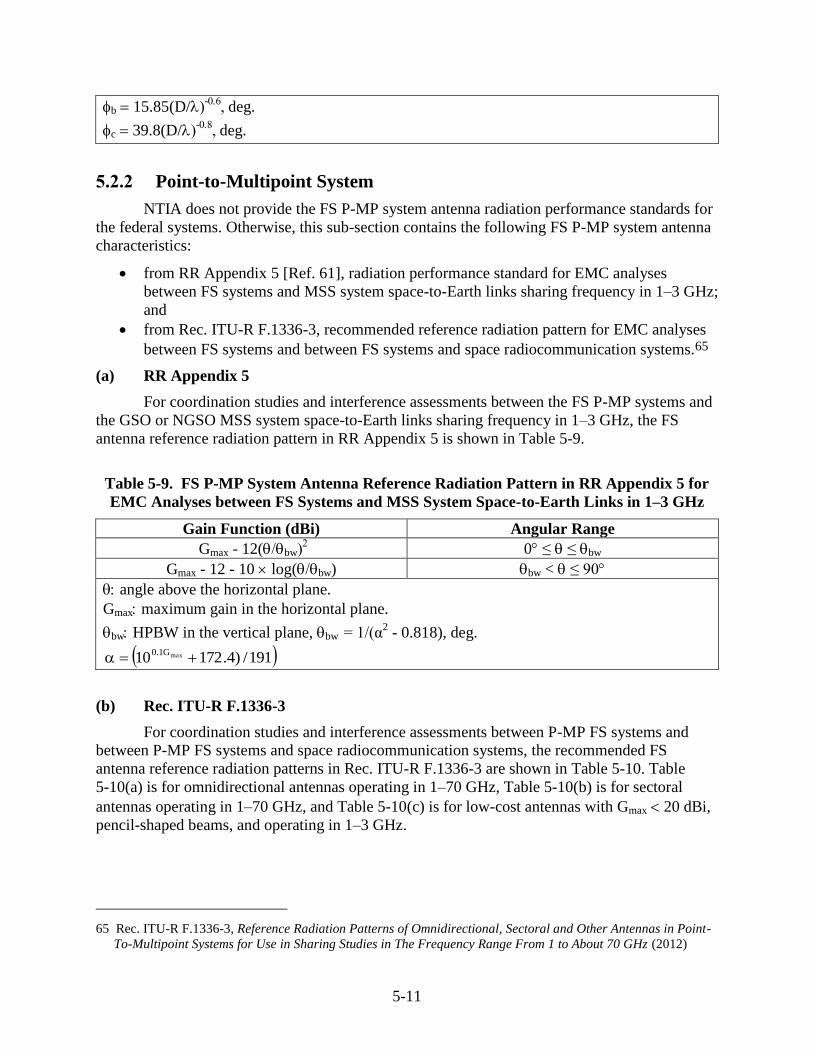
5-11
b 15.85(D/-deg.
c 39.8(D/-deg.
5.2.2 Point-to-Multipoint System
NTIA does not provide the FS P-MP system antenna radiation performance standards for
the federal systems. Otherwise, this sub-section contains the following FS P-MP system antenna
characteristics:
from RR Appendix 5 [Ref. 61], radiation performance standard for EMC analyses
between FS systems and MSS system space-to-Earth links sharing frequency in 1–3 GHz;
and
from Rec. ITU-R F.1336-3, recommended reference radiation pattern for EMC analyses
between FS systems and between FS systems and space radiocommunication systems.65
(a) RR Appendix 5
For coordination studies and interference assessments between the FS P-MP systems and
the GSO or NGSO MSS system space-to-Earth links sharing frequency in 1–3 GHz, the FS
antenna reference radiation pattern in RR Appendix 5 is shown in Table 5-9.
Table 5-9. FS P-MP System Antenna Reference Radiation Pattern in RR Appendix 5 for
EMC Analyses between FS Systems and MSS System Space-to-Earth Links in 1–3 GHz
Gain Function (dBi) Angular Range
Gmax - 12(bw 0≤≤ bw
Gmax - 12 - 10 log(bw) bw <≤ 90
angle above the horizontal plane.
Gmax maximum gain in the horizontal plane.
bw HPBW in the vertical plane, bw = 1/(α2 - 0.818), deg.
191/)4.17210 maxG1.0
(b) Rec. ITU-R F.1336-3
For coordination studies and interference assessments between P-MP FS systems and
between P-MP FS systems and space radiocommunication systems, the recommended FS
antenna reference radiation patterns in Rec. ITU-R F.1336-3 are shown in Table 5-10. Table
5-10(a) is for omnidirectional antennas operating in 1–70 GHz, Table 5-10(b) is for sectoral
antennas operating in 1–70 GHz, and Table 5-10(c) is for low-cost antennas with Gmax 20 dBi,
pencil-shaped beams, and operating in 1–3 GHz.
65 Rec. ITU-R F.1336-3, Reference Radiation Patterns of Omnidirectional, Sectoral and Other Antennas in Point-
To-Multipoint Systems for Use in Sharing Studies in The Frequency Range From 1 to About 70 GHz (2012)
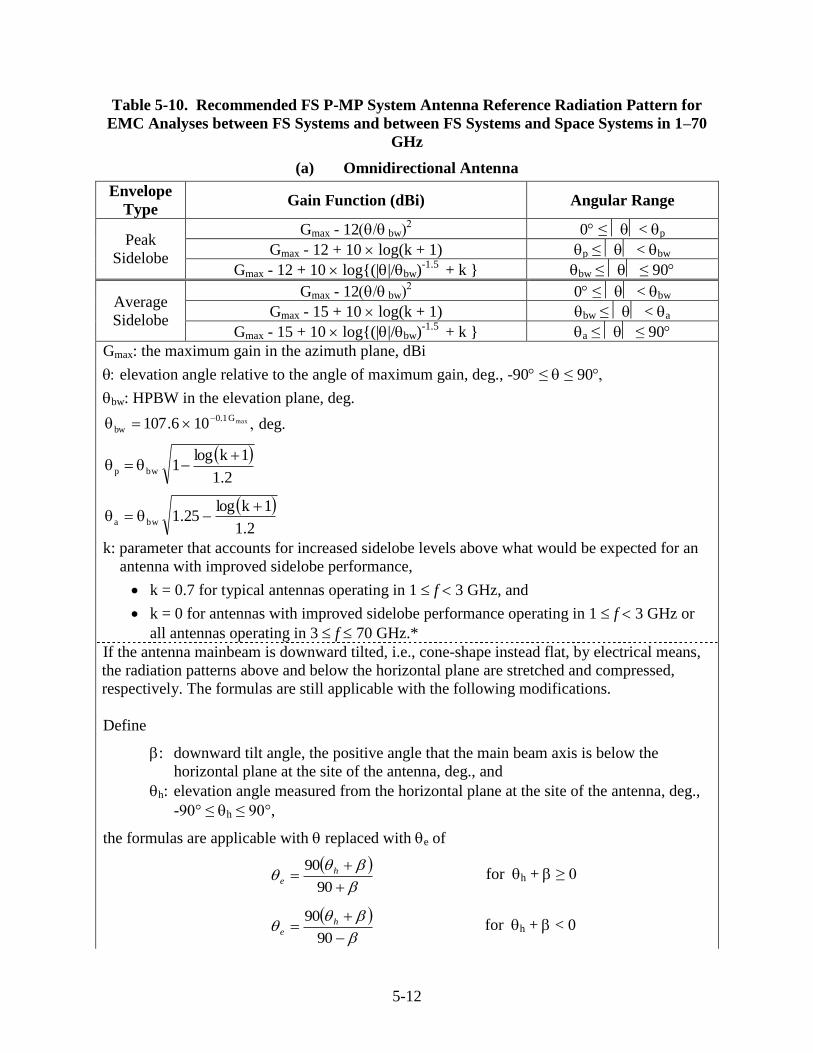
5-12
Table 5-10. Recommended FS P-MP System Antenna Reference Radiation Pattern for
EMC Analyses between FS Systems and between FS Systems and Space Systems in 1–70
GHz
(a) Omnidirectional Antenna
Envelope
Type Gain Function (dBi) Angular Range
Peak
Sidelobe
Gmax - 12 bw 0≤< p
Gmax - 12 + 10 log(k + 1) p≤< bw
Gmax - 12 + 10 log{(||/bw)-1.5
+ k } bw≤≤ 90
Average
Sidelobe
Gmax - 12 bw 0≤< bw
Gmax - 15 + 10 log(k + 1) bw≤< a
Gmax - 15 + 10 log{(||/bw)-1.5
+ k } a≤≤ 90
Gmax: the maximum gain in the azimuth plane, dBi
elevation angle relative to the angle of maximum gain, deg., -90≤≤ 90
bw: HPBW in the elevation plane, deg.
maxG1.0
bw 106.107
deg.
2.1
1klog1bwp
2.1
1klog25.1bwa
k: parameter that accounts for increased sidelobe levels above what would be expected for an
antenna with improved sidelobe performance,
k = 0.7 for typical antennas operating in 1f3 GHz, and
k = 0 for antennas with improved sidelobe performance operating in 1f3 GHz or
all antennas operating in 3f70 GHz.*
If the antenna mainbeam is downward tilted, i.e., cone-shape instead flat, by electrical means,
the radiation patterns above and below the horizontal plane are stretched and compressed,
respectively. The formulas are still applicable with the following modifications.
Define
: downward tilt angle, the positive angle that the main beam axis is below the
horizontal plane at the site of the antenna, deg., and
h: elevation angle measured from the horizontal plane at the site of the antenna, deg.,
-90° ≤ h ≤ 90°,
the formulas are applicable with replaced with e of
90
90 h
e for h + ≥ 0
90
90 h
e for h + < 0
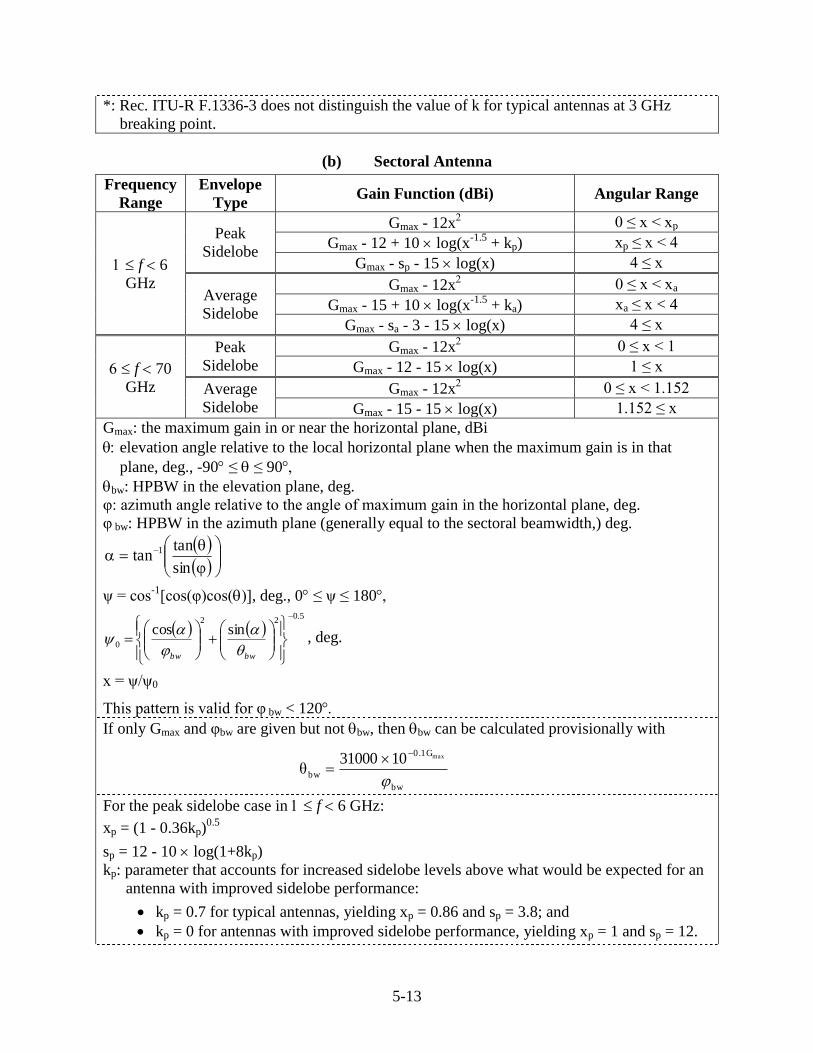
5-13
*: Rec. ITU-R F.1336-3 does not distinguish the value of k for typical antennas at 3 GHz
breaking point.
(b) Sectoral Antenna
Frequency
Range
Envelope
Type Gain Function (dBi) Angular Range
f6
GHz
Peak
Sidelobe
Gmax - 12x 0 ≤ x < xp
Gmax - 12 + 10 log(x-1.5
+ kp) xp ≤ x < 4
Gmax - sp - 15 log(x) 4 ≤ x
Average
Sidelobe
Gmax - 12x 0 ≤ x < xa
Gmax - 15 + 10 log(x-1.5
+ ka) xa ≤ x < 4
Gmax - sa - 3 - 15 log(x) 4 ≤ x
f70
GHz
Peak
Sidelobe
Gmax - 12x 0 ≤ x < 1
Gmax - 12 - 15 log(x) 1 ≤ x
Average
Sidelobe
Gmax - 12x 0 ≤ x < 1.152
Gmax - 15 - 15 log(x) 1.152 ≤ x
Gmax: the maximum gain in or near the horizontal plane, dBi
elevation angle relative to the local horizontal plane when the maximum gain is in that
plane, deg., -90≤≤ 90
bw: HPBW in the elevation plane, deg.
φ: azimuth angle relative to the angle of maximum gain in the horizontal plane, deg.
φ bw: HPBW in the azimuth plane (generally equal to the sectoral beamwidth,) deg.
sin
tantan 1
ψ = cos-1
[cos(φ)cos(, deg., 0≤ ψ≤ 180
5.0
22
0
sincos
bwbw
, deg.
x = ψ/ψ0
This pattern is valid for φ bw < 120
If only Gmaxand φbware given but notbw, then bw can be calculated provisionally with
bw
0.1G
bw
max1031000θ
For the peak sidelobe case in f6 GHz:
xp = (1 - 0.36kp)0.5
sp = 12 -10 log(1+8kp)
kp: parameter that accounts for increased sidelobe levels above what would be expected for an
antenna with improved sidelobe performance:
kp = 0.7 for typical antennas, yielding xp = 0.86 and sp = 3.8; and
kp = 0 for antennas with improved sidelobe performance, yielding xp = 1 and sp = 12.
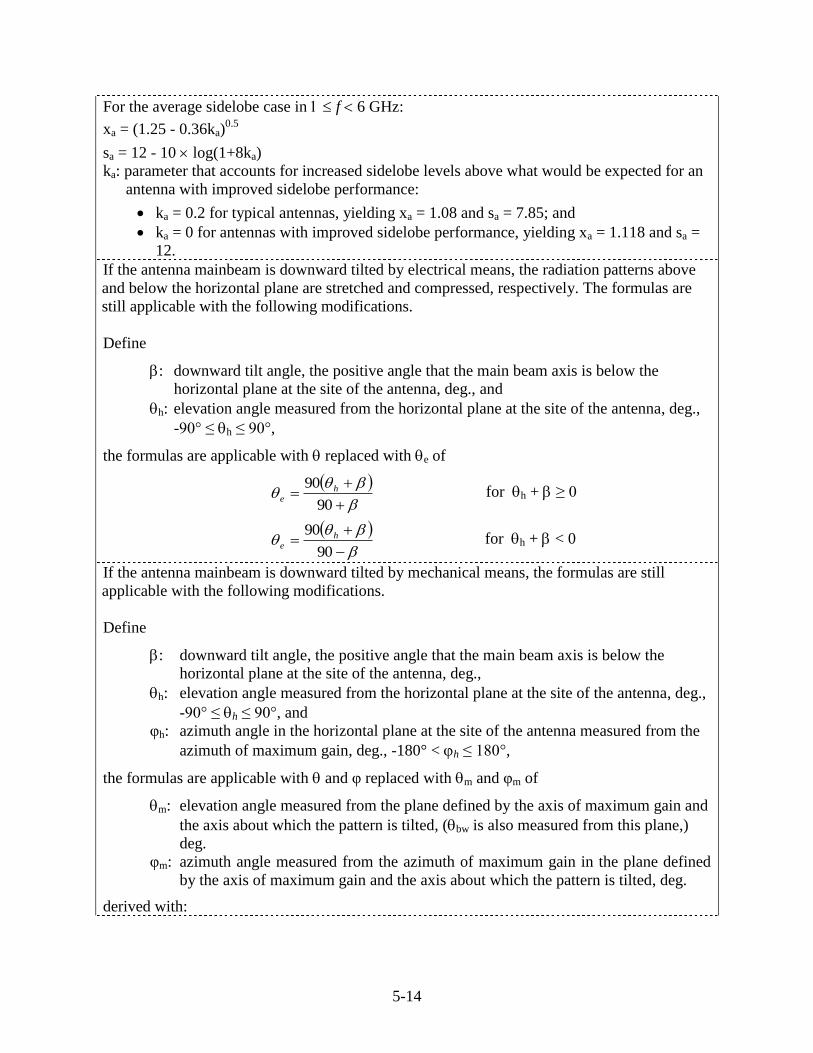
5-14
For the average sidelobe case in f6 GHz:
xa = (1.25 - 0.36ka)0.5
sa = 12 - 10 log(1+8ka)
ka: parameter that accounts for increased sidelobe levels above what would be expected for an
antenna with improved sidelobe performance:
ka = 0.2 for typical antennas, yielding xa = 1.08 and sa = 7.85; and
ka = 0 for antennas with improved sidelobe performance, yielding xa = 1.118 and sa =
12.
If the antenna mainbeam is downward tilted by electrical means, the radiation patterns above
and below the horizontal plane are stretched and compressed, respectively. The formulas are
still applicable with the following modifications.
Define
: downward tilt angle, the positive angle that the main beam axis is below the
horizontal plane at the site of the antenna, deg., and
h: elevation angle measured from the horizontal plane at the site of the antenna, deg.,
-90° ≤ h ≤ 90°,
the formulas are applicable with replaced with e of
90
90 h
e for h + ≥ 0
90
90 h
e for h + < 0
If the antenna mainbeam is downward tilted by mechanical means, the formulas are still
applicable with the following modifications.
Define
: downward tilt angle, the positive angle that the main beam axis is below the
horizontal plane at the site of the antenna, deg.,
h: elevation angle measured from the horizontal plane at the site of the antenna, deg.,
-90° ≤ h ≤ 90°, and
φh: azimuth angle in the horizontal plane at the site of the antenna measured from the
azimuth of maximum gain, deg., -180° < h ≤ 180°,
the formulas are applicable with and φ replaced with m and φm of
m: elevation angle measured from the plane defined by the axis of maximum gain and
the axis about which the pattern is tilted, (bw is also measured from this plane,)
deg.
φm: azimuth angle measured from the azimuth of maximum gain in the plane defined
by the axis of maximum gain and the axis about which the pattern is tilted, deg.
derived with:
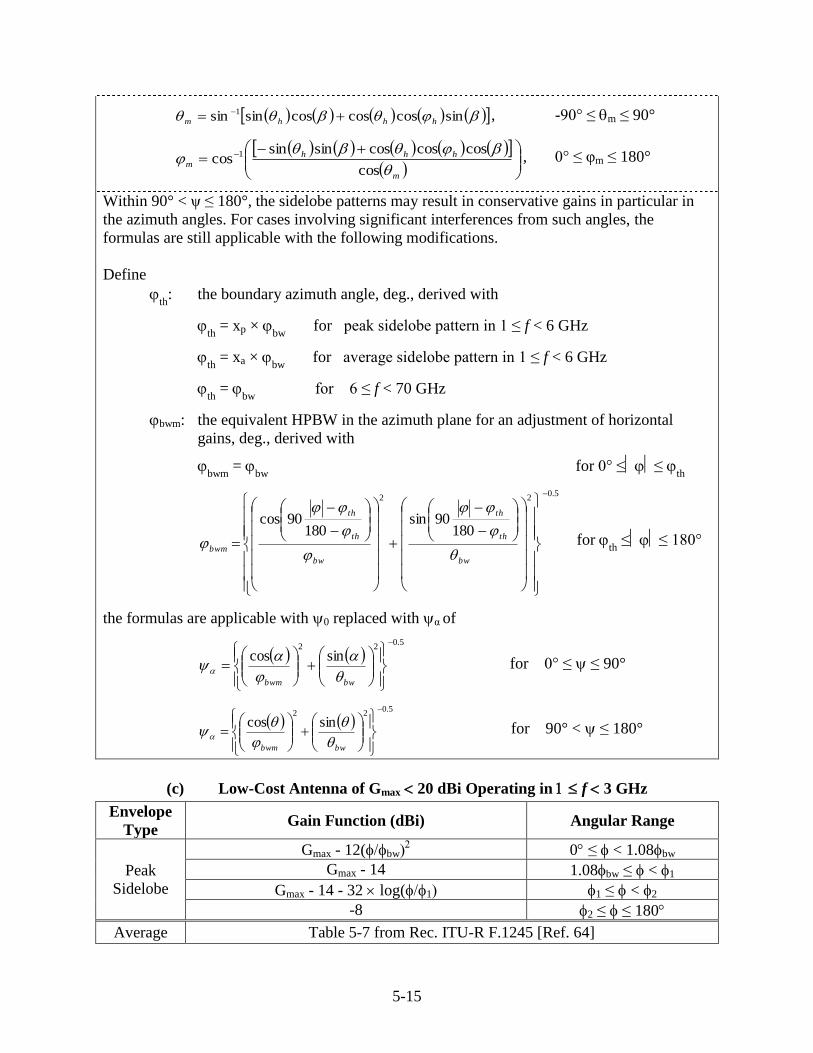
5-15
sincoscoscossinsin 1
hhhm , -90° ≤ m ≤ 90°
m
hhh
m
cos
coscoscossinsincos 1 , 0° ≤ φm ≤ 180°
Within 90° < ψ ≤ 180°, the sidelobe patterns may result in conservative gains in particular in
the azimuth angles. For cases involving significant interferences from such angles, the
formulas are still applicable with the following modifications.
Define
th
: the boundary azimuth angle, deg., derived with
th
= xp × bw
for peak sidelobe pattern in 1 ≤ f < 6 GHz
th
= xa × bw
for average sidelobe pattern in 1 ≤ f < 6 GHz
th
= bw
for 6 ≤ f < 70 GHz
bwm: the equivalent HPBW in the azimuth plane for an adjustment of horizontal
gains, deg., derived with
bwm
= bw
for 0° ≤≤ th
5.022
18090sin
18090cos
bw
th
th
bw
th
th
bwm
for th
≤≤ 180°
the formulas are applicable with 0 replaced with α of
5.0
22
sincos
bwbwm
for 0° ≤ ≤ 90°
5.0
22
sincos
bwbwm
for 90° < ≤ 180°
(c) Low-Cost Antenna of Gmax 20 dBi Operating in f3 GHz
Envelope
Type Gain Function (dBi) Angular Range
Peak
Sidelobe
Gmax - 12(bw 0≤< 1.08bw
Gmax - 14 1.08bw ≤< 1
Gmax - 14 - 32 log(1 1≤< 2
-8 2≤≤ 180
Average Table 5-7 from Rec. ITU-R F.1245 [Ref. 64]
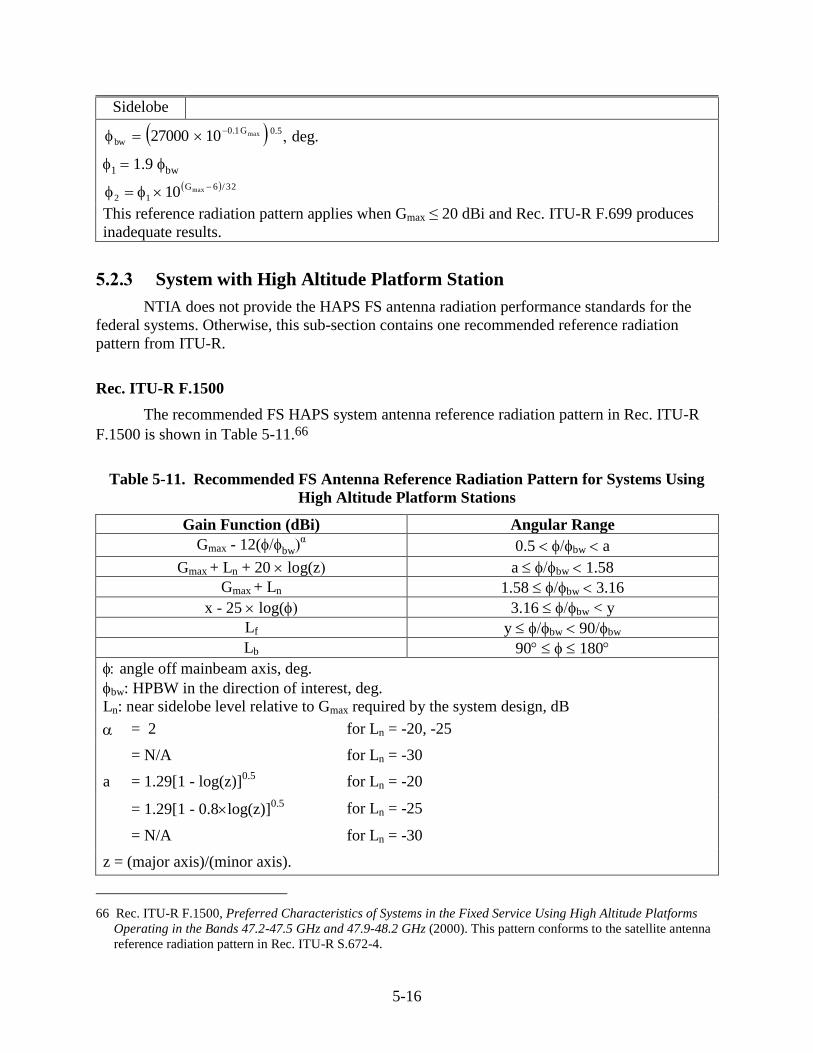
5-16
Sidelobe
5.0G1.0
bwmax1027000
deg.
1 1.9 bw
32/6G
12max10
This reference radiation pattern applies when Gmax ≤ 20 dBi and Rec. ITU-R F.699 produces
inadequate results.
5.2.3 System with High Altitude Platform Station
NTIA does not provide the HAPS FS antenna radiation performance standards for the
federal systems. Otherwise, this sub-section contains one recommended reference radiation
pattern from ITU-R.
Rec. ITU-R F.1500
The recommended FS HAPS system antenna reference radiation pattern in Rec. ITU-R
F.1500 is shown in Table 5-11.66
Table 5-11. Recommended FS Antenna Reference Radiation Pattern for Systems Using
High Altitude Platform Stations
Gain Function (dBi) Angular Range
Gmax - 12(bwα 0.5 bw a
Gmax + Ln + 20 log(z a bw 1.58
Gmax + Ln 1.58 bw 3.16
x - 25 log( 3.16 bw < y
Lf y bw 90bw
Lb 90 180
angle off mainbeam axis, deg.
bw: HPBW in the direction of interest, deg.
Ln: near sidelobe level relative to Gmax required by the system design, dB
= 2 for Ln = -20, -25
= N/A for Ln = -30
a = 1.29[1 - log(z)]0.5
for Ln = -20
= 1.29[1 - 0.8log(z)]0.5 for Ln = -25
= N/A for Ln = -30
z = (major axis)/(minor axis).
66 Rec. ITU-R F.1500, Preferred Characteristics of Systems in the Fixed Service Using High Altitude Platforms
Operating in the Bands 47.2-47.5 GHz and 47.9-48.2 GHz (2000). This pattern conforms to the satellite antenna
reference radiation pattern in Rec. ITU-R S.672-4.
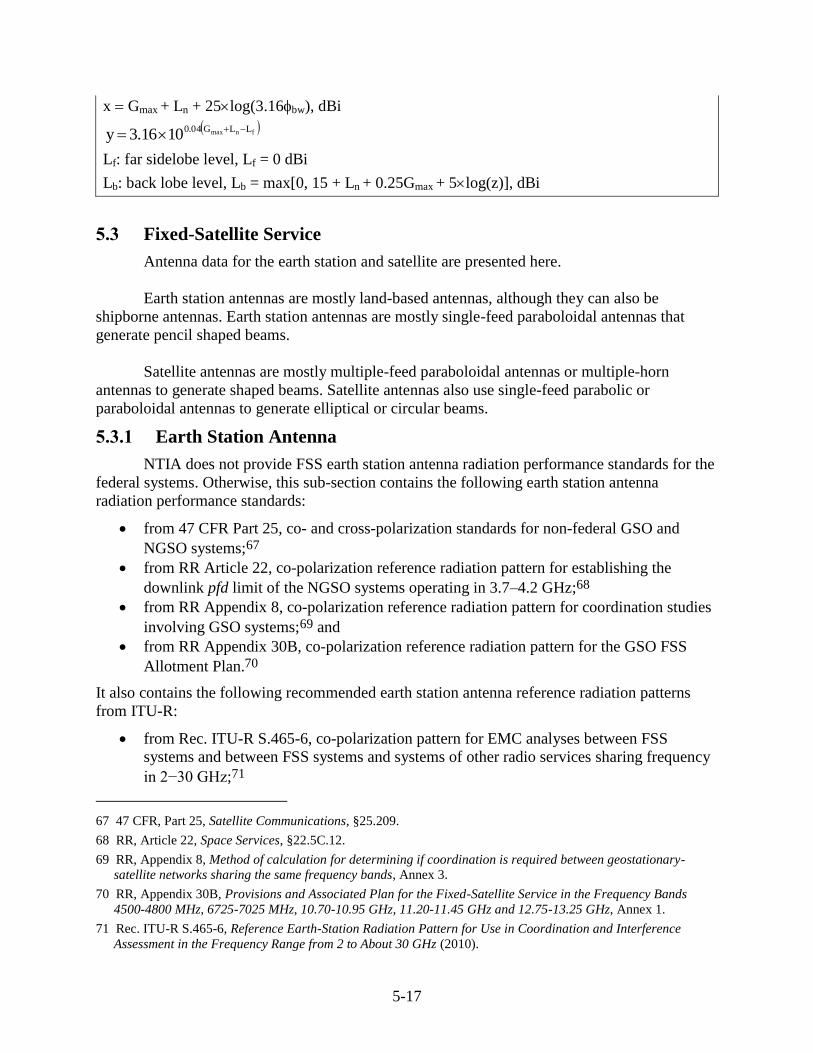
5-17
x Gmax + Ln + 25log(3.16bw), dBi
fnmax LLG04.01016.3y
Lf: far sidelobe level, Lf = 0 dBi
Lb: back lobe level, Lb = max[0, 15 + Ln + 0.25Gmax + 5log(z)], dBi
5.3 Fixed-Satellite Service
Antenna data for the earth station and satellite are presented here.
Earth station antennas are mostly land-based antennas, although they can also be
shipborne antennas. Earth station antennas are mostly single-feed paraboloidal antennas that
generate pencil shaped beams.
Satellite antennas are mostly multiple-feed paraboloidal antennas or multiple-horn
antennas to generate shaped beams. Satellite antennas also use single-feed parabolic or
paraboloidal antennas to generate elliptical or circular beams.
5.3.1 Earth Station Antenna
NTIA does not provide FSS earth station antenna radiation performance standards for the
federal systems. Otherwise, this sub-section contains the following earth station antenna
radiation performance standards:
from 47 CFR Part 25, co- and cross-polarization standards for non-federal GSO and
NGSO systems;67
from RR Article 22, co-polarization reference radiation pattern for establishing the
downlink pfd limit of the NGSO systems operating in 3.7–4.2 GHz;68
from RR Appendix 8, co-polarization reference radiation pattern for coordination studies
involving GSO systems;69 and
from RR Appendix 30B, co-polarization reference radiation pattern for the GSO FSS
Allotment Plan.70
It also contains the following recommended earth station antenna reference radiation patterns
from ITU-R:
from Rec. ITU-R S.465-6, co-polarization pattern for EMC analyses between FSS
systems and between FSS systems and systems of other radio services sharing frequency
in 2−30 GHz;71
67 47 CFR, Part 25, Satellite Communications, §25.209.
68 RR, Article 22, Space Services, §22.5C.12.
69 RR, Appendix 8, Method of calculation for determining if coordination is required between geostationary-
satellite networks sharing the same frequency bands, Annex 3.
70 RR, Appendix 30B, Provisions and Associated Plan for the Fixed-Satellite Service in the Frequency Bands
4500-4800 MHz, 6725-7025 MHz, 10.70-10.95 GHz, 11.20-11.45 GHz and 12.75-13.25 GHz, Annex 1.
71 Rec. ITU-R S.465-6, Reference Earth-Station Radiation Pattern for Use in Coordination and Interference
Assessment in the Frequency Range from 2 to About 30 GHz (2010).
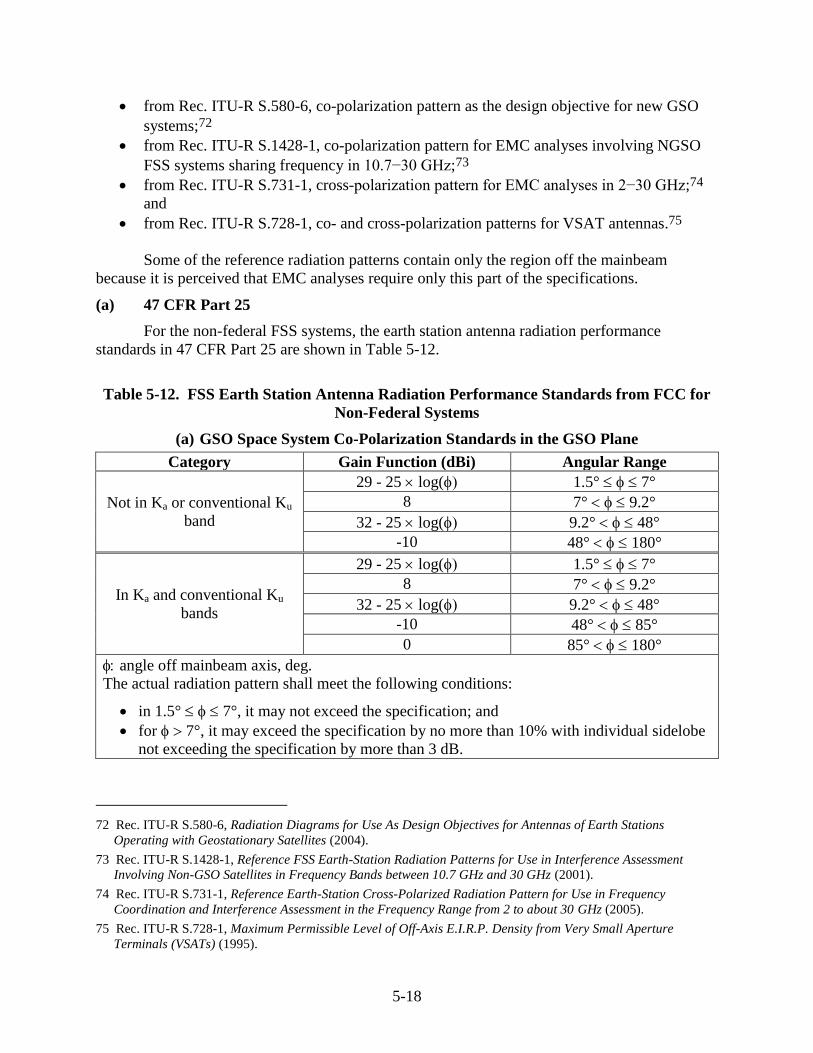
5-18
from Rec. ITU-R S.580-6, co-polarization pattern as the design objective for new GSO
systems;72
from Rec. ITU-R S.1428-1, co-polarization pattern for EMC analyses involving NGSO
FSS systems sharing frequency in 10.7−30 GHz;73
from Rec. ITU-R S.731-1, cross-polarization pattern for EMC analyses in 2−30 GHz;74
and
from Rec. ITU-R S.728-1, co- and cross-polarization patterns for VSAT antennas.75
Some of the reference radiation patterns contain only the region off the mainbeam
because it is perceived that EMC analyses require only this part of the specifications.
(a) 47 CFR Part 25
For the non-federal FSS systems, the earth station antenna radiation performance
standards in 47 CFR Part 25 are shown in Table 5-12.
Table 5-12. FSS Earth Station Antenna Radiation Performance Standards from FCC for
Non-Federal Systems
(a) GSO Space System Co-Polarization Standards in the GSO Plane
Category Gain Function (dBi) Angular Range
Not in Ka or conventional Ku
band
29 - 25 log( 1.5° 7°
8 7° 9.2°
32 - 25 log( 9.2° 48°
-10 48° 180°
In Ka and conventional Ku
bands
29 - 25 log( 1.5° 7°
8 7° 9.2°
32 - 25 log( 9.2° 48°
-10 48° 85°
0 85° 180°
angle off mainbeam axis, deg.
The actual radiation pattern shall meet the following conditions:
in 1.5° 7°, it may not exceed the specification; and
for 7°, it may exceed the specification by no more than 10% with individual sidelobe
not exceeding the specification by more than 3 dB.
72 Rec. ITU-R S.580-6, Radiation Diagrams for Use As Design Objectives for Antennas of Earth Stations
Operating with Geostationary Satellites (2004).
73 Rec. ITU-R S.1428-1, Reference FSS Earth-Station Radiation Patterns for Use in Interference Assessment
Involving Non-GSO Satellites in Frequency Bands between 10.7 GHz and 30 GHz (2001).
74 Rec. ITU-R S.731-1, Reference Earth-Station Cross-Polarized Radiation Pattern for Use in Frequency
Coordination and Interference Assessment in the Frequency Range from 2 to about 30 GHz (2005).
75 Rec. ITU-R S.728-1, Maximum Permissible Level of Off-Axis E.I.R.P. Density from Very Small Aperture
Terminals (VSATs) (1995).
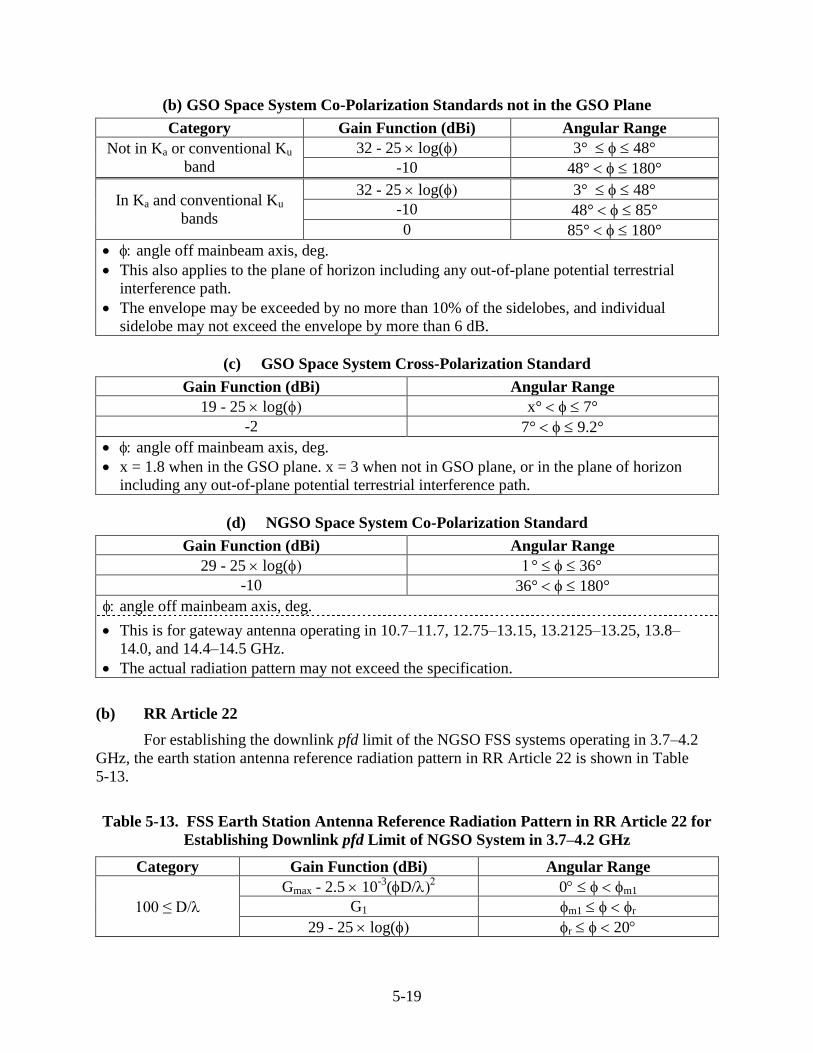
5-19
(b) GSO Space System Co-Polarization Standards not in the GSO Plane
Category Gain Function (dBi) Angular Range
Not in Ka or conventional Ku
band
32 - 25 log( 3° 48°
-10 48° 180°
In Ka and conventional Ku
bands
32 - 25 log( 3° 48°
-10 48° 85°
0 85° 180°
angle off mainbeam axis, deg.
This also applies to the plane of horizon including any out-of-plane potential terrestrial
interference path.
The envelope may be exceeded by no more than 10% of the sidelobes, and individual
sidelobe may not exceed the envelope by more than 6 dB.
(c) GSO Space System Cross-Polarization Standard
Gain Function (dBi) Angular Range
19 - 25 log( x° 7°
-2 7° 9.2°
angle off mainbeam axis, deg.
x = 1.8 when in the GSO plane. x = 3 when not in GSO plane, or in the plane of horizon
including any out-of-plane potential terrestrial interference path.
(d) NGSO Space System Co-Polarization Standard
Gain Function (dBi) Angular Range
29 - 25 log( ° 36°
-10 36° 180°
angle off mainbeam axis, deg.
This is for gateway antenna operating in 10.7–11.7, 12.75–13.15, 13.2125–13.25, 13.8–
14.0, and 14.4–14.5 GHz.
The actual radiation pattern may not exceed the specification.
(b) RR Article 22
For establishing the downlink pfd limit of the NGSO FSS systems operating in 3.7–4.2
GHz, the earth station antenna reference radiation pattern in RR Article 22 is shown in Table
5-13.
Table 5-13. FSS Earth Station Antenna Reference Radiation Pattern in RR Article 22 for
Establishing Downlink pfd Limit of NGSO System in 3.7–4.2 GHz
Category Gain Function (dBi) Angular Range
100 ≤ D/
Gmax - 2.5 10-3
(D/ 0 m1
G1 m1 r
29 - 25 log( r 20
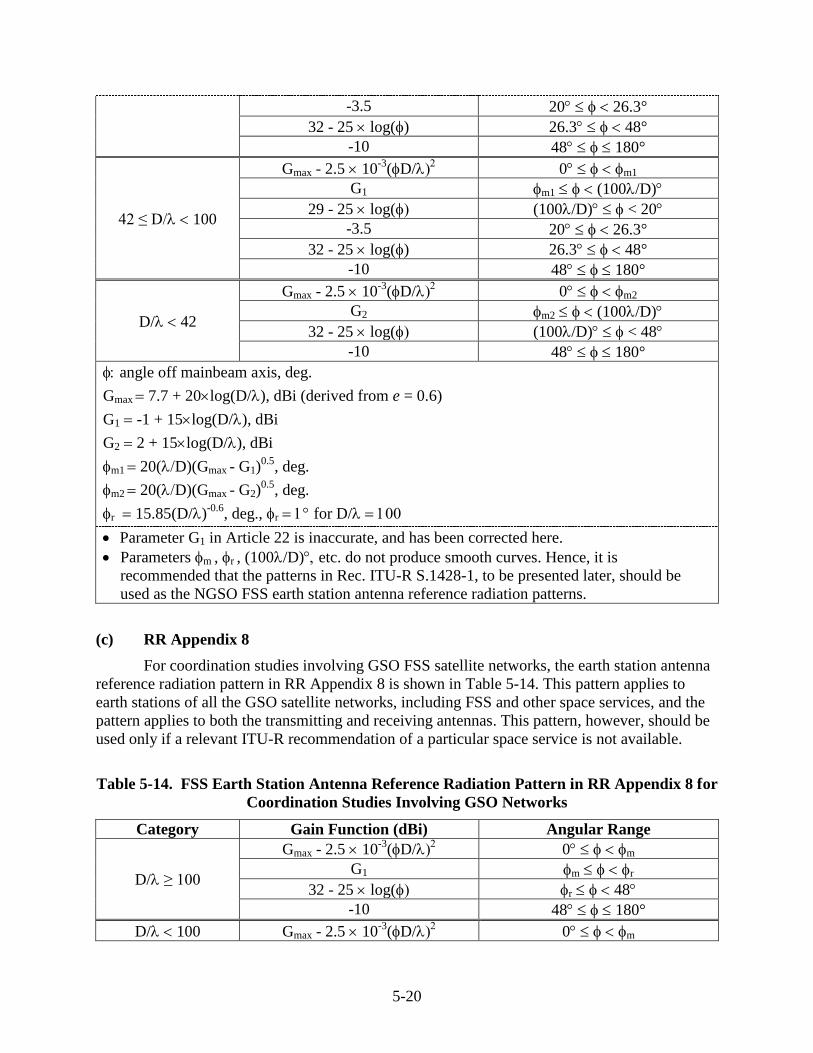
5-20
-3.5 20 26.3°
32 - 25 log() 26.3 48°
-10 48 180°
42 ≤ D/ 100
Gmax - 2.5 10-3
(D/ 0 m1
G1 m1 (100/D)
29 - 25 log( (100/D) < 20
-3.5 20 26.3°
32 - 25 log() 26.3 48°
-10 48 180°
D/42
Gmax - 2.5 10-3
(D/ 0 m2
G2 m2 (100/D)
32 - 25 log( (100/D) < 48
-10 48 180°
angle off mainbeam axis, deg.
Gmax 7.7 + 20log(D/), dBi (derived from e = 0.6)
G1 -1 + 15log(D/), dBi
G2 2 + 15log(D/), dBi
m1 20(D)(Gmax - G1)0.5
, deg.
m2 20(D)(Gmax - G2)0.5
, deg.
r 15.85(D/)-0.6
, deg.,r for D/
Parameter G1 in Article 22 is inaccurate, and has been corrected here.
Parameters m , r , (100/D)etc. do not produce smooth curves. Hence, it is
recommended that the patterns in Rec. ITU-R S.1428-1, to be presented later, should be
used as the NGSO FSS earth station antenna reference radiation patterns.
(c) RR Appendix 8
For coordination studies involving GSO FSS satellite networks, the earth station antenna
reference radiation pattern in RR Appendix 8 is shown in Table 5-14. This pattern applies to
earth stations of all the GSO satellite networks, including FSS and other space services, and the
pattern applies to both the transmitting and receiving antennas. This pattern, however, should be
used only if a relevant ITU-R recommendation of a particular space service is not available.
Table 5-14. FSS Earth Station Antenna Reference Radiation Pattern in RR Appendix 8 for
Coordination Studies Involving GSO Networks
Category Gain Function (dBi) Angular Range
D/≥ 100
Gmax - 2.5 10-3
(D/ 0 m
G1 m r
32 - 25 log( r 48
-10 48 180°
D/100 Gmax - 2.5 10-3
(D/ 0 m
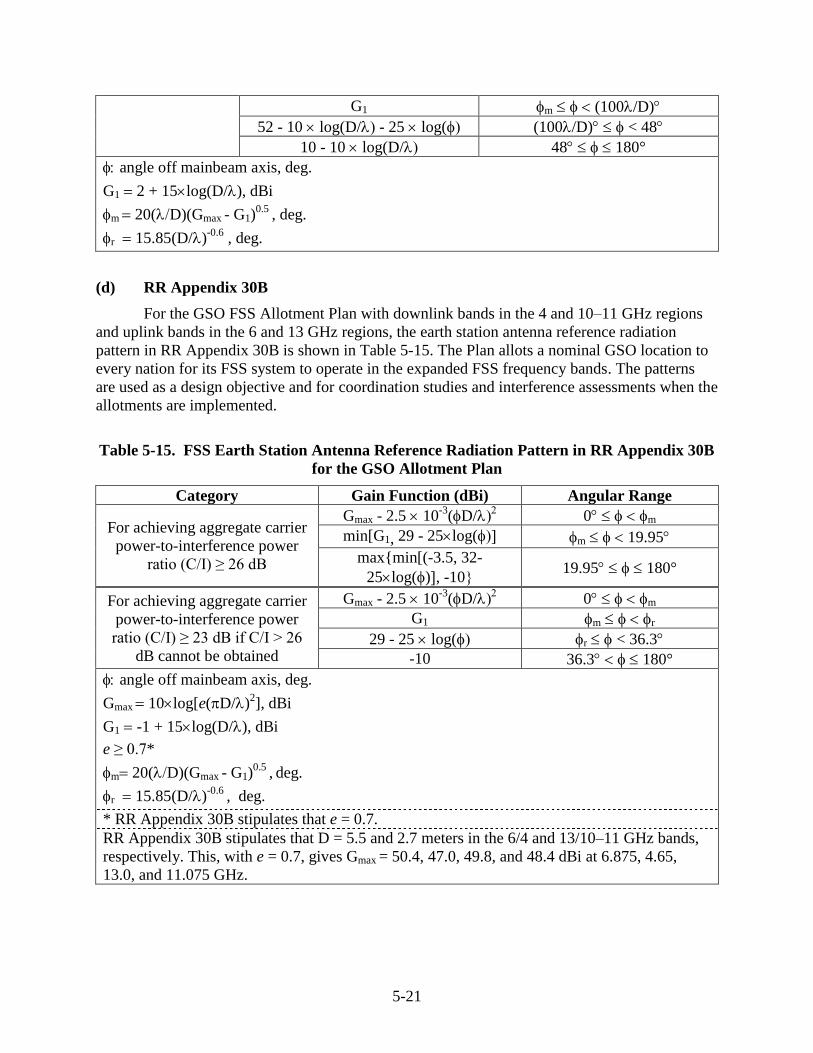
5-21
G1 m (100/D)
52 - 10 log(D/-25 log( (100/D) < 48
10 - 10 log(D/ 48 180°
angle off mainbeam axis, deg.
G1 2 + 15log(D/), dBi
m 20(D)(Gmax - G1)0.5
, deg.
r 15.85(D/)-0.6
, deg.
(d) RR Appendix 30B
For the GSO FSS Allotment Plan with downlink bands in the 4 and 10–11 GHz regions
and uplink bands in the 6 and 13 GHz regions, the earth station antenna reference radiation
pattern in RR Appendix 30B is shown in Table 5-15. The Plan allots a nominal GSO location to
every nation for its FSS system to operate in the expanded FSS frequency bands. The patterns
are used as a design objective and for coordination studies and interference assessments when the
allotments are implemented.
Table 5-15. FSS Earth Station Antenna Reference Radiation Pattern in RR Appendix 30B
for the GSO Allotment Plan
Category Gain Function (dBi) Angular Range
For achieving aggregate carrier
power-to-interference power
ratio (C/I) ≥ 26 dB
Gmax - 2.5 10-3
(D/ 0 m
min[G1, 29 - 25log( m 19.95
max{min[(-3.5, 32-
25log(), -10 19.95 180°
For achieving aggregate carrier
power-to-interference power
ratio (C/I) ≥ 23 dB if C/I > 26
dB cannot be obtained
Gmax - 2.5 10-3
(D/ 0 m
G1 m r
29 - 25 log( r < 36.3
-10 36.3 180°
angle off mainbeam axis, deg.
Gmax 10log[e(D/)2], dBi
G1 -1 + 15log(D/), dBi
e ≥ 0.7*
m 20(D)(Gmax - G1)0.5
, deg.
r 15.85(D/)-0.6
, deg.
* RR Appendix 30B stipulates that e = 0.7.
RR Appendix 30B stipulates that D = 5.5 and 2.7 meters in the 6/4 and 13/10–11 GHz bands,
respectively. This, with e = 0.7, gives Gmax = 50.4, 47.0, 49.8, and 48.4 dBi at 6.875, 4.65,
13.0, and 11.075 GHz.
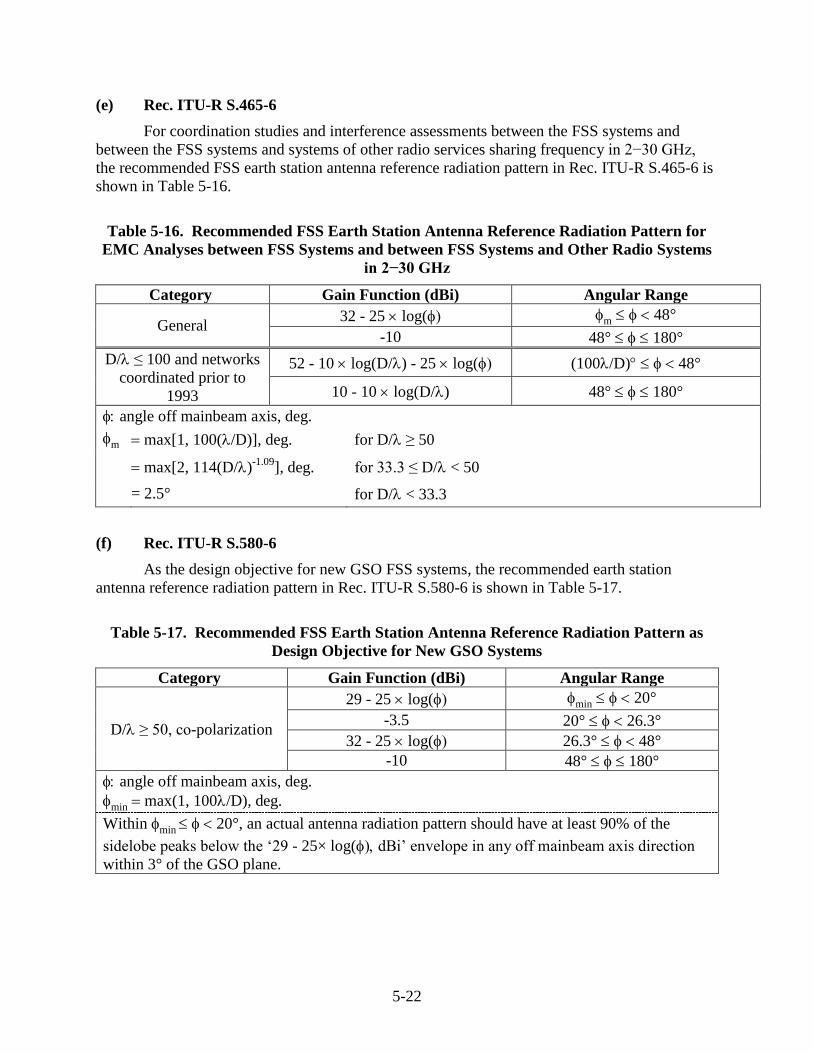
5-22
(e) Rec. ITU-R S.465-6
For coordination studies and interference assessments between the FSS systems and
between the FSS systems and systems of other radio services sharing frequency in 2−30 GHz,
the recommended FSS earth station antenna reference radiation pattern in Rec. ITU-R S.465-6 is
shown in Table 5-16.
Table 5-16. Recommended FSS Earth Station Antenna Reference Radiation Pattern for
EMC Analyses between FSS Systems and between FSS Systems and Other Radio Systems
in 2−30 GHz
Category Gain Function (dBi) Angular Range
General 32 - 25 log( m 48°
-10 48° 180°
D/ ≤ 100 and networks
coordinated prior to
1993
52 - 10 log(D/) - 25 log( (100/D) 48°
10 - 10 log(D/) 48° 180°
angle off mainbeam axis, deg.
m max[1, 100(/D)], deg. for D/ ≥ 50
max[2, 114(D/)-1.09
], deg. for 33.3 ≤ D/ < 50
= 2.5° for D/ < 33.3
(f) Rec. ITU-R S.580-6
As the design objective for new GSO FSS systems, the recommended earth station
antenna reference radiation pattern in Rec. ITU-R S.580-6 is shown in Table 5-17.
Table 5-17. Recommended FSS Earth Station Antenna Reference Radiation Pattern as
Design Objective for New GSO Systems
Category Gain Function (dBi) Angular Range
D/≥ 50, co-polarization
29 - 25 log( min 20°
-3.5 20° 26.3°
32 - 25 log( 26.3° 48°
-10 48° 180°
angle off mainbeam axis, deg.
min max(1, 100/D), deg.
Within min 20°, an actual antenna radiation pattern should have at least 90% of the
sidelobe peaks below the ‘29 - 25× log(dBi’ envelope in any off mainbeam axis direction
within 3° of the GSO plane.
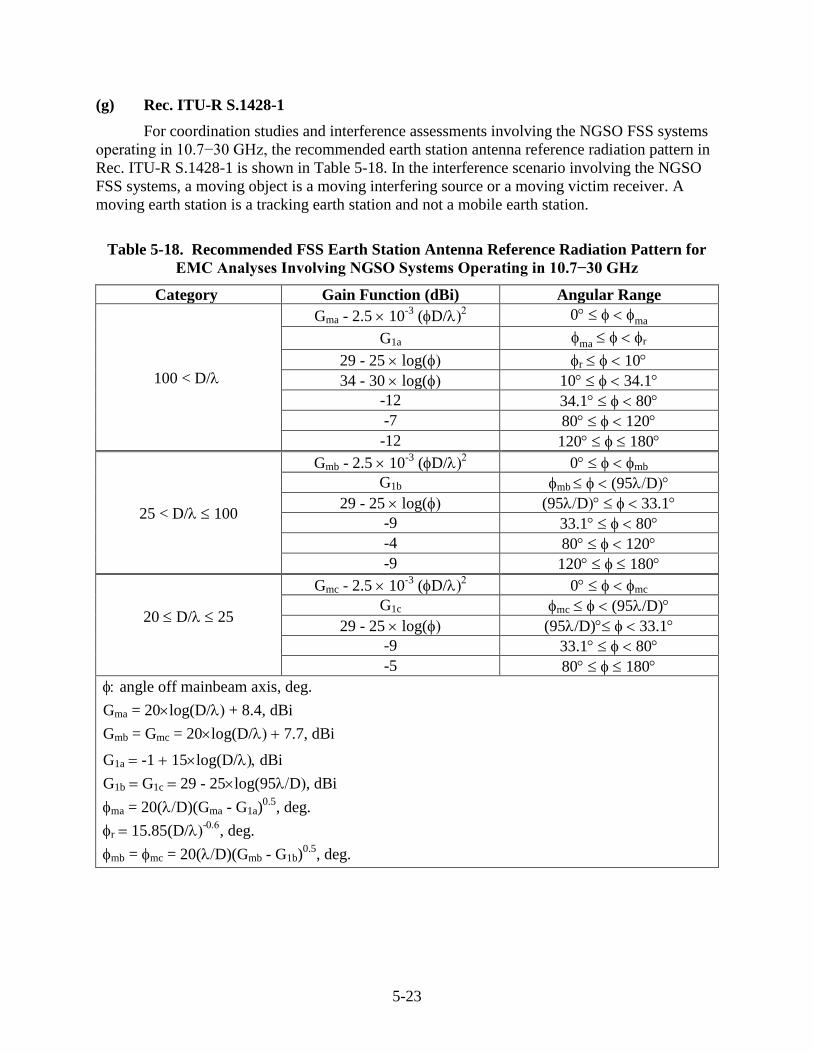
5-23
(g) Rec. ITU-R S.1428-1
For coordination studies and interference assessments involving the NGSO FSS systems
operating in 10.7−30 GHz, the recommended earth station antenna reference radiation pattern in
Rec. ITU-R S.1428-1 is shown in Table 5-18. In the interference scenario involving the NGSO
FSS systems, a moving object is a moving interfering source or a moving victim receiver. A
moving earth station is a tracking earth station and not a mobile earth station.
Table 5-18. Recommended FSS Earth Station Antenna Reference Radiation Pattern for
EMC Analyses Involving NGSO Systems Operating in 10.7−30 GHz
Category Gain Function (dBi) Angular Range
100 < D/
Gma - 2.5 10-3
(D/ 0 ma
G1a ma r
29 - 25 log( r 10
34 - 30 log( 10 34.1
-12 34.1 80
-7 80 120
-12 120 180
25 < D/ 100
Gmb - 2.5 10-3
(D/ 0 mb
G1b mb (95D
29 - 25 log( (95D 33.1
-9 33.1 80
-4 80 120
-9 120 180
20 D/ 25
Gmc - 2.5 10-3
(D/ 0 mc
G1c mc (95/D)
29 - 25 log( (95/D) 33.1
-9 33.1 80
-5 80 180
angle off mainbeam axis, deg.
Gma = 20log(D/ + 8.4, dBi
Gmb = Gmc = 20log(D/ 7.7, dBi
G1a -1 15log(D/dBi
G1b G1c 29 - 25log(95D, dBi
ma = 20(D)(Gma - G1a)0.5
, deg.
r 15.85(D/-
, deg.
mb = mc = 20(D)(Gmb - G1b)0.5
, deg.
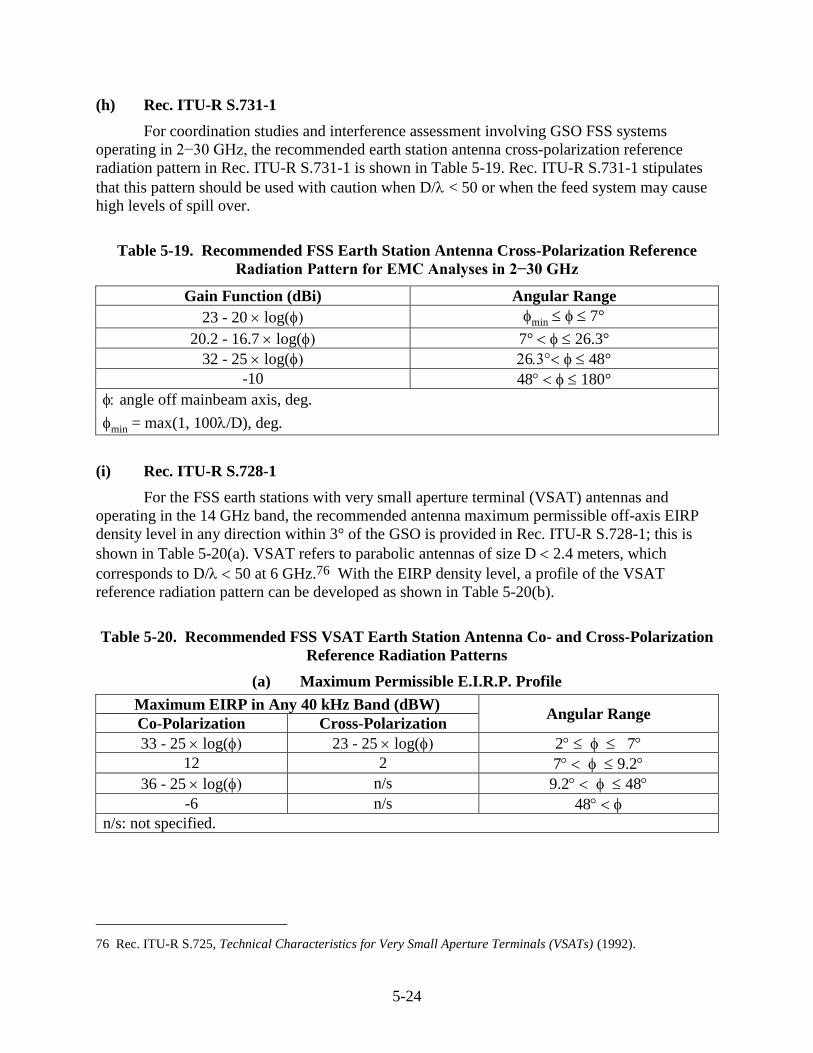
5-24
(h) Rec. ITU-R S.731-1
For coordination studies and interference assessment involving GSO FSS systems
operating in 2−30 GHz, the recommended earth station antenna cross-polarization reference
radiation pattern in Rec. ITU-R S.731-1 is shown in Table 5-19. Rec. ITU-R S.731-1 stipulates
that this pattern should be used with caution when D/ < 50 or when the feed system may cause
high levels of spill over.
Table 5-19. Recommended FSS Earth Station Antenna Cross-Polarization Reference
Radiation Pattern for EMC Analyses in 2−30 GHz
Gain Function (dBi) Angular Range
23 - 20 log( min 7°
20.2 - 16.7 log( 7° 26.3°
32 - 25 log( 6 48°
-10 48 180°
angle off mainbeam axis, deg.
min = max(1, 100/D), deg.
(i) Rec. ITU-R S.728-1
For the FSS earth stations with very small aperture terminal (VSAT) antennas and
operating in the 14 GHz band, the recommended antenna maximum permissible off-axis EIRP
density level in any direction within 3° of the GSO is provided in Rec. ITU-R S.728-1; this is
shown in Table 5-20(a). VSAT refers to parabolic antennas of size D2.4 meters, which
corresponds to D/50 at 6 GHz.76 With the EIRP density level, a profile of the VSAT
reference radiation pattern can be developed as shown in Table 5-20(b).
Table 5-20. Recommended FSS VSAT Earth Station Antenna Co- and Cross-Polarization
Reference Radiation Patterns
(a) Maximum Permissible E.I.R.P. Profile
Maximum EIRP in Any 40 kHz Band (dBW) Angular Range
Co-Polarization Cross-Polarization
33 - 25 log( 23 - 25 log( 2 7
12 2 7 9.2
36 - 25 log( n/s 9.2 48
-6 n/s 48
n/s: not specified.
76 Rec. ITU-R S.725, Technical Characteristics for Very Small Aperture Terminals (VSATs) (1992).
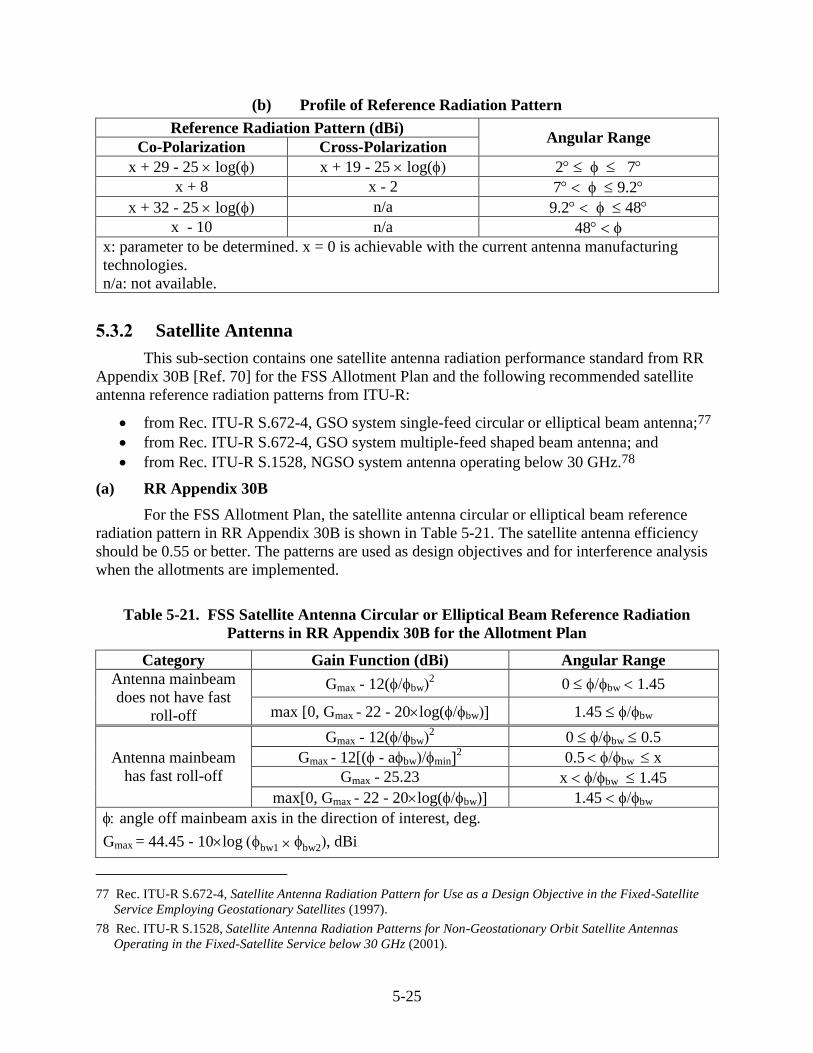
5-25
(b) Profile of Reference Radiation Pattern
Reference Radiation Pattern (dBi) Angular Range
Co-Polarization Cross-Polarization
x + 29 - 25 log( x + 19 - 25 log( 2 7
x + 8 x - 2 7 9.2
x + 32 - 25 log( n/a 9.2 48
x - 10 n/a 48
x: parameter to be determined. x = 0 is achievable with the current antenna manufacturing
technologies.
n/a: not available.
5.3.2 Satellite Antenna
This sub-section contains one satellite antenna radiation performance standard from RR
Appendix 30B [Ref. 70] for the FSS Allotment Plan and the following recommended satellite
antenna reference radiation patterns from ITU-R:
from Rec. ITU-R S.672-4, GSO system single-feed circular or elliptical beam antenna;77
from Rec. ITU-R S.672-4, GSO system multiple-feed shaped beam antenna; and
from Rec. ITU-R S.1528, NGSO system antenna operating below 30 GHz.78
(a) RR Appendix 30B
For the FSS Allotment Plan, the satellite antenna circular or elliptical beam reference
radiation pattern in RR Appendix 30B is shown in Table 5-21. The satellite antenna efficiency
should be 0.55 or better. The patterns are used as design objectives and for interference analysis
when the allotments are implemented.
Table 5-21. FSS Satellite Antenna Circular or Elliptical Beam Reference Radiation
Patterns in RR Appendix 30B for the Allotment Plan
Category Gain Function (dBi) Angular Range
Antenna mainbeam
does not have fast
roll-off
Gmax - 12(bw2 0 bw 1.45
max [0, Gmax - 22 - 20log(bw 1.45 bw
Antenna mainbeam
has fast roll-off
Gmax - 12(bw2 0 bw 0.5
Gmax - 12[(- abwmin2 0.5 bw x
Gmax - 25.23 x bw 1.45
max[0, Gmax - 22 - 20log(bw 1.45 bw
angle off mainbeam axis in the direction of interest, deg.
Gmax = 44.45 - 10logbw1 ×bw2, dBi
77 Rec. ITU-R S.672-4, Satellite Antenna Radiation Pattern for Use as a Design Objective in the Fixed-Satellite
Service Employing Geostationary Satellites (1997).
78 Rec. ITU-R S.1528, Satellite Antenna Radiation Patterns for Non-Geostationary Orbit Satellite Antennas
Operating in the Fixed-Satellite Service below 30 GHz (2001).
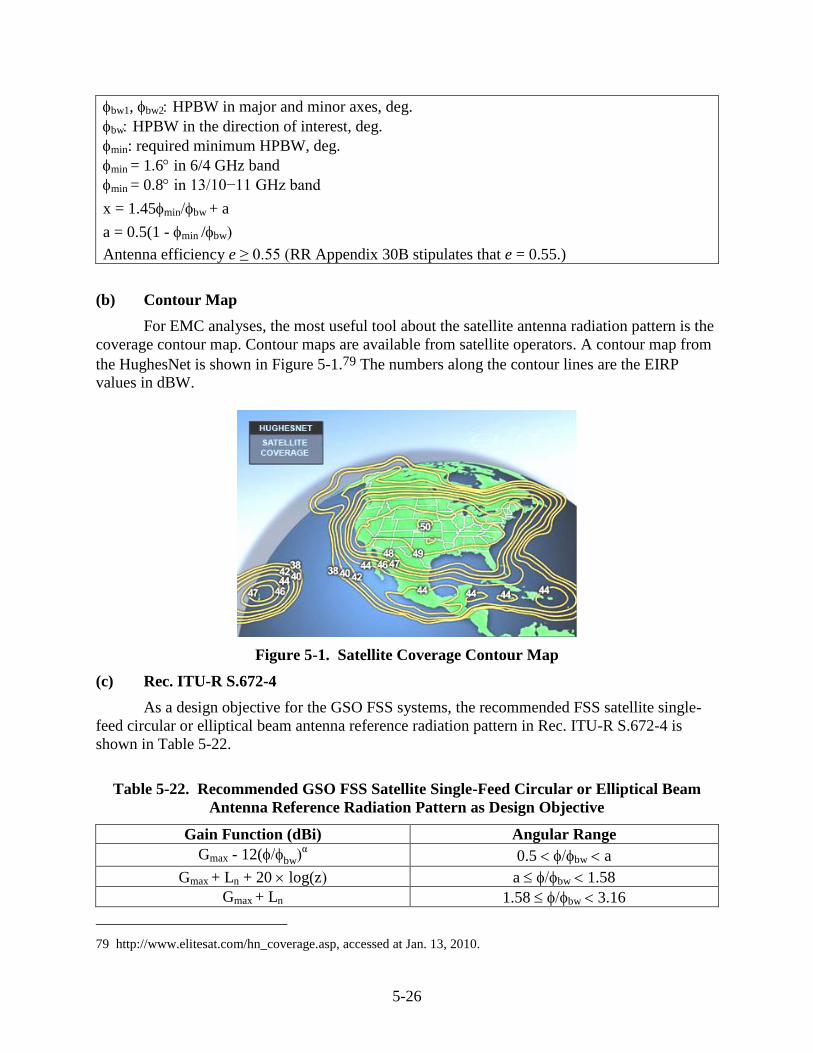
5-26
bw1, bw2 HPBW in major and minor axes, deg.
bw HPBW in the direction of interest, deg.
min: required minimum HPBW, deg.
min = 1.6in 6/4 GHz band
min = 0.8in 13/10−11 GHz band
x = 1.45minbw + a
a = 0.5(1 - min /bw
Antenna efficiency e ≥ 0.55 (RR Appendix 30B stipulates that e = 0.55.)
(b) Contour Map
For EMC analyses, the most useful tool about the satellite antenna radiation pattern is the
coverage contour map. Contour maps are available from satellite operators. A contour map from
the HughesNet is shown in Figure 5-1.79 The numbers along the contour lines are the EIRP
values in dBW.
Figure 5-1. Satellite Coverage Contour Map
(c) Rec. ITU-R S.672-4
As a design objective for the GSO FSS systems, the recommended FSS satellite single-
feed circular or elliptical beam antenna reference radiation pattern in Rec. ITU-R S.672-4 is
shown in Table 5-22.
Table 5-22. Recommended GSO FSS Satellite Single-Feed Circular or Elliptical Beam
Antenna Reference Radiation Pattern as Design Objective
Gain Function (dBi) Angular Range
Gmax - 12(bwα 0.5 bw a
Gmax + Ln + 20 log(z a bw 1.58
Gmax + Ln 1.58 bw 3.16
79 http://www.elitesat.com/hn_coverage.asp, accessed at Jan. 13, 2010.
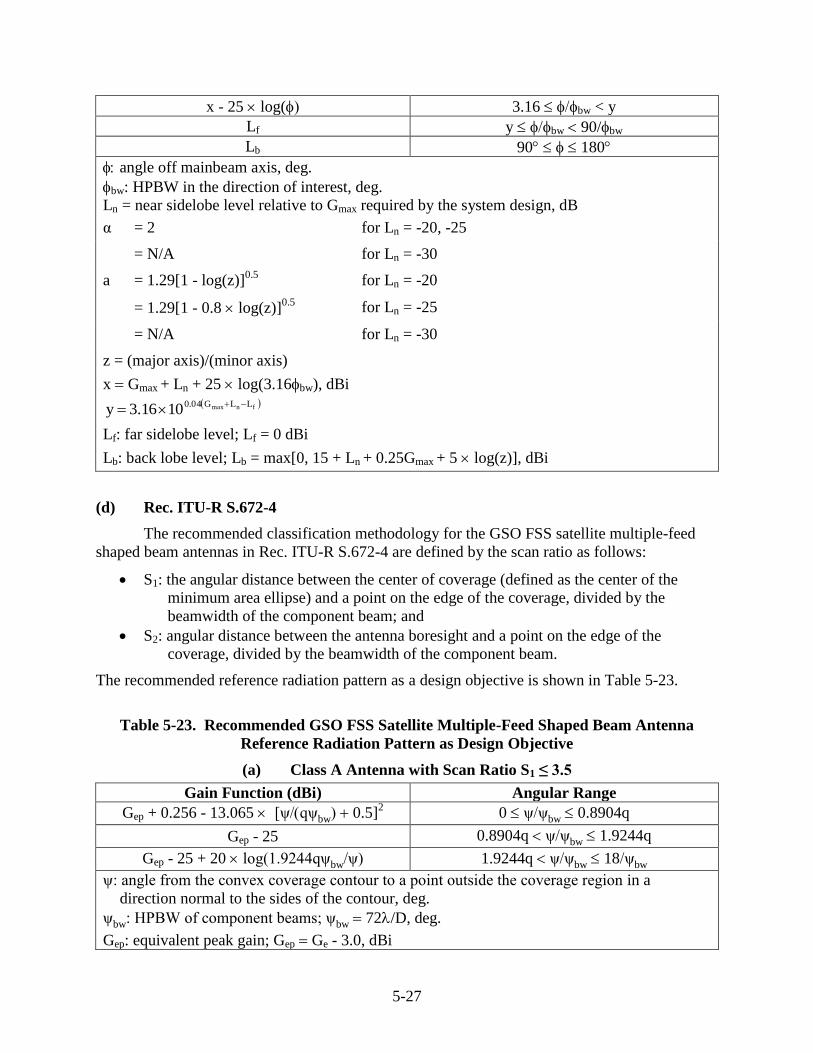
5-27
x - 25 log( 3.16 bw < y
Lf y bw 90/bw
Lb 90 180
angle off mainbeam axis, deg.
bw: HPBW in the direction of interest, deg.
Ln = near sidelobe level relative to Gmax required by the system design, dB
α = 2 for Ln = -20, -25
= N/A for Ln = -30
a = 1.29[1 - log(z)]0.5 for Ln = -20
= 1.29[1 - 0.8 log(z)]0.5 for Ln = -25
= N/A for Ln = -30
z = (major axis)/(minor axis)
x Gmax + Ln + 25 log(3.16bw), dBi fnmax LLG04.0
1016.3y
Lf: far sidelobe level; Lf = 0 dBi
Lb: back lobe level; Lb = max[0, 15 + Ln + 0.25Gmax + 5 log(z)], dBi
(d) Rec. ITU-R S.672-4
The recommended classification methodology for the GSO FSS satellite multiple-feed
shaped beam antennas in Rec. ITU-R S.672-4 are defined by the scan ratio as follows:
S1: the angular distance between the center of coverage (defined as the center of the
minimum area ellipse) and a point on the edge of the coverage, divided by the
beamwidth of the component beam; and
S2: angular distance between the antenna boresight and a point on the edge of the
coverage, divided by the beamwidth of the component beam.
The recommended reference radiation pattern as a design objective is shown in Table 5-23.
Table 5-23. Recommended GSO FSS Satellite Multiple-Feed Shaped Beam Antenna
Reference Radiation Pattern as Design Objective
(a) Class A Antenna with Scan Ratio S1 ≤ 3.5
Gain Function (dBi) Angular Range
Gep + 0.256 - 13.065 [ψqψbw0.5]2 0 ψψbw 0.8904q
Gep - 25 0.8904q ψψbw 1.9244q
Gep - 25 + 20 log(1.9244qψbwψ 1.9244q ψψbw 18ψbw
ψ: angle from the convex coverage contour to a point outside the coverage region in a
direction normal to the sides of the contour, deg.
ψbw: HPBW of component beams; ψbw72/D, deg.
Gep: equivalent peak gain; Gep Ge - 3.0, dBi
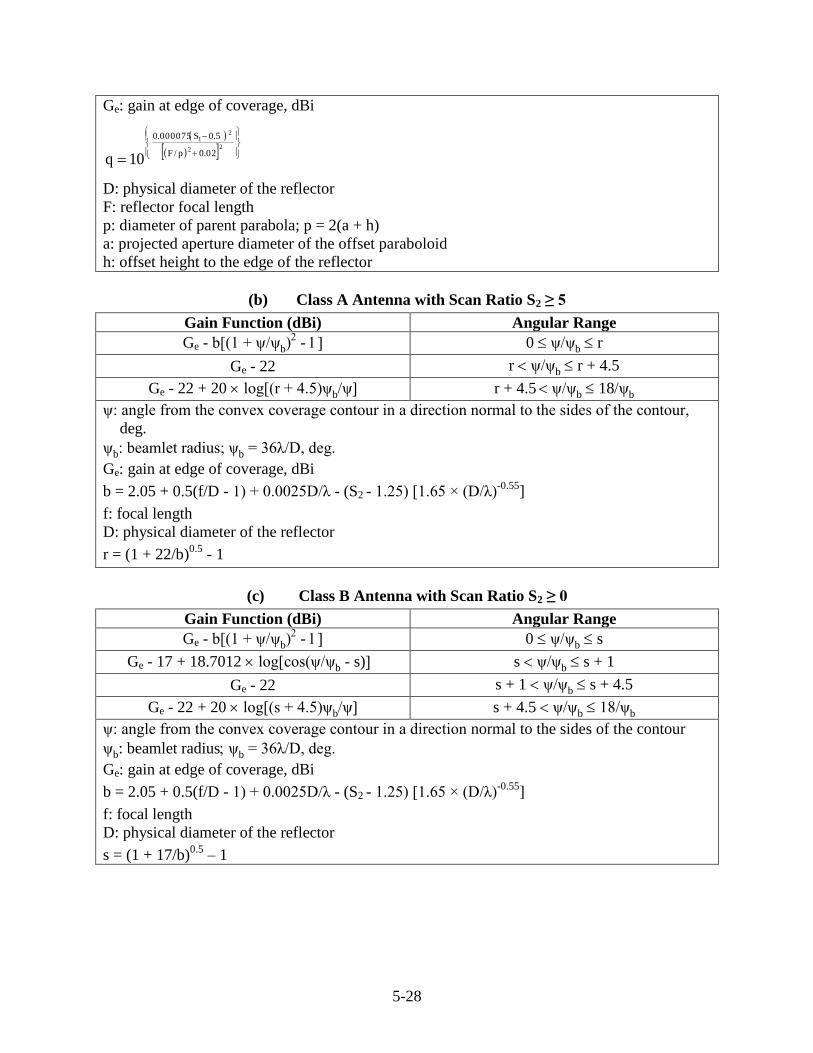
5-28
Ge: gain at edge of coverage, dBi
22
21
02.0p/F
5.0S000075.0
10q
D: physical diameter of the reflector
F: reflector focal length
p: diameter of parent parabola; p = 2(a + h)
a: projected aperture diameter of the offset paraboloid
h: offset height to the edge of the reflector
(b) Class A Antenna with Scan Ratio S2 ≥ 5
Gain Function (dBi) Angular Range
Ge - b[(1 + ψψb- 0 ψψb r
Ge - 22 r ψψb r + 4.5
Ge - 22 + 20 log[(r + 4.5)ψbψ r + 4.5 ψψb 18ψb
ψ: angle from the convex coverage contour in a direction normal to the sides of the contour,
deg.
ψb: beamlet radius; ψb= 36λ/D, deg.
Ge: gain at edge of coverage, dBi
b = 2.05 + 0.5(f/D - 1) + 0.0025D/λ - (S2 - 1.25) [1.65 × (D/λ)-0.55
]
f: focal length
D: physical diameter of the reflector
r = (1 + 22/b)0.5
- 1
(c) Class B Antenna with Scan Ratio S2 ≥ 0
Gain Function (dBi) Angular Range
Ge - b[(1 + ψψb- 0 ψψb s
Ge - 17 + 18.7012 log[cos(ψψb - s) s ψ/ψb s + 1
Ge - 22 s + 1 ψ/ψb s + 4.5
Ge - 22 + 20 log[(s + 4.5)ψbψ s + 4.5 ψ/ψb 18/ψb
ψ: angle from the convex coverage contour in a direction normal to the sides of the contour
ψb: beamlet radiusψb= 36λ/D, deg.
Ge: gain at edge of coverage, dBi
b = 2.05 + 0.5(f/D - 1) + 0.0025D/λ - (S2 - 1.25) [1.65 × (D/λ)-0.55
]
f: focal length
D: physical diameter of the reflector
s = (1 + 17/b)0.5
– 1
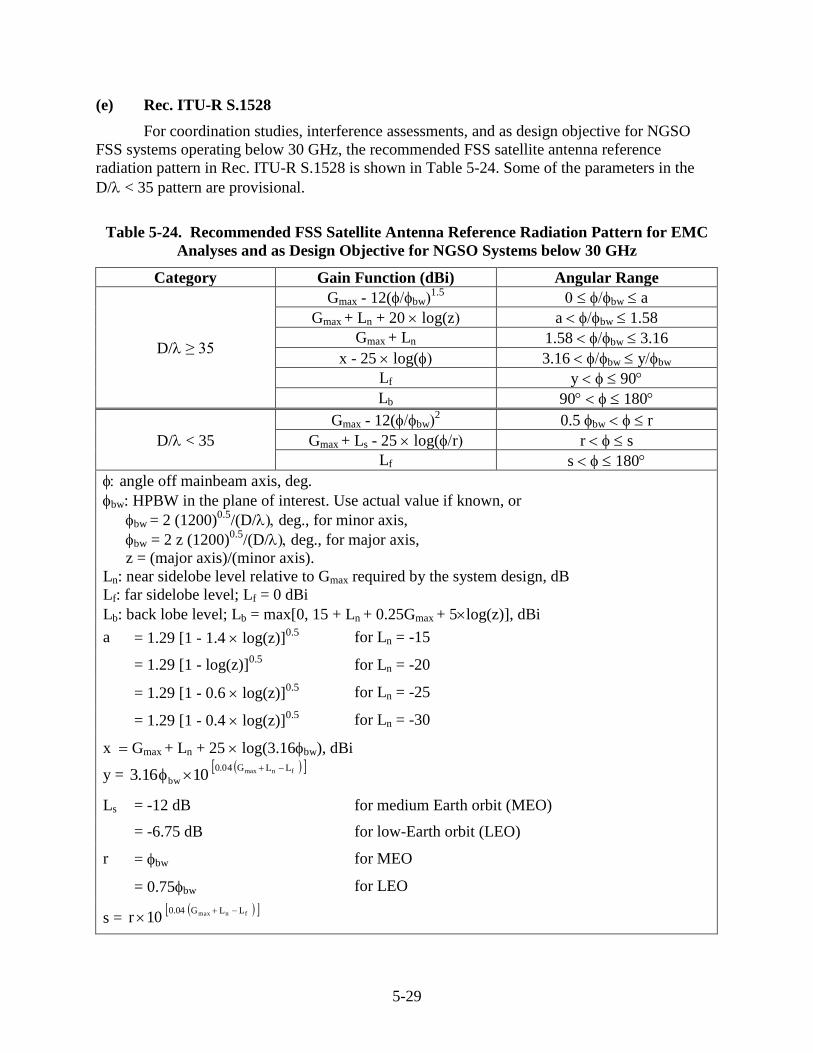
5-29
(e) Rec. ITU-R S.1528
For coordination studies, interference assessments, and as design objective for NGSO
FSS systems operating below 30 GHz, the recommended FSS satellite antenna reference
radiation pattern in Rec. ITU-R S.1528 is shown in Table 5-24. Some of the parameters in the
D/< 35 pattern are provisional.
Table 5-24. Recommended FSS Satellite Antenna Reference Radiation Pattern for EMC
Analyses and as Design Objective for NGSO Systems below 30 GHz
Category Gain Function (dBi) Angular Range
D/≥ 35
Gmax - 12(bw1.5
bw a
Gmax + Ln + 20 log(z a bw 1.58
Gmax + Ln 1.58 bw 3.16
x - 25 log( 3.16 bw ybw
Lf y 90
Lb 90 180
D/< 35
Gmax - 12(bw2 0.5 bw r
Gmax + Ls - 25 log(r r s
Lf s 180
angle off mainbeam axis, deg.
bw: HPBW in the plane of interest. Use actual value if known, or
bw = 2 (1200)0.5
/(D/deg., for minor axis,
bw = 2 z (1200)0.5
/(D/deg., for major axis,
z = (major axis)/(minor axis).
Ln: near sidelobe level relative to Gmax required by the system design, dB
Lf: far sidelobe level; Lf = 0 dBi
Lb: back lobe level; Lb = max[0, 15 + Ln + 0.25Gmax + 5log(z)], dBi
a = 1.29 [1 - 1.4 log(z)]0.5
for Ln = -15
= 1.29 [1 - log(z)]0.5 for Ln = -20
= 1.29 [1 - 0.6 log(z)]0.5
for Ln = -25
= 1.29 [1 - 0.4 log(z)]0.5
for Ln = -30
x Gmax + Ln + 25 log(3.16bw), dBi
y = fnmax LLG04.0
bw 1016.3
Ls = -12 dB for medium Earth orbit (MEO)
= -6.75 dB for low-Earth orbit (LEO)
r = bw for MEO
= 0.75bw for LEO
s = fnmax LLG04.0
10r
5-30
(f) Rec. ITU-R S.1553
Rec. ITU-R S.1553 provides information for evaluating and determining the variances of
FSS satellite antenna radiation patterns due to environmental, operational, ageing and other
factors.80
5.4 Broadcasting Service
BS provides amplitude modulation (AM) audio, frequency modulation (FM) audio, and
TV services. The BS stations can be broadcasting stations with transmitting antennas and
receiving stations with receiving antennas.
NTIA does not provide the BS antenna radiation performance standards for the federal
systems because federal agencies do not operate domestic BS system.81
5.4.1 AM Audio
AM audio programming operates mostly in the LF and MF bands. It also operates in the
HF bands, where it is referred to as the short-wave radio. The transmitting and receiving
antennas for the AM audio system are discussed here.
5.4.1.1 Transmitting Antenna
The AM audio transmitting antenna in the LF and MF bands can be either an
omnidirectional or directional antenna. The omnidirectional antennas can be short vertical
monopoles whose electric length is much shorter than λ/4. The directional antennas are mostly
arrays of either vertical radiators or combination of vertical radiators and passive elements. The
radiation pattern of an array antenna is designed for the service area of interest, and is usually
obtained from numerical analyses and then verified by measurements. Various radiating
structures, such as self-supporting towers, guyed masts and wire elements, are commonly used.
The picture of an AM audio transmitting antenna is shown in Figure 5-2.82
80 Rec. ITU-R S.1553, A Possible Method to Account for Environmental and Other Effects on Satellite Antenna
Patterns (2002).
81 The Federal Government operates Voice of America whose service areas are not domestic.
82 http://www.flickr.com/photos/theslowlane/6111796632/in/set-72157627464774731/, accessed Jan. 14, 2010.
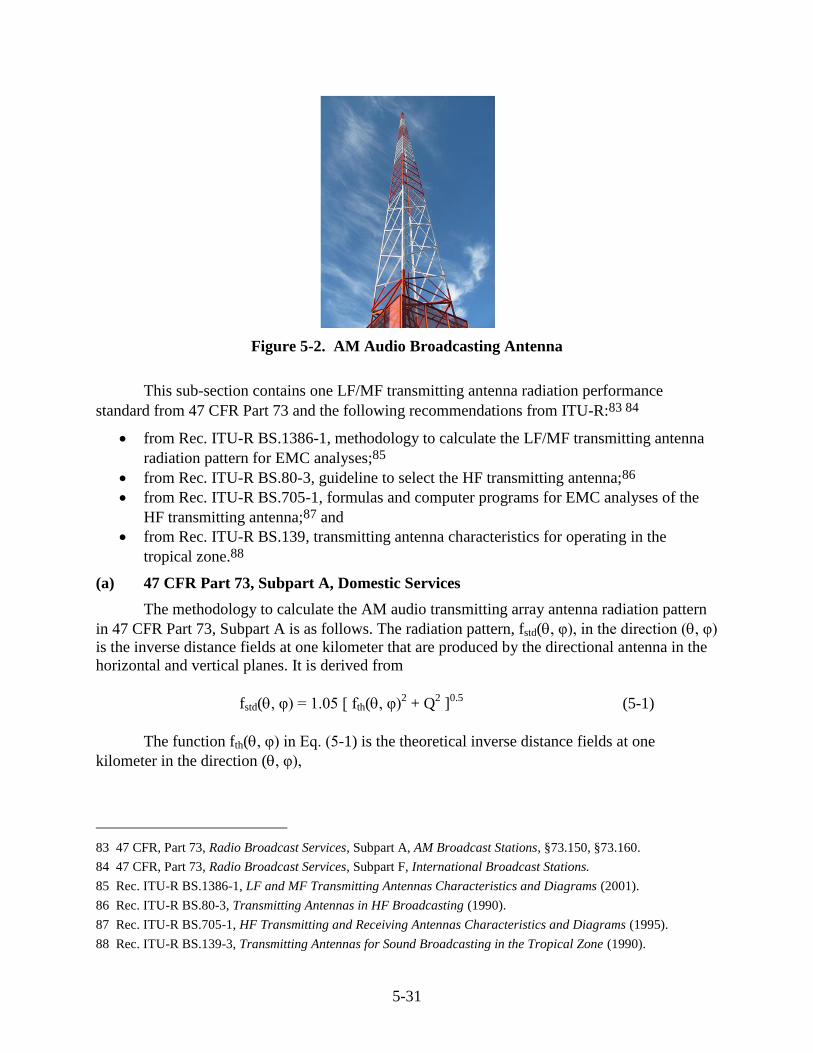
5-31
Figure 5-2. AM Audio Broadcasting Antenna
This sub-section contains one LF/MF transmitting antenna radiation performance
standard from 47 CFR Part 73 and the following recommendations from ITU-R:83 84
from Rec. ITU-R BS.1386-1, methodology to calculate the LF/MF transmitting antenna
radiation pattern for EMC analyses;85
from Rec. ITU-R BS.80-3, guideline to select the HF transmitting antenna;86
from Rec. ITU-R BS.705-1, formulas and computer programs for EMC analyses of the
HF transmitting antenna;87 and
from Rec. ITU-R BS.139, transmitting antenna characteristics for operating in the
tropical zone.88
(a) 47 CFR Part 73, Subpart A, Domestic Services
The methodology to calculate the AM audio transmitting array antenna radiation pattern
in 47 CFR Part 73, Subpart A is as follows. The radiation pattern, fstd(, φ), in the direction (, φ)
is the inverse distance fields at one kilometer that are produced by the directional antenna in the
horizontal and vertical planes. It is derived from
fstd(, φ) = 1.05 [ fth(, φ)2 + Q
2 ]
0.5 (5-1)
The function fth(, φ) in Eq. (5-1) is the theoretical inverse distance fields at one
kilometer in the direction (, φ),
83 47 CFR, Part 73, Radio Broadcast Services, Subpart A, AM Broadcast Stations, §73.150, §73.160.
84 47 CFR, Part 73, Radio Broadcast Services, Subpart F, International Broadcast Stations.
85 Rec. ITU-R BS.1386-1, LF and MF Transmitting Antennas Characteristics and Diagrams (2001).
86 Rec. ITU-R BS.80-3, Transmitting Antennas in HF Broadcasting (1990).
87 Rec. ITU-R BS.705-1, HF Transmitting and Receiving Antennas Characteristics and Diagrams (1995).
88 Rec. ITU-R BS.139-3, Transmitting Antennas for Sound Broadcasting in the Tropical Zone (1990).
5-32
n
1i iii
iith
coscosS
fFk,f (5-2)
where
k: the multiplying constant that determines the basic pattern size,
i: ith
array element or ith
tower,
n: the total number of elements in the array,
Fi: the field ratio of the ith
array element,
fi(): the vertical plane radiation characteristic of the ith
array element,
Si: electrical spacing of the ith
array element from the reference point,
φi: azimuth (with respect to true north) of the ith
array element, and
Ψi: electrical phase angle of the current in the ith
array element.
The value of k in Eq. (5-2) is chosen so that the root-mean-square value of the theoretical
field in the horizontal plane is no greater than the value computed on the assumption that
nominal station power is delivered to the directional array, and that a lumped loss resistance of
one ohm exists at the current loop of each element of the array, or at the base of each element of
electrical height lower than 0.25 wavelength, and no less than the value required in
§73.189(b)(2) for a station of the class and nominal power for which the pattern is designed.
The value of fi() in Eq. (5-2) depends on the tower height as well as whether the tower is
top-loaded or sectionalized:
(1) For a typical tower that is not top-loaded nor sectionalized,
coscos1
cossincosf
G
GG (5-3)
where G is the electrical height of the tower, not including the base insulator and pier, in
electrical degrees. In the case of a folded monopole tower, the entire radiating structure’s
electrical height is used.
(2) For a top-loaded tower,
BAcosBcoscos
BAcossinAsinBsinsinsinAcosBcosf
(5-4)
where
A: the physical height of the tower, in electrical degrees,
G: the apparent electrical height of the tower, based on current distribution, in electrical
degrees,
B = G – A.
5-33
(3) For a sectionalized tower,
cosDcosBsincosBcossincos
fBsinfsinf 21
G (5-5)
where
f1 = cos(B)cos[A×sin(θ)] - cos(G),
f2 = cos(D)cos[C×sin(θ)] - sin(θ)sin(D)sin[C sin(θ)] - cos(Δ)cos[A×sin(θ)],
A: the physical height of the lower section of the tower, in electrical degrees,
G: the apparent electrical height of the lower section of the tower, based on current
distribution, in electrical degrees,
B = G - A,
C: the physical height of the entire tower, in electrical degrees,
H: the apparent electrical height of the tower, based on current distribution, in electrical
degrees,
D = H - C, D = 0 if the sectionalized tower is not top-loaded, and
Δ = H - A.
Here “height in electrical degrees” means height divided by λ then multiplied by 360.
The value of Q in Eq. (5-1) is calculated with
Q = max [0.025×g() Erss , 10×g()(PkW) 0.5
] (5-6)
where
g(): the shortest element of the fi() array. If the shortest element has an electrical height
in excess of 0.5λ, then
g() = [f()2 + 0.0625]
0.5/1.030776 (5-7)
Erss: the root sum square of the amplitudes of the inverse fields of the elements in the
horizontal plane, i.e.,
5.0
n
1i
2
irss FkE
(5-8)
PkW: the nominal station power expressed in kilowatts. PkW = 1 if the nominal power is
less than one kilowatt.
(b) 47 CFR Part 73, Subpart F, International Services
The standard for the international HF AM audio broadcasting transmitting antenna is not
specified in 47 CFR Part 73, Subpart F.
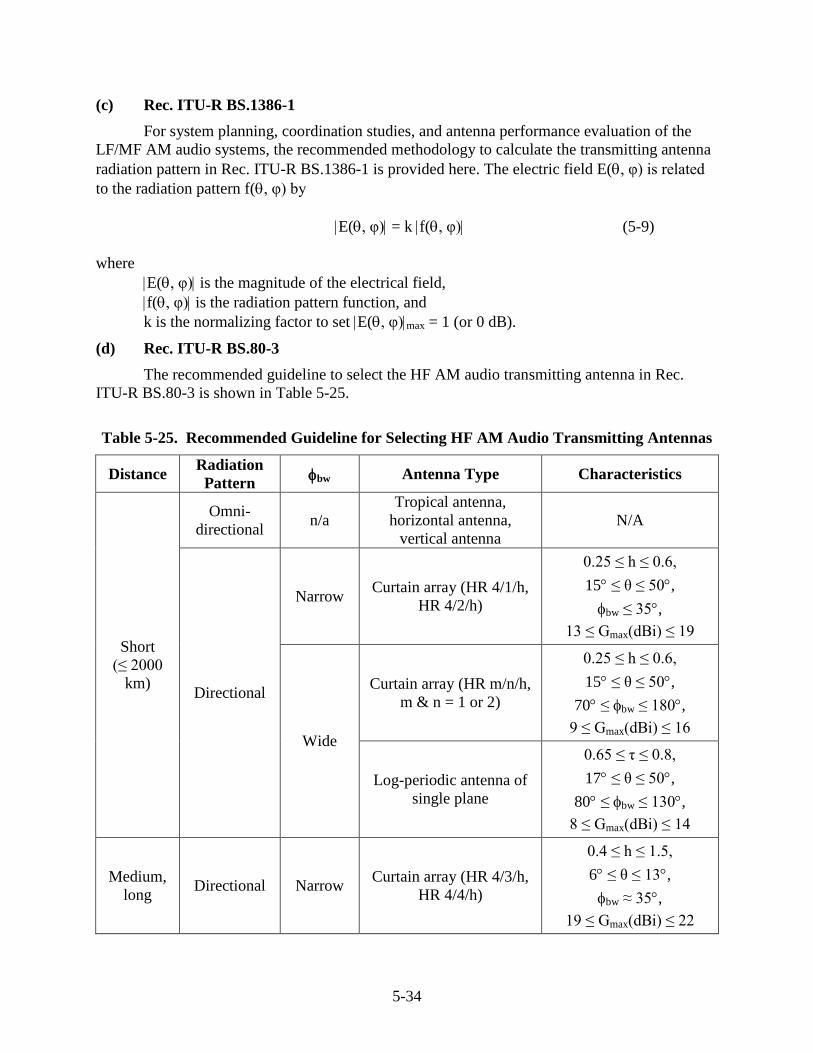
5-34
(c) Rec. ITU-R BS.1386-1
For system planning, coordination studies, and antenna performance evaluation of the
LF/MF AM audio systems, the recommended methodology to calculate the transmitting antenna
radiation pattern in Rec. ITU-R BS.1386-1 is provided here. The electric field E(, φ) is related
to the radiation pattern f(, φ) by
E(, φ) = k f(, φ) (5-9)
where
E(, φ) is the magnitude of the electrical field,
f(, φ) is the radiation pattern function, and
k is the normalizing factor to set E(, φ)max = 1 (or 0 dB).
(d) Rec. ITU-R BS.80-3
The recommended guideline to select the HF AM audio transmitting antenna in Rec.
ITU-R BS.80-3 is shown in Table 5-25.
Table 5-25. Recommended Guideline for Selecting HF AM Audio Transmitting Antennas
Distance Radiation
Pattern bw Antenna Type Characteristics
Short
(≤ 2000
km)
Omni-
directional n/a
Tropical antenna,
horizontal antenna,
vertical antenna
N/A
Directional
Narrow Curtain array (HR 4/1/h,
HR 4/2/h)
0.25 ≤ h ≤ 0.6,
15 ≤ θ ≤ 50,
bw ≤ 35,
13 ≤ Gmax(dBi) ≤ 19
Wide
Curtain array (HR m/n/h,
m & n = 1 or 2)
0.25 ≤ h ≤ 0.6,
15 ≤ θ ≤ 50,
70 ≤ bw ≤ 180,
9 ≤ Gmax(dBi) ≤ 16
Log-periodic antenna of
single plane
0.65 ≤ τ ≤ 0.8,
17 ≤ θ ≤ 50,
80 ≤ bw ≤ 130,
8 ≤ Gmax(dBi) ≤ 14
Medium,
long Directional Narrow
Curtain array (HR 4/3/h,
HR 4/4/h)
0.4 ≤ h ≤ 1.5,
6 ≤ θ ≤ 13,
bw ≈ 35,
19 ≤ Gmax(dBi) ≤ 22
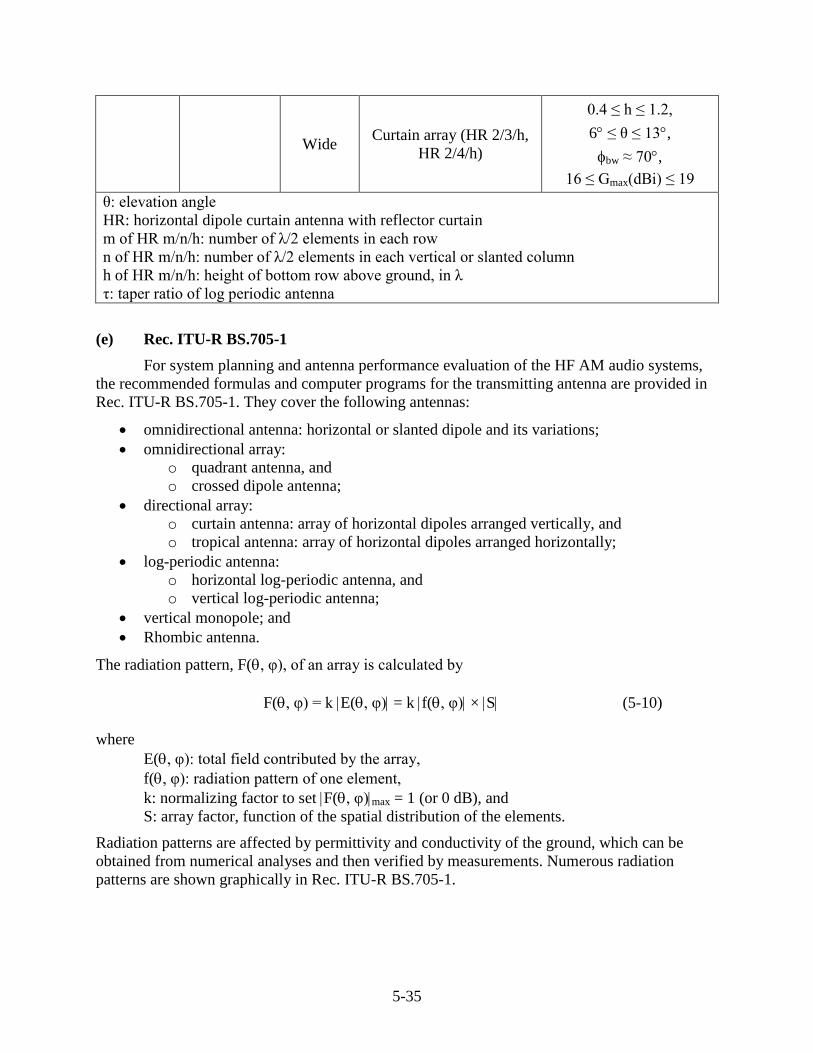
5-35
Wide Curtain array (HR 2/3/h,
HR 2/4/h)
0.4 ≤ h ≤ 1.2,
6 ≤ θ ≤ 13,
bw ≈ 70,
16 ≤ Gmax(dBi) ≤ 19
θ: elevation angle
HR: horizontal dipole curtain antenna with reflector curtain
m of HR m/n/h: number of λ/2 elements in each row
n of HR m/n/h: number of λ/2 elements in each vertical or slanted column
h of HR m/n/h: height of bottom row above ground, in λ
τ: taper ratio of log periodic antenna
(e) Rec. ITU-R BS.705-1
For system planning and antenna performance evaluation of the HF AM audio systems,
the recommended formulas and computer programs for the transmitting antenna are provided in
Rec. ITU-R BS.705-1. They cover the following antennas:
omnidirectional antenna: horizontal or slanted dipole and its variations;
omnidirectional array:
o quadrant antenna, and
o crossed dipole antenna;
directional array:
o curtain antenna: array of horizontal dipoles arranged vertically, and
o tropical antenna: array of horizontal dipoles arranged horizontally;
log-periodic antenna:
o horizontal log-periodic antenna, and
o vertical log-periodic antenna;
vertical monopole; and
Rhombic antenna.
The radiation pattern, F(, φ), of an array is calculated by
F(, φ) = k E(, φ) = k f(, φ) × S (5-10)
where
E(, φ): total field contributed by the array,
f(, φ): radiation pattern of one element,
k: normalizing factor to set F(, φ)max = 1 (or 0 dB), and
S: array factor, function of the spatial distribution of the elements.
Radiation patterns are affected by permittivity and conductivity of the ground, which can be
obtained from numerical analyses and then verified by measurements. Numerous radiation
patterns are shown graphically in Rec. ITU-R BS.705-1.
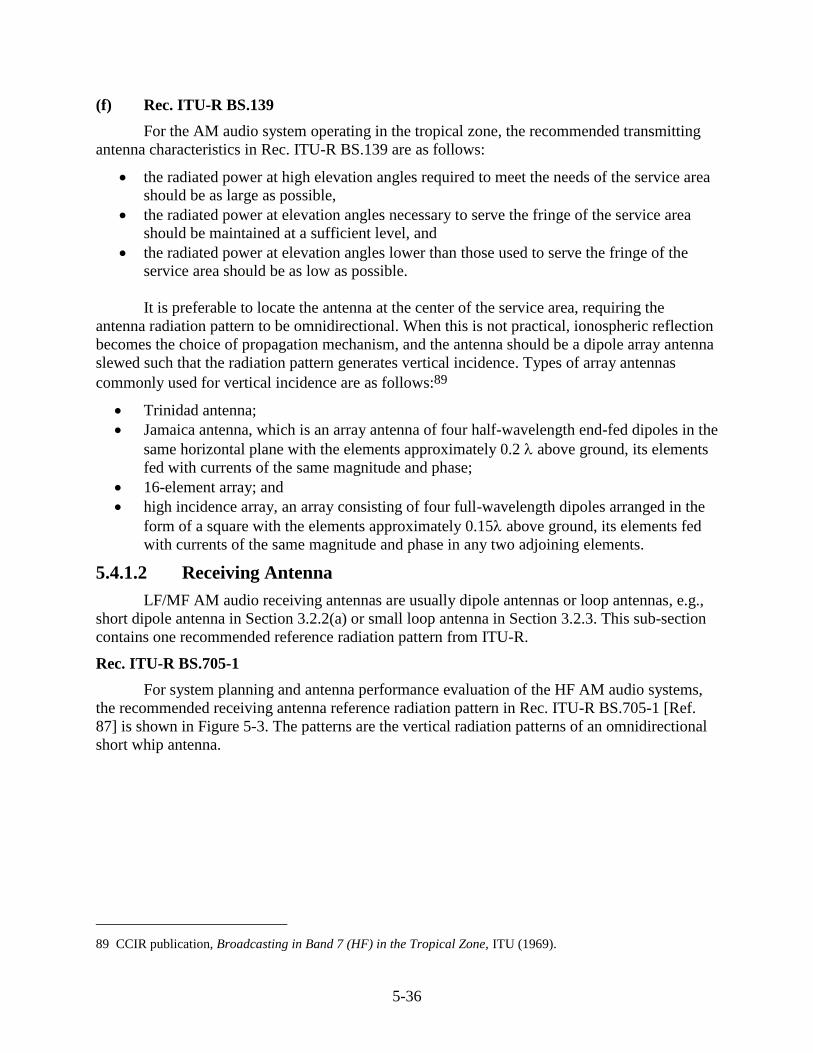
5-36
(f) Rec. ITU-R BS.139
For the AM audio system operating in the tropical zone, the recommended transmitting
antenna characteristics in Rec. ITU-R BS.139 are as follows:
the radiated power at high elevation angles required to meet the needs of the service area
should be as large as possible,
the radiated power at elevation angles necessary to serve the fringe of the service area
should be maintained at a sufficient level, and
the radiated power at elevation angles lower than those used to serve the fringe of the
service area should be as low as possible.
It is preferable to locate the antenna at the center of the service area, requiring the
antenna radiation pattern to be omnidirectional. When this is not practical, ionospheric reflection
becomes the choice of propagation mechanism, and the antenna should be a dipole array antenna
slewed such that the radiation pattern generates vertical incidence. Types of array antennas
commonly used for vertical incidence are as follows:89
Trinidad antenna;
Jamaica antenna, which is an array antenna of four half-wavelength end-fed dipoles in the
same horizontal plane with the elements approximately 0.2 above ground, its elements
fed with currents of the same magnitude and phase;
16-element array; and
high incidence array, an array consisting of four full-wavelength dipoles arranged in the
form of a square with the elements approximately 0.15above ground, its elements fed
with currents of the same magnitude and phase in any two adjoining elements.
5.4.1.2 Receiving Antenna
LF/MF AM audio receiving antennas are usually dipole antennas or loop antennas, e.g.,
short dipole antenna in Section 3.2.2(a) or small loop antenna in Section 3.2.3. This sub-section
contains one recommended reference radiation pattern from ITU-R.
Rec. ITU-R BS.705-1
For system planning and antenna performance evaluation of the HF AM audio systems,
the recommended receiving antenna reference radiation pattern in Rec. ITU-R BS.705-1 [Ref.
87] is shown in Figure 5-3. The patterns are the vertical radiation patterns of an omnidirectional
short whip antenna.
89 CCIR publication, Broadcasting in Band 7 (HF) in the Tropical Zone, ITU (1969).
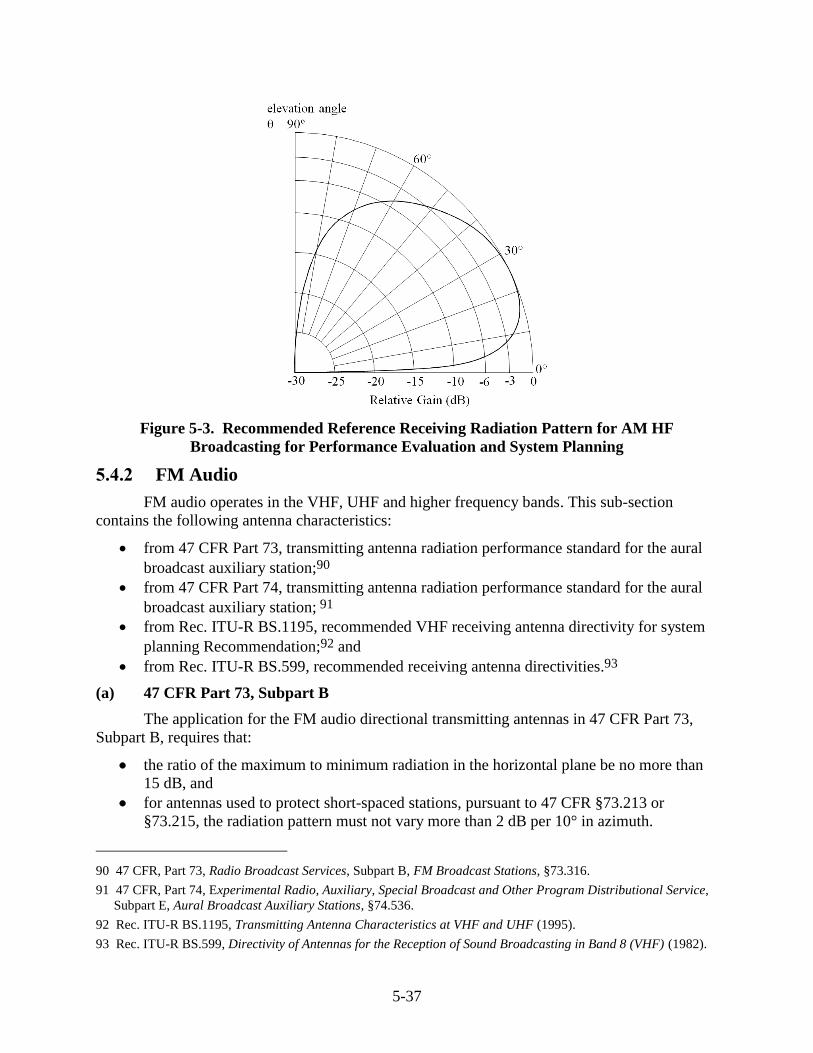
5-37
Figure 5-3. Recommended Reference Receiving Radiation Pattern for AM HF
Broadcasting for Performance Evaluation and System Planning
5.4.2 FM Audio
FM audio operates in the VHF, UHF and higher frequency bands. This sub-section
contains the following antenna characteristics:
from 47 CFR Part 73, transmitting antenna radiation performance standard for the aural
broadcast auxiliary station;90
from 47 CFR Part 74, transmitting antenna radiation performance standard for the aural
broadcast auxiliary station; 91
from Rec. ITU-R BS.1195, recommended VHF receiving antenna directivity for system
planning Recommendation;92 and
from Rec. ITU-R BS.599, recommended receiving antenna directivities.93
(a) 47 CFR Part 73, Subpart B
The application for the FM audio directional transmitting antennas in 47 CFR Part 73,
Subpart B, requires that:
the ratio of the maximum to minimum radiation in the horizontal plane be no more than
15 dB, and
for antennas used to protect short-spaced stations, pursuant to 47 CFR §73.213 or
§73.215, the radiation pattern must not vary more than 2 dB per 10° in azimuth.
90 47 CFR, Part 73, Radio Broadcast Services, Subpart B, FM Broadcast Stations, §73.316.
91 47 CFR, Part 74, Experimental Radio, Auxiliary, Special Broadcast and Other Program Distributional Service,
Subpart E, Aural Broadcast Auxiliary Stations, §74.536.
92 Rec. ITU-R BS.1195, Transmitting Antenna Characteristics at VHF and UHF (1995).
93 Rec. ITU-R BS.599, Directivity of Antennas for the Reception of Sound Broadcasting in Band 8 (VHF) (1982).
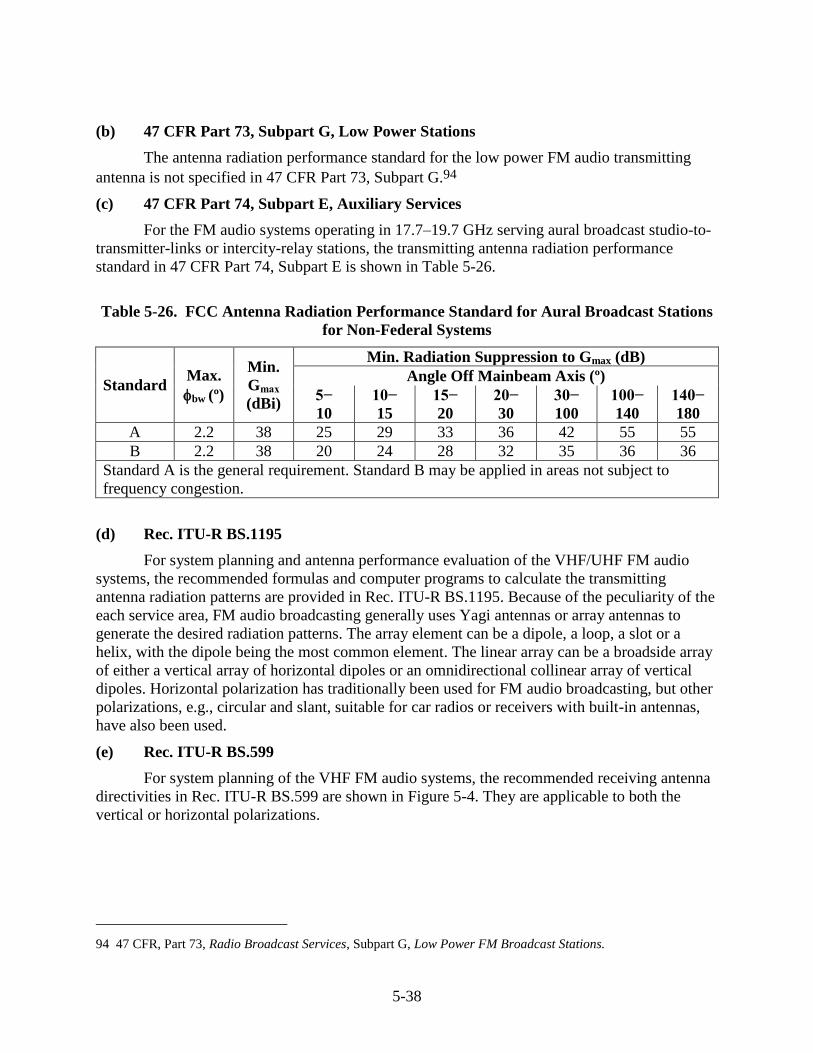
5-38
(b) 47 CFR Part 73, Subpart G, Low Power Stations
The antenna radiation performance standard for the low power FM audio transmitting
antenna is not specified in 47 CFR Part 73, Subpart G.94
(c) 47 CFR Part 74, Subpart E, Auxiliary Services
For the FM audio systems operating in 17.7–19.7 GHz serving aural broadcast studio-to-
transmitter-links or intercity-relay stations, the transmitting antenna radiation performance
standard in 47 CFR Part 74, Subpart E is shown in Table 5-26.
Table 5-26. FCC Antenna Radiation Performance Standard for Aural Broadcast Stations
for Non-Federal Systems
Standard Max.
bw (º)
Min.
Gmax
(dBi)
Min. Radiation Suppression to Gmax (dB)
Angle Off Mainbeam Axis (º)
5−
10
10−
15
15−
20
20−
30
30−
100
100−
140
140−
180
A 2.2 38 25 29 33 36 42 55 55
B 2.2 38 20 24 28 32 35 36 36
Standard A is the general requirement. Standard B may be applied in areas not subject to
frequency congestion.
(d) Rec. ITU-R BS.1195
For system planning and antenna performance evaluation of the VHF/UHF FM audio
systems, the recommended formulas and computer programs to calculate the transmitting
antenna radiation patterns are provided in Rec. ITU-R BS.1195. Because of the peculiarity of the
each service area, FM audio broadcasting generally uses Yagi antennas or array antennas to
generate the desired radiation patterns. The array element can be a dipole, a loop, a slot or a
helix, with the dipole being the most common element. The linear array can be a broadside array
of either a vertical array of horizontal dipoles or an omnidirectional collinear array of vertical
dipoles. Horizontal polarization has traditionally been used for FM audio broadcasting, but other
polarizations, e.g., circular and slant, suitable for car radios or receivers with built-in antennas,
have also been used.
(e) Rec. ITU-R BS.599
For system planning of the VHF FM audio systems, the recommended receiving antenna
directivities in Rec. ITU-R BS.599 are shown in Figure 5-4. They are applicable to both the
vertical or horizontal polarizations.
94 47 CFR, Part 73, Radio Broadcast Services, Subpart G, Low Power FM Broadcast Stations.
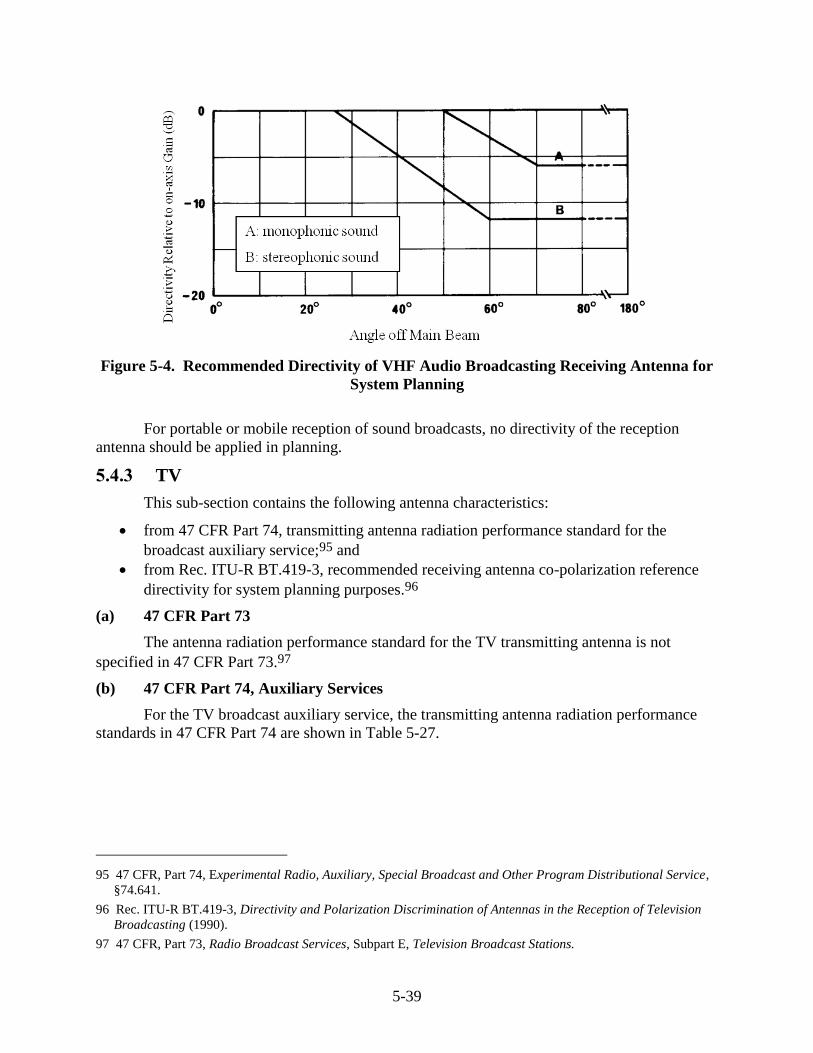
5-39
Figure 5-4. Recommended Directivity of VHF Audio Broadcasting Receiving Antenna for
System Planning
For portable or mobile reception of sound broadcasts, no directivity of the reception
antenna should be applied in planning.
5.4.3 TV
This sub-section contains the following antenna characteristics:
from 47 CFR Part 74, transmitting antenna radiation performance standard for the
broadcast auxiliary service;95 and
from Rec. ITU-R BT.419-3, recommended receiving antenna co-polarization reference
directivity for system planning purposes.96
(a) 47 CFR Part 73
The antenna radiation performance standard for the TV transmitting antenna is not
specified in 47 CFR Part 73.97
(b) 47 CFR Part 74, Auxiliary Services
For the TV broadcast auxiliary service, the transmitting antenna radiation performance
standards in 47 CFR Part 74 are shown in Table 5-27.
95 47 CFR, Part 74, Experimental Radio, Auxiliary, Special Broadcast and Other Program Distributional Service,
§74.641.
96 Rec. ITU-R BT.419-3, Directivity and Polarization Discrimination of Antennas in the Reception of Television
Broadcasting (1990).
97 47 CFR, Part 73, Radio Broadcast Services, Subpart E, Television Broadcast Stations.
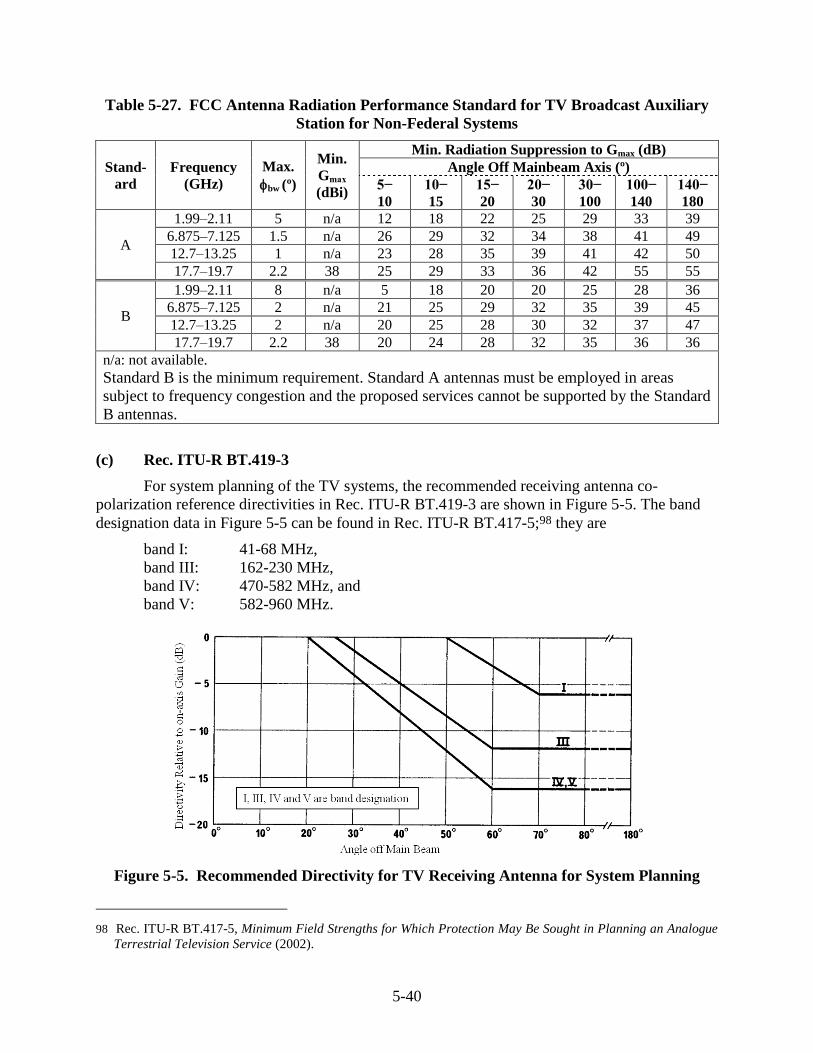
5-40
Table 5-27. FCC Antenna Radiation Performance Standard for TV Broadcast Auxiliary
Station for Non-Federal Systems
Stand-
ard
Frequency
(GHz)
Max.
bw (º)
Min.
Gmax
(dBi)
Min. Radiation Suppression to Gmax (dB)
Angle Off Mainbeam Axis (º)
5−
10
10−
15
15−
20
20−
30
30−
100
100−
140
140−
180
A
1.99–2.11 5 n/a 12 18 22 25 29 33 39
6.875–7.125 1.5 n/a 26 29 32 34 38 41 49
12.7–13.25 1 n/a 23 28 35 39 41 42 50
17.7–19.7 2.2 38 25 29 33 36 42 55 55
B
1.99–2.11 8 n/a 5 18 20 20 25 28 36
6.875–7.125 2 n/a 21 25 29 32 35 39 45
12.7–13.25 2 n/a 20 25 28 30 32 37 47
17.7–19.7 2.2 38 20 24 28 32 35 36 36
n/a: not available.
Standard B is the minimum requirement. Standard A antennas must be employed in areas
subject to frequency congestion and the proposed services cannot be supported by the Standard
B antennas.
(c) Rec. ITU-R BT.419-3
For system planning of the TV systems, the recommended receiving antenna co-
polarization reference directivities in Rec. ITU-R BT.419-3 are shown in Figure 5-5. The band
designation data in Figure 5-5 can be found in Rec. ITU-R BT.417-5;98 they are
band I: 41-68 MHz,
band III: 162-230 MHz,
band IV: 470-582 MHz, and
band V: 582-960 MHz.
Figure 5-5. Recommended Directivity for TV Receiving Antenna for System Planning
98 Rec. ITU-R BT.417-5, Minimum Field Strengths for Which Protection May Be Sought in Planning an Analogue
Terrestrial Television Service (2002).
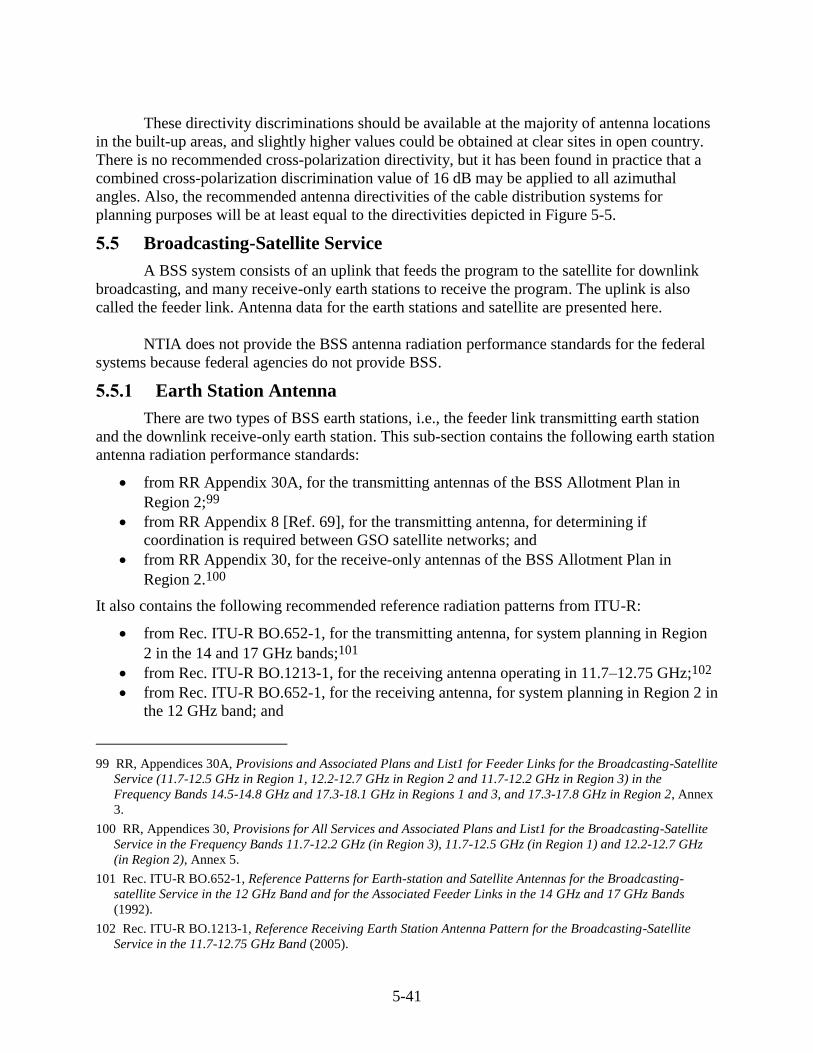
5-41
These directivity discriminations should be available at the majority of antenna locations
in the built-up areas, and slightly higher values could be obtained at clear sites in open country.
There is no recommended cross-polarization directivity, but it has been found in practice that a
combined cross-polarization discrimination value of 16 dB may be applied to all azimuthal
angles. Also, the recommended antenna directivities of the cable distribution systems for
planning purposes will be at least equal to the directivities depicted in Figure 5-5.
5.5 Broadcasting-Satellite Service
A BSS system consists of an uplink that feeds the program to the satellite for downlink
broadcasting, and many receive-only earth stations to receive the program. The uplink is also
called the feeder link. Antenna data for the earth stations and satellite are presented here.
NTIA does not provide the BSS antenna radiation performance standards for the federal
systems because federal agencies do not provide BSS.
5.5.1 Earth Station Antenna
There are two types of BSS earth stations, i.e., the feeder link transmitting earth station
and the downlink receive-only earth station. This sub-section contains the following earth station
antenna radiation performance standards:
from RR Appendix 30A, for the transmitting antennas of the BSS Allotment Plan in
Region 2;99
from RR Appendix 8 [Ref. 69], for the transmitting antenna, for determining if
coordination is required between GSO satellite networks; and
from RR Appendix 30, for the receive-only antennas of the BSS Allotment Plan in
Region 2.100
It also contains the following recommended reference radiation patterns from ITU-R:
from Rec. ITU-R BO.652-1, for the transmitting antenna, for system planning in Region
2 in the 14 and 17 GHz bands;101
from Rec. ITU-R BO.1213-1, for the receiving antenna operating in 11.7–12.75 GHz;102
from Rec. ITU-R BO.652-1, for the receiving antenna, for system planning in Region 2 in
the 12 GHz band; and
99 RR, Appendices 30A, Provisions and Associated Plans and List1 for Feeder Links for the Broadcasting-Satellite
Service (11.7-12.5 GHz in Region 1, 12.2-12.7 GHz in Region 2 and 11.7-12.2 GHz in Region 3) in the
Frequency Bands 14.5-14.8 GHz and 17.3-18.1 GHz in Regions 1 and 3, and 17.3-17.8 GHz in Region 2, Annex
3.
100 RR, Appendices 30, Provisions for All Services and Associated Plans and List1 for the Broadcasting-Satellite
Service in the Frequency Bands 11.7-12.2 GHz (in Region 3), 11.7-12.5 GHz (in Region 1) and 12.2-12.7 GHz
(in Region 2), Annex 5.
101 Rec. ITU-R BO.652-1, Reference Patterns for Earth-station and Satellite Antennas for the Broadcasting-
satellite Service in the 12 GHz Band and for the Associated Feeder Links in the 14 GHz and 17 GHz Bands
(1992).
102 Rec. ITU-R BO.1213-1, Reference Receiving Earth Station Antenna Pattern for the Broadcasting-Satellite
Service in the 11.7-12.75 GHz Band (2005).
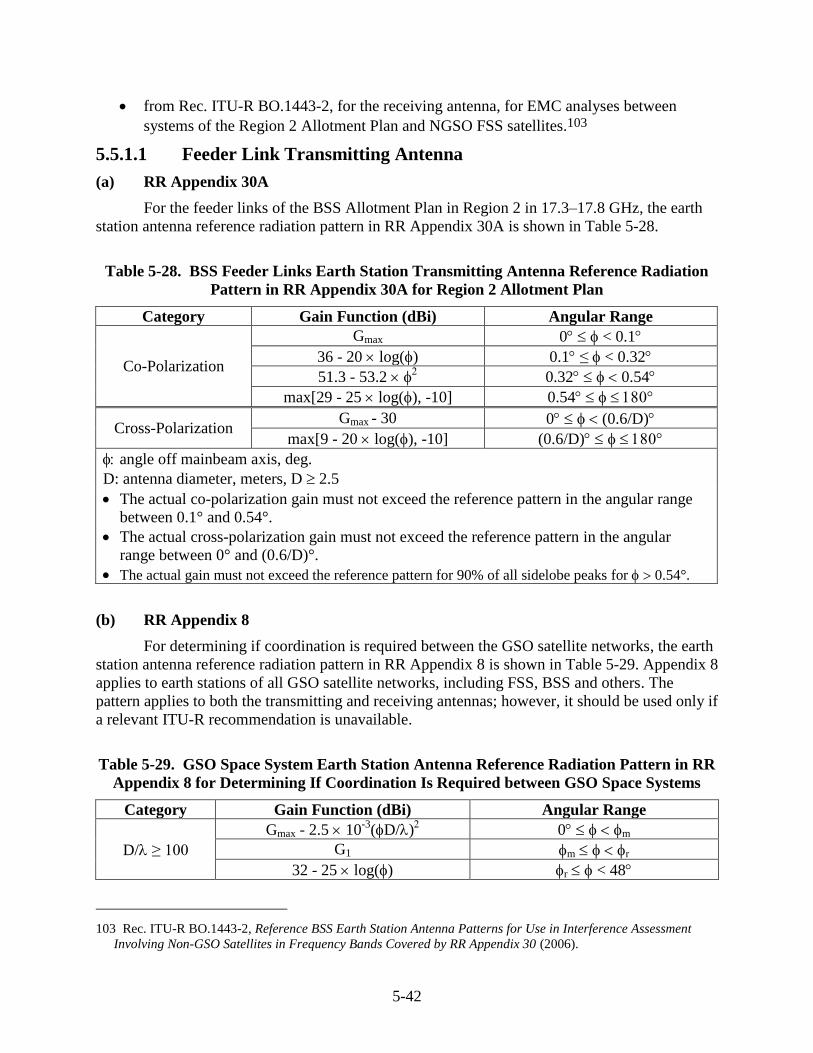
5-42
from Rec. ITU-R BO.1443-2, for the receiving antenna, for EMC analyses between
systems of the Region 2 Allotment Plan and NGSO FSS satellites.103
5.5.1.1 Feeder Link Transmitting Antenna
(a) RR Appendix 30A
For the feeder links of the BSS Allotment Plan in Region 2 in 17.3–17.8 GHz, the earth
station antenna reference radiation pattern in RR Appendix 30A is shown in Table 5-28.
Table 5-28. BSS Feeder Links Earth Station Transmitting Antenna Reference Radiation
Pattern in RR Appendix 30A for Region 2 Allotment Plan
Category Gain Function (dBi) Angular Range
Co-Polarization
Gmax 0 < 0.1
36 - 20 log() 0.1 ≤ < 0.32
51.3 - 53.2 0.32 0.54
max[29 - 25 log(), -10] 0.54
Cross-Polarization Gmax - 30 0(0.6/D)
max[9 - 20 log(), -10] (0.6/D)
angle off mainbeam axis, deg.
D: antenna diameter, meters, D 2.5
The actual co-polarization gain must not exceed the reference pattern in the angular range
between 0.1° and 0.54°.
The actual cross-polarization gain must not exceed the reference pattern in the angular
range between 0° and (0.6/D)°.
The actual gain must not exceed the reference pattern for 90% of all sidelobe peaks for 0.54°.
(b) RR Appendix 8
For determining if coordination is required between the GSO satellite networks, the earth
station antenna reference radiation pattern in RR Appendix 8 is shown in Table 5-29. Appendix 8
applies to earth stations of all GSO satellite networks, including FSS, BSS and others. The
pattern applies to both the transmitting and receiving antennas; however, it should be used only if
a relevant ITU-R recommendation is unavailable.
Table 5-29. GSO Space System Earth Station Antenna Reference Radiation Pattern in RR
Appendix 8 for Determining If Coordination Is Required between GSO Space Systems
Category Gain Function (dBi) Angular Range
D/≥ 100
Gmax - 2.5 10-3
(D/) 0 m
G1 m r
32 - 25 log() r < 48
103 Rec. ITU-R BO.1443-2, Reference BSS Earth Station Antenna Patterns for Use in Interference Assessment
Involving Non-GSO Satellites in Frequency Bands Covered by RR Appendix 30 (2006).
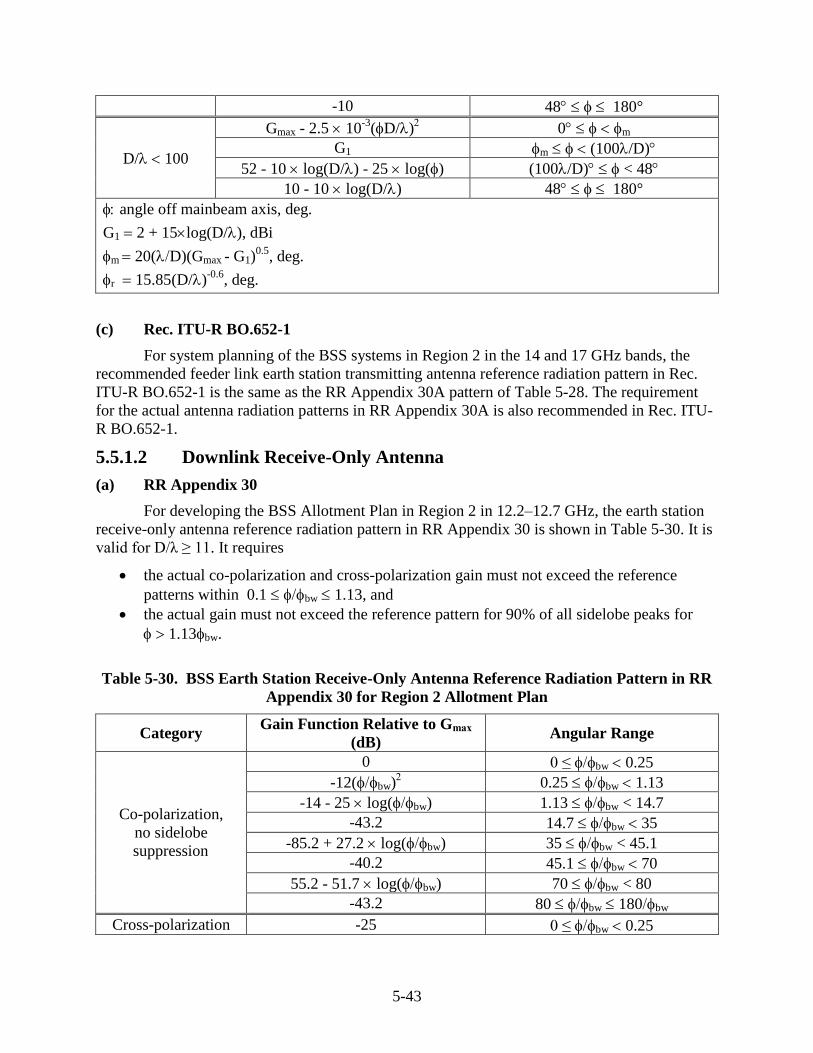
5-43
-10 48 180°
D/ 100
Gmax - 2.5 10-3
(D/) 0 m
G1 m (100/D)
52 - 10 log(D/)-25 log() (100/D) < 48
10 - 10 log(D/) 48 180°
angle off mainbeam axis, deg.
G1 2 + 15log(D/), dBi
m 20(D)(Gmax - G1)0.5
, deg.
r 15.85(D/)-0.6
, deg.
(c) Rec. ITU-R BO.652-1
For system planning of the BSS systems in Region 2 in the 14 and 17 GHz bands, the
recommended feeder link earth station transmitting antenna reference radiation pattern in Rec.
ITU-R BO.652-1 is the same as the RR Appendix 30A pattern of Table 5-28. The requirement
for the actual antenna radiation patterns in RR Appendix 30A is also recommended in Rec. ITU-
R BO.652-1.
5.5.1.2 Downlink Receive-Only Antenna
(a) RR Appendix 30
For developing the BSS Allotment Plan in Region 2 in 12.2–12.7 GHz, the earth station
receive-only antenna reference radiation pattern in RR Appendix 30 is shown in Table 5-30. It is
valid for D/λ ≥ 11. It requires
the actual co-polarization and cross-polarization gain must not exceed the reference
patterns within 0.1 bw 1.13, and
the actual gain must not exceed the reference pattern for 90% of all sidelobe peaks for
1.13bw.
Table 5-30. BSS Earth Station Receive-Only Antenna Reference Radiation Pattern in RR
Appendix 30 for Region 2 Allotment Plan
Category Gain Function Relative to Gmax
(dB) Angular Range
Co-polarization,
no sidelobe
suppression
0 0 ≤ bw 0.25
-12(bw) 0.25 bw 1.13
-14 - 25 log(bw) 1.13 bw < 14.7
-43.2 14.7 bw 35
-85.2 + 27.2 log(bw) 35 bw < 45.1
-40.2 45.1 bw 70
55.2 - 51.7 log(bw) 70 bw < 80
-43.2 80 bw 180bw
Cross-polarization -25 0 ≤ bw 0.25
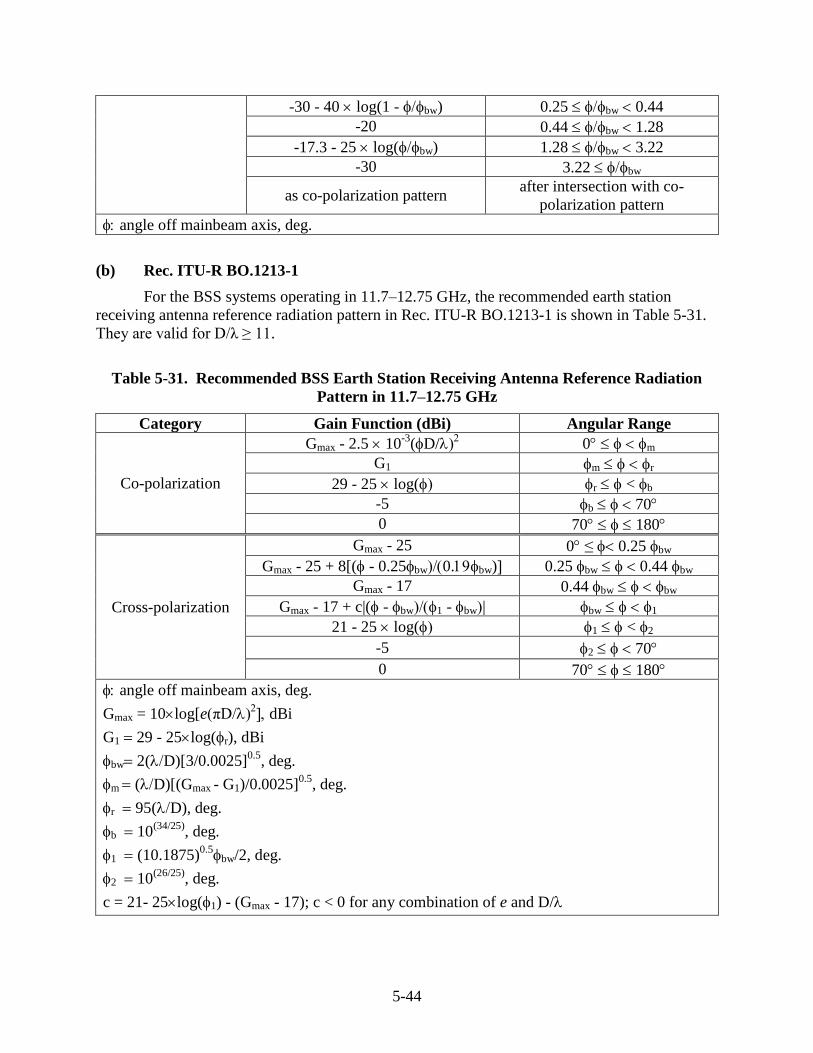
5-44
-30 - 40 log(1 - bw) 0.25 bw 0.44
-20 0.44 bw 1.28
-17.3 - 25 log(bw) 1.28 bw 3.22
-30 3.22 bw
as co-polarization pattern after intersection with co-
polarization pattern
angle off mainbeam axis, deg.
(b) Rec. ITU-R BO.1213-1
For the BSS systems operating in 11.7–12.75 GHz, the recommended earth station
receiving antenna reference radiation pattern in Rec. ITU-R BO.1213-1 is shown in Table 5-31.
They are valid for D/λ ≥ 11.
Table 5-31. Recommended BSS Earth Station Receiving Antenna Reference Radiation
Pattern in 11.7–12.75 GHz
Category Gain Function (dBi) Angular Range
Co-polarization
Gmax - 2.5 10-3
(D/ 0 m
G1 m r
29 - 25 log( r < b
-5 b 70
0 70 180
Cross-polarization
Gmax - 25 0 ≤ 0.25 bw
Gmax - 25 + 8[(- 0.25bw0.bw) 0.25 bw 0.44 bw
Gmax - 17 0.44 bw bw
Gmax - 17 + c|( - bw1 - bw| bw 1
21 - 25 log( 1 < 2
-5 2 70
0 70 180
angle off mainbeam axis, deg.
Gmax = 10log[e(πD/dBi
G1 29 - 25log(r), dBi
bw 2(D)[3/0.0025]0.5
, deg.
m (D)[(Gmax - G1)/0.0025]0.5
, deg.
r 95(D), deg.
b 10(34/25)
, deg.
1 (10.1875)0.5bw/2, deg.
2 10(26/25)
, deg.
c = 21- 25log(1) - (Gmax - 17); c < 0 for any combination of e and D/
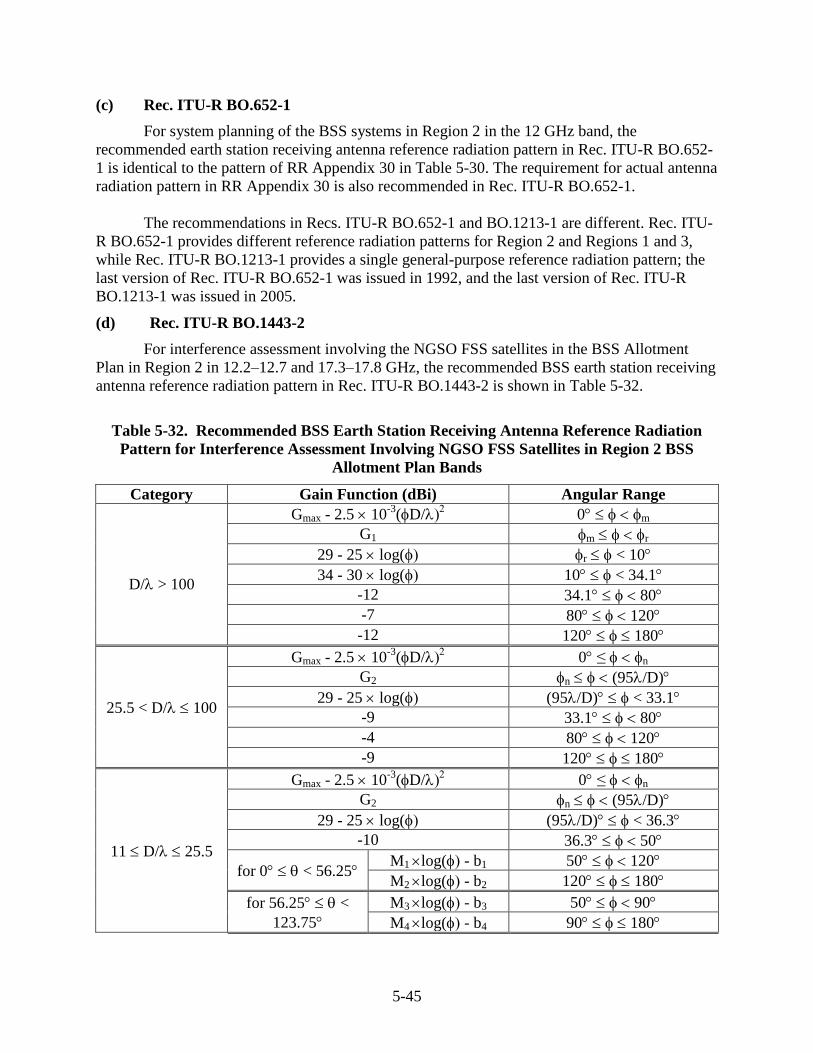
5-45
(c) Rec. ITU-R BO.652-1
For system planning of the BSS systems in Region 2 in the 12 GHz band, the
recommended earth station receiving antenna reference radiation pattern in Rec. ITU-R BO.652-
1 is identical to the pattern of RR Appendix 30 in Table 5-30. The requirement for actual antenna
radiation pattern in RR Appendix 30 is also recommended in Rec. ITU-R BO.652-1.
The recommendations in Recs. ITU-R BO.652-1 and BO.1213-1 are different. Rec. ITU-
R BO.652-1 provides different reference radiation patterns for Region 2 and Regions 1 and 3,
while Rec. ITU-R BO.1213-1 provides a single general-purpose reference radiation pattern; the
last version of Rec. ITU-R BO.652-1 was issued in 1992, and the last version of Rec. ITU-R
BO.1213-1 was issued in 2005.
(d) Rec. ITU-R BO.1443-2
For interference assessment involving the NGSO FSS satellites in the BSS Allotment
Plan in Region 2 in 12.2–12.7 and 17.3–17.8 GHz, the recommended BSS earth station receiving
antenna reference radiation pattern in Rec. ITU-R BO.1443-2 is shown in Table 5-32.
Table 5-32. Recommended BSS Earth Station Receiving Antenna Reference Radiation
Pattern for Interference Assessment Involving NGSO FSS Satellites in Region 2 BSS
Allotment Plan Bands
Category Gain Function (dBi) Angular Range
D/> 100
Gmax - 2.5 10-3
(D/ 0 m
G1 m r
29 - 25 log( r < 10
34 - 30 log( 10 < 34.1
-12 34.1 80
-7 80 120
-12 120 180
25.5 < D/ 100
Gmax - 2.5 10-3
(D/ 0 ≤ n
G2 n (95/D)
29 - 25 log( (95/D) < 33.1
-9 33.1 80
-4 80 120
-9 120 180
11 D/ 25.5
Gmax - 2.5 10-3
(D/ 0 ≤ n
G2 n (95/D)
29 - 25 log( (95/D) < 36.3
-10 36.3 50
for 0 < 56.25 M1 log( - b1 50 120
M2 log( - b2 120 180
for 56.25 <
123.75
M3 log( - b3 50 90
M4 log( - b4 90 180
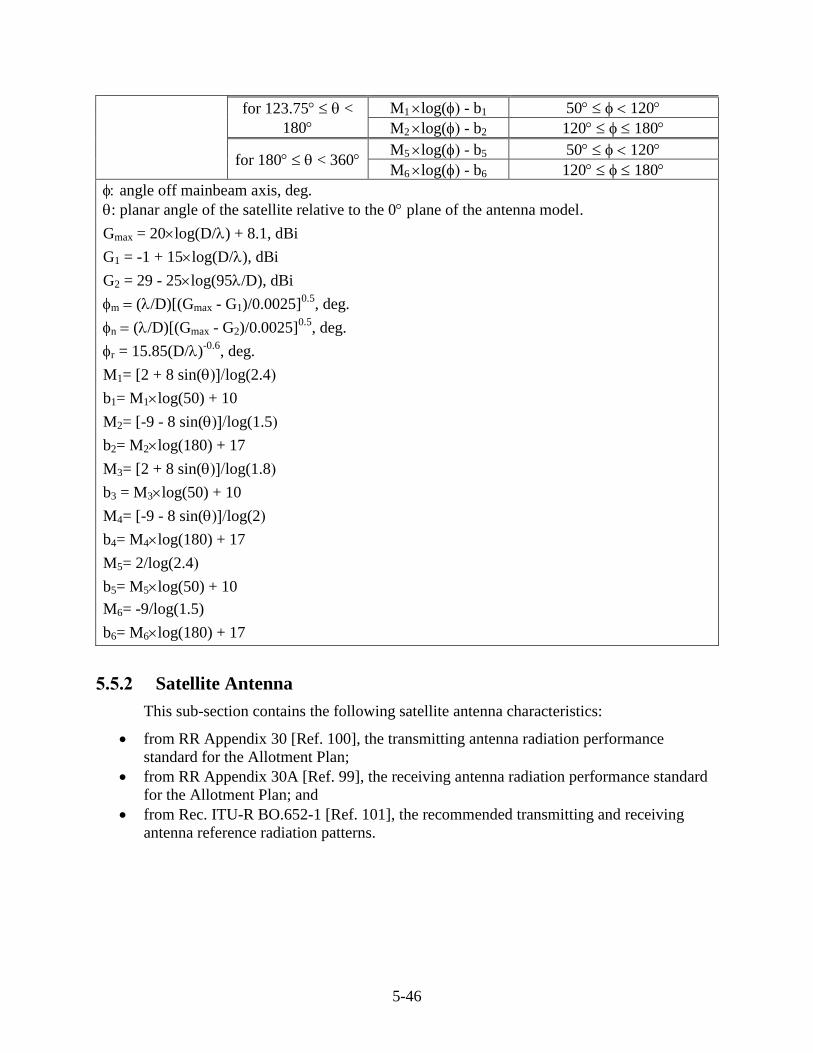
5-46
for 123.75 <
180
M1 log( - b1 50 120
M2 log( - b2 120 180
for 180 < 360 M5 log( - b5 50 120
M6 log( - b6 120 180
angle off mainbeam axis, deg.
: planar angle of the satellite relative to the 0 plane of the antenna model.
Gmax = 20log(D/) + 8.1, dBi
G1 = -1 + 15log(D/), dBi
G2 = 29 - 25log(95/D), dBi
m (/D)[(Gmax - G1)/0.0025]0.5
, deg.
n (/D)[(Gmax - G2)/0.0025]0.5
, deg.
r = 15.85(D/)-0.6
, deg.
M1= [2 + 8 sin(log(2.4
b1= M1log(50) + 10
M2= [-9 - 8 sin(log(1.5
b2= M2log(180) + 17
M3= [2 + 8 sin(log(1.8
b3 = M3log(50) + 10
M4= [-9 - 8 sin(log(2
b4= M4log(180) + 17
M5= 2/log(2.4
b5= M5log(50) + 10
M6= -9/log(1.5)
b6= M6log(180) + 17
5.5.2 Satellite Antenna
This sub-section contains the following satellite antenna characteristics:
from RR Appendix 30 [Ref. 100], the transmitting antenna radiation performance
standard for the Allotment Plan;
from RR Appendix 30A [Ref. 99], the receiving antenna radiation performance standard
for the Allotment Plan; and
from Rec. ITU-R BO.652-1 [Ref. 101], the recommended transmitting and receiving
antenna reference radiation patterns.
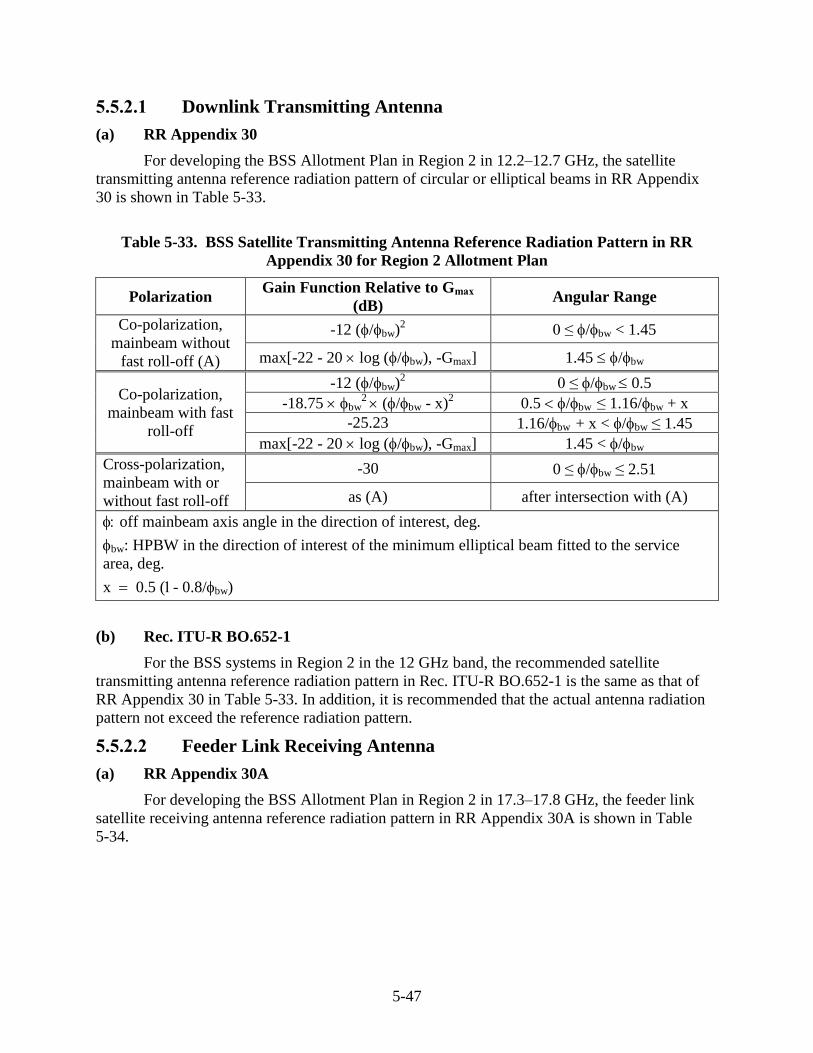
5-47
5.5.2.1 Downlink Transmitting Antenna
(a) RR Appendix 30
For developing the BSS Allotment Plan in Region 2 in 12.2–12.7 GHz, the satellite
transmitting antenna reference radiation pattern of circular or elliptical beams in RR Appendix
30 is shown in Table 5-33.
Table 5-33. BSS Satellite Transmitting Antenna Reference Radiation Pattern in RR
Appendix 30 for Region 2 Allotment Plan
Polarization Gain Function Relative to Gmax
(dB) Angular Range
Co-polarization,
mainbeam without
fast roll-off (A)
-12 (/bw)2 0 ≤ /bw < 1.45
max[-22 - 20 log (/bw), -Gmax] 1.45 /bw
Co-polarization,
mainbeam with fast
roll-off
-12 (/bw)2 0 ≤ /bw 0.5
-18.75 bw2 (/bw - x)
2 0.5 /bw ≤ 1.16/bw+ x
-25.23 1.16/bw + x < /bw ≤ 1.45
max[-22 - 20 log (/bw), -Gmax] 1.45 < /bw
Cross-polarization,
mainbeam with or
without fast roll-off
-30 0 ≤ /bw ≤ 2.51
as (A) after intersection with (A)
off mainbeam axis angle in the direction of interest, deg.
bw: HPBW in the direction of interest of the minimum elliptical beam fitted to the service
area, deg.
x 0.5 (- 0.8/bw)
(b) Rec. ITU-R BO.652-1
For the BSS systems in Region 2 in the 12 GHz band, the recommended satellite
transmitting antenna reference radiation pattern in Rec. ITU-R BO.652-1 is the same as that of
RR Appendix 30 in Table 5-33. In addition, it is recommended that the actual antenna radiation
pattern not exceed the reference radiation pattern.
5.5.2.2 Feeder Link Receiving Antenna
(a) RR Appendix 30A
For developing the BSS Allotment Plan in Region 2 in 17.3–17.8 GHz, the feeder link
satellite receiving antenna reference radiation pattern in RR Appendix 30A is shown in Table
5-34.
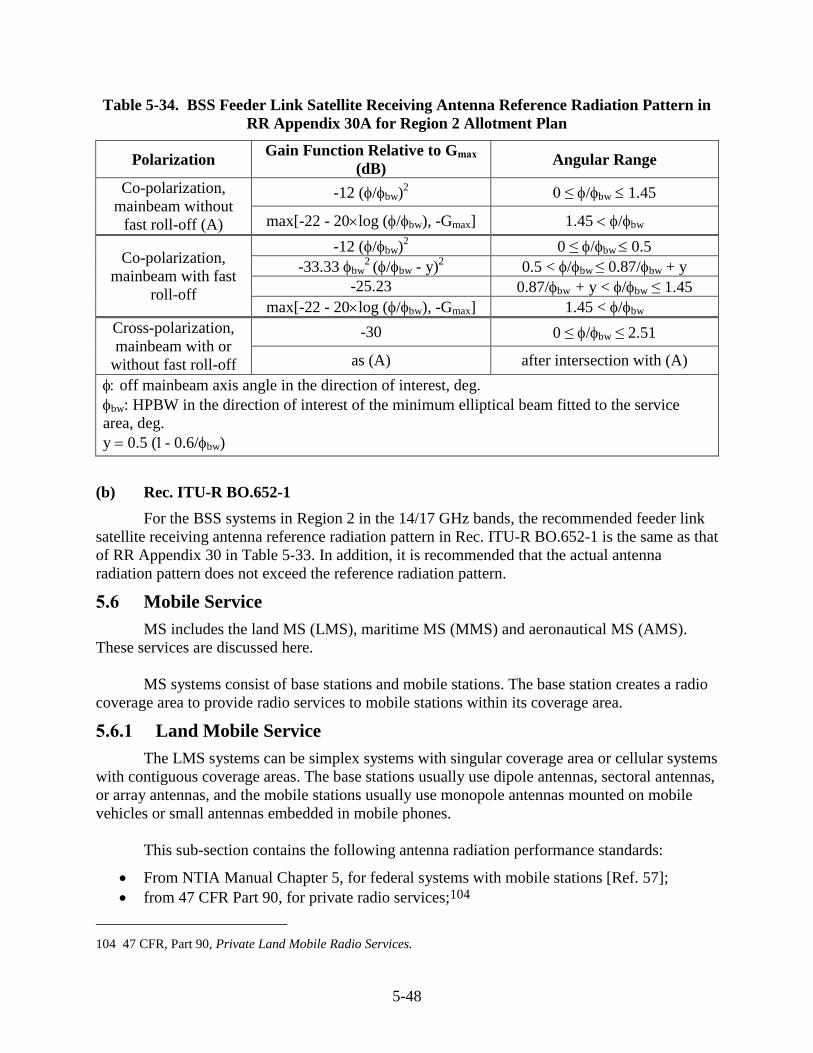
5-48
Table 5-34. BSS Feeder Link Satellite Receiving Antenna Reference Radiation Pattern in
RR Appendix 30A for Region 2 Allotment Plan
Polarization Gain Function Relative to Gmax
(dB) Angular Range
Co-polarization,
mainbeam without
fast roll-off (A)
-12 (/bw)2 0 ≤ /bw 1.45
max[-22 - 20log (/bw), -Gmax] 1.45 /bw
Co-polarization,
mainbeam with fast
roll-off
-12 (/bw)2 0 ≤ /bw 0.5
-33.33 bw2
(/bw - y)2 0.5 < /bw ≤ 0.87/bw+ y
-25.23 0.87/bw + y < /bw ≤ 1.45
max[-22 - 20log (/bw), -Gmax] 1.45 < /bw
Cross-polarization,
mainbeam with or
without fast roll-off
-30 0 ≤ /bw ≤ 2.51
as (A) after intersection with (A)
off mainbeam axis angle in the direction of interest, deg.
bw: HPBW in the direction of interest of the minimum elliptical beam fitted to the service
area, deg.
y 0.5 (- 0.6/bw)
(b) Rec. ITU-R BO.652-1
For the BSS systems in Region 2 in the 14/17 GHz bands, the recommended feeder link
satellite receiving antenna reference radiation pattern in Rec. ITU-R BO.652-1 is the same as that
of RR Appendix 30 in Table 5-33. In addition, it is recommended that the actual antenna
radiation pattern does not exceed the reference radiation pattern.
5.6 Mobile Service
MS includes the land MS (LMS), maritime MS (MMS) and aeronautical MS (AMS).
These services are discussed here.
MS systems consist of base stations and mobile stations. The base station creates a radio
coverage area to provide radio services to mobile stations within its coverage area.
5.6.1 Land Mobile Service
The LMS systems can be simplex systems with singular coverage area or cellular systems
with contiguous coverage areas. The base stations usually use dipole antennas, sectoral antennas,
or array antennas, and the mobile stations usually use monopole antennas mounted on mobile
vehicles or small antennas embedded in mobile phones.
This sub-section contains the following antenna radiation performance standards:
From NTIA Manual Chapter 5, for federal systems with mobile stations [Ref. 57];
from 47 CFR Part 90, for private radio services;104
104 47 CFR, Part 90, Private Land Mobile Radio Services.
5-49
from 47 CFR Part 95, for personal radio services;105 and
from RR Resolution 221, for HAPS antennas.106
It also contains one recommended reference radiation pattern from Rec. ITU-R M.1652-1.107
(a) NTIA Manual Chapter 5
NTIA does not provide the LMS antenna radiation performance standards for the federal
systems. However, NTIA Manual §5.3 states that, to the extent practicable, land stations
operating HF single sideband and independent sideband transmission in 2–29.7 MHz must use
antennas designed so as to reduce their radiation and/or their susceptibility to interference in
those directions where service is not required.
(b) 47 CFR Part 90
For the LMS private radio services, the antenna radiation performance standards in 47
CFR Part 90 are as follows:
§90.35: For industrial/business pool,
o operational fixed stations must use directional antennas having a front-to-back
ratio ≥ 20 dB, and
o omnidirectional antennas may be employed for stations communicating with at
least three receiving locations within a 160º arc in azimuth.
§90.241: For radio call box operations,
o the antenna gain shall not exceed 0 dBd in any horizontal direction, and
o the transmission must be vertically polarized.
§90.242: For travelers' information stations,
o conventional radiating antenna (e.g., vertical monopole, directional array) must
use vertical polarization, and
o length of the leaky cable antenna must be less than 3.0 km (1.9 miles).
§90.261: For fixed operations in 450–470 MHz,
o all fixed systems must employ directional antennas with a front-to-back ratio of
15 dB, and
o omnidirectional antennas may be employed by stations communicating with at
least three receiving locations within a 160º arc in azimuth.
(c) 47 CFR Part 95
In the LMS personal radio service, for the Family Radio Service, and the Radio Control
Radio Service transmitting in 72–76 MHz, the antenna radiation performance standard in 47
CFR Part 95 is 0 dBd gain and vertical polarization.
105 47 CFR, Part 95, Personal Radio Services, §95.647.
106 RR, Resolution 221, Use of high altitude platform stations providing IMT-2000 in the bands 1885-1980 MHz,
2010-2025 MHz and 2110-2170 MHz in Regions 1 and 3 and 1885-1980 MHz and 2110-2160 MHz in Region 2.
107 Rec. ITU-R M.1652-1, Dynamic frequency selection (DFS) in wireless access systems including radio local
area networks for the purpose of protecting the radiodetermination service in the 5 GHz band (2011).
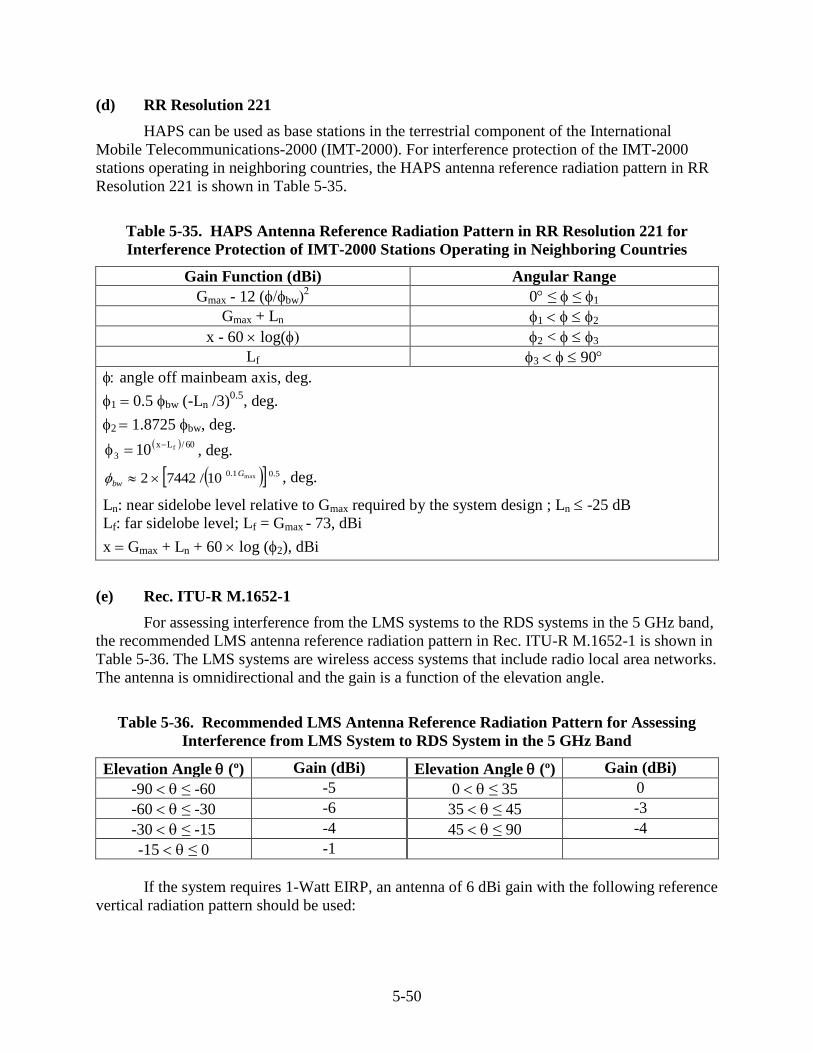
5-50
(d) RR Resolution 221
HAPS can be used as base stations in the terrestrial component of the International
Mobile Telecommunications-2000 (IMT-2000). For interference protection of the IMT-2000
stations operating in neighboring countries, the HAPS antenna reference radiation pattern in RR
Resolution 221 is shown in Table 5-35.
Table 5-35. HAPS Antenna Reference Radiation Pattern in RR Resolution 221 for
Interference Protection of IMT-2000 Stations Operating in Neighboring Countries
Gain Function (dBi) Angular Range
Gmax - 12 (bw 0 ≤ ≤ 1
Gmax + Ln 1 2
x - 60 log( 2 < 3
Lf 3 90
angle off mainbeam axis, deg.
1 0.5 bw (-Ln /3)0.5
, deg.
2 1.8725 bw, deg. 60/Lx
3f10
, deg.
5.01.0 max10/74422G
bw , deg.
Ln: near sidelobe level relative to Gmax required by the system design ; Ln -25 dB
Lf: far sidelobe level; Lf = Gmax - 73, dBi
x Gmax + Ln + 60 log (2), dBi
(e) Rec. ITU-R M.1652-1
For assessing interference from the LMS systems to the RDS systems in the 5 GHz band,
the recommended LMS antenna reference radiation pattern in Rec. ITU-R M.1652-1 is shown in
Table 5-36. The LMS systems are wireless access systems that include radio local area networks.
The antenna is omnidirectional and the gain is a function of the elevation angle.
Table 5-36. Recommended LMS Antenna Reference Radiation Pattern for Assessing
Interference from LMS System to RDS System in the 5 GHz Band
Elevation Angle (º) Gain (dBi) Elevation Angle (º) Gain (dBi)
-90 ≤ -60 -5 0 ≤ 35 0
-60 ≤ -30 -6 35 ≤ 45 -3
-30 ≤ -15 -4 45 ≤ 90 -4
-15 ≤ 0 -1
If the system requires 1-Watt EIRP, an antenna of 6 dBi gain with the following reference
vertical radiation pattern should be used:
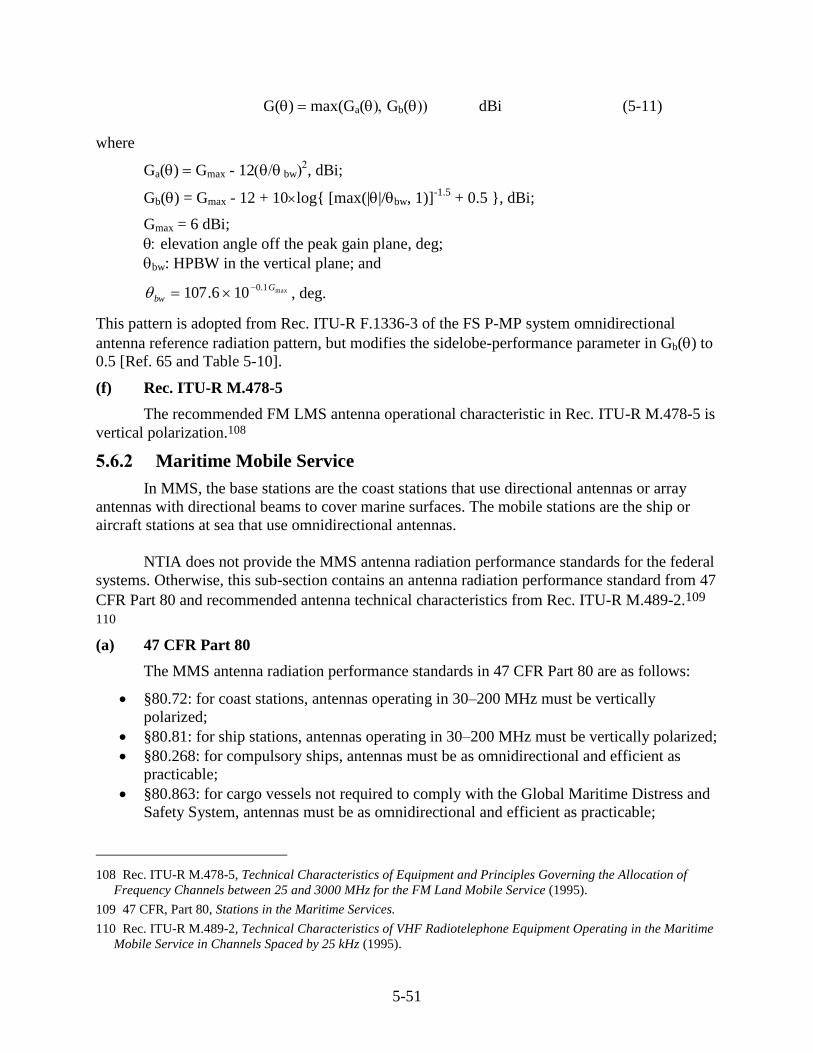
5-51
G() max(Ga(Gb( dBi (5-11)
where
Ga() Gmax - 12 bw, dBi;
Gb() = Gmax - 12 + 10log{ [max(||/bw, 1)]-1.5
+ 0.5 }, dBi;
Gmax = 6 dBi;
elevation angle off the peak gain plane, deg;
bw: HPBW in the vertical plane; and
max1.0106.107
G
bw
, deg.
This pattern is adopted from Rec. ITU-R F.1336-3 of the FS P-MP system omnidirectional
antenna reference radiation pattern, but modifies the sidelobe-performance parameter in Gb() to
0.5 [Ref. 65 and Table 5-10].
(f) Rec. ITU-R M.478-5
The recommended FM LMS antenna operational characteristic in Rec. ITU-R M.478-5 is
vertical polarization.108
5.6.2 Maritime Mobile Service
In MMS, the base stations are the coast stations that use directional antennas or array
antennas with directional beams to cover marine surfaces. The mobile stations are the ship or
aircraft stations at sea that use omnidirectional antennas.
NTIA does not provide the MMS antenna radiation performance standards for the federal
systems. Otherwise, this sub-section contains an antenna radiation performance standard from 47
CFR Part 80 and recommended antenna technical characteristics from Rec. ITU-R M.489-2.109
110
(a) 47 CFR Part 80
The MMS antenna radiation performance standards in 47 CFR Part 80 are as follows:
§80.72: for coast stations, antennas operating in 30–200 MHz must be vertically
polarized;
§80.81: for ship stations, antennas operating in 30–200 MHz must be vertically polarized;
§80.268: for compulsory ships, antennas must be as omnidirectional and efficient as
practicable;
§80.863: for cargo vessels not required to comply with the Global Maritime Distress and
Safety System, antennas must be as omnidirectional and efficient as practicable;
108 Rec. ITU-R M.478-5, Technical Characteristics of Equipment and Principles Governing the Allocation of
Frequency Channels between 25 and 3000 MHz for the FM Land Mobile Service (1995).
109 47 CFR, Part 80, Stations in the Maritime Services.
110 Rec. ITU-R M.489-2, Technical Characteristics of VHF Radiotelephone Equipment Operating in the Maritime
Mobile Service in Channels Spaced by 25 kHz (1995).
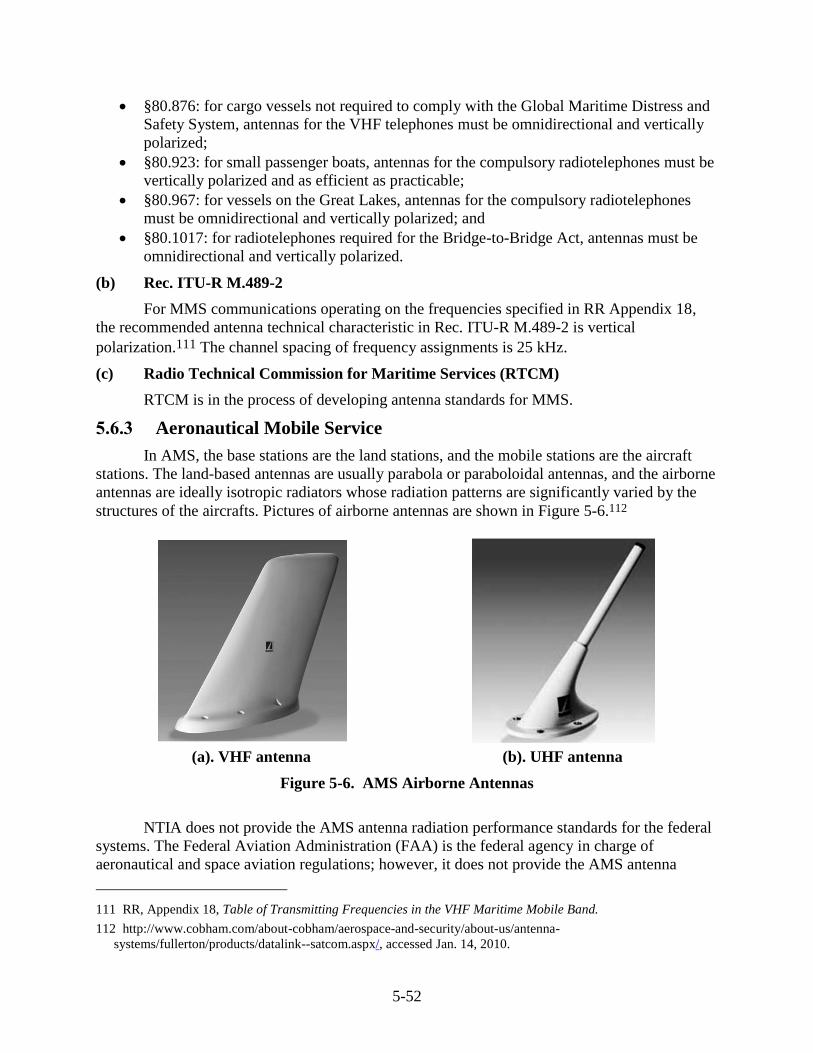
5-52
§80.876: for cargo vessels not required to comply with the Global Maritime Distress and
Safety System, antennas for the VHF telephones must be omnidirectional and vertically
polarized;
§80.923: for small passenger boats, antennas for the compulsory radiotelephones must be
vertically polarized and as efficient as practicable;
§80.967: for vessels on the Great Lakes, antennas for the compulsory radiotelephones
must be omnidirectional and vertically polarized; and
§80.1017: for radiotelephones required for the Bridge-to-Bridge Act, antennas must be
omnidirectional and vertically polarized.
(b) Rec. ITU-R M.489-2
For MMS communications operating on the frequencies specified in RR Appendix 18,
the recommended antenna technical characteristic in Rec. ITU-R M.489-2 is vertical
polarization.111 The channel spacing of frequency assignments is 25 kHz.
(c) Radio Technical Commission for Maritime Services (RTCM)
RTCM is in the process of developing antenna standards for MMS.
5.6.3 Aeronautical Mobile Service
In AMS, the base stations are the land stations, and the mobile stations are the aircraft
stations. The land-based antennas are usually parabola or paraboloidal antennas, and the airborne
antennas are ideally isotropic radiators whose radiation patterns are significantly varied by the
structures of the aircrafts. Pictures of airborne antennas are shown in Figure 5-6.112
(a). VHF antenna (b). UHF antenna
Figure 5-6. AMS Airborne Antennas
NTIA does not provide the AMS antenna radiation performance standards for the federal
systems. The Federal Aviation Administration (FAA) is the federal agency in charge of
aeronautical and space aviation regulations; however, it does not provide the AMS antenna
111 RR, Appendix 18, Table of Transmitting Frequencies in the VHF Maritime Mobile Band.
112 http://www.cobham.com/about-cobham/aerospace-and-security/about-us/antenna-
systems/fullerton/products/datalink--satcom.aspx/, accessed Jan. 14, 2010.
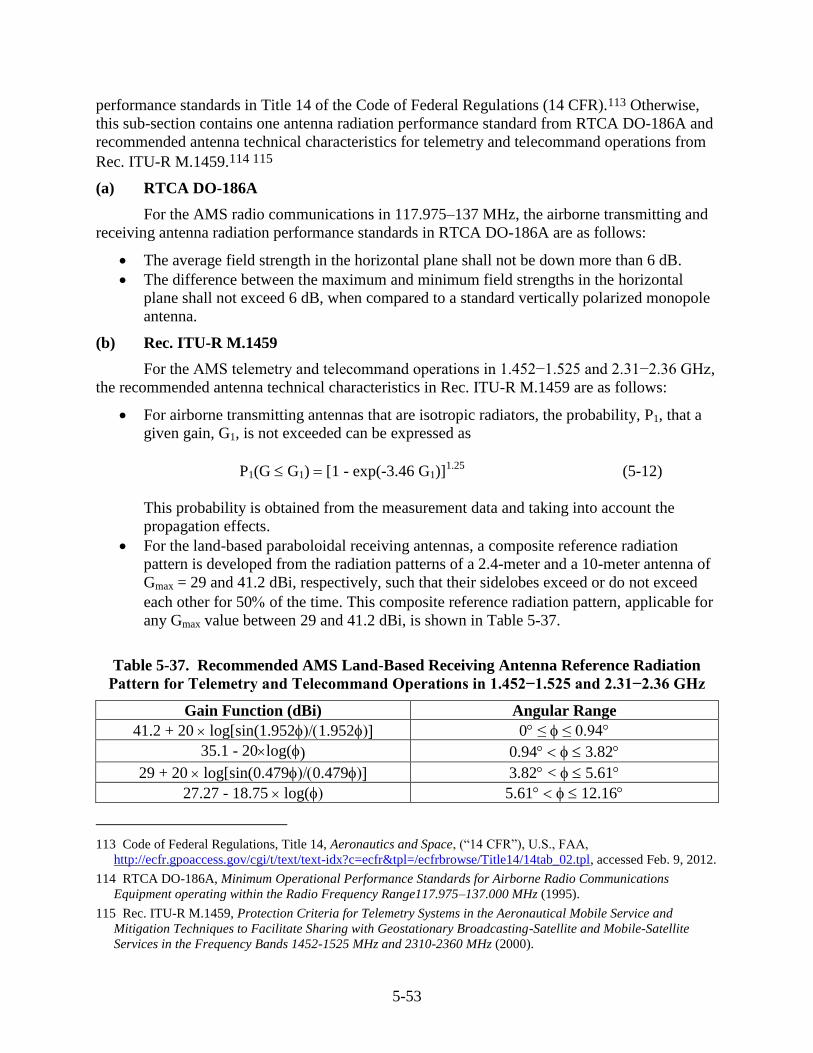
5-53
performance standards in Title 14 of the Code of Federal Regulations (14 CFR).113 Otherwise,
this sub-section contains one antenna radiation performance standard from RTCA DO-186A and
recommended antenna technical characteristics for telemetry and telecommand operations from
Rec. ITU-R M.1459.114 115
(a) RTCA DO-186A
For the AMS radio communications in 117.975–137 MHz, the airborne transmitting and
receiving antenna radiation performance standards in RTCA DO-186A are as follows:
The average field strength in the horizontal plane shall not be down more than 6 dB.
The difference between the maximum and minimum field strengths in the horizontal
plane shall not exceed 6 dB, when compared to a standard vertically polarized monopole
antenna.
(b) Rec. ITU-R M.1459
For the AMS telemetry and telecommand operations in 1.452−1.525 and 2.31−2.36 GHz,
the recommended antenna technical characteristics in Rec. ITU-R M.1459 are as follows:
For airborne transmitting antennas that are isotropic radiators, the probability, P1, that a
given gain, G1, is not exceeded can be expressed as
P1(G G1) [1 - exp(-3.46 G1)]1.25
(5-12)
This probability is obtained from the measurement data and taking into account the
propagation effects.
For the land-based paraboloidal receiving antennas, a composite reference radiation
pattern is developed from the radiation patterns of a 2.4-meter and a 10-meter antenna of
Gmax = 29 and 41.2 dBi, respectively, such that their sidelobes exceed or do not exceed
each other for 50 of the time. This composite reference radiation pattern, applicable for
any Gmax value between 29 and 41.2 dBi, is shown in Table 5-37.
Table 5-37. Recommended AMS Land-Based Receiving Antenna Reference Radiation
Pattern for Telemetry and Telecommand Operations in 1.452−1.525 and 2.31−2.36 GHz
Gain Function (dBi) Angular Range
41.2 + 20 log[sin(1.9521.952 0 ≤ ≤ 0.94
35.1 - 20log() 0.94 3.82
29 + 20 log[sin(0.4790.479 3.82 < 5.61
27.27 - 18.75 log( 5.61 12.16
113 Code of Federal Regulations, Title 14, Aeronautics and Space, (“14 CFR”), U.S., FAA,
http://ecfr.gpoaccess.gov/cgi/t/text/text-idx?c=ecfr&tpl=/ecfrbrowse/Title14/14tab_02.tpl, accessed Feb. 9, 2012.
114 RTCA DO-186A, Minimum Operational Performance Standards for Airborne Radio Communications
Equipment operating within the Radio Frequency Range117.975–137.000 MHz (1995).
115 Rec. ITU-R M.1459, Protection Criteria for Telemetry Systems in the Aeronautical Mobile Service and
Mitigation Techniques to Facilitate Sharing with Geostationary Broadcasting-Satellite and Mobile-Satellite
Services in the Frequency Bands 1452-1525 MHz and 2310-2360 MHz (2000).
5-54
34.05 - 25 log( 12.16 48
-8 48 180
off mainbeam axis angle, deg.
“Sin(x)/x” is one of the formulas to model the antenna mainbeam radiation pattern. Since
there are two sin(x)/x formulas here, it is apparent that this reference radiation pattern is the
combination of two reference radiation patterns of different antenna sizes.
5.7 Mobile Satellite Service
MSS includes the land MSS (LMSS), maritime MSS (MMSS) and aeronautical MSS
(AMSS). These services are discussed here.
5.7.1 Land Mobile Satellite Service
This section covers the earth station antennas and satellite antennas.
5.7.1.1 Earth Station Antenna
NTIA does not provide the LMSS earth station antenna radiation performance standards
for the federal systems. Otherwise, this sub-section contains one recommended earth station
antenna reference radiation pattern from Rec. ITU-R M.1091.116
Rec. ITU-R M.1091
For the LMSS systems operating in 1−3 GHz, the recommended earth station antenna
reference radiation pattern in Rec. ITU-R M.1091 is provided in Table 5-38.
Table 5-38. Recommended LMSS Earth Station Antenna Reference Radiation Patterns in
1−3 GHz
(a) Transportable or Vehicle-Mounted Antenna with Axis-Symmetric or
Near-Symmetric Beam and 12 Gmax(dBi) 18
Gain Function (dBi) Angular Range
≤ 44 - 25 × log( 40 90
≤ -5 90
angle off mainbeam axis, deg.
(b) Vehicle-Mounted Vertical Array Antenna with Toroidal Beam
and 7 Gmax(dBi) 13
Gain Function (dBi) Angular Range
Gmax - 10 45 ( - o)
Gmax - 0.3 × [( - o)/10]2.3
20 ( - o) 45
Gmax - 0.3 × [(o - )/10]2.3
20 (o - ) 50
Gmax - 13 50 (o - )
116 Rec. ITU-R M.1091, Reference Off-mainbeam axis Radiation Patterns for Mobile Earth Station Antennas
Operating in the Land Mobile-Satellite Service in the Frequency Range 1 to 3 GHz (1994).
5-55
elevation angle, deg.
o: mainbeam elevation angle, deg.
This is an omnidirectional beam with narrow beamwidth in elevation direction.
(c) Vehicle-Mounted Tracking Antenna with Fan-Beam and Operating in
Low Elevation Angle
Gain Function (dBi) Angular Range
≤ 4 0 60
k0
elevation and azimuth angles, deg.
oo: mainbeam elevation and azimuth angles, deg.
k(= 0.33 for Gmax = 11−15, dBi.
k( is TBD for Gmax = 9−11, dBi.
(d) Vehicle-Mounted Near-Omnidirectional Antenna
5.7.1.2 Satellite Antenna
The LMSS satellite antennas are usually array antennas generating shaped beams to cover
the intended coverage area.
5.7.2 Maritime Mobile Satellite Service
This section covers the earth station antennas and satellite antennas.
5.7.2.1 Earth Station Antenna
The MMSS earth station antennas are either ship earth station antennas or coastal earth
station antennas. NTIA does not provide the MMSS earth station antenna radiation performance
standards for the federal systems. Otherwise, this sub-section contains one recommended
shipborne antenna reference radiation pattern from Rec. ITU-R M.694-1.117 The RTCM is in
the process of developing antenna standards for the MMSS.
117 Rec. ITU-R M.694-1, Reference Radiation Pattern for Ship Earth Station Antennas (2005).
Gain Function (dBi) Angular Range
≤ 5 -2020
≤ 0 -2020
elevation angle, deg.
The expression in Rec. ITU-R M.1091 is
G ≤ 5 dBi for -20
G ≤ 0 dBi for -20
this is not an accurate formula for the omnidirectional pattern.
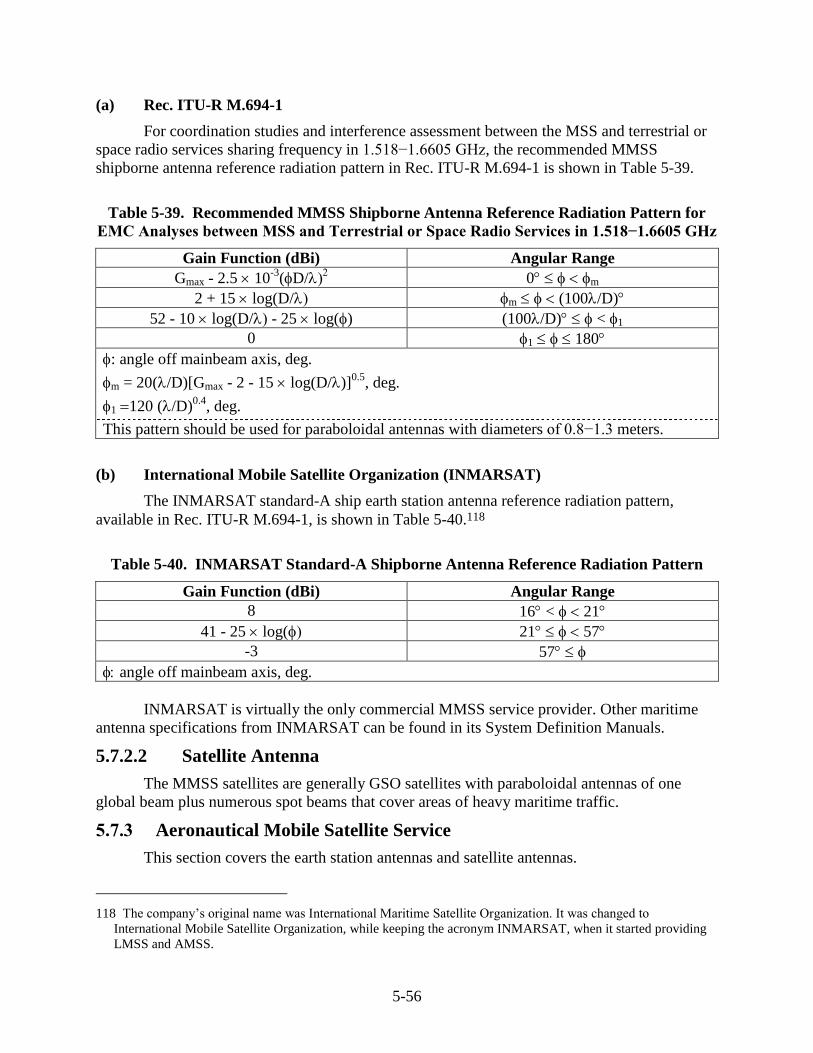
5-56
(a) Rec. ITU-R M.694-1
For coordination studies and interference assessment between the MSS and terrestrial or
space radio services sharing frequency in 1.518−1.6605 GHz, the recommended MMSS
shipborne antenna reference radiation pattern in Rec. ITU-R M.694-1 is shown in Table 5-39.
Table 5-39. Recommended MMSS Shipborne Antenna Reference Radiation Pattern for
EMC Analyses between MSS and Terrestrial or Space Radio Services in 1.518−1.6605 GHz
Gain Function (dBi) Angular Range
Gmax - 2.5 10-3
(D/ 0 m
2 + 15 log(D/ m (100/D)
52 - 10 log(D/- 25 log() (100/D) < 1
0 1 180
: angle off mainbeam axis, deg.
m = 20(/D)[Gmax - 2 - 15 log(D/)]0.5
, deg.
1 120 (/D)0.4
, deg.
This pattern should be used for paraboloidal antennas with diameters of 0.8−1.3 meters.
(b) International Mobile Satellite Organization (INMARSAT)
The INMARSAT standard-A ship earth station antenna reference radiation pattern,
available in Rec. ITU-R M.694-1, is shown in Table 5-40.118
Table 5-40. INMARSAT Standard-A Shipborne Antenna Reference Radiation Pattern
Gain Function (dBi) Angular Range
8 16 < 21
41 - 25 log( 21 57
-3 57
angle off mainbeam axis, deg.
INMARSAT is virtually the only commercial MMSS service provider. Other maritime
antenna specifications from INMARSAT can be found in its System Definition Manuals.
5.7.2.2 Satellite Antenna
The MMSS satellites are generally GSO satellites with paraboloidal antennas of one
global beam plus numerous spot beams that cover areas of heavy maritime traffic.
5.7.3 Aeronautical Mobile Satellite Service
This section covers the earth station antennas and satellite antennas.
118 The company’s original name was International Maritime Satellite Organization. It was changed to
International Mobile Satellite Organization, while keeping the acronym INMARSAT, when it started providing
LMSS and AMSS.
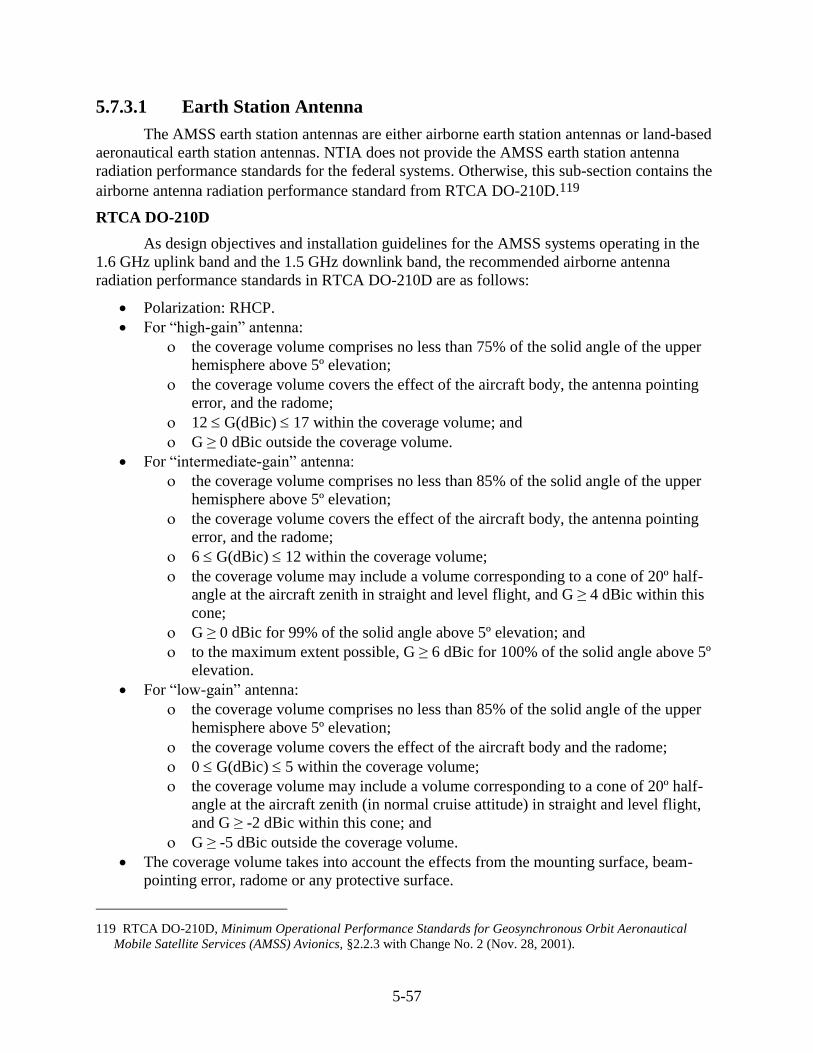
5-57
5.7.3.1 Earth Station Antenna
The AMSS earth station antennas are either airborne earth station antennas or land-based
aeronautical earth station antennas. NTIA does not provide the AMSS earth station antenna
radiation performance standards for the federal systems. Otherwise, this sub-section contains the
airborne antenna radiation performance standard from RTCA DO-210D.119
RTCA DO-210D
As design objectives and installation guidelines for the AMSS systems operating in the
1.6 GHz uplink band and the 1.5 GHz downlink band, the recommended airborne antenna
radiation performance standards in RTCA DO-210D are as follows:
Polarization: RHCP.
For “high-gain” antenna:
the coverage volume comprises no less than 75% of the solid angle of the upper
hemisphere above 5º elevation;
the coverage volume covers the effect of the aircraft body, the antenna pointing
error, and the radome;
12 G(dBic) 17 within the coverage volume; and
G ≥ 0 dBic outside the coverage volume.
For “intermediate-gain” antenna:
the coverage volume comprises no less than 85% of the solid angle of the upper
hemisphere above 5º elevation;
the coverage volume covers the effect of the aircraft body, the antenna pointing
error, and the radome;
6 G(dBic) 12 within the coverage volume;
the coverage volume may include a volume corresponding to a cone of 20º half-
angle at the aircraft zenith in straight and level flight, and G ≥ 4 dBic within this
cone;
G ≥ 0 dBic for 99% of the solid angle above 5º elevation; and
to the maximum extent possible, G ≥ 6 dBic for 100% of the solid angle above 5º
elevation.
For “low-gain” antenna:
the coverage volume comprises no less than 85% of the solid angle of the upper
hemisphere above 5º elevation;
the coverage volume covers the effect of the aircraft body and the radome;
0 G(dBic) 5 within the coverage volume;
the coverage volume may include a volume corresponding to a cone of 20º half-
angle at the aircraft zenith (in normal cruise attitude) in straight and level flight,
and G ≥ -2 dBic within this cone; and
G ≥ -5 dBic outside the coverage volume.
The coverage volume takes into account the effects from the mounting surface, beam-
pointing error, radome or any protective surface.
119 RTCA DO-210D, Minimum Operational Performance Standards for Geosynchronous Orbit Aeronautical
Mobile Satellite Services (AMSS) Avionics, §2.2.3 with Change No. 2 (Nov. 28, 2001).
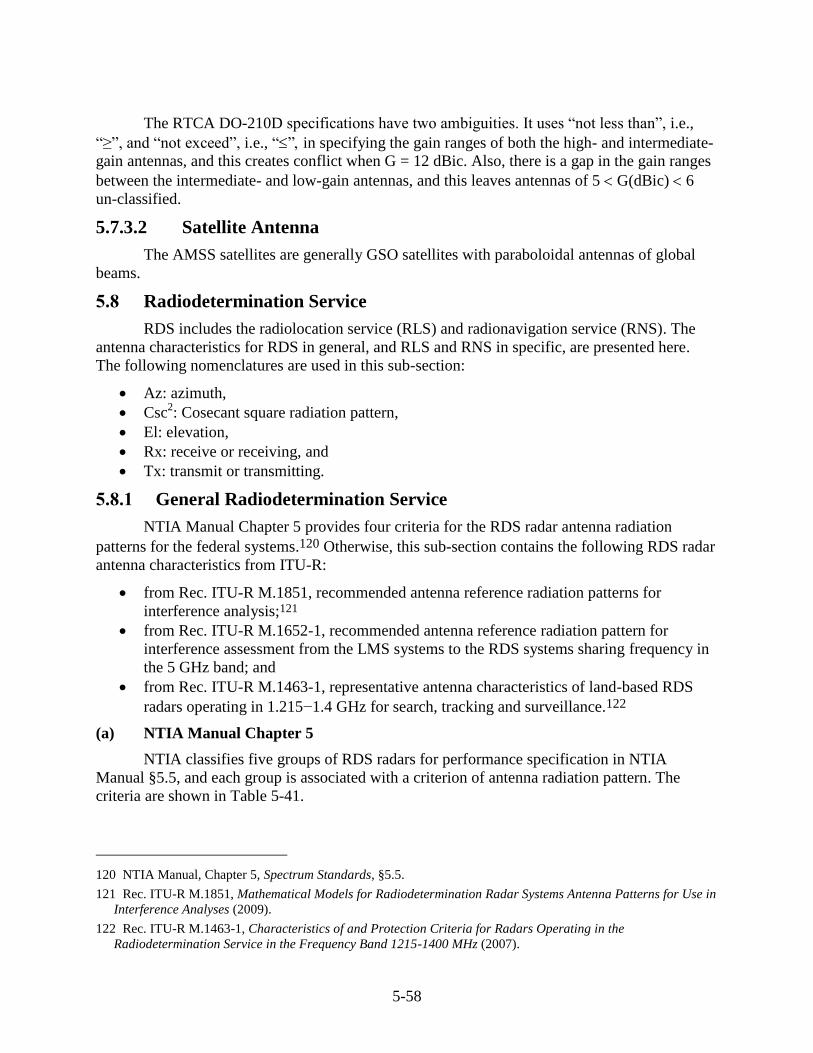
5-58
The RTCA DO-210D specifications have two ambiguities. It uses “not less than”, i.e.,
“≥”, and “not exceed”, i.e.,“” in specifying the gain ranges of both the high- and intermediate-
gain antennas, and this creates conflict when G = 12 dBic. Also, there is a gap in the gain ranges
between the intermediate- and low-gain antennas, and this leaves antennas of 5 G(dBic) 6
un-classified.
5.7.3.2 Satellite Antenna
The AMSS satellites are generally GSO satellites with paraboloidal antennas of global
beams.
5.8 Radiodetermination Service
RDS includes the radiolocation service (RLS) and radionavigation service (RNS). The
antenna characteristics for RDS in general, and RLS and RNS in specific, are presented here.
The following nomenclatures are used in this sub-section:
Az: azimuth,
Csc2: Cosecant square radiation pattern,
El: elevation,
Rx: receive or receiving, and
Tx: transmit or transmitting.
5.8.1 General Radiodetermination Service
NTIA Manual Chapter 5 provides four criteria for the RDS radar antenna radiation
patterns for the federal systems.120 Otherwise, this sub-section contains the following RDS radar
antenna characteristics from ITU-R:
from Rec. ITU-R M.1851, recommended antenna reference radiation patterns for
interference analysis;121
from Rec. ITU-R M.1652-1, recommended antenna reference radiation pattern for
interference assessment from the LMS systems to the RDS systems sharing frequency in
the 5 GHz band; and
from Rec. ITU-R M.1463-1, representative antenna characteristics of land-based RDS
radars operating in 1.215−1.4 GHz for search, tracking and surveillance.122
(a) NTIA Manual Chapter 5
NTIA classifies five groups of RDS radars for performance specification in NTIA
Manual §5.5, and each group is associated with a criterion of antenna radiation pattern. The
criteria are shown in Table 5-41.
120 NTIA Manual, Chapter 5, Spectrum Standards, §5.5.
121 Rec. ITU-R M.1851, Mathematical Models for Radiodetermination Radar Systems Antenna Patterns for Use in
Interference Analyses (2009).
122 Rec. ITU-R M.1463-1, Characteristics of and Protection Criteria for Radars Operating in the
Radiodetermination Service in the Frequency Band 1215-1400 MHz (2007).
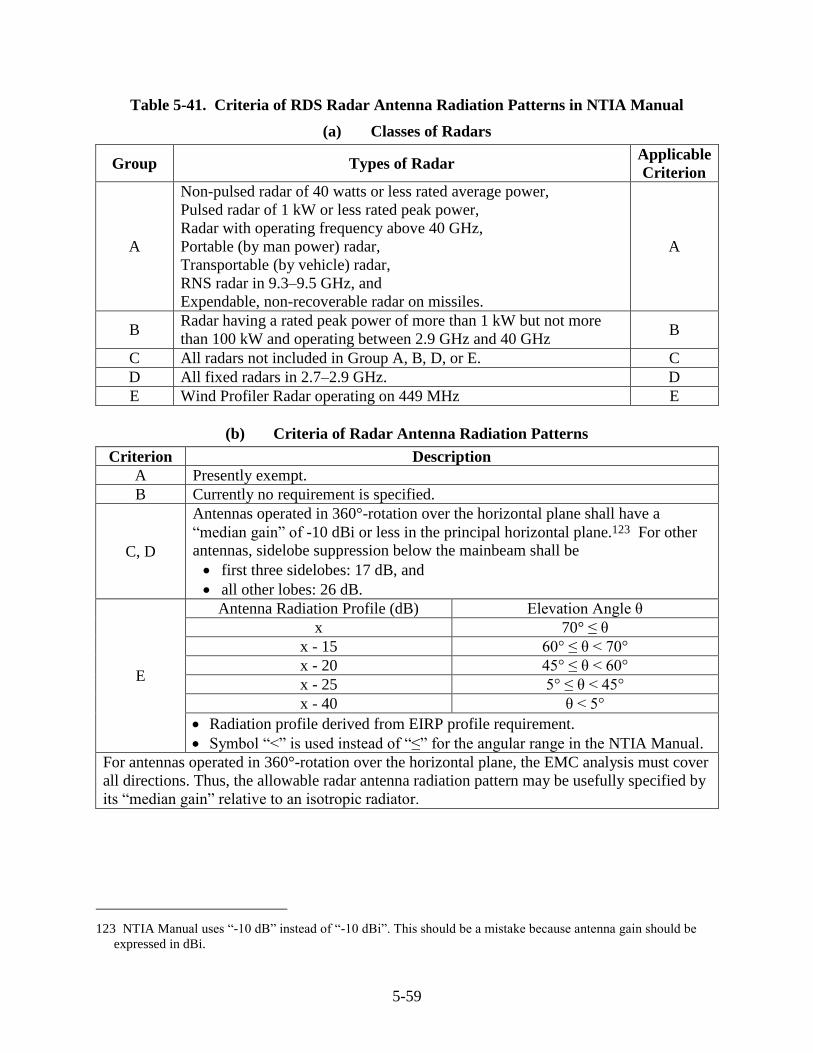
5-59
Table 5-41. Criteria of RDS Radar Antenna Radiation Patterns in NTIA Manual
(a) Classes of Radars
Group Types of Radar Applicable
Criterion
A
Non-pulsed radar of 40 watts or less rated average power,
Pulsed radar of 1 kW or less rated peak power,
Radar with operating frequency above 40 GHz,
Portable (by man power) radar,
Transportable (by vehicle) radar,
RNS radar in 9.3–9.5 GHz, and
Expendable, non-recoverable radar on missiles.
A
B Radar having a rated peak power of more than 1 kW but not more
than 100 kW and operating between 2.9 GHz and 40 GHz B
C All radars not included in Group A, B, D, or E. C
D All fixed radars in 2.7–2.9 GHz. D
E Wind Profiler Radar operating on 449 MHz E
(b) Criteria of Radar Antenna Radiation Patterns
Criterion Description
A Presently exempt.
B Currently no requirement is specified.
C, D
Antennas operated in 360°-rotation over the horizontal plane shall have a
“median gain” of -10 dBi or less in the principal horizontal plane.123 For other
antennas, sidelobe suppression below the mainbeam shall be
first three sidelobes: 17 dB, and
all other lobes: 26 dB.
E
Antenna Radiation Profile (dB) Elevation Angle θ
x 70° ≤ θ
x - 15 60° ≤ θ < 70°
x - 20 45° ≤ θ < 60°
x - 25 5° ≤ θ < 45°
x - 40 θ < 5°
Radiation profile derived from EIRP profile requirement.
Symbol “<” is used instead of “≤” for the angular range in the NTIA Manual.
For antennas operated in 360°-rotation over the horizontal plane, the EMC analysis must cover
all directions. Thus, the allowable radar antenna radiation pattern may be usefully specified by
its “median gain” relative to an isotropic radiator.
123 NTIA Manual uses “-10 dB” instead of “-10 dBi”. This should be a mistake because antenna gain should be
expressed in dBi.
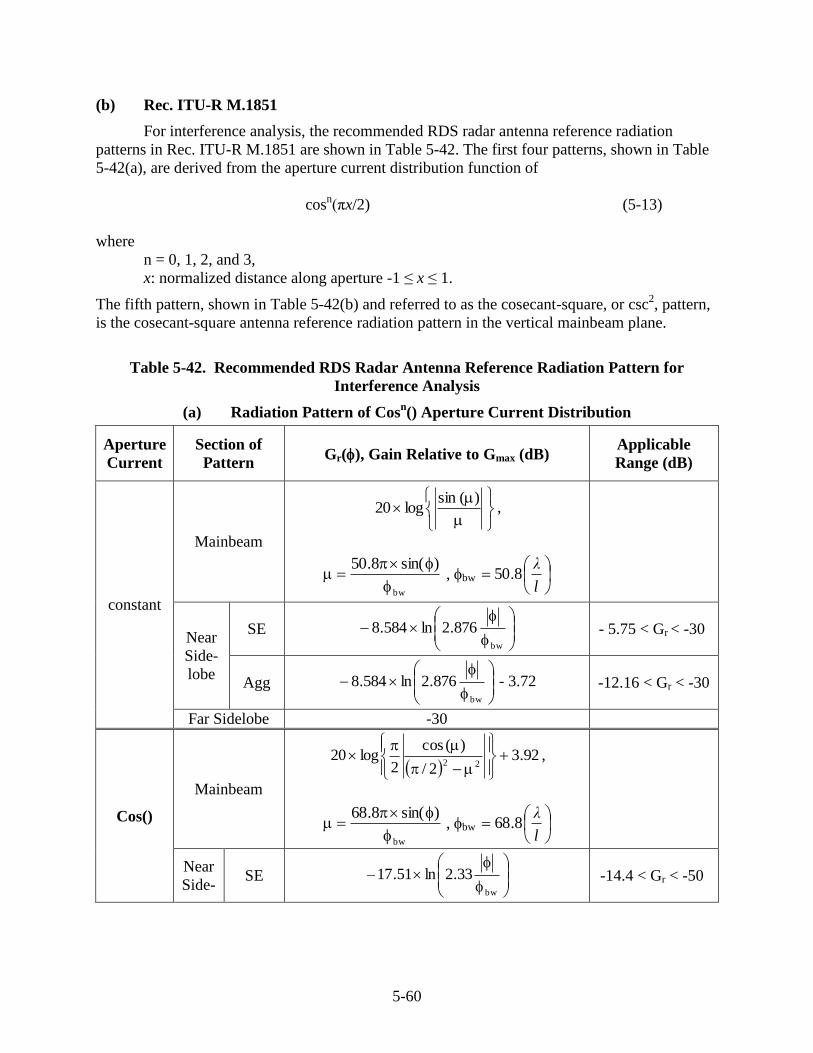
5-60
(b) Rec. ITU-R M.1851
For interference analysis, the recommended RDS radar antenna reference radiation
patterns in Rec. ITU-R M.1851 are shown in Table 5-42. The first four patterns, shown in Table
5-42(a), are derived from the aperture current distribution function of
cosn(πx/2) (5-13)
where
n = 0, 1, 2, and 3,
x: normalized distance along aperture -1 ≤ x ≤ 1.
The fifth pattern, shown in Table 5-42(b) and referred to as the cosecant-square, or csc2, pattern,
is the cosecant-square antenna reference radiation pattern in the vertical mainbeam plane.
Table 5-42. Recommended RDS Radar Antenna Reference Radiation Pattern for
Interference Analysis
(a) Radiation Pattern of Cosn() Aperture Current Distribution
Aperture
Current
Section of
Pattern Gr(), Gain Relative to Gmax (dB)
Applicable
Range (dB)
constant
Mainbeam
)(sinlog20 ,
bw
)sin(8.50
, bw
l
λ8.50
Near
Side-
lobe
SE
bw
876.2ln584.8 - 5.75 < Gr < -30
Agg
bw
876.2ln584.8 - 3.72 -12.16 < Gr < -30
Far Sidelobe -30
Cos()
Mainbeam
92.3
2/
)(cos
2log20
22
,
bw
)sin(8.68
, bw
l
λ8.68
Near
Side-SE
bw
33.2ln51.17– -14.4 < Gr < -50
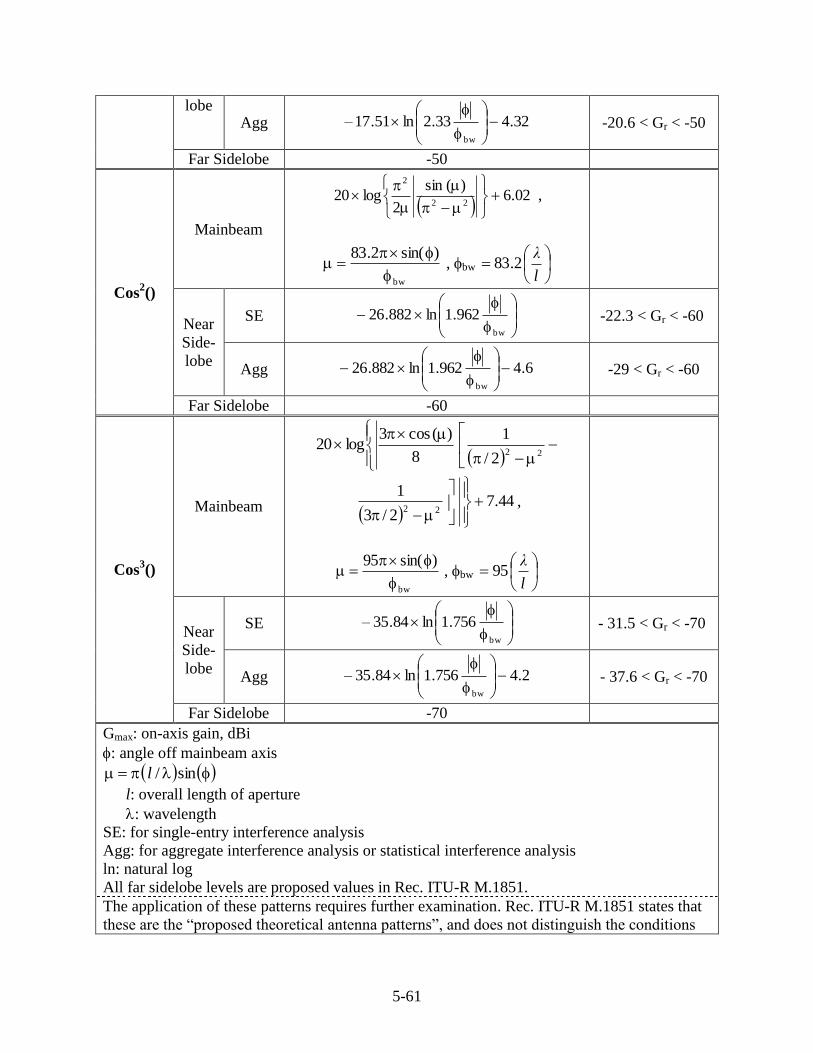
5-61
lobe Agg 32.433.2ln51.17–
bw
-20.6 < Gr < -50
Far Sidelobe -50
Cos2()
Mainbeam
02.6
)(sin
2log20
22
2
,
bw
)sin(2.83
, bw
l
λ2.83
Near
Side-
lobe
SE
bw
962.1ln882.26 -22.3 < Gr < -60
Agg 6.4962.1ln882.26bw
-29 < Gr < -60
Far Sidelobe -60
Cos3()
Mainbeam
222/
1
8
)(cos3log20
44.7
2/3
122
,
bw
)sin(95
, bw
l
λ95
Near
Side-
lobe
SE
bw
756.1ln84.35– - 31.5 < Gr < -70
Agg 2.4756.1ln84.35–bw
- 37.6 < Gr < -70
Far Sidelobe -70
Gmax: on-axis gain, dBi
: angle off mainbeam axis
sin/l
l: overall length of aperture
: wavelength
SE: for single-entry interference analysis
Agg: for aggregate interference analysis or statistical interference analysis
ln: natural log
All far sidelobe levels are proposed values in Rec. ITU-R M.1851.
The application of these patterns requires further examination. Rec. ITU-R M.1851 states that
these are the “proposed theoretical antenna patterns”, and does not distinguish the conditions
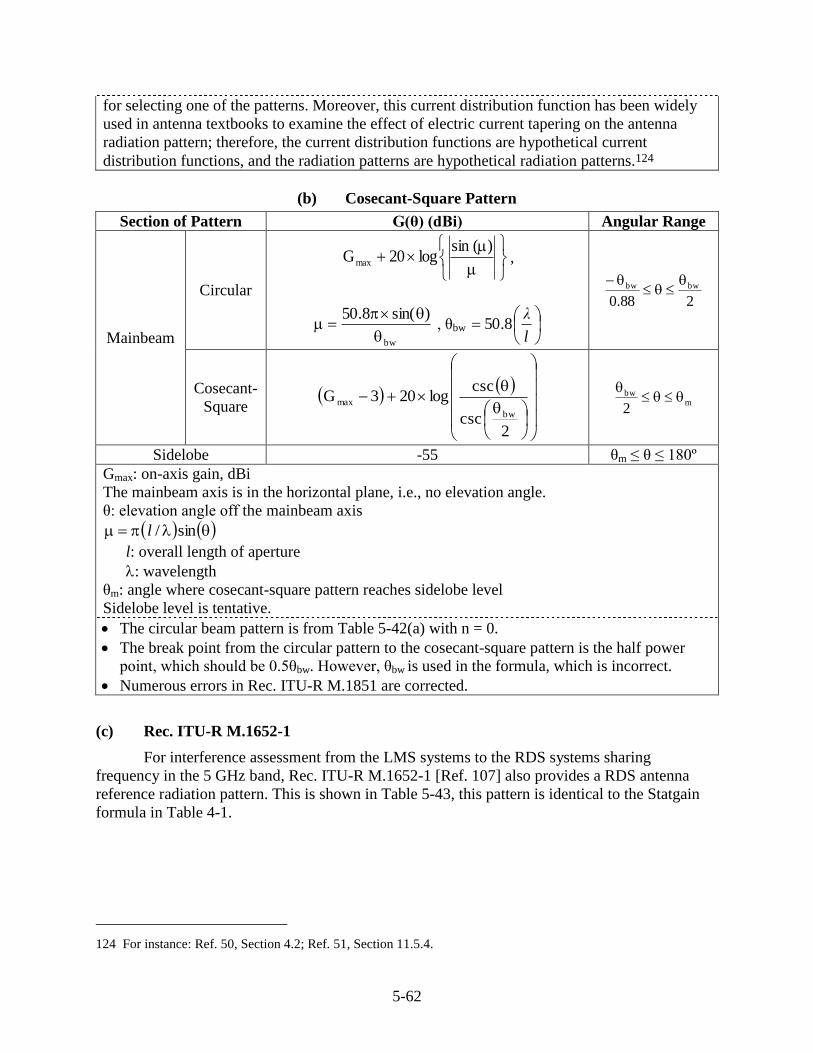
5-62
for selecting one of the patterns. Moreover, this current distribution function has been widely
used in antenna textbooks to examine the effect of electric current tapering on the antenna
radiation pattern; therefore, the current distribution functions are hypothetical current
distribution functions, and the radiation patterns are hypothetical radiation patterns.124
(b) Cosecant-Square Pattern
Section of Pattern G(θ) (dBi) Angular Range
Mainbeam
Circular
)(sinlog20Gmax ,
bw
)sin(8.50
, θbw
l
λ8.50
288.0
bwbw
Cosecant-
Square
2csc
csclog203G
bw
max mbw
2
Sidelobe -55 θm ≤ θ ≤ 180º
Gmax: on-axis gain, dBi
The mainbeam axis is in the horizontal plane, i.e., no elevation angle.
θ: elevation angle off the mainbeam axis
sin/l
l: overall length of aperture
: wavelength
θm: angle where cosecant-square pattern reaches sidelobe level
Sidelobe level is tentative.
The circular beam pattern is from Table 5-42(a) with n = 0.
The break point from the circular pattern to the cosecant-square pattern is the half power
point, which should be 0.5θbw. However, θbw is used in the formula, which is incorrect.
Numerous errors in Rec. ITU-R M.1851 are corrected.
(c) Rec. ITU-R M.1652-1
For interference assessment from the LMS systems to the RDS systems sharing
frequency in the 5 GHz band, Rec. ITU-R M.1652-1 [Ref. 107] also provides a RDS antenna
reference radiation pattern. This is shown in Table 5-43, this pattern is identical to the Statgain
formula in Table 4-1.
124 For instance: Ref. 50, Section 4.2; Ref. 51, Section 11.5.4.
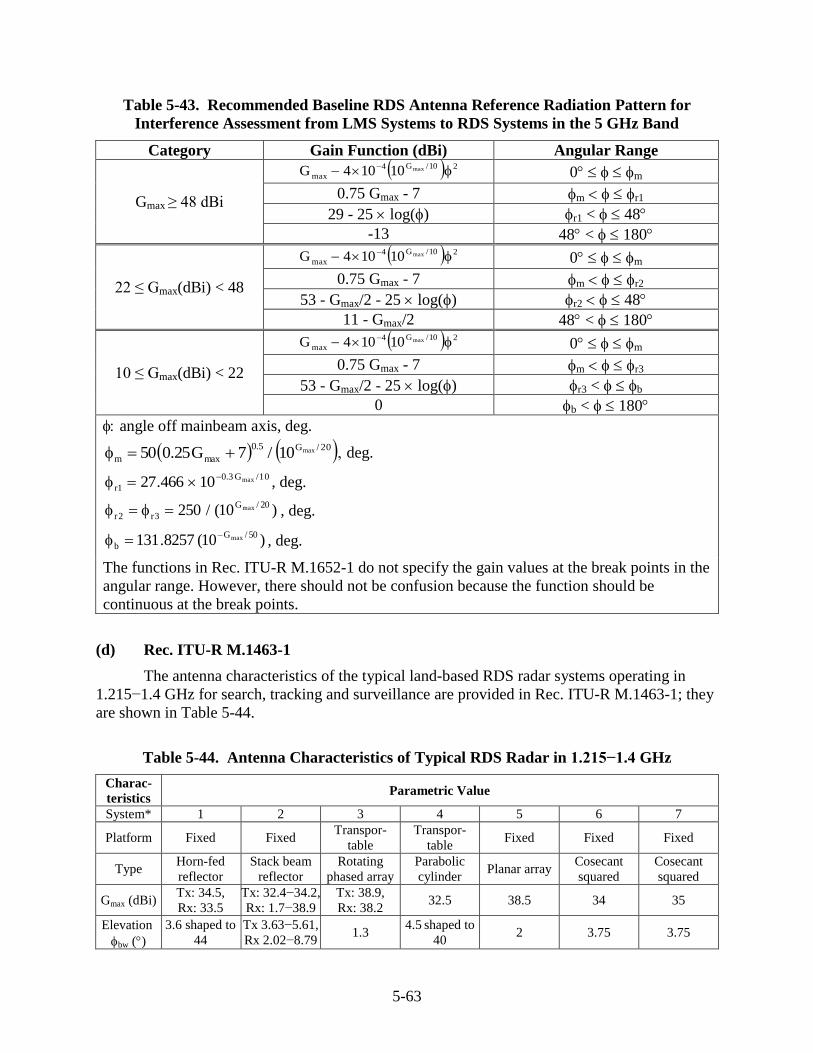
5-63
Table 5-43. Recommended Baseline RDS Antenna Reference Radiation Pattern for
Interference Assessment from LMS Systems to RDS Systems in the 5 GHz Band
Category Gain Function (dBi) Angular Range
Gmax ≥ 48 dBi
210/G4
maxmax10104G 0 m
0.75 Gmax - 7 m r1
29 - 25 log() r1< 48
-13 48 < 180
22 ≤ Gmax(dBi) < 48
210/G4
maxmax10104G 0 m
0.75 Gmax - 7 m r2
53 - Gmax/2 - 25 log() r2 48
11 - Gmax/2 48 < 180
10 ≤ Gmax(dBi) < 22
210/G4
maxmax10104G 0 m
0.75 Gmax - 7 m r3
53 - Gmax/2 - 25 log() r3< b
0 b < 180
angle off mainbeam axis, deg.
20/G5.0
maxmmax10/7G25.050 deg.
10/G3.0
1rmax10466.27
, deg.
)10(/25020/G
3r2rmax , deg.
)10(8257.13150/G
bmax
, deg.
The functions in Rec. ITU-R M.1652-1 do not specify the gain values at the break points in the
angular range. However, there should not be confusion because the function should be
continuous at the break points.
(d) Rec. ITU-R M.1463-1
The antenna characteristics of the typical land-based RDS radar systems operating in
1.215−1.4 GHz for search, tracking and surveillance are provided in Rec. ITU-R M.1463-1; they
are shown in Table 5-44.
Table 5-44. Antenna Characteristics of Typical RDS Radar in 1.215−1.4 GHz
Charac-
teristics Parametric Value
System* 1 2 3 4 5 6 7
Platform Fixed Fixed Transpor-
table
Transpor-
table Fixed Fixed Fixed
Type Horn-fed
reflector
Stack beam
reflector
Rotating
phased array
Parabolic
cylinder Planar array
Cosecant
squared
Cosecant
squared
Gmax (dBi) Tx: 34.5,
Rx: 33.5
Tx: 32.4−34.2,
Rx: 1.7−38.9
Tx: 38.9,
Rx: 38.2 32.5 38.5 34 35
Elevation
bw ()
3.6 shaped to
44
Tx 3.63−5.61,
Rx 2.02−8.79 1.3
4.5 shaped to
40 2 3.75 3.75
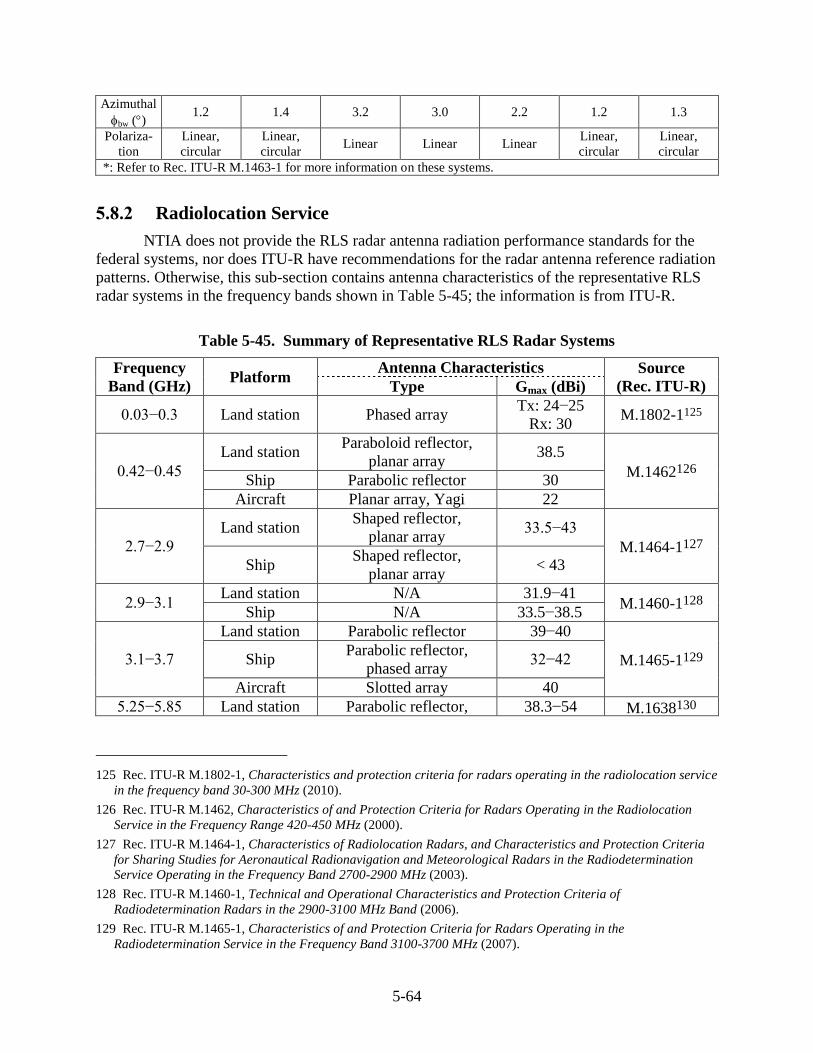
5-64
Azimuthal
bw ()1.2 1.4 3.2 3.0 2.2 1.2 1.3
Polariza-
tion
Linear,
circular
Linear,
circular Linear Linear Linear
Linear,
circular
Linear,
circular
*: Refer to Rec. ITU-R M.1463-1 for more information on these systems.
5.8.2 Radiolocation Service
NTIA does not provide the RLS radar antenna radiation performance standards for the
federal systems, nor does ITU-R have recommendations for the radar antenna reference radiation
patterns. Otherwise, this sub-section contains antenna characteristics of the representative RLS
radar systems in the frequency bands shown in Table 5-45; the information is from ITU-R.
Table 5-45. Summary of Representative RLS Radar Systems
Frequency
Band (GHz) Platform
Antenna Characteristics Source
(Rec. ITU-R) Type Gmax (dBi)
0.03−0.3 Land station Phased array Tx: 24−25
Rx: 30 M.1802-1125
0.42−0.45
Land station Paraboloid reflector,
planar array 38.5
M.1462126 Ship Parabolic reflector 30
Aircraft Planar array, Yagi 22
2.7−2.9
Land station Shaped reflector,
planar array 33.5−43
M.1464-1127 Ship
Shaped reflector,
planar array < 43
2.9−3.1 Land station N/A 31.9−41
M.1460-1128 Ship N/A 33.5−38.5
3.1−3.7
Land station Parabolic reflector 39−40
M.1465-1129 Ship Parabolic reflector,
phased array 32−42
Aircraft Slotted array 40
5.25−5.85 Land station Parabolic reflector, 38.3−54 M.1638130
125 Rec. ITU-R M.1802-1, Characteristics and protection criteria for radars operating in the radiolocation service
in the frequency band 30-300 MHz (2010).
126 Rec. ITU-R M.1462, Characteristics of and Protection Criteria for Radars Operating in the Radiolocation
Service in the Frequency Range 420-450 MHz (2000).
127 Rec. ITU-R M.1464-1, Characteristics of Radiolocation Radars, and Characteristics and Protection Criteria
for Sharing Studies for Aeronautical Radionavigation and Meteorological Radars in the Radiodetermination
Service Operating in the Frequency Band 2700-2900 MHz (2003).
128 Rec. ITU-R M.1460-1, Technical and Operational Characteristics and Protection Criteria of
Radiodetermination Radars in the 2900-3100 MHz Band (2006).
129 Rec. ITU-R M.1465-1, Characteristics of and Protection Criteria for Radars Operating in the
Radiodetermination Service in the Frequency Band 3100-3700 MHz (2007).
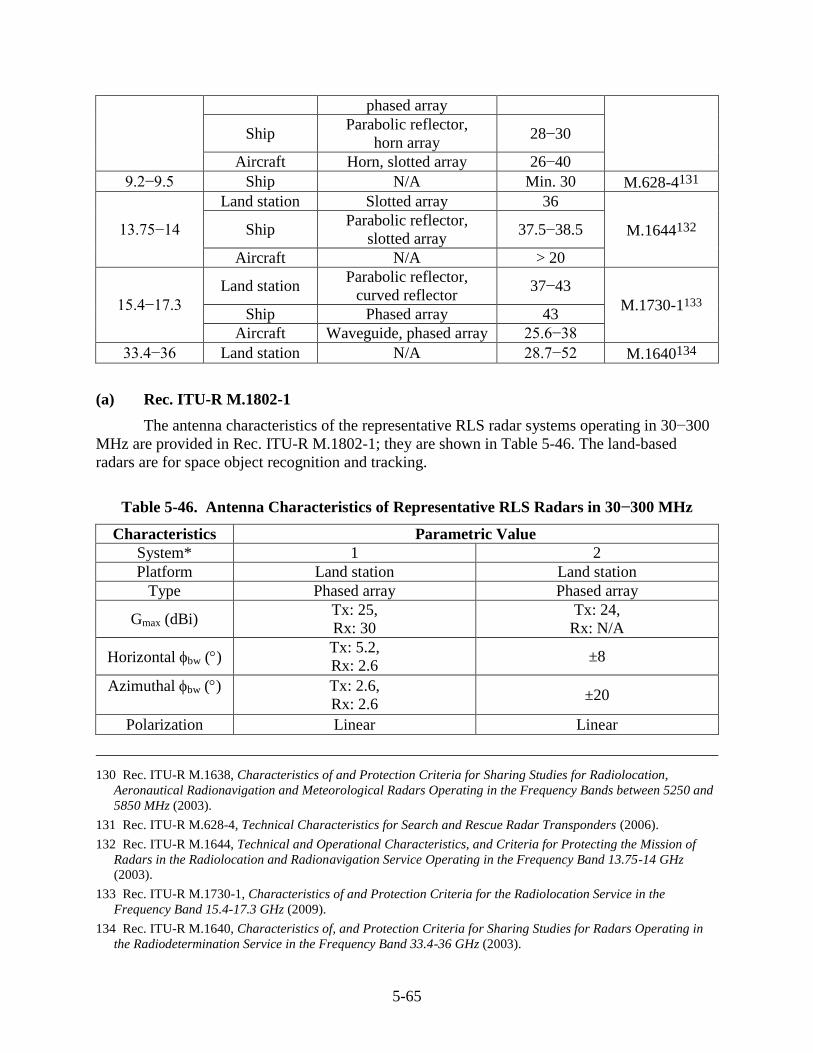
5-65
phased array
Ship Parabolic reflector,
horn array 28−30
Aircraft Horn, slotted array 26−40
9.2−9.5 Ship N/A Min. 30 M.628-4131
13.75−14
Land station Slotted array 36
M.1644132 Ship Parabolic reflector,
slotted array 37.5−38.5
Aircraft N/A > 20
15.4−17.3
Land station Parabolic reflector,
curved reflector 37−43
M.1730-1133 Ship Phased array 43
Aircraft Waveguide, phased array 25.6−38
33.4−36 Land station N/A 28.7−52 M.1640134
(a) Rec. ITU-R M.1802-1
The antenna characteristics of the representative RLS radar systems operating in 30−300
MHz are provided in Rec. ITU-R M.1802-1; they are shown in Table 5-46. The land-based
radars are for space object recognition and tracking.
Table 5-46. Antenna Characteristics of Representative RLS Radars in 30−300 MHz
Characteristics Parametric Value
System* 1 2
Platform Land station Land station
Type Phased array Phased array
Gmax (dBi) Tx: 25,
Rx: 30
Tx: 24,
Rx: N/A
Horizontal bw () Tx: 5.2,
Rx: 2.6 ±8
Azimuthal bw ()
Tx: 2.6,
Rx: 2.6 ±20
Polarization Linear Linear
130 Rec. ITU-R M.1638, Characteristics of and Protection Criteria for Sharing Studies for Radiolocation,
Aeronautical Radionavigation and Meteorological Radars Operating in the Frequency Bands between 5250 and
5850 MHz (2003).
131 Rec. ITU-R M.628-4, Technical Characteristics for Search and Rescue Radar Transponders (2006).
132 Rec. ITU-R M.1644, Technical and Operational Characteristics, and Criteria for Protecting the Mission of
Radars in the Radiolocation and Radionavigation Service Operating in the Frequency Band 13.75-14 GHz
(2003).
133 Rec. ITU-R M.1730-1, Characteristics of and Protection Criteria for the Radiolocation Service in the
Frequency Band 15.4-17.3 GHz (2009).
134 Rec. ITU-R M.1640, Characteristics of, and Protection Criteria for Sharing Studies for Radars Operating in
the Radiodetermination Service in the Frequency Band 33.4-36 GHz (2003).
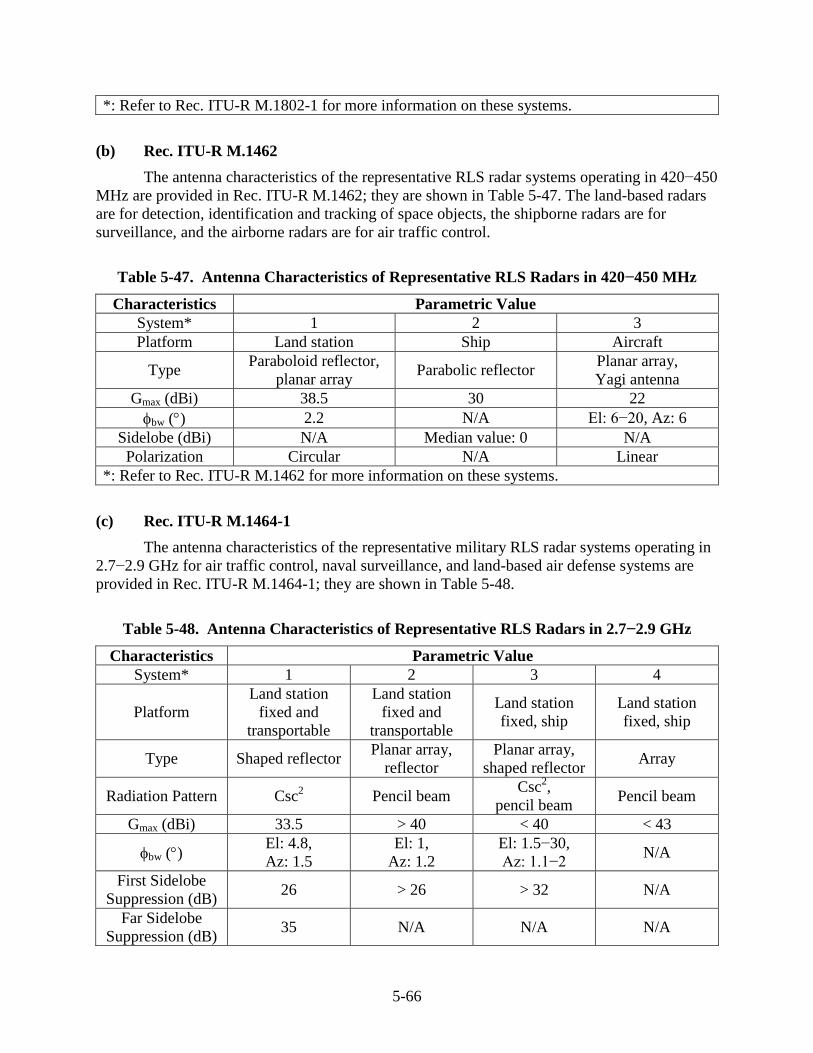
5-66
*: Refer to Rec. ITU-R M.1802-1 for more information on these systems.
(b) Rec. ITU-R M.1462
The antenna characteristics of the representative RLS radar systems operating in 420−450
MHz are provided in Rec. ITU-R M.1462; they are shown in Table 5-47. The land-based radars
are for detection, identification and tracking of space objects, the shipborne radars are for
surveillance, and the airborne radars are for air traffic control.
Table 5-47. Antenna Characteristics of Representative RLS Radars in 420−450 MHz
Characteristics Parametric Value
System* 1 2 3
Platform Land station Ship Aircraft
Type Paraboloid reflector,
planar array Parabolic reflector
Planar array,
Yagi antenna
Gmax (dBi) 38.5 30 22
bw () 2.2 N/A El: 6−20, Az: 6
Sidelobe (dBi) N/A Median value: 0 N/A
Polarization Circular N/A Linear
*: Refer to Rec. ITU-R M.1462 for more information on these systems.
(c) Rec. ITU-R M.1464-1
The antenna characteristics of the representative military RLS radar systems operating in
2.7−2.9 GHz for air traffic control, naval surveillance, and land-based air defense systems are
provided in Rec. ITU-R M.1464-1; they are shown in Table 5-48.
Table 5-48. Antenna Characteristics of Representative RLS Radars in 2.7−2.9 GHz
Characteristics Parametric Value
System* 1 2 3 4
Platform
Land station
fixed and
transportable
Land station
fixed and
transportable
Land station
fixed, ship
Land station
fixed, ship
Type Shaped reflector Planar array,
reflector
Planar array,
shaped reflector Array
Radiation Pattern Csc2 Pencil beam
Csc2,
pencil beam Pencil beam
Gmax (dBi) 33.5 > 40 < 40 < 43
bw () El: 4.8,
Az: 1.5
El: 1,
Az: 1.2
El: 1.5−30,
Az: 1.1−2 N/A
First Sidelobe
Suppression (dB) 26 > 26 > 32 N/A
Far Sidelobe
Suppression (dB) 35 N/A N/A N/A
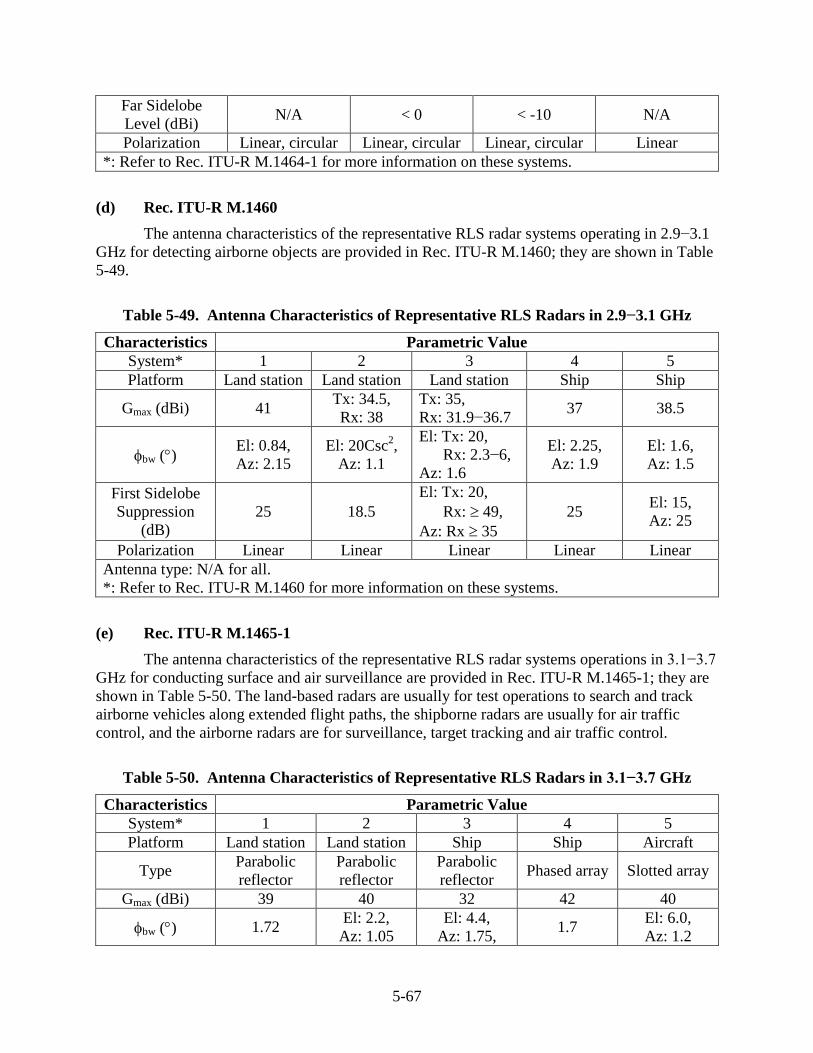
5-67
Far Sidelobe
Level (dBi) N/A < 0 < -10 N/A
Polarization Linear, circular Linear, circular Linear, circular Linear
*: Refer to Rec. ITU-R M.1464-1 for more information on these systems.
(d) Rec. ITU-R M.1460
The antenna characteristics of the representative RLS radar systems operating in 2.9−3.1
GHz for detecting airborne objects are provided in Rec. ITU-R M.1460; they are shown in Table
5-49.
Table 5-49. Antenna Characteristics of Representative RLS Radars in 2.9−3.1 GHz
Characteristics Parametric Value
System* 1 2 3 4 5
Platform Land station Land station Land station Ship Ship
Gmax (dBi) 41 Tx: 34.5,
Rx: 38
Tx: 35,
Rx: 31.9−36.7 37 38.5
bw () El: 0.84,
Az: 2.15
El: 20Csc2,
Az: 1.1
El: Tx: 20,
Rx: 2.3−6,
Az: 1.6
El: 2.25,
Az: 1.9
El: 1.6,
Az: 1.5
First Sidelobe
Suppression
(dB)
25 18.5
El: Tx: 20,
Rx: 49,
Az: Rx 35
25 El: 15,
Az: 25
Polarization Linear Linear Linear Linear Linear
Antenna type: N/A for all.
*: Refer to Rec. ITU-R M.1460 for more information on these systems.
(e) Rec. ITU-R M.1465-1
The antenna characteristics of the representative RLS radar systems operations in 3.1−3.7
GHz for conducting surface and air surveillance are provided in Rec. ITU-R M.1465-1; they are
shown in Table 5-50. The land-based radars are usually for test operations to search and track
airborne vehicles along extended flight paths, the shipborne radars are usually for air traffic
control, and the airborne radars are for surveillance, target tracking and air traffic control.
Table 5-50. Antenna Characteristics of Representative RLS Radars in 3.1−3.7 GHz
Characteristics Parametric Value
System* 1 2 3 4 5
Platform Land station Land station Ship Ship Aircraft
Type Parabolic
reflector
Parabolic
reflector
Parabolic
reflector Phased array Slotted array
Gmax (dBi) 39 40 32 42 40
bw () 1.72 El: 2.2,
Az: 1.05
El: 4.4,
Az: 1.75, 1.7
El: 6.0,
Az: 1.2
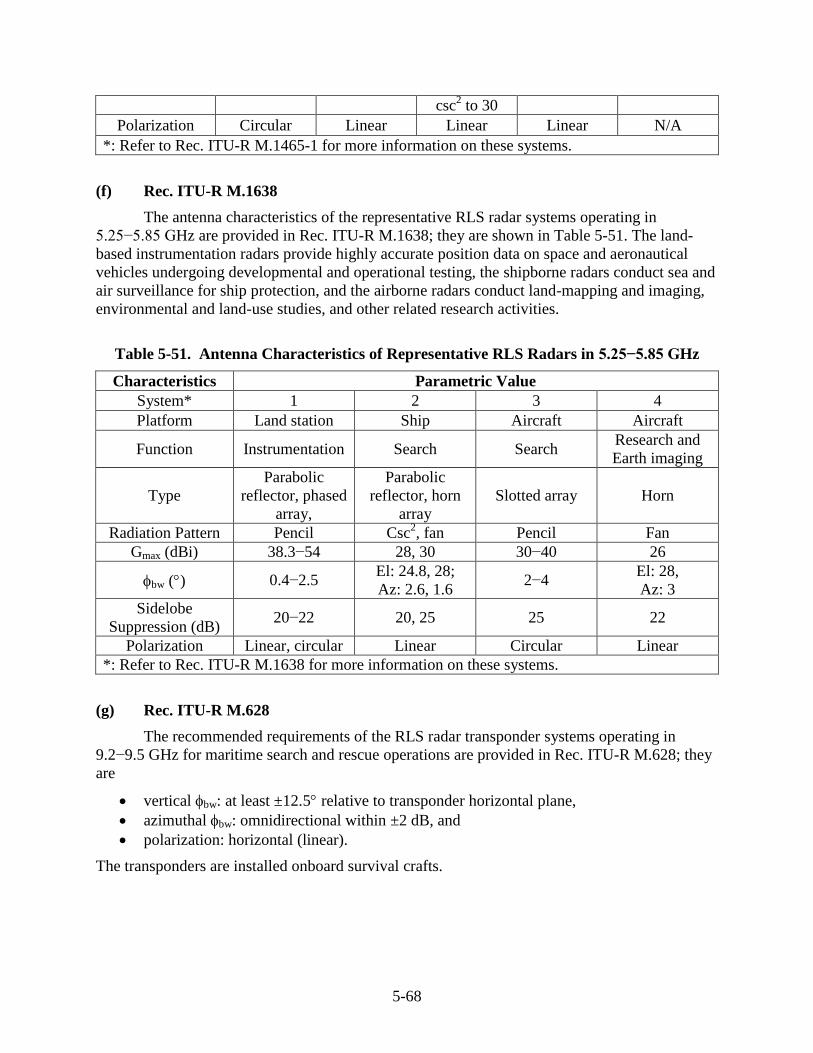
5-68
csc2 to 30
Polarization Circular Linear Linear Linear N/A
*: Refer to Rec. ITU-R M.1465-1 for more information on these systems.
(f) Rec. ITU-R M.1638
The antenna characteristics of the representative RLS radar systems operating in
5.25−5.85 GHz are provided in Rec. ITU-R M.1638; they are shown in Table 5-51. The land-
based instrumentation radars provide highly accurate position data on space and aeronautical
vehicles undergoing developmental and operational testing, the shipborne radars conduct sea and
air surveillance for ship protection, and the airborne radars conduct land-mapping and imaging,
environmental and land-use studies, and other related research activities.
Table 5-51. Antenna Characteristics of Representative RLS Radars in 5.25−5.85 GHz
Characteristics Parametric Value
System* 1 2 3 4
Platform Land station Ship Aircraft Aircraft
Function Instrumentation Search Search Research and
Earth imaging
Type
Parabolic
reflector, phased
array,
Parabolic
reflector, horn
array
Slotted array Horn
Radiation Pattern Pencil Csc2, fan Pencil Fan
Gmax (dBi) 38.3−54 28, 30 30−40 26
bw () 0.4−2.5 El: 24.8, 28;
Az: 2.6, 1.6 2−4
El: 28,
Az: 3
Sidelobe
Suppression (dB) 20−22 20, 25 25 22
Polarization Linear, circular Linear Circular Linear
*: Refer to Rec. ITU-R M.1638 for more information on these systems.
(g) Rec. ITU-R M.628
The recommended requirements of the RLS radar transponder systems operating in
9.2−9.5 GHz for maritime search and rescue operations are provided in Rec. ITU-R M.628; they
are
vertical bw: at least ±12.5 relative to transponder horizontal plane,
azimuthal bw: omnidirectional within ±2 dB, and
polarization: horizontal (linear).
The transponders are installed onboard survival crafts.
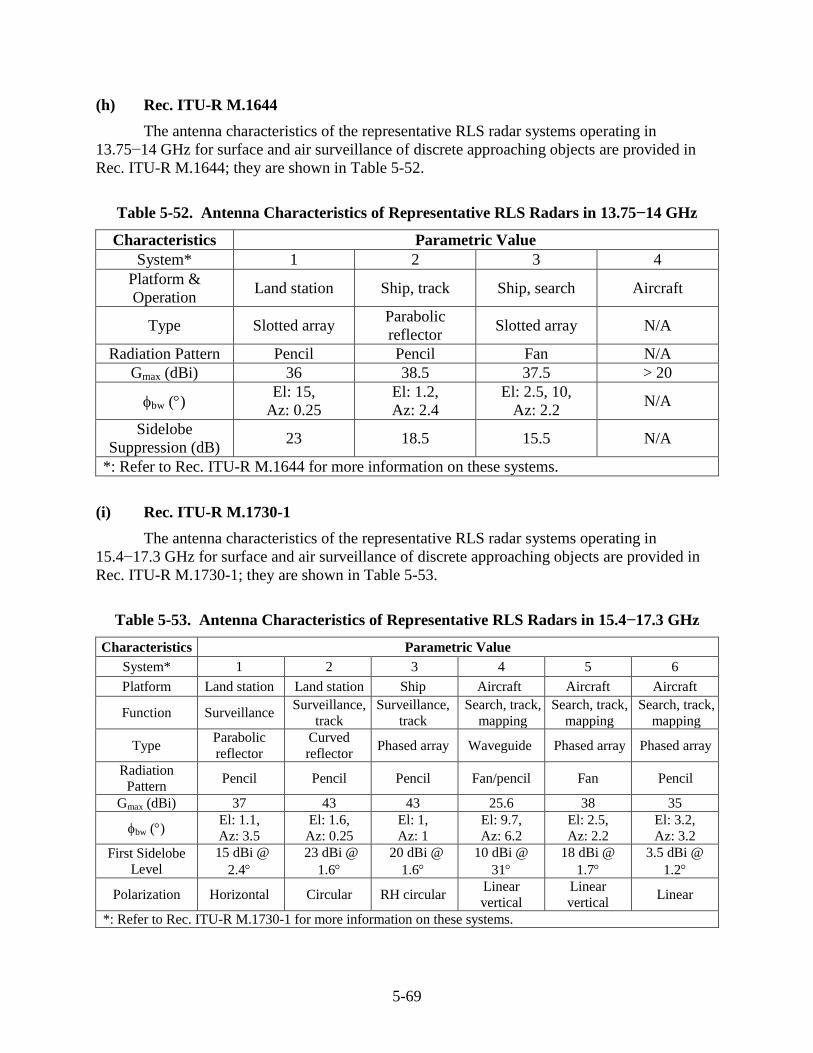
5-69
(h) Rec. ITU-R M.1644
The antenna characteristics of the representative RLS radar systems operating in
13.75−14 GHz for surface and air surveillance of discrete approaching objects are provided in
Rec. ITU-R M.1644; they are shown in Table 5-52.
Table 5-52. Antenna Characteristics of Representative RLS Radars in 13.75−14 GHz
Characteristics Parametric Value
System* 1 2 3 4
Platform &
Operation Land station Ship, track Ship, search Aircraft
Type Slotted array Parabolic
reflector Slotted array N/A
Radiation Pattern Pencil Pencil Fan N/A
Gmax (dBi) 36 38.5 37.5 > 20
bw () El: 15,
Az: 0.25
El: 1.2,
Az: 2.4
El: 2.5, 10,
Az: 2.2 N/A
Sidelobe
Suppression (dB) 23 18.5 15.5 N/A
*: Refer to Rec. ITU-R M.1644 for more information on these systems.
(i) Rec. ITU-R M.1730-1
The antenna characteristics of the representative RLS radar systems operating in
15.4−17.3 GHz for surface and air surveillance of discrete approaching objects are provided in
Rec. ITU-R M.1730-1; they are shown in Table 5-53.
Table 5-53. Antenna Characteristics of Representative RLS Radars in 15.4−17.3 GHz
Characteristics Parametric Value
System* 1 2 3 4 5 6
Platform Land station Land station Ship Aircraft Aircraft Aircraft
Function Surveillance Surveillance,
track
Surveillance,
track
Search, track,
mapping
Search, track,
mapping
Search, track,
mapping
Type Parabolic
reflector
Curved
reflector Phased array Waveguide Phased array Phased array
Radiation
Pattern Pencil Pencil Pencil Fan/pencil Fan Pencil
Gmax (dBi) 37 43 43 25.6 38 35
bw () El: 1.1,
Az: 3.5
El: 1.6,
Az: 0.25
El: 1,
Az: 1
El: 9.7,
Az: 6.2
El: 2.5,
Az: 2.2
El: 3.2,
Az: 3.2
First Sidelobe
Level
15 dBi @
2.4
23 dBi @
1.6
20 dBi @
1.6
10 dBi @
31
18 dBi @
1.7
3.5 dBi @
1.2
Polarization Horizontal Circular RH circular Linear
vertical
Linear
vertical Linear
*: Refer to Rec. ITU-R M.1730-1 for more information on these systems.
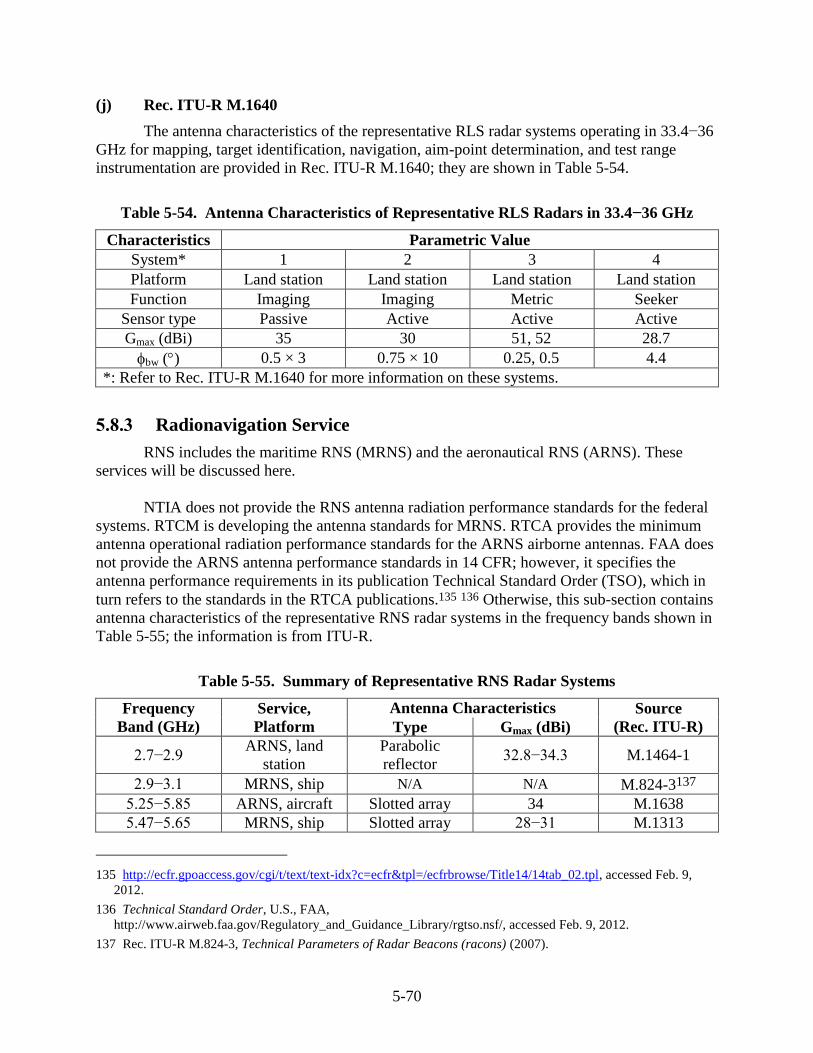
5-70
(j) Rec. ITU-R M.1640
The antenna characteristics of the representative RLS radar systems operating in 33.4−36
GHz for mapping, target identification, navigation, aim-point determination, and test range
instrumentation are provided in Rec. ITU-R M.1640; they are shown in Table 5-54.
Table 5-54. Antenna Characteristics of Representative RLS Radars in 33.4−36 GHz
Characteristics Parametric Value
System* 1 2 3 4
Platform Land station Land station Land station Land station
Function Imaging Imaging Metric Seeker
Sensor type Passive Active Active Active
Gmax (dBi) 35 30 51, 52 28.7
bw () 0.5 × 3 0.75 × 10 0.25, 0.5 4.4
*: Refer to Rec. ITU-R M.1640 for more information on these systems.
5.8.3 Radionavigation Service
RNS includes the maritime RNS (MRNS) and the aeronautical RNS (ARNS). These
services will be discussed here.
NTIA does not provide the RNS antenna radiation performance standards for the federal
systems. RTCM is developing the antenna standards for MRNS. RTCA provides the minimum
antenna operational radiation performance standards for the ARNS airborne antennas. FAA does
not provide the ARNS antenna performance standards in 14 CFR; however, it specifies the
antenna performance requirements in its publication Technical Standard Order (TSO), which in
turn refers to the standards in the RTCA publications.135 136 Otherwise, this sub-section contains
antenna characteristics of the representative RNS radar systems in the frequency bands shown in
Table 5-55; the information is from ITU-R.
Table 5-55. Summary of Representative RNS Radar Systems
Frequency
Band (GHz)
Service,
Platform
Antenna Characteristics Source
(Rec. ITU-R) Type Gmax (dBi)
2.7−2.9 ARNS, land
station
Parabolic
reflector 32.8−34.3 M.1464-1
2.9−3.1 MRNS, ship N/A N/A M.824-3137
5.25−5.85 ARNS, aircraft Slotted array 34 M.1638
5.47−5.65 MRNS, ship Slotted array 28−31 M.1313
135 http://ecfr.gpoaccess.gov/cgi/t/text/text-idx?c=ecfr&tpl=/ecfrbrowse/Title14/14tab_02.tpl, accessed Feb. 9,
2012.
136 Technical Standard Order, U.S., FAA,
http://www.airweb.faa.gov/Regulatory_and_Guidance_Library/rgtso.nsf/, accessed Feb. 9, 2012.
137 Rec. ITU-R M.824-3, Technical Parameters of Radar Beacons (racons) (2007).
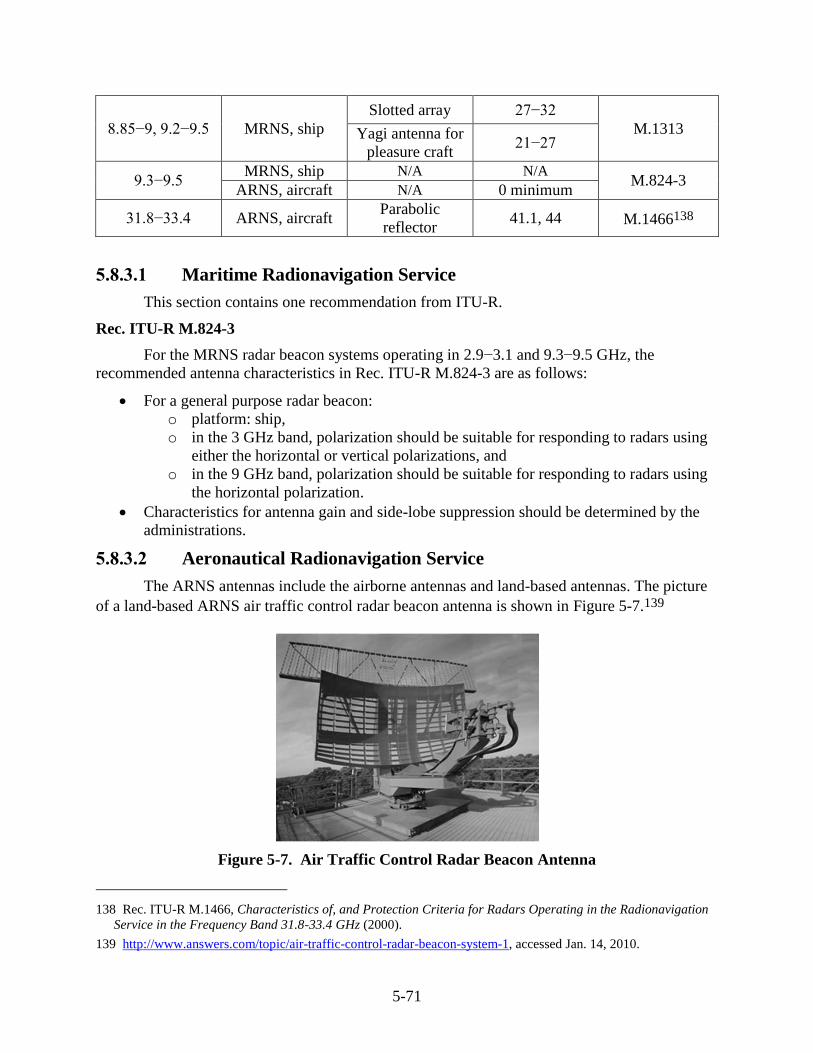
5-71
8.85−9, 9.2−9.5 MRNS, ship
Slotted array 27−32
M.1313 Yagi antenna for
pleasure craft 21−27
9.3−9.5 MRNS, ship N/A N/A
M.824-3 ARNS, aircraft N/A 0 minimum
31.8−33.4 ARNS, aircraft Parabolic
reflector 41.1, 44 M.1466138
5.8.3.1 Maritime Radionavigation Service
This section contains one recommendation from ITU-R.
Rec. ITU-R M.824-3
For the MRNS radar beacon systems operating in 2.9−3.1 and 9.3−9.5 GHz, the
recommended antenna characteristics in Rec. ITU-R M.824-3 are as follows:
For a general purpose radar beacon:
o platform: ship,
o in the 3 GHz band, polarization should be suitable for responding to radars using
either the horizontal or vertical polarizations, and
o in the 9 GHz band, polarization should be suitable for responding to radars using
the horizontal polarization.
Characteristics for antenna gain and side-lobe suppression should be determined by the
administrations.
5.8.3.2 Aeronautical Radionavigation Service
The ARNS antennas include the airborne antennas and land-based antennas. The picture
of a land-based ARNS air traffic control radar beacon antenna is shown in Figure 5-7.139
Figure 5-7. Air Traffic Control Radar Beacon Antenna
138 Rec. ITU-R M.1466, Characteristics of, and Protection Criteria for Radars Operating in the Radionavigation
Service in the Frequency Band 31.8-33.4 GHz (2000).
139 http://www.answers.com/topic/air-traffic-control-radar-beacon-system-1, accessed Jan. 14, 2010.
5-72
The standards from RTCA and the recommendations and representative characteristics
from ITU-R are discussed here.
(a) RTCA DO-195
For the airborne instrument landing system (ILS) localizer receiving equipment operating
in 108–112 MHz, the minimum antenna operational radiation performance standards in RTCA
DO-195 are as follows:140
Radiation pattern: The horizontal component of the radiated signal in the forward and
rearward directions shall not be down more than 10 dB when compared to the maximum
radiation from a standard horizontal dipole antenna resonant at 113 MHz and mounted 10
inches above the ground plane.
Gain variation: The difference between the maximum and minimum field strength of the
horizontal component in the azimuth plane shall not exceed 20 dB.
Polarization discrimination: The reception of vertically polarized signals from any
horizontal direction with respect to the antenna shall be at least 10 dB below the
reception of horizontally polarized signals from the same direction.
(b) RTCA DO-196
For the airborne VHF Omnidirectional Range receiving equipment operating in 108–
117.95 MHz, the minimum antenna operational radiation performance standards in RTCA DO-
196 are as follows:141
Radiation pattern: The horizontal component of the radiated signal in the forward and
rearward directions shall not be down more than 10 dB when compared to the maximum
radiation from a standard horizontal dipole antenna resonant at 113 MHz and mounted 10
inches above the ground plane.
Gain variation: The difference between the maximum and minimum field strength of the
horizontal component in the azimuth plane shall not exceed 20 dB.
Polarization discrimination: The reception of vertically polarized signals from any
horizontal direction with respect to the antenna shall be at least 10 dB below the
reception of horizontally polarized signals from the same direction.
(c) RTCA DO-253A
For the local area augmentation system of GPS operating in 108–117.975 MHz, the
minimum airborne antenna operational radiation performance standards in RTCA DO-253A are
as follows:142
Antenna type: omnidirectional antenna.
Horizontal gain:
140 RTCA DO-195, Minimum Operational Performance Standards for Airborne ILS Localizer Receiving
Equipment Operating within the Radio Frequency Range of 108- 112 Megahertz (1986).
141 RTCA DO-196, Minimum Operational Performance Standards for Airborne VOR Receiving Equipment
Operating within the Radio Frequency Range of 108- 117.95 Megahertz (1986).
142 RTCA DO-253A, Minimum Operational Performance Standards for GPS Local Area Augmentation System
Airborne Equipment, §2.2.10.2, Antenna Characteristics (November 28, 2001).
5-73
o The reception of the horizontally polarized component in the horizontal plane
from the forward and rearward directions shall not be down more than 10 dB
when compared to the maximum output response of a standard horizontal dipole
antenna which is mounted 25.4 cm (10 inches) above the ground plane and
resonant at 113 MHz.
o The difference between the maximum and minimum reception of the horizontally
polarized component from any direction in the horizontal plane shall not exceed
20 dB.
Vertical gain:
o When mounted on a 4×4 inch2 (or larger) ground plane, the reception of the
vertically polarized component in the horizontal azimuth plane shall not be down
more than 6 dB when compared to a standard vertically polarized monopole
antenna.
o When mounted on a 4×4 inch2 (or larger) ground plane, the difference between
the maximum and minimum reception of the vertical polarized component from
any direction in the horizontal azimuth plane shall not exceed 6 dB.
(d) RTCA DO-192
For the airborne ILS glide slope receiving equipment operating in 328.6–335.4 MHz, the
minimum antenna operational radiation performance standards in RTCA DO-192 are as
follows:143
Radiation pattern: The horizontal component of the radiated signal in the forward
direction shall not be down more than 15 dB when compared to the maximum radiation
from a standard horizontal dipole antenna resonant at 332 MHz in free space.
Polarization discrimination: The reception of vertically polarized signals from any
horizontal direction with respect to the antenna shall be at least 10 dB below the
reception of horizontally polarized signals from the same direction.
(e) RTCA DO-189
For the airborne Distance Measuring Equipment operating in 960–1215 MHz, the
minimum antenna operational radiation performance standards in RTCA DO-189 are as
follows:144
Polarization: predominately vertically polarized.
Field strength: The average field strength in the horizontal plane shall be equal to the
field strength of a matched resonant ¼λ vertical antenna.
Gain variation: The difference between the maximum and minimum field strengths in the
horizontal plane shall not exceed 6 dB when the antenna is mounted at the center of the
1.2-meter (4-foot) diameter (or larger) flat circular ground plane.
143 RTCA DO-192, Minimum Operational Performance Standards for Airborne ILS Glide Slope Receiving
Equipment Operating within the Radio Frequency Range of 328.6-335.4 Megahertz (1986).
144 RTCA DO-189, Minimum Operational Performance Standards for Airborne Distance Measuring Equipment
(DME) Operating within the Radio Frequency Range of 960-1215 MHz (1985).
5-74
(f) RTCA DO-181C
For the air traffic control radar beacon system and mode select airborne equipment
operating in 1.03–1.09 GHz, the minimum antenna operational radiation performance standards
in RTCA DO-181C are as follows:145
Polarization: vertically polarized.
Radiation pattern: The gain shall not be less than the gain of a matched ¼λ stub minus 3
dB over 90% of the coverage volume 0–360º in azimuth and 5–30º in elevation when
installed at the center of a 1.2-meter (4-foot) diameter (or larger) circular ground plane.
(g) RTCA DO-185
For the traffic alert and collision avoidance system II transmitting in the 1.03 GHz band
and receiving in 1.087–1.093 GHz, the minimum antenna operational radiation performance
standards in RTCA DO-185 are as follows:146
Polarization: vertically polarized.
Radiation pattern: The gain shall not be less than the gain of a matched ¼λ stub minus 1
dB over 90% of the coverage volume 0–360º in azimuth and (-15)–20º in elevation when
installed at the center of a 1.2-meter (4-foot) diameter (or larger) circular ground plane,
which can be flat or cylindrical.
(h) RTCA DO-197A
For the active traffic alert and collision avoidance system I transmitting in the 1.03 GHz
band and receiving in 1.087–1.093 GHz, the minimum antenna operational radiation
performance standards in RTCA DO-197A are as follows:147
Type: omnidirectional antenna or multiple beams to cover all azimuth directions.
Polarization: vertically polarized.
Radiation pattern: covering 360º in azimuth and at least (-10)–20º in elevation.
(i) RTCA DO-260A
For the Automatic Dependent Surveillance (ADS) system and Traffic Information
Service (TIS) system operating at 1.09 GHz, the minimum antenna operational radiation
performance standards in RTCA DO-260A are as follows:148
Type: omnidirectional antenna.
Polarization: vertically polarized.
145 RTCA DO-181C, Minimum Operational Performance Standards for Air Traffic Control Radar Beacon
System/Mode Select (ATCRBS/Mode S) Airborne Equipment (1983).
146 RTCA DO-185, Minimum Operational Performance Standards for Traffic Alert and Collision Avoidance
System II (TCAS II) Airborne Equipment (1990).
147 RTCA DO-197A, Minimum Operational Performance Standards for an Active Traffic Alert and Collision
Avoidance System I (Active TCAS I) (1994).
148 RTCA DO-260A, Minimum Operational Performance Standards for 1090 MHz Extended Squitter Automatic
Dependent Surveillance - Broadcast (ADS-B) and Traffic Information Services - Broadcast (TIS-B), §2.2.13,
Antenna System (April 10, 2003).
5-75
Transmit radiation pattern: The gain shall not be less than the gain of a matched ¼λ stub
minus 3 dB over 90% of a coverage volume from 0–360º in azimuth and 5–30º above the
ground plane when installed at the center of 1.2 meters (4 feet) or larger flat circular
ground plane.
Receive radiation pattern: The gain should not be less than the gain of a matched ¼λ stub
minus 1 dB over 90% of a coverage volume from 0–360º in azimuth and (-15)–(+20)º in
elevation when installed at the center of 1.2 meters (4 feet) or larger circular ground
plane, which can be either flat or cylindrical.
This standard is referred to in the FAA TSO-C166b for the extended squitter ADS-
broadcast and TIS-broadcast equipment operating on 1090 MHz, and TSO-C166b is referred to
in 14 CFR §91.227 for the ADS-broadcast out equipment performance requirements.149 150
(j) Rec. ITU-R M.1464-1
The antenna characteristics of the representative ARNS radar systems in Rec. ITU-R
M.1464-1, for the airport air traffic control systems operating in 2.7−2.9 GHz, are as follows:
Platform: land station fixed and transportable.
Type: parabolic reflector.
Radiation pattern: Csc2.
Gmax: 32.8−34.3 dBi.
bw: 4−5 elevation, 1.3−1.6 azimuth.
First sidelobe level: 7.3−9.5 dBi.
Polarization: linear and circular.
(k) Rec. ITU-R M.1638
The antenna characteristics of the representative ARNS airborne radar systems operating
in 5.25−5.85 GHz, for weather avoidance, wind shear detection, and safety services, are provided
in Rec. ITU-R M.1638; they are as follows:
Type: slotted array.
Radiation pattern: pencil beam.
Gmax: 34 dBi.
bw: 3.5.
Sidelobe suppression: 31 dB.
Polarization: linear.
149 FAA TSO-C166b, Extended Squitter Automatic Dependent Surveillance - Broadcast (ADS-B) and Traffic
Information Service - Broadcast (TIS-B) Equipment Operating on the Radio Frequency of 1090 Megahertz
(MHz) (December 2, 2009),
http://www.airweb.faa.gov/Regulatory_and_Guidance_Library/rgtso.nsf/0/e70544d62a001f87862576820057970
f/$FILE/TSO-166b.pdf.
150 http://ecfr.gpoaccess.gov/cgi/t/text/text-
idx?c=ecfr&sid=d6c9ee5df86ab4132bba03a78525d969&rgn=div8&view=text&node=14:2.0.1.3.10.3.7.14&idno
=14.
5-76
(l) Rec. ITU-R M.824-3
For the ARNS land-based general purpose radar beacon systems operating in 9.3−9.5
GHz, the recommended antenna characteristics in Rec. ITU-R M.824-3 are as follows:
Gmax: 0 dB minimum (it is not specified whether it is dBi or dBd).
bw: 360 azimuthal, 30 elevation.
Polarization: horizontal.
(m) Rec. ITU-R M.1466
The antenna characteristics of the representative ARNS airborne radar systems operating
in 31.8−33.4 GHz are provided in Rec. ITU-R M.1466; they are as follows:
Type: parabolic reflector.
Gmax: 41.1 and 44, dBi.
The radars are used for ground mapping, weather avoidance, and calibration of airborne on-
board navigation systems for accurate aerial delivery in adverse weather conditions.
5.9 Radiodetermination-Satellite Service
RDSS includes the radiolocation-satellite service (RLSS) and radionavigation-satellite
service (RNSS). Satellite and earth station antenna characteristics for these services are presented
here.
5.9.1 Radiolocation-Satellite Service
The Cospas-Sarsat International Satellite System, of which the U.S. is one of the
founders, is the only operational RLSS system providing land, maritime and aeronautical search
and rescue (SAR) services.151 The Cospas-Sarsat system consists of GSO satellites (currently
five satellites) and a LEO satellite constellation (currently four satellites). The land vehicles and
persons, maritime ships and aeronautical crafts use beacons to transmit distress signals, which
can be received by the satellites and relayed to the Cospas-Sarsat earth stations.
NTIA does not provide the RLSS antenna radiation performance standards for the federal
systems. Otherwise, this sub-section contains satellite and earth station antenna characteristics
from Cospas-Sarsat system technical documents, and one recommended satellite antenna gain
pattern from ITU-R.
(a) C/S T.011
A Cospas-Sarsat GSO satellite has a receiving antenna operating at 406.05 MHz and a
transmitting antenna operating at 1544.5 MHz, performing the SAR repeater (SARR) function
and the SAR processor (SARP) operation. Characteristics of the GSO satellite antennas are in the
Cospas-Sarsat International Satellite System technical document C/S T.011.152 In general, the
satellite transmitting and receiving antennas have global beam coverage, and the polarizations
151 http://www.cospas-sarsat.org.
152 C/S T.011, Description of the 406 MHz Payloads Used in the Cospas-Sarsat GEOSAR System, Issue 1,
Revision 6, (October 2010), http://www.cospas-
sarsat.org/images/stories/SystemDocs/Current/t11oct28.10_completedoc.pdf.
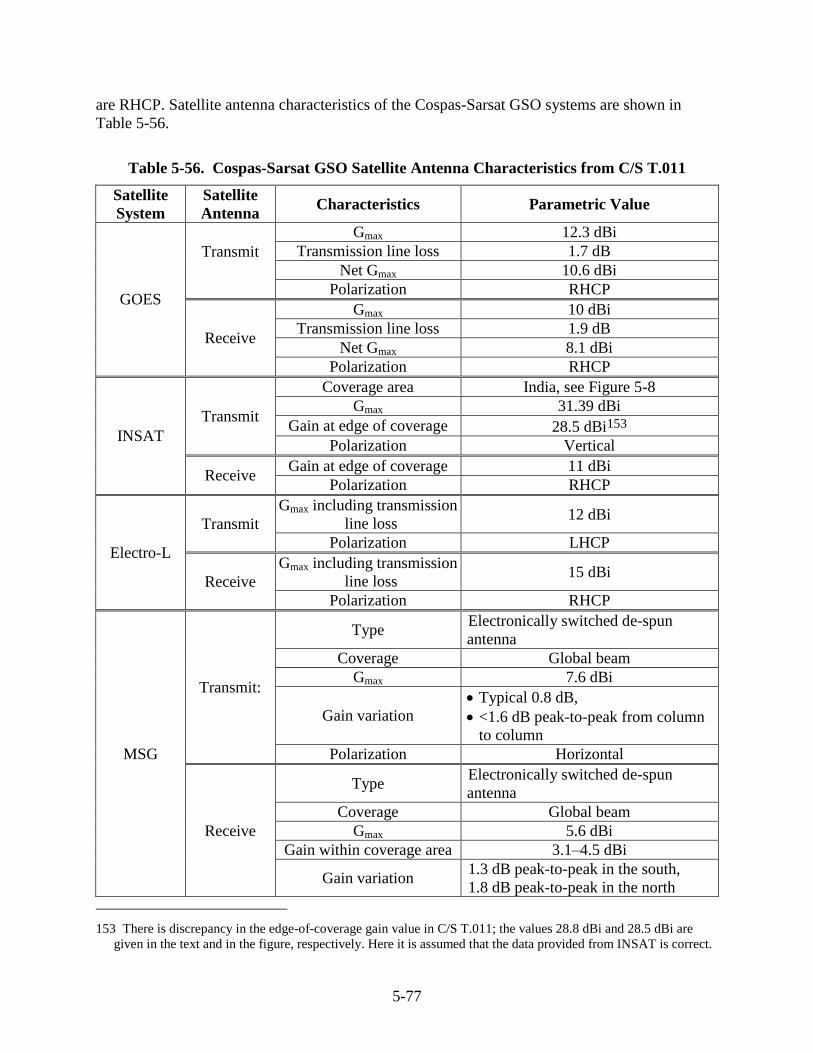
5-77
are RHCP. Satellite antenna characteristics of the Cospas-Sarsat GSO systems are shown in
Table 5-56.
Table 5-56. Cospas-Sarsat GSO Satellite Antenna Characteristics from C/S T.011
Satellite
System
Satellite
Antenna Characteristics Parametric Value
GOES
Transmit
Gmax 12.3 dBi
Transmission line loss 1.7 dB
Net Gmax 10.6 dBi
Polarization RHCP
Receive
Gmax 10 dBi
Transmission line loss 1.9 dB
Net Gmax 8.1 dBi
Polarization RHCP
INSAT
Transmit
Coverage area India, see Figure 5-8
Gmax 31.39 dBi
Gain at edge of coverage 28.5 dBi153
Polarization Vertical
Receive Gain at edge of coverage 11 dBi
Polarization RHCP
Electro-L
Transmit
Gmax including transmission
line loss 12 dBi
Polarization LHCP
Receive
Gmax including transmission
line loss 15 dBi
Polarization RHCP
MSG
Transmit:
Type Electronically switched de-spun
antenna
Coverage Global beam
Gmax 7.6 dBi
Gain variation
Typical 0.8 dB,
<1.6 dB peak-to-peak from column
to column
Polarization Horizontal
Receive
Type Electronically switched de-spun
antenna
Coverage Global beam
Gmax 5.6 dBi
Gain within coverage area 3.1–4.5 dBi
Gain variation 1.3 dB peak-to-peak in the south,
1.8 dB peak-to-peak in the north
153 There is discrepancy in the edge-of-coverage gain value in C/S T.011; the values 28.8 dBi and 28.5 dBi are
given in the text and in the figure, respectively. Here it is assumed that the data provided from INSAT is correct.
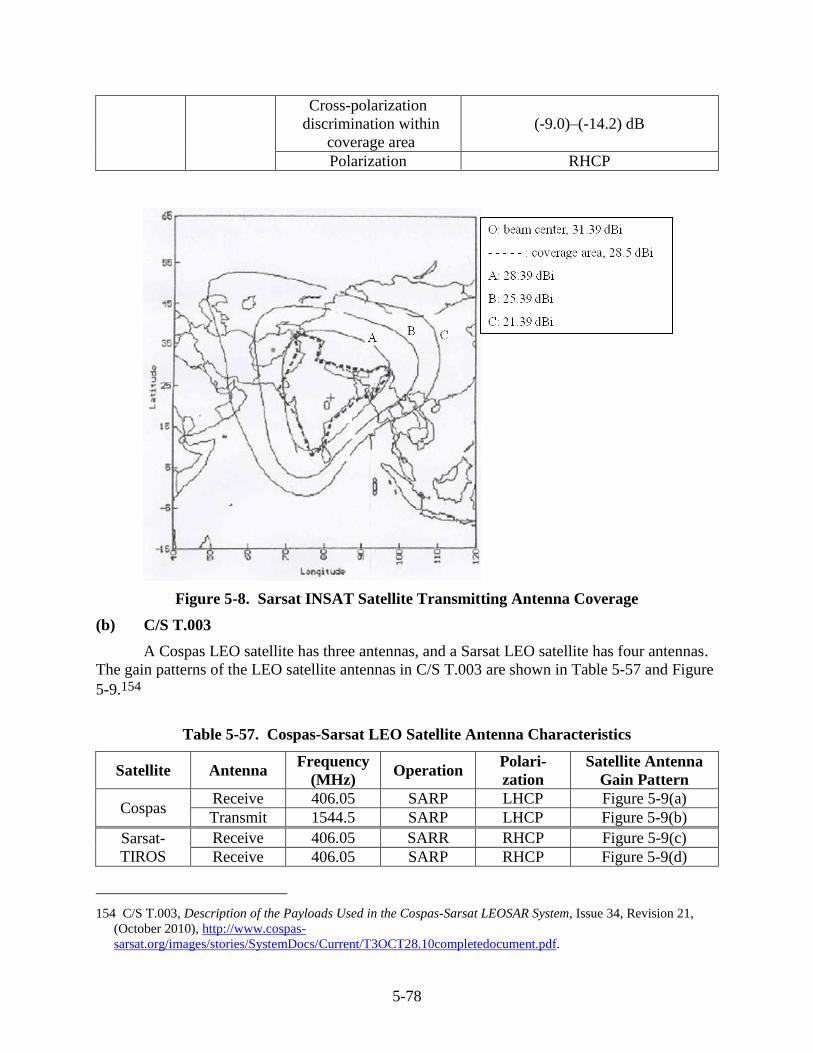
5-78
Cross-polarization
discrimination within
coverage area
(-9.0)–(-14.2) dB
Polarization RHCP
Figure 5-8. Sarsat INSAT Satellite Transmitting Antenna Coverage
(b) C/S T.003
A Cospas LEO satellite has three antennas, and a Sarsat LEO satellite has four antennas.
The gain patterns of the LEO satellite antennas in C/S T.003 are shown in Table 5-57 and Figure
5-9.154
Table 5-57. Cospas-Sarsat LEO Satellite Antenna Characteristics
Satellite Antenna Frequency
(MHz) Operation
Polari-
zation
Satellite Antenna
Gain Pattern
Cospas Receive 406.05 SARP LHCP Figure 5-9(a)
Transmit 1544.5 SARP LHCP Figure 5-9(b)
Sarsat-
TIROS
Receive 406.05 SARR RHCP Figure 5-9(c)
Receive 406.05 SARP RHCP Figure 5-9(d)
154 C/S T.003, Description of the Payloads Used in the Cospas-Sarsat LEOSAR System, Issue 34, Revision 21,
(October 2010), http://www.cospas-
sarsat.org/images/stories/SystemDocs/Current/T3OCT28.10completedocument.pdf.
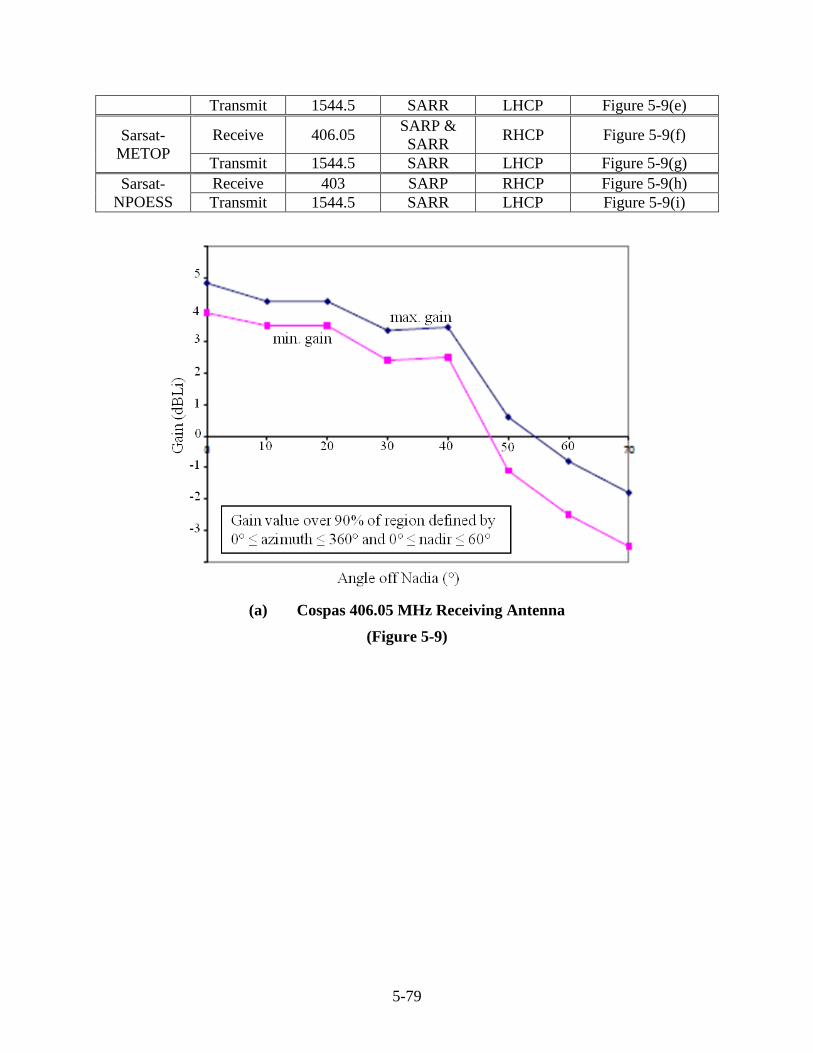
5-79
Transmit 1544.5 SARR LHCP Figure 5-9(e)
Sarsat-
METOP
Receive 406.05 SARP &
SARR RHCP Figure 5-9(f)
Transmit 1544.5 SARR LHCP Figure 5-9(g)
Sarsat-
NPOESS
Receive 403 SARP RHCP Figure 5-9(h)
Transmit 1544.5 SARR LHCP Figure 5-9(i)
(a) Cospas 406.05 MHz Receiving Antenna
(Figure 5-9)
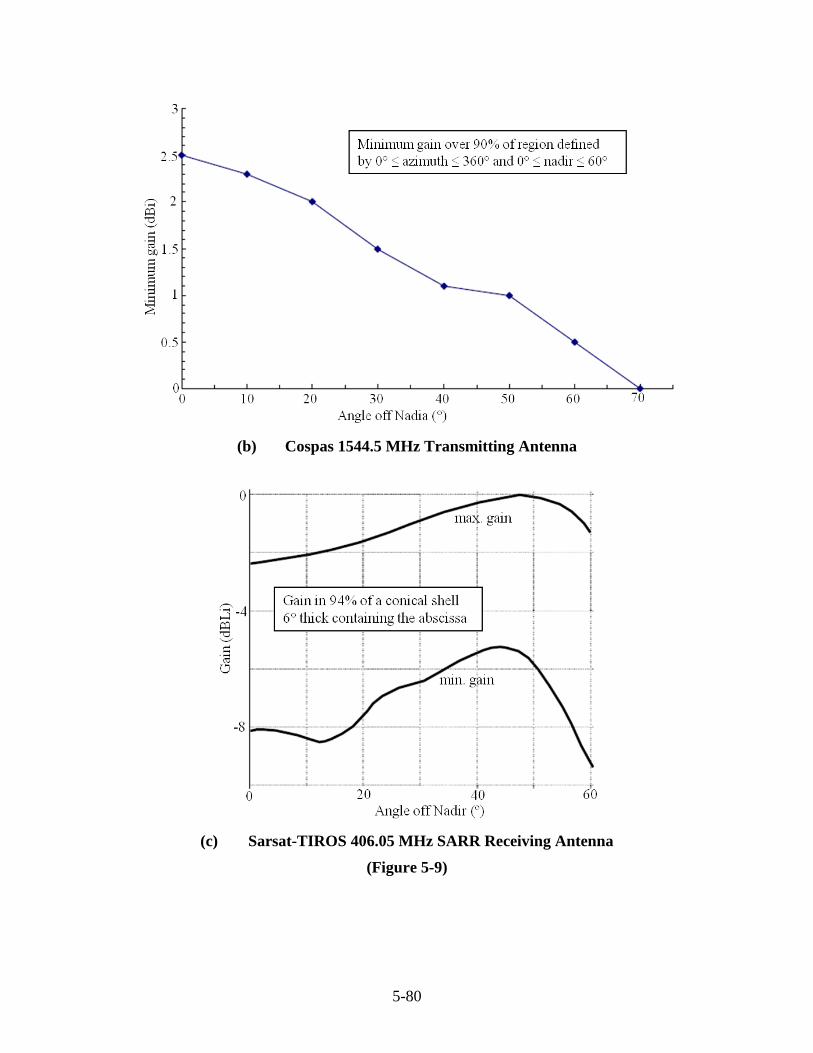
5-80
(b) Cospas 1544.5 MHz Transmitting Antenna
(c) Sarsat-TIROS 406.05 MHz SARR Receiving Antenna
(Figure 5-9)
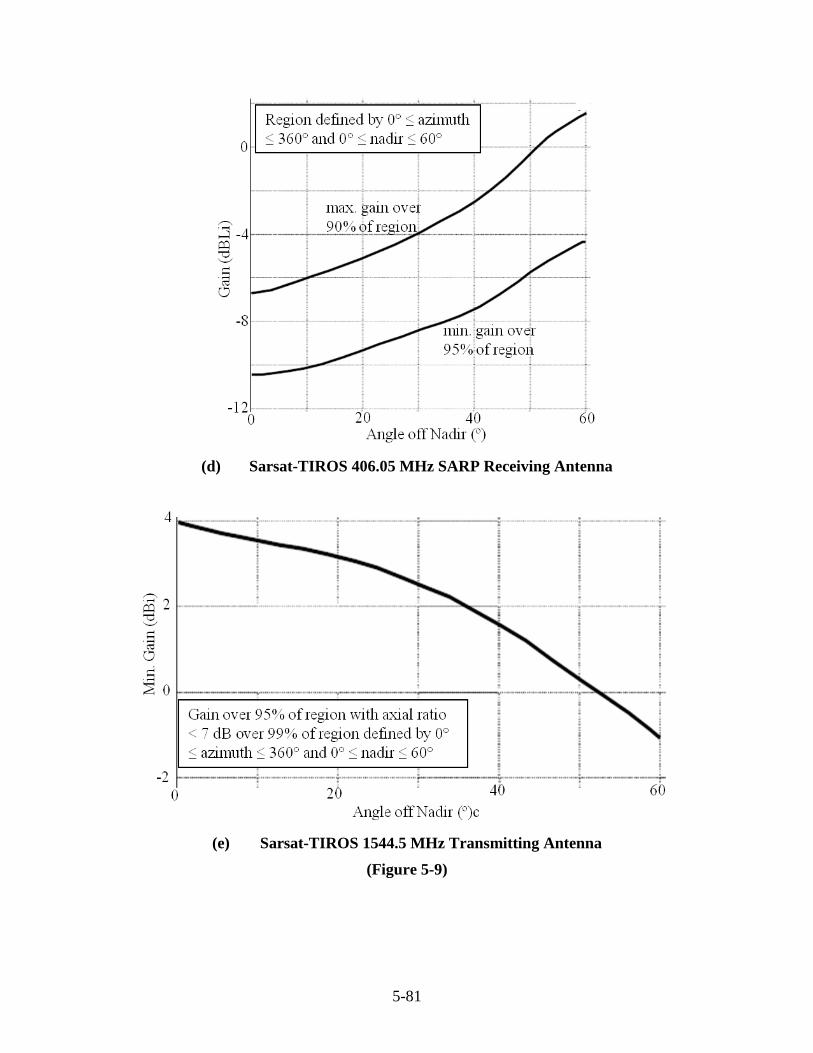
5-81
(d) Sarsat-TIROS 406.05 MHz SARP Receiving Antenna
(e) Sarsat-TIROS 1544.5 MHz Transmitting Antenna
(Figure 5-9)
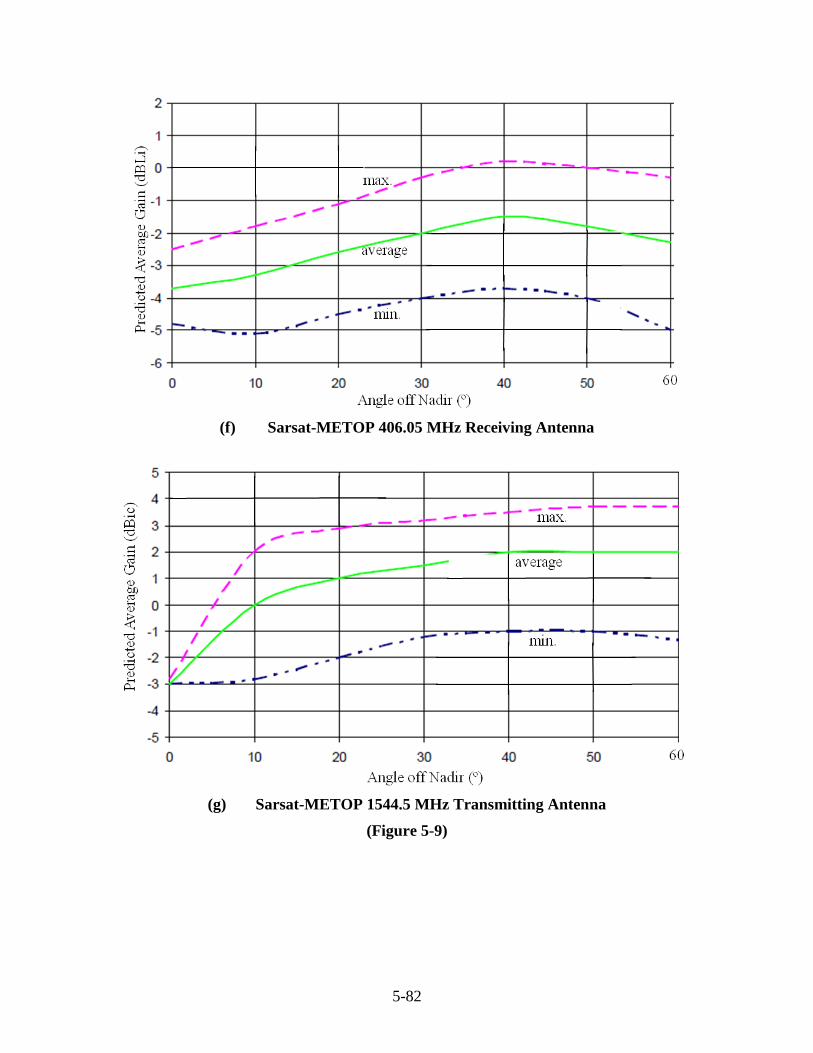
5-82
(f) Sarsat-METOP 406.05 MHz Receiving Antenna
(g) Sarsat-METOP 1544.5 MHz Transmitting Antenna
(Figure 5-9)
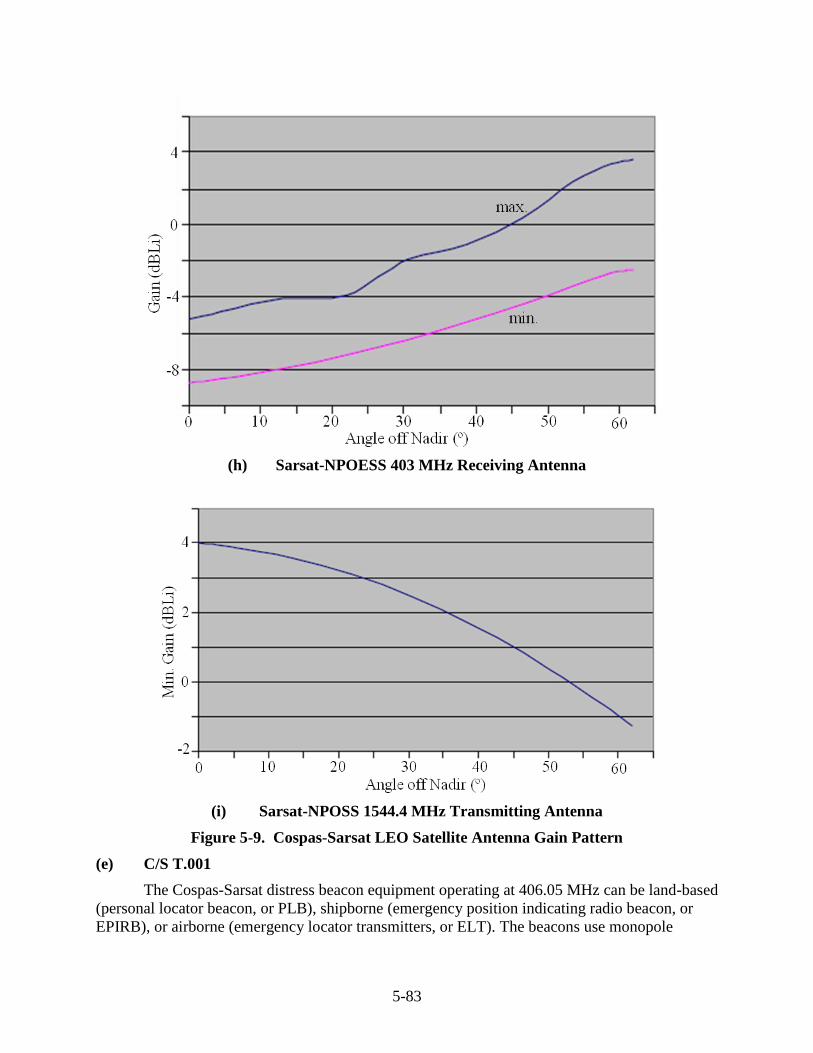
5-83
(h) Sarsat-NPOESS 403 MHz Receiving Antenna
(i) Sarsat-NPOSS 1544.4 MHz Transmitting Antenna
Figure 5-9. Cospas-Sarsat LEO Satellite Antenna Gain Pattern
(e) C/S T.001
The Cospas-Sarsat distress beacon equipment operating at 406.05 MHz can be land-based
(personal locator beacon, or PLB), shipborne (emergency position indicating radio beacon, or
EPIRB), or airborne (emergency locator transmitters, or ELT). The beacons use monopole
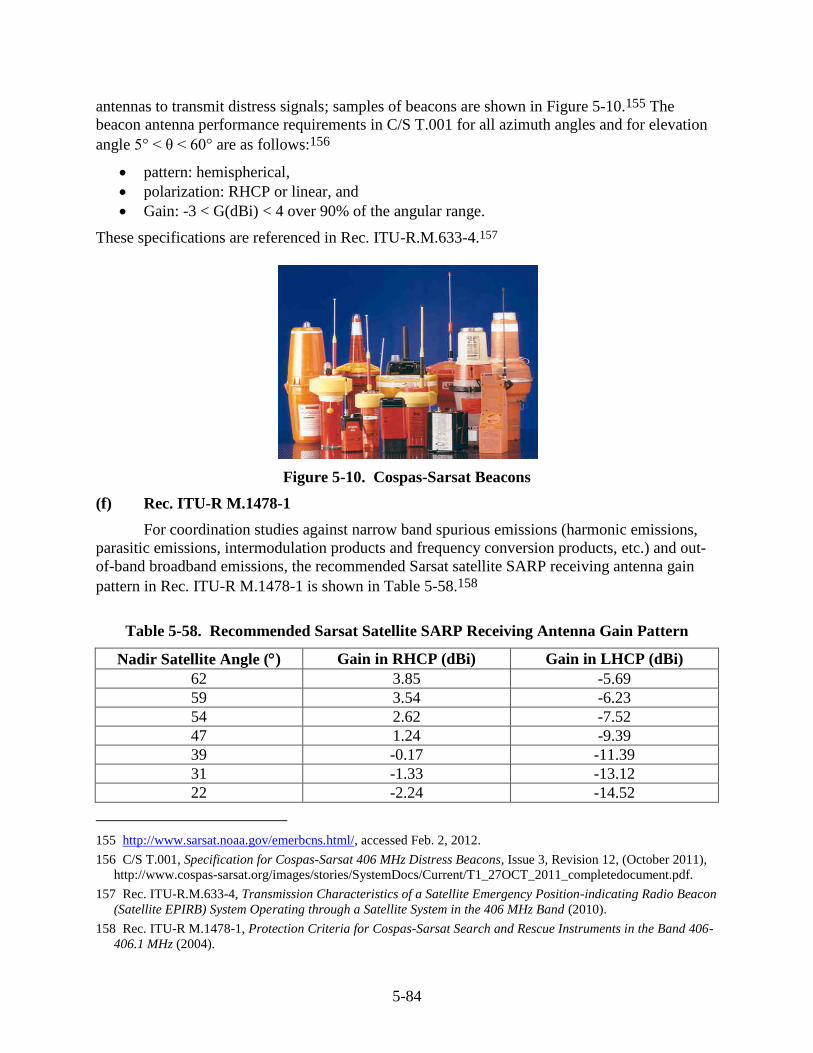
5-84
antennas to transmit distress signals; samples of beacons are shown in Figure 5-10.155 The
beacon antenna performance requirements in C/S T.001 for all azimuth angles and for elevation
angle 5° < θ < 60° are as follows:156
pattern: hemispherical,
polarization: RHCP or linear, and
Gain: -3 < G(dBi) < 4 over 90% of the angular range.
These specifications are referenced in Rec. ITU-R.M.633-4.157
Figure 5-10. Cospas-Sarsat Beacons
(f) Rec. ITU-R M.1478-1
For coordination studies against narrow band spurious emissions (harmonic emissions,
parasitic emissions, intermodulation products and frequency conversion products, etc.) and out-
of-band broadband emissions, the recommended Sarsat satellite SARP receiving antenna gain
pattern in Rec. ITU-R M.1478-1 is shown in Table 5-58.158
Table 5-58. Recommended Sarsat Satellite SARP Receiving Antenna Gain Pattern
Nadir Satellite Angle () Gain in RHCP (dBi) Gain in LHCP (dBi)
62 3.85 -5.69
59 3.54 -6.23
54 2.62 -7.52
47 1.24 -9.39
39 -0.17 -11.39
31 -1.33 -13.12
22 -2.24 -14.52
155 http://www.sarsat.noaa.gov/emerbcns.html/, accessed Feb. 2, 2012.
156 C/S T.001, Specification for Cospas-Sarsat 406 MHz Distress Beacons, Issue 3, Revision 12, (October 2011),
http://www.cospas-sarsat.org/images/stories/SystemDocs/Current/T1_27OCT_2011_completedocument.pdf.
157 Rec. ITU-R.M.633-4, Transmission Characteristics of a Satellite Emergency Position-indicating Radio Beacon
(Satellite EPIRB) System Operating through a Satellite System in the 406 MHz Band (2010).
158 Rec. ITU-R M.1478-1, Protection Criteria for Cospas-Sarsat Search and Rescue Instruments in the Band 406-
406.1 MHz (2004).
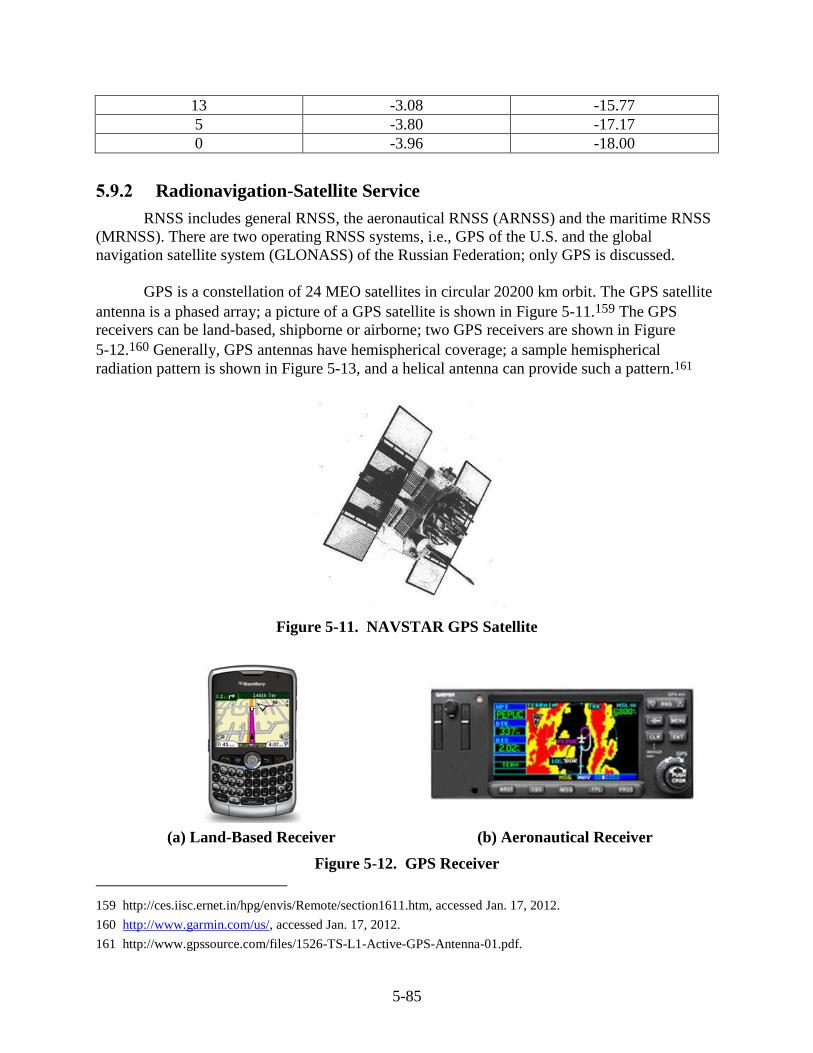
5-85
13 -3.08 -15.77
5 -3.80 -17.17
0 -3.96 -18.00
5.9.2 Radionavigation-Satellite Service
RNSS includes general RNSS, the aeronautical RNSS (ARNSS) and the maritime RNSS
(MRNSS). There are two operating RNSS systems, i.e., GPS of the U.S. and the global
navigation satellite system (GLONASS) of the Russian Federation; only GPS is discussed.
GPS is a constellation of 24 MEO satellites in circular 20200 km orbit. The GPS satellite
antenna is a phased array; a picture of a GPS satellite is shown in Figure 5-11.159 The GPS
receivers can be land-based, shipborne or airborne; two GPS receivers are shown in Figure
5-12.160 Generally, GPS antennas have hemispherical coverage; a sample hemispherical
radiation pattern is shown in Figure 5-13, and a helical antenna can provide such a pattern.161
Figure 5-11. NAVSTAR GPS Satellite
(a) Land-Based Receiver (b) Aeronautical Receiver
Figure 5-12. GPS Receiver
159 http://ces.iisc.ernet.in/hpg/envis/Remote/section1611.htm, accessed Jan. 17, 2012.
160 http://www.garmin.com/us/, accessed Jan. 17, 2012.
161 http://www.gpssource.com/files/1526-TS-L1-Active-GPS-Antenna-01.pdf.
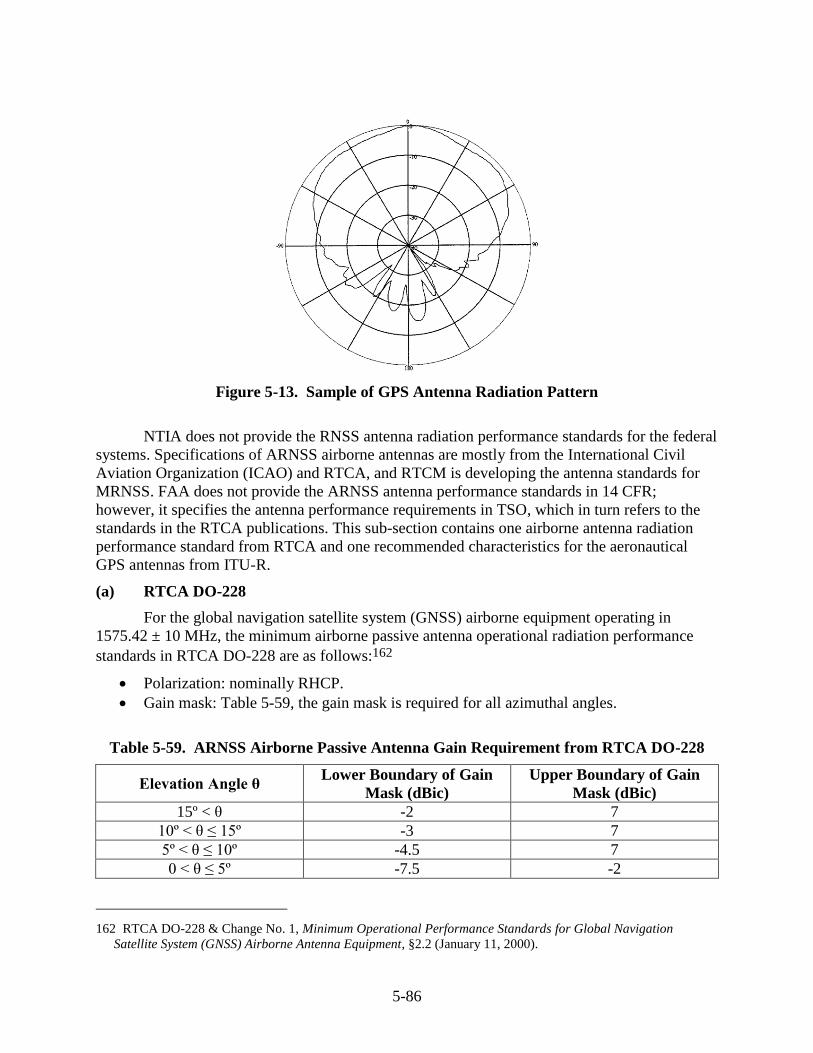
5-86
Figure 5-13. Sample of GPS Antenna Radiation Pattern
NTIA does not provide the RNSS antenna radiation performance standards for the federal
systems. Specifications of ARNSS airborne antennas are mostly from the International Civil
Aviation Organization (ICAO) and RTCA, and RTCM is developing the antenna standards for
MRNSS. FAA does not provide the ARNSS antenna performance standards in 14 CFR;
however, it specifies the antenna performance requirements in TSO, which in turn refers to the
standards in the RTCA publications. This sub-section contains one airborne antenna radiation
performance standard from RTCA and one recommended characteristics for the aeronautical
GPS antennas from ITU-R.
(a) RTCA DO-228
For the global navigation satellite system (GNSS) airborne equipment operating in
1575.42 ± 10 MHz, the minimum airborne passive antenna operational radiation performance
standards in RTCA DO-228 are as follows:162
Polarization: nominally RHCP.
Gain mask: Table 5-59, the gain mask is required for all azimuthal angles.
Table 5-59. ARNSS Airborne Passive Antenna Gain Requirement from RTCA DO-228
Elevation Angle θ Lower Boundary of Gain
Mask (dBic)
Upper Boundary of Gain
Mask (dBic)
15º < θ -2 7
10º < θ ≤ 15º -3 7
5º < θ ≤ 10º -4.5 7
0 < θ ≤ 5º -7.5 -2
162 RTCA DO-228 & Change No. 1, Minimum Operational Performance Standards for Global Navigation
Satellite System (GNSS) Airborne Antenna Equipment, §2.2 (January 11, 2000).
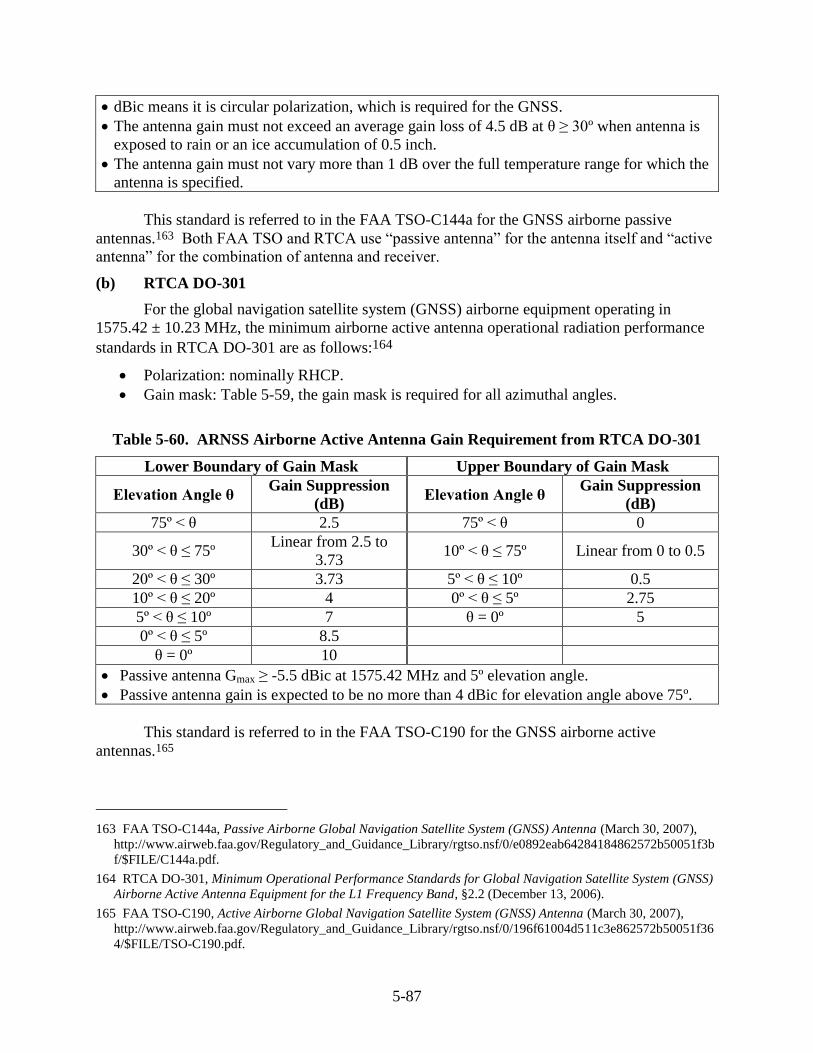
5-87
dBic means it is circular polarization, which is required for the GNSS.
The antenna gain must not exceed an average gain loss of 4.5 dB at θ ≥ 30º when antenna is
exposed to rain or an ice accumulation of 0.5 inch.
The antenna gain must not vary more than 1 dB over the full temperature range for which the
antenna is specified.
This standard is referred to in the FAA TSO-C144a for the GNSS airborne passive
antennas.163 Both FAA TSO and RTCA use “passive antenna” for the antenna itself and “active
antenna” for the combination of antenna and receiver.
(b) RTCA DO-301
For the global navigation satellite system (GNSS) airborne equipment operating in
1575.42 ± 10.23 MHz, the minimum airborne active antenna operational radiation performance
standards in RTCA DO-301 are as follows:164
Polarization: nominally RHCP.
Gain mask: Table 5-59, the gain mask is required for all azimuthal angles.
Table 5-60. ARNSS Airborne Active Antenna Gain Requirement from RTCA DO-301
Lower Boundary of Gain Mask Upper Boundary of Gain Mask
Elevation Angle θ Gain Suppression
(dB) Elevation Angle θ
Gain Suppression
(dB)
75º < θ 2.5 75º < θ 0
30º < θ ≤ 75º Linear from 2.5 to
3.73 10º < θ ≤ 75º Linear from 0 to 0.5
20º < θ ≤ 30º 3.73 5º < θ ≤ 10º 0.5
10º < θ ≤ 20º 4 0º < θ ≤ 5º 2.75
5º < θ ≤ 10º 7 θ = 0º 5
0º < θ ≤ 5º 8.5
θ = 0º 10
Passive antenna Gmax ≥ -5.5 dBic at 1575.42 MHz and 5º elevation angle.
Passive antenna gain is expected to be no more than 4 dBic for elevation angle above 75º.
This standard is referred to in the FAA TSO-C190 for the GNSS airborne active
antennas.165
163 FAA TSO-C144a, Passive Airborne Global Navigation Satellite System (GNSS) Antenna (March 30, 2007),
http://www.airweb.faa.gov/Regulatory_and_Guidance_Library/rgtso.nsf/0/e0892eab64284184862572b50051f3b
f/$FILE/C144a.pdf.
164 RTCA DO-301, Minimum Operational Performance Standards for Global Navigation Satellite System (GNSS)
Airborne Active Antenna Equipment for the L1 Frequency Band, §2.2 (December 13, 2006).
165 FAA TSO-C190, Active Airborne Global Navigation Satellite System (GNSS) Antenna (March 30, 2007),
http://www.airweb.faa.gov/Regulatory_and_Guidance_Library/rgtso.nsf/0/196f61004d511c3e862572b50051f36
4/$FILE/TSO-C190.pdf.
5-88
(c) Rec. ITU-R M.1477
For coordination studies and interference analysis in 1559−1610 MHz, the recommended
antenna characteristics of three types of aeronautical GPS receivers in Rec. ITU-R M.1477 are as
follows:166
Type 1, the airborne receiver meeting the requirements of the satellite-based
augmentation system and providing category I precision approach operation: 167
o maximum antenna gain in upper hemisphere: 7 dBic,
o minimum antenna gain towards satellite at 5 elevation: -4.5 dBic, and
o assumed antenna gain in lower hemisphere: -10 dBic.
Type 2, the airborne receiver meeting the requirements of the land-based augmentation
system and providing category II/III precision approach operation:
o maximum antenna gain in upper hemisphere: 7 dBic,
o minimum antenna gain towards satellite at 5 elevation: -4.5 dBic, and
o minimum antenna gain towards pseudolite: -21 dBic.168
Type 3, the land-based receivers used in the satellite-based augmentation system to
determine the ionospheric delay:
o maximum antenna gain: 7 dBic, and
o minimum antenna gain towards satellite at 5 elevation: -4.5 dBic.
Land and ship station navigation receivers are similar to the type 1 receiver. Commercial land
network receivers operating with a single frequency are similar to the type 1 receiver, and those
operating with two frequencies are similar to the type 3 receiver.
5.10 Radio Astronomy Service
RAS uses telescopes or large paraboloidal antennas (D/> 100) for its observation
operations.
NTIA does not provide the RAS antenna radiation performance standards for the federal
systems. Otherwise, this sub-section contains the following RAS antenna characteristics from
ITU-R:
from Rec. ITU-R RA.1631, recommended antenna reference radiation pattern for EMC
analyses between NGSO space systems and RAS antennas sharing frequencies above 150
MHz;169
166 Rec. ITU-R M.1477, Technical and Performance Characteristics of Current and Planned Radionavigation-
Satellite Service (Space-to-Earth) and Aeronautical Radionavigation Service Receivers to be Considered in
Interference Studies in the Band 1559-1610 MHz (2000).
167 Satellite-based augmentation system uses additional messages from the GPS satellites to augment GPS
receivers’ performance. Ground-based augmentation system uses additional messages from a terrestrial network
to augment GPS receivers’ performance.
168 Pseudolite, or pseudo-satellite, refers to a radio terminal which is not a satellite but provides radio services
similar to satellites. In GPS, pseudolites are ground-based terminals functioning as local GPS alternatives.
169 Rec. ITU-R RA.1631, Reference Radio Astronomy Antenna Pattern to be Used for Compatibility Analyses
between Non-GSO Systems And Radio Astronomy Service Stations Based on the epfd Concept (2003).
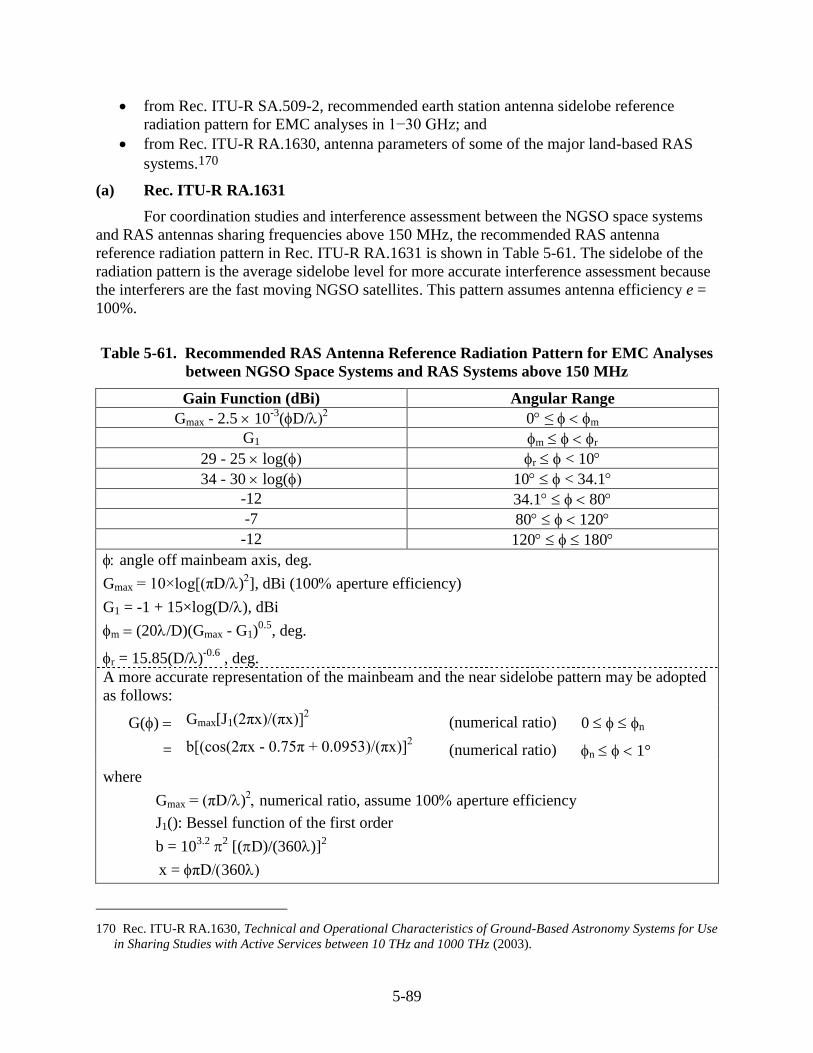
5-89
from Rec. ITU-R SA.509-2, recommended earth station antenna sidelobe reference
radiation pattern for EMC analyses in 1−30 GHz; and
from Rec. ITU-R RA.1630, antenna parameters of some of the major land-based RAS
systems.170
(a) Rec. ITU-R RA.1631
For coordination studies and interference assessment between the NGSO space systems
and RAS antennas sharing frequencies above 150 MHz, the recommended RAS antenna
reference radiation pattern in Rec. ITU-R RA.1631 is shown in Table 5-61. The sidelobe of the
radiation pattern is the average sidelobe level for more accurate interference assessment because
the interferers are the fast moving NGSO satellites. This pattern assumes antenna efficiency e =
100%.
Table 5-61. Recommended RAS Antenna Reference Radiation Pattern for EMC Analyses
between NGSO Space Systems and RAS Systems above 150 MHz
Gain Function (dBi) Angular Range
Gmax - 2.5 10-3
(D/ 0 ≤ m
G1 m r
29 - 25 log( r < 10
34 - 30 log( 10 < 34.1
-12 34.1 80
-7 80 120
-12 120 180
angle off mainbeam axis, deg.
Gmax = 10×log[(πD/)], dBi (100 aperture efficiency)
G1 = -1 + 15×log(D/), dBi
m (20/D)(Gmax - G1)0.5
, deg.
r = 15.85(D/)-0.6
, deg.
A more accurate representation of the mainbeam and the near sidelobe pattern may be adopted
as follows:
G() Gmax[J1(2πx)/(πx)] (numerical ratio) 0 n
= b[(cos(2πx - 0.75π + 0.0953)/(πx)] (numerical ratio) n 1°
where
Gmax = (πD/)numerical ratio, assume 100 aperture efficiency
J1(): Bessel function of the first order
b = 103.2
2 [(D)/(360)]
2
x = πD360
170 Rec. ITU-R RA.1630, Technical and Operational Characteristics of Ground-Based Astronomy Systems for Use
in Sharing Studies with Active Services between 10 THz and 1000 THz (2003).
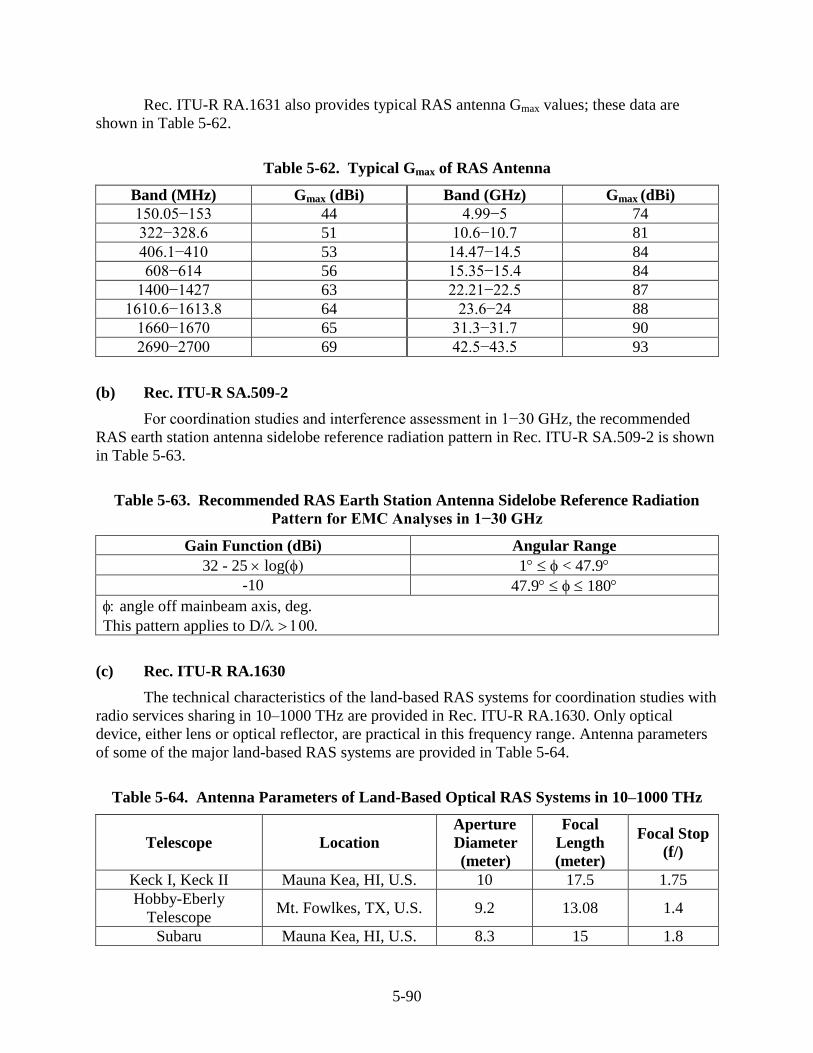
5-90
Rec. ITU-R RA.1631 also provides typical RAS antenna Gmax values; these data are
shown in Table 5-62.
Table 5-62. Typical Gmax of RAS Antenna
Band (MHz) Gmax (dBi) Band (GHz) Gmax (dBi)
150.05−153 44 4.99−5 74
322−328.6 51 10.6−10.7 81
406.1−410 53 14.47−14.5 84
608−614 56 15.35−15.4 84
1400−1427 63 22.21−22.5 87
1610.6−1613.8 64 23.6−24 88
1660−1670 65 31.3−31.7 90
2690−2700 69 42.5−43.5 93
(b) Rec. ITU-R SA.509-2
For coordination studies and interference assessment in 1−30 GHz, the recommended
RAS earth station antenna sidelobe reference radiation pattern in Rec. ITU-R SA.509-2 is shown
in Table 5-63.
Table 5-63. Recommended RAS Earth Station Antenna Sidelobe Reference Radiation
Pattern for EMC Analyses in 1−30 GHz
Gain Function (dBi) Angular Range
32 - 25 log( 1 < 47.9
-10 47.9 180
angle off mainbeam axis, deg.
This pattern applies to D/
(c) Rec. ITU-R RA.1630
The technical characteristics of the land-based RAS systems for coordination studies with
radio services sharing in 10–1000 THz are provided in Rec. ITU-R RA.1630. Only optical
device, either lens or optical reflector, are practical in this frequency range. Antenna parameters
of some of the major land-based RAS systems are provided in Table 5-64.
Table 5-64. Antenna Parameters of Land-Based Optical RAS Systems in 10–1000 THz
Telescope Location
Aperture
Diameter
(meter)
Focal
Length
(meter)
Focal Stop
(f/)
Keck I, Keck II Mauna Kea, HI, U.S. 10 17.5 1.75
Hobby-Eberly
Telescope Mt. Fowlkes, TX, U.S. 9.2 13.08 1.4
Subaru Mauna Kea, HI, U.S. 8.3 15 1.8
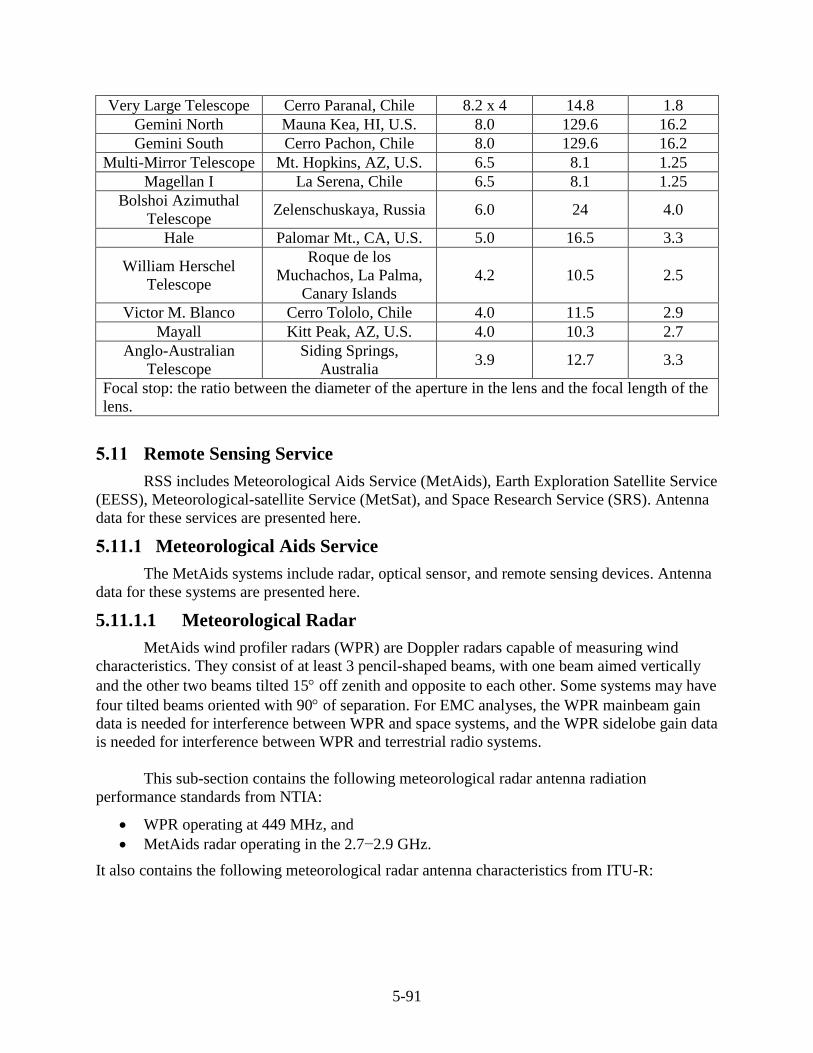
5-91
Very Large Telescope Cerro Paranal, Chile 8.2 x 4 14.8 1.8
Gemini North Mauna Kea, HI, U.S. 8.0 129.6 16.2
Gemini South Cerro Pachon, Chile 8.0 129.6 16.2
Multi-Mirror Telescope Mt. Hopkins, AZ, U.S. 6.5 8.1 1.25
Magellan I La Serena, Chile 6.5 8.1 1.25
Bolshoi Azimuthal
Telescope Zelenschuskaya, Russia 6.0 24 4.0
Hale Palomar Mt., CA, U.S. 5.0 16.5 3.3
William Herschel
Telescope
Roque de los
Muchachos, La Palma,
Canary Islands
4.2 10.5 2.5
Victor M. Blanco Cerro Tololo, Chile 4.0 11.5 2.9
Mayall Kitt Peak, AZ, U.S. 4.0 10.3 2.7
Anglo-Australian
Telescope
Siding Springs,
Australia 3.9 12.7 3.3
Focal stop: the ratio between the diameter of the aperture in the lens and the focal length of the
lens.
5.11 Remote Sensing Service
RSS includes Meteorological Aids Service (MetAids), Earth Exploration Satellite Service
(EESS), Meteorological-satellite Service (MetSat), and Space Research Service (SRS). Antenna
data for these services are presented here.
5.11.1 Meteorological Aids Service
The MetAids systems include radar, optical sensor, and remote sensing devices. Antenna
data for these systems are presented here.
5.11.1.1 Meteorological Radar
MetAids wind profiler radars (WPR) are Doppler radars capable of measuring wind
characteristics. They consist of at least 3 pencil-shaped beams, with one beam aimed vertically
and the other two beams tilted 15 off zenith and opposite to each other. Some systems may have
four tilted beams oriented with 90 of separation. For EMC analyses, the WPR mainbeam gain
data is needed for interference between WPR and space systems, and the WPR sidelobe gain data
is needed for interference between WPR and terrestrial radio systems.
This sub-section contains the following meteorological radar antenna radiation
performance standards from NTIA:
WPR operating at 449 MHz, and
MetAids radar operating in the 2.7−2.9 GHz.
It also contains the following meteorological radar antenna characteristics from ITU-R:
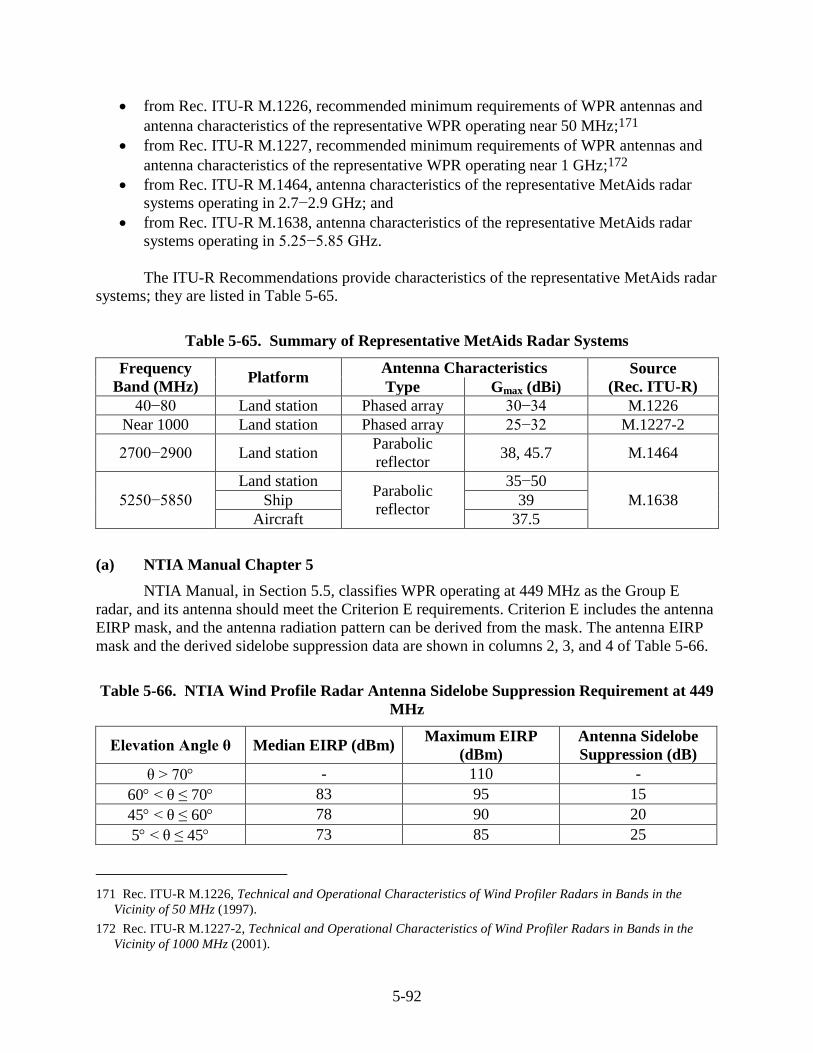
5-92
from Rec. ITU-R M.1226, recommended minimum requirements of WPR antennas and
antenna characteristics of the representative WPR operating near 50 MHz;171
from Rec. ITU-R M.1227, recommended minimum requirements of WPR antennas and
antenna characteristics of the representative WPR operating near 1 GHz;172
from Rec. ITU-R M.1464, antenna characteristics of the representative MetAids radar
systems operating in 2.7−2.9 GHz; and
from Rec. ITU-R M.1638, antenna characteristics of the representative MetAids radar
systems operating in 5.25−5.85 GHz.
The ITU-R Recommendations provide characteristics of the representative MetAids radar
systems; they are listed in Table 5-65.
Table 5-65. Summary of Representative MetAids Radar Systems
Frequency
Band (MHz) Platform
Antenna Characteristics Source
(Rec. ITU-R) Type Gmax (dBi)
40−80 Land station Phased array 30−34 M.1226
Near 1000 Land station Phased array 25−32 M.1227-2
2700−2900 Land station Parabolic
reflector 38, 45.7 M.1464
5250−5850
Land station Parabolic
reflector
35−50
M.1638 Ship 39
Aircraft 37.5
(a) NTIA Manual Chapter 5
NTIA Manual, in Section 5.5, classifies WPR operating at 449 MHz as the Group E
radar, and its antenna should meet the Criterion E requirements. Criterion E includes the antenna
EIRP mask, and the antenna radiation pattern can be derived from the mask. The antenna EIRP
mask and the derived sidelobe suppression data are shown in columns 2, 3, and 4 of Table 5-66.
Table 5-66. NTIA Wind Profile Radar Antenna Sidelobe Suppression Requirement at 449
MHz
Elevation Angle θ Median EIRP (dBm) Maximum EIRP
(dBm)
Antenna Sidelobe
Suppression (dB)
θ > 70 - 110 -
60 < θ ≤ 70 83 95 15
45 < θ ≤ 60 78 90 20
5 < θ ≤ 45 73 85 25
171 Rec. ITU-R M.1226, Technical and Operational Characteristics of Wind Profiler Radars in Bands in the
Vicinity of 50 MHz (1997).
172 Rec. ITU-R M.1227-2, Technical and Operational Characteristics of Wind Profiler Radars in Bands in the
Vicinity of 1000 MHz (2001).
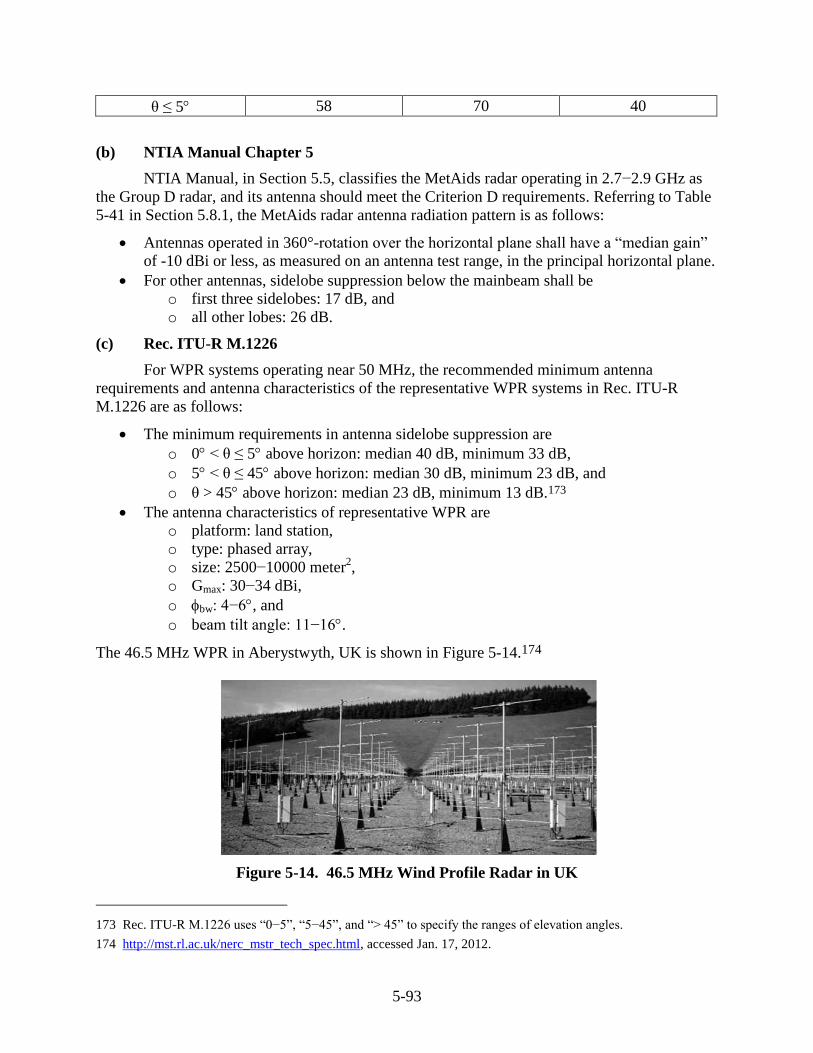
5-93
θ ≤ 5 58 70 40
(b) NTIA Manual Chapter 5
NTIA Manual, in Section 5.5, classifies the MetAids radar operating in 2.7−2.9 GHz as
the Group D radar, and its antenna should meet the Criterion D requirements. Referring to Table
5-41 in Section 5.8.1, the MetAids radar antenna radiation pattern is as follows:
Antennas operated in 360°-rotation over the horizontal plane shall have a “median gain”
of -10 dBi or less, as measured on an antenna test range, in the principal horizontal plane.
For other antennas, sidelobe suppression below the mainbeam shall be
o first three sidelobes: 17 dB, and
o all other lobes: 26 dB.
(c) Rec. ITU-R M.1226
For WPR systems operating near 50 MHz, the recommended minimum antenna
requirements and antenna characteristics of the representative WPR systems in Rec. ITU-R
M.1226 are as follows:
The minimum requirements in antenna sidelobe suppression are
o 0 < θ ≤ 5 above horizon: median 40 dB, minimum 33 dB,
o 5 < θ ≤ 45 above horizon: median 30 dB, minimum 23 dB, and
o θ > 45 above horizon: median 23 dB, minimum 13 dB.173
The antenna characteristics of representative WPR are
o platform: land station,
o type: phased array,
o size: 2500−10000 meter2,
o Gmax: 30−34 dBi,
o bw: 4−6, and
o beam tilt angle: 11−16.
The 46.5 MHz WPR in Aberystwyth, UK is shown in Figure 5-14.174
Figure 5-14. 46.5 MHz Wind Profile Radar in UK
173 Rec. ITU-R M.1226 uses “0−5”, “5−45”, and “> 45” to specify the ranges of elevation angles.
174 http://mst.rl.ac.uk/nerc_mstr_tech_spec.html, accessed Jan. 17, 2012.
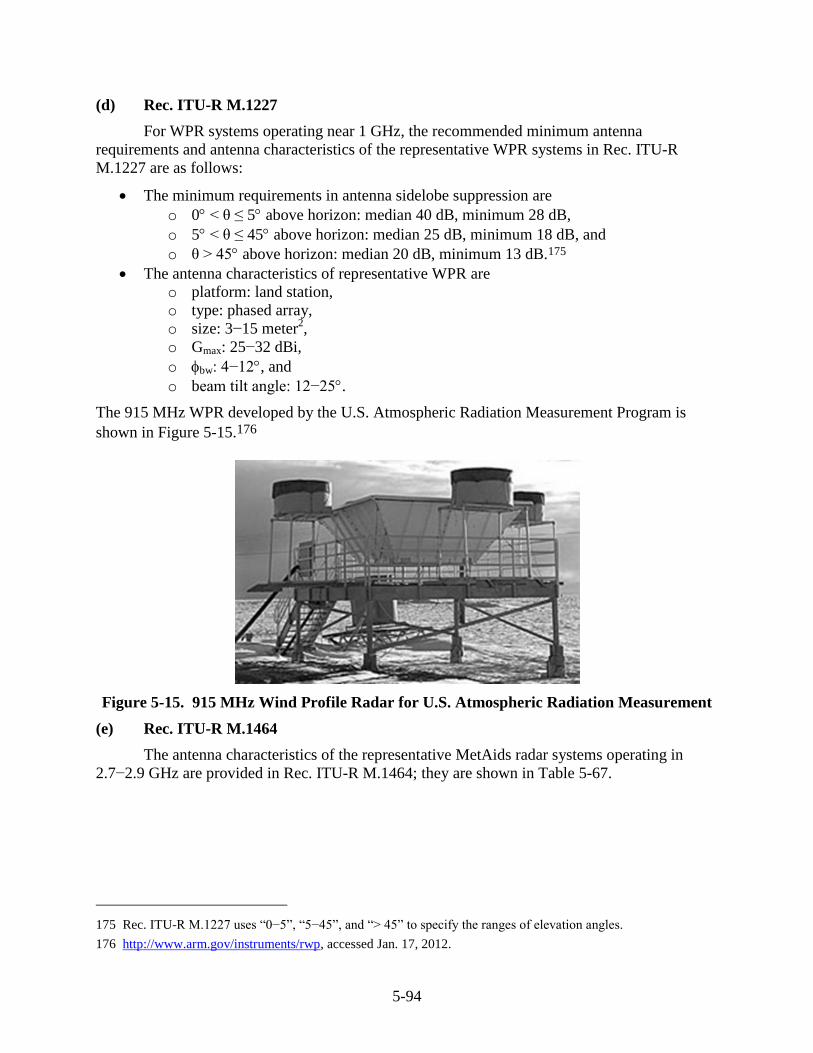
5-94
(d) Rec. ITU-R M.1227
For WPR systems operating near 1 GHz, the recommended minimum antenna
requirements and antenna characteristics of the representative WPR systems in Rec. ITU-R
M.1227 are as follows:
The minimum requirements in antenna sidelobe suppression are
o 0 < θ ≤ 5 above horizon: median 40 dB, minimum 28 dB,
o 5 < θ ≤ 45 above horizon: median 25 dB, minimum 18 dB, and
o θ > 45 above horizon: median 20 dB, minimum 13 dB.175
The antenna characteristics of representative WPR are
o platform: land station,
o type: phased array,
o size: 3−15 meter2,
o Gmax: 25−32 dBi,
o bw: 4−12, and
o beam tilt angle: 12−25.
The 915 MHz WPR developed by the U.S. Atmospheric Radiation Measurement Program is
shown in Figure 5-15.176
Figure 5-15. 915 MHz Wind Profile Radar for U.S. Atmospheric Radiation Measurement
(e) Rec. ITU-R M.1464
The antenna characteristics of the representative MetAids radar systems operating in
2.7−2.9 GHz are provided in Rec. ITU-R M.1464; they are shown in Table 5-67.
175 Rec. ITU-R M.1227 uses “0−5”, “5−45”, and “> 45” to specify the ranges of elevation angles.
176 http://www.arm.gov/instruments/rwp, accessed Jan. 17, 2012.
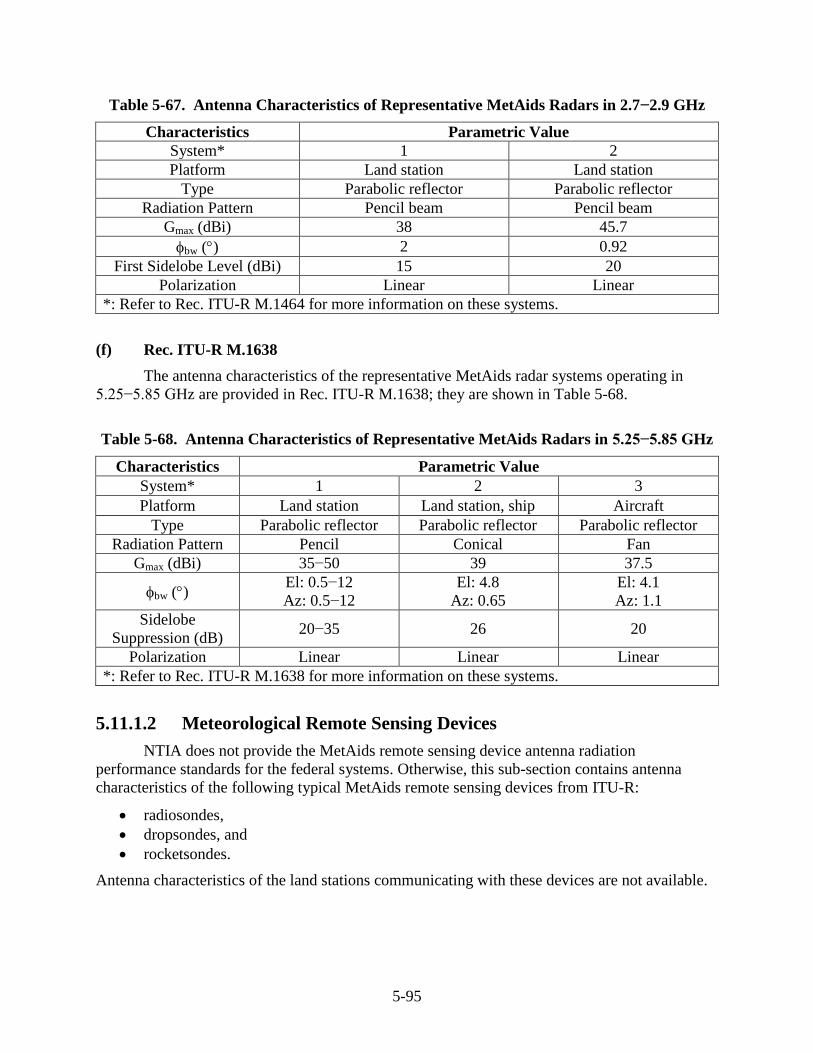
5-95
Table 5-67. Antenna Characteristics of Representative MetAids Radars in 2.7−2.9 GHz
Characteristics Parametric Value
System* 1 2
Platform Land station Land station
Type Parabolic reflector Parabolic reflector
Radiation Pattern Pencil beam Pencil beam
Gmax (dBi) 38 45.7
bw () 2 0.92
First Sidelobe Level (dBi) 15 20
Polarization Linear Linear
*: Refer to Rec. ITU-R M.1464 for more information on these systems.
(f) Rec. ITU-R M.1638
The antenna characteristics of the representative MetAids radar systems operating in
5.25−5.85 GHz are provided in Rec. ITU-R M.1638; they are shown in Table 5-68.
Table 5-68. Antenna Characteristics of Representative MetAids Radars in 5.25−5.85 GHz
Characteristics Parametric Value
System* 1 2 3
Platform Land station Land station, ship Aircraft
Type Parabolic reflector Parabolic reflector Parabolic reflector
Radiation Pattern Pencil Conical Fan
Gmax (dBi) 35−50 39 37.5
bw () El: 0.5−12
Az: 0.5−12
El: 4.8
Az: 0.65
El: 4.1
Az: 1.1
Sidelobe
Suppression (dB) 20−35 26 20
Polarization Linear Linear Linear
*: Refer to Rec. ITU-R M.1638 for more information on these systems.
5.11.1.2 Meteorological Remote Sensing Devices
NTIA does not provide the MetAids remote sensing device antenna radiation
performance standards for the federal systems. Otherwise, this sub-section contains antenna
characteristics of the following typical MetAids remote sensing devices from ITU-R:
radiosondes,
dropsondes, and
rocketsondes.
Antenna characteristics of the land stations communicating with these devices are not available.
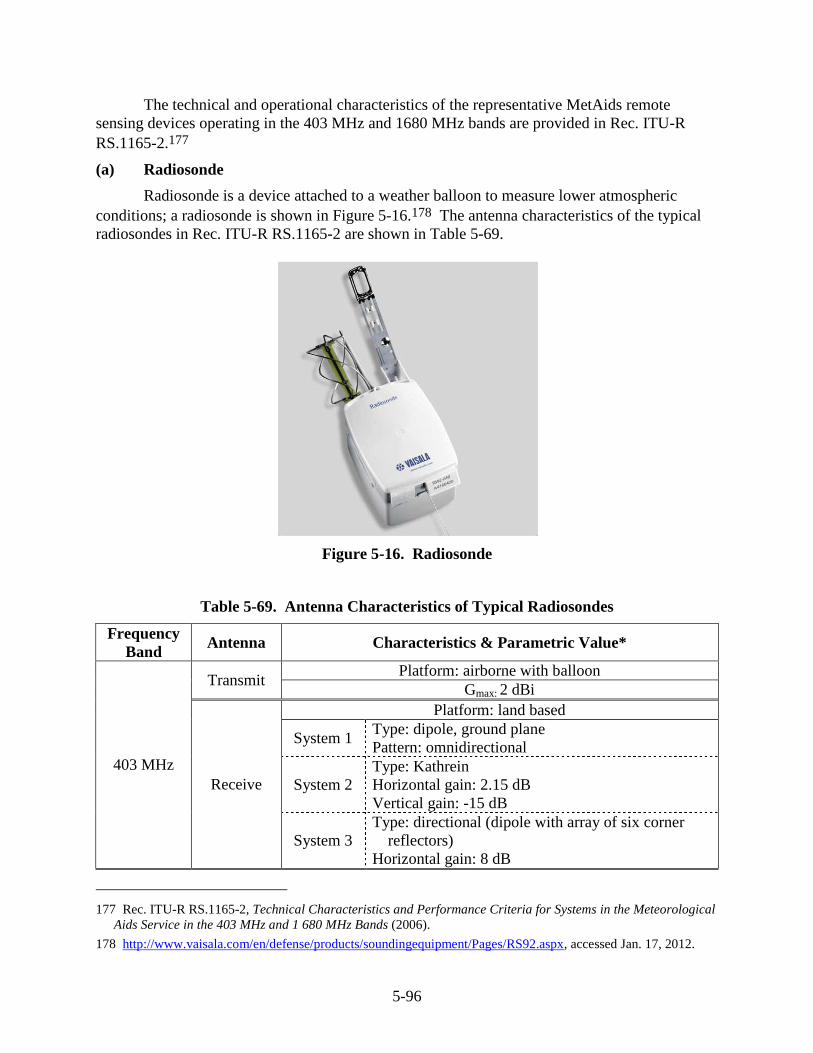
5-96
The technical and operational characteristics of the representative MetAids remote
sensing devices operating in the 403 MHz and 1680 MHz bands are provided in Rec. ITU-R
RS.1165-2.177
(a) Radiosonde
Radiosonde is a device attached to a weather balloon to measure lower atmospheric
conditions; a radiosonde is shown in Figure 5-16.178 The antenna characteristics of the typical
radiosondes in Rec. ITU-R RS.1165-2 are shown in Table 5-69.
Figure 5-16. Radiosonde
Table 5-69. Antenna Characteristics of Typical Radiosondes
Frequency
Band Antenna Characteristics & Parametric Value*
403 MHz
Transmit Platform: airborne with balloon
Gmax: 2 dBi
Receive
Platform: land based
System 1 Type: dipole, ground plane
Pattern: omnidirectional
System 2
Type: Kathrein
Horizontal gain: 2.15 dB
Vertical gain: -15 dB
System 3
Type: directional (dipole with array of six corner
reflectors)
Horizontal gain: 8 dB
177 Rec. ITU-R RS.1165-2, Technical Characteristics and Performance Criteria for Systems in the Meteorological
Aids Service in the 403 MHz and 1 680 MHz Bands (2006).
178 http://www.vaisala.com/en/defense/products/soundingequipment/Pages/RS92.aspx, accessed Jan. 17, 2012.
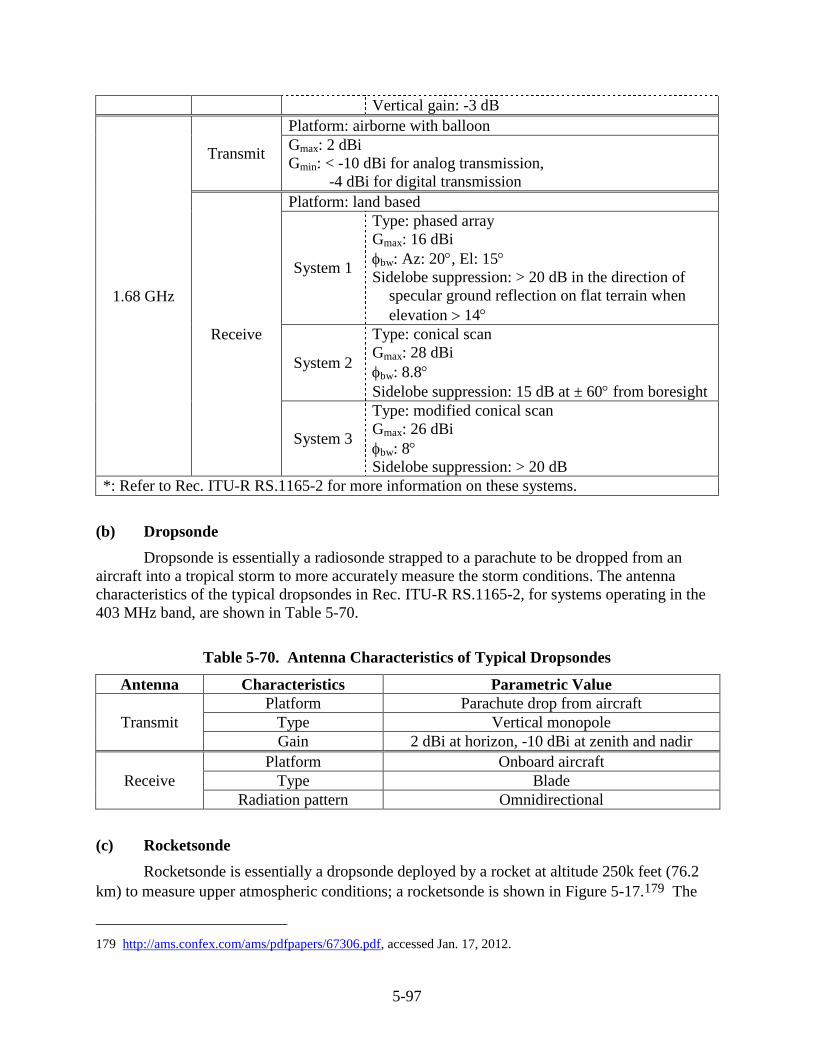
5-97
Vertical gain: -3 dB
1.68 GHz
Transmit
Platform: airborne with balloon
Gmax: 2 dBi
Gmin: < -10 dBi for analog transmission,
-4 dBi for digital transmission
Receive
Platform: land based
System 1
Type: phased array
Gmax: 16 dBi
bw: Az: 20, El: 15
Sidelobe suppression: > 20 dB in the direction of
specular ground reflection on flat terrain when
elevation 14
System 2
Type: conical scan
Gmax: 28 dBi
bw: 8.8
Sidelobe suppression: 15 dB at ± 60 from boresight
System 3
Type: modified conical scan
Gmax: 26 dBi
bw: 8
Sidelobe suppression: > 20 dB
*: Refer to Rec. ITU-R RS.1165-2 for more information on these systems.
(b) Dropsonde
Dropsonde is essentially a radiosonde strapped to a parachute to be dropped from an
aircraft into a tropical storm to more accurately measure the storm conditions. The antenna
characteristics of the typical dropsondes in Rec. ITU-R RS.1165-2, for systems operating in the
403 MHz band, are shown in Table 5-70.
Table 5-70. Antenna Characteristics of Typical Dropsondes
Antenna Characteristics Parametric Value
Transmit
Platform Parachute drop from aircraft
Type Vertical monopole
Gain 2 dBi at horizon, -10 dBi at zenith and nadir
Receive
Platform Onboard aircraft
Type Blade
Radiation pattern Omnidirectional
(c) Rocketsonde
Rocketsonde is essentially a dropsonde deployed by a rocket at altitude 250k feet (76.2
km) to measure upper atmospheric conditions; a rocketsonde is shown in Figure 5-17.179 The
179 http://ams.confex.com/ams/pdfpapers/67306.pdf, accessed Jan. 17, 2012.
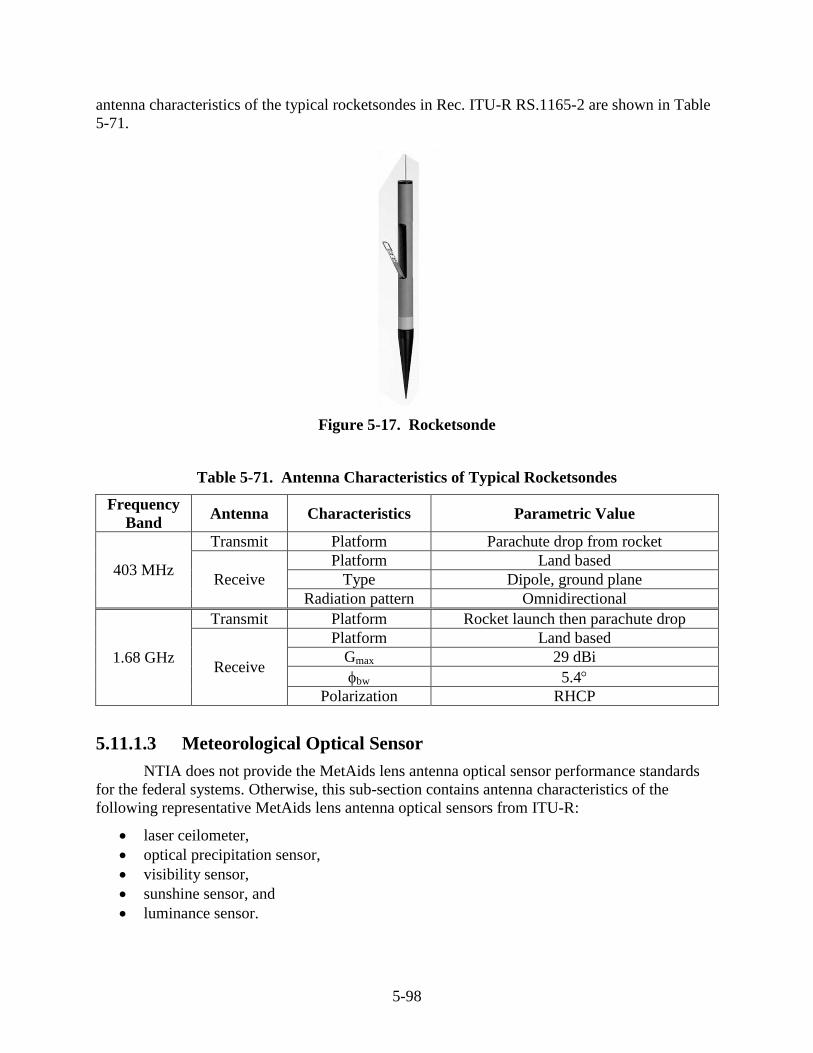
5-98
antenna characteristics of the typical rocketsondes in Rec. ITU-R RS.1165-2 are shown in Table
5-71.
Figure 5-17. Rocketsonde
Table 5-71. Antenna Characteristics of Typical Rocketsondes
Frequency
Band Antenna Characteristics Parametric Value
403 MHz
Transmit Platform Parachute drop from rocket
Receive
Platform Land based
Type Dipole, ground plane
Radiation pattern Omnidirectional
1.68 GHz
Transmit Platform Rocket launch then parachute drop
Receive
Platform Land based
Gmax 29 dBi
bw 5.4
Polarization RHCP
5.11.1.3 Meteorological Optical Sensor
NTIA does not provide the MetAids lens antenna optical sensor performance standards
for the federal systems. Otherwise, this sub-section contains antenna characteristics of the
following representative MetAids lens antenna optical sensors from ITU-R:
laser ceilometer,
optical precipitation sensor,
visibility sensor,
sunshine sensor, and
luminance sensor.
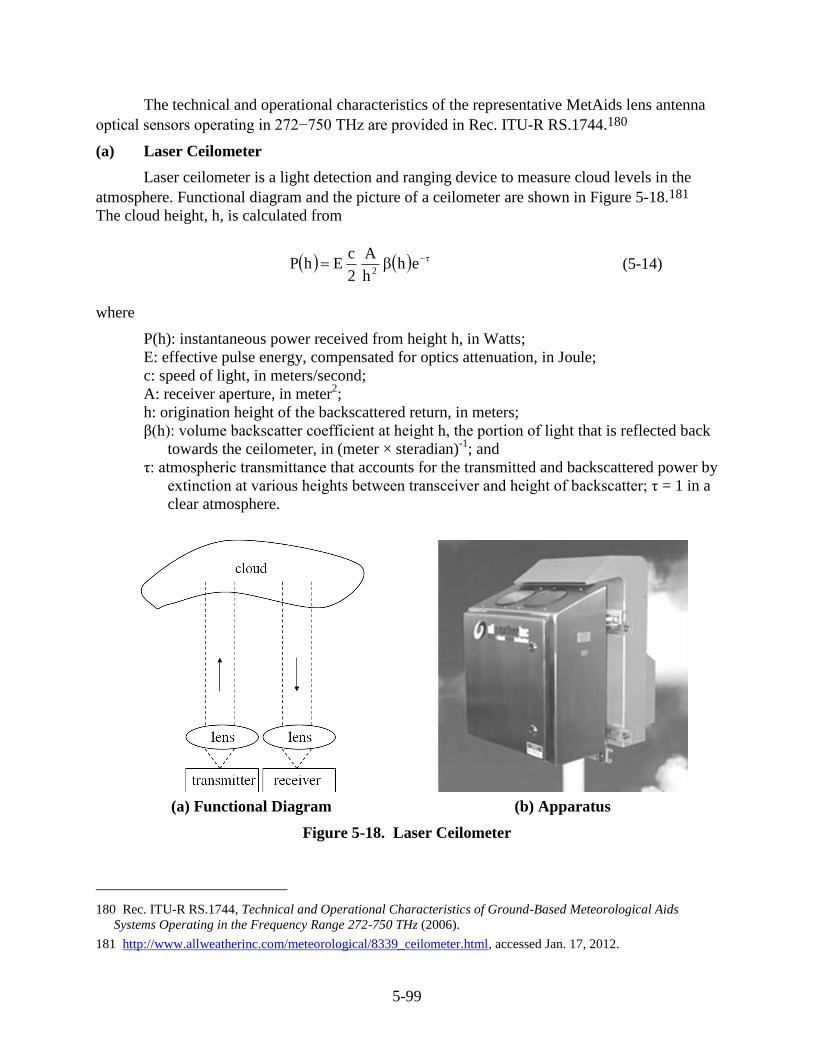
5-99
The technical and operational characteristics of the representative MetAids lens antenna
optical sensors operating in 272−750 THz are provided in Rec. ITU-R RS.1744.180
(a) Laser Ceilometer
Laser ceilometer is a light detection and ranging device to measure cloud levels in the
atmosphere. Functional diagram and the picture of a ceilometer are shown in Figure 5-18.181
The cloud height, h, is calculated from
ehh
A
2
cEhP
2 (5-14)
where
P(h): instantaneous power received from height h, in Watts;
E: effective pulse energy, compensated for optics attenuation, in Joule;
c: speed of light, in meters/second;
A: receiver aperture, in meter2;
h: origination height of the backscattered return, in meters;
β(h): volume backscatter coefficient at height h, the portion of light that is reflected back
towards the ceilometer, in (meter × steradian)-1
; and
τ: atmospheric transmittance that accounts for the transmitted and backscattered power by
extinction at various heights between transceiver and height of backscatter; τ = 1 in a
clear atmosphere.
(a) Functional Diagram (b) Apparatus
Figure 5-18. Laser Ceilometer
180 Rec. ITU-R RS.1744, Technical and Operational Characteristics of Ground-Based Meteorological Aids
Systems Operating in the Frequency Range 272-750 THz (2006).
181 http://www.allweatherinc.com/meteorological/8339_ceilometer.html, accessed Jan. 17, 2012.
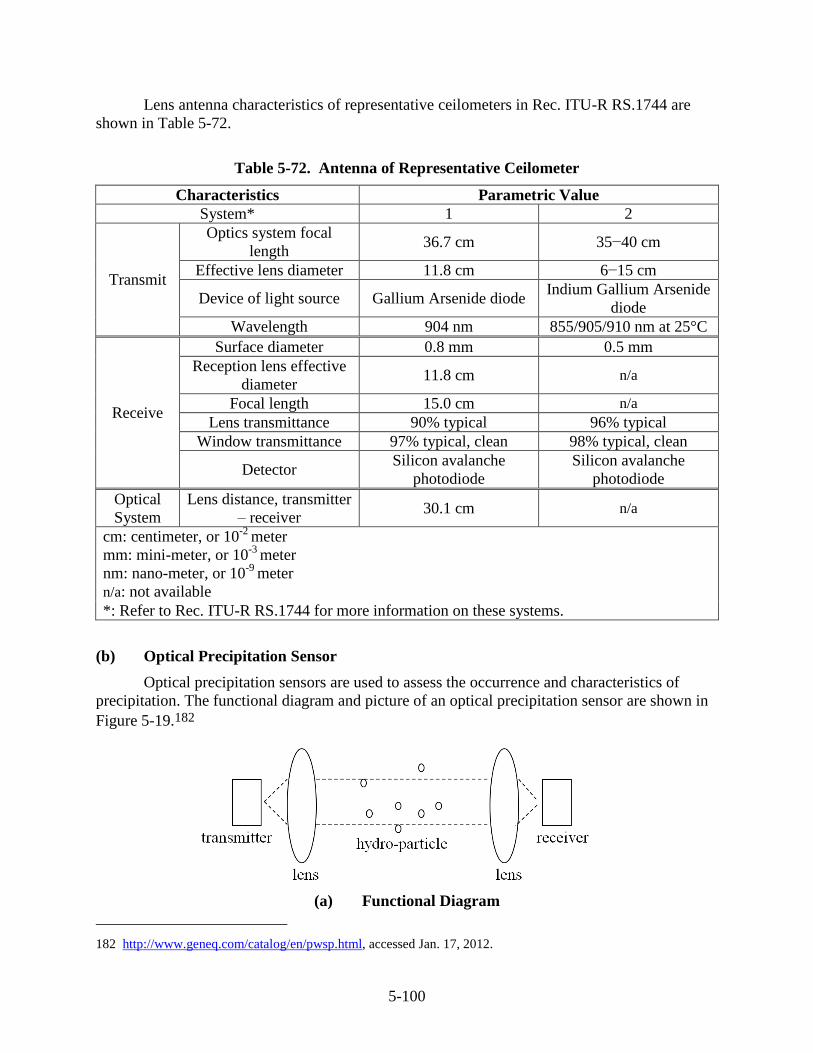
5-100
Lens antenna characteristics of representative ceilometers in Rec. ITU-R RS.1744 are
shown in Table 5-72.
Table 5-72. Antenna of Representative Ceilometer
Characteristics Parametric Value
System* 1 2
Transmit
Optics system focal
length 36.7 cm 35−40 cm
Effective lens diameter 11.8 cm 6−15 cm
Device of light source Gallium Arsenide diode Indium Gallium Arsenide
diode
Wavelength 904 nm 855/905/910 nm at 25°C
Receive
Surface diameter 0.8 mm 0.5 mm
Reception lens effective
diameter 11.8 cm n/a
Focal length 15.0 cm n/a
Lens transmittance 90% typical 96% typical
Window transmittance 97% typical, clean 98% typical, clean
Detector Silicon avalanche
photodiode
Silicon avalanche
photodiode
Optical
System
Lens distance, transmitter
– receiver 30.1 cm n/a
cm: centimeter, or 10-2
meter
mm: mini-meter, or 10-3
meter
nm: nano-meter, or 10-9
meter
n/a: not available
*: Refer to Rec. ITU-R RS.1744 for more information on these systems.
(b) Optical Precipitation Sensor
Optical precipitation sensors are used to assess the occurrence and characteristics of
precipitation. The functional diagram and picture of an optical precipitation sensor are shown in
Figure 5-19.182
(a) Functional Diagram
182 http://www.geneq.com/catalog/en/pwsp.html, accessed Jan. 17, 2012.
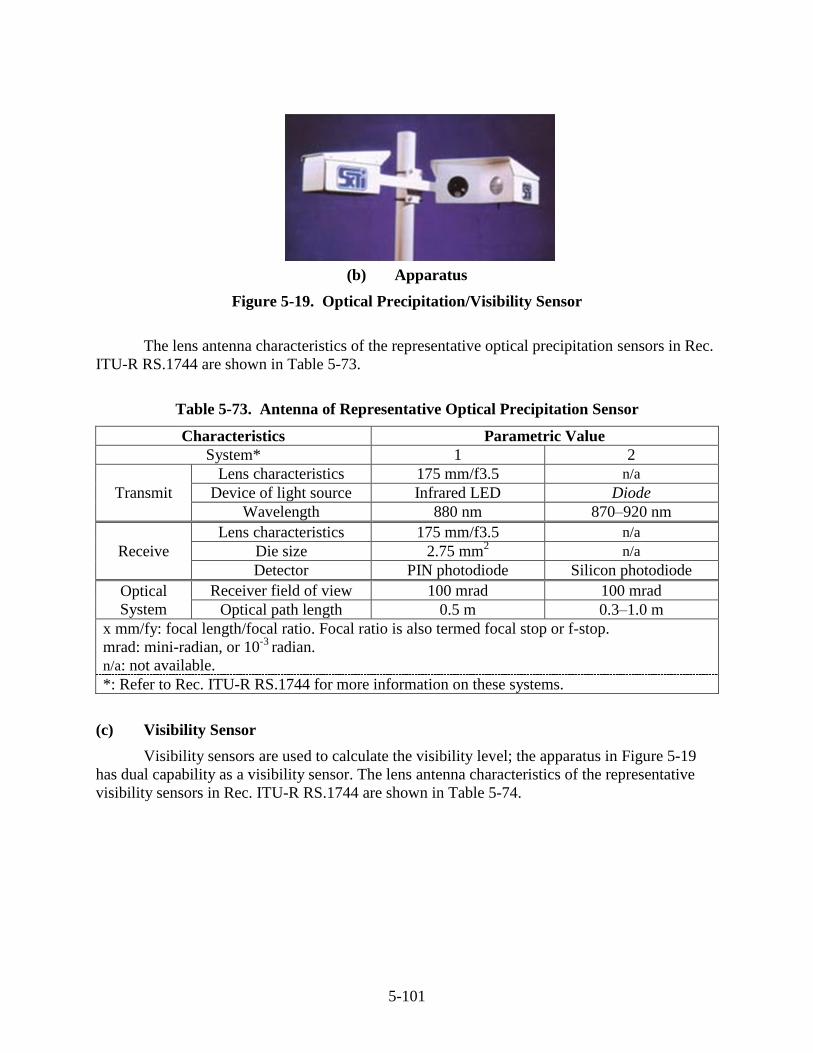
5-101
(b) Apparatus
Figure 5-19. Optical Precipitation/Visibility Sensor
The lens antenna characteristics of the representative optical precipitation sensors in Rec.
ITU-R RS.1744 are shown in Table 5-73.
Table 5-73. Antenna of Representative Optical Precipitation Sensor
Characteristics Parametric Value
System* 1 2
Transmit
Lens characteristics 175 mm/f3.5 n/a
Device of light source Infrared LED Diode
Wavelength 880 nm 870–920 nm
Receive
Lens characteristics 175 mm/f3.5 n/a
Die size 2.75 mm2 n/a
Detector PIN photodiode Silicon photodiode
Optical
System
Receiver field of view 100 mrad 100 mrad
Optical path length 0.5 m 0.3–1.0 m
x mm/fy: focal length/focal ratio. Focal ratio is also termed focal stop or f-stop.
mrad: mini-radian, or 10-3
radian.
n/a: not available.
*: Refer to Rec. ITU-R RS.1744 for more information on these systems.
(c) Visibility Sensor
Visibility sensors are used to calculate the visibility level; the apparatus in Figure 5-19
has dual capability as a visibility sensor. The lens antenna characteristics of the representative
visibility sensors in Rec. ITU-R RS.1744 are shown in Table 5-74.
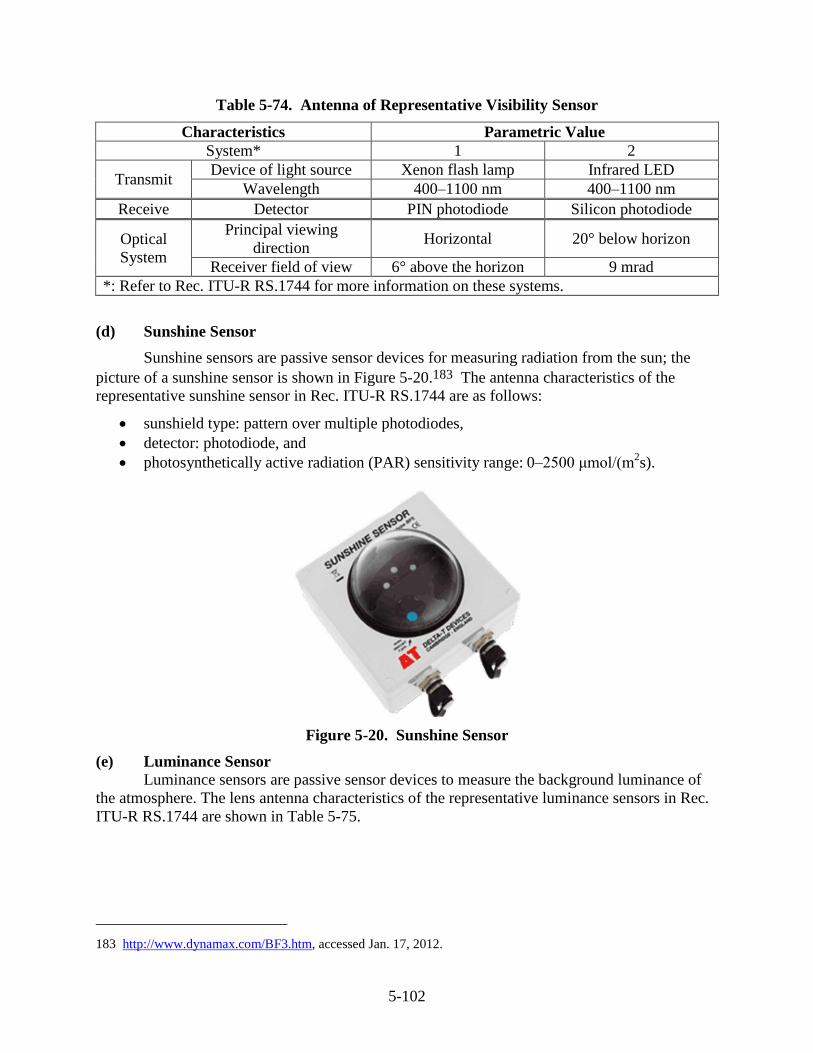
5-102
Table 5-74. Antenna of Representative Visibility Sensor
Characteristics Parametric Value
System* 1 2
Transmit Device of light source Xenon flash lamp Infrared LED
Wavelength 400–1100 nm 400–1100 nm
Receive Detector PIN photodiode Silicon photodiode
Optical
System
Principal viewing
direction Horizontal 20° below horizon
Receiver field of view 6° above the horizon 9 mrad
*: Refer to Rec. ITU-R RS.1744 for more information on these systems.
(d) Sunshine Sensor
Sunshine sensors are passive sensor devices for measuring radiation from the sun; the
picture of a sunshine sensor is shown in Figure 5-20.183 The antenna characteristics of the
representative sunshine sensor in Rec. ITU-R RS.1744 are as follows:
sunshield type: pattern over multiple photodiodes,
detector: photodiode, and
photosynthetically active radiation (PAR) sensitivity range: 0–2500 μmol/(m2s).
Figure 5-20. Sunshine Sensor
(e) Luminance Sensor
Luminance sensors are passive sensor devices to measure the background luminance of
the atmosphere. The lens antenna characteristics of the representative luminance sensors in Rec.
ITU-R RS.1744 are shown in Table 5-75.
183 http://www.dynamax.com/BF3.htm, accessed Jan. 17, 2012.
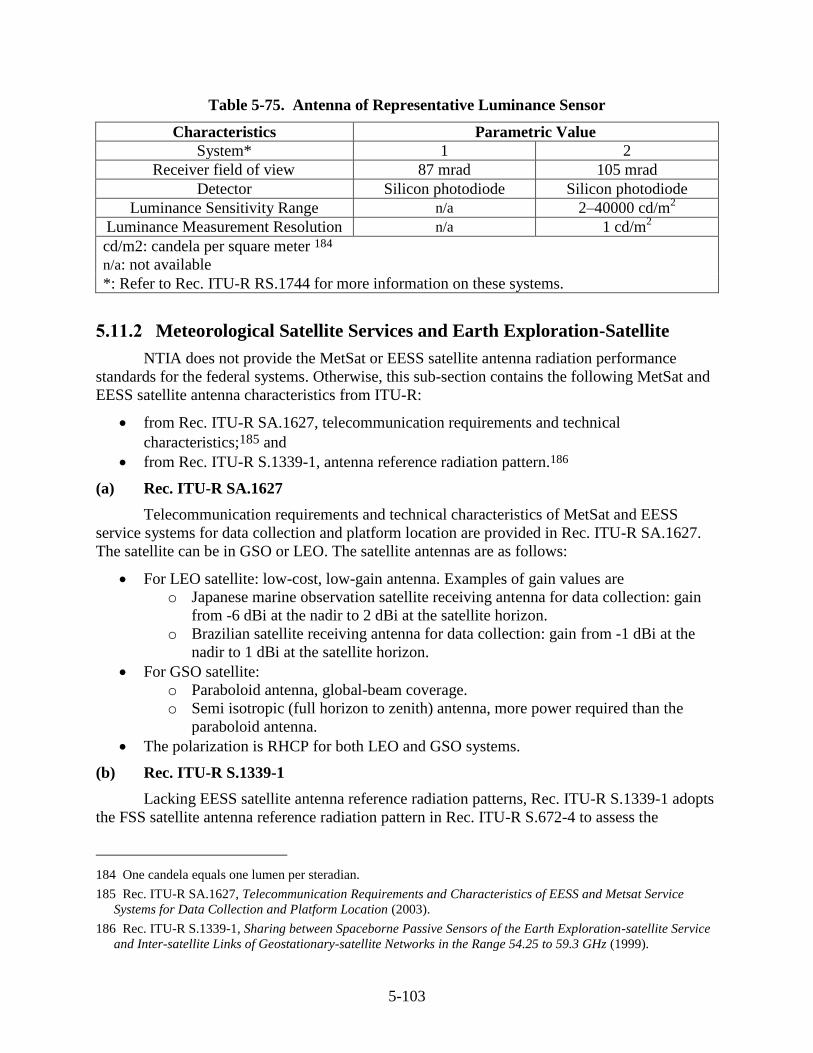
5-103
Table 5-75. Antenna of Representative Luminance Sensor
Characteristics Parametric Value
System* 1 2
Receiver field of view 87 mrad 105 mrad
Detector Silicon photodiode Silicon photodiode
Luminance Sensitivity Range n/a 2–40000 cd/m2
Luminance Measurement Resolution n/a 1 cd/m2
cd/m2: candela per square meter 184
n/a: not available
*: Refer to Rec. ITU-R RS.1744 for more information on these systems.
5.11.2 Meteorological Satellite Services and Earth Exploration-Satellite
NTIA does not provide the MetSat or EESS satellite antenna radiation performance
standards for the federal systems. Otherwise, this sub-section contains the following MetSat and
EESS satellite antenna characteristics from ITU-R:
from Rec. ITU-R SA.1627, telecommunication requirements and technical
characteristics;185 and
from Rec. ITU-R S.1339-1, antenna reference radiation pattern.186
(a) Rec. ITU-R SA.1627
Telecommunication requirements and technical characteristics of MetSat and EESS
service systems for data collection and platform location are provided in Rec. ITU-R SA.1627.
The satellite can be in GSO or LEO. The satellite antennas are as follows:
For LEO satellite: low-cost, low-gain antenna. Examples of gain values are
o Japanese marine observation satellite receiving antenna for data collection: gain
from -6 dBi at the nadir to 2 dBi at the satellite horizon.
o Brazilian satellite receiving antenna for data collection: gain from -1 dBi at the
nadir to 1 dBi at the satellite horizon.
For GSO satellite:
o Paraboloid antenna, global-beam coverage.
o Semi isotropic (full horizon to zenith) antenna, more power required than the
paraboloid antenna.
The polarization is RHCP for both LEO and GSO systems.
(b) Rec. ITU-R S.1339-1
Lacking EESS satellite antenna reference radiation patterns, Rec. ITU-R S.1339-1 adopts
the FSS satellite antenna reference radiation pattern in Rec. ITU-R S.672-4 to assess the
184 One candela equals one lumen per steradian.
185 Rec. ITU-R SA.1627, Telecommunication Requirements and Characteristics of EESS and Metsat Service
Systems for Data Collection and Platform Location (2003).
186 Rec. ITU-R S.1339-1, Sharing between Spaceborne Passive Sensors of the Earth Exploration-satellite Service
and Inter-satellite Links of Geostationary-satellite Networks in the Range 54.25 to 59.3 GHz (1999).
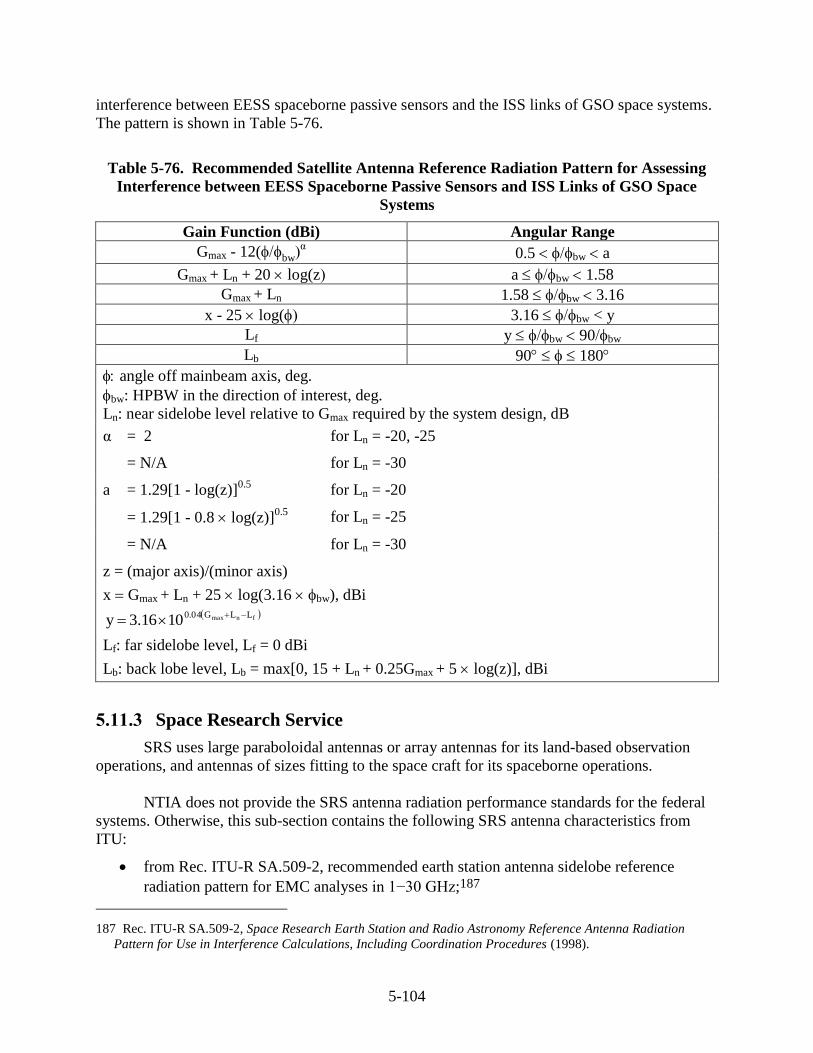
5-104
interference between EESS spaceborne passive sensors and the ISS links of GSO space systems.
The pattern is shown in Table 5-76.
Table 5-76. Recommended Satellite Antenna Reference Radiation Pattern for Assessing
Interference between EESS Spaceborne Passive Sensors and ISS Links of GSO Space
Systems
Gain Function (dBi) Angular Range
Gmax - 12(bwα 0.5 bw a
Gmax + Ln + 20 log(z a bw 1.58
Gmax + Ln 1.58 bw 3.16
x - 25 log( 3.16 bw < y
Lf y bw 90bw
Lb 90 180
angle off mainbeam axis, deg.
bw: HPBW in the direction of interest, deg.
Ln: near sidelobe level relative to Gmax required by the system design, dB
α = 2 for Ln = -20, -25
= N/A for Ln = -30
a = 1.29[1 - log(z)]0.5 for Ln = -20
= 1.29[1 - 0.8 log(z)]0.5
for Ln = -25
= N/A for Ln = -30
z = (major axis)/(minor axis)
x Gmax + Ln + 25 log(3.16 bw), dBi fnmax LLG04.0
1016.3y
Lf: far sidelobe level, Lf = 0 dBi
Lb: back lobe level, Lb = max[0, 15 + Ln + 0.25Gmax + 5 log(z)], dBi
5.11.3 Space Research Service
SRS uses large paraboloidal antennas or array antennas for its land-based observation
operations, and antennas of sizes fitting to the space craft for its spaceborne operations.
NTIA does not provide the SRS antenna radiation performance standards for the federal
systems. Otherwise, this sub-section contains the following SRS antenna characteristics from
ITU:
from Rec. ITU-R SA.509-2, recommended earth station antenna sidelobe reference
radiation pattern for EMC analyses in 1−30 GHz;187
187 Rec. ITU-R SA.509-2, Space Research Earth Station and Radio Astronomy Reference Antenna Radiation
Pattern for Use in Interference Calculations, Including Coordination Procedures (1998).
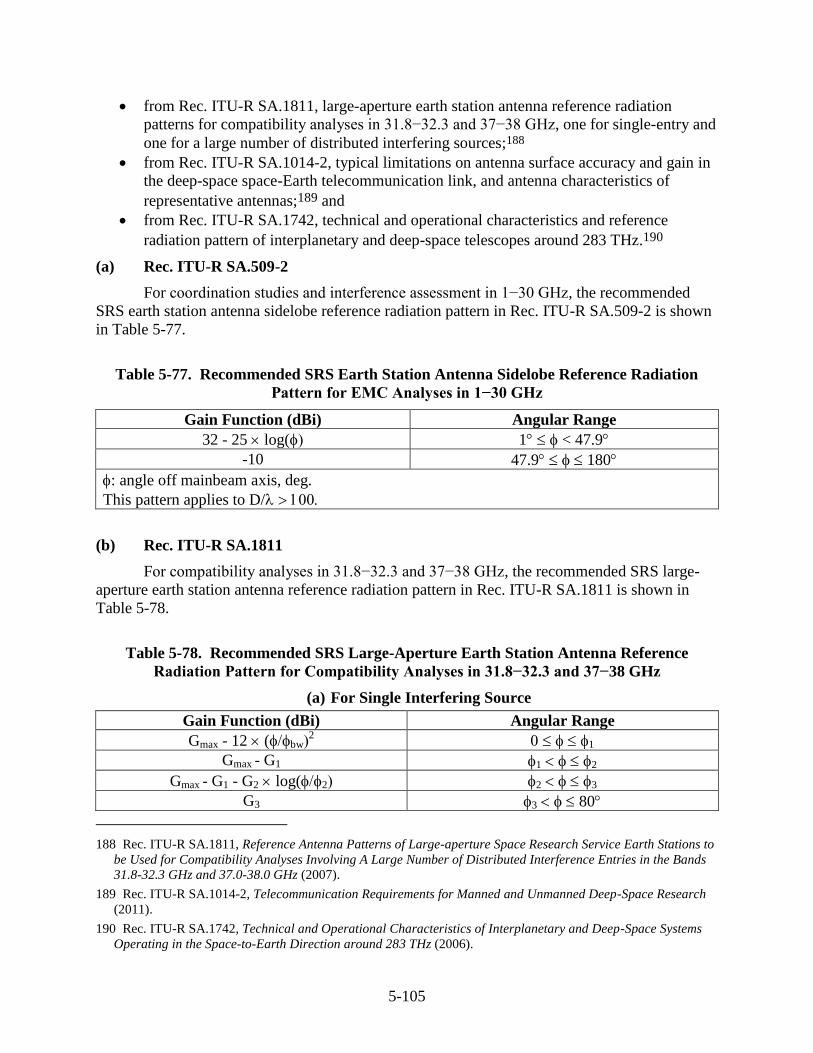
5-105
from Rec. ITU-R SA.1811, large-aperture earth station antenna reference radiation
patterns for compatibility analyses in 31.8−32.3 and 37−38 GHz, one for single-entry and
one for a large number of distributed interfering sources;188
from Rec. ITU-R SA.1014-2, typical limitations on antenna surface accuracy and gain in
the deep-space space-Earth telecommunication link, and antenna characteristics of
representative antennas;189 and
from Rec. ITU-R SA.1742, technical and operational characteristics and reference
radiation pattern of interplanetary and deep-space telescopes around 283 THz.190
(a) Rec. ITU-R SA.509-2
For coordination studies and interference assessment in 1−30 GHz, the recommended
SRS earth station antenna sidelobe reference radiation pattern in Rec. ITU-R SA.509-2 is shown
in Table 5-77.
Table 5-77. Recommended SRS Earth Station Antenna Sidelobe Reference Radiation
Pattern for EMC Analyses in 1−30 GHz
Gain Function (dBi) Angular Range
32 - 25 log( 1 < 47.9
-10 47.9 180
: angle off mainbeam axis, deg.
This pattern applies to D/
(b) Rec. ITU-R SA.1811
For compatibility analyses in 31.8−32.3 and 37−38 GHz, the recommended SRS large-
aperture earth station antenna reference radiation pattern in Rec. ITU-R SA.1811 is shown in
Table 5-78.
Table 5-78. Recommended SRS Large-Aperture Earth Station Antenna Reference
Radiation Pattern for Compatibility Analyses in 31.8−32.3 and 37−38 GHz
(a) For Single Interfering Source
Gain Function (dBi) Angular Range
Gmax - 12 (bw2 1
Gmax - G1 1 2
Gmax - G1 - G2 log(2 2 3
G3 3 80
188 Rec. ITU-R SA.1811, Reference Antenna Patterns of Large-aperture Space Research Service Earth Stations to
be Used for Compatibility Analyses Involving A Large Number of Distributed Interference Entries in the Bands
31.8-32.3 GHz and 37.0-38.0 GHz (2007).
189 Rec. ITU-R SA.1014-2, Telecommunication Requirements for Manned and Unmanned Deep-Space Research
(2011).
190 Rec. ITU-R SA.1742, Technical and Operational Characteristics of Interplanetary and Deep-Space Systems
Operating in the Space-to-Earth Direction around 283 THz (2006).
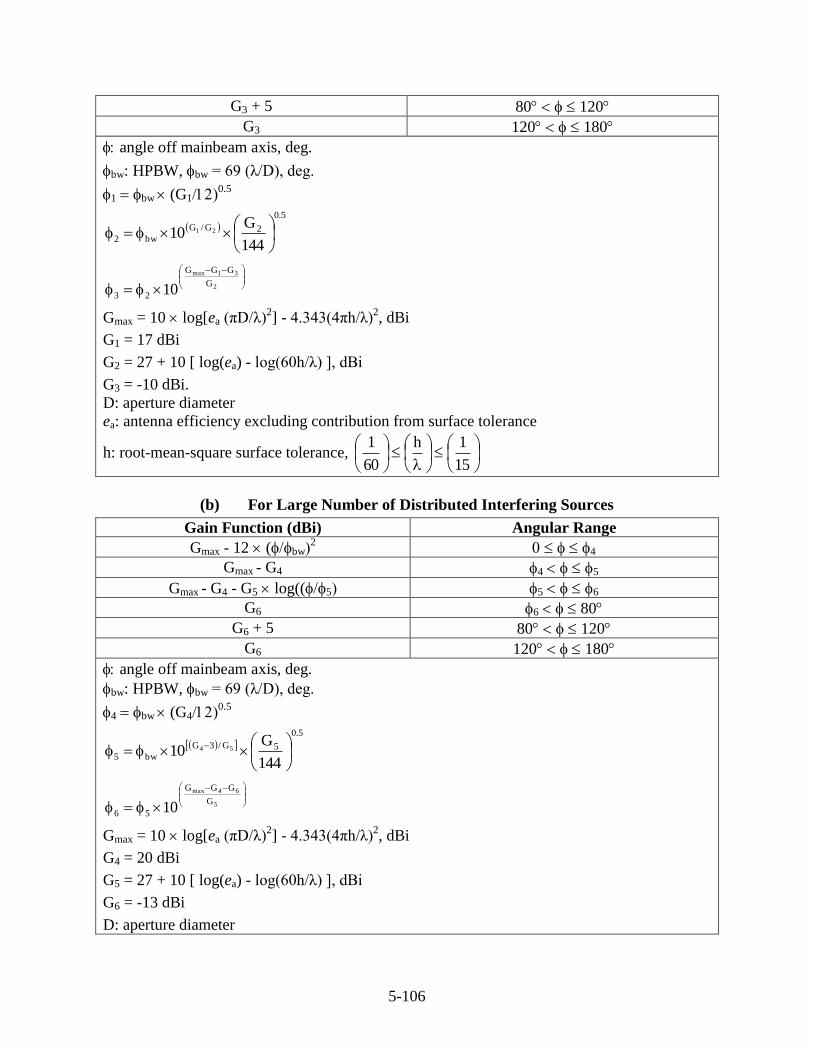
5-106
G3 + 5 80 120
G3 120 180
angle off mainbeam axis, deg.
bw: HPBW, bw = 69 (λ/D), deg.
1 bw (G10.5
5.0
2G/G
bw2144
G10 21
2
31max
G
GGG
23 10
Gmax = 10 log[ea (πD/λ)2] - 4.343(4πh/λ)
2, dBi
G1 = 17 dBi
G2 = 27 + 10 [ log(ea) - log(60h/λ) ], dBi
G3 = -10 dBi.
D: aperture diameter
ea: antenna efficiency excluding contribution from surface tolerance
h: root-mean-square surface tolerance,
15
1h
60
1
(b) For Large Number of Distributed Interfering Sources
Gain Function (dBi) Angular Range
Gmax - 12 (bw2 4
Gmax - G4 4 5
Gmax - G4 - G5 log((5 5 6
G6 6 80
G6 + 5 80 120
G6 120 180
angle off mainbeam axis, deg.
bw: HPBW, bw = 69 (λ/D), deg.
4 bw (G40.5
5.0
5G/3G
bw5144
G10 54
5
64max
G
GGG
56 10
Gmax = 10 log[ea (πD/λ)2] - 4.343(4πh/λ)
2, dBi
G4 = 20 dBi
G5 = 27 + 10 [ log(ea) - log(60h/λ) ], dBi
G6 = -13 dBi
D: aperture diameter
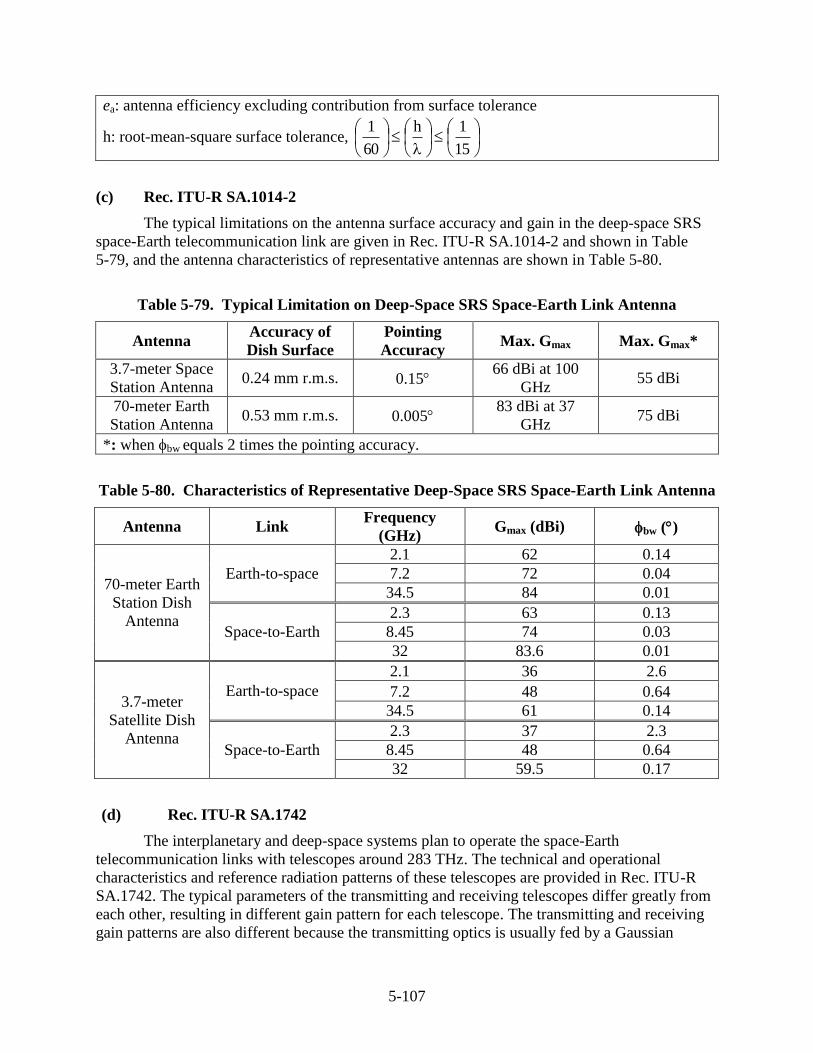
5-107
ea: antenna efficiency excluding contribution from surface tolerance
h: root-mean-square surface tolerance,
15
1h
60
1
(c) Rec. ITU-R SA.1014-2
The typical limitations on the antenna surface accuracy and gain in the deep-space SRS
space-Earth telecommunication link are given in Rec. ITU-R SA.1014-2 and shown in Table
5-79, and the antenna characteristics of representative antennas are shown in Table 5-80.
Table 5-79. Typical Limitation on Deep-Space SRS Space-Earth Link Antenna
Antenna Accuracy of
Dish Surface
Pointing
Accuracy Max. Gmax Max. Gmax*
3.7-meter Space
Station Antenna 0.24 mm r.m.s. 0.15
66 dBi at 100
GHz 55 dBi
70-meter Earth
Station Antenna 0.53 mm r.m.s. 0.005
83 dBi at 37
GHz 75 dBi
*: when bw equals 2 times the pointing accuracy.
Table 5-80. Characteristics of Representative Deep-Space SRS Space-Earth Link Antenna
Antenna Link Frequency
(GHz) Gmax (dBi) bw ()
70-meter Earth
Station Dish
Antenna
Earth-to-space
2.1 62 0.14
7.2 72 0.04
34.5 84 0.01
Space-to-Earth
2.3 63 0.13
8.45 74 0.03
32 83.6 0.01
3.7-meter
Satellite Dish
Antenna
Earth-to-space
2.1 36 2.6
7.2 48 0.64
34.5 61 0.14
Space-to-Earth
2.3 37 2.3
8.45 48 0.64
32 59.5 0.17
(d) Rec. ITU-R SA.1742
The interplanetary and deep-space systems plan to operate the space-Earth
telecommunication links with telescopes around 283 THz. The technical and operational
characteristics and reference radiation patterns of these telescopes are provided in Rec. ITU-R
SA.1742. The typical parameters of the transmitting and receiving telescopes differ greatly from
each other, resulting in different gain pattern for each telescope. The transmitting and receiving
gain patterns are also different because the transmitting optics is usually fed by a Gaussian
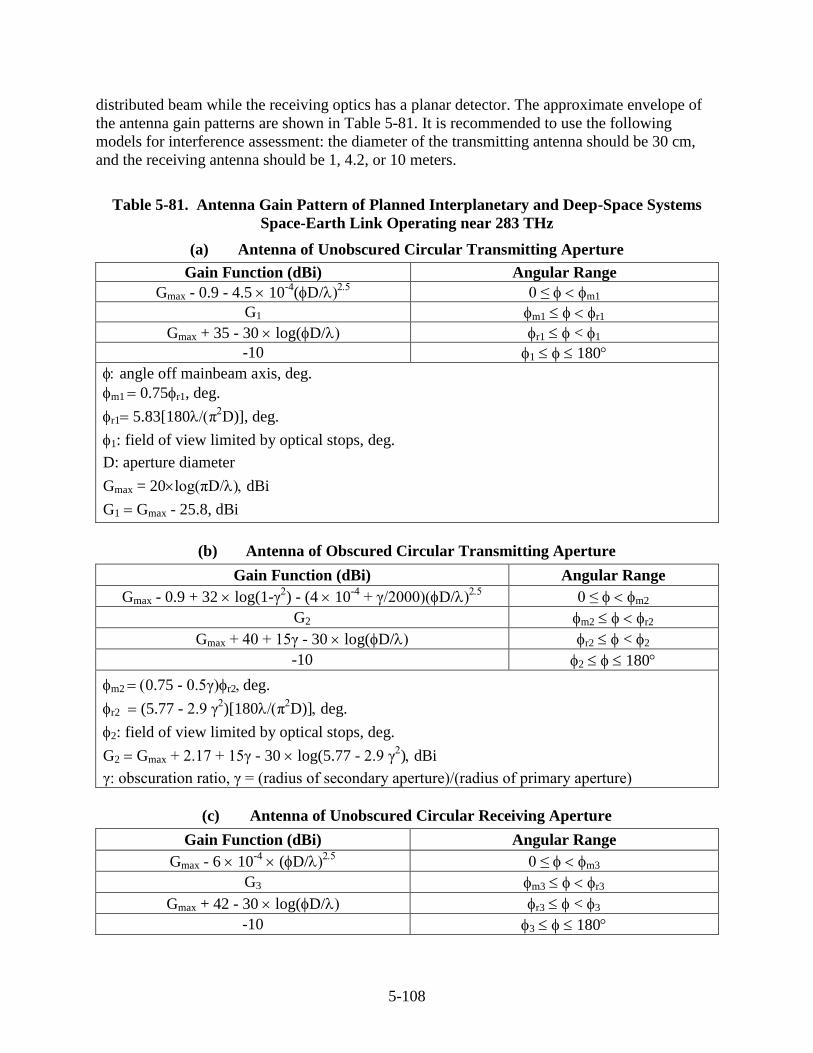
5-108
distributed beam while the receiving optics has a planar detector. The approximate envelope of
the antenna gain patterns are shown in Table 5-81. It is recommended to use the following
models for interference assessment: the diameter of the transmitting antenna should be 30 cm,
and the receiving antenna should be 1, 4.2, or 10 meters.
Table 5-81. Antenna Gain Pattern of Planned Interplanetary and Deep-Space Systems
Space-Earth Link Operating near 283 THz
(a) Antenna of Unobscured Circular Transmitting Aperture
Gain Function (dBi) Angular Range
Gmax - 0.9 - 4.5 10-4
(D/
0 ≤ m1
G1 m1 r1
Gmax + 35 - 30 log(D/ r1 < 1
-10 1 180
angle off mainbeam axis, deg.
m1 0.75r1, deg.
r1 5.83[180πD)], deg.
1: field of view limited by optical stops, deg.
D: aperture diameter
Gmax = 20log(πD/dBi
G1 Gmax - 25.8, dBi
(b) Antenna of Obscured Circular Transmitting Aperture
Gain Function (dBi) Angular Range
Gmax - 0.9 + 32 log(1-γ) - (4 10
-4 + γ/2000)(D/
0 ≤ m2
G2 m2 r2
Gmax + 40 + 15γ - 30 log(D/ r2 < 2
-10 2 180
m2 0.75 - 0.5γ)r2 deg.
r2 (5.77 - 2.9 γ)[180π
D)] deg.
2: field of view limited by optical stops, deg.
G2 Gmax + 2.17 + 15γ - 30 log(5.77 - 2.9 γ) dBi
γ: obscuration ratio, γ = (radius of secondary aperture)/(radius of primary aperture)
(c) Antenna of Unobscured Circular Receiving Aperture
Gain Function (dBi) Angular Range
Gmax - 6 10-4
(D/ 0 ≤ m3
G3 m3 r3
Gmax + 42 - 30 log(D/ r3 < 3
-10 3 180
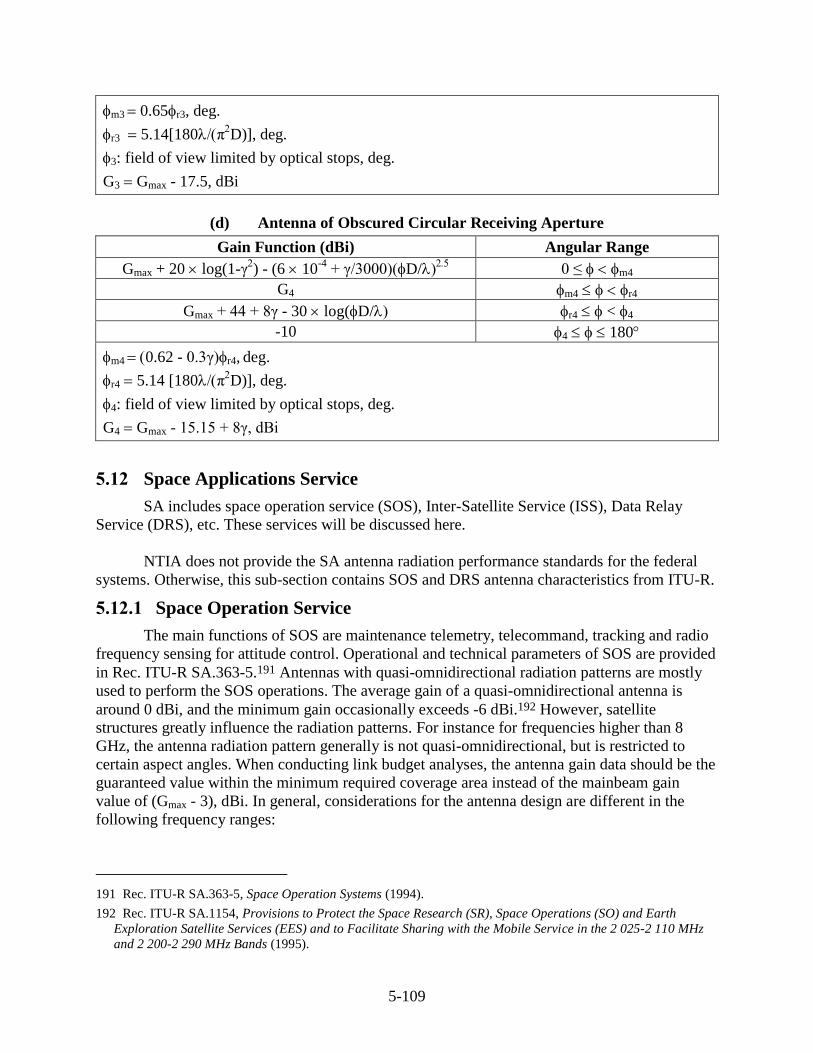
5-109
m3 0.65r3, deg.
r3 5.14[180πD)], deg.
3: field of view limited by optical stops, deg.
G3 Gmax - 17.5, dBi
(d) Antenna of Obscured Circular Receiving Aperture
Gain Function (dBi) Angular Range
Gmax + 20 log(1-γ) - (6 10
-4 + γ/3000)(D/
0 ≤ m4
G4 m4 r4
Gmax + 44 + 8γ - 30 log(D/ r4 < 4
-10 4 180
m4 0.62 - 0.3γ)r4, deg.
r4 5.14 [180πD)], deg.
4: field of view limited by optical stops, deg.
G4 Gmax - 15.15 + 8γ, dBi
5.12 Space Applications Service
SA includes space operation service (SOS), Inter-Satellite Service (ISS), Data Relay
Service (DRS), etc. These services will be discussed here.
NTIA does not provide the SA antenna radiation performance standards for the federal
systems. Otherwise, this sub-section contains SOS and DRS antenna characteristics from ITU-R.
5.12.1 Space Operation Service
The main functions of SOS are maintenance telemetry, telecommand, tracking and radio
frequency sensing for attitude control. Operational and technical parameters of SOS are provided
in Rec. ITU-R SA.363-5.191 Antennas with quasi-omnidirectional radiation patterns are mostly
used to perform the SOS operations. The average gain of a quasi-omnidirectional antenna is
around 0 dBi, and the minimum gain occasionally exceeds -6 dBi.192 However, satellite
structures greatly influence the radiation patterns. For instance for frequencies higher than 8
GHz, the antenna radiation pattern generally is not quasi-omnidirectional, but is restricted to
certain aspect angles. When conducting link budget analyses, the antenna gain data should be the
guaranteed value within the minimum required coverage area instead of the mainbeam gain
value of (Gmax - 3), dBi. In general, considerations for the antenna design are different in the
following frequency ranges:
191 Rec. ITU-R SA.363-5, Space Operation Systems (1994).
192 Rec. ITU-R SA.1154, Provisions to Protect the Space Research (SR), Space Operations (SO) and Earth
Exploration Satellite Services (EES) and to Facilitate Sharing with the Mobile Service in the 2 025-2 110 MHz
and 2 200-2 290 MHz Bands (1995).
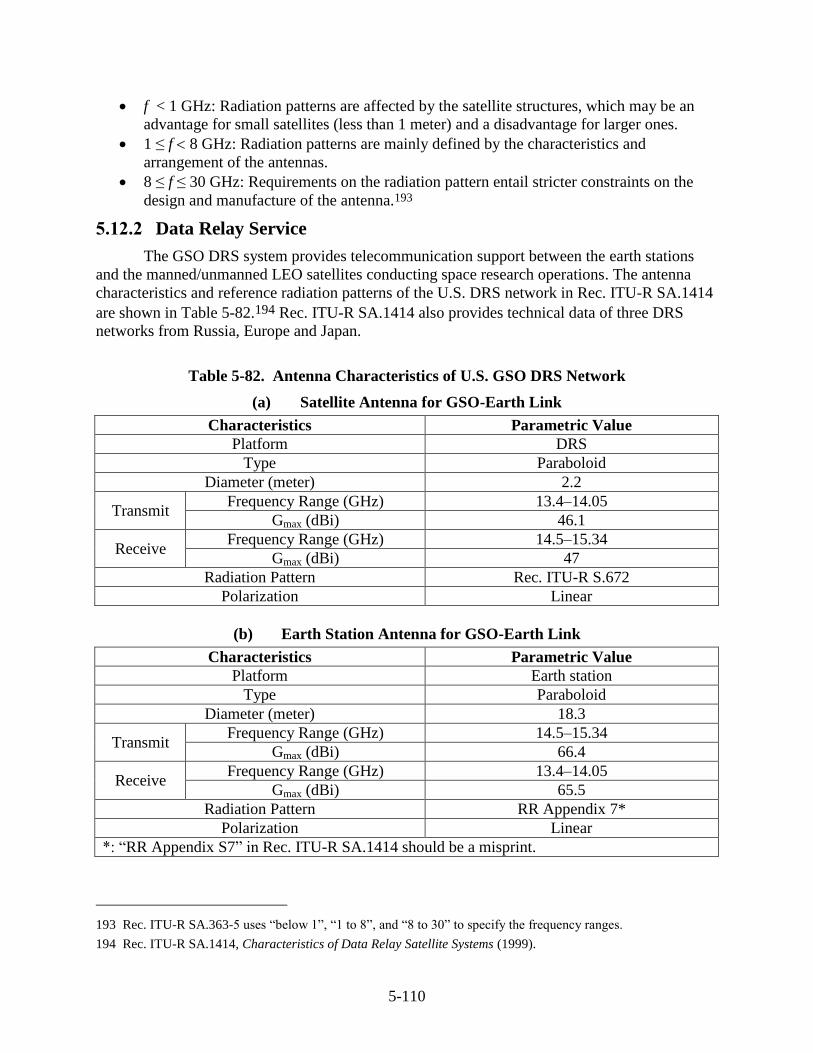
5-110
f < 1 GHz: Radiation patterns are affected by the satellite structures, which may be an
advantage for small satellites (less than 1 meter) and a disadvantage for larger ones.
1 ≤ f 8 GHz: Radiation patterns are mainly defined by the characteristics and
arrangement of the antennas.
8 ≤ f ≤ 30 GHz: Requirements on the radiation pattern entail stricter constraints on the
design and manufacture of the antenna.193
5.12.2 Data Relay Service
The GSO DRS system provides telecommunication support between the earth stations
and the manned/unmanned LEO satellites conducting space research operations. The antenna
characteristics and reference radiation patterns of the U.S. DRS network in Rec. ITU-R SA.1414
are shown in Table 5-82.194 Rec. ITU-R SA.1414 also provides technical data of three DRS
networks from Russia, Europe and Japan.
Table 5-82. Antenna Characteristics of U.S. GSO DRS Network
(a) Satellite Antenna for GSO-Earth Link
Characteristics Parametric Value
Platform DRS
Type Paraboloid
Diameter (meter) 2.2
Transmit Frequency Range (GHz) 13.4–14.05
Gmax (dBi) 46.1
Receive Frequency Range (GHz) 14.5–15.34
Gmax (dBi) 47
Radiation Pattern Rec. ITU-R S.672
Polarization Linear
(b) Earth Station Antenna for GSO-Earth Link
Characteristics Parametric Value
Platform Earth station
Type Paraboloid
Diameter (meter) 18.3
Transmit Frequency Range (GHz) 14.5–15.34
Gmax (dBi) 66.4
Receive Frequency Range (GHz) 13.4–14.05
Gmax (dBi) 65.5
Radiation Pattern RR Appendix 7*
Polarization Linear
*: “RR Appendix S7” in Rec. ITU-R SA.1414 should be a misprint.
193 Rec. ITU-R SA.363-5 uses “below 1”, “1 to 8”, and “8 to 30” to specify the frequency ranges.
194 Rec. ITU-R SA.1414, Characteristics of Data Relay Satellite Systems (1999).
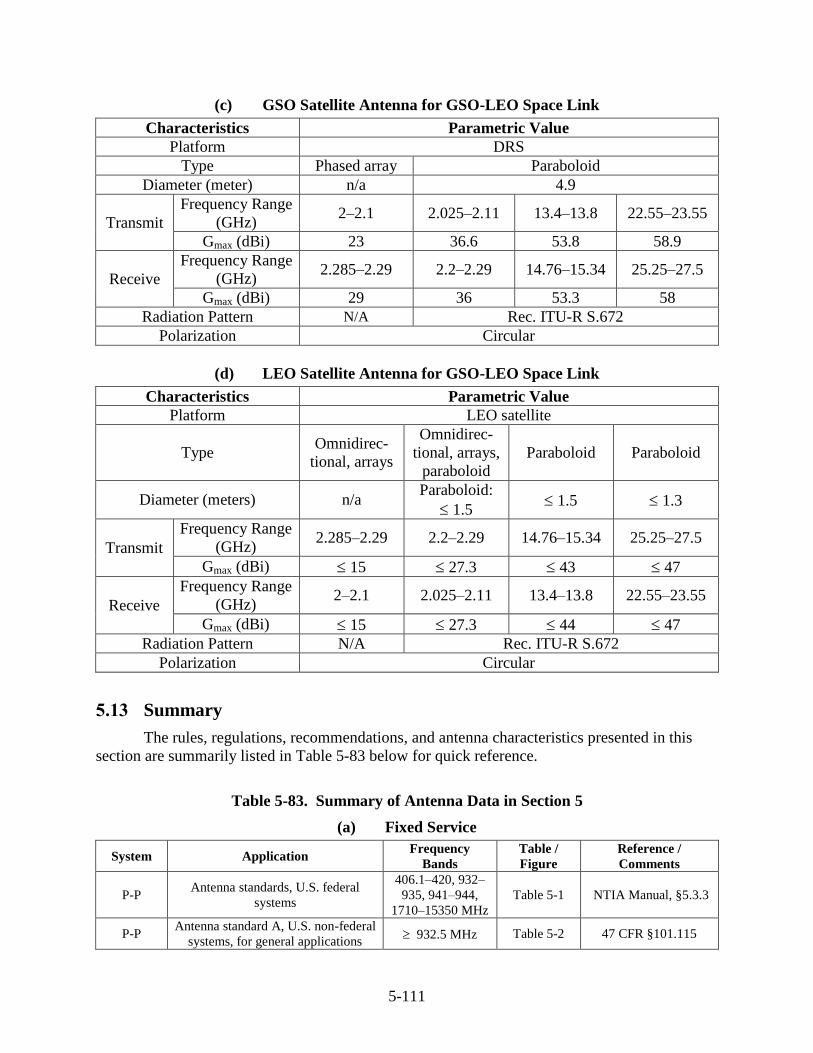
5-111
(c) GSO Satellite Antenna for GSO-LEO Space Link
Characteristics Parametric Value
Platform DRS
Type Phased array Paraboloid
Diameter (meter) n/a 4.9
Transmit
Frequency Range
(GHz) 2–2.1 2.025–2.11 13.4–13.8 22.55–23.55
Gmax (dBi) 23 36.6 53.8 58.9
Receive
Frequency Range
(GHz) 2.285–2.29 2.2–2.29 14.76–15.34 25.25–27.5
Gmax (dBi) 29 36 53.3 58
Radiation Pattern N/A Rec. ITU-R S.672
Polarization Circular
(d) LEO Satellite Antenna for GSO-LEO Space Link
Characteristics Parametric Value
Platform LEO satellite
Type Omnidirec-
tional, arrays
Omnidirec-
tional, arrays,
paraboloid
Paraboloid Paraboloid
Diameter (meters) n/a Paraboloid:
1.5 1.5 1.3
Transmit
Frequency Range
(GHz) 2.285–2.29 2.2–2.29 14.76–15.34 25.25–27.5
Gmax (dBi) 15 27.3 43 47
Receive
Frequency Range
(GHz) 2–2.1 2.025–2.11 13.4–13.8 22.55–23.55
Gmax (dBi) 15 27.3 44 47
Radiation Pattern N/A Rec. ITU-R S.672
Polarization Circular
5.13 Summary
The rules, regulations, recommendations, and antenna characteristics presented in this
section are summarily listed in Table 5-83 below for quick reference.
Table 5-83. Summary of Antenna Data in Section 5
(a) Fixed Service
System Application Frequency
Bands
Table /
Figure
Reference /
Comments
P-P Antenna standards, U.S. federal
systems
406.1–420, 932–
935, 941–944,
1710–15350 MHz
Table 5-1 NTIA Manual, §5.3.3
P-P Antenna standard A, U.S. non-federal
systems, for general applications 932.5 MHz Table 5-2 47 CFR §101.115
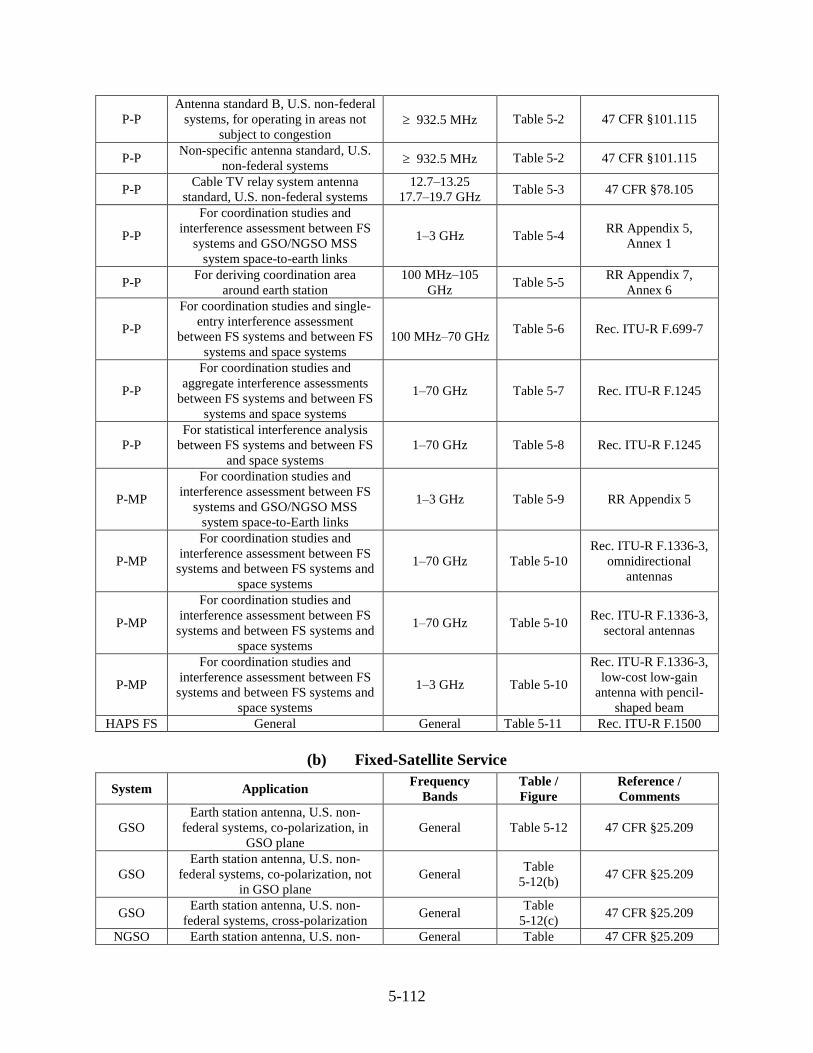
5-112
P-P
Antenna standard B, U.S. non-federal
systems, for operating in areas not
subject to congestion 932.5 MHz Table 5-2 47 CFR §101.115
P-P Non-specific antenna standard, U.S.
non-federal systems 932.5 MHz Table 5-2 47 CFR §101.115
P-P Cable TV relay system antenna
standard, U.S. non-federal systems
12.7–13.25
17.7–19.7 GHz Table 5-3 47 CFR §78.105
P-P
For coordination studies and
interference assessment between FS
systems and GSO/NGSO MSS
system space-to-earth links
1–3 GHz Table 5-4 RR Appendix 5,
Annex 1
P-P For deriving coordination area
around earth station
100 MHz–105
GHz Table 5-5
RR Appendix 7,
Annex 6
P-P
For coordination studies and single-
entry interference assessment
between FS systems and between FS
systems and space systems
100 MHz–70 GHz Table 5-6 Rec. ITU-R F.699-7
P-P
For coordination studies and
aggregate interference assessments
between FS systems and between FS
systems and space systems
1–70 GHz Table 5-7 Rec. ITU-R F.1245
P-P
For statistical interference analysis
between FS systems and between FS
and space systems
1–70 GHz Table 5-8 Rec. ITU-R F.1245
P-MP
For coordination studies and
interference assessment between FS
systems and GSO/NGSO MSS
system space-to-Earth links
1–3 GHz Table 5-9 RR Appendix 5
P-MP
For coordination studies and
interference assessment between FS
systems and between FS systems and
space systems
1–70 GHz Table 5-10
Rec. ITU-R F.1336-3,
omnidirectional
antennas
P-MP
For coordination studies and
interference assessment between FS
systems and between FS systems and
space systems
1–70 GHz Table 5-10 Rec. ITU-R F.1336-3,
sectoral antennas
P-MP
For coordination studies and
interference assessment between FS
systems and between FS systems and
space systems
1–3 GHz Table 5-10
Rec. ITU-R F.1336-3,
low-cost low-gain
antenna with pencil-
shaped beam
HAPS FS General General Table 5-11 Rec. ITU-R F.1500
(b) Fixed-Satellite Service
System Application Frequency
Bands
Table /
Figure
Reference /
Comments
GSO
Earth station antenna, U.S. non-
federal systems, co-polarization, in
GSO plane
General Table 5-12 47 CFR §25.209
GSO
Earth station antenna, U.S. non-
federal systems, co-polarization, not
in GSO plane
General Table
5-12(b) 47 CFR §25.209
GSO Earth station antenna, U.S. non-
federal systems, cross-polarization General
Table
5-12(c) 47 CFR §25.209
NGSO Earth station antenna, U.S. non- General Table 47 CFR §25.209
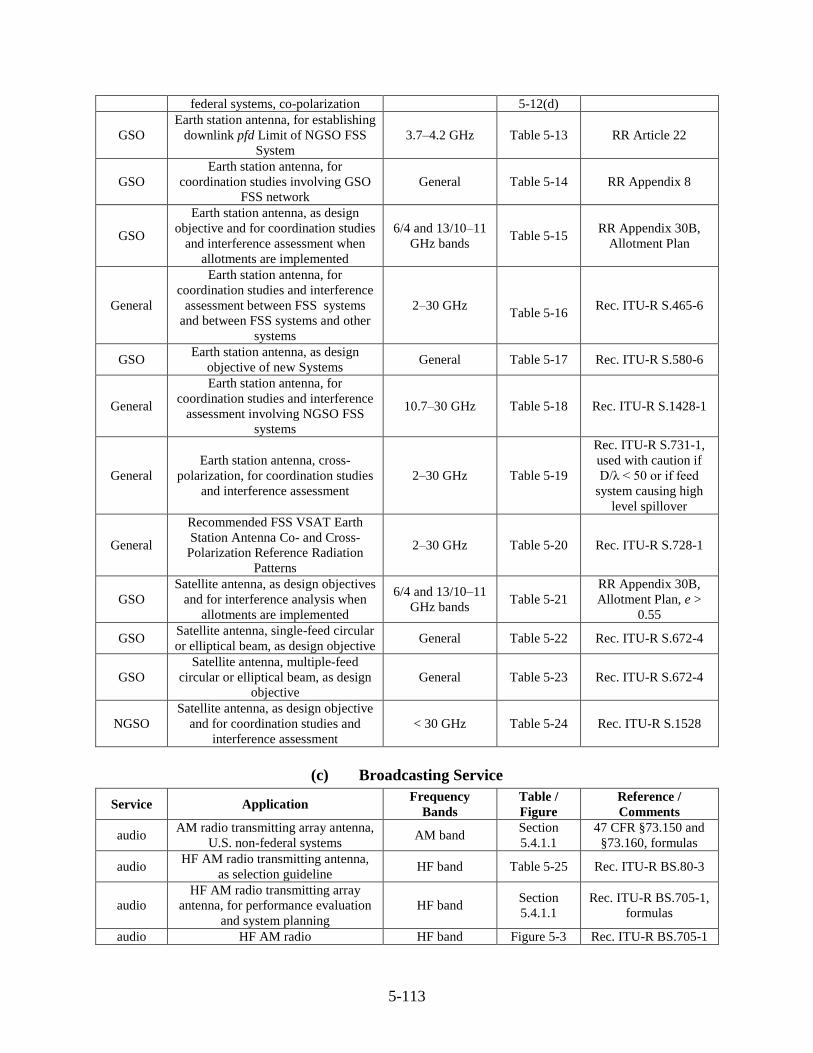
5-113
federal systems, co-polarization 5-12(d)
GSO
Earth station antenna, for establishing
downlink pfd Limit of NGSO FSS
System
3.7–4.2 GHz Table 5-13 RR Article 22
GSO
Earth station antenna, for
coordination studies involving GSO
FSS network
General Table 5-14 RR Appendix 8
GSO
Earth station antenna, as design
objective and for coordination studies
and interference assessment when
allotments are implemented
6/4 and 13/10–11
GHz bands Table 5-15
RR Appendix 30B,
Allotment Plan
General
Earth station antenna, for
coordination studies and interference
assessment between FSS systems
and between FSS systems and other
systems
2–30 GHz
Table 5-16 Rec. ITU-R S.465-6
GSO Earth station antenna, as design
objective of new Systems General Table 5-17 Rec. ITU-R S.580-6
General
Earth station antenna, for
coordination studies and interference
assessment involving NGSO FSS
systems
10.7–30 GHz Table 5-18 Rec. ITU-R S.1428-1
General
Earth station antenna, cross-
polarization, for coordination studies
and interference assessment
2–30 GHz Table 5-19
Rec. ITU-R S.731-1,
used with caution if
D/λ < 50 or if feed
system causing high
level spillover
General
Recommended FSS VSAT Earth
Station Antenna Co- and Cross-
Polarization Reference Radiation
Patterns
2–30 GHz Table 5-20 Rec. ITU-R S.728-1
GSO
Satellite antenna, as design objectives
and for interference analysis when
allotments are implemented
6/4 and 13/10–11
GHz bands Table 5-21
RR Appendix 30B,
Allotment Plan, e >
0.55
GSO Satellite antenna, single-feed circular
or elliptical beam, as design objective General Table 5-22 Rec. ITU-R S.672-4
GSO
Satellite antenna, multiple-feed
circular or elliptical beam, as design
objective
General Table 5-23 Rec. ITU-R S.672-4
NGSO
Satellite antenna, as design objective
and for coordination studies and
interference assessment
< 30 GHz Table 5-24 Rec. ITU-R S.1528
(c) Broadcasting Service
Service Application Frequency
Bands
Table /
Figure
Reference /
Comments
audio AM radio transmitting array antenna,
U.S. non-federal systems AM band
Section
5.4.1.1
47 CFR §73.150 and
§73.160, formulas
audio HF AM radio transmitting antenna,
as selection guideline HF band Table 5-25 Rec. ITU-R BS.80-3
audio
HF AM radio transmitting array
antenna, for performance evaluation
and system planning
HF band Section
5.4.1.1
Rec. ITU-R BS.705-1,
formulas
audio HF AM radio HF band Figure 5-3 Rec. ITU-R BS.705-1
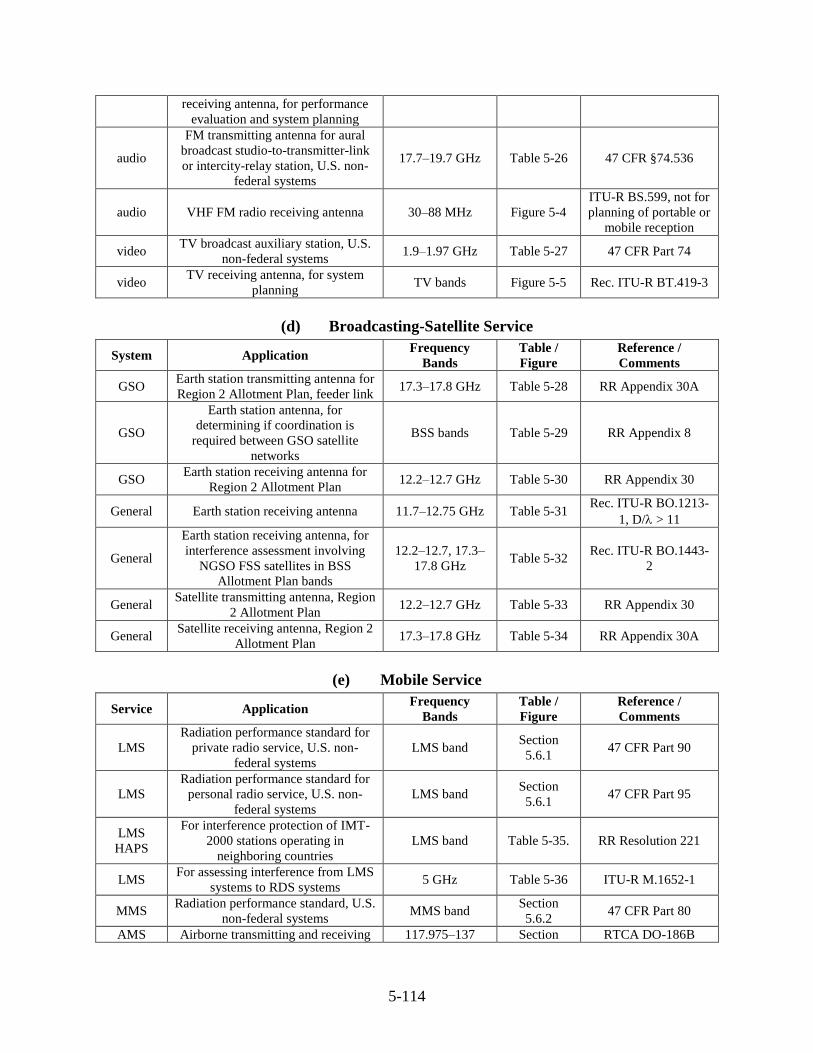
5-114
receiving antenna, for performance
evaluation and system planning
audio
FM transmitting antenna for aural
broadcast studio-to-transmitter-link
or intercity-relay station, U.S. non-
federal systems
17.7–19.7 GHz Table 5-26 47 CFR §74.536
audio VHF FM radio receiving antenna 30–88 MHz Figure 5-4
ITU-R BS.599, not for
planning of portable or
mobile reception
video TV broadcast auxiliary station, U.S.
non-federal systems 1.9–1.97 GHz Table 5-27 47 CFR Part 74
video TV receiving antenna, for system
planning TV bands Figure 5-5 Rec. ITU-R BT.419-3
(d) Broadcasting-Satellite Service
System Application Frequency
Bands
Table /
Figure
Reference /
Comments
GSO Earth station transmitting antenna for
Region 2 Allotment Plan, feeder link 17.3–17.8 GHz Table 5-28 RR Appendix 30A
GSO
Earth station antenna, for
determining if coordination is
required between GSO satellite
networks
BSS bands Table 5-29 RR Appendix 8
GSO Earth station receiving antenna for
Region 2 Allotment Plan 12.2–12.7 GHz Table 5-30 RR Appendix 30
General Earth station receiving antenna 11.7–12.75 GHz Table 5-31 Rec. ITU-R BO.1213-
1, D/ > 11
General
Earth station receiving antenna, for
interference assessment involving
NGSO FSS satellites in BSS
Allotment Plan bands
12.2–12.7, 17.3–
17.8 GHz Table 5-32
Rec. ITU-R BO.1443-
2
General Satellite transmitting antenna, Region
2 Allotment Plan 12.2–12.7 GHz Table 5-33 RR Appendix 30
General Satellite receiving antenna, Region 2
Allotment Plan 17.3–17.8 GHz Table 5-34 RR Appendix 30A
(e) Mobile Service
Service Application Frequency
Bands
Table /
Figure
Reference /
Comments
LMS
Radiation performance standard for
private radio service, U.S. non-
federal systems
LMS band Section
5.6.1 47 CFR Part 90
LMS
Radiation performance standard for
personal radio service, U.S. non-
federal systems
LMS band Section
5.6.1 47 CFR Part 95
LMS
HAPS
For interference protection of IMT-
2000 stations operating in
neighboring countries
LMS band Table 5-35. RR Resolution 221
LMS For assessing interference from LMS
systems to RDS systems 5 GHz Table 5-36 ITU-R M.1652-1
MMS Radiation performance standard, U.S.
non-federal systems MMS band
Section
5.6.2 47 CFR Part 80
AMS Airborne transmitting and receiving 117.975–137 Section RTCA DO-186B
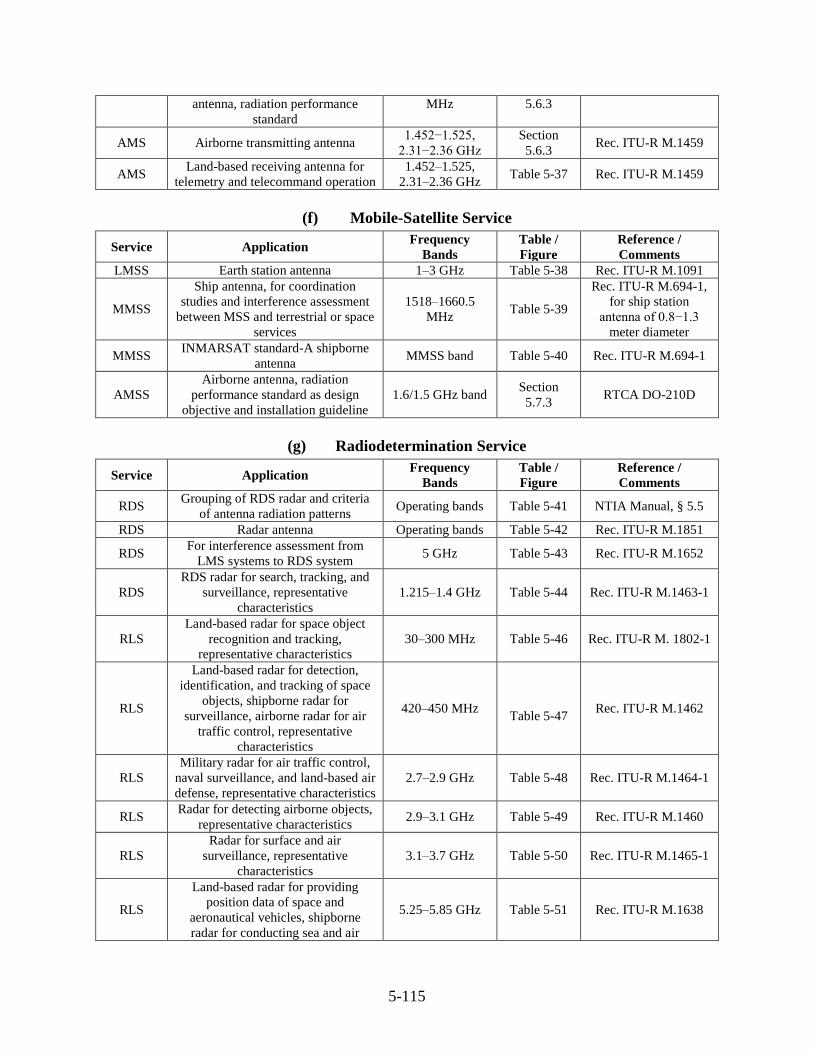
5-115
antenna, radiation performance
standard
MHz 5.6.3
AMS Airborne transmitting antenna 1.452−1.525,
2.31−2.36 GHz
Section
5.6.3 Rec. ITU-R M.1459
AMS Land-based receiving antenna for
telemetry and telecommand operation
1.452–1.525,
2.31–2.36 GHz Table 5-37 Rec. ITU-R M.1459
(f) Mobile-Satellite Service
Service Application Frequency
Bands
Table /
Figure
Reference /
Comments
LMSS Earth station antenna 1–3 GHz Table 5-38 Rec. ITU-R M.1091
MMSS
Ship antenna, for coordination
studies and interference assessment
between MSS and terrestrial or space
services
1518–1660.5
MHz Table 5-39
Rec. ITU-R M.694-1,
for ship station
antenna of 0.8−1.3
meter diameter
MMSS INMARSAT standard-A shipborne
antenna MMSS band Table 5-40 Rec. ITU-R M.694-1
AMSS
Airborne antenna, radiation
performance standard as design
objective and installation guideline
1.6/1.5 GHz band Section
5.7.3 RTCA DO-210D
(g) Radiodetermination Service
Service Application Frequency
Bands
Table /
Figure
Reference /
Comments
RDS Grouping of RDS radar and criteria
of antenna radiation patterns Operating bands Table 5-41 NTIA Manual, § 5.5
RDS Radar antenna Operating bands Table 5-42 Rec. ITU-R M.1851
RDS For interference assessment from
LMS systems to RDS system 5 GHz Table 5-43 Rec. ITU-R M.1652
RDS
RDS radar for search, tracking, and
surveillance, representative
characteristics
1.215–1.4 GHz Table 5-44 Rec. ITU-R M.1463-1
RLS
Land-based radar for space object
recognition and tracking,
representative characteristics
30–300 MHz Table 5-46 Rec. ITU-R M. 1802-1
RLS
Land-based radar for detection,
identification, and tracking of space
objects, shipborne radar for
surveillance, airborne radar for air
traffic control, representative
characteristics
420–450 MHz
Table 5-47 Rec. ITU-R M.1462
RLS
Military radar for air traffic control,
naval surveillance, and land-based air
defense, representative characteristics
2.7–2.9 GHz Table 5-48 Rec. ITU-R M.1464-1
RLS Radar for detecting airborne objects,
representative characteristics 2.9–3.1 GHz Table 5-49 Rec. ITU-R M.1460
RLS
Radar for surface and air
surveillance, representative
characteristics
3.1–3.7 GHz Table 5-50 Rec. ITU-R M.1465-1
RLS
Land-based radar for providing
position data of space and
aeronautical vehicles, shipborne
radar for conducting sea and air
5.25–5.85 GHz Table 5-51 Rec. ITU-R M.1638
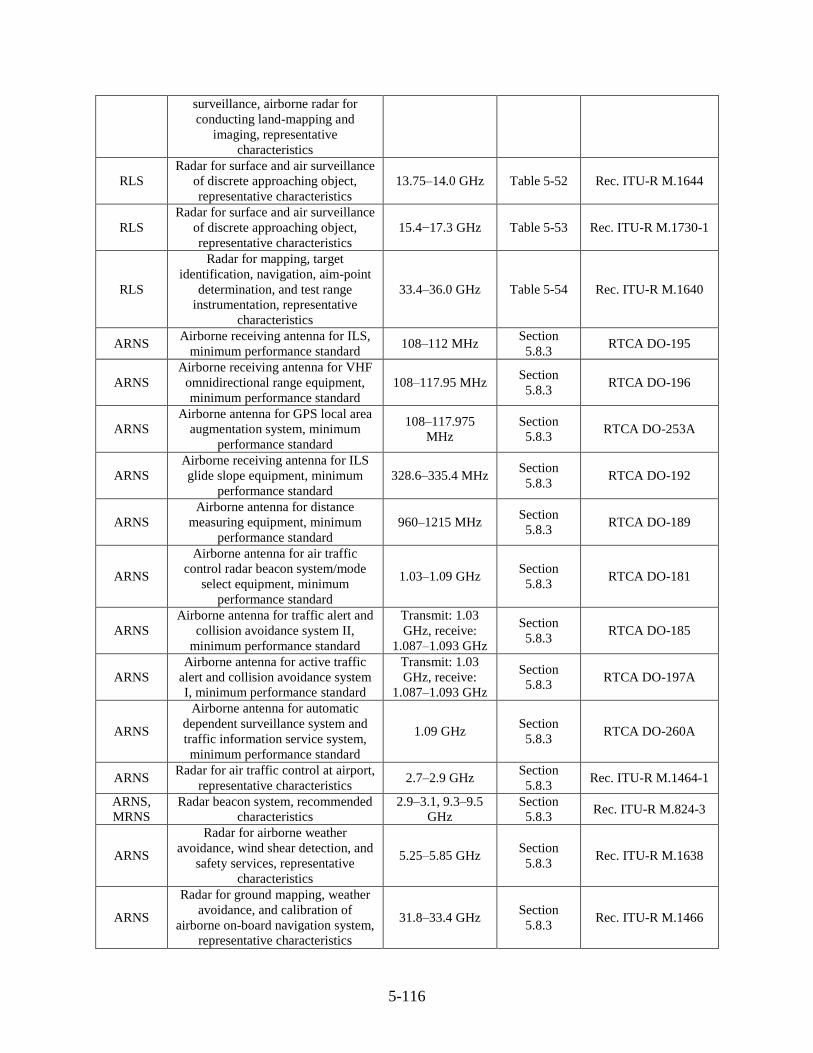
5-116
surveillance, airborne radar for
conducting land-mapping and
imaging, representative
characteristics
RLS
Radar for surface and air surveillance
of discrete approaching object,
representative characteristics
13.75–14.0 GHz Table 5-52 Rec. ITU-R M.1644
RLS
Radar for surface and air surveillance
of discrete approaching object,
representative characteristics
15.4−17.3 GHz Table 5-53 Rec. ITU-R M.1730-1
RLS
Radar for mapping, target
identification, navigation, aim-point
determination, and test range
instrumentation, representative
characteristics
33.4–36.0 GHz Table 5-54 Rec. ITU-R M.1640
ARNS Airborne receiving antenna for ILS,
minimum performance standard 108–112 MHz
Section
5.8.3 RTCA DO-195
ARNS
Airborne receiving antenna for VHF
omnidirectional range equipment,
minimum performance standard
108–117.95 MHz Section
5.8.3 RTCA DO-196
ARNS
Airborne antenna for GPS local area
augmentation system, minimum
performance standard
108–117.975
MHz
Section
5.8.3 RTCA DO-253A
ARNS
Airborne receiving antenna for ILS
glide slope equipment, minimum
performance standard
328.6–335.4 MHz Section
5.8.3 RTCA DO-192
ARNS
Airborne antenna for distance
measuring equipment, minimum
performance standard
960–1215 MHz Section
5.8.3 RTCA DO-189
ARNS
Airborne antenna for air traffic
control radar beacon system/mode
select equipment, minimum
performance standard
1.03–1.09 GHz Section
5.8.3 RTCA DO-181
ARNS
Airborne antenna for traffic alert and
collision avoidance system II,
minimum performance standard
Transmit: 1.03
GHz, receive:
1.087–1.093 GHz
Section
5.8.3 RTCA DO-185
ARNS
Airborne antenna for active traffic
alert and collision avoidance system
I, minimum performance standard
Transmit: 1.03
GHz, receive:
1.087–1.093 GHz
Section
5.8.3 RTCA DO-197A
ARNS
Airborne antenna for automatic
dependent surveillance system and
traffic information service system,
minimum performance standard
1.09 GHz Section
5.8.3 RTCA DO-260A
ARNS Radar for air traffic control at airport,
representative characteristics 2.7–2.9 GHz
Section
5.8.3 Rec. ITU-R M.1464-1
ARNS,
MRNS
Radar beacon system, recommended
characteristics
2.9–3.1, 9.3–9.5
GHz
Section
5.8.3 Rec. ITU-R M.824-3
ARNS
Radar for airborne weather
avoidance, wind shear detection, and
safety services, representative
characteristics
5.25–5.85 GHz Section
5.8.3 Rec. ITU-R M.1638
ARNS
Radar for ground mapping, weather
avoidance, and calibration of
airborne on-board navigation system,
representative characteristics
31.8–33.4 GHz Section
5.8.3 Rec. ITU-R M.1466
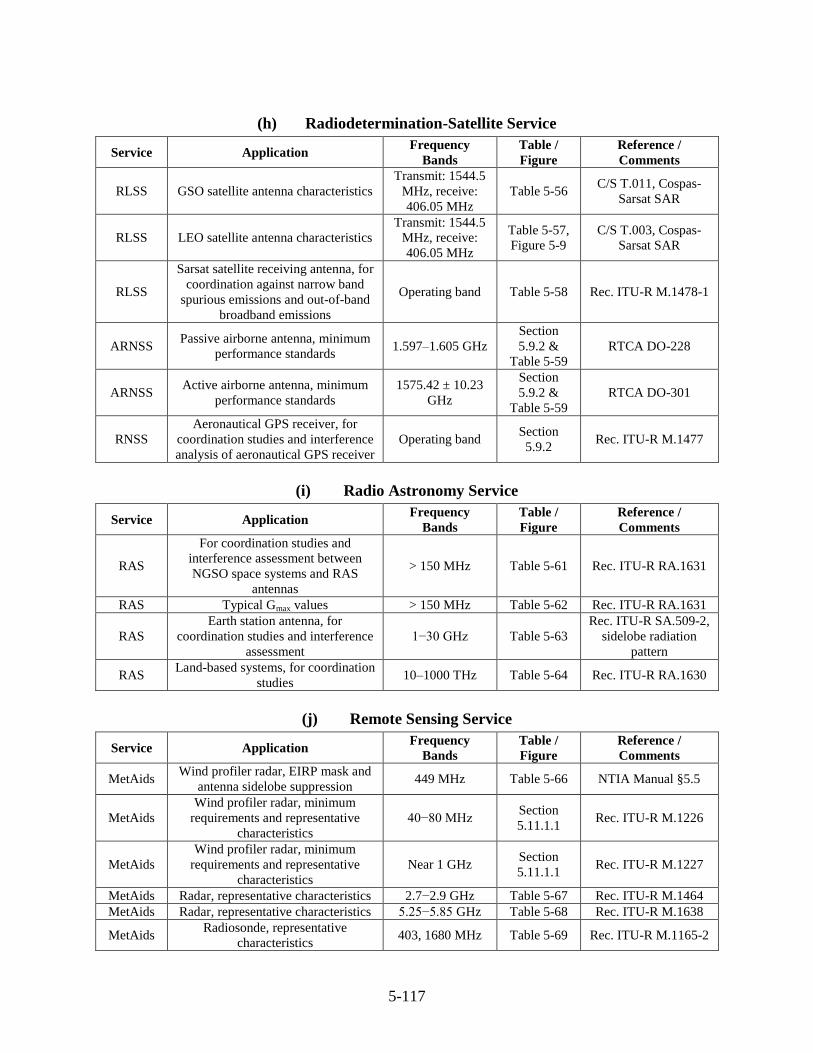
5-117
(h) Radiodetermination-Satellite Service
Service Application Frequency
Bands
Table /
Figure
Reference /
Comments
RLSS GSO satellite antenna characteristics
Transmit: 1544.5
MHz, receive:
406.05 MHz
Table 5-56 C/S T.011, Cospas-
Sarsat SAR
RLSS LEO satellite antenna characteristics
Transmit: 1544.5
MHz, receive:
406.05 MHz
Table 5-57,
Figure 5-9
C/S T.003, Cospas-
Sarsat SAR
RLSS
Sarsat satellite receiving antenna, for
coordination against narrow band
spurious emissions and out-of-band
broadband emissions
Operating band Table 5-58 Rec. ITU-R M.1478-1
ARNSS Passive airborne antenna, minimum
performance standards 1.597–1.605 GHz
Section
5.9.2 &
Table 5-59
RTCA DO-228
ARNSS Active airborne antenna, minimum
performance standards
1575.42 ± 10.23
GHz
Section
5.9.2 &
Table 5-59
RTCA DO-301
RNSS
Aeronautical GPS receiver, for
coordination studies and interference
analysis of aeronautical GPS receiver
Operating band Section
5.9.2 Rec. ITU-R M.1477
(i) Radio Astronomy Service
Service Application Frequency
Bands
Table /
Figure
Reference /
Comments
RAS
For coordination studies and
interference assessment between
NGSO space systems and RAS
antennas
> 150 MHz Table 5-61 Rec. ITU-R RA.1631
RAS Typical Gmax values > 150 MHz Table 5-62 Rec. ITU-R RA.1631
RAS
Earth station antenna, for
coordination studies and interference
assessment
1−30 GHz Table 5-63
Rec. ITU-R SA.509-2,
sidelobe radiation
pattern
RAS Land-based systems, for coordination
studies 10–1000 THz Table 5-64 Rec. ITU-R RA.1630
(j) Remote Sensing Service
Service Application Frequency
Bands
Table /
Figure
Reference /
Comments
MetAids Wind profiler radar, EIRP mask and
antenna sidelobe suppression 449 MHz Table 5-66 NTIA Manual §5.5
MetAids
Wind profiler radar, minimum
requirements and representative
characteristics
40−80 MHz Section
5.11.1.1 Rec. ITU-R M.1226
MetAids
Wind profiler radar, minimum
requirements and representative
characteristics
Near 1 GHz Section
5.11.1.1 Rec. ITU-R M.1227
MetAids Radar, representative characteristics 2.7−2.9 GHz Table 5-67 Rec. ITU-R M.1464
MetAids Radar, representative characteristics 5.25−5.85 GHz Table 5-68 Rec. ITU-R M.1638
MetAids Radiosonde, representative
characteristics 403, 1680 MHz Table 5-69 Rec. ITU-R M.1165-2
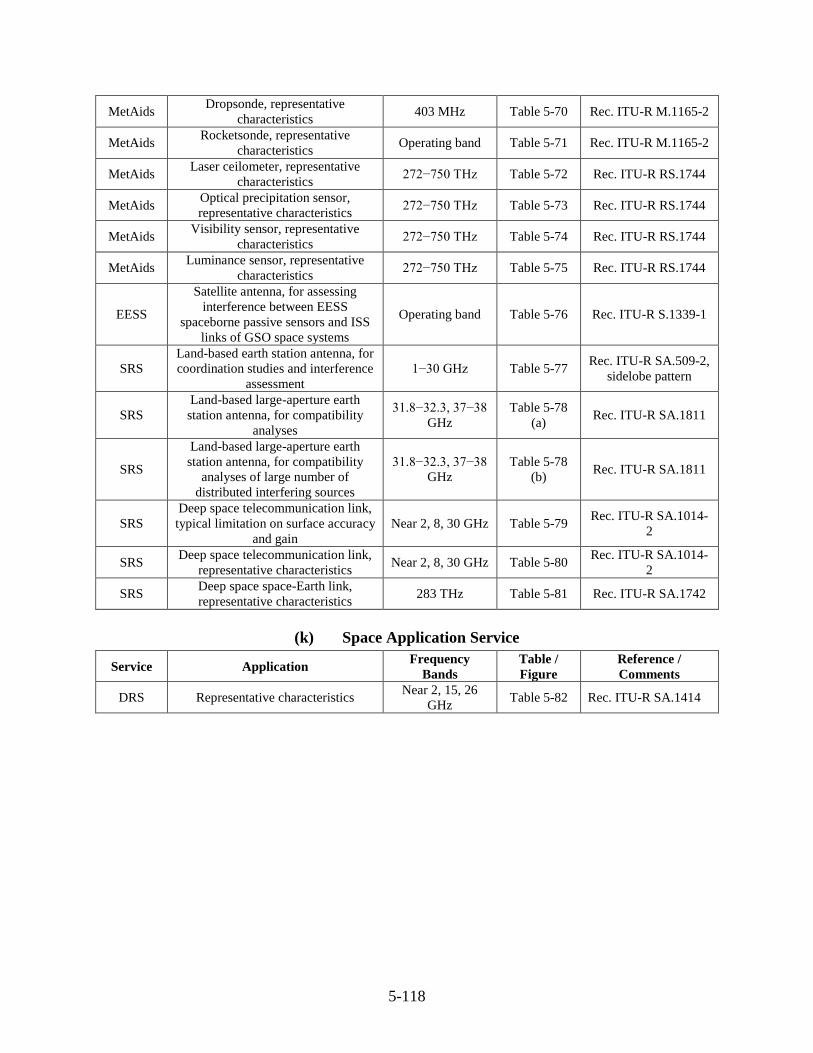
5-118
MetAids Dropsonde, representative
characteristics 403 MHz Table 5-70 Rec. ITU-R M.1165-2
MetAids Rocketsonde, representative
characteristics Operating band Table 5-71 Rec. ITU-R M.1165-2
MetAids Laser ceilometer, representative
characteristics 272−750 THz Table 5-72 Rec. ITU-R RS.1744
MetAids Optical precipitation sensor,
representative characteristics 272−750 THz Table 5-73 Rec. ITU-R RS.1744
MetAids Visibility sensor, representative
characteristics 272−750 THz Table 5-74 Rec. ITU-R RS.1744
MetAids Luminance sensor, representative
characteristics 272−750 THz Table 5-75 Rec. ITU-R RS.1744
EESS
Satellite antenna, for assessing
interference between EESS
spaceborne passive sensors and ISS
links of GSO space systems
Operating band Table 5-76 Rec. ITU-R S.1339-1
SRS
Land-based earth station antenna, for
coordination studies and interference
assessment
1−30 GHz Table 5-77 Rec. ITU-R SA.509-2,
sidelobe pattern
SRS
Land-based large-aperture earth
station antenna, for compatibility
analyses
31.8−32.3, 37−38
GHz
Table 5-78
(a) Rec. ITU-R SA.1811
SRS
Land-based large-aperture earth
station antenna, for compatibility
analyses of large number of
distributed interfering sources
31.8−32.3, 37−38
GHz
Table 5-78
(b) Rec. ITU-R SA.1811
SRS
Deep space telecommunication link,
typical limitation on surface accuracy
and gain
Near 2, 8, 30 GHz Table 5-79 Rec. ITU-R SA.1014-
2
SRS Deep space telecommunication link,
representative characteristics Near 2, 8, 30 GHz Table 5-80
Rec. ITU-R SA.1014-
2
SRS Deep space space-Earth link,
representative characteristics 283 THz Table 5-81 Rec. ITU-R SA.1742
(k) Space Application Service
Service Application Frequency
Bands
Table /
Figure
Reference /
Comments
DRS Representative characteristics Near 2, 15, 26
GHz Table 5-82 Rec. ITU-R SA.1414
6-1
SECTION 6. RECOMMENDATIONS
6.1 Introduction
NTIA conducts the following EMC analysis tasks: system review for equipment
approval, frequency assignment, and spectrum sharing analyses for the federal radio systems.
System review is the system certification process. Its EMC analyses require antenna
radiation masks to approve antennas for installation.
Frequency assignment is the process of assessing radio interference between new radio
systems and existing radio systems in order to determine the feasibility of providing frequency
assignments to the new systems. Its EMC analyses require the antenna actual radiation patterns.
However, antenna reference radiation patterns, which are developed from the actual radiation
patterns and are agreed-upon by regulators and engineers, are usually used because the actual
radiation patterns are usually not readily available.
Spectrum sharing analysis examines if a new radio system or a new radio service,
whether federal or non-federal, may co-exist with the existing federal systems. Its EMC analyses
require representative antenna radiation patterns that “represent” the federal radio operations in
certain frequency bands.
6.1.1 Objective
NTIA provides authoritative antenna parameters in the NTIA Manual for itself and the
federal agencies to conduct the EMC analysis tasks. However, NTIA only provides some
antenna parameters for some radio services to conduct some of these tasks. As seen in Section 5,
antenna parameters of many radio services are not available in the NTIA Manual. NTIA had on
occasion used ad hoc antenna radiation patterns when the authoritative antenna parameters were
not available, and the results had become contentious.
In order to provide the complete information, NTIA developed recommendations of
antenna parameters for all of the radio services and all of the EMC analysis tasks for itself and
the federal agencies. This information is presented in this section.
6.1.2 Methodology
The antenna parameters recommended for the EMC analysis tasks will be developed
from the antenna parameters in Sections 4 and 5. The antenna parameters in Sections 4 and 5 are
either widely used by NTIA and the federal agencies, or are from NTIA, FCC, ITU, and other
authoritative institutions like ICAO. These parameters are for certain specific spectrum
management tasks under certain conditions; for instance, the FS P-P system antenna radiation
performance standards in Table 5-1 are for NTIA to conduct the system review task; or, the FSS
earth station antenna radiation performance standards in Table 5-12 are for the non-federal FSS
system operators to conduct EMC analyses in frequency assignment and spectrum sharing
analyses.
For the system review task, antenna radiation masks will be adopted or developed. For
the frequency assignment task, antenna reference radiation patterns will be adopted or developed.
6-2
The hierarchy of adoption is as follows: NTIA, FCC, RR, authoritative institutions, ITU-R
recommendations, and other sources. When the radiation mask or pattern for a radio service is
not available, it will be adopted or developed from other radio services with similar antenna
usage.
The above hierarchy of adoption does not follow the instruction in the NTIA Manual
which states that “[i]f spectrum standards are not specified in this chapter, the appropriate
provisions of the ITU Radio Regulations normally shall apply. If spectrum standards are not
specified in this chapter or in the ITU Radio Regulations, the appropriate criteria contained in
current Recommendations of the ITU-R shall be used as guidelines.”195 However, any standard
issued from the FCC becomes the industry standard in the U.S., and the equipment would be
available commercially off the shelf (COTS). Therefore, it is more practical to select the FCC
standards over the ITU standards or recommendations.
For the spectrum sharing analyses task, representative antenna radiation patterns for the
federal frequency bands or non-federal frequency bands with significant federal presence will be
developed. The radiation pattern for developing the representative radiation pattern is the
reference radiation pattern for the frequency assignment task. The procedure to develop a
representative antenna radiation pattern is as follows:
(1) For a radio service, obtain the list of frequency bands where federal agencies operate
their radio systems. These bands are mostly in the federal bands, and they also can be in
non-federal bands that federal agencies lease capacities from the commercial operators;
this information is available in the Government Master File (GMF).196
(2) Retrieve frequency assignment records in a specific frequency band from the GMF.
(3) Develop the antenna Gmax population profile, i.e., the distribution of the number of
frequency assignments vs. Gmax and its cumulative curve.
(4) Select the representative Gmax value where the cumulative curve is closest to 75%, i.e.,
approximately 75% of the Gmax population is less than or equal to the representative
value. In the case when two Gmax data have equal (or almost equal) spacing to the 75%
threshold, the larger one is chosen such that more federal systems can be protected from
interference.
(5) Develop the representative radiation pattern from the reference radiation pattern for the
frequency assignment task and the representative Gmax value.
In the following sub-sections, antenna parameters for the spectrum management tasks of
system review, frequency assignment, and spectrum sharing analyses are developed for FS, FSS,
MS, MSS, RDS, RDSS, RAS, RSS, and SA. Parameters for BS and BSS will not be developed
because NTIA and the federal agencies do not conduct EMC analysis tasks for these radio
services.
6.2 Fixed Service
Because most of the domestic antenna manufacturers use the unit “foot” to specify the FS
antenna size, in this sub-section the main unit for specifying the antenna size will be in feet.
195 NTIA Manual, Chapter 5.1.1.
196 GMF March 2009 CD ROM release.
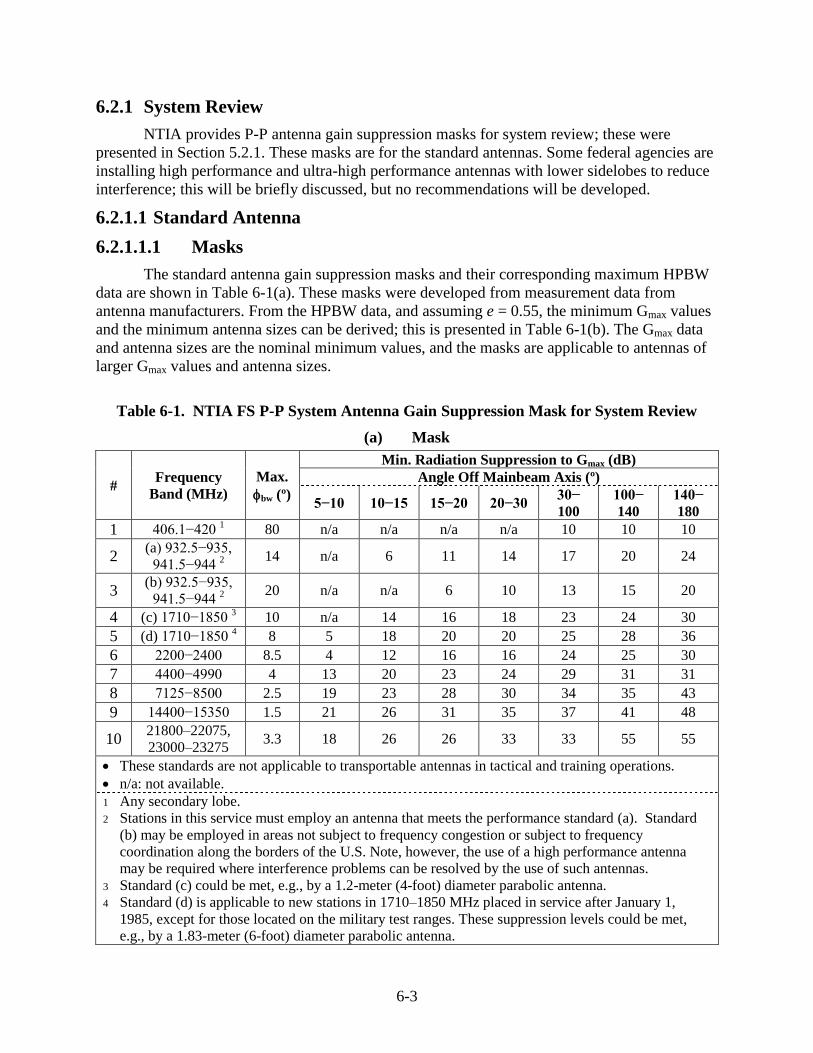
6-3
6.2.1 System Review
NTIA provides P-P antenna gain suppression masks for system review; these were
presented in Section 5.2.1. These masks are for the standard antennas. Some federal agencies are
installing high performance and ultra-high performance antennas with lower sidelobes to reduce
interference; this will be briefly discussed, but no recommendations will be developed.
6.2.1.1 Standard Antenna
6.2.1.1.1 Masks
The standard antenna gain suppression masks and their corresponding maximum HPBW
data are shown in Table 6-1(a). These masks were developed from measurement data from
antenna manufacturers. From the HPBW data, and assuming e = 0.55, the minimum Gmax values
and the minimum antenna sizes can be derived; this is presented in Table 6-1(b). The Gmax data
and antenna sizes are the nominal minimum values, and the masks are applicable to antennas of
larger Gmax values and antenna sizes.
Table 6-1. NTIA FS P-P System Antenna Gain Suppression Mask for System Review
(a) Mask
# Frequency
Band (MHz)
Max.
bw (º)
Min. Radiation Suppression to Gmax (dB)
Angle Off Mainbeam Axis (º)
5−10 10−15 15−20 20−30 30−
100
100−
140
140−
180
1 406.1−420 1 80 n/a n/a n/a n/a 10 10 10
2 (a) 932.5−935,
941.5−944 2
14 n/a 6 11 14 17 20 24
3 (b) 932.5−935,
941.5−944 2
20 n/a n/a 6 10 13 15 20
4 (c) 1710−1850 3 10 n/a 14 16 18 23 24 30
5 (d) 1710−1850 4 8 5 18 20 20 25 28 36
6 2200−2400 8.5 4 12 16 16 24 25 30
7 4400−4990 4 13 20 23 24 29 31 31
8 7125−8500 2.5 19 23 28 30 34 35 43
9 14400−15350 1.5 21 26 31 35 37 41 48
10 21800–22075,
23000–23275 3.3 18 26 26 33 33 55 55
These standards are not applicable to transportable antennas in tactical and training operations.
n/a: not available.
1 Any secondary lobe.
2 Stations in this service must employ an antenna that meets the performance standard (a). Standard
(b) may be employed in areas not subject to frequency congestion or subject to frequency
coordination along the borders of the U.S. Note, however, the use of a high performance antenna
may be required where interference problems can be resolved by the use of such antennas.
3 Standard (c) could be met, e.g., by a 1.2-meter (4-foot) diameter parabolic antenna.
4 Standard (d) is applicable to new stations in 1710–1850 MHz placed in service after January 1,
1985, except for those located on the military test ranges. These suppression levels could be met,
e.g., by a 1.83-meter (6-foot) diameter parabolic antenna.
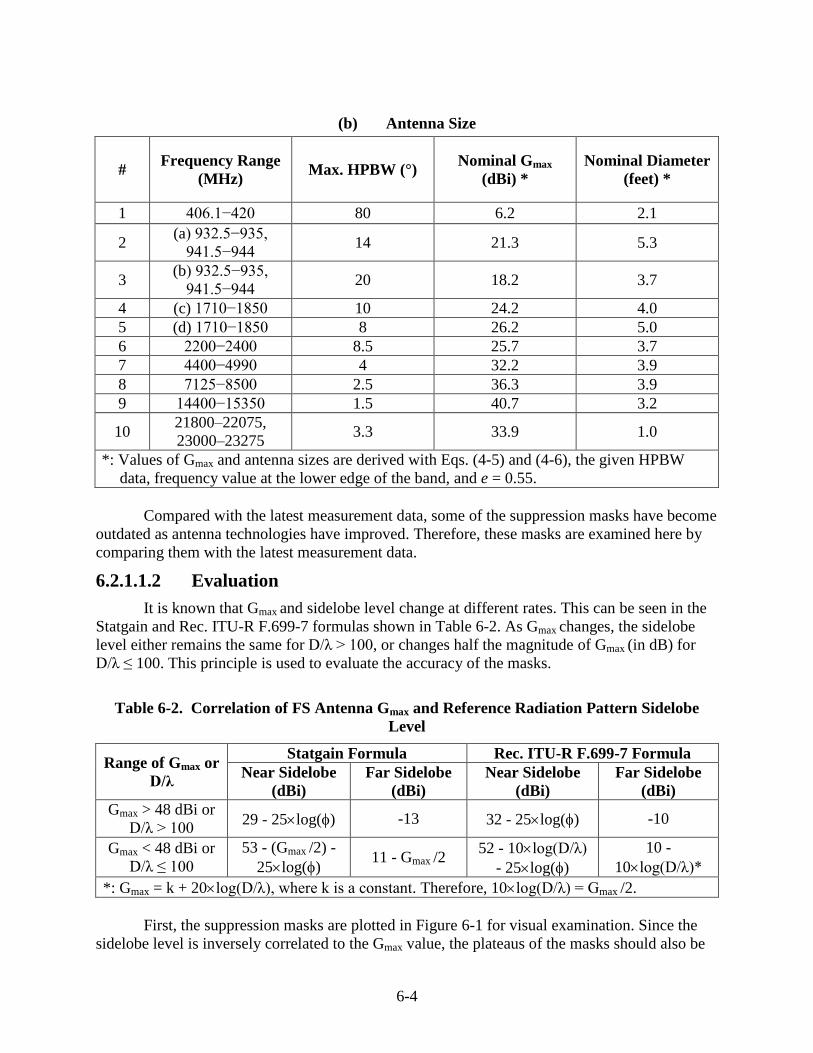
6-4
(b) Antenna Size
# Frequency Range
(MHz) Max. HPBW (°)
Nominal Gmax
(dBi) *
Nominal Diameter
(feet) *
1 406.1−420 80 6.2 2.1
2 (a) 932.5−935,
941.5−944 14 21.3 5.3
3 (b) 932.5−935,
941.5−944 20 18.2 3.7
4 (c) 1710−1850 10 24.2 4.0
5 (d) 1710−1850 8 26.2 5.0
6 2200−2400 8.5 25.7 3.7
7 4400−4990 4 32.2 3.9
8 7125−8500 2.5 36.3 3.9
9 14400−15350 1.5 40.7 3.2
10 21800–22075,
23000–23275 3.3 33.9 1.0
*: Values of Gmax and antenna sizes are derived with Eqs. (4-5) and (4-6), the given HPBW
data, frequency value at the lower edge of the band, and e = 0.55.
Compared with the latest measurement data, some of the suppression masks have become
outdated as antenna technologies have improved. Therefore, these masks are examined here by
comparing them with the latest measurement data.
6.2.1.1.2 Evaluation
It is known that Gmax and sidelobe level change at different rates. This can be seen in the
Statgain and Rec. ITU-R F.699-7 formulas shown in Table 6-2. As Gmax changes, the sidelobe
level either remains the same for D/λ > 100, or changes half the magnitude of Gmax (in dB) for
D/λ ≤ 100. This principle is used to evaluate the accuracy of the masks.
Table 6-2. Correlation of FS Antenna Gmax and Reference Radiation Pattern Sidelobe
Level
Range of Gmax or
D/λ
Statgain Formula Rec. ITU-R F.699-7 Formula
Near Sidelobe
(dBi)
Far Sidelobe
(dBi)
Near Sidelobe
(dBi)
Far Sidelobe
(dBi)
Gmax > 48 dBi or
D/λ > 100 29 - 25log() -13 32 - 25log() -10
Gmax < 48 dBi or
D/λ ≤ 100
53 - (Gmax /2) -
25log() 11 - Gmax /2
52 - 10log(D/λ)
- 25log()
10 -
10log(D/λ)*
*: Gmax = k + 20log(D/λ), where k is a constant. Therefore, 10log(D/λ) = Gmax /2.
First, the suppression masks are plotted in Figure 6-1 for visual examination. Since the
sidelobe level is inversely correlated to the Gmax value, the plateaus of the masks should also be
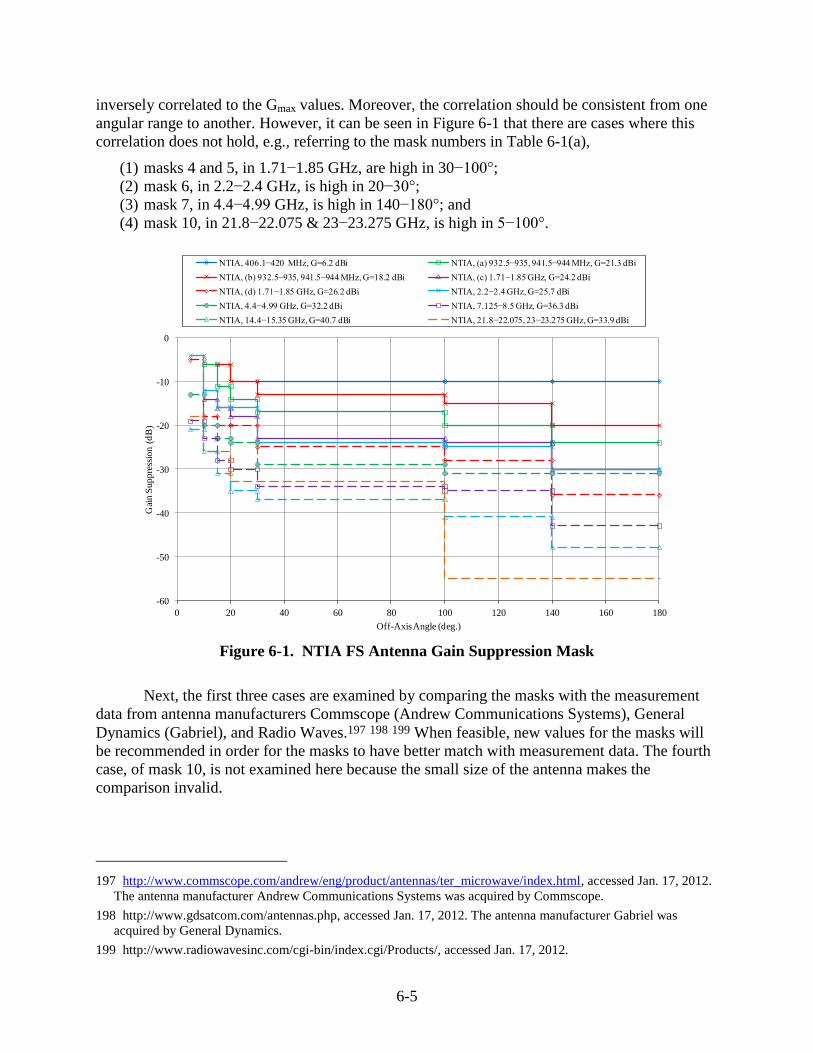
6-5
inversely correlated to the Gmax values. Moreover, the correlation should be consistent from one
angular range to another. However, it can be seen in Figure 6-1 that there are cases where this
correlation does not hold, e.g., referring to the mask numbers in Table 6-1(a),
(1) masks 4 and 5, in 1.71−1.85 GHz, are high in 30−100°;
(2) mask 6, in 2.2−2.4 GHz, is high in 20−30°;
(3) mask 7, in 4.4−4.99 GHz, is high in 140−180°; and
(4) mask 10, in 21.8−22.075 & 23−23.275 GHz, is high in 5−100°.
-60
-50
-40
-30
-20
-10
0
0 20 40 60 80 100 120 140 160 180
Gai
n S
up
pre
ssio
n (
dB
)
Off-Axis Angle (deg.)
NTIA, 406.1−420 MHz, G=6.2 dBi NTIA, (a) 932.5−935, 941.5−944 MHz, G=21.3 dBi
NTIA, (b) 932.5−935, 941.5−944 MHz, G=18.2 dBi NTIA, (c) 1.71−1.85 GHz, G=24.2 dBi
NTIA, (d) 1.71−1.85 GHz, G=26.2 dBi NTIA, 2.2−2.4 GHz, G=25.7 dBi
NTIA, 4.4−4.99 GHz, G=32.2 dBi NTIA, 7.125−8.5 GHz, G=36.3 dBi
NTIA, 14.4−15.35 GHz, G=40.7 dBi NTIA, 21.8−22.075, 23−23.275 GHz, G=33.9 dBi
Figure 6-1. NTIA FS Antenna Gain Suppression Mask
Next, the first three cases are examined by comparing the masks with the measurement
data from antenna manufacturers Commscope (Andrew Communications Systems), General
Dynamics (Gabriel), and Radio Waves.197 198 199 When feasible, new values for the masks will
be recommended in order for the masks to have better match with measurement data. The fourth
case, of mask 10, is not examined here because the small size of the antenna makes the
comparison invalid.
197 http://www.commscope.com/andrew/eng/product/antennas/ter_microwave/index.html, accessed Jan. 17, 2012.
The antenna manufacturer Andrew Communications Systems was acquired by Commscope.
198 http://www.gdsatcom.com/antennas.php, accessed Jan. 17, 2012. The antenna manufacturer Gabriel was
acquired by General Dynamics.
199 http://www.radiowavesinc.com/cgi-bin/index.cgi/Products/, accessed Jan. 17, 2012.
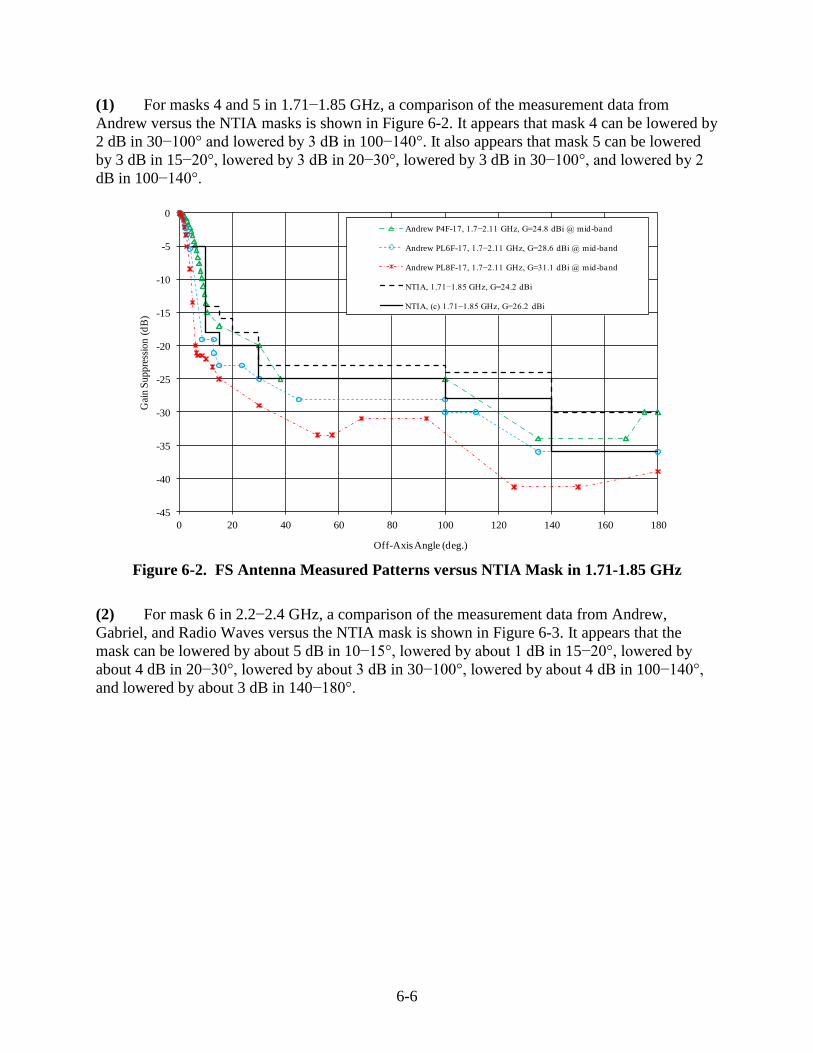
6-6
(1) For masks 4 and 5 in 1.71−1.85 GHz, a comparison of the measurement data from
Andrew versus the NTIA masks is shown in Figure 6-2. It appears that mask 4 can be lowered by
2 dB in 30−100° and lowered by 3 dB in 100−140°. It also appears that mask 5 can be lowered
by 3 dB in 15−20°, lowered by 3 dB in 20−30°, lowered by 3 dB in 30−100°, and lowered by 2
dB in 100−140°.
-45
-40
-35
-30
-25
-20
-15
-10
-5
0
0 20 40 60 80 100 120 140 160 180
Gai
n S
upp
ress
ion (
dB
)
Off-Axis Angle (deg.)
Andrew P4F-17, 1.7−2.11 GHz, G=24.8 dBi @ mid-band
Andrew PL6F-17, 1.7−2.11 GHz, G=28.6 dBi @ mid-band
Andrew PL8F-17, 1.7−2.11 GHz, G=31.1 dBi @ mid-band
NTIA, 1.71−1.85 GHz, G=24.2 dBi
NTIA, (c) 1.71−1.85 GHz, G=26.2 dBi
Figure 6-2. FS Antenna Measured Patterns versus NTIA Mask in 1.71-1.85 GHz
(2) For mask 6 in 2.2−2.4 GHz, a comparison of the measurement data from Andrew,
Gabriel, and Radio Waves versus the NTIA mask is shown in Figure 6-3. It appears that the
mask can be lowered by about 5 dB in 10−15°, lowered by about 1 dB in 15−20°, lowered by
about 4 dB in 20−30°, lowered by about 3 dB in 30−100°, lowered by about 4 dB in 100−140°,
and lowered by about 3 dB in 140−180°.
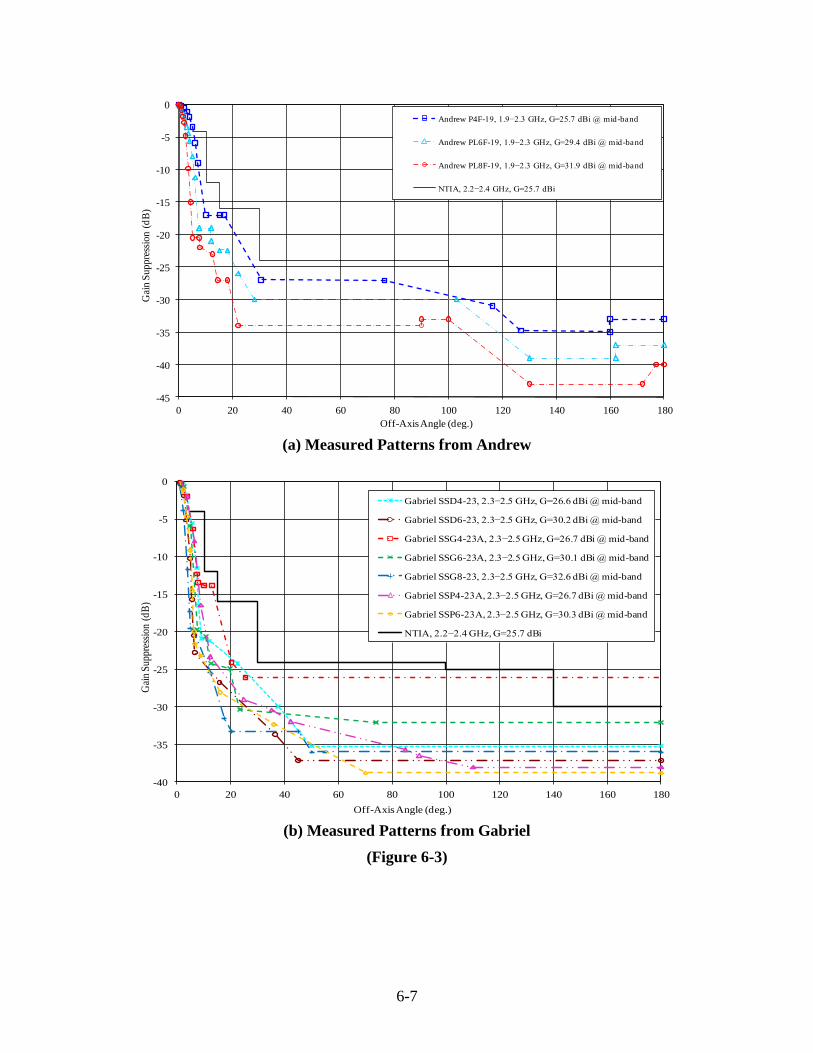
6-7
-45
-40
-35
-30
-25
-20
-15
-10
-5
0
0 20 40 60 80 100 120 140 160 180
Gai
n S
up
pre
ssio
n (
dB
)
Off-Axis Angle (deg.)
Andrew P4F-19, 1.9−2.3 GHz, G=25.7 dBi @ mid-band
Andrew PL6F-19, 1.9−2.3 GHz, G=29.4 dBi @ mid-band
Andrew PL8F-19, 1.9−2.3 GHz, G=31.9 dBi @ mid-band
NTIA, 2.2−2.4 GHz, G=25.7 dBi
(a) Measured Patterns from Andrew
(b) Measured Patterns from Gabriel
(Figure 6-3)
-40
-35
-30
-25
-20
-15
-10
-5
0
0 20 40 60 80 100 120 140 160 180
Gai
n S
uppr
essi
on (
dB
)
Off-Axis Angle (deg.)
Gabriel SSD4-23, 2.3−2.5 GHz, G=26.6 dBi @ mid-band
Gabriel SSD6-23, 2.3−2.5 GHz, G=30.2 dBi @ mid-band
Gabriel SSG4-23A, 2.3−2.5 GHz, G=26.7 dBi @ mid-band
Gabriel SSG6-23A, 2.3−2.5 GHz, G=30.1 dBi @ mid-band
Gabriel SSG8-23, 2.3−2.5 GHz, G=32.6 dBi @ mid-band
Gabriel SSP4-23A, 2.3−2.5 GHz, G=26.7 dBi @ mid-band
Gabriel SSP6-23A, 2.3−2.5 GHz, G=30.3 dBi @ mid-band
NTIA, 2.2−2.4 GHz, G=25.7 dBi
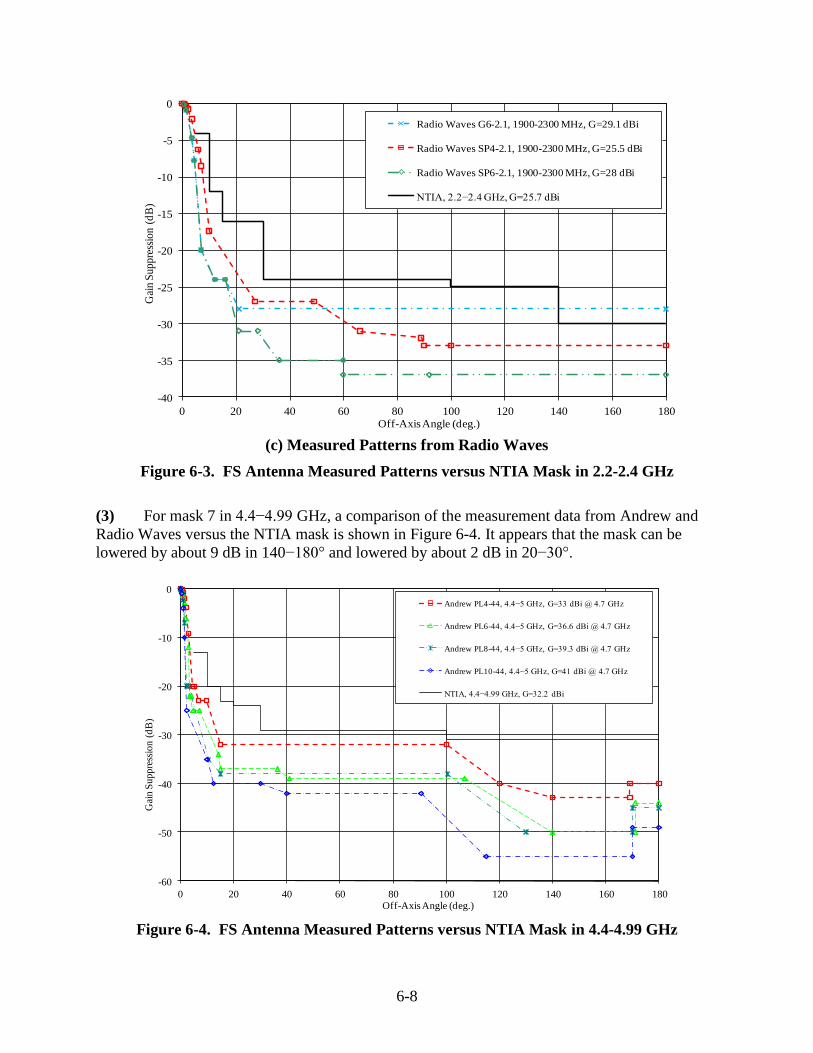
6-8
-40
-35
-30
-25
-20
-15
-10
-5
0
0 20 40 60 80 100 120 140 160 180
Gai
n S
upp
ress
ion (
dB
)
Off-Axis Angle (deg.)
Radio Waves G6-2.1, 1900-2300 MHz, G=29.1 dBi
Radio Waves SP4-2.1, 1900-2300 MHz, G=25.5 dBi
Radio Waves SP6-2.1, 1900-2300 MHz, G=28 dBi
NTIA, 2.2−2.4 GHz, G=25.7 dBi
(c) Measured Patterns from Radio Waves
Figure 6-3. FS Antenna Measured Patterns versus NTIA Mask in 2.2-2.4 GHz
(3) For mask 7 in 4.4−4.99 GHz, a comparison of the measurement data from Andrew and
Radio Waves versus the NTIA mask is shown in Figure 6-4. It appears that the mask can be
lowered by about 9 dB in 140−180° and lowered by about 2 dB in 20−30°.
-60
-50
-40
-30
-20
-10
0
0 20 40 60 80 100 120 140 160 180
Gai
n S
up
pre
ssio
n (
dB
)
Off-Axis Angle (deg.)
Andrew PL4-44, 4.4−5 GHz, G=33 dBi @ 4.7 GHz
Andrew PL6-44, 4.4−5 GHz, G=36.6 dBi @ 4.7 GHz
Andrew PL8-44, 4.4−5 GHz, G=39.3 dBi @ 4.7 GHz
Andrew PL10-44, 4.4−5 GHz, G=41 dBi @ 4.7 GHz
NTIA, 4.4−4.99 GHz, G=32.2 dBi
Figure 6-4. FS Antenna Measured Patterns versus NTIA Mask in 4.4-4.99 GHz
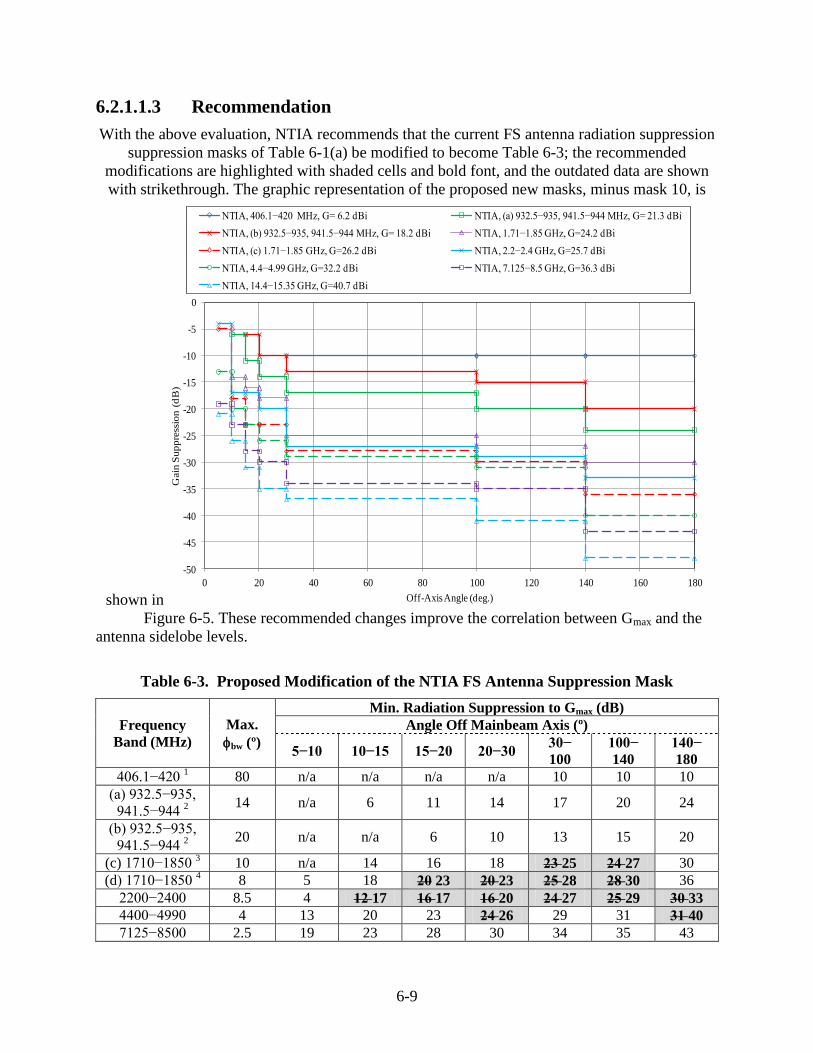
6-9
6.2.1.1.3 Recommendation
With the above evaluation, NTIA recommends that the current FS antenna radiation suppression
suppression masks of Table 6-1(a) be modified to become Table 6-3; the recommended
modifications are highlighted with shaded cells and bold font, and the outdated data are shown
with strikethrough. The graphic representation of the proposed new masks, minus mask 10, is
shown in
-50
-45
-40
-35
-30
-25
-20
-15
-10
-5
0
0 20 40 60 80 100 120 140 160 180
Gain
Supp
ress
ion (
dB
)
Off-Axis Angle (deg.)
NTIA, 406.1−420 MHz, G= 6.2 dBi NTIA, (a) 932.5−935, 941.5−944 MHz, G= 21.3 dBi
NTIA, (b) 932.5−935, 941.5−944 MHz, G= 18.2 dBi NTIA, 1.71−1.85 GHz, G=24.2 dBi
NTIA, (c) 1.71−1.85 GHz, G=26.2 dBi NTIA, 2.2−2.4 GHz, G=25.7 dBi
NTIA, 4.4−4.99 GHz, G=32.2 dBi NTIA, 7.125−8.5 GHz, G=36.3 dBi
NTIA, 14.4−15.35 GHz, G=40.7 dBi
Figure 6-5. These recommended changes improve the correlation between Gmax and the
antenna sidelobe levels.
Table 6-3. Proposed Modification of the NTIA FS Antenna Suppression Mask
Frequency
Band (MHz)
Max.
bw (º)
Min. Radiation Suppression to Gmax (dB)
Angle Off Mainbeam Axis (º)
5−10 10−15 15−20 20−30 30−
100
100−
140
140−
180
406.1−420 1 80 n/a n/a n/a n/a 10 10 10
(a) 932.5−935,
941.5−944 2
14 n/a 6 11 14 17 20 24
(b) 932.5−935,
941.5−944 2
20 n/a n/a 6 10 13 15 20
(c) 1710−1850 3 10 n/a 14 16 18 23 25 24 27 30
(d) 1710−1850 4 8 5 18 20 23 20 23 25 28 28 30 36
2200−2400 8.5 4 12 17 16 17 16 20 24 27 25 29 30 33
4400−4990 4 13 20 23 24 26 29 31 31 40
7125−8500 2.5 19 23 28 30 34 35 43
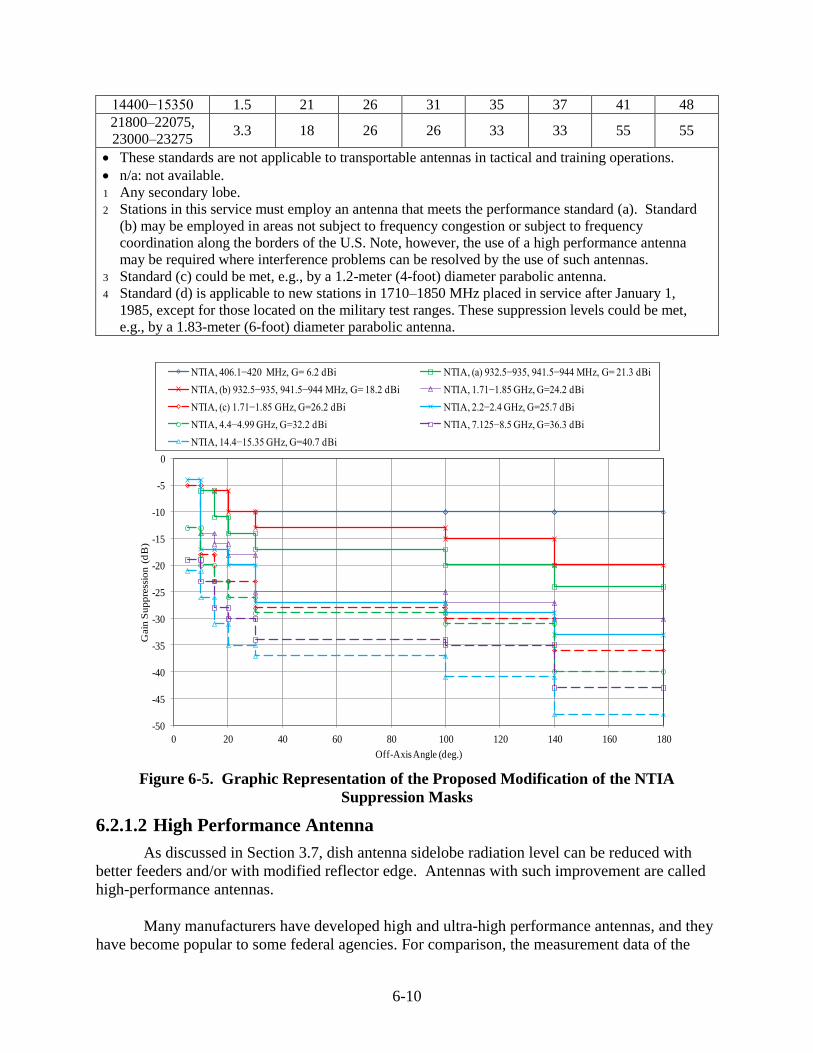
6-10
14400−15350 1.5 21 26 31 35 37 41 48
21800–22075,
23000–23275 3.3 18 26 26 33 33 55 55
These standards are not applicable to transportable antennas in tactical and training operations.
n/a: not available.
1 Any secondary lobe.
2 Stations in this service must employ an antenna that meets the performance standard (a). Standard
(b) may be employed in areas not subject to frequency congestion or subject to frequency
coordination along the borders of the U.S. Note, however, the use of a high performance antenna
may be required where interference problems can be resolved by the use of such antennas.
3 Standard (c) could be met, e.g., by a 1.2-meter (4-foot) diameter parabolic antenna.
4 Standard (d) is applicable to new stations in 1710–1850 MHz placed in service after January 1,
1985, except for those located on the military test ranges. These suppression levels could be met,
e.g., by a 1.83-meter (6-foot) diameter parabolic antenna.
-50
-45
-40
-35
-30
-25
-20
-15
-10
-5
0
0 20 40 60 80 100 120 140 160 180
Gain
Supp
ress
ion (
dB
)
Off-Axis Angle (deg.)
NTIA, 406.1−420 MHz, G= 6.2 dBi NTIA, (a) 932.5−935, 941.5−944 MHz, G= 21.3 dBi
NTIA, (b) 932.5−935, 941.5−944 MHz, G= 18.2 dBi NTIA, 1.71−1.85 GHz, G=24.2 dBi
NTIA, (c) 1.71−1.85 GHz, G=26.2 dBi NTIA, 2.2−2.4 GHz, G=25.7 dBi
NTIA, 4.4−4.99 GHz, G=32.2 dBi NTIA, 7.125−8.5 GHz, G=36.3 dBi
NTIA, 14.4−15.35 GHz, G=40.7 dBi
Figure 6-5. Graphic Representation of the Proposed Modification of the NTIA
Suppression Masks
6.2.1.2 High Performance Antenna
As discussed in Section 3.7, dish antenna sidelobe radiation level can be reduced with
better feeders and/or with modified reflector edge. Antennas with such improvement are called
high-performance antennas.
Many manufacturers have developed high and ultra-high performance antennas, and they
have become popular to some federal agencies. For comparison, the measurement data of the
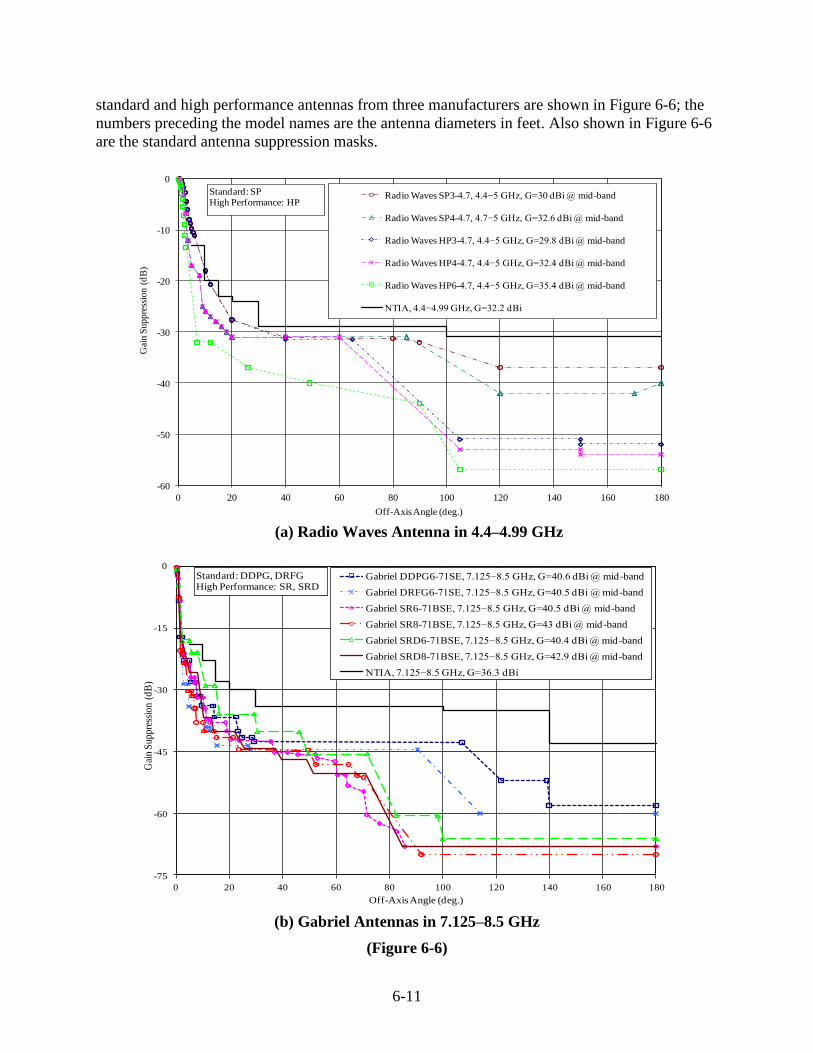
6-11
standard and high performance antennas from three manufacturers are shown in Figure 6-6; the
numbers preceding the model names are the antenna diameters in feet. Also shown in Figure 6-6
are the standard antenna suppression masks.
-60
-50
-40
-30
-20
-10
0
0 20 40 60 80 100 120 140 160 180
Gai
n S
up
pre
ssio
n (
dB
)
Off-Axis Angle (deg.)
Radio Waves SP3-4.7, 4.4−5 GHz, G=30 dBi @ mid-band
Radio Waves SP4-4.7, 4.7−5 GHz, G=32.6 dBi @ mid-band
Radio Waves HP3-4.7, 4.4−5 GHz, G=29.8 dBi @ mid-band
Radio Waves HP4-4.7, 4.4−5 GHz, G=32.4 dBi @ mid-band
Radio Waves HP6-4.7, 4.4−5 GHz, G=35.4 dBi @ mid-band
NTIA, 4.4−4.99 GHz, G=32.2 dBi
Standard: SPHigh Performance: HP
(a) Radio Waves Antenna in 4.4–4.99 GHz
-75
-60
-45
-30
-15
0
0 20 40 60 80 100 120 140 160 180
Gai
n S
up
pres
sio
n (
dB
)
Off-Axis Angle (deg.)
Gabriel DDPG6-71SE, 7.125−8.5 GHz, G=40.6 dBi @ mid-band
Gabriel DRFG6-71SE, 7.125−8.5 GHz, G=40.5 dBi @ mid-band
Gabriel SR6-71BSE, 7.125−8.5 GHz, G=40.5 dBi @ mid-band
Gabriel SR8-71BSE, 7.125−8.5 GHz, G=43 dBi @ mid-band
Gabriel SRD6-71BSE, 7.125−8.5 GHz, G=40.4 dBi @ mid-band
Gabriel SRD8-71BSE, 7.125−8.5 GHz, G=42.9 dBi @ mid-band
NTIA, 7.125−8.5 GHz, G=36.3 dBi
Standard: DDPG, DRFGHigh Performance: SR, SRD
(b) Gabriel Antennas in 7.125–8.5 GHz
(Figure 6-6)
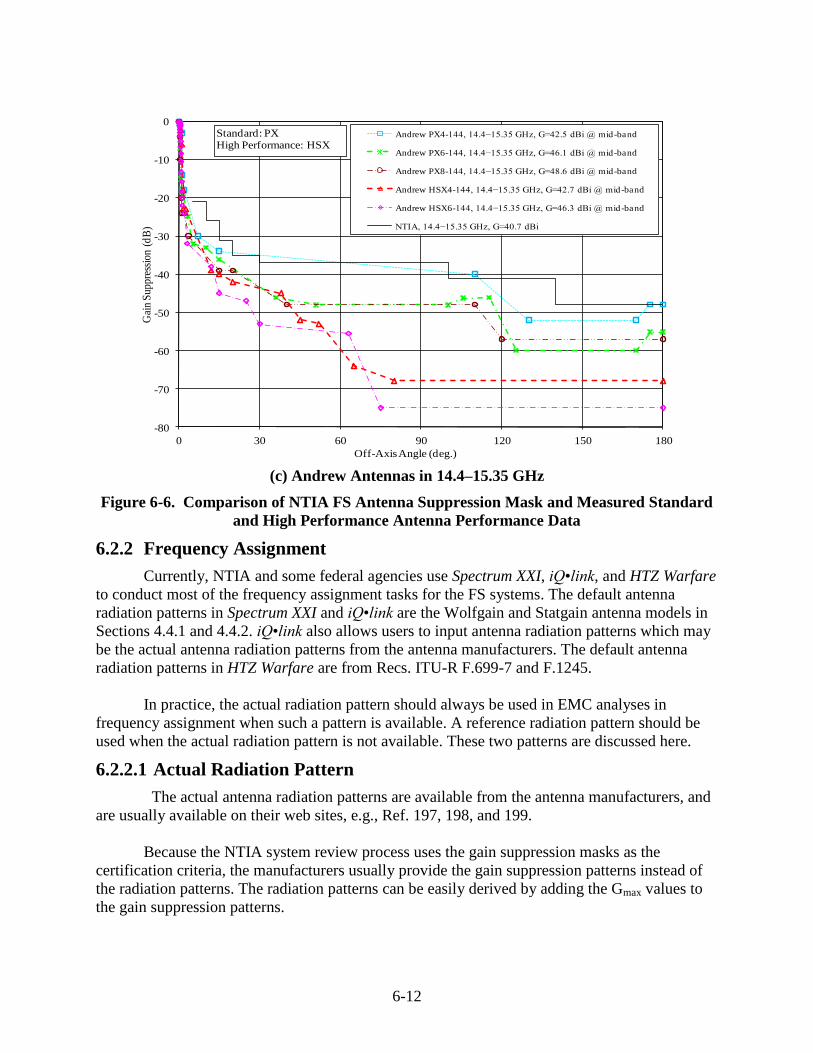
6-12
-80
-70
-60
-50
-40
-30
-20
-10
0
0 30 60 90 120 150 180
Gai
n S
upp
ress
ion
(dB
)
Off-Axis Angle (deg.)
Andrew PX4-144, 14.4−15.35 GHz, G=42.5 dBi @ mid -band
Andrew PX6-144, 14.4−15.35 GHz, G=46.1 dBi @ mid -band
Andrew PX8-144, 14.4−15.35 GHz, G=48.6 dBi @ mid-band
Andrew HSX4-144, 14.4−15.35 GHz, G=42.7 dBi @ mid -band
Andrew HSX6-144, 14.4−15.35 GHz, G=46.3 dBi @ mid -band
NTIA, 14.4−15.35 GHz, G=40.7 dBi
Standard: PXHigh Performance: HSX
(c) Andrew Antennas in 14.4–15.35 GHz
Figure 6-6. Comparison of NTIA FS Antenna Suppression Mask and Measured Standard
and High Performance Antenna Performance Data
6.2.2 Frequency Assignment
Currently, NTIA and some federal agencies use Spectrum XXI, iQ•link, and HTZ Warfare
to conduct most of the frequency assignment tasks for the FS systems. The default antenna
radiation patterns in Spectrum XXI and iQ•link are the Wolfgain and Statgain antenna models in
Sections 4.4.1 and 4.4.2. iQ•link also allows users to input antenna radiation patterns which may
be the actual antenna radiation patterns from the antenna manufacturers. The default antenna
radiation patterns in HTZ Warfare are from Recs. ITU-R F.699-7 and F.1245.
In practice, the actual radiation pattern should always be used in EMC analyses in
frequency assignment when such a pattern is available. A reference radiation pattern should be
used when the actual radiation pattern is not available. These two patterns are discussed here.
6.2.2.1 Actual Radiation Pattern
The actual antenna radiation patterns are available from the antenna manufacturers, and
are usually available on their web sites, e.g., Ref. 197, 198, and 199.
Because the NTIA system review process uses the gain suppression masks as the
certification criteria, the manufacturers usually provide the gain suppression patterns instead of
the radiation patterns. The radiation patterns can be easily derived by adding the Gmax values to
the gain suppression patterns.
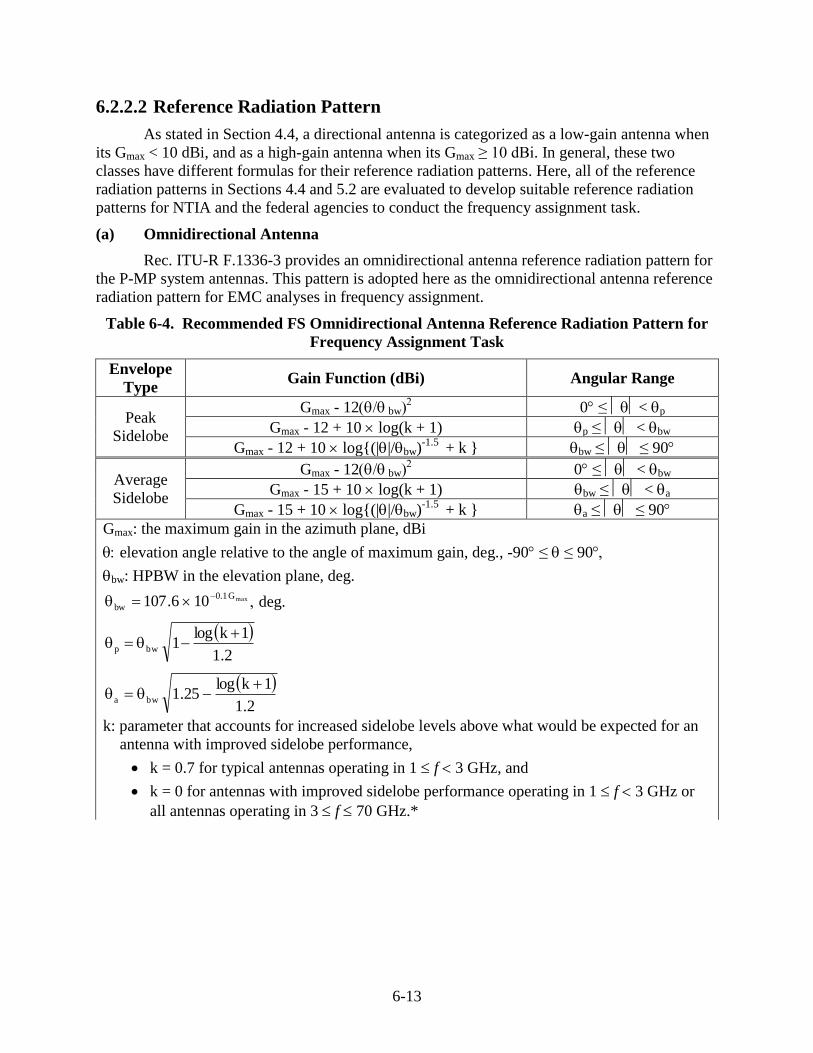
6-13
6.2.2.2 Reference Radiation Pattern
As stated in Section 4.4, a directional antenna is categorized as a low-gain antenna when
its Gmax < 10 dBi, and as a high-gain antenna when its Gmax ≥ 10 dBi. In general, these two
classes have different formulas for their reference radiation patterns. Here, all of the reference
radiation patterns in Sections 4.4 and 5.2 are evaluated to develop suitable reference radiation
patterns for NTIA and the federal agencies to conduct the frequency assignment task.
(a) Omnidirectional Antenna
Rec. ITU-R F.1336-3 provides an omnidirectional antenna reference radiation pattern for
the P-MP system antennas. This pattern is adopted here as the omnidirectional antenna reference
radiation pattern for EMC analyses in frequency assignment.
Table 6-4. Recommended FS Omnidirectional Antenna Reference Radiation Pattern for
Frequency Assignment Task
Envelope
Type Gain Function (dBi) Angular Range
Peak
Sidelobe
Gmax - 12 bw 0≤< p
Gmax - 12 + 10 log(k + 1) p≤< bw
Gmax - 12 + 10 log{(||/bw)-1.5
+ k } bw≤≤ 90
Average
Sidelobe
Gmax - 12 bw 0≤< bw
Gmax - 15 + 10 log(k + 1) bw≤< a
Gmax - 15 + 10 log{(||/bw)-1.5
+ k } a≤≤ 90
Gmax: the maximum gain in the azimuth plane, dBi
elevation angle relative to the angle of maximum gain, deg., -90≤≤ 90
bw: HPBW in the elevation plane, deg.
maxG1.0
bw 106.107
deg.
2.1
1klog1bwp
2.1
1klog25.1bwa
k: parameter that accounts for increased sidelobe levels above what would be expected for an
antenna with improved sidelobe performance,
k = 0.7 for typical antennas operating in 1f3 GHz, and
k = 0 for antennas with improved sidelobe performance operating in 1f3 GHz or
all antennas operating in 3f70 GHz.*
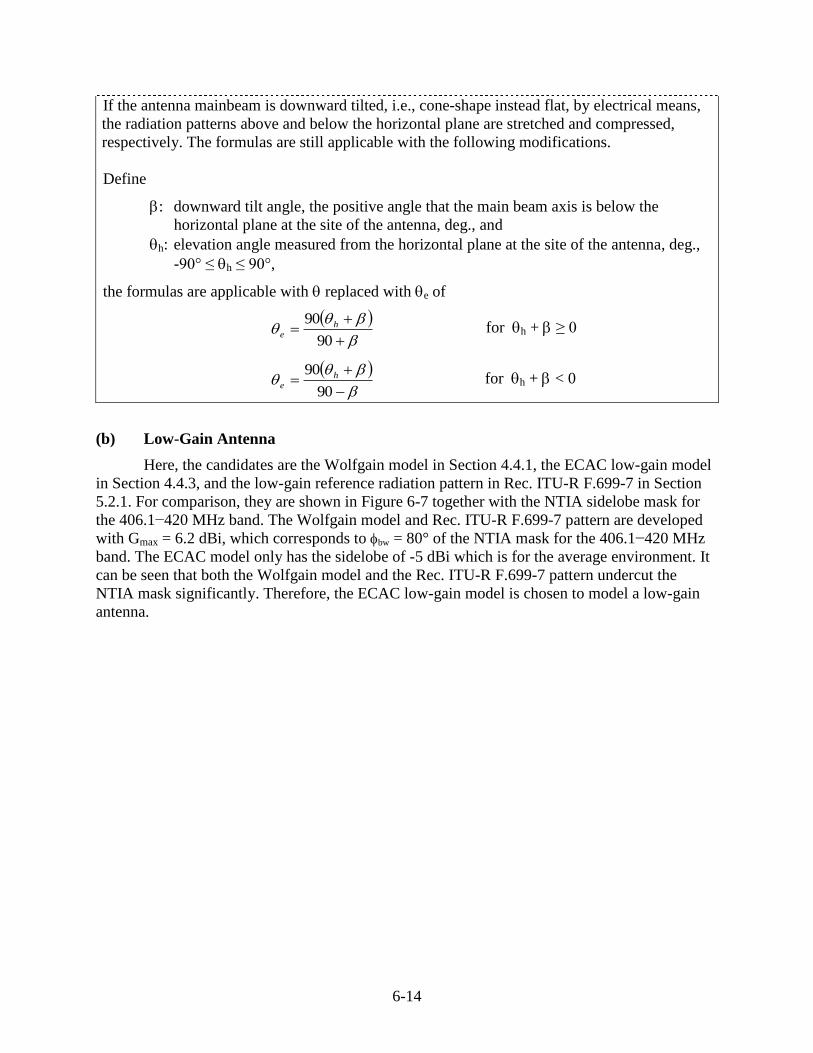
6-14
If the antenna mainbeam is downward tilted, i.e., cone-shape instead flat, by electrical means,
the radiation patterns above and below the horizontal plane are stretched and compressed,
respectively. The formulas are still applicable with the following modifications.
Define
: downward tilt angle, the positive angle that the main beam axis is below the
horizontal plane at the site of the antenna, deg., and
h: elevation angle measured from the horizontal plane at the site of the antenna, deg.,
-90° ≤ h ≤ 90°,
the formulas are applicable with replaced with e of
90
90 h
e for h + ≥ 0
90
90 h
e for h + < 0
(b) Low-Gain Antenna
Here, the candidates are the Wolfgain model in Section 4.4.1, the ECAC low-gain model
in Section 4.4.3, and the low-gain reference radiation pattern in Rec. ITU-R F.699-7 in Section
5.2.1. For comparison, they are shown in Figure 6-7 together with the NTIA sidelobe mask for
the 406.1−420 MHz band. The Wolfgain model and Rec. ITU-R F.699-7 pattern are developed
with Gmax = 6.2 dBi, which corresponds to bw = 80° of the NTIA mask for the 406.1−420 MHz
band. The ECAC model only has the sidelobe of -5 dBi which is for the average environment. It
can be seen that both the Wolfgain model and the Rec. ITU-R F.699-7 pattern undercut the
NTIA mask significantly. Therefore, the ECAC low-gain model is chosen to model a low-gain
antenna.
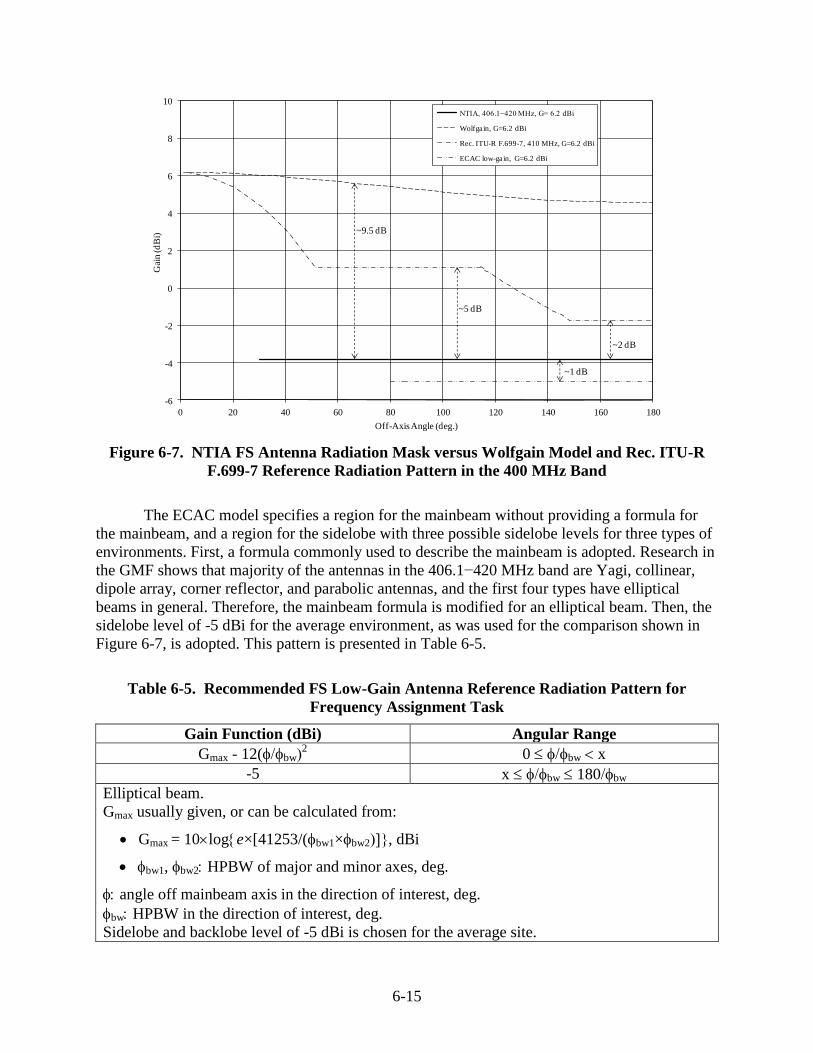
6-15
-6
-4
-2
0
2
4
6
8
10
0 20 40 60 80 100 120 140 160 180
Gai
n (
dB
i)
Off-Axis Angle (deg.)
NTIA, 406.1−420 MHz, G= 6.2 dBi
Wolfgain, G=6.2 dBi
Rec. ITU-R F.699-7, 410 MHz, G=6.2 dBi
ECAC low-gain, G=6.2 dBi
~9.5 dB
~5 dB
~2 dB
~1 dB
Figure 6-7. NTIA FS Antenna Radiation Mask versus Wolfgain Model and Rec. ITU-R
F.699-7 Reference Radiation Pattern in the 400 MHz Band
The ECAC model specifies a region for the mainbeam without providing a formula for
the mainbeam, and a region for the sidelobe with three possible sidelobe levels for three types of
environments. First, a formula commonly used to describe the mainbeam is adopted. Research in
the GMF shows that majority of the antennas in the 406.1−420 MHz band are Yagi, collinear,
dipole array, corner reflector, and parabolic antennas, and the first four types have elliptical
beams in general. Therefore, the mainbeam formula is modified for an elliptical beam. Then, the
sidelobe level of -5 dBi for the average environment, as was used for the comparison shown in
Figure 6-7, is adopted. This pattern is presented in Table 6-5.
Table 6-5. Recommended FS Low-Gain Antenna Reference Radiation Pattern for
Frequency Assignment Task
Gain Function (dBi) Angular Range
Gmax - 12(bw2 0 bw x
-5 x bw 180bw
Elliptical beam.
Gmax usually given, or can be calculated from:
Gmax = 10loge×[41253/(bw1×bw2, dBi
bw1, bw2 HPBW of major and minor axes, deg.
angle off mainbeam axis in the direction of interest, deg.
bw HPBW in the direction of interest, deg.
Sidelobe and backlobe level of -5 dBi is chosen for the average site.
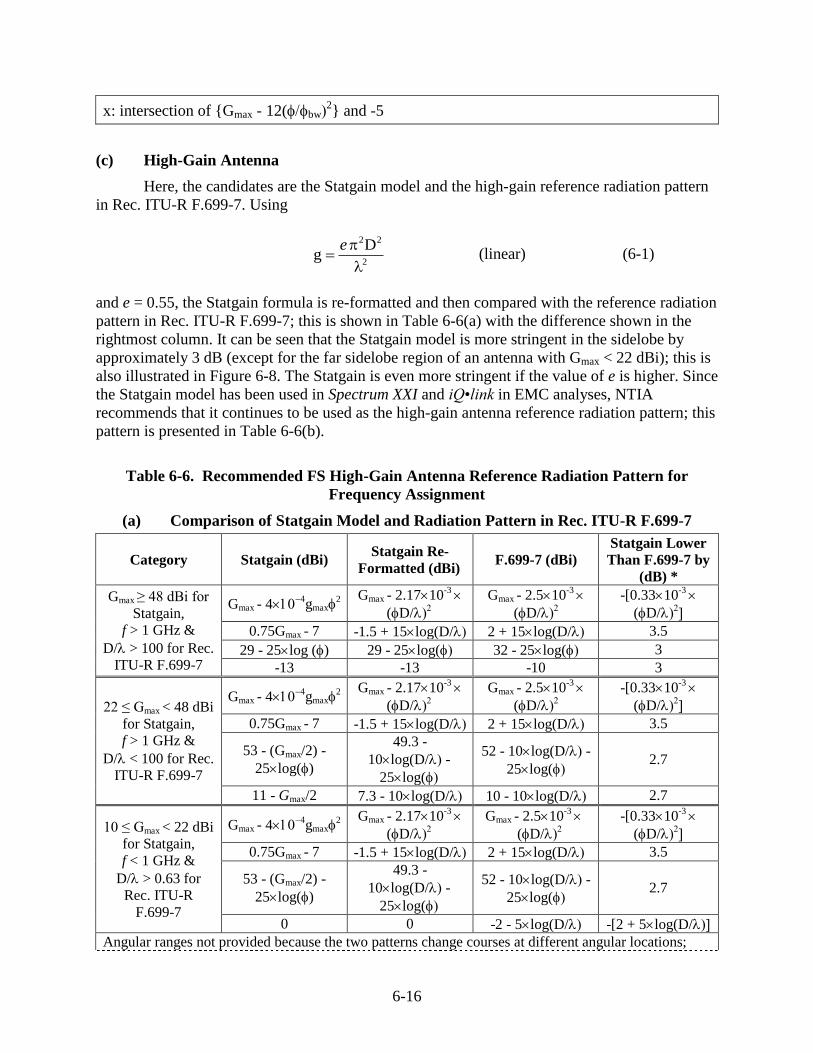
6-16
x: intersection of {Gmax - 12(bw2} and -5
(c) High-Gain Antenna
Here, the candidates are the Statgain model and the high-gain reference radiation pattern
in Rec. ITU-R F.699-7. Using
2
22Dg
e (linear) (6-1)
and e = 0.55, the Statgain formula is re-formatted and then compared with the reference radiation
pattern in Rec. ITU-R F.699-7; this is shown in Table 6-6(a) with the difference shown in the
rightmost column. It can be seen that the Statgain model is more stringent in the sidelobe by
approximately 3 dB (except for the far sidelobe region of an antenna with Gmax < 22 dBi); this is
also illustrated in Figure 6-8. The Statgain is even more stringent if the value of e is higher. Since
the Statgain model has been used in Spectrum XXI and iQ•link in EMC analyses, NTIA
recommends that it continues to be used as the high-gain antenna reference radiation pattern; this
pattern is presented in Table 6-6(b).
Table 6-6. Recommended FS High-Gain Antenna Reference Radiation Pattern for
Frequency Assignment
(a) Comparison of Statgain Model and Radiation Pattern in Rec. ITU-R F.699-7
Category Statgain (dBi) Statgain Re-
Formatted (dBi) F.699-7 (dBi)
Statgain Lower
Than F.699-7 by
(dB) *
Gmax ≥ 48 dBi for
Statgain,
f > 1 GHz &
D/> 100 for Rec.
ITU-R F.699-7
Gmax - 4
gmax2
Gmax - 2.1710-3
(D/
Gmax - 2.510-3
(D/
-[0.3310-3
(D/
0.75Gmax - 7 -1.5 + 15log(D/ 2 + 15log(D/ 3.5
29 - 25log () 29 - 25log( 32 - 25log( 3
-13 -13 -10 3
22 ≤ Gmax < 48 dBi
for Statgain,
f > 1 GHz &
D/< 100 for Rec.
ITU-R F.699-7
Gmax - 4
gmax2
Gmax - 2.1710-3
(D/
Gmax - 2.510-3
(D/
-[0.3310-3
(D/
0.75Gmax - 7 -1.5 + 15log(D/ 2 + 15log(D/ 3.5
53 - (Gmax/2) -
25log()
49.3 -
10log(D/-
25log(
52 - 10log(D/-
25log( 2.7
11 - Gmax/2 7.3 - 10log(D/ 10 - 10log(D/ 2.7
10 ≤ Gmax < 22 dBi
for Statgain,
f < 1 GHz &
D/> 0.63 for
Rec. ITU-R
F.699-7
Gmax - 4
gmax2
Gmax - 2.1710-3
(D/
Gmax - 2.510-3
(D/
-[0.3310-3
(D/
0.75Gmax - 7 -1.5 + 15log(D/ 2 + 15log(D/ 3.5
53 - (Gmax/2) -
25log()
49.3 -
10log(D/-
25log(
52 - 10log(D/-
25log( 2.7
0 0 -2 - 5log(D/ -[2 + 5log(D/
Angular ranges not provided because the two patterns change courses at different angular locations;
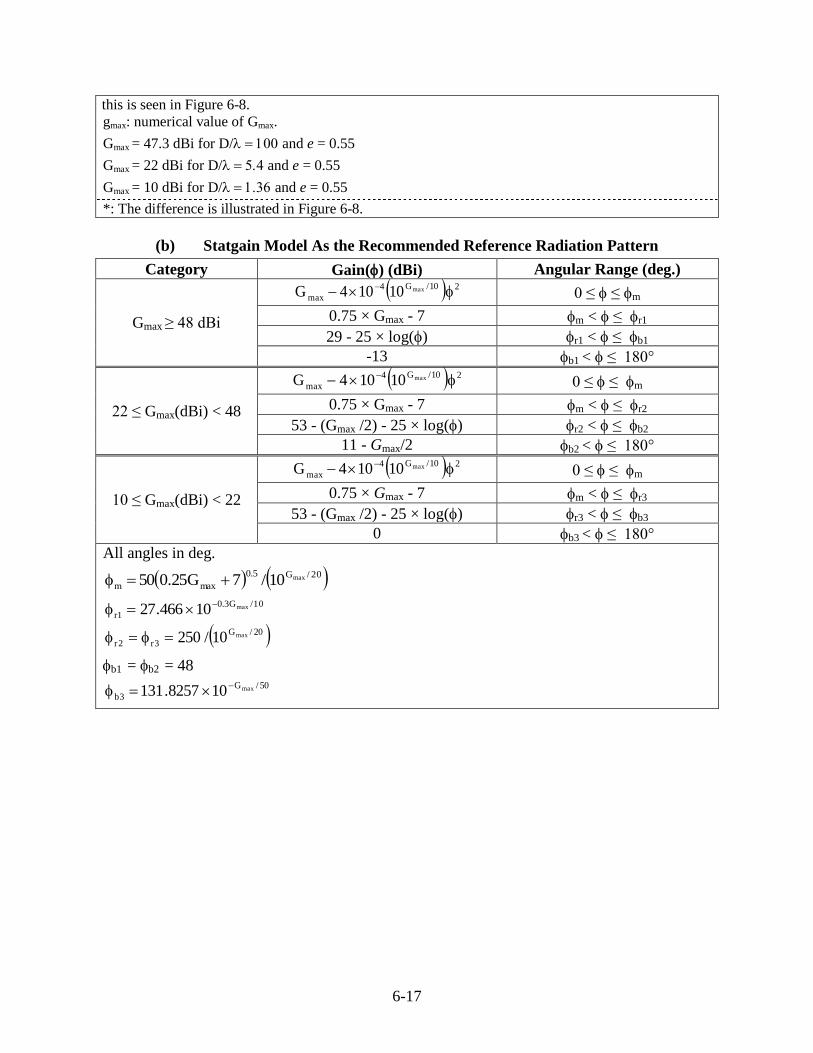
6-17
this is seen in Figure 6-8.
gmax: numerical value of Gmax.
Gmax = 47.3 dBi for D/ande = 0.55
Gmax = 22 dBi for D/ande = 0.55
Gmax = 10 dBi for D/ande = 0.55
*: The difference is illustrated in Figure 6-8.
(b) Statgain Model As the Recommended Reference Radiation Pattern
Category Gain() (dBi) Angular Range (deg.)
Gmax ≥ 48 dBi
210/G4
maxmax10104G
0 ≤ ≤ m
0.75 × Gmax - 7 m < ≤ r1
29 - 25 × log() r1 < ≤ b1
-13 b1 < ≤ 180°
22 ≤ Gmax(dBi) < 48
210/G4
maxmax10104G
0 ≤ ≤ m
0.75 × Gmax - 7 m < ≤ r2
53 - (Gmax /2) - 25 × log() r2 < ≤ b2
11 - Gmax/2 b2 < ≤ 180°
10 ≤ Gmax(dBi) < 22
210/G4
maxmax10104G
0 ≤ ≤ m
0.75 × Gmax - 7 m < ≤ r3
53 - (Gmax /2) - 25 × log() r3 < ≤ b3
0 b3 < ≤ 180°
All angles in deg.
20/G5.0
maxmmax10/7G25.050
10/G3.0
1rmax10466.27
20/G
3r2rmax10/250
b1 = b2 = 48 50/G
3bmax108257.131
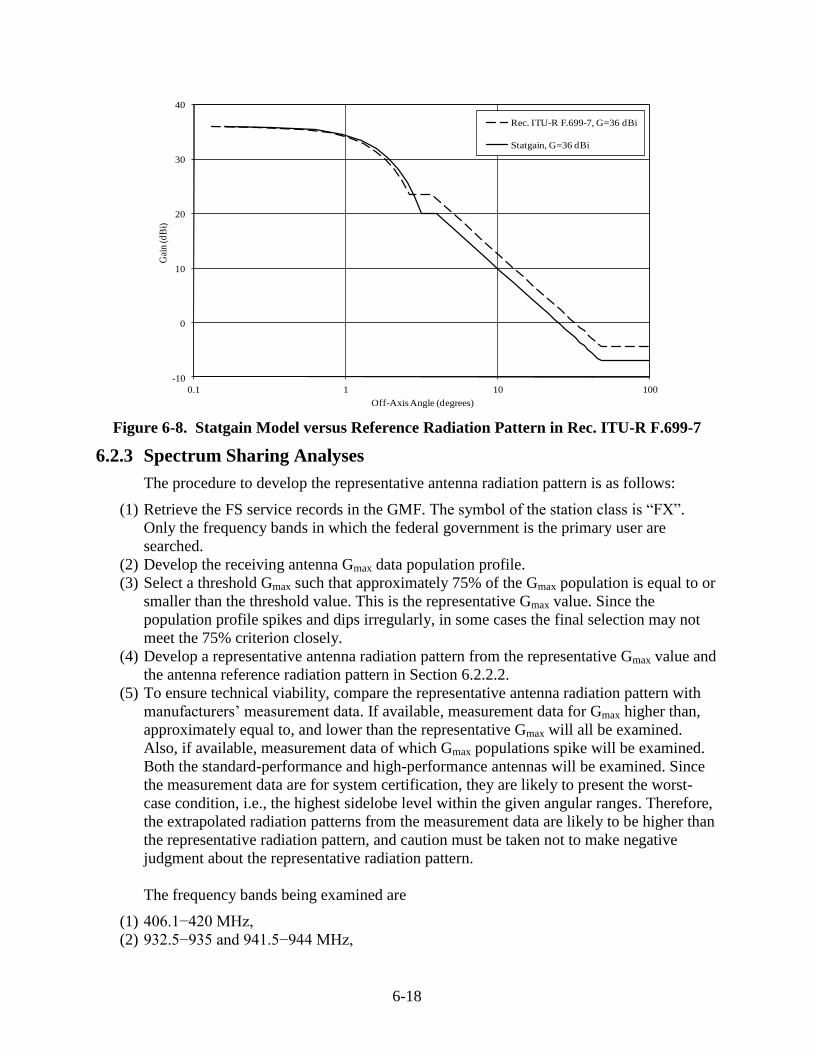
6-18
-10
0
10
20
30
40
0.1 1 10 100
Gai
n (
dB
i)
Off-Axis Angle (degrees)
Rec. ITU-R F.699-7, G=36 dBi
Statgain, G=36 dBi
Figure 6-8. Statgain Model versus Reference Radiation Pattern in Rec. ITU-R F.699-7
6.2.3 Spectrum Sharing Analyses
The procedure to develop the representative antenna radiation pattern is as follows:
(1) Retrieve the FS service records in the GMF. The symbol of the station class is “FX”.
Only the frequency bands in which the federal government is the primary user are
searched.
(2) Develop the receiving antenna Gmax data population profile.
(3) Select a threshold Gmax such that approximately 75% of the Gmax population is equal to or
smaller than the threshold value. This is the representative Gmax value. Since the
population profile spikes and dips irregularly, in some cases the final selection may not
meet the 75% criterion closely.
(4) Develop a representative antenna radiation pattern from the representative Gmax value and
the antenna reference radiation pattern in Section 6.2.2.2.
(5) To ensure technical viability, compare the representative antenna radiation pattern with
manufacturers’ measurement data. If available, measurement data for Gmax higher than,
approximately equal to, and lower than the representative Gmax will all be examined.
Also, if available, measurement data of which Gmax populations spike will be examined.
Both the standard-performance and high-performance antennas will be examined. Since
the measurement data are for system certification, they are likely to present the worst-
case condition, i.e., the highest sidelobe level within the given angular ranges. Therefore,
the extrapolated radiation patterns from the measurement data are likely to be higher than
the representative radiation pattern, and caution must be taken not to make negative
judgment about the representative radiation pattern.
The frequency bands being examined are
(1) 406.1−420 MHz,
(2) 932.5−935 and 941.5−944 MHz,
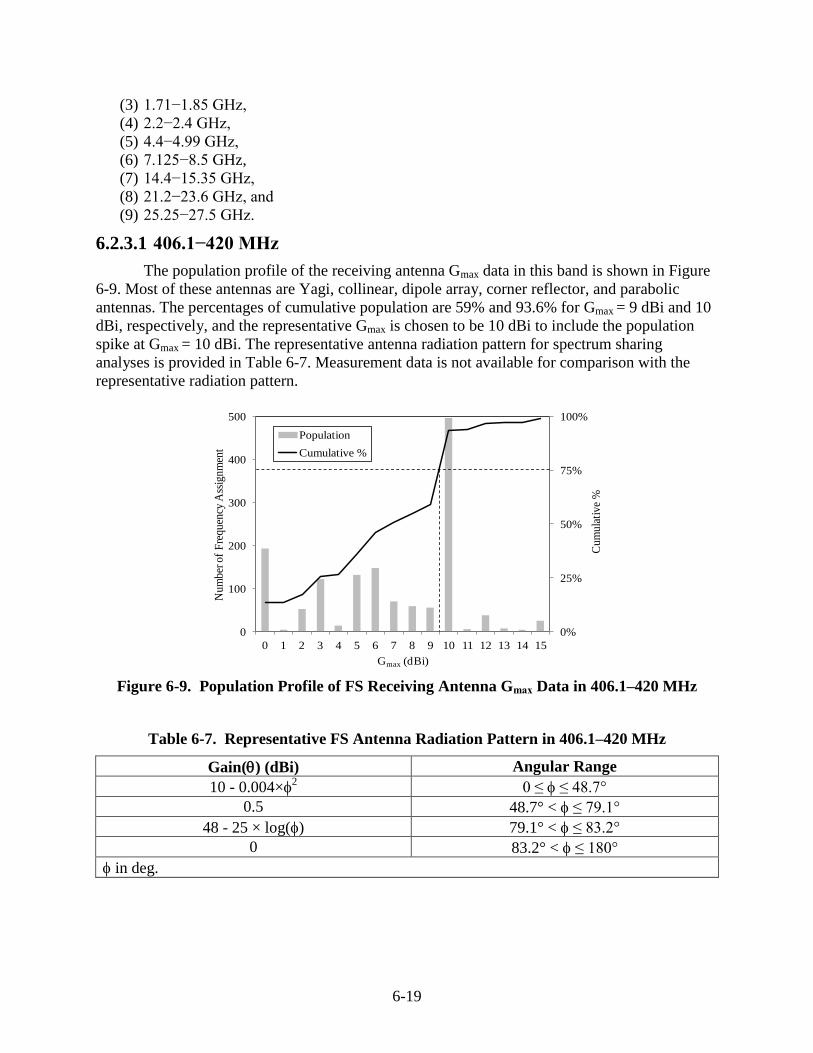
6-19
(3) 1.71−1.85 GHz,
(4) 2.2−2.4 GHz,
(5) 4.4−4.99 GHz,
(6) 7.125−8.5 GHz,
(7) 14.4−15.35 GHz,
(8) 21.2−23.6 GHz, and
(9) 25.25−27.5 GHz.
6.2.3.1 406.1−420 MHz
The population profile of the receiving antenna Gmax data in this band is shown in Figure
6-9. Most of these antennas are Yagi, collinear, dipole array, corner reflector, and parabolic
antennas. The percentages of cumulative population are 59% and 93.6% for Gmax = 9 dBi and 10
dBi, respectively, and the representative Gmax is chosen to be 10 dBi to include the population
spike at Gmax = 10 dBi. The representative antenna radiation pattern for spectrum sharing
analyses is provided in Table 6-7. Measurement data is not available for comparison with the
representative radiation pattern.
0%
25%
50%
75%
100%
0
100
200
300
400
500
0 1 2 3 4 5 6 7 8 9 10 11 12 13 14 15
Cu
mu
lati
ve
%
Nu
mb
er o
f F
req
uen
cy A
ssig
nm
ent
Gmax (dBi)
Population
Cumulative %
Figure 6-9. Population Profile of FS Receiving Antenna Gmax Data in 406.1–420 MHz
Table 6-7. Representative FS Antenna Radiation Pattern in 406.1–420 MHz
Gain() (dBi) Angular Range
10 - 0.004×2 0 ≤ ≤ 48.7°
0.5 48.7° < ≤ 79.1°
48 - 25 × log() 79.1° < ≤ 83.2°
0 83.2° < ≤ 180°
in deg.
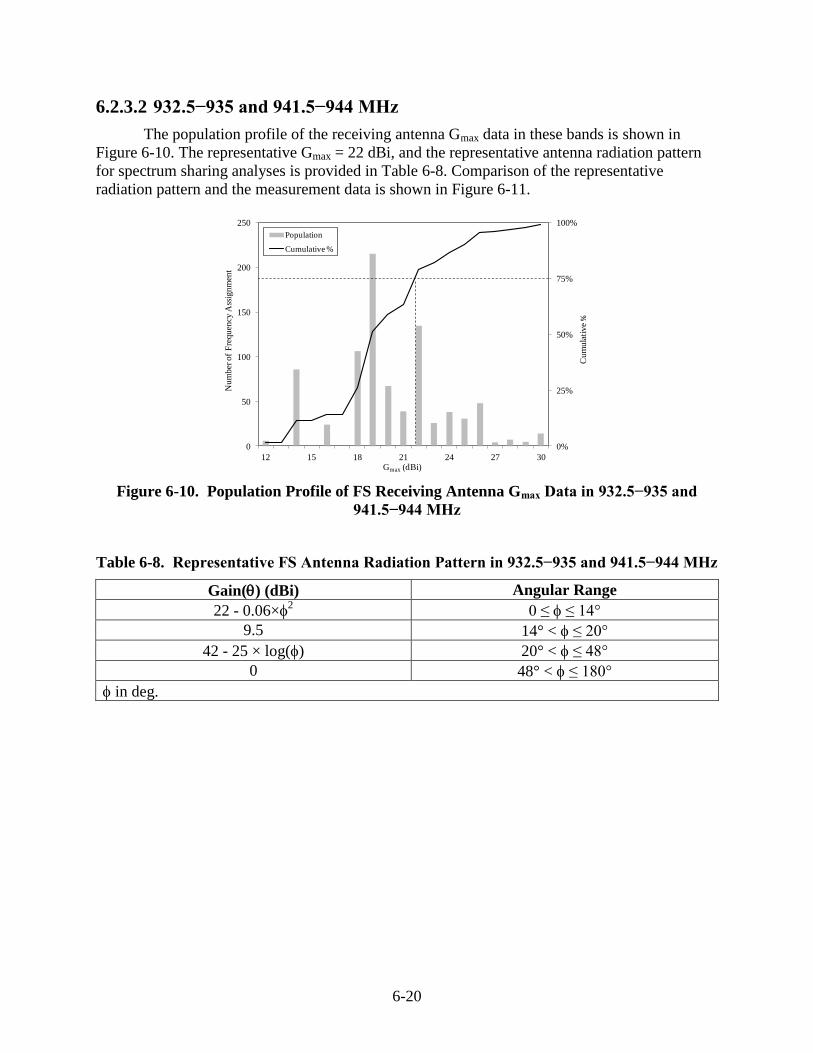
6-20
6.2.3.2 932.5−935 and 941.5−944 MHz
The population profile of the receiving antenna Gmax data in these bands is shown in
Figure 6-10. The representative Gmax = 22 dBi, and the representative antenna radiation pattern
for spectrum sharing analyses is provided in Table 6-8. Comparison of the representative
radiation pattern and the measurement data is shown in Figure 6-11.
0%
25%
50%
75%
100%
0
50
100
150
200
250
12 15 18 21 24 27 30
Nu
mb
er o
f F
req
uen
cy A
ssig
nm
ent
Gmax (dBi)
Population
Cumulative %
Cu
mu
lati
ve
%
Figure 6-10. Population Profile of FS Receiving Antenna Gmax Data in 932.5−935 and
941.5−944 MHz
Table 6-8. Representative FS Antenna Radiation Pattern in 932.5−935 and 941.5−944 MHz
Gain() (dBi) Angular Range
22 - 0.06×2 0 ≤ ≤ 14°
9.5 14° < ≤ 20°
42 - 25 × log() 20° < ≤ 48°
0 48° < ≤ 180°
in deg.
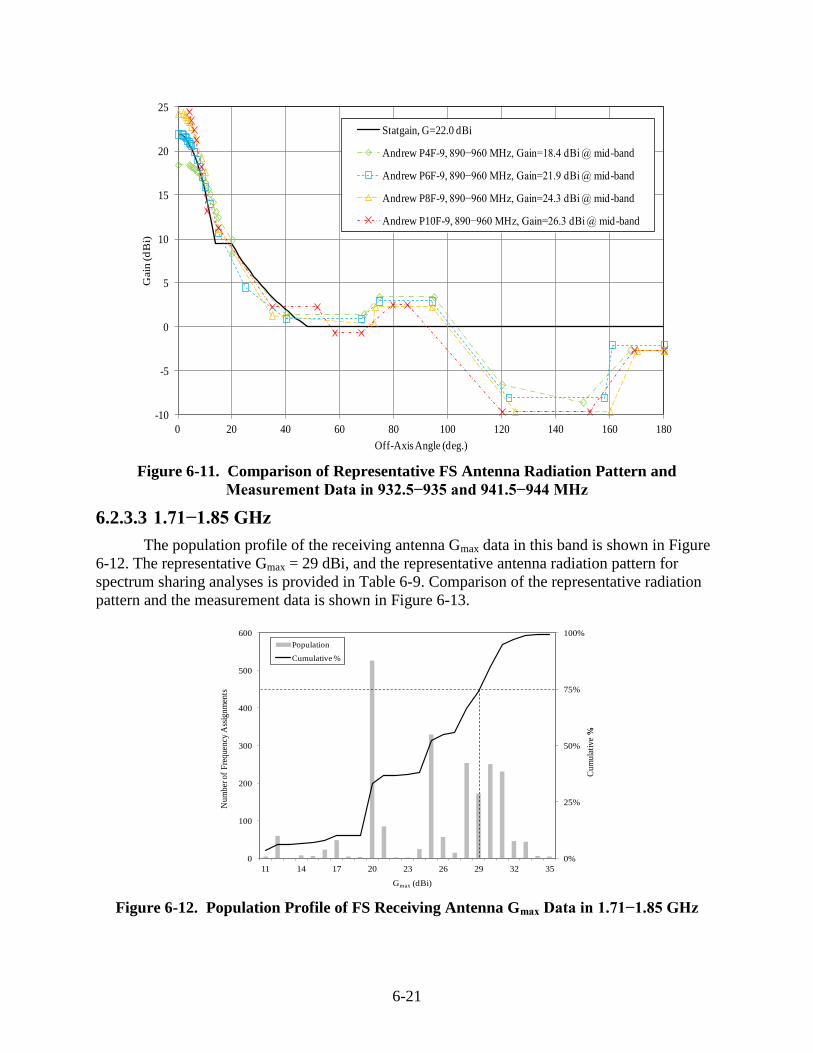
6-21
Figure 6-11. Comparison of Representative FS Antenna Radiation Pattern and
Measurement Data in 932.5−935 and 941.5−944 MHz
6.2.3.3 1.71−1.85 GHz
The population profile of the receiving antenna Gmax data in this band is shown in Figure
6-12. The representative Gmax = 29 dBi, and the representative antenna radiation pattern for
spectrum sharing analyses is provided in Table 6-9. Comparison of the representative radiation
pattern and the measurement data is shown in Figure 6-13.
0%
25%
50%
75%
100%
0
100
200
300
400
500
600
11 14 17 20 23 26 29 32 35
Nu
mb
er o
f F
req
uen
cy A
ssig
nm
ents
Gmax (dBi)
Population
Cumulative %
Cum
ula
tive
%
Figure 6-12. Population Profile of FS Receiving Antenna Gmax Data in 1.71−1.85 GHz
-10
-5
0
5
10
15
20
25
0 20 40 60 80 100 120 140 160 180
Gain
(d
Bi)
Off-Axis Angle (deg.)
Statgain, G=22.0 dBi
Andrew P4F-9, 890−960 MHz, Gain=18.4 dBi @ mid-band
Andrew P6F-9, 890−960 MHz, Gain=21.9 dBi @ mid-band
Andrew P8F-9, 890−960 MHz, Gain=24.3 dBi @ mid-band
Andrew P10F-9, 890−960 MHz, Gain=26.3 dBi @ mid-band
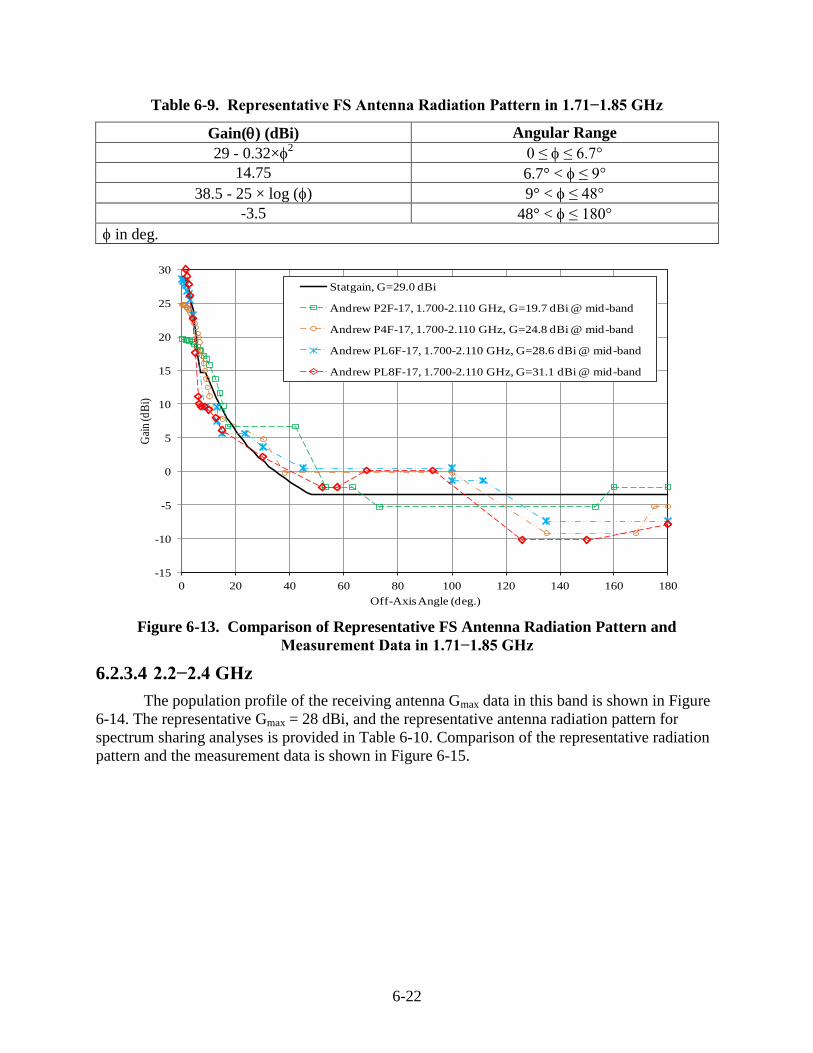
6-22
Table 6-9. Representative FS Antenna Radiation Pattern in 1.71−1.85 GHz
Gain() (dBi) Angular Range
29 - 0.32×2 0 ≤ ≤ 6.7°
14.75 6.7° < ≤ 9°
38.5 - 25 × log () 9° < ≤ 48°
-3.5 48° < ≤ 180°
in deg.
Figure 6-13. Comparison of Representative FS Antenna Radiation Pattern and
Measurement Data in 1.71−1.85 GHz
6.2.3.4 2.2−2.4 GHz
The population profile of the receiving antenna Gmax data in this band is shown in Figure
6-14. The representative Gmax = 28 dBi, and the representative antenna radiation pattern for
spectrum sharing analyses is provided in Table 6-10. Comparison of the representative radiation
pattern and the measurement data is shown in Figure 6-15.
-15
-10
-5
0
5
10
15
20
25
30
0 20 40 60 80 100 120 140 160 180
Gai
n (d
Bi)
Off-Axis Angle (deg.)
Statgain, G=29.0 dBi
Andrew P2F-17, 1.700-2.110 GHz, G=19.7 dBi @ mid-band
Andrew P4F-17, 1.700-2.110 GHz, G=24.8 dBi @ mid-band
Andrew PL6F-17, 1.700-2.110 GHz, G=28.6 dBi @ mid-band
Andrew PL8F-17, 1.700-2.110 GHz, G=31.1 dBi @ mid-band
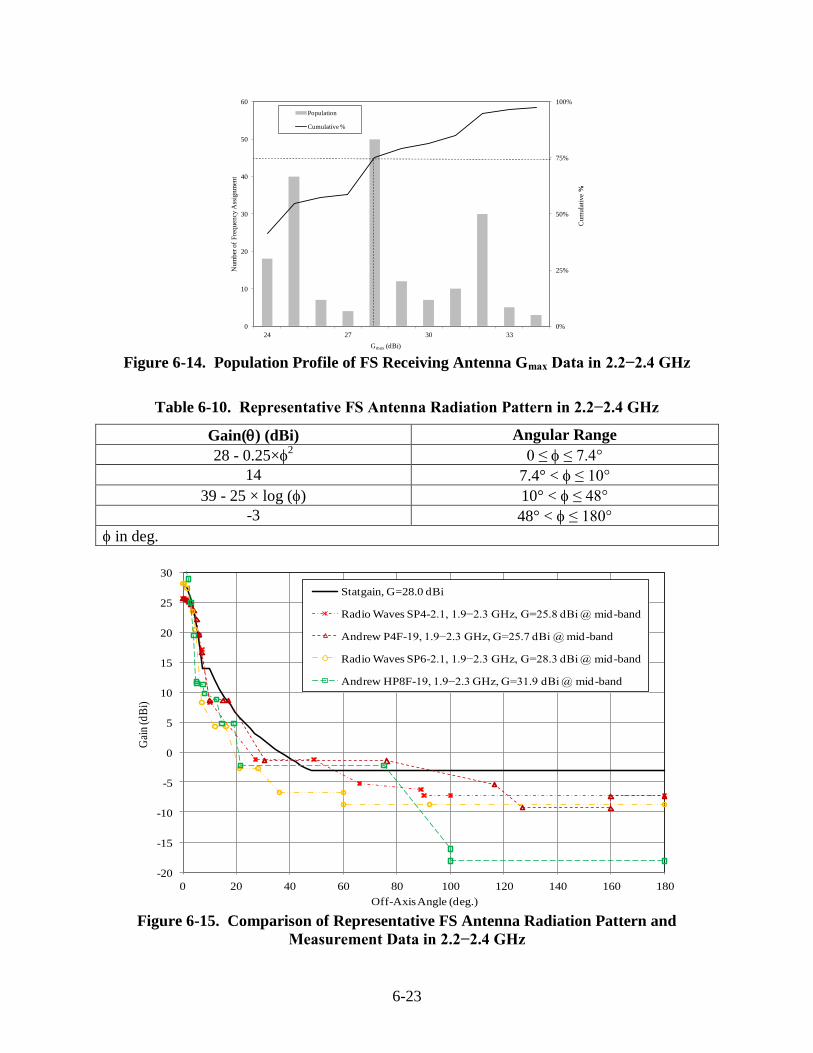
6-23
0%
25%
50%
75%
100%
0
10
20
30
40
50
60
24 27 30 33
Num
ber
of
Fre
qu
ency
Ass
ign
men
t
Gmax (dBi)
Population
Cumulative %
Cu
mu
lati
ve
%
Figure 6-14. Population Profile of FS Receiving Antenna Gmax Data in 2.2−2.4 GHz
Table 6-10. Representative FS Antenna Radiation Pattern in 2.2−2.4 GHz
Gain() (dBi) Angular Range
28 - 0.25×2 0 ≤ ≤ 7.4°
14 7.4° < ≤ 10°
39 - 25 × log () 10° < ≤ 48°
-3 48° < ≤ 180°
in deg.
-20
-15
-10
-5
0
5
10
15
20
25
30
0 20 40 60 80 100 120 140 160 180
Gai
n (d
Bi)
Off-Axis Angle (deg.)
Statgain, G=28.0 dBi
Radio Waves SP4-2.1, 1.9−2.3 GHz, G=25.8 dBi @ mid-band
Andrew P4F-19, 1.9−2.3 GHz, G=25.7 dBi @ mid-band
Radio Waves SP6-2.1, 1.9−2.3 GHz, G=28.3 dBi @ mid-band
Andrew HP8F-19, 1.9−2.3 GHz, G=31.9 dBi @ mid-band
Figure 6-15. Comparison of Representative FS Antenna Radiation Pattern and
Measurement Data in 2.2−2.4 GHz
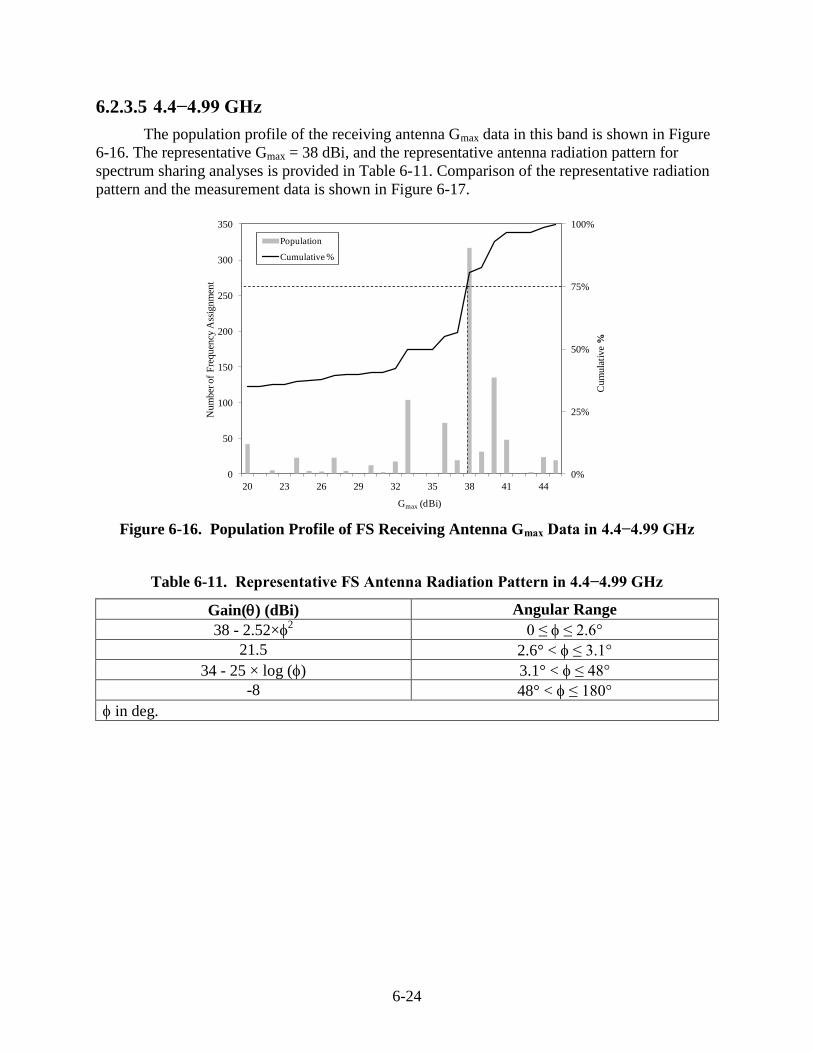
6-24
6.2.3.5 4.4−4.99 GHz
The population profile of the receiving antenna Gmax data in this band is shown in Figure
6-16. The representative Gmax = 38 dBi, and the representative antenna radiation pattern for
spectrum sharing analyses is provided in Table 6-11. Comparison of the representative radiation
pattern and the measurement data is shown in Figure 6-17.
0%
25%
50%
75%
100%
0
50
100
150
200
250
300
350
20 23 26 29 32 35 38 41 44
Nu
mb
er o
f F
req
uen
cy A
ssig
nm
ent
Gmax (dBi)
Population
Cumulative %
Cu
mu
lati
ve
%
Figure 6-16. Population Profile of FS Receiving Antenna Gmax Data in 4.4−4.99 GHz
Table 6-11. Representative FS Antenna Radiation Pattern in 4.4−4.99 GHz
Gain() (dBi) Angular Range
38 - 2.52×2 0 ≤ ≤ 2.6°
21.5 2.6° < ≤ 3.1°
34 - 25 × log () 3.1° < ≤ 48°
-8 48° < ≤ 180°
in deg.
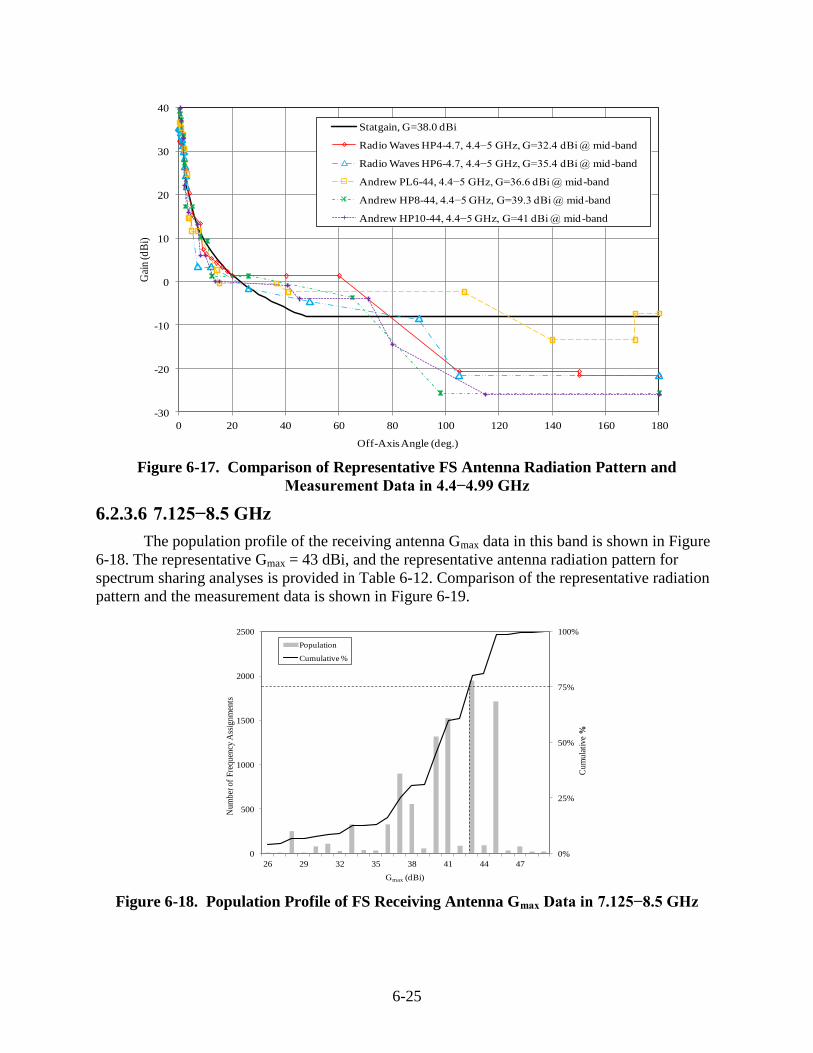
6-25
-30
-20
-10
0
10
20
30
40
0 20 40 60 80 100 120 140 160 180
Gai
n (
dB
i)
Off-Axis Angle (deg.)
Statgain, G=38.0 dBi
Radio Waves HP4-4.7, 4.4−5 GHz, G=32.4 dBi @ mid-band
Radio Waves HP6-4.7, 4.4−5 GHz, G=35.4 dBi @ mid-band
Andrew PL6-44, 4.4−5 GHz, G=36.6 dBi @ mid-band
Andrew HP8-44, 4.4−5 GHz, G=39.3 dBi @ mid-band
Andrew HP10-44, 4.4−5 GHz, G=41 dBi @ mid-band
Figure 6-17. Comparison of Representative FS Antenna Radiation Pattern and
Measurement Data in 4.4−4.99 GHz
6.2.3.6 7.125−8.5 GHz
The population profile of the receiving antenna Gmax data in this band is shown in Figure
6-18. The representative Gmax = 43 dBi, and the representative antenna radiation pattern for
spectrum sharing analyses is provided in Table 6-12. Comparison of the representative radiation
pattern and the measurement data is shown in Figure 6-19.
0%
25%
50%
75%
100%
0
500
1000
1500
2000
2500
26 29 32 35 38 41 44 47
Nu
mb
er o
f F
req
uen
cy A
ssig
nm
ents
Gmax (dBi)
Population
Cumulative %
Cu
mu
lati
ve
%
Figure 6-18. Population Profile of FS Receiving Antenna Gmax Data in 7.125−8.5 GHz
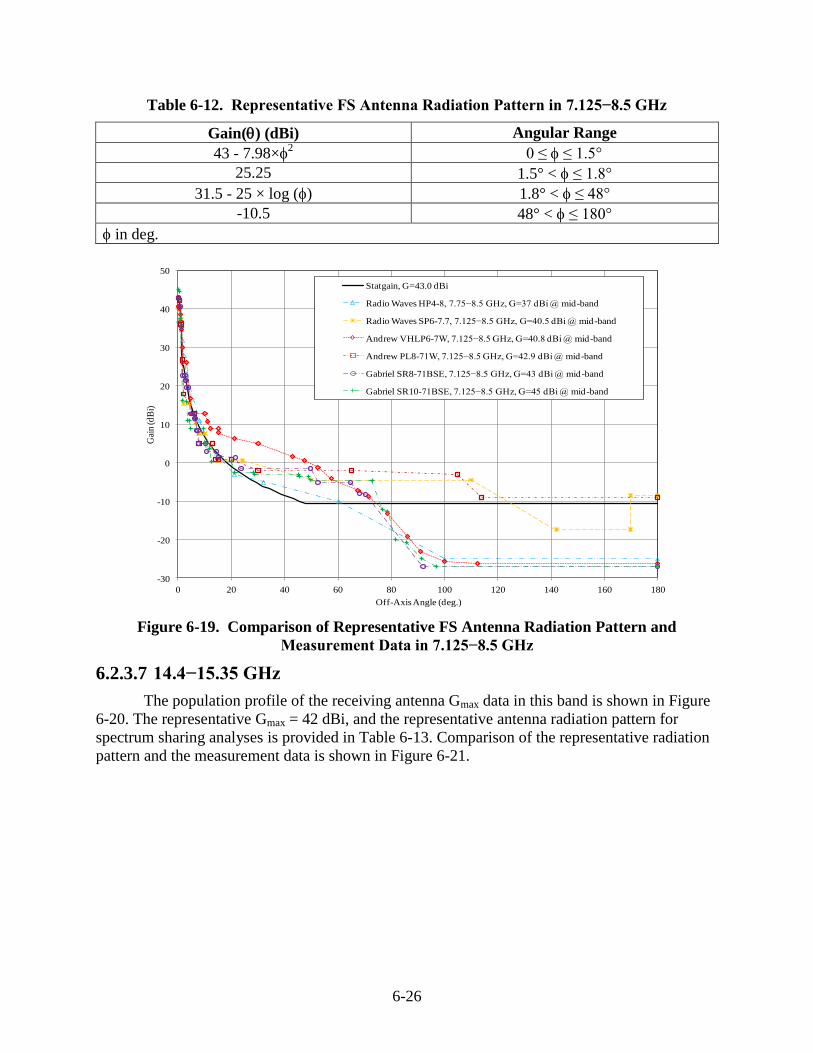
6-26
Table 6-12. Representative FS Antenna Radiation Pattern in 7.125−8.5 GHz
Gain() (dBi) Angular Range
43 - 7.98×2 0 ≤ ≤ 1.5°
25.25 1.5° < ≤ 1.8°
31.5 - 25 × log () 1.8° < ≤ 48°
-10.5 48° < ≤ 180°
in deg.
-30
-20
-10
0
10
20
30
40
50
0 20 40 60 80 100 120 140 160 180
Gai
n (d
Bi)
Off-Axis Angle (deg.)
Statgain, G=43.0 dBi
Radio Waves HP4-8, 7.75−8.5 GHz, G=37 dBi @ mid-band
Radio Waves SP6-7.7, 7.125−8.5 GHz, G=40.5 dBi @ mid-band
Andrew VHLP6-7W, 7.125−8.5 GHz, G=40.8 dBi @ mid-band
Andrew PL8-71W, 7.125−8.5 GHz, G=42.9 dBi @ mid-band
Gabriel SR8-71BSE, 7.125−8.5 GHz, G=43 dBi @ mid-band
Gabriel SR10-71BSE, 7.125−8.5 GHz, G=45 dBi @ mid-band
Figure 6-19. Comparison of Representative FS Antenna Radiation Pattern and
Measurement Data in 7.125−8.5 GHz
6.2.3.7 14.4−15.35 GHz
The population profile of the receiving antenna Gmax data in this band is shown in Figure
6-20. The representative Gmax = 42 dBi, and the representative antenna radiation pattern for
spectrum sharing analyses is provided in Table 6-13. Comparison of the representative radiation
pattern and the measurement data is shown in Figure 6-21.
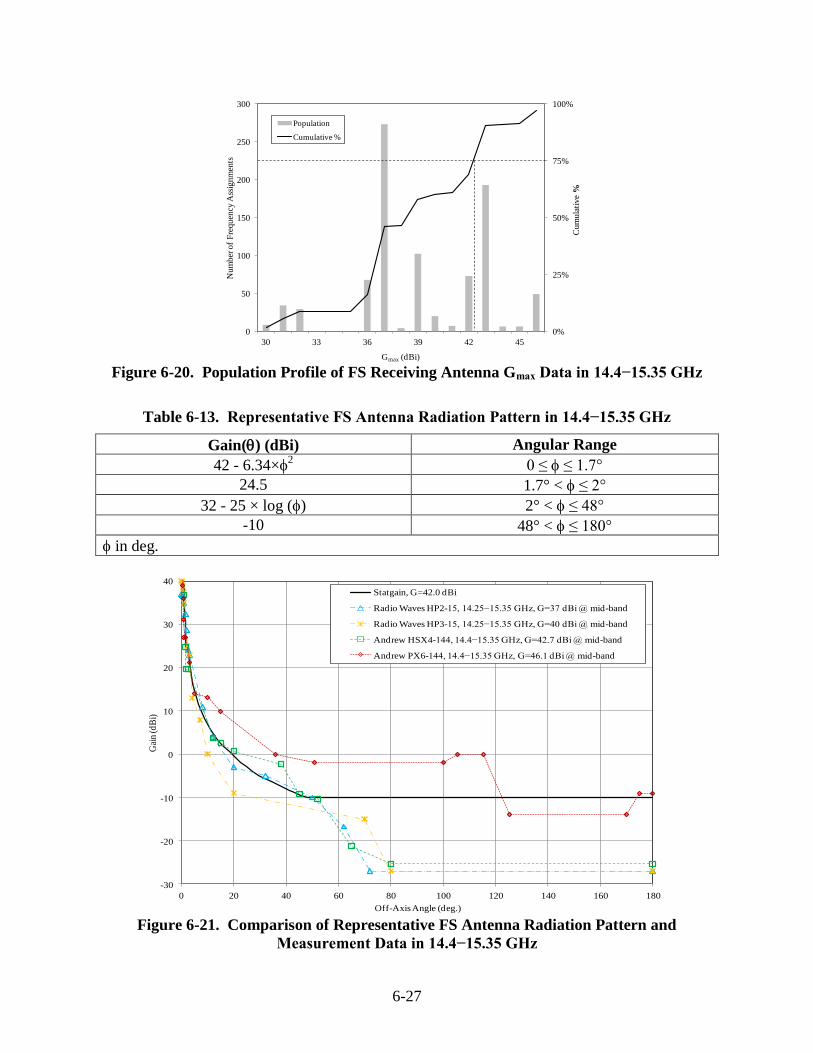
6-27
0%
25%
50%
75%
100%
0
50
100
150
200
250
300
30 33 36 39 42 45
Nu
mb
er o
f F
req
uen
cy A
ssig
nm
ents
Gmax (dBi)
Population
Cumulative %
Cum
ula
tive
%
Figure 6-20. Population Profile of FS Receiving Antenna Gmax Data in 14.4−15.35 GHz
Table 6-13. Representative FS Antenna Radiation Pattern in 14.4−15.35 GHz
Gain() (dBi) Angular Range
42 - 6.34×2 0 ≤ ≤ 1.7°
24.5 1.7° < ≤ 2°
32 - 25 × log () 2° < ≤ 48°
-10 48° < ≤ 180°
in deg.
-30
-20
-10
0
10
20
30
40
0 20 40 60 80 100 120 140 160 180
Gai
n (d
Bi)
Off-Axis Angle (deg.)
Statgain, G=42.0 dBi
Radio Waves HP2-15, 14.25−15.35 GHz, G=37 dBi @ mid-band
Radio Waves HP3-15, 14.25−15.35 GHz, G=40 dBi @ mid-band
Andrew HSX4-144, 14.4−15.35 GHz, G=42.7 dBi @ mid-band
Andrew PX6-144, 14.4−15.35 GHz, G=46.1 dBi @ mid-band
Figure 6-21. Comparison of Representative FS Antenna Radiation Pattern and
Measurement Data in 14.4−15.35 GHz
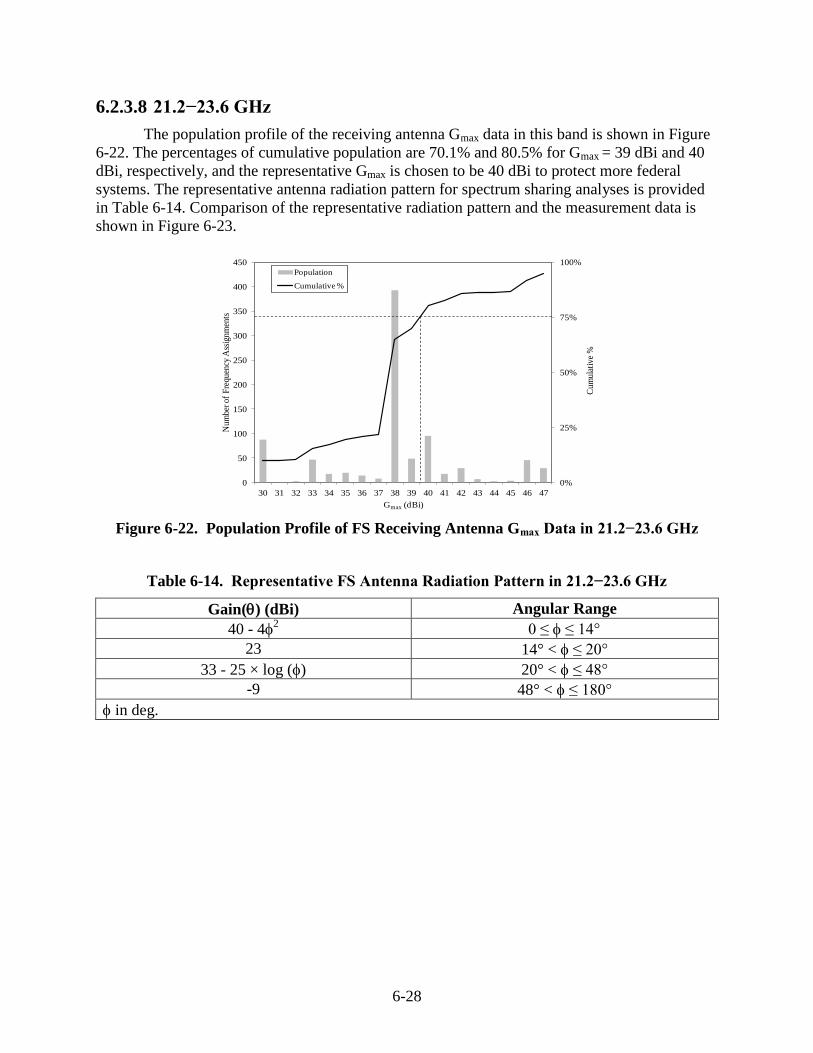
6-28
6.2.3.8 21.2−23.6 GHz
The population profile of the receiving antenna Gmax data in this band is shown in Figure
6-22. The percentages of cumulative population are 70.1% and 80.5% for Gmax = 39 dBi and 40
dBi, respectively, and the representative Gmax is chosen to be 40 dBi to protect more federal
systems. The representative antenna radiation pattern for spectrum sharing analyses is provided
in Table 6-14. Comparison of the representative radiation pattern and the measurement data is
shown in Figure 6-23.
0%
25%
50%
75%
100%
0
50
100
150
200
250
300
350
400
450
30 31 32 33 34 35 36 37 38 39 40 41 42 43 44 45 46 47
Cum
ula
tive
%
Num
ber
of
Fre
quen
cy A
ssig
nm
ents
Gmax (dBi)
Population
Cumulative %
Figure 6-22. Population Profile of FS Receiving Antenna Gmax Data in 21.2−23.6 GHz
Table 6-14. Representative FS Antenna Radiation Pattern in 21.2−23.6 GHz
Gain() (dBi) Angular Range
40 - 42 0 ≤ ≤ 14°
23 14° < ≤ 20°
33 - 25 × log () 20° < ≤ 48°
-9 48° < ≤ 180°
in deg.
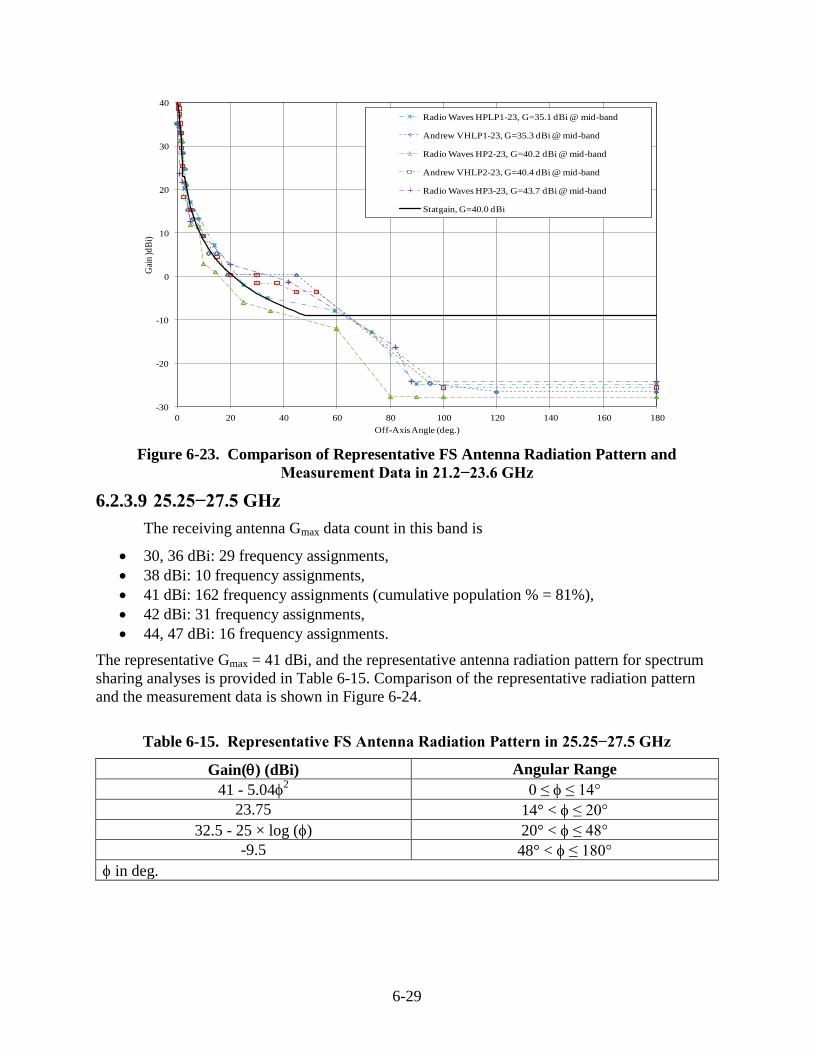
6-29
-30
-20
-10
0
10
20
30
40
0 20 40 60 80 100 120 140 160 180
Gai
n )d
Bi)
Off-Axis Angle (deg.)
Radio Waves HPLP1-23, G=35.1 dBi @ mid-band
Andrew VHLP1-23, G=35.3 dBi @ mid-band
Radio Waves HP2-23, G=40.2 dBi @ mid-band
Andrew VHLP2-23, G=40.4 dBi @ mid-band
Radio Waves HP3-23, G=43.7 dBi @ mid-band
Statgain, G=40.0 dBi
Figure 6-23. Comparison of Representative FS Antenna Radiation Pattern and
Measurement Data in 21.2−23.6 GHz
6.2.3.9 25.25−27.5 GHz
The receiving antenna Gmax data count in this band is
30, 36 dBi: 29 frequency assignments,
38 dBi: 10 frequency assignments,
41 dBi: 162 frequency assignments (cumulative population % = 81%),
42 dBi: 31 frequency assignments,
44, 47 dBi: 16 frequency assignments.
The representative Gmax = 41 dBi, and the representative antenna radiation pattern for spectrum
sharing analyses is provided in Table 6-15. Comparison of the representative radiation pattern
and the measurement data is shown in Figure 6-24.
Table 6-15. Representative FS Antenna Radiation Pattern in 25.25−27.5 GHz
Gain() (dBi) Angular Range
41 - 5.042 0 ≤ ≤ 14°
23.75 14° < ≤ 20°
32.5 - 25 × log () 20° < ≤ 48°
-9.5 48° < ≤ 180°
in deg.
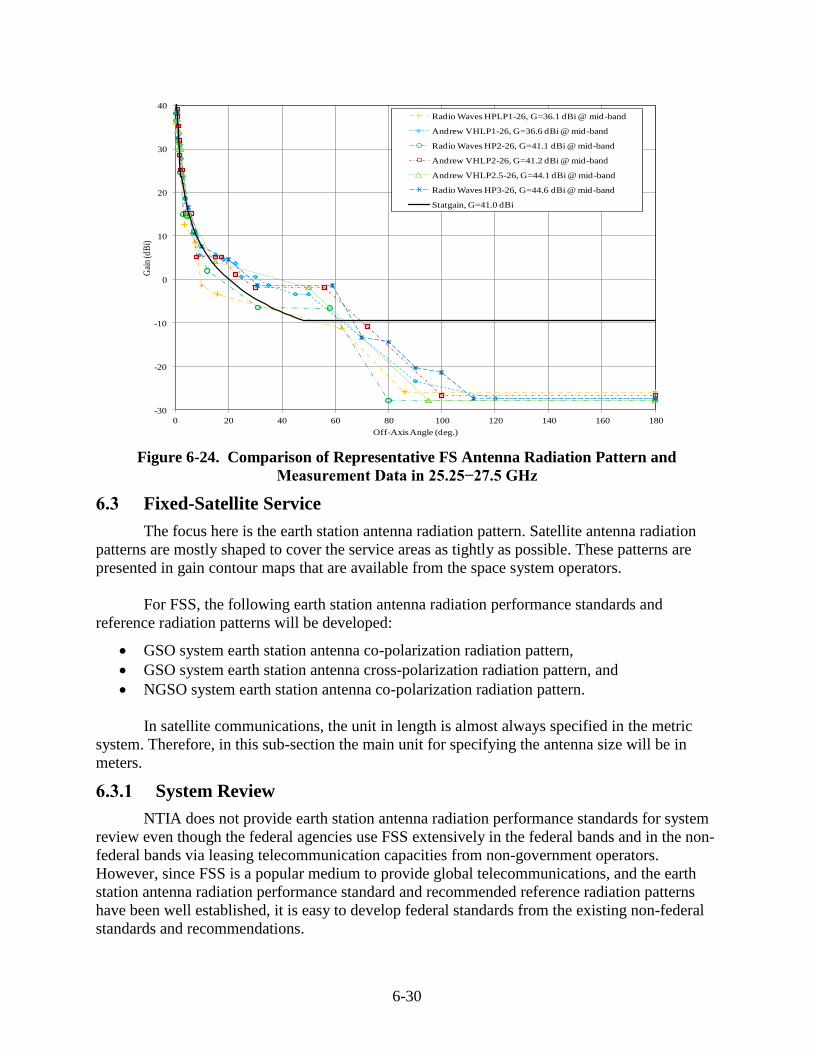
6-30
-30
-20
-10
0
10
20
30
40
0 20 40 60 80 100 120 140 160 180
Gai
n (d
Bi)
Off-Axis Angle (deg.)
Radio Waves HPLP1-26, G=36.1 dBi @ mid-band
Andrew VHLP1-26, G=36.6 dBi @ mid-band
Radio Waves HP2-26, G=41.1 dBi @ mid-band
Andrew VHLP2-26, G=41.2 dBi @ mid-band
Andrew VHLP2.5-26, G=44.1 dBi @ mid-band
Radio Waves HP3-26, G=44.6 dBi @ mid-band
Statgain, G=41.0 dBi
Figure 6-24. Comparison of Representative FS Antenna Radiation Pattern and
Measurement Data in 25.25−27.5 GHz
6.3 Fixed-Satellite Service
The focus here is the earth station antenna radiation pattern. Satellite antenna radiation
patterns are mostly shaped to cover the service areas as tightly as possible. These patterns are
presented in gain contour maps that are available from the space system operators.
For FSS, the following earth station antenna radiation performance standards and
reference radiation patterns will be developed:
GSO system earth station antenna co-polarization radiation pattern,
GSO system earth station antenna cross-polarization radiation pattern, and
NGSO system earth station antenna co-polarization radiation pattern.
In satellite communications, the unit in length is almost always specified in the metric
system. Therefore, in this sub-section the main unit for specifying the antenna size will be in
meters.
6.3.1 System Review
NTIA does not provide earth station antenna radiation performance standards for system
review even though the federal agencies use FSS extensively in the federal bands and in the non-
federal bands via leasing telecommunication capacities from non-government operators.
However, since FSS is a popular medium to provide global telecommunications, and the earth
station antenna radiation performance standard and recommended reference radiation patterns
have been well established, it is easy to develop federal standards from the existing non-federal
standards and recommendations.
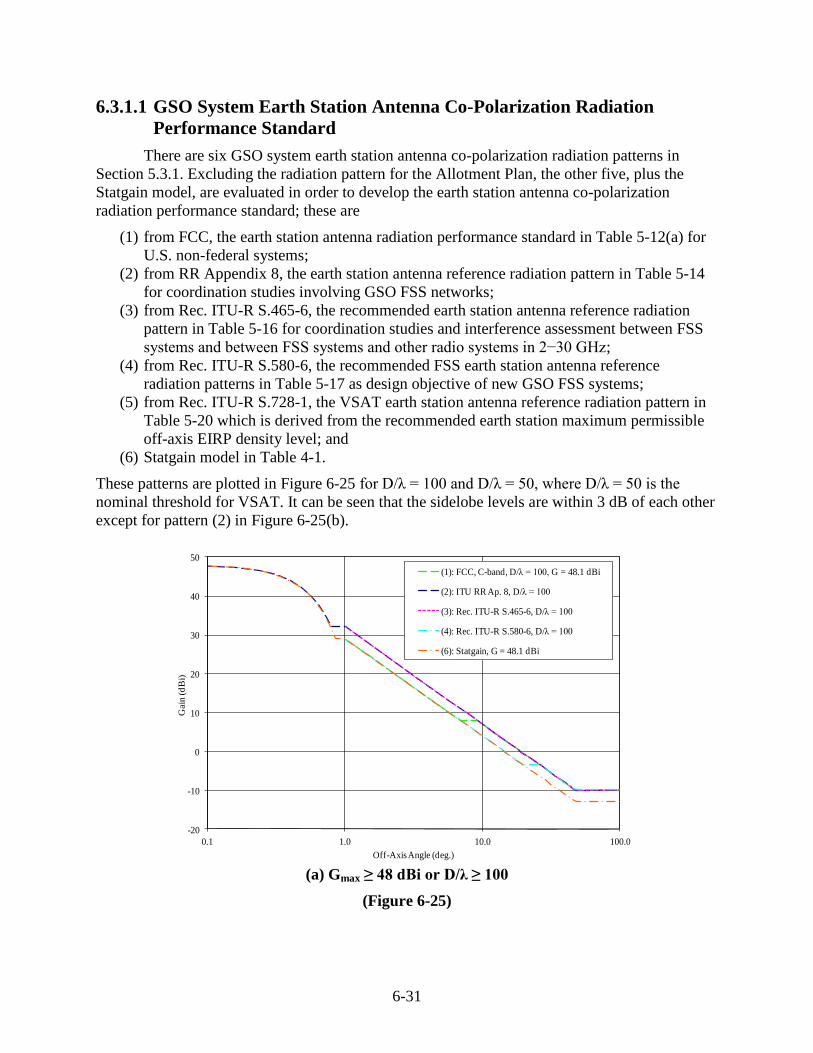
6-31
6.3.1.1 GSO System Earth Station Antenna Co-Polarization Radiation
Performance Standard
There are six GSO system earth station antenna co-polarization radiation patterns in
Section 5.3.1. Excluding the radiation pattern for the Allotment Plan, the other five, plus the
Statgain model, are evaluated in order to develop the earth station antenna co-polarization
radiation performance standard; these are
(1) from FCC, the earth station antenna radiation performance standard in Table 5-12(a) for
U.S. non-federal systems;
(2) from RR Appendix 8, the earth station antenna reference radiation pattern in Table 5-14
for coordination studies involving GSO FSS networks;
(3) from Rec. ITU-R S.465-6, the recommended earth station antenna reference radiation
pattern in Table 5-16 for coordination studies and interference assessment between FSS
systems and between FSS systems and other radio systems in 2−30 GHz;
(4) from Rec. ITU-R S.580-6, the recommended FSS earth station antenna reference
radiation patterns in Table 5-17 as design objective of new GSO FSS systems;
(5) from Rec. ITU-R S.728-1, the VSAT earth station antenna reference radiation pattern in
Table 5-20 which is derived from the recommended earth station maximum permissible
off-axis EIRP density level; and
(6) Statgain model in Table 4-1.
These patterns are plotted in Figure 6-25 for D/λ = 100 and D/λ = 50, where D/λ = 50 is the
nominal threshold for VSAT. It can be seen that the sidelobe levels are within 3 dB of each other
except for pattern (2) in Figure 6-25(b).
-20
-10
0
10
20
30
40
50
0.1 1.0 10.0 100.0
Gain
(d
Bi)
Off-Axis Angle (deg.)
(1): FCC, C-band, D/λ = 100, G = 48.1 dBi
(2): ITU RR Ap. 8, D/λ = 100
(3): Rec. ITU-R S.465-6, D/λ = 100
(4): Rec. ITU-R S.580-6, D/λ = 100
(6): Statgain, G = 48.1 dBi
(a) Gmax ≥ 48 dBi or D/λ ≥ 100
(Figure 6-25)
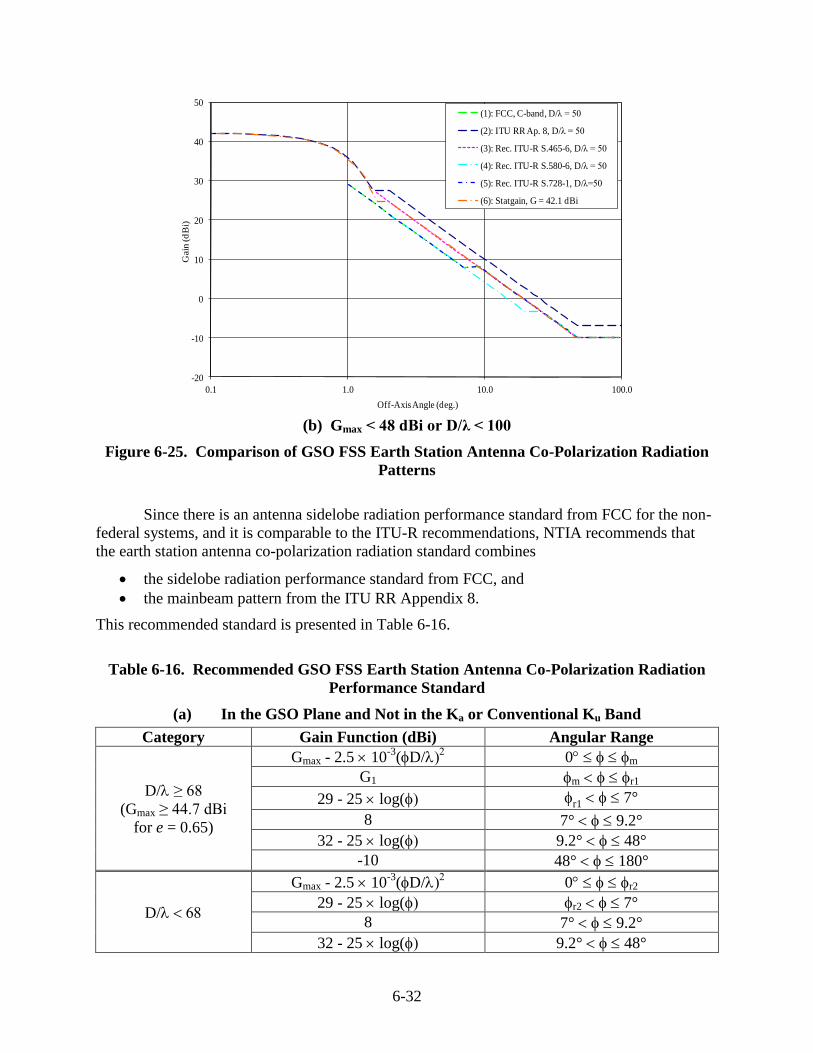
6-32
-20
-10
0
10
20
30
40
50
0.1 1.0 10.0 100.0
Gain
(d
Bi)
Off-Axis Angle (deg.)
(1): FCC, C-band, D/λ = 50
(2): ITU RR Ap. 8, D/λ = 50
(3): Rec. ITU-R S.465-6, D/λ = 50
(4): Rec. ITU-R S.580-6, D/λ = 50
(5): Rec. ITU-R S.728-1, D/λ=50
(6): Statgain, G = 42.1 dBi
(b) Gmax < 48 dBi or D/λ < 100
Figure 6-25. Comparison of GSO FSS Earth Station Antenna Co-Polarization Radiation
Patterns
Since there is an antenna sidelobe radiation performance standard from FCC for the non-
federal systems, and it is comparable to the ITU-R recommendations, NTIA recommends that
the earth station antenna co-polarization radiation standard combines
the sidelobe radiation performance standard from FCC, and
the mainbeam pattern from the ITU RR Appendix 8.
This recommended standard is presented in Table 6-16.
Table 6-16. Recommended GSO FSS Earth Station Antenna Co-Polarization Radiation
Performance Standard
(a) In the GSO Plane and Not in the Ka or Conventional Ku Band
Category Gain Function (dBi) Angular Range
D/≥ 68
(Gmax ≥ 44.7 dBi
for e = 0.65)
Gmax - 2.5 10-3
(D/ 0 m
G1 m r1
29 - 25 log( r1 7°
8 7° 9.2°
32 - 25 log( 9.2° 48°
-10 48° 180°
D/
Gmax - 2.5 10-3
(D/ 0 r2
29 - 25 log( r2 7°
8 7° 9.2°
32 - 25 log( 9.2° 48°
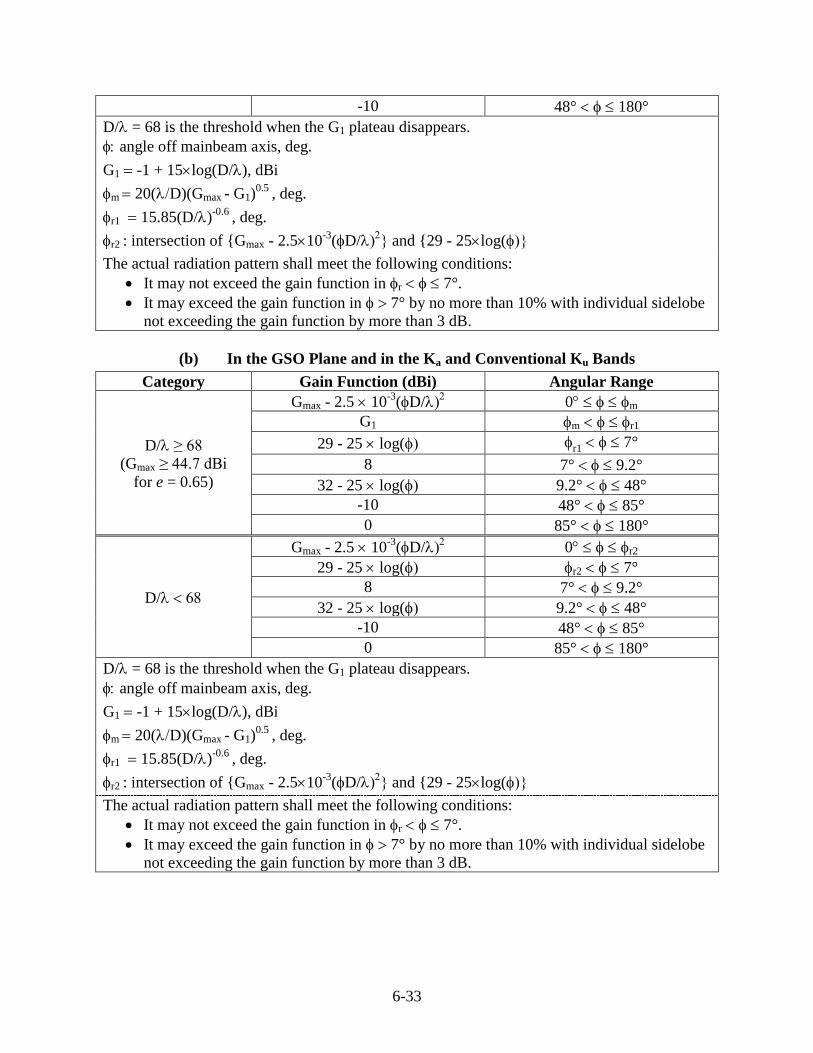
6-33
-10 48° 180°
D/= 68 is the threshold when the G1 plateau disappears.
angle off mainbeam axis, deg.
G1 -1 + 15log(D/), dBi
m 20(D)(Gmax - G1)0.5
, deg.
r1 15.85(D/)-0.6
, deg.
r2 : intersection of {Gmax - 2.510-3
(D/ and {29 - 25log(
The actual radiation pattern shall meet the following conditions:
It may not exceed the gain function in r 7°.
It may exceed the gain function in 7° by no more than 10% with individual sidelobe
not exceeding the gain function by more than 3 dB.
(b) In the GSO Plane and in the Ka and Conventional Ku Bands
Category Gain Function (dBi) Angular Range
D/≥ 68
(Gmax ≥ 44.7 dBi
for e = 0.65)
Gmax - 2.5 10-3
(D/ 0 m
G1 m r1
29 - 25 log( r1 7°
8 7° 9.2°
32 - 25 log( 9.2° 48°
-10 48° 85°
0 85° 180°
D/
Gmax - 2.5 10-3
(D/ 0 r2
29 - 25 log( r2 7°
8 7° 9.2°
32 - 25 log( 9.2° 48°
-10 48° 85°
0 85° 180°
D/= 68 is the threshold when the G1 plateau disappears.
angle off mainbeam axis, deg.
G1 -1 + 15log(D/), dBi
m 20(D)(Gmax - G1)0.5
, deg.
r1 15.85(D/)-0.6
, deg.
r2 : intersection of {Gmax - 2.510-3
(D/ and {29 - 25log(
The actual radiation pattern shall meet the following conditions:
It may not exceed the gain function in r 7°.
It may exceed the gain function in 7° by no more than 10% with individual sidelobe
not exceeding the gain function by more than 3 dB.
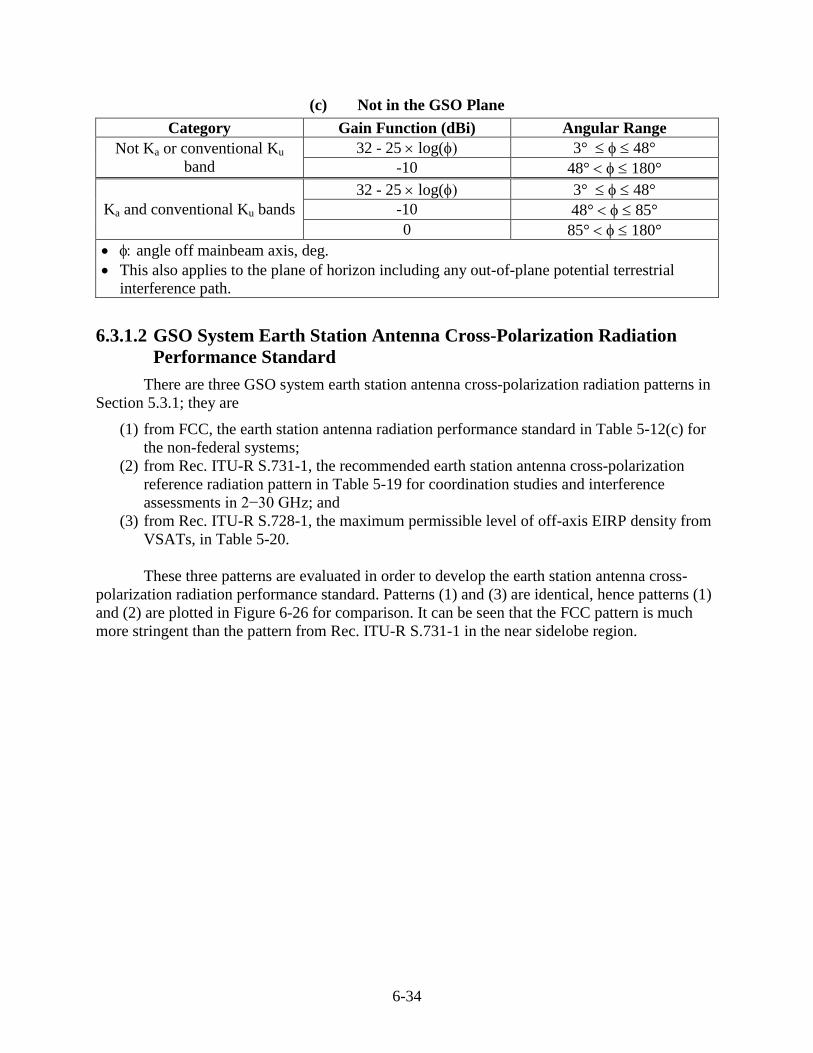
6-34
(c) Not in the GSO Plane
Category Gain Function (dBi) Angular Range
Not Ka or conventional Ku
band
32 - 25 log( 3° 48°
-10 48° 180°
Ka and conventional Ku bands
32 - 25 log( 3° 48°
-10 48° 85°
0 85° 180°
angle off mainbeam axis, deg.
This also applies to the plane of horizon including any out-of-plane potential terrestrial
interference path.
6.3.1.2 GSO System Earth Station Antenna Cross-Polarization Radiation
Performance Standard
There are three GSO system earth station antenna cross-polarization radiation patterns in
Section 5.3.1; they are
(1) from FCC, the earth station antenna radiation performance standard in Table 5-12(c) for
the non-federal systems;
(2) from Rec. ITU-R S.731-1, the recommended earth station antenna cross-polarization
reference radiation pattern in Table 5-19 for coordination studies and interference
assessments in 2−30 GHz; and
(3) from Rec. ITU-R S.728-1, the maximum permissible level of off-axis EIRP density from
VSATs, in Table 5-20.
These three patterns are evaluated in order to develop the earth station antenna cross-
polarization radiation performance standard. Patterns (1) and (3) are identical, hence patterns (1)
and (2) are plotted in Figure 6-26 for comparison. It can be seen that the FCC pattern is much
more stringent than the pattern from Rec. ITU-R S.731-1 in the near sidelobe region.
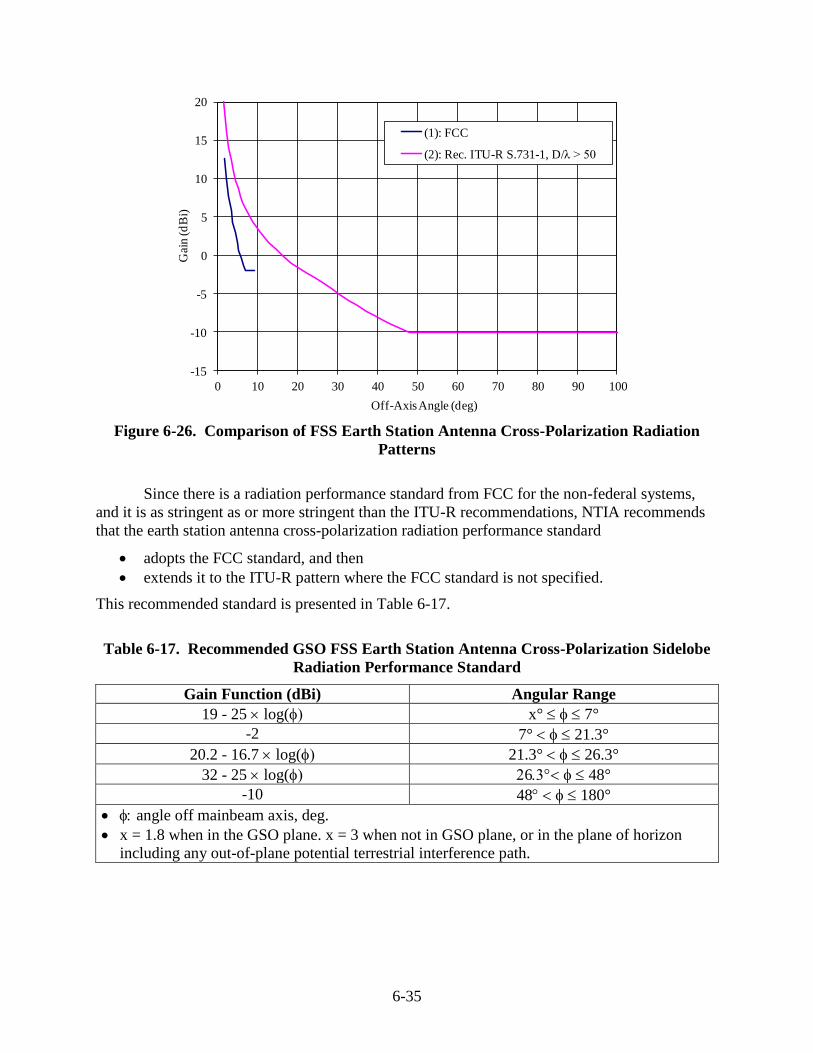
6-35
-15
-10
-5
0
5
10
15
20
0 10 20 30 40 50 60 70 80 90 100
Gai
n (
dB
i)
Off-Axis Angle (deg)
(1): FCC
(2): Rec. ITU-R S.731-1, D/λ > 50
Figure 6-26. Comparison of FSS Earth Station Antenna Cross-Polarization Radiation
Patterns
Since there is a radiation performance standard from FCC for the non-federal systems,
and it is as stringent as or more stringent than the ITU-R recommendations, NTIA recommends
that the earth station antenna cross-polarization radiation performance standard
adopts the FCC standard, and then
extends it to the ITU-R pattern where the FCC standard is not specified.
This recommended standard is presented in Table 6-17.
Table 6-17. Recommended GSO FSS Earth Station Antenna Cross-Polarization Sidelobe
Radiation Performance Standard
Gain Function (dBi) Angular Range
19 - 25 log( x° 7°
-2 7° 21.3°
20.2 - 16.7 log( 21.3° 26.3°
32 - 25 log( 6 48°
-10 48 180°
angle off mainbeam axis, deg.
x = 1.8 when in the GSO plane. x = 3 when not in GSO plane, or in the plane of horizon
including any out-of-plane potential terrestrial interference path.
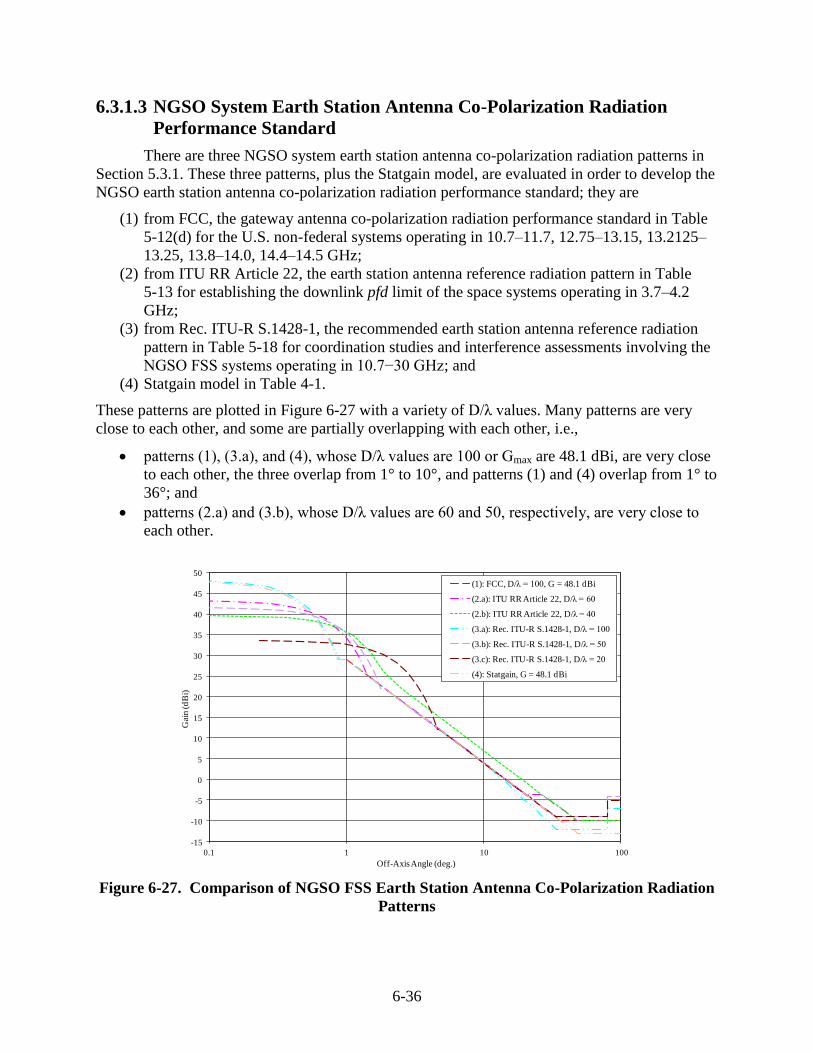
6-36
6.3.1.3 NGSO System Earth Station Antenna Co-Polarization Radiation
Performance Standard
There are three NGSO system earth station antenna co-polarization radiation patterns in
Section 5.3.1. These three patterns, plus the Statgain model, are evaluated in order to develop the
NGSO earth station antenna co-polarization radiation performance standard; they are
(1) from FCC, the gateway antenna co-polarization radiation performance standard in Table
5-12(d) for the U.S. non-federal systems operating in 10.7–11.7, 12.75–13.15, 13.2125–
13.25, 13.8–14.0, 14.4–14.5 GHz;
(2) from ITU RR Article 22, the earth station antenna reference radiation pattern in Table
5-13 for establishing the downlink pfd limit of the space systems operating in 3.7–4.2
GHz;
(3) from Rec. ITU-R S.1428-1, the recommended earth station antenna reference radiation
pattern in Table 5-18 for coordination studies and interference assessments involving the
NGSO FSS systems operating in 10.7−30 GHz; and
(4) Statgain model in Table 4-1.
These patterns are plotted in Figure 6-27 with a variety of D/λ values. Many patterns are very
close to each other, and some are partially overlapping with each other, i.e.,
patterns (1), (3.a), and (4), whose D/λ values are 100 or Gmax are 48.1 dBi, are very close
to each other, the three overlap from 1° to 10°, and patterns (1) and (4) overlap from 1° to
36°; and
patterns (2.a) and (3.b), whose D/λ values are 60 and 50, respectively, are very close to
each other.
-15
-10
-5
0
5
10
15
20
25
30
35
40
45
50
0.1 1 10 100
Gai
n (d
Bi)
Off-Axis Angle (deg.)
(1): FCC, D/λ = 100, G = 48.1 dBi
(2.a): ITU RR Article 22, D/λ = 60
(2.b): ITU RR Article 22, D/λ = 40
(3.a): Rec. ITU-R S.1428-1, D/λ = 100
(3.b): Rec. ITU-R S.1428-1, D/λ = 50
(3.c): Rec. ITU-R S.1428-1, D/λ = 20
(4): Statgain, G = 48.1 dBi
Figure 6-27. Comparison of NGSO FSS Earth Station Antenna Co-Polarization Radiation
Patterns
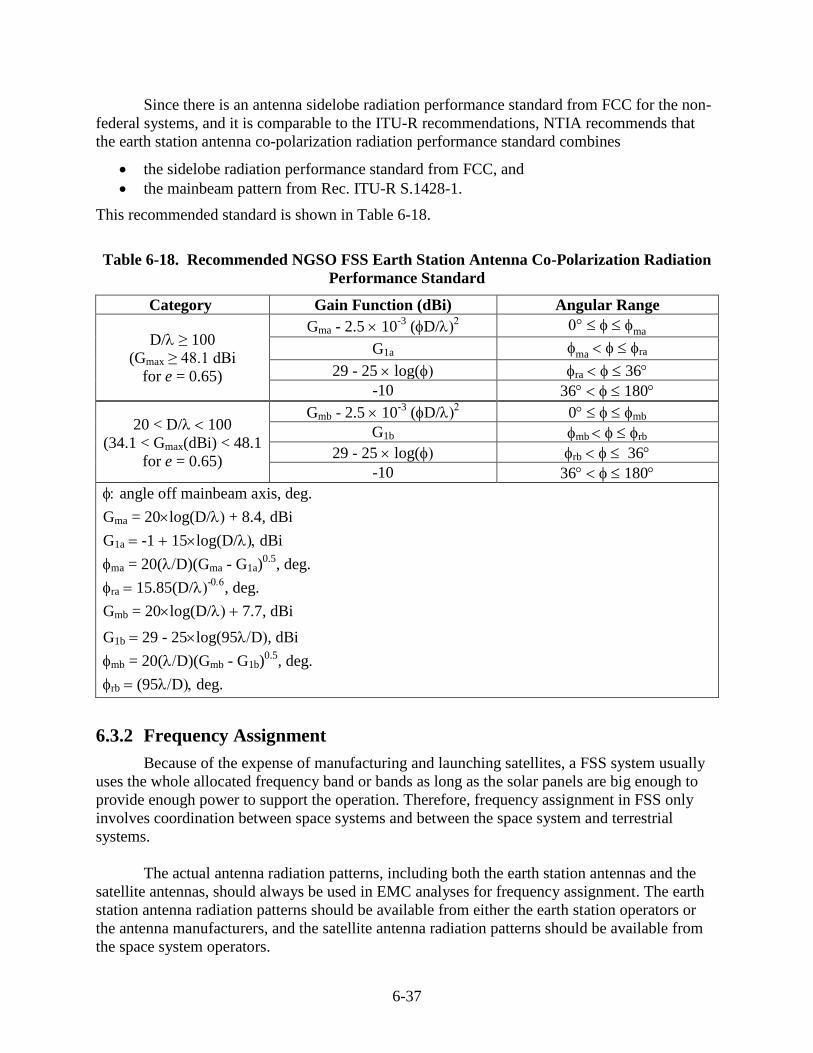
6-37
Since there is an antenna sidelobe radiation performance standard from FCC for the non-
federal systems, and it is comparable to the ITU-R recommendations, NTIA recommends that
the earth station antenna co-polarization radiation performance standard combines
the sidelobe radiation performance standard from FCC, and
the mainbeam pattern from Rec. ITU-R S.1428-1.
This recommended standard is shown in Table 6-18.
Table 6-18. Recommended NGSO FSS Earth Station Antenna Co-Polarization Radiation
Performance Standard
Category Gain Function (dBi) Angular Range
D/ ≥ 100
(Gmax ≥ 48.1 dBi
for e = 0.65)
Gma - 2.5 10-3
(D/ ma
G1a ma ra
29 - 25 log( ra 36
-10 36 180
20 < D/ 100
(34.1 < Gmax(dBi) < 48.1
for e = 0.65)
Gmb - 2.5 10-3
(D/ 0 mb
G1b mb rb
29 - 25 log( rb 36
-10 36 180
angle off mainbeam axis, deg.
Gma = 20log(D/ + 8.4, dBi
G1a -1 15log(D/dBi
ma = 20(D)(Gma - G1a)0.5
, deg.
ra 15.85(D/-
, deg.
Gmb = 20log(D/ 7.7, dBi
G1b 29 - 25log(95D, dBi
mb = 20(D)(Gmb - G1b)0.5
, deg.
rb (95Ddeg.
6.3.2 Frequency Assignment
Because of the expense of manufacturing and launching satellites, a FSS system usually
uses the whole allocated frequency band or bands as long as the solar panels are big enough to
provide enough power to support the operation. Therefore, frequency assignment in FSS only
involves coordination between space systems and between the space system and terrestrial
systems.
The actual antenna radiation patterns, including both the earth station antennas and the
satellite antennas, should always be used in EMC analyses for frequency assignment. The earth
station antenna radiation patterns should be available from either the earth station operators or
the antenna manufacturers, and the satellite antenna radiation patterns should be available from
the space system operators.
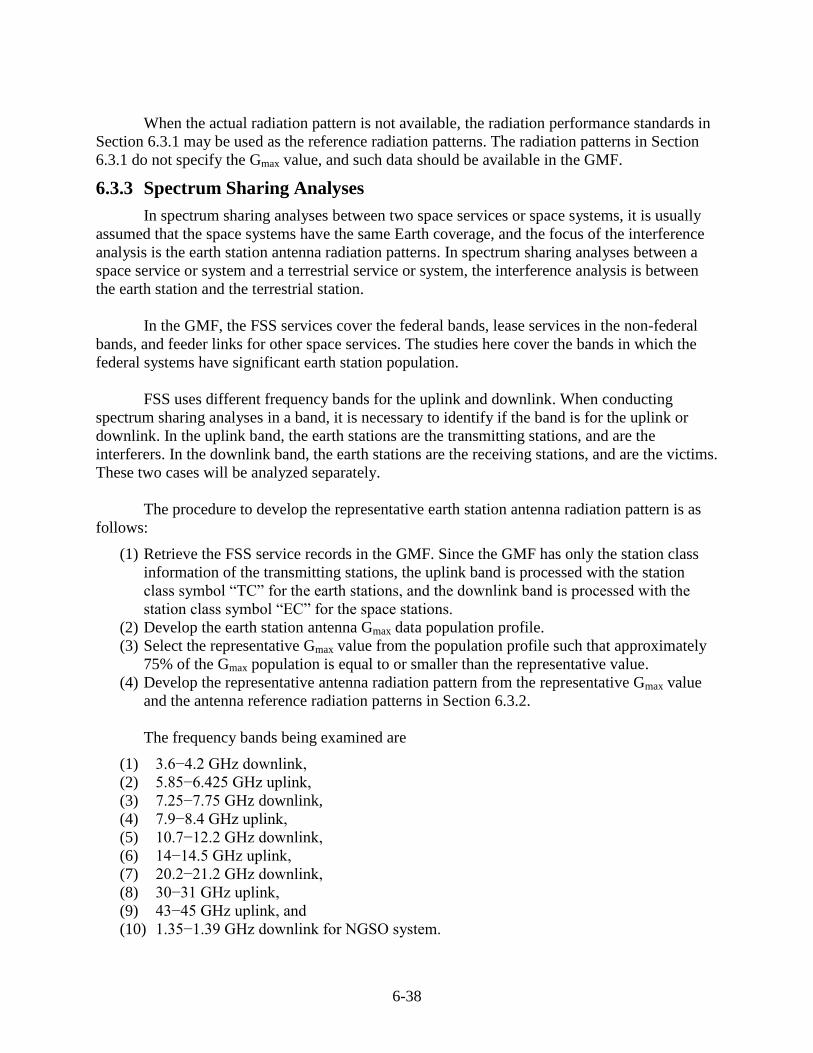
6-38
When the actual radiation pattern is not available, the radiation performance standards in
Section 6.3.1 may be used as the reference radiation patterns. The radiation patterns in Section
6.3.1 do not specify the Gmax value, and such data should be available in the GMF.
6.3.3 Spectrum Sharing Analyses
In spectrum sharing analyses between two space services or space systems, it is usually
assumed that the space systems have the same Earth coverage, and the focus of the interference
analysis is the earth station antenna radiation patterns. In spectrum sharing analyses between a
space service or system and a terrestrial service or system, the interference analysis is between
the earth station and the terrestrial station.
In the GMF, the FSS services cover the federal bands, lease services in the non-federal
bands, and feeder links for other space services. The studies here cover the bands in which the
federal systems have significant earth station population.
FSS uses different frequency bands for the uplink and downlink. When conducting
spectrum sharing analyses in a band, it is necessary to identify if the band is for the uplink or
downlink. In the uplink band, the earth stations are the transmitting stations, and are the
interferers. In the downlink band, the earth stations are the receiving stations, and are the victims.
These two cases will be analyzed separately.
The procedure to develop the representative earth station antenna radiation pattern is as
follows:
(1) Retrieve the FSS service records in the GMF. Since the GMF has only the station class
information of the transmitting stations, the uplink band is processed with the station
class symbol “TC” for the earth stations, and the downlink band is processed with the
station class symbol “EC” for the space stations.
(2) Develop the earth station antenna Gmax data population profile.
(3) Select the representative Gmax value from the population profile such that approximately
75% of the Gmax population is equal to or smaller than the representative value.
(4) Develop the representative antenna radiation pattern from the representative Gmax value
and the antenna reference radiation patterns in Section 6.3.2.
The frequency bands being examined are
(1) 3.6−4.2 GHz downlink,
(2) 5.85−6.425 GHz uplink,
(3) 7.25−7.75 GHz downlink,
(4) 7.9−8.4 GHz uplink,
(5) 10.7−12.2 GHz downlink,
(6) 14−14.5 GHz uplink,
(7) 20.2−21.2 GHz downlink,
(8) 30−31 GHz uplink,
(9) 43−45 GHz uplink, and
(10) 1.35−1.39 GHz downlink for NGSO system.
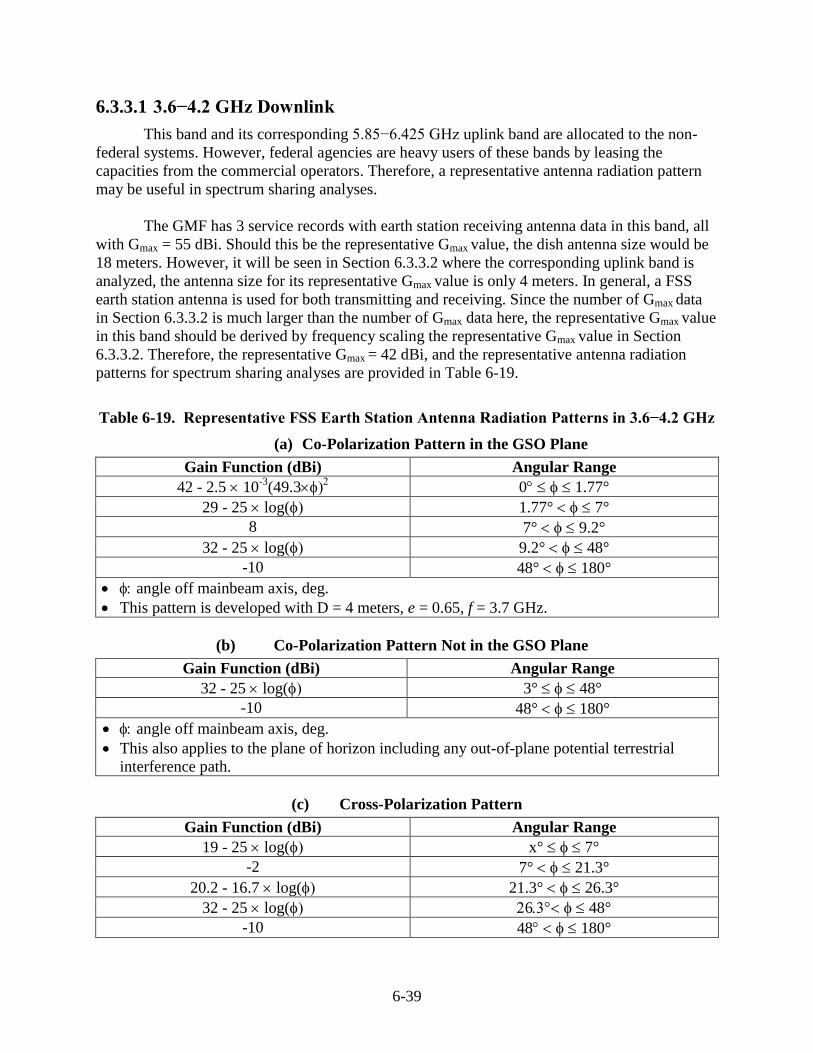
6-39
6.3.3.1 3.6−4.2 GHz Downlink
This band and its corresponding 5.85−6.425 GHz uplink band are allocated to the non-
federal systems. However, federal agencies are heavy users of these bands by leasing the
capacities from the commercial operators. Therefore, a representative antenna radiation pattern
may be useful in spectrum sharing analyses.
The GMF has 3 service records with earth station receiving antenna data in this band, all
with Gmax = 55 dBi. Should this be the representative Gmax value, the dish antenna size would be
18 meters. However, it will be seen in Section 6.3.3.2 where the corresponding uplink band is
analyzed, the antenna size for its representative Gmax value is only 4 meters. In general, a FSS
earth station antenna is used for both transmitting and receiving. Since the number of Gmax data
in Section 6.3.3.2 is much larger than the number of Gmax data here, the representative Gmax value
in this band should be derived by frequency scaling the representative Gmax value in Section
6.3.3.2. Therefore, the representative Gmax = 42 dBi, and the representative antenna radiation
patterns for spectrum sharing analyses are provided in Table 6-19.
Table 6-19. Representative FSS Earth Station Antenna Radiation Patterns in 3.6−4.2 GHz
(a) Co-Polarization Pattern in the GSO Plane
Gain Function (dBi) Angular Range
42 - 2.5 10-3
(49.3 0 1.77°
29 - 25 log( 1.77° 7°
8 7° 9.2°
32 - 25 log( 9.2° 48°
-10 48° 180°
angle off mainbeam axis, deg.
This pattern is developed with D = 4 meters, e = 0.65, f = 3.7 GHz.
(b) Co-Polarization Pattern Not in the GSO Plane
Gain Function (dBi) Angular Range
32 - 25 log( 3° 48°
-10 48° 180°
angle off mainbeam axis, deg.
This also applies to the plane of horizon including any out-of-plane potential terrestrial
interference path.
(c) Cross-Polarization Pattern
Gain Function (dBi) Angular Range
19 - 25 log( x° 7°
-2 7° 21.3°
20.2 - 16.7 log( 21.3° 26.3°
32 - 25 log( 6 48°
-10 48 180°
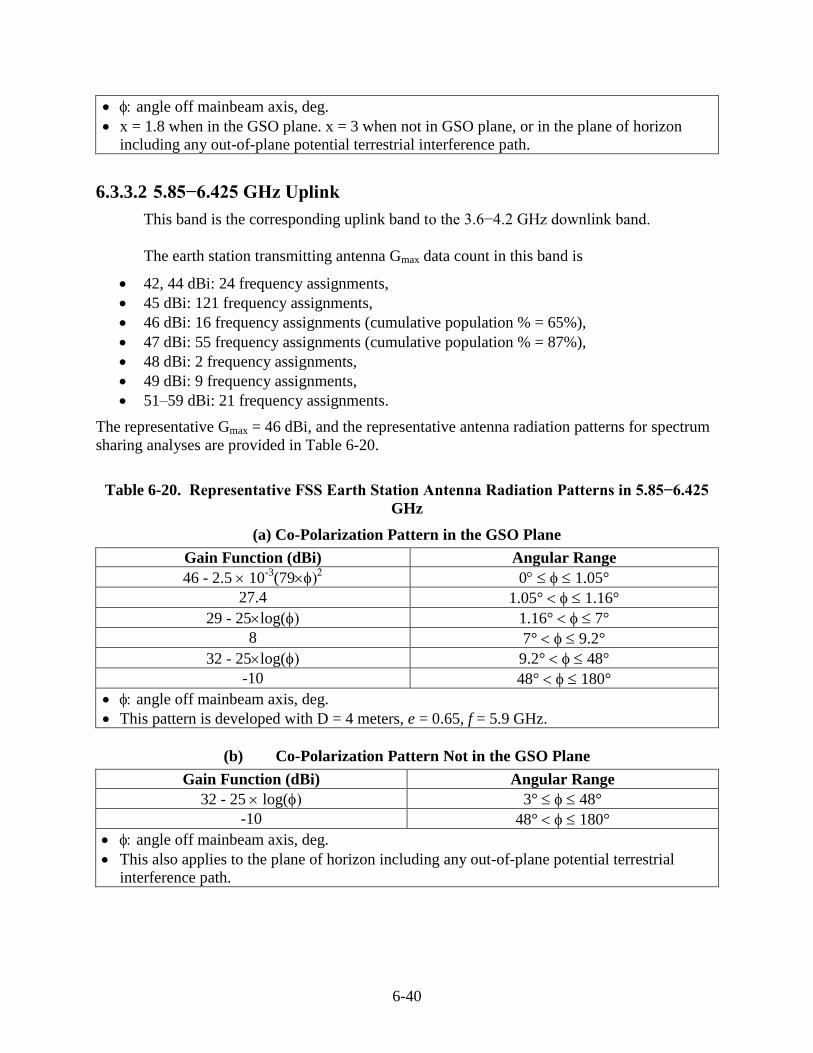
6-40
angle off mainbeam axis, deg.
x = 1.8 when in the GSO plane. x = 3 when not in GSO plane, or in the plane of horizon
including any out-of-plane potential terrestrial interference path.
6.3.3.2 5.85−6.425 GHz Uplink
This band is the corresponding uplink band to the 3.6−4.2 GHz downlink band.
The earth station transmitting antenna Gmax data count in this band is
42, 44 dBi: 24 frequency assignments,
45 dBi: 121 frequency assignments,
46 dBi: 16 frequency assignments (cumulative population % = 65%),
47 dBi: 55 frequency assignments (cumulative population % = 87%),
48 dBi: 2 frequency assignments,
49 dBi: 9 frequency assignments,
51–59 dBi: 21 frequency assignments.
The representative Gmax = 46 dBi, and the representative antenna radiation patterns for spectrum
sharing analyses are provided in Table 6-20.
Table 6-20. Representative FSS Earth Station Antenna Radiation Patterns in 5.85−6.425
GHz
(a) Co-Polarization Pattern in the GSO Plane
Gain Function (dBi) Angular Range
46 - 2.5 10-3
(79 0 1.05°
27.4 1.05° 1.16°
29 - 25log( 1.16° 7°
8 7° 9.2°
32 - 25log( 9.2° 48°
-10 48° 180°
angle off mainbeam axis, deg.
This pattern is developed with D = 4 meters, e = 0.65, f = 5.9 GHz.
(b) Co-Polarization Pattern Not in the GSO Plane
Gain Function (dBi) Angular Range
32 - 25 log( 3° 48°
-10 48° 180°
angle off mainbeam axis, deg.
This also applies to the plane of horizon including any out-of-plane potential terrestrial
interference path.
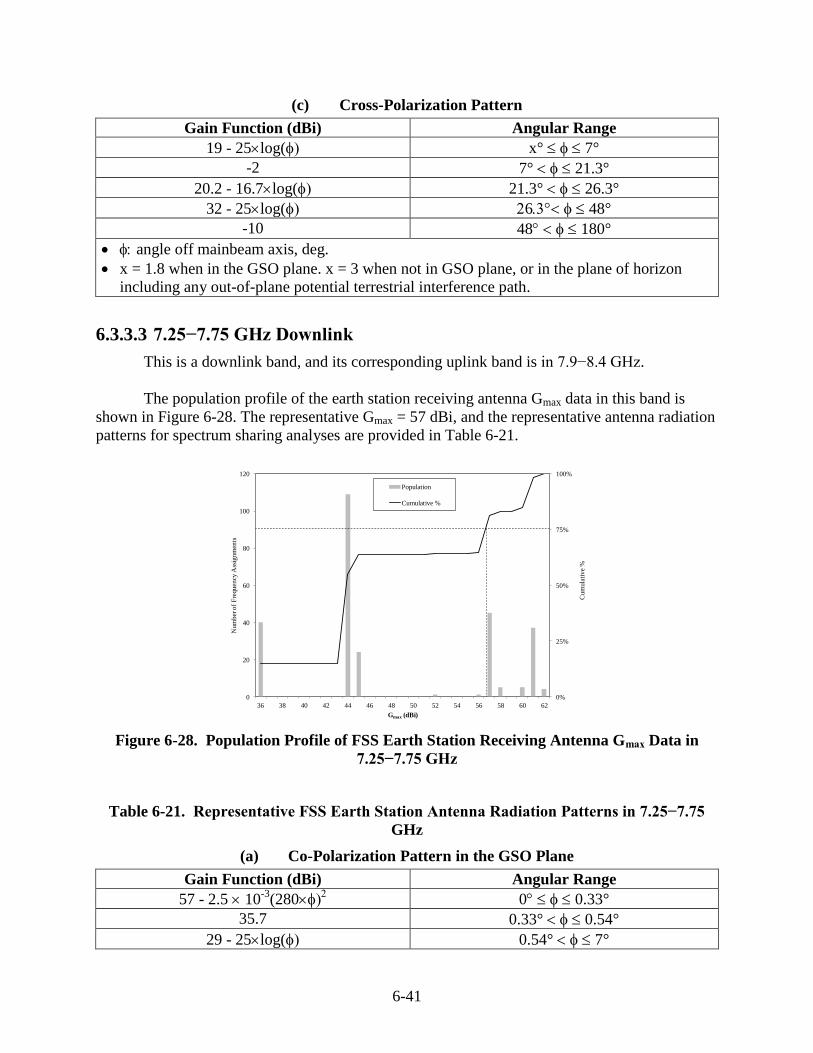
6-41
(c) Cross-Polarization Pattern
Gain Function (dBi) Angular Range
19 - 25log( x° 7°
-2 7° 21.3°
20.2 - 16.7log( 21.3° 26.3°
32 - 25log( 6 48°
-10 48 180°
angle off mainbeam axis, deg.
x = 1.8 when in the GSO plane. x = 3 when not in GSO plane, or in the plane of horizon
including any out-of-plane potential terrestrial interference path.
6.3.3.3 7.25−7.75 GHz Downlink
This is a downlink band, and its corresponding uplink band is in 7.9−8.4 GHz.
The population profile of the earth station receiving antenna Gmax data in this band is
shown in Figure 6-28. The representative Gmax = 57 dBi, and the representative antenna radiation
patterns for spectrum sharing analyses are provided in Table 6-21.
0%
25%
50%
75%
100%
0
20
40
60
80
100
120
36 38 40 42 44 46 48 50 52 54 56 58 60 62
Cu
mu
lati
ve
%
Nu
mb
er o
f F
req
uen
cy A
ssig
nm
ents
Gmax (dBi)
Population
Cumulative %
Figure 6-28. Population Profile of FSS Earth Station Receiving Antenna Gmax Data in
7.25−7.75 GHz
Table 6-21. Representative FSS Earth Station Antenna Radiation Patterns in 7.25−7.75
GHz
(a) Co-Polarization Pattern in the GSO Plane
Gain Function (dBi) Angular Range
57 - 2.5 10-3
(280 0 0.33°
35.7 0.33° 0.54°
29 - 25log( 0.54° 7°
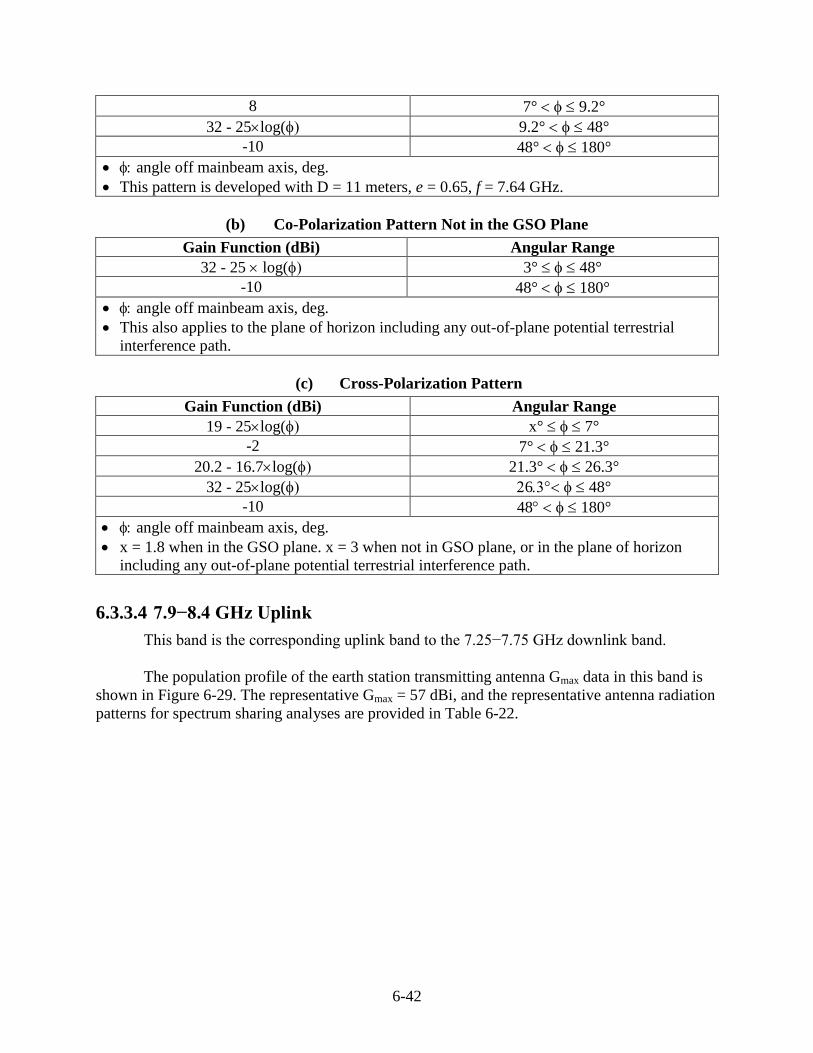
6-42
8 7° 9.2°
32 - 25log( 9.2° 48°
-10 48° 180°
angle off mainbeam axis, deg.
This pattern is developed with D = 11 meters, e = 0.65, f = 7.64 GHz.
(b) Co-Polarization Pattern Not in the GSO Plane
Gain Function (dBi) Angular Range
32 - 25 log( 3° 48°
-10 48° 180°
angle off mainbeam axis, deg.
This also applies to the plane of horizon including any out-of-plane potential terrestrial
interference path.
(c) Cross-Polarization Pattern
Gain Function (dBi) Angular Range
19 - 25log( x° 7°
-2 7° 21.3°
20.2 - 16.7log( 21.3° 26.3°
32 - 25log( 6 48°
-10 48 180°
angle off mainbeam axis, deg.
x = 1.8 when in the GSO plane. x = 3 when not in GSO plane, or in the plane of horizon
including any out-of-plane potential terrestrial interference path.
6.3.3.4 7.9−8.4 GHz Uplink
This band is the corresponding uplink band to the 7.25−7.75 GHz downlink band.
The population profile of the earth station transmitting antenna Gmax data in this band is
shown in Figure 6-29. The representative Gmax = 57 dBi, and the representative antenna radiation
patterns for spectrum sharing analyses are provided in Table 6-22.
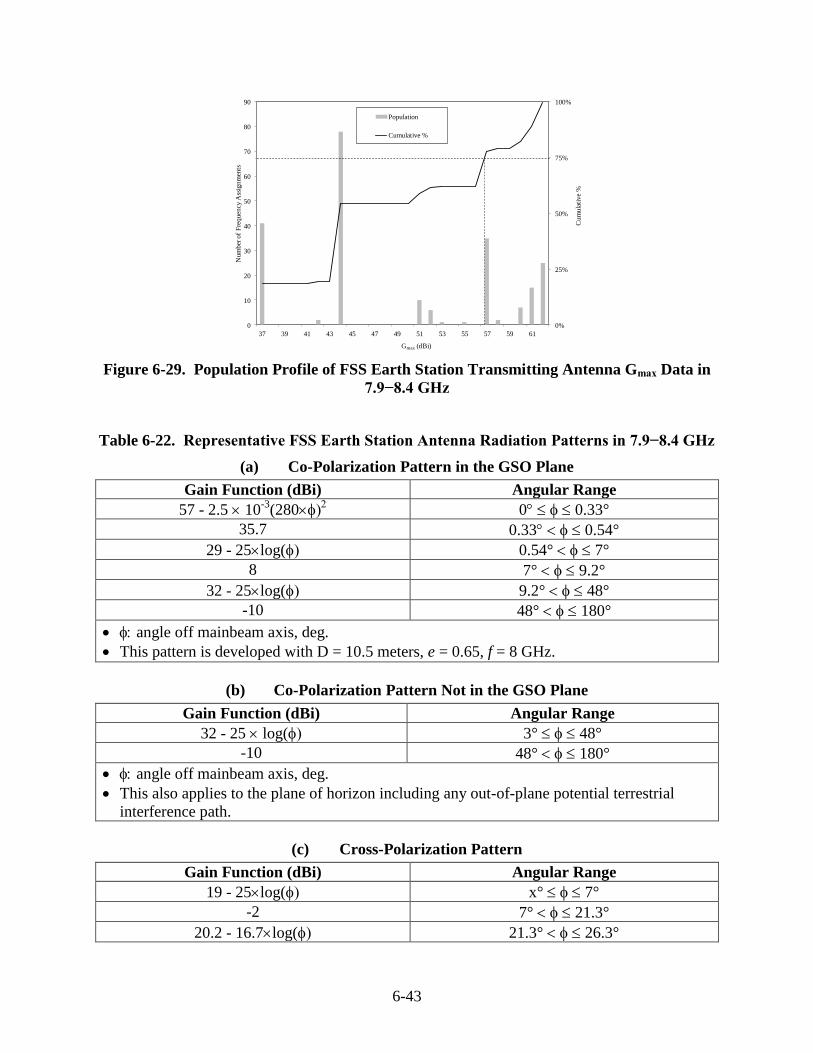
6-43
0%
25%
50%
75%
100%
0
10
20
30
40
50
60
70
80
90
37 39 41 43 45 47 49 51 53 55 57 59 61
Cum
ula
tive
%
Num
ber
of
Fre
quen
cy A
ssig
nm
ents
Gmax (dBi)
Population
Cumulative %
Figure 6-29. Population Profile of FSS Earth Station Transmitting Antenna Gmax Data in
7.9−8.4 GHz
Table 6-22. Representative FSS Earth Station Antenna Radiation Patterns in 7.9−8.4 GHz
(a) Co-Polarization Pattern in the GSO Plane
Gain Function (dBi) Angular Range
57 - 2.5 10-3
(280 0 0.33°
35.7 0.33 0.54°
29 - 25log( 0.54° 7°
8 7° 9.2°
32 - 25log( 9.2° 48°
-10 48° 180°
angle off mainbeam axis, deg.
This pattern is developed with D = 10.5 meters, e = 0.65, f = 8 GHz.
(b) Co-Polarization Pattern Not in the GSO Plane
Gain Function (dBi) Angular Range
32 - 25 log( 3° 48°
-10 48° 180°
angle off mainbeam axis, deg.
This also applies to the plane of horizon including any out-of-plane potential terrestrial
interference path.
(c) Cross-Polarization Pattern
Gain Function (dBi) Angular Range
19 - 25log( x° 7°
-2 7° 21.3°
20.2 - 16.7log( 21.3° 26.3°
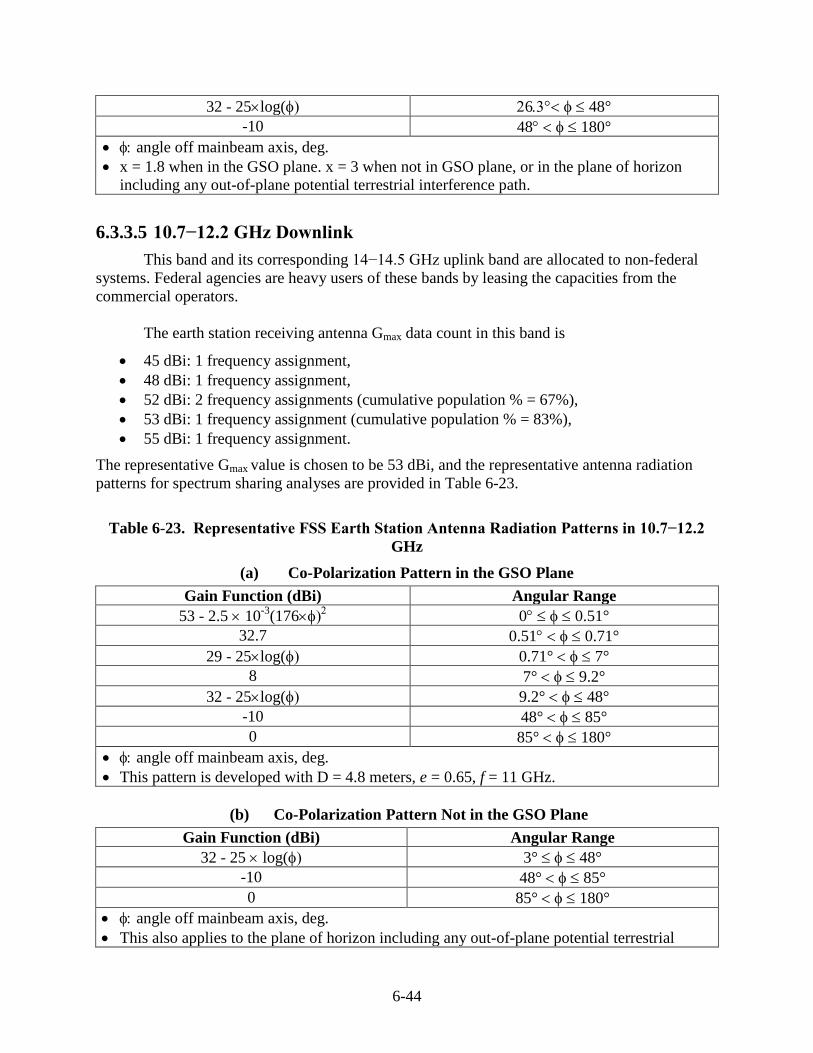
6-44
32 - 25log( 6 48°
-10 48 180°
angle off mainbeam axis, deg.
x = 1.8 when in the GSO plane. x = 3 when not in GSO plane, or in the plane of horizon
including any out-of-plane potential terrestrial interference path.
6.3.3.5 10.7−12.2 GHz Downlink
This band and its corresponding 14−14.5 GHz uplink band are allocated to non-federal
systems. Federal agencies are heavy users of these bands by leasing the capacities from the
commercial operators.
The earth station receiving antenna Gmax data count in this band is
45 dBi: 1 frequency assignment,
48 dBi: 1 frequency assignment,
52 dBi: 2 frequency assignments (cumulative population % = 67%),
53 dBi: 1 frequency assignment (cumulative population % = 83%),
55 dBi: 1 frequency assignment.
The representative Gmax value is chosen to be 53 dBi, and the representative antenna radiation
patterns for spectrum sharing analyses are provided in Table 6-23.
Table 6-23. Representative FSS Earth Station Antenna Radiation Patterns in 10.7−12.2
GHz
(a) Co-Polarization Pattern in the GSO Plane
Gain Function (dBi) Angular Range
53 - 2.5 10-3
(176 0 0.51°
32.7 0.51 0.71°
29 - 25log( 0.71° 7°
8 7° 9.2°
32 - 25log( 9.2° 48°
-10 48° 85°
0 85° 180°
angle off mainbeam axis, deg.
This pattern is developed with D = 4.8 meters, e = 0.65, f = 11 GHz.
(b) Co-Polarization Pattern Not in the GSO Plane
Gain Function (dBi) Angular Range
32 - 25 log( 3° 48°
-10 48° 85°
0 85° 180°
angle off mainbeam axis, deg.
This also applies to the plane of horizon including any out-of-plane potential terrestrial
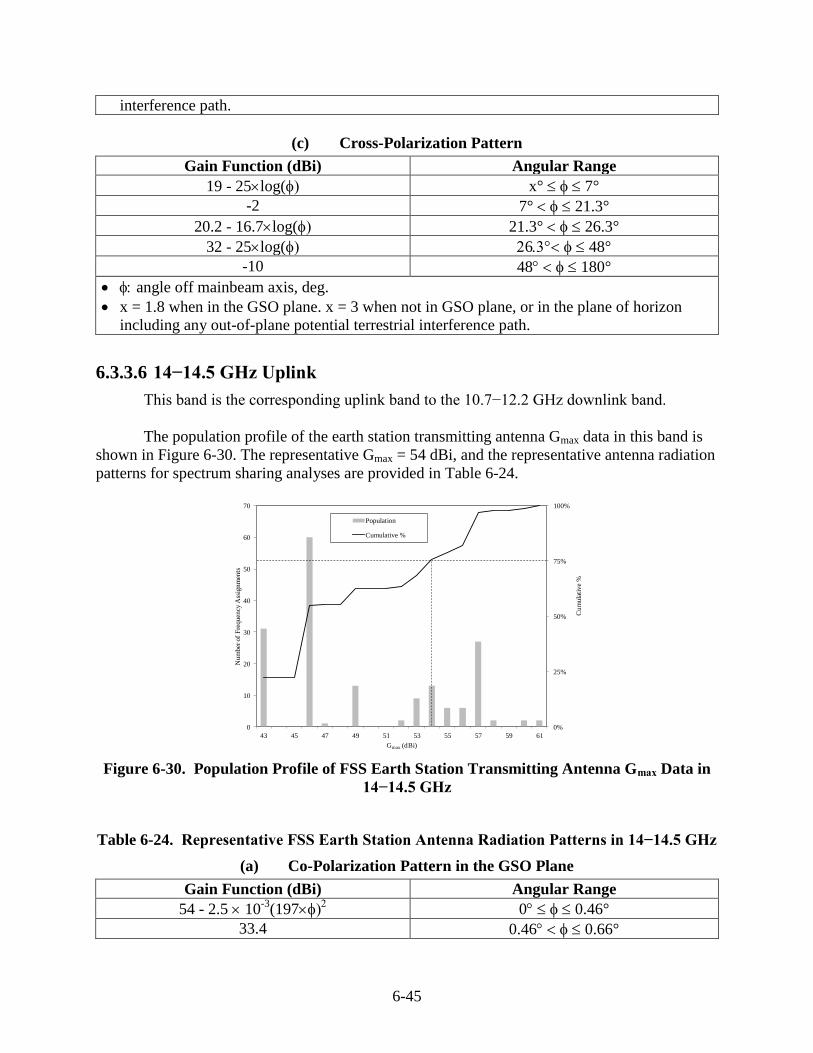
6-45
interference path.
(c) Cross-Polarization Pattern
Gain Function (dBi) Angular Range
19 - 25log( x° 7°
-2 7° 21.3°
20.2 - 16.7log( 21.3° 26.3°
32 - 25log( 6 48°
-10 48 180°
angle off mainbeam axis, deg.
x = 1.8 when in the GSO plane. x = 3 when not in GSO plane, or in the plane of horizon
including any out-of-plane potential terrestrial interference path.
6.3.3.6 14−14.5 GHz Uplink
This band is the corresponding uplink band to the 10.7−12.2 GHz downlink band.
The population profile of the earth station transmitting antenna Gmax data in this band is
shown in Figure 6-30. The representative Gmax = 54 dBi, and the representative antenna radiation
patterns for spectrum sharing analyses are provided in Table 6-24.
0%
25%
50%
75%
100%
0
10
20
30
40
50
60
70
43 45 47 49 51 53 55 57 59 61
Cu
mu
lati
ve
%
Nu
mb
er o
f F
req
uen
cy A
ssig
nm
ents
Gmax (dBi)
Population
Cumulative %
Figure 6-30. Population Profile of FSS Earth Station Transmitting Antenna Gmax Data in
14−14.5 GHz
Table 6-24. Representative FSS Earth Station Antenna Radiation Patterns in 14−14.5 GHz
(a) Co-Polarization Pattern in the GSO Plane
Gain Function (dBi) Angular Range
54 - 2.5 10-3
(197 0 0.46°
33.4 0.46 0.66°
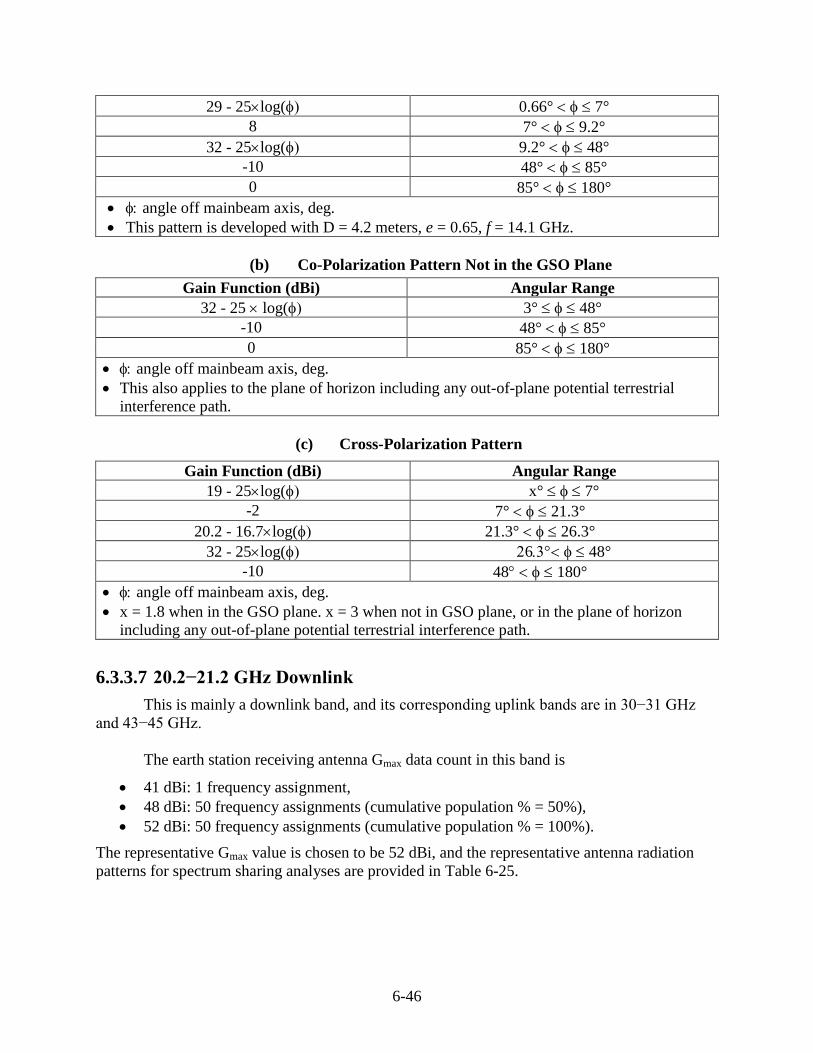
6-46
29 - 25log( 0.66° 7°
8 7° 9.2°
32 - 25log( 9.2° 48°
-10 48° 85°
0 85° 180°
angle off mainbeam axis, deg.
This pattern is developed with D = 4.2 meters, e = 0.65, f = 14.1 GHz.
(b) Co-Polarization Pattern Not in the GSO Plane
Gain Function (dBi) Angular Range
32 - 25 log( 3° 48°
-10 48° 85°
0 85° 180°
angle off mainbeam axis, deg.
This also applies to the plane of horizon including any out-of-plane potential terrestrial
interference path.
(c) Cross-Polarization Pattern
Gain Function (dBi) Angular Range
19 - 25log( x° 7°
-2 7° 21.3°
20.2 - 16.7log( 21.3° 26.3°
32 - 25log( 6 48°
-10 48 180°
angle off mainbeam axis, deg.
x = 1.8 when in the GSO plane. x = 3 when not in GSO plane, or in the plane of horizon
including any out-of-plane potential terrestrial interference path.
6.3.3.7 20.2−21.2 GHz Downlink
This is mainly a downlink band, and its corresponding uplink bands are in 30−31 GHz
and 43−45 GHz.
The earth station receiving antenna Gmax data count in this band is
41 dBi: 1 frequency assignment,
48 dBi: 50 frequency assignments (cumulative population % = 50%),
52 dBi: 50 frequency assignments (cumulative population % = 100%).
The representative Gmax value is chosen to be 52 dBi, and the representative antenna radiation
patterns for spectrum sharing analyses are provided in Table 6-25.
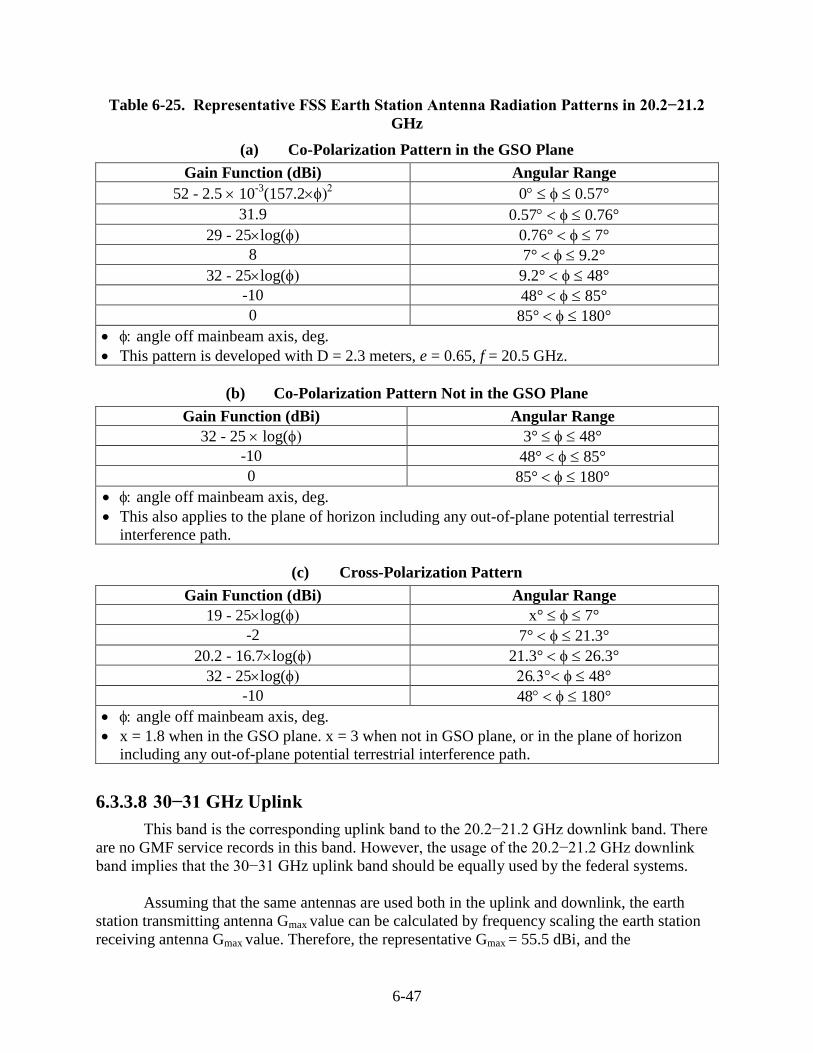
6-47
Table 6-25. Representative FSS Earth Station Antenna Radiation Patterns in 20.2−21.2
GHz
(a) Co-Polarization Pattern in the GSO Plane
Gain Function (dBi) Angular Range
52 - 2.5 10-3
(157.2 0 0.57°
31.9 0.57 0.76°
29 - 25log( 0.76° 7°
8 7° 9.2°
32 - 25log( 9.2° 48°
-10 48° 85°
0 85° 180°
angle off mainbeam axis, deg.
This pattern is developed with D = 2.3 meters, e = 0.65, f = 20.5 GHz.
(b) Co-Polarization Pattern Not in the GSO Plane
Gain Function (dBi) Angular Range
32 - 25 log( 3° 48°
-10 48° 85°
0 85° 180°
angle off mainbeam axis, deg.
This also applies to the plane of horizon including any out-of-plane potential terrestrial
interference path.
(c) Cross-Polarization Pattern
Gain Function (dBi) Angular Range
19 - 25log( x° 7°
-2 7° 21.3°
20.2 - 16.7log( 21.3° 26.3°
32 - 25log( 6 48°
-10 48 180°
angle off mainbeam axis, deg.
x = 1.8 when in the GSO plane. x = 3 when not in GSO plane, or in the plane of horizon
including any out-of-plane potential terrestrial interference path.
6.3.3.8 30−31 GHz Uplink
This band is the corresponding uplink band to the 20.2−21.2 GHz downlink band. There
are no GMF service records in this band. However, the usage of the 20.2−21.2 GHz downlink
band implies that the 30−31 GHz uplink band should be equally used by the federal systems.
Assuming that the same antennas are used both in the uplink and downlink, the earth
station transmitting antenna Gmax value can be calculated by frequency scaling the earth station
receiving antenna Gmax value. Therefore, the representative Gmax = 55.5 dBi, and the
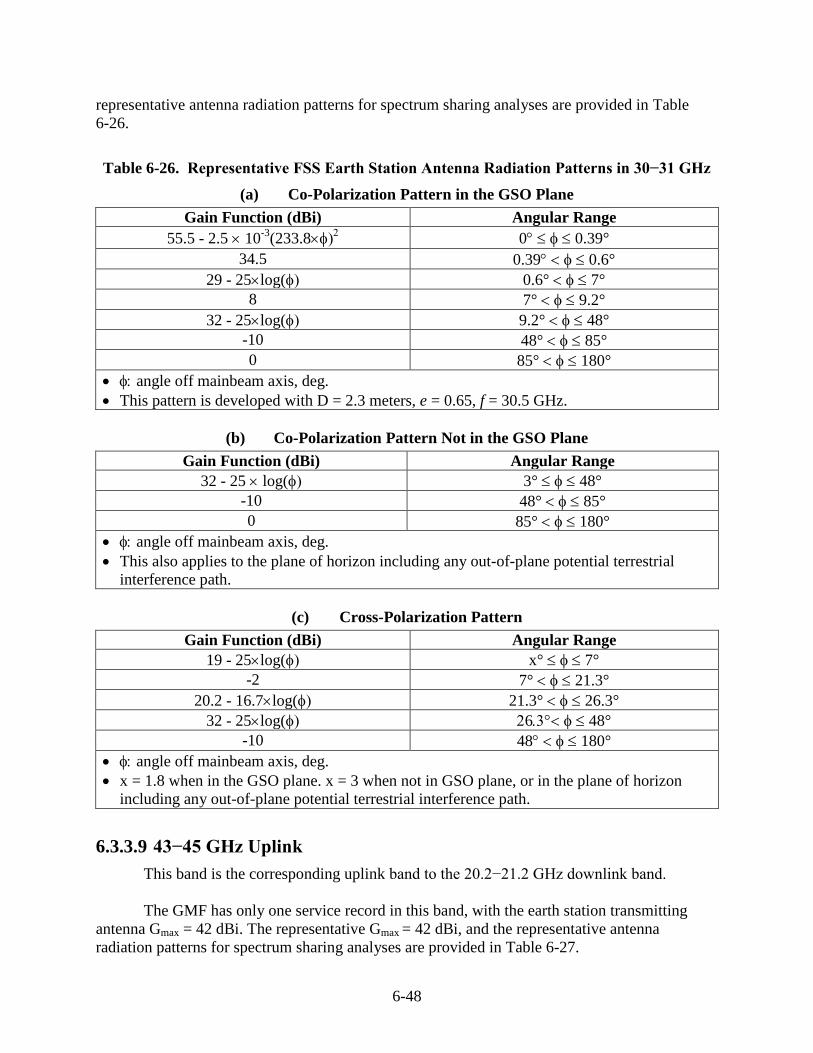
6-48
representative antenna radiation patterns for spectrum sharing analyses are provided in Table
6-26.
Table 6-26. Representative FSS Earth Station Antenna Radiation Patterns in 30−31 GHz
(a) Co-Polarization Pattern in the GSO Plane
Gain Function (dBi) Angular Range
55.5 - 2.5 10-3
(233.8 0 0.39°
34.5 0.39 0.6°
29 - 25log( 0.6° 7°
8 7° 9.2°
32 - 25log( 9.2° 48°
-10 48° 85°
0 85° 180°
angle off mainbeam axis, deg.
This pattern is developed with D = 2.3 meters, e = 0.65, f = 30.5 GHz.
(b) Co-Polarization Pattern Not in the GSO Plane
Gain Function (dBi) Angular Range
32 - 25 log( 3° 48°
-10 48° 85°
0 85° 180°
angle off mainbeam axis, deg.
This also applies to the plane of horizon including any out-of-plane potential terrestrial
interference path.
(c) Cross-Polarization Pattern
Gain Function (dBi) Angular Range
19 - 25log( x° 7°
-2 7° 21.3°
20.2 - 16.7log( 21.3° 26.3°
32 - 25log( 6 48°
-10 48 180°
angle off mainbeam axis, deg.
x = 1.8 when in the GSO plane. x = 3 when not in GSO plane, or in the plane of horizon
including any out-of-plane potential terrestrial interference path.
6.3.3.9 43−45 GHz Uplink
This band is the corresponding uplink band to the 20.2−21.2 GHz downlink band.
The GMF has only one service record in this band, with the earth station transmitting
antenna Gmax = 42 dBi. The representative Gmax = 42 dBi, and the representative antenna
radiation patterns for spectrum sharing analyses are provided in Table 6-27.
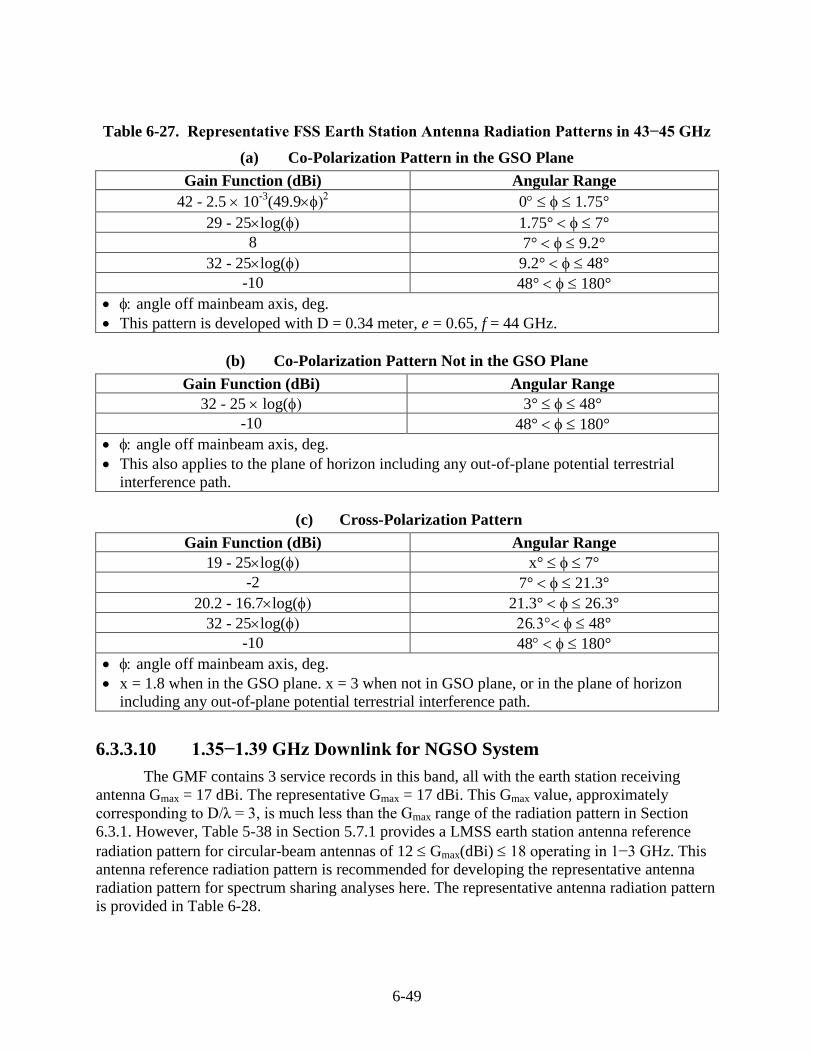
6-49
Table 6-27. Representative FSS Earth Station Antenna Radiation Patterns in 43−45 GHz
(a) Co-Polarization Pattern in the GSO Plane
Gain Function (dBi) Angular Range
42 - 2.5 10-3
(49.9 0 1.75°
29 - 25log( 1.75° 7°
8 7° 9.2°
32 - 25log( 9.2° 48°
-10 48° 180°
angle off mainbeam axis, deg.
This pattern is developed with D = 0.34 meter, e = 0.65, f = 44 GHz.
(b) Co-Polarization Pattern Not in the GSO Plane
Gain Function (dBi) Angular Range
32 - 25 log( 3° 48°
-10 48° 180°
angle off mainbeam axis, deg.
This also applies to the plane of horizon including any out-of-plane potential terrestrial
interference path.
(c) Cross-Polarization Pattern
Gain Function (dBi) Angular Range
19 - 25log( x° 7°
-2 7° 21.3°
20.2 - 16.7log( 21.3° 26.3°
32 - 25log( 6 48°
-10 48 180°
angle off mainbeam axis, deg.
x = 1.8 when in the GSO plane. x = 3 when not in GSO plane, or in the plane of horizon
including any out-of-plane potential terrestrial interference path.
6.3.3.10 1.35−1.39 GHz Downlink for NGSO System
The GMF contains 3 service records in this band, all with the earth station receiving
antenna Gmax = 17 dBi. The representative Gmax = 17 dBi. This Gmax value, approximately
corresponding to D/λ = 3, is much less than the Gmax range of the radiation pattern in Section
6.3.1. However, Table 5-38 in Section 5.7.1 provides a LMSS earth station antenna reference
radiation pattern for circular-beam antennas of 12 Gmax(dBi) 18 operating in 1−3 GHz. This
antenna reference radiation pattern is recommended for developing the representative antenna
radiation pattern for spectrum sharing analyses here. The representative antenna radiation pattern
is provided in Table 6-28.
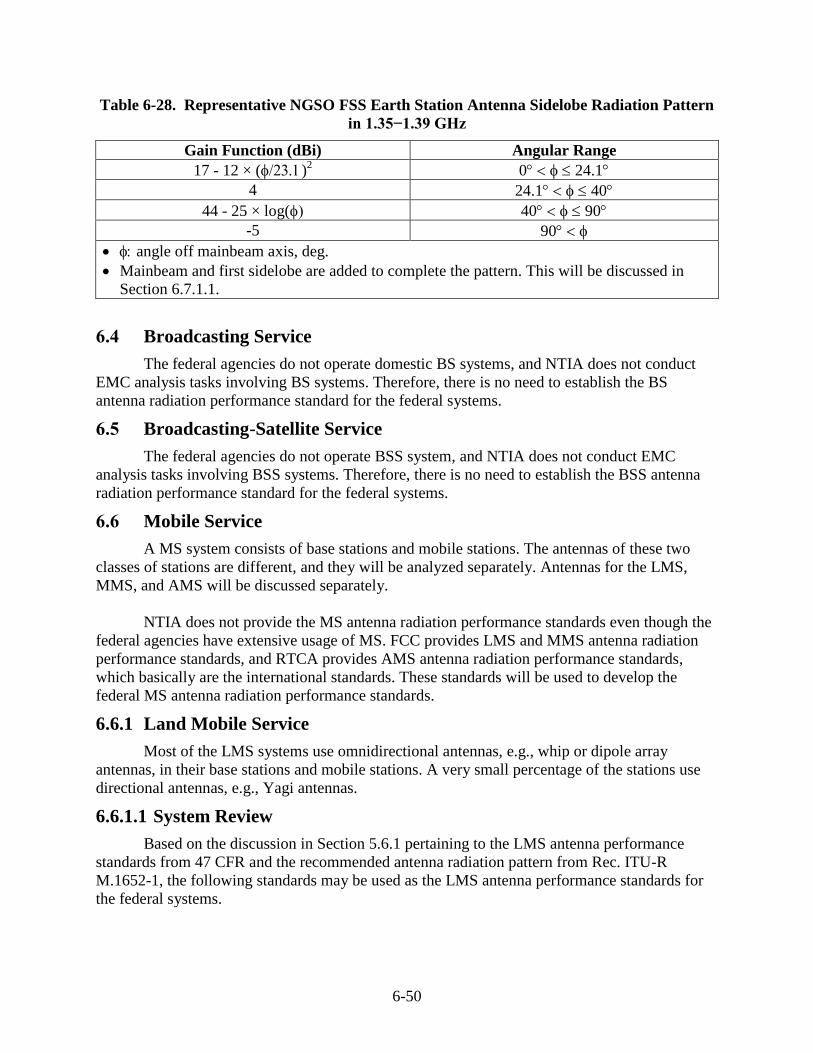
6-50
Table 6-28. Representative NGSO FSS Earth Station Antenna Sidelobe Radiation Pattern
in 1.35−1.39 GHz
Gain Function (dBi) Angular Range
17 - 12 × ()2 0 24.1
4 24.1 40
44 - 25 × log( 40 90
-5 90
angle off mainbeam axis, deg.
Mainbeam and first sidelobe are added to complete the pattern. This will be discussed in
Section 6.7.1.1.
6.4 Broadcasting Service
The federal agencies do not operate domestic BS systems, and NTIA does not conduct
EMC analysis tasks involving BS systems. Therefore, there is no need to establish the BS
antenna radiation performance standard for the federal systems.
6.5 Broadcasting-Satellite Service
The federal agencies do not operate BSS system, and NTIA does not conduct EMC
analysis tasks involving BSS systems. Therefore, there is no need to establish the BSS antenna
radiation performance standard for the federal systems.
6.6 Mobile Service
A MS system consists of base stations and mobile stations. The antennas of these two
classes of stations are different, and they will be analyzed separately. Antennas for the LMS,
MMS, and AMS will be discussed separately.
NTIA does not provide the MS antenna radiation performance standards even though the
federal agencies have extensive usage of MS. FCC provides LMS and MMS antenna radiation
performance standards, and RTCA provides AMS antenna radiation performance standards,
which basically are the international standards. These standards will be used to develop the
federal MS antenna radiation performance standards.
6.6.1 Land Mobile Service
Most of the LMS systems use omnidirectional antennas, e.g., whip or dipole array
antennas, in their base stations and mobile stations. A very small percentage of the stations use
directional antennas, e.g., Yagi antennas.
6.6.1.1 System Review
Based on the discussion in Section 5.6.1 pertaining to the LMS antenna performance
standards from 47 CFR and the recommended antenna radiation pattern from Rec. ITU-R
M.1652-1, the following standards may be used as the LMS antenna performance standards for
the federal systems.
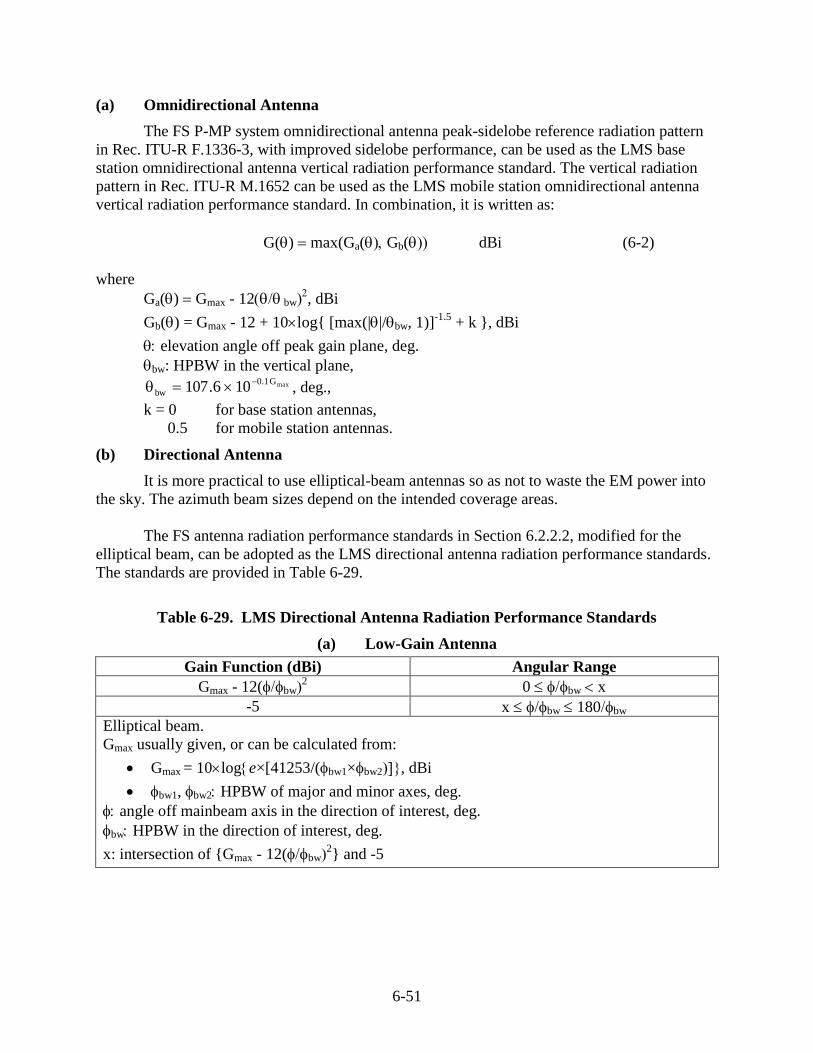
6-51
(a) Omnidirectional Antenna
The FS P-MP system omnidirectional antenna peak-sidelobe reference radiation pattern
in Rec. ITU-R F.1336-3, with improved sidelobe performance, can be used as the LMS base
station omnidirectional antenna vertical radiation performance standard. The vertical radiation
pattern in Rec. ITU-R M.1652 can be used as the LMS mobile station omnidirectional antenna
vertical radiation performance standard. In combination, it is written as:
G() max(Ga(Gb( dBi (6-2)
where
Ga() Gmax - 12 bw, dBi
Gb() = Gmax - 12 + 10log{ [max(||/bw, 1)]-1.5
+ k }, dBi
elevation angle off peak gain plane, deg.
bw: HPBW in the vertical plane, maxG1.0
bw 106.107
, deg.,
k = 0 for base station antennas,
0.5 for mobile station antennas.
(b) Directional Antenna
It is more practical to use elliptical-beam antennas so as not to waste the EM power into
the sky. The azimuth beam sizes depend on the intended coverage areas.
The FS antenna radiation performance standards in Section 6.2.2.2, modified for the
elliptical beam, can be adopted as the LMS directional antenna radiation performance standards.
The standards are provided in Table 6-29.
Table 6-29. LMS Directional Antenna Radiation Performance Standards
(a) Low-Gain Antenna
Gain Function (dBi) Angular Range
Gmax - 12(bw2 0 bw x
-5 x bw 180bw
Elliptical beam.
Gmax usually given, or can be calculated from:
Gmax = 10loge×[41253/(bw1×bw2, dBi
bw1, bw2 HPBW of major and minor axes, deg.
angle off mainbeam axis in the direction of interest, deg.
bw HPBW in the direction of interest, deg.
x: intersection of {Gmax - 12(bw2} and -5
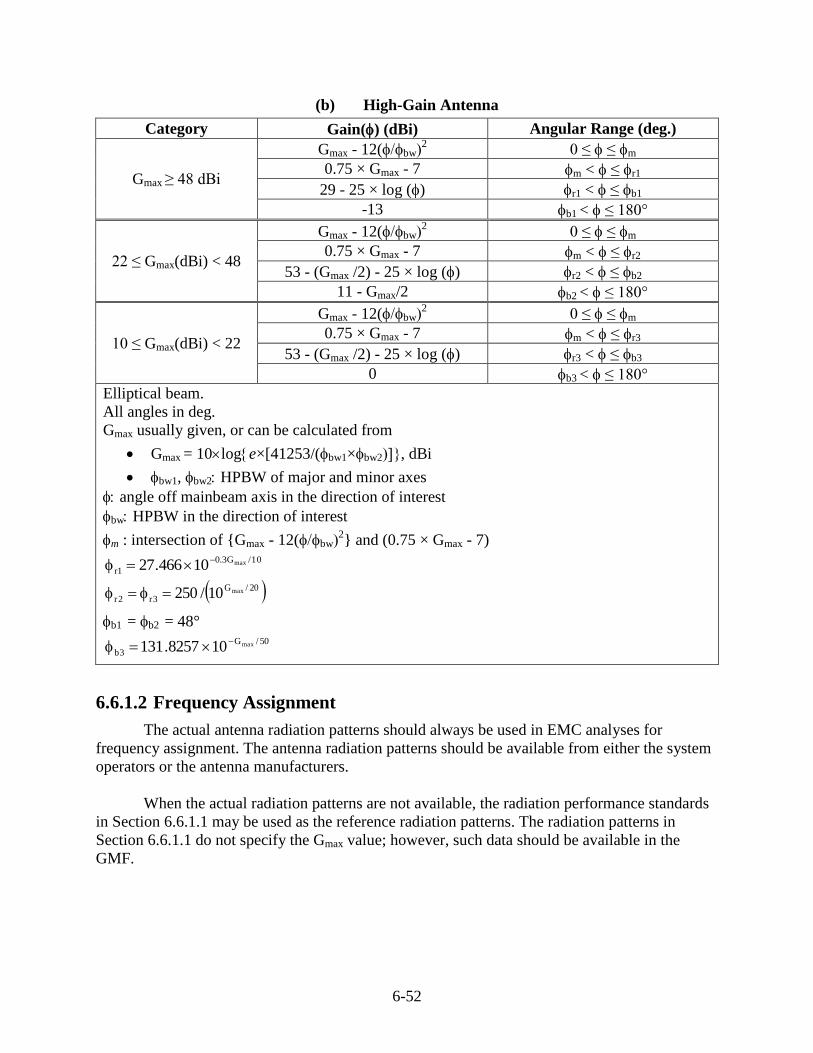
6-52
(b) High-Gain Antenna
Category Gain() (dBi) Angular Range (deg.)
Gmax ≥ 48 dBi
Gmax - 12(bw2 0 ≤ ≤ m
0.75 × Gmax - 7 m < ≤ r1
29 - 25 × log () r1 < ≤ b1
-13 b1 < ≤ 180°
22 ≤ Gmax(dBi) < 48
Gmax - 12(bw2 0 ≤ ≤ m
0.75 × Gmax - 7 m < ≤ r2
53 - (Gmax /2) - 25 × log () r2 < ≤ b2
11 - Gmax/2 b2 < ≤ 180°
10 ≤ Gmax(dBi) < 22
Gmax - 12(bw2 0 ≤ ≤ m
0.75 × Gmax - 7 m < ≤ r3
53 - (Gmax /2) - 25 × log () r3 < ≤ b3
0 b3 < ≤ 180°
Elliptical beam.
All angles in deg.
Gmax usually given, or can be calculated from
Gmax = 10loge×[41253/(bw1×bw2, dBi
bw1, bw2 HPBW of major and minor axes
angle off mainbeam axis in the direction of interest
bw HPBW in the direction of interest
m : intersection of {Gmax - 12(bw2} and (0.75 × Gmax - 7)
10/G3.0
1rmax10466.27
20/G
3r2rmax10/250
b1 = b2 = 48° 50/G
3bmax108257.131
6.6.1.2 Frequency Assignment
The actual antenna radiation patterns should always be used in EMC analyses for
frequency assignment. The antenna radiation patterns should be available from either the system
operators or the antenna manufacturers.
When the actual radiation patterns are not available, the radiation performance standards
in Section 6.6.1.1 may be used as the reference radiation patterns. The radiation patterns in
Section 6.6.1.1 do not specify the Gmax value; however, such data should be available in the
GMF.
6-53
6.6.1.3 Spectrum Sharing Analyses
In the GMF, only the transmitting antennas have the antenna class information indicating
they are for base stations, mobile stations, or repeaters. Hence, the transmitting antennas will be
used to develop the representative antenna radiation patterns.
The procedure to develop the representative antenna radiation pattern is as follows:
(1) Retrieve the LMS service records in the GMF. The symbols of the station classes are
“FB” for base station, “FBR” for base station and repeater, “ML” for mobile station,
“MLR” for mobile station and repeater, “MLP” for portable mobile station, and “MLPR”
for portable mobile station and repeater. Only the frequency bands in which the federal
government is the primary user are searched.
(2) Develop the base station antenna Gmax data population profile.
(3) Select the threshold Gmax value such that approximately 75% of the Gmax population is
equal to or smaller than the threshold value. This is the representative Gmax value. Since
the population profile spikes and dips irregularly, the final selection may not meet the
75% criterion closely in some cases.
(4) Develop the representative antenna radiation pattern from the representative Gmax value
and the antenna reference radiation patterns in Section 6.6.1.2.
(5) Repeat Steps (2–4) for the mobile station antennas.
The Gmax data of several adjacent MS and LMS bands have similar population profiles,
leading to the same representative Gmax value and radiation pattern. These bands will be
examined together.
The frequency bands being examined are
(1) 498–505 and 525–535 kHz,
(2) 1.605–1.615 and 1.705–1.8 MHz,
(3) 2–3.4 MHz range containing the following bands:
2–2.065 MHz,
2.107–2.17 MHz,
2.1735–2.1905 MHz,
2.194–2.495 MHz,
2.505–2.85 MHz,
3.155–3.4 MHz,
(4) 4.438–8.1 MHz range containing the following bands:
4.438–4.65 MHz,
4.75–4.995 MHz,
5.73–5.9 MHz,
6.765–7 MHz,
7.4–8.1 MHz,
(5) 23.35–24.89 MHz,
(6) 25.33–25.55 and 26.48–26.95 MHz,
(7) 27.54–28 MHz,
(8) 29.89–75.4 MHz range containing the following bands:
6-54
29.89–29.92 MHz,
30–30.56 MHz,
32–33 MHz,
34–35 MHz,
36–37 MHz,
38–39 MHz,
40–42 MHz,
46.6–47 MHz,
49.6–50 MHz,
74.6–74.8 MHz,
75.2–75.4 MHz,
(9) 138–144, 148–149.9, and 150.05–150.8 MHz,
(10) 162.0125–173.2 and 173.4–174 MHz,
(11) 220–420 MHz range containing the following bands:
220–222 MHz,
225–328.6 MHz,
335.4–399.9 MHz,
406.1–420 MHz,
(12) 1.755–1.85 GHz,
(13) 2.2–2.3 and 2.36–2.395 GHz, and
(14) 21.2–23.6 GHz.
6.6.1.3.1 496–535 kHz
This frequency range contains the 498–505 and 525–535 kHz MS bands. The GMF only
has service records in 498–505 kHz, but the result should be applicable to 525–535 kHz.
(a) Base Station Antenna
The base station transmitting antenna Gmax data count in these bands is
0 dBi: 15 frequency assignments,
2 dBi: 5 frequency assignments.
The representative Gmax = 0 dBi, and the representative antenna vertical radiation pattern for
spectrum sharing analyses is
G() -12 dBi for || ≤ 99.4° (6-3)
= -12 + 10log{ [max(||/107.6, 1)]-1.5
} dBi for || > 99.4°
where is the elevation angle off peak gain plane, in deg.
(b) Mobile Station Antenna
Lacking the mobile station transmitting antenna service records, the receiving antenna
service records, which should be for the mobile stations, are used to derive the mobile station
antenna Gmax data. The mobile station receiving antenna Gmax data count is
0 dBi: 16 frequency assignments,
2 dBi: 1 frequency assignment.
6-55
The representative Gmax = 0 dBi, and the representative antenna vertical radiation pattern for
spectrum sharing analyses is
G() -12 dBi for || ≤ 99.4° (6-4)
= -12 + 10log{ [max(||/107.6, 1)]-1.5
+ 0.5 } dBi for || > 99.4°
where is the elevation angle off the peak gain plane, in deg.
6.6.1.3.2 1.605–1.8 MHz
This frequency range contains the 1.605–1.615 and 1.705–1.8 MHz MS bands. The GMF
only has service records in 1.605–1.615 MHz, but the result should be applicable to 1.705–1.8
MHz.
(a) Base Station Antenna
The base station transmitting antenna Gmax data count in these bands is
0 dBi: 17 frequency assignments,
1 dBi: 2 frequency assignments (cumulative population % = 76%),
2 dBi: 5 frequency assignments,
3 dBi: 1 frequency assignment.
The representative Gmax = 1 dBi, and the representative antenna vertical radiation pattern for
spectrum sharing analyses is
G() 1 - 12 dBi for || ≤ 78.9° (6-5)
= -11 + 10log{ [max(||/85.5, 1)]-1.5
} dBi for || > 78.9°
where is the elevation angle off the peak gain plane, in deg.
(b) Mobile Station Antenna
The GMF does not have service records containing the mobile station transmitting
antenna data in these bands. Hence, the receiving antenna service records, which should be for
the mobile stations, are used to derive the mobile station antenna Gmax data. The mobile station
receiving antenna service records all have Gmax = 0 dBi. The representative Gmax = 0 dBi, and the
representative antenna vertical radiation pattern for spectrum sharing analyses is
G() -12 dBi for || ≤ 99.4° (6-6)
= -12 + 10log{ [max(||/107.6, 1)]-1.5
+ 0.5 } dBi for || > 99.4°
where is the elevation angle off the peak gain plane, in deg.
6.6.1.3.3 2–3.4 MHz
This frequency range contains the following MS bands:
2–2.065 MHz,
2.107–2.17 MHz,
2.1735–2.1905 MHz,
6-56
2.194–2.495 MHz,
2.505–2.85 MHz,
3.155–3.4 MHz.
The GMF does not have service records in 2.1735–2.1905 MHz, but the results derived from the
other bands should be applicable in this band.
(a) Base Station Antenna
The base station transmitting antenna Gmax data count in these bands is
0 dBi: 58 frequency assignments,
1, 2 dBi: 12 frequency assignments,
3 dBi: 164 frequency assignments (cumulative population % = 87%),
4 dBi: 9 frequency assignments,
5 dBi: 22 frequency assignments,
6–12 dBi: 4 frequency assignments.
The representative Gmax = 3 dBi, and the representative antenna vertical radiation pattern for
spectrum sharing analyses is
G() - 12 dBi for || 49.8° (6-7)
= -9 + 10log{ [max(||/53.9, 1)]-1.5
} dBi for || > 49.8°
where is the elevation angle off the peak gain plane, in deg.
(b) Mobile Station Antenna
The mobile station transmitting antenna Gmax data count in these bands is
0 dBi: 124 frequency assignments,
1 dBi: 4 frequency assignments,
2 dBi: 38 frequency assignments,
3 dBi: 196 frequency assignments (cumulative population % = 88%),
4 dBi: 10 frequency assignments,
5 dBi: 21 frequency assignments,
6–12 dBi: 19 frequency assignments.
The representative Gmax = 3 dBi, and the representative antenna vertical radiation pattern for
spectrum sharing analyses is
G() - 12 dBi for || 49.8° (6-8)
= -9 + 10log{ [max(||/53.9, 1)]-1.5
+ 0.5 } dBi for || > 49.8°
where is the elevation angle off the peak gain plane, in deg.
6-57
6.6.1.3.4 4.438–8.1 MHz
This frequency range contains the following MS bands:
4.438–4.65 MHz,
4.75–4.995 MHz,
5.73–5.9 MHz,
6.765–7 MHz,
7.4–8.1 MHz.
(a) Base Station Antenna
The base station transmitting antenna Gmax data count in these bands is
0 dBi: 120 frequency assignments,
1 dBi: 5 frequency assignments,
2 dBi: 17 frequency assignments (cumulative population % = 72.1%),
3 dBi: 14 frequency assignments (cumulative population % = 79.2%),
4 dBi: 10 frequency assignments,
5 dBi: 21 frequency assignments,
6–12 dBi: 10 frequency assignments.
The representative Gmax = 2 dBi. The representative antenna vertical radiation pattern for
spectrum sharing studies is
G() 2 - 12 dBi for || ≤ 62.7° (6-9)
= -10 + 10log{ [max(||/67.9, 1)]-1.5
} dBi for || > 62.7°
where is the elevation angle off the peak gain plane, in deg.
(b) Mobile Station Antenna
The population profile of the mobile station transmitting antenna Gmax data in these bands
is shown in Figure 6-31. The representative Gmax = 3 dBi, and the representative antenna vertical
radiation pattern for spectrum sharing analyses is
G() - 12 dBi for || 49.8° (6-10)
= -9 + 10log{ [max(||/53.9, 1)]-1.5
+ 0.5 } dBi for || > 49.8°
where is the elevation angle off the peak gain plane, in deg.
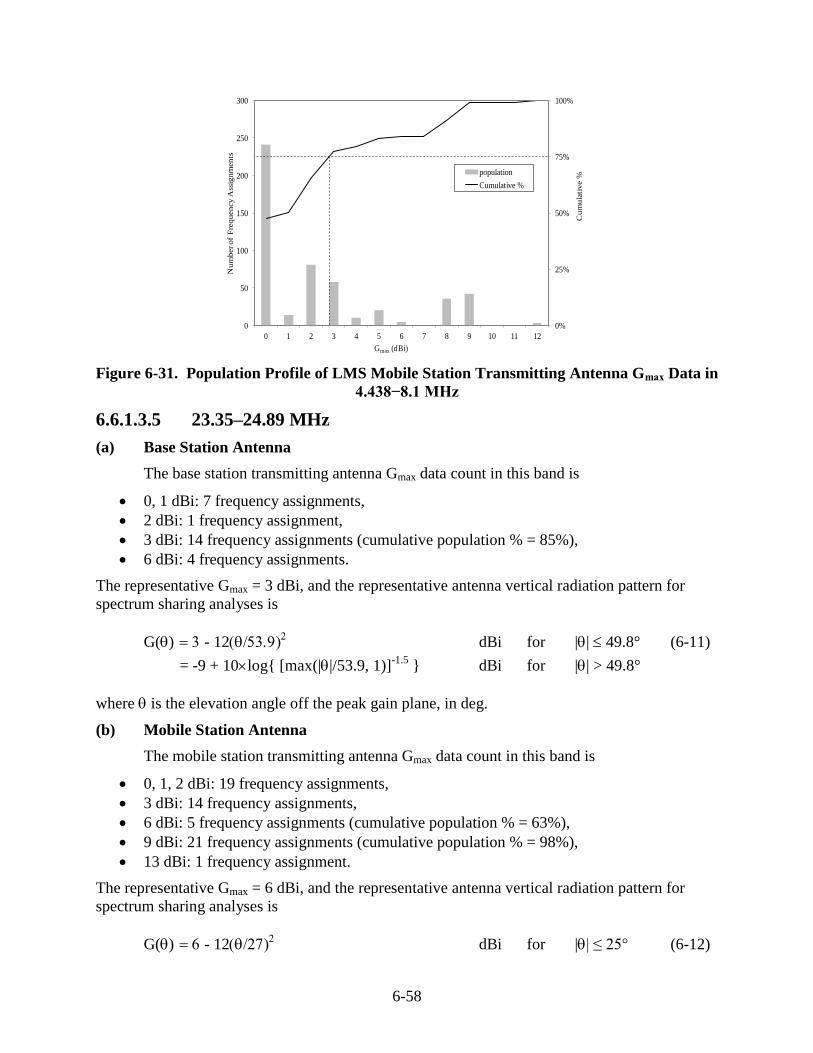
6-58
0%
25%
50%
75%
100%
0
50
100
150
200
250
300
0 1 2 3 4 5 6 7 8 9 10 11 12
Cu
mu
lati
ve %
Nu
mb
er o
f F
req
uen
cy
Ass
ign
men
ts
Gmax (dBi)
population
Cumulative %
Figure 6-31. Population Profile of LMS Mobile Station Transmitting Antenna Gmax Data in
4.438−8.1 MHz
6.6.1.3.5 23.35–24.89 MHz
(a) Base Station Antenna
The base station transmitting antenna Gmax data count in this band is
0, 1 dBi: 7 frequency assignments,
2 dBi: 1 frequency assignment,
3 dBi: 14 frequency assignments (cumulative population % = 85%),
6 dBi: 4 frequency assignments.
The representative Gmax = 3 dBi, and the representative antenna vertical radiation pattern for
spectrum sharing analyses is
G() - 12 dBi for || 49.8° (6-11)
= -9 + 10log{ [max(||/53.9, 1)]-1.5
} dBi for || > 49.8°
where is the elevation angle off the peak gain plane, in deg.
(b) Mobile Station Antenna
The mobile station transmitting antenna Gmax data count in this band is
0, 1, 2 dBi: 19 frequency assignments,
3 dBi: 14 frequency assignments,
6 dBi: 5 frequency assignments (cumulative population % = 63%),
9 dBi: 21 frequency assignments (cumulative population % = 98%),
13 dBi: 1 frequency assignment.
The representative Gmax = 6 dBi, and the representative antenna vertical radiation pattern for
spectrum sharing analyses is
G() - 12 dBi for || ≤ 25° (6-12)
6-59
= -6 + 10log{ [max(||/27, 1)]-1.5
+ 0.5 } dBi for || > 25°
where is the elevation angle off the peak gain plane, in deg.
6.6.1.3.6 25.33–26.95 MHz
This frequency range contains the 25.33–25.55 and 26.48–26.95 MHz MS bands.
(a) Base Station Antenna
The base station transmitting antenna Gmax data count in these bands is
0 dBi: 34 frequency assignments (cumulative population % = 89%),
2, 3 dBi: 4 frequency assignments.
The representative Gmax = 0 dBi, and the representative antenna vertical radiation pattern for
spectrum sharing analyses is
G() -12 dBi for || ≤ 99.4° (6-13)
= -12 + 10log{ [max(||/107.6, 1)]-1.5
} dBi for || > 99.4°
where is the elevation angle off the peak gain plane, in deg.
(b) Mobile Station Antenna
The mobile station transmitting antenna Gmax data count in these bands is
0 dBi: 49 frequency assignments (cumulative population % = 79%),
2, 3 dBi: 13 frequency assignments.
The representative Gmax = 0 dBi, and the representative antenna vertical radiation pattern for
spectrum sharing analyses is
G() -12 dBi for || ≤ 99.4° (6-14)
= -12 + 10log{ [max(||/107.6, 1)]-1.5
+ 0.5 } dBi for || > 99.4°
where is the elevation angle off the peak gain plane, in deg.
6.6.1.3.7 27.54–28 MHz
(a) Base Station Antenna
The base station transmitting antenna Gmax data count in this band is
0 dBi: 8 frequency assignments,
2 dBi: 1 frequency assignment,
3 dBi: 16 frequency assignments.
The representative Gmax = 3 dBi, and the representative antenna vertical radiation pattern for
spectrum sharing analyses is
G() - 12 dBi for || 49.8° (6-15)
= -9 + 10log{ [max(||/53.9, 1)]-1.5
} dBi for || > 49.8°
6-60
where is the elevation angle off the peak gain plane, in deg.
(b) Mobile Station Antenna
The mobile station transmitting antenna Gmax data count in this band is
0 dBi: 14 frequency assignments,
2 dBi: 4 frequency assignments,
3 dBi: 19 frequency assignments.
The representative Gmax = 3 dBi, and the representative antenna vertical radiation pattern for
spectrum sharing analyses is
G() - 12 dBi for || 49.8° (6-16)
= -9 + 10log{ [max(||/53.9, 1)]-1.5
+ 0.5 } dBi for || > 49.8°
where is the elevation angle off the peak gain plane, in deg.
6.6.1.3.8 29.89–75.4 MHz
This frequency range contains the following MS bands:
29.89–29.92 MHz,
30–30.56 MHz,
32–33 MHz,
34–35 MHz,
36–37 MHz,
38–39 MHz,
40–42 MHz,
46.6–47 MHz,
49.6–50 MHz,
74.6–74.8 MHz,
75.2–75.4 MHz.
(a) Base Station Antenna
The base station transmitting antenna Gmax data count in these bands is
0 dBi: 109 frequency assignments,
1 dBi: 6 frequency assignments,
2 dBi: 52 frequency assignments (cumulative population % = 82%),
3 dBi: 20 frequency assignments,
5–8 dBi: 17 frequency assignments.
The representative Gmax = 2 dBi, and the representative antenna vertical radiation pattern for
spectrum sharing analyses is
G() 2 - 12 dBi for || ≤ 62.7° (6-17)
= -10 + 10log{ [max(||/67.9, 1)]-1.5
} dBi for || > 62.7°
6-61
where is the elevation angle off the peak gain plane, in deg.
(b) Mobile Station Antenna
The mobile station transmitting antenna Gmax data count in these bands is
0 dBi: 451 frequency assignments,
1 dBi: 12 frequency assignments,
2 dBi: 221 frequency assignments (cumulative population % = 85%),
3 dBi: 91 frequency assignments,
5–7 dBi: 29 frequency assignments.
The representative Gmax = 2 dBi, and the representative antenna vertical radiation pattern for
spectrum sharing analyses is
G() 2 - 12 dBi for || ≤ 62.7° (6-18)
= -10 + 10log{ [max(||/67.9, 1)]-1.5
+ 0.5 } dBi for || > 62.7°
where is the elevation angle off the peak gain plane, in deg.
6.6.1.3.9 138–150.08 MHz
This frequency range contains the following MS bands:
138–144 MHz,
148–149.9 MHz,
150.05–150.8 MHz.
(a) Base Station Antenna
The population profile of the base station transmitting antenna Gmax data in these bands is
shown in Figure 6-32. The representative Gmax = 5 dBi, and the representative antenna vertical
radiation pattern for spectrum sharing analyses is
G() - 12 dBi for || ≤ 31.4° (6-19)
= -7 + 10log{ [max(||/34, 1)]-1.5
} dBi for || > 31.4°
where is the elevation angle off the peak gain plane, in deg.
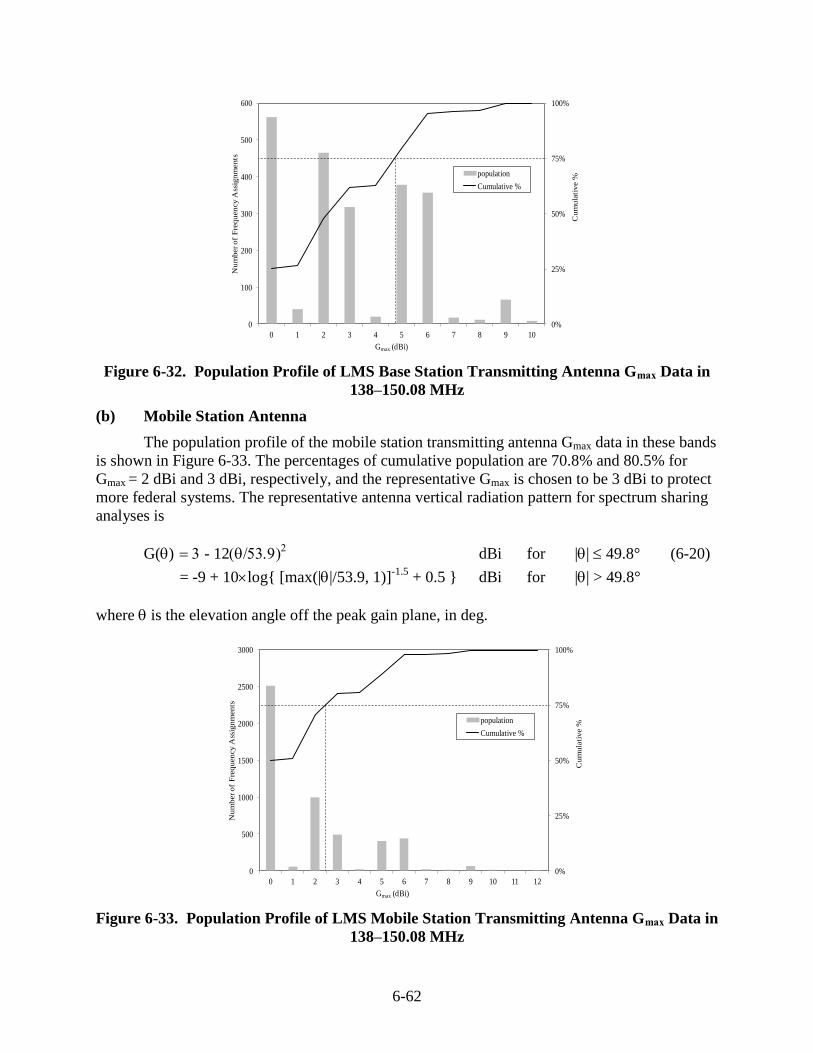
6-62
0%
25%
50%
75%
100%
0
100
200
300
400
500
600
0 1 2 3 4 5 6 7 8 9 10
Cu
mu
lati
ve %
Nu
mb
er o
f F
req
uen
cy
Ass
ign
men
ts
Gmax (dBi)
population
Cumulative %
Figure 6-32. Population Profile of LMS Base Station Transmitting Antenna Gmax Data in
138–150.08 MHz
(b) Mobile Station Antenna
The population profile of the mobile station transmitting antenna Gmax data in these bands
is shown in Figure 6-33. The percentages of cumulative population are 70.8% and 80.5% for
Gmax = 2 dBi and 3 dBi, respectively, and the representative Gmax is chosen to be 3 dBi to protect
more federal systems. The representative antenna vertical radiation pattern for spectrum sharing
analyses is
G() - 12 dBi for || 49.8° (6-20)
= -9 + 10log{ [max(||/53.9, 1)]-1.5
+ 0.5 } dBi for || > 49.8°
where is the elevation angle off the peak gain plane, in deg.
0%
25%
50%
75%
100%
0
500
1000
1500
2000
2500
3000
0 1 2 3 4 5 6 7 8 9 10 11 12
Cu
mu
lati
ve %
Nu
mb
er o
f F
req
uen
cy
Ass
ign
men
ts
Gmax (dBi)
population
Cumulative %
Figure 6-33. Population Profile of LMS Mobile Station Transmitting Antenna Gmax Data in
138–150.08 MHz
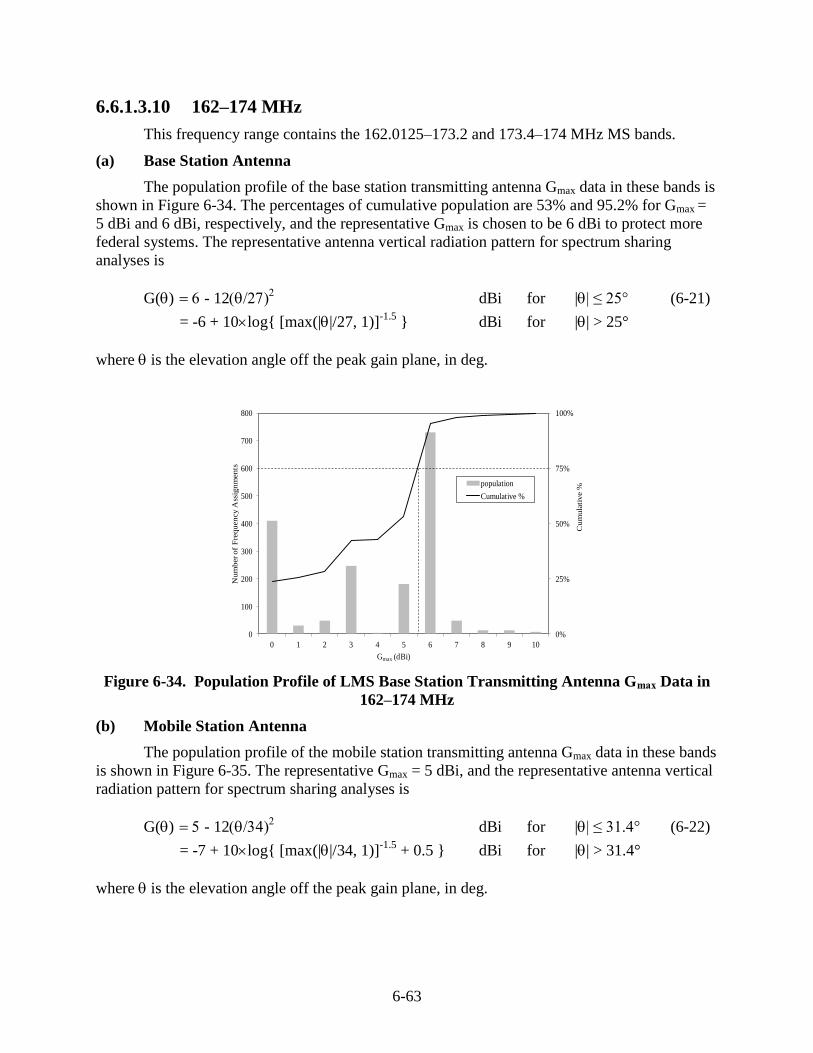
6-63
6.6.1.3.10 162–174 MHz
This frequency range contains the 162.0125–173.2 and 173.4–174 MHz MS bands.
(a) Base Station Antenna
The population profile of the base station transmitting antenna Gmax data in these bands is
shown in Figure 6-34. The percentages of cumulative population are 53% and 95.2% for Gmax =
5 dBi and 6 dBi, respectively, and the representative Gmax is chosen to be 6 dBi to protect more
federal systems. The representative antenna vertical radiation pattern for spectrum sharing
analyses is
G() - 12 dBi for || ≤ 25° (6-21)
= -6 + 10log{ [max(||/27, 1)]-1.5
} dBi for || > 25°
where is the elevation angle off the peak gain plane, in deg.
0%
25%
50%
75%
100%
0
100
200
300
400
500
600
700
800
0 1 2 3 4 5 6 7 8 9 10
Cum
ula
tive %
Num
ber of
Fre
quency A
ssig
nm
ents
Gmax (dBi)
population
Cumulative %
Figure 6-34. Population Profile of LMS Base Station Transmitting Antenna Gmax Data in
162–174 MHz
(b) Mobile Station Antenna
The population profile of the mobile station transmitting antenna Gmax data in these bands
is shown in Figure 6-35. The representative Gmax = 5 dBi, and the representative antenna vertical
radiation pattern for spectrum sharing analyses is
G() - 12 dBi for || ≤ 31.4° (6-22)
= -7 + 10log{ [max(||/34, 1)]-1.5
+ 0.5 } dBi for || > 31.4°
where is the elevation angle off the peak gain plane, in deg.
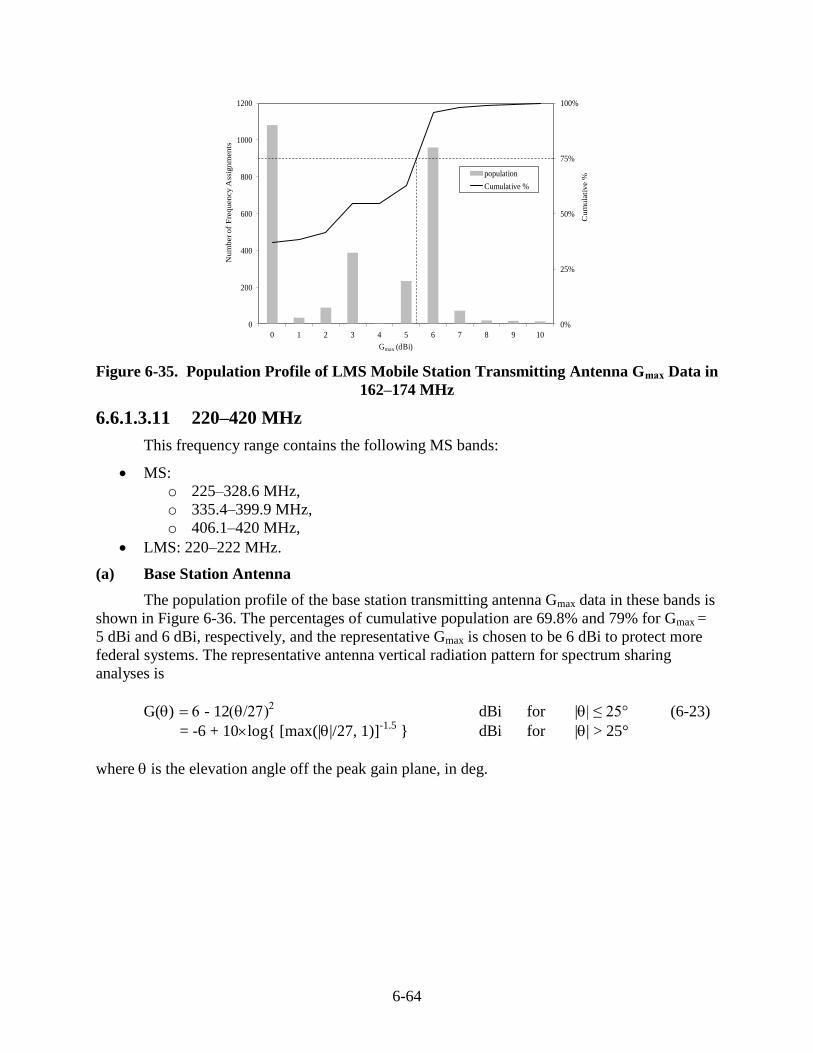
6-64
0%
25%
50%
75%
100%
0
200
400
600
800
1000
1200
0 1 2 3 4 5 6 7 8 9 10
Cu
mu
lati
ve %
Nu
mb
er o
f F
req
uen
cy
Ass
ign
men
ts
Gmax (dBi)
population
Cumulative %
Figure 6-35. Population Profile of LMS Mobile Station Transmitting Antenna Gmax Data in
162–174 MHz
6.6.1.3.11 220–420 MHz
This frequency range contains the following MS bands:
MS:
o 225–328.6 MHz,
o 335.4–399.9 MHz,
o 406.1–420 MHz,
LMS: 220–222 MHz.
(a) Base Station Antenna
The population profile of the base station transmitting antenna Gmax data in these bands is
shown in Figure 6-36. The percentages of cumulative population are 69.8% and 79% for Gmax =
5 dBi and 6 dBi, respectively, and the representative Gmax is chosen to be 6 dBi to protect more
federal systems. The representative antenna vertical radiation pattern for spectrum sharing
analyses is
G() - 12 dBi for || ≤ 25° (6-23)
= -6 + 10log{ [max(||/27, 1)]-1.5
} dBi for || > 25°
where is the elevation angle off the peak gain plane, in deg.
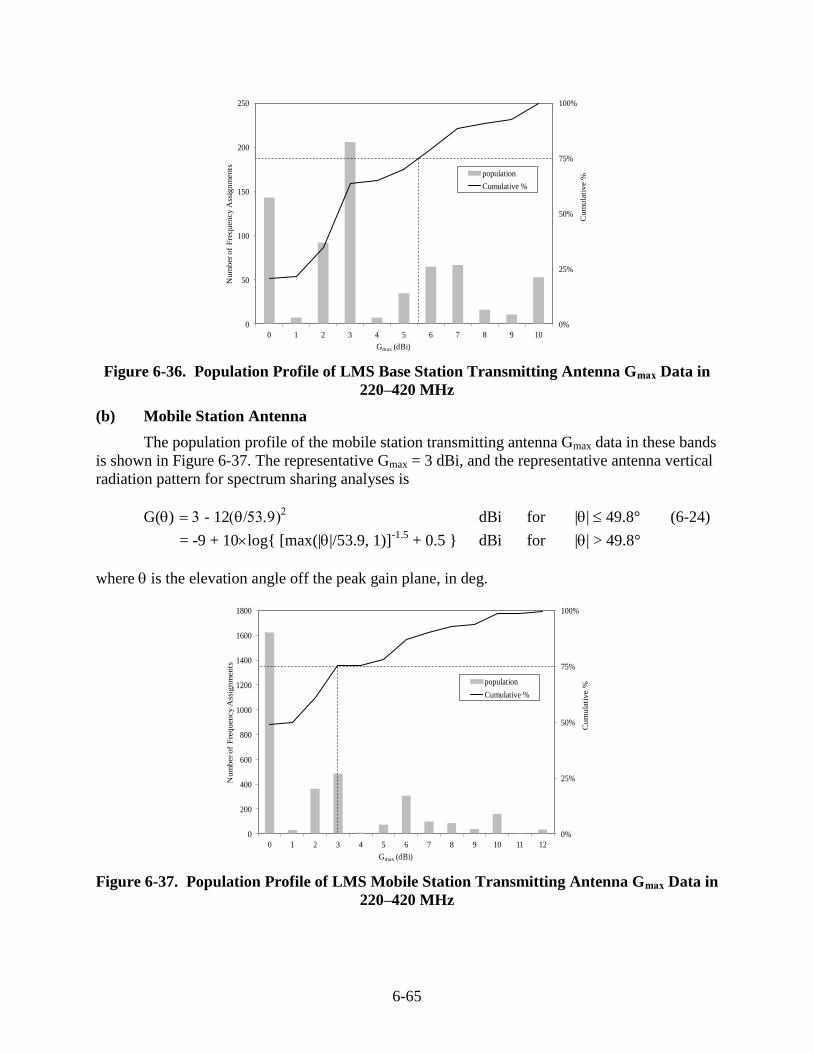
6-65
0%
25%
50%
75%
100%
0
50
100
150
200
250
0 1 2 3 4 5 6 7 8 9 10
Cu
mu
lati
ve %
Nu
mb
er o
f F
req
uen
cy
Ass
ign
men
ts
Gmax (dBi)
population
Cumulative %
Figure 6-36. Population Profile of LMS Base Station Transmitting Antenna Gmax Data in
220–420 MHz
(b) Mobile Station Antenna
The population profile of the mobile station transmitting antenna Gmax data in these bands
is shown in Figure 6-37. The representative Gmax = 3 dBi, and the representative antenna vertical
radiation pattern for spectrum sharing analyses is
G() - 12 dBi for || 49.8° (6-24)
= -9 + 10log{ [max(||/53.9, 1)]-1.5
+ 0.5 } dBi for || > 49.8°
where is the elevation angle off the peak gain plane, in deg.
0%
25%
50%
75%
100%
0
200
400
600
800
1000
1200
1400
1600
1800
0 1 2 3 4 5 6 7 8 9 10 11 12
Cum
ula
tive %
Nu
mb
er o
f F
req
uen
cy
Ass
ign
men
ts
Gmax (dBi)
population
Cumulative %
Figure 6-37. Population Profile of LMS Mobile Station Transmitting Antenna Gmax Data in
220–420 MHz
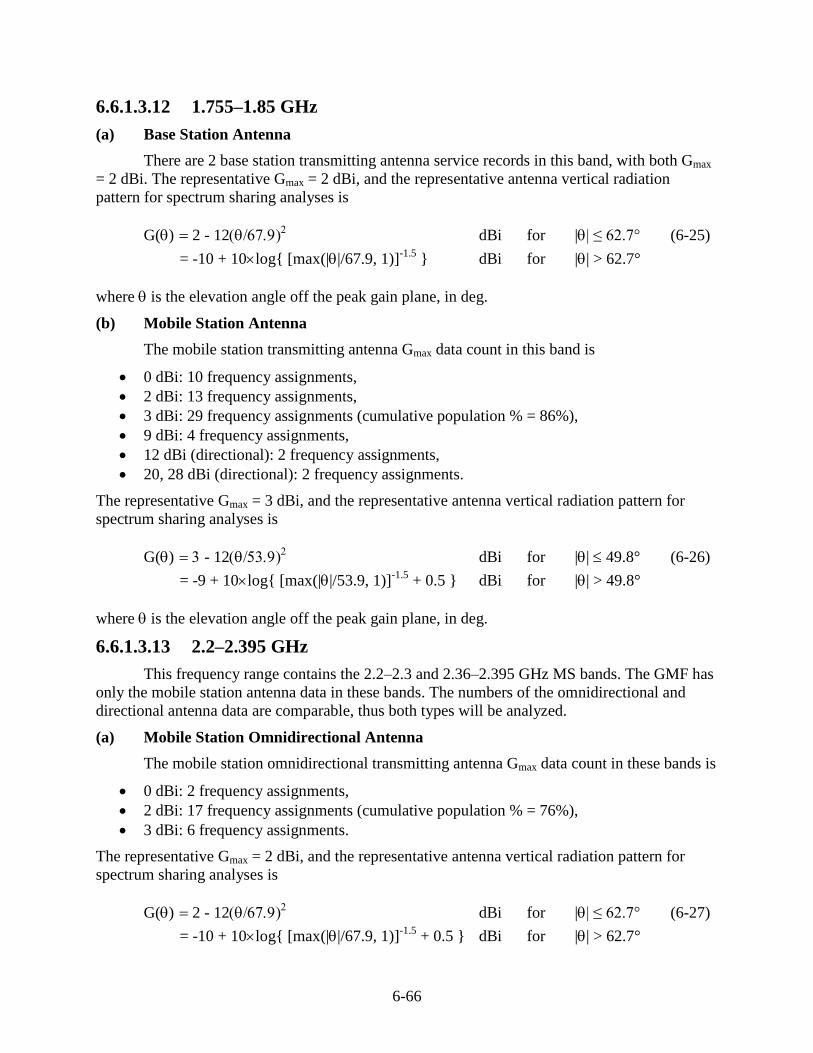
6-66
6.6.1.3.12 1.755–1.85 GHz
(a) Base Station Antenna
There are 2 base station transmitting antenna service records in this band, with both Gmax
= 2 dBi. The representative Gmax = 2 dBi, and the representative antenna vertical radiation
pattern for spectrum sharing analyses is
G() 2 - 12 dBi for || ≤ 62.7° (6-25)
= -10 + 10log{ [max(||/67.9, 1)]-1.5
} dBi for || > 62.7°
where is the elevation angle off the peak gain plane, in deg.
(b) Mobile Station Antenna
The mobile station transmitting antenna Gmax data count in this band is
0 dBi: 10 frequency assignments,
2 dBi: 13 frequency assignments,
3 dBi: 29 frequency assignments (cumulative population % = 86%),
9 dBi: 4 frequency assignments,
12 dBi (directional): 2 frequency assignments,
20, 28 dBi (directional): 2 frequency assignments.
The representative Gmax = 3 dBi, and the representative antenna vertical radiation pattern for
spectrum sharing analyses is
G() - 12 dBi for || 49.8° (6-26)
= -9 + 10log{ [max(||/53.9, 1)]-1.5
+ 0.5 } dBi for || > 49.8°
where is the elevation angle off the peak gain plane, in deg.
6.6.1.3.13 2.2–2.395 GHz
This frequency range contains the 2.2–2.3 and 2.36–2.395 GHz MS bands. The GMF has
only the mobile station antenna data in these bands. The numbers of the omnidirectional and
directional antenna data are comparable, thus both types will be analyzed.
(a) Mobile Station Omnidirectional Antenna
The mobile station omnidirectional transmitting antenna Gmax data count in these bands is
0 dBi: 2 frequency assignments,
2 dBi: 17 frequency assignments (cumulative population % = 76%),
3 dBi: 6 frequency assignments.
The representative Gmax = 2 dBi, and the representative antenna vertical radiation pattern for
spectrum sharing analyses is
G() 2 - 12 dBi for || ≤ 62.7° (6-27)
= -10 + 10log{ [max(||/67.9, 1)]-1.5
+ 0.5 } dBi for || > 62.7°
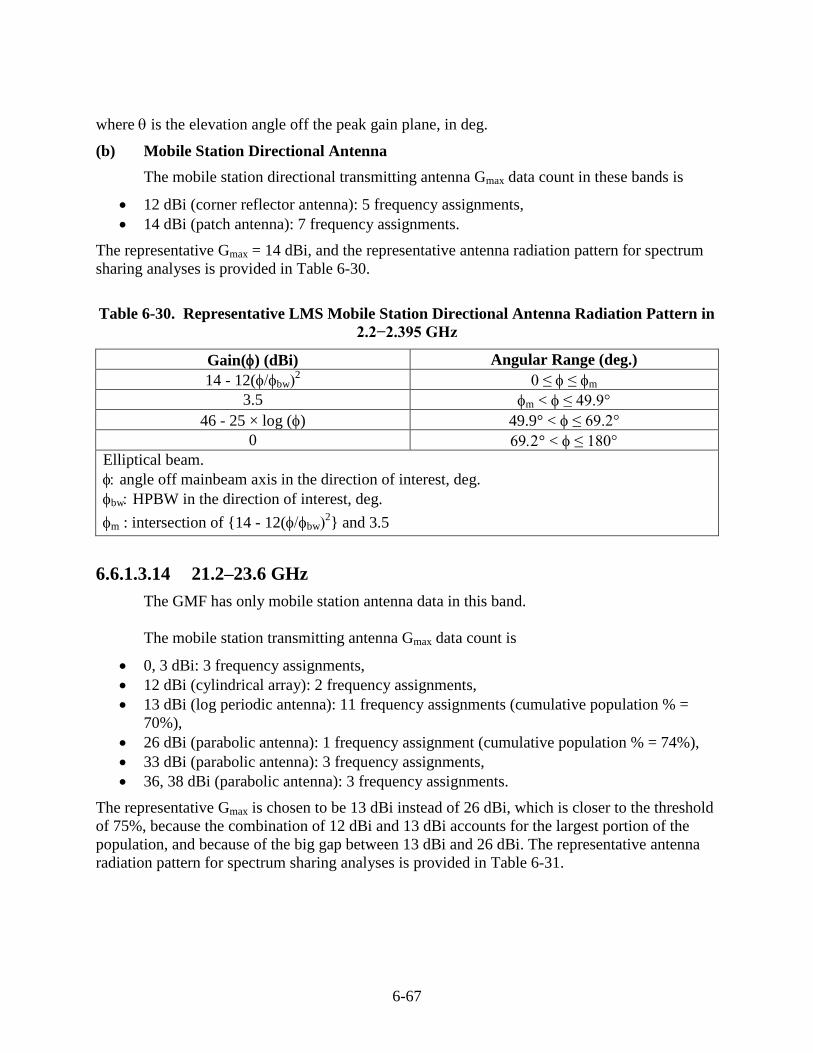
6-67
where is the elevation angle off the peak gain plane, in deg.
(b) Mobile Station Directional Antenna
The mobile station directional transmitting antenna Gmax data count in these bands is
12 dBi (corner reflector antenna): 5 frequency assignments,
14 dBi (patch antenna): 7 frequency assignments.
The representative Gmax = 14 dBi, and the representative antenna radiation pattern for spectrum
sharing analyses is provided in Table 6-30.
Table 6-30. Representative LMS Mobile Station Directional Antenna Radiation Pattern in
2.2−2.395 GHz
Gain() (dBi) Angular Range (deg.)
14 - 12(bw2 0 ≤ ≤ m
3.5 m < ≤ 49.9°
46 - 25 × log () 49.9° < ≤ 69.2°
0 ° < ≤ 180°
Elliptical beam.
angle off mainbeam axis in the direction of interest, deg.
bw HPBW in the direction of interest, deg.
m : intersection of {14 - 12(bw2} and 3.5
6.6.1.3.14 21.2–23.6 GHz
The GMF has only mobile station antenna data in this band.
The mobile station transmitting antenna Gmax data count is
0, 3 dBi: 3 frequency assignments,
12 dBi (cylindrical array): 2 frequency assignments,
13 dBi (log periodic antenna): 11 frequency assignments (cumulative population % =
70%),
26 dBi (parabolic antenna): 1 frequency assignment (cumulative population % = 74%),
33 dBi (parabolic antenna): 3 frequency assignments,
36, 38 dBi (parabolic antenna): 3 frequency assignments.
The representative Gmax is chosen to be 13 dBi instead of 26 dBi, which is closer to the threshold
of 75%, because the combination of 12 dBi and 13 dBi accounts for the largest portion of the
population, and because of the big gap between 13 dBi and 26 dBi. The representative antenna
radiation pattern for spectrum sharing analyses is provided in Table 6-31.
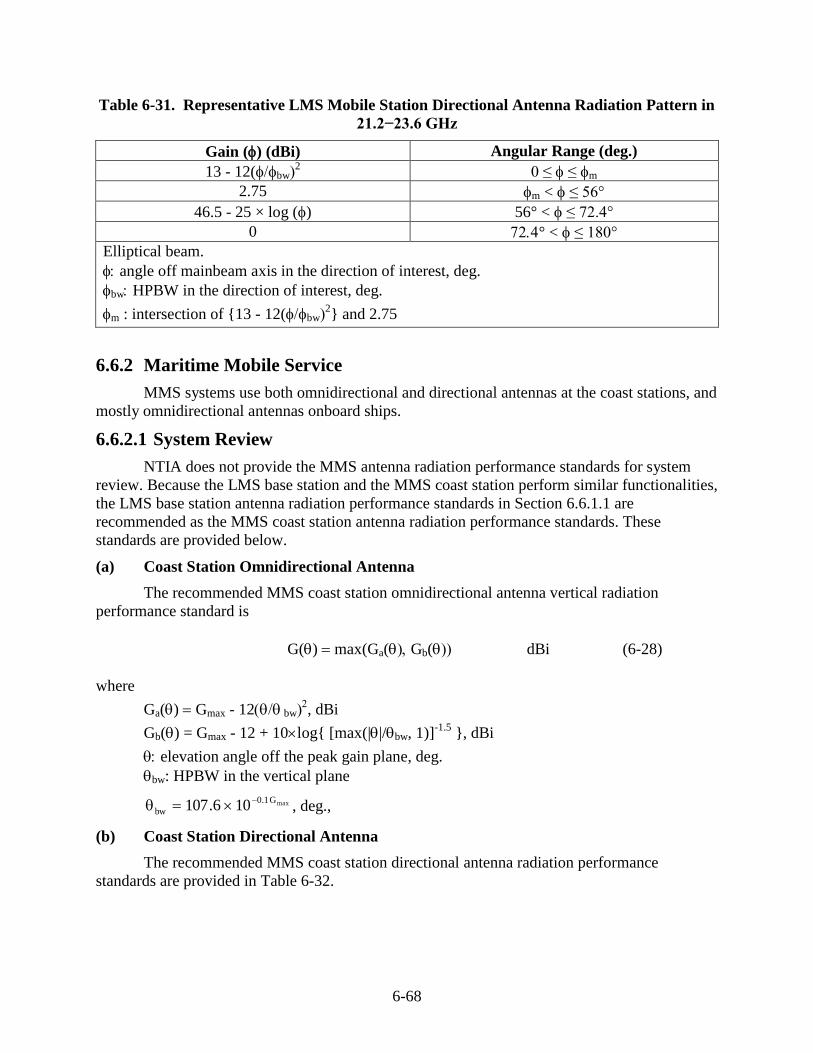
6-68
Table 6-31. Representative LMS Mobile Station Directional Antenna Radiation Pattern in
21.2−23.6 GHz
Gain () (dBi) Angular Range (deg.)
13 - 12(bw2 0 ≤ ≤ m
2.75 m < ≤ 56°
46.5 - 25 × log () 56° < ≤ 72.4°
0 ° < ≤ 180°
Elliptical beam.
angle off mainbeam axis in the direction of interest, deg.
bw HPBW in the direction of interest, deg.
m : intersection of {13 - 12(bw2} and 2.75
6.6.2 Maritime Mobile Service
MMS systems use both omnidirectional and directional antennas at the coast stations, and
mostly omnidirectional antennas onboard ships.
6.6.2.1 System Review
NTIA does not provide the MMS antenna radiation performance standards for system
review. Because the LMS base station and the MMS coast station perform similar functionalities,
the LMS base station antenna radiation performance standards in Section 6.6.1.1 are
recommended as the MMS coast station antenna radiation performance standards. These
standards are provided below.
(a) Coast Station Omnidirectional Antenna
The recommended MMS coast station omnidirectional antenna vertical radiation
performance standard is
G() max(Ga(Gb( dBi (6-28)
where
Ga() Gmax - 12 bw, dBi
Gb() = Gmax - 12 + 10log{ [max(||/bw, 1)]-1.5
}, dBi
elevation angle off the peak gain plane, deg.
bw: HPBW in the vertical plane
maxG1.0
bw 106.107
, deg.,
(b) Coast Station Directional Antenna
The recommended MMS coast station directional antenna radiation performance
standards are provided in Table 6-32.
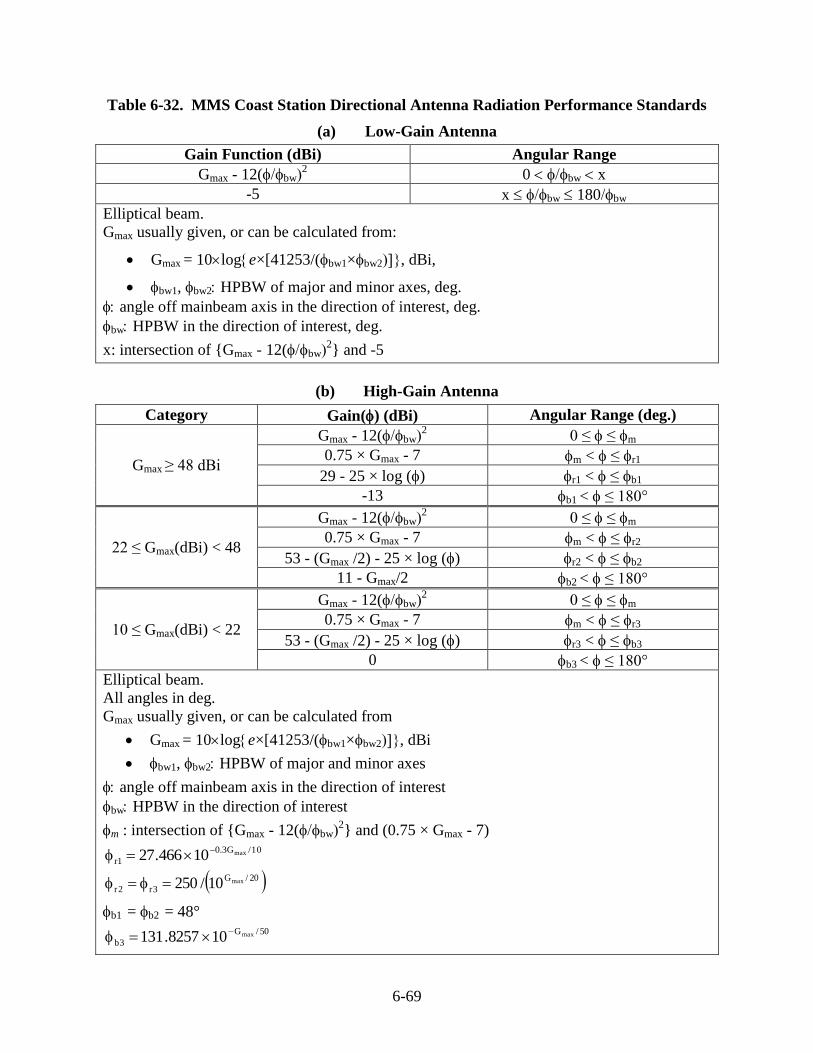
6-69
Table 6-32. MMS Coast Station Directional Antenna Radiation Performance Standards
(a) Low-Gain Antenna
Gain Function (dBi) Angular Range
Gmax - 12(bw2 0 bw x
-5 x bw 180bw
Elliptical beam.
Gmax usually given, or can be calculated from:
Gmax = 10loge×[41253/(bw1×bw2, dBi,
bw1, bw2 HPBW of major and minor axes, deg.
angle off mainbeam axis in the direction of interest, deg.
bw HPBW in the direction of interest, deg.
x: intersection of {Gmax - 12(bw2} and -5
(b) High-Gain Antenna
Category Gain() (dBi) Angular Range (deg.)
Gmax ≥ 48 dBi
Gmax - 12(bw2 0 ≤ ≤ m
0.75 × Gmax - 7 m < ≤ r1
29 - 25 × log () r1 < ≤ b1
-13 b1 < ≤ 180°
22 ≤ Gmax(dBi) < 48
Gmax - 12(bw2 0 ≤ ≤ m
0.75 × Gmax - 7 m < ≤ r2
53 - (Gmax /2) - 25 × log () r2 < ≤ b2
11 - Gmax/2 b2 < ≤ 180°
10 ≤ Gmax(dBi) < 22
Gmax - 12(bw2 0 ≤ ≤ m
0.75 × Gmax - 7 m < ≤ r3
53 - (Gmax /2) - 25 × log () r3 < ≤ b3
0 b3 < ≤ 180°
Elliptical beam.
All angles in deg.
Gmax usually given, or can be calculated from
Gmax = 10loge×[41253/(bw1×bw2, dBi
bw1, bw2 HPBW of major and minor axes
angle off mainbeam axis in the direction of interest
bw HPBW in the direction of interest
m : intersection of {Gmax - 12(bw2} and (0.75 × Gmax - 7)
10/G3.0
1rmax10466.27
20/G
3r2rmax10/250
b1 = b2 = 48° 50/G
3bmax108257.131
6-70
(c) Shipborne Omnidirectional Antenna
When an antenna is installed on a ship, its radiation pattern is heavily influenced by the
ship structure and the antenna installation. Lacking any viable data, the recommended LMS
omnidirectional antenna vertical radiation performance standard in Section 6.6.1.1 is used as the
MMS shipborne omnidirectional antenna vertical radiation performance standard; it is
G() max(Ga(Gb( dBi (6-29)
where
Ga() Gmax - 12 bw, dBi
Gb() = Gmax - 12 + 10 log{ [max(||/bw, 1)]-1.5
+ 0.5 }, dBi
elevation angle off the peak gain plane, deg.
bw: HPBW in the vertical plane
maxG1.0
bw 106.107
, deg.
RTCM is currently developing the MMS shipborne antenna radiation performance
standards. Its result, when established, will be examined to determine if the federal standards
should be amended.
6.6.2.2 Frequency Assignment
The actual antenna radiation patterns should always be used in EMC analyses for
frequency assignment. The antenna radiation patterns should be available from either the system
operators or the antenna manufacturers.
When the actual radiation patterns are not available, the radiation performance standards
in Section 6.6.2.1 may be used as the reference radiation patterns. The radiation patterns in
Section 6.6.2.1 do not specify the Gmax value; however, such data should be available in the
GMF.
6.6.2.3 Spectrum Sharing Analyses
In the GMF, only the transmitting antennas have the station class information indicating
they are coast stations, ship stations, or repeaters. Since in general the antennas are for both
transmitting and receiving, the transmitting antennas will be used to obtain the representative
antenna Gmax value and the radiation patterns.
The procedure to develop the representative antenna radiation pattern is as follows:
(1) Retrieve the MMS service records in the GMF. The station classes are “FC” for coast
stations, “FCB” for broadcasting coast stations, “FCD” for telecommand coast stations,
“MS” for ship stations, “MSD” for ship telecommand stations, and “MSP” for portable
ship stations. Only the frequency bands in which the federal government is the primary
user are searched.
(2) Develop the costal station antenna Gmax data population profile.
6-71
(3) Select the threshold Gmax value such that approximately 75% of the Gmax population is
equal to or smaller than the threshold value. This is the representative Gmax value.
(4) Develop the representative antenna radiation pattern from the representative Gmax value
and the antenna reference radiation patterns in Section 6.6.2.2.
(5) Repeat Steps (2–4) for the shipborne antennas. Only the ship stations whose locations are
in the 50 States, D.C., U.S. Commonwealths and Possessions, and within the U.S. coastal
waters are processed.
The Gmax data of several adjacent MS and MMS bands have similar population profiles,
leading to the same representative antenna Gmax value and radiation pattern. These bands will be
examined together.
The frequency bands being examined are
(1) 20.05–59, 61–90, and 110–190 kHz,
(2) 415–535 kHz range containing the following bands:
415–495 kHz,
496–505 kHz,
505–525 kHz.
525–535 kHz,
(3) 2.065–2.107, 2.17–2.1735, and 2.1905–2.194 MHz,
(4) 2–3.4 MHz range containing the following bands:
2–2.065 MHz,
2.107–2.17 MHz,
2.1735–2.1905 MHz,
2.194–2.495 MHz,
2.505–2.85 MHz,
3.155–3.4 MHz,
(5) 4–5.9 MHz range containing the following bands:
4.438–4.65 MHz,
4.75–4.995 MHz,
5.73–5.9 MHz,
4–4.438 MHz,
(6) 6.765–7, 7.4–8.1, 8.1–8.815 MHz,
(7) 12.23–19.8 MHz range containing the following bands:
12.23−13.2 MHz,
16.36−17.41 MHz,
18.78−18.9 MHz,
19.68−19.8 MHz,
(8) 23.35–28 MHz range containing the following bands:
23.35–24.89 MHz,
25.07–25.21 MHz,
25.33–25.55 MHz,
26.1–26.175 MHz,
26.48–26.95 MHz,
27.54–28 MHz,
6-72
(9) 138–174 MHz range containing the following bands:
138–144 MHz,
148–149.9 MHz,
150.05–150.8 MHz,
157.0375–157.1875 MHz,
162.0125–173.2 MHz, and
173.4–174 MHz.
6.6.2.3.1 20–190 kHz
This frequency range contains the following MMS bands:
20.05–59 kHz,
61–90 kHz,
110–190 kHz.
(a) Coast Station Antenna
The coast station transmitting antennas are all omnidirectional in these bands, and the
Gmax data count is
0 dBi: 11 frequency assignments (cumulative population % = 85%),
2 dBi: 1 frequency assignment,
4 dBi: 1 frequency assignment.
The representative Gmax = 0 dBi, and the representative antenna vertical radiation pattern for
spectrum sharing analyses is
G() -12 dBi for || 99.4° (6-30)
= -12 + 10log{ [max(||/107.6, 1)]-1.5
} dBi for || > 99.4°
where is the elevation angle off the peak gain plane, in deg.
(b) Shipborne Antenna
The GMF does not have shipborne transmitting antenna service records in these bands.
However, it has 4 receiving antenna service records, which should be shipborne, with all the
Gmax = 0 dBi. The representative Gmax = 0 dBi, and this is an omnidirectional antenna; the
representative antenna vertical radiation pattern for spectrum sharing analyses is
G() -12 dBi for || 99.4° (6-31)
= -12 + 10log{ [max(||/107.6, 1)]-1.5
+ 0.5 } dBi for || > 99.4°
where is the elevation angle off the peak gain plane, in deg.
6.6.2.3.2 415–535 kHz
This frequency range contains the following MS bands:
MS:
o 496–505 kHz,
6-73
o 525–535 kHz,
MMS:
o 415–495 kHz,
o 505–525 kHz.
The GMF has 2 service records in the 415–495 kHz band, and the transmission is from Newport
News, Virginia to coastal Virginia. The result should be applicable to all bands.
(a) Coast Station Antenna
Both coast station transmitting antennas are omnidirectional, with both Gmax = 2 dBi. The
representative Gmax = 2 dBi, and the representative antenna vertical radiation pattern for spectrum
sharing analyses is
G() 2 - 12 dBi for || 62.7° (6-32)
= -10 + 10log{ [max(||/67.9, 1)]-1.5
} dBi for || > 62.7°
where is the elevation angle off the peak gain plane, in deg.
(b) Shipborne Antenna
Both shipborne receiving antennas are omnidirectional, with both Gmax = 2 dBi. The
representative Gmax = 2 dBi, and the representative antenna vertical radiation pattern for spectrum
sharing analyses is
G() 2 - 12 dBi for || 62.7° (6-33)
= -10 + 10log{ [max(||/67.9, 1)]-1.5
+ 0.5 } dBi for || > 62.7°
where is the elevation angle off the peak gain plane, in deg.
6.6.2.3.3 2.065–2.194 MHz
This frequency range contains the following MMS bands:
2.065–2.107 MHz,
2.17–2.1735 MHz,
2.1905–2.194 MHz.
The GMF has five MMS service records in the 2.065–2.107 MHz band, and they are from coast
stations to ships and aircrafts over coastal water. The result should be applicable to all the bands
in this frequency range.
(a) Coast Station Antenna
The coast station transmitting antennas are all omnidirectional in these bands, and the
Gmax data count is
0 dBi: 4 frequency assignments (cumulative population % = 80%),
2 dBi: 1 frequency assignment.
The representative Gmax = 0 dBi, and the representative antenna vertical radiation pattern for
spectrum sharing analyses is
6-74
G() -12 dBi for || 99.4° (6-34)
= -12 + 10log{ [max(||/107.6, 1)]-1.5
} dBi for || > 99.4°
where is the elevation angle off the peak gain plane, in deg.
(b) Shipborne Antenna
The shipborne receiving antennas are all omnidirectional in these bands, and the Gmax
data count is
0 dBi: 3 frequency assignments (cumulative population % = 75%),
3 dBi: 1 frequency assignment.
The representative Gmax = 0 dBi, and the representative antenna vertical radiation pattern for
spectrum sharing analyses is
G() -12 dBi for || 99.4° (6-35)
= -12 + 10log{ [max(||/107.6, 1)]-1.5
+ 0.5 } dBi for || > 99.4°
where is the elevation angle off the peak gain plane, in deg.
6.6.2.3.4 2–3.4 MHz
This frequency range contains the following MS bands:
2–2.065 MHz,
2.107–2.17 MHz,
2.1735–2.1905 MHz,
2.194–2.495 MHz,
2.505–2.85 MHz,
3.155–3.4 MHz.
(a) Coast Station Antenna
The coast station transmitting antennas are all omnidirectional in these bands, and the
Gmax data count is
0 dBi: 84 frequency assignments,
1 dBi: 11 frequency assignments,
2 dBi: 28 frequency assignments (cumulative population % = 73.6%),
3 dBi: 6 frequency assignments (cumulative population % = 77.3%),
4 dBi: 9 frequency assignments,
5–10 dBi: 29 frequency assignments.
The representative Gmax = 2 dBi, and the representative antenna vertical radiation pattern for
spectrum sharing analyses is
G() 2 - 12 dBi for || 62.7° (6-36)
= -10 + 10log{ [max(||/67.9, 1)]-1.5
} dBi for || > 62.7°
6-75
where is the elevation angle off the peak gain plane, in deg.
(b) Shipborne Antenna
The shipborne transmitting antennas are all omnidirectional in these bands, and the Gmax
data count is
0 dBi: 146 frequency assignments (cumulative population % = 76%),
1−4 dBi: 22 frequency assignments,
5 dBi: 21 frequency assignments,
6−10 dBi: 4 frequency assignments.
The representative Gmax = 0 dBi, and the representative antenna vertical radiation pattern for
spectrum sharing analyses is
G() -12 dBi for || 99.4° (6-37)
= -12 + 10log{ [max(||/107.6, 1)]-1.5
+ 0.5 } dBi for || > 99.4°
where is the elevation angle off the peak gain plane, in deg.
6.6.2.3.5 4–5.9 MHz
This frequency range contains the following MS bands:
MS:
o 4.438–4.65 MHz,
o 4.75–4.995 MHz,
o 5.73–5.9 MHz,
MMS: 4–4.438 MHz.
(a) Coast Station Antenna
The coast station transmitting antennas are all omnidirectional in these bands, and the
Gmax data count is
0 dBi: 65 frequency assignments,
1 dBi: 8 frequency assignments (cumulative population % = 61%),
2 dBi: 32 frequency assignments (cumulative population % = 88%),
3–6 dBi: 14 frequency assignments.
The representative Gmax = 2 dBi, and the representative antenna vertical radiation pattern for
spectrum sharing analyses is
G() 2 - 12 dBi for || 62.7° (6-38)
= -10 + 10log{ [max(||/67.9, 1)]-1.5
} dBi for || > 62.7°
where is the elevation angle off the peak gain plane, in deg.
6-76
(b) Shipborne Antenna
The shipborne transmitting antennas are all omnidirectional in these bands, and the Gmax
data count is
0 dBi: 32 frequency assignments,
1 dBi: 27 frequency assignments (cumulative population % = 74.7%),
2 dBi: 13 frequency assignments,
3–6 dBi: 7 frequency assignments.
The representative Gmax = 1 dBi, and the representative antenna vertical radiation pattern for
spectrum sharing analyses is
G() - 12 dBi for || 78.9° (6-39)
= -11 + 10log{ [max(||/85.5, 1)]-1.5
+ 0.5 } dBi for || > 78.9°
where is the elevation angle off the peak gain plane, in deg.
6.6.2.3.6 6.765–8.815 MHz
This frequency range contains the following MS bands:
MS:
o 6.765–7 MHz,
o 7.4–8.1MHz ,
MMS: 8.1–8.815 MHz.
(a) Coast Station Antenna
The coast station transmitting antennas are all omnidirectional in these bands, and the
Gmax data count is
0 dBi: 108 frequency assignments,
1 dBi: 5 frequency assignments,
2 dBi: 42 frequency assignments (cumulative population % = 77.5%),
3 dBi: 7 frequency assignments,
4–12 dBi: 38 frequency assignments.
The representative Gmax = 2 dBi, and the representative antenna vertical radiation pattern for
spectrum sharing analyses is
G() 2 - 12 dBi for || 62.7° (6-40)
= -10 + 10log{ [max(||/67.9, 1)]-1.5
} dBi for || > 62.7°
where is the elevation angle off the peak gain plane, in deg.
(b) Shipborne Antenna
Only the stations whose localities are in the U.S. and labeled as “coastal water” are
processed. The shipborne transmitting antennas are all omnidirectional in these bands, and the
Gmax data count is
6-77
0 dBi: 77 frequency assignments,
1 dBi: 19 frequency assignments,
2 dBi: 14 frequency assignments (cumulative population % = 75.3%),
3 dBi: 4 frequency assignments,
5 dBi: 21 frequency assignments,
6, 12 dBi: 11 frequency assignments.
The representative Gmax = 2 dBi, and the representative antenna vertical radiation pattern for
spectrum sharing analyses is
G() 2 - 12 dBi for || 62.7° (6-41)
= -10 + 10log{ [max(||/67.9, 1)]-1.5
+ 0.5 } dBi for || > 62.7°
where is the elevation angle off the peak gain plane, in deg.
6.6.2.3.7 12.23–19.8 MHz
This frequency range contains the following MMS bands:
12.23−13.2 MHz,
16.36−17.41 MHz,
18.78−18.9 MHz,
19.68−19.8 MHz.
(a) Coast Station Antenna
The coast station transmitting antennas are all omnidirectional in these bands, and the
Gmax data count is
0 dBi: 40 frequency assignments,
1 dBi: 9 frequency assignments (cumulative population % = 62%),
2 dBi: 20 frequency assignments (cumulative population % = 87.3%),
3 dBi: 3 frequency assignments,
4 dBi: 3 frequency assignments,
5, 6, 14 dBi: 4 frequency assignments.
The representative Gmax is chosen to be 2 dBi, and the representative antenna vertical radiation
pattern for spectrum sharing analyses is
G() 2 - 12 dBi for || 62.7° (6-42)
= -10 + 10log{ [max(||/67.9, 1)]-1.5
} dBi for || > 62.7°
where is the elevation angle off the peak gain plane, in deg.
(b) Shipborne Antenna
The shipborne transmitting antennas are all omnidirectional in these bands, and the Gmax
data count is
0 dBi: 20 frequency assignments,
1 dBi: 41 frequency assignments (cumulative population % = 75.3%),
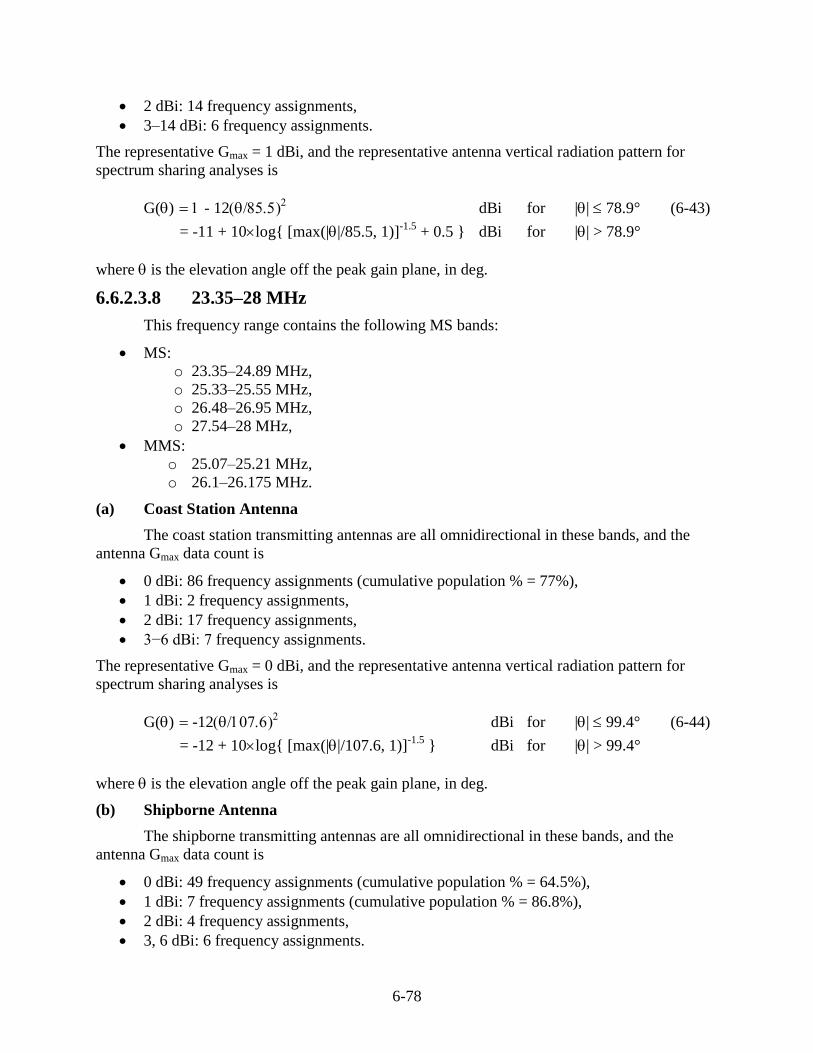
6-78
2 dBi: 14 frequency assignments,
3–14 dBi: 6 frequency assignments.
The representative Gmax = 1 dBi, and the representative antenna vertical radiation pattern for
spectrum sharing analyses is
G() - 12 dBi for || 78.9° (6-43)
= -11 + 10log{ [max(||/85.5, 1)]-1.5
+ 0.5 } dBi for || > 78.9°
where is the elevation angle off the peak gain plane, in deg.
6.6.2.3.8 23.35–28 MHz
This frequency range contains the following MS bands:
MS:
o 23.35–24.89 MHz,
o 25.33–25.55 MHz,
o 26.48–26.95 MHz,
o 27.54–28 MHz,
MMS:
o 25.07–25.21 MHz,
o 26.1–26.175 MHz.
(a) Coast Station Antenna
The coast station transmitting antennas are all omnidirectional in these bands, and the
antenna Gmax data count is
0 dBi: 86 frequency assignments (cumulative population % = 77%),
1 dBi: 2 frequency assignments,
2 dBi: 17 frequency assignments,
3−6 dBi: 7 frequency assignments.
The representative Gmax = 0 dBi, and the representative antenna vertical radiation pattern for
spectrum sharing analyses is
G() -12 dBi for || 99.4° (6-44)
= -12 + 10log{ [max(||/107.6, 1)]-1.5
} dBi for || > 99.4°
where is the elevation angle off the peak gain plane, in deg.
(b) Shipborne Antenna
The shipborne transmitting antennas are all omnidirectional in these bands, and the
antenna Gmax data count is
0 dBi: 49 frequency assignments (cumulative population % = 64.5%),
1 dBi: 7 frequency assignments (cumulative population % = 86.8%),
2 dBi: 4 frequency assignments,
3, 6 dBi: 6 frequency assignments.
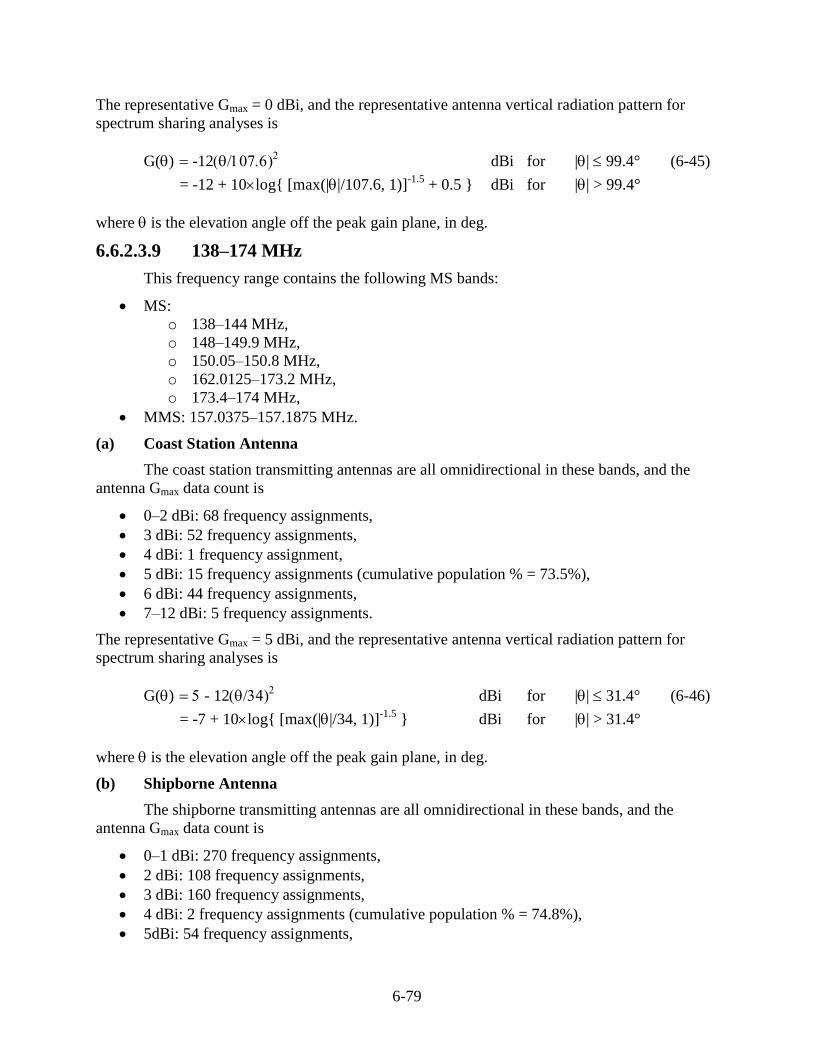
6-79
The representative Gmax = 0 dBi, and the representative antenna vertical radiation pattern for
spectrum sharing analyses is
G() -12 dBi for || 99.4° (6-45)
= -12 + 10log{ [max(||/107.6, 1)]-1.5
+ 0.5 } dBi for || > 99.4°
where is the elevation angle off the peak gain plane, in deg.
6.6.2.3.9 138–174 MHz
This frequency range contains the following MS bands:
MS:
o 138–144 MHz,
o 148–149.9 MHz,
o 150.05–150.8 MHz,
o 162.0125–173.2 MHz,
o 173.4–174 MHz,
MMS: 157.0375–157.1875 MHz.
(a) Coast Station Antenna
The coast station transmitting antennas are all omnidirectional in these bands, and the
antenna Gmax data count is
0–2 dBi: 68 frequency assignments,
3 dBi: 52 frequency assignments,
4 dBi: 1 frequency assignment,
5 dBi: 15 frequency assignments (cumulative population % = 73.5%),
6 dBi: 44 frequency assignments,
7–12 dBi: 5 frequency assignments.
The representative Gmax = 5 dBi, and the representative antenna vertical radiation pattern for
spectrum sharing analyses is
G() - 12 dBi for || 31.4° (6-46)
= -7 + 10log{ [max(||/34, 1)]-1.5
} dBi for || > 31.4°
where is the elevation angle off the peak gain plane, in deg.
(b) Shipborne Antenna
The shipborne transmitting antennas are all omnidirectional in these bands, and the
antenna Gmax data count is
0–1 dBi: 270 frequency assignments,
2 dBi: 108 frequency assignments,
3 dBi: 160 frequency assignments,
4 dBi: 2 frequency assignments (cumulative population % = 74.8%),
5dBi: 54 frequency assignments,
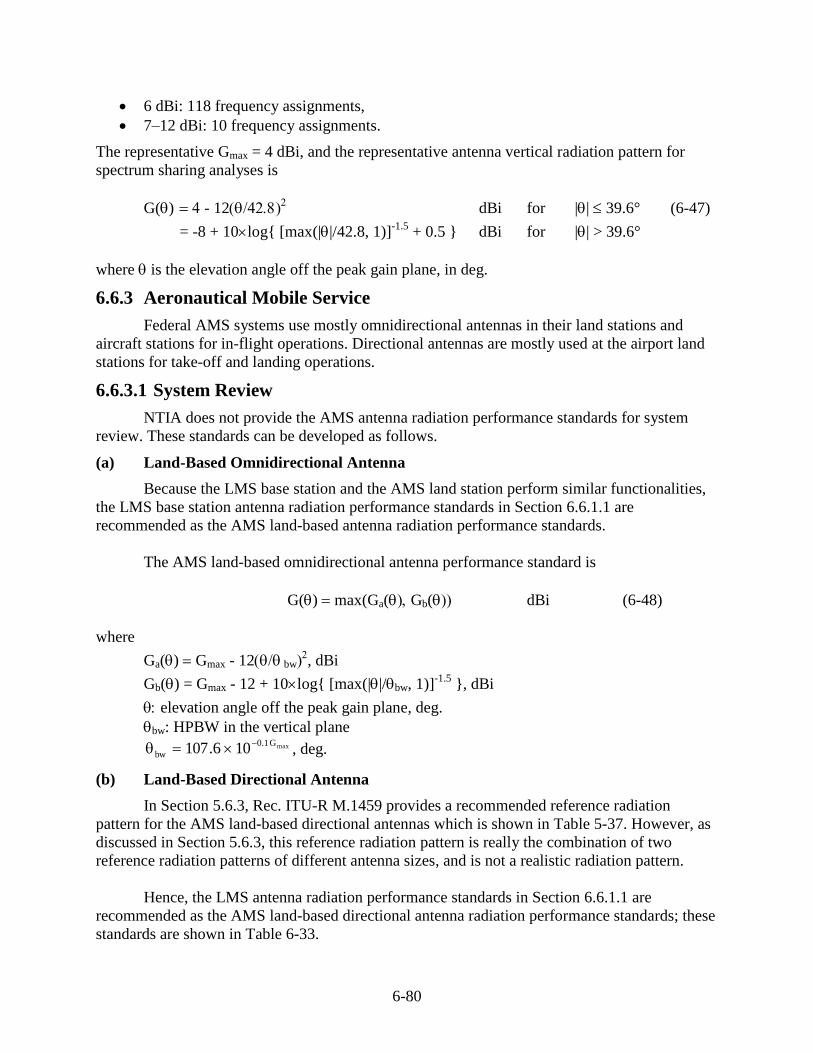
6-80
6 dBi: 118 frequency assignments,
7–12 dBi: 10 frequency assignments.
The representative Gmax = 4 dBi, and the representative antenna vertical radiation pattern for
spectrum sharing analyses is
G() - 12 dBi for || 39.6° (6-47)
= -8 + 10log{ [max(||/42.8, 1)]-1.5
+ 0.5 } dBi for || > 39.6°
where is the elevation angle off the peak gain plane, in deg.
6.6.3 Aeronautical Mobile Service
Federal AMS systems use mostly omnidirectional antennas in their land stations and
aircraft stations for in-flight operations. Directional antennas are mostly used at the airport land
stations for take-off and landing operations.
6.6.3.1 System Review
NTIA does not provide the AMS antenna radiation performance standards for system
review. These standards can be developed as follows.
(a) Land-Based Omnidirectional Antenna
Because the LMS base station and the AMS land station perform similar functionalities,
the LMS base station antenna radiation performance standards in Section 6.6.1.1 are
recommended as the AMS land-based antenna radiation performance standards.
The AMS land-based omnidirectional antenna performance standard is
G() max(Ga(Gb( dBi (6-48)
where
Ga() Gmax - 12 bw, dBi
Gb() = Gmax - 12 + 10log{ [max(||/bw, 1)]-1.5
}, dBi
elevation angle off the peak gain plane, deg.
bw: HPBW in the vertical plane maxG1.0
bw 106.107
, deg.
(b) Land-Based Directional Antenna
In Section 5.6.3, Rec. ITU-R M.1459 provides a recommended reference radiation
pattern for the AMS land-based directional antennas which is shown in Table 5-37. However, as
discussed in Section 5.6.3, this reference radiation pattern is really the combination of two
reference radiation patterns of different antenna sizes, and is not a realistic radiation pattern.
Hence, the LMS antenna radiation performance standards in Section 6.6.1.1 are
recommended as the AMS land-based directional antenna radiation performance standards; these
standards are shown in Table 6-33.
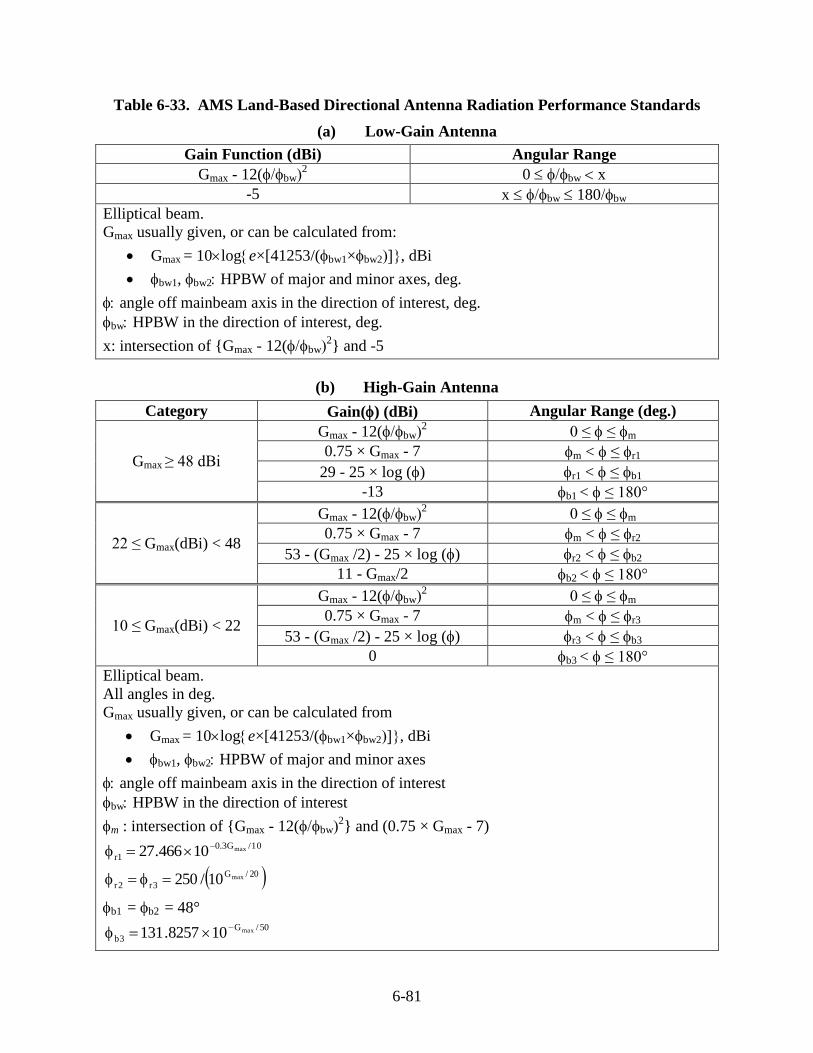
6-81
Table 6-33. AMS Land-Based Directional Antenna Radiation Performance Standards
(a) Low-Gain Antenna
Gain Function (dBi) Angular Range
Gmax - 12(bw2 0 bw x
-5 x bw 180bw
Elliptical beam.
Gmax usually given, or can be calculated from:
Gmax = 10loge×[41253/(bw1×bw2, dBi
bw1, bw2 HPBW of major and minor axes, deg.
angle off mainbeam axis in the direction of interest, deg.
bw HPBW in the direction of interest, deg.
x: intersection of {Gmax - 12(bw2} and -5
(b) High-Gain Antenna
Category Gain() (dBi) Angular Range (deg.)
Gmax ≥ 48 dBi
Gmax - 12(bw2 0 ≤ ≤ m
0.75 × Gmax - 7 m < ≤ r1
29 - 25 × log () r1 < ≤ b1
-13 b1 < ≤ 180°
22 ≤ Gmax(dBi) < 48
Gmax - 12(bw2 0 ≤ ≤ m
0.75 × Gmax - 7 m < ≤ r2
53 - (Gmax /2) - 25 × log () r2 < ≤ b2
11 - Gmax/2 b2 < ≤ 180°
10 ≤ Gmax(dBi) < 22
Gmax - 12(bw2 0 ≤ ≤ m
0.75 × Gmax - 7 m < ≤ r3
53 - (Gmax /2) - 25 × log () r3 < ≤ b3
0 b3 < ≤ 180°
Elliptical beam.
All angles in deg.
Gmax usually given, or can be calculated from
Gmax = 10loge×[41253/(bw1×bw2, dBi
bw1, bw2 HPBW of major and minor axes
angle off mainbeam axis in the direction of interest
bw HPBW in the direction of interest
m : intersection of {Gmax - 12(bw2} and (0.75 × Gmax - 7)
10/G3.0
1rmax10466.27
20/G
3r2rmax10/250
b1 = b2 = 48° 50/G
3bmax108257.131
6-82
(c) Airborne Antenna
One of the factors for selecting an airborne antenna is aerodynamics. Therefore, antenna
radiation performance standards should not be established for the purpose of system review.
6.6.3.2 Frequency Assignment
The actual antenna radiation patterns should always be used in EMC analyses for
frequency assignment. The antenna radiation patterns should be available from either the system
operators or the antenna manufacturers.
For the land-based antenna, when the actual antenna radiation patterns are not available,
the radiation performance standards in Section 6.6.3.1 may be used as the reference radiation
patterns. The radiation performance standards in Section 6.6.3.1 do not specify the Gmax value;
however, such data should be available in the GMF.
The airborne antenna radiation pattern is heavily influenced by the aircraft structure and
antenna installation; thus, it is impossible to develop a general radiation pattern.
For the airborne omnidirectional antenna, Section 5.6.3 contains the recommended
airborne omnidirectional antenna technical characteristics from Rec. ITU-R M.1459 for the
telemetry and telecommand operations in the 1.452−1.525 and 2.31−2.36 GHz bands, which
recommends that the power gain follows the rule:
P1(G G1) [1 - exp(-3.46 G1)]1.25
(6-49)
where P1 is the probability that a given gain value, G1, may not exceed. However, this cannot be
used to develop a radiation pattern. Here, using the worst-case scenario for frequency
assignment, the reference radiation pattern has three-dimensional uniformity, with gain values
equal Gmax in all directions. The measured airborne omnidirectional antenna radiation pattern,
shown in Figure 6-38, justifies the worst-case scenario. The Gmax data should be available in the
GMF.
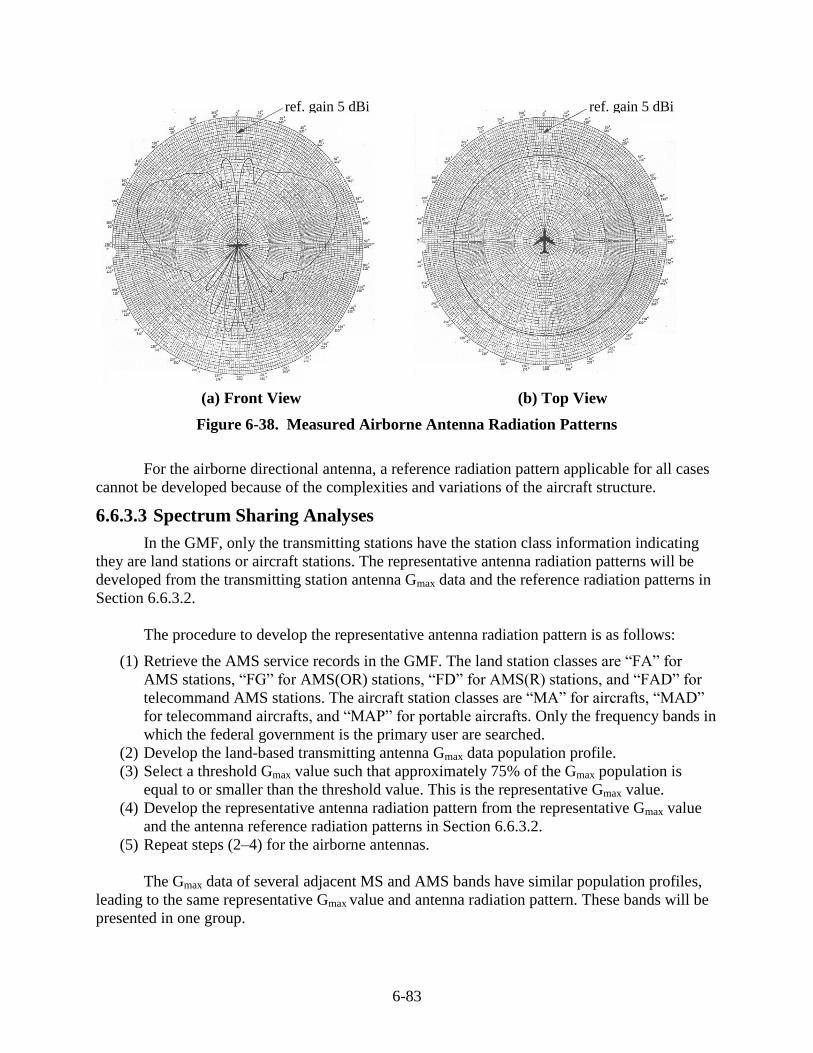
6-83
(a) Front View (b) Top View
Figure 6-38. Measured Airborne Antenna Radiation Patterns
For the airborne directional antenna, a reference radiation pattern applicable for all cases
cannot be developed because of the complexities and variations of the aircraft structure.
6.6.3.3 Spectrum Sharing Analyses
In the GMF, only the transmitting stations have the station class information indicating
they are land stations or aircraft stations. The representative antenna radiation patterns will be
developed from the transmitting station antenna Gmax data and the reference radiation patterns in
Section 6.6.3.2.
The procedure to develop the representative antenna radiation pattern is as follows:
(1) Retrieve the AMS service records in the GMF. The land station classes are “FA” for
AMS stations, “FG” for AMS(OR) stations, “FD” for AMS(R) stations, and “FAD” for
telecommand AMS stations. The aircraft station classes are “MA” for aircrafts, “MAD”
for telecommand aircrafts, and “MAP” for portable aircrafts. Only the frequency bands in
which the federal government is the primary user are searched.
(2) Develop the land-based transmitting antenna Gmax data population profile.
(3) Select a threshold Gmax value such that approximately 75% of the Gmax population is
equal to or smaller than the threshold value. This is the representative Gmax value.
(4) Develop the representative antenna radiation pattern from the representative Gmax value
and the antenna reference radiation patterns in Section 6.6.3.2.
(5) Repeat steps (2–4) for the airborne antennas.
The Gmax data of several adjacent MS and AMS bands have similar population profiles,
leading to the same representative Gmax value and antenna radiation pattern. These bands will be
presented in one group.
ref. gain 5 dBi ref. gain 5 dBi
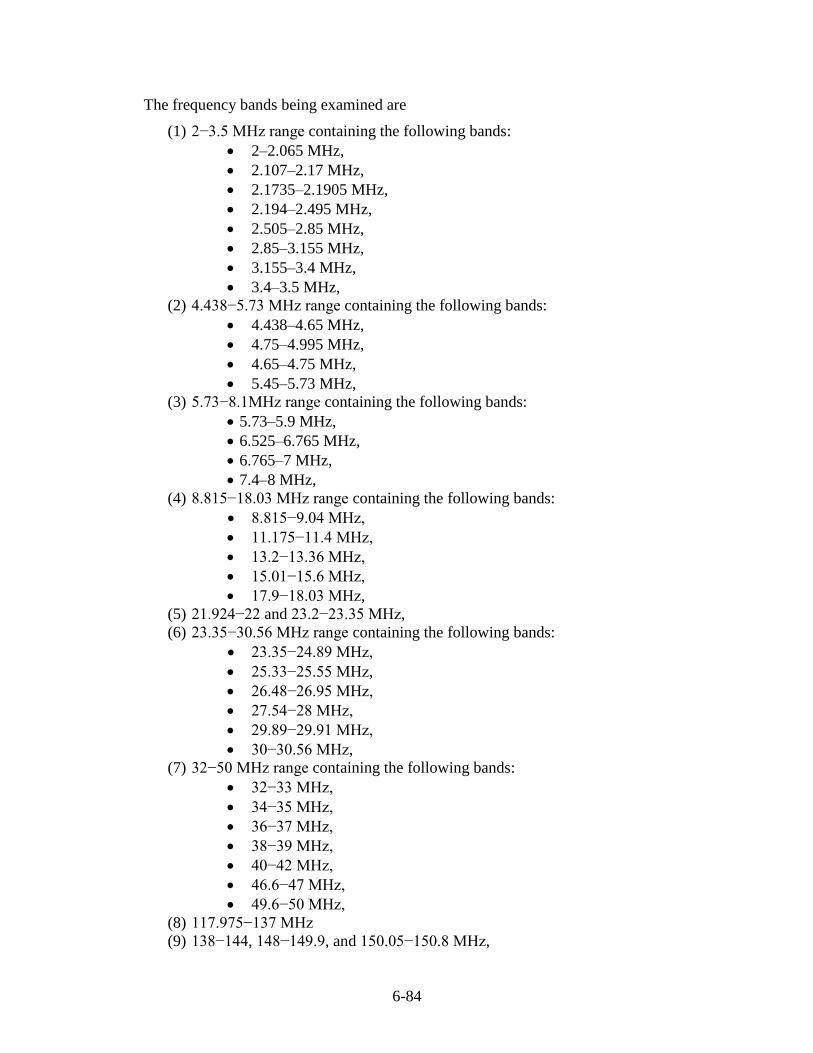
6-84
The frequency bands being examined are
(1) 2−3.5 MHz range containing the following bands:
2–2.065 MHz,
2.107–2.17 MHz,
2.1735–2.1905 MHz,
2.194–2.495 MHz,
2.505–2.85 MHz,
2.85–3.155 MHz,
3.155–3.4 MHz,
3.4–3.5 MHz,
(2) 4.438−5.73 MHz range containing the following bands:
4.438–4.65 MHz,
4.75–4.995 MHz,
4.65–4.75 MHz,
5.45–5.73 MHz,
(3) 5.73−8.1MHz range containing the following bands:
5.73–5.9 MHz,
6.525–6.765 MHz,
6.765–7 MHz,
7.4–8 MHz,
(4) 8.815−18.03 MHz range containing the following bands:
8.815−9.04 MHz,
11.175−11.4 MHz,
13.2−13.36 MHz,
15.01−15.6 MHz,
17.9−18.03 MHz,
(5) 21.924−22 and 23.2−23.35 MHz,
(6) 23.35−30.56 MHz range containing the following bands:
23.35−24.89 MHz,
25.33−25.55 MHz,
26.48−26.95 MHz,
27.54−28 MHz,
29.89−29.91 MHz,
30−30.56 MHz,
(7) 32−50 MHz range containing the following bands:
32−33 MHz,
34−35 MHz,
36−37 MHz,
38−39 MHz,
40−42 MHz,
46.6−47 MHz,
49.6−50 MHz,
(8) 117.975−137 MHz
(9) 138−144, 148−149.9, and 150.05−150.8 MHz,
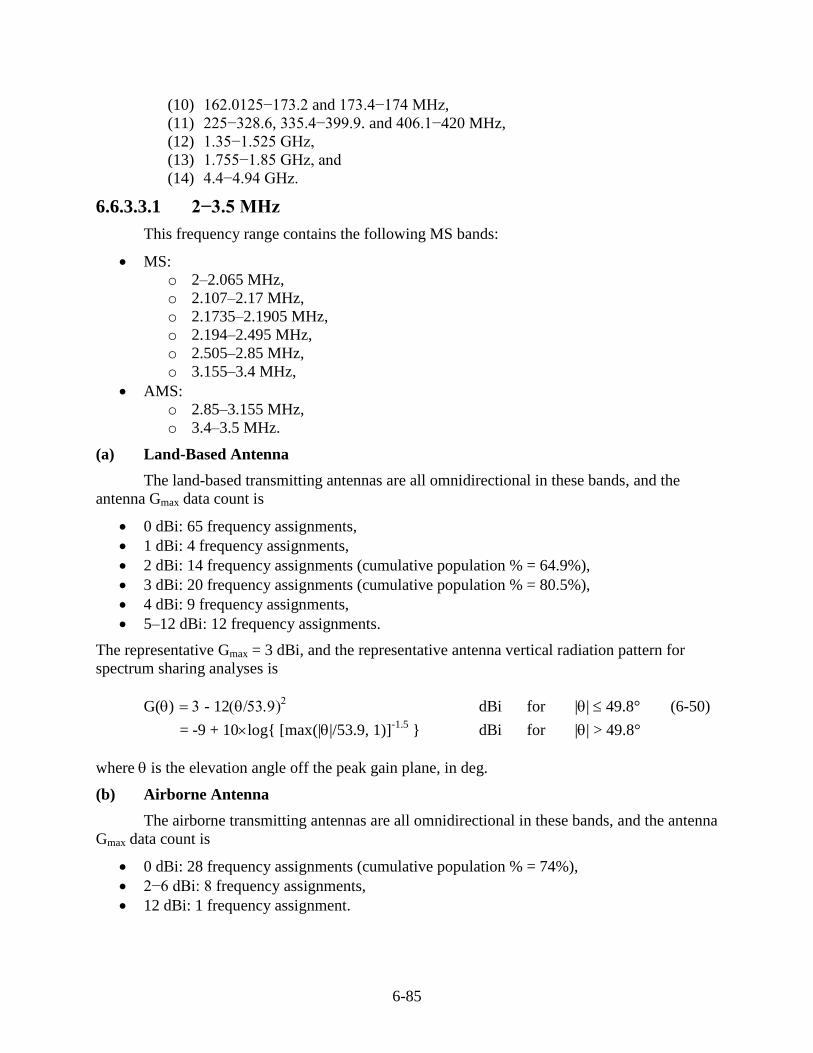
6-85
(10) 162.0125−173.2 and 173.4−174 MHz,
(11) 225−328.6, 335.4−399.9. and 406.1−420 MHz,
(12) 1.35−1.525 GHz,
(13) 1.755−1.85 GHz, and
(14) 4.4−4.94 GHz.
6.6.3.3.1 2−3.5 MHz
This frequency range contains the following MS bands:
MS:
o 2–2.065 MHz,
o 2.107–2.17 MHz,
o 2.1735–2.1905 MHz,
o 2.194–2.495 MHz,
o 2.505–2.85 MHz,
o 3.155–3.4 MHz,
AMS:
o 2.85–3.155 MHz,
o 3.4–3.5 MHz.
(a) Land-Based Antenna
The land-based transmitting antennas are all omnidirectional in these bands, and the
antenna Gmax data count is
0 dBi: 65 frequency assignments,
1 dBi: 4 frequency assignments,
2 dBi: 14 frequency assignments (cumulative population % = 64.9%),
3 dBi: 20 frequency assignments (cumulative population % = 80.5%),
4 dBi: 9 frequency assignments,
5–12 dBi: 12 frequency assignments.
The representative Gmax = 3 dBi, and the representative antenna vertical radiation pattern for
spectrum sharing analyses is
G() - 12 dBi for || 49.8° (6-50)
= -9 + 10log{ [max(||/53.9, 1)]-1.5
} dBi for || > 49.8°
where is the elevation angle off the peak gain plane, in deg.
(b) Airborne Antenna
The airborne transmitting antennas are all omnidirectional in these bands, and the antenna
Gmax data count is
0 dBi: 28 frequency assignments (cumulative population % = 74%),
2−6 dBi: 8 frequency assignments,
12 dBi: 1 frequency assignment.
6-86
The representative Gmax = 0 dBi. The radiation pattern is uniform, with G = Gmax = 0 dBi in all
directions.
6.6.3.3.2 4.438−5.73 MHz
This frequency range contains the following MS bands:
MS:
o 4.438–4.65 MHz,
o 4.75–4.995 MHz,
AMS:
o 4.65–4.75 MHz,
o 5.45–5.73 MHz.
(a) Land-Based Antenna
The land-based transmitting antennas are all omnidirectional in these bands, and the
antenna Gmax data count is
0, 1 dBi: 59 frequency assignments,
2 dBi: 29 frequency assignments,
3 dBi: 44 frequency assignments (cumulative population % = 74.6%),
4 dBi: 16 frequency assignments,
5–12 dBi: 29 frequency assignments.
The representative Gmax = 3 dBi, and the representative antenna vertical radiation pattern for
spectrum sharing analyses is
G() - 12 dBi for || 49.8° (6-51)
= -9 + 10log{ [max(||/53.9, 1)]-1.5
} dBi for || > 49.8°
where is the elevation angle off the peak gain plane, in deg.
(b) Airborne Antenna
The airborne transmitting antennas are all omnidirectional in these bands, and the antenna
Gmax data count is
0 dBi: 31 frequency assignments,
2 dBi: 6 frequency assignments (cumulative population % = 40%),
3 dBi: 50 frequency assignments (cumulative population % = 94.5%),
6, 12 dBi: 5 frequency assignments.
The representative Gmax = 3 dBi. The radiation pattern is uniform, with G = Gmax = 3 dBi in all
directions.
6.6.3.3.3 5.73−8.1MHz
This frequency range contains the following MS bands:
MS:
o 5.73–5.9 MHz,
o 6.765–7 MHz,
6-87
o 7.4–8 MHz,
AMS: 6.525–6.765 MHz.
(a) Land-Based Antenna
The land-based transmitting antennas are all omnidirectional in these bands, and the
antenna Gmax data count is
0, 1 dBi: 95 frequency assignments,
2 dBi: 35 frequency assignments,
3 dBi: 27 frequency assignments (cumulative population % = 73.7%),
4 dBi: 10 frequency assignments (cumulative population % = 78.4%),
5 dBi: 4 frequency assignments,
6 dBi: 27 frequency assignments,
8–14 dBi: 15 frequency assignments.
The representative Gmax = 3 dBi, and the representative antenna vertical radiation pattern for
spectrum sharing analyses is
G() - 12 dBi for || 49.8° (6-52)
= -9 + 10log{ [max(||/53.9, 1)]-1.5
} dBi for || > 49.8°
where is the elevation angle off the peak gain plane, in deg.
(b) Airborne Antenna
The airborne transmitting antennas are mostly omnidirectional in these bands, and the
antenna Gmax data count is
0 dBi: 223 frequency assignments (cumulative population % = 82%),
1, 2 dBi: 9 frequency assignments,
3 dBi: 27 frequency assignments,
4−6 dBi: 10 frequency assignments,
12 dBi: 2 frequency assignments.
The representative Gmax = 0 dBi. The radiation pattern is uniform, with G = Gmax = 0 dBi in all
directions.
6.6.3.3.4 8.815−18.03 MHz
This frequency range contains the following AMS bands:
8.815−9.04 MHz,
11.175−11.4 MHz,
13.2−13.36 MHz,
15.01−15.6 MHz,
17.9−18.03 MHz.
(a) Land-Based Antenna
The land-based transmitting antennas are all omnidirectional in these bands, and the
antenna Gmax data count is
6-88
0, 1 dBi: 157 frequency assignments,
2 dBi: 54 frequency assignments (cumulative population % = 65.5%),
3 dBi: 58 frequency assignments (cumulative population % = 83.5%),
4 dBi: 4 frequency assignments,
5−12 dBi: 49 frequency assignments.
The representative Gmax = 3 dBi, and the representative antenna vertical radiation pattern for
spectrum sharing analyses is
G() - 12 dBi for || 49.8° (6-53)
= -9 + 10log{ [max(||/53.9, 1)]-1.5
} dBi for || > 49.8°
where is the elevation angle off the peak gain plane, in deg.
(b) Airborne Antenna
The airborne transmitting antennas are all omnidirectional in these bands, and the antenna
Gmax data count is
0 dBi: 92 frequency assignments,
2 dBi: 4 frequency assignments,
3 dBi: 147 frequency assignments (cumulative population % = 85.6%),
5−12 dBi: 41 frequency assignments.
The representative Gmax = 3 dBi. The radiation pattern is uniform, with G = Gmax = 3 dBi in all
directions.
6.6.3.3.5 21.924−23.35 MHz
This frequency range contains the 21.924−22 MHz band for AMS(R) and 23.2−23.35
MHz band for AMS(OR). The GMF only contains service records in the 23.2−23.35 MHz band,
but the result should be applicable to the other band.
(a) Land-Based Antenna
The land-based transmitting antennas are all omnidirectional in the 23.2−23.35 MHz
band, and the antenna Gmax data count is
0 dBi: 27 frequency assignments,
1 dBi: 2 frequency assignments (cumulative population % = 69%),
2 dBi: 6 frequency assignments (cumulative population % = 83.3%),
3 dBi: 2 frequency assignments,
9 dBi: 5 frequency assignments.
The representative Gmax = 1 dBi, and the representative antenna vertical radiation pattern for
spectrum sharing analyses is
G() - 12 dBi for || 78.9° (6-54)
= -11 + 10log{ [max(||/85.5, 1)]-1.5
} dBi for || > 78.9°
where is the elevation angle off the peak gain plane, in deg.
6-89
(b) Airborne Antenna
The airborne transmitting antennas are all omnidirectional in the 23.2−23.35 MHz, and
the antenna Gmax data count is
0 dBi: 7 frequency assignments,
3 dBi: 6 frequency assignments (cumulative population % = 86.7%),
6 dBi: 1 frequency assignment,
9 dBi: 1 frequency assignment.
The representative Gmax = 3 dBi. The radiation pattern is uniform, with G = Gmax = 3 dBi in all
directions.
6.6.3.3.6 23.35−30.56 MHz
This frequency range contains the following MS bands:
23.35−24.89 MHz,
25.33−25.55 MHz,
26.48−26.95 MHz,
27.54−28 MHz,
29.89−29.91 MHz,
30−30.56 MHz.
(a) Land-Based Antenna
The land-based transmitting antennas are all omnidirectional in these bands, and the
antenna Gmax data count is
0 dBi: 54 frequency assignments,
1 dBi: 4 frequency assignments,
2 dBi: 6 frequency assignments (cumulative population % = 71.9%),
3 dBi: 16 frequency assignments,
4–12 dBi: 9 frequency assignments.
The representative Gmax = 2 dBi, and the representative antenna vertical radiation pattern for
spectrum sharing analyses is
G() 2 - 12 dBi for || 62.7° (6-55)
= -10 + 10log{ [max(||/67.9, 1)]-1.5
} dBi for || > 62.7°
where is the elevation angle off the peak gain plane, in deg.
(b) Airborne Antenna
The airborne transmitting antennas are all omnidirectional in these bands, and the antenna
Gmax data count is
0 dBi: 62 frequency assignments (cumulative population % = 82%),
1 dBi: 5 frequency assignments,
2−5 dBi: 9 frequency assignments.
6-90
The representative Gmax = 0 dBi. The radiation pattern is uniform, with G = Gmax = 0 dBi in all
directions.
6.6.3.3.7 32−50 MHz
This frequency range contains the following MS bands:
32−33 MHz,
34−35 MHz,
36−37 MHz,
38−39 MHz,
40−42 MHz,
46.6−47 MHz,
49.6−50 MHz.
(a) Land-Based Antenna
The land-based transmitting antennas are all omnidirectional in these bands, and the
antenna Gmax data count is
0 dBi: 196 frequency assignments (cumulative population % = 74%),
1 dBi: 16 frequency assignments,
2 dBi: 34 frequency assignments,
3 dBi: 9 frequency assignments,
5 dBi: 1 frequency assignment.
The representative Gmax = 0 dBi, and the representative antenna vertical radiation pattern for
spectrum sharing analyses is
G() -12 dBi for || 99.4° (6-56)
= -12 + 10log{ [max(||/107.6, 1)]-1.5
} dBi for || > 99.4°
where is the elevation angle off the peak gain plane, in deg.
(b) Airborne Antenna
The airborne transmitting antennas are all omnidirectional in these bands, and the antenna
Gmax data count is
0 dBi: 290 frequency assignments,
1 dBi: 21 frequency assignments (cumulative population % = 76%),
2 dBi: 61 frequency assignments,
3 dBi: 34 frequency assignments,
5, 10 dBi: 3 frequency assignments.
The representative Gmax = 1 dBi. The radiation pattern is uniform, with G = Gmax = 1 dBi in all
directions.
6-91
6.6.3.3.8 117.975−137 MHz
This is an AMS band.
(a) Land-Based Antenna
The land-based transmitting antennas are mostly omnidirectional in this band, and the
antenna Gmax data count is
0 dBi: 3579 frequency assignments (cumulative population % = 84%),
1 dBi: 19 frequency assignments,
2 dBi: 465 frequency assignments,
3 dBi: 107 frequency assignments,
4−20 dBi: 87 frequency assignments.
The representative Gmax = 0 dBi, and the representative antenna vertical radiation pattern for
conducting spectrum sharing analyses is
G() -12 dBi for || 99.4° (6-57)
= -12 + 10log{ [max(||/107.6, 1)]-1.5
} dBi for || > 99.4°
where is the elevation angle off the peak gain plane, in deg.
(b) Airborne Antenna
The airborne transmitting antennas are all omnidirectional in these bands, and the antenna
Gmax data count is
0 dBi: 165 frequency assignments,
1 dBi: 9 frequency assignments (cumulative population % = 63%),
2 dBi: 57 frequency assignments (cumulative population % = 83.7%),
3 dBi: 36 frequency assignments,
4−6 dBi: 9 frequency assignments.
The representative Gmax = 2 dBi. The radiation pattern is uniform, with G = Gmax = 2 dBi in all
directions.
6.6.3.3.9 138−150.8 MHz
This frequency range contains the following MS bands:
138−144 MHz,
148−149.9 MHz,
150.05−150.8 MHz.
(a) Land-Based Antenna
The land-based transmitting antennas are all omnidirectional in these bands, and the
antenna Gmax data count is
0 dBi: 346 frequency assignments,
1 dBi: 39 frequency assignments,
2 dBi: 292 frequency assignments (cumulative population % = 80.7%),
6-92
3 dBi: 113 frequency assignments,
4−9 dBi: 49 frequency assignments.
The representative Gmax = 2 dBi, and the representative antenna vertical radiation pattern for
spectrum sharing analyses is
G() 2 - 12 dBi for || 62.7° (6-58)
= -10 + 10log{ [max(||/67.9, 1)]-1.5
} dBi for || > 62.7°
where is the elevation angle off the peak gain plane, in deg.
(b) Airborne Antenna
The airborne transmitting antennas are all omnidirectional in these bands, and the antenna
Gmax data count is
0 dBi: 561 frequency assignments,
1 dBi: 49 frequency assignments,
2 dBi: 301 frequency assignments (cumulative population % = 79.9%),
3 dBi: 125 frequency assignments,
4−9 dBi: 104 frequency assignments.
The representative Gmax = 2 dBi. The radiation pattern is uniform, with G = Gmax = 2 dBi in all
directions.
6.6.3.3.10 162.0125−174 MHz
This frequency range contains the 162.0125−173.2 and 173.4−174 MHz MS bands.
(a) Land-Based Antenna
The land-based transmitting antennas are all omnidirectional in these bands, and the
antenna Gmax data count is
0 dBi: 25 frequency assignments,
2−5 dBi: 7 frequency assignments,
6 dBi: 70 frequency assignments (cumulative population % = 98.1%),
7, 8 dBi: 2 frequency assignments.
The representative Gmax = 6 dBi, and the representative antenna vertical radiation pattern for
spectrum sharing analyses is
G() - 12 dBi for || 25° (6-59)
= -6 + 10log{ [max(||/27, 1)]-1.5
} dBi for || > 25°
where is the elevation angle off the peak gain plane, in deg.
(b) Airborne Antenna
The airborne transmitting antennas are all omnidirectional in these bands, and the antenna
Gmax data count is
0 dBi: 63 frequency assignments,
6-93
1−5 dBi: 13 frequency assignments,
6 dBi: 159 frequency assignments (cumulative population % = 96.3%),
7−9 dBi: 9 frequency assignments.
The representative Gmax = 6 dBi. The radiation pattern is uniform, with G = Gmax = 6 dBi in all
directions.
6.6.3.3.11 225−420 MHz Range
This frequency range contains the following MS bands:
225−328.6 MHz,
335.4−399.9 MHz,
406.1−420 MHz.
(a) Land-Based Antenna
The land-based transmitting antennas are all omnidirectional in these bands, and the
antenna Gmax data count is
0 dBi: 3572 frequency assignments,
1 dBi: 104 frequency assignments,
2 dBi: 1458 frequency assignments (cumulative population % = 78.9%),
3 dBi: 877 frequency assignments,
4−24 dBi: 496 frequency assignments.
The representative Gmax = 2 dBi, and the representative antenna vertical radiation pattern for
spectrum sharing analyses is
G() 2 - 12 dBi for || 62.7° (6-60)
= -10 + 10log{ [max(||/67.9, 1)]-1.5
} dBi for || > 62.7°
where is the elevation angle off the peak gain plane, in deg.
(b) Airborne Antenna
The airborne transmitting antennas are all omnidirectional in these bands, and the antenna
Gmax data count is
0 dBi: 1211 frequency assignments,
1 dBi: 105 frequency assignments,
2 dBi: 1928 frequency assignments (cumulative population % = 72.1%),
3 dBi: 884 frequency assignments,
4-10 dBi: 352 frequency assignments,
11-19 dBi: 17 frequency assignments,
30 dBi: 1 frequency assignment.
The representative Gmax = 2 dBi. The radiation pattern is uniform, with G = Gmax = 2 dBi in all
directions.
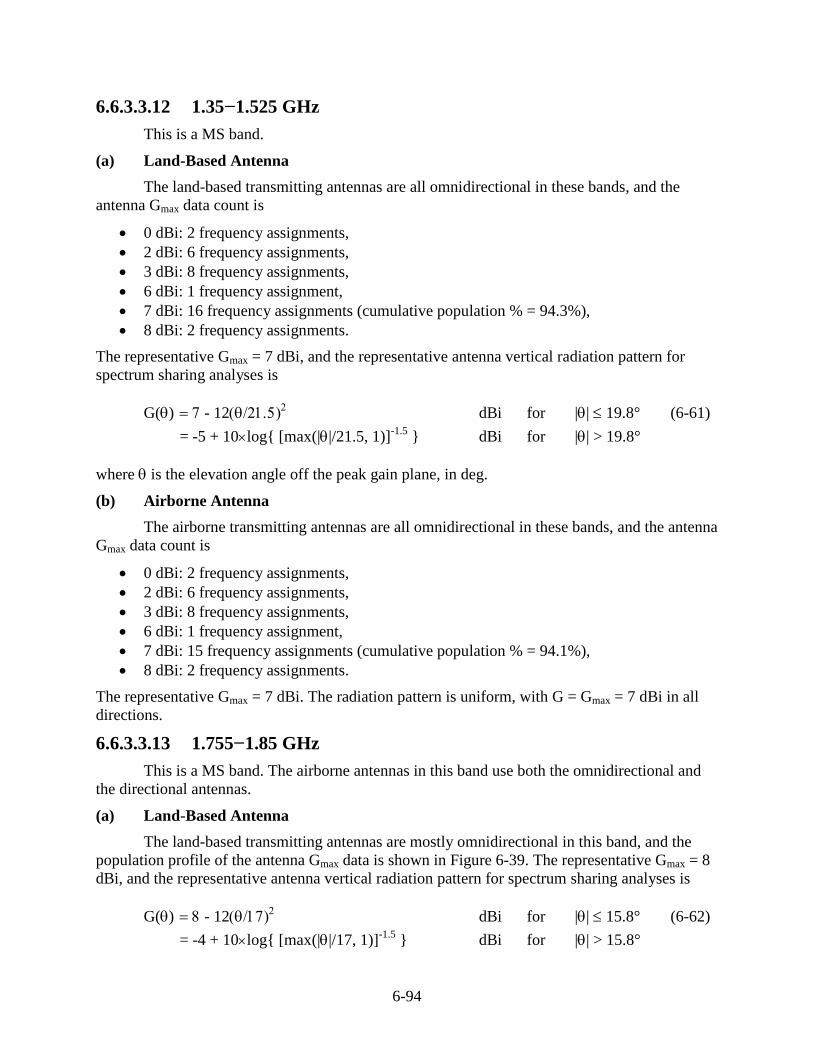
6-94
6.6.3.3.12 1.35−1.525 GHz
This is a MS band.
(a) Land-Based Antenna
The land-based transmitting antennas are all omnidirectional in these bands, and the
antenna Gmax data count is
0 dBi: 2 frequency assignments,
2 dBi: 6 frequency assignments,
3 dBi: 8 frequency assignments,
6 dBi: 1 frequency assignment,
7 dBi: 16 frequency assignments (cumulative population % = 94.3%),
8 dBi: 2 frequency assignments.
The representative Gmax = 7 dBi, and the representative antenna vertical radiation pattern for
spectrum sharing analyses is
G() - 12 dBi for || 19.8° (6-61)
= -5 + 10log{ [max(||/21.5, 1)]-1.5
} dBi for || > 19.8°
where is the elevation angle off the peak gain plane, in deg.
(b) Airborne Antenna
The airborne transmitting antennas are all omnidirectional in these bands, and the antenna
Gmax data count is
0 dBi: 2 frequency assignments,
2 dBi: 6 frequency assignments,
3 dBi: 8 frequency assignments,
6 dBi: 1 frequency assignment,
7 dBi: 15 frequency assignments (cumulative population % = 94.1%),
8 dBi: 2 frequency assignments.
The representative Gmax = 7 dBi. The radiation pattern is uniform, with G = Gmax = 7 dBi in all
directions.
6.6.3.3.13 1.755−1.85 GHz
This is a MS band. The airborne antennas in this band use both the omnidirectional and
the directional antennas.
(a) Land-Based Antenna
The land-based transmitting antennas are mostly omnidirectional in this band, and the
population profile of the antenna Gmax data is shown in Figure 6-39. The representative Gmax = 8
dBi, and the representative antenna vertical radiation pattern for spectrum sharing analyses is
G() - 12 dBi for || 15.8° (6-62)
= -4 + 10log{ [max(||/17, 1)]-1.5
} dBi for || > 15.8°
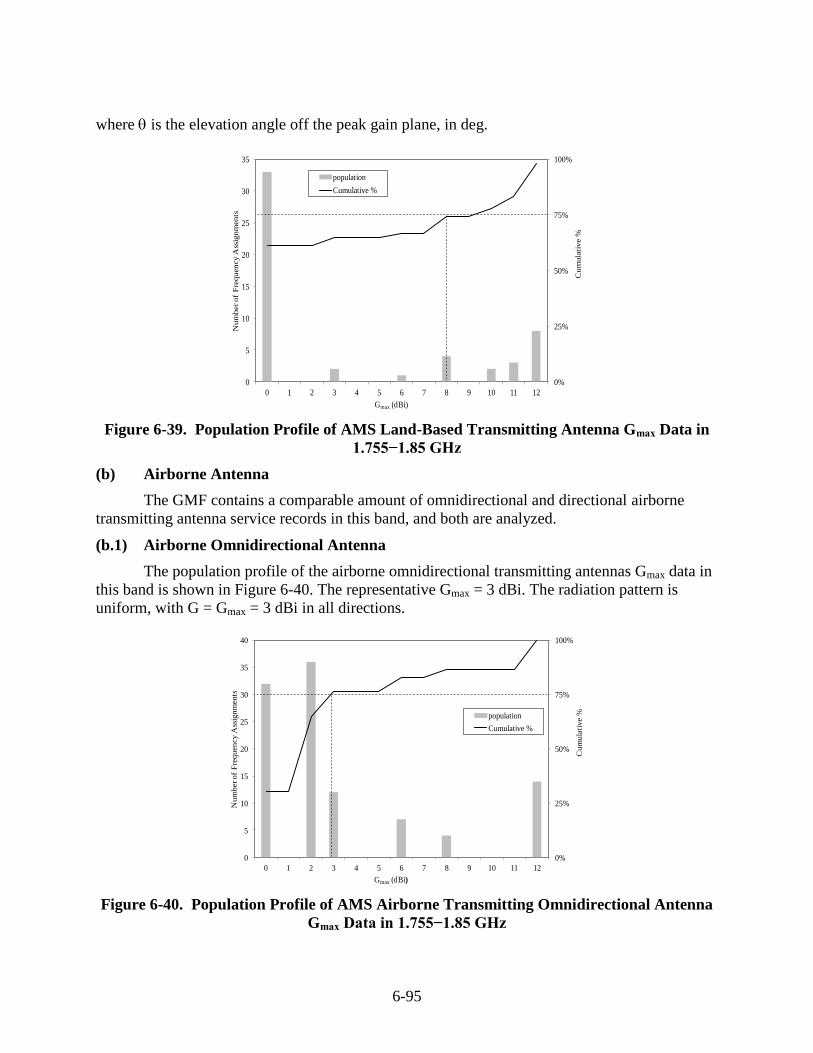
6-95
where is the elevation angle off the peak gain plane, in deg.
0%
25%
50%
75%
100%
0
5
10
15
20
25
30
35
0 1 2 3 4 5 6 7 8 9 10 11 12
Cum
ula
tive %
Num
ber of
Fre
quency A
ssig
nm
ents
Gmax (dBi)
population
Cumulative %
Figure 6-39. Population Profile of AMS Land-Based Transmitting Antenna Gmax Data in
1.755−1.85 GHz
(b) Airborne Antenna
The GMF contains a comparable amount of omnidirectional and directional airborne
transmitting antenna service records in this band, and both are analyzed.
(b.1) Airborne Omnidirectional Antenna
The population profile of the airborne omnidirectional transmitting antennas Gmax data in
this band is shown in Figure 6-40. The representative Gmax = 3 dBi. The radiation pattern is
uniform, with G = Gmax = 3 dBi in all directions.
0%
25%
50%
75%
100%
0
5
10
15
20
25
30
35
40
0 1 2 3 4 5 6 7 8 9 10 11 12
Cu
mu
lati
ve %
Nu
mb
er o
f F
req
uen
cy
Ass
ign
men
ts
Gmax (dBi)
population
Cumulative %
Figure 6-40. Population Profile of AMS Airborne Transmitting Omnidirectional Antenna
Gmax Data in 1.755−1.85 GHz
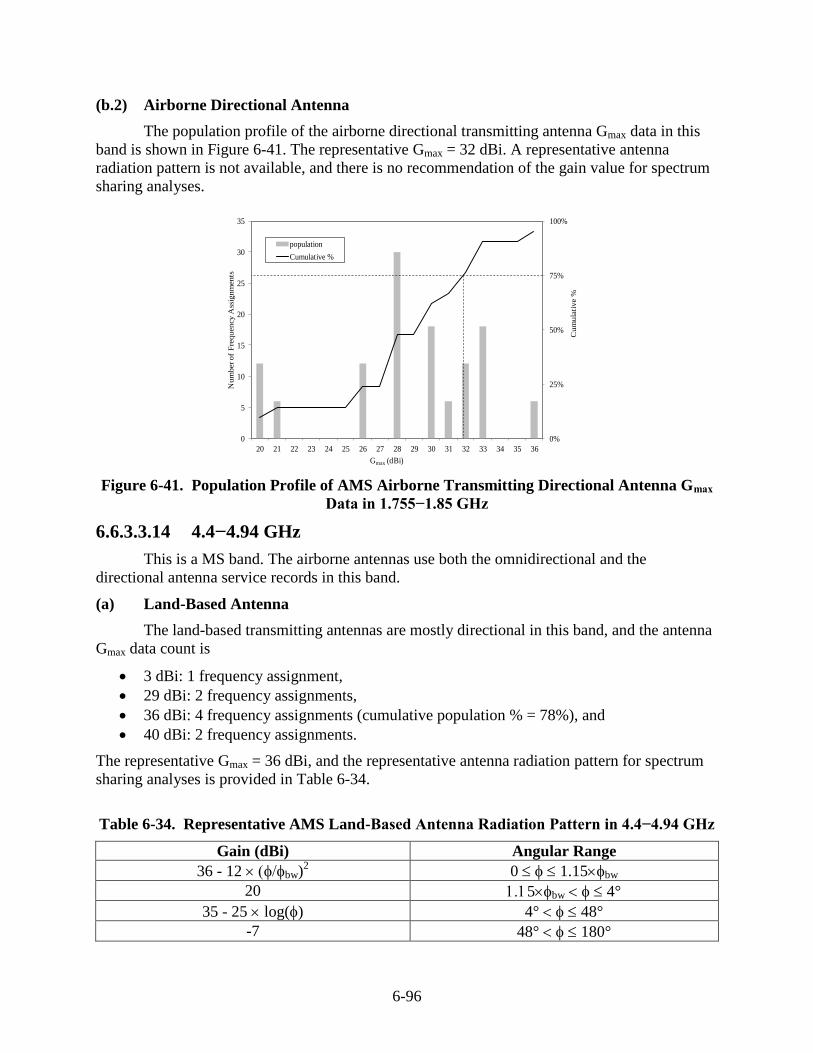
6-96
(b.2) Airborne Directional Antenna
The population profile of the airborne directional transmitting antenna Gmax data in this
band is shown in Figure 6-41. The representative Gmax = 32 dBi. A representative antenna
radiation pattern is not available, and there is no recommendation of the gain value for spectrum
sharing analyses.
0%
25%
50%
75%
100%
0
5
10
15
20
25
30
35
20 21 22 23 24 25 26 27 28 29 30 31 32 33 34 35 36
Cum
ula
tive %
Num
ber of
Fre
quency A
ssig
nm
ents
Gmax (dBi)
population
Cumulative %
Figure 6-41. Population Profile of AMS Airborne Transmitting Directional Antenna Gmax
Data in 1.755−1.85 GHz
6.6.3.3.14 4.4−4.94 GHz
This is a MS band. The airborne antennas use both the omnidirectional and the
directional antenna service records in this band.
(a) Land-Based Antenna
The land-based transmitting antennas are mostly directional in this band, and the antenna
Gmax data count is
3 dBi: 1 frequency assignment,
29 dBi: 2 frequency assignments,
36 dBi: 4 frequency assignments (cumulative population % = 78%), and
40 dBi: 2 frequency assignments.
The representative Gmax = 36 dBi, and the representative antenna radiation pattern for spectrum
sharing analyses is provided in Table 6-34.
Table 6-34. Representative AMS Land-Based Antenna Radiation Pattern in 4.4−4.94 GHz
Gain (dBi) Angular Range
36 - 12 bw)2 0 1.15bw
20 5bw 4°
35 - 25 log() 4° 48°
-7 48° 180°
6-97
Elliptical beam.
angle off mainbeam axis in the direction of interest, deg.
bw HPBW in the direction of interest, deg.
(b) Airborne Antenna
The GMF has a comparable amount of airborne omnidirectional and directional
transmitting antenna service records in this band, and both will be analyzed.
(b.1) Airborne Omnidirectional Antenna
The airborne omnidirectional transmitting antenna Gmax data count in this band is
0−2 dBi: 11 frequency assignments,
3 dBi: 31 frequency assignments (cumulative population % = 90%),
5, 6 dBi: 3 frequency assignments, and
12 dBi: 2 frequency assignments.
The representative Gmax = 3 dBi. The radiation pattern is uniform, with G = Gmax = 3 dBi in all
directions.
(b.2) Airborne Directional Antenna
The airborne directional transmitting antenna Gmax data count in this band is
13−16 dBi: 4 frequency assignments,
19, 20 dBi: 2 frequency assignments,
26−30 dBi: 2 frequency assignments,
32, 33 dBi: 4 frequency assignments,
36 dBi: 2 frequency assignments (cumulative population % = 70%), and
38, 39 dBi: 6 frequency assignments.
The representative Gmax = 36 dBi. A representative antenna radiation pattern is not available, and
there is no recommendation of the gain value for spectrum sharing analyses.
6.7 Mobile-Satellite Service
The primary MSS bands for the federal agencies are
240−270 MHz downlink and 290−320 MHz uplink,
1.525−1.559 GHz downlink and 1.61−1.6605 GHz uplink,
7.25−7.3 GHz downlink and 7.9−8.025 GHz uplink,
20.2−21.2 GHz downlink and 30−31 GHz uplink,
39.5−40.5 GHz downlink and 43.5−47 GHz uplink, and
others.
Sometimes the 43.5−47 GHz band is used as the corresponding uplink band to the 20.2−21.2
GHz downlink band. In the uplink band, the earth stations are the transmitting stations, and are
the potential interferers.
In EMC analyses between two MSS systems or between a MSS system and another space
system, it is usually assumed that the space systems have the same Earth coverage. For instance
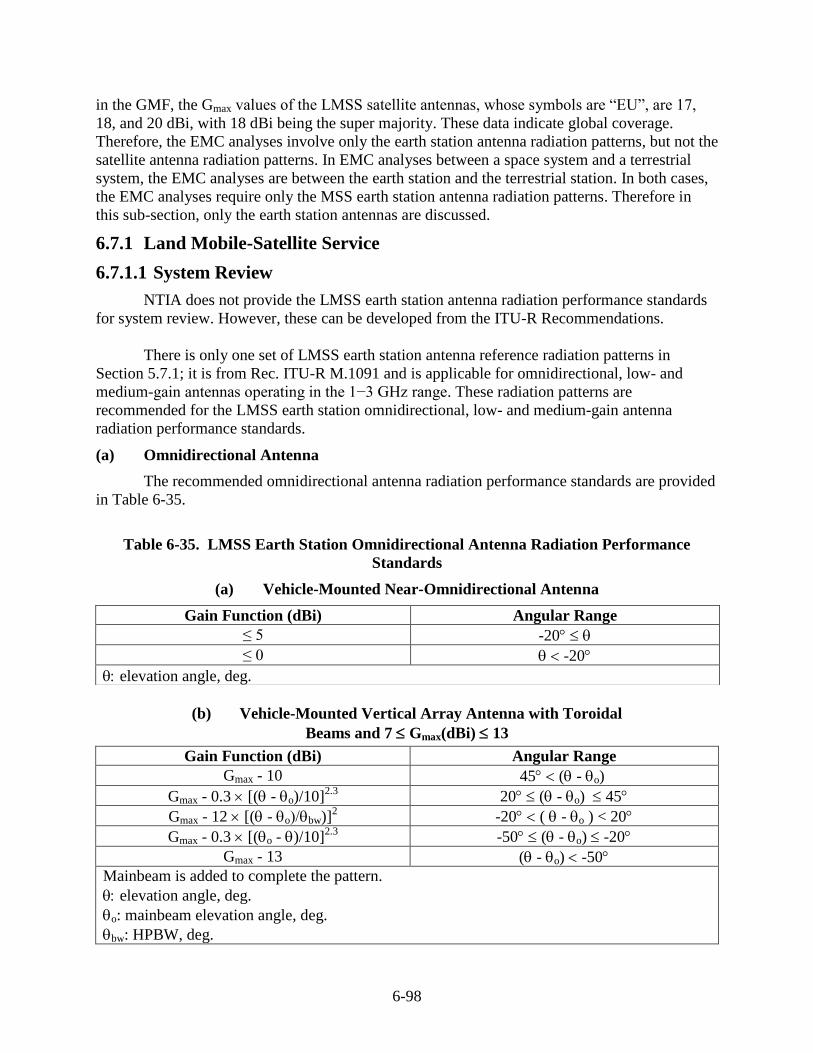
6-98
in the GMF, the Gmax values of the LMSS satellite antennas, whose symbols are “EU”, are 17,
18, and 20 dBi, with 18 dBi being the super majority. These data indicate global coverage.
Therefore, the EMC analyses involve only the earth station antenna radiation patterns, but not the
satellite antenna radiation patterns. In EMC analyses between a space system and a terrestrial
system, the EMC analyses are between the earth station and the terrestrial station. In both cases,
the EMC analyses require only the MSS earth station antenna radiation patterns. Therefore in
this sub-section, only the earth station antennas are discussed.
6.7.1 Land Mobile-Satellite Service
6.7.1.1 System Review
NTIA does not provide the LMSS earth station antenna radiation performance standards
for system review. However, these can be developed from the ITU-R Recommendations.
There is only one set of LMSS earth station antenna reference radiation patterns in
Section 5.7.1; it is from Rec. ITU-R M.1091 and is applicable for omnidirectional, low- and
medium-gain antennas operating in the 1−3 GHz range. These radiation patterns are
recommended for the LMSS earth station omnidirectional, low- and medium-gain antenna
radiation performance standards.
(a) Omnidirectional Antenna
The recommended omnidirectional antenna radiation performance standards are provided
in Table 6-35.
Table 6-35. LMSS Earth Station Omnidirectional Antenna Radiation Performance
Standards
(a) Vehicle-Mounted Near-Omnidirectional Antenna
(b) Vehicle-Mounted Vertical Array Antenna with Toroidal
Beams and 7 Gmax(dBi) 13
Gain Function (dBi) Angular Range
Gmax - 10 45 ( - o)
Gmax - 0.3 [( - o)/10]2.3
20 ( - o) 45
Gmax - 12 [( - obw)]2 -20 ( - o) < 20
Gmax - 0.3 [(o - )/10]2.3
-50 ( - o) -20
Gmax - 13 ( - o) -50
Mainbeam is added to complete the pattern.
elevation angle, deg.
o: mainbeam elevation angle, deg.
bw: HPBW, deg.
Gain Function (dBi) Angular Range
≤ 5 -20
≤ 0 -20
elevation angle, deg.
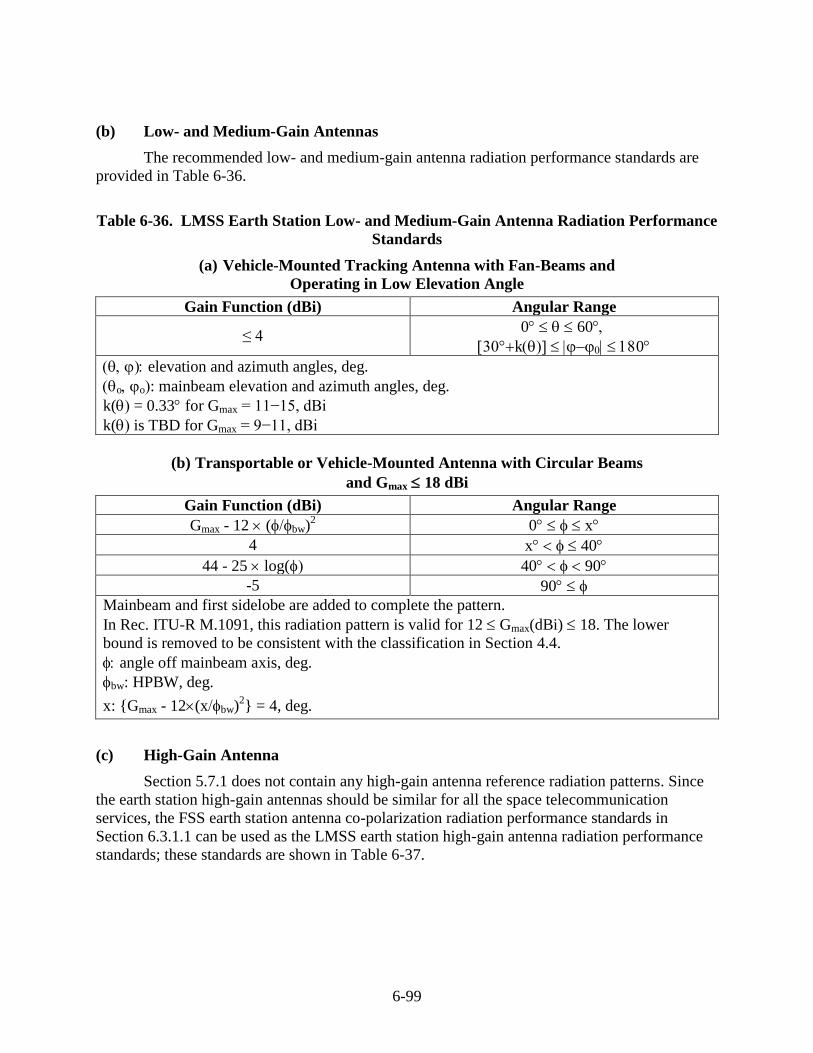
6-99
(b) Low- and Medium-Gain Antennas
The recommended low- and medium-gain antenna radiation performance standards are
provided in Table 6-36.
Table 6-36. LMSS Earth Station Low- and Medium-Gain Antenna Radiation Performance
Standards
(a) Vehicle-Mounted Tracking Antenna with Fan-Beams and
Operating in Low Elevation Angle
Gain Function (dBi) Angular Range
≤ 4 0 60
k0
elevation and azimuth angles, deg.
oo: mainbeam elevation and azimuth angles, deg.
k(= 0.33 for Gmax = 11−15, dBi
k( is TBD for Gmax = 9−11, dBi
(b) Transportable or Vehicle-Mounted Antenna with Circular Beams
and Gmax 18 dBi
Gain Function (dBi) Angular Range
Gmax - 12 (bw)2 0 x
4 x 40
44 - 25 log( 40 90
-5 90
Mainbeam and first sidelobe are added to complete the pattern.
In Rec. ITU-R M.1091, this radiation pattern is valid for 12 Gmax(dBi) 18. The lower
bound is removed to be consistent with the classification in Section 4.4.
angle off mainbeam axis, deg.
bw: HPBW, deg.
x: {Gmax - 12(xbw)2} = 4, deg.
(c) High-Gain Antenna
Section 5.7.1 does not contain any high-gain antenna reference radiation patterns. Since
the earth station high-gain antennas should be similar for all the space telecommunication
services, the FSS earth station antenna co-polarization radiation performance standards in
Section 6.3.1.1 can be used as the LMSS earth station high-gain antenna radiation performance
standards; these standards are shown in Table 6-37.
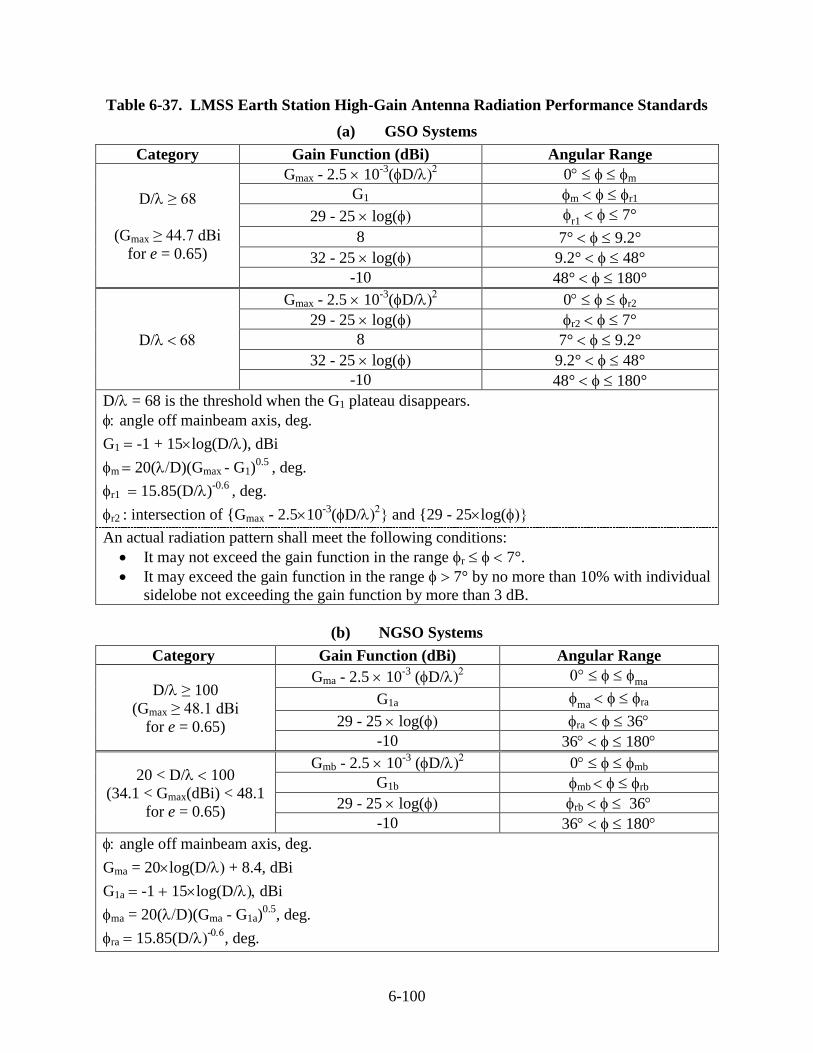
6-100
Table 6-37. LMSS Earth Station High-Gain Antenna Radiation Performance Standards
(a) GSO Systems
Category Gain Function (dBi) Angular Range
D/≥ 68
(Gmax ≥ 44.7 dBi
for e = 0.65)
Gmax - 2.5 10-3
(D/ 0 m
G1 m r1
29 - 25 log( r1 7°
8 7° 9.2°
32 - 25 log( 9.2° 48°
-10 48° 180°
D/
Gmax - 2.5 10-3
(D/ 0 r2
29 - 25 log( r2 7°
8 7° 9.2°
32 - 25 log( 9.2° 48°
-10 48° 180°
D/= 68 is the threshold when the G1 plateau disappears.
angle off mainbeam axis, deg.
G1 -1 + 15log(D/), dBi
m 20(D)(Gmax - G1)0.5
, deg.
r1 15.85(D/)-0.6
, deg.
r2 : intersection of {Gmax - 2.510-3
(D/ and {29 - 25log(
An actual radiation pattern shall meet the following conditions:
It may not exceed the gain function in the range r 7°.
It may exceed the gain function in the range 7° by no more than 10% with individual
sidelobe not exceeding the gain function by more than 3 dB.
(b) NGSO Systems
Category Gain Function (dBi) Angular Range
D/ ≥ 100
(Gmax ≥ 48.1 dBi
for e = 0.65)
Gma - 2.5 10-3
(D/ ma
G1a ma ra
29 - 25 log( ra 36
-10 36 180
20 < D/ 100
(34.1 < Gmax(dBi) < 48.1
for e = 0.65)
Gmb - 2.5 10-3
(D/ 0 mb
G1b mb rb
29 - 25 log( rb 36
-10 36 180
angle off mainbeam axis, deg.
Gma = 20log(D/ + 8.4, dBi
G1a -1 15log(D/dBi
ma = 20(D)(Gma - G1a)0.5
, deg.
ra 15.85(D/-
, deg.
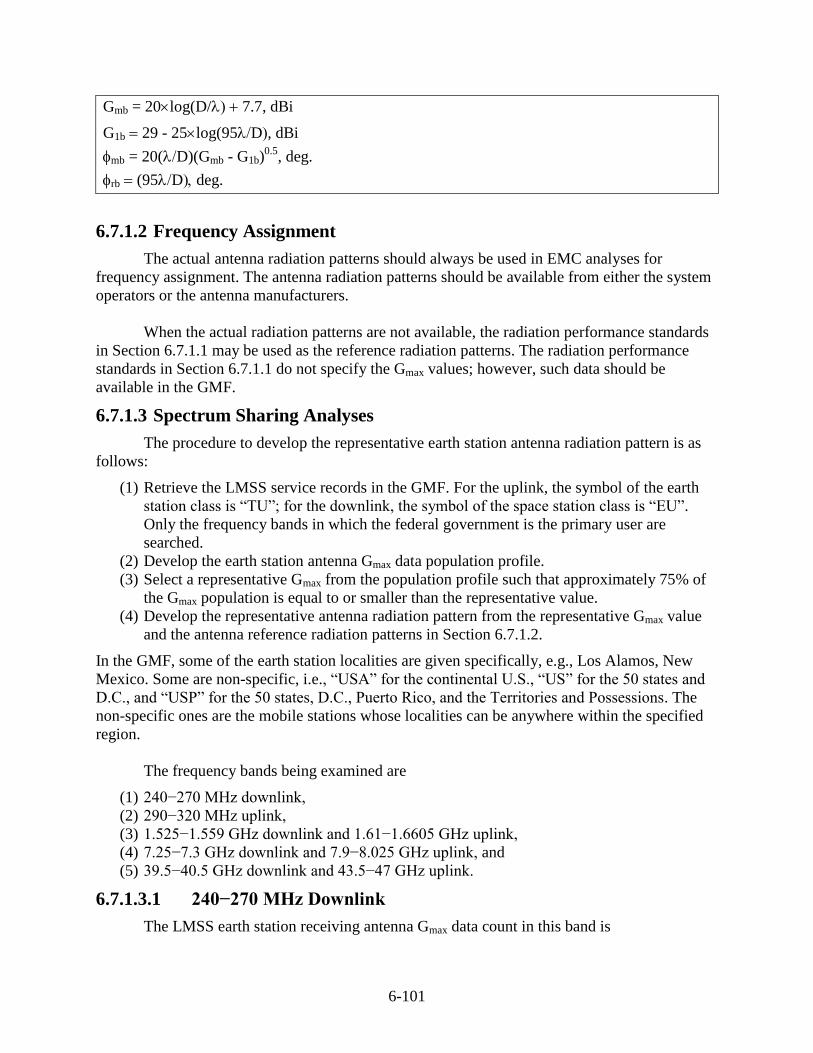
6-101
Gmb = 20log(D/ 7.7, dBi
G1b 29 - 25log(95D, dBi
mb = 20(D)(Gmb - G1b)0.5
, deg.
rb (95Ddeg.
6.7.1.2 Frequency Assignment
The actual antenna radiation patterns should always be used in EMC analyses for
frequency assignment. The antenna radiation patterns should be available from either the system
operators or the antenna manufacturers.
When the actual radiation patterns are not available, the radiation performance standards
in Section 6.7.1.1 may be used as the reference radiation patterns. The radiation performance
standards in Section 6.7.1.1 do not specify the Gmax values; however, such data should be
available in the GMF.
6.7.1.3 Spectrum Sharing Analyses
The procedure to develop the representative earth station antenna radiation pattern is as
follows:
(1) Retrieve the LMSS service records in the GMF. For the uplink, the symbol of the earth
station class is “TU”; for the downlink, the symbol of the space station class is “EU”.
Only the frequency bands in which the federal government is the primary user are
searched.
(2) Develop the earth station antenna Gmax data population profile.
(3) Select a representative Gmax from the population profile such that approximately 75% of
the Gmax population is equal to or smaller than the representative value.
(4) Develop the representative antenna radiation pattern from the representative Gmax value
and the antenna reference radiation patterns in Section 6.7.1.2.
In the GMF, some of the earth station localities are given specifically, e.g., Los Alamos, New
Mexico. Some are non-specific, i.e., “USA” for the continental U.S., “US” for the 50 states and
D.C., and “USP” for the 50 states, D.C., Puerto Rico, and the Territories and Possessions. The
non-specific ones are the mobile stations whose localities can be anywhere within the specified
region.
The frequency bands being examined are
(1) 240−270 MHz downlink,
(2) 290−320 MHz uplink,
(3) 1.525−1.559 GHz downlink and 1.61−1.6605 GHz uplink,
(4) 7.25−7.3 GHz downlink and 7.9−8.025 GHz uplink, and
(5) 39.5−40.5 GHz downlink and 43.5−47 GHz uplink.
6.7.1.3.1 240−270 MHz Downlink
The LMSS earth station receiving antenna Gmax data count in this band is
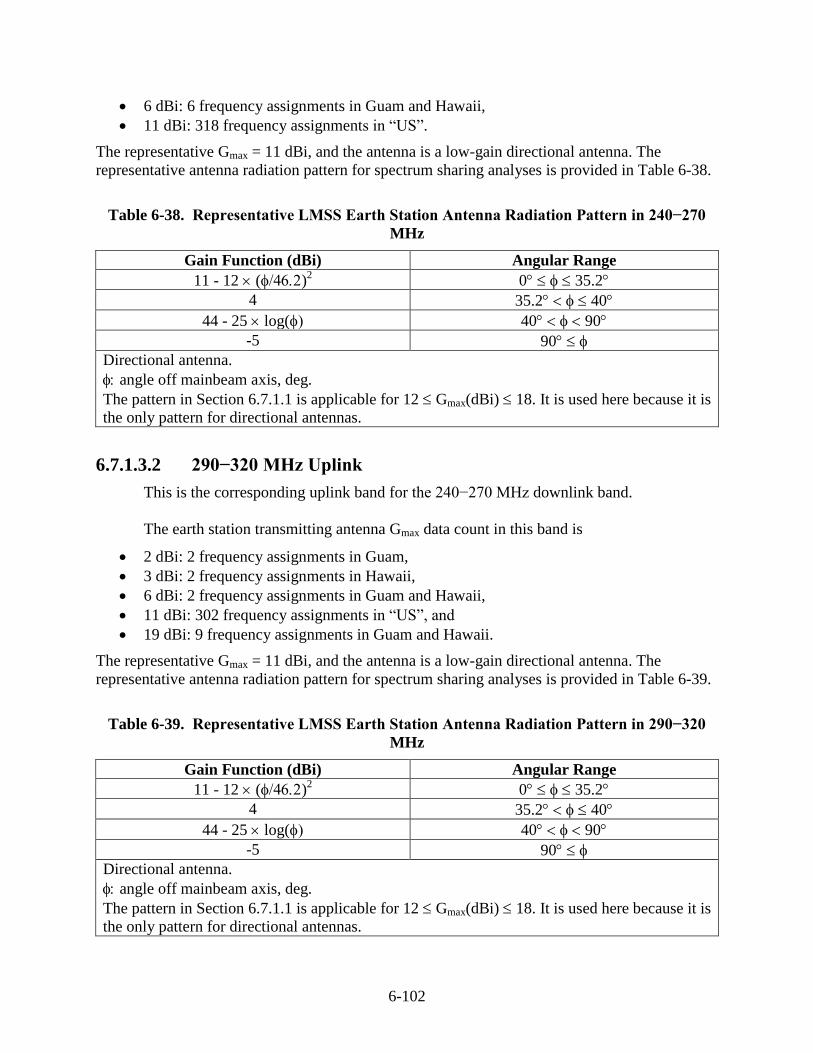
6-102
6 dBi: 6 frequency assignments in Guam and Hawaii,
11 dBi: 318 frequency assignments in “US”.
The representative Gmax = 11 dBi, and the antenna is a low-gain directional antenna. The
representative antenna radiation pattern for spectrum sharing analyses is provided in Table 6-38.
Table 6-38. Representative LMSS Earth Station Antenna Radiation Pattern in 240−270
MHz
Gain Function (dBi) Angular Range
11 - 12 ()2 0 35.2
4 35.2 40
44 - 25 log( 40 90
-5 90
Directional antenna.
angle off mainbeam axis, deg.
The pattern in Section 6.7.1.1 is applicable for 12 Gmax(dBi) 18. It is used here because it is
the only pattern for directional antennas.
6.7.1.3.2 290−320 MHz Uplink
This is the corresponding uplink band for the 240−270 MHz downlink band.
The earth station transmitting antenna Gmax data count in this band is
2 dBi: 2 frequency assignments in Guam,
3 dBi: 2 frequency assignments in Hawaii,
6 dBi: 2 frequency assignments in Guam and Hawaii,
11 dBi: 302 frequency assignments in “US”, and
19 dBi: 9 frequency assignments in Guam and Hawaii.
The representative Gmax = 11 dBi, and the antenna is a low-gain directional antenna. The
representative antenna radiation pattern for spectrum sharing analyses is provided in Table 6-39.
Table 6-39. Representative LMSS Earth Station Antenna Radiation Pattern in 290−320
MHz
Gain Function (dBi) Angular Range
11 - 12 ()2 0 35.2
4 35.2 40
44 - 25 log( 40 90
-5 90
Directional antenna.
angle off mainbeam axis, deg.
The pattern in Section 6.7.1.1 is applicable for 12 Gmax(dBi) 18. It is used here because it is
the only pattern for directional antennas.
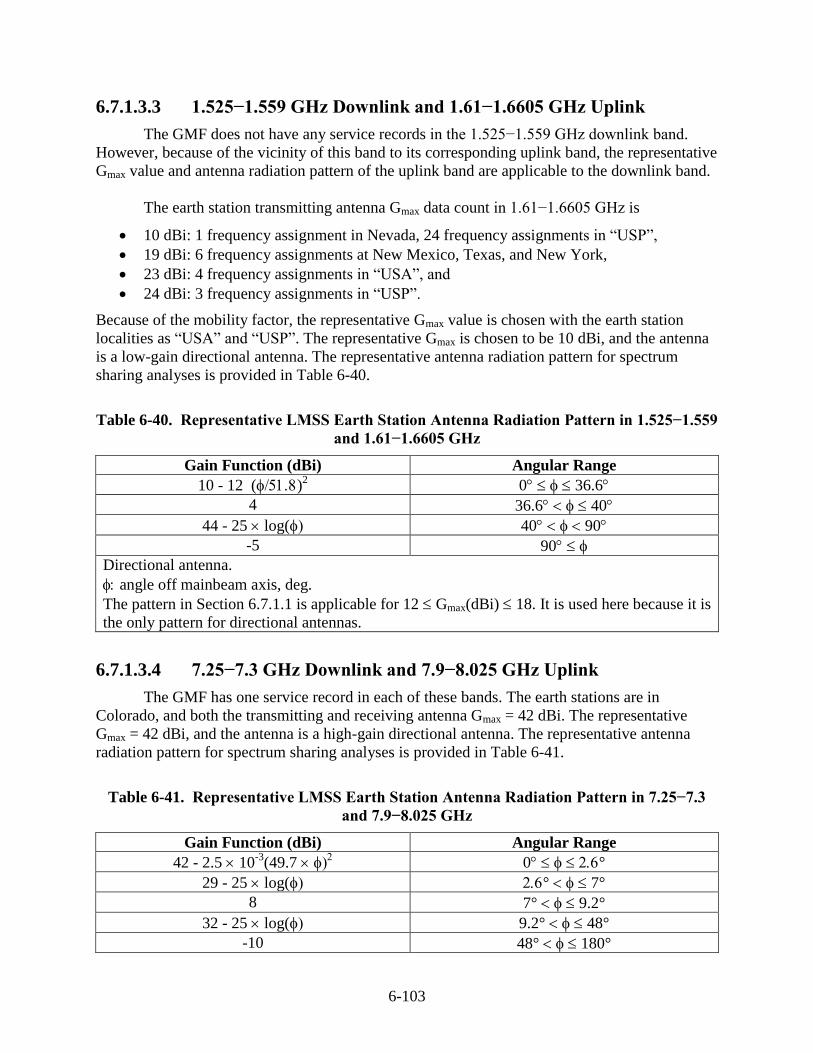
6-103
6.7.1.3.3 1.525−1.559 GHz Downlink and 1.61−1.6605 GHz Uplink
The GMF does not have any service records in the 1.525−1.559 GHz downlink band.
However, because of the vicinity of this band to its corresponding uplink band, the representative
Gmax value and antenna radiation pattern of the uplink band are applicable to the downlink band.
The earth station transmitting antenna Gmax data count in 1.61−1.6605 GHz is
10 dBi: 1 frequency assignment in Nevada, 24 frequency assignments in “USP”,
19 dBi: 6 frequency assignments at New Mexico, Texas, and New York,
23 dBi: 4 frequency assignments in “USA”, and
24 dBi: 3 frequency assignments in “USP”.
Because of the mobility factor, the representative Gmax value is chosen with the earth station
localities as “USA” and “USP”. The representative Gmax is chosen to be 10 dBi, and the antenna
is a low-gain directional antenna. The representative antenna radiation pattern for spectrum
sharing analyses is provided in Table 6-40.
Table 6-40. Representative LMSS Earth Station Antenna Radiation Pattern in 1.525−1.559
and 1.61−1.6605 GHz
Gain Function (dBi) Angular Range
10 - 12 ()2 0 36.6
4 36.6 40
44 - 25 log( 40 90
-5 90
Directional antenna.
angle off mainbeam axis, deg.
The pattern in Section 6.7.1.1 is applicable for 12 Gmax(dBi) 18. It is used here because it is
the only pattern for directional antennas.
6.7.1.3.4 7.25−7.3 GHz Downlink and 7.9−8.025 GHz Uplink
The GMF has one service record in each of these bands. The earth stations are in
Colorado, and both the transmitting and receiving antenna Gmax = 42 dBi. The representative
Gmax = 42 dBi, and the antenna is a high-gain directional antenna. The representative antenna
radiation pattern for spectrum sharing analyses is provided in Table 6-41.
Table 6-41. Representative LMSS Earth Station Antenna Radiation Pattern in 7.25−7.3
and 7.9−8.025 GHz
Gain Function (dBi) Angular Range
42 - 2.5 10-3
(49.7 0 °
29 - 25 log( ° 7°
8 7° 9.2°
32 - 25 log( 9.2° 48°
-10 48° 180°
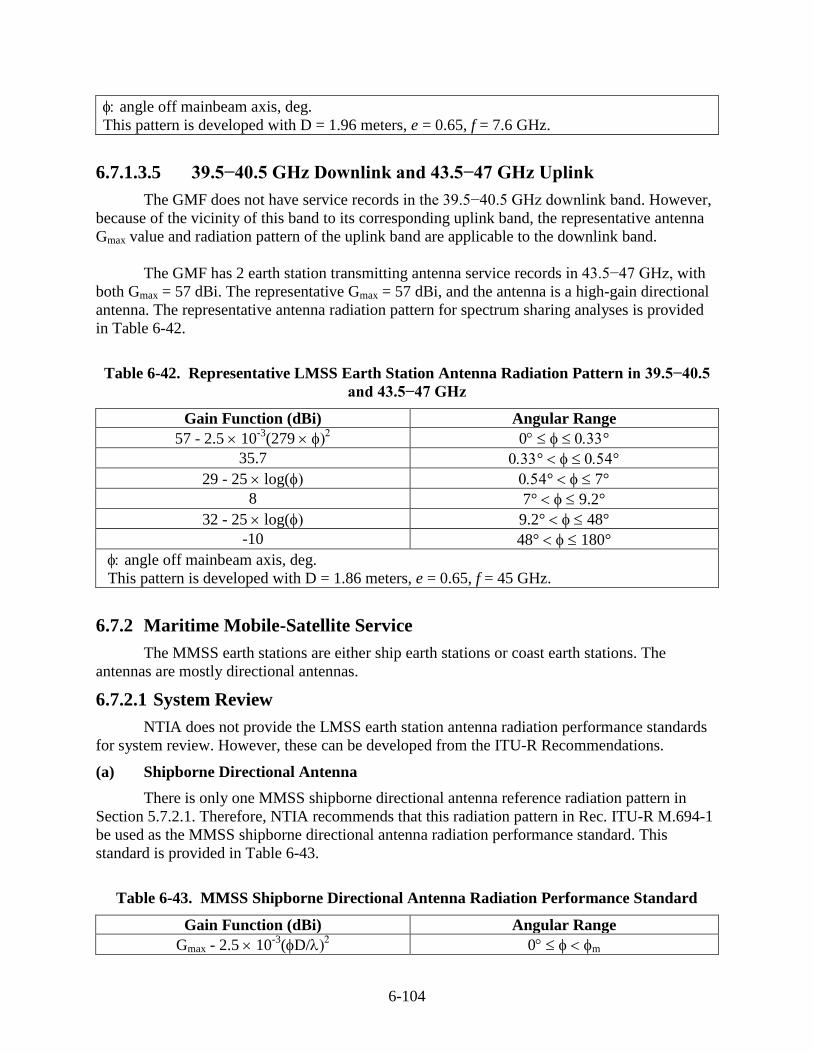
6-104
angle off mainbeam axis, deg.
This pattern is developed with D = 1.96 meters, e = 0.65, f = 7.6 GHz.
6.7.1.3.5 39.5−40.5 GHz Downlink and 43.5−47 GHz Uplink
The GMF does not have service records in the 39.5−40.5 GHz downlink band. However,
because of the vicinity of this band to its corresponding uplink band, the representative antenna
Gmax value and radiation pattern of the uplink band are applicable to the downlink band.
The GMF has 2 earth station transmitting antenna service records in 43.5−47 GHz, with
both Gmax = 57 dBi. The representative Gmax = 57 dBi, and the antenna is a high-gain directional
antenna. The representative antenna radiation pattern for spectrum sharing analyses is provided
in Table 6-42.
Table 6-42. Representative LMSS Earth Station Antenna Radiation Pattern in 39.5−40.5
and 43.5−47 GHz
Gain Function (dBi) Angular Range
57 - 2.5 10-3
(279 0 °
35.7 ° °
29 - 25 log( ° 7°
8 7° 9.2°
32 - 25 log( 9.2° 48°
-10 48° 180°
angle off mainbeam axis, deg.
This pattern is developed with D = 1.86 meters, e = 0.65, f = 45 GHz.
6.7.2 Maritime Mobile-Satellite Service
The MMSS earth stations are either ship earth stations or coast earth stations. The
antennas are mostly directional antennas.
6.7.2.1 System Review
NTIA does not provide the LMSS earth station antenna radiation performance standards
for system review. However, these can be developed from the ITU-R Recommendations.
(a) Shipborne Directional Antenna
There is only one MMSS shipborne directional antenna reference radiation pattern in
Section 5.7.2.1. Therefore, NTIA recommends that this radiation pattern in Rec. ITU-R M.694-1
be used as the MMSS shipborne directional antenna radiation performance standard. This
standard is provided in Table 6-43.
Table 6-43. MMSS Shipborne Directional Antenna Radiation Performance Standard
Gain Function (dBi) Angular Range
Gmax - 2.5 10-3
(D/ 0 m
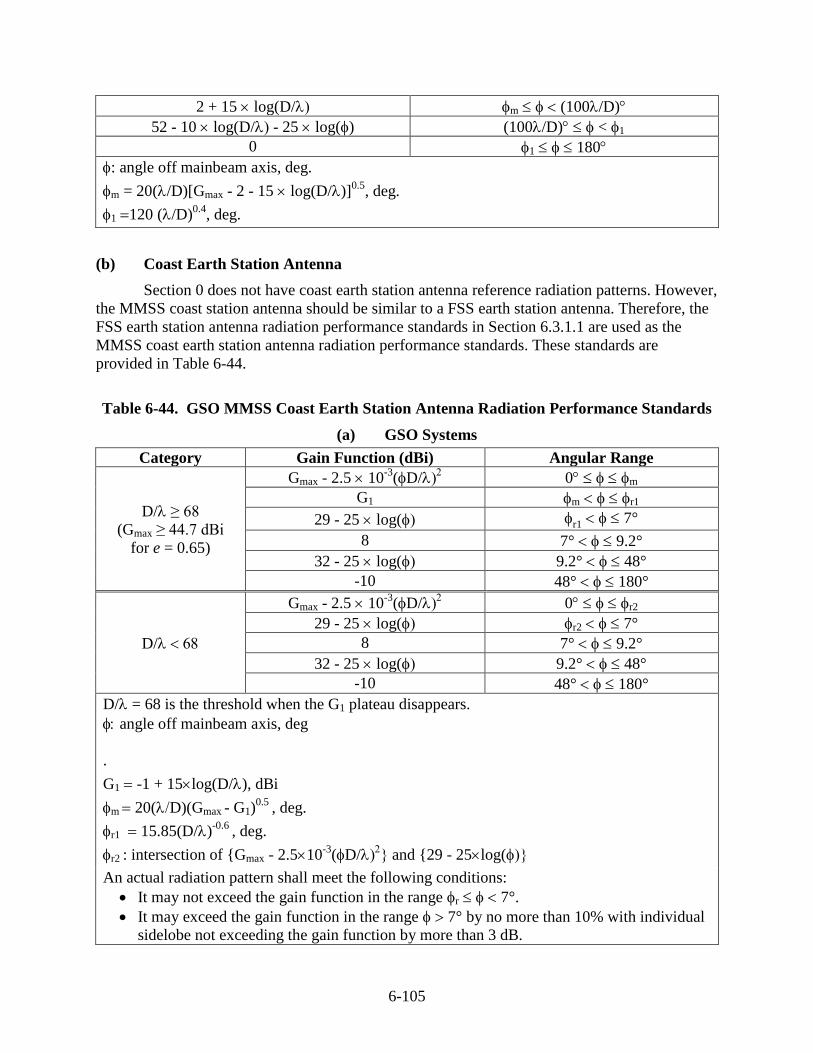
6-105
2 + 15 log(D/ m (100/D)
52 - 10 log(D/- 25 log() (100/D) < 1
0 1 180
: angle off mainbeam axis, deg.
m = 20(/D)[Gmax - 2 - 15 log(D/)]0.5
, deg.
1 120 (/D)0.4
, deg.
(b) Coast Earth Station Antenna
Section 0 does not have coast earth station antenna reference radiation patterns. However,
the MMSS coast station antenna should be similar to a FSS earth station antenna. Therefore, the
FSS earth station antenna radiation performance standards in Section 6.3.1.1 are used as the
MMSS coast earth station antenna radiation performance standards. These standards are
provided in Table 6-44.
Table 6-44. GSO MMSS Coast Earth Station Antenna Radiation Performance Standards
(a) GSO Systems
Category Gain Function (dBi) Angular Range
D/≥ 68
(Gmax ≥ 44.7 dBi
for e = 0.65)
Gmax - 2.5 10-3
(D/ 0 m
G1 m r1
29 - 25 log( r1 7°
8 7° 9.2°
32 - 25 log( 9.2° 48°
-10 48° 180°
D/
Gmax - 2.5 10-3
(D/ 0 r2
29 - 25 log( r2 7°
8 7° 9.2°
32 - 25 log( 9.2° 48°
-10 48° 180°
D/= 68 is the threshold when the G1 plateau disappears.
angle off mainbeam axis, deg
.
G1 -1 + 15log(D/), dBi
m 20(D)(Gmax - G1)0.5
, deg.
r1 15.85(D/)-0.6
, deg.
r2 : intersection of {Gmax - 2.510-3
(D/ and {29 - 25log(
An actual radiation pattern shall meet the following conditions:
It may not exceed the gain function in the range r 7°.
It may exceed the gain function in the range 7° by no more than 10% with individual
sidelobe not exceeding the gain function by more than 3 dB.
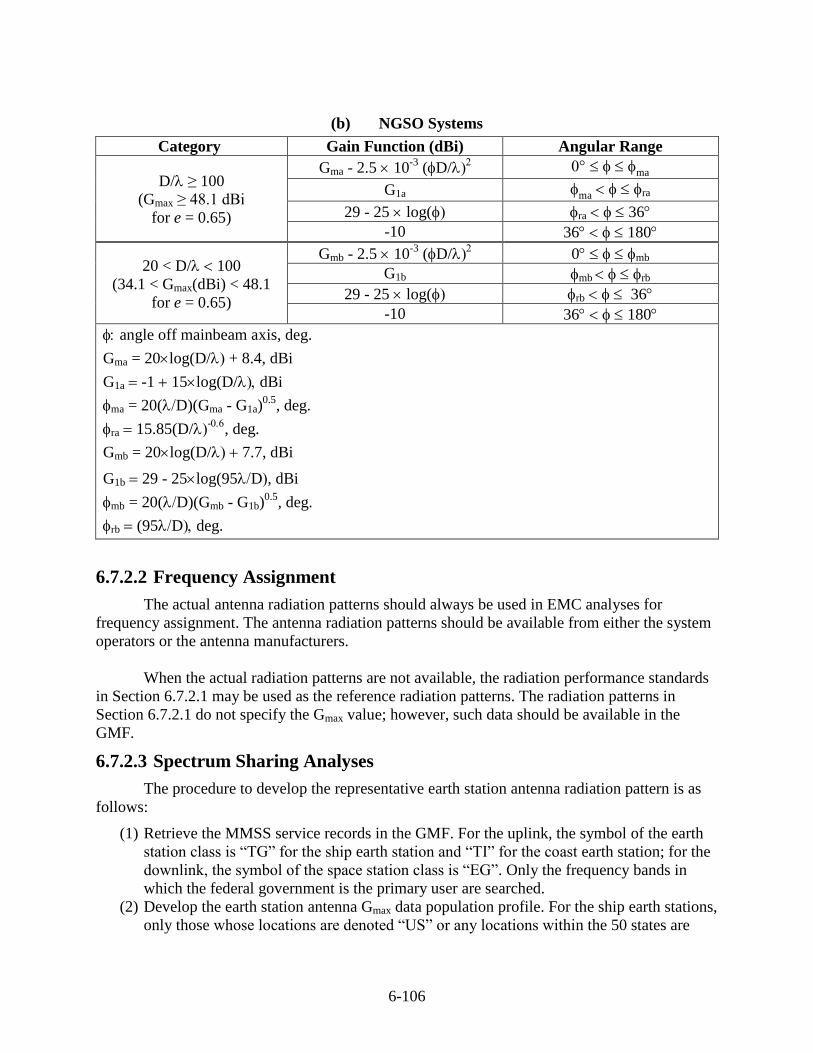
6-106
(b) NGSO Systems
Category Gain Function (dBi) Angular Range
D/ ≥ 100
(Gmax ≥ 48.1 dBi
for e = 0.65)
Gma - 2.5 10-3
(D/ ma
G1a ma ra
29 - 25 log( ra 36
-10 36 180
20 < D/ 100
(34.1 < Gmax(dBi) < 48.1
for e = 0.65)
Gmb - 2.5 10-3
(D/ 0 mb
G1b mb rb
29 - 25 log( rb 36
-10 36 180
angle off mainbeam axis, deg.
Gma = 20log(D/ + 8.4, dBi
G1a -1 15log(D/dBi
ma = 20(D)(Gma - G1a)0.5
, deg.
ra 15.85(D/-
, deg.
Gmb = 20log(D/ 7.7, dBi
G1b 29 - 25log(95D, dBi
mb = 20(D)(Gmb - G1b)0.5
, deg.
rb (95Ddeg.
6.7.2.2 Frequency Assignment
The actual antenna radiation patterns should always be used in EMC analyses for
frequency assignment. The antenna radiation patterns should be available from either the system
operators or the antenna manufacturers.
When the actual radiation patterns are not available, the radiation performance standards
in Section 6.7.2.1 may be used as the reference radiation patterns. The radiation patterns in
Section 6.7.2.1 do not specify the Gmax value; however, such data should be available in the
GMF.
6.7.2.3 Spectrum Sharing Analyses
The procedure to develop the representative earth station antenna radiation pattern is as
follows:
(1) Retrieve the MMSS service records in the GMF. For the uplink, the symbol of the earth
station class is “TG” for the ship earth station and “TI” for the coast earth station; for the
downlink, the symbol of the space station class is “EG”. Only the frequency bands in
which the federal government is the primary user are searched.
(2) Develop the earth station antenna Gmax data population profile. For the ship earth stations,
only those whose locations are denoted “US” or any locations within the 50 states are
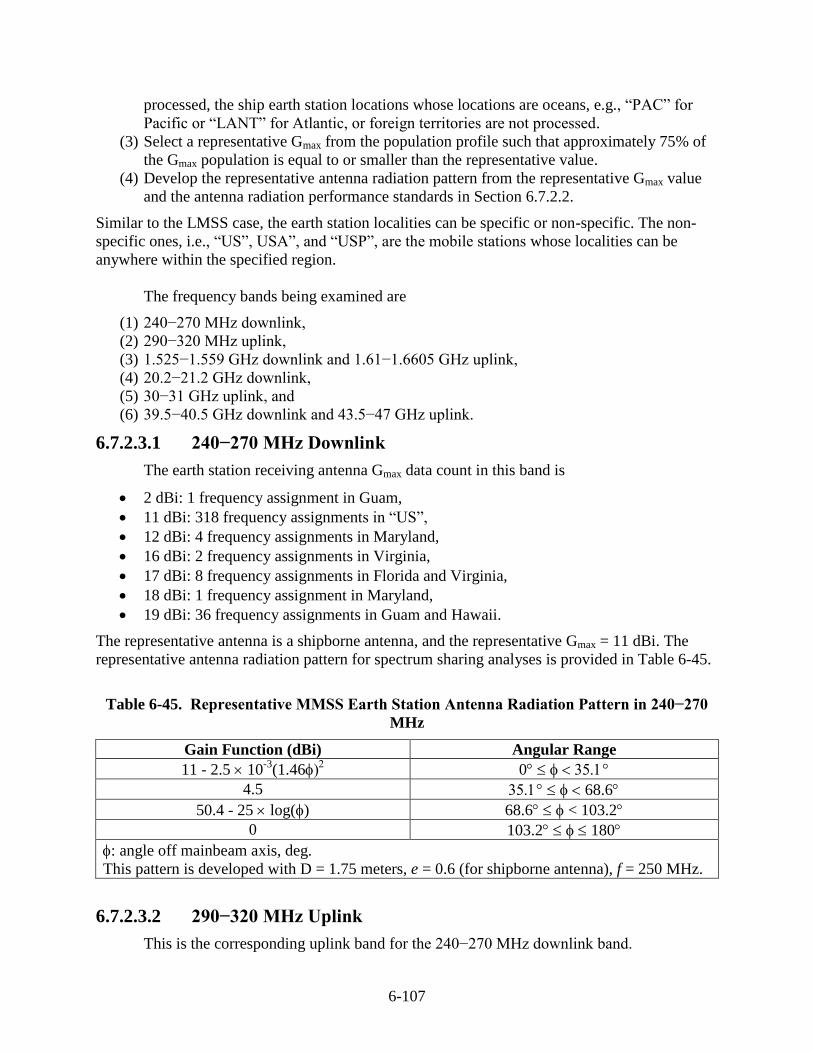
6-107
processed, the ship earth station locations whose locations are oceans, e.g., “PAC” for
Pacific or “LANT” for Atlantic, or foreign territories are not processed.
(3) Select a representative Gmax from the population profile such that approximately 75% of
the Gmax population is equal to or smaller than the representative value.
(4) Develop the representative antenna radiation pattern from the representative Gmax value
and the antenna radiation performance standards in Section 6.7.2.2.
Similar to the LMSS case, the earth station localities can be specific or non-specific. The non-
specific ones, i.e., “US”, USA”, and “USP”, are the mobile stations whose localities can be
anywhere within the specified region.
The frequency bands being examined are
(1) 240−270 MHz downlink,
(2) 290−320 MHz uplink,
(3) 1.525−1.559 GHz downlink and 1.61−1.6605 GHz uplink,
(4) 20.2−21.2 GHz downlink,
(5) 30−31 GHz uplink, and
(6) 39.5−40.5 GHz downlink and 43.5−47 GHz uplink.
6.7.2.3.1 240−270 MHz Downlink
The earth station receiving antenna Gmax data count in this band is
2 dBi: 1 frequency assignment in Guam,
11 dBi: 318 frequency assignments in “US”,
12 dBi: 4 frequency assignments in Maryland,
16 dBi: 2 frequency assignments in Virginia,
17 dBi: 8 frequency assignments in Florida and Virginia,
18 dBi: 1 frequency assignment in Maryland,
19 dBi: 36 frequency assignments in Guam and Hawaii.
The representative antenna is a shipborne antenna, and the representative Gmax = 11 dBi. The
representative antenna radiation pattern for spectrum sharing analyses is provided in Table 6-45.
Table 6-45. Representative MMSS Earth Station Antenna Radiation Pattern in 240−270
MHz
Gain Function (dBi) Angular Range
11 - 2.5 10-3
(1.46 0
4.5 68.6
50.4- 25 log() 68.6 < 103.2
0 103.2 180
: angle off mainbeam axis, deg.
This pattern is developed with D = 1.75 meters, e = 0.6 (for shipborne antenna), f = 250 MHz.
6.7.2.3.2 290−320 MHz Uplink
This is the corresponding uplink band for the 240−270 MHz downlink band.
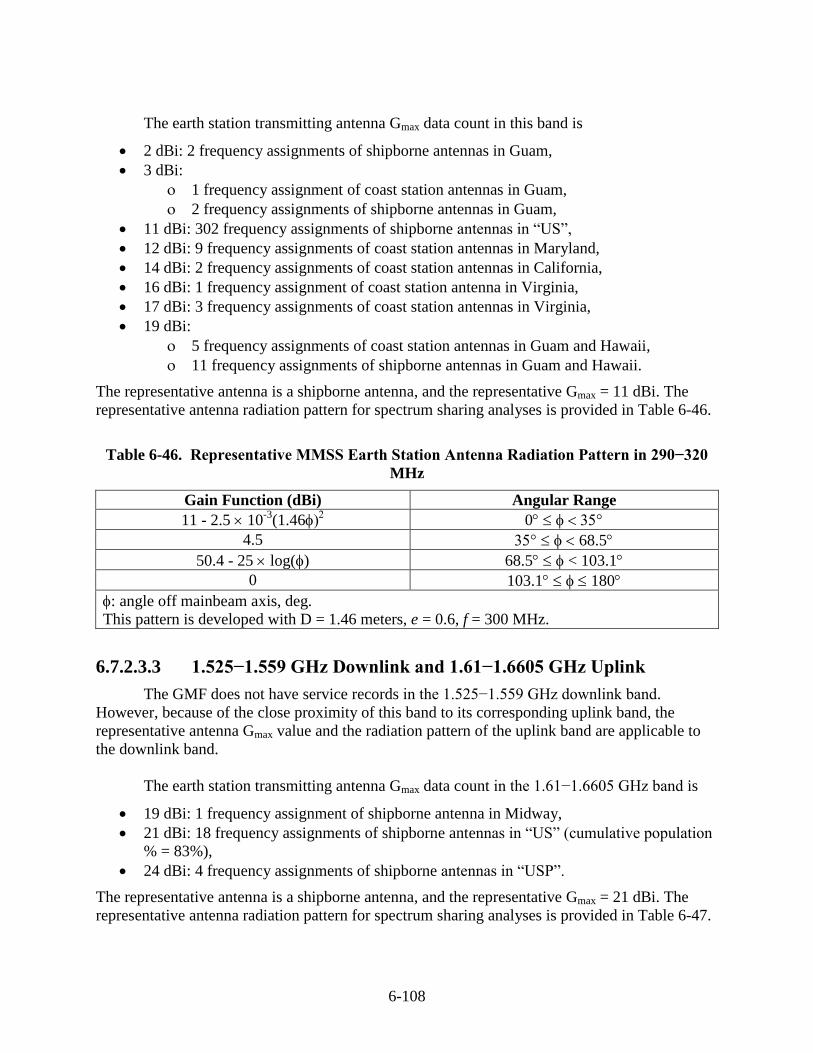
6-108
The earth station transmitting antenna Gmax data count in this band is
2 dBi: 2 frequency assignments of shipborne antennas in Guam,
3 dBi:
1 frequency assignment of coast station antennas in Guam,
2 frequency assignments of shipborne antennas in Guam,
11 dBi: 302 frequency assignments of shipborne antennas in “US”,
12 dBi: 9 frequency assignments of coast station antennas in Maryland,
14 dBi: 2 frequency assignments of coast station antennas in California,
16 dBi: 1 frequency assignment of coast station antenna in Virginia,
17 dBi: 3 frequency assignments of coast station antennas in Virginia,
19 dBi:
5 frequency assignments of coast station antennas in Guam and Hawaii,
11 frequency assignments of shipborne antennas in Guam and Hawaii.
The representative antenna is a shipborne antenna, and the representative Gmax = 11 dBi. The
representative antenna radiation pattern for spectrum sharing analyses is provided in Table 6-46.
Table 6-46. Representative MMSS Earth Station Antenna Radiation Pattern in 290−320
MHz
Gain Function (dBi) Angular Range
11 - 2.5 10-3
(1.46 0
4.5 68.5
50.4- 25 log() 68.5 < 103.1
0 103.1 180
: angle off mainbeam axis, deg.
This pattern is developed with D = 1.46 meters, e = 0.6, f = 300 MHz.
6.7.2.3.3 1.525−1.559 GHz Downlink and 1.61−1.6605 GHz Uplink
The GMF does not have service records in the 1.525−1.559 GHz downlink band.
However, because of the close proximity of this band to its corresponding uplink band, the
representative antenna Gmax value and the radiation pattern of the uplink band are applicable to
the downlink band.
The earth station transmitting antenna Gmax data count in the 1.61−1.6605 GHz band is
19 dBi: 1 frequency assignment of shipborne antenna in Midway,
21 dBi: 18 frequency assignments of shipborne antennas in “US” (cumulative population
% = 83%),
24 dBi: 4 frequency assignments of shipborne antennas in “USP”.
The representative antenna is a shipborne antenna, and the representative Gmax = 21 dBi. The
representative antenna radiation pattern for spectrum sharing analyses is provided in Table 6-47.
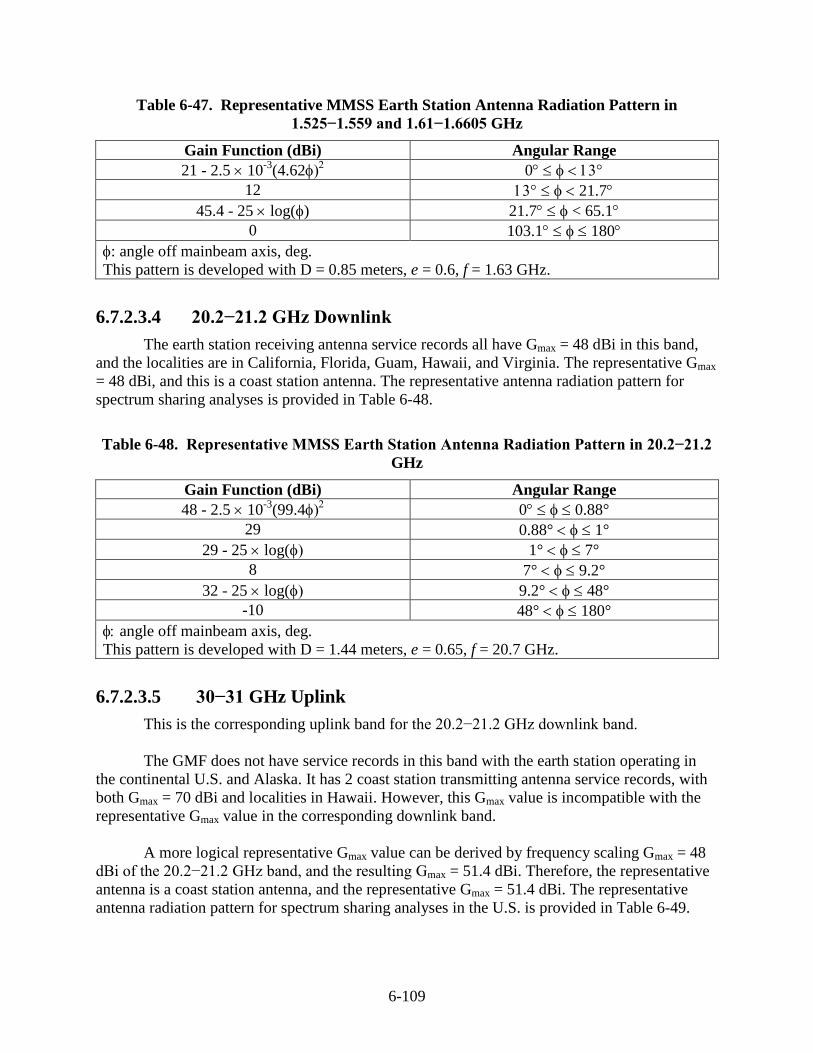
6-109
Table 6-47. Representative MMSS Earth Station Antenna Radiation Pattern in
1.525−1.559 and 1.61−1.6605 GHz
Gain Function (dBi) Angular Range
21 - 2.5 10-3
(4.62 0
12 21.7
45.4- 25 log() 21.7 < 65.1
0 103.1 180
: angle off mainbeam axis, deg.
This pattern is developed with D = 0.85 meters, e = 0.6, f = 1.63 GHz.
6.7.2.3.4 20.2−21.2 GHz Downlink
The earth station receiving antenna service records all have Gmax = 48 dBi in this band,
and the localities are in California, Florida, Guam, Hawaii, and Virginia. The representative Gmax
= 48 dBi, and this is a coast station antenna. The representative antenna radiation pattern for
spectrum sharing analyses is provided in Table 6-48.
Table 6-48. Representative MMSS Earth Station Antenna Radiation Pattern in 20.2−21.2
GHz
Gain Function (dBi) Angular Range
48 - 2.5 10-3
(99.4 0 0.88°
29 0.88° 1°
29 - 25 log( 1° 7°
8 7° 9.2°
32 - 25 log( 9.2° 48°
-10 48° 180°
angle off mainbeam axis, deg.
This pattern is developed with D = 1.44 meters, e = 0.65, f = 20.7 GHz.
6.7.2.3.5 30−31 GHz Uplink
This is the corresponding uplink band for the 20.2−21.2 GHz downlink band.
The GMF does not have service records in this band with the earth station operating in
the continental U.S. and Alaska. It has 2 coast station transmitting antenna service records, with
both Gmax = 70 dBi and localities in Hawaii. However, this Gmax value is incompatible with the
representative Gmax value in the corresponding downlink band.
A more logical representative Gmax value can be derived by frequency scaling Gmax = 48
dBi of the 20.2−21.2 GHz band, and the resulting Gmax = 51.4 dBi. Therefore, the representative
antenna is a coast station antenna, and the representative Gmax = 51.4 dBi. The representative
antenna radiation pattern for spectrum sharing analyses in the U.S. is provided in Table 6-49.
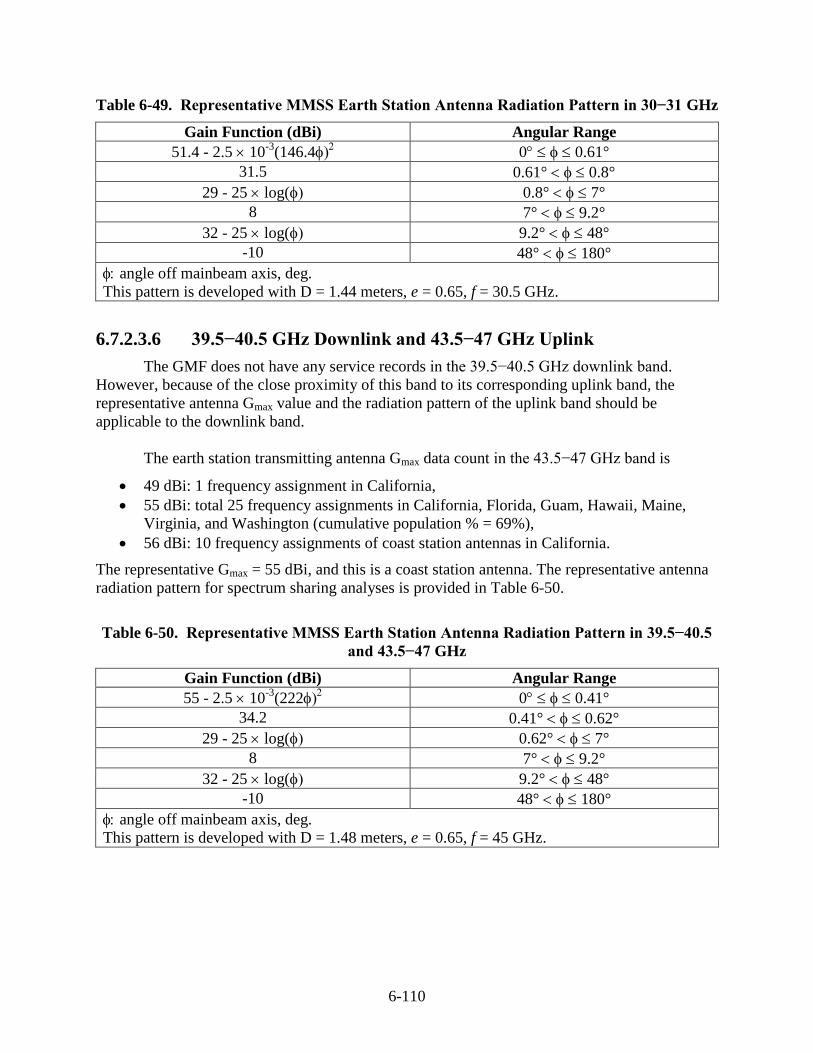
6-110
Table 6-49. Representative MMSS Earth Station Antenna Radiation Pattern in 30−31 GHz
Gain Function (dBi) Angular Range
51.4 - 2.5 10-3
(146.4 0 0.61°
31.5 0.61° 0.8°
29 - 25 log( 0.8° 7°
8 7° 9.2°
32 - 25 log( 9.2° 48°
-10 48° 180°
angle off mainbeam axis, deg.
This pattern is developed with D = 1.44 meters, e = 0.65, f = 30.5 GHz.
6.7.2.3.6 39.5−40.5 GHz Downlink and 43.5−47 GHz Uplink
The GMF does not have any service records in the 39.5−40.5 GHz downlink band.
However, because of the close proximity of this band to its corresponding uplink band, the
representative antenna Gmax value and the radiation pattern of the uplink band should be
applicable to the downlink band.
The earth station transmitting antenna Gmax data count in the 43.5−47 GHz band is
49 dBi: 1 frequency assignment in California,
55 dBi: total 25 frequency assignments in California, Florida, Guam, Hawaii, Maine,
Virginia, and Washington (cumulative population % = 69%),
56 dBi: 10 frequency assignments of coast station antennas in California.
The representative Gmax = 55 dBi, and this is a coast station antenna. The representative antenna
radiation pattern for spectrum sharing analyses is provided in Table 6-50.
Table 6-50. Representative MMSS Earth Station Antenna Radiation Pattern in 39.5−40.5
and 43.5−47 GHz
Gain Function (dBi) Angular Range
55 - 2.5 10-3
(222 0 0.41°
34.2 0.41° 0.62°
29 - 25 log( 0.62° 7°
8 7° 9.2°
32 - 25 log( 9.2° 48°
-10 48° 180°
angle off mainbeam axis, deg.
This pattern is developed with D = 1.48 meters, e = 0.65, f = 45 GHz.
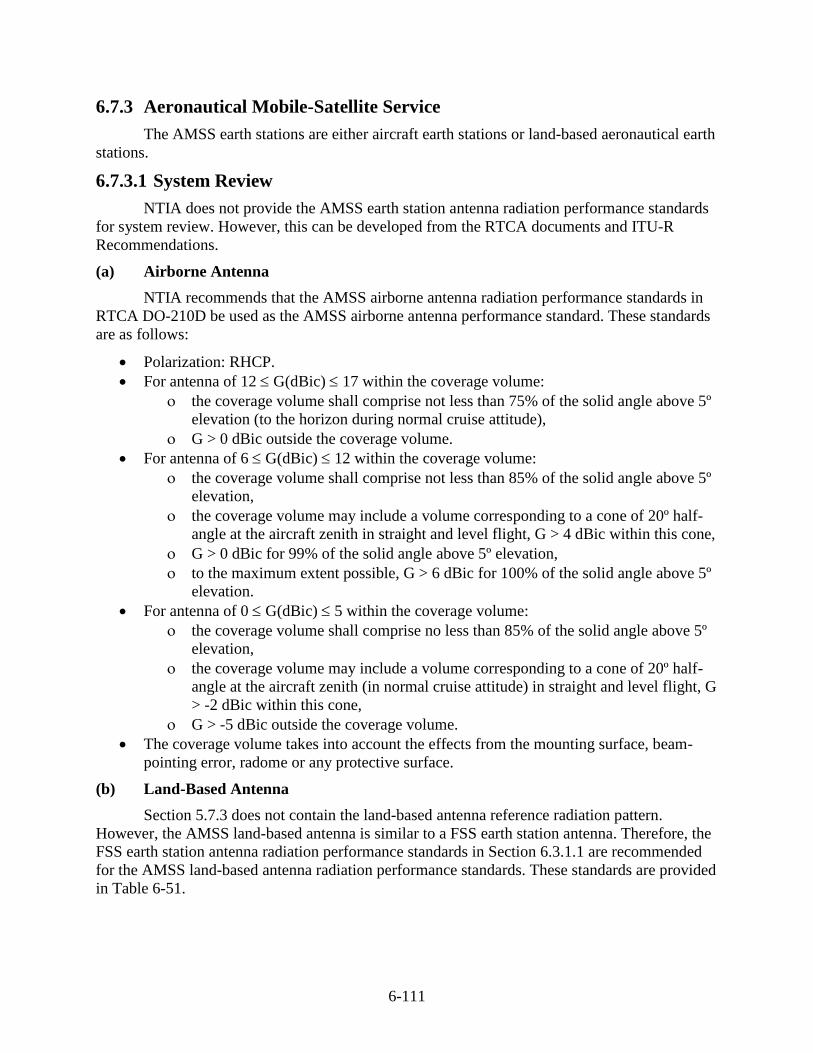
6-111
6.7.3 Aeronautical Mobile-Satellite Service
The AMSS earth stations are either aircraft earth stations or land-based aeronautical earth
stations.
6.7.3.1 System Review
NTIA does not provide the AMSS earth station antenna radiation performance standards
for system review. However, this can be developed from the RTCA documents and ITU-R
Recommendations.
(a) Airborne Antenna
NTIA recommends that the AMSS airborne antenna radiation performance standards in
RTCA DO-210D be used as the AMSS airborne antenna performance standard. These standards
are as follows:
Polarization: RHCP.
For antenna of 12 G(dBic) 17 within the coverage volume:
the coverage volume shall comprise not less than 75% of the solid angle above 5º
elevation (to the horizon during normal cruise attitude),
G > 0 dBic outside the coverage volume.
For antenna of 6 G(dBic) 12 within the coverage volume:
the coverage volume shall comprise not less than 85% of the solid angle above 5º
elevation,
the coverage volume may include a volume corresponding to a cone of 20º half-
angle at the aircraft zenith in straight and level flight, G > 4 dBic within this cone,
G > 0 dBic for 99% of the solid angle above 5º elevation,
to the maximum extent possible, G > 6 dBic for 100% of the solid angle above 5º
elevation.
For antenna of 0 G(dBic) 5 within the coverage volume:
the coverage volume shall comprise no less than 85% of the solid angle above 5º
elevation,
the coverage volume may include a volume corresponding to a cone of 20º half-
angle at the aircraft zenith (in normal cruise attitude) in straight and level flight, G
> -2 dBic within this cone,
G > -5 dBic outside the coverage volume.
The coverage volume takes into account the effects from the mounting surface, beam-
pointing error, radome or any protective surface.
(b) Land-Based Antenna
Section 5.7.3 does not contain the land-based antenna reference radiation pattern.
However, the AMSS land-based antenna is similar to a FSS earth station antenna. Therefore, the
FSS earth station antenna radiation performance standards in Section 6.3.1.1 are recommended
for the AMSS land-based antenna radiation performance standards. These standards are provided
in Table 6-51.
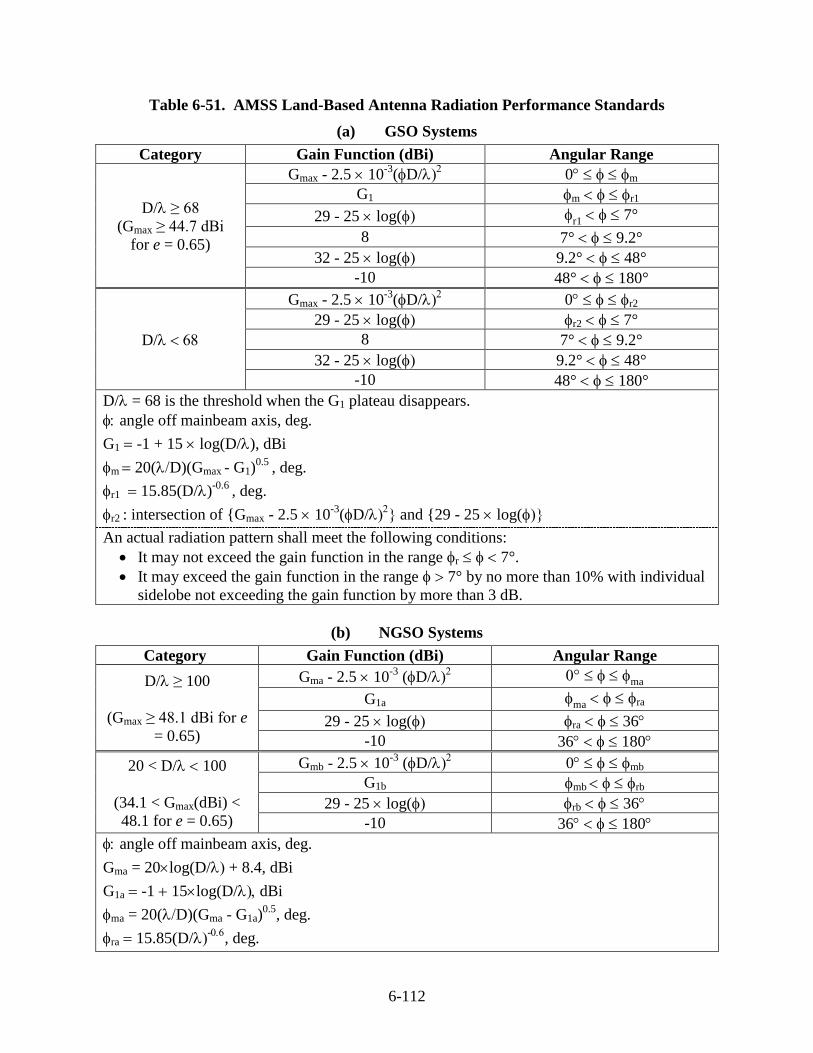
6-112
Table 6-51. AMSS Land-Based Antenna Radiation Performance Standards
(a) GSO Systems
Category Gain Function (dBi) Angular Range
D/≥ 68
(Gmax ≥ 44.7 dBi
for e = 0.65)
Gmax - 2.5 10-3
(D/ 0 m
G1 m r1
29 - 25 log( r1 7°
8 7° 9.2°
32 - 25 log( 9.2° 48°
-10 48° 180°
D/
Gmax - 2.5 10-3
(D/ 0 r2
29 - 25 log( r2 7°
8 7° 9.2°
32 - 25 log( 9.2° 48°
-10 48° 180°
D/= 68 is the threshold when the G1 plateau disappears.
angle off mainbeam axis, deg.
G1 -1 + 15 log(D/), dBi
m 20(D)(Gmax - G1)0.5
, deg.
r1 15.85(D/)-0.6
, deg.
r2 : intersection of {Gmax - 2.5 10-3
(D/ and {29 - 25 log(
An actual radiation pattern shall meet the following conditions:
It may not exceed the gain function in the range r 7°.
It may exceed the gain function in the range 7° by no more than 10% with individual
sidelobe not exceeding the gain function by more than 3 dB.
(b) NGSO Systems
Category Gain Function (dBi) Angular Range
D/ ≥ 100
(Gmax ≥ 48.1 dBi for e
= 0.65)
Gma - 2.5 10-3
(D/ ma
G1a ma ra
29 - 25 log( ra 36
-10 36 180
20 < D/ 100
(34.1 < Gmax(dBi) <
48.1 for e = 0.65)
Gmb - 2.5 10-3
(D/ 0 mb
G1b mb rb
29 - 25 log( rb 36
-10 36 180
angle off mainbeam axis, deg.
Gma = 20log(D/ + 8.4, dBi
G1a -1 15log(D/dBi
ma = 20(D)(Gma - G1a)0.5
, deg.
ra 15.85(D/-
, deg.
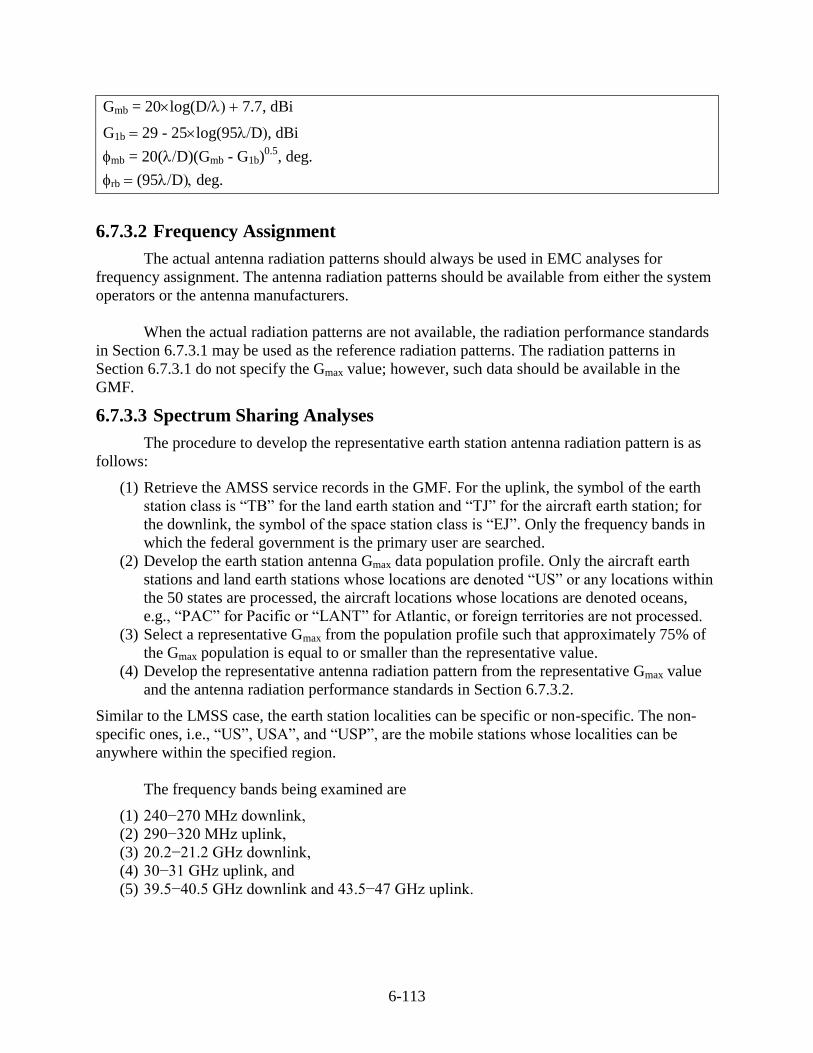
6-113
Gmb = 20log(D/ 7.7, dBi
G1b 29 - 25log(95D, dBi
mb = 20(D)(Gmb - G1b)0.5
, deg.
rb (95Ddeg.
6.7.3.2 Frequency Assignment
The actual antenna radiation patterns should always be used in EMC analyses for
frequency assignment. The antenna radiation patterns should be available from either the system
operators or the antenna manufacturers.
When the actual radiation patterns are not available, the radiation performance standards
in Section 6.7.3.1 may be used as the reference radiation patterns. The radiation patterns in
Section 6.7.3.1 do not specify the Gmax value; however, such data should be available in the
GMF.
6.7.3.3 Spectrum Sharing Analyses
The procedure to develop the representative earth station antenna radiation pattern is as
follows:
(1) Retrieve the AMSS service records in the GMF. For the uplink, the symbol of the earth
station class is “TB” for the land earth station and “TJ” for the aircraft earth station; for
the downlink, the symbol of the space station class is “EJ”. Only the frequency bands in
which the federal government is the primary user are searched.
(2) Develop the earth station antenna Gmax data population profile. Only the aircraft earth
stations and land earth stations whose locations are denoted “US” or any locations within
the 50 states are processed, the aircraft locations whose locations are denoted oceans,
e.g., “PAC” for Pacific or “LANT” for Atlantic, or foreign territories are not processed.
(3) Select a representative Gmax from the population profile such that approximately 75% of
the Gmax population is equal to or smaller than the representative value.
(4) Develop the representative antenna radiation pattern from the representative Gmax value
and the antenna radiation performance standards in Section 6.7.3.2.
Similar to the LMSS case, the earth station localities can be specific or non-specific. The non-
specific ones, i.e., “US”, USA”, and “USP”, are the mobile stations whose localities can be
anywhere within the specified region.
The frequency bands being examined are
(1) 240−270 MHz downlink,
(2) 290−320 MHz uplink,
(3) 20.2−21.2 GHz downlink,
(4) 30−31 GHz uplink, and
(5) 39.5−40.5 GHz downlink and 43.5−47 GHz uplink.
6-114
6.7.3.3.1 240−270 MHz Downlink
The earth station receiving antenna Gmax data count in this band is
2 dBi: 1 frequency assignment in Guam,
11 dBi: 321 frequency assignments in “USP”,
12 dBi: 1 frequency assignment in Nebraska,
14 dBi: 1 frequency assignment in Hawaii,
16 dBi: 3 frequency assignments in Texas and Virginia,
17 dBi: 8 frequency assignments in Florida and Virginia,
19 dBi: 36 frequency assignments in Guam and Hawaii.
The representative Gmax = 11 dBi, and this is an airborne antenna. The representative antenna
radiation characteristics for spectrum sharing analyses are as follows:
Polarization: RHCP.
The coverage volume shall comprise not less than 85% of the solid angle above 5º
elevation.
6 G(dBic) 11 within the coverage volume.
The coverage volume may include a volume corresponding to a cone of 20º half-angle at
the aircraft zenith in straight and level flight, G > 4 dBic within this cone.
G > 0 dBic for 99% of the solid angle above 5º elevation.
To the maximum extent possible, G > 6 dBic for 100% of the solid angle above 5º
elevation.
The coverage volume takes into account the effects from the mounting surface, beam-
pointing error, radome or any protective surface.
6.7.3.3.2 290−320 MHz Uplink
This is the corresponding uplink for the 240−270 MHz downlink band.
The earth station transmitting antenna Gmax data count in this band is
2 dBi: 2 frequency assignments of airborne antennas in Guam,
3 dBi: 2 frequency assignments of airborne antennas in Guam, 1 frequency assignment of
land-based antennas in Guam,
11 dBi: 2 frequency assignments of land-based antennas in “USA”, 306 frequency
assignments of airborne antennas in “USP”,
12 dBi: 2 frequency assignments of land-based antenna in Nebraska and Texas,
16 dBi: 1 frequency assignment of land-based antenna in Texas, 1 frequency assignment
of airborne antenna in Virginia,
17 dBi: 3 frequency assignments of land-based antennas in Virginia,
20 dBi: 1 frequency assignment of land-based antenna in Wyoming,
14 dBi: 1 frequency assignment of airborne antenna in Hawaii, and
19 dBi: 11 frequency assignments of airborne antennas in Guam and Hawaii, 4 frequency
assignments of land-based antennas in Guam and Hawaii.
The representative Gmax = 11 dBi, and this is an airborne antenna. The representative antenna
radiation characteristics for spectrum sharing analyses are as follows:
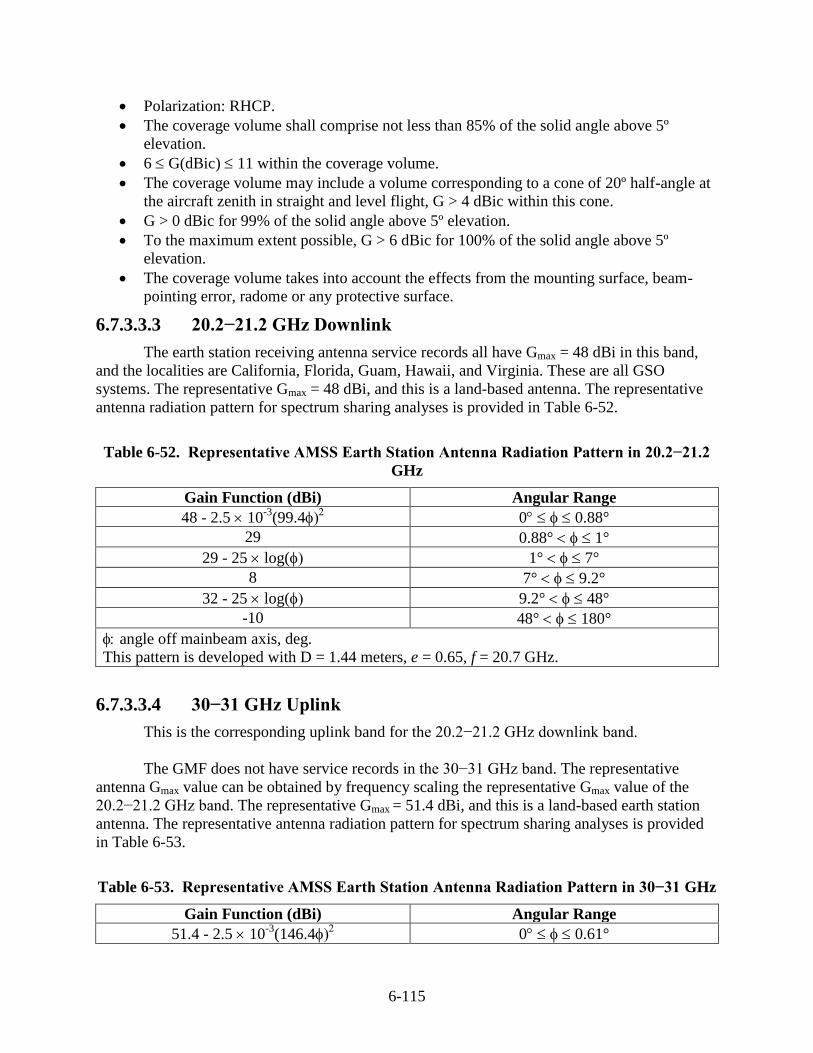
6-115
Polarization: RHCP.
The coverage volume shall comprise not less than 85% of the solid angle above 5º
elevation.
6 G(dBic) 11 within the coverage volume.
The coverage volume may include a volume corresponding to a cone of 20º half-angle at
the aircraft zenith in straight and level flight, G > 4 dBic within this cone.
G > 0 dBic for 99% of the solid angle above 5º elevation.
To the maximum extent possible, G > 6 dBic for 100% of the solid angle above 5º
elevation.
The coverage volume takes into account the effects from the mounting surface, beam-
pointing error, radome or any protective surface.
6.7.3.3.3 20.2−21.2 GHz Downlink
The earth station receiving antenna service records all have Gmax = 48 dBi in this band,
and the localities are California, Florida, Guam, Hawaii, and Virginia. These are all GSO
systems. The representative Gmax = 48 dBi, and this is a land-based antenna. The representative
antenna radiation pattern for spectrum sharing analyses is provided in Table 6-52.
Table 6-52. Representative AMSS Earth Station Antenna Radiation Pattern in 20.2−21.2
GHz
Gain Function (dBi) Angular Range
48 - 2.5 10-3
(99.4 0 0.88°
29 0.88° 1°
29 - 25 log( 1° 7°
8 7° 9.2°
32 - 25 log( 9.2° 48°
-10 48° 180°
angle off mainbeam axis, deg.
This pattern is developed with D = 1.44 meters, e = 0.65, f = 20.7 GHz.
6.7.3.3.4 30−31 GHz Uplink
This is the corresponding uplink band for the 20.2−21.2 GHz downlink band.
The GMF does not have service records in the 30−31 GHz band. The representative
antenna Gmax value can be obtained by frequency scaling the representative Gmax value of the
20.2−21.2 GHz band. The representative Gmax = 51.4 dBi, and this is a land-based earth station
antenna. The representative antenna radiation pattern for spectrum sharing analyses is provided
in Table 6-53.
Table 6-53. Representative AMSS Earth Station Antenna Radiation Pattern in 30−31 GHz
Gain Function (dBi) Angular Range
51.4 - 2.5 10-3
(146.4 0 0.61°
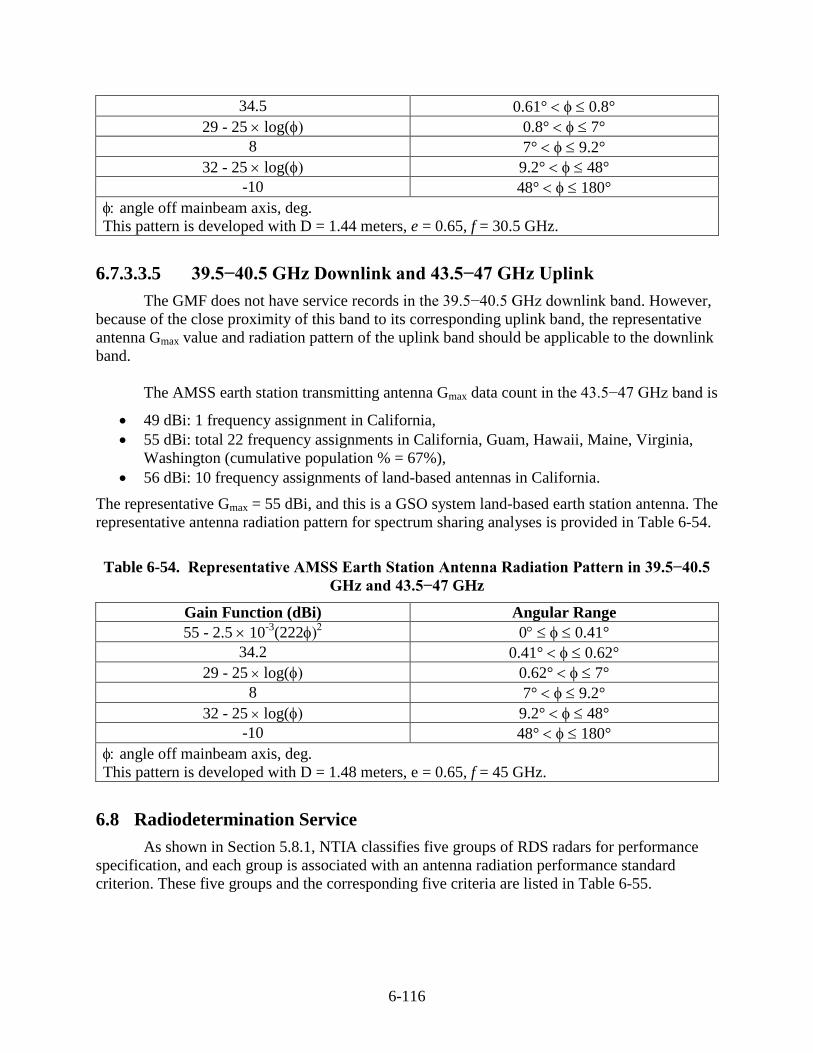
6-116
34.5 0.61° 0.8°
29 - 25 log( 0.8° 7°
8 7° 9.2°
32 - 25 log( 9.2° 48°
-10 48° 180°
angle off mainbeam axis, deg.
This pattern is developed with D = 1.44 meters, e = 0.65, f = 30.5 GHz.
6.7.3.3.5 39.5−40.5 GHz Downlink and 43.5−47 GHz Uplink
The GMF does not have service records in the 39.5−40.5 GHz downlink band. However,
because of the close proximity of this band to its corresponding uplink band, the representative
antenna Gmax value and radiation pattern of the uplink band should be applicable to the downlink
band.
The AMSS earth station transmitting antenna Gmax data count in the 43.5−47 GHz band is
49 dBi: 1 frequency assignment in California,
55 dBi: total 22 frequency assignments in California, Guam, Hawaii, Maine, Virginia,
Washington (cumulative population % = 67%),
56 dBi: 10 frequency assignments of land-based antennas in California.
The representative Gmax = 55 dBi, and this is a GSO system land-based earth station antenna. The
representative antenna radiation pattern for spectrum sharing analyses is provided in Table 6-54.
Table 6-54. Representative AMSS Earth Station Antenna Radiation Pattern in 39.5−40.5
GHz and 43.5−47 GHz
Gain Function (dBi) Angular Range
55 - 2.5 10-3
(222 0 0.41°
34.2 0.41° 0.62°
29 - 25 log( 0.62° 7°
8 7° 9.2°
32 - 25 log( 9.2° 48°
-10 48° 180°
angle off mainbeam axis, deg.
This pattern is developed with D = 1.48 meters, e = 0.65, f = 45 GHz.
6.8 Radiodetermination Service
As shown in Section 5.8.1, NTIA classifies five groups of RDS radars for performance
specification, and each group is associated with an antenna radiation performance standard
criterion. These five groups and the corresponding five criteria are listed in Table 6-55.
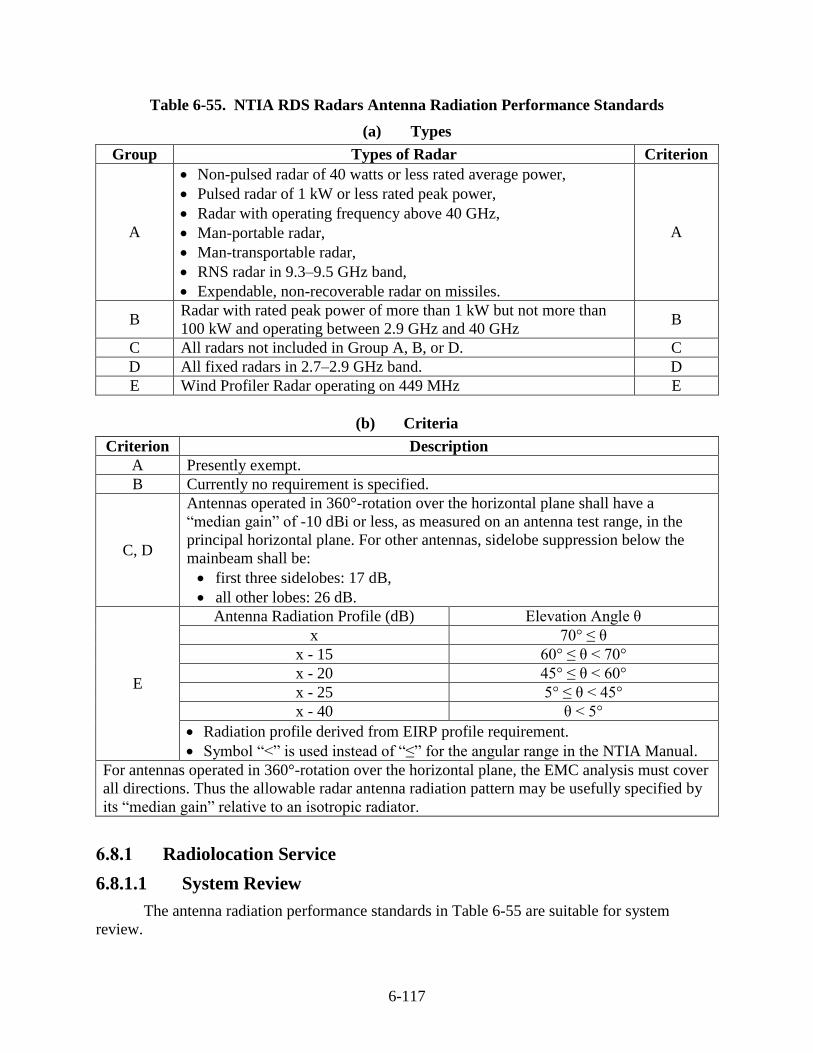
6-117
Table 6-55. NTIA RDS Radars Antenna Radiation Performance Standards
(a) Types
Group Types of Radar Criterion
A
Non-pulsed radar of 40 watts or less rated average power,
Pulsed radar of 1 kW or less rated peak power,
Radar with operating frequency above 40 GHz,
Man-portable radar,
Man-transportable radar,
RNS radar in 9.3–9.5 GHz band,
Expendable, non-recoverable radar on missiles.
A
B Radar with rated peak power of more than 1 kW but not more than
100 kW and operating between 2.9 GHz and 40 GHz B
C All radars not included in Group A, B, or D. C
D All fixed radars in 2.7–2.9 GHz band. D
E Wind Profiler Radar operating on 449 MHz E
(b) Criteria
Criterion Description
A Presently exempt.
B Currently no requirement is specified.
C, D
Antennas operated in 360°-rotation over the horizontal plane shall have a
“median gain” of -10 dBi or less, as measured on an antenna test range, in the
principal horizontal plane. For other antennas, sidelobe suppression below the
mainbeam shall be:
first three sidelobes: 17 dB,
all other lobes: 26 dB.
E
Antenna Radiation Profile (dB) Elevation Angle θ
x 70° ≤ θ
x - 15 60° ≤ θ < 70°
x - 20 45° ≤ θ < 60°
x - 25 5° ≤ θ < 45°
x - 40 θ < 5°
Radiation profile derived from EIRP profile requirement.
Symbol “<” is used instead of “≤” for the angular range in the NTIA Manual.
For antennas operated in 360°-rotation over the horizontal plane, the EMC analysis must cover
all directions. Thus the allowable radar antenna radiation pattern may be usefully specified by
its “median gain” relative to an isotropic radiator.
6.8.1 Radiolocation Service
6.8.1.1 System Review
The antenna radiation performance standards in Table 6-55 are suitable for system
review.
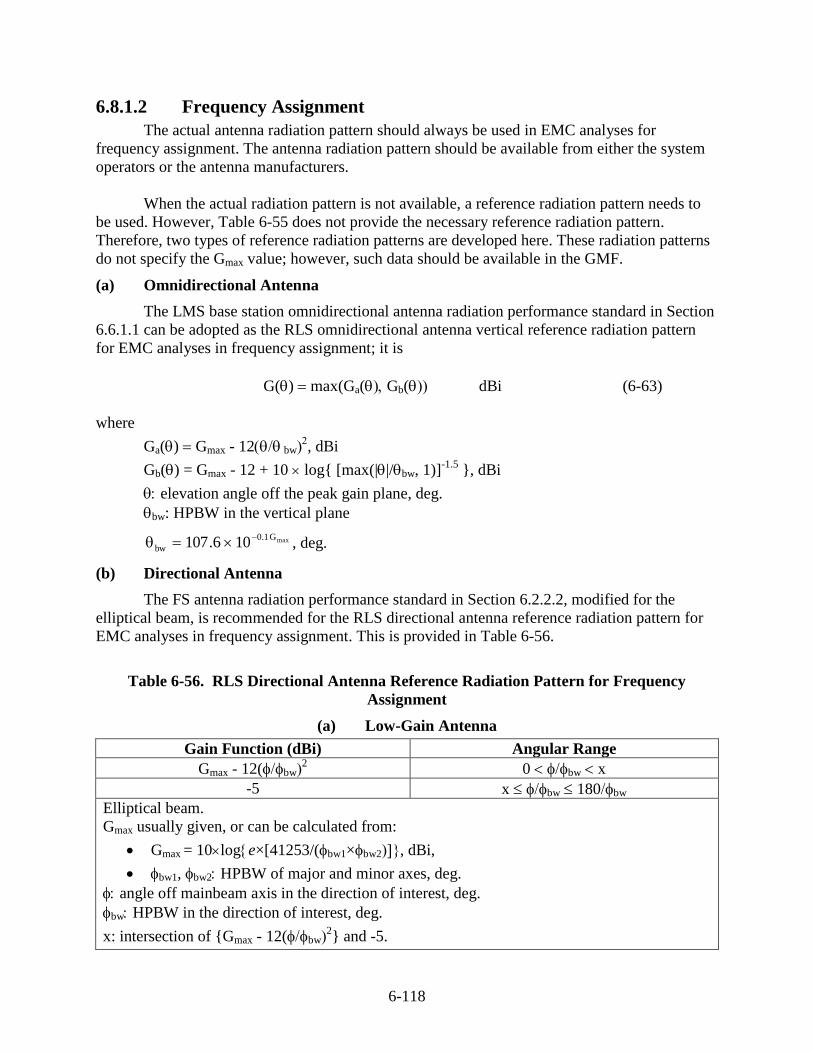
6-118
6.8.1.2 Frequency Assignment
The actual antenna radiation pattern should always be used in EMC analyses for
frequency assignment. The antenna radiation pattern should be available from either the system
operators or the antenna manufacturers.
When the actual radiation pattern is not available, a reference radiation pattern needs to
be used. However, Table 6-55 does not provide the necessary reference radiation pattern.
Therefore, two types of reference radiation patterns are developed here. These radiation patterns
do not specify the Gmax value; however, such data should be available in the GMF.
(a) Omnidirectional Antenna
The LMS base station omnidirectional antenna radiation performance standard in Section
6.6.1.1 can be adopted as the RLS omnidirectional antenna vertical reference radiation pattern
for EMC analyses in frequency assignment; it is
G() max(Ga(Gb( dBi (6-63)
where
Ga() Gmax - 12 bw, dBi
Gb() = Gmax - 12 + 10 log{ [max(||/bw, 1)]-1.5
}, dBi
elevation angle off the peak gain plane, deg.
bw: HPBW in the vertical plane
maxG1.0
bw 106.107
, deg.
(b) Directional Antenna
The FS antenna radiation performance standard in Section 6.2.2.2, modified for the
elliptical beam, is recommended for the RLS directional antenna reference radiation pattern for
EMC analyses in frequency assignment. This is provided in Table 6-56.
Table 6-56. RLS Directional Antenna Reference Radiation Pattern for Frequency
Assignment
(a) Low-Gain Antenna
Gain Function (dBi) Angular Range
Gmax - 12(bw2 0 bw x
-5 x bw 180bw
Elliptical beam.
Gmax usually given, or can be calculated from:
Gmax = 10loge×[41253/(bw1×bw2, dBi,
bw1, bw2 HPBW of major and minor axes, deg.
angle off mainbeam axis in the direction of interest, deg.
bw HPBW in the direction of interest, deg.
x: intersection of {Gmax - 12(bw2} and -5.
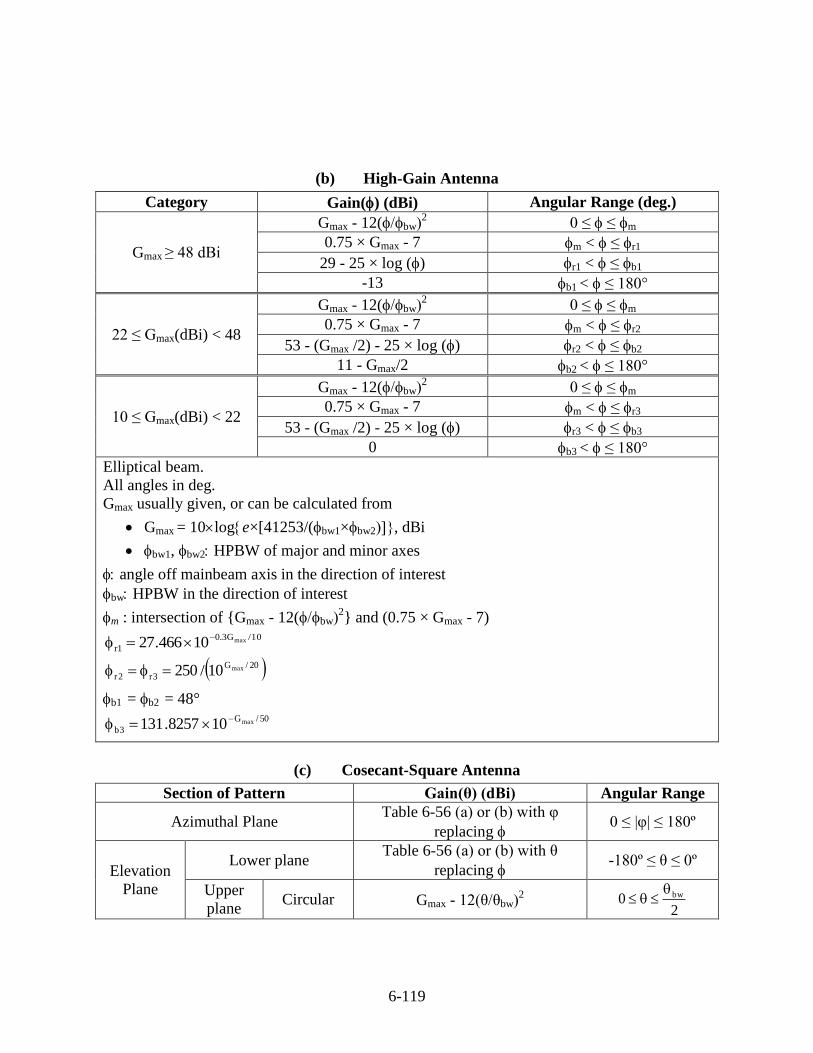
6-119
(b) High-Gain Antenna
Category Gain() (dBi) Angular Range (deg.)
Gmax ≥ 48 dBi
Gmax - 12(bw2 0 ≤ ≤ m
0.75 × Gmax - 7 m < ≤ r1
29 - 25 × log () r1 < ≤ b1
-13 b1 < ≤ 180°
22 ≤ Gmax(dBi) < 48
Gmax - 12(bw2 0 ≤ ≤ m
0.75 × Gmax - 7 m < ≤ r2
53 - (Gmax /2) - 25 × log () r2 < ≤ b2
11 - Gmax/2 b2 < ≤ 180°
10 ≤ Gmax(dBi) < 22
Gmax - 12(bw2 0 ≤ ≤ m
0.75 × Gmax - 7 m < ≤ r3
53 - (Gmax /2) - 25 × log () r3 < ≤ b3
0 b3 < ≤ 180°
Elliptical beam.
All angles in deg.
Gmax usually given, or can be calculated from
Gmax = 10loge×[41253/(bw1×bw2, dBi
bw1, bw2 HPBW of major and minor axes
angle off mainbeam axis in the direction of interest
bw HPBW in the direction of interest
m : intersection of {Gmax - 12(bw2} and (0.75 × Gmax - 7)
10/G3.0
1rmax10466.27
20/G
3r2rmax10/250
b1 = b2 = 48° 50/G
3bmax108257.131
(c) Cosecant-Square Antenna
Section of Pattern Gain(θ) (dBi) Angular Range
Azimuthal Plane Table 6-56 (a) or (b) with φ
replacing 0 ≤ |φ| ≤ 180º
Elevation
Plane
Lower plane Table 6-56 (a) or (b) with θ
replacing -180º ≤ θ ≤ 0º
Upper
plane Circular Gmax - 12(θθbw
2
20 bw
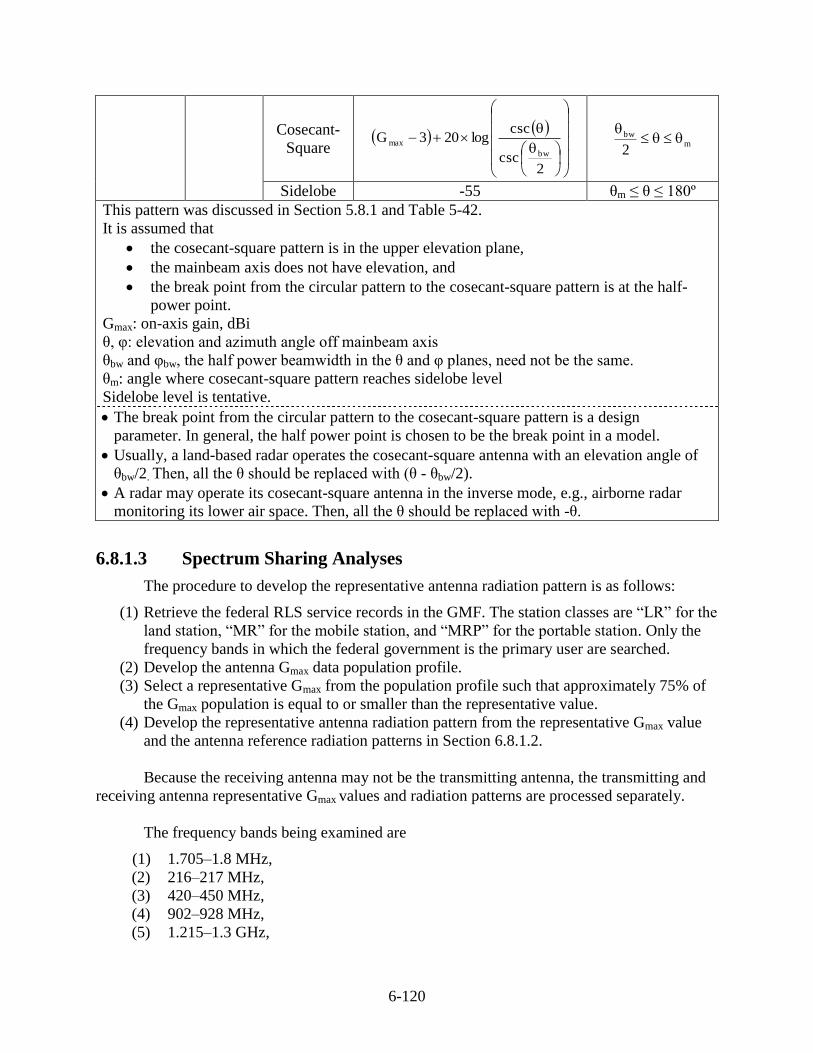
6-120
Cosecant-
Square
2csc
csclog203G
bw
max
mbw
2
Sidelobe -55 θm ≤ θ ≤ 180º
This pattern was discussed in Section 5.8.1 and Table 5-42.
It is assumed that
the cosecant-square pattern is in the upper elevation plane,
the mainbeam axis does not have elevation, and
the break point from the circular pattern to the cosecant-square pattern is at the half-
power point.
Gmax: on-axis gain, dBi
θ, φ: elevation and azimuth angle off mainbeam axis
θbw and φbw, the half power beamwidth in the θ and φ planes, need not be the same.
θm: angle where cosecant-square pattern reaches sidelobe level
Sidelobe level is tentative.
The break point from the circular pattern to the cosecant-square pattern is a design
parameter. In general, the half power point is chosen to be the break point in a model.
Usually, a land-based radar operates the cosecant-square antenna with an elevation angle of
θbw/2. Then, all the θ should be replaced with (θ - θbw/2).
A radar may operate its cosecant-square antenna in the inverse mode, e.g., airborne radar
monitoring its lower air space. Then, all the θ should be replaced with -θ.
6.8.1.3 Spectrum Sharing Analyses
The procedure to develop the representative antenna radiation pattern is as follows:
(1) Retrieve the federal RLS service records in the GMF. The station classes are “LR” for the
land station, “MR” for the mobile station, and “MRP” for the portable station. Only the
frequency bands in which the federal government is the primary user are searched.
(2) Develop the antenna Gmax data population profile.
(3) Select a representative Gmax from the population profile such that approximately 75% of
the Gmax population is equal to or smaller than the representative value.
(4) Develop the representative antenna radiation pattern from the representative Gmax value
and the antenna reference radiation patterns in Section 6.8.1.2.
Because the receiving antenna may not be the transmitting antenna, the transmitting and
receiving antenna representative Gmax values and radiation patterns are processed separately.
The frequency bands being examined are
(1) 1.705–1.8 MHz,
(2) 216–217 MHz,
(3) 420–450 MHz,
(4) 902–928 MHz,
(5) 1.215–1.3 GHz,
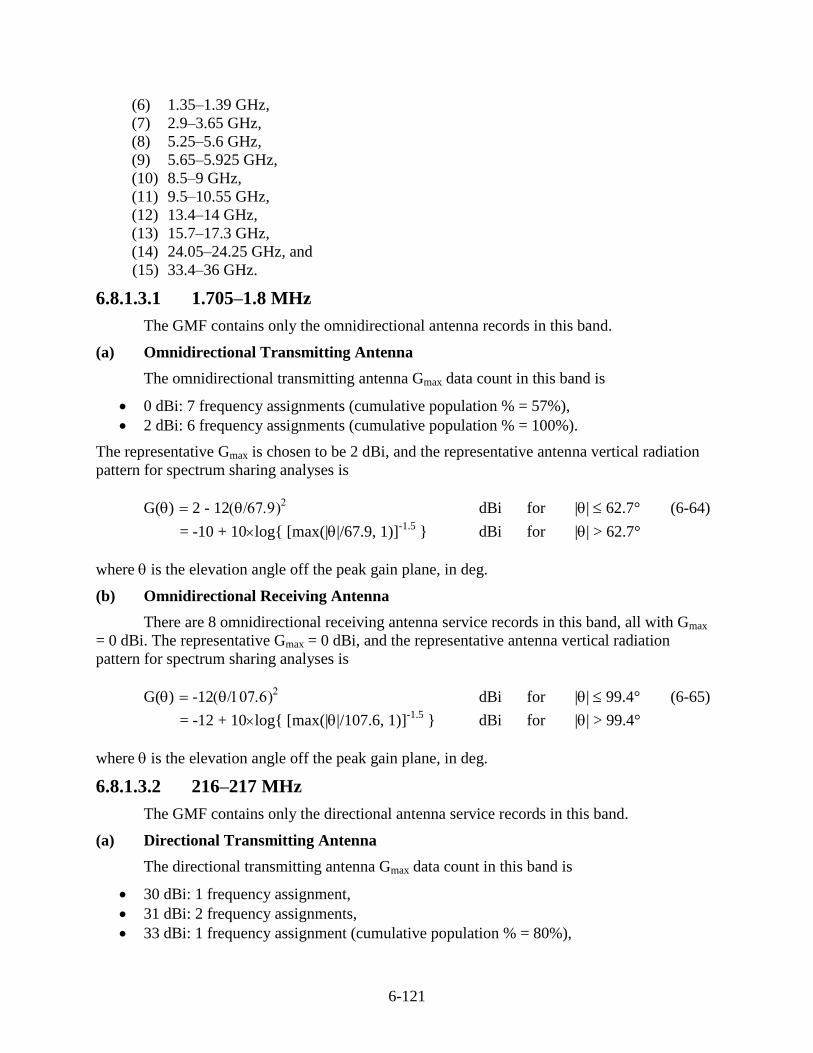
6-121
(6) 1.35–1.39 GHz,
(7) 2.9–3.65 GHz,
(8) 5.25–5.6 GHz,
(9) 5.65–5.925 GHz,
(10) 8.5–9 GHz,
(11) 9.5–10.55 GHz,
(12) 13.4–14 GHz,
(13) 15.7–17.3 GHz,
(14) 24.05–24.25 GHz, and
(15) 33.4–36 GHz.
6.8.1.3.1 1.705–1.8 MHz
The GMF contains only the omnidirectional antenna records in this band.
(a) Omnidirectional Transmitting Antenna
The omnidirectional transmitting antenna Gmax data count in this band is
0 dBi: 7 frequency assignments (cumulative population % = 57%),
2 dBi: 6 frequency assignments (cumulative population % = 100%).
The representative Gmax is chosen to be 2 dBi, and the representative antenna vertical radiation
pattern for spectrum sharing analyses is
G() 2 - 12 dBi for || 62.7° (6-64)
= -10 + 10log{ [max(||/67.9, 1)]-1.5
} dBi for || > 62.7°
where is the elevation angle off the peak gain plane, in deg.
(b) Omnidirectional Receiving Antenna
There are 8 omnidirectional receiving antenna service records in this band, all with Gmax
= 0 dBi. The representative Gmax = 0 dBi, and the representative antenna vertical radiation
pattern for spectrum sharing analyses is
G() -12 dBi for || 99.4° (6-65)
= -12 + 10log{ [max(||/107.6, 1)]-1.5
} dBi for || > 99.4°
where is the elevation angle off the peak gain plane, in deg.
6.8.1.3.2 216–217 MHz
The GMF contains only the directional antenna service records in this band.
(a) Directional Transmitting Antenna
The directional transmitting antenna Gmax data count in this band is
30 dBi: 1 frequency assignment,
31 dBi: 2 frequency assignments,
33 dBi: 1 frequency assignment (cumulative population % = 80%),
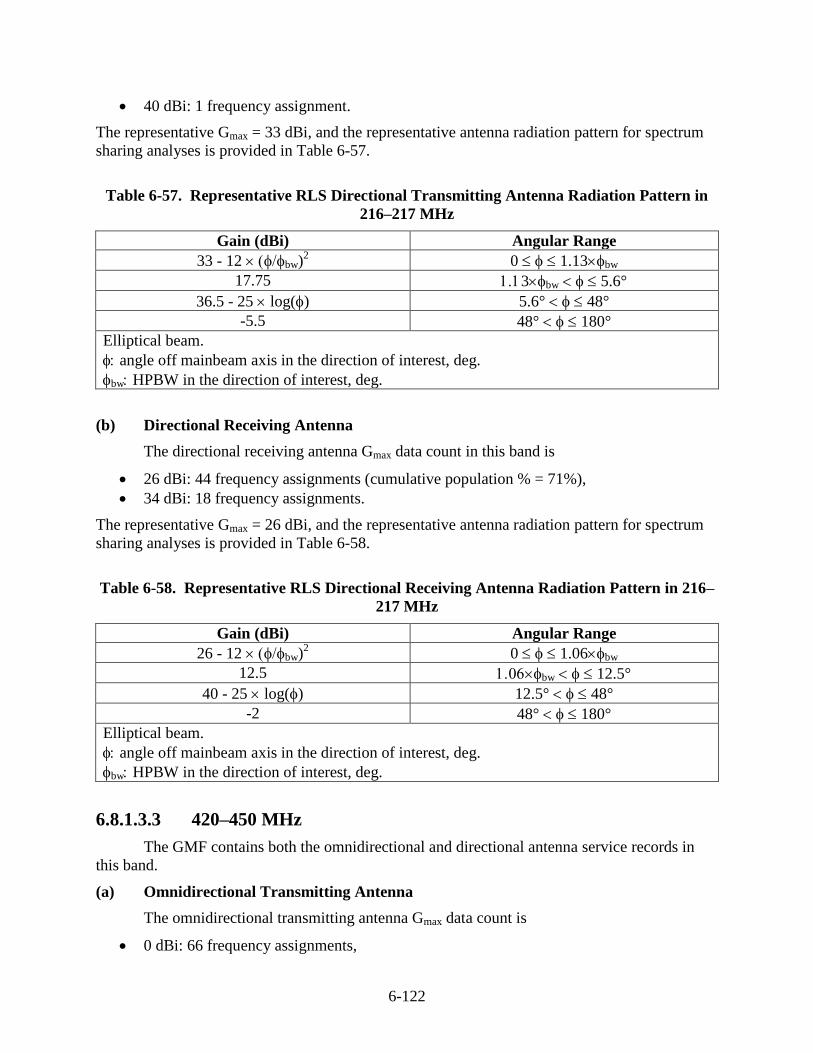
6-122
40 dBi: 1 frequency assignment.
The representative Gmax = 33 dBi, and the representative antenna radiation pattern for spectrum
sharing analyses is provided in Table 6-57.
Table 6-57. Representative RLS Directional Transmitting Antenna Radiation Pattern in
216–217 MHz
Gain (dBi) Angular Range
33 - 12 bw)2 0 1.13bw
17.75 3bw 5.6°
36.5 - 25 log() 5.6° 48°
-5.5 48° 180°
Elliptical beam.
angle off mainbeam axis in the direction of interest, deg.
bw HPBW in the direction of interest, deg.
(b) Directional Receiving Antenna
The directional receiving antenna Gmax data count in this band is
26 dBi: 44 frequency assignments (cumulative population % = 71%),
34 dBi: 18 frequency assignments.
The representative Gmax = 26 dBi, and the representative antenna radiation pattern for spectrum
sharing analyses is provided in Table 6-58.
Table 6-58. Representative RLS Directional Receiving Antenna Radiation Pattern in 216–
217 MHz
Gain (dBi) Angular Range
26 - 12 bw)2 0 1.06bw
12.5 bw 12.5°
40 - 25 log() 12.5° 48°
-2 48° 180°
Elliptical beam.
angle off mainbeam axis in the direction of interest, deg.
bw HPBW in the direction of interest, deg.
6.8.1.3.3 420–450 MHz
The GMF contains both the omnidirectional and directional antenna service records in
this band.
(a) Omnidirectional Transmitting Antenna
The omnidirectional transmitting antenna Gmax data count is
0 dBi: 66 frequency assignments,
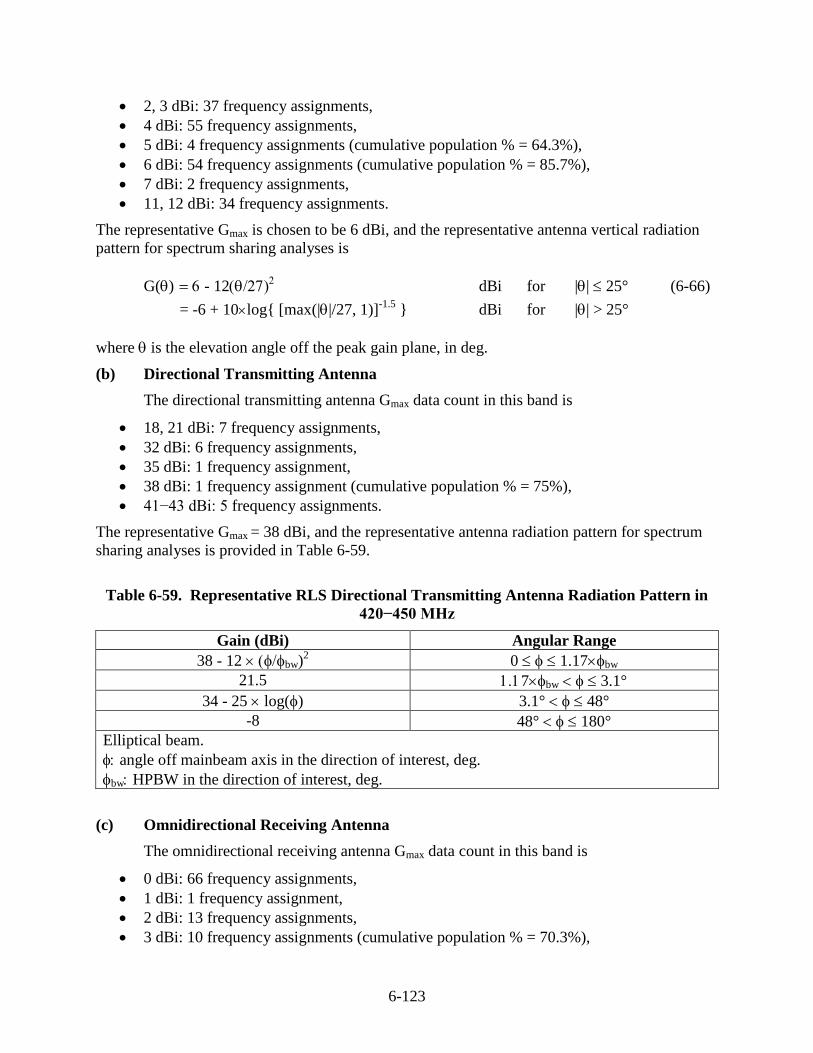
6-123
2, 3 dBi: 37 frequency assignments,
4 dBi: 55 frequency assignments,
5 dBi: 4 frequency assignments (cumulative population % = 64.3%),
6 dBi: 54 frequency assignments (cumulative population % = 85.7%),
7 dBi: 2 frequency assignments,
11, 12 dBi: 34 frequency assignments.
The representative Gmax is chosen to be 6 dBi, and the representative antenna vertical radiation
pattern for spectrum sharing analyses is
G() - 12 dBi for || 25° (6-66)
= -6 + 10log{ [max(||/27, 1)]-1.5
} dBi for || > 25°
where is the elevation angle off the peak gain plane, in deg.
(b) Directional Transmitting Antenna
The directional transmitting antenna Gmax data count in this band is
18, 21 dBi: 7 frequency assignments,
32 dBi: 6 frequency assignments,
35 dBi: 1 frequency assignment,
38 dBi: 1 frequency assignment (cumulative population % = 75%),
41−43 dBi: 5 frequency assignments.
The representative Gmax = 38 dBi, and the representative antenna radiation pattern for spectrum
sharing analyses is provided in Table 6-59.
Table 6-59. Representative RLS Directional Transmitting Antenna Radiation Pattern in
420−450 MHz
Gain (dBi) Angular Range
38 - 12 bw)2 0 1.17bw
21.5 7bw 3.1°
34 - 25 log() 3.1° 48°
-8 48° 180°
Elliptical beam.
angle off mainbeam axis in the direction of interest, deg.
bw HPBW in the direction of interest, deg.
(c) Omnidirectional Receiving Antenna
The omnidirectional receiving antenna Gmax data count in this band is
0 dBi: 66 frequency assignments,
1 dBi: 1 frequency assignment,
2 dBi: 13 frequency assignments,
3 dBi: 10 frequency assignments (cumulative population % = 70.3%),
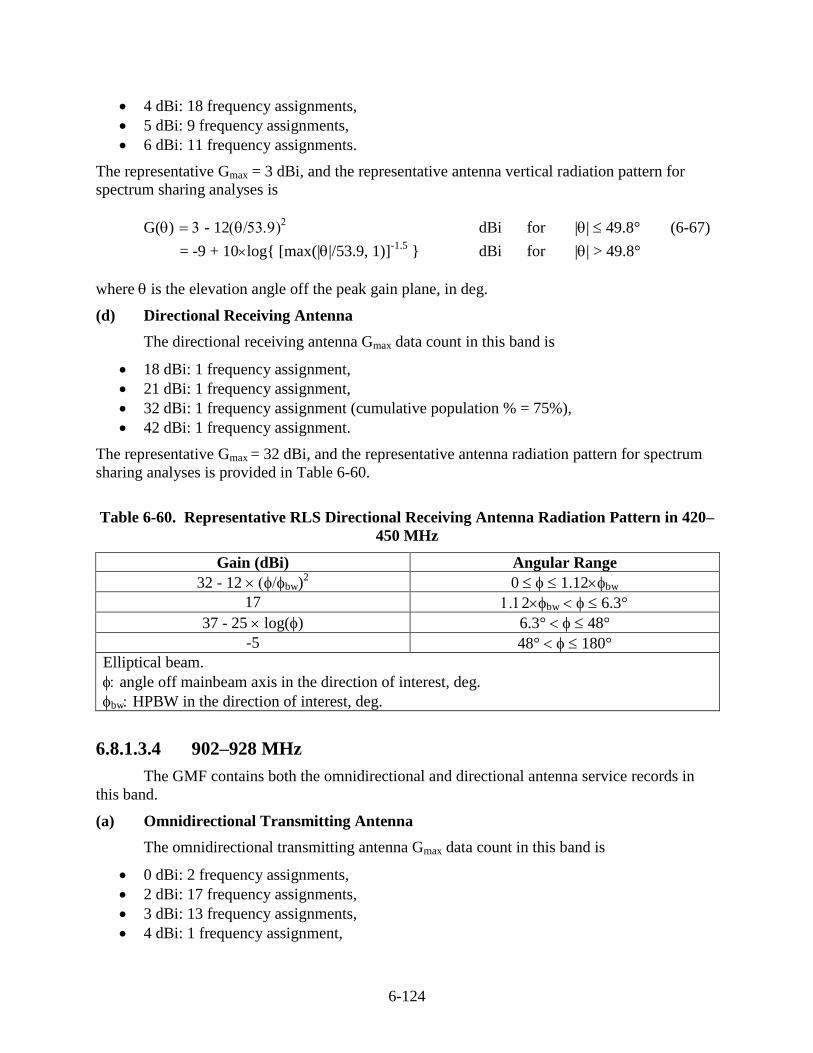
6-124
4 dBi: 18 frequency assignments,
5 dBi: 9 frequency assignments,
6 dBi: 11 frequency assignments.
The representative Gmax = 3 dBi, and the representative antenna vertical radiation pattern for
spectrum sharing analyses is
G() - 12 dBi for || 49.8° (6-67)
= -9 + 10log{ [max(||/53.9, 1)]-1.5
} dBi for || > 49.8°
where is the elevation angle off the peak gain plane, in deg.
(d) Directional Receiving Antenna
The directional receiving antenna Gmax data count in this band is
18 dBi: 1 frequency assignment,
21 dBi: 1 frequency assignment,
32 dBi: 1 frequency assignment (cumulative population % = 75%),
42 dBi: 1 frequency assignment.
The representative Gmax = 32 dBi, and the representative antenna radiation pattern for spectrum
sharing analyses is provided in Table 6-60.
Table 6-60. Representative RLS Directional Receiving Antenna Radiation Pattern in 420–
450 MHz
Gain (dBi) Angular Range
32 - 12 bw)2 0 1.12bw
17 2bw 6.3°
37 - 25 log() 6.3° 48°
-5 48° 180°
Elliptical beam.
angle off mainbeam axis in the direction of interest, deg.
bw HPBW in the direction of interest, deg.
6.8.1.3.4 902–928 MHz
The GMF contains both the omnidirectional and directional antenna service records in
this band.
(a) Omnidirectional Transmitting Antenna
The omnidirectional transmitting antenna Gmax data count in this band is
0 dBi: 2 frequency assignments,
2 dBi: 17 frequency assignments,
3 dBi: 13 frequency assignments,
4 dBi: 1 frequency assignment,
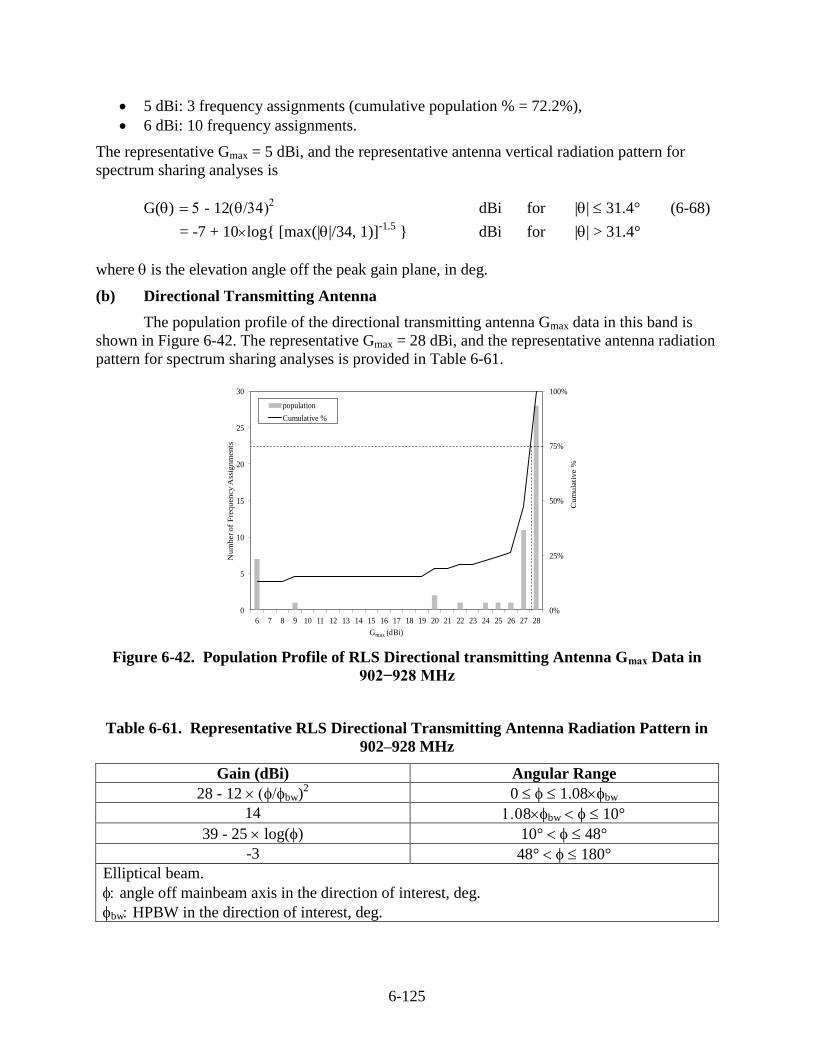
6-125
5 dBi: 3 frequency assignments (cumulative population % = 72.2%),
6 dBi: 10 frequency assignments.
The representative Gmax = 5 dBi, and the representative antenna vertical radiation pattern for
spectrum sharing analyses is
G() - 12 dBi for || 31.4° (6-68)
= -7 + 10log{ [max(||/34, 1)]-1.5
} dBi for || > 31.4°
where is the elevation angle off the peak gain plane, in deg.
(b) Directional Transmitting Antenna
The population profile of the directional transmitting antenna Gmax data in this band is
shown in Figure 6-42. The representative Gmax = 28 dBi, and the representative antenna radiation
pattern for spectrum sharing analyses is provided in Table 6-61.
0%
25%
50%
75%
100%
0
5
10
15
20
25
30
6 7 8 9 10 11 12 13 14 15 16 17 18 19 20 21 22 23 24 25 26 27 28
Cu
mu
lati
ve %
Nu
mb
er o
f F
req
uen
cy
Ass
ign
men
ts
Gmax (dBi)
population
Cumulative %
Figure 6-42. Population Profile of RLS Directional transmitting Antenna Gmax Data in
902−928 MHz
Table 6-61. Representative RLS Directional Transmitting Antenna Radiation Pattern in
902–928 MHz
Gain (dBi) Angular Range
28 - 12 bw)2 0 1.08bw
14 8bw 10°
39 - 25 log() 10° 48°
-3 48° 180°
Elliptical beam.
angle off mainbeam axis in the direction of interest, deg.
bw HPBW in the direction of interest, deg.
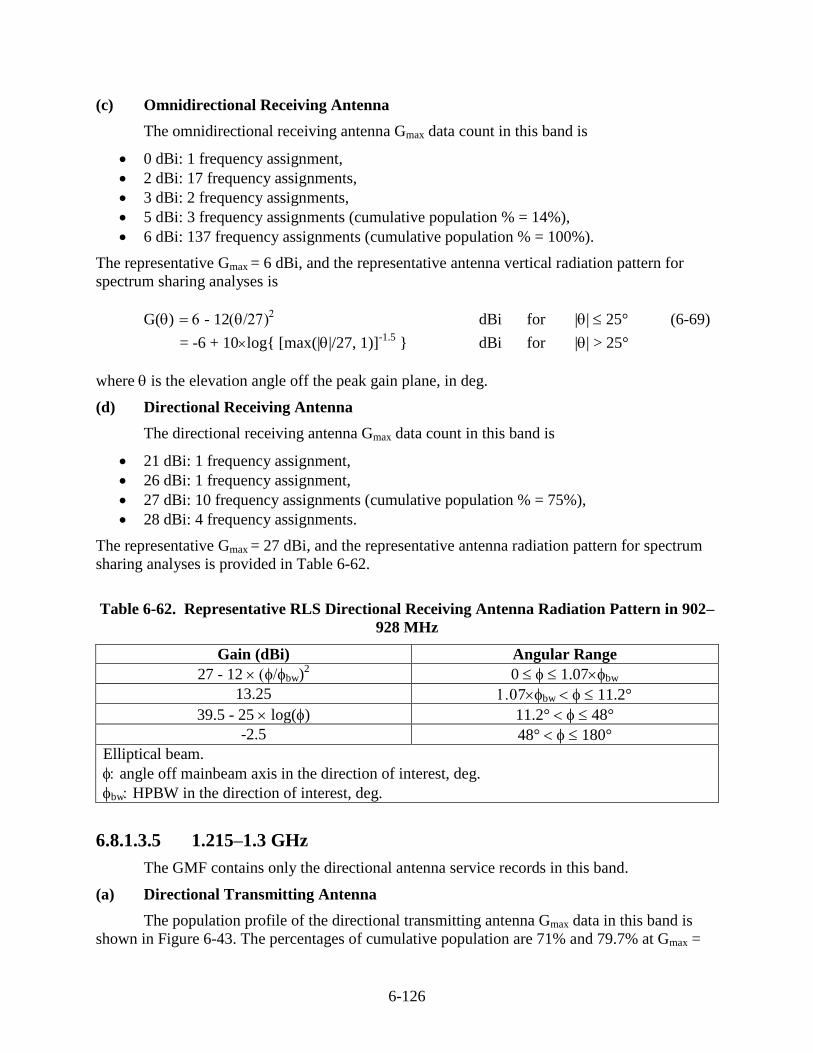
6-126
(c) Omnidirectional Receiving Antenna
The omnidirectional receiving antenna Gmax data count in this band is
0 dBi: 1 frequency assignment,
2 dBi: 17 frequency assignments,
3 dBi: 2 frequency assignments,
5 dBi: 3 frequency assignments (cumulative population % = 14%),
6 dBi: 137 frequency assignments (cumulative population % = 100%).
The representative Gmax = 6 dBi, and the representative antenna vertical radiation pattern for
spectrum sharing analyses is
G() - 12 dBi for || 25° (6-69)
= -6 + 10log{ [max(||/27, 1)]-1.5
} dBi for || > 25°
where is the elevation angle off the peak gain plane, in deg.
(d) Directional Receiving Antenna
The directional receiving antenna Gmax data count in this band is
21 dBi: 1 frequency assignment,
26 dBi: 1 frequency assignment,
27 dBi: 10 frequency assignments (cumulative population % = 75%),
28 dBi: 4 frequency assignments.
The representative Gmax = 27 dBi, and the representative antenna radiation pattern for spectrum
sharing analyses is provided in Table 6-62.
Table 6-62. Representative RLS Directional Receiving Antenna Radiation Pattern in 902–
928 MHz
Gain (dBi) Angular Range
27 - 12 bw)2 0 1.07bw
13.25 7bw 11.2°
39.5 - 25 log() 11.2° 48°
-2.5 48° 180°
Elliptical beam.
angle off mainbeam axis in the direction of interest, deg.
bw HPBW in the direction of interest, deg.
6.8.1.3.5 1.215–1.3 GHz
The GMF contains only the directional antenna service records in this band.
(a) Directional Transmitting Antenna
The population profile of the directional transmitting antenna Gmax data in this band is
shown in Figure 6-43. The percentages of cumulative population are 71% and 79.7% at Gmax =
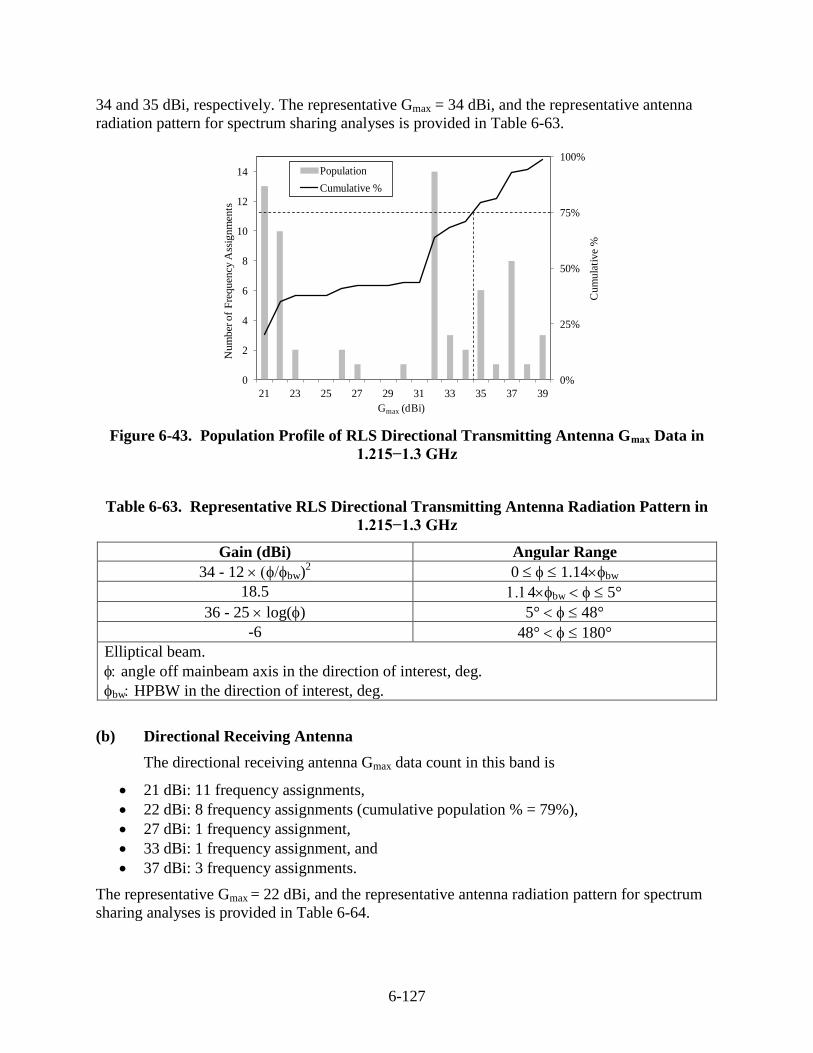
6-127
34 and 35 dBi, respectively. The representative Gmax = 34 dBi, and the representative antenna
radiation pattern for spectrum sharing analyses is provided in Table 6-63.
0%
25%
50%
75%
100%
0
2
4
6
8
10
12
14
21 23 25 27 29 31 33 35 37 39
Cu
mu
lati
ve
%
Nu
mb
er o
f F
req
uen
cy A
ssig
nm
ents
Gmax (dBi)
Population
Cumulative %
Figure 6-43. Population Profile of RLS Directional Transmitting Antenna Gmax Data in
1.215−1.3 GHz
Table 6-63. Representative RLS Directional Transmitting Antenna Radiation Pattern in
1.215−1.3 GHz
Gain (dBi) Angular Range
34 - 12 bw)2 0 1.14bw
18.5 4bw 5°
36 - 25 log() 5° 48°
-6 48° 180°
Elliptical beam.
angle off mainbeam axis in the direction of interest, deg.
bw HPBW in the direction of interest, deg.
(b) Directional Receiving Antenna
The directional receiving antenna Gmax data count in this band is
21 dBi: 11 frequency assignments,
22 dBi: 8 frequency assignments (cumulative population % = 79%),
27 dBi: 1 frequency assignment,
33 dBi: 1 frequency assignment, and
37 dBi: 3 frequency assignments.
The representative Gmax = 22 dBi, and the representative antenna radiation pattern for spectrum
sharing analyses is provided in Table 6-64.
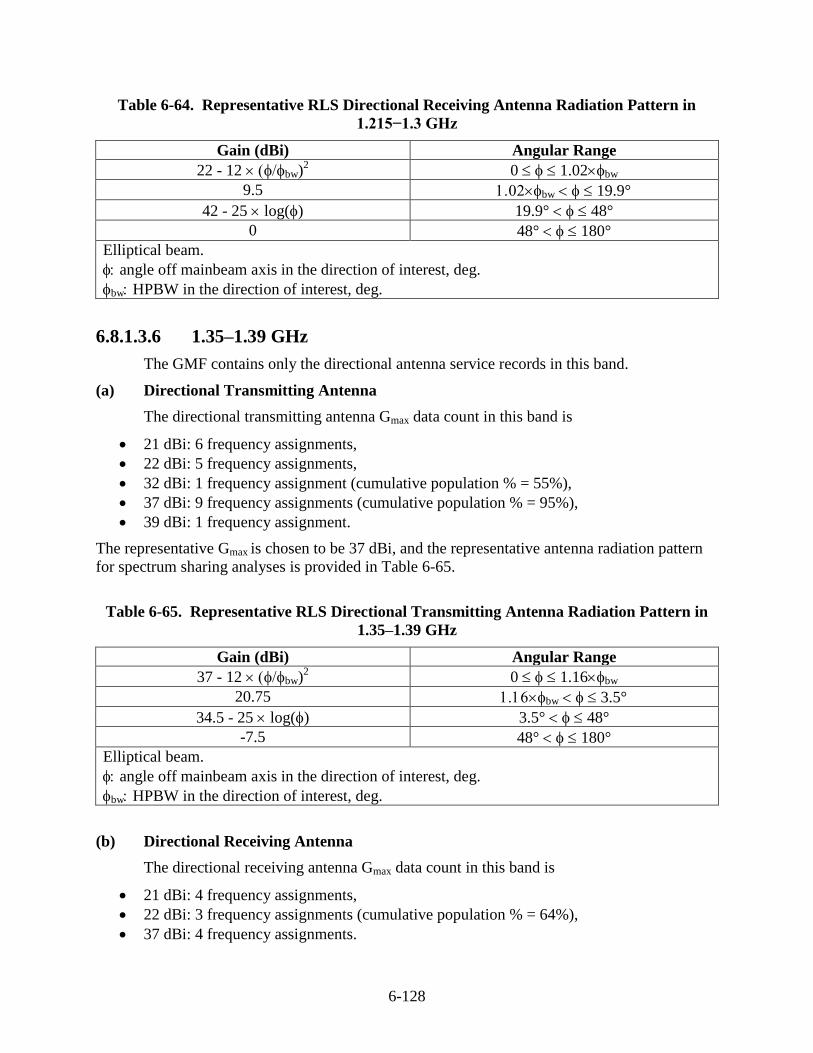
6-128
Table 6-64. Representative RLS Directional Receiving Antenna Radiation Pattern in
1.215−1.3 GHz
Gain (dBi) Angular Range
22 - 12 bw)2 0 1.02bw
9.5 bw 19.9°
42 - 25 log() 19.9° 48°
0 48° 180°
Elliptical beam.
angle off mainbeam axis in the direction of interest, deg.
bw HPBW in the direction of interest, deg.
6.8.1.3.6 1.35–1.39 GHz
The GMF contains only the directional antenna service records in this band.
(a) Directional Transmitting Antenna
The directional transmitting antenna Gmax data count in this band is
21 dBi: 6 frequency assignments,
22 dBi: 5 frequency assignments,
32 dBi: 1 frequency assignment (cumulative population % = 55%),
37 dBi: 9 frequency assignments (cumulative population % = 95%),
39 dBi: 1 frequency assignment.
The representative Gmax is chosen to be 37 dBi, and the representative antenna radiation pattern
for spectrum sharing analyses is provided in Table 6-65.
Table 6-65. Representative RLS Directional Transmitting Antenna Radiation Pattern in
1.35–1.39 GHz
Gain (dBi) Angular Range
37 - 12 bw)2 0 1.16bw
20.75 bw 3.5°
34.5 - 25 log() 3.5° 48°
-7.5 48° 180°
Elliptical beam.
angle off mainbeam axis in the direction of interest, deg.
bw HPBW in the direction of interest, deg.
(b) Directional Receiving Antenna
The directional receiving antenna Gmax data count in this band is
21 dBi: 4 frequency assignments,
22 dBi: 3 frequency assignments (cumulative population % = 64%),
37 dBi: 4 frequency assignments.
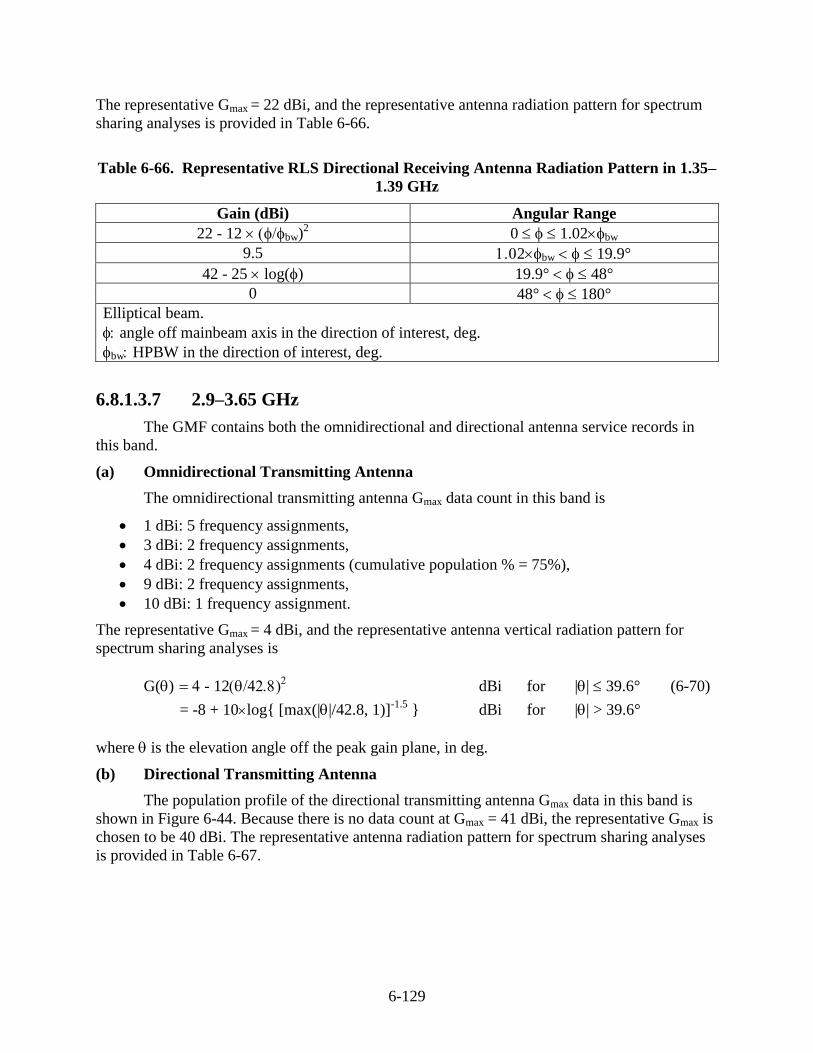
6-129
The representative Gmax = 22 dBi, and the representative antenna radiation pattern for spectrum
sharing analyses is provided in Table 6-66.
Table 6-66. Representative RLS Directional Receiving Antenna Radiation Pattern in 1.35–
1.39 GHz
Gain (dBi) Angular Range
22 - 12 bw)2 0 1.02bw
9.5 2bw 19.9°
42 - 25 log() 19.9° 48°
0 48° 180°
Elliptical beam.
angle off mainbeam axis in the direction of interest, deg.
bw HPBW in the direction of interest, deg.
6.8.1.3.7 2.9–3.65 GHz
The GMF contains both the omnidirectional and directional antenna service records in
this band.
(a) Omnidirectional Transmitting Antenna
The omnidirectional transmitting antenna Gmax data count in this band is
1 dBi: 5 frequency assignments,
3 dBi: 2 frequency assignments,
4 dBi: 2 frequency assignments (cumulative population % = 75%),
9 dBi: 2 frequency assignments,
10 dBi: 1 frequency assignment.
The representative Gmax = 4 dBi, and the representative antenna vertical radiation pattern for
spectrum sharing analyses is
G() - 12 dBi for || 39.6° (6-70)
= -8 + 10log{ [max(||/42.8, 1)]-1.5
} dBi for || > 39.6°
where is the elevation angle off the peak gain plane, in deg.
(b) Directional Transmitting Antenna
The population profile of the directional transmitting antenna Gmax data in this band is
shown in Figure 6-44. Because there is no data count at Gmax = 41 dBi, the representative Gmax is
chosen to be 40 dBi. The representative antenna radiation pattern for spectrum sharing analyses
is provided in Table 6-67.
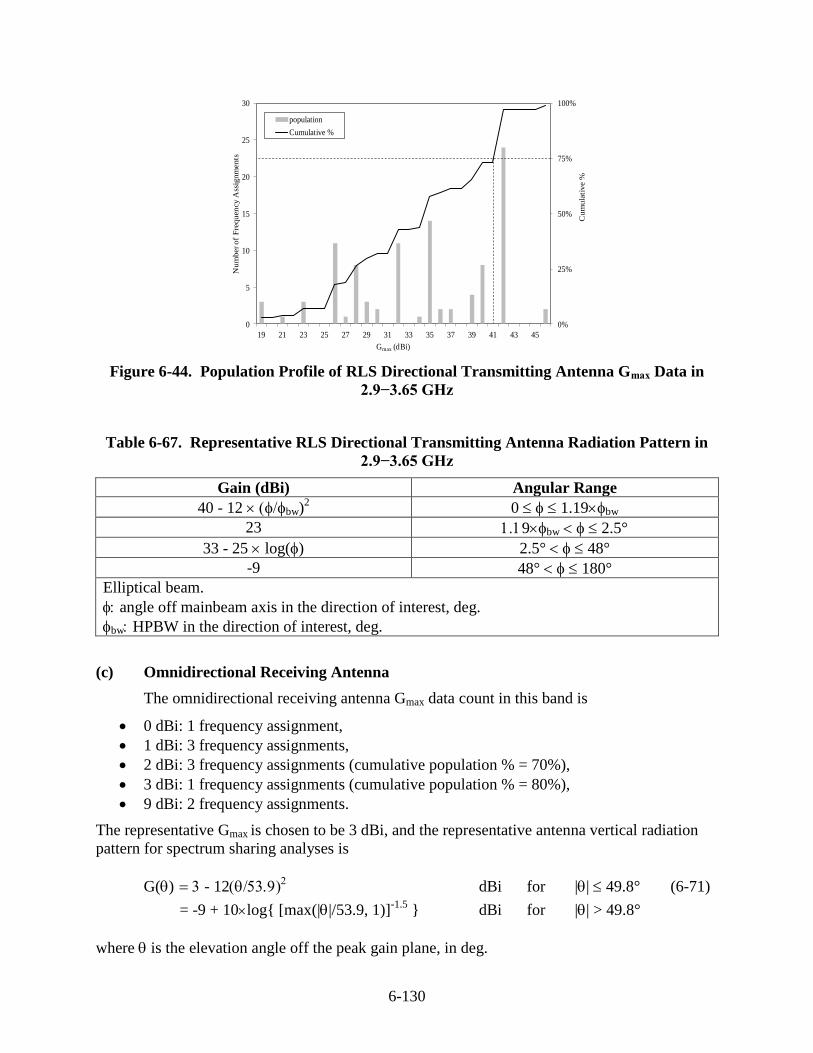
6-130
0%
25%
50%
75%
100%
0
5
10
15
20
25
30
19 21 23 25 27 29 31 33 35 37 39 41 43 45
Cu
mu
lati
ve %
Nu
mb
er o
f F
req
uen
cy
Ass
ign
men
ts
Gmax (dBi)
population
Cumulative %
Figure 6-44. Population Profile of RLS Directional Transmitting Antenna Gmax Data in
2.9−3.65 GHz
Table 6-67. Representative RLS Directional Transmitting Antenna Radiation Pattern in
2.9−3.65 GHz
Gain (dBi) Angular Range
40 - 12 bw)2 0 1.19bw
23 9bw 2.5°
33 - 25 log() 2.5° 48°
-9 48° 180°
Elliptical beam.
angle off mainbeam axis in the direction of interest, deg.
bw HPBW in the direction of interest, deg.
(c) Omnidirectional Receiving Antenna
The omnidirectional receiving antenna Gmax data count in this band is
0 dBi: 1 frequency assignment,
1 dBi: 3 frequency assignments,
2 dBi: 3 frequency assignments (cumulative population % = 70%),
3 dBi: 1 frequency assignments (cumulative population % = 80%),
9 dBi: 2 frequency assignments.
The representative Gmax is chosen to be 3 dBi, and the representative antenna vertical radiation
pattern for spectrum sharing analyses is
G() - 12 dBi for || 49.8° (6-71)
= -9 + 10log{ [max(||/53.9, 1)]-1.5
} dBi for || > 49.8°
where is the elevation angle off the peak gain plane, in deg.
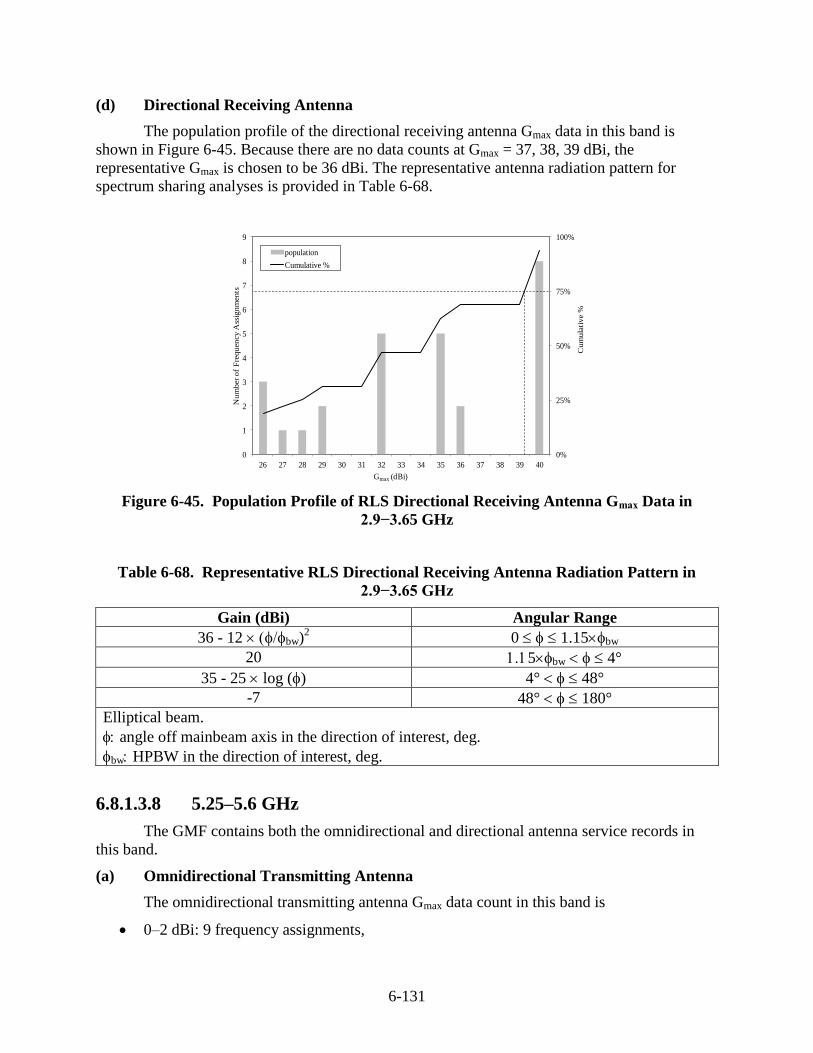
6-131
(d) Directional Receiving Antenna
The population profile of the directional receiving antenna Gmax data in this band is
shown in Figure 6-45. Because there are no data counts at Gmax = 37, 38, 39 dBi, the
representative Gmax is chosen to be 36 dBi. The representative antenna radiation pattern for
spectrum sharing analyses is provided in Table 6-68.
0%
25%
50%
75%
100%
0
1
2
3
4
5
6
7
8
9
26 27 28 29 30 31 32 33 34 35 36 37 38 39 40
Cum
ula
tive %
Num
ber of
Fre
quency A
ssig
nm
ents
Gmax (dBi)
population
Cumulative %
Figure 6-45. Population Profile of RLS Directional Receiving Antenna Gmax Data in
2.9−3.65 GHz
Table 6-68. Representative RLS Directional Receiving Antenna Radiation Pattern in
2.9−3.65 GHz
Gain (dBi) Angular Range
36 - 12 bw)2 0 1.15bw
20 5bw 4°
35 - 25 log () 4° 48°
-7 48° 180°
Elliptical beam.
angle off mainbeam axis in the direction of interest, deg.
bw HPBW in the direction of interest, deg.
6.8.1.3.8 5.25–5.6 GHz
The GMF contains both the omnidirectional and directional antenna service records in
this band.
(a) Omnidirectional Transmitting Antenna
The omnidirectional transmitting antenna Gmax data count in this band is
0–2 dBi: 9 frequency assignments,
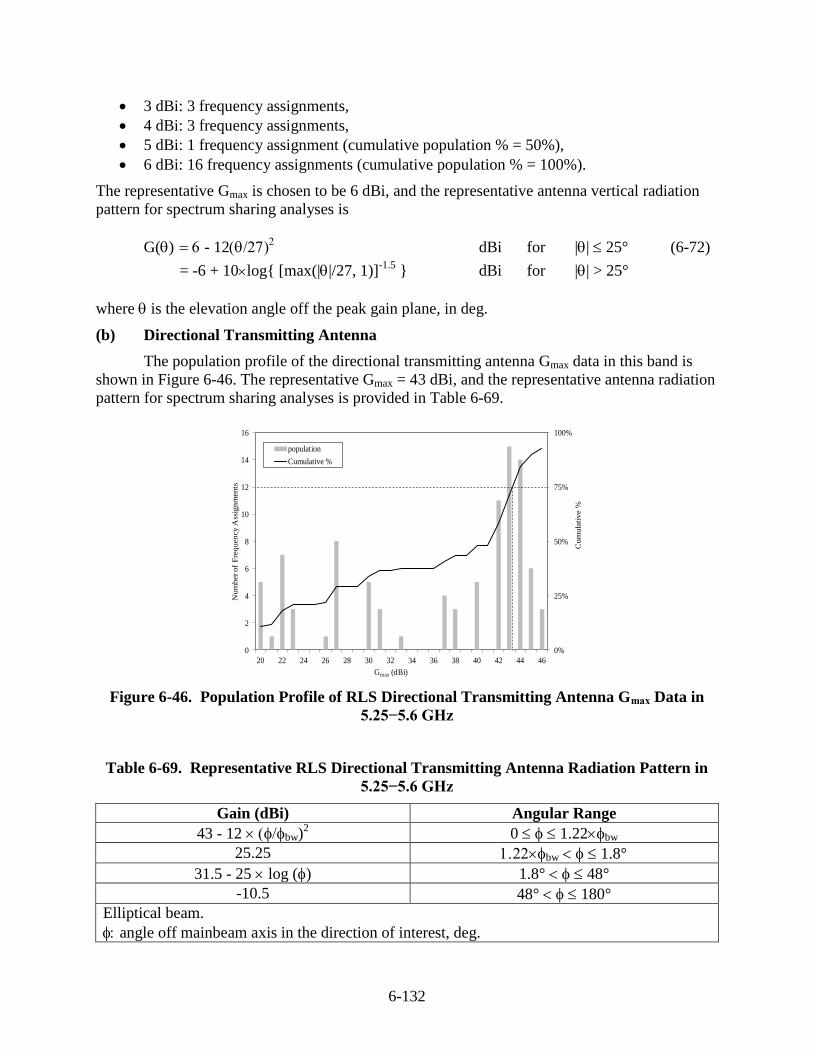
6-132
3 dBi: 3 frequency assignments,
4 dBi: 3 frequency assignments,
5 dBi: 1 frequency assignment (cumulative population % = 50%),
6 dBi: 16 frequency assignments (cumulative population % = 100%).
The representative Gmax is chosen to be 6 dBi, and the representative antenna vertical radiation
pattern for spectrum sharing analyses is
G() - 12 dBi for || 25° (6-72)
= -6 + 10log{ [max(||/27, 1)]-1.5
} dBi for || > 25°
where is the elevation angle off the peak gain plane, in deg.
(b) Directional Transmitting Antenna
The population profile of the directional transmitting antenna Gmax data in this band is
shown in Figure 6-46. The representative Gmax = 43 dBi, and the representative antenna radiation
pattern for spectrum sharing analyses is provided in Table 6-69.
0%
25%
50%
75%
100%
0
2
4
6
8
10
12
14
16
20 22 24 26 28 30 32 34 36 38 40 42 44 46
Cum
ula
tive %
Num
ber of
Fre
quency A
ssig
nm
ents
Gmax (dBi)
population
Cumulative %
Figure 6-46. Population Profile of RLS Directional Transmitting Antenna Gmax Data in
5.25−5.6 GHz
Table 6-69. Representative RLS Directional Transmitting Antenna Radiation Pattern in
5.25−5.6 GHz
Gain (dBi) Angular Range
43 - 12 bw)2 0 1.22bw
25.25 bw 1.8°
31.5 - 25 log () 1.8° 48°
-10.5 48° 180°
Elliptical beam.
angle off mainbeam axis in the direction of interest, deg.
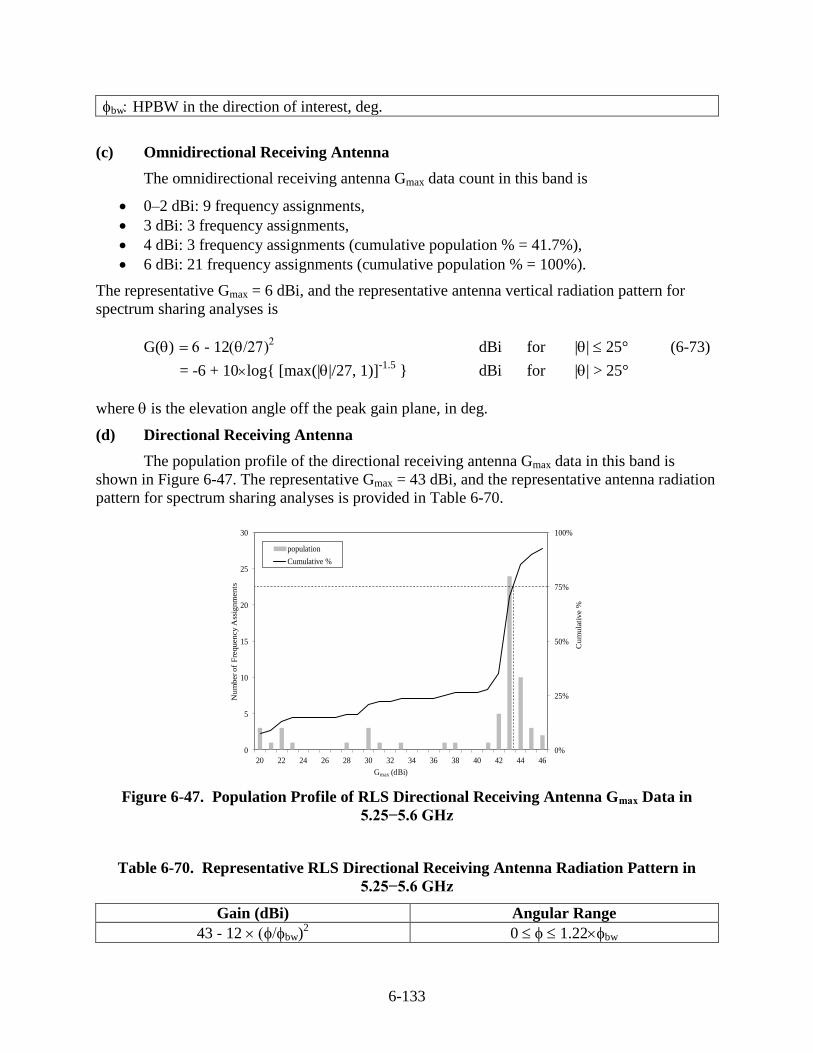
6-133
bw HPBW in the direction of interest, deg.
(c) Omnidirectional Receiving Antenna
The omnidirectional receiving antenna Gmax data count in this band is
0–2 dBi: 9 frequency assignments,
3 dBi: 3 frequency assignments,
4 dBi: 3 frequency assignments (cumulative population % = 41.7%),
6 dBi: 21 frequency assignments (cumulative population % = 100%).
The representative Gmax = 6 dBi, and the representative antenna vertical radiation pattern for
spectrum sharing analyses is
G() - 12 dBi for || 25° (6-73)
= -6 + 10log{ [max(||/27, 1)]-1.5
} dBi for || > 25°
where is the elevation angle off the peak gain plane, in deg.
(d) Directional Receiving Antenna
The population profile of the directional receiving antenna Gmax data in this band is
shown in Figure 6-47. The representative Gmax = 43 dBi, and the representative antenna radiation
pattern for spectrum sharing analyses is provided in Table 6-70.
0%
25%
50%
75%
100%
0
5
10
15
20
25
30
20 22 24 26 28 30 32 34 36 38 40 42 44 46
Cum
ula
tive %
Num
ber of
Fre
quency A
ssig
nm
ents
Gmax (dBi)
population
Cumulative %
Figure 6-47. Population Profile of RLS Directional Receiving Antenna Gmax Data in
5.25−5.6 GHz
Table 6-70. Representative RLS Directional Receiving Antenna Radiation Pattern in
5.25−5.6 GHz
Gain (dBi) Angular Range
43 - 12 bw)2 0 1.22bw
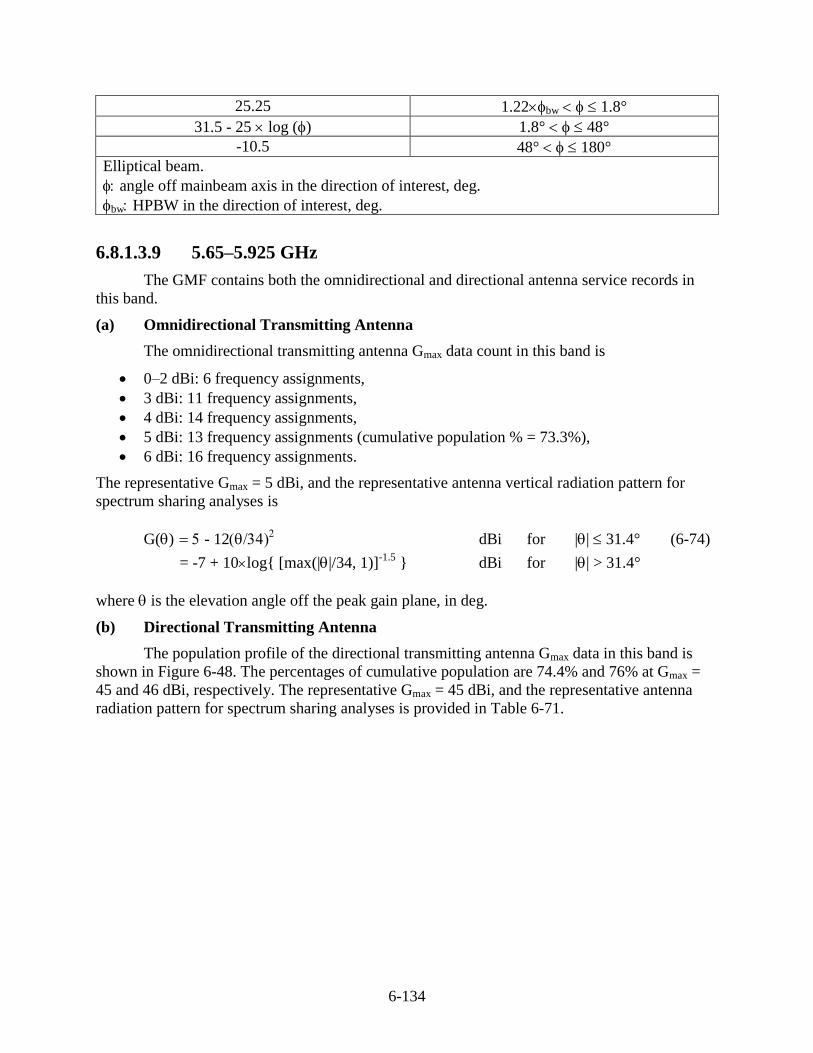
6-134
25.25 1.22bw 1.8°
31.5 - 25 log () 1.8° 48°
-10.5 48° 180°
Elliptical beam.
angle off mainbeam axis in the direction of interest, deg.
bw HPBW in the direction of interest, deg.
6.8.1.3.9 5.65–5.925 GHz
The GMF contains both the omnidirectional and directional antenna service records in
this band.
(a) Omnidirectional Transmitting Antenna
The omnidirectional transmitting antenna Gmax data count in this band is
0–2 dBi: 6 frequency assignments,
3 dBi: 11 frequency assignments,
4 dBi: 14 frequency assignments,
5 dBi: 13 frequency assignments (cumulative population % = 73.3%),
6 dBi: 16 frequency assignments.
The representative Gmax = 5 dBi, and the representative antenna vertical radiation pattern for
spectrum sharing analyses is
G() - 12 dBi for || 31.4° (6-74)
= -7 + 10log{ [max(||/34, 1)]-1.5
} dBi for || > 31.4°
where is the elevation angle off the peak gain plane, in deg.
(b) Directional Transmitting Antenna
The population profile of the directional transmitting antenna Gmax data in this band is
shown in Figure 6-48. The percentages of cumulative population are 74.4% and 76% at Gmax =
45 and 46 dBi, respectively. The representative Gmax = 45 dBi, and the representative antenna
radiation pattern for spectrum sharing analyses is provided in Table 6-71.
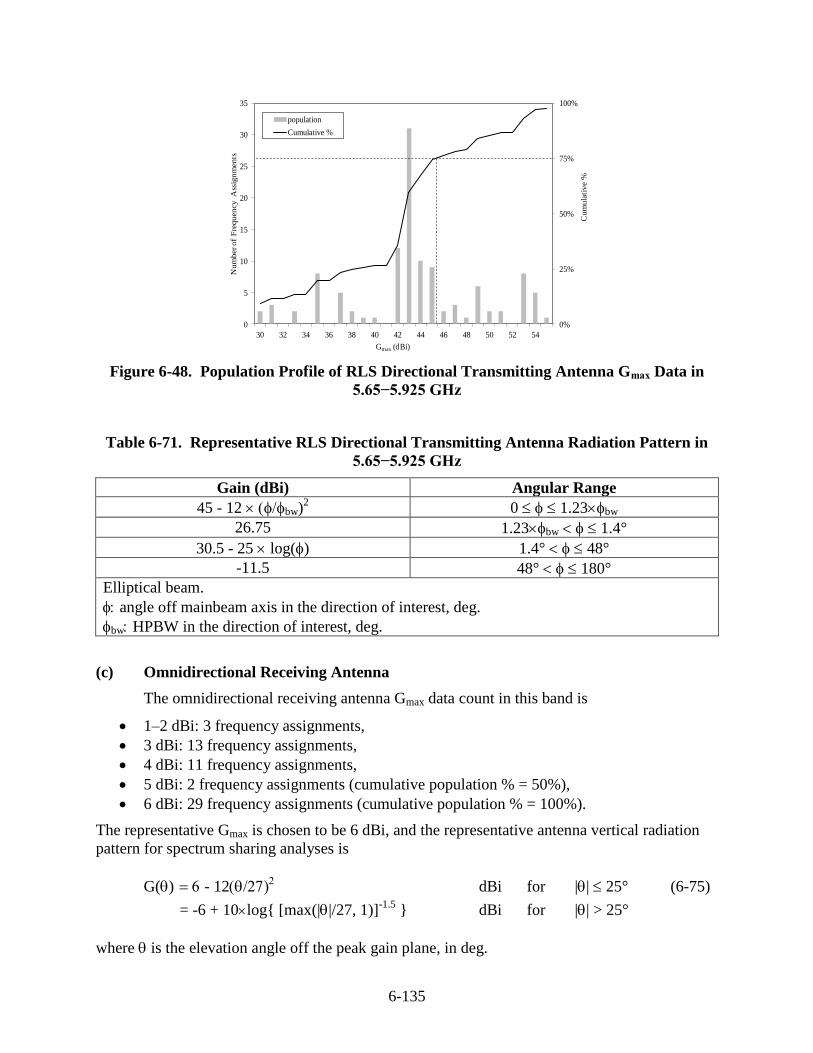
6-135
0%
25%
50%
75%
100%
0
5
10
15
20
25
30
35
30 32 34 36 38 40 42 44 46 48 50 52 54
Cu
mu
lati
ve %
Nu
mb
er o
f F
req
uen
cy
A
ssig
nm
en
ts
Gmax (dBi)
population
Cumulative %
Figure 6-48. Population Profile of RLS Directional Transmitting Antenna Gmax Data in
5.65−5.925 GHz
Table 6-71. Representative RLS Directional Transmitting Antenna Radiation Pattern in
5.65−5.925 GHz
Gain (dBi) Angular Range
45 - 12 bw)2 0 1.23bw
26.75 1.23bw 1.4°
30.5 - 25 log() 1.4° 48°
-11.5 48° 180°
Elliptical beam.
angle off mainbeam axis in the direction of interest, deg.
bw HPBW in the direction of interest, deg.
(c) Omnidirectional Receiving Antenna
The omnidirectional receiving antenna Gmax data count in this band is
1–2 dBi: 3 frequency assignments,
3 dBi: 13 frequency assignments,
4 dBi: 11 frequency assignments,
5 dBi: 2 frequency assignments (cumulative population % = 50%),
6 dBi: 29 frequency assignments (cumulative population % = 100%).
The representative Gmax is chosen to be 6 dBi, and the representative antenna vertical radiation
pattern for spectrum sharing analyses is
G() - 12 dBi for || 25° (6-75)
= -6 + 10log{ [max(||/27, 1)]-1.5
} dBi for || > 25°
where is the elevation angle off the peak gain plane, in deg.
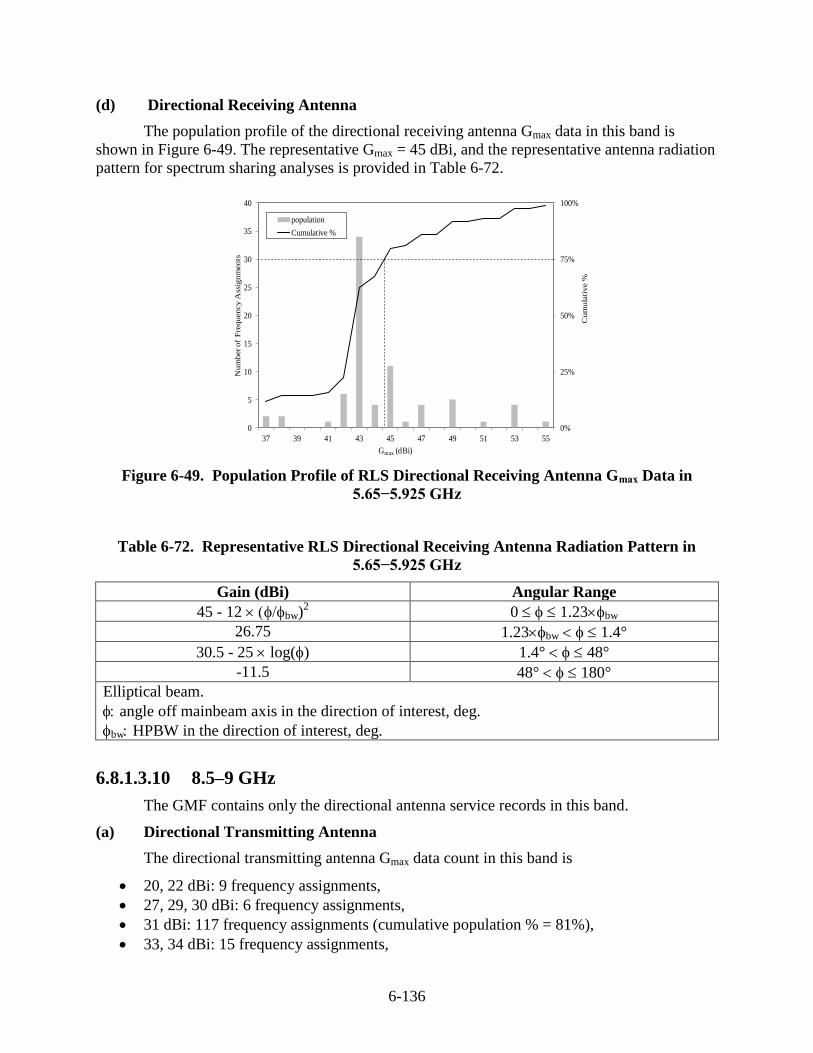
6-136
(d) Directional Receiving Antenna
The population profile of the directional receiving antenna Gmax data in this band is
shown in Figure 6-49. The representative Gmax = 45 dBi, and the representative antenna radiation
pattern for spectrum sharing analyses is provided in Table 6-72.
0%
25%
50%
75%
100%
0
5
10
15
20
25
30
35
40
37 39 41 43 45 47 49 51 53 55
Cu
mu
lati
ve %
Nu
mb
er o
f F
req
uen
cy
Ass
ign
men
ts
Gmax (dBi)
population
Cumulative %
Figure 6-49. Population Profile of RLS Directional Receiving Antenna Gmax Data in
5.65−5.925 GHz
Table 6-72. Representative RLS Directional Receiving Antenna Radiation Pattern in
5.65−5.925 GHz
Gain (dBi) Angular Range
45 - 12 bw)2 0 1.23bw
26.75 1.23bw 1.4°
30.5 - 25 log() 1.4° 48°
-11.5 48° 180°
Elliptical beam.
angle off mainbeam axis in the direction of interest, deg.
bw HPBW in the direction of interest, deg.
6.8.1.3.10 8.5–9 GHz
The GMF contains only the directional antenna service records in this band.
(a) Directional Transmitting Antenna
The directional transmitting antenna Gmax data count in this band is
20, 22 dBi: 9 frequency assignments,
27, 29, 30 dBi: 6 frequency assignments,
31 dBi: 117 frequency assignments (cumulative population % = 81%),
33, 34 dBi: 15 frequency assignments,
6-137
37–44 dBi: 16 frequency assignments.
The representative Gmax = 31 dBi, and the representative antenna radiation pattern for spectrum
sharing analyses is provided in Table 6-73.
Table 6-73. Representative RLS Directional Transmitting Antenna Radiation Pattern in e
8.5−9 GHz
Gain (dBi) Angular Range
31 - 12 bw)2 0 1.11bw
16.25 1.11bw 7°
37.5 - 25 log() 7° 48°
-4.5 48° 180°
Elliptical beam.
angle off mainbeam axis in the direction of interest, deg.
bw HPBW in the direction of interest, deg.
(b) Directional Receiving Antenna
The directional receiving antenna Gmax data count in this band is
27 dBi: 2 frequency assignments,
31 dBi: 118 frequency assignments (cumulative population % = 95%),
34–42 dBi: 6 frequency assignments.
The representative Gmax = 31 dBi, and the representative antenna radiation pattern for spectrum
sharing analyses is provided in Table 6-74.
Table 6-74. Representative RLS Directional Receiving Antenna Radiation Pattern in 8.5−9
GHz
Gain (dBi) Angular Range
31 - 12 bw)2 0 1.11bw
16.25 1.11bw 7°
37.5 - 25 log() 7° 48°
-4.5 48° 180°
Elliptical beam.
angle off mainbeam axis in the direction of interest, deg.
bw HPBW in the direction of interest, deg.
6.8.1.3.11 9.5–10.55 GHz
The GMF contains both the omnidirectional and directional antenna service records in
this band.
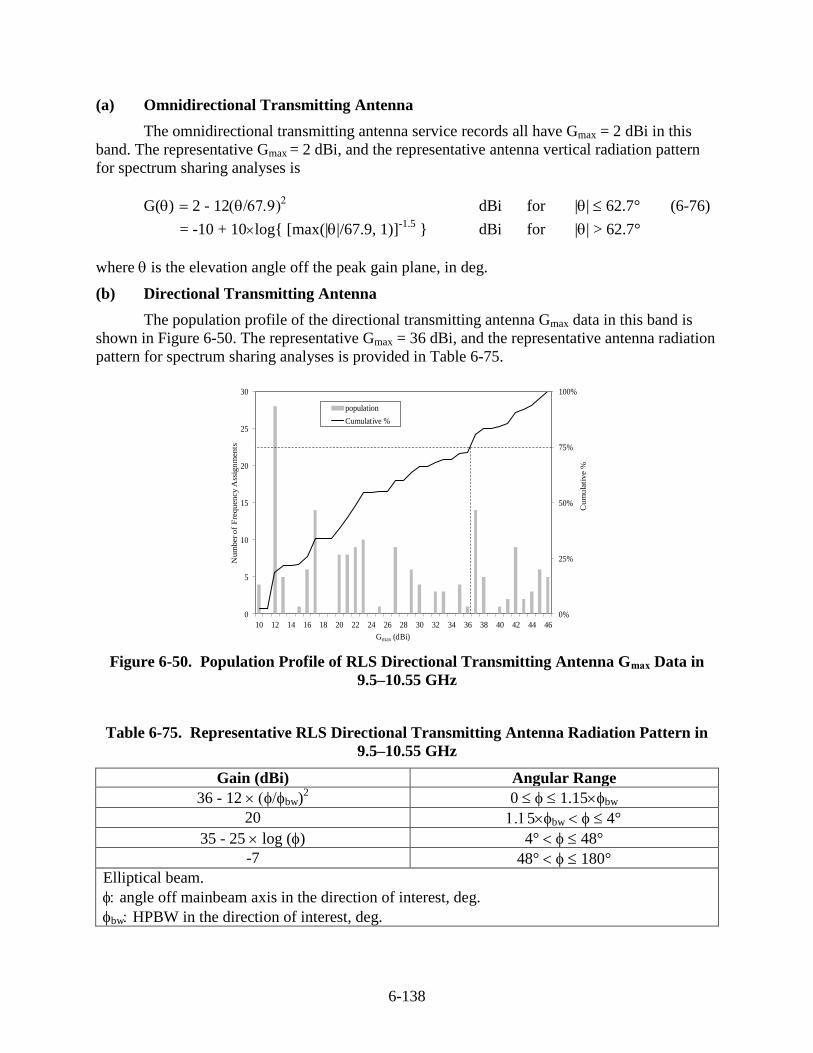
6-138
(a) Omnidirectional Transmitting Antenna
The omnidirectional transmitting antenna service records all have Gmax = 2 dBi in this
band. The representative Gmax = 2 dBi, and the representative antenna vertical radiation pattern
for spectrum sharing analyses is
G() 2 - 12 dBi for || 62.7° (6-76)
= -10 + 10log{ [max(||/67.9, 1)]-1.5
} dBi for || > 62.7°
where is the elevation angle off the peak gain plane, in deg.
(b) Directional Transmitting Antenna
The population profile of the directional transmitting antenna Gmax data in this band is
shown in Figure 6-50. The representative Gmax = 36 dBi, and the representative antenna radiation
pattern for spectrum sharing analyses is provided in Table 6-75.
0%
25%
50%
75%
100%
0
5
10
15
20
25
30
10 12 14 16 18 20 22 24 26 28 30 32 34 36 38 40 42 44 46
Cum
ula
tive %
Num
ber of
Fre
quency A
ssig
nm
ents
Gmax (dBi)
population
Cumulative %
Figure 6-50. Population Profile of RLS Directional Transmitting Antenna Gmax Data in
9.5–10.55 GHz
Table 6-75. Representative RLS Directional Transmitting Antenna Radiation Pattern in
9.5–10.55 GHz
Gain (dBi) Angular Range
36 - 12 bw)2 0 1.15bw
20 5bw 4°
35 - 25 log () 4° 48°
-7 48° 180°
Elliptical beam.
angle off mainbeam axis in the direction of interest, deg.
bw HPBW in the direction of interest, deg.
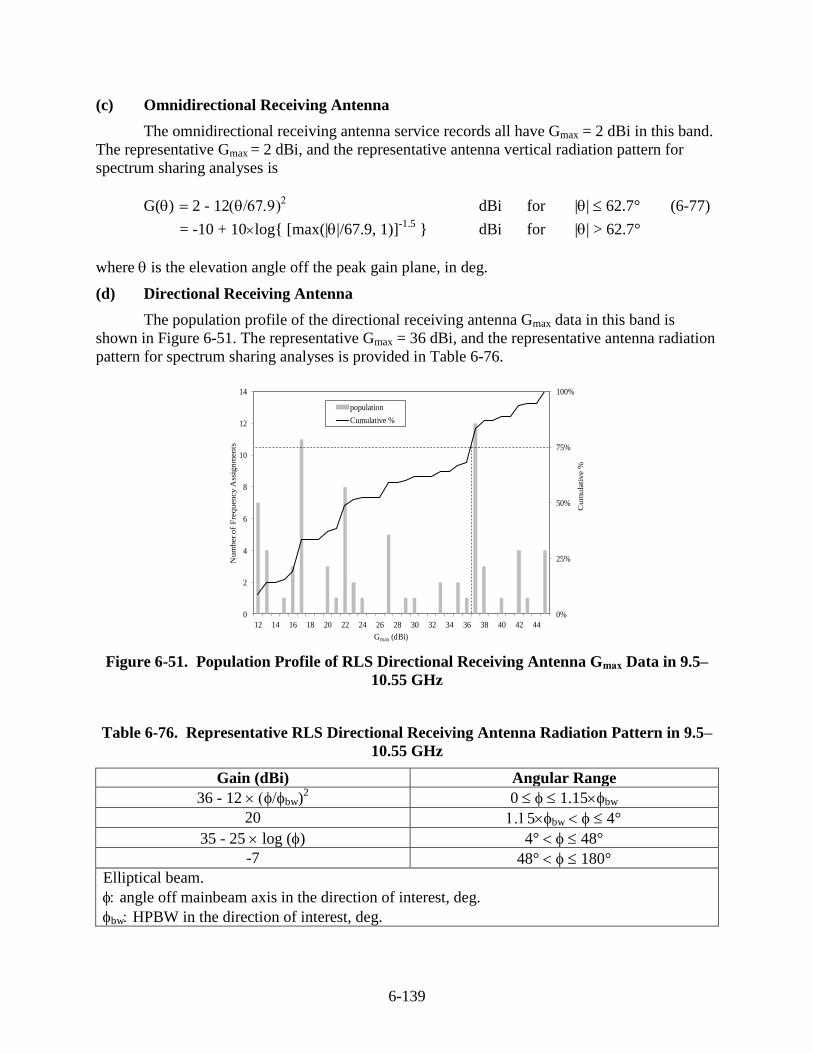
6-139
(c) Omnidirectional Receiving Antenna
The omnidirectional receiving antenna service records all have Gmax = 2 dBi in this band.
The representative Gmax = 2 dBi, and the representative antenna vertical radiation pattern for
spectrum sharing analyses is
G() 2 - 12 dBi for || 62.7° (6-77)
= -10 + 10log{ [max(||/67.9, 1)]-1.5
} dBi for || > 62.7°
where is the elevation angle off the peak gain plane, in deg.
(d) Directional Receiving Antenna
The population profile of the directional receiving antenna Gmax data in this band is
shown in Figure 6-51. The representative Gmax = 36 dBi, and the representative antenna radiation
pattern for spectrum sharing analyses is provided in Table 6-76.
0%
25%
50%
75%
100%
0
2
4
6
8
10
12
14
12 14 16 18 20 22 24 26 28 30 32 34 36 38 40 42 44
Cum
ula
tive %
Num
ber of
Fre
quency A
ssig
nm
ents
Gmax (dBi)
population
Cumulative %
Figure 6-51. Population Profile of RLS Directional Receiving Antenna Gmax Data in 9.5–
10.55 GHz
Table 6-76. Representative RLS Directional Receiving Antenna Radiation Pattern in 9.5–
10.55 GHz
Gain (dBi) Angular Range
36 - 12 bw)2 0 1.15bw
20 5bw 4°
35 - 25 log () 4° 48°
-7 48° 180°
Elliptical beam.
angle off mainbeam axis in the direction of interest, deg.
bw HPBW in the direction of interest, deg.
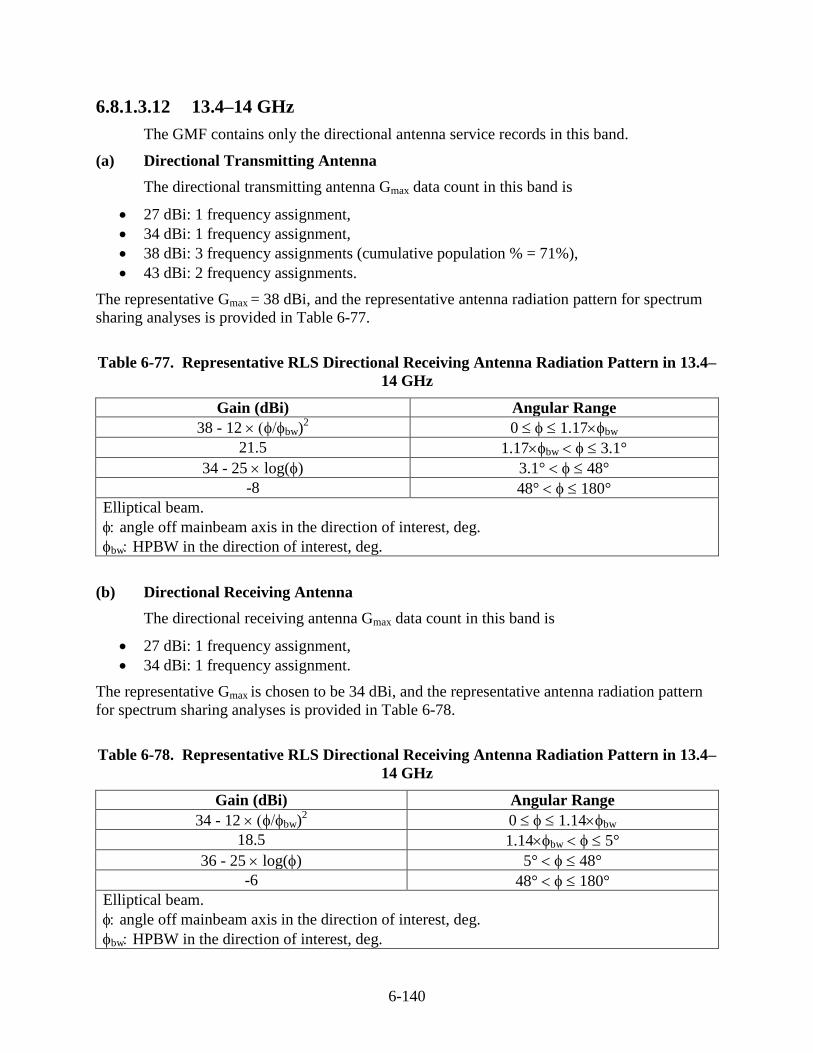
6-140
6.8.1.3.12 13.4–14 GHz
The GMF contains only the directional antenna service records in this band.
(a) Directional Transmitting Antenna
The directional transmitting antenna Gmax data count in this band is
27 dBi: 1 frequency assignment,
34 dBi: 1 frequency assignment,
38 dBi: 3 frequency assignments (cumulative population % = 71%),
43 dBi: 2 frequency assignments.
The representative Gmax = 38 dBi, and the representative antenna radiation pattern for spectrum
sharing analyses is provided in Table 6-77.
Table 6-77. Representative RLS Directional Receiving Antenna Radiation Pattern in 13.4–
14 GHz
Gain (dBi) Angular Range
38 - 12 bw)2 0 1.17bw
21.5 1.17bw 3.1°
34 - 25 log() 3.1° 48°
-8 48° 180°
Elliptical beam.
angle off mainbeam axis in the direction of interest, deg.
bw HPBW in the direction of interest, deg.
(b) Directional Receiving Antenna
The directional receiving antenna Gmax data count in this band is
27 dBi: 1 frequency assignment,
34 dBi: 1 frequency assignment.
The representative Gmax is chosen to be 34 dBi, and the representative antenna radiation pattern
for spectrum sharing analyses is provided in Table 6-78.
Table 6-78. Representative RLS Directional Receiving Antenna Radiation Pattern in 13.4–
14 GHz
Gain (dBi) Angular Range
34 - 12 bw)2 0 1.14bw
18.5 1.14bw 5°
36 - 25 log() 5° 48°
-6 48° 180°
Elliptical beam.
angle off mainbeam axis in the direction of interest, deg.
bw HPBW in the direction of interest, deg.
6-141
6.8.1.3.13 15.7–17.3 GHz
The GMF contains both the omnidirectional and directional antenna service records in
this band.
(a) Omnidirectional Transmitting Antenna
The omnidirectional transmitting antenna Gmax data count in this band is
0 dBi: 2 frequency assignments (cumulative population % = 67%),
2 dBi: 1 frequency assignment.
The representative Gmax = 0 dBi, and the representative antenna vertical radiation pattern for
spectrum sharing analyses is
G() -12 dBi for || 99.4° (6-78)
= -12 + 10log{ [max(||/107.6, 1)]-1.5
} dBi for || > 99.4°
where is the elevation angle off the peak gain plane, in deg.
(b) Directional Transmitting Antenna
The population profile of the directional transmitting antenna Gmax data in this band is
shown in Figure 6-52. The representative Gmax = 43 dBi, and the representative antenna radiation
pattern for spectrum sharing analyses is provided in Table 6-79.
0%
25%
50%
75%
100%
0
10
20
30
40
50
60
70
31 32 33 34 35 36 37 38 39 40 41 42 43 44 45
Cu
mu
lati
ve %
Nu
mb
er o
f F
req
uen
cy
Ass
ign
men
ts
Gmax (dBi)
population
Cumulative %
Figure 6-52. Population Profile of RLS Directional Transmitting Antenna Gmax Data in
15.7–17.3 GHz
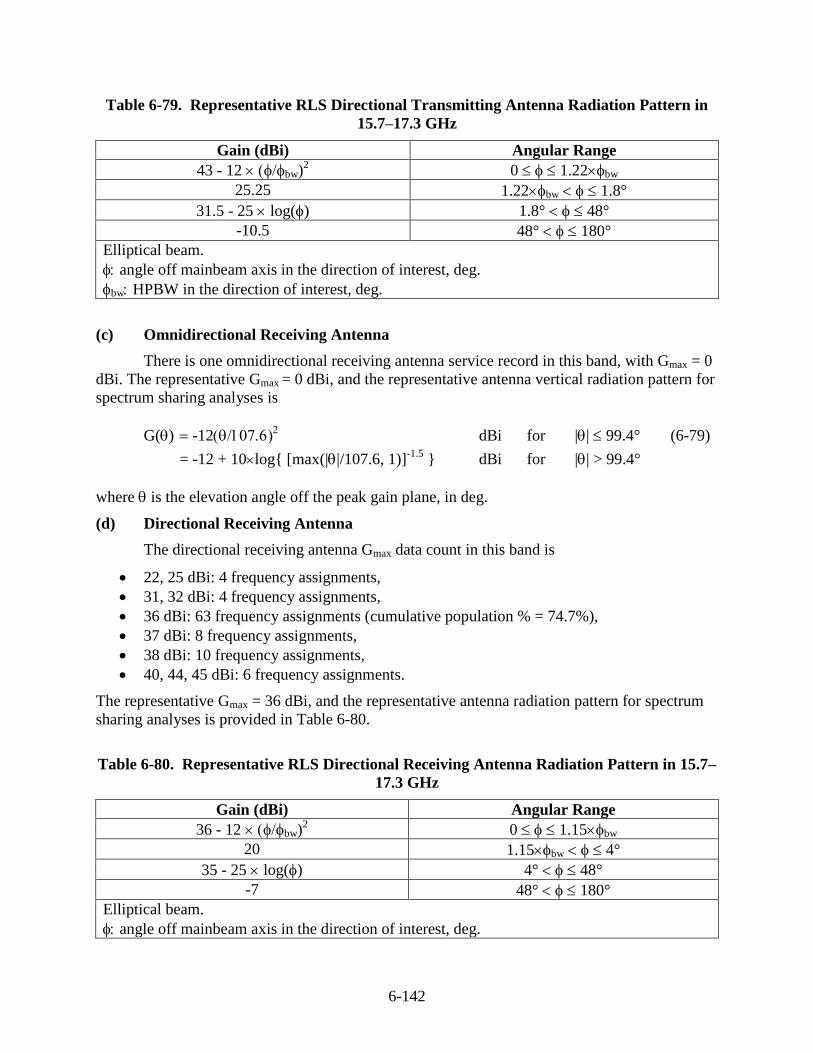
6-142
Table 6-79. Representative RLS Directional Transmitting Antenna Radiation Pattern in
15.7–17.3 GHz
Gain (dBi) Angular Range
43 - 12 bw)2 0 1.22bw
25.25 1.22bw 1.8°
31.5 - 25 log() 1.8° 48°
-10.5 48° 180°
Elliptical beam.
angle off mainbeam axis in the direction of interest, deg.
bw HPBW in the direction of interest, deg.
(c) Omnidirectional Receiving Antenna
There is one omnidirectional receiving antenna service record in this band, with Gmax = 0
dBi. The representative Gmax = 0 dBi, and the representative antenna vertical radiation pattern for
spectrum sharing analyses is
G() -12 dBi for || 99.4° (6-79)
= -12 + 10log{ [max(||/107.6, 1)]-1.5
} dBi for || > 99.4°
where is the elevation angle off the peak gain plane, in deg.
(d) Directional Receiving Antenna
The directional receiving antenna Gmax data count in this band is
22, 25 dBi: 4 frequency assignments,
31, 32 dBi: 4 frequency assignments,
36 dBi: 63 frequency assignments (cumulative population % = 74.7%),
37 dBi: 8 frequency assignments,
38 dBi: 10 frequency assignments,
40, 44, 45 dBi: 6 frequency assignments.
The representative Gmax = 36 dBi, and the representative antenna radiation pattern for spectrum
sharing analyses is provided in Table 6-80.
Table 6-80. Representative RLS Directional Receiving Antenna Radiation Pattern in 15.7–
17.3 GHz
Gain (dBi) Angular Range
36 - 12 bw)2 0 1.15bw
20 1.15bw 4°
35 - 25 log() 4° 48°
-7 48° 180°
Elliptical beam.
angle off mainbeam axis in the direction of interest, deg.
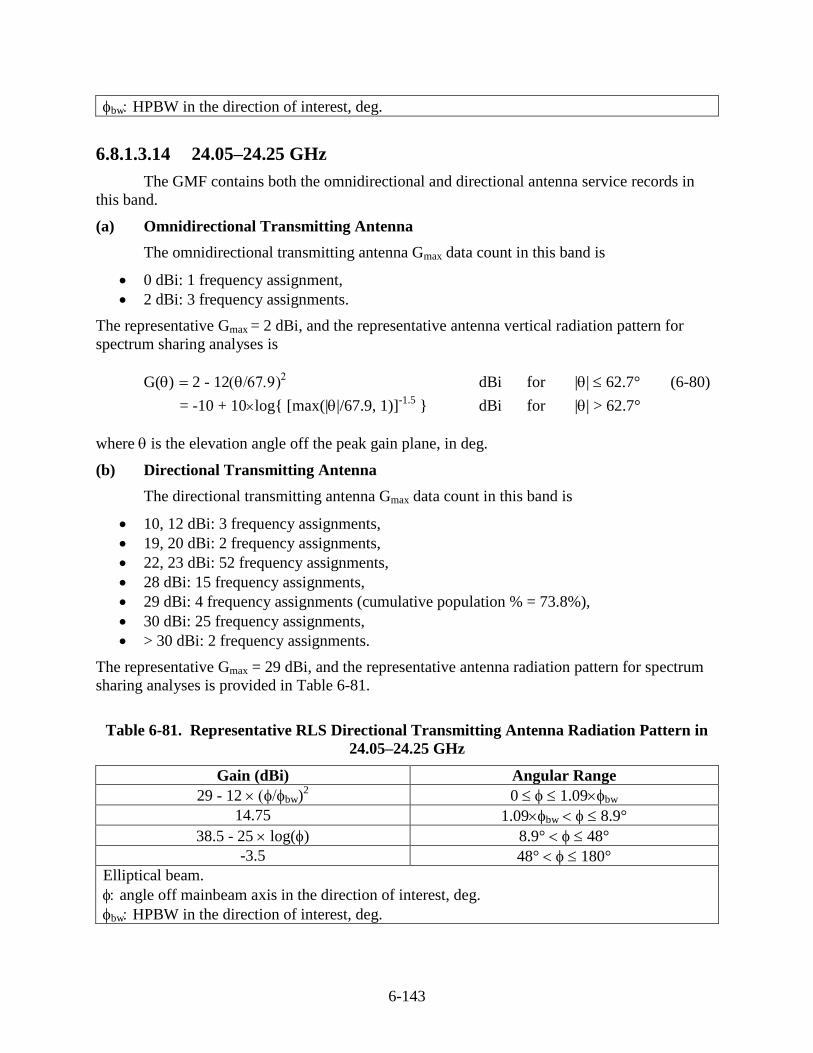
6-143
bw HPBW in the direction of interest, deg.
6.8.1.3.14 24.05–24.25 GHz
The GMF contains both the omnidirectional and directional antenna service records in
this band.
(a) Omnidirectional Transmitting Antenna
The omnidirectional transmitting antenna Gmax data count in this band is
0 dBi: 1 frequency assignment,
2 dBi: 3 frequency assignments.
The representative Gmax = 2 dBi, and the representative antenna vertical radiation pattern for
spectrum sharing analyses is
G() 2 - 12 dBi for || 62.7° (6-80)
= -10 + 10log{ [max(||/67.9, 1)]-1.5
} dBi for || > 62.7°
where is the elevation angle off the peak gain plane, in deg.
(b) Directional Transmitting Antenna
The directional transmitting antenna Gmax data count in this band is
10, 12 dBi: 3 frequency assignments,
19, 20 dBi: 2 frequency assignments,
22, 23 dBi: 52 frequency assignments,
28 dBi: 15 frequency assignments,
29 dBi: 4 frequency assignments (cumulative population % = 73.8%),
30 dBi: 25 frequency assignments,
> 30 dBi: 2 frequency assignments.
The representative Gmax = 29 dBi, and the representative antenna radiation pattern for spectrum
sharing analyses is provided in Table 6-81.
Table 6-81. Representative RLS Directional Transmitting Antenna Radiation Pattern in
24.05–24.25 GHz
Gain (dBi) Angular Range
29 - 12 bw)2 0 1.09bw
14.75 1.09bw 8.9°
38.5 - 25 log() 8.9° 48°
-3.5 48° 180°
Elliptical beam.
angle off mainbeam axis in the direction of interest, deg.
bw HPBW in the direction of interest, deg.
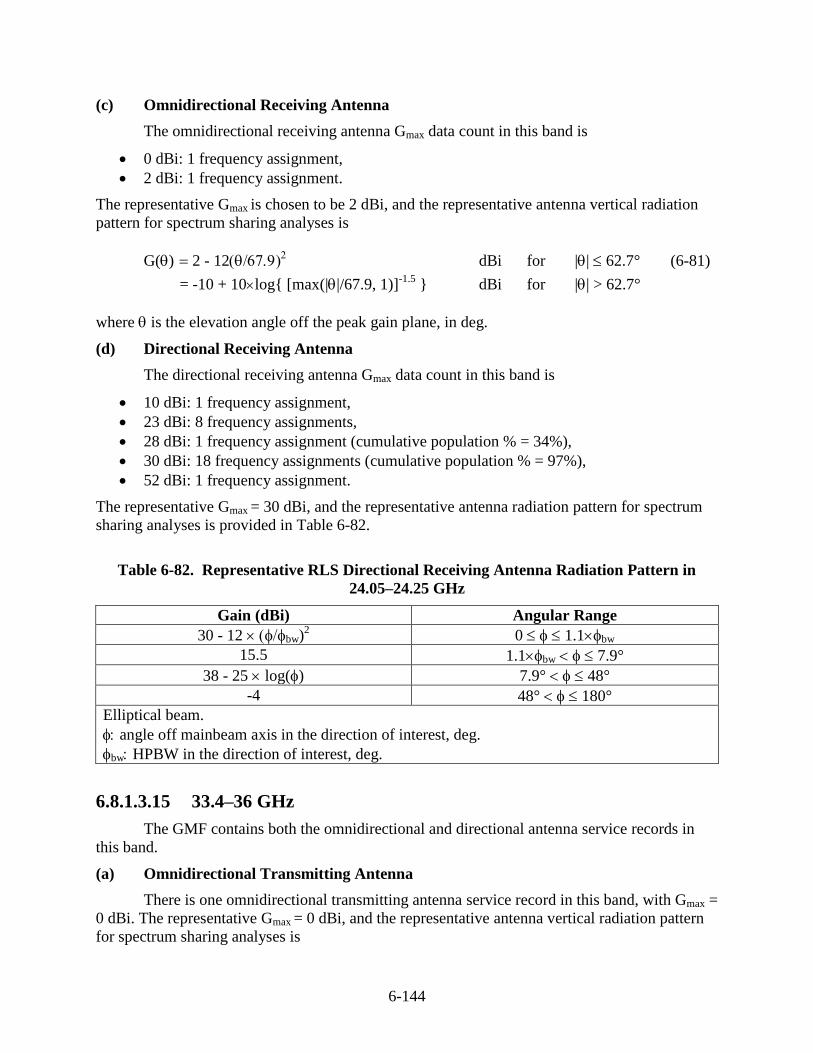
6-144
(c) Omnidirectional Receiving Antenna
The omnidirectional receiving antenna Gmax data count in this band is
0 dBi: 1 frequency assignment,
2 dBi: 1 frequency assignment.
The representative Gmax is chosen to be 2 dBi, and the representative antenna vertical radiation
pattern for spectrum sharing analyses is
G() 2 - 12 dBi for || 62.7° (6-81)
= -10 + 10log{ [max(||/67.9, 1)]-1.5
} dBi for || > 62.7°
where is the elevation angle off the peak gain plane, in deg.
(d) Directional Receiving Antenna
The directional receiving antenna Gmax data count in this band is
10 dBi: 1 frequency assignment,
23 dBi: 8 frequency assignments,
28 dBi: 1 frequency assignment (cumulative population % = 34%),
30 dBi: 18 frequency assignments (cumulative population % = 97%),
52 dBi: 1 frequency assignment.
The representative Gmax = 30 dBi, and the representative antenna radiation pattern for spectrum
sharing analyses is provided in Table 6-82.
Table 6-82. Representative RLS Directional Receiving Antenna Radiation Pattern in
24.05–24.25 GHz
Gain (dBi) Angular Range
30 - 12 bw)2 0 1.1bw
15.5 1.1bw 7.9°
38 - 25 log() 7.9° 48°
-4 48° 180°
Elliptical beam.
angle off mainbeam axis in the direction of interest, deg.
bw HPBW in the direction of interest, deg.
6.8.1.3.15 33.4–36 GHz
The GMF contains both the omnidirectional and directional antenna service records in
this band.
(a) Omnidirectional Transmitting Antenna
There is one omnidirectional transmitting antenna service record in this band, with Gmax =
0 dBi. The representative Gmax = 0 dBi, and the representative antenna vertical radiation pattern
for spectrum sharing analyses is
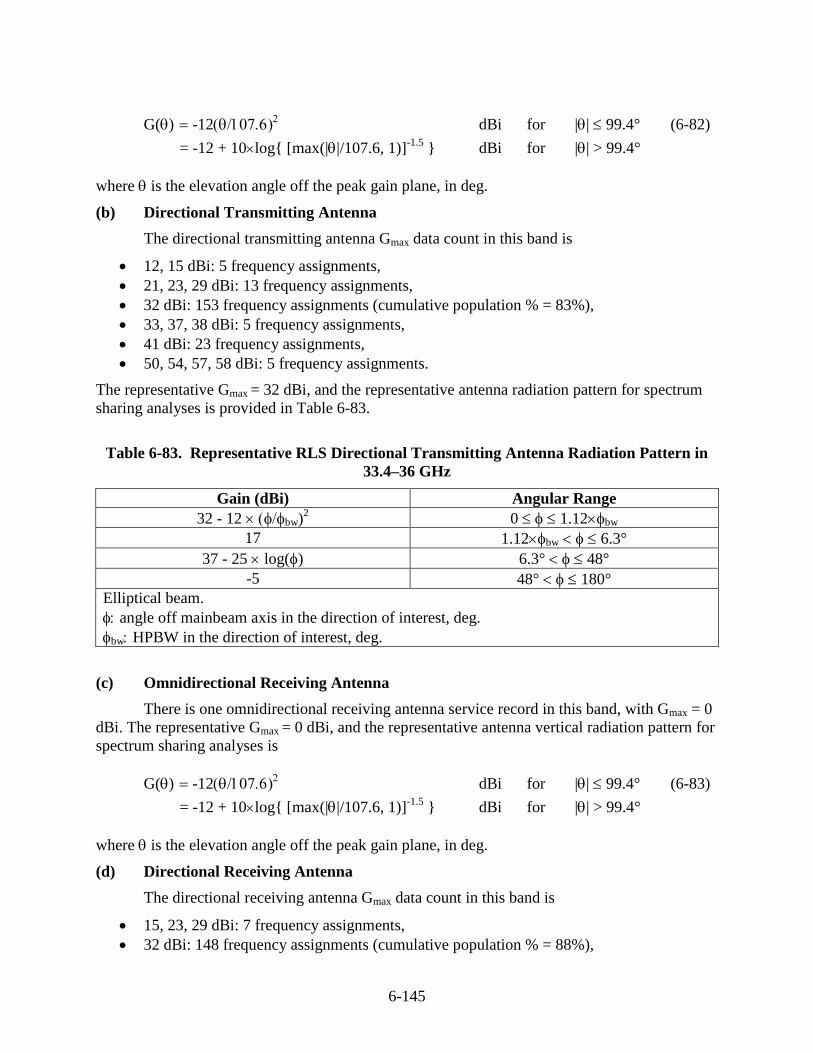
6-145
G() -12 dBi for || 99.4° (6-82)
= -12 + 10log{ [max(||/107.6, 1)]-1.5
} dBi for || > 99.4°
where is the elevation angle off the peak gain plane, in deg.
(b) Directional Transmitting Antenna
The directional transmitting antenna Gmax data count in this band is
12, 15 dBi: 5 frequency assignments,
21, 23, 29 dBi: 13 frequency assignments,
32 dBi: 153 frequency assignments (cumulative population % = 83%),
33, 37, 38 dBi: 5 frequency assignments,
41 dBi: 23 frequency assignments,
50, 54, 57, 58 dBi: 5 frequency assignments.
The representative Gmax = 32 dBi, and the representative antenna radiation pattern for spectrum
sharing analyses is provided in Table 6-83.
Table 6-83. Representative RLS Directional Transmitting Antenna Radiation Pattern in
33.4–36 GHz
Gain (dBi) Angular Range
32 - 12 bw)2 0 1.12bw
17 1.12bw 6.3°
37 - 25 log() 6.3° 48°
-5 48° 180°
Elliptical beam.
angle off mainbeam axis in the direction of interest, deg.
bw HPBW in the direction of interest, deg.
(c) Omnidirectional Receiving Antenna
There is one omnidirectional receiving antenna service record in this band, with Gmax = 0
dBi. The representative Gmax = 0 dBi, and the representative antenna vertical radiation pattern for
spectrum sharing analyses is
G() -12 dBi for || 99.4° (6-83)
= -12 + 10log{ [max(||/107.6, 1)]-1.5
} dBi for || > 99.4°
where is the elevation angle off the peak gain plane, in deg.
(d) Directional Receiving Antenna
The directional receiving antenna Gmax data count in this band is
15, 23, 29 dBi: 7 frequency assignments,
32 dBi: 148 frequency assignments (cumulative population % = 88%),
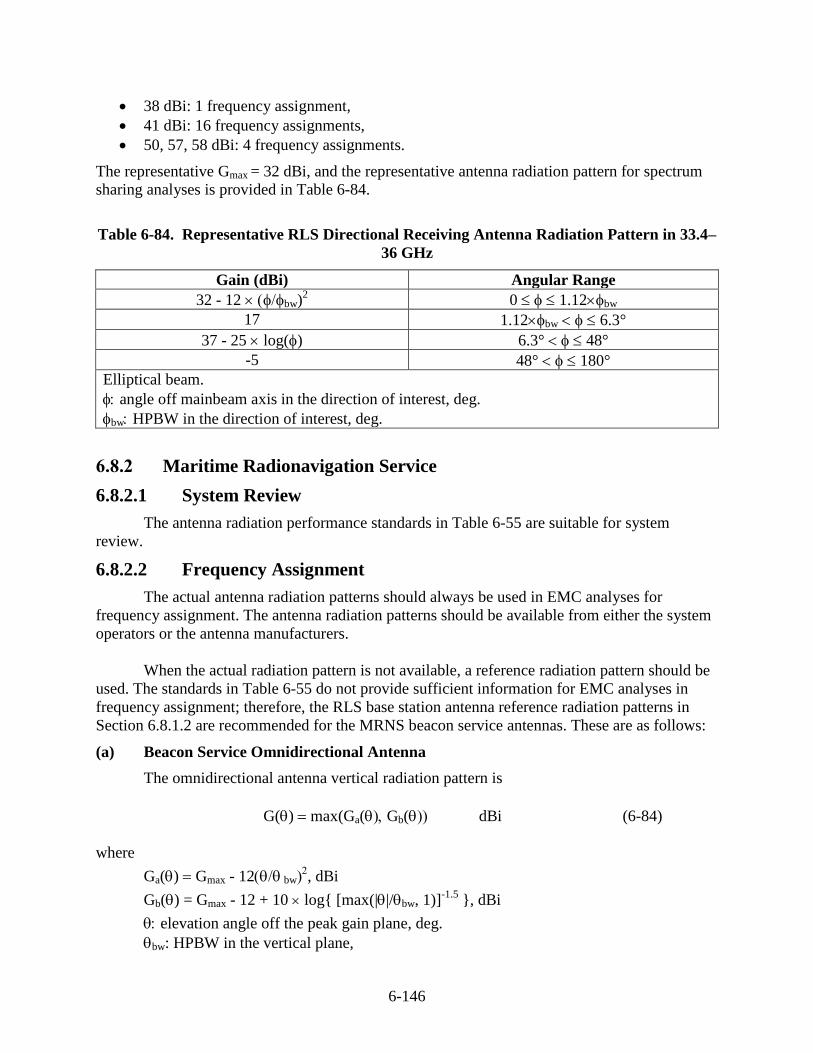
6-146
38 dBi: 1 frequency assignment,
41 dBi: 16 frequency assignments,
50, 57, 58 dBi: 4 frequency assignments.
The representative Gmax = 32 dBi, and the representative antenna radiation pattern for spectrum
sharing analyses is provided in Table 6-84.
Table 6-84. Representative RLS Directional Receiving Antenna Radiation Pattern in 33.4–
36 GHz
Gain (dBi) Angular Range
32 - 12 bw)2 0 1.12bw
17 1.12bw 6.3°
37 - 25 log() 6.3° 48°
-5 48° 180°
Elliptical beam.
angle off mainbeam axis in the direction of interest, deg.
bw HPBW in the direction of interest, deg.
6.8.2 Maritime Radionavigation Service
6.8.2.1 System Review
The antenna radiation performance standards in Table 6-55 are suitable for system
review.
6.8.2.2 Frequency Assignment
The actual antenna radiation patterns should always be used in EMC analyses for
frequency assignment. The antenna radiation patterns should be available from either the system
operators or the antenna manufacturers.
When the actual radiation pattern is not available, a reference radiation pattern should be
used. The standards in Table 6-55 do not provide sufficient information for EMC analyses in
frequency assignment; therefore, the RLS base station antenna reference radiation patterns in
Section 6.8.1.2 are recommended for the MRNS beacon service antennas. These are as follows:
(a) Beacon Service Omnidirectional Antenna
The omnidirectional antenna vertical radiation pattern is
G() max(Ga(Gb( dBi (6-84)
where
Ga() Gmax - 12 bw, dBi
Gb() = Gmax - 12 + 10 log{ [max(||/bw, 1)]-1.5
}, dBi
elevation angle off the peak gain plane, deg.
bw: HPBW in the vertical plane,
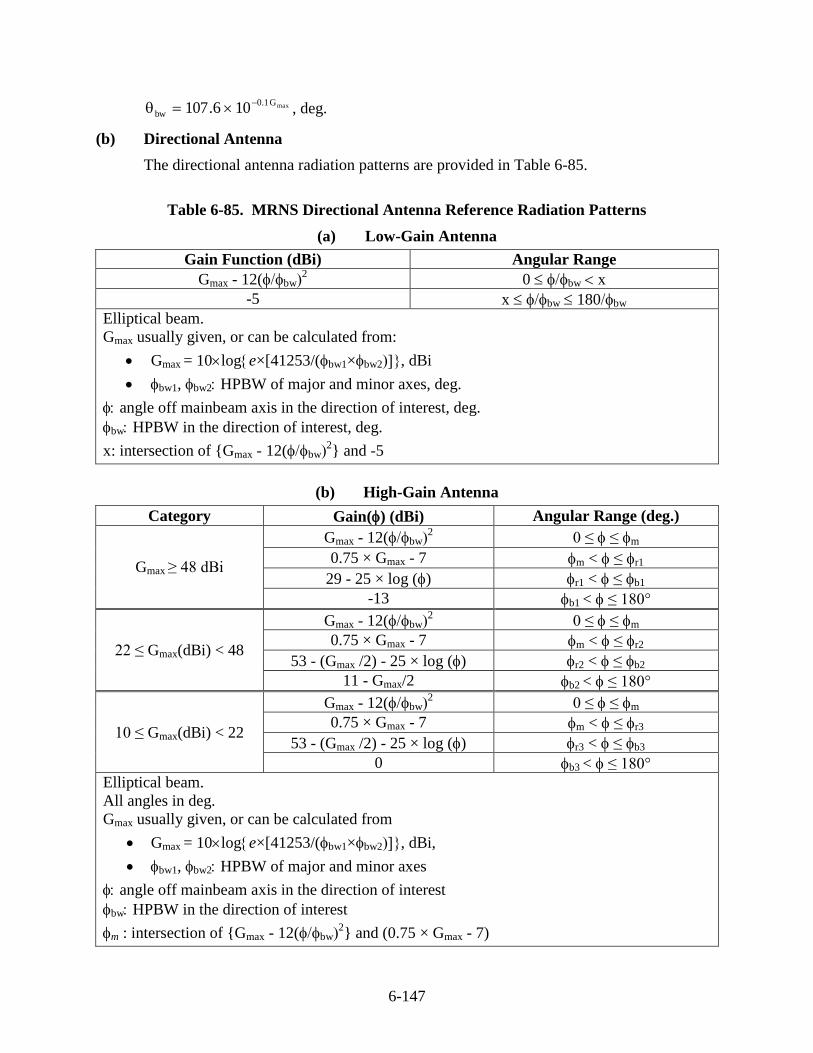
6-147
maxG1.0
bw 106.107
, deg.
(b) Directional Antenna
The directional antenna radiation patterns are provided in Table 6-85.
Table 6-85. MRNS Directional Antenna Reference Radiation Patterns
(a) Low-Gain Antenna
Gain Function (dBi) Angular Range
Gmax - 12(bw2 0 bw x
-5 x bw 180bw
Elliptical beam.
Gmax usually given, or can be calculated from:
Gmax = 10loge×[41253/(bw1×bw2, dBi
bw1, bw2 HPBW of major and minor axes, deg.
angle off mainbeam axis in the direction of interest, deg.
bw HPBW in the direction of interest, deg.
x: intersection of {Gmax - 12(bw2} and -5
(b) High-Gain Antenna
Category Gain() (dBi) Angular Range (deg.)
Gmax ≥ 48 dBi
Gmax - 12(bw2 0 ≤ ≤ m
0.75 × Gmax - 7 m < ≤ r1
29 - 25 × log () r1 < ≤ b1
-13 b1 < ≤ 180°
22 ≤ Gmax(dBi) < 48
Gmax - 12(bw2 0 ≤ ≤ m
0.75 × Gmax - 7 m < ≤ r2
53 - (Gmax /2) - 25 × log () r2 < ≤ b2
11 - Gmax/2 b2 < ≤ 180°
10 ≤ Gmax(dBi) < 22
Gmax - 12(bw2 0 ≤ ≤ m
0.75 × Gmax - 7 m < ≤ r3
53 - (Gmax /2) - 25 × log () r3 < ≤ b3
0 b3 < ≤ 180°
Elliptical beam.
All angles in deg.
Gmax usually given, or can be calculated from
Gmax = 10loge×[41253/(bw1×bw2, dBi,
bw1, bw2 HPBW of major and minor axes
angle off mainbeam axis in the direction of interest
bw HPBW in the direction of interest
m : intersection of {Gmax - 12(bw2} and (0.75 × Gmax - 7)
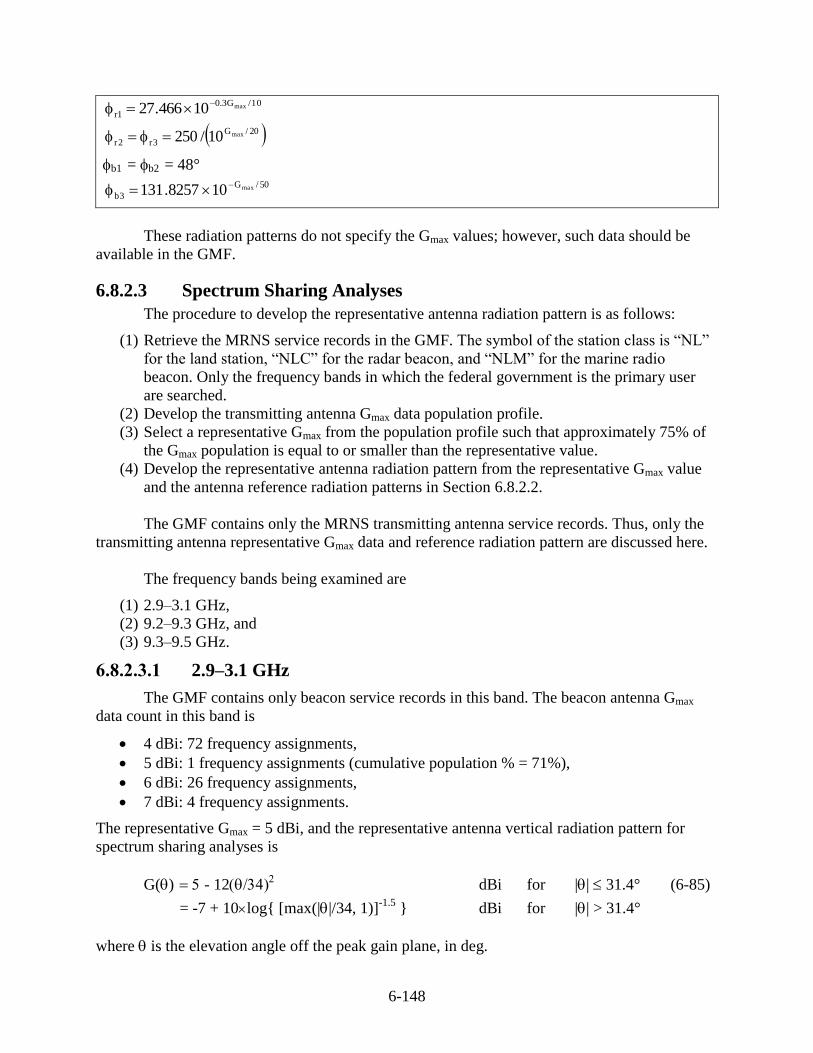
6-148
10/G3.0
1rmax10466.27
20/G
3r2rmax10/250
b1 = b2 = 48° 50/G
3bmax108257.131
These radiation patterns do not specify the Gmax values; however, such data should be
available in the GMF.
6.8.2.3 Spectrum Sharing Analyses
The procedure to develop the representative antenna radiation pattern is as follows:
(1) Retrieve the MRNS service records in the GMF. The symbol of the station class is “NL”
for the land station, “NLC” for the radar beacon, and “NLM” for the marine radio
beacon. Only the frequency bands in which the federal government is the primary user
are searched.
(2) Develop the transmitting antenna Gmax data population profile.
(3) Select a representative Gmax from the population profile such that approximately 75% of
the Gmax population is equal to or smaller than the representative value.
(4) Develop the representative antenna radiation pattern from the representative Gmax value
and the antenna reference radiation patterns in Section 6.8.2.2.
The GMF contains only the MRNS transmitting antenna service records. Thus, only the
transmitting antenna representative Gmax data and reference radiation pattern are discussed here.
The frequency bands being examined are
(1) 2.9–3.1 GHz,
(2) 9.2–9.3 GHz, and
(3) 9.3–9.5 GHz.
6.8.2.3.1 2.9–3.1 GHz
The GMF contains only beacon service records in this band. The beacon antenna Gmax
data count in this band is
4 dBi: 72 frequency assignments,
5 dBi: 1 frequency assignments (cumulative population % = 71%),
6 dBi: 26 frequency assignments,
7 dBi: 4 frequency assignments.
The representative Gmax = 5 dBi, and the representative antenna vertical radiation pattern for
spectrum sharing analyses is
G() - 12 dBi for || 31.4° (6-85)
= -7 + 10log{ [max(||/34, 1)]-1.5
} dBi for || > 31.4°
where is the elevation angle off the peak gain plane, in deg.
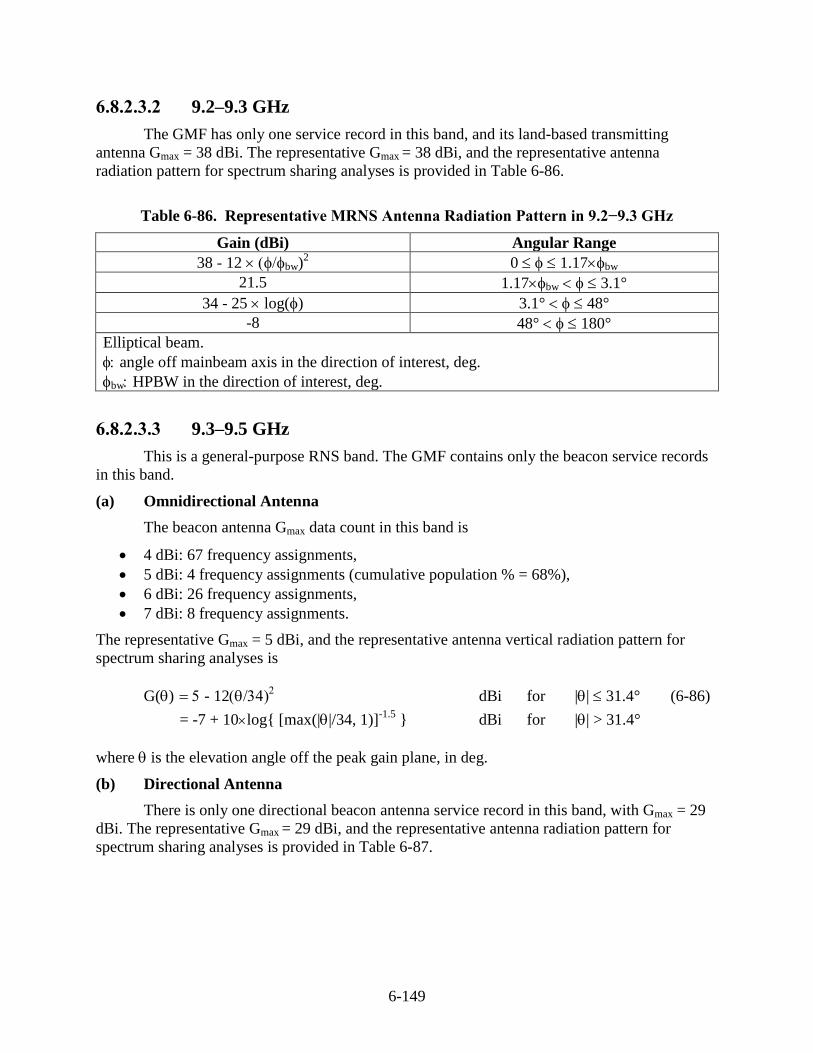
6-149
6.8.2.3.2 9.2–9.3 GHz
The GMF has only one service record in this band, and its land-based transmitting
antenna Gmax = 38 dBi. The representative Gmax = 38 dBi, and the representative antenna
radiation pattern for spectrum sharing analyses is provided in Table 6-86.
Table 6-86. Representative MRNS Antenna Radiation Pattern in 9.2−9.3 GHz
Gain (dBi) Angular Range
38 - 12 bw)2 0 1.17bw
21.5 1.17bw 3.1°
34 - 25 log() 3.1° 48°
-8 48° 180°
Elliptical beam.
angle off mainbeam axis in the direction of interest, deg.
bw HPBW in the direction of interest, deg.
6.8.2.3.3 9.3–9.5 GHz
This is a general-purpose RNS band. The GMF contains only the beacon service records
in this band.
(a) Omnidirectional Antenna
The beacon antenna Gmax data count in this band is
4 dBi: 67 frequency assignments,
5 dBi: 4 frequency assignments (cumulative population % = 68%),
6 dBi: 26 frequency assignments,
7 dBi: 8 frequency assignments.
The representative Gmax = 5 dBi, and the representative antenna vertical radiation pattern for
spectrum sharing analyses is
G() - 12 dBi for || 31.4° (6-86)
= -7 + 10log{ [max(||/34, 1)]-1.5
} dBi for || > 31.4°
where is the elevation angle off the peak gain plane, in deg.
(b) Directional Antenna
There is only one directional beacon antenna service record in this band, with Gmax = 29
dBi. The representative Gmax = 29 dBi, and the representative antenna radiation pattern for
spectrum sharing analyses is provided in Table 6-87.
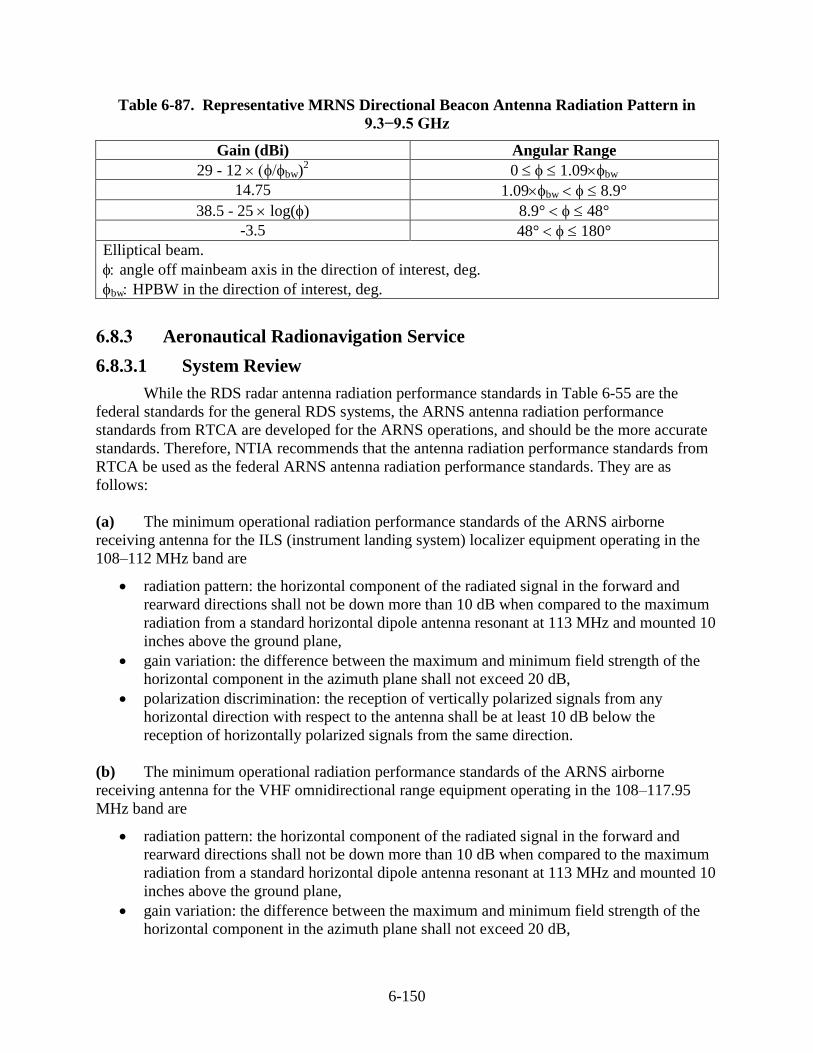
6-150
Table 6-87. Representative MRNS Directional Beacon Antenna Radiation Pattern in
9.3−9.5 GHz
Gain (dBi) Angular Range
29 - 12 bw)2 0 1.09bw
14.75 1.09bw 8.9°
38.5 - 25 log() 8.9° 48°
-3.5 48° 180°
Elliptical beam.
angle off mainbeam axis in the direction of interest, deg.
bw HPBW in the direction of interest, deg.
6.8.3 Aeronautical Radionavigation Service
6.8.3.1 System Review
While the RDS radar antenna radiation performance standards in Table 6-55 are the
federal standards for the general RDS systems, the ARNS antenna radiation performance
standards from RTCA are developed for the ARNS operations, and should be the more accurate
standards. Therefore, NTIA recommends that the antenna radiation performance standards from
RTCA be used as the federal ARNS antenna radiation performance standards. They are as
follows:
(a) The minimum operational radiation performance standards of the ARNS airborne
receiving antenna for the ILS (instrument landing system) localizer equipment operating in the
108–112 MHz band are
radiation pattern: the horizontal component of the radiated signal in the forward and
rearward directions shall not be down more than 10 dB when compared to the maximum
radiation from a standard horizontal dipole antenna resonant at 113 MHz and mounted 10
inches above the ground plane,
gain variation: the difference between the maximum and minimum field strength of the
horizontal component in the azimuth plane shall not exceed 20 dB,
polarization discrimination: the reception of vertically polarized signals from any
horizontal direction with respect to the antenna shall be at least 10 dB below the
reception of horizontally polarized signals from the same direction.
(b) The minimum operational radiation performance standards of the ARNS airborne
receiving antenna for the VHF omnidirectional range equipment operating in the 108–117.95
MHz band are
radiation pattern: the horizontal component of the radiated signal in the forward and
rearward directions shall not be down more than 10 dB when compared to the maximum
radiation from a standard horizontal dipole antenna resonant at 113 MHz and mounted 10
inches above the ground plane,
gain variation: the difference between the maximum and minimum field strength of the
horizontal component in the azimuth plane shall not exceed 20 dB,
6-151
polarization discrimination: the reception of vertically polarized signals from any
horizontal direction with respect to the antenna shall be at least 10 dB below the
reception of horizontally polarized signals from the same direction.
(c) The minimum operational radiation performance standards of the ARNS airborne antenna
for the GPS local area augmentation system operating in the 108–117.975 MHz band are
antenna type: omnidirectional antenna,
horizontal gain:
o the reception of the horizontally polarized component in the horizontal plane from
the forward and rearward directions shall not be down more than 10 dB when
compared to the maximum output response of a standard horizontal dipole
antenna that is mounted 25.4 cm (10 inches) above the ground plane and resonant
at 113 MHz,
o the difference between the maximum and minimum reception of the horizontally
polarized component from any direction in the horizontal plane shall not exceed
20 dB,
vertical gain:
o when mounted on a 4×4 inch2 (or larger) ground plane, the reception of the
vertically polarized component in the horizontal azimuth plane shall not be down
more than 6 dB when compared to a standard vertically polarized monopole
antenna,
o when mounted on a 4×4 inch2 (or larger) ground plane, the difference between the
maximum and minimum reception of the vertical polarized component from any
direction in the horizontal azimuth plane shall not exceed 6 dB.
(d) The minimum operational radiation performance standards of the ARNS airborne
receiving antenna for the ILS glide slope equipment operating in the 328.6–335.4 MHz band are
radiation pattern: the horizontal component of the radiated signal in the forward direction
shall not be down more than 15 dB when compared to the maximum radiation from a
standard horizontal dipole antenna resonant at 332 MHz in free space,
polarization discrimination: the reception of vertically polarized signals from any
horizontal direction with respect to the antenna shall be at least 10 dB below the
reception of horizontally polarized signals from the same direction.
(e) The minimum operational radiation performance standards of the ARNS airborne antenna
for the distance measuring equipment operating in the 960–1215 MHz band are
polarization: predominately vertically polarized,
radiation pattern: the average field strength in the horizontal plane shall be equal to the
field strength of a matched resonant ¼λ vertical antenna,
gain variation: the difference between the maximum and minimum field strengths in the
horizontal plane shall not exceed 6 dB when the antenna is mounted at the center of the
1.2-meter (4-foot) diameter (or larger) flat circular ground plane.
6-152
(f) The minimum operational radiation performance standards of the ARNS airborne antenna
for the air traffic control radar beacon system/mode select equipment operating in the 1030–1090
MHz band are
polarization: vertically polarized,
radiation pattern: the gain shall not be less than the gain of a matched ¼λ stub minus 3
dB over 90% of the coverage volume 0–360º in azimuth and 5–30º in elevation when
installed at the center of a 1.2-meter (4-foot) diameter (or larger) circular ground plane.
(g) The minimum operational radiation performance standards of the ARNS airborne antenna
for the traffic alert and collision avoidance system II transmitting in the 1030 MHz band and
receiving in the 1087–1093 MHz band are
polarization: vertically polarized,
radiation pattern: the gain shall not be less than the gain of a matched ¼λ stub minus 1
dB over 90% of the coverage volume 0–360º in azimuth and (-15)–20º in elevation when
installed at the center of a 1.2-meter (4-foot) diameter (or larger) circular ground plane,
which can be flat or cylindrical.
(h) The minimum operational radiation performance standards of the ARNS airborne antenna
for the active traffic alert and collision avoidance system I transmitting in the 1030 MHz band
and receiving in the 1087–1093 MHz band are
type: omnidirectional antenna or multiple beams to cover all azimuth directions,
polarization: vertically polarized,
radiation pattern: covering 360º in azimuth and at least (-10)–20º in elevation.
(i) The minimum operational radiation performance standards of the ARNS airborne antenna
for the automatic dependent surveillance system and traffic information service system operating
at 1090 MHz are
type: omnidirectional antenna,
polarization: vertically polarized,
transmit radiation pattern: the gain shall not be less than the gain of a matched ¼λ stub
minus 3 dB over 90% of a coverage volume from 0–360º in azimuth and 5–30º above the
ground plane when installed at the center of 1.2 meters (4 feet) or larger flat circular
ground plane,
receive radiation pattern: the gain should not be less than the gain of a matched ¼λ stub
minus 1 dB over 90% of a coverage volume from 0–360º in azimuth and (-15)–(+20)º in
elevation when installed at the center of 1.2 meters (4 feet) or larger circular ground
plane, which can be either flat or cylindrical.
6.8.3.2 Frequency Assignment
The actual antenna radiation patterns should always be used in EMC analyses for
frequency assignment. The antenna radiation patterns should be available from either the system
operators or the antenna manufacturers.
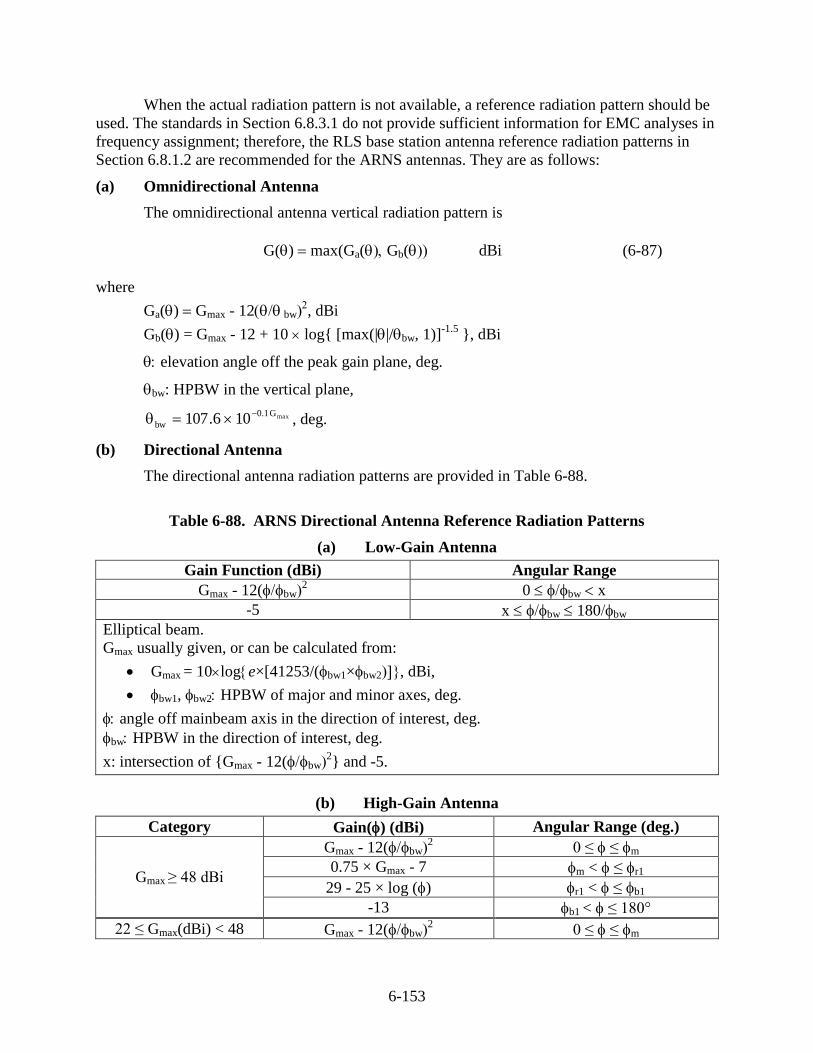
6-153
When the actual radiation pattern is not available, a reference radiation pattern should be
used. The standards in Section 6.8.3.1 do not provide sufficient information for EMC analyses in
frequency assignment; therefore, the RLS base station antenna reference radiation patterns in
Section 6.8.1.2 are recommended for the ARNS antennas. They are as follows:
(a) Omnidirectional Antenna
The omnidirectional antenna vertical radiation pattern is
G() max(Ga(Gb( dBi (6-87)
where
Ga() Gmax - 12 bw, dBi
Gb() = Gmax - 12 + 10 log{ [max(||/bw, 1)]-1.5
}, dBi
elevation angle off the peak gain plane, deg.
bw: HPBW in the vertical plane,
maxG1.0
bw 106.107
, deg.
(b) Directional Antenna
The directional antenna radiation patterns are provided in Table 6-88.
Table 6-88. ARNS Directional Antenna Reference Radiation Patterns
(a) Low-Gain Antenna
Gain Function (dBi) Angular Range
Gmax - 12(bw2 0 bw x
-5 x bw 180bw
Elliptical beam.
Gmax usually given, or can be calculated from:
Gmax = 10loge×[41253/(bw1×bw2, dBi,
bw1, bw2 HPBW of major and minor axes, deg.
angle off mainbeam axis in the direction of interest, deg.
bw HPBW in the direction of interest, deg.
x: intersection of {Gmax - 12(bw2} and -5.
(b) High-Gain Antenna
Category Gain() (dBi) Angular Range (deg.)
Gmax ≥ 48 dBi
Gmax - 12(bw2 0 ≤ ≤ m
0.75 × Gmax - 7 m < ≤ r1
29 - 25 × log () r1 < ≤ b1
-13 b1 < ≤ 180°
22 ≤ Gmax(dBi) < 48 Gmax - 12(bw2 0 ≤ ≤ m
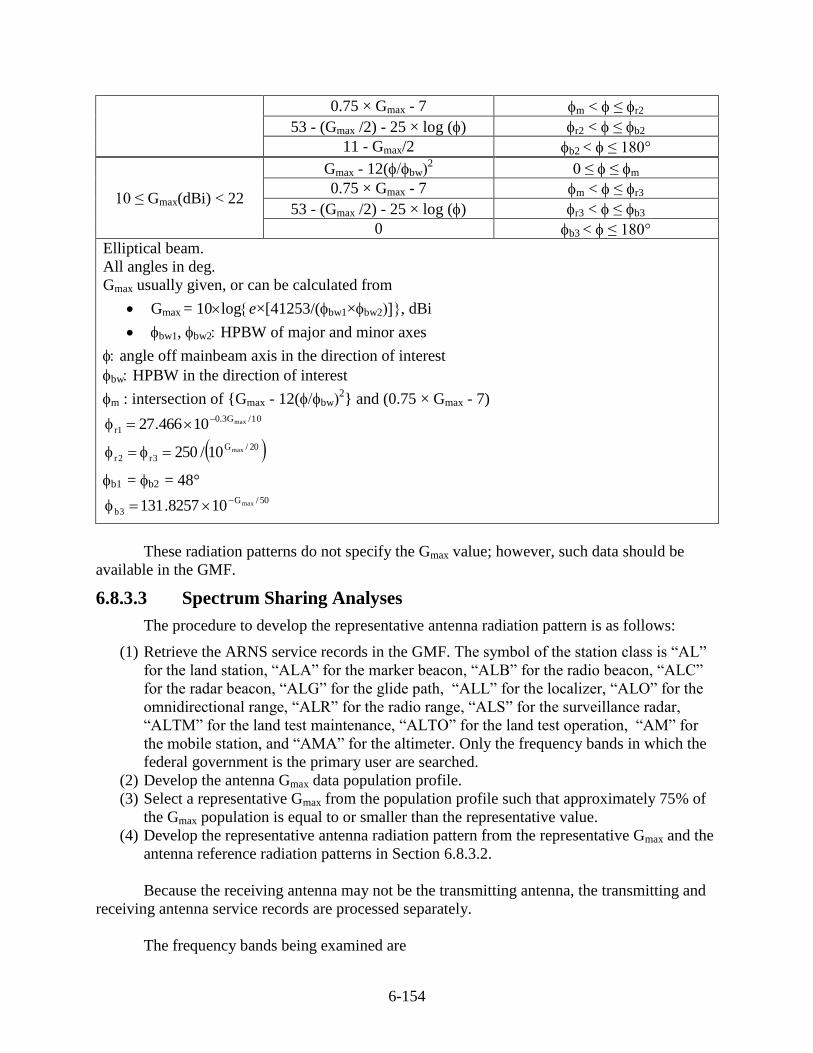
6-154
0.75 × Gmax - 7 m < ≤ r2
53 - (Gmax /2) - 25 × log () r2 < ≤ b2
11 - Gmax/2 b2 < ≤ 180°
10 ≤ Gmax(dBi) < 22
Gmax - 12(bw2 0 ≤ ≤ m
0.75 × Gmax - 7 m < ≤ r3
53 - (Gmax /2) - 25 × log () r3 < ≤ b3
0 b3 < ≤ 180°
Elliptical beam.
All angles in deg.
Gmax usually given, or can be calculated from
Gmax = 10loge×[41253/(bw1×bw2, dBi
bw1, bw2 HPBW of major and minor axes
angle off mainbeam axis in the direction of interest
bw HPBW in the direction of interest
m : intersection of {Gmax - 12(bw2} and (0.75 × Gmax - 7)
10/G3.0
1rmax10466.27
20/G
3r2rmax10/250
b1 = b2 = 48° 50/G
3bmax108257.131
These radiation patterns do not specify the Gmax value; however, such data should be
available in the GMF.
6.8.3.3 Spectrum Sharing Analyses
The procedure to develop the representative antenna radiation pattern is as follows:
(1) Retrieve the ARNS service records in the GMF. The symbol of the station class is “AL”
for the land station, “ALA” for the marker beacon, “ALB” for the radio beacon, “ALC”
for the radar beacon, “ALG” for the glide path, “ALL” for the localizer, “ALO” for the
omnidirectional range, “ALR” for the radio range, “ALS” for the surveillance radar,
“ALTM” for the land test maintenance, “ALTO” for the land test operation, “AM” for
the mobile station, and “AMA” for the altimeter. Only the frequency bands in which the
federal government is the primary user are searched.
(2) Develop the antenna Gmax data population profile.
(3) Select a representative Gmax from the population profile such that approximately 75% of
the Gmax population is equal to or smaller than the representative value.
(4) Develop the representative antenna radiation pattern from the representative Gmax and the
antenna reference radiation patterns in Section 6.8.3.2.
Because the receiving antenna may not be the transmitting antenna, the transmitting and
receiving antenna service records are processed separately.
The frequency bands being examined are
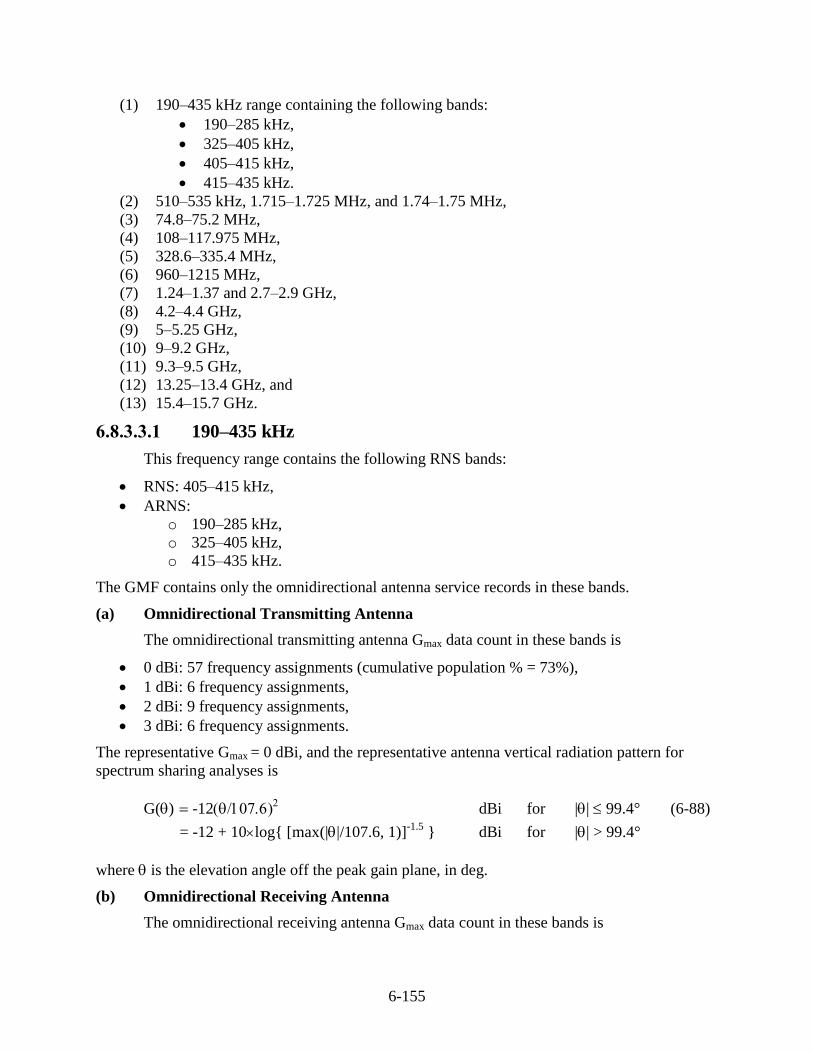
6-155
(1) 190–435 kHz range containing the following bands:
190–285 kHz,
325–405 kHz,
405–415 kHz,
415–435 kHz.
(2) 510–535 kHz, 1.715–1.725 MHz, and 1.74–1.75 MHz,
(3) 74.8–75.2 MHz,
(4) 108–117.975 MHz,
(5) 328.6–335.4 MHz,
(6) 960–1215 MHz,
(7) 1.24–1.37 and 2.7–2.9 GHz,
(8) 4.2–4.4 GHz,
(9) 5–5.25 GHz,
(10) 9–9.2 GHz,
(11) 9.3–9.5 GHz,
(12) 13.25–13.4 GHz, and
(13) 15.4–15.7 GHz.
6.8.3.3.1 190–435 kHz
This frequency range contains the following RNS bands:
RNS: 405–415 kHz,
ARNS:
o 190–285 kHz,
o 325–405 kHz,
o 415–435 kHz.
The GMF contains only the omnidirectional antenna service records in these bands.
(a) Omnidirectional Transmitting Antenna
The omnidirectional transmitting antenna Gmax data count in these bands is
0 dBi: 57 frequency assignments (cumulative population % = 73%),
1 dBi: 6 frequency assignments,
2 dBi: 9 frequency assignments,
3 dBi: 6 frequency assignments.
The representative Gmax = 0 dBi, and the representative antenna vertical radiation pattern for
spectrum sharing analyses is
G() -12 dBi for || 99.4° (6-88)
= -12 + 10log{ [max(||/107.6, 1)]-1.5
} dBi for || > 99.4°
where is the elevation angle off the peak gain plane, in deg.
(b) Omnidirectional Receiving Antenna
The omnidirectional receiving antenna Gmax data count in these bands is
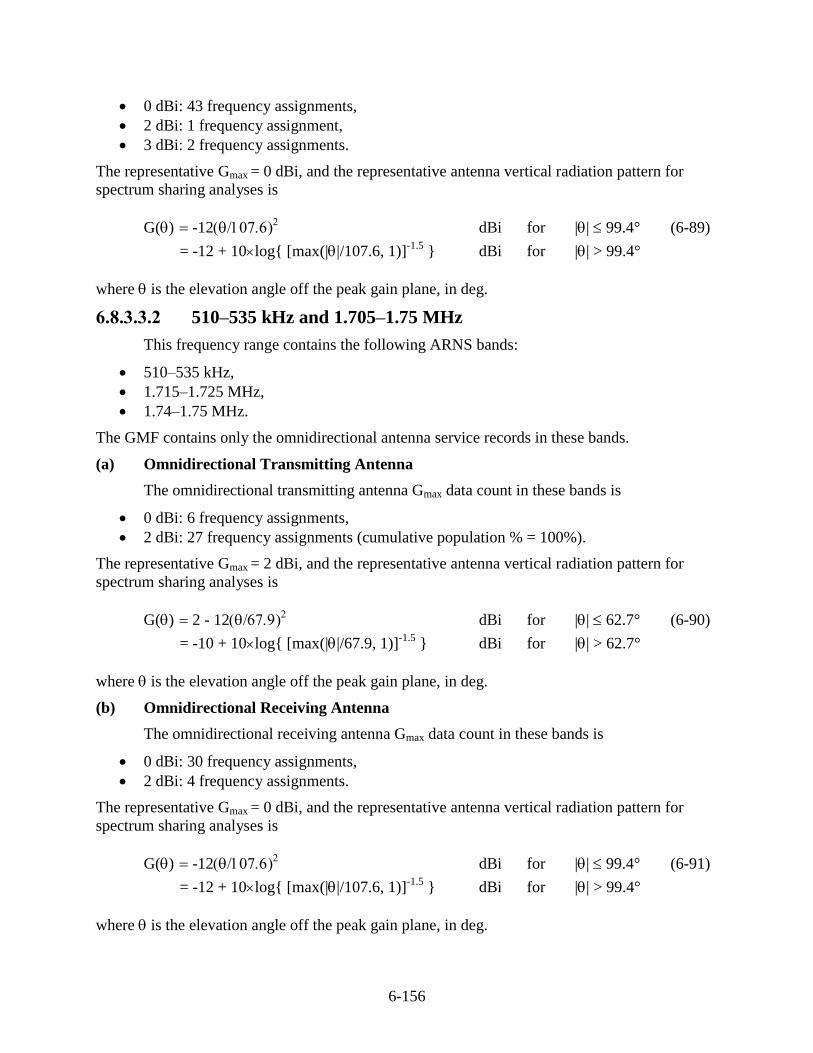
6-156
0 dBi: 43 frequency assignments,
2 dBi: 1 frequency assignment,
3 dBi: 2 frequency assignments.
The representative Gmax = 0 dBi, and the representative antenna vertical radiation pattern for
spectrum sharing analyses is
G() -12 dBi for || 99.4° (6-89)
= -12 + 10log{ [max(||/107.6, 1)]-1.5
} dBi for || > 99.4°
where is the elevation angle off the peak gain plane, in deg.
6.8.3.3.2 510–535 kHz and 1.705–1.75 MHz
This frequency range contains the following ARNS bands:
510–535 kHz,
1.715–1.725 MHz,
1.74–1.75 MHz.
The GMF contains only the omnidirectional antenna service records in these bands.
(a) Omnidirectional Transmitting Antenna
The omnidirectional transmitting antenna Gmax data count in these bands is
0 dBi: 6 frequency assignments,
2 dBi: 27 frequency assignments (cumulative population % = 100%).
The representative Gmax = 2 dBi, and the representative antenna vertical radiation pattern for
spectrum sharing analyses is
G() 2 - 12 dBi for || 62.7° (6-90)
= -10 + 10log{ [max(||/67.9, 1)]-1.5
} dBi for || > 62.7°
where is the elevation angle off the peak gain plane, in deg.
(b) Omnidirectional Receiving Antenna
The omnidirectional receiving antenna Gmax data count in these bands is
0 dBi: 30 frequency assignments,
2 dBi: 4 frequency assignments.
The representative Gmax = 0 dBi, and the representative antenna vertical radiation pattern for
spectrum sharing analyses is
G() -12 dBi for || 99.4° (6-91)
= -12 + 10log{ [max(||/107.6, 1)]-1.5
} dBi for || > 99.4°
where is the elevation angle off the peak gain plane, in deg.
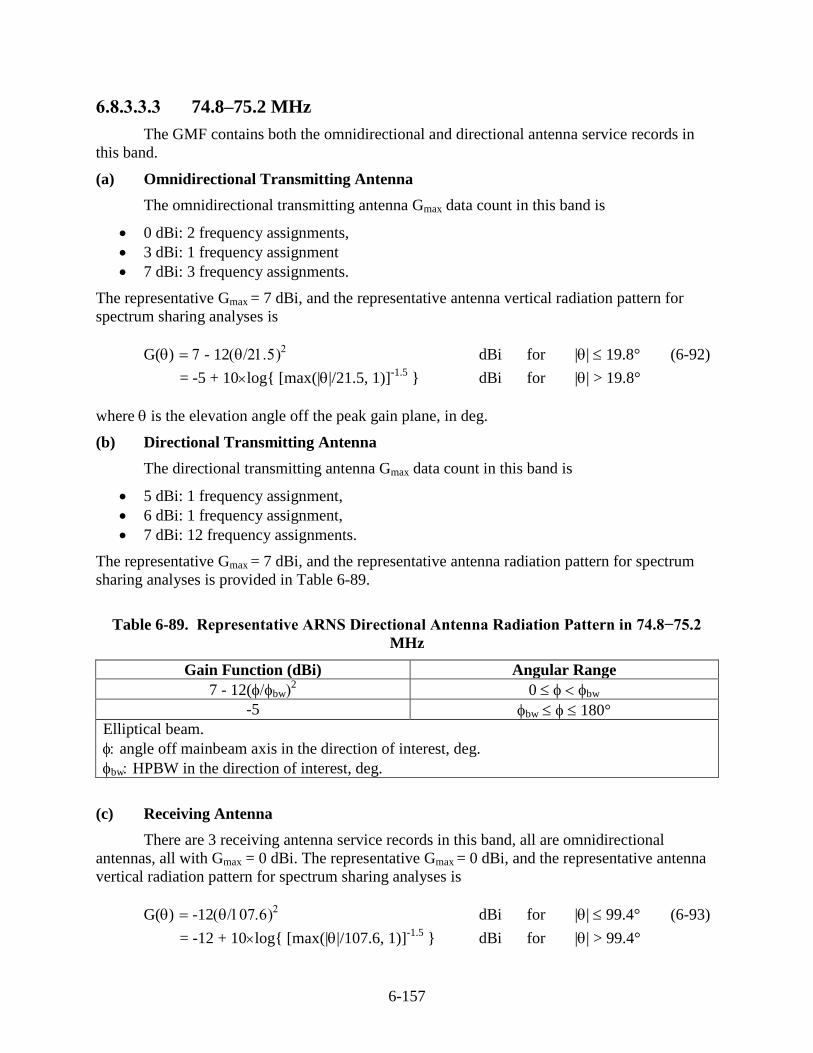
6-157
6.8.3.3.3 74.8–75.2 MHz
The GMF contains both the omnidirectional and directional antenna service records in
this band.
(a) Omnidirectional Transmitting Antenna
The omnidirectional transmitting antenna Gmax data count in this band is
0 dBi: 2 frequency assignments,
3 dBi: 1 frequency assignment
7 dBi: 3 frequency assignments.
The representative Gmax = 7 dBi, and the representative antenna vertical radiation pattern for
spectrum sharing analyses is
G() - 12 dBi for || 19.8° (6-92)
= -5 + 10log{ [max(||/21.5, 1)]-1.5
} dBi for || > 19.8°
where is the elevation angle off the peak gain plane, in deg.
(b) Directional Transmitting Antenna
The directional transmitting antenna Gmax data count in this band is
5 dBi: 1 frequency assignment,
6 dBi: 1 frequency assignment,
7 dBi: 12 frequency assignments.
The representative Gmax = 7 dBi, and the representative antenna radiation pattern for spectrum
sharing analyses is provided in Table 6-89.
Table 6-89. Representative ARNS Directional Antenna Radiation Pattern in 74.8−75.2
MHz
Gain Function (dBi) Angular Range
7 - 12(bw2 0 bw
-5 bw 180°
Elliptical beam.
angle off mainbeam axis in the direction of interest, deg.
bw HPBW in the direction of interest, deg.
(c) Receiving Antenna
There are 3 receiving antenna service records in this band, all are omnidirectional
antennas, all with Gmax = 0 dBi. The representative Gmax = 0 dBi, and the representative antenna
vertical radiation pattern for spectrum sharing analyses is
G() -12 dBi for || 99.4° (6-93)
= -12 + 10log{ [max(||/107.6, 1)]-1.5
} dBi for || > 99.4°
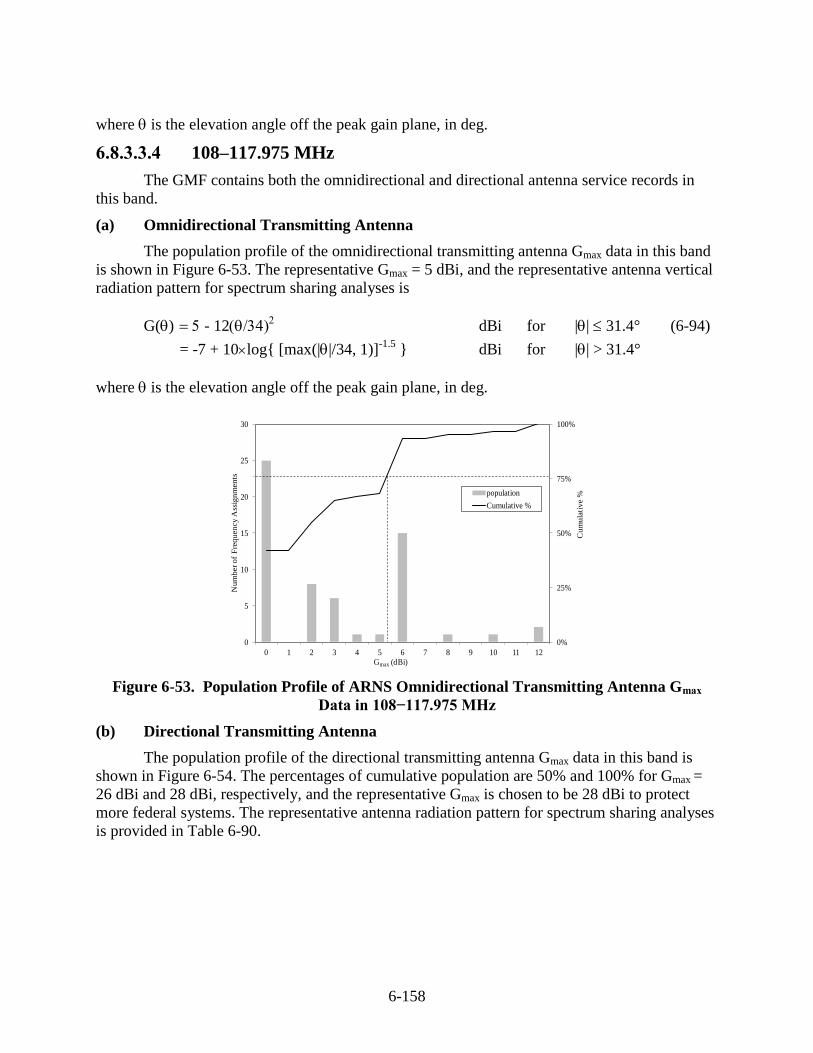
6-158
where is the elevation angle off the peak gain plane, in deg.
6.8.3.3.4 108–117.975 MHz
The GMF contains both the omnidirectional and directional antenna service records in
this band.
(a) Omnidirectional Transmitting Antenna
The population profile of the omnidirectional transmitting antenna Gmax data in this band
is shown in Figure 6-53. The representative Gmax = 5 dBi, and the representative antenna vertical
radiation pattern for spectrum sharing analyses is
G() - 12 dBi for || 31.4° (6-94)
= -7 + 10log{ [max(||/34, 1)]-1.5
} dBi for || > 31.4°
where is the elevation angle off the peak gain plane, in deg.
0%
25%
50%
75%
100%
0
5
10
15
20
25
30
0 1 2 3 4 5 6 7 8 9 10 11 12
Cu
mu
lati
ve %
Num
ber
of
Fre
quency A
ssig
nm
ents
Gmax (dBi)
population
Cumulative %
Figure 6-53. Population Profile of ARNS Omnidirectional Transmitting Antenna Gmax
Data in 108−117.975 MHz
(b) Directional Transmitting Antenna
The population profile of the directional transmitting antenna Gmax data in this band is
shown in Figure 6-54. The percentages of cumulative population are 50% and 100% for Gmax =
26 dBi and 28 dBi, respectively, and the representative Gmax is chosen to be 28 dBi to protect
more federal systems. The representative antenna radiation pattern for spectrum sharing analyses
is provided in Table 6-90.
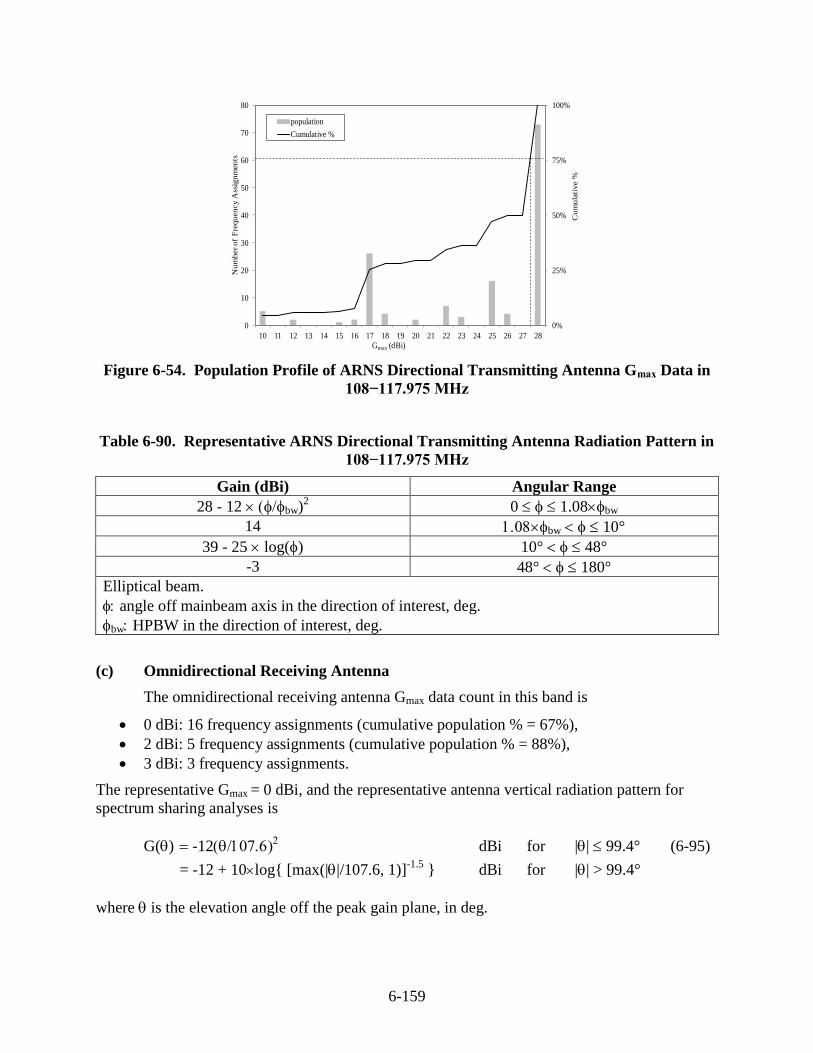
6-159
0%
25%
50%
75%
100%
0
10
20
30
40
50
60
70
80
10 11 12 13 14 15 16 17 18 19 20 21 22 23 24 25 26 27 28
Cum
ula
tive %
Nu
mb
er
of
Fre
qu
en
cy
Ass
ign
men
ts
Gmax (dBi)
population
Cumulative %
Figure 6-54. Population Profile of ARNS Directional Transmitting Antenna Gmax Data in
108−117.975 MHz
Table 6-90. Representative ARNS Directional Transmitting Antenna Radiation Pattern in
108−117.975 MHz
Gain (dBi) Angular Range
28 - 12 bw)2 0 1.08bw
14 bw 10°
39 - 25 log() 10° 48°
-3 48° 180°
Elliptical beam.
angle off mainbeam axis in the direction of interest, deg.
bw HPBW in the direction of interest, deg.
(c) Omnidirectional Receiving Antenna
The omnidirectional receiving antenna Gmax data count in this band is
0 dBi: 16 frequency assignments (cumulative population % = 67%),
2 dBi: 5 frequency assignments (cumulative population % = 88%),
3 dBi: 3 frequency assignments.
The representative Gmax = 0 dBi, and the representative antenna vertical radiation pattern for
spectrum sharing analyses is
G() -12 dBi for || 99.4° (6-95)
= -12 + 10log{ [max(||/107.6, 1)]-1.5
} dBi for || > 99.4°
where is the elevation angle off the peak gain plane, in deg.
6-160
(d) Directional Receiving Antenna
There are 2 directional receiving antenna service records in this band, with both Gmax =
25 dBi. The representative Gmax = 25 dBi, and the representative antenna radiation pattern for
spectrum sharing analyses is provided in Table 6-91.
Table 6-91. Representative ARNS Directional Transmitting Antenna Radiation Pattern in
108−117.975 MHz
Gain (dBi) Angular Range
25 - 12 bw)2 0 1.05bw
11.75 bw 14.1°
40.5 - 25 log () 14.1° 48°
-1.5 48° 180°
Elliptical beam.
angle off mainbeam axis in the direction of interest, deg.
bw HPBW in the direction of interest, deg.
6.8.3.3.5 328.6–335.4 MHz
The GMF contains both the omnidirectional and directional antenna service records in
this band.
(a) Omnidirectional Transmitting Antenna
The omnidirectional transmitting antenna Gmax data count in this band is
0 dBi: 3 frequency assignments,
3, 4 dBi: 8 frequency assignments,
5, 6 dBi: 6 frequency assignments,
8 dBi: 1 frequency assignment (cumulative population % = 45%),
10 dBi: 22 frequency assignments (cumulative population % = 100%).
The representative Gmax = 10 dBi, and the representative antenna vertical radiation pattern for
spectrum sharing analyses is
G() 10 - 12 dBi for || 9.9° (6-96)
= -2 + 10log{ [max(||/10.8, 1)]-1.5
} dBi for || > 9.9°
where is the elevation angle off the peak gain plane, in deg.
(b) Directional Transmitting Antenna
The directional transmitting antenna Gmax data count in this band is
10 dBi: 6 frequency assignments,
12, 13 dBi: 17 frequency assignments,
15 dBi: 2 frequency assignments,
16 dBi: 82 frequency assignments (cumulative population % = 97.3%),
6-161
17, 19, 20 dBi: 3 frequency assignments.
The representative Gmax = 16 dBi, and the representative antenna radiation pattern for spectrum
sharing analyses is provided in Table 6-92.
Table 6-92. Representative ARNS Directional Transmitting Antenna Radiation Pattern in
328.6–335.4 MHz
Gain (dBi) Angular Range
16 - 12 bw)2 0 0.96bw
5 bw 39.6°
45 - 25 log () 39.6° 63.1°
0 63.1° 180°
Elliptical beam.
angle off mainbeam axis in the direction of interest, deg.
bw HPBW in the direction of interest, deg.
(c) Receiving Antenna
The GMF contains only the omnidirectional antenna service records.
The omnidirectional receiving antenna Gmax data count in this band is
0 dBi: 8 frequency assignments,
1 dBi: 1 frequency assignment,
2 dBi: 1 frequency assignment (cumulative population % = 77%),
3 dBi: 2 frequency assignments,
10 dBi: 1 frequency assignment.
The representative Gmax = 2 dBi, and the representative antenna vertical radiation pattern for
spectrum sharing analyses is
G() 2 - 12 dBi for || 62.7° (6-97)
= -10 + 10log{ [max(||/67.9, 1)]-1.5
} dBi for || > 62.7°
where is the elevation angle off the peak gain plane, in deg.
6.8.3.3.6 960–1215 MHz
The GMF contains both the omnidirectional and directional antenna service records in
this band.
(a) Omnidirectional Transmitting Antenna
The population profile of the omnidirectional transmitting antenna Gmax data in this band
is shown in Figure 6-55. The representative Gmax = 4 dBi, and the representative antenna vertical
radiation pattern for spectrum sharing analyses is
G() - 12 dBi for || 39.6° (6-98)
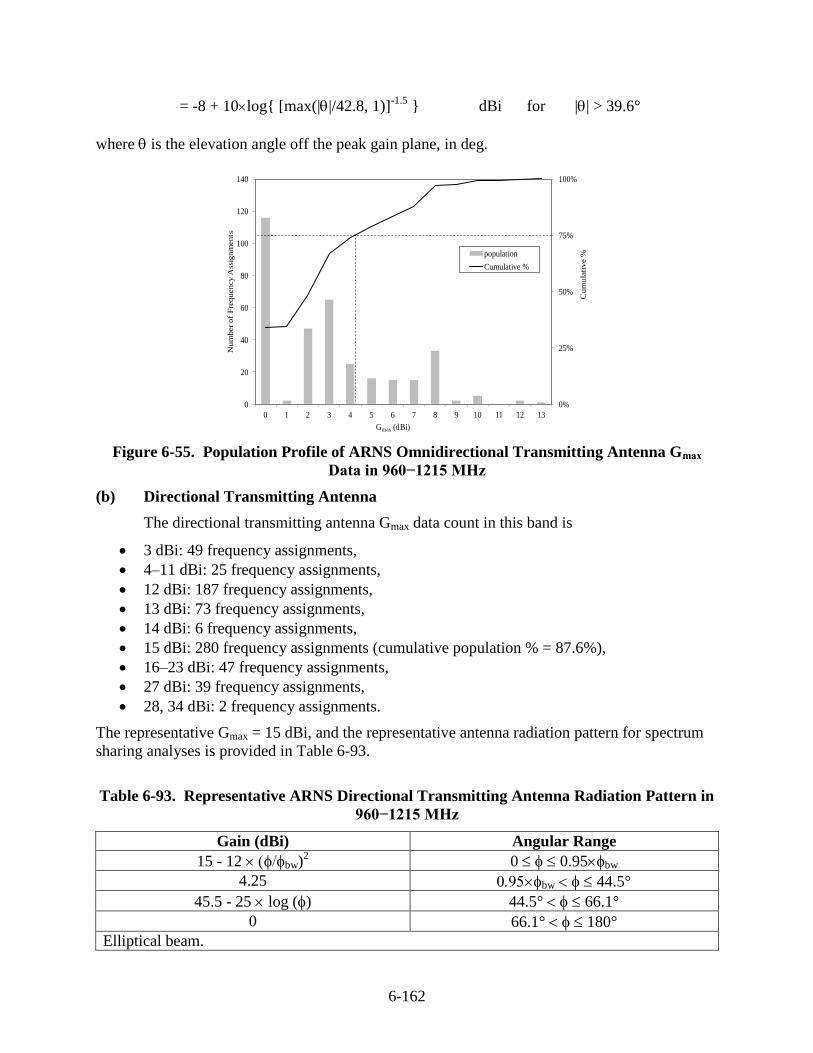
6-162
= -8 + 10log{ [max(||/42.8, 1)]-1.5
} dBi for || > 39.6°
where is the elevation angle off the peak gain plane, in deg.
0%
25%
50%
75%
100%
0
20
40
60
80
100
120
140
0 1 2 3 4 5 6 7 8 9 10 11 12 13
Cu
mu
lati
ve %
Nu
mb
er o
f F
req
uen
cy
Ass
ign
men
ts
Gmax (dBi)
population
Cumulative %
Figure 6-55. Population Profile of ARNS Omnidirectional Transmitting Antenna Gmax
Data in 960−1215 MHz
(b) Directional Transmitting Antenna
The directional transmitting antenna Gmax data count in this band is
3 dBi: 49 frequency assignments,
4–11 dBi: 25 frequency assignments,
12 dBi: 187 frequency assignments,
13 dBi: 73 frequency assignments,
14 dBi: 6 frequency assignments,
15 dBi: 280 frequency assignments (cumulative population % = 87.6%),
16–23 dBi: 47 frequency assignments,
27 dBi: 39 frequency assignments,
28, 34 dBi: 2 frequency assignments.
The representative Gmax = 15 dBi, and the representative antenna radiation pattern for spectrum
sharing analyses is provided in Table 6-93.
Table 6-93. Representative ARNS Directional Transmitting Antenna Radiation Pattern in
960−1215 MHz
Gain (dBi) Angular Range
15 - 12 bw)2 0 0.95bw
4.25 bw 44.5°
45.5 - 25 log () 44.5° 66.1°
0 66.1° 180°
Elliptical beam.
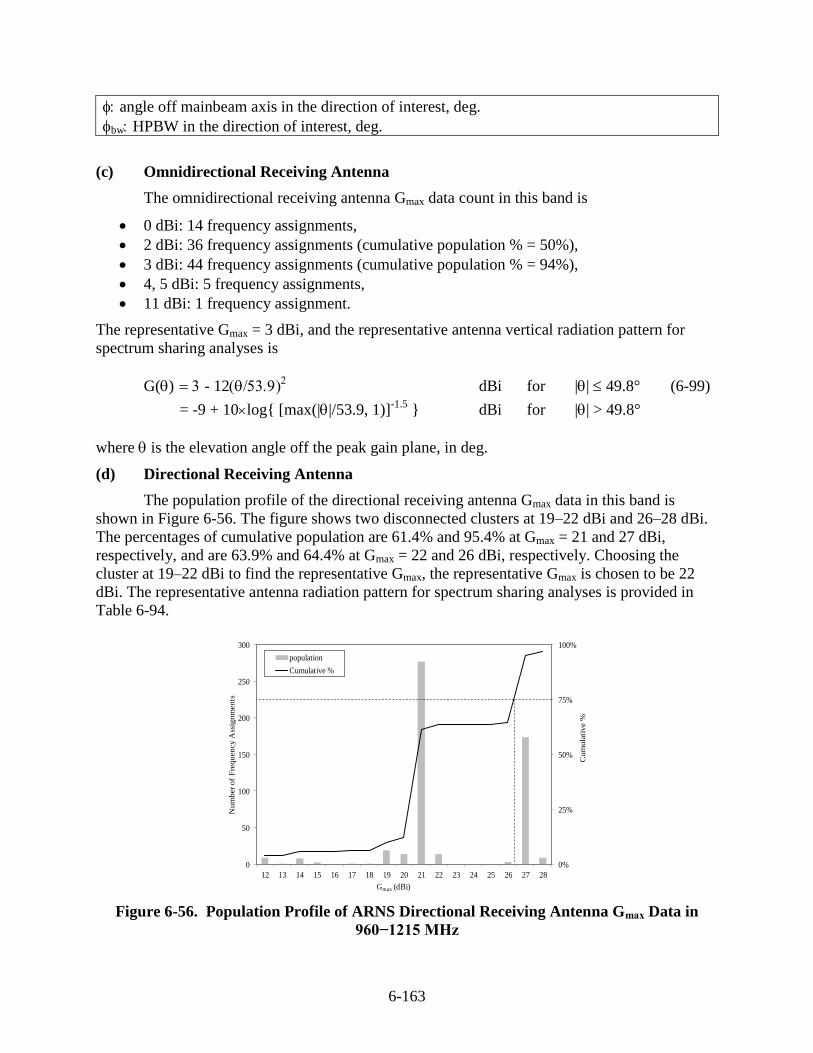
6-163
angle off mainbeam axis in the direction of interest, deg.
bw HPBW in the direction of interest, deg.
(c) Omnidirectional Receiving Antenna
The omnidirectional receiving antenna Gmax data count in this band is
0 dBi: 14 frequency assignments,
2 dBi: 36 frequency assignments (cumulative population % = 50%),
3 dBi: 44 frequency assignments (cumulative population % = 94%),
4, 5 dBi: 5 frequency assignments,
11 dBi: 1 frequency assignment.
The representative Gmax = 3 dBi, and the representative antenna vertical radiation pattern for
spectrum sharing analyses is
G() - 12 dBi for || 49.8° (6-99)
= -9 + 10log{ [max(||/53.9, 1)]-1.5
} dBi for || > 49.8°
where is the elevation angle off the peak gain plane, in deg.
(d) Directional Receiving Antenna
The population profile of the directional receiving antenna Gmax data in this band is
shown in Figure 6-56. The figure shows two disconnected clusters at 19–22 dBi and 26–28 dBi.
The percentages of cumulative population are 61.4% and 95.4% at Gmax = 21 and 27 dBi,
respectively, and are 63.9% and 64.4% at Gmax = 22 and 26 dBi, respectively. Choosing the
cluster at 19–22 dBi to find the representative Gmax, the representative Gmax is chosen to be 22
dBi. The representative antenna radiation pattern for spectrum sharing analyses is provided in
Table 6-94.
0%
25%
50%
75%
100%
0
50
100
150
200
250
300
12 13 14 15 16 17 18 19 20 21 22 23 24 25 26 27 28
Cum
ula
tive %
Num
ber of
Fre
quency A
ssig
nm
ents
Gmax (dBi)
population
Cumulative %
Figure 6-56. Population Profile of ARNS Directional Receiving Antenna Gmax Data in
960−1215 MHz
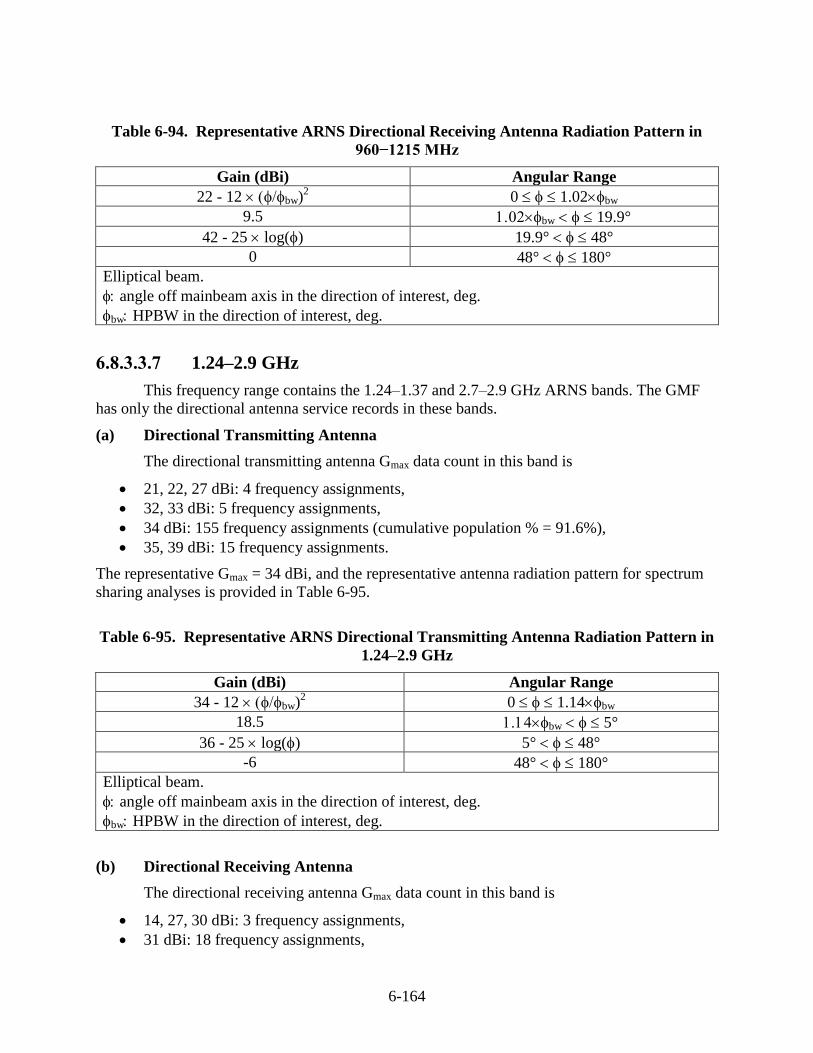
6-164
Table 6-94. Representative ARNS Directional Receiving Antenna Radiation Pattern in
960−1215 MHz
Gain (dBi) Angular Range
22 - 12 bw)2 0 1.02bw
9.5 bw 19.9°
42 - 25 log() 19.9° 48°
0 48° 180°
Elliptical beam.
angle off mainbeam axis in the direction of interest, deg.
bw HPBW in the direction of interest, deg.
6.8.3.3.7 1.24–2.9 GHz
This frequency range contains the 1.24–1.37 and 2.7–2.9 GHz ARNS bands. The GMF
has only the directional antenna service records in these bands.
(a) Directional Transmitting Antenna
The directional transmitting antenna Gmax data count in this band is
21, 22, 27 dBi: 4 frequency assignments,
32, 33 dBi: 5 frequency assignments,
34 dBi: 155 frequency assignments (cumulative population % = 91.6%),
35, 39 dBi: 15 frequency assignments.
The representative Gmax = 34 dBi, and the representative antenna radiation pattern for spectrum
sharing analyses is provided in Table 6-95.
Table 6-95. Representative ARNS Directional Transmitting Antenna Radiation Pattern in
1.24–2.9 GHz
Gain (dBi) Angular Range
34 - 12 bw)2 0 1.14bw
18.5 bw 5°
36 - 25 log() 5° 48°
-6 48° 180°
Elliptical beam.
angle off mainbeam axis in the direction of interest, deg.
bw HPBW in the direction of interest, deg.
(b) Directional Receiving Antenna
The directional receiving antenna Gmax data count in this band is
14, 27, 30 dBi: 3 frequency assignments,
31 dBi: 18 frequency assignments,
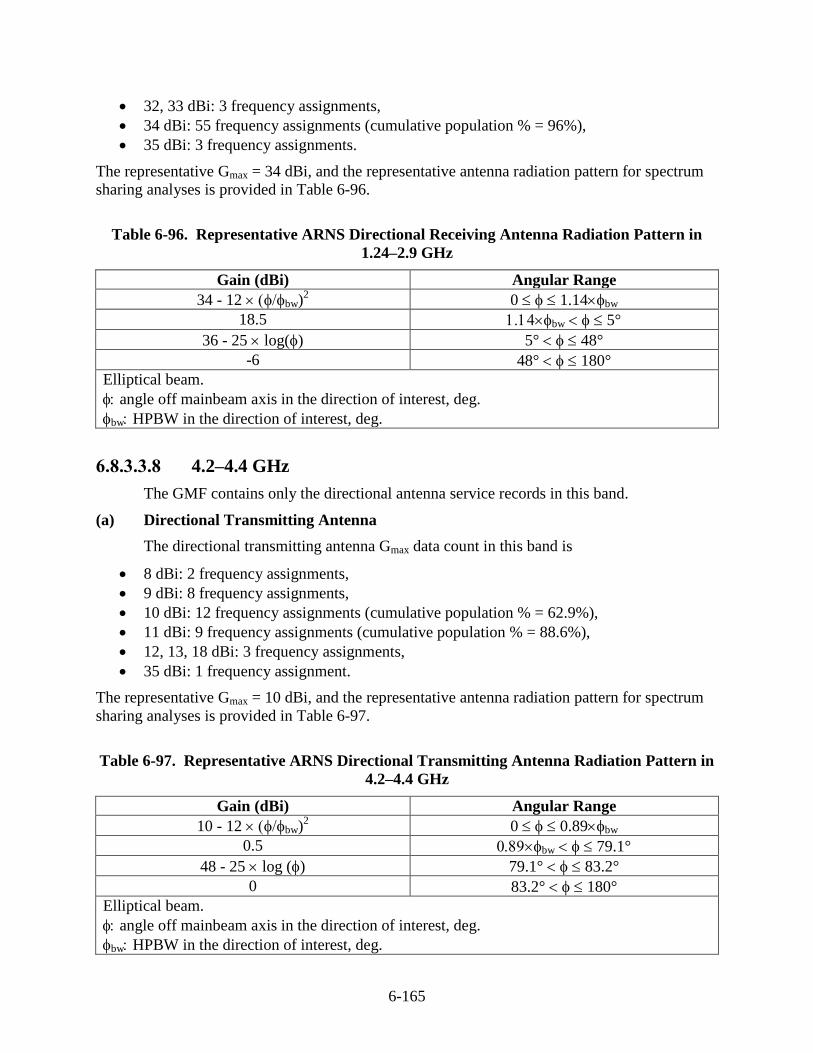
6-165
32, 33 dBi: 3 frequency assignments,
34 dBi: 55 frequency assignments (cumulative population % = 96%),
35 dBi: 3 frequency assignments.
The representative Gmax = 34 dBi, and the representative antenna radiation pattern for spectrum
sharing analyses is provided in Table 6-96.
Table 6-96. Representative ARNS Directional Receiving Antenna Radiation Pattern in
1.24–2.9 GHz
Gain (dBi) Angular Range
34 - 12 bw)2 0 1.14bw
18.5 bw 5°
36 - 25 log() 5° 48°
-6 48° 180°
Elliptical beam.
angle off mainbeam axis in the direction of interest, deg.
bw HPBW in the direction of interest, deg.
6.8.3.3.8 4.2–4.4 GHz
The GMF contains only the directional antenna service records in this band.
(a) Directional Transmitting Antenna
The directional transmitting antenna Gmax data count in this band is
8 dBi: 2 frequency assignments,
9 dBi: 8 frequency assignments,
10 dBi: 12 frequency assignments (cumulative population % = 62.9%),
11 dBi: 9 frequency assignments (cumulative population % = 88.6%),
12, 13, 18 dBi: 3 frequency assignments,
35 dBi: 1 frequency assignment.
The representative Gmax = 10 dBi, and the representative antenna radiation pattern for spectrum
sharing analyses is provided in Table 6-97.
Table 6-97. Representative ARNS Directional Transmitting Antenna Radiation Pattern in
4.2–4.4 GHz
Gain (dBi) Angular Range
10 - 12 bw)2 0 0.89bw
0.5 bw 79.1°
48 - 25 log () 79.1° 83.2°
0 83.2° 180°
Elliptical beam.
angle off mainbeam axis in the direction of interest, deg.
bw HPBW in the direction of interest, deg.
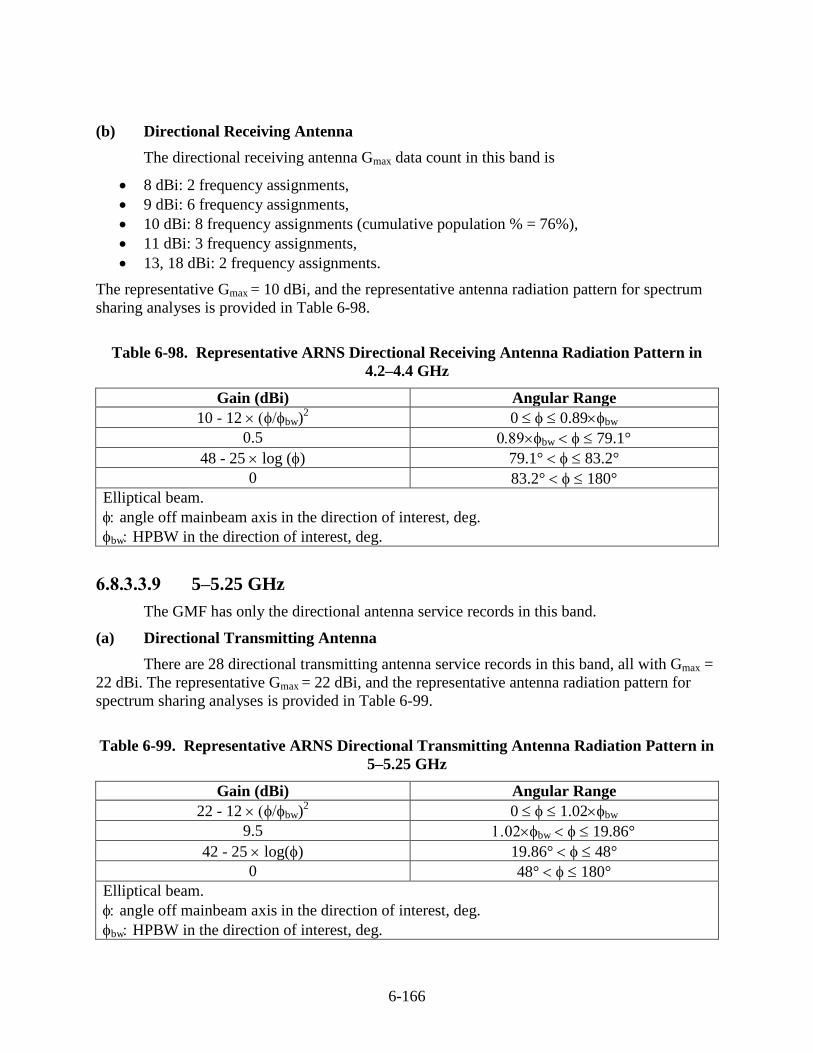
6-166
(b) Directional Receiving Antenna
The directional receiving antenna Gmax data count in this band is
8 dBi: 2 frequency assignments,
9 dBi: 6 frequency assignments,
10 dBi: 8 frequency assignments (cumulative population % = 76%),
11 dBi: 3 frequency assignments,
13, 18 dBi: 2 frequency assignments.
The representative Gmax = 10 dBi, and the representative antenna radiation pattern for spectrum
sharing analyses is provided in Table 6-98.
Table 6-98. Representative ARNS Directional Receiving Antenna Radiation Pattern in
4.2–4.4 GHz
Gain (dBi) Angular Range
10 - 12 bw)2 0 0.89bw
0.5 bw 79.1°
48 - 25 log () 79.1° 83.2°
0 83.2° 180°
Elliptical beam.
angle off mainbeam axis in the direction of interest, deg.
bw HPBW in the direction of interest, deg.
6.8.3.3.9 5–5.25 GHz
The GMF has only the directional antenna service records in this band.
(a) Directional Transmitting Antenna
There are 28 directional transmitting antenna service records in this band, all with Gmax =
22 dBi. The representative Gmax = 22 dBi, and the representative antenna radiation pattern for
spectrum sharing analyses is provided in Table 6-99.
Table 6-99. Representative ARNS Directional Transmitting Antenna Radiation Pattern in
5–5.25 GHz
Gain (dBi) Angular Range
22 - 12 bw)2 0 1.02bw
9.5 bw 19.86°
42 - 25 log() 19.86° 48°
0 48° 180°
Elliptical beam.
angle off mainbeam axis in the direction of interest, deg.
bw HPBW in the direction of interest, deg.
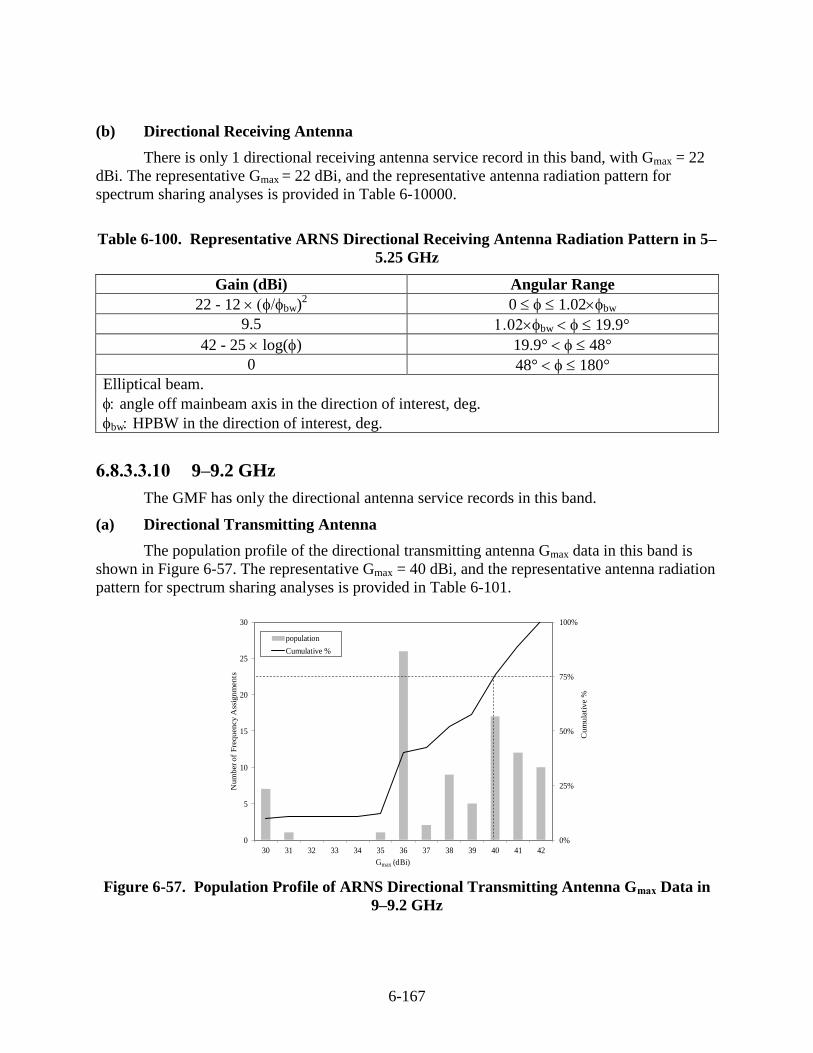
6-167
(b) Directional Receiving Antenna
There is only 1 directional receiving antenna service record in this band, with Gmax = 22
dBi. The representative Gmax = 22 dBi, and the representative antenna radiation pattern for
spectrum sharing analyses is provided in Table 6-10000.
Table 6-100. Representative ARNS Directional Receiving Antenna Radiation Pattern in 5–
5.25 GHz
Gain (dBi) Angular Range
22 - 12 bw)2 0 1.02bw
9.5 bw 19.9°
42 - 25 log() 19.9° 48°
0 48° 180°
Elliptical beam.
angle off mainbeam axis in the direction of interest, deg.
bw HPBW in the direction of interest, deg.
6.8.3.3.10 9–9.2 GHz
The GMF has only the directional antenna service records in this band.
(a) Directional Transmitting Antenna
The population profile of the directional transmitting antenna Gmax data in this band is
shown in Figure 6-57. The representative Gmax = 40 dBi, and the representative antenna radiation
pattern for spectrum sharing analyses is provided in Table 6-101.
0%
25%
50%
75%
100%
0
5
10
15
20
25
30
30 31 32 33 34 35 36 37 38 39 40 41 42
Cu
mu
lati
ve %
Nu
mb
er o
f F
req
uen
cy
Ass
ign
men
ts
Gmax (dBi)
population
Cumulative %
Figure 6-57. Population Profile of ARNS Directional Transmitting Antenna Gmax Data in
9–9.2 GHz
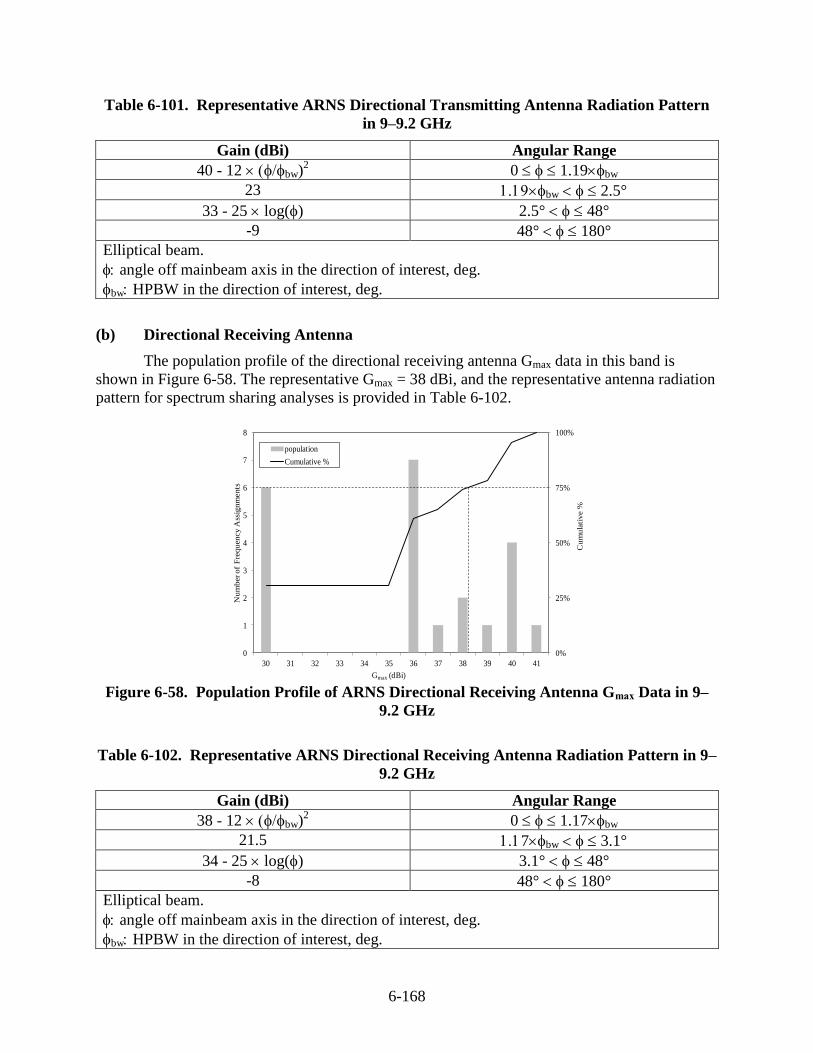
6-168
Table 6-101. Representative ARNS Directional Transmitting Antenna Radiation Pattern
in 9–9.2 GHz
Gain (dBi) Angular Range
40 - 12 bw)2 0 1.19bw
23 bw 2.5°
33 - 25 log() 2.5° 48°
-9 48° 180°
Elliptical beam.
angle off mainbeam axis in the direction of interest, deg.
bw HPBW in the direction of interest, deg.
(b) Directional Receiving Antenna
The population profile of the directional receiving antenna Gmax data in this band is
shown in Figure 6-58. The representative Gmax = 38 dBi, and the representative antenna radiation
pattern for spectrum sharing analyses is provided in Table 6-102.
0%
25%
50%
75%
100%
0
1
2
3
4
5
6
7
8
30 31 32 33 34 35 36 37 38 39 40 41
Cum
ula
tive %
Nu
mb
er o
f F
req
uen
cy
Ass
ign
men
ts
Gmax (dBi)
population
Cumulative %
Figure 6-58. Population Profile of ARNS Directional Receiving Antenna Gmax Data in 9–
9.2 GHz
Table 6-102. Representative ARNS Directional Receiving Antenna Radiation Pattern in 9–
9.2 GHz
Gain (dBi) Angular Range
38 - 12 bw)2 0 1.17bw
21.5 7bw 3.1°
34 - 25 log() 3.1° 48°
-8 48° 180°
Elliptical beam.
angle off mainbeam axis in the direction of interest, deg.
bw HPBW in the direction of interest, deg.
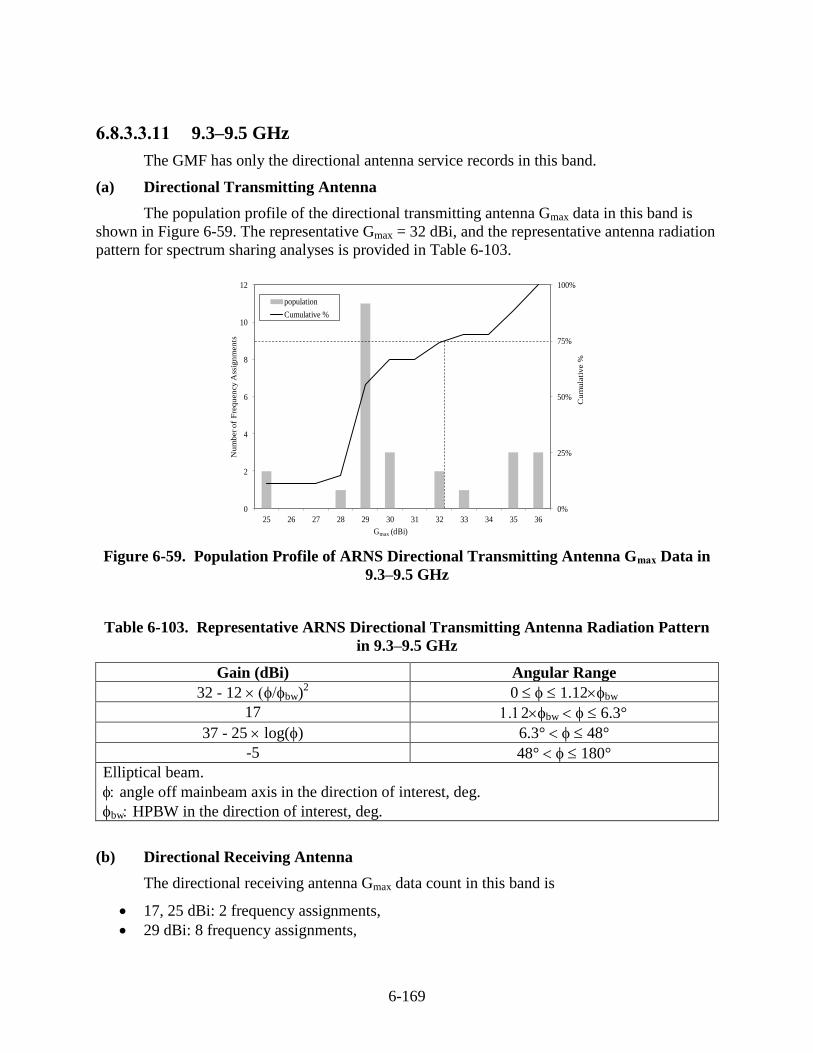
6-169
6.8.3.3.11 9.3–9.5 GHz
The GMF has only the directional antenna service records in this band.
(a) Directional Transmitting Antenna
The population profile of the directional transmitting antenna Gmax data in this band is
shown in Figure 6-59. The representative Gmax = 32 dBi, and the representative antenna radiation
pattern for spectrum sharing analyses is provided in Table 6-103.
0%
25%
50%
75%
100%
0
2
4
6
8
10
12
25 26 27 28 29 30 31 32 33 34 35 36
Cu
mu
lati
ve %
Nu
mb
er o
f F
req
uen
cy
Ass
ign
men
ts
Gmax (dBi)
population
Cumulative %
Figure 6-59. Population Profile of ARNS Directional Transmitting Antenna Gmax Data in
9.3–9.5 GHz
Table 6-103. Representative ARNS Directional Transmitting Antenna Radiation Pattern
in 9.3–9.5 GHz
Gain (dBi) Angular Range
32 - 12 bw)2 0 1.12bw
17 2bw 6.3°
37 - 25 log() 6.3° 48°
-5 48° 180°
Elliptical beam.
angle off mainbeam axis in the direction of interest, deg.
bw HPBW in the direction of interest, deg.
(b) Directional Receiving Antenna
The directional receiving antenna Gmax data count in this band is
17, 25 dBi: 2 frequency assignments,
29 dBi: 8 frequency assignments,
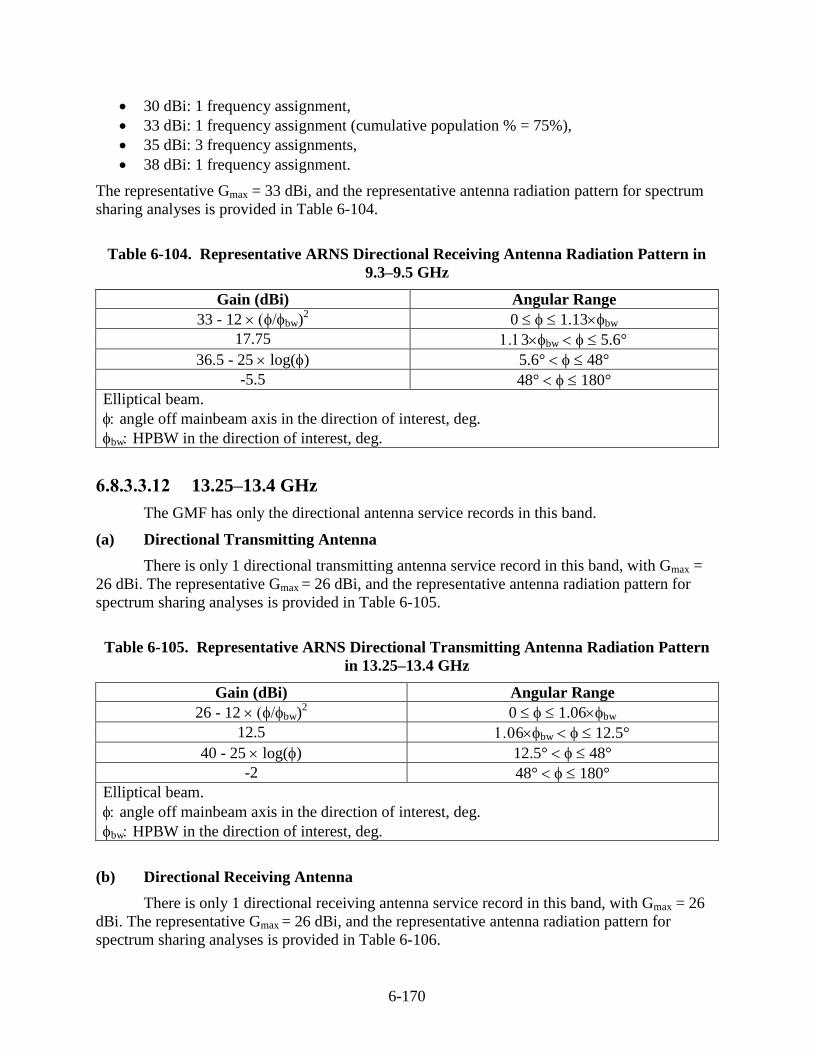
6-170
30 dBi: 1 frequency assignment,
33 dBi: 1 frequency assignment (cumulative population % = 75%),
35 dBi: 3 frequency assignments,
38 dBi: 1 frequency assignment.
The representative Gmax = 33 dBi, and the representative antenna radiation pattern for spectrum
sharing analyses is provided in Table 6-104.
Table 6-104. Representative ARNS Directional Receiving Antenna Radiation Pattern in
9.3–9.5 GHz
Gain (dBi) Angular Range
33 - 12 bw)2 0 1.13bw
17.75 3bw 5.6°
36.5 - 25 log() 5.6° 48°
-5.5 48° 180°
Elliptical beam.
angle off mainbeam axis in the direction of interest, deg.
bw HPBW in the direction of interest, deg.
6.8.3.3.12 13.25–13.4 GHz
The GMF has only the directional antenna service records in this band.
(a) Directional Transmitting Antenna
There is only 1 directional transmitting antenna service record in this band, with Gmax =
26 dBi. The representative Gmax = 26 dBi, and the representative antenna radiation pattern for
spectrum sharing analyses is provided in Table 6-105.
Table 6-105. Representative ARNS Directional Transmitting Antenna Radiation Pattern
in 13.25–13.4 GHz
Gain (dBi) Angular Range
26 - 12 bw)2 0 1.06bw
12.5 6bw 12.5°
40 - 25 log() 12.5° 48°
-2 48° 180°
Elliptical beam.
angle off mainbeam axis in the direction of interest, deg.
bw HPBW in the direction of interest, deg.
(b) Directional Receiving Antenna
There is only 1 directional receiving antenna service record in this band, with Gmax = 26
dBi. The representative Gmax = 26 dBi, and the representative antenna radiation pattern for
spectrum sharing analyses is provided in Table 6-106.
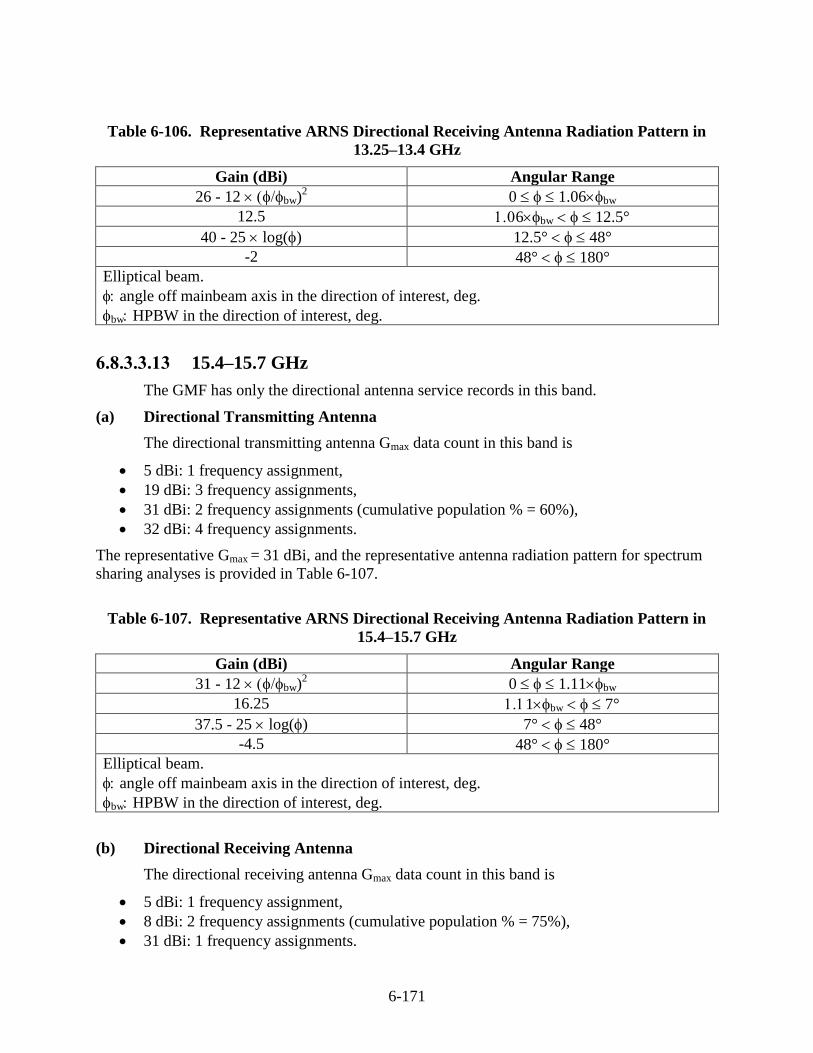
6-171
Table 6-106. Representative ARNS Directional Receiving Antenna Radiation Pattern in
13.25–13.4 GHz
Gain (dBi) Angular Range
26 - 12 bw)2 0 1.06bw
12.5 6bw 12.5°
40 - 25 log() 12.5° 48°
-2 48° 180°
Elliptical beam.
angle off mainbeam axis in the direction of interest, deg.
bw HPBW in the direction of interest, deg.
6.8.3.3.13 15.4–15.7 GHz
The GMF has only the directional antenna service records in this band.
(a) Directional Transmitting Antenna
The directional transmitting antenna Gmax data count in this band is
5 dBi: 1 frequency assignment,
19 dBi: 3 frequency assignments,
31 dBi: 2 frequency assignments (cumulative population % = 60%),
32 dBi: 4 frequency assignments.
The representative Gmax = 31 dBi, and the representative antenna radiation pattern for spectrum
sharing analyses is provided in Table 6-107.
Table 6-107. Representative ARNS Directional Receiving Antenna Radiation Pattern in
15.4–15.7 GHz
Gain (dBi) Angular Range
31 - 12 bw)2 0 1.11bw
16.25 1bw 7°
37.5 - 25 log() 7° 48°
-4.5 48° 180°
Elliptical beam.
angle off mainbeam axis in the direction of interest, deg.
bw HPBW in the direction of interest, deg.
(b) Directional Receiving Antenna
The directional receiving antenna Gmax data count in this band is
5 dBi: 1 frequency assignment,
8 dBi: 2 frequency assignments (cumulative population % = 75%),
31 dBi: 1 frequency assignments.
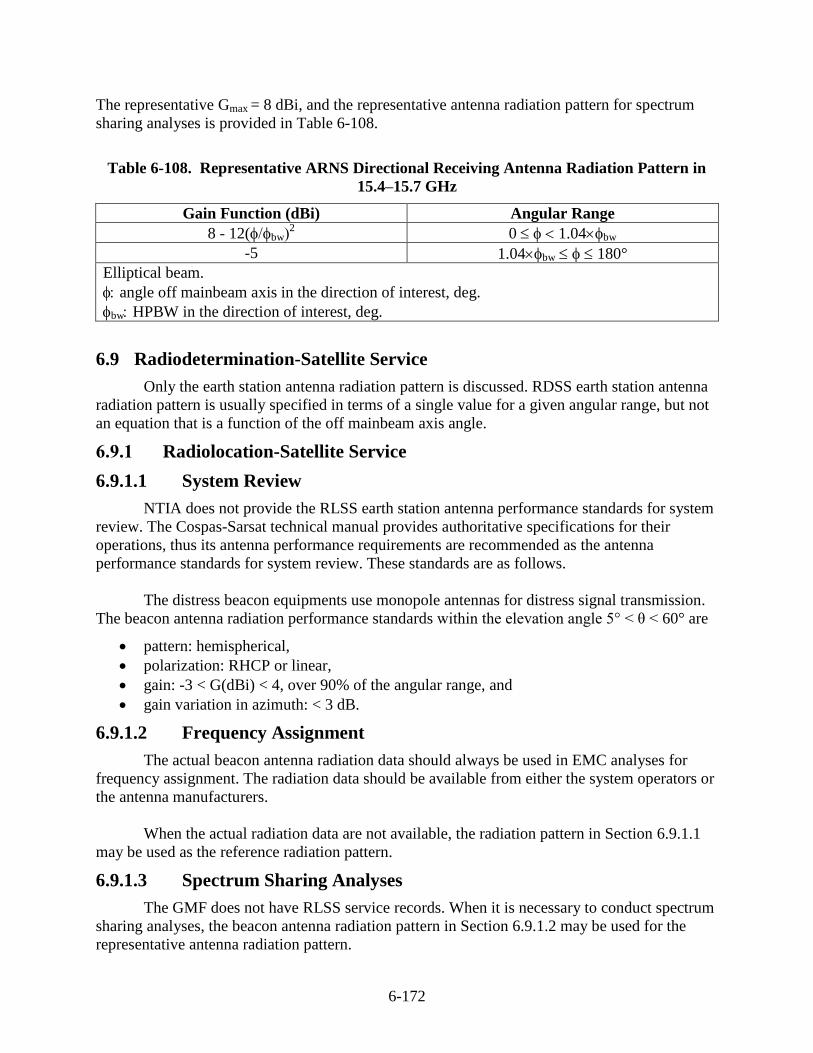
6-172
The representative Gmax = 8 dBi, and the representative antenna radiation pattern for spectrum
sharing analyses is provided in Table 6-108.
Table 6-108. Representative ARNS Directional Receiving Antenna Radiation Pattern in
15.4–15.7 GHz
Gain Function (dBi) Angular Range
8 - 12(bw2 0 1.04bw
-5 1.04bw 180°
Elliptical beam.
angle off mainbeam axis in the direction of interest, deg.
bw HPBW in the direction of interest, deg.
6.9 Radiodetermination-Satellite Service
Only the earth station antenna radiation pattern is discussed. RDSS earth station antenna
radiation pattern is usually specified in terms of a single value for a given angular range, but not
an equation that is a function of the off mainbeam axis angle.
6.9.1 Radiolocation-Satellite Service
6.9.1.1 System Review
NTIA does not provide the RLSS earth station antenna performance standards for system
review. The Cospas-Sarsat technical manual provides authoritative specifications for their
operations, thus its antenna performance requirements are recommended as the antenna
performance standards for system review. These standards are as follows.
The distress beacon equipments use monopole antennas for distress signal transmission.
The beacon antenna radiation performance standards within the elevation angle 5° < θ < 60° are
pattern: hemispherical,
polarization: RHCP or linear,
gain: -3 < G(dBi) < 4, over 90% of the angular range, and
gain variation in azimuth: < 3 dB.
6.9.1.2 Frequency Assignment
The actual beacon antenna radiation data should always be used in EMC analyses for
frequency assignment. The radiation data should be available from either the system operators or
the antenna manufacturers.
When the actual radiation data are not available, the radiation pattern in Section 6.9.1.1
may be used as the reference radiation pattern.
6.9.1.3 Spectrum Sharing Analyses
The GMF does not have RLSS service records. When it is necessary to conduct spectrum
sharing analyses, the beacon antenna radiation pattern in Section 6.9.1.2 may be used for the
representative antenna radiation pattern.
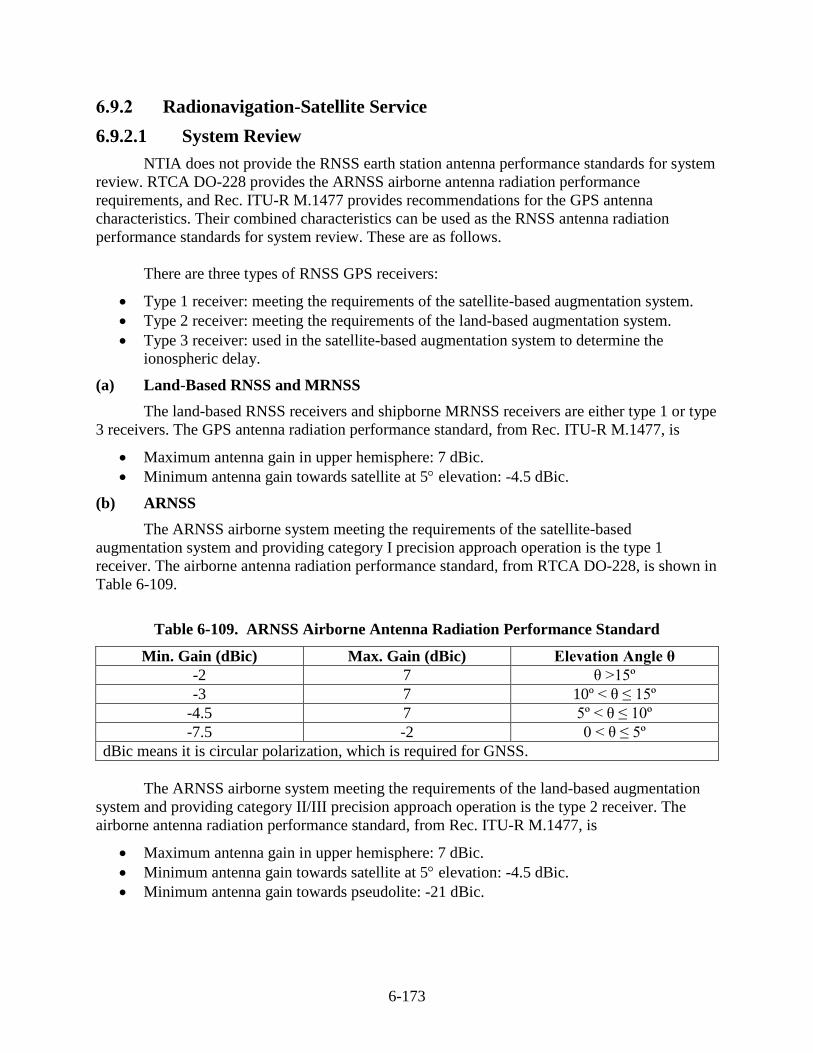
6-173
6.9.2 Radionavigation-Satellite Service
6.9.2.1 System Review
NTIA does not provide the RNSS earth station antenna performance standards for system
review. RTCA DO-228 provides the ARNSS airborne antenna radiation performance
requirements, and Rec. ITU-R M.1477 provides recommendations for the GPS antenna
characteristics. Their combined characteristics can be used as the RNSS antenna radiation
performance standards for system review. These are as follows.
There are three types of RNSS GPS receivers:
Type 1 receiver: meeting the requirements of the satellite-based augmentation system.
Type 2 receiver: meeting the requirements of the land-based augmentation system.
Type 3 receiver: used in the satellite-based augmentation system to determine the
ionospheric delay.
(a) Land-Based RNSS and MRNSS
The land-based RNSS receivers and shipborne MRNSS receivers are either type 1 or type
3 receivers. The GPS antenna radiation performance standard, from Rec. ITU-R M.1477, is
Maximum antenna gain in upper hemisphere: 7 dBic.
Minimum antenna gain towards satellite at 5 elevation: -4.5 dBic.
(b) ARNSS
The ARNSS airborne system meeting the requirements of the satellite-based
augmentation system and providing category I precision approach operation is the type 1
receiver. The airborne antenna radiation performance standard, from RTCA DO-228, is shown in
Table 6-109.
Table 6-109. ARNSS Airborne Antenna Radiation Performance Standard
Min. Gain (dBic) Max. Gain (dBic) Elevation Angle θ
-2 7 θ >15º
-3 7 10º < θ ≤ 15º
-4.5 7 5º < θ ≤ 10º
-7.5 -2 0 < θ ≤ 5º
dBic means it is circular polarization, which is required for GNSS.
The ARNSS airborne system meeting the requirements of the land-based augmentation
system and providing category II/III precision approach operation is the type 2 receiver. The
airborne antenna radiation performance standard, from Rec. ITU-R M.1477, is
Maximum antenna gain in upper hemisphere: 7 dBic.
Minimum antenna gain towards satellite at 5 elevation: -4.5 dBic.
Minimum antenna gain towards pseudolite: -21 dBic.
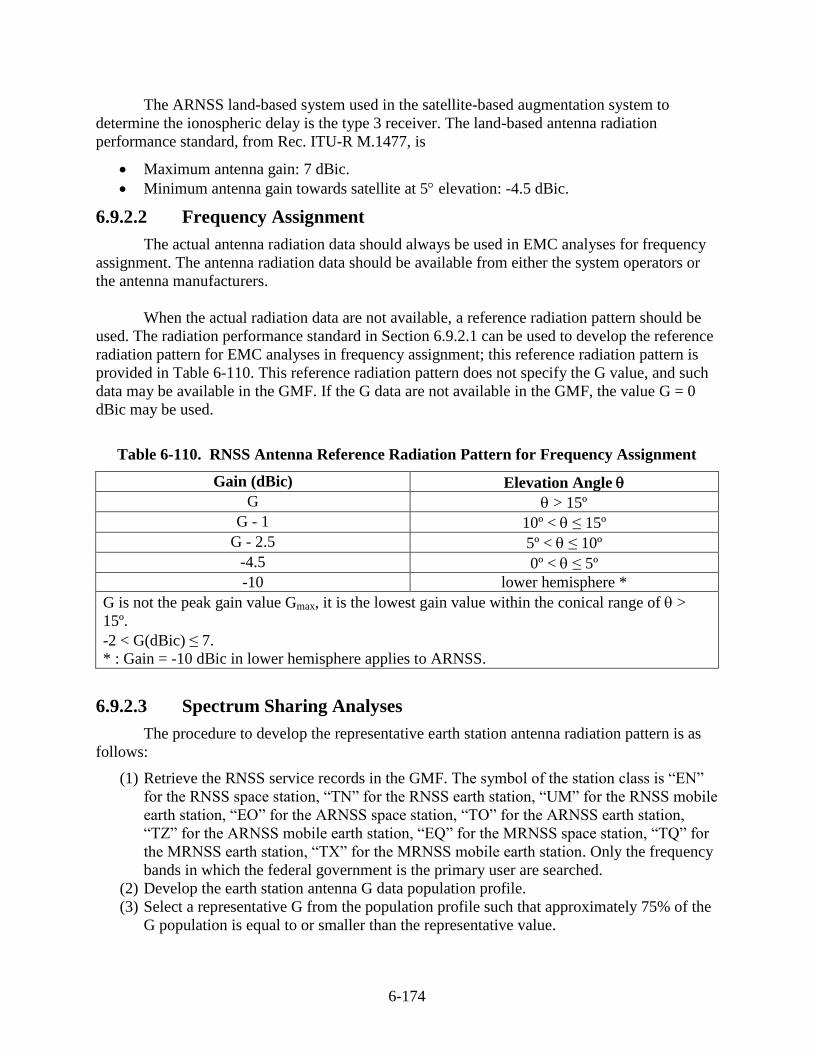
6-174
The ARNSS land-based system used in the satellite-based augmentation system to
determine the ionospheric delay is the type 3 receiver. The land-based antenna radiation
performance standard, from Rec. ITU-R M.1477, is
Maximum antenna gain: 7 dBic.
Minimum antenna gain towards satellite at 5 elevation: -4.5 dBic.
6.9.2.2 Frequency Assignment
The actual antenna radiation data should always be used in EMC analyses for frequency
assignment. The antenna radiation data should be available from either the system operators or
the antenna manufacturers.
When the actual radiation data are not available, a reference radiation pattern should be
used. The radiation performance standard in Section 6.9.2.1 can be used to develop the reference
radiation pattern for EMC analyses in frequency assignment; this reference radiation pattern is
provided in Table 6-110. This reference radiation pattern does not specify the G value, and such
data may be available in the GMF. If the G data are not available in the GMF, the value G = 0
dBic may be used.
Table 6-110. RNSS Antenna Reference Radiation Pattern for Frequency Assignment
Gain (dBic) Elevation Angle
G > 15º
G - 1 10º < ≤15º
G - 2.5 5º < ≤10º
-4.5 0º < ≤5º
-10 lower hemisphere *
G is not the peak gain value Gmax, it is the lowest gain value within the conical range of >
15º.
-2 < G(dBic)≤7.
* : Gain = -10 dBic in lower hemisphere applies to ARNSS.
6.9.2.3 Spectrum Sharing Analyses
The procedure to develop the representative earth station antenna radiation pattern is as
follows:
(1) Retrieve the RNSS service records in the GMF. The symbol of the station class is “EN”
for the RNSS space station, “TN” for the RNSS earth station, “UM” for the RNSS mobile
earth station, “EO” for the ARNSS space station, “TO” for the ARNSS earth station,
“TZ” for the ARNSS mobile earth station, “EQ” for the MRNSS space station, “TQ” for
the MRNSS earth station, “TX” for the MRNSS mobile earth station. Only the frequency
bands in which the federal government is the primary user are searched.
(2) Develop the earth station antenna G data population profile.
(3) Select a representative G from the population profile such that approximately 75% of the
G population is equal to or smaller than the representative value.
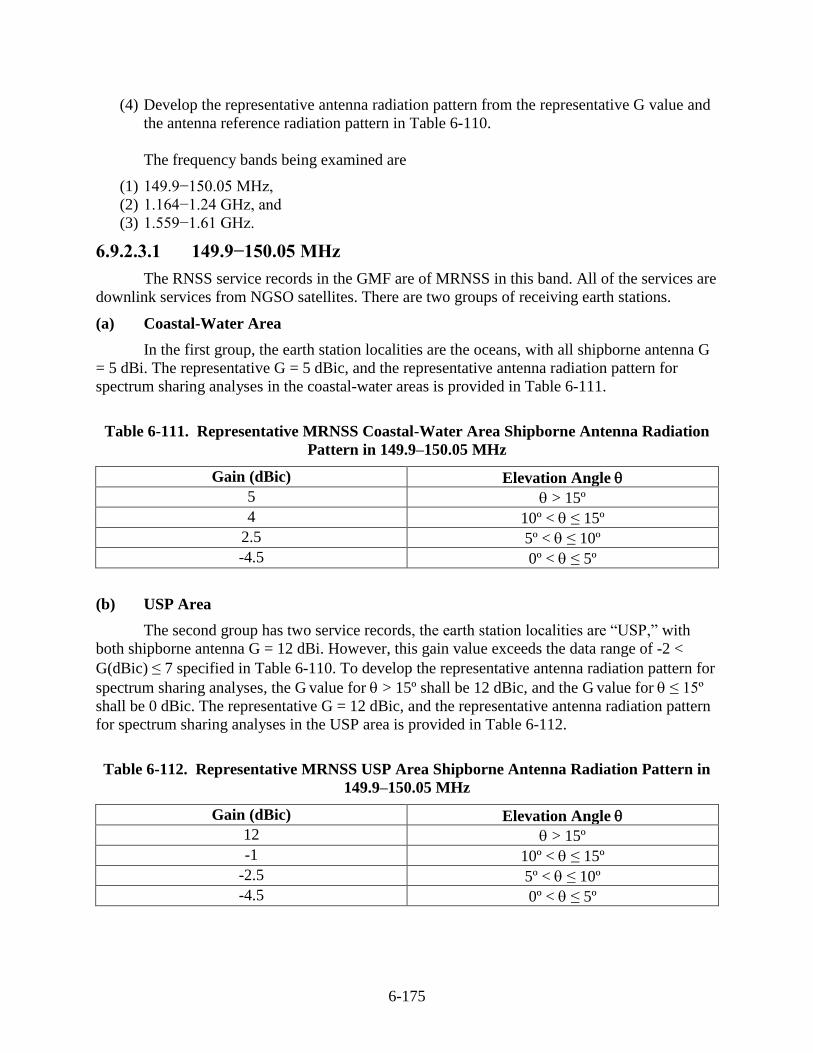
6-175
(4) Develop the representative antenna radiation pattern from the representative G value and
the antenna reference radiation pattern in Table 6-110.
The frequency bands being examined are
(1) 149.9−150.05 MHz,
(2) 1.164−1.24 GHz, and
(3) 1.559−1.61 GHz.
6.9.2.3.1 149.9−150.05 MHz
The RNSS service records in the GMF are of MRNSS in this band. All of the services are
downlink services from NGSO satellites. There are two groups of receiving earth stations.
(a) Coastal-Water Area
In the first group, the earth station localities are the oceans, with all shipborne antenna G
= 5 dBi. The representative G = 5 dBic, and the representative antenna radiation pattern for
spectrum sharing analyses in the coastal-water areas is provided in Table 6-111.
Table 6-111. Representative MRNSS Coastal-Water Area Shipborne Antenna Radiation
Pattern in 149.9–150.05 MHz
Gain (dBic) Elevation Angle
5 > 15º
4 10º < ≤15º
2.5 5º < ≤10º
-4.5 0º < ≤5º
(b) USP Area
The second group has two service records, the earth station localities are “USP,” with
both shipborne antenna G = 12 dBi. However, this gain value exceeds the data range of -2 <
G(dBic)≤7 specified in Table 6-110. To develop the representative antenna radiation pattern for
spectrum sharing analyses, the G value for > 15º shall be 12 dBic, and the G value for ≤ 15º
shall be 0 dBic. The representative G = 12 dBic, and the representative antenna radiation pattern
for spectrum sharing analyses in the USP area is provided in Table 6-112.
Table 6-112. Representative MRNSS USP Area Shipborne Antenna Radiation Pattern in
149.9–150.05 MHz
Gain (dBic) Elevation Angle
12 > 15º
-1 10º < ≤15º
-2.5 5º < ≤10º
-4.5 0º < ≤5º
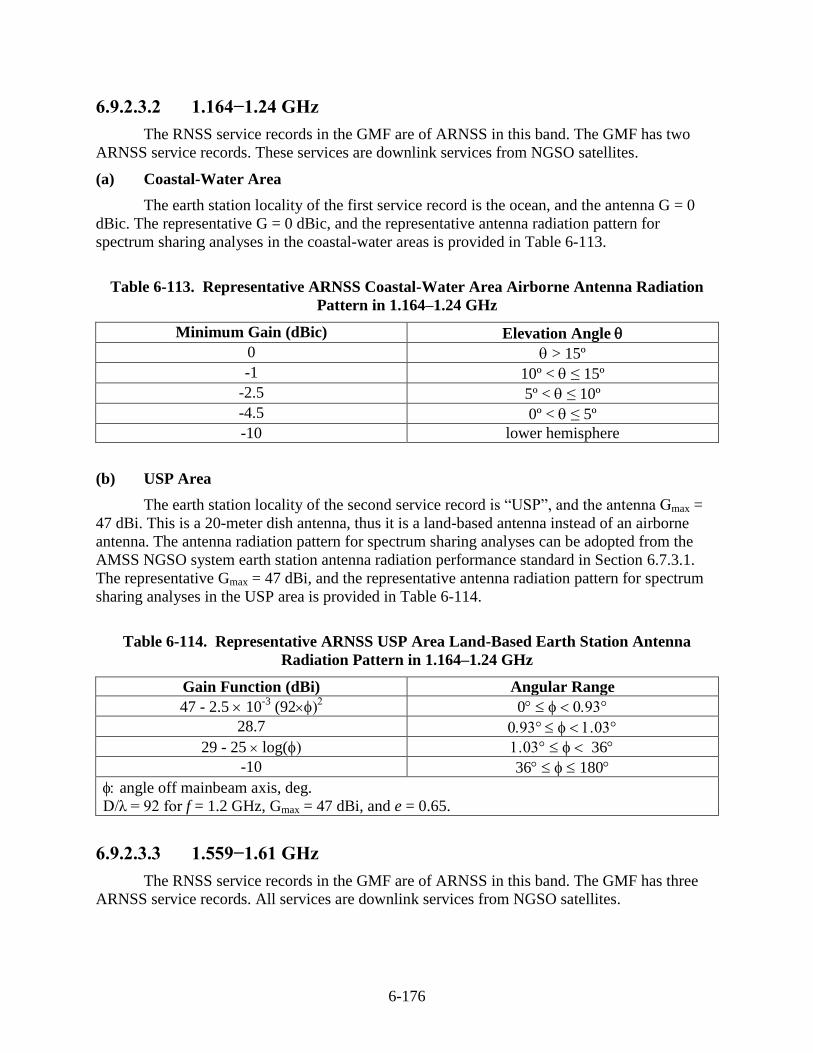
6-176
6.9.2.3.2 1.164−1.24 GHz
The RNSS service records in the GMF are of ARNSS in this band. The GMF has two
ARNSS service records. These services are downlink services from NGSO satellites.
(a) Coastal-Water Area
The earth station locality of the first service record is the ocean, and the antenna G = 0
dBic. The representative G = 0 dBic, and the representative antenna radiation pattern for
spectrum sharing analyses in the coastal-water areas is provided in Table 6-113.
Table 6-113. Representative ARNSS Coastal-Water Area Airborne Antenna Radiation
Pattern in 1.164–1.24 GHz
Minimum Gain (dBic) Elevation Angle
0 > 15º
-1 10º < ≤15º
-2.5 5º < ≤10º
-4.5 0º < ≤5º
-10 lower hemisphere
(b) USP Area
The earth station locality of the second service record is “USP”, and the antenna Gmax =
47 dBi. This is a 20-meter dish antenna, thus it is a land-based antenna instead of an airborne
antenna. The antenna radiation pattern for spectrum sharing analyses can be adopted from the
AMSS NGSO system earth station antenna radiation performance standard in Section 6.7.3.1.
The representative Gmax = 47 dBi, and the representative antenna radiation pattern for spectrum
sharing analyses in the USP area is provided in Table 6-114.
Table 6-114. Representative ARNSS USP Area Land-Based Earth Station Antenna
Radiation Pattern in 1.164–1.24 GHz
Gain Function (dBi) Angular Range
47 - 2.5 10-3
(92 0
28.7
29 - 25 log( 36
-10 36 180
angle off mainbeam axis, deg.
D/λ = 92 for f = 1.2 GHz, Gmax = 47 dBi, and e = 0.65.
6.9.2.3.3 1.559−1.61 GHz
The RNSS service records in the GMF are of ARNSS in this band. The GMF has three
ARNSS service records. All services are downlink services from NGSO satellites.
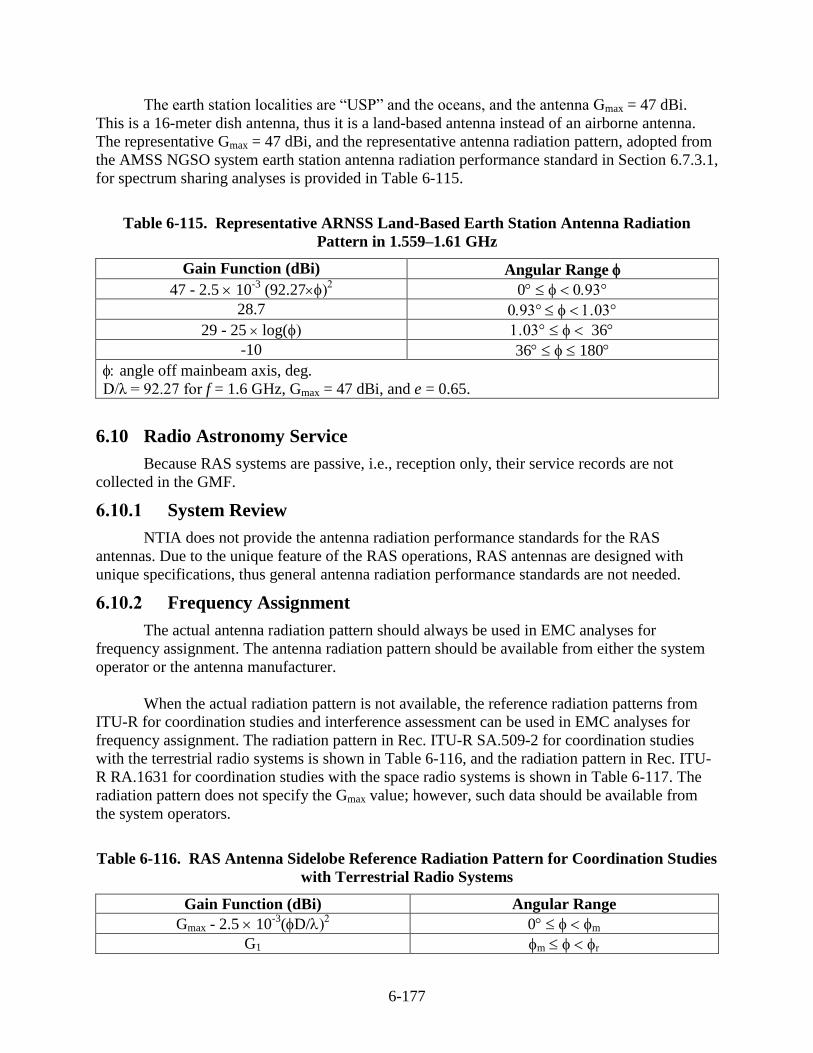
6-177
The earth station localities are “USP” and the oceans, and the antenna Gmax = 47 dBi.
This is a 16-meter dish antenna, thus it is a land-based antenna instead of an airborne antenna.
The representative Gmax = 47 dBi, and the representative antenna radiation pattern, adopted from
the AMSS NGSO system earth station antenna radiation performance standard in Section 6.7.3.1,
for spectrum sharing analyses is provided in Table 6-115.
Table 6-115. Representative ARNSS Land-Based Earth Station Antenna Radiation
Pattern in 1.559–1.61 GHz
Gain Function (dBi) Angular Range
47 - 2.5 10-3
(92.27 0
28.7
29 - 25 log( 36
-10 36 180
angle off mainbeam axis, deg.
D/λ = 92.27 for f = 1.6 GHz, Gmax = 47 dBi, and e = 0.65.
6.10 Radio Astronomy Service
Because RAS systems are passive, i.e., reception only, their service records are not
collected in the GMF.
6.10.1 System Review
NTIA does not provide the antenna radiation performance standards for the RAS
antennas. Due to the unique feature of the RAS operations, RAS antennas are designed with
unique specifications, thus general antenna radiation performance standards are not needed.
6.10.2 Frequency Assignment
The actual antenna radiation pattern should always be used in EMC analyses for
frequency assignment. The antenna radiation pattern should be available from either the system
operator or the antenna manufacturer.
When the actual radiation pattern is not available, the reference radiation patterns from
ITU-R for coordination studies and interference assessment can be used in EMC analyses for
frequency assignment. The radiation pattern in Rec. ITU-R SA.509-2 for coordination studies
with the terrestrial radio systems is shown in Table 6-116, and the radiation pattern in Rec. ITU-
R RA.1631 for coordination studies with the space radio systems is shown in Table 6-117. The
radiation pattern does not specify the Gmax value; however, such data should be available from
the system operators.
Table 6-116. RAS Antenna Sidelobe Reference Radiation Pattern for Coordination Studies
with Terrestrial Radio Systems
Gain Function (dBi) Angular Range
Gmax - 2.5 10-3
(D/ 0 m
G1 m r
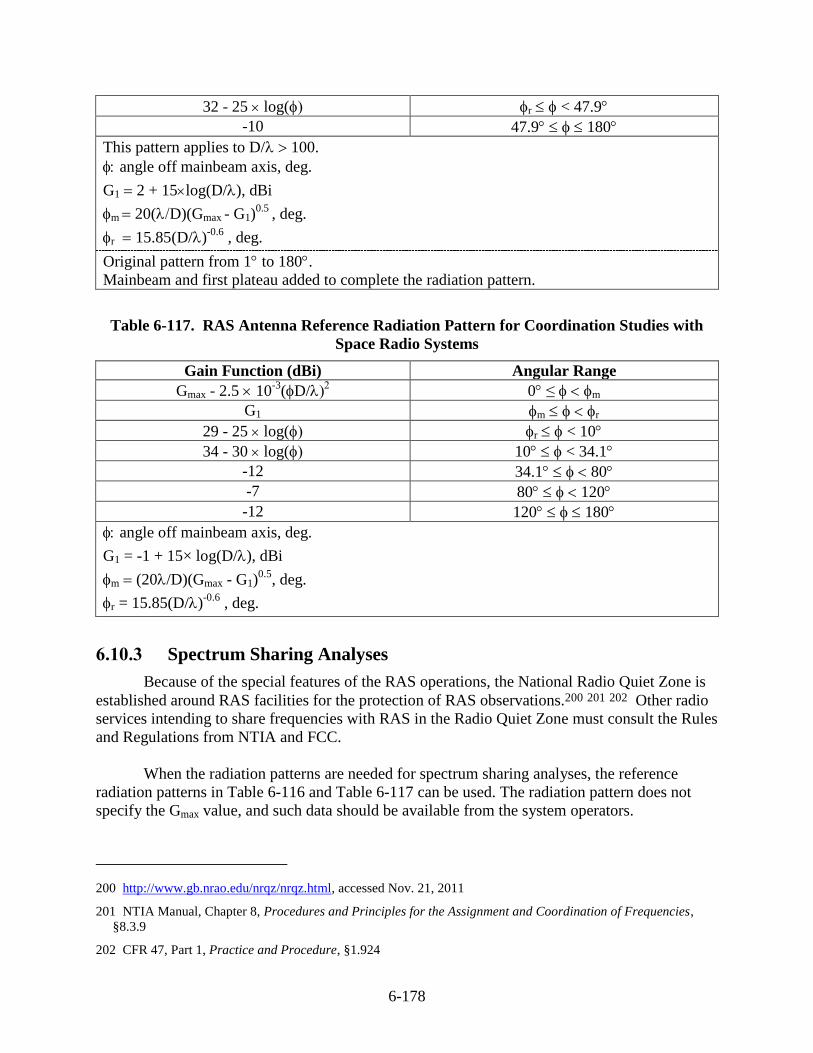
6-178
32 - 25 log( r < 47.9
-10 47.9 180
This pattern applies to D/100.
angle off mainbeam axis, deg.
G1 2 + 15log(D/), dBi
m 20(D)(Gmax - G1)0.5
, deg.
r 15.85(D/)-0.6
, deg.
Original pattern from 1to 180.
Mainbeam and first plateau added to complete the radiation pattern.
Table 6-117. RAS Antenna Reference Radiation Pattern for Coordination Studies with
Space Radio Systems
Gain Function (dBi) Angular Range
Gmax - 2.5 10-3
(D/ 0 ≤ m
G1 m r
29 - 25 log( r < 10
34 - 30 log( 10 < 34.1
-12 34.1 80
-7 80 120
-12 120 180
angle off mainbeam axis, deg.
G1 = -1 + 15× log(D/), dBi
m (20/D)(Gmax - G1)0.5
, deg.
r = 15.85(D/)-0.6
, deg.
6.10.3 Spectrum Sharing Analyses
Because of the special features of the RAS operations, the National Radio Quiet Zone is
established around RAS facilities for the protection of RAS observations.200 201 202 Other radio
services intending to share frequencies with RAS in the Radio Quiet Zone must consult the Rules
and Regulations from NTIA and FCC.
When the radiation patterns are needed for spectrum sharing analyses, the reference
radiation patterns in Table 6-116 and Table 6-117 can be used. The radiation pattern does not
specify the Gmax value, and such data should be available from the system operators.
200 http://www.gb.nrao.edu/nrqz/nrqz.html, accessed Nov. 21, 2011
201 NTIA Manual, Chapter 8, Procedures and Principles for the Assignment and Coordination of Frequencies,
§8.3.9
202 CFR 47, Part 1, Practice and Procedure, §1.924
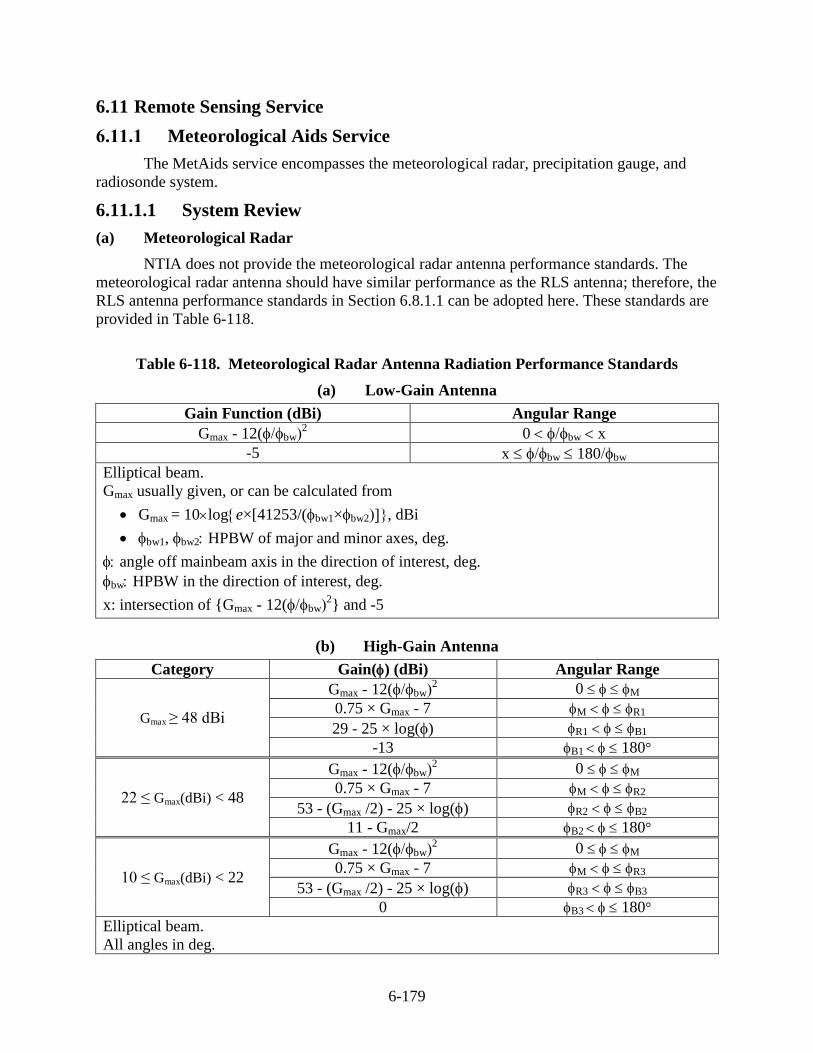
6-179
6.11 Remote Sensing Service
6.11.1 Meteorological Aids Service
The MetAids service encompasses the meteorological radar, precipitation gauge, and
radiosonde system.
6.11.1.1 System Review
(a) Meteorological Radar
NTIA does not provide the meteorological radar antenna performance standards. The
meteorological radar antenna should have similar performance as the RLS antenna; therefore, the
RLS antenna performance standards in Section 6.8.1.1 can be adopted here. These standards are
provided in Table 6-118.
Table 6-118. Meteorological Radar Antenna Radiation Performance Standards
(a) Low-Gain Antenna
Gain Function (dBi) Angular Range
Gmax - 12(bw2 0 bw x
-5 x bw 180bw
Elliptical beam.
Gmax usually given, or can be calculated from
Gmax = 10loge×[41253/(bw1×bw2, dBi
bw1, bw2 HPBW of major and minor axes, deg.
angle off mainbeam axis in the direction of interest, deg.
bw HPBW in the direction of interest, deg.
x: intersection of {Gmax - 12(bw2} and -5
(b) High-Gain Antenna
Category Gain() (dBi) Angular Range
Gmax ≥ 48 dBi
Gmax - 12(bw2 0 M
0.75 × Gmax - 7 M R1
29 - 25 × log() R1 B1
-13 B1 180°
22 ≤ Gmax(dBi) < 48
Gmax - 12(bw2 0 M
0.75 × Gmax - 7 M R2
53 - (Gmax /2) - 25 × log() R2 B2
11 - Gmax/2 B2 180°
10 ≤ Gmax(dBi) < 22
Gmax - 12(bw2 0 M
0.75 × Gmax - 7 M R3
53 - (Gmax /2) - 25 × log() R3 B3
0 B3 180°
Elliptical beam.
All angles in deg.
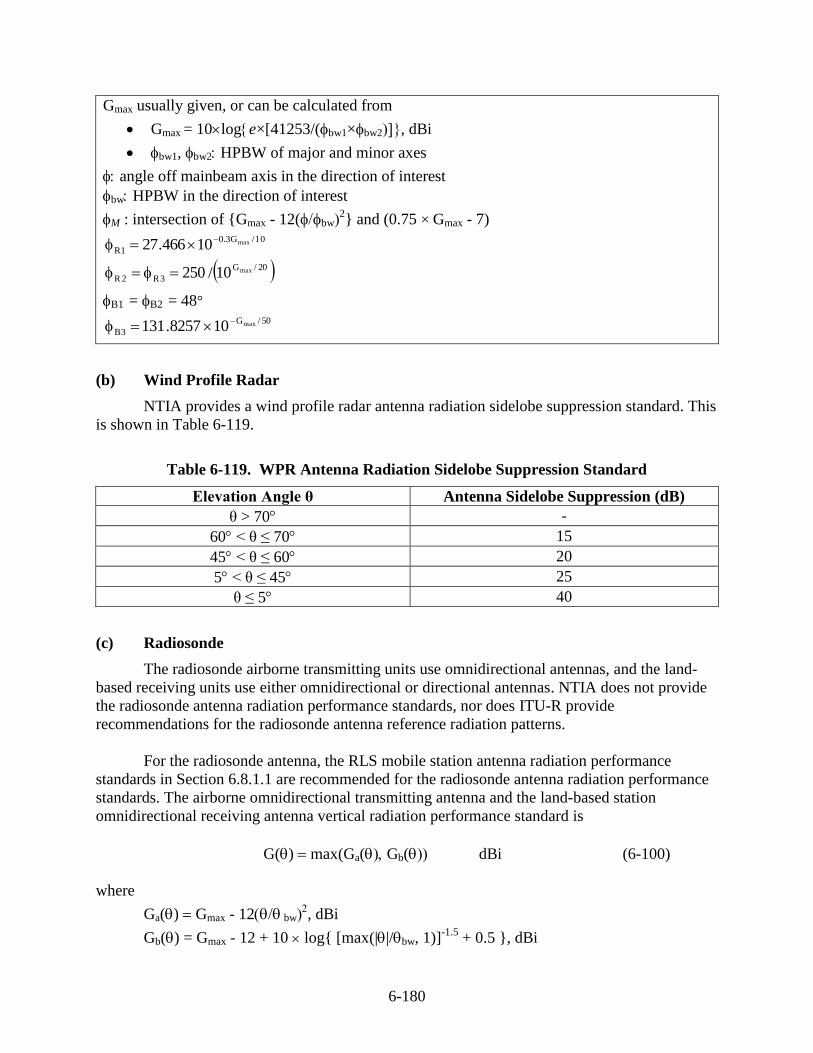
6-180
Gmax usually given, or can be calculated from
Gmax = 10loge×[41253/(bw1×bw2, dBi
bw1, bw2 HPBW of major and minor axes
angle off mainbeam axis in the direction of interest
bw HPBW in the direction of interest
M : intersection of {Gmax - 12(bw2} and (0.75 × Gmax - 7)
10/G3.0
1Rmax10466.27
20/G
3R2Rmax10/250
B1 = B2 = 48° 50/G
3Bmax108257.131
(b) Wind Profile Radar
NTIA provides a wind profile radar antenna radiation sidelobe suppression standard. This
is shown in Table 6-119.
Table 6-119. WPR Antenna Radiation Sidelobe Suppression Standard
Elevation Angle θ Antenna Sidelobe Suppression (dB)
θ > 70 -
60 < θ ≤ 70 15
45 < θ ≤ 60 20
5 < θ ≤ 45 25
θ ≤ 5 40
(c) Radiosonde
The radiosonde airborne transmitting units use omnidirectional antennas, and the land-
based receiving units use either omnidirectional or directional antennas. NTIA does not provide
the radiosonde antenna radiation performance standards, nor does ITU-R provide
recommendations for the radiosonde antenna reference radiation patterns.
For the radiosonde antenna, the RLS mobile station antenna radiation performance
standards in Section 6.8.1.1 are recommended for the radiosonde antenna radiation performance
standards. The airborne omnidirectional transmitting antenna and the land-based station
omnidirectional receiving antenna vertical radiation performance standard is
G() max(Ga(Gb( dBi (6-100)
where
Ga() Gmax - 12 bw, dBi
Gb() = Gmax - 12 + 10 log{ [max(||/bw, 1)]-1.5
+ 0.5 }, dBi
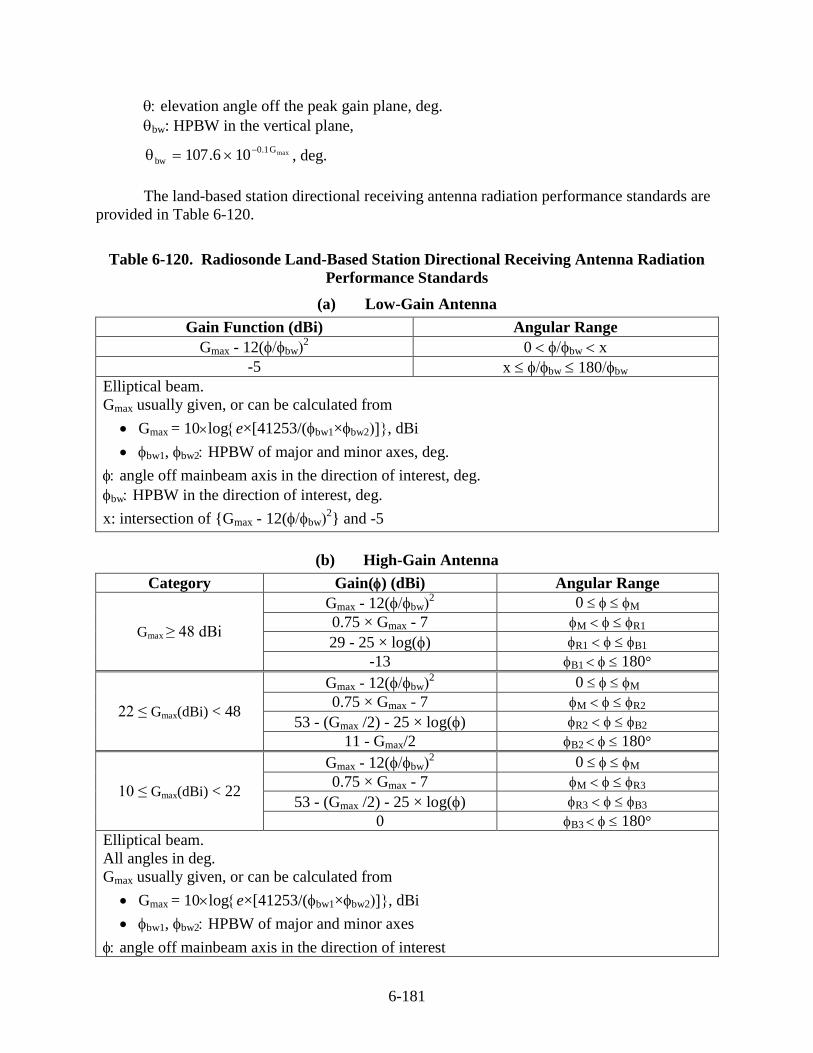
6-181
elevation angle off the peak gain plane, deg.
bw: HPBW in the vertical plane,
maxG1.0
bw 106.107
, deg.
The land-based station directional receiving antenna radiation performance standards are
provided in Table 6-120.
Table 6-120. Radiosonde Land-Based Station Directional Receiving Antenna Radiation
Performance Standards
(a) Low-Gain Antenna
Gain Function (dBi) Angular Range
Gmax - 12(bw2 0 bw x
-5 x bw 180bw
Elliptical beam.
Gmax usually given, or can be calculated from
Gmax = 10loge×[41253/(bw1×bw2, dBi
bw1, bw2 HPBW of major and minor axes, deg.
angle off mainbeam axis in the direction of interest, deg.
bw HPBW in the direction of interest, deg.
x: intersection of {Gmax - 12(bw2} and -5
(b) High-Gain Antenna
Category Gain() (dBi) Angular Range
Gmax ≥ 48 dBi
Gmax - 12(bw2 0 M
0.75 × Gmax - 7 M R1
29 - 25 × log() R1 B1
-13 B1 180°
22 ≤ Gmax(dBi) < 48
Gmax - 12(bw2 0 M
0.75 × Gmax - 7 M R2
53 - (Gmax /2) - 25 × log() R2 B2
11 - Gmax/2 B2 180°
10 ≤ Gmax(dBi) < 22
Gmax - 12(bw2 0 M
0.75 × Gmax - 7 M R3
53 - (Gmax /2) - 25 × log() R3 B3
0 B3 180°
Elliptical beam.
All angles in deg.
Gmax usually given, or can be calculated from
Gmax = 10loge×[41253/(bw1×bw2, dBi
bw1, bw2 HPBW of major and minor axes
angle off mainbeam axis in the direction of interest
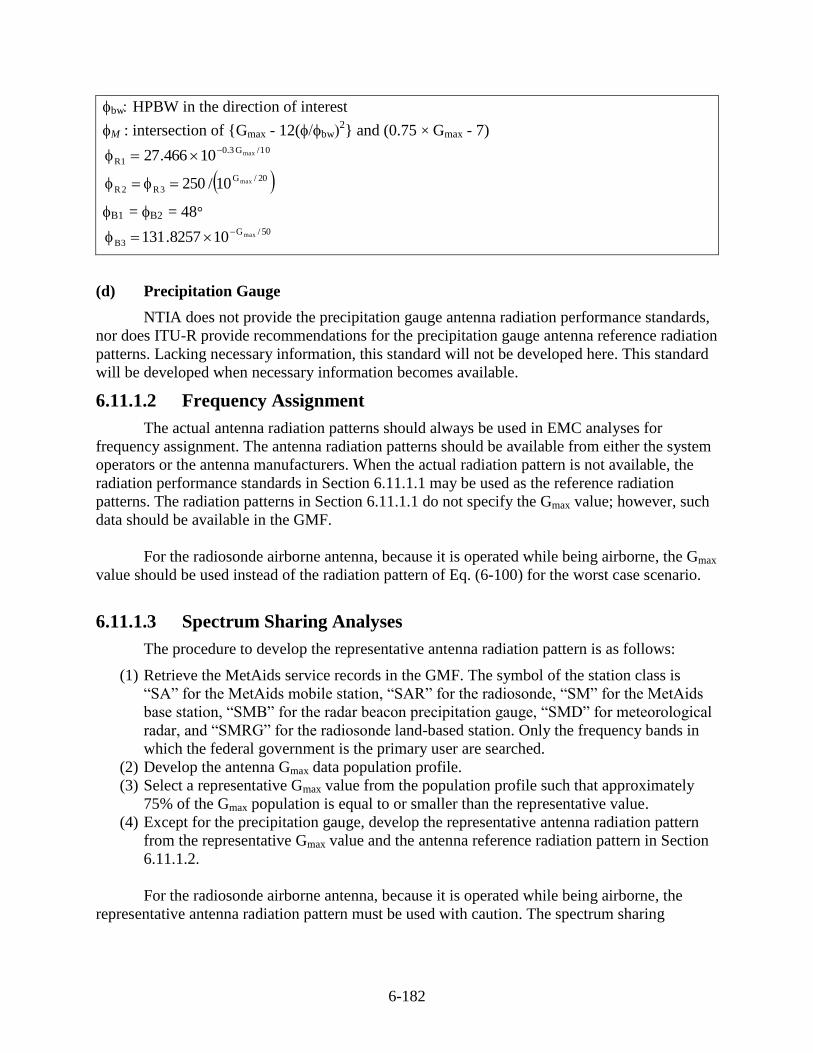
6-182
bw HPBW in the direction of interest
M : intersection of {Gmax - 12(bw2} and (0.75 × Gmax - 7)
10/G3.0
1Rmax10466.27
20/G
3R2Rmax10/250
B1 = B2 = 48° 50/G
3Bmax108257.131
(d) Precipitation Gauge
NTIA does not provide the precipitation gauge antenna radiation performance standards,
nor does ITU-R provide recommendations for the precipitation gauge antenna reference radiation
patterns. Lacking necessary information, this standard will not be developed here. This standard
will be developed when necessary information becomes available.
6.11.1.2 Frequency Assignment
The actual antenna radiation patterns should always be used in EMC analyses for
frequency assignment. The antenna radiation patterns should be available from either the system
operators or the antenna manufacturers. When the actual radiation pattern is not available, the
radiation performance standards in Section 6.11.1.1 may be used as the reference radiation
patterns. The radiation patterns in Section 6.11.1.1 do not specify the Gmax value; however, such
data should be available in the GMF.
For the radiosonde airborne antenna, because it is operated while being airborne, the Gmax
value should be used instead of the radiation pattern of Eq. (6-100) for the worst case scenario.
6.11.1.3 Spectrum Sharing Analyses
The procedure to develop the representative antenna radiation pattern is as follows:
(1) Retrieve the MetAids service records in the GMF. The symbol of the station class is
“SA” for the MetAids mobile station, “SAR” for the radiosonde, “SM” for the MetAids
base station, “SMB” for the radar beacon precipitation gauge, “SMD” for meteorological
radar, and “SMRG” for the radiosonde land-based station. Only the frequency bands in
which the federal government is the primary user are searched.
(2) Develop the antenna Gmax data population profile.
(3) Select a representative Gmax value from the population profile such that approximately
75% of the Gmax population is equal to or smaller than the representative value.
(4) Except for the precipitation gauge, develop the representative antenna radiation pattern
from the representative Gmax value and the antenna reference radiation pattern in Section
6.11.1.2.
For the radiosonde airborne antenna, because it is operated while being airborne, the
representative antenna radiation pattern must be used with caution. The spectrum sharing
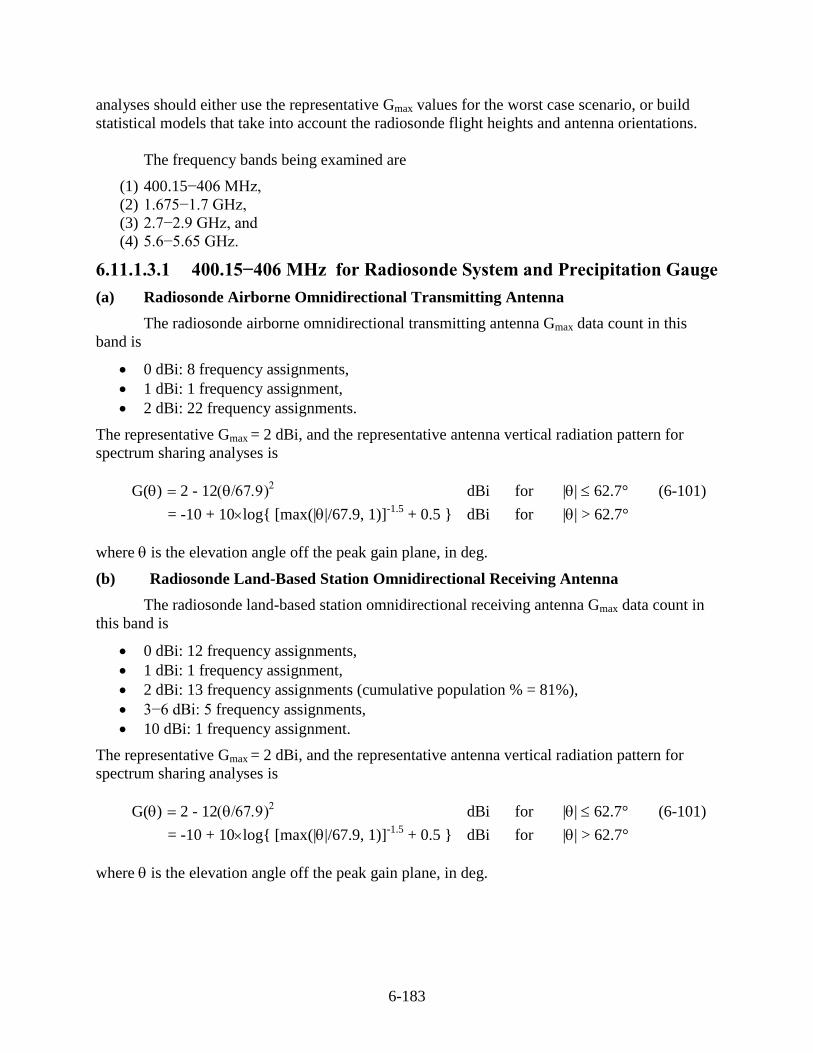
6-183
analyses should either use the representative Gmax values for the worst case scenario, or build
statistical models that take into account the radiosonde flight heights and antenna orientations.
The frequency bands being examined are
(1) 400.15−406 MHz,
(2) 1.675−1.7 GHz,
(3) 2.7−2.9 GHz, and
(4) 5.6−5.65 GHz.
6.11.1.3.1 400.15−406 MHz for Radiosonde System and Precipitation Gauge
(a) Radiosonde Airborne Omnidirectional Transmitting Antenna
The radiosonde airborne omnidirectional transmitting antenna Gmax data count in this
band is
0 dBi: 8 frequency assignments,
1 dBi: 1 frequency assignment,
2 dBi: 22 frequency assignments.
The representative Gmax = 2 dBi, and the representative antenna vertical radiation pattern for
spectrum sharing analyses is
G() 2 - 12 dBi for || 62.7° (6-101)
= -10 + 10log{ [max(||/67.9, 1)]-1.5
+ 0.5 } dBi for || > 62.7°
where is the elevation angle off the peak gain plane, in deg.
(b) Radiosonde Land-Based Station Omnidirectional Receiving Antenna
The radiosonde land-based station omnidirectional receiving antenna Gmax data count in
this band is
0 dBi: 12 frequency assignments,
1 dBi: 1 frequency assignment,
2 dBi: 13 frequency assignments (cumulative population % = 81%),
3−6 dBi: 5 frequency assignments,
10 dBi: 1 frequency assignment.
The representative Gmax = 2 dBi, and the representative antenna vertical radiation pattern for
spectrum sharing analyses is
G() 2 - 12 dBi for || 62.7° (6-101)
= -10 + 10log{ [max(||/67.9, 1)]-1.5
+ 0.5 } dBi for || > 62.7°
where is the elevation angle off the peak gain plane, in deg.
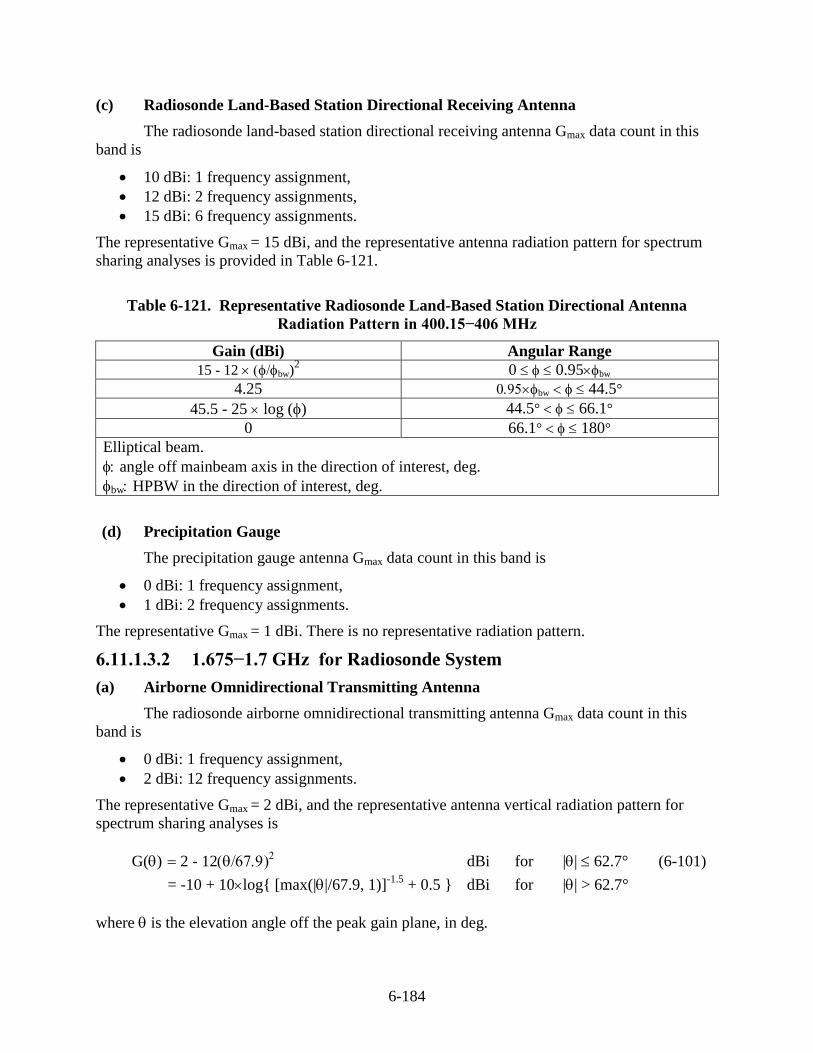
6-184
(c) Radiosonde Land-Based Station Directional Receiving Antenna
The radiosonde land-based station directional receiving antenna Gmax data count in this
band is
10 dBi: 1 frequency assignment,
12 dBi: 2 frequency assignments,
15 dBi: 6 frequency assignments.
The representative Gmax = 15 dBi, and the representative antenna radiation pattern for spectrum
sharing analyses is provided in Table 6-121.
Table 6-121. Representative Radiosonde Land-Based Station Directional Antenna
Radiation Pattern in 400.15−406 MHz
Gain (dBi) Angular Range
15 - 12 bw)2 0 0.95bw
4.25 bw 44.5°
45.5 - 25 log () 44.5° 66.1°
0 66.1° 180°
Elliptical beam.
angle off mainbeam axis in the direction of interest, deg.
bw HPBW in the direction of interest, deg.
(d) Precipitation Gauge
The precipitation gauge antenna Gmax data count in this band is
0 dBi: 1 frequency assignment,
1 dBi: 2 frequency assignments.
The representative Gmax = 1 dBi. There is no representative radiation pattern.
6.11.1.3.2 1.675−1.7 GHz for Radiosonde System
(a) Airborne Omnidirectional Transmitting Antenna
The radiosonde airborne omnidirectional transmitting antenna Gmax data count in this
band is
0 dBi: 1 frequency assignment,
2 dBi: 12 frequency assignments.
The representative Gmax = 2 dBi, and the representative antenna vertical radiation pattern for
spectrum sharing analyses is
G() 2 - 12 dBi for || 62.7° (6-101)
= -10 + 10log{ [max(||/67.9, 1)]-1.5
+ 0.5 } dBi for || > 62.7°
where is the elevation angle off the peak gain plane, in deg.
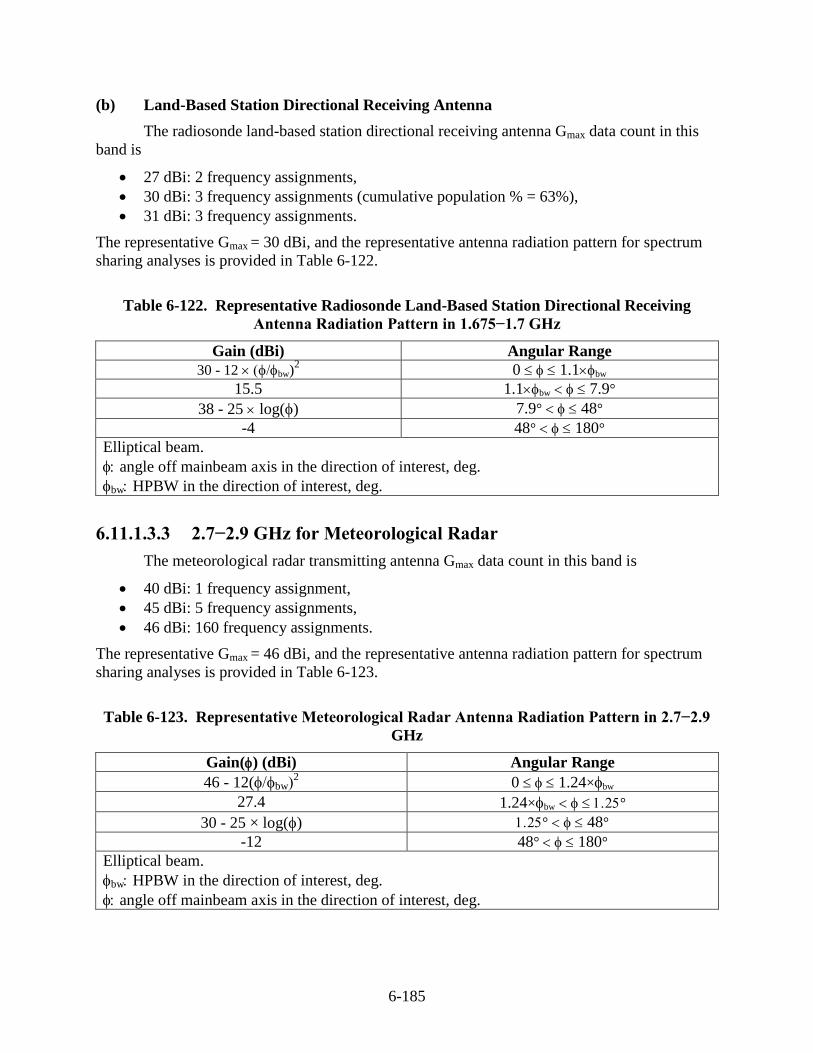
6-185
(b) Land-Based Station Directional Receiving Antenna
The radiosonde land-based station directional receiving antenna Gmax data count in this
band is
27 dBi: 2 frequency assignments,
30 dBi: 3 frequency assignments (cumulative population % = 63%),
31 dBi: 3 frequency assignments.
The representative Gmax = 30 dBi, and the representative antenna radiation pattern for spectrum
sharing analyses is provided in Table 6-122.
Table 6-122. Representative Radiosonde Land-Based Station Directional Receiving
Antenna Radiation Pattern in 1.675−1.7 GHz
Gain (dBi) Angular Range
30 - 12 bw)2 0 1.1bw
15.5 1.1bw 7.9°
38 - 25 log() 7.9° 48°
-4 48° 180°
Elliptical beam.
angle off mainbeam axis in the direction of interest, deg.
bw HPBW in the direction of interest, deg.
6.11.1.3.3 2.7−2.9 GHz for Meteorological Radar
The meteorological radar transmitting antenna Gmax data count in this band is
40 dBi: 1 frequency assignment,
45 dBi: 5 frequency assignments,
46 dBi: 160 frequency assignments.
The representative Gmax = 46 dBi, and the representative antenna radiation pattern for spectrum
sharing analyses is provided in Table 6-123.
Table 6-123. Representative Meteorological Radar Antenna Radiation Pattern in 2.7−2.9
GHz
Gain() (dBi) Angular Range
46 - 12(bw2 0 1.24×bw
27.4 1.24×bw °
30 - 25 × log() ° 48°
-12 48° 180°
Elliptical beam.
bw HPBW in the direction of interest, deg.
angle off mainbeam axis in the direction of interest, deg.
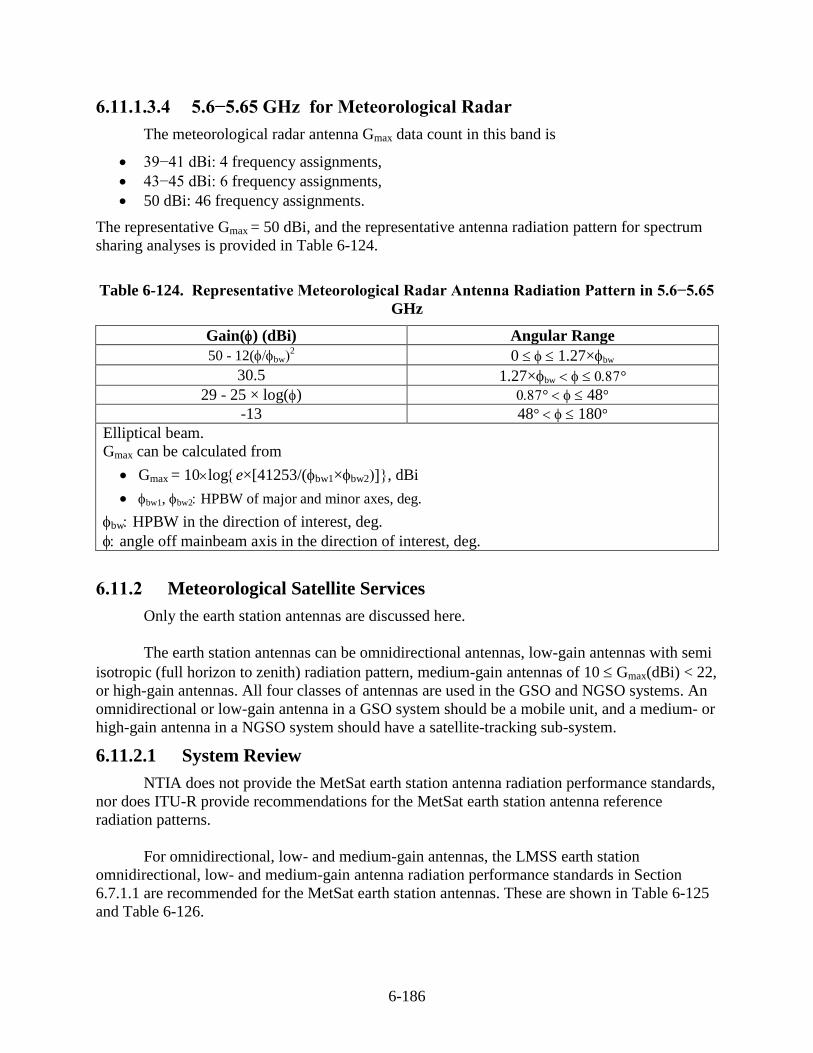
6-186
6.11.1.3.4 5.6−5.65 GHz for Meteorological Radar
The meteorological radar antenna Gmax data count in this band is
39−41 dBi: 4 frequency assignments,
43−45 dBi: 6 frequency assignments,
50 dBi: 46 frequency assignments.
The representative Gmax = 50 dBi, and the representative antenna radiation pattern for spectrum
sharing analyses is provided in Table 6-124.
Table 6-124. Representative Meteorological Radar Antenna Radiation Pattern in 5.6−5.65
GHz
Gain() (dBi) Angular Range
50 - 12(bw2 0 1.27×bw
30.5 1.27×bw °
29 - 25 × log() ° 48°
-13 48° 180°
Elliptical beam.
Gmax can be calculated from
Gmax = 10loge×[41253/(bw1×bw2, dBi
bw1, bw2 HPBW of major and minor axes, deg.
bw HPBW in the direction of interest, deg.
angle off mainbeam axis in the direction of interest, deg.
6.11.2 Meteorological Satellite Services
Only the earth station antennas are discussed here.
The earth station antennas can be omnidirectional antennas, low-gain antennas with semi
isotropic (full horizon to zenith) radiation pattern, medium-gain antennas of 10 Gmax(dBi) < 22,
or high-gain antennas. All four classes of antennas are used in the GSO and NGSO systems. An
omnidirectional or low-gain antenna in a GSO system should be a mobile unit, and a medium- or
high-gain antenna in a NGSO system should have a satellite-tracking sub-system.
6.11.2.1 System Review
NTIA does not provide the MetSat earth station antenna radiation performance standards,
nor does ITU-R provide recommendations for the MetSat earth station antenna reference
radiation patterns.
For omnidirectional, low- and medium-gain antennas, the LMSS earth station
omnidirectional, low- and medium-gain antenna radiation performance standards in Section
6.7.1.1 are recommended for the MetSat earth station antennas. These are shown in Table 6-125
and Table 6-126.
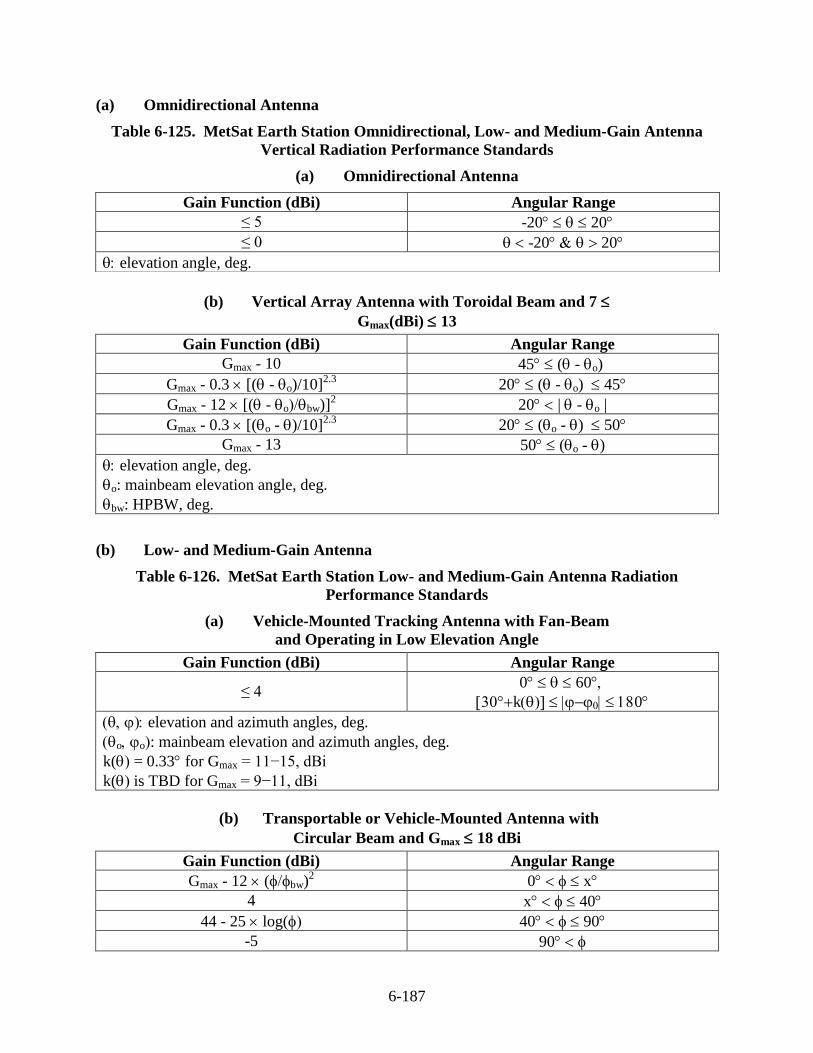
6-187
(a) Omnidirectional Antenna
Table 6-125. MetSat Earth Station Omnidirectional, Low- and Medium-Gain Antenna
Vertical Radiation Performance Standards
(a) Omnidirectional Antenna
(b) Vertical Array Antenna with Toroidal Beam and 7
Gmax(dBi) 13
Gain Function (dBi) Angular Range
Gmax - 10 45 ( - o)
Gmax - 0.3 [( - o)/10]2.3
20 ( - o) 45
Gmax - 12 [( - obw)]2 20 | - o|
Gmax - 0.3 [(o - )/10]2.3
20 (o - ) 50
Gmax - 13 50 (o - )
elevation angle, deg.
o: mainbeam elevation angle, deg.
bw: HPBW, deg.
(b) Low- and Medium-Gain Antenna
Table 6-126. MetSat Earth Station Low- and Medium-Gain Antenna Radiation
Performance Standards
(a) Vehicle-Mounted Tracking Antenna with Fan-Beam
and Operating in Low Elevation Angle
Gain Function (dBi) Angular Range
≤ 4 0 60
k0
elevation and azimuth angles, deg.
oo: mainbeam elevation and azimuth angles, deg.
k(= 0.33 for Gmax = 11−15, dBi
k( is TBD for Gmax = 9−11, dBi
(b) Transportable or Vehicle-Mounted Antenna with
Circular Beam and Gmax 18 dBi
Gain Function (dBi) Angular Range
Gmax - 12 (bw)2 0 x
4 x 40
44 - 25 log( 40 90
-5 90
Gain Function (dBi) Angular Range
≤ 5 -2020
≤ 0 -2020
elevation angle, deg.
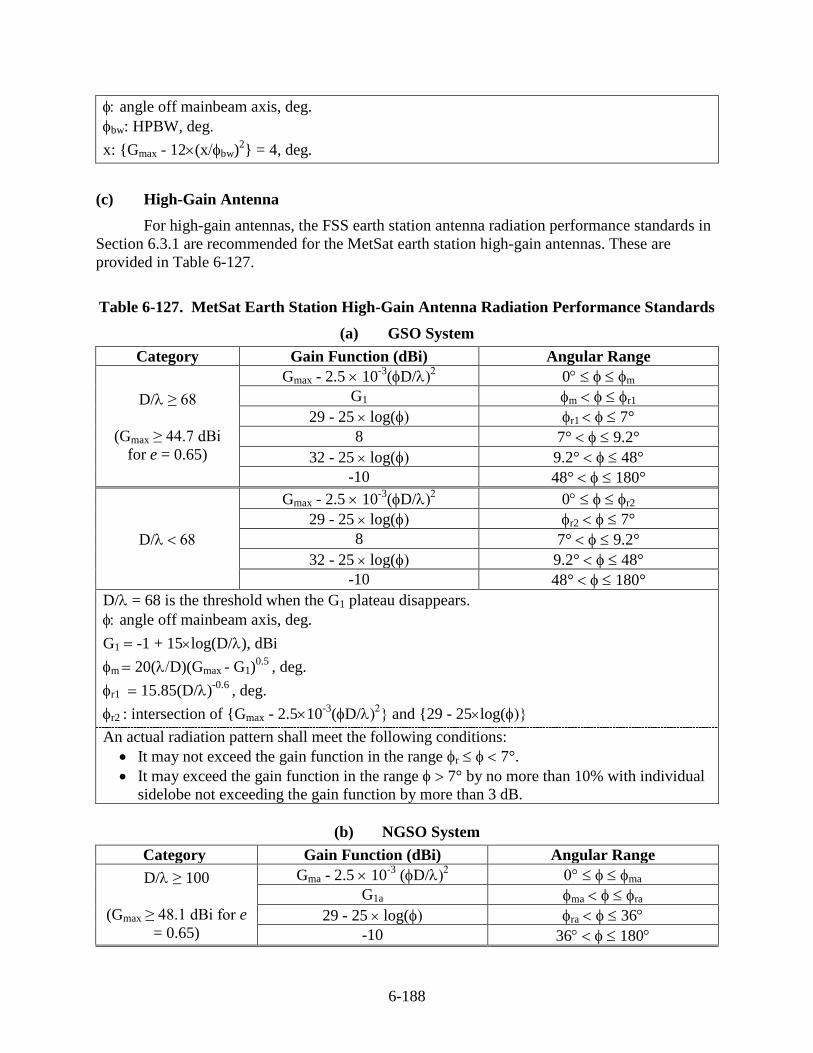
6-188
angle off mainbeam axis, deg.
bw: HPBW, deg.
x: {Gmax - 12(xbw)2} = 4, deg.
(c) High-Gain Antenna
For high-gain antennas, the FSS earth station antenna radiation performance standards in
Section 6.3.1 are recommended for the MetSat earth station high-gain antennas. These are
provided in Table 6-127.
Table 6-127. MetSat Earth Station High-Gain Antenna Radiation Performance Standards
(a) GSO System
Category Gain Function (dBi) Angular Range
D/≥ 68
(Gmax ≥ 44.7 dBi
for e = 0.65)
Gmax - 2.5 10-3
(D/ 0 m
G1 m r1
29 - 25 log( r1 7°
8 7° 9.2°
32 - 25 log( 9.2° 48°
-10 48° 180°
D/
Gmax - 2.5 10-3
(D/ 0 r2
29 - 25 log( r2 7°
8 7° 9.2°
32 - 25 log( 9.2° 48°
-10 48° 180°
D/= 68 is the threshold when the G1 plateau disappears.
angle off mainbeam axis, deg.
G1 -1 + 15log(D/), dBi
m 20(D)(Gmax - G1)0.5
, deg.
r1 15.85(D/)-0.6
, deg.
r2 : intersection of {Gmax - 2.510-3
(D/ and {29 - 25log(
An actual radiation pattern shall meet the following conditions:
It may not exceed the gain function in the range r 7°.
It may exceed the gain function in the range 7° by no more than 10% with individual
sidelobe not exceeding the gain function by more than 3 dB.
(b) NGSO System
Category Gain Function (dBi) Angular Range
D/ ≥ 100
(Gmax ≥ 48.1 dBi for e
= 0.65)
Gma - 2.5 10-3
(D/ ma
G1a ma ra
29 - 25 log( ra 36
-10 36 180
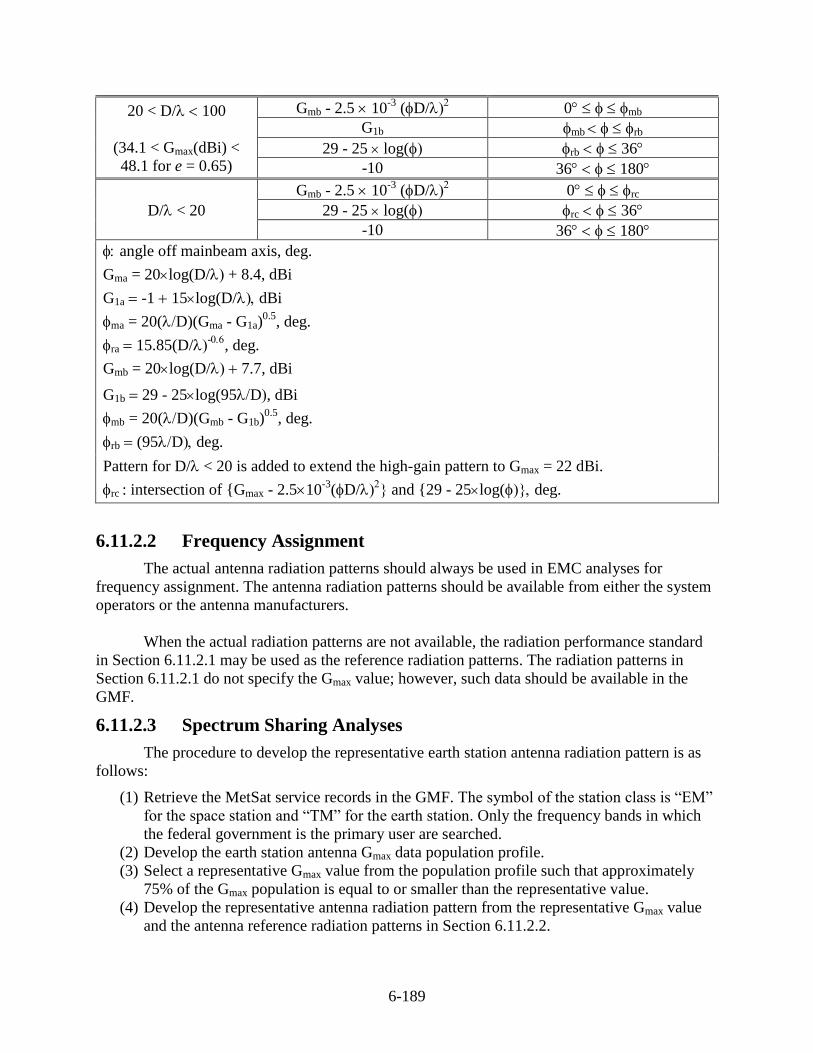
6-189
20 < D/ 100
(34.1 < Gmax(dBi) <
48.1 for e = 0.65)
Gmb - 2.5 10-3
(D/ 0 mb
G1b mb rb
29 - 25 log( rb 36
-10 36 180
D/< 20
Gmb - 2.5 10-3
(D/ 0 rc
29 - 25 log( rc 36
-10 36 180
angle off mainbeam axis, deg.
Gma = 20log(D/ + 8.4, dBi
G1a -1 15log(D/dBi
ma = 20(D)(Gma - G1a)0.5
, deg.
ra 15.85(D/-
, deg.
Gmb = 20log(D/ 7.7, dBi
G1b 29 - 25log(95D, dBi
mb = 20(D)(Gmb - G1b)0.5
, deg.
rb (95Ddeg.
Pattern for D/< 20 is added to extend the high-gain pattern to Gmax = 22 dBi.
rc : intersection of {Gmax - 2.510-3
(D/ and {29 - 25log(deg.
6.11.2.2 Frequency Assignment
The actual antenna radiation patterns should always be used in EMC analyses for
frequency assignment. The antenna radiation patterns should be available from either the system
operators or the antenna manufacturers.
When the actual radiation patterns are not available, the radiation performance standard
in Section 6.11.2.1 may be used as the reference radiation patterns. The radiation patterns in
Section 6.11.2.1 do not specify the Gmax value; however, such data should be available in the
GMF.
6.11.2.3 Spectrum Sharing Analyses
The procedure to develop the representative earth station antenna radiation pattern is as
follows:
(1) Retrieve the MetSat service records in the GMF. The symbol of the station class is “EM”
for the space station and “TM” for the earth station. Only the frequency bands in which
the federal government is the primary user are searched.
(2) Develop the earth station antenna Gmax data population profile.
(3) Select a representative Gmax value from the population profile such that approximately
75% of the Gmax population is equal to or smaller than the representative value.
(4) Develop the representative antenna radiation pattern from the representative Gmax value
and the antenna reference radiation patterns in Section 6.11.2.2.
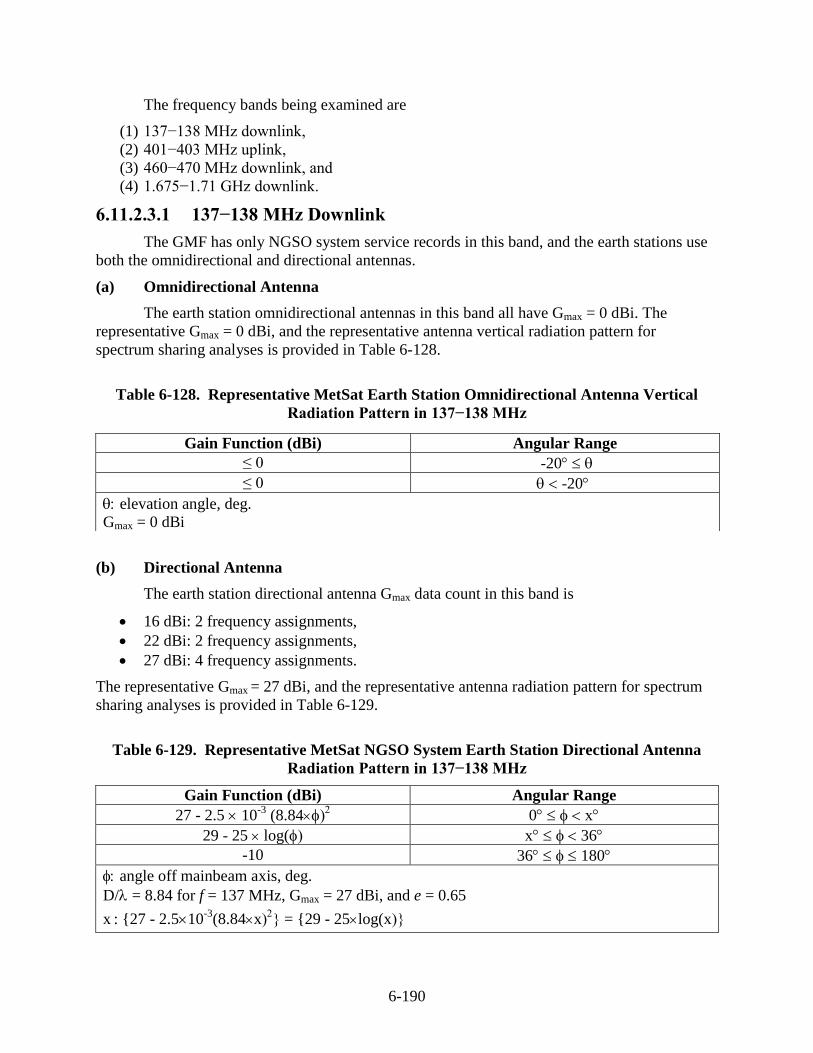
6-190
The frequency bands being examined are
(1) 137−138 MHz downlink,
(2) 401−403 MHz uplink,
(3) 460−470 MHz downlink, and
(4) 1.675−1.71 GHz downlink.
6.11.2.3.1 137−138 MHz Downlink
The GMF has only NGSO system service records in this band, and the earth stations use
both the omnidirectional and directional antennas.
(a) Omnidirectional Antenna
The earth station omnidirectional antennas in this band all have Gmax = 0 dBi. The
representative Gmax = 0 dBi, and the representative antenna vertical radiation pattern for
spectrum sharing analyses is provided in Table 6-128.
Table 6-128. Representative MetSat Earth Station Omnidirectional Antenna Vertical
Radiation Pattern in 137−138 MHz
(b) Directional Antenna
The earth station directional antenna Gmax data count in this band is
16 dBi: 2 frequency assignments,
22 dBi: 2 frequency assignments,
27 dBi: 4 frequency assignments.
The representative Gmax = 27 dBi, and the representative antenna radiation pattern for spectrum
sharing analyses is provided in Table 6-129.
Table 6-129. Representative MetSat NGSO System Earth Station Directional Antenna
Radiation Pattern in 137−138 MHz
Gain Function (dBi) Angular Range
27 - 2.5 10-3
(8.84 0 x
29 - 25 log( x 36
-10 36 180
angle off mainbeam axis, deg.
D/= 8.84 for f = 137 MHz, Gmax = 27 dBi, and e = 0.65
x : {27 - 2.510-3
(8.84x = {29 - 25log(x
Gain Function (dBi) Angular Range
≤ 0 -20
≤ 0 -20
elevation angle, deg.
Gmax = 0 dBi
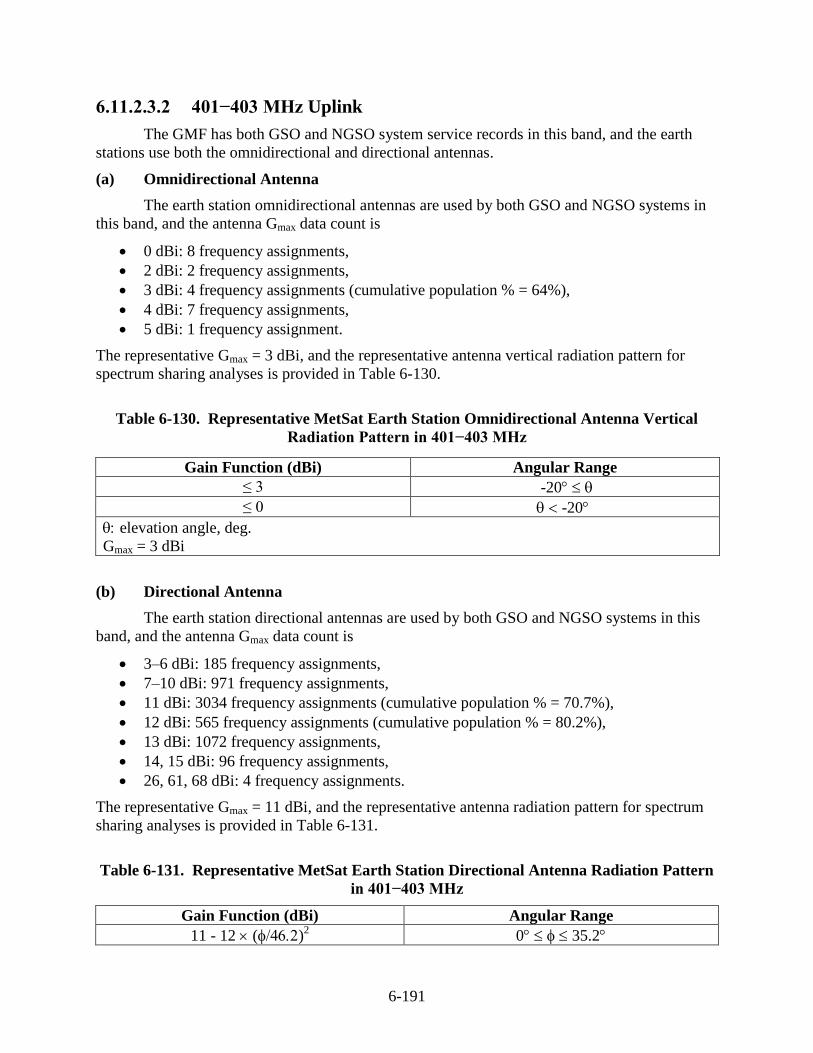
6-191
6.11.2.3.2 401−403 MHz Uplink
The GMF has both GSO and NGSO system service records in this band, and the earth
stations use both the omnidirectional and directional antennas.
(a) Omnidirectional Antenna
The earth station omnidirectional antennas are used by both GSO and NGSO systems in
this band, and the antenna Gmax data count is
0 dBi: 8 frequency assignments,
2 dBi: 2 frequency assignments,
3 dBi: 4 frequency assignments (cumulative population % = 64%),
4 dBi: 7 frequency assignments,
5 dBi: 1 frequency assignment.
The representative Gmax = 3 dBi, and the representative antenna vertical radiation pattern for
spectrum sharing analyses is provided in Table 6-130.
Table 6-130. Representative MetSat Earth Station Omnidirectional Antenna Vertical
Radiation Pattern in 401−403 MHz
(b) Directional Antenna
The earth station directional antennas are used by both GSO and NGSO systems in this
band, and the antenna Gmax data count is
3–6 dBi: 185 frequency assignments,
7–10 dBi: 971 frequency assignments,
11 dBi: 3034 frequency assignments (cumulative population % = 70.7%),
12 dBi: 565 frequency assignments (cumulative population % = 80.2%),
13 dBi: 1072 frequency assignments,
14, 15 dBi: 96 frequency assignments,
26, 61, 68 dBi: 4 frequency assignments.
The representative Gmax = 11 dBi, and the representative antenna radiation pattern for spectrum
sharing analyses is provided in Table 6-131.
Table 6-131. Representative MetSat Earth Station Directional Antenna Radiation Pattern
in 401−403 MHz
Gain Function (dBi) Angular Range
11 - 12 ()2 0 35.2
Gain Function (dBi) Angular Range
≤ 3 -20
≤ 0 -20
elevation angle, deg.
Gmax = 3 dBi
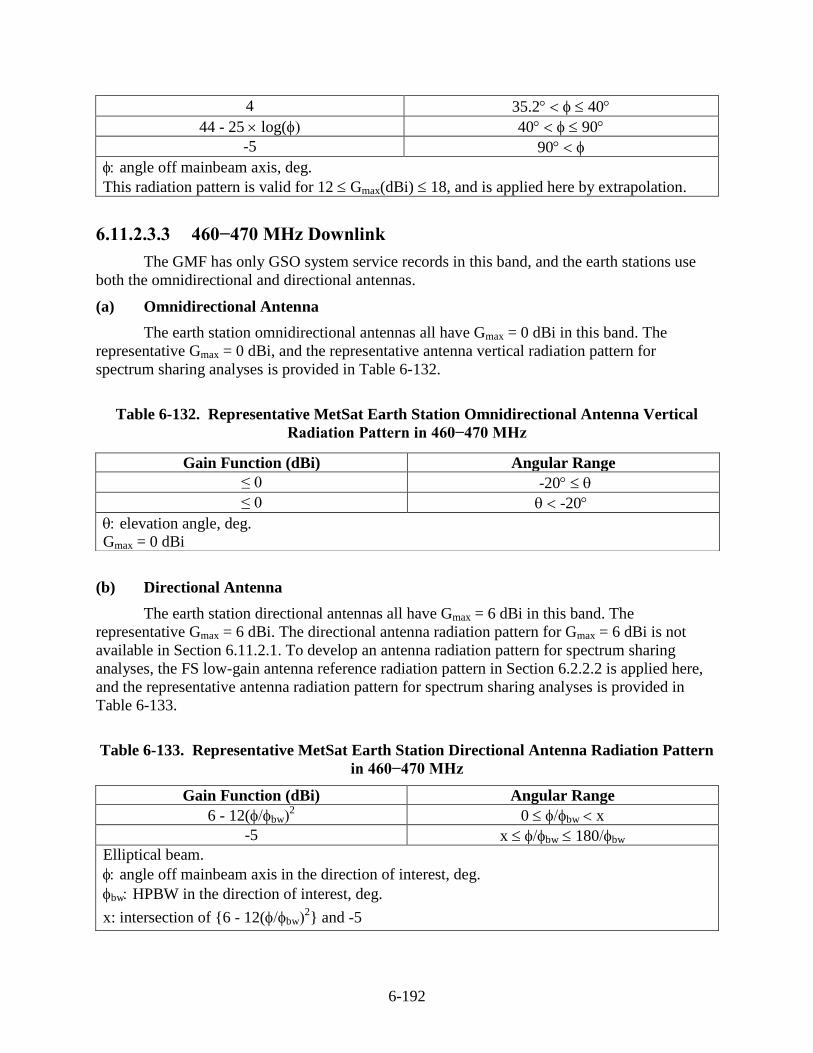
6-192
4 35.2 40
44 - 25 log( 40 90
-5 90
angle off mainbeam axis, deg.
This radiation pattern is valid for 12 Gmax(dBi) 18, and is applied here by extrapolation.
6.11.2.3.3 460−470 MHz Downlink
The GMF has only GSO system service records in this band, and the earth stations use
both the omnidirectional and directional antennas.
(a) Omnidirectional Antenna
The earth station omnidirectional antennas all have Gmax = 0 dBi in this band. The
representative Gmax = 0 dBi, and the representative antenna vertical radiation pattern for
spectrum sharing analyses is provided in Table 6-132.
Table 6-132. Representative MetSat Earth Station Omnidirectional Antenna Vertical
Radiation Pattern in 460−470 MHz
(b) Directional Antenna
The earth station directional antennas all have Gmax = 6 dBi in this band. The
representative Gmax = 6 dBi. The directional antenna radiation pattern for Gmax = 6 dBi is not
available in Section 6.11.2.1. To develop an antenna radiation pattern for spectrum sharing
analyses, the FS low-gain antenna reference radiation pattern in Section 6.2.2.2 is applied here,
and the representative antenna radiation pattern for spectrum sharing analyses is provided in
Table 6-133.
Table 6-133. Representative MetSat Earth Station Directional Antenna Radiation Pattern
in 460−470 MHz
Gain Function (dBi) Angular Range
6 - 12(bw2 0 bw x
-5 x bw 180bw
Elliptical beam.
angle off mainbeam axis in the direction of interest, deg.
bw HPBW in the direction of interest, deg.
x: intersection of {6 - 12(bw2} and -5
Gain Function (dBi) Angular Range
≤ 0 -20
≤ 0 -20
elevation angle, deg.
Gmax = 0 dBi
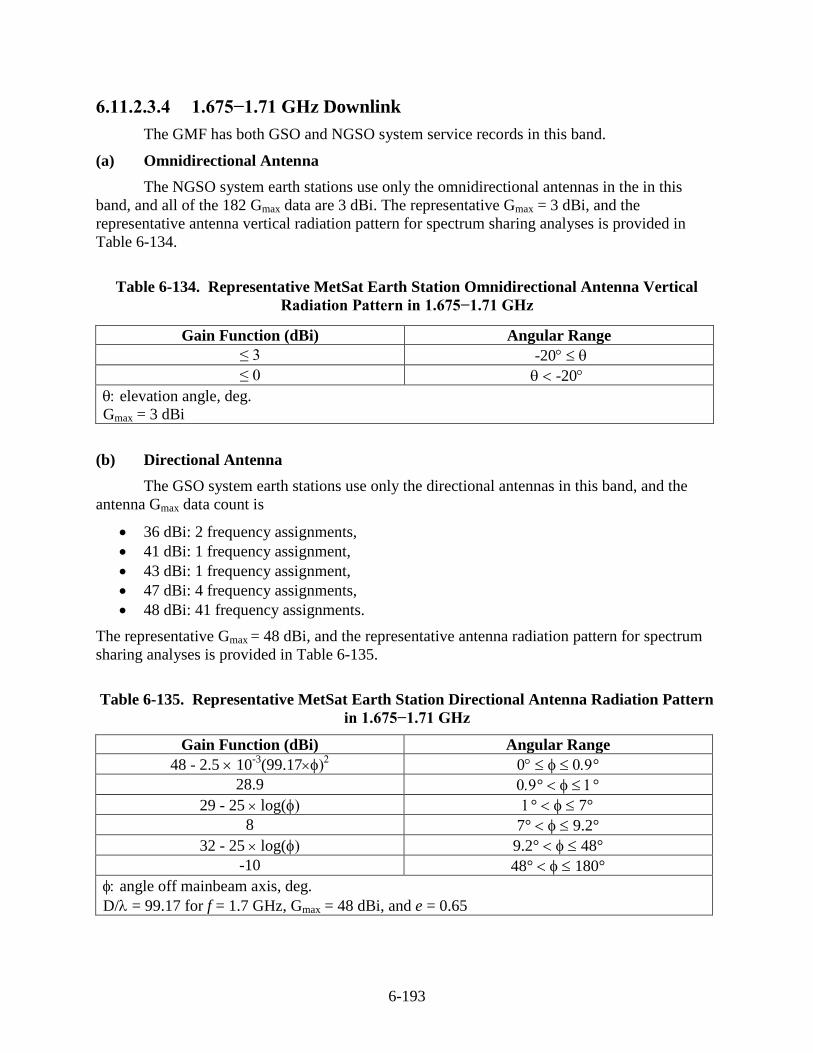
6-193
6.11.2.3.4 1.675−1.71 GHz Downlink
The GMF has both GSO and NGSO system service records in this band.
(a) Omnidirectional Antenna
The NGSO system earth stations use only the omnidirectional antennas in the in this
band, and all of the 182 Gmax data are 3 dBi. The representative Gmax = 3 dBi, and the
representative antenna vertical radiation pattern for spectrum sharing analyses is provided in
Table 6-134.
Table 6-134. Representative MetSat Earth Station Omnidirectional Antenna Vertical
Radiation Pattern in 1.675−1.71 GHz
(b) Directional Antenna
The GSO system earth stations use only the directional antennas in this band, and the
antenna Gmax data count is
36 dBi: 2 frequency assignments,
41 dBi: 1 frequency assignment,
43 dBi: 1 frequency assignment,
47 dBi: 4 frequency assignments,
48 dBi: 41 frequency assignments.
The representative Gmax = 48 dBi, and the representative antenna radiation pattern for spectrum
sharing analyses is provided in Table 6-135.
Table 6-135. Representative MetSat Earth Station Directional Antenna Radiation Pattern
in 1.675−1.71 GHz
Gain Function (dBi) Angular Range
48 - 2.5 10-3
(99.17 0 °
28.9 ° °
29 - 25 log( ° 7°
8 7° 9.2°
32 - 25 log( 9.2° 48°
-10 48° 180°
angle off mainbeam axis, deg.
D/= 99.17 for f = 1.7 GHz, Gmax = 48 dBi, and e = 0.65
Gain Function (dBi) Angular Range
≤ 3 -20
≤ 0 -20
elevation angle, deg.
Gmax = 3 dBi
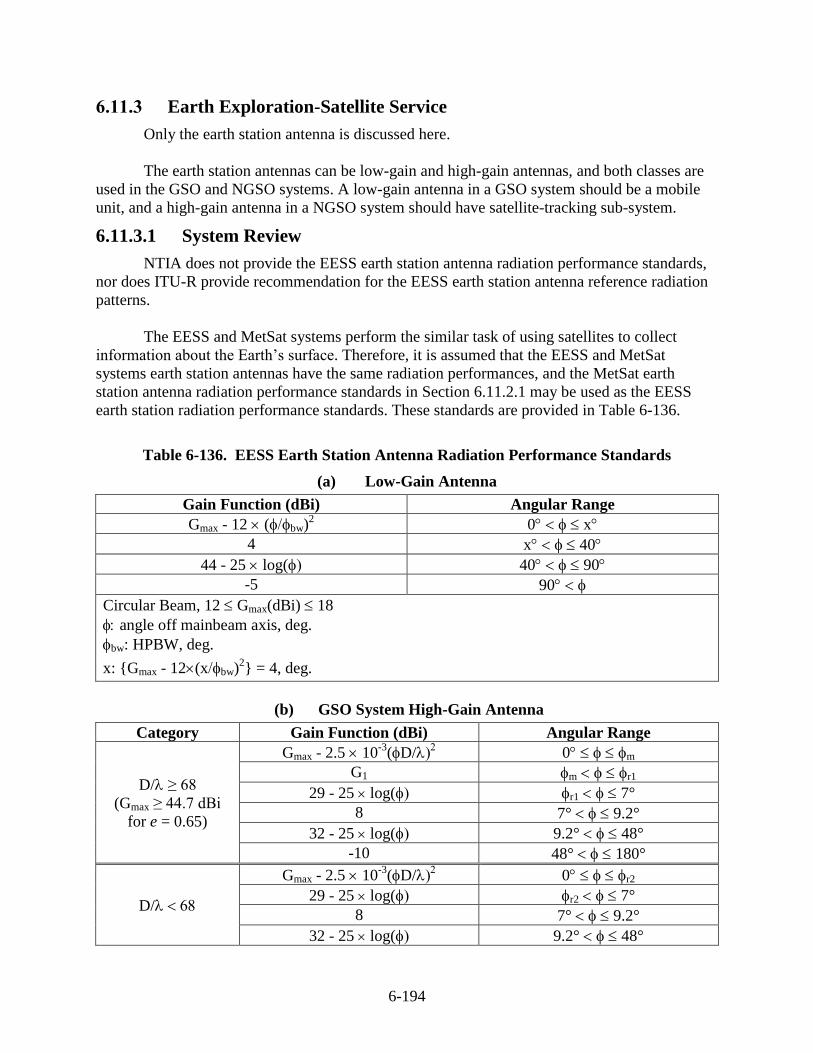
6-194
6.11.3 Earth Exploration-Satellite Service
Only the earth station antenna is discussed here.
The earth station antennas can be low-gain and high-gain antennas, and both classes are
used in the GSO and NGSO systems. A low-gain antenna in a GSO system should be a mobile
unit, and a high-gain antenna in a NGSO system should have satellite-tracking sub-system.
6.11.3.1 System Review
NTIA does not provide the EESS earth station antenna radiation performance standards,
nor does ITU-R provide recommendation for the EESS earth station antenna reference radiation
patterns.
The EESS and MetSat systems perform the similar task of using satellites to collect
information about the Earth’s surface. Therefore, it is assumed that the EESS and MetSat
systems earth station antennas have the same radiation performances, and the MetSat earth
station antenna radiation performance standards in Section 6.11.2.1 may be used as the EESS
earth station radiation performance standards. These standards are provided in Table 6-136.
Table 6-136. EESS Earth Station Antenna Radiation Performance Standards
(a) Low-Gain Antenna
Gain Function (dBi) Angular Range
Gmax - 12 (bw)2 0 x
4 x 40
44 - 25 log( 40 90
-5 90
Circular Beam, 12 Gmax(dBi) 18
angle off mainbeam axis, deg.
bw: HPBW, deg.
x: {Gmax - 12(xbw)2} = 4, deg.
(b) GSO System High-Gain Antenna
Category Gain Function (dBi) Angular Range
D/≥ 68
(Gmax ≥ 44.7 dBi
for e = 0.65)
Gmax - 2.5 10-3
(D/ 0 m
G1 m r1
29 - 25 log( r1 7°
8 7° 9.2°
32 - 25 log( 9.2° 48°
-10 48° 180°
D/
Gmax - 2.5 10-3
(D/ 0 r2
29 - 25 log( r2 7°
8 7° 9.2°
32 - 25 log( 9.2° 48°
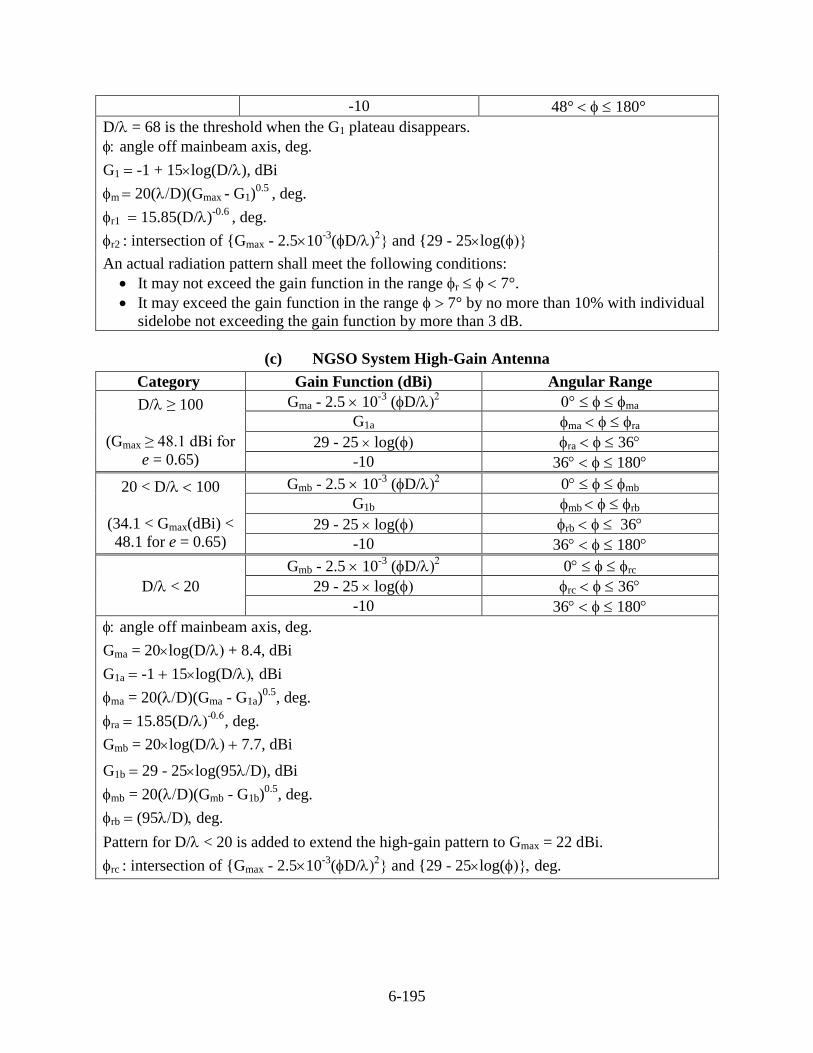
6-195
-10 48° 180°
D/= 68 is the threshold when the G1 plateau disappears.
angle off mainbeam axis, deg.
G1 -1 + 15log(D/), dBi
m 20(D)(Gmax - G1)0.5
, deg.
r1 15.85(D/)-0.6
, deg.
r2 : intersection of {Gmax - 2.510-3
(D/ and {29 - 25log(
An actual radiation pattern shall meet the following conditions:
It may not exceed the gain function in the range r 7°.
It may exceed the gain function in the range 7° by no more than 10% with individual
sidelobe not exceeding the gain function by more than 3 dB.
(c) NGSO System High-Gain Antenna
Category Gain Function (dBi) Angular Range
D/ ≥ 100
(Gmax ≥ 48.1 dBi for
e = 0.65)
Gma - 2.5 10-3
(D/ ma
G1a ma ra
29 - 25 log( ra 36
-10 36 180
20 < D/ 100
(34.1 < Gmax(dBi) <
48.1 for e = 0.65)
Gmb - 2.5 10-3
(D/ 0 mb
G1b mb rb
29 - 25 log( rb 36
-10 36 180
D/< 20
Gmb - 2.5 10-3
(D/ 0 rc
29 - 25 log( rc 36
-10 36 180
angle off mainbeam axis, deg.
Gma = 20log(D/ + 8.4, dBi
G1a -1 15log(D/dBi
ma = 20(D)(Gma - G1a)0.5
, deg.
ra 15.85(D/-
, deg.
Gmb = 20log(D/ 7.7, dBi
G1b 29 - 25log(95D, dBi
mb = 20(D)(Gmb - G1b)0.5
, deg.
rb (95Ddeg.
Pattern for D/< 20 is added to extend the high-gain pattern to Gmax = 22 dBi.
rc : intersection of {Gmax - 2.510-3
(D/ and {29 - 25log(deg.
6-196
6.11.3.2 Frequency Assignment
The actual antenna radiation patterns should always be used in EMC analyses for
frequency assignment. The antenna radiation patterns should be available from either the system
operators or the antenna manufacturers.
When the actual radiation patterns are not available, the radiation performance standard
in Section 6.11.3.1 may be used as the reference radiation patterns. The radiation patterns in
Section 6.11.3.1 do not specify the Gmax value; however, such data should be available in the
GMF.
6.11.3.3 Spectrum Sharing Analyses
The procedure to develop the representative earth station antenna radiation pattern is as
follows:
(1) Retrieve the EESS service records in the GMF. The symbol of the station class is “EW”
for the space station and “TW” for the earth station. Only the frequency bands in which
the federal government is the primary user are searched.
(2) Develop the earth station antenna Gmax data population profile.
(3) Select a representative Gmax value from the population profile such that approximately
75% of the Gmax population is equal to or smaller than the representative value.
(4) Develop the representative antenna radiation pattern from the representative Gmax value
and the antenna reference radiation patterns in Section 6.11.3.2.
The frequency bands being examined are
(1) 401−403 MHz uplink,
(2) 2.025−2.11 GHz,
(3) 2.2−2.29 GHz downlink,
(4) 8.025−8.4 GHz downlink, and
(5) 25.5−27 GHz downlink.
6.11.3.3.1 401−403 MHz Uplink
The GMF has both the GSO and NGSO system service records in this band, and the earth
stations use only directional antennas.
(a) GSO System
The GSO system earth station transmitting antenna Gmax data count in this band is
6 dBi: 1 frequency assignment,
13 dBi: 3 frequency assignments.
The representative Gmax = 13 dBi, and the representative antenna radiation pattern for spectrum
sharing analyses is provided in Table 6-137.
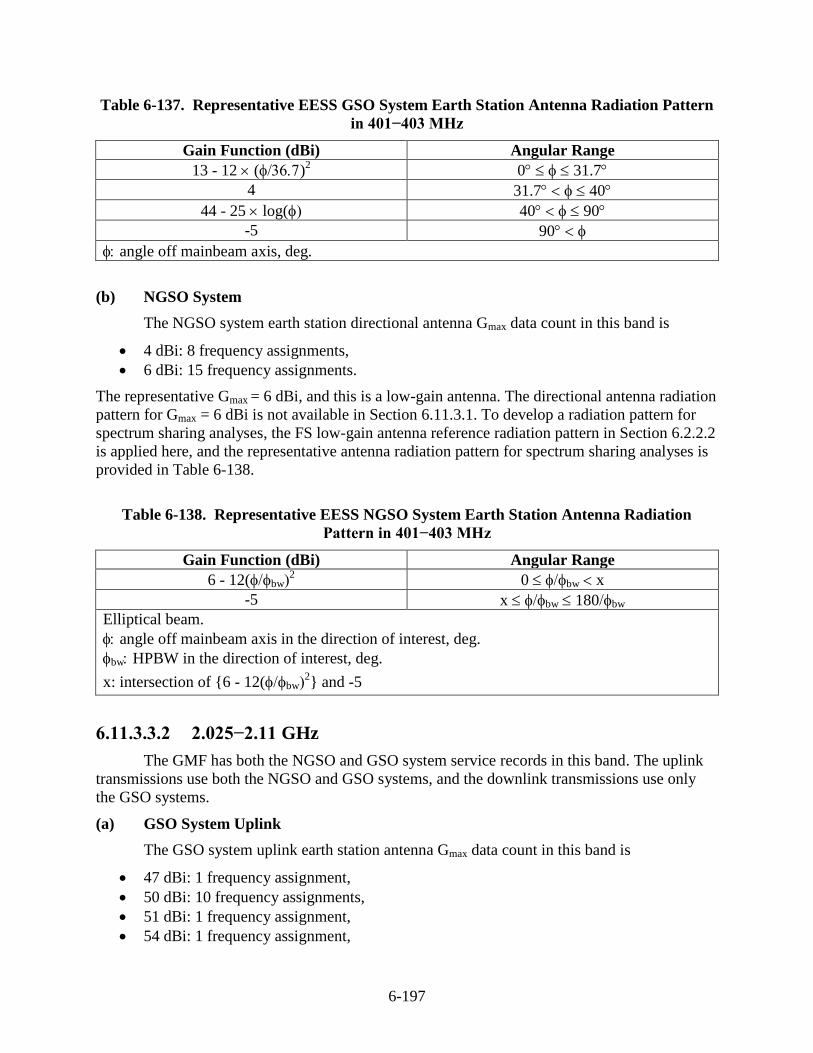
6-197
Table 6-137. Representative EESS GSO System Earth Station Antenna Radiation Pattern
in 401−403 MHz
Gain Function (dBi) Angular Range
13 - 12 ()2 0 31.7
4 31.7 40
44 - 25 log( 40 90
-5 90
angle off mainbeam axis, deg.
(b) NGSO System
The NGSO system earth station directional antenna Gmax data count in this band is
4 dBi: 8 frequency assignments,
6 dBi: 15 frequency assignments.
The representative Gmax = 6 dBi, and this is a low-gain antenna. The directional antenna radiation
pattern for Gmax = 6 dBi is not available in Section 6.11.3.1. To develop a radiation pattern for
spectrum sharing analyses, the FS low-gain antenna reference radiation pattern in Section 6.2.2.2
is applied here, and the representative antenna radiation pattern for spectrum sharing analyses is
provided in Table 6-138.
Table 6-138. Representative EESS NGSO System Earth Station Antenna Radiation
Pattern in 401−403 MHz
Gain Function (dBi) Angular Range
6 - 12(bw2 0 bw x
-5 x bw 180bw
Elliptical beam.
angle off mainbeam axis in the direction of interest, deg.
bw HPBW in the direction of interest, deg.
x: intersection of {6 - 12(bw2} and -5
6.11.3.3.2 2.025−2.11 GHz
The GMF has both the NGSO and GSO system service records in this band. The uplink
transmissions use both the NGSO and GSO systems, and the downlink transmissions use only
the GSO systems.
(a) GSO System Uplink
The GSO system uplink earth station antenna Gmax data count in this band is
47 dBi: 1 frequency assignment,
50 dBi: 10 frequency assignments,
51 dBi: 1 frequency assignment,
54 dBi: 1 frequency assignment,
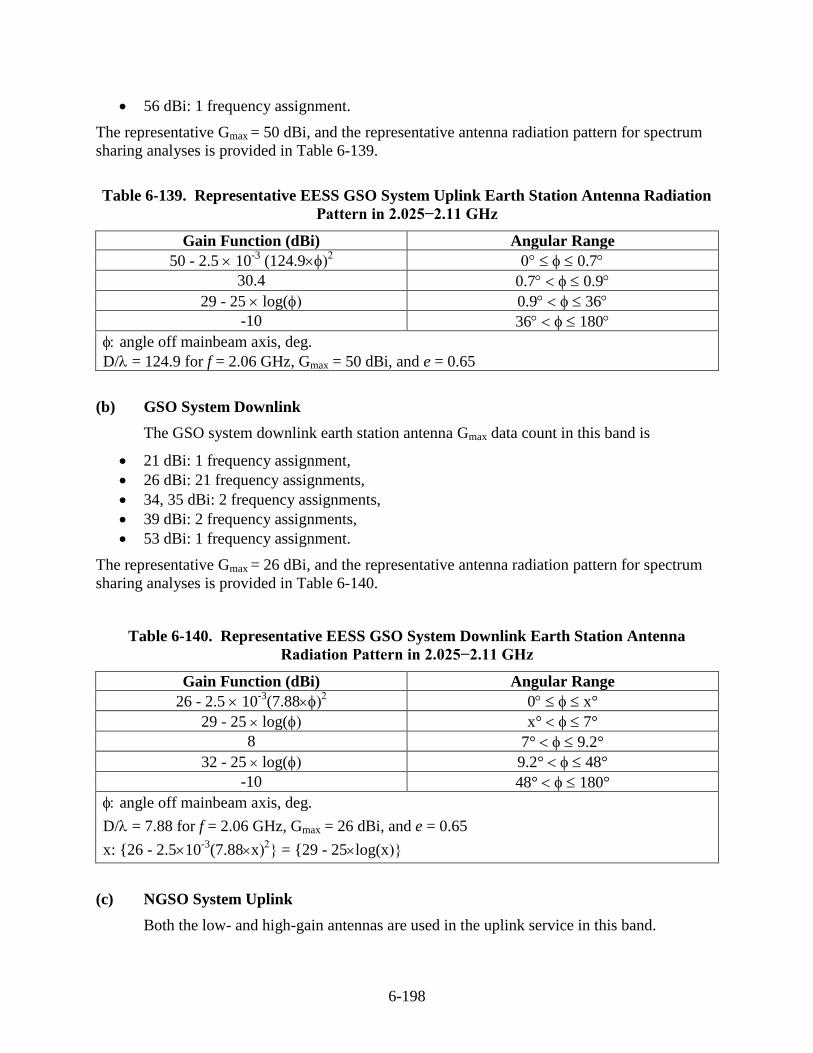
6-198
56 dBi: 1 frequency assignment.
The representative Gmax = 50 dBi, and the representative antenna radiation pattern for spectrum
sharing analyses is provided in Table 6-139.
Table 6-139. Representative EESS GSO System Uplink Earth Station Antenna Radiation
Pattern in 2.025−2.11 GHz
Gain Function (dBi) Angular Range
50 - 2.5 10-3
(124.9 0.7
30.4 0.7 0.9
29 - 25 log( 0.9 36
-10 36 180
angle off mainbeam axis, deg.
D/= 124.9 for f = 2.06 GHz, Gmax = 50 dBi, and e = 0.65
(b) GSO System Downlink
The GSO system downlink earth station antenna Gmax data count in this band is
21 dBi: 1 frequency assignment,
26 dBi: 21 frequency assignments,
34, 35 dBi: 2 frequency assignments,
39 dBi: 2 frequency assignments,
53 dBi: 1 frequency assignment.
The representative Gmax = 26 dBi, and the representative antenna radiation pattern for spectrum
sharing analyses is provided in Table 6-140.
Table 6-140. Representative EESS GSO System Downlink Earth Station Antenna
Radiation Pattern in 2.025−2.11 GHz
Gain Function (dBi) Angular Range
26 - 2.5 10-3
(7.88 0 x°
29 - 25 log( x° 7°
8 7° 9.2°
32 - 25 log( 9.2° 48°
-10 48° 180°
angle off mainbeam axis, deg.
D/= 7.88 for f = 2.06 GHz, Gmax = 26 dBi, and e = 0.65
x: {26 - 2.510-3
(7.88x = {29 - 25log(x
(c) NGSO System Uplink
Both the low- and high-gain antennas are used in the uplink service in this band.
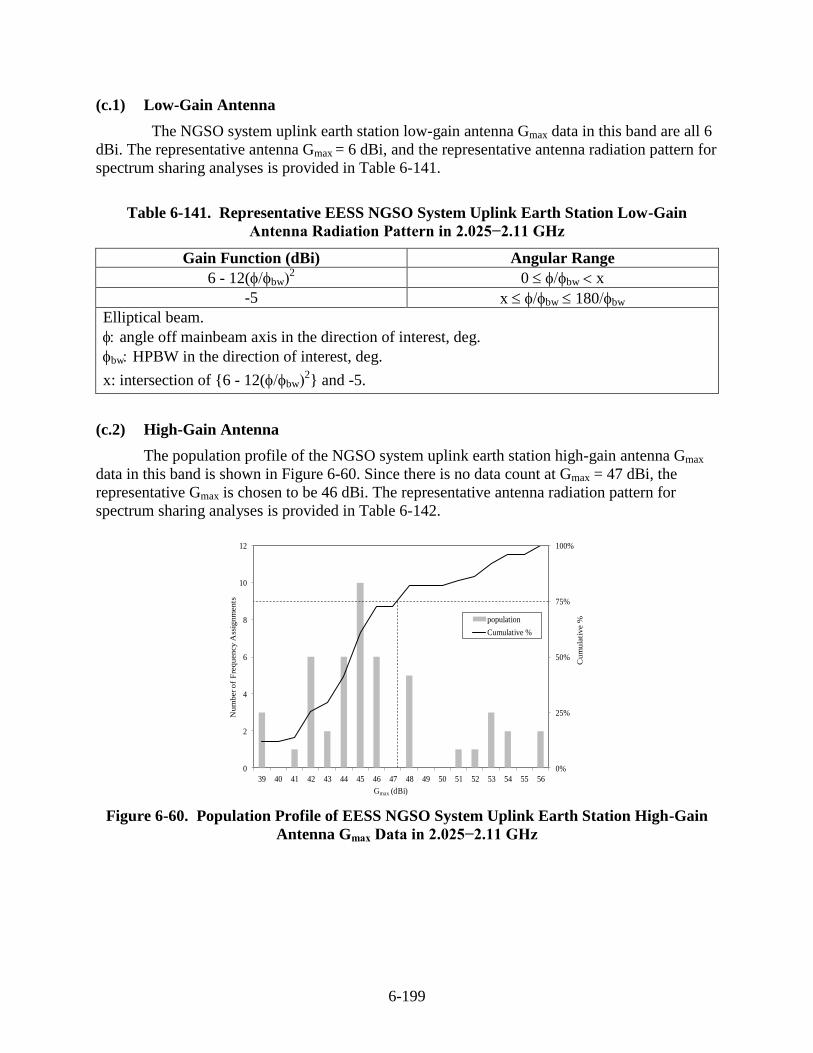
6-199
(c.1) Low-Gain Antenna
The NGSO system uplink earth station low-gain antenna Gmax data in this band are all 6
dBi. The representative antenna Gmax = 6 dBi, and the representative antenna radiation pattern for
spectrum sharing analyses is provided in Table 6-141.
Table 6-141. Representative EESS NGSO System Uplink Earth Station Low-Gain
Antenna Radiation Pattern in 2.025−2.11 GHz
Gain Function (dBi) Angular Range
6 - 12(bw2 0 bw x
-5 x bw 180bw
Elliptical beam.
angle off mainbeam axis in the direction of interest, deg.
bw HPBW in the direction of interest, deg.
x: intersection of {6 - 12(bw2} and -5.
(c.2) High-Gain Antenna
The population profile of the NGSO system uplink earth station high-gain antenna Gmax
data in this band is shown in Figure 6-60. Since there is no data count at Gmax = 47 dBi, the
representative Gmax is chosen to be 46 dBi. The representative antenna radiation pattern for
spectrum sharing analyses is provided in Table 6-142.
0%
25%
50%
75%
100%
0
2
4
6
8
10
12
39 40 41 42 43 44 45 46 47 48 49 50 51 52 53 54 55 56
Cum
ula
tive %
Num
ber of
Fre
quency A
ssig
nm
ents
Gmax (dBi)
population
Cumulative %
Figure 6-60. Population Profile of EESS NGSO System Uplink Earth Station High-Gain
Antenna Gmax Data in 2.025−2.11 GHz
6-200
Table 6-142. Representative EESS NGSO System Uplink Earth Station High-Gain
Antenna Radiation Pattern in 2.025−2.11 GHz
Gain Function (dBi) Angular Range
46 - 2.5 10-3
(78.78 0
27.4
29 - 25 log( 36
-10 36 180
angle off mainbeam axis, deg.
D/= 82.2 for f = 2.06 GHz, Gmax = 46 dBi, and e = 0.65
6.11.3.3.3 2.2−2.29 GHz Downlink
The GMF has only the NGSO system service records in this band.
The population profile of the earth station antenna Gmax data in this band is shown in
Figure 6-61. The representative Gmax = 46 dBi, and the representative antenna radiation pattern
for spectrum sharing analyses is provided in Table 6-143.
0%
25%
50%
75%
100%
0
5
10
15
20
25
30
38 39 40 41 42 43 44 45 46 47 48 49 50 51 52 53 54 55 56 57
Cum
ula
tive %
Num
ber of
Fre
quency A
ssig
nm
ents
Gmax (dBi)
population
Cumulative %
Figure 6-61. Population Profile of EESS Earth Station Antenna Gmax Data in 2.2−2.29 GHz
Table 6-143. Representative EESS Earth Station Antenna Radiation Pattern in 2.2−2.29
GHz
Gain Function (dBi) Angular Range
46 - 2.5 10-3
(78.78 0
27.4
29 - 25 log( 36
-10 36 180
angle off mainbeam axis, deg.
D/= 82.2 for f = 2.25 GHz, Gmax = 46 dBi, and e = 0.65
6-201
6.11.3.3.4 8.025−8.4 GHz Downlink
The GMF has only the NGSO system service records in this band.
The earth station antenna Gmax data count in this band is
42 dBi: 1 frequency assignment,
44 dBi: 48 frequency assignments,
45 dBi: 4 frequency assignments,
46 dBi: 6 frequency assignments (cumulative population % = 73.8%),
54 dBi: 1 frequency assignment (cumulative population % = 75%),
56 dBi: 3 frequency assignments,
57, 58, 59 dBi: 17 frequency assignments.
There are two disconnected clusters at 42–46 dBi and 54–59 dBi. Even though the
percentage of cumulative population is 75% at Gmax = 54 dBi, the cluster at 42–46 dBi is
chosen to find the representative Gmax, and the representative Gmax is chosen to be 46 dBi. The
representative antenna radiation pattern for spectrum sharing analyses is provided in Table
6-144.
Table 6-144. Representative EESS Earth Station Antenna Radiation Pattern in 8.025−8.4
GHz
Gain Function (dBi) Angular Range
46 - 2.5 10-3
(82.2 1.05
27.4 1.05 1.16
29 - 25 log( 1.16 36
-10 36 180
angle off mainbeam axis, deg.
D/= 82.2 for f = 8.2 GHz, Gmax = 46 dBi, and e = 0.65
6.11.3.3.5 25.5−27 GHz Downlink
The GMF has only the NGSO system service records in this band.
All of the earth station antenna Gmax data in this band are 58 dBi. The representative Gmax
= 58 dBi, and the representative antenna radiation pattern for spectrum sharing analyses is
provided in Table 6-145.
Table 6-145. Representative EESS Earth Station Antenna Radiation Pattern in 25.5−27
GHz
Gain Function (dBi) Angular Range
58 - 2.5 10-3
(313.6 0.3
36.4 0.3 0.5
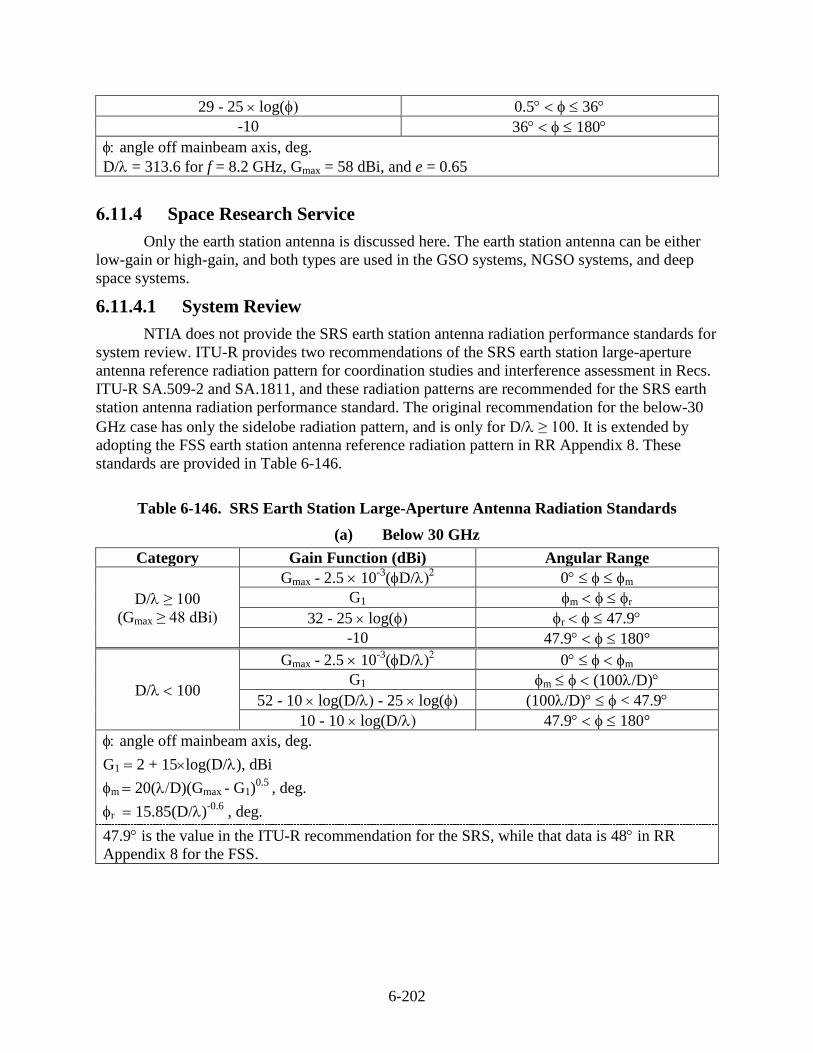
6-202
29 - 25 log( 0.5 36
-10 36 180
angle off mainbeam axis, deg.
D/= 313.6 for f = 8.2 GHz, Gmax = 58 dBi, and e = 0.65
6.11.4 Space Research Service
Only the earth station antenna is discussed here. The earth station antenna can be either
low-gain or high-gain, and both types are used in the GSO systems, NGSO systems, and deep
space systems.
6.11.4.1 System Review
NTIA does not provide the SRS earth station antenna radiation performance standards for
system review. ITU-R provides two recommendations of the SRS earth station large-aperture
antenna reference radiation pattern for coordination studies and interference assessment in Recs.
ITU-R SA.509-2 and SA.1811, and these radiation patterns are recommended for the SRS earth
station antenna radiation performance standard. The original recommendation for the below-30
GHz case has only the sidelobe radiation pattern, and is only for D/≥ 100. It is extended by
adopting the FSS earth station antenna reference radiation pattern in RR Appendix 8. These
standards are provided in Table 6-146.
Table 6-146. SRS Earth Station Large-Aperture Antenna Radiation Standards
(a) Below 30 GHz
Category Gain Function (dBi) Angular Range
D/≥ 100
(Gmax ≥ 48 dBi)
Gmax - 2.5 10-3
(D/ 0 m
G1 m r
32 - 25 log( r 47.9
-10 47.9 180°
D/100
Gmax - 2.5 10-3
(D/ 0 m
G1 m (100/D)
52 - 10 log(D/-25 log( (100/D) < 47.9
10 - 10 log(D/ 47.9 180°
angle off mainbeam axis, deg.
G1 2 + 15log(D/), dBi
m 20(D)(Gmax - G1)0.5
, deg.
r 15.85(D/)-0.6
, deg.
47.9 is the value in the ITU-R recommendation for the SRS, while that data is 48 in RR
Appendix 8 for the FSS.
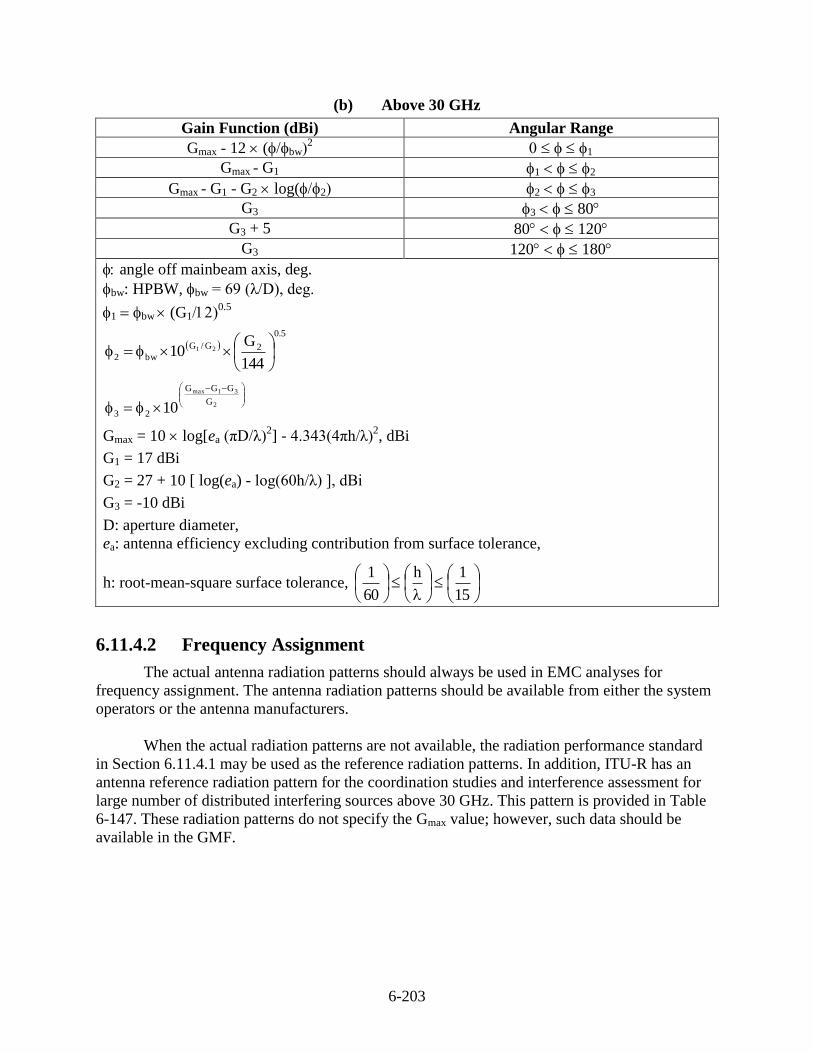
6-203
(b) Above 30 GHz
Gain Function (dBi) Angular Range
Gmax - 12 (bw2 1
Gmax - G1 1 2
Gmax - G1 - G2 log(2 2 3
G3 3 80
G3 + 5 80 120
G3 120 180
angle off mainbeam axis, deg.
bw: HPBW, bw = 69 (λ/D), deg.
1 bw (G10.5
5.0
2G/G
bw2144
G10 21
2
31max
G
GGG
23 10
Gmax = 10 log[ea (πD/λ)2] - 4.343(4πh/λ)
2, dBi
G1 = 17 dBi
G2 = 27 + 10 [ log(ea) - log(60h/λ) ], dBi
G3 = -10 dBi
D: aperture diameter,
ea: antenna efficiency excluding contribution from surface tolerance,
h: root-mean-square surface tolerance,
15
1h
60
1
6.11.4.2 Frequency Assignment
The actual antenna radiation patterns should always be used in EMC analyses for
frequency assignment. The antenna radiation patterns should be available from either the system
operators or the antenna manufacturers.
When the actual radiation patterns are not available, the radiation performance standard
in Section 6.11.4.1 may be used as the reference radiation patterns. In addition, ITU-R has an
antenna reference radiation pattern for the coordination studies and interference assessment for
large number of distributed interfering sources above 30 GHz. This pattern is provided in Table
6-147. These radiation patterns do not specify the Gmax value; however, such data should be
available in the GMF.
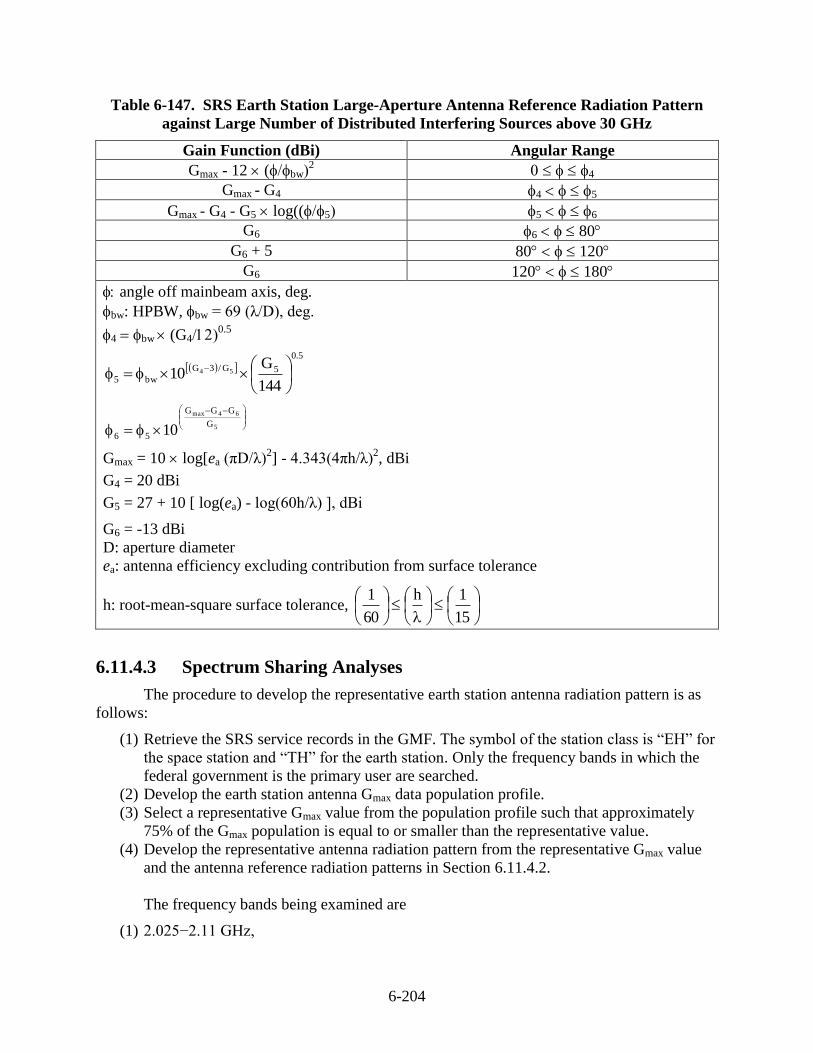
6-204
Table 6-147. SRS Earth Station Large-Aperture Antenna Reference Radiation Pattern
against Large Number of Distributed Interfering Sources above 30 GHz
Gain Function (dBi) Angular Range
Gmax - 12 (bw2 4
Gmax - G4 4 5
Gmax - G4 - G5 log((5 5 6
G6 6 80
G6 + 5 80 120
G6 120 180
angle off mainbeam axis, deg.
bw: HPBW, bw = 69 (λ/D), deg.
4 bw (G40.5
5.0
5G/3G
bw5144
G10 54
5
64max
G
GGG
56 10
Gmax = 10 log[ea (πD/λ)2] - 4.343(4πh/λ)
2, dBi
G4 = 20 dBi
G5 = 27 + 10 [ log(ea) - log(60h/λ) ], dBi
G6 = -13 dBi
D: aperture diameter
ea: antenna efficiency excluding contribution from surface tolerance
h: root-mean-square surface tolerance,
15
1h
60
1
6.11.4.3 Spectrum Sharing Analyses
The procedure to develop the representative earth station antenna radiation pattern is as
follows:
(1) Retrieve the SRS service records in the GMF. The symbol of the station class is “EH” for
the space station and “TH” for the earth station. Only the frequency bands in which the
federal government is the primary user are searched.
(2) Develop the earth station antenna Gmax data population profile.
(3) Select a representative Gmax value from the population profile such that approximately
75% of the Gmax population is equal to or smaller than the representative value.
(4) Develop the representative antenna radiation pattern from the representative Gmax value
and the antenna reference radiation patterns in Section 6.11.4.2.
The frequency bands being examined are
(1) 2.025−2.11 GHz,
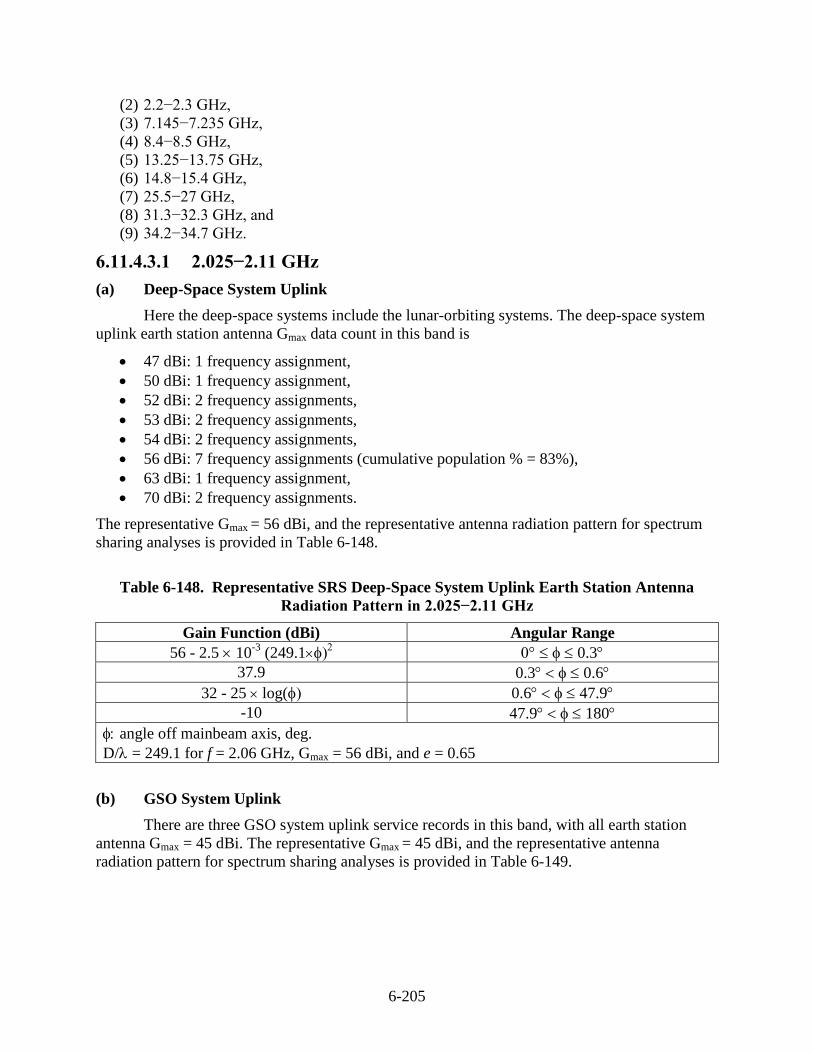
6-205
(2) 2.2−2.3 GHz,
(3) 7.145−7.235 GHz,
(4) 8.4−8.5 GHz,
(5) 13.25−13.75 GHz,
(6) 14.8−15.4 GHz,
(7) 25.5−27 GHz,
(8) 31.3−32.3 GHz, and
(9) 34.2−34.7 GHz.
6.11.4.3.1 2.025−2.11 GHz
(a) Deep-Space System Uplink
Here the deep-space systems include the lunar-orbiting systems. The deep-space system
uplink earth station antenna Gmax data count in this band is
47 dBi: 1 frequency assignment,
50 dBi: 1 frequency assignment,
52 dBi: 2 frequency assignments,
53 dBi: 2 frequency assignments,
54 dBi: 2 frequency assignments,
56 dBi: 7 frequency assignments (cumulative population % = 83%),
63 dBi: 1 frequency assignment,
70 dBi: 2 frequency assignments.
The representative Gmax = 56 dBi, and the representative antenna radiation pattern for spectrum
sharing analyses is provided in Table 6-148.
Table 6-148. Representative SRS Deep-Space System Uplink Earth Station Antenna
Radiation Pattern in 2.025−2.11 GHz
Gain Function (dBi) Angular Range
56 - 2.5 10-3
(249.1 0.3
37.9 0.3 0.6
32 - 25 log( 0.6 47.9
-10 47.9 180
angle off mainbeam axis, deg.
D/= 249.1 for f = 2.06 GHz, Gmax = 56 dBi, and e = 0.65
(b) GSO System Uplink
There are three GSO system uplink service records in this band, with all earth station
antenna Gmax = 45 dBi. The representative Gmax = 45 dBi, and the representative antenna
radiation pattern for spectrum sharing analyses is provided in Table 6-149.
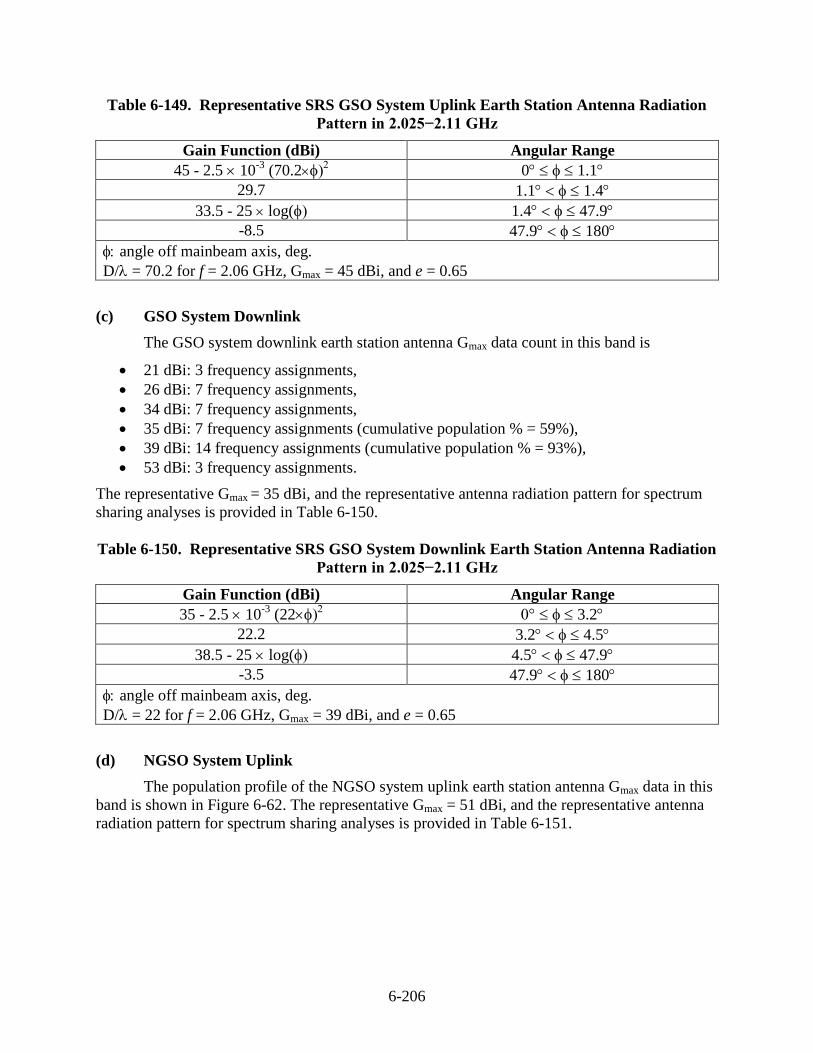
6-206
Table 6-149. Representative SRS GSO System Uplink Earth Station Antenna Radiation
Pattern in 2.025−2.11 GHz
Gain Function (dBi) Angular Range
45 - 2.5 10-3
(70.2 0 1.1
29.7 1.1 1.4
33.5 - 25 log( 1.4 47.9
-8.5 47.9 180
angle off mainbeam axis, deg.
D/= 70.2 for f = 2.06 GHz, Gmax = 45 dBi, and e = 0.65
(c) GSO System Downlink
The GSO system downlink earth station antenna Gmax data count in this band is
21 dBi: 3 frequency assignments,
26 dBi: 7 frequency assignments,
34 dBi: 7 frequency assignments,
35 dBi: 7 frequency assignments (cumulative population % = 59%),
39 dBi: 14 frequency assignments (cumulative population % = 93%),
53 dBi: 3 frequency assignments.
The representative Gmax = 35 dBi, and the representative antenna radiation pattern for spectrum
sharing analyses is provided in Table 6-150.
Table 6-150. Representative SRS GSO System Downlink Earth Station Antenna Radiation
Pattern in 2.025−2.11 GHz
Gain Function (dBi) Angular Range
35 - 2.5 10-3
(22 3.2
22.2 3.2 4.5
38.5 - 25 log( 4.5 47.9
-3.5 47.9 180
angle off mainbeam axis, deg.
D/= 22 for f = 2.06 GHz, Gmax = 39 dBi, and e = 0.65
(d) NGSO System Uplink
The population profile of the NGSO system uplink earth station antenna Gmax data in this
band is shown in Figure 6-62. The representative Gmax = 51 dBi, and the representative antenna
radiation pattern for spectrum sharing analyses is provided in Table 6-151.
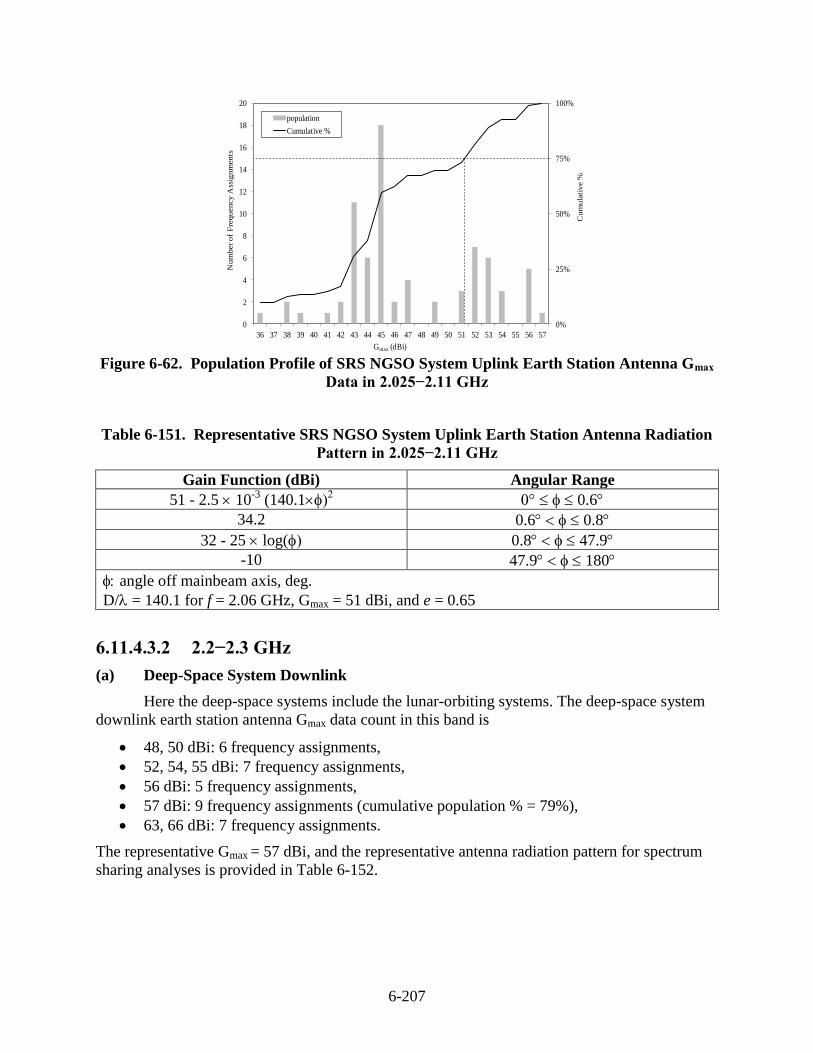
6-207
0%
25%
50%
75%
100%
0
2
4
6
8
10
12
14
16
18
20
36 37 38 39 40 41 42 43 44 45 46 47 48 49 50 51 52 53 54 55 56 57
Cu
mu
lati
ve %
Nu
mb
er
of
Fre
qu
en
cy
Ass
ign
men
ts
Gmax (dBi)
population
Cumulative %
Figure 6-62. Population Profile of SRS NGSO System Uplink Earth Station Antenna Gmax
Data in 2.025−2.11 GHz
Table 6-151. Representative SRS NGSO System Uplink Earth Station Antenna Radiation
Pattern in 2.025−2.11 GHz
Gain Function (dBi) Angular Range
51 - 2.5 10-3
(140.1 0.6
34.2 0.6 0.8
32 - 25 log( 0.8 47.9
-10 47.9 180
angle off mainbeam axis, deg.
D/= 140.1 for f = 2.06 GHz, Gmax = 51 dBi, and e = 0.65
6.11.4.3.2 2.2−2.3 GHz
(a) Deep-Space System Downlink
Here the deep-space systems include the lunar-orbiting systems. The deep-space system
downlink earth station antenna Gmax data count in this band is
48, 50 dBi: 6 frequency assignments,
52, 54, 55 dBi: 7 frequency assignments,
56 dBi: 5 frequency assignments,
57 dBi: 9 frequency assignments (cumulative population % = 79%),
63, 66 dBi: 7 frequency assignments.
The representative Gmax = 57 dBi, and the representative antenna radiation pattern for spectrum
sharing analyses is provided in Table 6-152.
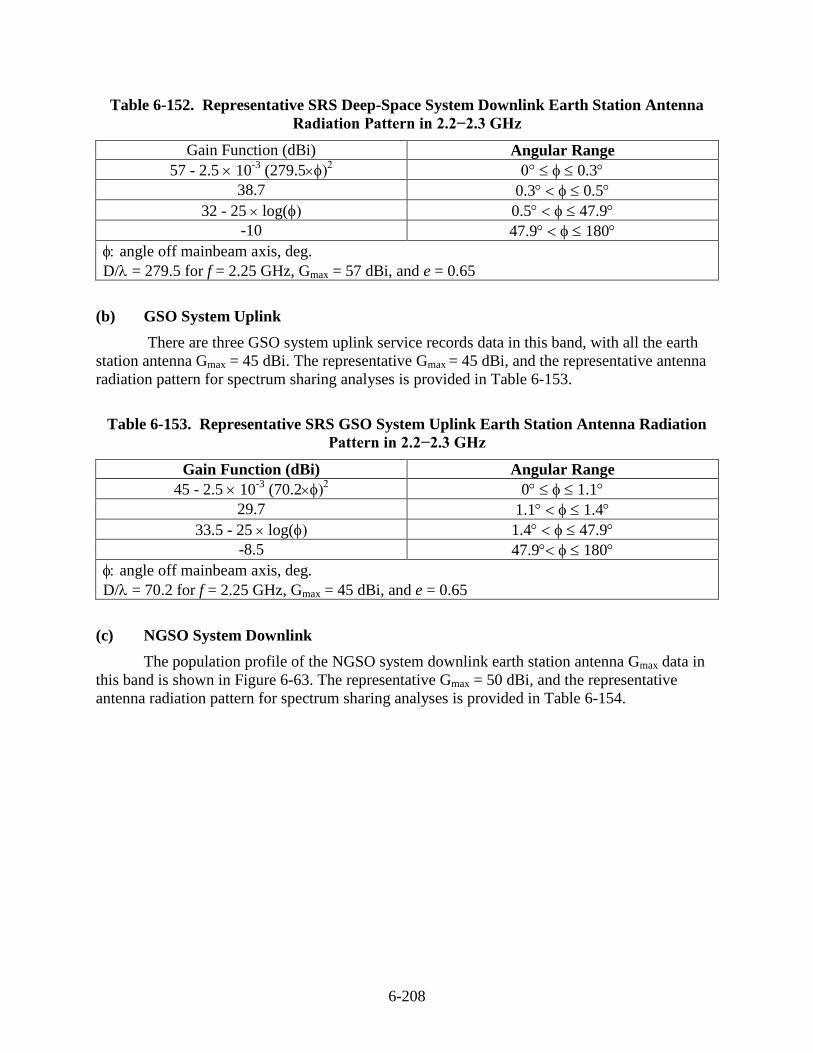
6-208
Table 6-152. Representative SRS Deep-Space System Downlink Earth Station Antenna
Radiation Pattern in 2.2−2.3 GHz
Gain Function (dBi) Angular Range
57 - 2.5 10-3
(279.5 0.3
38.7 0.3 0.5
32 - 25 log( 0.5 47.9
-10 47.9 180
angle off mainbeam axis, deg.
D/= 279.5 for f = 2.25 GHz, Gmax = 57 dBi, and e = 0.65
(b) GSO System Uplink
There are three GSO system uplink service records data in this band, with all the earth
station antenna Gmax = 45 dBi. The representative Gmax = 45 dBi, and the representative antenna
radiation pattern for spectrum sharing analyses is provided in Table 6-153.
Table 6-153. Representative SRS GSO System Uplink Earth Station Antenna Radiation
Pattern in 2.2−2.3 GHz
Gain Function (dBi) Angular Range
45 - 2.5 10-3
(70.2 0 1.1
29.7 1.1 1.4
33.5 - 25 log( 1.4 47.9
-8.5 47.9 180
angle off mainbeam axis, deg.
D/= 70.2 for f = 2.25 GHz, Gmax = 45 dBi, and e = 0.65
(c) NGSO System Downlink
The population profile of the NGSO system downlink earth station antenna Gmax data in
this band is shown in Figure 6-63. The representative Gmax = 50 dBi, and the representative
antenna radiation pattern for spectrum sharing analyses is provided in Table 6-154.
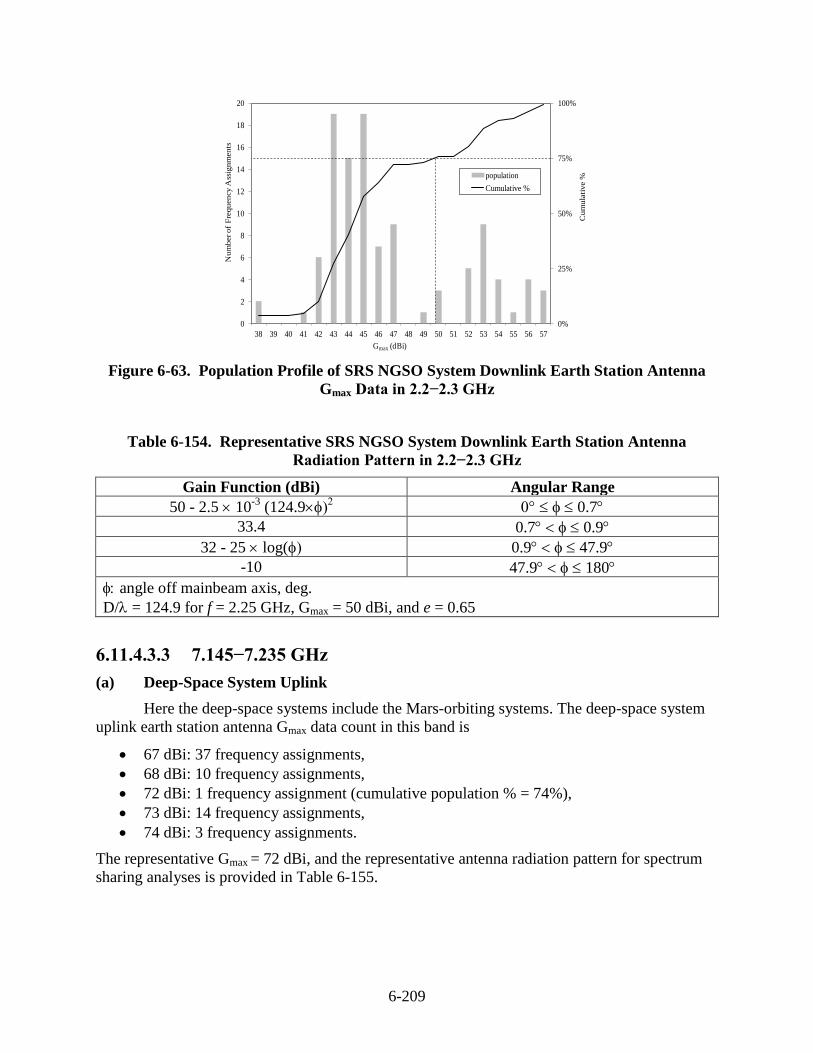
6-209
0%
25%
50%
75%
100%
0
2
4
6
8
10
12
14
16
18
20
38 39 40 41 42 43 44 45 46 47 48 49 50 51 52 53 54 55 56 57
Cu
mu
lati
ve %
Num
ber of
Fre
qu
ency A
ssig
nm
ents
Gmax (dBi)
population
Cumulative %
Figure 6-63. Population Profile of SRS NGSO System Downlink Earth Station Antenna
Gmax Data in 2.2−2.3 GHz
Table 6-154. Representative SRS NGSO System Downlink Earth Station Antenna
Radiation Pattern in 2.2−2.3 GHz
Gain Function (dBi) Angular Range
50 - 2.5 10-3
(124.9 0.7
33.4 0.7 0.9
32 - 25 log( 0.9 47.9
-10 47.9 180
angle off mainbeam axis, deg.
D/= 124.9 for f = 2.25 GHz, Gmax = 50 dBi, and e = 0.65
6.11.4.3.3 7.145−7.235 GHz
(a) Deep-Space System Uplink
Here the deep-space systems include the Mars-orbiting systems. The deep-space system
uplink earth station antenna Gmax data count in this band is
67 dBi: 37 frequency assignments,
68 dBi: 10 frequency assignments,
72 dBi: 1 frequency assignment (cumulative population % = 74%),
73 dBi: 14 frequency assignments,
74 dBi: 3 frequency assignments.
The representative Gmax = 72 dBi, and the representative antenna radiation pattern for spectrum
sharing analyses is provided in Table 6-155.
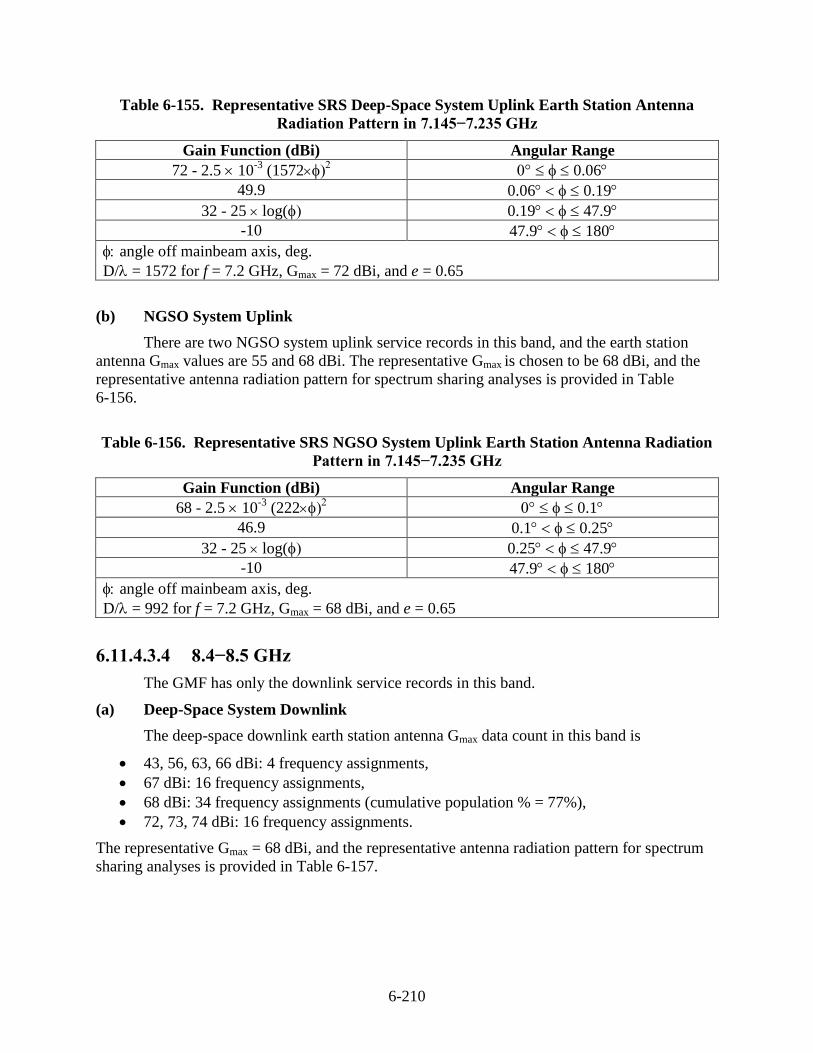
6-210
Table 6-155. Representative SRS Deep-Space System Uplink Earth Station Antenna
Radiation Pattern in 7.145−7.235 GHz
Gain Function (dBi) Angular Range
72 - 2.5 10-3
(1572 0.06
49.9 0.06 0.19
32 - 25 log( 0.19 47.9
-10 47.9 180
angle off mainbeam axis, deg.
D/= 1572 for f = 7.2 GHz, Gmax = 72 dBi, and e = 0.65
(b) NGSO System Uplink
There are two NGSO system uplink service records in this band, and the earth station
antenna Gmax values are 55 and 68 dBi. The representative Gmax is chosen to be 68 dBi, and the
representative antenna radiation pattern for spectrum sharing analyses is provided in Table
6-156.
Table 6-156. Representative SRS NGSO System Uplink Earth Station Antenna Radiation
Pattern in 7.145−7.235 GHz
Gain Function (dBi) Angular Range
68 - 2.5 10-3
(222 0.1
46.9 0.1 0.25
32 - 25 log( 0.25 47.9
-10 47.9 180
angle off mainbeam axis, deg.
D/= 992 for f = 7.2 GHz, Gmax = 68 dBi, and e = 0.65
6.11.4.3.4 8.4−8.5 GHz
The GMF has only the downlink service records in this band.
(a) Deep-Space System Downlink
The deep-space downlink earth station antenna Gmax data count in this band is
43, 56, 63, 66 dBi: 4 frequency assignments,
67 dBi: 16 frequency assignments,
68 dBi: 34 frequency assignments (cumulative population % = 77%),
72, 73, 74 dBi: 16 frequency assignments.
The representative Gmax = 68 dBi, and the representative antenna radiation pattern for spectrum
sharing analyses is provided in Table 6-157.
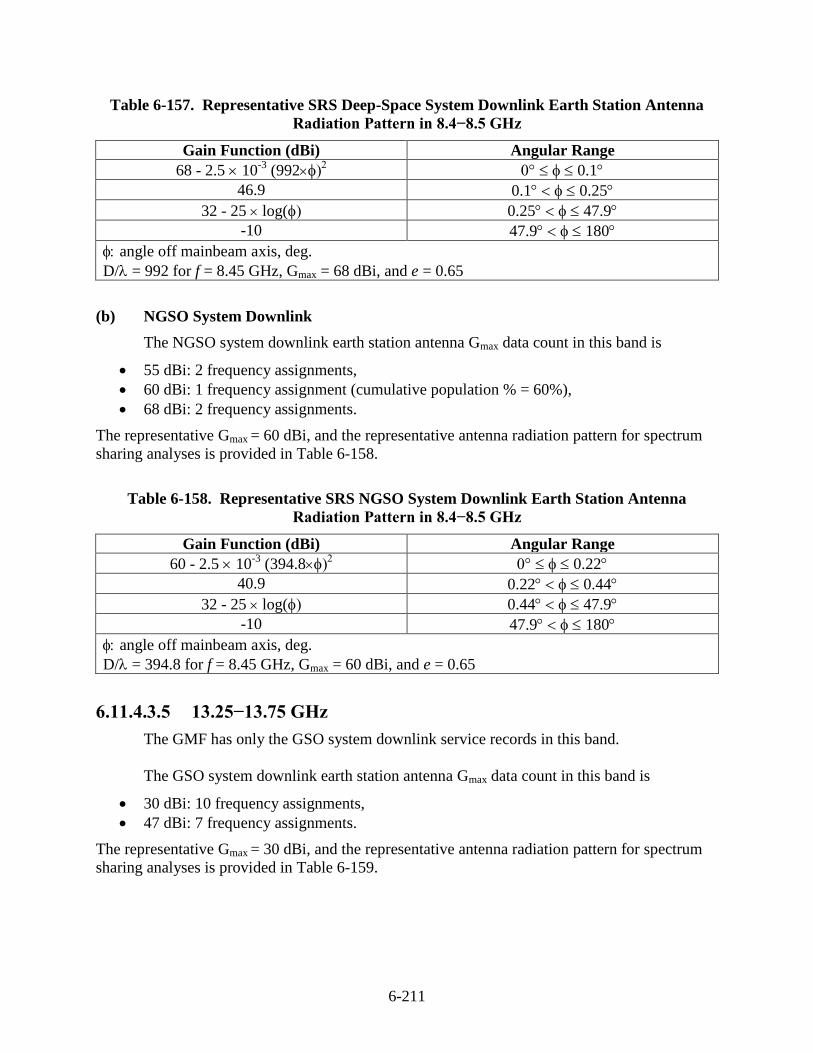
6-211
Table 6-157. Representative SRS Deep-Space System Downlink Earth Station Antenna
Radiation Pattern in 8.4−8.5 GHz
Gain Function (dBi) Angular Range
68 - 2.5 10-3
(992 0.1
46.9 0.1 0.25
32 - 25 log( 0.25 47.9
-10 47.9 180
angle off mainbeam axis, deg.
D/= 992 for f = 8.45 GHz, Gmax = 68 dBi, and e = 0.65
(b) NGSO System Downlink
The NGSO system downlink earth station antenna Gmax data count in this band is
55 dBi: 2 frequency assignments,
60 dBi: 1 frequency assignment (cumulative population % = 60%),
68 dBi: 2 frequency assignments.
The representative Gmax = 60 dBi, and the representative antenna radiation pattern for spectrum
sharing analyses is provided in Table 6-158.
Table 6-158. Representative SRS NGSO System Downlink Earth Station Antenna
Radiation Pattern in 8.4−8.5 GHz
Gain Function (dBi) Angular Range
60 - 2.5 10-3
(394.8 0.22
40.9 0.22 0.44
32 - 25 log( 0.44 47.9
-10 47.9 180
angle off mainbeam axis, deg.
D/= 394.8 for f = 8.45 GHz, Gmax = 60 dBi, and e = 0.65
6.11.4.3.5 13.25−13.75 GHz
The GMF has only the GSO system downlink service records in this band.
The GSO system downlink earth station antenna Gmax data count in this band is
30 dBi: 10 frequency assignments,
47 dBi: 7 frequency assignments.
The representative Gmax = 30 dBi, and the representative antenna radiation pattern for spectrum
sharing analyses is provided in Table 6-159.
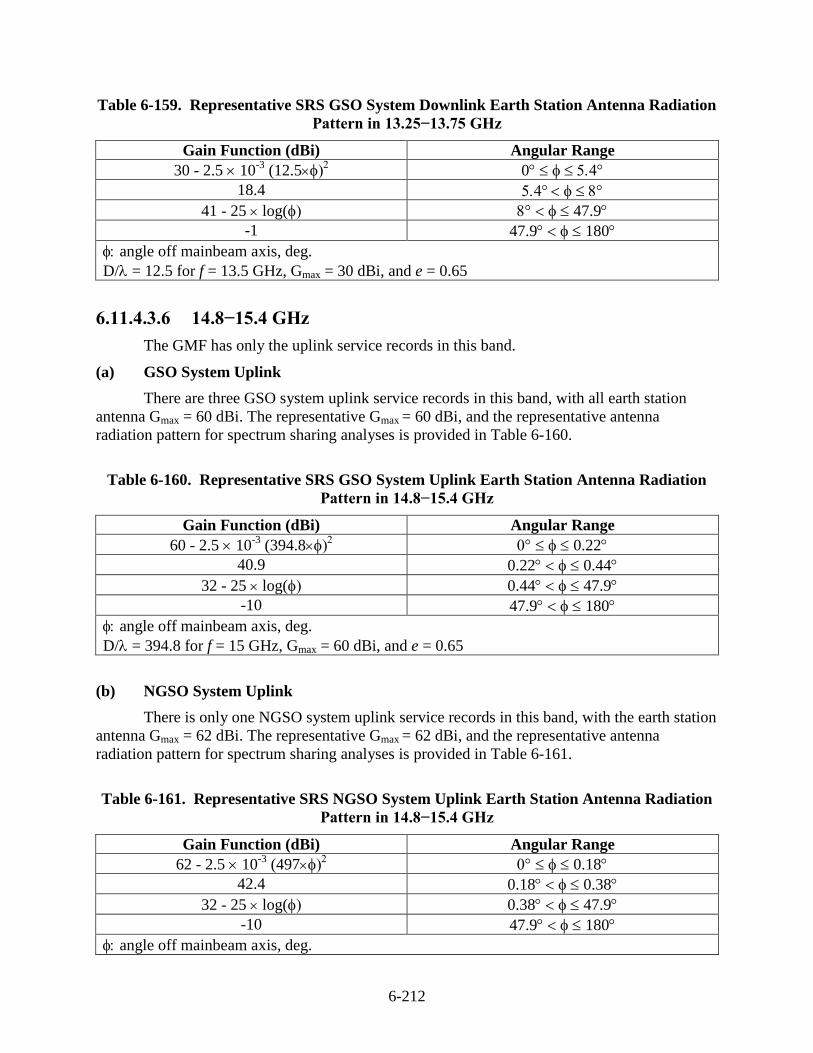
6-212
Table 6-159. Representative SRS GSO System Downlink Earth Station Antenna Radiation
Pattern in 13.25−13.75 GHz
Gain Function (dBi) Angular Range
30 - 2.5 10-3
(12.5 0
18.4
41 - 25 log( 47.9
-1 47.9 180
angle off mainbeam axis, deg.
D/= 12.5 for f = 13.5 GHz, Gmax = 30 dBi, and e = 0.65
6.11.4.3.6 14.8−15.4 GHz
The GMF has only the uplink service records in this band.
(a) GSO System Uplink
There are three GSO system uplink service records in this band, with all earth station
antenna Gmax = 60 dBi. The representative Gmax = 60 dBi, and the representative antenna
radiation pattern for spectrum sharing analyses is provided in Table 6-160.
Table 6-160. Representative SRS GSO System Uplink Earth Station Antenna Radiation
Pattern in 14.8−15.4 GHz
Gain Function (dBi) Angular Range
60 - 2.5 10-3
(394.8 0.22
40.9 0.22 0.44
32 - 25 log( 0.44 47.9
-10 47.9 180
angle off mainbeam axis, deg.
D/= 394.8 for f = 15 GHz, Gmax = 60 dBi, and e = 0.65
(b) NGSO System Uplink
There is only one NGSO system uplink service records in this band, with the earth station
antenna Gmax = 62 dBi. The representative Gmax = 62 dBi, and the representative antenna
radiation pattern for spectrum sharing analyses is provided in Table 6-161.
Table 6-161. Representative SRS NGSO System Uplink Earth Station Antenna Radiation
Pattern in 14.8−15.4 GHz
Gain Function (dBi) Angular Range
62 - 2.5 10-3
(497 0.18
42.4 0.18 0.38
32 - 25 log( 0.38 47.9
-10 47.9 180
angle off mainbeam axis, deg.
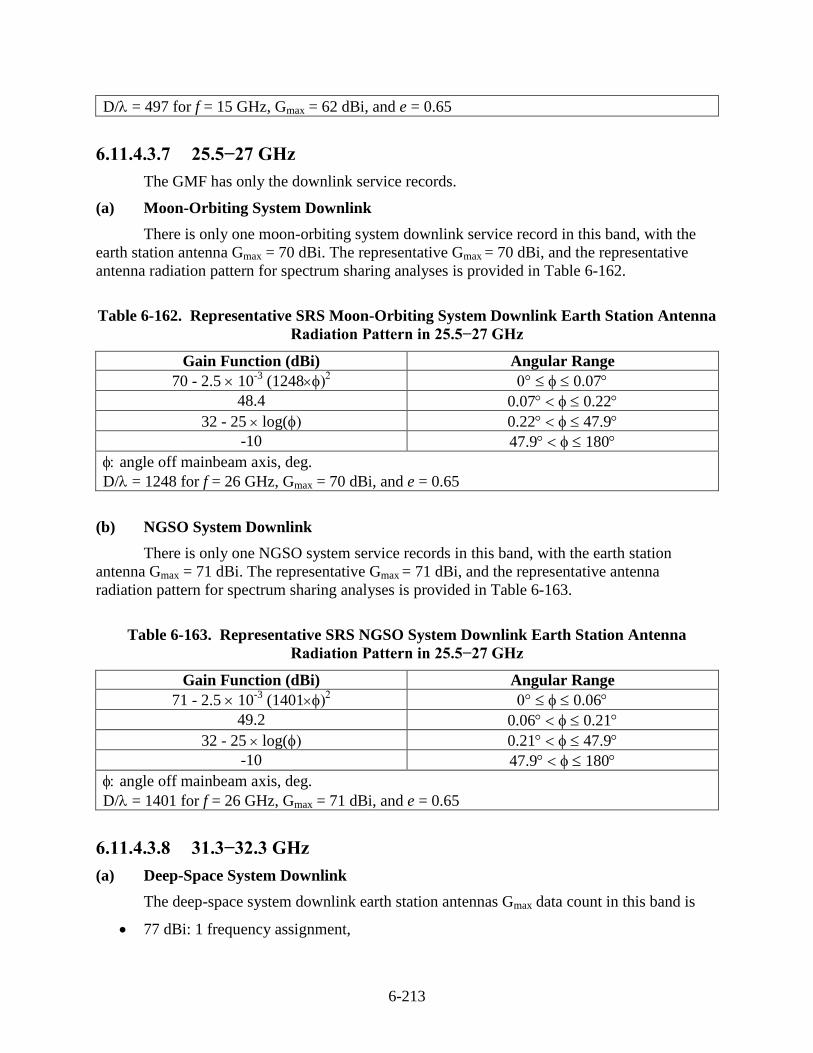
6-213
D/= 497 for f = 15 GHz, Gmax = 62 dBi, and e = 0.65
6.11.4.3.7 25.5−27 GHz
The GMF has only the downlink service records.
(a) Moon-Orbiting System Downlink
There is only one moon-orbiting system downlink service record in this band, with the
earth station antenna Gmax = 70 dBi. The representative Gmax = 70 dBi, and the representative
antenna radiation pattern for spectrum sharing analyses is provided in Table 6-162.
Table 6-162. Representative SRS Moon-Orbiting System Downlink Earth Station Antenna
Radiation Pattern in 25.5−27 GHz
Gain Function (dBi) Angular Range
70 - 2.5 10-3
(1248 0.07
48.4 0.07 0.22
32 - 25 log( 0.22 47.9
-10 47.9 180
angle off mainbeam axis, deg.
D/= 1248 for f = 26 GHz, Gmax = 70 dBi, and e = 0.65
(b) NGSO System Downlink
There is only one NGSO system service records in this band, with the earth station
antenna Gmax = 71 dBi. The representative Gmax = 71 dBi, and the representative antenna
radiation pattern for spectrum sharing analyses is provided in Table 6-163.
Table 6-163. Representative SRS NGSO System Downlink Earth Station Antenna
Radiation Pattern in 25.5−27 GHz
Gain Function (dBi) Angular Range
71 - 2.5 10-3
(1401 0.06
49.2 0.06 0.21
32 - 25 log( 0.21 47.9
-10 47.9 180
angle off mainbeam axis, deg.
D/= 1401 for f = 26 GHz, Gmax = 71 dBi, and e = 0.65
6.11.4.3.8 31.3−32.3 GHz
(a) Deep-Space System Downlink
The deep-space system downlink earth station antennas Gmax data count in this band is
77 dBi: 1 frequency assignment,
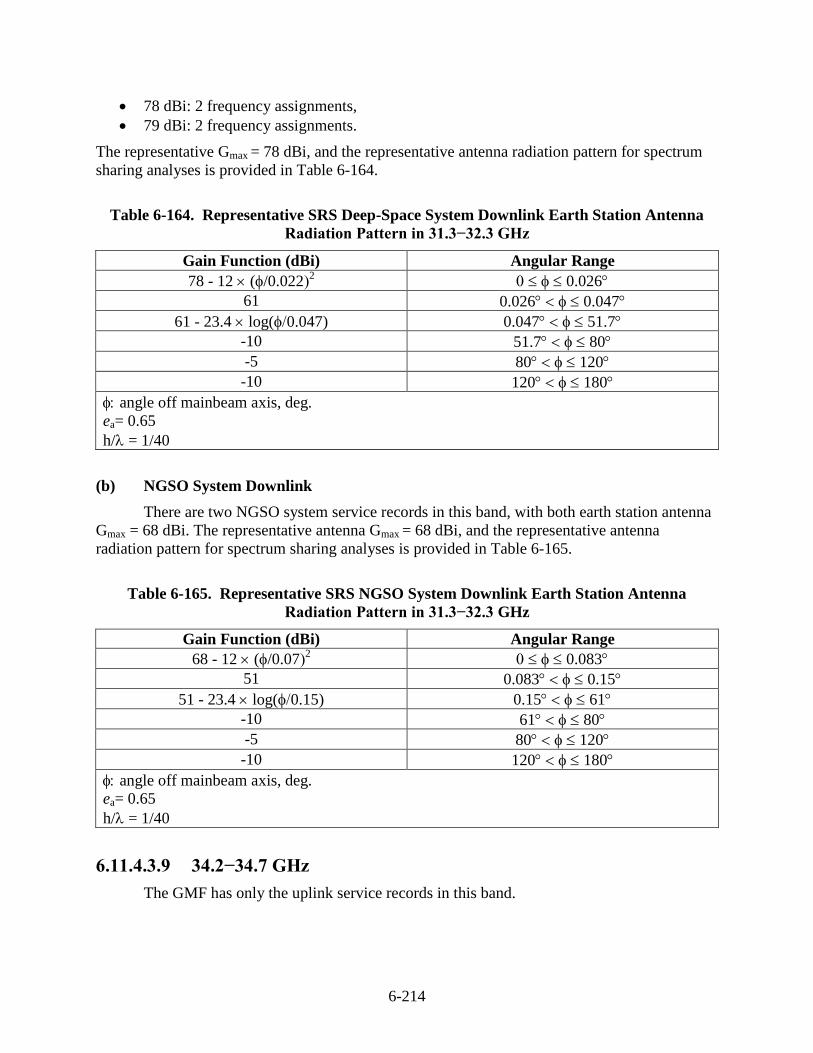
6-214
78 dBi: 2 frequency assignments,
79 dBi: 2 frequency assignments.
The representative Gmax = 78 dBi, and the representative antenna radiation pattern for spectrum
sharing analyses is provided in Table 6-164.
Table 6-164. Representative SRS Deep-Space System Downlink Earth Station Antenna
Radiation Pattern in 31.3−32.3 GHz
Gain Function (dBi) Angular Range
78 - 12 (/0.0222 0.026
61 0.026 0.047
61 - 23.4 log(0.047) 0.047 51.7
-10 51.7 80
-5 80 120
-10 120 180
angle off mainbeam axis, deg.
ea= 0.65
h/= 1/40
(b) NGSO System Downlink
There are two NGSO system service records in this band, with both earth station antenna
Gmax = 68 dBi. The representative antenna Gmax = 68 dBi, and the representative antenna
radiation pattern for spectrum sharing analyses is provided in Table 6-165.
Table 6-165. Representative SRS NGSO System Downlink Earth Station Antenna
Radiation Pattern in 31.3−32.3 GHz
Gain Function (dBi) Angular Range
68 - 12 (/0.072 0.083
51 0.083 0.15
51 - 23.4 log(0.15) 0.15 61
-10 61 80
-5 80 120
-10 120 180
angle off mainbeam axis, deg.
ea= 0.65
h/= 1/40
6.11.4.3.9 34.2−34.7 GHz
The GMF has only the uplink service records in this band.
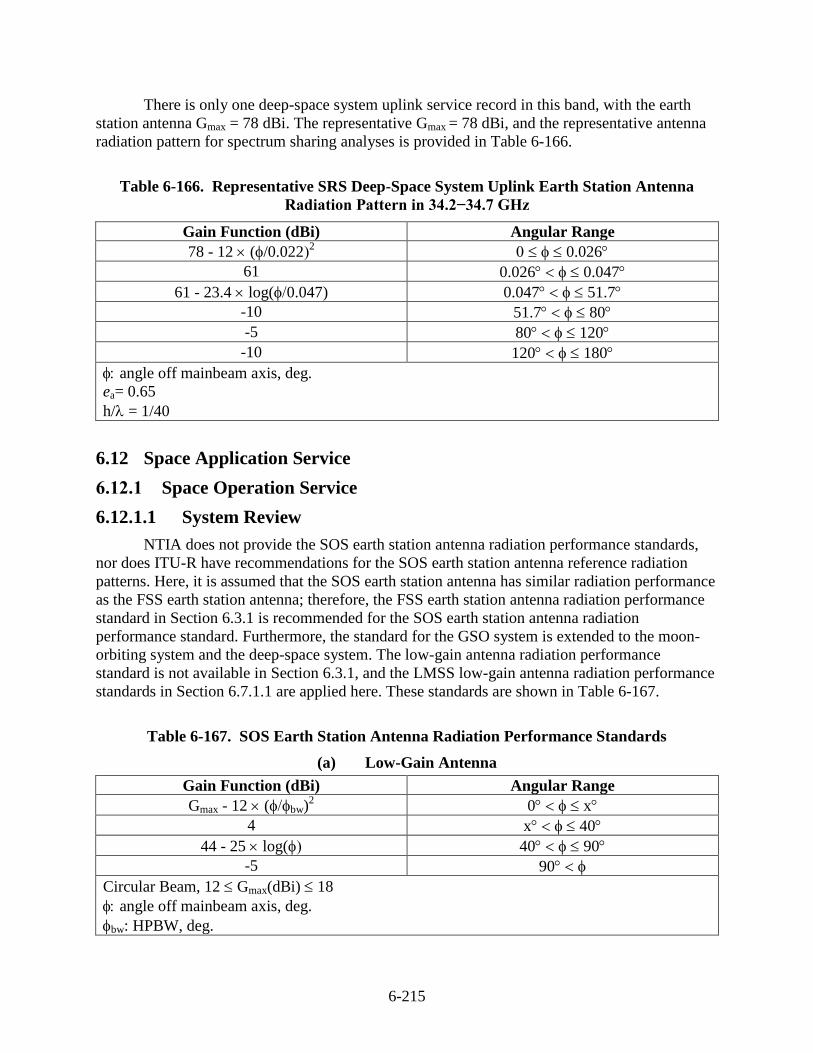
6-215
There is only one deep-space system uplink service record in this band, with the earth
station antenna Gmax = 78 dBi. The representative Gmax = 78 dBi, and the representative antenna
radiation pattern for spectrum sharing analyses is provided in Table 6-166.
Table 6-166. Representative SRS Deep-Space System Uplink Earth Station Antenna
Radiation Pattern in 34.2−34.7 GHz
Gain Function (dBi) Angular Range
78 - 12 (/0.0222 0.026
61 0.026 0.047
61 - 23.4 log(0.047) 0.047 51.7
-10 51.7 80
-5 80 120
-10 120 180
angle off mainbeam axis, deg.
ea= 0.65
h/= 1/40
6.12 Space Application Service
6.12.1 Space Operation Service
6.12.1.1 System Review
NTIA does not provide the SOS earth station antenna radiation performance standards,
nor does ITU-R have recommendations for the SOS earth station antenna reference radiation
patterns. Here, it is assumed that the SOS earth station antenna has similar radiation performance
as the FSS earth station antenna; therefore, the FSS earth station antenna radiation performance
standard in Section 6.3.1 is recommended for the SOS earth station antenna radiation
performance standard. Furthermore, the standard for the GSO system is extended to the moon-
orbiting system and the deep-space system. The low-gain antenna radiation performance
standard is not available in Section 6.3.1, and the LMSS low-gain antenna radiation performance
standards in Section 6.7.1.1 are applied here. These standards are shown in Table 6-167.
Table 6-167. SOS Earth Station Antenna Radiation Performance Standards
(a) Low-Gain Antenna
Gain Function (dBi) Angular Range
Gmax - 12 (bw)2 0 x
4 x 40
44 - 25 log( 40 90
-5 90
Circular Beam, 12 Gmax(dBi) 18
angle off mainbeam axis, deg.
bw: HPBW, deg.
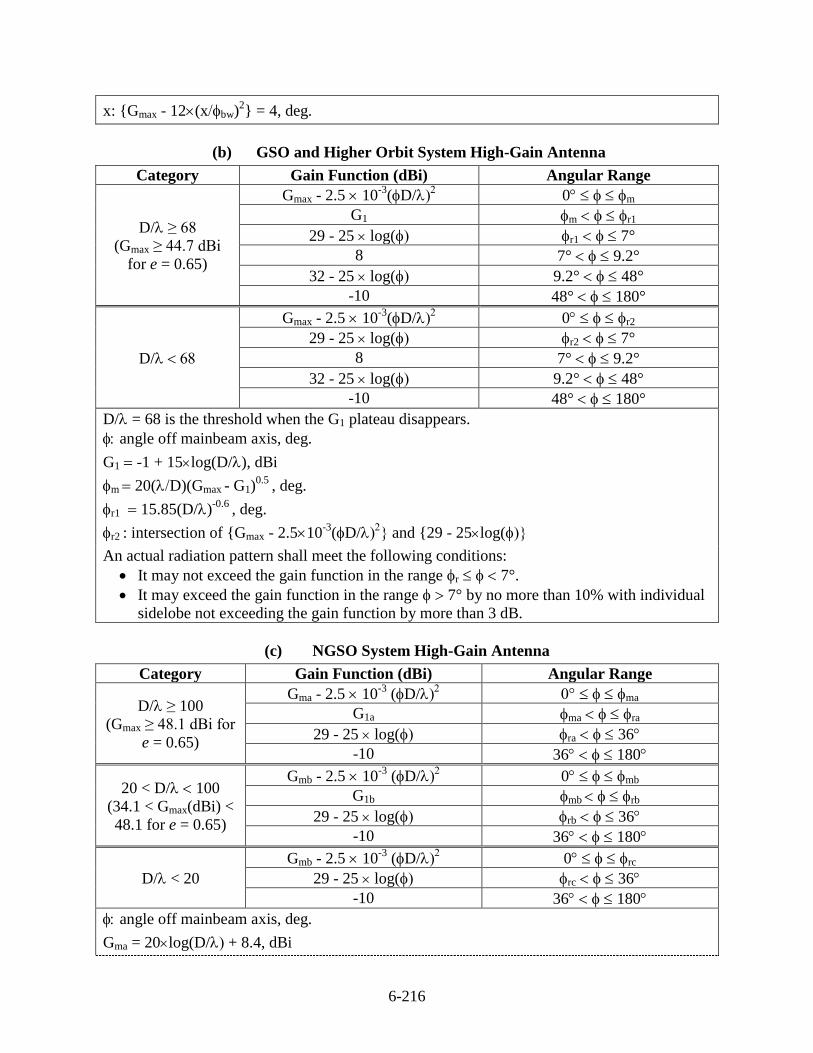
6-216
x: {Gmax - 12(xbw)2} = 4, deg.
(b) GSO and Higher Orbit System High-Gain Antenna
Category Gain Function (dBi) Angular Range
D/≥ 68
(Gmax ≥ 44.7 dBi
for e = 0.65)
Gmax - 2.5 10-3
(D/ 0 m
G1 m r1
29 - 25 log( r1 7°
8 7° 9.2°
32 - 25 log( 9.2° 48°
-10 48° 180°
D/
Gmax - 2.5 10-3
(D/ 0 r2
29 - 25 log( r2 7°
8 7° 9.2°
32 - 25 log( 9.2° 48°
-10 48° 180°
D/= 68 is the threshold when the G1 plateau disappears.
angle off mainbeam axis, deg.
G1 -1 + 15log(D/), dBi
m 20(D)(Gmax - G1)0.5
, deg.
r1 15.85(D/)-0.6
, deg.
r2 : intersection of {Gmax - 2.510-3
(D/ and {29 - 25log(
An actual radiation pattern shall meet the following conditions:
It may not exceed the gain function in the range r 7°.
It may exceed the gain function in the range 7° by no more than 10% with individual
sidelobe not exceeding the gain function by more than 3 dB.
(c) NGSO System High-Gain Antenna
Category Gain Function (dBi) Angular Range
D/ ≥ 100
(Gmax ≥ 48.1 dBi for
e = 0.65)
Gma - 2.5 10-3
(D/ ma
G1a ma ra
29 - 25 log( ra 36
-10 36 180
20 < D/ 100
(34.1 < Gmax(dBi) <
48.1 for e = 0.65)
Gmb - 2.5 10-3
(D/ 0 mb
G1b mb rb
29 - 25 log( rb 36
-10 36 180
D/< 20
Gmb - 2.5 10-3
(D/ 0 rc
29 - 25 log( rc 36
-10 36 180
angle off mainbeam axis, deg.
Gma = 20log(D/ + 8.4, dBi
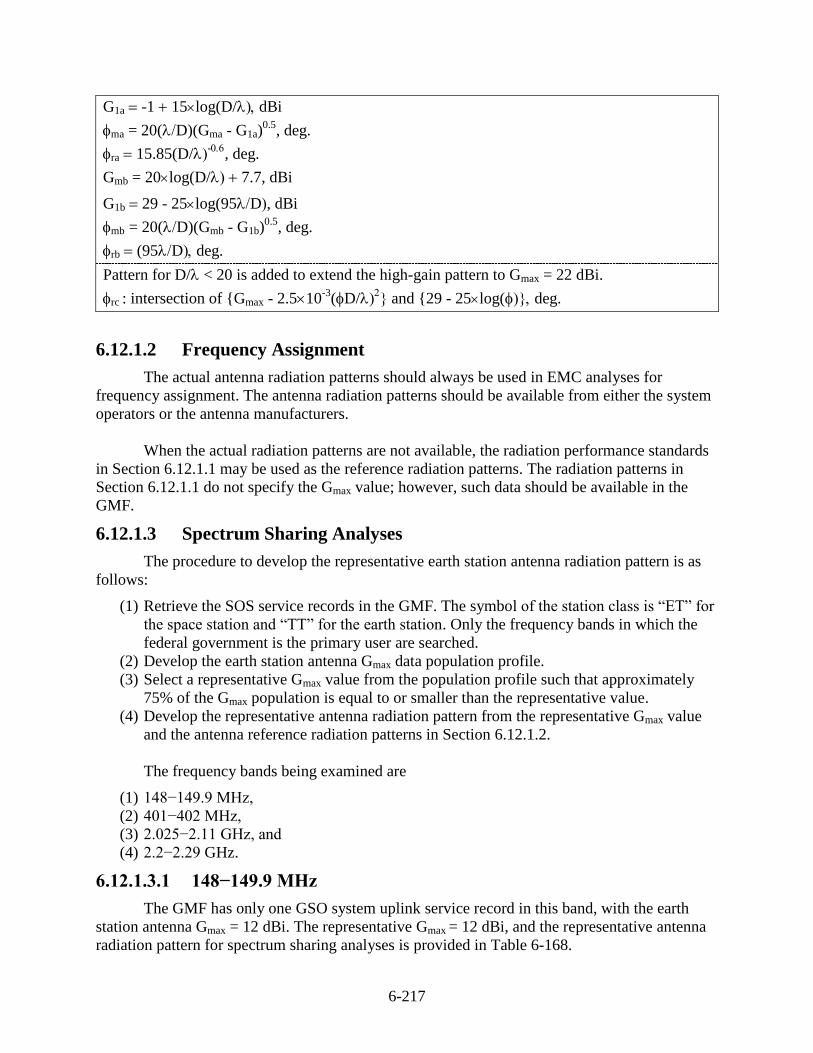
6-217
G1a -1 15log(D/dBi
ma = 20(D)(Gma - G1a)0.5
, deg.
ra 15.85(D/-
, deg.
Gmb = 20log(D/ 7.7, dBi
G1b 29 - 25log(95D, dBi
mb = 20(D)(Gmb - G1b)0.5
, deg.
rb (95Ddeg.
Pattern for D/< 20 is added to extend the high-gain pattern to Gmax = 22 dBi.
rc : intersection of {Gmax - 2.510-3
(D/ and {29 - 25log(deg.
6.12.1.2 Frequency Assignment
The actual antenna radiation patterns should always be used in EMC analyses for
frequency assignment. The antenna radiation patterns should be available from either the system
operators or the antenna manufacturers.
When the actual radiation patterns are not available, the radiation performance standards
in Section 6.12.1.1 may be used as the reference radiation patterns. The radiation patterns in
Section 6.12.1.1 do not specify the Gmax value; however, such data should be available in the
GMF.
6.12.1.3 Spectrum Sharing Analyses
The procedure to develop the representative earth station antenna radiation pattern is as
follows:
(1) Retrieve the SOS service records in the GMF. The symbol of the station class is “ET” for
the space station and “TT” for the earth station. Only the frequency bands in which the
federal government is the primary user are searched.
(2) Develop the earth station antenna Gmax data population profile.
(3) Select a representative Gmax value from the population profile such that approximately
75% of the Gmax population is equal to or smaller than the representative value.
(4) Develop the representative antenna radiation pattern from the representative Gmax value
and the antenna reference radiation patterns in Section 6.12.1.2.
The frequency bands being examined are
(1) 148−149.9 MHz,
(2) 401−402 MHz,
(3) 2.025−2.11 GHz, and
(4) 2.2−2.29 GHz.
6.12.1.3.1 148−149.9 MHz
The GMF has only one GSO system uplink service record in this band, with the earth
station antenna Gmax = 12 dBi. The representative Gmax = 12 dBi, and the representative antenna
radiation pattern for spectrum sharing analyses is provided in Table 6-168.
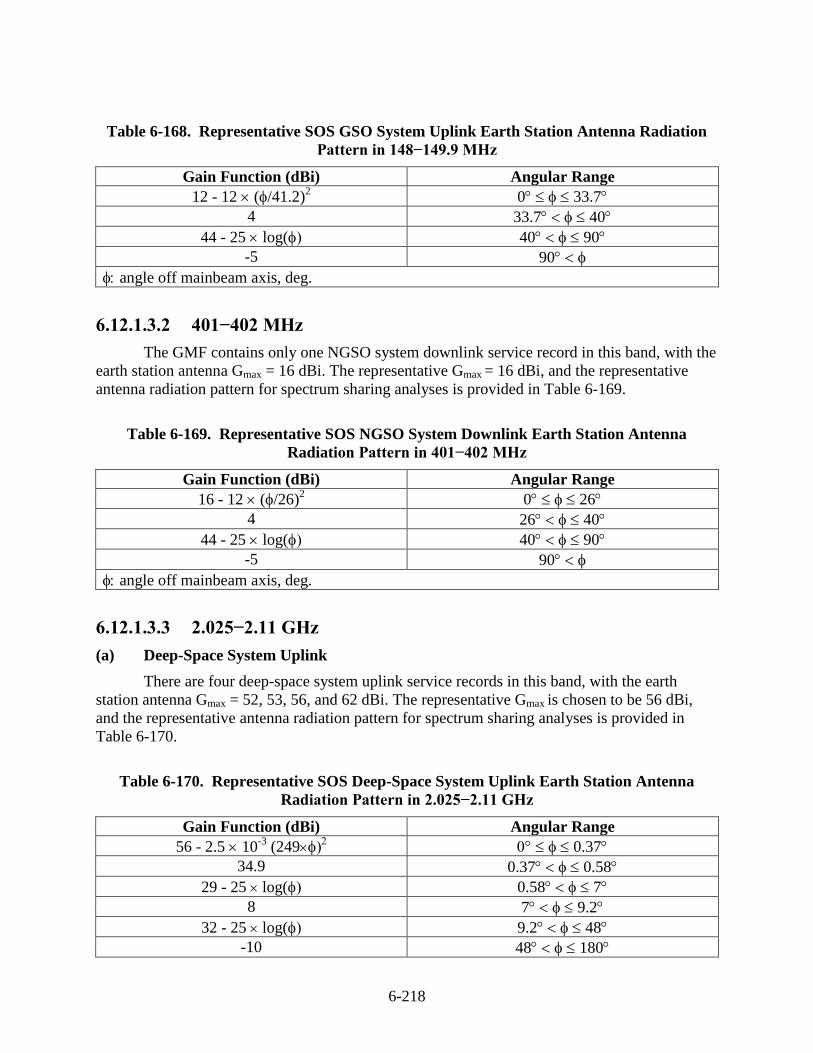
6-218
Table 6-168. Representative SOS GSO System Uplink Earth Station Antenna Radiation
Pattern in 148−149.9 MHz
Gain Function (dBi) Angular Range
12 - 12 (/41.2)2 0 33.7
4 33.7 40
44 - 25 log( 40 90
-5 90
angle off mainbeam axis, deg.
6.12.1.3.2 401−402 MHz
The GMF contains only one NGSO system downlink service record in this band, with the
earth station antenna Gmax = 16 dBi. The representative Gmax = 16 dBi, and the representative
antenna radiation pattern for spectrum sharing analyses is provided in Table 6-169.
Table 6-169. Representative SOS NGSO System Downlink Earth Station Antenna
Radiation Pattern in 401−402 MHz
Gain Function (dBi) Angular Range
16 - 12 (/26)2 0 26
4 26 40
44 - 25 log( 40 90
-5 90
angle off mainbeam axis, deg.
6.12.1.3.3 2.025−2.11 GHz
(a) Deep-Space System Uplink
There are four deep-space system uplink service records in this band, with the earth
station antenna Gmax = 52, 53, 56, and 62 dBi. The representative Gmax is chosen to be 56 dBi,
and the representative antenna radiation pattern for spectrum sharing analyses is provided in
Table 6-170.
Table 6-170. Representative SOS Deep-Space System Uplink Earth Station Antenna
Radiation Pattern in 2.025−2.11 GHz
Gain Function (dBi) Angular Range
56 - 2.5 10-3
(249 0.37
34.9 0.37 0.58
29 - 25 log( 0.58 7
8 7 9.2
32 - 25 log( 9.2 48
-10 48 180
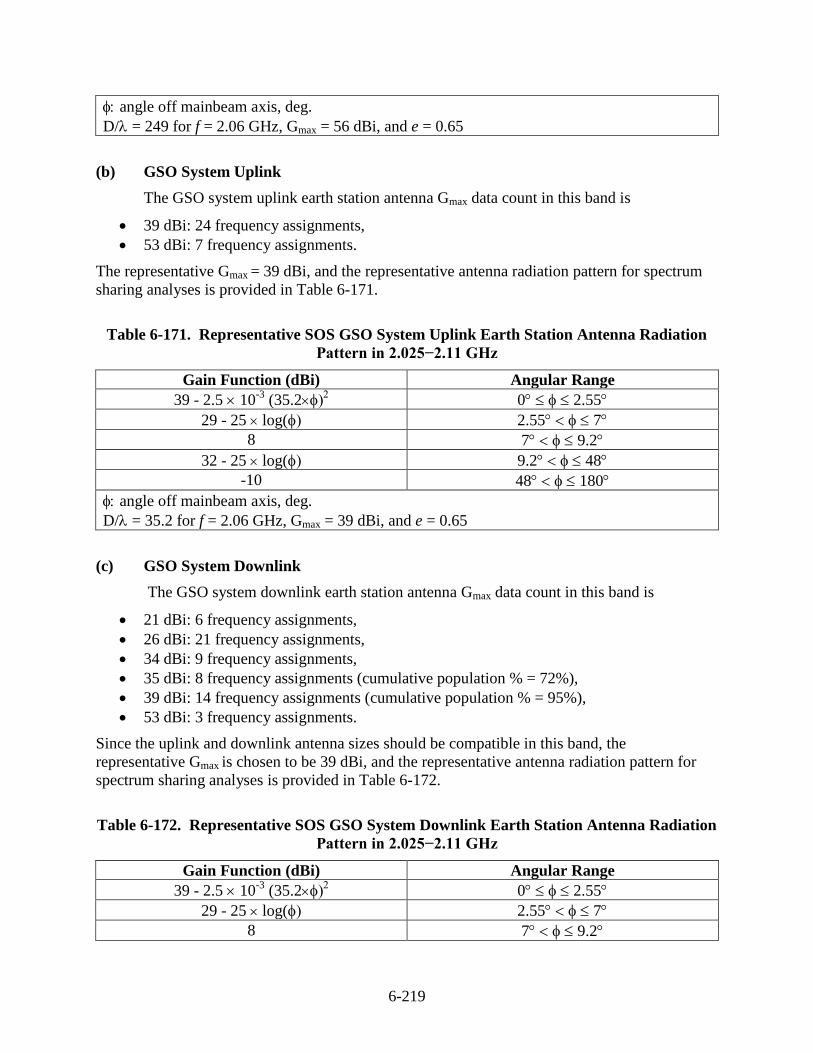
6-219
angle off mainbeam axis, deg.
D/= 249 for f = 2.06 GHz, Gmax = 56 dBi, and e = 0.65
(b) GSO System Uplink
The GSO system uplink earth station antenna Gmax data count in this band is
39 dBi: 24 frequency assignments,
53 dBi: 7 frequency assignments.
The representative Gmax = 39 dBi, and the representative antenna radiation pattern for spectrum
sharing analyses is provided in Table 6-171.
Table 6-171. Representative SOS GSO System Uplink Earth Station Antenna Radiation
Pattern in 2.025−2.11 GHz
Gain Function (dBi) Angular Range
39 - 2.5 10-3
(35.2 0 2.55
29 - 25 log( 2.55 7
8 7 9.2
32 - 25 log( 9.2 48
-10 48 180
angle off mainbeam axis, deg.
D/= 35.2 for f = 2.06 GHz, Gmax = 39 dBi, and e = 0.65
(c) GSO System Downlink
The GSO system downlink earth station antenna Gmax data count in this band is
21 dBi: 6 frequency assignments,
26 dBi: 21 frequency assignments,
34 dBi: 9 frequency assignments,
35 dBi: 8 frequency assignments (cumulative population % = 72%),
39 dBi: 14 frequency assignments (cumulative population % = 95%),
53 dBi: 3 frequency assignments.
Since the uplink and downlink antenna sizes should be compatible in this band, the
representative Gmax is chosen to be 39 dBi, and the representative antenna radiation pattern for
spectrum sharing analyses is provided in Table 6-172.
Table 6-172. Representative SOS GSO System Downlink Earth Station Antenna Radiation
Pattern in 2.025−2.11 GHz
Gain Function (dBi) Angular Range
39 - 2.5 10-3
(35.2 0 2.55
29 - 25 log( 2.55 7
8 7 9.2
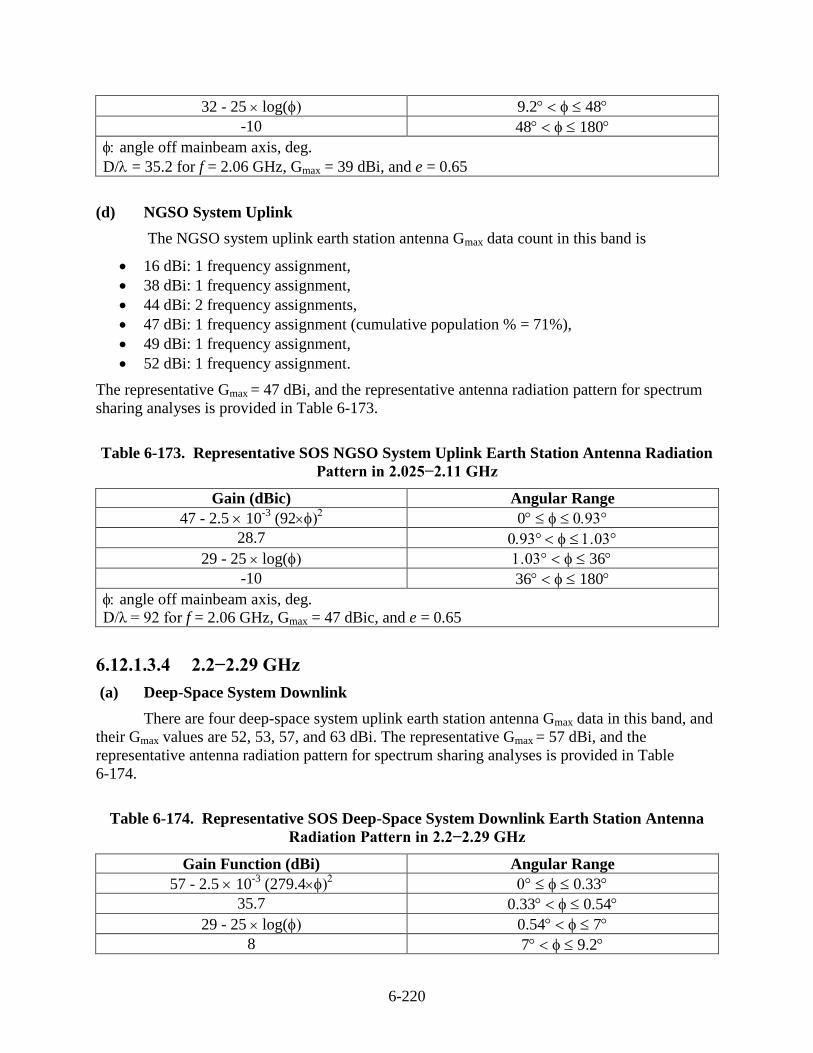
6-220
32 - 25 log( 9.2 48
-10 48 180
angle off mainbeam axis, deg.
D/= 35.2 for f = 2.06 GHz, Gmax = 39 dBi, and e = 0.65
(d) NGSO System Uplink
The NGSO system uplink earth station antenna Gmax data count in this band is
16 dBi: 1 frequency assignment,
38 dBi: 1 frequency assignment,
44 dBi: 2 frequency assignments,
47 dBi: 1 frequency assignment (cumulative population % = 71%),
49 dBi: 1 frequency assignment,
52 dBi: 1 frequency assignment.
The representative Gmax = 47 dBi, and the representative antenna radiation pattern for spectrum
sharing analyses is provided in Table 6-173.
Table 6-173. Representative SOS NGSO System Uplink Earth Station Antenna Radiation
Pattern in 2.025−2.11 GHz
Gain (dBic) Angular Range
47 - 2.5 10-3
(92 0
28.7
29 - 25 log( 36
-10 36 180
angle off mainbeam axis, deg.
D/λ = 92 for f = 2.06 GHz, Gmax = 47 dBic, and e = 0.65
6.12.1.3.4 2.2−2.29 GHz
(a) Deep-Space System Downlink
There are four deep-space system uplink earth station antenna Gmax data in this band, and
their Gmax values are 52, 53, 57, and 63 dBi. The representative Gmax = 57 dBi, and the
representative antenna radiation pattern for spectrum sharing analyses is provided in Table
6-174.
Table 6-174. Representative SOS Deep-Space System Downlink Earth Station Antenna
Radiation Pattern in 2.2−2.29 GHz
Gain Function (dBi) Angular Range
57 - 2.5 10-3
(279.4 0.33
35.7 0.33 0.54
29 - 25 log( 0.54 7
8 7 9.2
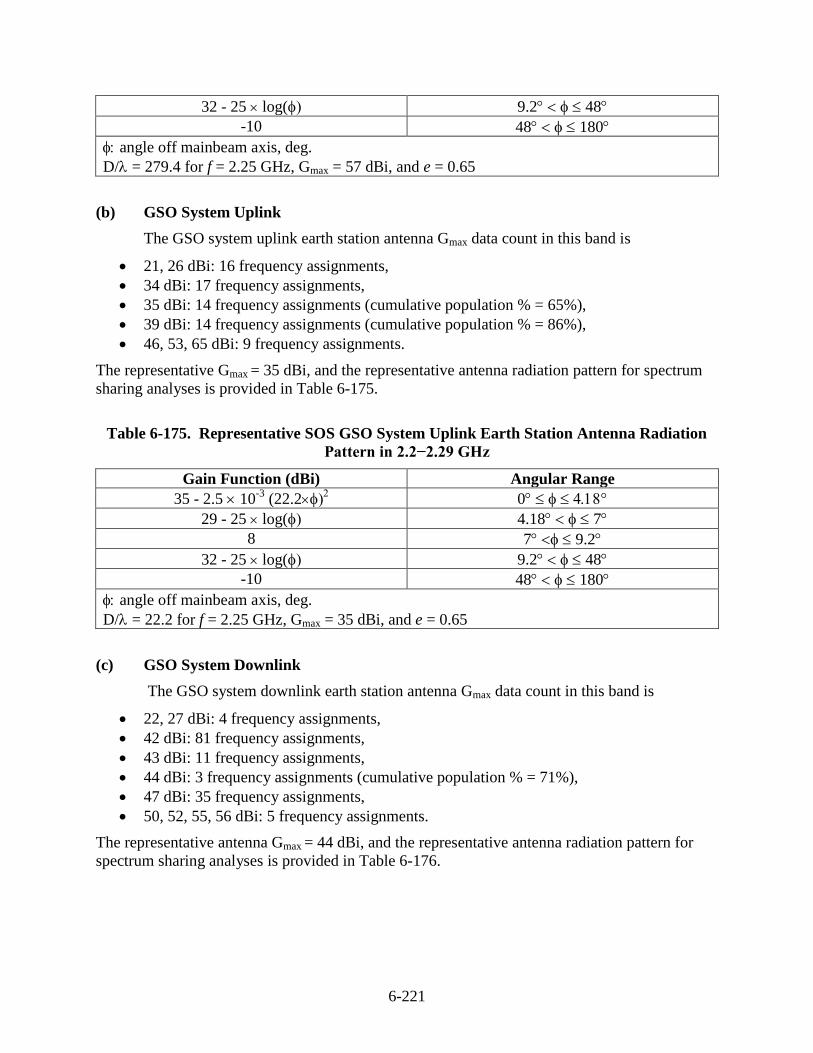
6-221
32 - 25 log( 9.2 48
-10 48 180
angle off mainbeam axis, deg.
D/= 279.4 for f = 2.25 GHz, Gmax = 57 dBi, and e = 0.65
(b) GSO System Uplink
The GSO system uplink earth station antenna Gmax data count in this band is
21, 26 dBi: 16 frequency assignments,
34 dBi: 17 frequency assignments,
35 dBi: 14 frequency assignments (cumulative population % = 65%),
39 dBi: 14 frequency assignments (cumulative population % = 86%),
46, 53, 65 dBi: 9 frequency assignments.
The representative Gmax = 35 dBi, and the representative antenna radiation pattern for spectrum
sharing analyses is provided in Table 6-175.
Table 6-175. Representative SOS GSO System Uplink Earth Station Antenna Radiation
Pattern in 2.2−2.29 GHz
Gain Function (dBi) Angular Range
35 - 2.5 10-3
(22.2 0
29 - 25 log( 4.18 7
8 7 9.2
32 - 25 log( 9.2 48
-10 48 180
angle off mainbeam axis, deg.
D/= 22.2 for f = 2.25 GHz, Gmax = 35 dBi, and e = 0.65
(c) GSO System Downlink
The GSO system downlink earth station antenna Gmax data count in this band is
22, 27 dBi: 4 frequency assignments,
42 dBi: 81 frequency assignments,
43 dBi: 11 frequency assignments,
44 dBi: 3 frequency assignments (cumulative population % = 71%),
47 dBi: 35 frequency assignments,
50, 52, 55, 56 dBi: 5 frequency assignments.
The representative antenna Gmax = 44 dBi, and the representative antenna radiation pattern for
spectrum sharing analyses is provided in Table 6-176.
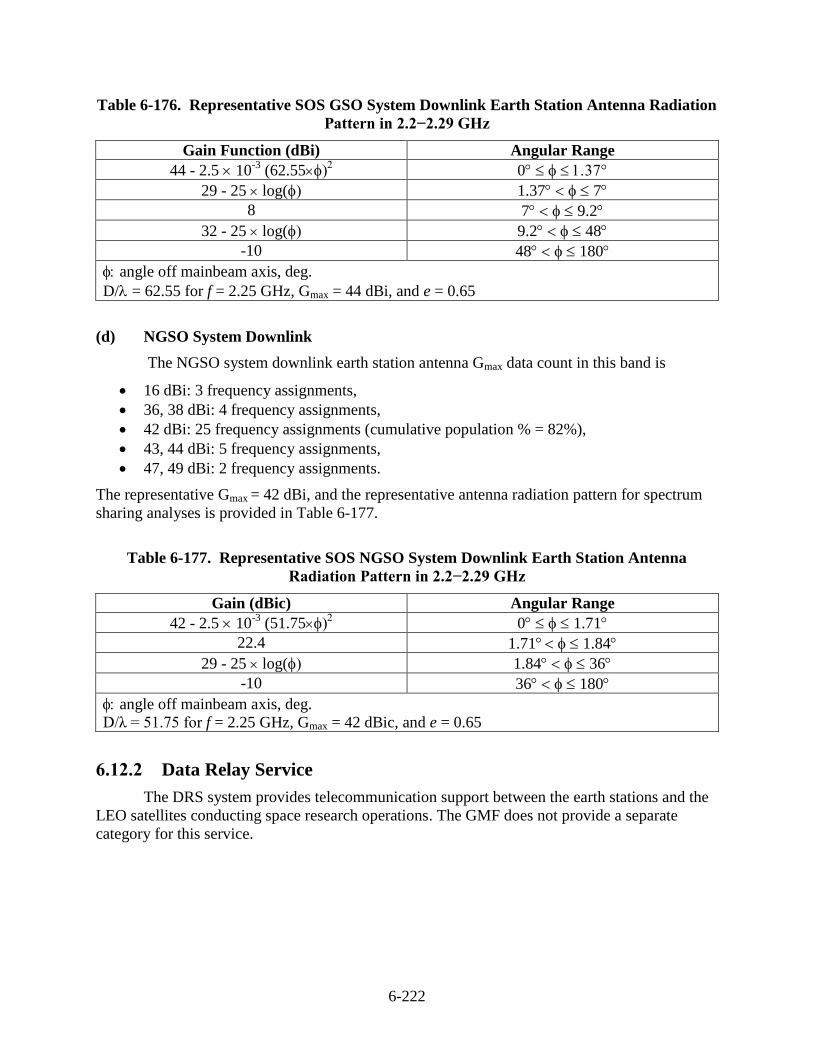
6-222
Table 6-176. Representative SOS GSO System Downlink Earth Station Antenna Radiation
Pattern in 2.2−2.29 GHz
Gain Function (dBi) Angular Range
44 - 2.5 10-3
(62.55 0
29 - 25 log( 1.37 7
8 7 9.2
32 - 25 log( 9.2 48
-10 48 180
angle off mainbeam axis, deg.
D/= 62.55 for f = 2.25 GHz, Gmax = 44 dBi, and e = 0.65
(d) NGSO System Downlink
The NGSO system downlink earth station antenna Gmax data count in this band is
16 dBi: 3 frequency assignments,
36, 38 dBi: 4 frequency assignments,
42 dBi: 25 frequency assignments (cumulative population % = 82%),
43, 44 dBi: 5 frequency assignments,
47, 49 dBi: 2 frequency assignments.
The representative Gmax = 42 dBi, and the representative antenna radiation pattern for spectrum
sharing analyses is provided in Table 6-177.
Table 6-177. Representative SOS NGSO System Downlink Earth Station Antenna
Radiation Pattern in 2.2−2.29 GHz
Gain (dBic) Angular Range
42 - 2.5 10-3
(51.75 0 1.71
22.4 1.71 1.84
29 - 25 log( 1.84 36
-10 36 180
angle off mainbeam axis, deg.
D/λ = 51.75 for f = 2.25 GHz, Gmax = 42 dBic, and e = 0.65
6.12.2 Data Relay Service
The DRS system provides telecommunication support between the earth stations and the
LEO satellites conducting space research operations. The GMF does not provide a separate
category for this service.
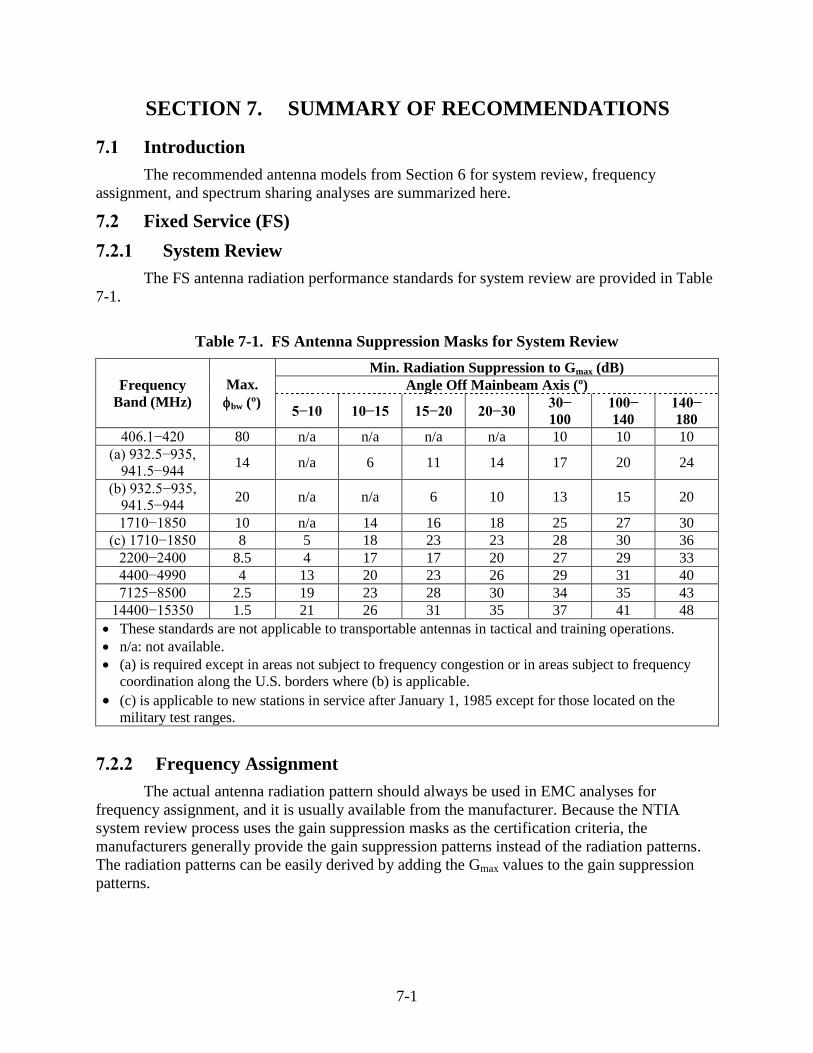
7-1
SECTION 7. SUMMARY OF RECOMMENDATIONS
7.1 Introduction
The recommended antenna models from Section 6 for system review, frequency
assignment, and spectrum sharing analyses are summarized here.
7.2 Fixed Service (FS)
7.2.1 System Review
The FS antenna radiation performance standards for system review are provided in Table
7-1.
Table 7-1. FS Antenna Suppression Masks for System Review
Frequency
Band (MHz)
Max.
bw (º)
Min. Radiation Suppression to Gmax (dB)
Angle Off Mainbeam Axis (º)
5−10 10−15 15−20 20−30 30−
100
100−
140
140−
180
406.1−420 80 n/a n/a n/a n/a 10 10 10
(a) 932.5−935,
941.5−944 14 n/a 6 11 14 17 20 24
(b) 932.5−935,
941.5−944 20 n/a n/a 6 10 13 15 20
1710−1850 10 n/a 14 16 18 25 27 30
(c) 1710−1850 8 5 18 23 23 28 30 36
2200−2400 8.5 4 17 17 20 27 29 33
4400−4990 4 13 20 23 26 29 31 40
7125−8500 2.5 19 23 28 30 34 35 43
14400−15350 1.5 21 26 31 35 37 41 48
These standards are not applicable to transportable antennas in tactical and training operations.
n/a: not available.
(a) is required except in areas not subject to frequency congestion or in areas subject to frequency
coordination along the U.S. borders where (b) is applicable.
(c) is applicable to new stations in service after January 1, 1985 except for those located on the
military test ranges.
7.2.2 Frequency Assignment
The actual antenna radiation pattern should always be used in EMC analyses for
frequency assignment, and it is usually available from the manufacturer. Because the NTIA
system review process uses the gain suppression masks as the certification criteria, the
manufacturers generally provide the gain suppression patterns instead of the radiation patterns.
The radiation patterns can be easily derived by adding the Gmax values to the gain suppression
patterns.
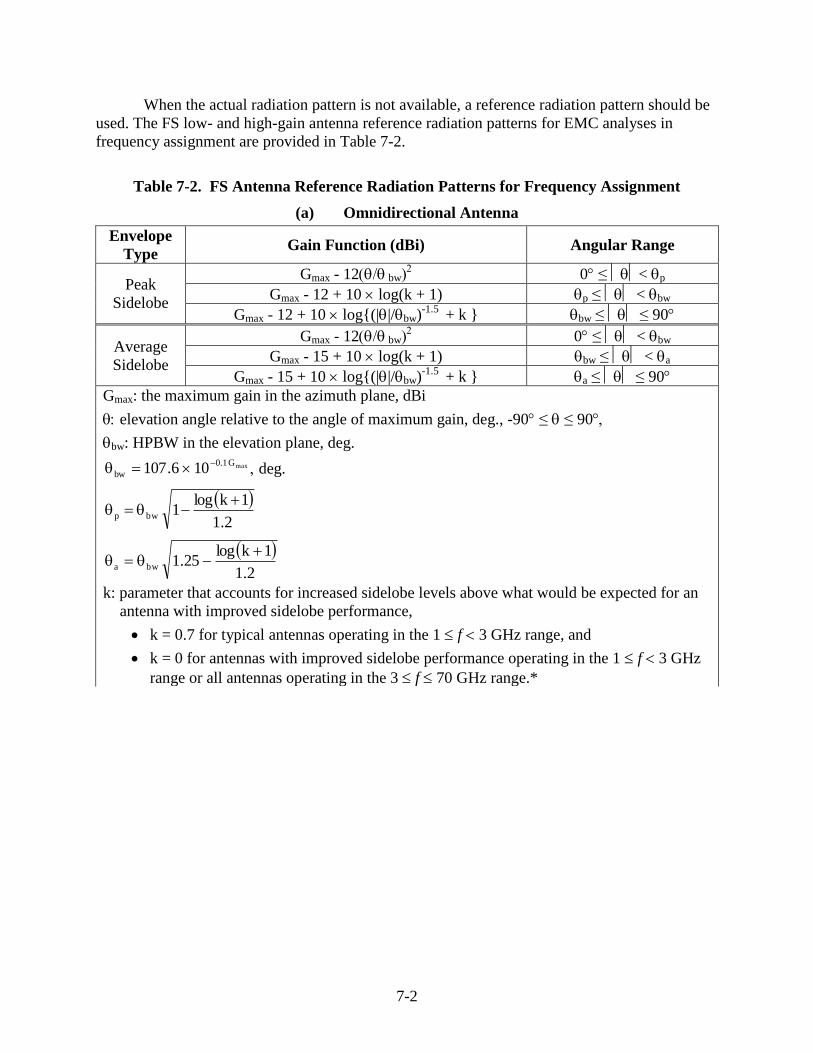
7-2
When the actual radiation pattern is not available, a reference radiation pattern should be
used. The FS low- and high-gain antenna reference radiation patterns for EMC analyses in
frequency assignment are provided in Table 7-2.
Table 7-2. FS Antenna Reference Radiation Patterns for Frequency Assignment
(a) Omnidirectional Antenna
Envelope
Type Gain Function (dBi) Angular Range
Peak
Sidelobe
Gmax - 12 bw 0≤< p
Gmax - 12 + 10 log(k + 1) p≤< bw
Gmax - 12 + 10 log{(||/bw)-1.5
+ k } bw≤≤ 90
Average
Sidelobe
Gmax - 12 bw 0≤< bw
Gmax - 15 + 10 log(k + 1) bw≤< a
Gmax - 15 + 10 log{(||/bw)-1.5
+ k } a≤≤ 90
Gmax: the maximum gain in the azimuth plane, dBi
elevation angle relative to the angle of maximum gain, deg., -90≤≤ 90
bw: HPBW in the elevation plane, deg.
maxG1.0
bw 106.107
deg.
2.1
1klog1bwp
2.1
1klog25.1bwa
k: parameter that accounts for increased sidelobe levels above what would be expected for an
antenna with improved sidelobe performance,
k = 0.7 for typical antennas operating in the 1f3 GHz range, and
k = 0 for antennas with improved sidelobe performance operating in the 1f3 GHz
range or all antennas operating in the 3f70 GHz range.*
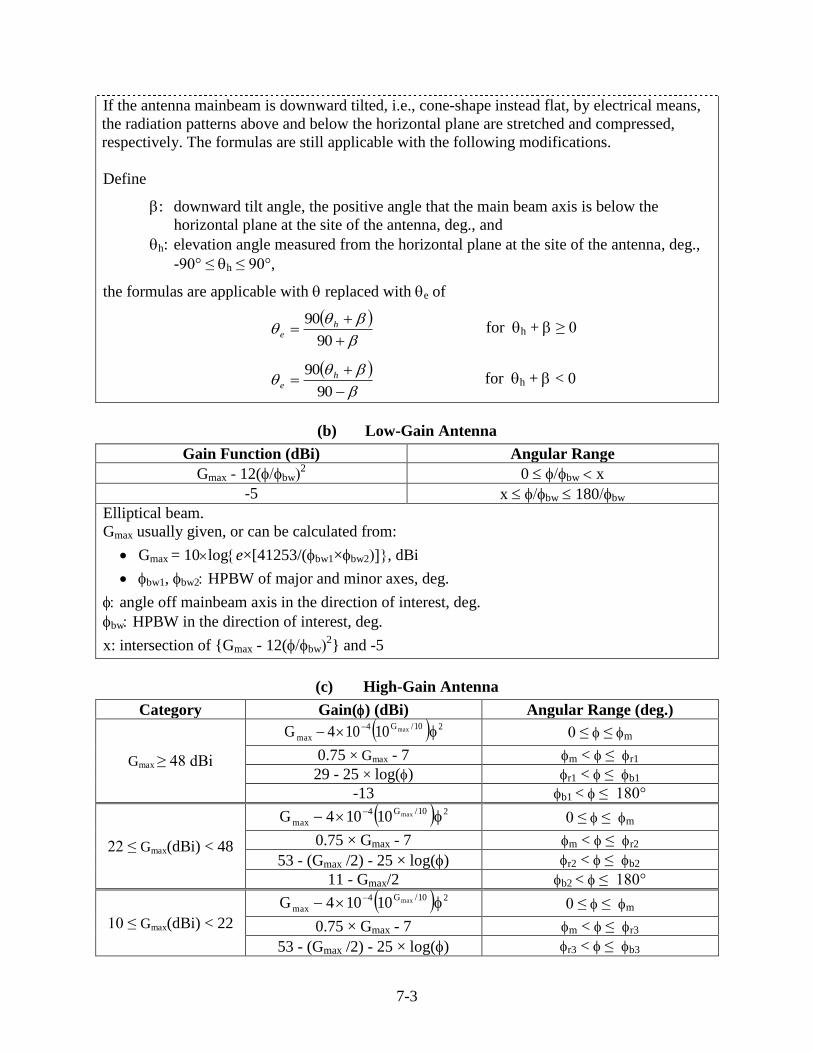
7-3
If the antenna mainbeam is downward tilted, i.e., cone-shape instead flat, by electrical means,
the radiation patterns above and below the horizontal plane are stretched and compressed,
respectively. The formulas are still applicable with the following modifications.
Define
: downward tilt angle, the positive angle that the main beam axis is below the
horizontal plane at the site of the antenna, deg., and
h: elevation angle measured from the horizontal plane at the site of the antenna, deg.,
-90° ≤ h ≤ 90°,
the formulas are applicable with replaced with e of
90
90 h
e for h + ≥ 0
90
90 h
e for h + < 0
(b) Low-Gain Antenna
Gain Function (dBi) Angular Range
Gmax - 12(bw2 0 bw x
-5 x bw 180bw
Elliptical beam.
Gmax usually given, or can be calculated from:
Gmax = 10loge×[41253/(bw1×bw2, dBi
bw1, bw2 HPBW of major and minor axes, deg.
angle off mainbeam axis in the direction of interest, deg.
bw HPBW in the direction of interest, deg.
x: intersection of {Gmax - 12(bw2} and -5
(c) High-Gain Antenna
Category Gain() (dBi) Angular Range (deg.)
Gmax ≥ 48 dBi
210/G4
maxmax10104G
0 ≤ ≤ m
0.75 × Gmax - 7 m < ≤ r1
29 - 25 × log() r1 < ≤ b1
-13 b1 < ≤ 180°
22 ≤ Gmax(dBi) < 48
210/G4
maxmax10104G
0 ≤ ≤ m
0.75 × Gmax - 7 m < ≤ r2
53 - (Gmax /2) - 25 × log() r2 < ≤ b2
11 - Gmax/2 b2 < ≤ 180°
10 ≤ Gmax(dBi) < 22
210/G4
maxmax10104G
0 ≤ ≤ m
0.75 × Gmax - 7 m < ≤ r3
53 - (Gmax /2) - 25 × log() r3 < ≤ b3
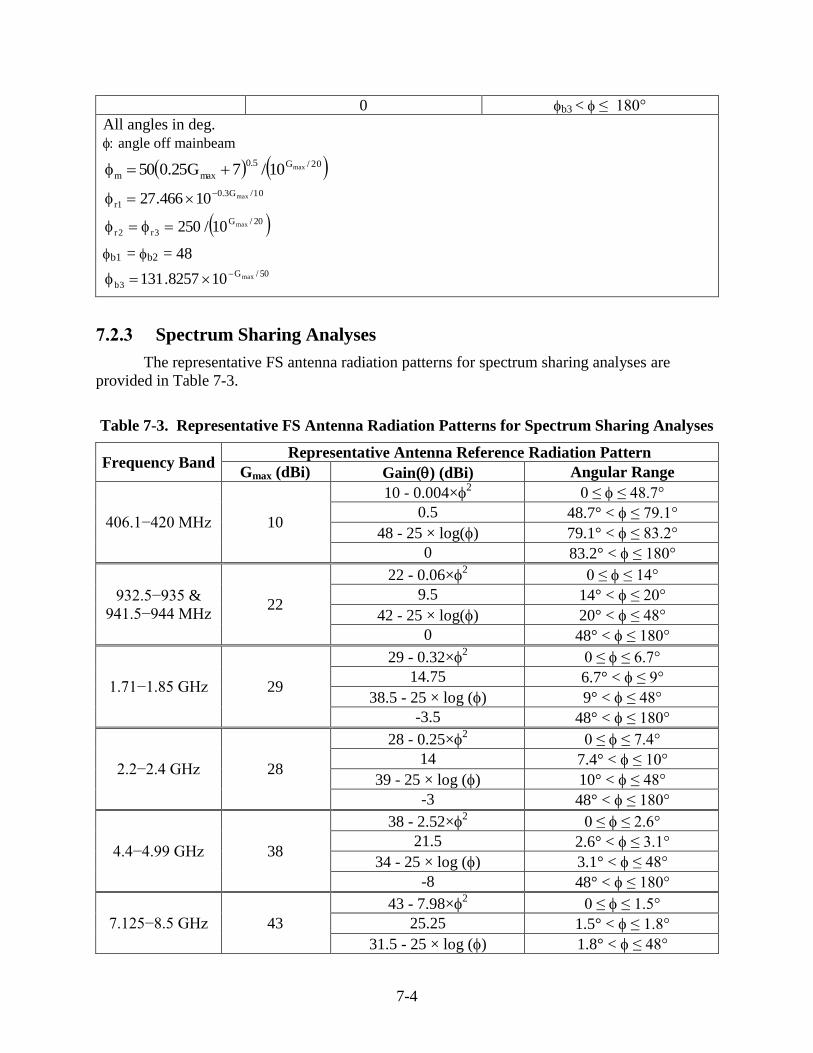
7-4
0 b3 < ≤ 180°
All angles in deg.
angle off mainbeam
20/G5.0
maxmmax10/7G25.050
10/G3.0
1rmax10466.27
20/G
3r2rmax10/250
b1 = b2 = 48 50/G
3bmax108257.131
7.2.3 Spectrum Sharing Analyses
The representative FS antenna radiation patterns for spectrum sharing analyses are
provided in Table 7-3.
Table 7-3. Representative FS Antenna Radiation Patterns for Spectrum Sharing Analyses
Frequency Band Representative Antenna Reference Radiation Pattern
Gmax (dBi) Gain() (dBi) Angular Range
406.1−420 MHz 10
10 - 0.004×2 0 ≤ ≤ 48.7°
0.5 48.7° < ≤ 79.1°
48 - 25 × log() 79.1° < ≤ 83.2°
0 83.2° < ≤ 180°
932.5−935 &
941.5−944 MHz 22
22 - 0.06×2 0 ≤ ≤ 14°
9.5 14° < ≤ 20°
42 - 25 × log() 20° < ≤ 48°
0 48° < ≤ 180°
1.71−1.85 GHz 29
29 - 0.32×2 0 ≤ ≤ 6.7°
14.75 6.7° < ≤ 9°
38.5 - 25 × log () 9° < ≤ 48°
-3.5 48° < ≤ 180°
2.2−2.4 GHz 28
28 - 0.25×2 0 ≤ ≤ 7.4°
14 7.4° < ≤ 10°
39 - 25 × log () 10° < ≤ 48°
-3 48° < ≤ 180°
4.4−4.99 GHz 38
38 - 2.52×2 0 ≤ ≤ 2.6°
21.5 2.6° < ≤ 3.1°
34 - 25 × log () 3.1° < ≤ 48°
-8 48° < ≤ 180°
7.125−8.5 GHz 43
43 - 7.98×2 0 ≤ ≤ 1.5°
25.25 1.5° < ≤ 1.8°
31.5 - 25 × log () 1.8° < ≤ 48°
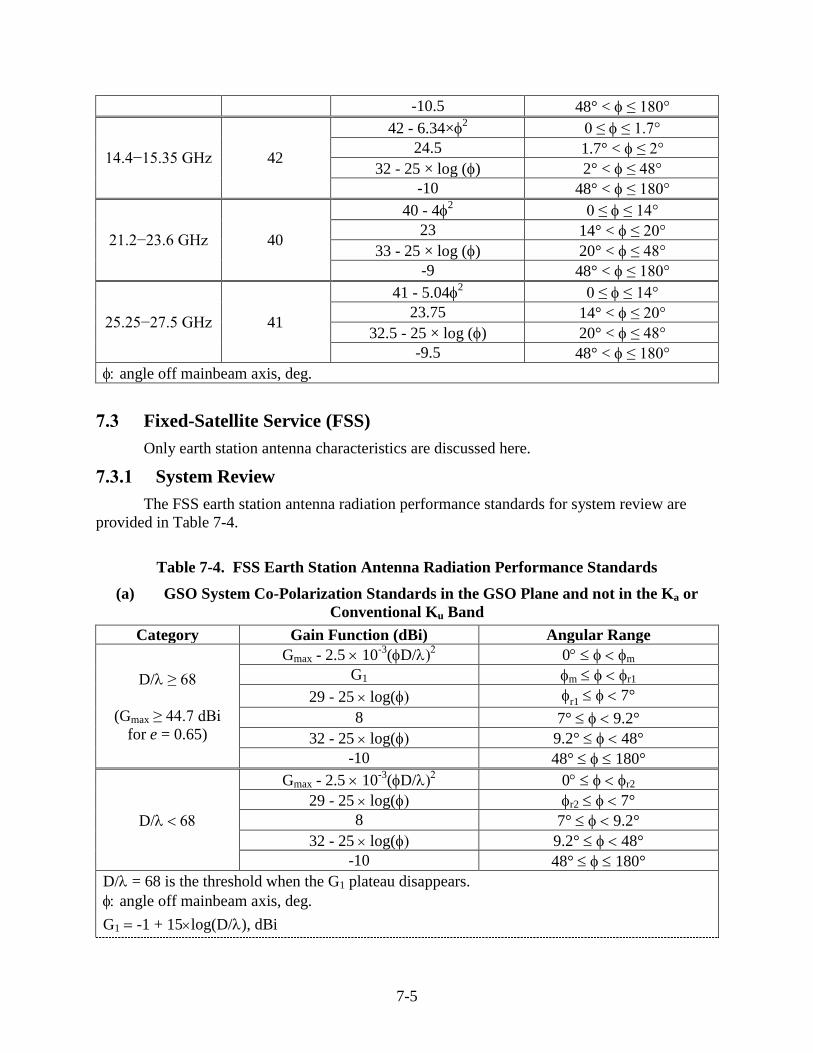
7-5
-10.5 48° < ≤ 180°
14.4−15.35 GHz 42
42 - 6.34×2 0 ≤ ≤ 1.7°
24.5 1.7° < ≤ 2°
32 - 25 × log () 2° < ≤ 48°
-10 48° < ≤ 180°
21.2−23.6 GHz 40
40 - 42 0 ≤ ≤ 14°
23 14° < ≤ 20°
33 - 25 × log () 20° < ≤ 48°
-9 48° < ≤ 180°
25.25−27.5 GHz 41
41 - 5.042 0 ≤ ≤ 14°
23.75 14° < ≤ 20°
32.5 - 25 × log () 20° < ≤ 48°
-9.5 48° < ≤ 180°
angle off mainbeam axis, deg.
7.3 Fixed-Satellite Service (FSS)
Only earth station antenna characteristics are discussed here.
7.3.1 System Review
The FSS earth station antenna radiation performance standards for system review are
provided in Table 7-4.
Table 7-4. FSS Earth Station Antenna Radiation Performance Standards
(a) GSO System Co-Polarization Standards in the GSO Plane and not in the Ka or
Conventional Ku Band
Category Gain Function (dBi) Angular Range
D/≥ 68
(Gmax ≥ 44.7 dBi
for e = 0.65)
Gmax - 2.5 10-3
(D/ 0 m
G1 m r1
29 - 25 log( r1 7°
8 7° 9.2°
32 - 25 log( 9.2° 48°
-10 48° 180°
D/
Gmax - 2.5 10-3
(D/ 0 r2
29 - 25 log( r2 7°
8 7° 9.2°
32 - 25 log( 9.2° 48°
-10 48° 180°
D/= 68 is the threshold when the G1 plateau disappears.
angle off mainbeam axis, deg.
G1 -1 + 15log(D/), dBi
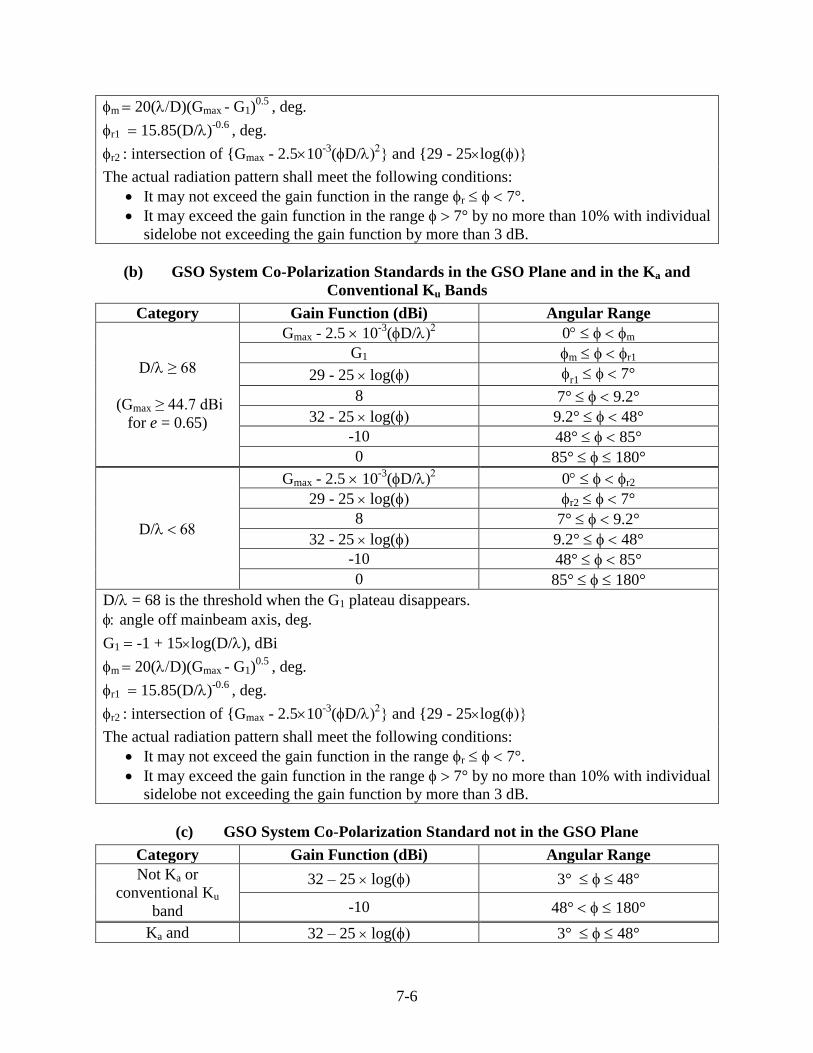
7-6
m 20(D)(Gmax - G1)0.5
, deg.
r1 15.85(D/)-0.6
, deg.
r2 : intersection of {Gmax - 2.510-3
(D/ and {29 - 25log(
The actual radiation pattern shall meet the following conditions:
It may not exceed the gain function in the range r 7°.
It may exceed the gain function in the range 7° by no more than 10% with individual
sidelobe not exceeding the gain function by more than 3 dB.
(b) GSO System Co-Polarization Standards in the GSO Plane and in the Ka and
Conventional Ku Bands
Category Gain Function (dBi) Angular Range
D/≥ 68
(Gmax ≥ 44.7 dBi
for e = 0.65)
Gmax - 2.5 10-3
(D/ 0 m
G1 m r1
29 - 25 log( r1 7°
8 7° 9.2°
32 - 25 log( 9.2° 48°
-10 48° 85°
0 85° 180°
D/
Gmax - 2.5 10-3
(D/ 0 r2
29 - 25 log( r2 7°
8 7° 9.2°
32 - 25 log( 9.2° 48°
-10 48° 85°
0 85° 180°
D/= 68 is the threshold when the G1 plateau disappears.
angle off mainbeam axis, deg.
G1 -1 + 15log(D/), dBi
m 20(D)(Gmax - G1)0.5
, deg.
r1 15.85(D/)-0.6
, deg.
r2 : intersection of {Gmax - 2.510-3
(D/ and {29 - 25log(
The actual radiation pattern shall meet the following conditions:
It may not exceed the gain function in the range r 7°.
It may exceed the gain function in the range 7° by no more than 10% with individual
sidelobe not exceeding the gain function by more than 3 dB.
(c) GSO System Co-Polarization Standard not in the GSO Plane
Category Gain Function (dBi) Angular Range
Not Ka or
conventional Ku
band
32 – 25 log( 3° 48°
-10 48° 180°
Ka and 32 – 25 log( 3° 48°
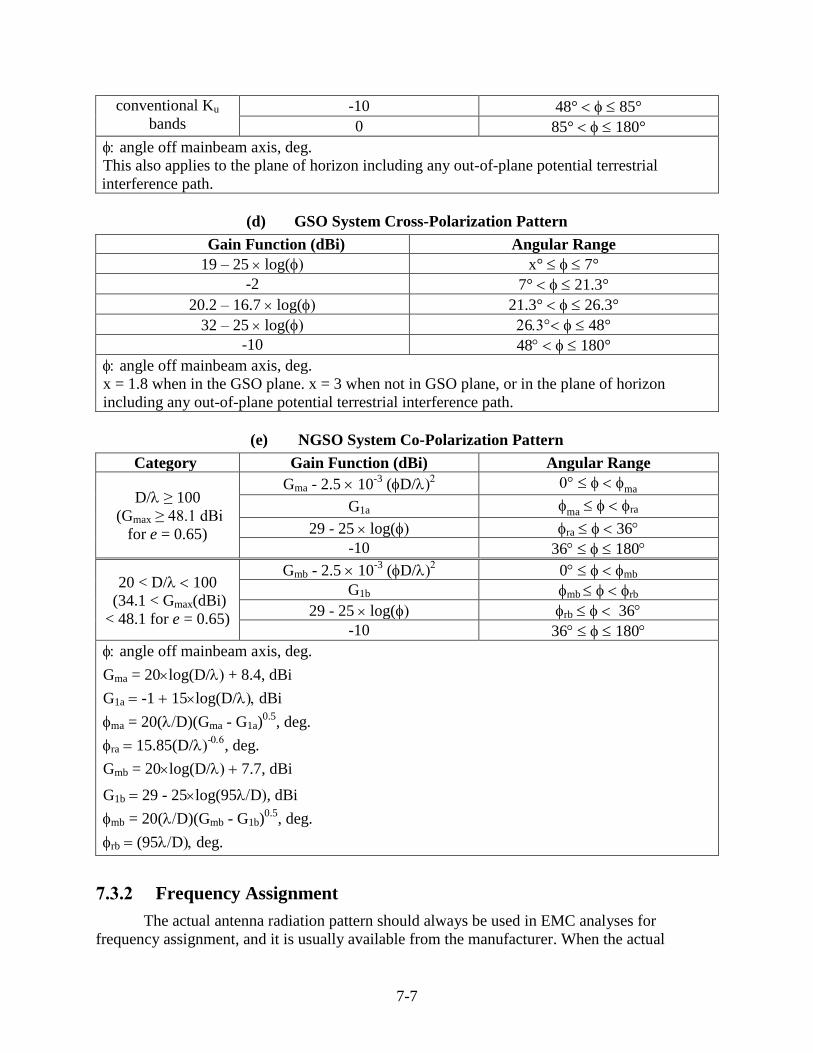
7-7
conventional Ku
bands -10 48° 85°
0 85° 180°
angle off mainbeam axis, deg.
This also applies to the plane of horizon including any out-of-plane potential terrestrial
interference path.
(d) GSO System Cross-Polarization Pattern
Gain Function (dBi) Angular Range
19 – 25 log( x° 7°
-2 7° 21.3°
20.2 – 16.7 log( 21.3° 26.3°
32 – 25 log( 6 48°
-10 48 180°
angle off mainbeam axis, deg.
x = 1.8 when in the GSO plane. x = 3 when not in GSO plane, or in the plane of horizon
including any out-of-plane potential terrestrial interference path.
(e) NGSO System Co-Polarization Pattern
Category Gain Function (dBi) Angular Range
D/ ≥ 100
(Gmax ≥ 48.1 dBi
for e = 0.65)
Gma - 2.5 10-3
(D/ ma
G1a ma ra
29 - 25 log( ra 36
-10 36 180
20 < D/ 100
(34.1 < Gmax(dBi)
< 48.1 for e = 0.65)
Gmb - 2.5 10-3
(D/ 0 mb
G1b mb rb
29 - 25 log( rb 36
-10 36 180
angle off mainbeam axis, deg.
Gma = 20log(D/ + 8.4, dBi
G1a -1 15log(D/dBi
ma = 20(D)(Gma - G1a)0.5
, deg.
ra 15.85(D/-
, deg.
Gmb = 20log(D/ 7.7, dBi
G1b 29 - 25log(95D, dBi
mb = 20(D)(Gmb - G1b)0.5
, deg.
rb (95Ddeg.
7.3.2 Frequency Assignment
The actual antenna radiation pattern should always be used in EMC analyses for
frequency assignment, and it is usually available from the manufacturer. When the actual
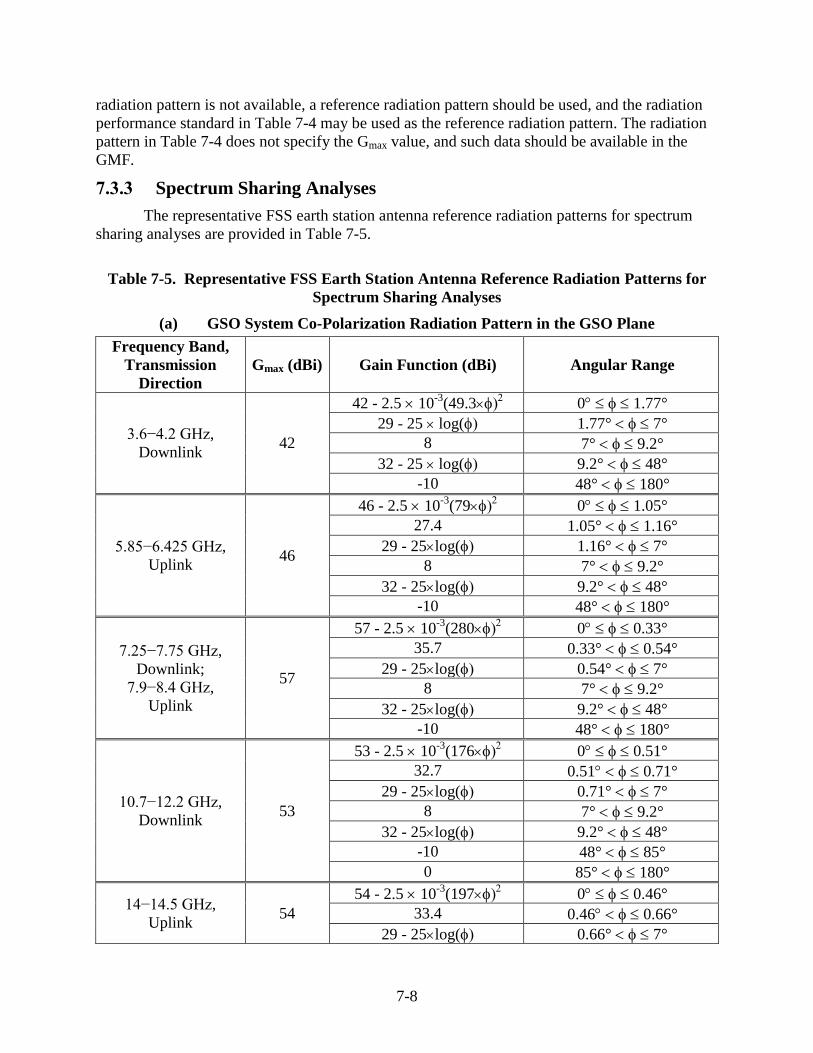
7-8
radiation pattern is not available, a reference radiation pattern should be used, and the radiation
performance standard in Table 7-4 may be used as the reference radiation pattern. The radiation
pattern in Table 7-4 does not specify the Gmax value, and such data should be available in the
GMF.
7.3.3 Spectrum Sharing Analyses
The representative FSS earth station antenna reference radiation patterns for spectrum
sharing analyses are provided in Table 7-5.
Table 7-5. Representative FSS Earth Station Antenna Reference Radiation Patterns for
Spectrum Sharing Analyses
(a) GSO System Co-Polarization Radiation Pattern in the GSO Plane
Frequency Band,
Transmission
Direction
Gmax (dBi) Gain Function (dBi) Angular Range
3.6−4.2 GHz,
Downlink 42
42 - 2.5 10-3
(49.3 0 1.77°
29 - 25 log( 1.77° 7°
8 7° 9.2°
32 - 25 log( 9.2° 48°
-10 48° 180°
5.85−6.425 GHz,
Uplink 46
46 - 2.5 10-3
(79 0 1.05°
27.4 1.05° 1.16°
29 - 25log( 1.16° 7°
8 7° 9.2°
32 - 25log( 9.2° 48°
-10 48° 180°
7.25−7.75 GHz,
Downlink;
7.9−8.4 GHz,
Uplink
57
57 - 2.5 10-3
(280 0 0.33°
35.7 0.33° 0.54°
29 - 25log( 0.54° 7°
8 7° 9.2°
32 - 25log( 9.2° 48°
-10 48° 180°
10.7−12.2 GHz,
Downlink 53
53 - 2.5 10-3
(176 0 0.51°
32.7 0.51 0.71°
29 - 25log( 0.71° 7°
8 7° 9.2°
32 - 25log( 9.2° 48°
-10 48° 85°
0 85° 180°
14−14.5 GHz,
Uplink 54
54 - 2.5 10-3
(197 0 0.46°
33.4 0.46 0.66°
29 - 25log( 0.66° 7°
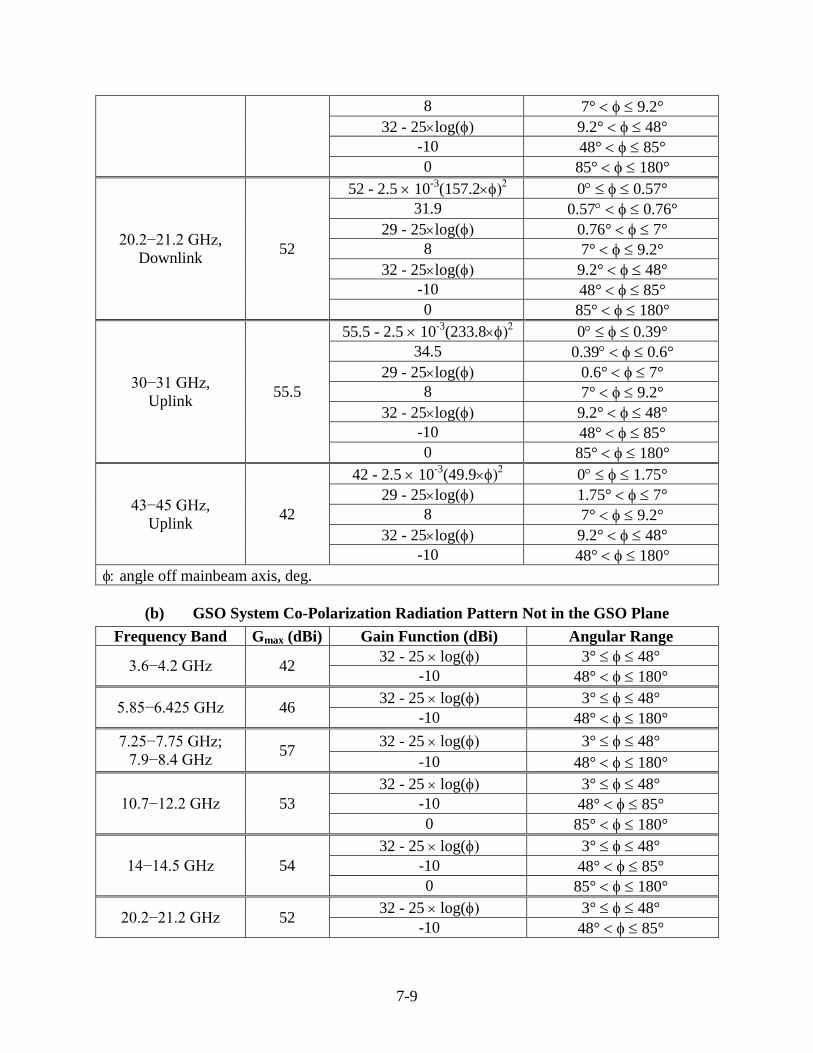
7-9
8 7° 9.2°
32 - 25log( 9.2° 48°
-10 48° 85°
0 85° 180°
20.2−21.2 GHz,
Downlink 52
52 - 2.5 10-3
(157.2 0 0.57°
31.9 0.57 0.76°
29 - 25log( 0.76° 7°
8 7° 9.2°
32 - 25log( 9.2° 48°
-10 48° 85°
0 85° 180°
30−31 GHz,
Uplink 55.5
55.5 - 2.5 10-3
(233.8 0 0.39°
34.5 0.39 0.6°
29 - 25log( 0.6° 7°
8 7° 9.2°
32 - 25log( 9.2° 48°
-10 48° 85°
0 85° 180°
43−45 GHz,
Uplink 42
42 - 2.5 10-3
(49.9 0 1.75°
29 - 25log( 1.75° 7°
8 7° 9.2°
32 - 25log( 9.2° 48°
-10 48° 180°
angle off mainbeam axis, deg.
(b) GSO System Co-Polarization Radiation Pattern Not in the GSO Plane
Frequency Band Gmax (dBi) Gain Function (dBi) Angular Range
3.6−4.2 GHz 42 32 - 25 log( 3° 48°
-10 48° 180°
5.85−6.425 GHz 46 32 - 25 log( 3° 48°
-10 48° 180°
7.25−7.75 GHz;
7.9−8.4 GHz 57
32 - 25 log( 3° 48°
-10 48° 180°
10.7−12.2 GHz 53
32 - 25 log( 3° 48°
-10 48° 85°
0 85° 180°
14−14.5 GHz 54
32 - 25 log( 3° 48°
-10 48° 85°
0 85° 180°
20.2−21.2 GHz 52 32 - 25 log( 3° 48°
-10 48° 85°
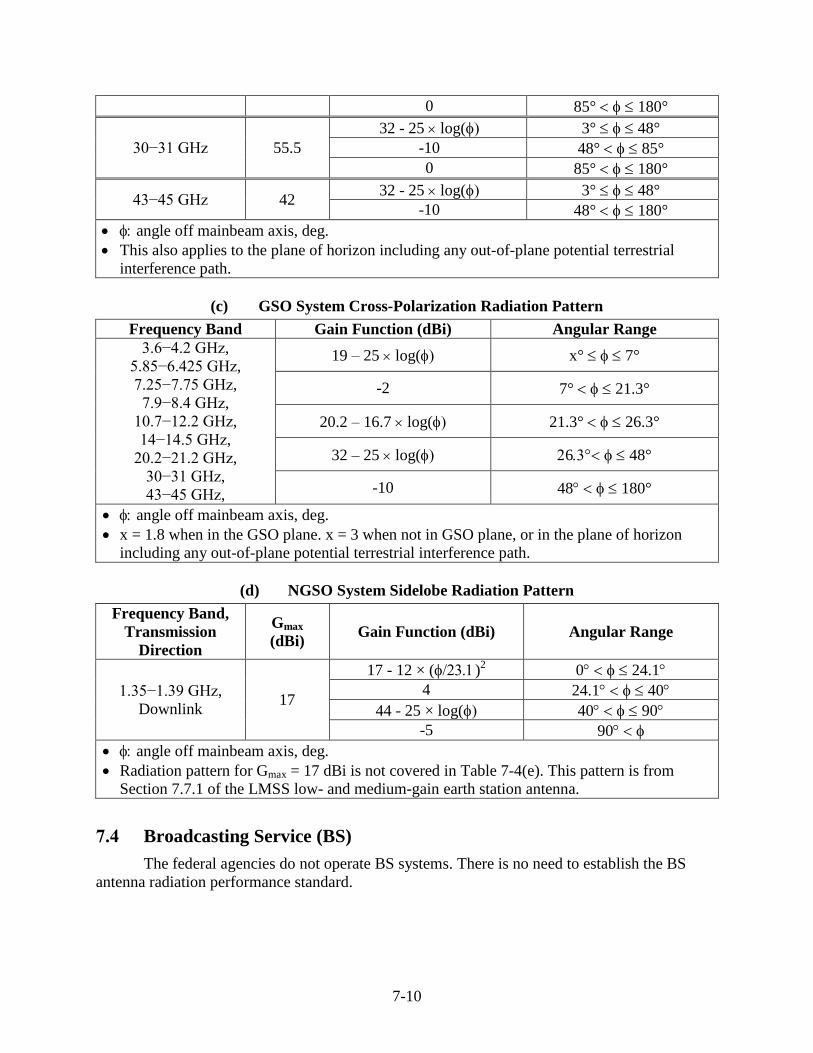
7-10
0 85° 180°
30−31 GHz 55.5
32 - 25 log( 3° 48°
-10 48° 85°
0 85° 180°
43−45 GHz 42 32 - 25 log( 3° 48°
-10 48° 180°
angle off mainbeam axis, deg.
This also applies to the plane of horizon including any out-of-plane potential terrestrial
interference path.
(c) GSO System Cross-Polarization Radiation Pattern
Frequency Band Gain Function (dBi) Angular Range
3.6−4.2 GHz,
5.85−6.425 GHz,
7.25−7.75 GHz,
7.9−8.4 GHz,
10.7−12.2 GHz,
14−14.5 GHz,
20.2−21.2 GHz,
30−31 GHz,
43−45 GHz,
19 – 25 log( x° 7°
-2 7° 21.3°
20.2 – 16.7 log( 21.3° 26.3°
32 – 25 log( 6 48°
-10 48 180°
angle off mainbeam axis, deg.
x = 1.8 when in the GSO plane. x = 3 when not in GSO plane, or in the plane of horizon
including any out-of-plane potential terrestrial interference path.
(d) NGSO System Sidelobe Radiation Pattern
Frequency Band,
Transmission
Direction
Gmax
(dBi) Gain Function (dBi) Angular Range
1.35−1.39 GHz,
Downlink 17
17 - 12 × ()2 0 24.1
4 24.1 40
44 - 25 × log( 40 90
-5 90
angle off mainbeam axis, deg.
Radiation pattern for Gmax = 17 dBi is not covered in Table 7-4(e). This pattern is from
Section 7.7.1 of the LMSS low- and medium-gain earth station antenna.
7.4 Broadcasting Service (BS)
The federal agencies do not operate BS systems. There is no need to establish the BS
antenna radiation performance standard.
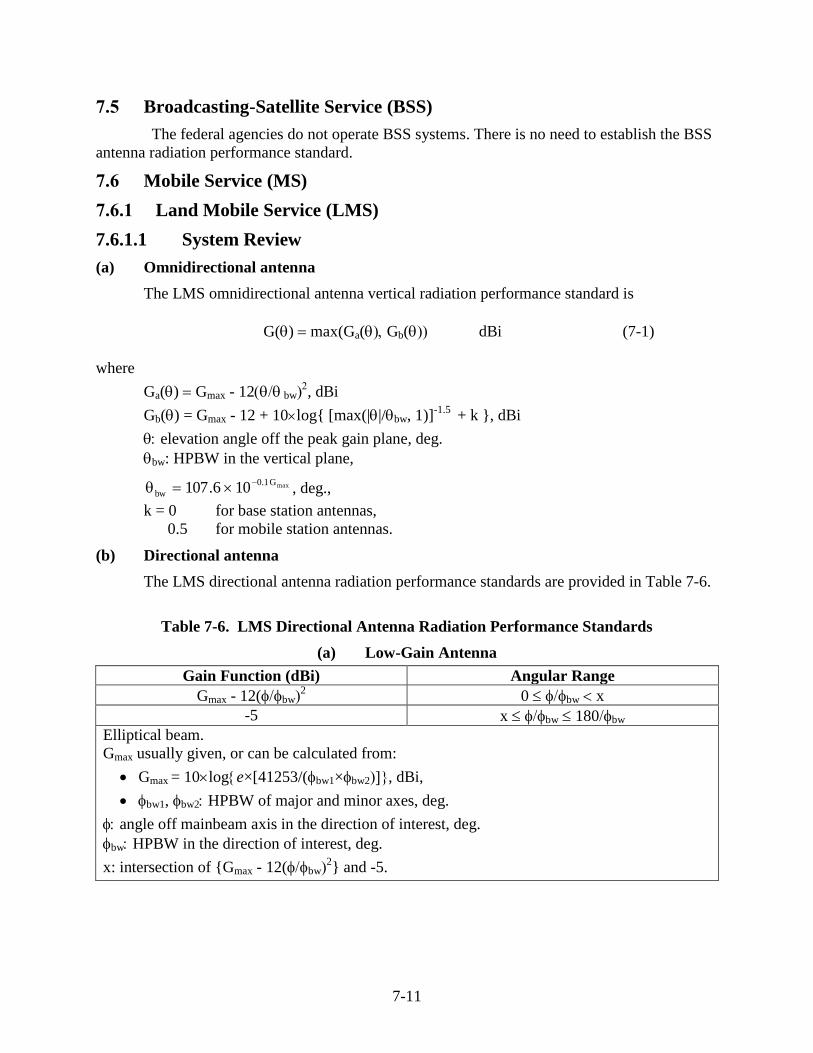
7-11
7.5 Broadcasting-Satellite Service (BSS)
The federal agencies do not operate BSS systems. There is no need to establish the BSS
antenna radiation performance standard.
7.6 Mobile Service (MS)
7.6.1 Land Mobile Service (LMS)
7.6.1.1 System Review
(a) Omnidirectional antenna
The LMS omnidirectional antenna vertical radiation performance standard is
G() max(Ga(Gb( dBi (7-1)
where
Ga() Gmax - 12 bw, dBi
Gb() = Gmax - 12 + 10log{ [max(||/bw, 1)]-1.5
+ k }, dBi
elevation angle off the peak gain plane, deg.
bw: HPBW in the vertical plane,
maxG1.0
bw 106.107
, deg.,
k = 0 for base station antennas,
0.5 for mobile station antennas.
(b) Directional antenna
The LMS directional antenna radiation performance standards are provided in Table 7-6.
Table 7-6. LMS Directional Antenna Radiation Performance Standards
(a) Low-Gain Antenna
Gain Function (dBi) Angular Range
Gmax - 12(bw2 0 bw x
-5 x bw 180bw
Elliptical beam.
Gmax usually given, or can be calculated from:
Gmax = 10loge×[41253/(bw1×bw2, dBi,
bw1, bw2 HPBW of major and minor axes, deg.
angle off mainbeam axis in the direction of interest, deg.
bw HPBW in the direction of interest, deg.
x: intersection of {Gmax - 12(bw2} and -5.
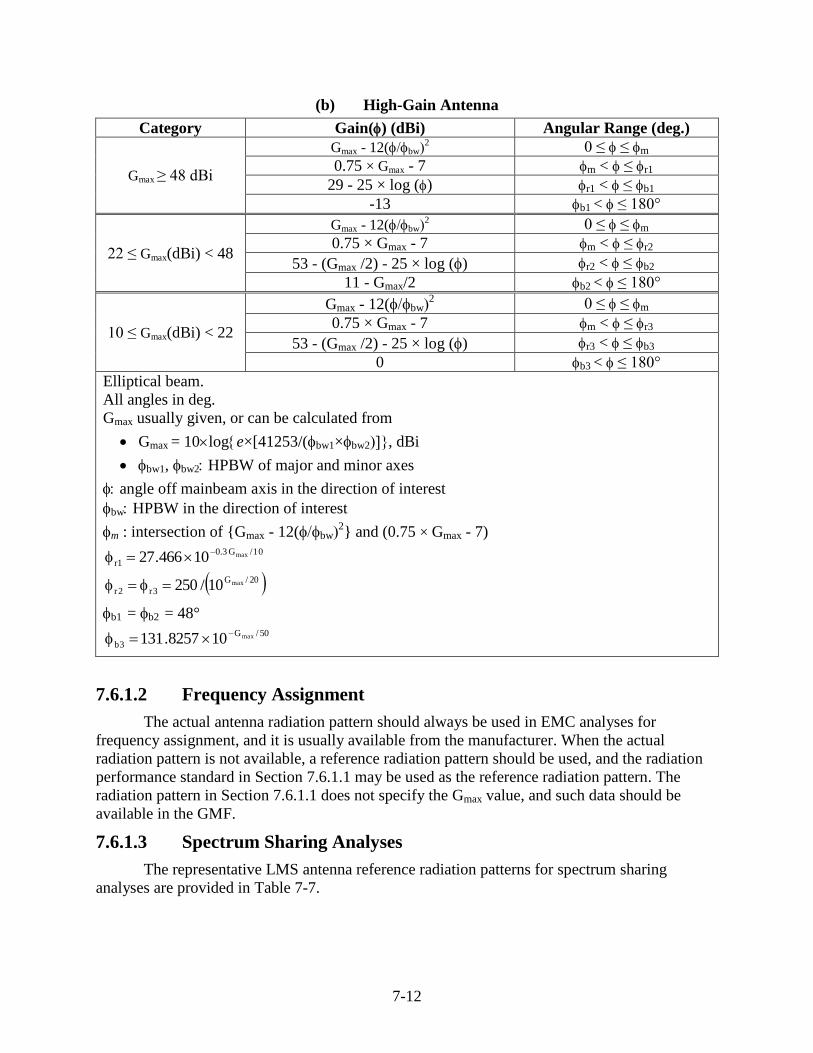
7-12
(b) High-Gain Antenna
Category Gain() (dBi) Angular Range (deg.)
Gmax ≥ 48 dBi
Gmax - 12(bw2 0 ≤ ≤ m
0.75 × Gmax - 7 m < ≤ r1
29 - 25 × log () r1 < ≤ b1
-13 b1 < ≤ 180°
22 ≤ Gmax(dBi) < 48
Gmax - 12(bw2 0 ≤ ≤ m
0.75 × Gmax - 7 m < ≤ r2
53 - (Gmax /2) - 25 × log () r2 < ≤ b2
11 - Gmax/2 b2 < ≤ 180°
10 ≤ Gmax(dBi) < 22
Gmax - 12(bw2 0 ≤ ≤ m
0.75 × Gmax - 7 m < ≤ r3
53 - (Gmax /2) - 25 × log () r3 < ≤ b3
0 b3 < ≤ 180°
Elliptical beam.
All angles in deg.
Gmax usually given, or can be calculated from
Gmax = 10loge×[41253/(bw1×bw2, dBi
bw1, bw2 HPBW of major and minor axes
angle off mainbeam axis in the direction of interest
bw HPBW in the direction of interest
m : intersection of {Gmax - 12(bw2} and (0.75 × Gmax - 7)
10/G3.0
1rmax10466.27
20/G
3r2rmax10/250
b1 = b2 = 48° 50/G
3bmax108257.131
7.6.1.2 Frequency Assignment
The actual antenna radiation pattern should always be used in EMC analyses for
frequency assignment, and it is usually available from the manufacturer. When the actual
radiation pattern is not available, a reference radiation pattern should be used, and the radiation
performance standard in Section 7.6.1.1 may be used as the reference radiation pattern. The
radiation pattern in Section 7.6.1.1 does not specify the Gmax value, and such data should be
available in the GMF.
7.6.1.3 Spectrum Sharing Analyses
The representative LMS antenna reference radiation patterns for spectrum sharing
analyses are provided in Table 7-7.
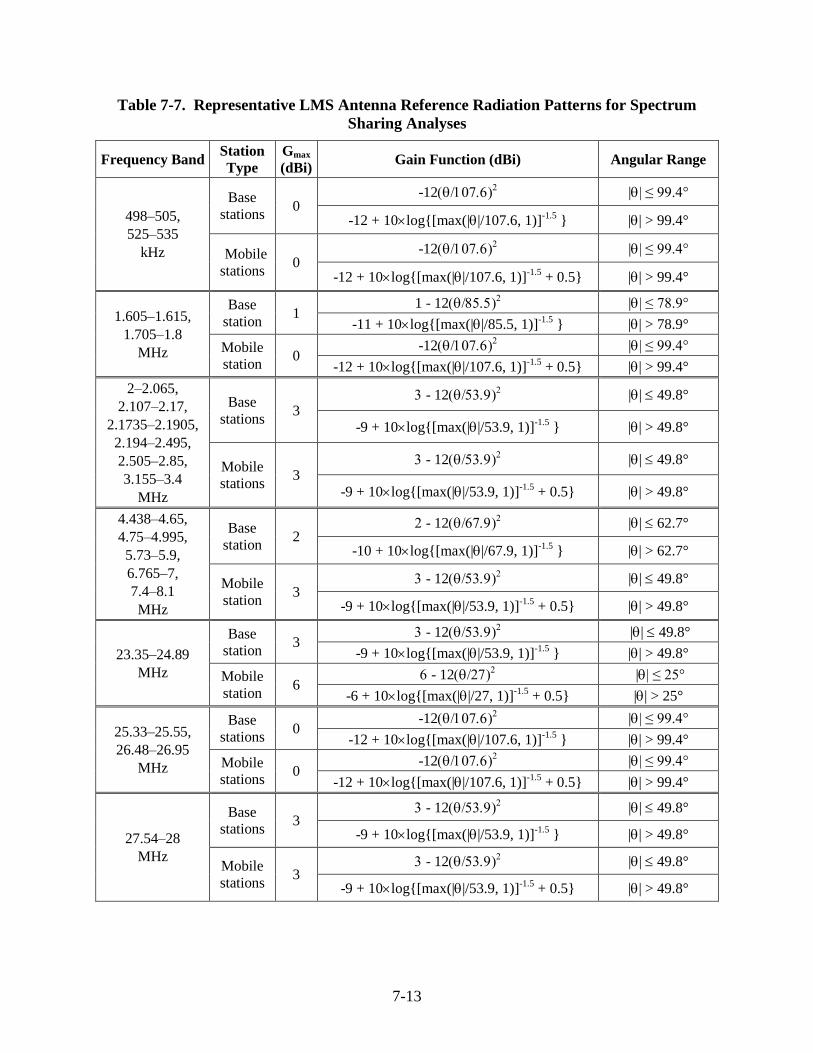
7-13
Table 7-7. Representative LMS Antenna Reference Radiation Patterns for Spectrum
Sharing Analyses
Frequency Band Station
Type
Gmax
(dBi) Gain Function (dBi) Angular Range
498–505,
525–535
kHz
Base
stations 0
-12 || ≤ 99.4°
-12 + 10log{[max(||/107.6, 1)]-1.5
} || > 99.4°
Mobile
stations 0
-12 || ≤ 99.4°
-12 + 10log{[max(||/107.6, 1)]-1.5
+ 0.5} || > 99.4°
1.605–1.615,
1.705–1.8
MHz
Base
station 1
1 - 12 || ≤ 78.9°
-11 + 10log{[max(||/85.5, 1)]-1.5
} || > 78.9°
Mobile
station 0
-12 || ≤ 99.4°
-12 + 10log{[max(||/107.6, 1)]-1.5
+ 0.5} || > 99.4°
2–2.065,
2.107–2.17,
2.1735–2.1905,
2.194–2.495,
2.505–2.85,
3.155–3.4
MHz
Base
stations 3
- 12 || 49.8°
-9 + 10log{[max(||/53.9, 1)]-1.5
} || > 49.8°
Mobile
stations 3
- 12 || 49.8°
-9 + 10log{[max(||/53.9, 1)]-1.5
+ 0.5} || > 49.8°
4.438–4.65,
4.75–4.995,
5.73–5.9,
6.765–7,
7.4–8.1
MHz
Base
station 2
- 12 || 62.7°
-10 + 10log{[max(||/67.9, 1)]-1.5
} || > 62.7°
Mobile
station 3
- 12 || 49.8°
-9 + 10log{[max(||/53.9, 1)]-1.5
+ 0.5} || > 49.8°
23.35–24.89
MHz
Base
station 3
- 12 || 49.8°
-9 + 10log{[max(||/53.9, 1)]-1.5
} || > 49.8°
Mobile
station 6
- 12 || ≤ 25°
-6 + 10log{[max(||/27, 1)]-1.5
+ 0.5} || > 25°
25.33–25.55,
26.48–26.95
MHz
Base
stations 0
-12 || ≤ 99.4°
-12 + 10log{[max(||/107.6, 1)]-1.5
} || > 99.4°
Mobile
stations 0
-12 || ≤ 99.4°
-12 + 10log{[max(||/107.6, 1)]-1.5
+ 0.5} || > 99.4°
27.54–28
MHz
Base
stations 3
- 12 || 49.8°
-9 + 10log{[max(||/53.9, 1)]-1.5
} || > 49.8°
Mobile
stations 3
- 12 || 49.8°
-9 + 10log{[max(||/53.9, 1)]-1.5
+ 0.5} || > 49.8°
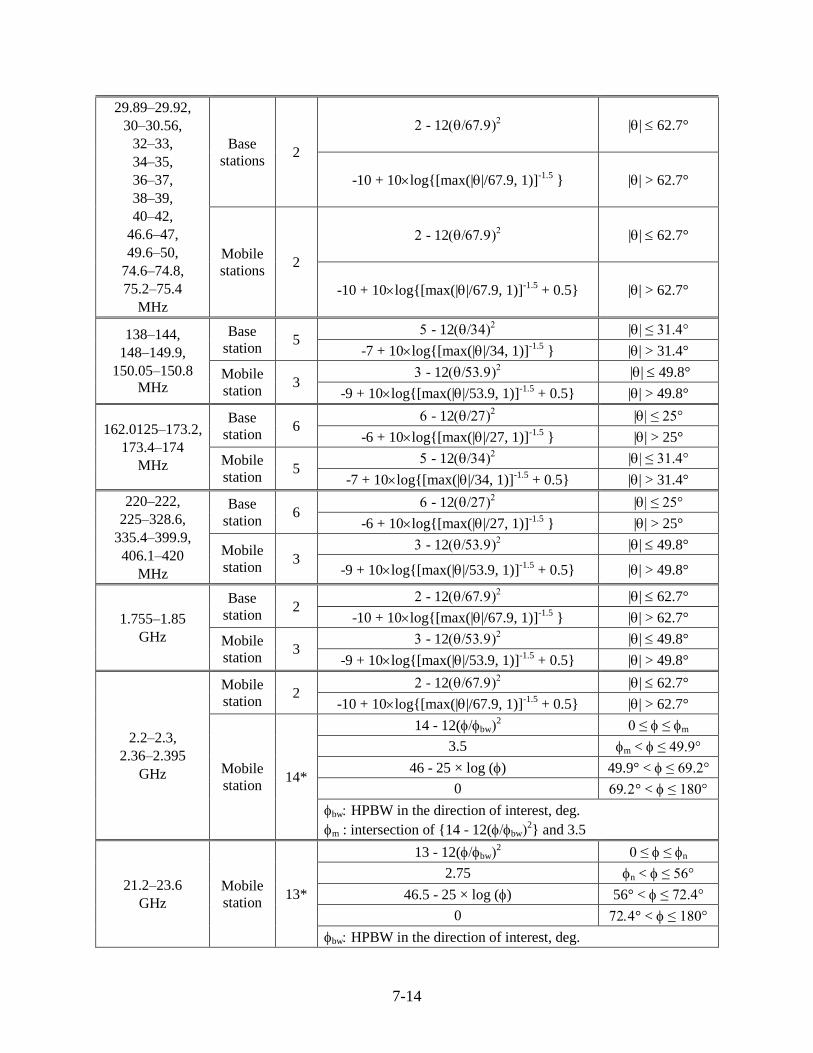
7-14
29.89–29.92,
30–30.56,
32–33,
34–35,
36–37,
38–39,
40–42,
46.6–47,
49.6–50,
74.6–74.8,
75.2–75.4
MHz
Base
stations 2
- 12 || 62.7°
-10 + 10log{[max(||/67.9, 1)]-1.5
} || > 62.7°
Mobile
stations 2
- 12 || 62.7°
-10 + 10log{[max(||/67.9, 1)]-1.5
+ 0.5} || > 62.7°
138–144,
148–149.9,
150.05–150.8
MHz
Base
station 5
- 12 || ≤ 31.4°
-7 + 10log{[max(||/34, 1)]-1.5
} || > 31.4°
Mobile
station 3
- 12 || 49.8°
-9 + 10log{[max(||/53.9, 1)]-1.5
+ 0.5} || > 49.8°
162.0125–173.2,
173.4–174
MHz
Base
station 6
- 12 || ≤ 25°
-6 + 10log{[max(||/27, 1)]-1.5
} || > 25°
Mobile
station 5
- 12 || ≤ 31.4°
-7 + 10log{[max(||/34, 1)]-1.5
+ 0.5} || > 31.4°
220–222,
225–328.6,
335.4–399.9,
406.1–420
MHz
Base
station 6
- 12 || ≤ 25°
-6 + 10log{[max(||/27, 1)]-1.5
} || > 25°
Mobile
station 3
- 12 || 49.8°
-9 + 10log{[max(||/53.9, 1)]-1.5
+ 0.5} || > 49.8°
1.755–1.85
GHz
Base
station 2
- 12 || 62.7°
-10 + 10log{[max(||/67.9, 1)]-1.5
} || > 62.7°
Mobile
station 3
- 12 || 49.8°
-9 + 10log{[max(||/53.9, 1)]-1.5
+ 0.5} || > 49.8°
2.2–2.3,
2.36–2.395
GHz
Mobile
station 2
- 12 || 62.7°
-10 + 10log{[max(||/67.9, 1)]-1.5
+ 0.5} || > 62.7°
Mobile
station 14*
14 - 12(bw2 0 ≤ ≤ m
3.5 m < ≤ 49.9°
46 - 25 × log () 49.9° < ≤ 69.2°
0 ° < ≤ 180°
bw HPBW in the direction of interest, deg.
m : intersection of {14 - 12(bw2} and 3.5
21.2–23.6
GHz
Mobile
station 13*
13 - 12(bw2 0 ≤ ≤ n
2.75 n < ≤ 56°
46.5 - 25 × log () 56° < ≤ 72.4°
0 ° < ≤ 180°
bw HPBW in the direction of interest, deg.
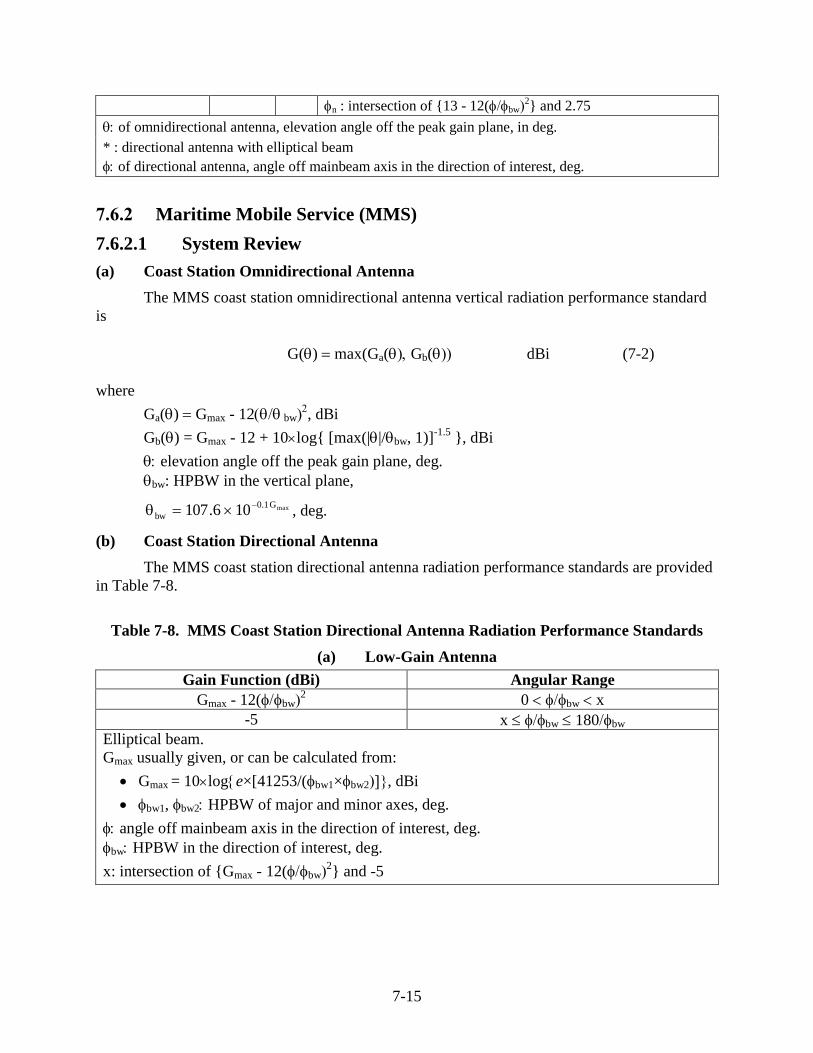
7-15
n : intersection of {13 - 12(bw2} and 2.75
ofomnidirectional antenna, elevation angle off the peak gain plane, in deg.
* : directional antenna with elliptical beam
of directional antenna, angle off mainbeam axis in the direction of interest, deg.
7.6.2 Maritime Mobile Service (MMS)
7.6.2.1 System Review
(a) Coast Station Omnidirectional Antenna
The MMS coast station omnidirectional antenna vertical radiation performance standard
is
G() max(Ga(Gb( dBi (7-2)
where
Ga() Gmax - 12 bw, dBi
Gb() = Gmax - 12 + 10log{ [max(||/bw, 1)]-1.5
}, dBi
elevation angle off the peak gain plane, deg.
bw: HPBW in the vertical plane,
maxG1.0
bw 106.107
, deg.
(b) Coast Station Directional Antenna
The MMS coast station directional antenna radiation performance standards are provided
in Table 7-8.
Table 7-8. MMS Coast Station Directional Antenna Radiation Performance Standards
(a) Low-Gain Antenna
Gain Function (dBi) Angular Range
Gmax - 12(bw2 0 bw x
-5 x bw 180bw
Elliptical beam.
Gmax usually given, or can be calculated from:
Gmax = 10loge×[41253/(bw1×bw2, dBi
bw1, bw2 HPBW of major and minor axes, deg.
angle off mainbeam axis in the direction of interest, deg.
bw HPBW in the direction of interest, deg.
x: intersection of {Gmax - 12(bw2} and -5
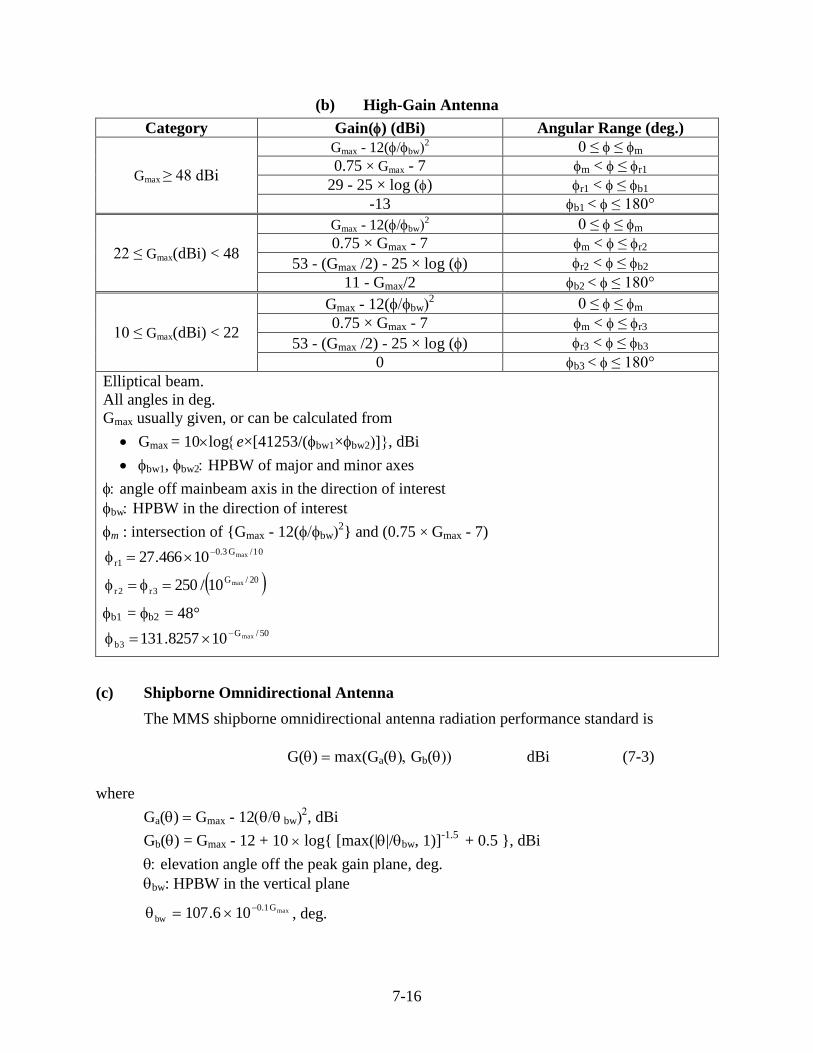
7-16
(b) High-Gain Antenna
Category Gain() (dBi) Angular Range (deg.)
Gmax ≥ 48 dBi
Gmax - 12(bw2 0 ≤ ≤ m
0.75 × Gmax - 7 m < ≤ r1
29 - 25 × log () r1 < ≤ b1
-13 b1 < ≤ 180°
22 ≤ Gmax(dBi) < 48
Gmax - 12(bw2 0 ≤ ≤ m
0.75 × Gmax - 7 m < ≤ r2
53 - (Gmax /2) - 25 × log () r2 < ≤ b2
11 - Gmax/2 b2 < ≤ 180°
10 ≤ Gmax(dBi) < 22
Gmax - 12(bw2 0 ≤ ≤ m
0.75 × Gmax - 7 m < ≤ r3
53 - (Gmax /2) - 25 × log () r3 < ≤ b3
0 b3 < ≤ 180°
Elliptical beam.
All angles in deg.
Gmax usually given, or can be calculated from
Gmax = 10loge×[41253/(bw1×bw2, dBi
bw1, bw2 HPBW of major and minor axes
angle off mainbeam axis in the direction of interest
bw HPBW in the direction of interest
m : intersection of {Gmax - 12(bw2} and (0.75 × Gmax - 7)
10/G3.0
1rmax10466.27
20/G
3r2rmax10/250
b1 = b2 = 48° 50/G
3bmax108257.131
(c) Shipborne Omnidirectional Antenna
The MMS shipborne omnidirectional antenna radiation performance standard is
G() max(Ga(Gb( dBi (7-3)
where
Ga() Gmax - 12 bw, dBi
Gb() = Gmax - 12 + 10 log{ [max(||/bw, 1)]-1.5
+ 0.5 }, dBi
elevation angle off the peak gain plane, deg.
bw: HPBW in the vertical plane
maxG1.0
bw 106.107
, deg.
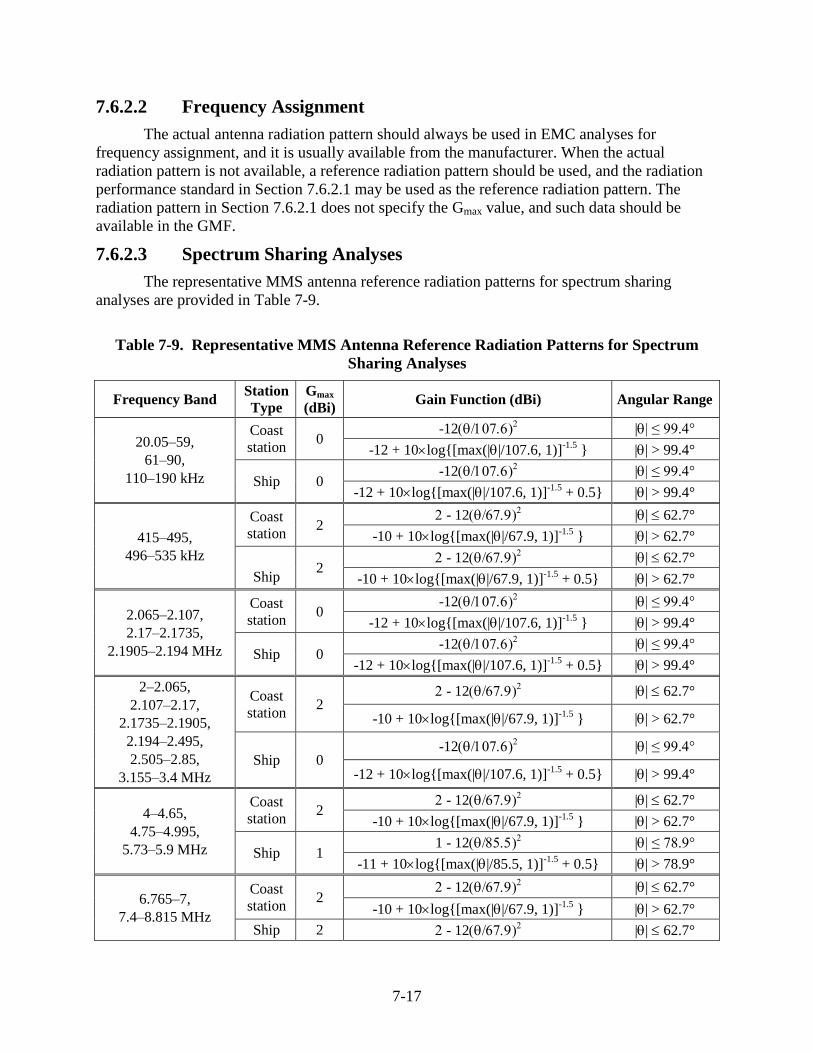
7-17
7.6.2.2 Frequency Assignment
The actual antenna radiation pattern should always be used in EMC analyses for
frequency assignment, and it is usually available from the manufacturer. When the actual
radiation pattern is not available, a reference radiation pattern should be used, and the radiation
performance standard in Section 7.6.2.1 may be used as the reference radiation pattern. The
radiation pattern in Section 7.6.2.1 does not specify the Gmax value, and such data should be
available in the GMF.
7.6.2.3 Spectrum Sharing Analyses
The representative MMS antenna reference radiation patterns for spectrum sharing
analyses are provided in Table 7-9.
Table 7-9. Representative MMS Antenna Reference Radiation Patterns for Spectrum
Sharing Analyses
Frequency Band Station
Type
Gmax
(dBi) Gain Function (dBi) Angular Range
20.05–59,
61–90,
110–190 kHz
Coast
station 0
-12 || ≤ 99.4°
-12 + 10log{[max(||/107.6, 1)]-1.5
} || > 99.4°
Ship 0 -12
|| ≤ 99.4°
-12 + 10log{[max(||/107.6, 1)]-1.5
+ 0.5} || > 99.4°
415–495,
496–535 kHz
Coast
station 2
- 12 || 62.7°
-10 + 10log{[max(||/67.9, 1)]-1.5
} || > 62.7°
Ship 2
- 12 || 62.7°
-10 + 10log{[max(||/67.9, 1)]-1.5
+ 0.5} || > 62.7°
2.065–2.107,
2.17–2.1735,
2.1905–2.194 MHz
Coast
station 0
-12 || ≤ 99.4°
-12 + 10log{[max(||/107.6, 1)]-1.5
} || > 99.4°
Ship 0 -12
|| ≤ 99.4°
-12 + 10log{[max(||/107.6, 1)]-1.5
+ 0.5} || > 99.4°
2–2.065,
2.107–2.17,
2.1735–2.1905,
2.194–2.495,
2.505–2.85,
3.155–3.4 MHz
Coast
station 2
- 12 || 62.7°
-10 + 10log{[max(||/67.9, 1)]-1.5
} || > 62.7°
Ship 0 -12
|| ≤ 99.4°
-12 + 10log{[max(||/107.6, 1)]-1.5
+ 0.5} || > 99.4°
4–4.65,
4.75–4.995,
5.73–5.9 MHz
Coast
station 2
- 12 || 62.7°
-10 + 10log{[max(||/67.9, 1)]-1.5
} || > 62.7°
Ship 1 1 - 12
|| ≤ 78.9°
-11 + 10log{[max(||/85.5, 1)]-1.5
+ 0.5} || > 78.9°
6.765–7,
7.4–8.815 MHz
Coast
station 2
- 12 || 62.7°
-10 + 10log{[max(||/67.9, 1)]-1.5
} || > 62.7°
Ship 2 - 12 || 62.7°
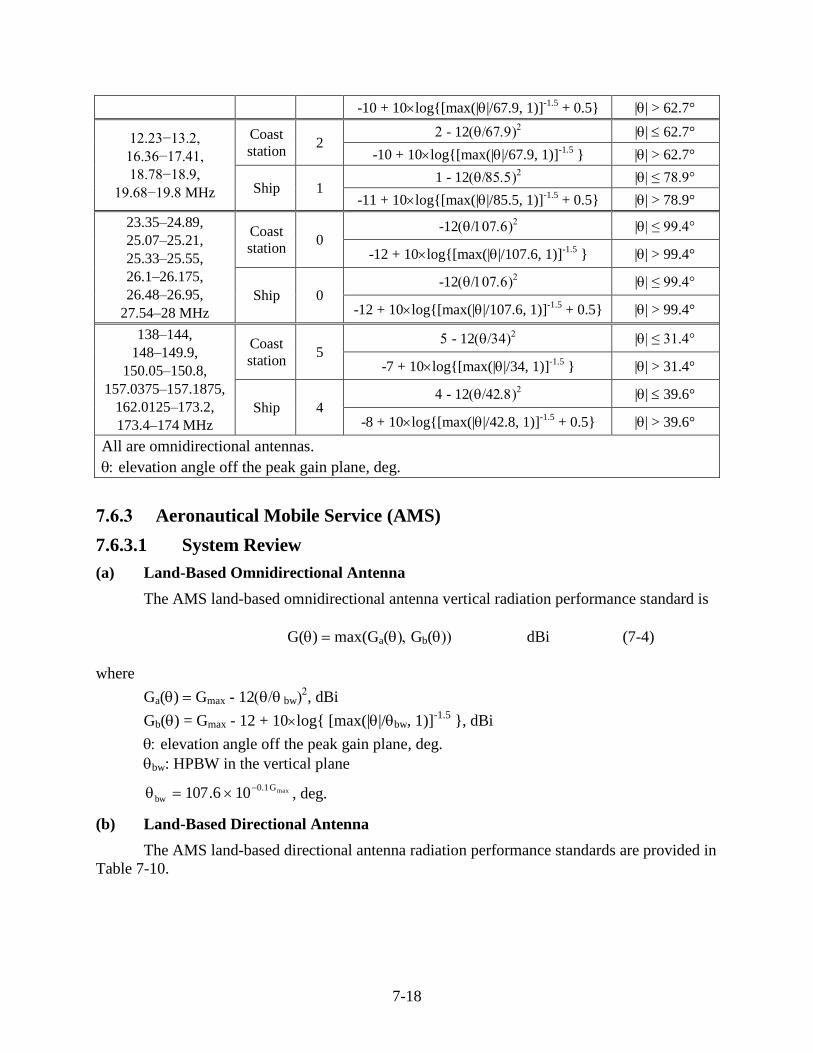
7-18
-10 + 10log{[max(||/67.9, 1)]-1.5
+ 0.5} || > 62.7°
12.23−13.2,
16.36−17.41,
18.78−18.9,
19.68−19.8 MHz
Coast
station 2
- 12 || 62.7°
-10 + 10log{[max(||/67.9, 1)]-1.5
} || > 62.7°
Ship 1 1 - 12
|| ≤ 78.9°
-11 + 10log{[max(||/85.5, 1)]-1.5
+ 0.5} || > 78.9°
23.35–24.89,
25.07–25.21,
25.33–25.55,
26.1–26.175,
26.48–26.95,
27.54–28 MHz
Coast
station 0
-12 || ≤ 99.4°
-12 + 10log{[max(||/107.6, 1)]-1.5
} || > 99.4°
Ship 0 -12
|| ≤ 99.4°
-12 + 10log{[max(||/107.6, 1)]-1.5
+ 0.5} || > 99.4°
138–144,
148–149.9,
150.05–150.8,
157.0375–157.1875,
162.0125–173.2,
173.4–174 MHz
Coast
station 5
- 12 || ≤ 31.4°
-7 + 10log{[max(||/34, 1)]-1.5
} || > 31.4°
Ship 4 - 12
|| 39.6°
-8 + 10log{[max(||/42.8, 1)]-1.5
+ 0.5} || > 39.6°
All are omnidirectional antennas.
elevation angle off the peak gain plane, deg.
7.6.3 Aeronautical Mobile Service (AMS)
7.6.3.1 System Review
(a) Land-Based Omnidirectional Antenna
The AMS land-based omnidirectional antenna vertical radiation performance standard is
G() max(Ga(Gb( dBi (7-4)
where
Ga() Gmax - 12 bw, dBi
Gb() = Gmax - 12 + 10log{ [max(||/bw, 1)]-1.5
}, dBi
elevation angle off the peak gain plane, deg.
bw: HPBW in the vertical plane
maxG1.0
bw 106.107
, deg.
(b) Land-Based Directional Antenna
The AMS land-based directional antenna radiation performance standards are provided in
Table 7-10.
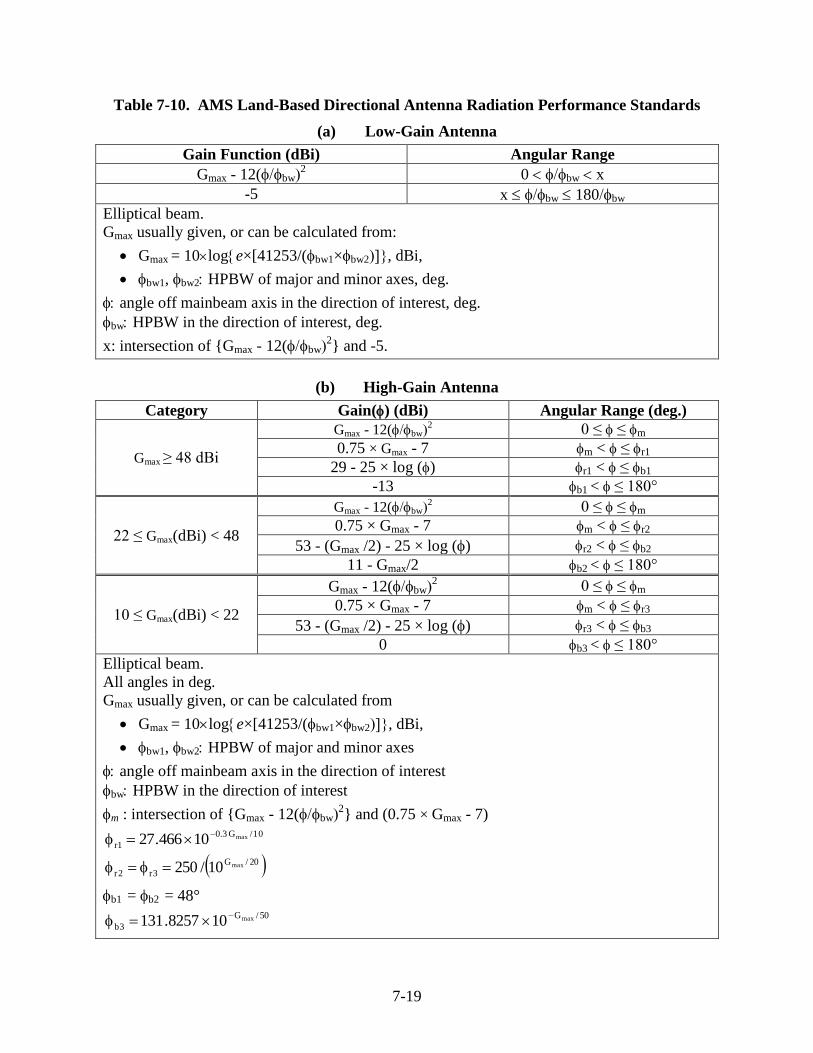
7-19
Table 7-10. AMS Land-Based Directional Antenna Radiation Performance Standards
(a) Low-Gain Antenna
Gain Function (dBi) Angular Range
Gmax - 12(bw2 0 bw x
-5 x bw 180bw
Elliptical beam.
Gmax usually given, or can be calculated from:
Gmax = 10loge×[41253/(bw1×bw2, dBi,
bw1, bw2 HPBW of major and minor axes, deg.
angle off mainbeam axis in the direction of interest, deg.
bw HPBW in the direction of interest, deg.
x: intersection of {Gmax - 12(bw2} and -5.
(b) High-Gain Antenna
Category Gain() (dBi) Angular Range (deg.)
Gmax ≥ 48 dBi
Gmax - 12(bw2 0 ≤ ≤ m
0.75 × Gmax - 7 m < ≤ r1
29 - 25 × log () r1 < ≤ b1
-13 b1 < ≤ 180°
22 ≤ Gmax(dBi) < 48
Gmax - 12(bw2 0 ≤ ≤ m
0.75 × Gmax - 7 m < ≤ r2
53 - (Gmax /2) - 25 × log () r2 < ≤ b2
11 - Gmax/2 b2 < ≤ 180°
10 ≤ Gmax(dBi) < 22
Gmax - 12(bw2 0 ≤ ≤ m
0.75 × Gmax - 7 m < ≤ r3
53 - (Gmax /2) - 25 × log () r3 < ≤ b3
0 b3 < ≤ 180°
Elliptical beam.
All angles in deg.
Gmax usually given, or can be calculated from
Gmax = 10loge×[41253/(bw1×bw2, dBi,
bw1, bw2 HPBW of major and minor axes
angle off mainbeam axis in the direction of interest
bw HPBW in the direction of interest
m : intersection of {Gmax - 12(bw2} and (0.75 × Gmax - 7)
10/G3.0
1rmax10466.27
20/G
3r2rmax10/250
b1 = b2 = 48° 50/G
3bmax108257.131
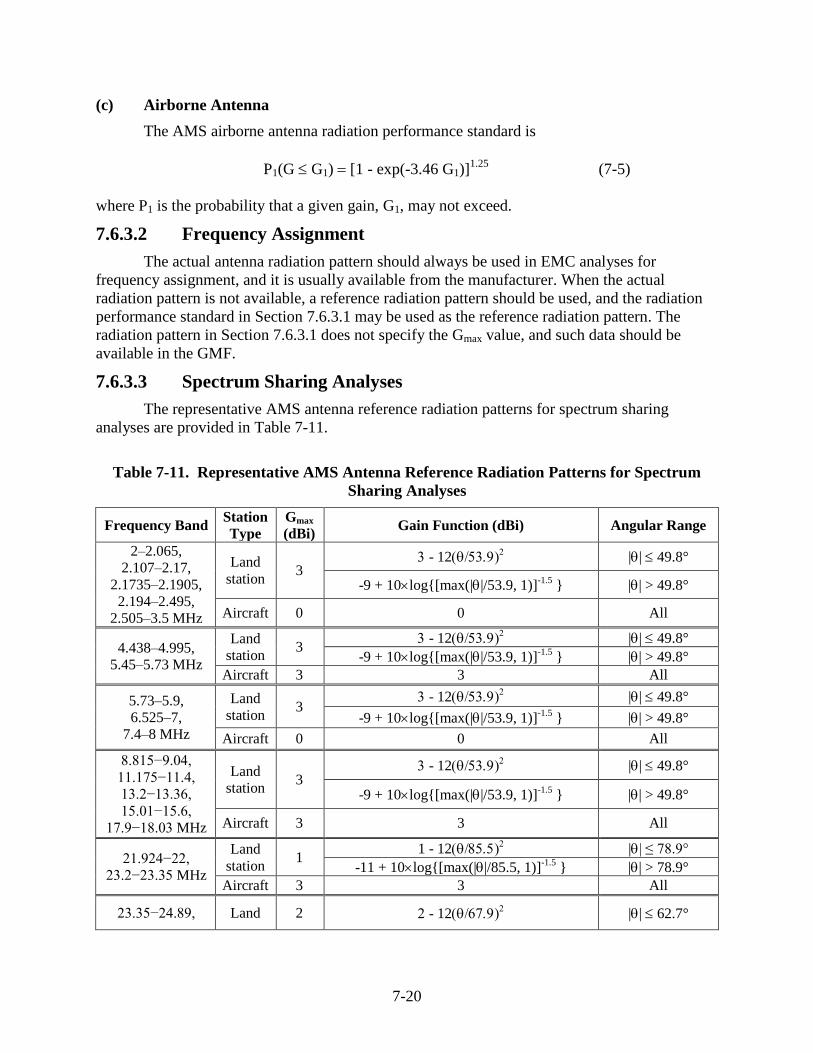
7-20
(c) Airborne Antenna
The AMS airborne antenna radiation performance standard is
P1(G G1) [1 - exp(-3.46 G1)]1.25
(7-5)
where P1 is the probability that a given gain, G1, may not exceed.
7.6.3.2 Frequency Assignment
The actual antenna radiation pattern should always be used in EMC analyses for
frequency assignment, and it is usually available from the manufacturer. When the actual
radiation pattern is not available, a reference radiation pattern should be used, and the radiation
performance standard in Section 7.6.3.1 may be used as the reference radiation pattern. The
radiation pattern in Section 7.6.3.1 does not specify the Gmax value, and such data should be
available in the GMF.
7.6.3.3 Spectrum Sharing Analyses
The representative AMS antenna reference radiation patterns for spectrum sharing
analyses are provided in Table 7-11.
Table 7-11. Representative AMS Antenna Reference Radiation Patterns for Spectrum
Sharing Analyses
Frequency Band Station
Type
Gmax
(dBi) Gain Function (dBi) Angular Range
2–2.065,
2.107–2.17,
2.1735–2.1905,
2.194–2.495,
2.505–3.5 MHz
Land
station 3
- 12 || 49.8°
-9 + 10log{[max(||/53.9, 1)]-1.5
} || > 49.8°
Aircraft 0 0 All
4.438–4.995,
5.45–5.73 MHz
Land
station 3
- 12 || 49.8°
-9 + 10log{[max(||/53.9, 1)]-1.5
} || > 49.8°
Aircraft 3 3 All
5.73–5.9,
6.525–7,
7.4–8 MHz
Land
station 3
- 12 || 49.8°
-9 + 10log{[max(||/53.9, 1)]-1.5
} || > 49.8°
Aircraft 0 0 All
8.815−9.04,
11.175−11.4,
13.2−13.36,
15.01−15.6,
17.9−18.03 MHz
Land
station 3
- 12 || 49.8°
-9 + 10log{[max(||/53.9, 1)]-1.5
} || > 49.8°
Aircraft 3 3 All
21.924−22,
23.2−23.35 MHz
Land
station 1
1 - 12 || ≤ 78.9°
-11 + 10log{[max(||/85.5, 1)]-1.5
} || > 78.9°
Aircraft 3 3 All
23.35−24.89, Land 2 - 12 || 62.7°
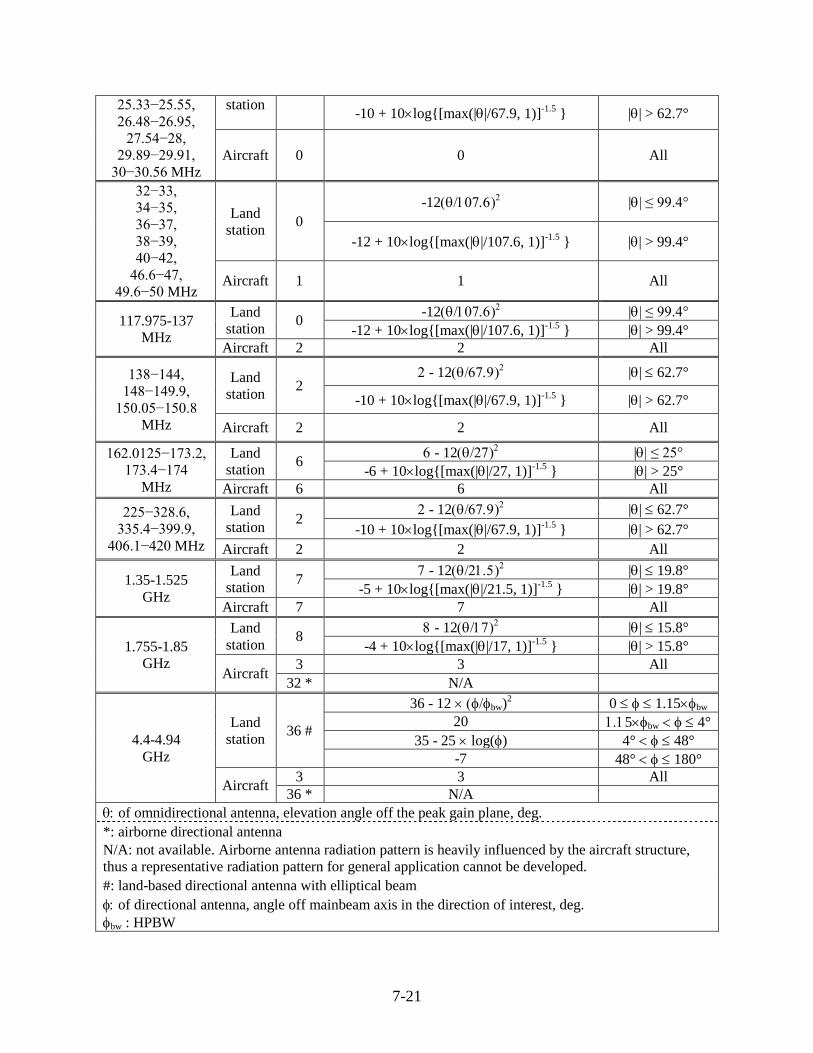
7-21
25.33−25.55,
26.48−26.95,
27.54−28,
29.89−29.91,
30−30.56 MHz
station -10 + 10log{[max(||/67.9, 1)]
-1.5 } || > 62.7°
Aircraft 0 0 All
32−33,
34−35,
36−37,
38−39,
40−42,
46.6−47,
49.6−50 MHz
Land
station 0
-12 || ≤ 99.4°
-12 + 10log{[max(||/107.6, 1)]-1.5
} || > 99.4°
Aircraft 1 1 All
117.975-137
MHz
Land
station 0
-12 || ≤ 99.4°
-12 + 10log{[max(||/107.6, 1)]-1.5
} || > 99.4°
Aircraft 2 2 All
138−144,
148−149.9,
150.05−150.8
MHz
Land
station 2
- 12 || 62.7°
-10 + 10log{[max(||/67.9, 1)]-1.5
} || > 62.7°
Aircraft 2 2 All
162.0125−173.2,
173.4−174
MHz
Land
station 6
- 12 || ≤ 25°
-6 + 10log{[max(||/27, 1)]-1.5
} || > 25°
Aircraft 6 6 All
225−328.6,
335.4−399.9,
406.1−420 MHz
Land
station 2
- 12 || 62.7°
-10 + 10log{[max(||/67.9, 1)]-1.5
} || > 62.7°
Aircraft 2 2 All
1.35-1.525
GHz
Land
station 7
- 12 || 19.8°
-5 + 10log{[max(||/21.5, 1)]-1.5
} || > 19.8°
Aircraft 7 7 All
1.755-1.85
GHz
Land
station 8
- 12 || 15.8°
-4 + 10log{[max(||/17, 1)]-1.5
} || > 15.8°
Aircraft 3 3 All
32 * N/A
4.4-4.94
GHz
Land
station 36 #
36 - 12 bw)2 0 1.15bw
20 5bw 4°
35 - 25 log() 4° 48°
-7 48° 180°
Aircraft 3 3 All
36 * N/A
ofomnidirectional antenna, elevation angle off the peak gain plane, deg.
*: airborne directional antenna
N/A: not available. Airborne antenna radiation pattern is heavily influenced by the aircraft structure,
thus a representative radiation pattern for general application cannot be developed.
#: land-based directional antenna with elliptical beam
of directional antenna, angle off mainbeam axis in the direction of interest, deg.
bw : HPBW
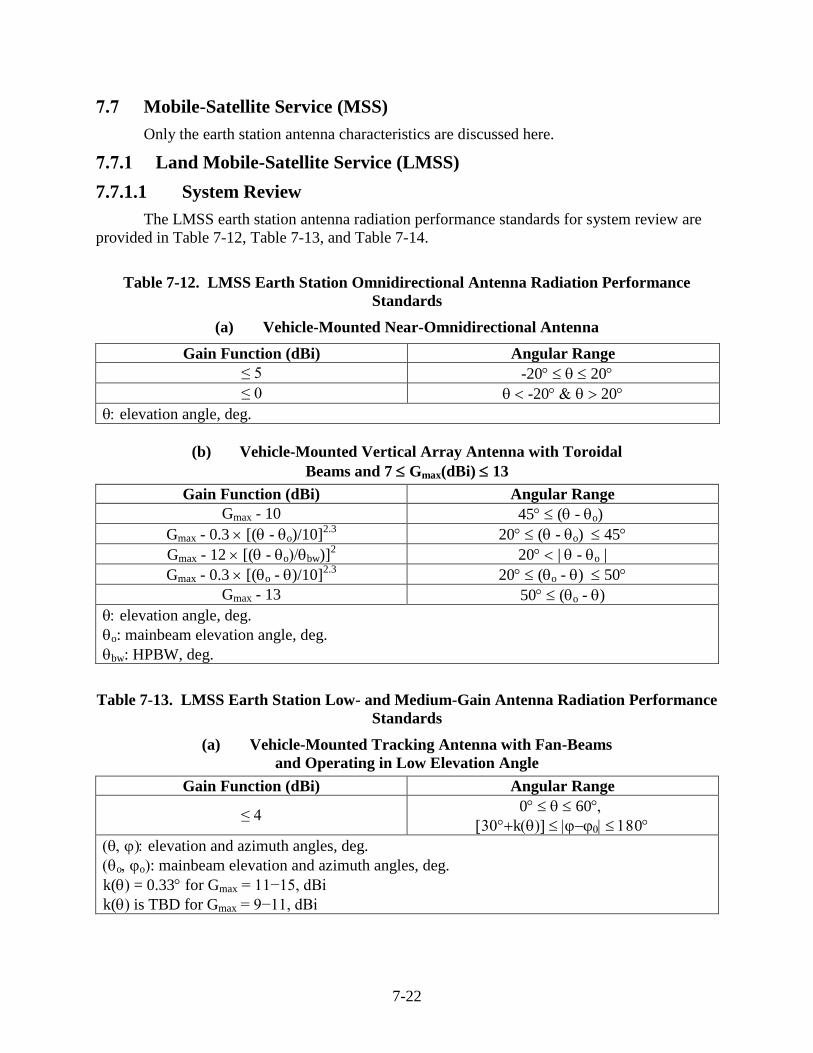
7-22
7.7 Mobile-Satellite Service (MSS)
Only the earth station antenna characteristics are discussed here.
7.7.1 Land Mobile-Satellite Service (LMSS)
7.7.1.1 System Review
The LMSS earth station antenna radiation performance standards for system review are
provided in Table 7-12, Table 7-13, and Table 7-14.
Table 7-12. LMSS Earth Station Omnidirectional Antenna Radiation Performance
Standards
(a) Vehicle-Mounted Near-Omnidirectional Antenna
(b) Vehicle-Mounted Vertical Array Antenna with Toroidal
Beams and 7 Gmax(dBi) 13
Gain Function (dBi) Angular Range
Gmax - 10 45 ( - o)
Gmax - 0.3 [( - o)/10]2.3
20 ( - o) 45
Gmax - 12 [( - obw)]2 20 | - o|
Gmax - 0.3 [(o - )/10]2.3
20 (o - ) 50
Gmax - 13 50 (o - )
elevation angle, deg.
o: mainbeam elevation angle, deg.
bw: HPBW, deg.
Table 7-13. LMSS Earth Station Low- and Medium-Gain Antenna Radiation Performance
Standards
(a) Vehicle-Mounted Tracking Antenna with Fan-Beams
and Operating in Low Elevation Angle
Gain Function (dBi) Angular Range
≤ 4 0 60
k0
elevation and azimuth angles, deg.
oo: mainbeam elevation and azimuth angles, deg.
k(= 0.33 for Gmax = 11−15, dBi
k( is TBD for Gmax = 9−11, dBi
Gain Function (dBi) Angular Range
≤ 5 -2020
≤ 0 -2020
elevation angle, deg.
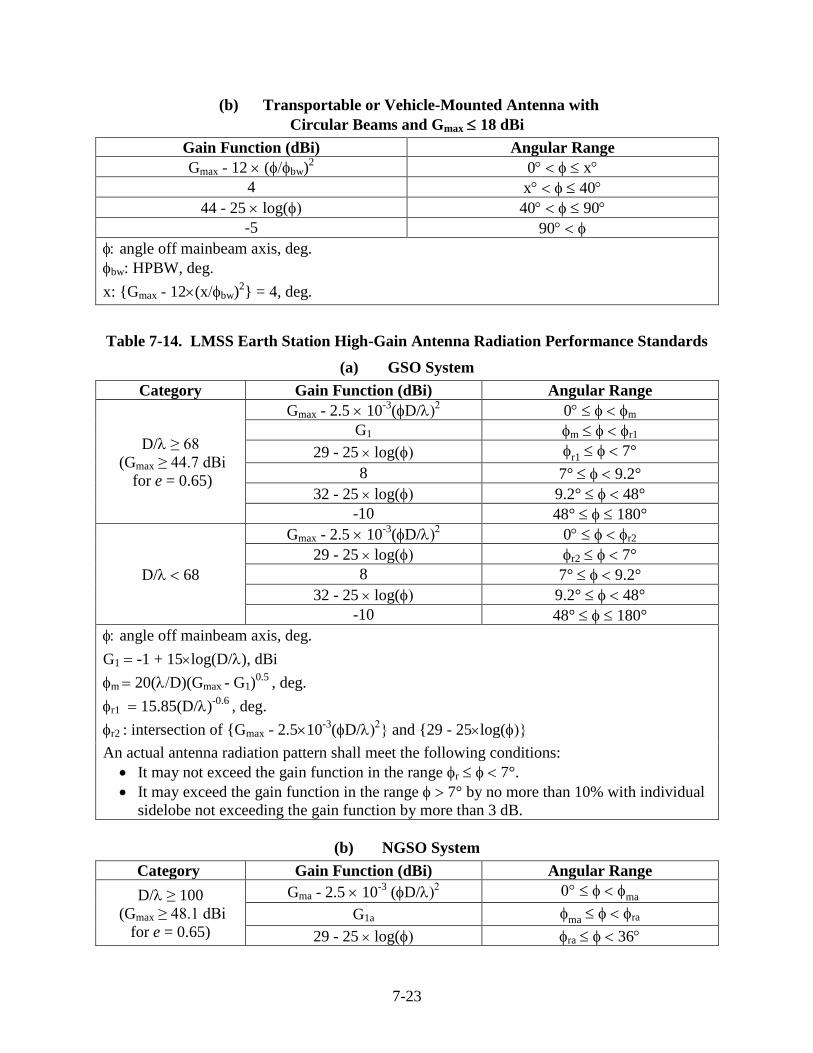
7-23
(b) Transportable or Vehicle-Mounted Antenna with
Circular Beams and Gmax 18 dBi
Gain Function (dBi) Angular Range
Gmax - 12 (bw)2 0 x
4 x 40
44 - 25 log( 40 90
-5 90
angle off mainbeam axis, deg.
bw: HPBW, deg.
x: {Gmax - 12(xbw)2} = 4, deg.
Table 7-14. LMSS Earth Station High-Gain Antenna Radiation Performance Standards
(a) GSO System
Category Gain Function (dBi) Angular Range
D/≥ 68
(Gmax ≥ 44.7 dBi
for e = 0.65)
Gmax - 2.5 10-3
(D/ 0 m
G1 m r1
29 - 25 log( r1 7°
8 7° 9.2°
32 - 25 log( 9.2° 48°
-10 48° 180°
D/68
Gmax - 2.5 10-3
(D/ 0 r2
29 - 25 log( r2 7°
8 7° 9.2°
32 - 25 log( 9.2° 48°
-10 48° 180°
angle off mainbeam axis, deg.
G1 -1 + 15log(D/), dBi
m 20(D)(Gmax - G1)0.5
, deg.
r1 15.85(D/)-0.6
, deg.
r2 : intersection of {Gmax - 2.510-3
(D/ and {29 - 25log(
An actual antenna radiation pattern shall meet the following conditions:
It may not exceed the gain function in the range r 7°.
It may exceed the gain function in the range 7° by no more than 10% with individual
sidelobe not exceeding the gain function by more than 3 dB.
(b) NGSO System
Category Gain Function (dBi) Angular Range
D/ ≥ 100
(Gmax ≥ 48.1 dBi
for e = 0.65)
Gma - 2.5 10-3
(D/ ma
G1a ma ra
29 - 25 log( ra 36
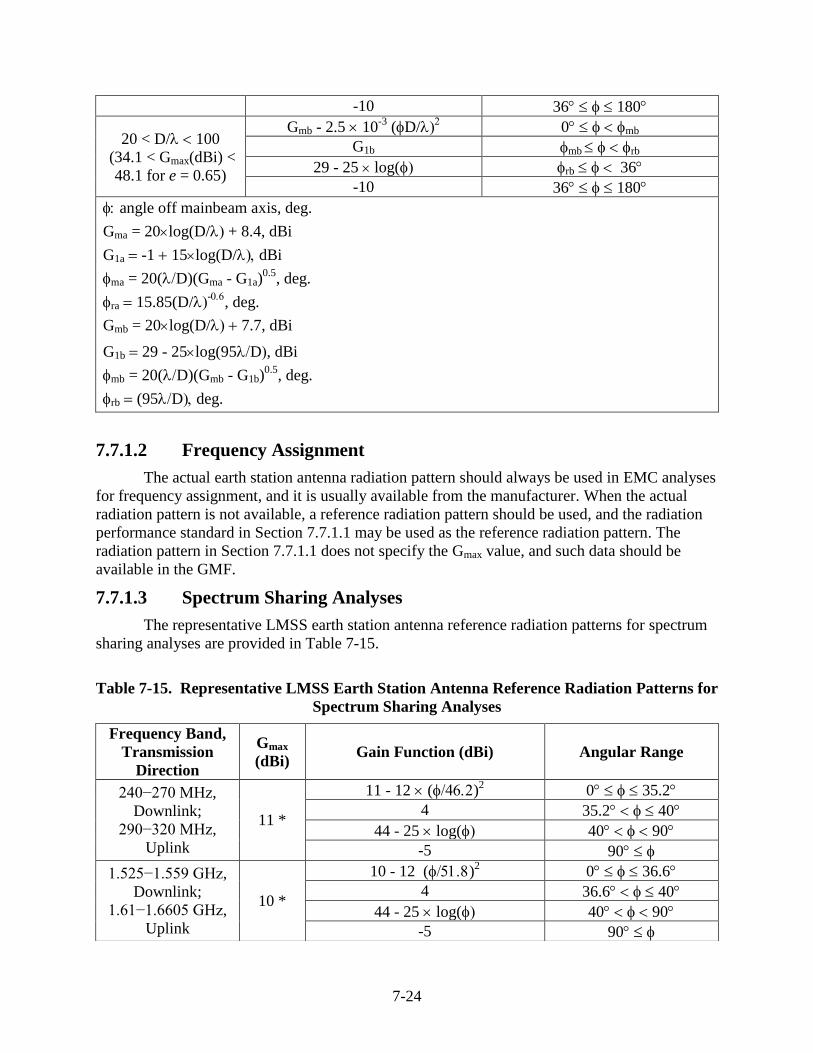
7-24
-10 36 180
20 < D/ 100
(34.1 < Gmax(dBi) <
48.1 for e = 0.65)
Gmb - 2.5 10-3
(D/ 0 mb
G1b mb rb
29 - 25 log( rb 36
-10 36 180
angle off mainbeam axis, deg.
Gma = 20log(D/ + 8.4, dBi
G1a -1 15log(D/dBi
ma = 20(D)(Gma - G1a)0.5
, deg.
ra 15.85(D/-
, deg.
Gmb = 20log(D/ 7.7, dBi
G1b 29 - 25log(95D, dBi
mb = 20(D)(Gmb - G1b)0.5
, deg.
rb (95Ddeg.
7.7.1.2 Frequency Assignment
The actual earth station antenna radiation pattern should always be used in EMC analyses
for frequency assignment, and it is usually available from the manufacturer. When the actual
radiation pattern is not available, a reference radiation pattern should be used, and the radiation
performance standard in Section 7.7.1.1 may be used as the reference radiation pattern. The
radiation pattern in Section 7.7.1.1 does not specify the Gmax value, and such data should be
available in the GMF.
7.7.1.3 Spectrum Sharing Analyses
The representative LMSS earth station antenna reference radiation patterns for spectrum
sharing analyses are provided in Table 7-15.
Table 7-15. Representative LMSS Earth Station Antenna Reference Radiation Patterns for
Spectrum Sharing Analyses
Frequency Band,
Transmission
Direction
Gmax
(dBi) Gain Function (dBi) Angular Range
240−270 MHz,
Downlink;
290−320 MHz,
Uplink
11 *
11 - 12 ()2 0 35.2
4 35.2 40
44 - 25 log( 40 90
-5 90
1.525−1.559 GHz,
Downlink;
1.61−1.6605 GHz,
Uplink
10 *
10 - 12 ()2 0 36.6
4 36.6 40
44 - 25 log( 40 90
-5 90
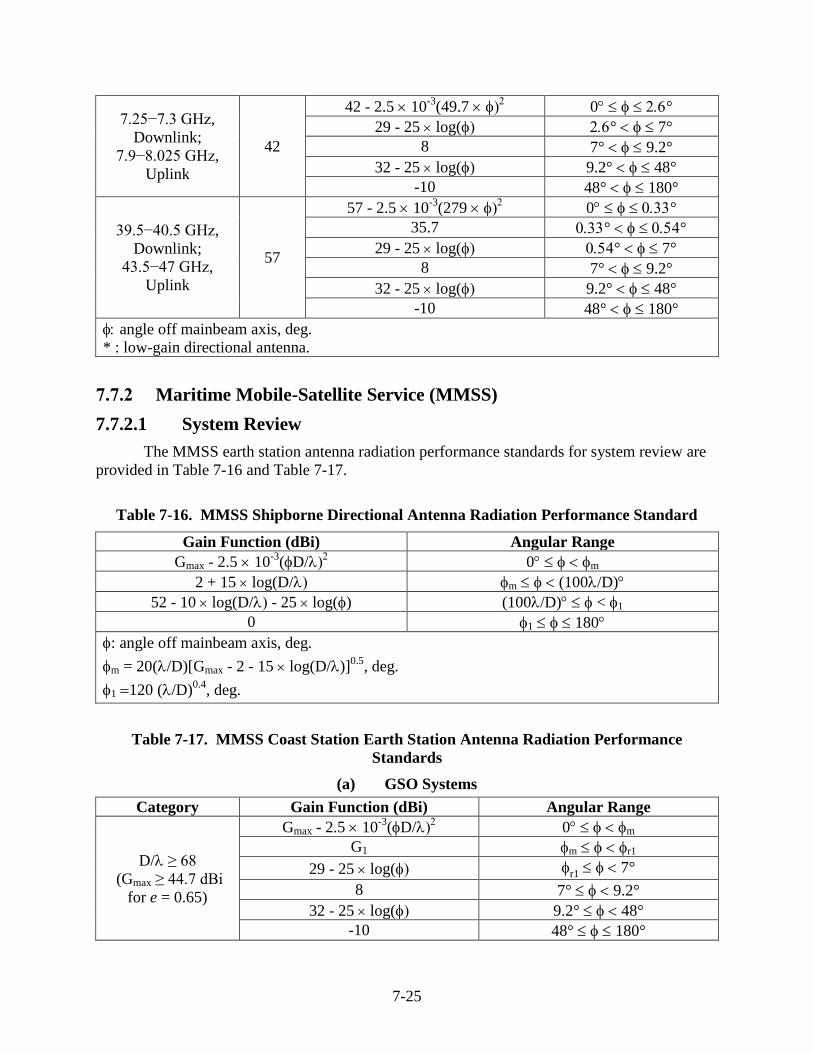
7-25
7.7.2 Maritime Mobile-Satellite Service (MMSS)
7.7.2.1 System Review
The MMSS earth station antenna radiation performance standards for system review are
provided in Table 7-16 and Table 7-17.
Table 7-16. MMSS Shipborne Directional Antenna Radiation Performance Standard
Gain Function (dBi) Angular Range
Gmax - 2.5 10-3
(D/ 0 m
2 + 15 log(D/ m (100/D)
52 - 10 log(D/- 25 log() (100/D) < 1
0 1 180
: angle off mainbeam axis, deg.
m = 20(/D)[Gmax - 2 - 15 log(D/)]0.5
, deg.
1 120 (/D)0.4
, deg.
Table 7-17. MMSS Coast Station Earth Station Antenna Radiation Performance
Standards
(a) GSO Systems
Category Gain Function (dBi) Angular Range
D/≥ 68
(Gmax ≥ 44.7 dBi
for e = 0.65)
Gmax - 2.5 10-3
(D/ 0 m
G1 m r1
29 - 25 log( r1 7°
8 7° 9.2°
32 - 25 log( 9.2° 48°
-10 48° 180°
7.25−7.3 GHz,
Downlink;
7.9−8.025 GHz,
Uplink
42
42 - 2.5 10-3
(49.7 0 °
29 - 25 log( ° 7°
8 7° 9.2°
32 - 25 log( 9.2° 48°
-10 48° 180°
39.5−40.5 GHz,
Downlink;
43.5−47 GHz,
Uplink
57
57 - 2.5 10-3
(279 0 °
35.7 ° °
29 - 25 log( ° 7°
8 7° 9.2°
32 - 25 log( 9.2° 48°
-10 48° 180°
angle off mainbeam axis, deg.
* : low-gain directional antenna.
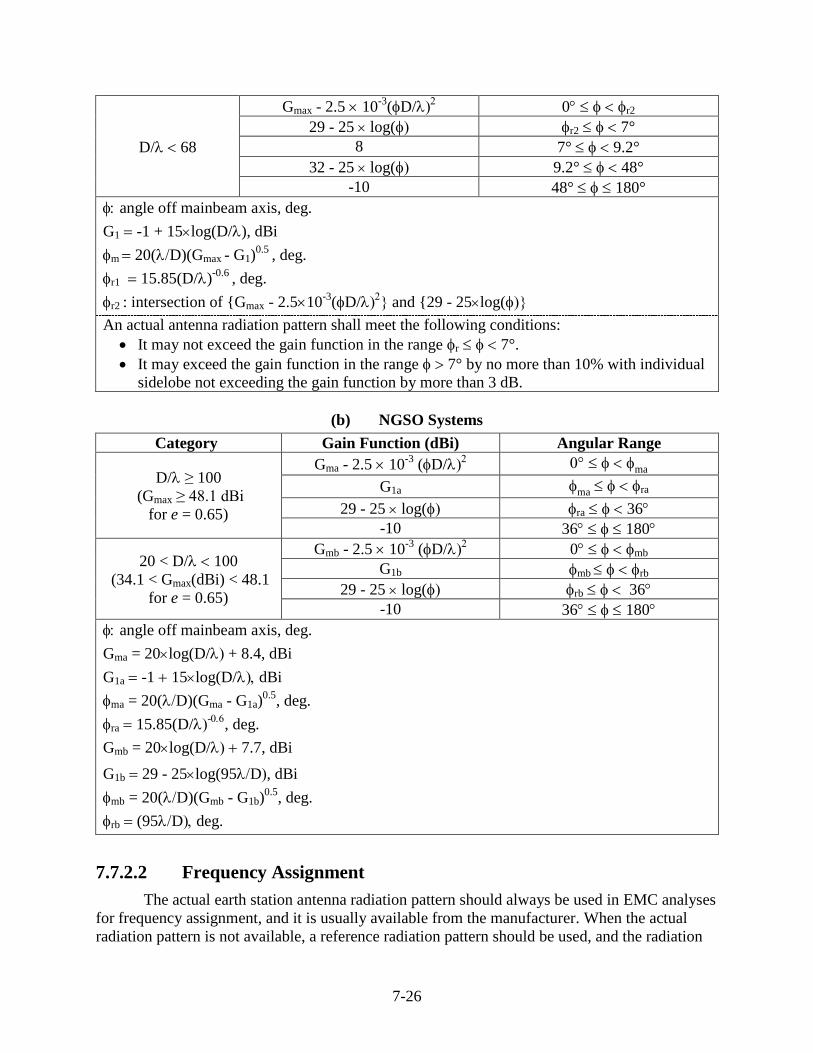
7-26
D/68
Gmax - 2.5 10-3
(D/ 0 r2
29 - 25 log( r2 7°
8 7° 9.2°
32 - 25 log( 9.2° 48°
-10 48° 180°
angle off mainbeam axis, deg.
G1 -1 + 15log(D/), dBi
m 20(D)(Gmax - G1)0.5
, deg.
r1 15.85(D/)-0.6
, deg.
r2 : intersection of {Gmax - 2.510-3
(D/ and {29 - 25log(
An actual antenna radiation pattern shall meet the following conditions:
It may not exceed the gain function in the range r 7°.
It may exceed the gain function in the range 7° by no more than 10% with individual
sidelobe not exceeding the gain function by more than 3 dB.
(b) NGSO Systems
Category Gain Function (dBi) Angular Range
D/ ≥ 100
(Gmax ≥ 48.1 dBi
for e = 0.65)
Gma - 2.5 10-3
(D/ ma
G1a ma ra
29 - 25 log( ra 36
-10 36 180
20 < D/ 100
(34.1 < Gmax(dBi) < 48.1
for e = 0.65)
Gmb - 2.5 10-3
(D/ 0 mb
G1b mb rb
29 - 25 log( rb 36
-10 36 180
angle off mainbeam axis, deg.
Gma = 20log(D/ + 8.4, dBi
G1a -1 15log(D/dBi
ma = 20(D)(Gma - G1a)0.5
, deg.
ra 15.85(D/-
, deg.
Gmb = 20log(D/ 7.7, dBi
G1b 29 - 25log(95D, dBi
mb = 20(D)(Gmb - G1b)0.5
, deg.
rb (95Ddeg.
7.7.2.2 Frequency Assignment
The actual earth station antenna radiation pattern should always be used in EMC analyses
for frequency assignment, and it is usually available from the manufacturer. When the actual
radiation pattern is not available, a reference radiation pattern should be used, and the radiation
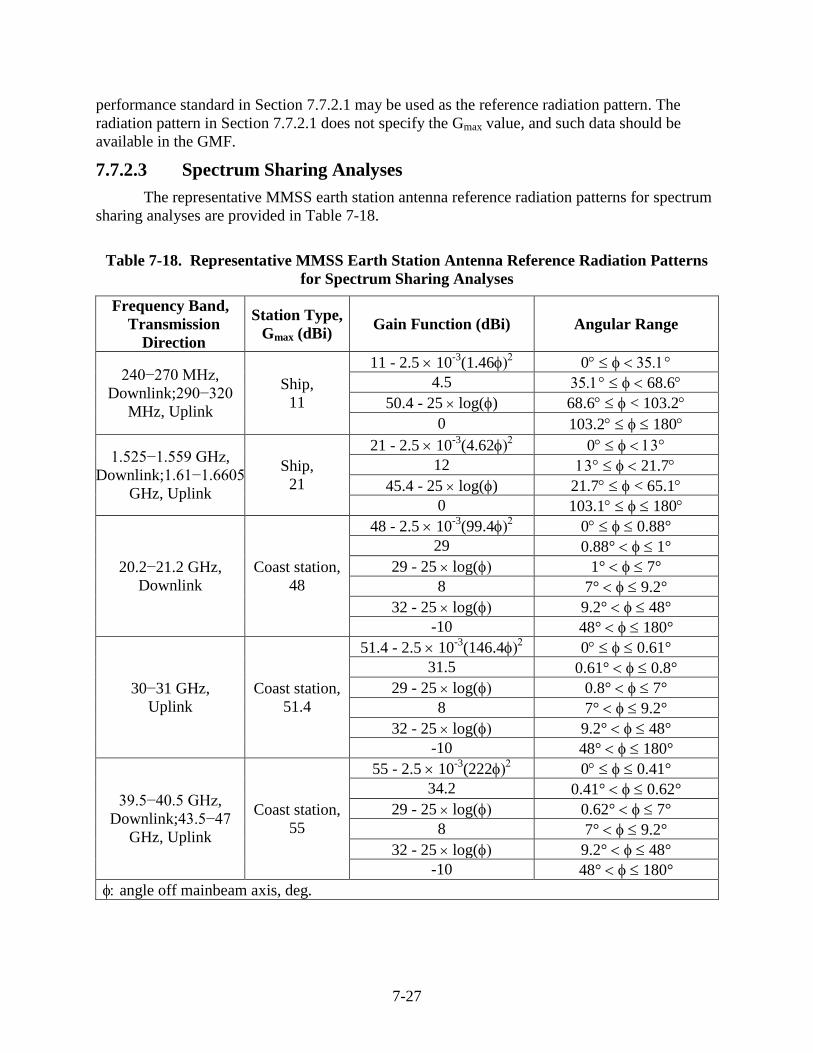
7-27
performance standard in Section 7.7.2.1 may be used as the reference radiation pattern. The
radiation pattern in Section 7.7.2.1 does not specify the Gmax value, and such data should be
available in the GMF.
7.7.2.3 Spectrum Sharing Analyses
The representative MMSS earth station antenna reference radiation patterns for spectrum
sharing analyses are provided in Table 7-18.
Table 7-18. Representative MMSS Earth Station Antenna Reference Radiation Patterns
for Spectrum Sharing Analyses
Frequency Band,
Transmission
Direction
Station Type,
Gmax (dBi) Gain Function (dBi) Angular Range
240−270 MHz,
Downlink;290−320
MHz, Uplink
Ship,
11
11 - 2.5 10-3
(1.46 0
4.5 68.6
50.4- 25 log() 68.6 < 103.2
0 103.2 180
1.525−1.559 GHz,
Downlink;1.61−1.6605
GHz, Uplink
Ship,
21
21 - 2.5 10-3
(4.62 0
12 21.7
45.4- 25 log() 21.7 < 65.1
0 103.1 180
20.2−21.2 GHz,
Downlink
Coast station,
48
48 - 2.5 10-3
(99.4 0 0.88°
29 0.88° 1°
29 - 25 log( 1° 7°
8 7° 9.2°
32 - 25 log( 9.2° 48°
-10 48° 180°
30−31 GHz,
Uplink
Coast station,
51.4
51.4 - 2.5 10-3
(146.4 0 0.61°
31.5 0.61° 0.8°
29 - 25 log( 0.8° 7°
8 7° 9.2°
32 - 25 log( 9.2° 48°
-10 48° 180°
39.5−40.5 GHz,
Downlink;43.5−47
GHz, Uplink
Coast station,
55
55 - 2.5 10-3
(222 0 0.41°
34.2 0.41° 0.62°
29 - 25 log( 0.62° 7°
8 7° 9.2°
32 - 25 log( 9.2° 48°
-10 48° 180°
angle off mainbeam axis, deg.
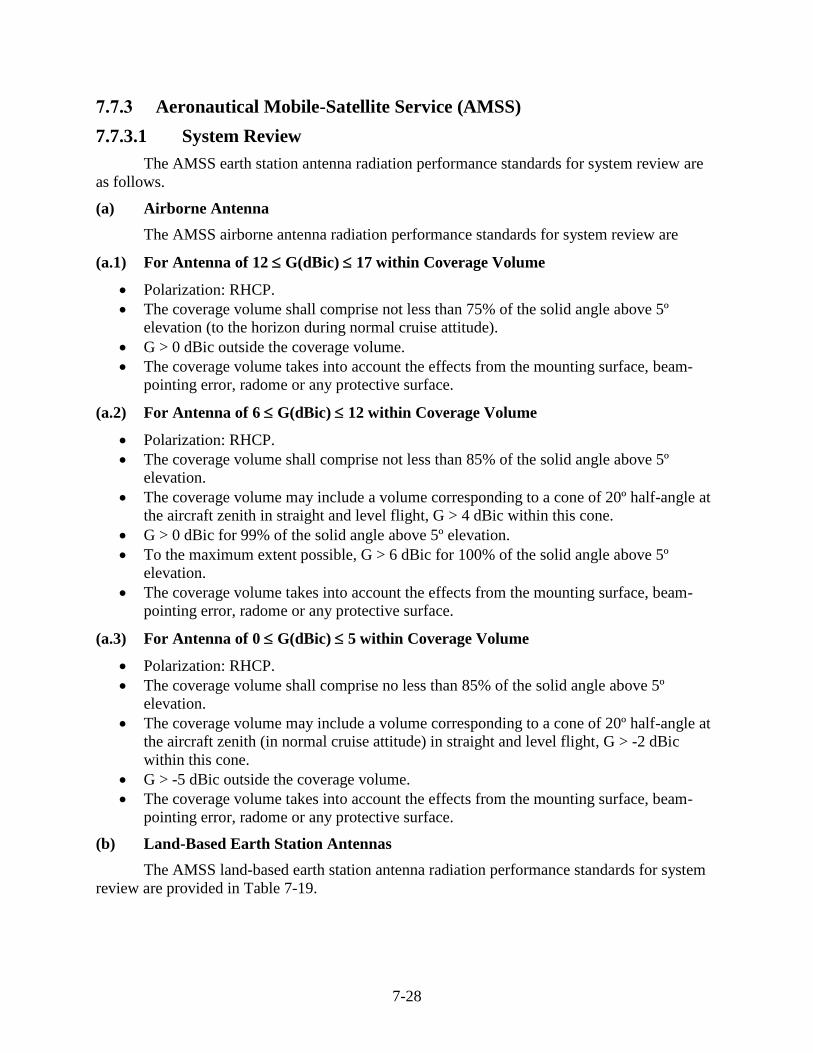
7-28
7.7.3 Aeronautical Mobile-Satellite Service (AMSS)
7.7.3.1 System Review
The AMSS earth station antenna radiation performance standards for system review are
as follows.
(a) Airborne Antenna
The AMSS airborne antenna radiation performance standards for system review are
(a.1) For Antenna of 12 G(dBic) 17 within Coverage Volume
Polarization: RHCP.
The coverage volume shall comprise not less than 75% of the solid angle above 5º
elevation (to the horizon during normal cruise attitude).
G > 0 dBic outside the coverage volume.
The coverage volume takes into account the effects from the mounting surface, beam-
pointing error, radome or any protective surface.
(a.2) For Antenna of 6 G(dBic) 12 within Coverage Volume
Polarization: RHCP.
The coverage volume shall comprise not less than 85% of the solid angle above 5º
elevation.
The coverage volume may include a volume corresponding to a cone of 20º half-angle at
the aircraft zenith in straight and level flight, G > 4 dBic within this cone.
G > 0 dBic for 99% of the solid angle above 5º elevation.
To the maximum extent possible, G > 6 dBic for 100% of the solid angle above 5º
elevation.
The coverage volume takes into account the effects from the mounting surface, beam-
pointing error, radome or any protective surface.
(a.3) For Antenna of 0 G(dBic) 5 within Coverage Volume
Polarization: RHCP.
The coverage volume shall comprise no less than 85% of the solid angle above 5º
elevation.
The coverage volume may include a volume corresponding to a cone of 20º half-angle at
the aircraft zenith (in normal cruise attitude) in straight and level flight, G > -2 dBic
within this cone.
G > -5 dBic outside the coverage volume.
The coverage volume takes into account the effects from the mounting surface, beam-
pointing error, radome or any protective surface.
(b) Land-Based Earth Station Antennas
The AMSS land-based earth station antenna radiation performance standards for system
review are provided in Table 7-19.
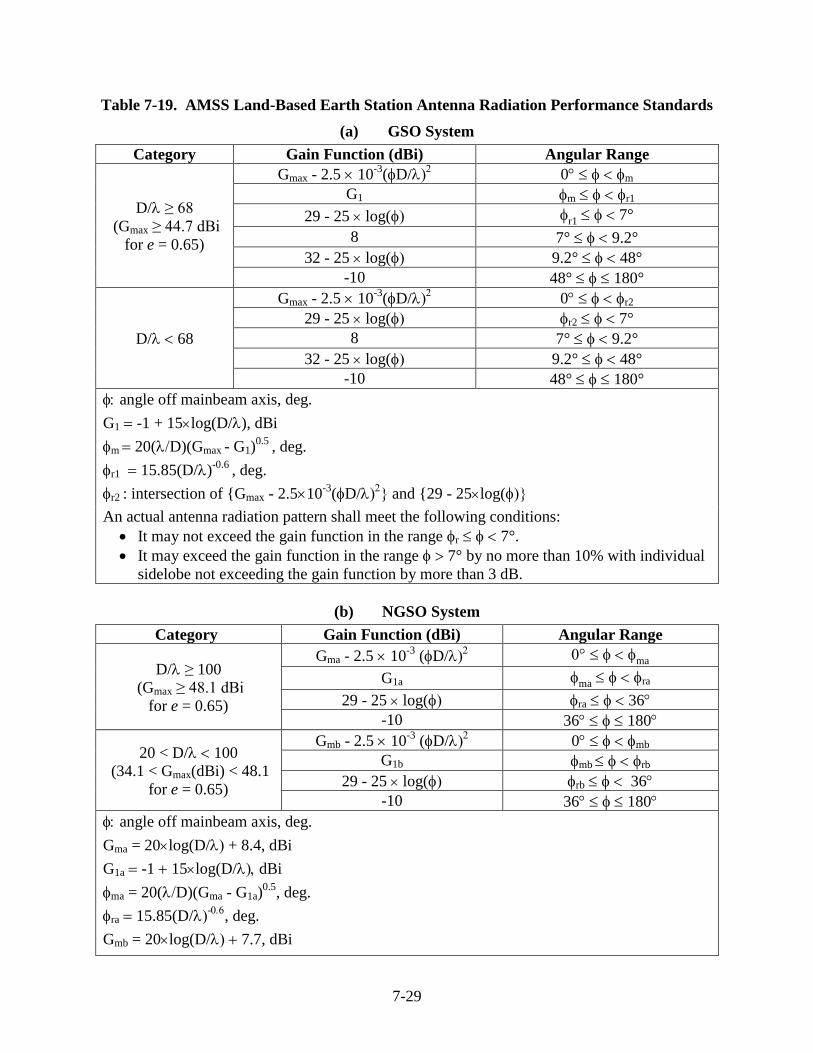
7-29
Table 7-19. AMSS Land-Based Earth Station Antenna Radiation Performance Standards
(a) GSO System
Category Gain Function (dBi) Angular Range
D/≥ 68
(Gmax ≥ 44.7 dBi
for e = 0.65)
Gmax - 2.5 10-3
(D/ 0 m
G1 m r1
29 - 25 log( r1 7°
8 7° 9.2°
32 - 25 log( 9.2° 48°
-10 48° 180°
D/68
Gmax - 2.5 10-3
(D/ 0 r2
29 - 25 log( r2 7°
8 7° 9.2°
32 - 25 log( 9.2° 48°
-10 48° 180°
angle off mainbeam axis, deg.
G1 -1 + 15log(D/), dBi
m 20(D)(Gmax - G1)0.5
, deg.
r1 15.85(D/)-0.6
, deg.
r2 : intersection of {Gmax - 2.510-3
(D/ and {29 - 25log(
An actual antenna radiation pattern shall meet the following conditions:
It may not exceed the gain function in the range r 7°.
It may exceed the gain function in the range 7° by no more than 10% with individual
sidelobe not exceeding the gain function by more than 3 dB.
(b) NGSO System
Category Gain Function (dBi) Angular Range
D/ ≥ 100
(Gmax ≥ 48.1 dBi
for e = 0.65)
Gma - 2.5 10-3
(D/ ma
G1a ma ra
29 - 25 log( ra 36
-10 36 180
20 < D/ 100
(34.1 < Gmax(dBi) < 48.1
for e = 0.65)
Gmb - 2.5 10-3
(D/ 0 mb
G1b mb rb
29 - 25 log( rb 36
-10 36 180
angle off mainbeam axis, deg.
Gma = 20log(D/ + 8.4, dBi
G1a -1 15log(D/dBi
ma = 20(D)(Gma - G1a)0.5
, deg.
ra 15.85(D/-
, deg.
Gmb = 20log(D/ 7.7, dBi
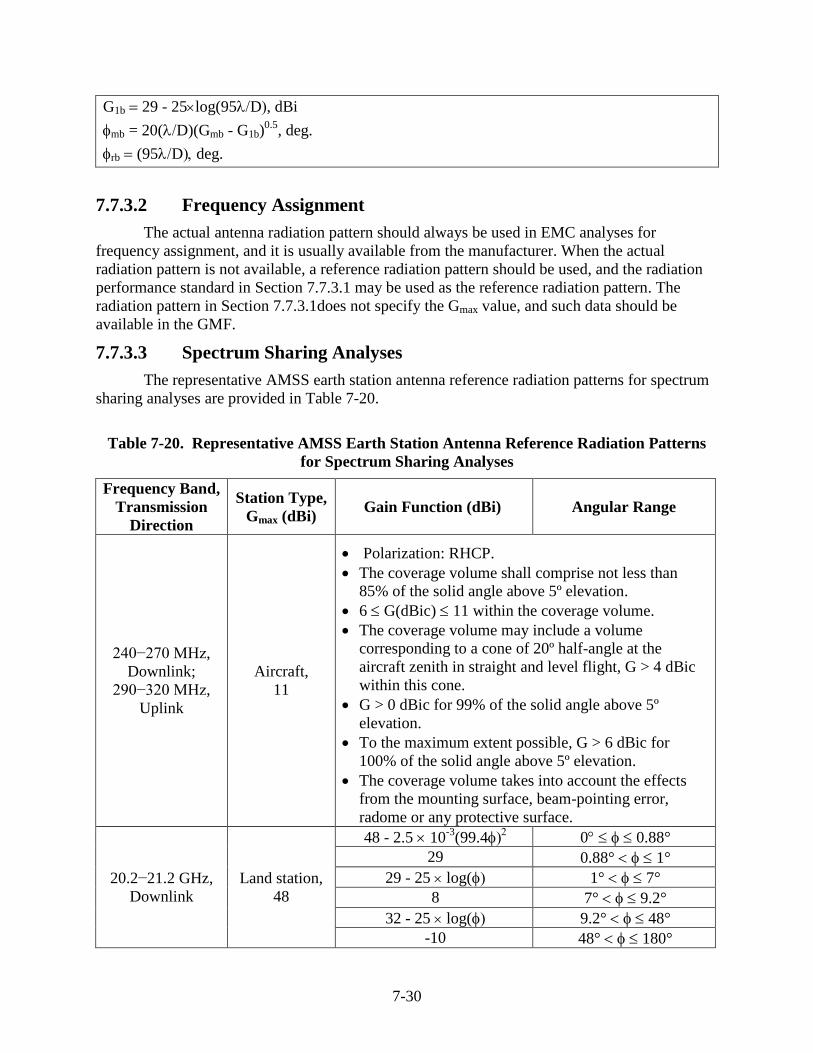
7-30
G1b 29 - 25log(95D, dBi
mb = 20(D)(Gmb - G1b)0.5
, deg.
rb (95Ddeg.
7.7.3.2 Frequency Assignment
The actual antenna radiation pattern should always be used in EMC analyses for
frequency assignment, and it is usually available from the manufacturer. When the actual
radiation pattern is not available, a reference radiation pattern should be used, and the radiation
performance standard in Section 7.7.3.1 may be used as the reference radiation pattern. The
radiation pattern in Section 7.7.3.1does not specify the Gmax value, and such data should be
available in the GMF.
7.7.3.3 Spectrum Sharing Analyses
The representative AMSS earth station antenna reference radiation patterns for spectrum
sharing analyses are provided in Table 7-20.
Table 7-20. Representative AMSS Earth Station Antenna Reference Radiation Patterns
for Spectrum Sharing Analyses
Frequency Band,
Transmission
Direction
Station Type,
Gmax (dBi) Gain Function (dBi) Angular Range
240−270 MHz,
Downlink;
290−320 MHz,
Uplink
Aircraft,
11
Polarization: RHCP.
The coverage volume shall comprise not less than
85% of the solid angle above 5º elevation.
6 G(dBic) 11 within the coverage volume.
The coverage volume may include a volume
corresponding to a cone of 20º half-angle at the
aircraft zenith in straight and level flight, G > 4 dBic
within this cone.
G > 0 dBic for 99% of the solid angle above 5º
elevation.
To the maximum extent possible, G > 6 dBic for
100% of the solid angle above 5º elevation.
The coverage volume takes into account the effects
from the mounting surface, beam-pointing error,
radome or any protective surface.
20.2−21.2 GHz,
Downlink
Land station,
48
48 - 2.5 10-3
(99.4 0 0.88°
29 0.88° 1°
29 - 25 log( 1° 7°
8 7° 9.2°
32 - 25 log( 9.2° 48°
-10 48° 180°
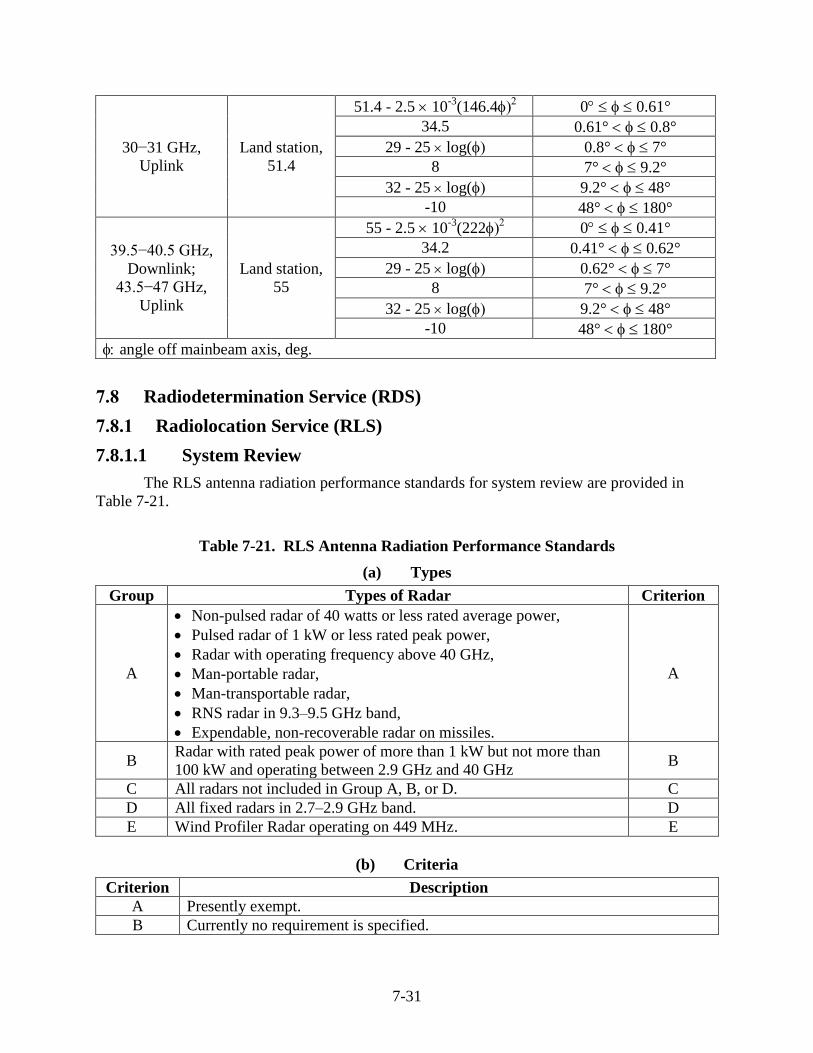
7-31
30−31 GHz,
Uplink
Land station,
51.4
51.4 - 2.5 10-3
(146.4 0 0.61°
34.5 0.61° 0.8°
29 - 25 log( 0.8° 7°
8 7° 9.2°
32 - 25 log( 9.2° 48°
-10 48° 180°
39.5−40.5 GHz,
Downlink;
43.5−47 GHz,
Uplink
Land station,
55
55 - 2.5 10-3
(222 0 0.41°
34.2 0.41° 0.62°
29 - 25 log( 0.62° 7°
8 7° 9.2°
32 - 25 log( 9.2° 48°
-10 48° 180°
angle off mainbeam axis, deg.
7.8 Radiodetermination Service (RDS)
7.8.1 Radiolocation Service (RLS)
7.8.1.1 System Review
The RLS antenna radiation performance standards for system review are provided in
Table 7-21.
Table 7-21. RLS Antenna Radiation Performance Standards
(a) Types
Group Types of Radar Criterion
A
Non-pulsed radar of 40 watts or less rated average power,
Pulsed radar of 1 kW or less rated peak power,
Radar with operating frequency above 40 GHz,
Man-portable radar,
Man-transportable radar,
RNS radar in 9.3–9.5 GHz band,
Expendable, non-recoverable radar on missiles.
A
B Radar with rated peak power of more than 1 kW but not more than
100 kW and operating between 2.9 GHz and 40 GHz B
C All radars not included in Group A, B, or D. C
D All fixed radars in 2.7–2.9 GHz band. D
E Wind Profiler Radar operating on 449 MHz. E
(b) Criteria
Criterion Description
A Presently exempt.
B Currently no requirement is specified.
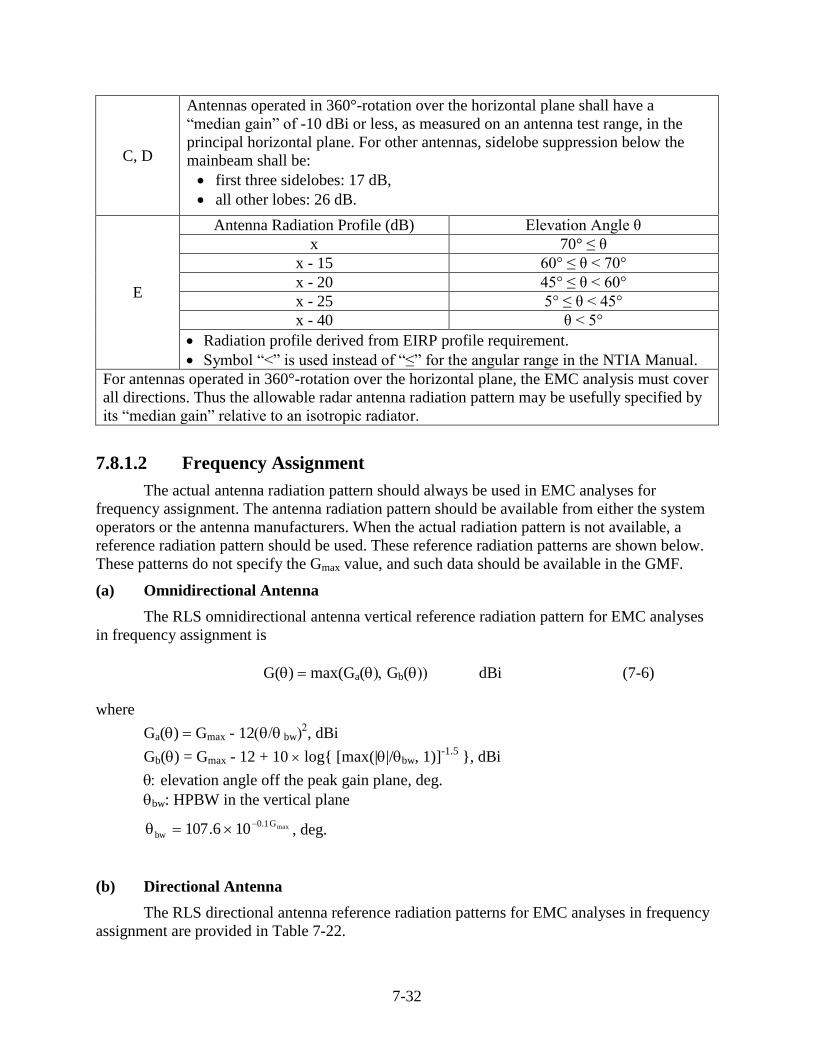
7-32
C, D
Antennas operated in 360°-rotation over the horizontal plane shall have a
“median gain” of -10 dBi or less, as measured on an antenna test range, in the
principal horizontal plane. For other antennas, sidelobe suppression below the
mainbeam shall be:
first three sidelobes: 17 dB,
all other lobes: 26 dB.
E
Antenna Radiation Profile (dB) Elevation Angle θ
x 70° ≤ θ
x - 15 60° ≤ θ < 70°
x - 20 45° ≤ θ < 60°
x - 25 5° ≤ θ < 45°
x - 40 θ < 5°
Radiation profile derived from EIRP profile requirement.
Symbol “<” is used instead of “≤” for the angular range in the NTIA Manual.
For antennas operated in 360°-rotation over the horizontal plane, the EMC analysis must cover
all directions. Thus the allowable radar antenna radiation pattern may be usefully specified by
its “median gain” relative to an isotropic radiator.
7.8.1.2 Frequency Assignment
The actual antenna radiation pattern should always be used in EMC analyses for
frequency assignment. The antenna radiation pattern should be available from either the system
operators or the antenna manufacturers. When the actual radiation pattern is not available, a
reference radiation pattern should be used. These reference radiation patterns are shown below.
These patterns do not specify the Gmax value, and such data should be available in the GMF.
(a) Omnidirectional Antenna
The RLS omnidirectional antenna vertical reference radiation pattern for EMC analyses
in frequency assignment is
G() max(Ga(Gb( dBi (7-6)
where
Ga() Gmax - 12 bw, dBi
Gb() = Gmax - 12 + 10 log{ [max(||/bw, 1)]-1.5
}, dBi
elevation angle off the peak gain plane, deg.
bw: HPBW in the vertical plane
maxG1.0
bw 106.107
, deg.
(b) Directional Antenna
The RLS directional antenna reference radiation patterns for EMC analyses in frequency
assignment are provided in Table 7-22.
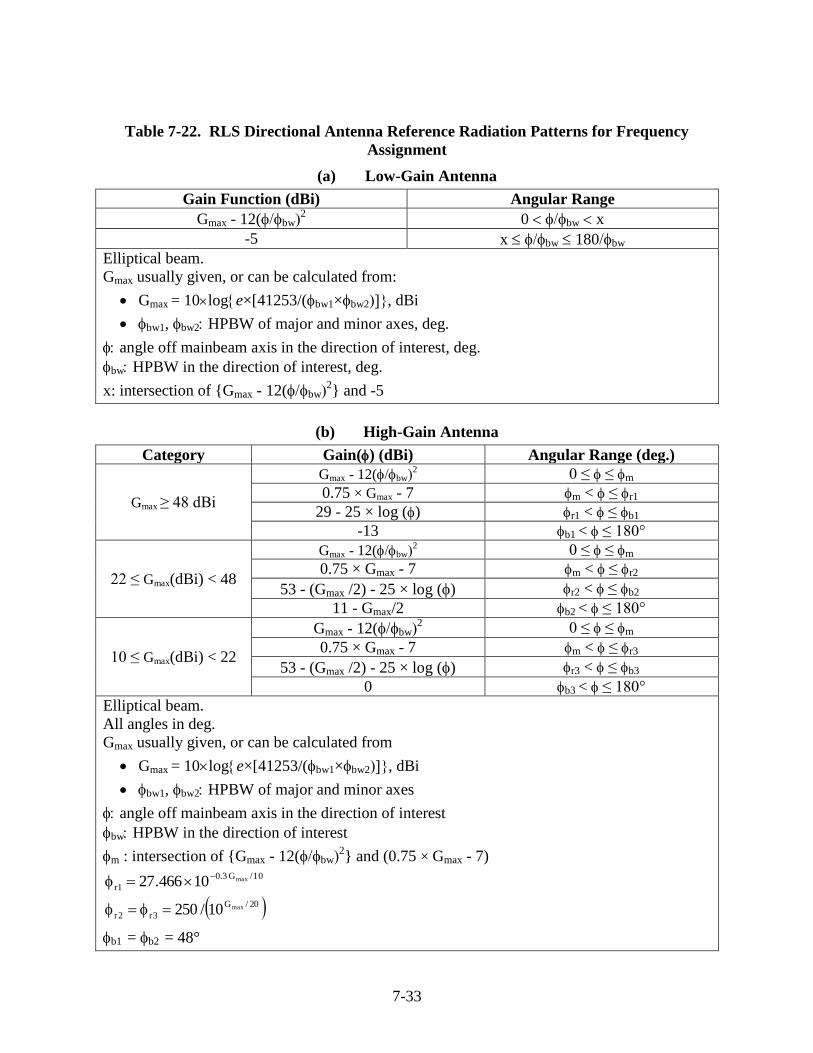
7-33
Table 7-22. RLS Directional Antenna Reference Radiation Patterns for Frequency
Assignment
(a) Low-Gain Antenna
Gain Function (dBi) Angular Range
Gmax - 12(bw2 0 bw x
-5 x bw 180bw
Elliptical beam.
Gmax usually given, or can be calculated from:
Gmax = 10loge×[41253/(bw1×bw2, dBi
bw1, bw2 HPBW of major and minor axes, deg.
angle off mainbeam axis in the direction of interest, deg.
bw HPBW in the direction of interest, deg.
x: intersection of {Gmax - 12(bw2} and -5
(b) High-Gain Antenna
Category Gain() (dBi) Angular Range (deg.)
Gmax ≥ 48 dBi
Gmax - 12(bw2 0 ≤ ≤ m
0.75 × Gmax - 7 m < ≤ r1
29 - 25 × log () r1 < ≤ b1
-13 b1 < ≤ 180°
22 ≤ Gmax(dBi) < 48
Gmax - 12(bw2 0 ≤ ≤ m
0.75 × Gmax - 7 m < ≤ r2
53 - (Gmax /2) - 25 × log () r2 < ≤ b2
11 - Gmax/2 b2 < ≤ 180°
10 ≤ Gmax(dBi) < 22
Gmax - 12(bw2 0 ≤ ≤ m
0.75 × Gmax - 7 m < ≤ r3
53 - (Gmax /2) - 25 × log () r3 < ≤ b3
0 b3 < ≤ 180°
Elliptical beam.
All angles in deg.
Gmax usually given, or can be calculated from
Gmax = 10loge×[41253/(bw1×bw2, dBi
bw1, bw2 HPBW of major and minor axes
angle off mainbeam axis in the direction of interest
bw HPBW in the direction of interest
m : intersection of {Gmax - 12(bw2} and (0.75 × Gmax - 7)
10/G3.0
1rmax10466.27
20/G
3r2rmax10/250
b1 = b2 = 48°
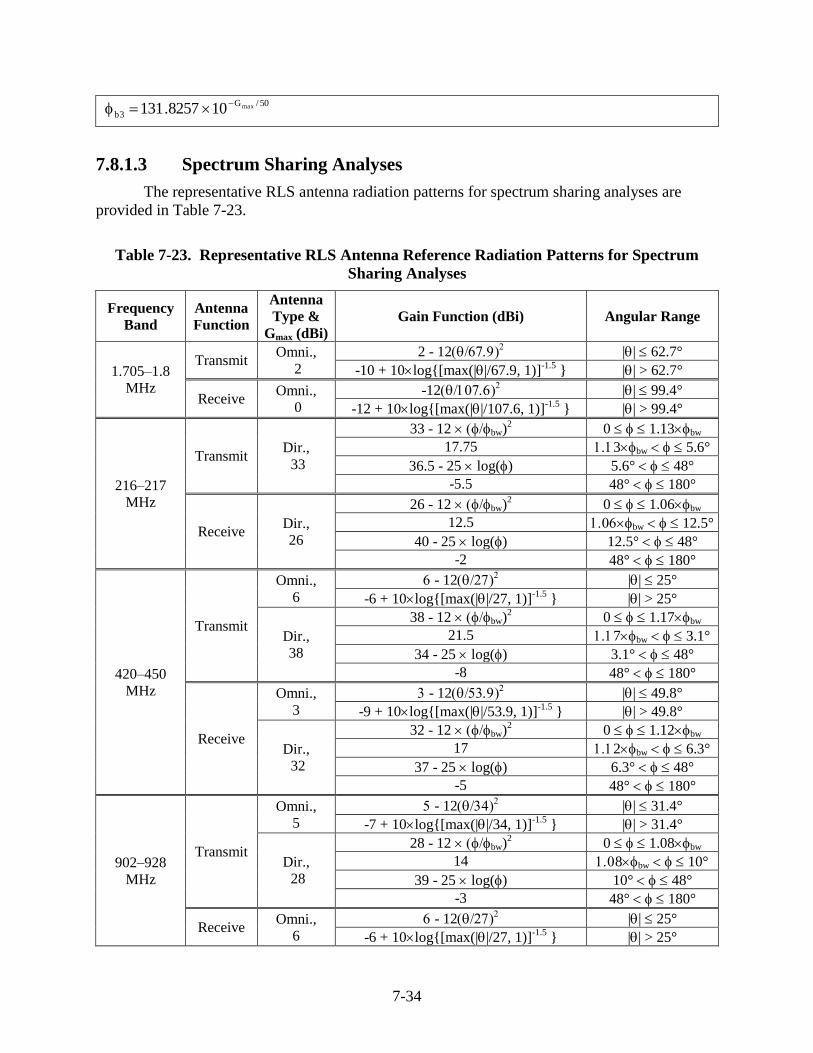
7-34
50/G
3bmax108257.131
7.8.1.3 Spectrum Sharing Analyses
The representative RLS antenna radiation patterns for spectrum sharing analyses are
provided in Table 7-23.
Table 7-23. Representative RLS Antenna Reference Radiation Patterns for Spectrum
Sharing Analyses
Frequency
Band
Antenna
Function
Antenna
Type &
Gmax (dBi)
Gain Function (dBi) Angular Range
1.705–1.8
MHz
Transmit Omni.,
2
2 - 12 || 62.7°
-10 + 10log{[max(||/67.9, 1)]-1.5
} || > 62.7°
Receive Omni.,
0
-12 || 99.4°
-12 + 10log{[max(||/107.6, 1)]-1.5
} || > 99.4°
216–217
MHz
Transmit Dir.,
33
33 - 12 bw)2 0 1.13bw
17.75 3bw 5.6°
36.5 - 25 log() 5.6° 48°
-5.5 48° 180°
Receive Dir.,
26
26 - 12 bw)2 0 1.06bw
12.5 bw 12.5°
40 - 25 log() 12.5° 48°
-2 48° 180°
420–450
MHz
Transmit
Omni.,
6
- 12 || 25°
-6 + 10log{[max(||/27, 1)]-1.5
} || > 25°
Dir.,
38
38 - 12 bw)2 0 1.17bw
21.5 7bw 3.1°
34 - 25 log() 3.1° 48°
-8 48° 180°
Receive
Omni.,
3
- 12 || 49.8°
-9 + 10log{[max(||/53.9, 1)]-1.5
} || > 49.8°
Dir.,
32
32 - 12 bw)2 0 1.12bw
17 2bw 6.3°
37 - 25 log() 6.3° 48°
-5 48° 180°
902–928
MHz
Transmit
Omni.,
5
- 12 || 31.4°
-7 + 10log{[max(||/34, 1)]-1.5
} || > 31.4°
Dir.,
28
28 - 12 bw)2 0 1.08bw
14 8bw 10°
39 - 25 log() 10° 48°
-3 48° 180°
Receive Omni.,
6
- 12 || 25°
-6 + 10log{[max(||/27, 1)]-1.5
} || > 25°
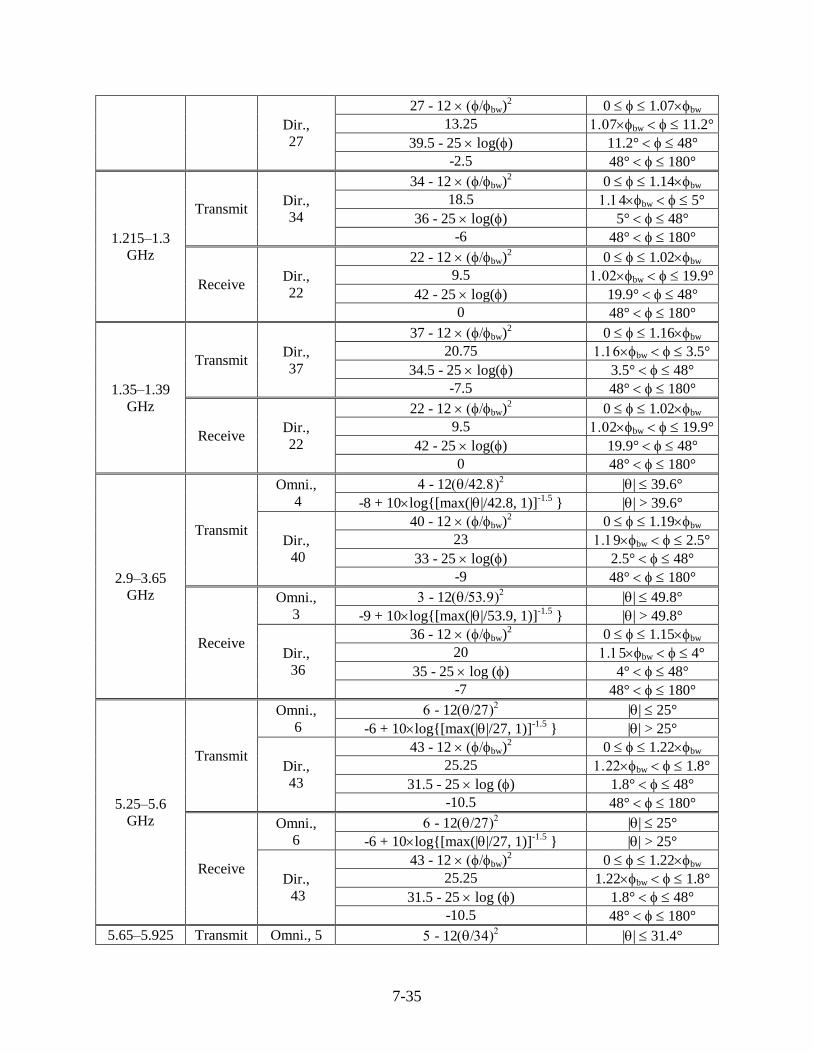
7-35
Dir.,
27
27 - 12 bw)2 0 1.07bw
13.25 7bw 11.2°
39.5 - 25 log() 11.2° 48°
-2.5 48° 180°
1.215–1.3
GHz
Transmit Dir.,
34
34 - 12 bw)2 0 1.14bw
18.5 4bw 5°
36 - 25 log() 5° 48°
-6 48° 180°
Receive Dir.,
22
22 - 12 bw)2 0 1.02bw
9.5 bw 19.9°
42 - 25 log() 19.9° 48°
0 48° 180°
1.35–1.39
GHz
Transmit Dir.,
37
37 - 12 bw)2 0 1.16bw
20.75 bw 3.5°
34.5 - 25 log() 3.5° 48°
-7.5 48° 180°
Receive Dir.,
22
22 - 12 bw)2 0 1.02bw
9.5 2bw 19.9°
42 - 25 log() 19.9° 48°
0 48° 180°
2.9–3.65
GHz
Transmit
Omni.,
4
- 12 || 39.6°
-8 + 10log{[max(||/42.8, 1)]-1.5
} || > 39.6°
Dir.,
40
40 - 12 bw)2 0 1.19bw
23 9bw 2.5°
33 - 25 log() 2.5° 48°
-9 48° 180°
Receive
Omni.,
3
- 12 || 49.8°
-9 + 10log{[max(||/53.9, 1)]-1.5
} || > 49.8°
Dir.,
36
36 - 12 bw)2 0 1.15bw
20 5bw 4°
35 - 25 log () 4° 48°
-7 48° 180°
5.25–5.6
GHz
Transmit
Omni.,
6
- 12 || 25°
-6 + 10log{[max(||/27, 1)]-1.5
} || > 25°
Dir.,
43
43 - 12 bw)2 0 1.22bw
25.25 bw 1.8°
31.5 - 25 log () 1.8° 48°
-10.5 48° 180°
Receive
Omni.,
6
- 12 || 25°
-6 + 10log{[max(||/27, 1)]-1.5
} || > 25°
Dir.,
43
43 - 12 bw)2 0 1.22bw
25.25 1.22bw 1.8°
31.5 - 25 log () 1.8° 48°
-10.5 48° 180°
5.65–5.925 Transmit Omni., 5 - 12 || 31.4°
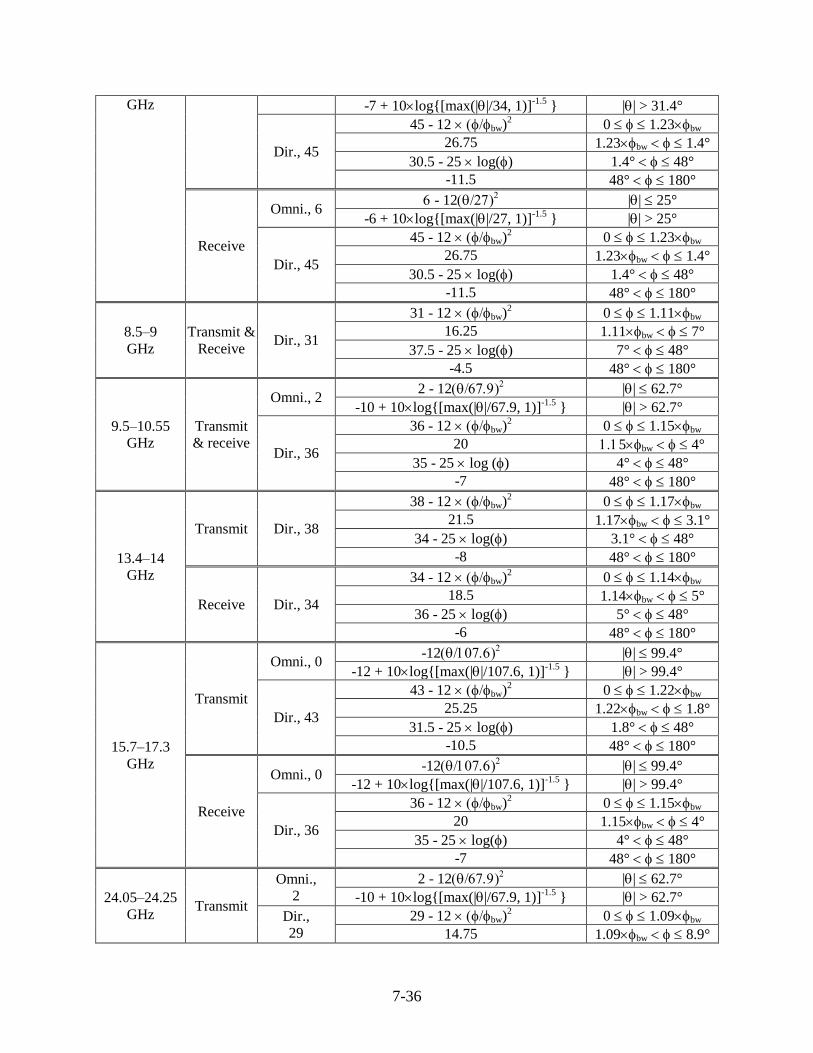
7-36
GHz -7 + 10log{[max(||/34, 1)]-1.5
} || > 31.4°
Dir., 45
45 - 12 bw)2 0 1.23bw
26.75 1.23bw 1.4°
30.5 - 25 log() 1.4° 48°
-11.5 48° 180°
Receive
Omni., 6 - 12
|| 25°
-6 + 10log{[max(||/27, 1)]-1.5
} || > 25°
Dir., 45
45 - 12 bw)2 0 1.23bw
26.75 1.23bw 1.4°
30.5 - 25 log() 1.4° 48°
-11.5 48° 180°
8.5–9
GHz
Transmit &
Receive Dir., 31
31 - 12 bw)2 0 1.11bw
16.25 1.11bw 7°
37.5 - 25 log() 7° 48°
-4.5 48° 180°
9.5–10.55
GHz
Transmit
& receive
Omni., 2 2 - 12
|| 62.7°
-10 + 10log{[max(||/67.9, 1)]-1.5
} || > 62.7°
Dir., 36
36 - 12 bw)2 0 1.15bw
20 5bw 4°
35 - 25 log () 4° 48°
-7 48° 180°
13.4–14
GHz
Transmit Dir., 38
38 - 12 bw)2 0 1.17bw
21.5 1.17bw 3.1°
34 - 25 log() 3.1° 48°
-8 48° 180°
Receive Dir., 34
34 - 12 bw)2 0 1.14bw
18.5 1.14bw 5°
36 - 25 log() 5° 48°
-6 48° 180°
15.7–17.3
GHz
Transmit
Omni., 0 -12
|| 99.4°
-12 + 10log{[max(||/107.6, 1)]-1.5
} || > 99.4°
Dir., 43
43 - 12 bw)2 0 1.22bw
25.25 1.22bw 1.8°
31.5 - 25 log() 1.8° 48°
-10.5 48° 180°
Receive
Omni., 0 -12
|| 99.4°
-12 + 10log{[max(||/107.6, 1)]-1.5
} || > 99.4°
Dir., 36
36 - 12 bw)2 0 1.15bw
20 1.15bw 4°
35 - 25 log() 4° 48°
-7 48° 180°
24.05–24.25
GHz Transmit
Omni.,
2
2 - 12 || 62.7°
-10 + 10log{[max(||/67.9, 1)]-1.5
} || > 62.7°
Dir.,
29
29 - 12 bw)2 0 1.09bw
14.75 1.09bw 8.9°
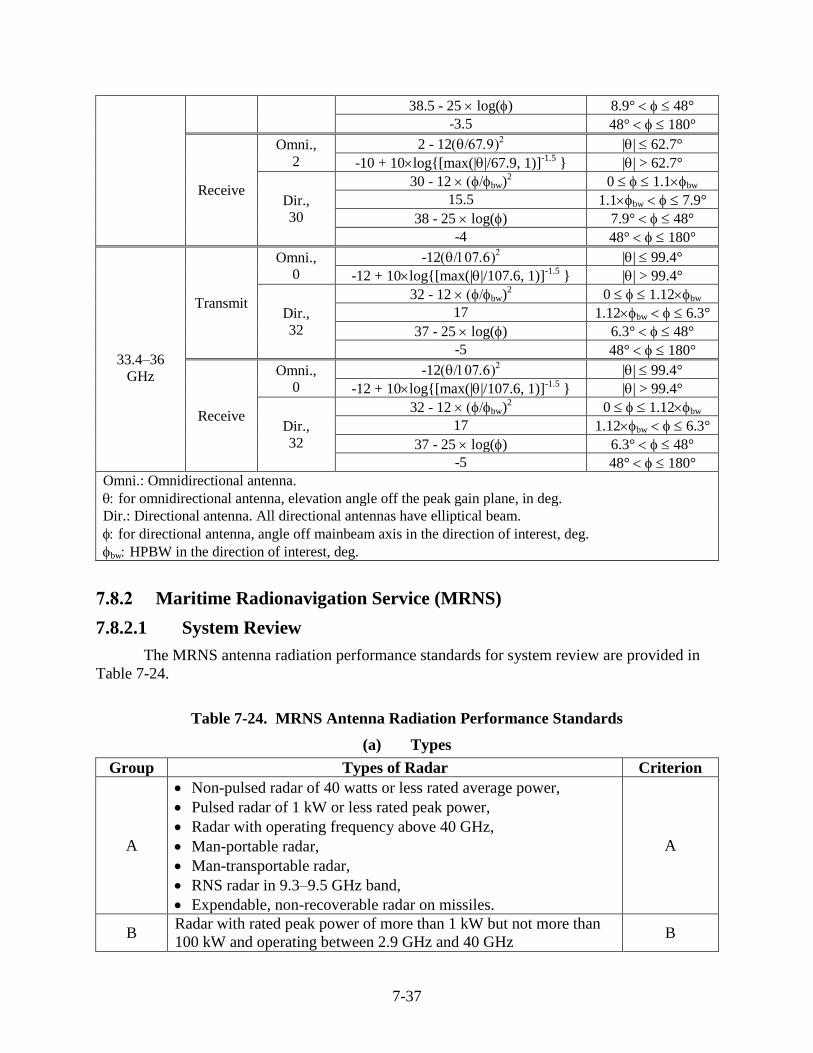
7-37
38.5 - 25 log() 8.9° 48°
-3.5 48° 180°
Receive
Omni.,
2
2 - 12 || 62.7°
-10 + 10log{[max(||/67.9, 1)]-1.5
} || > 62.7°
Dir.,
30
30 - 12 bw)2 0 1.1bw
15.5 1.1bw 7.9°
38 - 25 log() 7.9° 48°
-4 48° 180°
33.4–36
GHz
Transmit
Omni.,
0
-12 || 99.4°
-12 + 10log{[max(||/107.6, 1)]-1.5
} || > 99.4°
Dir.,
32
32 - 12 bw)2 0 1.12bw
17 1.12bw 6.3°
37 - 25 log() 6.3° 48°
-5 48° 180°
Receive
Omni.,
0
-12 || 99.4°
-12 + 10log{[max(||/107.6, 1)]-1.5
} || > 99.4°
Dir.,
32
32 - 12 bw)2 0 1.12bw
17 1.12bw 6.3°
37 - 25 log() 6.3° 48°
-5 48° 180°
Omni.: Omnidirectional antenna.
for omnidirectional antenna, elevation angle off the peak gain plane, in deg.
Dir.: Directional antenna. All directional antennas have elliptical beam.
for directional antenna, angle off mainbeam axis in the direction of interest, deg.
bw HPBW in the direction of interest, deg.
7.8.2 Maritime Radionavigation Service (MRNS)
7.8.2.1 System Review
The MRNS antenna radiation performance standards for system review are provided in
Table 7-24.
Table 7-24. MRNS Antenna Radiation Performance Standards
(a) Types
Group Types of Radar Criterion
A
Non-pulsed radar of 40 watts or less rated average power,
Pulsed radar of 1 kW or less rated peak power,
Radar with operating frequency above 40 GHz,
Man-portable radar,
Man-transportable radar,
RNS radar in 9.3–9.5 GHz band,
Expendable, non-recoverable radar on missiles.
A
B Radar with rated peak power of more than 1 kW but not more than
100 kW and operating between 2.9 GHz and 40 GHz B
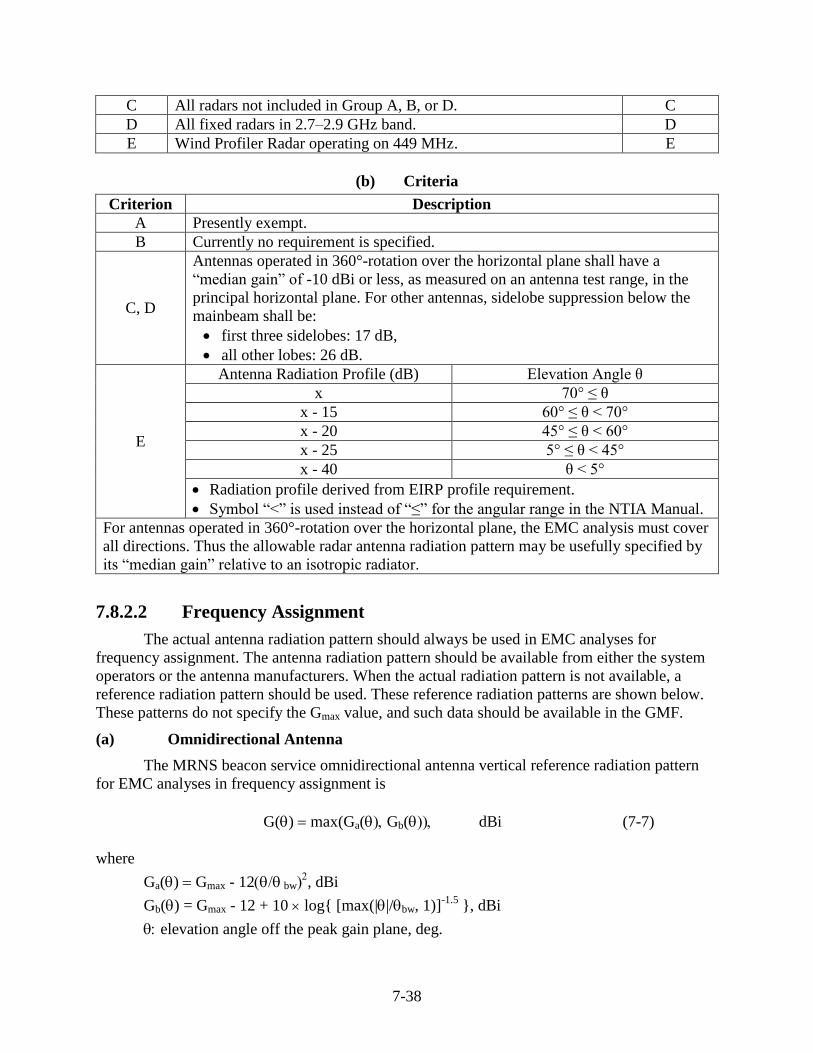
7-38
C All radars not included in Group A, B, or D. C
D All fixed radars in 2.7–2.9 GHz band. D
E Wind Profiler Radar operating on 449 MHz. E
(b) Criteria
Criterion Description
A Presently exempt.
B Currently no requirement is specified.
C, D
Antennas operated in 360°-rotation over the horizontal plane shall have a
“median gain” of -10 dBi or less, as measured on an antenna test range, in the
principal horizontal plane. For other antennas, sidelobe suppression below the
mainbeam shall be:
first three sidelobes: 17 dB,
all other lobes: 26 dB.
E
Antenna Radiation Profile (dB) Elevation Angle θ
x 70° ≤ θ
x - 15 60° ≤ θ < 70°
x - 20 45° ≤ θ < 60°
x - 25 5° ≤ θ < 45°
x - 40 θ < 5°
Radiation profile derived from EIRP profile requirement.
Symbol “<” is used instead of “≤” for the angular range in the NTIA Manual.
For antennas operated in 360°-rotation over the horizontal plane, the EMC analysis must cover
all directions. Thus the allowable radar antenna radiation pattern may be usefully specified by
its “median gain” relative to an isotropic radiator.
7.8.2.2 Frequency Assignment
The actual antenna radiation pattern should always be used in EMC analyses for
frequency assignment. The antenna radiation pattern should be available from either the system
operators or the antenna manufacturers. When the actual radiation pattern is not available, a
reference radiation pattern should be used. These reference radiation patterns are shown below.
These patterns do not specify the Gmax value, and such data should be available in the GMF.
(a) Omnidirectional Antenna
The MRNS beacon service omnidirectional antenna vertical reference radiation pattern
for EMC analyses in frequency assignment is
G() max(Ga(Gb( dBi (7-7)
where
Ga() Gmax - 12 bw, dBi
Gb() = Gmax - 12 + 10 log{ [max(||/bw, 1)]-1.5
}, dBi
elevation angle off the peak gain plane, deg.
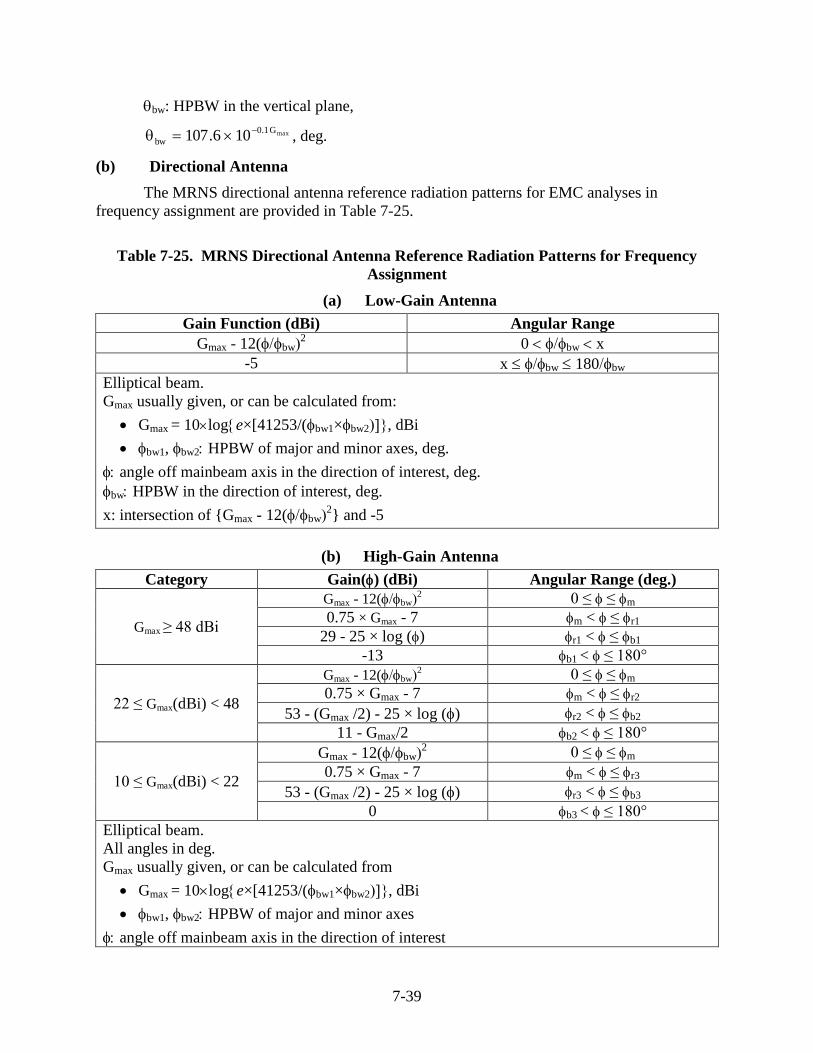
7-39
bw: HPBW in the vertical plane,
maxG1.0
bw 106.107
, deg.
(b) Directional Antenna
The MRNS directional antenna reference radiation patterns for EMC analyses in
frequency assignment are provided in Table 7-25.
Table 7-25. MRNS Directional Antenna Reference Radiation Patterns for Frequency
Assignment
(a) Low-Gain Antenna
Gain Function (dBi) Angular Range
Gmax - 12(bw2 0 bw x
-5 x bw 180bw
Elliptical beam.
Gmax usually given, or can be calculated from:
Gmax = 10loge×[41253/(bw1×bw2, dBi
bw1, bw2 HPBW of major and minor axes, deg.
angle off mainbeam axis in the direction of interest, deg.
bw HPBW in the direction of interest, deg.
x: intersection of {Gmax - 12(bw2} and -5
(b) High-Gain Antenna
Category Gain() (dBi) Angular Range (deg.)
Gmax ≥ 48 dBi
Gmax - 12(bw2 0 ≤ ≤ m
0.75 × Gmax - 7 m < ≤ r1
29 - 25 × log () r1 < ≤ b1
-13 b1 < ≤ 180°
22 ≤ Gmax(dBi) < 48
Gmax - 12(bw2 0 ≤ ≤ m
0.75 × Gmax - 7 m < ≤ r2
53 - (Gmax /2) - 25 × log () r2 < ≤ b2
11 - Gmax/2 b2 < ≤ 180°
10 ≤ Gmax(dBi) < 22
Gmax - 12(bw2 0 ≤ ≤ m
0.75 × Gmax - 7 m < ≤ r3
53 - (Gmax /2) - 25 × log () r3 < ≤ b3
0 b3 < ≤ 180°
Elliptical beam.
All angles in deg.
Gmax usually given, or can be calculated from
Gmax = 10loge×[41253/(bw1×bw2, dBi
bw1, bw2 HPBW of major and minor axes
angle off mainbeam axis in the direction of interest
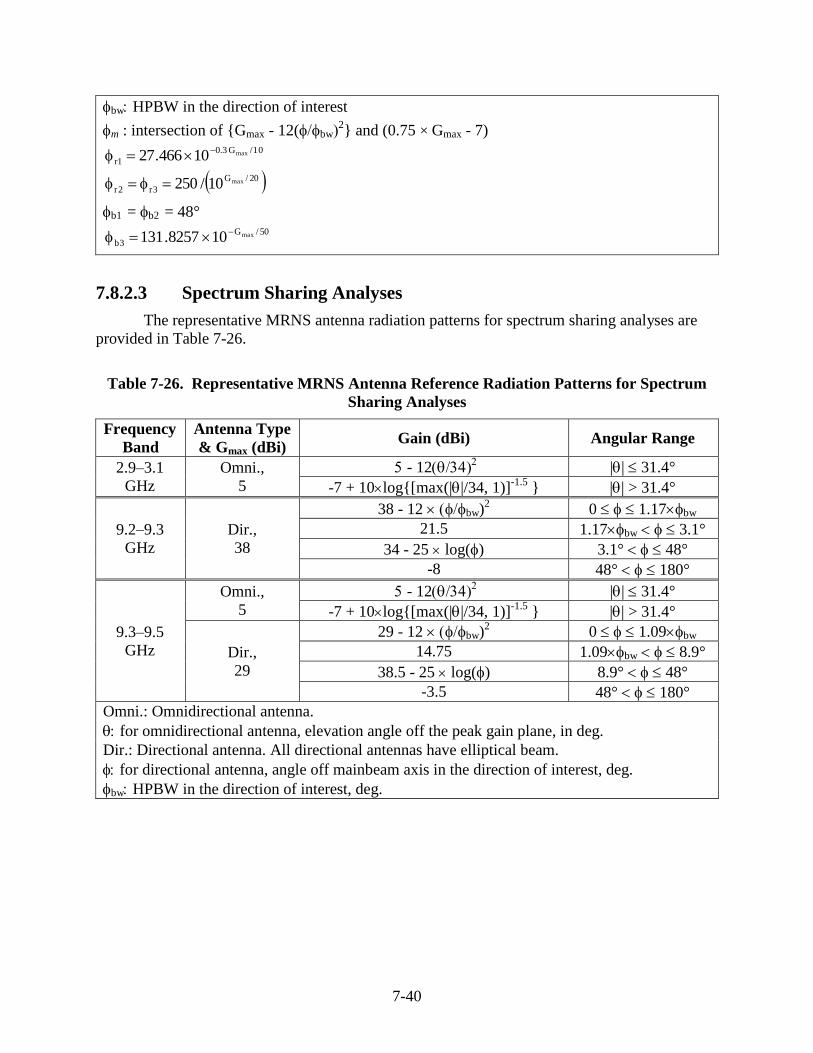
7-40
bw HPBW in the direction of interest
m : intersection of {Gmax - 12(bw2} and (0.75 × Gmax - 7)
10/G3.0
1rmax10466.27
20/G
3r2rmax10/250
b1 = b2 = 48° 50/G
3bmax108257.131
7.8.2.3 Spectrum Sharing Analyses
The representative MRNS antenna radiation patterns for spectrum sharing analyses are
provided in Table 7-26.
Table 7-26. Representative MRNS Antenna Reference Radiation Patterns for Spectrum
Sharing Analyses
Frequency
Band
Antenna Type
& Gmax (dBi) Gain (dBi) Angular Range
2.9–3.1
GHz
Omni.,
5
- 12 || 31.4°
-7 + 10log{[max(||/34, 1)]-1.5
} || > 31.4°
9.2–9.3
GHz
Dir.,
38
38 - 12 bw)2 0 1.17bw
21.5 1.17bw 3.1°
34 - 25 log() 3.1° 48°
-8 48° 180°
9.3–9.5
GHz
Omni.,
5
- 12 || 31.4°
-7 + 10log{[max(||/34, 1)]-1.5
} || > 31.4°
Dir.,
29
29 - 12 bw)2 0 1.09bw
14.75 1.09bw 8.9°
38.5 - 25 log() 8.9° 48°
-3.5 48° 180°
Omni.: Omnidirectional antenna.
for omnidirectional antenna, elevation angle off the peak gain plane, in deg.
Dir.: Directional antenna. All directional antennas have elliptical beam.
for directional antenna, angle off mainbeam axis in the direction of interest, deg.
bw HPBW in the direction of interest, deg.
7-41
7.8.3 Aeronautical Radionavigation Service (ARNS)
7.8.3.1 System Review
The ARNS antenna radiation performance standard for system review is as follows.
(a) The minimum operational radiation performance standards of the ARNS airborne
receiving antenna for the ILS (instrument landing system) localizer equipment operating in the
108–112 MHz band are
radiation pattern: the horizontal component of the radiated signal in the forward and
rearward directions shall not be down more than 10 dB when compared to the maximum
radiation from a standard horizontal dipole antenna resonant at 113 MHz and mounted 10
inches above the ground plane,
gain variation: the difference between the maximum and minimum field strength of the
horizontal component in the azimuth plane shall not exceed 20 dB,
polarization discrimination: the reception of vertically polarized signals from any
horizontal direction with respect to the antenna shall be at least 10 dB below the
reception of horizontally polarized signals from the same direction.
(b) The minimum operational radiation performance standards of the ARNS airborne
receiving antenna for the VHF omnidirectional range equipment operating in the 108–117.95
MHz band are
radiation pattern: the horizontal component of the radiated signal in the forward and
rearward directions shall not be down more than 10 dB when compared to the maximum
radiation from a standard horizontal dipole antenna resonant at 113 MHz and mounted 10
inches above the ground plane,
gain variation: the difference between the maximum and minimum field strength of the
horizontal component in the azimuth plane shall not exceed 20 dB,
polarization discrimination: the reception of vertically polarized signals from any
horizontal direction with respect to the antenna shall be at least 10 dB below the
reception of horizontally polarized signals from the same direction.
(c) The minimum operational radiation performance standards of the ARNS airborne antenna
for the GPS local area augmentation system operating in the 108–117.975 MHz band are
antenna type: omnidirectional antenna,
horizontal gain:
o the reception of the horizontally polarized component in the horizontal plane from
the forward and rearward directions shall not be down more than 10 dB when
compared to the maximum output response of a standard horizontal dipole
antenna that is mounted 25.4 cm (10 inches) above the ground plane and resonant
at 113 MHz,
o the difference between the maximum and minimum reception of the horizontally
polarized component from any direction in the horizontal plane shall not exceed
20 dB,
vertical gain:
7-42
o when mounted on a 4×4 inch2 (or larger) ground plane, the reception of the
vertically polarized component in the horizontal azimuth plane shall not be down
more than 6 dB when compared to a standard vertically polarized monopole
antenna,
o when mounted on a 4×4 inch2 (or larger) ground plane, the difference between the
maximum and minimum reception of the vertical polarized component from any
direction in the horizontal azimuth plane shall not exceed 6 dB.
(d) The minimum operational radiation performance standards of the ARNS airborne
receiving antenna for the ILS glide slope equipment operating in the 328.6–335.4 MHz band are
radiation pattern: the horizontal component of the radiated signal in the forward direction
shall not be down more than 15 dB when compared to the maximum radiation from a
standard horizontal dipole antenna resonant at 332 MHz in free space,
polarization discrimination: the reception of vertically polarized signals from any
horizontal direction with respect to the antenna shall be at least 10 dB below the
reception of horizontally polarized signals from the same direction.
(e) The minimum operational radiation performance standards of the ARNS airborne antenna
for the distance measuring equipment operating in the 960–1215 MHz band are
polarization: predominately vertically polarized,
radiation pattern: the average field strength in the horizontal plane shall be equal to the
field strength of a matched resonant ¼λ vertical antenna,
gain variation: the difference between the maximum and minimum field strengths in the
horizontal plane shall not exceed 6 dB when the antenna is mounted at the center of the
1.2-meter (4-foot) diameter (or larger) flat circular ground plane.
(f) The minimum operational radiation performance standards of the ARNS airborne antenna
for the air traffic control radar beacon system/mode select equipment operating in the 1030–1090
MHz band are
polarization: vertically polarized,
radiation pattern: the gain shall not be less than the gain of a matched ¼λ stub minus 3
dB over 90% of the coverage volume 0–360º in azimuth and 5–30º in elevation when
installed at the center of a 1.2-meter (4-foot) diameter (or larger) circular ground plane.
(g) The minimum operational radiation performance standards of the ARNS airborne antenna
for the traffic alert and collision avoidance system II transmitting in the 1030 MHz band and
receiving in the 1087–1093 MHz band are
polarization: vertically polarized,
radiation pattern: the gain shall not be less than the gain of a matched ¼λ stub minus 1
dB over 90% of the coverage volume 0–360º in azimuth and (-15)–20º in elevation when
installed at the center of a 1.2-meter (4-foot) diameter (or larger) circular ground plane,
which can be flat or cylindrical.
7-43
(h) The minimum operational radiation performance standards of the ARNS airborne antenna
for the active traffic alert and collision avoidance system I transmitting in the 1030 MHz band
and receiving in the 1087–1093 MHz band are
type: omnidirectional antenna or multiple beams to cover all azimuth directions,
polarization: vertically polarized,
radiation pattern: covering 360º in azimuth and at least (-10)–20º in elevation.
(i) The minimum operational radiation performance standards of the ARNS airborne antenna
for the automatic dependent surveillance system and traffic information service system operating
at 1090 MHz are
type: omnidirectional antenna,
polarization: vertically polarized,
transmit radiation pattern: the gain shall not be less than the gain of a matched ¼λ stub
minus 3 dB over 90% of a coverage volume from 0–360º in azimuth and 5–30º above the
ground plane when installed at the center of 1.2 meters (4 feet) or larger flat circular
ground plane,
receive radiation pattern: the gain should not be less than the gain of a matched ¼λ stub
minus 1 dB over 90% of a coverage volume from 0–360º in azimuth and (-15)–(+20)º in
elevation when installed at the center of 1.2 meters (4 feet) or larger circular ground
plane, which can be either flat or cylindrical.
7.8.3.2 Frequency Assignment
The actual antenna radiation pattern should always be used in EMC analyses for
frequency assignment. The antenna radiation pattern should be available from either the system
operators or the antenna manufacturers. When the actual radiation pattern is not available, a
reference radiation pattern should be used. These reference radiation patterns are shown below.
These patterns do not specify the Gmax value, and such data should be available in the GMF.
(a) Omnidirectional Antenna
The ARNS omnidirectional antenna vertical reference radiation pattern for EMC analyses
in frequency assignment is
G() max(Ga(Gb( dBi (7-8)
where
Ga() Gmax - 12 bw, dBi
Gb() = Gmax - 12 + 10 log{ [max(||/bw, 1)]-1.5
}, dBi
elevation angle off the peak gain plane, deg.
bw: HPBW in the vertical plane
maxG1.0
bw 106.107
, deg.
(b) Directional Antenna
The ARNS directional antenna reference radiation patterns for EMC analyses in
frequency assignment are provided in Table 7-27.
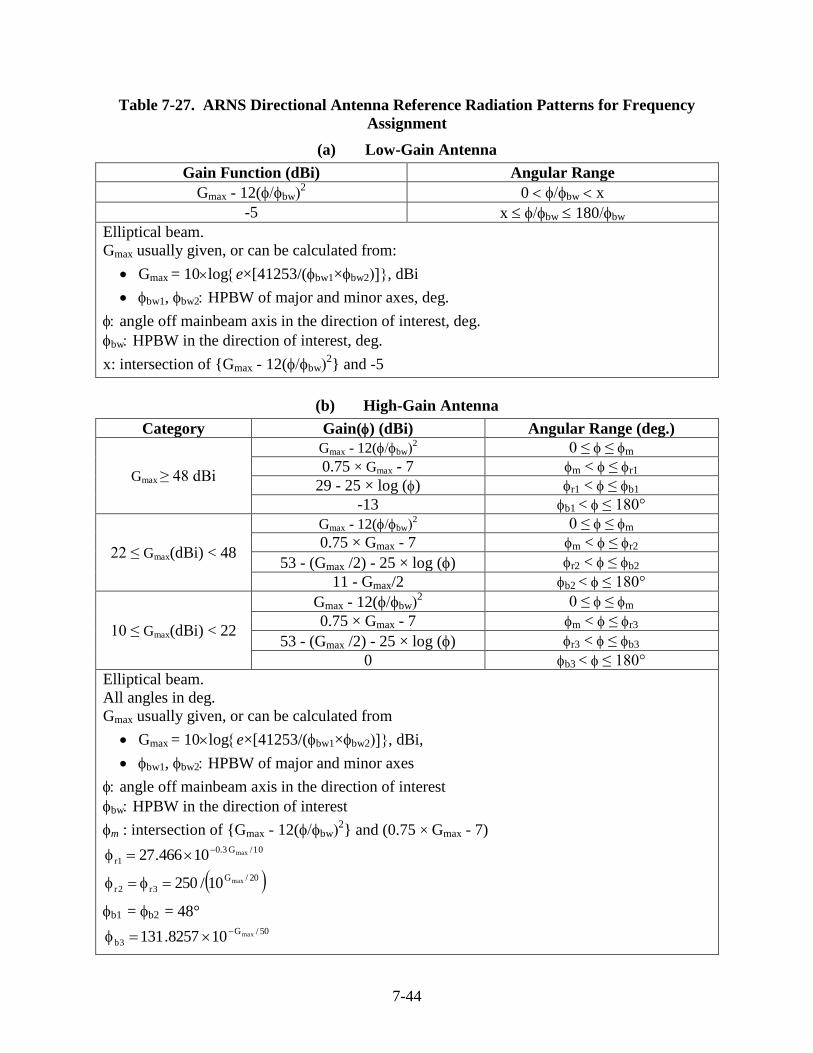
7-44
Table 7-27. ARNS Directional Antenna Reference Radiation Patterns for Frequency
Assignment
(a) Low-Gain Antenna
Gain Function (dBi) Angular Range
Gmax - 12(bw2 0 bw x
-5 x bw 180bw
Elliptical beam.
Gmax usually given, or can be calculated from:
Gmax = 10loge×[41253/(bw1×bw2, dBi
bw1, bw2 HPBW of major and minor axes, deg.
angle off mainbeam axis in the direction of interest, deg.
bw HPBW in the direction of interest, deg.
x: intersection of {Gmax - 12(bw2} and -5
(b) High-Gain Antenna
Category Gain() (dBi) Angular Range (deg.)
Gmax ≥ 48 dBi
Gmax - 12(bw2 0 ≤ ≤ m
0.75 × Gmax - 7 m < ≤ r1
29 - 25 × log () r1 < ≤ b1
-13 b1 < ≤ 180°
22 ≤ Gmax(dBi) < 48
Gmax - 12(bw2 0 ≤ ≤ m
0.75 × Gmax - 7 m < ≤ r2
53 - (Gmax /2) - 25 × log () r2 < ≤ b2
11 - Gmax/2 b2 < ≤ 180°
10 ≤ Gmax(dBi) < 22
Gmax - 12(bw2 0 ≤ ≤ m
0.75 × Gmax - 7 m < ≤ r3
53 - (Gmax /2) - 25 × log () r3 < ≤ b3
0 b3 < ≤ 180°
Elliptical beam.
All angles in deg.
Gmax usually given, or can be calculated from
Gmax = 10loge×[41253/(bw1×bw2, dBi,
bw1, bw2 HPBW of major and minor axes
angle off mainbeam axis in the direction of interest
bw HPBW in the direction of interest
m : intersection of {Gmax - 12(bw2} and (0.75 × Gmax - 7)
10/G3.0
1rmax10466.27
20/G
3r2rmax10/250
b1 = b2 = 48° 50/G
3bmax108257.131
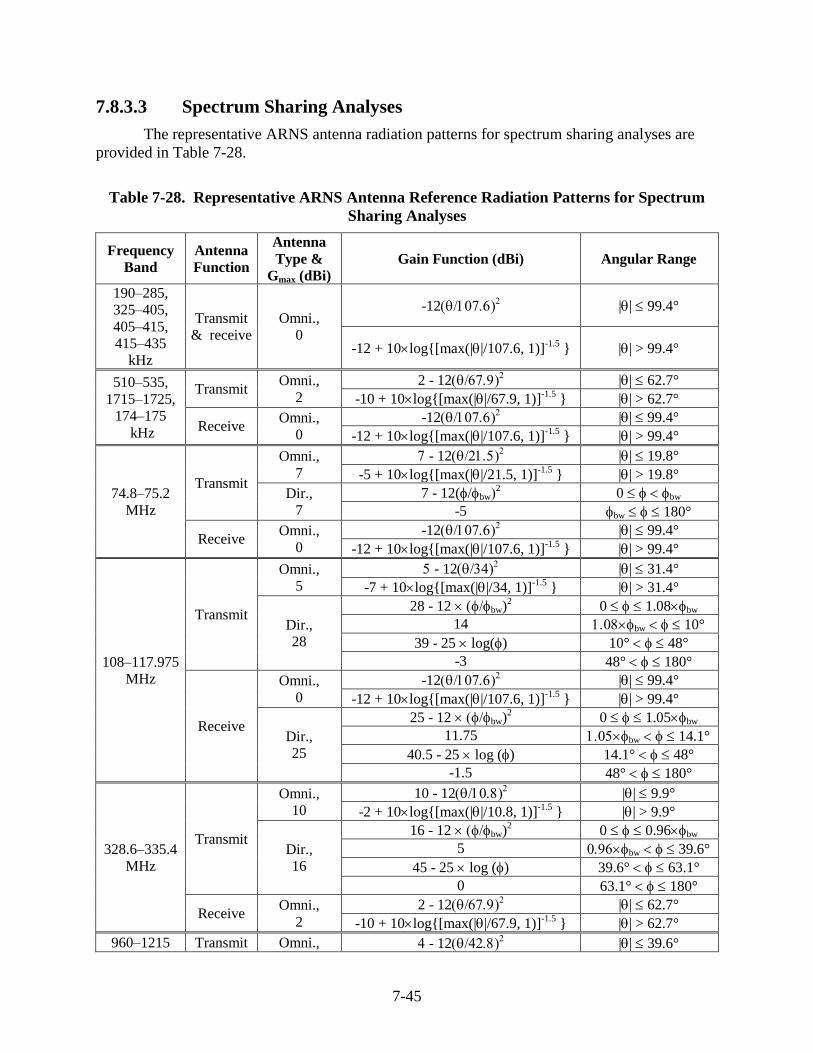
7-45
7.8.3.3 Spectrum Sharing Analyses
The representative ARNS antenna radiation patterns for spectrum sharing analyses are
provided in Table 7-28.
Table 7-28. Representative ARNS Antenna Reference Radiation Patterns for Spectrum
Sharing Analyses
Frequency
Band
Antenna
Function
Antenna
Type &
Gmax (dBi)
Gain Function (dBi) Angular Range
190–285,
325–405,
405–415,
415–435
kHz
Transmit
& receive
Omni.,
0
-12 || 99.4°
-12 + 10log{[max(||/107.6, 1)]-1.5
} || > 99.4°
510–535,
1715–1725,
174–175
kHz
Transmit Omni.,
2
2 - 12 || 62.7°
-10 + 10log{[max(||/67.9, 1)]-1.5
} || > 62.7°
Receive Omni.,
0
-12 || 99.4°
-12 + 10log{[max(||/107.6, 1)]-1.5
} || > 99.4°
74.8–75.2
MHz
Transmit
Omni.,
7
- 12 || 19.8°
-5 + 10log{[max(||/21.5, 1)]-1.5
} || > 19.8°
Dir.,
7
7 - 12(bw2 0 bw
-5 bw 180°
Receive Omni.,
0
-12 || 99.4°
-12 + 10log{[max(||/107.6, 1)]-1.5
} || > 99.4°
108–117.975
MHz
Transmit
Omni.,
5
- 12 || 31.4°
-7 + 10log{[max(||/34, 1)]-1.5
} || > 31.4°
Dir.,
28
28 - 12 bw)2 0 1.08bw
14 bw 10°
39 - 25 log() 10° 48°
-3 48° 180°
Receive
Omni.,
0
-12 || 99.4°
-12 + 10log{[max(||/107.6, 1)]-1.5
} || > 99.4°
Dir.,
25
25 - 12 bw)2 0 1.05bw
11.75 bw 14.1°
40.5 - 25 log () 14.1° 48°
-1.5 48° 180°
328.6–335.4
MHz
Transmit
Omni.,
10
10 - 12 || 9.9°
-2 + 10log{[max(||/10.8, 1)]-1.5
} || > 9.9°
Dir.,
16
16 - 12 bw)2 0 0.96bw
5 bw 39.6°
45 - 25 log () 39.6° 63.1°
0 63.1° 180°
Receive Omni.,
2
2 - 12 || 62.7°
-10 + 10log{[max(||/67.9, 1)]-1.5
} || > 62.7°
960–1215 Transmit Omni., - 12 || 39.6°
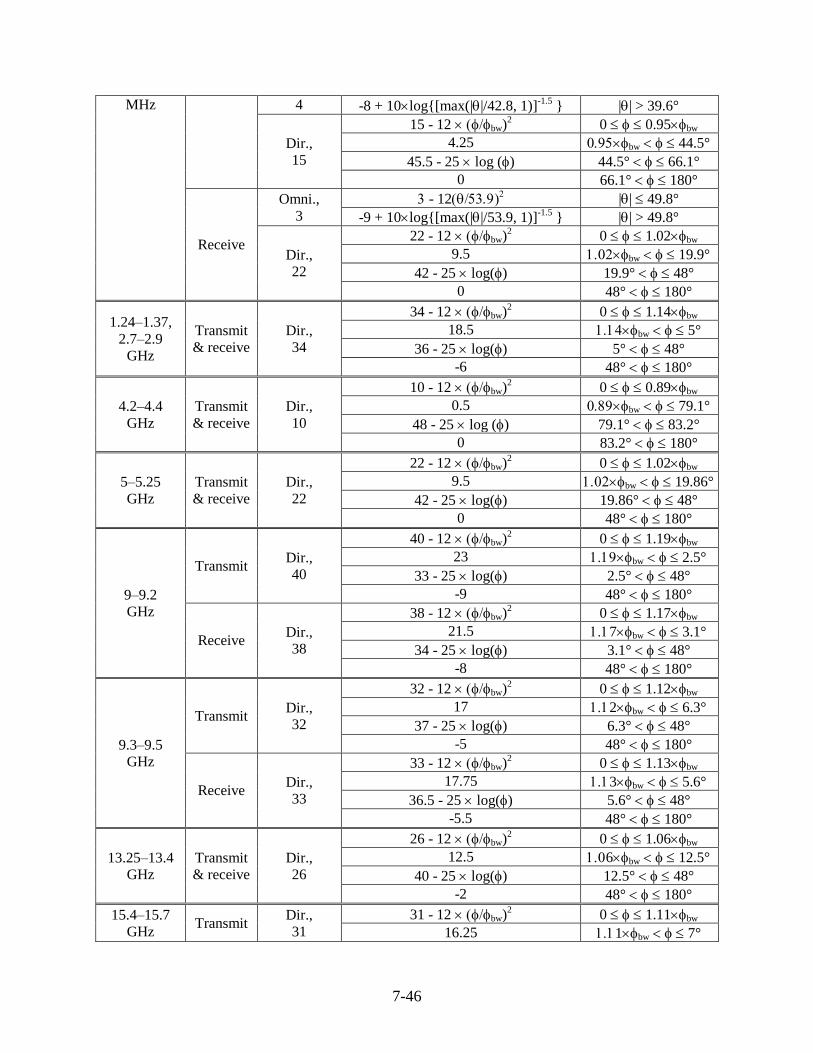
7-46
MHz 4 -8 + 10log{[max(||/42.8, 1)]-1.5
} || > 39.6°
Dir.,
15
15 - 12 bw)2 0 0.95bw
4.25 bw 44.5°
45.5 - 25 log () 44.5° 66.1°
0 66.1° 180°
Receive
Omni.,
3
- 12 || 49.8°
-9 + 10log{[max(||/53.9, 1)]-1.5
} || > 49.8°
Dir.,
22
22 - 12 bw)2 0 1.02bw
9.5 bw 19.9°
42 - 25 log() 19.9° 48°
0 48° 180°
1.24–1.37,
2.7–2.9
GHz
Transmit
& receive
Dir.,
34
34 - 12 bw)2 0 1.14bw
18.5 bw 5°
36 - 25 log() 5° 48°
-6 48° 180°
4.2–4.4
GHz
Transmit
& receive
Dir.,
10
10 - 12 bw)2 0 0.89bw
0.5 bw 79.1°
48 - 25 log () 79.1° 83.2°
0 83.2° 180°
5–5.25
GHz
Transmit
& receive
Dir.,
22
22 - 12 bw)2 0 1.02bw
9.5 bw 19.86°
42 - 25 log() 19.86° 48°
0 48° 180°
9–9.2
GHz
Transmit Dir.,
40
40 - 12 bw)2 0 1.19bw
23 bw 2.5°
33 - 25 log() 2.5° 48°
-9 48° 180°
Receive Dir.,
38
38 - 12 bw)2 0 1.17bw
21.5 7bw 3.1°
34 - 25 log() 3.1° 48°
-8 48° 180°
9.3–9.5
GHz
Transmit Dir.,
32
32 - 12 bw)2 0 1.12bw
17 2bw 6.3°
37 - 25 log() 6.3° 48°
-5 48° 180°
Receive Dir.,
33
33 - 12 bw)2 0 1.13bw
17.75 3bw 5.6°
36.5 - 25 log() 5.6° 48°
-5.5 48° 180°
13.25–13.4
GHz
Transmit
& receive
Dir.,
26
26 - 12 bw)2 0 1.06bw
12.5 6bw 12.5°
40 - 25 log() 12.5° 48°
-2 48° 180°
15.4–15.7
GHz Transmit
Dir.,
31
31 - 12 bw)2 0 1.11bw
16.25 1bw 7°
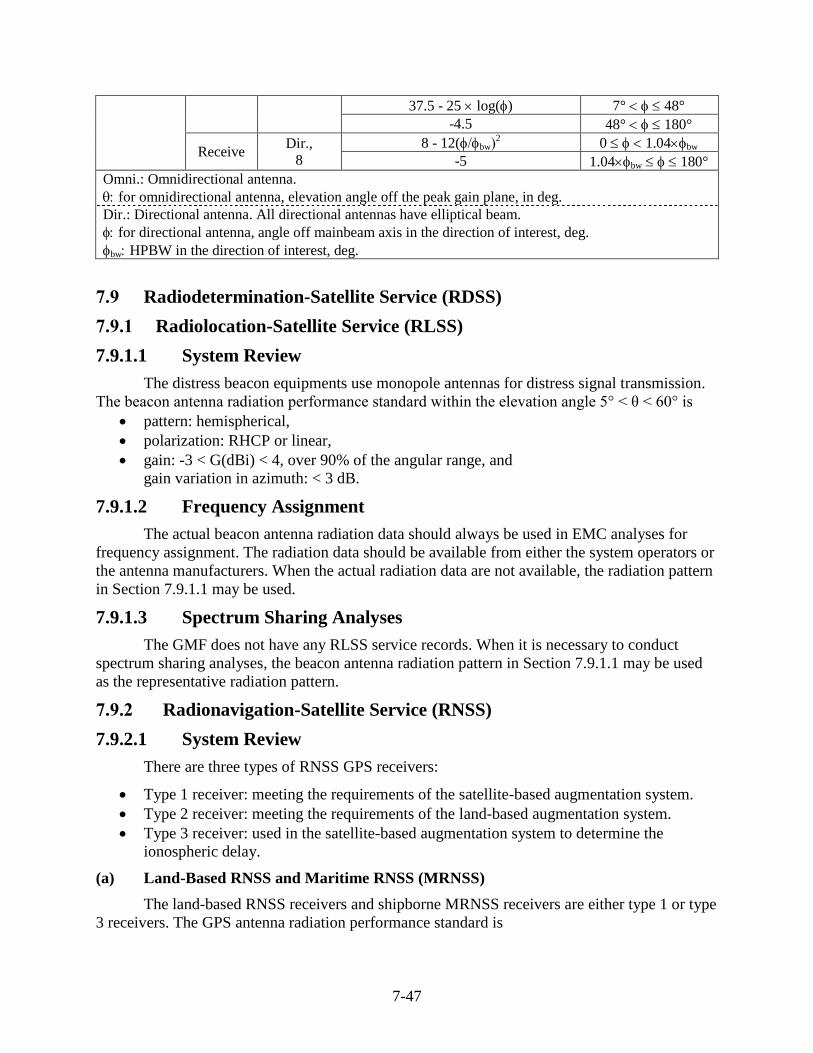
7-47
37.5 - 25 log() 7° 48°
-4.5 48° 180°
Receive Dir.,
8
8 - 12(bw2 0 1.04bw
-5 1.04bw 180°
Omni.: Omnidirectional antenna.
for omnidirectional antenna, elevation angle off the peak gain plane, in deg.
Dir.: Directional antenna. All directional antennas have elliptical beam.
for directional antenna, angle off mainbeam axis in the direction of interest, deg.
bw HPBW in the direction of interest, deg.
7.9 Radiodetermination-Satellite Service (RDSS)
7.9.1 Radiolocation-Satellite Service (RLSS)
7.9.1.1 System Review
The distress beacon equipments use monopole antennas for distress signal transmission.
The beacon antenna radiation performance standard within the elevation angle 5° < θ < 60° is
pattern: hemispherical,
polarization: RHCP or linear,
gain: -3 < G(dBi) < 4, over 90% of the angular range, and
gain variation in azimuth: < 3 dB.
7.9.1.2 Frequency Assignment
The actual beacon antenna radiation data should always be used in EMC analyses for
frequency assignment. The radiation data should be available from either the system operators or
the antenna manufacturers. When the actual radiation data are not available, the radiation pattern
in Section 7.9.1.1 may be used.
7.9.1.3 Spectrum Sharing Analyses
The GMF does not have any RLSS service records. When it is necessary to conduct
spectrum sharing analyses, the beacon antenna radiation pattern in Section 7.9.1.1 may be used
as the representative radiation pattern.
7.9.2 Radionavigation-Satellite Service (RNSS)
7.9.2.1 System Review
There are three types of RNSS GPS receivers:
Type 1 receiver: meeting the requirements of the satellite-based augmentation system.
Type 2 receiver: meeting the requirements of the land-based augmentation system.
Type 3 receiver: used in the satellite-based augmentation system to determine the
ionospheric delay.
(a) Land-Based RNSS and Maritime RNSS (MRNSS)
The land-based RNSS receivers and shipborne MRNSS receivers are either type 1 or type
3 receivers. The GPS antenna radiation performance standard is
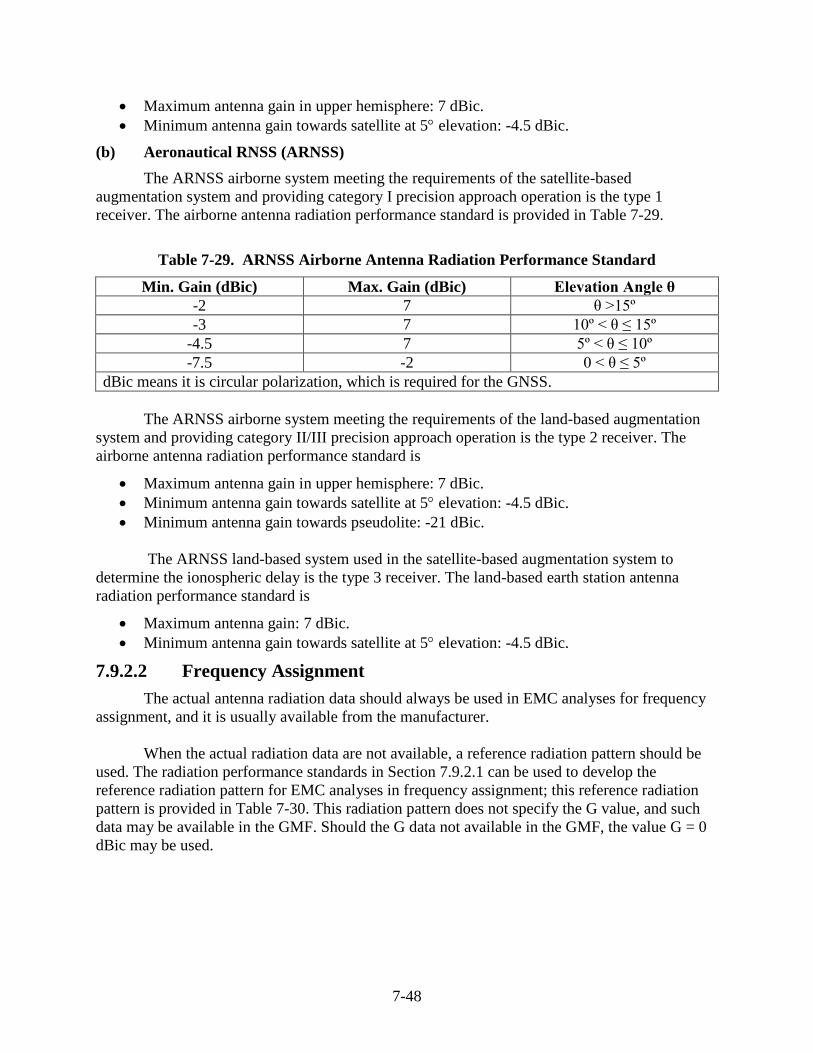
7-48
Maximum antenna gain in upper hemisphere: 7 dBic.
Minimum antenna gain towards satellite at 5 elevation: -4.5 dBic.
(b) Aeronautical RNSS (ARNSS)
The ARNSS airborne system meeting the requirements of the satellite-based
augmentation system and providing category I precision approach operation is the type 1
receiver. The airborne antenna radiation performance standard is provided in Table 7-29.
Table 7-29. ARNSS Airborne Antenna Radiation Performance Standard
Min. Gain (dBic) Max. Gain (dBic) Elevation Angle θ
-2 7 θ >15º
-3 7 10º < θ ≤ 15º
-4.5 7 5º < θ ≤ 10º
-7.5 -2 0 < θ ≤ 5º
dBic means it is circular polarization, which is required for the GNSS.
The ARNSS airborne system meeting the requirements of the land-based augmentation
system and providing category II/III precision approach operation is the type 2 receiver. The
airborne antenna radiation performance standard is
Maximum antenna gain in upper hemisphere: 7 dBic.
Minimum antenna gain towards satellite at 5 elevation: -4.5 dBic.
Minimum antenna gain towards pseudolite: -21 dBic.
The ARNSS land-based system used in the satellite-based augmentation system to
determine the ionospheric delay is the type 3 receiver. The land-based earth station antenna
radiation performance standard is
Maximum antenna gain: 7 dBic.
Minimum antenna gain towards satellite at 5 elevation: -4.5 dBic.
7.9.2.2 Frequency Assignment
The actual antenna radiation data should always be used in EMC analyses for frequency
assignment, and it is usually available from the manufacturer.
When the actual radiation data are not available, a reference radiation pattern should be
used. The radiation performance standards in Section 7.9.2.1 can be used to develop the
reference radiation pattern for EMC analyses in frequency assignment; this reference radiation
pattern is provided in Table 7-30. This radiation pattern does not specify the G value, and such
data may be available in the GMF. Should the G data not available in the GMF, the value G = 0
dBic may be used.
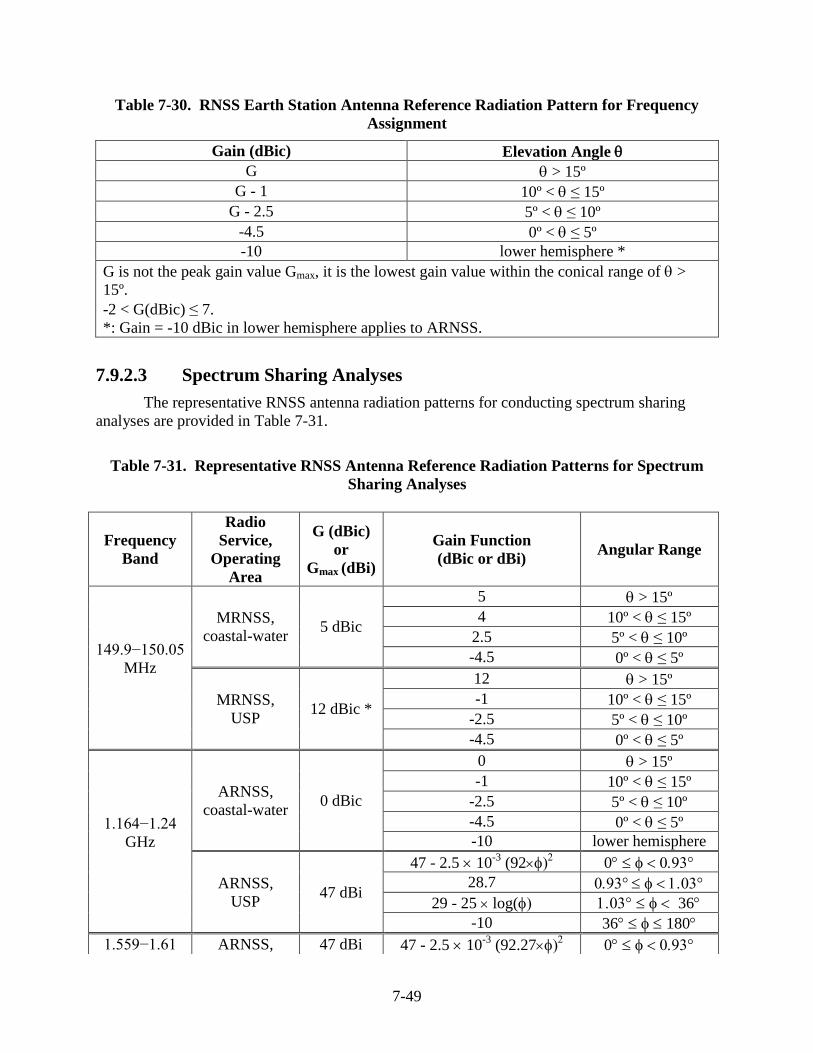
7-49
Table 7-30. RNSS Earth Station Antenna Reference Radiation Pattern for Frequency
Assignment
Gain (dBic) Elevation Angle
G > 15º
G - 1 10º < ≤15º
G - 2.5 5º < ≤10º
-4.5 0º < ≤5º
-10 lower hemisphere *
G is not the peak gain value Gmax, it is the lowest gain value within the conical range of >
15º.
-2 < G(dBic)≤7.
*: Gain = -10 dBic in lower hemisphere applies to ARNSS.
7.9.2.3 Spectrum Sharing Analyses
The representative RNSS antenna radiation patterns for conducting spectrum sharing
analyses are provided in Table 7-31.
Table 7-31. Representative RNSS Antenna Reference Radiation Patterns for Spectrum
Sharing Analyses
Frequency
Band
Radio
Service,
Operating
Area
G (dBic)
or
Gmax (dBi)
Gain Function
(dBic or dBi) Angular Range
149.9−150.05
MHz
MRNSS,
coastal-water 5 dBic
5 > 15º
4 10º < ≤15º
2.5 5º < ≤10º
-4.5 0º < ≤5º
MRNSS,
USP 12 dBic *
12 > 15º
-1 10º < ≤15º
-2.5 5º < ≤10º
-4.5 0º < ≤5º
1.164−1.24
GHz
ARNSS,
coastal-water 0 dBic
0 > 15º
-1 10º < ≤15º
-2.5 5º < ≤10º
-4.5 0º < ≤5º
-10 lower hemisphere
ARNSS,
USP 47 dBi
47 - 2.5 10-3
(92 0
28.7
29 - 25 log( 36
-10 36 180
1.559−1.61 ARNSS, 47 dBi 47 - 2.5 10-3
(92.27 0
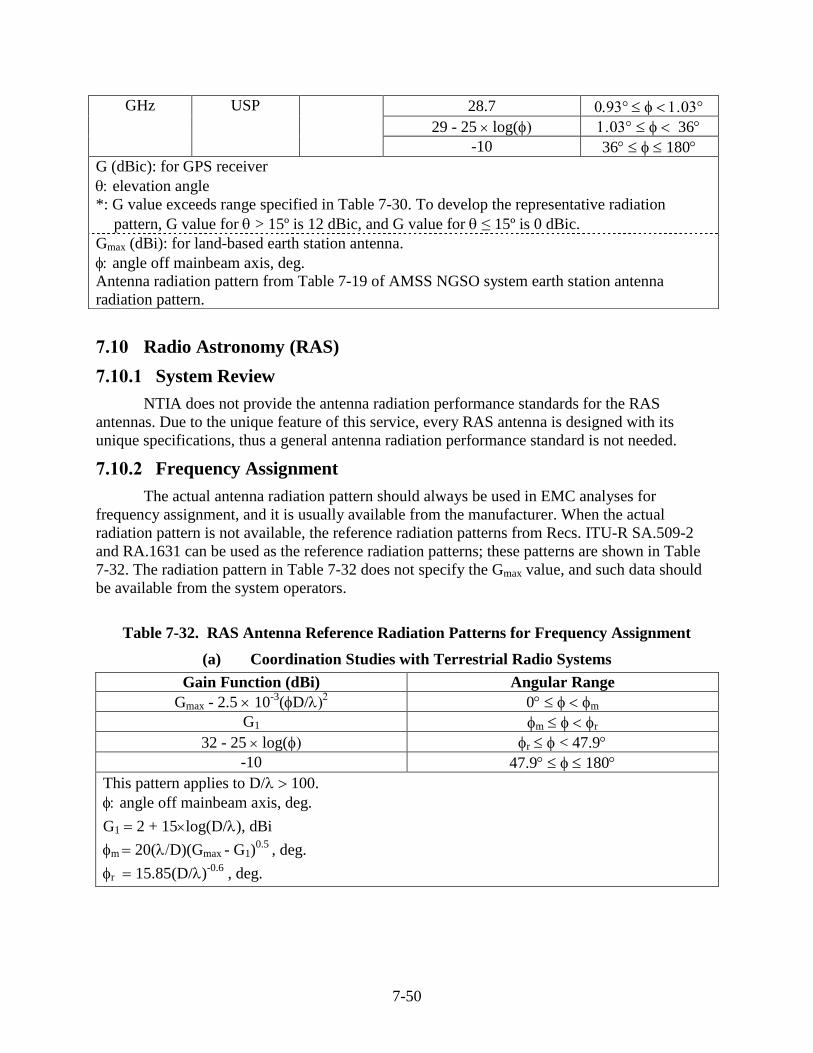
7-50
7.10 Radio Astronomy (RAS)
7.10.1 System Review
NTIA does not provide the antenna radiation performance standards for the RAS
antennas. Due to the unique feature of this service, every RAS antenna is designed with its
unique specifications, thus a general antenna radiation performance standard is not needed.
7.10.2 Frequency Assignment
The actual antenna radiation pattern should always be used in EMC analyses for
frequency assignment, and it is usually available from the manufacturer. When the actual
radiation pattern is not available, the reference radiation patterns from Recs. ITU-R SA.509-2
and RA.1631 can be used as the reference radiation patterns; these patterns are shown in Table
7-32. The radiation pattern in Table 7-32 does not specify the Gmax value, and such data should
be available from the system operators.
Table 7-32. RAS Antenna Reference Radiation Patterns for Frequency Assignment
(a) Coordination Studies with Terrestrial Radio Systems
Gain Function (dBi) Angular Range
Gmax - 2.5 10-3
(D/ 0 m
G1 m r
32 - 25 log( r < 47.9
-10 47.9 180
This pattern applies to D/100.
angle off mainbeam axis, deg.
G1 2 + 15log(D/), dBi
m 20(D)(Gmax - G1)0.5
, deg.
r 15.85(D/)-0.6
, deg.
GHz
USP 28.7
29 - 25 log( 36
-10 36 180
G (dBic): for GPS receiver
elevation angle
*: G value exceeds range specified in Table 7-30. To develop the representative radiation
pattern, G value for >15º is 12 dBic, and G value for ≤15º is 0 dBic.
Gmax (dBi): for land-based earth station antenna.
angle off mainbeam axis, deg.
Antenna radiation pattern from Table 7-19 of AMSS NGSO system earth station antenna
radiation pattern.
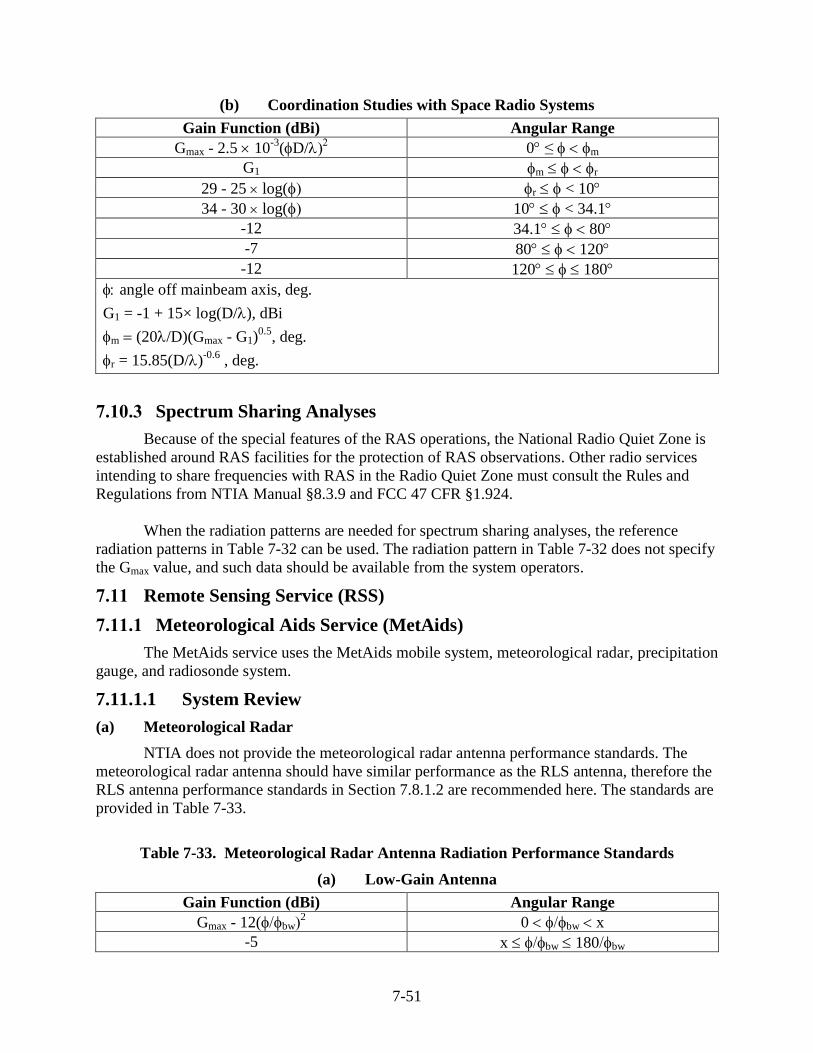
7-51
(b) Coordination Studies with Space Radio Systems
Gain Function (dBi) Angular Range
Gmax - 2.5 10-3
(D/ 0 ≤ m
G1 m r
29 - 25 log( r < 10
34 - 30 log( 10 < 34.1
-12 34.1 80
-7 80 120
-12 120 180
angle off mainbeam axis, deg.
G1 = -1 + 15× log(D/), dBi
m (20/D)(Gmax - G1)0.5
, deg.
r = 15.85(D/)-0.6
, deg.
7.10.3 Spectrum Sharing Analyses
Because of the special features of the RAS operations, the National Radio Quiet Zone is
established around RAS facilities for the protection of RAS observations. Other radio services
intending to share frequencies with RAS in the Radio Quiet Zone must consult the Rules and
Regulations from NTIA Manual §8.3.9 and FCC 47 CFR §1.924.
When the radiation patterns are needed for spectrum sharing analyses, the reference
radiation patterns in Table 7-32 can be used. The radiation pattern in Table 7-32 does not specify
the Gmax value, and such data should be available from the system operators.
7.11 Remote Sensing Service (RSS)
7.11.1 Meteorological Aids Service (MetAids)
The MetAids service uses the MetAids mobile system, meteorological radar, precipitation
gauge, and radiosonde system.
7.11.1.1 System Review
(a) Meteorological Radar
NTIA does not provide the meteorological radar antenna performance standards. The
meteorological radar antenna should have similar performance as the RLS antenna, therefore the
RLS antenna performance standards in Section 7.8.1.2 are recommended here. The standards are
provided in Table 7-33.
Table 7-33. Meteorological Radar Antenna Radiation Performance Standards
(a) Low-Gain Antenna
Gain Function (dBi) Angular Range
Gmax - 12(bw2 0 bw x
-5 x bw 180bw
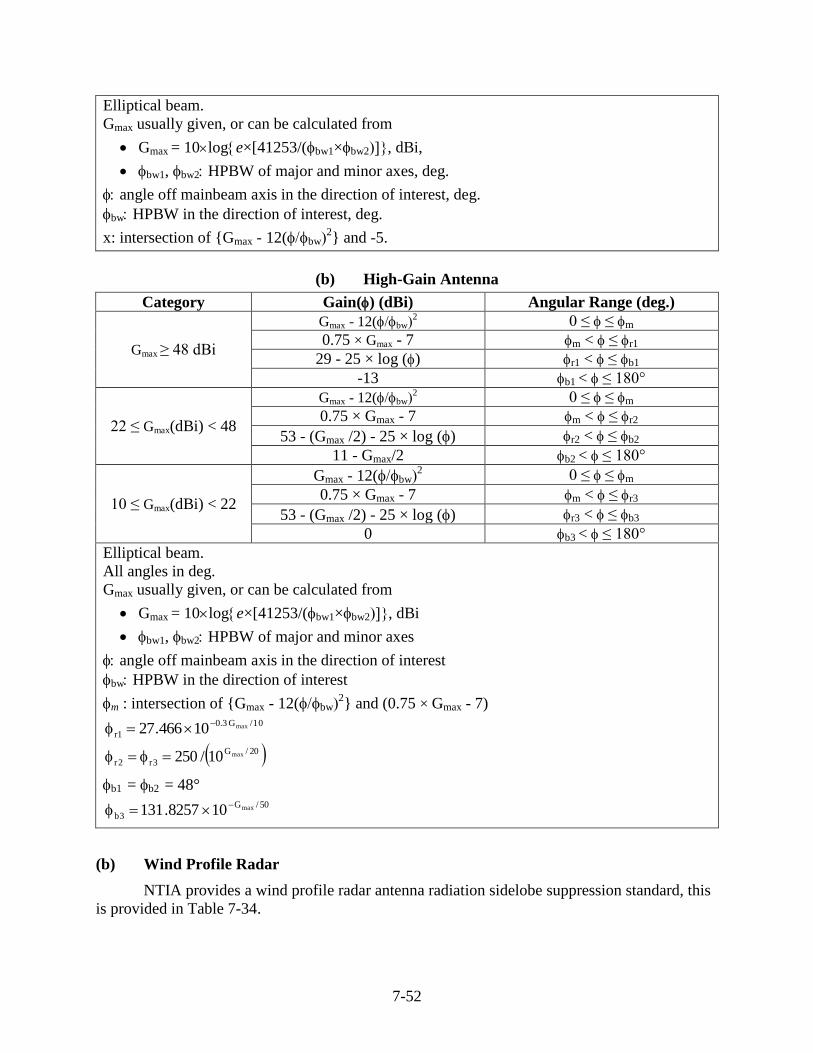
7-52
Elliptical beam.
Gmax usually given, or can be calculated from
Gmax = 10loge×[41253/(bw1×bw2, dBi,
bw1, bw2 HPBW of major and minor axes, deg.
angle off mainbeam axis in the direction of interest, deg.
bw HPBW in the direction of interest, deg.
x: intersection of {Gmax - 12(bw2} and -5.
(b) High-Gain Antenna
Category Gain() (dBi) Angular Range (deg.)
Gmax ≥ 48 dBi
Gmax - 12(bw2 0 ≤ ≤ m
0.75 × Gmax - 7 m < ≤ r1
29 - 25 × log () r1 < ≤ b1
-13 b1 < ≤ 180°
22 ≤ Gmax(dBi) < 48
Gmax - 12(bw2 0 ≤ ≤ m
0.75 × Gmax - 7 m < ≤ r2
53 - (Gmax /2) - 25 × log () r2 < ≤ b2
11 - Gmax/2 b2 < ≤ 180°
10 ≤ Gmax(dBi) < 22
Gmax - 12(bw2 0 ≤ ≤ m
0.75 × Gmax - 7 m < ≤ r3
53 - (Gmax /2) - 25 × log () r3 < ≤ b3
0 b3 < ≤ 180°
Elliptical beam.
All angles in deg.
Gmax usually given, or can be calculated from
Gmax = 10loge×[41253/(bw1×bw2, dBi
bw1, bw2 HPBW of major and minor axes
angle off mainbeam axis in the direction of interest
bw HPBW in the direction of interest
m : intersection of {Gmax - 12(bw2} and (0.75 × Gmax - 7)
10/G3.0
1rmax10466.27
20/G
3r2rmax10/250
b1 = b2 = 48° 50/G
3bmax108257.131
(b) Wind Profile Radar
NTIA provides a wind profile radar antenna radiation sidelobe suppression standard, this
is provided in Table 7-34.
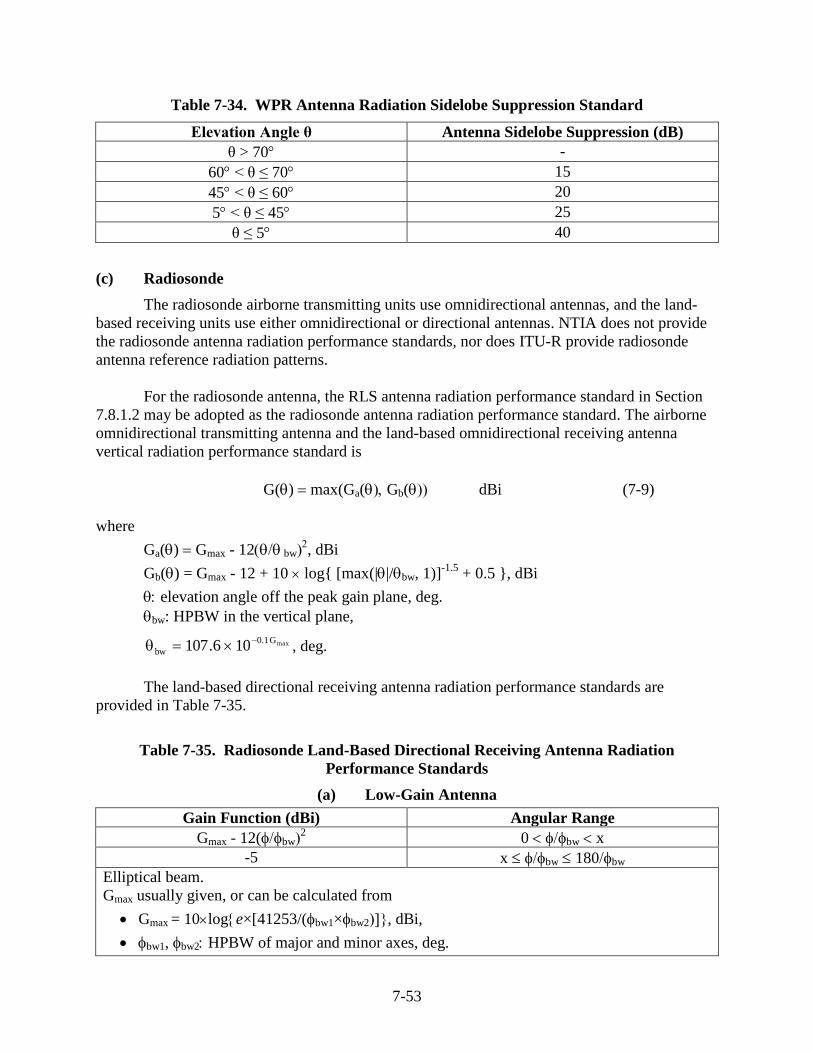
7-53
Table 7-34. WPR Antenna Radiation Sidelobe Suppression Standard
Elevation Angle θ Antenna Sidelobe Suppression (dB)
θ > 70 -
60 < θ ≤ 70 15
45 < θ ≤ 60 20
5 < θ ≤ 45 25
θ ≤ 5 40
(c) Radiosonde
The radiosonde airborne transmitting units use omnidirectional antennas, and the land-
based receiving units use either omnidirectional or directional antennas. NTIA does not provide
the radiosonde antenna radiation performance standards, nor does ITU-R provide radiosonde
antenna reference radiation patterns.
For the radiosonde antenna, the RLS antenna radiation performance standard in Section
7.8.1.2 may be adopted as the radiosonde antenna radiation performance standard. The airborne
omnidirectional transmitting antenna and the land-based omnidirectional receiving antenna
vertical radiation performance standard is
G() max(Ga(Gb( dBi (7-9)
where
Ga() Gmax - 12 bw, dBi
Gb() = Gmax - 12 + 10 log{ [max(||/bw, 1)]-1.5
+ 0.5 }, dBi
elevation angle off the peak gain plane, deg.
bw: HPBW in the vertical plane,
maxG1.0
bw 106.107
, deg.
The land-based directional receiving antenna radiation performance standards are
provided in Table 7-35.
Table 7-35. Radiosonde Land-Based Directional Receiving Antenna Radiation
Performance Standards
(a) Low-Gain Antenna
Gain Function (dBi) Angular Range
Gmax - 12(bw2 0 bw x
-5 x bw 180bw
Elliptical beam.
Gmax usually given, or can be calculated from
Gmax = 10loge×[41253/(bw1×bw2, dBi,
bw1, bw2 HPBW of major and minor axes, deg.
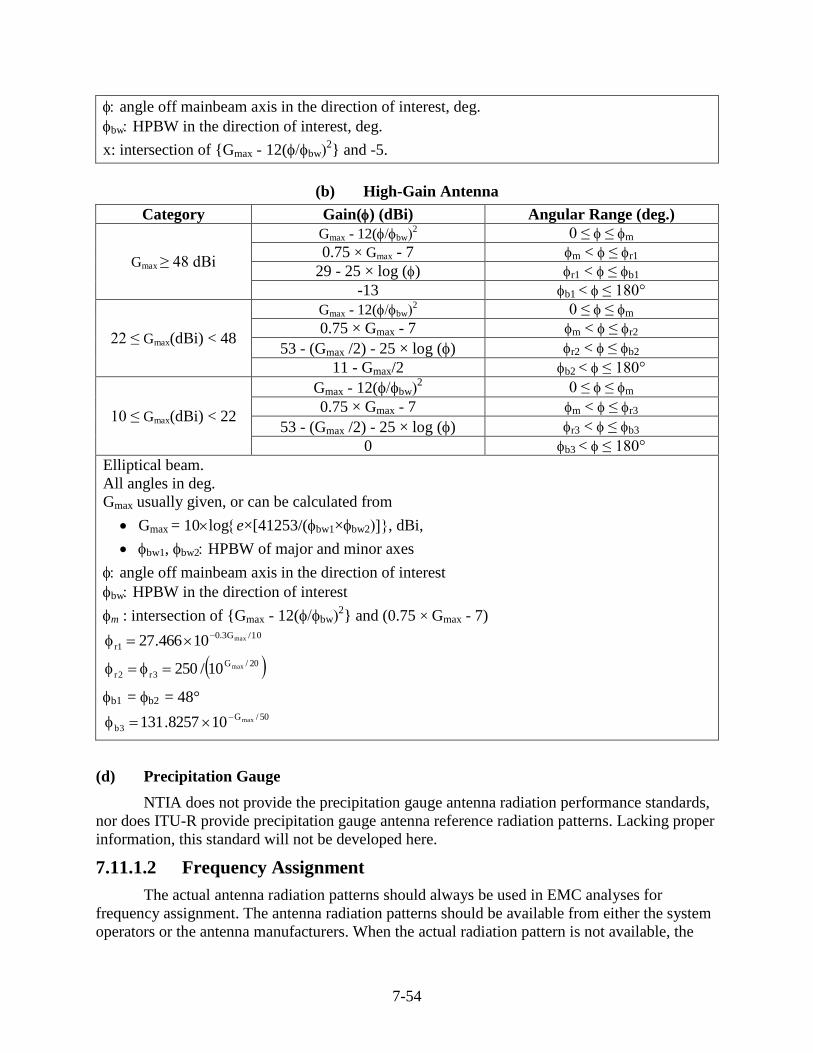
7-54
angle off mainbeam axis in the direction of interest, deg.
bw HPBW in the direction of interest, deg.
x: intersection of {Gmax - 12(bw2} and -5.
(b) High-Gain Antenna
Category Gain() (dBi) Angular Range (deg.)
Gmax ≥ 48 dBi
Gmax - 12(bw2 0 ≤ ≤ m
0.75 × Gmax - 7 m < ≤ r1
29 - 25 × log () r1 < ≤ b1
-13 b1 < ≤ 180°
22 ≤ Gmax(dBi) < 48
Gmax - 12(bw2 0 ≤ ≤ m
0.75 × Gmax - 7 m < ≤ r2
53 - (Gmax /2) - 25 × log () r2 < ≤ b2
11 - Gmax/2 b2 < ≤ 180°
10 ≤ Gmax(dBi) < 22
Gmax - 12(bw2 0 ≤ ≤ m
0.75 × Gmax - 7 m < ≤ r3
53 - (Gmax /2) - 25 × log () r3 < ≤ b3
0 b3 < ≤ 180°
Elliptical beam.
All angles in deg.
Gmax usually given, or can be calculated from
Gmax = 10loge×[41253/(bw1×bw2, dBi,
bw1, bw2 HPBW of major and minor axes
angle off mainbeam axis in the direction of interest
bw HPBW in the direction of interest
m : intersection of {Gmax - 12(bw2} and (0.75 × Gmax - 7)
10/G3.0
1rmax10466.27
20/G
3r2rmax10/250
b1 = b2 = 48° 50/G
3bmax108257.131
(d) Precipitation Gauge
NTIA does not provide the precipitation gauge antenna radiation performance standards,
nor does ITU-R provide precipitation gauge antenna reference radiation patterns. Lacking proper
information, this standard will not be developed here.
7.11.1.2 Frequency Assignment
The actual antenna radiation patterns should always be used in EMC analyses for
frequency assignment. The antenna radiation patterns should be available from either the system
operators or the antenna manufacturers. When the actual radiation pattern is not available, the
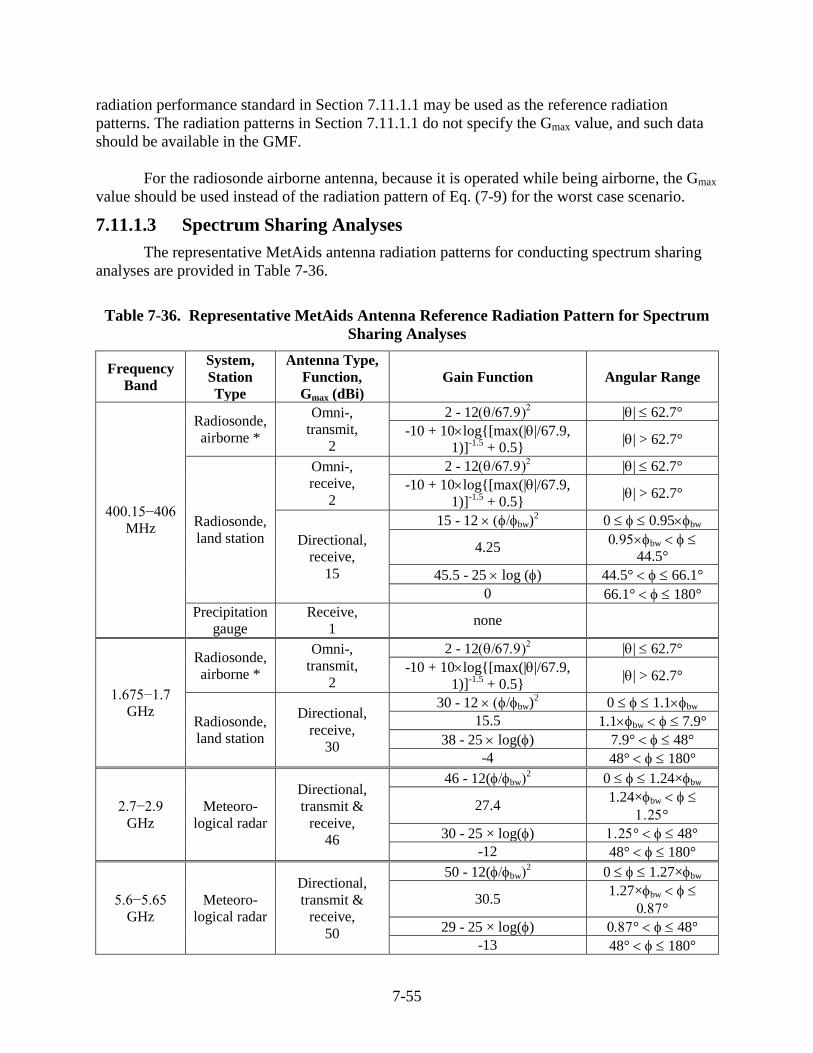
7-55
radiation performance standard in Section 7.11.1.1 may be used as the reference radiation
patterns. The radiation patterns in Section 7.11.1.1 do not specify the Gmax value, and such data
should be available in the GMF.
For the radiosonde airborne antenna, because it is operated while being airborne, the Gmax
value should be used instead of the radiation pattern of Eq. (7-9) for the worst case scenario.
7.11.1.3 Spectrum Sharing Analyses
The representative MetAids antenna radiation patterns for conducting spectrum sharing
analyses are provided in Table 7-36.
Table 7-36. Representative MetAids Antenna Reference Radiation Pattern for Spectrum
Sharing Analyses
Frequency
Band
System,
Station
Type
Antenna Type,
Function,
Gmax (dBi)
Gain Function Angular Range
400.15−406
MHz
Radiosonde,
airborne *
Omni-,
transmit,
2
2 - 12 || 62.7°
-10 + 10log{[max(||/67.9,
1)]-1.5
+ 0.5} || > 62.7°
Radiosonde,
land station
Omni-,
receive,
2
2 - 12 || 62.7°
-10 + 10log{[max(||/67.9,
1)]-1.5
+ 0.5} || > 62.7°
Directional,
receive,
15
15 - 12 bw)2 0 0.95bw
4.25 bw
44.5°
45.5 - 25 log () 44.5° 66.1°
0 66.1° 180°
Precipitation
gauge
Receive,
1 none
1.675−1.7
GHz
Radiosonde,
airborne *
Omni-,
transmit,
2
2 - 12 || 62.7°
-10 + 10log{[max(||/67.9,
1)]-1.5
+ 0.5} || > 62.7°
Radiosonde,
land station
Directional,
receive,
30
30 - 12 bw)2 0 1.1bw
15.5 1.1bw 7.9°
38 - 25 log() 7.9° 48°
-4 48° 180°
2.7−2.9
GHz
Meteoro-
logical radar
Directional,
transmit &
receive,
46
46 - 12(bw2 0 1.24×bw
27.4 1.24×bw
°
30 - 25 × log() ° 48°
-12 48° 180°
5.6−5.65
GHz
Meteoro-
logical radar
Directional,
transmit &
receive,
50
50 - 12(bw2 0 1.27×bw
30.5 1.27×bw
°
29 - 25 × log() ° 48°
-13 48° 180°
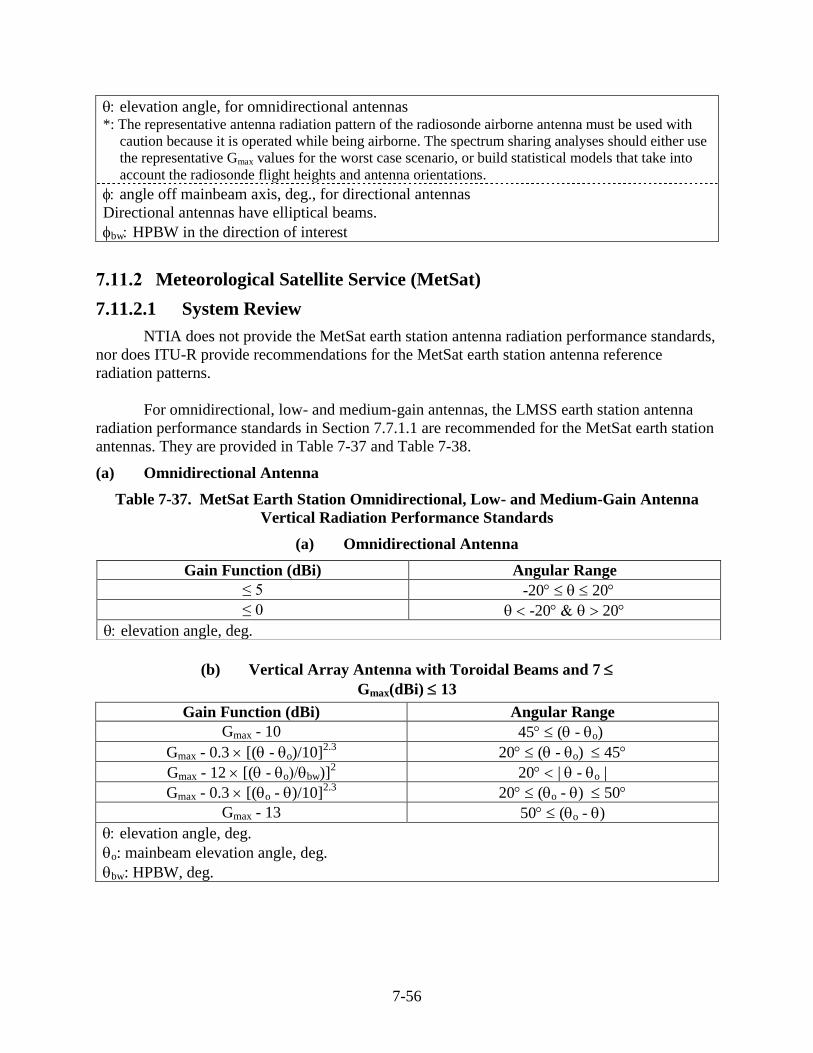
7-56
elevation angle, for omnidirectional antennas *: The representative antenna radiation pattern of the radiosonde airborne antenna must be used with
caution because it is operated while being airborne. The spectrum sharing analyses should either use
the representative Gmax values for the worst case scenario, or build statistical models that take into
account the radiosonde flight heights and antenna orientations.
angle off mainbeam axis, deg., for directional antennas
Directional antennas have elliptical beams.
bw HPBW in the direction of interest
7.11.2 Meteorological Satellite Service (MetSat)
7.11.2.1 System Review
NTIA does not provide the MetSat earth station antenna radiation performance standards,
nor does ITU-R provide recommendations for the MetSat earth station antenna reference
radiation patterns.
For omnidirectional, low- and medium-gain antennas, the LMSS earth station antenna
radiation performance standards in Section 7.7.1.1 are recommended for the MetSat earth station
antennas. They are provided in Table 7-37 and Table 7-38.
(a) Omnidirectional Antenna
Table 7-37. MetSat Earth Station Omnidirectional, Low- and Medium-Gain Antenna
Vertical Radiation Performance Standards
(a) Omnidirectional Antenna
(b) Vertical Array Antenna with Toroidal Beams and 7
Gmax(dBi) 13
Gain Function (dBi) Angular Range
Gmax - 10 45 ( - o)
Gmax - 0.3 [( - o)/10]2.3
20 ( - o) 45
Gmax - 12 [( - obw)]2 20 | - o|
Gmax - 0.3 [(o - )/10]2.3
20 (o - ) 50
Gmax - 13 50 (o - )
elevation angle, deg.
o: mainbeam elevation angle, deg.
bw: HPBW, deg.
Gain Function (dBi) Angular Range
≤ 5 -2020
≤ 0 -2020
elevation angle, deg.
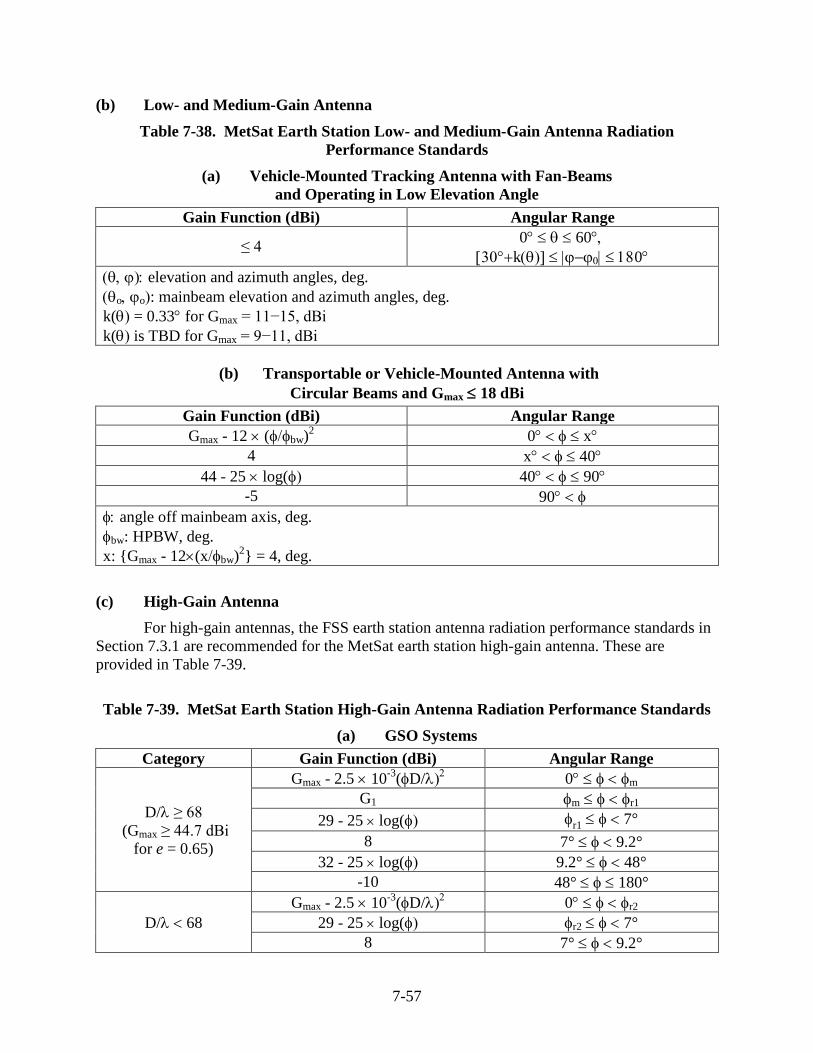
7-57
(b) Low- and Medium-Gain Antenna
Table 7-38. MetSat Earth Station Low- and Medium-Gain Antenna Radiation
Performance Standards
(a) Vehicle-Mounted Tracking Antenna with Fan-Beams
and Operating in Low Elevation Angle
Gain Function (dBi) Angular Range
≤ 4 0 60
k0
elevation and azimuth angles, deg.
oo: mainbeam elevation and azimuth angles, deg.
k(= 0.33 for Gmax = 11−15, dBi
k( is TBD for Gmax = 9−11, dBi
(b) Transportable or Vehicle-Mounted Antenna with
Circular Beams and Gmax 18 dBi
Gain Function (dBi) Angular Range
Gmax - 12 (bw)2 0 x
4 x 40
44 - 25 log( 40 90
-5 90
angle off mainbeam axis, deg.
bw: HPBW, deg.
x: {Gmax - 12(xbw)2} = 4, deg.
(c) High-Gain Antenna
For high-gain antennas, the FSS earth station antenna radiation performance standards in
Section 7.3.1 are recommended for the MetSat earth station high-gain antenna. These are
provided in Table 7-39.
Table 7-39. MetSat Earth Station High-Gain Antenna Radiation Performance Standards
(a) GSO Systems
Category Gain Function (dBi) Angular Range
D/≥ 68
(Gmax ≥ 44.7 dBi
for e = 0.65)
Gmax - 2.5 10-3
(D/ 0 m
G1 m r1
29 - 25 log( r1 7°
8 7° 9.2°
32 - 25 log( 9.2° 48°
-10 48° 180°
D/68
Gmax - 2.5 10-3
(D/ 0 r2
29 - 25 log( r2 7°
8 7° 9.2°
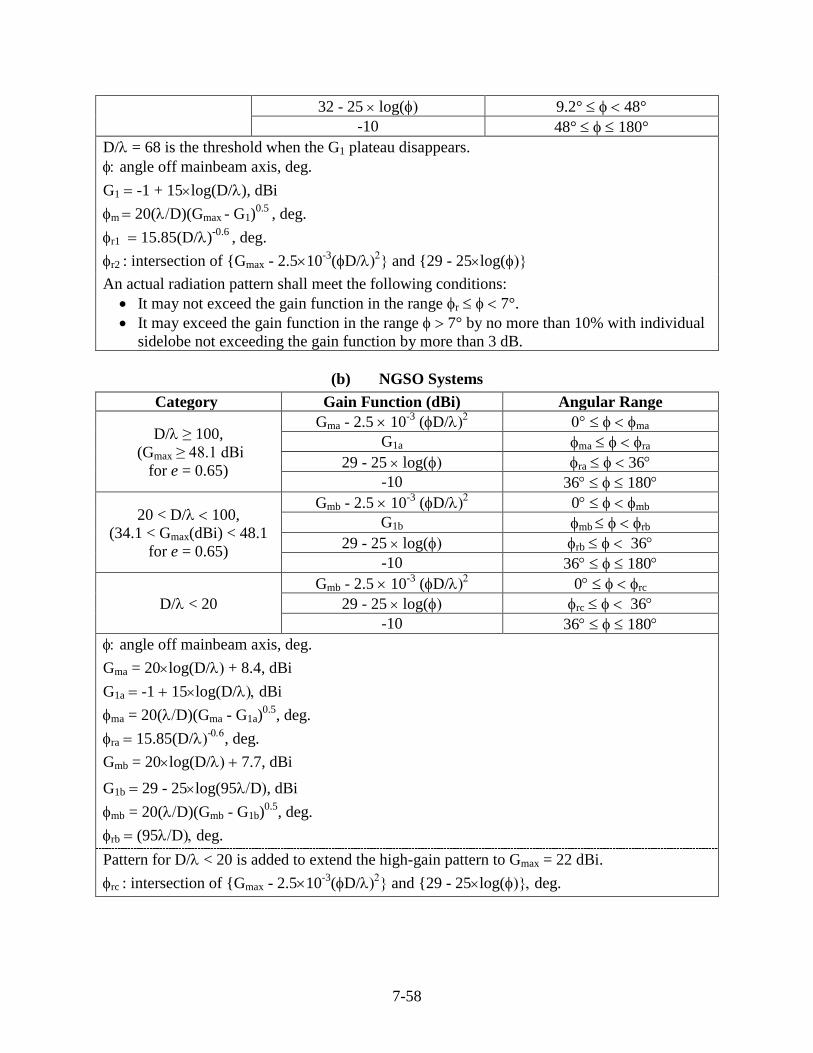
7-58
32 - 25 log( 9.2° 48°
-10 48° 180°
D/= 68 is the threshold when the G1 plateau disappears.
angle off mainbeam axis, deg.
G1 -1 + 15log(D/), dBi
m 20(D)(Gmax - G1)0.5
, deg.
r1 15.85(D/)-0.6
, deg.
r2 : intersection of {Gmax - 2.510-3
(D/ and {29 - 25log(
An actual radiation pattern shall meet the following conditions:
It may not exceed the gain function in the range r 7°.
It may exceed the gain function in the range 7° by no more than 10% with individual
sidelobe not exceeding the gain function by more than 3 dB.
(b) NGSO Systems
Category Gain Function (dBi) Angular Range
D/ ≥ 100,
(Gmax ≥ 48.1 dBi
for e = 0.65)
Gma - 2.5 10-3
(D/ ma
G1a ma ra
29 - 25 log( ra 36
-10 36 180
20 < D/ 100,
(34.1 < Gmax(dBi) < 48.1
for e = 0.65)
Gmb - 2.5 10-3
(D/ 0 mb
G1b mb rb
29 - 25 log( rb 36
-10 36 180
D/< 20
Gmb - 2.5 10-3
(D/ 0 rc
29 - 25 log( rc 36
-10 36 180
angle off mainbeam axis, deg.
Gma = 20log(D/ + 8.4, dBi
G1a -1 15log(D/dBi
ma = 20(D)(Gma - G1a)0.5
, deg.
ra 15.85(D/-
, deg.
Gmb = 20log(D/ 7.7, dBi
G1b 29 - 25log(95D, dBi
mb = 20(D)(Gmb - G1b)0.5
, deg.
rb (95Ddeg.
Pattern for D/< 20 is added to extend the high-gain pattern to Gmax = 22 dBi.
rc : intersection of {Gmax - 2.510-3
(D/ and {29 - 25log(deg.
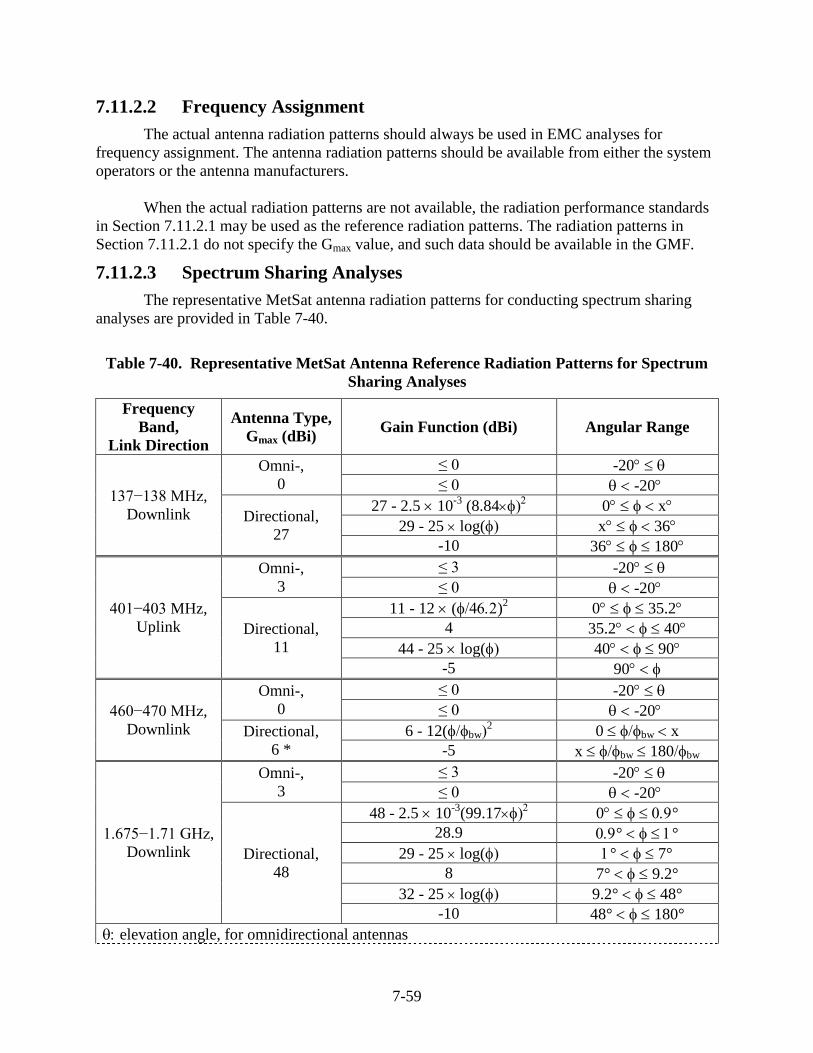
7-59
7.11.2.2 Frequency Assignment
The actual antenna radiation patterns should always be used in EMC analyses for
frequency assignment. The antenna radiation patterns should be available from either the system
operators or the antenna manufacturers.
When the actual radiation patterns are not available, the radiation performance standards
in Section 7.11.2.1 may be used as the reference radiation patterns. The radiation patterns in
Section 7.11.2.1 do not specify the Gmax value, and such data should be available in the GMF.
7.11.2.3 Spectrum Sharing Analyses
The representative MetSat antenna radiation patterns for conducting spectrum sharing
analyses are provided in Table 7-40.
Table 7-40. Representative MetSat Antenna Reference Radiation Patterns for Spectrum
Sharing Analyses
Frequency
Band,
Link Direction
Antenna Type,
Gmax (dBi) Gain Function (dBi) Angular Range
137−138 MHz,
Downlink
Omni-,
0
≤ 0 -20
≤ 0 -20
Directional,
27
27 - 2.5 10-3
(8.84 0 x
29 - 25 log( x 36
-10 36 180
401−403 MHz,
Uplink
Omni-,
3
≤ 3 -20
≤ 0 -20
Directional,
11
11 - 12 ()2 0 35.2
4 35.2 40
44 - 25 log( 40 90
-5 90
460−470 MHz,
Downlink
Omni-,
0
≤ 0 -20
≤ 0 -20
Directional,
6 *
6 - 12(bw2 0 bw x
-5 x bw 180bw
1.675−1.71 GHz,
Downlink
Omni-,
3
≤ 3 -20
≤ 0 -20
Directional,
48
48 - 2.5 10-3
(99.17 0 °
28.9 ° °
29 - 25 log( ° 7°
8 7° 9.2°
32 - 25 log( 9.2° 48°
-10 48° 180°
elevation angle, for omnidirectional antennas
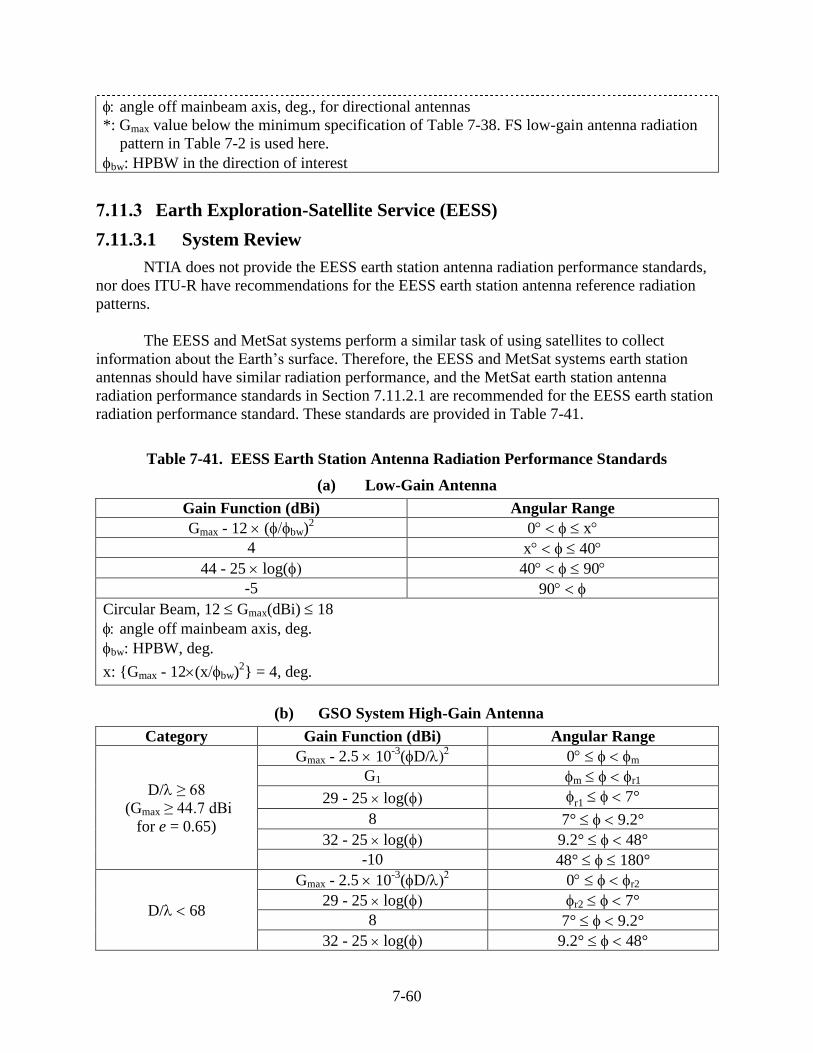
7-60
angle off mainbeam axis, deg., for directional antennas
*: Gmax value below the minimum specification of Table 7-38. FS low-gain antenna radiation
pattern in Table 7-2 is used here.
bw: HPBW in the direction of interest
7.11.3 Earth Exploration-Satellite Service (EESS)
7.11.3.1 System Review
NTIA does not provide the EESS earth station antenna radiation performance standards,
nor does ITU-R have recommendations for the EESS earth station antenna reference radiation
patterns.
The EESS and MetSat systems perform a similar task of using satellites to collect
information about the Earth’s surface. Therefore, the EESS and MetSat systems earth station
antennas should have similar radiation performance, and the MetSat earth station antenna
radiation performance standards in Section 7.11.2.1 are recommended for the EESS earth station
radiation performance standard. These standards are provided in Table 7-41.
Table 7-41. EESS Earth Station Antenna Radiation Performance Standards
(a) Low-Gain Antenna
Gain Function (dBi) Angular Range
Gmax - 12 (bw)2 0 x
4 x 40
44 - 25 log( 40 90
-5 90
Circular Beam, 12 Gmax(dBi) 18
angle off mainbeam axis, deg.
bw: HPBW, deg.
x: {Gmax - 12(xbw)2} = 4, deg.
(b) GSO System High-Gain Antenna
Category Gain Function (dBi) Angular Range
D/≥ 68
(Gmax ≥ 44.7 dBi
for e = 0.65)
Gmax - 2.5 10-3
(D/ 0 m
G1 m r1
29 - 25 log( r1 7°
8 7° 9.2°
32 - 25 log( 9.2° 48°
-10 48° 180°
D/68
Gmax - 2.5 10-3
(D/ 0 r2
29 - 25 log( r2 7°
8 7° 9.2°
32 - 25 log( 9.2° 48°
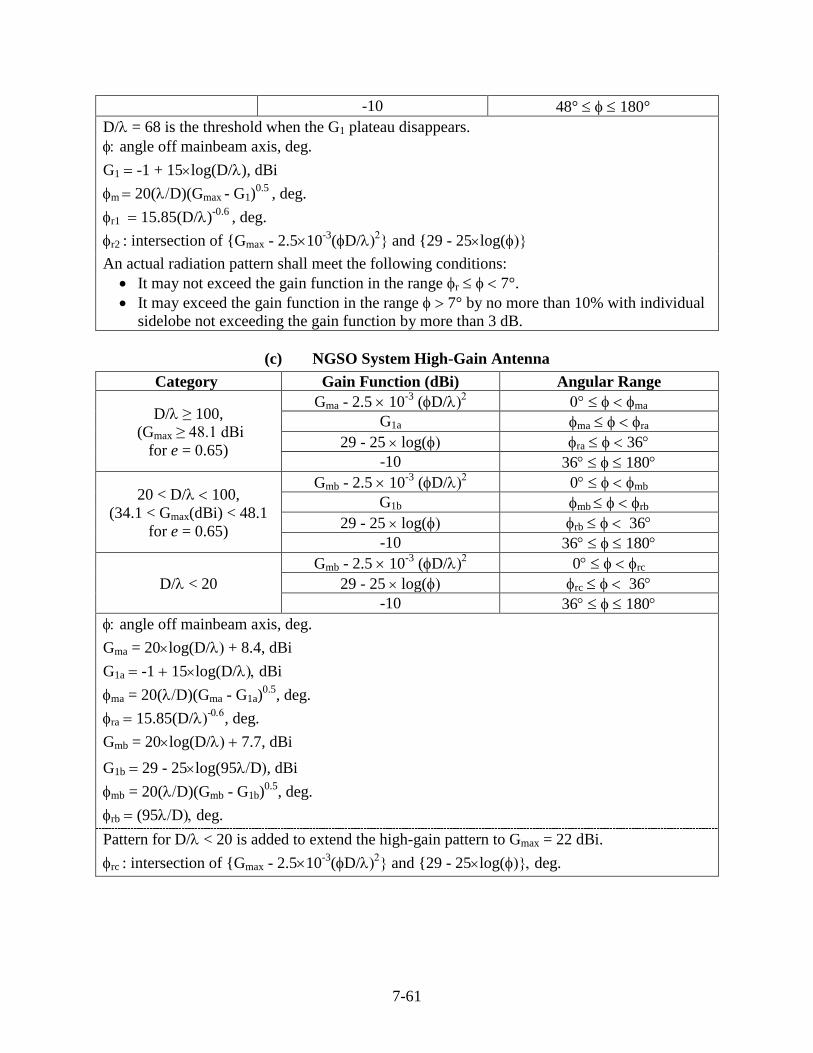
7-61
-10 48° 180°
D/= 68 is the threshold when the G1 plateau disappears.
angle off mainbeam axis, deg.
G1 -1 + 15log(D/), dBi
m 20(D)(Gmax - G1)0.5
, deg.
r1 15.85(D/)-0.6
, deg.
r2 : intersection of {Gmax - 2.510-3
(D/ and {29 - 25log(
An actual radiation pattern shall meet the following conditions:
It may not exceed the gain function in the range r 7°.
It may exceed the gain function in the range 7° by no more than 10% with individual
sidelobe not exceeding the gain function by more than 3 dB.
(c) NGSO System High-Gain Antenna
Category Gain Function (dBi) Angular Range
D/ ≥ 100,
(Gmax ≥ 48.1 dBi
for e = 0.65)
Gma - 2.5 10-3
(D/ ma
G1a ma ra
29 - 25 log( ra 36
-10 36 180
20 < D/ 100,
(34.1 < Gmax(dBi) < 48.1
for e = 0.65)
Gmb - 2.5 10-3
(D/ 0 mb
G1b mb rb
29 - 25 log( rb 36
-10 36 180
D/< 20
Gmb - 2.5 10-3
(D/ 0 rc
29 - 25 log( rc 36
-10 36 180
angle off mainbeam axis, deg.
Gma = 20log(D/ + 8.4, dBi
G1a -1 15log(D/dBi
ma = 20(D)(Gma - G1a)0.5
, deg.
ra 15.85(D/-
, deg.
Gmb = 20log(D/ 7.7, dBi
G1b 29 - 25log(95D, dBi
mb = 20(D)(Gmb - G1b)0.5
, deg.
rb (95Ddeg.
Pattern for D/< 20 is added to extend the high-gain pattern to Gmax = 22 dBi.
rc : intersection of {Gmax - 2.510-3
(D/ and {29 - 25log(deg.
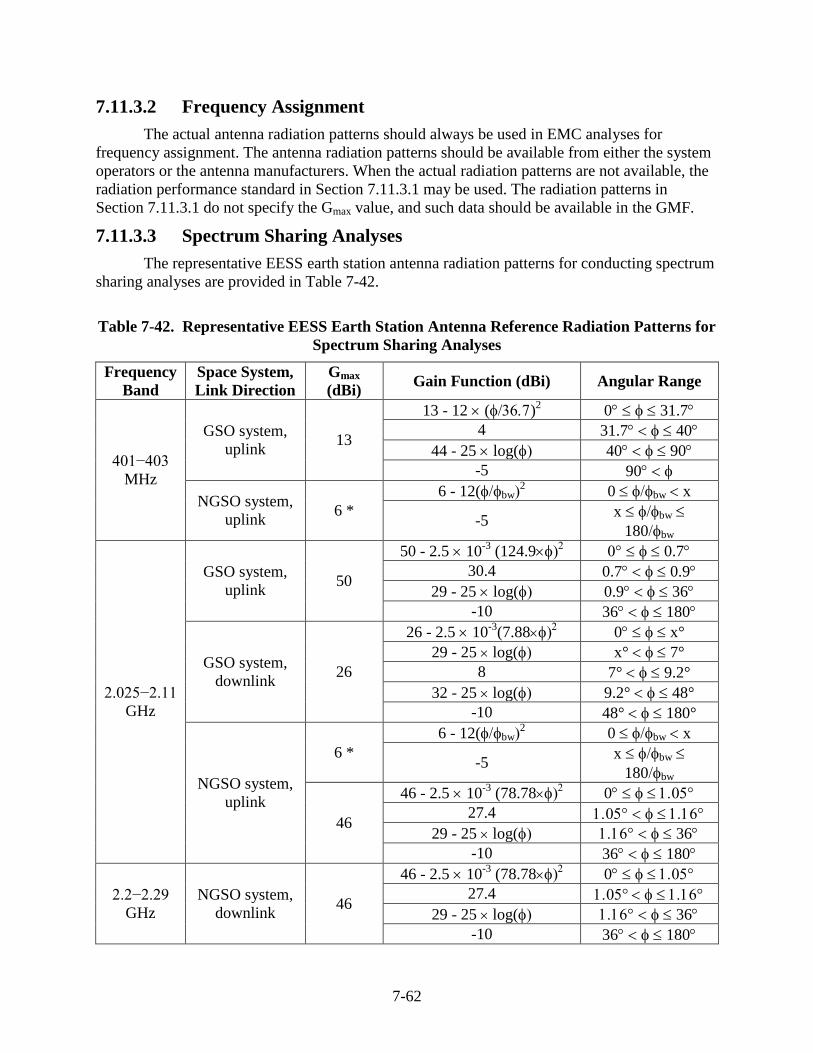
7-62
7.11.3.2 Frequency Assignment
The actual antenna radiation patterns should always be used in EMC analyses for
frequency assignment. The antenna radiation patterns should be available from either the system
operators or the antenna manufacturers. When the actual radiation patterns are not available, the
radiation performance standard in Section 7.11.3.1 may be used. The radiation patterns in
Section 7.11.3.1 do not specify the Gmax value, and such data should be available in the GMF.
7.11.3.3 Spectrum Sharing Analyses
The representative EESS earth station antenna radiation patterns for conducting spectrum
sharing analyses are provided in Table 7-42.
Table 7-42. Representative EESS Earth Station Antenna Reference Radiation Patterns for
Spectrum Sharing Analyses
Frequency
Band
Space System,
Link Direction
Gmax
(dBi) Gain Function (dBi) Angular Range
401−403
MHz
GSO system,
uplink 13
13 - 12 ()2 0 31.7
4 31.7 40
44 - 25 log( 40 90
-5 90
NGSO system,
uplink 6 *
6 - 12(bw2 0 bw x
-5 x bw
180bw
2.025−2.11
GHz
GSO system,
uplink 50
50 - 2.5 10-3
(124.9 0.7
30.4 0.7 0.9
29 - 25 log( 0.9 36
-10 36 180
GSO system,
downlink 26
26 - 2.5 10-3
(7.88 0 x°
29 - 25 log( x° 7°
8 7° 9.2°
32 - 25 log( 9.2° 48°
-10 48° 180°
NGSO system,
uplink
6 *
6 - 12(bw2 0 bw x
-5 x bw
180bw
46
46 - 2.5 10-3
(78.78 0
27.4
29 - 25 log( 36
-10 36 180
2.2−2.29
GHz
NGSO system,
downlink 46
46 - 2.5 10-3
(78.78 0
27.4
29 - 25 log( 36
-10 36 180
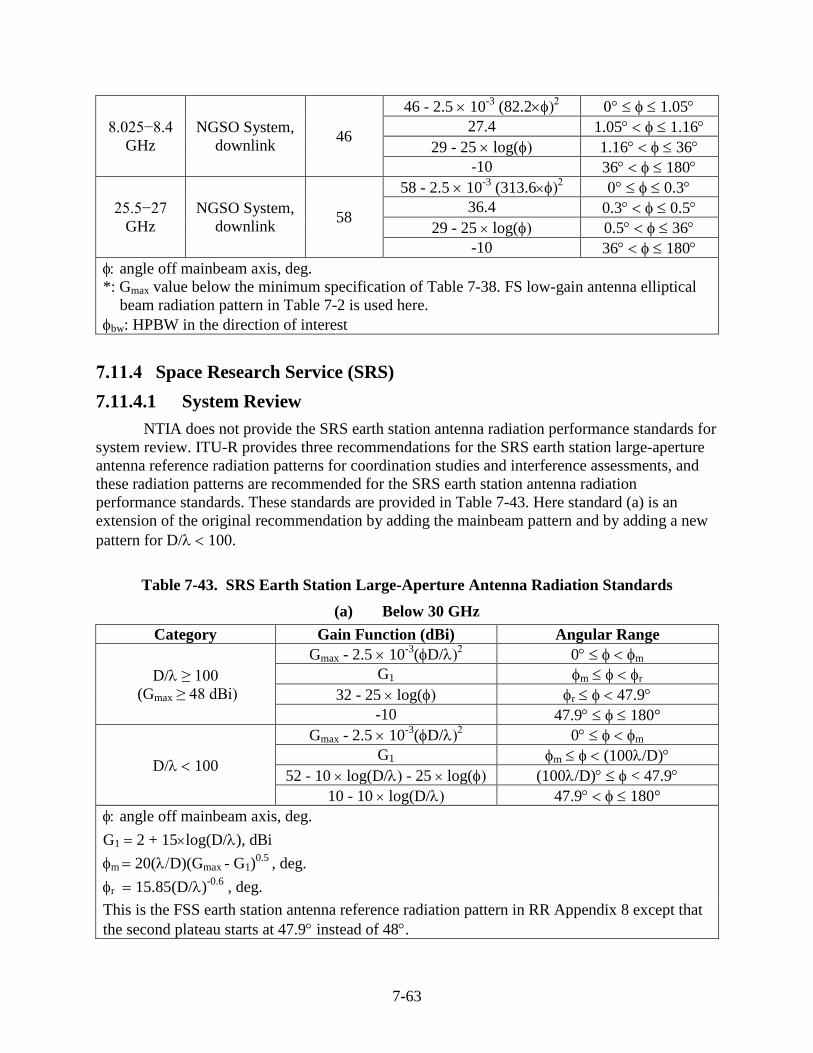
7-63
8.025−8.4
GHz
NGSO System,
downlink 46
46 - 2.5 10-3
(82.2 1.05
27.4 1.05 1.16
29 - 25 log( 1.16 36
-10 36 180
25.5−27
GHz
NGSO System,
downlink 58
58 - 2.5 10-3
(313.6 0.3
36.4 0.3 0.5
29 - 25 log( 0.5 36
-10 36 180
angle off mainbeam axis, deg.
*: Gmax value below the minimum specification of Table 7-38. FS low-gain antenna elliptical
beam radiation pattern in Table 7-2 is used here.
bw: HPBW in the direction of interest
7.11.4 Space Research Service (SRS)
7.11.4.1 System Review
NTIA does not provide the SRS earth station antenna radiation performance standards for
system review. ITU-R provides three recommendations for the SRS earth station large-aperture
antenna reference radiation patterns for coordination studies and interference assessments, and
these radiation patterns are recommended for the SRS earth station antenna radiation
performance standards. These standards are provided in Table 7-43. Here standard (a) is an
extension of the original recommendation by adding the mainbeam pattern and by adding a new
pattern for D/100.
Table 7-43. SRS Earth Station Large-Aperture Antenna Radiation Standards
(a) Below 30 GHz
Category Gain Function (dBi) Angular Range
D/≥ 100
(Gmax ≥ 48 dBi)
Gmax - 2.5 10-3
(D/ 0 m
G1 m r
32 - 25 log( r 47.9
-10 47.9 180°
D/100
Gmax - 2.5 10-3
(D/ 0 m
G1 m (100/D)
52 - 10 log(D/-25 log( (100/D) < 47.9
10 - 10 log(D/ 47.9 180°
angle off mainbeam axis, deg.
G1 2 + 15log(D/), dBi
m 20(D)(Gmax - G1)0.5
, deg.
r 15.85(D/)-0.6
, deg.
This is the FSS earth station antenna reference radiation pattern in RR Appendix 8 except that
the second plateau starts at 47.9 instead of 48.
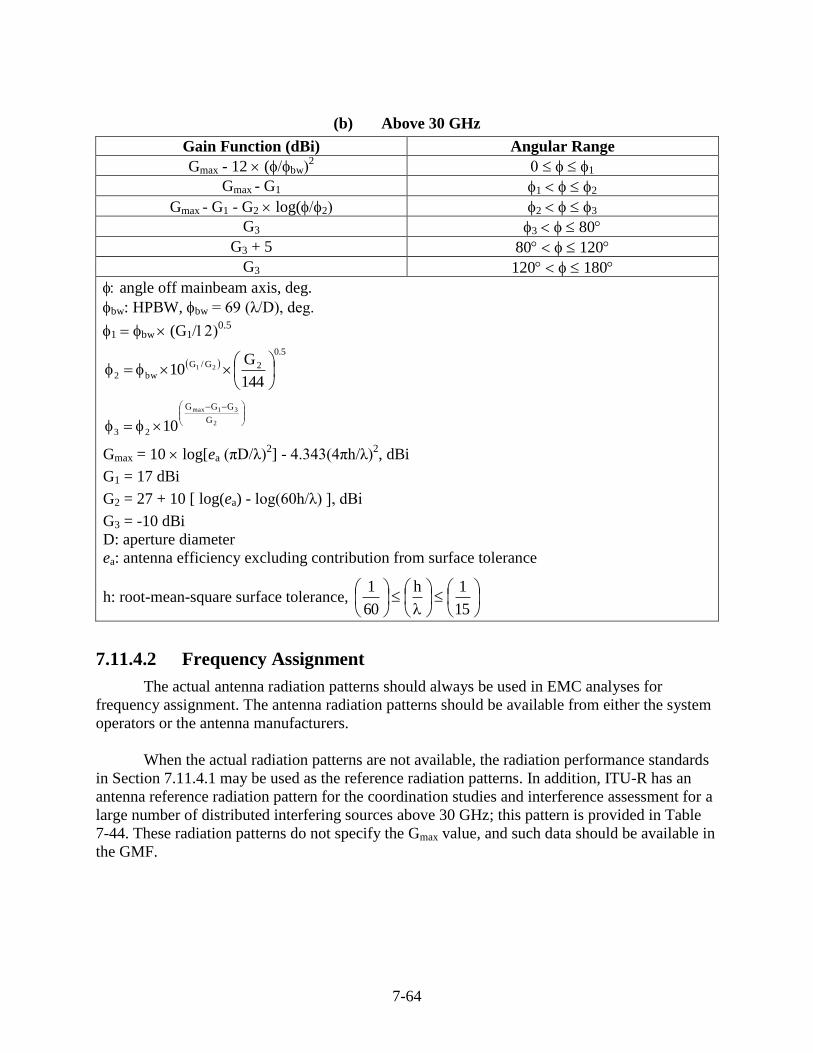
7-64
(b) Above 30 GHz
Gain Function (dBi) Angular Range
Gmax - 12 (bw2 1
Gmax - G1 1 2
Gmax - G1 - G2 log(2 2 3
G3 3 80
G3 + 5 80 120
G3 120 180
angle off mainbeam axis, deg.
bw: HPBW, bw = 69 (λ/D), deg.
1 bw (G10.5
5.0
2G/G
bw2144
G10 21
2
31max
G
GGG
23 10
Gmax = 10 log[ea (πD/λ)2] - 4.343(4πh/λ)
2, dBi
G1 = 17 dBi
G2 = 27 + 10 [ log(ea) - log(60h/λ) ], dBi
G3 = -10 dBi
D: aperture diameter
ea: antenna efficiency excluding contribution from surface tolerance
h: root-mean-square surface tolerance,
15
1h
60
1
7.11.4.2 Frequency Assignment
The actual antenna radiation patterns should always be used in EMC analyses for
frequency assignment. The antenna radiation patterns should be available from either the system
operators or the antenna manufacturers.
When the actual radiation patterns are not available, the radiation performance standards
in Section 7.11.4.1 may be used as the reference radiation patterns. In addition, ITU-R has an
antenna reference radiation pattern for the coordination studies and interference assessment for a
large number of distributed interfering sources above 30 GHz; this pattern is provided in Table
7-44. These radiation patterns do not specify the Gmax value, and such data should be available in
the GMF.
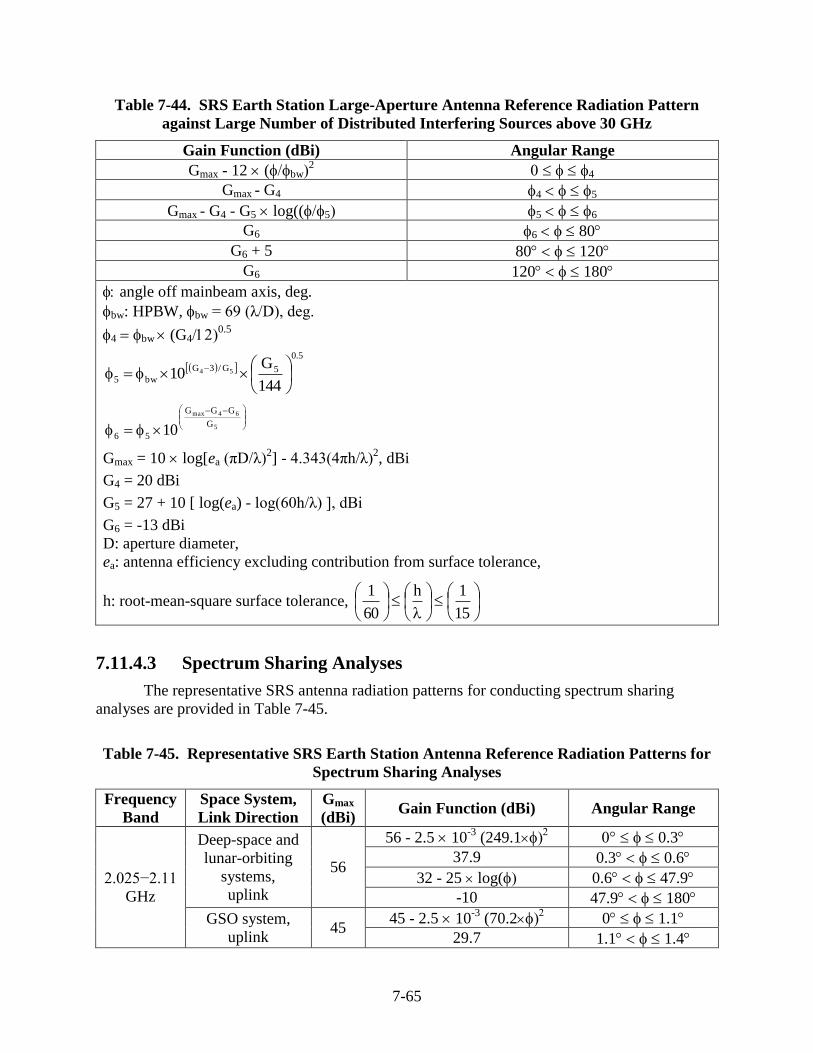
7-65
Table 7-44. SRS Earth Station Large-Aperture Antenna Reference Radiation Pattern
against Large Number of Distributed Interfering Sources above 30 GHz
Gain Function (dBi) Angular Range
Gmax - 12 (bw2 4
Gmax - G4 4 5
Gmax - G4 - G5 log((5 5 6
G6 6 80
G6 + 5 80 120
G6 120 180
angle off mainbeam axis, deg.
bw: HPBW, bw = 69 (λ/D), deg.
4 bw (G40.5
5.0
5G/3G
bw5144
G10 54
5
64max
G
GGG
56 10
Gmax = 10 log[ea (πD/λ)2] - 4.343(4πh/λ)
2, dBi
G4 = 20 dBi
G5 = 27 + 10 [ log(ea) - log(60h/λ) ], dBi
G6 = -13 dBi
D: aperture diameter,
ea: antenna efficiency excluding contribution from surface tolerance,
h: root-mean-square surface tolerance,
15
1h
60
1
7.11.4.3 Spectrum Sharing Analyses
The representative SRS antenna radiation patterns for conducting spectrum sharing
analyses are provided in Table 7-45.
Table 7-45. Representative SRS Earth Station Antenna Reference Radiation Patterns for
Spectrum Sharing Analyses
Frequency
Band
Space System,
Link Direction
Gmax
(dBi) Gain Function (dBi) Angular Range
2.025−2.11
GHz
Deep-space and
lunar-orbiting
systems,
uplink
56
56 - 2.5 10-3
(249.1 0.3
37.9 0.3 0.6
32 - 25 log( 0.6 47.9
-10 47.9 180
GSO system,
uplink 45
45 - 2.5 10-3
(70.2 0 1.1
29.7 1.1 1.4
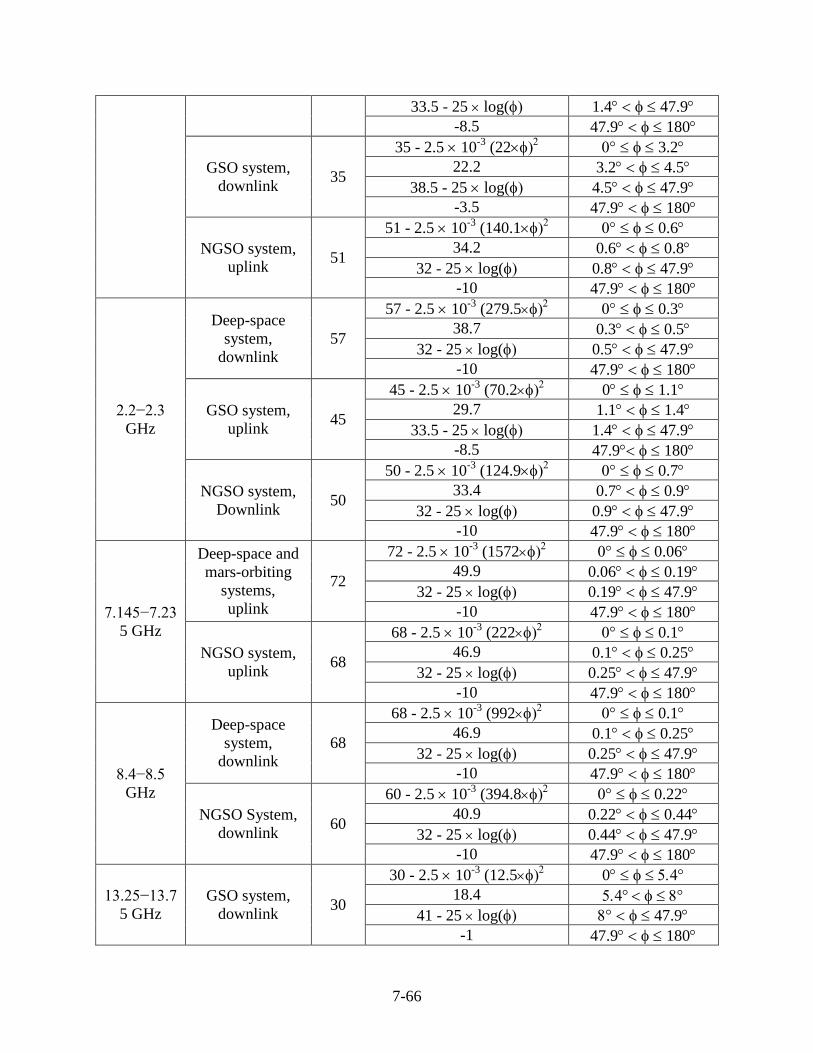
7-66
33.5 - 25 log( 1.4 47.9
-8.5 47.9 180
GSO system,
downlink 35
35 - 2.5 10-3
(22 3.2
22.2 3.2 4.5
38.5 - 25 log( 4.5 47.9
-3.5 47.9 180
NGSO system,
uplink 51
51 - 2.5 10-3
(140.1 0.6
34.2 0.6 0.8
32 - 25 log( 0.8 47.9
-10 47.9 180
2.2−2.3
GHz
Deep-space
system,
downlink
57
57 - 2.5 10-3
(279.5 0.3
38.7 0.3 0.5
32 - 25 log( 0.5 47.9
-10 47.9 180
GSO system,
uplink 45
45 - 2.5 10-3
(70.2 0 1.1
29.7 1.1 1.4
33.5 - 25 log( 1.4 47.9
-8.5 47.9 180
NGSO system,
Downlink 50
50 - 2.5 10-3
(124.9 0.7
33.4 0.7 0.9
32 - 25 log( 0.9 47.9
-10 47.9 180
7.145−7.23
5 GHz
Deep-space and
mars-orbiting
systems,
uplink
72
72 - 2.5 10-3
(1572 0.06
49.9 0.06 0.19
32 - 25 log( 0.19 47.9
-10 47.9 180
NGSO system,
uplink 68
68 - 2.5 10-3
(222 0.1
46.9 0.1 0.25
32 - 25 log( 0.25 47.9
-10 47.9 180
8.4−8.5
GHz
Deep-space
system,
downlink
68
68 - 2.5 10-3
(992 0.1
46.9 0.1 0.25
32 - 25 log( 0.25 47.9
-10 47.9 180
NGSO System,
downlink 60
60 - 2.5 10-3
(394.8 0.22
40.9 0.22 0.44
32 - 25 log( 0.44 47.9
-10 47.9 180
13.25−13.7
5 GHz
GSO system,
downlink 30
30 - 2.5 10-3
(12.5 0
18.4
41 - 25 log( 47.9
-1 47.9 180
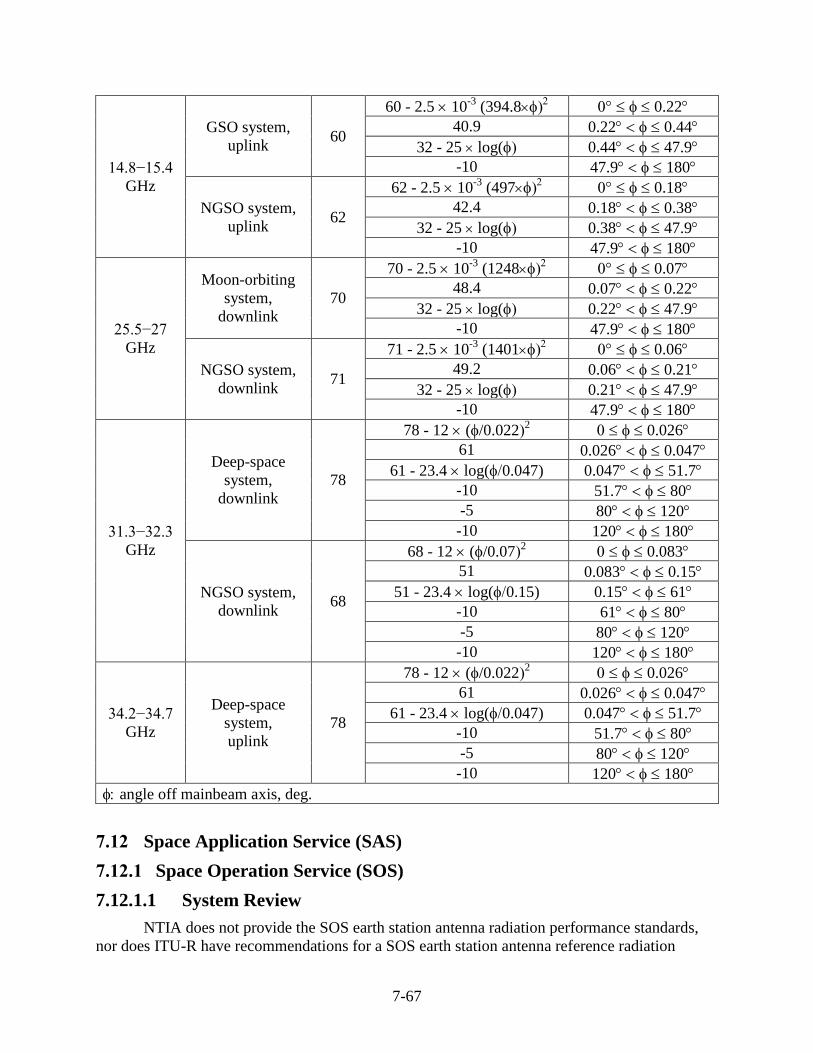
7-67
14.8−15.4
GHz
GSO system,
uplink 60
60 - 2.5 10-3
(394.8 0.22
40.9 0.22 0.44
32 - 25 log( 0.44 47.9
-10 47.9 180
NGSO system,
uplink 62
62 - 2.5 10-3
(497 0.18
42.4 0.18 0.38
32 - 25 log( 0.38 47.9
-10 47.9 180
25.5−27
GHz
Moon-orbiting
system,
downlink
70
70 - 2.5 10-3
(1248 0.07
48.4 0.07 0.22
32 - 25 log( 0.22 47.9
-10 47.9 180
NGSO system,
downlink 71
71 - 2.5 10-3
(1401 0.06
49.2 0.06 0.21
32 - 25 log( 0.21 47.9
-10 47.9 180
31.3−32.3
GHz
Deep-space
system,
downlink
78
78 - 12 (/0.0222 0.026
61 0.026 0.047
61 - 23.4 log(0.047) 0.047 51.7
-10 51.7 80
-5 80 120
-10 120 180
NGSO system,
downlink 68
68 - 12 (/0.072 0.083
51 0.083 0.15
51 - 23.4 log(0.15) 0.15 61
-10 61 80
-5 80 120
-10 120 180
34.2−34.7
GHz
Deep-space
system,
uplink
78
78 - 12 (/0.0222 0.026
61 0.026 0.047
61 - 23.4 log(0.047) 0.047 51.7
-10 51.7 80
-5 80 120
-10 120 180
angle off mainbeam axis, deg.
7.12 Space Application Service (SAS)
7.12.1 Space Operation Service (SOS)
7.12.1.1 System Review
NTIA does not provide the SOS earth station antenna radiation performance standards,
nor does ITU-R have recommendations for a SOS earth station antenna reference radiation
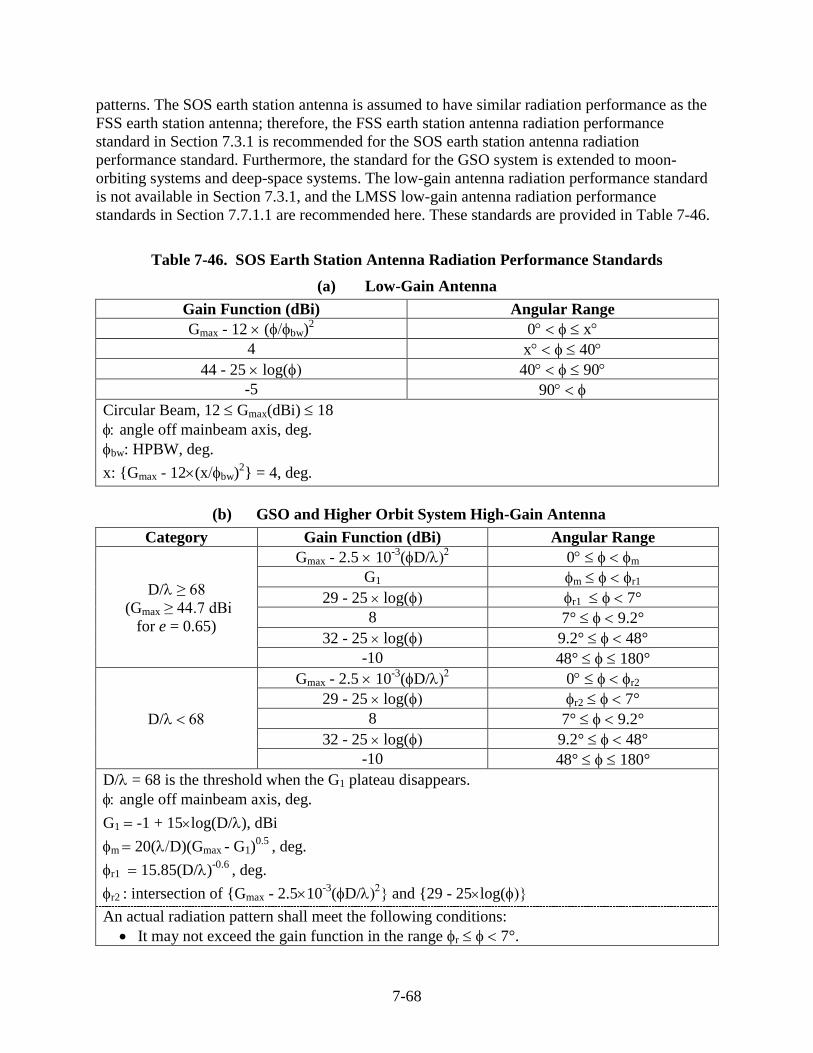
7-68
patterns. The SOS earth station antenna is assumed to have similar radiation performance as the
FSS earth station antenna; therefore, the FSS earth station antenna radiation performance
standard in Section 7.3.1 is recommended for the SOS earth station antenna radiation
performance standard. Furthermore, the standard for the GSO system is extended to moon-
orbiting systems and deep-space systems. The low-gain antenna radiation performance standard
is not available in Section 7.3.1, and the LMSS low-gain antenna radiation performance
standards in Section 7.7.1.1 are recommended here. These standards are provided in Table 7-46.
Table 7-46. SOS Earth Station Antenna Radiation Performance Standards
(a) Low-Gain Antenna
Gain Function (dBi) Angular Range
Gmax - 12 (bw)2 0 x
4 x 40
44 - 25 log( 40 90
-5 90
Circular Beam, 12 Gmax(dBi) 18
angle off mainbeam axis, deg.
bw: HPBW, deg.
x: {Gmax - 12(xbw)2} = 4, deg.
(b) GSO and Higher Orbit System High-Gain Antenna
Category Gain Function (dBi) Angular Range
D/≥ 68
(Gmax ≥ 44.7 dBi
for e = 0.65)
Gmax - 2.5 10-3
(D/ 0 m
G1 m r1
29 - 25 log( r1 7°
8 7° 9.2°
32 - 25 log( 9.2° 48°
-10 48° 180°
D/
Gmax - 2.5 10-3
(D/ 0 r2
29 - 25 log( r2 7°
8 7° 9.2°
32 - 25 log( 9.2° 48°
-10 48° 180°
D/= 68 is the threshold when the G1 plateau disappears.
angle off mainbeam axis, deg.
G1 -1 + 15log(D/), dBi
m 20(D)(Gmax - G1)0.5
, deg.
r1 15.85(D/)-0.6
, deg.
r2 : intersection of {Gmax - 2.510-3
(D/ and {29 - 25log(
An actual radiation pattern shall meet the following conditions:
It may not exceed the gain function in the range r 7°.
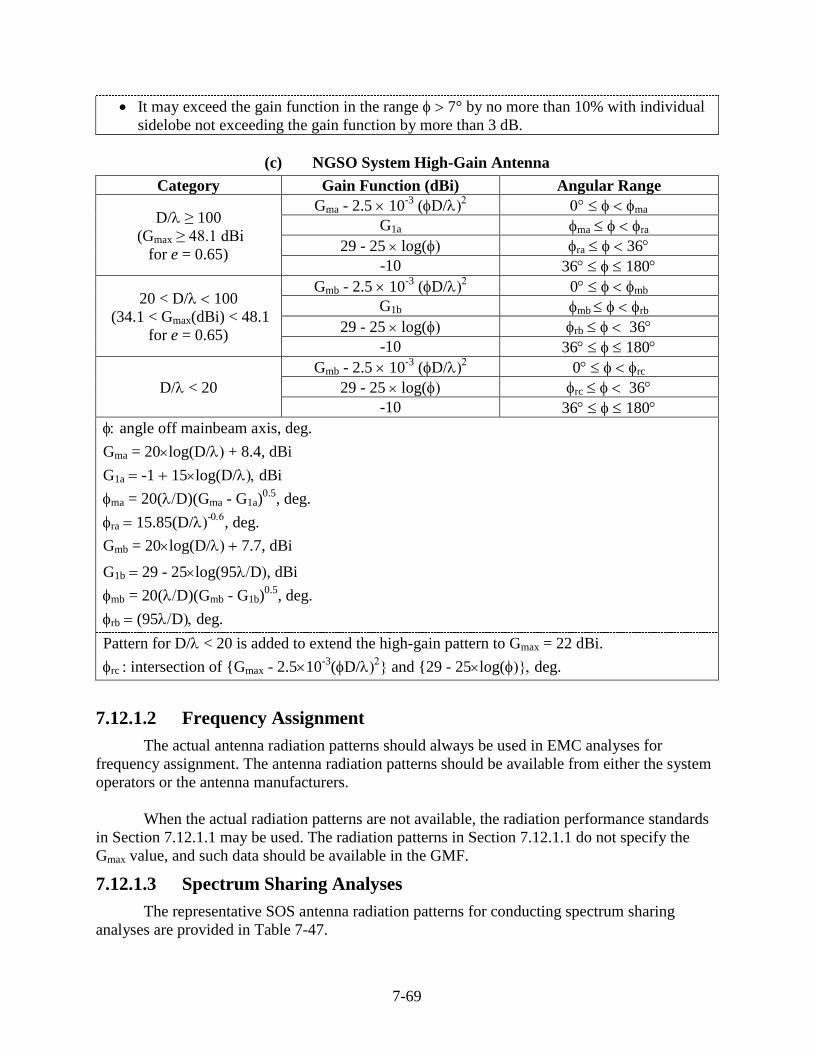
7-69
It may exceed the gain function in the range 7° by no more than 10% with individual
sidelobe not exceeding the gain function by more than 3 dB.
(c) NGSO System High-Gain Antenna
Category Gain Function (dBi) Angular Range
D/ ≥ 100
(Gmax ≥ 48.1 dBi
for e = 0.65)
Gma - 2.5 10-3
(D/ ma
G1a ma ra
29 - 25 log( ra 36
-10 36 180
20 < D/ 100
(34.1 < Gmax(dBi) < 48.1
for e = 0.65)
Gmb - 2.5 10-3
(D/ 0 mb
G1b mb rb
29 - 25 log( rb 36
-10 36 180
D/< 20
Gmb - 2.5 10-3
(D/ 0 rc
29 - 25 log( rc 36
-10 36 180
angle off mainbeam axis, deg.
Gma = 20log(D/ + 8.4, dBi
G1a -1 15log(D/dBi
ma = 20(D)(Gma - G1a)0.5
, deg.
ra 15.85(D/-
, deg.
Gmb = 20log(D/ 7.7, dBi
G1b 29 - 25log(95D, dBi
mb = 20(D)(Gmb - G1b)0.5
, deg.
rb (95Ddeg.
Pattern for D/< 20 is added to extend the high-gain pattern to Gmax = 22 dBi.
rc : intersection of {Gmax - 2.510-3
(D/ and {29 - 25log(deg.
7.12.1.2 Frequency Assignment
The actual antenna radiation patterns should always be used in EMC analyses for
frequency assignment. The antenna radiation patterns should be available from either the system
operators or the antenna manufacturers.
When the actual radiation patterns are not available, the radiation performance standards
in Section 7.12.1.1 may be used. The radiation patterns in Section 7.12.1.1 do not specify the
Gmax value, and such data should be available in the GMF.
7.12.1.3 Spectrum Sharing Analyses
The representative SOS antenna radiation patterns for conducting spectrum sharing
analyses are provided in Table 7-47.
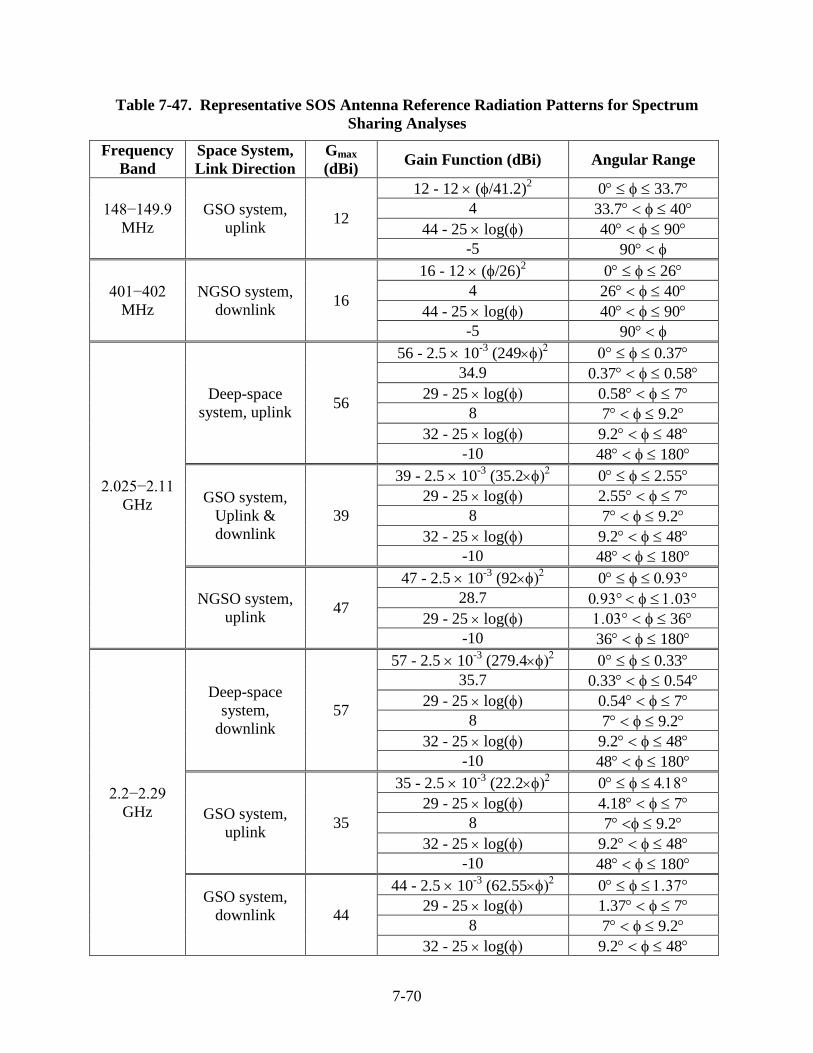
7-70
Table 7-47. Representative SOS Antenna Reference Radiation Patterns for Spectrum
Sharing Analyses
Frequency
Band
Space System,
Link Direction
Gmax
(dBi) Gain Function (dBi) Angular Range
148−149.9
MHz
GSO system,
uplink 12
12 - 12 (/41.2)2 0 33.7
4 33.7 40
44 - 25 log( 40 90
-5 90
401−402
MHz
NGSO system,
downlink 16
16 - 12 (/26)2 0 26
4 26 40
44 - 25 log( 40 90
-5 90
2.025−2.11
GHz
Deep-space
system, uplink 56
56 - 2.5 10-3
(249 0.37
34.9 0.37 0.58
29 - 25 log( 0.58 7
8 7 9.2
32 - 25 log( 9.2 48
-10 48 180
GSO system,
Uplink &
downlink
39
39 - 2.5 10-3
(35.2 0 2.55
29 - 25 log( 2.55 7
8 7 9.2
32 - 25 log( 9.2 48
-10 48 180
NGSO system,
uplink 47
47 - 2.5 10-3
(92 0
28.7
29 - 25 log( 36
-10 36 180
2.2−2.29
GHz
Deep-space
system,
downlink
57
57 - 2.5 10-3
(279.4 0.33
35.7 0.33 0.54
29 - 25 log( 0.54 7
8 7 9.2
32 - 25 log( 9.2 48
-10 48 180
GSO system,
uplink 35
35 - 2.5 10-3
(22.2 0
29 - 25 log( 4.18 7
8 7 9.2
32 - 25 log( 9.2 48
-10 48 180
GSO system,
downlink
44
44 - 2.5 10-3
(62.55 0
29 - 25 log( 1.37 7
8 7 9.2
32 - 25 log( 9.2 48
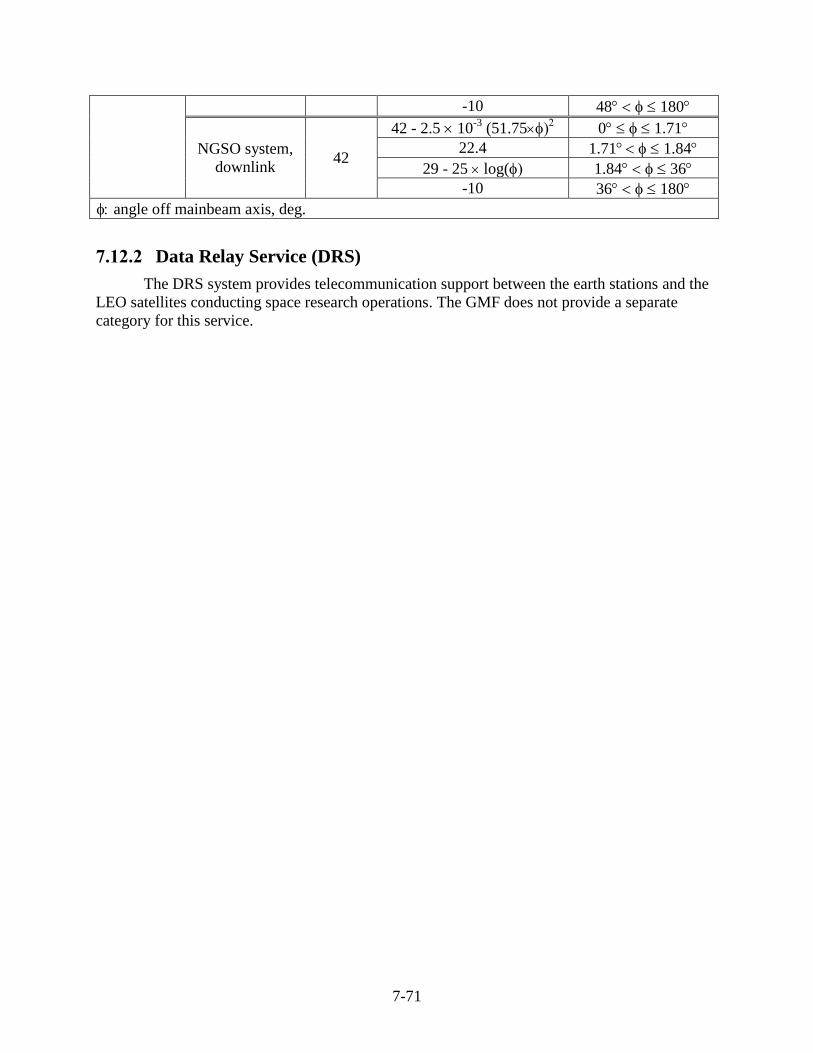
7-71
-10 48 180
NGSO system,
downlink 42
42 - 2.5 10-3
(51.75 0 1.71
22.4 1.71 1.84
29 - 25 log( 1.84 36
-10 36 180
angle off mainbeam axis, deg.
7.12.2 Data Relay Service (DRS)
The DRS system provides telecommunication support between the earth stations and the
LEO satellites conducting space research operations. The GMF does not provide a separate
category for this service.