Embed Size (px)
Citation preview
Investment Thesis
I initiate a BUY recommendation on Antero Resources (AR) with a price
target of $38 by taking the average of my range of $36-$40, which were
derived from altering the Bloomberg DCF model based on historical trends
and future guidance along with a Comparables Valuation. Antero is well
positioned to benefit in the short and long term as the company will continue
to increase revenue as Natural Gas (NG1) and Natural Gas Liquid (NGLs)
commodity prices go down. Effective cost-cutting measures have been taken
to weather the recently low commodity prices of NG1 and NGLs which
allowed Antero to produce a profit in FY 2015 along with Q1 and Q2 2016.
Future demand for Natural Gas looks promising as it encompasses many
economic and environmental benefits which will benefit AR going forward.
Antero Resources (AR) Time Horizon | 15 Months
Equity | Energy, Oil and Natural Gas Exploration and Production Price: $24.62
Price Objective: $38.00
Recommendation: BUY December 21, 2016
.
Equity Characteristics
Avg 1 Day Volume: 3,389,899
Market Cap: 8,330M
Dividend Yield: N/A
YTD Yield: 22.57%
Total Return 1 Year: 37.52%
Total Return 1 Month: 8.71%
Total Return 6 Months:-5.72%
P/E Ratio: 52.6
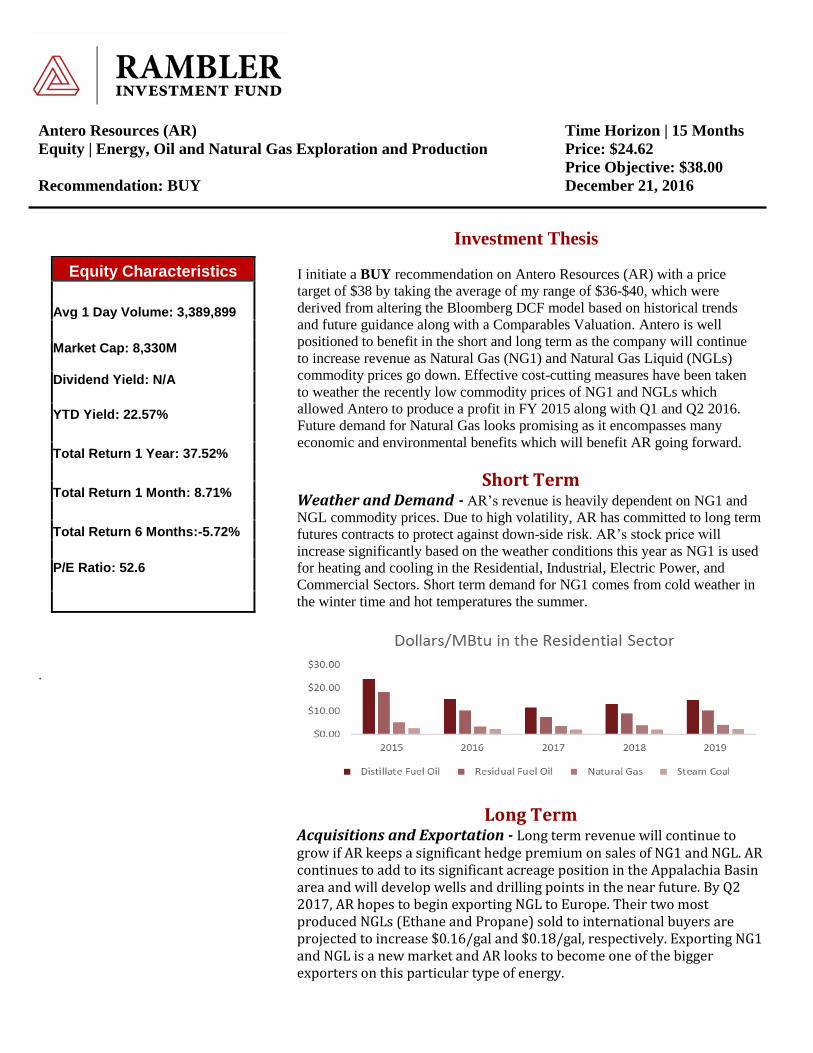
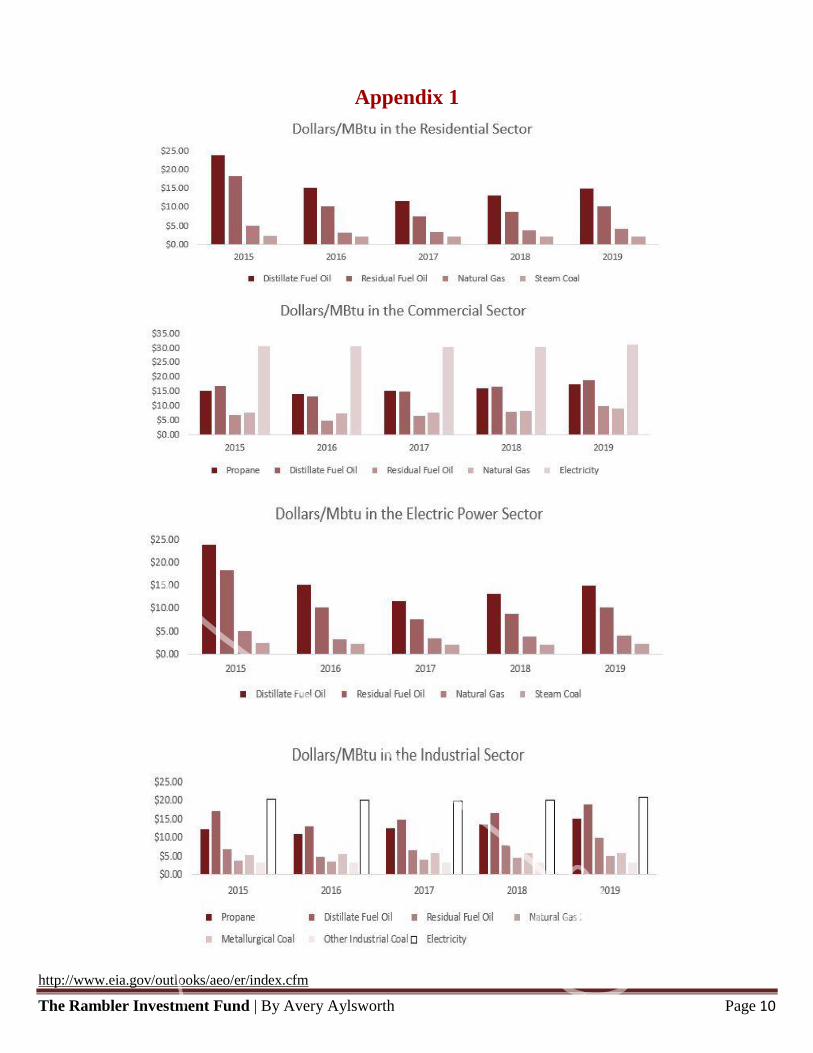
Short Term Weather and Demand - AR’s revenue is heavily dependent on NG1 and
NGL commodity prices. Due to high volatility, AR has committed to long term
futures contracts to protect against down-side risk. AR’s stock price will
increase significantly based on the weather conditions this year as NG1 is used
for heating and cooling in the Residential, Industrial, Electric Power, and
Commercial Sectors. Short term demand for NG1 comes from cold weather in
the winter time and hot temperatures the summer.
Long Term
Acquisitions and Exportation - Long term revenue will continue to grow if AR keeps a significant hedge premium on sales of NG1 and NGL. AR continues to add to its significant acreage position in the Appalachia Basin area and will develop wells and drilling points in the near future. By Q2 2017, AR hopes to begin exporting NGL to Europe. Their two most produced NGLs (Ethane and Propane) sold to international buyers are projected to increase $0.16/gal and $0.18/gal, respectively. Exporting NG1 and NGL is a new market and AR looks to become one of the bigger exporters on this particular type of energy.
The Rambler Investment Fund | By Avery Aylsworth Page 2
Macroeconomic Environment
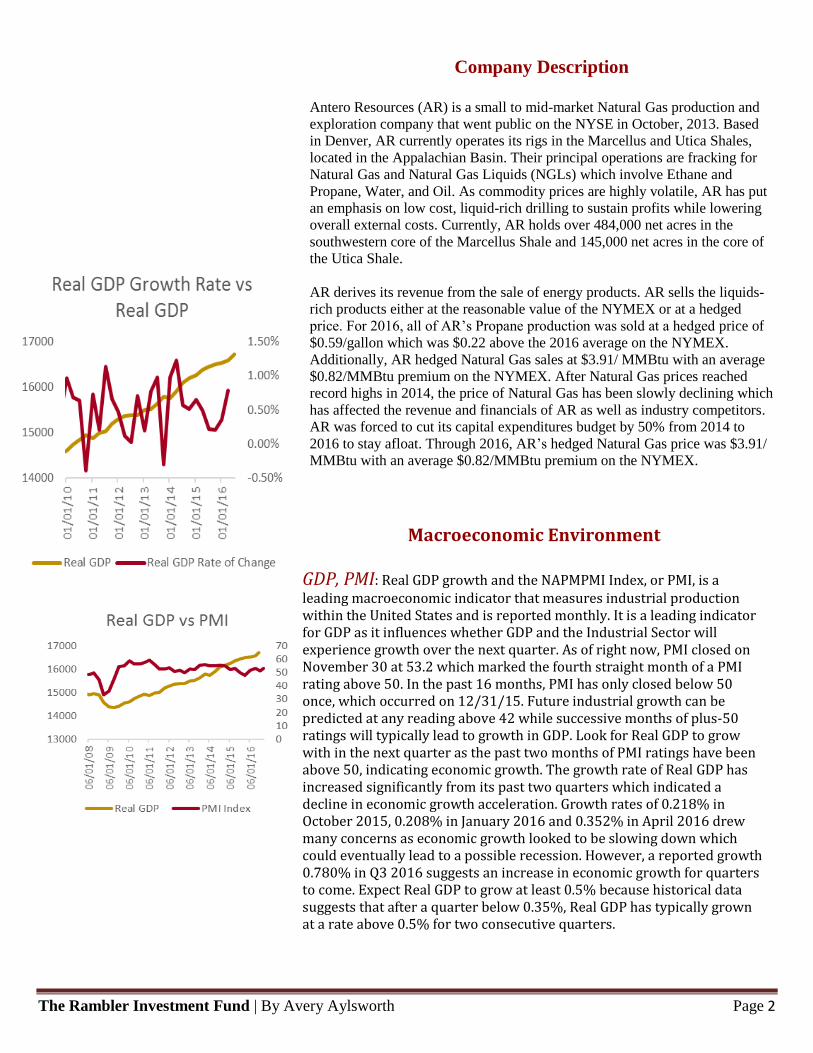
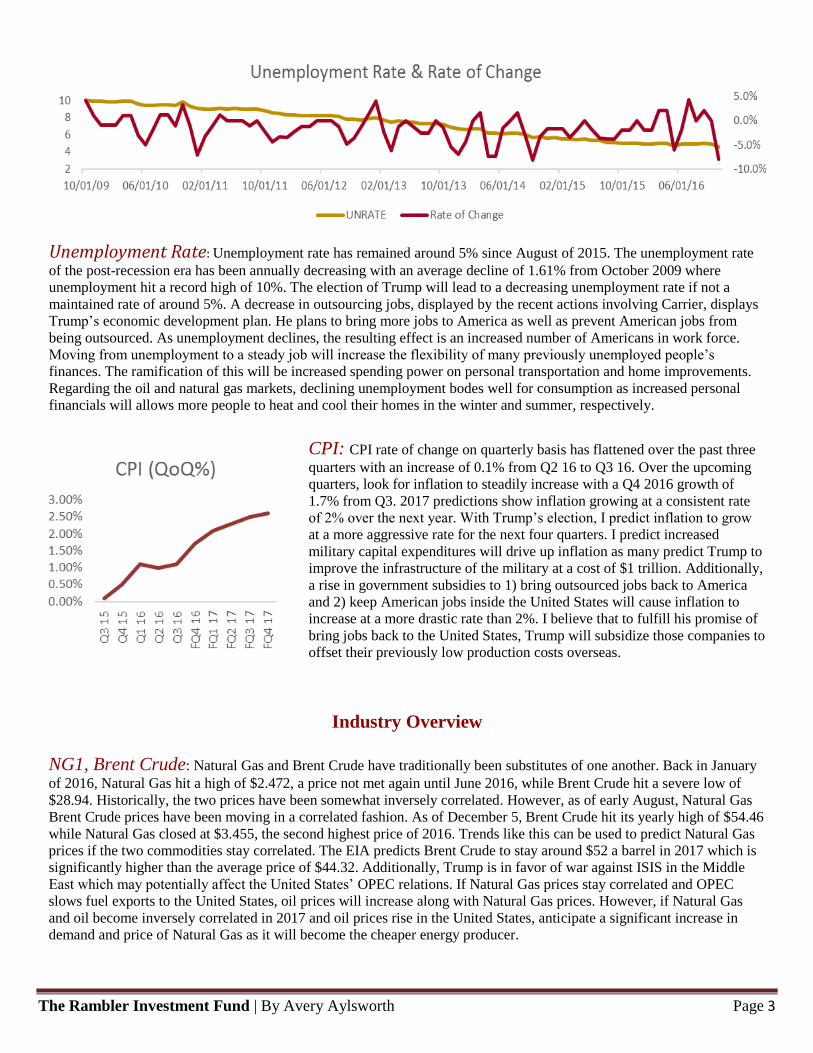
GDP, PMI: Real GDP growth and the NAPMPMI Index, or PMI, is a leading macroeconomic indicator that measures industrial production within the United States and is reported monthly. It is a leading indicator for GDP as it influences whether GDP and the Industrial Sector will experience growth over the next quarter. As of right now, PMI closed on November 30 at 53.2 which marked the fourth straight month of a PMI rating above 50. In the past 16 months, PMI has only closed below 50 once, which occurred on 12/31/15. Future industrial growth can be predicted at any reading above 42 while successive months of plus-50 ratings will typically lead to growth in GDP. Look for Real GDP to grow with in the next quarter as the past two months of PMI ratings have been above 50, indicating economic growth. The growth rate of Real GDP has increased significantly from its past two quarters which indicated a decline in economic growth acceleration. Growth rates of 0.218% in October 2015, 0.208% in January 2016 and 0.352% in April 2016 drew many concerns as economic growth looked to be slowing down which could eventually lead to a possible recession. However, a reported growth 0.780% in Q3 2016 suggests an increase in economic growth for quarters to come. Expect Real GDP to grow at least 0.5% because historical data suggests that after a quarter below 0.35%, Real GDP has typically grown at a rate above 0.5% for two consecutive quarters.
Company Description
Antero Resources (AR) is a small to mid-market Natural Gas production and
exploration company that went public on the NYSE in October, 2013. Based
in Denver, AR currently operates its rigs in the Marcellus and Utica Shales,
located in the Appalachian Basin. Their principal operations are fracking for
Natural Gas and Natural Gas Liquids (NGLs) which involve Ethane and
Propane, Water, and Oil. As commodity prices are highly volatile, AR has put
an emphasis on low cost, liquid-rich drilling to sustain profits while lowering
overall external costs. Currently, AR holds over 484,000 net acres in the
southwestern core of the Marcellus Shale and 145,000 net acres in the core of
the Utica Shale.
AR derives its revenue from the sale of energy products. AR sells the liquids-
rich products either at the reasonable value of the NYMEX or at a hedged
price. For 2016, all of AR’s Propane production was sold at a hedged price of
$0.59/gallon which was $0.22 above the 2016 average on the NYMEX.
Additionally, AR hedged Natural Gas sales at $3.91/ MMBtu with an average
$0.82/MMBtu premium on the NYMEX. After Natural Gas prices reached
record highs in 2014, the price of Natural Gas has been slowly declining which
has affected the revenue and financials of AR as well as industry competitors.
AR was forced to cut its capital expenditures budget by 50% from 2014 to
2016 to stay afloat. Through 2016, AR’s hedged Natural Gas price was $3.91/
MMBtu with an average $0.82/MMBtu premium on the NYMEX.
The Rambler Investment Fund | By Avery Aylsworth Page 3
Unemployment Rate: Unemployment rate has remained around 5% since August of 2015. The unemployment rate
of the post-recession era has been annually decreasing with an average decline of 1.61% from October 2009 where
unemployment hit a record high of 10%. The election of Trump will lead to a decreasing unemployment rate if not a
maintained rate of around 5%. A decrease in outsourcing jobs, displayed by the recent actions involving Carrier, displays
Trump’s economic development plan. He plans to bring more jobs to America as well as prevent American jobs from
being outsourced. As unemployment declines, the resulting effect is an increased number of Americans in work force.
Moving from unemployment to a steady job will increase the flexibility of many previously unemployed people’s
finances. The ramification of this will be increased spending power on personal transportation and home improvements.
Regarding the oil and natural gas markets, declining unemployment bodes well for consumption as increased personal
financials will allows more people to heat and cool their homes in the winter and summer, respectively.
Industry Overview
NG1, Brent Crude: Natural Gas and Brent Crude have traditionally been substitutes of one another. Back in January
of 2016, Natural Gas hit a high of $2.472, a price not met again until June 2016, while Brent Crude hit a severe low of
$28.94. Historically, the two prices have been somewhat inversely correlated. However, as of early August, Natural Gas
Brent Crude prices have been moving in a correlated fashion. As of December 5, Brent Crude hit its yearly high of $54.46
while Natural Gas closed at $3.455, the second highest price of 2016. Trends like this can be used to predict Natural Gas
prices if the two commodities stay correlated. The EIA predicts Brent Crude to stay around $52 a barrel in 2017 which is
significantly higher than the average price of $44.32. Additionally, Trump is in favor of war against ISIS in the Middle
East which may potentially affect the United States’ OPEC relations. If Natural Gas prices stay correlated and OPEC
slows fuel exports to the United States, oil prices will increase along with Natural Gas prices. However, if Natural Gas
and oil become inversely correlated in 2017 and oil prices rise in the United States, anticipate a significant increase in
demand and price of Natural Gas as it will become the cheaper energy producer.
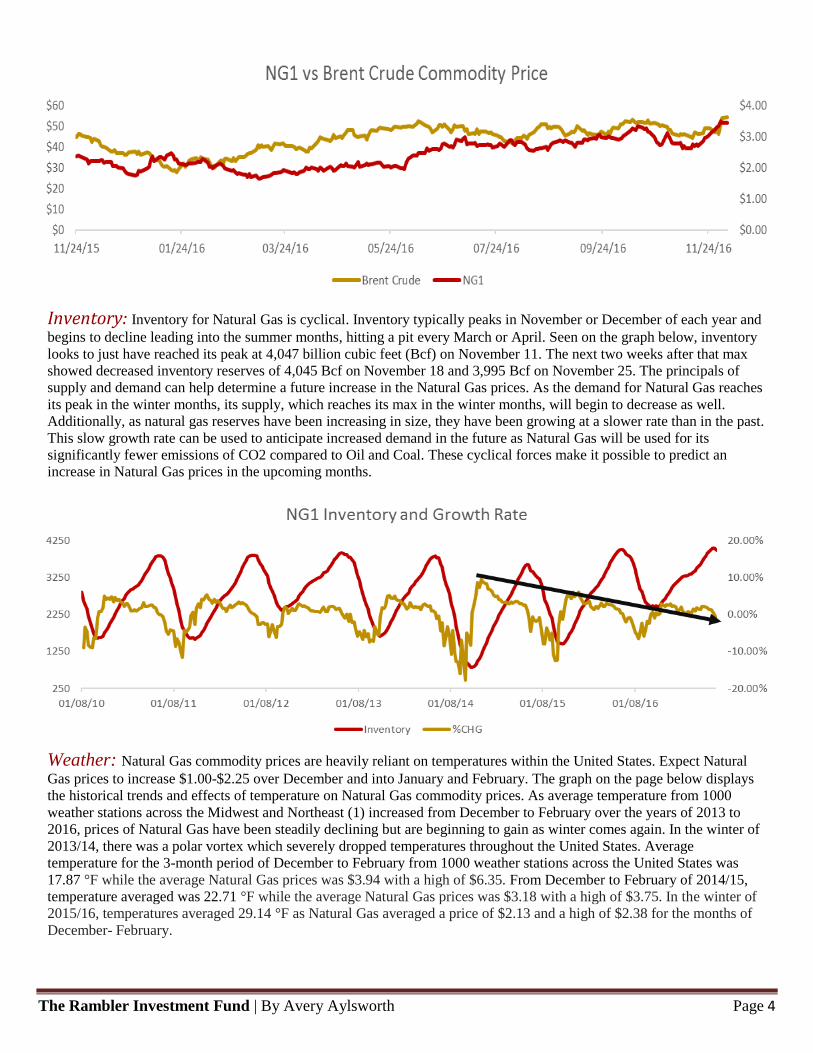
CPI: CPI rate of change on quarterly basis has flattened over the past three
quarters with an increase of 0.1% from Q2 16 to Q3 16. Over the upcoming
quarters, look for inflation to steadily increase with a Q4 2016 growth of
1.7% from Q3. 2017 predictions show inflation growing at a consistent rate
of 2% over the next year. With Trump’s election, I predict inflation to grow
at a more aggressive rate for the next four quarters. I predict increased
military capital expenditures will drive up inflation as many predict Trump to
improve the infrastructure of the military at a cost of $1 trillion. Additionally,
a rise in government subsidies to 1) bring outsourced jobs back to America
and 2) keep American jobs inside the United States will cause inflation to
increase at a more drastic rate than 2%. I believe that to fulfill his promise of
bring jobs back to the United States, Trump will subsidize those companies to
offset their previously low production costs overseas.
The Rambler Investment Fund | By Avery Aylsworth Page 4
`
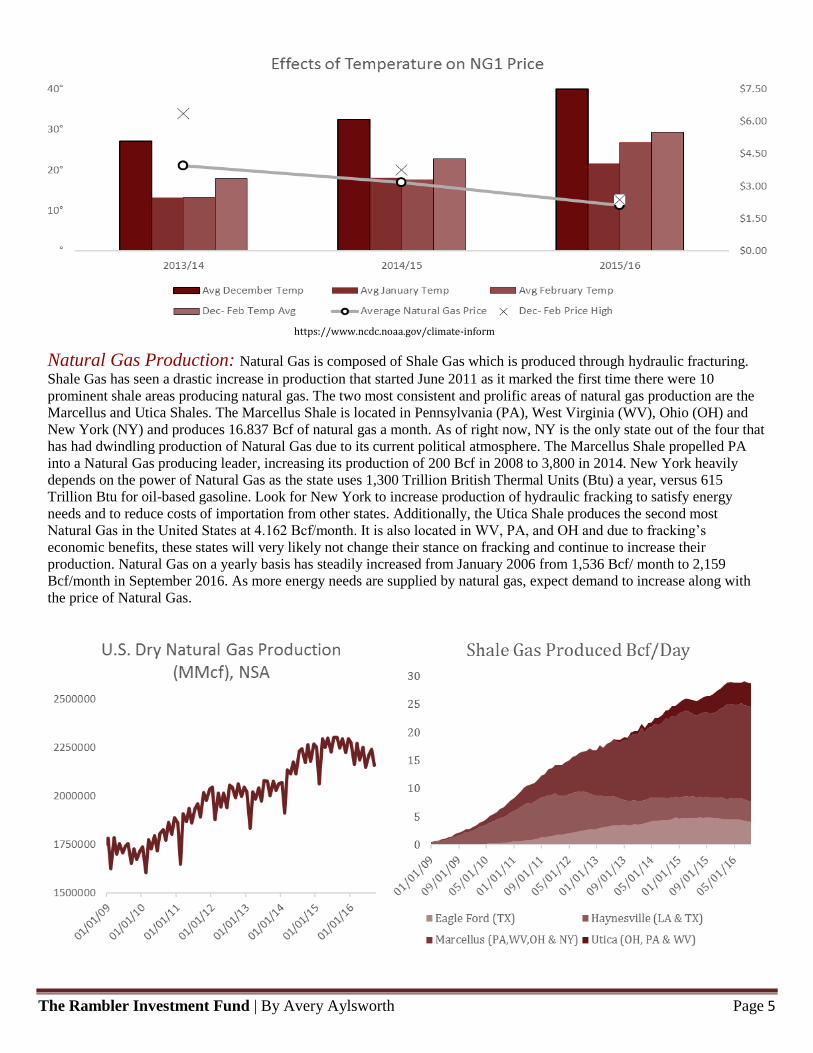
Inventory: Inventory for Natural Gas is cyclical. Inventory typically peaks in November or December of each year and
begins to decline leading into the summer months, hitting a pit every March or April. Seen on the graph below, inventory
looks to just have reached its peak at 4,047 billion cubic feet (Bcf) on November 11. The next two weeks after that max
showed decreased inventory reserves of 4,045 Bcf on November 18 and 3,995 Bcf on November 25. The principals of
supply and demand can help determine a future increase in the Natural Gas prices. As the demand for Natural Gas reaches
its peak in the winter months, its supply, which reaches its max in the winter months, will begin to decrease as well.
Additionally, as natural gas reserves have been increasing in size, they have been growing at a slower rate than in the past.
This slow growth rate can be used to anticipate increased demand in the future as Natural Gas will be used for its
significantly fewer emissions of CO2 compared to Oil and Coal. These cyclical forces make it possible to predict an
increase in Natural Gas prices in the upcoming months.
Weather: Natural Gas commodity prices are heavily reliant on temperatures within the United States. Expect Natural
Gas prices to increase $1.00-$2.25 over December and into January and February. The graph on the page below displays
the historical trends and effects of temperature on Natural Gas commodity prices. As average temperature from 1000
weather stations across the Midwest and Northeast (1) increased from December to February over the years of 2013 to
2016, prices of Natural Gas have been steadily declining but are beginning to gain as winter comes again. In the winter of
2013/14, there was a polar vortex which severely dropped temperatures throughout the United States. Average
temperature for the 3-month period of December to February from 1000 weather stations across the United States was
17.87 °F while the average Natural Gas prices was $3.94 with a high of $6.35. From December to February of 2014/15,
temperature averaged was 22.71 °F while the average Natural Gas prices was $3.18 with a high of $3.75. In the winter of
2015/16, temperatures averaged 29.14 °F as Natural Gas averaged a price of $2.13 and a high of $2.38 for the months of
December- February.
The Rambler Investment Fund | By Avery Aylsworth Page 5
https://www.ncdc.noaa.gov/climate-inform
Natural Gas Production: Natural Gas is composed of Shale Gas which is produced through hydraulic fracturing.
Shale Gas has seen a drastic increase in production that started June 2011 as it marked the first time there were 10
prominent shale areas producing natural gas. The two most consistent and prolific areas of natural gas production are the
Marcellus and Utica Shales. The Marcellus Shale is located in Pennsylvania (PA), West Virginia (WV), Ohio (OH) and
New York (NY) and produces 16.837 Bcf of natural gas a month. As of right now, NY is the only state out of the four that
has had dwindling production of Natural Gas due to its current political atmosphere. The Marcellus Shale propelled PA
into a Natural Gas producing leader, increasing its production of 200 Bcf in 2008 to 3,800 in 2014. New York heavily
depends on the power of Natural Gas as the state uses 1,300 Trillion British Thermal Units (Btu) a year, versus 615
Trillion Btu for oil-based gasoline. Look for New York to increase production of hydraulic fracking to satisfy energy
needs and to reduce costs of importation from other states. Additionally, the Utica Shale produces the second most
Natural Gas in the United States at 4.162 Bcf/month. It is also located in WV, PA, and OH and due to fracking’s
economic benefits, these states will very likely not change their stance on fracking and continue to increase their
production. Natural Gas on a yearly basis has steadily increased from January 2006 from 1,536 Bcf/ month to 2,159
Bcf/month in September 2016. As more energy needs are supplied by natural gas, expect demand to increase along with
the price of Natural Gas.
The Rambler Investment Fund | By Avery Aylsworth Page 6
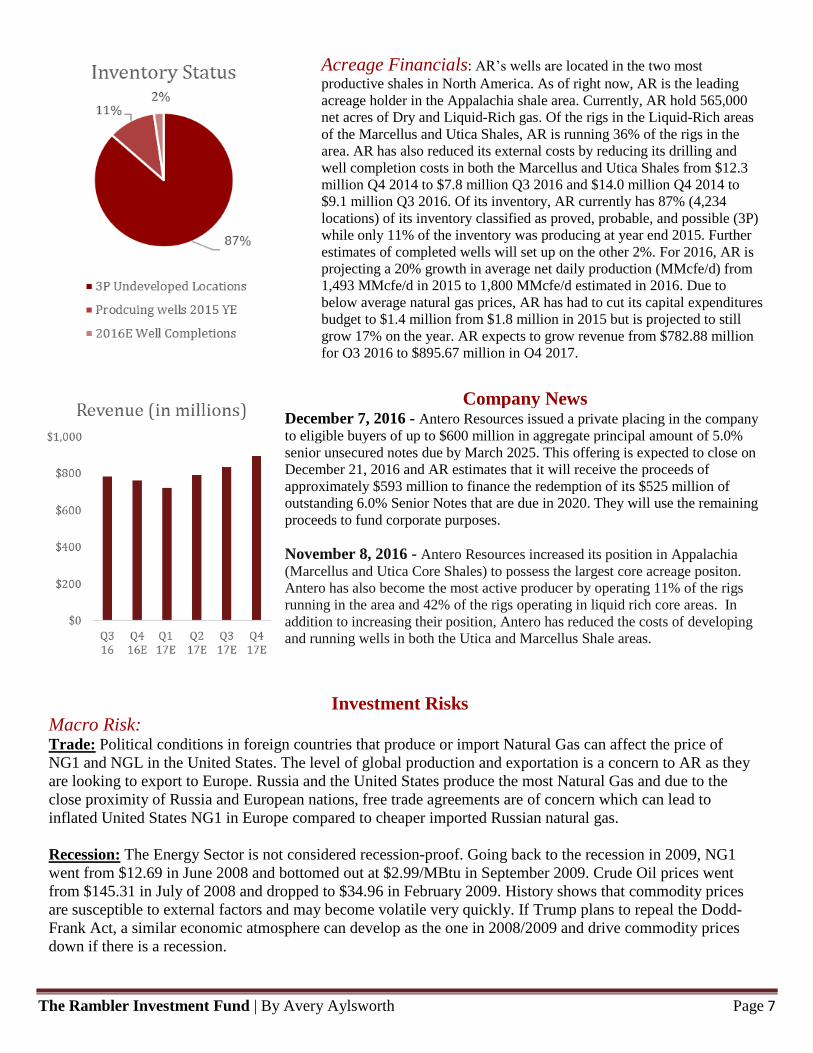
AR and NG1 Correlation: The stock price of AR has been correlated
with Natural Gas commodity prices since it went public in October 2013.
AR had an IPO of $44 and during the polar vortex winter of 2013/14, the
AR stock hit an all-time high of $65.67 as the prices and consumption hit
highs, as well as record highs and lows for temperature. After the 2013/14
winter, Natural Gas prices have been steadily decreasing, hitting a low of
$1.639 March 3, 2016. High winter temperatures directly affect the price of
Natural Gas which directly affects the price of AR’s stock. The continual
drop in Natural Gas prices along with increase winter temperatures caused
the value of AR’s stock to drop significantly to $19.12 in December of 2015
which was one of the warmest winters ever recorded. As climate change
continues to progress, more severe weather events will occur with increased
frequency creating more energy demand. Natural Gas is used for both
heating and cooling and in 2015, it was one of the cheapest forms of energy.
In 2015, for every million Btu’s consumed in the residential and commercial
sectors, Natural Gas was the cheapest at $10.73 and $8.95, respectively. It is
also the second cheapest form of energy (per million Btu’s) in the
Transportation and Electric Power sectors at $18.44 and $5.06 in 2015,
respectively. These low prices for Natural Gas use will drive up demand,
therefor increasing the Natural Gas Commodity price and eventually driving
up AR’s revenue and stock price.
Company Overview
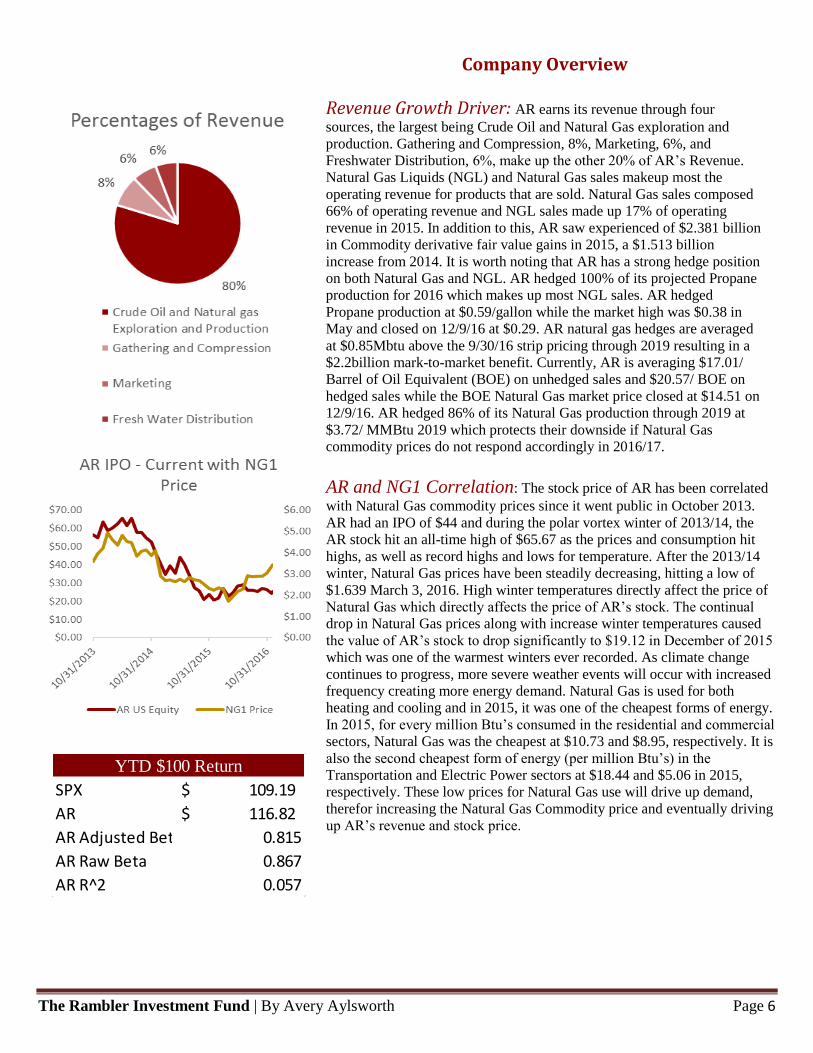
Revenue Growth Driver: AR earns its revenue through four
sources, the largest being Crude Oil and Natural Gas exploration and
production. Gathering and Compression, 8%, Marketing, 6%, and
Freshwater Distribution, 6%, make up the other 20% of AR’s Revenue.
Natural Gas Liquids (NGL) and Natural Gas sales makeup most the
operating revenue for products that are sold. Natural Gas sales composed
66% of operating revenue and NGL sales made up 17% of operating
revenue in 2015. In addition to this, AR saw experienced of $2.381 billion
in Commodity derivative fair value gains in 2015, a $1.513 billion
increase from 2014. It is worth noting that AR has a strong hedge position
on both Natural Gas and NGL. AR hedged 100% of its projected Propane
production for 2016 which makes up most NGL sales. AR hedged
Propane production at $0.59/gallon while the market high was $0.38 in
May and closed on 12/9/16 at $0.29. AR natural gas hedges are averaged
at $0.85Mbtu above the 9/30/16 strip pricing through 2019 resulting in a
$2.2billion mark-to-market benefit. Currently, AR is averaging $17.01/
Barrel of Oil Equivalent (BOE) on unhedged sales and $20.57/ BOE on
hedged sales while the BOE Natural Gas market price closed at $14.51 on
12/9/16. AR hedged 86% of its Natural Gas production through 2019 at
$3.72/ MMBtu 2019 which protects their downside if Natural Gas
commodity prices do not respond accordingly in 2016/17.
SPX 109.19$
AR 116.82$
AR Adjusted Beta 0.815
AR Raw Beta 0.867
AR R^2 0.057
YTD $100 Return
The Rambler Investment Fund | By Avery Aylsworth Page 7
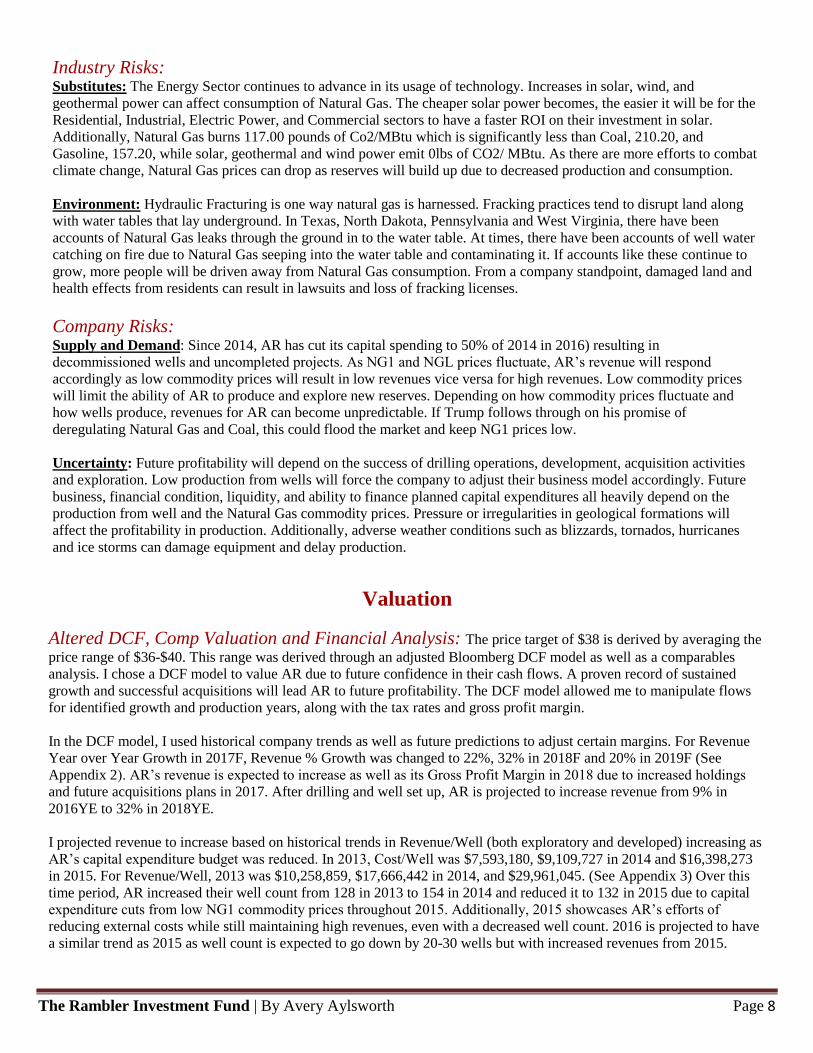
Acreage Financials: AR’s wells are located in the two most
productive shales in North America. As of right now, AR is the leading
acreage holder in the Appalachia shale area. Currently, AR hold 565,000
net acres of Dry and Liquid-Rich gas. Of the rigs in the Liquid-Rich areas
of the Marcellus and Utica Shales, AR is running 36% of the rigs in the
area. AR has also reduced its external costs by reducing its drilling and
well completion costs in both the Marcellus and Utica Shales from $12.3
million Q4 2014 to $7.8 million Q3 2016 and $14.0 million Q4 2014 to
$9.1 million Q3 2016. Of its inventory, AR currently has 87% (4,234
locations) of its inventory classified as proved, probable, and possible (3P)
while only 11% of the inventory was producing at year end 2015. Further
estimates of completed wells will set up on the other 2%. For 2016, AR is
projecting a 20% growth in average net daily production (MMcfe/d) from
1,493 MMcfe/d in 2015 to 1,800 MMcfe/d estimated in 2016. Due to
below average natural gas prices, AR has had to cut its capital expenditures
budget to $1.4 million from $1.8 million in 2015 but is projected to still
grow 17% on the year. AR expects to grow revenue from $782.88 million
for Q3 2016 to $895.67 million in Q4 2017.
Company News December 7, 2016 - Antero Resources issued a private placing in the company
to eligible buyers of up to $600 million in aggregate principal amount of 5.0%
senior unsecured notes due by March 2025. This offering is expected to close on
December 21, 2016 and AR estimates that it will receive the proceeds of
approximately $593 million to finance the redemption of its $525 million of
outstanding 6.0% Senior Notes that are due in 2020. They will use the remaining
proceeds to fund corporate purposes.
November 8, 2016 - Antero Resources increased its position in Appalachia
(Marcellus and Utica Core Shales) to possess the largest core acreage positon.
Antero has also become the most active producer by operating 11% of the rigs
running in the area and 42% of the rigs operating in liquid rich core areas. In
addition to increasing their position, Antero has reduced the costs of developing
and running wells in both the Utica and Marcellus Shale areas.
Investment Risks
Macro Risk: Trade: Political conditions in foreign countries that produce or import Natural Gas can affect the price of
NG1 and NGL in the United States. The level of global production and exportation is a concern to AR as they
are looking to export to Europe. Russia and the United States produce the most Natural Gas and due to the
close proximity of Russia and European nations, free trade agreements are of concern which can lead to
inflated United States NG1 in Europe compared to cheaper imported Russian natural gas.
Recession: The Energy Sector is not considered recession-proof. Going back to the recession in 2009, NG1
went from $12.69 in June 2008 and bottomed out at $2.99/MBtu in September 2009. Crude Oil prices went
from $145.31 in July of 2008 and dropped to $34.96 in February 2009. History shows that commodity prices
are susceptible to external factors and may become volatile very quickly. If Trump plans to repeal the Dodd-
Frank Act, a similar economic atmosphere can develop as the one in 2008/2009 and drive commodity prices
down if there is a recession.
The Rambler Investment Fund | By Avery Aylsworth Page 8
Industry Risks: Substitutes: The Energy Sector continues to advance in its usage of technology. Increases in solar, wind, and
geothermal power can affect consumption of Natural Gas. The cheaper solar power becomes, the easier it will be for the
Residential, Industrial, Electric Power, and Commercial sectors to have a faster ROI on their investment in solar.
Additionally, Natural Gas burns 117.00 pounds of Co2/MBtu which is significantly less than Coal, 210.20, and
Gasoline, 157.20, while solar, geothermal and wind power emit 0lbs of CO2/ MBtu. As there are more efforts to combat
climate change, Natural Gas prices can drop as reserves will build up due to decreased production and consumption.
Environment: Hydraulic Fracturing is one way natural gas is harnessed. Fracking practices tend to disrupt land along
with water tables that lay underground. In Texas, North Dakota, Pennsylvania and West Virginia, there have been
accounts of Natural Gas leaks through the ground in to the water table. At times, there have been accounts of well water
catching on fire due to Natural Gas seeping into the water table and contaminating it. If accounts like these continue to
grow, more people will be driven away from Natural Gas consumption. From a company standpoint, damaged land and
health effects from residents can result in lawsuits and loss of fracking licenses.
Company Risks: Supply and Demand: Since 2014, AR has cut its capital spending to 50% of 2014 in 2016) resulting in
decommissioned wells and uncompleted projects. As NG1 and NGL prices fluctuate, AR’s revenue will respond
accordingly as low commodity prices will result in low revenues vice versa for high revenues. Low commodity prices
will limit the ability of AR to produce and explore new reserves. Depending on how commodity prices fluctuate and
how wells produce, revenues for AR can become unpredictable. If Trump follows through on his promise of
deregulating Natural Gas and Coal, this could flood the market and keep NG1 prices low.
Uncertainty: Future profitability will depend on the success of drilling operations, development, acquisition activities
and exploration. Low production from wells will force the company to adjust their business model accordingly. Future
business, financial condition, liquidity, and ability to finance planned capital expenditures all heavily depend on the
production from well and the Natural Gas commodity prices. Pressure or irregularities in geological formations will
affect the profitability in production. Additionally, adverse weather conditions such as blizzards, tornados, hurricanes
and ice storms can damage equipment and delay production.
Valuation
Altered DCF, Comp Valuation and Financial Analysis: The price target of $38 is derived by averaging the
price range of $36-$40. This range was derived through an adjusted Bloomberg DCF model as well as a comparables
analysis. I chose a DCF model to value AR due to future confidence in their cash flows. A proven record of sustained
growth and successful acquisitions will lead AR to future profitability. The DCF model allowed me to manipulate flows
for identified growth and production years, along with the tax rates and gross profit margin.
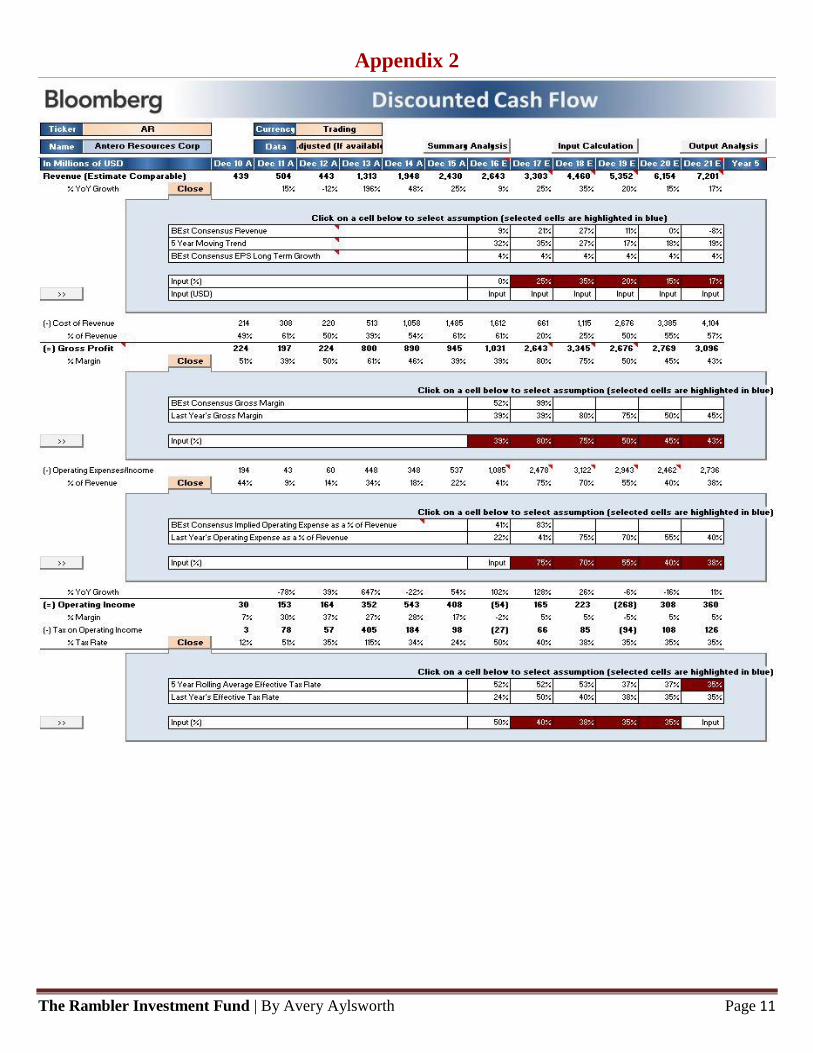
In the DCF model, I used historical company trends as well as future predictions to adjust certain margins. For Revenue
Year over Year Growth in 2017F, Revenue % Growth was changed to 22%, 32% in 2018F and 20% in 2019F (See
Appendix 2). AR’s revenue is expected to increase as well as its Gross Profit Margin in 2018 due to increased holdings
and future acquisitions plans in 2017. After drilling and well set up, AR is projected to increase revenue from 9% in
2016YE to 32% in 2018YE.
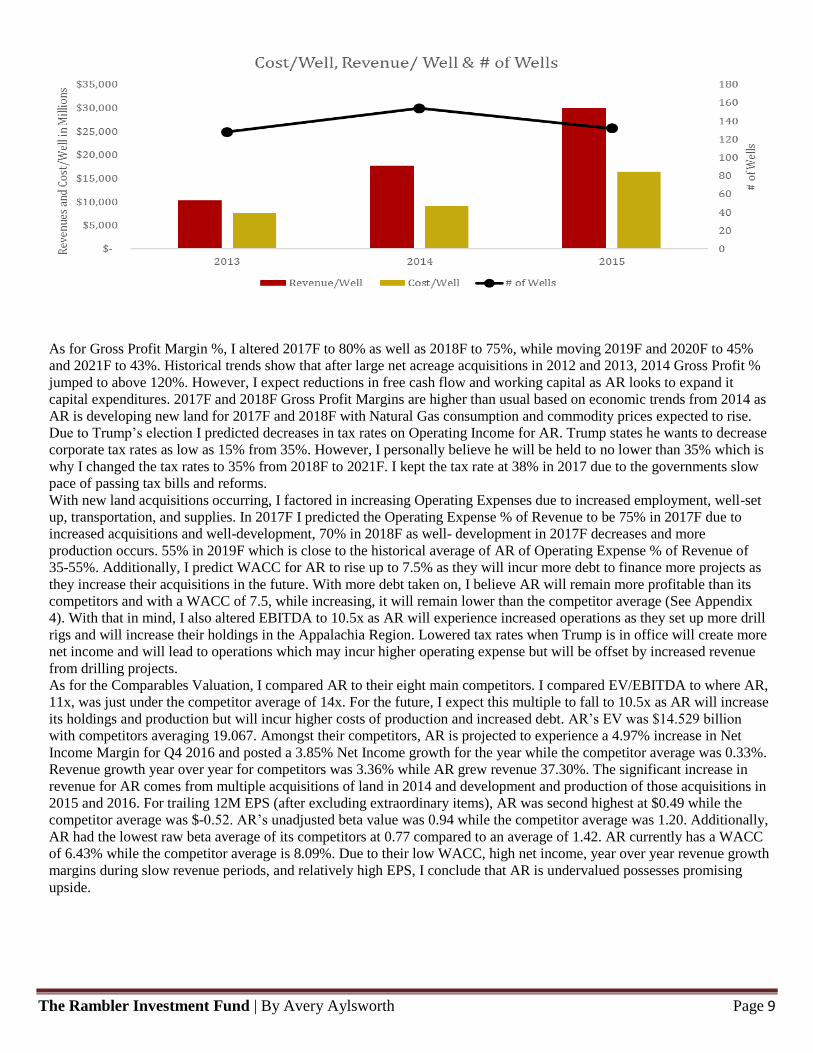
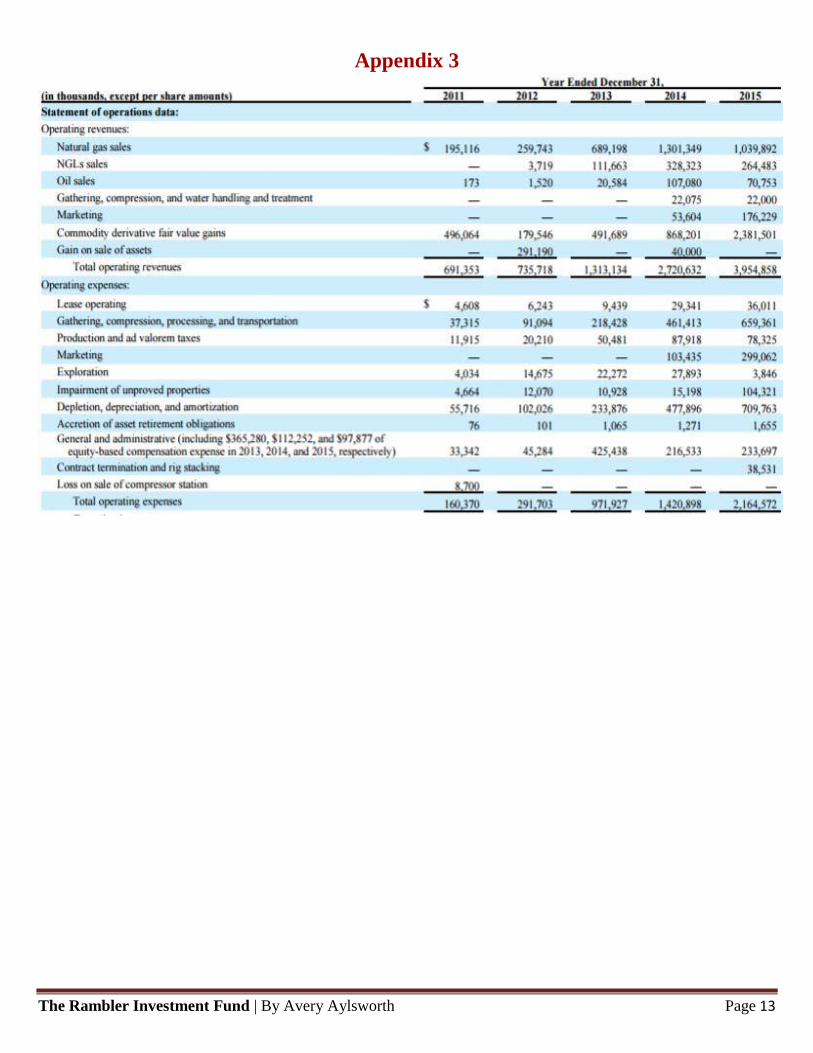
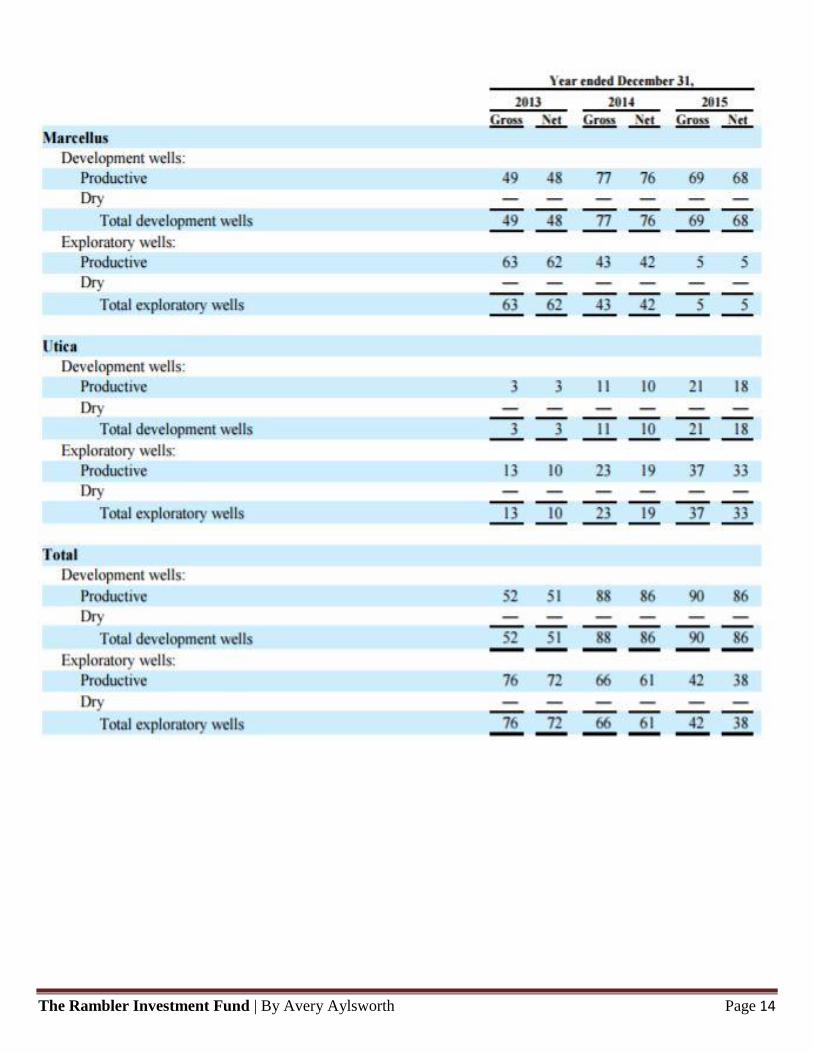
I projected revenue to increase based on historical trends in Revenue/Well (both exploratory and developed) increasing as
AR’s capital expenditure budget was reduced. In 2013, Cost/Well was $7,593,180, $9,109,727 in 2014 and $16,398,273
in 2015. For Revenue/Well, 2013 was $10,258,859, $17,666,442 in 2014, and $29,961,045. (See Appendix 3) Over this
time period, AR increased their well count from 128 in 2013 to 154 in 2014 and reduced it to 132 in 2015 due to capital
expenditure cuts from low NG1 commodity prices throughout 2015. Additionally, 2015 showcases AR’s efforts of
reducing external costs while still maintaining high revenues, even with a decreased well count. 2016 is projected to have
a similar trend as 2015 as well count is expected to go down by 20-30 wells but with increased revenues from 2015.
The Rambler Investment Fund | By Avery Aylsworth Page 9
As for Gross Profit Margin %, I altered 2017F to 80% as well as 2018F to 75%, while moving 2019F and 2020F to 45%
and 2021F to 43%. Historical trends show that after large net acreage acquisitions in 2012 and 2013, 2014 Gross Profit %
jumped to above 120%. However, I expect reductions in free cash flow and working capital as AR looks to expand it
capital expenditures. 2017F and 2018F Gross Profit Margins are higher than usual based on economic trends from 2014 as
AR is developing new land for 2017F and 2018F with Natural Gas consumption and commodity prices expected to rise.
Due to Trump’s election I predicted decreases in tax rates on Operating Income for AR. Trump states he wants to decrease
corporate tax rates as low as 15% from 35%. However, I personally believe he will be held to no lower than 35% which is
why I changed the tax rates to 35% from 2018F to 2021F. I kept the tax rate at 38% in 2017 due to the governments slow
pace of passing tax bills and reforms.
With new land acquisitions occurring, I factored in increasing Operating Expenses due to increased employment, well-set
up, transportation, and supplies. In 2017F I predicted the Operating Expense % of Revenue to be 75% in 2017F due to
increased acquisitions and well-development, 70% in 2018F as well- development in 2017F decreases and more
production occurs. 55% in 2019F which is close to the historical average of AR of Operating Expense % of Revenue of
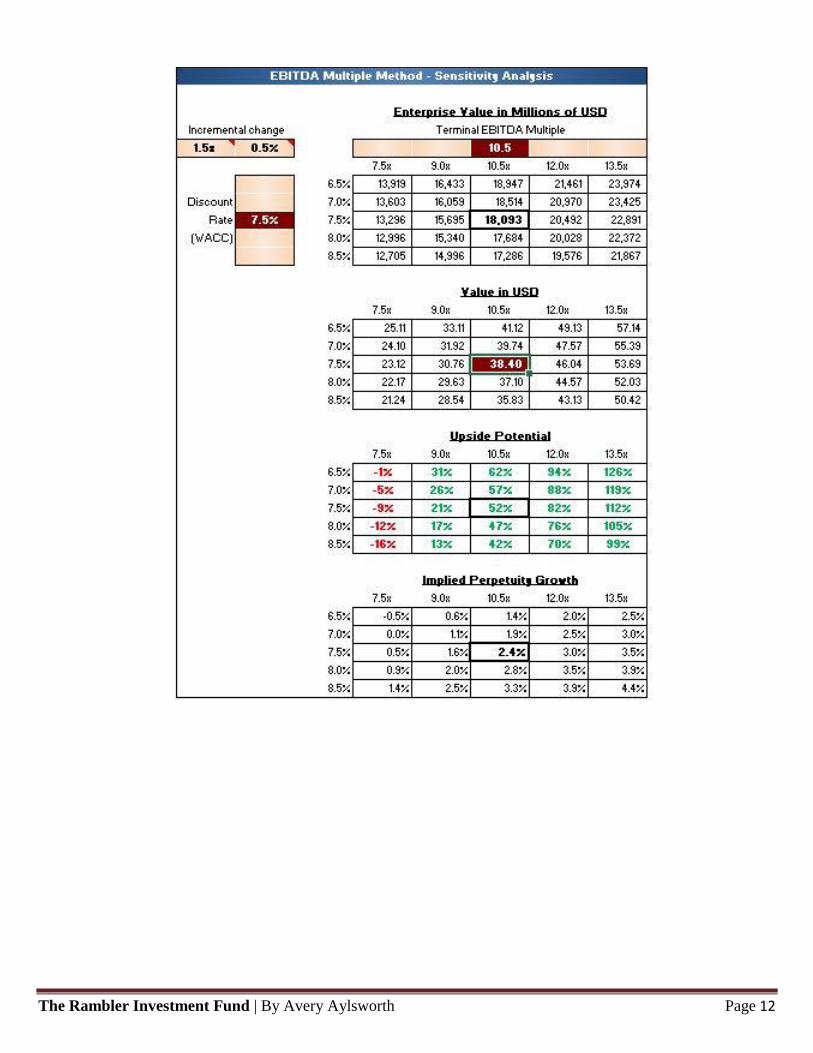
35-55%. Additionally, I predict WACC for AR to rise up to 7.5% as they will incur more debt to finance more projects as
they increase their acquisitions in the future. With more debt taken on, I believe AR will remain more profitable than its
competitors and with a WACC of 7.5, while increasing, it will remain lower than the competitor average (See Appendix
4). With that in mind, I also altered EBITDA to 10.5x as AR will experience increased operations as they set up more drill
rigs and will increase their holdings in the Appalachia Region. Lowered tax rates when Trump is in office will create more
net income and will lead to operations which may incur higher operating expense but will be offset by increased revenue
from drilling projects.
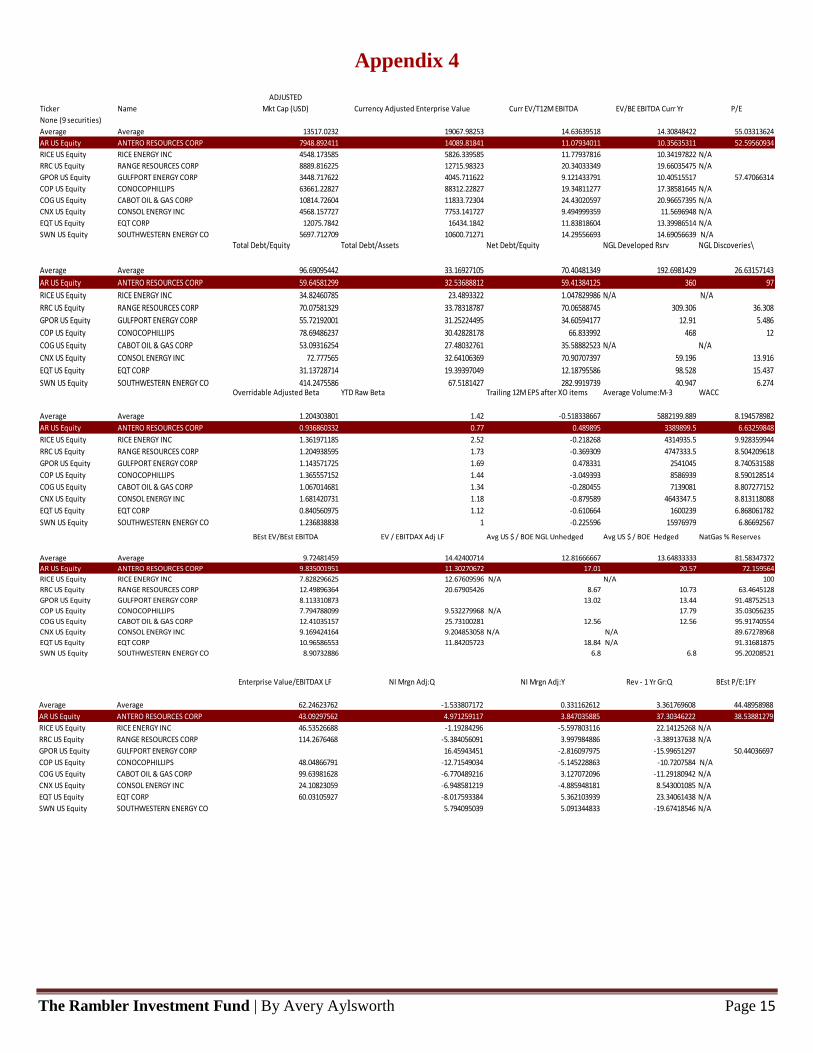
As for the Comparables Valuation, I compared AR to their eight main competitors. I compared EV/EBITDA to where AR,
11x, was just under the competitor average of 14x. For the future, I expect this multiple to fall to 10.5x as AR will increase
its holdings and production but will incur higher costs of production and increased debt. AR’s EV was $14.529 billion
with competitors averaging 19.067. Amongst their competitors, AR is projected to experience a 4.97% increase in Net
Income Margin for Q4 2016 and posted a 3.85% Net Income growth for the year while the competitor average was 0.33%.
Revenue growth year over year for competitors was 3.36% while AR grew revenue 37.30%. The significant increase in
revenue for AR comes from multiple acquisitions of land in 2014 and development and production of those acquisitions in
2015 and 2016. For trailing 12M EPS (after excluding extraordinary items), AR was second highest at $0.49 while the
competitor average was $-0.52. AR’s unadjusted beta value was 0.94 while the competitor average was 1.20. Additionally,
AR had the lowest raw beta average of its competitors at 0.77 compared to an average of 1.42. AR currently has a WACC
of 6.43% while the competitor average is 8.09%. Due to their low WACC, high net income, year over year revenue growth
margins during slow revenue periods, and relatively high EPS, I conclude that AR is undervalued possesses promising
upside.
The Rambler Investment Fund | By Avery Aylsworth Page 10
Appendix 1 http://www.eia.gov/outlooks/aeo/er/index.cfm
The Rambler Investment Fund | By Avery Aylsworth Page 11
Appendix 2
The Rambler Investment Fund | By Avery Aylsworth Page 12
The Rambler Investment Fund | By Avery Aylsworth Page 13
Appendix 3
10 k with
The Rambler Investment Fund | By Avery Aylsworth Page 14
The Rambler Investment Fund | By Avery Aylsworth Page 15
Appendix 4
BEst EV/BEst EBITDA EV / EBITDAX Adj LF Avg US $ / BOE NGL Unhedged Avg US $ / BOE Hedged NatGas % Reserves
Average Average 9.72481459 14.42400714 12.81666667 13.64833333 81.58347372
AR US Equity ANTERO RESOURCES CORP 9.835001951 11.30270672 17.01 20.57 72.159564
RICE US Equity RICE ENERGY INC 7.828296625 12.67609596 N/A N/A 100
RRC US Equity RANGE RESOURCES CORP 12.49896364 20.67905426 8.67 10.73 63.4645128
GPOR US Equity GULFPORT ENERGY CORP 8.113310873 13.02 13.44 91.48752513
COP US Equity CONOCOPHILLIPS 7.794788099 9.532279968 N/A 17.79 35.03056235
COG US Equity CABOT OIL & GAS CORP 12.41035157 25.73100281 12.56 12.56 95.91740554
CNX US Equity CONSOL ENERGY INC 9.169424164 9.204853058 N/A N/A 89.67278968
EQT US Equity EQT CORP 10.96586553 11.84205723 18.84 N/A 91.31681875
SWN US Equity SOUTHWESTERN ENERGY CO 8.90732886 6.8 6.8 95.20208521
ADJUSTED
Ticker Name Mkt Cap (USD) Currency Adjusted Enterprise Value Curr EV/T12M EBITDA EV/BE EBITDA Curr Yr P/E
None (9 securities)
Average Average 13517.0232 19067.98253 14.63639518 14.30848422 55.03313624
AR US Equity ANTERO RESOURCES CORP 7948.892411 14089.81841 11.07934011 10.35635311 52.59560934
RICE US Equity RICE ENERGY INC 4548.173585 5826.339585 11.77937816 10.34197822 N/A
RRC US Equity RANGE RESOURCES CORP 8889.816225 12715.98323 20.34033349 19.66035475 N/A
GPOR US Equity GULFPORT ENERGY CORP 3448.717622 4045.711622 9.121433791 10.40515517 57.47066314
COP US Equity CONOCOPHILLIPS 63661.22827 88312.22827 19.34811277 17.38581645 N/A
COG US Equity CABOT OIL & GAS CORP 10814.72604 11833.72304 24.43020597 20.96657395 N/A
CNX US Equity CONSOL ENERGY INC 4568.157727 7753.141727 9.494999359 11.5696948 N/A
EQT US Equity EQT CORP 12075.7842 16434.1842 11.83818604 13.39986514 N/A
SWN US Equity SOUTHWESTERN ENERGY CO 5697.712709 10600.71271 14.29556693 14.69056639 N/A
Total Debt/Equity Total Debt/Assets Net Debt/Equity NGL Developed Rsrv NGL Discoveries\
Average Average 96.69095442 33.16927105 70.40481349 192.6981429 26.63157143
AR US Equity ANTERO RESOURCES CORP 59.64581299 32.53688812 59.41384125 360 97
RICE US Equity RICE ENERGY INC 34.82460785 23.4893322 1.047829986 N/A N/A
RRC US Equity RANGE RESOURCES CORP 70.07581329 33.78318787 70.06588745 309.306 36.308
GPOR US Equity GULFPORT ENERGY CORP 55.72192001 31.25224495 34.60594177 12.91 5.486
COP US Equity CONOCOPHILLIPS 78.69486237 30.42828178 66.833992 468 12
COG US Equity CABOT OIL & GAS CORP 53.09316254 27.48032761 35.58882523 N/A N/A
CNX US Equity CONSOL ENERGY INC 72.777565 32.64106369 70.90707397 59.196 13.916
EQT US Equity EQT CORP 31.13728714 19.39397049 12.18795586 98.528 15.437
SWN US Equity SOUTHWESTERN ENERGY CO 414.2475586 67.5181427 282.9919739 40.947 6.274Overridable Adjusted Beta YTD Raw Beta Trailing 12M EPS after XO items Average Volume:M-3 WACC
Average Average 1.204303801 1.42 -0.518338667 5882199.889 8.194578982
AR US Equity ANTERO RESOURCES CORP 0.936860332 0.77 0.489895 3389899.5 6.63259848
RICE US Equity RICE ENERGY INC 1.361971185 2.52 -0.218268 4314935.5 9.928359944
RRC US Equity RANGE RESOURCES CORP 1.204938595 1.73 -0.369309 4747333.5 8.504209618
GPOR US Equity GULFPORT ENERGY CORP 1.143571725 1.69 0.478331 2541045 8.740531588
COP US Equity CONOCOPHILLIPS 1.365557152 1.44 -3.049393 8586939 8.590128514
COG US Equity CABOT OIL & GAS CORP 1.067014681 1.34 -0.280455 7139081 8.807277152
CNX US Equity CONSOL ENERGY INC 1.681420731 1.18 -0.879589 4643347.5 8.813118088
EQT US Equity EQT CORP 0.840560975 1.12 -0.610664 1600239 6.868061782
SWN US Equity SOUTHWESTERN ENERGY CO 1.236838838 1 -0.225596 15976979 6.86692567
Enterprise Value/EBITDAX LF NI Mrgn Adj:Q NI Mrgn Adj:Y Rev - 1 Yr Gr:Q BEst P/E:1FY
Average Average 62.24623762 -1.533807172 0.331162612 3.361769608 44.48958988
AR US Equity ANTERO RESOURCES CORP 43.09297562 4.971259117 3.847035885 37.30346222 38.53881279
RICE US Equity RICE ENERGY INC 46.53526688 -1.19284296 -5.597803116 22.14125268 N/A
RRC US Equity RANGE RESOURCES CORP 114.2676468 -5.384056091 3.997984886 -3.389137638 N/A
GPOR US Equity GULFPORT ENERGY CORP 16.45943451 -2.816097975 -15.99651297 50.44036697
COP US Equity CONOCOPHILLIPS 48.04866791 -12.71549034 -5.145228863 -10.7207584 N/A
COG US Equity CABOT OIL & GAS CORP 99.63981628 -6.770489216 3.127072096 -11.29180942 N/A
CNX US Equity CONSOL ENERGY INC 24.10823059 -6.948581219 -4.885948181 8.543001085 N/A
EQT US Equity EQT CORP 60.03105927 -8.017593384 5.362103939 23.34061438 N/A
SWN US Equity SOUTHWESTERN ENERGY CO 5.794095039 5.091344833 -19.67418546 N/A