Embed Size (px)
Citation preview
Antioxidant capacity of lycopene-containing foods
Zora Djuric and LaKesha C. Powell
Barbara Ann Karmanos Cancer Institute, 110 East Warren, Detroit, MI 48201, USA
Increased consumption of tomatoes and tomato products has been associated withdecreased cancer risks. One fat-soluble compound identified in tomatoes which maybe responsible for this association is lycopene. There may, however, be otherantioxidants present in tomato-based foods, and total antioxidant capacity may beanother way to rate the health benefits of these foods. In this work, we examined theTrolox-equivalent antioxidant capacity (TEAC) of aqueous and organic extracts oflycopene-containing foods: ketchup, fresh tomatoes, tomato paste, tomato sauce,tomato soup, tomato juice, vegetable juice, canned tomatoes and watermelon.Antioxidant activity in these food extracts was greater in the aqueous versus organicfractions, except for watermelon and tomato sauce where the levels were similar inthe two fractions. Lycopene levels in the food samples tested, however, wererelatively greater in the organic fractions, with the exception of the two juices,which had similar levels in the two fractions, and two highly concentrated tomatoproducts, tomato paste and ketchup, which had relatively higher lycopene levels inthe aqueous fractions. The foods with the highest antioxidant capacity per servingoverall (tomato soup was highest) did not have the highest lycopene levels. Thisindicates that it may be important to consume a variety of tomato-containingproducts in order to obtain the largest variety of dietary antioxidants possible.
Introduction
Increased consumption of tomato products hasbeen associated with decreased risks of variousforms of cancer, and most recently muchattention has been focused on decreased risk ofprostate cancer in particular (Weisburger, 1998).One component of tomatoes that may beresponsible for decreased prostate cancer riskamong persons who consume relatively higheramount of tomato products may be lycopene, amember of the carotenoid family (Clinton,1998). There are, however, many other com-pounds in tomatoes that could function in acancer-preventive fashion. It also has been
suggested that measuring bioactivity, such asantioxidant capacity, may be more useful forassessing the overall ‘healthiness’ of foods thanthe measurement of specific micronutrients,especially in processed foods (vanBoekel &Jongen, 1997).
One way to examine the total amount ofantioxidants in foods is to measure total anti-oxidant capacity of extracts. The Trolox-equiva-lent antioxidant capacity (TEAC) assay wasdeveloped as means to gauge the total anti-oxidant capacity of various analytes versus astandard antioxidant, Trolox, which is a water-
Correspondence to: Zora Djuric.
ISSN 0963-7486 printed/ISSN 1465-3478 online01/020143-07 © 2001 Taylor & Francis LtdDOI: 10.1080/09637480020027000
International Journal of Food Sciences and Nutrition (2001) 52, 143–149
Int J
Foo
d Sc
i Nut
r D
ownl
oade
d fr
om in
form
ahea
lthca
re.c
om b
y T
ham
mas
at U
nive
rsity
on
10/0
4/14
For
pers
onal
use
onl
y.
144 Z. Djuric and L. C. Powell
soluble vitamin E analog (Rice-Evans & Miller,1994). In this work, we have used the TEACassay to measure the antioxidant capacity ofvarious lycopene-containing foods. We com-pared the relative levels of lycopene and totalantioxidants in aqueous and organic extracts ofthese foods to examine in which fraction mostof the antioxidants can be found. In addition, itwas important to analyze both the aqueous andorganic fractions since organic-soluble anti-oxidants like lycopene may be present in thecrystal state in these foods making their detec-tion difficult unless an organic extraction isdone to solubilize them.
Methods
Food extractsThree brands or types of each food werepurchased in Detroit area supermarkets duringthe summer of 1998. The foods were freshtomatoes, tomato juice, vegetable juice, cannedtomatoes, tomato sauce, tomato soup, tomatopaste, ketchup and watermelon. Typically weincluded one store brand and two name-brands.For fresh tomatoes and watermelon, we useddifferent varieties of the fruits with threedifferent UPC codes.
A sample of food (0.5–1 g) was minced ifneeded, 0.5 ml water was added (except for thejuices), and samples were centrifuged at14,000 g for 0.5 min. The pellet washed with0.5 ml water twice. The supernatants werecombined to yield an aqueous fraction. Thepellet was then washed three times with 1 ml ofHPLC-grade acetone/methanol (7 : 3), usingvigorous vortexing and sonication to suspendthe pellet, and the supernatants after centrifuga-tion were combined to yield an organic fraction.This solvent has been shown to be useful forextraction of carotenoids from foods (Britton etal., 1995). For most foods the organic fractionconsisted of three combined washings, but forsome up to six washings were used in order tocompletely decolorize the pellet. The fractionswere analyzed immediately for TEAC andlycopene.
Lycopene analysesLycopene levels in the extracts were analyzedby HPLC using a C-30, 3 m reverse-phase YMCcolumn (Wilmington, NC), and typically
10–20 m l injections of either the aqueous ororganic fraction were made. The solvent was18% hexane, 52% methanol, 30% methyl tert-butyl ether and 0.1% triethylamine pumped at1 ml/min and detection was at 440 nm. Levelswere determined relative to a standard curveconstructed with all trans-lycopene from SigmaChemical Co. (St Louis, MO).
TEAC assayThe TEAC assay was conducted essentially asdescribed previously (Rice-Evans & Miller,1994) using 12 m l of either the aqueous ororganic fraction. Briefly, calibration curveswere constructed using Trolox to quench freeradicals generated from hydrogen peroxide and2,29 -azinobis-(3-ethylbenzothiazoline-6-sulfonicacid) (ABTS). Separate calibration curves wereconstructed for analysis of the organic fractionsafter adding 12 m l of the organic solvent, whichappeared to be a weak antioxidant. Recently, amodified version of this assay has been devel-oped, but values for vitamin C and lycopene aresimilar with both versions of this assay (Re etal., 1999). Each extract was analyzed in at leastduplicate, and there were two separate extractsfrom each food sample. Aliquots of the sameTrolox preparation were used for calibration ofthe assay each day that it was done. In addition,a sample of a serum pool was analyzed each dayas a quality control measure; daily TEAC valuesfor this quality control sample did not varymore than 7% from the mean.
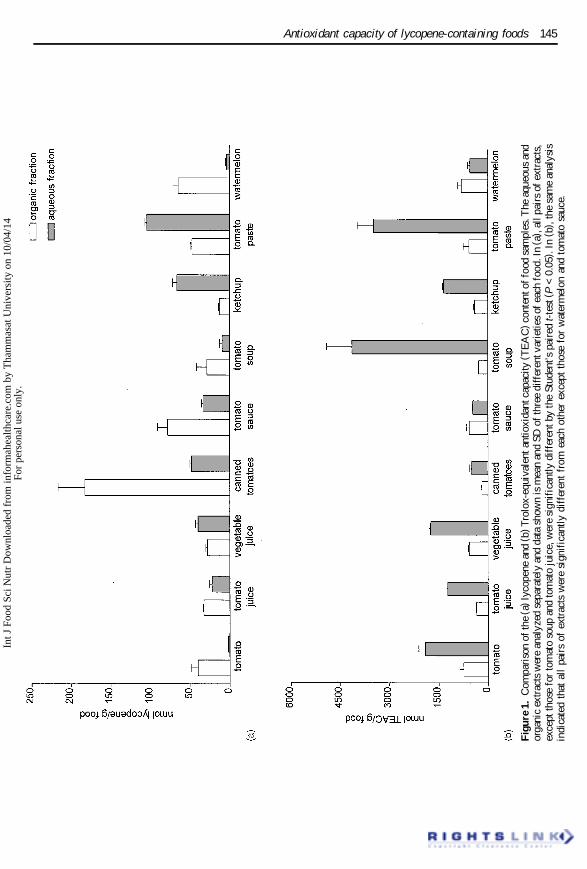
Statistical analysesThe values obtained for each extract (anaverage of at least duplicate determinations foreither TEAC or lycopene) were averaged, andthe average for two extracts from each foodsample was used as the value for that foodsample. The means and standard deviations(SD) for the three different samples of eachfood were calculated and reported as the TEACor lycopene value for the aqueous and organicfractions of each food (Figure 1). Differencesbetween food extracts were analyzed using one-way analysis of co-variance (ANOVA) andTukey–Kramer post-tests to examine differ-ences between pairs of foods. Differencesbetween the organic and aqueous fractions wereanalyzed using paired Student’s t-tests.
Int J
Foo
d Sc
i Nut
r D
ownl
oade
d fr
om in
form
ahea
lthca
re.c
om b
y T
ham
mas
at U
nive
rsity
on
10/0
4/14
For
pers
onal
use
onl
y.
Antioxidant capacity of lycopene-containing foods 145
Fig
ure
1.C
ompa
riso
n of
the
( a)
lyco
pene
and
(b)
Tro
lox-
equi
vale
nt a
ntio
xida
nt c
apac
ity (
TE
AC
) co
nten
t of
food
sam
ples
. The
aqu
eous
and
orga
nic
extr
acts
wer
e an
alyz
ed s
epar
atel
y an
d da
ta s
how
n is
mea
n an
d SD
of
thre
e di
ffer
ent v
arie
ties
of e
ach
food
. In
( a) ,
all
pair
s of
ext
ract
s,ex
cept
thos
e fo
r to
mat
o so
up a
nd to
mat
o ju
ice,
wer
e si
gnif
ican
tly d
iffe
rent
by
the
Stud
ent’s
pai
red
t-te
st (
P<
0.0
5). I
n ( b
) , th
e sa
me
anal
ysis
indi
cate
d th
at a
ll p
airs
of
extr
acts
wer
e si
gnif
ican
tly
diff
eren
t fr
om e
ach
othe
r ex
cept
tho
se f
or w
ater
mel
on a
nd t
omat
o sa
uce.
Int J
Foo
d Sc
i Nut
r D
ownl
oade
d fr
om in
form
ahea
lthca
re.c
om b
y T
ham
mas
at U
nive
rsity
on
10/0
4/14
For
pers
onal
use
onl
y.
146 Z. Djuric and L. C. Powell
The mean TEAC and lycopene contents ofeach food were calculated after adding theTEAC or lycopene content of the aqueous andorganic fractions of each food sample, and theamount per serving was calculated using USFood and Drug Administration (USDA) servingsizes: 1 cup of juice (242 g for vegetable juiceand 242.6 g for tomato juice), soup (245 g, afterdilution according to label instructions with anequal volume of water), or watermelon (280 g);1�2 cup of canned tomatoes (130 g); 1 mediumtomato (85 g); 1�4 cup of sauce (60 g); 2 table-spoons of tomato paste (30 g); 1 tablespoon ofketchup (15 g). Mean values of TEAC orlycopene/serving of food were compared usingANOVA with Tukey–Kramer post-tests. Allanalyses were carried out with the GraphPadInStat program, version 2.0 (San Diego, CA)and differences were considered significantwhen P < 0.05.
Results
Mean total lycopene levels reported herewere not the same as the USDA referencevalues, but they were reasonable based on theranges previously reported (AgriculturalResearch Service, 1998b; Clinton, 1998).The chief differences were in our valuesfor the juices and canned tomatoes, whichwere somewhat higher than previously repor-ted, and our values for ketchup and soup,which were relatively lower. Specifically,lycopene values, in m g lycopene/100 g food,were as follows with values obtained in thisstudy listed first and the maximum range ofvalues reported previously (AgriculturalResearch Service, 1998b; Clinton, 1998) listedsecond:
2275 m g/100 g vs 880–4200 m g/100 gfor tomatoes;
29,896 m g/100 g vs 5000–11,600 m g/100 gfor tomato juice;
36,871 m g/100 g vs 9660 m g/100 gfor vegetable juice (no range reported);
12,384 m g/100 g vs 9270–10,145 m g/100 gfor canned tomatoes;
6013 m g/100 g vs 7300–17,980 m g/100 gfor tomato sauce;
2040 m g/100 g vs 3995–5460 m g/100 gfor tomato soup prepared with water;
4284 m g/100 g vs 9900–17,230 m g/100 gfor ketchup;
8161 m g/100 g vs 5400–150,000 m g/100 gfor tomato paste; and
3706 m g/100 g vs 2300–7200 m g/100 gfor watermelon.
Our values for the total lycopene content ofthe food were calculated from the sum of thelycopene content of the organic and aqueousfractions, which could result in discrepancies,and there is variability normally present infoods for a variety of reasons, such as from thedegree of tomato ripening (Liu & Lau, 1977),the type of tomatoes that are used (Hart & Scott,1995) or from differences in processing forprepared foods. The ranges that have beenreported previously for lycopene values offoods are quite broad (Agricultural ResearchService, 1998b; Clinton, 1998).
Analysis of relative levels of lycopene in theaqueous and organic fractions using the pairedStudent’s t-test indicated that all pairs ofextracts, except those for tomato soup andtomato juice, were significantly different (P <0.05). For TEAC, the same analysis indicatedthat all pairs of extracts were significantlydifferent from each other except those forwatermelon and tomato sauce. ANOVA analy-ses were used to compare the TEAC andlycopene levels per serving, and this indicatedthere were significant differences present inboth (P < 0.0001 in each case). Using Tukey–Kramer post-tests, lycopene levels were sig-nificantly higher in canned tomatoes than any ofthe other food samples (P < 0.05). Watermelonlycopene levels were significantly higher thanthose of vegetable juice, tomatoes, tomatopaste, ketchup and tomato soup. Both juices hadhigher lycopene values per serving than tomatosauce, soup, ketchup, paste and tomatoes. ForTEAC per serving, tomato soup was sig-nificantly higher than any other food sample.Vegetable juice had significantly higher TEAClevels than canned tomatoes, sauce, paste andketchup, while tomato juice had significantlyhigher levels than tomatoes, sauce and ketchup.Watermelon TEAC was significantly higherthan that of sauce or ketchup.
Int J
Foo
d Sc
i Nut
r D
ownl
oade
d fr
om in
form
ahea
lthca
re.c
om b
y T
ham
mas
at U
nive
rsity
on
10/0
4/14
For
pers
onal
use
onl
y.

Antioxidant capacity of lycopene-containing foods 147
Fig
ure
2.C
ompa
riso
n of
the
lyc
open
e an
d T
rolo
x-eq
uiva
lent
ant
ioxi
dant
cap
acity
(T
EA
C)
of f
oods
exp
ress
ed a
snm
oles
per
ser
ving
. T
hese
val
ues
wer
e ob
tain
ed b
y ad
ding
the
TE
AC
and
lyc
open
e co
nten
t of
the
aqu
eous
and
org
anic
foo
d fr
acti
ons,
and
dat
a sh
own
is t
he m
ean
and
SD f
or t
hree
dif
fere
nt v
arie
ties
of
each
foo
d. A
NO
VA
ana
lyse
s in
dica
ted
that
lyco
pene
leve
ls, p
er s
ervi
ng, w
ere
sign
ific
antly
hig
her
in c
anne
d to
mat
oes
than
any
of
the
othe
r fo
od s
ampl
es (
P<
0.0
5). F
or T
EA
C p
er s
ervi
ng, t
omat
o so
up w
as s
igni
fica
ntly
high
er t
han
any
othe
r fo
od s
ampl
e.
Int J
Foo
d Sc
i Nut
r D
ownl
oade
d fr
om in
form
ahea
lthca
re.c
om b
y T
ham
mas
at U
nive
rsity
on
10/0
4/14
For
pers
onal
use
onl
y.
148 Z. Djuric and L. C. Powell
Discussion
Tomato-containing foods and watermelon arethe major sources of lycopene in the Americandiet (Clinton, 1998). Lycopene is thought to bechemopreventive compound, and one mecha-nism by which lycopene may inhibit tumor cellgrowth, including prostate tumor cell growth, isvia its antioxidant potential. Other compoundsin these foods, however, may also have anti-oxidant properties. For example, many fla-vonoids found in fruits and vegetables haveantioxidant properties, such as quercetin (Rice-Evans & Miller, 1996). We therefore evaluatedthe total antioxidant capacity of nine lycopene-containing foods.
This investigation was limited to three brandsor types of each food purchased in the Detroit,MI supermarkets. As such, the results mighthave been different if more or different brandsor types of each food were purchased. The datanonetheless should be useful to give an indica-tion of the antioxidant levels that can be foundin the aqueous and organic fractions of tomato-containing foods and watermelon.
Lycopene is a fat-soluble micronutrient,and accordingly its levels were relativelyhigher in the organic fractions of most of thefoods, except for the juices, which had similarlevels, and tomato paste and ketchup whichhad significantly higher levels in the aqueousfractions (Figure 1(a)). These latter two foodsare very concentrated tomato products, andthis could affect the ability of lycopene tobe released into the aqueous fraction. Thiscould be one factor contributing to theincreased lycopene bioavailability fromtomato paste versus fresh tomatoes (Gartneret al., 1997). For the two juices, lycopenelevels (per g food) were fairly similar in thetwo fractions.
TEAC values tended to be higher in theaqueous fractions of the foods (Figure 1b). Theonly two foods with higher TEAC in the organicversus aqueous fraction were tomato sauce andwatermelon. It may be of interest to examine
which compounds may be responsible for thisactivity since if lycopene was responsible,canned tomatoes would have been expected tohave the highest TEAC in the organic fraction.The antioxidant capacity of fresh tomato frac-tions has been reported previously, and agreeswell with our findings of threefold higher levelsin the aqueous versus organic fractions (Re etal., 1999).
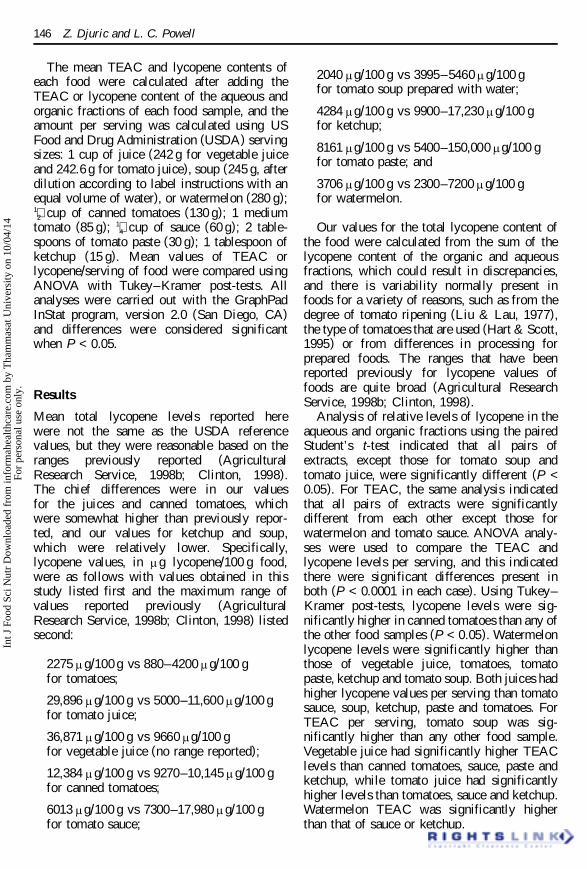
The TEAC and lycopene values were alsoexpressed as total amount per serving of food,in order that the foods could be compared inamounts that would typically be consumed(Figure 2). TEAC values of the foods analyzedwere quite different from that of lycopenelevels. The food with by far the highest TEACvalue overall, per serving, was tomato soup,followed by the two juices and fresh tomatoes.This does not appear to be due solely to vitaminC content since the standard reference USDAvalues for vitamin C in foods indicate thatvegetable juice has about the same amount ofvitamin C per serving as tomato soup, and thata serving of watermelon has slightly morevitamin C than fresh tomatoes (AgriculturalResearch Service, 1998a). The foods highest inlycopene content, per serving, were dicedcanned tomatoes, watermelon and the twojuices (Figure 2).
In summary, the foods which contained thehighest levels of antioxidants, as assessed by theTEAC assay, were not necessarily the foodswith the highest levels of lycopene. This may bedue to the multitude of antioxidants that may bepresent in these foods. The TEAC assaysindicated that most of the antioxidants werefound in the aqueous extracts of the foods. Inorder to better understand the health effects oflycopene-containing foods, it would be ofinterest to characterize more of the compoundspresent in these foods.
Acknowledgments— LaKesha Powell was the recipient of aDetroit High School Summer Research Apprenticeship fromthe Barbara Ann Karmanos Cancer Institute, which isfunded in part by United Way Community Services ofSoutheast Michigan.
References
Agricultural Research Service (1998a): USDA NutritientData Laboratory Database for Standard Reference,release number 12, March 1998. Beltsville, MD: Belts-ville Human Nutrition Research Center.
Agricultural Research Service (1998b): USDA-NCC Car-otenoid Database for U.S. Foods – 1998. Beltsville, MD:Beltsville Human Nutrition Research Center.
Britton G, Liaaen-Jensen S & Pfander H (1995): Car-
Int J
Foo
d Sc
i Nut
r D
ownl
oade
d fr
om in
form
ahea
lthca
re.c
om b
y T
ham
mas
at U
nive
rsity
on
10/0
4/14
For
pers
onal
use
onl
y.
Antioxidant capacity of lycopene-containing foods 149
otenoids. Vol. 1A: Isolation and Analysis. Basel: Bir-khauser Verlag.
Clinton SK (1998): Lycopene: chemistry, biology, andimplications for human health and disease. NutritionReviews 56, 35– 51.
Gartner C, Stahl W & Sies H (1997): Lycopene is morebioavailable from tomato paste than from fresh tomatoes.Am. J. Clin. Nutr. 66, 116–122.
Hart DJ & Scott KJ (1995): Development and validation ofan HPLC method for the analysis of carotenoids in foods,and the measurement of the carotenoid content ofvegetables and fruits commonly consumed in the UK.Food Chemistry 54, 101–111.
Liu YK & Lau SS (1977): Effect of harvest maturity oncaroentoids in pastes made from VF-145–7879 tomatoes.J. Food Sci. 42, 216– 220.
Re R, Pellegrini N, Proteggente A, Pannala A, Yang M &Rice-Evans C (1999): Antioxidant activity applying animproved ABTS radical cation decolorization assay. FreeRadic. Biol. Med. 26, 1231–1237.
Rice-Evans C & Miller NJ (1994): Total antioxidant statusin plasma and body fluids. Methods in Enzymology 234,279–293.
Rice-Evans CA & Miller NJ (1996): Antioxidant activitiesof flavonoids as bioactive components of food. Bio-chemical Society Transactions 24, 790–795.
vanBoekel MAJS & Jongen WMF (1997): Product qualityand food processing: how to quantify the healthiness of aproduct. Cancer Letters 114, 65– 69.
Weisburger JH (1998): Evaluation of the evidence on therole of tomato products in disease prevention. Proc. Soc.Exper. Biol. Med. 218, 140–143.
Int J
Foo
d Sc
i Nut
r D
ownl
oade
d fr
om in
form
ahea
lthca
re.c
om b
y T
ham
mas
at U
nive
rsity
on
10/0
4/14
For
pers
onal
use
onl
y.


![Welcome! [] · 2019-09-16 · Infographic #DYK tomatoes contain lycopene, an antioxidant that is good for your heart and helps prevent some cancers. ... antioxidants, and dietary](https://img.pdfslide.net/doc/110x75/5f48eb97d39abd31d5409e5c/welcome-2019-09-16-infographic-dyk-tomatoes-contain-lycopene-an-antioxidant.jpg)