Embed Size (px)
Citation preview

AP Statistics-Adams Name: ____________________________ Year End Review Period: ______ Date: ________________
Use these data for Questions 1–3.
This table lists the number of applications to a sample of ten colleges that are located in the same state. The values are in 100’s.
Colleges
Number of Applications
(100’s) Colleges
Number of Applications
(100’s)
A 72.0 F 26.9
B 63.1 G 25.0
C 54.7 H 23.9
D 54.3 I 23.0
E 29.0 J 20.0
1. What is the sample variance of the number of applications (rounded to two decimal places)?
18.54 19.54 343.75 381.94 none of these
2. Assuming that the mean and standard deviation of the numbers of applications are 40 and 19, respectively, what is the z-score for college A?
0.292 0.594 1.68 2.15 32
3. Which display would be least appropriate for these data?
stem-and-leaf dot plot histogram scatterplot All of these are appropriate.

4. For an approximately normal distribution, the 80th percentile is defined as
the z-score that cuts off an area of 0.80 to its left the value of the variable whose z-score cuts off an area of 0.80 to its left the z-score such that 10% of the area under the normal curve is shaded both at the upper and lower tails of the curve
the value whose z-score is such that 10% of the area under the normal curve is shaded both at the upper and lower tails of the curve
None of these is the definition of a percentile.
5. You are given the regression equation
temperature = 30.4 – 0.072(distance)
where temperature is the temperature displayed on a sensor in °C and distance is the distance in centimeters from the sensor to a heat source. Which of these is not a reasonable conclusion?
Using this regression line, the predicted value of the temperature of the heat source is 30.4°C.
The temperature decreases approximately 0.72°C for each centimeter the sensor is moved away from the heat source.
You can predict that the sensor displays a temperature of 21.76°C when the sensor is 12 centimeters away from the heat source.
The correlation coefficient between temperature and distance indicates a negative relationship.
All of these are reasonable.
6. Which of these statements is always true about a histogram?
It is exactly the same as a bar graph. The exact value of the mean of the data can be calculated from the plot. The intervals defining the widths of the bars are segments of the real number line. The total area beneath all of the bars equals 1. All of the above are false.
7. Which data value, x, selected from the population with parameters given, has the higher z-score?
I. x = 25.4, µ = 12.9, σ = 3.7
II. x = 137.5, µ = 73.7, σ = 17.1 I II The z-scores are equal. It cannot be determined, because you don’t know the sample standard deviations. It cannot be determined, because you don’t know if the populations are normally distributed.
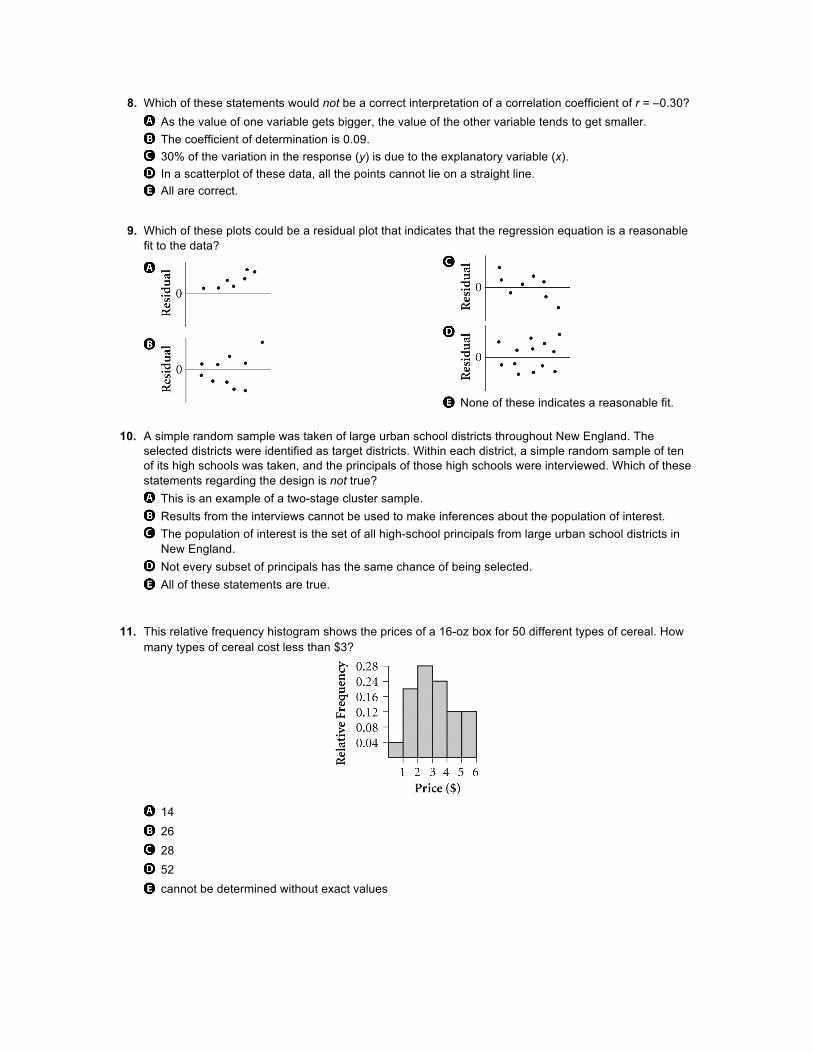
8. Which of these statements would not be a correct interpretation of a correlation coefficient of r = –0.30? As the value of one variable gets bigger, the value of the other variable tends to get smaller. The coefficient of determination is 0.09. 30% of the variation in the response (y) is due to the explanatory variable (x). In a scatterplot of these data, all the points cannot lie on a straight line. All are correct.
9. Which of these plots could be a residual plot that indicates that the regression equation is a reasonable
fit to the data?
None of these indicates a reasonable fit. 10. A simple random sample was taken of large urban school districts throughout New England. The
selected districts were identified as target districts. Within each district, a simple random sample of ten of its high schools was taken, and the principals of those high schools were interviewed. Which of these statements regarding the design is not true?
This is an example of a two-stage cluster sample. Results from the interviews cannot be used to make inferences about the population of interest. The population of interest is the set of all high-school principals from large urban school districts in New England.
Not every subset of principals has the same chance of being selected. All of these statements are true.
11. This relative frequency histogram shows the prices of a 16-oz box for 50 different types of cereal. How many types of cereal cost less than $3?
14 26 28 52 cannot be determined without exact values

12. Which of these scatterplots could have this as its residual plot?
None of these could have a residual plot similar to the given plot.
13. A main purpose of a randomized block design is to reduce the variability within treatment groups. Which design for a sample survey has a similar main purpose of reducing variability within sampled groups?
simple random sample multistage cluster sample stratified random sample convenience sample systematic sample with random start

14. The Association of Wanna-Be-Popular Students takes a survey of all juniors, classifying each by the color of shirt they are wearing and whether they are popular. This table gives the results. B
Color of Shirt
White Pastel Dark Total
Popular 14 32 25 71
Not popular 27 41 17 85
Total 41 73 42 156
What is the probability that a junior randomly selected from those wearing a white shirt is popular?
14156
1441
1471
71156
41156
15. Refer to the table in Question 4. Are the events wearing a white shirt and popular independent?
no, because 14 1441 156
≠
no, because 14 7141 156
≠
no, because 14 1471 41
≠
no, because 14 students are wearing a white shirt and are popular yes, because 14 students are wearing a white shirt and are popular
16. Which of these statements is not true about the variance in a binomial distribution B(n, p)?
For a fixed p, the variance increases as n increases. For a fixed n, the variance is maximum when p = 0.5. The variance depends only on n. The variance is constant for a specific n and p. None of these are true.
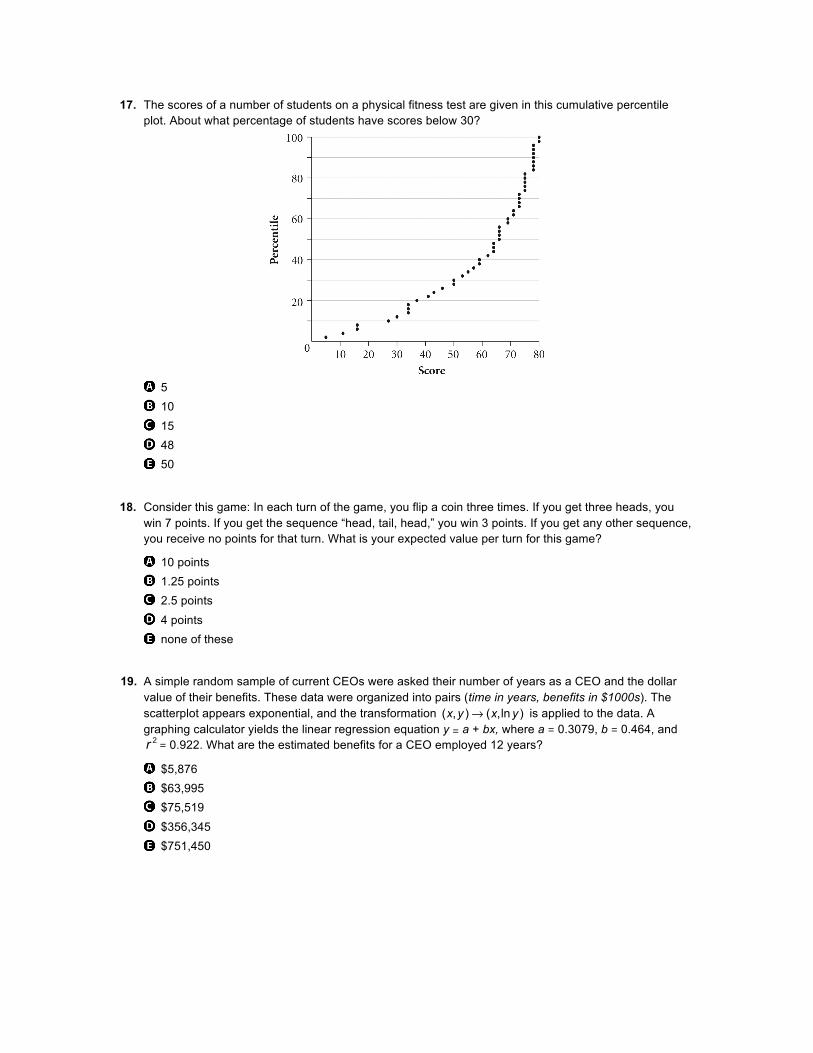
17. The scores of a number of students on a physical fitness test are given in this cumulative percentile plot. About what percentage of students have scores below 30?
5 10 15 48 50
18. Consider this game: In each turn of the game, you flip a coin three times. If you get three heads, you win 7 points. If you get the sequence “head, tail, head,” you win 3 points. If you get any other sequence, you receive no points for that turn. What is your expected value per turn for this game?
10 points 1.25 points 2.5 points 4 points none of these
19. A simple random sample of current CEOs were asked their number of years as a CEO and the dollar value of their benefits. These data were organized into pairs (time in years, benefits in $1000s). The scatterplot appears exponential, and the transformation ( , ) ( ,ln )x y x y→ is applied to the data. A graphing calculator yields the linear regression equation y = a + bx, where a = 0.3079, b = 0.464, and 2r = 0.922. What are the estimated benefits for a CEO employed 12 years?
$5,876 $63,995 $75,519 $356,345 $751,450

20. To study the effects of location and music on studying, a researcher selects 100 college students at random and has them study 2 hours for a standardized test. Half of the students study in a familiar location (their dorm room), and the other half study in an unfamiliar location (a study carrel at the library). Within each group, music is played for half of the students and no music is played for the other half. After 2 hours of study time, all of the students take the standardized test and their scores are compared. Which of these terms best describes the combination of being in an unfamiliar location and having no music playing?
experimental unit factor level response variable treatment
21. The standard deviation of this distribution is closest to which value?
0.25 0.5 1 3.5 4
22. A coefficient of determination, 2r , is found to be 0.81. Which of these statements is true?
81% of the variation between the variables is accounted for in the linear relationship. 81% of the data points lie on a line. The correlation coefficient is 0.9. 19% of the variation between the variables is accounted for in the linear relationship. All of these are true.
23. In order to assess the membership’s attitudes about a new Supreme Court decision, a local bar association selects a simple random sample of 100 lawyers from its membership list. Surveys are delivered to the selected lawyers. Only 63 of the lawyers return their surveys. Which of these is of great concern in this situation?
Nothing is known about the parameters of population interest. Nothing is stated regarding the methodology of the simple random sample. There may be a problem with the sampling frame. There may be a problem with nonresponse bias. None of these statements is of concern.

24. A personnel director at a large company studied the eating habits of employees by watching the movement of a selected group of employees at lunchtime. The purpose of the study was to determine the proportions of employees who buy lunch in the cafeteria, bring their own lunches, and go out to lunch.
If the director includes only the employees in one department in her study, she has a simple random sample quota sample convenience sample multistage cluster sample census
25. Two simple random samples of 50 students from two different universities are taken to determine the proportion of students who approve of the food service at their respective schools. The first university has an enrollment of 5,000 students, while the second university has an enrollment of 35,000. Which of these is the best statement regarding possible bias in the estimates?
There is more bias with the larger university. There is more bias with the smaller university. No bias is expected because the sample sizes are equal. No bias is expected because both populations are at least 10 times the sample size. No bias is expected because these are
random samples. 26. Which of these statements are true regarding means and standard deviations for all data distributions?
I. Approximately 95% of the values will be within 1.96 standard deviations of the mean. II. The standard deviation is smaller than the mean. III. If the distribution is symmetric, the mean and the median are equal.
I only II only III only I and II only None is true.
27. In past years, 20% of all freshmen at a large university have been placed on academic probation at the end of their first semester. In a random sample of 100 of this year’s freshmen, 25% were placed on academic probation at the end of their first semester. The results of this sample
are surprising because 5% more of these freshmen were placed on academic probation than was expected.
are surprising because SAT scores have been increasing over the past few years. are not surprising because getting 25% placed on probation is reasonably likely in a sample of size 100 even if the percentage hasn’t increased from 20%.
are surprising because getting 25% placed on probation would be unlikely in a sample of size 100 if the percentage hasn’t increased from 20%.
are biased.

28. Which of these statements about the design of experiments is true?
All experiments must have a control group. Blocking is employed to reduce within-treatment variability so that the true treatment differences can be more easily detected.
Random assignment is critical for treatment groups, but not for the control group. The units in each block should reflect the variability in the population. None of these is true.
Use these probability distributions to answer Questions 29 and 30.
I II III IV
x p x p x p x p
0 0.2 10 0.2 –2 0 1 0.1
1 0.4 12 0.2 –5 0 2 0.2
2 0.3 15 0.3 –10 0.3 3 0.3
3 0.1 19 0.2 –14 0.3 4 0.3
4 0 25 0.1 –20 0.4 5 0.1
29. Which of the probability distributions has the greatest mean?
I II III IV There is no maximum.
30. Which of the probability distributions has the smallest standard deviation?
I II III IV There is no minimum.
31. If a distribution is relatively symmetric and mound-shaped, order (from least to greatest) these three values.
I. the value with a z-score of 1 II. the value of Q3 III. a value in the 70th percentile
I, II, III I, III, II III, II, I III, I, II II, III, I
32. In a recent year, the U.S. Census Bureau reported that the proportion of Americans that play sports at least once a year is 0.45. If you randomly selected five Americans, approximate the probability that at least three of them play sports at least once a year.
0.105 0.276 0.337 0.407 0.593
33. A least squares regression equation is y = 2.5 + 0.3x. Which of these statements must be true?
The regression line passes through at least one of the original data points. The regression line passes through the point ( ),x y .
The sum of the residuals is 0.3. The sum of the squared residuals is zero. None of these statements must be true.
34. In a hypothesis test, the decision between a one-sided and a two-sided alternative hypothesis is based on
which alternative hypothesis gives you a significant result. the alternative hypothesis appropriate for the context of the problem. how accurate you want the results of the test to be. the level of significance of the test. the statement of the null hypothesis.
35. A sampling distribution of the sample mean is generated for samples of size n from a skewed population. This original sampling distribution has mean xµ and standard error σ .x A new sampling distribution of the sample mean is generated using samples of size 9n. Which of these statements are true?
I. The mean of the new sampling distribution will remain µ .x
II. The standard error of the new sampling distribution will become σ3 .x
III. The shape of the sampling distribution will become more skewed.
I only II only III only I and II I, II, and III
36. The test scores at a large school have an approximately normal distribution with mean 50. What would the standard deviation of the distribution of scores have to be so that 80% of the students are within 12 points (above or below) the mean?
5.875 9.375 10.375 14.5 The answer cannot be determined from the given information.
37. Based on a random sample from a population with a fixed mean, you construct a two-sided test of a hypothesized value of that mean at a fixed significance level. Using the same sample, you then construct a confidence interval estimate of the population mean, choosing a confidence level so that any mean rejected by the hypothesis test will not fall inside the confidence interval of plausible values for the population mean. How are the significance level and the confidence level related?
The confidence level equals the significance level. The difference between the confidence level and significance level is 5. The difference between the confidence level and significance level is 0.90. The sum of the confidence level and the significance level is 0. The significance level is 1 minus the confidence level.
38. Marta flipped a coin several times and kept track of the number of heads. After 10 flips, the proportion of heads was 3
10 , or 0.3. After 50 flips, the proportion of heads was 2950 , or 0.58. After 250 flips, the proportion of heads was 123250 , or 0.492. Marta’s results best illustrate which concept of probability?
Addition Rule for mutually exclusive events conditional probability Fundamental Principle of Counting Law of Large Numbers Multiplication Rule for independent events
39. When you buy a bottle of cola that has a yellow cap, there is a 14 probability that under the cap it says, “You WIN a free bottle!” There is a 34 probability that it says, “Sorry, try again.” Assume that the bottles are randomly distributed to stores and that there are enough bottles available to assume each trial is independent. Which of these scenarios has the greatest probability?
Ali buys one bottle each day and wins for the first time with his fourth bottle. Bob buys one bottle each day and wins for the first time with his eighth bottle. Clarice buys one bottle each day and wins for the first time with her first bottle. Damita buys four bottles at once and wins exactly one time. Enrique buys 20 bottles at once and wins exactly five times.
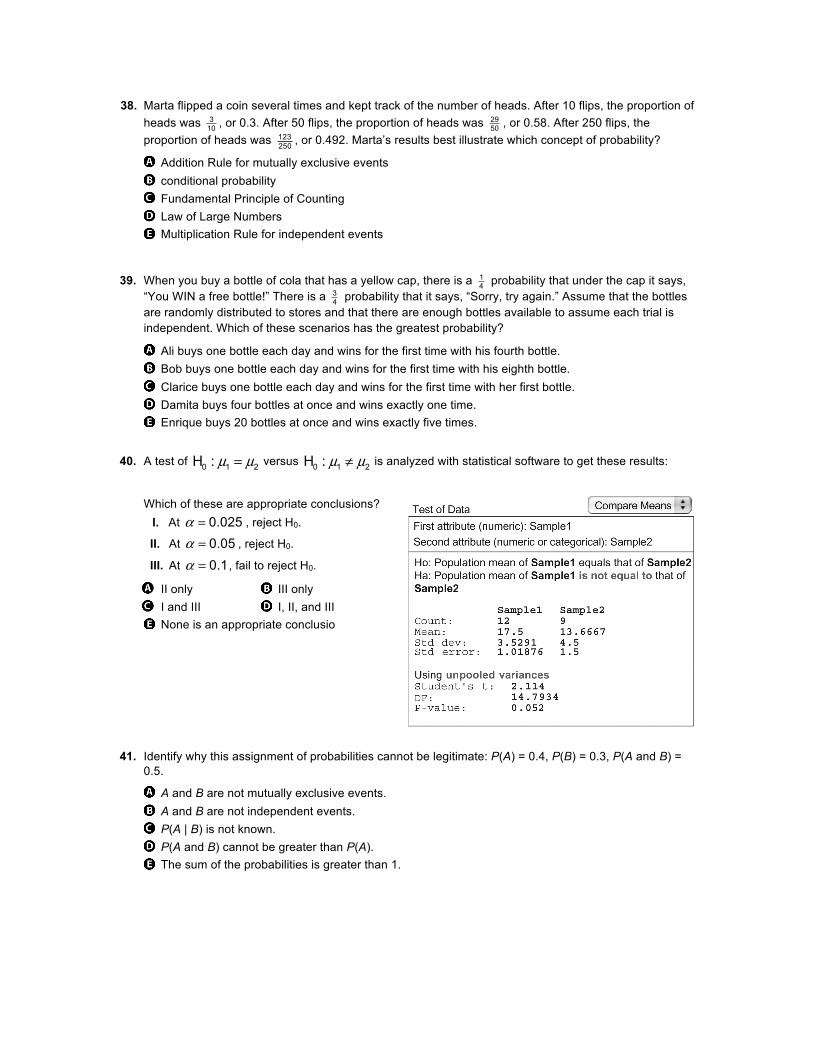
40. A test of 0 1 2H : µ µ= versus 0 1 2H : µ µ≠ is analyzed with statistical software to get these results:
Which of these are appropriate conclusions? I. At 0.025α = , reject H0.
II. At 0.05α = , reject H0.
III. At 0.1α = , fail to reject H0.
II only III only I and III I, II, and III None is an appropriate conclusio
41. Identify why this assignment of probabilities cannot be legitimate: P(A) = 0.4, P(B) = 0.3, P(A and B) = 0.5.
A and B are not mutually exclusive events. A and B are not independent events. P(A | B) is not known. P(A and B) cannot be greater than P(A). The sum of the probabilities is greater than 1.
42. The principal at West Valley High School surveyed a random sample of 20 seniors to see whether they plan to attend college. At West Valley, 85% of those surveyed said they were going to college. The principal at Central High School surveyed a random sample of 40 seniors to see whether they plan to attend college. At Central, only 75% of those surveyed said they were going to college. Which of these is a correct statement about the 95% confidence interval for the difference between the proportions of seniors at West Valley High School and at Central High School who say they are going to college?
The confidence interval is 0.1 ± 0.081. The confidence interval is 0.1 ± 0.134. The confidence interval is 0.1 ± 0.156. The confidence interval is 0.1 ± 0.206. You shouldn’t calculate the confidence interval because the conditions are not met.
43. A bakery owner determines that it will be profitable to sell a particular type of cake if the mean time the cake decorator takes to decorate such a cake does not exceed 45 minutes. The owner documents the time spent on 20 randomly chosen cakes and performs a one-sided test of the null hypothesis that the true mean time is 45 minutes or less versus the alternative that the true mean time exceeds 45 minutes, using 0.05α = . If conditions are met and the P-value of the test is 0.032, then he should conclude
it’s plausible that the mean time is 45 minutes or less, so it won’t be profitable to sell this kind of cake.
it’s plausible that the mean time is 45 minutes or less, so it will be profitable to sell this kind of cake. it’s plausible that the mean time is more than 45 minutes, so it won’t be profitable to sell this kind of cake.
it’s plausible that the mean time is more than 45 minutes, so it will be profitable to sell this kind of cake.
A conclusion cannot be drawn from this information.
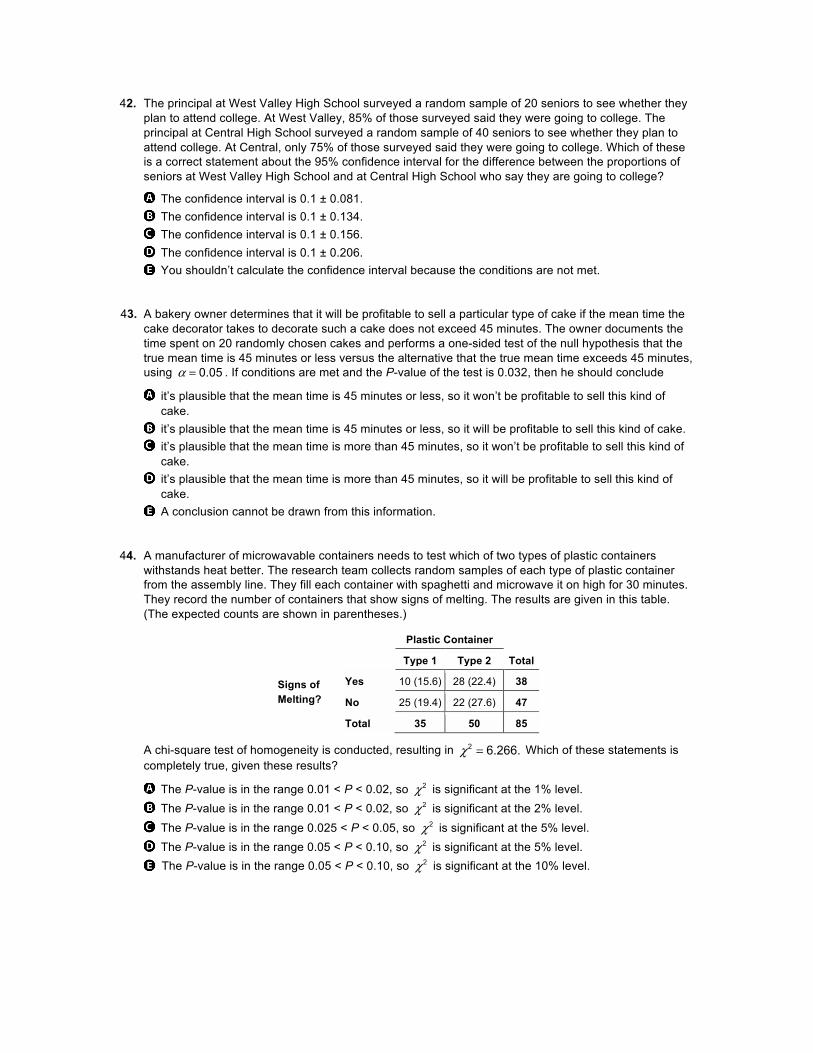
44. A manufacturer of microwavable containers needs to test which of two types of plastic containers withstands heat better. The research team collects random samples of each type of plastic container from the assembly line. They fill each container with spaghetti and microwave it on high for 30 minutes. They record the number of containers that show signs of melting. The results are given in this table. (The expected counts are shown in parentheses.)
Plastic Container
Type 1 Type 2 Total
Signs of Melting?
Yes 10 (15.6) 28 (22.4) 38
No 25 (19.4) 22 (27.6) 47
Total 35 50 85
A chi-square test of homogeneity is conducted, resulting in χ =2 6.266. Which of these statements is completely true, given these results?
The P-value is in the range 0.01 < P < 0.02, so 2χ is significant at the 1% level. The P-value is in the range 0.01 < P < 0.02, so 2χ is significant at the 2% level. The P-value is in the range 0.025 < P < 0.05, so 2χ is significant at the 5% level. The P-value is in the range 0.05 < P < 0.10, so 2χ is significant at the 5% level.
The P-value is in the range 0.05 < P < 0.10, so 2χ is significant at the 10% level.
45. If the 90% confidence interval for the slope of a regression line does not contain 0, then which of these is a valid conclusion?
The confidence interval is not valid. The null hypothesis that the slope of the true regression line is 0 cannot be rejected at the 10% level of significance.
There is sufficient evidence to conclude, at the 10% level of significance, that the slope of the true regression line is 0.
There is sufficient evidence to conclude, at the 10% level of significance, that the slope of the true regression line is not 0.
None of these is valid.