Embed Size (px)
Citation preview
8/12/2019 Apache Investor Day CANADA presentation
http://slidepdf.com/reader/full/apache-investor-day-canada-presentation 1/15
CANADA
John Christmann
February 26, 2014
8/12/2019 Apache Investor Day CANADA presentation
http://slidepdf.com/reader/full/apache-investor-day-canada-presentation 2/15
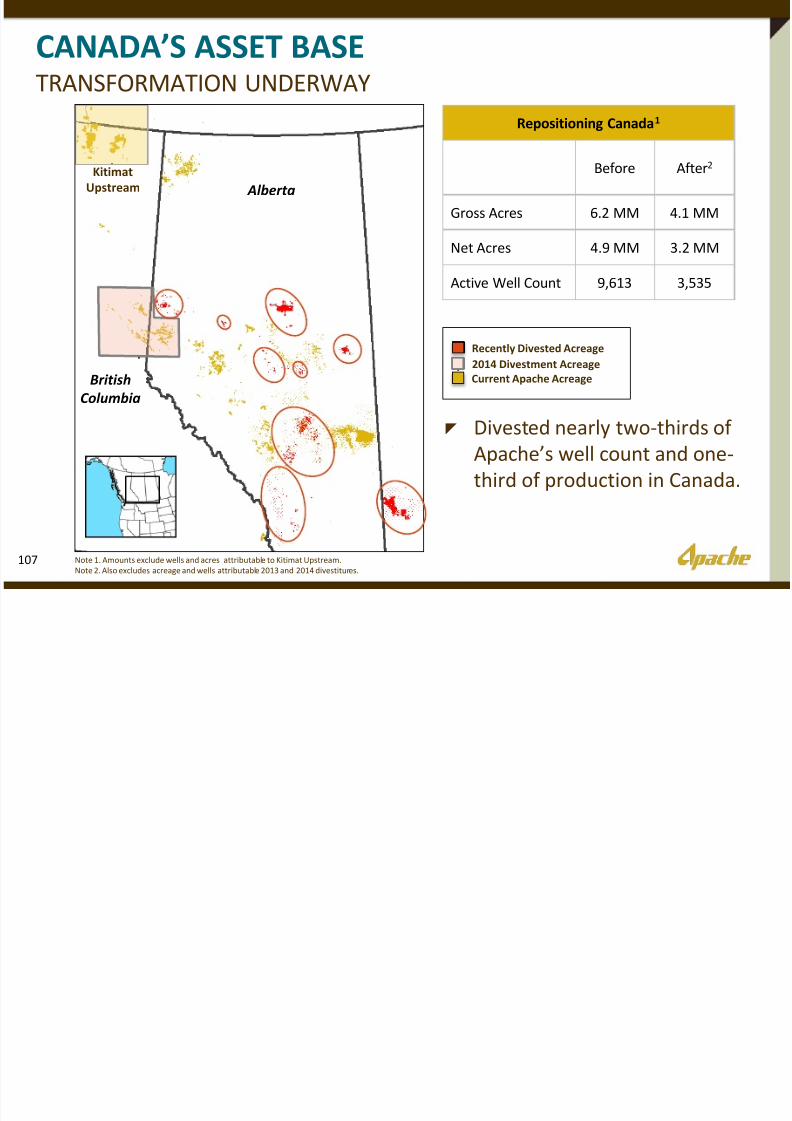
CANADA’S ASSET BASETRANSFORMATION UNDERWAY
107
Recently Divested Acreage
Alberta
Repositioning Canada1
Before After2
Gross Acres 6.2 MM 4.1 MM
Net Acres 4.9 MM 3.2 MM
Active Well Count 9,613 3,535
British
Columbia
Kitimat
Upstream
Note 1. Amounts exclude wells and acres attributable to Kitimat Upstream.
Note 2. Also excludes acreage and wells attributable 2013 and 2014 divestitures.
2014 Divestment Acreage
Current Apache Acreage
Divested nearly two-thirds of
Apache’s well count and one-
third of production in Canada.
8/12/2019 Apache Investor Day CANADA presentation
http://slidepdf.com/reader/full/apache-investor-day-canada-presentation 3/15
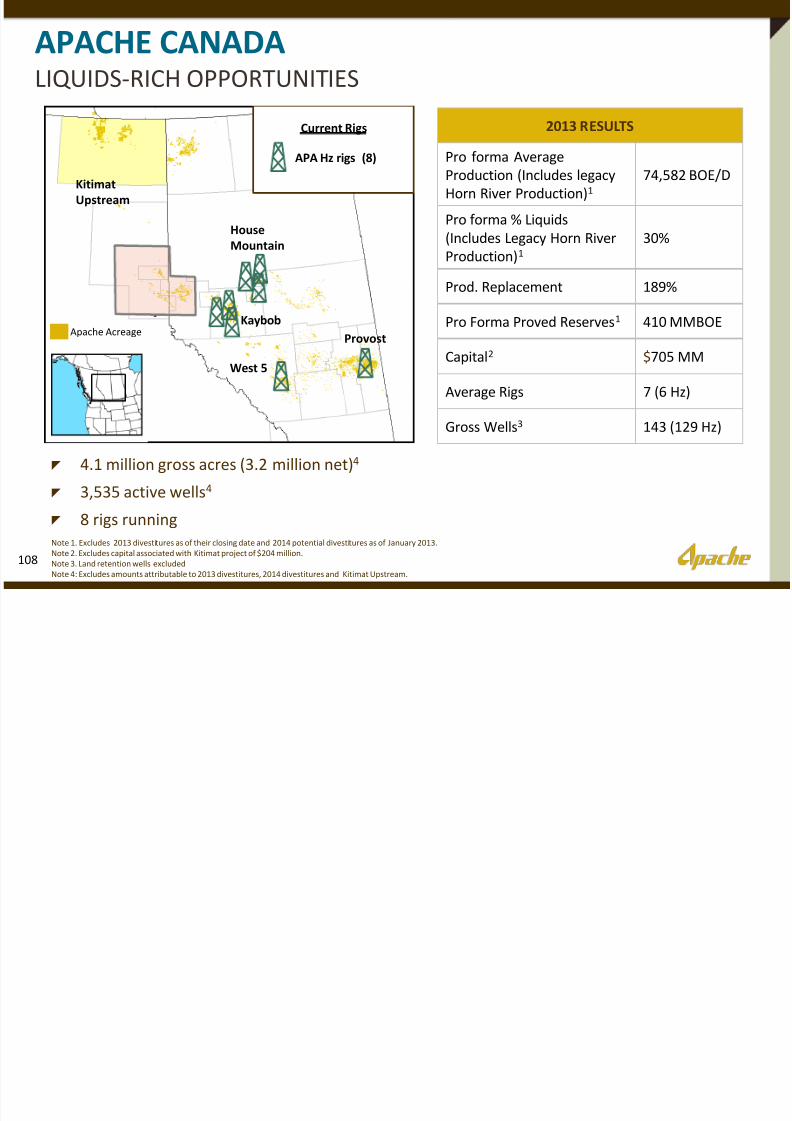
APACHE CANADALIQUIDS-RICH OPPORTUNITIES
108
Apache AcreageKaybob
West 5
Provost
House
Mountain
Kitimat
Upstream
APA Hz rigs (8)
Note 1. Excludes 2013 divestitures as of their closing date and 2014 potential divestitures as of January 2013.
Note 2. Excludes capital associated with Kitimat project of $204 million.Note 3. Land retention wells excluded
Note 4: Excludes amounts attributable to 2013 divestitures, 2014 divestitures and Kitimat Upstream.
2013 RESULTS
Pro forma Average
Production (Includes legacy
Horn River Production)1
74,582 BOE/D
Pro forma % Liquids
(Includes Legacy Horn River
Production)1
30%
Prod. Replacement 189%
Pro Forma Proved Reserves1 410 MMBOE
Capital2 $705 MM
Average Rigs 7 (6 Hz)
Gross Wells3 143 (129 Hz)
4.1 million gross acres (3.2 million net)4
3,535 active wells4
8 rigs running
Current Rigs
8/12/2019 Apache Investor Day CANADA presentation
http://slidepdf.com/reader/full/apache-investor-day-canada-presentation 4/15
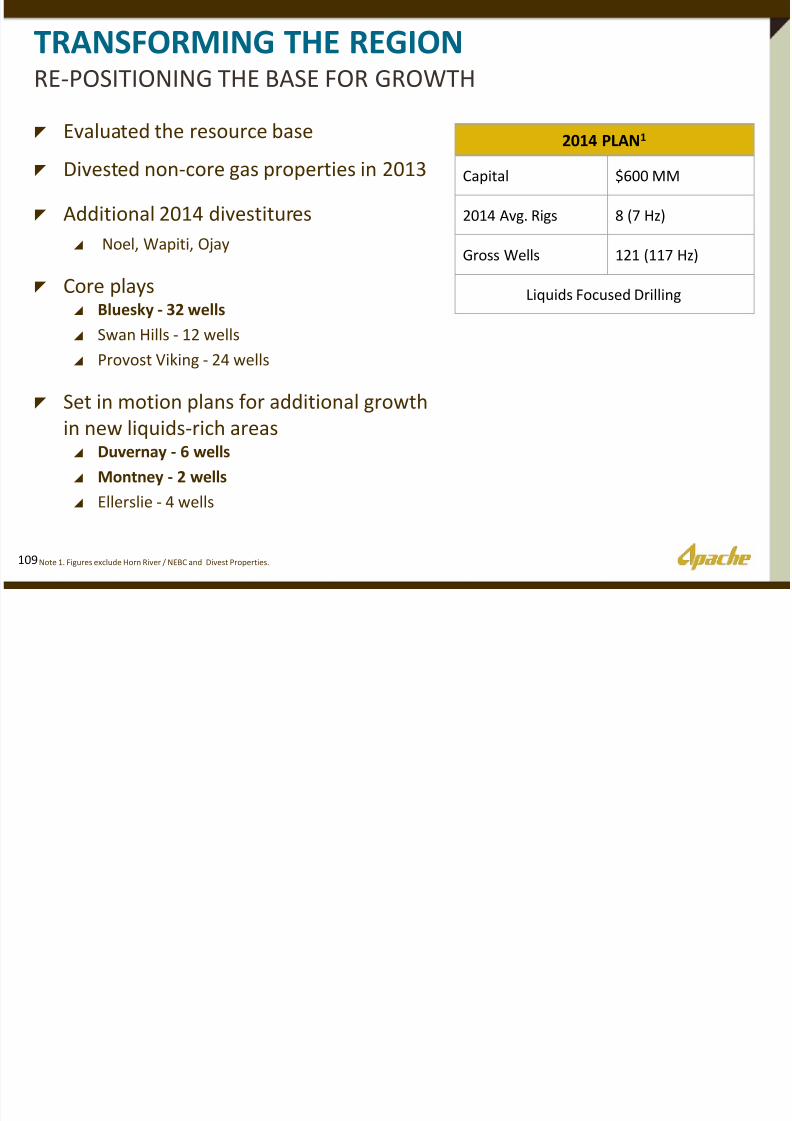
TRANSFORMING THE REGIONRE-POSITIONING THE BASE FOR GROWTH
Note 1. Figures exclude Horn River / NEBC and Divest Properties.109
2014 PLAN1
Capital $600 MM
2014 Avg. Rigs 8 (7 Hz)
Gross Wells 121 (117 Hz)
Liquids Focused Drilling
Evaluated the resource base Divested non-core gas properties in 2013
Additional 2014 divestitures
Noel, Wapiti, Ojay
Core plays Bluesky - 32 wells
Swan Hills - 12 wells
Provost Viking - 24 wells
Set in motion plans for additional growth
in new liquids-rich areas Duvernay - 6 wells
Montney - 2 wells
Ellerslie - 4 wells
8/12/2019 Apache Investor Day CANADA presentation
http://slidepdf.com/reader/full/apache-investor-day-canada-presentation 5/15
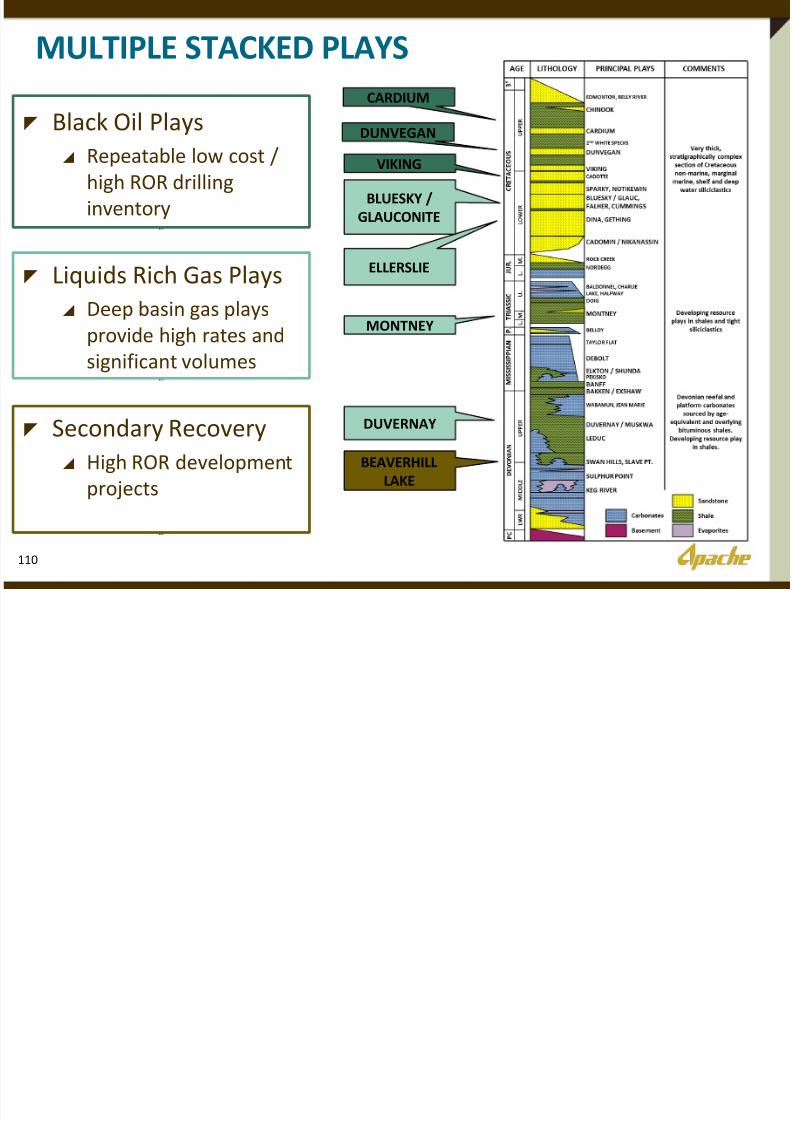
ELLERSLIE
MULTIPLE STACKED PLAYS
CARDIUM
VIKING
DUNVEGAN
DUVERNAY
BEAVERHILL
LAKE
MONTNEY
BLUESKY /
GLAUCONITE
Black Oil Plays
Repeatable low cost /
high ROR drilling
inventory
Liquids Rich Gas Plays Deep basin gas plays
provide high rates and
significant volumes
Secondary Recovery
High ROR development
projects
110
8/12/2019 Apache Investor Day CANADA presentation
http://slidepdf.com/reader/full/apache-investor-day-canada-presentation 6/15
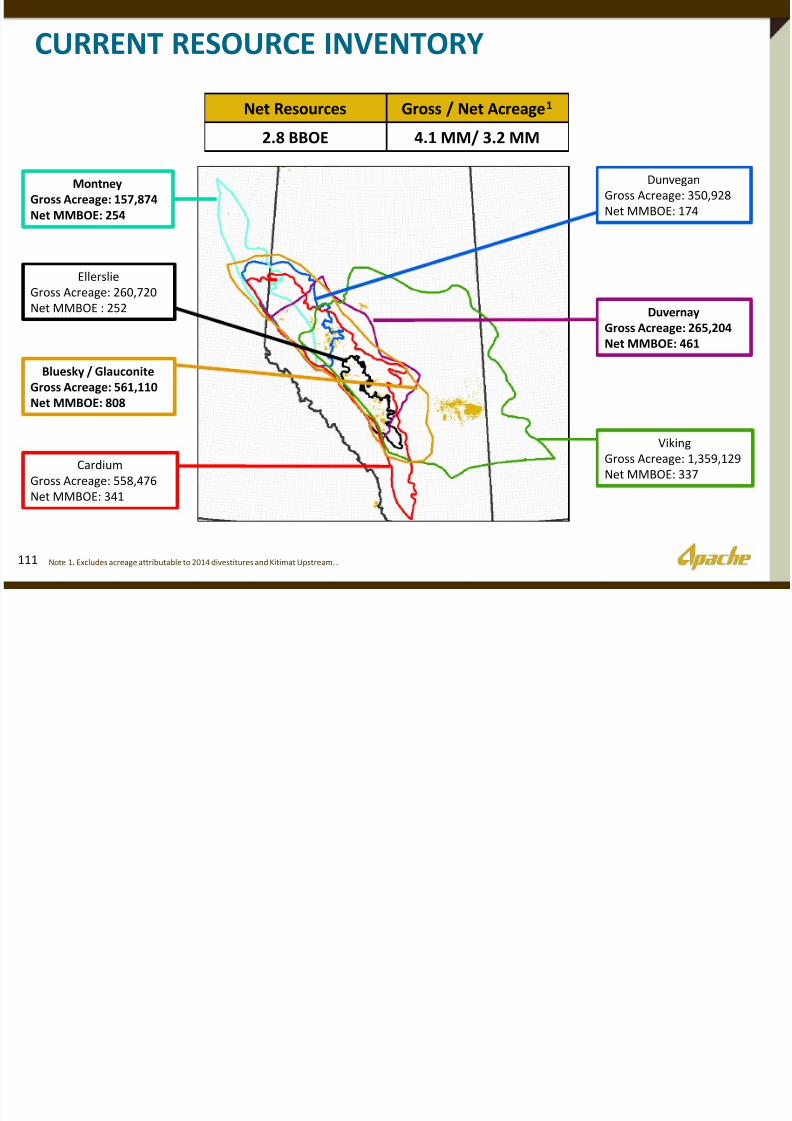
CURRENT RESOURCE INVENTORY
Dunvegan
Gross Acreage: 350,928
Net MMBOE: 174
Duvernay
Gross Acreage: 265,204
Net MMBOE: 461
Bluesky / Glauconite
Gross Acreage: 561,110
Net MMBOE: 808
Viking
Gross Acreage: 1,359,129
Net MMBOE: 337
Montney
Gross Acreage: 157,874
Net MMBOE: 254
Cardium
Gross Acreage: 558,476
Net MMBOE: 341
Net Resources Gross / Net Acreage1
2.8 BBOE 4.1 MM/ 3.2 MM
EllerslieGross Acreage: 260,720
Net MMBOE : 252
111 Note 1. Excludes acreage attributable to 2014 divestitures and Kitimat Upstream..
8/12/2019 Apache Investor Day CANADA presentation
http://slidepdf.com/reader/full/apache-investor-day-canada-presentation 7/15
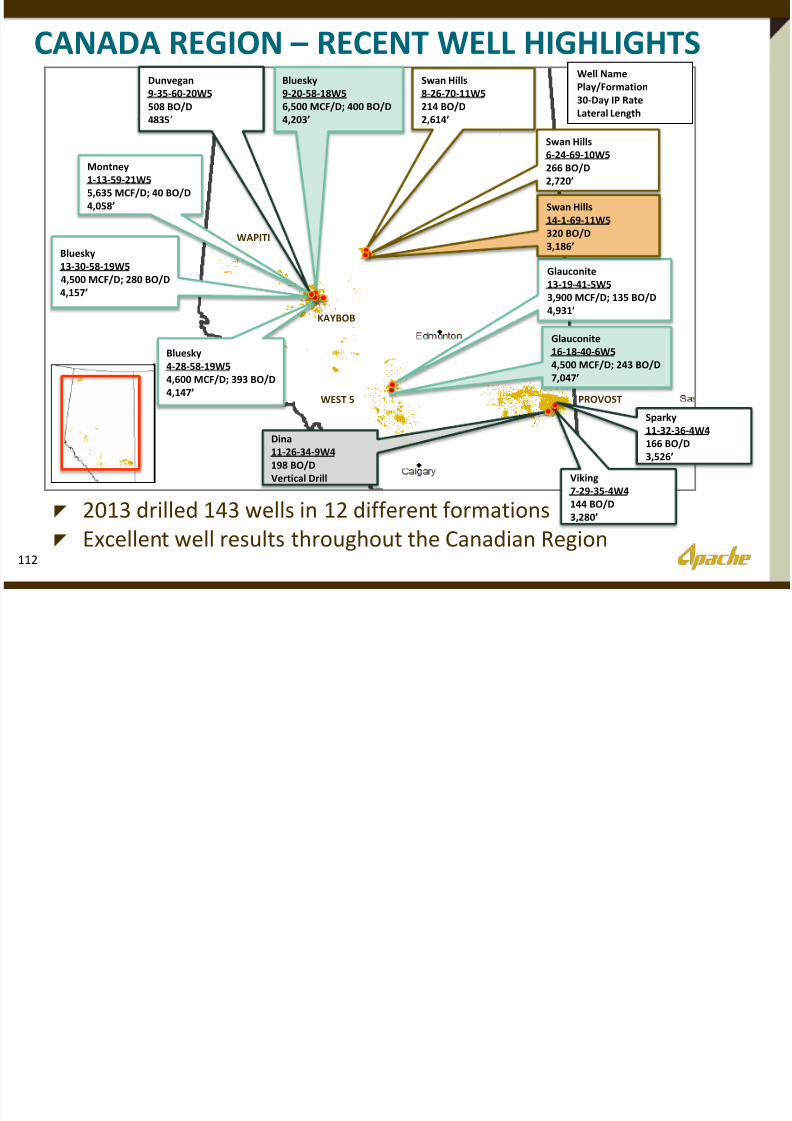
CANADA REGION – RECENT WELL HIGHLIGHTSBluesky
9-20-58-18W5
6,500 MCF/D; 400 BO/D
4,203’
Dunvegan
9-35-60-20W5
508 BO/D
4835’
Dina
11-26-34-9W4
198 BO/D
Vertical Drill
PROVOSTWEST 5
KAYBOB
WAPITI
Noel
Bluesky
13-30-58-19W5
4,500 MCF/D; 280 BO/D4,157’
Bluesky
4-28-58-19W5
4,600 MCF/D; 393 BO/D
4,147’
2013 drilled 143 wells in 12 different formations
Excellent well results throughout the Canadian Region
Glauconite
13-19-41-5W5
3,900 MCF/D; 135 BO/D
4,931’
Glauconite
16-18-40-6W5
4,500 MCF/D; 243 BO/D
7,047’
Swan Hills
8-26-70-11W5
214 BO/D
2,614’
Swan Hills6-24-69-10W5
266 BO/D
2,720’
Swan Hills
14-1-69-11W5
320 BO/D
3,186’
Viking
7-29-35-4W4
144 BO/D
3,280’
Montney
1-13-59-21W5
5,635 MCF/D; 40 BO/D
4,058’
112
Well Name
Play/Formation
30-Day IP Rate
Lateral Length
Sparky11-32-36-4W4
166 BO/D
3,526’
8/12/2019 Apache Investor Day CANADA presentation
http://slidepdf.com/reader/full/apache-investor-day-canada-presentation 8/15
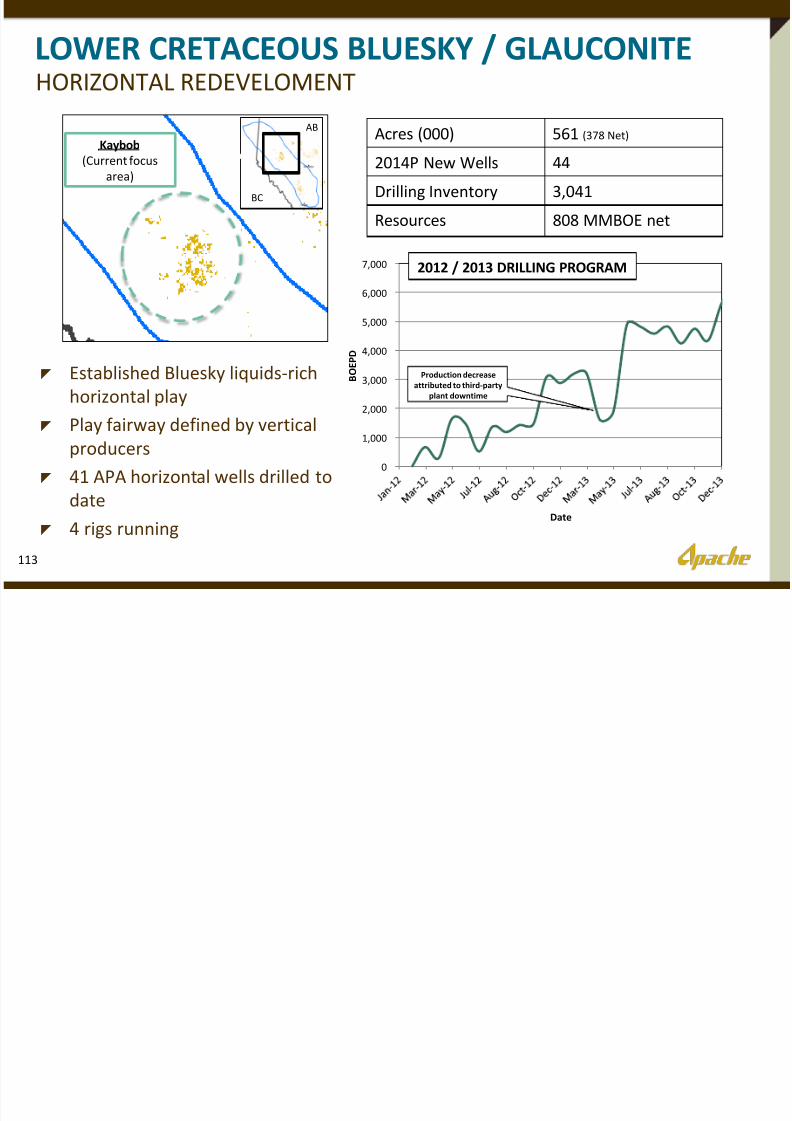
LOWER CRETACEOUS BLUESKY / GLAUCONITE
113
HORIZONTAL REDEVELOMENT
Acres (000) 561 (378 Net)
2014P New Wells 44
Drilling Inventory 3,041
Resources 808 MMBOE net
Established Bluesky liquids-rich
horizontal play
Play fairway defined by vertical
producers
41 APA horizontal wells drilled to
date
4 rigs running
Kaybob
(Current focus
area)
BC
AB
0
1,000
2,000
3,000
4,000
5,000
6,000
7,000
B O E P D
Date
2012 / 2013 DRILLING PROGRAM
Production decrease
attributed to third-party
plant downtime
8/12/2019 Apache Investor Day CANADA presentation
http://slidepdf.com/reader/full/apache-investor-day-canada-presentation 9/15
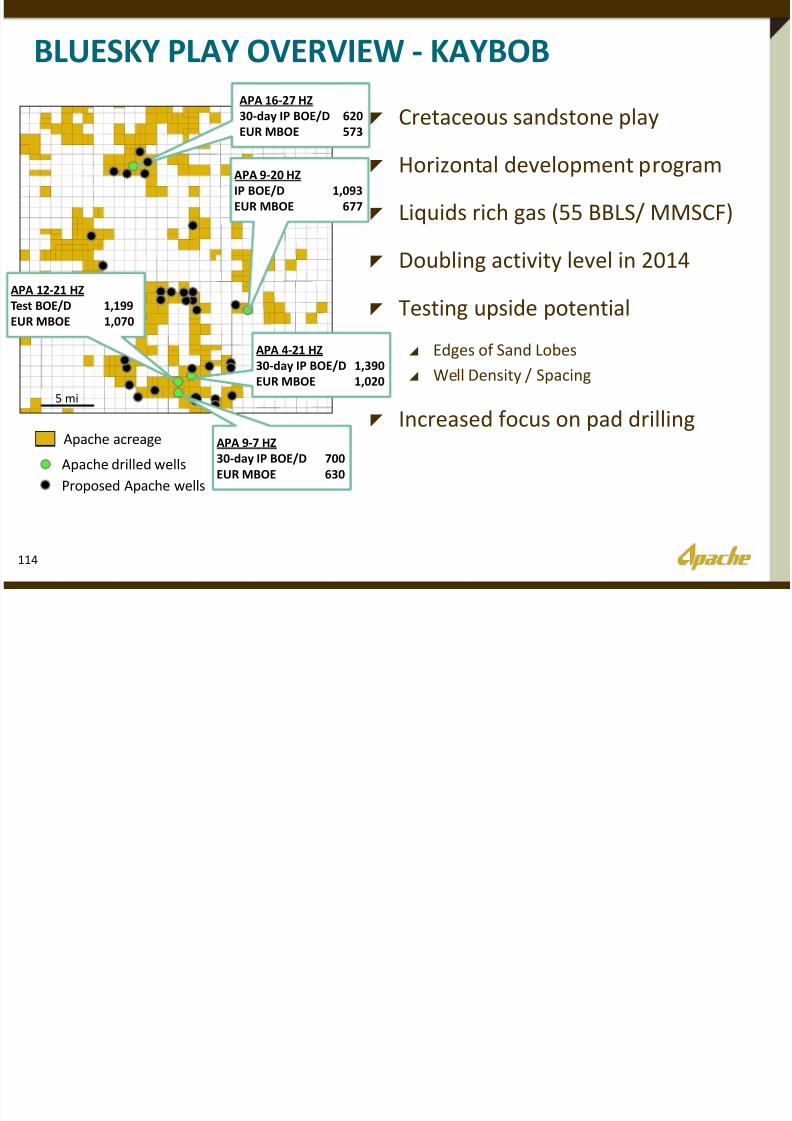
BLUESKY PLAY OVERVIEW - KAYBOB
Cretaceous sandstone play
Horizontal development program
Liquids rich gas (55 BBLS/ MMSCF)
Doubling activity level in 2014
Testing upside potential
Edges of Sand Lobes
Well Density / Spacing
Increased focus on pad drilling
APA 16-27 HZ
30-day IP BOE/D 620
EUR MBOE 573
APA 12-21 HZ
Test BOE/D 1,199
EUR MBOE 1,070
APA 4-21 HZ
30-day IP BOE/D 1,390
EUR MBOE 1,020
5 mi
APA 9-20 HZ
IP BOE/D 1,093
EUR MBOE 677
APA 9-7 HZ
30-day IP BOE/D 700
EUR MBOE 630
Apache acreage
Proposed Apache wells
Apache drilled wells
114
8/12/2019 Apache Investor Day CANADA presentation
http://slidepdf.com/reader/full/apache-investor-day-canada-presentation 10/15
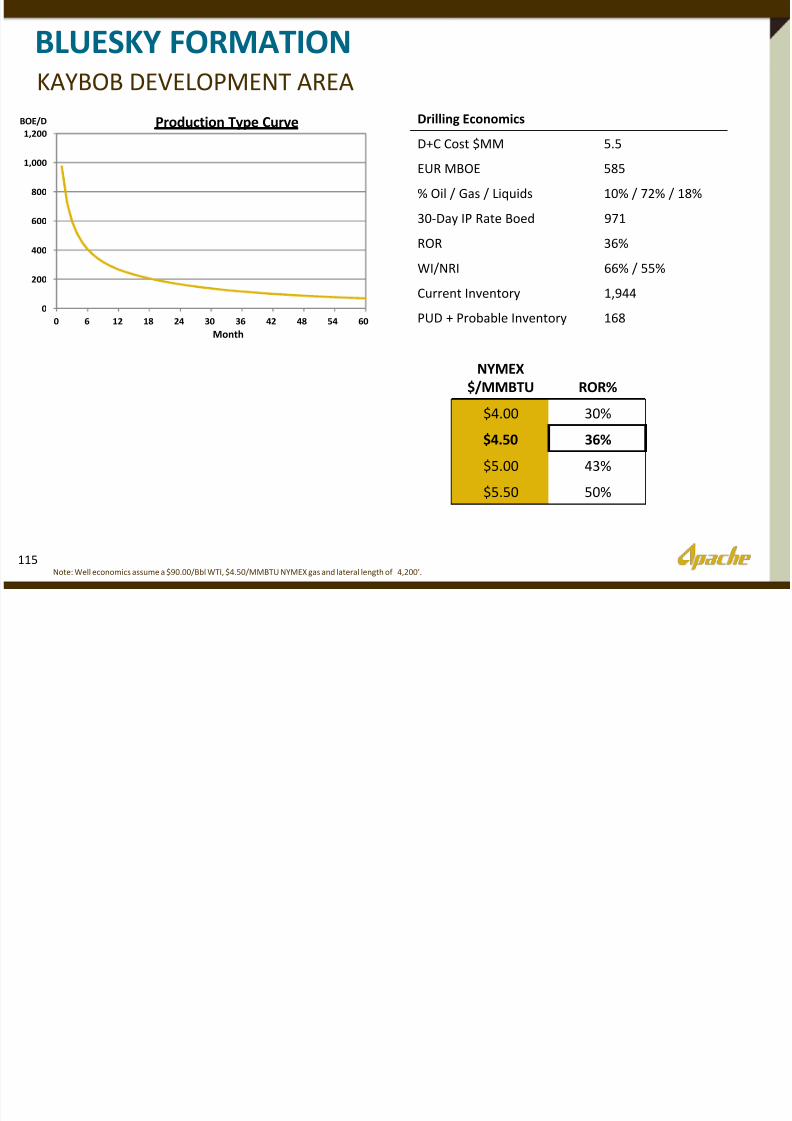
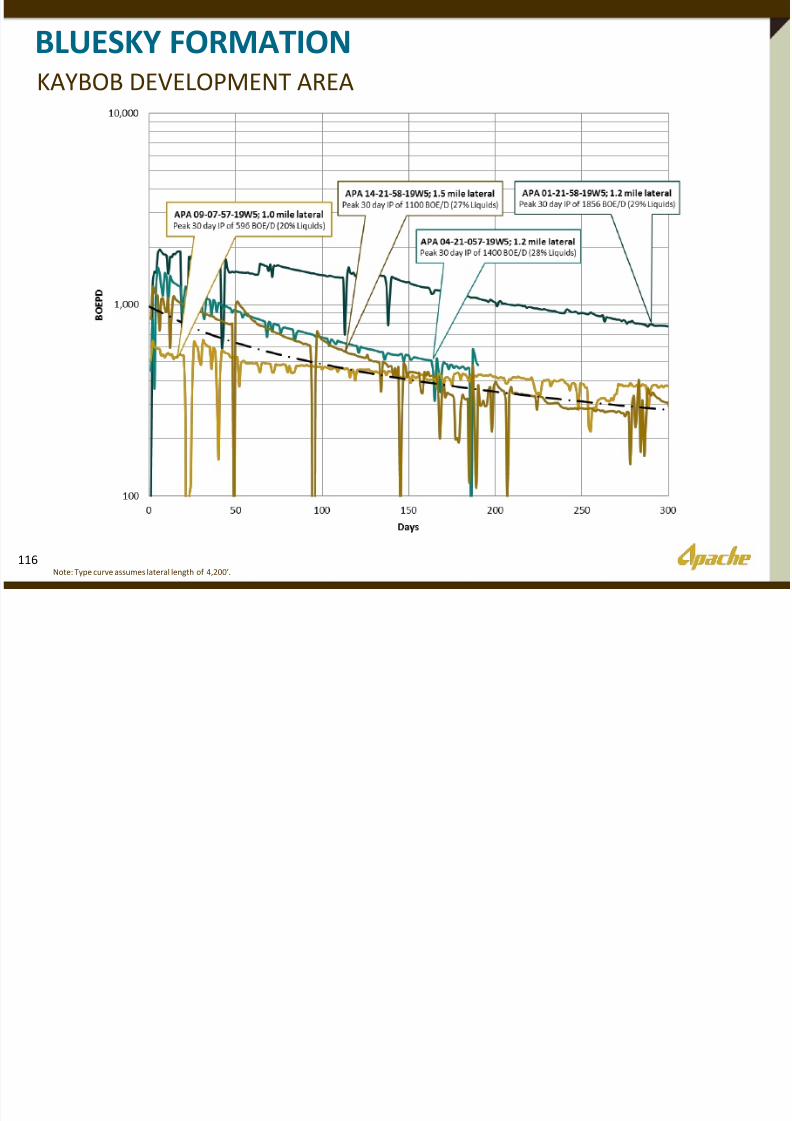
BLUESKY FORMATION
115
Drilling Economics
D+C Cost $MM 5.5
EUR MBOE 585
% Oil / Gas / Liquids 10% / 72% / 18%
30-Day IP Rate Boed 971
ROR 36%
WI/NRI 66% / 55%
Current Inventory 1,944
PUD + Probable Inventory 168
KAYBOB DEVELOPMENT AREA
0
200
400
600
800
1,000
1,200
0 6 12 18 24 30 36 42 48 54 60
BOE/D Production Type Curve
Month
Note: Well economics assume a $90.00/Bbl WTI, $4.50/MMBTU NYMEX gas and lateral length of 4,200’.
NYMEX
$/MMBTU ROR%
$4.00 30%$4.50 36%
$5.00 43%
$5.50 50%
8/12/2019 Apache Investor Day CANADA presentation
http://slidepdf.com/reader/full/apache-investor-day-canada-presentation 11/15
BLUESKY FORMATION
116
KAYBOB DEVELOPMENT AREA
Note: Type curve assumes lateral length of 4,200’.
8/12/2019 Apache Investor Day CANADA presentation
http://slidepdf.com/reader/full/apache-investor-day-canada-presentation 12/15
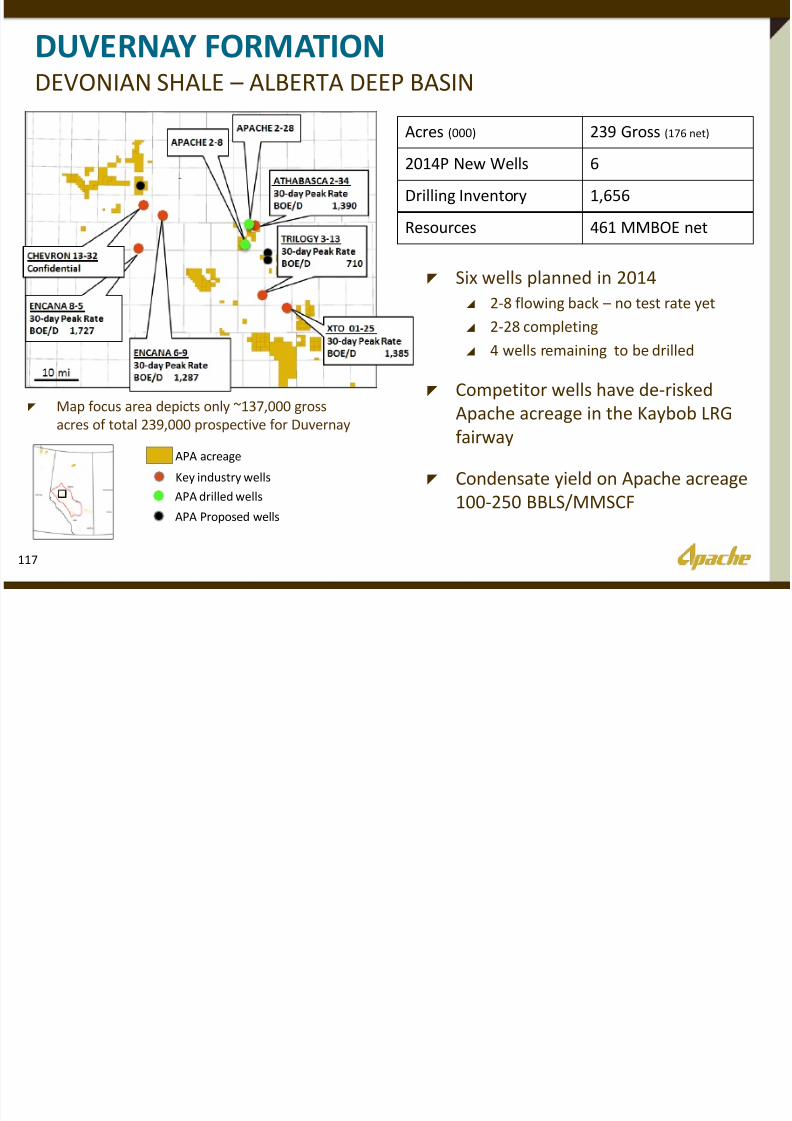
DUVERNAY FORMATION
117
DEVONIAN SHALE – ALBERTA DEEP BASIN
Acres(000)
239 Gross(176 net)
2014P New Wells 6
Drilling Inventory 1,656
Resources 461 MMBOE net
Six wells planned in 2014 2-8 flowing back – no test rate yet
2-28 completing
4 wells remaining to be drilled
Competitor wells have de-risked
Apache acreage in the Kaybob LRGfairway
Condensate yield on Apache acreage
100-250 BBLS/MMSCF
APA acreage
Key industry wells
APA Proposed wells
APA drilled wells
Map focus area depicts only ~137,000 gross
acres of total 239,000 prospective for Duvernay
8/12/2019 Apache Investor Day CANADA presentation
http://slidepdf.com/reader/full/apache-investor-day-canada-presentation 13/15
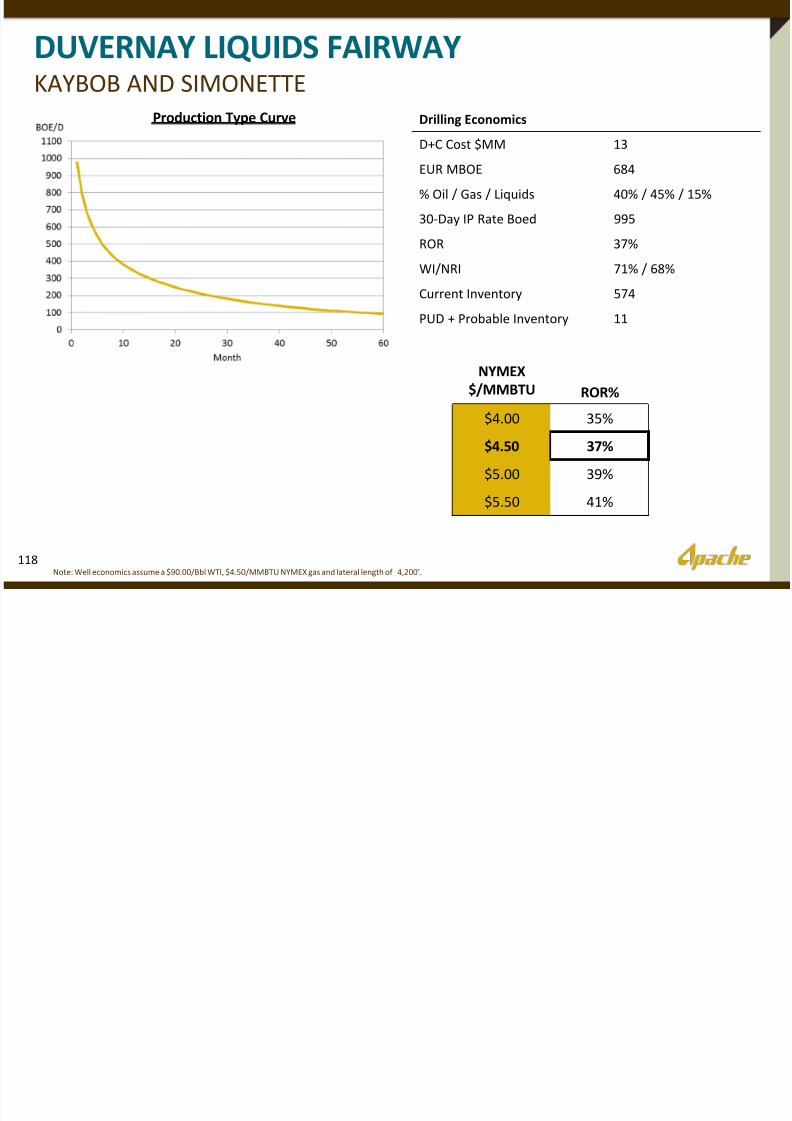
DUVERNAY LIQUIDS FAIRWAYKAYBOB AND SIMONETTE
Drilling Economics
D+C Cost $MM 13
EUR MBOE 684
% Oil / Gas / Liquids 40% / 45% / 15%
30-Day IP Rate Boed 995
ROR 37%
WI/NRI 71% / 68%
Current Inventory 574
PUD + Probable Inventory 11
Production Type Curve
NYMEX
$/MMBTU ROR%
$4.00 35%
$4.50 37%
$5.00 39%
$5.50 41%
118Note: Well economics assume a $90.00/Bbl WTI, $4.50/MMBTU NYMEX gas and lateral length of 4,200’.
8/12/2019 Apache Investor Day CANADA presentation
http://slidepdf.com/reader/full/apache-investor-day-canada-presentation 14/15
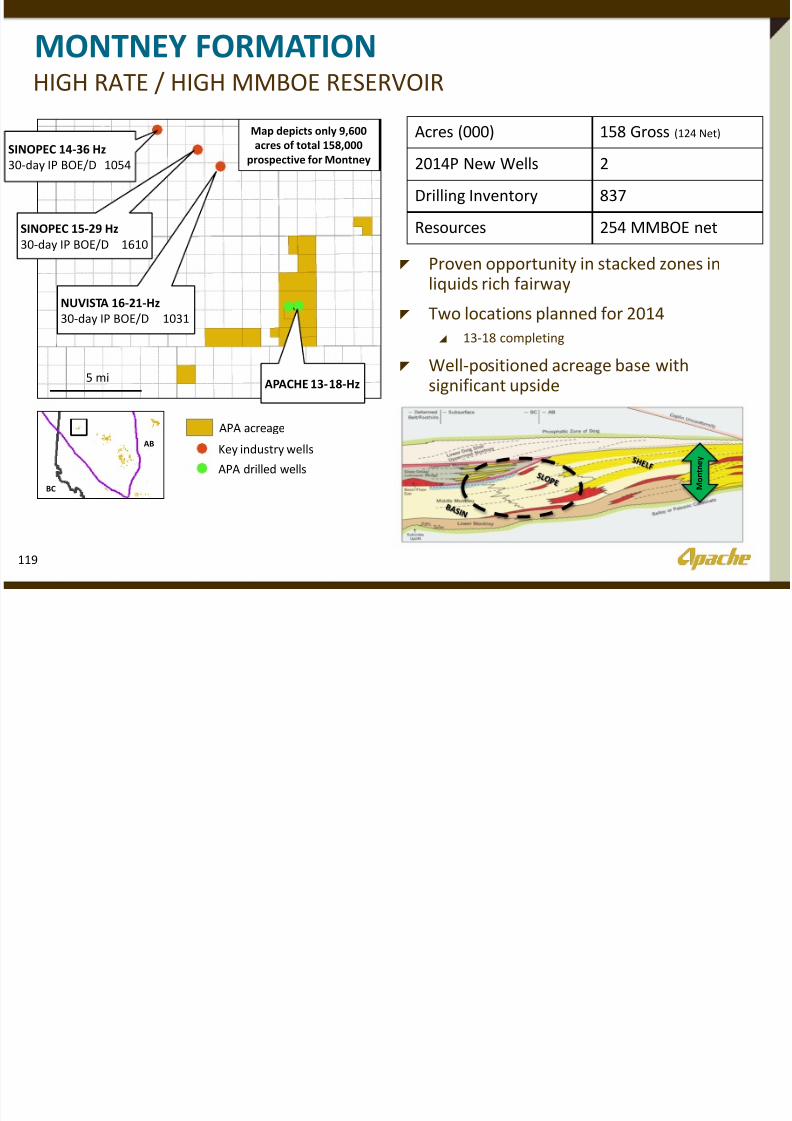
MONTNEY FORMATION
119
HIGH RATE / HIGH MMBOE RESERVOIR
Acres (000) 158 Gross(124 Net)
2014P New Wells 2
Drilling Inventory 837
Resources 254 MMBOE net
Proven opportunity in stacked zones in
liquids rich fairway
Two locations planned for 2014
13-18 completing
Well-positioned acreage base withsignificant upside
M o n t n e y
NUVISTA 16-21-Hz
30-day IP BOE/D 1031
SINOPEC 14-36 Hz
30-day IP BOE/D 1054
SINOPEC 15-29 Hz
30-day IP BOE/D 1610
5 miAPACHE 13-18-Hz
APA acreage
Key industry wells
APA drilled wells
Map depicts only 9,600
acres of total 158,000
prospective for Montney
BC
AB
8/12/2019 Apache Investor Day CANADA presentation
http://slidepdf.com/reader/full/apache-investor-day-canada-presentation 15/15
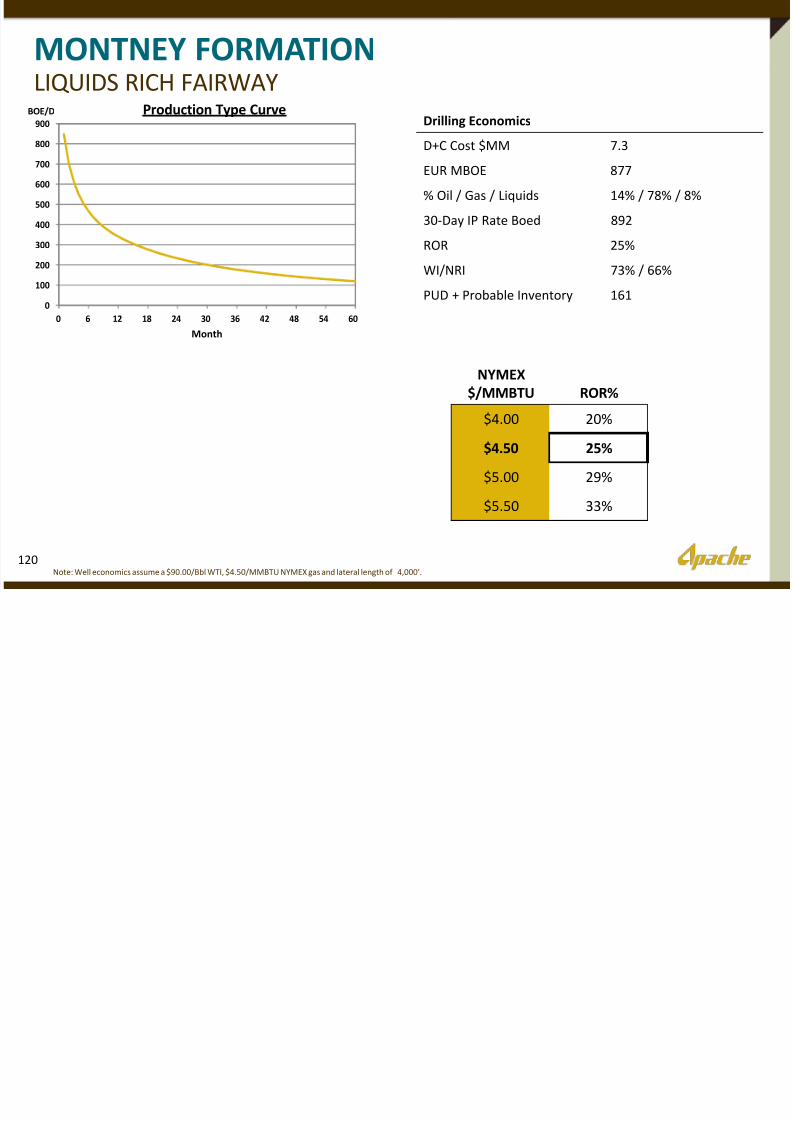
MONTNEY FORMATION
120
LIQUIDS RICH FAIRWAY
Drilling Economics
D+C Cost $MM 7.3
EUR MBOE 877
% Oil / Gas / Liquids 14% / 78% / 8%
30-Day IP Rate Boed 892
ROR 25%
WI/NRI 73% / 66%
PUD + Probable Inventory 1610
100
200
300
400
500
600
700
800
900
0 6 12 18 24 30 36 42 48 54 60
BOE/D Production Type Curve
Month
NYMEX
$/MMBTU ROR%
$4.00 20%
$4.50 25%
$5.00 29%
$5.50 33%
Note: Well economics assume a $90.00/Bbl WTI, $4.50/MMBTU NYMEX gas and lateral length of 4,000’.