Embed Size (px)
Citation preview
1
APEC’s Ease of Doing Business – Interim Assessment 2015-2016
APEC Policy Support Unit September 2017
Prepared by:
Carlos Kuriyama, Denise Cheok and Darren Aw Tsin Liang
Asia-Pacific Economic Cooperation Policy Support Unit
Asia-Pacific Economic Cooperation Secretariat
35 Heng Mui Keng Terrace
Tel: (65) 6891-9600 Fax: (65) 6891-9690
Email: [email protected] Website: www.apec.org
Produced for:
Asia-Pacific Economic Cooperation Policy Support Unit
Asia-Pacific Economic Cooperation Secretariat
35 Heng Mui Keng Terrace
Tel: (65) 6891-9500 Fax: (65) 6891-9690
Email: [email protected] Website: www.apec.org
APEC#217-SE-01.22
This work is licensed under the Creative Commons Attribution-NonCommercial-
ShareAlike 3.0 Singapore License. To view a copy of this license, visit
http://creativecommons.org/licenses/by-nc-sa/3.0/sg/.
The authors are Senior Analyst, Researcher and Intern at the APEC Policy Support Unit (PSU). The
views expressed in this paper are those of the authors and do not necessarily represent those of APEC
Member Economies.
Table of Contents
i
TABLE OF CONTENTS
EXECUTIVE SUMMARY ........................................................................................................ 1
1. INTRODUCTION: APEC’s EASE OF DOING BUSINESS ............................................ 3
A. HISTORY ........................................................................................................................... 3
B. OVERALL TARGET ......................................................................................................... 4
C. MEASUREMENT APPROACH ....................................................................................... 4
2. APEC’S IMPROVEMENTS BY PRIORITY AREAS ................................................. 6
A. STARTING A BUSINESS ............................................................................................. 6
B. DEALING WITH CONSTRUCTION PERMITS........................................................ 11
C. GETTING CREDIT ...................................................................................................... 16
D. TRADING ACROSS BORDERS ................................................................................ 22
E. ENFORCING CONTRACTS ....................................................................................... 27
REFERENCES ....................................................................................................................... 33
APPENDIX: METHODOLOGY ......................................................................................... 34
Table of Contents
ii
LIST OF FIGURES
Figure 1: Average and Median Number of Procedures Required to Start a Business ............... 6
Figure 2: Average and Median Time in Days Required to Start a Business ............................. 7
Figure 3: Average and Median Cost (% of income per capita) to Start a Business ................... 7
Figure 4: Percentage change in Average Values for Starting a Business Indicators between
2015 and 2016 ............................................................................................................................ 8
Figure 5: Percentage change in Median Values for Starting a Business Indicators between 2009
.................................................................................................................................................... 9
Figure 6: Average and Median Procedures to Deal with Construction Permits ...................... 11
Figure 7: Average and Median Time to Deal with Construction Permits ............................... 12
Figure 8: Average and Median Cost (% of warehouse value) of Dealing with Construction
Permits ..................................................................................................................................... 12
Figure 9: Average and Median Building Quality Control Index (DTF) .................................. 13
Figure 10: Percentage Change in Average Values for Dealing with Construction Permits
Indicators between 2015 and 2016 .......................................................................................... 13
Figure 11: Percentage change in Median Values for Dealing with Construction Permits
Indicators between 2015 and 2016 .......................................................................................... 14
Figure 12: Average and Median Strength of Legal Rights Index for Getting Credit .............. 16
Figure 13: Average and Median Depth of Credit Information Index for Getting Credit ........ 17
Figure 14: Average and Median Coverage of Credit Information in Private Bureaus or Public
Registries (% of adult population) ........................................................................................... 17
Figure 15: Percentage change in Average Values for Getting Credit between 2015 and 2016
.................................................................................................................................................. 18
Figure 16: Percentage change in Median Values for Getting Credit between 2015 and 2016 19
Figure 17: Share of Credit Information Features Available in APEC and the Rest of the World
.................................................................................................................................................. 20
Figure 18: Average and Median Time to Export for Trading Across Borders ........................ 22
Figure 19: Average and Median Time to Import for Trading Across Borders ........................ 23
Figure 20: Average and Median Cost to Export for Trading Across Borders ......................... 23
Figure 21: Average and Median Cost to Import for Trading Across Borders ......................... 24
Figure 22: Percentage change in Average Values for Trading Across Borders between 2015
and 2016 ................................................................................................................................... 24
Figure 23: Percentage change in Median Values for Trading Across Borders between 2015 and
2016.......................................................................................................................................... 25
Figure 24: Average and Median Time for Enforcing Contracts .............................................. 27
Figure 25: Average and Median Cost of Enforcing Contracts ................................................ 28
Figure 26: Average and Median Quality of Judicial Processes Index for Enforcing Contracts
.................................................................................................................................................. 28
Figure 27: Percentage change in Average Values for Enforcing Contracts Indicators between
2015 and 2016 .......................................................................................................................... 29
Figure 28: Share of ADR features available in APEC and the Rest of the World .................. 32
Table of Contents
iii
LIST OF TABLES
Table 1: Comparison of APEC’s Starting a Business Average Indicators with 2020 Targets .. 8 Table 2: Comparison of APEC’s Starting a Business Median Indicators with 2020 Targets ... 9 Table 3: Comparison of APEC’s Dealing with Construction Permits Average Indicators with
2018 Targets............................................................................................................................. 14 Table 4: Comparison of APEC’s Dealing with Construction Permits Median Indicators with
2018 Targets............................................................................................................................. 15 Table 5: Comparison of APEC’s Getting Credit Average Indicators with 2018 Targets ........ 18 Table 6: Comparison of APEC’s Getting Credit Median Indicators with 2020 Targets ......... 19 Table 7: Comparison of APEC’s Trading Across Borders Average Indicators with 2018 Targets
.................................................................................................................................................. 25 Table 8 : Comparison of APEC’s Trading Across Borders Median Indicators with 2018 Targets
.................................................................................................................................................. 26 Table 9: Comparison of APEC’s Enforcing Contracts Average Indicators with 2018 Targets
.................................................................................................................................................. 29 Table 10: Comparison of APEC’s Enforcing Contracts Average Indicators with 2020 Targets
.................................................................................................................................................. 30
LIST OF BOXES
Box 1: Improvements to Facilitate Starting a Business in the APEC Region ........................... 9
Box 2: Greater Ease in Obtaining Construction Permits ......................................................... 15
Box 3: Depth of Credit Information in APEC ......................................................................... 20
Box 4: Examples of Improved Credit Information Systems in APEC .................................... 21
Box 5: Technological Advancements for Cross-Border Trade................................................ 26
Box 6: Improved Regulatory Changes for Enforcing Contracts .............................................. 30
Box 7: Alternative Dispute Resolutions .................................................................................. 31
Executive Summary
1
EXECUTIVE SUMMARY
This interim assessment of the APEC’s Ease of Doing Business (EoDB) initiative during the
year 2016 looks at the progress made by the APEC region in five priority areas: 1) Starting a
Business; 2) Dealing with Construction Permits; 3) Getting Credit; 4) Trading Across Borders;
and 5) Enforcing Contracts. This exercise, conducted as part of the Second EoDB Action Plan
2016-2018, also establishes the baseline values that will be used in evaluating APEC’s
combined progress during this period.
By using the indicators of the World Bank’s Doing Business in these five priority areas, and
their corresponding values in 2015 as baseline, this assessment examines whether APEC’s
combined performance in 2016 is on track to meet the overall target of 10% improvement
across priority areas for the period 2016-2018.
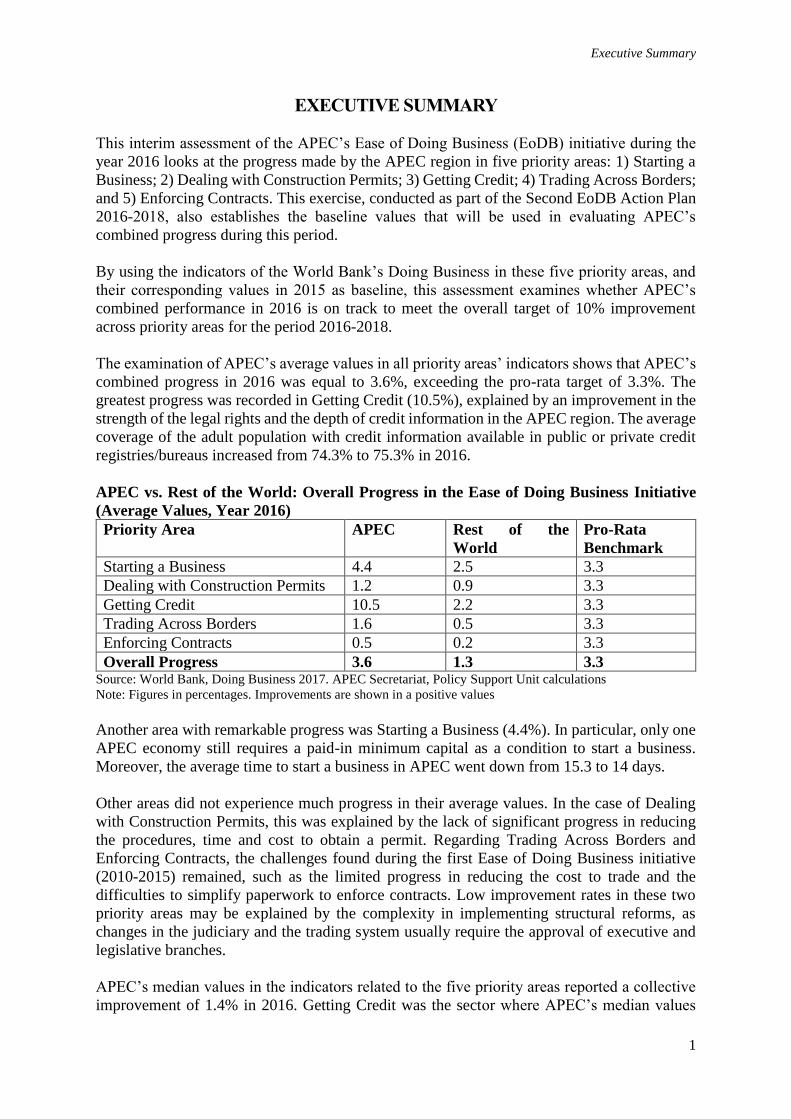
The examination of APEC’s average values in all priority areas’ indicators shows that APEC’s
combined progress in 2016 was equal to 3.6%, exceeding the pro-rata target of 3.3%. The
greatest progress was recorded in Getting Credit (10.5%), explained by an improvement in the
strength of the legal rights and the depth of credit information in the APEC region. The average
coverage of the adult population with credit information available in public or private credit
registries/bureaus increased from 74.3% to 75.3% in 2016.
APEC vs. Rest of the World: Overall Progress in the Ease of Doing Business Initiative
(Average Values, Year 2016)
Priority Area APEC Rest of the
World
Pro-Rata
Benchmark
Starting a Business 4.4 2.5 3.3
Dealing with Construction Permits 1.2 0.9 3.3
Getting Credit 10.5 2.2 3.3
Trading Across Borders 1.6 0.5 3.3
Enforcing Contracts 0.5 0.2 3.3
Overall Progress 3.6 1.3 3.3 Source: World Bank, Doing Business 2017. APEC Secretariat, Policy Support Unit calculations
Note: Figures in percentages. Improvements are shown in a positive values
Another area with remarkable progress was Starting a Business (4.4%). In particular, only one
APEC economy still requires a paid-in minimum capital as a condition to start a business.
Moreover, the average time to start a business in APEC went down from 15.3 to 14 days.
Other areas did not experience much progress in their average values. In the case of Dealing
with Construction Permits, this was explained by the lack of significant progress in reducing
the procedures, time and cost to obtain a permit. Regarding Trading Across Borders and
Enforcing Contracts, the challenges found during the first Ease of Doing Business initiative
(2010-2015) remained, such as the limited progress in reducing the cost to trade and the
difficulties to simplify paperwork to enforce contracts. Low improvement rates in these two
priority areas may be explained by the complexity in implementing structural reforms, as
changes in the judiciary and the trading system usually require the approval of executive and
legislative branches.
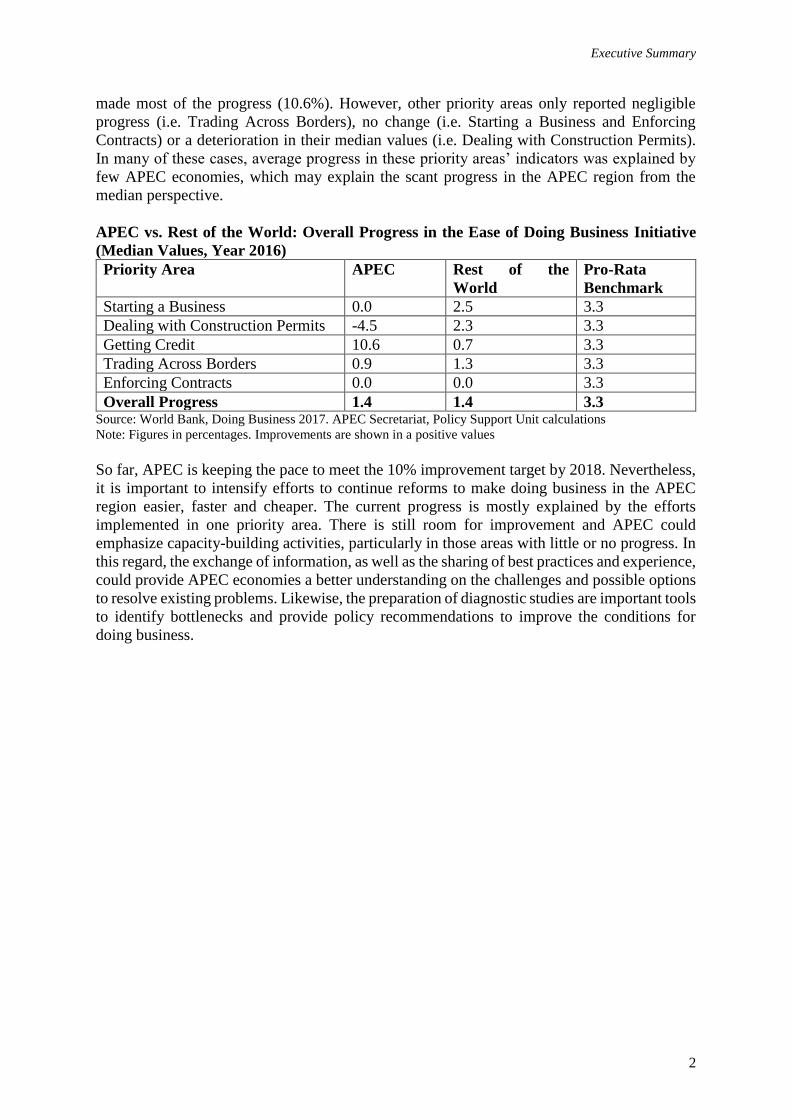
APEC’s median values in the indicators related to the five priority areas reported a collective
improvement of 1.4% in 2016. Getting Credit was the sector where APEC’s median values
Executive Summary
2
made most of the progress (10.6%). However, other priority areas only reported negligible
progress (i.e. Trading Across Borders), no change (i.e. Starting a Business and Enforcing
Contracts) or a deterioration in their median values (i.e. Dealing with Construction Permits).
In many of these cases, average progress in these priority areas’ indicators was explained by
few APEC economies, which may explain the scant progress in the APEC region from the
median perspective.
APEC vs. Rest of the World: Overall Progress in the Ease of Doing Business Initiative
(Median Values, Year 2016)
Priority Area APEC Rest of the
World
Pro-Rata
Benchmark
Starting a Business 0.0 2.5 3.3
Dealing with Construction Permits -4.5 2.3 3.3
Getting Credit 10.6 0.7 3.3
Trading Across Borders 0.9 1.3 3.3
Enforcing Contracts 0.0 0.0 3.3
Overall Progress 1.4 1.4 3.3 Source: World Bank, Doing Business 2017. APEC Secretariat, Policy Support Unit calculations
Note: Figures in percentages. Improvements are shown in a positive values
So far, APEC is keeping the pace to meet the 10% improvement target by 2018. Nevertheless,
it is important to intensify efforts to continue reforms to make doing business in the APEC
region easier, faster and cheaper. The current progress is mostly explained by the efforts
implemented in one priority area. There is still room for improvement and APEC could
emphasize capacity-building activities, particularly in those areas with little or no progress. In
this regard, the exchange of information, as well as the sharing of best practices and experience,
could provide APEC economies a better understanding on the challenges and possible options
to resolve existing problems. Likewise, the preparation of diagnostic studies are important tools
to identify bottlenecks and provide policy recommendations to improve the conditions for
doing business.
Introduction
3
1. INTRODUCTION: APEC’s EASE OF DOING BUSINESS
A. HISTORY
The Second APEC’s Ease of Doing Business (EoDB) Action Plan is the continuation of the
initial EoDB initiative launched by APEC in 2009, with the goal of improving the business
environment in the APEC region through regulatory reforms to make it cheaper, faster and
easier to do business1.
Based on the World Bank’s Doing Business program, this initiative focuses its attention in five
priority areas, namely: 1) Starting a Business; 2) Dealing with Construction Permits; 3) Getting
Credit; 4) Trading Across Borders; and 5) Enforcing Contracts.
Since the beginning, the APEC’s EoDB initiative aims to make doing business more efficient
across the APEC region. In this regard, EoDB has been implementing a series of activities,
such as capacity-building events, diagnostic studies, advisory services and guided visits, with
the support of champion economies in each priority area.
The current champion economies for the Second APEC’s EoDB Action Plan are:
Starting a Business: New Zealand and the United States
Dealing with Construction Permits: Singapore
Getting Credit: Mexico and the United States
Trading Across Borders: Malaysia and Singapore
Enforcing Contracts: Hong Kong, China and Korea
Despite the fact that APEC fell short of the overall target of 25% improvement during the First
APEC’s EoDB Action Plan for the period 2009-2015, the progress achieved during that period
cannot be negated as the business conditions in the region have improved since then. Currently,
it is cheaper, faster and easier to do business than prior to the first Action Plan, and this has
benefitted businesses and customers. Additionally, this initiative has helped the APEC region
“to formalize a space for public discussion in order to identify and promote actions to improve
the quality of regulations”2.
The vast support by APEC economies to continue with this initiative motivated its extension
for three additional years until 2018. The Second APEC’s EoDB Action Plan for the period
2016-2018 focuses on the same priority areas and emphasizes the need for capacity-building
activities tailored to address the main challenges faced by economies when implementing
reforms. APEC-wide workshops where APEC economies share experiences, best practices and
lessons learned are also considered for this Second APEC’s EoDB Action Plan.
1 APEC (2009), “Discussion Paper on Ease of Doing Business (EoDB)”, 2009/SOM/023, Concluding Senior
Officials’ Meeting – Plenary Session, 9 November. 2 APEC Policy Support Unit (2016). “APEC’s Ease of Doing Business – Final Assessment 2009-2015”, APEC
Secretariat, APEC#216-SE-01.10, p. 33.
Introduction
4
B. OVERALL TARGET
The overall target for the Second APEC’s EoDB Action Plan 2016-2018 is a collective 10%
improvement across the five priority areas. The assessment will use the results in year 2015 as
baseline to calculate the progress achieved by APEC on an annual basis.
The selection of this quantitative target took into account several factors. First, for credibility
reasons, it was important to set a target that was neither overambitious nor unimpressive.
Second, based on the progress obtained during the First APEC’s EoDB Action Plan, it was
difficult for economies to improve 5% every year in order to meet the 25% improvement target
rate for the period 2010-2015. The more the progress achieved in a year, the more difficult it
is to make further improvements. Third, the decision considered the views of APEC economies,
many of which supported the establishment of a quantitative target, as “governments could be
more motivated to pursue policies to get closer to the target”3.
Considering that APEC economies preferred to extend this initiative for three more years, it
was clear that it was not realistic to set a target of 5% improvement per year (15% improvement
for the whole period) based on the fact that APEC improved at an average rate of 2.5% per year
during the First APEC’s EoDB Action Plan. Similarly, a target of 2.5% per year (7.5%
improvement for three years) would have been deemed as not ambitious enough. In this sense,
establishing an overall target rate equivalent to a 10% improvement (i.e. 3.3% improvement
per year) was considered as a suitable target for APEC member economies.
C. MEASUREMENT APPROACH
In terms of the methodology to calculate the progress within the APEC region, the report
calculated the APEC average annual values for each of the EoDB priority areas’ indicators.
Averages for year 2016 were compared against those of the baseline year 2015 to calculate
improvement rates for each indicator. In each priority area, a combined improvement rate is
calculated by a simple average of the improvement rates of indicators belonging to that priority
area. The combined improvement rates for the five priority areas are simple averaged in order
to obtain the overall progress by the APEC region in the EoDB initiative for year 2016.
The assessment also includes median values for a more comprehensive assessment. The
calculation of progress by comparing APEC’s median values is similar to the process explained
in the previous paragraph. As explained in previous APEC’s EoDB assessments, “the inclusion
of median values is justified by the presence of extreme values (outliers) in many of the EoDB
indicators (…), median values provide a closer indication of the trend that APEC members are
collectively following in their EoDB indicators”4
The assessment of the Second EoDB Action Plan includes some methodological changes in
comparison to that for the Final Assessment of the First APEC’s EoDB Action Plan conducted
last year, due to modifications in the World Bank’s Doing Business database and widespread
progress achieved by APEC economies in one of the indicators.
3 APEC Policy Support Unit (2015). “APEC’s Ease of Doing Business – Interim Assessment 2009-2014”,
APEC Secretariat, APEC#215-SE-01.17, p. 33. 4 Ibid, p. 6.
Introduction
5
In the Starting a Business priority area, the report does not include the progress made by APEC
in the indicator concerning the paid-in minimum capital required to initiate a business in the
calculations. The reason is that this requirement has already been abolished in all APEC
economies except one in 2016.
The priority areas concerning Dealing with Construction Permits and Enforcing Contracts
include new indicators5 to measure the availability of particular features in their regulatory
frameworks. These indices are included in the assessment, and take a higher value when they
include more specific features. However, APEC’s progress in these indices are calculated not
by comparing their scores, but comparing the distance to frontier in each of the indices between
2015 and 2016. The distance to frontier reflects the difference between the index’s score and
the maximum possible score.
The Getting Credit priority area includes two indices: strength of legal rights and depth of credit
information, whose progress is calculated by using the distance to frontier. Additionally, this
priority area now includes a single indicator reflecting the percentage of the adult population
with their credit information available in either public credit registries or private credit bureaus.
In comparison, the previous assessment of EoDB included instead two separate indicators, one
regarding public credit registries and the other on private credit bureaus.
More details on the methodological changes can be found in the Appendix.
5 These new indicators are: building quality index for Dealing with Construction Permits and the quality of
judicial processes index for Enforcing Contracts.
APEC’s Improvements By Priority Areas – Starting a Business
6
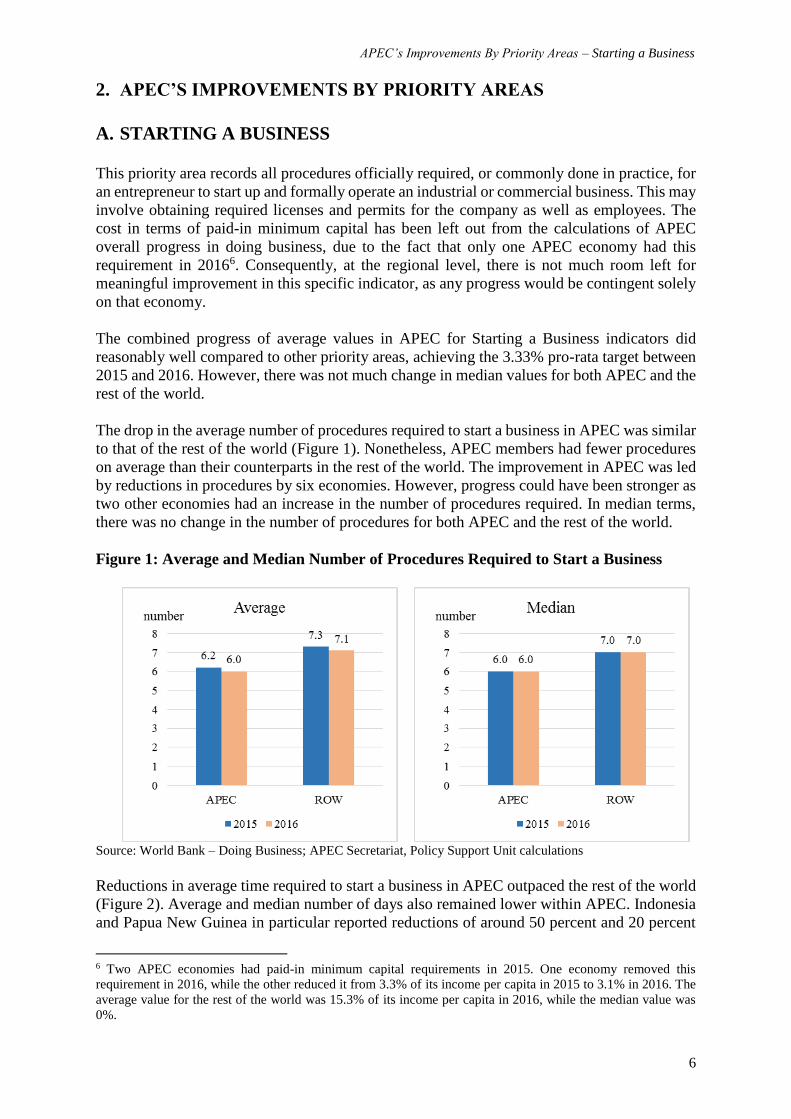
2. APEC’S IMPROVEMENTS BY PRIORITY AREAS
A. STARTING A BUSINESS
This priority area records all procedures officially required, or commonly done in practice, for
an entrepreneur to start up and formally operate an industrial or commercial business. This may
involve obtaining required licenses and permits for the company as well as employees. The
cost in terms of paid-in minimum capital has been left out from the calculations of APEC
overall progress in doing business, due to the fact that only one APEC economy had this
requirement in 20166. Consequently, at the regional level, there is not much room left for
meaningful improvement in this specific indicator, as any progress would be contingent solely
on that economy.
The combined progress of average values in APEC for Starting a Business indicators did
reasonably well compared to other priority areas, achieving the 3.33% pro-rata target between
2015 and 2016. However, there was not much change in median values for both APEC and the
rest of the world.
The drop in the average number of procedures required to start a business in APEC was similar
to that of the rest of the world (Figure 1). Nonetheless, APEC members had fewer procedures
on average than their counterparts in the rest of the world. The improvement in APEC was led
by reductions in procedures by six economies. However, progress could have been stronger as
two other economies had an increase in the number of procedures required. In median terms,
there was no change in the number of procedures for both APEC and the rest of the world.
Figure 1: Average and Median Number of Procedures Required to Start a Business
Source: World Bank – Doing Business; APEC Secretariat, Policy Support Unit calculations
Reductions in average time required to start a business in APEC outpaced the rest of the world
(Figure 2). Average and median number of days also remained lower within APEC. Indonesia
and Papua New Guinea in particular reported reductions of around 50 percent and 20 percent
6 Two APEC economies had paid-in minimum capital requirements in 2015. One economy removed this
requirement in 2016, while the other reduced it from 3.3% of its income per capita in 2015 to 3.1% in 2016. The
average value for the rest of the world was 15.3% of its income per capita in 2016, while the median value was
0%.
APEC’s Improvements By Priority Areas – Starting a Business
7
respectively, which contributed strongly to the improvement in APEC. Three other economies
also reduced the number of days required, while two others increased instead. Median values
remained constant for both APEC and the rest of the world between 2015 and 2016.
Figure 2: Average and Median Time in Days Required to Start a Business
Source: World Bank – Doing Business; APEC Secretariat, Policy Support Unit calculations
Relative to the rest of the world, the average and median cost of starting a business in the APEC
region remained considerably lower (Figure 3). Indeed, costs were less than 20% of income
per capita for 16 APEC members in both 2015 and 2016. While there was a smaller reduction
in average and median costs in APEC than the rest of the world, future average and median
improvements APEC will mostly depend on the progress by those APEC economies keeping
relatively high costs, as it may be difficult to further reduce the already-low cost within the
majority of APEC economies.
Figure 3: Average and Median Cost (% of income per capita) to Start a Business
Source: World Bank – Doing Business; APEC Secretariat, Policy Support Unit calculations
When looking at the combined progress in terms of starting a business (Figure 4), APEC
averages made more progress than those for rest of the world. In fact, the average combined
progress of starting a business in APEC (4.45) exceeded the 3.33% pro-rata target, due
significant reductions in the required time. The other two indicators, procedures and cost to
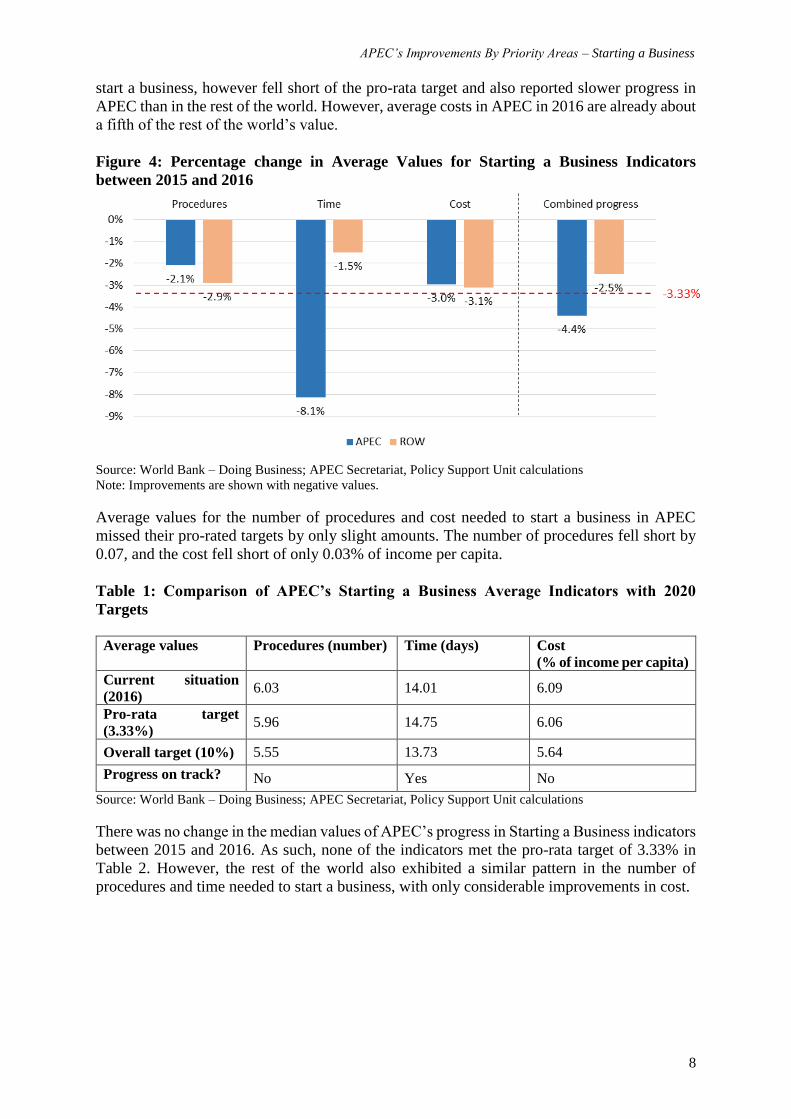
APEC’s Improvements By Priority Areas – Starting a Business
8
start a business, however fell short of the pro-rata target and also reported slower progress in
APEC than in the rest of the world. However, average costs in APEC in 2016 are already about
a fifth of the rest of the world’s value.
Figure 4: Percentage change in Average Values for Starting a Business Indicators
between 2015 and 2016
Source: World Bank – Doing Business; APEC Secretariat, Policy Support Unit calculations
Note: Improvements are shown with negative values.
Average values for the number of procedures and cost needed to start a business in APEC
missed their pro-rated targets by only slight amounts. The number of procedures fell short by
0.07, and the cost fell short of only 0.03% of income per capita.
Table 1: Comparison of APEC’s Starting a Business Average Indicators with 2020
Targets
Average values Procedures (number) Time (days) Cost
(% of income per capita)
Current situation
(2016) 6.03 14.01 6.09
Pro-rata target
(3.33%) 5.96 14.75 6.06
Overall target (10%) 5.55 13.73 5.64
Progress on track? No Yes No
Source: World Bank – Doing Business; APEC Secretariat, Policy Support Unit calculations
There was no change in the median values of APEC’s progress in Starting a Business indicators
between 2015 and 2016. As such, none of the indicators met the pro-rata target of 3.33% in
Table 2. However, the rest of the world also exhibited a similar pattern in the number of
procedures and time needed to start a business, with only considerable improvements in cost.
APEC’s Improvements By Priority Areas – Starting a Business
9
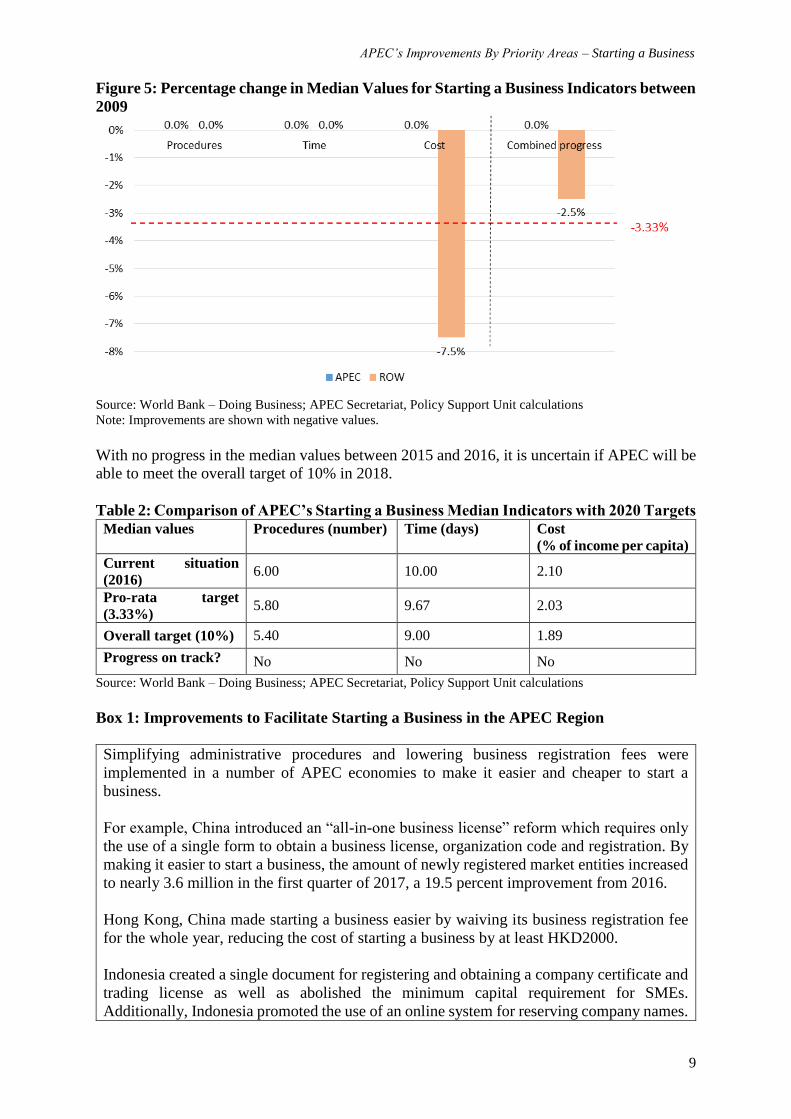
Figure 5: Percentage change in Median Values for Starting a Business Indicators between
2009
Source: World Bank – Doing Business; APEC Secretariat, Policy Support Unit calculations
Note: Improvements are shown with negative values.
With no progress in the median values between 2015 and 2016, it is uncertain if APEC will be
able to meet the overall target of 10% in 2018.
Table 2: Comparison of APEC’s Starting a Business Median Indicators with 2020 Targets
Median values Procedures (number) Time (days) Cost
(% of income per capita)
Current situation
(2016) 6.00 10.00 2.10
Pro-rata target
(3.33%) 5.80 9.67 2.03
Overall target (10%) 5.40 9.00 1.89
Progress on track? No No No
Source: World Bank – Doing Business; APEC Secretariat, Policy Support Unit calculations
Box 1: Improvements to Facilitate Starting a Business in the APEC Region
Simplifying administrative procedures and lowering business registration fees were
implemented in a number of APEC economies to make it easier and cheaper to start a
business.
For example, China introduced an “all-in-one business license” reform which requires only
the use of a single form to obtain a business license, organization code and registration. By
making it easier to start a business, the amount of newly registered market entities increased
to nearly 3.6 million in the first quarter of 2017, a 19.5 percent improvement from 2016.
Hong Kong, China made starting a business easier by waiving its business registration fee
for the whole year, reducing the cost of starting a business by at least HKD2000.
Indonesia created a single document for registering and obtaining a company certificate and
trading license as well as abolished the minimum capital requirement for SMEs.
Additionally, Indonesia promoted the use of an online system for reserving company names.
APEC’s Improvements By Priority Areas – Starting a Business
10
The number of days to start a business in Indonesia fell from 47 days to 22 days from the
previous year.
Papua New Guinea began streamlining business registration procedures at the Investment
Promotion Agency which made starting a business faster.
Sources:
AECN News Today; “Ease of Doing Business: Indonesia Leads the World in Reforms”; November
2016; https://aecnewstoday.com/2016/ease-of-doing-business-indonesia-leads-the-world-in-reforms/
EMTV Online; “Papua New Guinea Rises 14 Places in World Bank ‘Ease of Doing Business’ Ratings”;
http://www.emtv.com.pg/news/2016/11/papua-new-guinea-rises-14-places-in-world-bank-ease-of-
doing-business-ratings/
Inland Revenue Department; “Business Registration Fee and Levy Table”;
http://www.ird.gov.hk/eng/tax/bre_lcc.htm
The State Council of the People’s Republic of China; “Administrative reforms revitalize market, data
shows”; April 2017; http://english.gov.cn/news/top_news/2017/04/17/content_281475629446883.htm
World Bank; “Business Reforms for Starting a Business”;
http://www.doingbusiness.org/reforms/overview/topic/starting-a-business
APEC’s Improvements By Priority Areas – Dealing With Construction Permits
11
B. DEALING WITH CONSTRUCTION PERMITS
The Dealing with Construction Permits indicators measure procedures, time, cost and quality
of buildings from the pre-construction period all the way to post-construction, and the utilities
required. While the methodology behind most indicators in this area is fairly straightforward,
the building quality index in particular is sum of the scores of six other indicators: the quality
of building regulations, quality control before, during, and after construction, liability and
insurance regimes, and professional certifications indices. The index ranges from 0 to 15, with
higher values indicating higher building quality.
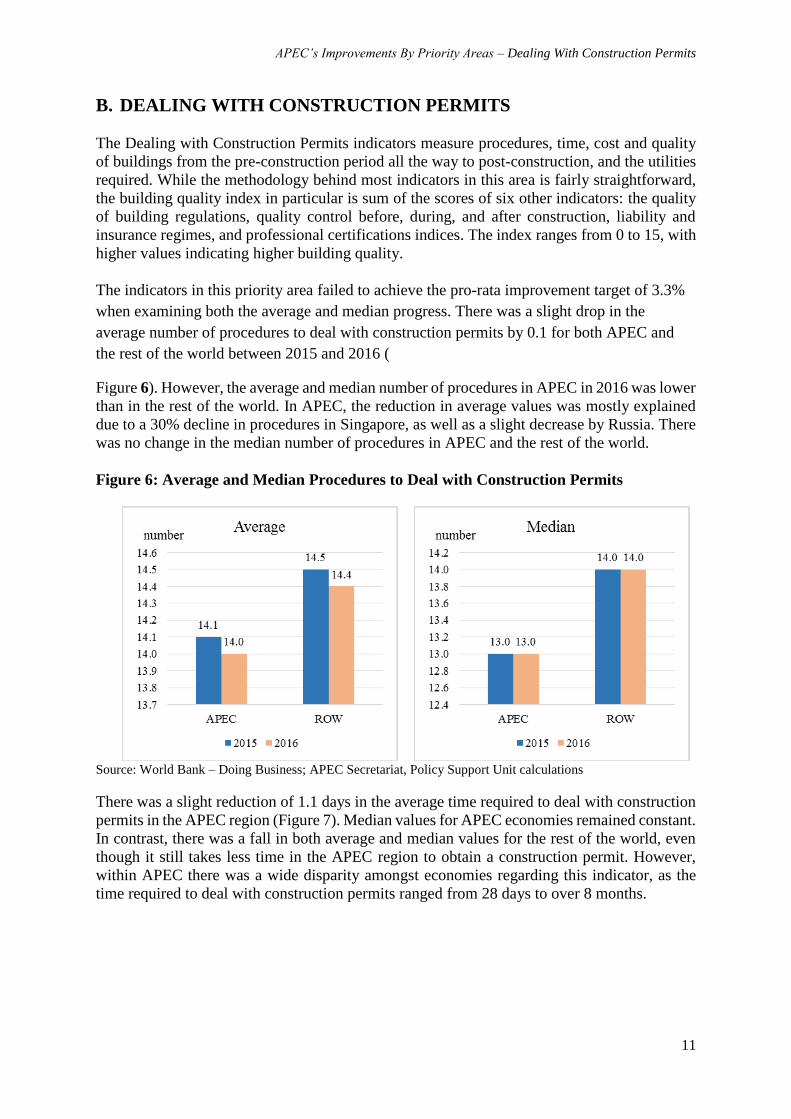
The indicators in this priority area failed to achieve the pro-rata improvement target of 3.3%
when examining both the average and median progress. There was a slight drop in the
average number of procedures to deal with construction permits by 0.1 for both APEC and
the rest of the world between 2015 and 2016 (
Figure 6). However, the average and median number of procedures in APEC in 2016 was lower
than in the rest of the world. In APEC, the reduction in average values was mostly explained
due to a 30% decline in procedures in Singapore, as well as a slight decrease by Russia. There
was no change in the median number of procedures in APEC and the rest of the world.
Figure 6: Average and Median Procedures to Deal with Construction Permits
Source: World Bank – Doing Business; APEC Secretariat, Policy Support Unit calculations
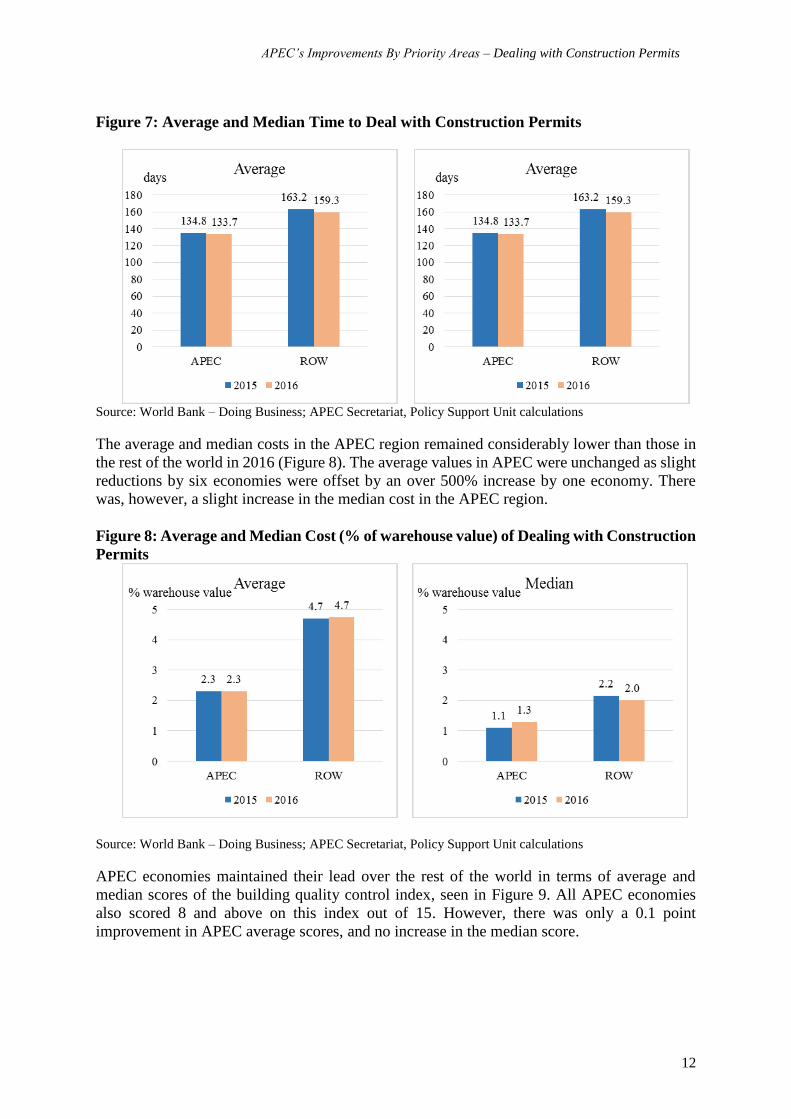
There was a slight reduction of 1.1 days in the average time required to deal with construction
permits in the APEC region (Figure 7). Median values for APEC economies remained constant.
In contrast, there was a fall in both average and median values for the rest of the world, even
though it still takes less time in the APEC region to obtain a construction permit. However,
within APEC there was a wide disparity amongst economies regarding this indicator, as the
time required to deal with construction permits ranged from 28 days to over 8 months.
APEC’s Improvements By Priority Areas – Dealing with Construction Permits
12
Figure 7: Average and Median Time to Deal with Construction Permits
Source: World Bank – Doing Business; APEC Secretariat, Policy Support Unit calculations
The average and median costs in the APEC region remained considerably lower than those in
the rest of the world in 2016 (Figure 8). The average values in APEC were unchanged as slight
reductions by six economies were offset by an over 500% increase by one economy. There
was, however, a slight increase in the median cost in the APEC region.
Figure 8: Average and Median Cost (% of warehouse value) of Dealing with Construction
Permits
Source: World Bank – Doing Business; APEC Secretariat, Policy Support Unit calculations
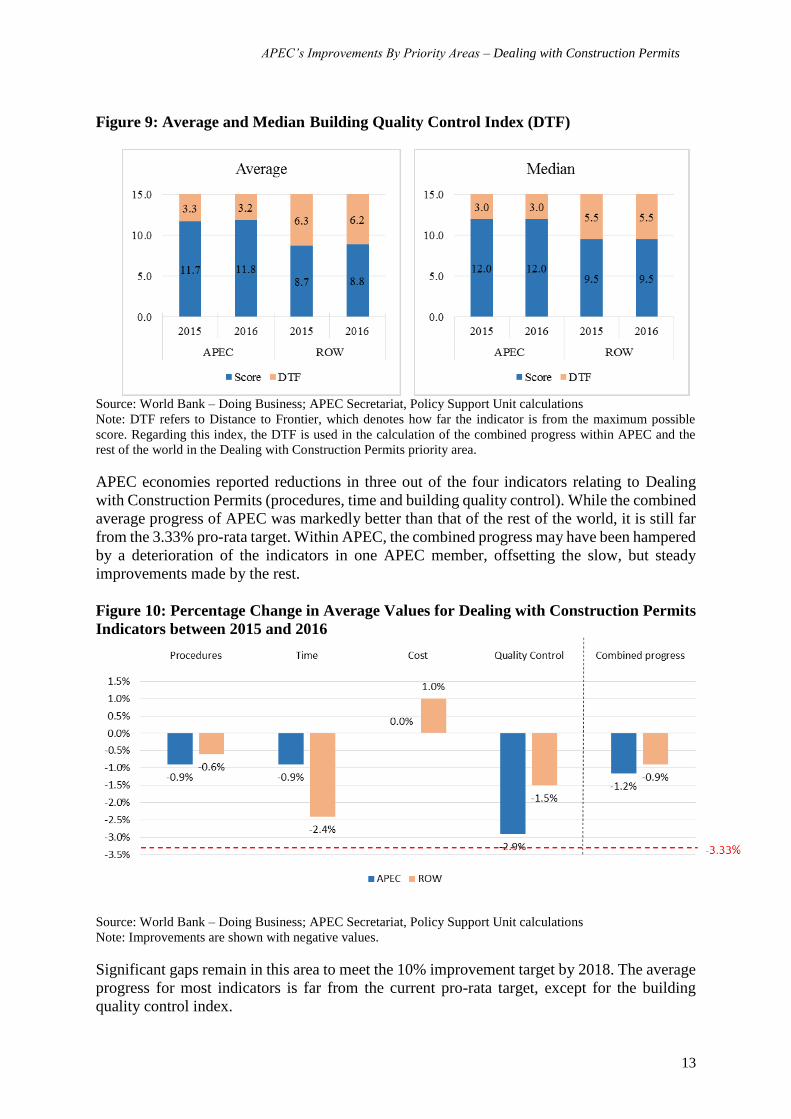
APEC economies maintained their lead over the rest of the world in terms of average and
median scores of the building quality control index, seen in Figure 9. All APEC economies
also scored 8 and above on this index out of 15. However, there was only a 0.1 point
improvement in APEC average scores, and no increase in the median score.
APEC’s Improvements By Priority Areas – Dealing with Construction Permits
13
Figure 9: Average and Median Building Quality Control Index (DTF)
Source: World Bank – Doing Business; APEC Secretariat, Policy Support Unit calculations
Note: DTF refers to Distance to Frontier, which denotes how far the indicator is from the maximum possible
score. Regarding this index, the DTF is used in the calculation of the combined progress within APEC and the
rest of the world in the Dealing with Construction Permits priority area.
APEC economies reported reductions in three out of the four indicators relating to Dealing
with Construction Permits (procedures, time and building quality control). While the combined
average progress of APEC was markedly better than that of the rest of the world, it is still far
from the 3.33% pro-rata target. Within APEC, the combined progress may have been hampered
by a deterioration of the indicators in one APEC member, offsetting the slow, but steady
improvements made by the rest.
Figure 10: Percentage Change in Average Values for Dealing with Construction Permits
Indicators between 2015 and 2016
Source: World Bank – Doing Business; APEC Secretariat, Policy Support Unit calculations
Note: Improvements are shown with negative values.
Significant gaps remain in this area to meet the 10% improvement target by 2018. The average
progress for most indicators is far from the current pro-rata target, except for the building
quality control index.
APEC’s Improvements By Priority Areas – Dealing with Construction Permits
14
Table 3: Comparison of APEC’s Dealing with Construction Permits Average Indicators
with 2018 Targets
Average values Procedures
(number)
Time (days) Cost
(% of warehouse
value)
Building
Quality Control
Index (DTF)
Current
situation (2016) 13.98 133.66 2.30 3.20
Pro-rata target
(3.33%) 13.63 130.35 2.22 3.19
Overall target
(10%) 12.69 121.35 2.07 2.97
Progress on
track? No No No No
Source: World Bank – Doing Business; APEC Secretariat, Policy Support Unit calculations
Note: DTF refers to Distance to Frontier, which denotes how far the indicator is from the maximum possible
score. Regarding the Building Quality Control Index, the DTF is used in the calculation of the combined progress
within APEC and the rest of the world in the Dealing with Construction Permits priority area.
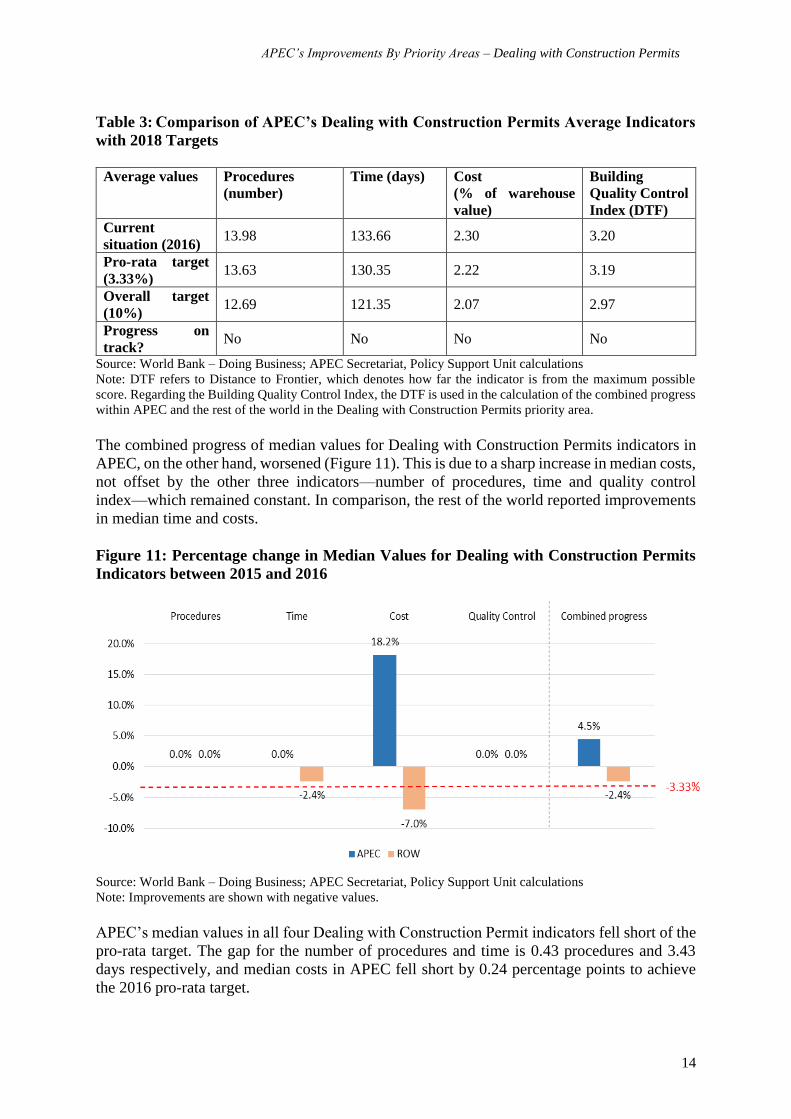
The combined progress of median values for Dealing with Construction Permits indicators in
APEC, on the other hand, worsened (Figure 11). This is due to a sharp increase in median costs,
not offset by the other three indicators—number of procedures, time and quality control
index—which remained constant. In comparison, the rest of the world reported improvements
in median time and costs.
Figure 11: Percentage change in Median Values for Dealing with Construction Permits
Indicators between 2015 and 2016
Source: World Bank – Doing Business; APEC Secretariat, Policy Support Unit calculations
Note: Improvements are shown with negative values.
APEC’s median values in all four Dealing with Construction Permit indicators fell short of the
pro-rata target. The gap for the number of procedures and time is 0.43 procedures and 3.43
days respectively, and median costs in APEC fell short by 0.24 percentage points to achieve
the 2016 pro-rata target.
APEC’s Improvements By Priority Areas – Dealing with Construction Permits
15
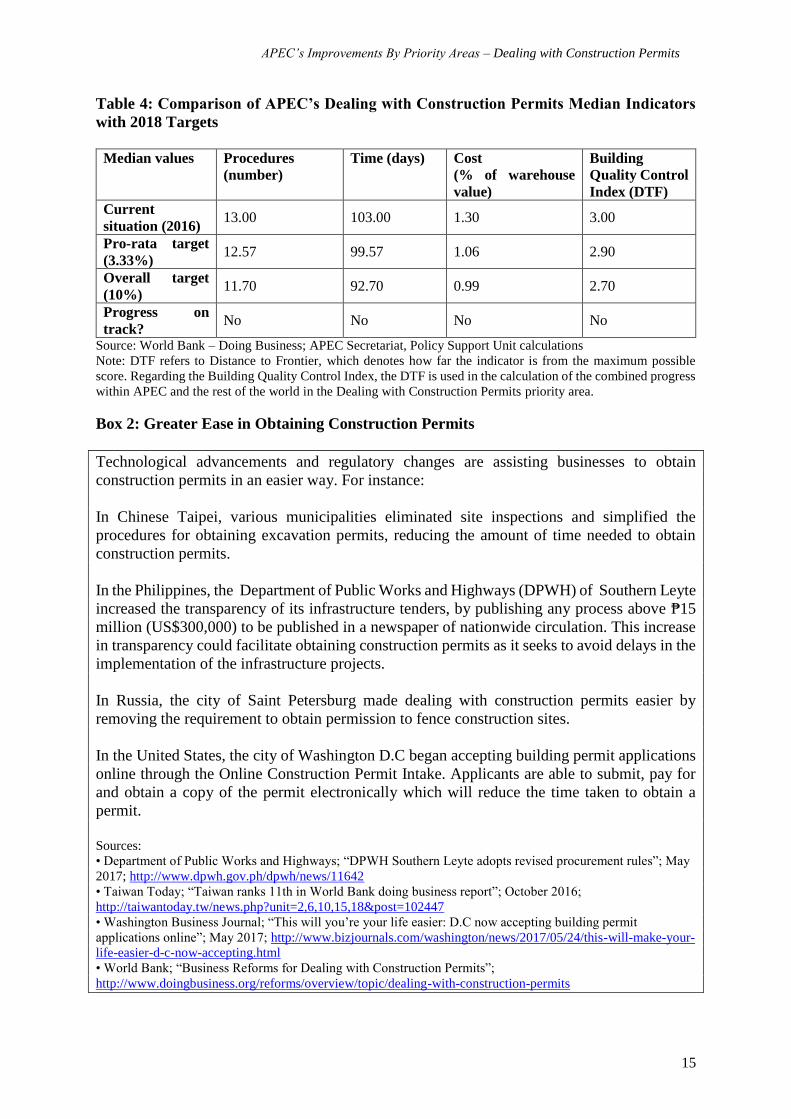
Table 4: Comparison of APEC’s Dealing with Construction Permits Median Indicators
with 2018 Targets
Median values Procedures
(number)
Time (days) Cost
(% of warehouse
value)
Building
Quality Control
Index (DTF)
Current
situation (2016) 13.00 103.00 1.30 3.00
Pro-rata target
(3.33%) 12.57 99.57 1.06 2.90
Overall target
(10%) 11.70 92.70 0.99 2.70
Progress on
track? No No No No
Source: World Bank – Doing Business; APEC Secretariat, Policy Support Unit calculations
Note: DTF refers to Distance to Frontier, which denotes how far the indicator is from the maximum possible
score. Regarding the Building Quality Control Index, the DTF is used in the calculation of the combined progress
within APEC and the rest of the world in the Dealing with Construction Permits priority area.
Box 2: Greater Ease in Obtaining Construction Permits
Technological advancements and regulatory changes are assisting businesses to obtain
construction permits in an easier way. For instance:
In Chinese Taipei, various municipalities eliminated site inspections and simplified the
procedures for obtaining excavation permits, reducing the amount of time needed to obtain
construction permits.
In the Philippines, the Department of Public Works and Highways (DPWH) of Southern Leyte
increased the transparency of its infrastructure tenders, by publishing any process above ₱15
million (US$300,000) to be published in a newspaper of nationwide circulation. This increase
in transparency could facilitate obtaining construction permits as it seeks to avoid delays in the
implementation of the infrastructure projects.
In Russia, the city of Saint Petersburg made dealing with construction permits easier by
removing the requirement to obtain permission to fence construction sites.
In the United States, the city of Washington D.C began accepting building permit applications
online through the Online Construction Permit Intake. Applicants are able to submit, pay for
and obtain a copy of the permit electronically which will reduce the time taken to obtain a
permit.
Sources:
• Department of Public Works and Highways; “DPWH Southern Leyte adopts revised procurement rules”; May
2017; http://www.dpwh.gov.ph/dpwh/news/11642
• Taiwan Today; “Taiwan ranks 11th in World Bank doing business report”; October 2016;
http://taiwantoday.tw/news.php?unit=2,6,10,15,18&post=102447
• Washington Business Journal; “This will you’re your life easier: D.C now accepting building permit
applications online”; May 2017; http://www.bizjournals.com/washington/news/2017/05/24/this-will-make-your-
life-easier-d-c-now-accepting.html
• World Bank; “Business Reforms for Dealing with Construction Permits”;
http://www.doingbusiness.org/reforms/overview/topic/dealing-with-construction-permits
APEC’s Improvements by Priority Areas – Getting Credit
16
C. GETTING CREDIT
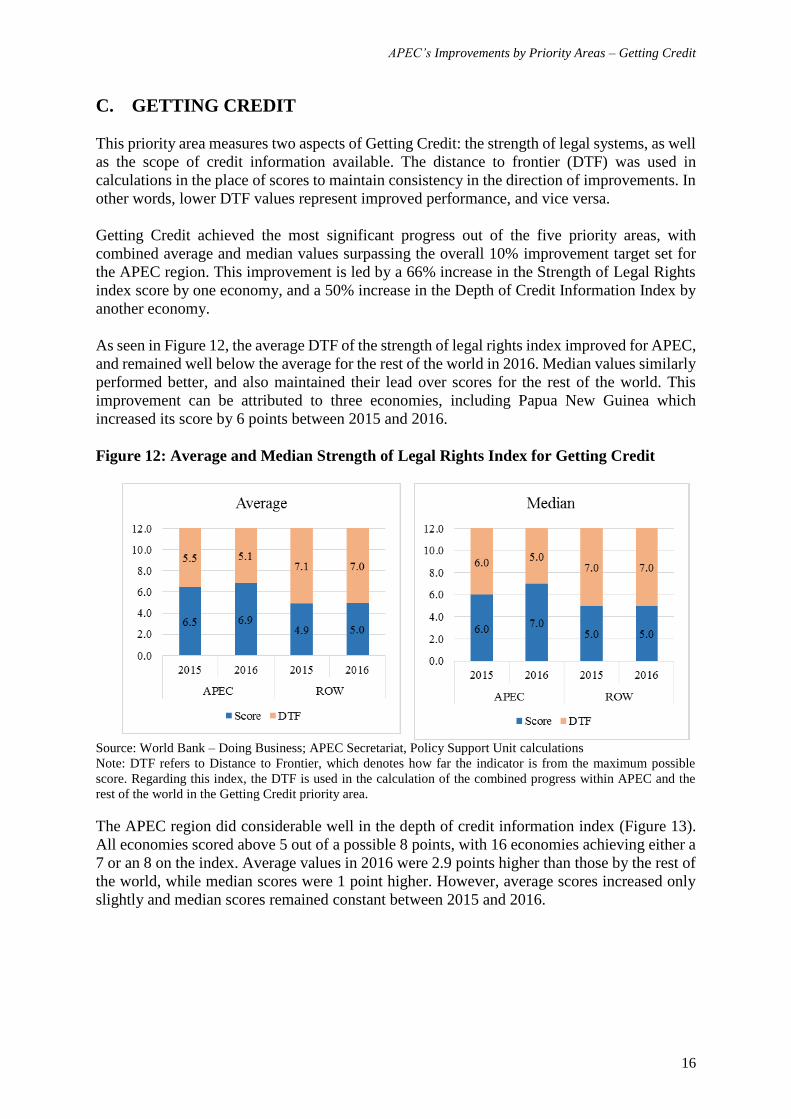
This priority area measures two aspects of Getting Credit: the strength of legal systems, as well
as the scope of credit information available. The distance to frontier (DTF) was used in
calculations in the place of scores to maintain consistency in the direction of improvements. In
other words, lower DTF values represent improved performance, and vice versa.
Getting Credit achieved the most significant progress out of the five priority areas, with
combined average and median values surpassing the overall 10% improvement target set for
the APEC region. This improvement is led by a 66% increase in the Strength of Legal Rights
index score by one economy, and a 50% increase in the Depth of Credit Information Index by
another economy.
As seen in Figure 12, the average DTF of the strength of legal rights index improved for APEC,
and remained well below the average for the rest of the world in 2016. Median values similarly
performed better, and also maintained their lead over scores for the rest of the world. This
improvement can be attributed to three economies, including Papua New Guinea which
increased its score by 6 points between 2015 and 2016.
Figure 12: Average and Median Strength of Legal Rights Index for Getting Credit
Source: World Bank – Doing Business; APEC Secretariat, Policy Support Unit calculations
Note: DTF refers to Distance to Frontier, which denotes how far the indicator is from the maximum possible
score. Regarding this index, the DTF is used in the calculation of the combined progress within APEC and the
rest of the world in the Getting Credit priority area.
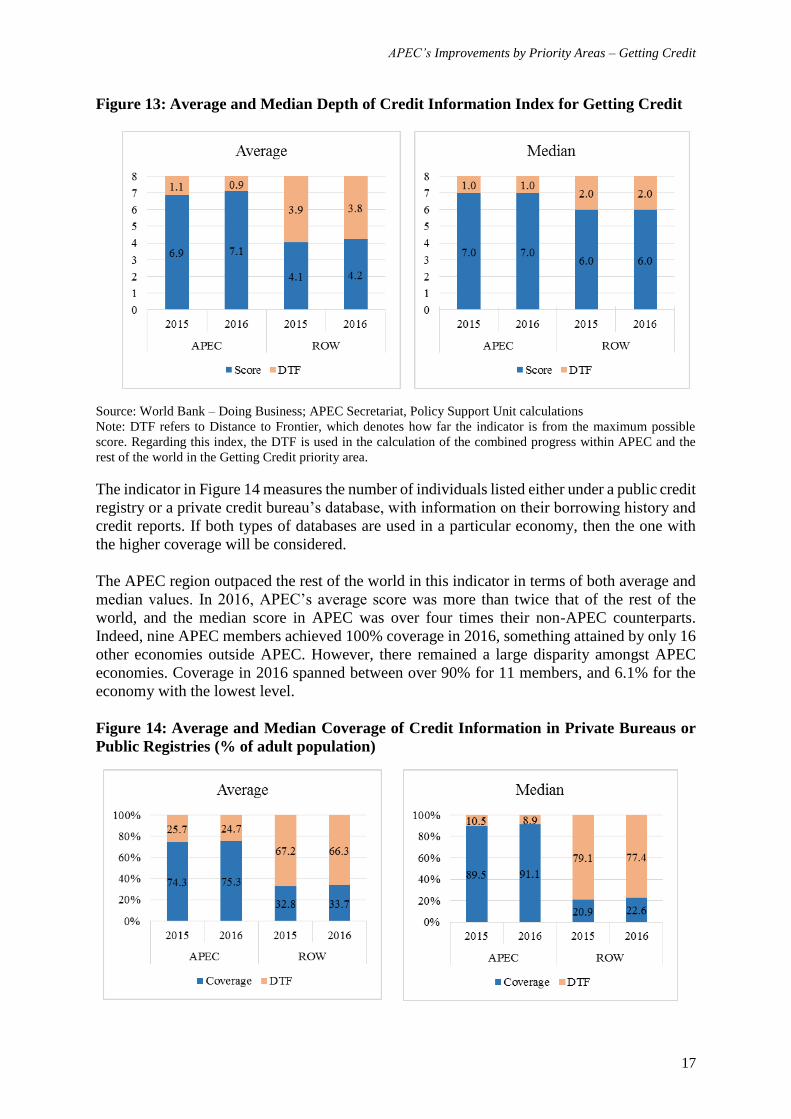
The APEC region did considerable well in the depth of credit information index (Figure 13).
All economies scored above 5 out of a possible 8 points, with 16 economies achieving either a
7 or an 8 on the index. Average values in 2016 were 2.9 points higher than those by the rest of
the world, while median scores were 1 point higher. However, average scores increased only
slightly and median scores remained constant between 2015 and 2016.
APEC’s Improvements by Priority Areas – Getting Credit
17
Figure 13: Average and Median Depth of Credit Information Index for Getting Credit
Source: World Bank – Doing Business; APEC Secretariat, Policy Support Unit calculations
Note: DTF refers to Distance to Frontier, which denotes how far the indicator is from the maximum possible
score. Regarding this index, the DTF is used in the calculation of the combined progress within APEC and the
rest of the world in the Getting Credit priority area.
The indicator in Figure 14 measures the number of individuals listed either under a public credit
registry or a private credit bureau’s database, with information on their borrowing history and
credit reports. If both types of databases are used in a particular economy, then the one with
the higher coverage will be considered.
The APEC region outpaced the rest of the world in this indicator in terms of both average and
median values. In 2016, APEC’s average score was more than twice that of the rest of the
world, and the median score in APEC was over four times their non-APEC counterparts.
Indeed, nine APEC members achieved 100% coverage in 2016, something attained by only 16
other economies outside APEC. However, there remained a large disparity amongst APEC
economies. Coverage in 2016 spanned between over 90% for 11 members, and 6.1% for the
economy with the lowest level.
Figure 14: Average and Median Coverage of Credit Information in Private Bureaus or
Public Registries (% of adult population)
APEC’s Improvements by Priority Areas – Getting Credit
18
Source: World Bank – Doing Business; APEC Secretariat, Policy Support Unit calculations
Note: DTF refers to Distance to Frontier, which denotes how far the indicator is from the maximum possible
score. Regarding this indicator, the DTF is used in the calculation of the combined progress within APEC and the
rest of the world in the Getting Credit priority area.
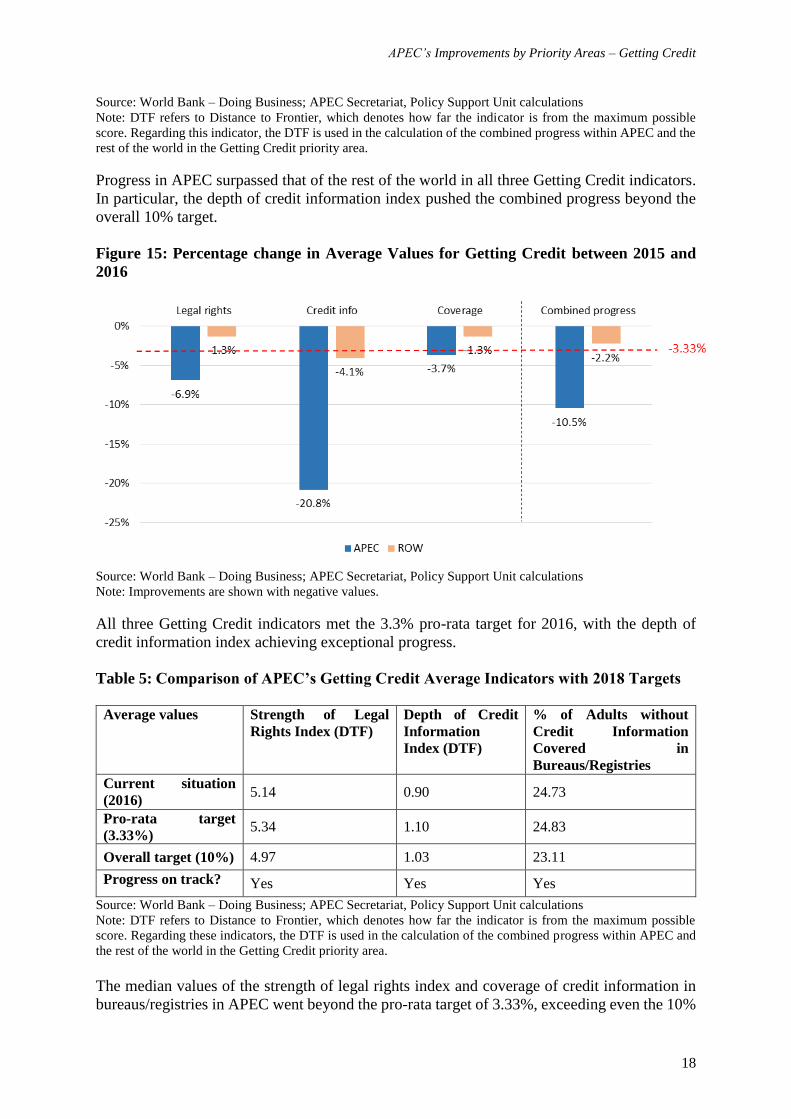
Progress in APEC surpassed that of the rest of the world in all three Getting Credit indicators.
In particular, the depth of credit information index pushed the combined progress beyond the
overall 10% target.
Figure 15: Percentage change in Average Values for Getting Credit between 2015 and
2016
Source: World Bank – Doing Business; APEC Secretariat, Policy Support Unit calculations
Note: Improvements are shown with negative values.
All three Getting Credit indicators met the 3.3% pro-rata target for 2016, with the depth of
credit information index achieving exceptional progress.
Table 5: Comparison of APEC’s Getting Credit Average Indicators with 2018 Targets
Average values Strength of Legal
Rights Index (DTF)
Depth of Credit
Information
Index (DTF)
% of Adults without
Credit Information
Covered in
Bureaus/Registries
Current situation
(2016) 5.14 0.90 24.73
Pro-rata target
(3.33%) 5.34 1.10 24.83
Overall target (10%) 4.97 1.03 23.11
Progress on track? Yes Yes Yes
Source: World Bank – Doing Business; APEC Secretariat, Policy Support Unit calculations
Note: DTF refers to Distance to Frontier, which denotes how far the indicator is from the maximum possible
score. Regarding these indicators, the DTF is used in the calculation of the combined progress within APEC and
the rest of the world in the Getting Credit priority area.
The median values of the strength of legal rights index and coverage of credit information in
bureaus/registries in APEC went beyond the pro-rata target of 3.33%, exceeding even the 10%
APEC’s Improvements by Priority Areas – Getting Credit
19
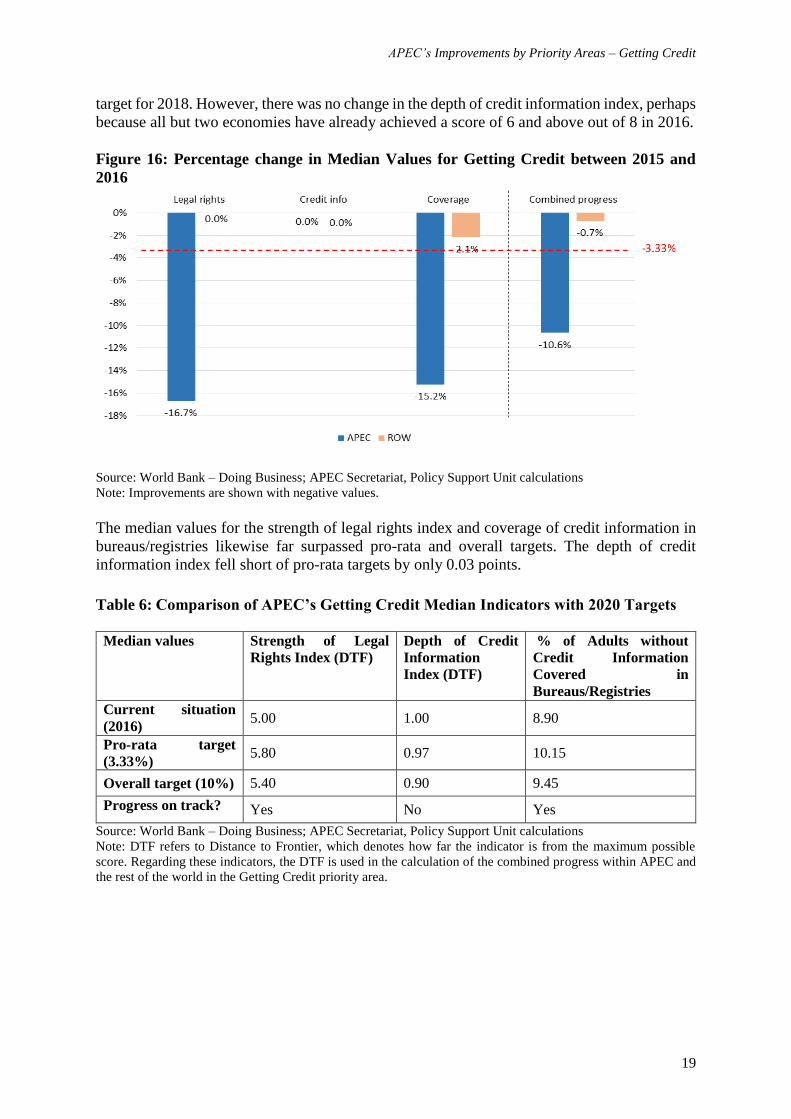
target for 2018. However, there was no change in the depth of credit information index, perhaps
because all but two economies have already achieved a score of 6 and above out of 8 in 2016.
Figure 16: Percentage change in Median Values for Getting Credit between 2015 and
2016
Source: World Bank – Doing Business; APEC Secretariat, Policy Support Unit calculations
Note: Improvements are shown with negative values.
The median values for the strength of legal rights index and coverage of credit information in
bureaus/registries likewise far surpassed pro-rata and overall targets. The depth of credit
information index fell short of pro-rata targets by only 0.03 points.
Table 6: Comparison of APEC’s Getting Credit Median Indicators with 2020 Targets
Median values Strength of Legal
Rights Index (DTF)
Depth of Credit
Information
Index (DTF)
% of Adults without
Credit Information
Covered in
Bureaus/Registries
Current situation
(2016) 5.00 1.00 8.90
Pro-rata target
(3.33%) 5.80 0.97 10.15
Overall target (10%) 5.40 0.90 9.45
Progress on track? Yes No Yes
Source: World Bank – Doing Business; APEC Secretariat, Policy Support Unit calculations
Note: DTF refers to Distance to Frontier, which denotes how far the indicator is from the maximum possible
score. Regarding these indicators, the DTF is used in the calculation of the combined progress within APEC and
the rest of the world in the Getting Credit priority area.
APEC’s Improvements by Priority Areas – Getting Credit
20
Box 3: Depth of Credit Information in APEC
Credit information allows lenders to make better loan decisions, improves credit access for
small firms, improves borrower discipline and supports banks in monitoring credit risks. They
can either be negative or positive. The former includes late payments on loans and credit cards,
delinquent accounts and bankruptcies, among others. The latter includes a borrower’s original
loan amounts, outstanding loan amounts and on-time payments, among others. Typically,
providing both negative and positive credit information would be more beneficial than sharing
either one alone. For instance, a study conducted by Hamn and Lee (2011) found that banks in
Korea using both types of information were able to better differentiate credit risks, as well as
had higher profits than banks that only used negative information.
There are several sources from which credit information can be collected, such as commercial
banks and other non-bank financial institutions. However, individuals that are new to credit
would face difficulties in gaining access to credit, as many creditors, such as banks, require
borrowers to have an existing credit history. This problem can be reduced through the use of
data from non-financial creditors such as retailers and utility companies, which are more widely
and commonly used by the general population. Information of payment history on retailing and
utility services could also facilitate institutions to determine the creditworthiness of a loan
applicant.
Since credit information has an impact on a borrower’s loan applications, it is important to
place safeguards against inaccurate or unlawful collection of credit information. Providing
borrowers with access to their own information allows them to check for inaccuracies and
ensures transparency.
Credit Information in APEC
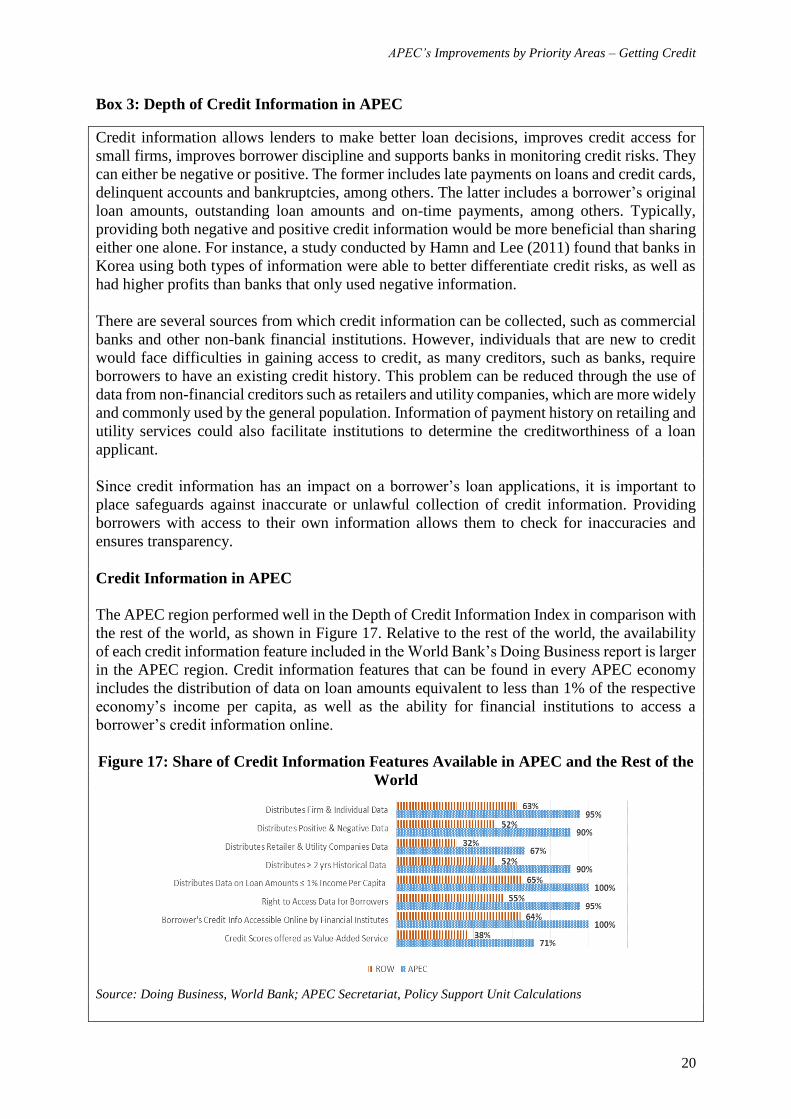
The APEC region performed well in the Depth of Credit Information Index in comparison with
the rest of the world, as shown in Figure 17. Relative to the rest of the world, the availability
of each credit information feature included in the World Bank’s Doing Business report is larger
in the APEC region. Credit information features that can be found in every APEC economy
includes the distribution of data on loan amounts equivalent to less than 1% of the respective
economy’s income per capita, as well as the ability for financial institutions to access a
borrower’s credit information online.
Figure 17: Share of Credit Information Features Available in APEC and the Rest of the
World
Source: Doing Business, World Bank; APEC Secretariat, Policy Support Unit Calculations
APEC’s Improvements by Priority Areas – Getting Credit
21
The least available credit information feature in the APEC region is the distribution of credit
data from retailers and utility companies, with 67% of APEC economies having such data
available in a credit bureau or registry. Nonetheless, this was twice the share that was available
in the rest of the world, where only 32% had this feature.
Sources:
World Bank (2011), “General Principles for Credit Reporting”
World Bank (undated), “Why it matters in Getting Credit - Doing Business - World Bank Group”.
http://www.doingbusiness.org/data/exploretopics/getting-credit/why-matters
Hahm, Joon-Ho and Sangche Lee. "Economic Effects of Positive Credit Information Sharing: The Case of
Korea." Applied Economics 43, no. 30 (2011): 4879-4890
Turner, Michael A., et.al. (2009), “New To Credit from Alternative Data”. PERC Press. Chapel Hill, North
Carolina. USA.
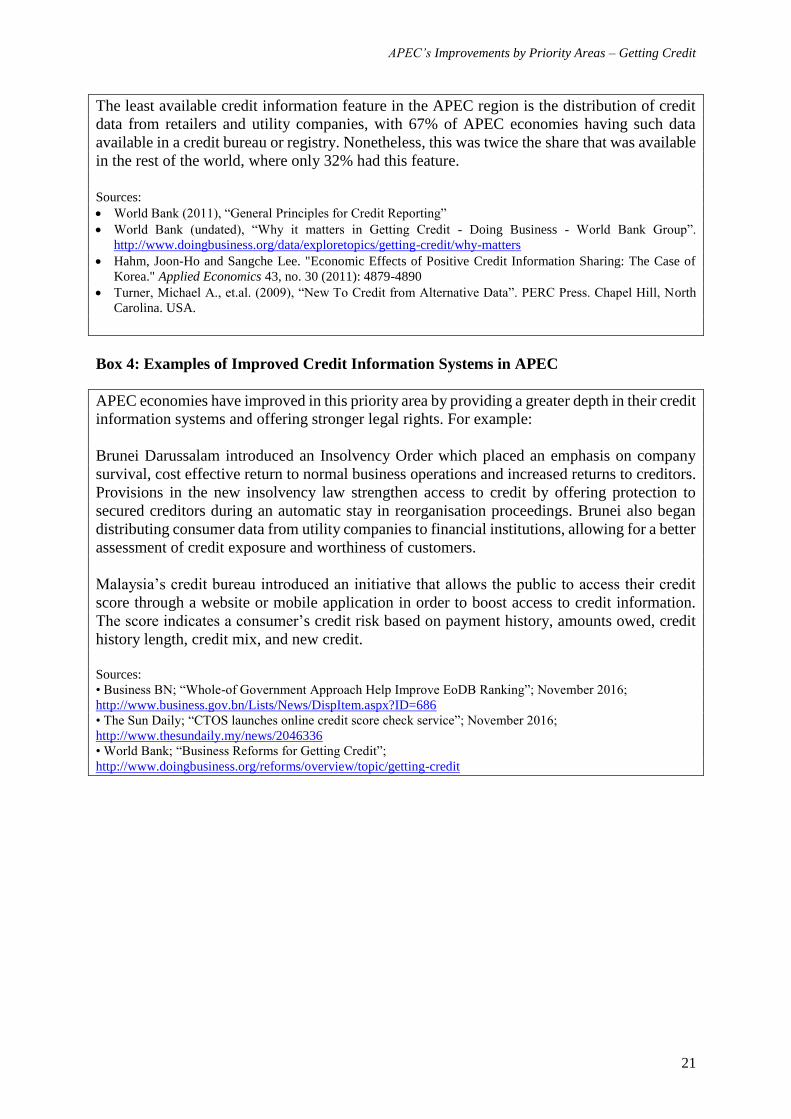
Box 4: Examples of Improved Credit Information Systems in APEC
APEC economies have improved in this priority area by providing a greater depth in their credit
information systems and offering stronger legal rights. For example:
Brunei Darussalam introduced an Insolvency Order which placed an emphasis on company
survival, cost effective return to normal business operations and increased returns to creditors.
Provisions in the new insolvency law strengthen access to credit by offering protection to
secured creditors during an automatic stay in reorganisation proceedings. Brunei also began
distributing consumer data from utility companies to financial institutions, allowing for a better
assessment of credit exposure and worthiness of customers.
Malaysia’s credit bureau introduced an initiative that allows the public to access their credit
score through a website or mobile application in order to boost access to credit information.
The score indicates a consumer’s credit risk based on payment history, amounts owed, credit
history length, credit mix, and new credit.
Sources:
• Business BN; “Whole-of Government Approach Help Improve EoDB Ranking”; November 2016;
http://www.business.gov.bn/Lists/News/DispItem.aspx?ID=686
• The Sun Daily; “CTOS launches online credit score check service”; November 2016;
http://www.thesundaily.my/news/2046336
• World Bank; “Business Reforms for Getting Credit”;
http://www.doingbusiness.org/reforms/overview/topic/getting-credit
APEC’s Improvements by Priority Areas – Trading Across Borders
22
D. TRADING ACROSS BORDERS
The World Bank’s Doing Business measures the time and cost of trading goods across borders
in terms of three sets of procedures: 1) documentary compliance, 2) border compliance and 3)
domestic transport. However, time and costs associated with domestic transport are excluded
from this section, as no data was provided for APEC economies. Costs are calculated as the
sum of expenses incurred in the areas of documentary and border compliance, and likewise for
time. For simplicity, the indicators in this section assume that documentary and border
compliance cannot be performed simultaneously.
While there have been improvements in Trading Across Borders indicators, the combined
average and median progress has not meet the pro-rata target of 3.33% in 2016. This is due to
the lack of progress in reducing the cost to trade, in particular for imports, which offsets
improvements in other areas.
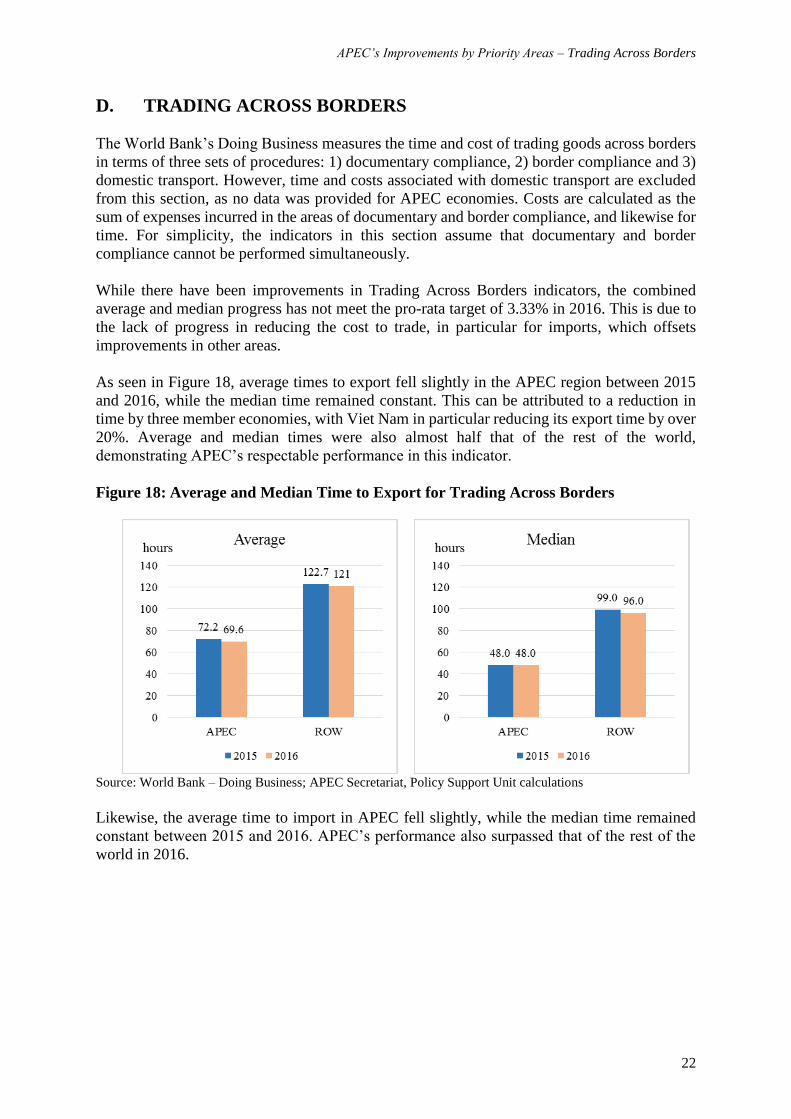
As seen in Figure 18, average times to export fell slightly in the APEC region between 2015
and 2016, while the median time remained constant. This can be attributed to a reduction in
time by three member economies, with Viet Nam in particular reducing its export time by over
20%. Average and median times were also almost half that of the rest of the world,
demonstrating APEC’s respectable performance in this indicator.
Figure 18: Average and Median Time to Export for Trading Across Borders
Source: World Bank – Doing Business; APEC Secretariat, Policy Support Unit calculations
Likewise, the average time to import in APEC fell slightly, while the median time remained
constant between 2015 and 2016. APEC’s performance also surpassed that of the rest of the
world in 2016.
APEC’s Improvements by Priority Areas – Trading Across Borders
23
Figure 19: Average and Median Time to Import for Trading Across Borders
Source: World Bank – Doing Business; APEC Secretariat, Policy Support Unit calculations
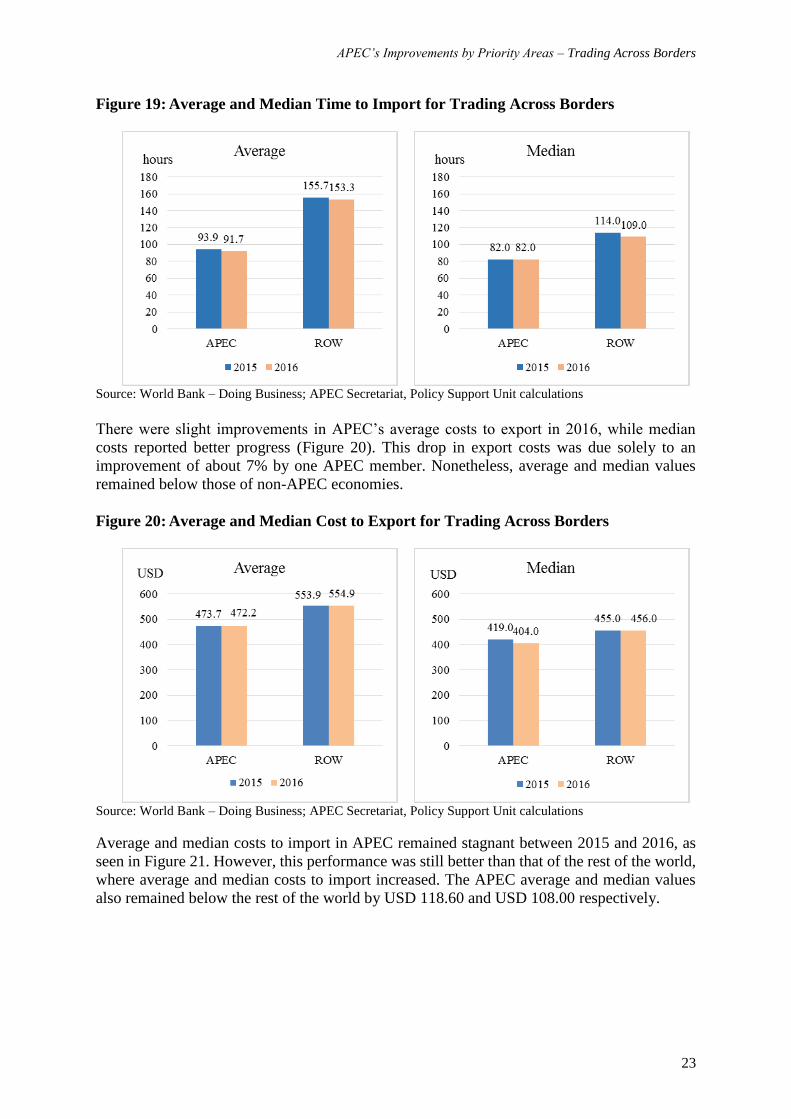
There were slight improvements in APEC’s average costs to export in 2016, while median
costs reported better progress (Figure 20). This drop in export costs was due solely to an
improvement of about 7% by one APEC member. Nonetheless, average and median values
remained below those of non-APEC economies.
Figure 20: Average and Median Cost to Export for Trading Across Borders
Source: World Bank – Doing Business; APEC Secretariat, Policy Support Unit calculations
Average and median costs to import in APEC remained stagnant between 2015 and 2016, as
seen in Figure 21. However, this performance was still better than that of the rest of the world,
where average and median costs to import increased. The APEC average and median values
also remained below the rest of the world by USD 118.60 and USD 108.00 respectively.
APEC’s Improvements by Priority Areas – Trading Across Borders
24
Figure 21: Average and Median Cost to Import for Trading Across Borders
Source: World Bank – Doing Business; APEC Secretariat, Policy Support Unit calculations
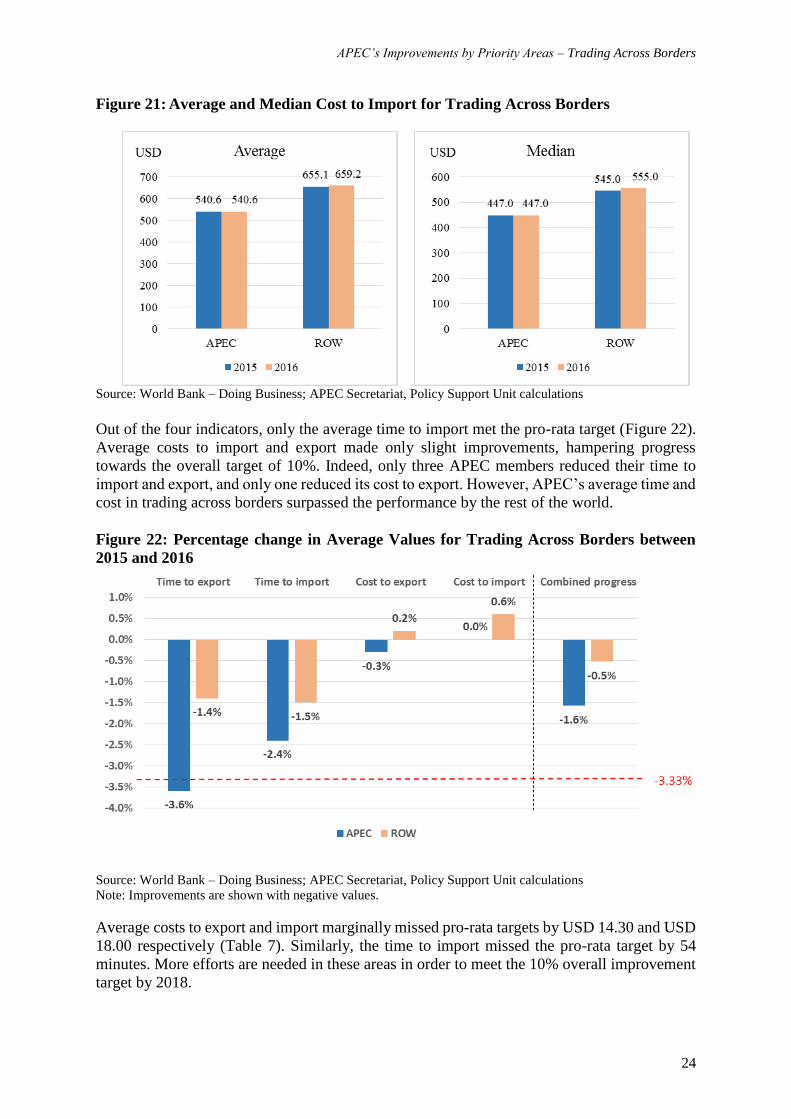
Out of the four indicators, only the average time to import met the pro-rata target (Figure 22).
Average costs to import and export made only slight improvements, hampering progress
towards the overall target of 10%. Indeed, only three APEC members reduced their time to
import and export, and only one reduced its cost to export. However, APEC’s average time and
cost in trading across borders surpassed the performance by the rest of the world.
Figure 22: Percentage change in Average Values for Trading Across Borders between
2015 and 2016
Source: World Bank – Doing Business; APEC Secretariat, Policy Support Unit calculations
Note: Improvements are shown with negative values.
Average costs to export and import marginally missed pro-rata targets by USD 14.30 and USD
18.00 respectively (Table 7). Similarly, the time to import missed the pro-rata target by 54
minutes. More efforts are needed in these areas in order to meet the 10% overall improvement
target by 2018.
APEC’s Improvements by Priority Areas – Trading Across Borders
25
Table 7: Comparison of APEC’s Trading Across Borders Average Indicators with 2018
Targets
Average values Time to Export Time to Import Cost to Export Cost to Import
Current situation
(2016) 69.6 91.7 472.2 540.6
Pro-rata target
(3.33%) 69.8 90.8 457.9 522.6
Overall target
(10%) 65.0 84.5 426.3 486.6
Progress on
track? Yes No No No
Source: World Bank – Doing Business; APEC Secretariat, Policy Support Unit calculations
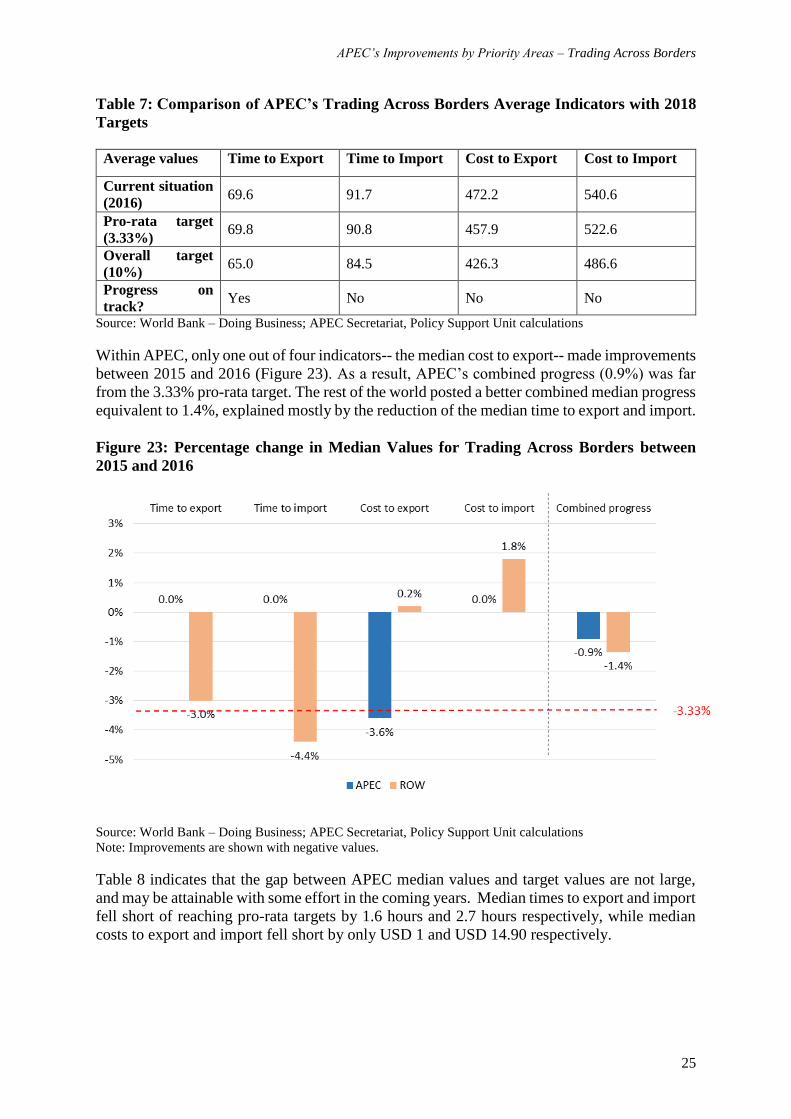
Within APEC, only one out of four indicators-- the median cost to export-- made improvements
between 2015 and 2016 (Figure 23). As a result, APEC’s combined progress (0.9%) was far
from the 3.33% pro-rata target. The rest of the world posted a better combined median progress
equivalent to 1.4%, explained mostly by the reduction of the median time to export and import.
Figure 23: Percentage change in Median Values for Trading Across Borders between
2015 and 2016
Source: World Bank – Doing Business; APEC Secretariat, Policy Support Unit calculations
Note: Improvements are shown with negative values.
Table 8 indicates that the gap between APEC median values and target values are not large,
and may be attainable with some effort in the coming years. Median times to export and import
fell short of reaching pro-rata targets by 1.6 hours and 2.7 hours respectively, while median
costs to export and import fell short by only USD 1 and USD 14.90 respectively.
APEC’s Improvements by Priority Areas – Trading Across Borders
26
Table 8 : Comparison of APEC’s Trading Across Borders Median Indicators with 2018
Targets
Median values Time to Export Time to Import Cost to Export Cost to Import
Current situation
(2016) 48.0 82.0 404.0 447.0
Pro-rata target
(3.33%) 46.4 79.3 405.0 432.1
Overall target
(10%) 43.2 73.8 377.1 402.3
Progress on
track? No No Yes No
Source: World Bank – Doing Business; APEC Secretariat, Policy Support Unit calculations
Box 5: Technological Advancements for Cross-Border Trade
APEC economies are taking shorter times to export and import. A noticeable common trend
that explains this progress is the use of new technologies.
For example, Singapore adopted a trade platform which provides a single electronic window
connecting various foreign businesses and government agencies. The platform facilitates
the electronic exchange of trade documents across borders, helps traders meet regulatory
requirements and allows companies to clear customs more quickly and efficiently. The
platform allows businesses and governments to simplify trading processes and accelerate
cross border connectivity.
Thailand began an electronic customs service that connects the Customs Department with
the Port Authority of Thailand as well as its operators in order to expedite trade. Thailand
also made exporting and importing easier by improving its National Single Window (NSW),
which allows for a secure and efficient electronic exchange of trade documents and
simplifies the import, export and transit-related regulatory processes. Additionally,
declarations, payments and licenses can also be submitted electronically.
Viet Nam implemented an electronic customs clearance system that significantly reduced
the time for clearance of goods across borders. The time required to import fell from 106
to 76 hours, while the time to export fell from 83 to 50 hours.
Sources:
• Bangkok Post; “Higher ranking on ease of doing business index eyed”; May 2017;
http://www.bangkokpost.com/business/finance/1247890/higher-ranking-on-ease-of-doing-business-index-
eyed
• Customs News; Vietnam’s import and export facilitated thanks to e-Customs; December 2016;
http://customsnews.vn/vietnams-import-and-export-facilitated-thanks-to-e-customs-1880.html
• Enterprise Innovation; “Global trade connectivity platform launched in Singapore”; May 2016;
https://www.enterpriseinnovation.net/article/global-trade-connectivity-platform-launched-singapore-
965705551
• OpenGov; “Connecting all relevant agencies to National Single Window for Customs processing in
Thailand”; January 2017; http://www.opengovasia.com/articles/7323-exclusive---connecting-all-relevant-
agencies-to-national-single-window-for-customs-processing-in-thailand
• World Bank; “Business Reforms for Trading Across Borders”;
http://www.doingbusiness.org/reforms/overview/topic/trading-across-borders
APEC’s Improvements By Priority Areas – Enforcing Contracts
27
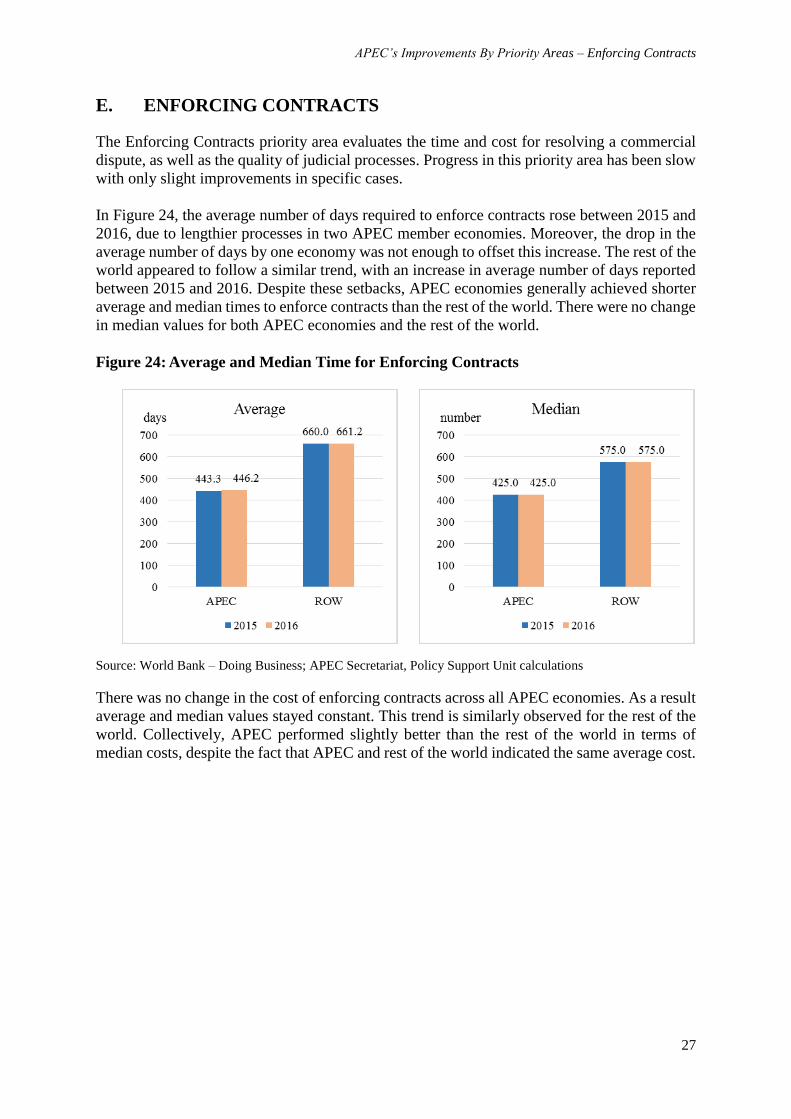
E. ENFORCING CONTRACTS
The Enforcing Contracts priority area evaluates the time and cost for resolving a commercial
dispute, as well as the quality of judicial processes. Progress in this priority area has been slow
with only slight improvements in specific cases.
In Figure 24, the average number of days required to enforce contracts rose between 2015 and
2016, due to lengthier processes in two APEC member economies. Moreover, the drop in the
average number of days by one economy was not enough to offset this increase. The rest of the
world appeared to follow a similar trend, with an increase in average number of days reported
between 2015 and 2016. Despite these setbacks, APEC economies generally achieved shorter
average and median times to enforce contracts than the rest of the world. There were no change
in median values for both APEC economies and the rest of the world.
Figure 24: Average and Median Time for Enforcing Contracts
Source: World Bank – Doing Business; APEC Secretariat, Policy Support Unit calculations
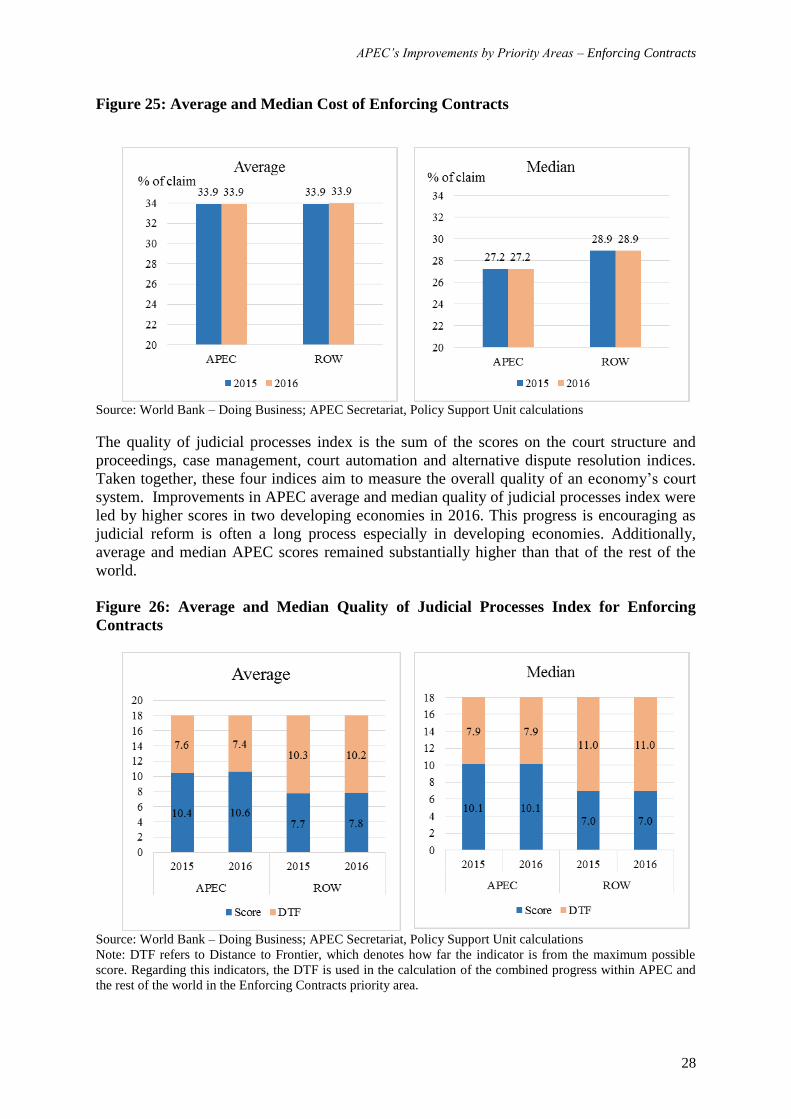
There was no change in the cost of enforcing contracts across all APEC economies. As a result
average and median values stayed constant. This trend is similarly observed for the rest of the
world. Collectively, APEC performed slightly better than the rest of the world in terms of
median costs, despite the fact that APEC and rest of the world indicated the same average cost.
APEC’s Improvements by Priority Areas – Enforcing Contracts
28
Figure 25: Average and Median Cost of Enforcing Contracts
Source: World Bank – Doing Business; APEC Secretariat, Policy Support Unit calculations
The quality of judicial processes index is the sum of the scores on the court structure and
proceedings, case management, court automation and alternative dispute resolution indices.
Taken together, these four indices aim to measure the overall quality of an economy’s court
system. Improvements in APEC average and median quality of judicial processes index were
led by higher scores in two developing economies in 2016. This progress is encouraging as
judicial reform is often a long process especially in developing economies. Additionally,
average and median APEC scores remained substantially higher than that of the rest of the
world.
Figure 26: Average and Median Quality of Judicial Processes Index for Enforcing
Contracts
Source: World Bank – Doing Business; APEC Secretariat, Policy Support Unit calculations
Note: DTF refers to Distance to Frontier, which denotes how far the indicator is from the maximum possible
score. Regarding this indicators, the DTF is used in the calculation of the combined progress within APEC and
the rest of the world in the Enforcing Contracts priority area.
APEC’s Improvements by Priority Areas – Enforcing Contracts
29
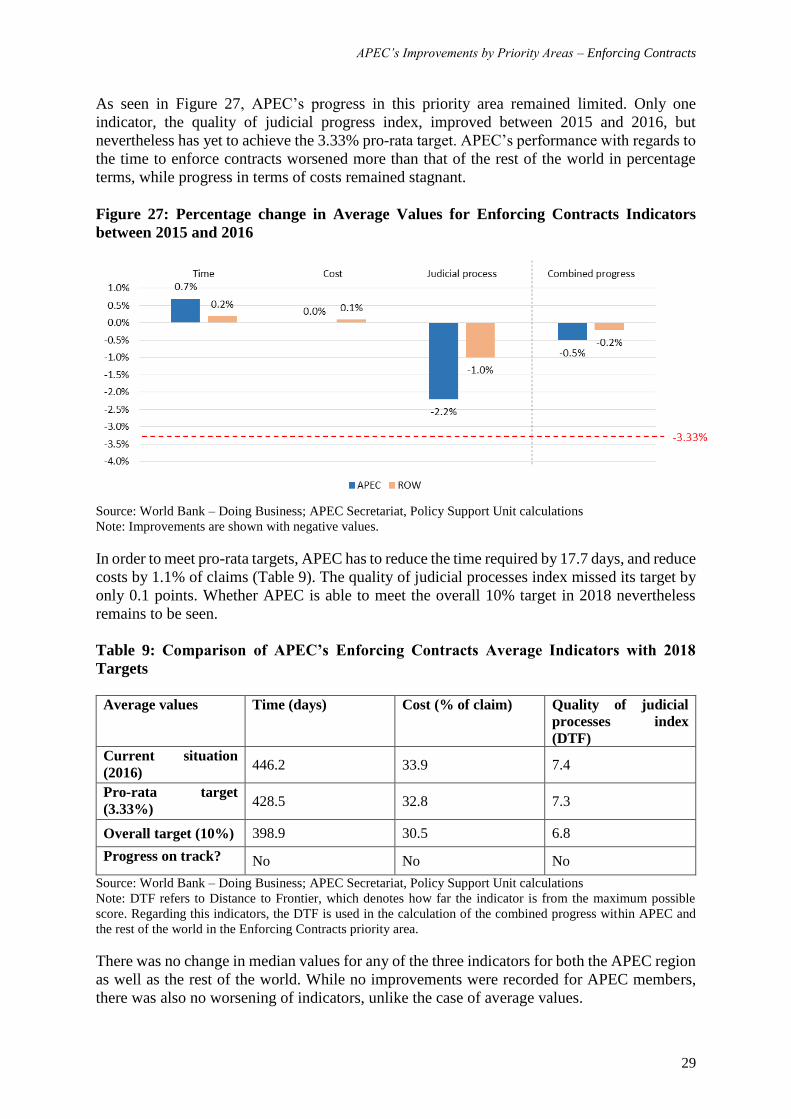
As seen in Figure 27, APEC’s progress in this priority area remained limited. Only one
indicator, the quality of judicial progress index, improved between 2015 and 2016, but
nevertheless has yet to achieve the 3.33% pro-rata target. APEC’s performance with regards to
the time to enforce contracts worsened more than that of the rest of the world in percentage
terms, while progress in terms of costs remained stagnant.
Figure 27: Percentage change in Average Values for Enforcing Contracts Indicators
between 2015 and 2016
Source: World Bank – Doing Business; APEC Secretariat, Policy Support Unit calculations
Note: Improvements are shown with negative values.
In order to meet pro-rata targets, APEC has to reduce the time required by 17.7 days, and reduce
costs by 1.1% of claims (Table 9). The quality of judicial processes index missed its target by
only 0.1 points. Whether APEC is able to meet the overall 10% target in 2018 nevertheless
remains to be seen.
Table 9: Comparison of APEC’s Enforcing Contracts Average Indicators with 2018
Targets
Average values Time (days) Cost (% of claim) Quality of judicial
processes index
(DTF)
Current situation
(2016) 446.2 33.9 7.4
Pro-rata target
(3.33%) 428.5 32.8 7.3
Overall target (10%) 398.9 30.5 6.8
Progress on track? No No No
Source: World Bank – Doing Business; APEC Secretariat, Policy Support Unit calculations
Note: DTF refers to Distance to Frontier, which denotes how far the indicator is from the maximum possible
score. Regarding this indicators, the DTF is used in the calculation of the combined progress within APEC and
the rest of the world in the Enforcing Contracts priority area.
There was no change in median values for any of the three indicators for both the APEC region
as well as the rest of the world. While no improvements were recorded for APEC members,
there was also no worsening of indicators, unlike the case of average values.
APEC’s Improvements by Priority Areas – Enforcing Contracts
30
The gap between current median values and pro-rata targets remained considerable (see Table
10). Similar to the average values, whether APEC is able to meet the overall 10% target
depends on the extent of effort made by member economies in the coming years.
Table 10: Comparison of APEC’s Enforcing Contracts Average Indicators with 2020
Targets
Median values Time (days) Cost (% of claim) Quality of judicial
processes index
(DTF)
Current situation
(2016) 425.0 27.2 7.9
Pro-rata target
(3.33%) 410.8 26.3 7.6
Overall target (10%) 382.5 24.5 7.1
Progress on track? No No No
Source: World Bank – Doing Business; APEC Secretariat, Policy Support Unit calculations
Note: DTF refers to Distance to Frontier, which denotes how far the indicator is from the maximum possible
score. Regarding this indicators, the DTF is used in the calculation of the combined progress within APEC and
the rest of the world in the Enforcing Contracts priority area.
Box 6: Improved Regulatory Changes for Enforcing Contracts
Some APEC economies have introduced changes of prevailing laws and procedures to improve
the regulatory framework for enforcing contracts.
Indonesia introduced a dedicated procedure for the Small Claims Court, to allow for parties’
self-representation. Small claims are now examined and decided by a single judge, where the
decision is final and cannot be brought to appeal or cassation.
The Republic of Korea revised its Arbitration Act with a simplified procedure for recognizing
and enforcing arbitral awards. The revision provides greater assurance to parties and their
counsel that enforcement proceedings will be concluded expeditiously through issuance of an
order, as compared to the previous entry of judgment.
Mexico enacted a nationwide change with the introduction of open oral trials. This resulted in
a reduction in the time taken for commercial trials and sentencing by 48 days from 389 to 340.7
days.
Sources:
• Lexology; “Latest Developments: Revision of the Korean Arbitration Act”; June 2016;
http://www.lexology.com/library/detail.aspx?g=23b728ca-09ae-420b-b81a-5ada9a0aa83f
• Secretaría de Economía; “Ambiente de Negocios: Resultados Doing Business 2017”; November 2016;
http://www.gob.mx/se/acciones-y-programas/resultados-doing-business-2017
• The Jakarta Post; “Revitalizing Indonesian civil justice”; March 2016;
http://www.thejakartapost.com/news/2016/03/29/revitalizing-indonesian-civil-justice.html
• World Bank; “Business Reforms for Enforcing Contracts”;
http://www.doingbusiness.org/reforms/overview/topic/enforcing-contracts
APEC’s Improvements by Priority Areas – Enforcing Contracts
31
Box 7: Alternative Dispute Resolutions
Alternative Dispute Resolutions (ADR) refer to a set of methods used for resolving disputes
between parties. A central feature of these methods is their minimal involvement, or in some
cases, non-involvement in court action. They are thus alternatives to conventional litigation
processes in which cases are brought to and resolved in court. Three important ADR methods
are arbitration, mediation and conciliation. Arbitration involves either a single or a panel of
qualified third party arbitrators who determine the outcome of the case.
In mediation, a neutral third party mediator with a specialized subject expertise jointly
facilitates dialogue between the parties through a structured process but does not decide on the
outcome of the case. The role of the mediator is critical for the parties to share their concerns
and articulate possible solutions to reach a mutually acceptable agreement. Conciliation
facilitates disputes between parties through a conciliator who meets each party separately to
advise on possible solutions and make proposals for settlement.
Benefits and Importance
ADR methods reduce the costs and duration of dispute resolutions relative to traditional
litigation. For example, a study on Hawaii’s Court-Annexed Arbitration Program (CAAP)
showed that arbitration could reduce legal fees by US$500 per party. The study also reported
that 92% of the lawyers perceived CAAP to be faster than litigation.
The International Financial Corporation also found that in Bosnia and Herzegovina, the direct
costs associated with mediation averaged US$225, which was approximately half of the costs
of litigation. In Colombia, a reform that made conciliation mandatory before filing in court
takes place was reported to contribute to time savings in tenant eviction cases. Cases could be
resolved with mandatory conciliation in 4 months on average in comparison to traditional
litigation that could take an average of 15 months.
ADR also offers both parties confidentiality in the dispute resolution process as parties can
agree on keeping the whole process private. Furthermore, ADR potentially reduces the number
of court cases filed which alleviates congestion in courts. In Pakistan, the number of pending
cases for tax appeals fell from 2,500 to 770 after the introduction of ADR processes.
ADR in APEC
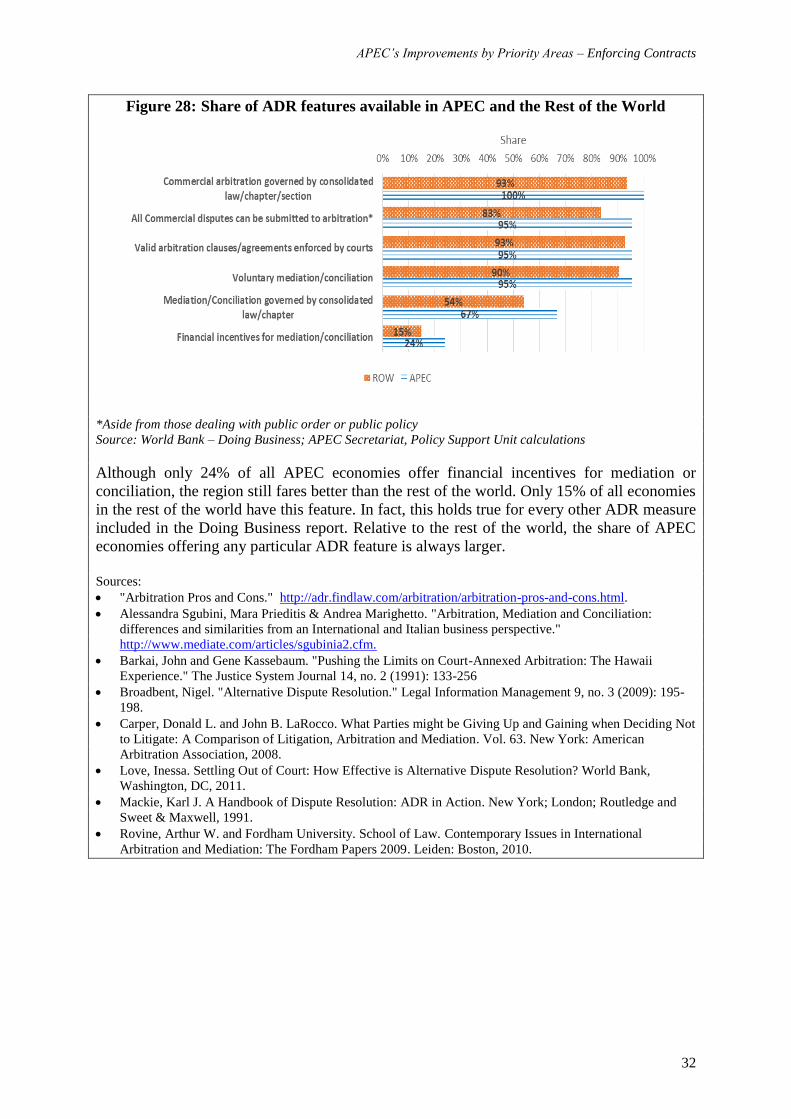
According to the World Bank’s Doing Business reports, arbitration is widely available in the
APEC region. In every APEC economy, commercial arbitration is governed by a consolidated
law, chapter or section of the applicable code of civil procedure.
In 20 APEC member economies, or 95% of all APEC economies, parties are able to submit all
commercial disputes to arbitration (aside from those dealing with public order or public policy).
Likewise, 20 economies have valid arbitration clauses and agreements that are frequently
enforced by the courts.
While voluntary mediation or conciliation is also available in 20 economies, they are only
governed by a consolidated law, chapter or section of the applicable code of civil procedure in
14 economies. In order to attract parties to engage in mediation or conciliation, 5 APEC
economies offer financial incentives for successfully resolved disputes. These financial
incentives take the form of refunding court filing fees or income tax credits.
APEC’s Improvements by Priority Areas – Enforcing Contracts
32
Figure 28: Share of ADR features available in APEC and the Rest of the World
*Aside from those dealing with public order or public policy
Source: World Bank – Doing Business; APEC Secretariat, Policy Support Unit calculations
Although only 24% of all APEC economies offer financial incentives for mediation or
conciliation, the region still fares better than the rest of the world. Only 15% of all economies
in the rest of the world have this feature. In fact, this holds true for every other ADR measure
included in the Doing Business report. Relative to the rest of the world, the share of APEC
economies offering any particular ADR feature is always larger.
Sources:
"Arbitration Pros and Cons." http://adr.findlaw.com/arbitration/arbitration-pros-and-cons.html.
Alessandra Sgubini, Mara Prieditis & Andrea Marighetto. "Arbitration, Mediation and Conciliation:
differences and similarities from an International and Italian business perspective."
http://www.mediate.com/articles/sgubinia2.cfm.
Barkai, John and Gene Kassebaum. "Pushing the Limits on Court-Annexed Arbitration: The Hawaii
Experience." The Justice System Journal 14, no. 2 (1991): 133-256
Broadbent, Nigel. "Alternative Dispute Resolution." Legal Information Management 9, no. 3 (2009): 195-
198.
Carper, Donald L. and John B. LaRocco. What Parties might be Giving Up and Gaining when Deciding Not
to Litigate: A Comparison of Litigation, Arbitration and Mediation. Vol. 63. New York: American
Arbitration Association, 2008.
Love, Inessa. Settling Out of Court: How Effective is Alternative Dispute Resolution? World Bank,
Washington, DC, 2011.
Mackie, Karl J. A Handbook of Dispute Resolution: ADR in Action. New York; London; Routledge and
Sweet & Maxwell, 1991.
Rovine, Arthur W. and Fordham University. School of Law. Contemporary Issues in International
Arbitration and Mediation: The Fordham Papers 2009. Leiden: Boston, 2010.
References
33
REFERENCES
APEC (2009), “Discussion Paper on Ease of Doing Business (EoDB)”, 2009/SOM/023,
Concluding Senior Officials’ Meeting – Plenary Session, 9 November.
APEC Policy Support Unit (2015). “APEC’s Ease of Doing Business – Interim Assessment
2009-2014”, APEC Secretariat, APEC#215-SE-01.17
APEC Policy Support Unit (2016). “APEC’s Ease of Doing Business – Final Assessment 2009-
2015”, APEC Secretariat, APEC#216-SE-01.10.
US-ATAARI (2015), “Introduction to the APEC Second EODB Action Plan”,
2015/SOM3/EC/WKSP2/003,
http://mddb.apec.org/Documents/2015/EC/WKSP4/15_ec_wksp4_003.pdf
World Bank (2015), “Doing Business 2016 – Measuring Regulatory Quality and Efficiency”.
Washington: The World Bank and the International Finance Corporation.
World Bank (2016), “Doing Business 2017 – Equal Opportunity for All”. Washington: The
World Bank and the International Finance Corporation.
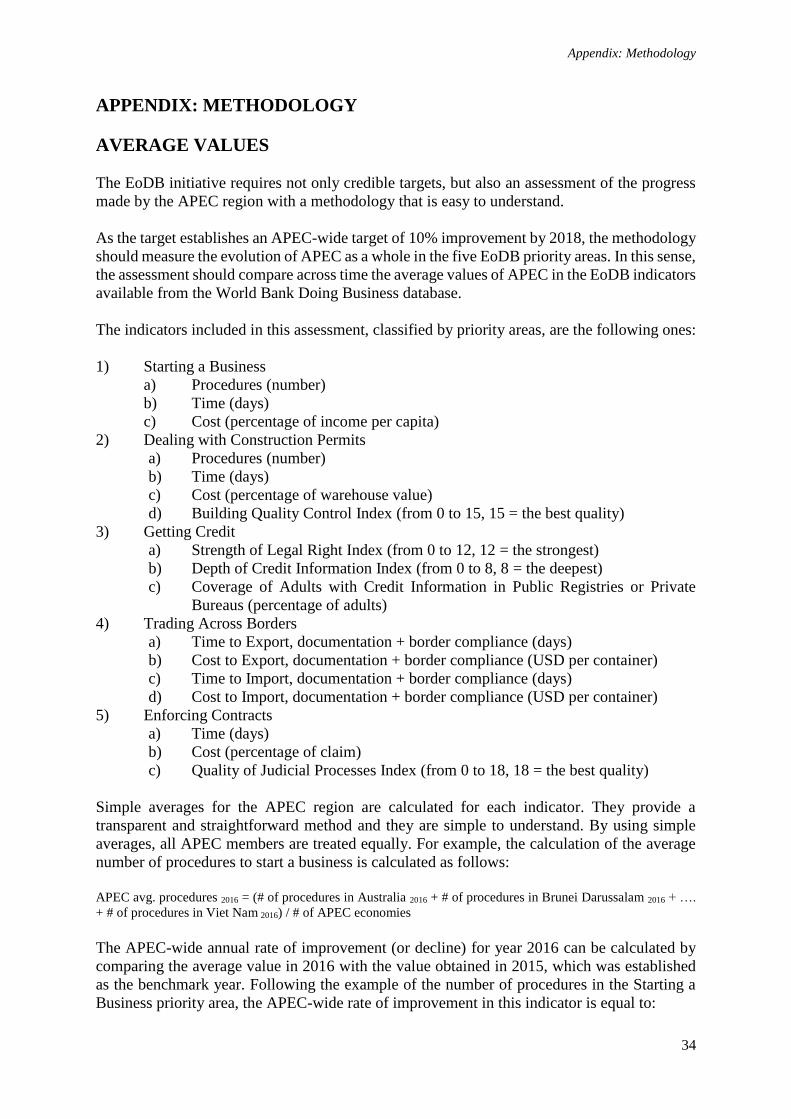
Appendix: Methodology
34
APPENDIX: METHODOLOGY
AVERAGE VALUES
The EoDB initiative requires not only credible targets, but also an assessment of the progress
made by the APEC region with a methodology that is easy to understand.
As the target establishes an APEC-wide target of 10% improvement by 2018, the methodology
should measure the evolution of APEC as a whole in the five EoDB priority areas. In this sense,
the assessment should compare across time the average values of APEC in the EoDB indicators
available from the World Bank Doing Business database.
The indicators included in this assessment, classified by priority areas, are the following ones:
1) Starting a Business
a) Procedures (number)
b) Time (days)
c) Cost (percentage of income per capita)
2) Dealing with Construction Permits
a) Procedures (number)
b) Time (days)
c) Cost (percentage of warehouse value)
d) Building Quality Control Index (from 0 to 15, 15 = the best quality)
3) Getting Credit
a) Strength of Legal Right Index (from 0 to 12, 12 = the strongest)
b) Depth of Credit Information Index (from 0 to 8, 8 = the deepest)
c) Coverage of Adults with Credit Information in Public Registries or Private
Bureaus (percentage of adults)
4) Trading Across Borders
a) Time to Export, documentation + border compliance (days)
b) Cost to Export, documentation + border compliance (USD per container)
c) Time to Import, documentation + border compliance (days)
d) Cost to Import, documentation + border compliance (USD per container)
5) Enforcing Contracts
a) Time (days)
b) Cost (percentage of claim)
c) Quality of Judicial Processes Index (from 0 to 18, 18 = the best quality)
Simple averages for the APEC region are calculated for each indicator. They provide a
transparent and straightforward method and they are simple to understand. By using simple
averages, all APEC members are treated equally. For example, the calculation of the average
number of procedures to start a business is calculated as follows:
APEC avg. procedures 2016 = (# of procedures in Australia 2016 + # of procedures in Brunei Darussalam 2016 + ….
+ # of procedures in Viet Nam 2016) / # of APEC economies
The APEC-wide annual rate of improvement (or decline) for year 2016 can be calculated by
comparing the average value in 2016 with the value obtained in 2015, which was established
as the benchmark year. Following the example of the number of procedures in the Starting a
Business priority area, the APEC-wide rate of improvement in this indicator is equal to:
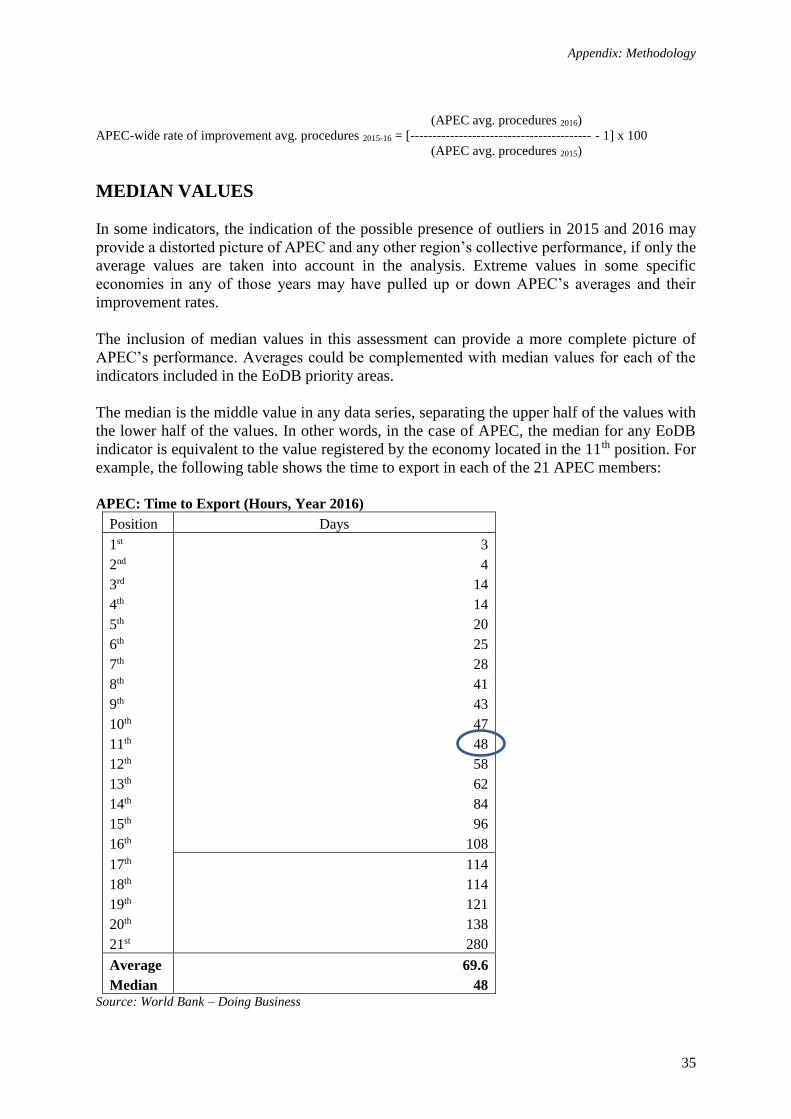
Appendix: Methodology
35
(APEC avg. procedures 2016)
APEC-wide rate of improvement avg. procedures 2015-16 = [----------------------------------------- - 1] x 100
(APEC avg. procedures 2015)
MEDIAN VALUES
In some indicators, the indication of the possible presence of outliers in 2015 and 2016 may
provide a distorted picture of APEC and any other region’s collective performance, if only the
average values are taken into account in the analysis. Extreme values in some specific
economies in any of those years may have pulled up or down APEC’s averages and their
improvement rates.
The inclusion of median values in this assessment can provide a more complete picture of
APEC’s performance. Averages could be complemented with median values for each of the
indicators included in the EoDB priority areas.
The median is the middle value in any data series, separating the upper half of the values with
the lower half of the values. In other words, in the case of APEC, the median for any EoDB
indicator is equivalent to the value registered by the economy located in the 11th position. For
example, the following table shows the time to export in each of the 21 APEC members:
APEC: Time to Export (Hours, Year 2016)
Position Days
1st 3
2nd 4
3rd 14
4th 14
5th 20
6th 25
7th 28
8th 41
9th 43
10th 47
11th 48
12th 58
13th 62
14th 84
15th 96
16th 108
17th 114
18th 114
19th 121
20th 138
21st 280
Average 69.6
Median 48 Source: World Bank – Doing Business
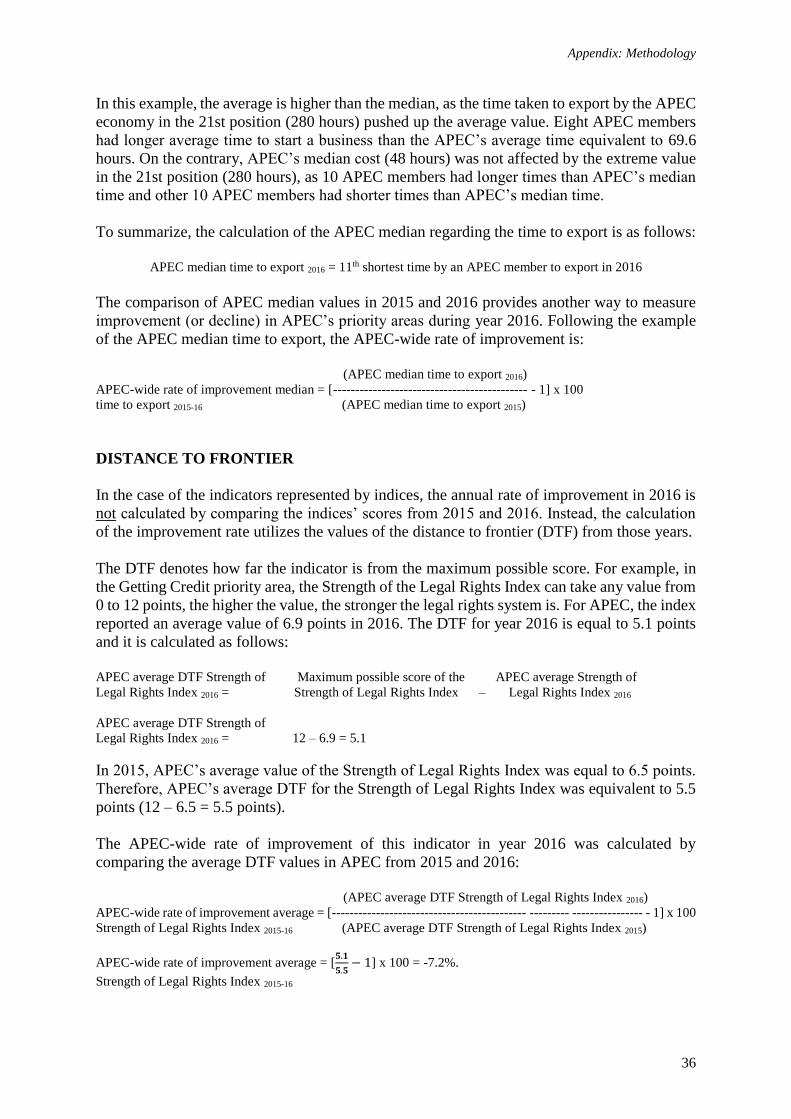
Appendix: Methodology
36
In this example, the average is higher than the median, as the time taken to export by the APEC
economy in the 21st position (280 hours) pushed up the average value. Eight APEC members
had longer average time to start a business than the APEC’s average time equivalent to 69.6
hours. On the contrary, APEC’s median cost (48 hours) was not affected by the extreme value
in the 21st position (280 hours), as 10 APEC members had longer times than APEC’s median
time and other 10 APEC members had shorter times than APEC’s median time.
To summarize, the calculation of the APEC median regarding the time to export is as follows:
APEC median time to export 2016 = 11th shortest time by an APEC member to export in 2016
The comparison of APEC median values in 2015 and 2016 provides another way to measure
improvement (or decline) in APEC’s priority areas during year 2016. Following the example
of the APEC median time to export, the APEC-wide rate of improvement is:
(APEC median time to export 2016)
APEC-wide rate of improvement median = [-------------------------------------------- - 1] x 100
time to export 2015-16 (APEC median time to export 2015)
DISTANCE TO FRONTIER
In the case of the indicators represented by indices, the annual rate of improvement in 2016 is
not calculated by comparing the indices’ scores from 2015 and 2016. Instead, the calculation
of the improvement rate utilizes the values of the distance to frontier (DTF) from those years.
The DTF denotes how far the indicator is from the maximum possible score. For example, in
the Getting Credit priority area, the Strength of the Legal Rights Index can take any value from
0 to 12 points, the higher the value, the stronger the legal rights system is. For APEC, the index
reported an average value of 6.9 points in 2016. The DTF for year 2016 is equal to 5.1 points
and it is calculated as follows:
APEC average DTF Strength of Maximum possible score of the APEC average Strength of
Legal Rights Index 2016 = Strength of Legal Rights Index – Legal Rights Index 2016
APEC average DTF Strength of
Legal Rights Index 2016 = 12 – 6.9 = 5.1
In 2015, APEC’s average value of the Strength of Legal Rights Index was equal to 6.5 points.
Therefore, APEC’s average DTF for the Strength of Legal Rights Index was equivalent to 5.5
points (12 – 6.5 = 5.5 points).
The APEC-wide rate of improvement of this indicator in year 2016 was calculated by
comparing the average DTF values in APEC from 2015 and 2016:
(APEC average DTF Strength of Legal Rights Index 2016)
APEC-wide rate of improvement average = [-------------------------------------------- --------- ---------------- - 1] x 100
Strength of Legal Rights Index 2015-16 (APEC average DTF Strength of Legal Rights Index 2015)
APEC-wide rate of improvement average = [𝟓.𝟏
𝟓.𝟓− 1] x 100 = -7.2%.
Strength of Legal Rights Index 2015-16
Appendix: Methodology
37
APEC’s average DTF in this indicator fell by 7.2% in 2016. This means that APEC’s average
value of this index is 7.2% closer to the highest possible score of 12 points in comparison to
the its average value in 2015.
The DTF is used in all the EoDB indicators in which improvements are reflected with an
increase in their scores/values. For example, the Getting Credit indicator on the Coverage of
Adults with Credit Information in Public Registries or Private Bureaus (% of adult population)
improved its average in the APEC region from 74.3% to 75.3% of the adult population between
2015 and 2016. Since the maximum possible value of the indicator is 100% of the adult
population, then the APEC DTF for this indicator was equivalent to 100%-75.3% = 24.7% of
the adult population in 2016 and 100%-74.3% = 25.7% of the adult population in 2015.
CALCULATION OF THE COVERAGE OF ADULTS WITH CREDIT
INFORMATION IN PUBLIC REGISTRIES OR PRIVATE BUREAUS
The World Bank’s Doing Business provides two separate indicators to determine the coverage
of credit information from the adult population in each economy. One of the indicators show
the percentage of adults with their information available in public credit registries. The other
indicator measures the same, but in private credit bureaus. Both institutions, public credit
registries and private credit bureaus, seek to improve the availability of credit information in
order to facilitate decisions to lenders regarding loan applications.
Within the APEC region, credit information databases are available in all economies. While
private credit bureaus are available in 18 APEC economies, 7 economies have public credit
registries in place. Only 4 economies have both of them. Since most of the economies only
have in place one of these two systems, calculating the rate of progress in APEC of these two
indicators separately would not necessarily give a proper indication of the percentage of adults
whose credit information is available to lenders. Instead, this report combines both indicators,
by taking the highest value every year in each APEC economy. Those highest values in each
economy are taken into account to calculate this indicator’s average and median values for the
whole APEC region.
For example, Malaysia reported that the credit information coverage was equal to 41.5% of the
adult population in public credit registries and 6.9% in private credit bureaus in 2015. For that
year, the indicator in the assessment for Malaysia took the highest value of 41.5% of the adult
population, which is taken into account in the calculation of APEC’s average and median credit
information coverage.
OBTAINING THE APEC-WIDE RATE OF IMPROVEMENT BY
PRIORITY AREA AND APEC-WIDE OVERALL IMPROVEMENT
Since all the priority areas are comprised of indicators with different natures and units of
measurement (i.e. numbers, days and percentage of income per capita, among others), the
estimation of the APEC-wide rate of improvement in any priority area can be obtained by
calculating the simple average of the rates of improvement (or decline) in each of the indicators
belonging to the particular priority area. This can be calculated by using the rates of
improvement (or decline) for either APEC averages or APEC median values.
Appendix: Methodology
38
For example, the APEC-wide average rate of improvement in the Starting a Business priority
area in the period 2015-2016 can be obtained by using the rates of improvement (or decline)
of the averages in each of the three indicators belonging to this priority area:
APEC-wide rate of improvement Starting a Business 2015-16 =
(APEC-wide rate of improvement avg. procedures2015-16 + APEC-wide rate of improvement avg. time2015-16 +
APEC-wide rate of improvement avg. cost2015-16) / # of indicators
By using a simple average, the measurement gives the same importance to each of the
indicators within the specific priority area.
Similarly, the APEC-wide median rate of improvement in the Starting a Business priority area
can be obtained by using the rates of improvement (or decline) of APEC median values in each
of the three indicators that are part of this priority area:
APEC-wide rate of improvement Starting a Business 2015-16 =
(APEC-wide rate of improvement median procedures2015-16 + APEC-wide rate of improvement median
time2015-16 + APEC-wide rate of improvement median cost2015-16) / # of indicators
The methodology allows the identification of the priority areas and indicators in which APEC
has met or surpassed its aspirational targets and assists APEC in recognizing areas where more
work is needed. The calculation of the APEC-wide rate of improvement in any priority area by
using average and median values separately also provides an indication whether the progress
in the priority areas’ indicators is explained by a small group of APEC members or is more
widespread amongst a larger group of economies.
This methodology also provides a measure of the overall APEC-wide rate of improvement for
the whole EoDB initiative. In this regard, this measure can be attained by combining the APEC-
wide rates of improvement in the five priority areas:
APEC-wide rate of improvement EoDB 2015-16= (APEC-wide rate of improvement Starting a Business2015-16 +
APEC-wide rate of improvement Dealing with Construction Permits2015-16 + APEC-wide rate of improvement
Getting Credit2015-16 + APEC-wide rate of improvement Trading Across Borders2015-16 + APEC-wide rate of
improvement Enforcing Contracts2015-16) / # of priority areas
The APEC-wide rate of improvement in the EoDB initiative can be calculated by using either
the rates of improvement concerning APEC averages or those concerning APEC median
values.
The intention of the EoDB initiative is to reach an APEC-wide improvement of 10 percent by
2018. Measuring the overall improvement by using a simple average of the rates of
improvement (or decline) of the five priority areas reduces the subjectivity of the assessment
by considering all priority areas as equally important7.
7 If weighted averages are introduced, the overall results could be skewed toward the priority area assigned with
the greater weight. Assigning weights could introduce additional complications, such as the criteria to be used. It
is also possible that individual APEC economies differ on the importance to assign to each of the priority areas
based on their particular realities.