Embed Size (px)
Citation preview

IHC Nuclear Image Analysis
User’s Guide
ii IHC Nuclear Image Analysis User’s Guide
©Copyright 2007 Aperio Technologies, Inc. Part Number/Revision: MAN-0027, Revision B
Date: January 2, 2007
This document applies to software versions Release 8.0 and later.
All rights reserved. This document may not be copied in whole or in part or reproduced in any other media without the express written permission of Aperio Technologies, Inc. Please note that under copyright law, copying includes translation into another language.
User Resources For the latest information on Aperio Technologies products and services, please visit the Aperio Technologies website at: http://www.aperio.com.
Disclaimers This manual is not a substitute for the detailed operator training provided by Aperio Technologies, Inc., or for other advanced instruction. Aperio Technologies Field Representatives should be contacted immediately for assistance in the event of any instrument malfunction. Installation of hardware should only be performed by a certified Aperio Technologies Service Engineer.
ImageServer is intended for use with the svs file format (the native format for digital slides created by scanning glass slides with the ScanScope scanner). Educators will use Aperio software to view and modify digital slides in Composite WebSlide (CWS) format.
CAUTION For research and education uses only, not for use in diagnostic procedures. This product has not been approved or cleared as a medical device by the U.S. Food and Drug Administration. The data and images obtained or viewed using this product are not intended for clinical or diagnostic use.
Trademarks and Patents ScanScope is a registered trademark and ImageServer, TMALab, ImageScope, and Spectrum are trademarks of Aperio Technologies, Inc. All other trade names and trademarks are the property of their respective holders.
Aperio products are protected by U.S. Patents: 6,711,283; 6,917,696; 7,035,478; and 7,116,440; and licensed under one or more of the following U.S. Patents: 6,101,265; 6,272,235; 6,522,774; 6,775,402; 6,396,941; 6,674,881; 6,226,392; 6,404,906; 6,674,884; and 6,466,690.
Contact Information Headquarters: Aperio Technologies, Inc.
1430 Vantage Court, Suite 106 Vista, CA 92081 United States
European Office: Aperio 3 The Sanctuary Eden Office Park Ham Green Bristol BS20 0DD, UK
United States of America
Tel: 866-478-4111 (toll free) Fax: 760-539-1116 Customer Service Tel: 866-478-4111 (toll free) Technical Support Tel: 866-478-4111 (toll free) Email: [email protected]
Europe Tel: +44 (0) 1275 375123 Fax: +44(0) 1275 373501 Customer Service Tel: +44 (0) 1275 375123 Technical Support Tel: +44 (0) 1275 375123 Email: [email protected]
IHC Nuclear Image Analysis User’s Guide iii
Contents
CHAPTER 1 - OVERVIEW ............................................................................................................... 1 IHC Workflow .......................................................................................................................................................1 Who This Guide Is Intended For........................................................................................................................2 Intended Use ..........................................................................................................................................................2 Algorithm Description .........................................................................................................................................2
CHAPTER 2 - ANALYSIS STEP-BY-STEP............................................................................................. 7 Access a Digital Slide in SIM (Spectrum Information Manager) ................................................................7
Patient Data Confidentiality.............................................................................................................................7 Manual Read of a Slide ........................................................................................................................................8 Image Analysis in ImageScope.........................................................................................................................10
Outline Tumor Regions...................................................................................................................................10 Run Algorithm .................................................................................................................................................12 View Results .....................................................................................................................................................13
Final Score ............................................................................................................................................................16 More Information................................................................................................................................................16
CHAPTER 3 - INSTALLATION ........................................................................................................ 17
CHAPTER 4 - SLIDE PREPARATION ................................................................................................. 19
CHAPTER 5 - SCANNING............................................................................................................. 21
CHAPTER 6 - ALGORITHM SETUP .................................................................................................. 23 Data Sets................................................................................................................................................................23 Cell Feature Detection Parameters ...................................................................................................................29 Scoring Scheme Parameters...............................................................................................................................37 Validate Algorithm Setup..................................................................................................................................40
CHAPTER 7 - VALIDATION .......................................................................................................... 41

Contents
iv IHC Nuclear Image Analysis User’s Guide
IHC Nuclear Image Analysis User’s Guide 1
1 Overview
This chapter provides an overview of Aperio’s IHC (ImmunoHistoChemistry) Nuclear Image Analysis algorithm.
The following chapters of this manual provide step-by-step instructions for a pathologist on how to use the algorithm as well as detailed information on proper slide preparation and scanning, and the installation, setup and performance validation of the algorithm.
IHC Workflow A lab receives a specimen from a biopsy and prepares a block from which an H&E (Haematoxylin and Eosin) slide is prepared. The typical IHC (ImmunoHistoChemistry) workflow starts with the diagnosis of cancer by a pathologist reviewing the H&E slide.
Once the pathologist has determined that a patient has cancer he/she orders an IHC panel. An IHC panel consists of consecutively cut slides from the same specimen block that are then stained with different IHC stains. A typical IHC panel for breast cancer includes the following IHC stains: HER2 (Human Epidermal growth factor Receptor 2), ER (Estrogen Receptor) and PR (Progesterone Receptor). The pathologist then provides a semi-quantitative assessment of the IHC slides to determine the appropriate treatment option (prognostic).
HER2 is a membrane stain from which the pathologist assesses the intensity and completeness of the membrane staining of the tumor cells and determines a score of 0, 1+, 2+ or 3+ for the slide. HER2 is used specifically to assess Herceptin® (Trastuzumab) as a treatment option and to determine the aggressiveness of breast tumors.
ER and PR are nuclear stains from which the pathologist assesses the staining intensity of the nuclei of the tumor cells and determines the percentage of positive stained nuclei as a percentage between 0 to 100% and the average staining intensity of the positive nuclei as a score of 0, 1+, 2+ or 3+. Different labs use different scoring schemes for the nuclear stains. For example, some labs use only the percentage of positive nuclei as a score and use different cut-off thresholds of 1%, 5% or 10% for the interpretation; other labs use the percentage of positive nuclei and the average staining intensity of the positive nuclei to calculate a combined score like the Allred Score.
Chapter 1 – Overview
2 IHC Nuclear Image Analysis User’s Guide
Who This Guide Is Intended For This guide is a reference document that covers all aspects of using the Aperio IHC (ImmunoHistoChemistry) Nuclear Image Analysis algorithm. Different steps of your image analysis workflow may involve different people with different skills and responsibilities. Therefore, the chapters in this guide are organized by function so that a particular reader can go directly to the section of interest to him or her:
Functional Area Responsible Person Where to Find Information
Overview All readers Chapter 1, “Overview” on page 1
Step-by step analysis—everything the pathologist needs to know to perform daily tasks
Pathologist Chapter 2, “Analysis Step-by-Step,” on page 7
Tips for ensuring your glass slides are optimized for image analysis
Lab manager Chapter 4, “Slide Preparation,” on page 19
Tips on performing high quality slide scans
ScanScope operator Chapter 5, “Scanning,” on page 21
Installation of the algorithm IT administrator Chapter 2, “Installation,” on page 7
How to set up the parameters of the algorithm to optimize analysis results
Person responsible for image analysis services
Chapter 6, “Algorithm Setup,” on page 23
Validation of algorithm performance
Medical Director Chapter 7, “Validation,” on page 41
Intended Use The IHC (ImmunoHistoChemistry) Nuclear Image Analysis algorithm is intended to be used as an aid to the pathologists for the assessment of IHC ER (Estrogen Receptor) and PR (Progesterone Receptor) stained breast tissue slides.
Although the IHC Nuclear Image Analysis algorithm has been optimized for IHC ER, PR, Ki-67, and P53 staining on breast tissue, it is a general nuclear algorithm that can be used for other tissue types and nuclear stains.
CAUTION:
For research and educational uses only, not for use in diagnostic procedures. This product has not been approved or cleared as a medical device by the U.S. Food and Drug Administration. The data and images obtained or viewed using this product are not intended for clinical or diagnostic use.
Algorithm Description Prior to running the algorithm, a qualified pathologist needs to use the ImageScope annotation tools to outline a set of tumor-cell only regions that are representative of the tumor.
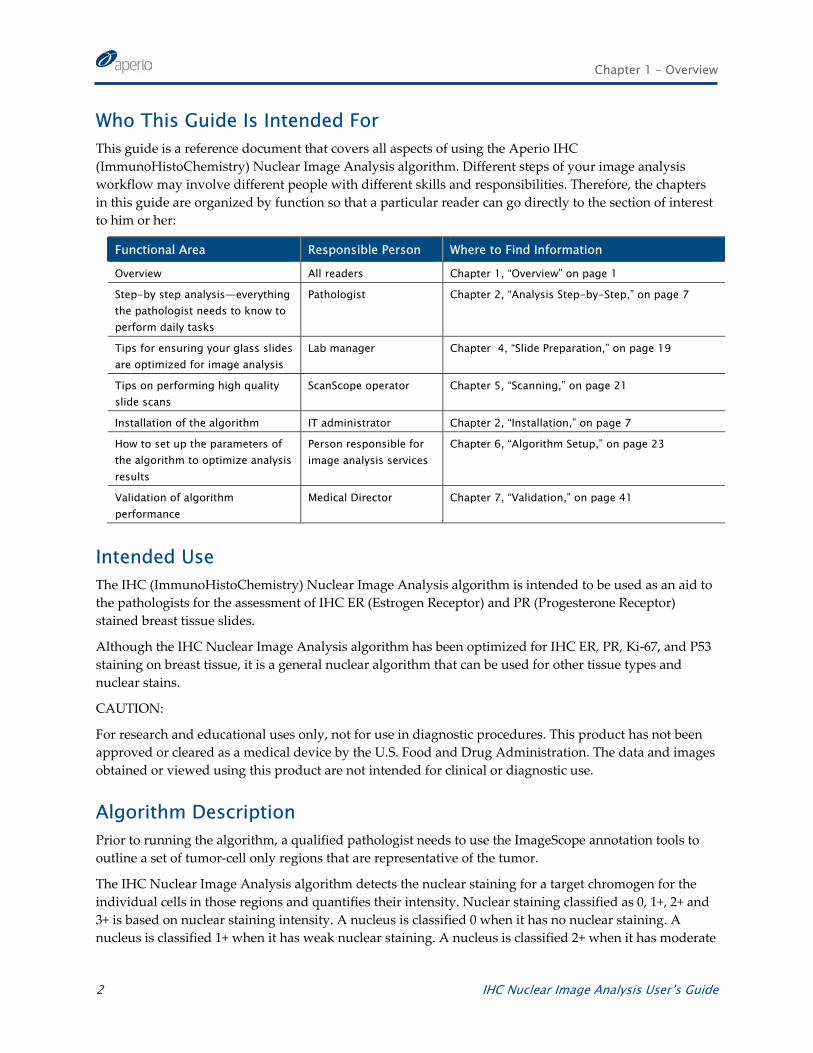
The IHC Nuclear Image Analysis algorithm detects the nuclear staining for a target chromogen for the individual cells in those regions and quantifies their intensity. Nuclear staining classified as 0, 1+, 2+ and 3+ is based on nuclear staining intensity. A nucleus is classified 0 when it has no nuclear staining. A nucleus is classified 1+ when it has weak nuclear staining. A nucleus is classified 2+ when it has moderate
Chapter 1 – Overview
IHC Nuclear Image Analysis User’s Guide 3
nuclear staining. A nucleus is classified 3+ when it has intense nuclear staining. Based on the percentages of 0, 1+, 2+ and 3+ nuclei, the percentage of positive stained nuclei as a percentage of 0 to 100% and the average staining intensity of the positive nuclei as a score of 0, 1+, 2+ or 3+ is determined.
Nuclear 0
Nuclear 1+
Nuclear 2+
Nuclear 3+
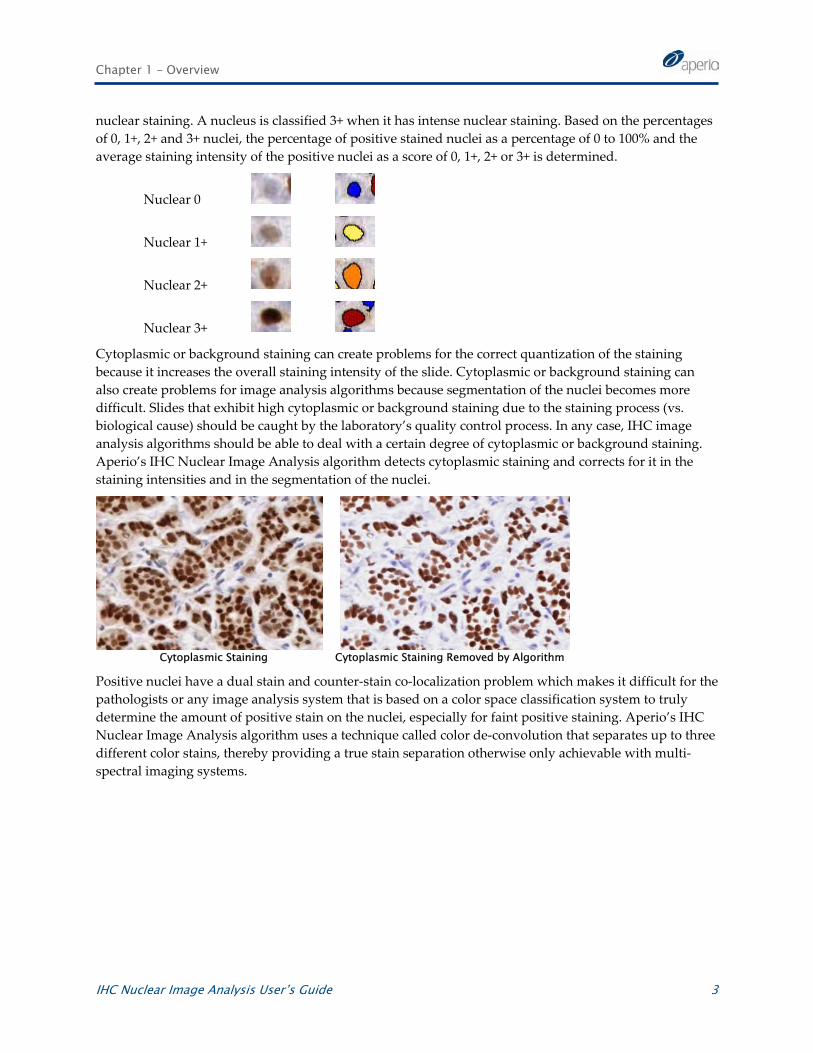
Cytoplasmic or background staining can create problems for the correct quantization of the staining because it increases the overall staining intensity of the slide. Cytoplasmic or background staining can also create problems for image analysis algorithms because segmentation of the nuclei becomes more difficult. Slides that exhibit high cytoplasmic or background staining due to the staining process (vs. biological cause) should be caught by the laboratory’s quality control process. In any case, IHC image analysis algorithms should be able to deal with a certain degree of cytoplasmic or background staining. Aperio’s IHC Nuclear Image Analysis algorithm detects cytoplasmic staining and corrects for it in the staining intensities and in the segmentation of the nuclei.
Cytoplasmic Staining Cytoplasmic Staining Removed by Algorithm
Positive nuclei have a dual stain and counter-stain co-localization problem which makes it difficult for the pathologists or any image analysis system that is based on a color space classification system to truly determine the amount of positive stain on the nuclei, especially for faint positive staining. Aperio’s IHC Nuclear Image Analysis algorithm uses a technique called color de-convolution that separates up to three different color stains, thereby providing a true stain separation otherwise only achievable with multi-spectral imaging systems.
Chapter 1 – Overview
4 IHC Nuclear Image Analysis User’s Guide
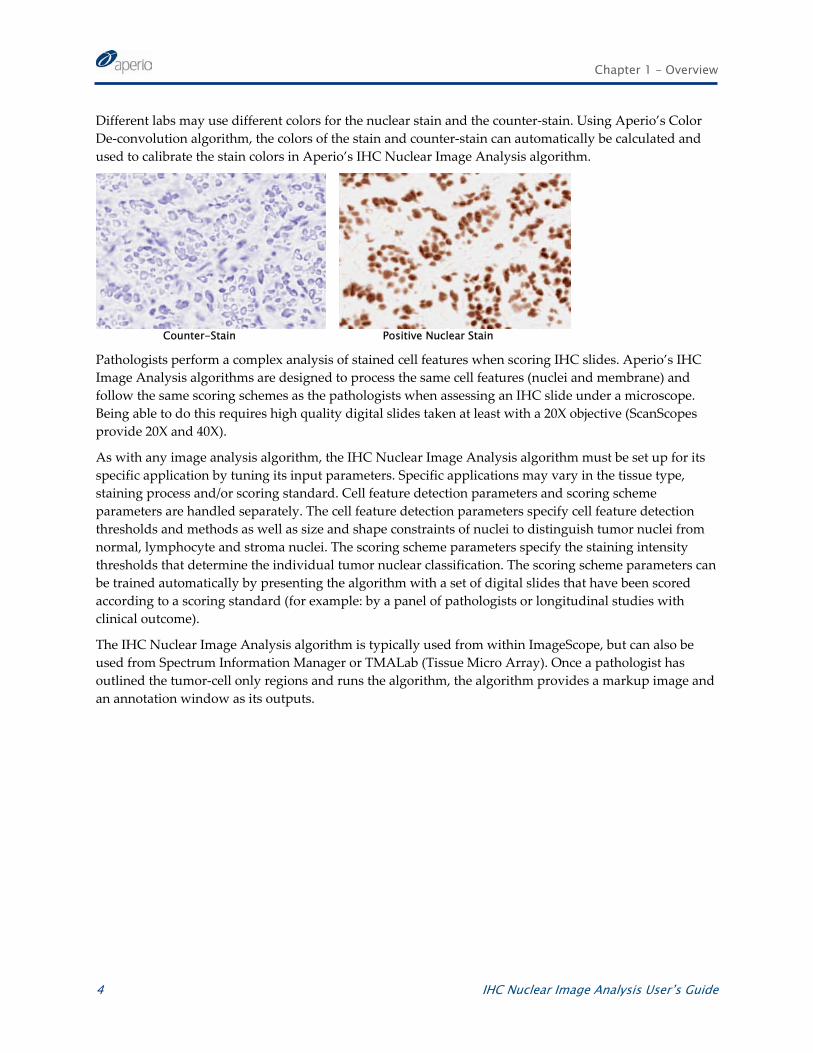
Different labs may use different colors for the nuclear stain and the counter-stain. Using Aperio’s Color De-convolution algorithm, the colors of the stain and counter-stain can automatically be calculated and used to calibrate the stain colors in Aperio’s IHC Nuclear Image Analysis algorithm.
Counter-Stain Positive Nuclear Stain
Pathologists perform a complex analysis of stained cell features when scoring IHC slides. Aperio’s IHC Image Analysis algorithms are designed to process the same cell features (nuclei and membrane) and follow the same scoring schemes as the pathologists when assessing an IHC slide under a microscope. Being able to do this requires high quality digital slides taken at least with a 20X objective (ScanScopes provide 20X and 40X).
As with any image analysis algorithm, the IHC Nuclear Image Analysis algorithm must be set up for its specific application by tuning its input parameters. Specific applications may vary in the tissue type, staining process and/or scoring standard. Cell feature detection parameters and scoring scheme parameters are handled separately. The cell feature detection parameters specify cell feature detection thresholds and methods as well as size and shape constraints of nuclei to distinguish tumor nuclei from normal, lymphocyte and stroma nuclei. The scoring scheme parameters specify the staining intensity thresholds that determine the individual tumor nuclear classification. The scoring scheme parameters can be trained automatically by presenting the algorithm with a set of digital slides that have been scored according to a scoring standard (for example: by a panel of pathologists or longitudinal studies with clinical outcome).
The IHC Nuclear Image Analysis algorithm is typically used from within ImageScope, but can also be used from Spectrum Information Manager or TMALab (Tissue Micro Array). Once a pathologist has outlined the tumor-cell only regions and runs the algorithm, the algorithm provides a markup image and an annotation window as its outputs.
Chapter 1 – Overview
IHC Nuclear Image Analysis User’s Guide 5
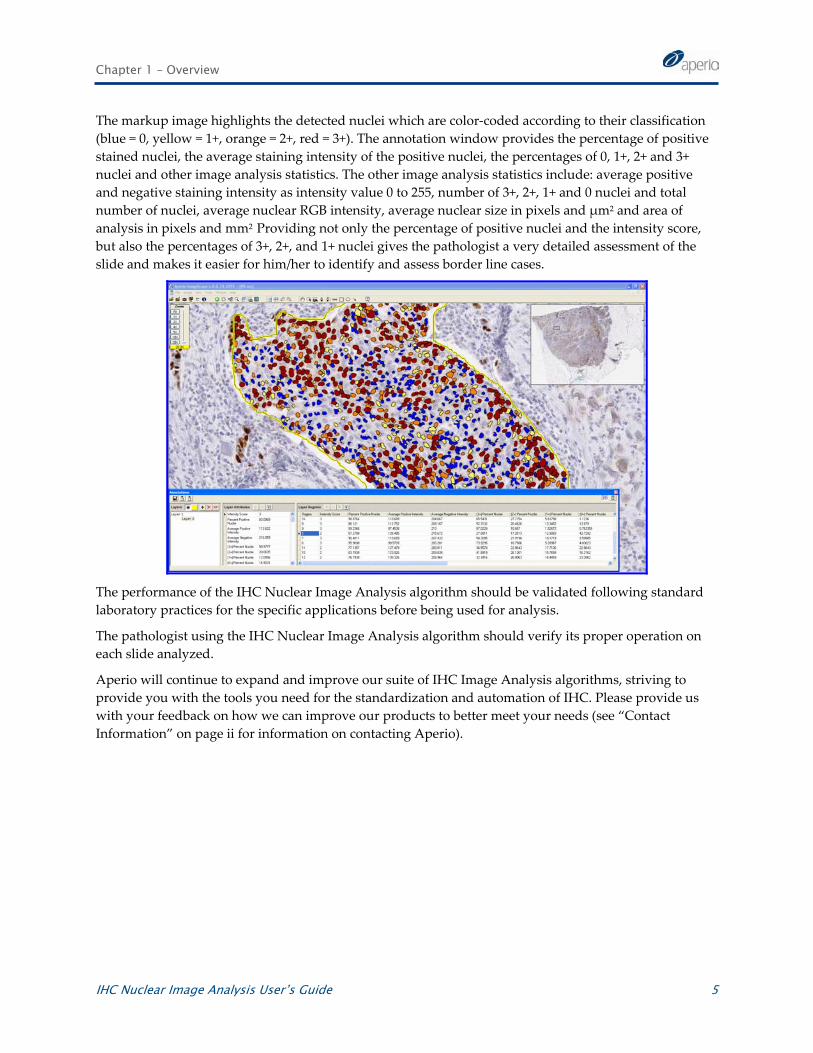
The markup image highlights the detected nuclei which are color-coded according to their classification (blue = 0, yellow = 1+, orange = 2+, red = 3+). The annotation window provides the percentage of positive stained nuclei, the average staining intensity of the positive nuclei, the percentages of 0, 1+, 2+ and 3+ nuclei and other image analysis statistics. The other image analysis statistics include: average positive and negative staining intensity as intensity value 0 to 255, number of 3+, 2+, 1+ and 0 nuclei and total number of nuclei, average nuclear RGB intensity, average nuclear size in pixels and µm2 and area of analysis in pixels and mm2 Providing not only the percentage of positive nuclei and the intensity score, but also the percentages of 3+, 2+, and 1+ nuclei gives the pathologist a very detailed assessment of the slide and makes it easier for him/her to identify and assess border line cases.
The performance of the IHC Nuclear Image Analysis algorithm should be validated following standard laboratory practices for the specific applications before being used for analysis.
The pathologist using the IHC Nuclear Image Analysis algorithm should verify its proper operation on each slide analyzed.
Aperio will continue to expand and improve our suite of IHC Image Analysis algorithms, striving to provide you with the tools you need for the standardization and automation of IHC. Please provide us with your feedback on how we can improve our products to better meet your needs (see “Contact Information” on page ii for information on contacting Aperio).

Chapter 1 – Overview
6 IHC Nuclear Image Analysis User’s Guide
IHC Nuclear Image Analysis User’s Guide 7
2 Analysis Step-by-Step
This chapter provides step-by-step instructions on how a pathologist would use the IHC Nuclear Image Analysis algorithm as an aid for the semi-quantitative assessment of an IHC ER (Estrogen Receptor) or PR (Progesterone Receptor) breast tissue slide when reviewing a case via Spectrum Information Manager (SIM).
Access a Digital Slide in SIM (Spectrum Information Manager) Cases, specimens and digital slides are managed using Aperio’s SIM (Spectrum Information Manager). A pathologist who wants to access a digital slide first needs to log into SIM and navigate to the case and the specimen that shows the list of its associated digital slides (H&E, HER2, ER, PR, …).
1. Please ask your SIM administrator for the SIM web-address, your login name, and a password.
2. Open Microsoft Internet Explorer (or another web viewer like Firefox) and enter the SIM web-address. SIM will provide you with a login page.
3. Log into SIM by entering your login and password and clicking the Login button.
4. Navigate to the list of cases by clicking List all Cases.
5. Open the case you want to review by clicking on the open data icon for the case.
6. Open the specimen digital slides list by clicking on the open data icon for the case specimen.
Patient Data Confidentiality Spectrum Information Manager provides a full security system that ensures that users can only access data they are authorized to see, thus protecting patient data from unauthorized access.
Digital slides and related meta-data reside in the Spectrum Information Manager database. Spectrum Information Manager uses an administrator/user structure that restricts security-sensitive actions to an authorized administrator. The administrator can:
Set up users with passwords. Users must log into Spectrum Information Manager with their user name and password and be authenticated before they can access data.
Set up data groups that restrict access to specific users.
Set users’ access permissions to grant them full access, read-only access or no access to the defined data groups.
Chapter 2 – Analysis Step-by-Step
8 IHC Nuclear Image Analysis User’s Guide
Manual Read of a Slide Traditionally, the pathologist reads the IHC glass slide manually using a microscope. Aperio provides a digital pathology workflow in which the pathologist can do a manual read of the digital slide.
A good monitor is a recommended investment for any pathologist who uses a computer monitor for the manual read of a digital slide.
We recommend any high quality LCD monitor meeting the following minimum requirements:
Display Type: LCD Screen Resolution: 1680(h) x 1050(v) pixels
Screen Size: 24” Color Depth: 24 bit Brightness: 300 cd/m2 Contrast Ratio: 500:1
Stand-alone image analysis systems that work as an adjunct to manual microscopy create extra work for the lab technicians and the pathologists. Aperio’s IHC Image Analysis algorithms are well integrated into the Digital Pathology workflow provided by Aperio’s ScanScope systems and Spectrum software suite. With the touch of a button, the IHC Image Analysis algorithm can be used while you view the digital slide.
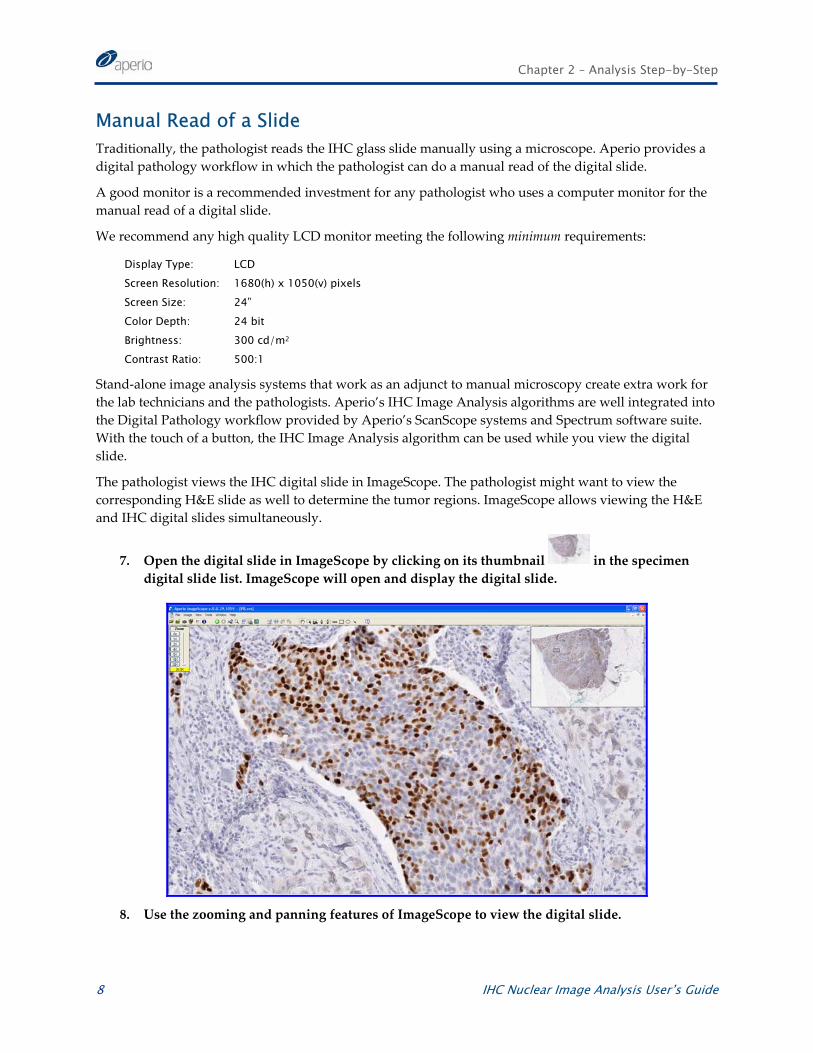
The pathologist views the IHC digital slide in ImageScope. The pathologist might want to view the corresponding H&E slide as well to determine the tumor regions. ImageScope allows viewing the H&E and IHC digital slides simultaneously.
7. Open the digital slide in ImageScope by clicking on its thumbnail in the specimen digital slide list. ImageScope will open and display the digital slide.
8. Use the zooming and panning features of ImageScope to view the digital slide.
Chapter 2 – Analysis Step-by-Step
IHC Nuclear Image Analysis User’s Guide 9
Here is a short list of common zooming and panning features in ImageScope (commands in italic are preferred for fast, single-hand operation):
Zoom: Adjust zoom level by clicking on the controls in the “zoom window”—fit, 1X, … 20X, 40X—slider.
Increase and decrease zoom by rolling the mouse wheel: toward you (zoom in) and away from you (zoom out). Click first anywhere on the digital slide to enable this mode. If you accidentally click the wheel, you start a panning mode not described here – just click anywhere on the digital slide to return to zoom mode.
Go to maximum zoom level by double-clicking any location of the digital slide.
Pan: Position your view by clicking on the rectangle (current view) in the slide thumbnail window, holding and moving to the desired position.
Move your view by clicking on the slide, holding, and moving
Move to an adjacent view by pressing the Shift and arrow-up, -down, -left, and -right keys.
Slide Quality Control
Note that the quality of the manual read of a slide and the IHC Image Analysis depends on the laboratory following the quality control instructions recommended in the labeling of IHC assays.
The staining process can yield artifacts that need to be assessed properly by the pathologists. Typical artifacts to consider are: normal epithelium staining, heterogeneous staining, background staining, cystoplasmic staining as well as edge, thermal and crush artifacts. Staining artifacts should be considered carefully and regions with staining artifacts may need to be excluded from the manual read and IHC Image Analysis.
The IHC Nuclear Image Analysis algorithm is sensitive to excessive cytoplasmic staining and tissue being out of focus. It is the responsibility of the pathologist to know the limitations of the algorithm and to make sure that only good quality digital slides are used for the IHC Nuclear Image Analysis algorithm.
If slides have poor quality, it might be necessary to prepare a new slide or to re-scan the slide.
9. The pathologist assesses the presence of any staining artifacts, in particular cytoplasmic staining, and requests the preparation of a new slide if excessive cytoplasmic staining is observed.
10. The pathologist assesses the focus of the digital slide and requests a re-scan of the slide if the tissue in the tumor regions is out of focus.
It is recommended that the pathologist follows the appropriate instructions in the specific IHC assay and associated scoring guide to perform the manual read of the slide.
11. The pathologist determines the percentage of positive nuclei and average staining intensity of positive nuclei based on his/her manual read of the slide.
Chapter 2 – Analysis Step-by-Step
10 IHC Nuclear Image Analysis User’s Guide
Image Analysis in ImageScope There are three simple steps involved in performing the IHC Nuclear Image Analysis on a digital slide: (1) outline tumor regions, (2) run algorithm, and (3) view results.
Typically, a pathologist performs all three steps in ImageScope after he has done the manual read of the slide. To accommodate different workflows, this process can be broken into separate distinct steps in which the algorithm can be executed from Spectrum Information Manager (batch processing).
Outline Tumor Regions It is up to the pathologist to identify the tumor regions and outline a representative set of tumor-cell only regions for the algorithm to analyze. The pathologist needs to make sure he properly identifies invasive cancer (vs. carcinoma in situ) and does not include regions with staining artifacts in the outlined tumor regions. For the selection of the tumor regions it is important to appropriately (same ratio of tumor cells) represent the heterogeneity of staining of a tumor by providing a sufficiently large number of tumor cells (if possible between 15 and 20 regions and a minimum of about 1000 tumor cells) to maximize robust analysis results. The IHC Nuclear Image Analysis algorithm provides only a limited capability to identify tumor cells (vs. normal, lymphocyte or stroma cells); therefore the pathologist should only outline tumor-cell only regions in the tumor regions.
12. The pathologist uses the mouse with the pen tools in ImageScope to outline a representative and extensive set of tumor-cell only regions to be analyzed by the IHC Nuclear Image Analysis algorithm. Regions can be outlined anywhere in the slide and at any magnification level (images are processed at 20X).
Chapter 2 – Analysis Step-by-Step
IHC Nuclear Image Analysis User’s Guide 11
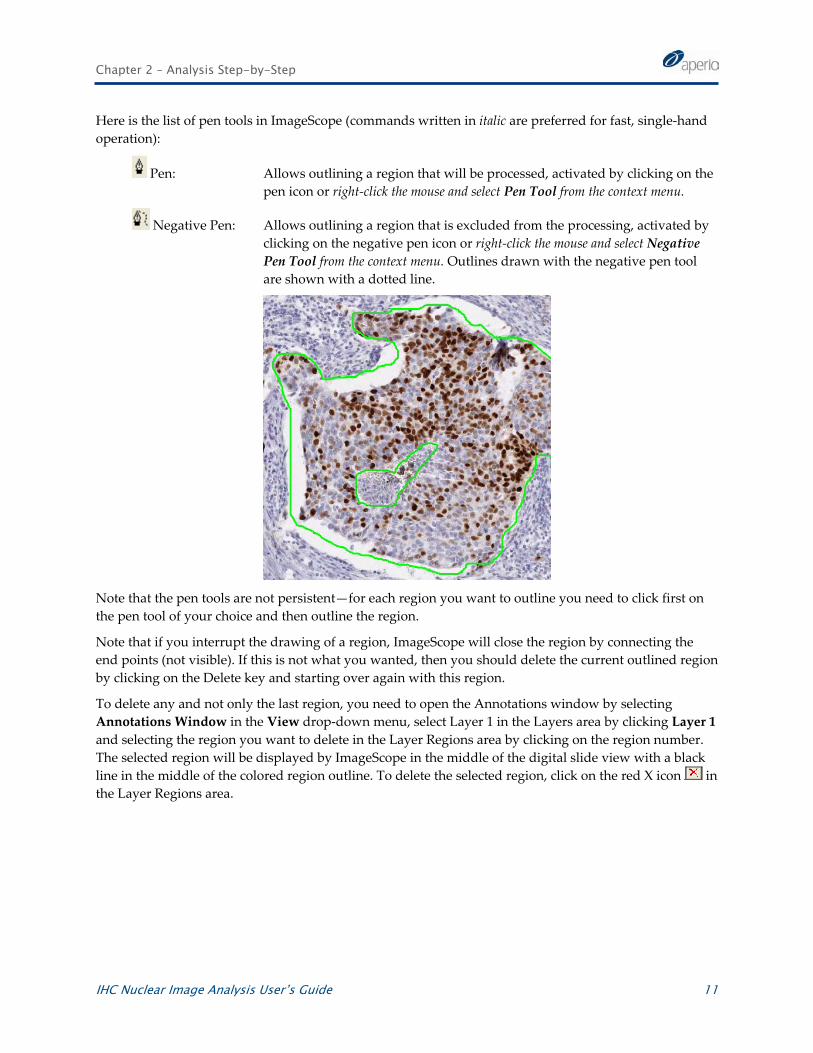
Here is the list of pen tools in ImageScope (commands written in italic are preferred for fast, single-hand operation):
Pen: Allows outlining a region that will be processed, activated by clicking on the pen icon or right-click the mouse and select Pen Tool from the context menu.
Negative Pen: Allows outlining a region that is excluded from the processing, activated by clicking on the negative pen icon or right-click the mouse and select Negative Pen Tool from the context menu. Outlines drawn with the negative pen tool are shown with a dotted line.
Note that the pen tools are not persistent—for each region you want to outline you need to click first on the pen tool of your choice and then outline the region.
Note that if you interrupt the drawing of a region, ImageScope will close the region by connecting the end points (not visible). If this is not what you wanted, then you should delete the current outlined region by clicking on the Delete key and starting over again with this region.
To delete any and not only the last region, you need to open the Annotations window by selecting Annotations Window in the View drop-down menu, select Layer 1 in the Layers area by clicking Layer 1 and selecting the region you want to delete in the Layer Regions area by clicking on the region number. The selected region will be displayed by ImageScope in the middle of the digital slide view with a black line in the middle of the colored region outline. To delete the selected region, click on the red X icon in the Layer Regions area.
Chapter 2 – Analysis Step-by-Step
12 IHC Nuclear Image Analysis User’s Guide
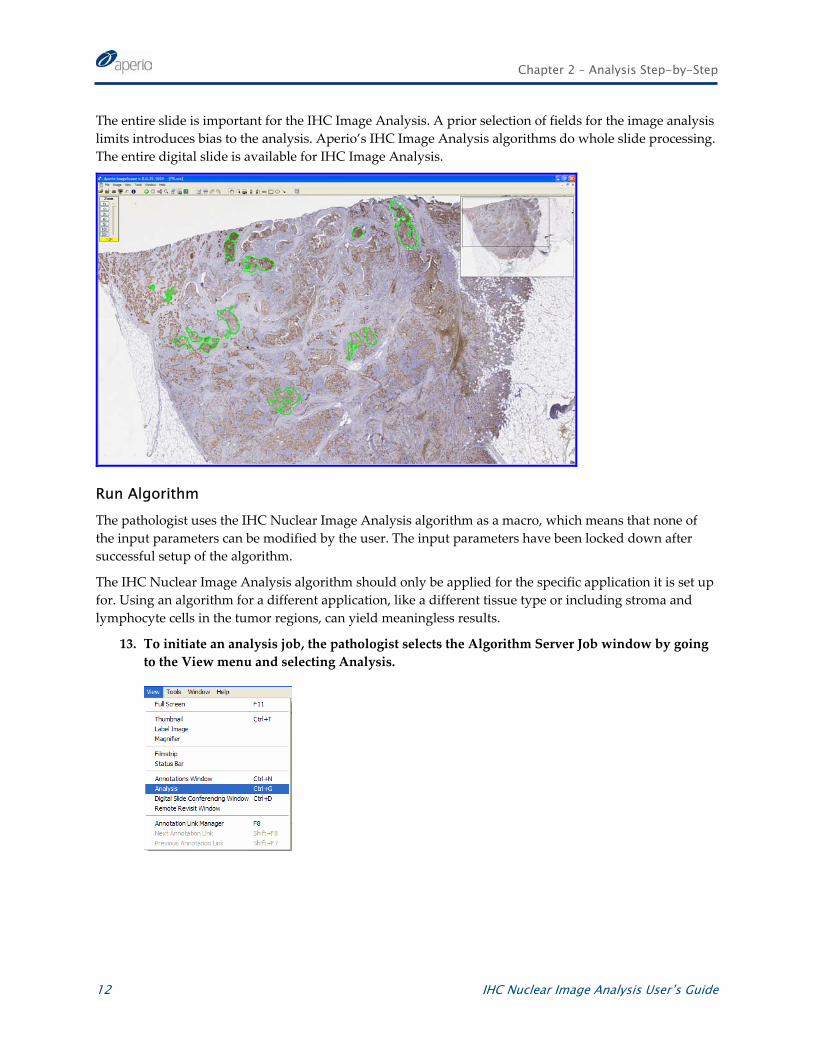
The entire slide is important for the IHC Image Analysis. A prior selection of fields for the image analysis limits introduces bias to the analysis. Aperio’s IHC Image Analysis algorithms do whole slide processing. The entire digital slide is available for IHC Image Analysis.
Run Algorithm The pathologist uses the IHC Nuclear Image Analysis algorithm as a macro, which means that none of the input parameters can be modified by the user. The input parameters have been locked down after successful setup of the algorithm.
The IHC Nuclear Image Analysis algorithm should only be applied for the specific application it is set up for. Using an algorithm for a different application, like a different tissue type or including stroma and lymphocyte cells in the tumor regions, can yield meaningless results.
13. To initiate an analysis job, the pathologist selects the Algorithm Server Job window by going to the View menu and selecting Analysis.
Chapter 2 – Analysis Step-by-Step
IHC Nuclear Image Analysis User’s Guide 13
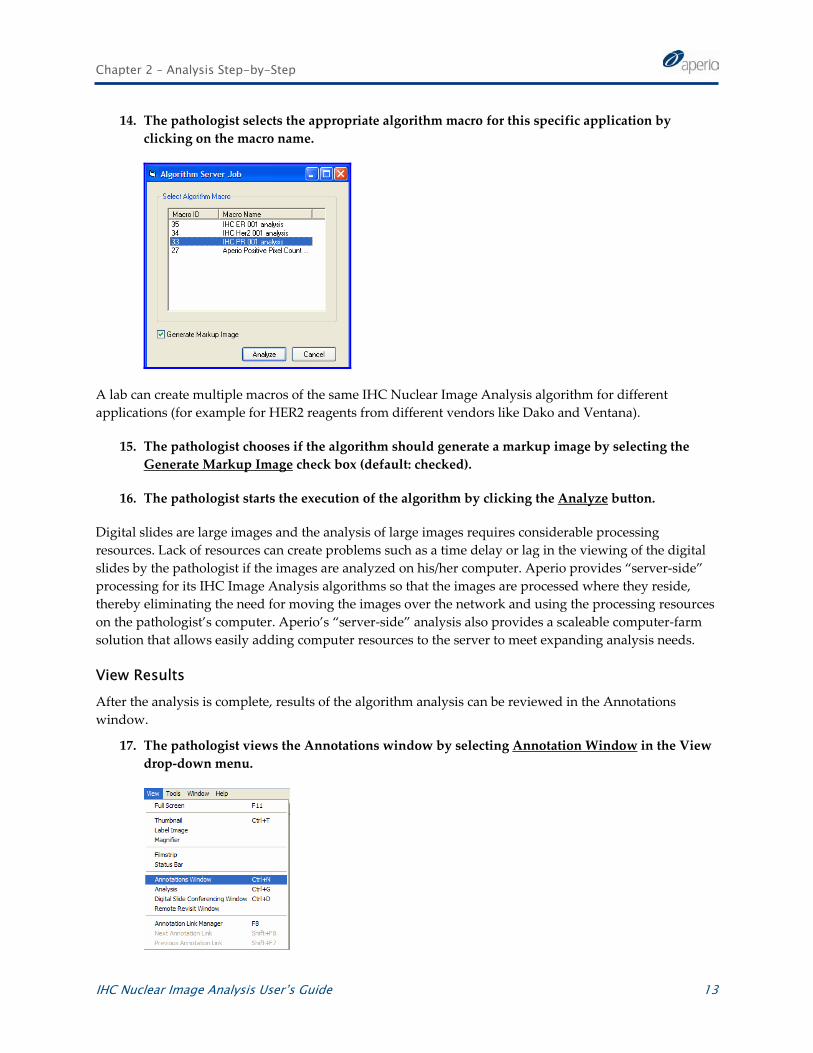
14. The pathologist selects the appropriate algorithm macro for this specific application by clicking on the macro name.
A lab can create multiple macros of the same IHC Nuclear Image Analysis algorithm for different applications (for example for HER2 reagents from different vendors like Dako and Ventana).
15. The pathologist chooses if the algorithm should generate a markup image by selecting the Generate Markup Image check box (default: checked).
16. The pathologist starts the execution of the algorithm by clicking the Analyze button.
Digital slides are large images and the analysis of large images requires considerable processing resources. Lack of resources can create problems such as a time delay or lag in the viewing of the digital slides by the pathologist if the images are analyzed on his/her computer. Aperio provides “server-side” processing for its IHC Image Analysis algorithms so that the images are processed where they reside, thereby eliminating the need for moving the images over the network and using the processing resources on the pathologist’s computer. Aperio’s “server-side” analysis also provides a scaleable computer-farm solution that allows easily adding computer resources to the server to meet expanding analysis needs.
View Results After the analysis is complete, results of the algorithm analysis can be reviewed in the Annotations window.
17. The pathologist views the Annotations window by selecting Annotation Window in the View drop-down menu.
Chapter 2 – Analysis Step-by-Step
14 IHC Nuclear Image Analysis User’s Guide
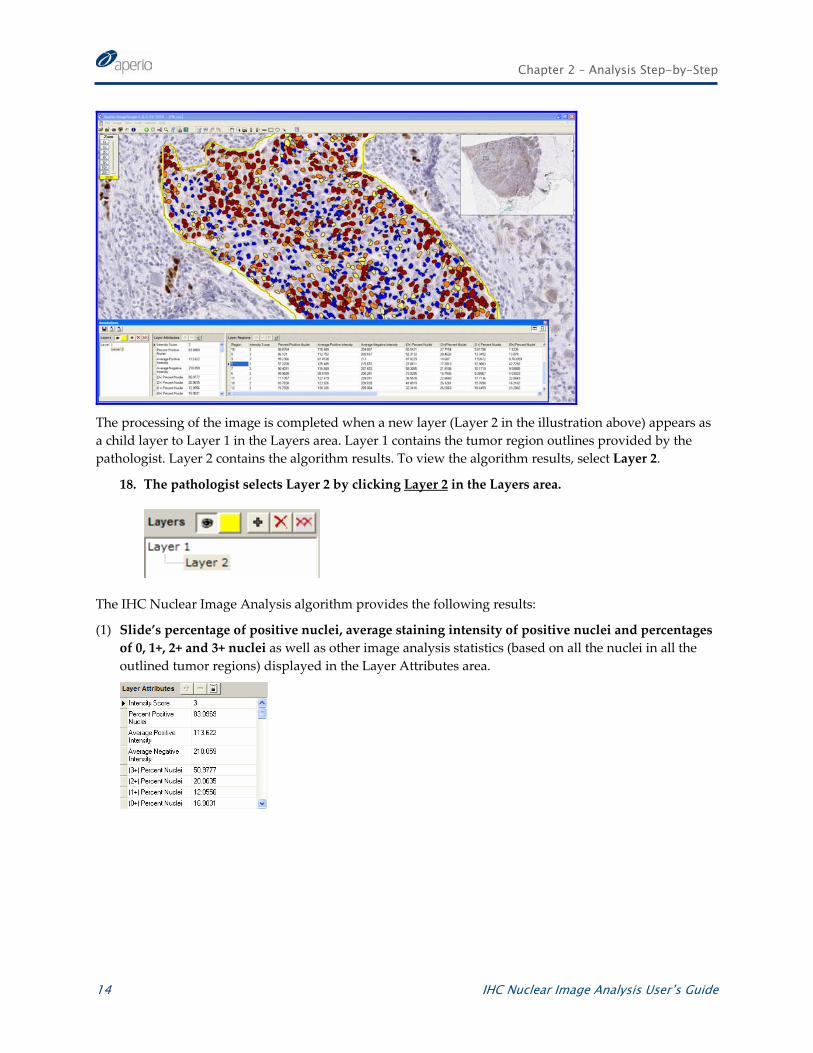
The processing of the image is completed when a new layer (Layer 2 in the illustration above) appears as a child layer to Layer 1 in the Layers area. Layer 1 contains the tumor region outlines provided by the pathologist. Layer 2 contains the algorithm results. To view the algorithm results, select Layer 2.
18. The pathologist selects Layer 2 by clicking Layer 2 in the Layers area.
The IHC Nuclear Image Analysis algorithm provides the following results:
(1) Slide’s percentage of positive nuclei, average staining intensity of positive nuclei and percentages of 0, 1+, 2+ and 3+ nuclei as well as other image analysis statistics (based on all the nuclei in all the outlined tumor regions) displayed in the Layer Attributes area.
Chapter 2 – Analysis Step-by-Step
IHC Nuclear Image Analysis User’s Guide 15
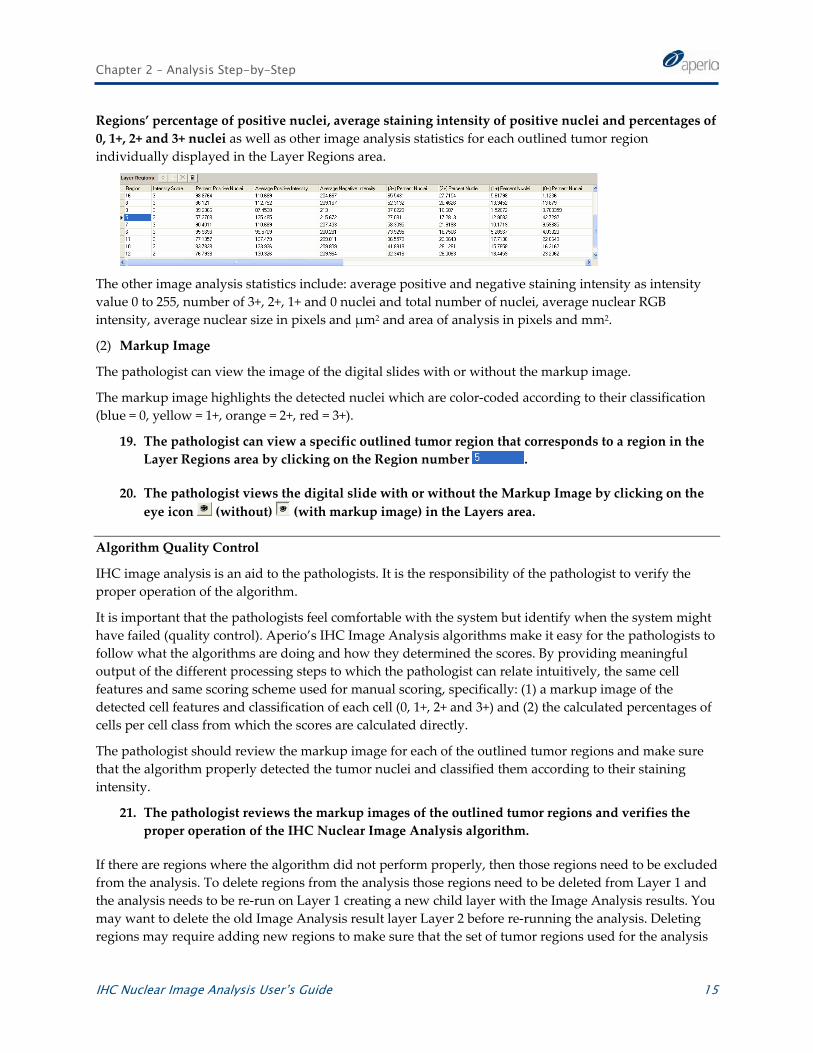
Regions’ percentage of positive nuclei, average staining intensity of positive nuclei and percentages of 0, 1+, 2+ and 3+ nuclei as well as other image analysis statistics for each outlined tumor region individually displayed in the Layer Regions area.
The other image analysis statistics include: average positive and negative staining intensity as intensity value 0 to 255, number of 3+, 2+, 1+ and 0 nuclei and total number of nuclei, average nuclear RGB intensity, average nuclear size in pixels and µm2 and area of analysis in pixels and mm2.
(2) Markup Image
The pathologist can view the image of the digital slides with or without the markup image.
The markup image highlights the detected nuclei which are color-coded according to their classification (blue = 0, yellow = 1+, orange = 2+, red = 3+).
19. The pathologist can view a specific outlined tumor region that corresponds to a region in the Layer Regions area by clicking on the Region number .
20. The pathologist views the digital slide with or without the Markup Image by clicking on the eye icon (without) (with markup image) in the Layers area.
Algorithm Quality Control
IHC image analysis is an aid to the pathologists. It is the responsibility of the pathologist to verify the proper operation of the algorithm.
It is important that the pathologists feel comfortable with the system but identify when the system might have failed (quality control). Aperio’s IHC Image Analysis algorithms make it easy for the pathologists to follow what the algorithms are doing and how they determined the scores. By providing meaningful output of the different processing steps to which the pathologist can relate intuitively, the same cell features and same scoring scheme used for manual scoring, specifically: (1) a markup image of the detected cell features and classification of each cell (0, 1+, 2+ and 3+) and (2) the calculated percentages of cells per cell class from which the scores are calculated directly.
The pathologist should review the markup image for each of the outlined tumor regions and make sure that the algorithm properly detected the tumor nuclei and classified them according to their staining intensity.
21. The pathologist reviews the markup images of the outlined tumor regions and verifies the proper operation of the IHC Nuclear Image Analysis algorithm.
If there are regions where the algorithm did not perform properly, then those regions need to be excluded from the analysis. To delete regions from the analysis those regions need to be deleted from Layer 1 and the analysis needs to be re-run on Layer 1 creating a new child layer with the Image Analysis results. You may want to delete the old Image Analysis result layer Layer 2 before re-running the analysis. Deleting regions may require adding new regions to make sure that the set of tumor regions used for the analysis
Chapter 2 – Analysis Step-by-Step
16 IHC Nuclear Image Analysis User’s Guide
is representative for the tumor. If it is impossible to outline a representative set of tumor regions where the algorithm performs properly, then the IHC Nuclear Image Analysis should not be used for this particular slide. Please let us know if you have slides on which the IHC Nuclear Image Analysis unexpectedly does not work.
Final Score The IHC Nuclear Image Analysis is intended to be used as an aid to a pathologist. It is the responsibility of the pathologist to provide the final score based on his/her qualitative assessment and the quantitative information provided by the IHC Nuclear Image Analysis algorithm.
22. The pathologist determines the final percentage of positive nuclei and average staining intensity of positive nuclei.
Different labs use different scoring schemes for nuclear stains. For example, some labs use only the percentage of positive nuclei as a score and use different cut-off thresholds of 1%, 5% or 10% for the interpretation, other labs use the percentage of positive nuclei and the average staining intensity of the positive nuclei to calculate a combined score like the Allred Score. Aperio’s IHC Nuclear Image Analysis algorithm provides the percentage of positive nuclei as well as the average staining intensity of the positive nuclei as result and thereby supports a wide range of scoring schemes used today including the Allred score.
New scoring schemes like the H-Score have been introduced that are based on the same calculated percentages of cells per cell class as the traditional IHC scores, but provide a finer quantization. Aperio’s IHC Image Analysis algorithms provide those calculated percentages of cells per cell class as well and thereby support new scoring schemes including the H-score.
23. When you are done with ImageScope, please exit (go to the File menu and select Exit).
24. When you are done with reviewing cases in SIM, please log out from SIM (go to the Logout menu) and exit Microsoft Internet Explorer (go the File menu and select Exit).
More Information The IHC Membrane Image Analysis algorithm is typically used from within ImageScope, but can also be used from Spectrum Information Manager or TMALab (Tissue Micro Array).
For more details on how to run Aperio algorithms, see:
Spectrum Information Manager Operator’s Guide.
Spectrum Information Manager Administrator’s Guide.
ImageScope User’s Guide.
IHC Nuclear Image Analysis User’s Guide 17
3 Installation
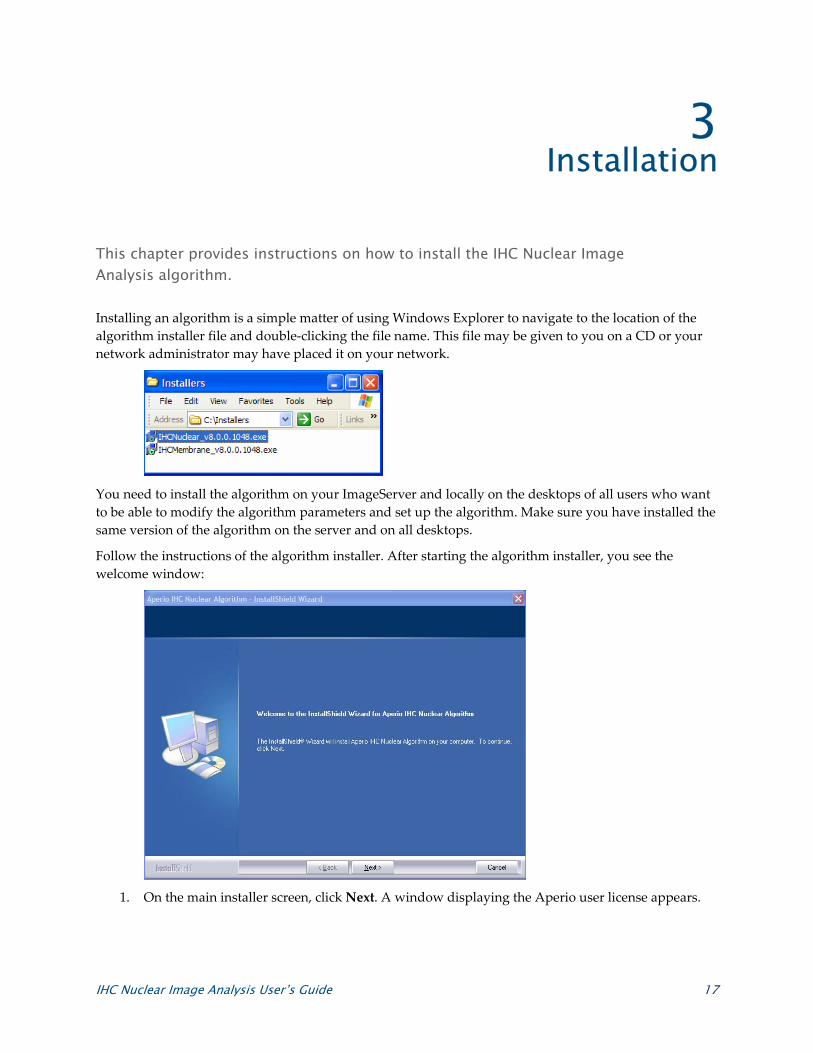
This chapter provides instructions on how to install the IHC Nuclear Image Analysis algorithm.
Installing an algorithm is a simple matter of using Windows Explorer to navigate to the location of the algorithm installer file and double-clicking the file name. This file may be given to you on a CD or your network administrator may have placed it on your network.
You need to install the algorithm on your ImageServer and locally on the desktops of all users who want to be able to modify the algorithm parameters and set up the algorithm. Make sure you have installed the same version of the algorithm on the server and on all desktops.
Follow the instructions of the algorithm installer. After starting the algorithm installer, you see the welcome window:
1. On the main installer screen, click Next. A window displaying the Aperio user license appears.
Chapter 3 – Installation
18 IHC Nuclear Image Analysis User’s Guide
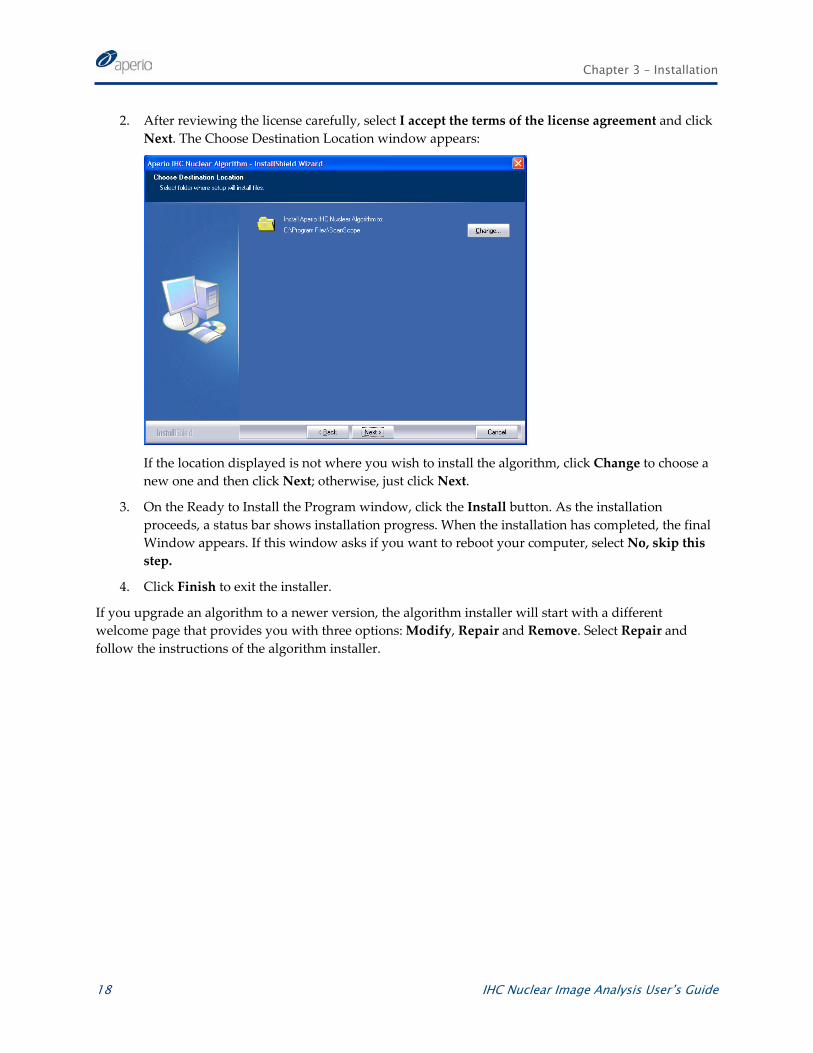
2. After reviewing the license carefully, select I accept the terms of the license agreement and click Next. The Choose Destination Location window appears:
If the location displayed is not where you wish to install the algorithm, click Change to choose a new one and then click Next; otherwise, just click Next.
3. On the Ready to Install the Program window, click the Install button. As the installation proceeds, a status bar shows installation progress. When the installation has completed, the final Window appears. If this window asks if you want to reboot your computer, select No, skip this step.
4. Click Finish to exit the installer.
If you upgrade an algorithm to a newer version, the algorithm installer will start with a different welcome page that provides you with three options: Modify, Repair and Remove. Select Repair and follow the instructions of the algorithm installer.
IHC Nuclear Image Analysis User’s Guide 19
4 Slide Preparation
Slide preparation has a considerable influence on how well image analysis algorithms will perform. Optimizing the slide preparation for image analysis is a good idea to get the most out of automatic image analysis. Keep in mind—an algorithm can only be as good as its input data, the slide. Make sure to control the quality of the glass slides!
Tissue Preparation The tissue preparation is important for scan quality. Folds in the tissue and tissue sections that are too thick will result in blurry images. If working with a blurry slide, preparation of a new slide might be required or the regions affected need to be excluded from the analysis.
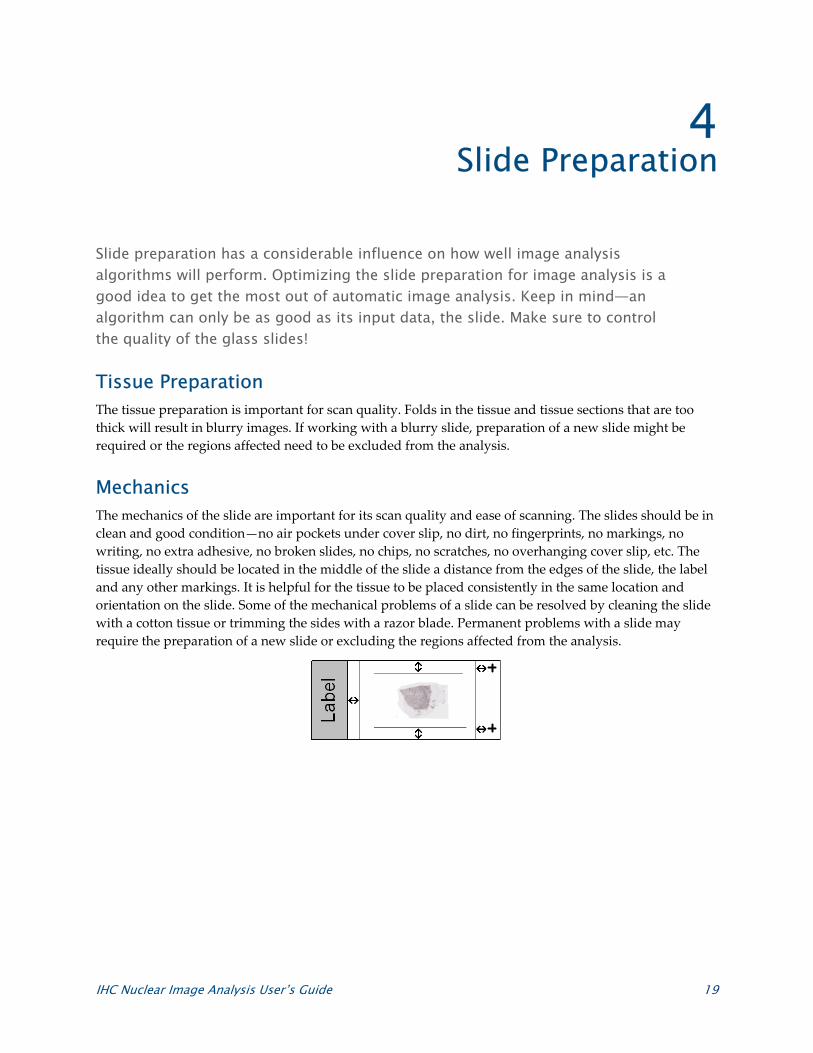
Mechanics The mechanics of the slide are important for its scan quality and ease of scanning. The slides should be in clean and good condition—no air pockets under cover slip, no dirt, no fingerprints, no markings, no writing, no extra adhesive, no broken slides, no chips, no scratches, no overhanging cover slip, etc. The tissue ideally should be located in the middle of the slide a distance from the edges of the slide, the label and any other markings. It is helpful for the tissue to be placed consistently in the same location and orientation on the slide. Some of the mechanical problems of a slide can be resolved by cleaning the slide with a cotton tissue or trimming the sides with a razor blade. Permanent problems with a slide may require the preparation of a new slide or excluding the regions affected from the analysis.
Chapter 4 –Slide Preparation
20 IHC Nuclear Image Analysis User’s Guide
Staining Reproducibility of the IHC stains is important for consistent algorithm performance. The algorithm will be set up for a specific staining process, but it is important to make sure that the variations of the staining process are controlled and eliminated to the greatest extent possible. For this reason, we recommend the use of FDA cleared and approved IHC kits and to employ appropriate morphological studies and controls as specified in the instructions for the IHC kits.
Glass Slide Quality Control
It is the responsibility of the lab to verify the quality of the tissue preparation, the mechanics of a slide and the staining.
IHC Nuclear Image Analysis User’s Guide 21
5 Scanning
The imaging system and its calibration as well as scanning parameters are critical to transforming a glass slide into a high quality digital slide. Scan slides automatically with “one-touch” operation. Make sure to control the quality of the digital slides!
Imaging System The performance of any image analysis system is very dependent on the quality of the images it processes. Aperio’s ScanScope systems are based on Aperio’s patented line-scanning technology which provides superior high-quality, high-resolution digital slides with virtually no artifacts affecting image analysis.
Calibration Color and intensity reproducibility is important for reliable image analysis. The ScanScope systems provide a high degree of color and intensity reproducibility scan after scan and also from one ScanScope to another. The ScanScope calibrates each slide when it is scanned by performing a white balance (called a “prescan”). This is optimum, as the calibration takes into account the characteristics of each slide and the system at the exact moment of the scan and not at the moment in time when a daily or factory calibration was performed. To assure proper operation of the ScanScope for each scan, the ScanScope analyzes the “prescan” of each slide to determine possible variations of the system, like changing characteristics of the light bulb.
Compression Digital Pathology would not be practical without a lossy data compression of the large digital slide images. With Aperio’s ScanScopes, the user can choose between the standard JPEG and JPEG2000 image compression types and quality factors between 0 and 100.
The IHC Nuclear Image Analysis algorithm has been designed to be robust with regard to image compression artifacts. Nevertheless, you should decide on one compression type and one quality factor that will be used for the scanning of all IHC slides.
We recommend compressing the images of IHC slides with the standard JPEG2000 compression type and a quality factor of 70.
Aperio’s ScanScopes provide the capability of applying a sharpening filter while the slides are scanned to provide pathologists with enhanced sharpness of the digital slides. Image analysis algorithms work best on raw imagery; therefore the sharpening filter should be disabled during scanning if the digital slides are intended to be used for image analysis.
Chapter 5 – Scanning
22 IHC Nuclear Image Analysis User’s Guide
Resolution for IHC Slides Pathologists using a standard microscope typically view IHC slides with a 20X objective which is required to view all relevant cell features for their IHC scoring. The ScanScopes provide slide scanning with 20X and 40X objectives.
The IHC Nuclear Image Analysis algorithm is analyzing the same cell features as assessed by the pathologists and therefore requires the same image resolution as used by the pathologists. Although scanning with a 40X objective provides more details, it also requires longer scan times and larger file sizes.
We recommend scanning IHC slides with a 20X objective.
Scanning Parameter Setting It is important that all IHC slides are scanned with the same parameter setting. An IHC scanning parameter set can be set up in the controller XML file to help the operator to make sure that all IHC slides are scanned with the same parameter settings.
Automatic “One-Touch” Scanning Aperio’s ScanScopes can scan slides automatically using “one-touch” operation. The ScanScopes provide a quality factor for each scan from 0 (worst) to 100 (best). Note that a poor quality factor can be caused by poor slide preparation, like dirt, but that the scan of the tissue still might be good—therefore the operator should not rely on the quality factor alone to determine the quality of a scan; he/she may want to use the quality factor as a triage tool to determine which slide he/she wants to review. Poor slide preparation leads to poor image quality which in some cases can be improved by manually scanning the slide; this allows the operator to select the tissue region to be scanned, position the “pre-scan” and position and manually focus the focus points.
Digital Slide Quality Control
It is the responsibility of the ScanScope operator to verify that the entire tissue has been scanned and that the entire tissue is in focus.
IHC Nuclear Image Analysis User’s Guide 23
6 Algorithm Setup
The IHC Nuclear Image Analysis algorithm needs to be set up for its specific application by tuning its input parameters. Specific applications may have different tissue types, staining processes and/or scoring standards. In the setup, we distinguish between cell feature detection parameters and scoring scheme parameters.
Parameter tuning must be done by a skilled user knowledgeable in image analysis and the biochemistry of the clinical application. If you want help with the setup of the algorithm, please contact Aperio for image analysis services.
Labs use different IHC reagents and kits (for example: Dako and Ventana) with different staining characteristics. Different labs also have slightly different IHC staining processes with different staining characteristics. Aperio’s Image Analysis algorithms provide an automated algorithm training feature that optimizes the algorithm parameters for specific staining characteristics and scoring standards. Keep in mind that to assure the accuracy of the IHC Image Analysis algorithms, the lab needs to follow the quality control instructions recommended in the manufacturer’s labeling of the IHC reagent or kit.
If changes are made in the staining procedure, repeat tuning and validation of the algorithm may be necessary.
Data Sets The tuning of the algorithm should be based on a training data set that is representative for the specific application you want to set up the algorithm for—tissue type, staining process and scoring standard. We recommend using a minimum of twenty slides with about equal distribution in the percentage of positive nuclei ranges: negative [0% - 1%), very low positive [1% - 5%), low positive [5% - 10%), positive [10% - 50%), and strongly positive [50% - 100%] and intensity score classes: 0, 1+, 2+ and 3+.
Scoring Standard As there is no gold standard for IHC scoring, there are different ways you might want to define a scoring standard for the setup of your algorithm: (1) scores from a panel of three pathologists, (2) a consensus score by a panel of pathologists or (3) a score based on longitudinal studies relating to the clinical outcome.
The following shows an example of how to set up the algorithm with a scoring standard based on three pathologists—the most complex in terms of setting up the training data set, as three pathologists need to score the same slides independently from each other. Scoring standard training requires both a manual read of the glass slide as well as a read of the digital slide.
Chapter 6 – Algorithm Setup
24 IHC Nuclear Image Analysis User’s Guide
Identify Slides for the Training Data Set First, you need to identify slides that you would like to use for the training data set. For example, in a clinical environment where pathologists review digital slides routinely, pathologists could identify appropriate glass slide by the label and digital slides by their Filename and Date. This information is easily accessible in ImageScope when viewing a digital slide by selecting Information… in the Image drop-down menu or by clicking on the information icon . Filename and Date are provided on the Information tab and the label under the Label Image tab.
Manual Read of Glass Slides The digital slide scores and image analysis results need to be related back to manual microscopy scores as those are considered the standard for IHC scoring. Have the three pathologists independently score and record their reads of the corresponding glass slides using a microscope.
Gather Digital Slides for the Training Data Set Navigate to the directory where the digital slides reside. Typically, the ScanScope creates the digital slides after scanning directly in a sub-folder that has the Date as folder name in the D:\Images directory on the ImageServer.
To separate the training data set from the clinical operation, you need to create a copy of the digital slides. If you use multiple pathologists to provide blind scores for the scoring standard you need to create a copy of the training data set for each pathologist—in our example, we therefore need three copies.
To organize the digital slides for the training data set you could create subfolders in the D:\Images directory. You could have one sub-folder that identifies the specific application and identifies in the folder name the stain, the manufacturer and tissue type (e.g., ER_Dako_Breast, ER_ Ventana _Breast, PR_Dako_Breast, PR_ Ventana _Breast). In this subfolder you could then have a separate subfolder for each copy of the training data set (e.g., Training1, Training2, Training3).
Organize Training Data Sets in Spectrum Information Manager and Manage Access Rights The administrator (or any user with administrative rights) first makes sure that restricted access rights are set up to protect all data related to the setup of the algorithm and to limit the access to specific data sets to individual pathologists. Spectrum Information Manager uses a three-step process to set up access rights: (1) create data groups, (2) grant individual users access to data groups and, (3) associate data to data groups.
Chapter 6 – Algorithm Setup
IHC Nuclear Image Analysis User’s Guide 25
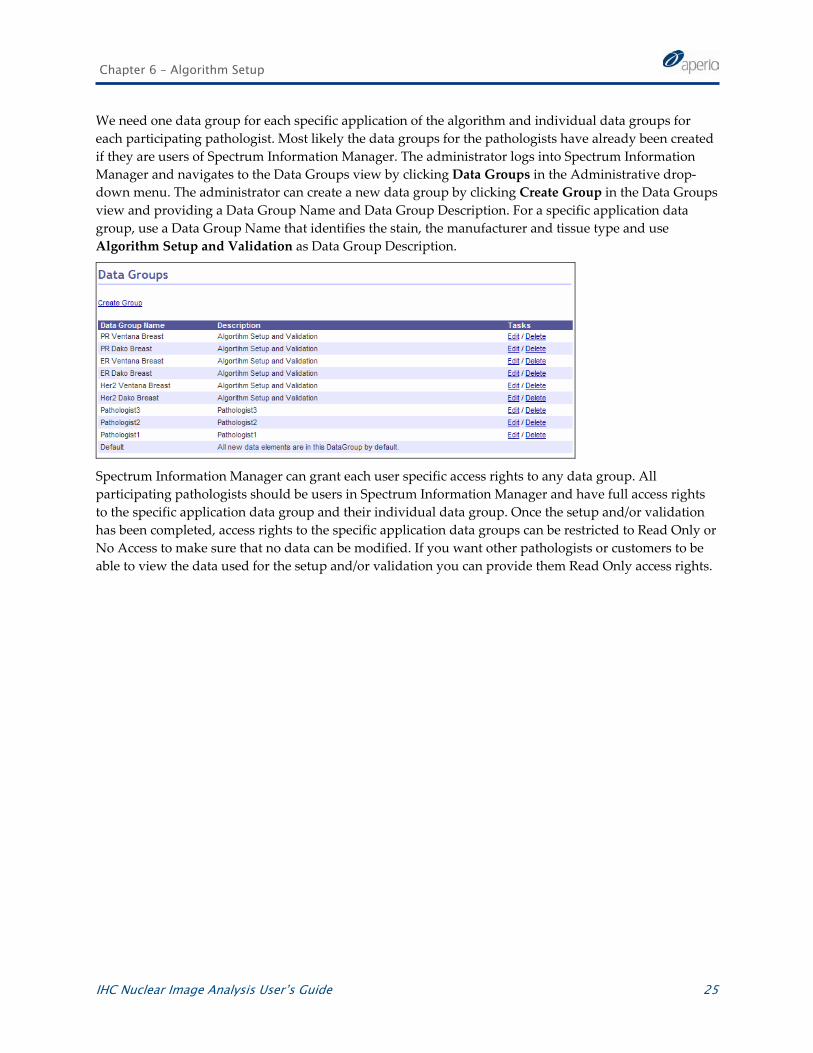
We need one data group for each specific application of the algorithm and individual data groups for each participating pathologist. Most likely the data groups for the pathologists have already been created if they are users of Spectrum Information Manager. The administrator logs into Spectrum Information Manager and navigates to the Data Groups view by clicking Data Groups in the Administrative drop-down menu. The administrator can create a new data group by clicking Create Group in the Data Groups view and providing a Data Group Name and Data Group Description. For a specific application data group, use a Data Group Name that identifies the stain, the manufacturer and tissue type and use Algorithm Setup and Validation as Data Group Description.
Spectrum Information Manager can grant each user specific access rights to any data group. All participating pathologists should be users in Spectrum Information Manager and have full access rights to the specific application data group and their individual data group. Once the setup and/or validation has been completed, access rights to the specific application data groups can be restricted to Read Only or No Access to make sure that no data can be modified. If you want other pathologists or customers to be able to view the data used for the setup and/or validation you can provide them Read Only access rights.
Chapter 6 – Algorithm Setup
26 IHC Nuclear Image Analysis User’s Guide
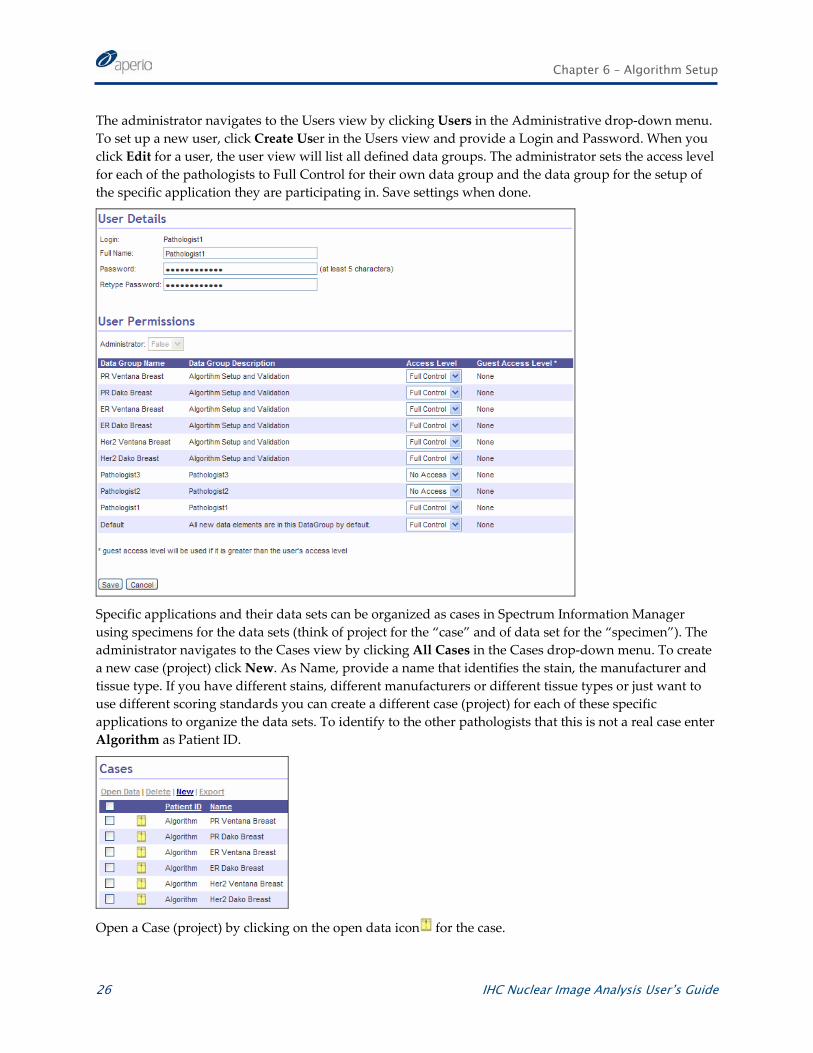
The administrator navigates to the Users view by clicking Users in the Administrative drop-down menu. To set up a new user, click Create User in the Users view and provide a Login and Password. When you click Edit for a user, the user view will list all defined data groups. The administrator sets the access level for each of the pathologists to Full Control for their own data group and the data group for the setup of the specific application they are participating in. Save settings when done.
Specific applications and their data sets can be organized as cases in Spectrum Information Manager using specimens for the data sets (think of project for the “case” and of data set for the “specimen”). The administrator navigates to the Cases view by clicking All Cases in the Cases drop-down menu. To create a new case (project) click New. As Name, provide a name that identifies the stain, the manufacturer and tissue type. If you have different stains, different manufacturers or different tissue types or just want to use different scoring standards you can create a different case (project) for each of these specific applications to organize the data sets. To identify to the other pathologists that this is not a real case enter Algorithm as Patient ID.
Open a Case (project) by clicking on the open data icon for the case.
Chapter 6 – Algorithm Setup
IHC Nuclear Image Analysis User’s Guide 27
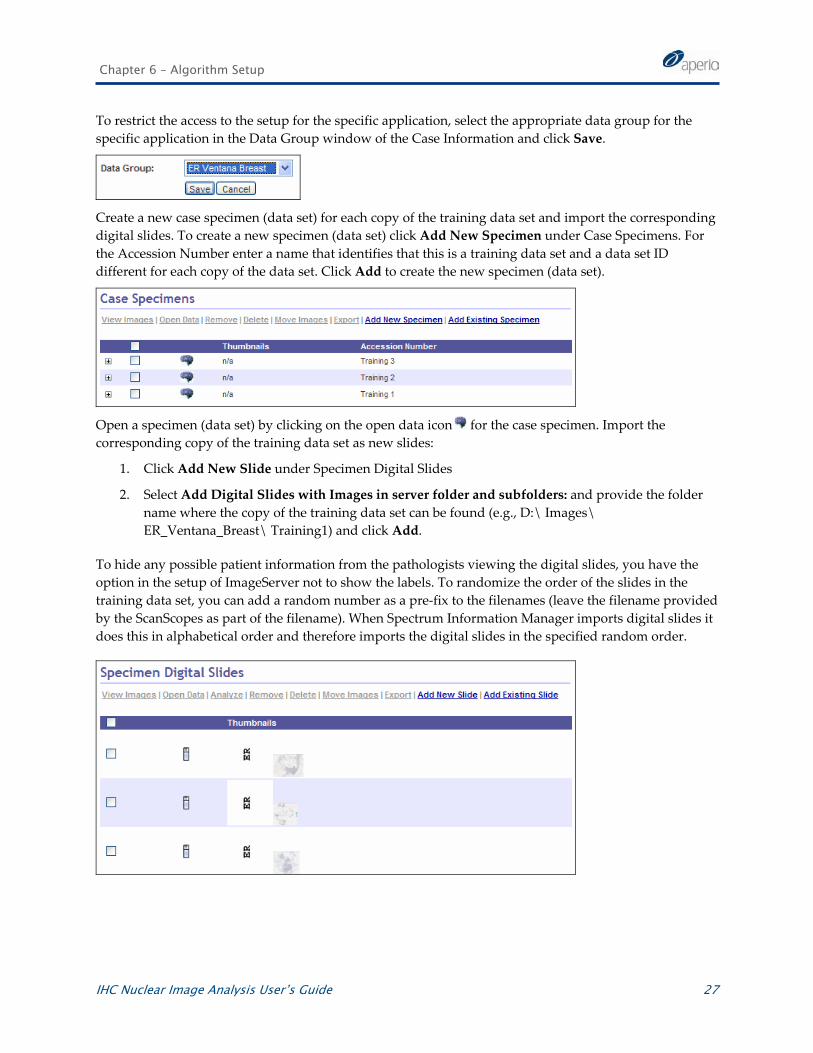
To restrict the access to the setup for the specific application, select the appropriate data group for the specific application in the Data Group window of the Case Information and click Save.
Create a new case specimen (data set) for each copy of the training data set and import the corresponding digital slides. To create a new specimen (data set) click Add New Specimen under Case Specimens. For the Accession Number enter a name that identifies that this is a training data set and a data set ID different for each copy of the data set. Click Add to create the new specimen (data set).
Open a specimen (data set) by clicking on the open data icon for the case specimen. Import the corresponding copy of the training data set as new slides:
1. Click Add New Slide under Specimen Digital Slides
2. Select Add Digital Slides with Images in server folder and subfolders: and provide the folder name where the copy of the training data set can be found (e.g., D:\ Images\ ER_Ventana_Breast\ Training1) and click Add.
To hide any possible patient information from the pathologists viewing the digital slides, you have the option in the setup of ImageServer not to show the labels. To randomize the order of the slides in the training data set, you can add a random number as a pre-fix to the filenames (leave the filename provided by the ScanScopes as part of the filename). When Spectrum Information Manager imports digital slides it does this in alphabetical order and therefore imports the digital slides in the specified random order.
Chapter 6 – Algorithm Setup
28 IHC Nuclear Image Analysis User’s Guide
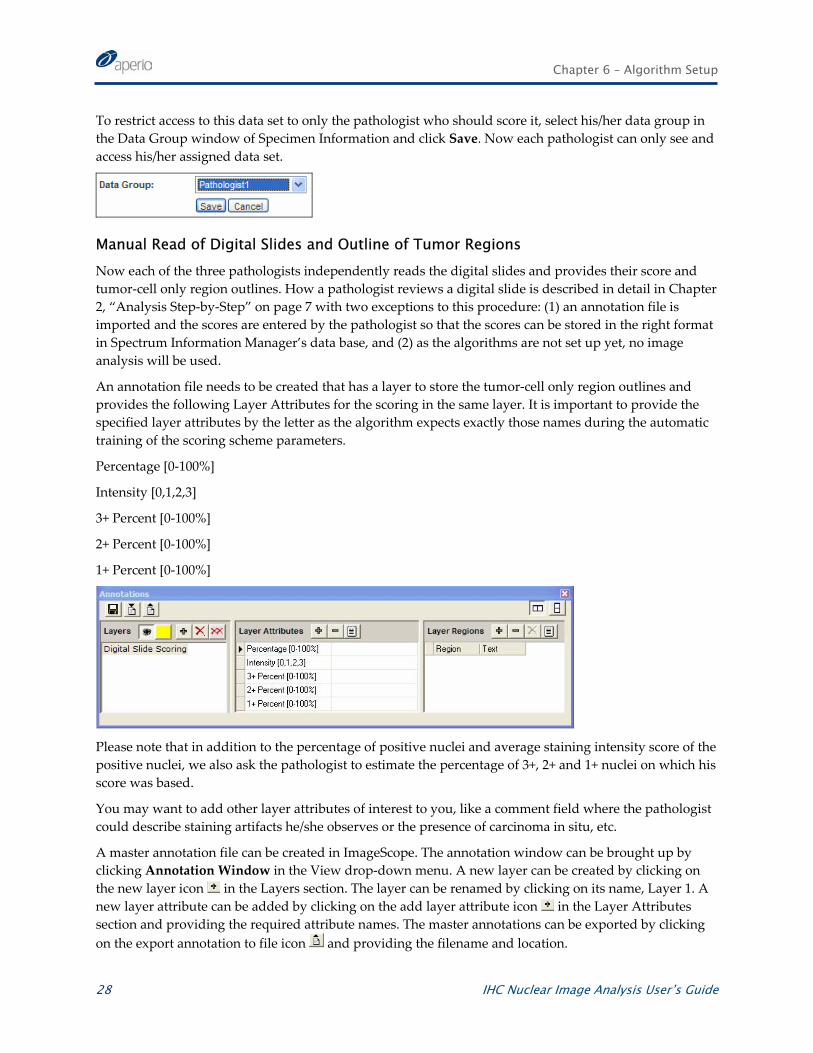
To restrict access to this data set to only the pathologist who should score it, select his/her data group in the Data Group window of Specimen Information and click Save. Now each pathologist can only see and access his/her assigned data set.
Manual Read of Digital Slides and Outline of Tumor Regions Now each of the three pathologists independently reads the digital slides and provides their score and tumor-cell only region outlines. How a pathologist reviews a digital slide is described in detail in Chapter 2, “Analysis Step-by-Step” on page 7 with two exceptions to this procedure: (1) an annotation file is imported and the scores are entered by the pathologist so that the scores can be stored in the right format in Spectrum Information Manager’s data base, and (2) as the algorithms are not set up yet, no image analysis will be used.
An annotation file needs to be created that has a layer to store the tumor-cell only region outlines and provides the following Layer Attributes for the scoring in the same layer. It is important to provide the specified layer attributes by the letter as the algorithm expects exactly those names during the automatic training of the scoring scheme parameters.
Percentage [0-100%]
Intensity [0,1,2,3]
3+ Percent [0-100%]
2+ Percent [0-100%]
1+ Percent [0-100%]
Please note that in addition to the percentage of positive nuclei and average staining intensity score of the positive nuclei, we also ask the pathologist to estimate the percentage of 3+, 2+ and 1+ nuclei on which his score was based.
You may want to add other layer attributes of interest to you, like a comment field where the pathologist could describe staining artifacts he/she observes or the presence of carcinoma in situ, etc.
A master annotation file can be created in ImageScope. The annotation window can be brought up by clicking Annotation Window in the View drop-down menu. A new layer can be created by clicking on the new layer icon in the Layers section. The layer can be renamed by clicking on its name, Layer 1. A new layer attribute can be added by clicking on the add layer attribute icon in the Layer Attributes section and providing the required attribute names. The master annotations can be exported by clicking on the export annotation to file icon and providing the filename and location.
Chapter 6 – Algorithm Setup
IHC Nuclear Image Analysis User’s Guide 29
The pathologist can import the master annotation file in ImageScope each time he reviews a digital slide. He brings up the annotation window by clicking Annotation Window in the View drop-down menu. The pathologist imports the master annotation by clicking on the import annotation from file icon and selecting the appropriate file in the browser. Make sure that the pathologists have file system access to the master annotation file.
When the pathologist fills out the scores, he/she needs to make sure that he/she only enters numbers, no % or + signs, and enters a number for each of the layer attributes, even if the number is 0.
When the pathologist has outlined the tumor-cell only regions and provided his/her scores in the annotation layer attributes, he/she saves his/her annotations in Spectrum Information Manager’s data base by clicking on the save annotations icon .
Eliminating Outliers To make sure that the image analysis is in agreement with the manual read of a glass slide, you may want to exclude digital slides in the training data set when the score provided by the pathologists differs between their manual read of the glass slide versus the digital slide read.
As there is quite some variability between pathologists scoring an IHC slide, you may want to exclude digital slides in the training data set where one pathologist does not agree with at least one other pathologist.
You can exclude a digital slide from the training data set, either by deleting the digital slide in Spectrum Information Manager or by excluding the digital slide from the batch analysis. To delete a digital slide in Spectrum Information Manager, select the check box for the digital slide in the Specimen Digital Slides list in the specimen (data set) that holds the corresponding copy of the training data set and click Delete. To exclude a digital slide from batch analysis, unselect the check box for the digital slide when the digital slides are selected to run the algorithm.
Cell Feature Detection Parameters The cell feature detection parameters specify cell feature detection thresholds and methods as well as size and shape constraints of nuclei to distinguish tumor nuclei from other nuclei like normal, lymphocyte and stroma nuclei.
The default parameter settings have been optimized for ER/PR stains and breast tissue. If you are going to use the IHC Nuclear Algorithm for ER/PR stains and breast tissue you may want to first test the default parameter settings as those may work for you.
Parameter List It is not necessary nor recommended to modify the following Aperio Algorithm Framework (AAF) common parameters: View Width = 1000, View Height = 1000, Overlap Size = 100, Image Zoom = 1, Markup Compression Type = 0 – JPEG and Compression Quality = 30.
Pre-Processing
Averaging Radius – Radius (microns) for Noise Reduction [0 < Value < 100] (Default: 1).
The radius of a smoothing filter, which reduces noise resulting in smoother object edges.
Chapter 6 – Algorithm Setup
30 IHC Nuclear Image Analysis User’s Guide
Stains
Nuclear Stain (Red) – OD for nuclear red [0.0 ≤ Value ≤ 1.0] (Default: Hematoxylin with 0.65).
Nuclear Stain (Green) – OD for nuclear green [0.0 ≤ Value ≤ 1.0] (Default: Hematoxylin with 0.704).
Nuclear Stain (Blue) – OD for nuclear blue [0.0 ≤ Value ≤ 1.0] (Default: Hematoxylin with 0.286).
Positive Stain (Red) – OD for positive red [0.0 ≤ Value ≤ 1.0] (Default: DAB with 0.268).
Positive Stain (Green) – OD for positive green [0.0 ≤ Value ≤ 1.0] (Default: DAB with 0.57).
Positive Stain (Blue) – OD for positive blue [0.0 ≤ Value ≤ 1.0] (Default: DAB with 0.776).
3rd Stain (Red) – OD for color (3) red [0.0 ≤ Value ≤ 1.0] (Default: None with 0).
3rd Stain (Green) – OD for color (3) green [0.0 ≤ Value ≤ 1.0] (Default: None with 0).
3rd Stain (Blue) – OD for color (3) blue [0.0 ≤ Value ≤ 1.0] (Default: None with 0).
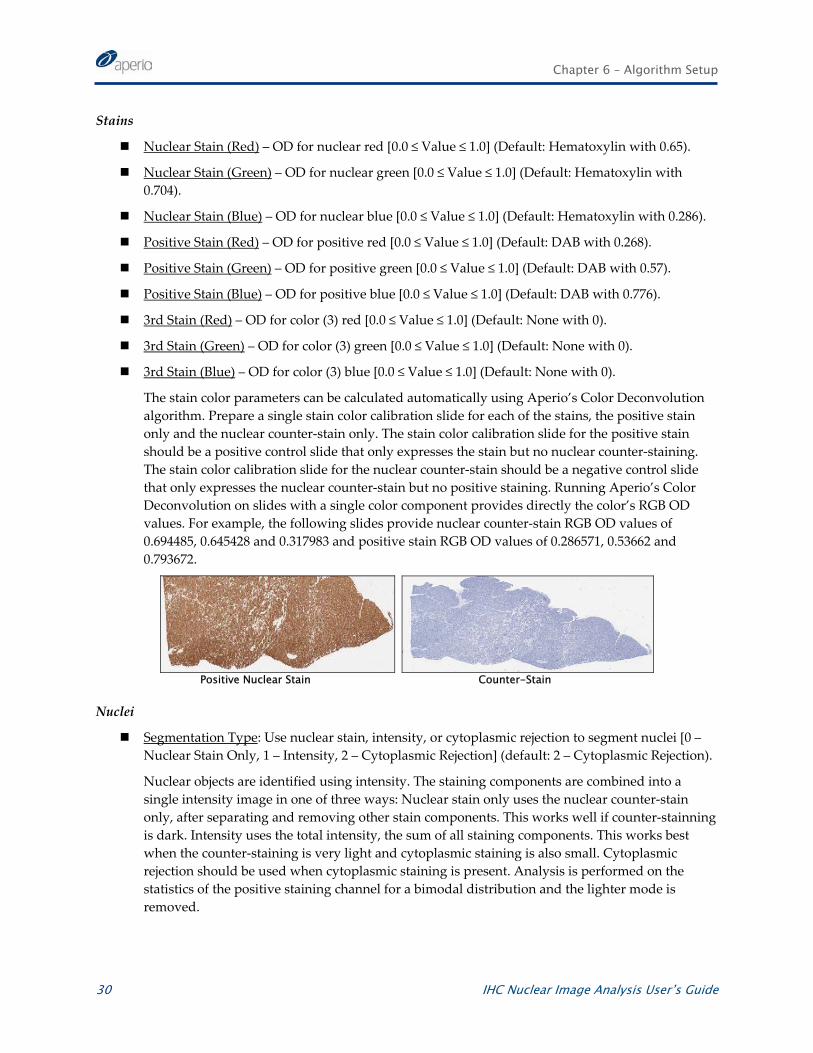
The stain color parameters can be calculated automatically using Aperio’s Color Deconvolution algorithm. Prepare a single stain color calibration slide for each of the stains, the positive stain only and the nuclear counter-stain only. The stain color calibration slide for the positive stain should be a positive control slide that only expresses the stain but no nuclear counter-staining. The stain color calibration slide for the nuclear counter-stain should be a negative control slide that only expresses the nuclear counter-stain but no positive staining. Running Aperio’s Color Deconvolution on slides with a single color component provides directly the color’s RGB OD values. For example, the following slides provide nuclear counter-stain RGB OD values of 0.694485, 0.645428 and 0.317983 and positive stain RGB OD values of 0.286571, 0.53662 and 0.793672.
Positive Nuclear Stain Counter-Stain
Nuclei
Segmentation Type: Use nuclear stain, intensity, or cytoplasmic rejection to segment nuclei [0 – Nuclear Stain Only, 1 – Intensity, 2 – Cytoplasmic Rejection] (default: 2 – Cytoplasmic Rejection).
Nuclear objects are identified using intensity. The staining components are combined into a single intensity image in one of three ways: Nuclear stain only uses the nuclear counter-stain only, after separating and removing other stain components. This works well if counter-stainning is dark. Intensity uses the total intensity, the sum of all staining components. This works best when the counter-staining is very light and cytoplasmic staining is also small. Cytoplasmic rejection should be used when cytoplasmic staining is present. Analysis is performed on the statistics of the positive staining channel for a bimodal distribution and the lighter mode is removed.
Chapter 6 – Algorithm Setup
IHC Nuclear Image Analysis User’s Guide 31
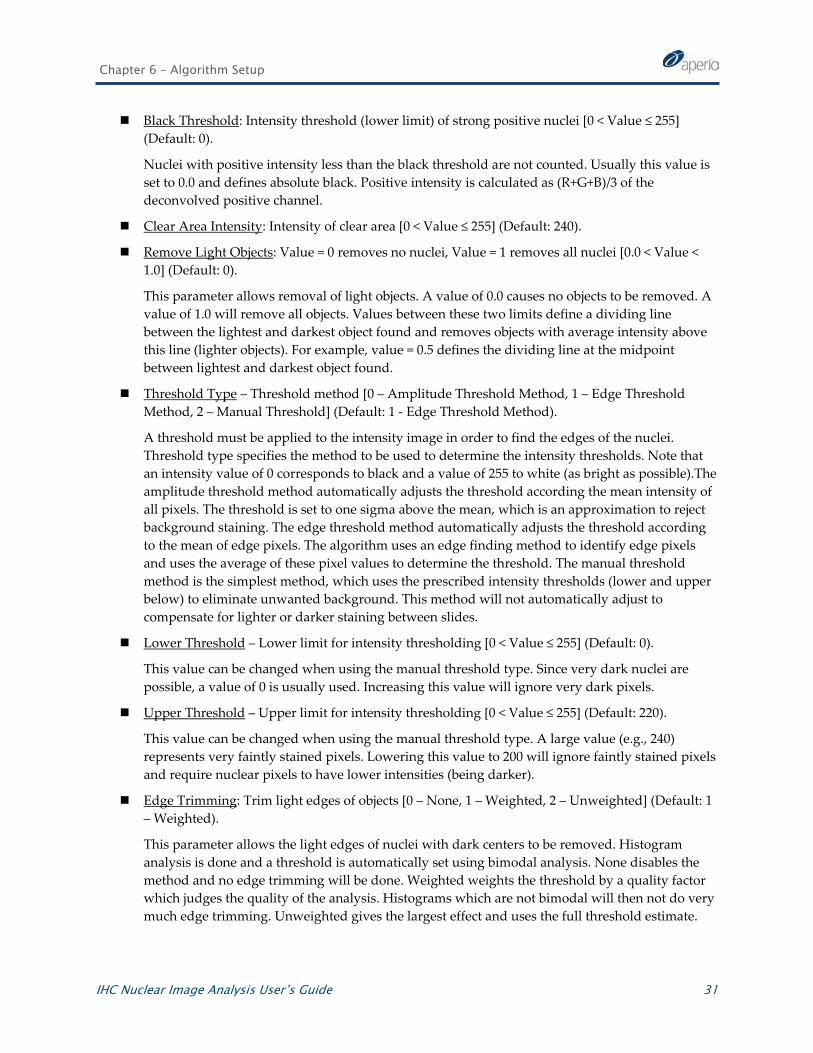
Black Threshold: Intensity threshold (lower limit) of strong positive nuclei [0 < Value ≤ 255] (Default: 0).
Nuclei with positive intensity less than the black threshold are not counted. Usually this value is set to 0.0 and defines absolute black. Positive intensity is calculated as (R+G+B)/3 of the deconvolved positive channel.
Clear Area Intensity: Intensity of clear area [0 < Value ≤ 255] (Default: 240).
Remove Light Objects: Value = 0 removes no nuclei, Value = 1 removes all nuclei [0.0 < Value < 1.0] (Default: 0).
This parameter allows removal of light objects. A value of 0.0 causes no objects to be removed. A value of 1.0 will remove all objects. Values between these two limits define a dividing line between the lightest and darkest object found and removes objects with average intensity above this line (lighter objects). For example, value = 0.5 defines the dividing line at the midpoint between lightest and darkest object found.
Threshold Type – Threshold method [0 – Amplitude Threshold Method, 1 – Edge Threshold Method, 2 – Manual Threshold] (Default: 1 - Edge Threshold Method).
A threshold must be applied to the intensity image in order to find the edges of the nuclei. Threshold type specifies the method to be used to determine the intensity thresholds. Note that an intensity value of 0 corresponds to black and a value of 255 to white (as bright as possible).The amplitude threshold method automatically adjusts the threshold according the mean intensity of all pixels. The threshold is set to one sigma above the mean, which is an approximation to reject background staining. The edge threshold method automatically adjusts the threshold according to the mean of edge pixels. The algorithm uses an edge finding method to identify edge pixels and uses the average of these pixel values to determine the threshold. The manual threshold method is the simplest method, which uses the prescribed intensity thresholds (lower and upper below) to eliminate unwanted background. This method will not automatically adjust to compensate for lighter or darker staining between slides.
Lower Threshold – Lower limit for intensity thresholding [0 < Value ≤ 255] (Default: 0).
This value can be changed when using the manual threshold type. Since very dark nuclei are possible, a value of 0 is usually used. Increasing this value will ignore very dark pixels.
Upper Threshold – Upper limit for intensity thresholding [0 < Value ≤ 255] (Default: 220).
This value can be changed when using the manual threshold type. A large value (e.g., 240) represents very faintly stained pixels. Lowering this value to 200 will ignore faintly stained pixels and require nuclear pixels to have lower intensities (being darker).
Edge Trimming: Trim light edges of objects [0 – None, 1 – Weighted, 2 – Unweighted] (Default: 1 – Weighted).
This parameter allows the light edges of nuclei with dark centers to be removed. Histogram analysis is done and a threshold is automatically set using bimodal analysis. None disables the method and no edge trimming will be done. Weighted weights the threshold by a quality factor which judges the quality of the analysis. Histograms which are not bimodal will then not do very much edge trimming. Unweighted gives the largest effect and uses the full threshold estimate.
Chapter 6 – Algorithm Setup
32 IHC Nuclear Image Analysis User’s Guide
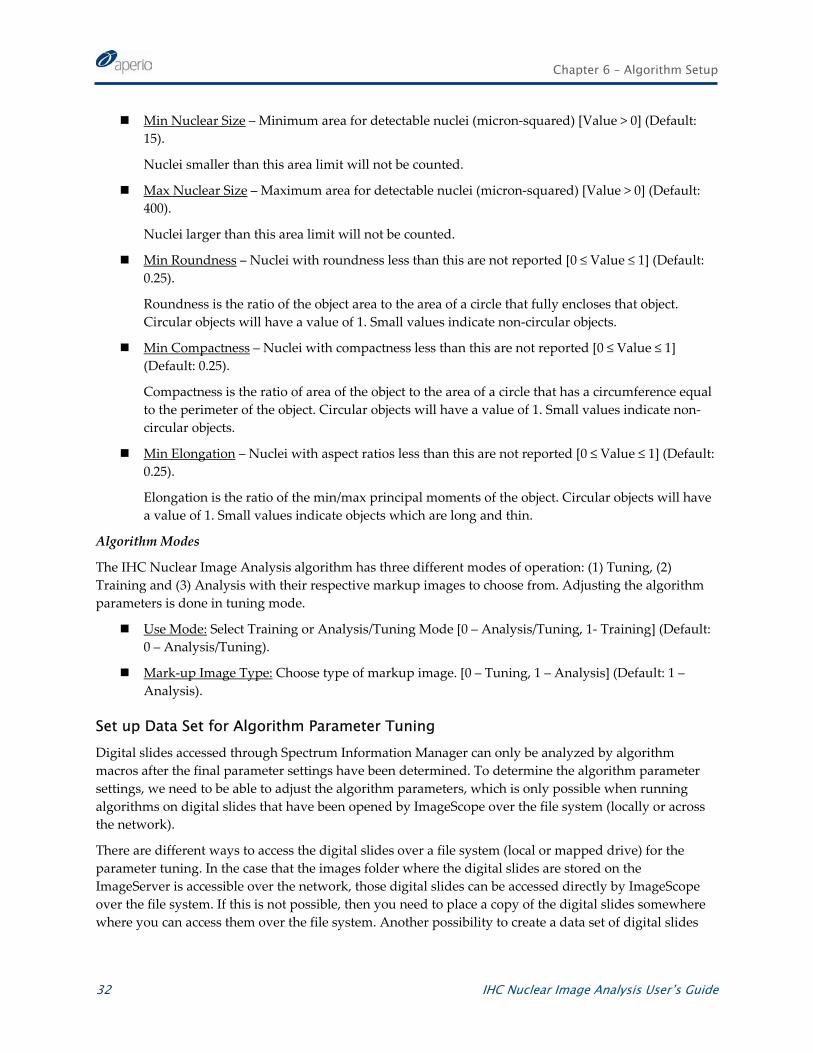
Min Nuclear Size – Minimum area for detectable nuclei (micron-squared) [Value > 0] (Default: 15).
Nuclei smaller than this area limit will not be counted.
Max Nuclear Size – Maximum area for detectable nuclei (micron-squared) [Value > 0] (Default: 400).
Nuclei larger than this area limit will not be counted.
Min Roundness – Nuclei with roundness less than this are not reported [0 ≤ Value ≤ 1] (Default: 0.25).
Roundness is the ratio of the object area to the area of a circle that fully encloses that object. Circular objects will have a value of 1. Small values indicate non-circular objects.
Min Compactness – Nuclei with compactness less than this are not reported [0 ≤ Value ≤ 1] (Default: 0.25).
Compactness is the ratio of area of the object to the area of a circle that has a circumference equal to the perimeter of the object. Circular objects will have a value of 1. Small values indicate non-circular objects.
Min Elongation – Nuclei with aspect ratios less than this are not reported [0 ≤ Value ≤ 1] (Default: 0.25).
Elongation is the ratio of the min/max principal moments of the object. Circular objects will have a value of 1. Small values indicate objects which are long and thin.
Algorithm Modes
The IHC Nuclear Image Analysis algorithm has three different modes of operation: (1) Tuning, (2) Training and (3) Analysis with their respective markup images to choose from. Adjusting the algorithm parameters is done in tuning mode.
Use Mode: Select Training or Analysis/Tuning Mode [0 – Analysis/Tuning, 1- Training] (Default: 0 – Analysis/Tuning).
Mark-up Image Type: Choose type of markup image. [0 – Tuning, 1 – Analysis] (Default: 1 – Analysis).
Set up Data Set for Algorithm Parameter Tuning Digital slides accessed through Spectrum Information Manager can only be analyzed by algorithm macros after the final parameter settings have been determined. To determine the algorithm parameter settings, we need to be able to adjust the algorithm parameters, which is only possible when running algorithms on digital slides that have been opened by ImageScope over the file system (locally or across the network).
There are different ways to access the digital slides over a file system (local or mapped drive) for the parameter tuning. In the case that the images folder where the digital slides are stored on the ImageServer is accessible over the network, those digital slides can be accessed directly by ImageScope over the file system. If this is not possible, then you need to place a copy of the digital slides somewhere where you can access them over the file system. Another possibility to create a data set of digital slides
Chapter 6 – Algorithm Setup
IHC Nuclear Image Analysis User’s Guide 33
for algorithm tuning is to extract the significant regions from the digital slides (use the annotations from the pathologists to identify those regions and their significance) and store them locally.
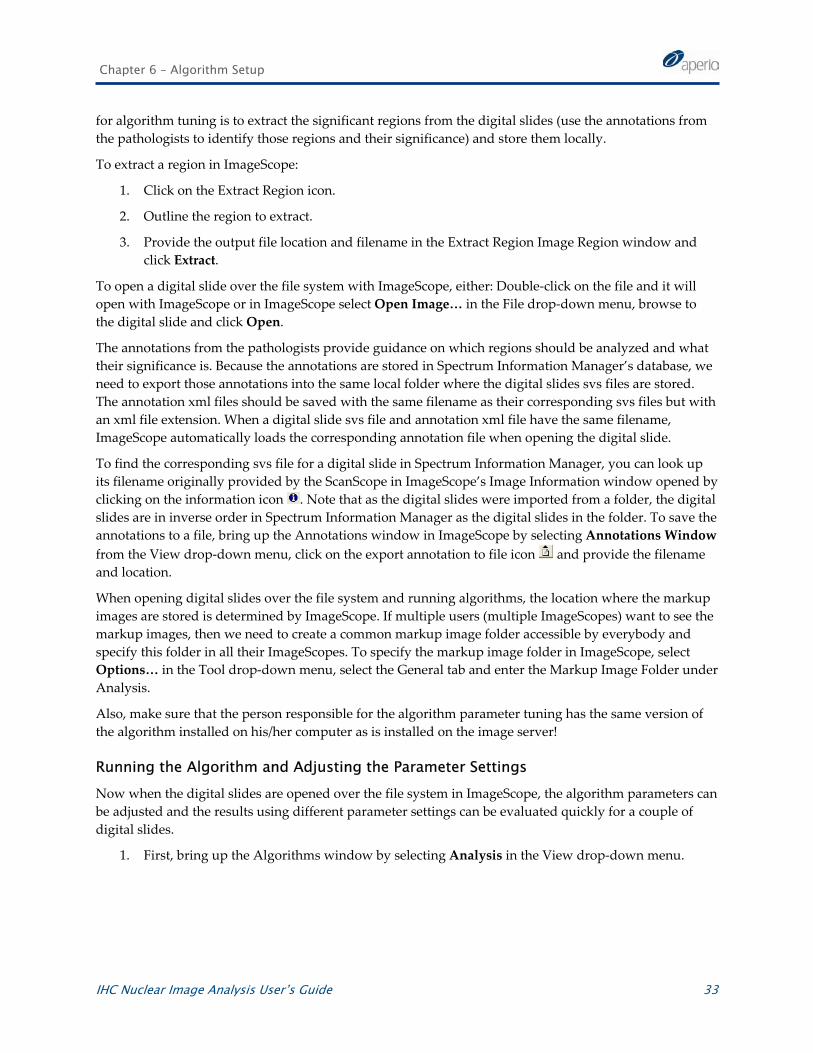
To extract a region in ImageScope:
1. Click on the Extract Region icon.
2. Outline the region to extract.
3. Provide the output file location and filename in the Extract Region Image Region window and click Extract.
To open a digital slide over the file system with ImageScope, either: Double-click on the file and it will open with ImageScope or in ImageScope select Open Image… in the File drop-down menu, browse to the digital slide and click Open.
The annotations from the pathologists provide guidance on which regions should be analyzed and what their significance is. Because the annotations are stored in Spectrum Information Manager’s database, we need to export those annotations into the same local folder where the digital slides svs files are stored. The annotation xml files should be saved with the same filename as their corresponding svs files but with an xml file extension. When a digital slide svs file and annotation xml file have the same filename, ImageScope automatically loads the corresponding annotation file when opening the digital slide.
To find the corresponding svs file for a digital slide in Spectrum Information Manager, you can look up its filename originally provided by the ScanScope in ImageScope’s Image Information window opened by clicking on the information icon . Note that as the digital slides were imported from a folder, the digital slides are in inverse order in Spectrum Information Manager as the digital slides in the folder. To save the annotations to a file, bring up the Annotations window in ImageScope by selecting Annotations Window from the View drop-down menu, click on the export annotation to file icon and provide the filename and location.
When opening digital slides over the file system and running algorithms, the location where the markup images are stored is determined by ImageScope. If multiple users (multiple ImageScopes) want to see the markup images, then we need to create a common markup image folder accessible by everybody and specify this folder in all their ImageScopes. To specify the markup image folder in ImageScope, select Options… in the Tool drop-down menu, select the General tab and enter the Markup Image Folder under Analysis.
Also, make sure that the person responsible for the algorithm parameter tuning has the same version of the algorithm installed on his/her computer as is installed on the image server!
Running the Algorithm and Adjusting the Parameter Settings Now when the digital slides are opened over the file system in ImageScope, the algorithm parameters can be adjusted and the results using different parameter settings can be evaluated quickly for a couple of digital slides.
1. First, bring up the Algorithms window by selecting Analysis in the View drop-down menu.
Chapter 6 – Algorithm Setup
34 IHC Nuclear Image Analysis User’s Guide
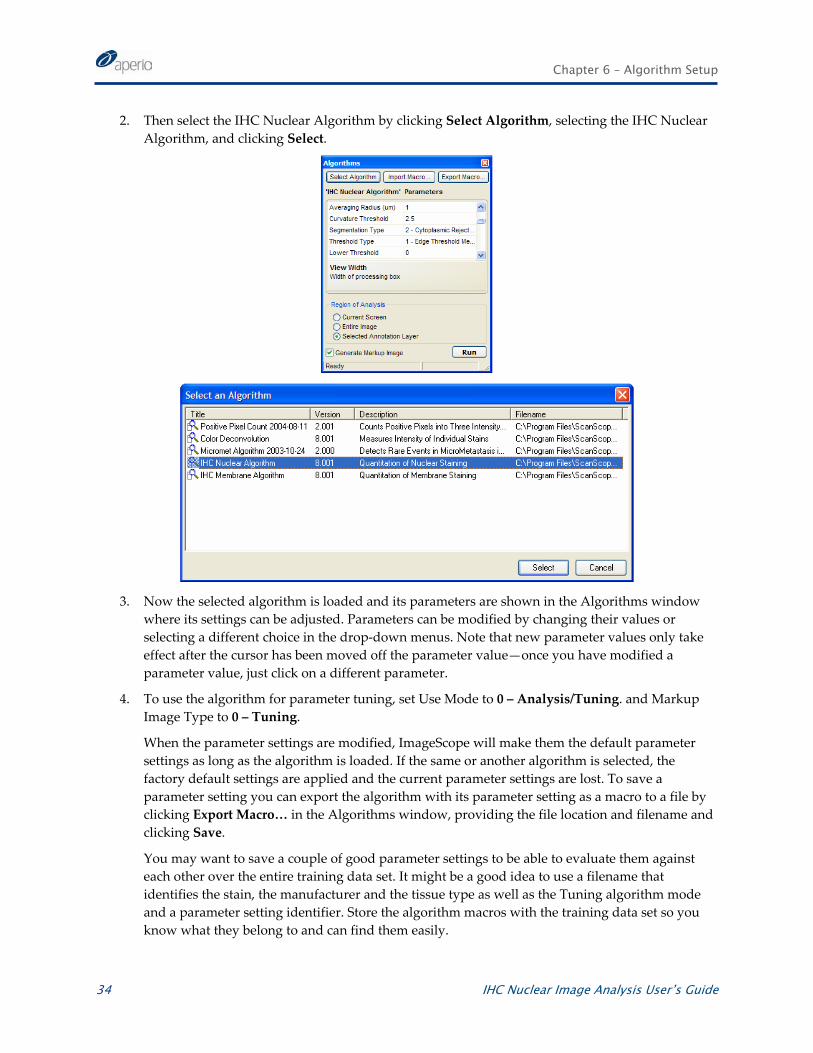
2. Then select the IHC Nuclear Algorithm by clicking Select Algorithm, selecting the IHC Nuclear Algorithm, and clicking Select.
3. Now the selected algorithm is loaded and its parameters are shown in the Algorithms window
where its settings can be adjusted. Parameters can be modified by changing their values or selecting a different choice in the drop-down menus. Note that new parameter values only take effect after the cursor has been moved off the parameter value—once you have modified a parameter value, just click on a different parameter.
4. To use the algorithm for parameter tuning, set Use Mode to 0 – Analysis/Tuning. and Markup Image Type to 0 – Tuning.
When the parameter settings are modified, ImageScope will make them the default parameter settings as long as the algorithm is loaded. If the same or another algorithm is selected, the factory default settings are applied and the current parameter settings are lost. To save a parameter setting you can export the algorithm with its parameter setting as a macro to a file by clicking Export Macro… in the Algorithms window, providing the file location and filename and clicking Save.
You may want to save a couple of good parameter settings to be able to evaluate them against each other over the entire training data set. It might be a good idea to use a filename that identifies the stain, the manufacturer and the tissue type as well as the Tuning algorithm mode and a parameter setting identifier. Store the algorithm macros with the training data set so you know what they belong to and can find them easily.
Chapter 6 – Algorithm Setup
IHC Nuclear Image Analysis User’s Guide 35
The user has a choice between Current Screen, the Entire Image and the regions outlined in the Selected Annotation Layer for the Region of Analysis. Use caution when using Current Screen as the digital slide will be processed at the resolution defined by the zoom level in ImageScope and will only be processed at 20X if the zoom level is set to 20X (required for the IHC Nuclear Algorithm). To evaluate different parameter settings, the best approach is to select a small region that exhibits certain characteristics to which the algorithm should be tuned and select Selected Annotation Layer and then study the impact of changing the parameter settings. Note that the processing of the Entire Image takes a long time and does not necessarily provide more valuable data for the algorithm tuning.
5. The best way to evaluate the results of an image analysis algorithm is visually; therefore select the Generate Markup Image check box.
The markup image for tuning shows the nuclei in green with a black outline. Note that the scoring scheme parameters that determine the classification of the nuclei have not been determined yet therefore showing the color-coded classification of the nuclei would not be meaningful.
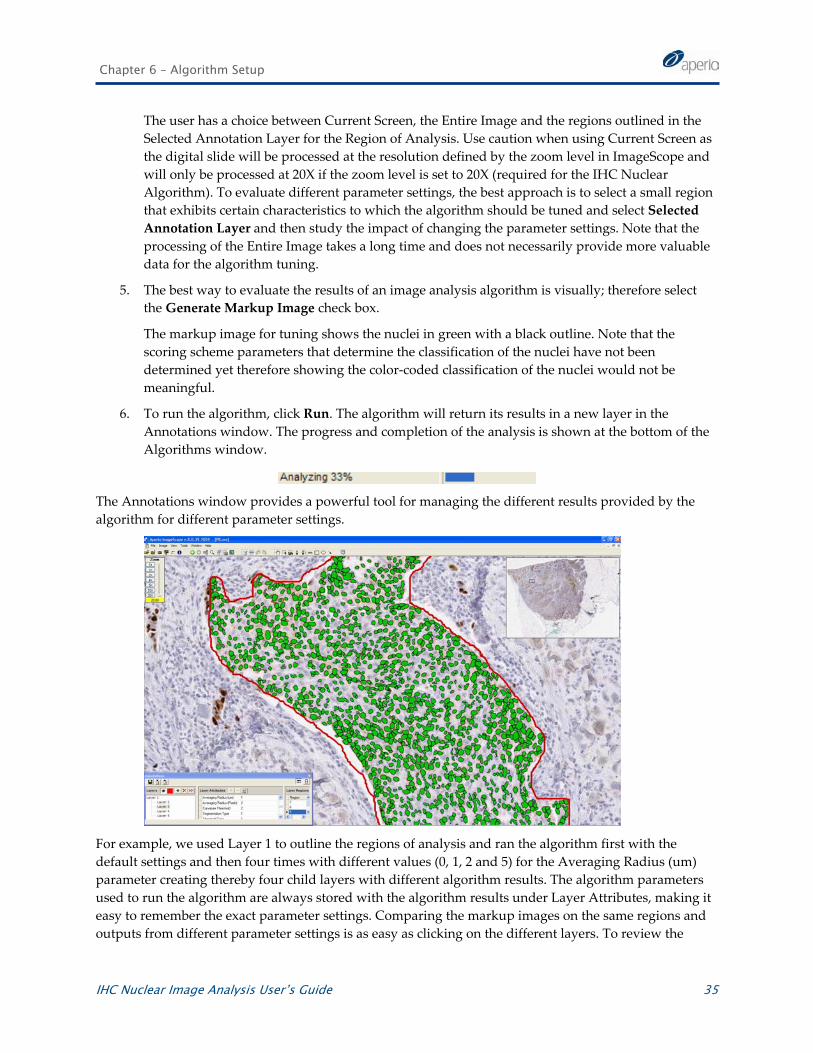
6. To run the algorithm, click Run. The algorithm will return its results in a new layer in the Annotations window. The progress and completion of the analysis is shown at the bottom of the Algorithms window.
The Annotations window provides a powerful tool for managing the different results provided by the algorithm for different parameter settings.
For example, we used Layer 1 to outline the regions of analysis and ran the algorithm first with the default settings and then four times with different values (0, 1, 2 and 5) for the Averaging Radius (um) parameter creating thereby four child layers with different algorithm results. The algorithm parameters used to run the algorithm are always stored with the algorithm results under Layer Attributes, making it easy to remember the exact parameter settings. Comparing the markup images on the same regions and outputs from different parameter settings is as easy as clicking on the different layers. To review the
Chapter 6 – Algorithm Setup
36 IHC Nuclear Image Analysis User’s Guide
original image, click on the show/hide layer icon in the Layers section of the Annotations window and toggle between the markup image and the original image.
Test Parameter Settings To test one or more parameter settings on the entire training data set, import the algorithm macros into Spectrum Information Manager and run them in batch mode on all digital slides in the training data set using the annotations provided by the pathologists to define the regions of analysis.
1. Import an algorithm macro into Spectrum Information Manager by first opening an Internet browser and logging into Spectrum Information Manager using the same workstation used to save the tuning parameters and going to the Analysis Macros view by clicking Macros under the Analysis drop-down menu.
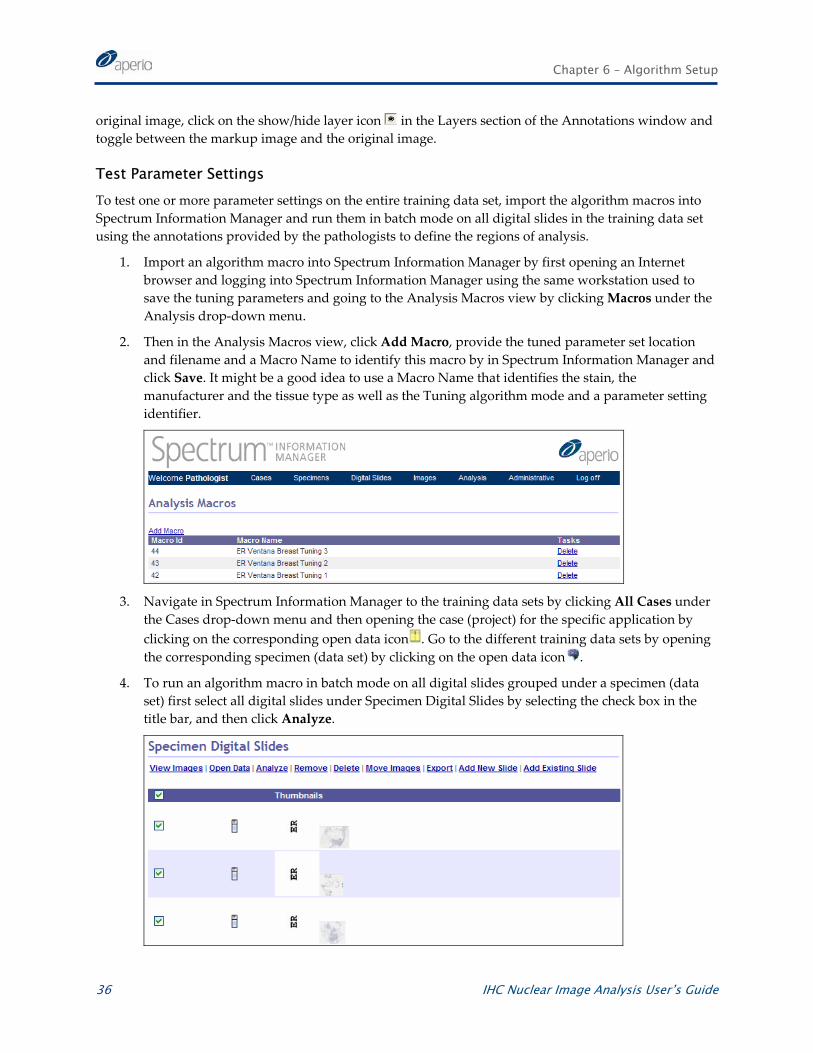
2. Then in the Analysis Macros view, click Add Macro, provide the tuned parameter set location and filename and a Macro Name to identify this macro by in Spectrum Information Manager and click Save. It might be a good idea to use a Macro Name that identifies the stain, the manufacturer and the tissue type as well as the Tuning algorithm mode and a parameter setting identifier.
3. Navigate in Spectrum Information Manager to the training data sets by clicking All Cases under
the Cases drop-down menu and then opening the case (project) for the specific application by clicking on the corresponding open data icon . Go to the different training data sets by opening the corresponding specimen (data set) by clicking on the open data icon .
4. To run an algorithm macro in batch mode on all digital slides grouped under a specimen (data set) first select all digital slides under Specimen Digital Slides by selecting the check box in the title bar, and then click Analyze.
Chapter 6 – Algorithm Setup
IHC Nuclear Image Analysis User’s Guide 37
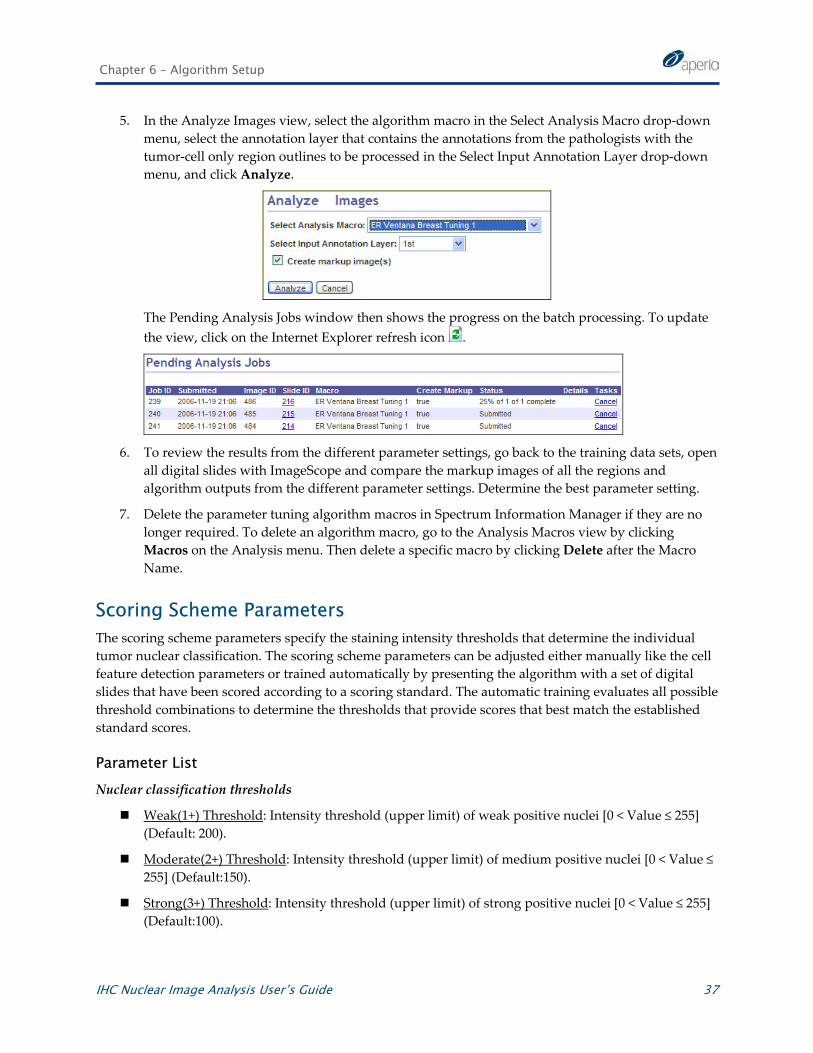
5. In the Analyze Images view, select the algorithm macro in the Select Analysis Macro drop-down menu, select the annotation layer that contains the annotations from the pathologists with the tumor-cell only region outlines to be processed in the Select Input Annotation Layer drop-down menu, and click Analyze.
The Pending Analysis Jobs window then shows the progress on the batch processing. To update the view, click on the Internet Explorer refresh icon .
6. To review the results from the different parameter settings, go back to the training data sets, open
all digital slides with ImageScope and compare the markup images of all the regions and algorithm outputs from the different parameter settings. Determine the best parameter setting.
7. Delete the parameter tuning algorithm macros in Spectrum Information Manager if they are no longer required. To delete an algorithm macro, go to the Analysis Macros view by clicking Macros on the Analysis menu. Then delete a specific macro by clicking Delete after the Macro Name.
Scoring Scheme Parameters The scoring scheme parameters specify the staining intensity thresholds that determine the individual tumor nuclear classification. The scoring scheme parameters can be adjusted either manually like the cell feature detection parameters or trained automatically by presenting the algorithm with a set of digital slides that have been scored according to a scoring standard. The automatic training evaluates all possible threshold combinations to determine the thresholds that provide scores that best match the established standard scores.
Parameter List Nuclear classification thresholds
Weak(1+) Threshold: Intensity threshold (upper limit) of weak positive nuclei [0 < Value ≤ 255] (Default: 200).
Moderate(2+) Threshold: Intensity threshold (upper limit) of medium positive nuclei [0 < Value ≤ 255] (Default:150).
Strong(3+) Threshold: Intensity threshold (upper limit) of strong positive nuclei [0 < Value ≤ 255] (Default:100).
Chapter 6 – Algorithm Setup
38 IHC Nuclear Image Analysis User’s Guide
Algorithm Modes
The IHC Nuclear Image Analysis algorithm has three different modes of operation: (1) Tuning, (2) Training and (3) Analysis with their respective markup images to choose from. Training the scoring scheme parameters is done in training mode.
Use Mode: Select Training or Analysis/Tuning Mode [0 – Analysis/Tuning, 1- Training] (Default: 0 – Analysis/Tuning).
Mark-up Image Type: Choose type of markup image. [0 – Tuning, 1 – Analysis] (Default: 1 – Analysis).
Automatic Parameter Training
Classifier Type: Select type of classifier [0 – IHCMembrane, 1- IHCNuclear] (Default: 1- IHCNuclear).
Classifier Definition File: Name of classifier definition file [folder name]. (Default: IHCNuclearTraining).
Automatic Parameter Training Create an algorithm macro for the automatic parameter training.
Start with the cell feature detection parameters that yield the best results on the training data sets.
1. Open ImageScope (just the program) and import the algorithm macro with the best cell feature detection parameter settings.
2. To import an algorithm macro, first click Analysis on the View menu to show the Analysis window.
3. In the Analysis window, click Import Macro… and provide the file location and filename of the algorithm macro and click Open.
4. To use the algorithm for automatic training, set the Use Mode to 1 – Training.
5. Set the Classifier Definition File parameter to the name of the folder to receive the training results. The algorithm will create a folder with this name in the ScanScope program folder under AAF and Algorithms (\Program Files\ScanScope\AAF\Algorithms). As we will run the algorithm macro on the server, the folder will be created on the ImageServer. Each time you want to automatically train the scoring scheme parameters, you need to provide a different Classifier Definition File folder name. You may want to choose a name that identifies the stain, the manufacturer and tissue type as you need to train the scoring scheme parameters for each specific application. Note that each time you run the algorithm on a digital slide in training mode and use an existing Classifier Definition File folder, it will add to the training and update the trained scoring scheme parameters.
a) To re-start/re-initialize the training, delete the Classifier Definition File folder.
b) To finish the training, change the User Mode to 0 – Analysis/Tuning and the training results will no longer be updated.
6. Export the algorithm with its parameter setting as a macro to a file. It might be a good idea to use a filename that identifies the stain, the manufacturer and the tissue type as well as the Training
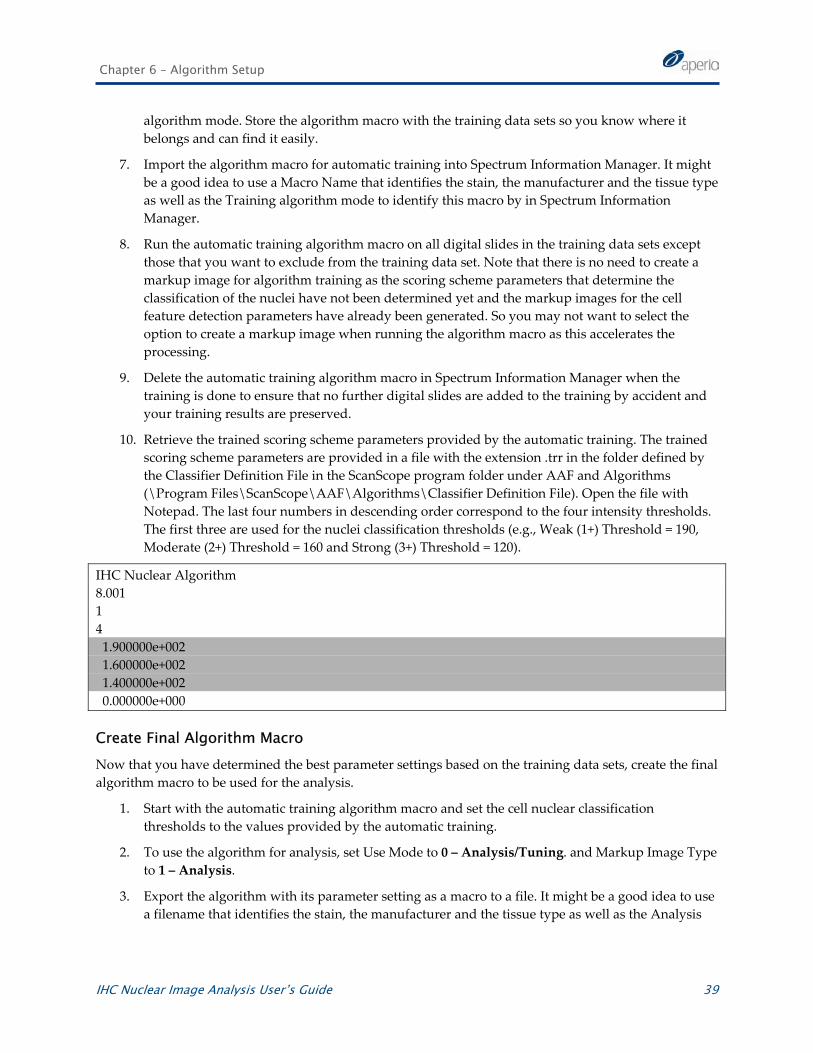
Chapter 6 – Algorithm Setup
IHC Nuclear Image Analysis User’s Guide 39
algorithm mode. Store the algorithm macro with the training data sets so you know where it belongs and can find it easily.
7. Import the algorithm macro for automatic training into Spectrum Information Manager. It might be a good idea to use a Macro Name that identifies the stain, the manufacturer and the tissue type as well as the Training algorithm mode to identify this macro by in Spectrum Information Manager.
8. Run the automatic training algorithm macro on all digital slides in the training data sets except those that you want to exclude from the training data set. Note that there is no need to create a markup image for algorithm training as the scoring scheme parameters that determine the classification of the nuclei have not been determined yet and the markup images for the cell feature detection parameters have already been generated. So you may not want to select the option to create a markup image when running the algorithm macro as this accelerates the processing.
9. Delete the automatic training algorithm macro in Spectrum Information Manager when the training is done to ensure that no further digital slides are added to the training by accident and your training results are preserved.
10. Retrieve the trained scoring scheme parameters provided by the automatic training. The trained scoring scheme parameters are provided in a file with the extension .trr in the folder defined by the Classifier Definition File in the ScanScope program folder under AAF and Algorithms (\Program Files\ScanScope\AAF\Algorithms\Classifier Definition File). Open the file with Notepad. The last four numbers in descending order correspond to the four intensity thresholds. The first three are used for the nuclei classification thresholds (e.g., Weak (1+) Threshold = 190, Moderate (2+) Threshold = 160 and Strong (3+) Threshold = 120).
IHC Nuclear Algorithm 8.001 1 4 1.900000e+002 1.600000e+002 1.400000e+002 0.000000e+000
Create Final Algorithm Macro Now that you have determined the best parameter settings based on the training data sets, create the final algorithm macro to be used for the analysis.
1. Start with the automatic training algorithm macro and set the cell nuclear classification thresholds to the values provided by the automatic training.
2. To use the algorithm for analysis, set Use Mode to 0 – Analysis/Tuning. and Markup Image Type to 1 – Analysis.
3. Export the algorithm with its parameter setting as a macro to a file. It might be a good idea to use a filename that identifies the stain, the manufacturer and the tissue type as well as the Analysis
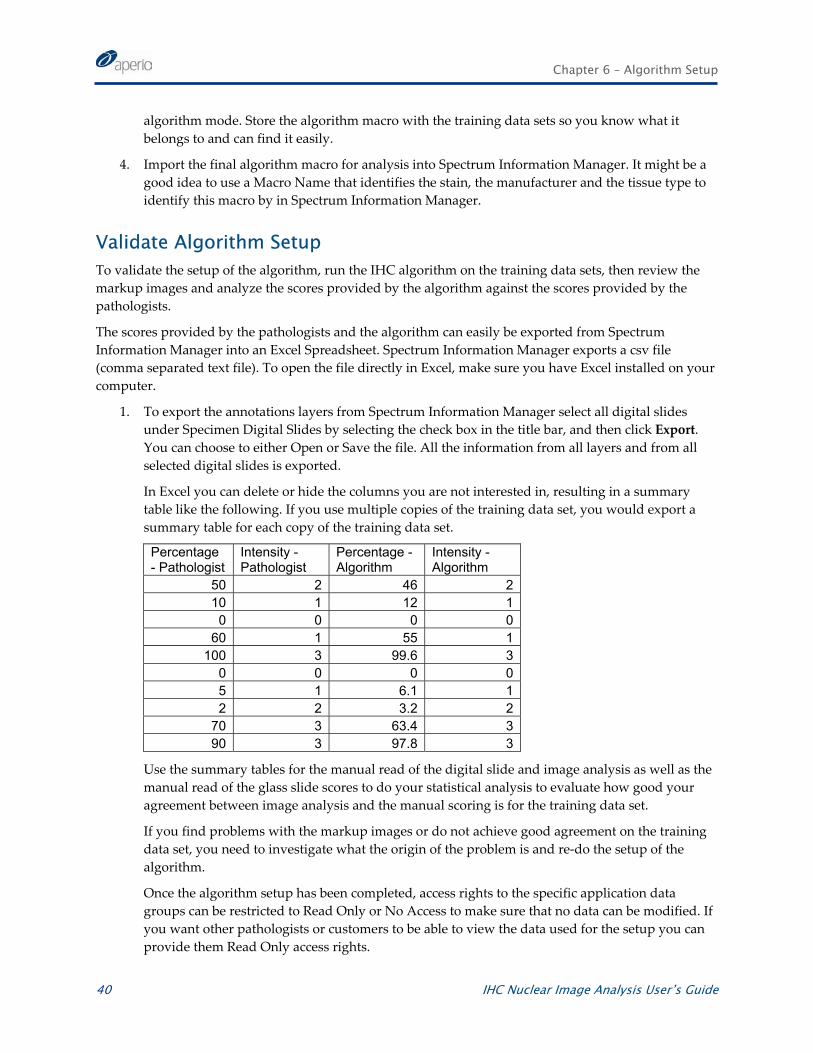
Chapter 6 – Algorithm Setup
40 IHC Nuclear Image Analysis User’s Guide
algorithm mode. Store the algorithm macro with the training data sets so you know what it belongs to and can find it easily.
4. Import the final algorithm macro for analysis into Spectrum Information Manager. It might be a good idea to use a Macro Name that identifies the stain, the manufacturer and the tissue type to identify this macro by in Spectrum Information Manager.
Validate Algorithm Setup To validate the setup of the algorithm, run the IHC algorithm on the training data sets, then review the markup images and analyze the scores provided by the algorithm against the scores provided by the pathologists.
The scores provided by the pathologists and the algorithm can easily be exported from Spectrum Information Manager into an Excel Spreadsheet. Spectrum Information Manager exports a csv file (comma separated text file). To open the file directly in Excel, make sure you have Excel installed on your computer.
1. To export the annotations layers from Spectrum Information Manager select all digital slides under Specimen Digital Slides by selecting the check box in the title bar, and then click Export. You can choose to either Open or Save the file. All the information from all layers and from all selected digital slides is exported.
In Excel you can delete or hide the columns you are not interested in, resulting in a summary table like the following. If you use multiple copies of the training data set, you would export a summary table for each copy of the training data set.
Percentage - Pathologist
Intensity - Pathologist
Percentage - Algorithm
Intensity - Algorithm
50 2 46 210 1 12 1
0 0 0 060 1 55 1
100 3 99.6 30 0 0 05 1 6.1 12 2 3.2 2
70 3 63.4 390 3 97.8 3
Use the summary tables for the manual read of the digital slide and image analysis as well as the manual read of the glass slide scores to do your statistical analysis to evaluate how good your agreement between image analysis and the manual scoring is for the training data set.
If you find problems with the markup images or do not achieve good agreement on the training data set, you need to investigate what the origin of the problem is and re-do the setup of the algorithm.
Once the algorithm setup has been completed, access rights to the specific application data groups can be restricted to Read Only or No Access to make sure that no data can be modified. If you want other pathologists or customers to be able to view the data used for the setup you can provide them Read Only access rights.
IHC Nuclear Image Analysis User’s Guide 41
7 Validation
How well the IHC Nuclear Image Analysis algorithm will perform for your application will depend on your setup of the algorithm and your slide preparation. Before using the IHC Nuclear Image Analysis algorithm for analysis, we recommend validating the performance of the algorithm.
How to validate the IHC Nuclear Image Analysis algorithm for your application is entirely up to you. We show an example of what we think could be a possible study design and how to use Spectrum Information Manager to execute the study.
Study Design Example As there is no gold standard for IHC scoring, we base the validation on the scores from a panel of three pathologists. The goal for the performance validation study should be to demonstrate substantial equivalence of IHC Nuclear Image Analysis algorithm to conventional manual microscopy. This can be demonstrated by calculating measures of reliability separately for pathologists using manual microscopy and the image analysis system, and across both methods. Substantive equivalence will be established by finding no substantial differences for the separate and combined estimates of reliability.
The lab should use FDA cleared kits/reagents for ER/PR. The lab should employ appropriate morphological studies and controls as specified in the instructions for the IHC kits/reagents.
The evaluation slides should be taken from the clinical operation as the cases come in. A sufficient number of slides per percentage range: 0%, 1-5%, 6-10%, 11-50% and 51-100% and intensity scores: 0, 1+, 2+ and 3+ are required to provide sufficient power for the statistical analysis.
The slides in the data set should pass a quality inspection by a pathologist in terms of having a good representation of tumor regions present in the specimen and cleanness and good condition of the slides in order to be included in the validation study.
The slides should be made anonymous and therefore not contain any human subject information.
The study should have three blind evaluation arms: manual microscopy, digital slide scoring and image analysis.
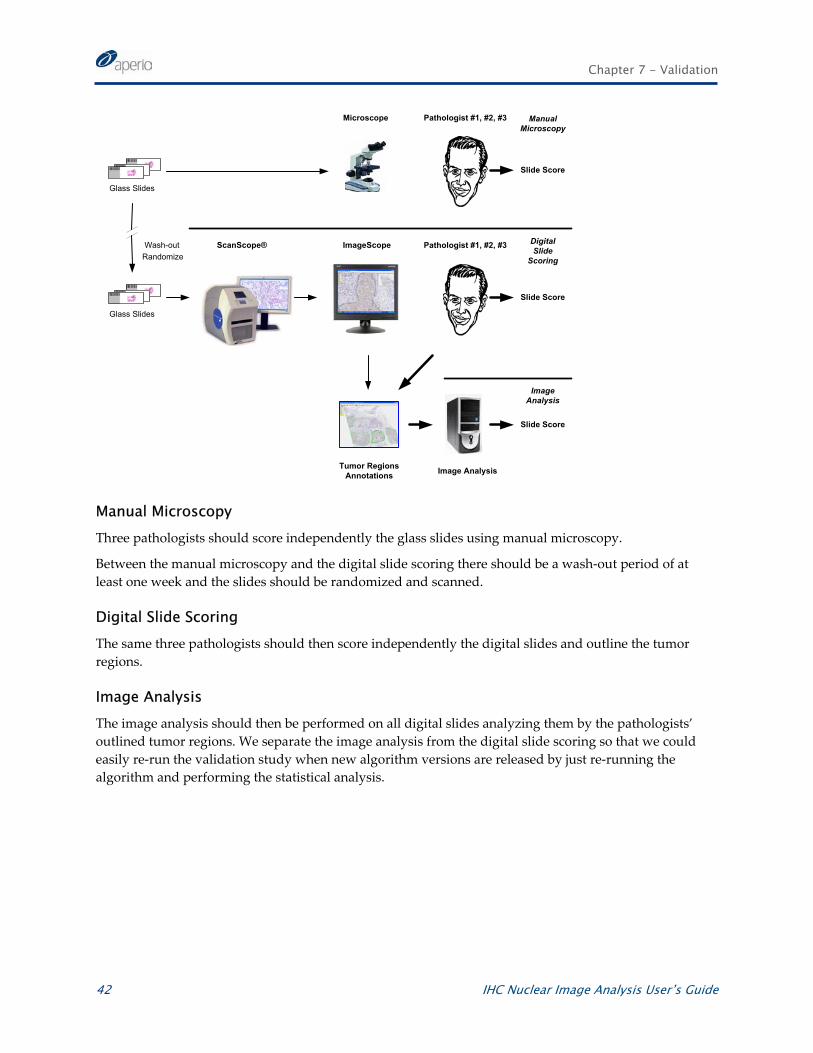
Chapter 7 - Validation
42 IHC Nuclear Image Analysis User’s Guide
Microscope Pathologist #1, #2, #3
Wash-out
ManualMicroscopy
DigitalSlide
Scoring
Pathologist #1, #2, #3ScanScope®
Tumor RegionsAnnotations
Slide Score
Slide Score
Slide Score
Image Analysis
Image Analysis
Glass Slides
Glass Slides
ImageScopeRandomize
Manual Microscopy Three pathologists should score independently the glass slides using manual microscopy.
Between the manual microscopy and the digital slide scoring there should be a wash-out period of at least one week and the slides should be randomized and scanned.
Digital Slide Scoring The same three pathologists should then score independently the digital slides and outline the tumor regions.
Image Analysis The image analysis should then be performed on all digital slides analyzing them by the pathologists’ outlined tumor regions. We separate the image analysis from the digital slide scoring so that we could easily re-run the validation study when new algorithm versions are released by just re-running the algorithm and performing the statistical analysis.
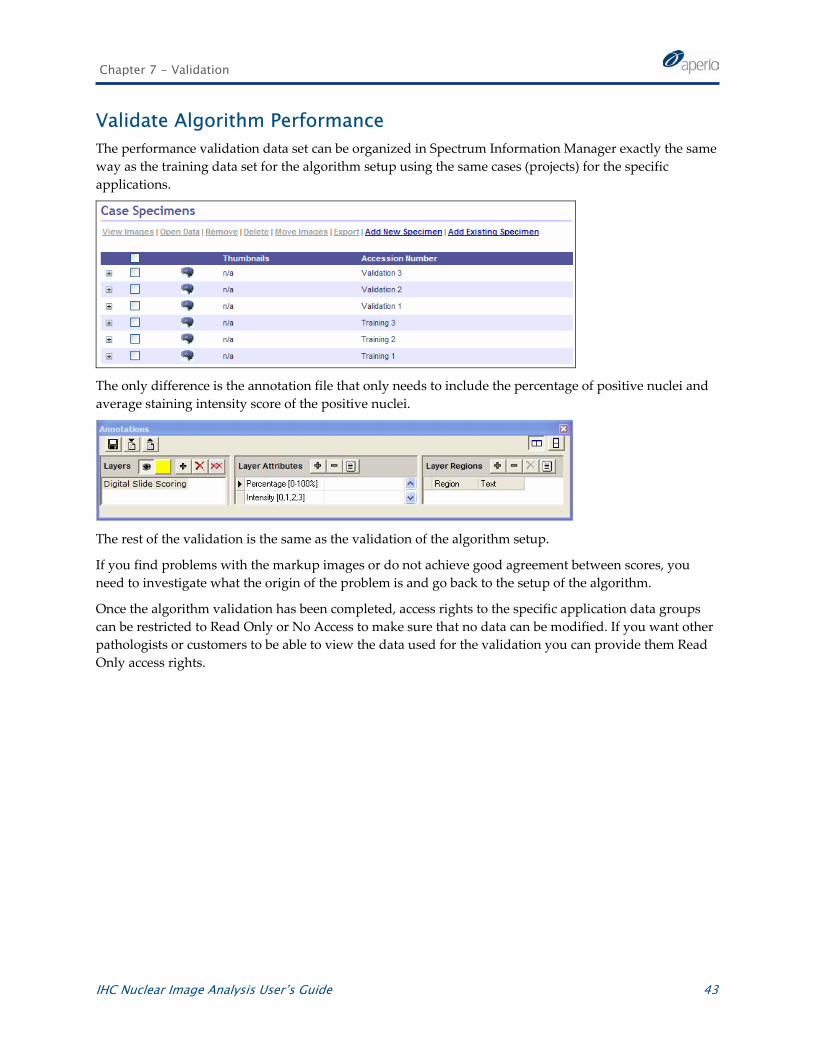
Chapter 7 - Validation
IHC Nuclear Image Analysis User’s Guide 43
Validate Algorithm Performance The performance validation data set can be organized in Spectrum Information Manager exactly the same way as the training data set for the algorithm setup using the same cases (projects) for the specific applications.
The only difference is the annotation file that only needs to include the percentage of positive nuclei and average staining intensity score of the positive nuclei.
The rest of the validation is the same as the validation of the algorithm setup.
If you find problems with the markup images or do not achieve good agreement between scores, you need to investigate what the origin of the problem is and go back to the setup of the algorithm.
Once the algorithm validation has been completed, access rights to the specific application data groups can be restricted to Read Only or No Access to make sure that no data can be modified. If you want other pathologists or customers to be able to view the data used for the validation you can provide them Read Only access rights.

IHC Nuclear Image Analysis User’s Guide
MAN-0027, Revision B