Embed Size (px)
Citation preview
APPENDIX A
FREQUENCY CONSIDERATIONS FOR TELEMETRY
Paragraph Title Page 1.0 Purpose............................................................................................................ A-1 2.0 Scope............................................................................................................... A-1 3.0 Authorization to Use a Telemetry System...................................................... A-3 4.0 Frequency Usage Guidance ............................................................................ A-4 5.0 Bandwidth....................................................................................................... A-8 6.0 Spectral Occupancy Limits ........................................................................... A-15 7.0 Technical Characteristics of Digital Modulation Methods........................... A-18 8.0 FQPSK-B and FQPSK-JR Characteristics ................................................... A-19 9.0 SOQPSK-TG Characteristics........................................................................ A-22 10.0 Advanced Range Telemetry (ARTM) CPM Characteristics. ....................... A-23 11.0 PCM/FM ....................................................................................................... A-24
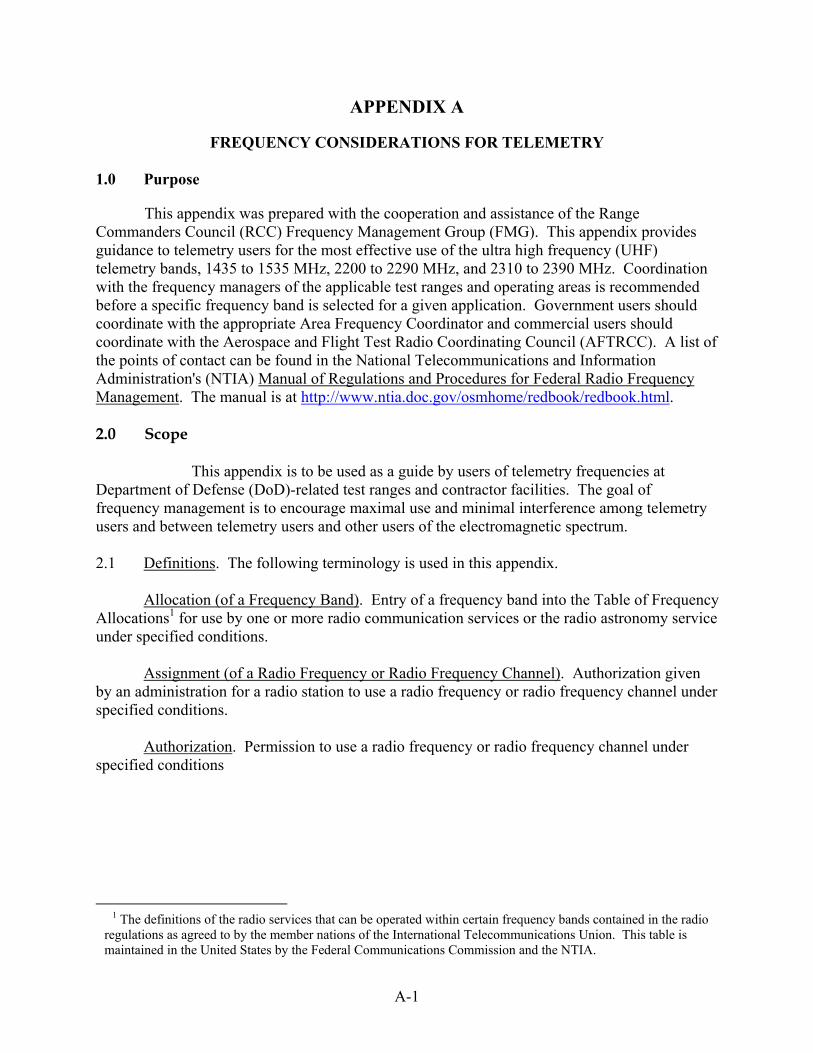
LIST OF FIGURES Figure A-1. Spectra of 10-Mb/s CPFSK, ARTM CPM, FQPSK-JR,
SOQPSK-TG signals. ..................................................................................... A-4 Figure A-2. 5 Mb/s PCM/FM signals with 11 MHz center frequency separation. ............ A-6 Figure A-3. 10 Mb/s ARTM CPM signals with 9 MHz center frequency separation........ A-6 Figure A-4. RNRZ PCM/FM signal. ................................................................................ A-10 Figure A-5. Spectrum analyzer calibration of 0-dBc level............................................... A-11 Figure A-6. Biφ PCM/PM signal...................................................................................... A-12 Figure A-7. FM/AM signal and Carson’s Rule ................................................................ A-12 Figure A-8. Typical receiver RLC IF filter response (-3 dB bandwidth = 1 MHz). ........ A-14 Figure A-9. RLC and SAW IF filters ............................................................................... A-15 Figure A-10. Filtered 5-Mb/s RNRZ PCM/FM signal and spectral mask. ........................ A-17 Figure A-11. Unfiltered 5-Mb/s RNRZ PCM/FM signal and spectral mask. .................. A-17 Figure A-12. Typical 5-Mb/s SOQPSK-TG signal and spectral mask. ............................. A-18 Figure A-13. Typical 5-Mb/s ARTM CPM signal and spectral mask. .............................. A-18 Figure A-14. OQPSK modulator. ....................................................................................... A-19 Figure A-15. I & Q constellation........................................................................................ A-19 Figure A-16. FQPSK wavelet eye diagram........................................................................ A-20 Figure A-17. FQPSK-B I & Q eye diagrams (at input to IQ modulator). ......................... A-20 Figure A-18. FQPSK-B vector diagram............................................................................. A-20 Figure A-19. 5 Mb/s FQPSK-JR spectrum with random input data and small (blue)
and large (red) modulator errors. .................................................................. A-21 Figure A-20. FQPSK-B spectrum with all 0’s input and large modulator errors.............. A-21 Figure A-21. FQPSK-JR BEP vs. Eb/N0. ........................................................................... A-22 Figure A-22. Measured SOQPSK-TG phase trajectory ..................................................... A-22 Figure A-23. SOQPSK-TG Power Spectrum (5 Mb/s). ..................................................... A-23 Figure A-24. BEP versus Eb/No performance of 5 Mb/s SOQPSK-TG. ............................ A-23
Figure A-25. Power spectrum of 5 Mb/s ARTM CPM. ..................................................... A-23 Figure A-26. BEP versus Eb/No performance of 5 Mb/s ARTM CPM. ............................. A-24 Figure A-27. Power spectrum of 5 Mb/s PCM/FM signal. ................................................ A-24 Figure A-28. BEP versus Eb/No performance of 5 Mb/s PCM/FM with multi-symbol
bit detector and three single symbol receivers/detectors. ............................. A-25
LIST OF TABLES Table A-1. Coefficients For Minimum Frequency Separation Calculation...................... A-5 Table A-2. 99 Percent Power Bandwidths For Various Digital Modulation Methods ... A-10 Table A-3. Characteristics Of Various Modulation Methods. ........................................ A-18
ii
APPENDIX A
FREQUENCY CONSIDERATIONS FOR TELEMETRY
1.0 Purpose
This appendix was prepared with the cooperation and assistance of the Range Commanders Council (RCC) Frequency Management Group (FMG). This appendix provides guidance to telemetry users for the most effective use of the ultra high frequency (UHF) telemetry bands, 1435 to 1535 MHz, 2200 to 2290 MHz, and 2310 to 2390 MHz. Coordination with the frequency managers of the applicable test ranges and operating areas is recommended before a specific frequency band is selected for a given application. Government users should coordinate with the appropriate Area Frequency Coordinator and commercial users should coordinate with the Aerospace and Flight Test Radio Coordinating Council (AFTRCC). A list of the points of contact can be found in the National Telecommunications and Information Administration's (NTIA) Manual of Regulations and Procedures for Federal Radio Frequency Management. The manual is at http://www.ntia.doc.gov/osmhome/redbook/redbook.html. 2.0 Scope This appendix is to be used as a guide by users of telemetry frequencies at Department of Defense (DoD)-related test ranges and contractor facilities. The goal of frequency management is to encourage maximal use and minimal interference among telemetry users and between telemetry users and other users of the electromagnetic spectrum. 2.1 Definitions. The following terminology is used in this appendix. Allocation (of a Frequency Band). Entry of a frequency band into the Table of Frequency Allocations1 for use by one or more radio communication services or the radio astronomy service under specified conditions. Assignment (of a Radio Frequency or Radio Frequency Channel). Authorization given by an administration for a radio station to use a radio frequency or radio frequency channel under specified conditions. Authorization. Permission to use a radio frequency or radio frequency channel under specified conditions
1 The definitions of the radio services that can be operated within certain frequency bands contained in the radio
regulations as agreed to by the member nations of the International Telecommunications Union. This table is maintained in the United States by the Federal Communications Commission and the NTIA.
A-1
Certification. The Military Communications-Electronics Board’s (MCEB) process of verifying that a proposed system complies with the appropriate rules, regulations, and technical standards. J/F 12 Number. The identification number assigned to a system by the MCEB after the Application for Equipment Frequency Allocation (DD Form 1494) is approved; for example, J/F 12/6309 (sometimes called the J-12 number). Resolution Bandwidth. The -3 dB bandwidth of the measurement device. 2.2 Modulation methods. 2.2.1 Traditional Modulation Methods. The traditional modulation methods for aeronautical telemetry are Frequency Modulation (FM) and Phase Modulation (PM). Pulse Code Modulation (PCM)/Frequency Modulation (FM) has been the most popular telemetry modulation since around 1970. The PCM/FM method could also be called filtered Continuous Phase Frequency Shift Keying (CPFSK). The RF signal is typically generated by filtering the baseband non-return-to-zero-level (NRZ-L) signal and then frequency modulating a voltage-controlled oscillator (VCO). The optimum peak deviation is 0.35 times the bit rate and a good choice for a premodulation filter is a multi-pole linear phase filter with bandwidth equal to 0.7 times the bit rate. Frequency and phase modulation have a variety of desirable features but may not provide the required bandwidth efficiency, especially for higher bit rates. 2.2.2 Improved Bandwidth Efficiency. When better bandwidth efficiency is required, the standard methods for digital signal transmission are the Feher Patented Quadrature Phase Shift Keying (FQPSK-B and FQPSK-JR), the Shaped Offset Quadrature Phase Shift Keying (SOQPSK-TG), and the Advanced Range Telemetry (ARTM) Continuous Phase Modulation (CPM). Each of these methods offers constant, or nearly constant, envelope characteristics and are compatible with non-linear amplifiers with minimal spectral regrowth and minimal degradation of detection efficiency. The first three methods (FQPSK-B, FQPSK-JR, and SOQPSK-TG) are interoperable and require the use of the differential encoder described in Chapter 2, paragraph 2.4.3.1.1. Additional information on this differential encoder is contained in Appendix M. All of these bandwidth-efficient modulation methods require the data to be randomized. 2.3 Other Notations. The following notations are used in this appendix. Other references may define these terms slightly differently.
• B99% -Bandwidth containing 99 percent of the total power • B-25dBm -Bandwidth containing all components larger than -25 dBm • B-60dBc -Bandwidth containing all components larger than the power
-level that is 60 dB below the unmodulated carrier power • dBc -Decibels relative to the power level of the unmodulated carrier • fc -Assigned center frequency
A-2
3.0 Authorization to Use a Telemetry System All radio frequency (RF) emitting devices must have approval to operate in the United States and Possessions (US&P) via a frequency assignment unless granted an exemption by the national authority. The NTIA is the President's designated national authority and spectrum manager. The NTIA manages and controls the use of RF spectrum by federal agencies in US&P territory. Obtaining a frequency assignment involves the two-step process of obtaining an RF spectrum support certification of major RF systems design, followed by an operational frequency assignment to the RF system user. These steps are discussed below. 3.1 RF Spectrum Support Certification. All major RF systems used by federal agencies must be submitted to the NTIA, via the Interdepartmental Radio Advisory Committee (IRAC), for system review and spectrum support certification prior to committing funds for acquisition/procurement. During the system review process, compliance with applicable RF standards, and RF allocation tables, rules, and regulations is checked. For Department of Defense (DoD) agencies, and for support of DoD contracts, this is accomplished via the submission of a DD Form 1494 to the MCEB. Noncompliance with standards, the tables, rules, or regulations can result in denial of support, limited support, or support on an unprotected non- priority basis. All RF users must obtain frequency assignments for any RF system (even if not considered major). This assignment is accomplished by submission of frequency use proposals through the appropriate frequency management offices. Frequency assignments may not be granted for major systems that have not obtained spectrum support certification. 3.1.1 Frequency Allocation. As stated before, telemetry systems must normally operate within the frequency bands designated for their use in the National Table of Frequency Allocations. With sufficient justification, use of other bands may at times be permitted, but the certification process is much more difficult, and the outcome is uncertain. Even if certification is granted on a noninterference basis to other users, the frequency manager is often unable to grant assignments because of local users who will get interference. 3.1.1.1 Telemetry Bands. Air and space-to-ground telemetering is allocated in the UHF bands 1435 to 1535, 2200 to 2290, and 2310 to 2390 MHz, commonly known as the lower-L band, the lower-S band, and the upper-S band. Other mobile bands, such as 1755-1850 MHz, can also be used at many test ranges. Since these other bands are not considered a standard telemetry band per this document, potential users must coordinate, in advance, with the individual range(s) and ensure use of this band can be supported at the subject range(s) and that their technical requirements will be met. 3.1.1.2 Very High Frequency (VHF) Telemetry. The VHF band, 216-265 MHz, was used for telemetry operations in the past. Telemetry bands were moved to the UHF bands as of 1 January 1970 to prevent interference to critical government land mobile and military tactical communications. Telemetry operation in this band is strongly discouraged and is considered only on an exceptional case-by-case basis.
A-3
3.1.2 Technical Standards. The MCEB and the NTIA review proposed telemetry systems for compliance with applicable technical standards. For the UHF telemetry bands, the current revisions of the following standards are considered applicable:
• RCC Document IRIG 106, Telemetry Standards
• MIL-STD-461, Requirements for the Control of Electromagnetic Interference Emissions and Susceptibility
• Manual of Regulations and Procedures for Federal Radio Frequency Management (NTIA)
Applications for certification are also thoroughly checked in many other ways including necessary and occupied bandwidths, modulation characteristics, reasonableness of output power, correlation between output power and amplifier type, and antenna type and characteristics. The associated receiver normally must be specified or referenced. The characteristics of the receiver are also verified. 3.2 Frequency Authorization. Spectrum certification of a telemetry system verifies that the system meets the technical requirements for successful operation in the electromagnetic environment. However, a user is not permitted to radiate with the telemetry system before requesting and receiving a specific frequency assignment. The assignment process considers when, where, and how the user plans to radiate. Use of the assignments is tightly scheduled by and among the individual ranges to make the most efficient use of the limited telemetry radio frequency (RF) spectrum and to ensure that one user does not interfere with other users. 4.0 Frequency Usage Guidance Frequency usage is controlled by scheduling in the areas where the tests will be conducted. The following recommendations are based on good engineering practice for such usage and it is assumed that the occupied bandwidth fits within the telemetry band in all cases.
-70
-60
-50
-40
-30
-20
-10
Pow
er (d
Bc)
-2 -1 0 1 2 Normalized Frequency (bit rate = 1)
PCM/FM ARTM CPM FQPSK-JR SOQPSK-TG
10 Mb/s4.1 Minimum Frequency Separation. The minimum required frequency separation can be calculated using the formula:
∆F0 = as*Rs + ai*Ri (A-1) where: ∆F0 = the minimum required center frequency separation in MHz Rs=bit rate of desired signal in Mb/s Figure A-1. Spectra of 10-Mb/s CPFSK,
ARTM CPM, FQPSK-JR, SOQPSK-TG signals.
Ri=bit rate of interfering signal in Mb/s as is determined by the desired signal type and receiving equipment (Table A-1).
A-4
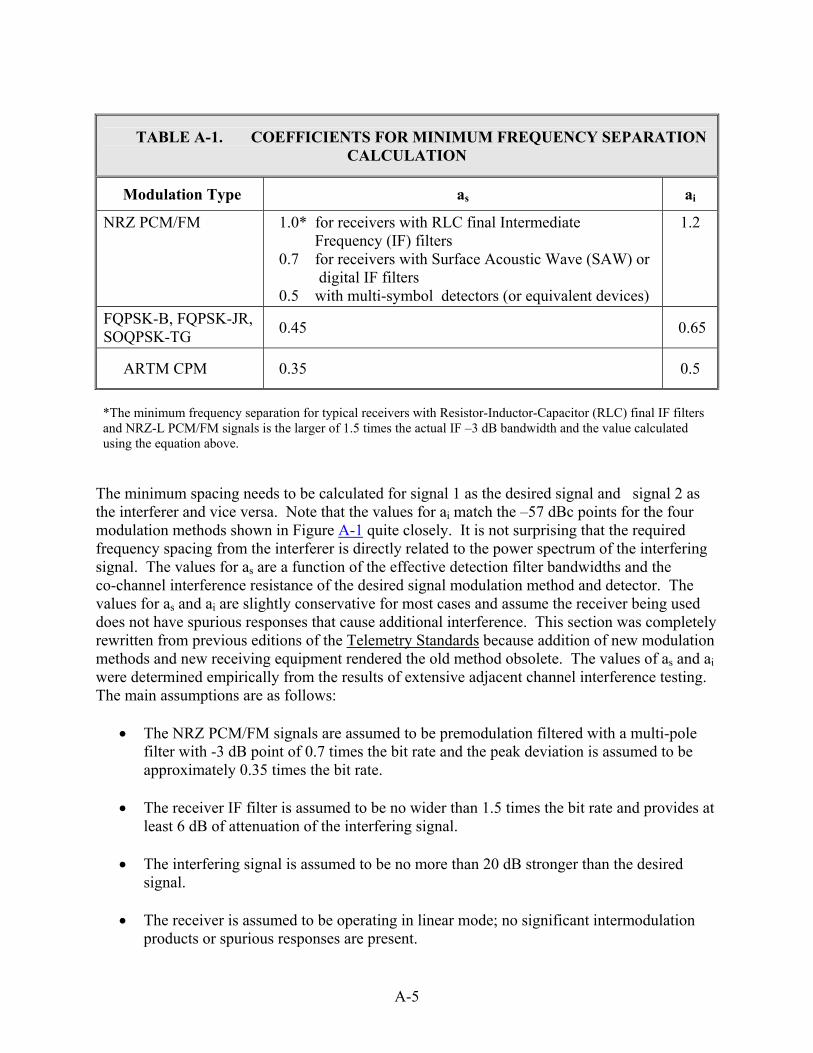
TABLE A-1. COEFFICIENTS FOR MINIMUM FREQUENCY SEPARATION CALCULATION
Modulation Type as ai
NRZ PCM/FM 1.0* for receivers with RLC final Intermediate Frequency (IF) filters 0.7 for receivers with Surface Acoustic Wave (SAW) or
digital IF filters 0.5 with multi-symbol detectors (or equivalent devices)
1.2
FQPSK-B, FQPSK-JR, SOQPSK-TG 0.45 0.65
ARTM CPM 0.35 0.5
*The minimum frequency separation for typical receivers with Resistor-Inductor-Capacitor (RLC) final IF filters and NRZ-L PCM/FM signals is the larger of 1.5 times the actual IF –3 dB bandwidth and the value calculated using the equation above.
The minimum spacing needs to be calculated for signal 1 as the desired signal and signal 2 as the interferer and vice versa. Note that the values for ai match the –57 dBc points for the four modulation methods shown in Figure A-1 quite closely. It is not surprising that the required frequency spacing from the interferer is directly related to the power spectrum of the interfering signal. The values for as are a function of the effective detection filter bandwidths and the co-channel interference resistance of the desired signal modulation method and detector. The values for as and ai are slightly conservative for most cases and assume the receiver being used does not have spurious responses that cause additional interference. This section was completely rewritten from previous editions of the Telemetry Standards because addition of new modulation methods and new receiving equipment rendered the old method obsolete. The values of as and ai were determined empirically from the results of extensive adjacent channel interference testing. The main assumptions are as follows:
• The NRZ PCM/FM signals are assumed to be premodulation filtered with a multi-pole filter with -3 dB point of 0.7 times the bit rate and the peak deviation is assumed to be approximately 0.35 times the bit rate.
• The receiver IF filter is assumed to be no wider than 1.5 times the bit rate and provides at
least 6 dB of attenuation of the interfering signal.
• The interfering signal is assumed to be no more than 20 dB stronger than the desired signal.
• The receiver is assumed to be operating in linear mode; no significant intermodulation
products or spurious responses are present.
A-5
Examples are shown below:
5 Mb/s PCM/FM and 0.8 Mb/s PCM/FM using a receiver with 6 MHz IF bandwidth for the 5 Mb/s signal (this receiver has RLC IF filters)
1.0*5 + 1.2*0.8 = 5.96 MHz, 1.0*.8 + 1.2*5 = 6.8 MHz, 1.5*6= 9.0 MHz; the largest value is 9 MHz and the frequencies are assigned in 1 MHz steps so the minimum spacing is 9 MHz
5 Mb/s PCM/FM and 5 Mb/s PCM/FM using a receiver with 6 MHz IF bandwidth for the 5 Mb/s signals (these receivers have RLC IF filters; see Figure A-2)
1.0*5 + 1.2*5 = 11 MHz, 1.5*6= 9.0 MHz; the larger value is 11 MHz and the frequencies are assigned in 1 MHz steps so the minimum spacing is 11 MHz
5 Mb/s PCM/FM and 5 Mb/s PCM/FM using a receiver with 6 MHz IF bandwidth for the 5 Mb/s signal (this receiver has RLC IF filters but a multi-symbol detector is used)
0.5*5 + 1.2*5 = 8.5 MHz; the frequencies are assigned in 1 MHz steps so the minimum spacing is 9 MHz
5 Mb/s PCM/FM and 5 Mb/s SOQPSK-TG using a receiver with 6 MHz IF bandwidth for the 5 Mb/s signals (this receiver has RLC IF filters but a multi-symbol detector is used)
0.5*5 + 0.65*5 = 5.75 MHz, 0.45*5 + 1.2*5 = 8.25 MHz; the largest value is 8.25 MHz and the frequencies are assigned in 1 MHz steps so the minimum spacing is 9 MHz 5 Mb/s FQPSK-B and 5 Mb/s ARTM CPM using a receiver with 6 MHz IF bandwidth for the 5 Mb/s signals
0.45*5 + 0.5*5 = 4.75 MHz 0.35*5 + 0.7*5 = 5.25 MHz; the largest value is 5.25 MHz and the frequencies are assigned in 1 MHz steps so the minimum spacing is 6 MHz
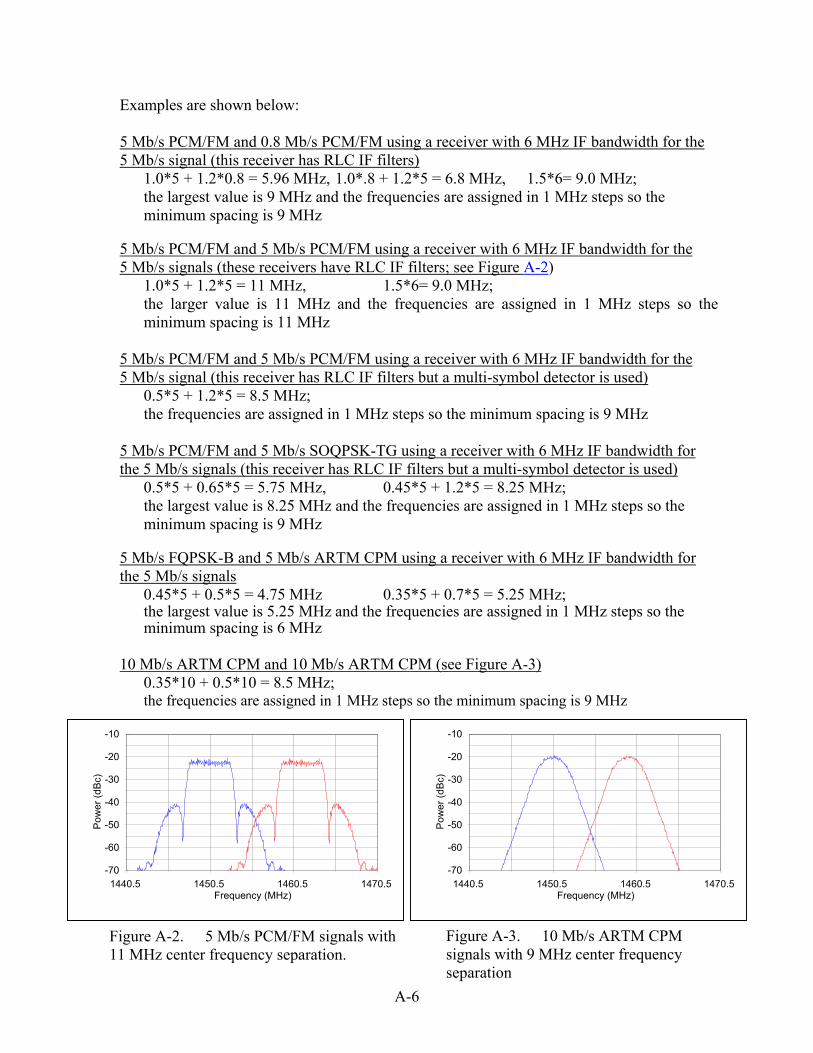
10 Mb/s ARTM CPM and 10 Mb/s ARTM CPM (see Figure A-3) 0.35*10 + 0.5*10 = 8.5 MHz;
the frequencies are assigned in 1 MHz steps so the minimum spacing is 9 MHz
Figure A-2. 5 Mb/s PCM/FM signals with 11 MHz center frequency separation.
-70
-60
-50
-40
-30
-20
-10
Pow
er (d
Bc)
1440.5 1450.5 1460.5 1470.5 Frequency (MHz)
Figure A-3. 10 Mb/s ARTM CPM signals with 9 MHz center frequency separation
-70
-60
-50
-40
-30
-20
-10
Pow
er (d
Bc)
1440.5 1450.5 1460.5 1470.5 Frequency (MHz)
A-6
4.2 Alternative method for determining frequency separation. In some cases it may be desirable to set aside a bandwidth for each signal independent of other signals. If one uses a bandwidth factor of 2*ai for each signal, then one gets a separation of ∆F0 = ai*Rs + ai*Ri and one gets a more conservative (wider) separation than one would using ∆F0 = as*Rs + ai*Ri because the value of ai is bigger than the value of as for all of these modulation methods. One problem with this approach is that it does not include receiver or detector characteristics and therefore the calculated frequency separations are often different from those calculated using the formula in section 4.1.
Examples of frequency separation are shown below: 5 Mb/s PCM/FM and 0.8 Mb/s PCM/FM using a receiver with 6 MHz IF bandwidth for the 5 Mb/s signal (this receiver has RLC IF filters)
1.2*5 + 1.2*0.8 = 6.96 MHz; the frequencies are assigned in 1 MHz steps so the minimum spacing is 7 MHz
5 Mb/s PCM/FM and 5 Mb/s PCM/FM using a receiver with 6 MHz IF bandwidth for the 5 Mb/s signals (these receivers have RLC IF filters)
1.2*5 + 1.2*5 = 12 MHz; the frequencies are assigned in 1 MHz steps so the minimum spacing is 12 MHz
5 Mb/s PCM/FM and 5 Mb/s PCM/FM using a receiver with 6 MHz IF bandwidth for the 5 Mb/s signal (this receiver has RLC IF filters but a multi-symbol detector is used)
1.2*5 + 1.2*5 = 12 MHz; the frequencies are assigned in 1 MHz steps so the minimum spacing is 12 MHz
5 Mb/s PCM/FM and 5 Mb/s SOQPSK-TG using a receiver with 6 MHz IF bandwidth for the 5 Mb/s signals (this receiver has RLC IF filters but a multi-symbol detector is used)
1.2*5 + 0.65*5 = 9.25 MHz; the frequencies are assigned in 1 MHz steps so the minimum spacing is 10 MHz
5 Mb/s FQPSK-B and 5 Mb/s ARTM CPM using a receiver with 6 MHz IF bandwidth for the 5 Mb/s signals
0.7*5 + 0.5*5 = 6 MHz; the frequencies are assigned in 1 MHz steps so the minimum spacing is 6 MHz
10 Mb/s ARTM CPM and 10 Mb/s ARTM CPM 0.5*10 + 0.5*10 = 10 MHz;
the frequencies are assigned in 1 MHz steps so the minimum spacing is 10 MHz 4.3 Geographical Separation. Geographical separation can be used to further reduce the probability of interference from adjacent signals. 4.4 Multicarrier Operation. If two transmitters are operated simultaneously and sent or received through the same antenna system, interference due to intermodulation is likely at (2f1 - f2) and
A-7
(2f2 - f1). Between three transmitters, the two-frequency possibilities exist, but intermodulation products may exist as well at (f1 + f2 - f3), (f1 + f3 - f2), and (f2 + f3 - f1), where f1, f2, and f3 represent the output frequencies of the transmitters. Intermodulation products can arise from nonlinearities in the transmitter output circuitry that cause mixing products between a transmitter output signal and the fundamental signal coming from nearby transmitters. Intermodulation products also can arise from nonlinearities in the antenna systems. The generation of intermodulation products is inevitable, but the effects are generally of concern only when such products exceed -25 dBm. The general rule for avoiding third-order intermodulation interference is that in any group of transmitter frequencies, the separation between any pair of frequencies should not be equal to the separation between any other pair of frequencies. Because individual signals have sidebands, it should be noted that intermodulation products have sidebands spectrally wider than the sidebands of the individual signals that caused them. 4.5 Transmitter Antenna System Emission Testing. Radiated tests will be made in lieu of transmitter output tests only when the transmitter is inaccessible. Radiated tests may still be required if the antenna is intended to be part of the filtering of spurious products from the transmitter or is suspected of generating spurious products by itself or in interaction with the transmitter and feed lines. These tests should be made with normal modulation. 5.0 Bandwidth The definitions of bandwidth in this section are universally applicable. The limits shown here are applicable for telemetry operations in the telemetry bands 1435 to 1535, 2200 to 2290, and 2310 to 2390 MHz. For the purposes of telemetry signal spectral occupancy, the bandwidths used are the 99-percent power bandwidth and the -25 dBm bandwidth. A power level of −25 dBm is exactly equivalent to an attenuation of the transmitter power by 55 + 10×log(P) dB where P is the transmitter power expressed in watts. How bandwidth is actually measured and what the limits are, expressed in terms of that measuring system, are detailed in the following paragraphs. 5.1 Concept. The term "bandwidth" has an exact meaning in situations where an amplitude modulation (AM), double sideband (DSB), or single sideband (SSB) signal is produced with a band-limited modulating signal. In systems employing frequency modulation (FM) or phase modulation (PM), or any modulation system where the modulating signal is not band limited, bandwidth is infinite with energy extending toward zero and infinite frequency falling off from the peak value in some exponential fashion. In this more general case, bandwidth is defined as the band of frequencies in which most of the signal's energy is contained. The definition of "most" is imprecise. The following terms are applied to bandwidth. 5.1.1 Authorized Bandwidth. For purposes of this document, the authorized bandwidth is the necessary bandwidth required for transmission and reception of intelligence and does not include allowance for transmitter drift or Doppler shift. 5.1.2 Occupied Bandwidth. The width of a frequency band such that below the lower and above the upper frequency limits, the mean powers emitted are each equal to a specified percentage of the total mean power of a given emission. Unless otherwise specified by the International
A-8
Telecommunication Union (ITU) for the appropriate class of emission, the specified percentage shall be 0.5 percent. The occupied bandwidth is also called the 99-percent power bandwidth. 5.1.3 Necessary Bandwidth For a Given Class of Emission. For a given class of emission, the width of the frequency band which is just sufficient to ensure the transmission of information at the rate and with the quality required under specified conditions. 5.1.3.1 The NTIA Manual of Regulations and Procedures for Federal Radio Frequency Management states that "All reasonable effort shall be made in equipment design and operation by Government agencies to maintain the occupied bandwidth of the emission of any authorized transmission as closely to the necessary bandwidth as is reasonably practicable." 5.1.3.2 Necessary Bandwidth (DD Form 1494). The necessary bandwidth is part of the emission designator on the DD Form 1494. For telemetry purposes, the necessary bandwidth can be calculated using the equations shown below. Equations for other modulation methods are contained in the NTIA Manual of Regulations and Procedures for Federal Radio Frequency Management. The necessary bandwidth as calculated below is a reasonable bandwidth to use for telemetry frequency scheduling. Filtered non-return-to-zero (NRZ) pulse code modulatiom/frequency modulation (PCM/FM)
Bn = 2.4Xbit rate with h=0.7 and premodulation filter bandwidth = 0.7 times bit rate. Example: PCM/FM modulation used to send 5 megabits per second using frequency modulation with 2 signaling states and 1.75 MHz peak deviation; bit rate=5X10⁶; necessary bandwidth (Bn) = 12 MHz.
Constant envelope offset quadrature phase shift keying; Feher’s patented quadrature phase shift keying (FQPSK-B, FQPSK-JR) or shaped offset quadrature phase shift keying (SOQPSK-TG)
Bn = 1.3Xbit rate. Example: SOPQSK-TG modulation used to send 5 megabits per second using 4 signaling states; bit rate=5X10⁶; Bn = 6.5 MHz.
Advanced Range Telemetry (ARTM) Continuous Phase Modulation (CPM)
Bn = bit rate with h=4/16 and 5/16 on alternating symbols; Digital modulation used to send 5 megabits per second using frequency modulation with 4 signaling states and with alternating modulation index each symbol; bit rate=5X10⁶;Bn = 5 MHz.
5.1.4 Received (or Receiver) Bandwidth. The received bandwidth is usually the -3 dB bandwidth of the receiver intermediate frequency (IF) section. 5.2 Bandwidth Estimation and Measurement. Various methods are used to estimate or measure the bandwidth of a signal that is not band limited. The bandwidth measurements are performed using a spectrum analyzer (or equivalent device) with the following settings: 30-kHz resolution bandwidth, 300-Hz video bandwidth, and no max hold detector or averaging. These settings are different than those in earlier versions of the Telemetry Standards. The settings were changed to get more consistent results across a variety of bit rates, modulation methods, and spectrum analyzers. The most common measurement and estimation methods are described in the following paragraphs.
A-9
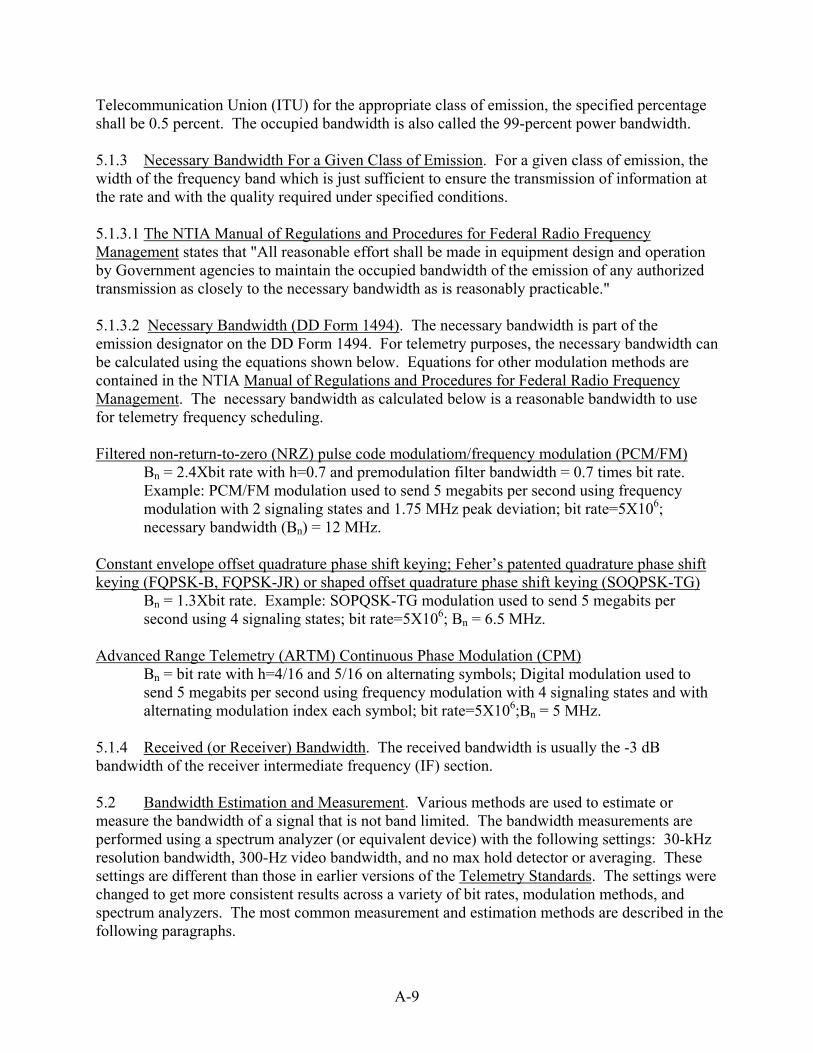
5.2.1 99-Percent Power Bandwidth. This bandwidth contains 99 percent of the total power. The 99-percent power bandwidth is typically measured using a spectrum analyzer or estimated using equations for the modulation type and bit rate used. If the two points that define the edges of the band are not symmetrical about the assigned center frequency, their actual frequencies and difference should be noted. The 99-percent power band edges of randomized NRZ (RNRZ) PCM/FM signals are shown in Figure A-4 below. Table A-2 presents the 99-percent power bandwidth for several digital modulation methods as a function of the bit rate (R).
TABLE A-2. 99 PERCENT POWER BANDWIDTHS FOR VARIOUS DIGITAL MODULATION METHODS
DESCRIPTION 99% POWER BANDWIDTH
NRZ PCM/FM, premod filter BW=0.7R, ∆f=0.35R 1.16 R NRZ PCM/FM, no premod filter, ∆f=0.25R 1.18 R NRZ PCM/FM, no premod filter, ∆f=0.35R 1.78 R NRZ PCM/FM, no premod filter, ∆f=0.40R 1.93 R NRZ PCM/FM, premod filter BW=0.7R, ∆f=0.40R 1.57 R Minimum shift keying (MSK), no filter 1.18 R FQPSK-B, FQPSK-JR or SOQPSK-TG 0.78 R ARTM CPM 0.56 R 5.2.2 -25 dBm Bandwidth. The -25 dBm bandwidth is the bandwidth containing all components larger than -25 dBm. A power level of –25 dBm is exactly equivalent to an attenuation of the transmitter power by 55 + 10×log(P) dB where P is the transmitter pexpressed in watts. The -25 dBm bandwidth limits ashown in Figure A-4. The –25 dBm bandwidthprimarily a function of the modulation method, transmitter power, and bit rate. The transmitteand construction techniques also strongly influence t–25 dBm andwidth. With a bit rate of 5 Mb/s and a transmitter power of 5 watts the –25 dBm bandwidth of an NRZ PCM/FM system with near optimum parameter settings is about 13.3 MHz, while the –25 dsystem is about 7.5 MHz, and the −25 dBm bandwidth of an equivalent ARTM CPM system is about 5.8 MHz.
ower re
is
r design he
Bm bandwidth of an equivalent FQPSK-B
Figure A-4. RNRZ PCM/FM signal.
A-10
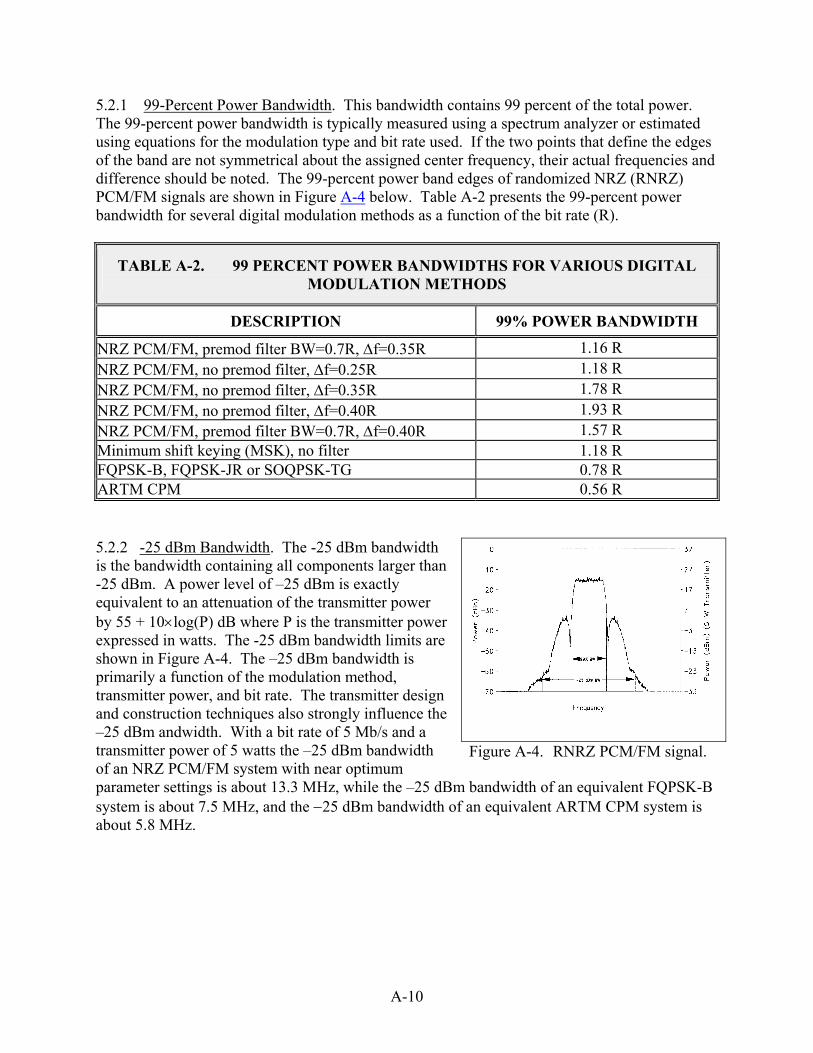
5.2.3 Other Bandwidth Measurement Methods. The methods discussed above are the standard methods for measuring the bandwidth of telemetry signals. The following methods are also sometimes used to measure or to estimate the bandwidth of telemetry signals. 5.2.3.1 Below Unmodulated Carrier. This method measures the power spectrum with respect to the unmodulated carrier power. To calibrate the measured spectrum on a spectrum analyzer, the unmodulated carrier power must be known. This power level is the 0-dB reference (commonly set to the top of the display). In AM systems, the carrier power never changes; in FM and PM systems, the carrier power is a function of the modulating signal. Therefore, a method to estimate the unmodulated carrier power is required if the modulation cannot be turned off. For most practical angle modulated systems, the total carrier power at the spectrum analyzer input can be found by setting the spectrum analyzer's resolution and video bandwidths to their widest settings, setting the analyzer output to max hold, and allowing the analyzer to make several sweeps (see Figure A-3 above). The maximum value of this trace will be a good approximation of the unmodulated carrier level. Figure A-5 shows the spectrum of a 5-Mb/s RNRZ PCM/FM signal measured using the standard spectrum analyzer settings discussed previously and the spectrum measured using 3-MHz resolution, video bandwidths, and max hold. The peak of the spectrum measured with the latter conditions is very close to 0-dBc and can be used to estimate the unmodulated carrier power (0-dBc) in the presence of frequency or phase modulation. In practice, the 0-dBc calibration would be performed first, and the display settings would then be adjusted to use the peak of the curve as the reference level (0-dBc level) to calibrate the spectrum measured using the standard spectrum analyzer settings. With the spectrum analyzer set for a specific resolution bandwidth, video bandwidth, and detector type, the bandwidth is taken as the distance between the two points outside of which the spectrum is thereafter some number (say, 60 dB) below the unmodulated carrier power determined above. The -60 dBc bandwidth for the 5-Mb/s signal shown in Figure A-5 is approximately 13 MHz.
Figure A-5. Spectrum analyzer calibration of 0-dBc level
The -60 dBc bandwidth of a random NRZ PCM/FM signal with a peak deviation of 0.35R, a four-pole premodulation filter with -3 dB corner at 0.7R, and a bit rate greater than or equal to 1 Mb/s can be approximated by B-60dBc = {2.78 - 0.3 x log10(R)} x R (A-3) where B is in MHz and R is in Mb/s. Thus the -60 dBc bandwidth of a 5-Mb/s RNRZ signal under these conditions would be approximately 12.85 MHz. The -60 dBc bandwidth will be greater if peak deviation is increased or the number of filter poles is decreased.
A-11
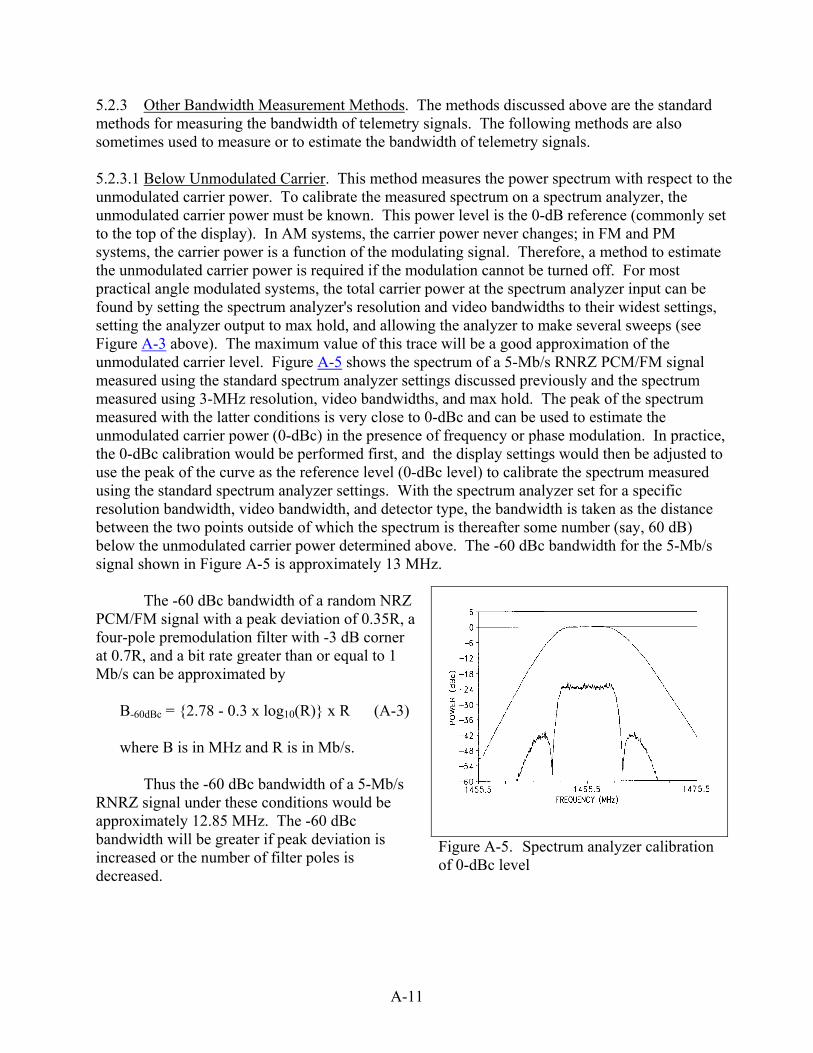
5.2.3.2 Below Peak. This method is not recommended for measuring the bandwidth of telemetry signals. The modulated peak method, the least accurate measurement method, measures between points where the spectrum is thereafter XX dB below the level of the highest point on the modulated spectrum. Figure A-6 shows the radio frequency spectrum of a 400-kb/s Biφ-L PCM/PM signal with a peak deviation of 75° and a pre-modulation filter bandwidth of 800 kHz. The largest peak has a power level of -7 dBc. In comparison, the largest peak in Figure A-5 had a power level of -22 dBc. This 15-dB difference would skew a bandwidth comparison that used the peak level in the measured spectrum as a common reference point. In the absence of an unmodulated carrier to use for calibration, the below peak measurement is often (erroneously) used and described as a below unmodulated carrier measurement. Using max hold exacerbates this effect still further. In all instances the bandwidth is overstated, but the amount varies.
Figure A-6. Biφ PCM/PM signal
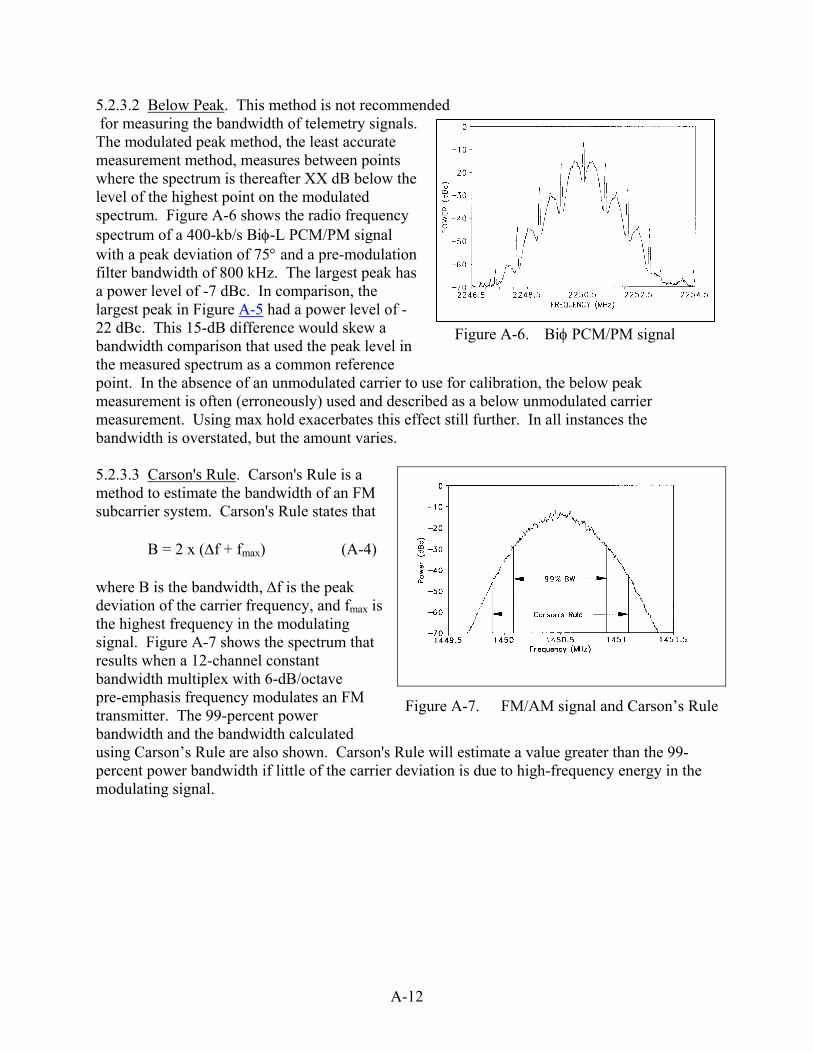
5.2.3.3 Carson's Rule. Carson's Rule is a method to estimate the bandwidth of an FM subcarrier system. Carson's Rule states that B = 2 x (∆f + fmax) (A-4) where B is the bandwidth, ∆f is the peak deviation of the carrier frequency, and fmax is the highest frequency in the modulating signal. Figure A-7 shows the spectrum that results when a 12-channel constant bandwidth multiplex with 6-dB/octave pre-emphasis frequency modulates an FM transmitter. The 99-percent power bandwidth and the bandwidth calculated using Carson’s Rule are also shown. Carson's Rule will estimate a value greater than the 99-percent power bandwidth if little of the carrier deviation is due to high-frequency energy in the modulating signal.
Figure A-7. FM/AM signal and Carson’s Rule
A-12
5.2.4 Spectral Equations. The following equations can be used to calculate the RF spectra for several digital modulation methods with unfiltered waveforms.2, 3, 4 These equations can be modified to include the effects of filtering.5, 6
• Random NRZ PCM/FM (valid when D≠integer, D = 0.5 gives MSK spectrum)
( ) Q < D ,D+XDcos2-1
X-D)X-D(
DRB4 = 2
2
22
2SA π
πππππ
πcos
coscoscoscos
S(f) (A-5)
• Random NRZ PSK
2X
2X
R
B = S(f) 2
2
SA
π
πsin
• Random NRZ QPSK and OQPSK
( )( )X
X R
2B = S(f) 2
2SA
ππsin
• Random Biφ PCM/FM
}){(sinsinsin
nRff
2)D-X(
)2D( D
+
4D)+(X
4D)+(X
4D)-(X
4D)-(X
2D
4RB = c22
22
SA −−
δπ
π
π
π
π
ππS(f)
2 I. Korn, Digital Communications, New York, Van Nostrand, 1985. 3 M. G. Pelchat, "The Autocorrelation Function and Power Spectrum of PCM/FM with Random Binary
Modulating Waveforms," IEEE Transactions, Vol. SET-10, No. 1, pp. 39-44, March 1964. 4 W. M. Tey, and T. T. Tjhung, "Characteristics of Manchester-Coded FSK," IEEE Transactions on
Communications, Vol. COM-27, pp. 209-216, January 1979. 5 A. D. Watt, V. J. Zurick, and R. M. Coon, "Reduction of Adjacent-Channel Interference Compone
Frequency-Shift-Keyed Carriers," IRE Transactions on Communication Systems, Vol. CS-6, pp. 39-47, 1958.
6 E. L. Law, "RF Spectral Characteristics of Random PCM/FM and PSK Signals," International TelemConference Proceedings, pp. 71-80, 1991.
A-13
(A-6)
(A-7)
(A-8)
nts from December
etering
• Random Biφ PCM/PM
2
,f(f)( +
4X
4X
R)( B = S(f) c
22
42
SA πβδβπ
πβ
≤−
)cossin
sin (A-9)
where S(f) = power spectrum (dBc) at frequency f BSA = spectrum analyzer resolution bandwidth* R = bit rate D = 2∆f/R X = 2(f-fc)/R ∆f = peak deviation β = peak phase deviation in radians fc = carrier frequency δ = Dirac delta function n = 0, ±1, ±2, … Q = quantity related to narrow band spectral peaking when D≈1, 2, 3, ... Q ≈ 0.99 for BSA = 0.003 R, Q ≈ 0.9 for BSA = 0.03 R
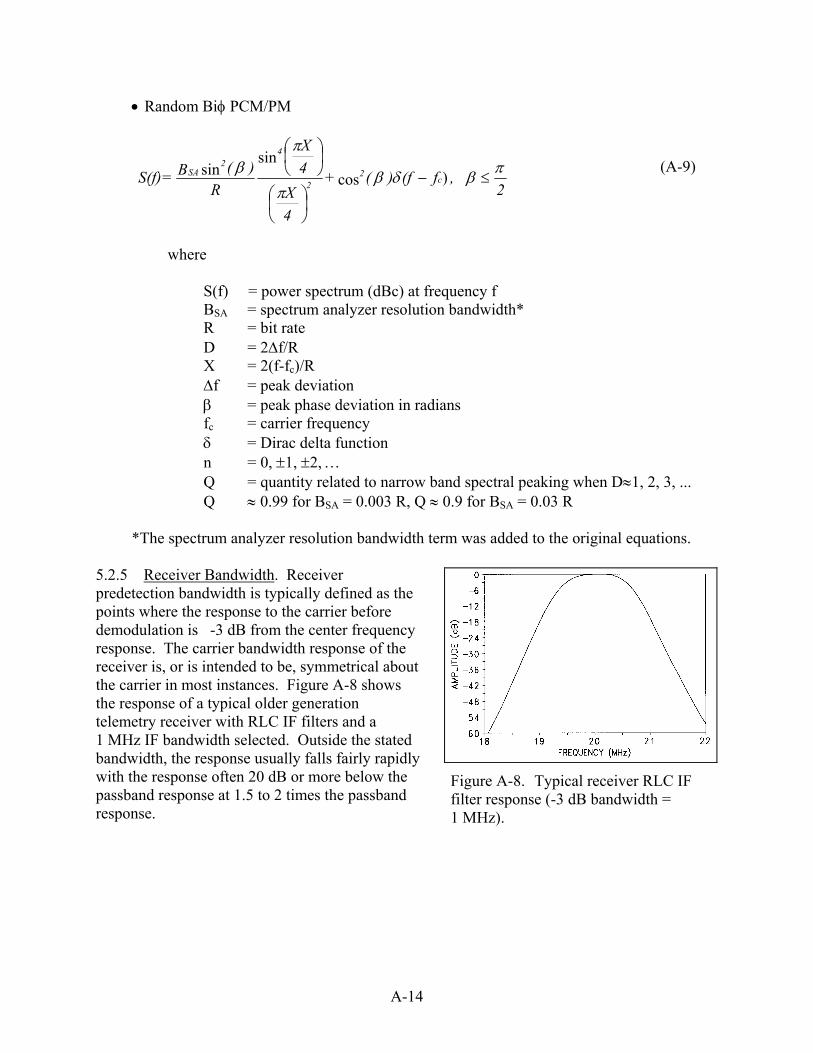
*The spectrum analyzer resolution bandwidth term was added to the original equations. 5.2.5 Receiver Bandwidth. Receiver predetection bandwidth is typically defined as the points where the response to the carrier before demodulation is -3 dB from the center frequency response. The carrier bandwidth response of the receiver is, or is intended to be, symmetrical about the carrier in most instances. Figure A-8 shows the response of a typical older generation telemetry receiver with RLC IF filters and a 1 MHz IF bandwidth selected. Outside the stated bandwidth, the response usually falls fairly rapidly with the response often 20 dB or more below the passband response at 1.5 to 2 times the passband response.
Figure A-8. Typical receiver RLC IF filter response (-3 dB bandwidth = 1 MHz).
A-14
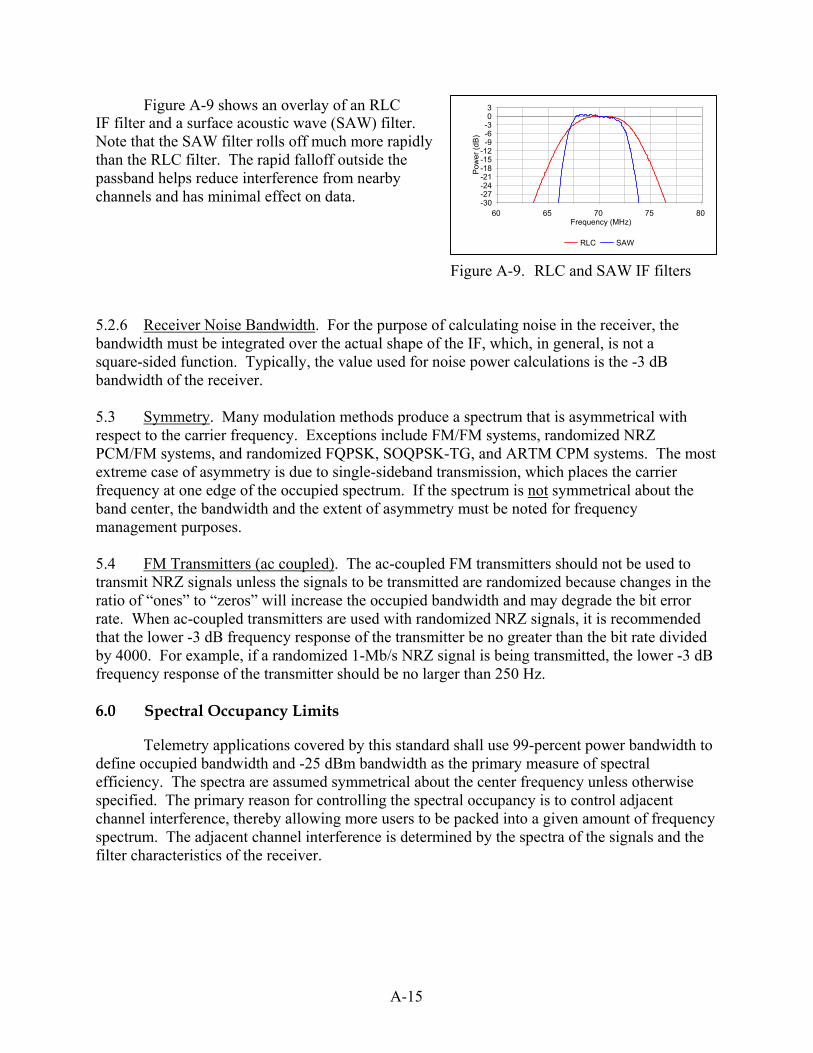
Figure A-9 shows an overlay of an RLC
Figure A-9. RLC and SAW IF filters
-30 -27 -24 -21 -18 -15 -12 -9 -6 -3 0 3
Pow
er (d
B)
60 65 70 75 80 Frequency (MHz)
RLC SAW
IF filter and a surface acoustic wave (SAW) filter. Note that the SAW filter rolls off much more rapidly than the RLC filter. The rapid falloff outside the passband helps reduce interference from nearby channels and has minimal effect on data. 5.2.6 Receiver Noise Bandwidth. For the purpose of calculating noise in the receiver, the bandwidth must be integrated over the actual shape of the IF, which, in general, is not a square-sided function. Typically, the value used for noise power calculations is the -3 dB bandwidth of the receiver. 5.3 Symmetry. Many modulation methods produce a spectrum that is asymmetrical with respect to the carrier frequency. Exceptions include FM/FM systems, randomized NRZ PCM/FM systems, and randomized FQPSK, SOQPSK-TG, and ARTM CPM systems. The most extreme case of asymmetry is due to single-sideband transmission, which places the carrier frequency at one edge of the occupied spectrum. If the spectrum is not symmetrical about the band center, the bandwidth and the extent of asymmetry must be noted for frequency management purposes. 5.4 FM Transmitters (ac coupled). The ac-coupled FM transmitters should not be used to transmit NRZ signals unless the signals to be transmitted are randomized because changes in the ratio of “ones” to “zeros” will increase the occupied bandwidth and may degrade the bit error rate. When ac-coupled transmitters are used with randomized NRZ signals, it is recommended that the lower -3 dB frequency response of the transmitter be no greater than the bit rate divided by 4000. For example, if a randomized 1-Mb/s NRZ signal is being transmitted, the lower -3 dB frequency response of the transmitter should be no larger than 250 Hz. 6.0 Spectral Occupancy Limits Telemetry applications covered by this standard shall use 99-percent power bandwidth to define occupied bandwidth and -25 dBm bandwidth as the primary measure of spectral efficiency. The spectra are assumed symmetrical about the center frequency unless otherwise specified. The primary reason for controlling the spectral occupancy is to control adjacent channel interference, thereby allowing more users to be packed into a given amount of frequency spectrum. The adjacent channel interference is determined by the spectra of the signals and the filter characteristics of the receiver.
A-15
6.1 Spectral Mask. One common method of describing the spectral occupancy limits is a spectral mask. The aeronautical telemetry spectral mask is described below. Note that the mask in this standard is different than the masks contained in the earlier versions of the Telemetry Standards. All spectral components larger than –(55 + 10×log(P)) dBc, (i.e. larger than -25 dBm) at the transmitter output must be within the spectral mask calculated using the following equation:
( )mRffffRKf cc ≥−−−+= ;log100log90M (A-10)
where M(f) = power (dBc) at frequency f (MHz) K = -20 for analog signals K = -28 for binary signals K = -61 for FQPSK-B, FQPSK-JR, SOQPSK-TG K = -73 for ARTM CPM fc = transmitter center frequency (MHz) R = bit rate (Mb/s) for digital signals or for analog FM signals ( )(MHzff max+∆ ) m = number of states in modulating signal; m = 2 for binary signals m = 4 for quaternary signals and analog signals ∆ f = peak deviation fmax = maximum modulation frequency These bandwidths are measured using a spectrum analyzer with settings of 30-kHz resolution bandwidth, 300-Hz video bandwidth, and no max hold detector or averaging. Note that these settings are different than those listed in previous editions of the Telemetry Standards. The changes were made to get more consistent results with various bit rates and spectrum analyzers. The spectra measured with these settings give slightly larger power levels than with the previous settings; this is why the value of “K” was changed from –63 to –61 for FQPSK and SOQPSK signals. The power levels near center frequency should be approximately J −10log(R) dBc where J= −10 for ARTM CPM, −12 for FQPSK and SOQPSK-TG, and −15.5 for PCM/FM signals. For a bit rate of 5 Mb/s, the levels would be approximately -17 dBc for ARTM CPM, -19 dBc for FQPSK, and -22.5 dBc for PCM/FM. If the power levels near center frequency are not within 3 dB of these values, then a measurement problem exists and the carrier power level (0 dBc) and spectrum analyzer settings should be verified. The -25 dBm bandwidth is not required to be narrower than 1 MHz. The first term “K” in equation (A-10) accounts for bandwidth differences between modulation methods. Equation (A-10) can be rewritten as M(f) = K – 10logR – 100log|(f−fc)/R|. When equation (A-10) is written this way, the 10logR term accounts for the increased spectral spreading and decreased power per unit bandwidth as the modulation rate increases. The last term forces the spectral mask to roll off at 30-dB/octave (100-dB/decade). Any error detection or error correction bits, which are added to the data stream, are counted as bits for the purposes of this spectral mask.
A-16
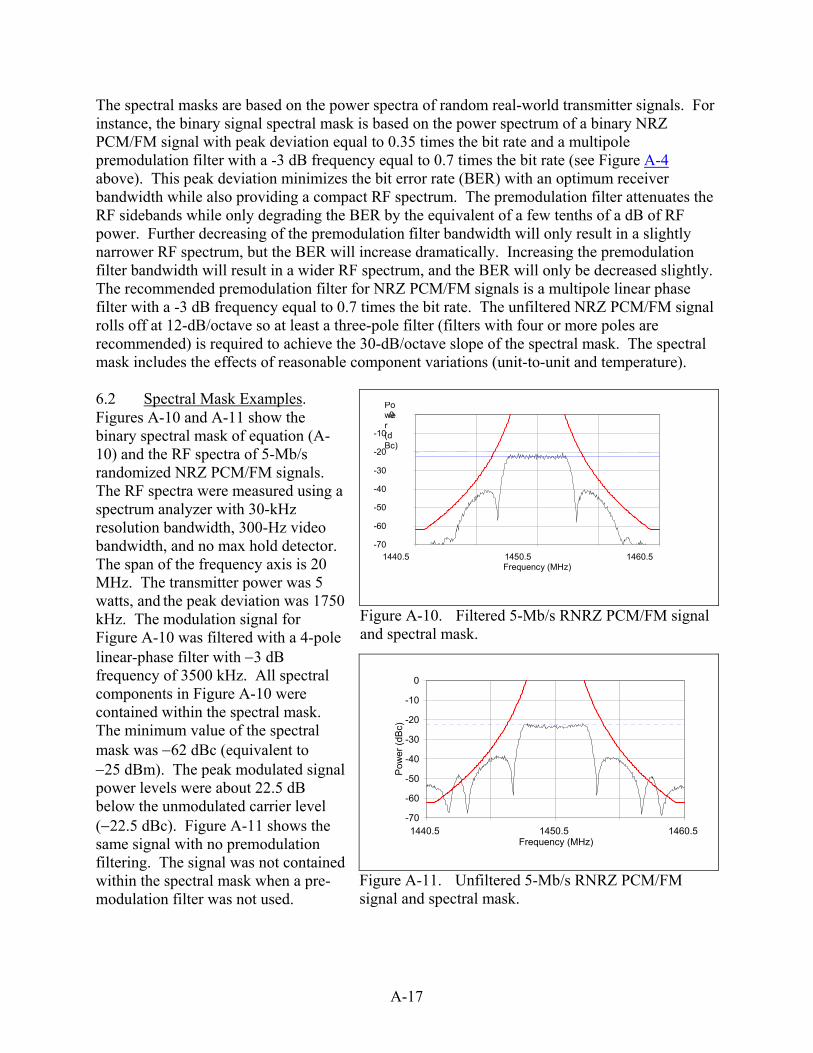
The spectral masks are based on the power spectra of random real-world transmitter signals. For instance, the binary signal spectral mask is based on the power spectrum of a binary NRZ PCM/FM signal with peak deviation equal to 0.35 times the bit rate and a multipole premodulation filter with a -3 dB frequency equal to 0.7 times the bit rate (see Figure A-4 above). This peak deviation minimizes the bit error rate (BER) with an optimum receiver bandwidth while also providing a compact RF spectrum. The premodulation filter attenuates the RF sidebands while only degrading the BER by the equivalent of a few tenths of a dB of RF power. Further decreasing of the premodulation filter bandwidth will only result in a slightly narrower RF spectrum, but the BER will increase dramatically. Increasing the premodulation filter bandwidth will result in a wider RF spectrum, and the BER will only be decreased slightly. The recommended premodulation filter for NRZ PCM/FM signals is a multipole linear phase filter with a -3 dB frequency equal to 0.7 times the bit rate. The unfiltered NRZ PCM/FM signal rolls off at 12-dB/octave so at least a three-pole filter (filters with four or more poles are recommended) is required to achieve the 30-dB/octave slope of the spectral mask. The spectral mask includes the effects of reasonable component variations (unit-to-unit and temperature). 6.2 Spectral Mask Examples.
Figure A-10. Filtered 5-Mb/s RNRZ PCM/FM signal and spectral mask.
-70
-60
-50
-40
-30
-20
-10
0 Power (dBc)
1440.5 1450.5 1460.5 Frequency (MHz)
-70
-60
-50
-40
-30
-20
-10
0
Pow
er (d
Bc)
1440.5 1450.5 1460.5 Frequency (MHz)
Figure A-11. Unfiltered 5-Mb/s RNRZ PCM/FM signal and spectral mask.
Figures A-10 and A-11 show the binary spectral mask of equation (A-10) and the RF spectra of 5-Mb/s randomized NRZ PCM/FM signals. The RF spectra were measured using a spectrum analyzer with 30-kHz resolution bandwidth, 300-Hz video bandwidth, and no max hold detector. The span of the frequency axis is 20 MHz. The transmitter power was 5 watts, and the peak deviation was 1750 kHz. The modulation signal for Figure A-10 was filtered with a 4-pole linear-phase filter with −3 dB frequency of 3500 kHz. All spectral components in Figure A-10 were contained within the spectral mask. The minimum value of the spectral mask was −62 dBc (equivalent to −25 dBm). The peak modulated signal power levels were about 22.5 dB below the unmodulated carrier level (−22.5 dBc). Figure A-11 shows the same signal with no premodulation filtering. The signal was not contained within the spectral mask when a pre-modulation filter was not used.
A-17
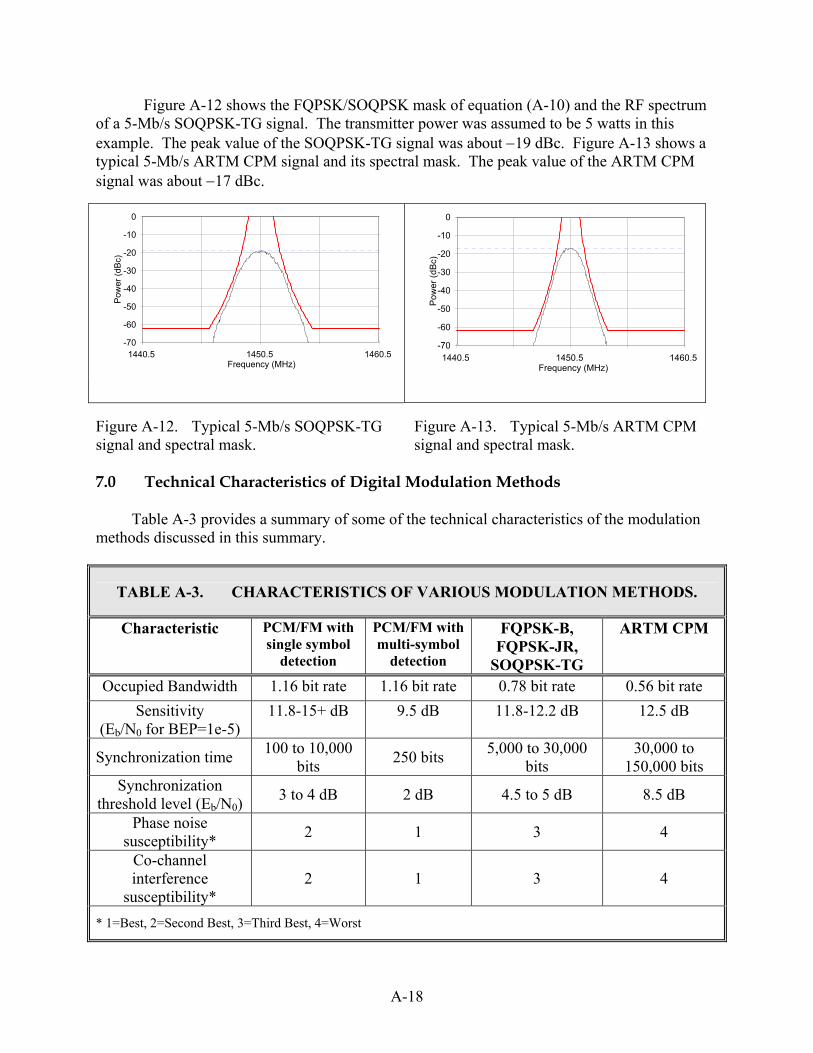
Figure A-12 shows the FQPSK/SOQPSK mask of equation (A-10) and the RF spectrum of a 5-Mb/s SOQPSK-TG signal. The transmitter power was assumed to be 5 watts in this example. The peak value of the SOQPSK-TG signal was about −19 dBc. Figure A-13 shows a typical 5-Mb/s ARTM CPM signal and its spectral mask. The peak value of the ARTM CPM signal was about −17 dBc.
7.0 Technical Characteristics of Digital Modulation Methods Table A-3 provides a summary of some of the technical characteristics of the modulation methods discussed in this summary.
TABLE A-3. CHARACTERISTICS OF VARIOUS MODULATION METHODS.
Characteristic PCM/FM with single symbol
detection
PCM/FM with multi-symbol
detection
FQPSK-B, FQPSK-JR,
SOQPSK-TG
ARTM CPM
Occupied Bandwidth 1.16 bit rate 1.16 bit rate 0.78 bit rate 0.56 bit rate Sensitivity
(Eb/N0 for BEP=1e-5) 11.8-15+ dB 9.5 dB 11.8-12.2 dB 12.5 dB
Synchronization time 100 to 10,000 bits 250 bits 5,000 to 30,000
bits 30,000 to
150,000 bits Synchronization
threshold level (Eb/N0) 3 to 4 dB 2 dB 4.5 to 5 dB 8.5 dB
Phase noise susceptibility* 2 1 3 4
Co-channel interference
susceptibility* 2 1 3 4
* 1=Best, 2=Second Best, 3=Third Best, 4=Worst
-70
-60
-50
-40
-30
-20
-10
0
Pow
er (d
Bc)
1440.5 1450.5 1460.5 Frequency (MHz)
-70
-60
-50
-40
-30
-20
-10
0
Pow
er (d
Bc)
1440.5 1450.5 1460.5 Frequency (MHz)
Figure A-12. Typical 5-Mb/s SOQPSK-TG signal and spectral mask.
Figure A-13. Typical 5-Mb/s ARTM CPM signal and spectral mask.
A-18
8.0 FQPSK-B and FQPSK-JR Characteristics
Figure A-14. OQPSK modulator.
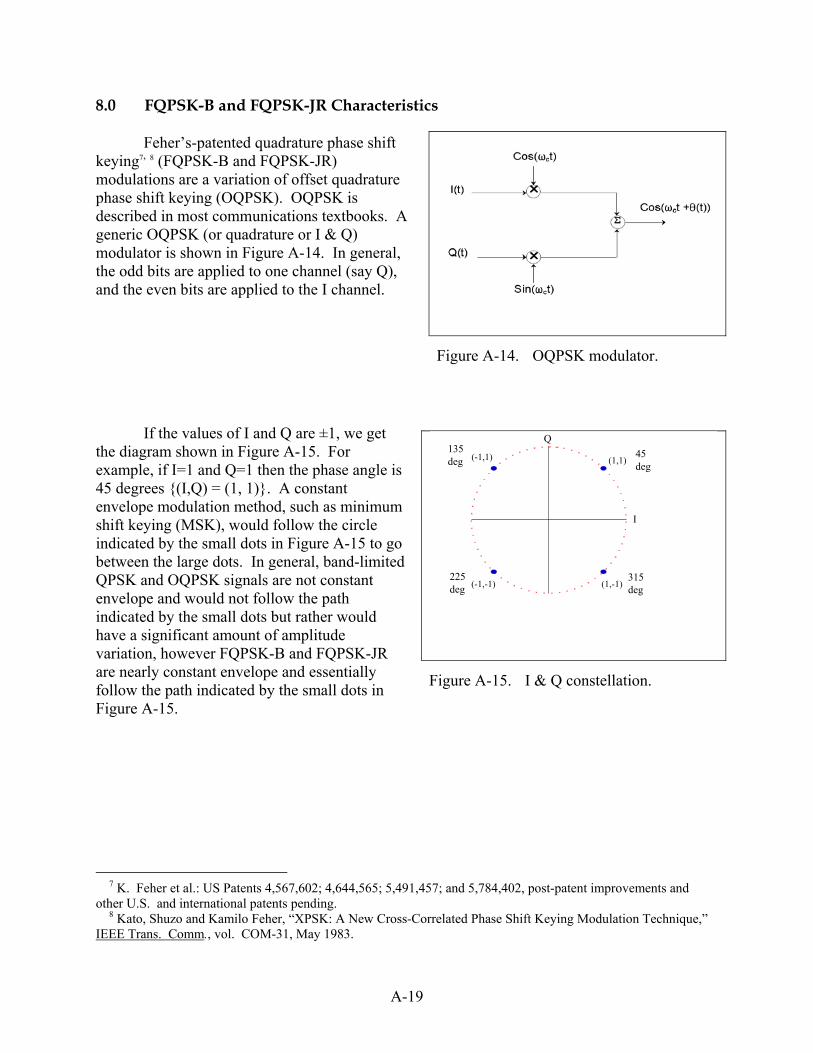
Feher’s-patented quadrature phase shift keying7, 8 (FQPSK-B and FQPSK-JR) modulations are a variation of offset quadrature phase shift keying (OQPSK). OQPSK is described in most communications textbooks. A generic OQPSK (or quadrature or I & Q) modulator is shown in Figure A-14. In general, the odd bits are applied to one channel (say Q), and the even bits are applied to the I channel.
If the values of I and Q are ±1, we get the diagram shown in Figure A-15. For example, if I=1 and Q=1 then the phase angle is 45 degrees {(I,Q) = (1, 1)}. A constant envelope modulation method, such as minimum shift keying (MSK), would follow the circle indicated by the small dots in Figure A-15 to go between the large dots. In general, band-limited QPSK and OQPSK signals are not constant envelope and would not follow the path indicated by the small dots but rather would have a significant amount of amplitude variation, however FQPSK-B and FQPSK-JR are nearly constant envelope and essentially follow the path indicated by the small dots in Figure A-15.
Figure A-15. I & Q constellation.
-1
0
1
-1 0 1
(-1,1)
(-1,-1) (1,-1)
I
Q
(1,1)45deg
135deg
225deg
315deg
7 K. Feher et al.: US Patents 4,567,602; 4,644,565; 5,491,457; and 5,784,402, post-patent improvements and other U.S. and international patents pending. 8 Kato, Shuzo and Kamilo Feher, “XPSK: A New Cross-Correlated Phase Shift Keying Modulation Technique,” IEEE Trans. Comm., vol. COM-31, May 1983.
A-19
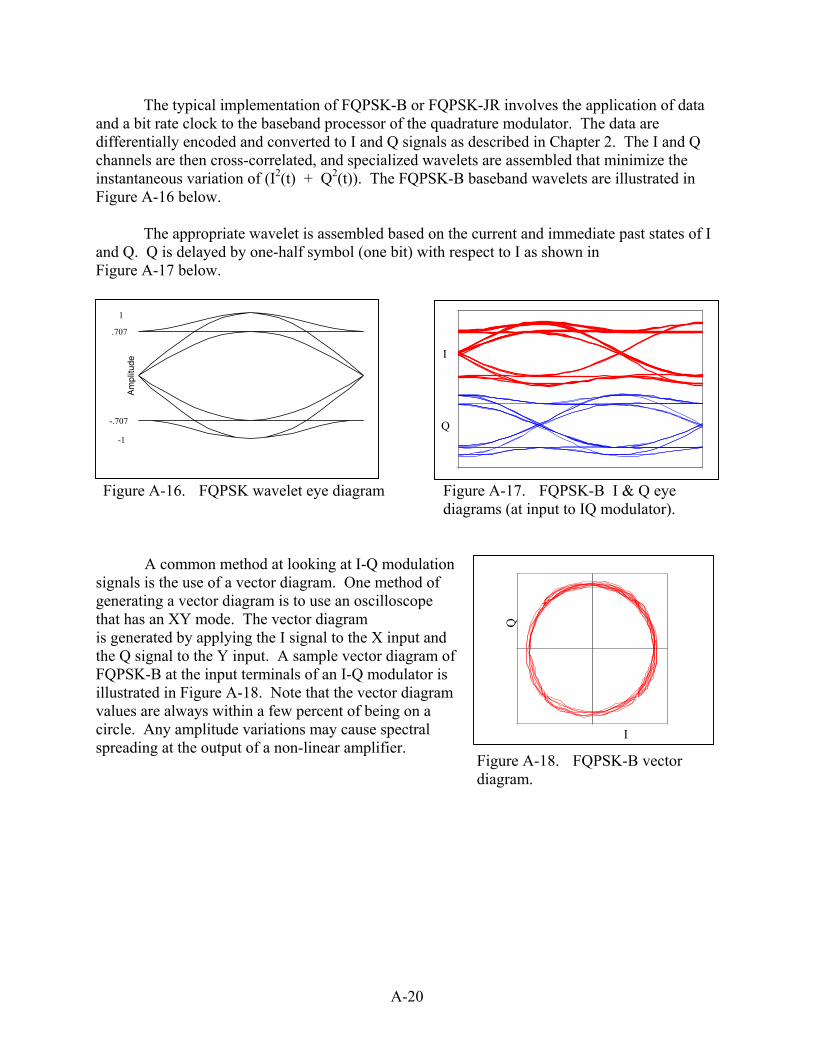
The typical implementation of FQPSK-B or FQPSK-JR involves the application of data and a bit rate clock to the baseband processor of the quadrature modulator. The data are differentially encoded and converted to I and Q signals as described in Chapter 2. The I and Q channels are then cross-correlated, and specialized wavelets are assembled that minimize the instantaneous variation of (I2(t) + Q2(t)). The FQPSK-B baseband wavelets are illustrated in Figure A-16 below.
The appropriate wavelet is assembled based on the current and immediate past states of I
and Q. Q is delayed by one-half symbol (one bit) with respect to I as shown in Figure A-17 below.
1
3
Am
plitu
de
0 1
.707
-.707
1
-1
0.4
2.6
0 3
I
Q
Figure A-16. FQPSK wavelet eye diagram Figure A-17. FQPSK-B I & Q eye diagrams (at input to IQ modulator).
A common method at looking at I-Q modulation signals is the use of a vector diagram. One method of generating a vector diagram is to use an oscilloscope that has an XY mode. The vector diagram
-0.5
0
0.5
Q
-0.5 0 0.5
I
is generated by applying the I signal to the X input and the Q signal to the Y input. A sample vector diagram of FQPSK-B at the input terminals of an I-Q modulator is illustrated in Figure A-18. Note that the vector diagram values are always within a few percent of being on a circle. Any amplitude variations may cause spectral spreading at the output of a non-linear amplifier.
Figure A-18. FQPSK-B vector diagram.
A-20
-70
-60
-50
-40
-30
-20
-10
0
Pow
er (d
Bc)
-1 -0.5 0 0.5 1 Relative Frequency (Bit Rate=1)
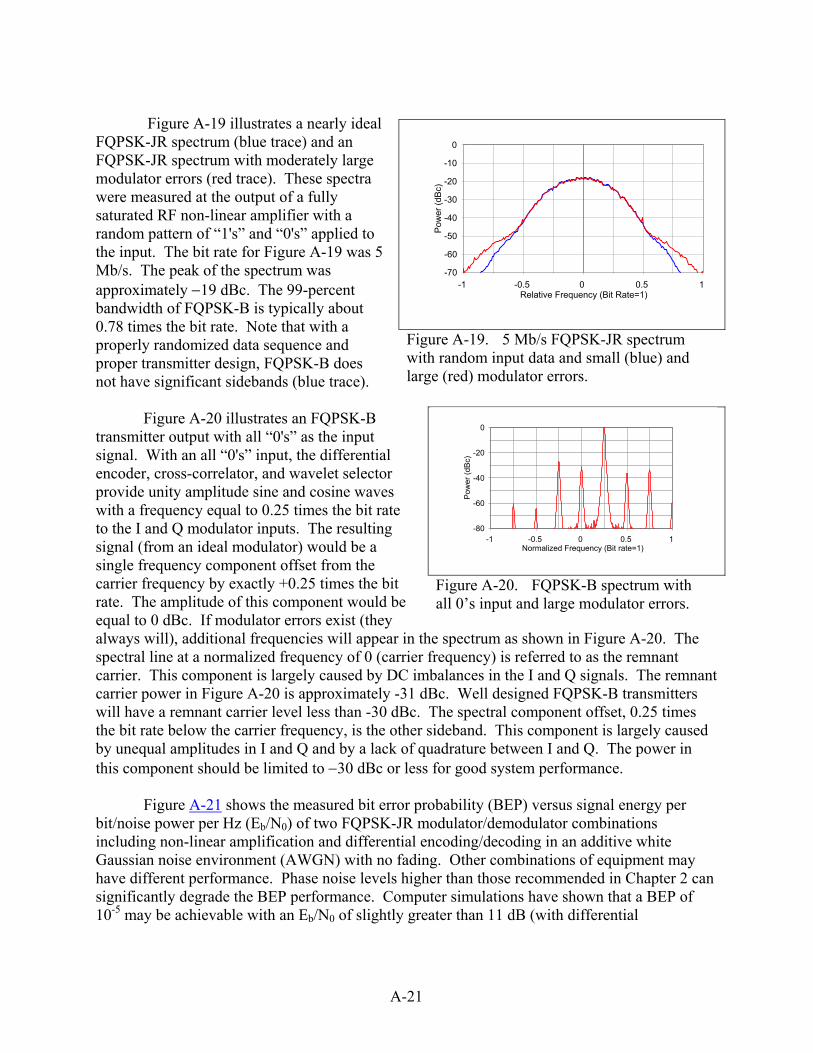
Figure A-19 illustrates a nearly ideal
FQPSK-JR spectrum (blue trace) and an FQPSK-JR spectrum with moderately large modulator errors (red trace). These spectra were measured at the output of a fully saturated RF non-linear amplifier with a random pattern of “1's” and “0's” applied to the input. The bit rate for Figure A-19 was 5 Mb/s. The peak of the spectrum was approximately −19 dBc. The 99-percent bandwidth of FQPSK-B is typically about 0.78 times the bit rate. Note that with a properly randomized data sequence and proper transmitter design, FQPSK-B does not have significant sidebands (blue trace).
Figure A-20 illustrates an FQPSK-B
transmitter output with all “0's” as the input signal. With an all “0's” input, the differential encoder, cross-correlator, and wavelet selector provide unity amplitude sine and cosine waves with a frequency equal to 0.25 times the bit rate to the I and Q modulator inputs. The resulting signal (from an ideal modulator) would be a single frequency component offset from the carrier frequency by exactly +0.25 times the bit rate. The amplitude of this component would be equal to 0 dBc. If modulator errors exist (they always will), additional frequencies will appear in the spectrum as shown in Figure A-20. The spectral line at a normalized frequency of 0 (carrier frequency) is referred to as the remnant carrier. This component is largely caused by DC imbalances in the I and Q signals. The remnant carrier power in Figure A-20 is approximately -31 dBc. Well designed FQPSK-B transmitters will have a remnant carrier level less than -30 dBc. The spectral component offset, 0.25 times the bit rate below the carrier frequency, is the other sideband. This component is largely caused by unequal amplitudes in I and Q and by a lack of quadrature between I and Q. The power in this component should be limited to −30 dBc or less for good system performance.
Figure A-19. 5 Mb/s FQPSK-JR spectrum with random input data and small (blue) and large (red) modulator errors.
Figure A-20. FQPSK-B spectrum with all 0’s input and large modulator errors.
-80
-60
-40
-20
0
Pow
er (d
Bc)
-1 -0.5 0 0.5 1 Normalized Frequency (Bit rate=1)
Figure A-21 shows the measured bit error probability (BEP) versus signal energy per
bit/noise power per Hz (Eb/N0) of two FQPSK-JR modulator/demodulator combinations including non-linear amplification and differential encoding/decoding in an additive white Gaussian noise environment (AWGN) with no fading. Other combinations of equipment may have different performance. Phase noise levels higher than those recommended in Chapter 2 can significantly degrade the BEP performance. Computer simulations have shown that a BEP of 10-5 may be achievable with an Eb/N0 of slightly greater than 11 dB (with differential
A-21
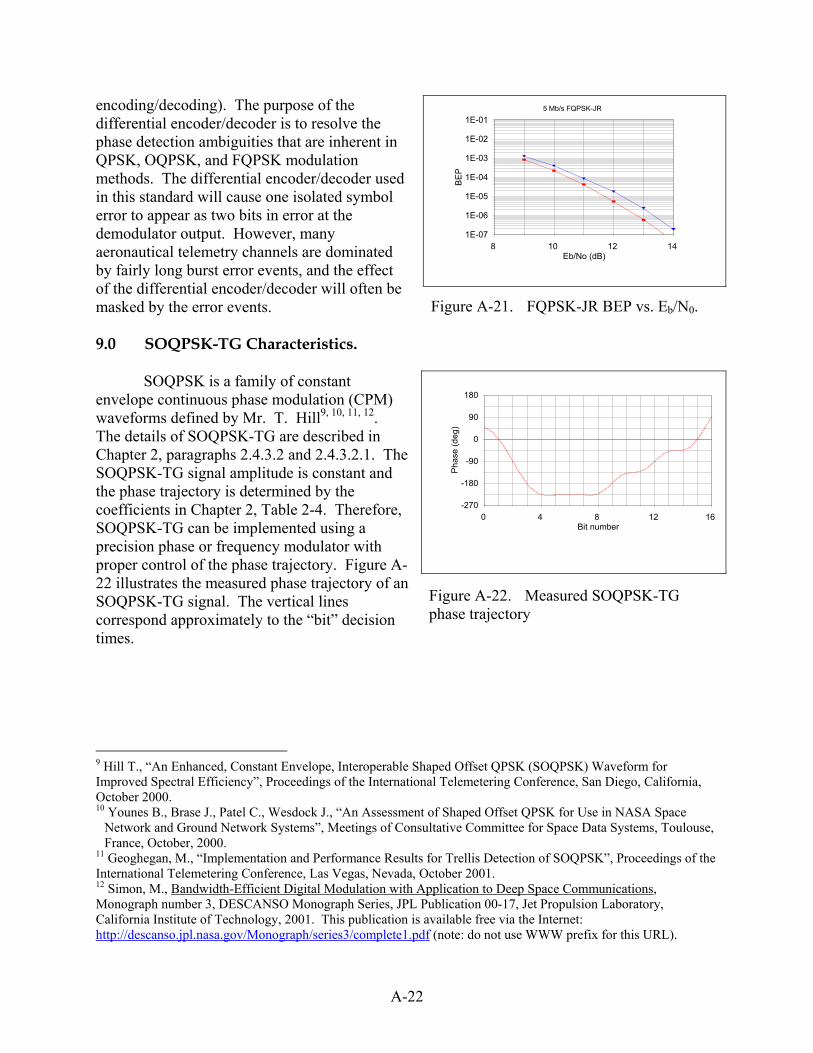
encoding/decoding). The purpose of the differential encoder/decoder is to resolve the phase detection ambiguities that are inherent in QPSK, OQPSK, and FQPSK modulation methods. The differential encoder/decoder used in this standard will cause one isolated symbol error to appear as two bits in error at the demodulator output. However, many aeronautical telemetry channels are dominated by fairly long burst error events, and the effect of the differential encoder/decoder will often be masked by the error events.
Figure A-21. FQPSK-JR BEP vs. Eb/N0.
1E-07
1E-06
1E-05
1E-04
1E-03
1E-02
1E-01
BE
P
8 10 12 14 Eb/No (dB)
5 Mb/s FQPSK-JR
9.0 SOQPSK-TG Characteristics.
SOQPSK is a family of constant envelope continuous phase modulation (CPM) waveforms defined by Mr. T. Hill9, 10, 11, 12. The details of SOQPSK-TG are described in Chapter 2, paragraphs 2.4.3.2 and 2.4.3.2.1. The SOQPSK-TG signal amplitude is constant and the phase trajectory is determined by the coefficients in Chapter 2, Table 2-4. Therefore, SOQPSK-TG can be implemented using a precision phase or frequency modulator with proper control of the phase trajectory. Figure A-22 illustrates the measured phase trajectory of an SOQPSK-TG signal. The vertical lines correspond approximately to the “bit” decision times.
-270
-180
-90
0
90
180
Pha
se (d
eg)
0 4 8 12 16 Bit number
Figure A-22. Measured SOQPSK-TG phase trajectory
9 Hill T., “An Enhanced, Constant Envelope, Interoperable Shaped Offset QPSK (SOQPSK) Waveform for Improved Spectral Efficiency”, Proceedings of the International Telemetering Conference, San Diego, California, October 2000. 10 Younes B., Brase J., Patel C., Wesdock J., “An Assessment of Shaped Offset QPSK for Use in NASA Space
Network and Ground Network Systems”, Meetings of Consultative Committee for Space Data Systems, Toulouse, France, October, 2000.
11 Geoghegan, M., “Implementation and Performance Results for Trellis Detection of SOQPSK”, Proceedings of the International Telemetering Conference, Las Vegas, Nevada, October 2001. 12 Simon, M., Bandwidth-Efficient Digital Modulation with Application to Deep Space Communications, Monograph number 3, DESCANSO Monograph Series, JPL Publication 00-17, Jet Propulsion Laboratory, California Institute of Technology, 2001. This publication is available free via the Internet: http://descanso.jpl.nasa.gov/Monograph/series3/complete1.pdf (note: do not use WWW prefix for this URL).
A-22
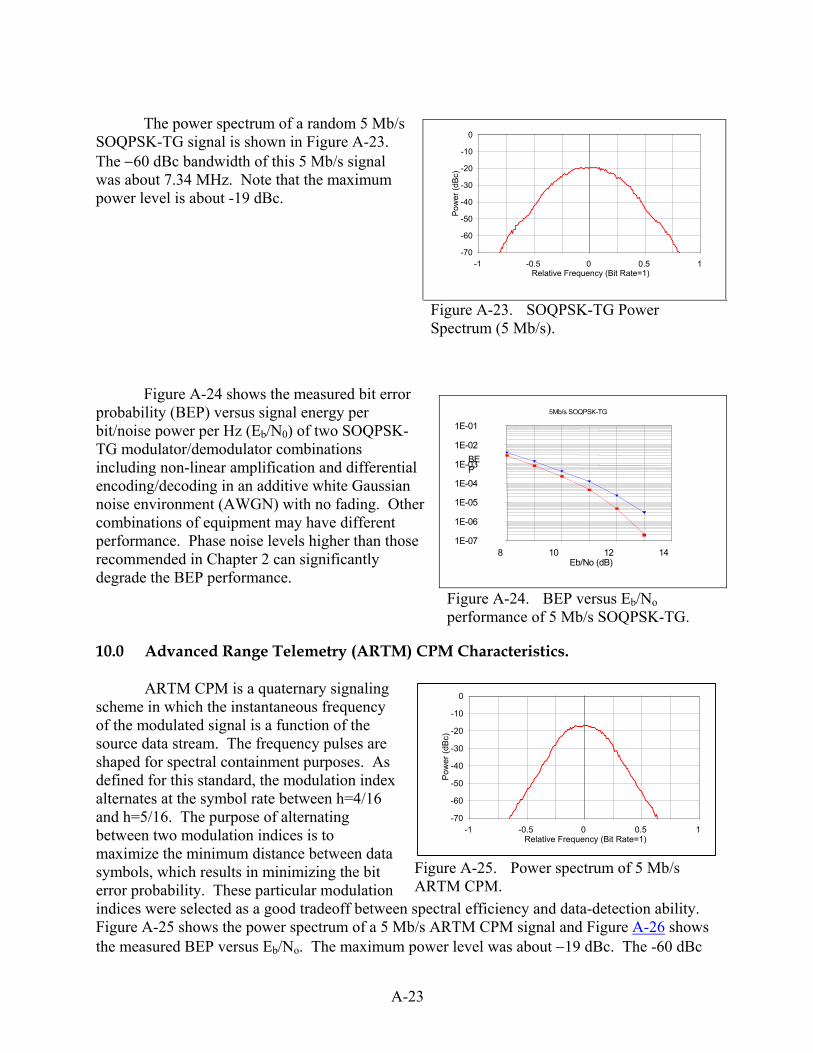
The power spectrum of a random 5 Mb/s SOQPSK-TG signal is shown in Figure A-23. The −60 dBc bandwidth of this 5 Mb/s signal was about 7.34 MHz. Note that the maximum power level is about -19 dBc.
Figure A-23. SOQPSK-TG Power Spectrum (5 Mb/s).
-70
-60
-50
-40
-30
-20
-10
0
Pow
er (d
Bc)
-1 -0.5 0 0.5 1 Relative Frequency (Bit Rate=1)
Figure A-24 shows the measured bit error
probability (BEP) versus signal energy per bit/noise power per Hz (Eb/N0) of two SOQPSK-TG modulator/demodulator combinations including non-linear amplification and differential encoding/decoding in an additive white Gaussian noise environment (AWGN) with no fading. Other combinations of equipment may have different performance. Phase noise levels higher than those recommended in Chapter 2 can significantly degrade the BEP performance.
Figure A-24. BEP versus Eb/No performance of 5 Mb/s SOQPSK-TG.
1E-07
1E-06
1E-05
1E-04
1E-03
1E-02
1E-01
BEP
8 10 12 14 Eb/No (dB)
5Mb/s SOQPSK-TG
10.0 Advanced Range Telemetry (ARTM) CPM Characteristics. ARTM CPM is a quaternary signaling scheme in which the instantaneous frequency of the modulated signal is a function of the source data stream. The frequency pulses are shaped for spectral containment purposes. As defined for this standard, the modulation index alternates at the symbol rate between h=4/16 and h=5/16. The purpose of alternating between two modulation indices is to maximize the minimum distance between data symbols, which results in minimizing the bit error probability. These particular modulation indices were selected as a good tradeoff between spectral efficiency and data-detection ability. Figure A-25 shows the power spectrum of a 5 Mb/s ARTM CPM signal and Figure A-26 shows the measured BEP versus Eb/No. The maximum power level was about −19 dBc. The -60 dBc
Figure A-25. Power spectrum of 5 Mb/s ARTM CPM.
-70
-60
-50
-40
-30
-20
-10
0
Pow
er (d
Bc)
-1 -0.5 0 0.5 1 Relative Frequency (Bit Rate=1)
A-23
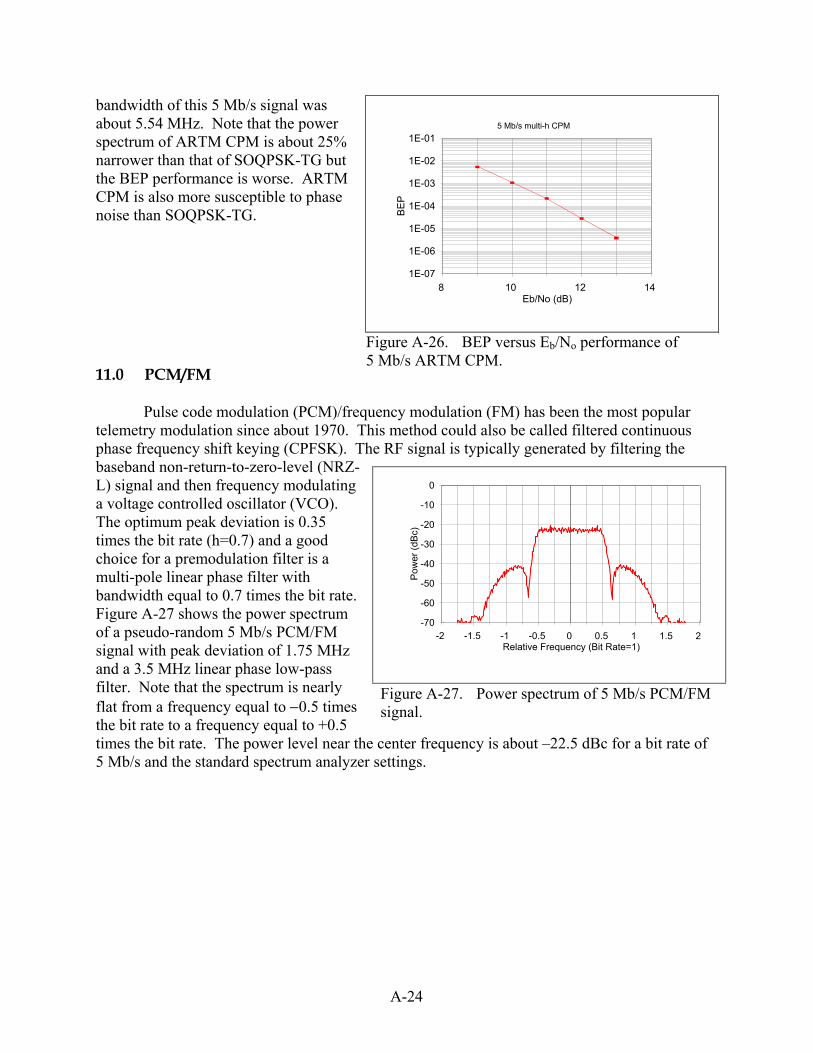
bandwidth of this 5 Mb/s signal was about 5.54 MHz. Note that the power spectrum of ARTM CPM is about 25% narrower than that of SOQPSK-TG but the BEP performance is worse. ARTM CPM is also more susceptible to phase noise than SOQPSK-TG.
Figure A-26. BEP versus Eb/No performance of 5 Mb/s ARTM CPM.
1E-07
1E-06
1E-05
1E-04
1E-03
1E-02
1E-01
BE
P
8 10 12 14 Eb/No (dB)
5 Mb/s multi-h CPM
11.0 PCM/FM
Pulse code modulation (PCM)/frequency modulation (FM) has been the most popular telemetry modulation since about 1970. This method could also be called filtered continuous phase frequency shift keying (CPFSK). The RF signal is typically generated by filtering the baseband non-return-to-zero-level (NRZ-L) signal and then frequency modulating a voltage controlled oscillator (VCO). The optimum peak deviation is 0.35 times the bit rate (h=0.7) and a good choice for a premodulation filter is a multi-pole linear phase filter with bandwidth equal to 0.7 times the bit rate. Figure A-27 shows the power spectrum of a pseudo-random 5 Mb/s PCM/FM signal with peak deviation of 1.75 MHz and a 3.5 MHz linear phase low-pass filter. Note that the spectrum is nearly flat from a frequency equal to −0.5 times the bit rate to a frequency equal to +0.5 times the bit rate. The power level near the center frequency is about –22.5 dBc for a bit rate of 5 Mb/s and the standard spectrum analyzer settings.
Figure A-27. Power spectrum of 5 Mb/s PCM/FM signal.
-70
-60
-50
-40
-30
-20
-10
0
Pow
er (d
Bc)
-2 -1.5 -1 -0.5 0 0.5 1 1.5 2 Relative Frequency (Bit Rate=1)
A-24
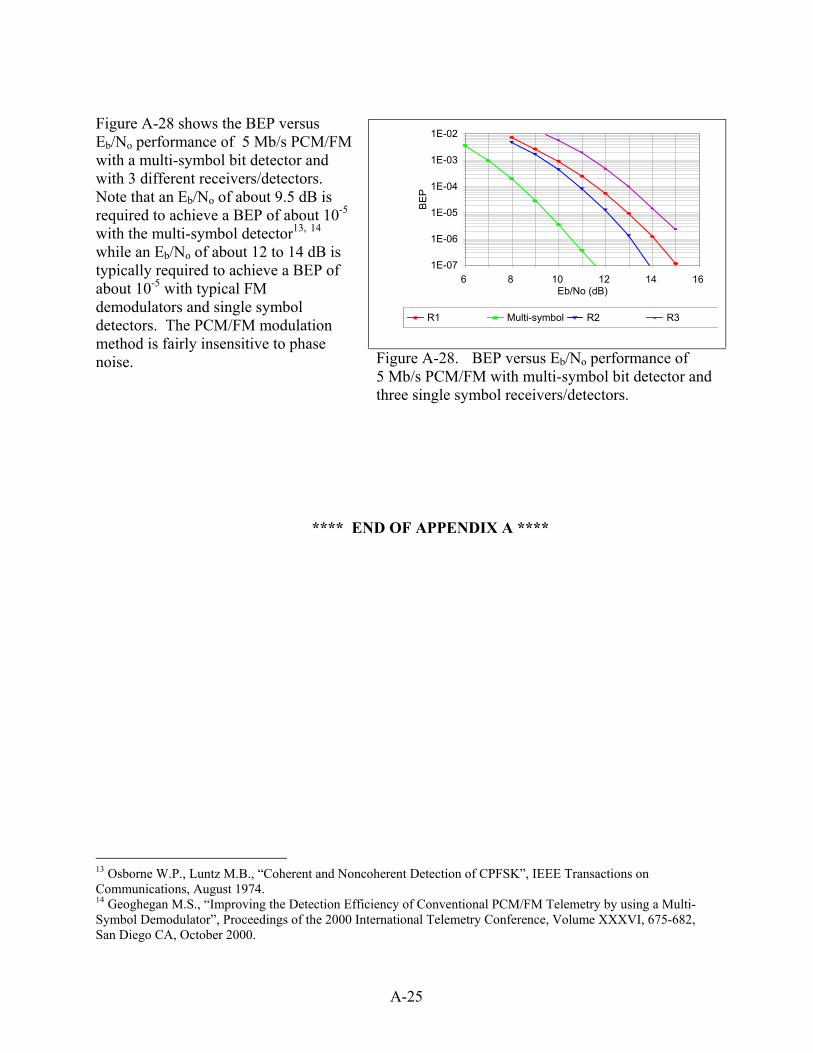
Figure A-28 shows the BEP versus Eb/No performance of 5 Mb/s PCM/FM with a multi-symbol bit detector and with 3 different receivers/detectors. Note that an Eb/No of about 9.5 dB is required to achieve a BEP of about 10-5 with the multi-symbol detector13, 14 while an Eb/No of about 12 to 14 dB is typically required to achieve a BEP of about 10-5 with typical FM demodulators and single symbol detectors. The PCM/FM modulation method is fairly insensitive to phase noise.
Figure A-28. BEP versus Eb/No performance of 5 Mb/s PCM/FM with multi-symbol bit detector and three single symbol receivers/detectors.
1E-07
1E-06
1E-05
1E-04
1E-03
1E-02
BE
P
6 8 10 12 14 16 Eb/No (dB)
R1 Multi-symbol R2 R3
**** END OF APPENDIX A ****
13 Osborne W.P., Luntz M.B., “Coherent and Noncoherent Detection of CPFSK”, IEEE Transactions on Communications, August 1974. 14 Geoghegan M.S., “Improving the Detection Efficiency of Conventional PCM/FM Telemetry by using a Multi-Symbol Demodulator”, Proceedings of the 2000 International Telemetry Conference, Volume XXXVI, 675-682, San Diego CA, October 2000.
A-25