Embed Size (px)
Citation preview
ZITHOLELE CONSULTING
Appendix L: Groundwater Pollution Plume Modelling
DUVHA POWER STATION
NUMERICAL POLLUTION PLUME MODEL
MARCH 2015
FINAL REPORT
for
DUVHA POWER STATION
by
GHT CONSULTING SCIENTISTS
PROJECT TEAM L.J. van Niekerk
S. Staats D. Moolman
Project no.: 336-23-ghd.727 Start Date: December 2014 Current Project: Numerical Model Start Date: January 2015 Report no.: RVN 727.1/1566 Report Date: March 2015
31 May 2015 RVN 727.1/1566 Duvha Power Station Environmental Manager Private Bag X2 Rietkuil 1097 FOR ATTENTION: Mrs. Morongwa Molewa Dear Madam
Duvha Power Station – Numerical Pollution Plume Model It is our pleasure to enclose one electronic copy of the draft report: RVN 727.1/1566 "DUVHA POWER STATION – NUMERICAL POLLUTION PLUME MODEL 2014". We trust that the report will fulfil the expectations of Duvha Power Station and we will supply any additional information if required. Yours sincerely,
L.J. van Niekerk. (Pr.Sci.Nat)
Copies: Two (2) hard copies and an electronic copy to Duvha Power Station Although Geo-Hydro Technologies (Pty) Ltd. exercises due care and diligence in rendering services and preparing documents, Geo-Hydro Technologies (Pty) Ltd. accepts no liability, and the client, by receiving this document, indemnifies Geo-Hydro Technologies (Pty) Ltd. and its directors, managers, agents and employees against all action, claims, demands, losses, liabilities, costs, damages and expenses arising from or in connection with services rendered, directly or indirectly by Geo-Hydro Technologies (Pty) Ltd. and by the use of the information contained in this document.
______________________________
This document contains confidential and proprietary information of Geo-Hydro Technologies (Pty) Ltd. and is protected by copyright in favour of Geo-Hydro Technologies (Pty) Ltd. and may not be reproduced, or used without the written consent of Geo-Hydro Technologies (Pty) Ltd., which has been obtained beforehand. This document is prepared exclusively for ESKOM Duvha Power Station and is subject to all confidentiality, copyright and trade secret rules, intellectual property law and practices of SOUTH AFRICA.
- i -
GHT CONSULTING SCIENTISTS DUVHA POWER STATION – NUMERICAL POLLUTION PLUME MODEL - 2014 RVN 727.1/15665
TABLE OF CONTENTS 1 INTRODUCTION 1
1.1 GENERAL 1 1.2 APPROACH TO STUDY 1
2 REGIONAL SETTING AND CLIMATE 2 2.1 RAINFALL DATA 2
3 SURFACE TOPOGRAPHY AND DRAINAGE 4 4 GEOLOGY 6
4.1 GEOLOGICAL SETTING 6 4.2 GEOPHYSICAL DATA 7
4.2.1 Interpretation of airborne magnetic data 7 4.2.2 Ground geophysical investigations 7
4.2.2.1 High Level Ash Water Return Dams 8 4.2.2.2 Low Level Ash Water Return Dam 9 4.2.2.3 Ash Dam 9 4.2.2.4 Raw Water Dam 9 4.2.2.5 Sewage Plant 9 4.2.2.6 Emergency Pan 9
4.3 GEOLOGICAL BOREHOLE LOGS 10 4.3.1 Raw Water Dam 11 4.3.2 Sewage Plant 11 4.3.3 High Level Ash Water Return Dams 11 4.3.4 Emergency Pan 11 4.3.5 Ash Dam 12 4.3.6 Low Level Ash Water Return Dam 12
5 GEOHYDRAULICS 13 5.1 GEOHYDRUALIC PROPERTIES OF THE SHALLOW UPPER AQUIFER (SUPERFICIAL SOILS) 13
5.1.1 Results of granulometric analyses 13 5.2 GEOHYDRUALIC PROPERTIES OF THE DEEP GEOLOGY 14
6 SURFACE- AND GROUNDWATER SAMPLING AND ANALYSES 17 6.1 SURFACE- AND GROUNDWATER QUALITY 18
6.1.1.1 Ashing Area 18 6.1.1.2 Power Station Area 19 6.1.1.3 Sewage Plant Area 19 6.1.1.4 Coal Stockyard Area 19
7 NUMERICAL MODELLING OF GROUNDWATER MIGRATION AND CONTAMINANT TRANSPORT 21
7.1 PREAMBLE 21 7.2 CONCEPTUAL GEOHYDROLOGICAL MODEL 21
7.2.1 Model Input – Hydraulic Parameters 23 7.2.2 Model Input – Groundwater Elevation 26 7.2.3 Model Input – SO4 Concentrations 27 7.2.4 Model Calibration 28
7.3 SENSITIVITY ANALYSIS 30 7.4 MODEL RESULTS – OPERATIONAL PHASE UNTIL 2036 34
7.4.1 Contaminant migration in the shallow geology (operational phase) 34 7.4.2 Contaminant migration in the deep geology (operational phase) 39
7.5 MODEL RESULTS – AFTER DECOMMISSIONING (FROM 2037 UNTIL 2136) 44 7.5.1 Contaminant migration in the shallow geology (after decommissioning) 44 7.5.2 Contaminant migration in the deep geology (after decommissioning) 48
8 CONCLUSIONS AND RECOMMENDATIONS 55 8.1 MODEL RESULTS – OPERATIONAL PHASE UNTIL 2036 56
8.1.1 Contaminant migration in the shallow geology (operational phase) 56 8.1.2 Contaminant migration in the deep geology (operational phase) 56
8.2 MODEL RESULTS – AFTER DECOMMISSIONING UNTIL 2136 57 8.3 RECOMMENDATIONS 57

- ii -
GHT CONSULTING SCIENTISTS DUVHA POWER STATION – NUMERICAL POLLUTION PLUME MODEL - 2014 RVN 727.1/15665
APPENDICES APPENDIX A: Locality Maps APPENDIX B: Geophysical Profiles APPENDIX C: Geological Borehole Logs APPENDIX D: Hydraulic Test Results APPENDIX E: Soil Hydraulic Conductivity Estimation
- 1 -
GHT CONSULTING SCIENTISTS DUVHA POWER STATION – NUMERICAL POLLUTION PLUME MODEL - 2014 RVN 727.1/1566
1 INTRODUCTION
1.1 General GHT was commissioned by Duvha Power Station to update the numerical pollution plume model constructed in 2011 which incorporated the major the pollution sources in and around the Duvha Power Station. This document reports on findings from historical geohydrological investigations as well as on newly gathered data through normal routine monitoring and newly drilled monitoring boreholes.
The numerical pollution plume model incorporates the following pollution sources and dams/reservoirs of Duvha Power Station:
• The Ash Dam,
• The Low Level Ash Water Return Dam,
• The High Level Ash Water Return Dams,
• The Raw Water Dam,
• The Maturation Ponds at the Sewage Plant,
• The Coal Stockyard, and
• The Emergency Pan.
A site map indicating the various power station activities and the positions of the pollution sources and dams that were included in this study is given in Appendix A.
1.2 Approach to study In the development of a complete numerical pollution plume model that covers all of the pollution sources at Duvha Power Station, the following approach was adopted:
• All monitoring data (groundwater levels and chemical analyses of groundwater samples and surface water samples) that has been gathered and captured in the Aquabase database since 2006 was taken into account in constructing, evaluating and calibrating the numerical pollution plume model.
• Data sets from the previously conducted hydraulic tests, as well as from tests performed on four newly drilled monitoring boreholes (two replacement boreholes north of the as stack, and two boreholes north of the station drain dams) were evaluated and used to obtain information on the hydraulic properties of geological formations in the vicinities of the various pollution sources.
• Granulometric results from historical soil samples taken from shallow horizons (of the drilled boreholes and surface locations) were used to evaluate the hydraulic properties of the soils in the vicinities of the dams.
• A conceptual model of the geohydrological environment was developed. Based on the conceptual model, a three dimensional numerical model was developed in order predict the possible migrations and extents of pollution plumes at the different pollution sources. The results of the numerical model were used to evaluate the risks associated with contaminant migration away from these potential pollution sources.
- 2 -
GHT CONSULTING SCIENTISTS DUVHA POWER STATION – NUMERICAL POLLUTION PLUME MODEL - 2014 RVN 727.1/1566
2 REGIONAL SETTING AND CLIMATE
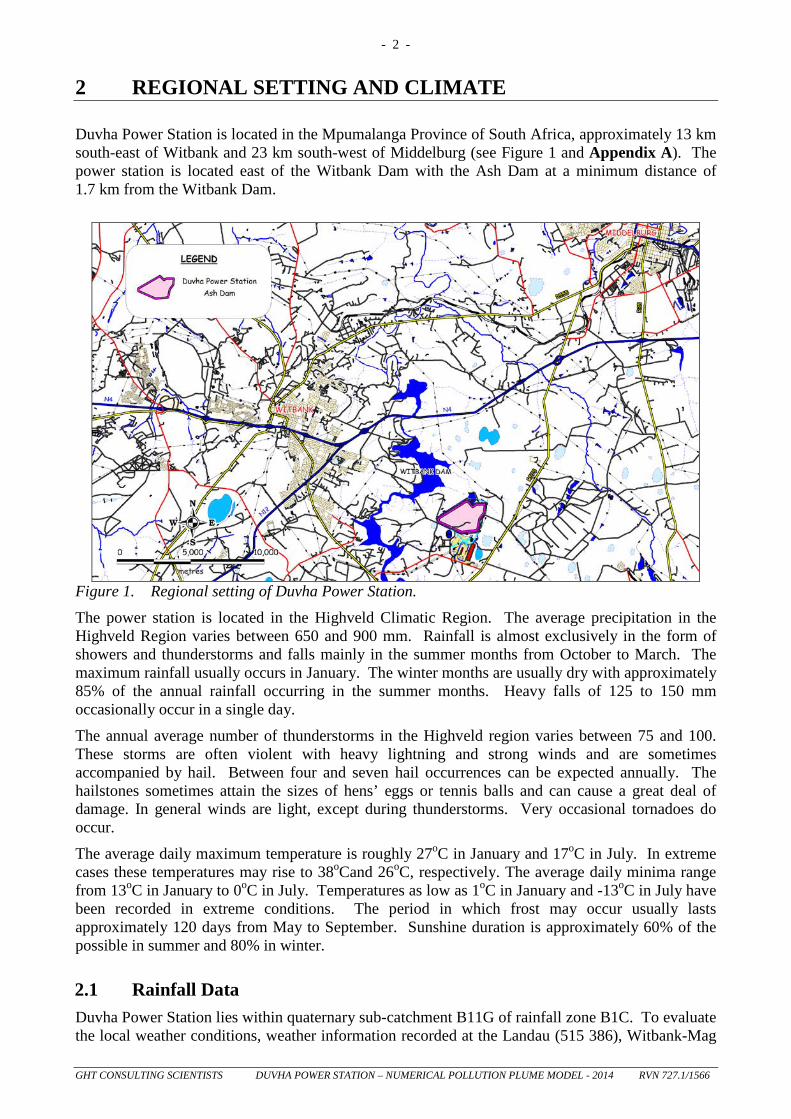
Duvha Power Station is located in the Mpumalanga Province of South Africa, approximately 13 km south-east of Witbank and 23 km south-west of Middelburg (see Figure 1 and Appendix A). The power station is located east of the Witbank Dam with the Ash Dam at a minimum distance of 1.7 km from the Witbank Dam.
Figure 1. Regional setting of Duvha Power Station. The power station is located in the Highveld Climatic Region. The average precipitation in the Highveld Region varies between 650 and 900 mm. Rainfall is almost exclusively in the form of showers and thunderstorms and falls mainly in the summer months from October to March. The maximum rainfall usually occurs in January. The winter months are usually dry with approximately 85% of the annual rainfall occurring in the summer months. Heavy falls of 125 to 150 mm occasionally occur in a single day.
The annual average number of thunderstorms in the Highveld region varies between 75 and 100. These storms are often violent with heavy lightning and strong winds and are sometimes accompanied by hail. Between four and seven hail occurrences can be expected annually. The hailstones sometimes attain the sizes of hens’ eggs or tennis balls and can cause a great deal of damage. In general winds are light, except during thunderstorms. Very occasional tornadoes do occur.
The average daily maximum temperature is roughly 27oC in January and 17oC in July. In extreme cases these temperatures may rise to 38oCand 26oC, respectively. The average daily minima range from 13oC in January to 0oC in July. Temperatures as low as 1oC in January and -13oC in July have been recorded in extreme conditions. The period in which frost may occur usually lasts approximately 120 days from May to September. Sunshine duration is approximately 60% of the possible in summer and 80% in winter.
2.1 Rainfall Data Duvha Power Station lies within quaternary sub-catchment B11G of rainfall zone B1C. To evaluate the local weather conditions, weather information recorded at the Landau (515 386), Witbank-Mag
- 3 -
GHT CONSULTING SCIENTISTS DUVHA POWER STATION – NUMERICAL POLLUTION PLUME MODEL - 2014 RVN 727.1/1566
(515 382) and Witbank-Mun (515 412) weather station will be used. These weather stations are situated at distances of approximately 11.3 to 14.3 km from the power station. The mean annual precipitation at theses weather stations are 689.2, 704.9 and 715.9 mm, respectively.
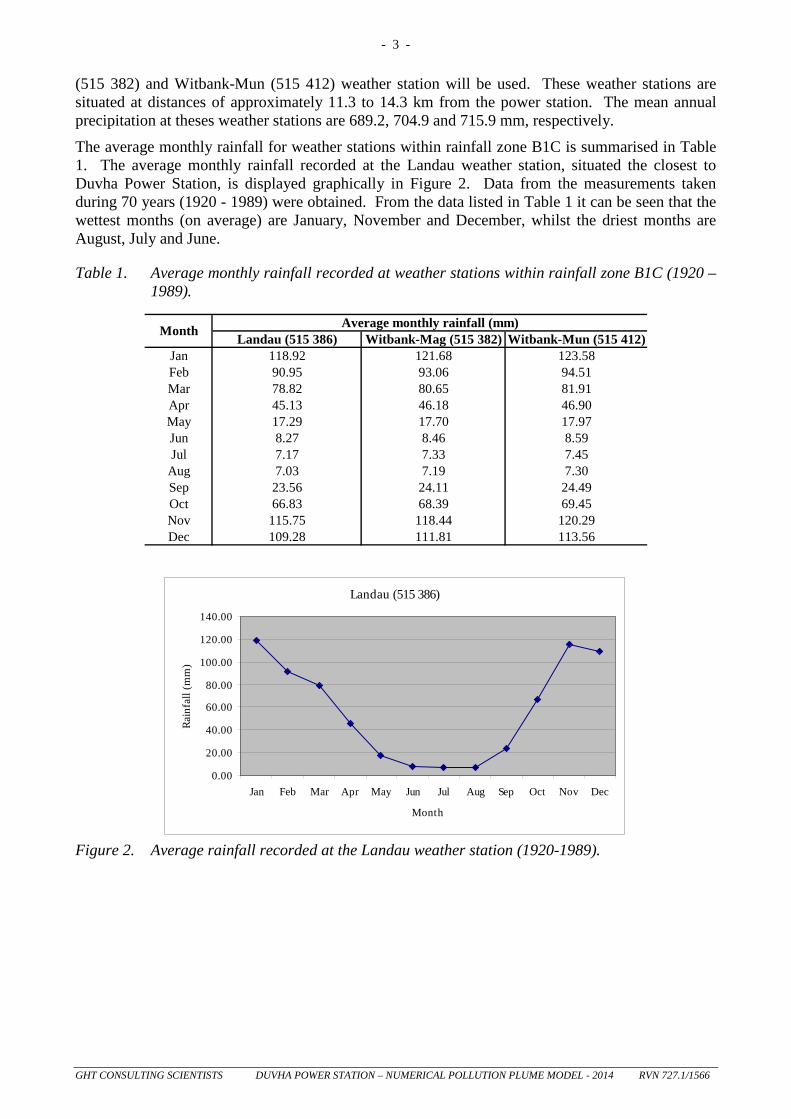
The average monthly rainfall for weather stations within rainfall zone B1C is summarised in Table 1. The average monthly rainfall recorded at the Landau weather station, situated the closest to Duvha Power Station, is displayed graphically in Figure 2. Data from the measurements taken during 70 years (1920 - 1989) were obtained. From the data listed in Table 1 it can be seen that the wettest months (on average) are January, November and December, whilst the driest months are August, July and June.
Table 1. Average monthly rainfall recorded at weather stations within rainfall zone B1C (1920 – 1989).
Landau (515 386) Witbank-Mag (515 382) Witbank-Mun (515 412)Jan 118.92 121.68 123.58Feb 90.95 93.06 94.51Mar 78.82 80.65 81.91Apr 45.13 46.18 46.90May 17.29 17.70 17.97Jun 8.27 8.46 8.59Jul 7.17 7.33 7.45
Aug 7.03 7.19 7.30Sep 23.56 24.11 24.49Oct 66.83 68.39 69.45Nov 115.75 118.44 120.29Dec 109.28 111.81 113.56
Month Average monthly rainfall (mm)
Landau (515 386)
0.00
20.00
40.00
60.00
80.00
100.00
120.00
140.00
Jan Feb Mar Apr May Jun Jul Aug Sep Oct Nov Dec
Month
Rain
fall
(mm
)
Figure 2. Average rainfall recorded at the Landau weather station (1920-1989).
- 4 -
GHT CONSULTING SCIENTISTS DUVHA POWER STATION – NUMERICAL POLLUTION PLUME MODEL - 2014 RVN 727.1/1566
3 SURFACE TOPOGRAPHY AND DRAINAGE
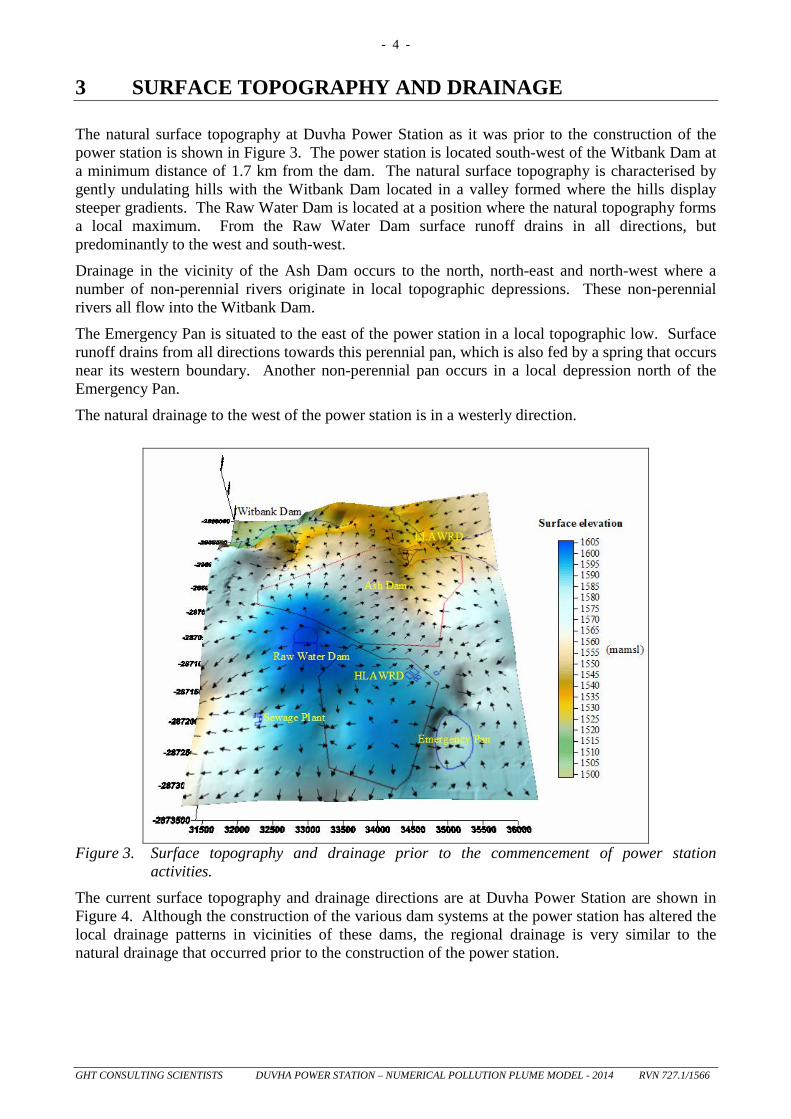
The natural surface topography at Duvha Power Station as it was prior to the construction of the power station is shown in Figure 3. The power station is located south-west of the Witbank Dam at a minimum distance of 1.7 km from the dam. The natural surface topography is characterised by gently undulating hills with the Witbank Dam located in a valley formed where the hills display steeper gradients. The Raw Water Dam is located at a position where the natural topography forms a local maximum. From the Raw Water Dam surface runoff drains in all directions, but predominantly to the west and south-west.
Drainage in the vicinity of the Ash Dam occurs to the north, north-east and north-west where a number of non-perennial rivers originate in local topographic depressions. These non-perennial rivers all flow into the Witbank Dam.
The Emergency Pan is situated to the east of the power station in a local topographic low. Surface runoff drains from all directions towards this perennial pan, which is also fed by a spring that occurs near its western boundary. Another non-perennial pan occurs in a local depression north of the Emergency Pan.
The natural drainage to the west of the power station is in a westerly direction.
Figure 3. Surface topography and drainage prior to the commencement of power station
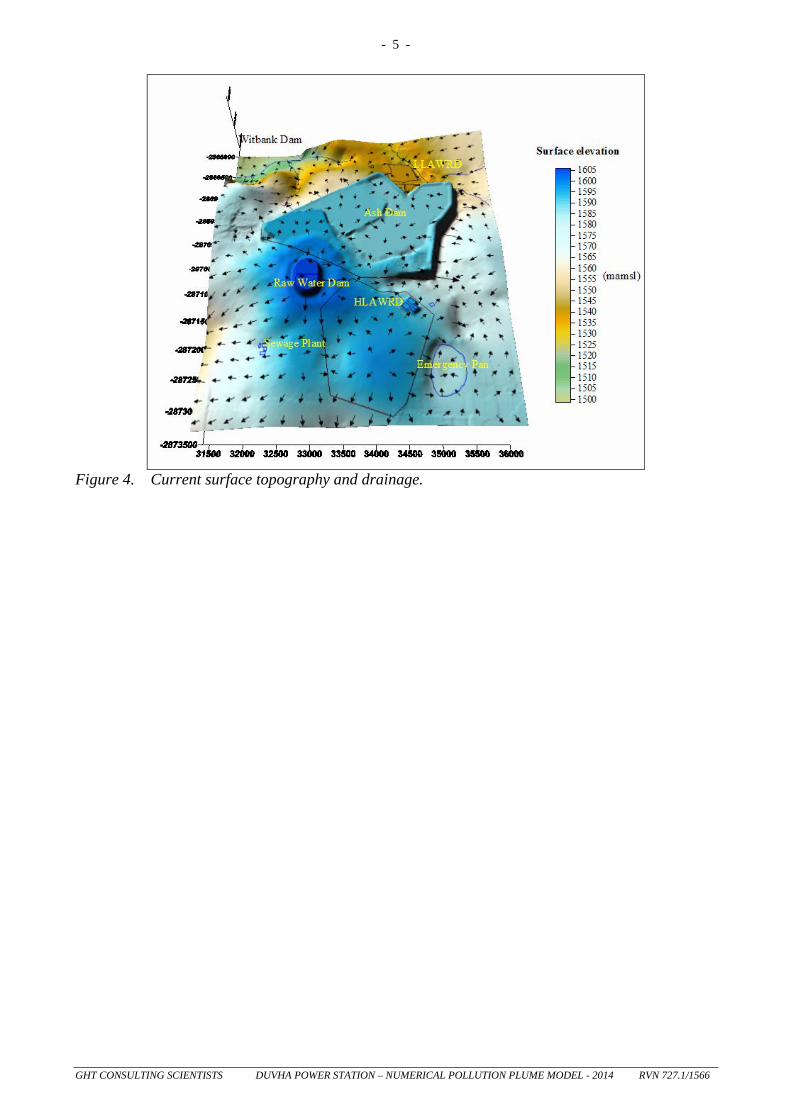
activities. The current surface topography and drainage directions are at Duvha Power Station are shown in Figure 4. Although the construction of the various dam systems at the power station has altered the local drainage patterns in vicinities of these dams, the regional drainage is very similar to the natural drainage that occurred prior to the construction of the power station.
- 5 -
GHT CONSULTING SCIENTISTS DUVHA POWER STATION – NUMERICAL POLLUTION PLUME MODEL - 2014 RVN 727.1/1566
Figure 4. Current surface topography and drainage.
- 6 -
GHT CONSULTING SCIENTISTS DUVHA POWER STATION – NUMERICAL POLLUTION PLUME MODEL - 2014 RVN 727.1/1566
4 GEOLOGY
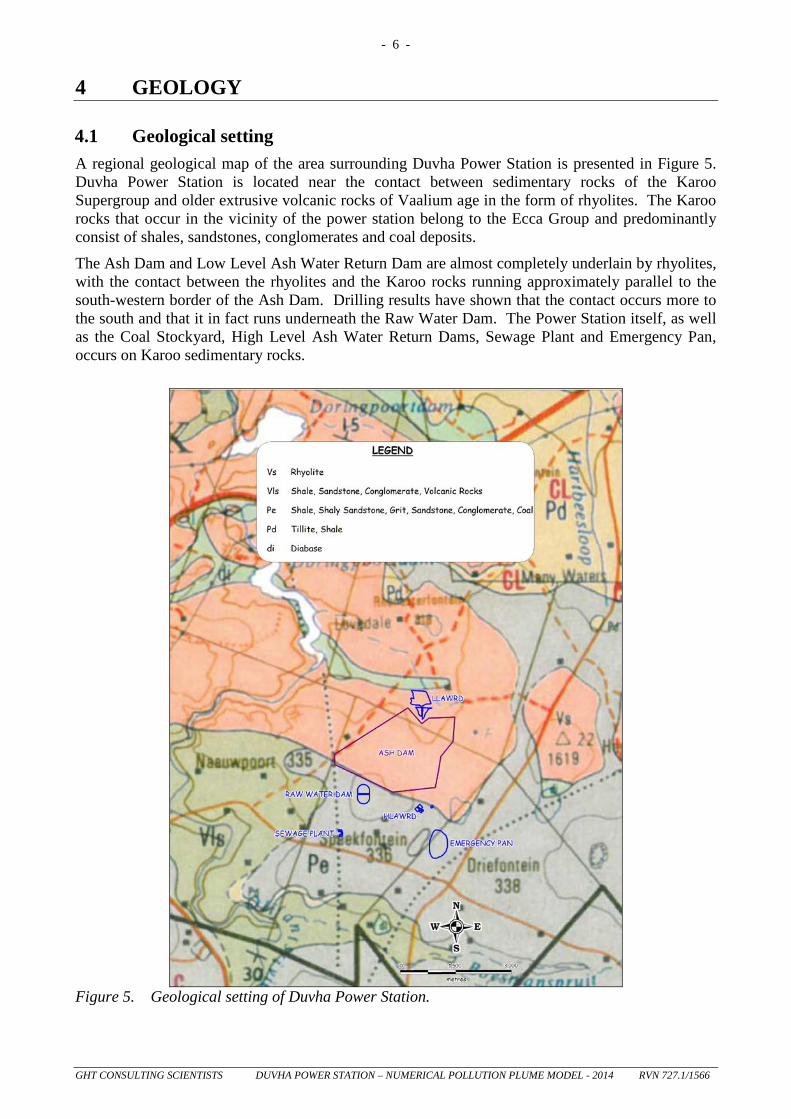
4.1 Geological setting A regional geological map of the area surrounding Duvha Power Station is presented in Figure 5. Duvha Power Station is located near the contact between sedimentary rocks of the Karoo Supergroup and older extrusive volcanic rocks of Vaalium age in the form of rhyolites. The Karoo rocks that occur in the vicinity of the power station belong to the Ecca Group and predominantly consist of shales, sandstones, conglomerates and coal deposits.
The Ash Dam and Low Level Ash Water Return Dam are almost completely underlain by rhyolites, with the contact between the rhyolites and the Karoo rocks running approximately parallel to the south-western border of the Ash Dam. Drilling results have shown that the contact occurs more to the south and that it in fact runs underneath the Raw Water Dam. The Power Station itself, as well as the Coal Stockyard, High Level Ash Water Return Dams, Sewage Plant and Emergency Pan, occurs on Karoo sedimentary rocks.
Figure 5. Geological setting of Duvha Power Station.
- 7 -
GHT CONSULTING SCIENTISTS DUVHA POWER STATION – NUMERICAL POLLUTION PLUME MODEL - 2014 RVN 727.1/1566
A large intrusive diabase body occurs to the north of the Low Level Ash Water Return Dam and partially underlies the return water dam. No outcrop of this body is, however, visible at surface. Geophysical data
4.2 Geophysical data The aim of geophysical investigations is to detect and delineate intrusive magmatic bodies that may influence groundwater migration. Magmatic bodies are often associated with baked zones near their contacts with the surrounding host rock. These baked zones are more likely to be extensively fractured and weathered and may therefore act as preferential pathways for groundwater migration and contaminant transport. Intrusive magmatic bodies may also act as barriers to groundwater flow in direction perpendicular to their strikes.
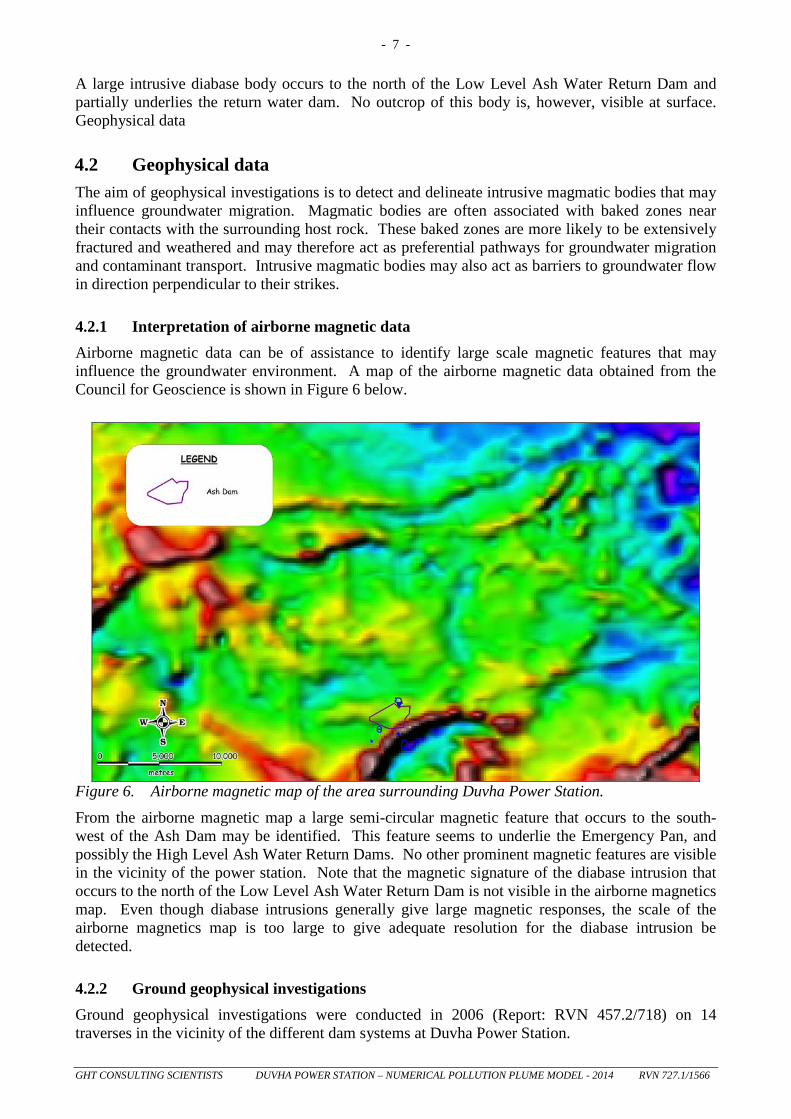
4.2.1 Interpretation of airborne magnetic data Airborne magnetic data can be of assistance to identify large scale magnetic features that may influence the groundwater environment. A map of the airborne magnetic data obtained from the Council for Geoscience is shown in Figure 6 below.
Figure 6. Airborne magnetic map of the area surrounding Duvha Power Station. From the airborne magnetic map a large semi-circular magnetic feature that occurs to the south-west of the Ash Dam may be identified. This feature seems to underlie the Emergency Pan, and possibly the High Level Ash Water Return Dams. No other prominent magnetic features are visible in the vicinity of the power station. Note that the magnetic signature of the diabase intrusion that occurs to the north of the Low Level Ash Water Return Dam is not visible in the airborne magnetics map. Even though diabase intrusions generally give large magnetic responses, the scale of the airborne magnetics map is too large to give adequate resolution for the diabase intrusion be detected.
4.2.2 Ground geophysical investigations Ground geophysical investigations were conducted in 2006 (Report: RVN 457.2/718) on 14 traverses in the vicinity of the different dam systems at Duvha Power Station.
- 8 -
GHT CONSULTING SCIENTISTS DUVHA POWER STATION – NUMERICAL POLLUTION PLUME MODEL - 2014 RVN 727.1/1566
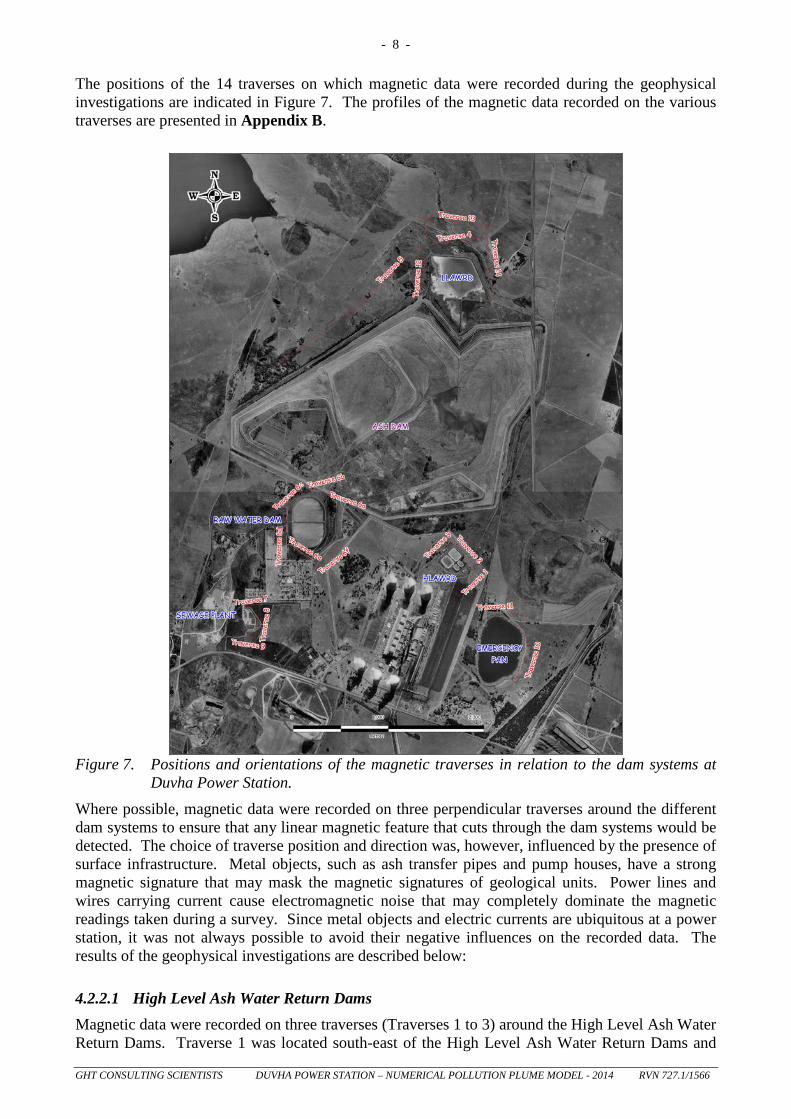
The positions of the 14 traverses on which magnetic data were recorded during the geophysical investigations are indicated in Figure 7. The profiles of the magnetic data recorded on the various traverses are presented in Appendix B.
Figure 7. Positions and orientations of the magnetic traverses in relation to the dam systems at
Duvha Power Station. Where possible, magnetic data were recorded on three perpendicular traverses around the different dam systems to ensure that any linear magnetic feature that cuts through the dam systems would be detected. The choice of traverse position and direction was, however, influenced by the presence of surface infrastructure. Metal objects, such as ash transfer pipes and pump houses, have a strong magnetic signature that may mask the magnetic signatures of geological units. Power lines and wires carrying current cause electromagnetic noise that may completely dominate the magnetic readings taken during a survey. Since metal objects and electric currents are ubiquitous at a power station, it was not always possible to avoid their negative influences on the recorded data. The results of the geophysical investigations are described below:
4.2.2.1 High Level Ash Water Return Dams Magnetic data were recorded on three traverses (Traverses 1 to 3) around the High Level Ash Water Return Dams. Traverse 1 was located south-east of the High Level Ash Water Return Dams and
- 9 -
GHT CONSULTING SCIENTISTS DUVHA POWER STATION – NUMERICAL POLLUTION PLUME MODEL - 2014 RVN 727.1/1566
had an approximate south-west/north-east strike. Traverse 3 ran approximately parallel to Traverse 1, but was located north-west of the High Level Ash Water Return Dams. Traverse 2 ran perpendicular to these two traverses on the north-eastern side of the dam system.
The only prominent magnetic anomalies observed in the profiles of Traverses 1, 2 and 3 are associated with surface infrastructure. No magnetic feature of a geological origin could be identified from the data recorded on these traverses.
4.2.2.2 Low Level Ash Water Return Dam Magnetic data were recorded on four traverses (Traverses 4, 12, 13 and 14) in the vicinity of the Low Level Ash Water Return Dam. Since an intrusive diabase body is known to occur near the dam and is expected to partially underlie the dam, the purpose of the geophysical investigations was to delineate this body.
Although the data recorded in the vicinity of the Low Level Ash Water Return Dam are likely to have been influenced by electromagnetic noise, the presence of the diabase intrusion was detected on all four traverses. Traverses 4 and 13 approximately ran along the strike of the body. The large variations in the magnetic field strength recorded on these two traverses are the typical response that may be expected from such an intrusive body. Traverses 12 and 14 ran approximately perpendicular to the expected strike of the diabase intrusion. Although the data recorded on Traverse 12 displayed large spatial variability along the entire length of the traverse, an increase in the amplitude and variability is noticed at a position 550 m from the start of the traverse. This position corresponds well with the mapped occurrence of the diabase intrusion. The data recorded on Traverse 14 were strongly influenced by man-made noise and are less useful in defining the contact with the diabase intrusion.
4.2.2.3 Ash Dam Traverse 5 ran approximately parallel to the north-western wall of the Ash Dam. The magnetic data again displayed a large degree of spatial variability. A sharp increase in the amplitudes and variability of the magnetic data is, however, apparent at a distance of approximately 1 700 m from the start of the traverse. This position again corresponds well with the mapped occurrence of the diabase intrusion.
4.2.2.4 Raw Water Dam Magnetic data were recorded on one traverse (Traverse 6) around the Raw Water Dam. Traverse 6 consisted of six shorter traverses that ran approximately parallel to the fence around the dam. Metal and electric objects occur in the vicinity of the dam. All the anomalies recorded along Traverse 6 are related to the presence of man-made noise and do not clearly indicate the presence of any geological feature in the vicinity of the dam.
4.2.2.5 Sewage Plant Traverses 7, 8 and 9 ran around the Sewage Plant on its northern, eastern and southern sides. All the magnetic anomalies recorded on these traverses were due to the presence of metal objects at surface. No magnetic geological features could be identified from the data recorded on these three traverses.
4.2.2.6 Emergency Pan Magnetic data were recorded on two traverses near the Emergency Pan. Traverse 10 ran along the eastern perimeter of the pan, while Traverse 11 ran approximately west/east on the northern side of the pan.
- 10 -
GHT CONSULTING SCIENTISTS DUVHA POWER STATION – NUMERICAL POLLUTION PLUME MODEL - 2014 RVN 727.1/1566
Very large magnetic variations with a low spatial frequency are apparent on Traverse 10. These variations are in all likelihood due to the large semi-circular magnetic feature identified on the airborne magnetics map (refer to Figure 6). The large wavelength of the magnetic anomalies suggest that the geological feature responsible for the magnetic response occurs at great depth and is unlikely to influence groundwater migration in the near surface.
The magnetic data recorded on Traverse 11 do not indicate the presence of a magnetic feature that could influence the groundwater environment. The lack of magnetic variation observed on Traverse 11 as compared to Traverse 10 suggests that Traverse 11 runs approximately parallel to the local strike of the magnetic feature that gives rise to the response observed along Traverse 10.
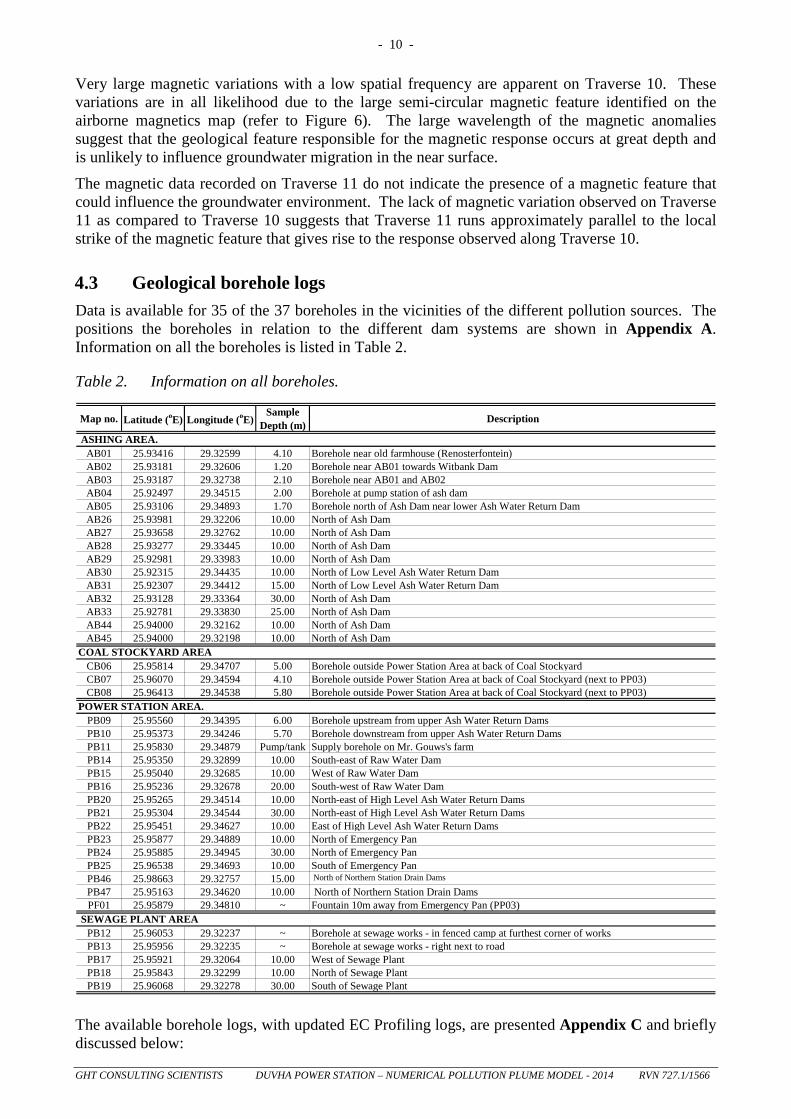
4.3 Geological borehole logs Data is available for 35 of the 37 boreholes in the vicinities of the different pollution sources. The positions the boreholes in relation to the different dam systems are shown in Appendix A. Information on all the boreholes is listed in Table 2.
Table 2. Information on all boreholes.
Map no. Latitude (oE) Longitude (oE)Sample
Depth (m) Description
AB01 25.93416 29.32599 4.10 Borehole near old farmhouse (Renosterfontein)AB02 25.93181 29.32606 1.20 Borehole near AB01 towards Witbank DamAB03 25.93187 29.32738 2.10 Borehole near AB01 and AB02AB04 25.92497 29.34515 2.00 Borehole at pump station of ash damAB05 25.93106 29.34893 1.70 Borehole north of Ash Dam near lower Ash Water Return Dam AB26 25.93981 29.32206 10.00 North of Ash DamAB27 25.93658 29.32762 10.00 North of Ash DamAB28 25.93277 29.33445 10.00 North of Ash DamAB29 25.92981 29.33983 10.00 North of Ash DamAB30 25.92315 29.34435 10.00 North of Low Level Ash Water Return DamAB31 25.92307 29.34412 15.00 North of Low Level Ash Water Return DamAB32 25.93128 29.33364 30.00 North of Ash DamAB33 25.92781 29.33830 25.00 North of Ash DamAB44 25.94000 29.32162 10.00 North of Ash DamAB45 25.94000 29.32198 10.00 North of Ash Dam
CB06 25.95814 29.34707 5.00 Borehole outside Power Station Area at back of Coal StockyardCB07 25.96070 29.34594 4.10 Borehole outside Power Station Area at back of Coal Stockyard (next to PP03)CB08 25.96413 29.34538 5.80 Borehole outside Power Station Area at back of Coal Stockyard (next to PP03)
PB09 25.95560 29.34395 6.00 Borehole upstream from upper Ash Water Return DamsPB10 25.95373 29.34246 5.70 Borehole downstream from upper Ash Water Return DamsPB11 25.95830 29.34879 Pump/tank Supply borehole on Mr. Gouws's farmPB14 25.95350 29.32899 10.00 South-east of Raw Water DamPB15 25.95040 29.32685 10.00 West of Raw Water DamPB16 25.95236 29.32678 20.00 South-west of Raw Water DamPB20 25.95265 29.34514 10.00 North-east of High Level Ash Water Return DamsPB21 25.95304 29.34544 30.00 North-east of High Level Ash Water Return DamsPB22 25.95451 29.34627 10.00 East of High Level Ash Water Return DamsPB23 25.95877 29.34889 10.00 North of Emergency PanPB24 25.95885 29.34945 30.00 North of Emergency PanPB25 25.96538 29.34693 10.00 South of Emergency PanPB46 25.98663 29.32757 15.00 North of Northern Station Drain Dams
PB47 25.95163 29.34620 10.00 North of Northern Station Drain DamsPF01 25.95879 29.34810 ~ Fountain 10m away from Emergency Pan (PP03)
PB12 25.96053 29.32237 ~ Borehole at sewage works - in fenced camp at furthest corner of worksPB13 25.95956 29.32235 ~ Borehole at sewage works - right next to roadPB17 25.95921 29.32064 10.00 West of Sewage PlantPB18 25.95843 29.32299 10.00 North of Sewage PlantPB19 25.96068 29.32278 30.00 South of Sewage Plant
COAL STOCKYARD AREA
SEWAGE PLANT AREA
POWER STATION AREA.
ASHING AREA.
The available borehole logs, with updated EC Profiling logs, are presented Appendix C and briefly discussed below:
- 11 -
GHT CONSULTING SCIENTISTS DUVHA POWER STATION – NUMERICAL POLLUTION PLUME MODEL - 2014 RVN 727.1/1566
4.3.1 Raw Water Dam Boreholes PB14 to PB16 were drilled (2006) in the vicinity of the Raw Water Dam. Since the geophysical investigations did not reveal the presence of any magnetic intrusive body that could be associated with preferential pathways for groundwater migration, these boreholes were drilled in positions to the south and west of the Raw Water Dam where the local topographic gradient is the highest. Borehole PB14 intersected coarse sandstones and soft siltstones of the Karoo Supergroup. Light brown clay was intersected at a depth of 8 metres below ground level (mbgl) and continued to the final depth of the borehole (10 mbgl).
Borehole PB15 is situated west on the Raw Water Dam. Weathered rhyolites were encountered along the entire length of the borehole. This observation shows that the contact between the Karoo rocks and the rhyolites must lie under the Raw Water Dam.
Borehole PB16 was drilled (2006) to the south-west of the Raw Water Dam. Sandstones and siltstones were again encountered up to a depth of 10 mbgl. Light grey and olive grey clayey silts occur at depths of between 10 and 20 mbgl. These silts are in all probability due to the decay of siltstones. The clayey material caused difficulties during drilling and it was decided to terminate drilling at a depth of 20 mbgl.
4.3.2 Sewage Plant Borehole PB17 was drilled (2006) west of the Sewage Plant on the property of Corobrik. Olive brown clayey silt was encountered along the entire length of the borehole (10 m). This clayey silt is mined by Corobrik for the making of oven-baked clay bricks.
Borehole PB18 is located north of the sewage plant. Silts and fine to medium grained sandstones were intersected during drilling. The borehole was drilled to a depth of 10 m.
Borehole PB19 was drilled (2006) south of the Sewage Plant to a depth of 30 m. Silts and sandstones were again encountered. Carbonaceous shale was intersected at a depth of around 18 mbgl. Below the carbonaceous shale a four metre thick layer of low-grade coal was encountered. Fine grained sandstones underlie the coal layer. Two minor water strikes occurred at depths of around 8 and 14 mbgl.
4.3.3 High Level Ash Water Return Dams Boreholes PB20, PB21 and PB22 were drilled (2006) to the north-east and east of the High Level Ash Water Return Dams, in the expected direction of groundwater flow away from the dam system. Clayey sandstones and siltstones were encountered during the drilling of these three boreholes. No water was struck during drilling. However, the drill cuttings from boreholes PB20 and PB21 were moist at shallow depths (< 5 mbgl).
Boreholes PB46 and PB47 were drilled (31m and 11m deeps respectively) in 2010 to the north of the high level ash water return dams. These boreholes are closely situated within three metres of one another to serve as deep and shallow aquifer monitoring boreholes. The first metre consisted of soil, followed by brownish red clay to a depth of six metres, where after a metre of weathered sandstone was encountered and followed by approximately another metre of fresh sandstone. Brown, massive sandstone occurs through the remainder of the length of the borehole up to the final drilling depths of 11 metres at PB47 and 31 metres at PB46. Minor water strikes were encountered at 9 metres in both boreholes.
4.3.4 Emergency Pan Two boreholes PB23 and PB24 were drilled (2006) north of the Emergency Pan. Borehole PB23 was drilled to a depth of 10 m and intersected coarse sandstones, silts and carbonaceous shale. PB24 was drilled to a depth of 30 m and intersected the same geological units as PB23 at shallow
- 12 -
GHT CONSULTING SCIENTISTS DUVHA POWER STATION – NUMERICAL POLLUTION PLUME MODEL - 2014 RVN 727.1/1566
depths. A five metre thick low-grade coal layer was intersected below the carbonaceous shales at a depth of between 15 and 20 mbgl. A minor water strike occurred within the coal layer. Shales were again encountered at depths of greater than 20 mbgl.
Borehole PB25 was drilled (2006) south of the Emergency Pan. Silty sand, siltstone and silt were intersected during drilling.
4.3.5 Ash Dam Four shallow boreholes and two deep boreholes were drilled (2006) north of the Ash Dam. All of these boreholes intersected rhyolites in various states of weathering. Boreholes AB26 to AB29 were drilled close to the Ash Dam to depths of only 10 m. All these boreholes intersected weathered rhyolites along most of their lengths. High levels of weathering were particularly evident at boreholes AB27, AB28 and AB29. Minor water strikes also occurred in these boreholes. These water strikes are in all probability due to seepage from the Ash Dam.
Boreholes AB32 and AB33 were drilled (2006) further away from the Ash Dam and to greater depths in order to allow investigation of the deeper, less weathered rhyolites. Borehole AB32 was drilled to a depth of 30 m and intersected rhyolites along its entire length. Two minor water strikes occurred at depths of around 21 and 25 mbgl. Borehole AB33 was drilled to a depth of 25 m and also encountered rhyolites along its entire length. A minor water strike occurred at a depth of around 11 mbgl.
Boreholes AB44 and AB45 were drilled in 2010 to respectively replace boreholes AB26 and AB27 on the north western side of the ash dam. The first two metres of both boreholes consisted of yellowish, brown loose soil. This was followed in borehole AB44 by one metre pinkish grey weathered rhyolite and eight metres light pink massive rhyolite (11 metres deep), where as a slightly soft light pink weathered rhyolite was encountered at AB45 for the next four metres, followed by another four metres greyish pink weathered rhyolite and finally four metres of hard massive rhyolite to a depth of 16 metres. A minor water strike was encountered at borehole AB45 on 10 metres.
4.3.6 Low Level Ash Water Return Dam Two boreholes were drilled (2006) north of the Low Level Ash Water Return Dam. Borehole AB30 was drilled to a depth of 10 m. At shallow depths alluvial clay deposits were encountered, followed by weathered rhyolites. Weathered diabase (dolerite) was struck at a depth of 6 mbgl and became fresh at a depth of around 7 mbgl.
Similar drilling results were obtained during the drilling of borehole AB31, although the diabase was intersected at a slightly greater depth (8 mbgl). Boreholes AB30 and AB31 were constructed differently to allow hydraulic testing and sampling of both the shallow and deep geology.
- 13 -
GHT CONSULTING SCIENTISTS DUVHA POWER STATION – NUMERICAL POLLUTION PLUME MODEL - 2014 RVN 727.1/1566
5 GEOHYDRAULICS
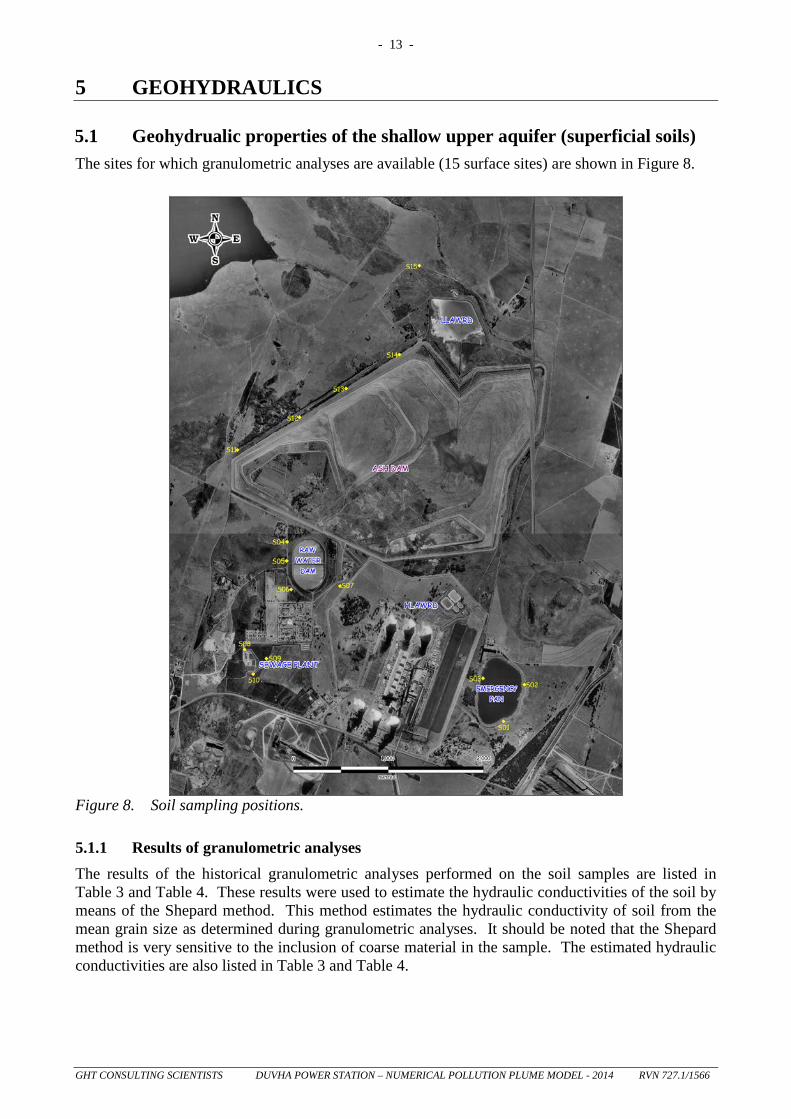
5.1 Geohydrualic properties of the shallow upper aquifer (superficial soils) The sites for which granulometric analyses are available (15 surface sites) are shown in Figure 8.
Figure 8. Soil sampling positions.
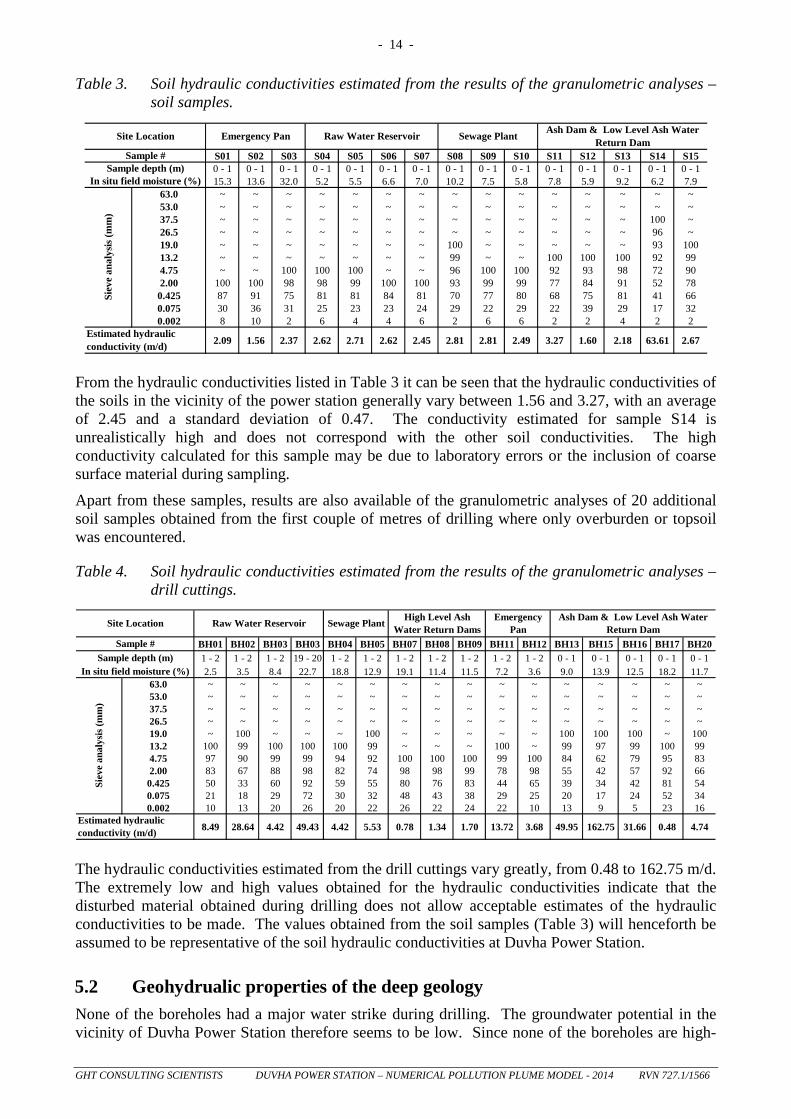
5.1.1 Results of granulometric analyses The results of the historical granulometric analyses performed on the soil samples are listed in Table 3 and Table 4. These results were used to estimate the hydraulic conductivities of the soil by means of the Shepard method. This method estimates the hydraulic conductivity of soil from the mean grain size as determined during granulometric analyses. It should be noted that the Shepard method is very sensitive to the inclusion of coarse material in the sample. The estimated hydraulic conductivities are also listed in Table 3 and Table 4.
- 14 -
GHT CONSULTING SCIENTISTS DUVHA POWER STATION – NUMERICAL POLLUTION PLUME MODEL - 2014 RVN 727.1/1566
Table 3. Soil hydraulic conductivities estimated from the results of the granulometric analyses – soil samples.
S01 S02 S03 S04 S05 S06 S07 S08 S09 S10 S11 S12 S13 S14 S150 - 1 0 - 1 0 - 1 0 - 1 0 - 1 0 - 1 0 - 1 0 - 1 0 - 1 0 - 1 0 - 1 0 - 1 0 - 1 0 - 1 0 - 115.3 13.6 32.0 5.2 5.5 6.6 7.0 10.2 7.5 5.8 7.8 5.9 9.2 6.2 7.9
63.0 ~ ~ ~ ~ ~ ~ ~ ~ ~ ~ ~ ~ ~ ~ ~53.0 ~ ~ ~ ~ ~ ~ ~ ~ ~ ~ ~ ~ ~ ~ ~37.5 ~ ~ ~ ~ ~ ~ ~ ~ ~ ~ ~ ~ ~ 100 ~26.5 ~ ~ ~ ~ ~ ~ ~ ~ ~ ~ ~ ~ ~ 96 ~19.0 ~ ~ ~ ~ ~ ~ ~ 100 ~ ~ ~ ~ ~ 93 10013.2 ~ ~ ~ ~ ~ ~ ~ 99 ~ ~ 100 100 100 92 994.75 ~ ~ 100 100 100 ~ ~ 96 100 100 92 93 98 72 902.00 100 100 98 98 99 100 100 93 99 99 77 84 91 52 78
0.425 87 91 75 81 81 84 81 70 77 80 68 75 81 41 660.075 30 36 31 25 23 23 24 29 22 29 22 39 29 17 320.002 8 10 2 6 4 4 6 2 6 6 2 2 4 2 2
2.09 1.56 2.37 2.62 2.71 2.62 2.45 2.81 2.81 2.49 3.27 1.60 2.18 63.61 2.67
Siev
e an
alys
is (m
m)
Estimated hydraulic conductivity (m/d)
Sample #Sample depth (m)
In situ field moisture (%)
Site Location Emergency Pan Raw Water Reservoir Sewage Plant Ash Dam & Low Level Ash Water Return Dam
From the hydraulic conductivities listed in Table 3 it can be seen that the hydraulic conductivities of the soils in the vicinity of the power station generally vary between 1.56 and 3.27, with an average of 2.45 and a standard deviation of 0.47. The conductivity estimated for sample S14 is unrealistically high and does not correspond with the other soil conductivities. The high conductivity calculated for this sample may be due to laboratory errors or the inclusion of coarse surface material during sampling.
Apart from these samples, results are also available of the granulometric analyses of 20 additional soil samples obtained from the first couple of metres of drilling where only overburden or topsoil was encountered.
Table 4. Soil hydraulic conductivities estimated from the results of the granulometric analyses – drill cuttings.
BH01 BH02 BH03 BH03 BH04 BH05 BH07 BH08 BH09 BH11 BH12 BH13 BH15 BH16 BH17 BH201 - 2 1 - 2 1 - 2 19 - 20 1 - 2 1 - 2 1 - 2 1 - 2 1 - 2 1 - 2 1 - 2 0 - 1 0 - 1 0 - 1 0 - 1 0 - 12.5 3.5 8.4 22.7 18.8 12.9 19.1 11.4 11.5 7.2 3.6 9.0 13.9 12.5 18.2 11.7
63.0 ~ ~ ~ ~ ~ ~ ~ ~ ~ ~ ~ ~ ~ ~ ~ ~53.0 ~ ~ ~ ~ ~ ~ ~ ~ ~ ~ ~ ~ ~ ~ ~ ~37.5 ~ ~ ~ ~ ~ ~ ~ ~ ~ ~ ~ ~ ~ ~ ~ ~26.5 ~ ~ ~ ~ ~ ~ ~ ~ ~ ~ ~ ~ ~ ~ ~ ~19.0 ~ 100 ~ ~ ~ 100 ~ ~ ~ ~ ~ 100 100 100 ~ 10013.2 100 99 100 100 100 99 ~ ~ ~ 100 ~ 99 97 99 100 994.75 97 90 99 99 94 92 100 100 100 99 100 84 62 79 95 832.00 83 67 88 98 82 74 98 98 99 78 98 55 42 57 92 66
0.425 50 33 60 92 59 55 80 76 83 44 65 39 34 42 81 540.075 21 18 29 72 30 32 48 43 38 29 25 20 17 24 52 340.002 10 13 20 26 20 22 26 22 24 22 10 13 9 5 23 16
8.49 28.64 4.42 49.43 4.42 5.53 0.78 1.34 1.70 13.72 3.68 49.95 162.75 31.66 0.48 4.74
Site Location Emergency Pan
Ash Dam & Low Level Ash Water Return DamRaw Water Reservoir Sewage Plant High Level Ash
Water Return Dams
Siev
e an
alys
is (m
m)
Sample #Sample depth (m)
In situ field moisture (%)
Estimated hydraulic conductivity (m/d)
The hydraulic conductivities estimated from the drill cuttings vary greatly, from 0.48 to 162.75 m/d. The extremely low and high values obtained for the hydraulic conductivities indicate that the disturbed material obtained during drilling does not allow acceptable estimates of the hydraulic conductivities to be made. The values obtained from the soil samples (Table 3) will henceforth be assumed to be representative of the soil hydraulic conductivities at Duvha Power Station.
5.2 Geohydrualic properties of the deep geology None of the boreholes had a major water strike during drilling. The groundwater potential in the vicinity of Duvha Power Station therefore seems to be low. Since none of the boreholes are high-
- 15 -
GHT CONSULTING SCIENTISTS DUVHA POWER STATION – NUMERICAL POLLUTION PLUME MODEL - 2014 RVN 727.1/1566
yielding, it was decided to perform slug tests, instead of injection-withdrawal test, on all the new monitoring boreholes.
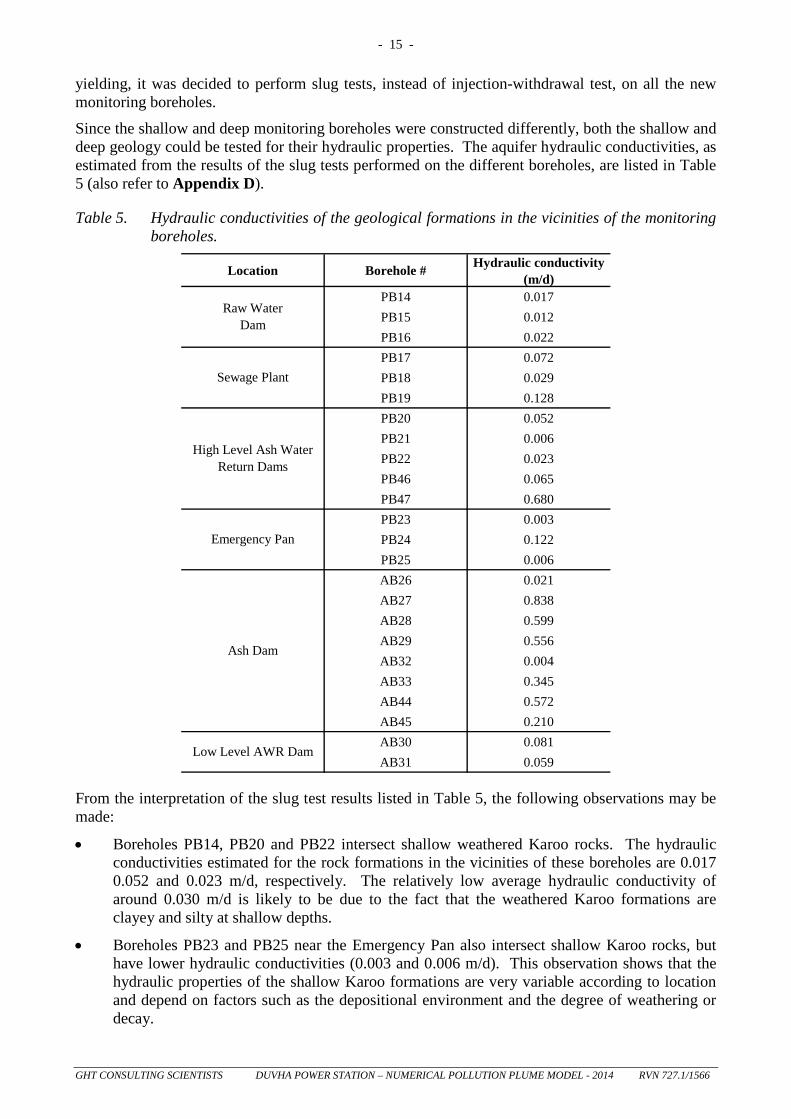
Since the shallow and deep monitoring boreholes were constructed differently, both the shallow and deep geology could be tested for their hydraulic properties. The aquifer hydraulic conductivities, as estimated from the results of the slug tests performed on the different boreholes, are listed in Table 5 (also refer to Appendix D).
Table 5. Hydraulic conductivities of the geological formations in the vicinities of the monitoring boreholes.
Location Borehole # Hydraulic conductivity (m/d)
PB14 0.017PB15 0.012PB16 0.022PB17 0.072PB18 0.029PB19 0.128PB20 0.052PB21 0.006PB22 0.023PB46 0.065PB47 0.680PB23 0.003PB24 0.122PB25 0.006AB26 0.021AB27 0.838AB28 0.599AB29 0.556AB32 0.004AB33 0.345AB44 0.572AB45 0.210AB30 0.081AB31 0.059
Raw WaterDam
Sewage Plant
Emergency Pan
Low Level AWR Dam
Ash Dam
High Level Ash Water Return Dams
From the interpretation of the slug test results listed in Table 5, the following observations may be made:
• Boreholes PB14, PB20 and PB22 intersect shallow weathered Karoo rocks. The hydraulic conductivities estimated for the rock formations in the vicinities of these boreholes are 0.017 0.052 and 0.023 m/d, respectively. The relatively low average hydraulic conductivity of around 0.030 m/d is likely to be due to the fact that the weathered Karoo formations are clayey and silty at shallow depths.
• Boreholes PB23 and PB25 near the Emergency Pan also intersect shallow Karoo rocks, but have lower hydraulic conductivities (0.003 and 0.006 m/d). This observation shows that the hydraulic properties of the shallow Karoo formations are very variable according to location and depend on factors such as the depositional environment and the degree of weathering or decay.
- 16 -
GHT CONSULTING SCIENTISTS DUVHA POWER STATION – NUMERICAL POLLUTION PLUME MODEL - 2014 RVN 727.1/1566
• Boreholes PB16, PB19, PB21 and PB24 intersect the deeper Karoo formations. The hydraulic conductivities estimated for these boreholes are 0.022, 0.128, 0.006 and 0.122 m/d, respectively. The low hydraulic conductivities (PB16 and PB21) were recorded in boreholes that did not intersect coal and did not have water strikes, whereas the opposite is true for the boreholes with high hydraulic conductivities (PB19 and PB24). This observation shows that minor fractures within the fresh Karoo rock can cause significant increases in the hydraulic conductivities of these formations.
• The hydraulic conductivity of the deep geology at borehole PB46 was calculated at 0.003m/d. The transmissivity of this borehole was calculated as 0.065 m2d. The estimated blow yield of the borehole was calculated at 0.01 L/s, which is classified as a very low yielding borehole.
• The hydraulic conductivity of the shallow geology at borehole PB47 was calculated at 0.08m/d. The transmissivity of this borehole was calculated as 0.68 m2d. The estimated blow yield of the borehole was calculated at 0.13 L/s, which is classified as a low yielding borehole.
• Boreholes PB15 and AB26 to AB29 intersected weathered rhyolites. The degree of weathering at boreholes PB15 and AB26 was noticeably lower than at the other boreholes. The results of the slug tests show that very high hydraulic conductivities of between 0.556 and 0.838 m/d can be expected for the highly weathered rhyolites, while lower hydraulic conductivities (~0.015 m/d) are to be expected for the less weathered rhyolites.
• The hydraulic conductivity of the geology at AB44 was calculated at 0.572m/d. The transmissivity of this borehole was calculated as 4.56 m2d. The estimated blow yield of the borehole was calculated at 0.91 L/s, which is classified as a low yielding borehole.
• The hydraulic conductivity of the geology at AB46 was calculated at 0.21m/d. The transmissivity of this borehole was calculated as 2.51 m2d. The estimated blow yield of the borehole was calculated at 0.5 L/s, which is classified as a low yielding borehole.
• Borehole AB32 intersects the deeper, un-weathered rhyolites. The low hydraulic conductivity estimated from the slug test performed on this borehole shows that the fresh rhyolites have low permeabilities and that groundwater migration through these rock will take place at a slow rate.
• The high hydraulic conductivity observed at borehole AB33 suggests that the deeper fresh rhyolites were not effectively isolated from the shallow weathered rhyolites during borehole construction.
• The hydraulic conductivities estimated for the geological units in the vicinity of boreholes AB30 and AB31 are relatively high, suggesting that the fractured and weathered diabases intersected by these boreholes are likely to act as a preferential pathways for groundwater migration and contaminant transport.
- 17 -
GHT CONSULTING SCIENTISTS DUVHA POWER STATION – NUMERICAL POLLUTION PLUME MODEL - 2014 RVN 727.1/1566
6 SURFACE- AND GROUNDWATER SAMPLING AND ANALYSES
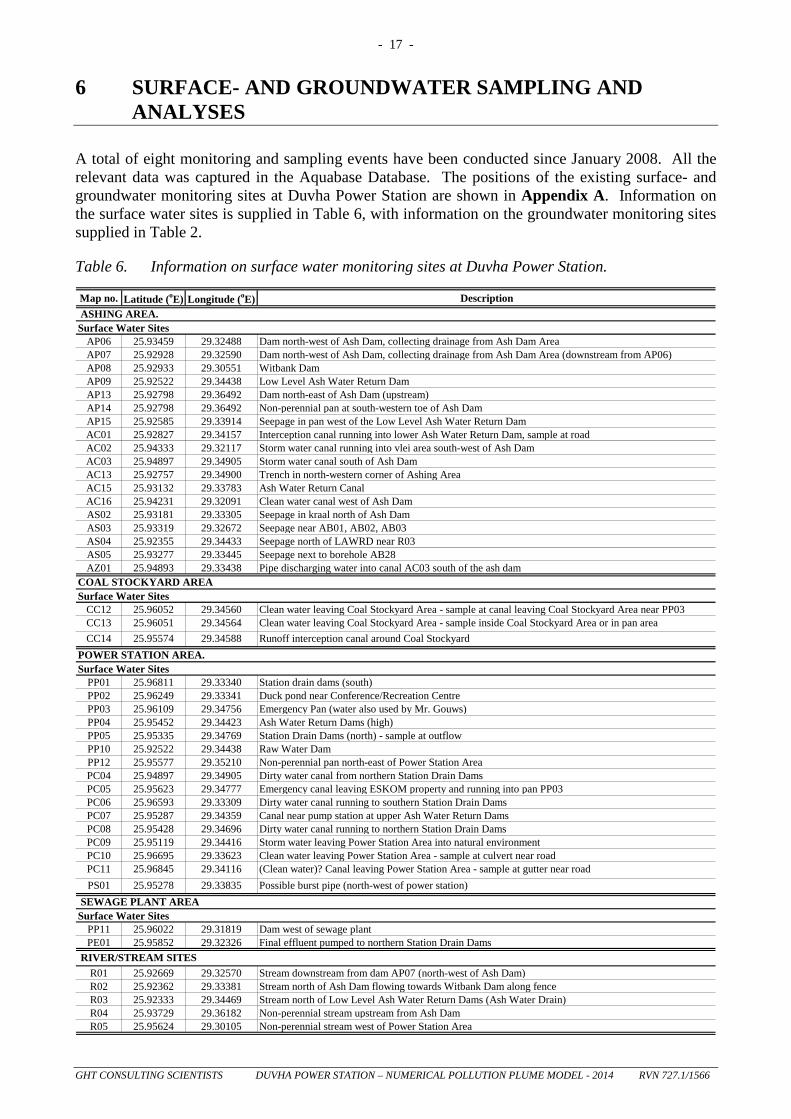
A total of eight monitoring and sampling events have been conducted since January 2008. All the relevant data was captured in the Aquabase Database. The positions of the existing surface- and groundwater monitoring sites at Duvha Power Station are shown in Appendix A. Information on the surface water sites is supplied in Table 6, with information on the groundwater monitoring sites supplied in Table 2.
Table 6. Information on surface water monitoring sites at Duvha Power Station.
Map no. Latitude (oE) Longitude (oE) Description
AP06 25.93459 29.32488 Dam north-west of Ash Dam, collecting drainage from Ash Dam AreaAP07 25.92928 29.32590 Dam north-west of Ash Dam, collecting drainage from Ash Dam Area (downstream from AP06)AP08 25.92933 29.30551 Witbank DamAP09 25.92522 29.34438 Low Level Ash Water Return DamAP13 25.92798 29.36492 Dam north-east of Ash Dam (upstream)AP14 25.92798 29.36492 Non-perennial pan at south-western toe of Ash DamAP15 25.92585 29.33914 Seepage in pan west of the Low Level Ash Water Return DamAC01 25.92827 29.34157 Interception canal running into lower Ash Water Return Dam, sample at roadAC02 25.94333 29.32117 Storm water canal running into vlei area south-west of Ash DamAC03 25.94897 29.34905 Storm water canal south of Ash DamAC13 25.92757 29.34900 Trench in north-western corner of Ashing AreaAC15 25.93132 29.33783 Ash Water Return CanalAC16 25.94231 29.32091 Clean water canal west of Ash DamAS02 25.93181 29.33305 Seepage in kraal north of Ash DamAS03 25.93319 29.32672 Seepage near AB01, AB02, AB03AS04 25.92355 29.34433 Seepage north of LAWRD near R03AS05 25.93277 29.33445 Seepage next to borehole AB28AZ01 25.94893 29.33438 Pipe discharging water into canal AC03 south of the ash dam
CC12 25.96052 29.34560 Clean water leaving Coal Stockyard Area - sample at canal leaving Coal Stockyard Area near PP03CC13 25.96051 29.34564 Clean water leaving Coal Stockyard Area - sample inside Coal Stockyard Area or in pan areaCC14 25.95574 29.34588 Runoff interception canal around Coal Stockyard
PP01 25.96811 29.33340 Station drain dams (south)PP02 25.96249 29.33341 Duck pond near Conference/Recreation CentrePP03 25.96109 29.34756 Emergency Pan (water also used by Mr. Gouws)PP04 25.95452 29.34423 Ash Water Return Dams (high)PP05 25.95335 29.34769 Station Drain Dams (north) - sample at outflowPP10 25.92522 29.34438 Raw Water DamPP12 25.95577 29.35210 Non-perennial pan north-east of Power Station AreaPC04 25.94897 29.34905 Dirty water canal from northern Station Drain DamsPC05 25.95623 29.34777 Emergency canal leaving ESKOM property and running into pan PP03PC06 25.96593 29.33309 Dirty water canal running to southern Station Drain DamsPC07 25.95287 29.34359 Canal near pump station at upper Ash Water Return DamsPC08 25.95428 29.34696 Dirty water canal running to northern Station Drain DamsPC09 25.95119 29.34416 Storm water leaving Power Station Area into natural environmentPC10 25.96695 29.33623 Clean water leaving Power Station Area - sample at culvert near roadPC11 25.96845 29.34116 (Clean water)? Canal leaving Power Station Area - sample at gutter near roadPS01 25.95278 29.33835 Possible burst pipe (north-west of power station)
PP11 25.96022 29.31819 Dam west of sewage plantPE01 25.95852 29.32326 Final effluent pumped to northern Station Drain Dams
R01 25.92669 29.32570 Stream downstream from dam AP07 (north-west of Ash Dam)R02 25.92362 29.33381 Stream north of Ash Dam flowing towards Witbank Dam along fenceR03 25.92333 29.34469 Stream north of Low Level Ash Water Return Dams (Ash Water Drain)R04 25.93729 29.36182 Non-perennial stream upstream from Ash DamR05 25.95624 29.30105 Non-perennial stream west of Power Station Area
COAL STOCKYARD AREASurface Water Sites
RIVER/STREAM SITES
Surface Water Sites
SEWAGE PLANT AREASurface Water Sites
POWER STATION AREA.Surface Water Sites
ASHING AREA.
- 18 -
GHT CONSULTING SCIENTISTS DUVHA POWER STATION – NUMERICAL POLLUTION PLUME MODEL - 2014 RVN 727.1/1566
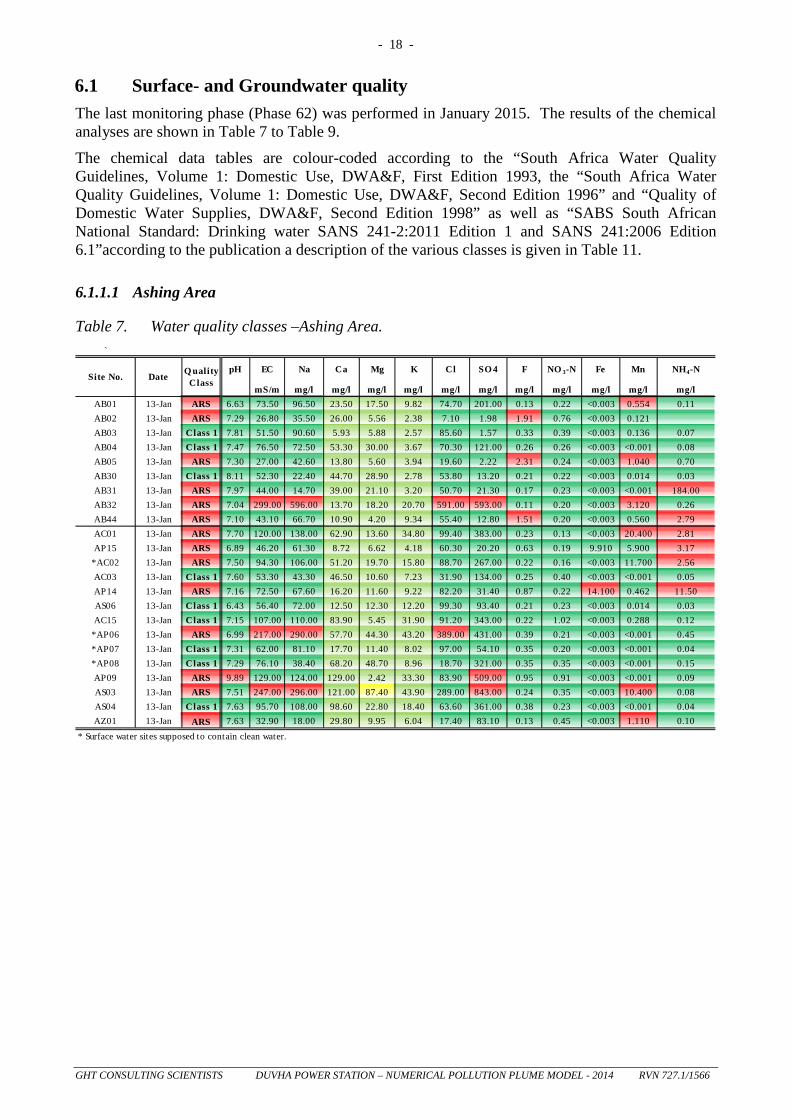
6.1 Surface- and Groundwater quality The last monitoring phase (Phase 62) was performed in January 2015. The results of the chemical analyses are shown in Table 7 to Table 9.
The chemical data tables are colour-coded according to the “South Africa Water Quality Guidelines, Volume 1: Domestic Use, DWA&F, First Edition 1993, the “South Africa Water Quality Guidelines, Volume 1: Domestic Use, DWA&F, Second Edition 1996” and “Quality of Domestic Water Supplies, DWA&F, Second Edition 1998” as well as “SABS South African National Standard: Drinking water SANS 241-2:2011 Edition 1 and SANS 241:2006 Edition 6.1”according to the publication a description of the various classes is given in Table 11.
6.1.1.1 Ashing Area
Table 7. Water quality classes –Ashing Area. `
pH EC Na Ca Mg K Cl SO 4 F NO 3-N Fe Mn NH4-N
mS/m mg/l mg/l mg/l mg/l mg/l mg/l mg/l mg/l mg/l mg/l mg/lAB01 13-Jan ARS 6.63 73.50 96.50 23.50 17.50 9.82 74.70 201.00 0.13 0.22 <0.003 0.554 0.11AB02 13-Jan ARS 7.29 26.80 35.50 26.00 5.56 2.38 7.10 1.98 1.91 0.76 <0.003 0.121AB03 13-Jan Class 1 7.81 51.50 90.60 5.93 5.88 2.57 85.60 1.57 0.33 0.39 <0.003 0.136 0.07AB04 13-Jan Class 1 7.47 76.50 72.50 53.30 30.00 3.67 70.30 121.00 0.26 0.26 <0.003 <0.001 0.08AB05 13-Jan ARS 7.30 27.00 42.60 13.80 5.60 3.94 19.60 2.22 2.31 0.24 <0.003 1.040 0.70AB30 13-Jan Class 1 8.11 52.30 22.40 44.70 28.90 2.78 53.80 13.20 0.21 0.22 <0.003 0.014 0.03AB31 13-Jan ARS 7.97 44.00 14.70 39.00 21.10 3.20 50.70 21.30 0.17 0.23 <0.003 <0.001 184.00AB32 13-Jan ARS 7.04 299.00 596.00 13.70 18.20 20.70 591.00 593.00 0.11 0.20 <0.003 3.120 0.26AB44 13-Jan ARS 7.10 43.10 66.70 10.90 4.20 9.34 55.40 12.80 1.51 0.20 <0.003 0.560 2.79AC01 13-Jan ARS 7.70 120.00 138.00 62.90 13.60 34.80 99.40 383.00 0.23 0.13 <0.003 20.400 2.81AP15 13-Jan ARS 6.89 46.20 61.30 8.72 6.62 4.18 60.30 20.20 0.63 0.19 9.910 5.900 3.17
*AC02 13-Jan ARS 7.50 94.30 106.00 51.20 19.70 15.80 88.70 267.00 0.22 0.16 <0.003 11.700 2.56AC03 13-Jan Class 1 7.60 53.30 43.30 46.50 10.60 7.23 31.90 134.00 0.25 0.40 <0.003 <0.001 0.05AP14 13-Jan ARS 7.16 72.50 67.60 16.20 11.60 9.22 82.20 31.40 0.87 0.22 14.100 0.462 11.50AS06 13-Jan Class 1 6.43 56.40 72.00 12.50 12.30 12.20 99.30 93.40 0.21 0.23 <0.003 0.014 0.03AC15 13-Jan Class 1 7.15 107.00 110.00 83.90 5.45 31.90 91.20 343.00 0.22 1.02 <0.003 0.288 0.12
*AP06 13-Jan ARS 6.99 217.00 290.00 57.70 44.30 43.20 389.00 431.00 0.39 0.21 <0.003 <0.001 0.45*AP07 13-Jan Class 1 7.31 62.00 81.10 17.70 11.40 8.02 97.00 54.10 0.35 0.20 <0.003 <0.001 0.04*AP08 13-Jan Class 1 7.29 76.10 38.40 68.20 48.70 8.96 18.70 321.00 0.35 0.35 <0.003 <0.001 0.15AP09 13-Jan ARS 9.89 129.00 124.00 129.00 2.42 33.30 83.90 509.00 0.95 0.91 <0.003 <0.001 0.09AS03 13-Jan ARS 7.51 247.00 296.00 121.00 87.40 43.90 289.00 843.00 0.24 0.35 <0.003 10.400 0.08AS04 13-Jan Class 1 7.63 95.70 108.00 98.60 22.80 18.40 63.60 361.00 0.38 0.23 <0.003 <0.001 0.04AZ01 13-Jan ARS 7.63 32.90 18.00 29.80 9.95 6.04 17.40 83.10 0.13 0.45 <0.003 1.110 0.10
* Surface water sites supposed to contain clean water.
Site No. Date Q ualityClass
- 19 -
GHT CONSULTING SCIENTISTS DUVHA POWER STATION – NUMERICAL POLLUTION PLUME MODEL - 2014 RVN 727.1/1566
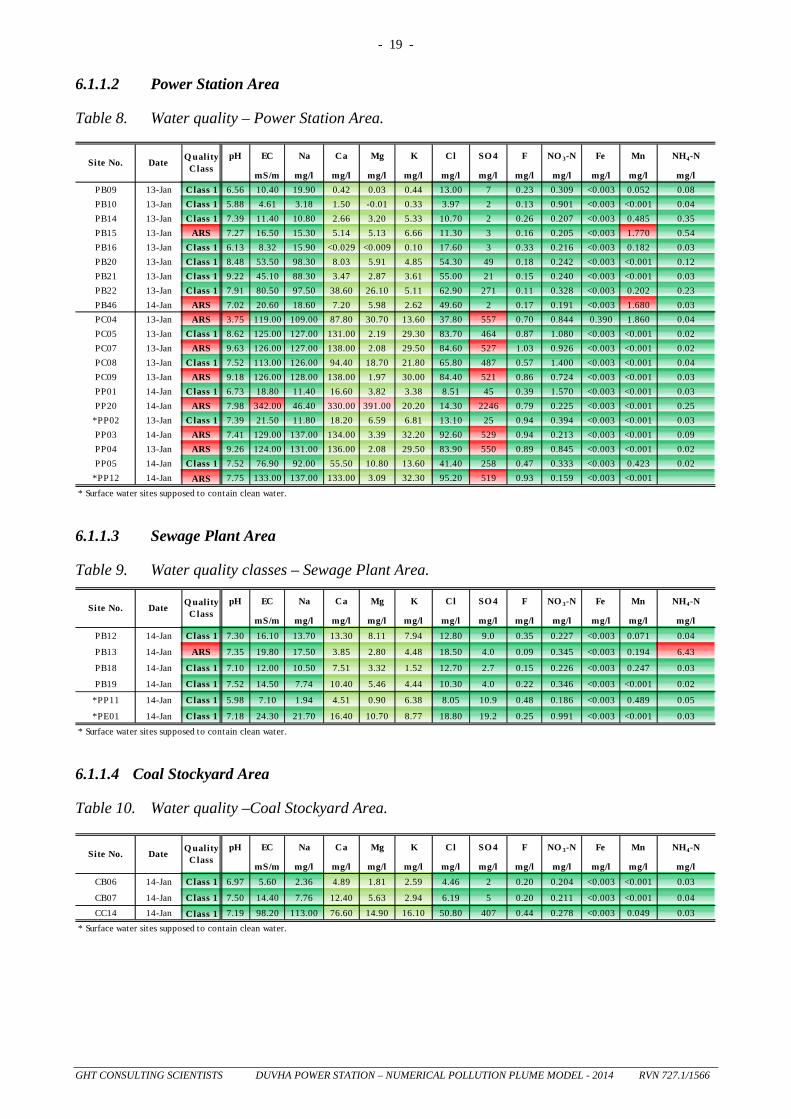
6.1.1.2 Power Station Area
Table 8. Water quality – Power Station Area.
pH EC Na Ca Mg K Cl SO 4 F NO 3-N Fe Mn NH4-N
mS/m mg/l mg/l mg/l mg/l mg/l mg/l mg/l mg/l mg/l mg/l mg/lPB09 13-Jan Class 1 6.56 10.40 19.90 0.42 0.03 0.44 13.00 7 0.23 0.309 <0.003 0.052 0.08PB10 13-Jan Class 1 5.88 4.61 3.18 1.50 -0.01 0.33 3.97 2 0.13 0.901 <0.003 <0.001 0.04PB14 13-Jan Class 1 7.39 11.40 10.80 2.66 3.20 5.33 10.70 2 0.26 0.207 <0.003 0.485 0.35PB15 13-Jan ARS 7.27 16.50 15.30 5.14 5.13 6.66 11.30 3 0.16 0.205 <0.003 1.770 0.54PB16 13-Jan Class 1 6.13 8.32 15.90 <0.029 <0.009 0.10 17.60 3 0.33 0.216 <0.003 0.182 0.03PB20 13-Jan Class 1 8.48 53.50 98.30 8.03 5.91 4.85 54.30 49 0.18 0.242 <0.003 <0.001 0.12PB21 13-Jan Class 1 9.22 45.10 88.30 3.47 2.87 3.61 55.00 21 0.15 0.240 <0.003 <0.001 0.03PB22 13-Jan Class 1 7.91 80.50 97.50 38.60 26.10 5.11 62.90 271 0.11 0.328 <0.003 0.202 0.23PB46 14-Jan ARS 7.02 20.60 18.60 7.20 5.98 2.62 49.60 2 0.17 0.191 <0.003 1.680 0.03PC04 13-Jan ARS 3.75 119.00 109.00 87.80 30.70 13.60 37.80 557 0.70 0.844 0.390 1.860 0.04PC05 13-Jan Class 1 8.62 125.00 127.00 131.00 2.19 29.30 83.70 464 0.87 1.080 <0.003 <0.001 0.02PC07 13-Jan ARS 9.63 126.00 127.00 138.00 2.08 29.50 84.60 527 1.03 0.926 <0.003 <0.001 0.02PC08 13-Jan Class 1 7.52 113.00 126.00 94.40 18.70 21.80 65.80 487 0.57 1.400 <0.003 <0.001 0.04PC09 13-Jan ARS 9.18 126.00 128.00 138.00 1.97 30.00 84.40 521 0.86 0.724 <0.003 <0.001 0.03PP01 14-Jan Class 1 6.73 18.80 11.40 16.60 3.82 3.38 8.51 45 0.39 1.570 <0.003 <0.001 0.03PP20 14-Jan ARS 7.98 342.00 46.40 330.00 391.00 20.20 14.30 2246 0.79 0.225 <0.003 <0.001 0.25
*PP02 13-Jan Class 1 7.39 21.50 11.80 18.20 6.59 6.81 13.10 25 0.94 0.394 <0.003 <0.001 0.03PP03 14-Jan ARS 7.41 129.00 137.00 134.00 3.39 32.20 92.60 529 0.94 0.213 <0.003 <0.001 0.09PP04 13-Jan ARS 9.26 124.00 131.00 136.00 2.08 29.50 83.90 550 0.89 0.845 <0.003 <0.001 0.02PP05 14-Jan Class 1 7.52 76.90 92.00 55.50 10.80 13.60 41.40 258 0.47 0.333 <0.003 0.423 0.02
*PP12 14-Jan ARS 7.75 133.00 137.00 133.00 3.09 32.30 95.20 519 0.93 0.159 <0.003 <0.001* Surface water sites supposed to contain clean water.
Q ualityClassSite No. Date
6.1.1.3 Sewage Plant Area
Table 9. Water quality classes – Sewage Plant Area.
pH EC Na Ca Mg K Cl SO 4 F NO 3-N Fe Mn NH4-N
mS/m mg/l mg/l mg/l mg/l mg/l mg/l mg/l mg/l mg/l mg/l mg/lPB12 14-Jan Class 1 7.30 16.10 13.70 13.30 8.11 7.94 12.80 9.0 0.35 0.227 <0.003 0.071 0.04
PB13 14-Jan ARS 7.35 19.80 17.50 3.85 2.80 4.48 18.50 4.0 0.09 0.345 <0.003 0.194 6.43
PB18 14-Jan Class 1 7.10 12.00 10.50 7.51 3.32 1.52 12.70 2.7 0.15 0.226 <0.003 0.247 0.03
PB19 14-Jan Class 1 7.52 14.50 7.74 10.40 5.46 4.44 10.30 4.0 0.22 0.346 <0.003 <0.001 0.02
*PP11 14-Jan Class 1 5.98 7.10 1.94 4.51 0.90 6.38 8.05 10.9 0.48 0.186 <0.003 0.489 0.05
*PE01 14-Jan Class 1 7.18 24.30 21.70 16.40 10.70 8.77 18.80 19.2 0.25 0.991 <0.003 <0.001 0.03* Surface water sites supposed to contain clean water.
Site No. Date Q ualityClass
6.1.1.4 Coal Stockyard Area
Table 10. Water quality –Coal Stockyard Area.
pH EC Na Ca Mg K Cl SO 4 F NO 3-N Fe Mn NH4-N
mS/m mg/l mg/l mg/l mg/l mg/l mg/l mg/l mg/l mg/l mg/l mg/lCB06 14-Jan Class 1 6.97 5.60 2.36 4.89 1.81 2.59 4.46 2 0.20 0.204 <0.003 <0.001 0.03
CB07 14-Jan Class 1 7.50 14.40 7.76 12.40 5.63 2.94 6.19 5 0.20 0.211 <0.003 <0.001 0.04CC14 14-Jan Class 1 7.19 98.20 113.00 76.60 14.90 16.10 50.80 407 0.44 0.278 <0.003 0.049 0.03
* Surface water sites supposed to contain clean water.
Site No. Date Q ualityClass
- 20 -
GHT CONSULTING SCIENTISTS DUVHA POWER STATION – NUMERICAL POLLUTION PLUME MODEL - 2014 RVN 727.1/1566
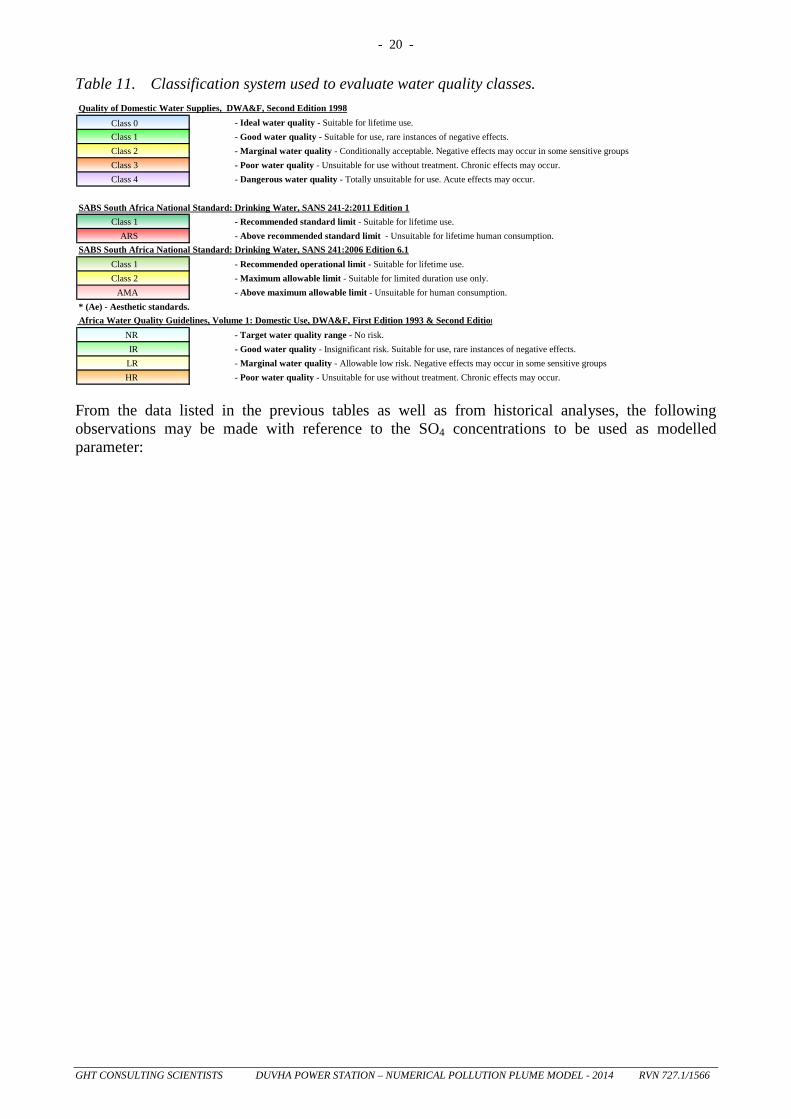
Table 11. Classification system used to evaluate water quality classes.
Class 0 - Ideal water quality - Suitable for lifetime use.Class 1 - Good water quality - Suitable for use, rare instances of negative effects.Class 2 - Marginal water quality - Conditionally acceptable. Negative effects may occur in some sensitive groupsClass 3 - Poor water quality - Unsuitable for use without treatment. Chronic effects may occur.Class 4 - Dangerous water quality - Totally unsuitable for use. Acute effects may occur.
SABS South Africa National Standard: Drinking Water, SANS 241-2:2011 Edition 1Class 1 - Recommended standard limit - Suitable for lifetime use.
ARS - Above recommended standard limit - Unsuitable for lifetime human consumption.
Class 1 - Recommended operational limit - Suitable for lifetime use.Class 2 - Maximum allowable limit - Suitable for limited duration use only.
AMA - Above maximum allowable limit - Unsuitable for human consumption.* (Ae) - Aesthetic standards.
NR - Target water quality range - No risk.IR - Good water quality - Insignificant risk. Suitable for use, rare instances of negative effects.
LR - Marginal water quality - Allowable low risk. Negative effects may occur in some sensitive groupsHR - Poor water quality - Unsuitable for use without treatment. Chronic effects may occur.
Africa Water Quality Guidelines, Volume 1: Domestic Use, DWA&F, First Edition 1993 & Second Edition
SABS South Africa National Standard: Drinking Water, SANS 241:2006 Edition 6.1
Quality of Domestic Water Supplies, DWA&F, Second Edition 1998
From the data listed in the previous tables as well as from historical analyses, the following observations may be made with reference to the SO4 concentrations to be used as modelled parameter:

- 21 -
GHT CONSULTING SCIENTISTS DUVHA POWER STATION – NUMERICAL POLLUTION PLUME MODEL - 2014 RVN 727.1/1566
7 NUMERICAL MODELLING OF GROUNDWATER MIGRATION AND CONTAMINANT TRANSPORT
7.1 Preamble Prior to the development of a numerical groundwater flow model, the hydrology and geohydrology of the study area must be understood conceptually. The development of a conceptual model includes designing and constructing equivalent but simplified conditions for a real world problem that are acceptable in view of the objectives of the numerical model and the associated management problems. Transferring the real world situation into an equivalent model system is a crucial step in groundwater modelling.
In order to model an aquifer system, certain assumptions have to be made. Limited geological and geohydrological data recorded at a few sites are assumed to be representative of the site geology and geohydrology. It is important to note that a numerical groundwater model is only a simplified representation of the actual system. It should therefore be regarded as only an approximation, the level of accuracy dependent on the quality of the data that are available. This implies that there are always errors associated with groundwater models due to uncertainty in site data and the capability of numerical methods to fully describe natural physical processes. Nevertheless, a numerical groundwater model is currently the best tool available to quantify groundwater flow behaviour and mass balances in order to make justifiable management decisions.
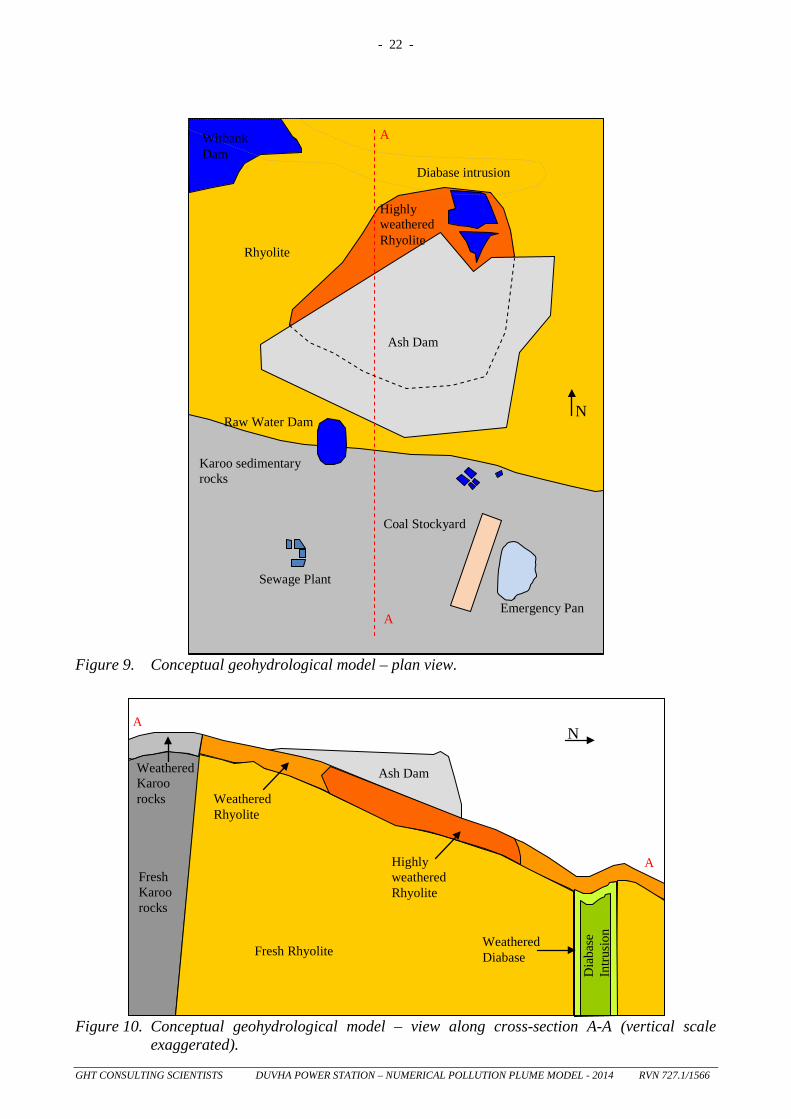
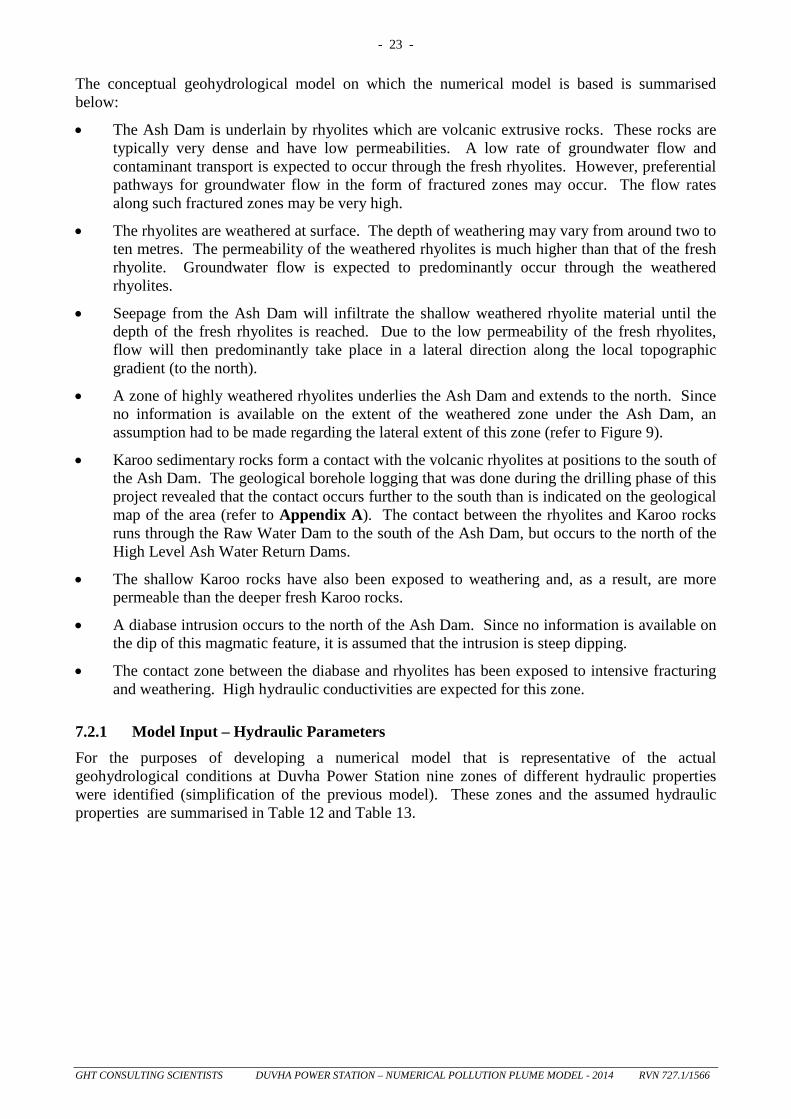
7.2 Conceptual Geohydrological Model The distribution of geological units used in the development of the conceptual geohydrological model of the area surrounding the Ash Dam is graphically illustrated in Figure 9 and Figure 10. Figure 9 shows a plan view of the modelled area while Figure 10 shows a south/north cross-section A-A through the modelled Area.
- 22 -
GHT CONSULTING SCIENTISTS DUVHA POWER STATION – NUMERICAL POLLUTION PLUME MODEL - 2014 RVN 727.1/1566
Figure 9. Conceptual geohydrological model – plan view.
Fresh Rhyolite
Ash Dam
Dia
base
In
trusi
on
Weathered Diabase
Weathered Rhyolite
Highly weathered Rhyolite
Fresh Karoo rocks
Weathered Karoo rocks
A
A
N
Figure 10. Conceptual geohydrological model – view along cross-section A-A (vertical scale
exaggerated).
Rhyolite
Karoo sedimentary rocks
Witbank Dam
Ash Dam
Diabase intrusion
A
A
Highly weathered Rhyolite
N
Sewage Plant
Coal Stockyard
Raw Water Dam
Emergency Pan
- 23 -
GHT CONSULTING SCIENTISTS DUVHA POWER STATION – NUMERICAL POLLUTION PLUME MODEL - 2014 RVN 727.1/1566
The conceptual geohydrological model on which the numerical model is based is summarised below:
• The Ash Dam is underlain by rhyolites which are volcanic extrusive rocks. These rocks are typically very dense and have low permeabilities. A low rate of groundwater flow and contaminant transport is expected to occur through the fresh rhyolites. However, preferential pathways for groundwater flow in the form of fractured zones may occur. The flow rates along such fractured zones may be very high.
• The rhyolites are weathered at surface. The depth of weathering may vary from around two to ten metres. The permeability of the weathered rhyolites is much higher than that of the fresh rhyolite. Groundwater flow is expected to predominantly occur through the weathered rhyolites.
• Seepage from the Ash Dam will infiltrate the shallow weathered rhyolite material until the depth of the fresh rhyolites is reached. Due to the low permeability of the fresh rhyolites, flow will then predominantly take place in a lateral direction along the local topographic gradient (to the north).
• A zone of highly weathered rhyolites underlies the Ash Dam and extends to the north. Since no information is available on the extent of the weathered zone under the Ash Dam, an assumption had to be made regarding the lateral extent of this zone (refer to Figure 9).
• Karoo sedimentary rocks form a contact with the volcanic rhyolites at positions to the south of the Ash Dam. The geological borehole logging that was done during the drilling phase of this project revealed that the contact occurs further to the south than is indicated on the geological map of the area (refer to Appendix A). The contact between the rhyolites and Karoo rocks runs through the Raw Water Dam to the south of the Ash Dam, but occurs to the north of the High Level Ash Water Return Dams.
• The shallow Karoo rocks have also been exposed to weathering and, as a result, are more permeable than the deeper fresh Karoo rocks.
• A diabase intrusion occurs to the north of the Ash Dam. Since no information is available on the dip of this magmatic feature, it is assumed that the intrusion is steep dipping.
• The contact zone between the diabase and rhyolites has been exposed to intensive fracturing and weathering. High hydraulic conductivities are expected for this zone.
7.2.1 Model Input – Hydraulic Parameters For the purposes of developing a numerical model that is representative of the actual geohydrological conditions at Duvha Power Station nine zones of different hydraulic properties were identified (simplification of the previous model). These zones and the assumed hydraulic properties are summarised in Table 12 and Table 13.
- 24 -
GHT CONSULTING SCIENTISTS DUVHA POWER STATION – NUMERICAL POLLUTION PLUME MODEL - 2014 RVN 727.1/1566
• Zone 1 – Weathered rhyolite and associated topsoil
• Zone 2 – Dry (or unsaturated) ash in the Ash Dam
• Zone 3 – Zone 3 – Saturated ash in the Ash Dam
• Zone 4 – Weathered Karoo rocks and associated topsoil
• Zone 5 – Highly weathered rhyolite and associated topsoil
• Zone 6 – Fresh, un-weathered Karoo rocks
• Zone 7 – Fresh, un-weathered diabase
• Zone 8 – Fresh un-weathered rhyolite
Table 12. Hydraulic conductivities of the geohydrological zones.
Table 13. Storage properties of the geohydrological zones.
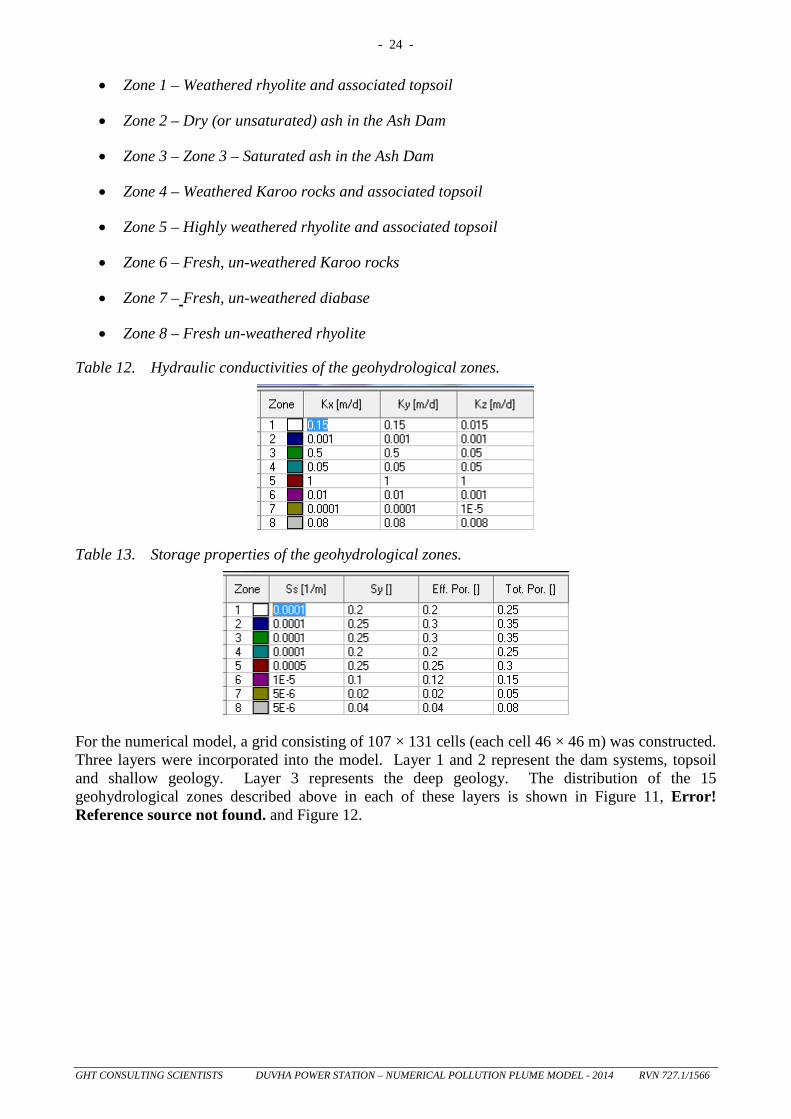
For the numerical model, a grid consisting of 107 × 131 cells (each cell 46 × 46 m) was constructed. Three layers were incorporated into the model. Layer 1 and 2 represent the dam systems, topsoil and shallow geology. Layer 3 represents the deep geology. The distribution of the 15 geohydrological zones described above in each of these layers is shown in Figure 11, Error! Reference source not found. and Figure 12.
- 25 -
GHT CONSULTING SCIENTISTS DUVHA POWER STATION – NUMERICAL POLLUTION PLUME MODEL - 2014 RVN 727.1/1566
Figure 11. Geohydrological zone distribution of the shallow Geology.
- 26 -
GHT CONSULTING SCIENTISTS DUVHA POWER STATION – NUMERICAL POLLUTION PLUME MODEL - 2014 RVN 727.1/1566
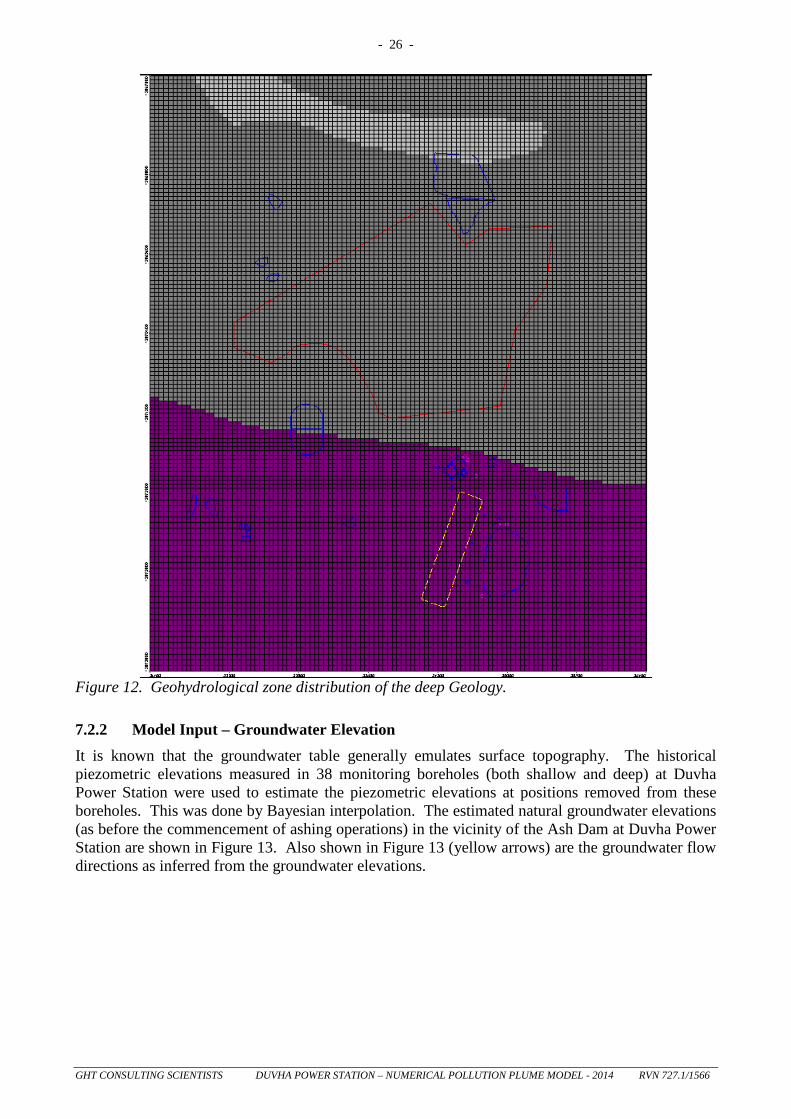
Figure 12. Geohydrological zone distribution of the deep Geology.
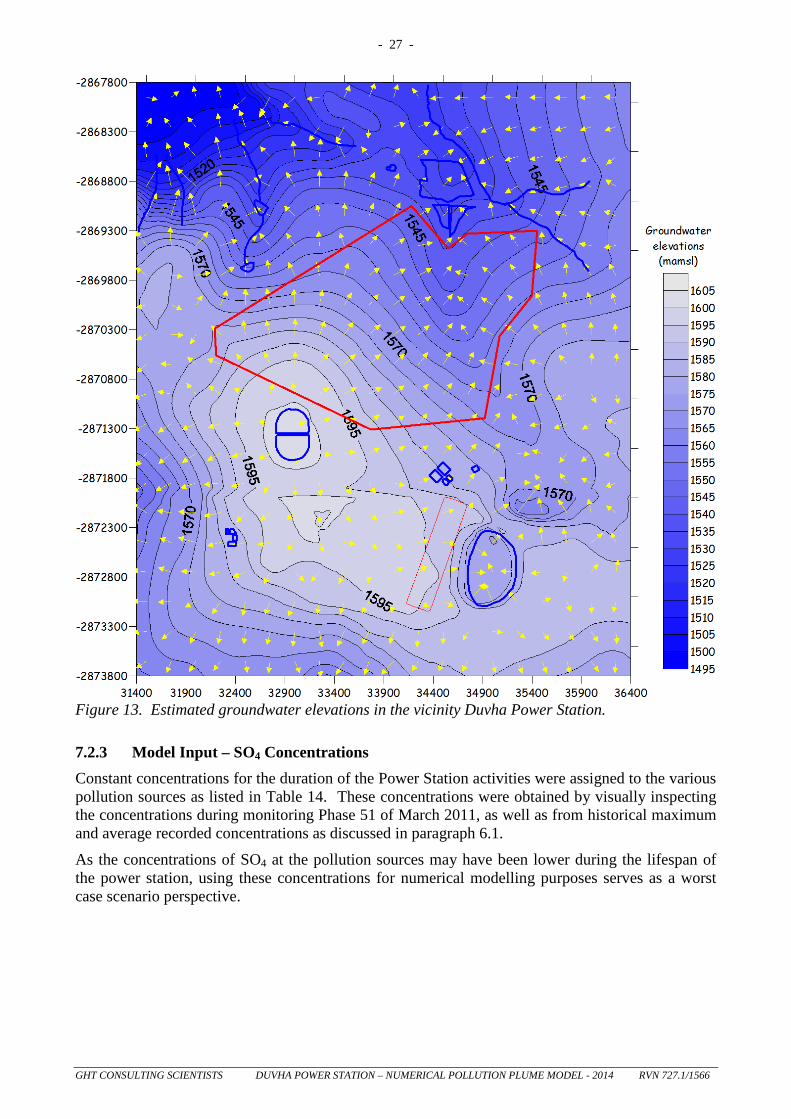
7.2.2 Model Input – Groundwater ElevationIt is known that the groundwater table generally emulates surface topography. The historical piezometric elevations measured in 38 monitoring boreholes (both shallow and deep) at Duvha Power Station were used to estimate the piezometric elevations at positions removed from these boreholes. This was done by Bayesian interpolation. The estimated natural groundwater elevations (as before the commencement of ashing operations) in the vicinity of the Ash Dam at Duvha Power Station are shown in Figure 13. Also shown in Figure 13 (yellow arrows) are the groundwater flow directions as inferred from the groundwater elevations.
- 27 -
GHT CONSULTING SCIENTISTS DUVHA POWER STATION – NUMERICAL POLLUTION PLUME MODEL - 2014 RVN 727.1/1566
Figure 13. Estimated groundwater elevations in the vicinity Duvha Power Station.
7.2.3 Model Input – SO4 Concentrations Constant concentrations for the duration of the Power Station activities were assigned to the various pollution sources as listed in Table 14. These concentrations were obtained by visually inspecting the concentrations during monitoring Phase 51 of March 2011, as well as from historical maximum and average recorded concentrations as discussed in paragraph 6.1.
As the concentrations of SO4 at the pollution sources may have been lower during the lifespan of the power station, using these concentrations for numerical modelling purposes serves as a worst case scenario perspective.
- 28 -
GHT CONSULTING SCIENTISTS DUVHA POWER STATION – NUMERICAL POLLUTION PLUME MODEL - 2014 RVN 727.1/1566
Table 14. Pollution source concentrations.
Nr. On Map DescriptionConcentration
(SO4 mg/l) Time
PP09 Low Level Ash Return water dams & Silt trap upstream 650 1989-2036PP10 Raw Water Dam 120 1989-2036PP04 High Level Ash Return water dams 650 1989-2036PP03CC14 Coal Stockyard and Emergency Pan 500 1989-2036
AC01AC15 Ash Dam 650 1989-2041
PE01 Sewage Plant 150 1989-2036
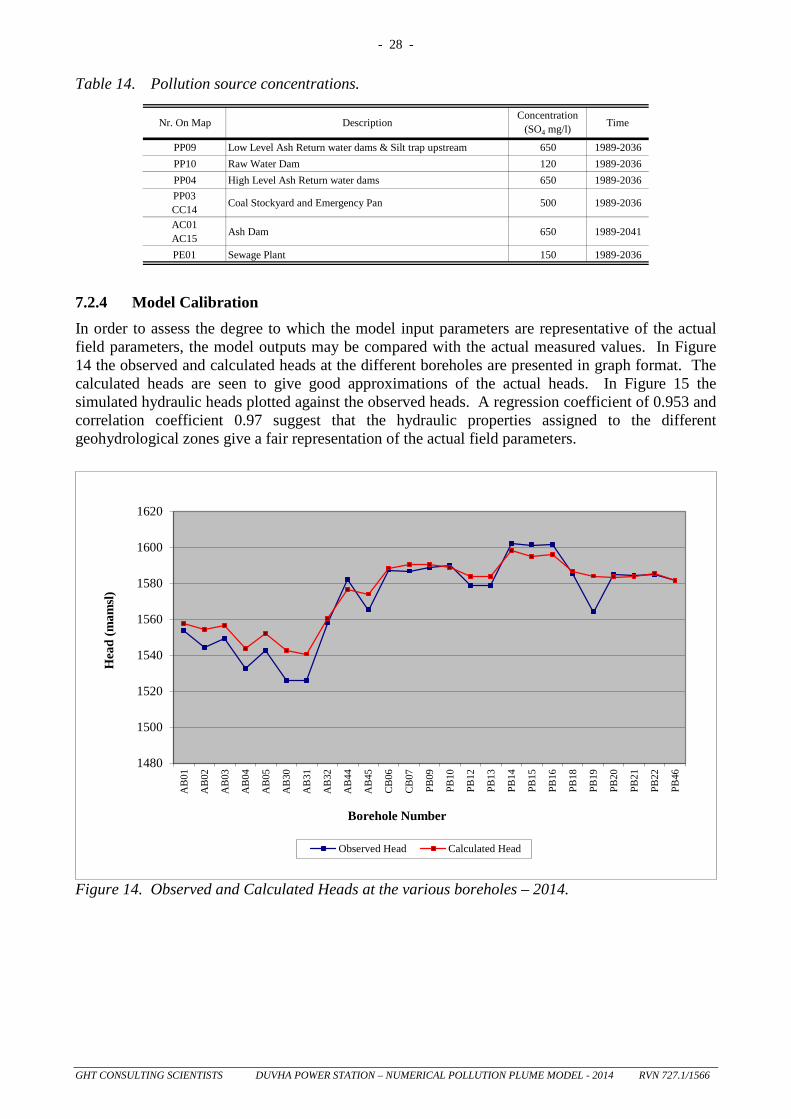
7.2.4 Model Calibration In order to assess the degree to which the model input parameters are representative of the actual field parameters, the model outputs may be compared with the actual measured values. In Figure 14 the observed and calculated heads at the different boreholes are presented in graph format. The calculated heads are seen to give good approximations of the actual heads. In Figure 15 the simulated hydraulic heads plotted against the observed heads. A regression coefficient of 0.953 and correlation coefficient 0.97 suggest that the hydraulic properties assigned to the different geohydrological zones give a fair representation of the actual field parameters.
1480
1500
1520
1540
1560
1580
1600
1620
AB
01
AB
02
AB
03
AB
04
AB
05
AB
30
AB
31
AB
32
AB
44
AB
45
CB06
CB07
PB09
PB10
PB12
PB13
PB14
PB15
PB16
PB18
PB19
PB20
PB21
PB22
PB46
Hea
d (m
amsl)
Borehole Number
Observed Head Calculated Head
Figure 14. Observed and Calculated Heads at the various boreholes – 2014.
- 29 -
GHT CONSULTING SCIENTISTS DUVHA POWER STATION – NUMERICAL POLLUTION PLUME MODEL - 2014 RVN 727.1/1566
R² = 0.9532
1530
1540
1550
1560
1570
1580
1590
1600
1610
1520
1530
1540
1550
1560
1570
1580
1590
1600
1610
Cal
cula
ted
Hea
d (m
amsl)
Observed Head (mamsl)
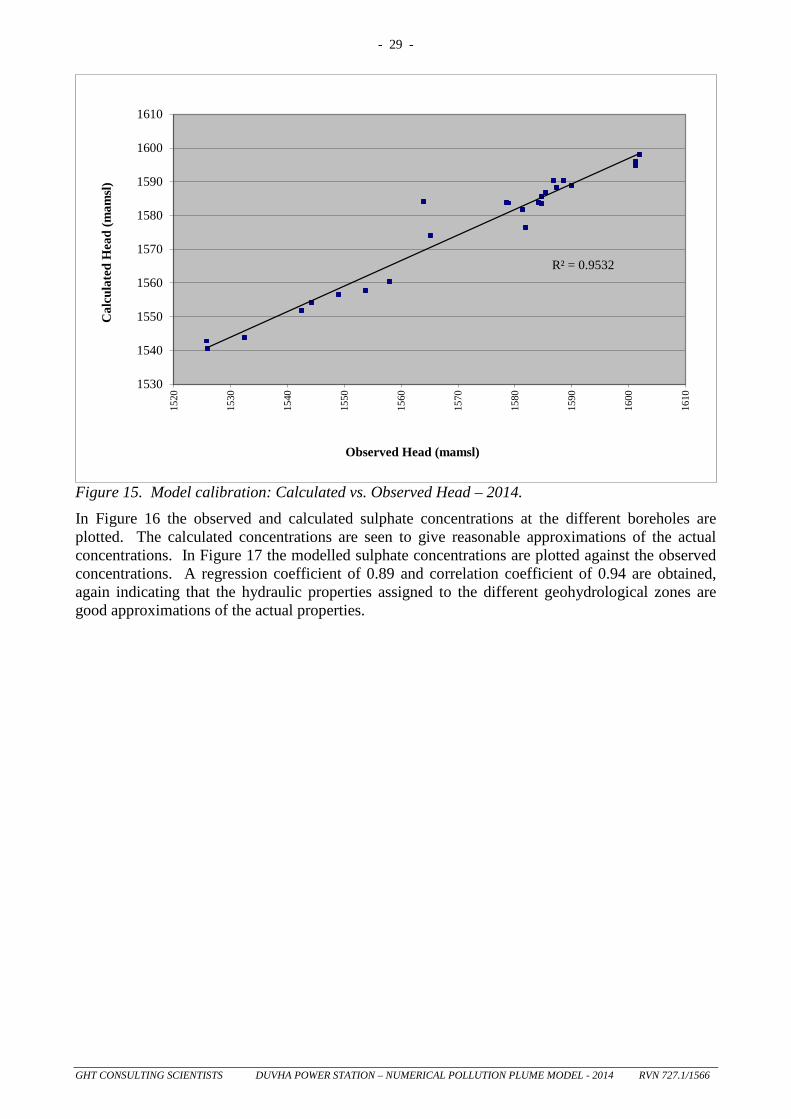
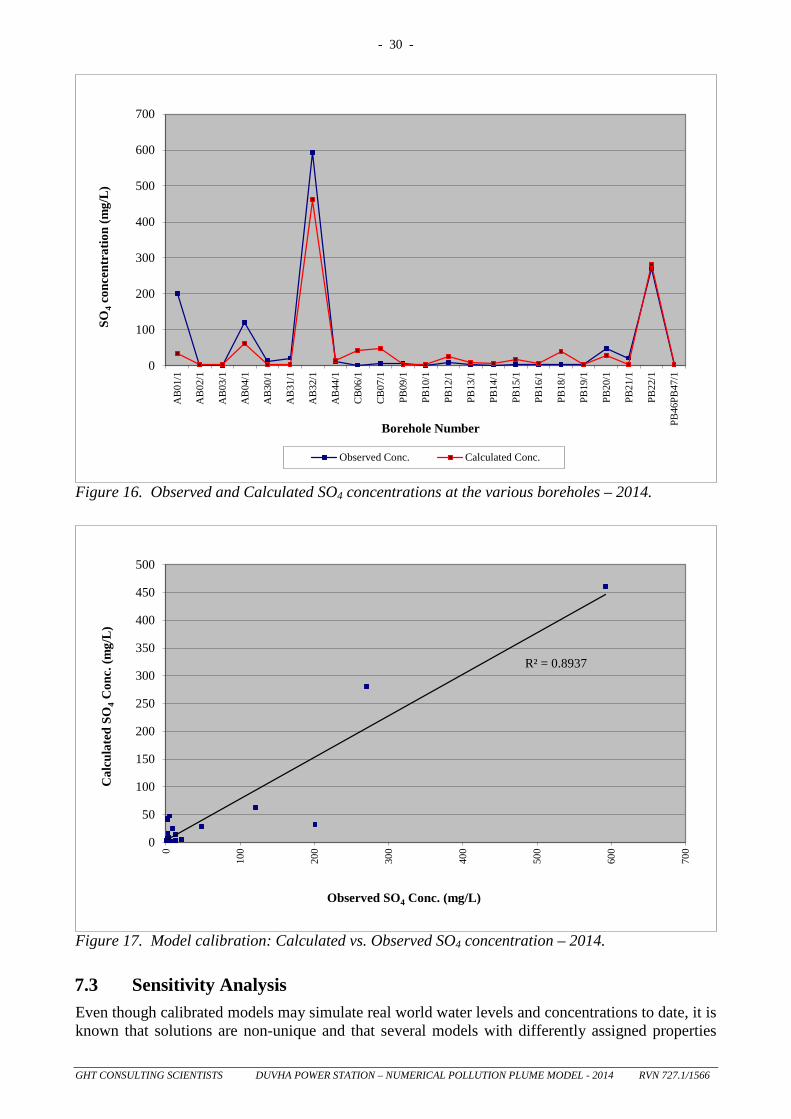
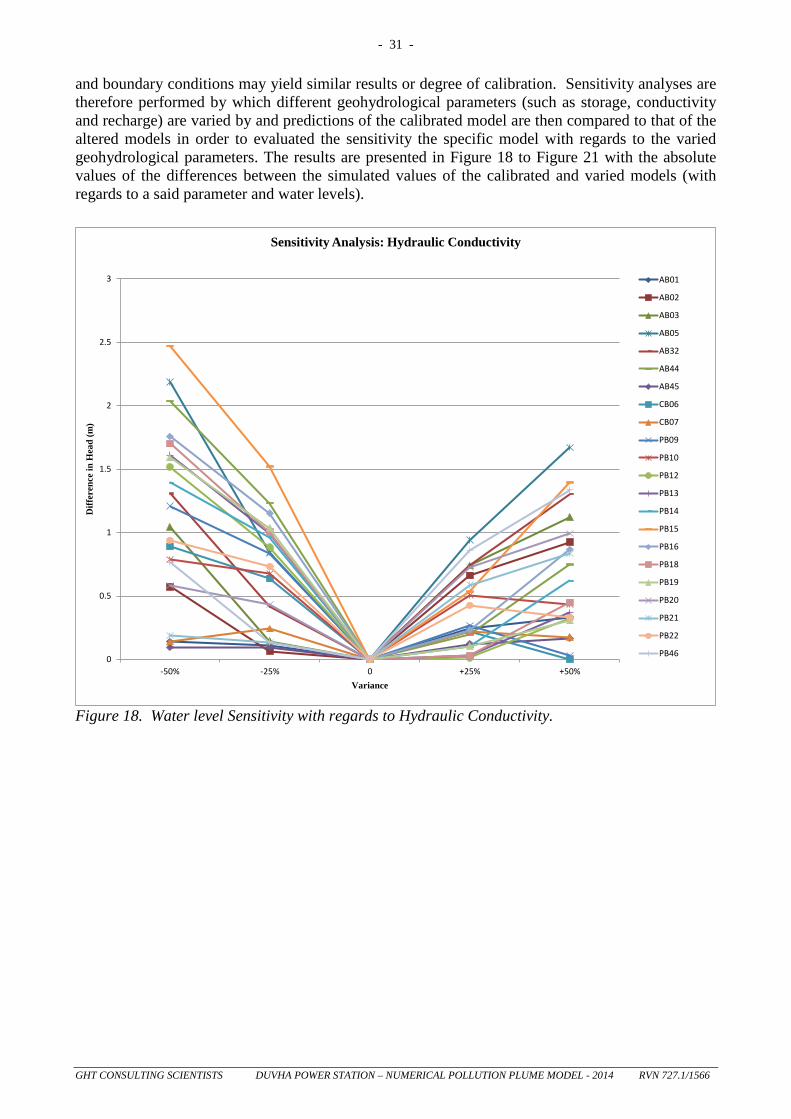
Figure 15. Model calibration: Calculated vs. Observed Head – 2014. In Figure 16 the observed and calculated sulphate concentrations at the different boreholes are plotted. The calculated concentrations are seen to give reasonable approximations of the actual concentrations. In Figure 17 the modelled sulphate concentrations are plotted against the observed concentrations. A regression coefficient of 0.89 and correlation coefficient of 0.94 are obtained, again indicating that the hydraulic properties assigned to the different geohydrological zones are good approximations of the actual properties.
- 30 -
GHT CONSULTING SCIENTISTS DUVHA POWER STATION – NUMERICAL POLLUTION PLUME MODEL - 2014 RVN 727.1/1566
0
100
200
300
400
500
600
700
AB
01/1
AB
02/1
AB
03/1
AB
04/1
AB
30/1
AB
31/1
AB
32/1
AB
44/1
CB06
/1
CB07
/1
PB09
/1
PB10
/1
PB12
/1
PB13
/1
PB14
/1
PB15
/1
PB16
/1
PB18
/1
PB19
/1
PB20
/1
PB21
/1
PB22
/1
PB46
PB47
/1
SO4
conc
entr
atio
n (m
g/L)
Borehole Number
Observed Conc. Calculated Conc.
Figure 16. Observed and Calculated SO4 concentrations at the various boreholes – 2014.
R² = 0.8937
0
50
100
150
200
250
300
350
400
450
500
0
100
200
300
400
500
600
700
Cal
cula
ted
SO4
Con
c. (m
g/L)
Observed SO4 Conc. (mg/L)
Figure 17. Model calibration: Calculated vs. Observed SO4 concentration – 2014.
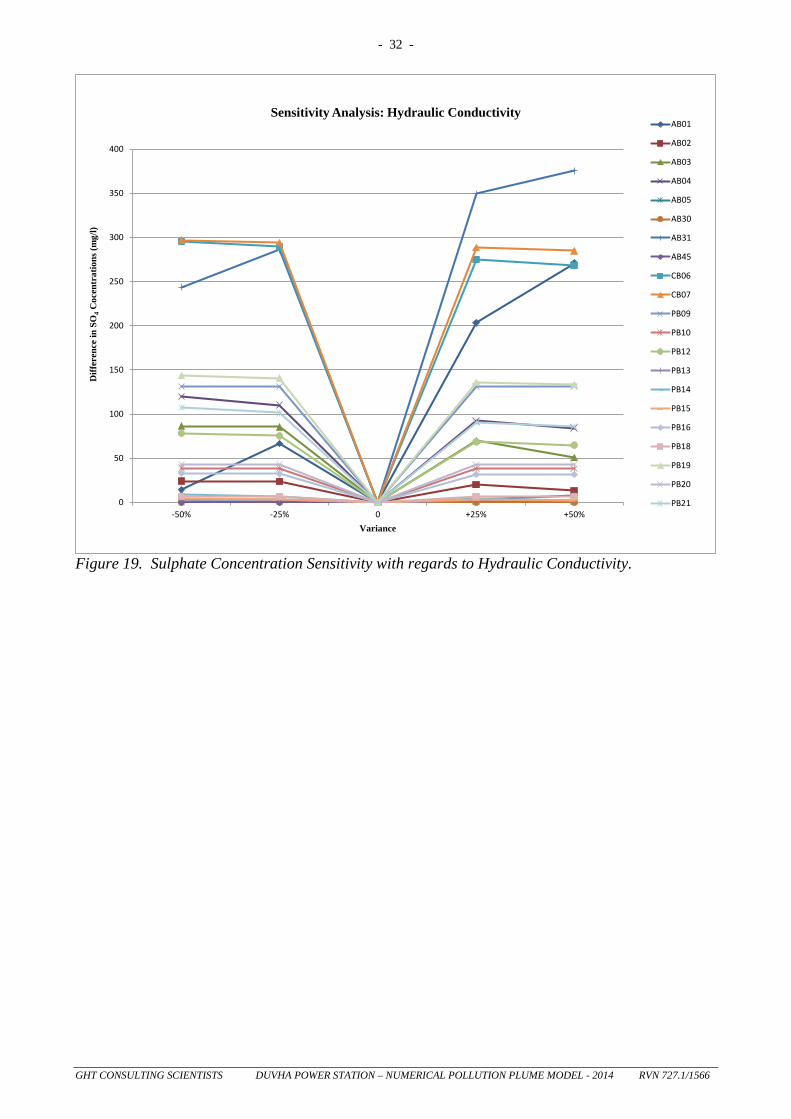
7.3 Sensitivity Analysis Even though calibrated models may simulate real world water levels and concentrations to date, it is known that solutions are non-unique and that several models with differently assigned properties
- 31 -
GHT CONSULTING SCIENTISTS DUVHA POWER STATION – NUMERICAL POLLUTION PLUME MODEL - 2014 RVN 727.1/1566
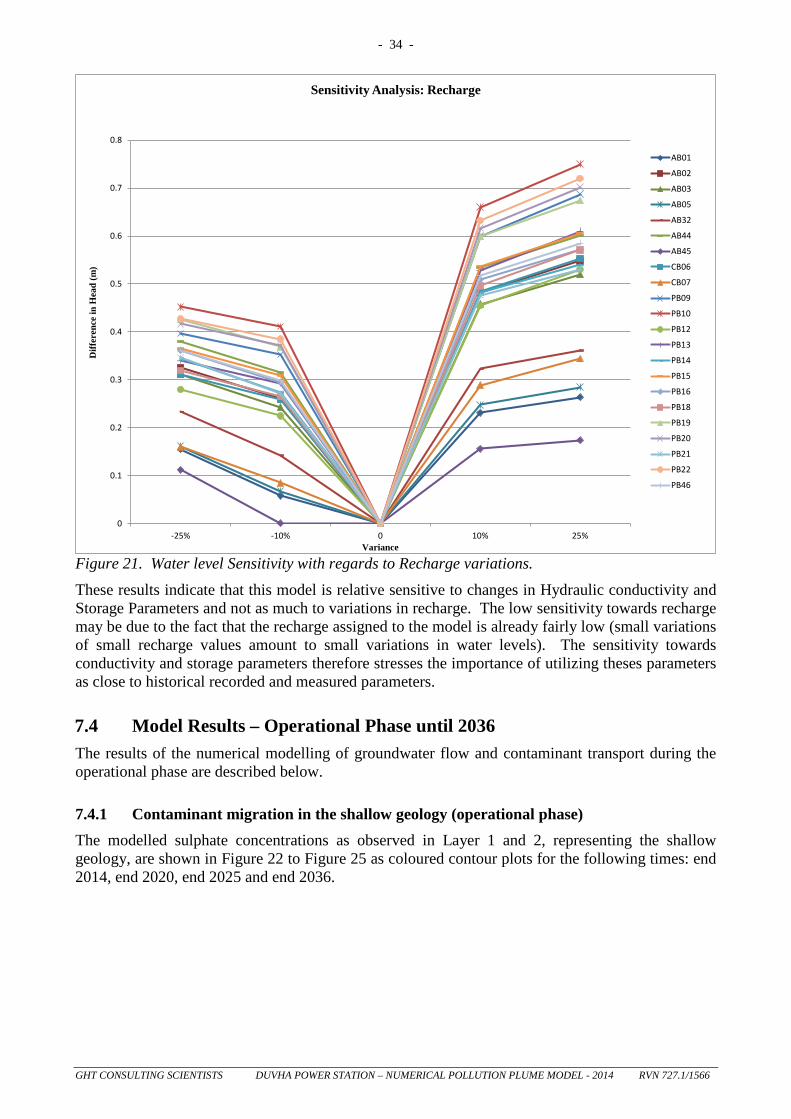
and boundary conditions may yield similar results or degree of calibration. Sensitivity analyses are therefore performed by which different geohydrological parameters (such as storage, conductivity and recharge) are varied by and predictions of the calibrated model are then compared to that of the altered models in order to evaluated the sensitivity the specific model with regards to the varied geohydrological parameters. The results are presented in Figure 18 to Figure 21 with the absolute values of the differences between the simulated values of the calibrated and varied models (with regards to a said parameter and water levels).
0
0.5
1
1.5
2
2.5
3
-50% -25% 0 +25% +50%
Diff
eren
ce in
Hea
d (m
)
Variance
Sensitivity Analysis: Hydraulic Conductivity
AB01
AB02
AB03
AB05
AB32
AB44
AB45
CB06
CB07
PB09
PB10
PB12
PB13
PB14
PB15
PB16
PB18
PB19
PB20
PB21
PB22
PB46
Figure 18. Water level Sensitivity with regards to Hydraulic Conductivity.
- 32 -
GHT CONSULTING SCIENTISTS DUVHA POWER STATION – NUMERICAL POLLUTION PLUME MODEL - 2014 RVN 727.1/1566
0
50
100
150
200
250
300
350
400
-50% -25% 0 +25% +50%
Diff
eren
ce in
SO
4C
ocen
trat
ions
(mg/
l)
Variance
Sensitivity Analysis: Hydraulic ConductivityAB01
AB02
AB03
AB04
AB05
AB30
AB31
AB45
CB06
CB07
PB09
PB10
PB12
PB13
PB14
PB15
PB16
PB18
PB19
PB20
PB21
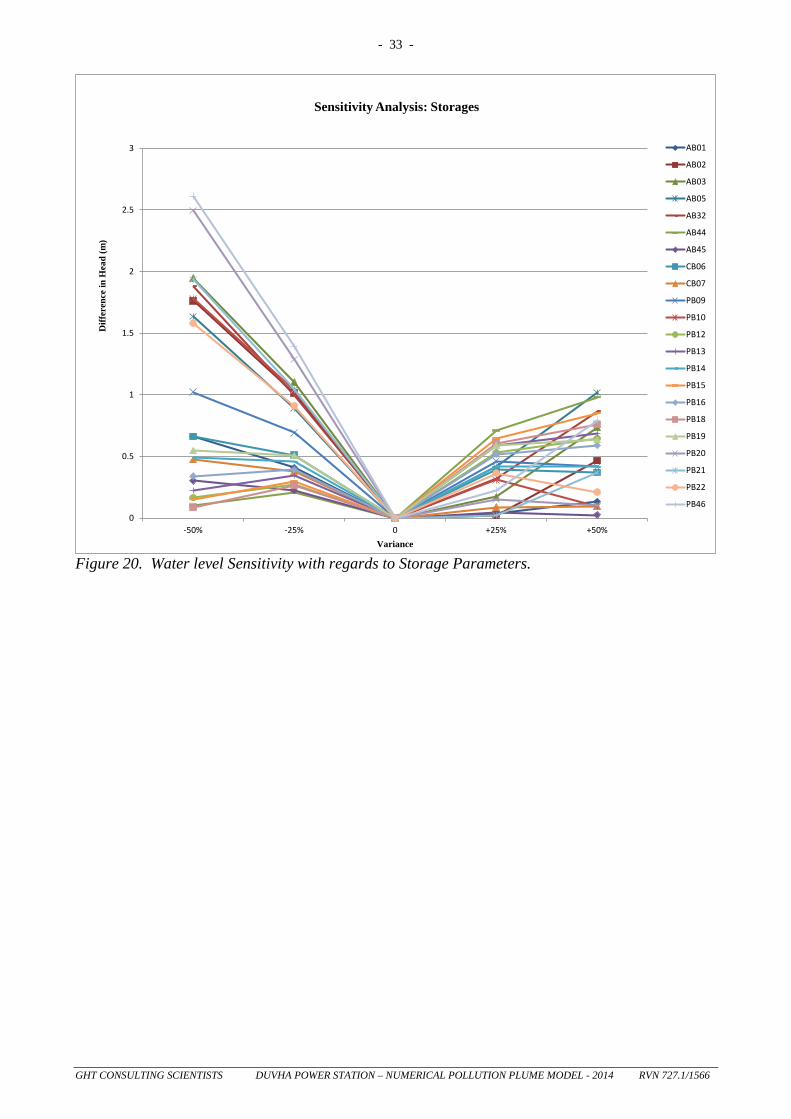
Figure 19. Sulphate Concentration Sensitivity with regards to Hydraulic Conductivity.
- 33 -
GHT CONSULTING SCIENTISTS DUVHA POWER STATION – NUMERICAL POLLUTION PLUME MODEL - 2014 RVN 727.1/1566
0
0.5
1
1.5
2
2.5
3
-50% -25% 0 +25% +50%
Diff
eren
ce in
Hea
d (m
)
Variance
Sensitivity Analysis: Storages
AB01
AB02
AB03
AB05
AB32
AB44
AB45
CB06
CB07
PB09
PB10
PB12
PB13
PB14
PB15
PB16
PB18
PB19
PB20
PB21
PB22
PB46
Figure 20. Water level Sensitivity with regards to Storage Parameters.
- 34 -
GHT CONSULTING SCIENTISTS DUVHA POWER STATION – NUMERICAL POLLUTION PLUME MODEL - 2014 RVN 727.1/1566
0
0.1
0.2
0.3
0.4
0.5
0.6
0.7
0.8
-25% -10% 0 10% 25%
Diff
eren
ce in
Hea
d (m
)
Variance
Sensitivity Analysis: Recharge
AB01
AB02
AB03
AB05
AB32
AB44
AB45
CB06
CB07
PB09
PB10
PB12
PB13
PB14
PB15
PB16
PB18
PB19
PB20
PB21
PB22
PB46
Figure 21. Water level Sensitivity with regards to Recharge variations. These results indicate that this model is relative sensitive to changes in Hydraulic conductivity and Storage Parameters and not as much to variations in recharge. The low sensitivity towards recharge may be due to the fact that the recharge assigned to the model is already fairly low (small variations of small recharge values amount to small variations in water levels). The sensitivity towards conductivity and storage parameters therefore stresses the importance of utilizing theses parameters as close to historical recorded and measured parameters.
7.4 Model Results – Operational Phase until 2036 The results of the numerical modelling of groundwater flow and contaminant transport during the operational phase are described below.
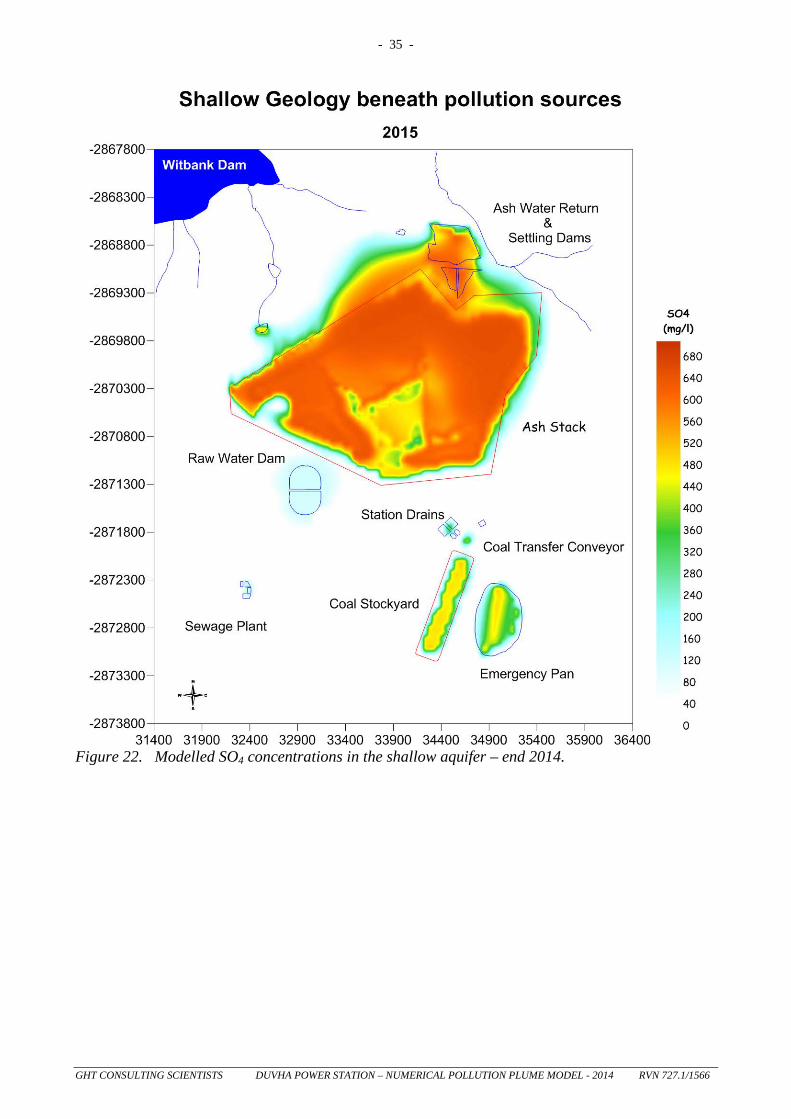
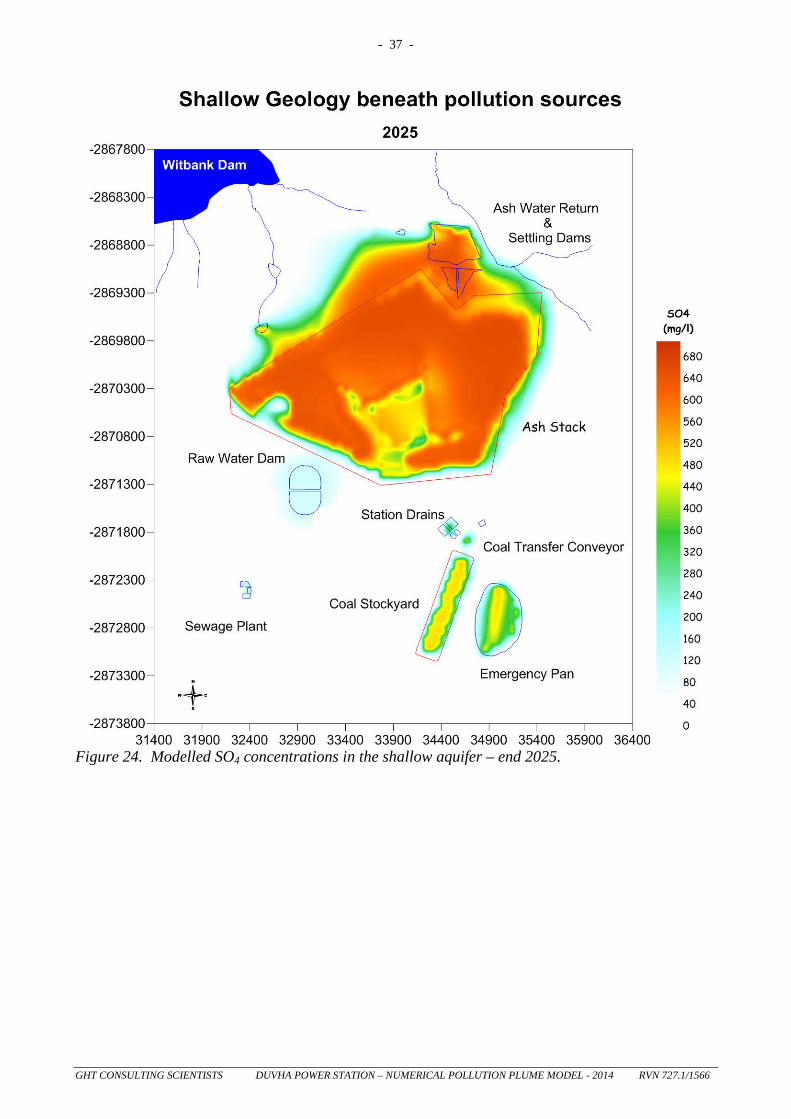
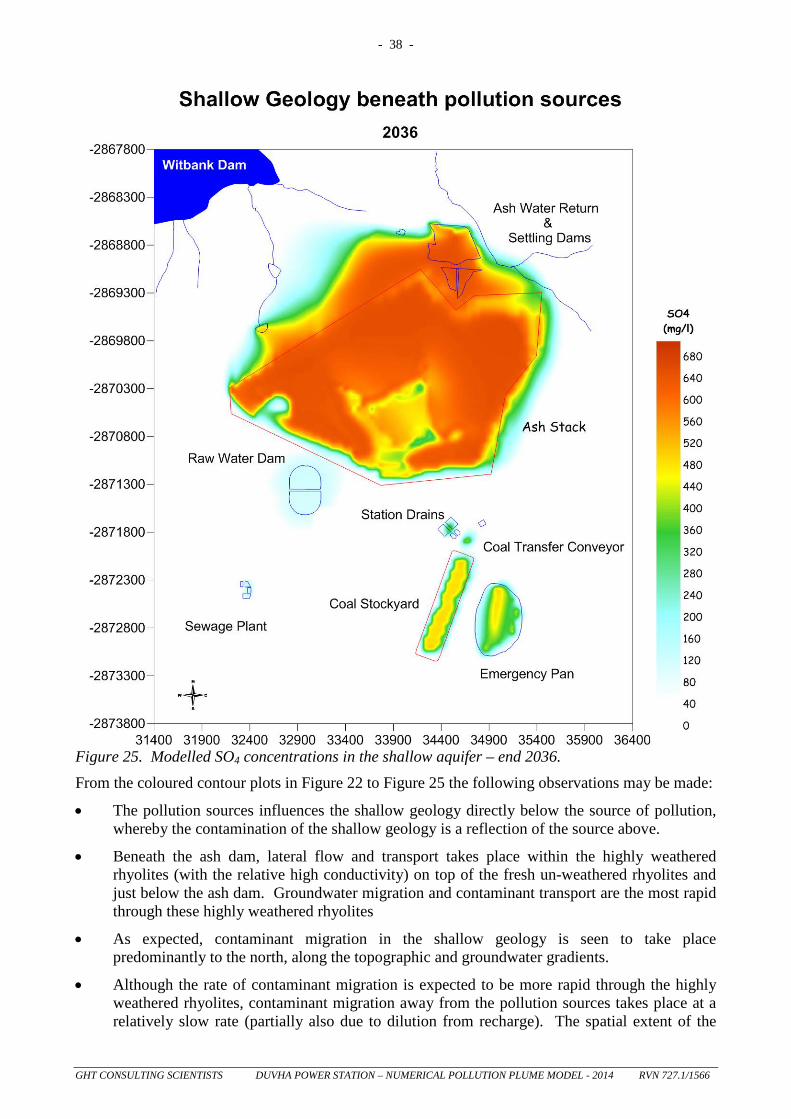
7.4.1 Contaminant migration in the shallow geology (operational phase) The modelled sulphate concentrations as observed in Layer 1 and 2, representing the shallow geology, are shown in Figure 22 to Figure 25 as coloured contour plots for the following times: end 2014, end 2020, end 2025 and end 2036.
- 35 -
GHT CONSULTING SCIENTISTS DUVHA POWER STATION – NUMERICAL POLLUTION PLUME MODEL - 2014 RVN 727.1/1566
Figure 22. Modelled SO4 concentrations in the shallow aquifer – end 2014.

- 36 -
GHT CONSULTING SCIENTISTS DUVHA POWER STATION – NUMERICAL POLLUTION PLUME MODEL - 2014 RVN 727.1/1566
Figure 23. Modelled SO4 concentrations in the shallow aquifer – end 2020.
- 37 -
GHT CONSULTING SCIENTISTS DUVHA POWER STATION – NUMERICAL POLLUTION PLUME MODEL - 2014 RVN 727.1/1566
Figure 24. Modelled SO4 concentrations in the shallow aquifer – end 2025.
- 38 -
GHT CONSULTING SCIENTISTS DUVHA POWER STATION – NUMERICAL POLLUTION PLUME MODEL - 2014 RVN 727.1/1566
Figure 25. Modelled SO4 concentrations in the shallow aquifer – end 2036. From the coloured contour plots in Figure 22 to Figure 25 the following observations may be made:
• The pollution sources influences the shallow geology directly below the source of pollution, whereby the contamination of the shallow geology is a reflection of the source above.
• Beneath the ash dam, lateral flow and transport takes place within the highly weathered rhyolites (with the relative high conductivity) on top of the fresh un-weathered rhyolites and just below the ash dam. Groundwater migration and contaminant transport are the most rapid through these highly weathered rhyolites
• As expected, contaminant migration in the shallow geology is seen to take place predominantly to the north, along the topographic and groundwater gradients.
• Although the rate of contaminant migration is expected to be more rapid through the highly weathered rhyolites, contaminant migration away from the pollution sources takes place at a relatively slow rate (partially also due to dilution from recharge). The spatial extent of the
- 39 -
GHT CONSULTING SCIENTISTS DUVHA POWER STATION – NUMERICAL POLLUTION PLUME MODEL - 2014 RVN 727.1/1566
contaminant plumes in the shallow aquifer remains limited – even at the end of ashing operations in 2036.
• Contaminant impacts are expected on the non-perennial streams that occur to the north of the Ash Dam and Low Level Ash Water Return Dam. The quality of the water in these streams is probably already affected by seepage and overflows from the dam systems. The dolerite intrusion north of the Low Level Ash Water Return Dam may however act as a preferential pathway along the weathered sides of the intrusion or as a barrier where it is fresh. This barrier effect is reflected in the uncontaminated chemical results as observed in borehole AB04 just north of the lower ash water return dam.
• Mitigation actions such as the dirty water canals around the Ash Dam and Coal Stockyard were implemented in the model in order to calibrate the model to both the water levels and SO4 concentrations as measured in vicinity of these pollution sources.
• Apart from surface activities (such as spillages) which are difficult to implement in a numerical model as exact times, durations and volumes are unknown, but which have a direct detrimental impact on groundwater, simulated pollution plumes at the various source remains fairly localized.
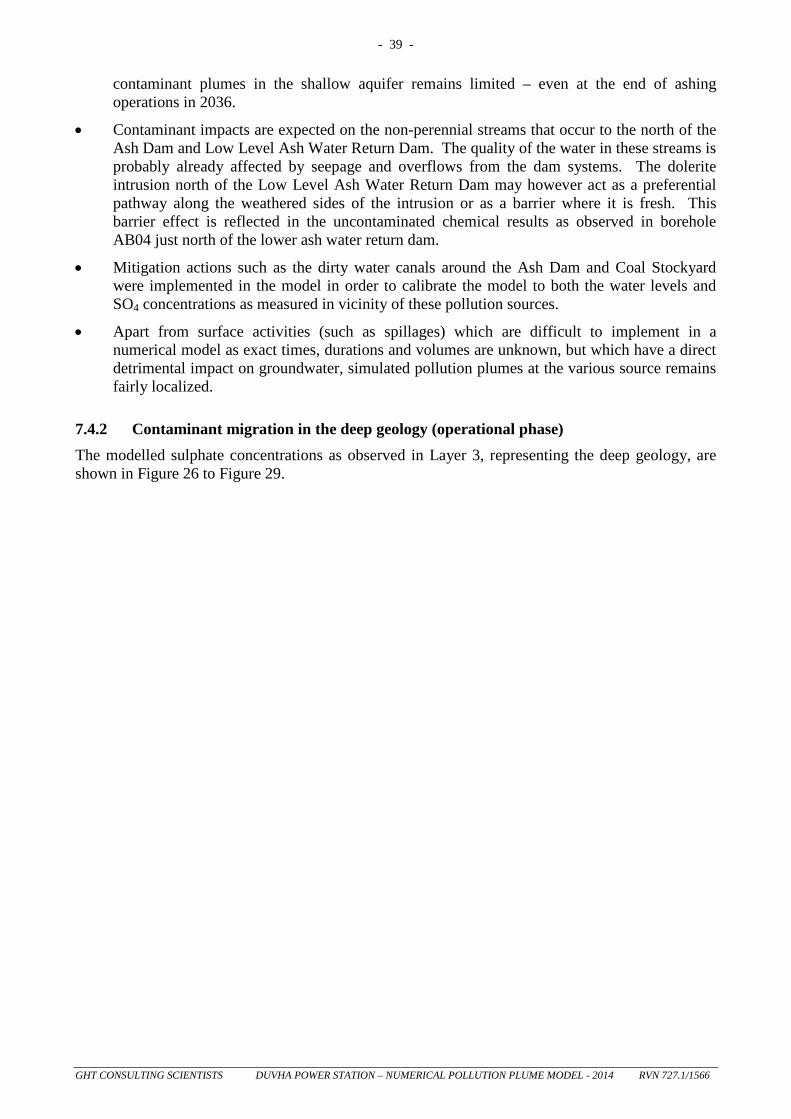
7.4.2 Contaminant migration in the deep geology (operational phase) The modelled sulphate concentrations as observed in Layer 3, representing the deep geology, are shown in Figure 26 to Figure 29.
- 40 -
GHT CONSULTING SCIENTISTS DUVHA POWER STATION – NUMERICAL POLLUTION PLUME MODEL - 2014 RVN 727.1/1566
Figure 26. Modelled SO4 concentrations in the deep geology – end 2014.

- 41 -
GHT CONSULTING SCIENTISTS DUVHA POWER STATION – NUMERICAL POLLUTION PLUME MODEL - 2014 RVN 727.1/1566
Figure 27. Modelled SO4 concentrations in the deep geology – end 2020.
- 42 -
GHT CONSULTING SCIENTISTS DUVHA POWER STATION – NUMERICAL POLLUTION PLUME MODEL - 2014 RVN 727.1/1566
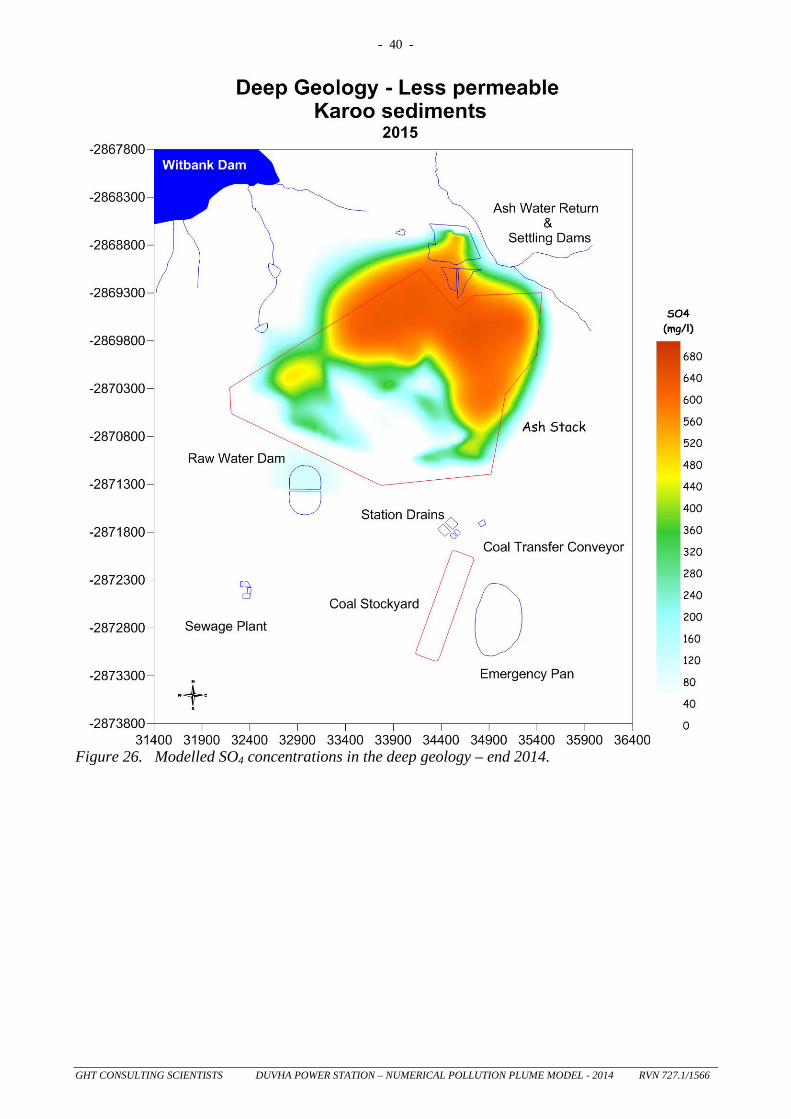
Figure 28. Modelled SO4 concentrations in the deep geology – end 2025.
- 43 -
GHT CONSULTING SCIENTISTS DUVHA POWER STATION – NUMERICAL POLLUTION PLUME MODEL - 2014 RVN 727.1/1566
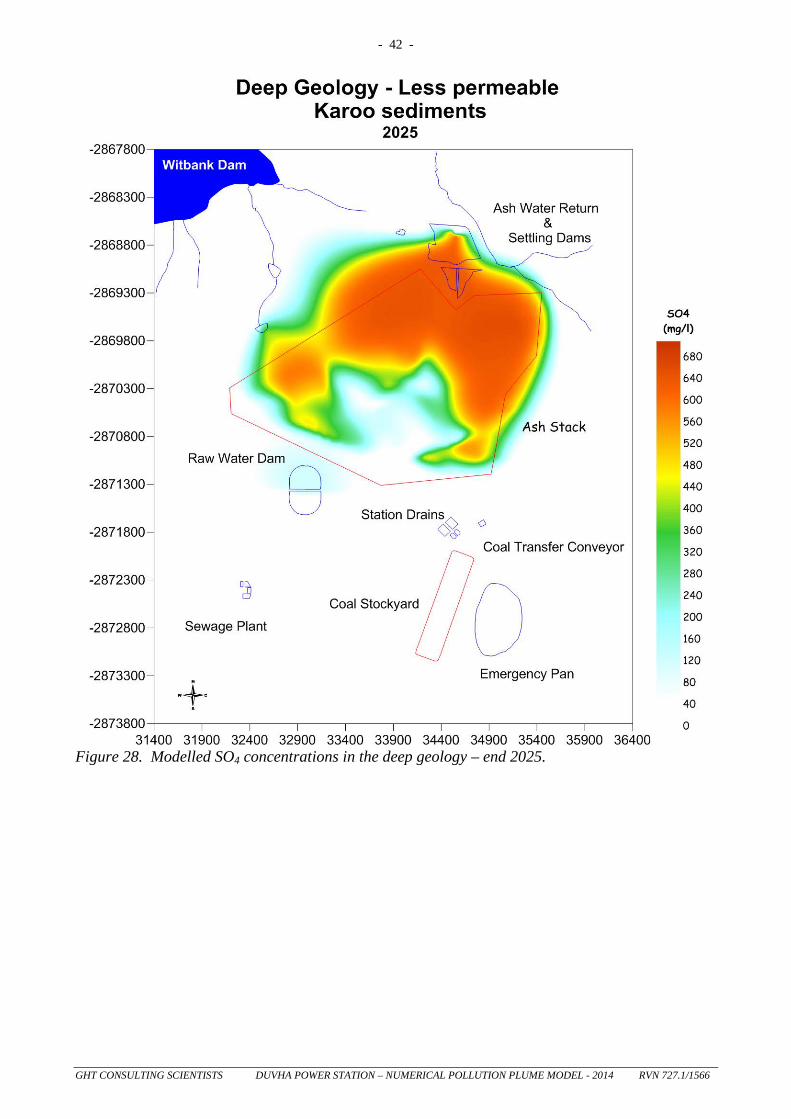
Figure 29. Modelled SO4 concentrations in the deep geology – end 2036. From the coloured contour plots in Figure 26 to Figure 29 the following observations may be made:
• Although not in the same concentrations, the contaminant plumes in the deep geology is expected to have a similar spatial extent than the plumes in the shallow geology.
• Although not simulated (due to unknown parameters and conditions) some mobilisation of contaminants along the weathered diabase intrusion may be expected to occur.
• Pollution from the Upper Ash Water Return Dams, the Coal Stockyard and the Emergency Pan to the deep geology within the fresh un-weathered Karoo rocks is limited. This is similar for pollution from the Sewage Plant and water from the Raw Water Dam, with yet almost unnoticeable effect on the deeper geology.
- 44 -
GHT CONSULTING SCIENTISTS DUVHA POWER STATION – NUMERICAL POLLUTION PLUME MODEL - 2014 RVN 727.1/1566
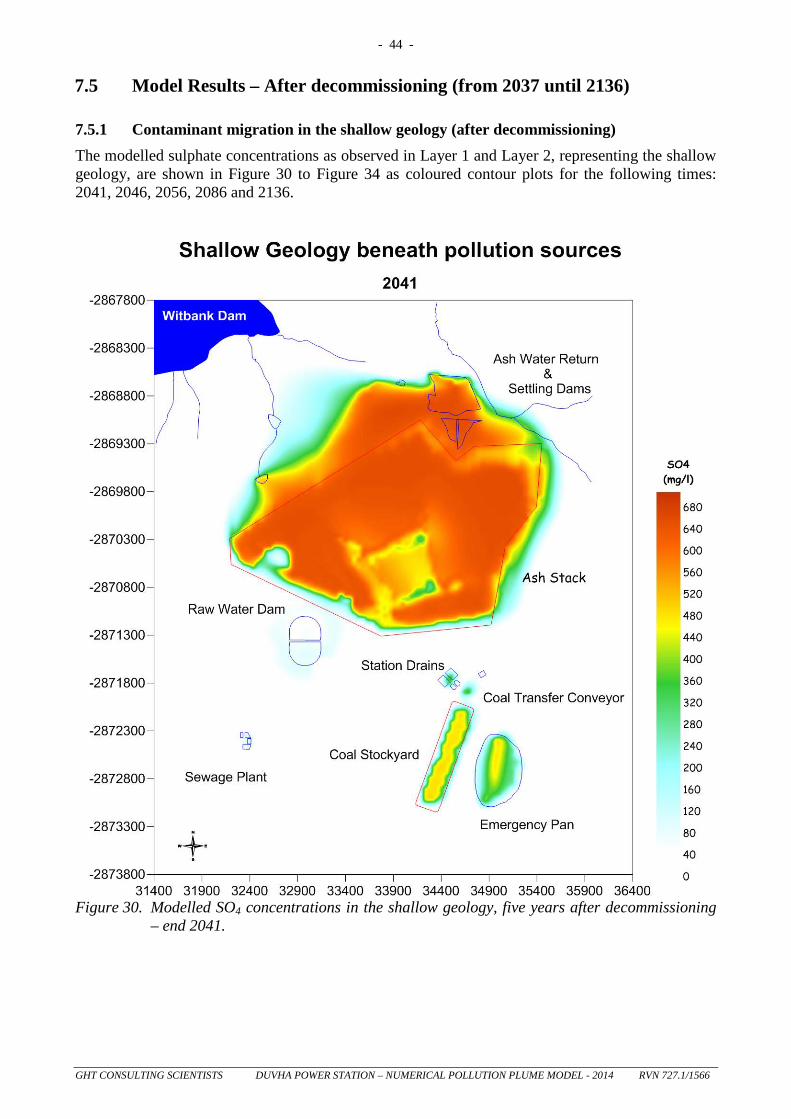
7.5 Model Results – After decommissioning (from 2037 until 2136)
7.5.1 Contaminant migration in the shallow geology (after decommissioning) The modelled sulphate concentrations as observed in Layer 1 and Layer 2, representing the shallow geology, are shown in Figure 30 to Figure 34 as coloured contour plots for the following times: 2041, 2046, 2056, 2086 and 2136.
Figure 30. Modelled SO4 concentrations in the shallow geology, five years after decommissioning
– end 2041.
- 45 -
GHT CONSULTING SCIENTISTS DUVHA POWER STATION – NUMERICAL POLLUTION PLUME MODEL - 2014 RVN 727.1/1566
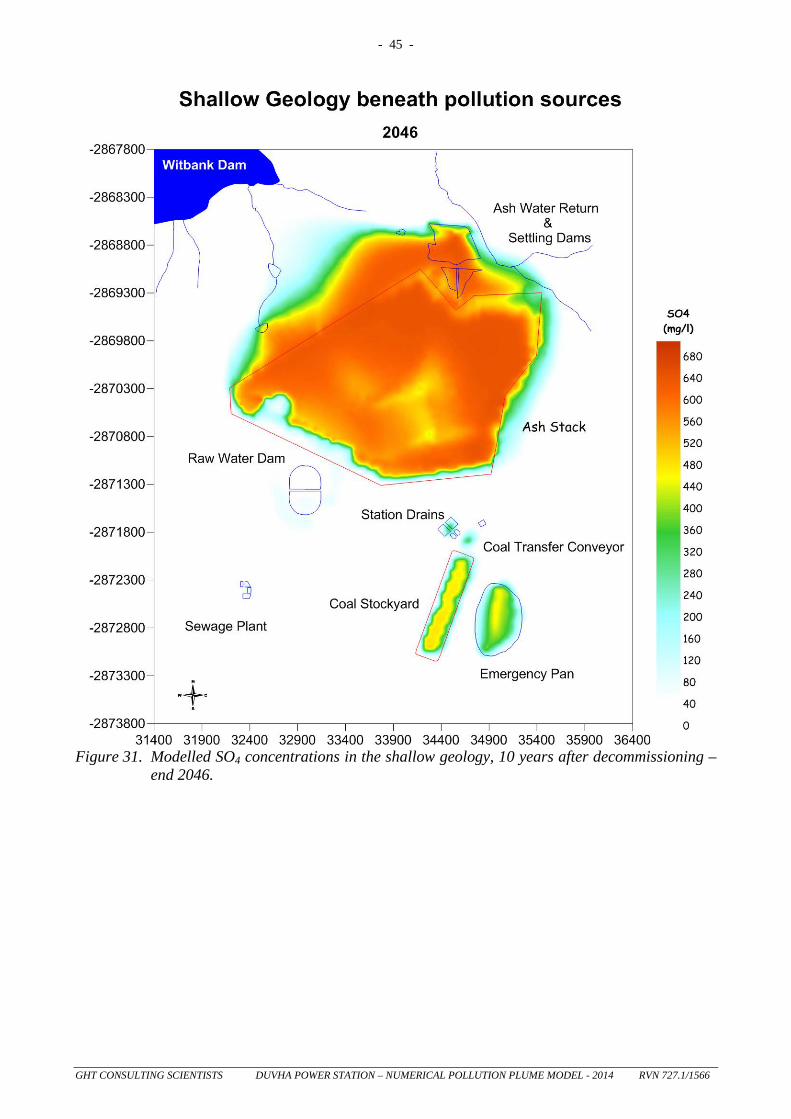
Figure 31. Modelled SO4 concentrations in the shallow geology, 10 years after decommissioning –
end 2046.
- 46 -
GHT CONSULTING SCIENTISTS DUVHA POWER STATION – NUMERICAL POLLUTION PLUME MODEL - 2014 RVN 727.1/1566
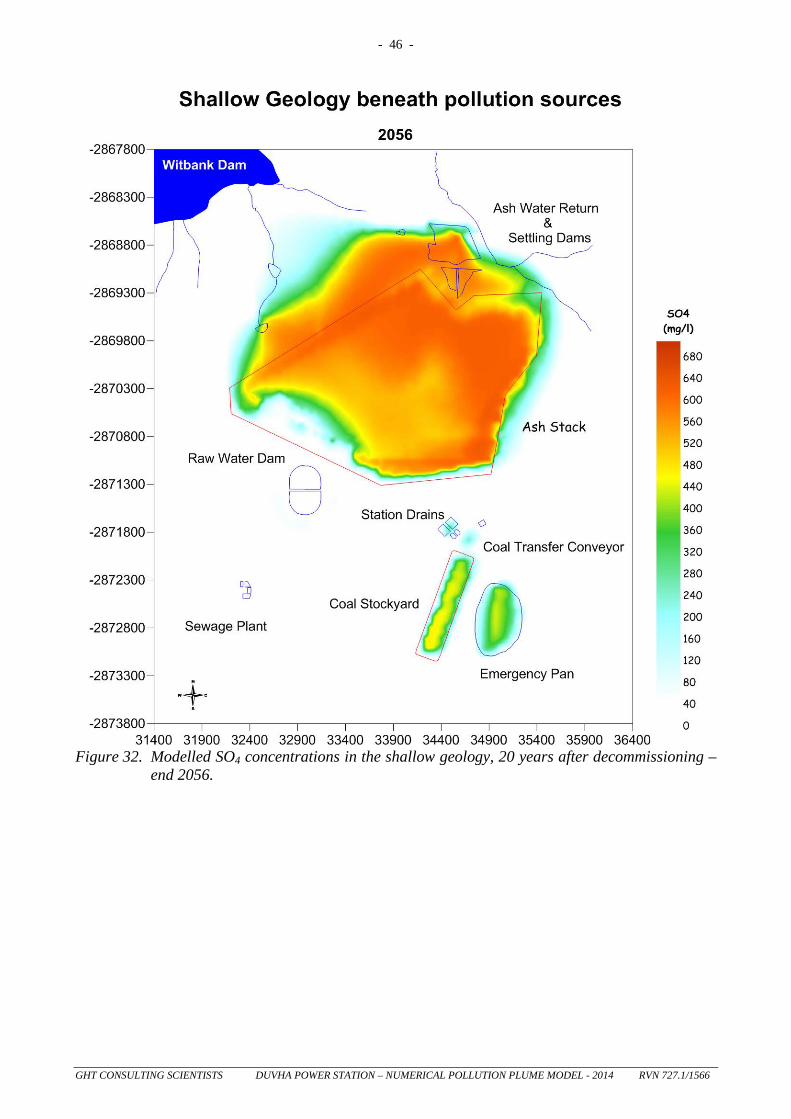
Figure 32. Modelled SO4 concentrations in the shallow geology, 20 years after decommissioning –
end 2056.
- 47 -
GHT CONSULTING SCIENTISTS DUVHA POWER STATION – NUMERICAL POLLUTION PLUME MODEL - 2014 RVN 727.1/1566
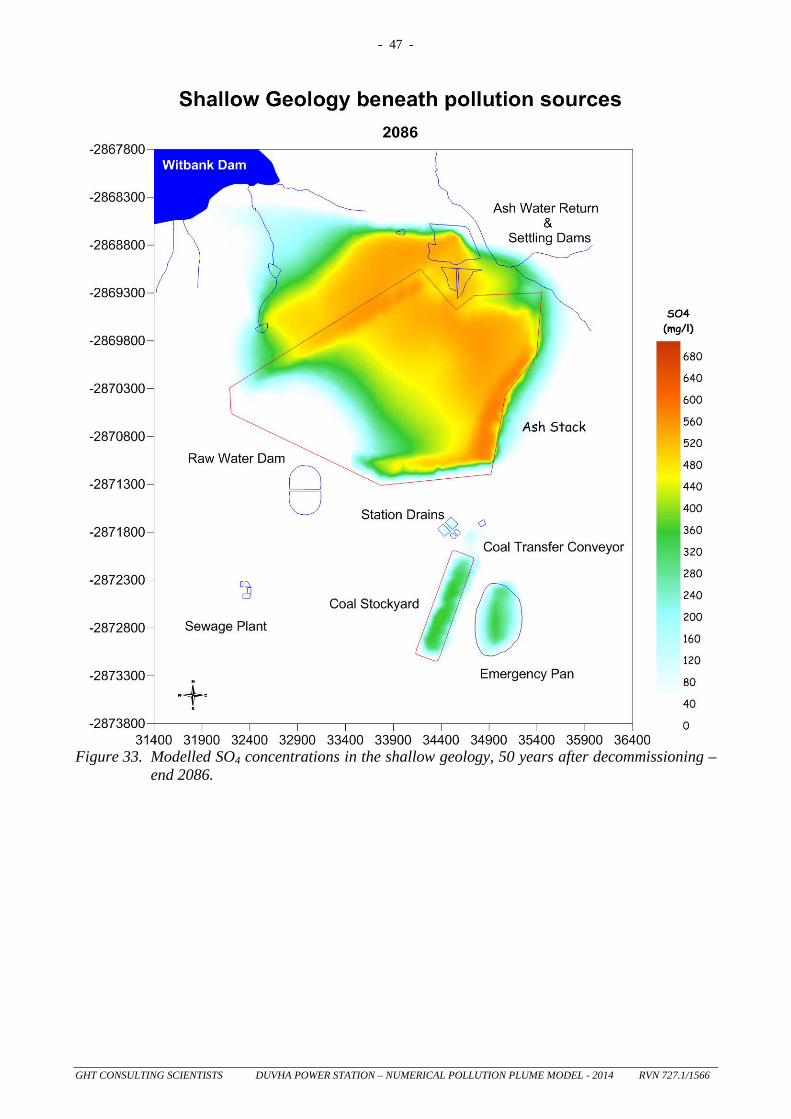
Figure 33. Modelled SO4 concentrations in the shallow geology, 50 years after decommissioning –
end 2086.
- 48 -
GHT CONSULTING SCIENTISTS DUVHA POWER STATION – NUMERICAL POLLUTION PLUME MODEL - 2014 RVN 727.1/1566
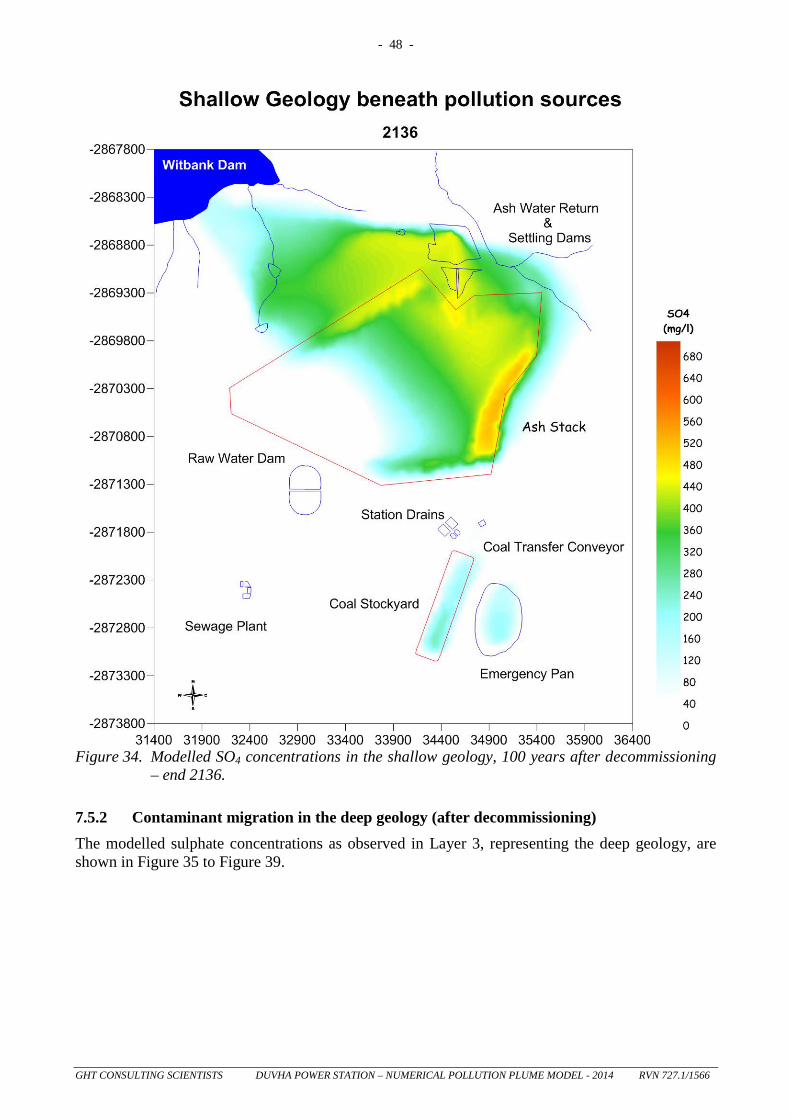
Figure 34. Modelled SO4 concentrations in the shallow geology, 100 years after decommissioning
– end 2136.
7.5.2 Contaminant migration in the deep geology (after decommissioning) The modelled sulphate concentrations as observed in Layer 3, representing the deep geology, are shown in Figure 35 to Figure 39.
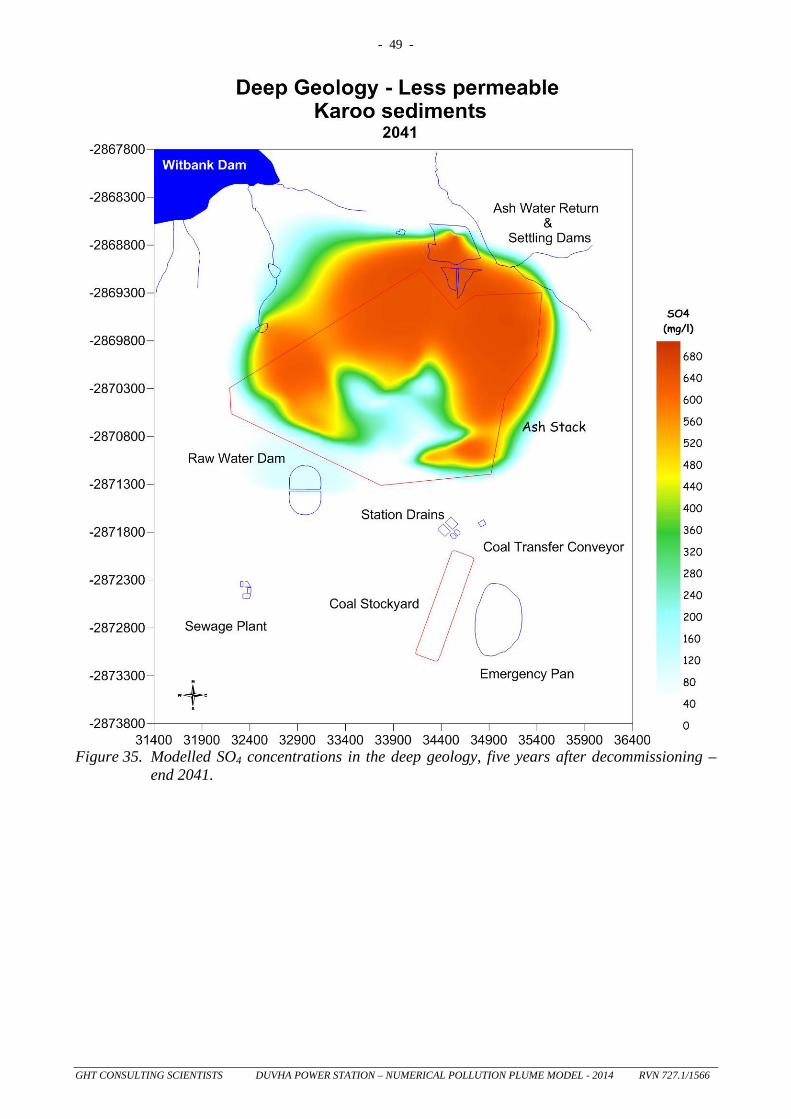
- 49 -
GHT CONSULTING SCIENTISTS DUVHA POWER STATION – NUMERICAL POLLUTION PLUME MODEL - 2014 RVN 727.1/1566
Figure 35. Modelled SO4 concentrations in the deep geology, five years after decommissioning –
end 2041.

- 50 -
GHT CONSULTING SCIENTISTS DUVHA POWER STATION – NUMERICAL POLLUTION PLUME MODEL - 2014 RVN 727.1/1566
Figure 36. Modelled SO4 concentrations in the deep geology, 10 years after decommissioning –
end 2046.
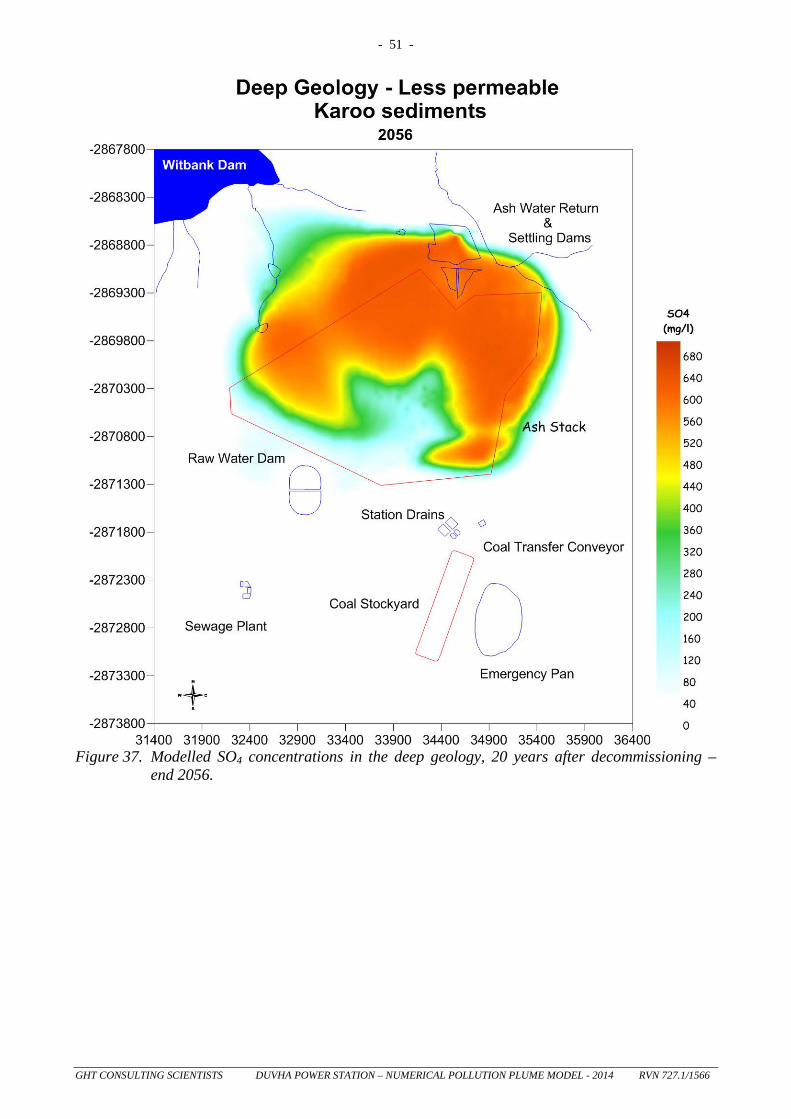
- 51 -
GHT CONSULTING SCIENTISTS DUVHA POWER STATION – NUMERICAL POLLUTION PLUME MODEL - 2014 RVN 727.1/1566
Figure 37. Modelled SO4 concentrations in the deep geology, 20 years after decommissioning –
end 2056.
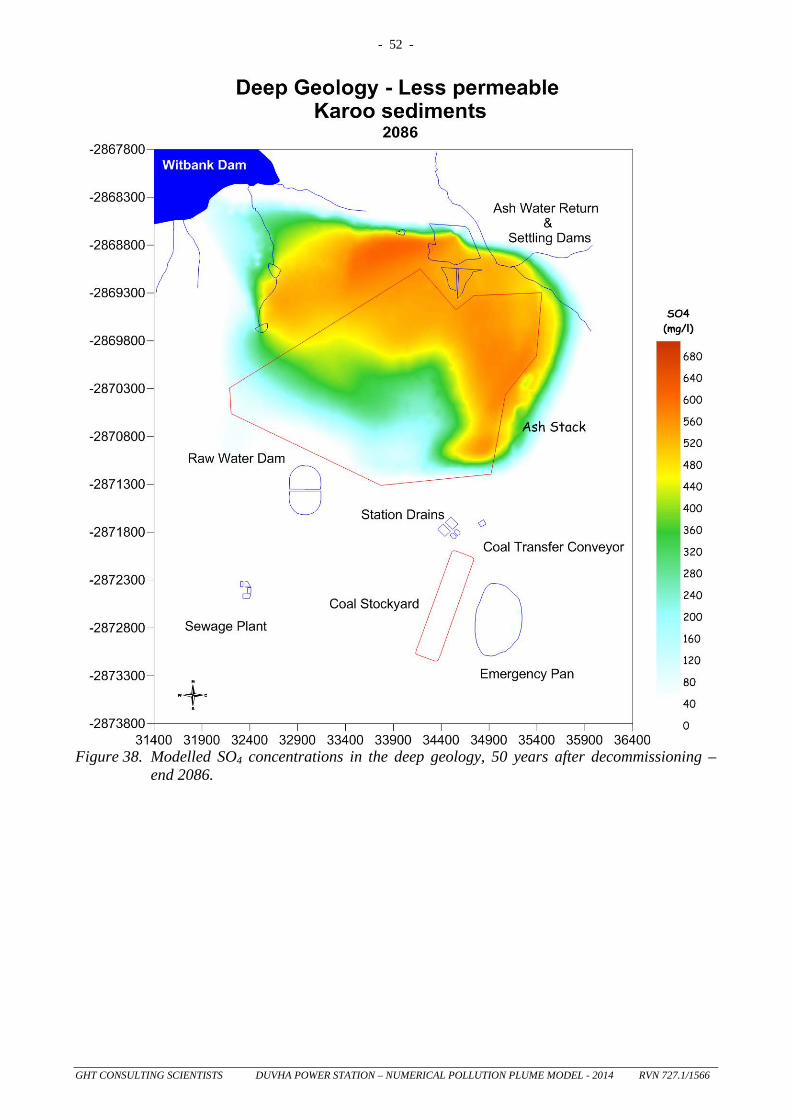
- 52 -
GHT CONSULTING SCIENTISTS DUVHA POWER STATION – NUMERICAL POLLUTION PLUME MODEL - 2014 RVN 727.1/1566
Figure 38. Modelled SO4 concentrations in the deep geology, 50 years after decommissioning –
end 2086.
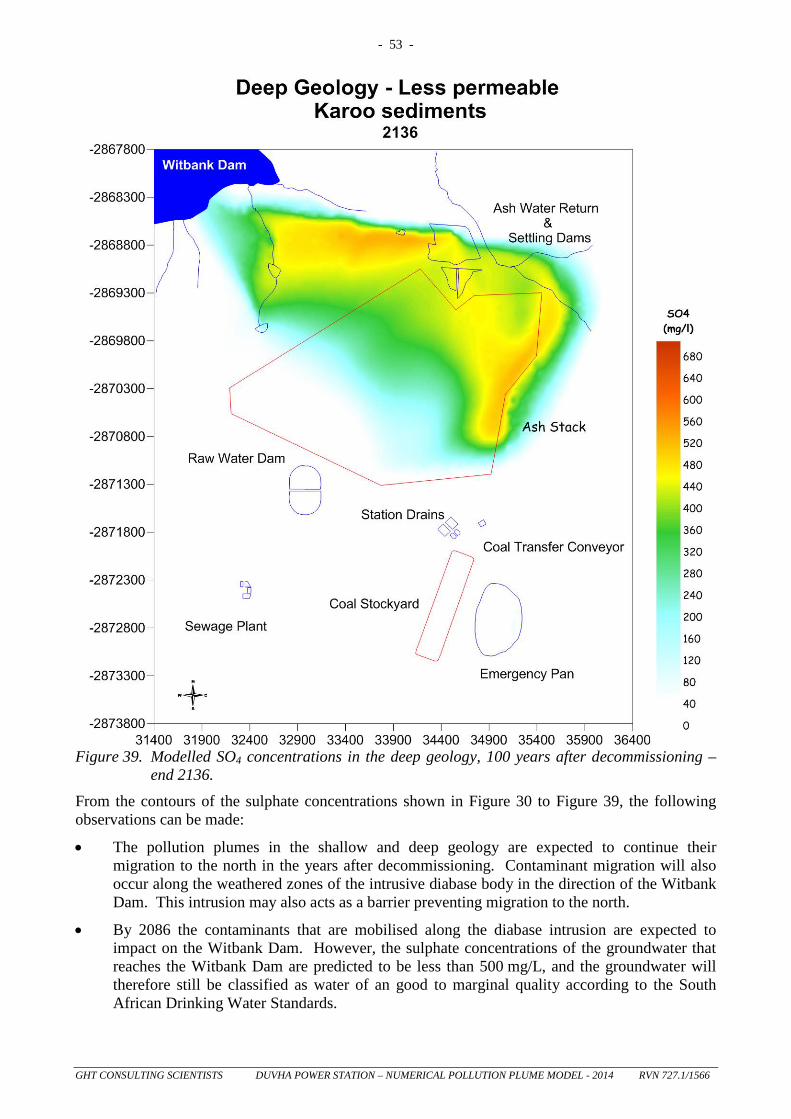
- 53 -
GHT CONSULTING SCIENTISTS DUVHA POWER STATION – NUMERICAL POLLUTION PLUME MODEL - 2014 RVN 727.1/1566
Figure 39. Modelled SO4 concentrations in the deep geology, 100 years after decommissioning –
end 2136. From the contours of the sulphate concentrations shown in Figure 30 to Figure 39, the following observations can be made:
• The pollution plumes in the shallow and deep geology are expected to continue their migration to the north in the years after decommissioning. Contaminant migration will also occur along the weathered zones of the intrusive diabase body in the direction of the Witbank Dam. This intrusion may also acts as a barrier preventing migration to the north.
• By 2086 the contaminants that are mobilised along the diabase intrusion are expected to impact on the Witbank Dam. However, the sulphate concentrations of the groundwater that reaches the Witbank Dam are predicted to be less than 500 mg/L, and the groundwater will therefore still be classified as water of an good to marginal quality according to the South African Drinking Water Standards.

- 54 -
GHT CONSULTING SCIENTISTS DUVHA POWER STATION – NUMERICAL POLLUTION PLUME MODEL - 2014 RVN 727.1/1566
• Once the concentrations of pollution sources are removed from the system (such as from the Coal Stockyard and Emergency Pan), one can see that the pollution plume associated with these pollution sources become diluted over time with the impact primarily upon the shallow geology.
• The encapsulation and rehabilitation of Ash Dam was simulated, simply by stopping the additional excess water on top of the ash dam. Lowering of the phreatic surface within the ash dam starts occurring within 10 years after decommissioning. The pollution will thus be encapsulated in the ash, once the water table has stabilised to natural elevations prior to the creation of the artificial elevated water table within the ash dam.
- 55 -
GHT CONSULTING SCIENTISTS DUVHA POWER STATION – NUMERICAL POLLUTION PLUME MODEL - 2014 RVN 727.1/1566
8 CONCLUSIONS AND RECOMMENDATIONS
A new numerical model has been constructed to include all the pollution sources at Duvha Power Station, namely:
• The Ash Dam,
• The Low Level Ash Water Return Dam,
• The High Level Ash Water Return Dams,
• The Raw Water Dam,
• The Maturation Ponds at the Sewage Plant,
• The Coal Stockyard, and
• The Emergency Pan. This model incorporates as far as possible all previous investigation, such as previously drilling exercises and geohydraulic parameter determination, granulometric and sieve analyses performed on soil samples, ground geophysical investigations and all historical chemical analyses. The numerical modelling was performed to simulate both the operational phase (from 1989 to 2036) as well as to 100 years after decommissioning.
Constant concentrations for the duration of the Power Station activities were assigned to the various pollution sources. These concentrations were obtained by visually inspecting the concentrations during monitoring Phase 51 of March 2011 as well as from historical maximum and average recorded concentrations. As the concentrations of SO4 at the pollution sources may have been lower during the lifespan of the power station, using these concentrations for numerical modelling purposes serves as a worst case scenario perspective.
In order to assess the degree to which the model input parameters are representative of the actual field parameters, the model outputs may be compared with the actual measured values whereby the following respective comparisons were obtained for the water levels and concentrations:
• A regression coefficient of 0.953 (and correlation coefficient of 0.97) for the water levels suggests that the hydraulic properties assigned to the different geohydrological zones give a fair representation of the actual field parameters.
• Even with many boreholes exhibiting very low concentrations for SO4, the calculated concentrations are seen to give reasonable approximations of the actual concentrations with a regression coefficient of 0.89 (and correlation coefficient of 0.94). Because predictions of SO4 concentrations at boreholes where these low concentrations were measured are generally a bit higher than the recorded values, this model favours a worst case scenario approach.
- 56 -
GHT CONSULTING SCIENTISTS DUVHA POWER STATION – NUMERICAL POLLUTION PLUME MODEL - 2014 RVN 727.1/1566
8.1 Model Results – Operational Phase until 2036
8.1.1 Contaminant migration in the shallow geology (operational phase)
• The pollution sources influences the shallow geology directly below the source of pollution, whereby the contamination of the shallow geology is a reflection of the source above.
• Beneath the ash dam, lateral flow and transport takes place within the highly weathered rhyolites (with the relative high conductivity) on top of the fresh un-weathered rhyolites and just below the ash dam. Groundwater migration and contaminant transport are the most rapid through these highly weathered rhyolites
• As expected, contaminant migration in the shallow geology is seen to take place predominantly to the north, along the topographic and groundwater gradients.
• Although the rate of contaminant migration is expected to be more rapid through the highly weathered rhyolites, contaminant migration away from the pollution sources takes place at a relatively slow rate (partially also due to dilution from recharge). The spatial extent of the contaminant plumes in the shallow aquifer remains limited – even at the end of ashing operations in 2036.
• Contaminant impacts are expected on the non-perennial streams that occur to the north of the Ash Dam and Low Level Ash Water Return Dam. The quality of the water in these streams is probably already affected by seepage and overflows from the dam systems. The dolerite intrusion north of the Low Level Ash Water Return Dam may however act as a preferential pathway along the weathered sides of the intrusion or as a barrier where it is fresh. This barrier effect is reflected in the uncontaminated chemical results as observed in borehole AB04 just north of the lower ash water return dam.
• Mitigation actions such as the dirty water canals around the Ash Dam and Coal Stockyard were implemented in the model in order to calibrate the model to both the water levels and SO4 concentrations as measured in vicinity of these pollution sources.
• Apart from surface activities (such as spillages) which are difficult to implement in a numerical model as exact times, durations and volumes are unknown, but which have a direct detrimental impact on groundwater, simulated pollution plumes at the various source remains fairly localized.
8.1.2 Contaminant migration in the deep geology (operational phase)
• Although not in the same concentrations, the contaminant plumes in the deep geology is expected to have a similar spatial extent than the plumes in the shallow geology.
• Although not simulated (due to unknown parameters and conditions) some mobilisation of contaminants along the weathered diabase intrusion may be expected to occur.
• Pollution from the Upper Ash Water Return Dams, the Coal Stockyard and the Emergency Pan to the deep geology within the fresh un-weathered Karoo rocks is limited. This is similar for pollution from the Sewage Plant and water from the Raw Water Dam, with yet almost unnoticeable effect on the deeper geology.
• The pollution plumes in the shallow and deep geology are expected to continue their migration to the north in the years after decommissioning. Contaminant migration will also occur along the weathered zones of the intrusive diabase body in the direction of the Witbank Dam. This intrusion may also acts as a barrier preventing migration to the north.
- 57 -
GHT CONSULTING SCIENTISTS DUVHA POWER STATION – NUMERICAL POLLUTION PLUME MODEL - 2014 RVN 727.1/1566
• By 2086 the contaminants that are mobilised along the diabase intrusion are expected to impact on the Witbank Dam. However, the sulphate concentrations of the groundwater that reaches the Witbank Dam are predicted to be less than 500 mg/L, and the groundwater will therefore still be classified as water of an good to marginal quality according to the South African Drinking Water Standards.
• Once the concentrations of pollution sources are removed from the system (such as from the Coal Stockyard and Emergency Pan), one can see that the pollution plume associated with these pollution sources become diluted over time with the impact primarily upon the shallow geology.
• The encapsulation and rehabilitation of Ash Dam was simulated, simply by stopping the additional excess water on top of the ash dam. Lowering of the phreatic surface within the ash dam starts occurring within 10 years after decommissioning. The pollution will thus be encapsulated in the ash, once the water table has stabilised to natural elevations prior to the creation of the artificial elevated water table within the ash dam.
8.2 Model Results – After decommissioning until 2136 • The pollution plumes in the shallow and deep geology are expected to continue their
migration to the north in the years after decommissioning. Contaminant migration will also occur along the weathered zones of the intrusive diabase body in the direction of the Witbank Dam. This intrusion may also acts as a barrier preventing migration to the north.
• By 2086 the contaminants that are mobilised along the diabase intrusion are expected to impact on the Witbank Dam. However, the sulphate concentrations of the groundwater that reaches the Witbank Dam are predicted to be less than 500 mg/L, and the groundwater will therefore still be classified as water of an good to marginal quality according to the South African Drinking Water Standards.
• Once the concentrations of pollution sources are removed from the system (such as from the Coal Stockyard and Emergency Pan), one can see that the pollution plume associated with these pollution sources become diluted over time with the impact primarily upon the shallow geology.
• The encapsulation and rehabilitation of Ash Dam was simulated, simply by stopping the additional excess water on top of the ash dam. Lowering of the phreatic surface within the ash dam starts occurring within 10 years after decommissioning. The pollution will thus be encapsulated in the ash, once the water table has stabilised to natural elevations prior to the creation of the artificial elevated water table within the ash dam.
8.3 Recommendations • The accuracy of any numerical model developed is always limited by a number of
uncertainties. One factor that strongly influences the results of the numerical model is the lateral extent of the zone of highly weathered rhyolites that partially underlies the Ash Dam. To allow better delineation of this zone, it is recommended that a number of boreholes be drilled through the ash at different locations on the Ash Dam in order to investigate the geological formations that underlie the dam. The boreholes will have to be constructed in such a way that they not form preferential pathways for contaminant migration from the Ash Dam into the aquifer systems.
• Surface impacts must be minimized by preventing any overflows from the Low Level Ash Water Return Dams and overflowing of the ash return water canals due to silting as any surface impacts will end up in the Witbank Dam and directly impact upon the groundwater qualities which would also ultimately reach the Witbank Dam.

- 58 -
GHT CONSULTING SCIENTISTS DUVHA POWER STATION – NUMERICAL POLLUTION PLUME MODEL - 2014 RVN 727.1/1566
• The removal or encapsulation of pollution sources as soon as possible during the decommissioning phase will definitely lead to improvement of groundwater quality.
• The current boreholes (AB44, AB45, AB28, AB32, AB05 and AB04) north of Ash Dam and Low Level Ash Water Return Dams are all in relative close proximity to the pollution source are all suitable for early pollution detection. Should the pollution in the future be detected in boreholes (AB01, AB03, AB02, AB33 and AB31) further away from the pollutions sources, additional boreholes must be drilled (for pollution plume monitoring and delineation) downstream from these boreholes in the path of the pollution plume migration as the model suggests.
31 May 2015 S. Staats Date