Embed Size (px)
Citation preview
JOURNAL OF IMMUNOLOGICAL METHODS
EISEVIER Journal of Immunological Methods 190 ( 1996) 15 I- 161
Application of experimental design techniques to optimize a competitive ELISA
G. Sitta Sittampalam a7*, Wendell C. Smith b, Thomas W. Miyakawa b, David R. Smith ‘, Clyde McMorris ‘J
a Technology Core Strategy Group, Lilly Research Laboratories, Eli Lilly and Company, Indianapolis, IN 46285, USA b Statistical and Mathematical Sciences, Lilly Research Laboratories. Eli Lilly and Company, Indianapolis, IN 46285, USA
’ Analytical Development, Clinton Laboratories. Eli Lilly and Company, Indianapolis, IN 46285, USA
Received 22 March 1995; revised 21 September 1995; accepted 1 November 1995
Abstract
This paper describes the application of experimental design techniques to optimize a sensitive ELBA for a hapten molecule with a calibration range of O-1000 pg/ml. Ten factors that were expected to affect the assay performance were initially screened, followed by factorial experiments to delineate the effects of the critical factors identified at the screening stage. Assay performance was evaluated using a unique rating system based on standard curve reproducibility, assay detection limits and the use of desirability functions. This rating system allowed multiple responses to be evaluated simultaneously. It was found that the substrate incubation time and enzyme label lot played an important role, while dilutions of the enzyme label and the anti-hapten antibody showed significant interaction. These observations were in good agreement with optimal assay conditions based on historical data collected over a period of two to three years. Application of experimental design techniques enabled us to confirm the significance of the factors affecting the assay within a three month period, with a minimum number of experiments. In addition, information on interaction between factors were determined.
Keywords: ELISA, competitive; Hapten; Experimental design; Assay optimization
1. Introduction
Enzyme-linked immunosorbent assay (ELISA) is
a powerful tool in biochemical trace analysis. It is
extensively employed in research and routine appli-
* Corresponding author. At: Technology Core Strategy Group, Mail drop 1543, Lilly Research Laboratories, Eli Lilly and Com- pany, Indianapolis, IN 46285, USA.
’ Present address: Case Western Reserve University School of Medicine, Cleveland, OH 44106, USA.
cations in the fields of biology, clinical medicine and biotechnology (Gosling, 1990). In recent years, ELISAs are also increasingly applied for screening environmental samples for trace levels of pollutants (Sherry, 1992). However, the development and opti- mization of ELISAs, and immunoassays in general, requires careful and systematic investigation of many factors that affect assay performance.
For quantitative trace analysis in the ng/ml to pg/ml range, problems can arise in the long-term performance of ELISAs. Problems are due to the complex nature of immunoassays that involve multi-
0022- 1759/%/$15.00 0 1996 Elsevier Science B.V. All rights reserved SSDI 0022.1759(95)00262-6
152 G.S. Sittampalam et al./Journal of Immunological Methods I90 (1996) 151-161
ple assay steps using multiple reagents. Biochemical reagents, such as antibodies and enzyme-labeled ana- lytes, are of limited supply or labile, and may have to be custom synthesized on a regular basis. Lot-to-lot variations in assay reagents may affect reproducibil- ity. These factors along with specialized data reduc-
tion and sample matrix interferences, place addi- tional constraints on the application of immunoas- says for quantitative measurements (Seiber et al., 1990; Pesce and Michael, 1992).
The traditional method of optimizing an ELISA is to identify the key variables through preliminary assays during the assay development phase. Operat-
ing conditions are then selected based on targeted experiments to optimize each key variable (Felds- camp and Smith, 1987; Ho, 1992 ). This approach relies on the traditional scientific paradigm of single-factor-at-a-time experimentation (Palasota and Deming, 1992; Ho, 1992). In this paradigm, if one wants to optimize many variables or factors that influence a response (such as a key assay perfor- mance parameter), each factor is studied by indepen- dently varying that factor while holding all others constant_ Although this method is useful in the early assay development phase, it can often lead to incom- plete understanding of the behavior of the assay, severely limiting predictive ability essential to the control of long-term performance. This is because most chemical systems are affected by more than one independent variable or factor (multifactor sys- tems), and exhibit interactions between two or more factors. Such interaction phenomena confound the interpretation of data obtained in single-factor-at-a- time experiments.
An alternate approach is to employ statistical experimental design techniques that allow for the investigation of multiple factors simultaneously. Ex- perimental design techniques allow for a comprehen- sive description of the assay behavior through a response surface model. In a recent paper, the contri- bution of 96-well plate design, number of replicates of the samples and calibrators and the choice of calibration curve concentrations was investigated us- ing a statistical design approach (Bunch et al., 1990). However, several other factors that affect optimum ELISA performance such as dilution of specific anti- body, stability of enzyme label, sample matrix ef- fects, assay incubation time and temperature etc..
were not addressed. It was assumed that these factors have been optimized and the operating conditions are known exactly. Optimization of these factors are critical in predicting and controlling the long-term
performance of ELISAs. In this paper, we describe the application of ex-
perimental design techniques for optimizing the per-
formance of a ‘valid working assay’. We define such an assay as one in which the necessary reagents have been developed and detailed assay procedures, cali- bration curve characteristics, and assay specificity have been established. At this stage, fundamental assay validity has been verified but experimental factors have not been optimized for long-term appli- cation.
We describe experimental design techniques for optimization of ‘inter-plate’ factors in a competitive ELISA for a hapten, Quinelorane@ (LY163502), originally described elsewhere (Taber et al., 1987). A Plackett-Burman (PB) screening design (Plackett and Burman, 1946) was used to initially sort through ten independent variables or factors that were identi- fied based on historical data. The PB design allows the scientist to simultaneously screen multiple var- ables (four or more) efficiently in a minimum num- ber of experiments. Results can be analyzed using straightforward statistical methods where the main effects of all the factors are estimable and separable. Three critical factors identified through the screening experiments were further evaluated using fractional factorial experiments.
All experiments were evaluated using desirability functions (DF). These functions were developed us- ing the JMP@ statistical data analysis package (ver- sion 3.0), and were based on the assessment of assay responses by the analyst. The same functions were applied at all stages of experimentation.
2. Materials and methods
2.1. Miscellaneous reagents
Affinity purified goat anti-rabbit IgG was pur- chased from Boehringer Mannheim (Indianapolis, IN). The peroxidase substrate TMB (3,3’,5,5’-tetra- methyl benzidine) was obtained form Kierkegaard and Perry Laboratories (Gaithersburg, MD). An-
G.S. Sittampalam et al./Journal of Immunological Methods 190 (1996) 151-161 153
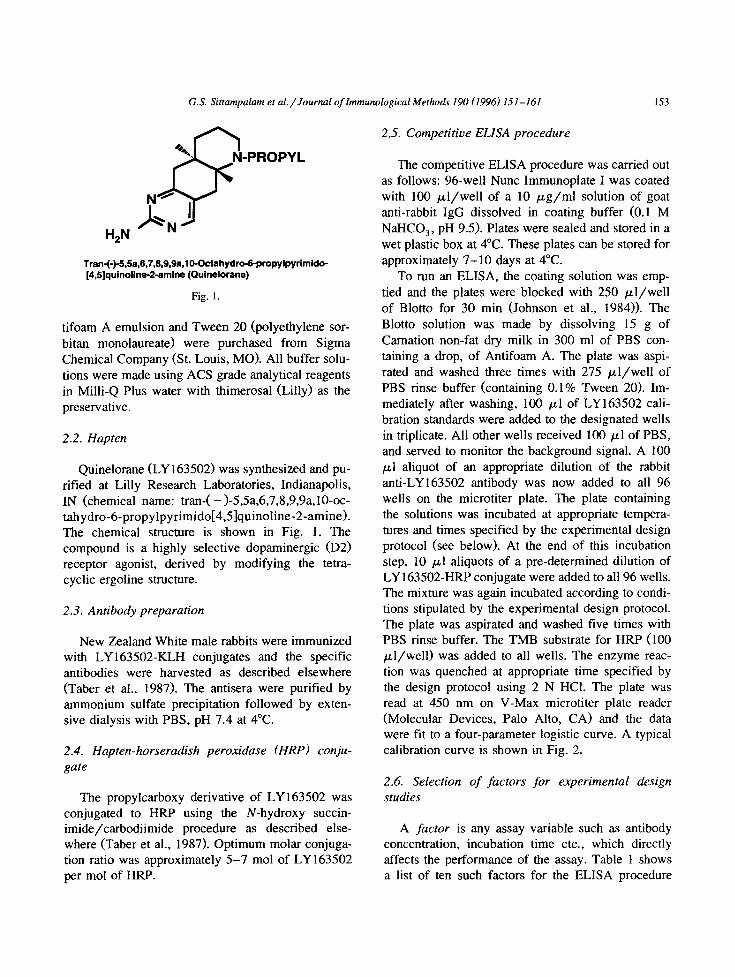
Tran-(-)-5,5a,6,7,8,9,9a,lO-Octahydro-6-propylpyrimido- [4,5]quinoline_2amlne (Quinelorane)
Fig. 1.
tifoam A emulsion and Tween 20 (polyethylene sor-
bitan monolaureate) were purchased from Sigma Chemical Company (St. Louis, MO). All buffer solu- tions were made using ACS grade analytical reagents in Milli-Q Plus water with thimerosal (Lilly) as the preservative.
2.2. Hapten
Quinelorane (LY 163502) was synthesized and pu- rified at Lilly Research Laboratories, Indianapolis, IN (chemical name: tran-( - )-.5,5a,6,7,8,9,9a,lO-oc- tahydro-6-propylpyrimido[4,5]quinoline-2-amine). The chemical structure is shown in Fig. 1. The compound is a highly selective dopaminergic (D2) receptor agonist, derived by modifying the tetra- cyclic ergoline structure.
2.3. Antibody preparation
New Zealand White male rabbits were immunized with LY163502-KLH conjugates and the specific antibodies were harvested as described elsewhere (Taber et al., 1987). The antisera were purified by ammonium sulfate precipitation followed by exten- sive dialysis with PBS, pH 7.4 at 4°C.
2.4. Hapten-horseradish peroxidase (HRP) conju- gate
The propylcarboxy derivative of LY163502 was conjugated to HRP using the N-hydroxy succin- imide/carbodiimide procedure as described else- where (Taber et al., 1987). Optimum molar conjuga- tion ratio was approximately 5-7 mol of LY163502 per mol of HRP.
2.5. Competitive ELISA procedure
The competitive ELISA procedure was carried out as follows: 96-well Nunc Immunoplate I was coated with 100 pi/well of a 10 pg/ml solution of goat anti-rabbit IgG dissolved in coating buffer (0.1 M NaHCO,, pH 9.5). Plates were sealed and stored in a
wet plastic box at 4°C. These plates can be stored for approximately 7-10 days at 4°C.
To run an ELISA, the coating solution was emp- tied and the plates were blocked with 250 pi/well of Blotto for 30 min (Johnson et al., 1984)). The
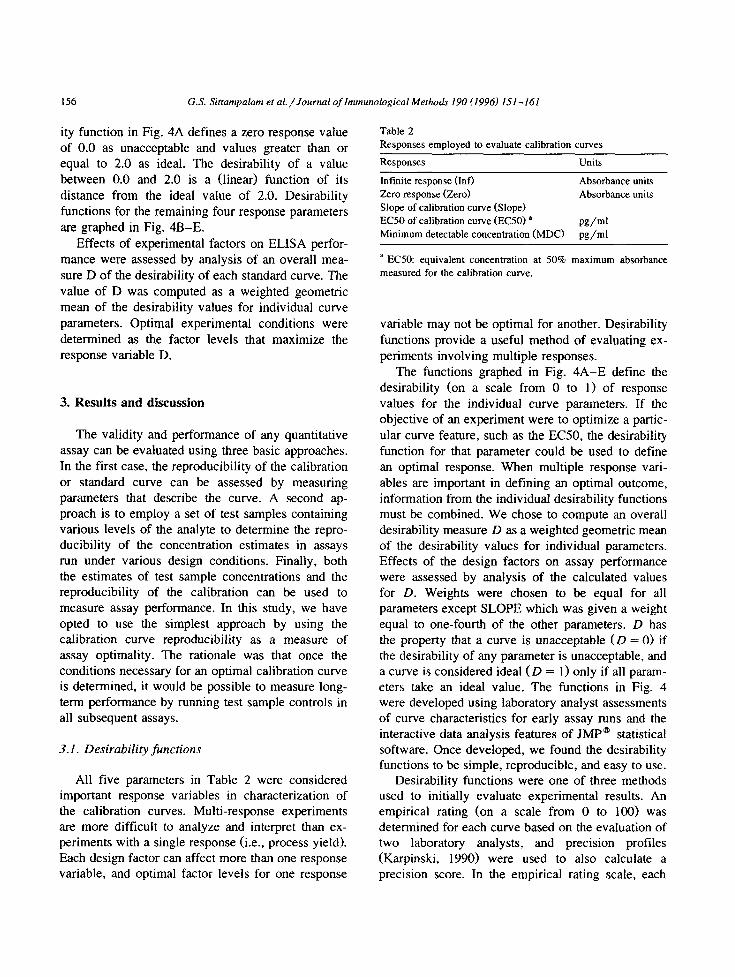
Blotto solution was made by dissolving 15 g of Carnation non-fat dry milk in 300 ml of PBS con- taining a drop, of Antifoam A. The plate was aspi- rated and washed three times with 275 pi/well of PBS rinse buffer (containing 0.1% Tween 20). Im- mediately after washing, 100 ~1 of LY163502 cali- bration standards were added to the designated wells in triplicate. All other wells received 100 ~1 of PBS, and served to monitor the background signal. A 100 ~1 aliquot of an appropriate dilution of the rabbit anti-LY 163502 antibody was now added to all 96 wells on the microtiter plate. The plate containing the solutions was incubated at appropriate tempera- tures and times specified by the experimental design protocol (see below). At the end of this incubation step, 10 ~1 aliquots of a pre-determined dilution of LY 163502-HRP conjugate were added to all 96 wells. The mixture was again incubated according to condi- tions stipulated by the experimental design protocol. The plate was aspirated and washed five times with PBS rinse buffer. The TMB substrate for HRP (100 pi/well) was added to all wells. The enzyme reac- tion was quenched at appropriate time specified by the design protocol using 2 N HCl. The plate was read at 450 nm on V-Max microtiter plate reader (Molecular Devices, Palo Alto, CA) and the data were fit to a four-parameter logistic curve. A typical calibration curve is shown in Fig. 2.
2.6. Selection of factors for experimental design studies
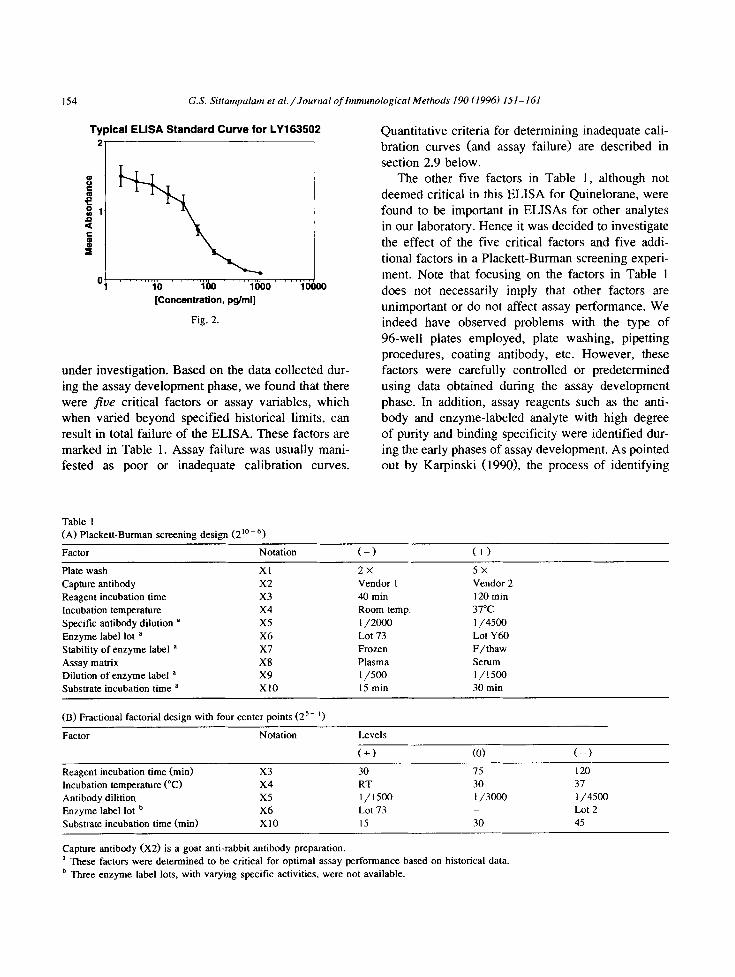
A factor is any assay variable such as antibody concentration, incubation time etc., which directly affects the performance of the assay. Table 1 shows a list of ten such factors for the ELISA procedure
154 G.S. Sittampulom et al./Journol of Immunological Methods 190 (1996) IS/-161
Typical ELISA Standard Curve for LY163502
rl
10 l&l 1000 looao
[Concentration, pgfml]
Fig. 2.
under investigation. Based on the data collected dur- ing the assay development phase, we found that there were jiue critical factors or assay variables, which when varied beyond specified historical limits, can result in total failure of the ELISA. These factors are marked in Table 1. Assay failure was usually mani- fested as poor or inadequate calibration curves.
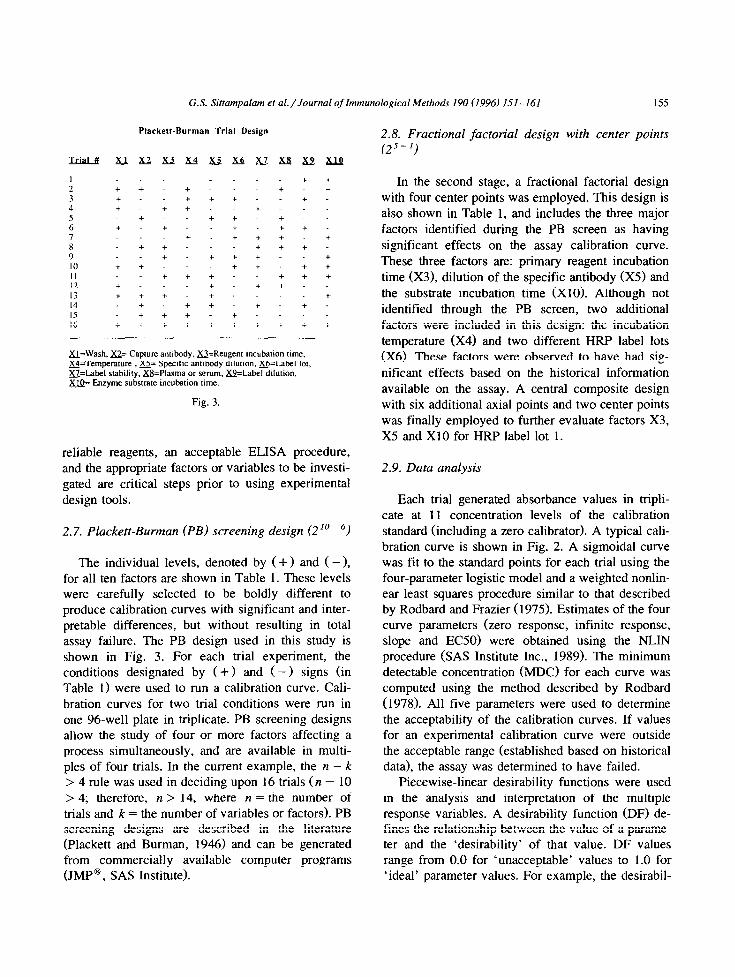
Table I (A) Plackett-Burn-ran screening design (2’OM6)
Quantitative criteria for determining inadequate cali- bration curves (and assay failure) are described in section 2.9 below.
The other five factors in Table 1, although not deemed critical in this ELISA for Quinelorane, were found to be important in ELISAs for other analytes in our laboratory. Hence it was decided to investigate
the effect of the five critical factors and five addi- tional factors in a Plackett-Burman screening experi- ment. Note that focusing on the factors in Table 1
does not necessarily imply that other factors are unimportant or do not affect assay performance. We indeed have observed problems with the type of 96well plates employed, plate washing, pipetting procedures, coating antibody, etc. However, these factors were carefully controlled or predetermined using data obtained during the assay development phase. In addition, assay reagents such as the anti- body and enzyme-labeled analyte with high degree of purity and binding specificity were identified dur- ing the early phases of assay development. As pointed out by Karpinski (19901, the process of identifying
Factor Notation (-) (+)
Plate wash Xl
Capture antibody x2
Reagent incubation time x3
Incubation temperature x4
Specific antibody dilution a x5
Enzyme label lot a X6
Stability of enzyme label a X7
Assay matrix X8
Dilution of enzyme label a x9
Substrate incubation time a x10
(B) Fractional factorial design with four center points (2s- ‘)
Factor Notation
2x
Vendor I 40min
Room temp.
l/2000 Lot -I3
Frozen
Plasma l/500 15 mm
Levels
(+)
5x
Vendor 2 120 min
37°C
l/4500 Lot Y60 F/thaw
Serum
l/1500 30 min
(0) t-j
Reagent incubation time (min)
Incubation temperature CC)
Antibody dilition
Enzyme label lot ’ Substrate. incubation time (mm)
x3 30 15 120 x4 RT 30 37
x5 l/l500 l/3000 I /4500
X6 Lot 73 _ Lot 2
x10 15 30 45
Capture antibody (X2) is a goat anti-rabbit antibody preparation. it These factors were determined to be critical for optimal assay performance based on historical data. b Three enzyme label lots, with varying specific activities. were not available.
G.S. Sittampalam et al./Journd of Immunological Methods 190 (1996) 151-161 155
Plackett-Burman Trial Design
I + + 2 + + - + - + + 3 + - + + + - + - J + + + - + - - 5 + - + + - + - 6 + + - + + + - 1 + - + + + - + 8 - + + - + + + 9 + - + + + - +
IO + + - - + + - + +
II + + + - - + + + 12 + + + + -
I3 + + + +. -. +
14 - + - + + + + -
15 - + + + + - -
16 + + + + + + + + + +
&L=Wash, u= Capture antibody, XJ=Reagent tncubation time, ~=Te.mperature , z= Specific antibody dilution. &fj=Label lot,
a=Laixl stability, B=Plasma or serum. m=Label dilution, XJQ= Enzyme substrate incubation time.
Fig. 3.
reliable reagents, an acceptable ELISA procedure, and the appropriate factors or variables to be investi- gated are critical steps prior to using experimental
design tools.
2.7. Plackett-Butman (PB) screening design (2”- 6,
The individual levels, denoted by (+I and (- ), for all ten factors are shown in Table 1. These levels were carefully selected to be boldly different to produce calibration curves with significant and inter- pretable differences, but without resulting in total assay failure. The PB design used in this study is shown in Fig. 3. For each trial experiment, the conditions designated by ( +) and (- ) signs (in Table 1) were used to run a calibration curve. Cali- bration curves for two trial conditions were run in one 96-well plate in triplicate. PB screening designs allow the study of four or more factors affecting a process simultaneously, and are available in multi- ples of four trials. In the current example, the n - k > 4 rule was used in deciding upon 16 trials (n - 10 > 4; therefore, n > 14, where n = the number of trials and k = the number of variables or factors). PB screening designs are described in the literature (Plackett and Burman, 1946) and can be generated from commercially available computer programs (JMP@, SAS Institute).
2.8. Fractional factorial design with center points (2j-l)
In the second stage, a fractional factorial design with four center points was employed. This design is also shown in Table 1, and includes the three major factors identified during the PB screen as having
significant effects on the assay calibration curve. These three factors are: primary reagent incubation
time (X3), dilution of the specific antibody (X5) and the substrate incubation time (X10). Although not identified through the PB screen, two additional factors were included in this design: the incubation
temperature (X4) and two different HRP label lots (X6). These factors were observed to have had sig- nificant effects based on the historical information available on the assay. A central composite design with six additional axial points and two center points was finally employed to further evaluate factors X3, X5 and X10 for HRP label lot 1.
2.9. Data analysis
Each trial generated absorbance values in tripli- cate at 11 concentration levels of the calibration standard (including a zero calibrator). A typical cali- bration curve is shown in Fig. 2. A sigmoidal curve was fit to the standard points for each trial using the four-parameter logistic model and a weighted nonlin- ear least squares procedure similar to that described by Rodbard and Frazier (1975). Estimates of the four curve parameters (zero response, infinite response, slope and EC50) were obtained using the NLIN procedure (SAS Institute Inc., 1989). The minimum detectable concentration (MDC) for each curve was computed using the method described by Rodbard (1978). All five parameters were used to determine the acceptability of the calibration curves. If values for an experimental calibration curve were outside the acceptable range (established based on historical data), the assay was determined to have failed.
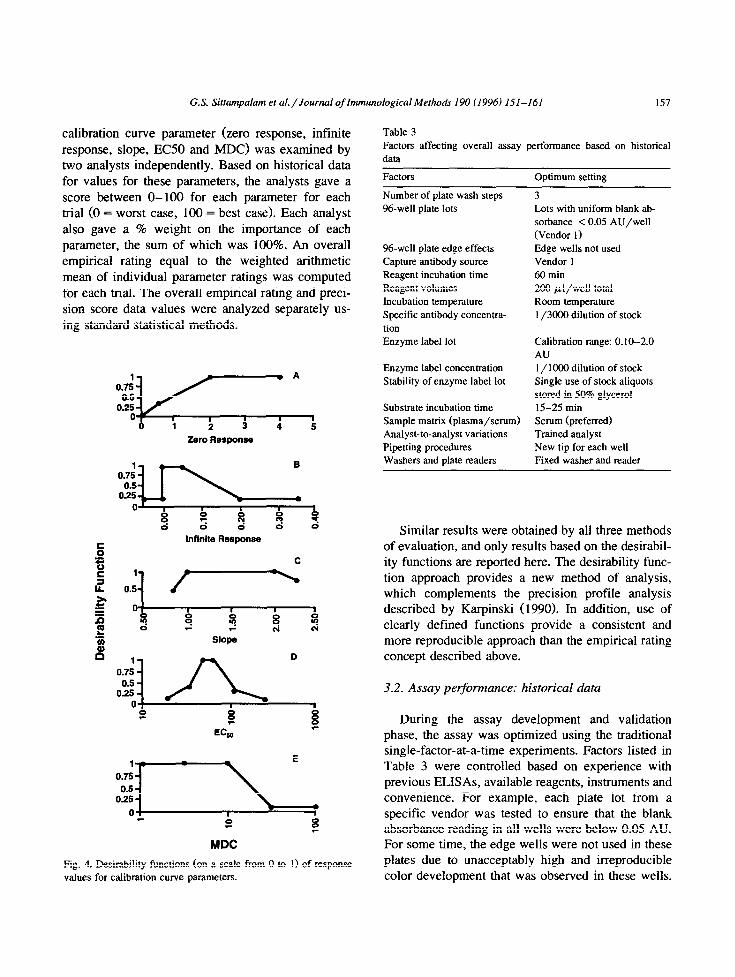
Piecewise-linear desirability functions were used in the analysis and interpretation of the multiple response variables. A desirability function (DF) de- fines the relationship between the value of a parame- ter and the ‘desirability’ of that value. DF values range from 0.0 for ‘unacceptable’ values to 1.0 for ‘ideal’ parameter values. For example, the desirabil-
156 G.S. Sittampalam et nl./Journal of Immunological Methods 190 (1996) 151-161
ity function in Fig. 4A defines a zero response value of 0.0 as unacceptable and values greater than or equal to 2.0 as ideal. The desirability of a value between 0.0 and 2.0 is a (linear) function of its distance from the ideal value of 2.0. Desirability functions for the remaining four response parameters are graphed in Fig. 4B-E.
Effects of experimental factors on ELISA perfor- mance were assessed by analysis of an overall mea- sure D of the desirability of each standard curve. The
value of D was computed as a weighted geometric mean of the desirability values for individual curve parameters. Optimal experimental conditions were determined as the factor levels that maximize the response variable D.
Table 2
Responses employed to evaluate calibration curves
Responses Units
Infinite response (In0 Absorbance units
Zero response (Zero) Absorbance units
Slope of calibration curve (Slope)
EC50 of calibration curve (ECSO) a pg/ml Minimum detectable concentration (MDC) pg/ml
’ EC50: equivalent concentration at 50% maximum absorbance
measured for the calibration cmve.
variable may not be optimal for another. Desirability
functions provide a useful method of evaluating ex- periments involving multiple responses.
3. Results and discussion
The validity and performance of any quantitative assay can be evaluated using three basic approaches. In the first case, the reproducibility of the calibration or standard curve can be assessed by measuring parameters that describe the curve. A second ap- proach is to employ a set of test samples containing various levels of the analyte to determine the repro- ducibility of the concentration estimates in assays run under various design conditions. Finally, both the estimates of test sample concentrations and the reproducibility of the calibration can be used to measure assay performance. In this study, we have opted to use the simplest approach by using the calibration curve reproducibility as a measure of assay optimality. The rationale was that once the conditions necessary for an optimal calibration curve is determined, it would be possible to measure long- term performance by running test sample controls in all subsequent assays.
3.1. Desirability functions
The functions graphed in Fig. 4A-E define the desirability (on a scale from 0 to 1) of response values for the individual curve parameters. If the objective of an experiment were to optimize a partic- ular curve feature, such as the EC50, the desirability function for that parameter could be used to define an optimal response. When multiple response vari- ables are important in defining an optimal outcome, information from the individual desirability functions must be combined. We chose to compute an overall desirability measure D as a weighted geometric mean of the desirability values for individual parameters. Effects of the design factors on assay performance were assessed by analysis of the calculated values for D. Weights were chosen to be equal for all parameters except SLOPE which was given a weight equal to one-fourth of the other parameters. D has the property that a curve is unacceptable (D = 0) if the desirability of any parameter is unacceptable, and a curve is considered ideal (D = 1) only if all param- eters take an ideal value. The functions in Fig. 4 were developed using laboratory analyst assessments of curve characteristics for early assay runs and the interactive data analysis features of JMP@ statistical software. Once developed, we found the desirability functions to be simple, reproducible, and easy to use.
All five parameters in Table 2 were considered Desirability functions were one of three methods important response variables in characterization of used to initially evaluate experimental results. An the calibration curves. Multi-response experiments empirical rating (on a scale from 0 to 100) was are more difficult to analyze and interpret than ex- determined for each curve based on the evaluation of periments with a single response (i.e., process yield). two laboratory analysts, and precision profiles Each design factor can affect more than one response (Karpinski, 1990) were used to also calculate a variable, and optimal factor levels for one response precision score. In the empirical rating scale, each
G.S. Sittampalam et al./Journal of Immunological Methods 190 (1996) 151-161 157
calibration curve parameter (zero response, infinite
response, slope, EC50 and MDC) was examined by two analysts independently. Based on historical data for values for these parameters, the analysts gave a score between O-100 for each parameter for each trial (0 = worst case, 100 = best case>. Each analyst also gave a % weight on the importance of each parameter, the sum of which was 100%. An overall empirical rating equal to the weighted arithmetic
mean of individual parameter ratings was computed for each trial. The overall empirical rating and preci- sion score data values were analyzed separately us-
ing standard statistical methods.
S
Infinite Response
‘S
2
1 H r2 0.5
Fig. 4. Desirability functions (on a scale from 0 to I) of response
values for calibration curve parameters.
Table 3
Factors affecting overall assay performance based on historical
data
Factors Optimum setting
Number of plate wash steps
%-well plate lots
%-well plate edge effects
Capture antibody source
Reagent incubation time
Reagent volumes
incubation temperature
Specific antibody concentra-
tion
Enzyme label lot
Enzyme label concentration
Stability of enzyme label lot
Substrate incubation time
Sample matrix (plasma/serum)
Analyst-to-analyst variations
Pipetting procedures
Washers and plate readers
3 Lots with uniform blank ab-
sorbance < 0.05 AU/well
(Vendor 1)
Edge wells not used
Vendor 1
60 min
200 kl/well total
Room temperature
l/3000 dilution of stock
Calibration range: 0.1 O-2.0
AU
I/ 1000 dilution of stock
Single use of stock aliquots
stored in 50% glycerol
15-25 min
Serum (preferred)
Trained analyst
New tip for each well
Fixed washer and reader
Similar results were obtained by all three methods of evaluation, and only results based on the desirabil- ity functions are reported here. The desirability func- tion approach provides a new method of analysis, which complements the precision profile analysis described by Karpinski (1990). In addition, use of clearly defined functions provide a consistent and more reproducible approach than the empirical rating concept described above.
3.2. Assay performance: historical data
During the assay development and validation phase, the assay was optimized using the traditional single-factor-at-a-time experiments. Factors listed in Table 3 were controlled based on experience with previous ELISAs, available reagents, instruments and convenience. For example, each plate lot from a specific vendor was tested to ensure that the blank absorbance reading in all wells were below 0.05 AU. For some time, the edge wells were not used in these plates due to unacceptably high and irreproducible color development that was observed in these wells.
158 G.S. Sittampulam et al./Journal oj’lmmunological Methods 190 (1996) 151-161
However, the plates currently available on the mar- ket have considerably improved absorbance charac- teristics, and the edge effect is practically insignifi- cant. The capture antibody (goat anti-rabbit) was purchased from a single vendor who consistently provided high affinity antibody lots with repro-
ducible characteristics. Assay conditions such as reagent volumes, pipet-
ting procedures, washers and plate reader were se- lected based on an existing ELISA. The total reagent volume was limited to 210 yl/well which included 100 ~1 of standard or sample, 100 ~1 of specific antibody and 10 ~1 of hapten-enzyme label. To minimize contaminating wells, a new tip was used for each well, including the replicates. Routinely calibrated 100 ~1 pipets were used to deliver the reagents. It was also found that the at room tempera- ture, a 45-60 min incubation of the reagents (specific antibody, analyte and label) was adequate to generate a calibration range of 1.5-2.0 AU.
Based on testing serum and plasma samples from rats, dogs, monkeys and humans, we found that plasma samples contained components that cross-re- acted with the specific antibody. Hence the preferred sample matrix was the serum. However, the method was finally modified to use Sep-Pak extraction car- tridges to isolate the analyte from both plasma and serum samples collected for metabolism studies. The extracted analyte was then reconstituted in assay buffer for analysis.
Data generated during validation, and early sup- port of metabolism studies using this ELISA, showed that the factors high-lighted in Table 3 were critical in determining day-to-day performance of the assay. In other words, these factors should be tightly con- trolled to prevent failure of the assay. (An assay failure was defined as the inability to generate a calibration curve in the range of 0.10-2.0 AU, and poor recovery of control samples.) For example, some lots of labels with optimum molar ratio of 5 mol of hapten/mol of HRP did not result in accept- able calibration curves at any dilution. New lots were made and purified to meet the criterion shown in Table 3. Successful lots were then stored in single-use aliquots to prevent stability problems associated with repeated freeze-thaw cycles of the stock solution. Stock aliquots of specific antibody diluted even marginally outside the 1/3ooO range resulted in poor
Table 4 Results from Plackett-Burman screening experiments
(a) Factors affecting overall assay performance
Plackett-Burman data
Historical data a
x5, x9, x10, x3
X5, X6, X7, X9, X10
(b) Factors affecting individual parameters
Curve parameters Significant factors
Upper asymptote (A) x9, x3, x10, x5, x2
Lower asymptote ( D) x4, x9, Xl
Slope(B) X4, X5, X9, X 1, X6
EC50 (Cl x5, x4, x9, x10, X8, x3
MDC x5, Xl
a Factors are listed in the order of statistical significance, except in
the case of historical data.
calibration curves. At this stage, although reliable and reproducible measurements could be made by a trained analyst, the assay was not under statistical control. In addition, no information was available on interacting factors that contributed to assay variance.
3.3. Plackett-Burman screening experiments
Table 4 summarizes the results of the screening analysis based on desirability functions. It is interest- ing to see that there is considerable agreement be- tween PB and historical data. Factors X5, X9 and Xl0 were identified by both procedures as affecting the overall assay performance. However, the PB screen identified X3, reagent incubation time, as an additional factor showing significant main effect. This observation is not surprising since the reagent incubation time was varied between 45-90 min to generate the historical data. Thus the interval se- lected may have been inadequate to observe signifi- cant differences. In PB experiments, however, the levels selected were 40 ( - ) and 120 ( + > min, thus resulting in the identification of a main effect not observable in previous experiments.
The PB data did not identify factors X6 and X7 as having main effects with respect to overall assay performance. Neither do they affect any of the cali- bration curve parameters as shown in Table 4b. This is a significant difference from the historical data. We later found that lot# 73 ( - > and lot# Y60 ( +) were not significantly different in their chemical and biochemical properties so as to generate measurable
G.S. Sittampalam et al./Journal of Immunological Methods 190 (1996) 151-161 159
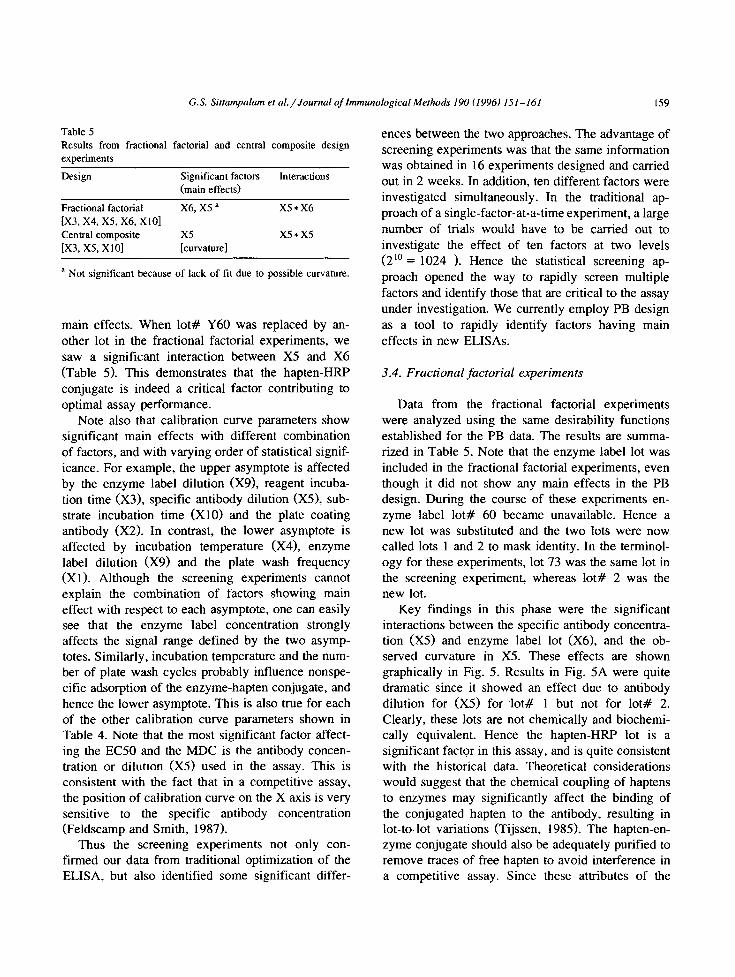
Table 5
Results from fractional factorial and central composite design
experiments
Design Significant factors
(main effects)
Interactions
Fractional factorial X6, X5 a X5*X6
[X3, X4, X5. X6, X101
Central composite x5 x5*x5
[X3, x5, x101 [curvature]
a Not significant because of lack of fit due to possible curvature.
main effects. When lot# Y60 was replaced by an- other lot in the fractional factorial experiments, we saw a significant interaction between X5 and X6
(Table 5). This demonstrates that the hapten-HRP conjugate is indeed a critical factor contributing to optimal assay performance.
Note also that calibration curve parameters show significant main effects with different combination of factors, and with varying order of statistical signif- icance. For example, the upper asymptote is affected by the enzyme label dilution (X9), reagent incuba- tion time (X3), specific antibody dilution (X5), sub- strate incubation time (X10) and the plate coating antibody (X2). In contrast, the lower asymptote is affected by incubation temperature (X4), enzyme label dilution (X9) and the plate wash frequency (Xl). Although the screening experiments cannot explain the combination of factors showing main effect with respect to each asymptote, one can easily see that the enzyme label concentration strongly affects the signal range defined by the two asymp- totes. Similarly, incubation temperature and the num- ber of plate wash cycles probably influence nonspe- cific adsorption of the enzyme-hapten conjugate, and hence the lower asymptote. This is also true for each of the other calibration curve parameters shown in Table 4. Note that the most significant factor affect- ing the EC50 and the MDC is the antibody concen- tration or dilution (X5) used in the assay. This is consistent with the fact that in a competitive assay, the position of calibration curve on the X axis is very sensitive to the specific antibody concentration (Feldscamp and Smith, 1987).
Thus the screening experiments not only con- firmed our data from traditional optimization of the ELISA, but also identified some significant differ-
ences between the two approaches. The advantage of screening experiments was that the same information was obtained in 16 experiments designed and carried out in 2 weeks. In addition, ten different factors were investigated simultaneously. In the traditional ap- proach of a single-factor-at-a-time experiment, a large number of trials would have to be carried out to
investigate the effect of ten factors at two levels (2” = 1024 ). Hence the statistical screening ap- proach opened the way to rapidly screen multiple factors and identify those that are critical to the assay under investigation. We currently employ PB design
as a tool to rapidly identify factors having main effects in new ELISAs.
3.4. Fractional factorial experiments
Data from the fractional factorial experiments were analyzed using the same desirability functions established for the PB data. The results are summa- rized in Table 5. Note that the enzyme label lot was included in the fractional factorial experiments, even though it did not show any main effects in the PB design. During the course of these experiments en- zyme label lot# 60 became unavailable. Hence a new lot was substituted and the two lots were now called lots 1 and 2 to mask identity. In the terminol- ogy for these experiments, lot 73 was the same lot in the screening experiment, whereas lot# 2 was the new lot.
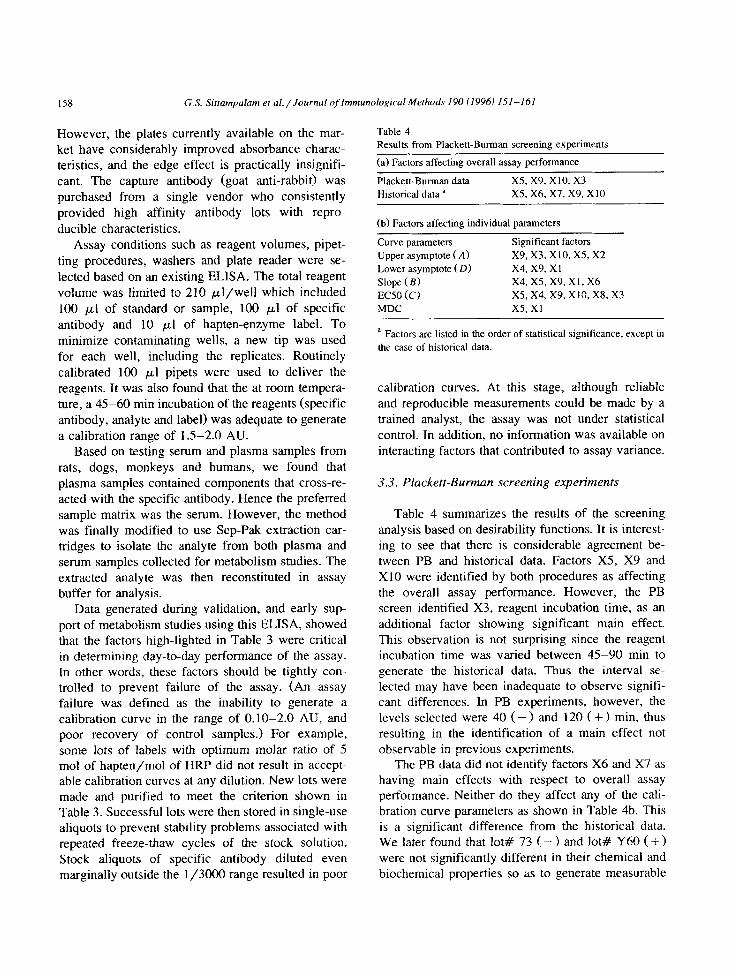
Key findings in this phase were the significant interactions between the specific antibody concentra- tion (X5) and enzyme label lot (X6), and the ob- served curvature in X5. These effects are shown graphically in Fig. 5. Results in Fig. 5A were quite dramatic since it showed an effect due to antibody dilution for (X5) for lot# 1 but not for lot# 2. Clearly, these lots are not chemically and biochemi- cally equivalent. Hence the hapten-HRP lot is a significant factor in this assay, and is quite consistent with the historical data. Theoretical considerations would suggest that the chemical coupling of haptens to enzymes may significantly affect the binding of the conjugated hapten to the antibody, resulting in lot-to-lot variations (Tijssen, 1985). The hapten-en- zyme conjugate should also be adequately purified to remove traces of free hapten to avoid interference in a competitive assay. Since these attributes of the
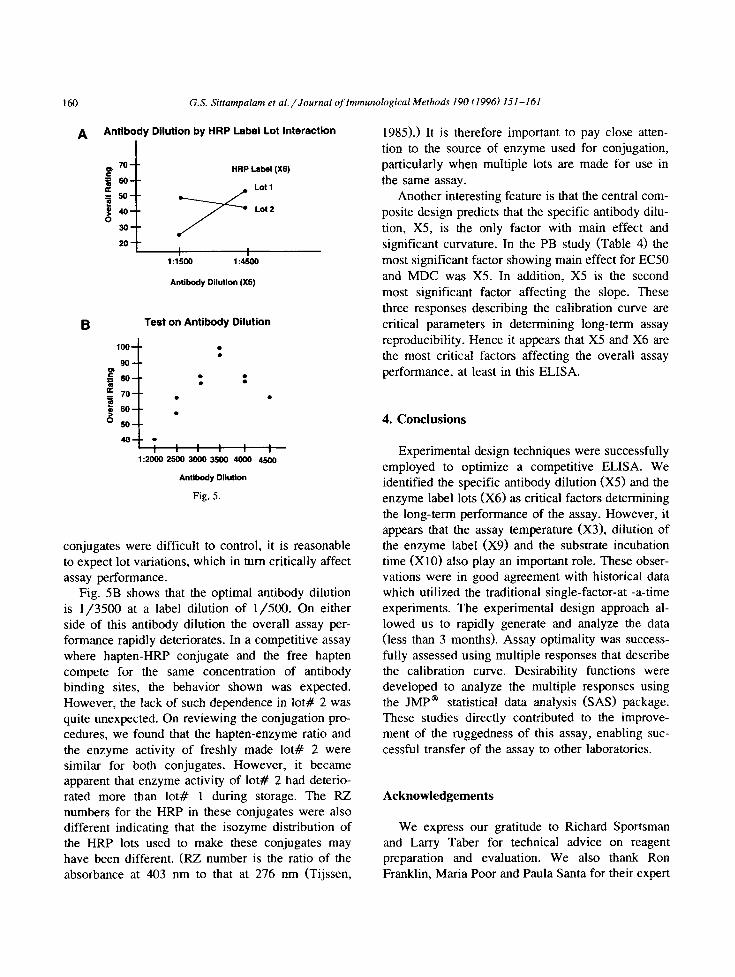
160 G.S. Sittampalam et aL/Journnl ofImmunological Methods 190 (1996) 151-161
A Antibody Dilution by HRP Label Lot Interaction
F z nz = e e 0
B
70-- HAP Label (X6)
60--
50--
40--
30-- 7
Lot 1
Lot 2
20--
1:l’soo 1:4.&O
Anthdy Dilution (X5)
Test on Antibody Dilution
100 t
.
. 90
gBO F : 70 . .
g60
! . . . . .
050
40 l
1 :zooo 2500 3ooo 3!xo 4ow 4MO
Antibody Dilution
Fig. 5.
conjugates were difficult to control, it is reasonable to expect lot variations, which in turn critically affect assay performance.
Fig. 5B shows that the optimal antibody dilution is l/3500 at a label dilution of l/500. On either side of this antibody dilution the overall assay per- formance rapidly deteriorates. In a competitive assay where hapten-HRP conjugate and the free hapten compete for the same concentration of antibody binding sites, me behavior shown was expected. However, the lack of such dependence in lot# 2 was quite unexpected. On reviewing the conjugation pro- cedures, we found that the hapten-enzyme ratio and the enzyme activity of freshly made lot# 2 were similar for both conjugates. However, it became apparent that enzyme activity of lot# 2 had deterio- rated more than lot# 1 during storage. The RZ numbers for the HRP in these conjugates were also different indicating that the isozyme distribution of the HRP lots used to make these conjugates may have been different. (RZ number is the ratio of the absorbance at 403 nm to that at 276 run (Tijssen,
1985).) It is therefore important to pay close atten- tion to the source of enzyme used for conjugation, particularly when multiple lots are made for use in
the same assay. Another interesting feature is that the central com-
posite design predicts that the specific antibody dilu- tion, X5, is the only factor with main effect and significant curvature. In the PB study (Table 4) the most significant factor showing main effect for EC50
and MDC was X5. In addition, X5 is the second most significant factor affecting the slope. These three responses describing the calibration curve are critical parameters in determining long-term assay reproducibility. Hence it appears that X5 and X6 are the most critical factors affecting the overall assay performance, at least in this ELISA.
4. Conclusions
Experimental design techniques were successfully employed to optimize a competitive ELISA. We identified the specific antibody dilution (X5) and the enzyme label lots (X6) as critical factors determining the long-term performance of the assay. However, it appears that the assay temperature (X3), dilution of the enzyme label (X9) and the substrate incubation time (X10) also play an important role. These obser- vations were in good agreement with historical data which utilized the traditional single-factor-at -a-time experiments. The experimental design approach al- lowed us to rapidly generate and analyze the data (less than 3 months). Assay optimality was success- fully assessed using multiple responses that describe the calibration curve. Desirability functions were developed to analyze the multiple responses using the JMP@ statistical data analysis @AS) package. These studies directly contributed to the improve- ment of the ruggedness of this assay, enabling suc- cessful transfer of the assay to other laboratories.
Acknowledgements
We express our gratitude to Richard Sportsman and Larry Taber for technical advice on reagent preparation and evaluation. We also thank Ron Franklin, Maria Poor and Paula Santa for their expert

G.S. Sittampalam et al./Journal of Immunological Methods 190 (1996) 151-161 161
technical assistance in assay transfer and optimiza- tion experiments
References
Bunch, D.A., Rocke, D.M. and Harrison, R.O. (1990) Statistical
design of ELISA protocols. J. Immunol. Methods 132, 247-
254.
Feldscamp, C.S. and Smith, S.W. (1987) Practical Guide to
Immunoassay method Evaluation. In: D.W. Chart and M.T.
Perlstein (Ed& Immunoassay: A Practical Guide. Academic
Press, New York, p. 49.
Gosling, J.P. (1990) A decade of development in immunoassay
methodology. Clin. Chem. 36, 1408- 1427.
Ho, K.-J. (1992) Development and optimization of an enzyme-lin-
ked immunosorbent assay employing two murine moncclonal
antibodies for absolute quantitation of human P-glucuroni-
dase. Biotech. Appl. B&hem. 16, l-10.
JMP” Statistical Discovery Software, SAS Institute, Car-y, North
Carolina.
Johnson, D.A., Gautsch, J.W., Sportsman, J.R. and Elder, J.H.
(1984). Improved technique utilizing nonfat dry milk for the
analysis of proteins and nucleic acids transferred to nitrocellu-
lose. Gene Anal. Techn. 1, 3-8.
Karpinski, K.F. (1990) Optimality assessment in the enzyme-lin-
ked immunosorbent assay (ELISAl. Biometrics 46, 381-390.
Palasota, J.A. and Deming, S.N. (1992) Central composite experi-
mental design. J. Chem. Educ. 69, 560-563.
Pesce, A.J. and Michael, J.G. (1992) Artifacts and limitations of
enzyme immunoassay. J. Immunol. Methods 150, 11 l-l 19.
Plackett, R.L. and Burman, J.P. (1946) The design of optimum
multifactorial experiments. Biometrika 33, 305-325
Rodbard. D. (1978) Statistical estimation of the minimum de-
tectable concentration (‘sensitivity’) for radioligand assays.
Anal. Biochem. 90, 1-12.
Rodbard, D. and Frazier, G.R. (1975) Statistical analysis of
radioligand assay data. Methods Enzymol. 37, 3-22.
SAS Institute Inc. (1989) The NLIN Procedure. In: SAS/STAT@
User’s Guide, Version 6, 4th edn., Vol. 2. SAS Institute Inc.,
Cary. NC, pp. 1135-l 193.
Seiber et al. (1990) Barriers to Adopting Immunoassays in the
Pesticide Analytical Laboratory. ACS Symposium Series N4.42,
Ch. 13. American Chemical Society, Washington, DC.
J.P. Sherry, (1992) Environmental chemistry: the immunoassay
option. Crit. Rev. Anal. Chem. 23, 217-300.
Taber, L.D., Apathy, J.M., DeLong, A.F. and Sportsman, J.R.
(1987) Enzyme-linked immunosorbent assay for LY 163502, a
potent dopamine agonist. J. Pharm. Sci. 76, 492-495.
Tijssen, P. (1985) Practice and Theory of Enzyme Immunoassays.
In: R.H. Burdon and P.H. van Knippenberg (Eds.), Laboratory
Techniques in Biochemistry and Molecular Biology. Elsevier, Amsterdam.


![COMPETITIVE INTELLIGENCE FOR SALES AND MARKETING: HOW TO WIN MORE OPPORTUNITIES AND OPTIMIZE YOUR MARKETING STRATEGY [INBOUND 2014]](https://img.pdfslide.net/doc/110x75/5589e5ccd8b42a930c8b457f/competitive-intelligence-for-sales-and-marketing-how-to-win-more-opportunities-and-optimize-your-marketing-strategy-inbound-2014.jpg)