Embed Size (px)
Citation preview
HAL Id: hal-00573913https://hal.archives-ouvertes.fr/hal-00573913
Submitted on 5 Mar 2011
HAL is a multi-disciplinary open accessarchive for the deposit and dissemination of sci-entific research documents, whether they are pub-lished or not. The documents may come fromteaching and research institutions in France orabroad, or from public or private research centers.
L’archive ouverte pluridisciplinaire HAL, estdestinée au dépôt et à la diffusion de documentsscientifiques de niveau recherche, publiés ou non,émanant des établissements d’enseignement et derecherche français ou étrangers, des laboratoirespublics ou privés.
Application of FTIR and Raman microspectroscopy tothe study of food/packaging interactions
Miguel Mauricio-Iglesias, Valérie Guillard, Nathalie Gontard, Stéphane Peyron
To cite this version:Miguel Mauricio-Iglesias, Valérie Guillard, Nathalie Gontard, Stéphane Peyron. Applicationof FTIR and Raman microspectroscopy to the study of food/packaging interactions. Foodadditives and contaminants, Informa UK (Taylor & Francis), 2009, 26 (11), pp.1515-1523.�10.1080/02652030903148306�. �hal-00573913�
For Peer Review O
nly
Application of FTIR and Raman microspectroscopy to the study of food/packaging interactions
Journal: Food Additives and Contaminants
Manuscript ID: TFAC-2009-090.R1
Manuscript Type: Original Research Paper
Date Submitted by the Author:
12-Jun-2009
Complete List of Authors: Mauricio-Iglesias, Miguel; University Montpellier 2, UMR 1208 IATE, UM2, CIRAD, INRA, Montpellier Supagro Guillard, Valérie; University Montpellier 2, UMR 1208 IATE, UM2, CIRAD, INRA, Montpellier Supagro Gontard, Nathalie; University Montpellier 2, UMR 1208 IATE, UM2, CIRAD, INRA, Montpellier Supagro Peyron, Stéphane; University Montpellier 2, UMR 1208 IATE, UM2, CIRAD, INRA, Montpellier Supagro
Methods/Techniques: Chemometrics, Method validation
Additives/Contaminants: Additives general, Packaging - migration modelling
Food Types: Olive oil
http://mc.manuscriptcentral.com/tfac Email: [email protected]
Food Additives and Contaminants
For Peer Review O
nly
1
Application of FTIR and Raman microspectroscopy to the study of
food/packaging interactions
Miguel Mauricio-Iglesias, Valérie Guillard, Nathalie Gontard, Stéphane
Peyron*
Joint Research Unit Agro-polymers Engineering and Emerging Technologies - UMR 1208 IATE
University Montpellier 2
CC023, Pl. E Bataillon F-34095 Montpellier cedex
E-mail : [email protected]
Tel :00 33 4 67 14 38 91
Page 1 of 24
http://mc.manuscriptcentral.com/tfac Email: [email protected]
Food Additives and Contaminants
123456789101112131415161718192021222324252627282930313233343536373839404142434445464748495051525354555657585960
For Peer Review O
nly
2
Abstract 1
This study assesses the suitability of FTIR and Raman spectroscopy for potential use as 2
analytical tools for determining the diffusivity of a migrant in a plastic packaging material, 3
one of the key points in safety assessment of food contact materials (FCM). Despite its 4
relative low sensitivity, FTIR based analysis supplied data for the material on desorption of an 5
additive (Uvitex OB) and sorption of a food constituent (olive oil) in a non-destructive and 6
“in situ” mode. These data allowed the determination of the diffusivity of Uvitex OB 7
(8.0±2.5⋅10-14
m2s
-1) and olive oil (6.9±3.4⋅10
-14 m
2s
-1) in LLDPE. Raman cartography 8
innovatively supplied the profile of additive concentration in the z-direction (thickness) of the 9
FCM and confirmed that mass transfer in the system roughly followed a Fickean behaviour. 10
11
Introduction 12
13
Testing for migration of food contact material additives into foods or food simulating liquid is 14
a crucial point of safety assessment of packaging materials. However these tests, based on 15
destructive extraction and quantification (e.g. chromatographic or spectrophotometric) 16
procedures, are expensive and time-consuming. The directive 2002/72/CE considers the use 17
of “generally recognised diffusion models based on experimental data [...] under certain 18
conditions” to determine overestimated migration levels. Most of these models, used to 19
describe migration, are based on Fick diffusion equation that involve (Crank 1980) at least 20
two key parameters : (i) the diffusion coefficient (D), a kinetic parameter, which measures the 21
average ability of molecules to diffuse across the permeable phase of polymer film, and (ii) 22
the partition coefficient (KPL) which is the ratio of additive content in the packaging material 23
and in the foodstuff at equilibrium. Empirical and semi-empirical relationships (Begley et al. 24
2005; Brandsch et al. 2002; Franz 2005; Piringer 1994; Reynier et al. 1999; Reynier et al. 25
2001b; Vitrac et al. 2006) enable a rough evaluation of these parameters that would require 26
otherwise a high number of experimental mass transfer tests, to be determined experimentally. 27
An outstanding example of such relationship is the so called “Piringer equation” used to 28
determine the diffusivity of a migrant and needs as inputs the temperature during the process, 29
the molecular weight of the migrant and five constants, two of which depend on the type of 30
polymer. All these parameters have been derived from a thorough analysis of reported 31
diffusion coefficients in order that the diffusion coefficient determined should always 32
overestimate the real value. Alternatives to the estimation of the diffusion coefficient have 33
used the volume of the migrant (Reynier et al. 2001b) ; the Van der Waals volume, the 34
Page 2 of 24
http://mc.manuscriptcentral.com/tfac Email: [email protected]
Food Additives and Contaminants
123456789101112131415161718192021222324252627282930313233343536373839404142434445464748495051525354555657585960
For Peer Review O
nly
3
gyration radius and a shape parameter (Vitrac et al. 2006) in order to refine the predictions. 1
Less attention has been paid though to the prediction of the partition coefficient and a 2
commonly accepted approach has been to take it as KPL=1 if the migrant is soluble in the 3
food/food simulant or KPL=1000 otherwise (European Commission 2003) . A “worst case” 4
relationship has been proposed aiming at the prediction of the partition coefficient in 5
foodstuff depending on the partition coefficient in the n-octanol/water system (logP) of the 6
migrant and two empiric parameters (Pocas et al. 2008) . 7
8
These “predictive approaches” have been the object of some criticism whenever they are used 9
with polymers other than polyolefins, or at high temperature or for high molecular weight 10
migrants, at least, until more experimental data are available. Helmroth et al (2002a) found 11
for instance that, if the Piringer model was applied to the case studied by Reynier et al 12
(2001a) in PP at 70 °C, 50% of the predicted values underestimated the experimental ones. 13
Other authors, such as Helmroth et al (2002b; 2003) and Reynier et al (2002) , have put in 14
turn efforts to formulate coherent methodologies to take into account the potential swelling of 15
the polymer caused by the sorption of a solvent, as well as to determine the influence of this 16
swelling in the release of substances into food. Of course, the success of these approaches lies 17
also in an efficient way to obtain the kinetic data. With this scope, spectroscopic methods 18
have been successfully used for investigation of sorption-desorption process of small 19
molecules in polymer films (Cava et al. 2005; Cotugno et al. 2001) . 20
21
This study aimed to explore the use of vibrational spectroscopy to study food/packaging 22
interactions and provide data that could be used to determine the mass transfer parameters of 23
the system. Despite its high detection limit, FT-IR based analysis supplied a very useful 24
experimental tool to monitor transfer properties of polymer films in a non-destructive mode. 25
Other methods, such as micro-UV(Reynier et al. 2002) , provide information about the 26
migration process taking place inside the polymers with a micrometer-scale spatial resolution. 27
Likewise, Raman micro-spectroscopy has been used to study to determine concentration 28
profile of low molecular weight compounds in the polymers at a micrometric scale (Sammon 29
et al. 1999) . This method could be considered as a promising complementary method of 30
micro UV (active molecules in UV are not necessarily active in Raman and vice versa), to 31
investigate in a versatile, quick and non-destructive way, the distribution profile of additives 32
in plastic material. With confocal collection optics, the method should allow to follow the 33
migration process as a function of both time and space and, consequently, to plot additive 34
Page 3 of 24
http://mc.manuscriptcentral.com/tfac Email: [email protected]
Food Additives and Contaminants
123456789101112131415161718192021222324252627282930313233343536373839404142434445464748495051525354555657585960
For Peer Review O
nly
4
concentration profile in the depth of polymer sample in order to easily gather mass transfer 1
parameters. To the best of our knowledge, this has never been done up to now, partly because 2
both methods are not considered as sensitive enough to study migration, but, as it will be seen 3
subsequently, they can be successfully used to characterize mass transfer in model systems. 4
5
Two different approaches were used to determine the diffusivity of a migrant in a plastic 6
packaging material by two vibrational spectroscopy methods i.e. FT-IR and Raman 7
spectroscopy. Uvitex OB, an optical brightener and UV stabiliser approved for Food Contact 8
Materials, was selected as model migrant to spike LLDPE films. The samples were submitted 9
to migration test according to EC directives and analysed by FT-IR and Raman 10
microspectroscopy during immersion in the worst case food simulating liquid i.e. the olive 11
oil, with the objective to determine the diffusion coefficient on the basis of a resolution of 12
Fick’s law. 13
14
Theory 15
The internal diffusion of migrant in the packaging is: 16
∂∂
∂∂
=∂∂
<<>x
CD
xt
Ct L,xL- ,0 (1) 17
where x is the distance (m), C the packaging concentration in migrant (kg additive/kg of 18
polymer) and D the migrant diffusivity in the packaging (m²s-1
). If D is independent of the 19
concentration of the diffusing substances (at least at the concentration range found in the 20
experiment), the system is said to follow Fickean kinetics. 21
Equation (1) was solved with the initial and boundary conditions that apply for this case 22
study i.e: 23
t = 0, - L < x < L, C = C in (2) 24
t > 0, x = +L, C =CL,∞ (3) 25
0 0,x ,0 =∂∂
=>x
Ct
(4) 26
27
where Cin is the concentration initially present in the polymer, CL,∞ is the concentration of the 28
diffusing substance on the surface of the polymer required to maintain equilibrium with the 29
concentration of this substance in the liquid at time t. 30
Page 4 of 24
http://mc.manuscriptcentral.com/tfac Email: [email protected]
Food Additives and Contaminants
123456789101112131415161718192021222324252627282930313233343536373839404142434445464748495051525354555657585960
For Peer Review O
nly
5
In some cases, the diffusivity D is dependent on the concentration of the diffusing substance 1
as it is the case of substances that alter the structure of the polymer. According to the free 2
volume theory, D is proportional to the exponential of the free volume within the polymer 3
(Duda and Zielinsky 1996) . Based on this assumption, several authors (Helmroth et al. 2003; 4
Reynier et al. 2002) have successfully modelled the dependence of D as: 5
( )
=
MAXc
txcDtxD
),(exp, 0 γ (5) 6
where D0 is the zero concentration diffusivity and γ is a proportional factor. Of course, if γ is 7
equal to zero, diffusivity is a constant and kinetics follows the Fickean model. Taking into 8
account the potential dependency of diffusivity and concentration, several scenarios are 9
possible; case i) diffusivity is independent of Uvitex OB and olive oil (Fickean kinetics); case 10
ii) diffusivity depends only on Uvitex OB concentration; case iii) diffusivity depends only on 11
olive oil concentration; and case iv) diffusivity depends on both Uvitex OB and olive oil. 12
13
Solving procedure 14
If the sorption/desorption phenomena follow Fickean kinetics, the system of equations (1-4), 15
can be solved analytically and the evolution of concentration with time is given by 16
Crank(1980) : 17
( )
+
+−
+−
−=−−
∑∞
=∞ L
xntD
L
n
nCC
CtxC
n
n
inL
in
2
)12(cos.
4
)12(exp
12
141
),(2
22
0,
πππ
(6) 18
( )
+−
+−=
−−
∑∞
=∞
tDL
n
nCC
CC
ninL
int.
4
)12(exp
12
181
2
22
022
,
ππ
(7) 19
where C is the concentration in diffusing substance in x at time t and tC is the average 20
concentration in diffusing substance in the packaging at time t. 21
Nevertheless, if Fickean kinetics cannot be assumed e.g. D varies with the concentration of 22
migrant and/or with olive oil entering the packaging, there is no analytical solution to 23
Equation (1). Considering an exponential relationship between concentration and diffusivity 24
(Equation (5)), Equation 1 was solved using a Crank-Nicholson-like scheme i.e. a central 25
difference in space and a trapezoidal rule in time. 26
27
Page 5 of 24
http://mc.manuscriptcentral.com/tfac Email: [email protected]
Food Additives and Contaminants
123456789101112131415161718192021222324252627282930313233343536373839404142434445464748495051525354555657585960
For Peer Review O
nly
6
Materials & Methods 1
Chemicals 2
Uvitex OB and solvents were of reagent grade or highest purity available. 2,5-Bis-(5-tert.-3
butyl-benzoxazol-2-yl)-thiophen (Uvitex OB, 430.6 g mol-1
) was purchased from Fluka.. 4
Methanol (99.9%), tetrahydrofurane (THT, 98%) and toluene (99%) were purchased from 5
Carlo Erba. LLDPE pellets were purchase from Sigma Aldrich. Olive oil was purchased in a 6
local supermarket. 7
8
Films fabrication. 9
LLDPE pellets were mixed with additives at 140°C (50 rpm) during 5 min in a twin counter 10
rotating internal mixer (Rheomix 600 Haake, Germany) connected to a control unit 11
(Rheocord 9000 Haake, Germany). Then, the dough material obtained after mixing was then 12
thermoformed (hot press) at 100 bar during 10 min at 140°C. Films preparation was kindly 13
carried out by IMCB (Naples, Italy). A nominal concentration of 0.4% w/w was used, higher 14
than found in commercial polymers. The thickness obtained was 656 ± 64 µm (measured by a 15
micrometer, Braive Instruments, Chécy, France). 16
17
Migration test 18
Following the conditions set in directives 85/572/EEC and 2002/72/EC, 3.5 cm2 film samples 19
were fully immersed in 6 ml olive oil at 40ºC. Before each measurement the sample were 20
removed from the olive oil and thoroughly wiped in a reproducible way with a precision 21
wipe. The weight was recorded to determine the uptake of olive oil. FTIR measurements were 22
done after 3, 6, 10, 15 and 26 days of storage. Raman measurements were done after 4h, 1 and 23
3 days of storage. 24
25
Additives extraction 26
3.5 cm2 samples were dissolved in 3 ml of toluene and reprecipited in 15 ml of methanol then 27
filtered with 2 x 5 ml of methanol. The extract was evaporated to dryness in a rotary 28
evaporator (Heidolph VV 2000, Germany) and dissolved again in 10.0 ml of THF. 29
30
UV spectroscopy analysis 31
The quantity of additive in THF extract was determined using a Cary 100 UV-visible 32
spectrometer (Varian) at λ = 374 nm at controlled temperature of 25 ± 2 °C. Two 33
measurements were performed for each sample. 34
Page 6 of 24
http://mc.manuscriptcentral.com/tfac Email: [email protected]
Food Additives and Contaminants
123456789101112131415161718192021222324252627282930313233343536373839404142434445464748495051525354555657585960
For Peer Review O
nly
7
1
FTIR measurement 2
LLDPE film samples were analyzed by means in transmission FTIR. Spectra were recorded 3
using a Nexus 5700 spectrometer (ThermoElectron Corp.) equipped with HeNe beam splitter 4
and a cooled MCT detector. Spectral data were accumulated from 128 scans with a resolution 5
of 4 cm-1
in the range 800-4000 cm-1
. Three samples were employed for the measure and 6
three spectra were recorded for each sample 7
8
All spectra pre-treatments were performed using Omnic v7.3 and TQ Analyst v7.3 softwares 9
(ThermoElectron) Processing included: (1) a multipoint linear baseline correction, (2) a 10
normalization according to the area of the LLDPE doublet (1369-1378 cm-1
) due to the CH3 11
symmetric deformation vibration. 12
13
Raman spectroscopy 14
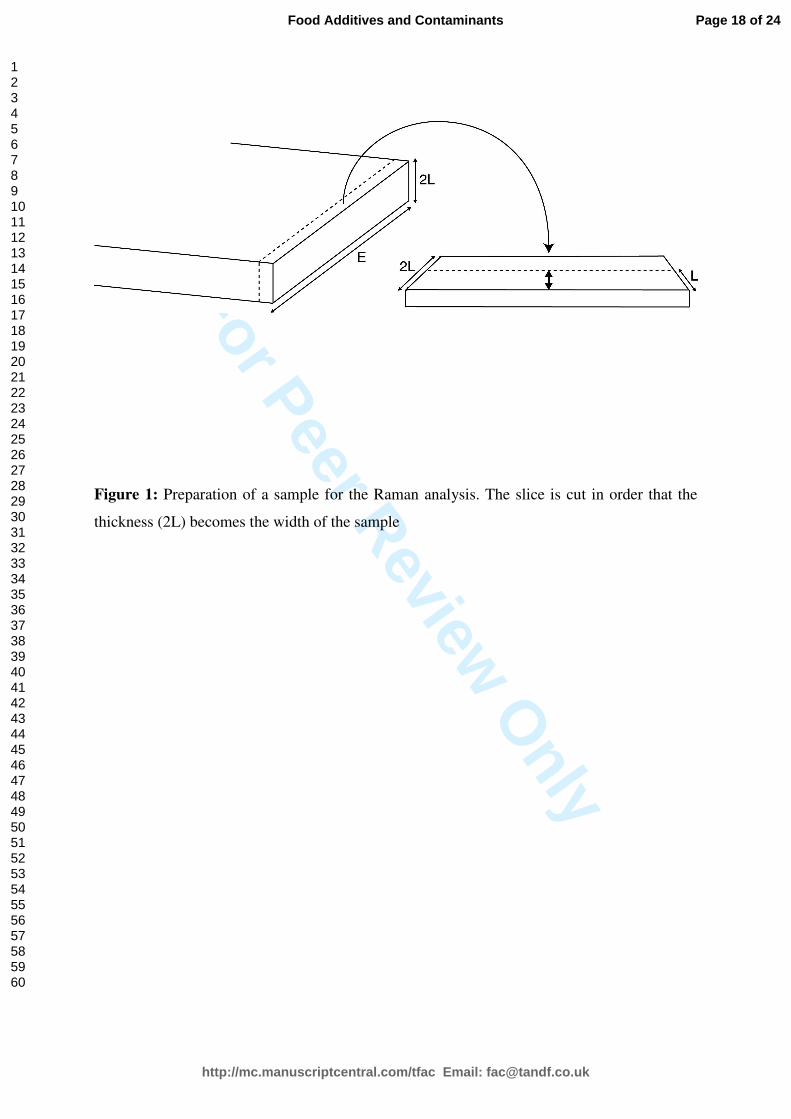
Uvitex concentration profiles in the LLDPE were determined as follow. Thin slices of 15
LLDPE were prepared using a razor blade and stuck on a microscope slide (Figure 1). 16
Raman spectra were recorded between 95 and 3500 cm−1
Raman shift using a confocal 17
Raman microspectrometer Almega (Thermo-Electron) with the following configuration: 18
excitation laser He–Ne λ0 = 633 nm, grating 500 grooves/mm, pinhole 25 µm, objective × 50. 19
The collection time was about 50 sec. Measurements were carried out in the depth sample 20
with a pitch of 2 µm from the sample center to the interface. Samples were exposed to 21
photobleaching for 15 s from the third day of test in order to avoid fluorescence caused by 22
olive oil sorption. Since the concentration in the samples was too heterogeneous as it will be 23
explained later, a measure of initial concentration was carried out by FTIR to all the samples 24
studied. 25
26
All spectra pre-treatments were performed with Omnic v7.1 (Thermo-Electron). Processing 27
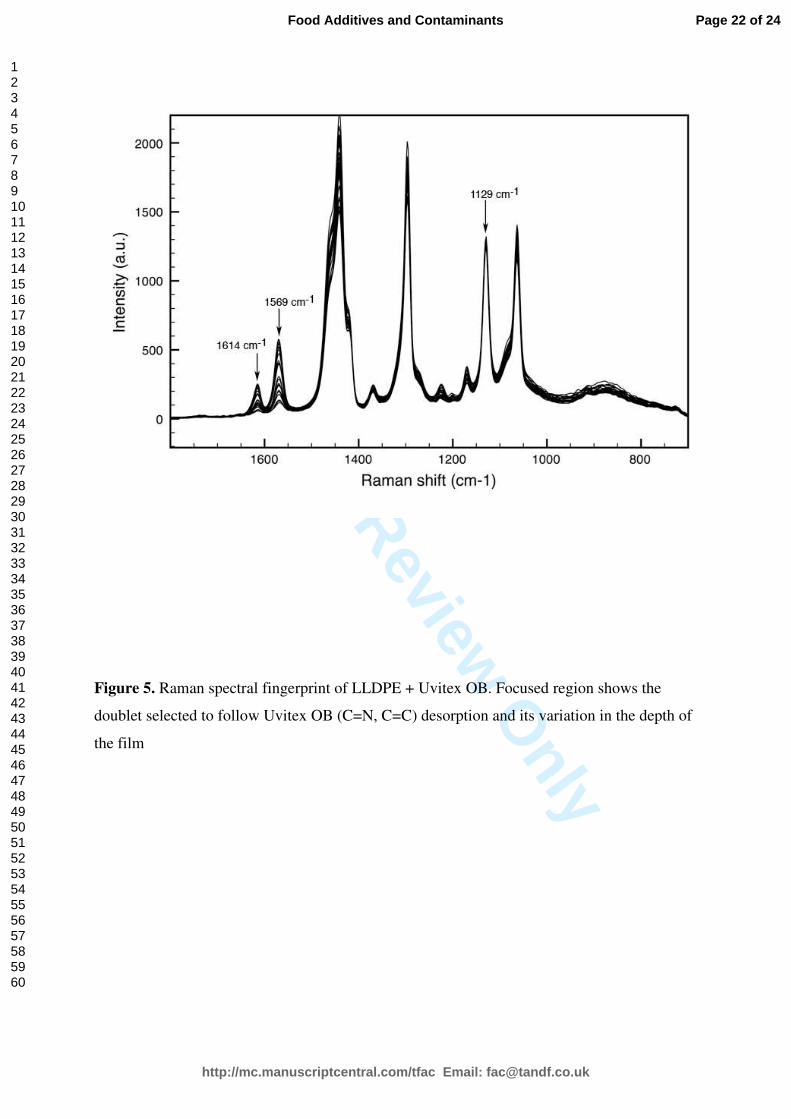
included: (i) a multipoint linear baseline correction, (ii) normalization according to the area of 28
the LLDPE specific band at 1129 cm-1
representing the symmetric C-C stretching of all-trans 29
PE chains. The relative content of Uvitex OB was assessed using the area of the specific 30
doublet (1569-1614 cm-1
) assigned to the aromatic C=C and C=N bands. 31
32
Statistics 33
Page 7 of 24
http://mc.manuscriptcentral.com/tfac Email: [email protected]
Food Additives and Contaminants
123456789101112131415161718192021222324252627282930313233343536373839404142434445464748495051525354555657585960
For Peer Review O
nly
8
The test of normality of Anderson-Darling (Trujillo-Ortiz et al. 2007) was used to analyse the 1
homogeneity of the samples. 2
The root mean square error (RMSE) was used to estimate the quality of model fitting and was 3
calculated as follows: 4
( )( )pN
yyRMSE
−
−=
2
exp (8) 5
where yexp and y are respectively the experimental and predicted additive content values (kg 6
of additive/kg of polymer), N is the number of additive content measurements and p is the 7
number of identified parameters. 8
For each experiment, the average of 95% confidence interval of all the replicates represented 9
the experimental error ( E in kg of additive/kg of polymer). For estimating the good fitting or 10
not of the model, the RMSE and the E were compared. A fitting was considered as good 11
when RMSE ≤ E . 12
13
Estimation of diffusivity 14
The additive diffusivity was identified from experimental data by minimizing the root mean 15
square error (RMSE) between experimental and predicted data (Equations (6) and (7)) and by 16
using an optimization method (Levenberg-Marquardt algorithm, optimization routine 17
predefine from Matlab software). A Monte Carlo sampling was applied to the input 18
parameters (concentration, thickness and time) in order to determine the 95% confidence 19
intervals as explained elsewhere (Hessler 1997; Press et al. 1989) . 20
21
22
Results 23
After determining the additive distribution in the film samples, the quantification of Uvitex 24
OB and olive oil content was investigated by FTIR throughout the test and used to determine 25
the migration level of Uvitex OB as well as the diffusivity of both olive oil and Uvitex OB. 26
Likewise, Raman measurements were used to determine diffusivity of Uvitex OB in LLDPE 27
and both results were compared 28
29
Uvitex OB distribution in LLDPE samples 30
The Uvitex OB concentration in LLDPE used for the tests turned out not to be 31
homogeneously distributed as determined by the test of normality of Anderson-Darling 32
Page 8 of 24
http://mc.manuscriptcentral.com/tfac Email: [email protected]
Food Additives and Contaminants
123456789101112131415161718192021222324252627282930313233343536373839404142434445464748495051525354555657585960
For Peer Review O
nly
9
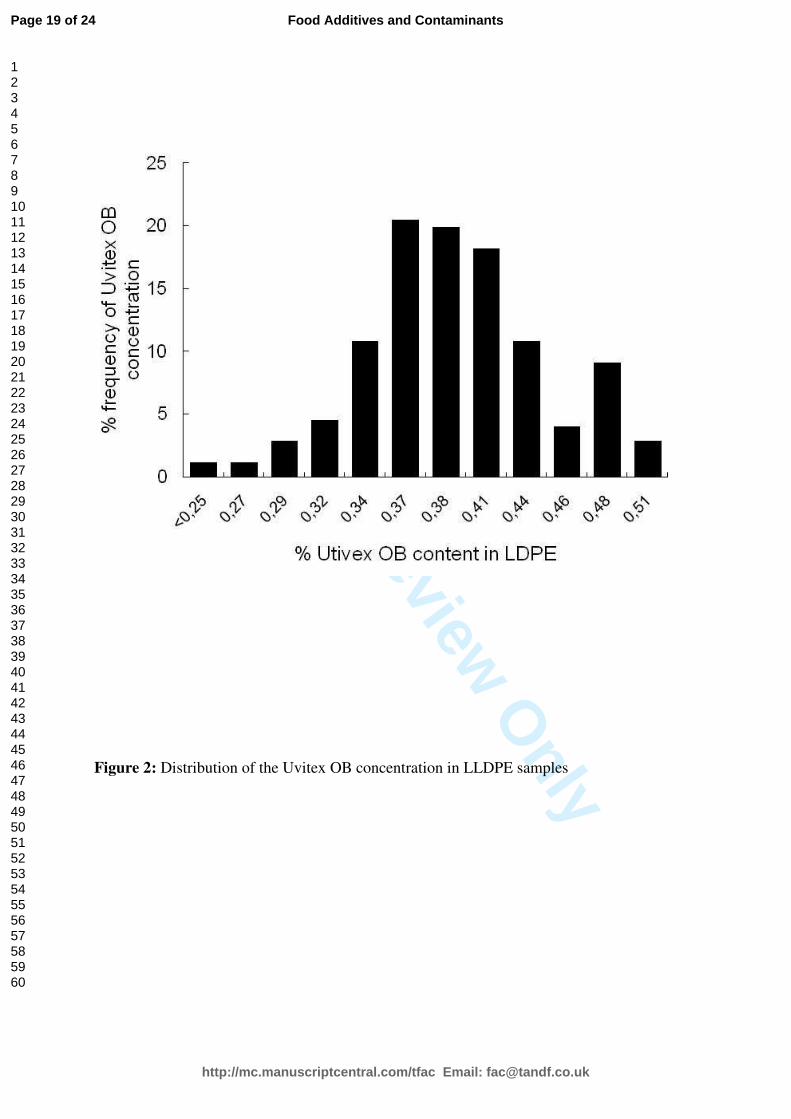
(Trujillo-Ortiz et al. 2007) (the result was positive for an α = 0.05). The distribution of the 1
additive (Figure 2) proved to be heterogeneous and normally distributed. The test of 2
normality was applied to 186 samples and gave as a result a mean concentration of 0.41% 3
w/w with a standard deviation of 0.051%. So the coefficient of variation, i.e. the quotient 4
between the standard deviation and the mean was of 12.2%. As an illustration, this means that 5
the 95% of the samples will have concentrations comprised between 0.31% and 0.50% w/w. 6
For a migration experiment, the additive content is usually assumed to be homogeneous in 7
migration tests for all the samples. However, the distribution of additive among the samples 8
hinders the use of standard destructive methods since the variations on the initial 9
concentration of each sample could be comparable to the variations of concentrations 10
throughout the test. This obstacle can be overcome either by increasing the number of 11
samples for destructive methods (highly time consuming), either using a non-destructive 12
method such as FTIR, that can thoroughly guarantee the traceability of the samples 13
throughout the test and then, avoid the uncertainty caused by the variations in the initial 14
content of additive. Finally, it must be borne in mind that the lack of sensitivity of the 15
methods implied using a high concentration (0.4% w/w of Uvitex OB). If the additive is not 16
completely soluble in LLDPE at that concentration, it would be the responsible for the 17
heterogeneous distribution of the additive. 18
19
Quantification of Uvitex OB and olive oil in LLDPE 20
Simultaneous desorption of Uvitex OB and sorption of olive oil were investigated using 21
FTIR. A detailed study of the additive fingerprint allowed to determine the most suitable 22
bands for the analysis. Considering the blend LLDPE spectrum, Uvitex OB fingerprint 23
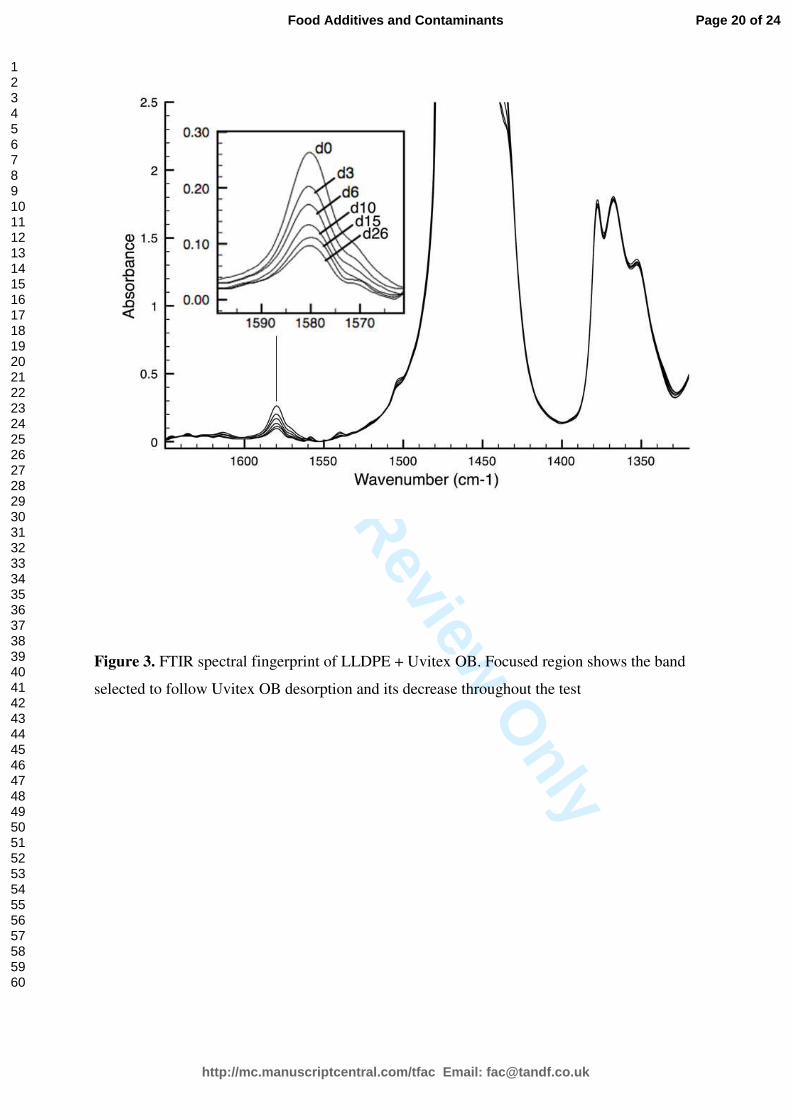
exhibited some specific bands which could be employed to detect its occurrence in the films. 24
Regarding the higher absorbance value, Uvitex OB occurrence was specifically detected at 25
1579 cm-1
assigned to the aromatic C=C stretching band (Figure 3). In turn, olive oil sorption 26
into LLDPE was followed in the ester stretching band at 1750 cm-1
. 27
28
With LLDPE samples including variable contents in Uvitex OB, a Partial Least Square (PLS) 29
model was calibrated on the basis of the intensity ratio 1579/1378 cm-1
. The regression 30
produced a linear relationship (R2 = 0.96, RMSE= 0.034% w/w) between spectral data and 31
additives concentration measured by UV spectroscopy analysis. 32
33
Page 9 of 24
http://mc.manuscriptcentral.com/tfac Email: [email protected]
Food Additives and Contaminants
123456789101112131415161718192021222324252627282930313233343536373839404142434445464748495051525354555657585960
For Peer Review O
nly
10
Subsequently, the same procedure was carried out to relate spectral data and olive oil content. 1
The uptake of olive oil was considered to be equal to the increase of mass of the sample less 2
the quantity of Uvitex desorbed (quantified with FTIR measurements). The data fitted 3
satisfactorily the model (R2 = 0.99, RMSE= 0.040% w/w). 4
5
Determination of the diffusivities of Uvitex OB and olive oil in LLDPE with FTIR 6
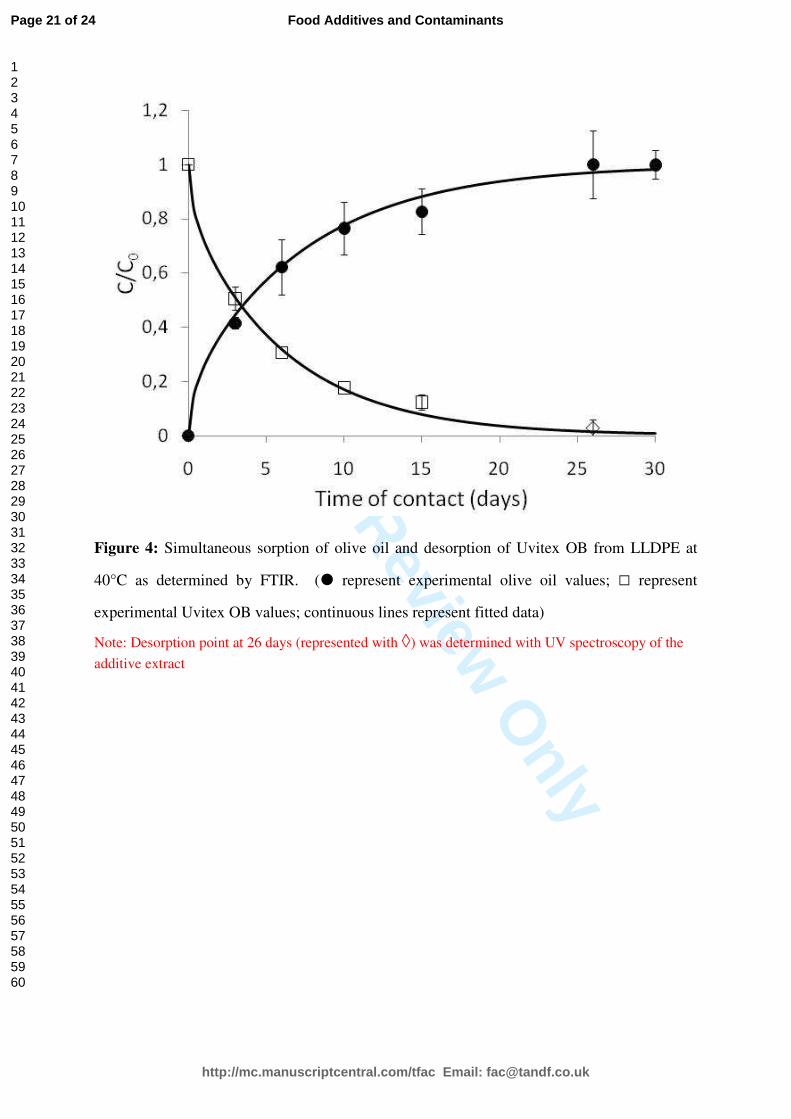
The migration of Uvitex OB in olive oil was followed during 26 days by FTIR. Spectra were 7
normalized on a specific LLDPE doublet (1369-1378 cm-1) and the decrease in absorbance at 8
1579 cm-1
showed the desorption of Uvitex OB from LLDPE film from an initial content of 9
0.4% w/w to a value below the detection limit after 26 days. Likewise, the uptake of olive oil 10
in the sample was obtained as a function of time and a plateau was determined at 1.3±0.1% 11
w/w of olive oil. From data obtained from FTIR experiments, desorption curves of Uvitex OB 12
from LLDPE in olive oil were obtained by plotting the relative concentration as a function of 13
time (Figure 4). 14
15
The determination of diffusivity values for Uvitex desorption and olive oil sorption in the 16
LLDPE film was evaluated during migration kinetics in olive oil using equation (7). For 17
Uvitex OB, the resulting diffusivity value was of 8.0±2.5⋅10-14
m2 s
-1 and the RMSE of 0.02% 18
w/w, lower than the experimental error evaluated as a 0.04% w/w. This results was in 19
agreement with experimental data previously reported since a value of diffusivity of 5⋅10-14
20
m2 s
-1 was found by Dole et al (2006) (same temperature but in LDPE). For olive oil the 21
diffusivity value was 6.9±3.4⋅10-14
m2 s
-1 and the RMSE 0.07 % w/w, slightly larger than the 22
experimental error estimated as 0.04% w/w but remaining still in an acceptable range. The use 23
of non-destructive measurement by FTIR allowed to fully trace the content of Uvitex OB of 24
the sample all throughout the experiment and thus, to determine an accurate value of 25
diffusivity which would not be feasible with other common analytical procedures with a 26
comparable accuracy. Furthermore, FTIR also provided data on the uptake of olive oil in the 27
sample that led to the determination of its diffusivity in LLDPE. Advantages of FTIR to carry 28
migration tests out include, besides the possibility to obtain non-destructive measurements, 29
supplying additional information of the polymer evolution (e.g. oxidation) and of a number of 30
substances that could be sorbed during the test. Its main disadvantage lies in its lack of 31
sensitivity compared to other analytical methods. When dealing with complex migration 32
behaviour, as for instance, when diffusivity can no longer be considered as a constant (non-33
Page 10 of 24
http://mc.manuscriptcentral.com/tfac Email: [email protected]
Food Additives and Contaminants
123456789101112131415161718192021222324252627282930313233343536373839404142434445464748495051525354555657585960
For Peer Review O
nly
11
Fickean kinetics), a large number of data are required that are difficult to obtain by FTIR or 1
other similar method that provided the average concentration of a sample. Raman 2
microspectroscopy was explored as a promising tool to obtain a further insight of mass 3
transfer in the polymer for it gives access to more information on migration kinetics such as 4
concentration profiles of Uvitex OB in the depth of the LLDPE sample as a function of time. 5
6
Raman Measurements 7
Concentration profiles were determined after contact times of 4h, one day and three days, 8
shorter than those required by FTIR, proving to be an efficient method for the determination 9
of diffusivity. For each contact time, Raman intensity profile obtained was compared to the 10
total mass of Uvitex remaining in the film determined by FTIR (Figure 5). The Raman profile 11
allowed the determination of the total content of Uvitex OB in the film according to equation 12
(9) 13
dzzCSUvitexofmass
L
L
∫+
−
= )(ρ (9) 14
where ρ stands for the bulk density of the polymer (920 kg m-3
for LLDPE), S for the surface 15
and C for the concentration. A linear regression was used to successfully correlate (R²=0.96) 16
the data supplied by FTIR and the band assigned to Uvitex (1569-1614 cm-1
) normalized with 17
the area ratio of the LLDPE specific band (1129 cm-1
). 18
19
Determination of the diffusivity of Uvitex OB in LLDPE 20
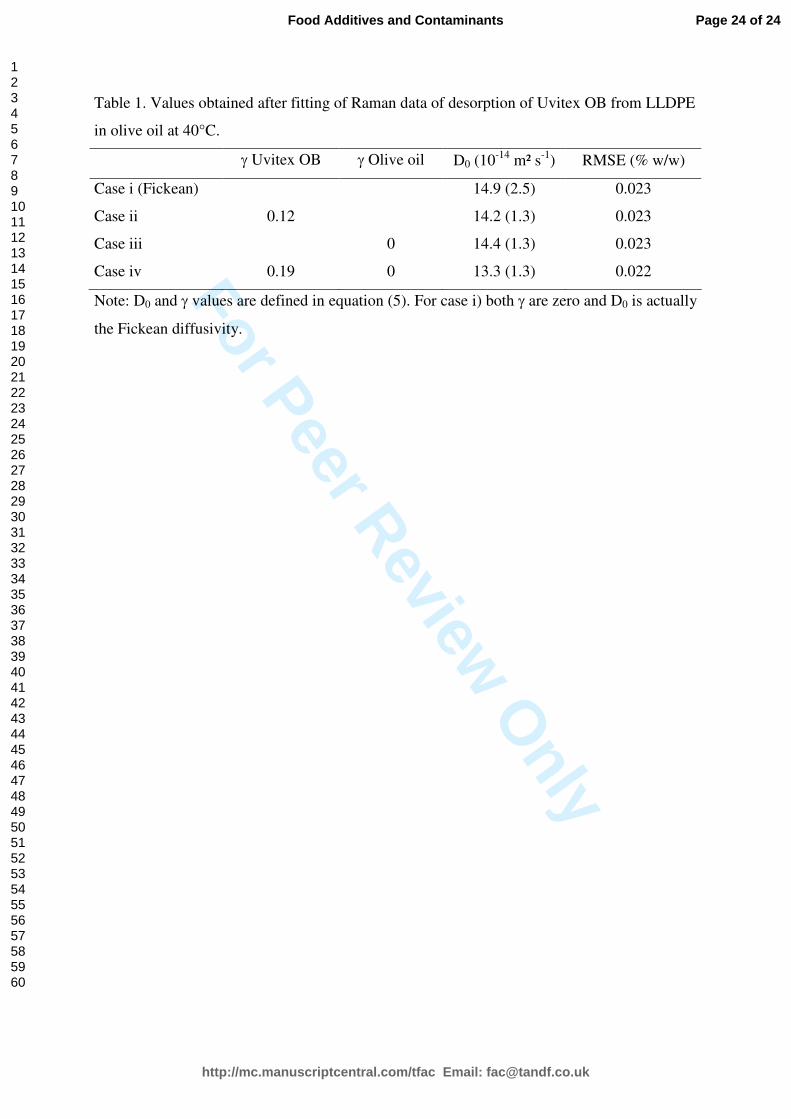
The three concentration profiles obtained were treated altogether and used to determine 21
whether diffusivity of Uvitex OB was independent of its own and/or olive oil concentration. 22
Four scenarios were considered (table 1): i) diffusivity is independent of Uvitex OB and olive 23
oil (Fickean kinetics), ii) diffusivity depends only on Uvitex OB concentration, iii) diffusivity 24
depends only on olive oil concentration and iv) diffusivity depends on both Uvitex OB and 25
olive oil. The first case was solved using equation (6) and the last three using a modification 26
of the Crank Nicolson method as stated in the Materials and Methods section. For cases iii) 27
and iv) olive oil was considered to modify the diffusivity of Uvitex OB in LLDPE but not its 28
own diffusivity. Thus, the constant value of diffusivity obtained with the FTIR analysis using 29
and equation (6) and, the concentration of olive oil in LLDPE samples was estimated as a 30
function of space and time. These values of concentration were then used to determine the 31
potential dependency of Uvitex OB diffusivity on olive oil content. On the basis of the RMSE 32
Page 11 of 24
http://mc.manuscriptcentral.com/tfac Email: [email protected]
Food Additives and Contaminants
123456789101112131415161718192021222324252627282930313233343536373839404142434445464748495051525354555657585960
For Peer Review O
nly
12
comparison (Table 1), it was verified that the increase of factors in the model did not 1
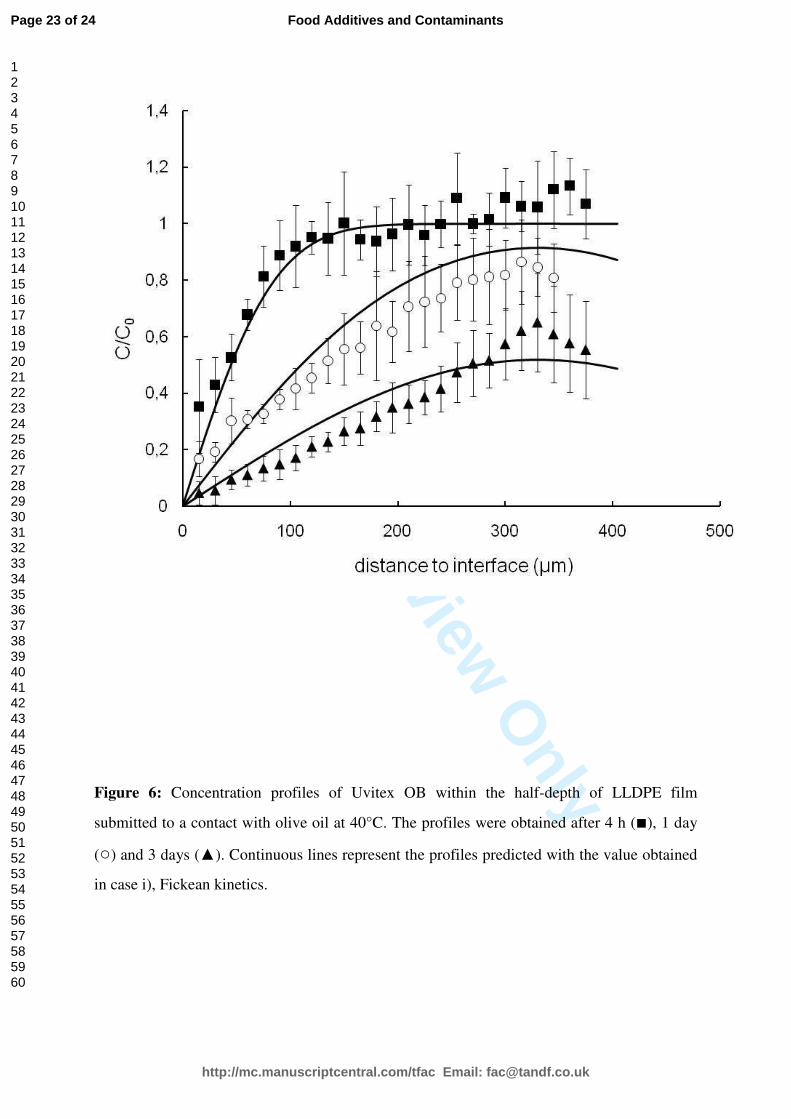
significantly increase the accuracy of the predictions. Figure 6 shows the experimental data of 2
concentration profiles of Uvitex OB in LLDPE as well as those predicted with the diffusivity 3
value obtained for scenario i), i.e. Fickean kinetics and how they are well correlated if 4
compared to previous works in which the concentration profile is fitted (Helmroth et al. 2003; 5
Reynier et al. 2002) . Therefore, scenario i) was accepted as the most likely and simplest, i.e. 6
Fickean kinetics and a diffusivity independent of the concentration of either olive oil or 7
Uvitex OB, at least in the concentration range found during the experiments, which confirms 8
the results obtained by FTIR. According to Raman measurements a value of diffusivity was 9
obtained of (14.6±2.5⋅10-14
m2 s
-1). Although significantly different for p=0.05, it lies in the 10
same range as the one obtained by FTIR, and indeed both values were no longer different 11
when considering a value of p=0.025. It is a quite meaningful result given the high deviations 12
that can be found in the determination of diffusivity. For example, Dole et al. (2006) reported 13
differences up to 350% for the diffusivity of Uvitex OB in PP measured with the same 14
method. 15
16
Hence, the investigation of diffusivity of a model molecule by Raman spectroscopy allowed 17
the assessment of several complex phenomena that influence migration in an integrated 18
approach. Raman microspectroscopy was used to provide large amount of data on the inside 19
of the polymer that can be used to assess diffusivity variations. Even though it is theoretically 20
possible to consider a variable diffusivity with global measurements as those performed by 21
FTIR or standard extraction/quantification methods, in reality it is often unfeasible since a 22
high number of experimental values are needed in practice to fit several parameters correctly 23
especially for non-linear models (Hessler 1997). In most cases, FTIR sensitivity is too low to 24
provide such a number of values from a desorption experiment and other conventional 25
methods turn out to be far too time-consuming. 26
27
It must be pointed out that the concentration at 15 µm of the interface was always 28
underestimated by the predicted values (Figure 6) what could mean that there is a non-29
negligible mass transfer resistance in the interface. This hypothesis is attractive and it would 30
make the Raman approach even more valuable since it would easily reveal whether mass 31
transfer resistance at the interface can be neglected. Unfortunately, the measurements of 32
points located so close to the interface are less reliable than those in the inside (Everall 2008). 33
Page 12 of 24
http://mc.manuscriptcentral.com/tfac Email: [email protected]
Food Additives and Contaminants
123456789101112131415161718192021222324252627282930313233343536373839404142434445464748495051525354555657585960
For Peer Review O
nly
13
Extreme care must be taken if assumptions are made based exclusively on the measurements 1
located the closest to the interface. 2
3
Regarding the effect of olive oil in desorption, it is sometimes widely accepted that, since the 4
polarity of triglycerides in olive oil is similar to that of polyolefins, olive oil is easily absorbed 5
and greatly influences the diffusivity in polyolefins. This has been tested for several low 6
molecular solvents (Helmroth et al. 2003) but very few results in the literature support this 7
hypothesis for olive oil. Several authors found that olive oil did not modify the release of 8
medium molecular weight additives from polyolefins (Goydan et al. 1990; Helmroth et al. 9
2002b; O'Brien et al. 1999) In contrast, Reynier et al.(2002) suggested an exponential 10
dependency of diffusivity with the triglyceride content, but they used glyceril tripelargonate 11
instead of olive oil, which could explain this discrepancy. Our results underpin the hypothesis 12
that olive oil does not modify the diffusivity of a medium molecular weight (431 g mol-1
) 13
additive in polyolefins. In addition, it must be borne in mind that the olive oil uptake is only 14
of a 1-2% w/w in polyolefins (1.3% w/w in our study) whereas it is commonly stated that, as 15
a rule of thumb, 15% w/w of solvent absorption accounts for an increase of ten folds of 16
diffusivity (Helmroth et al. 2002b) . With this in mind, olive oil sorption as observed in this 17
study is too low to carry out an important modification of diffusivity. 18
19
Conclusion 20
With the scope of improving the analysis of food/packaging interactions, the application of 21
two types of vibrational spectroscopy (FTIR and Raman) was presented. The aim of the 22
approach was not to quantify migration levels but to characterize mass transfer parameters in 23
the system. Both, FTIR and Raman, were successfully used to determine diffusivity values of 24
Uvitex OB that could be further use to simulate its release, according to legislation. With the 25
example developed here, each of the methods (FTIR and Raman) proved to be a very efficient 26
mean to access to the parameters necessary for predicting the migration in realistic conditions. 27
FTIR was used to know the average concentration in the LLDPE sample as a function of time. 28
Raman microspectroscopy gave the possibility to gather the concentration profile in the depth 29
of the sample and use these data to perform a complex analysis of the factors that could 30
influence the diffusion coefficient, e.g. it was demonstrated that olive oil sorption did not 31
modify the diffusivity of Uvitex OB in LLDPE. Regarding the experimental set up, a non-32
negligible time gain could be achieved. 33
34
Page 13 of 24
http://mc.manuscriptcentral.com/tfac Email: [email protected]
Food Additives and Contaminants
123456789101112131415161718192021222324252627282930313233343536373839404142434445464748495051525354555657585960
For Peer Review O
nly
14
Acknowledgements 1
This study has been carried out with financial support from the Commission of the European 2
Communities, Framework 6, Priority 5, “Food Quality and Safety”, Integrated Project Novel 3
Q FP6-CT-2006-015710. Authors would like to acknowledge Prof. Salvatore Iannace and co-4
workers from IMCB (Naples, Italy) for the preparation of the films used in this study. 5
6
References
Begley, T.; Castle, L.; Feigenbaum, A.; Franz, R.; Hinrichs, K.; Lickly, T.; Mercea, P.; 7
Milana, M.; O'Brien, A.; Rebre, S.; Rijk, R.; Piringer, O. 2005. Evaluation of 8
migration models that might be used in support of regulations for food-contact 9
plastics. Food Additives and Contaminants 22, 73-90. 10
Brandsch, J.; Mercea, P.; Ruter, M.; Tosa, V.; Piringer, O. 2002. Migration modelling as a 11
tool for quality assurance of food packaging. Food Additives and Contaminants 19, 12
29-41. 13
Cava, D.; Catala, R.; Gavara, R.; Lagaron, J. M. 2005. Testing limonene diffusion through 14
food contact polyethylene by FT-IR spectroscopy: Film thickness, permeant 15
concentration and outer medium effects. Polymer Testing 24, 483-489. 16
Cotugno, S.; Larobina, D.; Mensitieri, G.; Musto, P.; Ragosta, G. 2001. A novel 17
spectroscopic approach to investigate transport processes in polymers: the case of 18
water-epoxy system. Polymer 42, 6431-6438. 19
Crank, J. 1980. The Mathematics of Diffusion, 1st ed.; USA, Oxford University Press. 20
Dole, P.; Feigenbaum, A. E.; De la Cruz, C.; Pastorelli, S.; Paseiro, P.; Hankemeier, T.; 21
Voulzatis, Y.; Aucejo, S.; Saillard, P.; Papaspyrides, C. 2006. Typical diffusion 22
behaviour in packaging polymers - application to functional barriers. Food Additives 23
and Contaminants 23, 202-211. 24
Duda, J.; Zielinsky, J. Free volume theory. 1996 Diffusion in polymers CRC P. Neogi, Ed.; 25
Chapter 3 Free volume theory. pp 143-173. 26
European, C. 2003. A Practical Guide for Users of European Directives, Unit "Chemical and 27
physical risks; surveillance" of the Health & Consumer Protection Directorate-General 28
of the European Commission, 29
Everall, N. 2008. The influence of out-of-focus sample regions on the surface specificity of 30
confocal Raman microscopy. Applied Spectroscopy 62, 591-598. 31
Franz, R. 2005. Migration modelling from food-contact plastics into foodstuffs as a new tool 32
for consumer exposure estimation. Food Additives and Contaminants 22, 920-937. 33
Page 14 of 24
http://mc.manuscriptcentral.com/tfac Email: [email protected]
Food Additives and Contaminants
123456789101112131415161718192021222324252627282930313233343536373839404142434445464748495051525354555657585960
For Peer Review O
nly
15
Goydan, R.; Schwope, A. D.; Reid, R. C.; Cramer, G. 1990. High-Temperature Migration of 1
Antioxidants from Polyolefins. Food Additives and Contaminants 7, 323-337. 2
Helmroth, E.; Rijk, R.; Dekker, M.; Jongen, W. 2002a. Predictive modelling of migration 3
from packaging materials into food products for regulatory purposes. Trends in Food 4
Science & Technology 13, 102-+. 5
Helmroth, I. E.; Dekker, M.; Hankemeier, T. 2002b. Influence of solvent absorption on the 6
migration of Irganox 1076 from LDPE. Food Additives and Contaminants 19, 176-7
183. 8
Helmroth, I. E.; Dekker, M.; Hankemeier, T. 2003. Additive diffusion from LDPE slabs into 9
contacting solvents as a function of solvent absorption. Journal of Applied Polymer 10
Science 90, 1609-1617. 11
Hessler, J. P. 1997. The use of Monte Carlo simulations to evaluate kinetic data and analytic 12
approximations. International Journal of Chemical Kinetics 29, 803-817. 13
O'Brien, A.; Goodson, A.; Cooper, I. 1999. Polymer additive migration to foods - a direct 14
comparison of experimental data and values calculated from migration models for 15
high density polyethylene (HDPE). Food Additives and Contaminants 16, 367-380. 16
Piringer, O. G. 1994. Evaluation of Plastics for Food-Packaging. Food Additives and 17
Contaminants 11, 221-230. 18
Pocas, M. F.; Oliveira, J. C.; Oliveira, F. A. R.; Hogg, T. 2008. A Critical Survey of 19
Predictive Mathematical Models for Migration from Packaging. Critical Reviews in 20
Food Science and Nutrition 48, 913-928. 21
Press, W. H.; Flannery, B. P.; Teukolsky, S. A.; Vetterling, W. T. Modelling of data. 1989 22
Numerical Recipes in Pascal Cambridge University Press; Chapter 14 Modelling of 23
data. pp 547-599. 24
Reynier, A.; Dole, P.; Feigenbaum, A. 1999. Prediction of worst case migration: presentation 25
of a rigorous methodology. Food Additives and Contaminants 16, 137-152. 26
Reynier, A.; Dole, P.; Feigenbaum, A. 2001a. Additive diffusion coefficients in polyolefins. 27
II. Effect of swelling and temperature on the D = f(M) correlation. Journal of Applied 28
Polymer Science 82, 2434-2443. 29
Reynier, A.; Dole, P.; Humbel, S.; Feigenbaum, A. 2001b. Diffusion coefficients of additives 30
in polymers. I. Correlation with geometric parameters. Journal of Applied Polymer 31
Science 82, 2422-2433. 32
Page 15 of 24
http://mc.manuscriptcentral.com/tfac Email: [email protected]
Food Additives and Contaminants
123456789101112131415161718192021222324252627282930313233343536373839404142434445464748495051525354555657585960
For Peer Review O
nly
16
Reynier, A.; Dole, P.; Feigenbaum, A. 2002. Integrated approach of migration prediction 1
using numerical modelling associated to experimental determination of key 2
parameters. Food Additives and Contaminants 19, 42-55. 3
Sammon, C.; Hajatdoost, S.; Eaton, P.; Mura, C.; Yarwood, J. 1999. Materials analysis using 4
confocal Raman microscopy. Macromolecular Symposia 141, 247-262. 5
Trujillo-Ortiz, A.; Hernandez-Walls, R.; Barba-Rojo, K.; Castro-Perez, A. 6
AnDartest:Anderson-Darling test for assessing normality of a sample data. A 7
MATLAB file. [WWW document]. URL 8
http://www.mathworks.com/matlabcentral/fileexchange/loadFile.do?objectId=14807. 9
Vitrac, O.; Lezervant, J.; Feigenbaum, A. 2006. Decision trees as applied to the robust 10
estimation of diffusion coefficients in polyolefins. Journal of Applied Polymer 11
Science 101, 2167-2186. 12
13
14
Page 16 of 24
http://mc.manuscriptcentral.com/tfac Email: [email protected]
Food Additives and Contaminants
123456789101112131415161718192021222324252627282930313233343536373839404142434445464748495051525354555657585960
For Peer Review O
nly
Figure Captions
Figure 1: Preparation of a sample for the Raman analysis. The slice is cut in order that the
thickness (2L) becomes the width of the sample
Figure 2: Distribution of the Uvitex OB concentration in LLDPE samples
Figure 3. FTIR spectral fingerprint of LLDPE + Uvitex OB. Focused region shows the band
selected to follow Uvitex OB desorption and its decrease throughout the test
Figure 4: Simultaneous sorption of olive oil and desorption of Uvitex OB from LLDPE at
40°C as determined by FTIR. (� represent experimental olive oil values; □ represent
experimental Uvitex OB values; continuous lines represent fitted data)
Figure 5. Raman spectral fingerprint of LLDPE + Uvitex OB. Focused region shows the
doublet selected to follow Uvitex OB (C=N, C=C) desorption and its variation in the depth of
the film
Figure 6: Concentration profiles of Uvitex OB within the half-depth of LLDPE film
submitted to a contact with olive oil at 40°C. The profiles were obtained after 4 h (■), 1 day
(○) and 3 days (▲). Continuous lines represent the profiles predicted with the value obtained
in case i), Fickean kinetics.
Page 17 of 24
http://mc.manuscriptcentral.com/tfac Email: [email protected]
Food Additives and Contaminants
123456789101112131415161718192021222324252627282930313233343536373839404142434445464748495051525354555657585960
For Peer Review O
nly
Figure 1: Preparation of a sample for the Raman analysis. The slice is cut in order that the
thickness (2L) becomes the width of the sample
Page 18 of 24
http://mc.manuscriptcentral.com/tfac Email: [email protected]
Food Additives and Contaminants
123456789101112131415161718192021222324252627282930313233343536373839404142434445464748495051525354555657585960
For Peer Review O
nly
Figure 2: Distribution of the Uvitex OB concentration in LLDPE samples
Page 19 of 24
http://mc.manuscriptcentral.com/tfac Email: [email protected]
Food Additives and Contaminants
123456789101112131415161718192021222324252627282930313233343536373839404142434445464748495051525354555657585960
For Peer Review O
nly
Figure 3. FTIR spectral fingerprint of LLDPE + Uvitex OB. Focused region shows the band
selected to follow Uvitex OB desorption and its decrease throughout the test
Page 20 of 24
http://mc.manuscriptcentral.com/tfac Email: [email protected]
Food Additives and Contaminants
123456789101112131415161718192021222324252627282930313233343536373839404142434445464748495051525354555657585960
For Peer Review O
nly
Figure 4: Simultaneous sorption of olive oil and desorption of Uvitex OB from LLDPE at
40°C as determined by FTIR. (� represent experimental olive oil values; □ represent
experimental Uvitex OB values; continuous lines represent fitted data)
Note: Desorption point at 26 days (represented with ◊) was determined with UV spectroscopy of the
additive extract
Page 21 of 24
http://mc.manuscriptcentral.com/tfac Email: [email protected]
Food Additives and Contaminants
123456789101112131415161718192021222324252627282930313233343536373839404142434445464748495051525354555657585960
For Peer Review O
nly
Figure 5. Raman spectral fingerprint of LLDPE + Uvitex OB. Focused region shows the
doublet selected to follow Uvitex OB (C=N, C=C) desorption and its variation in the depth of
the film
Page 22 of 24
http://mc.manuscriptcentral.com/tfac Email: [email protected]
Food Additives and Contaminants
123456789101112131415161718192021222324252627282930313233343536373839404142434445464748495051525354555657585960
For Peer Review O
nly
Figure 6: Concentration profiles of Uvitex OB within the half-depth of LLDPE film
submitted to a contact with olive oil at 40°C. The profiles were obtained after 4 h (■), 1 day
(○) and 3 days (▲). Continuous lines represent the profiles predicted with the value obtained
in case i), Fickean kinetics.
Page 23 of 24
http://mc.manuscriptcentral.com/tfac Email: [email protected]
Food Additives and Contaminants
123456789101112131415161718192021222324252627282930313233343536373839404142434445464748495051525354555657585960
For Peer Review O
nly
Table 1. Values obtained after fitting of Raman data of desorption of Uvitex OB from LLDPE
in olive oil at 40°C.
γ Uvitex OB γ Olive oil D0 (10-14
m² s-1
) RMSE (% w/w)
Case i (Fickean) 14.9 (2.5) 0.023
Case ii 0.12 14.2 (1.3) 0.023
Case iii 0 14.4 (1.3) 0.023
Case iv 0.19 0 13.3 (1.3) 0.022
Note: D0 and γ values are defined in equation (5). For case i) both γ are zero and D0 is actually
the Fickean diffusivity.
Page 24 of 24
http://mc.manuscriptcentral.com/tfac Email: [email protected]
Food Additives and Contaminants
123456789101112131415161718192021222324252627282930313233343536373839404142434445464748495051525354555657585960