Embed Size (px)
Citation preview
* Corresponding author. E-mail address: [email protected] (R. Nyaoga) © 2016 Growing Science Ltd. All rights reserved. doi: 10.5267/j.dsl.2016.1.002
Decision Science Letters 5 (2016) 431–446
Contents lists available at GrowingScience
Decision Science Letters
homepage: www.GrowingScience.com/dsl
Application of Grey-TOPSIS approach to evaluate value chain performance of tea processing chains
Richard Nyaogaa*, Peterson Magutub and Mingzheng Wangc
aFaculty of Commerce, Department of Accounting, Finance and Management Science, Egerton University, Kenya bSchool of Business, Department of Management Science, University of Nairobi, Nairobi cSchool of Management Science and Engineering, Dalian University of Technology, China
C H R O N I C L E A B S T R A C T
Article history: Received October 25, 2015 Received in revised format: December 12, 2015 Accepted January 2, 2016 Available online January 4 2016
This study develops an effective method to measure value chain performance and rank them based on qualitative criteria and to determine the ranking order of the various forms of performance under study. This approach integrates the advantage of grey systems theory and TOPSIS to evaluate and rank value chain performance. Grey-TOPSIS approach has been applied to measure and rank the value chain performance of various firms. The results indicate that the proposed model is useful to facilitate multi-criteria decision-making (MCDM) problem under the environment of uncertainty and vagueness. The model also provides an appropriate ranking order based on the available alternatives. The Grey-TOPSIS approach that will be useful to the managers to use for solving the similar type of decision-making problems in their firms in the future has been discussed. Even though, the problem of choosing a suitable performance option is often addressed in practice and research, very few studies are available in the literature of Grey-TOPSIS decision models. Also, Grey-TOPSIS model application in the tea processing firms is non-existence hence this study is the very first to apply this model in evaluating value chain performance in the tea processing firms.
Growing Science Ltd. All rights reserved.6© 201
Keywords: Grey theory TOPSIS Multi-criteria decision making (MCDM) Value Chain Performance Theory of Constraints
1. Introduction
Due to stiff competition in today’s global markets, the heightened expectations of customers, and the introduction of shorter life cycle products have forced firms to invest in and focus attention on their supply chains. Companies need to measure their performance focusing on their financial and nonfinancial aspects if they are to survive. Customer satisfaction has become so important to manufacturers in that it has forced managers to concentrate on competitive priorities like flexibility, quality, responsiveness, and diversity as the common tools for creating a competitive edge. Many firms are concerned about how to manage supply chain activities more efficiently to improve their performance. The primary goal of supply chain management in any organization is to reduce production
432
costs, optimize inventory levels, improve customer service, reduce supply chain risk, make the maximum revenue, improve business processes leading to customer satisfaction, increasing competitiveness and profitability (Gunasekaran et al., 2004). Tea processing firms are consciously involved in value addition through the provision of pure branded teas blended at the source to their customers globally. This reinforces the need to embed constraints management into value chain performance efforts (“www.tearesearch.or.ke,” n.d.). Recently, the value chain performance evaluation using multi-criteria decision making has received considerable attention in the supply chain management literature in an attempt to manage value chain activities. A number of multi- criteria decision making (MCDM) methods to management value chain activities have been employed. Over the years, a number of techniques have been proposed to evaluate and rank value chain performance. Some of the MCDM include analytic hierarchy process (AHP), preference ranking organization method for enrichment evaluations (PROMETHEE), decision-making trial and evaluation laboratory (DEMATEL), data envelopment analysis (DEA), technique for order of preference by similarity to ideal solution (TOPSIS), etc.(Chaharsooghi & Ashrafi, 2014; Shahroudi & Tonekaboni, 2012; Wu, 2007). The decision makers judgments are often uncertain and cannot be defined with certainty thus, making the decision-making process very complicated. Recently, many researchers have integration different methodologies to solve problems that are vague in non-deterministic environments social and economic fields (Cao, Cheng, Zhang, Zhou, & Lian, 2006; Kuo, Yang, & Huang, 2008; Li, Yamaguchi, & Nagai, 2007; Zhang, Wu, & Olson, 2005). The Grey theory is superior in situations with uncertain information; it is used to study uncertainty and ambiguous human judgments (Li et al., 2007). Other researchers have used the Grey theory to evaluate different organizations’ strategies while others have used it in selecting suppliers, assessing the relationship between organization’s aspects and performance (Shukla et al., 2014; Kung & Wen, 2007). Karaveg et al. (2015) proposed a combined technique using SEM and TOPSIS for the commercialization capability of R&D project evaluation. Shukla et al. (2014) presented a decision-making model for selecting the best manufacturing system using grey system theory. Jadidi et al. (2008) proposed an integrated model of grey theory and TOPSIS to evaluate and select the best supplier in MCDM. Mishra et al. (2013) suggested a grey-based and fuzzy TOPSIS MCDM method for selecting the suitable flexible system for implementing mass customization strategies through assessing the alternatives and comparing them. Karimi, Azizi, Javanshir, & Ghomi Fatemi (2015) developed a hybrid approach based on SERVQUAL and fuzzy TOPSIS for evaluating banking service quality. Cao et al. (2006) in their work suggested the application of a grey situation decision-making theory in site selection. Kuo et al. (2008) proposed a multiple attribute decision making (MADM) method, grey relational analysis (GRA) to select dispatching rules. Kung and Wen (2007) applied Grey Relational Analysis and grey decision-making to evaluate the relationship between company attributes and its financial performance. Önder, Taş, and Hepşen (2010) in their study assessed the economic performance model and ranked banks using AHP and TOPSIS methodologies. Esfandiari and Rizvandi (2014) presented an empirical investigation to rank various business development strategies for Information Technology improvement using TOPSIS. Akman and Pjgkjn (2013) proposed a model based on AHP and TOPSIS for evaluating the environmental performance of suppliers and developed a hybrid multicriteria decision-making model. Ertuǧrul and Karakaşoǧlu (2009) and Akkoç and Vatansever (2013) developed a model to evaluate organizational performance using financial ratios and taking subjective judgments of decision makers into account using AHP and TOPSIS in a fuzzy environment. Kazan and Ozdemir (2014) assessed the financial performance of large-scale conglomerates using TOPSIS and CRITIC methods. Aliakbarzadeh and Tabriz (2014) applied Fuzzy AHP and TOPSIS to evaluate performance and rank branches of banks. The results indicated that the financial criteria had a higher ranking than non-
R. Nyaoga et al. / Decision Science Letters 5 (2016)
433
financial ones. Sadeghi and Razavi (2013) suggested a procedure based on grey TOPSIS to determine the preference of decisions to better aid managers in the decision-making process in a multi-criteria environment characterized by vagueness and uncertainty. Zhang (2008) developed an evaluating index system based on the modified technique for TOPSIS and grey relational analysis (GRA) in fuzzy for overall risk assessment in the supply chain. Jahanshahloo, Lotfi, & Izadikhah (2006) and Kia et al. (2014) extended the TOPSIS method to decision-making problems using fuzzy data in ranking products. Monjezi et al. (2012) applied TOPSIS to investigate the blasting and select the most appropriate blasting pattern. Bulgurcu (2012) proposed a multicriteria decision-making model to measure and compare the financial performance based on TOPSIS. Liao and Kao (2011) in their study they proposed an integrated fuzzy technique for TOPSIS and multi-choice goal programming (MCGP) approach in the supply chain to solve the supplier selection problem. Zaeri et al. (2011) developed a methodology to evaluate suppliers in supply chain cycle based on TOPSIS approach. Rostamzadeh et al. (2013) assessed and prioritized the proposed cost-effectiveness criteria in supply chain management using fuzzy multiple attribute decision making (MADM) approach and TOPSIS method. Sohani and Sharma (2013) used AHP and TOPSIS to analyze the Performance of Supply chain under an environment of uncertainty and using multi-criteria approach. Bottani and Rizzi (2006) presented a multi-criteria approach for the selection and ranking of the most suitable logistic service provider using a fuzzy TOPSIS approach. Roghanian et al. (2014) proposed a study to apply fuzzy TOPSIS to improve the process of supply chain management in the food industries. Shih et al. (2007) investigated the extension of TOPSIS to a group decision environment. Despite too many studies about multi-criteria decision-making methods, studies about constraint management and value chain performance evaluation using grey systems and TOPSIS in the tea industry is lacking. Hence, a novel model grey-based TOPSIS method is developed in this study. TOPSIS is a preferred decision-making technique because it can pragmatically visualize complicated causal relationship among the variables under study and provide a rank for decision making and it captures all objective and subjective criteria to choose the best constraint management. To deal with imprecise data and vague human judgments in the decision-making process, the grey theory is preferred. TOPSIS method can be integrated with another multi-criteria decision-making model to determine performances of the firms (Bulgurcu, 2012). The primary aim of this study is to propose a systematic evaluation model that makes it easy for processing firms to rank and select the most significant performance option in supply chain management (SCM) under grey-TOPSIS multi-criteria environment. The main contribution of this study will be to help decision makers to analyze the relationship between various objective and subjective criteria and to select the best likely option in a grey environment so as to improve firm value chain performance. In this study, an integrated grey-TOPSIS model is developed to evaluate and rank value chain performance. First, linguistic values expressed in grey numbers are applied to assess weights and ratings of performance evaluation criteria. Second, grey numbers criteria importance weights are de-greyed and normalized. Finally, TOPSIS multi-model based on fuzzy set theory is expressed and fuzzy positive and negative-ideal solutions are used to determine each performance’s closeness ideal solution and then ranked. The paper is organized as follows. The next section introduces the basic definitions and notations of fuzzy numbers and linguistic variables. Section 2 presents the methods and materials used to obtain data. Section 3 presents the proposed model. Section 4 presents a case application to illustrate the application of the proposed model. Section 5 presents the validation of the proposed model. The last section presents conclusions.
434
2. Material and methods
2.1 Research Design
This study adopted a cross-sectional survey to collect data on value chain performance based on constraint management in tea processing firms. The focus was to obtain relevant data to help in determining which of the performance measure options is perceived as the most important. The tea processing firms were used as the sample population from which the internal chain was selected. This is because operations activities are carried out in the internal value chain. The data used for the study was collected through a structured interview, internal organizational documentation, reports and archival records. The use of these multiple sources of evidence assisted in the triangulation of conclusions and the validation of the proposed conceptual framework. The personnel considered in this study were ten (10) experts (Production Managers). The ten (10) experts responded to the questionnaire on criteria importance on performance measures, and the relative importance of the criteria using a linguistic scale. A grey TOPSIS based method is used to analyse the data collected from the tea firms and suggest some findings and recommendations. This study proposed and utilized a grey-based TOPSIS model to achieve the set objective. 2.2 Multi-Criteria Decision Making
2.2.1 Grey Systems Theory
The grey systems theory that was coined by Deng Julong in 1982 out of the concept of the grey set is one of the new mathematical methods (Julong, 1982). Grey theory is an effective method used to solve uncertainty problems with discrete data and ambiguous information. Grey theory has been applied to various areas such as decision-making, forecasting, computer graphics, system control, etc. This approach is appropriate for solving the multi-criteria decision making (MCDM) problems in an environment of vagueness and uncertainty (Li et al., 2007). The theory has five parts: Grey relational analysis (GRA), grey prediction, grey programming, grey decision and grey control (Julong, 1989). Table 1
Linguistic variables and grey numbers for Criteria Weighting
2.2.1.1 Basic definitions and notation
Let us define kijx as the grey number for a decision maker k ’s rating of the influence of criteria j on
alternative i . Let l and u be the lower and the upper limits of the grey variables respectively, then the grey numbers for the lower limit is k
ijxl and that of the upper limit is kijxu respectively. It is necessary
to transform the grey numbers into crisp numbers. The defuzzification method of modified-CFCS (Converting Fuzzy data into Crisp Scores) is adopted for the transformation. The steps involved in convert grey numbers into crisp numbers in the modified-CFCS method is given below Step 1: Normalizing
maxminmin k
ijkij
kij luxu (1)
maxminmin k
ijkij
kij llxl (2)
Linguistic variables for criteria weight Linguistic variables for rating criteria
Grey numbers
Very Small Extent (VS) Very Low(VL) (0,2) Small Extent (S) Low (L) (2,4) Average (A) Medium (M) (4,6) Great extent (GE) High (H) (6,8) Very Great Extent (VG) Very High (VH) (8,10)
R. Nyaoga et al. / Decision Science Letters 5 (2016)
435
kij
kij lu minmaxmax
min
where kijumax is the maximum upper limit while k
ijlmin is the minimum lower limit within the grey
numbers. Step 2: Computation of the total normalized crisp values
kij
kij
kij
kij
kij
kij
kij xuxlxuxuxlxlx 1*1 (3)
Step 3: Crisp value computation
maxmin*min k
ijkij
kij xlz (4)
Step 4: Integration of crisp data matrices
kijijijijij zzzz
kz ...
1 321 (5)
2.2.2 TOPSIS Approach
TOPSIS (The Technique for Order Preference by Similarity to Ideal Solutions) method was introduced in 1981 by Hwang and Yoon as an ideal point multi-criteria decision analysis method and was tested by surveyors and different operators. TOPSIS method selects an alternative with the maximum similarity/closest to the positive ideal solution (Hwang & Yoon, 1981; Sun, 2010). In this method, options are rated based on ideal solution similarity. If an alternative is closer to an ideal solution, it has a higher grade. The Ideal solution is the best solution from any aspect that does not exist in reality and is being approximated. TOPSIS is premised on the concept that the ideal solution has the best level for all attributes under consideration while the negative ideal is the one with all the worst attribute values. The positive ideal solution maximizes the benefits option and minimizes the cost criteria while the negative ideal solution maximizes the cost option and minimizes the benefits option (Wang & Elhag, 2006). For measuring the similarity of an option to the ideal solution and non-ideal, we consider the distance of that option from ideal and non-ideal solution. 2.2.2.1 The TOPSIS Steps
General TOPSIS process step by step summary is given below
Step 1 Formation of a decision matrix that can be expressed as follows:
mnmjmmm
inijiii
nj
j
nj
xxxxA
xxxxA
xxxxA
xxxxA
CCCC
D
n
......
...........
...........
......
...........
...........
......
......
......
21
21
2222212
112111
21
1
(6)
where
436
is the ith firm is the numerical outcome of the ith firm with respect to jth criteria
Step 2
Normalization of the decision matrix D by applying the following formula
n
jij
ijij
x
Xr
1
2
(7)
Step 3 This step involves the construction of the weighted normalized decision matrix by multiplying the normalized decision matrix in step 2 by its related weights. An element of the new matrix ijV is
calculated as
ijnij rwV * (8)
where
n
jj
jn
w
wwand
1
n
1jj 1w
(9)
Step 4
Determination of the positive ideal solution and negative ideal solution.
'min,max JjVJjVV ijijij (10)
nj vvvvA ,...,..., 21
'max,min JjVJjVV ijijij (11)
nj vvvvA ,...,..., 21
nJ ,...3,2,1 where J is related to the benefit criteria
nJ ,...3,2,1' where 'J is related to the cost criteria
Step 5 Calculation of the separation measure. The separation of each option from the ideal positive one is
given by
2
jiji VVS (12)
where mi ,...3,2,1
Similarly, the separation of each option from the ideal negative one is given by:
2
jiji VVS (13)
ijA
ijx
R. Nyaoga et al. / Decision Science Letters 5 (2016)
437
where mi ,...3,2,1
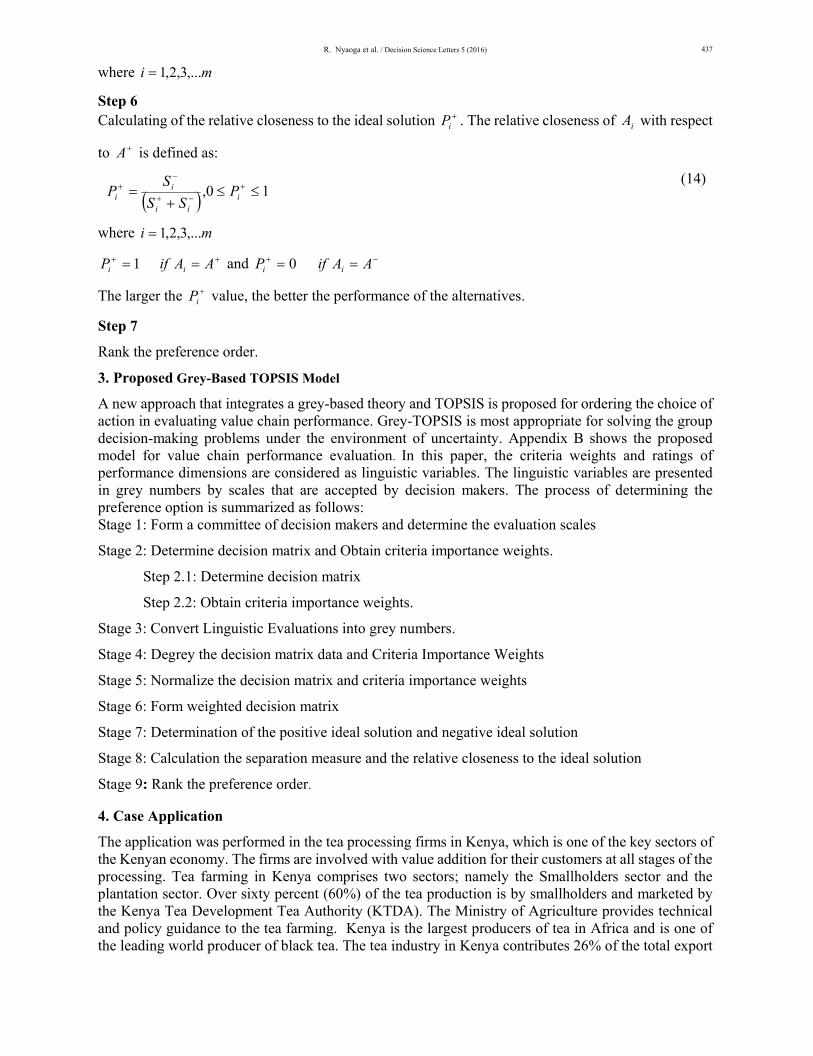
Step 6 Calculating of the relative closeness to the ideal solution
iP . The relative closeness of iA with respect
to A is defined as:
10,
iii
ii P
SS
SP
(14)
where mi ,...3,2,1
AAifP ii 1 and AAifP ii 0
The larger the iP value, the better the performance of the alternatives.
Step 7
Rank the preference order.
3. Proposed Grey-Based TOPSIS Model
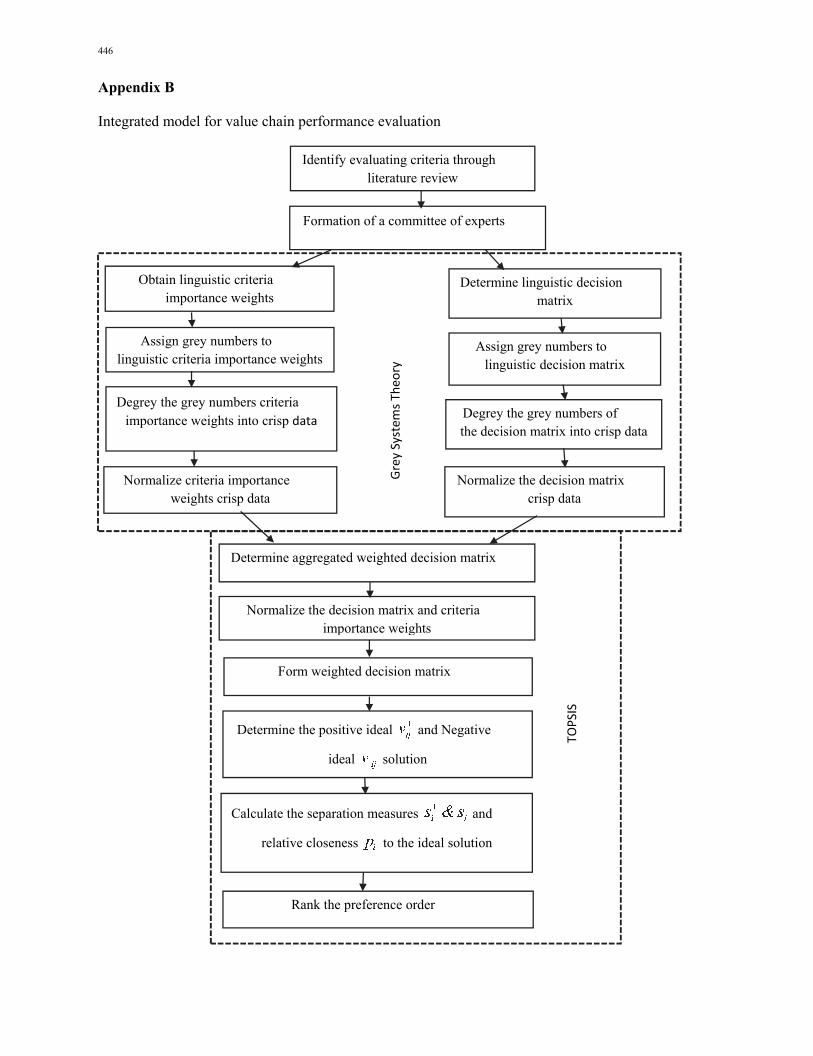
A new approach that integrates a grey-based theory and TOPSIS is proposed for ordering the choice of action in evaluating value chain performance. Grey-TOPSIS is most appropriate for solving the group decision-making problems under the environment of uncertainty. Appendix B shows the proposed model for value chain performance evaluation. In this paper, the criteria weights and ratings of performance dimensions are considered as linguistic variables. The linguistic variables are presented in grey numbers by scales that are accepted by decision makers. The process of determining the preference option is summarized as follows: Stage 1: Form a committee of decision makers and determine the evaluation scales
Stage 2: Determine decision matrix and Obtain criteria importance weights.
Step 2.1: Determine decision matrix
Step 2.2: Obtain criteria importance weights.
Stage 3: Convert Linguistic Evaluations into grey numbers.
Stage 4: Degrey the decision matrix data and Criteria Importance Weights
Stage 5: Normalize the decision matrix and criteria importance weights
Stage 6: Form weighted decision matrix
Stage 7: Determination of the positive ideal solution and negative ideal solution
Stage 8: Calculation the separation measure and the relative closeness to the ideal solution
Stage 9: Rank the preference order. 4. Case Application
The application was performed in the tea processing firms in Kenya, which is one of the key sectors of the Kenyan economy. The firms are involved with value addition for their customers at all stages of the processing. Tea farming in Kenya comprises two sectors; namely the Smallholders sector and the plantation sector. Over sixty percent (60%) of the tea production is by smallholders and marketed by the Kenya Tea Development Tea Authority (KTDA). The Ministry of Agriculture provides technical and policy guidance to the tea farming. Kenya is the largest producers of tea in Africa and is one of the leading world producer of black tea. The tea industry in Kenya contributes 26% of the total export
438
earnings, 8% of the total employment and 4% of the Gross Domestic Product (GDP). Even though new technologies have been introduced in tea picking, over 90% of tea in Kenya is handpicked. Kenyan tea is Exported to countries like the UK, Russian Federation, USA, Pakistan, Iraq, Egypt, and the United Arab Emirates (“www.teaboard.or.ke,” n.d.). The industry contributes to environmental conservation through improved water infiltration, reduced soil erosion and reduces energy consumption (“www.tearesearch.or.ke,” n.d.).
Over the years, the tea farming in Kenya has made significant strides in tea variety improvement, technologies in plant nutrition management, better agricultural and tea manufacturing practices, pests and disease control techniques, and sensitization on benefits of tea branding. Efforts for cost-cutting technologies like cost effective and environmentally friendly, alternative sources of energy cost efficient tea harvesting, and processing techniques have also been developed. Despite these developments, Kenya has continued to be a producer of processed tea with little product differentiation and less value addition that has hindered growth in profitability and meeting the shareholders’ needs and expectations. Therefore, the various constraints that affect productivity, quality, customer satisfaction, and environmental conservation were investigated to determine their influence on value chain performance. The grey-based TOPSIS model is applied as follows
Stage 1: Form a committee of decision makers and determine the evaluation scales.
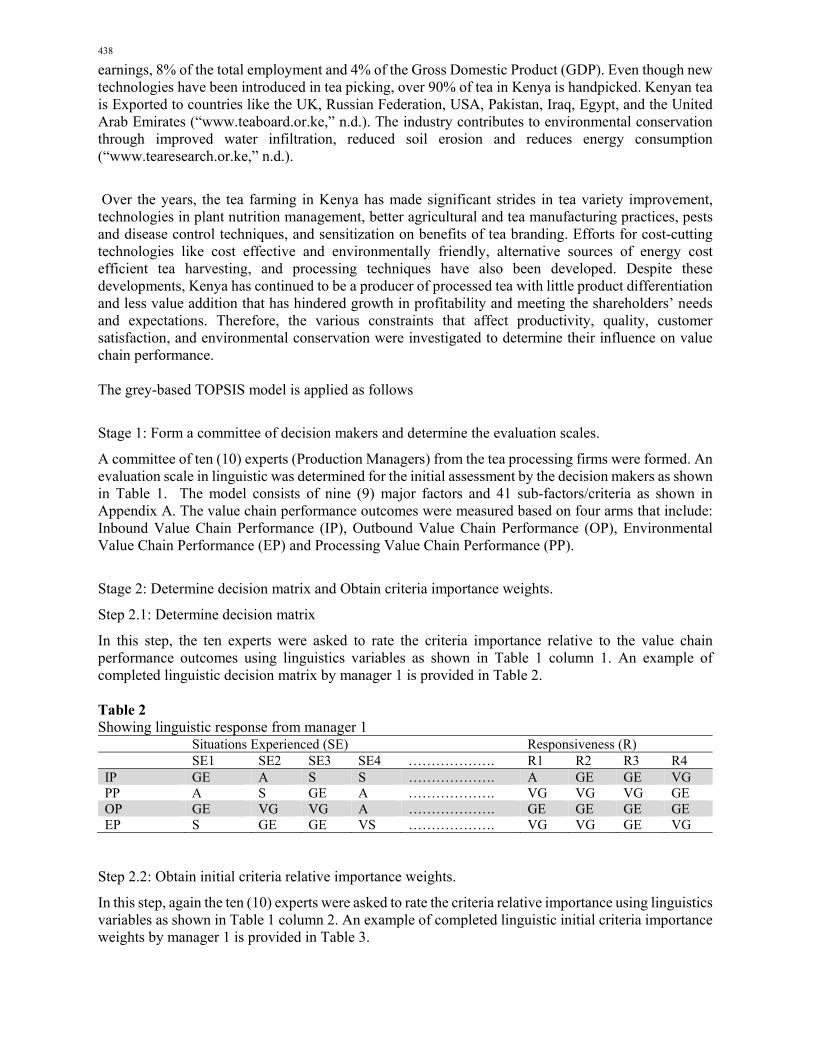
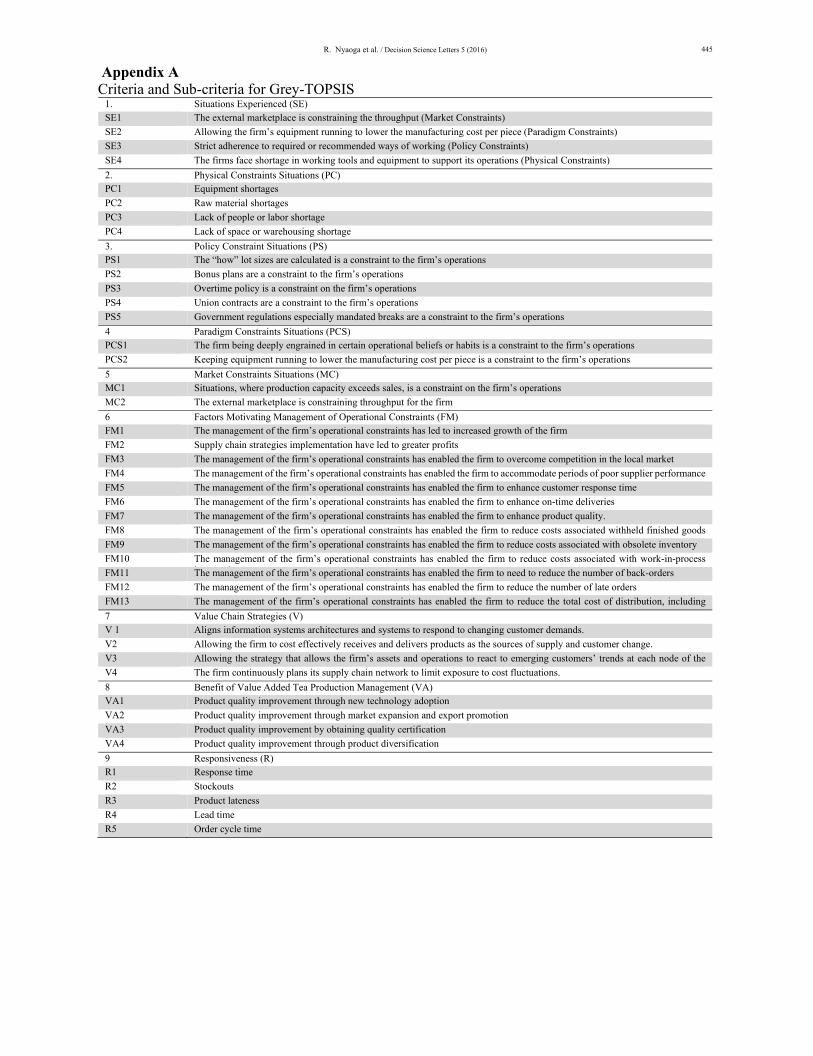
A committee of ten (10) experts (Production Managers) from the tea processing firms were formed. An evaluation scale in linguistic was determined for the initial assessment by the decision makers as shown in Table 1. The model consists of nine (9) major factors and 41 sub-factors/criteria as shown in Appendix A. The value chain performance outcomes were measured based on four arms that include: Inbound Value Chain Performance (IP), Outbound Value Chain Performance (OP), Environmental Value Chain Performance (EP) and Processing Value Chain Performance (PP).
Stage 2: Determine decision matrix and Obtain criteria importance weights.
Step 2.1: Determine decision matrix
In this step, the ten experts were asked to rate the criteria importance relative to the value chain performance outcomes using linguistics variables as shown in Table 1 column 1. An example of completed linguistic decision matrix by manager 1 is provided in Table 2.
Table 2 Showing linguistic response from manager 1 Situations Experienced (SE) Responsiveness (R) SE1 SE2 SE3 SE4 ………………. R1 R2 R3 R4 IP GE A S S ………………. A GE GE VG PP A S GE A ………………. VG VG VG GE OP GE VG VG A ………………. GE GE GE GE EP S GE GE VS ………………. VG VG GE VG
Step 2.2: Obtain initial criteria relative importance weights.
In this step, again the ten (10) experts were asked to rate the criteria relative importance using linguistics variables as shown in Table 1 column 2. An example of completed linguistic initial criteria importance weights by manager 1 is provided in Table 3.
R. Nyaoga et al. / Decision Science Letters 5 (2016)
439
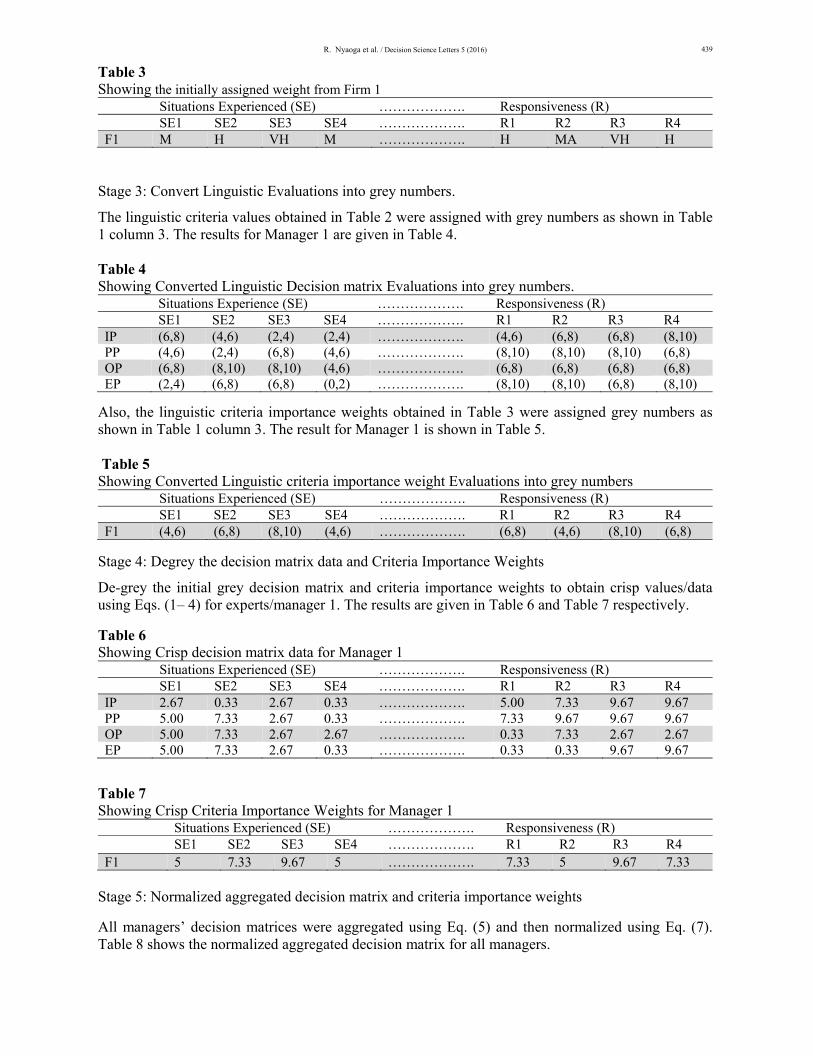
Table 3 Showing the initially assigned weight from Firm 1 Situations Experienced (SE) ………………. Responsiveness (R) SE1 SE2 SE3 SE4 ………………. R1 R2 R3 R4 F1 M H VH M ………………. H MA VH H
Stage 3: Convert Linguistic Evaluations into grey numbers.
The linguistic criteria values obtained in Table 2 were assigned with grey numbers as shown in Table 1 column 3. The results for Manager 1 are given in Table 4. Table 4 Showing Converted Linguistic Decision matrix Evaluations into grey numbers. Situations Experience (SE) ………………. Responsiveness (R) SE1 SE2 SE3 SE4 ………………. R1 R2 R3 R4 IP (6,8) (4,6) (2,4) (2,4) ………………. (4,6) (6,8) (6,8) (8,10) PP (4,6) (2,4) (6,8) (4,6) ………………. (8,10) (8,10) (8,10) (6,8) OP (6,8) (8,10) (8,10) (4,6) ………………. (6,8) (6,8) (6,8) (6,8) EP (2,4) (6,8) (6,8) (0,2) ………………. (8,10) (8,10) (6,8) (8,10)
Also, the linguistic criteria importance weights obtained in Table 3 were assigned grey numbers as shown in Table 1 column 3. The result for Manager 1 is shown in Table 5. Table 5 Showing Converted Linguistic criteria importance weight Evaluations into grey numbers Situations Experienced (SE) ………………. Responsiveness (R) SE1 SE2 SE3 SE4 ………………. R1 R2 R3 R4 F1 (4,6) (6,8) (8,10) (4,6) ………………. (6,8) (4,6) (8,10) (6,8)
Stage 4: Degrey the decision matrix data and Criteria Importance Weights
De-grey the initial grey decision matrix and criteria importance weights to obtain crisp values/data using Eqs. (1– 4) for experts/manager 1. The results are given in Table 6 and Table 7 respectively.
Table 6 Showing Crisp decision matrix data for Manager 1 Situations Experienced (SE) ………………. Responsiveness (R) SE1 SE2 SE3 SE4 ………………. R1 R2 R3 R4 IP 2.67 0.33 2.67 0.33 ………………. 5.00 7.33 9.67 9.67 PP 5.00 7.33 2.67 0.33 ………………. 7.33 9.67 9.67 9.67 OP 5.00 7.33 2.67 2.67 ………………. 0.33 7.33 2.67 2.67 EP 5.00 7.33 2.67 0.33 ………………. 0.33 0.33 9.67 9.67
Table 7 Showing Crisp Criteria Importance Weights for Manager 1 Situations Experienced (SE) ………………. Responsiveness (R) SE1 SE2 SE3 SE4 ………………. R1 R2 R3 R4 F1 5 7.33 9.67 5 ………………. 7.33 5 9.67 7.33
Stage 5: Normalized aggregated decision matrix and criteria importance weights
All managers’ decision matrices were aggregated using Eq. (5) and then normalized using Eq. (7). Table 8 shows the normalized aggregated decision matrix for all managers.
440
Table 8 Showing normalized aggregated decision matrix Situations Experienced (SE) ………………. Responsiveness (R) SE1 SE2 SE3 SE4 ………………. R1 R2 R3 R4 IP 0.15 0.13 0.17 0.09 ………………. 0.19 0.21 0.21 0.19 PP 0.18 0.13 0.14 0.07 ………………. 0.19 0.19 0.21 0.20 OP 0.19 0.19 0.16 0.04 ………………. 0.19 0.20 0.16 0.19 EP 0.12 0.16 0.17 0.09 ………………. 0.20 0.20 0.19 0.21
All managers’ criteria importance weights aggregated using Eq. (5) and then normalized using Eq. (9).
Table 9 shows the normalized aggregated criteria importance weights for all managers.
Table 9 Normalized aggregated criteria importance weights Situations Experienced (SE) ………………. Responsiveness (R) SE1 SE2 SE3 SE4 ………………. R1 R2 R3 R4 Normalized weights
0.023 0.024 0.026 0.019 ………………. 0.031 0.029 0.030 0.031
Stage 6: Weighted Normalized decision matrix
Obtain the weighted normalized decision matrix by multiplying the normalized aggregated criteria importance weights (Table 9) with respective corresponding criteria columns (Table 8) using Eq. (8). The result is shown in Table 10.
Table 10 Showing Weighted Normalized Situations Experienced (SE) ………………. Responsiveness (R) SE1 SE2 SE3 SE4 ………………. R1 R2 R3 R4 IP 0.0034 0.0032 0.0043 0.0018 ………………. 0.0057 0.0061 0.0063 0.0059 PP 0.0042 0.0032 0.0036 0.0014 ………………. 0.0059 0.0056 0.0063 0.0061 OP 0.0044 0.0046 0.0041 0.0008 ………………. 0.0058 0.0058 0.0048 0.0060 EP 0.0029 0.0039 0.0044 0.0017 ………………. 0.0061 0.0058 0.0056 0.0063
Stage 7: Determination of the positive ideal and negative ideal solutions
The positive ideal solutions ijV and negative ideal solutions
ijV are determined from Eq. (10) and Eq.
(11) respectively as shown in Table 11. Table 11 The positive ideal and negative ideal solutions Situations Experienced (SE) Responsiveness (R) SE1 SE2 SE3 SE4 ………………. R1 R2 R3 R4
ijV 0.0044 0.0046 0.0044 0.0018 ………………. 0.0061 0.0061 0.0063 0.0063
ijV 0.0029 0.0032 0.0036 0.0008 ………………. 0.0057 0.0056 0.0048 0.0059
Stage 8: Calculation of the separation measures and the relative closeness to the ideal solution Pi+.
The separation measures are calculated using the -dimensional Euclidean distance. The separation measure
iS of each option is calculated using Eq. (12) and the separation measure iS of each option is
calculated using Eq. (13). The relative closeness to the ideal solution iP is calculated using Eq. (14)
R. Nyaoga et al. / Decision Science Letters 5 (2016)
441
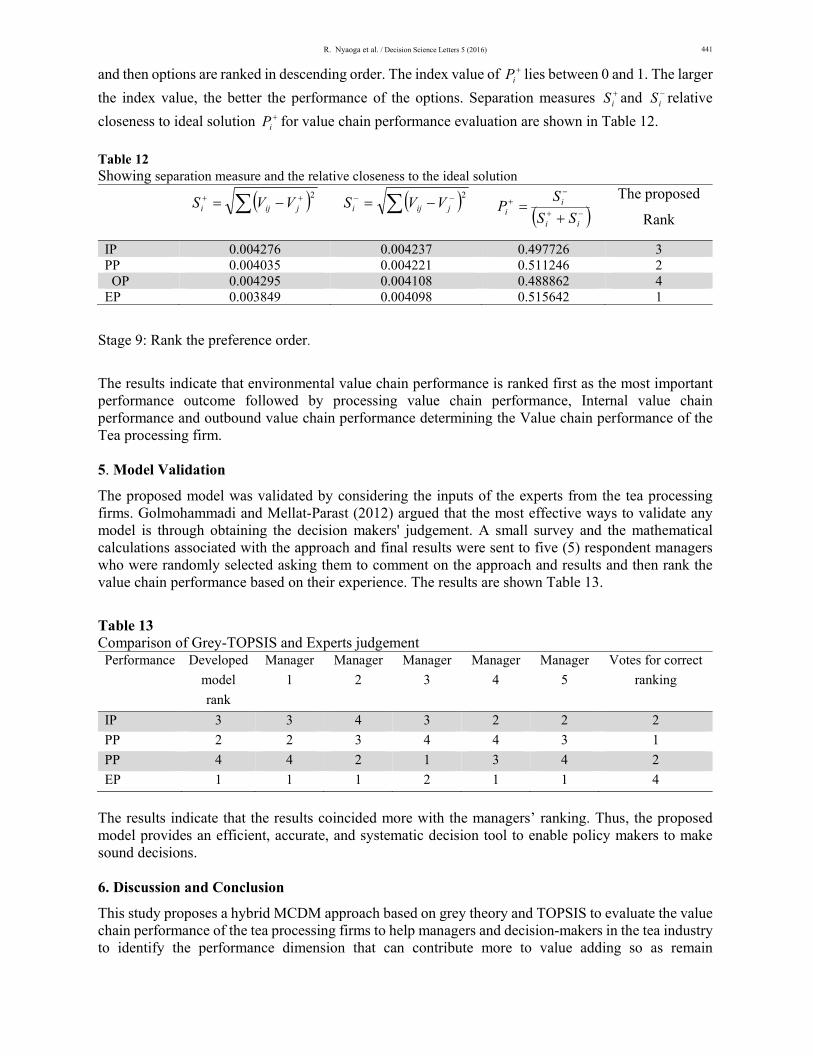
and then options are ranked in descending order. The index value of iP lies between 0 and 1. The larger
the index value, the better the performance of the options. Separation measures iS and
iS relative
closeness to ideal solution iP for value chain performance evaluation are shown in Table 12.
Table 12 Showing separation measure and the relative closeness to the ideal solution
2
jiji VVS 2
jiji VVS
ii
ii SS
SP
The proposed
Rank
IP 0.004276 0.004237 0.497726 3 PP 0.004035 0.004221 0.511246 2 OP 0.004295 0.004108 0.488862 4 EP 0.003849 0.004098 0.515642 1
Stage 9: Rank the preference order.
The results indicate that environmental value chain performance is ranked first as the most important performance outcome followed by processing value chain performance, Internal value chain performance and outbound value chain performance determining the Value chain performance of the Tea processing firm. 5. Model Validation
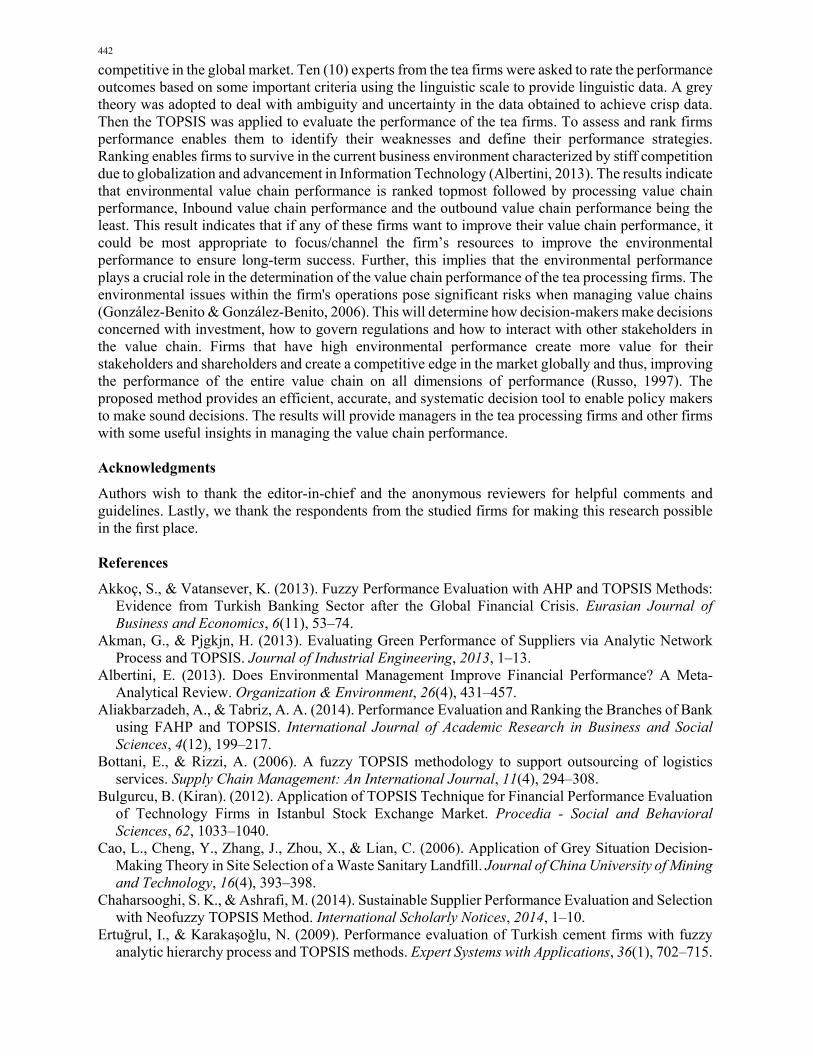
The proposed model was validated by considering the inputs of the experts from the tea processing firms. Golmohammadi and Mellat-Parast (2012) argued that the most effective ways to validate any model is through obtaining the decision makers' judgement. A small survey and the mathematical calculations associated with the approach and final results were sent to five (5) respondent managers who were randomly selected asking them to comment on the approach and results and then rank the value chain performance based on their experience. The results are shown Table 13.
Table 13 Comparison of Grey-TOPSIS and Experts judgement Performance Developed
model
rank
Manager
1
Manager
2
Manager
3
Manager
4
Manager
5
Votes for correct
ranking
IP 3 3 4 3 2 2 2
PP 2 2 3 4 4 3 1
PP 4 4 2 1 3 4 2
EP 1 1 1 2 1 1 4
The results indicate that the results coincided more with the managers’ ranking. Thus, the proposed model provides an efficient, accurate, and systematic decision tool to enable policy makers to make sound decisions. 6. Discussion and Conclusion
This study proposes a hybrid MCDM approach based on grey theory and TOPSIS to evaluate the value chain performance of the tea processing firms to help managers and decision-makers in the tea industry to identify the performance dimension that can contribute more to value adding so as remain
442
competitive in the global market. Ten (10) experts from the tea firms were asked to rate the performance outcomes based on some important criteria using the linguistic scale to provide linguistic data. A grey theory was adopted to deal with ambiguity and uncertainty in the data obtained to achieve crisp data. Then the TOPSIS was applied to evaluate the performance of the tea firms. To assess and rank firms performance enables them to identify their weaknesses and define their performance strategies. Ranking enables firms to survive in the current business environment characterized by stiff competition due to globalization and advancement in Information Technology (Albertini, 2013). The results indicate that environmental value chain performance is ranked topmost followed by processing value chain performance, Inbound value chain performance and the outbound value chain performance being the least. This result indicates that if any of these firms want to improve their value chain performance, it could be most appropriate to focus/channel the firm’s resources to improve the environmental performance to ensure long-term success. Further, this implies that the environmental performance plays a crucial role in the determination of the value chain performance of the tea processing firms. The environmental issues within the firm's operations pose significant risks when managing value chains (González-Benito & González-Benito, 2006). This will determine how decision-makers make decisions concerned with investment, how to govern regulations and how to interact with other stakeholders in the value chain. Firms that have high environmental performance create more value for their stakeholders and shareholders and create a competitive edge in the market globally and thus, improving the performance of the entire value chain on all dimensions of performance (Russo, 1997). The proposed method provides an efficient, accurate, and systematic decision tool to enable policy makers to make sound decisions. The results will provide managers in the tea processing firms and other firms with some useful insights in managing the value chain performance. Acknowledgments
Authors wish to thank the editor-in-chief and the anonymous reviewers for helpful comments and guidelines. Lastly, we thank the respondents from the studied firms for making this research possible in the first place. References
Akkoç, S., & Vatansever, K. (2013). Fuzzy Performance Evaluation with AHP and TOPSIS Methods: Evidence from Turkish Banking Sector after the Global Financial Crisis. Eurasian Journal of Business and Economics, 6(11), 53–74.
Akman, G., & Pjgkjn, H. (2013). Evaluating Green Performance of Suppliers via Analytic Network Process and TOPSIS. Journal of Industrial Engineering, 2013, 1–13.
Albertini, E. (2013). Does Environmental Management Improve Financial Performance? A Meta-Analytical Review. Organization & Environment, 26(4), 431–457.
Aliakbarzadeh, A., & Tabriz, A. A. (2014). Performance Evaluation and Ranking the Branches of Bank using FAHP and TOPSIS. International Journal of Academic Research in Business and Social Sciences, 4(12), 199–217.
Bottani, E., & Rizzi, A. (2006). A fuzzy TOPSIS methodology to support outsourcing of logistics services. Supply Chain Management: An International Journal, 11(4), 294–308.
Bulgurcu, B. (Kiran). (2012). Application of TOPSIS Technique for Financial Performance Evaluation of Technology Firms in Istanbul Stock Exchange Market. Procedia - Social and Behavioral Sciences, 62, 1033–1040.
Cao, L., Cheng, Y., Zhang, J., Zhou, X., & Lian, C. (2006). Application of Grey Situation Decision-Making Theory in Site Selection of a Waste Sanitary Landfill. Journal of China University of Mining and Technology, 16(4), 393–398.
Chaharsooghi, S. K., & Ashrafi, M. (2014). Sustainable Supplier Performance Evaluation and Selection with Neofuzzy TOPSIS Method. International Scholarly Notices, 2014, 1–10.
Ertuǧrul, I., & Karakaşoǧlu, N. (2009). Performance evaluation of Turkish cement firms with fuzzy analytic hierarchy process and TOPSIS methods. Expert Systems with Applications, 36(1), 702–715.
R. Nyaoga et al. / Decision Science Letters 5 (2016)
443
Esfandiari, M., & Rizvandi, M. (2014). An application of TOPSIS method for ranking different strategic planning methodology. Management Science Letters, 4(7), 1445–1448.
Golmohammadi, D., & Mellat-Parast, M. (2012). Developing a grey-based decision-making model for supplier selection. International Journal of Production Economics, 137(2), 191–200.
González-Benito, J., & González-Benito, Ó. (2006). A review of determinant factors of environmental proactivity. Business Strategy and the Environment, 15, 87–102.
Gunasekaran, A., Patel, C., & McGaughey, R. E. (2004). A framework for supply chain performance measurement. International Journal of Production Economics, 87(3), 333–347.
Hwang, C.-L., & Yoon, K. (1981). Multiple attributes decision making methods and applications (1st ed.). Berlin: Springer.
Jadidi, O., Yusuff, R. M., Firouzi, F., & Hong, T. S. (2008). Improvement of a Grey Based Method for supplier selection problem. Journal of Achievement in Materials and Manufacturing Engineering, 31(2), 770–777.
Jahanshahloo, G. R., Lotfi, F. H., & Izadikhah, M. (2006). Extension of the TOPSIS method for decision-making problems with fuzzy data. Applied Mathematics and Computation, 181(2), 1544–1551.
Ji Shukla, O., Soni, G., & Anand, G. (2014). An application of grey based decision making approach for the selection of manufacturing system. Grey Systems: Theory and Application, 4(3), 447–462.
Julong, D. (1982). Control problems of grey system. Syst. Control Lett, 1(5), 288–294. Julong, D. (1989). Introduction to Grey System Theory. The Journal of Grey System1, 1, 1–24. Karaveg, C., Thawesaengskulthai, N., & Chandrachai, A. (2015). A combined technique using SEM
and TOPSIS for the commercialization capability of R&D project evaluation. Decision Science Letters, 4(3), 379–396.
Karimi, M., Azizi, M., Javanshir, H., & Ghomi Fatemi, S. M. T. (2015). A hybrid approach based on SERVQUAL and fuzzy TOPSIS for evaluating transportation service quality. Decision Science Letters, 4(3), 349–362.
Kazan, H., & Ozdemir, O. (2014). Financial Performance Assessment of Large Conglomerates Via TOPSIS and CRITIC Methods. International Journal of Management and Sustainability, 3(4), 203–224.
Kia, S., Danaei, A., & Oroei, M. (2014). An application of fuzzy TOPSIS on ranking products: A case study of faucet devices. Decision Science Letters, 3(1), 43–48.
Kung, C. Y., & Wen, K. L. (2007). Applying Grey Relational Analysis and Grey Decision-Making to evaluate the relationship between company attributes and its financial performance-A case study of venture capital enterprises in Taiwan. Decision Support Systems, 43(3), 842–852. http://doi.org/10.1016/j.dss.2006.12.012
Kuo, Y., Yang, T., & Huang, G. W. (2008). The use of grey relational analysis in solving multiple attribute decision-making problems. Computers and Industrial Engineering, 55(1), 80–93.
Li, G.-D., Yamaguchi, D., & Nagai, M. (2007). A grey-based decision-making approach to the supplier selection problem. Mathematical and Computer Modelling, 46(3-4), 573–581.
Liao, C.-N., & Kao, H.-P. (2011). An integrated fuzzy TOPSIS and MCGP approach to supplier selection in supply chain management. Expert Systems with Applications, 38(9), 10803–10811.
Mishra, S., Datta, S., & Mahapatra, S. S. (2013). Grey-based and fuzzy TOPSIS decision-making approach for agility evaluation of mass customization systems. Benchmarking: An International Journal, 20(4), 440–462.
Monjezi, M., Dehghani, H., Singh, T. N., Sayadi, A. R., & Gholinejad, A. (2012). Application of TOPSIS method for selecting the most appropriate blast design. Arabian Journal of Geosciences, 5, 95–101.
Önder, E., Taş, N., & Hepşen, A. (2010). Performance Evaluation of Turkish Banks Using Analytical Hierarchy Process and TOPSIS method. Journal of International Scientific Publication: Economy & Business, 7(1), 470–503.
Roghanian, E., Sheykhan, A., & Sayyad Abendankashi, E. (2014). An application of fuzzy TOPSIS to improve the process of supply chain management in the food industries: A case study of protein
444
products manufacturing company. Decision Science Letters, 3(1), 17–26. Rostamzadeh, R., Sabaghi, M., & Esmaili, A. (2013). Evaluation of cost-effectiveness criteria in supply
chain management: Case study. Advances in Decision Sciences, 2013(c). Russo, M. V. (1997). A Resource-Based Perspective on Corporate Environmental Performance and
Profitability. Academy of Management Journal, 40(3), 534–559. Sadeghi, M., & Razavi, S. H. (2013). Application of Grey TOPSIS in Preference Ordering of Action
Plans in Balanced Scorecard and Strategy Map. INFORMATICA, 24(4), 619–635. Shahroudi, K., & Tonekaboni, S. M. S. (2012). Application of TOPSIS Method to Supplier Selection
in Iran Auto Supply Chain. Journal of Strategic Management, 12(1), 123–131. Shih, H. S., Shyur, H. J., & Lee, E. S. (2007). An extension of TOPSIS for group decision making.
Mathematical and Computer Modelling, 45(7-8), 801–813. Sohani, N., & Sharma, P. (2013). Analyzing the Performance of Supply Chain using TOPSIS.
International Journal of Science and Research, 2(4), 221–224. Sun, C. C. (2010). A performance evaluation model by integrating fuzzy AHP and fuzzy TOPSIS
methods. Expert Systems with Applications, 37(12), 7745–7754. Wang, Y.-M., & Elhag, T. M. S. (2006). Fuzzy TOPSIS method based on alpha level sets with an
application to bridge risk assessment. Expert Systems with Applications, 31(2), 309–319. Wu, M. (2007). TOPSIS-AHP simulation model and its application to supply chain management∗.
World Journal of Modelling and Simulation, 3(3), 196–201. www.teaboard.or.ke. (n.d.). www.tearesearch.or.ke. (n.d.). Zaeri, M. S., Sadeghi, A., Naderi, A., & Kalanaki, A. (2011). Application of multi-criteria decision
making technique to evaluation suppliers in supply chain management. African Journal of Mathematics and Computer Science Research, 4(3), 100–106.
Zhang, H. (2008). Supply Chain Overall Risk Evaluation Based on Grey Theory and Modified TOPSIS in Fuzzy Environment. 2008 International Conference on Intelligent Computation Technology and Automation (ICICTA), 2, 706–711.
Zhang, J., Wu, D., & Olson, D. L. (2005). The method of grey related analysis to multiple attribute decision making problems with interval numbers. Mathematical and Computer Modelling, 42(9-10), 991–998.
R. Nyaoga et al. / Decision Science Letters 5 (2016)
445
Appendix A Criteria and Sub-criteria for Grey-TOPSIS
1. Situations Experienced (SE) SE1 The external marketplace is constraining the throughput (Market Constraints)
SE2 Allowing the firm’s equipment running to lower the manufacturing cost per piece (Paradigm Constraints)
SE3 Strict adherence to required or recommended ways of working (Policy Constraints)
SE4 The firms face shortage in working tools and equipment to support its operations (Physical Constraints)
2. Physical Constraints Situations (PC) PC1 Equipment shortages
PC2 Raw material shortages
PC3 Lack of people or labor shortage
PC4 Lack of space or warehousing shortage
3. Policy Constraint Situations (PS) PS1 The “how” lot sizes are calculated is a constraint to the firm’s operations
PS2 Bonus plans are a constraint to the firm’s operations
PS3 Overtime policy is a constraint on the firm’s operations
PS4 Union contracts are a constraint to the firm’s operations
PS5 Government regulations especially mandated breaks are a constraint to the firm’s operations
4 Paradigm Constraints Situations (PCS) PCS1 The firm being deeply engrained in certain operational beliefs or habits is a constraint to the firm’s operations
PCS2 Keeping equipment running to lower the manufacturing cost per piece is a constraint to the firm’s operations
5 Market Constraints Situations (MC) MC1 Situations, where production capacity exceeds sales, is a constraint on the firm’s operations
MC2 The external marketplace is constraining throughput for the firm
6 Factors Motivating Management of Operational Constraints (FM) FM1 The management of the firm’s operational constraints has led to increased growth of the firm
FM2 Supply chain strategies implementation have led to greater profits
FM3 The management of the firm’s operational constraints has enabled the firm to overcome competition in the local market
FM4 The management of the firm’s operational constraints has enabled the firm to accommodate periods of poor supplier performance
FM5 The management of the firm’s operational constraints has enabled the firm to enhance customer response time
FM6 The management of the firm’s operational constraints has enabled the firm to enhance on-time deliveries
FM7 The management of the firm’s operational constraints has enabled the firm to enhance product quality.
FM8 The management of the firm’s operational constraints has enabled the firm to reduce costs associated withheld finished goods i iFM9 The management of the firm’s operational constraints has enabled the firm to reduce costs associated with obsolete inventory
FM10 The management of the firm’s operational constraints has enabled the firm to reduce costs associated with work-in-process i iFM11 The management of the firm’s operational constraints has enabled the firm to need to reduce the number of back-orders
FM12 The management of the firm’s operational constraints has enabled the firm to reduce the number of late orders
FM13 The management of the firm’s operational constraints has enabled the firm to reduce the total cost of distribution, including i d h dli7 Value Chain Strategies (V)
V 1 Aligns information systems architectures and systems to respond to changing customer demands.
V2 Allowing the firm to cost effectively receives and delivers products as the sources of supply and customer change.
V3 Allowing the strategy that allows the firm’s assets and operations to react to emerging customers’ trends at each node of the l h iV4 The firm continuously plans its supply chain network to limit exposure to cost fluctuations.
8 Benefit of Value Added Tea Production Management (VA) VA1 Product quality improvement through new technology adoption
VA2 Product quality improvement through market expansion and export promotion
VA3 Product quality improvement by obtaining quality certification
VA4 Product quality improvement through product diversification
9 Responsiveness (R) R1 Response time
R2 Stockouts
R3 Product lateness
R4 Lead time
R5 Order cycle time
446
Appendix B
Integrated model for value chain performance evaluation
Formation of a committee of experts
Identify evaluating criteria through literature review
Obtain linguistic criteria importance weights
Assign grey numbers to linguistic criteria importance weights
Assign grey numbers to linguistic decision matrix
Determine linguistic decision matrix
Degrey the grey numbers criteria importance weights into crisp data
Normalize criteria importance weights crisp data
Determine aggregated weighted decision matrix
Normalize the decision matrix and criteria importance weights
Degrey the grey numbers of the decision matrix into crisp data
Normalize the decision matrix crisp data
Form weighted decision matrix
and Negative Determine the positive ideal
solutionideal
and Calculate the separation measures
to the ideal solution relative closeness
Rank the preference order
Grey System
s Theo
ry
TOPSIS


![Arbaeen'e Razavi [Urdu]](https://img.pdfslide.net/doc/110x75/577cdeb51a28ab9e78afa861/arbaeene-razavi-urdu.jpg)